compositing semiconductor photocatalysts and their
TRANSCRIPT

International Journal of Photoenergy
Compositing Semiconductor Photocatalysts and Their Microstructure ModulationGuest Editors: Baibiao Huang, Stéphane Jobic, Xuxu Wang, and Weifeng Yao

Compositing Semiconductor Photocatalysts andTheir Microstructure Modulation

International Journal of Photoenergy
Compositing Semiconductor Photocatalysts andTheir Microstructure Modulation
Guest Editors: Baibiao Huang, Stephane Jobic, Xuxu Wang,and Weifeng Yao

Copyright © 2012 Hindawi Publishing Corporation. All rights reserved.
This is a special issue published in “International Journal of Photoenergy.” All articles are open access articles distributed under theCreative Commons Attribution License, which permits unrestricted use, distribution, and reproduction in any medium, provided theoriginal work is properly cited.

Editorial Board
Mohamed Abdel-Mottaleb, EgyptNihal Ahmad, USANicolas Alonso-Vante, FranceWayne A. Anderson, USAVincenzo Augugliaro, ItalyDetlef W. Bahnemann, GermanyMohammad A. Behnajady, IranIgnazio Renato Bellobono, ItalyRaghu N. Bhattacharya, USAGion Calzaferri, SwitzerlandAdriana G. Casas, ArgentinaWonyong Choi, KoreaVera Cimrova, Czech RepublicVikram L. Dalal, USADionysios D. Dionysiou, USAMahmoud M. El-Nahass, EgyptAhmed Ennaoui, GermanyDavid Ginley, USABeverley Glass, AustraliaJuozas Grazulevicius, LithuaniaShinya Higashimoto, JapanYadong Jiang, China
Shahed Khan, USACooper H. Langford, CanadaYuexiang Li, ChinaStefan Lis, PolandNiyaz M. Mahmoodi, IranDionissios Mantzavinos, GreeceUgo Mazzucato, ItalyJacek Miller, PolandKazuhiko Mizuno, JapanJarugu N. Moorthy, IndiaFranca Morazzoni, ItalyFabrice Morlet-Savary, FranceEbinazar B. Namdas, AustraliaMaria da Graca P. Neves, PortugalLeonidas Palilis, GreeceLeonardo Palmisano, ItalyRavindra K. Pandey, USADavid Lee Phillips, Hong KongPierre Pichat, FranceXie Quan, ChinaTijana Rajh, USAPeter Robertson, UK
Avigdor Scherz, IsraelLukas Schmidt-Mende, GermanyPanagiotis Smirniotis, USAZofia Stasicka, PolandJuliusz Sworakowski, PolandNobuyuki Tamaoki, JapanGopal N. Tiwari, IndiaNikolai V. Tkachenko, FinlandVeronica Vaida, USARoel van De Krol, The NetherlandsMark van Der Auweraer, BelgiumMan Shing Wong, Hong KongDavid Worrall, UKF. Yakuphanoglu, TurkeyMinjoong Yoon, KoreaHongtao Yu, USAJimmy C. Yu, Hong KongKlaas Zachariasse, GermanyLizhi Zhang, ChinaJincai Zhao, China
Contents
Compositing Semiconductor Photocatalysts and Their Microstructure Modulation, Baibiao Huang,Stephane Jobic, Xuxu Wang, and Weifeng YaoVolume 2012, Article ID 595021, 4 pages
Nitrogen Incorporation in TiO2: Does It Make a Visible Light Photo-Active Material?,B. Viswanathan and K. R. KrishanmurthyVolume 2012, Article ID 269654, 10 pages
Simultaneous Elimination of Formaldehyde and Ozone Byproduct Using Noble Metal Modified TiO2
Films in the Gaseous VUV Photocatalysis, Pingfeng Fu, Pengyi Zhang, and Jia LiVolume 2012, Article ID 174862, 8 pages
Synthesis of Neutral SiO2/TiO2 Hydrosol and Its Application as Antireflective Self-Cleaning Thin Film,Chiahung Huang, Hsunling Bai, Yaoling Huang, Shuling Liu, Shaoi Yen, and Yaohsuan TsengVolume 2012, Article ID 620764, 8 pages
Enhanced Photocatalytic Activity of Hierarchical Macro-Mesoporous Anatase by ZrO2 Incorporation,M. L. Garcıa-Benjume, M. I. Espitia-Cabrera, and M. E. Contreras-GarcıaVolume 2012, Article ID 609561, 10 pages
Doped Titanium Dioxide Films Prepared by Pulsed Laser Deposition Method, Juguang Hu, Huabin Tang,Xiaodong Lin, Zhongkuan Luo, Huiqun Cao, Qiwen Li, Yi Liu, Jinghua Long, and Pei WangVolume 2012, Article ID 758539, 8 pages
Solar Photocatalytic Removal of Chemical and Bacterial Pollutants from Water Using Pt/TiO2-CoatedCeramic Tiles, S. P. Devipriya, Suguna Yesodharan, and E. P. YesodharanVolume 2012, Article ID 970474, 8 pages
Synthesis and Photocatalytic Activity of TiOX Powders with Different Oxygen Defects, Leini Wang,Fei Lu, and Fanming MengVolume 2012, Article ID 208987, 7 pages
The Synthesis of Anatase Nanoparticles and the Preparation of Photocatalytically Active Coatings Basedon Wet Chemical Methods for Self-Cleaning Applications, Dejan Verhovsek, Nika Veronovski,Urska Lavrencic Stangar, Marko Kete, Kristina Zagar, and Miran CehVolume 2012, Article ID 329796, 10 pages
High-Efficiently Photoelectrochemical Hydrogen Production over Zn-Incorporated TiO2 Nanotubes,Gayoung Lee, Min-Kyeong Yeo, Myeong-Heon Um, and Misook KangVolume 2012, Article ID 843042, 10 pages
Statistical Optimization of Operational Parameters for Enhanced Naphthalene Degradation byTiO2/Fe3O4-SiO2 Photocatalyst, Aijuan Zhou, Jing Peng, Zhaobo Chen, Jingwen Du, Zechong Guo,Nanqi Ren, and Aijie WangVolume 2012, Article ID 607283, 9 pages
Photoetching of Immobilized TiO2-ENR50-PVC Composite for Improved Photocatalytic Activity,M. A. Nawi, Y. S. Ngoh, and S. M. ZainVolume 2012, Article ID 859294, 12 pages
Synthesis, Characterization, and Photocatalysis of Fe-Doped TiO2: A Combined Experimental andTheoretical Study, Liping Wen, Baoshun Liu, Xiujian Zhao, Kazuya Nakata, Taketoshi Murakami,and Akira FujishimaVolume 2012, Article ID 368750, 10 pages
Enhanced Photoactivity of Fe + N Codoped Anatase-Rutile TiO2 Nanowire Film under Visible LightIrradiation, Kewei Li, Haiying Wang, Chunxu Pan, Jianhong Wei, Rui Xiong, and Jing ShiVolume 2012, Article ID 398508, 8 pages
Enhanced Visible Light Photocatalytic Activity of V2O5 Cluster Modified N-Doped TiO2 for Degradationof Toluene in Air, Fan Dong, Yanjuan Sun, and Min FuVolume 2012, Article ID 569716, 10 pages
Preparation and Characterization of Visible-Light-Activated Fe-N Co-Doped TiO2 and Its PhotocatalyticInactivation Effect on Leukemia Tumors, Kangqiang Huang, Li Chen, Jianwen Xiong, and Meixiang LiaoVolume 2012, Article ID 631435, 9 pages
Synthesis and Characterization of Iron Oxide Nanoparticles and Applications in the Removal of HeavyMetals from Industrial Wastewater, Zuolian Cheng, Annie Lai Kuan Tan, Yong Tao, Dan Shan,Kok Eng Ting, and Xi Jiang YinVolume 2012, Article ID 608298, 5 pages
Nitrogen-Doped TiO2 Nanotube Arrays with Enhanced Photoelectrochemical Property, Shipu Li,Shiwei Lin, Jianjun Liao, Nengqian Pan, Danhong Li, and Jianbao LiVolume 2012, Article ID 794207, 7 pages
Photocatalytic Activity of Titanate Nanotube Powders in a Hybrid Pollution Control System,Sun-Jae Kim, Young-Seak Lee, Byung Hoon Kim, Seong-Gyu Seo, Sung Hoon Park, and Sang Chul JungVolume 2012, Article ID 901907, 6 pages
Synthesis of Core-Shell Fe3O4@SiO2@TiO2 Microspheres and Their Application as RecyclablePhotocatalysts, Zhenghua Wang, Ling Shen, and Shiyu ZhuVolume 2012, Article ID 202519, 6 pages
Enhanced Hydrogen Production over C-Doped CdO Photocatalyst in Na2S/Na2SO3 Solution underVisible Light Irradiation, Quan Gu, Huaqiang Zhuang, Jinlin Long, Xiaohan An, Huan Lin, Huaxiang Lin,and Xuxu WangVolume 2012, Article ID 857345, 7 pages
Synthesis of Hollow CdS-TiO2 Microspheres with Enhanced Visible-Light Photocatalytic Activity,Yuning Huo, Jia Zhang, Xiaofang Chen, and Hexing LiVolume 2012, Article ID 907290, 5 pages
Effects of Calcination Temperature on Preparation of Boron-Doped TiO2 by Sol-Gel Method,Wenjie Zhang, Bo Yang, and Jinlei ChenVolume 2012, Article ID 528637, 8 pages

Synthesis, Characterization, and Photocatalytic Activity of TiO2 Microspheres Functionalized withPorphyrin, Jin-Hua Cai, Jin-Wang Huang, Han-Cheng Yu, and Liang-Nian JiVolume 2012, Article ID 348292, 10 pages
Preparation and Characterization of (I2)n Sensitized Nanoporous TiO2 with Enhanced PhotocatalyticActivity under Visible-Light Irradiation, Juzheng Zhang, Xin Liu, Shanmin Gao, Quanwen Liu,Baibiao Huang, and Ying DaiVolume 2012, Article ID 536194, 8 pages
Facile Low-Temperature Synthesis of Carbon Nanotube/TiO2 Nanohybrids with EnhancedVisible-Light-Driven Photocatalytic Activity, Yunlong Xie, Huanhuan Qian, Yijun Zhong,Hangming Guo, and Yong HuVolume 2012, Article ID 682138, 6 pages
Preparation, Characterization, and Activity Evaluation of CuO/F-TiO2 Photocatalyst, Zhang Jinfeng,Yang Yunguang, and Liu WeiVolume 2012, Article ID 139739, 9 pages
Facile Preparation and Photoinduced Superhydrophilicity of Highly Ordered Sodium-Free TitanateNanotube Films by Electrophoretic Deposition, Minghua Zhou and Huogen YuVolume 2012, Article ID 830321, 6 pages
Light-Driven Preparation, Microstructure, and Visible-Light Photocatalytic Property of PorousCarbon-Doped TiO2, Xiao-Xin Zou, Guo-Dong Li, Jun Zhao, Juan Su, Xiao Wei, Kai-Xue Wang,Yu-Ning Wang, and Jie-Sheng ChenVolume 2012, Article ID 720183, 9 pages
One-Pot Template-Free Hydrothermal Synthesis of Monoclinic BiVO4 Hollow Microspheres and TheirEnhanced Visible-Light Photocatalytic Activity, Bei Cheng, Wenguang Wang, Lei Shi, Jun Zhang,Jingrun Ran, and Huogen YuVolume 2012, Article ID 797968, 10 pages
Hindawi Publishing CorporationInternational Journal of PhotoenergyVolume 2012, Article ID 595021, 4 pagesdoi:10.1155/2012/595021
Editorial
Compositing Semiconductor Photocatalysts and TheirMicrostructure Modulation
Baibiao Huang,1 Stephane Jobic,2 Xuxu Wang,3 and Weifeng Yao4
1 State Key Lab of Crystal Materials, Shandong University, Jinan 250100, China2 Institut des Materiaux Jean Rouxel, Universite de Nantes, BP 32229, 44322 Nantes Cedex 3, France3 Research Institute of Photocatalysis, Fuzhou University, Fuzhou 350002, China4 College of Energy and Environmental Engineering, Shanghai University of Electric Power, Shanghai 200090, China
Correspondence should be addressed to Baibiao Huang, [email protected]
Received 17 July 2012; Accepted 17 July 2012
Copyright © 2012 Baibiao Huang et al. This is an open access article distributed under the Creative Commons Attribution License,which permits unrestricted use, distribution, and reproduction in any medium, provided the original work is properly cited.
Photocatalytic materials have attracted increasing interestsowing to the potential applications on solving globalenergy and environmental problems. However, the rapidrecombination of photogenerated charge carriers and thelimited spectral response range greatly restricted their furtherdevelopment and practical applications. Compositing semi-conductor photocatalysts, by combining semiconductorswith other materials, can not only effectively expand thevisible-light absorption, but also improve the photogen-erated charge carriers’ separation, which would effectivelysolve the above problems and improve the photocatalyticactivities. Moreover, it also provides a way to develop anefficient photocatalyst by tailoring the band gaps and bandpositions to meet the requirements for specific applications.The microstructures of photocatalysts also greatly affect theirphotocatalytic performances. Therefore, it has become a hottopic in photocatalysis on the synthesis, photocatalytic char-acterization, and microstructure modulation of compositingsemiconductor photocatalysts.
The selected topics and papers in this special issuepresented the recent progresses on the synthesis of composit-ing semiconductor photocatalysts, as well as the practicalapplications on solving energy and environmental problems.Limited by the numbers of the papers,they cannot coverthe whole areas in photocatalysis, but they also provide richinformation and knowledge that we would like to share withthe readers. Moreover, we would like to thank the authorsfor their excellent contributions and patience in assisting us.Finally, the fundamental work of all reviewers on the specialissue is also warmly acknowledged.
The special issue contains twenty-nine papers, whichmainly focused on the synthesis, microstructure modulation,and practical applications of compositing semiconductorphotocatalysts. Among them eight papers are dealing withhetero-structured composite photocatalysts. Five papers arerelated to modified photocatalysts with noble metal or othersensitizing materials. Eleven papers are regarding the dopingor co-doping of wide band gap semiconductor photocata-lysts. Finally, five papers addresses the applications of pho-tocatalysts on solving environmental and energy problems.
In the paper entitled “One-pot template-free hydrothermalsynthesis of monoclinic BiVO4 hollow microspheres and theirenhanced visible-light photocatalytic activity,” B. Cheng et al.present a one-pot template-free hydrothermal synthesis ofBiVO4 hollow microspheres via a localized Ostwald ripeningmechanism. The reaction duration and urea concentrationplayed important roles in the formation of BiVO4 hollowmicrospheres. And photocatalytic properties of BiVO4 undervisible-light irradiation were also discussed.
In the paper entitled “Preparation, characterization, andactivity evaluation of CuO/F-TiO2 photocatalyst,” W. Liuet al. present the synthesis of CuO/F-TiO2 photocatalysts byball milling process. The light absorption range of CuO/F-TiO2 was effectively expanded comparing to pure TiO2. Andthe photocatalytic reduction activity was greatly improvedby increasing the amount of doped p-CuO in CuO/F-TiO2 composites. The effects of ball milling time and thephotocatalytic mechanism were also discussed.
In the paper entitled “Simultaneous elimination of formal-dehyde and ozone byproduct using noble metal modified TiO2
2 International Journal of Photoenergy
films in the gaseous VUV photocatalysis,” P. Y. Zhang et al.present asystematical investigations on the removal of lowconcentration formaldehyde and ozone byproduct in agaseous VUV (vacuum ultraviolet) photocatalytic systemby using noble metal modified TiO2 films. Metallic Pt orAu could reduce the recombination of h+/e− pairs, thus,simultaneously increase the elimination of HCHO andozone, but PdO oxide seemed to inhibit the HCHO oxidationin the UV254nm photocatalysis. And the effects of O3 on thedecomposition of HCHO and ozone under VUV were alsoinvestigated.
In the paper entitled “Synthesis of core-shell Fe3O4@SiO2@TiO2 microspheres and their application as recyclablephotocatalysts,” Z. H. Wang et al. report the fabricationof Fe3O4@SiO2@TiO2 core-shell microspheres through awet-chemical approach. The TiO2 nanoparticles on thesurfaces of microspheres can degrade organic dyes underthe illumination of UV light, and the samples can be easilyseparated from the solution after the photocatalytic processdue to the ferromagnetic Fe3O4 core, which provided a wayto recycle the photocatalysts for practical applications.
In the paper entitled “Synthesis and photocatalytic activ-ity of TiOx powder with different oxygen defects,” F. M.Meng et al. reported the synthesis of TiOx powders bymechanochemical technique and heating process. Carbonand chromium were used to control the degree of oxygenvacancies in TiOx by doping into the TiOx crystal matrix. Thephotocatalytic measurements indicate that the TiOx samplewith 66.93% mass fraction of Ti7O13 is the most efficienton the degradation of MO dye. Moreover, the origin forthe visible-light absorption and the effect of band gap onphotocatalytic activities were also discussed in this paper.
In the paper entitled “Nitrogen incorporation in TiO2—does it make a visible-light photoactive material?,” B. Viswa-nathan et al. examined the state and location of nitrogendoped in TiO2 lattice and the optical absorption induced bynitrogen doping. They found that the surface of N-dopedTiO2 adopted a non-native configuration, while the bulkmaterial was still in the native configuration of pure TiO2.Though N-doped TiO2 showed visible-light response, theimprovement on photocatalytic activity is only marginal inmost of the cases.
In the paper entitled “The synthesis of anatase nanopar-ticles and the preparation of photocatalytically active coatingbased on wet chemical methods for self-cleaning applications,”D. Verhovsek et al. reported an improved sol-gel method forproducing highly photocatalytic anatase TiO2 nanoparticlesand tested the coating for self-cleaning glass and ceramicsurfaces. Both the sol-gel synthesis and the coating prepa-ration are based on a wet chemical process, which providedan economic, facile, and non-toxic process for numerousapplications.
In the paper entitled “Synthesis, characterization, andphotocatalytic activity of TiO2 microspheres functionalizedwith phorphyin”, J.-H.Cai et al. reported a way to expandthe visible-light absorption of TiO2 by loading 5-(4-allylox-y)phenyl-10,15,20-tri(4-methylphenyl)porphyrin (APTMPP)on TiO2 surfaces. The photocatalytic experiment by theoxidation of α-terpinene under visible-light irradiation
indicated the photocatalytic activities were significantlyenhanced in presence of APEMPP-MPS-TiO2 comparedwith the nonmodified TiO2.
In the paper entitled “Synthesis, characterization, andphotocatalysis of Fe-doped TiO2: a combined experimental andtheoretical study,” B. S. Liu et al. prepared Fe-doped TiO2
nanoparticles using hydrothermal method. The photocat-alytic activity of as-prepared Fe-doped TiO2 first increasesand then decreases as the Fe concentration increases. Andthe different effects of bulk dopant and surface dopant onphotocatalytic activity were investigated systematically.
In the paper entitled “Enhanced photoactivity of Fe + NCo-doped anatase-rutile TiO2 nanowire film under visible-light irradiation,” R. Xiong et al. synthesized Fe + N codopedrutile-anatase mix-phase TiO2 nanowires by a two-stepanodic oxidation method. The co doping with nitrogenand iron could enhance the visible-light absorption andimproved the photocatalytic activity of TiO2 nanowires. Thereasons for the increase of photocatalytic activity in the Fe +N codoped sample were also discussed.
In the paper entitled “Effects of calcination temperatureon preparation of boron-doped TiO2 by sol-gel method,” W.J. Zhang et al. present the synthesis of boron-doped TiO2
by a modified sol-gel method. The effects of calcinationtemperature on the properties of the boron-doped TiO2 wereinvestigated. The photocatalytic activity of the samples wereexamined by degradation of methyl orange and the samplewith the optimal activity was obtained after being calcinatedat 400◦C.
In the paper entitled “Preparation and characterizationof (I2)n sensitized nanoporous TiO2 with enhanced photo-catalytic activity under visible-light irradiation,” S. M. Gaoet al. present an unique template-free synthetic strategy toprepare(I2)n sensitized nanoporous TiO2. I2 hydrosol is usedas nucleation center and sensitizer, while TiCl4 was used asthe precursor for TiO2 and the calcination temperature hasacrucial role in the amount of (I2)n sensitized nanoporousTiO2. The as-prepared samples shows enhanced photocat-alytic activity in visible region and the possible mechanismfor the enhanced photocatalytic activity was also proposed.
In the paper entitled “Enhanced visible-light photocat-alytic activity of V2O5 cluster modified N-doped TiO2 fordegradation of toluene in air,” F. Dong et al. reportedthe fabrication of V2O5 cluster modified N-doped TiO2
nanocomposites photocatalyst. The conduction band (CB)potential of V2O5 is lower than the CB level of N-doped TiO2,which favors the photogenerated electron transfer from CBof N-doped TiO2 to V2O5 clusters. This helps promote thetransfer and separation of photogenerated; thus, the visible-light activity of N-doped TiO2 was significantly enhanced byloading V2O5 clusters.
In the paper entitled “Statistical optimization of opera-tional parameters for enhanced naphthalene degradation byTiO2/Fe3O4-SiO2 Photocatalyst,” A. J. Wang et al. opti-mize the operational parameters for enhanced naphthalenedegradation by TiO2/Fe3O4-SiO2 (TFS) photocatalyst usingstatistical experimental design and analysis. The centralcomposite design method was adopted and the experi-mental results showed that irradiation time, pH, and TFS
International Journal of Photoenergy 3
photocatalyst loading had significant influence on naphtha-lene degradation.
In the paper entitled “Synthesis and characterizationof iron oxide nanoparticles and applications in the removalof heavy metals from industrial wastewater,” Z. L. Chenget al. synthesized maghemite (γ-Fe2O3) nanoparticles of60 nm using a co-precipitation method and investigated theapplicability of maghemite nanoparticles for the removalof Pb2+ from electroplating wastewater. This study showedthat the prepared γ-Fe2O3 nanoparticles could be used asan alternate to the conventional adsorbents for the removalof metal ions from wastewater with high removal efficiencywithin a very short time.
In the paper entitled “Enhanced photocatalytic activity ofhierarchical marcro-meso porous anatase by ZrO2 incorpora-tion,” M. E. Contreras-Garcıa et al. fabricated TiO2/ZrO2
macro-mesoporous nanostructure by sol-gel hydrothermalmethod. The mesoporous sizes of the binary oxides couldbe tailored by the variation of the molar ratios of the metalprecursors. With high surface areas, the meso-macroporousbinary oxides exhibit high photocatalytic activities and arepotential for photocatalytic applications.
In the paper entitled “Synthesis of neutral SiO2/TiO2
hydrosol and its application as antireflective self-cleaningthin film,” H. L. Bai et al. present a synthesis of neu-tral SiO2/TiO2 composite hydrosol by a coprecipitation-peptization method. The addition of SiO2 not only decreasesthe refractive index, but also suppresses the aggregationof TiO2, by forming Ti–O–Si bond with TiO2. And theas-prepared SiO2/TiO2 thin film also demonstrates anti-reflection and photocatalytic self-cleaning effect.
In the paper entitled “Preparation and characterization ofvisible-light activated Fe-N co-doped TiO2 and Its photocat-alytic inactivation effect on leukemia tumors”, J. W. Xiong et al.presented a study of inactivation effect on leukmia tumors byusing Fe-N co-doped TiO2 as photocatalysts under visible-light irradiation. Fe-N co-doped TiO2 exhibit a significantinhibition on the growth of HL60 cells and high inactivationefficiency in photo-deconstruction of HL60 cancer cells.
In the paper entitled “Facile low-temperature synthesisof carbon nanotube/TiO2 nanohybrids with enhanced visible-light-driven photocatalytic activity,” Y. L. Xie et al. reporta facile and novel low-temperature chemical precipitationroute to synthesize CNT/TiO2 nanohybrids which exhibithigh photocatalytic activity in decomposition of RhB undervisible-light irradiation.
In the paper entitled “Light-driven preparation,microstructure, and visible-light photocatalytic propertyof porous carbon-doped TiO2,” G.-D. Li et al. report anunusual light-driven strategy for the preparation of highlyporous C-doped TiO2. With thermal treatment at 200◦C,Ti–O–C bonds and the coke species were formed, which wereregarded to play a critical role on enhancing the visible-lightphotocatalytic activity for the as-prepared C-doped TiO2.
In the paper entitled “Doped titanium dioxide filmsprepared by pulsed laser deposition method,” X. D. Linet al. presented the fabrication of N-doped TiO2 film bypulsed laser deposition method using novel ceramic target ofmixture of TiN and TiO2 and developed a continuous optical
transmission auto-recorder method to evaluate the photo-catalytic properties. The results indicated the as-preparedN-doped TiO2 film exhibits high photocatalytic activity ondecomposing MO dye under visible-light irradiation.
In the paper entitled “Nitrogen-doped TiO2 nanotubearrays with enhanced photoelectrochemical property,” S. W.Lin et al. report a fabrication of N-doped TiO2 nanotube(NTN) arrays by electrochemical anodization in glycerolelectrolyte. Systemic studies are done in electrochemicalanodization process. And the prepared N-doped NTN arraysexhibit high visible-light-driven photocatalytic activity.
In the paper entitled “Facile preparation and photoin-duced superhydrophilicity of highly ordered sodium-free titan-ate nanotube films by electrophoretic deposition,” H. G. Yuet al. prepared highly ordered sodium-free titanate nanotubefilms by one-step preparation on F-doped SnO2-coated(FTO) glass via an electrophoretic deposition method byusing sodium titanate nanotubes as precursor. The self-assembled formation of highly ordered sodium titanatenanotube films was accompanied with the effective removalof sodium ions in the nanotubes during the EPD process,resulting in the final formation of protonated titanatenanotube film. The effects of calcination temperatures on thesurface morphology, microstructures as well as the propertiesof superhydrophilicity were studied.
In the paper entitled “High -efficiently photoelectrochemi-cal hydrogen production over Zn-incorporated TiO2 nanotubes(Zn-TNT),” M. Kang et al. designed Zn-incorporated TiO2
nanotube (Zn-TNT) photocatalyst to investigate the Zndopant and nanotube morphology effects of TiO2 in elec-trochemical hydrogen production from the photosplitting ofmethanol/water solution. The hydrogen production over theZn-TNT photocatalysts was higher than that over the TNT,which was attributed to the shift toward the visible regionand increased number of excited electrons and holes.
In the paper entitled “Enhanced hydrogen productionover C-doped CdO photocatalyst in Na2S/Na2SO3 solutionunder visible-light irradiation,” J. L. Long et al. report thefabrication of the C-doped CdO photocatalysts by high-temperature solid-state process. The doping of C results inthe red-shift of the optical absorption of CdO. The C-dopedCdO photocatalysts have higher photocatalytic activity overparent CdO under visible-light irradiation. The resultsindicate that the H2 production is due to the existence of CdSand the enhancement of visible-light photocatalytic activityof H2 production is originated from the doping of carboninto the CdO lattice. The probably reaction mechanism wasalso discussed and proposed.
In the paper entitled “Photo-etching of Immobilized TiO2-ENR50-PVC Composite for Improved Photocatalytic Activity”,M. A. Nawi et al. present the preparation of a highly reusableimmobilized TiO2-ENR50-PVC composite via simple dip-coating method. It exhibited better photocatalytic efficiencythan the TiO2 powder in a slurry. The photo-etched catalystand the photo-mineralization capability of the product arealso investigated. Such efficient immobilized photocatalystsystem offers excellent advantage of use and reuse withoutthe need to filter the treated water after the treatment andcan be easily adapted for continuous flow reactor.
4 International Journal of Photoenergy
In the paper entitled “Photocatalytic activity of titanatenanotube powders in a hybrid pollution control system,” S.-C. Jung et al. present a novel microwave/UV/photocatalysthybrid system to evaluate the photocatalytic activity of thetitanate nanotubes. The effects of each element techniqueas well as the synergy effects on decomposition of organicmaterial were investigated.
In the paper entitled “Synthesis of hollow CdS-TiO2
microspheres with enhanced visible-light photocatalytic activ-ity,” Y. N. Huo et al. synthesized CdS-TiO2 hollow micro-sphere via the hard-template preparation with polystyrenemicrospheres followed by ion-exchange approach. The intro-duction of CdS can effectively extend the photo-response ofTiO2 to visible-light region and improve the separation ofphotoinduced charges, thus enhances photocatalytic activityof decomposition of rhodamine B (RhB) in aqueous solu-tion.
In the paper entitled “Solar photocatalytic removal ofchemical and bacterial pollutants from water using Pt/TiO2-coated ceramic tiles,” E. P. Yesodharan et al. immobilizedPt/TiO2 on a ceramic tile in order to enhance the commercialviability of the catalyst by recycling. Optimum loading ofPt on TiO2 was found to be 0.5%. This catalyst was foundeffective for the solar photocatalytic removal of chemicaland bacterial pollutants from water. Once the parameters areoptimized, the Pt/TiO2/tile can find application in swimmingpools, hospitals, water theme parks, and even industries forthe decontamination of water.
Baibiao HuangStephane Jobic
Xuxu WangWeifeng Yao
Hindawi Publishing CorporationInternational Journal of PhotoenergyVolume 2012, Article ID 269654, 10 pagesdoi:10.1155/2012/269654
Review Article
Nitrogen Incorporation in TiO2: Does It Make a Visible LightPhoto-Active Material?
B. Viswanathan and K. R. Krishanmurthy
National Centre for Catalysis Research, Indian Institute of Technology Madras, Chennai 600 036, India
Correspondence should be addressed to B. Viswanathan, [email protected]
Received 18 January 2012; Revised 11 April 2012; Accepted 26 April 2012
Academic Editor: Xuxu Wang
Copyright © 2012 B. Viswanathan and K. R. Krishanmurthy. This is an open access article distributed under the CreativeCommons Attribution License, which permits unrestricted use, distribution, and reproduction in any medium, provided theoriginal work is properly cited.
The possibility of hydrogen production by photo-catalytic decomposition of water on titania has provided the incentive forintense research. Titania is the preferred semiconductor for this process, in spite of its large band gap (∼3.2 eV) that restrictsits utility only in the UV region. Various sensitization methodologies have been adopted to make titania to be active in thevisible region. Doping of TiO2 with nitrogen is one such method. The purpose of this presentation is to examine the state andlocation of nitrogen introduced in TiO2 lattice and how far the shift of optical response to visible radiation can be beneficialfor the observed photo-catalysis. The specific aspects that are discussed in this article are: (i) N-doped titania surface adopts anon-native configuration, though the bulk material is still in the native configuration of pure TiO2 (ii) Though the nitrogendoped materials showed optical response in the visible region, the changes/improvements in photo-catalytic activity are onlymarginal in most of the cases. (iii) The exact chemical nature/state of the introduced nitrogen, and its location in titanialattice, substitutional and/or interstitial, is still unclear (iv) Is there a limit to the incorporation of nitrogen in the lattice ofTiO2?
1. Introduction
In titanium-dioxide-promoted photocatalysis or photoelec-trochemical applications, the primary objective appears tobe “how to make this system respond to visible radiation?”This aspect can be generally termed as sensitization of thesemiconductor either intrinsically (conventionally termed asdoping even though this may not be the correct connotationwhen the dopant concentration exceeds a certain limit) or byusing visible light absorbing materials (usually dyes or somecomplex species) [1]. These studies have given rise to manyspin offs like understanding of the defect chemistry of thematerials, new synthesis strategies for generating these usefulsemiconducting oxides, and above all the understanding ofthe physics of the alternate energy levels that are induced bythe incorporation of dopants in the original semiconductor.It should be remarked that the efforts to push the photoactiverange of these materials to visible region (so that solarspectrum could be effectively utilized) have been the primemotive. It is therefore natural that a variety of synthesis
methods for incorporation of nitrogen in TiO2 have beenreported in literature [2, 3].
2. Role of Heteroatoms in Titania
In recent times, there are many reports dealing with het-eroatom, (typically, S, C, F, P, B, etc.) substituted (dopedor implanted) materials examined as catalysts. The drivingforce for these studies is the possibility of generating extraallowed energy levels in the wide band gap (e.g., TiO2)of the semiconductors. These additional allowed energylevels in the band gap of the semiconductor will not onlypromote absorption of visible light photons but also bring inalternate pathways for the electron-hole recombination, thusaltering their life times which are essential for an effectivephotocatalyst. Such electronic structure alterations could beinduced by these heteroatoms. Though the analysis of sucheffects may be interesting, this aspect is not considered inthis presentation. The scope of this presentation is therefore
2 International Journal of Photoenergy
restricted to considering incorporation of nitrogen in TiO2
especially from the points of view of:
(i) what is the exact chemical nature of the substitutedand interstitial nitrogen?
(ii) what is the net effect observed in shifting the absorp-tion edge of the semiconductor, and if it does, is thereany relationship with the extent of substitution?
(iii) the net changes that have been observed in thephotocatalytic activity of substituted systems
(iv) are there any qualitative correlations that can bederived from these observations?
The reason for this self-imposed restriction is that thereis considerable literature already available on these systems.In the last five years alone, a simple search with “Nitrogendoped TiO2” search term in Web of Knowledge returned940 articles with 93 proceedings and 25 reviews published.Publications, year wise, indicate continued interest in thetopic, with 123 in 2007, 146 in 2008, 138 in 2009, 174in 2010, and 153 in 2011. Proper evaluation of thesesystems may provide some directions on catalysis promotedby these systems, especially for important reactions likethe photo-catalytic decomposition of water or the photo-catalytic reduction of carbon dioxide. However, most ofthe investigations pertain to applications for degradation oforganic pollutants in aqueous streams, model compoundstherein, and typical dye chemicals.
3. Status on Nitrogen-Incorporated Titania
The doped nitrogen assuming substituting anionic positionsin (this is already an assumption!) titanium dioxide hasattracted attention due to its possible photo-catalytic activityin the visible region [4]. Even though the visible lightresponse of anion doped TiO2 has been reported as earlyas 1986 by Sato [5], the recent work by Asahi et al. [6]have reopened the interest in this system. In the recent past,few innovative preparation methods have been evolved inliterature for N, S, P, F, and B doped TiO2 catalysts [7–10].Simultaneously, there are also attempts to rationalize theobserved results from theoretical calculations on this system[11–18]. The complexities involved in N-doped titania,especially with respect to the type of N species, their effectson visible light absorption, and the moderate influence onphotocatalytic activity have been covered by Emeline et al.[19]. The current review addresses some of the issues thathave emerged from the earlier presentation.
Besides, it is also observed that the state of N in titania andits effectiveness in extending the light absorption edge dependupon the way it is introduced through several preparationmethods/techniques. Since this presentation mainly deals withnitrogen introduction in TiO2, it is appropriate to list thetypical preparation methods employed in literature, forincorporation of nitrogen in titania and look for possiblecorrelations between nature of N introduced and preparationmethods.
4. Preparation Methods for Incorporation ofNitrogen in TiO2
A number of preparative procedures have been adopted forintroduction of nitrogen in TiO2 lattice, which are brieflyconsidered below.
(1) Synthesis from solution phase (sol gel method): [20,21] Titanium isopropoxide (Ti(OPr)4) was dissolvedin ethanol with dodecylamine and refluxed to get aclear solution. After cooling the solution is neutral-ized with acetic acid followed by hydrolysis by water.This method has also been followed for multilayerformation of porous TiO2 by dip coating method andthen treated with nitrogen source. The preformedTiO2 films were usually annealed in the presence ofnitrogen precursors (e.g., NH3) [22].
(2) Reaction with ammonia or other N-containingorganic substrates like urea, guanidine hydrochlo-ride, or guanidine carbonate: [23, 24]. A driedcommercial TiO2 powder was treated in a flow ofdry air or inert gas mixtures containing nearly 50%ammonia or other nitrogen containing substratesand, the sample is heated to 500–700◦C.
(3) Preparation by plasma treatment [25]: the solid isfixed to a quartz disk and placed in a plasma chamberwith heating (400◦C). Purified nitrogen was meteredand introduced into the chamber, and the plasmatreatment was carried out for a definite time period(of the order of 10 minutes).
(4) Oxidation of TiN [26–29]: thin film of TiNx wasdeposited using DC magnetron sputtering (PVD)and then the film was oxidized. Instead, TiO2 is firstsputtered and then annealed in nitrogen. If suitablechemicals are chosen then TiO2 was coated on asubstrate and it is then treated with suitable nitrogensource like ammonia.
(5) Electrochemical anodization [30] of titanium foilswith suitable nitrogen source has also shown to be amethod for controlled incorporation.
(6) Low ion implantation method [31] has also beenused to introduce nitrogen in TiO2 single crystals.
It is not clear as to which of the methods give substitutedN and which other methods result in interstitial N. Accordingto one report [32], plasma-enhanced chemical vapor depo-sition yields substitutional nitrogen, while sol-gel method,annealing in NH3 and chemical methods in general producedpredominantly interstitial nitrogen.
None of the methods mentioned above could, however,give clear clues regarding the state of substituted nitrogen.This has to be elucidated by other structural techniques. Inmost of these studies the amount of nitrogen incorporatedis small and hence the X-ray patterns for doped samplesresembled that of pure titanium dioxide, and no clear cutchanges in the structure could be discerned.
International Journal of Photoenergy 3
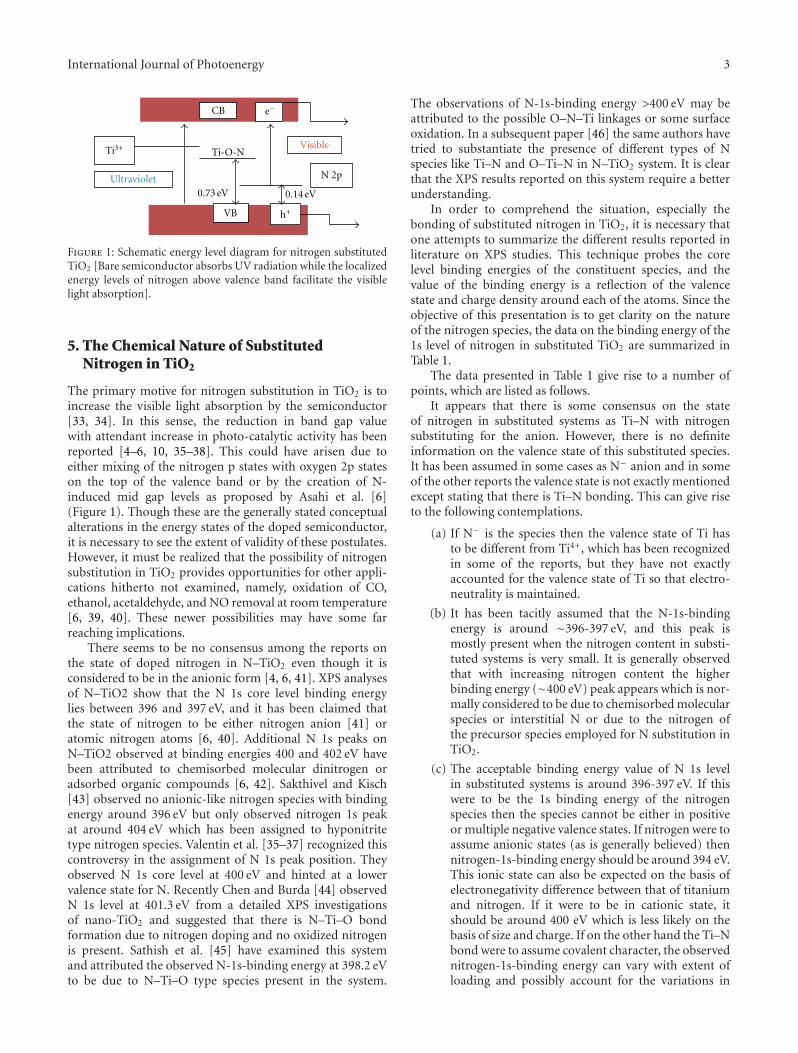
0.14 eV0.73 eV
CB
VB
Ti-O-NVisible
Ultraviolet N 2p
Ti3+
h+
e−
Figure 1: Schematic energy level diagram for nitrogen substitutedTiO2 [Bare semiconductor absorbs UV radiation while the localizedenergy levels of nitrogen above valence band facilitate the visiblelight absorption].
5. The Chemical Nature of SubstitutedNitrogen in TiO2
The primary motive for nitrogen substitution in TiO2 is toincrease the visible light absorption by the semiconductor[33, 34]. In this sense, the reduction in band gap valuewith attendant increase in photo-catalytic activity has beenreported [4–6, 10, 35–38]. This could have arisen due toeither mixing of the nitrogen p states with oxygen 2p stateson the top of the valence band or by the creation of N-induced mid gap levels as proposed by Asahi et al. [6](Figure 1). Though these are the generally stated conceptualalterations in the energy states of the doped semiconductor,it is necessary to see the extent of validity of these postulates.However, it must be realized that the possibility of nitrogensubstitution in TiO2 provides opportunities for other appli-cations hitherto not examined, namely, oxidation of CO,ethanol, acetaldehyde, and NO removal at room temperature[6, 39, 40]. These newer possibilities may have some farreaching implications.
There seems to be no consensus among the reports onthe state of doped nitrogen in N–TiO2 even though it isconsidered to be in the anionic form [4, 6, 41]. XPS analysesof N–TiO2 show that the N 1s core level binding energylies between 396 and 397 eV, and it has been claimed thatthe state of nitrogen to be either nitrogen anion [41] oratomic nitrogen atoms [6, 40]. Additional N 1s peaks onN–TiO2 observed at binding energies 400 and 402 eV havebeen attributed to chemisorbed molecular dinitrogen oradsorbed organic compounds [6, 42]. Sakthivel and Kisch[43] observed no anionic-like nitrogen species with bindingenergy around 396 eV but only observed nitrogen 1s peakat around 404 eV which has been assigned to hyponitritetype nitrogen species. Valentin et al. [35–37] recognized thiscontroversy in the assignment of N 1s peak position. Theyobserved N 1s core level at 400 eV and hinted at a lowervalence state for N. Recently Chen and Burda [44] observedN 1s level at 401.3 eV from a detailed XPS investigationsof nano-TiO2 and suggested that there is N–Ti–O bondformation due to nitrogen doping and no oxidized nitrogenis present. Sathish et al. [45] have examined this systemand attributed the observed N-1s-binding energy at 398.2 eVto be due to N–Ti–O type species present in the system.
The observations of N-1s-binding energy >400 eV may beattributed to the possible O–N–Ti linkages or some surfaceoxidation. In a subsequent paper [46] the same authors havetried to substantiate the presence of different types of Nspecies like Ti–N and O–Ti–N in N–TiO2 system. It is clearthat the XPS results reported on this system require a betterunderstanding.
In order to comprehend the situation, especially thebonding of substituted nitrogen in TiO2, it is necessary thatone attempts to summarize the different results reported inliterature on XPS studies. This technique probes the corelevel binding energies of the constituent species, and thevalue of the binding energy is a reflection of the valencestate and charge density around each of the atoms. Since theobjective of this presentation is to get clarity on the natureof the nitrogen species, the data on the binding energy of the1s level of nitrogen in substituted TiO2 are summarized inTable 1.
The data presented in Table 1 give rise to a number ofpoints, which are listed as follows.
It appears that there is some consensus on the stateof nitrogen in substituted systems as Ti–N with nitrogensubstituting for the anion. However, there is no definiteinformation on the valence state of this substituted species.It has been assumed in some cases as N− anion and in someof the other reports the valence state is not exactly mentionedexcept stating that there is Ti–N bonding. This can give riseto the following contemplations.
(a) If N− is the species then the valence state of Ti hasto be different from Ti4+, which has been recognizedin some of the reports, but they have not exactlyaccounted for the valence state of Ti so that electro-neutrality is maintained.
(b) It has been tacitly assumed that the N-1s-bindingenergy is around ∼396-397 eV, and this peak ismostly present when the nitrogen content in substi-tuted systems is very small. It is generally observedthat with increasing nitrogen content the higherbinding energy (∼400 eV) peak appears which is nor-mally considered to be due to chemisorbed molecularspecies or interstitial N or due to the nitrogen ofthe precursor species employed for N substitution inTiO2.
(c) The acceptable binding energy value of N 1s levelin substituted systems is around 396-397 eV. If thiswere to be the 1s binding energy of the nitrogenspecies then the species cannot be either in positiveor multiple negative valence states. If nitrogen were toassume anionic states (as is generally believed) thennitrogen-1s-binding energy should be around 394 eV.This ionic state can also be expected on the basis ofelectronegativity difference between that of titaniumand nitrogen. If it were to be in cationic state, itshould be around 400 eV which is less likely on thebasis of size and charge. If on the other hand the Ti–Nbond were to assume covalent character, the observednitrogen-1s-binding energy can vary with extent ofloading and possibly account for the variations in
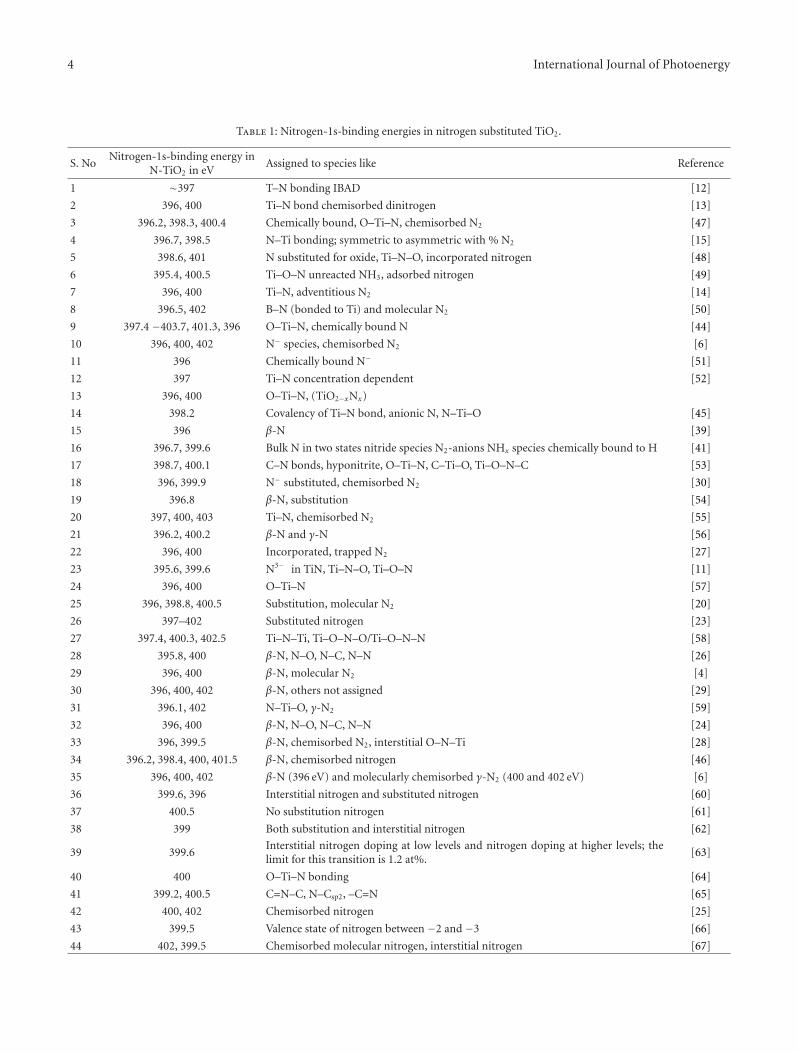
4 International Journal of Photoenergy
Table 1: Nitrogen-1s-binding energies in nitrogen substituted TiO2.
S. NoNitrogen-1s-binding energy in
N-TiO2 in eVAssigned to species like Reference
1 ∼397 T–N bonding IBAD [12]
2 396, 400 Ti–N bond chemisorbed dinitrogen [13]
3 396.2, 398.3, 400.4 Chemically bound, O–Ti–N, chemisorbed N2 [47]
4 396.7, 398.5 N–Ti bonding; symmetric to asymmetric with % N2 [15]
5 398.6, 401 N substituted for oxide, Ti–N–O, incorporated nitrogen [48]
6 395.4, 400.5 Ti–O–N unreacted NH3, adsorbed nitrogen [49]
7 396, 400 Ti–N, adventitious N2 [14]
8 396.5, 402 B–N (bonded to Ti) and molecular N2 [50]
9 397.4 −403.7, 401.3, 396 O–Ti–N, chemically bound N [44]
10 396, 400, 402 N− species, chemisorbed N2 [6]
11 396 Chemically bound N− [51]
12 397 Ti–N concentration dependent [52]
13 396, 400 O–Ti–N, (TiO2−xNx)
14 398.2 Covalency of Ti–N bond, anionic N, N–Ti–O [45]
15 396 β-N [39]
16 396.7, 399.6 Bulk N in two states nitride species N2-anions NHx species chemically bound to H [41]
17 398.7, 400.1 C–N bonds, hyponitrite, O–Ti–N, C–Ti–O, Ti–O–N–C [53]
18 396, 399.9 N− substituted, chemisorbed N2 [30]
19 396.8 β-N, substitution [54]
20 397, 400, 403 Ti–N, chemisorbed N2 [55]
21 396.2, 400.2 β-N and γ-N [56]
22 396, 400 Incorporated, trapped N2 [27]
23 395.6, 399.6 N3− in TiN, Ti–N–O, Ti–O–N [11]
24 396, 400 O–Ti–N [57]
25 396, 398.8, 400.5 Substitution, molecular N2 [20]
26 397–402 Substituted nitrogen [23]
27 397.4, 400.3, 402.5 Ti–N–Ti, Ti–O–N–O/Ti–O–N–N [58]
28 395.8, 400 β-N, N–O, N–C, N–N [26]
29 396, 400 β-N, molecular N2 [4]
30 396, 400, 402 β-N, others not assigned [29]
31 396.1, 402 N–Ti–O, γ-N2 [59]
32 396, 400 β-N, N–O, N–C, N–N [24]
33 396, 399.5 β-N, chemisorbed N2, interstitial O–N–Ti [28]
34 396.2, 398.4, 400, 401.5 β-N, chemisorbed nitrogen [46]
35 396, 400, 402 β-N (396 eV) and molecularly chemisorbed γ-N2 (400 and 402 eV) [6]
36 399.6, 396 Interstitial nitrogen and substituted nitrogen [60]
37 400.5 No substitution nitrogen [61]
38 399 Both substitution and interstitial nitrogen [62]
39 399.6Interstitial nitrogen doping at low levels and nitrogen doping at higher levels; thelimit for this transition is 1.2 at%.
[63]
40 400 O–Ti–N bonding [64]
41 399.2, 400.5 C=N–C, N–Csp2, –C=N [65]
42 400, 402 Chemisorbed nitrogen [25]
43 399.5 Valence state of nitrogen between −2 and −3 [66]
44 402, 399.5 Chemisorbed molecular nitrogen, interstitial nitrogen [67]
International Journal of Photoenergy 5
the binding energy values reported in literature. Theliterature is unfortunately silent on this aspect forsome unknown reasons.
(d) Another important aspect is that the type of speciesenvisaged, namely, either Ti–N or Ti–O–N, couldhave been present mostly on the surface as they havebeen detected only in XPS measurements with noindications in the X-ray diffraction patterns, whichare nearly the same as the starting TiO2. This meansthat the surface layers have a non-native configurationas compared to the native configuration that is presentin the bulk of the material. If this were to be true, thenthe reactivity (or even the photocatalytic consequencesreported) of the surface should be different from whatis generally observed on bare TiO2. Though this hasbeen observed in many publications, they have not beenassigned to the changes observed due to the nonnativeconfigurations that may be present on the surfaces ofsubstituted systems [68].
(e) Even though there are reports on the changes in theintensity of the emission due to N 1s level in thesubstitution state (namely, around 396-397 eV), it isnot clear from the available literature to what per-centage the nitrogen substitution in anionic positionwill take place and when the signal due to molecularlychemisorbed nitrogen species starts to appear. Thechanges observed or expected in the optical spectrumare critically dependent on this parameter.
(f) Observation of two XPS peaks at 396–398 eV and400–402 eV possibly indicates the presence of substi-tutional as well as interstitial nitrogen, respectively, intitania lattice though the exact chemical nature is notclear.
(g) Nitrogen incorporation in titanium dioxide has thusbeen claimed through a number of preparationmethods [65, 69]. It is generally presumed that thevisible light photo activity of the resultant materialis due to incorporation of nitrogen in the lattice. Analternate postulate is that nitrogen precursors couldgive rise to light active molecular species on thesurface (dye like) which function as sensitizers for theobserved visible light photo-activity [70–73]. How-ever, this concept cannot account wherein molecularnitrogen or other molecules, which on decomposi-tion yield molecular nitrogen, are employed for thepreparation of nitrogen substituted TiO2.
The data presented in Table 1 show that the nitrogenincorporated in TiO2 is mostly in the substitution positionfor the anion conventionally designated as β-N species.Several investigations have reported peaks at 400–402 eVindicating presence of interstitial nitrogen as well. However,there is no clear cut statement on the valence state of thenitrogen. Is it a trivalent anion? Or at least an anion withnegative charge on substituted nitrogen? The N substitutedsystems on further incorporation of nitrogen gives rise tomolecularly chemisorbed species. This observation leads oneto make an estimate of the possible extent of substitution in
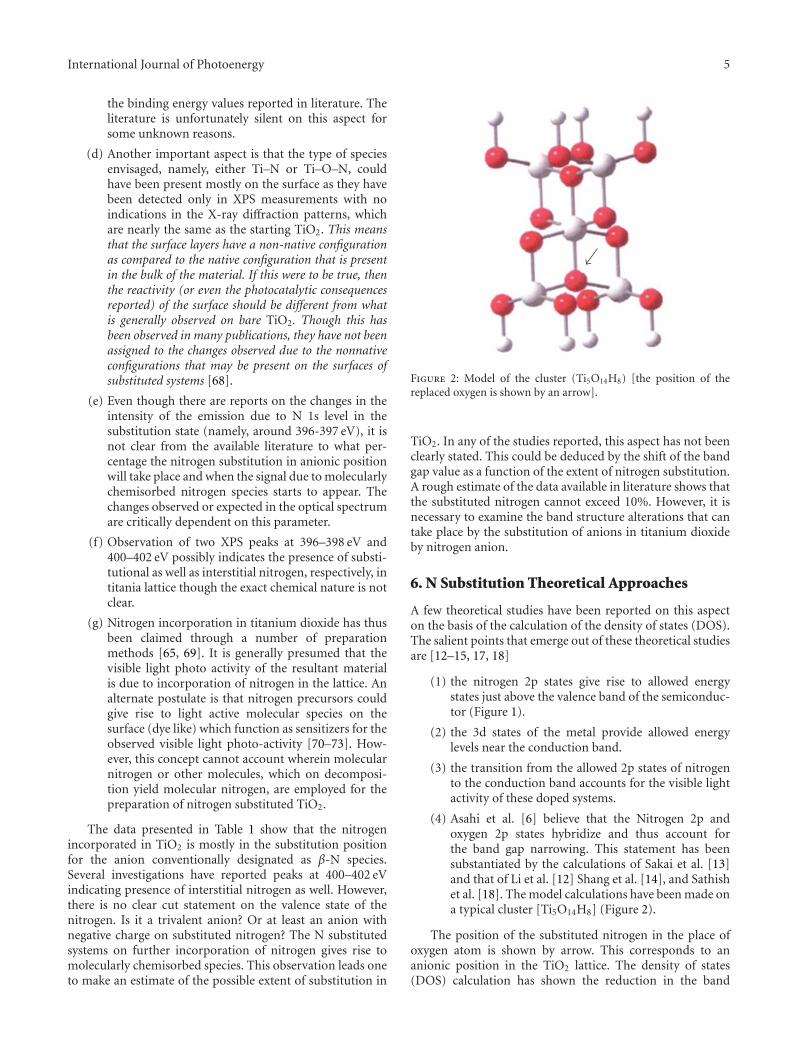
Figure 2: Model of the cluster (Ti5O14H8) [the position of thereplaced oxygen is shown by an arrow].
TiO2. In any of the studies reported, this aspect has not beenclearly stated. This could be deduced by the shift of the bandgap value as a function of the extent of nitrogen substitution.A rough estimate of the data available in literature shows thatthe substituted nitrogen cannot exceed 10%. However, it isnecessary to examine the band structure alterations that cantake place by the substitution of anions in titanium dioxideby nitrogen anion.
6. N Substitution Theoretical Approaches
A few theoretical studies have been reported on this aspecton the basis of the calculation of the density of states (DOS).The salient points that emerge out of these theoretical studiesare [12–15, 17, 18]
(1) the nitrogen 2p states give rise to allowed energystates just above the valence band of the semiconduc-tor (Figure 1).
(2) the 3d states of the metal provide allowed energylevels near the conduction band.
(3) the transition from the allowed 2p states of nitrogento the conduction band accounts for the visible lightactivity of these doped systems.
(4) Asahi et al. [6] believe that the Nitrogen 2p andoxygen 2p states hybridize and thus account forthe band gap narrowing. This statement has beensubstantiated by the calculations of Sakai et al. [13]and that of Li et al. [12] Shang et al. [14], and Sathishet al. [18]. The model calculations have been made ona typical cluster [Ti5O14H8] (Figure 2).
The position of the substituted nitrogen in the place ofoxygen atom is shown by arrow. This corresponds to ananionic position in the TiO2 lattice. The density of states(DOS) calculation has shown the reduction in the band
6 International Journal of Photoenergy
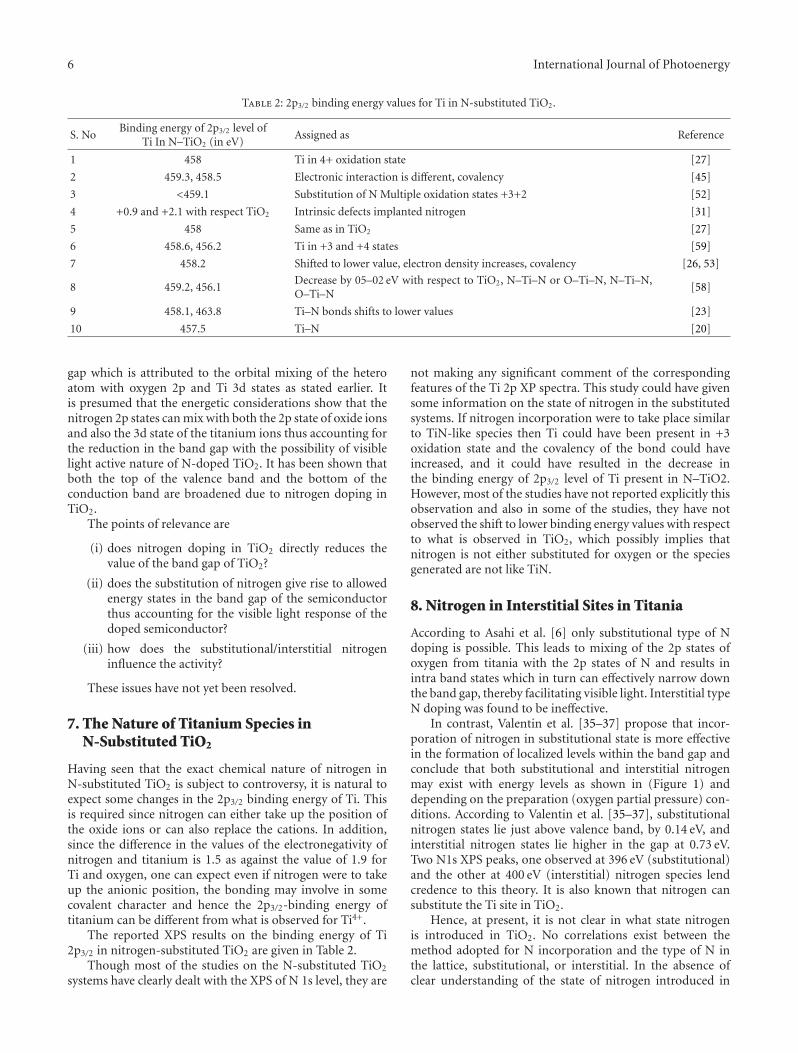
Table 2: 2p3/2 binding energy values for Ti in N-substituted TiO2.
S. NoBinding energy of 2p3/2 level of
Ti In N–TiO2 (in eV)Assigned as Reference
1 458 Ti in 4+ oxidation state [27]
2 459.3, 458.5 Electronic interaction is different, covalency [45]
3 <459.1 Substitution of N Multiple oxidation states +3+2 [52]
4 +0.9 and +2.1 with respect TiO2 Intrinsic defects implanted nitrogen [31]
5 458 Same as in TiO2 [27]
6 458.6, 456.2 Ti in +3 and +4 states [59]
7 458.2 Shifted to lower value, electron density increases, covalency [26, 53]
8 459.2, 456.1Decrease by 05–02 eV with respect to TiO2, N–Ti–N or O–Ti–N, N–Ti–N,O–Ti–N
[58]
9 458.1, 463.8 Ti–N bonds shifts to lower values [23]
10 457.5 Ti–N [20]
gap which is attributed to the orbital mixing of the heteroatom with oxygen 2p and Ti 3d states as stated earlier. Itis presumed that the energetic considerations show that thenitrogen 2p states can mix with both the 2p state of oxide ionsand also the 3d state of the titanium ions thus accounting forthe reduction in the band gap with the possibility of visiblelight active nature of N-doped TiO2. It has been shown thatboth the top of the valence band and the bottom of theconduction band are broadened due to nitrogen doping inTiO2.
The points of relevance are
(i) does nitrogen doping in TiO2 directly reduces thevalue of the band gap of TiO2?
(ii) does the substitution of nitrogen give rise to allowedenergy states in the band gap of the semiconductorthus accounting for the visible light response of thedoped semiconductor?
(iii) how does the substitutional/interstitial nitrogeninfluence the activity?
These issues have not yet been resolved.
7. The Nature of Titanium Species inN-Substituted TiO2
Having seen that the exact chemical nature of nitrogen inN-substituted TiO2 is subject to controversy, it is natural toexpect some changes in the 2p3/2 binding energy of Ti. Thisis required since nitrogen can either take up the position ofthe oxide ions or can also replace the cations. In addition,since the difference in the values of the electronegativity ofnitrogen and titanium is 1.5 as against the value of 1.9 forTi and oxygen, one can expect even if nitrogen were to takeup the anionic position, the bonding may involve in somecovalent character and hence the 2p3/2-binding energy oftitanium can be different from what is observed for Ti4+.
The reported XPS results on the binding energy of Ti2p3/2 in nitrogen-substituted TiO2 are given in Table 2.
Though most of the studies on the N-substituted TiO2
systems have clearly dealt with the XPS of N 1s level, they are
not making any significant comment of the correspondingfeatures of the Ti 2p XP spectra. This study could have givensome information on the state of nitrogen in the substitutedsystems. If nitrogen incorporation were to take place similarto TiN-like species then Ti could have been present in +3oxidation state and the covalency of the bond could haveincreased, and it could have resulted in the decrease inthe binding energy of 2p3/2 level of Ti present in N–TiO2.However, most of the studies have not reported explicitly thisobservation and also in some of the studies, they have notobserved the shift to lower binding energy values with respectto what is observed in TiO2, which possibly implies thatnitrogen is not either substituted for oxygen or the speciesgenerated are not like TiN.
8. Nitrogen in Interstitial Sites in Titania
According to Asahi et al. [6] only substitutional type of Ndoping is possible. This leads to mixing of the 2p states ofoxygen from titania with the 2p states of N and results inintra band states which in turn can effectively narrow downthe band gap, thereby facilitating visible light. Interstitial typeN doping was found to be ineffective.
In contrast, Valentin et al. [35–37] propose that incor-poration of nitrogen in substitutional state is more effectivein the formation of localized levels within the band gap andconclude that both substitutional and interstitial nitrogenmay exist with energy levels as shown in (Figure 1) anddepending on the preparation (oxygen partial pressure) con-ditions. According to Valentin et al. [35–37], substitutionalnitrogen states lie just above valence band, by 0.14 eV, andinterstitial nitrogen states lie higher in the gap at 0.73 eV.Two N1s XPS peaks, one observed at 396 eV (substitutional)and the other at 400 eV (interstitial) nitrogen species lendcredence to this theory. It is also known that nitrogen cansubstitute the Ti site in TiO2.
Hence, at present, it is not clear in what state nitrogenis introduced in TiO2. No correlations exist between themethod adopted for N incorporation and the type of N inthe lattice, substitutional, or interstitial. In the absence ofclear understanding of the state of nitrogen introduced in
International Journal of Photoenergy 7
Table 3: Typical photocatalytic studies reported on N-substitutedTiO2.
S. No Photo-catalytic studies on N–TiO2 Reference
1Photo-activity using stearic acid, no
visible-light-induced activity[27]
2Photo degradation of Phenol N–TiO2, anatase
is higher[55]
3Degradation of methylene blue, no specifictrend with respect to nitrogen substitution
[30, 39, 45,46]
4 Photo-degradation of methyl orange[48, 53,
58]
5 Photodecomposition of isopropyl alcohol [52, 75]
6 Photo-electrochemical decomposition of water [52]
7 Degradation of ethylene glycol [76]
8 Decomposition of 2-chlorophenol [14, 23]
9 Decomposition of VOC and Rhodamine B [29]
10 Decomposition of acetaldehyde [6]
titanium dioxide, it is difficult to interpret the photo-catalyticactivity observed with these systems since the creation ofnew adsorption centers could also be one of the reasons forthe observed photo-catalytic effect even though the photonabsorption range could have shifted to visible range.
9. Photo-Catalytic Studies onNitrogen-Introduced TiO2
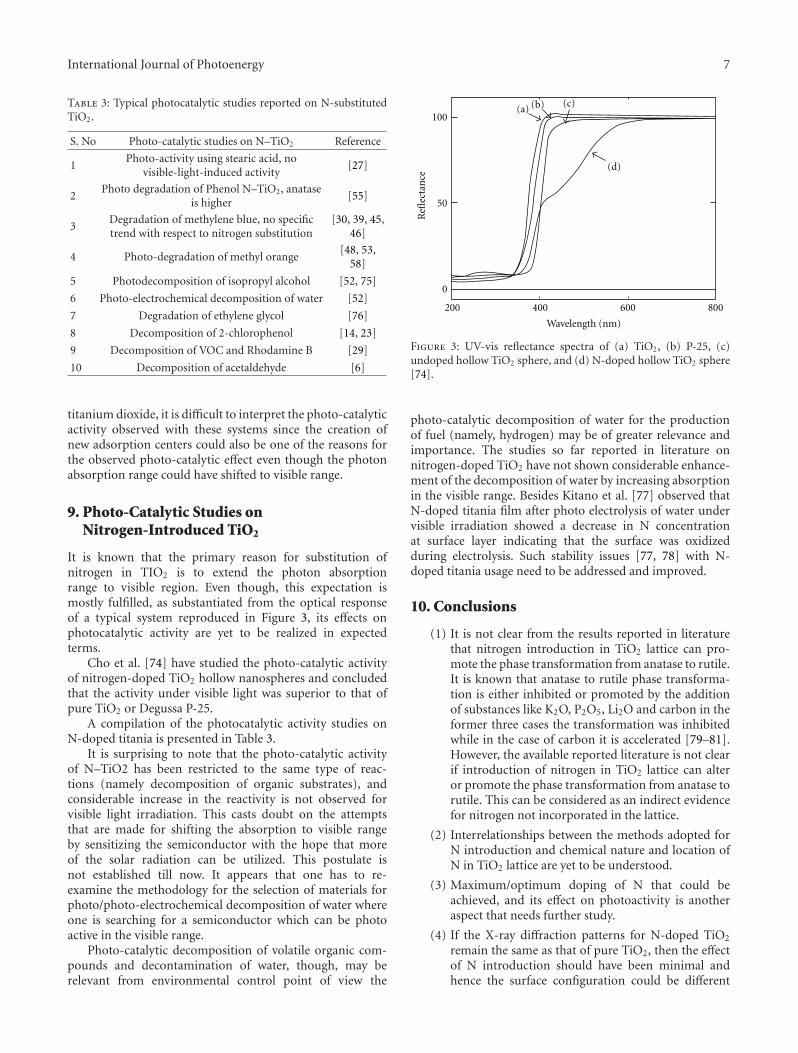
It is known that the primary reason for substitution ofnitrogen in TIO2 is to extend the photon absorptionrange to visible region. Even though, this expectation ismostly fulfilled, as substantiated from the optical responseof a typical system reproduced in Figure 3, its effects onphotocatalytic activity are yet to be realized in expectedterms.
Cho et al. [74] have studied the photo-catalytic activityof nitrogen-doped TiO2 hollow nanospheres and concludedthat the activity under visible light was superior to that ofpure TiO2 or Degussa P-25.
A compilation of the photocatalytic activity studies onN-doped titania is presented in Table 3.
It is surprising to note that the photo-catalytic activityof N–TiO2 has been restricted to the same type of reac-tions (namely decomposition of organic substrates), andconsiderable increase in the reactivity is not observed forvisible light irradiation. This casts doubt on the attemptsthat are made for shifting the absorption to visible rangeby sensitizing the semiconductor with the hope that moreof the solar radiation can be utilized. This postulate isnot established till now. It appears that one has to re-examine the methodology for the selection of materials forphoto/photo-electrochemical decomposition of water whereone is searching for a semiconductor which can be photoactive in the visible range.
Photo-catalytic decomposition of volatile organic com-pounds and decontamination of water, though, may berelevant from environmental control point of view the
100
50
0
Refl
ecta
nce
(a) (b) (c)
(d)
200 400 600 800
Wavelength (nm)
Figure 3: UV-vis reflectance spectra of (a) TiO2, (b) P-25, (c)undoped hollow TiO2 sphere, and (d) N-doped hollow TiO2 sphere[74].
photo-catalytic decomposition of water for the productionof fuel (namely, hydrogen) may be of greater relevance andimportance. The studies so far reported in literature onnitrogen-doped TiO2 have not shown considerable enhance-ment of the decomposition of water by increasing absorptionin the visible range. Besides Kitano et al. [77] observed thatN-doped titania film after photo electrolysis of water undervisible irradiation showed a decrease in N concentrationat surface layer indicating that the surface was oxidizedduring electrolysis. Such stability issues [77, 78] with N-doped titania usage need to be addressed and improved.
10. Conclusions
(1) It is not clear from the results reported in literaturethat nitrogen introduction in TiO2 lattice can pro-mote the phase transformation from anatase to rutile.It is known that anatase to rutile phase transforma-tion is either inhibited or promoted by the additionof substances like K2O, P2O5, Li2O and carbon in theformer three cases the transformation was inhibitedwhile in the case of carbon it is accelerated [79–81].However, the available reported literature is not clearif introduction of nitrogen in TiO2 lattice can alteror promote the phase transformation from anatase torutile. This can be considered as an indirect evidencefor nitrogen not incorporated in the lattice.
(2) Interrelationships between the methods adopted forN introduction and chemical nature and location ofN in TiO2 lattice are yet to be understood.
(3) Maximum/optimum doping of N that could beachieved, and its effect on photoactivity is anotheraspect that needs further study.
(4) If the X-ray diffraction patterns for N-doped TiO2
remain the same as that of pure TiO2, then the effectof N introduction should have been minimal andhence the surface configuration could be different
8 International Journal of Photoenergy
from that of the bulk native structure. If this archi-tecture is possible, then optical absorption changesobserved could have arisen out of the surface layersand hence only the adsorptive properties could havealtered, accounting for the increased photo-catalyticoxidation of organic substrates.
(5) Stability of the N-doped titanium dioxide underirradiation during photo-electrolysis of water [78] isa challenge to be addressed.
Acknowledgments
Grateful thanks are due to Department of Science andTechnology, Government of India for the generous supportof the National Centre for Catalysis Research, at IIT Madras.The authors also wish to thank one of the reviewers for hisremarks for the improvement of the paper.
References
[1] B. Viswanathan, Photo/Electrochemistry & Photobiology in theEnvironment, Energy and Fuel, Research Signpost, 2005.
[2] M. Kitano, M. Maatasuoka, M. Ueshima, and M. Anpo,“Recent developments in titanium oxide-based photocata-lysts,” Applied Catalysis A, vol. 325, no. 1, pp. 1–14, 2007.
[3] K. Hashimoto, H. Irie, and A. Fujishima, “TiO2 photocatalysis:a historical overview and future prospects,” Japanese Journal ofApplied Physics, vol. 44, no. 12, pp. 8269–8285, 2005.
[4] H. Irie, S. Washizuka, N. Yoshino, and K. Hashimoto, “Visible-light induced hydrophilicity on nitrogen-substituted titaniumdioxide films,” Chemical Communications, vol. 9, no. 11, pp.1298–1299, 2003.
[5] S. Sato, “Photo catalytic activity of NOx doped TiO2 in thevisible region,” Chemical Physics Letters, vol. 123, no. 1-2, pp.126–128, 1986.
[6] R. Asahi, T. Morikawa, T. Ohwaki, K. Aoki, and Y. Taga,“Visible-light photocatalysis in nitrogen-doped titaniumoxides,” Science, vol. 293, no. 5528, pp. 269–271, 2001.
[7] T. Morikawa, R. Asahi, T. Ohwaki, K. Aoki, and Y. Taga,“Band-gap narrowing of titanium dioxide by nitrogen dop-ing,” Japanese Journal of Applied Physics 2, vol. 40, no. 6A, pp.L561–L563, 2001.
[8] T. Umebayashi, T. Yamaki, H. Hoh, and K. Asai, “Band gapnarrowing of titanium dioxide by sulfur doping,” AppliedPhysics Letters, vol. 81, no. 3, pp. 454–456, 2002.
[9] S. C. Moon, H. Mametsuka, S. Tabata, and E. Suzuki,“Photocatalytic production of hydrogen from water usingTiO2 and B/TiO2,” Catalysis Today, vol. 58, no. 2, pp. 125–132,2000.
[10] R. Beranek, B. Neumann, S. Sakthivel et al., “Exploring theelectronic structure of nitrogen-modified TiO2 photo catalyststhrough photo current and surface photo voltage studies,”Chemical Physics, vol. 339, no. 1–3, pp. 11–19, 2007.
[11] J. Wang, D. N. Tafen, J. P. Lewis et al., “Origin of photocatalyticactivity of Nitrogen-doped TiO2 nanobelts,” Journal of theAmerican Chemical Society, vol. 131, no. 34, pp. 12290–12297,2009.
[12] Q. Li, J. Xue, W. Liang, J. H. Huang, and J. K. Shang,“Enhanced visible-light absorption in heavily nitrogen-dopedTiO2,” Philosophical Magazine Letters, vol. 88, no. 3, pp. 231–238, 2008.
[13] Y. W. Sakai, K. Obata, K. Hashimoto, and H. Irie, “Enhance-ment of visible light-induced hydrophilicity on nitrogen andsulfur-codoped TiO2 thin films,” Vacuum, vol. 83, no. 3, pp.683–687, 2008.
[14] G. Shang, H. Fu, S. Yang, and T. Xu, “Mechanistic studyof visible-light-induced photodegradation of 4-chlorophenolby TiO2−xNx (0.021 < x < 0.049) with low nitrogenconcentration,” International Journal of Photoenergy, vol. 2012,Article ID 759306, 9 pages, 2012.
[15] J. W. Chai, M. Yang, Q. Chen et al., “Effects of nitrogenincorporation on the electronic structure of rutile-TiO2,”Journal of Applied Physics, vol. 109, no. 2, Article ID 023707,2011.
[16] A. N. Enyashin, V. V. Ivanovskaya, Y. N. Makurin, V. G. Bam-burov, and A. L. Ivanovskii, “Electronic structure of dopedtitanium dioxide nanotubes,” Doklady Physical Chemistry, vol.391, no. 4—6, pp. 187–190, 2003.
[17] M. R. Benam, “First principles studies of the effect of nitrogenimpurities on the energy gap of rutile TiO2−xNx by pseudopotential approaches,” Journal of Engineerign and AppliedSciences, vol. 6, p. 18, 2011.
[18] M. Sathish, M. Sankaran, B. Viswanathan, and R. P.Viswanath, “DFT studies on anionic hetero atom (N or/andS) substitution in TiO2,” Indian Journal of Chemistry A, vol.46, no. 6, pp. 895–898, 2007.
[19] A. V. Emeline, V. N. Kuznetsov, V. K. Rybchuk, and N.Serpone, “Visible-light-active titania photocatalysts: the caseof N doped TiO2-properties and some fundamental issues,”International Journal of Photoenergy, vol. 2008, Article ID258394, 19 pages, 2008.
[20] C. Kusumawardani, K. Indiana, and Narsito, “Synthesis ofnanocrystalline N-doped TiO2 and its application on highefficiency of dye-sensitized solar cells,” Science Journal UBU,vol. 1, no. 1, pp. 1–8, 2010.
[21] S. Livraghi, M. C. Paganini, E. Giamello, A. Selloni, C.Di Valentin, and G. Pacchioni, “Origin of photoactivity ofnitrogen-doped titanium dioxide under visible light,” Journalof the American Chemical Society, vol. 128, no. 49, pp. 15666–15671, 2006.
[22] M. Gartner, P. Osiceanu, M. Anastasescu et al., “Investigationon the nitrogen doping of multilayered, porous TiO2 thinfilms,” Thin Solid Films, vol. 516, no. 22, pp. 8184–8189, 2008.
[23] S. Buzby, M. A. Barakat, H. Lin et al., “Visible light photo-catalysis with nitrogen-doped titanium dioxide nanoparticlesprepared by plasma assisted chemical vapor deposition,”Journal of Vacuum Science and Technology B, vol. 24, no. 3, pp.1210–1214, 2006.
[24] Y. Nosaka, M. Matsushita, J. Nishino, and A. Y. Nosaka,“Nitrogen-doped titanium dioxide photocatalysts for visibleresponse prepared by using organic compounds,” Science andTechnology of Advanced Materials, vol. 6, no. 2, pp. 143–148,2005.
[25] C. Chen, H. Bai, S. M. Chang, C. Chang, and W. Den,“Preparation of N-doped TiO2 photocatalyst by atmosphericpressure plasma process for VOCs decomposition under UVand visible light sources,” Journal of Nanoparticle Research, vol.9, no. 3, pp. 365–375, 2007.
[26] L. Zhu, J. Xie, X. Cui, J. Shen, X. Yang, and Z. Zhang,“Photoelectrochemical and optical properties of N-dopedTiO2 thin films prepared by oxidation of sputtered TiNxfilms,” Vacuum, vol. 84, no. 6, pp. 797–802, 2010.
[27] J. M. Yates, M. G. Nolan, D. W. Sheel, and M. E. Pemble, “Therole of nitrogen doping on the development of visible light-induced photocatalytic activity in thin TiO2 films grown on
International Journal of Photoenergy 9
glass by chemical vapour deposition,” Journal of Photochem-istry and Photobiology A, vol. 179, no. 1-2, pp. 213–223, 2006.
[28] C. J. Tavares, S. M. Marques, T. Viseu et al., “Enhancementof the photocatalytic nature of nitrogen-doped PVD-growntitanium dioxide thin films,” Journal of Applied Physics, vol.106, Article ID 113535, 2009.
[29] T. Morikawa, R. Asahi, T. Ohwaki, K. Aoki, K. Suzuki, and Y.Taga, R&D Review of Toyota CRDI, vol. 40, p. 46, 2005.
[30] D. Chen, Z. Jiang, J. Geng, Q. Wang, and D. Yang, “Carbonand nitrogen co-doped TiO2 with enhanced visible-lightphotocatalytic activity,” Industrial & Engineering ChemistryResearch, vol. 46, no. 9, pp. 2741–2746, 2007.
[31] M. Batzill, E. H. Morales, and U. Diebold, “Surface studies ofnitrogen implanted TiO2,” Chemical Physics, vol. 339, no. 1–3,pp. 36–43, 2007.
[32] A. Fujishima, X. Zhang, and D. A. Tryk, “TiO2 photocatalysisand related surface phenomena,” Surface Science Reports, vol.63, no. 12, pp. 515–582, 2008.
[33] A. Hattori, M. Yamamoto, H. Tada, and S. Ito, “A promotingeffect of NH4F addition on the photocatalytic activity of sol-gel TiO2 films,” Chemistry Letters, no. 8, pp. 707–708, 1998.
[34] T. Yamaki, T. Sumita, and S. Yamamoto, “Formation ofTiO2−xFx compounds in fluorine-implanted TiO2,” Journal ofMaterials Science Letters, vol. 21, no. 1, pp. 33–35, 2002.
[35] C. D. Valentin, G. Pacchioni, and A. Selloni, “heory of carbondoping of titanium dioxide,” Chemistry of Materials, vol. 17,no. 26, pp. 6656–6665, 2005.
[36] C. D. Valentin, G. Pacchioni, A. Selloni, S. Livraghi, andE. Giamello, “Characterization of paramagnetic species inN-doped TiO2 powders by EPR spectroscopy and DFTcalculations,” The Journal of Physical Chemistry B, vol. 109, no.23, pp. 11414–11419, 2005.
[37] D. Valentin, E. Finazzi, G. Pacchioni et al., “N-doped TiO2:theory and experiment,” Chemical Physics, vol. 339, no. 1–3,pp. 44–56, 2007.
[38] R. Nakamura, T. Tanaka, and Y. Nakato, “Mechanism forVisible Light Responses in Anodic Photocurrents at N-DopedTiO2 Film Electrodes,” The Journal of Physical Chemistry B, vol.108, pp. 10617–10620, 2004.
[39] J. L. Gole, J. D. Stout, C. Burda, Y. Lou, and X. Chen,“Highly efficient formation of visible light tunable TiO2-xNxphotocatalysts and their transformation at the nanoscale,”Journal of Physical Chemistry B, vol. 108, no. 4, pp. 1230–1240,2004.
[40] T. Sano, N. Negishi, K. Koike, K. Takeuchi, and S. Matsuzawa,“Preparation of a visible light-responsive photocatalyst from acomplex of Ti4+ with a nitrogen-containing ligand,” Journal ofMaterials Chemistry, vol. 14, no. 3, pp. 380–384, 2004.
[41] O. Diwald, T. L. Thompson, T. Zubkov, E. G. Goralski, S. D.Walck, and J. T. Yates, “Photochemical activity of nitrogen-doped rutile TiO2(110) in visible light,” Journal of PhysicalChemistry B, vol. 108, no. 19, pp. 6004–6008, 2004.
[42] N. C. Saha and H. G. Tompkins, “Titanium nitride oxidationchemistry: an X-ray photoelectron spectroscopy study,” Jour-nal of Applied Physics, vol. 72, no. 7, pp. 3072–3079, 1992.
[43] S. Sakthivel and H. Kisch, “Photocatalytic and photoelec-trochemical properties of nitrogen-doped titanium dioxide,”ChemPhysChem, vol. 4, no. 5, pp. 487–490, 2003.
[44] X. Chen and C. Burda, “Photoelectron spectroscopic investi-gation of Nitrogen doped Titania Nanoparticles,” The Journalof Physical Chemistry B, vol. 108, no. 40, pp. 15446–15449,2004.
[45] M. Sathish, B. Viswanathan, R. P. Viswanath, and C. S.Gopinath, “Synthesis, characterization, electronic structure,
and photocatalytic activity of nitrogen-doped TiO2 nanocat-alyst,” Chemistry of Materials, vol. 17, no. 25, pp. 6349–6353,2005.
[46] M. Sathish, B. Viswanathan, and R. P. Viswanath, “Character-ization and photocatalytic activity of N-doped TiO2 preparedby thermal decomposition of Ti-melamine complex,” AppliedCatalysis B, vol. 74, no. 3-4, pp. 307–312, 2007.
[47] T. Ma, M. Akiyama, E. Abe, and I. Imai, “High-efficiency dye-sensitized solar cell based on a nitrogen-doped nanostructuredtitania electrode,” Nano Letters, vol. 5, no. 12, pp. 2543–2547,2005.
[48] B. Naik, K. M. Parida, and C. S. Gopinath, “Facile synthesisof N-and S-incorporated nanocrystalline TiO2 and directsolar-light-driven photocatalytic activity,” Journal of PhysicalChemistry C, vol. 114, no. 45, pp. 19473–19482, 2010.
[49] H. M. Yates, M. G. Nolan, D. W. Sheel, and M. E. Pemble, “Therole of nitrogen doping on the development of visible light-induced photocatalytic activity in thin TiO2 films grown onglass by chemical vapour deposition,” Journal of Photochem-istry and Photobiology A, vol. 179, no. 1-2, pp. 213–223, 2006.
[50] C. Shifu, L. Xuqiang, L. Yunzhang, and C. Gengyu, “Thepreparation of nitrogen-doped TiO2−xNx photocatalyst coatedon hollow glass microbeads,” Applied Surface Science, vol. 253,no. 6, pp. 3077–3082, 2007.
[51] E. Gyorgy, A. P. D. Pino, P. Serra, and J. L. Morenza, “Depthprofiling characterisation of the surface layer obtained bypulsed Nd:YAG laser irradiation of titanium in nitrogen,”Surface and Coatings Technology, vol. 173, no. 2-3, pp. 265–270, 2007.
[52] M. Kitano, K. Funatsu, M. Matsuoka, M. Ueshima, and M.Anpo, “Preparation of Nitrogen-Substituted TiO2 Thin FilmPhoto catalysts by the Radio Frequency Magnetron SputteringDeposition Method and Their Photo catalytic Reactivity underVisible Light Irradiation,” The Journal of Physical Chemistry B,vol. 110, no. 50, pp. 25266–25272, 2006.
[53] J. Yang, H. Bai, X. Tan, and J. Lian, “IR and XPS investigationof visible-light photocatalysis-nitrogen-carbon-doped TiO2
film,” Applied Surface Science, vol. 253, no. 4, pp. 1988–1994,2006.
[54] K. Shankar, K. C. Tep, G. K. Mor, and C. A. Grimes, “Anelectrochemical strategy to incorporate nitrogen in nanos-tructured TiO2 thin films: modification of bandgap andphotoelectrochemical properties,” Journal of Physics D, vol. 39,no. 11, pp. 2361–2366, 2006.
[55] Z. Wang, W. Cai, X. Hong, X. Zhao, F. Xu, and C. Cai,“Photocatalytic degradation of phenol in aqueous nitrogen-doped TiO2 suspensions with various light sources,” AppliedCatalysis B, vol. 57, no. 3, pp. 223–231, 2005.
[56] R. P. Vitiello, J. M. Macak, A. Ghicov, H. Tsuchiya, L. F. P.Dick, and P. Schmuki, “N-Doping of anodic TiO2 nanotubesusing heat treatment in ammonia,” Electrochemistry Commu-nications, vol. 8, no. 4, pp. 544–548, 2006.
[57] Y. Wang, C. Feng, Z. Jin, J. Zhang, Y. Yang, and S. Zhang,“A novel N-doped TiO2 with high visible light photo catalyticactivity,” Journal of Molecular Catalysis A, vol. 260, no. 1–3, pp.1–3, 2006.
[58] F. Peng, L. Cai, L. Huang, H. Yu, and H. Wang, “Preparation ofnitrogen-doped titanium dioxide with visible-light photocat-alytic activity using a facile hydrothermal method,” Journal ofPhysics and Chemistry of Solids, vol. 69, no. 7, pp. 1657–1664,2008.
[59] C. Sarra-Bournet, B. Haberl, C. Charles, and R. Boswell,“Characterization of nanocrystalline nitrogen-containing tita-nium oxide obtained by N2/O2/Ar low-field helicon plasma
10 International Journal of Photoenergy
sputtering,” Journal of Physics D, vol. 44, no. 45, Article ID455202, 2011.
[60] X. Zhang, K. Udagawa, Z. Liu et al., “Photocatalytic and pho-toelectrochemical studies on N-doped TiO2 photocatalyst,”Journal of Photochemistry and Photobiology A, vol. 202, no. 1,pp. 39–47, 2009.
[61] K. S. Rane, R. Mhalsiker, S. Yin et al., “Visible light-sensitiveyellow TiO2−xNx and Fe-N co-doped Ti1−yFeyO2−xNx anatasephotocatalysts,” Journal of Solid State Chemistry, vol. 179, no.10, pp. 3033–3044, 2006.
[62] Y. Cong, J. Zhang, F. Chen, M. Anpo, and D. He, “Preparation,photocatalytic activity, and mechanism of nano-TiO2 Co-doped with nitrogen and iron (III),” Journal of PhysicalChemistry C, vol. 111, no. 28, pp. 10618–10623, 2007.
[63] J. Wang, D. N. Tafen, J. P. Lewis et al., “Origin of PhotocatalyticActivity of Nitrogen-Doped TiO2 Nanobelts,” Journal of theAmerican Chemical Society, vol. 131, no. 341, pp. 2290–12297,2009.
[64] J. Yang, H. Bai, X. Tan, and J. Lian, “IR and XPS investigationof visible-light photocatalysis-Nitrogen-carbon-doped TiO2
film,” Applied Surface Science, vol. 253, no. 4, pp. 1988–1994,2006.
[65] D. Mitorj and N. H. Kisch, “The nature of nitrogen-modifiedtitanium dioxide photocatalysts active in visible light,” Ange-wandte Chemie International Edition, vol. 47, no. 51, pp. 9975–9978, 2008.
[66] Z. Zhang, X. Wang, J. Long, Q. Gu, Z. Ding, and X. Fu,“Nitrogen-doped titanium dioxide visible light photocatalyst:spectroscopic identification of photoactive centers,” Journal ofCatalysis, vol. 276, no. 2, pp. 201–214, 2010.
[67] Y.-C. Tang, X.-H. Huang, H.-Q. Yu, and L.-H. Tang,“Nitrogen-doped TiO2 photocatalyst prepared bymechanochemical method: doping mechanisms and visiblephotoactivity of pollutant degradation,” International Journalof Photoenergy, vol. 2012, Article ID 960726, 10 pages, 2012.
[68] M. Pandey and R. S. Pala, “Stabilization and growth of non-native nano crystals at low and atmospheric pressures,” Journalof Chemical Physics, vol. 136, Article ID 044703, 2012.
[69] S. H. Lee, E. Yamasue, H. Okumura, and K. N. Ishihara,“Preparation of N-doped TiOx films as photocatalyst usingreactive sputtering with dry air,” Materials Transactions, vol.50, no. 7, pp. 1805–1811, 2009.
[70] N. Serpone, “Is the band gap of pristine TiO2 narrowed byanion- and cation-doping of titanium dioxide in second-generation photocatalysts?” The Journal of Physical ChemistryB, vol. 110, no. 48, pp. 24287–24293, 2006.
[71] V. N. Kuznetsov and N. Serpone, “Visible light absorption byvarious titanium dioxide specimens,” The Journal of PhysicalChemistry B, vol. 110, no. 50, pp. 25203–25209, 2006.
[72] V. N. Kuznetsov and N. Serpone, “Photoinduced colorationand photobleaching of titanium dioxide in TiO2/polymercompositions upon UV- and visible-light excitation of colorcenters’ absorption bands: direct experimental evidencenegating band-gap narrowing in anion-/cation-doped TiO2s,”The Journal of Physical Chemistry C, vol. 111, no. 42, pp.15277–15288, 2007.
[73] R. Beranek and H. Kisch, “Tuning the optical and photoelec-trochemical properties of surface-modified TiO2,” Photochem-ical & Photobiological Sciences, vol. 7, no. 1, pp. 40–48, 2008.
[74] H.-J. Cho, P.-G. Hwang, and D. Jung, “Preparation andphotocatalytic activity of nitrogen-doped TiO2 hollow
nanospheres,” Journal of Physics and Chemistry of Solids, vol.72, no. 12, pp. 1462–1466, 2011.
[75] C.-M. Huang, L.-C. Chen, K.-W. Cheng, and G.-T. Pan, “Effectof nitrogen-plasma surface treatment to the enhancement ofTiO2 photocatalytic activity under visible light irradiation,”Journal of Molecular Catalysis A, vol. 261, no. 2, pp. 218–224,2007.
[76] T. Tachikawa, Y. Takai, S. Tojo et al., “Visible light-induceddegradation of ethylene glycol on nitrogen-doped TiO2 Pow-ders,” Journal of Physical Chemistry B, vol. 110, no. 26, pp.13158–13165, 2006.
[77] M. Kitano, K. Funatsu, M. Matsuoka, M. Ueshima, and M.Anpo, “Preparation of nitrogen-substituted TiO2 thin filmphotocatalysts by the radio frequency magnetron sputteringdeposition method and their photocatalytic reactivity undervisible light irradiation,” Journal of Physical Chemistry B, vol.110, no. 50, pp. 25266–25272, 2006.
[78] T. Ihara, M. Miyoshi, Y. Iriyama, O. Matsumoto, and S.Sugihara, “Visible-light-active titanium oxide photocatalystrealized by an oxygen-deficient structure and by nitrogendoping,” Applied Catalysis B, vol. 42, no. 4, pp. 403–409, 2003.
[79] B. Grzmil, B. Kic, and M. Rabe, “Inhibition of the anatase—rutile phase transformation with addition of K2O, P2O5, andLi2O,” Chemical Papers, vol. 58, no. 6, pp. 410–414, 2004.
[80] A. Chatterjee, S. B. Wu, P. W. Chou, M. S. Wong, and C.L. Cheng, “Observation of carbon-facilitated phase transfor-mation of titanium dioxide forming mixed-phase titania byconfocal Raman microscopy,” Journal of Raman Spectroscopy,vol. 42, no. 5, pp. 1075–1080, 2011.
[81] K. Prasad, D. V. Pinjari, A. B. Pandit, and S. T. Mhaske,“Phase transformation of nanostructured titanium dioxidefrom anatase-to-rutile via combined ultrasound assisted sol-gel technique,” Ultrasonics Sonochemistry, vol. 17, no. 2, pp.409–415, 2010.
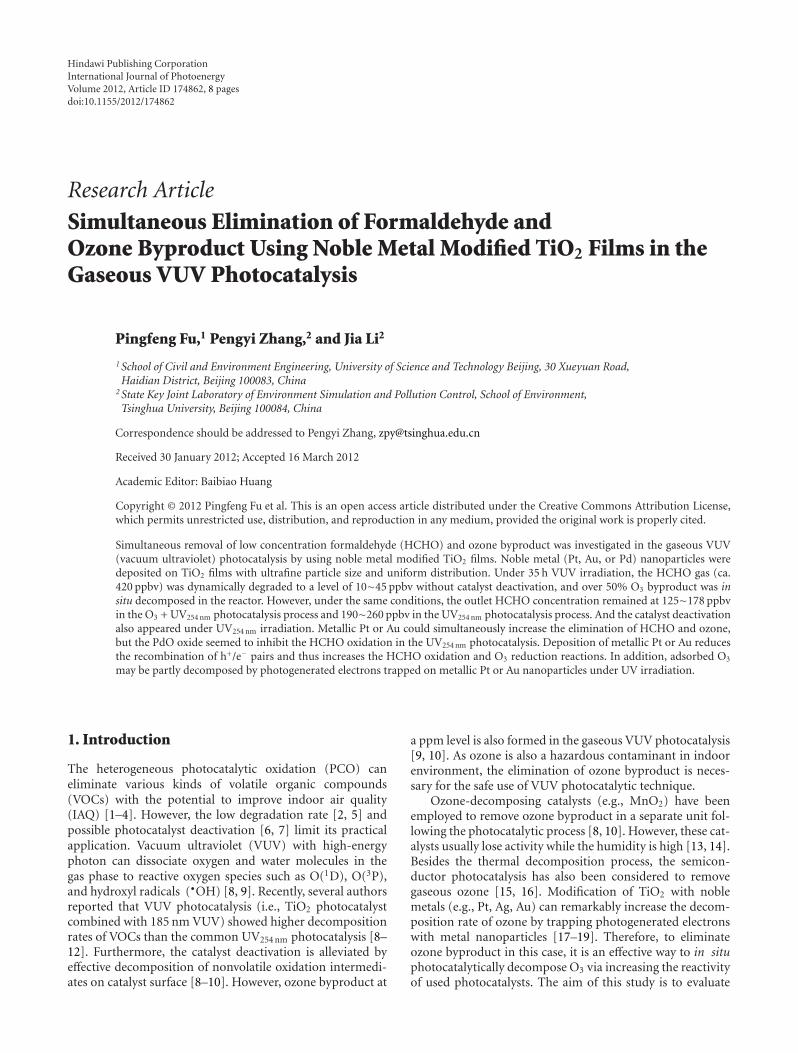
Hindawi Publishing CorporationInternational Journal of PhotoenergyVolume 2012, Article ID 174862, 8 pagesdoi:10.1155/2012/174862
Research Article
Simultaneous Elimination of Formaldehyde andOzone Byproduct Using Noble Metal Modified TiO2 Films in theGaseous VUV Photocatalysis
Pingfeng Fu,1 Pengyi Zhang,2 and Jia Li2
1 School of Civil and Environment Engineering, University of Science and Technology Beijing, 30 Xueyuan Road,Haidian District, Beijing 100083, China
2 State Key Joint Laboratory of Environment Simulation and Pollution Control, School of Environment,Tsinghua University, Beijing 100084, China
Correspondence should be addressed to Pengyi Zhang, [email protected]
Received 30 January 2012; Accepted 16 March 2012
Academic Editor: Baibiao Huang
Copyright © 2012 Pingfeng Fu et al. This is an open access article distributed under the Creative Commons Attribution License,which permits unrestricted use, distribution, and reproduction in any medium, provided the original work is properly cited.
Simultaneous removal of low concentration formaldehyde (HCHO) and ozone byproduct was investigated in the gaseous VUV(vacuum ultraviolet) photocatalysis by using noble metal modified TiO2 films. Noble metal (Pt, Au, or Pd) nanoparticles weredeposited on TiO2 films with ultrafine particle size and uniform distribution. Under 35 h VUV irradiation, the HCHO gas (ca.420 ppbv) was dynamically degraded to a level of 10∼45 ppbv without catalyst deactivation, and over 50% O3 byproduct was insitu decomposed in the reactor. However, under the same conditions, the outlet HCHO concentration remained at 125∼178 ppbvin the O3 + UV254 nm photocatalysis process and 190∼260 ppbv in the UV254 nm photocatalysis process. And the catalyst deactivationalso appeared under UV254 nm irradiation. Metallic Pt or Au could simultaneously increase the elimination of HCHO and ozone,but the PdO oxide seemed to inhibit the HCHO oxidation in the UV254 nm photocatalysis. Deposition of metallic Pt or Au reducesthe recombination of h+/e− pairs and thus increases the HCHO oxidation and O3 reduction reactions. In addition, adsorbed O3
may be partly decomposed by photogenerated electrons trapped on metallic Pt or Au nanoparticles under UV irradiation.
1. Introduction
The heterogeneous photocatalytic oxidation (PCO) caneliminate various kinds of volatile organic compounds(VOCs) with the potential to improve indoor air quality(IAQ) [1–4]. However, the low degradation rate [2, 5] andpossible photocatalyst deactivation [6, 7] limit its practicalapplication. Vacuum ultraviolet (VUV) with high-energyphoton can dissociate oxygen and water molecules in thegas phase to reactive oxygen species such as O(1D), O(3P),and hydroxyl radicals (•OH) [8, 9]. Recently, several authorsreported that VUV photocatalysis (i.e., TiO2 photocatalystcombined with 185 nm VUV) showed higher decompositionrates of VOCs than the common UV254 nm photocatalysis [8–12]. Furthermore, the catalyst deactivation is alleviated byeffective decomposition of nonvolatile oxidation intermedi-ates on catalyst surface [8–10]. However, ozone byproduct at
a ppm level is also formed in the gaseous VUV photocatalysis[9, 10]. As ozone is also a hazardous contaminant in indoorenvironment, the elimination of ozone byproduct is neces-sary for the safe use of VUV photocatalytic technique.
Ozone-decomposing catalysts (e.g., MnO2) have beenemployed to remove ozone byproduct in a separate unit fol-lowing the photocatalytic process [8, 10]. However, these cat-alysts usually lose activity while the humidity is high [13, 14].Besides the thermal decomposition process, the semicon-ductor photocatalysis has also been considered to removegaseous ozone [15, 16]. Modification of TiO2 with noblemetals (e.g., Pt, Ag, Au) can remarkably increase the decom-position rate of ozone by trapping photogenerated electronswith metal nanoparticles [17–19]. Therefore, to eliminateozone byproduct in this case, it is an effective way to in situphotocatalytically decompose O3 via increasing the reactivityof used photocatalysts. The aim of this study is to evaluate
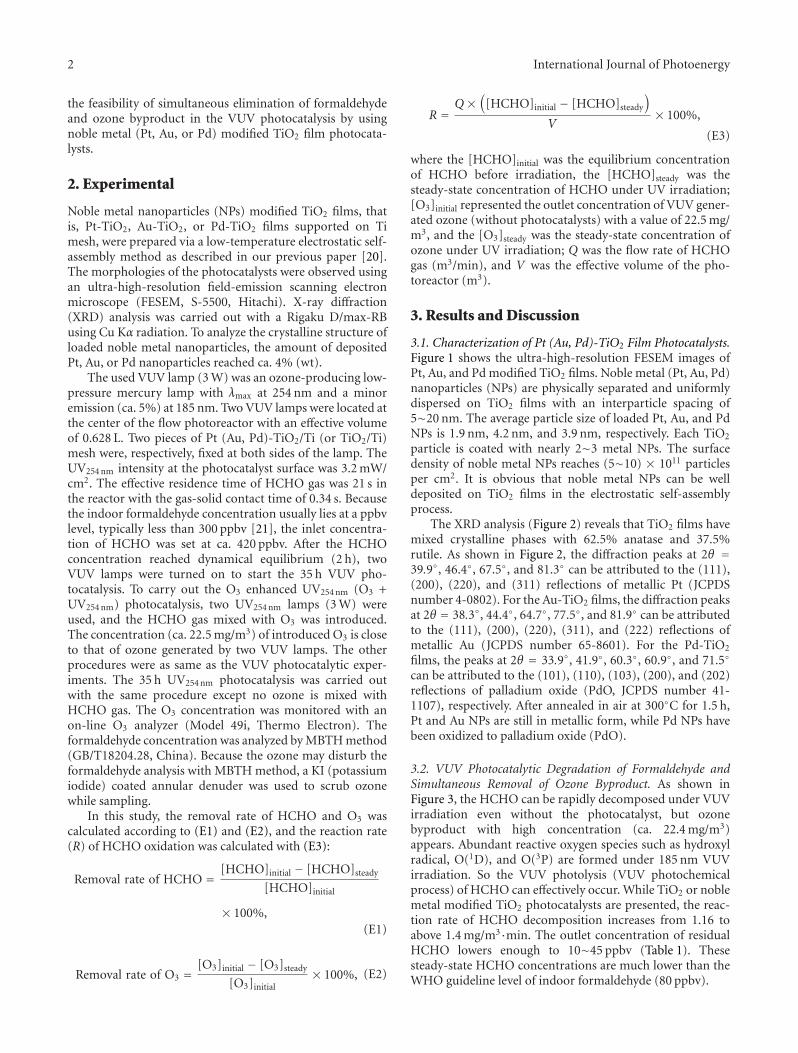
2 International Journal of Photoenergy
the feasibility of simultaneous elimination of formaldehydeand ozone byproduct in the VUV photocatalysis by usingnoble metal (Pt, Au, or Pd) modified TiO2 film photocata-lysts.
2. Experimental
Noble metal nanoparticles (NPs) modified TiO2 films, thatis, Pt-TiO2, Au-TiO2, or Pd-TiO2 films supported on Timesh, were prepared via a low-temperature electrostatic self-assembly method as described in our previous paper [20].The morphologies of the photocatalysts were observed usingan ultra-high-resolution field-emission scanning electronmicroscope (FESEM, S-5500, Hitachi). X-ray diffraction(XRD) analysis was carried out with a Rigaku D/max-RBusing Cu Kα radiation. To analyze the crystalline structure ofloaded noble metal nanoparticles, the amount of depositedPt, Au, or Pd nanoparticles reached ca. 4% (wt).
The used VUV lamp (3 W) was an ozone-producing low-pressure mercury lamp with λmax at 254 nm and a minoremission (ca. 5%) at 185 nm. Two VUV lamps were located atthe center of the flow photoreactor with an effective volumeof 0.628 L. Two pieces of Pt (Au, Pd)-TiO2/Ti (or TiO2/Ti)mesh were, respectively, fixed at both sides of the lamp. TheUV254 nm intensity at the photocatalyst surface was 3.2 mW/cm2. The effective residence time of HCHO gas was 21 s inthe reactor with the gas-solid contact time of 0.34 s. Becausethe indoor formaldehyde concentration usually lies at a ppbvlevel, typically less than 300 ppbv [21], the inlet concentra-tion of HCHO was set at ca. 420 ppbv. After the HCHOconcentration reached dynamical equilibrium (2 h), twoVUV lamps were turned on to start the 35 h VUV pho-tocatalysis. To carry out the O3 enhanced UV254 nm (O3 +UV254 nm) photocatalysis, two UV254 nm lamps (3 W) wereused, and the HCHO gas mixed with O3 was introduced.The concentration (ca. 22.5 mg/m3) of introduced O3 is closeto that of ozone generated by two VUV lamps. The otherprocedures were as same as the VUV photocatalytic exper-iments. The 35 h UV254 nm photocatalysis was carried outwith the same procedure except no ozone is mixed withHCHO gas. The O3 concentration was monitored with anon-line O3 analyzer (Model 49i, Thermo Electron). Theformaldehyde concentration was analyzed by MBTH method(GB/T18204.28, China). Because the ozone may disturb theformaldehyde analysis with MBTH method, a KI (potassiumiodide) coated annular denuder was used to scrub ozonewhile sampling.
In this study, the removal rate of HCHO and O3 wascalculated according to (E1) and (E2), and the reaction rate(R) of HCHO oxidation was calculated with (E3):
Removal rate of HCHO = [HCHO]initial − [HCHO]steady
[HCHO]initial
× 100%,(E1)
Removal rate of O3 =[O3]initial − [O3]steady
[O3]initial× 100%, (E2)
R =Q ×
([HCHO]initial − [HCHO]steady
)
V× 100%,
(E3)
where the [HCHO]initial was the equilibrium concentrationof HCHO before irradiation, the [HCHO]steady was thesteady-state concentration of HCHO under UV irradiation;[O3]initial represented the outlet concentration of VUV gener-ated ozone (without photocatalysts) with a value of 22.5 mg/m3, and the [O3]steady was the steady-state concentration ofozone under UV irradiation; Q was the flow rate of HCHOgas (m3/min), and V was the effective volume of the pho-toreactor (m3).
3. Results and Discussion
3.1. Characterization of Pt (Au, Pd)-TiO2 Film Photocatalysts.Figure 1 shows the ultra-high-resolution FESEM images ofPt, Au, and Pd modified TiO2 films. Noble metal (Pt, Au, Pd)nanoparticles (NPs) are physically separated and uniformlydispersed on TiO2 films with an interparticle spacing of5∼20 nm. The average particle size of loaded Pt, Au, and PdNPs is 1.9 nm, 4.2 nm, and 3.9 nm, respectively. Each TiO2
particle is coated with nearly 2∼3 metal NPs. The surfacedensity of noble metal NPs reaches (5∼10) × 1011 particlesper cm2. It is obvious that noble metal NPs can be welldeposited on TiO2 films in the electrostatic self-assemblyprocess.
The XRD analysis (Figure 2) reveals that TiO2 films havemixed crystalline phases with 62.5% anatase and 37.5%rutile. As shown in Figure 2, the diffraction peaks at 2θ =39.9◦, 46.4◦, 67.5◦, and 81.3◦ can be attributed to the (111),(200), (220), and (311) reflections of metallic Pt (JCPDSnumber 4-0802). For the Au-TiO2 films, the diffraction peaksat 2θ = 38.3◦, 44.4◦, 64.7◦, 77.5◦, and 81.9◦ can be attributedto the (111), (200), (220), (311), and (222) reflections ofmetallic Au (JCPDS number 65-8601). For the Pd-TiO2
films, the peaks at 2θ = 33.9◦, 41.9◦, 60.3◦, 60.9◦, and 71.5◦
can be attributed to the (101), (110), (103), (200), and (202)reflections of palladium oxide (PdO, JCPDS number 41-1107), respectively. After annealed in air at 300◦C for 1.5 h,Pt and Au NPs are still in metallic form, while Pd NPs havebeen oxidized to palladium oxide (PdO).
3.2. VUV Photocatalytic Degradation of Formaldehyde andSimultaneous Removal of Ozone Byproduct. As shown inFigure 3, the HCHO can be rapidly decomposed under VUVirradiation even without the photocatalyst, but ozonebyproduct with high concentration (ca. 22.4 mg/m3)appears. Abundant reactive oxygen species such as hydroxylradical, O(1D), and O(3P) are formed under 185 nm VUVirradiation. So the VUV photolysis (VUV photochemicalprocess) of HCHO can effectively occur. While TiO2 or noblemetal modified TiO2 photocatalysts are presented, the reac-tion rate of HCHO decomposition increases from 1.16 toabove 1.4 mg/m3·min. The outlet concentration of residualHCHO lowers enough to 10∼45 ppbv (Table 1). Thesesteady-state HCHO concentrations are much lower than theWHO guideline level of indoor formaldehyde (80 ppbv).
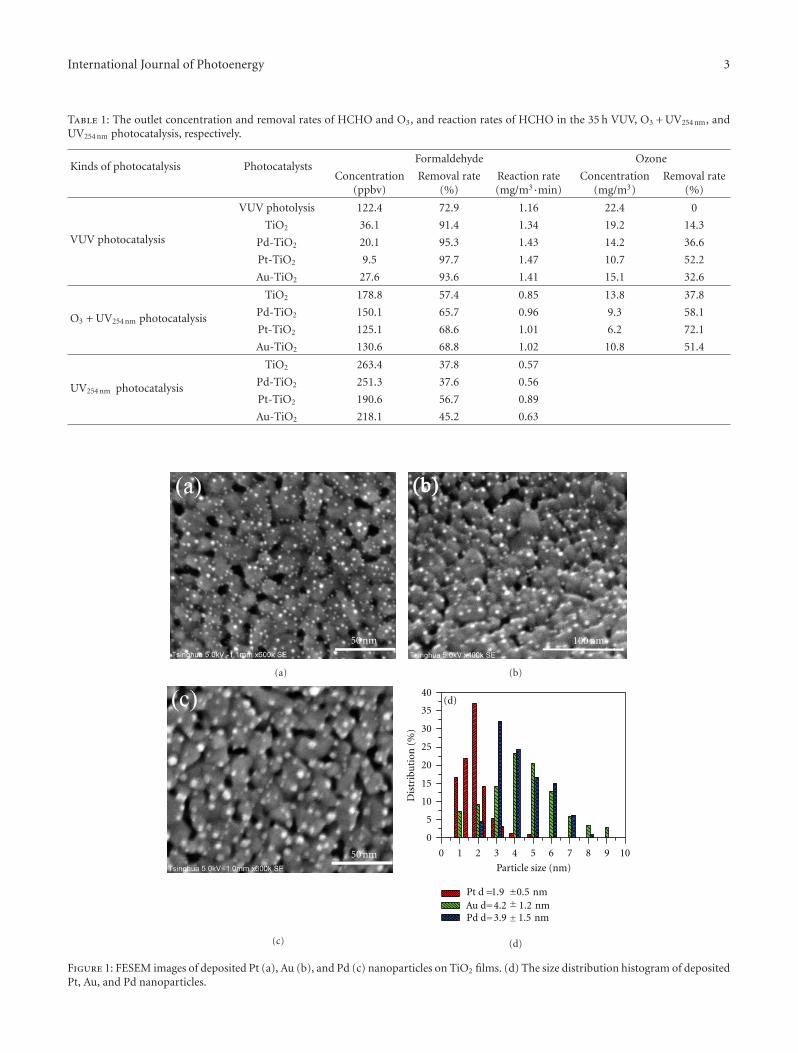
International Journal of Photoenergy 3
Table 1: The outlet concentration and removal rates of HCHO and O3, and reaction rates of HCHO in the 35 h VUV, O3 + UV254 nm, andUV254 nm photocatalysis, respectively.
Kinds of photocatalysis PhotocatalystsFormaldehyde Ozone
Concentration(ppbv)
Removal rate(%)
Reaction rate(mg/m3·min)
Concentration(mg/m3)
Removal rate(%)
VUV photocatalysis
VUV photolysis 122.4 72.9 1.16 22.4 0
TiO2 36.1 91.4 1.34 19.2 14.3
Pd-TiO2 20.1 95.3 1.43 14.2 36.6
Pt-TiO2 9.5 97.7 1.47 10.7 52.2
Au-TiO2 27.6 93.6 1.41 15.1 32.6
O3 + UV254 nm photocatalysis
TiO2 178.8 57.4 0.85 13.8 37.8
Pd-TiO2 150.1 65.7 0.96 9.3 58.1
Pt-TiO2 125.1 68.6 1.01 6.2 72.1
Au-TiO2 130.6 68.8 1.02 10.8 51.4
UV254 nm photocatalysis
TiO2 263.4 37.8 0.57
Pd-TiO2 251.3 37.6 0.56
Pt-TiO2 190.6 56.7 0.89
Au-TiO2 218.1 45.2 0.63
50 nm
(a)
100 nm
(b)
50 nm
(c)
0
5
10
15
20
25
30
35
40
Dis
trib
uti
on(%
)
Particle size (nm)
Pt d=1.9 0.5 nmAu d=4.2 1.2 nmPd d=3.9 1.5 nm
1 2 3 4 5 6 7 8 9 100
±±±
(d)
(d)
Figure 1: FESEM images of deposited Pt (a), Au (b), and Pd (c) nanoparticles on TiO2 films. (d) The size distribution histogram of depositedPt, Au, and Pd nanoparticles.
4 International Journal of Photoenergy
Pd
Pt
(d)
(c)
(b)
RA
A
APd
AuAuAu
Pt Pt
(a)
20 30 40 50 60 70 80 90
PdPd
2 theta (deg)
A: anatase
R: rutile
A
Figure 2: XRD patterns of as-prepared TiO2 films (a), Pt-TiO2 (b),Au-TiO2 (c), and Pd-TiO2 (d) nanocomposite films scratched fromTi wire net.
In the VUV photocatalysis, the HCHO can be decom-posed both in gas phase via VUV photochemical process andon the photocatalyst surface via UV254 nm excited photocatal-ysis [8–10]. So the presence of photocatalysts under VUVirradiation can remarkably increase the oxidation rate ofVOCs. However, in the VUV photocatalysis of HCHO, onlyminor improvement of HCHO removal is observed by mod-ifying TiO2 films with noble metals. This may be attributedto that most of HCHO molecules are decomposed in gasphase not on the photocatalyst surface.
However, the removal ratio of ozone byproduct increasesfrom 14.3% (TiO2) to 32∼52% (Au, Pd, or Pt-TiO2) with anenhancement of 2.3∼3.6-folds (Table 1). At the same time,the outlet O3 concentration can keep almost at a samelevel for a long steady-state period for noble metal modifiedTiO2, but it gradually rises in the case of pure TiO2. Theresult suggests that ozone byproduct can be in situ photocat-alytically decomposed in the photoreactor, and modificationof TiO2 films with noble metals can both enhance the photo-degradation of O3 and alleviate the catalyst deactivation. Theresults reveal that simultaneous removal of low concentra-tion HCHO and O3 byproduct is surly feasible in the VUVphotocatalysis when TiO2 films are modified with Pt, Au, orPd NPs.
3.3. Comparison of HCHO Degradation in Long-Term VUVPhotocatalysis, O3 + UV254 nm Photocatalysis and UV254 nm
Photocatalysis. Figures 4(a) and 5 show the outlet concen-trations of HCHO versus irradiation time in the O3 +UV254 nm and UV254 nm photocatalysis, respectively. As shownin Figures 4(a) and 5 and Table 1, the outlet concentrationof HCHO reaches 125∼178 ppbv in the O3 + UV254 nm pho-tocatalysis and 190∼260 ppbv in the UV254 nm photocatalysis,while it is just 10∼45 ppbv in the VUV photocatalysis whenthe same photocatalyst is used. The reaction rate of HCHOoxidation in the VUV photocatalysis is ca. 1.4 times and 2times higher than that in the O3 + UV254 nm and UV254 nm
photocatalysis, respectively. As listed in Table 1, the HCHOdegradation rate in the VUV photolysis (without photocata-lyst) has been much higher than that in the O3 + UV254 nm orUV254 nm photocatalysis. Obviously, the VUV photochemicalprocess in gas phase makes great contribution in theoxidation of HCHO molecules in the VUV photocatalysis.
Additionally, the stability of the outlet HCHO con-centration in the long-term VUV photocatalysis is alsovery different from that in the O3 + UV254 nm or UV254 nm
photocatalysis. The HCHO concentration gradually rises up,while the reaction time exceeds 25 h in the O3 + UV254 nm orUV254 nm photocatalysis (Figures 4(a) and 5), while it remainsat a very low level in the VUV photocatalysis (Figure 3).Due to the lower degradation rate of HCHO in the O3 +UV254 nm or UV254 nm photocatalysis, the reaction interme-diates combined with adsorbed HCHO molecules may per-sistently accumulate on the catalyst surfaces, which leads toobserved catalyst deactivation. Nevertheless, the degradationbehaviour under VUV irradiation suggests that no catalystdeactivation occurs in the VUV photocatalysis regardlessof modification of TiO2. Due to abundant reactive speciesgenerated in gas phase, the oxidation of reaction inter-mediates and HCHO should been significantly enhancedunder VUV irradiation. Therefore, the carbon accumulationon the catalyst could be alleviated even the HCHO gas iscontinuously introduced with very short residence time. Theresults in this study are highly consistent with the previouslyobserved long lifetime of the photocatalysts under VUVirradiation [8–10].
While the HCHO concentration is at a typical indoorlevel, the film-diffusional resistance at the interface of gasphase and catalyst film becomes very large, leading toremarkable decrease of HCHO degradation rate in theUV254 nm photocatalysis [22]. Until now, it is still a greatchallenge for UV254 nm photocatalysis using semiconductorfilms to effectively decompose low concentration HCHO,while the gas residence time becomes short enough to severalseconds [22–24]. In this study, the results indicate that theVUV photocatalysis cannot only rapidly decompose HCHOvapor with low concentration but also avoid the deactivationof the photocatalysts. Therefore, it can be anticipated thatthe VUV photocatalysis is an alternative method to efficientlydecompose indoor VOCs.
3.4. Enhanced Effects of Deposited Noble Metals on the Decom-position of HCHO and Ozone. As shown in Table 1, depo-sition of noble metals (Pt or Au) on TiO2 surface actuallyincreases the decomposition rate of HCHO in the VUV,
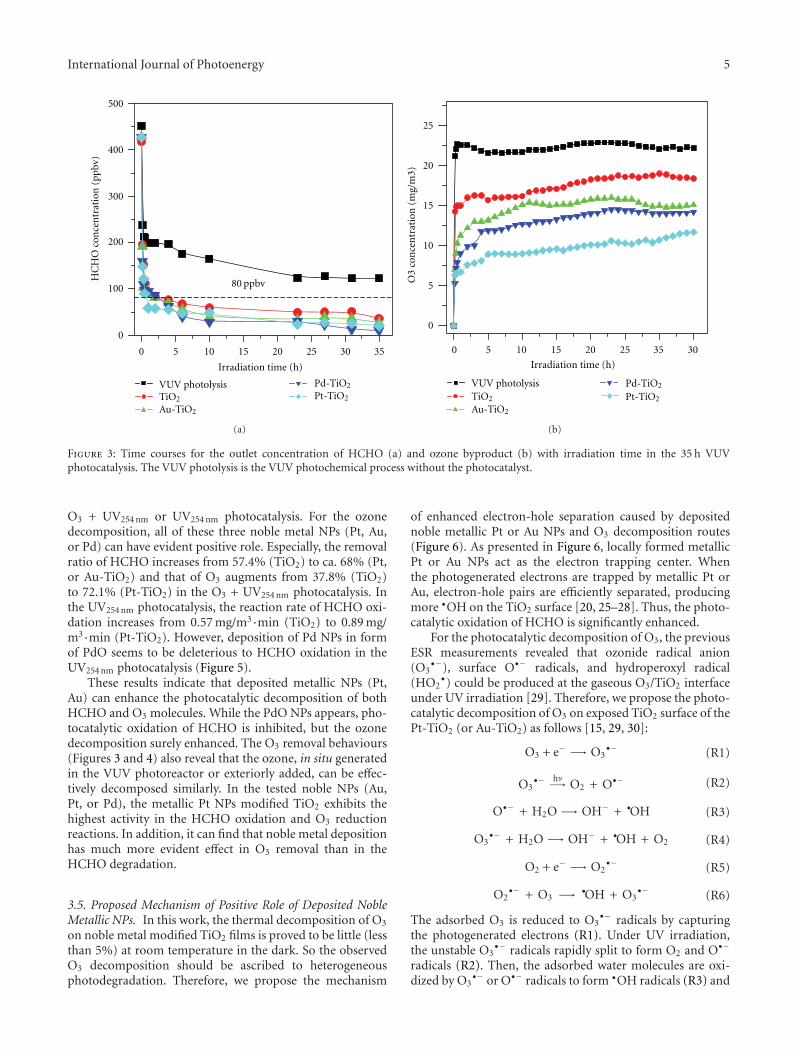
International Journal of Photoenergy 5
0 5 10 15 20 25 30 35
0
100
200
300
400
500
VUV photolysisTiO2
Au-TiO2
Pd-TiO2
Pt-TiO2
Irradiation time (h)
80 ppbvHC
HO
con
cen
trat
ion
(pp
bv)
(a)
0
5
10
15
20
25
0 5 10 15 20 25 35 30
Irradiation time (h)
VUV photolysisTiO2
Au-TiO2
Pd-TiO2
Pt-TiO2
O3
con
cen
trat
ion
(m
g/m
3)
(b)
Figure 3: Time courses for the outlet concentration of HCHO (a) and ozone byproduct (b) with irradiation time in the 35 h VUVphotocatalysis. The VUV photolysis is the VUV photochemical process without the photocatalyst.
O3 + UV254 nm or UV254 nm photocatalysis. For the ozonedecomposition, all of these three noble metal NPs (Pt, Au,or Pd) can have evident positive role. Especially, the removalratio of HCHO increases from 57.4% (TiO2) to ca. 68% (Pt,or Au-TiO2) and that of O3 augments from 37.8% (TiO2)to 72.1% (Pt-TiO2) in the O3 + UV254 nm photocatalysis. Inthe UV254 nm photocatalysis, the reaction rate of HCHO oxi-dation increases from 0.57 mg/m3·min (TiO2) to 0.89 mg/m3·min (Pt-TiO2). However, deposition of Pd NPs in formof PdO seems to be deleterious to HCHO oxidation in theUV254 nm photocatalysis (Figure 5).
These results indicate that deposited metallic NPs (Pt,Au) can enhance the photocatalytic decomposition of bothHCHO and O3 molecules. While the PdO NPs appears, pho-tocatalytic oxidation of HCHO is inhibited, but the ozonedecomposition surely enhanced. The O3 removal behaviours(Figures 3 and 4) also reveal that the ozone, in situ generatedin the VUV photoreactor or exteriorly added, can be effec-tively decomposed similarly. In the tested noble NPs (Au,Pt, or Pd), the metallic Pt NPs modified TiO2 exhibits thehighest activity in the HCHO oxidation and O3 reductionreactions. In addition, it can find that noble metal depositionhas much more evident effect in O3 removal than in theHCHO degradation.
3.5. Proposed Mechanism of Positive Role of Deposited NobleMetallic NPs. In this work, the thermal decomposition of O3
on noble metal modified TiO2 films is proved to be little (lessthan 5%) at room temperature in the dark. So the observedO3 decomposition should be ascribed to heterogeneousphotodegradation. Therefore, we propose the mechanism
of enhanced electron-hole separation caused by depositednoble metallic Pt or Au NPs and O3 decomposition routes(Figure 6). As presented in Figure 6, locally formed metallicPt or Au NPs act as the electron trapping center. Whenthe photogenerated electrons are trapped by metallic Pt orAu, electron-hole pairs are efficiently separated, producingmore •OH on the TiO2 surface [20, 25–28]. Thus, the photo-catalytic oxidation of HCHO is significantly enhanced.
For the photocatalytic decomposition of O3, the previousESR measurements revealed that ozonide radical anion(O3
•−), surface O•− radicals, and hydroperoxyl radical(HO2
•) could be produced at the gaseous O3/TiO2 interfaceunder UV irradiation [29]. Therefore, we propose the photo-catalytic decomposition of O3 on exposed TiO2 surface of thePt-TiO2 (or Au-TiO2) as follows [15, 29, 30]:
O3 + e− −→ O3•− (R1)
O3•− hν−→ O2 + O•− (R2)
O•− + H2O −→ OH− + •OH (R3)
O3•− + H2O −→ OH− + •OH + O2 (R4)
O2 + e− −→ O2•− (R5)
O2•− + O3 −→ •OH + O3
•− (R6)
The adsorbed O3 is reduced to O3•− radicals by capturing
the photogenerated electrons (R1). Under UV irradiation,the unstable O3
•− radicals rapidly split to form O2 and O•−
radicals (R2). Then, the adsorbed water molecules are oxi-dized by O3
•− or O•− radicals to form •OH radicals (R3) and
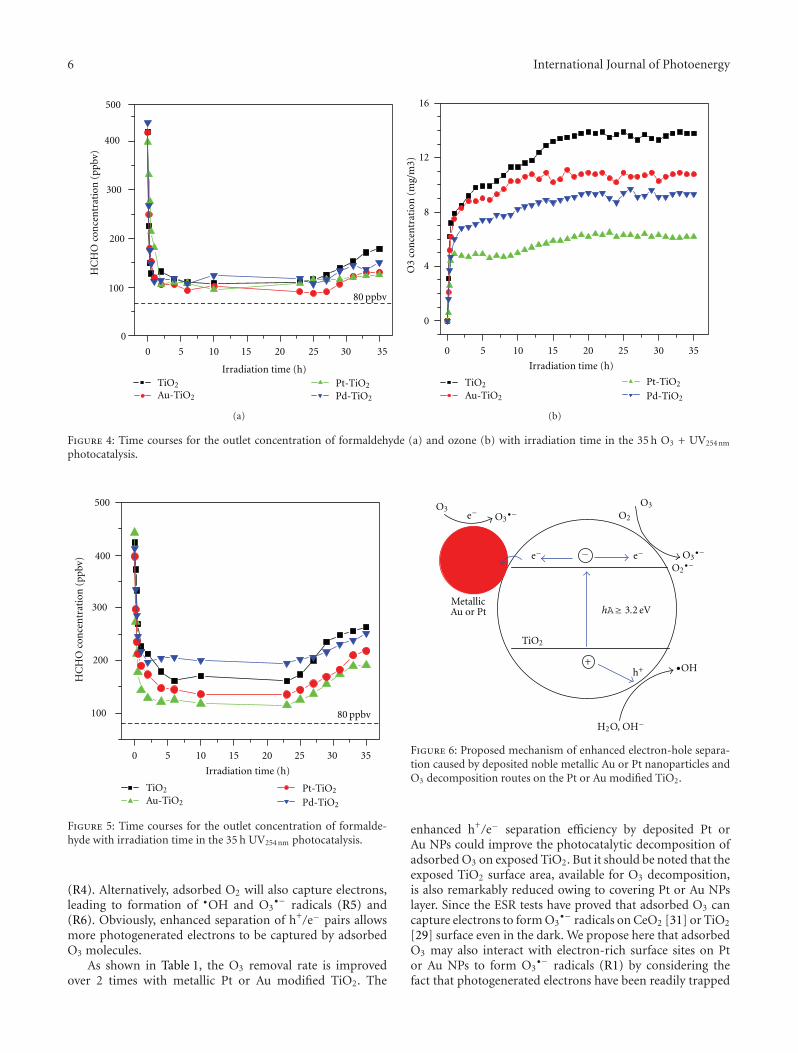
6 International Journal of Photoenergy
0 5 10 15 20 25 30 35
0
100
200
300
400
TiO2
Au-TiO2
Pt-TiO2
Pd-TiO2
HC
HO
con
cen
trat
ion
(ppb
v)
Irradiation time (h)
80 ppbv
500
(a)
0
4
8
12
16
Irradiation time (h)
TiO2
Au-TiO2
Pt-TiO2
Pd-TiO2
0 5 10 15 20 25 30 35
O3
con
cen
trat
ion
(m
g/m
3)(b)
Figure 4: Time courses for the outlet concentration of formaldehyde (a) and ozone (b) with irradiation time in the 35 h O3 + UV254 nm
photocatalysis.
500
0 5 10 15 20 25 30 35
100
200
300
400
HC
HO
con
cen
trat
ion
(ppb
v)
Irradiation time (h)
TiO2
Au-TiO2
Pt-TiO2
Pd-TiO2
80 ppbv
Figure 5: Time courses for the outlet concentration of formalde-hyde with irradiation time in the 35 h UV254 nm photocatalysis.
(R4). Alternatively, adsorbed O2 will also capture electrons,leading to formation of •OH and O3
•− radicals (R5) and(R6). Obviously, enhanced separation of h+/e− pairs allowsmore photogenerated electrons to be captured by adsorbedO3 molecules.
As shown in Table 1, the O3 removal rate is improvedover 2 times with metallic Pt or Au modified TiO2. The
−
+
H2O, OH−
O3
e− e−
O3
e− O2
TiO2
O3•−
O2•−
MetallicAu or Pt
h+
hA≥ 3.2 eV
O3•−
•OH
Figure 6: Proposed mechanism of enhanced electron-hole separa-tion caused by deposited noble metallic Au or Pt nanoparticles andO3 decomposition routes on the Pt or Au modified TiO2.
enhanced h+/e− separation efficiency by deposited Pt orAu NPs could improve the photocatalytic decomposition ofadsorbed O3 on exposed TiO2. But it should be noted that theexposed TiO2 surface area, available for O3 decomposition,is also remarkably reduced owing to covering Pt or Au NPslayer. Since the ESR tests have proved that adsorbed O3 cancapture electrons to form O3
•− radicals on CeO2 [31] or TiO2
[29] surface even in the dark. We propose here that adsorbedO3 may also interact with electron-rich surface sites on Ptor Au NPs to form O3
•− radicals (R1) by considering thefact that photogenerated electrons have been readily trapped
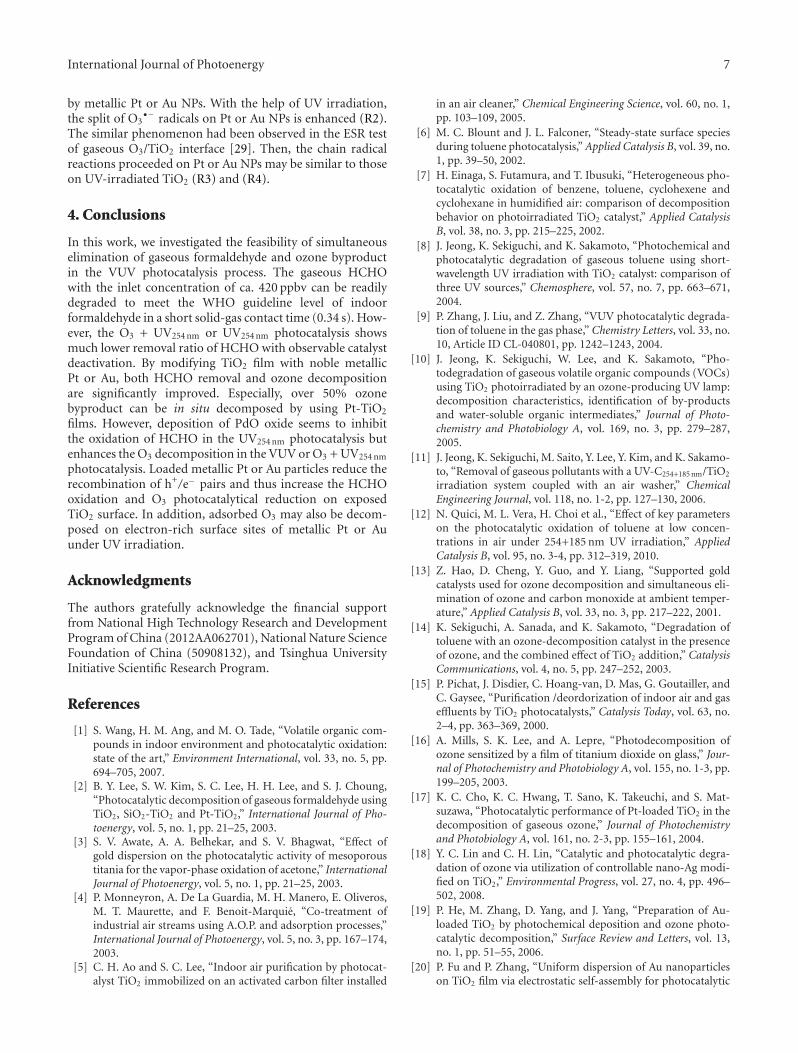
International Journal of Photoenergy 7
by metallic Pt or Au NPs. With the help of UV irradiation,the split of O3
•− radicals on Pt or Au NPs is enhanced (R2).The similar phenomenon had been observed in the ESR testof gaseous O3/TiO2 interface [29]. Then, the chain radicalreactions proceeded on Pt or Au NPs may be similar to thoseon UV-irradiated TiO2 (R3) and (R4).
4. Conclusions
In this work, we investigated the feasibility of simultaneouselimination of gaseous formaldehyde and ozone byproductin the VUV photocatalysis process. The gaseous HCHOwith the inlet concentration of ca. 420 ppbv can be readilydegraded to meet the WHO guideline level of indoorformaldehyde in a short solid-gas contact time (0.34 s). How-ever, the O3 + UV254 nm or UV254 nm photocatalysis showsmuch lower removal ratio of HCHO with observable catalystdeactivation. By modifying TiO2 film with noble metallicPt or Au, both HCHO removal and ozone decompositionare significantly improved. Especially, over 50% ozonebyproduct can be in situ decomposed by using Pt-TiO2
films. However, deposition of PdO oxide seems to inhibitthe oxidation of HCHO in the UV254 nm photocatalysis butenhances the O3 decomposition in the VUV or O3 + UV254 nm
photocatalysis. Loaded metallic Pt or Au particles reduce therecombination of h+/e− pairs and thus increase the HCHOoxidation and O3 photocatalytical reduction on exposedTiO2 surface. In addition, adsorbed O3 may also be decom-posed on electron-rich surface sites of metallic Pt or Auunder UV irradiation.
Acknowledgments
The authors gratefully acknowledge the financial supportfrom National High Technology Research and DevelopmentProgram of China (2012AA062701), National Nature ScienceFoundation of China (50908132), and Tsinghua UniversityInitiative Scientific Research Program.
References
[1] S. Wang, H. M. Ang, and M. O. Tade, “Volatile organic com-pounds in indoor environment and photocatalytic oxidation:state of the art,” Environment International, vol. 33, no. 5, pp.694–705, 2007.
[2] B. Y. Lee, S. W. Kim, S. C. Lee, H. H. Lee, and S. J. Choung,“Photocatalytic decomposition of gaseous formaldehyde usingTiO2, SiO2-TiO2 and Pt-TiO2,” International Journal of Pho-toenergy, vol. 5, no. 1, pp. 21–25, 2003.
[3] S. V. Awate, A. A. Belhekar, and S. V. Bhagwat, “Effect ofgold dispersion on the photocatalytic activity of mesoporoustitania for the vapor-phase oxidation of acetone,” InternationalJournal of Photoenergy, vol. 5, no. 1, pp. 21–25, 2003.
[4] P. Monneyron, A. De La Guardia, M. H. Manero, E. Oliveros,M. T. Maurette, and F. Benoit-Marquie, “Co-treatment ofindustrial air streams using A.O.P. and adsorption processes,”International Journal of Photoenergy, vol. 5, no. 3, pp. 167–174,2003.
[5] C. H. Ao and S. C. Lee, “Indoor air purification by photocat-alyst TiO2 immobilized on an activated carbon filter installed
in an air cleaner,” Chemical Engineering Science, vol. 60, no. 1,pp. 103–109, 2005.
[6] M. C. Blount and J. L. Falconer, “Steady-state surface speciesduring toluene photocatalysis,” Applied Catalysis B, vol. 39, no.1, pp. 39–50, 2002.
[7] H. Einaga, S. Futamura, and T. Ibusuki, “Heterogeneous pho-tocatalytic oxidation of benzene, toluene, cyclohexene andcyclohexane in humidified air: comparison of decompositionbehavior on photoirradiated TiO2 catalyst,” Applied CatalysisB, vol. 38, no. 3, pp. 215–225, 2002.
[8] J. Jeong, K. Sekiguchi, and K. Sakamoto, “Photochemical andphotocatalytic degradation of gaseous toluene using short-wavelength UV irradiation with TiO2 catalyst: comparison ofthree UV sources,” Chemosphere, vol. 57, no. 7, pp. 663–671,2004.
[9] P. Zhang, J. Liu, and Z. Zhang, “VUV photocatalytic degrada-tion of toluene in the gas phase,” Chemistry Letters, vol. 33, no.10, Article ID CL-040801, pp. 1242–1243, 2004.
[10] J. Jeong, K. Sekiguchi, W. Lee, and K. Sakamoto, “Pho-todegradation of gaseous volatile organic compounds (VOCs)using TiO2 photoirradiated by an ozone-producing UV lamp:decomposition characteristics, identification of by-productsand water-soluble organic intermediates,” Journal of Photo-chemistry and Photobiology A, vol. 169, no. 3, pp. 279–287,2005.
[11] J. Jeong, K. Sekiguchi, M. Saito, Y. Lee, Y. Kim, and K. Sakamo-to, “Removal of gaseous pollutants with a UV-C254+185 nm/TiO2
irradiation system coupled with an air washer,” ChemicalEngineering Journal, vol. 118, no. 1-2, pp. 127–130, 2006.
[12] N. Quici, M. L. Vera, H. Choi et al., “Effect of key parameterson the photocatalytic oxidation of toluene at low concen-trations in air under 254+185 nm UV irradiation,” AppliedCatalysis B, vol. 95, no. 3-4, pp. 312–319, 2010.
[13] Z. Hao, D. Cheng, Y. Guo, and Y. Liang, “Supported goldcatalysts used for ozone decomposition and simultaneous eli-mination of ozone and carbon monoxide at ambient temper-ature,” Applied Catalysis B, vol. 33, no. 3, pp. 217–222, 2001.
[14] K. Sekiguchi, A. Sanada, and K. Sakamoto, “Degradation oftoluene with an ozone-decomposition catalyst in the presenceof ozone, and the combined effect of TiO2 addition,” CatalysisCommunications, vol. 4, no. 5, pp. 247–252, 2003.
[15] P. Pichat, J. Disdier, C. Hoang-van, D. Mas, G. Goutailler, andC. Gaysee, “Purification /deordorization of indoor air and gaseffluents by TiO2 photocatalysts,” Catalysis Today, vol. 63, no.2–4, pp. 363–369, 2000.
[16] A. Mills, S. K. Lee, and A. Lepre, “Photodecomposition ofozone sensitized by a film of titanium dioxide on glass,” Jour-nal of Photochemistry and Photobiology A, vol. 155, no. 1-3, pp.199–205, 2003.
[17] K. C. Cho, K. C. Hwang, T. Sano, K. Takeuchi, and S. Mat-suzawa, “Photocatalytic performance of Pt-loaded TiO2 in thedecomposition of gaseous ozone,” Journal of Photochemistryand Photobiology A, vol. 161, no. 2-3, pp. 155–161, 2004.
[18] Y. C. Lin and C. H. Lin, “Catalytic and photocatalytic degra-dation of ozone via utilization of controllable nano-Ag modi-fied on TiO2,” Environmental Progress, vol. 27, no. 4, pp. 496–502, 2008.
[19] P. He, M. Zhang, D. Yang, and J. Yang, “Preparation of Au-loaded TiO2 by photochemical deposition and ozone photo-catalytic decomposition,” Surface Review and Letters, vol. 13,no. 1, pp. 51–55, 2006.
[20] P. Fu and P. Zhang, “Uniform dispersion of Au nanoparticleson TiO2 film via electrostatic self-assembly for photocatalytic
8 International Journal of Photoenergy
degradation of bisphenol A,” Applied Catalysis B, vol. 96, no.1-2, pp. 176–184, 2010.
[21] T. Salthammer, S. Mentese, and R. Marutzky, “Formaldehydein the indoor environment,” Chemical Reviews, vol. 110, no. 4,pp. 2536–2572, 2010.
[22] F. Shiraishi, D. Ohkubo, K. Toyoda, and S. Yamaguchi,“Decomposition of gaseous formaldehyde in a photocatalyticreactor with a parallel array of light sources: 1. Fundamentalexperiment for reactor design,” Chemical Engineering Journal,vol. 114, no. 1-3, pp. 153–159, 2005.
[23] L. Yang, Z. Liu, J. Shi, Y. Zhang, H. Hu, and W. Shangguan,“Degradation of indoor gaseous formaldehyde by hybridVUV and TiO2/UV processes,” Separation and PurificationTechnology, vol. 54, no. 2, pp. 204–211, 2007.
[24] L. Yang, Z. Liu, J. Shi, H. Hu, and W. Shangguan, “Designconsideration of photocatalytic oxidation reactors using TiO2-coated foam nickels for degrading indoor gaseous formalde-hyde,” Catalysis Today, vol. 126, no. 3-4, pp. 359–368, 2007.
[25] Z. Sheng, Z. Wu, Y. Liu, and H. Wang, “Gas-phase pho-tocatalytic oxidation of NO over palladium modified TiO2
catalysts,” Catalysis Communications, vol. 9, no. 9, pp. 1941–1944, 2008.
[26] M. A. Aramendıa, J. C. Colmenares, A. Marinas et al., “Effectof the redox treatment of Pt/TiO2 system on its photocatalyticbehaviour in the gas phase selective photooxidation of propan-2-ol,” Catalysis Today, vol. 128, no. 3-4, pp. 235–244, 2007.
[27] P. Falaras, I. M. Arabatzis, T. Stergiopoulos, and M. C.Bernard, “Enhanced activity of silver modified thin-film TiO2
photocatalysts,” International Journal of Photoenergy, vol. 5,no. 3, pp. 123–130, 2003.
[28] A. Yamakata, T. A. Ishibashi, and H. Onishi, “Pressuredependence of electron- and hole-consuming reactions inphotocatalytic water splitting on Pt/TiO2 studied by time-resolved IR absorption spectroscopy,” International Journal ofPhotoenergy, vol. 5, no. 1, pp. 7–9, 2003.
[29] M. D. Hernandez-Alonso, J. M. Coronado, A. Javier Maira, J.Soria, V. Loddo, and V. Augugliaro, “Ozone enhanced activityof aqueous titanium dioxide suspensions for photocatalyticoxidation of free cyanide ions,” Applied Catalysis B, vol. 39, no.3, pp. 257–267, 2002.
[30] M. Nicolas, M. Ndour, O. Ka, B. D’Anna, and C. George,“Photochemistry of atmospheric dust: ozone decompositionon illuminated titanium dioxide,” Environmental Science andTechnology, vol. 43, no. 19, pp. 7437–7442, 2009.
[31] A. Naydenov, R. Stoyanova, and D. Mehandjiev, “Ozonedecomposition and CO oxidation on CeO2,” Journal of Molec-ular Catalysis. A, Chemical, vol. 98, no. 1, pp. 9–14, 1995.
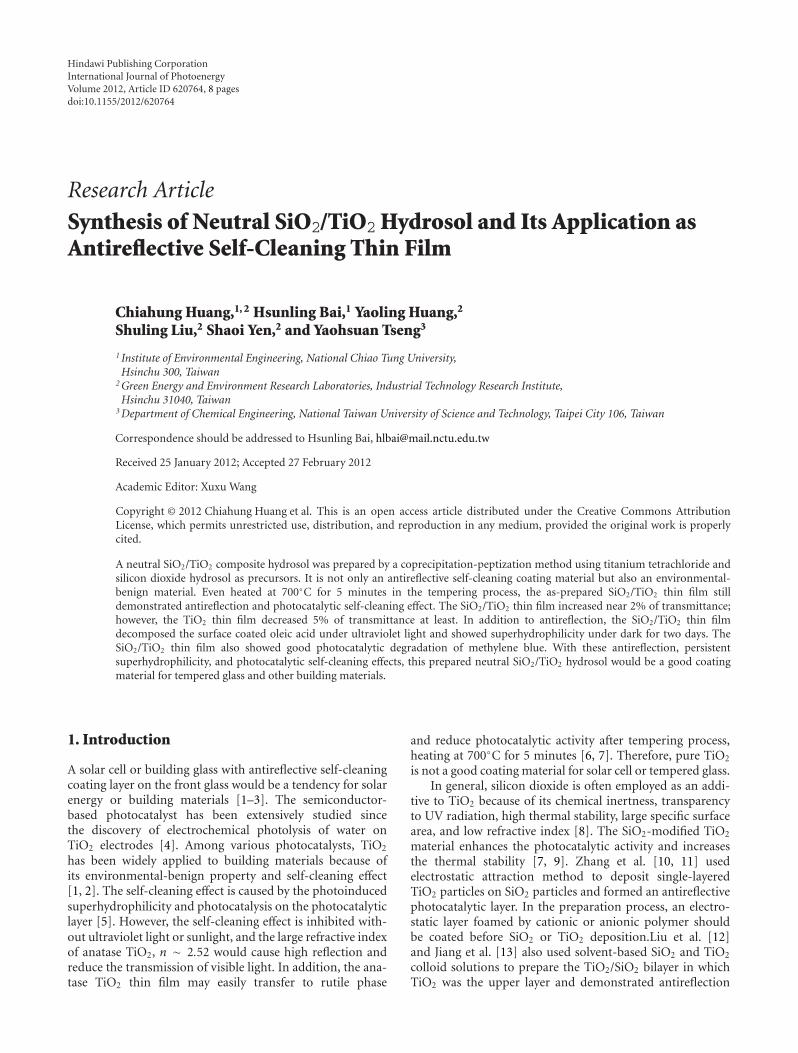
Hindawi Publishing CorporationInternational Journal of PhotoenergyVolume 2012, Article ID 620764, 8 pagesdoi:10.1155/2012/620764
Research Article
Synthesis of Neutral SiO2/TiO2Hydrosol and Its Application asAntireflective Self-Cleaning Thin Film
Chiahung Huang,1, 2 Hsunling Bai,1 Yaoling Huang,2
Shuling Liu,2 Shaoi Yen,2 and Yaohsuan Tseng3
1 Institute of Environmental Engineering, National Chiao Tung University,Hsinchu 300, Taiwan
2 Green Energy and Environment Research Laboratories, Industrial Technology Research Institute,Hsinchu 31040, Taiwan
3 Department of Chemical Engineering, National Taiwan University of Science and Technology, Taipei City 106, Taiwan
Correspondence should be addressed to Hsunling Bai, [email protected]
Received 25 January 2012; Accepted 27 February 2012
Academic Editor: Xuxu Wang
Copyright © 2012 Chiahung Huang et al. This is an open access article distributed under the Creative Commons AttributionLicense, which permits unrestricted use, distribution, and reproduction in any medium, provided the original work is properlycited.
A neutral SiO2/TiO2 composite hydrosol was prepared by a coprecipitation-peptization method using titanium tetrachloride andsilicon dioxide hydrosol as precursors. It is not only an antireflective self-cleaning coating material but also an environmental-benign material. Even heated at 700◦C for 5 minutes in the tempering process, the as-prepared SiO2/TiO2 thin film stilldemonstrated antireflection and photocatalytic self-cleaning effect. The SiO2/TiO2 thin film increased near 2% of transmittance;however, the TiO2 thin film decreased 5% of transmittance at least. In addition to antireflection, the SiO2/TiO2 thin filmdecomposed the surface coated oleic acid under ultraviolet light and showed superhydrophilicity under dark for two days. TheSiO2/TiO2 thin film also showed good photocatalytic degradation of methylene blue. With these antireflection, persistentsuperhydrophilicity, and photocatalytic self-cleaning effects, this prepared neutral SiO2/TiO2 hydrosol would be a good coatingmaterial for tempered glass and other building materials.
1. Introduction
A solar cell or building glass with antireflective self-cleaningcoating layer on the front glass would be a tendency for solarenergy or building materials [1–3]. The semiconductor-based photocatalyst has been extensively studied sincethe discovery of electrochemical photolysis of water onTiO2 electrodes [4]. Among various photocatalysts, TiO2
has been widely applied to building materials because ofits environmental-benign property and self-cleaning effect[1, 2]. The self-cleaning effect is caused by the photoinducedsuperhydrophilicity and photocatalysis on the photocatalyticlayer [5]. However, the self-cleaning effect is inhibited with-out ultraviolet light or sunlight, and the large refractive indexof anatase TiO2, n ∼ 2.52 would cause high reflection andreduce the transmission of visible light. In addition, the ana-tase TiO2 thin film may easily transfer to rutile phase
and reduce photocatalytic activity after tempering process,heating at 700◦C for 5 minutes [6, 7]. Therefore, pure TiO2
is not a good coating material for solar cell or tempered glass.In general, silicon dioxide is often employed as an addi-
tive to TiO2 because of its chemical inertness, transparencyto UV radiation, high thermal stability, large specific surfacearea, and low refractive index [8]. The SiO2-modified TiO2
material enhances the photocatalytic activity and increasesthe thermal stability [7, 9]. Zhang et al. [10, 11] usedelectrostatic attraction method to deposit single-layeredTiO2 particles on SiO2 particles and formed an antireflectivephotocatalytic layer. In the preparation process, an electro-static layer foamed by cationic or anionic polymer shouldbe coated before SiO2 or TiO2 deposition.Liu et al. [12]and Jiang et al. [13] also used solvent-based SiO2 and TiO2
colloid solutions to prepare the TiO2/SiO2 bilayer in whichTiO2 was the upper layer and demonstrated antireflection
2 International Journal of Photoenergy
and higher photocatalytic activity. In contrast, Lee et al. [14]prepared a SiO2/TiO2 thin film consisting of sequential pairsof positively charged TiO2 layer and negatively charged SiO2
layer via layer-by-layer method without organic binder. Anantireflective, antifogging, and photocatalytic thin film glasscould be prepared by increasing the number of SiO2/TiO2
bilayers. Similarly, Permpoon et al. [15] found that the upperSiO2 layer of SiO2/TiO2 bilayer showed natural hydrophilic-ity and stable Si–OH surface bond so that SiO2/TiO2
bilayer exhibited the optimal persistent superhydrophilicityunder dark. Although literature data demonstrated excellentresults, it takes many steps and energy to prepare SiO2/TiO2
or TiO2/SiO2 bilayers.Some researchers have prepared SiO2-TiO2 mixed sol
via sol-gel methods, and an antireflective self-cleaning thinfilm could be manufactured directly [16–19]. However, thesolvent-based SiO2-TiO2 mixed sol is not benign to environ-ment. Zhang et al. [20] dispersed the prepared SiO2/TiO2
powder in water by ultrasonic treatment and formed theSiO2-modified TiO2 hydrosol, but their results did notshow any antireflection and self-cleaning effects. However,some sediment may appear in the prepared SiO2-modifiedTiO2 hydrosol during storage. In this study, a modifiedcoprecipitation-peptization method was used to directlysynthesize a neutral SiO2/TiO2 hydrosol using titaniumtetrachloride and SiO2 hydrosol as raw materials. The char-acteristics of the synthesized hydrosol were investigated, andthe optical and self-cleaning effects of as-prepared thin filmwere evaluated. The optimal one-step-prepared SiO2/TiO2
composite thin film showed persistent superhydrophilicity,antireflection, and photocatalytic self-cleaning effect.
2. Experimental
2.1. Preparation of Neutral SiO2/TiO2 Hydrosol and ThinFilm. The neutral SiO2/TiO2 hydrosol was synthesized bya modified coprecipitation-peptization method using TiCl4solution and SiO2 hydrosol as precursors. Titanium tetra-chloride (99%, Showa chemical) was added into deionizedwater at 4◦C to form 1 M transparent TiCl4 solution. In orderto ensure complete hydrolysis, the NH4OH (4 M) solutionwas added into the 1 M TiCl4 solution and adjusted thepH value to 7.0 [7, 21]. A white precipitate, Ti(OH)4, wasthen obtained after aging for 2 hours. The precipitate wasfiltered and washed with deionized water for several times toremove ammonium and chloride ions. A proper amount ofdeionized water was then added to the filtered cake, and anaqueous H2O2 solution (30 wt%) was added to oxidize andpeptize the Ti(OH)4 precipitate to form titanium peroxidesolution. The weight ratio of H2O2/TiO2 was controlled tobe 2.0, and the peptization process should be kept for twohours with vigorous stirring [22]. The titanium peroxidesolution was heated at 90◦C for 4 hours, and various amountof crystalline SiO2 hydrosol (30%, Ludox SM-30, Aldrich)was then added into the solution. The neutral transparentSiO2/TiO2 hydrosols with various SiO2/TiO2 weight ratioswere obtained by heating the mixture at 90◦C for 4 hours.The weight ratios of SiO2/TiO2 in the prepared SiO2/TiO2
hydrosols were 0.0, 1.5, 3.0, and 5.0, which were labeled asTiO2, ST 1.5, ST 3, and ST 5, respectively. And the solidconcentration of TiO2 was fixed at 1 wt% for all preparedhydrosols. For comparison, a pure SiO2 (3 wt%) hydrosolwas also prepared by directly diluting the SM-30 with deion-ized water.
In order to simulate the tempering process, a quartz glass,10 cm × 6 cm × 0.15 cm, was used as the substrate, and theheating condition was controlled at 700◦C for 5 minuteswith increasing rate of 10◦C/min. The quartz glass wasimmersed in 1 M NaOH solution for 30 minutes to removeoily pollutants and rinsed with deionized water for severaltimes. After drying with air spray, a dip-coating method wasused to deposit TiO2, SiO2, or SiO2/TiO2 thin film on thequartz glass with corresponding hydrosol. The quartz glasswas pulled up at the rate of 10 cm/min; then, it was dried at60◦C for 5 minutes and heated at 700◦C for 5 minutes in air.
2.2. Characterization of SiO2/TiO2 Hydrosol and Thin Film.The zeta potential of various hydrosols was analyzed byMalvern Zetasizer Nano-ZS. The specific surface area of TiO2
or SiO2/TiO2 composite material which had been heated at700◦C for 5 minutes was measured by Micromeritics ASAP2020 using the Brunauer-Emmett-Teller (BET) method. Themorphology of TiO2, SiO2, and SiO2/TiO2 particles wascharacterized by transmission electron microscopy (TEM:Phillips Tecnai G2 F20, 100 kV). The crystal structure ofTiO2 and SiO2/TiO2 was determined by X-ray diffractometer(XRD: Bruker AXS/D2, Cu Kα radiation, 30 kV, 10 mA).The chemical bonds of SiO2/TiO2 composite materialswere analyzed by Fourier transform infrared spectroscopy(FTIR: HORIBA FT-730). The topography and roughnessof SiO2/TiO2 thin film were measured by atomic forcemicroscopy (AFM: Force Precision Instrument SThM). Thethickness and transmittance of coating layer on quartzglass were measured by reflectometry (Micropack NanoCalc-2000) and UV-VIS spectrometer (JASCO V-530), respec-tively.
2.3. Evaluation of Photocatalytic Self-Cleaning Effect
2.3.1. Contact Angle Measurement. The measurement ofwater contact angle is a standard method for evaluating theself-cleaning performance of photocatalytic material [23].This method deposits oleic acid on photocatalytic plate asoily pollutants. While the oleic acid is decomposed by thephotocatalytic plate, the surface would be more hydrophilicand the contact angle decreases. The water contact angle wasmeasured by FTA 125, First Ten Angstrom, and the volumeof water droplet was 1 μL.
First, the test piece should be irradiated under ultravioletlight (FL20SBLB, Sankyo Denki Co.) for 24 hours, andthe intensity was adjusted at 2 mW/cm2 measured by UVphotometer (UV-340A, Lutron). Second, the test piece wasdipped in a 0.5 vol% oleic acid solution (75093, Sigma-Aldrich Co., diluted with n-heptane), pulled up at a rate of60 cm/min, and then dried at 70◦C for 15 minutes. Next,thewater contact angle of test piece was measured before
International Journal of Photoenergy 3
UV irradiation and periodically under UV irradiation(1 mW/cm2) until less than 5◦. Then, the test piece was put indark, and the persistent hydrophilicity could be evaluated bythe periodic measurement of water contact angle.
2.3.2. Decomposition of Methylene Blue. The decompositionof methylene blue in an aqueous medium is also a standardmethod for measuring the self-cleaning activity of photo-catalytic surface [24, 25]. A modified reactor was made ofacrylic glass with higher ultraviolet transmittance, and theinner size was 7 cm (length)× 1 cm (width)× 6 cm (height).It held the test liquid (35 mL, 10μmol/L of methylene blue)and a test piece. Two UV lamps irradiated the test piece fromboth sides. The UV lamps and photometer were the same ascontact angle measurement, but the intensity was 2 mW/cm2
measured on both sides of the surface of the test piece. Theconcentration of methylene blue in test liquid was measuredby a UV-VIS spectrometer (V-530, JASCO) at 664 nm every20 minutes for 3 hours.
3. Results and Discussion
3.1. Characteristics of SiO2/TiO2 Hydrosols and Thin Films.The properties of prepared SiO2/TiO2 hydrosols and as-prepared thin films are summarized in Table 1. The pH valueof TiO2 and ST serial hydrosols was around 7 to 8 whichcould be considered as a neutral hydrosol. Because of theirneutral property, they could be applied to various substrateswithout the problem of corrosion. Meanwhile, each absolutevalue of zeta potential was higher than 40 mV and showedgood stability even in neutral condition. In our prior study[7], ST 1.5 and ST 3 hydrosols have been stored at roomtemperature for more than two years without any sediment.However, the hydrosol using ultrasonic treatment for suspen-sion only could be stable for 2 weeks [26]. This stability forstorage may not only be caused by the preparation methodbut also by the addition of SiO2. Because the zero pointof charge was 5.5 for TiO2 and 2.1 for SiO2, the surfacecharge of both TiO2 and SiO2 was negative while the pHvalue was around 7 to 8. The negatively charged TiO2 andSiO2 particles tended to separate each other and promote thestability of suspension. The TEM micrograph in Figure 1(a)indicates that the shape of TiO2 in TiO2 hydrosol wasarrowhead-like with long axis of 30–40 nm and short axis of6–10 nm, and Figure 1(b) shows the spherical SiO2 particleswith the size of 10 nm. However, the TiO2 and SiO2 hydrosolsshowed some aggregation. Figures 1(c) and 1(d) indicatevery slender rodlike shape TiO2 crystals (short axis of 2–4 nm) embedded deeply in spherical SiO2 particles and welldispersed in the ST 1.5 and ST 3 hydrosols. Therefore, theaddition of SiO2 in the preparation process could decreasethe particle size of TiO2 and increase the stability of neutralSiO2/TiO2 composite hydrosols.
A high temperature calcination was usually used topromote the immobility of TiO2 on a substrate but it woulddecrease the surface area and the photocatalytic activity ofTiO2 [27]. The surface area shown in Table 1 demonstratedthat the surface area of SiO2/TiO2 composite material was
increased with SiO2 content. For example, the surface area ofST 3 was almost three times that of TiO2. Figure 2 shows theXRD patterns of TiO2 and SiO2/TiO2 composite materialsafter heating at 700◦C for 5 minutes. All the four XRDpatterns showed anatase TiO2 structure, and the peak (2θ ∼22◦) as signed for SiO2 was only observed in SiO2/TiO2
composite materials. Using the Scherrer’s equation (i.e., d =0.94λ/β cos θ) to calculate the crystallite size of TiO2 basedon the XRD patterns in Figure 2, it was 40.5 nm, 8.5 nm,8.3 nm, and 7.8 nm for TiO2, ST 1.5, ST 3, and ST 5,respectively. On the other hand, the aggregation of TiO2 athigh temperature could be retarded by the added SiO2
particles which suppressed the growth of crystallite size. Thehigher thermal stability of SiO2/TiO2 composite materialsmay be caused by the Ti–O–Si bond formed in the SiO2/TiO2
hydrosols, as shown in Figure 3.In Figure 3, the FTIR spectra of TiO2, SiO2 and three
SiO2/TiO2 hydrosols heated at 100◦C for one hour weredepicted. The interaction between TiO2 and SiO2 in theprepared SiO2/TiO2 hydrosols was clearly shown in the Ti–O–Si bond (∼970 cm−1) [7–9]. The spectra of SiO2/TiO2
hydrosols showed that only part of SiO2 reacted with TiO2
to form Ti–O–Si structure. The Ti–O–Si bond improved thethermal stability of TiO2 and suppressed the phase transfor-mation from anatase to rutile. The band at 1100 cm−1 wasassigned as the asymmetric Si–O–Si stretching vibration,observed for SiO2 and all SiO2/TiO2 hydrosols. And the bandat 1400 cm−1 was attributed to Ti–O–Ti vibration, observedfor TiO2, ST 1.5 and ST 3 hydrosols. The spectra showedthat the intensity of Ti–O–Ti band was weaker while theweight ratio of SiO2/TiO2 was higher, and it could not bemeasured at ST 5. The band at 1630 cm−1 was assigned tothe bending vibration of the O–H bond of chemisorbedwater. And the broad band around 3400 cm−1 was due tothe stretching mode of the O–H bond of free water, bothmainly caused by the hydrophilicity of SiO2. This naturalwettability attributed to the upper O–H bonds on the STserial composite thin films would prefer to adsorb moisturethan oily pollutant and keep persistent superhydrophilicity.
Figure 4 depicts the transmittance spectra of SiO2, TiO2,and SiO2/TiO2 composite thin films coated on quartz glassand heated at 700◦C for 5 minutes; the heating conditionwas similar to the tempering process. The spectrum of TiO2
thin film showed the lowest transmittance because of itshighest refractive index, 2.52. In contrast, the spectrumof SiO2 thin film exhibited the highest transmittance andantireflection effect because of its lowest refractive index,1.46, whereas SiO2 thin film has no photocatalytic activity.While adding SiO2 into the preparation of neutral TiO2
hydrosol, the prepared neutral SiO2/TiO2 hydrosol had lowerrefractive index as presented in Table 1. And the as-preparedSiO2/TiO2 thin film exhibited photocatalytic activity andhigher transmittance. The ST 1.5 thin film increased by 1.6%of transmittance than TiO2 thin film at 600 nm but still lowerthan the substrate. When the SiO2/TiO2 weight ratio wasraised to 3, the transmittance was increased by 0∼1.6% ascompared to that of quartz glass in the range of 440 to800 nm. Further raised SiO2/TiO2 ratio to 5, the trans-mittance was raised by 2.7%, whereas some fluctuation
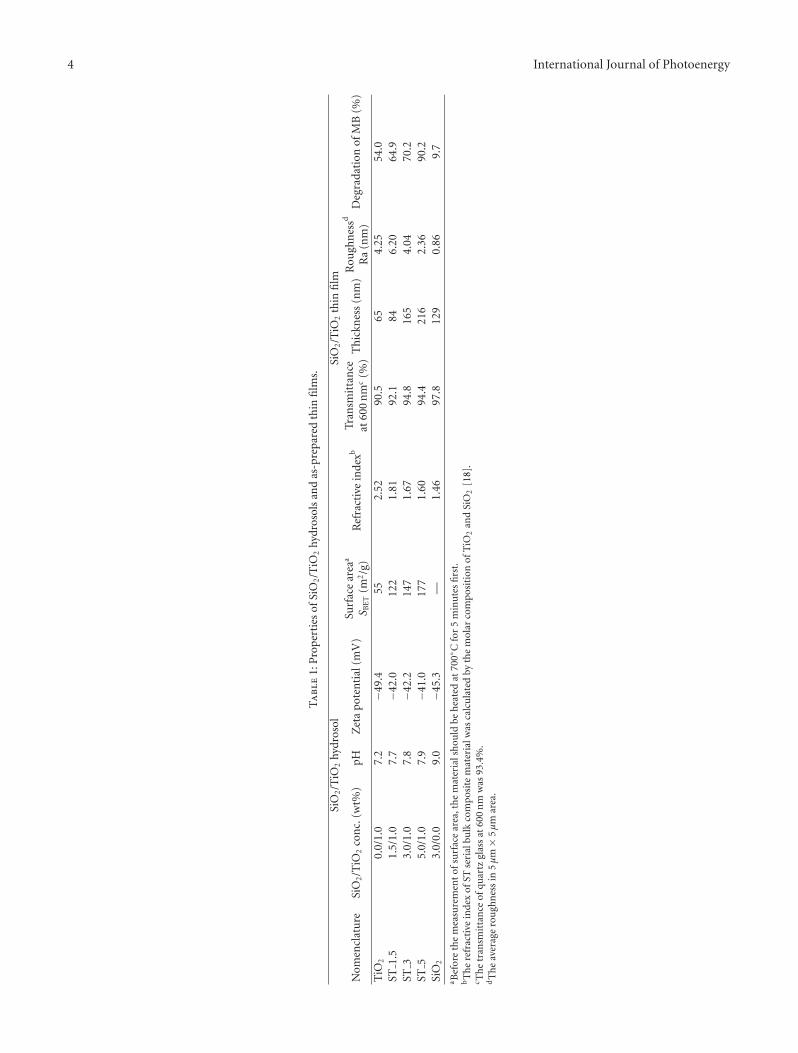
4 International Journal of Photoenergy
Ta
ble
1:P
rop
erti
esof
SiO
2/T
iO2
hydr
osol
san
das
-pre
pare
dth
infi
lms.
SiO
2/T
iO2
hydr
osol
SiO
2/T
iO2
thin
film
Nom
encl
atu
reSi
O2/T
iO2
con
c.(w
t%)
pHZ
eta
pote
nti
al(m
V)
Surf
ace
area
a
S BE
T(m
2/g
)R
efra
ctiv
ein
dexb
Tran
smit
tan
ceat
600
nm
c(%
)T
hic
knes
s(n
m)
Rou
ghn
essd
Ra
(nm
)D
egra
dati
onof
MB
(%)
TiO
20.
0/1.
07.
2−4
9.4
552.
5290
.565
4.25
54.0
ST1.
51.
5/1.
07.
7−4
2.0
122
1.81
92.1
846.
2064
.9ST
33.
0/1.
07.
8−4
2.2
147
1.67
94.8
165
4.04
70.2
ST5
5.0/
1.0
7.9
−41.
017
71.
6094
.421
62.
3690
.2Si
O2
3.0/
0.0
9.0
−45.
3—
1.46
97.8
129
0.86
9.7
a Bef
ore
the
mea
sure
men
tof
surf
ace
area
,th
em
ater
ials
hou
ldbe
hea
ted
at70
0◦C
for
5m
inu
tes
firs
t.bT
he
refr
acti
vein
dex
ofST
seri
albu
lkco
mpo
site
mat
eria
lwas
calc
ula
ted
byth
em
olar
com
posi
tion
ofT
iO2
and
SiO
2[1
8].
c Th
etr
ansm
itta
nce
ofqu
artz
glas
sat
600
nm
was
93.4
%.
dT
he
aver
age
rou
ghn
ess
in5μ
m×
5μ
mar
ea.
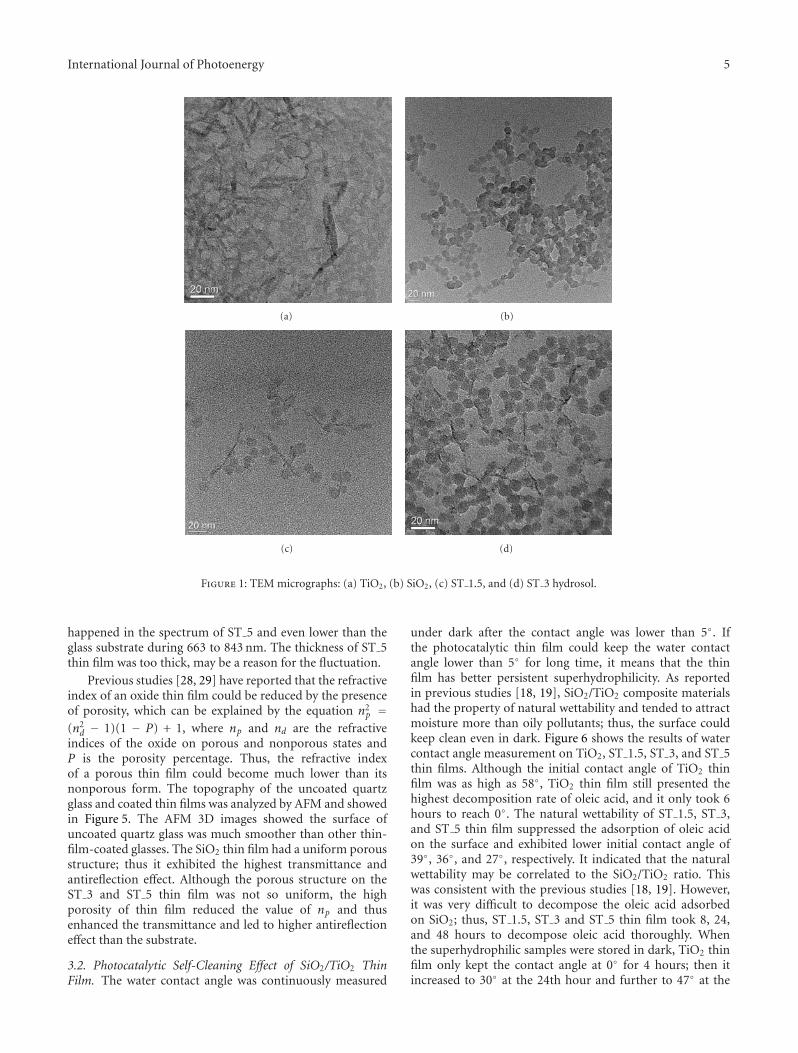
International Journal of Photoenergy 5
(a) (b)
(c) (d)
Figure 1: TEM micrographs: (a) TiO2, (b) SiO2, (c) ST 1.5, and (d) ST 3 hydrosol.
happened in the spectrum of ST 5 and even lower than theglass substrate during 663 to 843 nm. The thickness of ST 5thin film was too thick, may be a reason for the fluctuation.
Previous studies [28, 29] have reported that the refractiveindex of an oxide thin film could be reduced by the presenceof porosity, which can be explained by the equation n2
p =(n2
d − 1)(1 − P) + 1, where np and nd are the refractiveindices of the oxide on porous and nonporous states andP is the porosity percentage. Thus, the refractive indexof a porous thin film could become much lower than itsnonporous form. The topography of the uncoated quartzglass and coated thin films was analyzed by AFM and showedin Figure 5. The AFM 3D images showed the surface ofuncoated quartz glass was much smoother than other thin-film-coated glasses. The SiO2 thin film had a uniform porousstructure; thus it exhibited the highest transmittance andantireflection effect. Although the porous structure on theST 3 and ST 5 thin film was not so uniform, the highporosity of thin film reduced the value of np and thusenhanced the transmittance and led to higher antireflectioneffect than the substrate.
3.2. Photocatalytic Self-Cleaning Effect of SiO2/TiO2 ThinFilm. The water contact angle was continuously measured
under dark after the contact angle was lower than 5◦. Ifthe photocatalytic thin film could keep the water contactangle lower than 5◦ for long time, it means that the thinfilm has better persistent superhydrophilicity. As reportedin previous studies [18, 19], SiO2/TiO2 composite materialshad the property of natural wettability and tended to attractmoisture more than oily pollutants; thus, the surface couldkeep clean even in dark. Figure 6 shows the results of watercontact angle measurement on TiO2, ST 1.5, ST 3, and ST 5thin films. Although the initial contact angle of TiO2 thinfilm was as high as 58◦, TiO2 thin film still presented thehighest decomposition rate of oleic acid, and it only took 6hours to reach 0◦. The natural wettability of ST 1.5, ST 3,and ST 5 thin film suppressed the adsorption of oleic acidon the surface and exhibited lower initial contact angle of39◦, 36◦, and 27◦, respectively. It indicated that the naturalwettability may be correlated to the SiO2/TiO2 ratio. Thiswas consistent with the previous studies [18, 19]. However,it was very difficult to decompose the oleic acid adsorbedon SiO2; thus, ST 1.5, ST 3 and ST 5 thin film took 8, 24,and 48 hours to decompose oleic acid thoroughly. Whenthe superhydrophilic samples were stored in dark, TiO2 thinfilm only kept the contact angle at 0◦ for 4 hours; then itincreased to 30◦ at the 24th hour and further to 47◦ at the
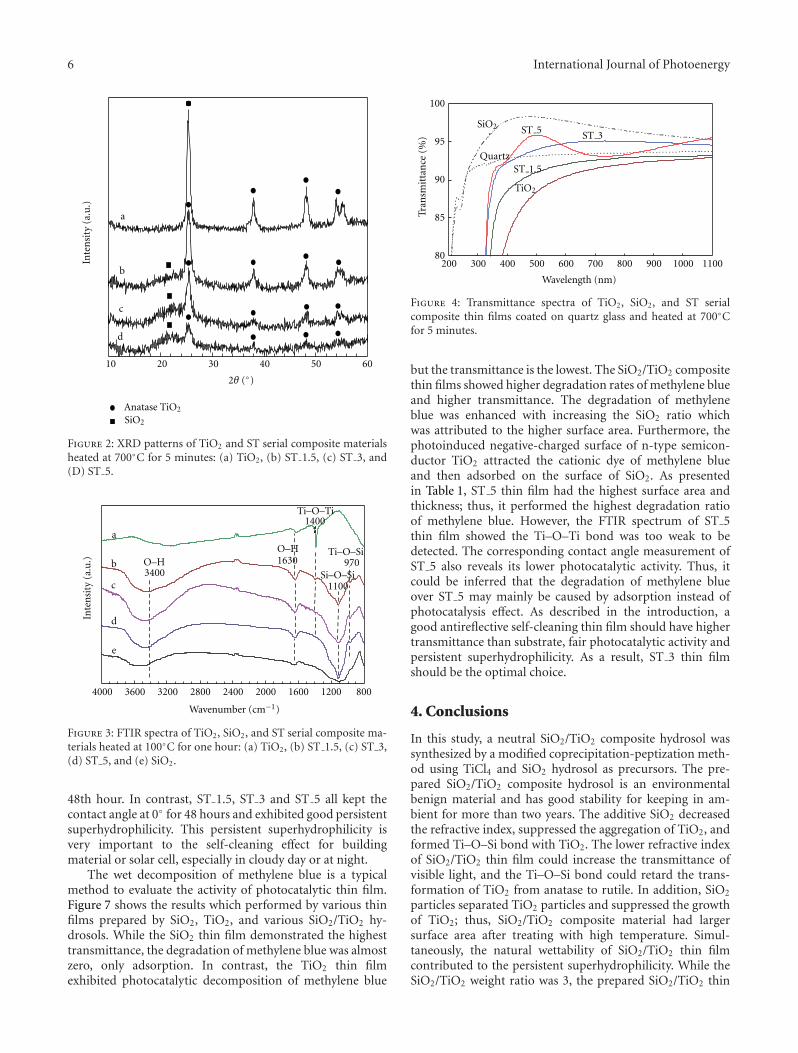
6 International Journal of Photoenergy
10 20 30 40 50 60
Inte
nsi
ty (
a.u
.)
a
b
c
d
2θ (◦)
Anatase TiO2
SiO2
Figure 2: XRD patterns of TiO2 and ST serial composite materialsheated at 700◦C for 5 minutes: (a) TiO2, (b) ST 1.5, (c) ST 3, and(D) ST 5.
80012001600200024002800320036004000
Inte
nsi
ty (
a.u
.)
d
c
b
a
e
1100
970
1400
16303400
Wavenumber (cm−1)
O–HO–H
Si–O–Si
Ti–O–Si
Ti–O–Ti
Figure 3: FTIR spectra of TiO2, SiO2, and ST serial composite ma-terials heated at 100◦C for one hour: (a) TiO2, (b) ST 1.5, (c) ST 3,(d) ST 5, and (e) SiO2.
48th hour. In contrast, ST 1.5, ST 3 and ST 5 all kept thecontact angle at 0◦ for 48 hours and exhibited good persistentsuperhydrophilicity. This persistent superhydrophilicity isvery important to the self-cleaning effect for buildingmaterial or solar cell, especially in cloudy day or at night.
The wet decomposition of methylene blue is a typicalmethod to evaluate the activity of photocatalytic thin film.Figure 7 shows the results which performed by various thinfilms prepared by SiO2, TiO2, and various SiO2/TiO2 hy-drosols. While the SiO2 thin film demonstrated the highesttransmittance, the degradation of methylene blue was almostzero, only adsorption. In contrast, the TiO2 thin filmexhibited photocatalytic decomposition of methylene blue
80
85
90
95
100
200 300 400 500 600 700 800 900 1000 1100
Wavelength (nm)
Tran
smit
tan
ce (
%)
SiO2
QuartzST 1.5
ST 5 ST 3
TiO2
Figure 4: Transmittance spectra of TiO2, SiO2, and ST serialcomposite thin films coated on quartz glass and heated at 700◦Cfor 5 minutes.
but the transmittance is the lowest. The SiO2/TiO2 compositethin films showed higher degradation rates of methylene blueand higher transmittance. The degradation of methyleneblue was enhanced with increasing the SiO2 ratio whichwas attributed to the higher surface area. Furthermore, thephotoinduced negative-charged surface of n-type semicon-ductor TiO2 attracted the cationic dye of methylene blueand then adsorbed on the surface of SiO2. As presentedin Table 1, ST 5 thin film had the highest surface area andthickness; thus, it performed the highest degradation ratioof methylene blue. However, the FTIR spectrum of ST 5thin film showed the Ti–O–Ti bond was too weak to bedetected. The corresponding contact angle measurement ofST 5 also reveals its lower photocatalytic activity. Thus, itcould be inferred that the degradation of methylene blueover ST 5 may mainly be caused by adsorption instead ofphotocatalysis effect. As described in the introduction, agood antireflective self-cleaning thin film should have highertransmittance than substrate, fair photocatalytic activity andpersistent superhydrophilicity. As a result, ST 3 thin filmshould be the optimal choice.
4. Conclusions
In this study, a neutral SiO2/TiO2 composite hydrosol wassynthesized by a modified coprecipitation-peptization meth-od using TiCl4 and SiO2 hydrosol as precursors. The pre-pared SiO2/TiO2 composite hydrosol is an environmentalbenign material and has good stability for keeping in am-bient for more than two years. The additive SiO2 decreasedthe refractive index, suppressed the aggregation of TiO2, andformed Ti–O–Si bond with TiO2. The lower refractive indexof SiO2/TiO2 thin film could increase the transmittance ofvisible light, and the Ti–O–Si bond could retard the trans-formation of TiO2 from anatase to rutile. In addition, SiO2
particles separated TiO2 particles and suppressed the growthof TiO2; thus, SiO2/TiO2 composite material had largersurface area after treating with high temperature. Simul-taneously, the natural wettability of SiO2/TiO2 thin filmcontributed to the persistent superhydrophilicity. While theSiO2/TiO2 weight ratio was 3, the prepared SiO2/TiO2 thin
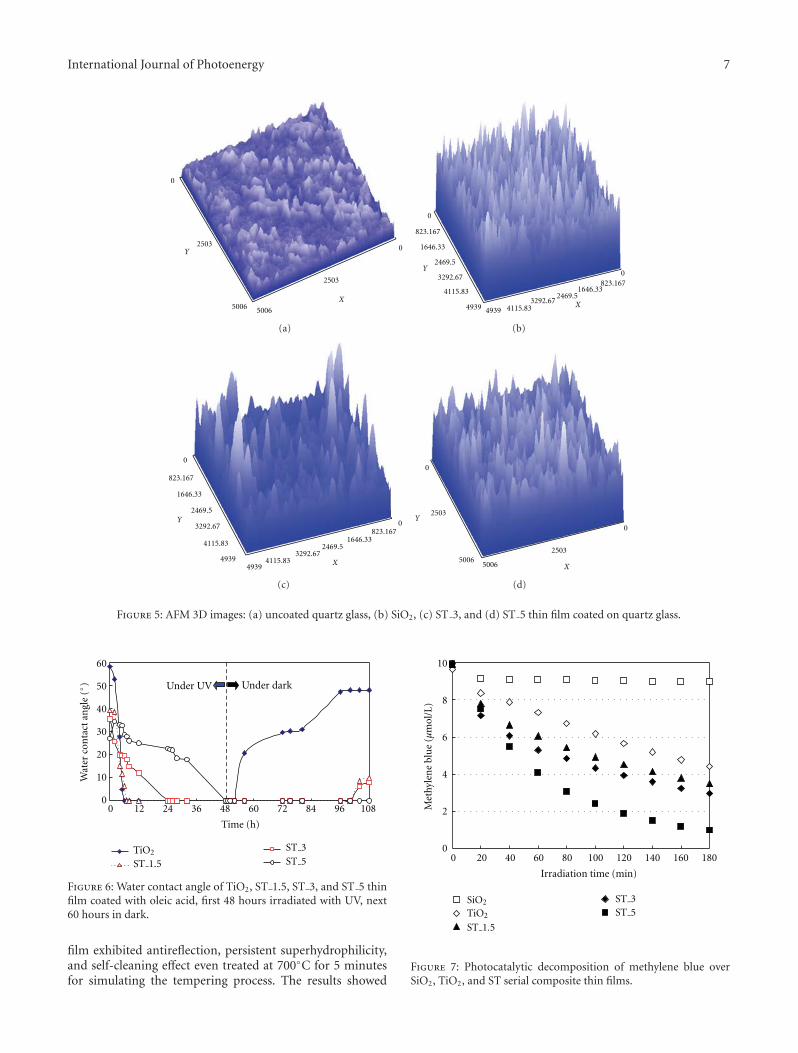
International Journal of Photoenergy 7
0
2503Y
5006
0
2503
X
5006
(a)
0
823.167
1646.33
2469.5
3292.67
4115.83
4939
Y0
823.1671646.33
2469.53292.67
4115.834939X
(b)
0
0
823.167
823.167
1646.33
1646.33
2469.5
2469.5
3292.67
3292.674115.83
4115.8349394939
X
Y
(c)
0
0
2503
2503
X
Y
50065006
(d)
Figure 5: AFM 3D images: (a) uncoated quartz glass, (b) SiO2, (c) ST 3, and (d) ST 5 thin film coated on quartz glass.
0
10
20
30
40
50
60
0 12 24 36 48 60 72 84 96 108
Time (h)
Under UV Under dark
Wat
er c
onta
ct a
ngl
e (◦
)
ST 5ST 1.5
ST 3TiO2
Figure 6: Water contact angle of TiO2, ST 1.5, ST 3, and ST 5 thinfilm coated with oleic acid, first 48 hours irradiated with UV, next60 hours in dark.
film exhibited antireflection, persistent superhydrophilicity,and self-cleaning effect even treated at 700◦C for 5 minutesfor simulating the tempering process. The results showed
0
2
4
6
8
10
0 20 40 60 80 100 120 140 160 180
Irradiation time (min)
Met
hyle
ne
blu
e (μ
mol
/L)
SiO2
ST 1.5
ST 5ST 3
TiO2
Figure 7: Photocatalytic decomposition of methylene blue overSiO2, TiO2, and ST serial composite thin films.
8 International Journal of Photoenergy
the neutral SiO2/TiO2 composite hydrosol could be a goodantireflective self-cleaning coating material for solar cell orbuilding materials.
Acknowledgments
This research was supported by the Industrial TechnologyResearch Institute, Taiwan, Republic of China. And the au-thors would like to thank Dr. Ching-chin Wu of GEL/ITRIfor the support of BET and AFM measurement.
References
[1] A. Fujishima, X. Zhang, and D. A. Tryk, “TiO2 photocatalysisand related surface phenomena,” Surface Science Reports, vol.63, no. 12, pp. 515–582, 2008.
[2] K. Hashimoto, H. Irie, and A. Fujishima, “TiO2 photocatalysis:a historical overview and future prospects,” Japanese Journal ofApplied Physics 1, vol. 44, no. 12, pp. 8269–8285, 2005.
[3] G. E. Jonsson, H. Fredriksson, R. Sellappan, and D. Chakarov,“Nanostructures for enhanced light absorption in solar energydevices,” International Journal of Photoenergy, vol. 2011,Article ID 939807, 11 pages, 2011.
[4] A. Fujishima and K. Honda, “Electrochemical photolysis ofwater at a semiconductor electrode,” Nature, vol. 238, no.5358, pp. 37–38, 1972.
[5] A. Fujishima, T. N. Rao, and D. A. Tryk, “Titanium dioxidephotocatalysis,” Journal of Photochemistry and Photobiology C,vol. 1, no. 1, pp. 1–21, 2000.
[6] Y. H. Tseng, H. Y. Lin, C. S. Kuo, Y. Y. Li, and C. P. Huang,“Thermostability of nano-TiO2 and its photocatalytic activ-ity,” Reaction Kinetics and Catalysis Letters, vol. 89, no. 1, pp.63–69, 2006.
[7] C. H. Huang, H. Bai, S. L. Liu, Y. L. Huang, and Y. H. Tseng,“Synthesis of neutral SiO2/TiO2 hydrosol and its photocatalyt-ic degradation of nitric oxide gas,” Micro & Nano Letters, vol.6, no. 8, pp. 646–649, 2011.
[8] X. Gao and I. E. Wachs, “Titania-silica as catalysts: molecularstructural characteristics and physico-chemical properties,”Catalysis Today, vol. 51, no. 2, pp. 233–254, 1999.
[9] M. Bellardita, M. Addamo, A. di Paola et al., “Photocatalyticactivity of TiO2/SiO2 systems,” Journal of Hazardous Materials,vol. 174, no. 1–3, pp. 707–713, 2010.
[10] X. T. Zhang, O. Sato, M. Taguchi, Y. Einaga, T. Murakami, andA. Fujishima, “Self-cleaning particle coating with antireflec-tion properties,” Chemistry of Materials, vol. 17, no. 3, pp. 696–700, 2005.
[11] X. Zhang, A. Fujishima, M. Jin, A. V. Emeline, and T.Murakami, “Double-layered TiO2-SiO2 nanostructured filmswith self-cleaning and antireflective properties,” Journal ofPhysical Chemistry B, vol. 110, no. 50, pp. 25142–25148, 2006.
[12] Z. Liu, X. Zhang, T. Murakami, and A. Fujishima, “Sol-gelSiO2/TiO2 bilayer films with self-cleaning and antireflectionproperties,” Solar Energy Materials and Solar Cells, vol. 92, no.11, pp. 1434–1438, 2008.
[13] B. Jiang, X. C. Duan, Z. C. Zhou, Y. J. Cheng, G. C. Liu,and Y. L. Liu, “Synthesis and characterization of self-cleaningand anti-reflective SiO2-TiO2 nanometric films,” Journal ofInorganic Materials, vol. 26, no. 4, pp. 375–380, 2011.
[14] D. Lee, M. F. Rubner, and R. E. Cohen, “All-nanoparticle thin-film coatings,” Nano Letters, vol. 6, no. 10, pp. 2305–2312,2006.
[15] S. Permpoon, M. Houmard, D. Riassetto et al., “Natural andpersistent superhydrophilicity of SiO2/TiO2 and TiO2/SiO2 bi-layer films,” Thin Solid Films, vol. 516, no. 6, pp. 957–966,2008.
[16] S. Permpoon, G. Berthome, B. Baroux, J. C. Joud, and M.Langlet, “Natural superhydrophilicity of sol-gel derived SiO2-TiO2 composite films,” Journal of Materials Science, vol. 41, no.22, pp. 7650–7662, 2006.
[17] K. Guan, “Relationship between photocatalytic activity, hy-drophilicity and self-cleaning effect of TiO2/SiO2 films,” Sur-face and Coatings Technology, vol. 191, no. 2-3, pp. 155–160,2005.
[18] M. Houmard, D. Riassetto, F. Roussel et al., “Morphology andnatural wettability properties of sol-gel derived TiO2-SiO2
composite thin films,” Applied Surface Science, vol. 254, no. 5,pp. 1405–1414, 2007.
[19] M. Houmard, D. Riassetto, F. Roussel et al., “Enhanced persis-tence of natural super-hydrophilicity in TiO2-SiO2 compositethin films deposited via a sol-gel route,” Surface Science, vol.602, no. 21, pp. 3364–3374, 2008.
[20] M. Zhang, L. Shi, S. Yuan, Y. Zhao, and J. Fang, “Synthesisand photocatalytic properties of highly stable and neutralTiO2/SiO2 hydrosol,” Journal of Colloid and Interface Science,vol. 330, no. 1, pp. 113–118, 2009.
[21] Y. H. Tseng, S. L. Liu, C. S. Kuo et al., “Preparation of nano-sized TiO2 sol and its visible-light-responsive photocatalysis inaquatic state,” Micro & Nano Letters, vol. 1, no. 2, pp. 116–119,2006.
[22] N. Sasirekha, B. Rajesh, and Y. W. Chen, “Synthesis of TiO2 solin a neutral solution using TiCl4 as a precursor and H2O2 as anoxidizing agent,” Thin Solid Films, vol. 518, no. 1, pp. 43–48,2009.
[23] International Organization for Standardization, “Fine ceram-ics (advanced ceramics, advanced technical ceramics)-testmethod for self-cleaning performance of semiconductingphotocatalytic materials—measurement of water contactangle,” Tech. Rep. ISO 27448, International Organization forStandardization, Geneva, Switzerland, 2009.
[24] International Organization for Standardization, “Fine ceram-ics (advanced ceramics, advanced technical ceramics)—determination of photocatalytic activity of surfaces in anaqueous medium by degradation of methylene blue,” Tech.Rep. ISO 10678, International Organization for Standardiza-tion, Geneva, Switzerland, 2010.
[25] J. Yao and C. Wang, “Decolorization of methylene bluewith TiO2 sol via UV irradiation photocatalytic degradation,”International Journal of Photoenergy, vol. 2010, Article ID643182, 6 pages, 2010.
[26] J. Xu, L. Li, Y. Yan et al., “Synthesis and photoluminescence ofwell-dispersible anatase TiO2 nanoparticles,” Journal of Colloidand Interface Science, vol. 318, no. 1, pp. 29–34, 2008.
[27] J. Yu, W. Wang, B. Cheng, B. Huang, and X. Zhang,“Preparation and photocatalytic activity of multi-modallymacro/mesoporous titania,” Research on Chemical Intermedi-ates, vol. 35, no. 6-7, pp. 653–665, 2009.
[28] B. E. Yoldas, “Investigation of porous oxides as an antireflec-tive coating for glass surfaces,” Applied Optics, vol. 19, no. 9,pp. 1425–1429, 1980.
[29] B. E. Yoldas and D. P. Partlow, “Formation of broad bandantireflective coatings on fused silica for high power laserapplications,” Thin Solid Films, vol. 129, no. 1-2, pp. 1–14,1985.
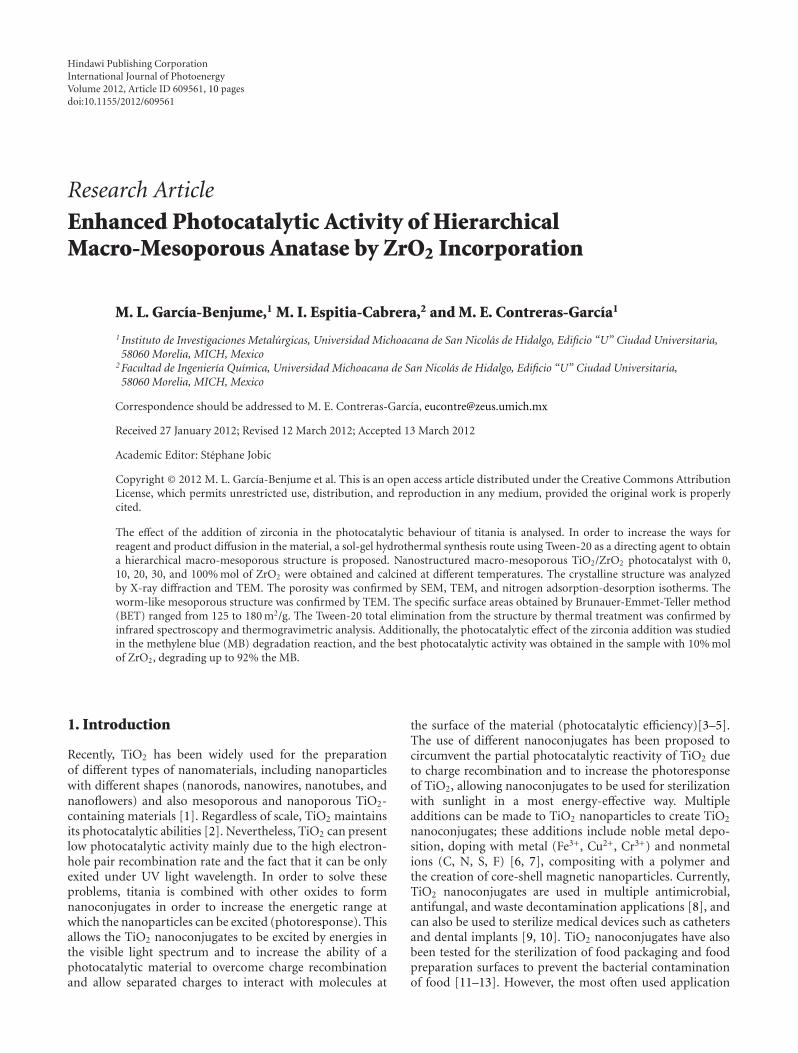
Hindawi Publishing CorporationInternational Journal of PhotoenergyVolume 2012, Article ID 609561, 10 pagesdoi:10.1155/2012/609561
Research Article
Enhanced Photocatalytic Activity of HierarchicalMacro-Mesoporous Anatase by ZrO2 Incorporation
M. L. Garcıa-Benjume,1 M. I. Espitia-Cabrera,2 and M. E. Contreras-Garcıa1
1 Instituto de Investigaciones Metalurgicas, Universidad Michoacana de San Nicolas de Hidalgo, Edificio “U” Ciudad Universitaria,58060 Morelia, MICH, Mexico
2 Facultad de Ingenierıa Quımica, Universidad Michoacana de San Nicolas de Hidalgo, Edificio “U” Ciudad Universitaria,58060 Morelia, MICH, Mexico
Correspondence should be addressed to M. E. Contreras-Garcıa, [email protected]
Received 27 January 2012; Revised 12 March 2012; Accepted 13 March 2012
Academic Editor: Stephane Jobic
Copyright © 2012 M. L. Garcıa-Benjume et al. This is an open access article distributed under the Creative Commons AttributionLicense, which permits unrestricted use, distribution, and reproduction in any medium, provided the original work is properlycited.
The effect of the addition of zirconia in the photocatalytic behaviour of titania is analysed. In order to increase the ways forreagent and product diffusion in the material, a sol-gel hydrothermal synthesis route using Tween-20 as a directing agent to obtaina hierarchical macro-mesoporous structure is proposed. Nanostructured macro-mesoporous TiO2/ZrO2 photocatalyst with 0,10, 20, 30, and 100% mol of ZrO2 were obtained and calcined at different temperatures. The crystalline structure was analyzedby X-ray diffraction and TEM. The porosity was confirmed by SEM, TEM, and nitrogen adsorption-desorption isotherms. Theworm-like mesoporous structure was confirmed by TEM. The specific surface areas obtained by Brunauer-Emmet-Teller method(BET) ranged from 125 to 180 m2/g. The Tween-20 total elimination from the structure by thermal treatment was confirmed byinfrared spectroscopy and thermogravimetric analysis. Additionally, the photocatalytic effect of the zirconia addition was studiedin the methylene blue (MB) degradation reaction, and the best photocatalytic activity was obtained in the sample with 10% molof ZrO2, degrading up to 92% the MB.
1. Introduction
Recently, TiO2 has been widely used for the preparationof different types of nanomaterials, including nanoparticleswith different shapes (nanorods, nanowires, nanotubes, andnanoflowers) and also mesoporous and nanoporous TiO2-containing materials [1]. Regardless of scale, TiO2 maintainsits photocatalytic abilities [2]. Nevertheless, TiO2 can presentlow photocatalytic activity mainly due to the high electron-hole pair recombination rate and the fact that it can be onlyexited under UV light wavelength. In order to solve theseproblems, titania is combined with other oxides to formnanoconjugates in order to increase the energetic range atwhich the nanoparticles can be excited (photoresponse). Thisallows the TiO2 nanoconjugates to be excited by energies inthe visible light spectrum and to increase the ability of aphotocatalytic material to overcome charge recombinationand allow separated charges to interact with molecules at
the surface of the material (photocatalytic efficiency)[3–5].The use of different nanoconjugates has been proposed tocircumvent the partial photocatalytic reactivity of TiO2 dueto charge recombination and to increase the photoresponseof TiO2, allowing nanoconjugates to be used for sterilizationwith sunlight in a most energy-effective way. Multipleadditions can be made to TiO2 nanoparticles to create TiO2
nanoconjugates; these additions include noble metal depo-sition, doping with metal (Fe3+, Cu2+, Cr3+) and nonmetalions (C, N, S, F) [6, 7], compositing with a polymer andthe creation of core-shell magnetic nanoparticles. Currently,TiO2 nanoconjugates are used in multiple antimicrobial,antifungal, and waste decontamination applications [8], andcan also be used to sterilize medical devices such as cathetersand dental implants [9, 10]. TiO2 nanoconjugates have alsobeen tested for the sterilization of food packaging and foodpreparation surfaces to prevent the bacterial contaminationof food [11–13]. However, the most often used application
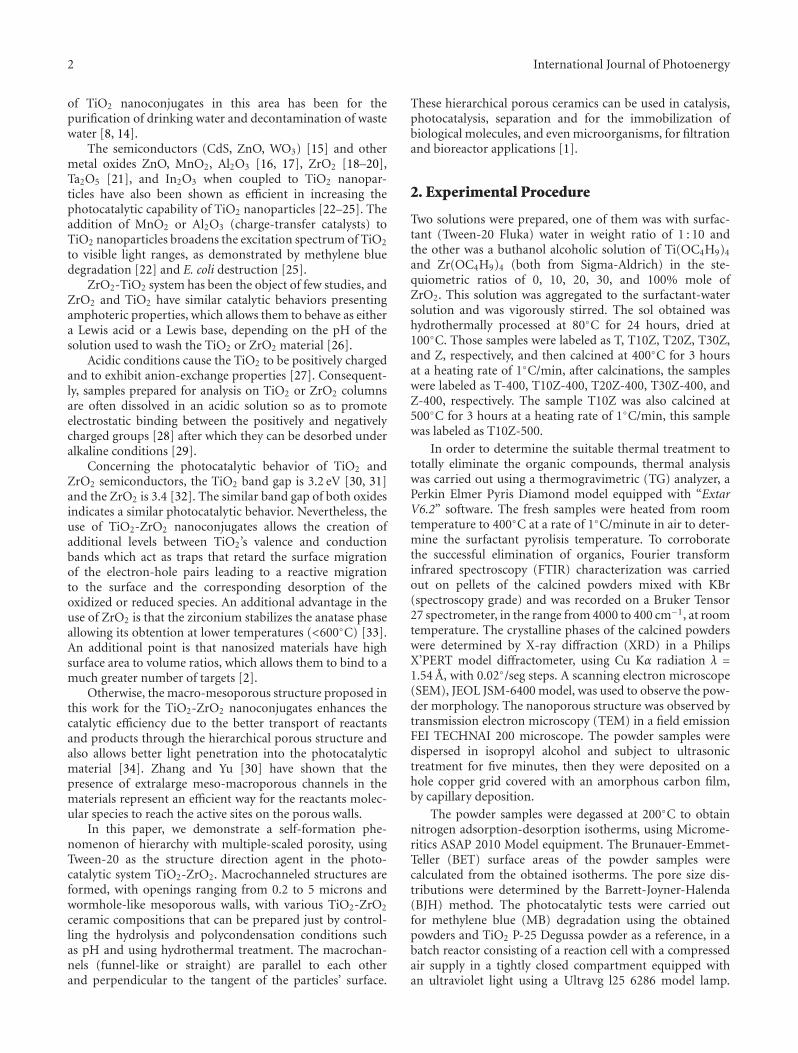
2 International Journal of Photoenergy
of TiO2 nanoconjugates in this area has been for thepurification of drinking water and decontamination of wastewater [8, 14].
The semiconductors (CdS, ZnO, WO3) [15] and othermetal oxides ZnO, MnO2, Al2O3 [16, 17], ZrO2 [18–20],Ta2O5 [21], and In2O3 when coupled to TiO2 nanopar-ticles have also been shown as efficient in increasing thephotocatalytic capability of TiO2 nanoparticles [22–25]. Theaddition of MnO2 or Al2O3 (charge-transfer catalysts) toTiO2 nanoparticles broadens the excitation spectrum of TiO2
to visible light ranges, as demonstrated by methylene bluedegradation [22] and E. coli destruction [25].
ZrO2-TiO2 system has been the object of few studies, andZrO2 and TiO2 have similar catalytic behaviors presentingamphoteric properties, which allows them to behave as eithera Lewis acid or a Lewis base, depending on the pH of thesolution used to wash the TiO2 or ZrO2 material [26].
Acidic conditions cause the TiO2 to be positively chargedand to exhibit anion-exchange properties [27]. Consequent-ly, samples prepared for analysis on TiO2 or ZrO2 columnsare often dissolved in an acidic solution so as to promoteelectrostatic binding between the positively and negativelycharged groups [28] after which they can be desorbed underalkaline conditions [29].
Concerning the photocatalytic behavior of TiO2 andZrO2 semiconductors, the TiO2 band gap is 3.2 eV [30, 31]and the ZrO2 is 3.4 [32]. The similar band gap of both oxidesindicates a similar photocatalytic behavior. Nevertheless, theuse of TiO2-ZrO2 nanoconjugates allows the creation ofadditional levels between TiO2’s valence and conductionbands which act as traps that retard the surface migrationof the electron-hole pairs leading to a reactive migrationto the surface and the corresponding desorption of theoxidized or reduced species. An additional advantage in theuse of ZrO2 is that the zirconium stabilizes the anatase phaseallowing its obtention at lower temperatures (<600◦C) [33].An additional point is that nanosized materials have highsurface area to volume ratios, which allows them to bind to amuch greater number of targets [2].
Otherwise, the macro-mesoporous structure proposed inthis work for the TiO2-ZrO2 nanoconjugates enhances thecatalytic efficiency due to the better transport of reactantsand products through the hierarchical porous structure andalso allows better light penetration into the photocatalyticmaterial [34]. Zhang and Yu [30] have shown that thepresence of extralarge meso-macroporous channels in thematerials represent an efficient way for the reactants molec-ular species to reach the active sites on the porous walls.
In this paper, we demonstrate a self-formation phe-nomenon of hierarchy with multiple-scaled porosity, usingTween-20 as the structure direction agent in the photo-catalytic system TiO2-ZrO2. Macrochanneled structures areformed, with openings ranging from 0.2 to 5 microns andwormhole-like mesoporous walls, with various TiO2-ZrO2
ceramic compositions that can be prepared just by control-ling the hydrolysis and polycondensation conditions suchas pH and using hydrothermal treatment. The macrochan-nels (funnel-like or straight) are parallel to each otherand perpendicular to the tangent of the particles’ surface.
These hierarchical porous ceramics can be used in catalysis,photocatalysis, separation and for the immobilization ofbiological molecules, and even microorganisms, for filtrationand bioreactor applications [1].
2. Experimental Procedure
Two solutions were prepared, one of them was with surfac-tant (Tween-20 Fluka) water in weight ratio of 1 : 10 andthe other was a buthanol alcoholic solution of Ti(OC4H9)4
and Zr(OC4H9)4 (both from Sigma-Aldrich) in the ste-quiometric ratios of 0, 10, 20, 30, and 100% mole ofZrO2. This solution was aggregated to the surfactant-watersolution and was vigorously stirred. The sol obtained washydrothermally processed at 80◦C for 24 hours, dried at100◦C. Those samples were labeled as T, T10Z, T20Z, T30Z,and Z, respectively, and then calcined at 400◦C for 3 hoursat a heating rate of 1◦C/min, after calcinations, the sampleswere labeled as T-400, T10Z-400, T20Z-400, T30Z-400, andZ-400, respectively. The sample T10Z was also calcined at500◦C for 3 hours at a heating rate of 1◦C/min, this samplewas labeled as T10Z-500.
In order to determine the suitable thermal treatment tototally eliminate the organic compounds, thermal analysiswas carried out using a thermogravimetric (TG) analyzer, aPerkin Elmer Pyris Diamond model equipped with “ExtarV6.2” software. The fresh samples were heated from roomtemperature to 400◦C at a rate of 1◦C/minute in air to deter-mine the surfactant pyrolisis temperature. To corroboratethe successful elimination of organics, Fourier transforminfrared spectroscopy (FTIR) characterization was carriedout on pellets of the calcined powders mixed with KBr(spectroscopy grade) and was recorded on a Bruker Tensor27 spectrometer, in the range from 4000 to 400 cm−1, at roomtemperature. The crystalline phases of the calcined powderswere determined by X-ray diffraction (XRD) in a PhilipsX’PERT model diffractometer, using Cu Kα radiation λ =1.54 A, with 0.02◦/seg steps. A scanning electron microscope(SEM), JEOL JSM-6400 model, was used to observe the pow-der morphology. The nanoporous structure was observed bytransmission electron microscopy (TEM) in a field emissionFEI TECHNAI 200 microscope. The powder samples weredispersed in isopropyl alcohol and subject to ultrasonictreatment for five minutes, then they were deposited on ahole copper grid covered with an amorphous carbon film,by capillary deposition.
The powder samples were degassed at 200◦C to obtainnitrogen adsorption-desorption isotherms, using Microme-ritics ASAP 2010 Model equipment. The Brunauer-Emmet-Teller (BET) surface areas of the powder samples werecalculated from the obtained isotherms. The pore size dis-tributions were determined by the Barrett-Joyner-Halenda(BJH) method. The photocatalytic tests were carried outfor methylene blue (MB) degradation using the obtainedpowders and TiO2 P-25 Degussa powder as a reference, in abatch reactor consisting of a reaction cell with a compressedair supply in a tightly closed compartment equipped withan ultraviolet light using a Ultravg l25 6286 model lamp.
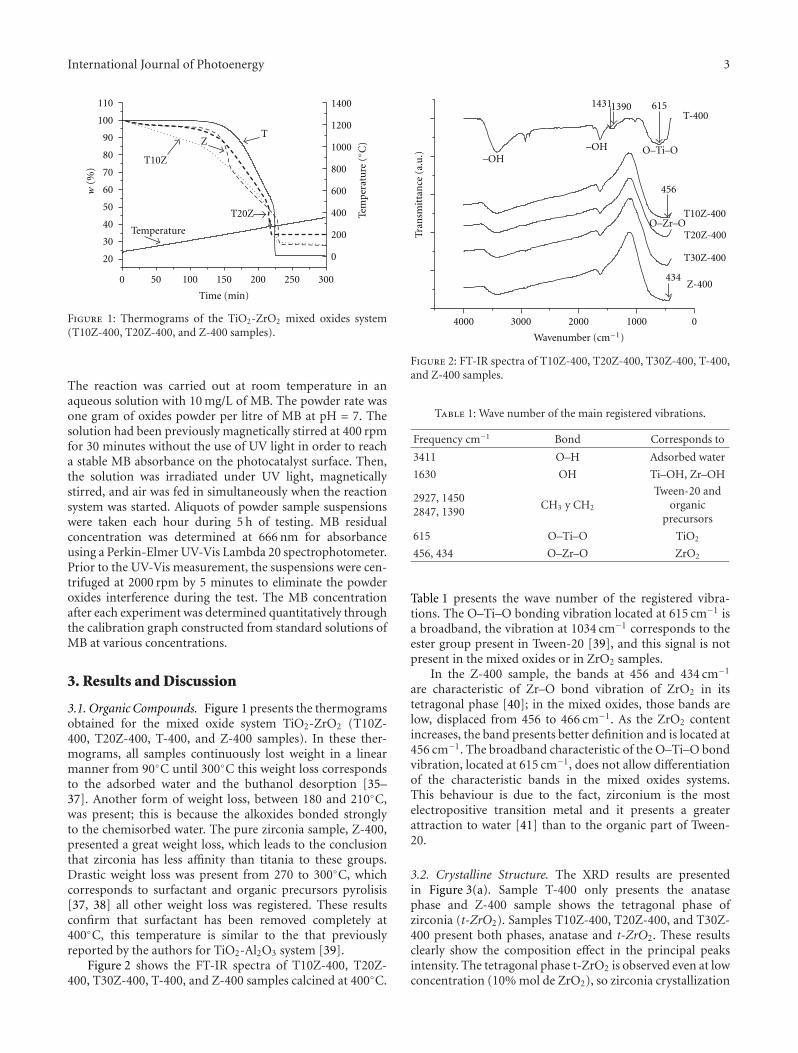
International Journal of Photoenergy 3
110
100
90
80
70
60
50
40
30
20
0 50 100 150 200 250 300
400
600
800
1000
1200
1400
Temperature
Time (min)
Tem
per
atu
re(◦
C)
T
T10Z
T20Z
0
200
Z
w(%
)
Figure 1: Thermograms of the TiO2-ZrO2 mixed oxides system(T10Z-400, T20Z-400, and Z-400 samples).
The reaction was carried out at room temperature in anaqueous solution with 10 mg/L of MB. The powder rate wasone gram of oxides powder per litre of MB at pH = 7. Thesolution had been previously magnetically stirred at 400 rpmfor 30 minutes without the use of UV light in order to reacha stable MB absorbance on the photocatalyst surface. Then,the solution was irradiated under UV light, magneticallystirred, and air was fed in simultaneously when the reactionsystem was started. Aliquots of powder sample suspensionswere taken each hour during 5 h of testing. MB residualconcentration was determined at 666 nm for absorbanceusing a Perkin-Elmer UV-Vis Lambda 20 spectrophotometer.Prior to the UV-Vis measurement, the suspensions were cen-trifuged at 2000 rpm by 5 minutes to eliminate the powderoxides interference during the test. The MB concentrationafter each experiment was determined quantitatively throughthe calibration graph constructed from standard solutions ofMB at various concentrations.
3. Results and Discussion
3.1. Organic Compounds. Figure 1 presents the thermogramsobtained for the mixed oxide system TiO2-ZrO2 (T10Z-400, T20Z-400, T-400, and Z-400 samples). In these ther-mograms, all samples continuously lost weight in a linearmanner from 90◦C until 300◦C this weight loss correspondsto the adsorbed water and the buthanol desorption [35–37]. Another form of weight loss, between 180 and 210◦C,was present; this is because the alkoxides bonded stronglyto the chemisorbed water. The pure zirconia sample, Z-400,presented a great weight loss, which leads to the conclusionthat zirconia has less affinity than titania to these groups.Drastic weight loss was present from 270 to 300◦C, whichcorresponds to surfactant and organic precursors pyrolisis[37, 38] all other weight loss was registered. These resultsconfirm that surfactant has been removed completely at400◦C, this temperature is similar to the that previouslyreported by the authors for TiO2-Al2O3 system [39].
Figure 2 shows the FT-IR spectra of T10Z-400, T20Z-400, T30Z-400, T-400, and Z-400 samples calcined at 400◦C.
4000 3000 2000 1000 0
434
456
61513901431
Wavenumber (cm−1)
T-400
T10Z-400
T20Z-400
T30Z-400
Z-400
O–Zr–O
O–Ti–O–OH–OH
Tran
smit
tan
ce (
a.u
.)
Figure 2: FT-IR spectra of T10Z-400, T20Z-400, T30Z-400, T-400,and Z-400 samples.
Table 1: Wave number of the main registered vibrations.
Frequency cm−1 Bond Corresponds to
3411 O–H Adsorbed water
1630 OH Ti–OH, Zr–OH
2927, 14502847, 1390
CH3 y CH2
Tween-20 andorganic
precursors
615 O–Ti–O TiO2
456, 434 O–Zr–O ZrO2
Table 1 presents the wave number of the registered vibra-tions. The O–Ti–O bonding vibration located at 615 cm−1 isa broadband, the vibration at 1034 cm−1 corresponds to theester group present in Tween-20 [39], and this signal is notpresent in the mixed oxides or in ZrO2 samples.
In the Z-400 sample, the bands at 456 and 434 cm−1
are characteristic of Zr–O bond vibration of ZrO2 in itstetragonal phase [40]; in the mixed oxides, those bands arelow, displaced from 456 to 466 cm−1. As the ZrO2 contentincreases, the band presents better definition and is located at456 cm−1. The broadband characteristic of the O–Ti–O bondvibration, located at 615 cm−1, does not allow differentiationof the characteristic bands in the mixed oxides systems.This behaviour is due to the fact, zirconium is the mostelectropositive transition metal and it presents a greaterattraction to water [41] than to the organic part of Tween-20.
3.2. Crystalline Structure. The XRD results are presentedin Figure 3(a). Sample T-400 only presents the anatasephase and Z-400 sample shows the tetragonal phase ofzirconia (t-ZrO2). Samples T10Z-400, T20Z-400, and T30Z-400 present both phases, anatase and t-ZrO2. These resultsclearly show the composition effect in the principal peaksintensity. The tetragonal phase t-ZrO2 is observed even at lowconcentration (10% mol de ZrO2), so zirconia crystallization
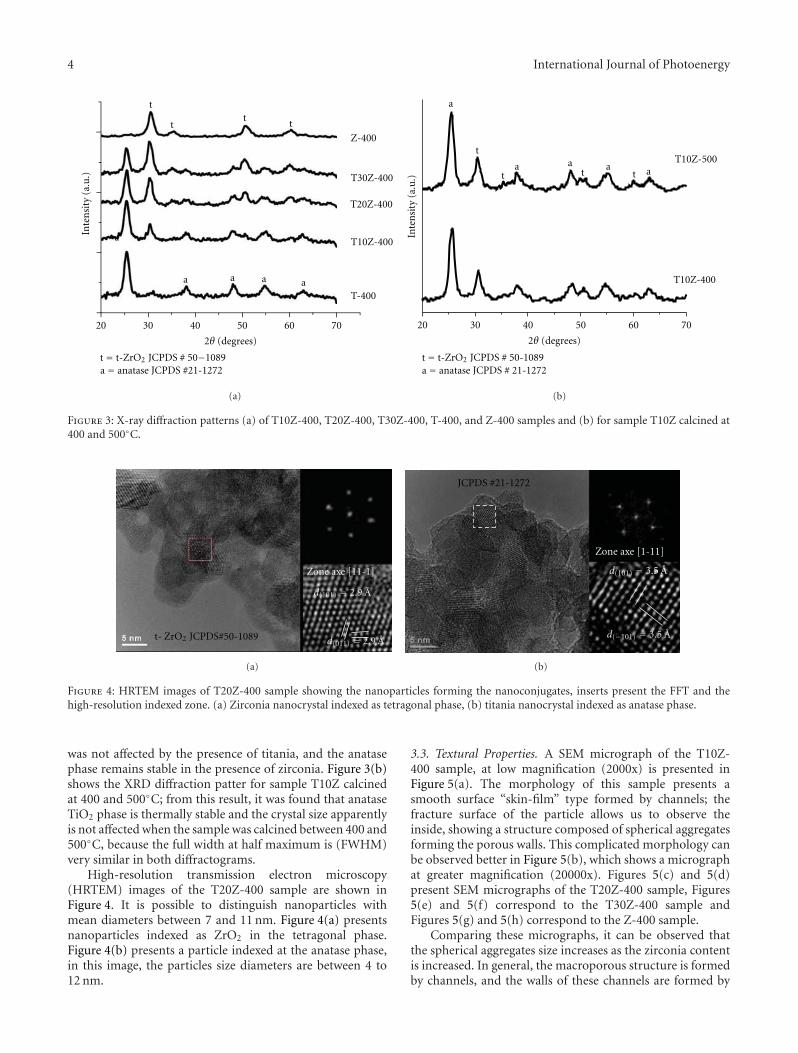
4 International Journal of Photoenergy
20 30 40 50 60 70
Z-400
T10Z-400
T-400
T20Z-400
T30Z-400
2θ (degrees)
Inte
nsi
ty(a
.u.)
t
a
a
a aa
ttt
a = anatase JCPDS #21-1272t = t-ZrO2 JCPDS # 50−1089
(a)
20 30 40 50 60 70
T10Z-400
T10Z-500
2θ (degrees)
Inte
nsi
ty(a
.u.)
a
t
t = t-ZrO2 JCPDS # 50-1089a = anatase JCPDS # 21-1272
ta
t ta aa
(b)
Figure 3: X-ray diffraction patterns (a) of T10Z-400, T20Z-400, T30Z-400, T-400, and Z-400 samples and (b) for sample T10Z calcined at400 and 500◦C.
Zone axe [11-1]
d(101) = 2.9 A
d(011) = 2.9 At- ZrO2 JCPDS#50-1089
(a)
Zone axe [1-11]
JCPDS #21-1272
d(101) = 3.5 A
d(−101) = 3.5 A
(b)
Figure 4: HRTEM images of T20Z-400 sample showing the nanoparticles forming the nanoconjugates, inserts present the FFT and thehigh-resolution indexed zone. (a) Zirconia nanocrystal indexed as tetragonal phase, (b) titania nanocrystal indexed as anatase phase.
was not affected by the presence of titania, and the anatasephase remains stable in the presence of zirconia. Figure 3(b)shows the XRD diffraction patter for sample T10Z calcinedat 400 and 500◦C; from this result, it was found that anataseTiO2 phase is thermally stable and the crystal size apparentlyis not affected when the sample was calcined between 400 and500◦C, because the full width at half maximum is (FWHM)very similar in both diffractograms.
High-resolution transmission electron microscopy(HRTEM) images of the T20Z-400 sample are shown inFigure 4. It is possible to distinguish nanoparticles withmean diameters between 7 and 11 nm. Figure 4(a) presentsnanoparticles indexed as ZrO2 in the tetragonal phase.Figure 4(b) presents a particle indexed at the anatase phase,in this image, the particles size diameters are between 4 to12 nm.
3.3. Textural Properties. A SEM micrograph of the T10Z-400 sample, at low magnification (2000x) is presented inFigure 5(a). The morphology of this sample presents asmooth surface “skin-film” type formed by channels; thefracture surface of the particle allows us to observe theinside, showing a structure composed of spherical aggregatesforming the porous walls. This complicated morphology canbe observed better in Figure 5(b), which shows a micrographat greater magnification (20000x). Figures 5(c) and 5(d)present SEM micrographs of the T20Z-400 sample, Figures5(e) and 5(f) correspond to the T30Z-400 sample andFigures 5(g) and 5(h) correspond to the Z-400 sample.
Comparing these micrographs, it can be observed thatthe spherical aggregates size increases as the zirconia contentis increased. In general, the macroporous structure is formedby channels, and the walls of these channels are formed by
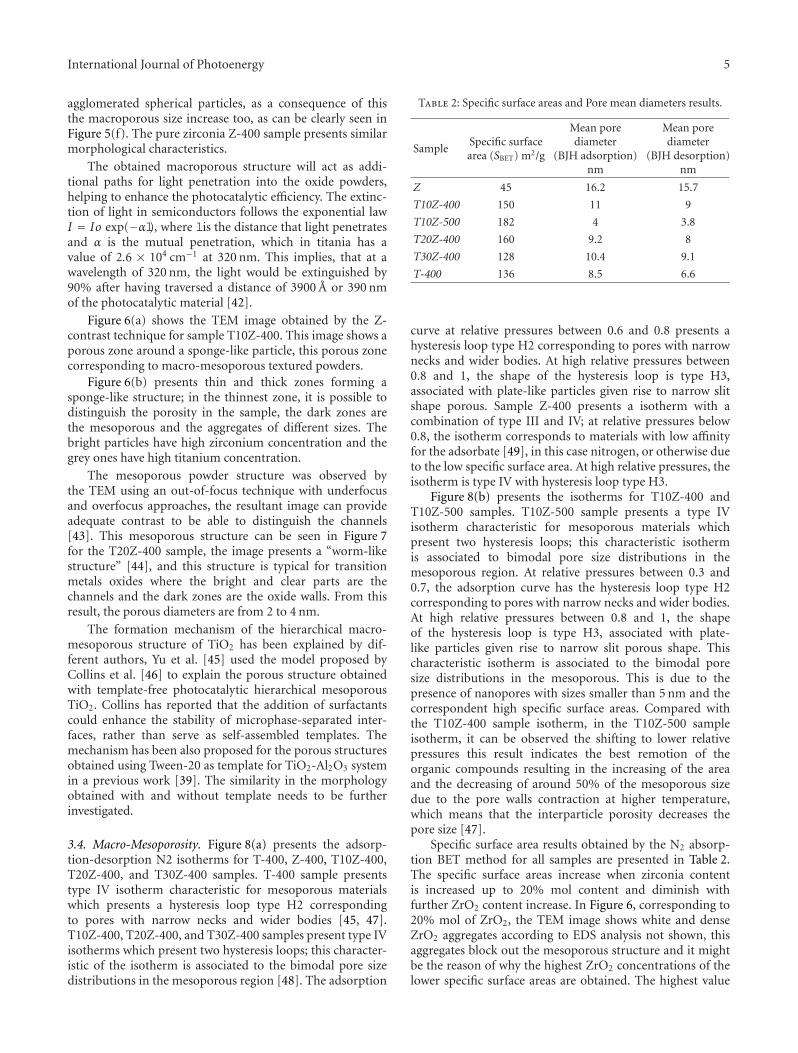
International Journal of Photoenergy 5
agglomerated spherical particles, as a consequence of thisthe macroporous size increase too, as can be clearly seen inFigure 5(f). The pure zirconia Z-400 sample presents similarmorphological characteristics.
The obtained macroporous structure will act as addi-tional paths for light penetration into the oxide powders,helping to enhance the photocatalytic efficiency. The extinc-tion of light in semiconductors follows the exponential lawI = Io exp(−αl), where lis the distance that light penetratesand α is the mutual penetration, which in titania has avalue of 2.6 × 104 cm−1 at 320 nm. This implies, that at awavelength of 320 nm, the light would be extinguished by90% after having traversed a distance of 3900 A or 390 nmof the photocatalytic material [42].
Figure 6(a) shows the TEM image obtained by the Z-contrast technique for sample T10Z-400. This image shows aporous zone around a sponge-like particle, this porous zonecorresponding to macro-mesoporous textured powders.
Figure 6(b) presents thin and thick zones forming asponge-like structure; in the thinnest zone, it is possible todistinguish the porosity in the sample, the dark zones arethe mesoporous and the aggregates of different sizes. Thebright particles have high zirconium concentration and thegrey ones have high titanium concentration.
The mesoporous powder structure was observed bythe TEM using an out-of-focus technique with underfocusand overfocus approaches, the resultant image can provideadequate contrast to be able to distinguish the channels[43]. This mesoporous structure can be seen in Figure 7for the T20Z-400 sample, the image presents a “worm-likestructure” [44], and this structure is typical for transitionmetals oxides where the bright and clear parts are thechannels and the dark zones are the oxide walls. From thisresult, the porous diameters are from 2 to 4 nm.
The formation mechanism of the hierarchical macro-mesoporous structure of TiO2 has been explained by dif-ferent authors, Yu et al. [45] used the model proposed byCollins et al. [46] to explain the porous structure obtainedwith template-free photocatalytic hierarchical mesoporousTiO2. Collins has reported that the addition of surfactantscould enhance the stability of microphase-separated inter-faces, rather than serve as self-assembled templates. Themechanism has been also proposed for the porous structuresobtained using Tween-20 as template for TiO2-Al2O3 systemin a previous work [39]. The similarity in the morphologyobtained with and without template needs to be furtherinvestigated.
3.4. Macro-Mesoporosity. Figure 8(a) presents the adsorp-tion-desorption N2 isotherms for T-400, Z-400, T10Z-400,T20Z-400, and T30Z-400 samples. T-400 sample presentstype IV isotherm characteristic for mesoporous materialswhich presents a hysteresis loop type H2 correspondingto pores with narrow necks and wider bodies [45, 47].T10Z-400, T20Z-400, and T30Z-400 samples present type IVisotherms which present two hysteresis loops; this character-istic of the isotherm is associated to the bimodal pore sizedistributions in the mesoporous region [48]. The adsorption
Table 2: Specific surface areas and Pore mean diameters results.
SampleSpecific surfacearea (SBET) m2/g
Mean porediameter
(BJH adsorption)nm
Mean porediameter
(BJH desorption)nm
Z 45 16.2 15.7
T10Z-400 150 11 9
T10Z-500 182 4 3.8
T20Z-400 160 9.2 8
T30Z-400 128 10.4 9.1
T-400 136 8.5 6.6
curve at relative pressures between 0.6 and 0.8 presents ahysteresis loop type H2 corresponding to pores with narrownecks and wider bodies. At high relative pressures between0.8 and 1, the shape of the hysteresis loop is type H3,associated with plate-like particles given rise to narrow slitshape porous. Sample Z-400 presents a isotherm with acombination of type III and IV; at relative pressures below0.8, the isotherm corresponds to materials with low affinityfor the adsorbate [49], in this case nitrogen, or otherwise dueto the low specific surface area. At high relative pressures, theisotherm is type IV with hysteresis loop type H3.
Figure 8(b) presents the isotherms for T10Z-400 andT10Z-500 samples. T10Z-500 sample presents a type IVisotherm characteristic for mesoporous materials whichpresent two hysteresis loops; this characteristic isothermis associated to bimodal pore size distributions in themesoporous region. At relative pressures between 0.3 and0.7, the adsorption curve has the hysteresis loop type H2corresponding to pores with narrow necks and wider bodies.At high relative pressures between 0.8 and 1, the shapeof the hysteresis loop is type H3, associated with plate-like particles given rise to narrow slit porous shape. Thischaracteristic isotherm is associated to the bimodal poresize distributions in the mesoporous. This is due to thepresence of nanopores with sizes smaller than 5 nm and thecorrespondent high specific surface areas. Compared withthe T10Z-400 sample isotherm, in the T10Z-500 sampleisotherm, it can be observed the shifting to lower relativepressures this result indicates the best remotion of theorganic compounds resulting in the increasing of the areaand the decreasing of around 50% of the mesoporous sizedue to the pore walls contraction at higher temperature,which means that the interparticle porosity decreases thepore size [47].
Specific surface area results obtained by the N2 absorp-tion BET method for all samples are presented in Table 2.The specific surface areas increase when zirconia contentis increased up to 20% mol content and diminish withfurther ZrO2 content increase. In Figure 6, corresponding to20% mol of ZrO2, the TEM image shows white and denseZrO2 aggregates according to EDS analysis not shown, thisaggregates block out the mesoporous structure and it mightbe the reason of why the highest ZrO2 concentrations of thelower specific surface areas are obtained. The highest value
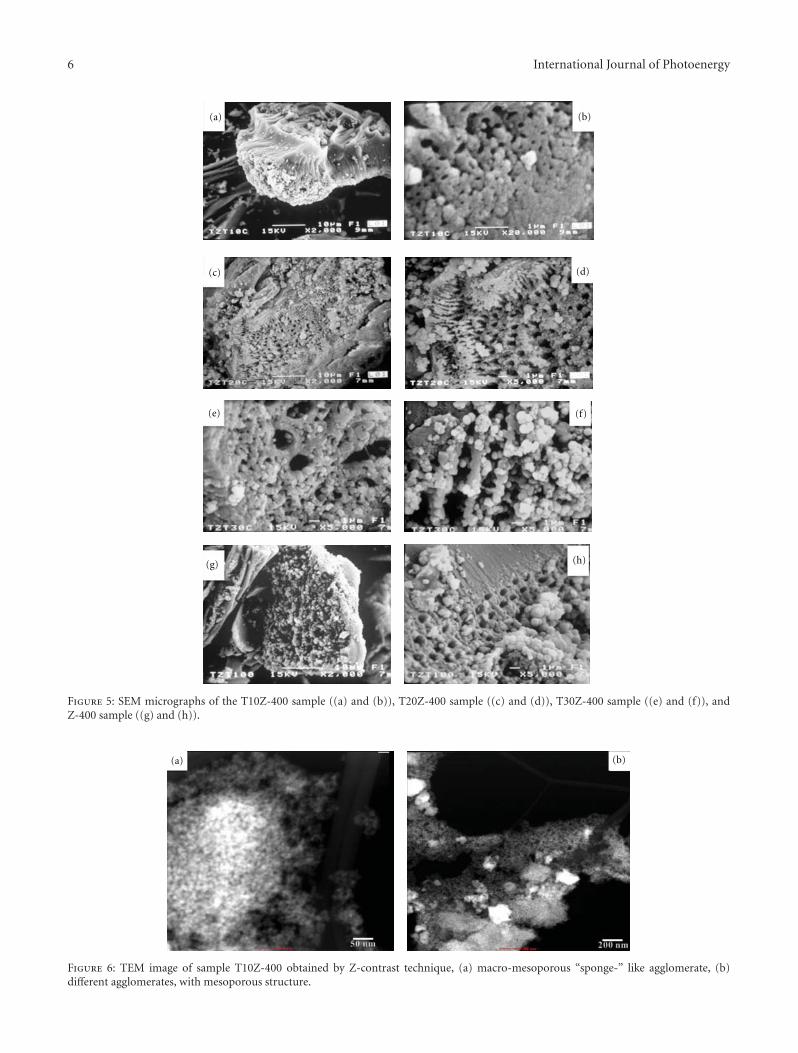
6 International Journal of Photoenergy
(a) (b)
(c) (d)
(e) (f)
(g) (h)
Figure 5: SEM micrographs of the T10Z-400 sample ((a) and (b)), T20Z-400 sample ((c) and (d)), T30Z-400 sample ((e) and (f)), andZ-400 sample ((g) and (h)).
(a) (b)
Figure 6: TEM image of sample T10Z-400 obtained by Z-contrast technique, (a) macro-mesoporous “sponge-” like agglomerate, (b)different agglomerates, with mesoporous structure.
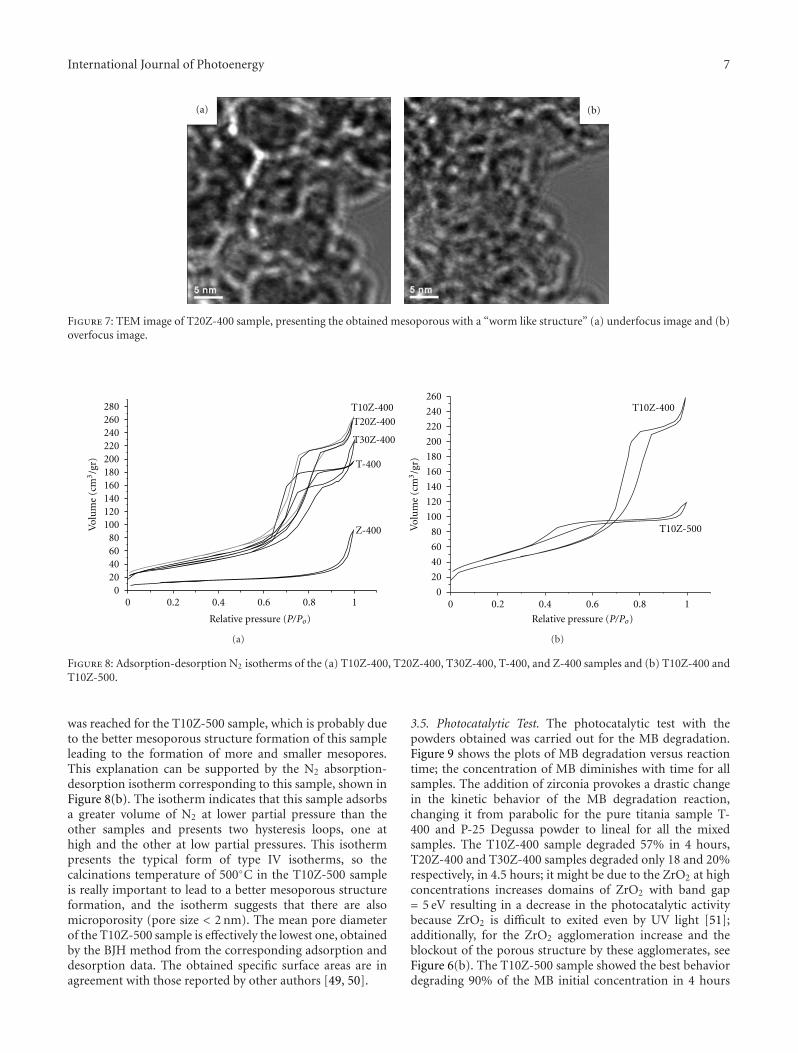
International Journal of Photoenergy 7
(a) (b)
Figure 7: TEM image of T20Z-400 sample, presenting the obtained mesoporous with a “worm like structure” (a) underfocus image and (b)overfocus image.
0 0.2 0.4 0.6 0.8 10
20406080
100120140160180200220240260280 T10Z-400
T30Z-400
T20Z-400
T-400
Z-400Vol
um
e(c
m3/g
r)
Relative pressure (P/Po)
(a)
0 0.2 0.4 0.6 0.8 10
20
40
60
80
100
120
140
160
180
200
220
240
260T10Z-400
Vol
um
e(c
m3/g
r)
T10Z-500
Relative pressure (P/Po)
(b)
Figure 8: Adsorption-desorption N2 isotherms of the (a) T10Z-400, T20Z-400, T30Z-400, T-400, and Z-400 samples and (b) T10Z-400 andT10Z-500.
was reached for the T10Z-500 sample, which is probably dueto the better mesoporous structure formation of this sampleleading to the formation of more and smaller mesopores.This explanation can be supported by the N2 absorption-desorption isotherm corresponding to this sample, shown inFigure 8(b). The isotherm indicates that this sample adsorbsa greater volume of N2 at lower partial pressure than theother samples and presents two hysteresis loops, one athigh and the other at low partial pressures. This isothermpresents the typical form of type IV isotherms, so thecalcinations temperature of 500◦C in the T10Z-500 sampleis really important to lead to a better mesoporous structureformation, and the isotherm suggests that there are alsomicroporosity (pore size < 2 nm). The mean pore diameterof the T10Z-500 sample is effectively the lowest one, obtainedby the BJH method from the corresponding adsorption anddesorption data. The obtained specific surface areas are inagreement with those reported by other authors [49, 50].
3.5. Photocatalytic Test. The photocatalytic test with thepowders obtained was carried out for the MB degradation.Figure 9 shows the plots of MB degradation versus reactiontime; the concentration of MB diminishes with time for allsamples. The addition of zirconia provokes a drastic changein the kinetic behavior of the MB degradation reaction,changing it from parabolic for the pure titania sample T-400 and P-25 Degussa powder to lineal for all the mixedsamples. The T10Z-400 sample degraded 57% in 4 hours,T20Z-400 and T30Z-400 samples degraded only 18 and 20%respectively, in 4.5 hours; it might be due to the ZrO2 at highconcentrations increases domains of ZrO2 with band gap= 5 eV resulting in a decrease in the photocatalytic activitybecause ZrO2 is difficult to exited even by UV light [51];additionally, for the ZrO2 agglomeration increase and theblockout of the porous structure by these agglomerates, seeFigure 6(b). The T10Z-500 sample showed the best behaviordegrading 90% of the MB initial concentration in 4 hours
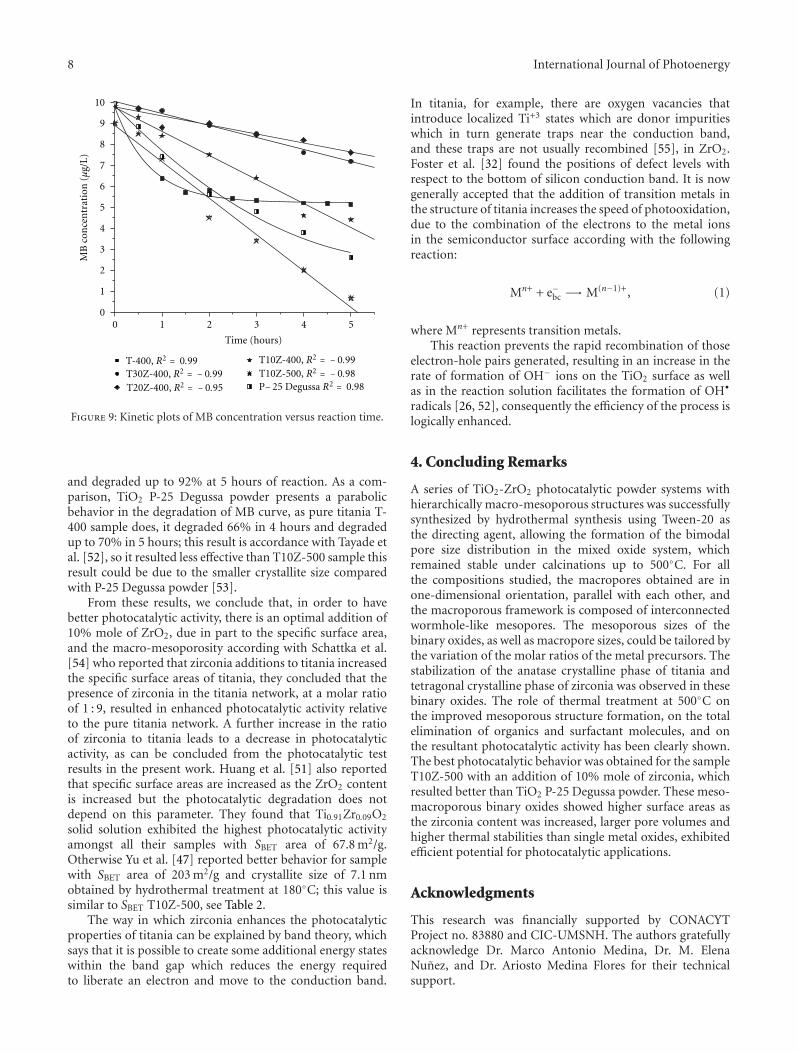
8 International Journal of Photoenergy
1
2
3
4
5
6
7
8
9
10
0
MB
con
cen
trat
ion
(μg/
L)
Time (hours)
T-400, R2 = 0.99T30Z-400, R2 = − 0.99T20Z-400, R2 = − 0.95
T10Z-400, R2 = − 0.99T10Z-500, R2 = − 0.98
1 2 3 4 50
P− 25 Degussa R2 = 0.98
Figure 9: Kinetic plots of MB concentration versus reaction time.
and degraded up to 92% at 5 hours of reaction. As a com-parison, TiO2 P-25 Degussa powder presents a parabolicbehavior in the degradation of MB curve, as pure titania T-400 sample does, it degraded 66% in 4 hours and degradedup to 70% in 5 hours; this result is accordance with Tayade etal. [52], so it resulted less effective than T10Z-500 sample thisresult could be due to the smaller crystallite size comparedwith P-25 Degussa powder [53].
From these results, we conclude that, in order to havebetter photocatalytic activity, there is an optimal addition of10% mole of ZrO2, due in part to the specific surface area,and the macro-mesoporosity according with Schattka et al.[54] who reported that zirconia additions to titania increasedthe specific surface areas of titania, they concluded that thepresence of zirconia in the titania network, at a molar ratioof 1 : 9, resulted in enhanced photocatalytic activity relativeto the pure titania network. A further increase in the ratioof zirconia to titania leads to a decrease in photocatalyticactivity, as can be concluded from the photocatalytic testresults in the present work. Huang et al. [51] also reportedthat specific surface areas are increased as the ZrO2 contentis increased but the photocatalytic degradation does notdepend on this parameter. They found that Ti0.91Zr0.09O2
solid solution exhibited the highest photocatalytic activityamongst all their samples with SBET area of 67.8 m2/g.Otherwise Yu et al. [47] reported better behavior for samplewith SBET area of 203 m2/g and crystallite size of 7.1 nmobtained by hydrothermal treatment at 180◦C; this value issimilar to SBET T10Z-500, see Table 2.
The way in which zirconia enhances the photocatalyticproperties of titania can be explained by band theory, whichsays that it is possible to create some additional energy stateswithin the band gap which reduces the energy requiredto liberate an electron and move to the conduction band.
In titania, for example, there are oxygen vacancies thatintroduce localized Ti+3 states which are donor impuritieswhich in turn generate traps near the conduction band,and these traps are not usually recombined [55], in ZrO2.Foster et al. [32] found the positions of defect levels withrespect to the bottom of silicon conduction band. It is nowgenerally accepted that the addition of transition metals inthe structure of titania increases the speed of photooxidation,due to the combination of the electrons to the metal ionsin the semiconductor surface according with the followingreaction:
Mn+ + e−bc −→ M(n−1)+, (1)
where Mn+ represents transition metals.This reaction prevents the rapid recombination of those
electron-hole pairs generated, resulting in an increase in therate of formation of OH− ions on the TiO2 surface as wellas in the reaction solution facilitates the formation of OH•
radicals [26, 52], consequently the efficiency of the process islogically enhanced.
4. Concluding Remarks
A series of TiO2-ZrO2 photocatalytic powder systems withhierarchically macro-mesoporous structures was successfullysynthesized by hydrothermal synthesis using Tween-20 asthe directing agent, allowing the formation of the bimodalpore size distribution in the mixed oxide system, whichremained stable under calcinations up to 500◦C. For allthe compositions studied, the macropores obtained are inone-dimensional orientation, parallel with each other, andthe macroporous framework is composed of interconnectedwormhole-like mesopores. The mesoporous sizes of thebinary oxides, as well as macropore sizes, could be tailored bythe variation of the molar ratios of the metal precursors. Thestabilization of the anatase crystalline phase of titania andtetragonal crystalline phase of zirconia was observed in thesebinary oxides. The role of thermal treatment at 500◦C onthe improved mesoporous structure formation, on the totalelimination of organics and surfactant molecules, and onthe resultant photocatalytic activity has been clearly shown.The best photocatalytic behavior was obtained for the sampleT10Z-500 with an addition of 10% mole of zirconia, whichresulted better than TiO2 P-25 Degussa powder. These meso-macroporous binary oxides showed higher surface areas asthe zirconia content was increased, larger pore volumes andhigher thermal stabilities than single metal oxides, exhibitedefficient potential for photocatalytic applications.
Acknowledgments
This research was financially supported by CONACYTProject no. 83880 and CIC-UMSNH. The authors gratefullyacknowledge Dr. Marco Antonio Medina, Dr. M. ElenaNunez, and Dr. Ariosto Medina Flores for their technicalsupport.
International Journal of Photoenergy 9
References
[1] H. Arora, C. Doty, and Y. Yuan, “Titanium dioxide nanocon-jugates,” in Nanomaterials for the Life Sciences, C. S. S. R.Kumar, Ed., vol. 8, Wiley-VCH, Weinheim, Germany, 2006,Nanoconjugates.
[2] S. S. Liang, H. Makamba, S. Y. Huang, and S. H. Chen, “Nano-titanium dioxide composites for the enrichment of phospho-peptides,” Journal of Chromatography A, vol. 1116, no. 1-2, pp.38–45, 2006.
[3] C. A. Paez, D. Poelman, J. P. Pirard, and B. Heinrichs, “Un-predictable photocatalytic ability of H2-reduced rutile-TiO2
xerogel in the degradation of dye-pollutants under UV andvisible light irradiation,” Applied Catalysis B, vol. 94, no. 3-4,pp. 263–271, 2010.
[4] W. Ren, Z. Ai, F. Jia, L. Zhang, X. Fan, and Z. Zou, “Low tem-perature preparation and visible light photocatalytic activity ofmesoporous carbon-doped crystalline TiO2,” Applied CatalysisB, vol. 69, no. 3-4, pp. 138–144, 2007.
[5] Q. Xiao, J. Zhang, C. Xiao, Z. Si, and X. Tan, “Solar photocat-alytic degradation of methylene blue in carbon-doped TiO2
nanoparticles suspension,” Solar Energy, vol. 82, no. 8, pp.706–713, 2008.
[6] S. K. Samantaray and K. M. Parida, “Effect of anions on thetextural and catalytic activity of titania,” Journal of MaterialsScience, vol. 38, no. 9, pp. 1835–1848, 2003.
[7] R. Asahi, T. Morikawa, T. Ohwaki, K. Aoki, and Y. Taga,“Visible-light photocatalysis in nitrogen-doped titaniumoxides,” Science, vol. 293, no. 5528, pp. 269–271, 2001.
[8] J. A. Byrne, P. A. Fernandez-Ibanez, P. S. M. Dunlop, D. M. A.Alrousan, and J. W. J. Hamilton, “Photocatalytic enhancementfor solar disinfection of water: a review,” International Journalof Photoenergy, vol. 2011, Article ID 798051, 2011.
[9] Y. Yao, Y. Ohko, Y. Sekiguchi, A. Fujishima, and Y. Kubota,“Self-sterilization using silicone catheters coated with Agand TiO2 nanocomposite thin film,” Journal of BiomedicalMaterials Research B, vol. 85, no. 2, pp. 453–460, 2008.
[10] A. Mo, W. Xu, S. Xian, Y. Li, and S. Bai, “Antibacterial activityof silver-hydroxyapatite/titania nanocomposite coating ontitanium against oral bacteria,” Key Engineering Materials, vol.330–332, pp. 455–458, 2007, Bioceramics 19 (parts 1 and 2).
[11] G. F. Fu, P. S. Vary, and C. T. Lin, “Anatase TiO2 nanocompos-ites for antimicrobial coatings,” Journal of Physical ChemistryB, vol. 109, no. 18, pp. 8889–8898, 2005.
[12] L. F. Liu, B. John, K. L. Yeung, and G. Si, “Non-UV basedgermicidal activity of metal-doped TiO2 coating on solidsurfaces,” Journal of Environmental Sciences, vol. 19, no. 6, pp.745–750, 2007.
[13] B. Mahltig, E. Gutmann, D. C. Meyer et al., “Solvothermalpreparation of metalized titania sols for photocatalytic andantimicrobial coatings,” Journal of Materials Chemistry, vol.17, no. 22, pp. 2367–2374, 2007.
[14] D. F. Ollis, “Integrating photocatalysis and membrane tech-nologies for water treatment,” Annals of the New York Academyof Sciences, vol. 984, pp. 65–84, 2003.
[15] S. Kohtani, A. Kudo, and T. Sakata, “Spectral sensitizationof a TiO2 semiconductor electrode by CdS microcrystals andits photoelectrochemical properties,” Chemical Physics Letters,vol. 206, no. 1–4, pp. 166–170, 1993.
[16] V. Subramanian, Z. Ni, E. G. Seebauer, and R. I. Masel,“Synthesis of high-temperature titania-alumina supports,”Industrial and Engineering Chemistry Research, vol. 45, no. 11,pp. 3815–3820, 2006.
[17] M. L. Garcıa-Benjume, M. I. Espitia-Cabrera, and M. E.Contreras-Garcıa, “Synthesis and characterization of meso-porous nanostructured TiO2–Al2O3 photocatalytic system,” inProcessing of Nanoparticle Structures and Composites: CeramicTransactions, T. Hinklin and K. Lu, Eds., vol. 208, pp. 79–89,2009.
[18] G. Tian, K. Pan, H. Fu, L. Jing, and W. Zhou, “Enhanced pho-tocatalytic activity of S-doped TiO2–ZrO2 nanoparticles undervisible-light irradiation,” Journal of Hazardous Materials, vol.166, no. 2-3, pp. 939–944, 2009.
[19] J. Y. Zheng, K. Y. Qiu, and Y. Wei, “Investigation of Zr-incorporated mesoporous titania materials via nonsurfactanttemplated sol-gel route: synthesis, characterization and stabil-ity,” Journal of Materials Science, vol. 38, no. 3, pp. 437–444,2003.
[20] F. Fresno, M. D. Hernandez-Alonso, D. Tudela, J. M. Coron-ado, and J. Soria, “Photocatalytic degradation of toluene overdoped and coupled (Ti,M)O2 (M = Sn or Zr) nanocrystallineoxides: influence of the heteroatom distribution on deactiva-tion,” Applied Catalysis B, vol. 84, no. 3-4, pp. 598–606, 2008.
[21] C. Wang, A. Geng, Y. Guo, S. Jiang, X. Qu, and L. Li, “A novelpreparation of three-dimensionally ordered macroporousM/Ti (M = Zr or Ta) mixed oxide nanoparticles with enhancedphotocatalytic activity,” Journal of Colloid and Interface Science,vol. 301, no. 1, pp. 236–247, 2006.
[22] M. Xue, L. Huang, J. Q. Wang et al., “The direct synthesisof mesoporous structured MnO2/TiO2 nanocomposite: anovel visible-light active photocatalyst with large pore size,”Nanotechnology, vol. 19, no. 18, Article ID 185604, 2008.
[23] Q. Wang, D. Yang, D. Chen, Y. Wang, and Z. Jiang, “Synthesisof anatase titania-carbon nanotubes nanocomposites withenhanced photocatalytic activity through a nanocoating-hydrothermal process,” Journal of Nanoparticle Research, vol.9, no. 6, pp. 1087–1096, 2007.
[24] M. L. Garcıa-Benjume, M. I. Espitia-Cabrera, and M. E.Contreras-Garcıa, “The effect of synthesis parameters on theproduction of titania nanostructured spherical aggregates,”Journal of Ceramic Processing Research, vol. 11, no. 2, pp. 198–203, 2010.
[25] E. Barajas-Ledesma, M. L. Garcıa-Benjume, I. Espitia-Cabrera,A. Bravo-Patino, and M. E. Contreras-Garcıa, “Biocide activityof TiO2 nanostructured films,” Journal of Nano Research, vol.9, pp. 17–24, 2010.
[26] J. Sin, S. Lam, A. R. Mohamed, and K. Lee, “Degradingendocrine discrupting chemicals from wastewater by TiO2
photocatalysis: a review,” International Journal of Photoenergy,vol. 2012, Article ID 185159, 2012.
[27] L. R. Yu, Z. Zhu, K. C. Chan, H. J. Issaq, D. S. Dimitrov,and T. D. Veenstra, “Improved titanium dioxide enrichmentof phosphopeptides from HeLa cells and high confidentphosphopeptide identification by cross-validation of MS/MSand MS/MS/MS spectra,” Journal of Proteome Research, vol. 6,no. 11, pp. 4150–4162, 2007.
[28] K. Ashman and E. L. Villar, “Phosphoproteomics and cancerresearch,” Clinical & Translational Oncology, vol. 11, no. 6, pp.356–362, 2009.
[29] A. Paradela and J. P. Albar, “Advances in the analysis of proteinphosphorylation,” Journal of Proteome Research, vol. 7, no. 5,pp. 1809–1818, 2008.
[30] L. Zhang and J. C. Yu, “A sonochemical approach to hier-archical porous titania spheres with enhanced photocatalyticactivity,” Chemical Communications, vol. 9, no. 16, pp. 2078–2079, 2003.
10 International Journal of Photoenergy
[31] P. Kluson, H. Luskova, L. Cerveny, J. Klisakova, and T.Cajthaml, “Partial photocatalytic oxidation of cyclopenteneover titanium(IV) oxide,” Journal of Molecular Catalysis A, vol.242, no. 1-2, pp. 62–67, 2005.
[32] A. S. Foster, V. B. Sulimov, F. Lopez Gejo, A. L. Shluger, and R.M. Nieminen, “Structure and electrical levels of point defectsin monoclinic zirconia,” Physical Review B, vol. 64, no. 22,Article ID 224108, 10 pages, 2001.
[33] J. M. Herrmann, “Heterogeneous photocatalysis: state of theart and present applications,” Topics in Catalysis, vol. 34, no.1–4, pp. 49–65, 2005.
[34] J. Yu, L. Zhang, B. Cheng, and Y. Su, “Hydrothermal prepa-ration and photocatalytic activity of hierarchically sponge-likemacro-/mesoporous titania,” Journal of Physical Chemistry C,vol. 111, no. 28, pp. 10582–10589, 2007.
[35] J. Escobar, J. A. de Los Reyes, and T. Viveros, “Influence of thesynthesis additive on the textural and structural characteristicsof sol-gel Al2O3–TiO2,” Industrial and Engineering ChemistryResearch, vol. 39, no. 3, pp. 666–672, 2000.
[36] E. Munoz, J. L. Boldu, E. Andrade et al., “Intrinsically formedtrivalent titanium ions in sol-gel titania,” Journal of theAmerican Ceramic Society, vol. 84, no. 2, pp. 392–398, 2001.
[37] G. Q. Liu, Z. G. Jin, X. X. Liu, T. Wang, and Z. F. Liu, “AnataseTiO2 porous thin films prepared by sol-gel method usingCTAB surfactant,” Journal of Sol-Gel Science and Technology,vol. 41, no. 1, pp. 49–55, 2007.
[38] S. G. Liu, H. Wang, J. P. Li, N. Zhao, W. Wei, and Y. H. Sun,“A facile route to synthesize mesoporous zirconia with ultrahigh thermal stability,” Materials Research Bulletin, vol. 42, no.1, pp. 171–176, 2007.
[39] M. L. Garcıa-Benjume, M. I. Espitia-Cabrera, and M. E.Contreras-Garcıa, “Hierarchical macro-mesoporous struc-tures in the system TiO2–Al2O3, obtained by hydrothermalsynthesis using Tween-20 as a directing agent,” MaterialsCharacterization, vol. 60, no. 12, pp. 1482–1488, 2009.
[40] F. del Monte, W. Larsen, and J. D. Mackenzie, “Stabilizationof tetragonal ZrO2 in ZrO2–SiO2 binary oxides,” Journal of theAmerican Ceramic Society, vol. 83, no. 3, pp. 628–634, 2000.
[41] D. A. Ward and E. I. Ko, “Synthesis and structural transforma-tion of zirconia aerogels,” Chemistry of Materials, vol. 5, no. 7,pp. 956–969, 1993.
[42] X. Wang, J. C. Yu, C. Ho, Y. Hou, and X. Fu, “Photocatalyticactivity of a hierarchically macro/mesoporous titania,” Lang-muir, vol. 21, no. 6, pp. 2552–2559, 2005.
[43] U. Ciesla and F. Schuth, “Ordered mesoporous materials,”Microporous and Mesoporous Materials, vol. 27, no. 2-3, pp.131–149, 1999.
[44] X. He and D. Antonelli, “Recent advances in synthesisand applications of transition metal containing mesoporousmolecular sieves,” Angewandte Chemie—International Edition,vol. 41, no. 2, pp. 215–229, 2002.
[45] J. Yu, Y. Su, and B. Cheng, “Template-free fabricationand enhanced photocatalytic activity of hierarchical macro-/mesoporous titania,” Advanced Functional Materials, vol. 17,no. 12, pp. 1984–1990, 2007.
[46] A. Collins, D. Carriazo, S. A. Davis, and S. Mann, “Sponta-neous template-free assembly of ordered macroporous tita-nia,” Chemical Communications, vol. 10, no. 5, pp. 568–569,2004.
[47] J. Yu, G. Wang, B. Cheng, and M. Zhou, “Effects of hydrother-mal temperature and time on the photocatalytic activityand microstructures of bimodal mesoporous TiO2 powders,”Applied Catalysis B, vol. 69, no. 3-4, pp. 171–180, 2007.
[48] J. Yu, J. C. Yu, W. Ho et al., “Effects of alcohol content andcalcination temperature on the textural properties of bimo-dally mesoporous titania,” Applied Catalysis A, vol. 255, no. 2,pp. 309–320, 2003.
[49] C. Flego, L. Carluccio, C. Rizzo, and C. Perego, “Synthesisof mesoporous SiO2–ZrO2 mixed oxides by sol-gel method,”Catalysis Communications, vol. 2, no. 2, pp. 43–48, 2001.
[50] J. Zhao, Y. Yue, W. Hua, and Z. Gao, “Catalytic activitiesand properties of mesoporous sulfated Al2O3–ZrO2,” CatalysisLetters, vol. 116, no. 1-2, pp. 27–34, 2007.
[51] Y. Huang, Z. Zheng, Z. Ai, L. Zhang, X. Fan, and Z. Zou,“Core - Shell microspherical Ti1−xZrxO2 solid solution pho-tocatalysts directly from ultrasonic spray pyrolysis,” Journal ofPhysical Chemistry B, vol. 110, no. 39, pp. 19323–19328, 2006.
[52] R. J. Tayade, T. S. Natarajan, and H. C. Bajaj, “Photocatalyticdegradation of methylene blue dye using ultraviolet light emit-ting diodes,” Industrial and Engineering Chemistry Research,vol. 48, no. 23, pp. 10262–10267, 2009.
[53] Y. Fan, G. Chen, D. Li et al., “Highly selective deethylationof rhodamine B on TiO2 prepared in supercritical fluids,”International Journal of Photoenergy, vol. 2012, Article ID173865, 2012.
[54] J. H. Schattka, D. G. Shchukin, J. Jia, M. Antonietti, and R.A. Caruso, “Photocatalytic activities of porous titania andtitania/zirconia structures formed by using a polymer geltemplating technique,” Chemistry of Materials, vol. 14, no. 12,pp. 5103–5108, 2002.
[55] A. L. Linsebigler, G. Lu, and J. T. Yates Jr., “Photocatalysis onTiO2 surfaces: principles, mechanisms, and selected results,”Chemical Reviews, vol. 95, no. 3, pp. 735–758, 1995.
Hindawi Publishing CorporationInternational Journal of PhotoenergyVolume 2012, Article ID 758539, 8 pagesdoi:10.1155/2012/758539
Research Article
Doped Titanium Dioxide Films Prepared byPulsed Laser Deposition Method
Juguang Hu,1 Huabin Tang,1 Xiaodong Lin,1 Zhongkuan Luo,2 Huiqun Cao,2
Qiwen Li,1 Yi Liu,1 Jinghua Long,1 and Pei Wang1
1 College of Physics Science and Technology, Shenzhen University, Guangdong, Shenzhen 518060, China2 College of Chemistry and Chemical Engineering, Shenzhen University, Guangdong, Shenzhen 518060, China
Correspondence should be addressed to Xiaodong Lin, [email protected]
Received 28 January 2012; Accepted 2 April 2012
Academic Editor: Baibiao Huang
Copyright © 2012 Juguang Hu et al. This is an open access article distributed under the Creative Commons Attribution License,which permits unrestricted use, distribution, and reproduction in any medium, provided the original work is properly cited.
TiO2 was intensively researched especially for photocatalystic applications. The nitrogen-doped TiO2 films prepared by pulsedlaser deposition (PLD) method were reviewed, and some recent new experimental results were also presented in this paper. Anew optical transmission method for evaluating the photocatalystic activity was presented. The main results are (1) PLD methodis versatile for preparing oxide material or complex component films with excellent controllability and high reproducibility. (2)Anatase nitrogen-doped TiO2 films were prepared at room temperature, 200◦C, and 400◦C by PLD method using novel ceramictarget of mixture of TiN and TiO2. UV/Vis spectra, AFM, Raman spectra, and photocatalystic activity for decomposition of methylorange (MO) tests showed that visible light response was improved at higher temperature. (3) The automatic, continuous opticaltransmission autorecorder method is suitable for detecting the photodecomposition dynamic process of organic compound.
1. Introduction
1.1. General Description of Preparation of TiO2 Films. Inrecent years, the field of photocatalysis has became anextremely well-researched field due to wide applicationinterest in self-cleaning surfaces, water or air purification,self-sterilizing surfaces, antifogging surfaces, optical or gassensor [1–4], and so forth. TiO2 is a fascinating material thathas been intensively researched by worldwide researchers.For photocatalystic applications, much attention has beenpaid to prepare and use TiO2 powder, for it has large specificarea [5, 6], but it has shortcoming of difficulty to recyclein aqueous fluid. TiO2 films have been prepared by manytechnologies, including chemical bath deposition (CBD)method [7, 8], electron-beam evaporation [9], reactiveelectron beam evaporation [10], magnetron sputtering [11,12], sol-gel [6, 9, 13–17], and thermal oxidation [18, 19].
Much effort has been given to understanding and alteringthe optical properties of titanium dioxide, especially forenhancing visible light absorption mainly by narrowing theband gap (3.2 eV) for using the economical and ecological
sunlight. Theoretical calculations have been performed toclarify the effect of anion doping of TiO2 on band gapmodifications [20–22].
Nitrogen-doped TiO2 materials were intensivelyresearched since Asahi et al. proposed that it has narrowband gap and little recombination of electrons and holes[23]. However, Batzill et al. reported that no band gapnarrowing is observed for N-doped TiO2 single crystals,but N-doping induces localized N 2p states within theband gap just above the valence band (VB). N is presentin an N(III) valence state, which facilitates the formationof oxygen vacancies and Ti 3d band gap states at elevatedtemperatures. This thermal instability may degrade thecatalyst during applications [24]. Socol et al. proposedthat both substitutional N and O vacancies contribute tothe visible light absorption [25]. The width of the TiO2
band gap was not affected by the presence of fluorineeither, as reported by Todorova et al. [5]. The red shift ofthe absorption edge was attributed to the increased rutilecontent in the fluorine-doped TiO2 powers. The codopingeffect between nitrogen and hydrogen is responsible for the
2 International Journal of Photoenergy
enhanced photoactivity of N-doped TiO2 in the range ofvisible light [26].
Balek et al. prepared nitrogen and fluorine codopedtitania photocatalyst samples for air purification by spraypyrolysis method [27]. A high photocatalytic activity ina visible light region of spectrum depended on the spraypyrolysis temperature and can be ascribed to a synergeticeffect of nitrogen and fluorine doping. Synergetic effectalso happened in Nd2O3 modified TiO2 nanoparticles,formation of the surface anatase/rutile phase junction favorsphotoinduced charge separation and further improves itsphotocatalytic activity [28].
Qu et al. prepared Fe(3+) and Ce(3+) codoped nanos-tructure titanium dioxide films via the improved sol-gelprocess. The samples had smaller crystal size, larger surfacearea, and larger pore volume. They also found that codopedions could obviously not only suppress the formation ofbrookite phase but also inhibit the transformation of anataseto rutile at high temperature. Fe(3+)/Ce(3+) codoped TiO2
film showed excellent photocatalytic activity compared withpure TiO2 film, Fe(3+) or Ce(3+) single doped TiO2 film.They concluded that the surface microstructure of the filmsand improved sol-gel process ions doping methods areresponsible for improving the photocatalytic activity [29].
Our group has reported works about hydrophilicitybetween titanium oxide coatings with and without additionof silica. Through the investigation of change of watercontact angle on the surface after UV exposure and sunlightradiation, it can be concluded that hydrophilicity of mixedcoatings with low-temperature heat treatment of titaniumoxide and silica is much better than a pure titanium oxidecoating. This effect makes for an improved self-cleaningcoating under natural sunlight. The mechanism is that par-ticles of titanium oxide separated by silica reduce the contactchance of recombination of electrons and holes, therebyincreasing the photocatalytic action on organic compounds.The addition of silica increases water absorption in thecoating. Water molecules absorbed by silica will be photo-catalyzed to free hydroxyl groups under the illumination ofUV light. These groups benefit the hydrophilicity of coating[30].
As for photo-induced hydrophilic effect, Fujishima et al.have reached the conclusion that there is an aspect of thiseffect that does not involve simply the cleaning of the surface.The precise nature of the effect has not been elucidated evennow, but researchers proposed that the surface species arebasically the same ones involved with conventional photo-catalysis [2]. Hendersonpresented recent research highlightsof the significant insights obtained from molecular-levelstudies of TiO2 photocatalysis. This comprehensive reviewhas illustrated how a surface science perspective on TiO2
photocatalysis can provide unique insights and motivatemore fundamental research in photocatalysis [3].
1.2. TiO2 Films Prepared by PLD Method. PLD technique is aversatile tool for preparing thin-films, because it is capable ofpreparing films with various properties by simply adjustingthe deposition conditions, like the type of target, type ofsubstrate and its temperature, distance between the target
and substrate, type and pressure of ambient air, and laserwavelength, and so forth. Its advantages for the film growthof oxides and other multicomponent materials include stoi-chiometric transfer, growth from an energetic plasma plume,reactive deposition, good adherence to the substrate surface,excellent controllability, and high reproducibility. PLD hasplayed a significant role in advancing our understanding ofthe physics of the thin-film structures, the material science ofa new system, and so forth [31].
With the use of PLD, TiO2 films doped with metal, tran-sition metal, or nonmetallic elements have been prepared,and their properties were controlled by varying the preparingparameters [25]. Socol et al. have grown crystalline anatasephase TiO2 thin films by PLD technique in oxygen, nitrogen,and methane and nitrogen with oxygen mixture. Theirstudies proved the positive influence of anion doping onthe photoreduction activity under visible light exposure. Thebest photoactivity under visible light exposure was obtainedfor films deposited in pure nitrogen, which was correlatedwith the highest red-shift (480 nm) of the absorption edgeand the larger nitrogen incorporation characteristic to thesefilms. Quite different evolutions were observed in case of UVlight irradiation. Significant results were obtained in this casefor the films deposited in pure oxygen or methane, whilethe photoactivity (quantum yield) of the films deposited innitrogen was lower as compared with the blank.
Sato et al. prepared N-doped TiO2 films by the atmo-spheric controlled PLD (AC-PLD) method to generate visiblelight active photocatalytic films [32]. For nitrogen doping,the use of CH(3)CN gas was found to be more effective thanthe use of NH(3). The visible light absorption propertiesof the films were very sensitive to the CH(3)CN partialpressure during ablation. When using CH(3)CN, nitrogenand an equal quantity of carbon was uniformly doped intothe TiO2 films. The resultant films showed better catalyticperformance than those which were either undoped or dopedusing NH(3). It is also suggested that stronger reducingagents such as carbon are required for doping nitrogen intoTiO2 films.
Metal nanoparticles can act as electron traps due to theformation of a Schottky barrier at the metal-semiconductorcontact. Holes can decompose organic substances moreefficiently, because it has strong oxidative power. Sauthier etal. used PLD technique to prepare Ag-TiO2 nanocompositesto improve photocatalytic activity and compared with thatof bare TiO2 [33]. It was proposed that two distinct mecha-nisms can contribute to the enhanced photoreactivity undernear-UV irradiation. The first is Ag NPs retard electron-hole recombination by photogenerated electron transferfrom TiO2. And the second one is localized surface plasmaresonance absorption of Ag NPs, which can have positiveeffect on the photocatalytic activity.
The films with more clusters exhibited higher photocat-alytic performances than the films with less clusters [34].The author pointed out that the specific surface area ofthe films was increased by the deposition of clusters. Thelarger contact area induces high decomposition rate [35]. Itis interesting that the clusters formed in PLD method arenot desirable in other semiconductor industrial fields, like
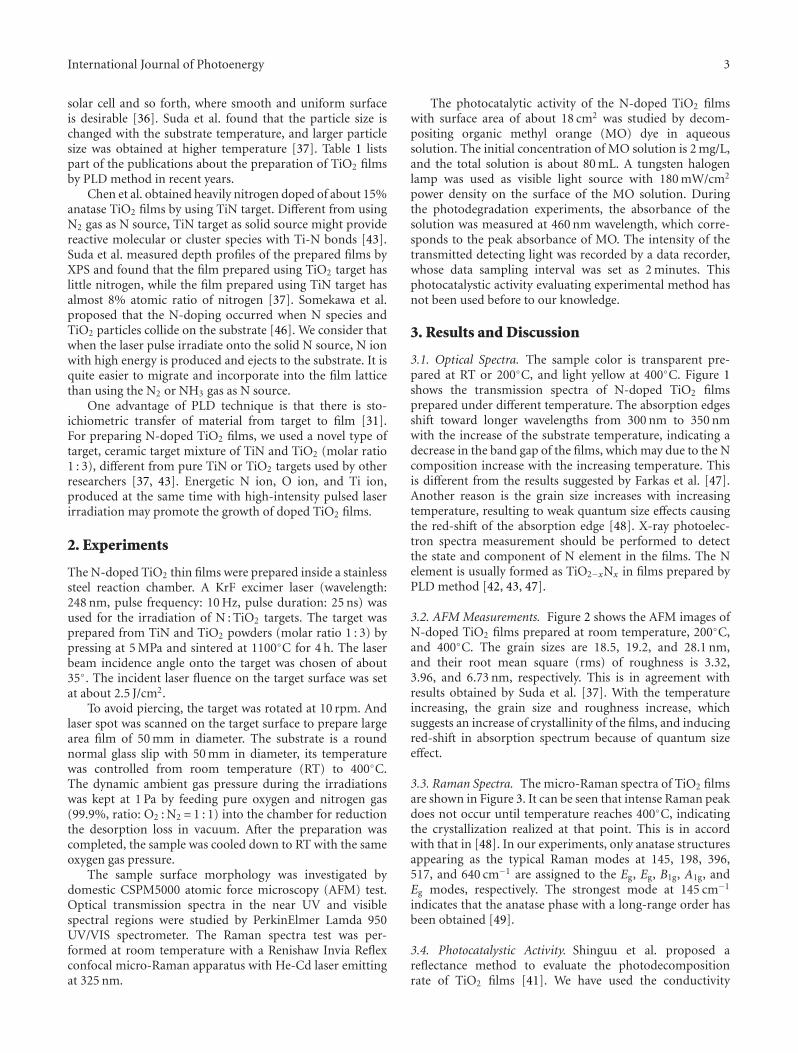
International Journal of Photoenergy 3
solar cell and so forth, where smooth and uniform surfaceis desirable [36]. Suda et al. found that the particle size ischanged with the substrate temperature, and larger particlesize was obtained at higher temperature [37]. Table 1 listspart of the publications about the preparation of TiO2 filmsby PLD method in recent years.
Chen et al. obtained heavily nitrogen doped of about 15%anatase TiO2 films by using TiN target. Different from usingN2 gas as N source, TiN target as solid source might providereactive molecular or cluster species with Ti-N bonds [43].Suda et al. measured depth profiles of the prepared films byXPS and found that the film prepared using TiO2 target haslittle nitrogen, while the film prepared using TiN target hasalmost 8% atomic ratio of nitrogen [37]. Somekawa et al.proposed that the N-doping occurred when N species andTiO2 particles collide on the substrate [46]. We consider thatwhen the laser pulse irradiate onto the solid N source, N ionwith high energy is produced and ejects to the substrate. It isquite easier to migrate and incorporate into the film latticethan using the N2 or NH3 gas as N source.
One advantage of PLD technique is that there is sto-ichiometric transfer of material from target to film [31].For preparing N-doped TiO2 films, we used a novel type oftarget, ceramic target mixture of TiN and TiO2 (molar ratio1 : 3), different from pure TiN or TiO2 targets used by otherresearchers [37, 43]. Energetic N ion, O ion, and Ti ion,produced at the same time with high-intensity pulsed laserirradiation may promote the growth of doped TiO2 films.
2. Experiments
The N-doped TiO2 thin films were prepared inside a stainlesssteel reaction chamber. A KrF excimer laser (wavelength:248 nm, pulse frequency: 10 Hz, pulse duration: 25 ns) wasused for the irradiation of N : TiO2 targets. The target wasprepared from TiN and TiO2 powders (molar ratio 1 : 3) bypressing at 5 MPa and sintered at 1100◦C for 4 h. The laserbeam incidence angle onto the target was chosen of about35◦. The incident laser fluence on the target surface was setat about 2.5 J/cm2.
To avoid piercing, the target was rotated at 10 rpm. Andlaser spot was scanned on the target surface to prepare largearea film of 50 mm in diameter. The substrate is a roundnormal glass slip with 50 mm in diameter, its temperaturewas controlled from room temperature (RT) to 400◦C.The dynamic ambient gas pressure during the irradiationswas kept at 1 Pa by feeding pure oxygen and nitrogen gas(99.9%, ratio: O2 : N2 = 1 : 1) into the chamber for reductionthe desorption loss in vacuum. After the preparation wascompleted, the sample was cooled down to RT with the sameoxygen gas pressure.
The sample surface morphology was investigated bydomestic CSPM5000 atomic force microscopy (AFM) test.Optical transmission spectra in the near UV and visiblespectral regions were studied by PerkinElmer Lamda 950UV/VIS spectrometer. The Raman spectra test was per-formed at room temperature with a Renishaw Invia Reflexconfocal micro-Raman apparatus with He-Cd laser emittingat 325 nm.
The photocatalytic activity of the N-doped TiO2 filmswith surface area of about 18 cm2 was studied by decom-positing organic methyl orange (MO) dye in aqueoussolution. The initial concentration of MO solution is 2 mg/L,and the total solution is about 80 mL. A tungsten halogenlamp was used as visible light source with 180 mW/cm2
power density on the surface of the MO solution. Duringthe photodegradation experiments, the absorbance of thesolution was measured at 460 nm wavelength, which corre-sponds to the peak absorbance of MO. The intensity of thetransmitted detecting light was recorded by a data recorder,whose data sampling interval was set as 2 minutes. Thisphotocatalystic activity evaluating experimental method hasnot been used before to our knowledge.
3. Results and Discussion
3.1. Optical Spectra. The sample color is transparent pre-pared at RT or 200◦C, and light yellow at 400◦C. Figure 1shows the transmission spectra of N-doped TiO2 filmsprepared under different temperature. The absorption edgesshift toward longer wavelengths from 300 nm to 350 nmwith the increase of the substrate temperature, indicating adecrease in the band gap of the films, which may due to the Ncomposition increase with the increasing temperature. Thisis different from the results suggested by Farkas et al. [47].Another reason is the grain size increases with increasingtemperature, resulting to weak quantum size effects causingthe red-shift of the absorption edge [48]. X-ray photoelec-tron spectra measurement should be performed to detectthe state and component of N element in the films. The Nelement is usually formed as TiO2−xNx in films prepared byPLD method [42, 43, 47].
3.2. AFM Measurements. Figure 2 shows the AFM images ofN-doped TiO2 films prepared at room temperature, 200◦C,and 400◦C. The grain sizes are 18.5, 19.2, and 28.1 nm,and their root mean square (rms) of roughness is 3.32,3.96, and 6.73 nm, respectively. This is in agreement withresults obtained by Suda et al. [37]. With the temperatureincreasing, the grain size and roughness increase, whichsuggests an increase of crystallinity of the films, and inducingred-shift in absorption spectrum because of quantum sizeeffect.
3.3. Raman Spectra. The micro-Raman spectra of TiO2 filmsare shown in Figure 3. It can be seen that intense Raman peakdoes not occur until temperature reaches 400◦C, indicatingthe crystallization realized at that point. This is in accordwith that in [48]. In our experiments, only anatase structuresappearing as the typical Raman modes at 145, 198, 396,517, and 640 cm−1 are assigned to the Eg, Eg, B1g, A1g, andEg modes, respectively. The strongest mode at 145 cm−1
indicates that the anatase phase with a long-range order hasbeen obtained [49].
3.4. Photocatalystic Activity. Shinguu et al. proposed areflectance method to evaluate the photodecompositionrate of TiO2 films [41]. We have used the conductivity
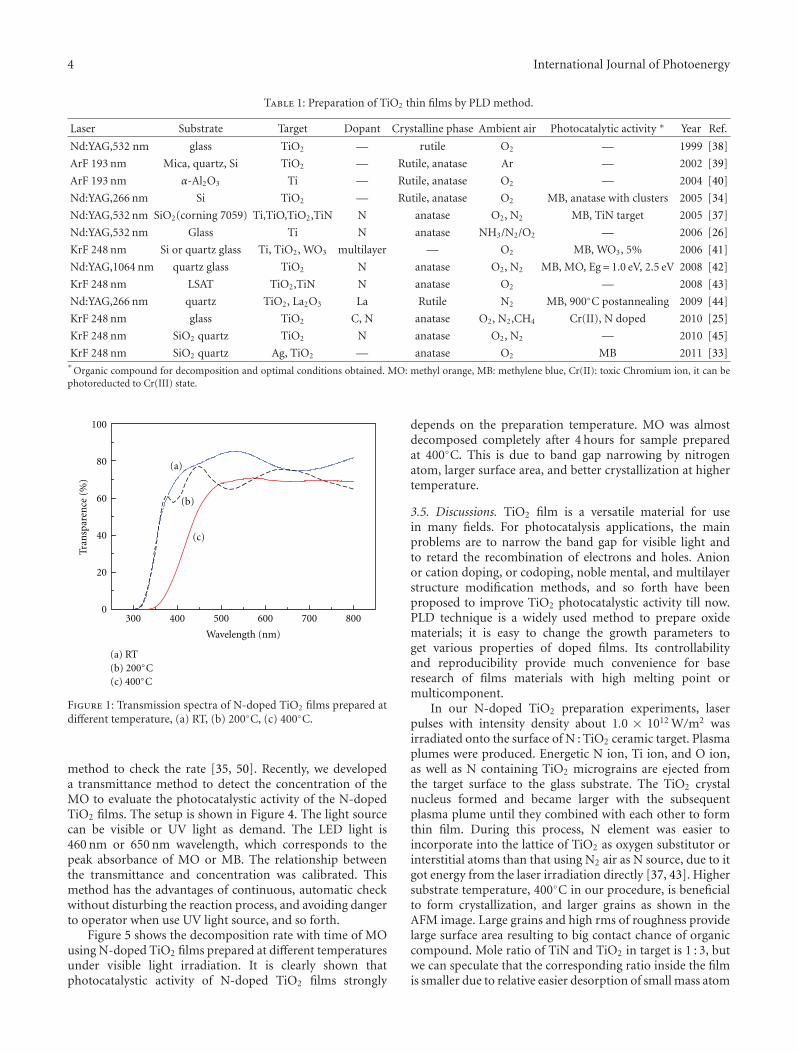
4 International Journal of Photoenergy
Table 1: Preparation of TiO2 thin films by PLD method.
Laser Substrate Target Dopant Crystalline phase Ambient air Photocatalytic activity ∗ Year Ref.
Nd:YAG,532 nm glass TiO2 — rutile O2 — 1999 [38]
ArF 193 nm Mica, quartz, Si TiO2 — Rutile, anatase Ar — 2002 [39]
ArF 193 nm α-Al2O3 Ti — Rutile, anatase O2 — 2004 [40]
Nd:YAG,266 nm Si TiO2 — Rutile, anatase O2 MB, anatase with clusters 2005 [34]
Nd:YAG,532 nm SiO2(corning 7059) Ti,TiO,TiO2,TiN N anatase O2, N2 MB, TiN target 2005 [37]
Nd:YAG,532 nm Glass Ti N anatase NH3/N2/O2 — 2006 [26]
KrF 248 nm Si or quartz glass Ti, TiO2, WO3 multilayer — O2 MB, WO3, 5% 2006 [41]
Nd:YAG,1064 nm quartz glass TiO2 N anatase O2, N2 MB, MO, Eg= 1.0 eV, 2.5 eV 2008 [42]
KrF 248 nm LSAT TiO2,TiN N anatase O2 — 2008 [43]
Nd:YAG,266 nm quartz TiO2, La2O3 La Rutile N2 MB, 900◦C postannealing 2009 [44]
KrF 248 nm glass TiO2 C, N anatase O2, N2,CH4 Cr(II), N doped 2010 [25]
KrF 248 nm SiO2 quartz TiO2 N anatase O2, N2 — 2010 [45]
KrF 248 nm SiO2 quartz Ag, TiO2 — anatase O2 MB 2011 [33]∗
Organic compound for decomposition and optimal conditions obtained. MO: methyl orange, MB: methylene blue, Cr(II): toxic Chromium ion, it can bephotoreducted to Cr(III) state.
300 400 500 600 700 8000
20
40
60
80
100
(c)
(b)
Tran
spar
ence
(%)
Wavelength (nm)
(a) RT(b) 200◦C(c) 400◦C
(a)
Figure 1: Transmission spectra of N-doped TiO2 films prepared atdifferent temperature, (a) RT, (b) 200◦C, (c) 400◦C.
method to check the rate [35, 50]. Recently, we developeda transmittance method to detect the concentration of theMO to evaluate the photocatalystic activity of the N-dopedTiO2 films. The setup is shown in Figure 4. The light sourcecan be visible or UV light as demand. The LED light is460 nm or 650 nm wavelength, which corresponds to thepeak absorbance of MO or MB. The relationship betweenthe transmittance and concentration was calibrated. Thismethod has the advantages of continuous, automatic checkwithout disturbing the reaction process, and avoiding dangerto operator when use UV light source, and so forth.
Figure 5 shows the decomposition rate with time of MOusing N-doped TiO2 films prepared at different temperaturesunder visible light irradiation. It is clearly shown thatphotocatalystic activity of N-doped TiO2 films strongly
depends on the preparation temperature. MO was almostdecomposed completely after 4 hours for sample preparedat 400◦C. This is due to band gap narrowing by nitrogenatom, larger surface area, and better crystallization at highertemperature.
3.5. Discussions. TiO2 film is a versatile material for usein many fields. For photocatalysis applications, the mainproblems are to narrow the band gap for visible light andto retard the recombination of electrons and holes. Anionor cation doping, or codoping, noble mental, and multilayerstructure modification methods, and so forth have beenproposed to improve TiO2 photocatalystic activity till now.PLD technique is a widely used method to prepare oxidematerials; it is easy to change the growth parameters toget various properties of doped films. Its controllabilityand reproducibility provide much convenience for baseresearch of films materials with high melting point ormulticomponent.
In our N-doped TiO2 preparation experiments, laserpulses with intensity density about 1.0 × 10¹² W/m2 wasirradiated onto the surface of N : TiO2 ceramic target. Plasmaplumes were produced. Energetic N ion, Ti ion, and O ion,as well as N containing TiO2 micrograins are ejected fromthe target surface to the glass substrate. The TiO2 crystalnucleus formed and became larger with the subsequentplasma plume until they combined with each other to formthin film. During this process, N element was easier toincorporate into the lattice of TiO2 as oxygen substitutor orinterstitial atoms than that using N2 air as N source, due to itgot energy from the laser irradiation directly [37, 43]. Highersubstrate temperature, 400◦C in our procedure, is beneficialto form crystallization, and larger grains as shown in theAFM image. Large grains and high rms of roughness providelarge surface area resulting to big contact chance of organiccompound. Mole ratio of TiN and TiO2 in target is 1 : 3, butwe can speculate that the corresponding ratio inside the filmis smaller due to relative easier desorption of small mass atom
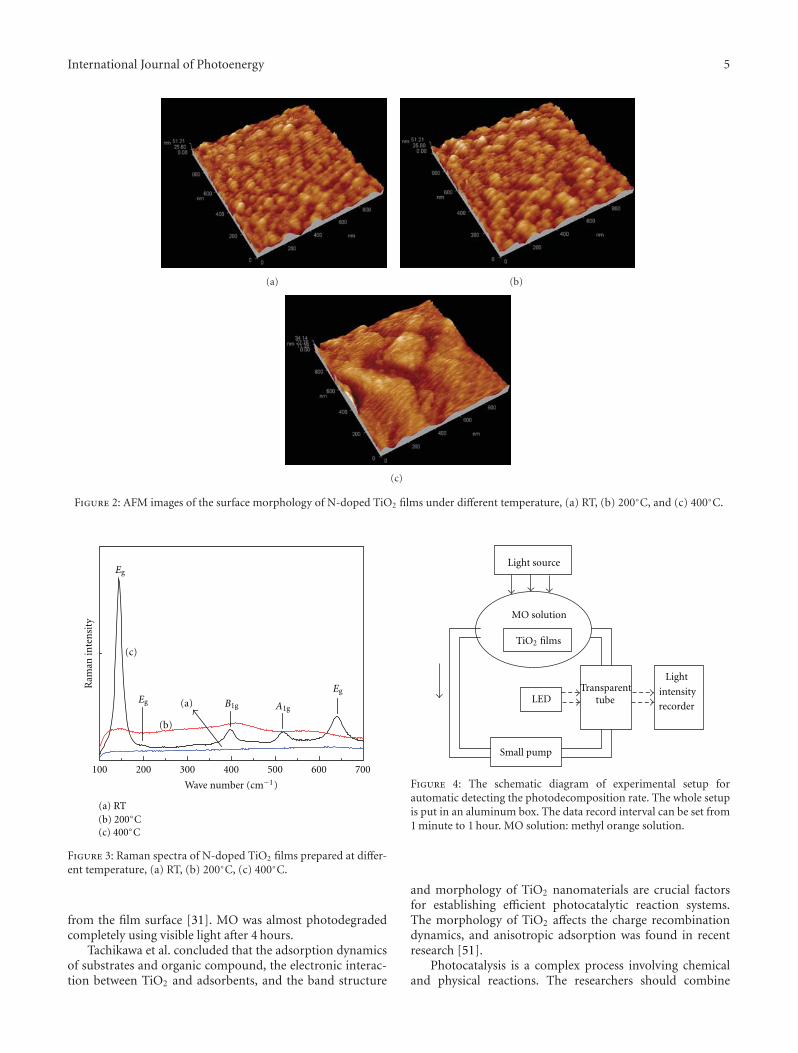
International Journal of Photoenergy 5
(a) (b)
(c)
Figure 2: AFM images of the surface morphology of N-doped TiO2 films under different temperature, (a) RT, (b) 200◦C, and (c) 400◦C.
100 200 300 400 500 600 700
Eg
(c)
(b)
Eg A1g
(a) RT(b) 200◦C(c) 400◦C
Eg
B1g(a)
Ram
an in
ten
sity
Wave number (cm−1)
Figure 3: Raman spectra of N-doped TiO2 films prepared at differ-ent temperature, (a) RT, (b) 200◦C, (c) 400◦C.
from the film surface [31]. MO was almost photodegradedcompletely using visible light after 4 hours.
Tachikawa et al. concluded that the adsorption dynamicsof substrates and organic compound, the electronic interac-tion between TiO2 and adsorbents, and the band structure
Light
intensity
recorder
Light source
MO solution
Transparenttube
Small pump
LED
TiO2 films
Figure 4: The schematic diagram of experimental setup forautomatic detecting the photodecomposition rate. The whole setupis put in an aluminum box. The data record interval can be set from1 minute to 1 hour. MO solution: methyl orange solution.
and morphology of TiO2 nanomaterials are crucial factorsfor establishing efficient photocatalytic reaction systems.The morphology of TiO2 affects the charge recombinationdynamics, and anisotropic adsorption was found in recentresearch [51].
Photocatalysis is a complex process involving chemicaland physical reactions. The researchers should combine
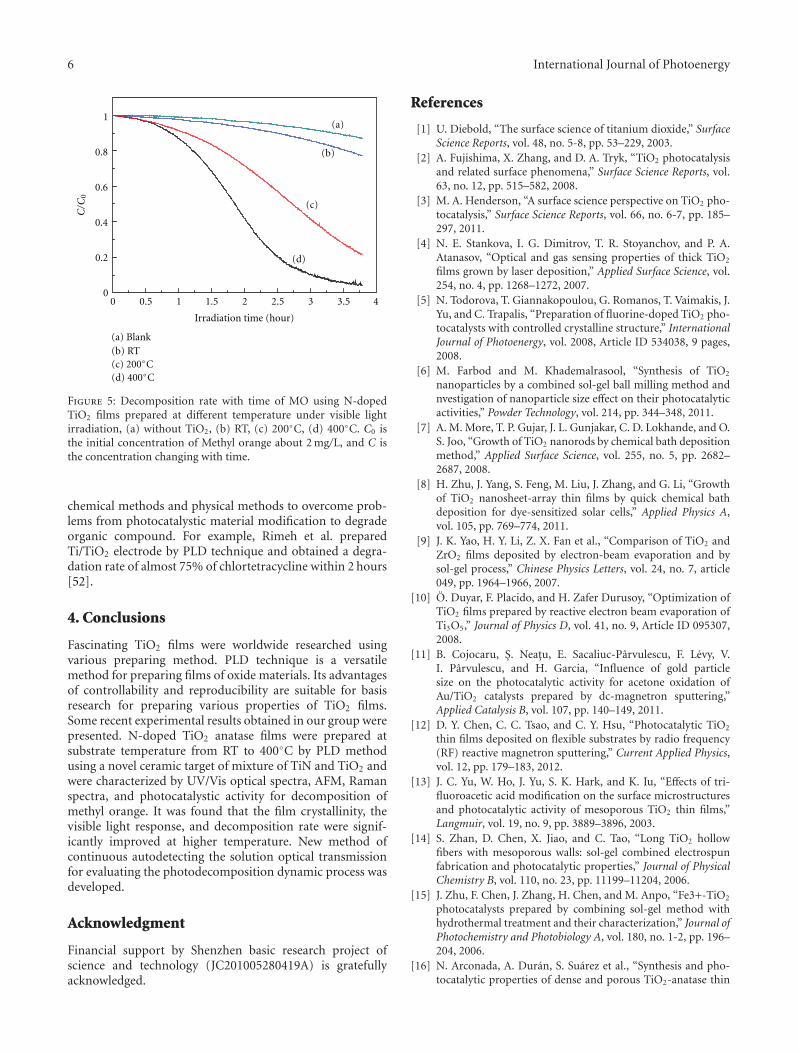
6 International Journal of Photoenergy
00.5 1 1.5 2 2.5 3 3.5 40
0.2
0.4
0.6
0.8
1
(d)
(c)
(b)
(a)
C/C
0
Irradiation time (hour)
(a) Blank(b) RT(c) 200◦C(d) 400◦C
Figure 5: Decomposition rate with time of MO using N-dopedTiO2 films prepared at different temperature under visible lightirradiation, (a) without TiO2, (b) RT, (c) 200◦C, (d) 400◦C. C0 isthe initial concentration of Methyl orange about 2 mg/L, and C isthe concentration changing with time.
chemical methods and physical methods to overcome prob-lems from photocatalystic material modification to degradeorganic compound. For example, Rimeh et al. preparedTi/TiO2 electrode by PLD technique and obtained a degra-dation rate of almost 75% of chlortetracycline within 2 hours[52].
4. Conclusions
Fascinating TiO2 films were worldwide researched usingvarious preparing method. PLD technique is a versatilemethod for preparing films of oxide materials. Its advantagesof controllability and reproducibility are suitable for basisresearch for preparing various properties of TiO2 films.Some recent experimental results obtained in our group werepresented. N-doped TiO2 anatase films were prepared atsubstrate temperature from RT to 400◦C by PLD methodusing a novel ceramic target of mixture of TiN and TiO2 andwere characterized by UV/Vis optical spectra, AFM, Ramanspectra, and photocatalystic activity for decomposition ofmethyl orange. It was found that the film crystallinity, thevisible light response, and decomposition rate were signif-icantly improved at higher temperature. New method ofcontinuous autodetecting the solution optical transmissionfor evaluating the photodecomposition dynamic process wasdeveloped.
Acknowledgment
Financial support by Shenzhen basic research project ofscience and technology (JC201005280419A) is gratefullyacknowledged.
References
[1] U. Diebold, “The surface science of titanium dioxide,” SurfaceScience Reports, vol. 48, no. 5-8, pp. 53–229, 2003.
[2] A. Fujishima, X. Zhang, and D. A. Tryk, “TiO2 photocatalysisand related surface phenomena,” Surface Science Reports, vol.63, no. 12, pp. 515–582, 2008.
[3] M. A. Henderson, “A surface science perspective on TiO2 pho-tocatalysis,” Surface Science Reports, vol. 66, no. 6-7, pp. 185–297, 2011.
[4] N. E. Stankova, I. G. Dimitrov, T. R. Stoyanchov, and P. A.Atanasov, “Optical and gas sensing properties of thick TiO2
films grown by laser deposition,” Applied Surface Science, vol.254, no. 4, pp. 1268–1272, 2007.
[5] N. Todorova, T. Giannakopoulou, G. Romanos, T. Vaimakis, J.Yu, and C. Trapalis, “Preparation of fluorine-doped TiO2 pho-tocatalysts with controlled crystalline structure,” InternationalJournal of Photoenergy, vol. 2008, Article ID 534038, 9 pages,2008.
[6] M. Farbod and M. Khademalrasool, “Synthesis of TiO2
nanoparticles by a combined sol-gel ball milling method andnvestigation of nanoparticle size effect on their photocatalyticactivities,” Powder Technology, vol. 214, pp. 344–348, 2011.
[7] A. M. More, T. P. Gujar, J. L. Gunjakar, C. D. Lokhande, and O.S. Joo, “Growth of TiO2 nanorods by chemical bath depositionmethod,” Applied Surface Science, vol. 255, no. 5, pp. 2682–2687, 2008.
[8] H. Zhu, J. Yang, S. Feng, M. Liu, J. Zhang, and G. Li, “Growthof TiO2 nanosheet-array thin films by quick chemical bathdeposition for dye-sensitized solar cells,” Applied Physics A,vol. 105, pp. 769–774, 2011.
[9] J. K. Yao, H. Y. Li, Z. X. Fan et al., “Comparison of TiO2 andZrO2 films deposited by electron-beam evaporation and bysol-gel process,” Chinese Physics Letters, vol. 24, no. 7, article049, pp. 1964–1966, 2007.
[10] O. Duyar, F. Placido, and H. Zafer Durusoy, “Optimization ofTiO2 films prepared by reactive electron beam evaporation ofTi3O5,” Journal of Physics D, vol. 41, no. 9, Article ID 095307,2008.
[11] B. Cojocaru, S. Neatu, E. Sacaliuc-Parvulescu, F. Levy, V.I. Parvulescu, and H. Garcia, “Influence of gold particlesize on the photocatalytic activity for acetone oxidation ofAu/TiO2 catalysts prepared by dc-magnetron sputtering,”Applied Catalysis B, vol. 107, pp. 140–149, 2011.
[12] D. Y. Chen, C. C. Tsao, and C. Y. Hsu, “Photocatalytic TiO2
thin films deposited on flexible substrates by radio frequency(RF) reactive magnetron sputtering,” Current Applied Physics,vol. 12, pp. 179–183, 2012.
[13] J. C. Yu, W. Ho, J. Yu, S. K. Hark, and K. Iu, “Effects of tri-fluoroacetic acid modification on the surface microstructuresand photocatalytic activity of mesoporous TiO2 thin films,”Langmuir, vol. 19, no. 9, pp. 3889–3896, 2003.
[14] S. Zhan, D. Chen, X. Jiao, and C. Tao, “Long TiO2 hollowfibers with mesoporous walls: sol-gel combined electrospunfabrication and photocatalytic properties,” Journal of PhysicalChemistry B, vol. 110, no. 23, pp. 11199–11204, 2006.
[15] J. Zhu, F. Chen, J. Zhang, H. Chen, and M. Anpo, “Fe3+-TiO2
photocatalysts prepared by combining sol-gel method withhydrothermal treatment and their characterization,” Journal ofPhotochemistry and Photobiology A, vol. 180, no. 1-2, pp. 196–204, 2006.
[16] N. Arconada, A. Duran, S. Suarez et al., “Synthesis and pho-tocatalytic properties of dense and porous TiO2-anatase thin
International Journal of Photoenergy 7
films prepared by sol-gel,” Applied Catalysis B, vol. 86, no. 1-2,pp. 1–7, 2009.
[17] Z. Luo, H. Cai, X. Ren, J. Liu, W. Hong, and P. Zhang,“Hydrophilicity of titanium oxide coatings with the additionof silica,” Materials Science and Engineering B, vol. 138, no. 2,pp. 151–156, 2007.
[18] J. L. Falconer and K. A. Magrini-Bair, “Photocatalytic andthermal catalytic oxidation of acetaldehyde on Pt/TiO2,”Journal of Catalysis, vol. 179, no. 1, pp. 171–178, 1998.
[19] J. Zhang, C. Pan, P. Fang, J. Wei, and R. Xiong, “Mo +C codoped TiO2 using thermal oxidation for enhancingphotocatalytic activity,” ACS Applied Materials and Interfaces,vol. 2, no. 4, pp. 1173–1176, 2010.
[20] R. Long and N. J. English, “Electronic properties of anatase-TiO2 codoped by cation-pairs from hybrid density functionaltheory calculations,” Chemical Physics Letters, no. 513, pp.218–223, 2011.
[21] D. J. Mowbray, J. I. Martinez, G. J. M. Lastra, K. S. Thygesen,and K. W. Jacobsen, “Stability and electronic properties ofTiO2 nanostructures with and without B and N doping,”Journal of Physical Chemistry C, vol. 113, no. 28, pp. 12301–12308, 2009.
[22] R. Long and N. J. English, “First-principles calculation ofnitrogen-tungsten codoping effects on the band structure ofanatase-titania,” Applied Physics Letters, vol. 94, no. 13, ArticleID 132102, 2009.
[23] R. Asahi, T. Morikawa, T. Ohwaki, K. Aoki, and Y. Taga,“Visible-light photocatalysis in nitrogen-doped titaniumoxides,” Science, vol. 293, no. 5528, pp. 269–271, 2001.
[24] M. Batzill, E. H. Morales, and U. Diebold, “Influence of nitro-gen doping on the defect formation and surface properties ofTiO2 rutile and anatase,” Physical Review Letters, vol. 96, no. 2,Article ID 026103, 4 pages, 2006.
[25] G. Socol, Y. Gnatyuk, N. Stefan et al., “Photocatalytic activityof pulsed laser deposited TiO2 thin films in N2, O2 and CH4,”Thin Solid Films, vol. 518, no. 16, pp. 4648–4653, 2010.
[26] P. Xu, L. Mi, and P. N. Wang, “Improved optical responsefor N-doped anatase TiO2 films prepared by pulsed laserdeposition in N2/NH3/O2 mixture,” Journal of Crystal Growth,vol. 289, no. 2, pp. 433–439, 2006.
[27] V. Balek, D. Li, J. Subrt et al., “Characterization of nitrogen andfluorine co-doped titania photocatalyst: effect of temperatureon microstructure and surface activity properties,” Journal ofPhysics and Chemistry of Solids, vol. 68, no. 5-6, pp. 770–774,2007.
[28] M. Yuan, J. Zhang, S. Yan et al., “Effect of Nd2O3 addition onthe surface phase of TiO2 and photocatalytic activity studiedby UV Raman spectroscopy,” Journal of Alloys and Compounds,vol. 509, no. 21, pp. 6227–6235, 2011.
[29] Y. Z. Qu, M. M. Yao, F. Li, and X. H. Sun, “Microstructures andPhotocatalytic Properties of Fe3+/Ce3+ Codoped Nanocrys-talline TiO2 Films,” Water, Air and Soil Pollution, vol. 221, no.1–4, pp. 13–21, 2011.
[30] Z. Luo, H. Cai, X. Ren, J. Liu, W. Hong, and P. Zhang,“Hydrophilicity of titanium oxide coatings with the additionof silica,” Materials Science and Engineering B, vol. 138, no. 2,pp. 151–156, 2007.
[31] J. Schou, “Physical aspects of the pulsed laser depositiontechnique: the stoichiometric transfer of material from targetto film,” Applied Surface Science, vol. 255, no. 10, pp. 5191–5198, 2009.
[32] N. Sato, M. Matsuda, M. Yoshinaga, T. Nakamura, S. Sato, andA. Muramatsu, “The synthesis and photocatalytic properties
of nitrogen doped TiO2 films prepared using the AC-PLDmethod,” Topics in Catalysis, vol. 52, no. 11, pp. 1592–1597,2009.
[33] G. Sauthier, A. Perez del Pino, A. Figueras, and E. Gyorgy,“Synthesis and characterization of Ag nanoparticles and Ag-loaded TiO2 photocatalysts,” Journal of the American CeramicSociety, vol. 94, no. 11, pp. 3780–3786, 2011.
[34] T. Yoshida, Y. Fukami, M. Okoshi, and N. Inoue, “Improve-ment of photocatalytic efficiency of TiO2 thin films preparedby pulsed laser deposition,” Japanese Journal of Applied Physics,Part 1, vol. 44, no. 5, pp. 3059–3062, 2005.
[35] Z. Luo, L. Song, H. Cai, J. Liu, W. Hong, and J. Huang, “Photo-catalytic De-chlorination of chlorinated methane by titaniumoxide sol,” Journal of Inorganic Materials, vol. 21, no. 1, pp.145–149, 2006.
[36] R. K. Thareja and A. Mohanta, “Gas suspended ZnO clustersand pulsed laser deposition of ZnO thin film,” Physica StatusSolidi, no. 5, pp. 1413–1416, 2010.
[37] Y. Suda, H. Kawasaki, T. Ueda, and T. Ohshima, “Prepa-ration of nitrogen-doped titanium oxide thin film using aPLD method as parameters of target material and nitrogenconcentration ratio in nitrogen/oxygen gas mixture,” ThinSolid Films, vol. 475, no. 1-2, pp. 337–341, 2005.
[38] L. Escobar-Alarcon, E. Haro-Poniatowski, M. A. Camacho-Lopez, M. Fernandez-Guasti, J. Jımenez-Jarquın, and A.Sanchez-Pineda, “Structural characterization of TiO2 thinfilms obtained by pulsed laser deposition,” Applied SurfaceScience, vol. 137, no. 1–3, pp. 38–44, 1999.
[39] N. Koshizaki, A. Narazaki, and T. Sasaki, “Preparation ofnanocrystalline titania films by pulsed laser deposition atroom temperature,” Applied Surface Science, vol. 197-198, pp.624–627, 2002.
[40] S. I. Kitazawa, Y. Choi, and S. Yamamoto, “In situ optical spec-troscopy of PLD of nano-structured TiO2,” Vacuum, vol. 74,no. 3-4, pp. 637–642, 2004.
[41] H. Shinguu, M. M. H. Bhuiyan, T. Ikegami, and K. Ebihara,“Preparation of TiO2/WO3 multilayer thin film by PLDmethod and its catalytic response to visible light,” Thin SolidFilms, vol. 506-507, pp. 111–114, 2006.
[42] L. Zhao, Q. Jiang, and J. Lian, “Visible-light photocatalyticactivity of nitrogen-doped TiO2 thin film prepared by pulsedlaser deposition,” Applied Surface Science, vol. 254, no. 15, pp.4620–4625, 2008.
[43] T. L. Chen, Y. Hirose, T. Hitosugi, and T. Hasegawa, “One unit-cell seed layer induced epitaxial growth of heavily nitrogendoped anatase TiO2 films,” Journal of Physics D, vol. 41, no.6, Article ID 062005, 2008.
[44] T. Ando, T. Wakamatsu, K. Masuda et al., “Photocatalyticbehavior of heavy La-doped TiO2 films deposited by pulsedlaser deposition using non-sintered target,” Applied SurfaceScience, vol. 255, no. 24, pp. 9688–9690, 2009.
[45] G. Sauthier, F. J. Ferrer, A. Figueras, and E. Gyorgy, “Growthand characterization of nitrogen-doped TiO2 thin films pre-pared by reactive pulsed laser deposition,” Thin Solid Films,vol. 519, no. 4, pp. 1464–1469, 2010.
[46] S. Somekawa, Y. Kusumoto, M. Ikeda, B. Ahmmad, and Y.Horie, “Fabrication of N-doped TiO2 thin films by laserablation method: mechanism of N-doping and evaluation ofthe thin films,” Catalysis Communications, vol. 9, no. 3, pp.437–440, 2008.
[47] B. Farkas, J. Budai, I. Kabalci, P. Heszler, and Z. Geretovszky,“Optical characterization of PLD grown nitrogen-doped TiO2
8 International Journal of Photoenergy
thin films,” Applied Surface Science, vol. 254, no. 11, pp. 3484–3488, 2008.
[48] X. Wang, J. Shen, and Q. Pan, “Raman spectroscopy of sol-gel derived titanium oxide thin films,” Journal of RamanSpectroscopy, vol. 42, no. 7, pp. 1578–1582, 2011.
[49] S. Sahoo, A. K. Arora, and V. Sridharan, “Raman line shapesof optical phonons of different symmetries in anatase TiO2
nanocrystals,” Journal of Physical Chemistry C, vol. 113, no. 39,pp. 16927–16933, 2009.
[50] Z. Luo, M. Li, H. Cai, and J. Liu, “Conductivity characteristicsof DCM solution under photo-oxidation of titanium oxidesol,” Journal of Materials Science & Engineering, vol. 22, no. 4,pp. 523–526, 2004.
[51] T. Tachikawa, M. Fujitsuka, and T. Majima, “Mechanisticinsight into the TiO2 photocatalytic reactions: design of newphotocatalysts,” Journal of Physical Chemistry C, vol. 111, no.14, pp. 5259–5275, 2007.
[52] D. Rimeh, D. Patrick, K. Ibrahima, E. Khakani, and M. Ali,“Photoelectrocatalytic degradation of chlortetracycline usingTi/TiO2 nanostructured electrodes deposited by means ofa Pulsed Laser Deposition process,” Journal of HazardousMaterials, vol. 199-200, pp. 15–24, 2012.
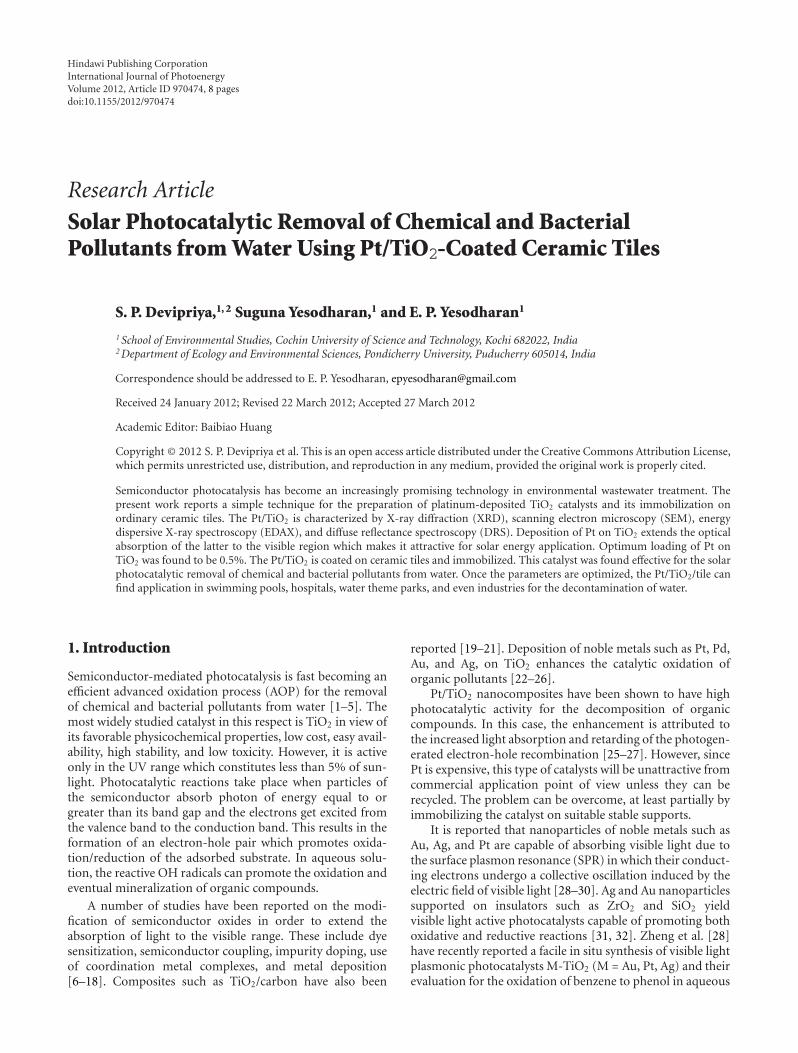
Hindawi Publishing CorporationInternational Journal of PhotoenergyVolume 2012, Article ID 970474, 8 pagesdoi:10.1155/2012/970474
Research Article
Solar Photocatalytic Removal of Chemical and BacterialPollutants from Water Using Pt/TiO2-Coated Ceramic Tiles
S. P. Devipriya,1, 2 Suguna Yesodharan,1 and E. P. Yesodharan1
1 School of Environmental Studies, Cochin University of Science and Technology, Kochi 682022, India2 Department of Ecology and Environmental Sciences, Pondicherry University, Puducherry 605014, India
Correspondence should be addressed to E. P. Yesodharan, [email protected]
Received 24 January 2012; Revised 22 March 2012; Accepted 27 March 2012
Academic Editor: Baibiao Huang
Copyright © 2012 S. P. Devipriya et al. This is an open access article distributed under the Creative Commons Attribution License,which permits unrestricted use, distribution, and reproduction in any medium, provided the original work is properly cited.
Semiconductor photocatalysis has become an increasingly promising technology in environmental wastewater treatment. Thepresent work reports a simple technique for the preparation of platinum-deposited TiO2 catalysts and its immobilization onordinary ceramic tiles. The Pt/TiO2 is characterized by X-ray diffraction (XRD), scanning electron microscopy (SEM), energydispersive X-ray spectroscopy (EDAX), and diffuse reflectance spectroscopy (DRS). Deposition of Pt on TiO2 extends the opticalabsorption of the latter to the visible region which makes it attractive for solar energy application. Optimum loading of Pt onTiO2 was found to be 0.5%. The Pt/TiO2 is coated on ceramic tiles and immobilized. This catalyst was found effective for the solarphotocatalytic removal of chemical and bacterial pollutants from water. Once the parameters are optimized, the Pt/TiO2/tile canfind application in swimming pools, hospitals, water theme parks, and even industries for the decontamination of water.
1. Introduction
Semiconductor-mediated photocatalysis is fast becoming anefficient advanced oxidation process (AOP) for the removalof chemical and bacterial pollutants from water [1–5]. Themost widely studied catalyst in this respect is TiO2 in view ofits favorable physicochemical properties, low cost, easy avail-ability, high stability, and low toxicity. However, it is activeonly in the UV range which constitutes less than 5% of sun-light. Photocatalytic reactions take place when particles ofthe semiconductor absorb photon of energy equal to orgreater than its band gap and the electrons get excited fromthe valence band to the conduction band. This results in theformation of an electron-hole pair which promotes oxida-tion/reduction of the adsorbed substrate. In aqueous solu-tion, the reactive OH radicals can promote the oxidation andeventual mineralization of organic compounds.
A number of studies have been reported on the modi-fication of semiconductor oxides in order to extend theabsorption of light to the visible range. These include dyesensitization, semiconductor coupling, impurity doping, useof coordination metal complexes, and metal deposition[6–18]. Composites such as TiO2/carbon have also been
reported [19–21]. Deposition of noble metals such as Pt, Pd,Au, and Ag, on TiO2 enhances the catalytic oxidation oforganic pollutants [22–26].
Pt/TiO2 nanocomposites have been shown to have highphotocatalytic activity for the decomposition of organiccompounds. In this case, the enhancement is attributed tothe increased light absorption and retarding of the photogen-erated electron-hole recombination [25–27]. However, sincePt is expensive, this type of catalysts will be unattractive fromcommercial application point of view unless they can berecycled. The problem can be overcome, at least partially byimmobilizing the catalyst on suitable stable supports.
It is reported that nanoparticles of noble metals such asAu, Ag, and Pt are capable of absorbing visible light due tothe surface plasmon resonance (SPR) in which their conduct-ing electrons undergo a collective oscillation induced by theelectric field of visible light [28–30]. Ag and Au nanoparticlessupported on insulators such as ZrO2 and SiO2 yieldvisible light active photocatalysts capable of promoting bothoxidative and reductive reactions [31, 32]. Zheng et al. [28]have recently reported a facile in situ synthesis of visible lightplasmonic photocatalysts M-TiO2 (M = Au, Pt, Ag) and theirevaluation for the oxidation of benzene to phenol in aqueous
2 International Journal of Photoenergy
phenol. Other efficient and stable plasmonic catalysts such asAg/AgCl [33] and Ag/AgBr/WO3·H2O [34] are also reported.In such catalysts, visible light is absorbed by nanoparticlesof the noble metal, and the photogenerated electrons andholes are separated by the metal-semiconductor interface.Thus, the electron-hole recombination is prevented, and thephotocatalytic process is accelerated. In the case of Au/TiO2
plasmonic photocatalysts, the mechanism of visible-light-induced photocatalytic oxidation involves the absorption oflight by Au nanoparticles which causes electron transferfrom them to the conduction band of TiO2 particles. Con-sequently, the oxidation of the organics will take place at theelectron-deficient Au nanoparticles [28].
In the present study, we have immobilized Pt/TiO2 on aceramic tile in order to enhance the commercial viability ofthe catalyst by recycling. The photocatalytic activity of thiscatalyst is tested for the removal of a typical chemical pol-lutant dye Rhodamine B and a bacterial pollutant E. coli.
2. Experimental
Degussa P-25 TiO2 is used as such without further treatment.It is 99% pure and consisted of approximately 70% anataseand 30% rutile forms. The average particle size was around200 nm, and the BET surface area was ∼15 m2/g. Analyticalgrade chloroplatinic acid (H2PtCl6·6H2O) and RhodamineB were from Sigma-Aldrich, India. All other chemicals usedwere of AR grade. Doubly distilled water was used in allthe experiments. The immobilized Pt/TiO2 photocatalyst(Pt/TiO2/tile) is prepared as follows [26].
Aqueous suspension containing specific quantity ofDegussa P-25 TiO2 was taken in the photoreactor and purgedwith nitrogen to remove dissolved oxygen. Specified amountsof H2PtCl6·6H2O dissolved in 20 mL methanol were thenadded to the aqueous suspension of TiO2 and agitated with amagnetic stirrer. The suspension under nitrogen atmosphereis then irradiated with 400 W UV lamp for 8 hr. The milkywhite suspension turns grayish with the deposition of Pt. Thesuspension is then filtered, and after repeated washings withdoubly distilled water, it is dried and powdered.
Common glazed tiles normally used for flooring areetched with dilute HF. The surface is then cleaned andcoated uniformly with the paste of Pt/TiO2 and polymethylmethacrylate in chloroform. The tile is then dried at 110◦Cand later heated at 350◦C for 3 hr. A thin film of Pt/TiO2 isformed on the surface of the tile. For control experiments,tiles were prepared exactly as above, one with TiO2 only andanother without any catalyst. The amount of catalyst coatedwas determined by measuring the weight difference of the tilebefore and after the coating.
X-ray diffraction pattern of the coated catalyst is deter-mined by using Rigaku X-ray diffractometer with CuKα radi-ation. Scanning electron microscopy (SEM) measurementswere performed with JEOL Model JSM-6390 LV. Energydispersive X-ray spectroscopy (EDAX) measurements weremade using JOEL model JED-2300 attached to SEM. Diffusereflectance spectra (DRS) were recorded with Varian Cary5000 using BaSO4 as the reference.
Photocatalytic experiments with dye solution were per-formed as follows.
The coated tile (12 × 8 × 0.5 cm) is placed in a jacketedglass vessel of approximately 20 cm diameter and 3 cmheight. The experimental dye solution of Rhodamine B(200 mL, 10 mg/L) is slowly added into the vessel. Water froma thermostat is circulated through the jacket to maintain thetemperature at 27± 1◦C. For UV experiments, the dye solu-tion is irradiated with a 400 W medium pressure mercuryvapor lamp. Solar experiments were performed by placingthe same system on the roof top of our laboratory at Kochi,Kerala, India (9◦ 57′ 51′′ N, 76◦16′ 59′′ E) during sunnydays in February–May 2010. Periodically, the dye solution ismixed gently. Samples were drawn periodically and analyzedfor the dye concentration by spectrophotometry (555 nm).Solution kept under identical conditions in the dark is usedas the reference in each case to eliminate the contributionfrom adsorption towards the reduction in the dye concentra-tion.
For bacterial disinfection studies, Escherichia coli (ATCC11775) was used as the test organism. Cells of E. coli weresubcultured under sterile conditions at 37◦C for 24 hr in100 mL nutrient broth (pH ∼ 7.2) containing 0.1 g of yeastextract, 0.5 g of peptone, and 0.5 g of NaCl. The cells weresedimented by centrifugation at 5000 rpm for 10 minutes,washed, and resuspended in sterile distilled water. Absorb-ance was measured using Shimadzu UV-1601 UV-VIS spec-trophotometer. Cell cultures corresponding to∼107 cells/mLwere used to inoculate the reaction systems and controls.Control experiments run in parallel consisted of samplesexposed to sunlight without catalyst and those in the darkwith and without catalysts, all maintained under otherwiseidentical conditions. In catalytic experiments, the coated tileswere placed in aquarium jars containing 10 liters of theinoculated water. The jars were placed in a trough throughwhich water at the required temperature is circulated andirradiated by sunlight. Sampling was done at predeterminedintervals by pipetting out 1 mL of the experimental solutioninto 9 mL sterile saline which was serially diluted. Aftermixing, 0.1 mL aliquots of each dilution were spread ontoMcConkey agar plates. The cell inactivation was monitoredby counting the colony forming units (CFU) after 24-hourincubation at 37◦C.
3. Results and Discussions
3.1. Surface Characterization of the Photocatalyst. The photodeposition of Platinum on the TiO2 surface was indicated bycolor change of the particles from white to grey. XRD analysisis done to study the phase structure of the catalyst. Figure 1shows characteristic peaks of TiO2 only with no indicationof the presence of Pt. This may be because either Pt is notgetting deposited on TiO2 or the concentration of Pt in theTiO2 matrix is too small to be detected by XRD. As the resultspresented later in this paper show, reflectance spectrum andenhanced photocatalytic activity of the prepared materialreveal modification in the properties of TiO2, which can beattributed to the presence of small amounts of highlydispersed Pt. Scanning electron microscopy (SEM) of
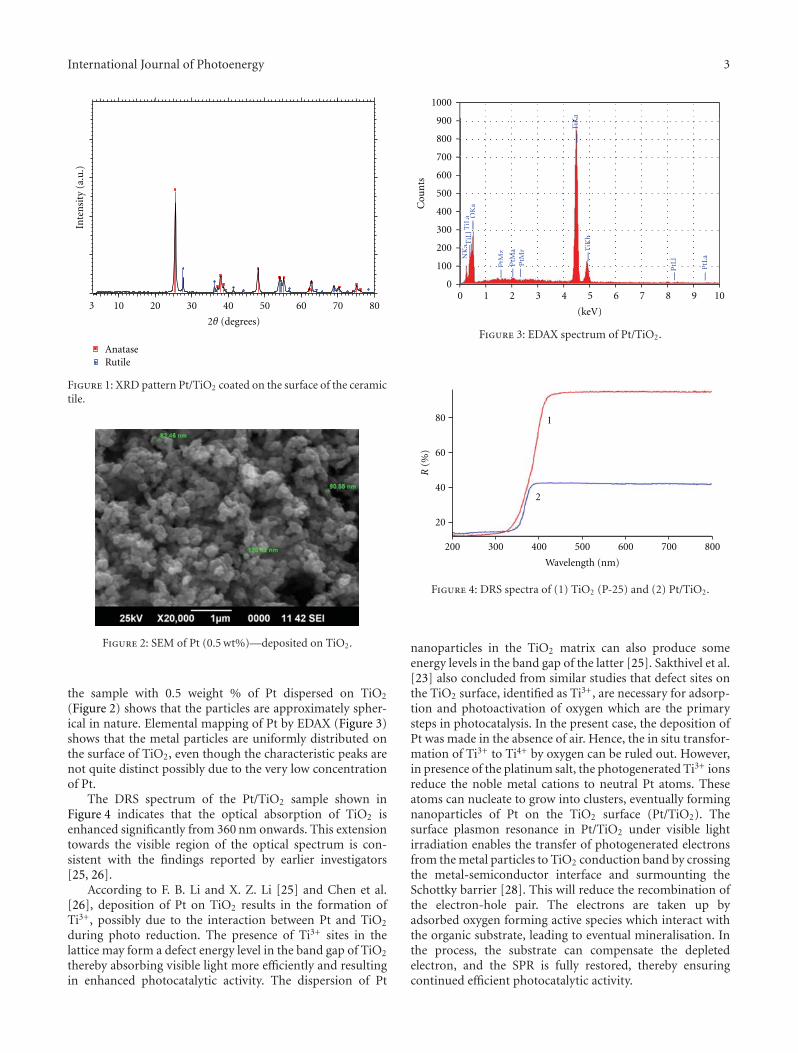
International Journal of Photoenergy 3
3 10 20 30 40 50 60 70 80
AnataseRutile
Inte
nsi
ty (
a.u
.)
2θ (degrees)
Figure 1: XRD pattern Pt/TiO2 coated on the surface of the ceramictile.
Figure 2: SEM of Pt (0.5 wt%)—deposited on TiO2.
the sample with 0.5 weight % of Pt dispersed on TiO2
(Figure 2) shows that the particles are approximately spher-ical in nature. Elemental mapping of Pt by EDAX (Figure 3)shows that the metal particles are uniformly distributed onthe surface of TiO2, even though the characteristic peaks arenot quite distinct possibly due to the very low concentrationof Pt.
The DRS spectrum of the Pt/TiO2 sample shown inFigure 4 indicates that the optical absorption of TiO2 isenhanced significantly from 360 nm onwards. This extensiontowards the visible region of the optical spectrum is con-sistent with the findings reported by earlier investigators[25, 26].
According to F. B. Li and X. Z. Li [25] and Chen et al.[26], deposition of Pt on TiO2 results in the formation ofTi3+, possibly due to the interaction between Pt and TiO2
during photo reduction. The presence of Ti3+ sites in thelattice may form a defect energy level in the band gap of TiO2
thereby absorbing visible light more efficiently and resultingin enhanced photocatalytic activity. The dispersion of Pt
1000
900
800
700
600
500
400
300
200
100
0
Cou
nts
0 1 2 3 4 5 6 7 8 9 10
(keV)
NK
a TiL
lTiL
a OK
a
PtM
z
PtM
aP
tMr T
iKb
TiK
a
PtL
l
PtL
aNK
aK
a TiL
lTiL
aT
OK
aK
PtM
zP P
tMa
PPtM PtM
rP
TiK
bTT
iKb
TiKiKKiKKKKiKKKKiKKKKKKKKii
Tii
Ti
TTTTTTTTTTTTTTTTTTTTTTTTTTK
PtL
lt PtL
aP
Figure 3: EDAX spectrum of Pt/TiO2.
1
2
200 300 400 500 600 700 800
Wavelength (nm)
R(%
)80
60
40
20
Figure 4: DRS spectra of (1) TiO2 (P-25) and (2) Pt/TiO2.
nanoparticles in the TiO2 matrix can also produce someenergy levels in the band gap of the latter [25]. Sakthivel et al.[23] also concluded from similar studies that defect sites onthe TiO2 surface, identified as Ti3+, are necessary for adsorp-tion and photoactivation of oxygen which are the primarysteps in photocatalysis. In the present case, the deposition ofPt was made in the absence of air. Hence, the in situ transfor-mation of Ti3+ to Ti4+ by oxygen can be ruled out. However,in presence of the platinum salt, the photogenerated Ti3+ ionsreduce the noble metal cations to neutral Pt atoms. Theseatoms can nucleate to grow into clusters, eventually formingnanoparticles of Pt on the TiO2 surface (Pt/TiO2). Thesurface plasmon resonance in Pt/TiO2 under visible lightirradiation enables the transfer of photogenerated electronsfrom the metal particles to TiO2 conduction band by crossingthe metal-semiconductor interface and surmounting theSchottky barrier [28]. This will reduce the recombination ofthe electron-hole pair. The electrons are taken up byadsorbed oxygen forming active species which interact withthe organic substrate, leading to eventual mineralisation. Inthe process, the substrate can compensate the depletedelectron, and the SPR is fully restored, thereby ensuringcontinued efficient photocatalytic activity.
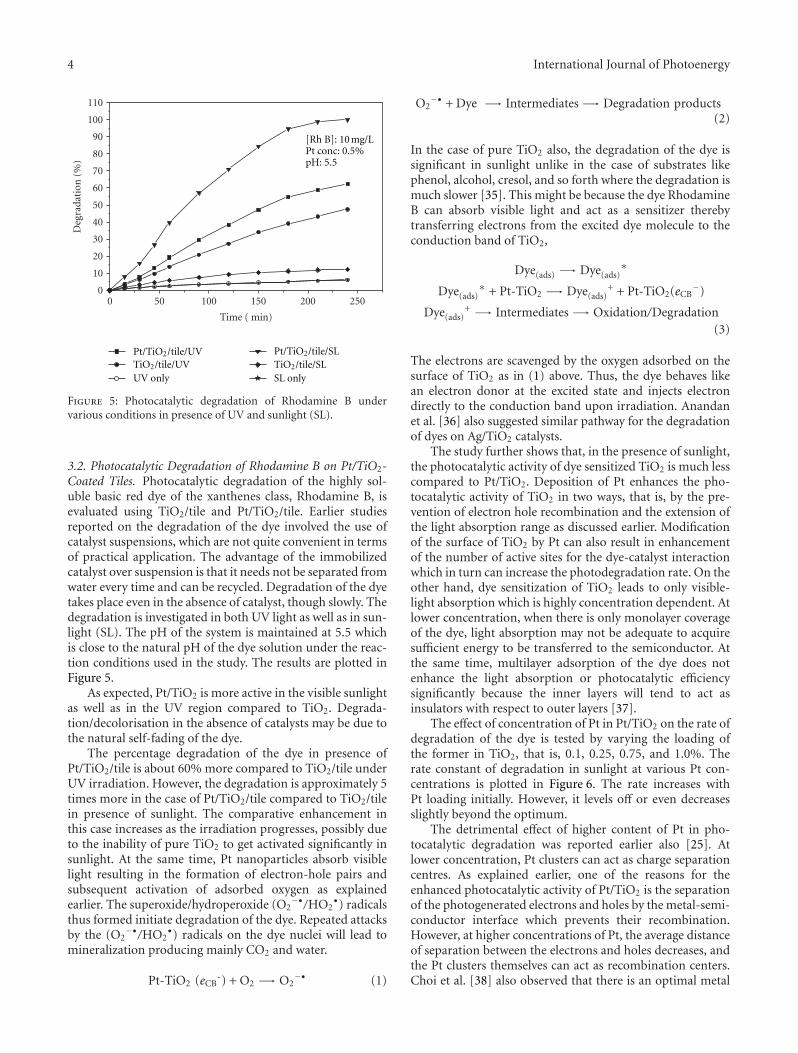
4 International Journal of Photoenergy
0 50 100 150 200 2500
10
20
30
40
50
60
70
80
90
100
110
Deg
rada
tion
(%
)
Time ( min)
[Rh B]: 10 mg/LPt conc: 0.5%pH: 5.5
Pt/TiO2/tile/UVTiO2/tile/UVUV only
Pt/TiO2/tile/SLTiO2/tile/SLSL only
Figure 5: Photocatalytic degradation of Rhodamine B undervarious conditions in presence of UV and sunlight (SL).
3.2. Photocatalytic Degradation of Rhodamine B on Pt/TiO2-Coated Tiles. Photocatalytic degradation of the highly sol-uble basic red dye of the xanthenes class, Rhodamine B, isevaluated using TiO2/tile and Pt/TiO2/tile. Earlier studiesreported on the degradation of the dye involved the use ofcatalyst suspensions, which are not quite convenient in termsof practical application. The advantage of the immobilizedcatalyst over suspension is that it needs not be separated fromwater every time and can be recycled. Degradation of the dyetakes place even in the absence of catalyst, though slowly. Thedegradation is investigated in both UV light as well as in sun-light (SL). The pH of the system is maintained at 5.5 whichis close to the natural pH of the dye solution under the reac-tion conditions used in the study. The results are plotted inFigure 5.
As expected, Pt/TiO2 is more active in the visible sunlightas well as in the UV region compared to TiO2. Degrada-tion/decolorisation in the absence of catalysts may be due tothe natural self-fading of the dye.
The percentage degradation of the dye in presence ofPt/TiO2/tile is about 60% more compared to TiO2/tile underUV irradiation. However, the degradation is approximately 5times more in the case of Pt/TiO2/tile compared to TiO2/tilein presence of sunlight. The comparative enhancement inthis case increases as the irradiation progresses, possibly dueto the inability of pure TiO2 to get activated significantly insunlight. At the same time, Pt nanoparticles absorb visiblelight resulting in the formation of electron-hole pairs andsubsequent activation of adsorbed oxygen as explainedearlier. The superoxide/hydroperoxide (O2
−•/HO2•) radicals
thus formed initiate degradation of the dye. Repeated attacksby the (O2
−•/HO2•) radicals on the dye nuclei will lead to
mineralization producing mainly CO2 and water.
Pt-TiO2 (eCB-) + O2 −→ O2
−• (1)
O2−• + Dye −→ Intermediates −→ Degradation products
(2)
In the case of pure TiO2 also, the degradation of the dye issignificant in sunlight unlike in the case of substrates likephenol, alcohol, cresol, and so forth where the degradation ismuch slower [35]. This might be because the dye RhodamineB can absorb visible light and act as a sensitizer therebytransferring electrons from the excited dye molecule to theconduction band of TiO2,
Dye(ads) −→ Dye(ads)∗
Dye(ads)∗ + Pt-TiO2 −→ Dye(ads)
+ + Pt-TiO2(eCB−)
Dye(ads)+ −→ Intermediates −→ Oxidation/Degradation
(3)
The electrons are scavenged by the oxygen adsorbed on thesurface of TiO2 as in (1) above. Thus, the dye behaves likean electron donor at the excited state and injects electrondirectly to the conduction band upon irradiation. Anandanet al. [36] also suggested similar pathway for the degradationof dyes on Ag/TiO2 catalysts.
The study further shows that, in the presence of sunlight,the photocatalytic activity of dye sensitized TiO2 is much lesscompared to Pt/TiO2. Deposition of Pt enhances the pho-tocatalytic activity of TiO2 in two ways, that is, by the pre-vention of electron hole recombination and the extension ofthe light absorption range as discussed earlier. Modificationof the surface of TiO2 by Pt can also result in enhancementof the number of active sites for the dye-catalyst interactionwhich in turn can increase the photodegradation rate. On theother hand, dye sensitization of TiO2 leads to only visible-light absorption which is highly concentration dependent. Atlower concentration, when there is only monolayer coverageof the dye, light absorption may not be adequate to acquiresufficient energy to be transferred to the semiconductor. Atthe same time, multilayer adsorption of the dye does notenhance the light absorption or photocatalytic efficiencysignificantly because the inner layers will tend to act asinsulators with respect to outer layers [37].
The effect of concentration of Pt in Pt/TiO2 on the rate ofdegradation of the dye is tested by varying the loading ofthe former in TiO2, that is, 0.1, 0.25, 0.75, and 1.0%. Therate constant of degradation in sunlight at various Pt con-centrations is plotted in Figure 6. The rate increases withPt loading initially. However, it levels off or even decreasesslightly beyond the optimum.
The detrimental effect of higher content of Pt in pho-tocatalytic degradation was reported earlier also [25]. Atlower concentration, Pt clusters can act as charge separationcentres. As explained earlier, one of the reasons for theenhanced photocatalytic activity of Pt/TiO2 is the separationof the photogenerated electrons and holes by the metal-semi-conductor interface which prevents their recombination.However, at higher concentrations of Pt, the average distanceof separation between the electrons and holes decreases, andthe Pt clusters themselves can act as recombination centers.Choi et al. [38] also observed that there is an optimal metal
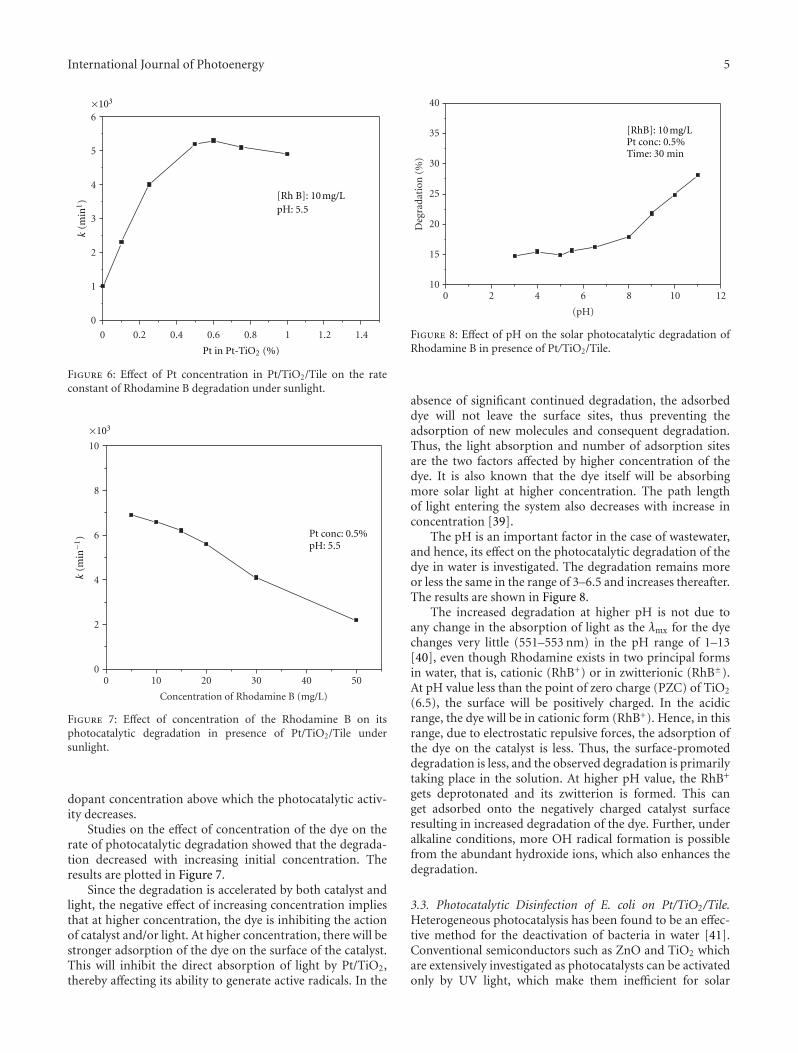
International Journal of Photoenergy 5
0 0.2 0.4 0.6 0.8 1 1.2 1.4
0
1
2
3
4
5
6
[Rh B]: 10 mg/LpH: 5.5
Pt in Pt-TiO2 (%)
×103
k(m
in1)
Figure 6: Effect of Pt concentration in Pt/TiO2/Tile on the rateconstant of Rhodamine B degradation under sunlight.
0 10 20 30 40 500
2
4
6
8
10
Concentration of Rhodamine B (mg/L)
Pt conc: 0.5%pH: 5.5
×103
k(m
in−1
)
Figure 7: Effect of concentration of the Rhodamine B on itsphotocatalytic degradation in presence of Pt/TiO2/Tile undersunlight.
dopant concentration above which the photocatalytic activ-ity decreases.
Studies on the effect of concentration of the dye on therate of photocatalytic degradation showed that the degrada-tion decreased with increasing initial concentration. Theresults are plotted in Figure 7.
Since the degradation is accelerated by both catalyst andlight, the negative effect of increasing concentration impliesthat at higher concentration, the dye is inhibiting the actionof catalyst and/or light. At higher concentration, there will bestronger adsorption of the dye on the surface of the catalyst.This will inhibit the direct absorption of light by Pt/TiO2,thereby affecting its ability to generate active radicals. In the
0 2 4 6 8 10 1210
15
20
25
30
35
40
Deg
rada
tion
(%
)
(pH)
[RhB]: 10 mg/LPt conc: 0.5%Time: 30 min
Figure 8: Effect of pH on the solar photocatalytic degradation ofRhodamine B in presence of Pt/TiO2/Tile.
absence of significant continued degradation, the adsorbeddye will not leave the surface sites, thus preventing theadsorption of new molecules and consequent degradation.Thus, the light absorption and number of adsorption sitesare the two factors affected by higher concentration of thedye. It is also known that the dye itself will be absorbingmore solar light at higher concentration. The path lengthof light entering the system also decreases with increase inconcentration [39].
The pH is an important factor in the case of wastewater,and hence, its effect on the photocatalytic degradation of thedye in water is investigated. The degradation remains moreor less the same in the range of 3–6.5 and increases thereafter.The results are shown in Figure 8.
The increased degradation at higher pH is not due toany change in the absorption of light as the λmx for the dyechanges very little (551–553 nm) in the pH range of 1–13[40], even though Rhodamine exists in two principal formsin water, that is, cationic (RhB+) or in zwitterionic (RhB±).At pH value less than the point of zero charge (PZC) of TiO2
(6.5), the surface will be positively charged. In the acidicrange, the dye will be in cationic form (RhB+). Hence, in thisrange, due to electrostatic repulsive forces, the adsorption ofthe dye on the catalyst is less. Thus, the surface-promoteddegradation is less, and the observed degradation is primarilytaking place in the solution. At higher pH value, the RhB+
gets deprotonated and its zwitterion is formed. This canget adsorbed onto the negatively charged catalyst surfaceresulting in increased degradation of the dye. Further, underalkaline conditions, more OH radical formation is possiblefrom the abundant hydroxide ions, which also enhances thedegradation.
3.3. Photocatalytic Disinfection of E. coli on Pt/TiO2/Tile.Heterogeneous photocatalysis has been found to be an effec-tive method for the deactivation of bacteria in water [41].Conventional semiconductors such as ZnO and TiO2 whichare extensively investigated as photocatalysts can be activatedonly by UV light, which make them inefficient for solar
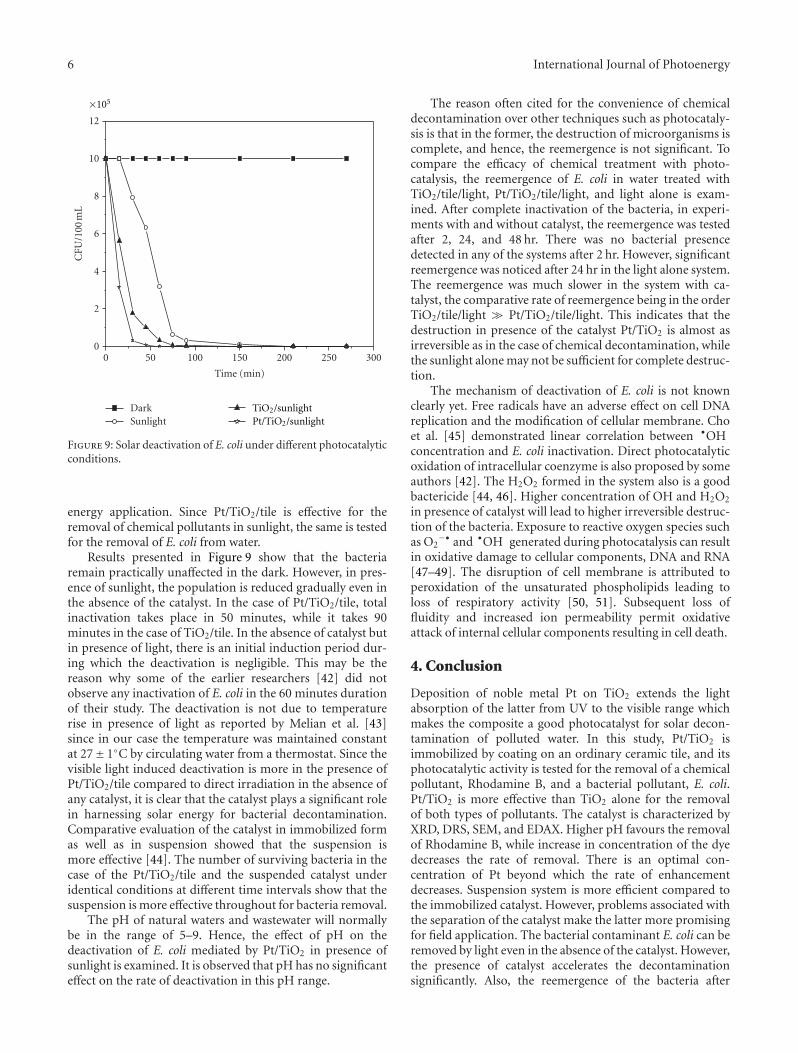
6 International Journal of Photoenergy
0 50 100 150 200 250 3000
2
4
6
8
10
12
CFU
/100
mL
Time (min)
DarkSunlight
×105
TiO2/sunlightPt/TiO2/sunlight
Figure 9: Solar deactivation of E. coli under different photocatalyticconditions.
energy application. Since Pt/TiO2/tile is effective for theremoval of chemical pollutants in sunlight, the same is testedfor the removal of E. coli from water.
Results presented in Figure 9 show that the bacteriaremain practically unaffected in the dark. However, in pres-ence of sunlight, the population is reduced gradually even inthe absence of the catalyst. In the case of Pt/TiO2/tile, totalinactivation takes place in 50 minutes, while it takes 90minutes in the case of TiO2/tile. In the absence of catalyst butin presence of light, there is an initial induction period dur-ing which the deactivation is negligible. This may be thereason why some of the earlier researchers [42] did notobserve any inactivation of E. coli in the 60 minutes durationof their study. The deactivation is not due to temperaturerise in presence of light as reported by Melian et al. [43]since in our case the temperature was maintained constantat 27± 1◦C by circulating water from a thermostat. Since thevisible light induced deactivation is more in the presence ofPt/TiO2/tile compared to direct irradiation in the absence ofany catalyst, it is clear that the catalyst plays a significant rolein harnessing solar energy for bacterial decontamination.Comparative evaluation of the catalyst in immobilized formas well as in suspension showed that the suspension ismore effective [44]. The number of surviving bacteria in thecase of the Pt/TiO2/tile and the suspended catalyst underidentical conditions at different time intervals show that thesuspension is more effective throughout for bacteria removal.
The pH of natural waters and wastewater will normallybe in the range of 5–9. Hence, the effect of pH on thedeactivation of E. coli mediated by Pt/TiO2 in presence ofsunlight is examined. It is observed that pH has no significanteffect on the rate of deactivation in this pH range.
The reason often cited for the convenience of chemicaldecontamination over other techniques such as photocataly-sis is that in the former, the destruction of microorganisms iscomplete, and hence, the reemergence is not significant. Tocompare the efficacy of chemical treatment with photo-catalysis, the reemergence of E. coli in water treated withTiO2/tile/light, Pt/TiO2/tile/light, and light alone is exam-ined. After complete inactivation of the bacteria, in experi-ments with and without catalyst, the reemergence was testedafter 2, 24, and 48 hr. There was no bacterial presencedetected in any of the systems after 2 hr. However, significantreemergence was noticed after 24 hr in the light alone system.The reemergence was much slower in the system with ca-talyst, the comparative rate of reemergence being in the orderTiO2/tile/light Pt/TiO2/tile/light. This indicates that thedestruction in presence of the catalyst Pt/TiO2 is almost asirreversible as in the case of chemical decontamination, whilethe sunlight alone may not be sufficient for complete destruc-tion.
The mechanism of deactivation of E. coli is not knownclearly yet. Free radicals have an adverse effect on cell DNAreplication and the modification of cellular membrane. Choet al. [45] demonstrated linear correlation between •OHconcentration and E. coli inactivation. Direct photocatalyticoxidation of intracellular coenzyme is also proposed by someauthors [42]. The H2O2 formed in the system also is a goodbactericide [44, 46]. Higher concentration of OH and H2O2
in presence of catalyst will lead to higher irreversible destruc-tion of the bacteria. Exposure to reactive oxygen species suchas O2
−• and •OH generated during photocatalysis can resultin oxidative damage to cellular components, DNA and RNA[47–49]. The disruption of cell membrane is attributed toperoxidation of the unsaturated phospholipids leading toloss of respiratory activity [50, 51]. Subsequent loss offluidity and increased ion permeability permit oxidativeattack of internal cellular components resulting in cell death.
4. Conclusion
Deposition of noble metal Pt on TiO2 extends the lightabsorption of the latter from UV to the visible range whichmakes the composite a good photocatalyst for solar decon-tamination of polluted water. In this study, Pt/TiO2 isimmobilized by coating on an ordinary ceramic tile, and itsphotocatalytic activity is tested for the removal of a chemicalpollutant, Rhodamine B, and a bacterial pollutant, E. coli.Pt/TiO2 is more effective than TiO2 alone for the removalof both types of pollutants. The catalyst is characterized byXRD, DRS, SEM, and EDAX. Higher pH favours the removalof Rhodamine B, while increase in concentration of the dyedecreases the rate of removal. There is an optimal con-centration of Pt beyond which the rate of enhancementdecreases. Suspension system is more efficient compared tothe immobilized catalyst. However, problems associated withthe separation of the catalyst make the latter more promisingfor field application. The bacterial contaminant E. coli can beremoved by light even in the absence of the catalyst. However,the presence of catalyst accelerates the decontaminationsignificantly. Also, the reemergence of the bacteria after
International Journal of Photoenergy 7
the light is off is inhibited to a great extent by the catalysts. Atentative mechanism for the chemical and bacterial decon-tamination is proposed and discussed.
Acknowledgments
Financial support from the Department of Science and Tech-nology (DST), Government of India to one of the authors(S. P. Devipriya) under the WOS-A scheme is gratefullyacknowledged.
References
[1] R. W. Matthews, “Photocatalytic oxidation of organic contam-inants in water: an aid to environmental preservation,” Pureand Applied Chemistry, vol. 64, pp. 1285–1290, 1992.
[2] S. Devipriya and S. Yesodharan, “Photocatalytic degradationof pesticide contaminants in water,” Solar Energy Materials andSolar Cells, vol. 86, no. 3, pp. 309–348, 2005.
[3] M. Muneer and C. Boxall, “Photocatalysed degradation ofa pesticide derivative glyphosate in aqueous suspensions oftitanium dioxide,” International Journal of Photoenergy, vol.2008, Article ID 197346, 7 pages, 2008.
[4] P. A. Deshpande and G. Madras, “Photocatalytic degradationof phenol by base metal-substituted orthovanadates,” Chemi-cal Engineering Journal, vol. 161, no. 1-2, pp. 136–145, 2010.
[5] D. Ollis, P. Pichat, and N. Serpone, “TiO2 photocatalysis-25years,” Applied Catalysis B, vol. 99, no. 3-4, p. 377, 2010.
[6] J. Moon, C. Y. Yun, K. W. Chung, M. S. Kang, and J. Yi,“Photocatalytic activation of TiO2 under visible light usingAcid Red 44,” Catalysis Today, vol. 87, no. 1–4, pp. 77–86, 2003.
[7] D. Pei and J. Luan, “Development of visible light-responsivesensitized photocatalysts,” International Journal of Photoen-ergy, vol. 2012, Article ID 262831, 13 pages, 2012.
[8] S. Kim and W. Choi, “Visible-light-induced photocatalyticdegradation of 4-chlorophenol and phenolic compoundsin aqueous suspension of pure titania: demonstrating theexistence of a surface-complex-mediated path,” Journal ofPhysical Chemistry B, vol. 109, no. 11, pp. 5143–5149, 2005.
[9] H. Chen, W. Li, H. Liu, and L. Zhu, “Performance enhance-ment of CdS-sensitized TiO2 mesoporous electrode withtwo different sizes of CdS nanoparticles,” Microporous andMesoporous Materials, vol. 138, no. 1–3, pp. 235–238, 2011.
[10] M. M. Rahman, K. M. Krishna, T. Soga, T. Jimbo, and M.Umeno, “Optical properties and X-ray photoelectron spectro-scopic study of pure and Pb-doped TiO2 thin films,” Journalof Physics and Chemistry of Solids, vol. 60, no. 2, pp. 201–210,1999.
[11] C. G. Wu, C. C. Chao, and F. T. Kuo, “Enhancement of thephoto catalytic performance of TiO2 catalysts via transitionmetal modification,” Catalysis Today, vol. 97, no. 2-3, pp. 103–112, 2004.
[12] E. Bae and W. Choi, “Highly enhanced photoreductivedegradation of perchlorinated compounds on dye-sensitizedmetal/TiO2 under visible light,” Environmental Science andTechnology, vol. 37, no. 1, pp. 147–152, 2003.
[13] Y. Pellegrin, L. Le Pleux, E. Blart et al., “Ruthenium polypyri-dine complexes as sensitisers in NiO based p-type dye-sensitized solar cells: effects of the anchoring groups,” Journalof Photochemistry and Photobiology A, vol. 219, no. 2, pp. 235–242, 2011.
[14] W. J. Youngblood, S. H. Anna Lee, K. Maeda, and T. E.Mallouk, “Visible light water splitting using dye-sensitized
oxide semiconductors,” Accounts of Chemical Research, vol. 42,no. 12, pp. 1966–1973, 2009.
[15] S. Sakthivel, B. Neppolian, M. V. Shankar, B. Arabindoo, M.Palanichamy, and V. Murugesan, “Solar photocatalytic degra-dation of azo dye: comparison of photocatalytic efficiency ofZnO and TiO2,” Solar Energy Materials and Solar Cells, vol. 77,no. 1, pp. 65–82, 2003.
[16] Y. Xu, W. Zheng, and W. Liu, “Enhanced photocatalyticactivity of supported TiO2: dispersing effect of SiO2,” Journalof Photochemistry and Photobiology A, vol. 122, no. 1, pp. 57–60, 1999.
[17] H. Tada, A. Hattori, Y. Tokihisa, K. Imai, N. Tohge, and S. Ito,“A patterned-TiO2/SnO2 bilayer type photocatalyst,” Journal ofPhysical Chemistry B, vol. 104, no. 19, pp. 4585–4587, 2000.
[18] Y. Li, S. Sun, M. Ma, Y. Ouyang, and W. Yan, “Kinetic studyand model of the photocatalytic degradation of rhodamine B(RhB) by a TiO2-coated activated carbon catalyst: effects ofinitial RhB content, light intensity and TiO2 content in thecatalyst,” Chemical Engineering Journal, vol. 142, no. 2, pp.147–155, 2008.
[19] H. Uchida, S. Itoh, and H. Yoneyama, “Photocatalytic decom-position of propyzamide using TiO2supported on activatedcarbon,” Chemistry Letters, vol. 22, pp. 1995–1998, 1993.
[20] D. K. Lee, S. C. Kim, I. C. Cho, S. J. Kim, and S. W. Kim,“Photocatalytic oxidation of microcystin-LR in a fluidized bedreactor having TiO2-coated activated carbon,” Separation andPurification Technology, vol. 34, no. 1–3, pp. 59–66, 2004.
[21] D. K. Lee, S. C. Kim, S. J. Kim, I. S. Chung, and S. W. Kim,“Photocatalytic oxidation of microcystin-LR with TiO2-coated activated carbon,” Chemical Engineering Journal, vol.102, no. 1, pp. 93–98, 2004.
[22] X. Z. Li and F. B. Li, “Study of Au/Au3+-TiO2 photocatalyststoward visible photooxidation for water and wastewatertreatment,” Environmental Science and Technology, vol. 35, no.11, pp. 2381–2387, 2001.
[23] S. Sakthivel, M. V. Shankar, M. Palanichamy, B. Arabindoo,D. W. Bahnemann, and V. Murugesan, “Enhancement ofphotocatalytic activity by metal deposition: Characterisationand photonic efficiency of Pt, Au and Pd deposited on TiO2
catalyst,” Water Research, vol. 38, no. 13, pp. 3001–3008, 2004.[24] V. M. Mendez-Florez, D. Friedmann, and D. W. Bahnemann,
“Durability of Ag-TiO2 photocatalysts assessed for the degra-dation of dichloroacetic acid,” International Journal of Pho-toenergy, vol. 2008, Article ID 280513, 11 pages, 2008.
[25] F. B. Li and X. Z. Li, “The enhancement of photodegradationefficiency using Pt-TiO2 catalyst,” Chemosphere, vol. 48, no. 10,pp. 1103–1111, 2002.
[26] H. W. Chen, Y. Ku, and Y. L. Kuo, “Effect of Pt/TiO2 charac-teristics on temporal behavior of o-cresol decomposition byvisible light-induced photocatalysis,” Water Research, vol. 41,no. 10, pp. 2069–2078, 2007.
[27] J. M. Herrmann, J. Disdier, and P. Pichat, “Photoassistedplatinum deposition on TiO2 powder using various platinumcomplexes,” Journal of Physical Chemistry, vol. 90, no. 22, pp.6028–6034, 1986.
[28] Z. Zheng, B. Huang, X. Qin, X. Zhang, Y. Dai, and M. H.Whangbo, “Facile in situ synthesis of visible-light plasmonicphotocatalysts M@TiO2 (M = Au, Pt, Ag) and evaluation oftheir photocatalytic oxidation of benzene to phenol,” Journalof Materials Chemistry, vol. 21, no. 25, pp. 9079–9087, 2011.
[29] P. V. Kamat, “Photophysical, photochemical and photocat-alytic aspects of metal nanoparticles,” Journal of PhysicalChemistry B, vol. 106, no. 32, pp. 7729–7744, 2002.
8 International Journal of Photoenergy
[30] S. Eustis and M. A. El-Sayed, “Why gold nanoparticles aremore precious than pretty gold: Noble metal surface plasmonresonance and its enhancement of the radiative and nonradia-tive properties of nanocrystals of different shapes,” ChemicalSociety Reviews, vol. 35, no. 3, pp. 209–217, 2006.
[31] H. Zhu, X. Chen, Z. Zheng et al., “Mechanism of supportedgold nanoparticles as photocatalysts under ultraviolet andvisible light irradiation,” Chemical Communications, no. 48,pp. 7524–7526, 2009.
[32] X. Chen, Z. Zheng, X. Ke et al., “Supported silver nanoparticlesas photocatalysts under ultraviolet and visible light irradia-tion,” Green Chemistry, vol. 12, no. 3, pp. 414–419, 2010.
[33] P. Wang, B. Huang, X. Qin et al., “Ag@AgCl: a highly efficientand stable photocatalyst active under visible light,” Ange-wandte Chemie - International Edition, vol. 47, no. 41, pp.7931–7933, 2008.
[34] P. Wang, B. Huang, X. Qin, X. Zhang, Y. Dai, and M.H. Whangbo, “Ag/AgBr/WO3·H2O: visible-light photocatalystfor bacteria destruction,” Inorganic Chemistry, vol. 48, no. 22,pp. 10697–10702, 2009.
[35] S. G. Anju, S. Yesodharan, and E. P. Yesodharan, “Sonopho-tocatalytic degradation of phenol over semiconductor oxides,”Chemical Engineering Journal, vol. 189-190, no. 1, pp. 84–93,2012.
[36] S. Anandan, P. Sathish Kumar, N. Pugazhenthiran, J. Madha-van, and P. Maruthamuthu, “Effect of loaded silver nanopar-ticles on TiO2 for photocatalytic degradation of Acid Red 88,”Solar Energy Materials and Solar Cells, vol. 92, no. 8, pp. 929–937, 2008.
[37] H. Gerischer, “Photodecomposition of semiconductors,”Berichte der Bunsengesellschaft fur physikalische Chemie, vol.77, pp. 771–779, 1973.
[38] W. Choi, A. Termin, and M. R. Hoffmann, “The role of metalion dopants in quantum-sized TiO2: correlation betweenphotoreactivity and charge carrier recombination dynamics,”Journal of Physical Chemistry, vol. 98, no. 51, pp. 13669–13679,1994.
[39] L. You-Ji and C. Wei, “Photocatalytic degradation of Rho-damine B using nanocrystalline TiO2-zeolite surface compos-ite catalysts: effects of photocatalytic condition on degradationefficiency,” Catalysis Science and Technology, vol. 1, no. 5, pp.802–809, 2011.
[40] S. Merouani, O. Hamdaoui, F. Saoudi, and M. Chiha, “Sono-chemical degradation of Rhodamine B in aqueous phase:effects of additives,” Chemical Engineering Journal, vol. 158, no.3, pp. 550–557, 2010.
[41] A. Mills and S. Le Hunte, “An overview of semiconductorphotocatalysis,” Journal of Photochemistry and Photobiology A,vol. 108, no. 1, pp. 1–35, 1997.
[42] C. Wei, W. Y. Lin, Z. Zainal et al., “Bactericidal activity of TiO2
photocatalyst in aqueous media: toward a solar-assisted waterdisinfection system,” Environmental Science and Technology,vol. 28, no. 5, pp. 934–938, 1994.
[43] J. A. H. Melian, J. M. D. Rodriguez, A. V. Suarez et al., “Thephotocatalytic disinfection of urban wastewaters,” Chemo-sphere, vol. 41, pp. 323–327, 2000.
[44] S. P. Devipriya, R. Kanjur, and S. Yesodharan, “Inactivationof Escherichia coli in water using TiO2 as photocatalyst,”Pollution Research, vol. 24, no. 1, pp. 87–91, 2005.
[45] M. Cho, H. Chung, W. Choi, and J. Yoon, “Linear correlationbetween inactivation of E. coli and OH radical concentrationin TiO2 photocatalytic disinfection,” Water Research, vol. 38,no. 4, pp. 1069–1077, 2004.
[46] M. R. Hoffmann, S. T. Martin, W. Choi, and D. W. Bah-nemann, “Environmental applications of semiconductor pho-tocatalysis,” Chemical Reviews, vol. 95, no. 1, pp. 69–96, 1995.
[47] Z. Huang, P. C. Maness, D. M. Blake, E. J. Wolfrum, S. L.Smolinski, and W. A. Jacoby, “Bactericidal mode of titaniumdioxide photocatalysis,” Journal of Photochemistry and Photo-biology A, vol. 130, no. 2-3, pp. 163–170, 2000.
[48] A. Erkan, U. Bakir, and G. Karakas, “Photocatalytic microbialinactivation over Pd doped SnO2 and TiO2 thin films,” Journalof Photochemistry and Photobiology A, vol. 184, no. 3, pp. 313–321, 2006.
[49] D. M. Blake, P. C. Maness, Z. Huang, E. J. Wolfrum, J. Huang,and W. A. Jacoby, “Application of the photocatalytic chemistryof titanium dioxide to disinfection and the killing of cancercells,” Separation and Purification Methods, vol. 28, no. 1, pp.1–50, 1999.
[50] A. G. Rincon, C. Pulgarin, N. Adler, and P. Peringer,“Interaction between E. coli inactivation and DBP-precursors-dihydroxybenzene isomers - in the photocatalytic process ofdrinking-water disinfection with TiO2,” Journal of Photochem-istry and Photobiology A, vol. 139, no. 2-3, pp. 233–241, 2001.
[51] A. G. Rincon and C. Pulgarin, “Field solar E. coli inactivationin the absence and presence of TiO2: is UV solar dose anappropriate parameter for standardization of water solar dis-infection?” Solar Energy, vol. 77, no. 5, pp. 635–648, 2004.
Hindawi Publishing CorporationInternational Journal of PhotoenergyVolume 2012, Article ID 208987, 7 pagesdoi:10.1155/2012/208987
Research Article
Synthesis and Photocatalytic Activity of TiOX Powders withDifferent Oxygen Defects
Leini Wang,1 Fei Lu,1 and Fanming Meng1, 2, 3
1 Anhui Key Laboratory of Information Materials and Devices, School of Physics and Materials Science, Anhui University,Hefei 230039, China
2 Department of Physics and Astronomy, University of Arkansas at Little Rock, Little Rock, AR 72204, USA3 Key Laboratory of Materials Modification by Laser, Ion and Electron Beams Dalian University of Technology, Ministry of Education,Dalian 116024, China
Correspondence should be addressed to Fanming Meng, [email protected]
Received 10 February 2012; Revised 28 March 2012; Accepted 30 March 2012
Academic Editor: Weifeng Yao
Copyright © 2012 Leini Wang et al. This is an open access article distributed under the Creative Commons Attribution License,which permits unrestricted use, distribution, and reproduction in any medium, provided the original work is properly cited.
The novel carbon- or chromium-doped TiOX photocatalysts with different oxygen defects were synthesized by mechanochemicaltechnique and heating process. The samples were characterized by X-ray diffraction, UV-vis spectrophotometer, and fluorescencespectrometer. Carbon and chromium species were incorporated into TiOX crystal matrix. The mass fraction of Ti7O13 in TiOX
photocatalysts could be tunable through carbon or chromium doping. The mass fraction of Ti7O13 could be an indication ofthe degree of oxygen defects (the concentration of Ti3+) in the TiOX. The degree of oxygen defects increased for carbon doping,while the degree of oxygen defects decreased for chromium doping. The photocatalytic activity measurement results showed thatphotodegradation rate of methyl orange reached the maximum value with mass fraction of Ti7O13 of about 66.93%, but thephotodegradation rate decreased when mass fraction of Ti7O13 is raised further. In addition, the origin of absorption in the visiblespectral range for carbon-doped TiOX as well as the effect of band gap on photocatalytic activity has also been discussed in thispaper.
1. Introduction
Currently, extensive research has been carried out on oxidesemiconductor photocatalysis in the conditions of aggrava-tion of environmental pollution and resources shortage [1–5]. In this sense, semiconductor photocatalysis can changesolar energy to electrical and chemical energy, drive redoxreactions, degrade organic substance, and improve environ-ment. As the leading candidate semiconductor photocatalyst,titania has attracted most attention due to its unique physic-ochemical properties, including good chemical stability, in-expensiveness, relatively good reactivity, and notoxicity [6,7]. However, the large band gap (3.2ev) of titania allows itto absorb only the ultraviolet light, which seriously restrictsits utilization efficiency for the solar photons. Furthermore,the low-quantum yield that results from high frequencyof recombination of photoinduced current carriers limitsits practical applications [8, 9]. Hence, significant efforts,
including metal or nonmetallic ions doping [10, 11], semi-conductor coupling [12], and deposition of noble metals[13], have been devoted to extend the spectral responseregion of titania and enhance its photocatalytic activity.
The photocatalytic activity of doped TiO2 is a complexfunction of the dopant concentration [14], crystal structure[11], surface area [15], and lattice defects. Especially oxygenvacancies play an important role in photocatalytic efficiencyof TiO2 [16–18]. However, the photocatalyst of the TiOX
with oxygen defects was little reported in previous literatures.
In this paper, TiOX powder including Ti7O13 and TiO2
was used as precursor. Carbon or chromium doping wasused to control the degree of oxygen defects of samples. Thephotocatalytic activities dependence on the degree of oxygendefects was evaluated in terms of the photodegradation ofmethyl orange (MO) under UV light irradiation. Further-more, a facile green synthetic route of C-doped TiOX was
2 International Journal of Photoenergy
developed, which could provide an effective technique for in-dustrial production due to its low cost.
2. Experimental
2.1. Preparation of Samples. The TiOX powder and chromicoxide (Cr2O3) were purchased from Tianjin Guangfu FineChemical Research Institute, China. Glucose (C6H12O6) waspurchased from Tianjin Guangfu technology developmentCo. Ltd., China. All the reagents were of analytical gradepurity and used without any further purification. Distilledwater was used in all experiments. A planetary ball mill wasused for sample synthesis.
Carbon- and chromium-codoped TiOX sample was pre-pared by following process. Appropriate amount of C6H12O6
and Cr2O3 were added to TiOX powder. The mass ratio ofCr2O3/C6H12O6/TiOX was kept constant at 2 : 9 : 200. Total40 g of above mixture was put into the bottle, and then 25 mLdistilled water was added. After being milled for 180 min ata speed of 400 rpm, the wet powder was dried in air over at90◦C for 10 h. The ground powder was subsequently heatedat 200◦C for 300 min. The prepared catalyst was namedC/Cr-TOV. Carbon-doped and chromium-doped and pureTiOX samples were also prepared through the same method,without adding the corresponding dopant, named as C-TOV,Cr-TOV, and TOV, respectively. Namely, for the synthesis ofCarbon-doped TiOX , the mass ratio of C6H12O6/TiOX waskept constant at 9 : 200. Total 40 g of above mixture was putinto the bottle followed by the addition of 25 mL of distilledwater.
2.2. Characterizations. The crystal phases of the sampleswere analyzed by X-ray diffraction (XRD) with CuKα. Thecrystalline sizes of anatase and Ti7O13 were calculated byScherrer formula. The average crystalline size was obtainedusing following equation [15]:
Dave = DaIa
Ia + Iv+ Dv
IvIa + Iv
, (1)
where Dave is average crystalline size, Da and Dv arecrystalline sizes of anatase and Ti7O13, respectively. Ia andIv are peak intensity of anatase (1 0 1) and Ti7O13 (1 2 5),respectively.
The mass fraction of anatase (Wa), Ti7O13 (Wv), andbrookite (Wb) were calculated using following equations[11, 19]:
Wa = Iakaa Ia/kaa + Iv/kva + Ib/kba
, (2)
Wv = Ivkva Ia/kaa + Iv/kva + Ib/kba
, (3)
Wb = Ibkba Ia/kaa + Iv/kva + Ib/kba
, (4)
where Ia, Iv, and Ib are peak intensity of anatase (1 0 1),Ti7O13 (1 2 5), and brookite (2 1 1), respectively. kaa , kva, andkba are constant (taken as 1, 0.1963, and 0.3354, resp.).
The UV-vis absorption spectroscopy of the samplewas measured using Ultraviolet-Visible-Near Infrared Spec-trophotometer (U-4100), while BaSO4 was used as a refer-ence. Photoluminescence (PL) spectra were obtained using afluorescence spectrophotometer (F-4500) at room tempera-ture.
2.3. Photocatalytic Activity. Photocatalytic activity of sam-ples was characterized by decolorization of methyl orange(MO). The photocatalyst (0.3 g) was dispersed in 25 mL MOaqueous solution with a concentration of 5 ppm in a dishwith diameter of 8 cm. The mixture was kept in the darkfor 30 min to obtain the absorption-desorption equilibriumbefore UV-light irradiation. A 100 W mercury lamp was usedas a light source. The distance between the lamp and thereaction solution was 9 cm. The absorbance of MO solutionat 464 nm was measured with UV-vis spectrophotometer atintervals of 15 min and the total irradiation time was 45 min.
3. Results and Discussion
Figure 1 (a, b, c, d) shows the XRD patterns of the samples.It is found that all the samples consist of mixed phases ofanatase, Ti7O13, and brookite. For doped TiOX (b, c, d), thecharacteristic peaks of carbon and Cr2O3 are not observed. Itmay be attributed to the small amount of dopant or carbon,and Cr2O3 is dispersed uniformly into the TiOX matrix[20, 21]. The average crystalline sizes of the samples and themass fraction of three phases are calculated by equations (1)–(4), as listed in Table 1. As can be seen from Table 1, theaverage crystalline sizes of doped TiOX are lower than thatof undoped TiOX.This result implies that the existence ofimpurity prevents the agglomeration of particles [15]. Thesamples show different mass fraction of three phases fordifferent doping. Especially the mass fraction of Ti7O13 ischanged through carbon and Cr2O3 doping, which suggestedthat carbon or chromium doping can change the degree ofoxygen defects for samples. This is because that the massfraction of Ti7O13 can be an indication of the degree ofoxygen defects (the concentration of Ti3+) in the TiOX .
From Figure 1 (e, f, g, h), it can be seen that, comparedwith TOV, anatase peaks (1 0 1) and Ti7O13 peaks (1 2 5) ofother samples shift to lower 2θ value, which imply that the d-spacing of TiOX increases. Furthermore, it is suggested thatsome of C/Cr atoms or ions have entered into the interstitialsites of TiOX host and that results in the expansion of TiOX
lattice [20, 22].Figure 2 shows the UV-vis absorption spectra of all the
samples. In contrast to the pure TiOX , carbon- or chromium-modified TiOX show, broader absorption shoulders in thevisible light region. The relation between absorption coef-ficient (α) and band gap (Eg) can be written as (αhv)1/2 ∝hv-Eg , where v is the frequency and h is Planck’s constant[14]. The band gap energies can be estimated by the plotof (αhv)1/2 versus photon energy (hv), as shown in Figure 3and listed in Table 1. It can be seen that the band gapfor carbon- or Cr2O3-doped TiOX is less than that ofundoped TiOX. Two small absorption peaks located at 450
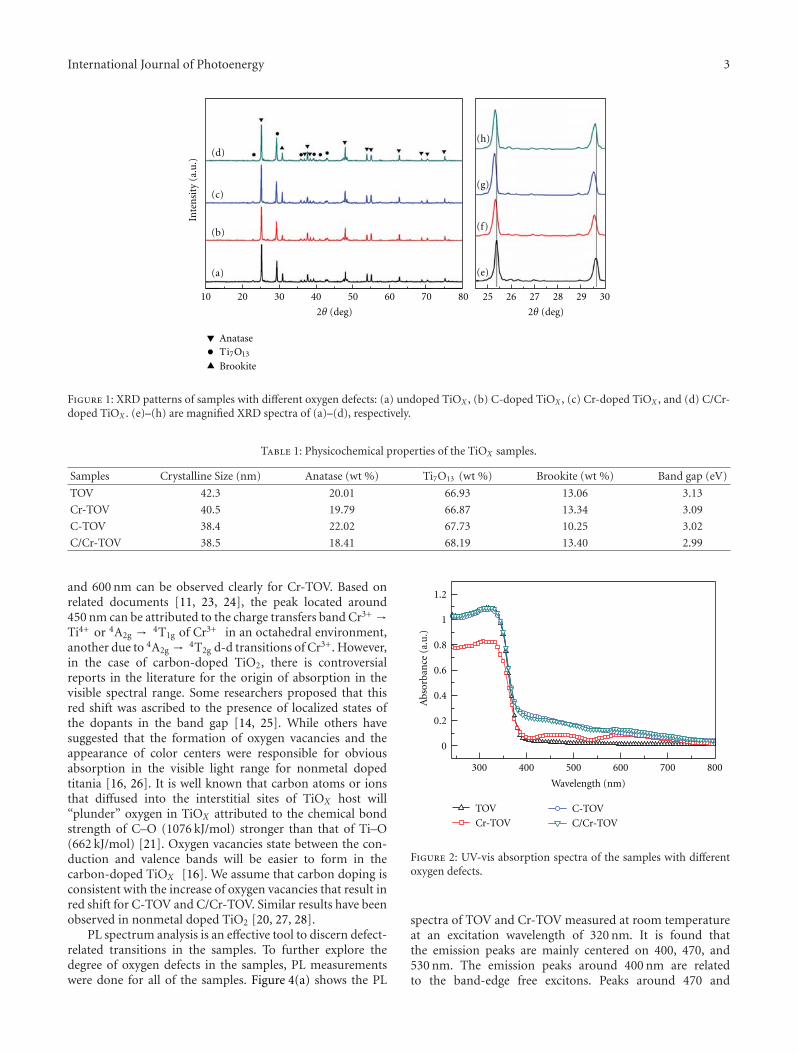
International Journal of Photoenergy 3
10 20 30 40 50 60 70 80 25 26 27 28 29 30
2θ (deg) 2θ (deg)
Inte
nsi
ty (
a.u
.)
AnataseTi7O13
Brookite
(a)
(b)
(c)
(d)
(e)
(f)
(g)
(h)
Figure 1: XRD patterns of samples with different oxygen defects: (a) undoped TiOX , (b) C-doped TiOX , (c) Cr-doped TiOX , and (d) C/Cr-doped TiOX . (e)–(h) are magnified XRD spectra of (a)–(d), respectively.
Table 1: Physicochemical properties of the TiOX samples.
Samples Crystalline Size (nm) Anatase (wt %) Ti7O13 (wt %) Brookite (wt %) Band gap (eV)
TOV 42.3 20.01 66.93 13.06 3.13
Cr-TOV 40.5 19.79 66.87 13.34 3.09
C-TOV 38.4 22.02 67.73 10.25 3.02
C/Cr-TOV 38.5 18.41 68.19 13.40 2.99
and 600 nm can be observed clearly for Cr-TOV. Based onrelated documents [11, 23, 24], the peak located around450 nm can be attributed to the charge transfers band Cr3+ →Ti4+ or 4A2g → 4T1g of Cr3+ in an octahedral environment,another due to 4A2g → 4T2g d-d transitions of Cr3+. However,in the case of carbon-doped TiO2, there is controversialreports in the literature for the origin of absorption in thevisible spectral range. Some researchers proposed that thisred shift was ascribed to the presence of localized states ofthe dopants in the band gap [14, 25]. While others havesuggested that the formation of oxygen vacancies and theappearance of color centers were responsible for obviousabsorption in the visible light range for nonmetal dopedtitania [16, 26]. It is well known that carbon atoms or ionsthat diffused into the interstitial sites of TiOX host will“plunder” oxygen in TiOX attributed to the chemical bondstrength of C–O (1076 kJ/mol) stronger than that of Ti–O(662 kJ/mol) [21]. Oxygen vacancies state between the con-duction and valence bands will be easier to form in thecarbon-doped TiOX [16]. We assume that carbon doping isconsistent with the increase of oxygen vacancies that result inred shift for C-TOV and C/Cr-TOV. Similar results have beenobserved in nonmetal doped TiO2 [20, 27, 28].
PL spectrum analysis is an effective tool to discern defect-related transitions in the samples. To further explore thedegree of oxygen defects in the samples, PL measurementswere done for all of the samples. Figure 4(a) shows the PL
300 400 500 600 700 800
Wavelength (nm)
Abs
orba
nce
(a.
u.)
1.2
1
0.8
0.6
0.4
0.2
0
TOV
Cr-TOV
C-TOV
C/Cr-TOV
Figure 2: UV-vis absorption spectra of the samples with differentoxygen defects.
spectra of TOV and Cr-TOV measured at room temperatureat an excitation wavelength of 320 nm. It is found thatthe emission peaks are mainly centered on 400, 470, and530 nm. The emission peaks around 400 nm are relatedto the band-edge free excitons. Peaks around 470 and
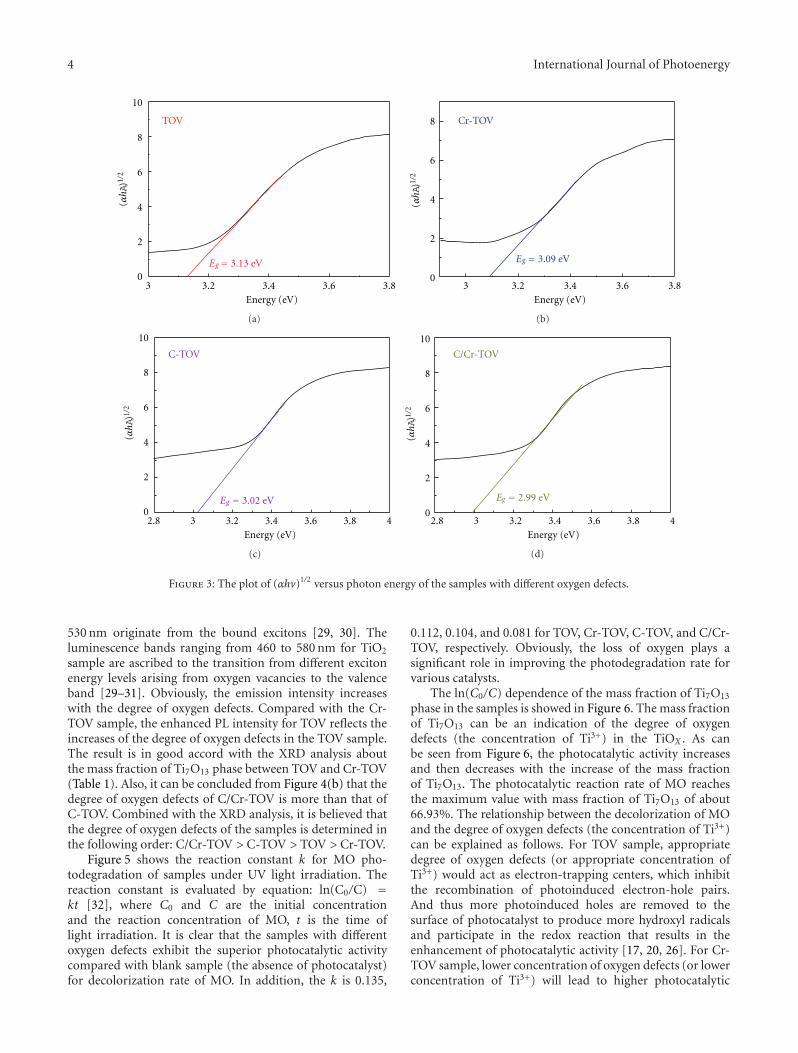
4 International Journal of Photoenergy
3 3.2 3.4 3.6Energy (eV)
3.8
TOV
Eg= 3.13 eV
10
8
6
4
2
0
(αhA)
1/2
(a)
3 3.2 3.4 3.6 3.8Energy (eV)
Cr-TOV
Eg = 3.09 eV
8
6
4
2
0
(αhA)
1/2
(b)
2.8 3 3.2 3.4 3.6 3.8 4Energy (eV)
C-TOV
Eg = 3.02 eV
10
8
6
4
2
0
(αhA)
1/2
(c)
2.8 3 3.2 3.4 3.6 3.8 4Energy (eV)
C/Cr-TOV
Eg = 2.99 eV
10
8
6
4
2
0
(αhA)
1/2
(d)
Figure 3: The plot of (αhv)1/2 versus photon energy of the samples with different oxygen defects.
530 nm originate from the bound excitons [29, 30]. Theluminescence bands ranging from 460 to 580 nm for TiO2
sample are ascribed to the transition from different excitonenergy levels arising from oxygen vacancies to the valenceband [29–31]. Obviously, the emission intensity increaseswith the degree of oxygen defects. Compared with the Cr-TOV sample, the enhanced PL intensity for TOV reflects theincreases of the degree of oxygen defects in the TOV sample.The result is in good accord with the XRD analysis aboutthe mass fraction of Ti7O13 phase between TOV and Cr-TOV(Table 1). Also, it can be concluded from Figure 4(b) that thedegree of oxygen defects of C/Cr-TOV is more than that ofC-TOV. Combined with the XRD analysis, it is believed thatthe degree of oxygen defects of the samples is determined inthe following order: C/Cr-TOV > C-TOV > TOV > Cr-TOV.
Figure 5 shows the reaction constant k for MO pho-todegradation of samples under UV light irradiation. Thereaction constant is evaluated by equation: ln(C0/C) =kt [32], where C0 and C are the initial concentrationand the reaction concentration of MO, t is the time oflight irradiation. It is clear that the samples with differentoxygen defects exhibit the superior photocatalytic activitycompared with blank sample (the absence of photocatalyst)for decolorization rate of MO. In addition, the k is 0.135,
0.112, 0.104, and 0.081 for TOV, Cr-TOV, C-TOV, and C/Cr-TOV, respectively. Obviously, the loss of oxygen plays asignificant role in improving the photodegradation rate forvarious catalysts.
The ln(C0/C) dependence of the mass fraction of Ti7O13
phase in the samples is showed in Figure 6. The mass fractionof Ti7O13 can be an indication of the degree of oxygendefects (the concentration of Ti3+) in the TiOX . As canbe seen from Figure 6, the photocatalytic activity increasesand then decreases with the increase of the mass fractionof Ti7O13. The photocatalytic reaction rate of MO reachesthe maximum value with mass fraction of Ti7O13 of about66.93%. The relationship between the decolorization of MOand the degree of oxygen defects (the concentration of Ti3+)can be explained as follows. For TOV sample, appropriatedegree of oxygen defects (or appropriate concentration ofTi3+) would act as electron-trapping centers, which inhibitthe recombination of photoinduced electron-hole pairs.And thus more photoinduced holes are removed to thesurface of photocatalyst to produce more hydroxyl radicalsand participate in the redox reaction that results in theenhancement of photocatalytic activity [17, 20, 26]. For Cr-TOV sample, lower concentration of oxygen defects (or lowerconcentration of Ti3+) will lead to higher photocatalytic
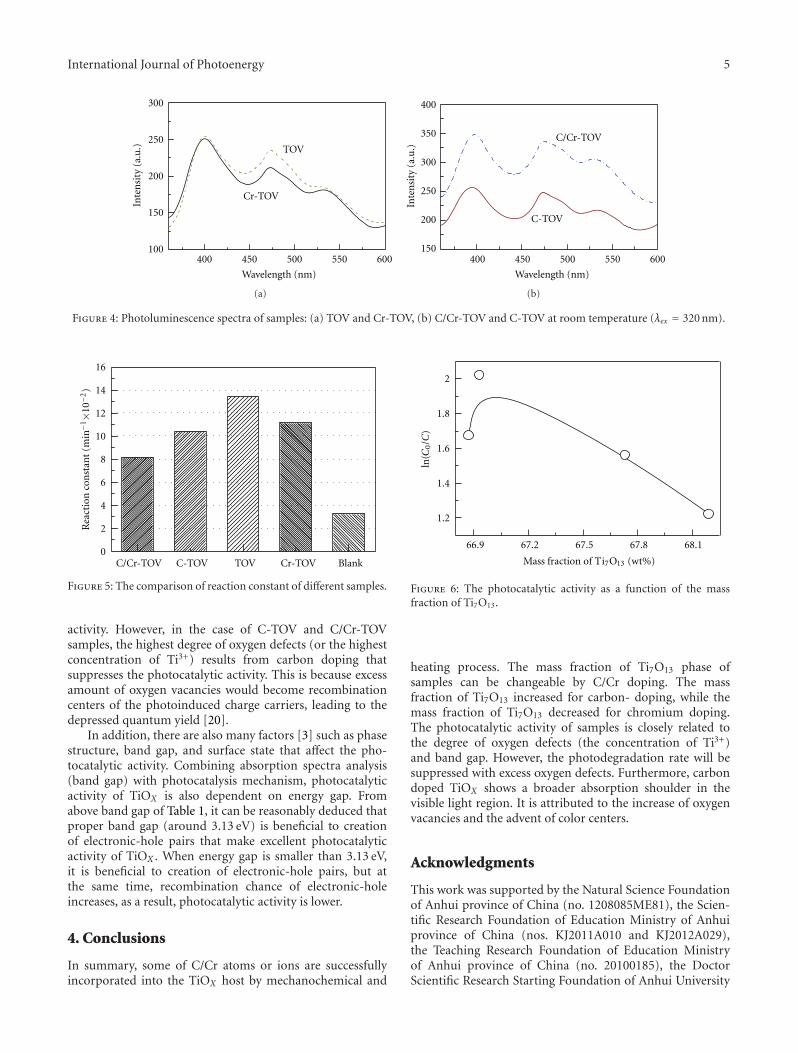
International Journal of Photoenergy 5
450400 500 550 600
Wavelength (nm)
TOV
Cr-TOV
300
250
200
150
100
Inte
nsi
ty (
a.u
.)
(a)
450400 500 550 600
Wavelength (nm)
C/Cr-TOV
C-TOV
400
350
300
250
200
150
Inte
nsi
ty (
a.u
.)
(b)
Figure 4: Photoluminescence spectra of samples: (a) TOV and Cr-TOV, (b) C/Cr-TOV and C-TOV at room temperature (λex = 320 nm).
C/Cr-TOV C-TOV TOV Cr-TOV Blank
16
14
12
10
8
6
4
2
0
Rea
ctio
n c
onst
ant
(min−1×1
0−2)
Figure 5: The comparison of reaction constant of different samples.
activity. However, in the case of C-TOV and C/Cr-TOVsamples, the highest degree of oxygen defects (or the highestconcentration of Ti3+) results from carbon doping thatsuppresses the photocatalytic activity. This is because excessamount of oxygen vacancies would become recombinationcenters of the photoinduced charge carriers, leading to thedepressed quantum yield [20].
In addition, there are also many factors [3] such as phasestructure, band gap, and surface state that affect the pho-tocatalytic activity. Combining absorption spectra analysis(band gap) with photocatalysis mechanism, photocatalyticactivity of TiOX is also dependent on energy gap. Fromabove band gap of Table 1, it can be reasonably deduced thatproper band gap (around 3.13 eV) is beneficial to creationof electronic-hole pairs that make excellent photocatalyticactivity of TiOX . When energy gap is smaller than 3.13 eV,it is beneficial to creation of electronic-hole pairs, but atthe same time, recombination chance of electronic-holeincreases, as a result, photocatalytic activity is lower.
4. Conclusions
In summary, some of C/Cr atoms or ions are successfullyincorporated into the TiOX host by mechanochemical and
2
1.8
1.6
1.4
1.2
66.9 67.2 67.5 67.8 68.1
ln(C
0/C
)
Mass fraction of Ti7O13 (wt%)
Figure 6: The photocatalytic activity as a function of the massfraction of Ti7O13.
heating process. The mass fraction of Ti7O13 phase ofsamples can be changeable by C/Cr doping. The massfraction of Ti7O13 increased for carbon- doping, while themass fraction of Ti7O13 decreased for chromium doping.The photocatalytic activity of samples is closely related tothe degree of oxygen defects (the concentration of Ti3+)and band gap. However, the photodegradation rate will besuppressed with excess oxygen defects. Furthermore, carbondoped TiOX shows a broader absorption shoulder in thevisible light region. It is attributed to the increase of oxygenvacancies and the advent of color centers.
Acknowledgments
This work was supported by the Natural Science Foundationof Anhui province of China (no. 1208085ME81), the Scien-tific Research Foundation of Education Ministry of Anhuiprovince of China (nos. KJ2011A010 and KJ2012A029),the Teaching Research Foundation of Education Ministryof Anhui province of China (no. 20100185), the DoctorScientific Research Starting Foundation of Anhui University
6 International Journal of Photoenergy
of China, the Foundation of “211 Project” of Anhui Uni-versity of China (no. KJTD004B), and the Foundation ofConstruction of Quality Project of Anhui University of China(nos. XJ200907, xj201140, and 39020012).
References
[1] M. R. Hoffmann, S. T. Martin, W. Choi, and D. W.Bahnemann, “Environmental applications of semiconductorphotocatalysis,” Chemical Reviews, vol. 95, no. 1, pp. 69–96,1995.
[2] F. M. Meng and F. Lu, “ure and silver (2.5–40 vol%) modifiedTiO2 thin films deposited by radio frequency magnetronsputtering at room temperature: surface topography, energygap and photo-induced hydrophilicity,” Journal of Alloys andCompounds, vol. 501, no. 1, pp. 154–158, 2010.
[3] F. Meng and F. Lu, “Characterization and photocatalytic activ-ity of TiO2 thin films prepared by RF magnetron sputtering,”Vacuum, vol. 85, no. 1, pp. 84–88, 2010.
[4] A. Fujishima and K. Honda, “Electrochemical photolysis ofwater at a semiconductor electrode,” Nature, vol. 238, no.5358, pp. 37–38, 1972.
[5] F. M. Meng, L. Xiao, and Z. Q. Sun, “Thermo-inducedhydrophilicity of nano-TiO2 thin films prepared by RFmagnetron sputtering,” Journal of Alloys and Compounds, vol.485, no. 1-2, pp. 848–852, 2009.
[6] M. Ksibi, S. Rossignol, J. M. Tatibouet, and C. Trapalis,“Synthesis and solid characterization of nitrogen and sulfur-doped TiO2 photocatalysts active under near visible light,”Materials Letters, vol. 62, no. 26, pp. 4204–4206, 2008.
[7] W. Wang, J. Zhang, F. Chen, D. He, and M. Anpo, “Preparationand photocatalytic properties of Fe3+-doped Ag@TiO2 core-shell nanoparticles,” Journal of Colloid and Interface Science,vol. 323, no. 1, pp. 182–186, 2008.
[8] H. G. Yu, S. C. Lee, J. G. Yu, and C. H. Ao, “Photocatalyticactivity of dispersed TiO2 particles deposited on glass fibers,”Journal of Molecular Catalysis A, vol. 246, no. 1-2, pp. 206–211,2006.
[9] J. G. Yu, G. H. Wang, B. Cheng, and M. H. Zhou, “Effectsof hydrothermal temperature and time on the photocatalyticactivity and microstructures of bimodal mesoporous TiO2
powders,” Applied Catalysis B, vol. 69, no. 3-4, pp. 171–180,2007.
[10] H. Wang, Z. Wang, and Y. Liu, “A simple two-step templateapproach for preparing carbon-doped mesoporous TiO2
hollow microspheres,” Journal of Physical Chemistry C, vol.113, no. 30, pp. 13317–13324, 2009.
[11] J. Choi, H. Park, and M. R. Hoffmann, “Effects of single metal-ion doping on the visible light photoreactivity of TiO2,” TheJournal of Physical Chemistry C, vol. 114, pp. 783–792, 2010.
[12] W. Ho, J. C. Yu, J. Lin, J. Yu, and P. Li, “Preparationand photocatalytic behavior of MoS2 and WS2 nanoclustersensitized TiO2,” Langmuir, vol. 20, no. 14, pp. 5865–5869,2004.
[13] L. L. Ren, Y. P. Zeng, and D. L. Jiang, “Preparation, character-ization and photocatalytic activities of Ag-deposited porousTiO2 sheets,” Catalysis Communications, vol. 10, no. 5, pp.645–649, 2009.
[14] Y. M. Wu, J. L. Zhang, L. Xiao, and F. Chen, “Properties ofcarbon and iron modified TiO2 photocatalyst synthesized atlow temperature and photodegradation of acid orange 7 undervisible light,” Applied Surface Science, vol. 256, no. 13, pp.4260–4268, 2010.
[15] I. C. Kang, Q. W. Zhang, S. Yin, T. Sato, and F. Saito, “Prepa-ration of a visible sensitive carbon doped TiO2 photo-catalystby grinding TiO2 with ethanol and heating treatment,” AppliedCatalysis B, vol. 80, no. 1-2, pp. 81–87, 2008.
[16] V. N. Kuznetsov and N. Serpone, “On the origin of the spectralbands in the visible absorption spectra of visible-light-activeTiO2 specimens analysis and assignments,” Journal of PhysicalChemistry C, vol. 113, no. 34, pp. 15110–15123, 2009.
[17] P. Sangpour, F. Hashemi, and A. Z. Moshfegh, “Photoen-hanced degradation of methylene blue on cosputtered M:TiO2
(M = Au, Ag, Cu) nanocomposite systems: a comparativestudy,” Journal of Physical Chemistry C, vol. 114, no. 33, pp.13955–13961, 2010.
[18] Y. Z. Li, D. S. Hwang, N. H. Lee, and S. J. Kim, “Synthesisand characterization of carbon-doped titania as an artificialsolar light sensitive photocatalyst,” Chemical Physics Letters,vol. 404, no. 1–3, pp. 25–29, 2005.
[19] R. A. Spurr and H. Myers, “Quantitative analysis of anatase-rutile mixtures with an X-ray diffractometer,” AnalyticalChemistry, vol. 29, no. 5, pp. 760–762, 1957.
[20] Y. M. Wu, M. Y. Xing, J. L. Zhang, and F. Chen, “Effective visi-ble light-active boron and carbon modified TiO2 photocatalystfor degradation of organic pollutant,” Applied Catalysis B, vol.97, no. 1-2, pp. 182–189, 2010.
[21] J. Zhang, Z. Zhao, X. Wang et al., “Increasing the oxygenvacancy density on the TiO2 surface by La-doping for dye-sensitized solar cells,” Journal of Physical Chemistry C, vol. 114,no. 43, pp. 18396–18400, 2010.
[22] Y. W. Ma, J. Ding, J. B. Yi, H. T. Zhang, and C. M. Ng,“Mechanism of room temperature ferromagnetism in ZnOdoped with Al,” Journal of Applied Physics, vol. 105, no. 7,Article ID 07C503, 3 pages, 2009.
[23] J. F. Zhu, Z. G. Deng, F. Chen, J. L. Zhang, and H. J. Chen,“Hydrothermal doping method for preparation of Cr3+-TiO2
photocatalysts with concentration gradient distribution ofCr3+,” Applied Catalysis B, vol. 62, no. 3-4, pp. 329–335, 2006.
[24] X. X. Fan, X. Y. Chen, S. P. Zhu et al., “The structural, physicaland photocatalytic properties of the mesoporous Cr-dopedTiO2,” Journal of Molecular Catalysis, vol. 284, no. 1-2, pp.155–160, 2008.
[25] X. B. Chen and C. Burda, “The electronic origin of the visible-light absorption properties of C-, N- and S-doped TiO2
nanomaterials,” Journal of the American Chemical Society, vol.130, pp. 5018–5019, 2008.
[26] N. Serpone, “Is the band gap of pristine TiO2 narrowed byanion- and cation-doping of titanium dioxide in second-generation photocatalysts?” Journal of Physical Chemistry B,vol. 110, no. 48, pp. 24287–24293, 2006.
[27] Y. Wang, C. X. Feng, M. Zhang, J. J. Yang, and Z. J. Zhang,“Enhanced visible light photocatalytic activity of N-dopedTiO2 in relation to single-electron-trapped oxygen vacancyand doped-nitrogen,” Applied Catalysis B, vol. 100, no. 1-2, pp.84–90, 2010.
[28] Q. Xiao, J. Zhang, C. Xiao, Z. Si, and X. Tan, “Solar photocat-alytic degradation of methylene blue in carbon-doped TiO2
nanoparticles suspension,” Solar Energy, vol. 82, no. 8, pp.706–713, 2008.
[29] K. Das, S. N. Sharma, M. Kumar, and S. K. De, “Morphologydependent luminescence properties of Co doped TiO2 nanos-tructures,” Journal of Physical Chemistry C, vol. 113, no. 33, pp.14783–14792, 2009.
[30] W. F. Zhang, M. S. Zhang, Z. Yin, and Q. Chen, “Photolu-minescence in anatase titanium dioxide nanocrystals,” AppliedPhysics B, vol. 70, pp. 261–265, 2000.

International Journal of Photoenergy 7
[31] L. D. Zhang and C. M. Mo, “Luminescence in nanostruc-tured materials,” Nanostructured Materials, vol. 6, no. 5–8, pp.831–834, 1995.
[32] F. Dong, W. Zhao, Z. Wu, and S. Guo, “Band structure andvisible light photocatalytic activity of multi-type nitrogendoped TiO2 nanoparticles prepared by thermal decomposi-tion,” Journal of Hazardous Materials, vol. 162, no. 2-3, pp.763–770, 2009.
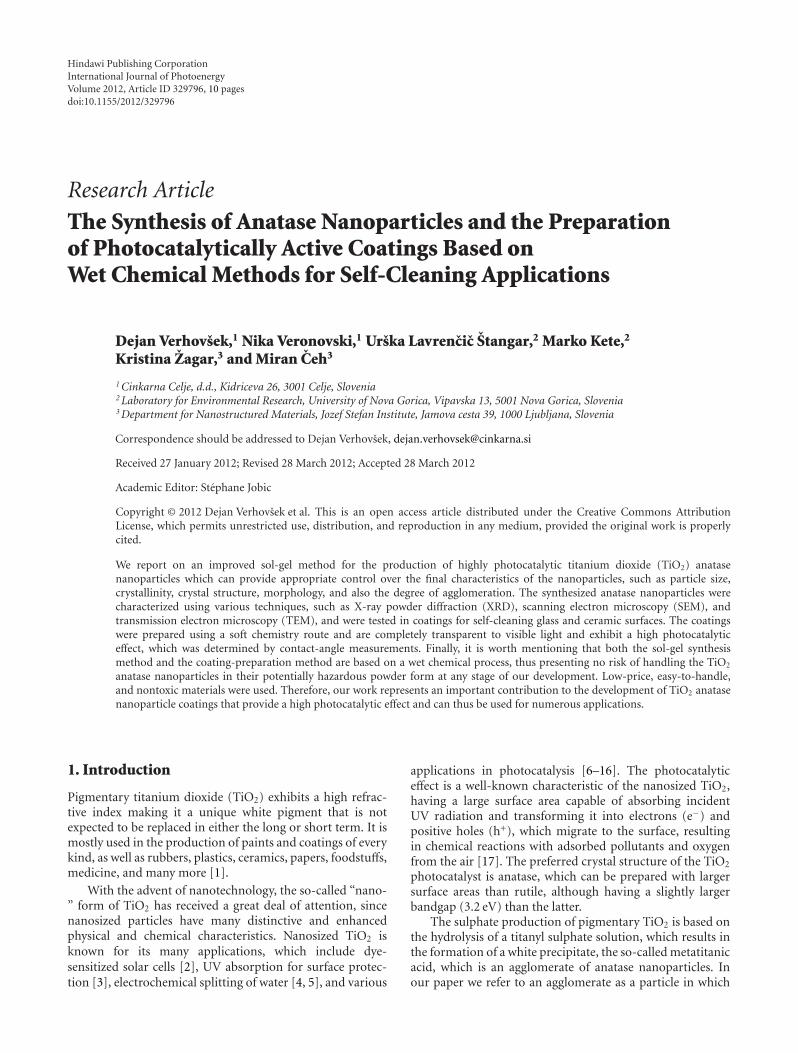
Hindawi Publishing CorporationInternational Journal of PhotoenergyVolume 2012, Article ID 329796, 10 pagesdoi:10.1155/2012/329796
Research Article
The Synthesis of Anatase Nanoparticles and the Preparationof Photocatalytically Active Coatings Based onWet Chemical Methods for Self-Cleaning Applications
Dejan Verhovsek,1 Nika Veronovski,1 Urska Lavrencic Stangar,2 Marko Kete,2
Kristina Zagar,3 and Miran Ceh3
1 Cinkarna Celje, d.d., Kidriceva 26, 3001 Celje, Slovenia2 Laboratory for Environmental Research, University of Nova Gorica, Vipavska 13, 5001 Nova Gorica, Slovenia3 Department for Nanostructured Materials, Jozef Stefan Institute, Jamova cesta 39, 1000 Ljubljana, Slovenia
Correspondence should be addressed to Dejan Verhovsek, [email protected]
Received 27 January 2012; Revised 28 March 2012; Accepted 28 March 2012
Academic Editor: Stephane Jobic
Copyright © 2012 Dejan Verhovsek et al. This is an open access article distributed under the Creative Commons AttributionLicense, which permits unrestricted use, distribution, and reproduction in any medium, provided the original work is properlycited.
We report on an improved sol-gel method for the production of highly photocatalytic titanium dioxide (TiO2) anatasenanoparticles which can provide appropriate control over the final characteristics of the nanoparticles, such as particle size,crystallinity, crystal structure, morphology, and also the degree of agglomeration. The synthesized anatase nanoparticles werecharacterized using various techniques, such as X-ray powder diffraction (XRD), scanning electron microscopy (SEM), andtransmission electron microscopy (TEM), and were tested in coatings for self-cleaning glass and ceramic surfaces. The coatingswere prepared using a soft chemistry route and are completely transparent to visible light and exhibit a high photocatalyticeffect, which was determined by contact-angle measurements. Finally, it is worth mentioning that both the sol-gel synthesismethod and the coating-preparation method are based on a wet chemical process, thus presenting no risk of handling the TiO2
anatase nanoparticles in their potentially hazardous powder form at any stage of our development. Low-price, easy-to-handle,and nontoxic materials were used. Therefore, our work represents an important contribution to the development of TiO2 anatasenanoparticle coatings that provide a high photocatalytic effect and can thus be used for numerous applications.
1. Introduction
Pigmentary titanium dioxide (TiO2) exhibits a high refrac-tive index making it a unique white pigment that is notexpected to be replaced in either the long or short term. It ismostly used in the production of paints and coatings of everykind, as well as rubbers, plastics, ceramics, papers, foodstuffs,medicine, and many more [1].
With the advent of nanotechnology, the so-called “nano-” form of TiO2 has received a great deal of attention, sincenanosized particles have many distinctive and enhancedphysical and chemical characteristics. Nanosized TiO2 isknown for its many applications, which include dye-sensitized solar cells [2], UV absorption for surface protec-tion [3], electrochemical splitting of water [4, 5], and various
applications in photocatalysis [6–16]. The photocatalyticeffect is a well-known characteristic of the nanosized TiO2,having a large surface area capable of absorbing incidentUV radiation and transforming it into electrons (e−) andpositive holes (h+), which migrate to the surface, resultingin chemical reactions with adsorbed pollutants and oxygenfrom the air [17]. The preferred crystal structure of the TiO2
photocatalyst is anatase, which can be prepared with largersurface areas than rutile, although having a slightly largerbandgap (3.2 eV) than the latter.
The sulphate production of pigmentary TiO2 is based onthe hydrolysis of a titanyl sulphate solution, which results inthe formation of a white precipitate, the so-called metatitanicacid, which is an agglomerate of anatase nanoparticles. Inour paper we refer to an agglomerate as a particle in which
2 International Journal of Photoenergy
the subunits are connected with each other mainly throughphysical bonding and can be broken when subjected tostronger attraction forces or changes in the surface charge.An aggregate, on the other hand, is a consolidated particlein which smaller crystallites are connected mainly withcrystalline bridges. An aggregate cannot be broken down intoindividual subunits. In view of this we refer to metatitanicacid as an agglomerate, being made up of smaller subunits,aggregates, which themselves are made up of very smallanatase crystallites. The crystallite mean size is about 5-6 nm, the aggregate size ranges from 40 to 100 nm, and theagglomerate size is in the order of 1-2 μm [18, 19]. Sincethe aggregate size is in the nanoregion, we refer to them asnanoparticles. It is very interesting that the size of the anatasenanoparticles can be easily adjusted, simply by controllingthe hydrolysis reactions of titanyl sulphate solution [19]. Theaggregates that form the metatitanic acid agglomerate aremainly connected through sulphate bridges. The sulphatebridges are electrostatic bonds which arise due to the negativecharge of the sulphate ion [19]. When subjected to water-soluble barium salts, the barium ion, having a greateraffinity for the sulphate ion, draws the sulphate ions holdingagglomerates together and thus breaks them apart intoindividual anatase nanoparticles. Since the final suspensionis acidic, the nanoparticles within it are well dispersed. Thesuspension is, therefore, very stable, enabling the separationof the nanoparticles from the barium sulphate precipitatewhich is a result of the reaction between the barium ionsand the sulphate ions [19]. There has been very little orno research on determining the photocatalytic activity ofanatase nanoparticles in the as-prepared suspension, nor hasmuch research been done on its possible applications. Sincemetatitanic acid is an intermediate in the production ofpigmentary TiO2, and thus prepared in very large amountswhen the sulphate process of production is used, it wouldbe very useful if a procedure could be developed to enablethe harvesting of anatase nanoparticles directly from it. Inour paper we report on such a procedure, enabling an easyand inexpensive production of a stable, acidic suspension ofanatase nanoparticles, having a good photocatalytic activityand self-cleaning applications.
2. Experimental Details
2.1. Metatitanic Acid Preparation. The metatitanic acid wasprepared using the sulphate process [1] in which ilmenite isdissolved with concentrated sulphuric acid (98%, CinkarnaCelje Inc.) and then hydrolysed in the presence of anataseseeds. The anatase seeds are prepared separately by hydroly-sing a titanyl sulphate solution at 80◦C and are added into thedissolved ilmenite solution. The amount added was variedthrough 0.1–1.8% in order to produce different metatitanictypes.
2.2. Preparation of a Stable Anatase Nanoparticle Suspension.A stable anatase nanoparticle suspension was prepared bymixing the metatitanic acid and a barium chloride solution(p.a., Fluka) in the molar ratio Ti : Ba ∼ 30 : 1. The molarconcentration of the barium chloride used in this case was
0.5 M. The concentration of barium chloride was variedbetween 0.25 and 1.4 M in order to prepare barium sulphateparticles of varying sizes. Barium chloride was added tothe metatitanic acid dropwise at room temperature whilemixing at 200 rpm. The reaction mixture was stirred foraround 15 minutes. Afterwards, the barium sulphate wasremoved by means of centrifugation (30 min at 3000 rpm).After the centrifugation a precipitate of barium sulphatewas present on the bottom of the vial, while the TiO2
suspension exhibited no sedimentation, thus allowing asimple separation via decantation.
2.3. Preparation of Anatase Self-Cleaning Coating. In order toprepare a stable colloid used for the final coating applicationthat exhibits good adhesion, mechanical stability, and alsosuperhydrophilicity, a soft chemical method was employed.The anatase was used in the form of an acidic suspensionprepared as described above. To the acidic anatase suspen-sion (5 mL), water (40 mL), ethanol (Fluka) (40 mL), and asilica binder solution (400 μL) (made from either of the twosilica sources, that is, colloidal silica Levasil (200/30%) andTEOS precursor) were added and stirred until a homogenousmixture formed [20]. The molar ratio of Ti and Si in thefinal suspension is 1.3 : 1. The as-prepared suspension is verystable and remains so for a period of about six months. Theas-prepared suspension was used to prepare self-cleaningcoatings using various techniques, such as spraying and dipcoating onto various substrates. No thermal treatment of theresulting coatings at elevated temperatures was required.
The coatings prepared differ in the size of anatasenanoparticles used. NTi1 and both NTi2 and NTi3 wereprepared with anatase nanoparticles synthesized with aseeding volume of 0.3 and 0.6%, respectively.
Coatings NTi4, NTi5, and NTi6 were prepared withanatase nanoparticles synthesized with a seeding volume of1.8, 0.6%, and 0.3%, respectively, and were used to test theeffect of particle size on the photocatalytic activity of the finalcoating. The three coating types were also thermally treatedat 450◦C (30 min) to achieve a good adhesion on the glasssubstrate.
2.4. Characterization Methods. For X-ray powder diffraction(XRD) investigations the suspensions were neutralized afterthe reaction, filtered, washed with distilled water, and driedat 80◦C in order to acquire TiO2 powder that was used forcharacterization. The TiO2 powder was pressed into a pelletand the spectra recorded from 10◦ to 70◦ (2-theta angle) witha CuKα radiation (λ = 1.5418 A) using a CubiX PRO PW3800 instrument (PANalytical). The TiO2 crystal structurewas identified using the X’Pert Data Viewer software.
Scanning Electron Microscopy (SEM) studies (Jeol JSM-7600F, Jeol Ltd., Tokyo, Japan) and Transmission Elec-tron Microscopy (TEM) studies (Jeol JEM-2100, Jeol Ltd.,Tokyo, Japan) were used to estimate their morphologyand dimensions. The samples for the TEM observationswere ultrasonically dispersed and placed onto lacey, carbon-coated nickel grids.
The optimum amount of barium chloride to be addedwas determined by using Dynamic Light Scattering (DLS)
International Journal of Photoenergy 3
measurements (Zeta PALS, Brookhaven). The samples forDLS measurement were prepared by dispersing a single TiO2
suspension droplet into 50 mL of distilled water. The finalsample was translucent. The sample was poured into a plasticvessel (10 mL) which was transferred to the instrument cellwhere it was analyzed at a fixed angle of 90◦ using a laserwith a wavelength of 660 nm.
The zeta potential of TiO2 nanoparticles was determinedby Zeta PALS (Brookhaven). The samples for zeta potentialmeasurement were prepared by dispersing a single TiO2
suspension droplet into 50 mL of distilled water and mixingit to form a translucent suspension. The electrophoreticmobility was converted to zeta potential using a PALSZeta Potential Analyzer software and was based on theSmoluchowski approximation.
Photocatalytic activity measurements were performedusing the contact-angle method [21, 22]. The TiO2 anatasesuspension was used to prepare an anatase nanoparticle layer,which was done by dip-coating microscope glass slides (76×26 mm, Menzel-Glaser) into an anatase suspension (100 g/L)(dipping speed of 70 or 100 mm/min). Dip coating of themicroscope glass slides was performed only once. The layerswere used as-prepared or were additionally thermally treated(450◦C, 30 min) in order to achieve better adhesion ontothe glass substrate and also to improve the crystallinity ofthe anatase nanoparticles. Methyl stearate (p.a., Fluka)(0.2 Msolution in hexane) was used as a test organic pollutantand was additionally deposited onto the anatase layers usingdip coating (100 mm/min). After the addition of the methylstearate the contact angle was measured, while the layers wereilluminated with UVA (CLEO light source, 20 W, 438 mm× 26 mm, λ 355 nm, Philips) of ca. 2 mW/cm2 irradiationintensity. Real-time contact-angle measurements provideda quantitative measurement of the photocatalytic activityof different anatase samples. It was determined for anatasenanoparticles of various sizes.
3. Results and Discussion
3.1. Metatitanic Acid Preparation. Metatitanic acid was pro-duced when a titanyl sulphate solution hydrolysed in thepresence of a certain amount of anatase seeds. Anatase seedsare crucial for the hydrolysis of the titanyl sulphate solution,since seeding provides better control over the final hydrolysisproduct. These seeds can have many distinctive benefits[18, 19, 23]:
(i) they promote the precipitation process;
(ii) they control particle formation and ensure a narrowsize distribution of the synthesised nanoparticles;
(iii) they increase the reaction yield;
(iv) they provide an active surface, which can greatlyaccelerate the crystallization process, since crystal-lization on a solid-solid interface is much easier thannucleation in a liquid phase;
(v) they decrease the activation energy of a reaction, thusfurther promoting crystallization.
The inoculation of a reaction mixture with suitable seedsprovides all the above-stated benefits through a processof heterogeneous nucleation. Since the seeds used in ourreactions are of the same crystal structure as the finalproduct, we call such heterogeneous nucleation a secondarynucleation.
In order to better understand the effect of seeding on thefinal product, we conducted experiments where we variedthe quantity of seeds added to the titanyl sulphate solution.According to the literature, the variation of the seeding vol-ume should directly affect the size of the primary aggregates(nanoparticles) [19]. The SEM results in Figures 1(a)–1(e)indeed showed that larger seeding volumes tend to producesmaller anatase nanoparticles, which are composed of asmaller number of crystallites. On the other hand, smallerseeding volumes produce anatase nanoparticles composed ofa larger number of crystallites. It was concluded that one caneffectively control the size of the anatase nanoparticles bychanging the amount of added anatase seeds. This result alsodemonstrates that the seeds directly control the nucleationprocess via secondary nucleation mechanisms.
The theory of heterogeneous nucleation states that thefree-energy change needed for the nucleation to occurdepends on the wetting angle in a liquid-solid system. Inthe case of secondary nucleation, the seeds of the samematerial as the one being crystallized are used; therefore, theaffinity in the liquid-solid system is complete. This meansthat the contact angle becomes zero and that the free energyof nucleation is also zero. In this case no additional nucleiare formed in the supersaturated reaction medium when itis seeded [24]. This is in direct agreement with the observedresults of our experiments. Since no additional nuclei wereproduced after the inoculation with the seeds, they are solelyresponsible for particle formation and thus also determinetheir size. As stated previously [19] the seeds added could actas centres for nucleation of the newly formed nanoparticles.It was shown that the number of nanoparticles formed isof the same order of magnitude as the number of crystalsinoculated as seeds. This suggests that every nanoparticlearises from a single seed particle, as shown in Figure 2.
The seeds used in the synthesis are large agglomeratesof very small anatase crystallites, as shown in Figure 3(a). Itis very likely that they break up when added to the titanylsulphate solution, since their surface charge changes becauseof the change in the pH value.
Zeta potential measurement of the anatase seeds wasperformed by using a diluted water suspension (∼5 g/L)which was titrated with sodium hydroxide solution (1 M).The titration was done starting at an acidic pH value (∼2.5)and raised to ∼10.5. As seen in the diagram of zeta potentialmeasurements in Figure 3(b), the seeds exhibit the isoelectricpoint (IEP) at a pH value of about 5, which is very near tothe actual pH of the seed suspension that was used. The IEPmeasured for anatase seeds is lower than expected for anatasewhich is around 6 [25]. The observed difference could havearisen because of surface impurities such as anions that wereadsorbed onto the TiO2 surface. Sulphate anions adsorbonto the TiO2 surface and may reduce the IEP value, as wasobserved in our measurements [26].
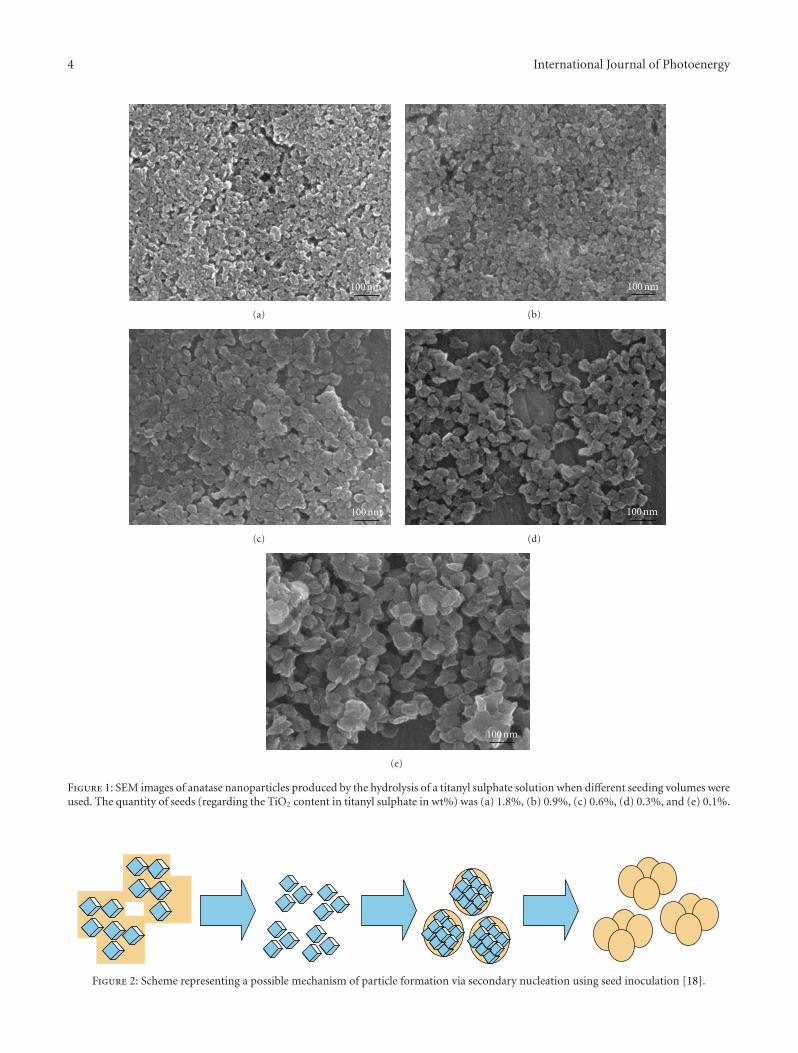
4 International Journal of Photoenergy
100 nm
(a)
100 nm
(b)
100 nm
(c)
100 nm
(d)
100 nm
(e)
Figure 1: SEM images of anatase nanoparticles produced by the hydrolysis of a titanyl sulphate solution when different seeding volumes wereused. The quantity of seeds (regarding the TiO2 content in titanyl sulphate in wt%) was (a) 1.8%, (b) 0.9%, (c) 0.6%, (d) 0.3%, and (e) 0.1%.
Figure 2: Scheme representing a possible mechanism of particle formation via secondary nucleation using seed inoculation [18].
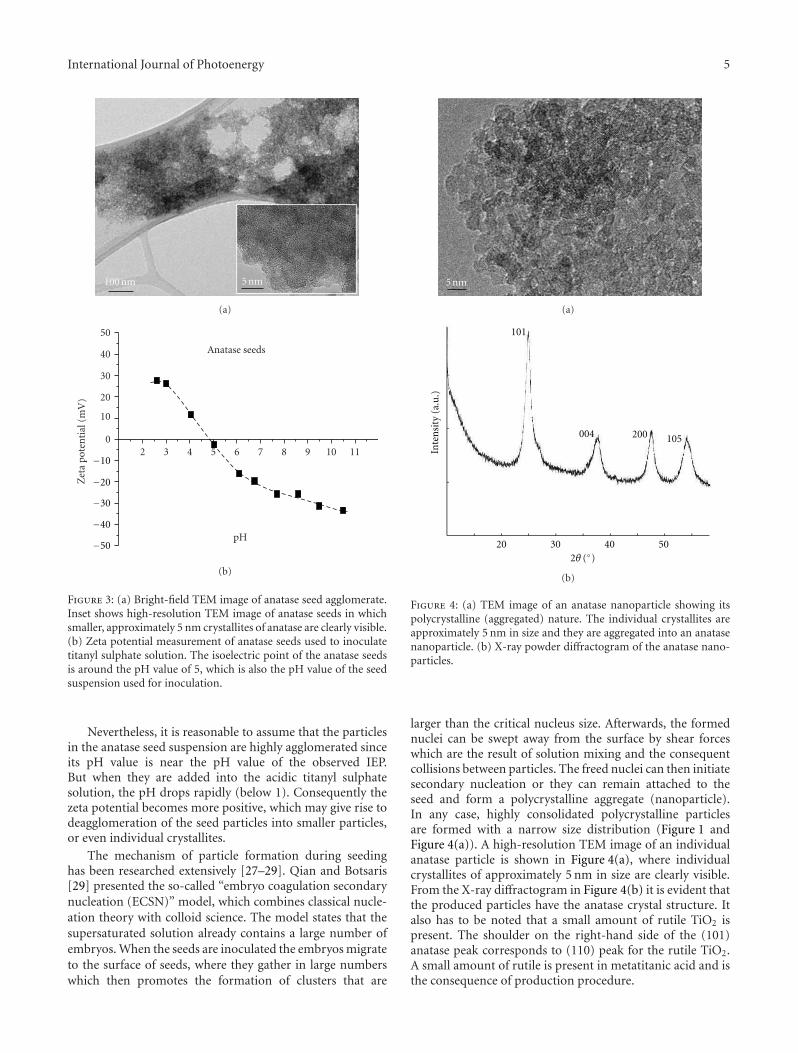
International Journal of Photoenergy 5
100 nm 5 nm
(a)
Zet
a po
ten
tial
(m
V)
pH
20
30
40
50
10
02 3 4 5 6 7 8 9 10 11
Anatase seeds
−10
−20
−30
−40
−50
(b)
Figure 3: (a) Bright-field TEM image of anatase seed agglomerate.Inset shows high-resolution TEM image of anatase seeds in whichsmaller, approximately 5 nm crystallites of anatase are clearly visible.(b) Zeta potential measurement of anatase seeds used to inoculatetitanyl sulphate solution. The isoelectric point of the anatase seedsis around the pH value of 5, which is also the pH value of the seedsuspension used for inoculation.
Nevertheless, it is reasonable to assume that the particlesin the anatase seed suspension are highly agglomerated sinceits pH value is near the pH value of the observed IEP.But when they are added into the acidic titanyl sulphatesolution, the pH drops rapidly (below 1). Consequently thezeta potential becomes more positive, which may give rise todeagglomeration of the seed particles into smaller particles,or even individual crystallites.
The mechanism of particle formation during seedinghas been researched extensively [27–29]. Qian and Botsaris[29] presented the so-called “embryo coagulation secondarynucleation (ECSN)” model, which combines classical nucle-ation theory with colloid science. The model states that thesupersaturated solution already contains a large number ofembryos. When the seeds are inoculated the embryos migrateto the surface of seeds, where they gather in large numberswhich then promotes the formation of clusters that are
5 nm
(a)
Inte
nsi
ty (
a.u
.)
20 30 40 50
101
004 200 105
2θ (◦)
(b)
Figure 4: (a) TEM image of an anatase nanoparticle showing itspolycrystalline (aggregated) nature. The individual crystallites areapproximately 5 nm in size and they are aggregated into an anatasenanoparticle. (b) X-ray powder diffractogram of the anatase nano-particles.
larger than the critical nucleus size. Afterwards, the formednuclei can be swept away from the surface by shear forceswhich are the result of solution mixing and the consequentcollisions between particles. The freed nuclei can then initiatesecondary nucleation or they can remain attached to theseed and form a polycrystalline aggregate (nanoparticle).In any case, highly consolidated polycrystalline particlesare formed with a narrow size distribution (Figure 1 andFigure 4(a)). A high-resolution TEM image of an individualanatase particle is shown in Figure 4(a), where individualcrystallites of approximately 5 nm in size are clearly visible.From the X-ray diffractogram in Figure 4(b) it is evident thatthe produced particles have the anatase crystal structure. Italso has to be noted that a small amount of rutile TiO2 ispresent. The shoulder on the right-hand side of the (101)anatase peak corresponds to (110) peak for the rutile TiO2.A small amount of rutile is present in metatitanic acid and isthe consequence of production procedure.
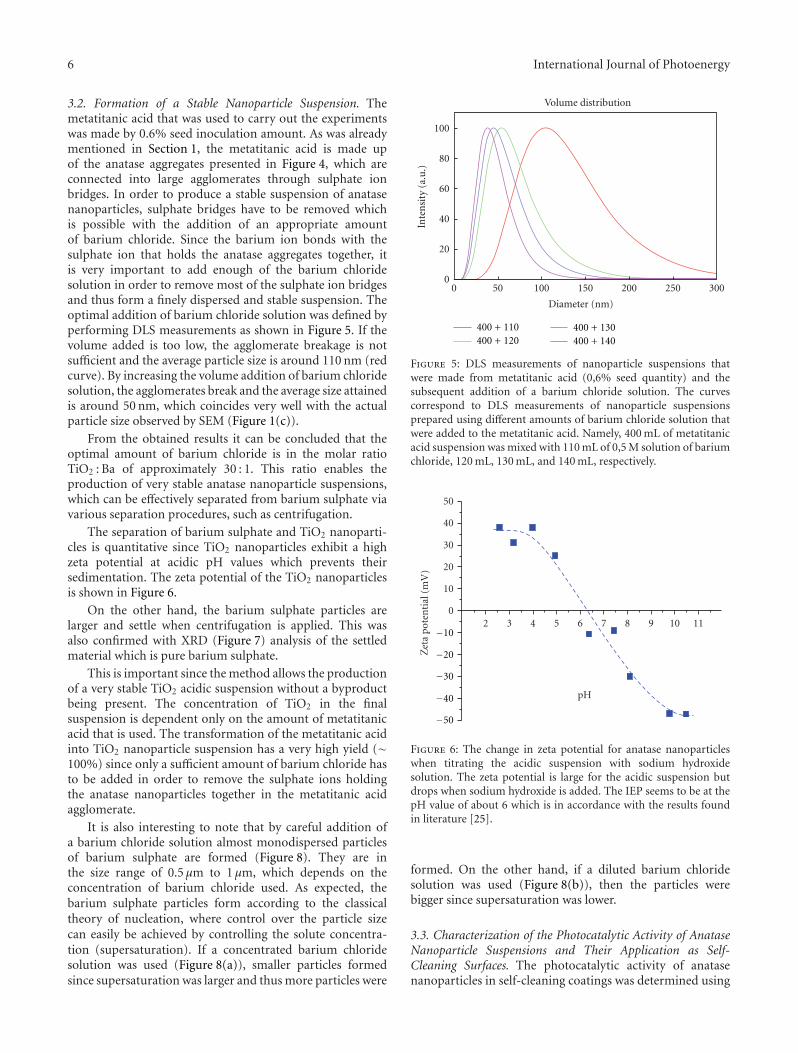
6 International Journal of Photoenergy
3.2. Formation of a Stable Nanoparticle Suspension. Themetatitanic acid that was used to carry out the experimentswas made by 0.6% seed inoculation amount. As was alreadymentioned in Section 1, the metatitanic acid is made upof the anatase aggregates presented in Figure 4, which areconnected into large agglomerates through sulphate ionbridges. In order to produce a stable suspension of anatasenanoparticles, sulphate bridges have to be removed whichis possible with the addition of an appropriate amountof barium chloride. Since the barium ion bonds with thesulphate ion that holds the anatase aggregates together, itis very important to add enough of the barium chloridesolution in order to remove most of the sulphate ion bridgesand thus form a finely dispersed and stable suspension. Theoptimal addition of barium chloride solution was defined byperforming DLS measurements as shown in Figure 5. If thevolume added is too low, the agglomerate breakage is notsufficient and the average particle size is around 110 nm (redcurve). By increasing the volume addition of barium chloridesolution, the agglomerates break and the average size attainedis around 50 nm, which coincides very well with the actualparticle size observed by SEM (Figure 1(c)).
From the obtained results it can be concluded that theoptimal amount of barium chloride is in the molar ratioTiO2 : Ba of approximately 30 : 1. This ratio enables theproduction of very stable anatase nanoparticle suspensions,which can be effectively separated from barium sulphate viavarious separation procedures, such as centrifugation.
The separation of barium sulphate and TiO2 nanoparti-cles is quantitative since TiO2 nanoparticles exhibit a highzeta potential at acidic pH values which prevents theirsedimentation. The zeta potential of the TiO2 nanoparticlesis shown in Figure 6.
On the other hand, the barium sulphate particles arelarger and settle when centrifugation is applied. This wasalso confirmed with XRD (Figure 7) analysis of the settledmaterial which is pure barium sulphate.
This is important since the method allows the productionof a very stable TiO2 acidic suspension without a byproductbeing present. The concentration of TiO2 in the finalsuspension is dependent only on the amount of metatitanicacid that is used. The transformation of the metatitanic acidinto TiO2 nanoparticle suspension has a very high yield (∼100%) since only a sufficient amount of barium chloride hasto be added in order to remove the sulphate ions holdingthe anatase nanoparticles together in the metatitanic acidagglomerate.
It is also interesting to note that by careful addition ofa barium chloride solution almost monodispersed particlesof barium sulphate are formed (Figure 8). They are inthe size range of 0.5 μm to 1 μm, which depends on theconcentration of barium chloride used. As expected, thebarium sulphate particles form according to the classicaltheory of nucleation, where control over the particle sizecan easily be achieved by controlling the solute concentra-tion (supersaturation). If a concentrated barium chloridesolution was used (Figure 8(a)), smaller particles formedsince supersaturation was larger and thus more particles were
Inte
nsi
ty (
a.u
.)
Diameter (nm)
Volume distribution
100
80
60
40
20
0250 300200150100500
400 + 110400 + 120
400 + 130400 + 140
Figure 5: DLS measurements of nanoparticle suspensions thatwere made from metatitanic acid (0,6% seed quantity) and thesubsequent addition of a barium chloride solution. The curvescorrespond to DLS measurements of nanoparticle suspensionsprepared using different amounts of barium chloride solution thatwere added to the metatitanic acid. Namely, 400 mL of metatitanicacid suspension was mixed with 110 mL of 0,5 M solution of bariumchloride, 120 mL, 130 mL, and 140 mL, respectively.
Zet
a po
ten
tial
(m
V)
pH
20
30
40
50
10
02 3 4 5 6 7 8 9 10 11
−10
−20
−30
−40
−50
Figure 6: The change in zeta potential for anatase nanoparticleswhen titrating the acidic suspension with sodium hydroxidesolution. The zeta potential is large for the acidic suspension butdrops when sodium hydroxide is added. The IEP seems to be at thepH value of about 6 which is in accordance with the results foundin literature [25].
formed. On the other hand, if a diluted barium chloridesolution was used (Figure 8(b)), then the particles werebigger since supersaturation was lower.
3.3. Characterization of the Photocatalytic Activity of AnataseNanoparticle Suspensions and Their Application as Self-Cleaning Surfaces. The photocatalytic activity of anatasenanoparticles in self-cleaning coatings was determined using
International Journal of Photoenergy 7
Inte
nsi
ty (
a.u
.)
20 30 40 502θ (◦)
Figure 7: The X-ray powder diffractogram of the material collectedafter the centrifugation cycle was finished. The diffractogramexhibits all the peaks for barium sulphate while no observable peaksfor anatase are evident.
(a)
(b)
Figure 8: SEM image of barium sulphate particles. (a) Bariumsulphate particles formed when a concentrated solution of bariumchloride was used. (b) Barium sulphate particles formed when adiluted solution of barium chloride was used.
contact-angle measurements. Figure 7 shows that the sam-ples NTi1 and NTi2 decompose the methyl stearate testpollutant rapidly, since the water contact angle fell in lessthan one hour of UVA irradiation from initial hydrophobicvalue, characteristic for the fatty deposit, to the finalhydrophilic value, characteristic for clean and hydroxylated
TiO2. The sample coating NTi1 performed slightly betterthan the sample coating NTi2, which can be attributed tothe fact that the layer thickness differs for the two samples.This could be due to the fact that the anatase nanoparticlesdiffer in size since they were prepared using 0.3 and 0.6%seeding volume, respectively. However, the difference in layerthickness was not examined. The slight difference in thephotocatalytic activity of the NTi1 and NTi2 coatings couldalso be a direct result of the fact that anatase nanoparticlesdiffer in size. The anatase nanoparticles used for NTi1coating are depicted in Figure 1(d), the anatase nanoparticlesused for NTi2 coating in Figure 1(c). Our results indicatethat the anatase nanoparticles depicted in Figure 1(d) couldbe slightly more photocatalytically active than the anatasenanoparticles depicted in Figure 1(c). However, raw anatasenanoparticles were not analysed for their photocatalyticactivity, and therefore the difference in the photocatalyticactivity for the NTi1 and NTi2 coating cannot be addressedadequately. Sample coating NTi3 performed worse eventhough the coatings were additionally thermally treated inorder to enhance the particle crystallinity and adhesion to thesubstrate. Such worsening in performance can be attributedto the fact that a thermal treatment was used. It is possiblethat during the treatment the nanoparticles present in thecoating became larger due to sintering, which lowered theirspecific surface and consequently the photocatalytic activityof the coating as a whole. Since anatase nanoparticles are wellcrystallised at the beginning, the thermal treatment does notcontribute to their crystallinity and thus does not enhance it(Figure 9).
As one can see (Figure 10) the photocatalytic activity ofthe anatase nanoparticles depends greatly on the synthesisprocedure, that is, on the seeding volume used for thesecondary nucleation during the nanoparticle synthesis.Although the nanoparticles synthesized using the 1.8% seed-ing volume (NTi4 coating) are smaller in size and thus have agreater specific surface, they performed worse in comparisonto the nanoparticles that were synthesized using the 0.6%seeding volume (NTi5 coating). This can be explained bythe fact that the hydrolysis and polycondensation reactionsduring the synthesis are carried out more rapidly when usinga greater seeding volume, which consequently influencesthe overall crystallinity of the final product. Since thehydrolysis/polycondensation reactions were very fast whenthe 1.8% seeding volume was used, it can be assumedthat the product crystallinity is worse since the kinetics ofthe reaction do not allow the crystal structure to be fullydeveloped during the synthesis. Therefore, smaller seedingvolumes are necessary and provide a better nanoparticulateanatase which is suitable for self-cleaning applications.However, it seems that a smaller seeding volume of 0.3%produces a photocatalytically more active anatase thanthe 0.6% seeding volume since the NTi6 coating (anataseprepared with 0.3% seeding volume) performs better thanthe NTi5 coating (anatase prepared with 0.6% seedingvolume).
Self-cleaning coatings were also tested in real-life envi-ronmental conditions (8-month testing period with seasonalclimate changes (summer-spring)). Self-cleaning coatings
8 International Journal of Photoenergy
t (m in)
200 40 60 80 100 1200
20
40
60
80
100
120
N-Ti1 (anatase, 10 cm /m in, dried at room tem perature)N-Ti2 (anatase, 7 cm /m in, dried at room tem perature)N-Ti3 (anatase, 10 cm /m in, dried at 400 ◦C 30 m in)
Contact angle (◦)
Figure 9: Contact-angle measurements for self-cleaning coatingsprepared from anatase nanoparticles presented in Figure 1(c) usinga soft chemical method. Water contact angles were measured afterdifferent times of irradiation of the coatings covered by methylstearate layer.
0 5 20
t (h)
25 300
20
40
60
80
100
Contact angle (◦)
N -Ti5 (0.6% seeding volum e, dried at 450 ◦C)N-Ti6 (0.3% seeding volum e, dried at 450 ◦C)
N-Ti4 (1.8% seeding volum e, dried at 450 ◦C)
Figure 10: Contact-angle measurements for different coatingsprepared from anatase nanoparticles using a soft chemical method.The anatase nanoparticles were prepared using different seedingvolumes during the synthesis and therefore differ in size. Watercontact angles were measured after different times of irradiation ofthe coatings covered by methyl stearate layer.
were applied on a glass surface (Figure 11) and exposed tochanging weather conditions over a period of 8 months. Thecoatings remained photocatalytically active and mechanicallystable over the whole testing period.
This was tested by performing swift quantitative testsfor photocatalytic performance using the resazurin dye. Thedye was stained onto the coated glass substrates depicted inFigure 11 which were then subjected to UV irradiation. If the
(a)
(b)
Figure 11: Glass substrates treated with self-cleaning coating andplaced in real-life conditions. One can see that the coatings exhibitthe superhydrophilic effect, which is depicted clearly in image (b),where a clear distinction between the treated (superhydrophilic)and untreated (water droplets) surface is shown.
TiO2 coating was to lose its activity or was even mechanicallywashed away due to improper and inadequate adhesion,the resazurin dye would not decompose and no observablechange in colour would occur (Figure 12).
As seen from Figure 12, the resazurin test has proventhat the TiO2 coating is still present and photocatalyticallyactive after eight months of exposure to real-life weatherconditions.
Nevertheless, it has to be noted that the contact-anglemeasurement technique that was used does not provide anentirely accurate impression on the photocatalytic activityof the coatings since the change in contact angle can alsoarise from the fact that TiO2 becomes superhydrophilic whenilluminated with UV light. Therefore the change in contactangle value cannot be attributed to the methyl stearatedecomposition solely, but also to the fact that the layeritself changes its surface properties. A more straightforwardtechnique to determine the photocatalytic activity of thecoatings should be used as will be the case in our futureresearch activities of self-cleaning coatings.
4. Conclusions
In summary, anatase nanoparticles were synthesized basedon a well-established sulphate process for TiO2 pigmentproduction in which metatitanic acid is produced. The
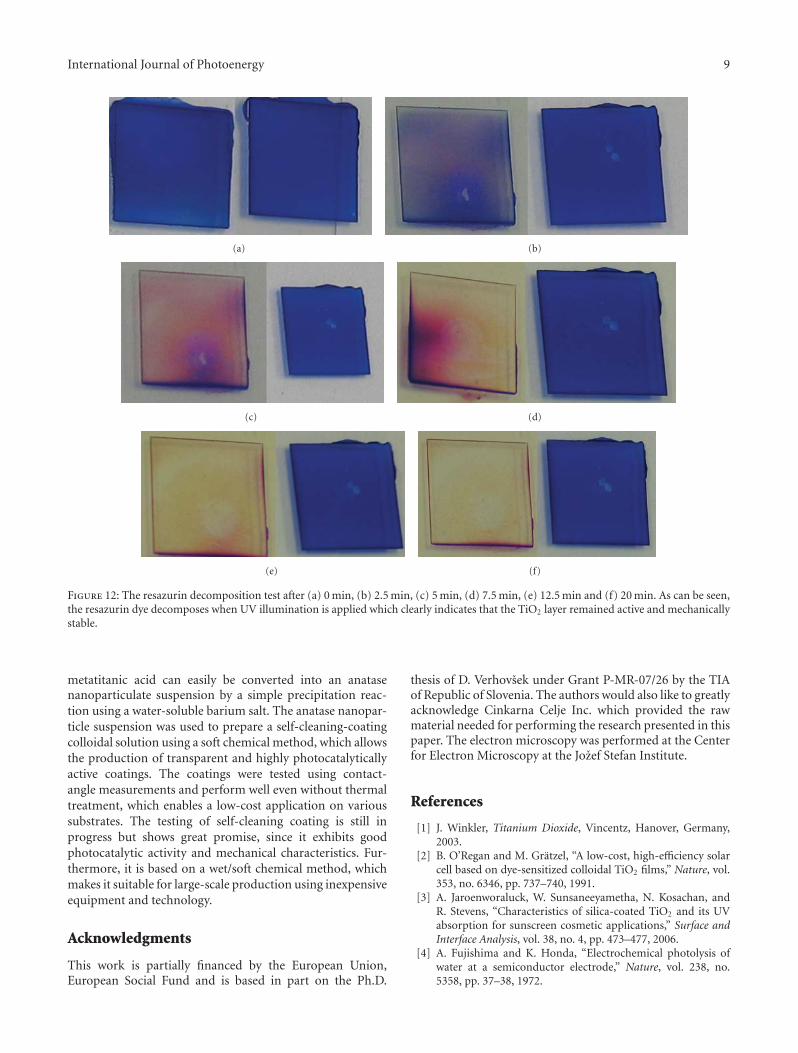
International Journal of Photoenergy 9
(a) (b)
(c) (d)
(e) (f)
Figure 12: The resazurin decomposition test after (a) 0 min, (b) 2.5 min, (c) 5 min, (d) 7.5 min, (e) 12.5 min and (f) 20 min. As can be seen,the resazurin dye decomposes when UV illumination is applied which clearly indicates that the TiO2 layer remained active and mechanicallystable.
metatitanic acid can easily be converted into an anatasenanoparticulate suspension by a simple precipitation reac-tion using a water-soluble barium salt. The anatase nanopar-ticle suspension was used to prepare a self-cleaning-coatingcolloidal solution using a soft chemical method, which allowsthe production of transparent and highly photocatalyticallyactive coatings. The coatings were tested using contact-angle measurements and perform well even without thermaltreatment, which enables a low-cost application on varioussubstrates. The testing of self-cleaning coating is still inprogress but shows great promise, since it exhibits goodphotocatalytic activity and mechanical characteristics. Fur-thermore, it is based on a wet/soft chemical method, whichmakes it suitable for large-scale production using inexpensiveequipment and technology.
Acknowledgments
This work is partially financed by the European Union,European Social Fund and is based in part on the Ph.D.
thesis of D. Verhovsek under Grant P-MR-07/26 by the TIAof Republic of Slovenia. The authors would also like to greatlyacknowledge Cinkarna Celje Inc. which provided the rawmaterial needed for performing the research presented in thispaper. The electron microscopy was performed at the Centerfor Electron Microscopy at the Jozef Stefan Institute.
References
[1] J. Winkler, Titanium Dioxide, Vincentz, Hanover, Germany,2003.
[2] B. O’Regan and M. Gratzel, “A low-cost, high-efficiency solarcell based on dye-sensitized colloidal TiO2 films,” Nature, vol.353, no. 6346, pp. 737–740, 1991.
[3] A. Jaroenworaluck, W. Sunsaneeyametha, N. Kosachan, andR. Stevens, “Characteristics of silica-coated TiO2 and its UVabsorption for sunscreen cosmetic applications,” Surface andInterface Analysis, vol. 38, no. 4, pp. 473–477, 2006.
[4] A. Fujishima and K. Honda, “Electrochemical photolysis ofwater at a semiconductor electrode,” Nature, vol. 238, no.5358, pp. 37–38, 1972.
10 International Journal of Photoenergy
[5] S. U. M. Khan, M. Al-Shahry, and W. B. Ingler, “Efficientphotochemical water splitting by a chemically modified n-TiO2,” Science, vol. 297, no. 5590, pp. 2243–2245, 2002.
[6] M. Schiavello, Photocatalysis and Environment: Trends andApplications, Kluwer Academic, Dodrecht, The Netherlands,1988.
[7] N. Serpone and E. Pelizetti, Photocatalysis: Fundamentals andApplications, Wiley, New York, NY, USA, 1989.
[8] D. F. Ollis and H. Al-Ekabi, Photocatalytic Purification andTreatment of Water and Air, Elsevier, Amsterdam, The Nether-lands, 1993.
[9] M. R. Hoffmann, S. T. Martin, W. Choi, and D. W. Bahne-mann, “Environmental applications of semiconductor photo-catalysis,” Chemical Reviews, vol. 95, no. 1, pp. 69–96, 1995.
[10] J. M. Herrmann, “Heterogeneous photocatalysis: fundamen-tals and applications to the removal of various types ofaqueous pollutants,” Catalysis Today, vol. 53, no. 1, pp. 115–129, 1999.
[11] D. Bahnemann, “Photocatalytic detoxification of pollutedwaters,” in Environmental Photochemistry, Springer, Berlin,Germany, 1999.
[12] A. Fujishima, K. Hashimoto, and T. Watanabe, TiO2 Photo-catalysis: Fundamentals and Applications, BKC, Tokyo, Japan,1999.
[13] P. Pichat, J. Disdier, C. Hoang-Van, D. Mas, G. Goutailler,and C. Gaysse, “Purification/deodorization of indoor air andgaseous effluents by TiO2 photocatalysis,” Catalysis Today, vol.63, no. 2–4, pp. 363–369, 2000.
[14] M. Muneer, S. Das, V. B. Manilal, and A. Haridas, “Pho-tocatalytic degradation of waste-water pollutants: titaniumdioxide-mediated oxidation of methyl vinyl ketone,” Journal ofPhotochemistry and Photobiology A, vol. 63, no. 1, pp. 107–114,1992.
[15] S. G. Botta, D. J. Rodrıguez, A. G. Leyva, and M. I. Litter,“Features of the transformation of HgII by heterogeneousphotocatalysis over TiO2,” Catalysis Today, vol. 76, no. 2–4, pp.247–258, 2002.
[16] S. C. Moon, Y. Matsumura, M. Kitano, M. Matsuoka, andM. Anpo, “Hydrogen production using semiconducting oxidephotocatalysts,” Research on Chemical Intermediates, vol. 29,no. 3, pp. 233–256, 2003.
[17] J. H. Carey, J. Lawrence, and H. M. Tosine, “Photodechlorina-tion of PCB’s in the presence of titanium dioxide in aqueoussuspensions,” Bulletin of Environmental Contamination andToxicology, vol. 16, no. 6, pp. 697–701, 1976.
[18] S. Sathyamoorthy, G. D. Moggridge, and M. J. Hounslow,“Controlling particle size during anatase precipitation,” AIChEJournal, vol. 47, no. 9, pp. 2012–2024, 2001.
[19] S. Sathyamoorthy, G. D. Moggridge, and M. J. Hounslow,“Particle formation during anatase precipitation of seededtitanyl sulfate solution,” Crystal Growth and Design, vol. 1, no.2, pp. 123–129, 2001.
[20] U. Cernigoj and U. L. Stangar, “Preparation of TiO2/SiO2
and use thereof for deposition of self-cleaning anti-fogging,”International patent application number PCT/SI2009/000052.International patent publication number WO 2010/053459A1; 2009.
[21] U. Cernigoj, M. Kete, and U. L. Stangar, “Development ofa fluorescence-based method for evaluation of self-cleaningproperties of photocatalytic layers,” Catalysis Today, vol. 151,no. 1-2, pp. 46–52, 2010.
[22] U. Cernigoj, M. Kete, U. L. Stangar, and V. Ducman, “Testingof photocatalytic activity of self-cleaning surfaces,” Advancesin Science and Technology, vol. 68, pp. 126–134, 2010.
[23] Y. Li, Y. Fan, and Y. Chen, “A novel method for preparationof nanocrystalline rutile TiO2 powders by liquid hydrolysis ofTiCl4,” Journal of Materials Chemistry, vol. 12, no. 5, pp. 1387–1390, 2002.
[24] J. W. Mullin, Cystallization, Butterworth-Heinemann, Lon-don, UK, 3rd edition, 1993.
[25] G. D. Parfitt, “Surface chemistry of oxides,” Pure and AppliedChemistry, vol. 48, pp. 415–418, 1976.
[26] G. D. Parfitt, J. Ramsbotham, and C. H. Rochester, “Anelectrophoretic investigation of the effect of chloride and ofsilanol groups on the properties of the surface of rutile,”Journal of Colloid And Interface Science, vol. 41, no. 3, pp. 437–444, 1972.
[27] T. W. Evans, A. F. Sarofim, and G. Margolis, “Models ofsecondary nucleation attributable to crystal-crystallizer andcrystal-crystal collisions,” AIChE Journal, vol. 20, no. 5, pp.959–966, 1974.
[28] E. G. Denk and G. D. Botsaris, “Mechanism of contactnucleation,” Journal of Crystal Growth, vol. 15, no. 1, pp. 57–60, 1972.
[29] R. Y. Qian and G. D. Botsaris, “A new mechanism for nucleiformation in suspension crystallizers: the role of interparticleforces,” Chemical Engineering Science, vol. 52, no. 20, pp. 3429–3440, 1997.
Hindawi Publishing CorporationInternational Journal of PhotoenergyVolume 2012, Article ID 843042, 10 pagesdoi:10.1155/2012/843042
Research Article
High-Efficiently Photoelectrochemical Hydrogen Production overZn-Incorporated TiO2 Nanotubes
Gayoung Lee,1 Min-Kyeong Yeo,2 Myeong-Heon Um,3 and Misook Kang1
1 Department of Chemistry, College of Science, Yeungnam University, Gyeongsan, Gyeongbuk 712-749, Republic of Korea2 Department of Environmental Science and Environmental Research, College of Engineering, Kyung Hee University, Yongin,Gyeonggi 446-701, Republic of Korea
3 Department of Chemical Engineering, College of Engineering, Kongju National University, Cheonan,Chungnam 330-717, Republic of Korea
Correspondence should be addressed to Misook Kang, [email protected]
Received 3 February 2012; Revised 21 March 2012; Accepted 22 March 2012
Academic Editor: Baibiao Huang
Copyright © 2012 Gayoung Lee et al. This is an open access article distributed under the Creative Commons Attribution License,which permits unrestricted use, distribution, and reproduction in any medium, provided the original work is properly cited.
To investigate the Zn dopant and nanotube morphology effects of TiO2 in electrochemical hydrogen production from the photo-splitting of methanol/water solution, we have designed a Zn-incorporated TiO2 nanotube (Zn-TNT) photocatalyst. The TNTand Zn-TNT materials had a width of 70∼100 nm. The hydrogen production over the Zn-TNT photocatalysts was higher thanthat over the TNT; specifically, 10.2 mL of H2 gas was produced after 9 hours when 0.5 g of 0.01 mol% Zn-TNT was used. Thezeta-potential values in aqueous solution determined by electrophoretic light scattering (ELS) had negative surface charges, whichwas related to the surface stability, and the absolute value was the largest in 0.01 mol% Zn-TNT. On the basis of UV-visible andphotoluminescence (PL) spectra results, the high photoactivity of Zn-TNT was attributed to the shift toward the visible region andincrease of PL intensity due to the increased number of excited electrons and holes.
1. Introduction
Hydrogen is likely to become an increasingly used energysource due to its environmental friendliness. Therefore, thetechnology for generating hydrogen by the photosplittingof water using a photocatalyst has attracted considerableresearch attention. The photocatalytic formation of hydro-gen and oxygen on semiconductors such as TiO2 [1–5] andMTiO3 [6–10] has been studied extensively due to the lowbandgap and high corrosion resistance of these semiconduc-tor materials. However, the photocatalytic decompositionof water on a TiO2 photocatalyst is ineffective because theamount of hydrogen produced is limited by the rapid recom-bination of holes and electrons, resulting in the formationof water. In order to overcome this rapid recombination, thenoble metals (Ag, Pd, Pt, and Ga) loaded TiO2 photocatalysts[11–14] have used in methanol or ethanol photodecompo-sition, rather than water which has relatively high activityand chemical stability under UV irradiation. However, the
hydrogen production remains uneconomically low, and no-ble metals are too expensive. Therefore, new and inexpensivephotocatalysts need to be developed that are environmentallyfriendly and possess greater hydrogen-producing activityunder visible light irradiation.
Nanotubes materials have recently been applied on pho-tocatalysis [15–17]. Xu et al. [15] reported an efficient Cu-incorporated TiO2 nanotube (Cu-TNT) photocatalyst forH2 production, with an average H2 generation rate re-corded across a 4-hour reaction of between 15.7 and40.2 mmol h−1 g−1 catalyst, depending on the initial Cu/Tiratio in the solution, which was optimized at 10 atom%. Sanget al. [16] have also researched the photoelectrochemicalhydrogen evolving over C- and N-doped TNT arrays elec-trode: C-TNT could harvest more light and produce morephotoactive sites than N-TNT, which also made the chargetransfer resistance in C-TNT larger than that in N-TNT.As the result, under UV-vis light irradiation, the averagehydrogen generation rate of C-TNT was 282 μL h−1 cm−2.
2 International Journal of Photoenergy
However, little research has been conducted on metal-TNT,and the correlation between TNT properties and hydro-genation performance has barely been addressed.
In this study, Zn-incorporated TNT (Zn-TNT) was syn-thesized using Zn-TiO2 nanosized particles as starting mat-erials with three molar ratios of Ti/Zn. The relationshipbetween the spectroscopic properties of the nanotube par-ticles and the photocatalytic performance for the productionof H2 was examined by X-ray diffraction (XRD), transmis-sion electron microscopy (TEM), UV-visible spectroscopy,photoluminescence (PL), electrophoretic light scattering(ELS), and cyclic voltammetry (CV).
2. Experimental
To synthesize the TNT and Zn-TNT, all the nanosized parti-cles of TiO2 and Zn-incorporated TiO2 were prepared usinga hydrothermal treatment as shown in Figure 1(a). First,the nanometer-sized TiO2 and Zn-TiO2 with various molfractions of zinc (0.1, 0.01, and 0.001 mol-%) were preparedusing a solvothermal treatment: titanium tetraisopropoxide(TTIP, 99.95%, Junsei Chemical, Japan) and zinc acetate(Zn(CH3COO)2·2H2O, 99.99%, Junsei Chemical, Japan)were used as the titanium and zinc precursors, respectively,and ethanol was used as the solvent. After 0.1, 0.01, and0.001 mol-% of zinc acetate and 1.0 mol TTIP were addedstepwise to 250 mL of ethanol, the mixture was stirredhomogeneously for 2 h. Acetic acid was added and thepH was maintained at 4.0 for rapid hydrolysis. The finalsolution was stirred homogeneously for 2 h and moved to anautoclave for thermal treatment. TTIP and zinc acetate werehydrolyzed during thermal treatment at 200◦C for 8 h undera nitrogen environment with a pressure of approximately15.0 atm. The resulting precipitate was washed with distilledwater until the pH was neutralized at 7.0 and then driedat 80◦C for 24 h. Next, the general preparation methodsof TNT and Zn-TNT powders have been described in theliterature [18]. Prepared TiO2 or Zn-TiO2 particles wereadded in 10.0 M NaOH aqueous solution (Figure 1(b)), andthe mixture was stirred homogeneously for 2 h and movedto an autoclave for thermal treatment at 130◦C for 24 h Theresulting precipitate was washed with HCl solution until thepH = 7.0 and then dried at 80◦C for 24 h. The TNT or Zn-TNT was in the form of multiwalled scroll nanotubes with anaverage width of about 70–100 nm.
The synthesized powders were examined by XRD (MPD,PANalytical) with nickel-filtered CuKα radiation (30 kV,30 mA). The sizes and shapes of the TNT and Zn-TNT weremeasured by a transmission electron microscope (TEM; H-7600, Hitachi) operated at 120 kV. UV-visible spectra wereobtained using a Cary500Scan (Varian) spectrometer witha reflectance sphere in the range of 200∼800 nm. PL spec-troscopy measurements were obtained using a LabRamHR(Jobin Yvon) spectrometer in the range of 200∼700 nm toexamine the number of photoexcited electron hole pairs forall of the samples. The specific surface area was calculatedaccording to the Brunauer-Emmett-Teller (BET) theory thatgives the isotherm equation for multilayer adsorption by
generalization of Langmuir’s treatment of the unimolecularlayer. The BET surface area was measured using a BelsorpII-mini (BEL, Japan inc.) equipped with a TCD instrument.The CV results were obtained using a BAS 100B instrumentat room temperature and a scan rate of 100 mV/s with0.1 M KCl as the supporting electrolyte, platinum wires asthe working and counter electrodes, and Ag/AgCl as thereference electrode. Zeta potentials of the TNT and Zn-TNT were determined by electrophoretic mobility using anelectrophoresis measurement apparatus (ELS 8000, OtsukaElectronics, Japan) with a plate sample cell. ELS determina-tions were performed with the reference beam mode and alaser light source wavelength of 670 nm, modular frequencyof 250 Hz, and scattering angle of 15◦. The standard errorof the zeta potentials, converted from the experimentallydetermined electrophoretic mobility according to the Smolu-chowsk [19] limit of the Henry equation, was typically <1.5%and the percent error <5%. To measure the zeta potentials,0.1 wt% of each sample was dispersed in deionized waterand the solution pH was adjusted with HCl or NaOH. Therelative molecular diameter size distributions of the varioussolutions were also measured by this equipment. The zetapotential distributions were obtained by averaging 2 or 3runs.
The photosplitting of methanol/water was carried outusing a liquid photoreactor designed in our laboratory. Forwater photosplitting, 0.5 g of the powdered TNT and Zn-TNT photocatalysts was added to 1.0-L of distilled water in a2.0-L Pyrex reactor. UV-lamps (6× 3 W cm−2 = 18 W cm−2,30 cm length × 2.0 cm diameter; Shinan, Korea) emittingradiation at 365 nm were used. Water photosplitting wascarried out for 9 h with constant stirring. Hydrogen evo-lution was measured after 1 h. The hydrogen gas (H2)produced during water photosplitting was analyzed using aTCD-type gas chromatograph (GC, model DS 6200; DonamInstruments Inc., Korea). To determine the products andintermediates, the GC was connected directly to the waterdecomposition reactor under the following GC conditions:TCD detector, Carbosphere column (Alltech, Deerfield, IL),413 K injection temp., 393 K initial temp., 393 K final temp.,and 423 K detector temp.
3. Results and Discussion
Figures 2(a) and 2(b) show the XRD patterns of the Zn-TiO2 nanoparticles (Zn-TNP) and Zn-TNT. The anatasestructure in both TNP and TNT without Zn element hadmain peaks at 24–25.3, 38.0, 48.2, 54, 63, and 68◦2θ, whichwere assigned to the (d101), (d004), (d200), (d105), (d211), and(d204) planes, respectively [20, 21]. The peak intensities ofthe anatase structures were decreased and slightly shiftedto high angles with increasing Zn content. Two specialpeaks (JSPDF#251164), which were assigned to Zn2TiO4 at2 θ = 28.5(d220) and 34.5(d311) in 0.1 mol% Zn-TNP andZn-TNTs, were attributed to the good connection betweenZn and the TiO2 framework. Following a literature [18], anH2Ti2O5 (d003, JSPDF#360654) peak also appears at samelocation to 28∼29◦ of Zn2TiO4 in TNT and Zn-TNT because
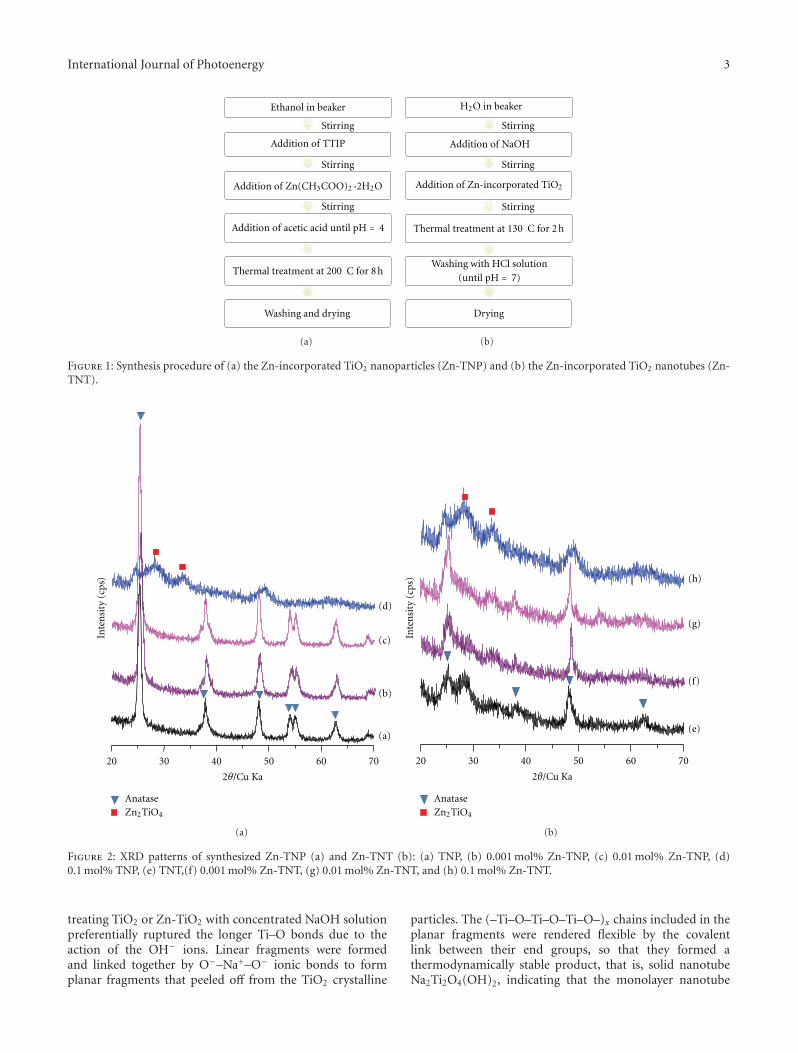
International Journal of Photoenergy 3
Addition of TTIP
Stirring
Stirring
Stirring
Ethanol in beaker
Washing and drying
Addition of Zn(CH3COO)2·2H2O
Addition of acetic acid until pH = 4
Thermal treatment at 200 C for 8 h
(a)
Stirring
Stirring
Stirring
Drying
Addition of Zn-incorporated TiO2
Addition of NaOH
H2O in beaker
Washing with HCl solution(until pH = 7)
Thermal treatment at 130 C for 2 h
(b)
Figure 1: Synthesis procedure of (a) the Zn-incorporated TiO2 nanoparticles (Zn-TNP) and (b) the Zn-incorporated TiO2 nanotubes (Zn-TNT).
20 30 40 50 60 70
AnataseZn2TiO4
Inte
nsi
ty (
cps)
2θ/Cu Ka
(a)
(b)
(c)
(d)
(a)
20 30 40 50 60 70
AnataseZn2TiO4
Inte
nsi
ty (
cps)
2θ/Cu Ka
(e)
(f)
(g)
(h)
(b)
Figure 2: XRD patterns of synthesized Zn-TNP (a) and Zn-TNT (b): (a) TNP, (b) 0.001 mol% Zn-TNP, (c) 0.01 mol% Zn-TNP, (d)0.1 mol% TNP, (e) TNT,(f) 0.001 mol% Zn-TNT, (g) 0.01 mol% Zn-TNT, and (h) 0.1 mol% Zn-TNT.
treating TiO2 or Zn-TiO2 with concentrated NaOH solutionpreferentially ruptured the longer Ti–O bonds due to theaction of the OH− ions. Linear fragments were formedand linked together by O−–Na+–O− ionic bonds to formplanar fragments that peeled off from the TiO2 crystalline
particles. The (–Ti–O–Ti–O–Ti–O–)x chains included in theplanar fragments were rendered flexible by the covalentlink between their end groups, so that they formed athermodynamically stable product, that is, solid nanotubeNa2Ti2O4(OH)2, indicating that the monolayer nanotube
4 International Journal of Photoenergy
20 nm
(a)
500 nm
(b)
20 nm
(c)
500 nm
(d)
20 nm
(e)
500 nm
(f)
20 nm
(g)
500 nm
(h)
Figure 3: TEM images of synthesized Zn-TNP and Zn-TNT: (a) TNP, (b) TNT, (c) 0.001 mol% Zn-TNP, (d) 0.001 mol% Zn-TNT, (e)0.01 mol% Zn-TNP, (f) 0.01 mol% Zn-TNT, (g) 0.1 mol% Zn-TNP, and (h) 0.1 mol% Zn-TNT.
may have acted as the template for the multilayer nanotubes.Such a formation process of nanotube Na2Ti2O4(OH)2 wasevident. After replacing Na+ with H+ using HCl solution atpH 1, the nanotube H2Ti2O5 finally appeared due to thewater elimination.
TEM images (Figure 3) show the particle shape of theTNP and Zn-TNP, and the pore shape and size of the TNTand Zn-TNT. TNP exhibited a mixture of rhombic andspherical particles of size distribution within the range of 5–10 nm, and increasing size and cubic shape as the Zn contentwas increased. The tube pore dimensions observed by TEMwere a width of about 70–100 nm, otherwise, the tube widthswere wide corresponds of Zn addition.
Figures 4(a)–4(d) show the adsorption-desorption iso-therms of N2 at 77 K for TNT and the three Zn-TNTsamples. The figure illustrates the shape and behavior ofthe N2 adsorption isotherms for nonporous and nanotubematerials. All the isotherms belong to IV types in the IUPACclassification [22]: the isotherm has been widely used, anda certain hysteresis slope can be observed at intermediateand high relative pressures in TNT, which is indicative ofthe presence of large nanopores (tubes) (type IV in theIUPAC classification). The adsorption and desorption linesfor TNT and Zn-TNT overlapped completely in the lowrelative pressure range, while the hysteresis loop was in thehigh relative pressure region (P/P0 > 0.4), mainly due tothe presence of ink-bottle pore types that have a largerpore size in the bottle body, which induces hysteresis inthe high relative pressure region [22, 23]. The BET surfaceareas of Zn-TNT were increased with increasing Zn content,although the total pore volume did not show any consistent
trend. The pore size distribution (PDS) is an importantcharacteristic for porous materials. Among the variousmethods that have been reported by researchers to identifythe PDS of porous materials, BJH and Comparison Plots[24, 25] are the most suitable for the range of nanopores. Therelative pressure at which pore filling takes place by capillarycondensation can be calculated from Kelvin’s equation [26],according to which the pore radius in which the capillarycondensation occurs actively can be determined as a functionof the relative pressure (P/P0). The mean pore diameter, Dp,was calculated from Dp = 4VT/S, where VT is the totalvolume of pores, and S the BET surface area. This was shownby the variation in the average pore diameter value, Dp,between 7.66 and 15.58 nm (Table 1).
Figure 5(b) summarizes the evolution of H2 from meth-anol/water photosplitting over the TNT and Zn-TNT photo-catalysts in a batch-type, liquid photoreactor system (Fig-ure 5(a)). A very small amount of H2 was collected over TNTafter methanol/water photodecomposition for 9 h, while asignificant amount of H2 gas was collected over Zn-TNT.The amount of H2 produced reached 10.2 mL over 0.5 g of0.01 mol% Zn-TNT, and consequently the emitted rate forhydrogen production was 0.225 mmol h−1 g−1 in 0.01 mol%Zn-TNT photocatalytic system. This result is significantcompared to the results that 120∼281μL h−1 of hydrogengases were produced over H-, N-, and C-TNT photocatalystsin reports by Sang et al. [16, 17]. While the amount producedwas lower on the 0.1 mol% Zn-TNT catalysts with higherloadings, possibly because of the structural damage. Theuse of two semiconductors, Zn and Ti oxides, with dif-ferent redox energy levels, in contact, can be considered
International Journal of Photoenergy 5
0
60
120
180
0 0.5 1
ADSDES
Vp/
cm3(S
TP
)g−
1
P/P0
(a)
0
150
300
450
0 0.5 1
ADSDES
Vp/
cm3(S
TP
)g−
1
P/P0
(b)
ADSDES
0
120
240
360
0 0.5 1
Vp/
cm3(S
TP
)g−
1
P/P0
(c)
ADSDES
0
90
180
270
0 0.5 1
Vp/
cm3(S
TP
)g−
1
P/P0
(d)
Figure 4: Adsorption-desorption isotherms of N2 at 77 K for TNT and Zn-TNT: (a) TNT, (b) 0.001 mol% Zn-TNT, (c) 0.01 mol% Zn-TNT,and (d) 0.1 mol% Zn-TNT.
Table 1: Surface areas and average pore-diameter for TNT and Zn-TNT calculated by BET method.
BET multipoint surfacearea [m2g−1]
Total pore volume(P/P0 = 0.990) [cm3g−1]
Average pore diameter[nm]
TNT 104.21 0.2325 8.9262
0.001 mol% Zn-TNT 118.21 0.4605 15.583
0.01 mol% Zn-TNT 135.71 0.428 12.615
0.1 mol% Zn-TNT 153.01 0.293 7.66
a promising method to improve charge separation and in-crease the lifetime of the charge carriers. Consequently, itenhances the efficiency of the interfacial charge transfer tothe adsorbed substrate. For efficient inter-particle electrontransfer between the semiconductor, which is considered theZnO and TNT, the conduction band of TNT must be moreanodic than the corresponding band of the ZnO. Undervisible irradiation, only the ZnO is excited, and electronsgenerated to their conduction band are injected into theinactivated TNT conduction band. If the valance band of theZnO is more cathodic than that of TNT, the holes generated
in the semiconductor remain there and cannot migrateto TNT. These thermodynamic conditions favor electroninjection. Additionally, the tube-shaped TNT offers a largersurface area, and with the increasing affinity of methanol,the performance degradation is eventually considered to behigher.
Tables 2 and 3 and Figure 6 depict the influence of pHon the position of the zeta potential distribution median ofTNT and Zn-TNT. The zeta potential of TNT suspensionwas significantly decreased with increasing pH. The surfacecharges were transferred from positive in acidic solution
6 International Journal of Photoenergy
Pump
Reactor
ILseparator
Gas chromatography
-TCD detector
-Carbonspere column
Ar Air
Reaction conditions
UV-lamp: 3 ea
(6 W/cm2, 365 nm)
Solution: MeOH (500 mL+ DI water (500 mL))
Reaction time: 1–9
h (stirring) Catalyst: 0.5 g
(a)
11
10
9
8
7
6
5
4
3
2
1
10
2 3 4 5 6 7 8 9
Time (h)
Hyd
roge
n p
rodu
ctio
n (
mL)
(A)(B)
(C)
(D)
TNT0.001
0.010.1
(b)
Figure 5: The evolution of H2 from methanol/water photosplitting over the TNT and Zn-TNT photocatalysts in a batch-type liquidphotoreactor system. (a) Photoreactor system for hydrogen production from methanol aqueous solution and (b) hydrogen productionfrom methanol aqueous solution according to the time on stream: (A) TNT, (B) 0.001 mol% Zn-TNT, (C) 0.01 mol% Zn-TNT, and (D)0.1 mol% Zn-TNT.
Zeta-potential curves
15
10
5
0
−5
−10
−15
−20
−25
3 5 7 9 11
Figure 6: Zeta-potential curve for 0.01 mol% Zn-TNT according topH.
to negative in alkali solution. For 0.01 mol% Zn-TNT, theisoelectric point was at pH 5.3 with large aggregation, butotherwise at pH = 7.0. The surface charge had the highestabsolute value of −21.41 mV, which indicated that the0.01 mol% Zn-TNT colloidal was stable [27, 28] having lessaggregation. Table 3 summarize the zeta-potential valuesand aggregated diameter sizes for all samples at pH = 7.0as determined by ELS. The Zn-TNT particles ranged from−18.86 to −21.41 mV on the surface and the particles were
Table 2: Zeta-potential values and aggregated diameter sizes for0.01 mol% Zn-TNT according to pH, as determined by ELS.
Zeta potential (mV) ELS diameter (nm)
pH = 3 9.28 3641.8
pH = 5 2.87 8385.4
pH = 7 −21.41 709.2
pH = 9 −18.44 687.5
pH = 11 −18.81 664.5
Table 3: Zeta-potential values and aggregated diameter sizes for allsamples at pH = 7.0, as determined by ELS.
Samples at pH = 7 Zeta potential (mV) ELS diameter (nm)
TNT −18.44 468.2
0.001 mol% Zn-TNT −18.86 728.0
0.010 mol% Zn-TNT −21.41 709.2
0.100 mol% Zn-TNT −19.07 618.2
suspended with high charge with the increase of the Zngradient. The zeta-potential was maximized at −21.41 mVin the 0.01 mol% Zn-TNT suspension. The zeta potentialand mobility of the Zn-TNT particles were relatively high forelectrophoretic display compared to those of TNT.
The absorption band of TNT and Zn-TNT for thetetrahedral symmetry of Ti4+ normally appeared at approx-imately 350∼400 nm (Figure 7(a)). The maximum absorp-tion bands in Zn-TNT were slightly shifted to a shorterwavelength than those of TNT but a broadened tail appearedin Zn-TNT. Bandgaps in semiconductor materials are
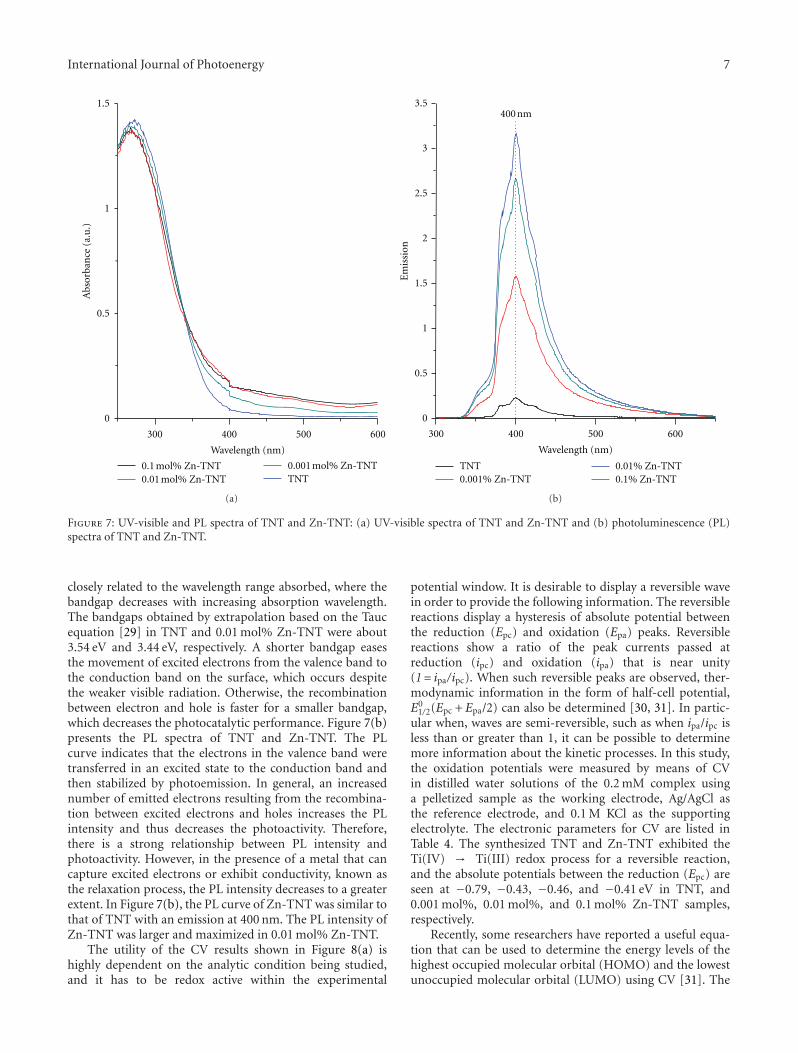
International Journal of Photoenergy 7
300 400 500 600
0
0.5
1
1.5
Abs
orba
nce
(a.
u.)
Wavelength (nm)
0.1 mol% Zn-TNT0.01 mol% Zn-TNT
0.001 mol% Zn-TNTTNT
(a)
300 400 500 600
0
0.5
1
1.5
2
2.5
3
3.5
Em
issi
on
Wavelength (nm)
400 nm
0.001% Zn-TNT0.01% Zn-TNT0.1% Zn-TNT
TNT
(b)
Figure 7: UV-visible and PL spectra of TNT and Zn-TNT: (a) UV-visible spectra of TNT and Zn-TNT and (b) photoluminescence (PL)spectra of TNT and Zn-TNT.
closely related to the wavelength range absorbed, where thebandgap decreases with increasing absorption wavelength.The bandgaps obtained by extrapolation based on the Taucequation [29] in TNT and 0.01 mol% Zn-TNT were about3.54 eV and 3.44 eV, respectively. A shorter bandgap easesthe movement of excited electrons from the valence band tothe conduction band on the surface, which occurs despitethe weaker visible radiation. Otherwise, the recombinationbetween electron and hole is faster for a smaller bandgap,which decreases the photocatalytic performance. Figure 7(b)presents the PL spectra of TNT and Zn-TNT. The PLcurve indicates that the electrons in the valence band weretransferred in an excited state to the conduction band andthen stabilized by photoemission. In general, an increasednumber of emitted electrons resulting from the recombina-tion between excited electrons and holes increases the PLintensity and thus decreases the photoactivity. Therefore,there is a strong relationship between PL intensity andphotoactivity. However, in the presence of a metal that cancapture excited electrons or exhibit conductivity, known asthe relaxation process, the PL intensity decreases to a greaterextent. In Figure 7(b), the PL curve of Zn-TNT was similar tothat of TNT with an emission at 400 nm. The PL intensity ofZn-TNT was larger and maximized in 0.01 mol% Zn-TNT.
The utility of the CV results shown in Figure 8(a) ishighly dependent on the analytic condition being studied,and it has to be redox active within the experimental
potential window. It is desirable to display a reversible wavein order to provide the following information. The reversiblereactions display a hysteresis of absolute potential betweenthe reduction (Epc) and oxidation (Epa) peaks. Reversiblereactions show a ratio of the peak currents passed atreduction (ipc) and oxidation (ipa) that is near unity(1= ipa/ipc). When such reversible peaks are observed, ther-modynamic information in the form of half-cell potential,E0
1/2(Epc +Epa/2) can also be determined [30, 31]. In partic-ular when, waves are semi-reversible, such as when ipa/ipc isless than or greater than 1, it can be possible to determinemore information about the kinetic processes. In this study,the oxidation potentials were measured by means of CVin distilled water solutions of the 0.2 mM complex usinga pelletized sample as the working electrode, Ag/AgCl asthe reference electrode, and 0.1 M KCl as the supportingelectrolyte. The electronic parameters for CV are listed inTable 4. The synthesized TNT and Zn-TNT exhibited theTi(IV) → Ti(III) redox process for a reversible reaction,and the absolute potentials between the reduction (Epc) areseen at −0.79, −0.43, −0.46, and −0.41 eV in TNT, and0.001 mol%, 0.01 mol%, and 0.1 mol% Zn-TNT samples,respectively.
Recently, some researchers have reported a useful equa-tion that can be used to determine the energy levels of thehighest occupied molecular orbital (HOMO) and the lowestunoccupied molecular orbital (LUMO) using CV [31]. The
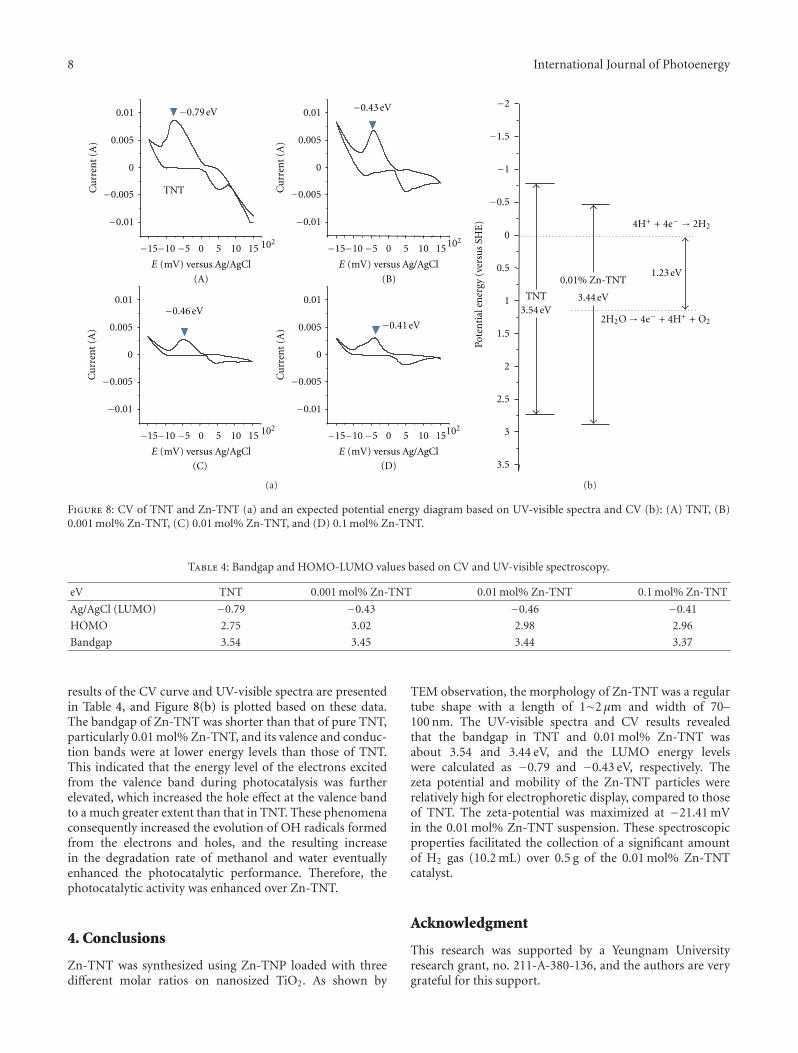
8 International Journal of Photoenergy
(A) (B)
0.01
0.005
0
−0.005
−0.01
Cu
rren
t (A
)
−15−10−5 0 5 10 15
E (mV) versus Ag/AgCl
−0.46 eV
(C) (D)
0.01
0.005
0
−0.005
−0.01
Cu
rren
t (A
)
−0.79 eV
TNT
−15−10−5 0 5 10 15
E (mV) versus Ag/AgCl
0.01
0.005
0
−0.005
−0.01
Cu
rren
t (A
)
−15−10−5 0 5 10 15
E (mV) versus Ag/AgCl
−0.43 eV
0.01
0.005
0
−0.005
−0.01
Cu
rren
t (A
)
−15−10−5 0 5 10 15
E (mV) versus Ag/AgCl
−0.41 eV
102
102 102
102
(a)
−2
−1.5
−1
−0.5
0
0.5
1
1.5
2
2.5
3
3.5Po
ten
tial
en
ergy
(ve
rsu
s SH
E)
2H2O→ 4e− + 4H+ + O2
1.23 eV
3.44 eV3.54 eV
TNT
0.01% Zn-TNT
4H+ + 4e− → 2H2
(b)
Figure 8: CV of TNT and Zn-TNT (a) and an expected potential energy diagram based on UV-visible spectra and CV (b): (A) TNT, (B)0.001 mol% Zn-TNT, (C) 0.01 mol% Zn-TNT, and (D) 0.1 mol% Zn-TNT.
Table 4: Bandgap and HOMO-LUMO values based on CV and UV-visible spectroscopy.
eV TNT 0.001 mol% Zn-TNT 0.01 mol% Zn-TNT 0.1 mol% Zn-TNT
Ag/AgCl (LUMO) −0.79 −0.43 −0.46 −0.41
HOMO 2.75 3.02 2.98 2.96
Bandgap 3.54 3.45 3.44 3.37
results of the CV curve and UV-visible spectra are presentedin Table 4, and Figure 8(b) is plotted based on these data.The bandgap of Zn-TNT was shorter than that of pure TNT,particularly 0.01 mol% Zn-TNT, and its valence and conduc-tion bands were at lower energy levels than those of TNT.This indicated that the energy level of the electrons excitedfrom the valence band during photocatalysis was furtherelevated, which increased the hole effect at the valence bandto a much greater extent than that in TNT. These phenomenaconsequently increased the evolution of OH radicals formedfrom the electrons and holes, and the resulting increasein the degradation rate of methanol and water eventuallyenhanced the photocatalytic performance. Therefore, thephotocatalytic activity was enhanced over Zn-TNT.
4. Conclusions
Zn-TNT was synthesized using Zn-TNP loaded with threedifferent molar ratios on nanosized TiO2. As shown by
TEM observation, the morphology of Zn-TNT was a regulartube shape with a length of 1∼2 μm and width of 70–100 nm. The UV-visible spectra and CV results revealedthat the bandgap in TNT and 0.01 mol% Zn-TNT wasabout 3.54 and 3.44 eV, and the LUMO energy levelswere calculated as −0.79 and −0.43 eV, respectively. Thezeta potential and mobility of the Zn-TNT particles wererelatively high for electrophoretic display, compared to thoseof TNT. The zeta-potential was maximized at −21.41 mVin the 0.01 mol% Zn-TNT suspension. These spectroscopicproperties facilitated the collection of a significant amountof H2 gas (10.2 mL) over 0.5 g of the 0.01 mol% Zn-TNTcatalyst.
Acknowledgment
This research was supported by a Yeungnam Universityresearch grant, no. 211-A-380-136, and the authors are verygrateful for this support.
International Journal of Photoenergy 9
References
[1] H.-W. Wang, H.-W. Chung, H.-T. Teng, and G. Cao, “Gener-ation of hydrogen from aluminum and water—effect of metaloxide nanocrystals and water quality,” International Journal ofHydrogen Energy, vol. 36, pp. 15136–15144, 2011.
[2] Y. Liu, L. Guo, W. Yan, and H. Liu, “A composite visible-light photocatalyst for hydrogen production,” Journal of PowerSources, vol. 159, no. 2, pp. 1300–1304, 2006.
[3] M. Antoniadou, P. Bouras, N. Strataki, and P. Lianos,“Hydrogen and electricity generation by photoelectrochemicaldecomposition of ethanol over nanocrystalline titania,” Inter-national Journal of Hydrogen Energy, vol. 33, no. 19, pp. 5045–5051, 2008.
[4] N.-L. Wu, M.-S. Lee, Z.-J. Pon, and J.-Z. Hsu, “Effect ofcalcination atmosphere on TiO2 photocatalysis in hydrogenproduction from methanol/water solution,” Journal of Photo-chemistry and Photobiology A, vol. 163, pp. 277–280, 2004.
[5] M. I. Badawy, M. Y. Ghaly, and M. E. M. Ali, “Photocatalytichydrogen production over nanostructured mesoporous titaniafrom olive mill wastewater,” Desalination, vol. 267, no. 2-3, pp.250–255, 2011.
[6] S. Xu, J. Ng, X. Zhang, H. Bai, and D. D. Sun, “Fabricationand comparison of highly efficient Cu incorporated TiO2 pho-tocatalyst for hydrogen generation from water,” InternationalJournal of Hydrogen Energy, vol. 35, no. 11, pp. 5254–5261,2010.
[7] R. Dholam, N. Patel, and A. Miotello, “Efficient H2 productionby water-splitting using indium-tin-oxide/V-doped TiO2 mul-tilayer thin film photocatalyst,” International Journal of Hydro-gen Energy, vol. 36, no. 11, pp. 6519–6528, 2011.
[8] T. Puangpetch, T. Sreethawong, and S. Chavadej, “Hydrogenproduction over metal-loaded mesoporous-assembled SrTiO3
nanocrystal photocatalysts: effects of metal type and loading,”International Journal of Hydrogen Energy, vol. 35, no. 13, pp.6531–6540, 2010.
[9] S. Onsuratoom, S. Chavadej, and T. Sreethawong, “Hydrogenproduction from water splitting under UV light irradiationover Ag-loaded mesoporous-assembled TiO2-ZrO2 mixed ox-ide nanocrystal photocatalysts,” International Journal of Hy-drogen Energy, vol. 36, no. 9, pp. 5246–5261, 2011.
[10] R. Sasikala, A. Shirole, V. Sudarsan et al., “Highly dispersedphase of SnO2 on TiO2 nanoparticles synthesized by polyol-mediated route: photocatalytic activity for hydrogen genera-tion,” International Journal of Hydrogen Energy, vol. 34, no. 9,pp. 3621–3630, 2009.
[11] M.-S. Park and M. Kang, “The preparation of the anataseand rutile forms of Ag–TiO2 and hydrogen production frommethanol/water decomposition,” Materials Letters, vol. 62, pp.183–187, 2008.
[12] B. S. Kwak, J. Chae, J. Kim, and M. Kang, “Enhanced hydrogenproduction from methanol/water photo-splitting in TiO2
including Pd component,” Bulletin of the Korean ChemicalSociety, vol. 30, pp. 1047–1053, 2009.
[13] X.-J. Zheng, L.-F. Wei, Z.-H. Zhang et al., “Research on pho-tocatalytic H2 production from acetic acid solution by Pt/TiO2
nanoparticles under UV irradiation,” International Journal ofHydrogen Energy, vol. 34, no. 22, pp. 9033–9041, 2009.
[14] J. Chae, J. Lee, J. H. Jeong, and M. Kang, “Hydrogen pro- duc-tion from photo splitting of water using the Ga-incorporatedTiO2s prepared by a solvothermal method and their character-istics,” Bulletin of the Korean Chemical Society, vol. 30, p. 302,2009.
[15] S. Xu, J. Ng, A. J. Du, J. Liu, and D. D. Sun, “Highly efficientTiO2 nanotube photocatalyst for simultaneous hydrogen pro-duction and copper removal from water,” International Journalof Hydrogen Energy, vol. 36, no. 11, pp. 6538–6545, 2011.
[16] L. X. Sang, Z. Y. Zhang, G. M. Bai, C. X. Du, and C. F. Ma, “Aphotoelectrochemical investigation of the hydrogen-evolvingdoped TiO2 nanotube arrays electrode,” International Journalof Hydrogen Energy, vol. 37, pp. 854–859, 2012.
[17] L. X. Sang, Z. Y. Zhang, and C. F. Ma, “Photoelectrical andcharge transfer properties of hydrogen-evolving TiO2 nan-otube arrays electrodes annealed in different gases,” Interna-tional Journal of Hydrogen Energy, vol. 36, no. 8, pp. 4732–4738, 2011.
[18] H.-H. Ou and S.-L. Lo, “Review of titania nanotubes synthe-sized via the hydrothermal treatment: fabrication, modifica-tion, and application,” Separation and Purification Technology,vol. 58, no. 1, pp. 179–191, 2007.
[19] J. Skvarla, “Evaluation of mutual interactions in binary min-eral suspensions by means of electrophoretic light scattering(ELS),” International Journal of Mineral Processing, vol. 48, pp.95–109, 1996.
[20] C. Li, J. Yuan, B. Han, L. Jiang, and W. Shangguan, “TiO2
nanotubes incorporated with CdS for photocatalytic hydrogenproduction from splitting water under visible light irradia-tion,” International Journal of Hydrogen Energy, vol. 35, no. 13,pp. 7073–7079, 2010.
[21] S. A. Setiadi, “Photocatalytic hydrogen generation fromglycerol and water using Pt loaded N-doped TiO2 nanotube,”International Journal of Engineering and Technology, vol. 11,no. 3, pp. 91–95, 2011.
[22] W. Stefaniak, J. Goworek, and B. Bilinski, “Pore size analysisby nitrogen adsorption and thermal desorption,” Colloids andSurfaces A, vol. 214, no. 1–3, pp. 231–237, 2003.
[23] S. Onsuratoom, S. Chavadej, and T. Sreethawong, “Hydrogenproduction from water splitting under UV light irradiationover Ag-loaded mesoporous-assembled TiO2-ZrO2 mixedoxide nanocrystal photocatalysts,” International Journal of Hy-drogen Energy, vol. 36, no. 9, pp. 5246–5261, 2011.
[24] M. Iza, S. Woerly, C. Danumah, S. Kaliaguine, and M.Bousmina, “Determination of pore size distribution for meso-porous materials and polymeric gels by means of DSC meas-urements: thermoporometry,” Polymer, vol. 41, no. 15, pp.5885–5893, 2000.
[25] H. Y. Zhu and G. Q. Lu, “Estimating pore size distributionfrom the differential curves of comparison plots,” Studies inSurface Science and Catalysis, vol. 128, pp. 243–250, 2000.
[26] A. C. Mitropoulos, “The Kelvin equation,” Journal of Colloidand Interface Science, vol. 317, no. 2, pp. 643–648, 2008.
[27] D. L. Liao, G. S. Wu, and B. Q. Liao, “Zeta potential of shape-controlled TiO2 nanoparticles with surfactants,” Colloids andSurfaces A, vol. 348, no. 1–3, pp. 270–275, 2009.
[28] K. Maeda, M. Eguchi, W. J. Youngblood, and T. E. Mal-louk, “Niobium oxide nanoscrolls as building blocks for dye-sensitized hydrogen production from water under visible lightirradiation,” Chemistry of Materials, vol. 20, no. 21, pp. 6770–6778, 2008.
[29] A. W. Burton, K. Ong, T. Rea, and I. Y. Chan, “On the esti-mation of average crystallite size of zeolites from the Scherrerequation: a critical evaluation of its application to zeolites withone-dimensional pore systems,” Microporous and MesoporousMaterials, vol. 117, pp. 75–90, 2009.
[30] K. B. Oldham and J. C. Myland, “Modelling cyclic voltamme-try without digital simulation,” Electrochimica Acta, vol. 56,no. 28, pp. 10612–10625, 2011.

10 International Journal of Photoenergy
[31] M. Wang, D.-J. Guo, and H.-L. Li, “High activity of novelPd/TiO2 nanotube catalysts for methanol electro-oxidation,”Journal of Solid State Chemistry, vol. 178, no. 6, pp. 1996–2000,2005.

Hindawi Publishing CorporationInternational Journal of PhotoenergyVolume 2012, Article ID 607283, 9 pagesdoi:10.1155/2012/607283
Research Article
Statistical Optimization of Operational Parameters for EnhancedNaphthalene Degradation by TiO2/Fe3O4-SiO2Photocatalyst
Aijuan Zhou,1 Jing Peng,2 Zhaobo Chen,3, 4 Jingwen Du,1 Zechong Guo,1
Nanqi Ren,1, 3 and Aijie Wang1, 3
1 School of Municipal and Environmental Engineering, Harbin Institute of Technology (HIT), 202 Haihe Road, Harbin 150090, China2 Institute of Architecture Design and Research, Harbin Institute of Technology, Harbin 150090, China3 State Key Laboratory of Urban Water Resource and Environment, Harbin Institute of Technology (SKLUWRE, HIT),Harbin 150090, China
4 Collage of Materials Science and Chemical Engineering, Harbin Engineering University, Harbin 150001, China
Correspondence should be addressed to Aijie Wang, [email protected]
Received 11 December 2011; Revised 13 February 2012; Accepted 15 February 2012
Academic Editor: Stephane Jobic
Copyright © 2012 Aijuan Zhou et al. This is an open access article distributed under the Creative Commons Attribution License,which permits unrestricted use, distribution, and reproduction in any medium, provided the original work is properly cited.
The optimization of operational parameters for enhanced naphthalene degradation by TiO2/Fe3O4-SiO2 (TFS) photocatalyst wasconducted using statistical experimental design and analysis. Central composite design method of response surface methodology(RSM) was adopted to investigate the optimum value of the selected factors for achieving maximum naphthalene degradation.Experimental results showed that irradiation time, pH, and TFS photocatalyst loading had significant influence on naphthalenedegradation and the maximum degradation rate of 97.39% was predicted when the operational parameters were irradiationtime 97.1 min, pH 2.1, and catalyst loading 0.962 g/L, respectively. The results were further verified by repeated experimentsunder optimal conditions. The excellent correlation between predicted and measured values further confirmed the validity andpracticability of this statistical optimum strategy.
1. Introduction
Naphthalene, as the first member of polycyclic aromatic hy-drocarbon (PAH) and one of the 16 PAHs classified as prior-ity pollutants by the Environmental Protection Agency (EPA)of the United States, is a class of persistent organic pollutantsof special concern. Naphthalene can be frequently foundin many anthropogenic fluxes, such as combustion fumes,used oil, and bilge water, which is exceedingly recalcitrant todegradation due to its inhibitory nature [1–3]. Since it is themost water-soluble PAH, naphthalene is the dominant one inwater which has been considered as possibly a carcinogen tohumans (EPA 1998, The International Agency for Researchon Cancer (IARC) 2002) and has both acute and chroniceffects on human and animal health.
A solution to this naphthalene pollution problem hasnow become urgent. Removing naphthalene from water ispossible via many techniques, including biofiltration [4],microbial degradation [5, 6], anaerobic degradation [7–9],
electron beam irradiation [10], electrolytic aeration [11], andphotocatalysis [12–14]. Among these techniques, biodegra-dation is expected to be an economical and energy-efficientapproach which attracts more and more attentions to inves-tigate the application to treat PAHs. Nevertheless, because ofits toxicity and low water solubility, the efficacy of bioreme-diation still remains a critical point [15].
Photocatalysis has been proposed as an alternative todegrade refractory organic compounds unquestionably dueto the specificity of hydroxyl radicals which represents highreaction rate and low selectivity [16–19]. Although this tech-nique presents critical advantages over other techniques,there are some problems to be resolved urgently. Amongthese, the commonly mentioned problems are the designsof adequate reactors for efficient utilization of photons andthe required higher degradability to persistent organic pol-lutants. Moreover, this technology has not been successfullycommercialized, in part because of the difficulty in separa-ting TiO2 nanoparticles from the suspension [20]. To resolve
2 International Journal of Photoenergy
this problem, TiO2 dispersed on magnetic oxide support(Fe3O4-SiO2) is used in this study as the catalyst for pho-tooxidative degradation of naphthalene which could be re-claimed using ferromagnetic separation processes.
In order to enhance the naphthalene degradation per-formance, an optimization approach should be employed.Response surface methodology (RSM) is an efficient stan-dard and well-established mathematical optimization proce-dure which can achieve such an optimization by analyzingand modeling the effects of multiple variables and theirresponses and finally optimizing the process [21]. Thismethod has been successfully employed for optimization insome photocatalytic oxidation processes [22–26]. However,to the best of our knowledge, the optimization of photocat-alytic degradation of naphthalene solution by TiO2/Fe3O4-SiO2(TFS) catalyst has not been reported. Therefore, theobjective of this study was to investigate the effect ofTiO2/Fe3O4-SiO2(TFS) photocatalyst on the treatment of asimulated high-concentration wastewater polluted by naph-thalene. The central composite circumscribed (CCC) designmethod of RSM was employed to determine the optimal pro-cess condition for maximizing naphthalene degradation rate.
2. Materials and Methods
2.1. Reagents and Photocatalyst Preparation. FeCl2, FeCl3,NaOH, HNO3, Fe3O4, absolute alcohol, and isopropanol(Tianjin Kermel Chemical Reagent Co. Ltd.) were of analyti-cal grade; naphthalene (Aldrich), Ti(OC4H9)4, 3-aminopro-pyltriethoxysilane, and tetraethoxysilane (J&K Chemical LtdCo.) were of reagent grad; all the reagents mentioned abovewere used as received without further purification. Milliporedeionized water was used for dilution.
For now, the TFS photocatalyst has been prepared suc-cessfully, and the specific preparation and characterizationhave been published in other paper [27]. The synthesis routeof TFS photocatalyst is shown in Figure 1.
2.2. Photoreactor. A schematic representation of the photore-actor is shown in Figure 2. The reactor mainly consistedof mechanical stirrer, mercury lamp, quartz cold trap, andbeaker. The irradiation experiments were carried out in fourparallel 250 mL quartz beakers. The light source was a high-pressure mercury lamp (HPK 125W, Philips) setting in aquartzose cold trap, emitting the near-UV (mainly around365 nm). The warp of photoreactor was made of polymethylmethacrylate (PMMA), inner surface of which clings silverpaper in order to return UV light.
2.3. Multivariate Experimental Design. A 3-factor CCC withsix replicates at the center point leading to 20 experimentswas employed to optimize the operational parameters forimproving naphthalene degradation. For statistical calcula-tion, the relation between the coded values and actual valuesof independent variable is described as follows.
Xi = Ai − A0
Ai, (1)
where Xi is the coded value of the independent variable, Ai
is the actual value of independent variable, A0 is the actualvalue of the Ai at the center point, and Ai is the step changeof independent variable.
In the study, catalyst loading, pH, and irradiation timewere taken as the independent variable and naphthalenedegradation rate was the dependent variable or response ofthe design experiments. By means of multilinear regressionmethod [28, 29], a second-order polynomial function wasfitted to correlate relationship between independent variableand response. Quadratic equation for the independent var-iable was expressed as follows.
y = β0 + β1x1 + β2x2 + β3x3 + β11x12
+ β22x22 + β33x3
2 + β12x1x2 + β13x1x3 + β23x2x3,(2)
where y represents the predicted response; β0 is the intercep-tion coefficient; β1, β2, and β3 are the linear coefficients; β11,β22, and β33 are the quadratic coefficients; β12, β13, and β23
are the interactive coefficients; x1, x2, and x3 represent theindependent variable studied.
The Design Expert (Version 7.4.1.0, Stat-Ease Inc.,Minneapolis, MN, USA) software was used for regressionand graphical analyzes of the data obtained. All experimentaldesigns were randomized, and mean values were applied.
2.4. Procedure. As the solubility of naphthalene is 25–30 mg/L at ambient temperature, this study chose to workwith the highest concentration in order to show the uniqueremoval efficiency of TFS photocatalyst [3]. In all the pho-tocatalytic experiments, the reaction temperature was keptconstant at 25± 0.1◦C. Unless required, pH was not initiallymodified or controlled in the reactor. When required, initialpH values were adjusted using 4 mol/L NaOH or H2SO4.
All experiments were carried out in 250 mL quartzosebeakers comprised of 100 mL aqueous naphthalene solutionand the appropriate amount of the TFS photocatalystpowder, stirring at 1000 rpm (higher rotated speed may resultin naphthalene volatilization without degradation). Beforeirradiation, the reaction mixture was premixed in the darkfor 20 min to reach adsorption equilibrium.
2.5. Analytical Methods. The residual naphthalene was deter-mined by a high-performance liquid chromatography (LC-10A, Shimadzu Corporation, Kyoto, Japan) equipped with adiode array detector and an Uptisphere C18 HDO column(stationary phase 3 μm, dimensions 150 mm × 3 mm) usinga mixture of methanol and deionized water (ratio 80 : 20) asthe mobile phase at a flow rate of 1.0 mL/min.
3. Results and Discussion
3.1. Effect of Catalyst Loading on Degradation of Naphthalene.The catalyst loading in slurry photocatalytic processes was animportant factor. Figure 3 presents the variation of the firstorder rate constant and the value of Ct/Co as a function of thecatalyst loading, where Ct is the naphthalene concentrationat t time and Co is the initial concentration of naphthalene.
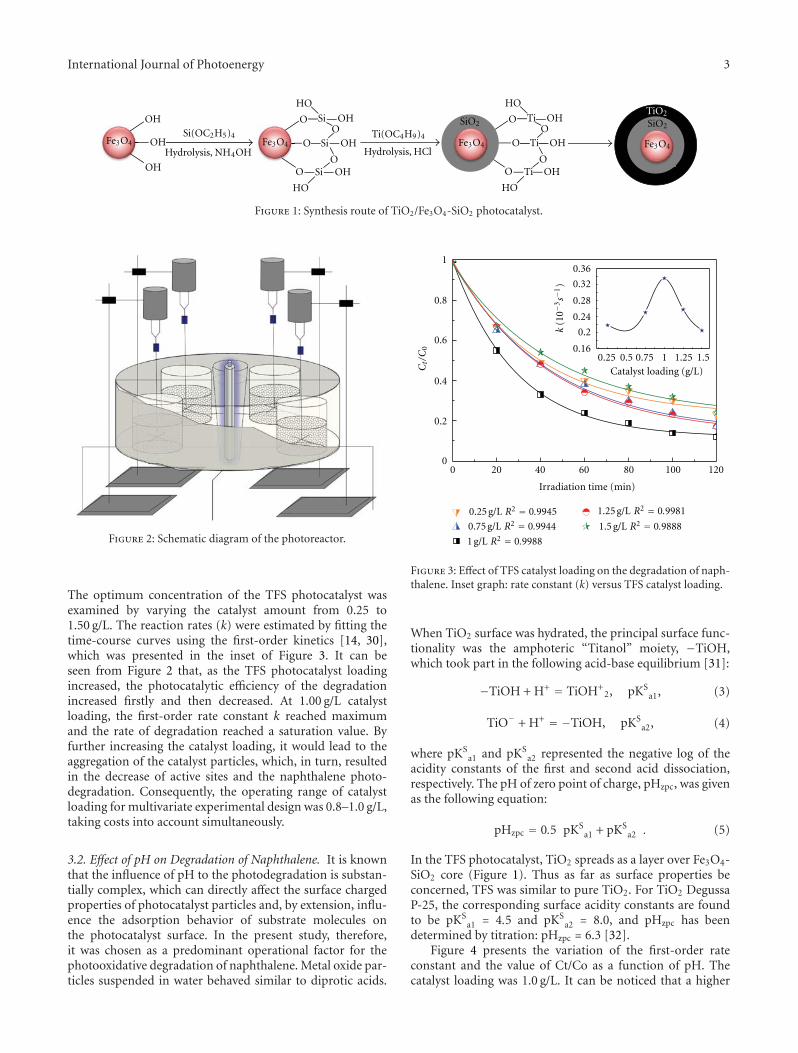
International Journal of Photoenergy 3
OH
OH
OH O Si OH
HO
HO
O
OO Si OH
O Si OH
O Ti OH
HO
HO
O
OO Ti OH
O Ti OH
Hydrolysis, HClFe3O4 Fe3O4 Fe3O4 Fe3O4
Si(OC2H5)4 Ti(OC4H9)4
SiO2SiO2
TiO2
Hydrolysis, NH4OH
Figure 1: Synthesis route of TiO2/Fe3O4-SiO2 photocatalyst.
Figure 2: Schematic diagram of the photoreactor.
The optimum concentration of the TFS photocatalyst wasexamined by varying the catalyst amount from 0.25 to1.50 g/L. The reaction rates (k) were estimated by fitting thetime-course curves using the first-order kinetics [14, 30],which was presented in the inset of Figure 3. It can beseen from Figure 2 that, as the TFS photocatalyst loadingincreased, the photocatalytic efficiency of the degradationincreased firstly and then decreased. At 1.00 g/L catalystloading, the first-order rate constant k reached maximumand the rate of degradation reached a saturation value. Byfurther increasing the catalyst loading, it would lead to theaggregation of the catalyst particles, which, in turn, resultedin the decrease of active sites and the naphthalene photo-degradation. Consequently, the operating range of catalystloading for multivariate experimental design was 0.8–1.0 g/L,taking costs into account simultaneously.
3.2. Effect of pH on Degradation of Naphthalene. It is knownthat the influence of pH to the photodegradation is substan-tially complex, which can directly affect the surface chargedproperties of photocatalyst particles and, by extension, influ-ence the adsorption behavior of substrate molecules onthe photocatalyst surface. In the present study, therefore,it was chosen as a predominant operational factor for thephotooxidative degradation of naphthalene. Metal oxide par-ticles suspended in water behaved similar to diprotic acids.
0 20 40 60 80 100 1200
0.2
0.4
0.6
0.8
1
0.25 0.5 0.75 1 1.25 1.50.16
0.2
0.24
0.28
0.32
0.36
k(1
0−3s−
1)
Catalyst loading (g/L)
Irradiation time (min)
Ct/C
0
0.25 g/L R2 = 0.9945
0.75 g/L R2 = 0.9944
1 g/L R2 = 0.9988
1.25 g/L R2 = 0.9981
1.5 g/L R2 = 0.9888
Figure 3: Effect of TFS catalyst loading on the degradation of naph-thalene. Inset graph: rate constant (k) versus TFS catalyst loading.
When TiO2 surface was hydrated, the principal surface func-tionality was the amphoteric “Titanol” moiety, −TiOH,which took part in the following acid-base equilibrium [31]:
−TiOH + H+ = TiOH+2, pKS
a1, (3)
TiO− + H+ = −TiOH, pKSa2, (4)
where pKSa1 and pKS
a2 represented the negative log of theacidity constants of the first and second acid dissociation,respectively. The pH of zero point of charge, pHzpc, was givenas the following equation:
pHzpc = 0.5 pKSa1 + pKS
a2 . (5)
In the TFS photocatalyst, TiO2 spreads as a layer over Fe3O4-SiO2 core (Figure 1). Thus as far as surface properties beconcerned, TFS was similar to pure TiO2. For TiO2 DegussaP-25, the corresponding surface acidity constants are foundto be pKS
a1 = 4.5 and pKSa2 = 8.0, and pHzpc has been
determined by titration: pHzpc = 6.3 [32].Figure 4 presents the variation of the first-order rate
constant and the value of Ct/Co as a function of pH. Thecatalyst loading was 1.0 g/L. It can be noticed that a higher
4 International Journal of Photoenergy
0 20 40 60 80 100 1200
0.2
0.4
0.6
0.8
1.2
1
Irradiation time (min)
Ct/C
0
2 4 6 8 100
0.1
0.2
0.3
0.4
0.5
0.6
k(1
0−3s−
1)
pH
pH 2 R2 = 0.9899
pH 3 R2 = 0.9927
pH 6 R2 = 0.9991
pH 8 R2 = 0.9944
pH 7 R2 = 0.9997
pH 10 R2 = 0.981
Figure 4: Effect of pH on the degradation of naphthalene. Insetgraph: rate constant (k) versus pH.
photodegradation effect existed in acid environment, whichwas assumed to be linked with the surface characteristic ofTFS photocatalyst particles. At low pH, hydroxyl radicalswere formed on the surface of TFS particles by the reactionof hole (hvb
+) with adsorbed H2O molecule: hvb+ + H2O →
OH• + H+, which made electron (e−) assemble to the surfaceof TFS particles and then reacted with adsorbed O2 to O2
−•,leading to longer lifetime of the electron/hole pair [33].Moreover, the increased hydrogen ions was beneficial to theproduction of H2O2 and OH• radicals. The specific reactionswere given as follows.
e− + O2ads −→ O2−ads•
O2−ads• + H+ −→ HO2
•
2HO2• −→ O2 + H2O2
H2O2 + O2−ads• −→ OH• + OH− + O2
(6)
At high pH, the TFS particles’ surface was negativelycharged which increased the work function for electronabjection and also trapped of valence-band holes. It madeagainst the photocatalytic reaction. But the reaction rates inpH 8 and 10 were a little increased than those in neutral inthis case, because the solutions at different pH had differentionic strength: HNO3 was present at acid solution and NaOHwas present at alkaline solution, whereas no ionic specieswere added at neutral pH 7, and additionally the quantitiesof ionic also affected the ionic strength.
As seen in the inset of Figure 4, the first-order rateconstant of the degradation (k) at pH 2 was higher than thoseat other pH values. As a consequence, the operating range ofpH for multivariate experimental design was 1.5–2.5.
Table 1: Effect of irradiation time on the degradation of naphtha-lene.
Irradiation time (min) 20 40 60 80 100 120
Degradation rate (%) 51.6 63.6 81.0 89.2 91.7 93.3
3.3. Effect of Irradiated Time on Degradation of Naphthalene.Table 1 shows the variation of the degradation rate in thecondition of optimal catalyst loading (1.00 g/L) and pH (2)as a function of irradiation time.
As displayed in Table 1, the increase of degradation ratewent flatter after 80 min. The degradation rate enhanced2.5% in the time range of 80∼100 min, while the degradationrate enhanced only 1.51% in the time range of 100∼120 minwhich was much lower than the previous three ranges. Theirradiation time counted little to the degradation rate ofnaphthalene after 80 min. Consequently, the operating rangeof irradiation time for multivariate experimental design was80–100 min, taking costs into account simultaneously.
3.4. Optimization of Operational Parameters for Enhancing theNaphthalene Degradation. Experimental design and resultsare shown in Table 2. By applying multiple regression analysison the experimental data, a second-order polynomial equa-tion was obtained to describe the correlation between theindependent variable and the naphthalene degradation rate:
y = −1262.32 + 15.63x1 + 54.20x2
+ 1130.84x3 − 0.11x1x2 − 2.56x1x3
+ 19.5x2x3 − 0.067x12 − 14.81x2
2 − 480.26x32,
(7)
where y is the predicted naphthalene degradation rate (%);x1, x2, and x3 are irradiation time (min), pH value, andcatalyst loading (g/L), respectively.
The analysis of variance (ANOVA) was conducted to testthe significance of the fit of the second-order polynomialequation for the degradation rate as shown in Table 3.
The F value, represented the likelihood of two differentgroups being statistically different, was 551.40 which impliedthat the model was significant because values of “Prob >F” less than 0.05 were considered to be significant. Therewas only less 0.01% chance that a model F value this largecould occur; the regression mathematical model was a goodfit to experimental data. In addition, the model did notshow lack of fit. The Pred R-squared was 0.9827 which wasin reasonable agreement with the Adj R-squared (0.9964).The disparity of R-squared (0.9982) and Adj R-squared wasprobably originated in the insignificance of x1x2 term. TheAdeq Precision was 64.080 which indicated an adequatesignal, measuring the signal to noise ratio. Myers pointed thatmodel adequacies should be checked by R2, Adj-R2, Pre-R2,Adeq. Precision, and CV (lack of fit > 0.1; R2 > 0.95; (Adj-R2–Pre-R2) < 0.2; CV < 10; Pre-R2 > 0.7; Adeq. Precision >4) [34]. After calculated, R2, Adj-R2, Pre-R2, Adeq. Precisionand coefficient of variation (CV, 1.00) all satisfied the requestof model adequacy; therefore, (7) properly described thedegradation rate of naphthalene in this study. From (7),
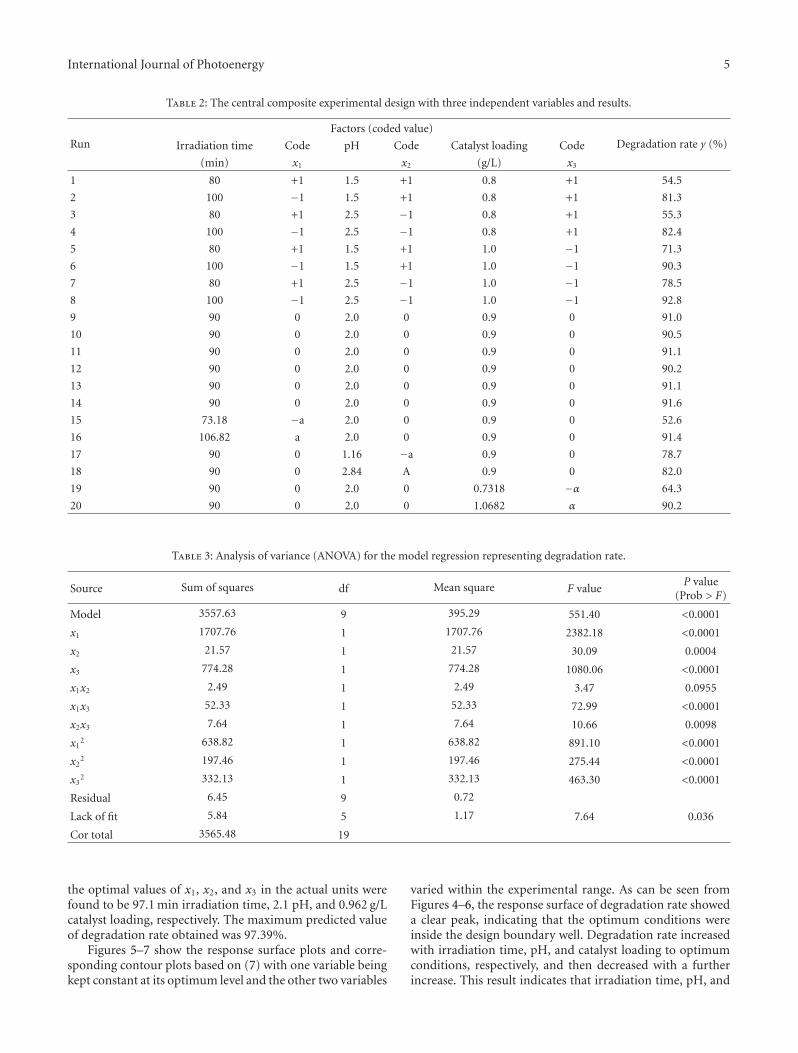
International Journal of Photoenergy 5
Table 2: The central composite experimental design with three independent variables and results.
RunFactors (coded value)
Degradation rate y (%)Irradiation time Code pH Code Catalyst loading Code
(min) x1 x2 (g/L) x3
1 80 +1 1.5 +1 0.8 +1 54.5
2 100 −1 1.5 +1 0.8 +1 81.3
3 80 +1 2.5 −1 0.8 +1 55.3
4 100 −1 2.5 −1 0.8 +1 82.4
5 80 +1 1.5 +1 1.0 −1 71.3
6 100 −1 1.5 +1 1.0 −1 90.3
7 80 +1 2.5 −1 1.0 −1 78.5
8 100 −1 2.5 −1 1.0 −1 92.8
9 90 0 2.0 0 0.9 0 91.0
10 90 0 2.0 0 0.9 0 90.5
11 90 0 2.0 0 0.9 0 91.1
12 90 0 2.0 0 0.9 0 90.2
13 90 0 2.0 0 0.9 0 91.1
14 90 0 2.0 0 0.9 0 91.6
15 73.18 −a 2.0 0 0.9 0 52.6
16 106.82 a 2.0 0 0.9 0 91.4
17 90 0 1.16 −a 0.9 0 78.7
18 90 0 2.84 A 0.9 0 82.0
19 90 0 2.0 0 0.7318 −α 64.3
20 90 0 2.0 0 1.0682 α 90.2
Table 3: Analysis of variance (ANOVA) for the model regression representing degradation rate.
Source Sum of squares df Mean square F valueP value
(Prob > F)
Model 3557.63 9 395.29 551.40 <0.0001
x1 1707.76 1 1707.76 2382.18 <0.0001
x2 21.57 1 21.57 30.09 0.0004
x3 774.28 1 774.28 1080.06 <0.0001
x1x2 2.49 1 2.49 3.47 0.0955
x1x3 52.33 1 52.33 72.99 <0.0001
x2x3 7.64 1 7.64 10.66 0.0098
x12 638.82 1 638.82 891.10 <0.0001
x22 197.46 1 197.46 275.44 <0.0001
x32 332.13 1 332.13 463.30 <0.0001
Residual 6.45 9 0.72
Lack of fit 5.84 5 1.17 7.64 0.036
Cor total 3565.48 19
the optimal values of x1, x2, and x3 in the actual units werefound to be 97.1 min irradiation time, 2.1 pH, and 0.962 g/Lcatalyst loading, respectively. The maximum predicted valueof degradation rate obtained was 97.39%.
Figures 5–7 show the response surface plots and corre-sponding contour plots based on (7) with one variable beingkept constant at its optimum level and the other two variables
varied within the experimental range. As can be seen fromFigures 4–6, the response surface of degradation rate showeda clear peak, indicating that the optimum conditions wereinside the design boundary well. Degradation rate increasedwith irradiation time, pH, and catalyst loading to optimumconditions, respectively, and then decreased with a furtherincrease. This result indicates that irradiation time, pH, and
6 International Journal of Photoenergy
80 85 90 95 1001.5
1.75
2
2.25
2.5
pH
75 7983
8791
95
71
Irradiation time (min)
(a)
2.5
2.25
2
1.75
1.5 80
85
90
95
100
67
74.25
81.25
88.75
96
Deg
rada
tion
rat
e (%
)
Irradiatio
n time (m
in)
92.84
52.56
Deg
rada
tion
rat
e
pH
(b)
Figure 5: The response surface plot and the corresponding contour plot showing the effects of irradiation time and pH on naphthalenedegradation rate.
80 85 90 95 1000.8
0.85
0.9
0.95
1
Cat
alys
t lo
adin
g (g
/L)
65
69
73
7785
89
93
97
81
Irradiation time (min)
(a)
0.95
0.9
0.85
0.8
1
58
68
78
88
98
80
85
90
95100
Catalyst loading (g/L)
Deg
rada
tion
rat
e (%
)
92.84
52.56D
egra
dati
on r
ate
Irradiatio
n time (m
in)
(b)
Figure 6: The response surface plot and the corresponding contour plot showing the effects of irradiation time and catalyst loading onnaphthalene degradation rate.
catalyst loading all had individual significant influences ondegradation rate. In addition, the angle of inclination of theprincipal axis was evidently towards either irradiation timeor catalyst loading in Table 1 and Figure 3, respectively, andthis indicated that the positive effect of increased irradiationtime or catalyst loading levels on degradation rate was morepronounced than pH increased.
3.5. Validation of the Model. In order to confirm the vali-dity of the statistical experimental strategy, the repeatedexperiments under optimal conditions were carried out(Table 4). As a consequence, the maximum standard errorbetween the observed value and the predicted value wasless than 4% which indicated that the quadratic model canpredict experimental results well. Furthermore, the standard
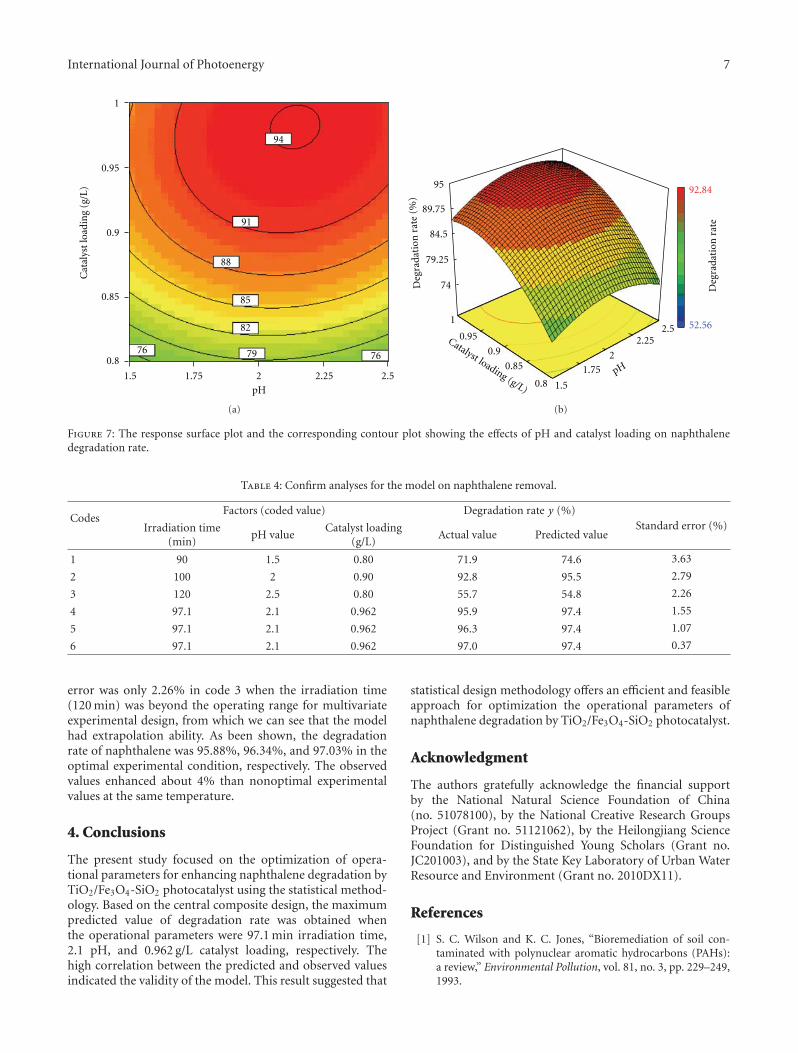
International Journal of Photoenergy 7
1.5 1.75 2 2.25 2.5
0.8
0.85
0.9
0.95
1
Cat
alys
t lo
adin
g (g
/L)
76 79
82
88
76
94
91
85
pH
(a)
0.95
0.9
0.85
0.8
1
74
79.25
84.5
89.75
95
1.5
1.75
2
2.252.5
Catalyst loading (g/L)
pH
Deg
rada
tion
rat
e (%
)
92.84
52.56
Deg
rada
tion
rat
e
(b)
Figure 7: The response surface plot and the corresponding contour plot showing the effects of pH and catalyst loading on naphthalenedegradation rate.
Table 4: Confirm analyses for the model on naphthalene removal.
CodesFactors (coded value) Degradation rate y (%)
Standard error (%)Irradiation time(min)
pH valueCatalyst loading
(g/L)Actual value Predicted value
1 90 1.5 0.80 71.9 74.6 3.63
2 100 2 0.90 92.8 95.5 2.79
3 120 2.5 0.80 55.7 54.8 2.26
4 97.1 2.1 0.962 95.9 97.4 1.55
5 97.1 2.1 0.962 96.3 97.4 1.07
6 97.1 2.1 0.962 97.0 97.4 0.37
error was only 2.26% in code 3 when the irradiation time(120 min) was beyond the operating range for multivariateexperimental design, from which we can see that the modelhad extrapolation ability. As been shown, the degradationrate of naphthalene was 95.88%, 96.34%, and 97.03% in theoptimal experimental condition, respectively. The observedvalues enhanced about 4% than nonoptimal experimentalvalues at the same temperature.
4. Conclusions
The present study focused on the optimization of opera-tional parameters for enhancing naphthalene degradation byTiO2/Fe3O4-SiO2 photocatalyst using the statistical method-ology. Based on the central composite design, the maximumpredicted value of degradation rate was obtained whenthe operational parameters were 97.1 min irradiation time,2.1 pH, and 0.962 g/L catalyst loading, respectively. Thehigh correlation between the predicted and observed valuesindicated the validity of the model. This result suggested that
statistical design methodology offers an efficient and feasibleapproach for optimization the operational parameters ofnaphthalene degradation by TiO2/Fe3O4-SiO2 photocatalyst.
Acknowledgment
The authors gratefully acknowledge the financial supportby the National Natural Science Foundation of China(no. 51078100), by the National Creative Research GroupsProject (Grant no. 51121062), by the Heilongjiang ScienceFoundation for Distinguished Young Scholars (Grant no.JC201003), and by the State Key Laboratory of Urban WaterResource and Environment (Grant no. 2010DX11).
References
[1] S. C. Wilson and K. C. Jones, “Bioremediation of soil con-taminated with polynuclear aromatic hydrocarbons (PAHs):a review,” Environmental Pollution, vol. 81, no. 3, pp. 229–249,1993.
8 International Journal of Photoenergy
[2] B. Guieysse, M. D. Cirne, and B. Mattiasson, “Microbial degra-dation of phenanthrene and pyrene in a two liquid phase-partioning bioreactor,” Applied Microbiology and Biotechnolo-gy, vol. 56, pp. 796–802, 2001.
[3] A. Lair, C. Ferronato, J. M. Chovelon, and J. M. Herrmann,“Naphthalene degradation in water by heterogeneous photo-catalysis: an investigation of the influence of inorganic anions,”Journal of Photochemistry and Photobiology A, vol. 193, no. 2-3,pp. 193–203, 2008.
[4] K. Maillacheruvu and S. Safaai, “Naphthalene removal fromaqueous systems by Sagittarius sp,” Journal of EnvironmentalScience and Health Part A, vol. 37, no. 5, pp. 845–861, 2002.
[5] H. Pathak, D. Kantharia, A. Malpani, and D. Madamwar,“Naphthalene degradation by Pseudomonas sp. HOB1: invitro studies and assessment of naphthalene degradation effi-ciency in simulated microcosms,” Journal of Hazardous Mate-rials, vol. 166, no. 2-3, pp. 1466–1473, 2009.
[6] Y. Jia, H. Yin, J. S. Ye et al., “Characteristics and pathway ofnaphthalene degradation by pseudomonas sp. N7,” Journal ofEnvironmental Science, vol. 29, no. 3, pp. 756–762, 2008.
[7] F. Musat, A. Galushko, J. Jacob et al., “Anaerobic degradationof naphthalene and 2-methylnaphthalene by strains of marinesulfate-reducing bacteria,” Environmental Microbiology, vol.11, no. 1, pp. 209–219, 2009.
[8] J. Dou, X. Liu, and A. Ding, “Anaerobic degradation ofnaphthalene by the mixed bacteria under nitrate reducing con-ditions,” Journal of Hazardous Materials, vol. 165, no. 1–3, pp.325–331, 2009.
[9] M. Safinowski and R. U. Meckenstock, “Methylation is theinitial reaction in anaerobic naphthalene degradation by asulfate-reducing enrichment culture,” Environmental Microbi-ology, vol. 8, no. 2, pp. 347–352, 2006.
[10] W. J. Cooper, M. G. Nickelsen, R. V. Green, and S. P. Mezyk,“The removal of naphthalene from aqueous solutions usinghigh-energy electron beam irradiation,” Radiation Physics andChemistry, vol. 65, no. 4-5, pp. 571–577, 2002.
[11] R. K. Goel, J. R. V. Flora, and J. Ferry, “Mechanisms fornaphthalene removal during electrolytic aeration,” WaterResearch, vol. 37, no. 4, pp. 891–901, 2003.
[12] E. Pramauro, A. B. Prevot, M. Vincenti, and R. Gamberini,“Photocatalytic degradation of naphthalene in aqueous TiO2
dispersions: effect of non ionic surfactants,” Chemosphere, vol.36, no. 7, pp. 1523–1542, 1998.
[13] S. Dass, M. Muneer, and K. R. Gopidas, “Photocatalytic degra-dation of wastewater pollutants. Titanium-dioxide-mediatedoxidation of polynuclear aromatic hydrocarbons,” Journal ofPhotochemistry and Photobiology A, vol. 77, no. 1, pp. 83–88,1994.
[14] L. Hykrdova, J. Jirkovsky, G. Mailhot, and M. Bolte, “Fe(III)photoinduced and Q-TiO2 photocatalysed degradation ofnaphthalene: comparison of kinetics and proposal of mecha-nism,” Journal of Photochemistry and Photobiology A, vol. 151,no. 1–3, pp. 181–193, 2002.
[15] S. V. Mohan, T. Kisa, T. Ohkuma, R. A. Kanaly, and Y.Shimizu, “Bioremediation technologies for treatment of PAH-contaminated soil and strategies to enhance process efficien-cy,” Reviews in Environmental Science and Biotechnology, vol.5, no. 4, pp. 347–374, 2006.
[16] M. Lindner, J. Theurich, and D. W. Bahnemann, “Photocat-alytic degradation of organic compounds: accelerating theprocess efficiency,” Water Science and Technology, vol. 35, no.4, pp. 79–86, 1997.
[17] T. Ohno, K. Tokieda, S. Higashida, and M. Matsumura,“Synergism between rutile and anatase TiO2 particles in
photocatalytic oxidation of naphthalene,” Applied Catalysis A,vol. 244, no. 2, pp. 383–391, 2003.
[18] B. Pal and M. Sharon, “Photodegradation of polyaromatichydrocarbons over thin film of TiO2 nanoparticles; a study ofintermediate photoproducts,” Journal of Molecular Catalysis A,vol. 160, no. 2, pp. 453–460, 2000.
[19] N. Barrios, P. Sivov, D. D’Andrea, and O. Nunez, “Conditionsfor selective photocatalytic degradation of naphthalene in tri-ton X-100 water solutions,” International Journal of ChemicalKinetics, vol. 37, no. 7, pp. 414–419, 2005.
[20] M. J. Garcıa-Martınez, L. Canoira, G. Blazquez, I. Da Riva,R. Alcantara, and J. F. Llamas, “Continuous photodegradationof naphthalene in water catalyzed by TiO2 supported on glassRaschig rings,” Chemical Engineering Journal, vol. 110, no. 1–3,pp. 123–128, 2005.
[21] J.-P. Wang, Y.-Z. Chen, Y. Wang, S.-J. Yuan, and H.-Q. Yu,“Optimization of the coagulation-flocculation process forpulp mill wastewater treatment using a combination of uni-form design and response surface methodology,” Water Re-search, vol. 45, no. 17, pp. 5633–5640, 2011.
[22] I. H. Cho and K. D. Zoh, “Photocatalytic degradation of azodye (Reactive Red 120) in TiO2/UV system: optimization andmodeling using a response surface methodology (RSM) basedon the central composite design,” Dyes and Pigments, vol. 75,no. 3, pp. 533–543, 2007.
[23] A. F. Caliman, C. Cojocaru, A. Antoniadis, and I. Poulios,“Optimized photocatalytic degradation of Alcian Blue 8 GX inthe presence of TiO2 suspensions,” Journal of Hazardous Mat-erials, vol. 144, no. 1-2, pp. 265–273, 2007.
[24] J. F. Fu, Y. Q. Zhao, X. D. Xue, W. C. Li, and A. O. Babatunde,“Multivariate-parameter optimization of acid blue-7 wastew-ater treatment by Ti/TiO2 photoelectrocatalysis via the Box-Behnken design,” Desalination, vol. 243, no. 1–3, pp. 42–51,2009.
[25] A. R. Khataee, M. Zarei, and S. K. Asl, “Photocatalytic treat-ment of a dye solution using immobilized TiO 2 nanoparticlescombined with photoelectro-Fenton process: optimization ofoperational parameters,” Journal of Electroanalytical Chem-istry, vol. 648, no. 2, pp. 143–150, 2010.
[26] M. Fathinia, A. R. Khataee, M. Zarei, and S. Aber, “Compara-tive photocatalytic degradation of two dyes on immobilizedTiO 2 nanoparticles: effect of dye molecular structure andresponse surface approach,” Journal of Molecular Catalysis A,vol. 333, no. 1-2, pp. 73–84, 2010.
[27] L. Y. Wang, H. X. Wang, A. J. Wang, and M. Liu, “Surface mod-ification of a magnetic SiO2 support and immobilization of anano-TiO2 photocatalyst on it,” Chinese Journal of Catalysis,vol. 30, no. 9, pp. 939–944, 2009.
[28] S. L. Akhnazarova and V. V. Kafarov, Experiment Optimizationin Chemistry and Chemical Engineering, Mir Publishers, Mos-cow, Russia, 1982.
[29] H. G. Neddermeijer, G. J. van Oortmarssen, N. Piersma, andR. Dekker, “Framework for Response Surface Methodology forsimulation optimization,” in Proceedings of the 32nd WinterSimulation Conference Proceedings, pp. 129–136, Orlando, Fla,USA, December 2000.
[30] E. Pramauro, A. B. Prevot, M. Vincenti, and R. Gamberini,“Photocatalytic degradation of naphthalene in aqueous TiO2
dispersions: effect of non ionic surfactants,” Chemosphere, vol.36, no. 7, pp. 1523–1542, 1998.
[31] M. R. Hoffmann, S. T. Martin, W. Choi, and D. W. Bahne-mann, “Environmental applications of semiconductor photo-catalysis,” Chemical Reviews, vol. 95, no. 1, pp. 69–96, 1995.

International Journal of Photoenergy 9
[32] N. Jaffrezic-Renault, P. Pichat, A. Foissy, and R. Mercier,“Study of the effect of deposited platinum particles on thesurface charge of titania aqueous suspensions by potentiom-etry, electrophoresis, and labeled-ion adsorption,” Journal ofPhysical Chemistry, vol. 90, pp. 2733–2738, 1986.
[33] D. Duonghong, J. Ramsden, and M. Gratzel, “Dynamics ofinterfacial electron-transfer processes in colloidal semicon-ductor systems,” Journal of the American Chemical Society, vol.104, no. 11, pp. 2977–2985, 1982.
[34] R. H. Myers, D. C. Montgomery, and C. M. Anderson-Cook, Response Surface Methodology: Process and Product Opti-mization Using Designed E xperiments, John Wiley & Sons, Ho-boken, NJ, USA, 2002.
Hindawi Publishing CorporationInternational Journal of PhotoenergyVolume 2012, Article ID 859294, 12 pagesdoi:10.1155/2012/859294
Research Article
Photoetching of Immobilized TiO2-ENR50-PVC Composite forImproved Photocatalytic Activity
M. A. Nawi, Y. S. Ngoh, and S. M. Zain
School of Chemical Sciences, Universiti Sains Malaysia, Minden 11800, Malaysia
Correspondence should be addressed to M. A. Nawi, [email protected]
Received 23 February 2012; Accepted 26 March 2012
Academic Editor: Stephane Jobic
Copyright © 2012 M. A. Nawi et al. This is an open access article distributed under the Creative Commons Attribution License,which permits unrestricted use, distribution, and reproduction in any medium, provided the original work is properly cited.
Commercially acquired TiO2 photocatalyst (99% anatase) powder was mixed with epoxidized natural rubber-50 (ENR50)/poly-vinyl chloride (PVC) blend by ultrasonication and immobilized onto glass plates as TiO2-ENR50-PVC composite via a dip-coatingmethod. Photoetching of the immobilized TiO2-ENR50-PVC composite was investigated under the irradiation of a 45 W compactfluorescent lamp and characterized by chemical oxygen demand (COD) analysis, scanning electron microscopy-energy dispersiveX-ray (SEM-EDX) spectrometry, thermogravimetry analysis (TGA), and fourier transform infrared (FTIR) spectroscopy. The BETsurface area of the photoetched TiO2 composite was observed to be larger than the original TiO2 powder due to the systematicremoval of ENR50 while PVC was retained within the composite. It also exhibited better photocatalytic efficiency than the TiO2
powder in a slurry mode and was highly reproducible and reusable. More than 98% of MB removal was consistently achieved for 10repeated runs of the photo-etched photocatalyst system. About 93% of the 20 mg L−1 MB was mineralized over a period of 480 min.The presence of SO4
2−, NO3−, and Cl− anions was detected in the mineralized solution where the solution pH was reduced
from 7 to 4.
1. Introduction
Semiconductor TiO2 has been broadly studied as a hetero-geneous photocatalyst for the decomposition of hazardouscompounds in water effluents, including organic dyes [1–3]. TiO2 is highly effective for producing oxidizing species,specifically HO• radicals, which possess significant oxidationpotential. Other advantages of TiO2 include its biologicaland chemical stability, nontoxicity, low cost, and availability[3]. However, as the use of this catalyst for photocatalyticreactions is usually carried out in slurry modes, the need forposttreatment or filtration step makes its practical applica-tions tedious and costly. Therefore, effective immobilizationtechnique of the catalyst for industrial scale application ishighly needed. However, immobilization of the catalyst ontosolid supports poses its own intrinsic problems. Due to thefixed surface area, the photocatalytic activity of the immobi-lized catalyst is often significantly reduced [4–6]. Some otherinherent problems created by immobilization of the photo-catalyst are potential loss of TiO2 and decreased adsorptionof organic substances on the TiO2 surface [7]. Thus, the
major challenge in industrializing this technology seems tolay in the effective immobilization of photocatalyst on solidsupport without decreasing its photocatalytic activity.
The use of rubber-related polymer for the immobiliza-tion of TiO2 powder has been explored by a number ofresearchers. Jin et al. [8] formed TiO2 layer on a naturalrubber substrate via liquid phase deposition while Sriwonget al. [9] incorporated TiO2 powder into rubber sheetin order to immobilize TiO2 powder. As for Silva et al.[10], they compounded silicone rubbers with TiO2 for thepurpose of immobilizing TiO2. While most of these worksreported good photocatalytic activities in removing theirrespective pollutants, no efforts have been made to monitorwhat happened to the rubber additive during irradiationof their photocatalytic systems. In other works, Nawi etal. [11, 12] had previously reported the use of ENR50 andENR50/phenol formaldehyde (PF) blend, respectively, forthe immobilization of TiO2 powder over aluminum usingelectrophoretic deposition and dip-coating method on glassplates for the removal of phenol. As reported by Nawi et al.[12], the ENR additive was highly degradable and could be
2 International Journal of Photoenergy
photocatalytically photoetched out and served as the pre-cursor for the formation of pores and also once completelyremoved from the immobilized photocatalyst could increasethe surface area, pore volume of the immobilized P-25 TiO2
particles.Polymer blends have become a subject of interest in the
field of polymeric materials since their individual propertiescan be modified to obtain desired new properties. Polymerblending is known to improve mechanical, environmental,and rheological properties of the polymers. One widelystudied polymer blend is epoxidized natural rubber-50(ENR50)/poly(vinyl) chloride (PVC), which is found toform miscible blends at any compositions ratio [13]. Theexcellent miscibility between ENR50 and PVC is believed tobe induced by the highly polar epoxide groups within theENR50 molecules [14]. PVC is also anticipated to providehigh tensile strength and good chemical resistance while ENRcan act as a plasticizer for PVC [15]. In fact, the mechanicalproperties of ENR50/PVC have been widely studied andreported in the literatures [13, 16].
The main objective of this work was to prepare a highlyreusable immobilized TiO2-ENR50-PVC composite havingcomparable or better photocatalytic activity than the catalystpowder applied in a slurry mode. In order to achieve thisobjective, the surface area of the immobilized catalyst com-posite would be improved via photoetching of the polymeradditive under light irradiation. The photo-etched catalystcomposite would also be systematically characterized inorder to understand the surface transformation process thatoccurred during the etching process. We also evaluated thephotomineralization capability of the prepared immobilizedTiO2 composite by using methylene blue (MB) as themodel pollutant. The reusability and reproducibility of theTiO2 composite in the degradation of MB were also tested.Therefore, this method was developed as a new approach inproducing immobilized TiO2 photocatalyst with comparableor better photocatalytic efficiency than the slurry mode butwith long-term reusability and without the cumbersomefiltration step of the treated water.
2. Materials and Methods
2.1. Chemicals. All chemicals were of analytical grades andused without further purification. Titanium (IV) oxide(TiO2) (99% anatase) was purchased from Sigma Aldrich.Epoxidized natural rubber (50% epoxidation) (ENR50) wasfrom Guthrie Group Limited. The 12% (w/w) ENR50
solution was prepared by refluxing 25.80±0.05 g solid ENR50
in 250 mL toluene (from BDH AnalaR) at 88–90◦C over aperiod of 80 h until it was completely dissolved. Poly (vinyl)chloride (PVC) powder was purchased from Petrochemicals(Malaysia) Sdn. Bhd. The K value of the PVC powder was 67.Acetone was obtained from Systerm and dichloromethanewas a product from R&M Chemicals. Methylene blue (MB)(∼98%, Colour Index Number: 52015, chemical formula:C16H18ClN3S·2H2O, λmax: 661 nm) was purchased fromUnilab, Ajax Chemicals. The 1000 mg L−1 MB stock solutionwas prepared by dissolving 1.00 g MB powder in 1 L ultrapure
water. For chemical oxygen demand (COD) analysis, digesterand COD reagent solutions were purchased from HACH.
2.2. Preparation of Immobilized TiO2-ENR50-PVC Composite
2.2.1. Preparation of TiO2-ENR50-PVC Dip-Coating Formu-lation. The TiO2-ENR50-PVC dip-coating formulation wasprepared by dissolving 0.80 g of PVC powder in 35 mLof dichloromethane and sonicated using ultrasonic cleaner(Crest Ultrasonics, 50 kHz) for 1 h. Then, 2 g of 12% (w/w)ENR50 solution and 65 mL of acetone were added beforeadding 12 g of TiO2 powder. The mixture was then homoge-nized via ultrasonication for 5 h at 30–40◦C. The preparedformulation was kept in an amber bottle to avoid theexposure of the formulation to light.
2.2.2. Deposition of TiO2-ENR50-PVC Composite onto GlassPlates. For coating the TiO2-ENR50-PVC composite ontothe glass plates, the formulation was poured into a custommade coating cell. The dip-coating process was then done byimmersing a preweighed cleaned glass plate with the dimen-sion of 4.0 cm× 7.5 cm into the dip-coating formulationwith uniform pulling rates. Before weighing the coated glassplate, it was left to dry in an oven at 50◦C for 5 minutesin order to allow the evaporation of the solvents. The pro-cess of coating-drying-weighing was done repeatedly untilthe desired amount of TiO2-ENR50-PVC composite wasdeposited onto the glass plate. The TiO2-ENR50-PVC com-posite loading used throughout this work was 1.00 mg cm−2.
The optimum composition of the dip-coating formu-lation (i.e., the amount of ENR50 solution, PVC powderand TiO2 powder) was obtained upon systematically varyingeach component of the formulation for optimum photocat-alytic activity and acceptable adhesion of the photocatalystcomposite onto the glass plates. The adhesion test of theseries of immobilized TiO2 composites with different ratioof ENR50 and PVC was carried out using a sonication test. Inthis test, the respective glass plates coated with TiO2-ENR50-PVC composite were first immersed in a beaker filled withultrapure water and then were subjected to an interval of5 s sonication in an ultrasonic cleaner until 30 s. After eachsuccessive intermittent sonication, the remaining coatingthat still adhered onto the glass plate was dried and weighed.The glass plate with the largest remaining TiO2-ENR50-PVCcomposite coating would be considered as having the highestdegree of adhesion. The adhesion of the TiO2-ENR50-PVCcomposite with different amounts of ENR50 and PVC wasthen compared against the reference plate, which was madeof TiO2-ENR50 or TiO2-PVC in order to find out their rel-ative strength. The relative strength values were obtained bymanipulating the following equation (1):
SP− RPCPi
× 100 = relative strength (%), (1)
where SP is the remaining weight of the TiO2-ENR50-PVCcomposite after 30 s of sonication. RP is the reference platethat could be either TiO2-ENR50 or TiO2-PVC compositealso after 30 s of sonication, respectively, while CPi is
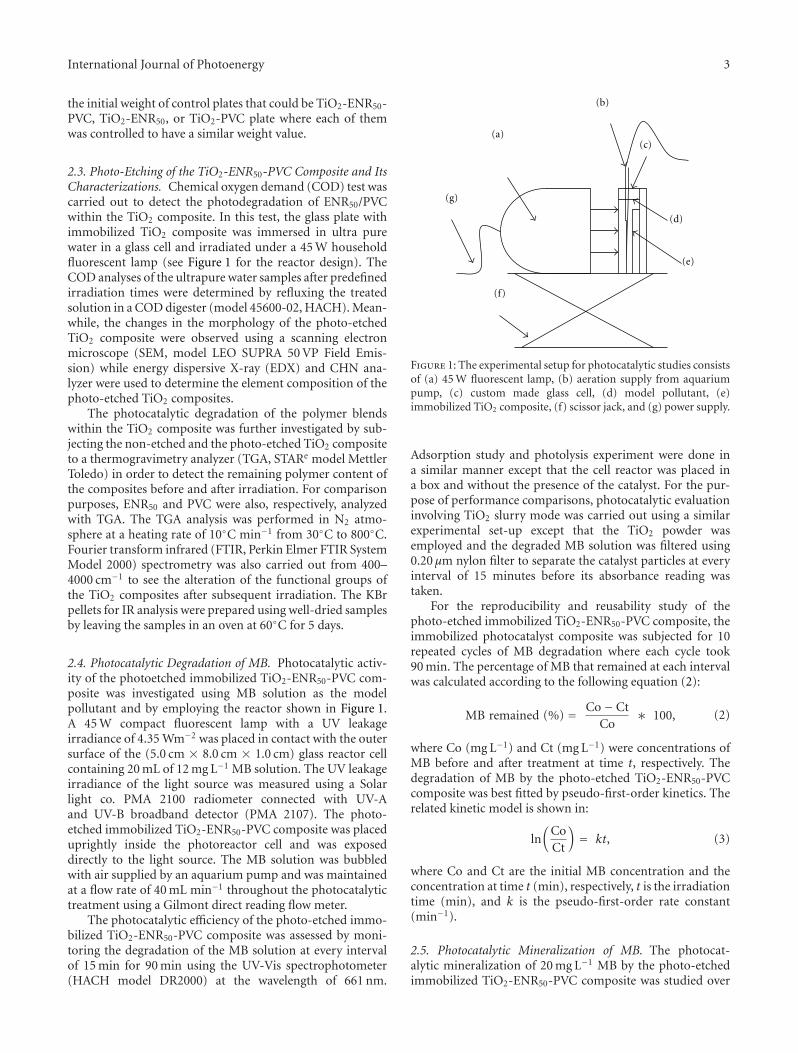
International Journal of Photoenergy 3
the initial weight of control plates that could be TiO2-ENR50-PVC, TiO2-ENR50, or TiO2-PVC plate where each of themwas controlled to have a similar weight value.
2.3. Photo-Etching of the TiO2-ENR50-PVC Composite and ItsCharacterizations. Chemical oxygen demand (COD) test wascarried out to detect the photodegradation of ENR50/PVCwithin the TiO2 composite. In this test, the glass plate withimmobilized TiO2 composite was immersed in ultra purewater in a glass cell and irradiated under a 45 W householdfluorescent lamp (see Figure 1 for the reactor design). TheCOD analyses of the ultrapure water samples after predefinedirradiation times were determined by refluxing the treatedsolution in a COD digester (model 45600-02, HACH). Mean-while, the changes in the morphology of the photo-etchedTiO2 composite were observed using a scanning electronmicroscope (SEM, model LEO SUPRA 50 VP Field Emis-sion) while energy dispersive X-ray (EDX) and CHN ana-lyzer were used to determine the element composition of thephoto-etched TiO2 composites.
The photocatalytic degradation of the polymer blendswithin the TiO2 composite was further investigated by sub-jecting the non-etched and the photo-etched TiO2 compositeto a thermogravimetry analyzer (TGA, STARe model MettlerToledo) in order to detect the remaining polymer content ofthe composites before and after irradiation. For comparisonpurposes, ENR50 and PVC were also, respectively, analyzedwith TGA. The TGA analysis was performed in N2 atmo-sphere at a heating rate of 10◦C min−1 from 30◦C to 800◦C.Fourier transform infrared (FTIR, Perkin Elmer FTIR SystemModel 2000) spectrometry was also carried out from 400–4000 cm−1 to see the alteration of the functional groups ofthe TiO2 composites after subsequent irradiation. The KBrpellets for IR analysis were prepared using well-dried samplesby leaving the samples in an oven at 60◦C for 5 days.
2.4. Photocatalytic Degradation of MB. Photocatalytic activ-ity of the photoetched immobilized TiO2-ENR50-PVC com-posite was investigated using MB solution as the modelpollutant and by employing the reactor shown in Figure 1.A 45 W compact fluorescent lamp with a UV leakageirradiance of 4.35 Wm−2 was placed in contact with the outersurface of the (5.0 cm × 8.0 cm × 1.0 cm) glass reactor cellcontaining 20 mL of 12 mg L−1 MB solution. The UV leakageirradiance of the light source was measured using a Solarlight co. PMA 2100 radiometer connected with UV-Aand UV-B broadband detector (PMA 2107). The photo-etched immobilized TiO2-ENR50-PVC composite was placeduprightly inside the photoreactor cell and was exposeddirectly to the light source. The MB solution was bubbledwith air supplied by an aquarium pump and was maintainedat a flow rate of 40 mL min−1 throughout the photocatalytictreatment using a Gilmont direct reading flow meter.
The photocatalytic efficiency of the photo-etched immo-bilized TiO2-ENR50-PVC composite was assessed by moni-toring the degradation of the MB solution at every intervalof 15 min for 90 min using the UV-Vis spectrophotometer(HACH model DR2000) at the wavelength of 661 nm.
(a)(c)
(d)
(e)
(f)
(g)
(b)
Figure 1: The experimental setup for photocatalytic studies consistsof (a) 45 W fluorescent lamp, (b) aeration supply from aquariumpump, (c) custom made glass cell, (d) model pollutant, (e)immobilized TiO2 composite, (f) scissor jack, and (g) power supply.
Adsorption study and photolysis experiment were done ina similar manner except that the cell reactor was placed ina box and without the presence of the catalyst. For the pur-pose of performance comparisons, photocatalytic evaluationinvolving TiO2 slurry mode was carried out using a similarexperimental set-up except that the TiO2 powder wasemployed and the degraded MB solution was filtered using0.20 μm nylon filter to separate the catalyst particles at everyinterval of 15 minutes before its absorbance reading wastaken.
For the reproducibility and reusability study of thephoto-etched immobilized TiO2-ENR50-PVC composite, theimmobilized photocatalyst composite was subjected for 10repeated cycles of MB degradation where each cycle took90 min. The percentage of MB that remained at each intervalwas calculated according to the following equation (2):
MB remained (%) = Co− CtCo
∗ 100, (2)
where Co (mg L−1) and Ct (mg L−1) were concentrations ofMB before and after treatment at time t, respectively. Thedegradation of MB by the photo-etched TiO2-ENR50-PVCcomposite was best fitted by pseudo-first-order kinetics. Therelated kinetic model is shown in:
ln(
CoCt
)= kt, (3)
where Co and Ct are the initial MB concentration and theconcentration at time t (min), respectively, t is the irradiationtime (min), and k is the pseudo-first-order rate constant(min−1).
2.5. Photocatalytic Mineralization of MB. The photocat-alytic mineralization of 20 mg L−1 MB by the photo-etchedimmobilized TiO2-ENR50-PVC composite was studied over
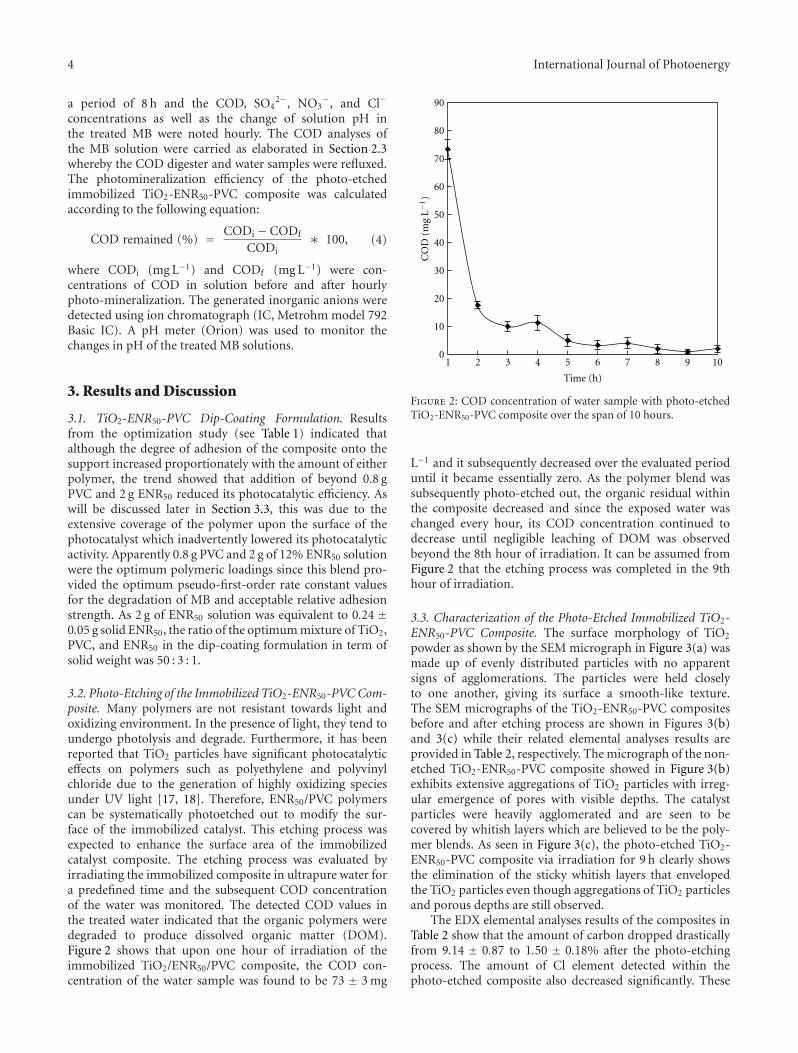
4 International Journal of Photoenergy
a period of 8 h and the COD, SO42−, NO3
−, and Cl−
concentrations as well as the change of solution pH inthe treated MB were noted hourly. The COD analyses ofthe MB solution were carried as elaborated in Section 2.3whereby the COD digester and water samples were refluxed.The photomineralization efficiency of the photo-etchedimmobilized TiO2-ENR50-PVC composite was calculatedaccording to the following equation:
COD remained (%) = CODi − CODf
CODi∗ 100, (4)
where CODi (mg L−1) and CODf (mg L−1) were con-centrations of COD in solution before and after hourlyphoto-mineralization. The generated inorganic anions weredetected using ion chromatograph (IC, Metrohm model 792Basic IC). A pH meter (Orion) was used to monitor thechanges in pH of the treated MB solutions.
3. Results and Discussion
3.1. TiO2-ENR50-PVC Dip-Coating Formulation. Resultsfrom the optimization study (see Table 1) indicated thatalthough the degree of adhesion of the composite onto thesupport increased proportionately with the amount of eitherpolymer, the trend showed that addition of beyond 0.8 gPVC and 2 g ENR50 reduced its photocatalytic efficiency. Aswill be discussed later in Section 3.3, this was due to theextensive coverage of the polymer upon the surface of thephotocatalyst which inadvertently lowered its photocatalyticactivity. Apparently 0.8 g PVC and 2 g of 12% ENR50 solutionwere the optimum polymeric loadings since this blend pro-vided the optimum pseudo-first-order rate constant valuesfor the degradation of MB and acceptable relative adhesionstrength. As 2 g of ENR50 solution was equivalent to 0.24 ±0.05 g solid ENR50, the ratio of the optimum mixture of TiO2,PVC, and ENR50 in the dip-coating formulation in term ofsolid weight was 50 : 3 : 1.
3.2. Photo-Etching of the Immobilized TiO2-ENR50-PVC Com-posite. Many polymers are not resistant towards light andoxidizing environment. In the presence of light, they tend toundergo photolysis and degrade. Furthermore, it has beenreported that TiO2 particles have significant photocatalyticeffects on polymers such as polyethylene and polyvinylchloride due to the generation of highly oxidizing speciesunder UV light [17, 18]. Therefore, ENR50/PVC polymerscan be systematically photoetched out to modify the sur-face of the immobilized catalyst. This etching process wasexpected to enhance the surface area of the immobilizedcatalyst composite. The etching process was evaluated byirradiating the immobilized composite in ultrapure water fora predefined time and the subsequent COD concentrationof the water was monitored. The detected COD values inthe treated water indicated that the organic polymers weredegraded to produce dissolved organic matter (DOM).Figure 2 shows that upon one hour of irradiation of theimmobilized TiO2/ENR50/PVC composite, the COD con-centration of the water sample was found to be 73 ± 3 mg
0
10
20
30
40
50
60
70
80
90
1 2 3 4 5 6 7 8 9 10
Time (h)
CO
D (
mg
L−1
)
Figure 2: COD concentration of water sample with photo-etchedTiO2-ENR50-PVC composite over the span of 10 hours.
L−1 and it subsequently decreased over the evaluated perioduntil it became essentially zero. As the polymer blend wassubsequently photo-etched out, the organic residual withinthe composite decreased and since the exposed water waschanged every hour, its COD concentration continued todecrease until negligible leaching of DOM was observedbeyond the 8th hour of irradiation. It can be assumed fromFigure 2 that the etching process was completed in the 9thhour of irradiation.
3.3. Characterization of the Photo-Etched Immobilized TiO2-ENR50-PVC Composite. The surface morphology of TiO2
powder as shown by the SEM micrograph in Figure 3(a) wasmade up of evenly distributed particles with no apparentsigns of agglomerations. The particles were held closelyto one another, giving its surface a smooth-like texture.The SEM micrographs of the TiO2-ENR50-PVC compositesbefore and after etching process are shown in Figures 3(b)and 3(c) while their related elemental analyses results areprovided in Table 2, respectively. The micrograph of the non-etched TiO2-ENR50-PVC composite showed in Figure 3(b)exhibits extensive aggregations of TiO2 particles with irreg-ular emergence of pores with visible depths. The catalystparticles were heavily agglomerated and are seen to becovered by whitish layers which are believed to be the poly-mer blends. As seen in Figure 3(c), the photo-etched TiO2-ENR50-PVC composite via irradiation for 9 h clearly showsthe elimination of the sticky whitish layers that envelopedthe TiO2 particles even though aggregations of TiO2 particlesand porous depths are still observed.
The EDX elemental analyses results of the composites inTable 2 show that the amount of carbon dropped drasticallyfrom 9.14 ± 0.87 to 1.50 ± 0.18% after the photo-etchingprocess. The amount of Cl element detected within thephoto-etched composite also decreased significantly. These
International Journal of Photoenergy 5
Table 1: (a) Pseudo-first-order rate constants for the adsorption and photocatalytic degradation of 12 mg L−1 MB in aqueous solution byTiO2-5 g ENR50-PVC formulations with different amount of PVC and (b) TiO2-ENR50-0.8 g PVC with different amount of ENR50 as well astheir respective relative adhesion strength upon the glass plates. TiO2 powder was maintained at 12 g.
PVC (g) ENR sol. (g)Pseudo-first-order rate constants (min−1)
Relative strength (%)Adsorption Photocatalysis
(a)
0.0 5 0.0049 0.0180 0.00
0.1 5 0.0047 0.0165 —
0.2 5 0.0048 0.0176 5.97
0.3 5 0.0050 0.0180 —
0.4 5 0.0054 0.0184 12.62
0.5 5 0.0055 0.0186 —
0.6 5 0.0056 0.0189 15.75
0.7 5 0.0064 0.0198 —
0.8 5 0.0068 0.0205 29.86
0.9 5 0.0034 0.0172 —
1.0 5 0.0028 0.0094 20.50
(b)
0.8 0.0 0.0045 0.0207 0.00
0.8 1.0 0.0048 0.0208 15.21
0.8 2.0 0.0049 0.0276 18.21
0.8 3.0 0.0045 0.0189 22.54
0.8 4.0 0.0052 0.0185 25.26
0.8 5.0 0.0068 0.0205 29.86
Table 2: (a) EDX and (b) CHN analyses of the nonetched TiO2-ENR50-PVC composite and the photoetched TiO2-ENR50-PVC composites.
SampleWeight (%)
Carbon Hydrogen Oxygen Titanium Chloride
(a) EDX
TiO2 composite 9.14± 0.87 — 40.20± 2.10 49.93± 3.54 1.04± 0.14
Etched TiO2
composite1.50± 0.18 — 40.06± 0.60 58.20± 0.74 0.25± 0.04
(b) CHN
TiO2 composite 4.61 0.51
Etched 3 h 3.22 0.09
Etched 6 h 3.15 0.15
Etched 9 h 1.39 0.01
Etched 10 h 1.20 0.05
results further confirmed that the ENR50/PVC blends withinthe TiO2 composite were degraded to a certain degree bythe applied light source. These results support the CODanalyses obtained earlier in Section 3.2. A detailed stepwisemonitoring of the etching process of the immobilized TiO2-ENR50-PVC composite via CHN analysis is provided in (b)of Table 2. The value of C element decreased with time ofirradiation indicating the continuous removal of the polymerblend. It can be inferred from here that the etching processwas completed after 9 h of irradiation since the value of Celement remained more or less constant beyond this timewhich was once again in good agreement with the previousEDX and COD analyses.
Figure 4 illustrates the TGA and DTG curves of ENR50,PVC and TiO2-ENR50-PVC composites before and afterphoto-etching. The corresponding thermogravimetric datais provided in Supplementary Table 1 (in SupplementaryMaterial available online at doi: 10.1155/2012/859294). Thedegradation of ENR50 shown in Figure 4(a) occurred in onestage with the maximum weight loss temperature (Tmax) at400◦C. The weight loss was determined to be 98.56%. Thedegradation of ENR50 was initiated by the fragmentation ofpolyisoprene chains and the epoxy polar groups, producingvolatile components such as isoprene and dipentene [14].On the other hand, Figure 4(b) shows that the degradationof PVC occurred in two stages. The first stage occurred at
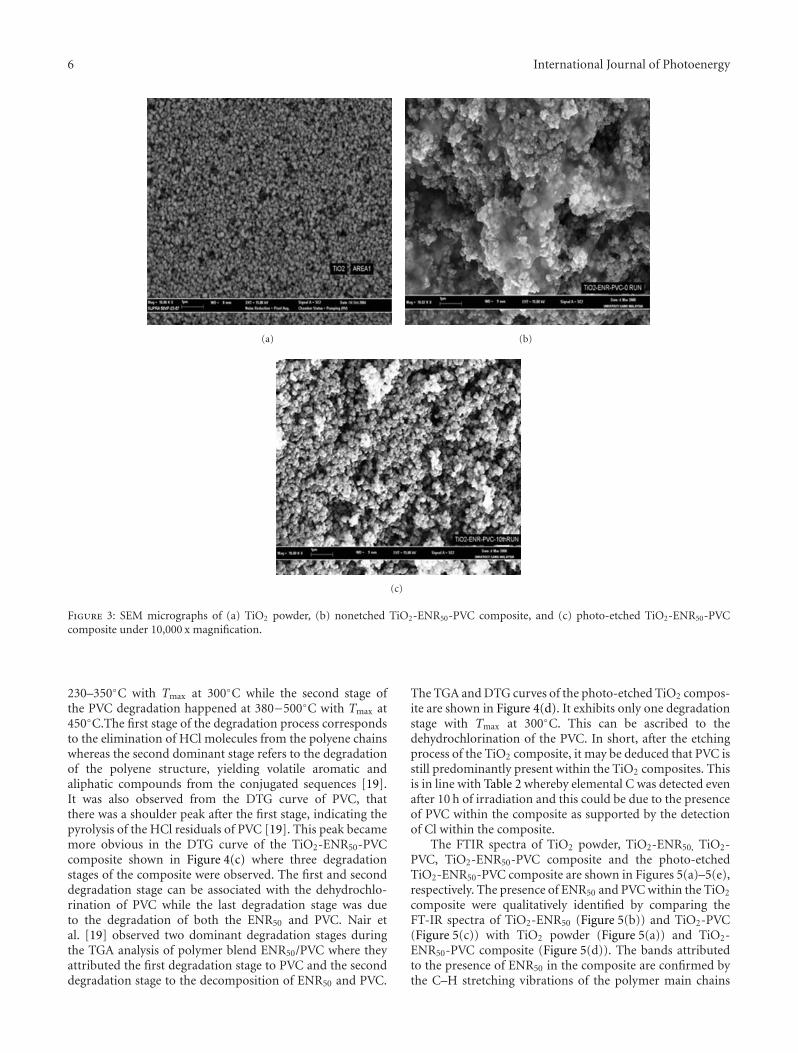
6 International Journal of Photoenergy
(a) (b)
(c)
Figure 3: SEM micrographs of (a) TiO2 powder, (b) nonetched TiO2-ENR50-PVC composite, and (c) photo-etched TiO2-ENR50-PVCcomposite under 10,000 x magnification.
230–350◦C with Tmax at 300◦C while the second stage ofthe PVC degradation happened at 380−500◦C with Tmax at450◦C.The first stage of the degradation process correspondsto the elimination of HCl molecules from the polyene chainswhereas the second dominant stage refers to the degradationof the polyene structure, yielding volatile aromatic andaliphatic compounds from the conjugated sequences [19].It was also observed from the DTG curve of PVC, thatthere was a shoulder peak after the first stage, indicating thepyrolysis of the HCl residuals of PVC [19]. This peak becamemore obvious in the DTG curve of the TiO2-ENR50-PVCcomposite shown in Figure 4(c) where three degradationstages of the composite were observed. The first and seconddegradation stage can be associated with the dehydrochlo-rination of PVC while the last degradation stage was dueto the degradation of both the ENR50 and PVC. Nair etal. [19] observed two dominant degradation stages duringthe TGA analysis of polymer blend ENR50/PVC where theyattributed the first degradation stage to PVC and the seconddegradation stage to the decomposition of ENR50 and PVC.
The TGA and DTG curves of the photo-etched TiO2 compos-ite are shown in Figure 4(d). It exhibits only one degradationstage with Tmax at 300◦C. This can be ascribed to thedehydrochlorination of the PVC. In short, after the etchingprocess of the TiO2 composite, it may be deduced that PVC isstill predominantly present within the TiO2 composites. Thisis in line with Table 2 whereby elemental C was detected evenafter 10 h of irradiation and this could be due to the presenceof PVC within the composite as supported by the detectionof Cl within the composite.
The FTIR spectra of TiO2 powder, TiO2-ENR50, TiO2-PVC, TiO2-ENR50-PVC composite and the photo-etchedTiO2-ENR50-PVC composite are shown in Figures 5(a)–5(e),respectively. The presence of ENR50 and PVC within the TiO2
composite were qualitatively identified by comparing theFT-IR spectra of TiO2-ENR50 (Figure 5(b)) and TiO2-PVC(Figure 5(c)) with TiO2 powder (Figure 5(a)) and TiO2-ENR50-PVC composite (Figure 5(d)). The bands attributedto the presence of ENR50 in the composite are confirmed bythe C–H stretching vibrations of the polymer main chains
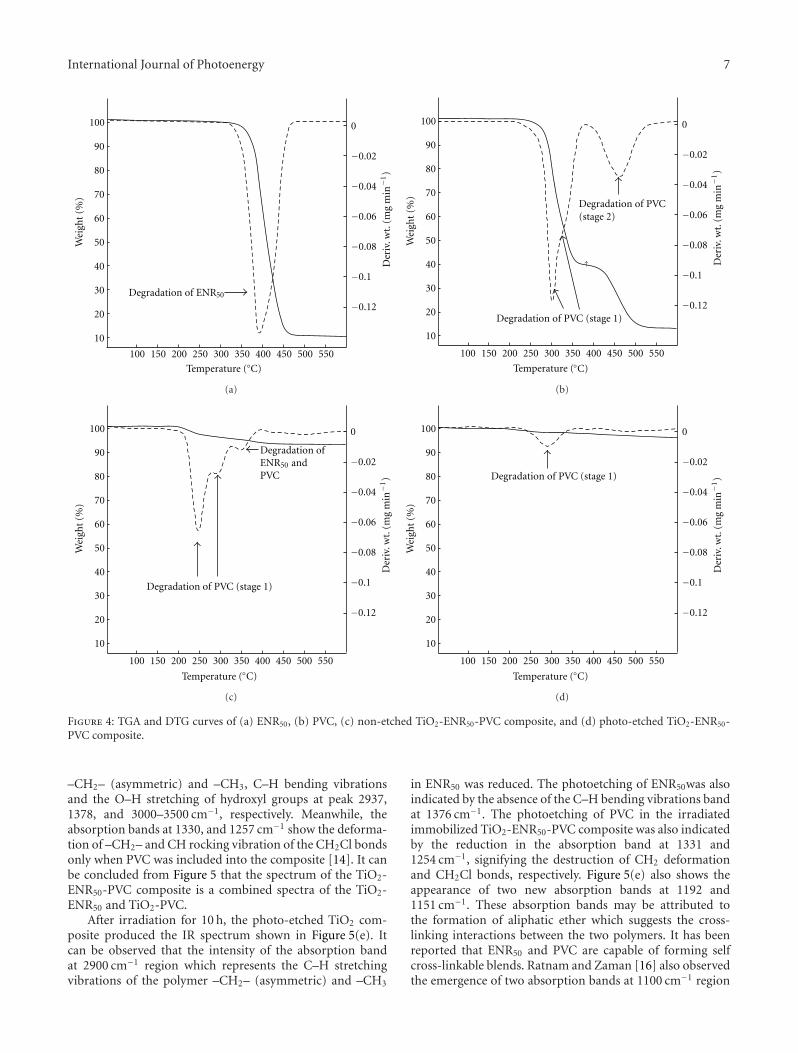
International Journal of Photoenergy 7
100
90
80
70
60
50
40
30
20
10
Wei
ght
(%)
100 150 200 250 300 350 400 450 500 550
Temperature (◦C)
Degradation of ENR50
Der
iv. w
t. (m
g m
in−1
)
0
−0.02
−0.04
−0.06
−0.08
−0.1
−0.12
(a)
100 150 200 250 300 350 400 450 500 550
Temperature (◦C)
100
90
80
70
60
50
40
30
20
10
Wei
ght
(%)
Degradation of PVC(stage 2)
Degradation of PVC (stage 1)
Der
iv. w
t. (m
g m
in−1
)
0
−0.02
−0.04
−0.06
−0.08
−0.1
−0.12
(b)
100 150 200 250 300 350 400 450 500 550
Temperature (◦C)
100
90
80
70
60
50
40
30
20
10
Wei
ght
(%)
Degradation of PVC (stage 1)
Degradation ofENR50 andPVC
Der
iv. w
t. (m
g m
in−1
)
0
−0.02
−0.04
−0.06
−0.08
−0.1
−0.12
(c)
100 150 200 250 300 350 400 450 500 550
Temperature (◦C)
100
90
80
70
60
50
40
30
20
10
Wei
ght
(%)
Der
iv. w
t. (m
g m
in−1
)Degradation of PVC (stage 1)
0
−0.02
−0.04
−0.06
−0.08
−0.1
−0.12
(d)
Figure 4: TGA and DTG curves of (a) ENR50, (b) PVC, (c) non-etched TiO2-ENR50-PVC composite, and (d) photo-etched TiO2-ENR50-PVC composite.
–CH2– (asymmetric) and –CH3, C–H bending vibrationsand the O–H stretching of hydroxyl groups at peak 2937,1378, and 3000–3500 cm−1, respectively. Meanwhile, theabsorption bands at 1330, and 1257 cm−1 show the deforma-tion of –CH2– and CH rocking vibration of the CH2Cl bondsonly when PVC was included into the composite [14]. It canbe concluded from Figure 5 that the spectrum of the TiO2-ENR50-PVC composite is a combined spectra of the TiO2-ENR50 and TiO2-PVC.
After irradiation for 10 h, the photo-etched TiO2 com-posite produced the IR spectrum shown in Figure 5(e). Itcan be observed that the intensity of the absorption bandat 2900 cm−1 region which represents the C–H stretchingvibrations of the polymer –CH2– (asymmetric) and –CH3
in ENR50 was reduced. The photoetching of ENR50was alsoindicated by the absence of the C–H bending vibrations bandat 1376 cm−1. The photoetching of PVC in the irradiatedimmobilized TiO2-ENR50-PVC composite was also indicatedby the reduction in the absorption band at 1331 and1254 cm−1, signifying the destruction of CH2 deformationand CH2Cl bonds, respectively. Figure 5(e) also shows theappearance of two new absorption bands at 1192 and1151 cm−1. These absorption bands may be attributed tothe formation of aliphatic ether which suggests the cross-linking interactions between the two polymers. It has beenreported that ENR50 and PVC are capable of forming selfcross-linkable blends. Ratnam and Zaman [16] also observedthe emergence of two absorption bands at 1100 cm−1 region
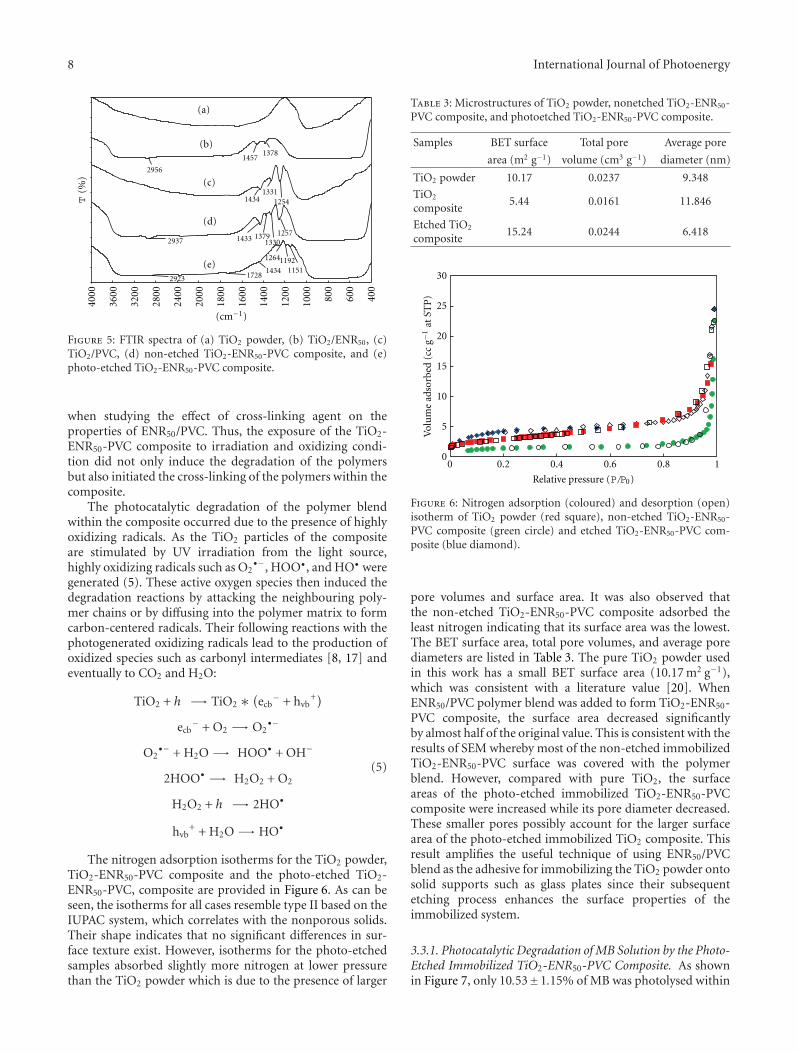
8 International Journal of Photoenergy
4000
3600
3200
2800
2400
2000
1800
1600
1400
1200
1000 80
0
600
400
(a)
(b)
(c)
(d)
13781457
2956
12541331
1434
12571330
137914332937
2923 1728(e)
1264119211511434
(cm−1)
T(%
)
Figure 5: FTIR spectra of (a) TiO2 powder, (b) TiO2/ENR50, (c)TiO2/PVC, (d) non-etched TiO2-ENR50-PVC composite, and (e)photo-etched TiO2-ENR50-PVC composite.
when studying the effect of cross-linking agent on theproperties of ENR50/PVC. Thus, the exposure of the TiO2-ENR50-PVC composite to irradiation and oxidizing condi-tion did not only induce the degradation of the polymersbut also initiated the cross-linking of the polymers within thecomposite.
The photocatalytic degradation of the polymer blendwithin the composite occurred due to the presence of highlyoxidizing radicals. As the TiO2 particles of the compositeare stimulated by UV irradiation from the light source,highly oxidizing radicals such as O2
•−, HOO•, and HO• weregenerated (5). These active oxygen species then induced thedegradation reactions by attacking the neighbouring poly-mer chains or by diffusing into the polymer matrix to formcarbon-centered radicals. Their following reactions with thephotogenerated oxidizing radicals lead to the production ofoxidized species such as carbonyl intermediates [8, 17] andeventually to CO2 and H2O:
TiO2 + h −→ TiO2 ∗(ecb
− + hvb+)
ecb− + O2 −→ O2
•−
O2•− + H2O −→ HOO• + OH−
2HOO• −→ H2O2 + O2
H2O2 + h −→ 2HO•
hvb+ + H2O −→ HO•
(5)
The nitrogen adsorption isotherms for the TiO2 powder,TiO2-ENR50-PVC composite and the photo-etched TiO2-ENR50-PVC, composite are provided in Figure 6. As can beseen, the isotherms for all cases resemble type II based on theIUPAC system, which correlates with the nonporous solids.Their shape indicates that no significant differences in sur-face texture exist. However, isotherms for the photo-etchedsamples absorbed slightly more nitrogen at lower pressurethan the TiO2 powder which is due to the presence of larger
Table 3: Microstructures of TiO2 powder, nonetched TiO2-ENR50-PVC composite, and photoetched TiO2-ENR50-PVC composite.
Samples BET surface Total pore Average pore
area (m2 g−1) volume (cm3 g−1) diameter (nm)
TiO2 powder 10.17 0.0237 9.348
TiO2
composite5.44 0.0161 11.846
Etched TiO2
composite15.24 0.0244 6.418
0
5
10
15
20
25
30
0 0.2 0.4 0.6 0.8 1
Relative pressure (P/P0)
Vol
um
e ad
sorb
ed (
cc g−1
at S
TP
)
Figure 6: Nitrogen adsorption (coloured) and desorption (open)isotherm of TiO2 powder (red square), non-etched TiO2-ENR50-PVC composite (green circle) and etched TiO2-ENR50-PVC com-posite (blue diamond).
pore volumes and surface area. It was also observed thatthe non-etched TiO2-ENR50-PVC composite adsorbed theleast nitrogen indicating that its surface area was the lowest.The BET surface area, total pore volumes, and average porediameters are listed in Table 3. The pure TiO2 powder usedin this work has a small BET surface area (10.17 m2 g−1),which was consistent with a literature value [20]. WhenENR50/PVC polymer blend was added to form TiO2-ENR50-PVC composite, the surface area decreased significantlyby almost half of the original value. This is consistent with theresults of SEM whereby most of the non-etched immobilizedTiO2-ENR50-PVC surface was covered with the polymerblend. However, compared with pure TiO2, the surfaceareas of the photo-etched immobilized TiO2-ENR50-PVCcomposite were increased while its pore diameter decreased.These smaller pores possibly account for the larger surfacearea of the photo-etched immobilized TiO2 composite. Thisresult amplifies the useful technique of using ENR50/PVCblend as the adhesive for immobilizing the TiO2 powder ontosolid supports such as glass plates since their subsequentetching process enhances the surface properties of theimmobilized system.
3.3.1. Photocatalytic Degradation of MB Solution by the Photo-Etched Immobilized TiO2-ENR50-PVC Composite. As shownin Figure 7, only 10.53±1.15% of MB was photolysed within
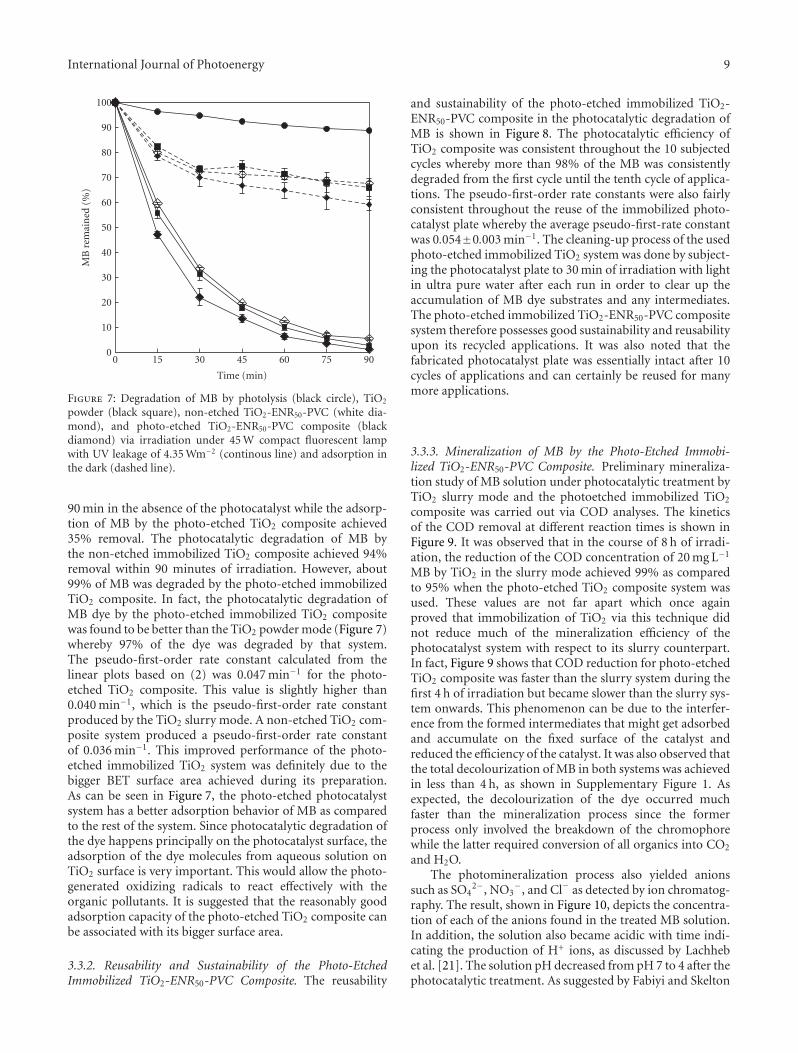
International Journal of Photoenergy 9
0
10
20
30
40
50
60
70
80
90
100
0 15 30 45 60 75 90
MB
rem
ain
ed (
%)
Time (min)
Figure 7: Degradation of MB by photolysis (black circle), TiO2
powder (black square), non-etched TiO2-ENR50-PVC (white dia-mond), and photo-etched TiO2-ENR50-PVC composite (blackdiamond) via irradiation under 45 W compact fluorescent lampwith UV leakage of 4.35 Wm−2 (continous line) and adsorption inthe dark (dashed line).
90 min in the absence of the photocatalyst while the adsorp-tion of MB by the photo-etched TiO2 composite achieved35% removal. The photocatalytic degradation of MB bythe non-etched immobilized TiO2 composite achieved 94%removal within 90 minutes of irradiation. However, about99% of MB was degraded by the photo-etched immobilizedTiO2 composite. In fact, the photocatalytic degradation ofMB dye by the photo-etched immobilized TiO2 compositewas found to be better than the TiO2 powder mode (Figure 7)whereby 97% of the dye was degraded by that system.The pseudo-first-order rate constant calculated from thelinear plots based on (2) was 0.047 min−1 for the photo-etched TiO2 composite. This value is slightly higher than0.040 min−1, which is the pseudo-first-order rate constantproduced by the TiO2 slurry mode. A non-etched TiO2 com-posite system produced a pseudo-first-order rate constantof 0.036 min−1. This improved performance of the photo-etched immobilized TiO2 system was definitely due to thebigger BET surface area achieved during its preparation.As can be seen in Figure 7, the photo-etched photocatalystsystem has a better adsorption behavior of MB as comparedto the rest of the system. Since photocatalytic degradation ofthe dye happens principally on the photocatalyst surface, theadsorption of the dye molecules from aqueous solution onTiO2 surface is very important. This would allow the photo-generated oxidizing radicals to react effectively with theorganic pollutants. It is suggested that the reasonably goodadsorption capacity of the photo-etched TiO2 composite canbe associated with its bigger surface area.
3.3.2. Reusability and Sustainability of the Photo-EtchedImmobilized TiO2-ENR50-PVC Composite. The reusability
and sustainability of the photo-etched immobilized TiO2-ENR50-PVC composite in the photocatalytic degradation ofMB is shown in Figure 8. The photocatalytic efficiency ofTiO2 composite was consistent throughout the 10 subjectedcycles whereby more than 98% of the MB was consistentlydegraded from the first cycle until the tenth cycle of applica-tions. The pseudo-first-order rate constants were also fairlyconsistent throughout the reuse of the immobilized photo-catalyst plate whereby the average pseudo-first-rate constantwas 0.054±0.003 min−1. The cleaning-up process of the usedphoto-etched immobilized TiO2 system was done by subject-ing the photocatalyst plate to 30 min of irradiation with lightin ultra pure water after each run in order to clear up theaccumulation of MB dye substrates and any intermediates.The photo-etched immobilized TiO2-ENR50-PVC compositesystem therefore possesses good sustainability and reusabilityupon its recycled applications. It was also noted that thefabricated photocatalyst plate was essentially intact after 10cycles of applications and can certainly be reused for manymore applications.
3.3.3. Mineralization of MB by the Photo-Etched Immobi-lized TiO2-ENR50-PVC Composite. Preliminary mineraliza-tion study of MB solution under photocatalytic treatment byTiO2 slurry mode and the photoetched immobilized TiO2
composite was carried out via COD analyses. The kineticsof the COD removal at different reaction times is shown inFigure 9. It was observed that in the course of 8 h of irradi-ation, the reduction of the COD concentration of 20 mg L−1
MB by TiO2 in the slurry mode achieved 99% as comparedto 95% when the photo-etched TiO2 composite system wasused. These values are not far apart which once againproved that immobilization of TiO2 via this technique didnot reduce much of the mineralization efficiency of thephotocatalyst system with respect to its slurry counterpart.In fact, Figure 9 shows that COD reduction for photo-etchedTiO2 composite was faster than the slurry system during thefirst 4 h of irradiation but became slower than the slurry sys-tem onwards. This phenomenon can be due to the interfer-ence from the formed intermediates that might get adsorbedand accumulate on the fixed surface of the catalyst andreduced the efficiency of the catalyst. It was also observed thatthe total decolourization of MB in both systems was achievedin less than 4 h, as shown in Supplementary Figure 1. Asexpected, the decolourization of the dye occurred muchfaster than the mineralization process since the formerprocess only involved the breakdown of the chromophorewhile the latter required conversion of all organics into CO2
and H2O.The photomineralization process also yielded anions
such as SO42−, NO3
−, and Cl− as detected by ion chromatog-raphy. The result, shown in Figure 10, depicts the concentra-tion of each of the anions found in the treated MB solution.In addition, the solution also became acidic with time indi-cating the production of H+ ions, as discussed by Lachhebet al. [21]. The solution pH decreased from pH 7 to 4 after thephotocatalytic treatment. As suggested by Fabiyi and Skelton
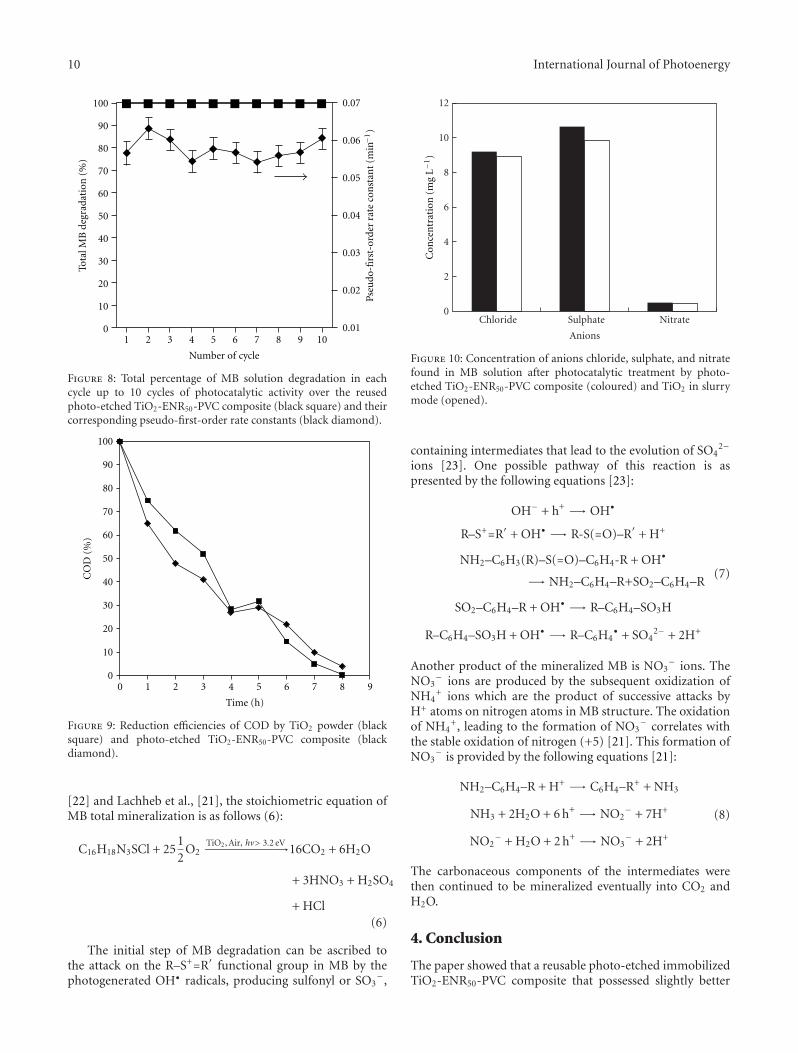
10 International Journal of Photoenergy
100
90
80
70
60
50
40
30
20
10
0
Tota
l MB
deg
rada
tion
(%
)
1 2 3 4 5 6 7 8 9 10
Number of cycle
0.07
0.06
0.05
0.04
0.03
0.02
0.01
Pseu
do-fi
rst-
orde
r ra
te c
onst
ant
(min−1
)Figure 8: Total percentage of MB solution degradation in eachcycle up to 10 cycles of photocatalytic activity over the reusedphoto-etched TiO2-ENR50-PVC composite (black square) and theircorresponding pseudo-first-order rate constants (black diamond).
0
10
20
30
40
50
60
70
80
90
100
0 1 2 3 4 5 6 7 8 9
CO
D (
%)
Time (h)
Figure 9: Reduction efficiencies of COD by TiO2 powder (blacksquare) and photo-etched TiO2-ENR50-PVC composite (blackdiamond).
[22] and Lachheb et al., [21], the stoichiometric equation ofMB total mineralization is as follows (6):
C16H18N3SCl + 2512
O2TiO2, Air, hv> 3.2 eV−−−−−−−−−−−→16CO2 + 6H2O
+ 3HNO3 + H2SO4
+ HCl(6)
The initial step of MB degradation can be ascribed tothe attack on the R–S+=R′ functional group in MB by thephotogenerated OH• radicals, producing sulfonyl or SO3
−,
0
2
4
6
8
10
12
Chloride Sulphate Nitrate
Anions
Con
cen
trat
ion
(m
g L−1
)
Figure 10: Concentration of anions chloride, sulphate, and nitratefound in MB solution after photocatalytic treatment by photo-etched TiO2-ENR50-PVC composite (coloured) and TiO2 in slurrymode (opened).
containing intermediates that lead to the evolution of SO42−
ions [23]. One possible pathway of this reaction is aspresented by the following equations [23]:
OH− + h+ −→ OH•
R–S+=R′ + OH• −→ R-S(=O)–R′ + H+
NH2–C6H3(R)–S(=O)–C6H4-R + OH•
−→ NH2–C6H4–R+SO2–C6H4–R
SO2–C6H4–R + OH• −→ R–C6H4–SO3H
R–C6H4–SO3H + OH• −→ R–C6H4• + SO4
2− + 2H+
(7)
Another product of the mineralized MB is NO3− ions. The
NO3− ions are produced by the subsequent oxidization of
NH4+ ions which are the product of successive attacks by
H+ atoms on nitrogen atoms in MB structure. The oxidationof NH4
+, leading to the formation of NO3− correlates with
the stable oxidation of nitrogen (+5) [21]. This formation ofNO3
− is provided by the following equations [21]:
NH2–C6H4–R + H+ −→ C6H4–R+ + NH3
NH3 + 2H2O + 6 h+ −→ NO2− + 7H+
NO2− + H2O + 2 h+ −→ NO3
− + 2H+
(8)
The carbonaceous components of the intermediates werethen continued to be mineralized eventually into CO2 andH2O.
4. Conclusion
The paper showed that a reusable photo-etched immobilizedTiO2-ENR50-PVC composite that possessed slightly better
International Journal of Photoenergy 11
photocatalytic efficiency than the TiO2 slurry mode can besuccessfully prepared via a simple dip-coating method. Thislow cost but effective method utilized a dip-coating emulsionprepared by mixing TiO2 powder with ENR50/PVC in mixedsolvent system via ultrasonication before being immobilizedon glass plates. Photodegradability of ENR50/PVC within theTiO2 composite under the irradiation of the applied lightsource (45 W compact fluorescent lamp) allowed us to etchout the polymer blend thus enhanced the surface propertiesof the system. It was observed that this technique produceda slightly bigger surface area than the initial TiO2 powder.The photo-etched immobilized TiO2-ENR50-PVC compositeperformed at par or better than the TiO2 slurry mode system.It was highly reusable with sustainable photocatalytic effi-ciencies in the photocatalytic degradation of MB solution.The photomineralization capability of the photo-etchedTiO2-ENR50-PVC composite was also comparable to theTiO2 slurry mode system. Therefore, it can be said that thephoto-etching technique is a potential new approach in fab-ricating immobilized TiO2 system without facing the usualreduction in photocatalytic activity as commonly observedfor immobilized photocatalyst systems. Such efficient immo-bilized photocatalyst system offers excellent advantage of useand reuse without the need to filter the treated water afterthe treatment and can be easily adapted for continuous flowreactor.
Acknowledgments
The authors thank Ministry of Science and Technology(MOSTI) of Malaysia and Universiti Sains Malaysia (USM)for their generous financial assistance under Grant FRGS:203/227/PKIMIA/67/027 and IRPA: 305/229/PKIMIA/613402. The authors are also grateful to the Institute ofPostgraduate Studies (IPS) USM for Fellowship Scheme andthe facilities provided by the USM throughout this research.
References
[1] O. Prieto, J. Fermoso, Y. Nunez, J. L. Del Valle, and R. Irusta,“Decolouration of textile dyes in wastewaters by photocatalysiswith TiO2,” Solar Energy, vol. 79, no. 4, pp. 376–383, 2005.
[2] M. Saquib, M. Abu Tariq, M. Faisal, and M. Muneer,“Photocatalytic degradation of two selected dye derivatives inaqueous suspensions of titanium dioxide,” Desalination, vol.219, no. 1–3, pp. 301–311, 2008.
[3] R. Jain and M. Shrivastava, “Photocatalytic removal ofhazardous dye cyanosine from industrial waste using titaniumdioxide,” Journal of Hazardous Materials, vol. 152, no. 1, pp.216–220, 2008.
[4] C. Guillard, H. Lachheb, A. Houas, M. Ksibi, E. Elaloui, and J.M. Herrmann, “Influence of chemical structure of dyes, of pHand of inorganic salts on their photocatalytic degradation byTiO2 comparison of the efficiency of powder and supportedTiO2,” Journal of Photochemistry and Photobiology A, vol. 158,no. 1, pp. 27–36, 2003.
[5] C. M. Ling, A. R. Mohamed, and S. Bhatia, “Performance ofphotocatalytic reactors using immobilized TiO2 film for thedegradation of phenol and methylene blue dye present inwater stream,” Chemosphere, vol. 57, no. 7, pp. 547–554, 2004.
[6] G. Mascolo, R. Comparelli, M. L. Curri, G. Lovecchio, A.Lopez, and A. Agostiano, “Photocatalytic degradation ofmethyl red by TiO2: comparison of the efficiency of immo-bilized nanoparticles versus conventional suspended catalyst,”Journal of Hazardous Materials, vol. 142, no. 1-2, pp. 130–137,2007.
[7] K. V. S. Rao, M. Subrahmanyam, and P. Boule, “ImmobilizedTiO2 photocatalyst during long-term use: decrease of itsactivity,” Applied Catalysis B, vol. 49, no. 4, pp. 239–249, 2004.
[8] M. Jin, X. Zhang, A. V. Emeline, T. Numata, T. Murakami,and A. Fujishima, “Surface modification of natural rubber byTiO2 film,” Surface and Coatings Technology, vol. 202, no. 8,pp. 1364–1370, 2008.
[9] C. Sriwong, S. Wongnawa, and O. Patarapaiboolchai, “Pho-tocatalytic activity of rubber sheet impregnated with TiO2
particles and its recyclability,” Catalysis Communications, vol.9, no. 2, pp. 213–218, 2008.
[10] V. P. Silva, M. P. Paschoalino, M. C. Goncalves, M. I. Felisberti,W. F. Jardim, and I. V. P. Yoshida, “Silicone rubbers filled withTiO2: characterization and photocatalytic activity,” MaterialsChemistry and Physics, vol. 113, no. 1, pp. 395–400, 2009.
[11] M. A. Nawi, L. C. Kean, K. Tanaka, and M. S. Jab, “Fabricationof photocatalytic TiO2-epoxidized natural rubber on Al platevia electrophoretic deposition,” Applied Catalysis B, vol. 46, no.1, pp. 165–174, 2003.
[12] M. A. Nawi, A. H. Jawad, S. Sabar, and W. S. W. Ngah, “Immo-bilized bilayer TiO2/chitosan system for the removal of phenolunder irradiation by a 45 watt compact fluorescent lamp,”Desalination, vol. 280, no. 1–3, pp. 288–296, 2011.
[13] C. T. Ratnam and K. Zaman, “Stabilization of poly(vinyl chlo-ride)/epoxidized natural rubber (PVC/ENR) blends,” PolymerDegradation and Stability, vol. 65, no. 1, pp. 99–105, 1999.
[14] U. S. Ishiaku and Z. A. M. Ishak, “Developments in poly (vinylchloride)/Epoxidized Natural Rubber Blends,” in PolymerBlends and Alloys, G. O. Shonaike and G. P. Simon, Eds.,Marcel Dekker, New York, NY, USA, 1999.
[15] M. C. S. Perera, U. S. Ishiaku, and Z. A. M. Ishak, “Thermaldegradation of PVC/NBR and PVC/ENR50 binary blends andPVC/ENR50/NBR ternary blends studied by DMA and solidstate NMR,” Polymer Degradation and Stability, vol. 68, no. 3,pp. 393–402, 2000.
[16] C. T. Ratnam and K. Zaman, “Modification of PVC/ENRblend by electron beam irradiation: effect of crosslinkingagents,” Nuclear Instruments and Methods in Physics Research,Section B, vol. 152, no. 2, pp. 335–342, 1999.
[17] S. Cho and W. Choi, “Solid-phase photocatalytic degradationof PVC-TiO2 polymer composites,” Journal of Photochemistryand Photobiology A, vol. 143, no. 2-3, pp. 221–228, 2001.
[18] S. S. Chin, T. M. Lim, K. Chiang, and A. G. Fane, “Factorsaffecting the performance of a low-pressure submerged mem-brane photocatalytic reactor,” Chemical Engineering Journal,vol. 130, no. 1, pp. 53–63, 2007.
[19] M. N. Radhakrishnan Nair, G. V. Thomas, and M. R.Gopinathan Nair, “Thermogravimetric analysis of PVC/ELNRblends,” Polymer Degradation and Stability, vol. 92, no. 2, pp.189–196, 2007.
[20] K. Khuanmar, W. Wirojanagud, P. Kajitvichyanukuk, and S.Maensiri, “Photocatalysis of phenolic compounds with syn-thesized nanoparticles TiO2/Sn2,” Journal of Applied Sciences,vol. 7, no. 14, pp. 1968–1972, 2007.
[21] H. Lachheb, E. Puzenat, A. Houas et al., “Photocatalytic de-gradation of various types of dyes (Alizarin S, Crocein Orange

12 International Journal of Photoenergy
G, Methyl Red, Congo Red, Methylene Blue) in water by UV-irradiated titania,” Applied Catalysis B, vol. 39, no. 1, pp. 75–90, 2002.
[22] M. E. Fabiyi and R. L. Skelton, “Photocatalytic mineralisationof methylene blue using buoyant TiO2-coated polystyrenebeads,” Journal of Photochemistry and Photobiology A, vol. 132,no. 1-2, pp. 121–128, 2000.
[23] A. Houas, H. Lachheb, M. Ksibi, E. Elaloui, C. Guillard,and J. M. Herrmann, “Photocatalytic degradation pathway ofmethylene blue in water,” Applied Catalysis B, vol. 31, no. 2,pp. 145–157, 2001.
Hindawi Publishing CorporationInternational Journal of PhotoenergyVolume 2012, Article ID 368750, 10 pagesdoi:10.1155/2012/368750
Research Article
Synthesis, Characterization, and Photocatalysis of Fe-DopedTiO2: A Combined Experimental and Theoretical Study
Liping Wen,1 Baoshun Liu,1, 2 Xiujian Zhao,1 Kazuya Nakata,2, 3
Taketoshi Murakami,2 and Akira Fujishima2, 3
1 State Key Laboratory of Silicate Materials for Architectures, Wuhan University of Technology, Wuhan City,Hubei Province 430070, China
2 Photocatalyst Group, Kanagawa Academy of Science and Technology, KSP East 412, 3-2-1 Sakado, Takatsu-ku, Kawasaki,Kanagawa 213-0012, Japan
3 Division of Photocatalyst for Energy and Environment, Research Institute for Science and Technology, Tokyo University of Science,1-3 Kagurazaka, Shinjuku-ku, Tokyo 162-8601, Japan
Correspondence should be addressed to Baoshun Liu, [email protected] and Kazuya Nakata, [email protected]
Received 6 January 2012; Revised 25 February 2012; Accepted 27 February 2012
Academic Editor: Baibiao Huang
Copyright © 2012 Liping Wen et al. This is an open access article distributed under the Creative Commons Attribution License,which permits unrestricted use, distribution, and reproduction in any medium, provided the original work is properly cited.
Fe-doped TiO2 was prepared by hydrothermal treating Ti peroxide sol with different amount of iron nitrate. Fe ions can enterTiO2 lattice by substituting Ti4+ ions, which significantly affect the crystallinity and morphology of TiO2 nanoparticles. Fe dopingalso influences the UV-Vis absorption and photoluminescence of TiO2, due to the change of electronic structure. It is shown thatFe ions are more easily doped on TiO2 surface than in bulk. The theoretical computation based on the density functional theory(DFT) shows that the Fe ions in TiO2 bulk are localized and mainly act as the recombination centers of photoinduced electronsand holes. Some results support that the Fe3+ ions on surface can form intermediate interfacial transfer pathway for electrons andholes, which is beneficial for increasing the photocatalytic activity of TiO2. The photocatalytic activity first increases and thendecreases as the Fe concentration increases, which is coaffected by the bulk-doped and surface-doped Fe ions.
1. Introduction
Since the publishing of photocatalytic water splitting [1],photocatalysis has drawn much attention in the world formany years [2–4]. Compared with other photocatalysts,TiO2 is extensively studied because of low-cost, non-toxicity,and high chemical-stability. Generally, pure TiO2 suffersfrom problems of large band gap (Eg) [5, 6] and lowquantum yield. Doping is proved to be effective to narrowEg and increases photocatalytic activity [7–14]. Transition-metal-doped TiO2 have been widely studied due to theird electronic configuration [15–18]. Fe is the most studiedbecause it has the radium identical to Ti4+ and the half-filledd electronic configuration [19–21]. It was reported that thephotocatalytic activity of Fe-doped titanate nanotubes is 2times higher than P25 under visible light illumination [19],and the Fe-doped Q (quantum)-TiO2 particles can removechloroform under UV light illumination due to the trappingof photoinduced electrons and holes [20].
It is always reported that the photocatalytic activityunder UV light illumination will firstly increase and thendecrease with the increase of doped Fe concentration [17,19, 20]. It is considered that the Fe ions can trap holes orelectrons for low-level doping, while they will change torecombination centers for high-level doping [17, 19, 22].However, the physical reason that the doped Fe3+ ions mainlyact as recombination centers is not well known. Althoughtunneling recombination is said to become significant forhigh doping level, no experimental proofs can supportthis conclusion. The research 20 devoted to studying thephotocatalytic mechanism of transition-metal-doped Q-TiO2 particles of 3-4 nm. In this case, Fe ions are mainly onsurface due to the small particle size, which can form effectivepathways for charge interfacial transfer. For example, Wanget al. reported that the Fe3+ ions can combine with thehydroxyl groups on TiO2 nanoparticle surface and form(OH)Fe3+ complexes, which is a good way for electron
2 International Journal of Photoenergy
transfer [23]. Other ions, such as Cu2+ ions, on TiO2 surfacecan also promote the electron transfer, and the mechanismof multielectron transfer is suggested [24, 25]. Comparedwith the Q-particles, the specific surface area decreases forlarge particles (>15 nm), and it is possible for the Fe ionsto enter TiO2 bulk beside surface. Since the carrier excitonBohr radius in TiO2 is ca. 2 nm [20], the holes or electronstrapped at Fe ions in bulk are difficult to migrate to surfacebefore going to recombination. It is also reported that theoptimal Fe-doped concentration is dependent on the particlesize [26], and the increase of particle sizes will result in thedecrease of optimal concentration, which may be due to thatmore Fe ions that enter the bulk for larger particles canincrease the recombination of electrons and holes. It predictsthat the Fe ions on surface may increase the photocatalyticactivity, while the Fe ions in bulk will have negative effect.
However, the different effect of bulk dopant and surfacedopant on photocatalysis is not systematically investigated.In this work, we aim to discuss the different functions ofFe ions on surface and in bulk during photocatalysis underUV light illumination. It is found that the surface doping isdominant for low-level doping, and more Fe ions will enterTiO2 bulk with the increase of doping concentration. Theab initio computation based on density functional theory(DFT) shows that the Fe ions in TiO2 bulk are localized, indi-cating that they mainly act as the recombination centers ofelectrons and holes. It is suggested that the role change of Feions from trapping to recombination centers as the doped Feconcentration increases is related to the transformation fromsurface to bulk doping, and this transformation explains thephotocatalytic behavior of Fe-doped TiO2 observed by usand other researchers.
2. Experimental
2.1. Sample Preparation. The TiO2 samples were synthesizedusing hydrothermal method. TiCl4 and Fe(NO3)3 wereused as the precursors of TiO2 and Fe ions. 4.0 mL TiCl4was added to 400 mL ice distilled water under vigorousstirring, and then, the resulted solution was stirred for24 h at room temperature. Subsequently, ammonia aqueoussolution (1 : 9) was added to adjust the solution pH toca. 7 to get Ti(OH)4 precipitation. The precipitation wasfiltered and cleaned using distilled water for many times.Afterwards, the Ti(OH)4 precipitation was dispersed in ice-distilled water. 30% H2O2 was dropped until it becameyellow and transparent. A designed amounts of Fe(NO3)3
were added under stirring, and then, the solutions wereheated in enclosed autoclave for 12 h at 160◦C to get Fe-doped TiO2 hydrosols. A series of Fe-doped TiO2 sampleswere prepared with the Fe: Ti molar ratio being 0, 0.1, 0.3,0.5, 0.8, 1.0, 2.0, and 5.0 at. %, respectively. Finally, thehydrosols were dried at 40◦C to obtain the powders.
2.2. Characterization. The X-ray diffraction (XRD) patternswere collected in the range of 20–80◦(2θ) with a HZG4-PC diffractometer using Cukα radiation with an acceleratingvoltage of 40 kV and current of 40 mA (λx = 1.5406 A).
The surface composition and element chemical states of Fe-doped samples were characterized by an X-ray photoelectronspectroscopy (XPS) in an ESCA system with monochro-matic Mg kα source and a charge neutralizer. The particlemorphologies ware observed with a JEM-2001 transmittanceelectron microscope (TEM) at an acceleration voltage of200 kV. Diffused reflectance spectra were recorded on a Shi-madzu UV2550-UV spectrophotometer equipped with anintegrating sphere assembly in the range of 190–700 nm, withBaSO4 used as the reference. The photoluminescence (PL)spectra were measured at room temperature with ShimadzuRF-5301 fluorospectrophotometer by using 320 nm line ofXe lamp as excitation source. The energy-dispersive X-ray(EDX) equipped on the JSM-7500F field emission scanningelectron microscope was used to detect the real elementconcentrations in the Fe-doped TiO2 samples.
2.3. Computational Detail. The computational calculationhas been performed within DFT plane wave pseudo potentialmethod. The general gradient approximation (GGA) withthe Perdew-Burke-Ernzerhof (PBE) functional and ultra-soft pseudopotentials was used to describe the exchange-correlation effects and electron ion interactions. The kineticenergetic cutoffs of 24 and 288 Ry for the smooth partof electronic wave functions and augmented electron den-sity were used. Quantum-ESPRESSO code, Pwscf package[27], was used to perform ab initio quantum calculation.Monkhorst-Pack (M-P) k-space sampling was adopted forgeometry optimization and density of the electronic states(DOS) calculation. The convergence threshold for the self-consistency energy calculation was set to 10−8 Ry, and allatomic relaxations were carried out until all components ofthe residual forces were less than 10−3 Ry/Bohr. A 3 × 3 ×1 supercell (i.e., 108 atoms of TiO2 anatase matrix) withtwo adjacent Fe ions and an oxygen vacancy between themwas employed to simulate Fe-doped reduced anatase TiO2.A 2 × 2 × 1 anatase supercell with one Fe ion substitutingone titanium ion models the Fe-doped TiO2 without oxygenvacancy. A 2 × 2 × 1 supercell with one oxygen vacancy wasconstructed to model the reduced anatase. In addition, pureTiO2 unit cell was also calculated for comparison. 4 × 4 ×3 and 2 × 2 × 3 M-P grids for 48 supercell and 108 atomsupercell were used for geometry optimization, and 8 × 8 ×6 and 4 × 4 × 6 M-P grids for 48 supercell and 108 atomsupercell were used for DOS calculation. For the unit cellcalculation (pure TiO2), a 6 × 6 × 3 and 12 × 12 × 6 M-P grids were used for geometry optimization and density ofstates (DOSs) calculation.
2.4. Photocatalytic Activity Evaluation. The photocatalyticactivities of the Fe-doped TiO2 samples under UV wereevaluated on the basis of the degradation rate of methylorange (MO) in a 100 × 20 self-designed quartz reactorcontaining 0.3 g of catalyst and 30 mL of 10 mg/L MOaqueous solution. Prior to photocatalytic reactions, thesuspension was allowed to reach adsorption equilibrium bystirring in dark about 60 min. The irradiation was performedwith a 365 nm 1300 μWcm−2.
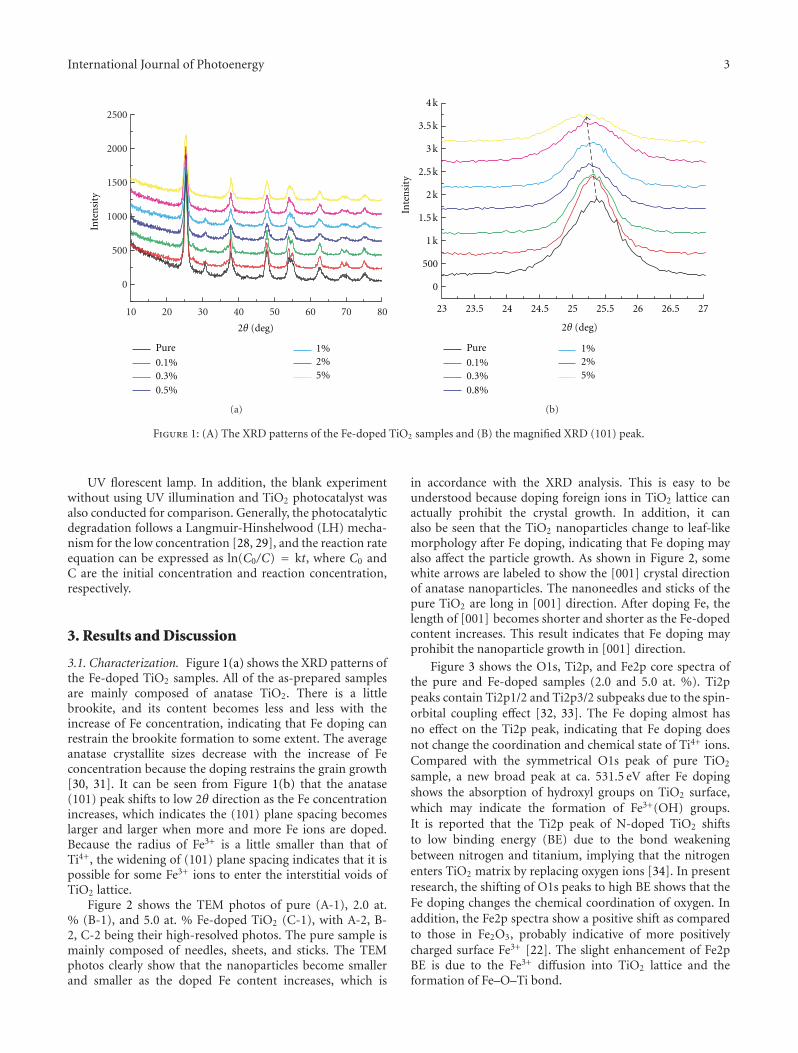
International Journal of Photoenergy 3
10 20 30 40 50 60 70 80
0
500
1000
1500
2000
2500
1%
5%2%
Inte
nsi
ty
2θ (deg)
0.5%
0.3%0.1%
Pure
(a)
0
500
1 k
1.5 k
2 k
2.5 k
3 k
3.5 k
4 k
23 23.5 24 24.5 25 25.5 26 26.5 27
1%
5%2%
Inte
nsi
ty
2θ (deg)
0.8%
0.3%0.1%
Pure
(b)
Figure 1: (A) The XRD patterns of the Fe-doped TiO2 samples and (B) the magnified XRD (101) peak.
UV florescent lamp. In addition, the blank experimentwithout using UV illumination and TiO2 photocatalyst wasalso conducted for comparison. Generally, the photocatalyticdegradation follows a Langmuir-Hinshelwood (LH) mecha-nism for the low concentration [28, 29], and the reaction rateequation can be expressed as ln(C0/C) = kt, where C0 andC are the initial concentration and reaction concentration,respectively.
3. Results and Discussion
3.1. Characterization. Figure 1(a) shows the XRD patterns ofthe Fe-doped TiO2 samples. All of the as-prepared samplesare mainly composed of anatase TiO2. There is a littlebrookite, and its content becomes less and less with theincrease of Fe concentration, indicating that Fe doping canrestrain the brookite formation to some extent. The averageanatase crystallite sizes decrease with the increase of Feconcentration because the doping restrains the grain growth[30, 31]. It can be seen from Figure 1(b) that the anatase(101) peak shifts to low 2θ direction as the Fe concentrationincreases, which indicates the (101) plane spacing becomeslarger and larger when more and more Fe ions are doped.Because the radius of Fe3+ is a little smaller than that ofTi4+, the widening of (101) plane spacing indicates that it ispossible for some Fe3+ ions to enter the interstitial voids ofTiO2 lattice.
Figure 2 shows the TEM photos of pure (A-1), 2.0 at.% (B-1), and 5.0 at. % Fe-doped TiO2 (C-1), with A-2, B-2, C-2 being their high-resolved photos. The pure sample ismainly composed of needles, sheets, and sticks. The TEMphotos clearly show that the nanoparticles become smallerand smaller as the doped Fe content increases, which is
in accordance with the XRD analysis. This is easy to beunderstood because doping foreign ions in TiO2 lattice canactually prohibit the crystal growth. In addition, it canalso be seen that the TiO2 nanoparticles change to leaf-likemorphology after Fe doping, indicating that Fe doping mayalso affect the particle growth. As shown in Figure 2, somewhite arrows are labeled to show the [001] crystal directionof anatase nanoparticles. The nanoneedles and sticks of thepure TiO2 are long in [001] direction. After doping Fe, thelength of [001] becomes shorter and shorter as the Fe-dopedcontent increases. This result indicates that Fe doping mayprohibit the nanoparticle growth in [001] direction.
Figure 3 shows the O1s, Ti2p, and Fe2p core spectra ofthe pure and Fe-doped samples (2.0 and 5.0 at. %). Ti2ppeaks contain Ti2p1/2 and Ti2p3/2 subpeaks due to the spin-orbital coupling effect [32, 33]. The Fe doping almost hasno effect on the Ti2p peak, indicating that Fe doping doesnot change the coordination and chemical state of Ti4+ ions.Compared with the symmetrical O1s peak of pure TiO2
sample, a new broad peak at ca. 531.5 eV after Fe dopingshows the absorption of hydroxyl groups on TiO2 surface,which may indicate the formation of Fe3+(OH) groups.It is reported that the Ti2p peak of N-doped TiO2 shiftsto low binding energy (BE) due to the bond weakeningbetween nitrogen and titanium, implying that the nitrogenenters TiO2 matrix by replacing oxygen ions [34]. In presentresearch, the shifting of O1s peaks to high BE shows that theFe doping changes the chemical coordination of oxygen. Inaddition, the Fe2p spectra show a positive shift as comparedto those in Fe2O3, probably indicative of more positivelycharged surface Fe3+ [22]. The slight enhancement of Fe2pBE is due to the Fe3+ diffusion into TiO2 lattice and theformation of Fe–O–Ti bond.
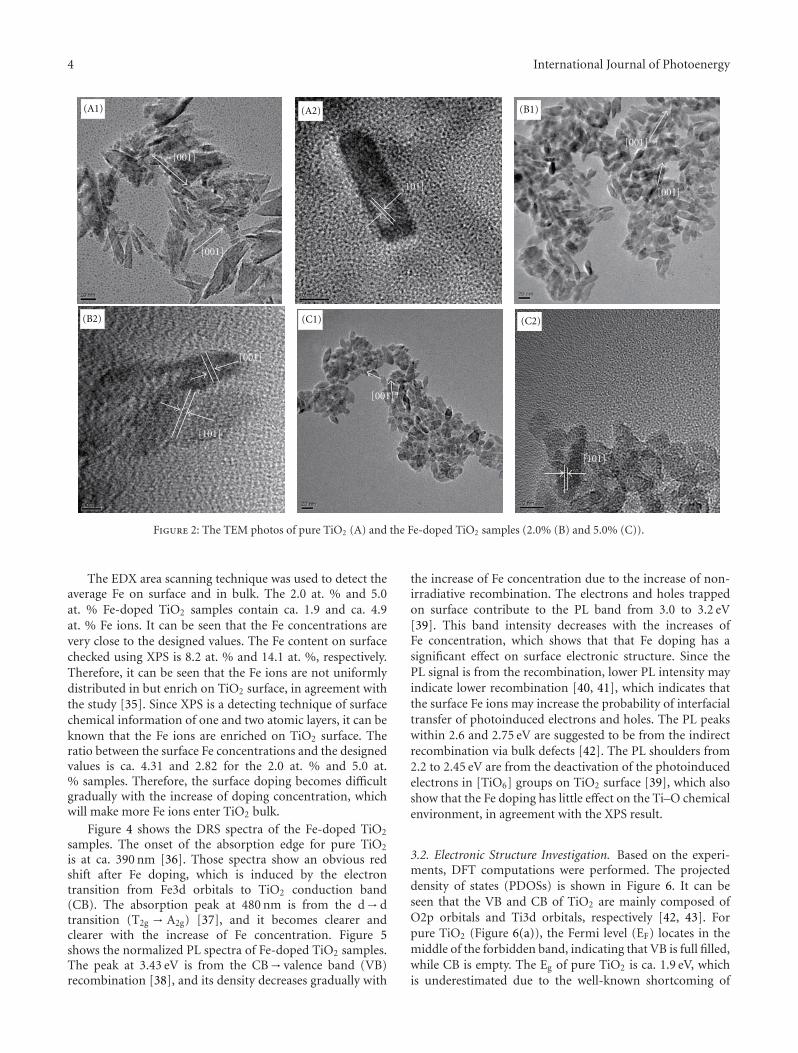
4 International Journal of Photoenergy
[001]
[001]
(A1)
[101]
(A2)
[001]
[001]
(B1)
[001]
[101]
(B2)
[001]
(C1)
[101]
(C2)
Figure 2: The TEM photos of pure TiO2 (A) and the Fe-doped TiO2 samples (2.0% (B) and 5.0% (C)).
The EDX area scanning technique was used to detect theaverage Fe on surface and in bulk. The 2.0 at. % and 5.0at. % Fe-doped TiO2 samples contain ca. 1.9 and ca. 4.9at. % Fe ions. It can be seen that the Fe concentrations arevery close to the designed values. The Fe content on surfacechecked using XPS is 8.2 at. % and 14.1 at. %, respectively.Therefore, it can be seen that the Fe ions are not uniformlydistributed in but enrich on TiO2 surface, in agreement withthe study [35]. Since XPS is a detecting technique of surfacechemical information of one and two atomic layers, it can beknown that the Fe ions are enriched on TiO2 surface. Theratio between the surface Fe concentrations and the designedvalues is ca. 4.31 and 2.82 for the 2.0 at. % and 5.0 at.% samples. Therefore, the surface doping becomes difficultgradually with the increase of doping concentration, whichwill make more Fe ions enter TiO2 bulk.
Figure 4 shows the DRS spectra of the Fe-doped TiO2
samples. The onset of the absorption edge for pure TiO2
is at ca. 390 nm [36]. Those spectra show an obvious redshift after Fe doping, which is induced by the electrontransition from Fe3d orbitals to TiO2 conduction band(CB). The absorption peak at 480 nm is from the d→dtransition (T2g → A2g) [37], and it becomes clearer andclearer with the increase of Fe concentration. Figure 5shows the normalized PL spectra of Fe-doped TiO2 samples.The peak at 3.43 eV is from the CB→ valence band (VB)recombination [38], and its density decreases gradually with
the increase of Fe concentration due to the increase of non-irradiative recombination. The electrons and holes trappedon surface contribute to the PL band from 3.0 to 3.2 eV[39]. This band intensity decreases with the increases ofFe concentration, which shows that that Fe doping has asignificant effect on surface electronic structure. Since thePL signal is from the recombination, lower PL intensity mayindicate lower recombination [40, 41], which indicates thatthe surface Fe ions may increase the probability of interfacialtransfer of photoinduced electrons and holes. The PL peakswithin 2.6 and 2.75 eV are suggested to be from the indirectrecombination via bulk defects [42]. The PL shoulders from2.2 to 2.45 eV are from the deactivation of the photoinducedelectrons in [TiO6] groups on TiO2 surface [39], which alsoshow that the Fe doping has little effect on the Ti–O chemicalenvironment, in agreement with the XPS result.
3.2. Electronic Structure Investigation. Based on the experi-ments, DFT computations were performed. The projecteddensity of states (PDOSs) is shown in Figure 6. It can beseen that the VB and CB of TiO2 are mainly composed ofO2p orbitals and Ti3d orbitals, respectively [42, 43]. Forpure TiO2 (Figure 6(a)), the Fermi level (EF) locates in themiddle of the forbidden band, indicating that VB is full filled,while CB is empty. The Eg of pure TiO2 is ca. 1.9 eV, whichis underestimated due to the well-known shortcoming of
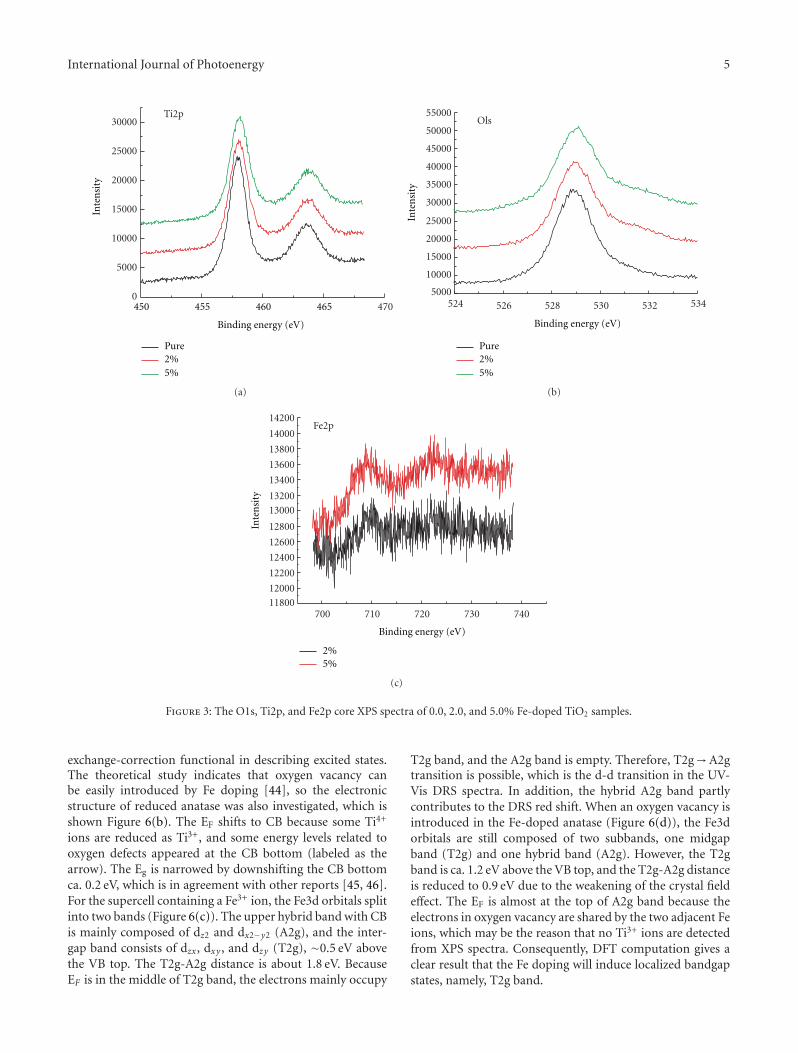
International Journal of Photoenergy 5
4700
5000
10000
15000
20000
25000
30000
Binding energy (eV)
Inte
nsi
ty
Pure2%5%
450 455 460 465
Ti2p
(a)
524 526 528 530 532 5345000
10000
15000
20000
25000
30000
35000
40000
45000
50000
55000
Pure2%5%
Binding energy (eV)
Inte
nsi
ty
Ols
(b)
700 710 720 730 74011800
12000
12200
12400
12600
12800
13000
13200
13400
13600
13800
14000
14200
2%5%
Binding energy (eV)
Inte
nsi
ty
Fe2p
(c)
Figure 3: The O1s, Ti2p, and Fe2p core XPS spectra of 0.0, 2.0, and 5.0% Fe-doped TiO2 samples.
exchange-correction functional in describing excited states.The theoretical study indicates that oxygen vacancy canbe easily introduced by Fe doping [44], so the electronicstructure of reduced anatase was also investigated, which isshown Figure 6(b). The EF shifts to CB because some Ti4+
ions are reduced as Ti3+, and some energy levels related tooxygen defects appeared at the CB bottom (labeled as thearrow). The Eg is narrowed by downshifting the CB bottomca. 0.2 eV, which is in agreement with other reports [45, 46].For the supercell containing a Fe3+ ion, the Fe3d orbitals splitinto two bands (Figure 6(c)). The upper hybrid band with CBis mainly composed of dz2 and dx2−y2 (A2g), and the inter-gap band consists of dzx, dxy , and dzy (T2g), ∼0.5 eV abovethe VB top. The T2g-A2g distance is about 1.8 eV. BecauseEF is in the middle of T2g band, the electrons mainly occupy
T2g band, and the A2g band is empty. Therefore, T2g→A2gtransition is possible, which is the d-d transition in the UV-Vis DRS spectra. In addition, the hybrid A2g band partlycontributes to the DRS red shift. When an oxygen vacancy isintroduced in the Fe-doped anatase (Figure 6(d)), the Fe3dorbitals are still composed of two subbands, one midgapband (T2g) and one hybrid band (A2g). However, the T2gband is ca. 1.2 eV above the VB top, and the T2g-A2g distanceis reduced to 0.9 eV due to the weakening of the crystal fieldeffect. The EF is almost at the top of A2g band because theelectrons in oxygen vacancy are shared by the two adjacent Feions, which may be the reason that no Ti3+ ions are detectedfrom XPS spectra. Consequently, DFT computation gives aclear result that the Fe doping will induce localized bandgapstates, namely, T2g band.
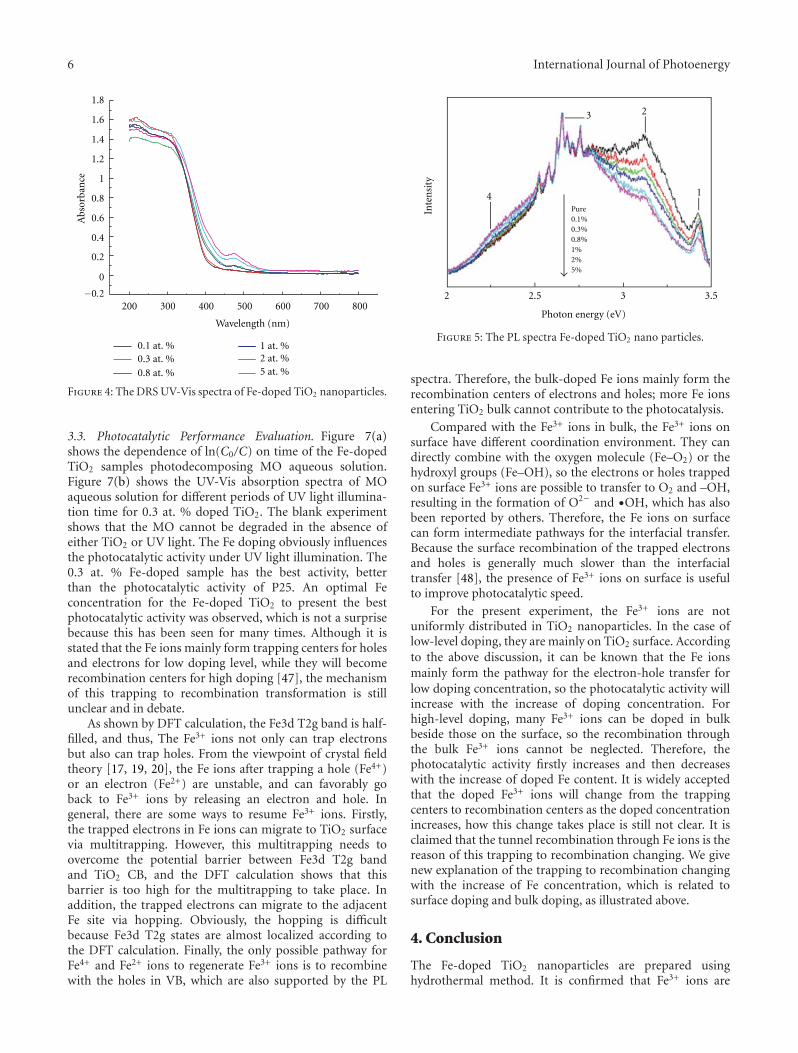
6 International Journal of Photoenergy
1.8
1.6
1.4
1.2
1
0.8
0.6
0.4
0.2
0
−0.2
Wavelength (nm)
Abs
orba
nce
0.1 at. %0.3 at. %0.8 at. %
1 at. %2 at. %5 at. %
300200 400 500 600 700 800
Figure 4: The DRS UV-Vis spectra of Fe-doped TiO2 nanoparticles.
3.3. Photocatalytic Performance Evaluation. Figure 7(a)shows the dependence of ln(C0/C) on time of the Fe-dopedTiO2 samples photodecomposing MO aqueous solution.Figure 7(b) shows the UV-Vis absorption spectra of MOaqueous solution for different periods of UV light illumina-tion time for 0.3 at. % doped TiO2. The blank experimentshows that the MO cannot be degraded in the absence ofeither TiO2 or UV light. The Fe doping obviously influencesthe photocatalytic activity under UV light illumination. The0.3 at. % Fe-doped sample has the best activity, betterthan the photocatalytic activity of P25. An optimal Feconcentration for the Fe-doped TiO2 to present the bestphotocatalytic activity was observed, which is not a surprisebecause this has been seen for many times. Although it isstated that the Fe ions mainly form trapping centers for holesand electrons for low doping level, while they will becomerecombination centers for high doping [47], the mechanismof this trapping to recombination transformation is stillunclear and in debate.
As shown by DFT calculation, the Fe3d T2g band is half-filled, and thus, The Fe3+ ions not only can trap electronsbut also can trap holes. From the viewpoint of crystal fieldtheory [17, 19, 20], the Fe ions after trapping a hole (Fe4+)or an electron (Fe2+) are unstable, and can favorably goback to Fe3+ ions by releasing an electron and hole. Ingeneral, there are some ways to resume Fe3+ ions. Firstly,the trapped electrons in Fe ions can migrate to TiO2 surfacevia multitrapping. However, this multitrapping needs toovercome the potential barrier between Fe3d T2g bandand TiO2 CB, and the DFT calculation shows that thisbarrier is too high for the multitrapping to take place. Inaddition, the trapped electrons can migrate to the adjacentFe site via hopping. Obviously, the hopping is difficultbecause Fe3d T2g states are almost localized according tothe DFT calculation. Finally, the only possible pathway forFe4+ and Fe2+ ions to regenerate Fe3+ ions is to recombinewith the holes in VB, which are also supported by the PL
Inte
nsi
ty
Pure
0.3%0.1%
0.8%1%2%5%
1
23
4
Photon energy (eV)
2 2.5 3 3.5
Figure 5: The PL spectra Fe-doped TiO2 nano particles.
spectra. Therefore, the bulk-doped Fe ions mainly form therecombination centers of electrons and holes; more Fe ionsentering TiO2 bulk cannot contribute to the photocatalysis.
Compared with the Fe3+ ions in bulk, the Fe3+ ions onsurface have different coordination environment. They candirectly combine with the oxygen molecule (Fe–O2) or thehydroxyl groups (Fe–OH), so the electrons or holes trappedon surface Fe3+ ions are possible to transfer to O2 and –OH,resulting in the formation of O2− and •OH, which has alsobeen reported by others. Therefore, the Fe ions on surfacecan form intermediate pathways for the interfacial transfer.Because the surface recombination of the trapped electronsand holes is generally much slower than the interfacialtransfer [48], the presence of Fe3+ ions on surface is usefulto improve photocatalytic speed.
For the present experiment, the Fe3+ ions are notuniformly distributed in TiO2 nanoparticles. In the case oflow-level doping, they are mainly on TiO2 surface. Accordingto the above discussion, it can be known that the Fe ionsmainly form the pathway for the electron-hole transfer forlow doping concentration, so the photocatalytic activity willincrease with the increase of doping concentration. Forhigh-level doping, many Fe3+ ions can be doped in bulkbeside those on the surface, so the recombination throughthe bulk Fe3+ ions cannot be neglected. Therefore, thephotocatalytic activity firstly increases and then decreaseswith the increase of doped Fe content. It is widely acceptedthat the doped Fe3+ ions will change from the trappingcenters to recombination centers as the doped concentrationincreases, how this change takes place is still not clear. It isclaimed that the tunnel recombination through Fe ions is thereason of this trapping to recombination changing. We givenew explanation of the trapping to recombination changingwith the increase of Fe concentration, which is related tosurface doping and bulk doping, as illustrated above.
4. Conclusion
The Fe-doped TiO2 nanoparticles are prepared usinghydrothermal method. It is confirmed that Fe3+ ions are
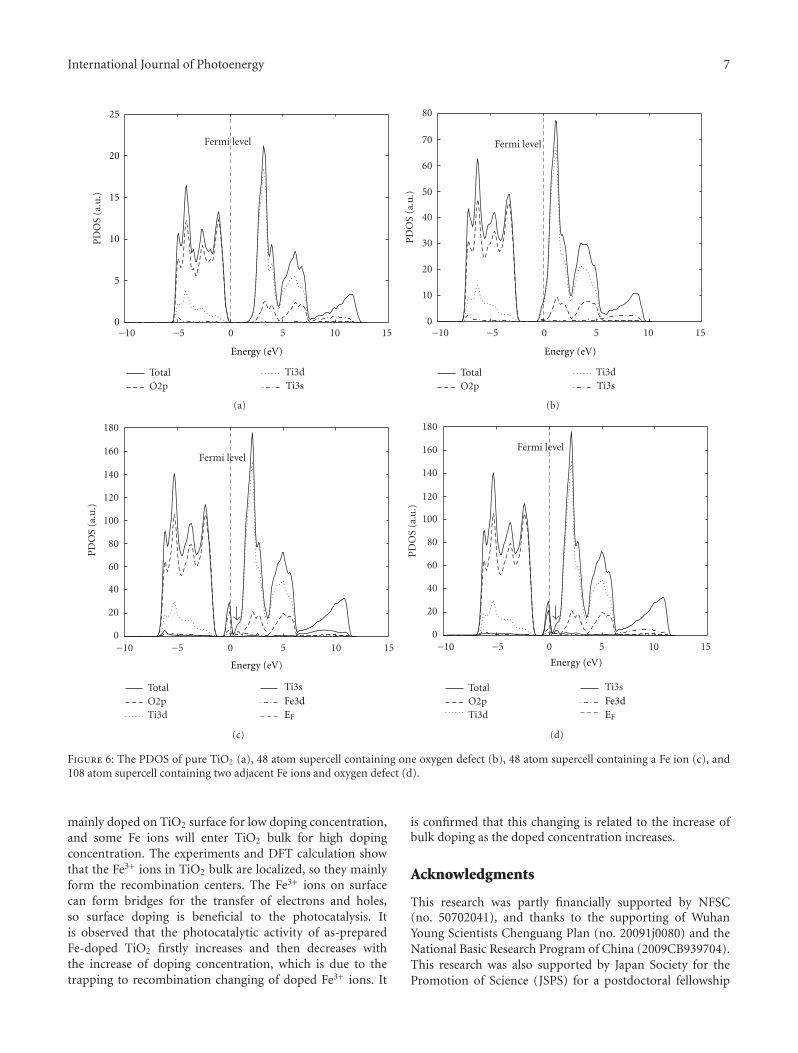
International Journal of Photoenergy 7
−10 −5 0 5 10 15
Energy (eV)
TotalO2p
Ti3dTi3s
0
5
10
15
20
25
PD
OS
(a.u
.)
Fermi level
(a)
0
10
20
30
40
50
60
70
80
PD
OS
(a.u
.)
−10 −5 0 5 10 15
Energy (eV)
Fermi level
TotalO2p
Ti3dTi3s
(b)
TotalO2pTi3d
Ti3s
0
20
40
60
80
100
120
140
160
180
PD
OS
(a.u
.)
−10 −5 0 5 10 15
Energy (eV)
Fe3dEF
Fermi level
(c)
Fermi level
TotalO2pTi3d
Ti3s
0
20
40
60
80
100
120
140
160
180
PD
OS
(a.u
.)
−10 −5 0 5 10 15
Energy (eV)
Fe3dEF
(d)
Figure 6: The PDOS of pure TiO2 (a), 48 atom supercell containing one oxygen defect (b), 48 atom supercell containing a Fe ion (c), and108 atom supercell containing two adjacent Fe ions and oxygen defect (d).
mainly doped on TiO2 surface for low doping concentration,and some Fe ions will enter TiO2 bulk for high dopingconcentration. The experiments and DFT calculation showthat the Fe3+ ions in TiO2 bulk are localized, so they mainlyform the recombination centers. The Fe3+ ions on surfacecan form bridges for the transfer of electrons and holes,so surface doping is beneficial to the photocatalysis. Itis observed that the photocatalytic activity of as-preparedFe-doped TiO2 firstly increases and then decreases withthe increase of doping concentration, which is due to thetrapping to recombination changing of doped Fe3+ ions. It
is confirmed that this changing is related to the increase ofbulk doping as the doped concentration increases.
Acknowledgments
This research was partly financially supported by NFSC(no. 50702041), and thanks to the supporting of WuhanYoung Scientists Chenguang Plan (no. 20091j0080) and theNational Basic Research Program of China (2009CB939704).This research was also supported by Japan Society for thePromotion of Science (JSPS) for a postdoctoral fellowship
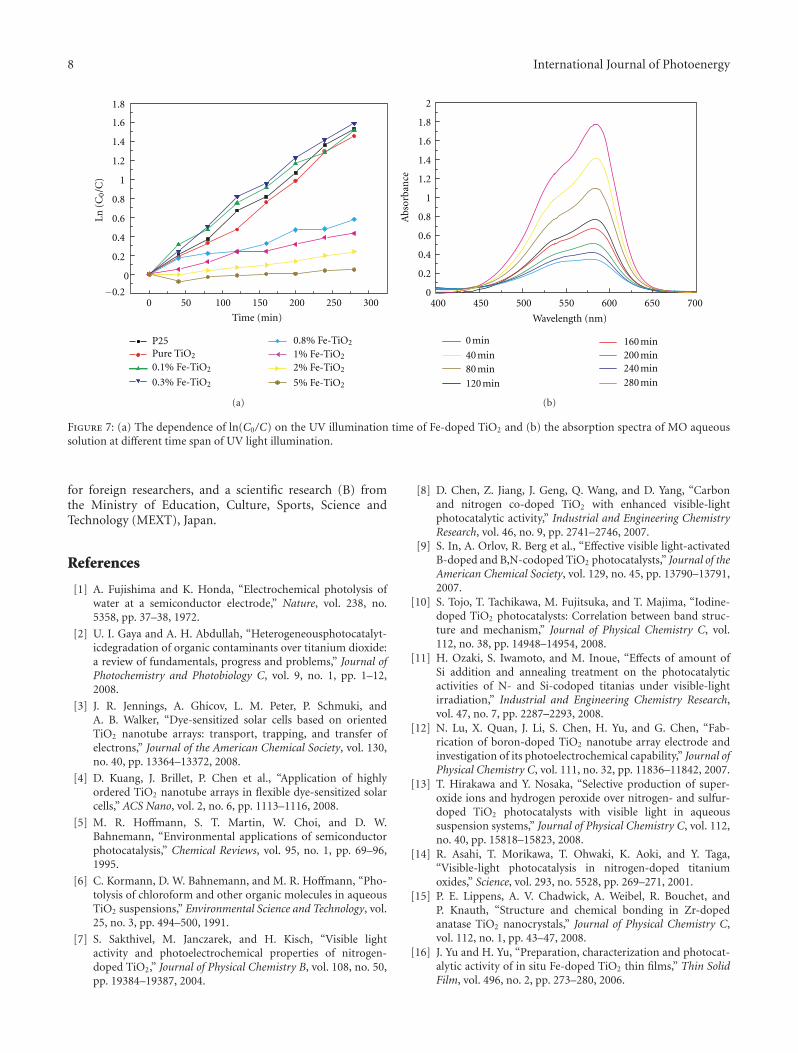
8 International Journal of Photoenergy
2000 50 100 150 250 300
P25Pure TiO2
0.1% Fe-TiO2
0.3% Fe-TiO2
0.8% Fe-TiO2
1% Fe-TiO2
2% Fe-TiO2
5% Fe-TiO2
Time (min)
1.6
−0.2
0
0.2
0.4
0.6
0.8
1
1.2
1.4
1.8Ln
(C
0/C
)
(a)
400 450 500 550 600 650 700
Wavelength (nm)
280 min
240 min200 min160 min
120 min
80 min40 min
0 min
Abs
orba
nce
1.6
0
0.2
0.4
0.6
0.8
1
1.2
1.4
1.8
2
(b)
Figure 7: (a) The dependence of ln(C0/C) on the UV illumination time of Fe-doped TiO2 and (b) the absorption spectra of MO aqueoussolution at different time span of UV light illumination.
for foreign researchers, and a scientific research (B) fromthe Ministry of Education, Culture, Sports, Science andTechnology (MEXT), Japan.
References
[1] A. Fujishima and K. Honda, “Electrochemical photolysis ofwater at a semiconductor electrode,” Nature, vol. 238, no.5358, pp. 37–38, 1972.
[2] U. I. Gaya and A. H. Abdullah, “Heterogeneousphotocatalyt-icdegradation of organic contaminants over titanium dioxide:a review of fundamentals, progress and problems,” Journal ofPhotochemistry and Photobiology C, vol. 9, no. 1, pp. 1–12,2008.
[3] J. R. Jennings, A. Ghicov, L. M. Peter, P. Schmuki, andA. B. Walker, “Dye-sensitized solar cells based on orientedTiO2 nanotube arrays: transport, trapping, and transfer ofelectrons,” Journal of the American Chemical Society, vol. 130,no. 40, pp. 13364–13372, 2008.
[4] D. Kuang, J. Brillet, P. Chen et al., “Application of highlyordered TiO2 nanotube arrays in flexible dye-sensitized solarcells,” ACS Nano, vol. 2, no. 6, pp. 1113–1116, 2008.
[5] M. R. Hoffmann, S. T. Martin, W. Choi, and D. W.Bahnemann, “Environmental applications of semiconductorphotocatalysis,” Chemical Reviews, vol. 95, no. 1, pp. 69–96,1995.
[6] C. Kormann, D. W. Bahnemann, and M. R. Hoffmann, “Pho-tolysis of chloroform and other organic molecules in aqueousTiO2 suspensions,” Environmental Science and Technology, vol.25, no. 3, pp. 494–500, 1991.
[7] S. Sakthivel, M. Janczarek, and H. Kisch, “Visible lightactivity and photoelectrochemical properties of nitrogen-doped TiO2,” Journal of Physical Chemistry B, vol. 108, no. 50,pp. 19384–19387, 2004.
[8] D. Chen, Z. Jiang, J. Geng, Q. Wang, and D. Yang, “Carbonand nitrogen co-doped TiO2 with enhanced visible-lightphotocatalytic activity,” Industrial and Engineering ChemistryResearch, vol. 46, no. 9, pp. 2741–2746, 2007.
[9] S. In, A. Orlov, R. Berg et al., “Effective visible light-activatedB-doped and B,N-codoped TiO2 photocatalysts,” Journal of theAmerican Chemical Society, vol. 129, no. 45, pp. 13790–13791,2007.
[10] S. Tojo, T. Tachikawa, M. Fujitsuka, and T. Majima, “Iodine-doped TiO2 photocatalysts: Correlation between band struc-ture and mechanism,” Journal of Physical Chemistry C, vol.112, no. 38, pp. 14948–14954, 2008.
[11] H. Ozaki, S. Iwamoto, and M. Inoue, “Effects of amount ofSi addition and annealing treatment on the photocatalyticactivities of N- and Si-codoped titanias under visible-lightirradiation,” Industrial and Engineering Chemistry Research,vol. 47, no. 7, pp. 2287–2293, 2008.
[12] N. Lu, X. Quan, J. Li, S. Chen, H. Yu, and G. Chen, “Fab-rication of boron-doped TiO2 nanotube array electrode andinvestigation of its photoelectrochemical capability,” Journal ofPhysical Chemistry C, vol. 111, no. 32, pp. 11836–11842, 2007.
[13] T. Hirakawa and Y. Nosaka, “Selective production of super-oxide ions and hydrogen peroxide over nitrogen- and sulfur-doped TiO2 photocatalysts with visible light in aqueoussuspension systems,” Journal of Physical Chemistry C, vol. 112,no. 40, pp. 15818–15823, 2008.
[14] R. Asahi, T. Morikawa, T. Ohwaki, K. Aoki, and Y. Taga,“Visible-light photocatalysis in nitrogen-doped titaniumoxides,” Science, vol. 293, no. 5528, pp. 269–271, 2001.
[15] P. E. Lippens, A. V. Chadwick, A. Weibel, R. Bouchet, andP. Knauth, “Structure and chemical bonding in Zr-dopedanatase TiO2 nanocrystals,” Journal of Physical Chemistry C,vol. 112, no. 1, pp. 43–47, 2008.
[16] J. Yu and H. Yu, “Preparation, characterization and photocat-alytic activity of in situ Fe-doped TiO2 thin films,” Thin SolidFilm, vol. 496, no. 2, pp. 273–280, 2006.
International Journal of Photoenergy 9
[17] M. Zhou, J. Yu, and B. Cheng, “Effects of Fe-doping on thephotocatalytic activity of mesoporous TiO2 powders preparedby an ultrasonic method,” Journal of Hazardous Materials, vol.137, no. 3, pp. 1838–1847, 2006.
[18] A. Mattsson, M. Leideborg, K. Larsson, G. Westing, andL. Osterlund, “Adsorption and solar light decomposition ofacetone on anatase TiO2 and niobium doped TiO2 thin films,”Journal of Physical Chemistry B, vol. 110, no. 3, pp. 1210–1220,2006.
[19] J. Yu, Q. Xiang, and M. Zhou, “Preparation, characterizationand visible-light-driven photocatalytic activity of Fe-dopedtitania nanorods and first-principles study for electronicstructures,” Applied Catalysis B, vol. 90, no. 3-4, pp. 595–602,2009.
[20] W. Choi, A. Termin, and M. R. Hoffmann, “The role of metalion dopants in quantum-sized TiO2: correlation betweenphotoreactivity and charge carrier recombination dynamics,”Journal of Physical Chemistry, vol. 98, no. 51, pp. 13669–13679,1994.
[21] J. Zhu, F. Chen, J. Zhang, H. Chen, and M. Anpo, “Fe3+-TiO2
photocatalysts prepared by combining sol-gel method withhydrothermal treatment and their characterization,” Journal ofPhotochemistry and Photobiology A, vol. 180, no. 1-2, pp. 196–204, 2006.
[22] T. Tong, J. Zhang, B. Tian, F. Chen, and D. He, “Preparation ofFe3+-doped TiO2 catalysts by controlled hydrolysis of titaniumalkoxide and study on their photocatalytic activity for methylorange degradation,” Journal of Hazardous Materials, vol. 155,no. 3, pp. 572–579, 2008.
[23] J. Wang, Z. Liu, and R. Cai, “A new role for Fe3+ in TiO2
hydrosol: accelerated photodegradation of dyes under visiblelight,” Environmental Science and Technology, vol. 42, no. 15,pp. 5759–5764, 2008.
[24] H. Yu, H. Irie, and K. Hashimoto, “Conduction band energylevel control of titanium dioxide: toward an efficient visible-light-sensitive photocatalyst,” Journal of the American Chemi-cal Society, vol. 132, no. 20, pp. 6898–6899, 2010.
[25] H. Irie, S. Miura, K. Kamiya, and K. Hashimoto, “Efficientvisible light-sensitive photocatalysts: grafting Cu(II) ions ontoTiO2 and WO3 photocatalysts,” Chemical Physics Letters, vol.457, no. 1–3, pp. 202–205, 2008.
[26] Z. Zhang, C. C. Wang, R. Zakaria, and J. Y. Ying, “Role ofparticle size in nanocrystalline TiO2-based photocatalysts,”Journal of Physical Chemistry B, vol. 102, no. 52, pp. 10871–10878, 1998.
[27] http://www.quantum-espresso.org/[28] S. Ardizzone, C. L. Bianchi, G. Cappelletti, S. Gialanella, C.
Pirola, and V. Ragaini, “Tailored anatase/brookite nanocrys-talline TiO2. The optimal particle features for liquidand gas-phase photocatalytic reactions,” Journal of Physical ChemistryC, vol. 111, no. 35, pp. 13222–13231, 2007.
[29] A. Testino, I. R. Bellobono, V. Buscaglia et al., “Optimizing thephotocatalytic properties of hydrothermal TiO2 by the controlof phase composition and particle morphology. A systematicapproach,” Journal of the American Chemical Society, vol. 129,no. 12, pp. 3564–3575, 2007.
[30] J. G. Yu, M. H. Zhou, B. Cheng, and X. J. Zhao, “Preparation,characterization and photocatalytic activity of in situ N,S-codoped TiO2 powders,” Journal of Molecular Catalysis A, vol.246, no. 1-2, pp. 176–184, 2006.
[31] B. Liu, X. Zhao, Q. Zhao, C. Li, and X. He, “The effect of O2
partial pressure on the structure and photocatalytic propertyof TiO2 films prepared by sputtering,” Materials Chemistry andPhysics, vol. 90, no. 1, pp. 207–212, 2005.
[32] Y. Lv, Y. Ding, J. Zhou, W. Xiao, and Y. Feng, “Preparation,characterization, and photocatalytic activity of N, S-codopedTiO2 nanoparticles,” Journal of the American Ceramic Society,vol. 92, no. 4, pp. 938–941, 2009.
[33] B. Liu, L. Wen, and X. Zhao, “The surface change of TiO2
film induced by UV illumination and the effects on UV-vistransmission spectra,” Applied Surface Science, vol. 255, no. 5,pp. 2752–2758, 2008.
[34] H. Choi, M. G. Antoniou, M. Pelaez, A. A. De LaCruz, J. A. Shoemaker, and D. D. Dionysiou, “Mesoporousnitrogen-doped TiO2 for the photocatalytic destruction ofthe cyanobacterial toxin microcystin-LR under visible lightirradiation,” Environmental Science and Technology, vol. 41,no. 21, pp. 7530–7535, 2007.
[35] Z. Ambrus, N. Balazs, T. Alapi et al., “Synthesis, structureand photocatalytic properties of Fe(III)-doped TiO2 preparedfrom TiCl3,” Applied Catalysis B: Environmental, vol. 81, no.1-2, pp. 27–37, 2008.
[36] B. Liu, X. Wang, G. Cai, L. Wen, Y. Song, and X. Zhao,“Low temperature fabrication of V-doped TiO2 nanoparticles,structure and photocatalytic studies,” Journal of HazardousMaterials, vol. 169, no. 1–3, pp. 1112–1118, 2009.
[37] K. S. W. Sing, D. H. Everett, R. A. W. Haul et al., “Reportingphysisorption data for gas/solid systems with special referenceto the determination of surface area and porosity,” Pure andApplied Chemistry, vol. 57, no. 4, pp. 603–619, 1984.
[38] B. Liu, L. Wen, and X. Zhao, “The photoluminescencespectroscopic study of anatase TiO2 prepared by magnetronsputtering,” Materials Chemistry and Physics, vol. 106, no. 2-3,pp. 350–353, 2007.
[39] B. Liu, X. Zhao, and L. Wen, “The structural and photolumi-nescence studies related to the surface of the TiO2 sol preparedby wet chemical method,” Materials Science and Engineering B,vol. 134, no. 1, pp. 27–31, 206.
[40] Y. Cong, J. Zhang, F. Chen, M. Anpo, and D. He, “Preparation,photocatalytic activity, and mechanism of nano-TiO2 Co-doped with nitrogen and iron (III),” Journal of PhysicalChemistry C, vol. 111, no. 28, pp. 10618–10623, 2007.
[41] H. Tang, K. Prasad, R. Sanjines, P. E. Schmid, and F. Levy,“Electrical and optical properties of TiO2 anatase thin films,”Journal of Applied Physics, vol. 75, no. 4, pp. 2042–2047, 1994.
[42] T. L. Villarreal, R. Gomez, M. Gonzalez, and P. Salvador, “Akinetic model for distinguishing between direct and indirectinterfacial hole transfer in the heterogeneous photooxidationof dissolved organics on TiO2 nanoparticle suspensions,”Journal of Physical Chemistry B, vol. 108, no. 52, pp. 20278–20290, 2004.
[43] K. Yang, Y. Dai, and B. Huang, “First-principles calculationsfor geometrical structures and electronic properties of Si-doped TiO2,” Chemical Physics Letters, vol. 456, no. 1–3, pp.71–75, 2008.
[44] A. Roldan, M. Boronat, A. Corma, and F. Illas, “Theoreticalconfirmation of the enhanced facility to increase oxygenvacancy concentration in TiO2 by iron doping,” Journal ofPhysical Chemistry C, vol. 114, no. 14, pp. 6511–6517, 2010.
[45] I. Justicia, P. Ordejon, G. Canto et al., “Designed self-doped titanium oxide thin films for efficient visible-lightphotocatalysis,” Advanced Materials, vol. 14, no. 19, pp. 1399–1402, 2002.
[46] F. Zuo, L. Wang, T. Wu, Z. Zhang, D. Borchardt, and P.Feng, “Self-doped Ti3+ enhanced photocatalyst for hydrogenproduction under visible light,” Journal of the AmericanChemical Society, vol. 132, no. 34, pp. 11856–11857, 2010.

10 International Journal of Photoenergy
[47] M. Gratzel, Heterogeneous Photochemical Electron TransferReactions, CRC Press, Boca Raton, Fla, USA, 1987.
[48] B. Liu, K. Nakata, X. Zhao, T. Ochiai, T. Murakami, andA. Fujishima, “Theoretical kinetic analysis of heterogeneousphotocatalysis: the effects of surface trapping and bulkrecombination through defects,” The Journal of Physics andChemistry, vol. 115, no. 32, pp. 16037–16042, 2011.
Hindawi Publishing CorporationInternational Journal of PhotoenergyVolume 2012, Article ID 398508, 8 pagesdoi:10.1155/2012/398508
Research Article
Enhanced Photoactivity of Fe + N Codoped Anatase-Rutile TiO2
Nanowire Film under Visible Light Irradiation
Kewei Li,1, 2 Haiying Wang,1, 2, 3 Chunxu Pan,3 Jianhong Wei,3 Rui Xiong,3, 4 and Jing Shi3
1 Department of Communication Engineering, Chengdu Institute of Technology, Chengdu 611730, China2 Intel-cec joint Lab, Institute of IC Mannufacturing Engineering, Chengdu 611730, China3 Key Laboratory of Artificial Micro- and Nanostructures of Ministry of Education and School of Physics and Technology,Wuhan University, Wuhan 430072, China
4 Ministry of Education Key Laboratory for the Green Preparation and Application of Functional Materials, Hubei University,Wuhan 430072, China
Correspondence should be addressed to Haiying Wang, [email protected] and Rui Xiong, [email protected]
Received 9 January 2012; Revised 22 February 2012; Accepted 22 February 2012
Academic Editor: Baibiao Huang
Copyright © 2012 Kewei Li et al. This is an open access article distributed under the Creative Commons Attribution License, whichpermits unrestricted use, distribution, and reproduction in any medium, provided the original work is properly cited.
Rutile-anatase phase mixed Fe + N codoped TiO2 nanowires were designed and prepared by a two-step anodic oxidation method.The results of X-ray diffraction, scanning electron microscopy, and high-resolution transmission electron microscopy confirm thatthe prepared Fe + N codoped TiO2 nanowires exhibit intimately contacted anatase-rutile heterostructure with the rutile contentof 21.89%. The X-ray photoelectron spectroscopy measurements show that nitrogen and iron atoms are incorporated into thetitania oxide lattice, and the UV-visible absorption spectra show that the codoping of iron and nitrogen atoms could extend theabsorption to visible light region. The photocatalytic activities of all the samples were evaluated by photocatalytic degradationof methylene blue under visible light irradiation. The Fe + N codoped sample achieves the best response to visible light and thehighest photocatalytic activities. The enhancement of photocatalytic activity for Fe + N codoped sample should be ascribed to thesynergistic effects of codoped nitrogen and iron ions and the anatase-rutile heterostructure.
1. Introduction
Titanium oxide is a multifunctional material with a widevariety of potential applications including solar cell [1],photocatalyst [2], water splitting [3], and gas sensors [4].However, the wide band gap of TiO2 (3.2 eV for the anatasephase and 3.0 eV for the rutile phase) requires ultraviolet(UV) light for electron-hole separation, which is only 5%of the natural solar light [5]. It is of great significanceto develop photocatalysts that can be used in visible lightregion to improve the photocatalytic efficiency. Numerousattempts have been made to optimize the band gap of TiO2
by different doping schemes, for example, nonmetal doping(such as C, S, N, I [6–11]), metal doping (such as Fe, V,Cr, Nb [12–15]), and nonmetal-metal codoping (such asMo + C codoping [16], Mo + N codoping [17], Pr + Ncodoping [18], and Cd + N codoping [19]), to improvethe photocatalytic activity. As a result, it was found that
the monodoping can generate the recombination centerinside the TiO2, which goes against the light-induced chargecarriers’ migration to the surface [16, 20]. In compensated n-p codoping systems, the defect bands can be passivated andwill not be effective as carrier recombination centers [16, 21]and the Columbic attraction between the n- and p-typedopants with opposite charge substantially enhances dopingconcentration [22]. Recently, noncompensated codoping wasproposed by Zhu et al., for its distinctive merit of ensuringthe creation of intermediate electronic bands in the gapregion and enhancing photoactivity manifested by efficientelectron-hole separation in the visible-light region [23].
It is well-known that powders consisting of anataseand rutile (a classical reference materials is Degussa P25,a mixture of 20% rutile, and 80% anatase) possess higherphotoactivity than those of pure anatase. It was thoughtthat the anatase-rutile heterojunction inside the TiO2 wasthe main reason for enhanced photoactivity [24]. Deak et
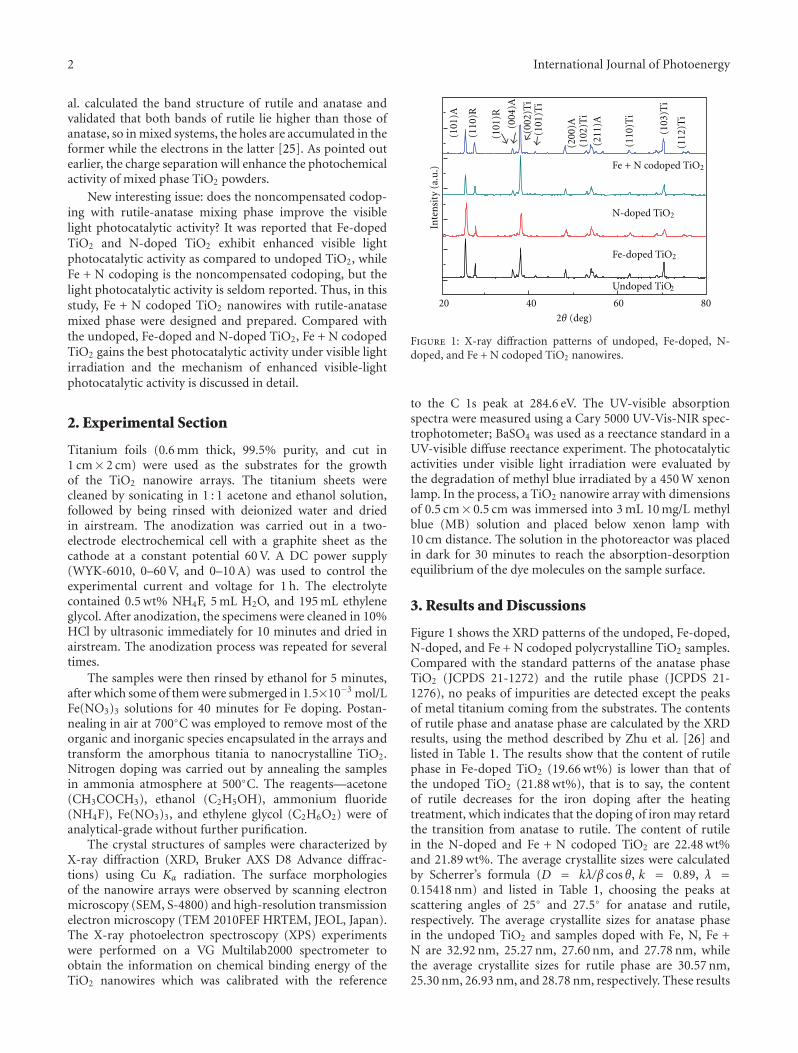
2 International Journal of Photoenergy
al. calculated the band structure of rutile and anatase andvalidated that both bands of rutile lie higher than those ofanatase, so in mixed systems, the holes are accumulated in theformer while the electrons in the latter [25]. As pointed outearlier, the charge separation will enhance the photochemicalactivity of mixed phase TiO2 powders.
New interesting issue: does the noncompensated codop-ing with rutile-anatase mixing phase improve the visiblelight photocatalytic activity? It was reported that Fe-dopedTiO2 and N-doped TiO2 exhibit enhanced visible lightphotocatalytic activity as compared to undoped TiO2, whileFe + N codoping is the noncompensated codoping, but thelight photocatalytic activity is seldom reported. Thus, in thisstudy, Fe + N codoped TiO2 nanowires with rutile-anatasemixed phase were designed and prepared. Compared withthe undoped, Fe-doped and N-doped TiO2, Fe + N codopedTiO2 gains the best photocatalytic activity under visible lightirradiation and the mechanism of enhanced visible-lightphotocatalytic activity is discussed in detail.
2. Experimental Section
Titanium foils (0.6 mm thick, 99.5% purity, and cut in1 cm× 2 cm) were used as the substrates for the growthof the TiO2 nanowire arrays. The titanium sheets werecleaned by sonicating in 1 : 1 acetone and ethanol solution,followed by being rinsed with deionized water and driedin airstream. The anodization was carried out in a two-electrode electrochemical cell with a graphite sheet as thecathode at a constant potential 60 V. A DC power supply(WYK-6010, 0–60 V, and 0–10 A) was used to control theexperimental current and voltage for 1 h. The electrolytecontained 0.5 wt% NH4F, 5 mL H2O, and 195 mL ethyleneglycol. After anodization, the specimens were cleaned in 10%HCl by ultrasonic immediately for 10 minutes and dried inairstream. The anodization process was repeated for severaltimes.
The samples were then rinsed by ethanol for 5 minutes,after which some of them were submerged in 1.5×10⁻³ mol/LFe(NO3)3 solutions for 40 minutes for Fe doping. Postan-nealing in air at 700◦C was employed to remove most of theorganic and inorganic species encapsulated in the arrays andtransform the amorphous titania to nanocrystalline TiO2.Nitrogen doping was carried out by annealing the samplesin ammonia atmosphere at 500◦C. The reagents—acetone(CH3COCH3), ethanol (C2H5OH), ammonium fluoride(NH4F), Fe(NO3)3, and ethylene glycol (C2H6O2) were ofanalytical-grade without further purification.
The crystal structures of samples were characterized byX-ray diffraction (XRD, Bruker AXS D8 Advance diffrac-tions) using Cu Kα radiation. The surface morphologiesof the nanowire arrays were observed by scanning electronmicroscopy (SEM, S-4800) and high-resolution transmissionelectron microscopy (TEM 2010FEF HRTEM, JEOL, Japan).The X-ray photoelectron spectroscopy (XPS) experimentswere performed on a VG Multilab2000 spectrometer toobtain the information on chemical binding energy of theTiO2 nanowires which was calibrated with the reference
Inte
nsi
ty (
a.u
.)
2θ (deg)
(101
)A
(110
)R
(101
)R
(004
)A
(002
)Ti
(101
)Ti
(200
)A(1
02)T
i(2
11)A
(110
)Ti
(103
)Ti
(112
)Ti
Fe + N codoped TiO2
N-doped TiO2
Fe-doped TiO2
Undoped TiO2
20 40 60 80
Figure 1: X-ray diffraction patterns of undoped, Fe-doped, N-doped, and Fe + N codoped TiO2 nanowires.
to the C 1s peak at 284.6 eV. The UV-visible absorptionspectra were measured using a Cary 5000 UV-Vis-NIR spec-trophotometer; BaSO4 was used as a reectance standard in aUV-visible diffuse reectance experiment. The photocatalyticactivities under visible light irradiation were evaluated bythe degradation of methyl blue irradiated by a 450 W xenonlamp. In the process, a TiO2 nanowire array with dimensionsof 0.5 cm× 0.5 cm was immersed into 3 mL 10 mg/L methylblue (MB) solution and placed below xenon lamp with10 cm distance. The solution in the photoreactor was placedin dark for 30 minutes to reach the absorption-desorptionequilibrium of the dye molecules on the sample surface.
3. Results and Discussions
Figure 1 shows the XRD patterns of the undoped, Fe-doped,N-doped, and Fe + N codoped polycrystalline TiO2 samples.Compared with the standard patterns of the anatase phaseTiO2 (JCPDS 21-1272) and the rutile phase (JCPDS 21-1276), no peaks of impurities are detected except the peaksof metal titanium coming from the substrates. The contentsof rutile phase and anatase phase are calculated by the XRDresults, using the method described by Zhu et al. [26] andlisted in Table 1. The results show that the content of rutilephase in Fe-doped TiO2 (19.66 wt%) is lower than that ofthe undoped TiO2 (21.88 wt%), that is to say, the contentof rutile decreases for the iron doping after the heatingtreatment, which indicates that the doping of iron may retardthe transition from anatase to rutile. The content of rutilein the N-doped and Fe + N codoped TiO2 are 22.48 wt%and 21.89 wt%. The average crystallite sizes were calculatedby Scherrer’s formula (D = kλ/β cos θ, k = 0.89, λ =0.15418 nm) and listed in Table 1, choosing the peaks atscattering angles of 25◦ and 27.5◦ for anatase and rutile,respectively. The average crystallite sizes for anatase phasein the undoped TiO2 and samples doped with Fe, N, Fe +N are 32.92 nm, 25.27 nm, 27.60 nm, and 27.78 nm, whilethe average crystallite sizes for rutile phase are 30.57 nm,25.30 nm, 26.93 nm, and 28.78 nm, respectively. These results
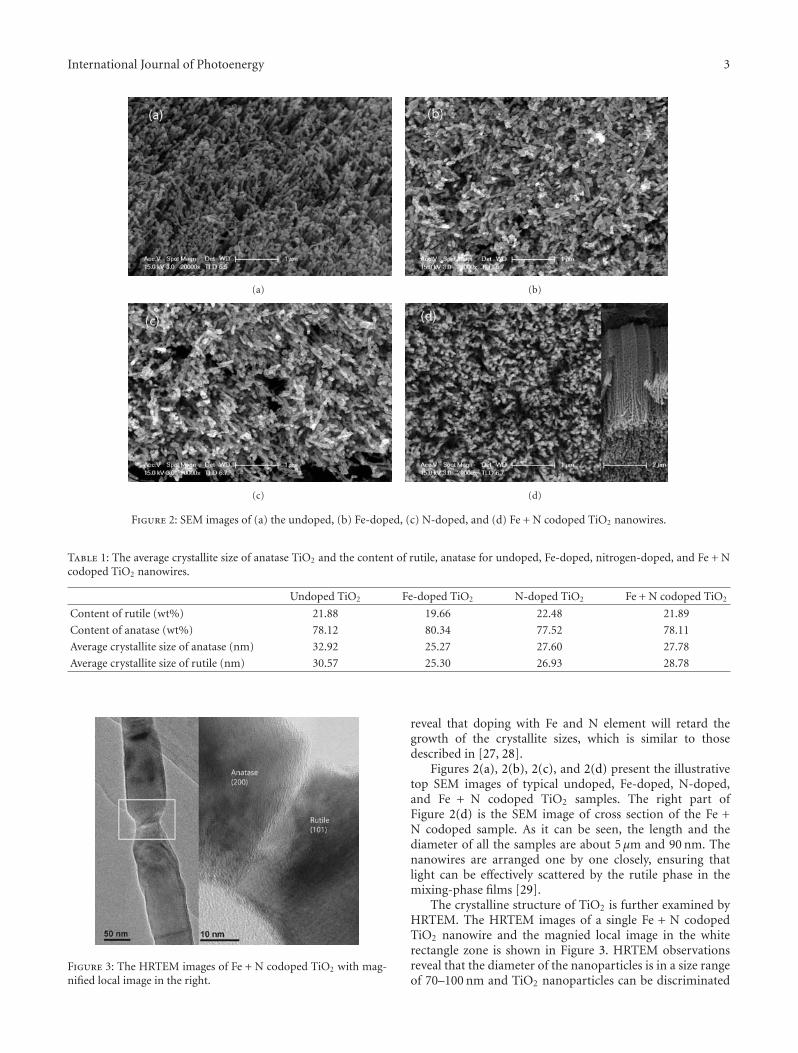
International Journal of Photoenergy 3
(a) (b)
(c) (d)
Figure 2: SEM images of (a) the undoped, (b) Fe-doped, (c) N-doped, and (d) Fe + N codoped TiO2 nanowires.
Table 1: The average crystallite size of anatase TiO2 and the content of rutile, anatase for undoped, Fe-doped, nitrogen-doped, and Fe + Ncodoped TiO2 nanowires.
Undoped TiO2 Fe-doped TiO2 N-doped TiO2 Fe + N codoped TiO2
Content of rutile (wt%) 21.88 19.66 22.48 21.89
Content of anatase (wt%) 78.12 80.34 77.52 78.11
Average crystallite size of anatase (nm) 32.92 25.27 27.60 27.78
Average crystallite size of rutile (nm) 30.57 25.30 26.93 28.78
Figure 3: The HRTEM images of Fe + N codoped TiO2 with mag-nified local image in the right.
reveal that doping with Fe and N element will retard thegrowth of the crystallite sizes, which is similar to thosedescribed in [27, 28].
Figures 2(a), 2(b), 2(c), and 2(d) present the illustrativetop SEM images of typical undoped, Fe-doped, N-doped,and Fe + N codoped TiO2 samples. The right part ofFigure 2(d) is the SEM image of cross section of the Fe +N codoped sample. As it can be seen, the length and thediameter of all the samples are about 5 μm and 90 nm. Thenanowires are arranged one by one closely, ensuring thatlight can be effectively scattered by the rutile phase in themixing-phase films [29].
The crystalline structure of TiO2 is further examined byHRTEM. The HRTEM images of a single Fe + N codopedTiO2 nanowire and the magnied local image in the whiterectangle zone is shown in Figure 3. HRTEM observationsreveal that the diameter of the nanoparticles is in a size rangeof 70–100 nm and TiO2 nanoparticles can be discriminated
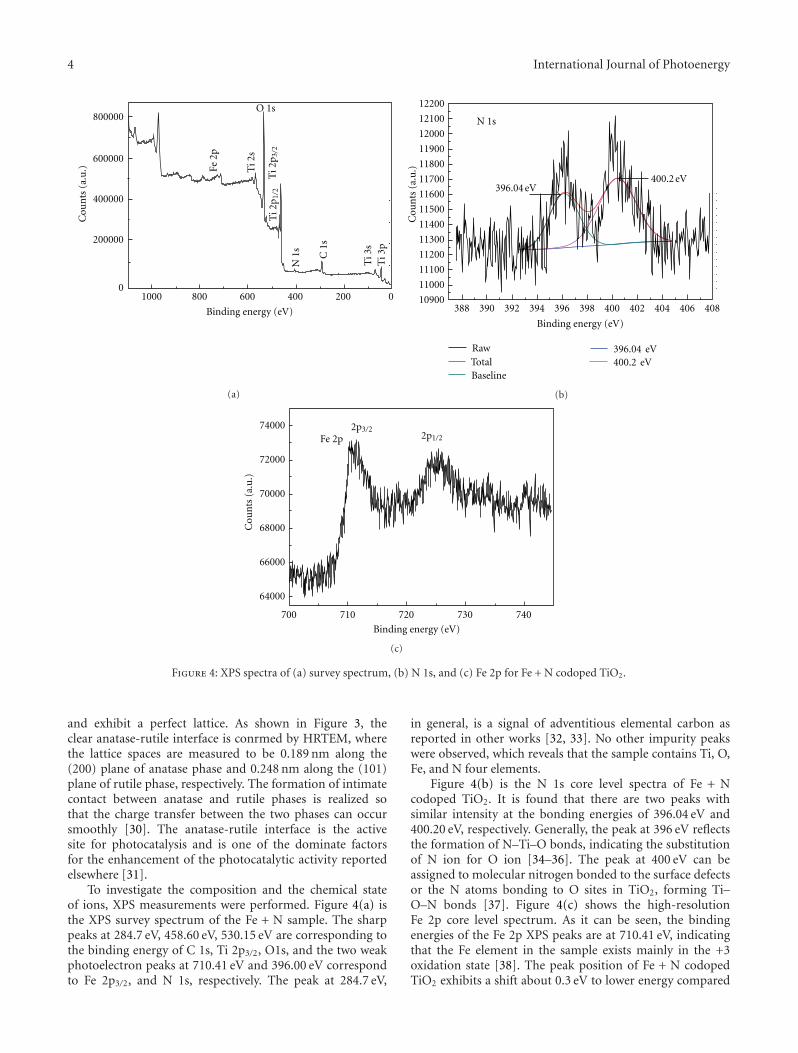
4 International Journal of Photoenergy
800000
600000
400000
200000
1000 800 600 400 2000
0
Ti 3
sT
i 3p
C 1
s
N 1
s
Ti 2
p1/
2T
i 2p
3/2
Ti 2
s
Fe 2
p
O 1s
Binding energy (eV)
Cou
nts
(a.
u.)
(a)
Binding energy (eV)
Cou
nts
(a.
u.)
12200
12100
12000
11900
11800
11700
11600
11500
11400
11300
11200
11100
11000
10900388 390 392 394 396 398 400 402 404 406 408
RawTotalBaseline
396.04 eV400.2 eV
400.2 eV396.04 eV
N 1s
(b)
74000
72000
70000
68000
66000
64000
700 710 720 730 740
2p1/22p3/2
Fe 2p
Binding energy (eV)
Cou
nts
(a.
u.)
(c)
Figure 4: XPS spectra of (a) survey spectrum, (b) N 1s, and (c) Fe 2p for Fe + N codoped TiO2.
and exhibit a perfect lattice. As shown in Figure 3, theclear anatase-rutile interface is conrmed by HRTEM, wherethe lattice spaces are measured to be 0.189 nm along the(200) plane of anatase phase and 0.248 nm along the (101)plane of rutile phase, respectively. The formation of intimatecontact between anatase and rutile phases is realized sothat the charge transfer between the two phases can occursmoothly [30]. The anatase-rutile interface is the activesite for photocatalysis and is one of the dominate factorsfor the enhancement of the photocatalytic activity reportedelsewhere [31].
To investigate the composition and the chemical stateof ions, XPS measurements were performed. Figure 4(a) isthe XPS survey spectrum of the Fe + N sample. The sharppeaks at 284.7 eV, 458.60 eV, 530.15 eV are corresponding tothe binding energy of C 1s, Ti 2p3/2, O1s, and the two weakphotoelectron peaks at 710.41 eV and 396.00 eV correspondto Fe 2p3/2, and N 1s, respectively. The peak at 284.7 eV,
in general, is a signal of adventitious elemental carbon asreported in other works [32, 33]. No other impurity peakswere observed, which reveals that the sample contains Ti, O,Fe, and N four elements.
Figure 4(b) is the N 1s core level spectra of Fe + Ncodoped TiO2. It is found that there are two peaks withsimilar intensity at the bonding energies of 396.04 eV and400.20 eV, respectively. Generally, the peak at 396 eV reflectsthe formation of N–Ti–O bonds, indicating the substitutionof N ion for O ion [34–36]. The peak at 400 eV can beassigned to molecular nitrogen bonded to the surface defectsor the N atoms bonding to O sites in TiO2, forming Ti–O–N bonds [37]. Figure 4(c) shows the high-resolutionFe 2p core level spectrum. As it can be seen, the bindingenergies of the Fe 2p XPS peaks are at 710.41 eV, indicatingthat the Fe element in the sample exists mainly in the +3oxidation state [38]. The peak position of Fe + N codopedTiO2 exhibits a shift about 0.3 eV to lower energy compared
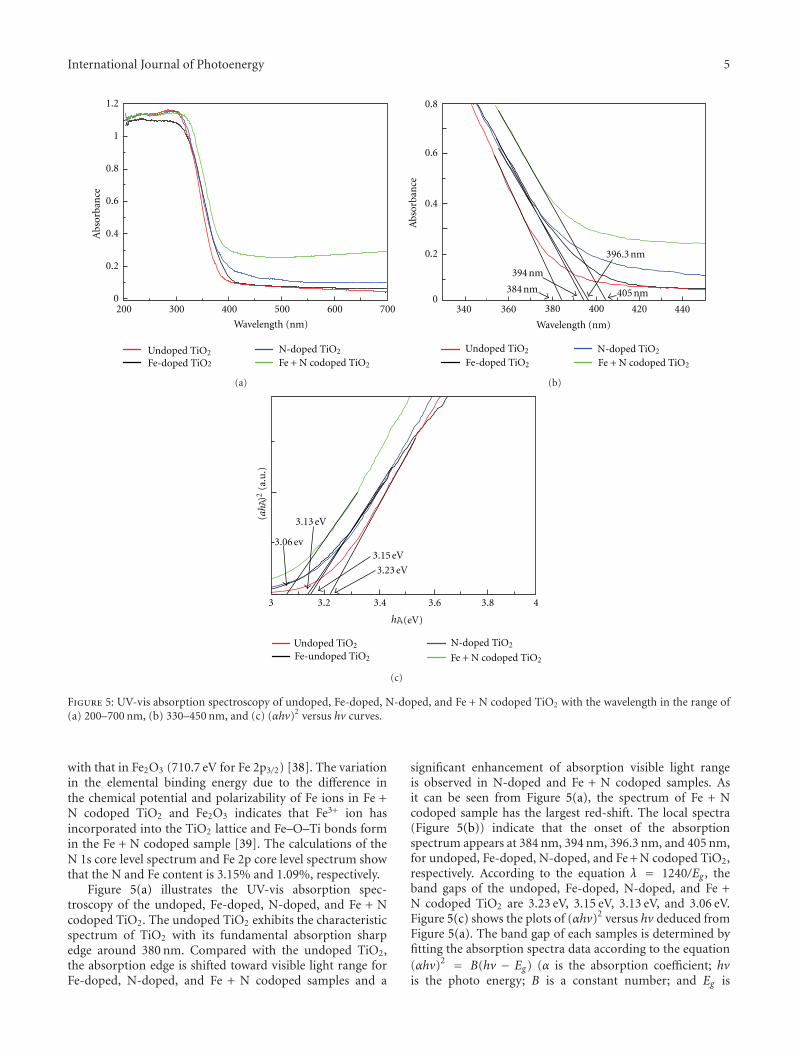
International Journal of Photoenergy 5
1.2
1
0.8
0.6
0.4
0.2
0200 300 400 500 600 700
Abs
orba
nce
Wavelength (nm)
Undoped TiO2
Fe-doped TiO2
N-doped TiO2
Fe + N codoped TiO2
(a)
0.8
0.6
0.4
0.2
0 340 360 380 400 420 440
394 nm
384 nm
396.3 nm
405 nm
Abs
orba
nce
Wavelength (nm)
Undoped TiO2
Fe-doped TiO2
N-doped TiO2
Fe + N codoped TiO2
(b)
(ahA
)2(a
.u.)
3 3.2 3.4 3.6 3.8 4
A(eV)
3.06 ev
3.13 eV
3.15 eV
3.23 eV
Undoped TiO2
Fe-undoped TiO2
N-doped TiO2
Fe + N codoped TiO2
h
(c)
Figure 5: UV-vis absorption spectroscopy of undoped, Fe-doped, N-doped, and Fe + N codoped TiO2 with the wavelength in the range of(a) 200–700 nm, (b) 330–450 nm, and (c) (αhv)2 versus hv curves.
with that in Fe2O3 (710.7 eV for Fe 2p3/2) [38]. The variationin the elemental binding energy due to the difference inthe chemical potential and polarizability of Fe ions in Fe +N codoped TiO2 and Fe2O3 indicates that Fe3+ ion hasincorporated into the TiO2 lattice and Fe–O–Ti bonds formin the Fe + N codoped sample [39]. The calculations of theN 1s core level spectrum and Fe 2p core level spectrum showthat the N and Fe content is 3.15% and 1.09%, respectively.
Figure 5(a) illustrates the UV-vis absorption spec-troscopy of the undoped, Fe-doped, N-doped, and Fe + Ncodoped TiO2. The undoped TiO2 exhibits the characteristicspectrum of TiO2 with its fundamental absorption sharpedge around 380 nm. Compared with the undoped TiO2,the absorption edge is shifted toward visible light range forFe-doped, N-doped, and Fe + N codoped samples and a
significant enhancement of absorption visible light rangeis observed in N-doped and Fe + N codoped samples. Asit can be seen from Figure 5(a), the spectrum of Fe + Ncodoped sample has the largest red-shift. The local spectra(Figure 5(b)) indicate that the onset of the absorptionspectrum appears at 384 nm, 394 nm, 396.3 nm, and 405 nm,for undoped, Fe-doped, N-doped, and Fe + N codoped TiO2,respectively. According to the equation λ = 1240/Eg , theband gaps of the undoped, Fe-doped, N-doped, and Fe +N codoped TiO2 are 3.23 eV, 3.15 eV, 3.13 eV, and 3.06 eV.Figure 5(c) shows the plots of (αhv)2 versus hv deduced fromFigure 5(a). The band gap of each samples is determined byfitting the absorption spectra data according to the equation(αhv)2 = B(hv − Eg) (α is the absorption coefficient; hvis the photo energy; B is a constant number; and Eg is
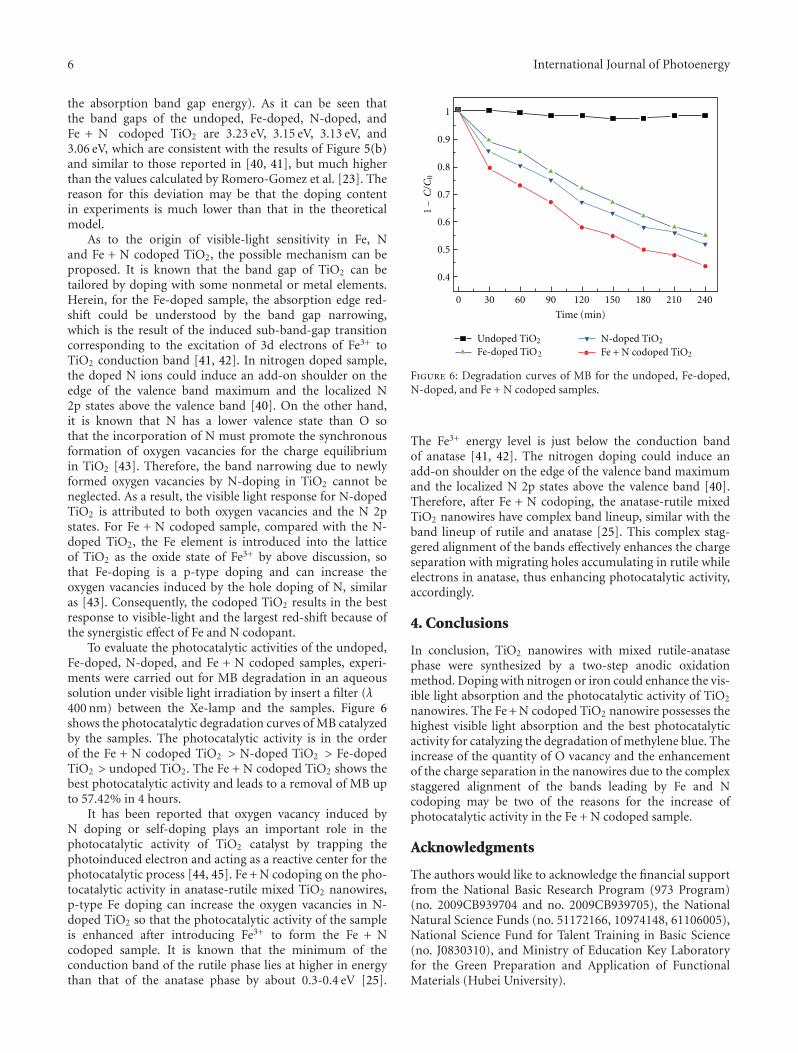
6 International Journal of Photoenergy
the absorption band gap energy). As it can be seen thatthe band gaps of the undoped, Fe-doped, N-doped, andFe + N codoped TiO2 are 3.23 eV, 3.15 eV, 3.13 eV, and3.06 eV, which are consistent with the results of Figure 5(b)and similar to those reported in [40, 41], but much higherthan the values calculated by Romero-Gomez et al. [23]. Thereason for this deviation may be that the doping contentin experiments is much lower than that in the theoreticalmodel.
As to the origin of visible-light sensitivity in Fe, Nand Fe + N codoped TiO2, the possible mechanism can beproposed. It is known that the band gap of TiO2 can betailored by doping with some nonmetal or metal elements.Herein, for the Fe-doped sample, the absorption edge red-shift could be understood by the band gap narrowing,which is the result of the induced sub-band-gap transitioncorresponding to the excitation of 3d electrons of Fe3+ toTiO2 conduction band [41, 42]. In nitrogen doped sample,the doped N ions could induce an add-on shoulder on theedge of the valence band maximum and the localized N2p states above the valence band [40]. On the other hand,it is known that N has a lower valence state than O sothat the incorporation of N must promote the synchronousformation of oxygen vacancies for the charge equilibriumin TiO2 [43]. Therefore, the band narrowing due to newlyformed oxygen vacancies by N-doping in TiO2 cannot beneglected. As a result, the visible light response for N-dopedTiO2 is attributed to both oxygen vacancies and the N 2pstates. For Fe + N codoped sample, compared with the N-doped TiO2, the Fe element is introduced into the latticeof TiO2 as the oxide state of Fe3+ by above discussion, sothat Fe-doping is a p-type doping and can increase theoxygen vacancies induced by the hole doping of N, similaras [43]. Consequently, the codoped TiO2 results in the bestresponse to visible-light and the largest red-shift because ofthe synergistic effect of Fe and N codopant.
To evaluate the photocatalytic activities of the undoped,Fe-doped, N-doped, and Fe + N codoped samples, experi-ments were carried out for MB degradation in an aqueoussolution under visible light irradiation by insert a filter (λ400 nm) between the Xe-lamp and the samples. Figure 6shows the photocatalytic degradation curves of MB catalyzedby the samples. The photocatalytic activity is in the orderof the Fe + N codoped TiO2 > N-doped TiO2 > Fe-dopedTiO2 > undoped TiO2. The Fe + N codoped TiO2 shows thebest photocatalytic activity and leads to a removal of MB upto 57.42% in 4 hours.
It has been reported that oxygen vacancy induced byN doping or self-doping plays an important role in thephotocatalytic activity of TiO2 catalyst by trapping thephotoinduced electron and acting as a reactive center for thephotocatalytic process [44, 45]. Fe + N codoping on the pho-tocatalytic activity in anatase-rutile mixed TiO2 nanowires,p-type Fe doping can increase the oxygen vacancies in N-doped TiO2 so that the photocatalytic activity of the sampleis enhanced after introducing Fe3+ to form the Fe + Ncodoped sample. It is known that the minimum of theconduction band of the rutile phase lies at higher in energythan that of the anatase phase by about 0.3-0.4 eV [25].
Undoped TiO2
Fe-doped TiO2
N-doped TiO2
Fe + N codoped TiO2
1
0.9
0.8
0.7
0.6
0.5
0.4
0 30 60 90 120 150 180 210 240
1−C/C
0
Time (min)
Figure 6: Degradation curves of MB for the undoped, Fe-doped,N-doped, and Fe + N codoped samples.
The Fe3+ energy level is just below the conduction bandof anatase [41, 42]. The nitrogen doping could induce anadd-on shoulder on the edge of the valence band maximumand the localized N 2p states above the valence band [40].Therefore, after Fe + N codoping, the anatase-rutile mixedTiO2 nanowires have complex band lineup, similar with theband lineup of rutile and anatase [25]. This complex stag-gered alignment of the bands effectively enhances the chargeseparation with migrating holes accumulating in rutile whileelectrons in anatase, thus enhancing photocatalytic activity,accordingly.
4. Conclusions
In conclusion, TiO2 nanowires with mixed rutile-anatasephase were synthesized by a two-step anodic oxidationmethod. Doping with nitrogen or iron could enhance the vis-ible light absorption and the photocatalytic activity of TiO2
nanowires. The Fe + N codoped TiO2 nanowire possesses thehighest visible light absorption and the best photocatalyticactivity for catalyzing the degradation of methylene blue. Theincrease of the quantity of O vacancy and the enhancementof the charge separation in the nanowires due to the complexstaggered alignment of the bands leading by Fe and Ncodoping may be two of the reasons for the increase ofphotocatalytic activity in the Fe + N codoped sample.
Acknowledgments
The authors would like to acknowledge the financial supportfrom the National Basic Research Program (973 Program)(no. 2009CB939704 and no. 2009CB939705), the NationalNatural Science Funds (no. 51172166, 10974148, 61106005),National Science Fund for Talent Training in Basic Science(no. J0830310), and Ministry of Education Key Laboratoryfor the Green Preparation and Application of FunctionalMaterials (Hubei University).
International Journal of Photoenergy 7
References
[1] C.-C. Wu, Y.-J. Zhuo, P.-N. Zhu, B. Chi, J. Pu, and J. Li,“Tunable fabrication of TiO2 nanotube arrays with high aspectratio and its application in dye sensitized solar cell,” Journal ofInorganic Materials, vol. 24, no. 5, pp. 897–901, 2009.
[2] S. Sreekantan, R. Hazan, and Z. Lockman, “Photoactivityof anatase-rutile TiO2 nanotubes formed by anodizationmethod,” Thin Solid Films, vol. 518, no. 1, pp. 16–21, 2009.
[3] Y. Liu, B. Zhou, J. Bai et al., “Efficient photochemical watersplitting and organic pollutant degradation by highly orderedTiO2 nanopore arrays,” Applied Catalysis B, vol. 89, no. 1-2,pp. 142–148, 2009.
[4] M. H. Seo, M. Yuasa, T. Kida, J. S. Huh, K. Shimanoe, and N.Yamazoe, “Gas sensing characteristics and porosity control ofnanostructured films composed of TiO2 nanotubes,” Sensorsand Actuators B, vol. 137, no. 2, pp. 513–520, 2009.
[5] X. Chen and S. S. Mao, “Titanium dioxide nanomaterials: syn-thesis, properties, modifications and applications,” ChemicalReviews, vol. 107, no. 7, pp. 2891–2959, 2007.
[6] X. Yang, C. Cao, K. Hohn et al., “Highly visible-light active C-and V-doped TiO2 for degradation of acetaldehyde,” Journal ofCatalysis, vol. 252, no. 2, pp. 296–302, 2007.
[7] T. Ohno, M. Akiyoshi, T. Umebayashi, K. Asai, T. Mitsui, andM. Matsumura, “Preparation of S-doped TiO2 photocatalystsand their photocatalytic activities under visible light,” AppliedCatalysis A, vol. 265, no. 1, pp. 115–121, 2004.
[8] R. Asahi, T. Morikawa, T. Ohwaki, K. Aoki, and Y. Taga,“Visible-light photocatalysis in nitrogen-doped titaniumoxides,” Science, vol. 293, no. 5528, pp. 269–271, 2001.
[9] C.-C. Hu, T.-C. Hsu, and L.-H. Kao, “One-step cohydrother-mal synthesis of nitrogen-doped titanium oxide nanotubeswith enhanced visible light photocatalytic activity,” Interna-tional Journal of Photoenergy, vol. 2012, Article ID 391958, 9pages, 2012.
[10] Y.-C. Tang, X.-H. Huang, H.-Q. Yu, and L.-H. Tang,“Nitrogen-doped TiO2 photocatalyst prepared by mechan-ochemical method: doping mechanisms and visible pho-toactivity of pollutant degradation,” International Journal ofPhotoenergy, vol. 2012, Article ID 960726, 10 pages, 2012.
[11] V. Stengl and T. M. Grygar, “The simplest way to iodine-doped anatase for photocatalysts activated by visible light,”International Journal of Photoenergy, vol. 2011, Article ID685935, 13 pages, 2011.
[12] S. Klosek and D. Raftery, “Visible light driven V-doped TiO2
photocatalyst and its photooxidation of ethanol,” Journal ofPhysical Chemistry B, vol. 105, no. 14, pp. 2815–2819, 2002.
[13] H. Kato and A. Kudo, “Visible-light-response and photocat-alytic activities of TiO2 and SrTiO3 photocatalysts codopedwith antimony and chromium,” Journal of Physical ChemistryB, vol. 106, no. 19, pp. 5029–5034, 2002.
[14] K. T. Ranjit and B. Viswanathan, “Synthesis, characterizationand photocatalytic properties of iron-doped TiO2 catalysts,”Journal of Photochemistry and Photobiology A, vol. 108, no. 1,pp. 79–84, 1997.
[15] W. Li, Y. Wang, H. Lin et al., “Band gap tailoring of Nd3+-doped TiO2 nanoparticles,” Applied Physics Letters, vol. 83, no.20, pp. 4143–4145, 2003.
[16] Y. Gai, J. Li, S.-S. Li, J.-B. Xia, and S.-H. Wei, “Designof narrow-gap TiO2: a passivated codoping approach forenhanced photoelectrochemical activity,” Physical Review Let-ters, vol. 102, no. 3, Article ID 036402, 2009.
[17] H. Liu, Z. Lu, L. Yue et al., “(Mo+N) codoped TiO2 forenhanced visible-light photoactivity,” Applied Surface Science,vol. 257, no. 22, pp. 9355–9361, 2011.
[18] J. Yang, J. Dai, and J. Li, “Synthesis, characterization anddegradation of Bisphenol A using Pr, N co-doped TiO2 withhighly visible light activity,” Applied Surface Science, vol. 257,no. 21, pp. 8965–8973, 2011.
[19] H. Gao, B. Lu, F. Liu, Y. Liu, and X. Zhao, “Photocatalyticalproperties and theoretical analysis of N, Cd-codoped TiO2
synthesized by thermal decomposition method,” InternationalJournal of Photoenergy, vol. 2012, Article ID 453018, 9 pages,2012.
[20] T. Umebayashi, T. Yamaki, H. Itoh, and K. Asai, “Analysis ofelectronic structures of 3d transition metal-doped TiO2 basedon band calculations,” Journal of Physics and Chemistry ofSolids, vol. 63, no. 10, pp. 1909–1920, 2002.
[21] K.-S. Ahn, Y. Yan, S. Shet, T. Deutsch, J. Turner, and M. Al-Jassim, “Enhanced photoelectrochemical responses of ZnOfilms through Ga and N codoping,” Applied Physics Letters, vol.91, no. 23, Article ID 231909, 2007.
[22] W. Zhu, X. Qiu, V. Iancu et al., “Band gap narrowing oftitanium oxide semiconductors by noncompensated anion-Cation codoping for enhanced visible-Light photoactivity,”Physical Review Letters, vol. 103, no. 22, Article ID 226401,2009.
[23] P. Romero-Gomez, A. Borras, A. Barranco, J. P. Espinos, andA. R. Gonzalez-Elipe, “Enhanced photoactivity in bilayer filmswith buried rutile-anatase heterojunctions,” ChemPhysChem,vol. 12, no. 1, pp. 191–196, 2011.
[24] P. Deak, B. Aradi, and T. Frauenheim, “Band lineup and chargecarrier separation in mixed rutile-anatase systems,” Journal ofPhysical Chemistry C, vol. 115, no. 8, pp. 3443–3446, 2011.
[25] K. Y. Jung and S. B. Park, “Anatase-phase titania: preparationby embedding silica and photocatalytic activity for the decom-position of trichloroethylene,” Journal of Photochemistry andPhotobiology A, vol. 127, no. 1–3, pp. 117–122, 1999.
[26] J. Zhu, W. Zheng, B. He, J. Zhang, and M. Anpo, “Characteri-zation of Fe-TiO2 photocatalysts synthesized by hydrothermalmethod and their photocatalytic reactivity for photodegra-dation of XRG dye diluted in water,” Journal of MolecularCatalysis A, vol. 216, no. 1, pp. 35–43, 2004.
[27] J. Yu, M. Zhou, H. Yu, Q. Zhang, and Y. Yu, “Enhanced pho-toinduced super-hydrophilicity of the sol-gel-derived TiO2
thin films by Fe-doping,” Materials Chemistry and Physics, vol.95, no. 2-3, pp. 193–196, 2006.
[28] W. Q. Peng, M. Yanagida, and L. Y. Han, “Rutile-anataseTiO2 photoanodes for dye-sensitized solar cells,” Journal ofNonlinear Optical Physics and Materials, vol. 19, no. 4, pp. 673–679, 2010.
[29] G. Liu, X. Yan, Z. Chen et al., “Synthesis of rutile-anatase core-shell structured TiO2 for photocatalysis,” Journal of MaterialsChemistry, vol. 19, no. 36, pp. 6590–6596, 2009.
[30] T. Miyagi, M. Kamei, T. Mitsuhashi, T. Ishigaki, and A.Yamazaki, “Charge separation at the rutile/anatase interface:a dominant factor of photocatalytic activity,” Chemical PhysicsLetters, vol. 390, no. 4–6, pp. 399–402, 2004.
[31] W. Ren, Z. Ai, F. Jia, L. Zhang, X. Fan, and Z. Zou, “Lowtemperature preparation and visible light photocatalytic activ-ity of mesoporous carbon-doped crystalline TiO2,” AppliedCatalysis B, vol. 69, no. 3-4, pp. 138–144, 2007.
[32] H. Irie, Y. Watanabe, and K. Hashimoto, “Carbon-dopedanatase TiO2 powders as a visible-light sensitive photocata-lyst,” Chemistry Letters, vol. 32, no. 8, pp. 772–773, 2003.
8 International Journal of Photoenergy
[33] J. L. Gole, J. D. Stout, C. Burda, Y. Lou, and X. Chen,“Highly efficient formation of visible light tunable TiO2-xNxphotocatalysts and their transformation at the nanoscale,”Journal of Physical Chemistry B, vol. 108, no. 4, pp. 1230–1240,2004.
[34] C. S. Gopinath, “Comment on ”photoelectron spectroscopicinvestigation of nitrogen-doped titania nanoparticles”,” Jour-nal of Physical Chemistry B, vol. 110, no. 13, pp. 7079–7080,2006.
[35] C. Burda and J. Gole, “Reply to “comment on ‘photoelec-tron spectroscopic investigation of nitrogen-doped titaniananoparticles”’,” Journal of Physical Chemistry B, vol. 110, no.13, pp. 7081–7082, 2006.
[36] J. F. Molder, W. F. Stickle, P. E. Sobol, and K. D. Bomben,Handbook of X-Ray Photoelectron Spectroscopy, Perkin-Elmer,Eden Prairie, Minn, USA, 2nd edition, 1992.
[37] C. D. Wagner, W. M. Riggs, L. E. Davis, J. F. Moulder,and G. E. Muilenberg, Handbook of Xray Photoelectron Spec-troscopy, PerkinElmer Corp., Physical Electronics Division,Eden Prairie, Minn, USA, 1979.
[38] J. Li, J. Xu, W.-L. Dai, H. Li, and K. Fan, “Direct hydro-alcoholthermal synthesis of special core-shell structured Fe-dopedtitania microspheres with extended visible light response andenhanced photoactivity,” Applied Catalysis B, vol. 85, no. 3-4,pp. 162–170, 2009.
[39] J. Wang, D. N. Tafen, J. P. Lewis et al., “Origin of photocatalyticactivity of Nitrogen-doped TiO2 nanobelts,” Journal of theAmerican Chemical Society, vol. 131, no. 34, pp. 12290–12297,2009.
[40] J. Yu, Q. Xiang, and M. Zhou, “Preparation, characterizationand visible-light-driven photocatalytic activity of Fe-dopedtitania nanorods and first-principles study for electronicstructures,” Applied Catalysis B, vol. 90, no. 3-4, pp. 595–602,2009.
[41] W. Choi, A. Termin, and M. R. Hoffmann, “The role of metalion dopants in quantum-sized TiO2: correlation betweenphotoreactivity and charge carrier recombination dynamics,”Journal of Physical Chemistry, vol. 98, no. 51, pp. 13669–13679,1994.
[42] K. Tan, H. Zhang, C. Xie, H. Zheng, Y. Gu, and W. F.Zhang, “Visible-light absorption and photocatalytic activityin molybdenum- and nitrogen-codoped TiO2,” Catalysis Com-munications, vol. 11, no. 5, pp. 331–335, 2010.
[43] T. Ihara, M. Miyoshi, Y. Iriyama, O. Matsumoto, and S.Sugihara, “Visible-light-active titanium oxide photocatalystrealized by an oxygen-deficient structure and by nitrogendoping,” Applied Catalysis B, vol. 42, no. 4, pp. 403–409, 2003.
[44] I. Nakamura, N. Negishi, S. Kutsuna, T. Ihara, S. Sugihara, andK. Takeuchi, “Role of oxygen vacancy in the plasma-treatedTiO2 photocatalyst with visible light activity for NO removal,”Journal of Molecular Catalysis A, vol. 161, no. 1-2, pp. 205–212,2000.
[45] I. Justicia, P. Ordejon, G. Canto et al., “Designed self-doped titanium oxide thin films for efficient visible-lightphotocatalysis,” Advanced Materials, vol. 14, no. 19, pp. 1399–1402, 2002.
Hindawi Publishing CorporationInternational Journal of PhotoenergyVolume 2012, Article ID 569716, 10 pagesdoi:10.1155/2012/569716
Research Article
Enhanced Visible Light Photocatalytic Activity of V2O5 ClusterModified N-Doped TiO2 for Degradation of Toluene in Air
Fan Dong, Yanjuan Sun, and Min Fu
College of Environmental and Biological Engineering, Key Laboratory of Catalysis Science and Technology ofChongqing Education Commission, Chongqing Technology and Business University, Chongqing 400067, China
Correspondence should be addressed to Fan Dong, [email protected]
Received 2 January 2012; Revised 19 February 2012; Accepted 20 February 2012
Academic Editor: Xuxu Wang
Copyright © 2012 Fan Dong et al. This is an open access article distributed under the Creative Commons Attribution License,which permits unrestricted use, distribution, and reproduction in any medium, provided the original work is properly cited.
V2O5 cluster-modified N-doped TiO2 (N-TiO2/V2O5) nanocomposites photocatalyst was prepared by a facile impregnation-calcination method. The effects of V2O5 cluster loading content on visible light photocatalytic activity of the as-prepared sampleswere investigated for degradation of toluene in air. The results showed that the visible light activity of N-doped TiO2 wassignificantly enhanced by loading V2O5 clusters. The optimal V2O5 loading content was found to be 0.5 wt.%, reaching a removalratio of 52.4% and a rate constant of 0.027 min−1, far exceeding that of unmodified N-doped TiO2. The enhanced activity is due tothe deposition of V2O5 clusters on the surface of N-doped TiO2. The conduction band (CB) potential of V2O5 (0.48 eV) is lowerthan the CB level of N-doped TiO2 (−0.19 V), which favors the photogenerated electron transfer from CB of N-doped TiO2 toV2O5 clusters. This function of V2O5 clusters helps promote the transfer and separation of photogenerated electrons and holes.The present work not only displays a feasible route for the utilization of low cost V2O5 clusters as a substitute for noble metals inenhancing the photocatalysis but also demonstrates a facile method for preparation of highly active composite photocatalyst forlarge-scale applications.
1. Introduction
Environmental pollution and energy crisis are the two majorglobal challenges faced by human beings. Semiconductorphotocatalysis is green technology that allows the use of sun-light for the destruction of pollutants and conversion of solarenergy to hydrogen, thus providing an attractive route topotentially solve the both problems [1–3]. The widely usedphotocatalyst TiO2 is, however, only UV active due to itsrelatively large band gap [4, 5]. As UV light accounts for asmall fraction (4%) of the sun’s energy compared to visiblelight with a large fraction of 45%, the shift in the optical ab-sorption of TiO2 from the UV to the visible region is ofsignificance for practical application of photocatalyst [6–8].
Visible light driven photocatalysis is one of the hottesttopics worldwide [9–22]. Pioneered by Asahi et al. whoreported that nitrogen doping can extend the optical ab-sorption of TiO2 into visible region and enhance the pho-tocatalytic activity under visible light irradiation [9], manyefforts have been devoted afterwards to developing nonmetal
doped TiO2 exhibiting enhanced visible light activities [10–14]. Among the various types of nonmetal doped TiO2, N-doped TiO2 is the most typical and has been intensivelyinvestigated for solar energy conversion and pollutants deg-radation [15–18]. However, nitrogen doping intrinsicallyfavored the formation of defects that act as recombinationcenter, which largely limited the photoactivity of N-dopedTiO2 under visible light illumination [19–22].
In order to improve the visible light photocatalytic per-formance of N-doped TiO2, further modification has beenemployed, including codoping with nonmetals (C, S, F) [23–25], co-doping with metal ions (Fe, La, V) [26–28], noblemetal deposition (Pt, Au) [29, 30] and metal oxide coupling(WO3, PdO, ZrO2) [31–33]. The modifications usually showpromotive effects on visible light photocatalytic activity ofN-doped TiO2. The activity promotion is related to phasestructure, optical absorption, charge transfer, and surfaceproperties. Recently, nanoscale clusters have been utilizedto modify different types of photocatalysts [34–42]. Highlyenhanced photocatalytic activities over the investigated
2 International Journal of Photoenergy
cluster/photocatalyst composites systems, including Ni(OH)2/TiO2, Cu(OH)2/TiO2, CuO/self-doped TiO2, V2O5/C-dopedTiO2, V2O5/TiO2, vanadium species/N-doped TiO2, Fe2O3/WO3, and CdS/graphene have been observed [34–42]. How-ever, to our knowledge, there are few reports on the enhancedphotocatalytic activity over V2O5 cluster-modified N-dopedTiO2 up to now.
In our previous study, N-doped TiO2 (N-TiO2) pho-tocatalyst was prepared by partial oxidation of TiN in air[43]. In the present study, we report the facile preparation ofV2O5 cluster-modified N-doped TiO2 nanocomposite for thefirst time through an impregnation-calcination method andenhanced visible light photocatalytic activity for degradationof toluene in air. The microstructure, optical, and surfaceproperties of the resulted nanocomposites photocatalystswere investigated systematically by XRD, Raman, TEM, XPS,UV-vis DRS, and PL. Based on the characterization results,a new mechanism on the promotive effects of V2O5 clustermodification on the charge transfer and visible light photo-catalysis of N-doped TiO2 was discussed and proposed.
2. Experimental Section
2.1. Preparation of Photocatalysts. N-doped TiO2 (N-TiO2)was prepared by partial oxidation of TiN. In a typical process,3.0 g TiN powder was loaded in a ceramic crucible, and thenplaced in the middle of muffle furnace open to the atmos-phere. The temperature was slowly ramped up to 450◦C at arate of 15◦C/min and kept for 2 h to obtain N-doped TiO2.V2O5 cluster modification was performed by incipient wet-ness impregnation of N-doped TiO2 with aqueous solutionsof NH4VO3 at room temperature, followed by stirring for 1 h,treating at 150◦C for water evaporation and heating at 300◦Cfor 1 h. The amount of loaded vanadium was controlled at 0,0.01, 0.05, 0.2, 0.5, and 1.0 wt.%. The as-prepared sampleswere labeled as N-TiO2/V2O5–x, where x represented thecontent of vanadium. For comparison, V2O5 (vanadium:0.5 wt.%) was also loaded on SiO2 instead of N-doped TiO2
by the same process. The reference sample was labeled asSiO2/V2O5–0.5%. Pure V2O5 was prepared accordingly inthe absence of N-doped TiO2 and SiO2.
2.2. Characterization. The crystal phase of the samples wasanalyzed by X-ray diffraction with Cu Kα radiation (XRD:model D/max RA, Rigaku Co., Japan). Raman spectra wererecorded at room temperature using a micro-Raman spec-trometer (Raman: RAMANLOG 6, USA) with a 514.5 nmAr+ laser as the excitation source in a backscattering geom-etry. The morphology and structure of the samples wereexamined by transmission electron microscopy (TEM: JEM-2010, Japan). X-ray photoelectron spectroscopy with Al KαX-rays (hν = 1486.6 eV) radiation (XPS: Thermo ESCALAB250, USA) was used to investigate the surface properties ofthe samples. The shift of the binding energy was correctedusing the C1s level at 284.8 eV as an internal standard. TheUV-vis diffuse reflection spectra were obtained for the dry-pressed disk samples using a Scan UV-vis spectrophotometer(UV-vis DRS: UV-2450, Japan) equipped with an integratingsphere assembly, using BaSO4 as reflectance sample. The
photoluminescence spectra were measured with a fluoros-pectrophotometer (PL: Fluorolog-3-Tau, France) using aXe lamp as excitation source with optical filter. Nitrogenadsorption-desorption isotherms were obtained on a nitro-gen adsorption apparatus (ASAP 2020, USA) with allsamples degassed at 200◦C prior to measurements. The BETsurface area was determined by a multipoint BET methodusing the adsorption data in the relative pressure (P/P0)range of 0.05–0.3.
2.3. Visible Light Photocatalytic Activity. The visible lightphotocatalytic activity was evaluated by removal of toluene inair in a continuous flow reactor at ambient temperature. Thevolume of the rectangular reactor, made of stainless steel andcovered with Saint-Glass, was 4.5 L (30 cm× 15 cm× 10 cm).A 300 W commercial Xe lamp was vertically placed outsidethe reactor. Four minifans were used to cool the lamp. Forthe visible light photocatalytic activity test, a UV cut-offfilter (420 nm) was adopted to remove UV light in the lightbeam. Photocatalyst (0.20 g) was coated onto a dish with adiameter of 12.0 cm. The coated dish was then treated at70◦C to remove water in the suspension. The toluene gas wasacquired from a compressed gas cylinder at a concentrationof 100 ppm of toluene. The initial concentration of toluenewas diluted to 1.0 ppm at indoor level by the air streamsupplied by compressed gas cylinder. The relative humidity(RH) level of the flow system was controlled at 50%. Thegas streams were premixed completely by a gas blender, andthe flow rate was controlled at 1.0 L/min by a mass flowcontroller. After the adsorption-desorption equilibrium wasachieved, the lamp was turned on. The concentration oftoluene was continuously measured by GC-FID (Shanghai,7890II). The removal ratio (η) of toluene was calculated asη(%) = (1 − C/C0 ) × 100%, where C and C0 are con-centrations of toluene in the outlet steam and the feedingstream, respectively. The kinetics of photocatalytic tolu-ene removal reaction is a pseudo first-order reaction asln(C0/C) = kt, where k is the initial apparent rate constant[44, 45].
3. Results and Discussion
3.1. Phase Structure. The XRD patterns of as-prepared sam-ples are shown in Figure 1. The phase structure of N-TiO2 and V2O5 cluster-modified N-TiO2 samples consists ofmixed phases of anatase (JCPDS file No. 21–1272) and rutile(JCPDS, file no. 77–442). In the absence of substrate N-TiO2,pure orthorhombic V2O5 phase (JSPD file no. 72–433) wasproduced. No characteristic diffraction peaks of V2O5 areobserved in N-TiO2/V2O5 composite samples because of itslower loading content, on the other hand, also indicating thatV2O5 clusters were well dispersed on the N-TiO2 surface [34,35]. Figure 1 also shows that V2O5 cluster loading has almostno influence on the phase structure of N-TiO2. By usingthe Debye-Scherrer equation, the crystallite sizes of anataseand rutile phase are calculated to be 18.3 and 22.8 nm, re-spectively. The BET surface areas of N-doped TiO2 aremeasured to be 62.8 cm2/g, and V2O5 cluster loading is foundto have little influence on the surface areas of N-doped TiO2.
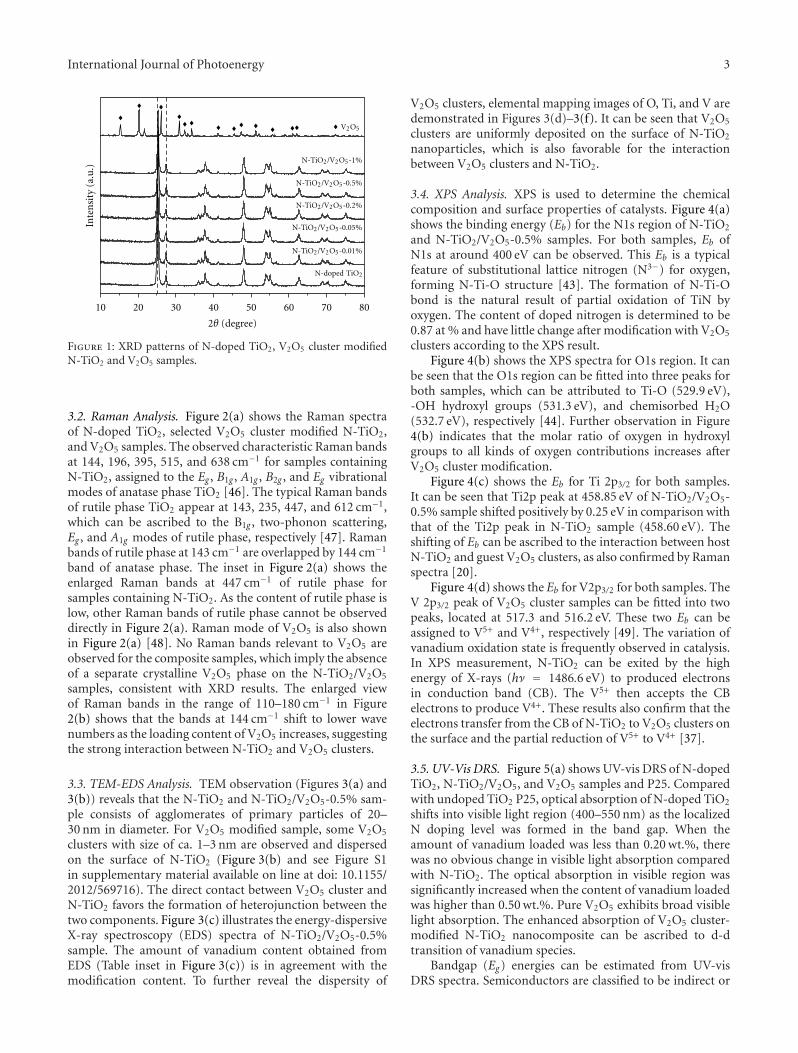
International Journal of Photoenergy 3
10 20 30 40 50 60 70 80
Inte
nsi
ty (
a.u
.)
2θ (degree)
N-TiO2/V2O5
V2O5
-1%
N-TiO2/V2O5-0.5%
N-TiO2/V2O5-0.2%
N-TiO2/V2O5-0.05%
N-TiO2/V2O5-0.01%
N-doped TiO2
Figure 1: XRD patterns of N-doped TiO2, V2O5 cluster modifiedN-TiO2 and V2O5 samples.
3.2. Raman Analysis. Figure 2(a) shows the Raman spectraof N-doped TiO2, selected V2O5 cluster modified N-TiO2,and V2O5 samples. The observed characteristic Raman bandsat 144, 196, 395, 515, and 638 cm−1 for samples containingN-TiO2, assigned to the Eg , B1g , A1g , B2g , and Eg vibrationalmodes of anatase phase TiO2 [46]. The typical Raman bandsof rutile phase TiO2 appear at 143, 235, 447, and 612 cm−1,which can be ascribed to the B1g , two-phonon scattering,Eg , and A1g modes of rutile phase, respectively [47]. Ramanbands of rutile phase at 143 cm−1 are overlapped by 144 cm−1
band of anatase phase. The inset in Figure 2(a) shows theenlarged Raman bands at 447 cm−1 of rutile phase forsamples containing N-TiO2. As the content of rutile phase islow, other Raman bands of rutile phase cannot be observeddirectly in Figure 2(a). Raman mode of V2O5 is also shownin Figure 2(a) [48]. No Raman bands relevant to V2O5 areobserved for the composite samples, which imply the absenceof a separate crystalline V2O5 phase on the N-TiO2/V2O5
samples, consistent with XRD results. The enlarged viewof Raman bands in the range of 110–180 cm−1 in Figure2(b) shows that the bands at 144 cm−1 shift to lower wavenumbers as the loading content of V2O5 increases, suggestingthe strong interaction between N-TiO2 and V2O5 clusters.
3.3. TEM-EDS Analysis. TEM observation (Figures 3(a) and3(b)) reveals that the N-TiO2 and N-TiO2/V2O5-0.5% sam-ple consists of agglomerates of primary particles of 20–30 nm in diameter. For V2O5 modified sample, some V2O5
clusters with size of ca. 1–3 nm are observed and dispersedon the surface of N-TiO2 (Figure 3(b) and see Figure S1in supplementary material available on line at doi: 10.1155/2012/569716). The direct contact between V2O5 cluster andN-TiO2 favors the formation of heterojunction between thetwo components. Figure 3(c) illustrates the energy-dispersiveX-ray spectroscopy (EDS) spectra of N-TiO2/V2O5-0.5%sample. The amount of vanadium content obtained fromEDS (Table inset in Figure 3(c)) is in agreement with themodification content. To further reveal the dispersity of
V2O5 clusters, elemental mapping images of O, Ti, and V aredemonstrated in Figures 3(d)–3(f). It can be seen that V2O5
clusters are uniformly deposited on the surface of N-TiO2
nanoparticles, which is also favorable for the interactionbetween V2O5 clusters and N-TiO2.
3.4. XPS Analysis. XPS is used to determine the chemicalcomposition and surface properties of catalysts. Figure 4(a)shows the binding energy (Eb) for the N1s region of N-TiO2
and N-TiO2/V2O5-0.5% samples. For both samples, Eb ofN1s at around 400 eV can be observed. This Eb is a typicalfeature of substitutional lattice nitrogen (N3−) for oxygen,forming N-Ti-O structure [43]. The formation of N-Ti-Obond is the natural result of partial oxidation of TiN byoxygen. The content of doped nitrogen is determined to be0.87 at % and have little change after modification with V2O5
clusters according to the XPS result.Figure 4(b) shows the XPS spectra for O1s region. It can
be seen that the O1s region can be fitted into three peaks forboth samples, which can be attributed to Ti-O (529.9 eV),-OH hydroxyl groups (531.3 eV), and chemisorbed H2O(532.7 eV), respectively [44]. Further observation in Figure4(b) indicates that the molar ratio of oxygen in hydroxylgroups to all kinds of oxygen contributions increases afterV2O5 cluster modification.
Figure 4(c) shows the Eb for Ti 2p3/2 for both samples.It can be seen that Ti2p peak at 458.85 eV of N-TiO2/V2O5-0.5% sample shifted positively by 0.25 eV in comparison withthat of the Ti2p peak in N-TiO2 sample (458.60 eV). Theshifting of Eb can be ascribed to the interaction between hostN-TiO2 and guest V2O5 clusters, as also confirmed by Ramanspectra [20].
Figure 4(d) shows the Eb for V2p3/2 for both samples. TheV 2p3/2 peak of V2O5 cluster samples can be fitted into twopeaks, located at 517.3 and 516.2 eV. These two Eb can beassigned to V5+ and V4+, respectively [49]. The variation ofvanadium oxidation state is frequently observed in catalysis.In XPS measurement, N-TiO2 can be exited by the highenergy of X-rays (hν = 1486.6 eV) to produced electronsin conduction band (CB). The V5+ then accepts the CBelectrons to produce V4+. These results also confirm that theelectrons transfer from the CB of N-TiO2 to V2O5 clusters onthe surface and the partial reduction of V5+ to V4+ [37].
3.5. UV-Vis DRS. Figure 5(a) shows UV-vis DRS of N-dopedTiO2, N-TiO2/V2O5, and V2O5 samples and P25. Comparedwith undoped TiO2 P25, optical absorption of N-doped TiO2
shifts into visible light region (400–550 nm) as the localizedN doping level was formed in the band gap. When theamount of vanadium loaded was less than 0.20 wt.%, therewas no obvious change in visible light absorption comparedwith N-TiO2. The optical absorption in visible region wassignificantly increased when the content of vanadium loadedwas higher than 0.50 wt.%. Pure V2O5 exhibits broad visiblelight absorption. The enhanced absorption of V2O5 cluster-modified N-TiO2 nanocomposite can be ascribed to d-dtransition of vanadium species.
Bandgap (Eg) energies can be estimated from UV-visDRS spectra. Semiconductors are classified to be indirect or
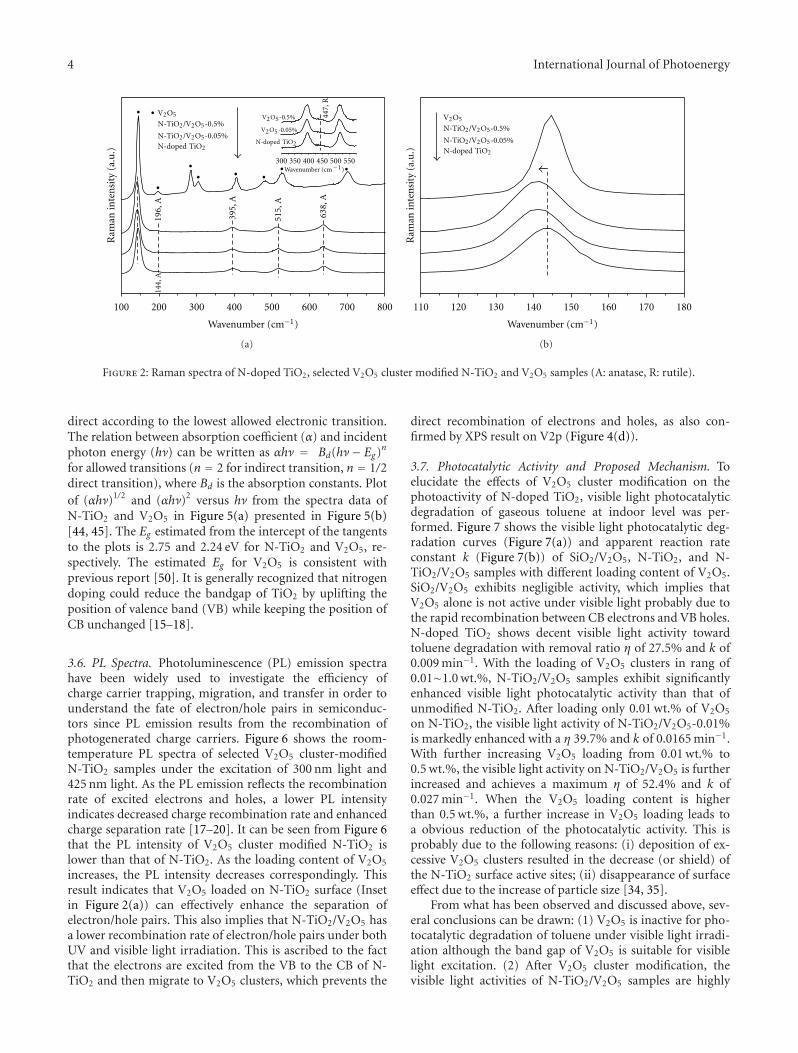
4 International Journal of Photoenergy
100 200 300 400 500 600 700 800
300 350 400 450 500 550
447,
R63
8, A
515,
A
395,
A
196,
A
Ram
an in
ten
sity
(a.
u.)
144,
A
N-TiO2/V2O5-0.5%
N-TiO2/V2O5-0.05%N-doped TiO2
V2O5
Wavenumber (cm−1)
V2O5-0.5%
V2O5-0.05%
N-doped TiO2
Wavenumber (cm−1)
(a)
Ram
an in
ten
sity
(a.
u.)
110 120 130 140 150 160 170 180
N-TiO2/V2O5-0.5%
N-TiO2/V2O5-0.05%N-doped TiO2
V2O5
Wavenumber (cm−1)
(b)
Figure 2: Raman spectra of N-doped TiO2, selected V2O5 cluster modified N-TiO2 and V2O5 samples (A: anatase, R: rutile).
direct according to the lowest allowed electronic transition.The relation between absorption coefficient (α) and incidentphoton energy (hν) can be written as αhν = Bd(hν− Eg)n
for allowed transitions (n = 2 for indirect transition, n = 1/2direct transition), where Bd is the absorption constants. Plotof (αhν)1/2 and (αhν)2 versus hν from the spectra data ofN-TiO2 and V2O5 in Figure 5(a) presented in Figure 5(b)[44, 45]. The Eg estimated from the intercept of the tangentsto the plots is 2.75 and 2.24 eV for N-TiO2 and V2O5, re-spectively. The estimated Eg for V2O5 is consistent withprevious report [50]. It is generally recognized that nitrogendoping could reduce the bandgap of TiO2 by uplifting theposition of valence band (VB) while keeping the position ofCB unchanged [15–18].
3.6. PL Spectra. Photoluminescence (PL) emission spectrahave been widely used to investigate the efficiency ofcharge carrier trapping, migration, and transfer in order tounderstand the fate of electron/hole pairs in semiconduc-tors since PL emission results from the recombination ofphotogenerated charge carriers. Figure 6 shows the room-temperature PL spectra of selected V2O5 cluster-modifiedN-TiO2 samples under the excitation of 300 nm light and425 nm light. As the PL emission reflects the recombinationrate of excited electrons and holes, a lower PL intensityindicates decreased charge recombination rate and enhancedcharge separation rate [17–20]. It can be seen from Figure 6that the PL intensity of V2O5 cluster modified N-TiO2 islower than that of N-TiO2. As the loading content of V2O5
increases, the PL intensity decreases correspondingly. Thisresult indicates that V2O5 loaded on N-TiO2 surface (Insetin Figure 2(a)) can effectively enhance the separation ofelectron/hole pairs. This also implies that N-TiO2/V2O5 hasa lower recombination rate of electron/hole pairs under bothUV and visible light irradiation. This is ascribed to the factthat the electrons are excited from the VB to the CB of N-TiO2 and then migrate to V2O5 clusters, which prevents the
direct recombination of electrons and holes, as also con-firmed by XPS result on V2p (Figure 4(d)).
3.7. Photocatalytic Activity and Proposed Mechanism. Toelucidate the effects of V2O5 cluster modification on thephotoactivity of N-doped TiO2, visible light photocatalyticdegradation of gaseous toluene at indoor level was per-formed. Figure 7 shows the visible light photocatalytic deg-radation curves (Figure 7(a)) and apparent reaction rateconstant k (Figure 7(b)) of SiO2/V2O5, N-TiO2, and N-TiO2/V2O5 samples with different loading content of V2O5.SiO2/V2O5 exhibits negligible activity, which implies thatV2O5 alone is not active under visible light probably due tothe rapid recombination between CB electrons and VB holes.N-doped TiO2 shows decent visible light activity towardtoluene degradation with removal ratio η of 27.5% and k of0.009 min−1. With the loading of V2O5 clusters in rang of0.01∼1.0 wt.%, N-TiO2/V2O5 samples exhibit significantlyenhanced visible light photocatalytic activity than that ofunmodified N-TiO2. After loading only 0.01 wt.% of V2O5
on N-TiO2, the visible light activity of N-TiO2/V2O5-0.01%is markedly enhanced with a η 39.7% and k of 0.0165 min−1.With further increasing V2O5 loading from 0.01 wt.% to0.5 wt.%, the visible light activity on N-TiO2/V2O5 is furtherincreased and achieves a maximum η of 52.4% and k of0.027 min−1. When the V2O5 loading content is higherthan 0.5 wt.%, a further increase in V2O5 loading leads toa obvious reduction of the photocatalytic activity. This isprobably due to the following reasons: (i) deposition of ex-cessive V2O5 clusters resulted in the decrease (or shield) ofthe N-TiO2 surface active sites; (ii) disappearance of surfaceeffect due to the increase of particle size [34, 35].
From what has been observed and discussed above, sev-eral conclusions can be drawn: (1) V2O5 is inactive for pho-tocatalytic degradation of toluene under visible light irradi-ation although the band gap of V2O5 is suitable for visiblelight excitation. (2) After V2O5 cluster modification, thevisible light activities of N-TiO2/V2O5 samples are highly
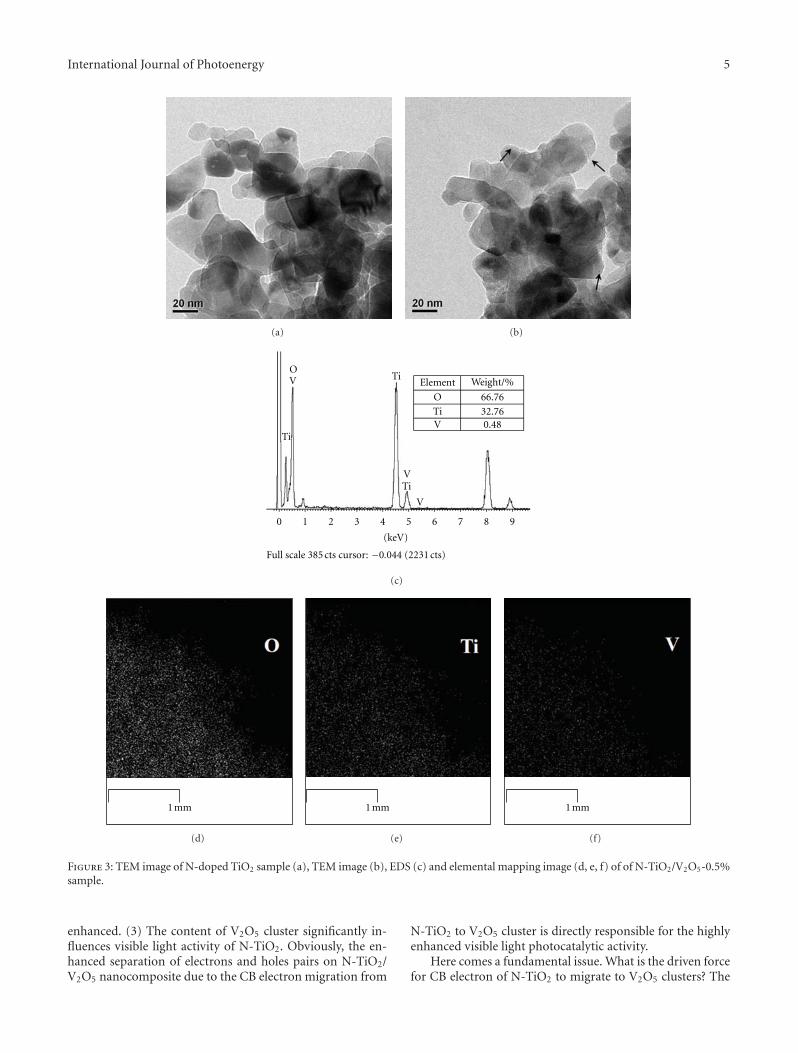
International Journal of Photoenergy 5
(a) (b)
Element Weight/%
O
O
Ti
Ti
Ti
TiV
V
V
V
66.76
32.760.48
0 1 2 3 4 5 6 7 8 9
(keV)
Full scale 385 cts cursor: −0.044 (2231 cts)
(c)
1 mm
(d)
1 mm
(e)
1 mm
(f)
Figure 3: TEM image of N-doped TiO2 sample (a), TEM image (b), EDS (c) and elemental mapping image (d, e, f) of of N-TiO2/V2O5-0.5%sample.
enhanced. (3) The content of V2O5 cluster significantly in-fluences visible light activity of N-TiO2. Obviously, the en-hanced separation of electrons and holes pairs on N-TiO2/V2O5 nanocomposite due to the CB electron migration from
N-TiO2 to V2O5 cluster is directly responsible for the highlyenhanced visible light photocatalytic activity.
Here comes a fundamental issue. What is the driven forcefor CB electron of N-TiO2 to migrate to V2O5 clusters? The
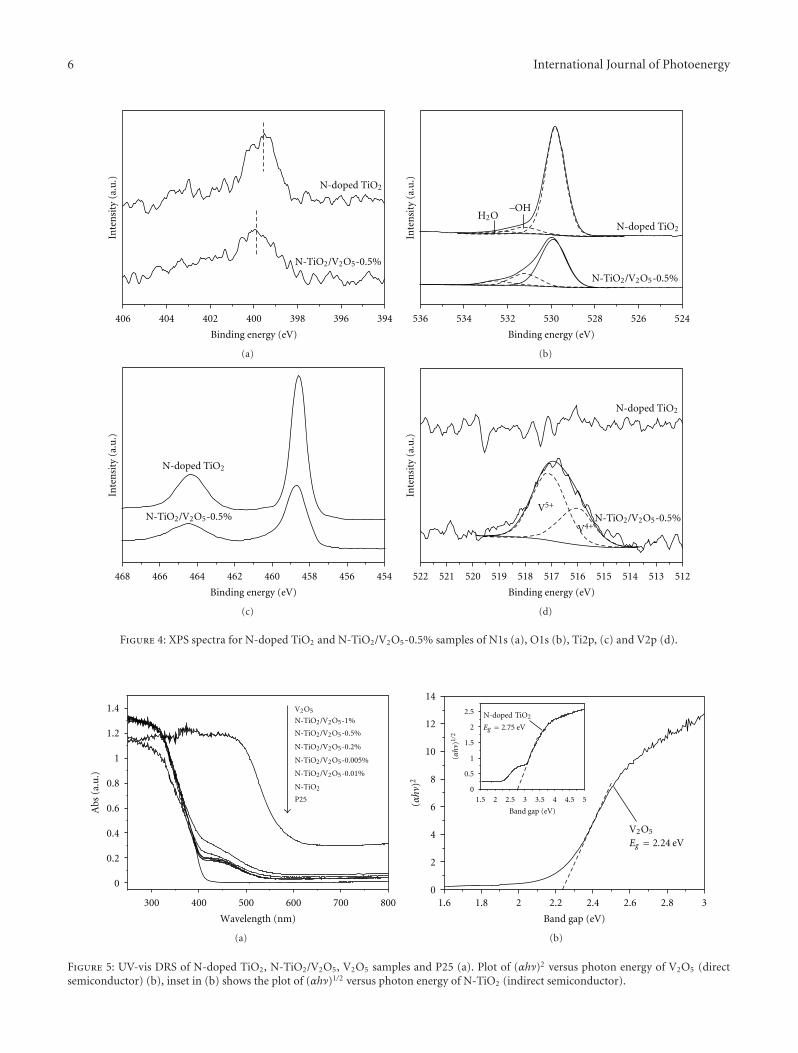
6 International Journal of Photoenergy
406 404 402 400 398 396 394
Inte
nsi
ty (
a.u
.)
Binding energy (eV)
N-TiO2/V2O5-0.5%
N-doped TiO2
(a)
Inte
nsi
ty (
a.u
.)
Binding energy (eV)
536 534 532 530 528 526 524
N-TiO2/V2O5-0.5%
N-doped TiO2
H2O–OH
(b)
Inte
nsi
ty (
a.u
.)
Binding energy (eV)
468 466 464 462 460 458 456 454
N-TiO2/V2O5-0.5%
N-doped TiO2
(c)
Inte
nsi
ty (
a.u
.)
Binding energy (eV)
522 521 520 519 518 517 516 515 514 513 512
N-doped TiO2
V5+
V4+N-TiO2/V2O5-0.5%
(d)
Figure 4: XPS spectra for N-doped TiO2 and N-TiO2/V2O5-0.5% samples of N1s (a), O1s (b), Ti2p, (c) and V2p (d).
300 400 500 600 700 800
0
0.2
0.4
0.6
0.8
1
1.2
1.4
Abs
(a.
u.)
Wavelength (nm)
P25
V2O5
N-TiO2/V2O5-1%
N-TiO2/V2O5-0.5%
N-TiO2/V2O5-0.2%
N-TiO2/V2O5-0.005%
N-TiO2/V2O5-0.01%
N-TiO2
(a)
1.6 1.8 2 2.2 2.4 2.6 2.8 30
2
4
6
8
10
12
14
1.5 2 2.5 3 3.5 4 4.5 50
0.5
1
1.5
2
2.5
Band gap (eV)
Band gap (eV)
(αh
A)2
(αh
A)1/
2
N-doped TiO2
Eg = 2.75 eV
V2O5
Eg = 2.24 eV
(b)
Figure 5: UV-vis DRS of N-doped TiO2, N-TiO2/V2O5, V2O5 samples and P25 (a). Plot of (αhν)2 versus photon energy of V2O5 (directsemiconductor) (b), inset in (b) shows the plot of (αhν)1/2 versus photon energy of N-TiO2 (indirect semiconductor).
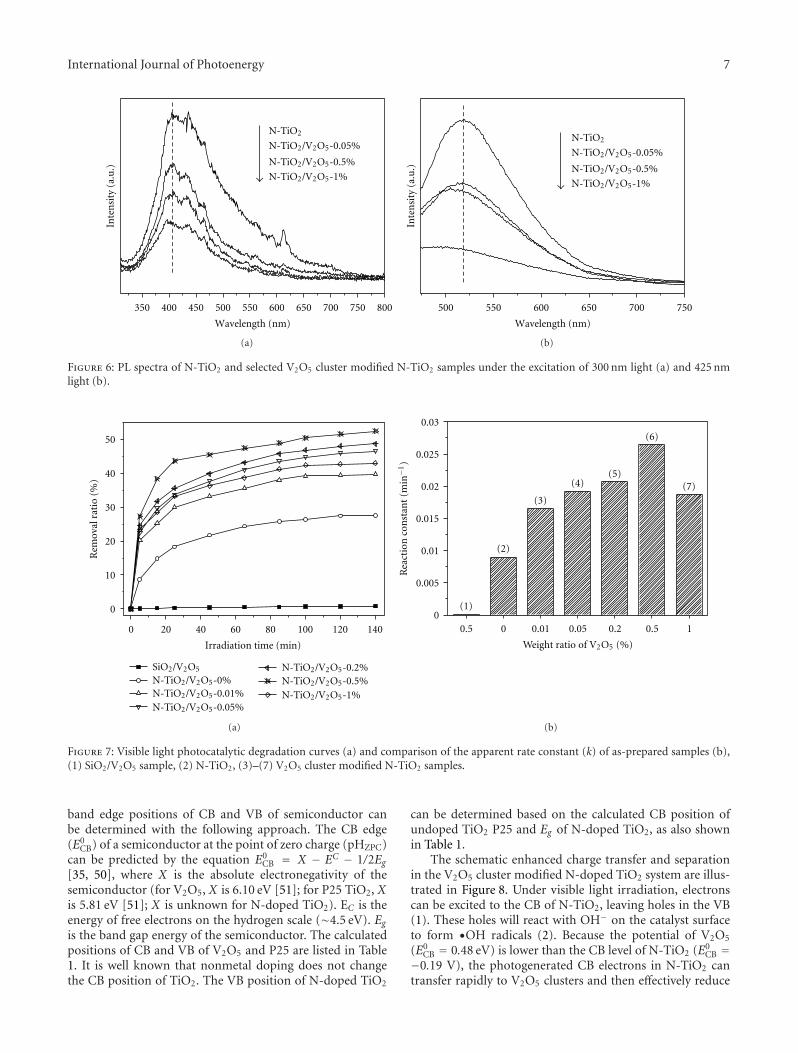
International Journal of Photoenergy 7
350 400 450 500 550 600 650 700 750 800
Inte
nsi
ty (
a.u
.)
Wavelength (nm)
N-TiO2
N-TiO2/V2O5-0.05%
N-TiO2/V2O5-0.5%
N-TiO2/V2O5-1%
(a)
Inte
nsi
ty (
a.u
.)
Wavelength (nm)
500 550 600 650 700 750
N-TiO2
N-TiO2/V2O5-0.05%
N-TiO2/V2O5-0.5%
N-TiO2/V2O5-1%
(b)
Figure 6: PL spectra of N-TiO2 and selected V2O5 cluster modified N-TiO2 samples under the excitation of 300 nm light (a) and 425 nmlight (b).
0 20 40 60 80 100 120 140
0
10
20
30
40
50
Rem
oval
rat
io (
%)
Irradiation time (min)
SiO2/V2O5
N-TiO2/V2O5-0%N-TiO2/V2O5-0.01%N-TiO2/V2O5-0.05%
N-TiO2/V2O5-0.2%N-TiO2/V2O5-0.5%N-TiO2/V2O5-1%
(a)
0
0.005
0.01
0.015
0.02
0.025
0.03
(7)
(6)
(5)(4)
(3)
(2)
10.50.20.050.0100.5
(1)
Rea
ctio
n c
onst
ant
(min− 1
)
Weight ratio of V2O5 (%)
(b)
Figure 7: Visible light photocatalytic degradation curves (a) and comparison of the apparent rate constant (k) of as-prepared samples (b),(1) SiO2/V2O5 sample, (2) N-TiO2, (3)–(7) V2O5 cluster modified N-TiO2 samples.
band edge positions of CB and VB of semiconductor canbe determined with the following approach. The CB edge(E0
CB) of a semiconductor at the point of zero charge (pHZPC)can be predicted by the equation E0
CB = X − EC − 1/2Eg[35, 50], where X is the absolute electronegativity of thesemiconductor (for V2O5, X is 6.10 eV [51]; for P25 TiO2, Xis 5.81 eV [51]; X is unknown for N-doped TiO2). EC is theenergy of free electrons on the hydrogen scale (∼4.5 eV). Egis the band gap energy of the semiconductor. The calculatedpositions of CB and VB of V2O5 and P25 are listed in Table1. It is well known that nonmetal doping does not changethe CB position of TiO2. The VB position of N-doped TiO2
can be determined based on the calculated CB position ofundoped TiO2 P25 and Eg of N-doped TiO2, as also shownin Table 1.
The schematic enhanced charge transfer and separationin the V2O5 cluster modified N-doped TiO2 system are illus-trated in Figure 8. Under visible light irradiation, electronscan be excited to the CB of N-TiO2, leaving holes in the VB(1). These holes will react with OH− on the catalyst surfaceto form •OH radicals (2). Because the potential of V2O5
(E0CB = 0.48 eV) is lower than the CB level of N-TiO2 (E0
CB =−0.19 V), the photogenerated CB electrons in N-TiO2 cantransfer rapidly to V2O5 clusters and then effectively reduce
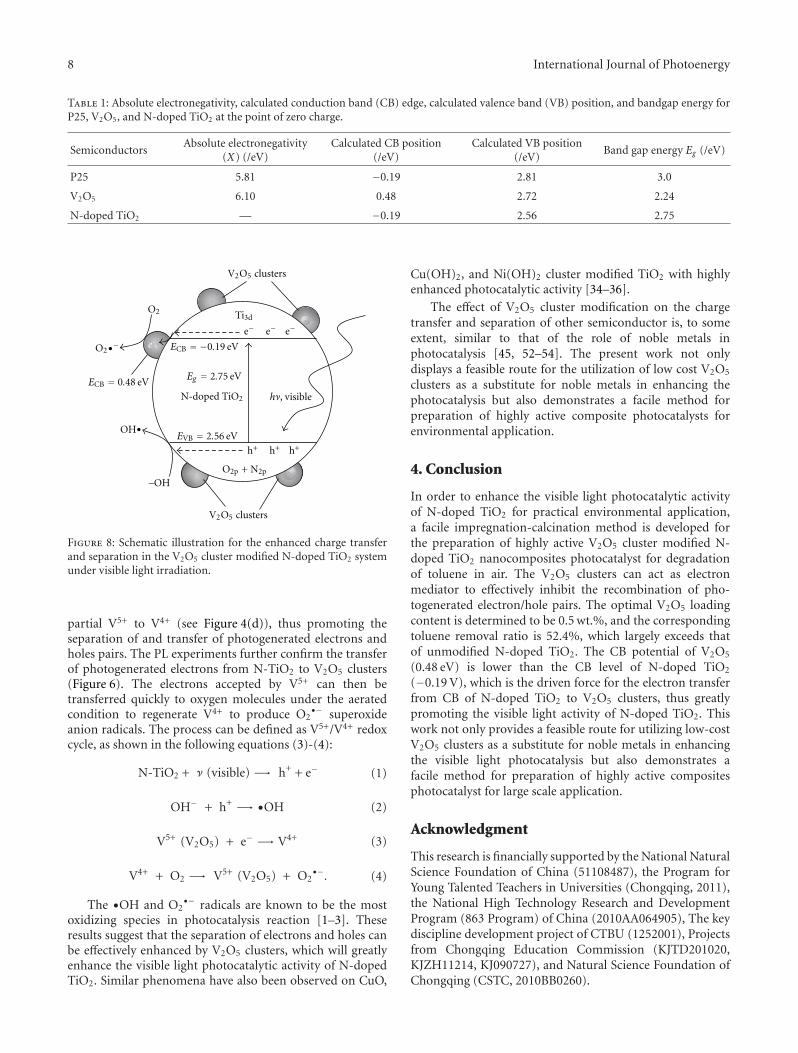
8 International Journal of Photoenergy
Table 1: Absolute electronegativity, calculated conduction band (CB) edge, calculated valence band (VB) position, and bandgap energy forP25, V2O5, and N-doped TiO2 at the point of zero charge.
SemiconductorsAbsolute electronegativity
(X) (/eV)Calculated CB position
(/eV)Calculated VB position
(/eV)Band gap energy Eg (/eV)
P25 5.81 −0.19 2.81 3.0
V2O5 6.10 0.48 2.72 2.24
N-doped TiO2 — −0.19 2.56 2.75
V2O5 clusters
V2O5 clusters
O2 Ti3d
e−e−e−
e−
ECB = 0.48 eV
OH
–OH
h+h+h+
O2p + N2p
EVB = 2.56 eV
N-doped TiO2 hA, visible
Eg = 2.75 eV
ECB = −0.19 eVO2•
•
−
Figure 8: Schematic illustration for the enhanced charge transferand separation in the V2O5 cluster modified N-doped TiO2 systemunder visible light irradiation.
partial V5+ to V4+ (see Figure 4(d)), thus promoting theseparation of and transfer of photogenerated electrons andholes pairs. The PL experiments further confirm the transferof photogenerated electrons from N-TiO2 to V2O5 clusters(Figure 6). The electrons accepted by V5+ can then betransferred quickly to oxygen molecules under the aeratedcondition to regenerate V4+ to produce O2
•− superoxideanion radicals. The process can be defined as V5+/V4+ redoxcycle, as shown in the following equations (3)-(4):
N-TiO2 + ν (visible) −→ h+ + e− (1)
OH− + h+ −→ •OH (2)
V5+ (V2O5) + e− −→ V4+ (3)
V4+ + O2 −→ V5+ (V2O5) + O2•−. (4)
The •OH and O2•− radicals are known to be the most
oxidizing species in photocatalysis reaction [1–3]. Theseresults suggest that the separation of electrons and holes canbe effectively enhanced by V2O5 clusters, which will greatlyenhance the visible light photocatalytic activity of N-dopedTiO2. Similar phenomena have also been observed on CuO,
Cu(OH)2, and Ni(OH)2 cluster modified TiO2 with highlyenhanced photocatalytic activity [34–36].
The effect of V2O5 cluster modification on the chargetransfer and separation of other semiconductor is, to someextent, similar to that of the role of noble metals inphotocatalysis [45, 52–54]. The present work not onlydisplays a feasible route for the utilization of low cost V2O5
clusters as a substitute for noble metals in enhancing thephotocatalysis but also demonstrates a facile method forpreparation of highly active composite photocatalysts forenvironmental application.
4. Conclusion
In order to enhance the visible light photocatalytic activityof N-doped TiO2 for practical environmental application,a facile impregnation-calcination method is developed forthe preparation of highly active V2O5 cluster modified N-doped TiO2 nanocomposites photocatalyst for degradationof toluene in air. The V2O5 clusters can act as electronmediator to effectively inhibit the recombination of pho-togenerated electron/hole pairs. The optimal V2O5 loadingcontent is determined to be 0.5 wt.%, and the correspondingtoluene removal ratio is 52.4%, which largely exceeds thatof unmodified N-doped TiO2. The CB potential of V2O5
(0.48 eV) is lower than the CB level of N-doped TiO2
(−0.19 V), which is the driven force for the electron transferfrom CB of N-doped TiO2 to V2O5 clusters, thus greatlypromoting the visible light activity of N-doped TiO2. Thiswork not only provides a feasible route for utilizing low-costV2O5 clusters as a substitute for noble metals in enhancingthe visible light photocatalysis but also demonstrates afacile method for preparation of highly active compositesphotocatalyst for large scale application.
Acknowledgment
This research is financially supported by the National NaturalScience Foundation of China (51108487), the Program forYoung Talented Teachers in Universities (Chongqing, 2011),the National High Technology Research and DevelopmentProgram (863 Program) of China (2010AA064905), The keydiscipline development project of CTBU (1252001), Projectsfrom Chongqing Education Commission (KJTD201020,KJZH11214, KJ090727), and Natural Science Foundation ofChongqing (CSTC, 2010BB0260).
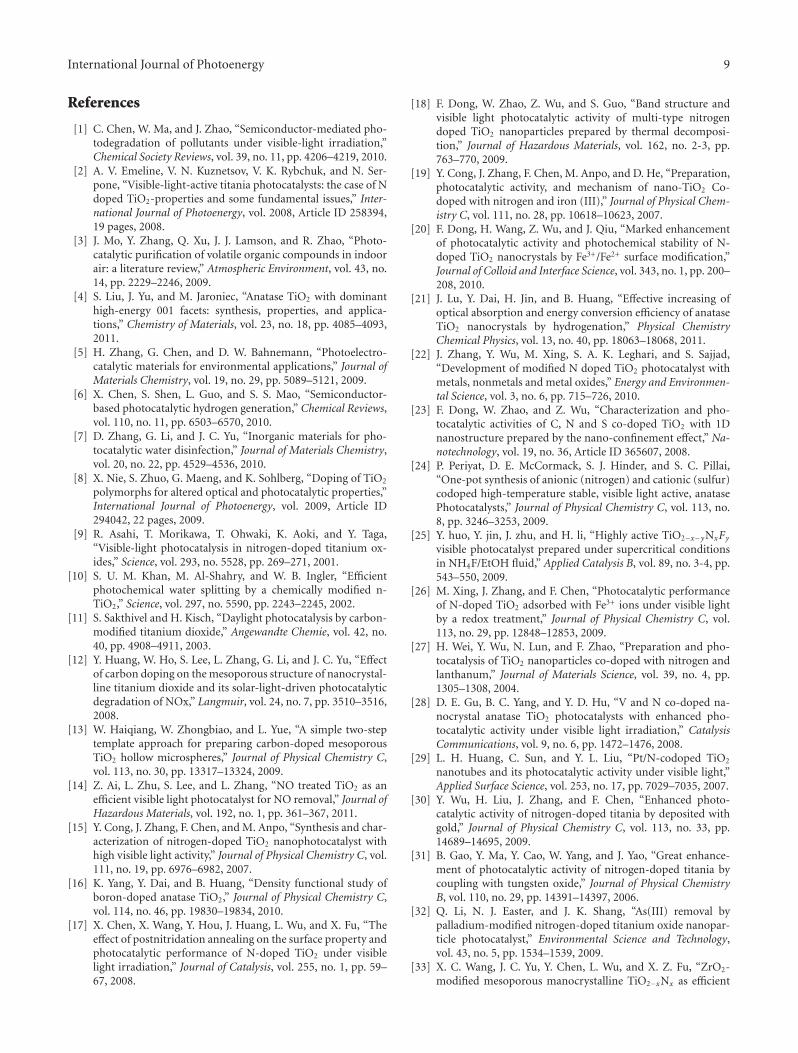
International Journal of Photoenergy 9
References
[1] C. Chen, W. Ma, and J. Zhao, “Semiconductor-mediated pho-todegradation of pollutants under visible-light irradiation,”Chemical Society Reviews, vol. 39, no. 11, pp. 4206–4219, 2010.
[2] A. V. Emeline, V. N. Kuznetsov, V. K. Rybchuk, and N. Ser-pone, “Visible-light-active titania photocatalysts: the case of Ndoped TiO2-properties and some fundamental issues,” Inter-national Journal of Photoenergy, vol. 2008, Article ID 258394,19 pages, 2008.
[3] J. Mo, Y. Zhang, Q. Xu, J. J. Lamson, and R. Zhao, “Photo-catalytic purification of volatile organic compounds in indoorair: a literature review,” Atmospheric Environment, vol. 43, no.14, pp. 2229–2246, 2009.
[4] S. Liu, J. Yu, and M. Jaroniec, “Anatase TiO2 with dominanthigh-energy 001 facets: synthesis, properties, and applica-tions,” Chemistry of Materials, vol. 23, no. 18, pp. 4085–4093,2011.
[5] H. Zhang, G. Chen, and D. W. Bahnemann, “Photoelectro-catalytic materials for environmental applications,” Journal ofMaterials Chemistry, vol. 19, no. 29, pp. 5089–5121, 2009.
[6] X. Chen, S. Shen, L. Guo, and S. S. Mao, “Semiconductor-based photocatalytic hydrogen generation,” Chemical Reviews,vol. 110, no. 11, pp. 6503–6570, 2010.
[7] D. Zhang, G. Li, and J. C. Yu, “Inorganic materials for pho-tocatalytic water disinfection,” Journal of Materials Chemistry,vol. 20, no. 22, pp. 4529–4536, 2010.
[8] X. Nie, S. Zhuo, G. Maeng, and K. Sohlberg, “Doping of TiO2
polymorphs for altered optical and photocatalytic properties,”International Journal of Photoenergy, vol. 2009, Article ID294042, 22 pages, 2009.
[9] R. Asahi, T. Morikawa, T. Ohwaki, K. Aoki, and Y. Taga,“Visible-light photocatalysis in nitrogen-doped titanium ox-ides,” Science, vol. 293, no. 5528, pp. 269–271, 2001.
[10] S. U. M. Khan, M. Al-Shahry, and W. B. Ingler, “Efficientphotochemical water splitting by a chemically modified n-TiO2,” Science, vol. 297, no. 5590, pp. 2243–2245, 2002.
[11] S. Sakthivel and H. Kisch, “Daylight photocatalysis by carbon-modified titanium dioxide,” Angewandte Chemie, vol. 42, no.40, pp. 4908–4911, 2003.
[12] Y. Huang, W. Ho, S. Lee, L. Zhang, G. Li, and J. C. Yu, “Effectof carbon doping on the mesoporous structure of nanocrystal-line titanium dioxide and its solar-light-driven photocatalyticdegradation of NOx,” Langmuir, vol. 24, no. 7, pp. 3510–3516,2008.
[13] W. Haiqiang, W. Zhongbiao, and L. Yue, “A simple two-steptemplate approach for preparing carbon-doped mesoporousTiO2 hollow microspheres,” Journal of Physical Chemistry C,vol. 113, no. 30, pp. 13317–13324, 2009.
[14] Z. Ai, L. Zhu, S. Lee, and L. Zhang, “NO treated TiO2 as anefficient visible light photocatalyst for NO removal,” Journal ofHazardous Materials, vol. 192, no. 1, pp. 361–367, 2011.
[15] Y. Cong, J. Zhang, F. Chen, and M. Anpo, “Synthesis and char-acterization of nitrogen-doped TiO2 nanophotocatalyst withhigh visible light activity,” Journal of Physical Chemistry C, vol.111, no. 19, pp. 6976–6982, 2007.
[16] K. Yang, Y. Dai, and B. Huang, “Density functional study ofboron-doped anatase TiO2,” Journal of Physical Chemistry C,vol. 114, no. 46, pp. 19830–19834, 2010.
[17] X. Chen, X. Wang, Y. Hou, J. Huang, L. Wu, and X. Fu, “Theeffect of postnitridation annealing on the surface property andphotocatalytic performance of N-doped TiO2 under visiblelight irradiation,” Journal of Catalysis, vol. 255, no. 1, pp. 59–67, 2008.
[18] F. Dong, W. Zhao, Z. Wu, and S. Guo, “Band structure andvisible light photocatalytic activity of multi-type nitrogendoped TiO2 nanoparticles prepared by thermal decomposi-tion,” Journal of Hazardous Materials, vol. 162, no. 2-3, pp.763–770, 2009.
[19] Y. Cong, J. Zhang, F. Chen, M. Anpo, and D. He, “Preparation,photocatalytic activity, and mechanism of nano-TiO2 Co-doped with nitrogen and iron (III),” Journal of Physical Chem-istry C, vol. 111, no. 28, pp. 10618–10623, 2007.
[20] F. Dong, H. Wang, Z. Wu, and J. Qiu, “Marked enhancementof photocatalytic activity and photochemical stability of N-doped TiO2 nanocrystals by Fe3+/Fe2+ surface modification,”Journal of Colloid and Interface Science, vol. 343, no. 1, pp. 200–208, 2010.
[21] J. Lu, Y. Dai, H. Jin, and B. Huang, “Effective increasing ofoptical absorption and energy conversion efficiency of anataseTiO2 nanocrystals by hydrogenation,” Physical ChemistryChemical Physics, vol. 13, no. 40, pp. 18063–18068, 2011.
[22] J. Zhang, Y. Wu, M. Xing, S. A. K. Leghari, and S. Sajjad,“Development of modified N doped TiO2 photocatalyst withmetals, nonmetals and metal oxides,” Energy and Environmen-tal Science, vol. 3, no. 6, pp. 715–726, 2010.
[23] F. Dong, W. Zhao, and Z. Wu, “Characterization and pho-tocatalytic activities of C, N and S co-doped TiO2 with 1Dnanostructure prepared by the nano-confinement effect,” Na-notechnology, vol. 19, no. 36, Article ID 365607, 2008.
[24] P. Periyat, D. E. McCormack, S. J. Hinder, and S. C. Pillai,“One-pot synthesis of anionic (nitrogen) and cationic (sulfur)codoped high-temperature stable, visible light active, anatasePhotocatalysts,” Journal of Physical Chemistry C, vol. 113, no.8, pp. 3246–3253, 2009.
[25] Y. huo, Y. jin, J. zhu, and H. li, “Highly active TiO2−x−yNxFy
visible photocatalyst prepared under supercritical conditionsin NH4F/EtOH fluid,” Applied Catalysis B, vol. 89, no. 3-4, pp.543–550, 2009.
[26] M. Xing, J. Zhang, and F. Chen, “Photocatalytic performanceof N-doped TiO2 adsorbed with Fe3+ ions under visible lightby a redox treatment,” Journal of Physical Chemistry C, vol.113, no. 29, pp. 12848–12853, 2009.
[27] H. Wei, Y. Wu, N. Lun, and F. Zhao, “Preparation and pho-tocatalysis of TiO2 nanoparticles co-doped with nitrogen andlanthanum,” Journal of Materials Science, vol. 39, no. 4, pp.1305–1308, 2004.
[28] D. E. Gu, B. C. Yang, and Y. D. Hu, “V and N co-doped na-nocrystal anatase TiO2 photocatalysts with enhanced pho-tocatalytic activity under visible light irradiation,” CatalysisCommunications, vol. 9, no. 6, pp. 1472–1476, 2008.
[29] L. H. Huang, C. Sun, and Y. L. Liu, “Pt/N-codoped TiO2
nanotubes and its photocatalytic activity under visible light,”Applied Surface Science, vol. 253, no. 17, pp. 7029–7035, 2007.
[30] Y. Wu, H. Liu, J. Zhang, and F. Chen, “Enhanced photo-catalytic activity of nitrogen-doped titania by deposited withgold,” Journal of Physical Chemistry C, vol. 113, no. 33, pp.14689–14695, 2009.
[31] B. Gao, Y. Ma, Y. Cao, W. Yang, and J. Yao, “Great enhance-ment of photocatalytic activity of nitrogen-doped titania bycoupling with tungsten oxide,” Journal of Physical ChemistryB, vol. 110, no. 29, pp. 14391–14397, 2006.
[32] Q. Li, N. J. Easter, and J. K. Shang, “As(III) removal bypalladium-modified nitrogen-doped titanium oxide nanopar-ticle photocatalyst,” Environmental Science and Technology,vol. 43, no. 5, pp. 1534–1539, 2009.
[33] X. C. Wang, J. C. Yu, Y. Chen, L. Wu, and X. Z. Fu, “ZrO2-modified mesoporous manocrystalline TiO2−xNx as efficient
10 International Journal of Photoenergy
visible light photocatalysts,” Environmental Science & Technol-ogy, vol. 40, no. 7, pp. 2369–2374, 2006.
[34] J. Yu, Y. Hai, and B. Cheng, “Enhanced photocatalytic H2-production activity of TiO2 by Ni(OH)2 cluster modification,”Journal of Physical Chemistry C, vol. 115, no. 11, pp. 4953–4958, 2011.
[35] J. Yu and J. Ran, “Facile preparation and enhanced photo-catalytic H2-production activity of Cu(OH)2 cluster modifiedTiO2,” Energy and Environmental Science, vol. 4, no. 4, pp.1364–1371, 2011.
[36] M. Liu, X. Qiu, M. Miyauchi, and K. Hashimoto, “Cu(II)oxide amorphous nanoclusters grafted Ti3+ self-doped TiO2:an efficient visible light photocatalyst,” Chemistry of Materials,vol. 23, no. 23, pp. 5282–5286, 2011.
[37] Z. Wu, F. Dong, Y. Liu, and H. Wang, “Enhancement of thevisible light photocatalytic performance of C-doped TiO2 byloading with V2O5,” Catalysis Communications, vol. 11, no. 2,pp. 82–86, 2009.
[38] M. A. Rauf, S. B. Bukallah, A. Hamadi, A. Sulaiman, andF. Hammadi, “The effect of operational parameters on thephotoinduced decoloration of dyes using a hybrid catalystV2O5/TiO2,” Chemical Engineering Journal, vol. 129, no. 1–3,pp. 167–172, 2007.
[39] K. Bhattacharyya, S. Varma, A. K. Tripathi, S. R. Bharadwaj,and A. K. Tyagi, “Effect of vanadia doping and its oxidationstate on the photocatalytic activity of TiO2 for gas-phaseoxidation of ethene,” Journal of Physical Chemistry C, vol. 112,no. 48, pp. 19102–19112, 2008.
[40] S. Higashimoto, W. Tanihata, Y. Nakagawa, M. Azuma, H.Ohue, and Y. Sakata, “Effective photocatalytic decompositionof VOC under visible-light irradiation on N-doped TiO2
modified by vanadium species,” Applied Catalysis A, vol. 340,no. 1, pp. 98–104, 2008.
[41] D. Bi and Y. Xu, “Improved photocatalytic activity of WO3
through clustered Fe2O3 for organic degradation in the pres-ence of H2O2,” Langmuir, vol. 27, no. 15, pp. 9359–9366, 2011.
[42] Q. Li, B. Guo, J. Yu et al., “Highly efficient visible-light-drivenphotocatalytic hydrogen production of CdS-cluster-decoratedgraphene nanosheets,” Journal of the American Chemical Soci-ety, vol. 133, no. 28, pp. 10878–10884, 2011.
[43] Z. Wu, F. Dong, W. Zhao, and S. Guo, “Visible light inducedelectron transfer process over nitrogen doped TiO2 nanocrys-tals prepared by oxidation of titanium nitride,” Journal ofHazardous Materials, vol. 157, no. 1, pp. 57–63, 2008.
[44] F. Dong, S. Guo, H. Wang, X. Li, and Z. Wu, “Enhancementof the visible light photocatalytic activity of C-doped TiO2
nanomaterials prepared by a green synthetic approach,” Jour-nal of Physical Chemistry C, vol. 115, no. 27, pp. 13285–13292,2011.
[45] F. Dong, H. Wang, G. Sen, Z. Wu, and S. C. Lee, “Enhancedvisible light photocatalytic activity of novel Pt/C-doped TiO2/PtCl4 three-component nanojunction system for degradationof toluene in air,” Journal of Hazardous Materials, vol. 187, no.1–3, pp. 509–516, 2011.
[46] Y. Su, J. Yu, and J. Lin, “Vapor-thermal preparation of highlycrystallized TiO2 powder and its photocatalytic activity,” Jour-nal of Solid State Chemistry, vol. 180, no. 7, pp. 2080–2087,2007.
[47] J. Zhang, M. Li, Z. Feng, J. Chen, and C. Li, “UV raman spec-troscopic study on TiO2 I. phase transformation at the surfaceand in the bulk,” Journal of Physical Chemistry B, vol. 110, no.2, pp. 927–935, 2006.
[48] F. Chen, J. Wang, J. Q. Xu, and X. P. Zhou, “Visible lightphotodegradation of organic compounds over V2O5/MgF2
catalyst,” Applied Catalysis A, vol. 348, no. 1, pp. 54–59, 2008.
[49] M. Heber and W. Grunert, “Application of ultraviolet pho-toelectron spectroscopy in the surface characterization ofpolycrystalline oxide catalysts. 2. Depth variation of thereduction degree in the surface region of partially reducedV2O5,” Journal of Physical Chemistry B, vol. 104, no. 22, pp.5288–5297, 2000.
[50] H. Jiang, M. Nagai, and K. Kobayashi, “Enhanced photocat-alytic activity for degradation of methylene blue over V2O5/BiVO4 composite,” Journal of Alloys and Compounds, vol. 479,no. 1-2, pp. 821–827, 2009.
[51] X. Yong and M. A. A. Schoonen, “The absolute energy po-sitions of conduction and valence bands of selected semicon-ducting minerals,” American Mineralogist, vol. 85, no. 3-4, pp.543–556, 2000.
[52] H. Park, W. Choi, and M. R. Hoffmann, “Effects of the prepa-ration method of the ternary CdS/TiO2/Pt hybrid photocata-lysts on visible light-induced hydrogen production,” Journal ofMaterials Chemistry, vol. 18, no. 20, pp. 2379–2385, 2008.
[53] H. Tada, T. Mitsui, T. Kiyonaga, T. Akita, and K. Tanaka, “All-solid-state Z-scheme in CdS-Au-TiO2 three-component nano-junction system,” Nature Materials, vol. 5, no. 10, pp. 782–786,2006.
[54] H. Wang, Z. Wu, Y. Liu, and Y. Wang, “Influences of variousPt dopants over surface platinized TiO2 on the photocatalyticoxidation of nitric oxide,” Chemosphere, vol. 74, no. 6, pp. 773–778, 2009.
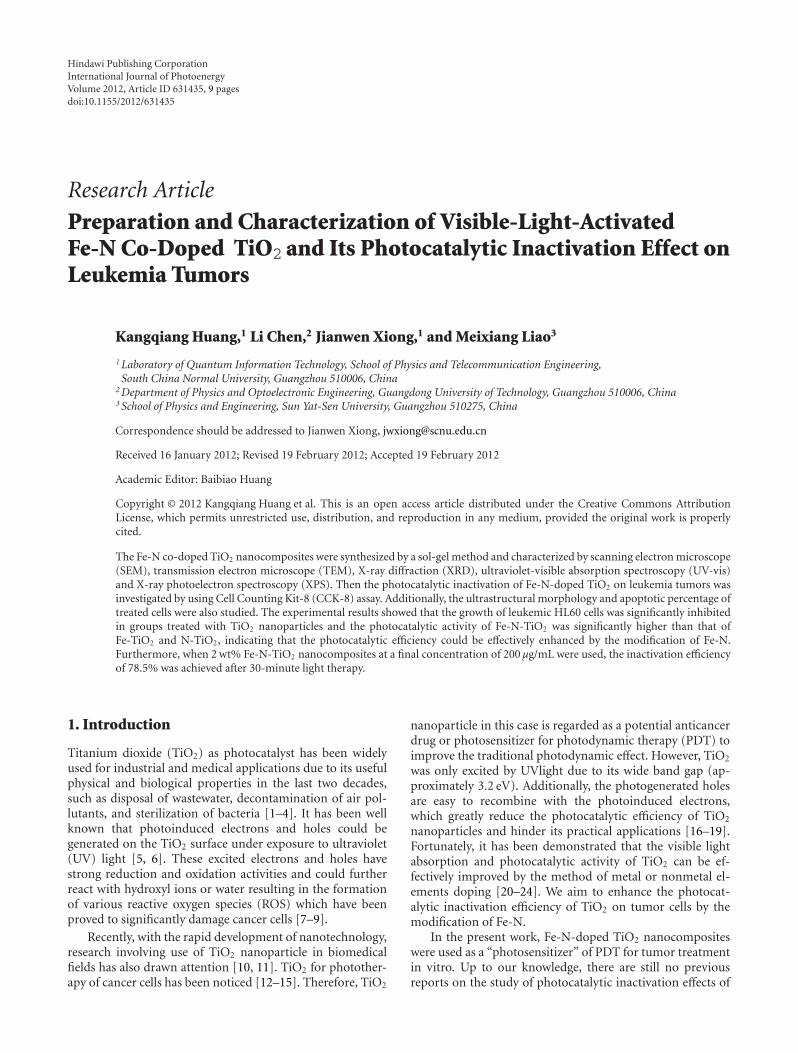
Hindawi Publishing CorporationInternational Journal of PhotoenergyVolume 2012, Article ID 631435, 9 pagesdoi:10.1155/2012/631435
Research Article
Preparation and Characterization of Visible-Light-ActivatedFe-N Co-Doped TiO2 and Its Photocatalytic Inactivation Effect onLeukemia Tumors
Kangqiang Huang,1 Li Chen,2 Jianwen Xiong,1 and Meixiang Liao3
1 Laboratory of Quantum Information Technology, School of Physics and Telecommunication Engineering,South China Normal University, Guangzhou 510006, China
2 Department of Physics and Optoelectronic Engineering, Guangdong University of Technology, Guangzhou 510006, China3 School of Physics and Engineering, Sun Yat-Sen University, Guangzhou 510275, China
Correspondence should be addressed to Jianwen Xiong, [email protected]
Received 16 January 2012; Revised 19 February 2012; Accepted 19 February 2012
Academic Editor: Baibiao Huang
Copyright © 2012 Kangqiang Huang et al. This is an open access article distributed under the Creative Commons AttributionLicense, which permits unrestricted use, distribution, and reproduction in any medium, provided the original work is properlycited.
The Fe-N co-doped TiO2 nanocomposites were synthesized by a sol-gel method and characterized by scanning electron microscope(SEM), transmission electron microscope (TEM), X-ray diffraction (XRD), ultraviolet-visible absorption spectroscopy (UV-vis)and X-ray photoelectron spectroscopy (XPS). Then the photocatalytic inactivation of Fe-N-doped TiO2 on leukemia tumors wasinvestigated by using Cell Counting Kit-8 (CCK-8) assay. Additionally, the ultrastructural morphology and apoptotic percentage oftreated cells were also studied. The experimental results showed that the growth of leukemic HL60 cells was significantly inhibitedin groups treated with TiO2 nanoparticles and the photocatalytic activity of Fe-N-TiO2 was significantly higher than that ofFe-TiO2 and N-TiO2, indicating that the photocatalytic efficiency could be effectively enhanced by the modification of Fe-N.Furthermore, when 2 wt% Fe-N-TiO2 nanocomposites at a final concentration of 200 μg/mL were used, the inactivation efficiencyof 78.5% was achieved after 30-minute light therapy.
1. Introduction
Titanium dioxide (TiO2) as photocatalyst has been widelyused for industrial and medical applications due to its usefulphysical and biological properties in the last two decades,such as disposal of wastewater, decontamination of air pol-lutants, and sterilization of bacteria [1–4]. It has been wellknown that photoinduced electrons and holes could begenerated on the TiO2 surface under exposure to ultraviolet(UV) light [5, 6]. These excited electrons and holes havestrong reduction and oxidation activities and could furtherreact with hydroxyl ions or water resulting in the formationof various reactive oxygen species (ROS) which have beenproved to significantly damage cancer cells [7–9].
Recently, with the rapid development of nanotechnology,research involving use of TiO2 nanoparticle in biomedicalfields has also drawn attention [10, 11]. TiO2 for photother-apy of cancer cells has been noticed [12–15]. Therefore, TiO2
nanoparticle in this case is regarded as a potential anticancerdrug or photosensitizer for photodynamic therapy (PDT) toimprove the traditional photodynamic effect. However, TiO2
was only excited by UVlight due to its wide band gap (ap-proximately 3.2 eV). Additionally, the photogenerated holesare easy to recombine with the photoinduced electrons,which greatly reduce the photocatalytic efficiency of TiO2
nanoparticles and hinder its practical applications [16–19].Fortunately, it has been demonstrated that the visible lightabsorption and photocatalytic activity of TiO2 can be ef-fectively improved by the method of metal or nonmetal el-ements doping [20–24]. We aim to enhance the photocat-alytic inactivation efficiency of TiO2 on tumor cells by themodification of Fe-N.
In the present work, Fe-N-doped TiO2 nanocompositeswere used as a “photosensitizer” of PDT for tumor treatmentin vitro. Up to our knowledge, there are still no previousreports on the study of photocatalytic inactivation effects of
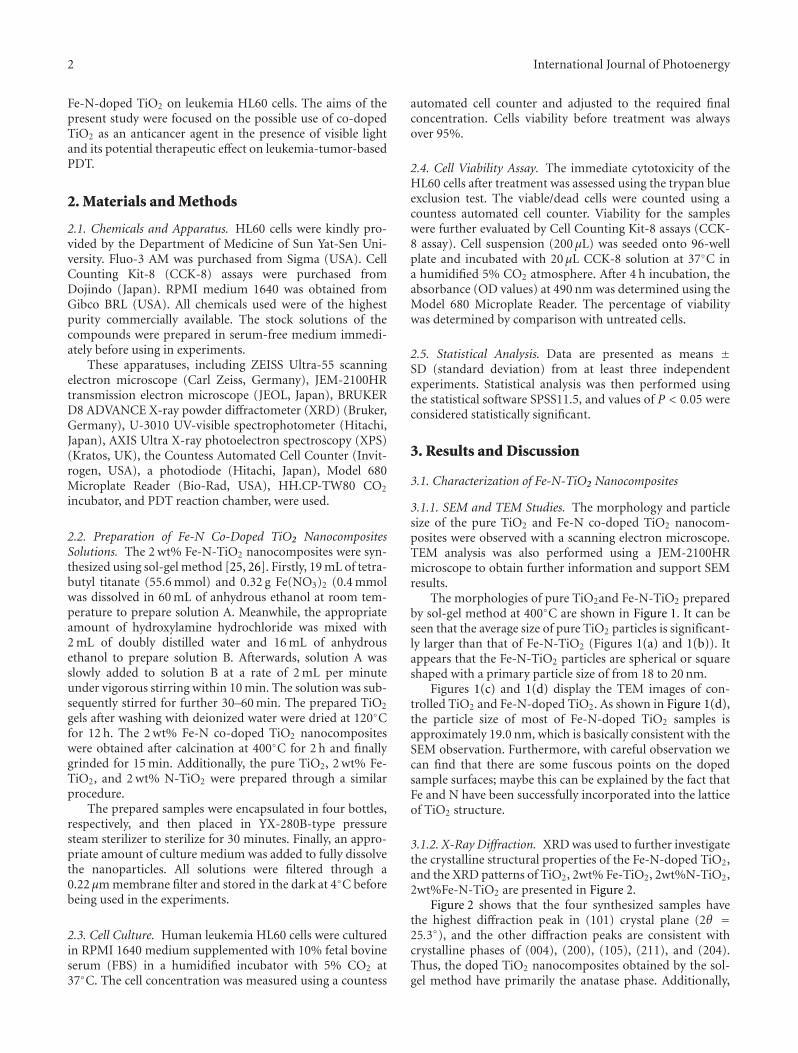
2 International Journal of Photoenergy
Fe-N-doped TiO2 on leukemia HL60 cells. The aims of thepresent study were focused on the possible use of co-dopedTiO2 as an anticancer agent in the presence of visible lightand its potential therapeutic effect on leukemia-tumor-basedPDT.
2. Materials and Methods
2.1. Chemicals and Apparatus. HL60 cells were kindly pro-vided by the Department of Medicine of Sun Yat-Sen Uni-versity. Fluo-3 AM was purchased from Sigma (USA). CellCounting Kit-8 (CCK-8) assays were purchased fromDojindo (Japan). RPMI medium 1640 was obtained fromGibco BRL (USA). All chemicals used were of the highestpurity commercially available. The stock solutions of thecompounds were prepared in serum-free medium immedi-ately before using in experiments.
These apparatuses, including ZEISS Ultra-55 scanningelectron microscope (Carl Zeiss, Germany), JEM-2100HRtransmission electron microscope (JEOL, Japan), BRUKERD8 ADVANCE X-ray powder diffractometer (XRD) (Bruker,Germany), U-3010 UV-visible spectrophotometer (Hitachi,Japan), AXIS Ultra X-ray photoelectron spectroscopy (XPS)(Kratos, UK), the Countess Automated Cell Counter (Invit-rogen, USA), a photodiode (Hitachi, Japan), Model 680Microplate Reader (Bio-Rad, USA), HH.CP-TW80 CO2
incubator, and PDT reaction chamber, were used.
2.2. Preparation of Fe-N Co-Doped TiO2 NanocompositesSolutions. The 2 wt% Fe-N-TiO2 nanocomposites were syn-thesized using sol-gel method [25, 26]. Firstly, 19 mL of tetra-butyl titanate (55.6 mmol) and 0.32 g Fe(NO3)2 (0.4 mmolwas dissolved in 60 mL of anhydrous ethanol at room tem-perature to prepare solution A. Meanwhile, the appropriateamount of hydroxylamine hydrochloride was mixed with2 mL of doubly distilled water and 16 mL of anhydrousethanol to prepare solution B. Afterwards, solution A wasslowly added to solution B at a rate of 2 mL per minuteunder vigorous stirring within 10 min. The solution was sub-sequently stirred for further 30–60 min. The prepared TiO2
gels after washing with deionized water were dried at 120◦Cfor 12 h. The 2 wt% Fe-N co-doped TiO2 nanocompositeswere obtained after calcination at 400◦C for 2 h and finallygrinded for 15 min. Additionally, the pure TiO2, 2 wt% Fe-TiO2, and 2 wt% N-TiO2 were prepared through a similarprocedure.
The prepared samples were encapsulated in four bottles,respectively, and then placed in YX-280B-type pressuresteam sterilizer to sterilize for 30 minutes. Finally, an appro-priate amount of culture medium was added to fully dissolvethe nanoparticles. All solutions were filtered through a0.22 μm membrane filter and stored in the dark at 4◦C beforebeing used in the experiments.
2.3. Cell Culture. Human leukemia HL60 cells were culturedin RPMI 1640 medium supplemented with 10% fetal bovineserum (FBS) in a humidified incubator with 5% CO2 at37◦C. The cell concentration was measured using a countess
automated cell counter and adjusted to the required finalconcentration. Cells viability before treatment was alwaysover 95%.
2.4. Cell Viability Assay. The immediate cytotoxicity of theHL60 cells after treatment was assessed using the trypan blueexclusion test. The viable/dead cells were counted using acountess automated cell counter. Viability for the sampleswere further evaluated by Cell Counting Kit-8 assays (CCK-8 assay). Cell suspension (200 μL) was seeded onto 96-wellplate and incubated with 20 μL CCK-8 solution at 37◦C ina humidified 5% CO2 atmosphere. After 4 h incubation, theabsorbance (OD values) at 490 nm was determined using theModel 680 Microplate Reader. The percentage of viabilitywas determined by comparison with untreated cells.
2.5. Statistical Analysis. Data are presented as means ±SD (standard deviation) from at least three independentexperiments. Statistical analysis was then performed usingthe statistical software SPSS11.5, and values of P < 0.05 wereconsidered statistically significant.
3. Results and Discussion
3.1. Characterization of Fe-N-TiO2 Nanocomposites
3.1.1. SEM and TEM Studies. The morphology and particlesize of the pure TiO2 and Fe-N co-doped TiO2 nanocom-posites were observed with a scanning electron microscope.TEM analysis was also performed using a JEM-2100HRmicroscope to obtain further information and support SEMresults.
The morphologies of pure TiO2and Fe-N-TiO2 preparedby sol-gel method at 400◦C are shown in Figure 1. It can beseen that the average size of pure TiO2 particles is significant-ly larger than that of Fe-N-TiO2 (Figures 1(a) and 1(b)). Itappears that the Fe-N-TiO2 particles are spherical or squareshaped with a primary particle size of from 18 to 20 nm.
Figures 1(c) and 1(d) display the TEM images of con-trolled TiO2 and Fe-N-doped TiO2. As shown in Figure 1(d),the particle size of most of Fe-N-doped TiO2 samples isapproximately 19.0 nm, which is basically consistent with theSEM observation. Furthermore, with careful observation wecan find that there are some fuscous points on the dopedsample surfaces; maybe this can be explained by the fact thatFe and N have been successfully incorporated into the latticeof TiO2 structure.
3.1.2. X-Ray Diffraction. XRD was used to further investigatethe crystalline structural properties of the Fe-N-doped TiO2,and the XRD patterns of TiO2, 2wt% Fe-TiO2, 2wt%N-TiO2,2wt%Fe-N-TiO2 are presented in Figure 2.
Figure 2 shows that the four synthesized samples havethe highest diffraction peak in (101) crystal plane (2θ =25.3◦), and the other diffraction peaks are consistent withcrystalline phases of (004), (200), (105), (211), and (204).Thus, the doped TiO2 nanocomposites obtained by the sol-gel method have primarily the anatase phase. Additionally,
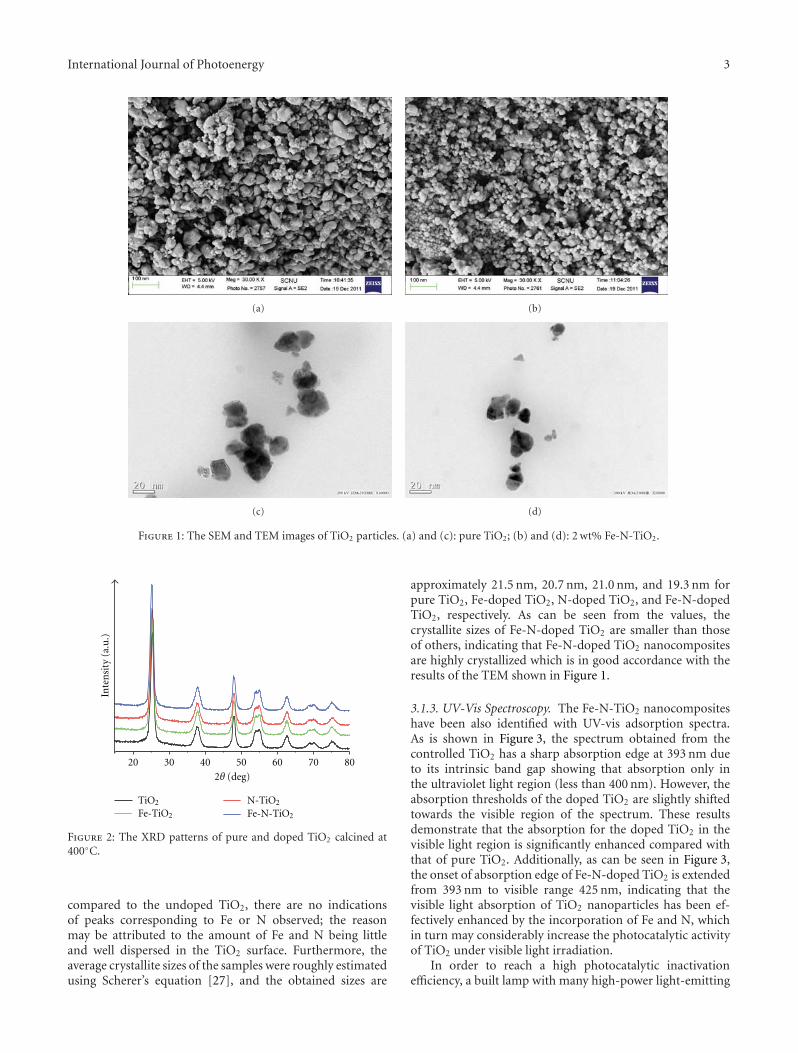
International Journal of Photoenergy 3
(a) (b)
(c) (d)
Figure 1: The SEM and TEM images of TiO2 particles. (a) and (c): pure TiO2; (b) and (d): 2 wt% Fe-N-TiO2.
20 30 40 50 60 70 80
Inte
nsi
ty (
a.u
.)
2θ (deg)
TiO2
Fe-TiO2
N-TiO2
Fe-N-TiO2
Figure 2: The XRD patterns of pure and doped TiO2 calcined at400◦C.
compared to the undoped TiO2, there are no indicationsof peaks corresponding to Fe or N observed; the reasonmay be attributed to the amount of Fe and N being littleand well dispersed in the TiO2 surface. Furthermore, theaverage crystallite sizes of the samples were roughly estimatedusing Scherer’s equation [27], and the obtained sizes are
approximately 21.5 nm, 20.7 nm, 21.0 nm, and 19.3 nm forpure TiO2, Fe-doped TiO2, N-doped TiO2, and Fe-N-dopedTiO2, respectively. As can be seen from the values, thecrystallite sizes of Fe-N-doped TiO2 are smaller than thoseof others, indicating that Fe-N-doped TiO2 nanocompositesare highly crystallized which is in good accordance with theresults of the TEM shown in Figure 1.
3.1.3. UV-Vis Spectroscopy. The Fe-N-TiO2 nanocompositeshave been also identified with UV-vis adsorption spectra.As is shown in Figure 3, the spectrum obtained from thecontrolled TiO2 has a sharp absorption edge at 393 nm dueto its intrinsic band gap showing that absorption only inthe ultraviolet light region (less than 400 nm). However, theabsorption thresholds of the doped TiO2 are slightly shiftedtowards the visible region of the spectrum. These resultsdemonstrate that the absorption for the doped TiO2 in thevisible light region is significantly enhanced compared withthat of pure TiO2. Additionally, as can be seen in Figure 3,the onset of absorption edge of Fe-N-doped TiO2 is extendedfrom 393 nm to visible range 425 nm, indicating that thevisible light absorption of TiO2 nanoparticles has been ef-fectively enhanced by the incorporation of Fe and N, whichin turn may considerably increase the photocatalytic activityof TiO2 under visible light irradiation.
In order to reach a high photocatalytic inactivationefficiency, a built lamp with many high-power light-emitting
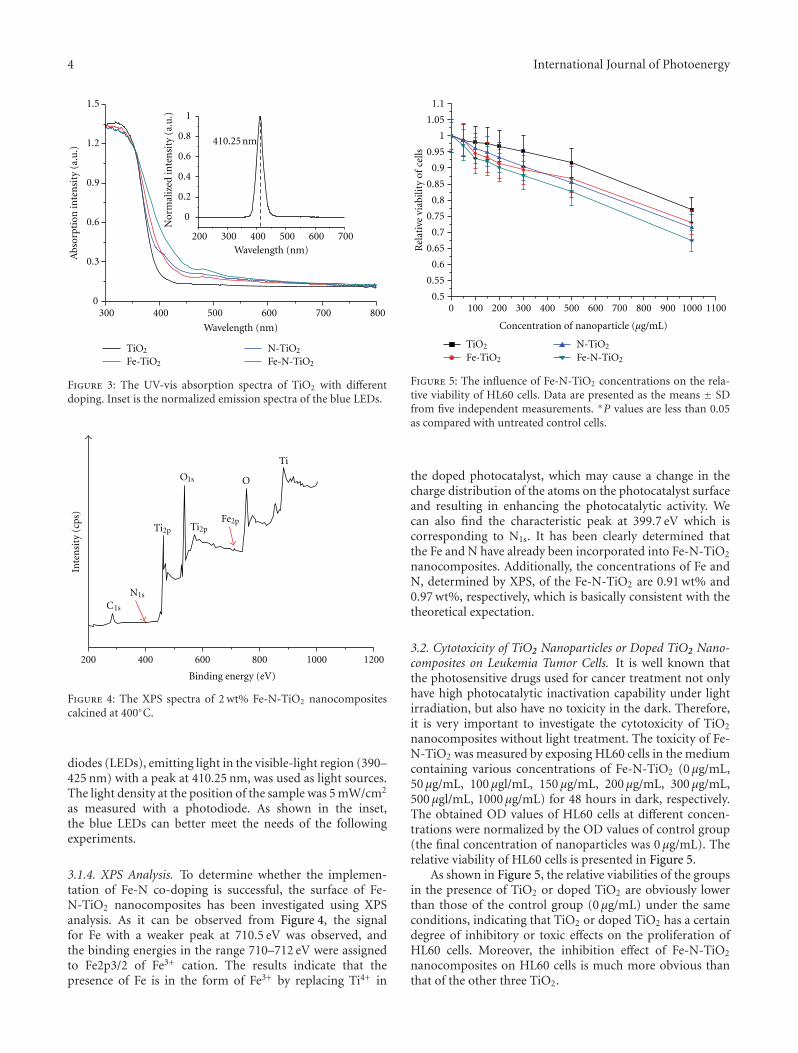
4 International Journal of Photoenergy
300 400 500 600 700 8000
0.3
0.6
0.9
1.2
1.5
200 300 400 500 600 700
0
0.2
0.4
0.6
0.8
1
Nor
mal
ized
inte
nsi
ty (
a.u
.)
Wavelength (nm)
410.25 nm
Abs
orpt
ion
inte
nsi
ty (
a.u
.)
Wavelength (nm)
TiO2
Fe-TiO2
N-TiO2
Fe-N-TiO2
Figure 3: The UV-vis absorption spectra of TiO2 with differentdoping. Inset is the normalized emission spectra of the blue LEDs.
200 400 600 800 1000 1200
Ti
O
Inte
nsi
ty (
cps)
Binding energy (eV)
Ti2pTi2p
Fe2p
O1s
N1s
C1s
Figure 4: The XPS spectra of 2 wt% Fe-N-TiO2 nanocompositescalcined at 400◦C.
diodes (LEDs), emitting light in the visible-light region (390–425 nm) with a peak at 410.25 nm, was used as light sources.The light density at the position of the sample was 5 mW/cm2
as measured with a photodiode. As shown in the inset,the blue LEDs can better meet the needs of the followingexperiments.
3.1.4. XPS Analysis. To determine whether the implemen-tation of Fe-N co-doping is successful, the surface of Fe-N-TiO2 nanocomposites has been investigated using XPSanalysis. As it can be observed from Figure 4, the signalfor Fe with a weaker peak at 710.5 eV was observed, andthe binding energies in the range 710–712 eV were assignedto Fe2p3/2 of Fe3+ cation. The results indicate that thepresence of Fe is in the form of Fe3+ by replacing Ti4+ in
0 100 200 300 400 500 600 700 800 900 1000 11000.5
0.55
0.6
0.65
0.7
0.75
0.8
0.85
0.9
0.95
1
1.05
1.1
Rel
ativ
e vi
abili
ty o
f ce
lls
Concentration of nanoparticle (μg/mL)
TiO2
Fe-TiO2
N-TiO2
Fe-N-TiO2
Figure 5: The influence of Fe-N-TiO2 concentrations on the rela-tive viability of HL60 cells. Data are presented as the means ± SDfrom five independent measurements. ∗P values are less than 0.05as compared with untreated control cells.
the doped photocatalyst, which may cause a change in thecharge distribution of the atoms on the photocatalyst surfaceand resulting in enhancing the photocatalytic activity. Wecan also find the characteristic peak at 399.7 eV which iscorresponding to N1s. It has been clearly determined thatthe Fe and N have already been incorporated into Fe-N-TiO2
nanocomposites. Additionally, the concentrations of Fe andN, determined by XPS, of the Fe-N-TiO2 are 0.91 wt% and0.97 wt%, respectively, which is basically consistent with thetheoretical expectation.
3.2. Cytotoxicity of TiO2 Nanoparticles or Doped TiO2 Nano-composites on Leukemia Tumor Cells. It is well known thatthe photosensitive drugs used for cancer treatment not onlyhave high photocatalytic inactivation capability under lightirradiation, but also have no toxicity in the dark. Therefore,it is very important to investigate the cytotoxicity of TiO2
nanocomposites without light treatment. The toxicity of Fe-N-TiO2 was measured by exposing HL60 cells in the mediumcontaining various concentrations of Fe-N-TiO2 (0 μg/mL,50 μg/mL, 100 μgl/mL, 150 μg/mL, 200 μg/mL, 300 μg/mL,500 μgl/mL, 1000 μg/mL) for 48 hours in dark, respectively.The obtained OD values of HL60 cells at different concen-trations were normalized by the OD values of control group(the final concentration of nanoparticles was 0 μg/mL). Therelative viability of HL60 cells is presented in Figure 5.
As shown in Figure 5, the relative viabilities of the groupsin the presence of TiO2 or doped TiO2 are obviously lowerthan those of the control group (0 μg/mL) under the sameconditions, indicating that TiO2 or doped TiO2 has a certaindegree of inhibitory or toxic effects on the proliferation ofHL60 cells. Moreover, the inhibition effect of Fe-N-TiO2
nanocomposites on HL60 cells is much more obvious thanthat of the other three TiO2.
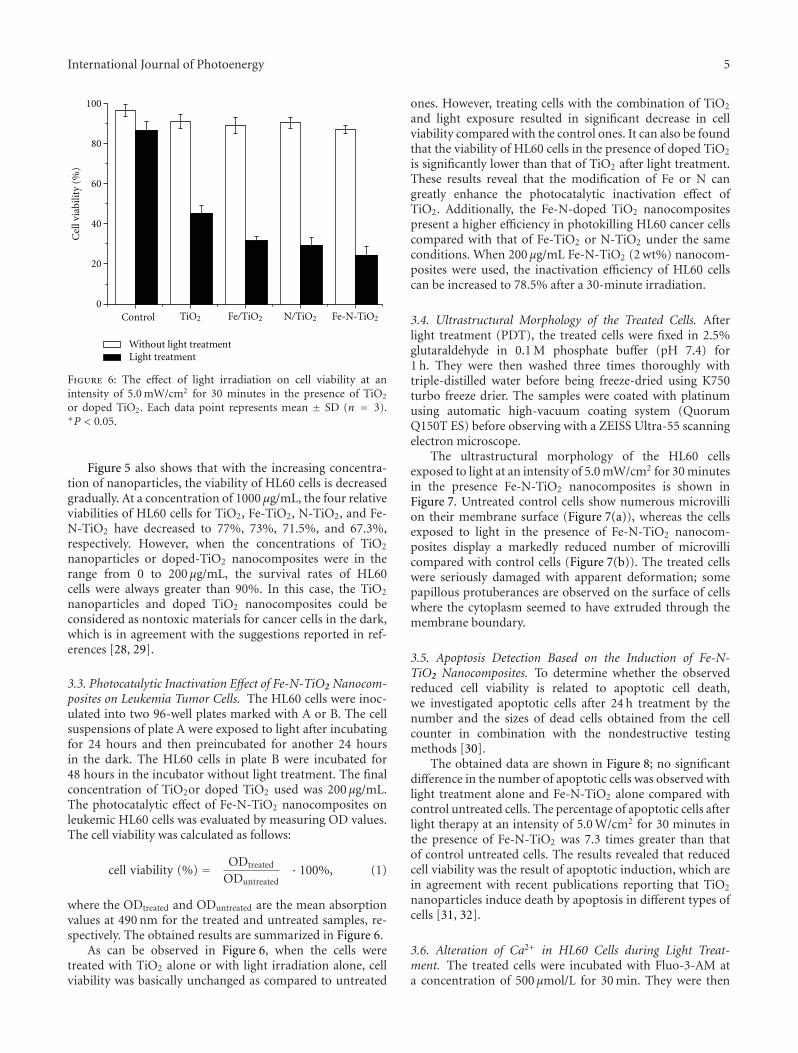
International Journal of Photoenergy 5
Control0
20
40
60
80
100
Cel
l via
bilit
y (%
)
Without light treatmentLight treatment
TiO2 Fe-N-TiO2Fe/TiO2 N/TiO2
Figure 6: The effect of light irradiation on cell viability at anintensity of 5.0 mW/cm2 for 30 minutes in the presence of TiO2
or doped TiO2. Each data point represents mean ± SD (n = 3).∗P < 0.05.
Figure 5 also shows that with the increasing concentra-tion of nanoparticles, the viability of HL60 cells is decreasedgradually. At a concentration of 1000 μg/mL, the four relativeviabilities of HL60 cells for TiO2, Fe-TiO2, N-TiO2, and Fe-N-TiO2 have decreased to 77%, 73%, 71.5%, and 67.3%,respectively. However, when the concentrations of TiO2
nanoparticles or doped-TiO2 nanocomposites were in therange from 0 to 200 μg/mL, the survival rates of HL60cells were always greater than 90%. In this case, the TiO2
nanoparticles and doped TiO2 nanocomposites could beconsidered as nontoxic materials for cancer cells in the dark,which is in agreement with the suggestions reported in ref-erences [28, 29].
3.3. Photocatalytic Inactivation Effect of Fe-N-TiO2 Nanocom-posites on Leukemia Tumor Cells. The HL60 cells were inoc-ulated into two 96-well plates marked with A or B. The cellsuspensions of plate A were exposed to light after incubatingfor 24 hours and then preincubated for another 24 hoursin the dark. The HL60 cells in plate B were incubated for48 hours in the incubator without light treatment. The finalconcentration of TiO2or doped TiO2 used was 200 μg/mL.The photocatalytic effect of Fe-N-TiO2 nanocomposites onleukemic HL60 cells was evaluated by measuring OD values.The cell viability was calculated as follows:
cell viability (%) = ODtreated
ODuntreated· 100%, (1)
where the ODtreated and ODuntreated are the mean absorptionvalues at 490 nm for the treated and untreated samples, re-spectively. The obtained results are summarized in Figure 6.
As can be observed in Figure 6, when the cells weretreated with TiO2 alone or with light irradiation alone, cellviability was basically unchanged as compared to untreated
ones. However, treating cells with the combination of TiO2
and light exposure resulted in significant decrease in cellviability compared with the control ones. It can also be foundthat the viability of HL60 cells in the presence of doped TiO2
is significantly lower than that of TiO2 after light treatment.These results reveal that the modification of Fe or N cangreatly enhance the photocatalytic inactivation effect ofTiO2. Additionally, the Fe-N-doped TiO2 nanocompositespresent a higher efficiency in photokilling HL60 cancer cellscompared with that of Fe-TiO2 or N-TiO2 under the sameconditions. When 200 μg/mL Fe-N-TiO2 (2 wt%) nanocom-posites were used, the inactivation efficiency of HL60 cellscan be increased to 78.5% after a 30-minute irradiation.
3.4. Ultrastructural Morphology of the Treated Cells. Afterlight treatment (PDT), the treated cells were fixed in 2.5%glutaraldehyde in 0.1 M phosphate buffer (pH 7.4) for1 h. They were then washed three times thoroughly withtriple-distilled water before being freeze-dried using K750turbo freeze drier. The samples were coated with platinumusing automatic high-vacuum coating system (QuorumQ150T ES) before observing with a ZEISS Ultra-55 scanningelectron microscope.
The ultrastructural morphology of the HL60 cellsexposed to light at an intensity of 5.0 mW/cm2 for 30 minutesin the presence Fe-N-TiO2 nanocomposites is shown inFigure 7. Untreated control cells show numerous microvillion their membrane surface (Figure 7(a)), whereas the cellsexposed to light in the presence of Fe-N-TiO2 nanocom-posites display a markedly reduced number of microvillicompared with control cells (Figure 7(b)). The treated cellswere seriously damaged with apparent deformation; somepapillous protuberances are observed on the surface of cellswhere the cytoplasm seemed to have extruded through themembrane boundary.
3.5. Apoptosis Detection Based on the Induction of Fe-N-TiO2 Nanocomposites. To determine whether the observedreduced cell viability is related to apoptotic cell death,we investigated apoptotic cells after 24 h treatment by thenumber and the sizes of dead cells obtained from the cellcounter in combination with the nondestructive testingmethods [30].
The obtained data are shown in Figure 8; no significantdifference in the number of apoptotic cells was observed withlight treatment alone and Fe-N-TiO2 alone compared withcontrol untreated cells. The percentage of apoptotic cells afterlight therapy at an intensity of 5.0 W/cm2 for 30 minutes inthe presence of Fe-N-TiO2 was 7.3 times greater than thatof control untreated cells. The results revealed that reducedcell viability was the result of apoptotic induction, which arein agreement with recent publications reporting that TiO2
nanoparticles induce death by apoptosis in different types ofcells [31, 32].
3.6. Alteration of Ca2+ in HL60 Cells during Light Treat-ment. The treated cells were incubated with Fluo-3-AM ata concentration of 500 μmol/L for 30 min. They were then
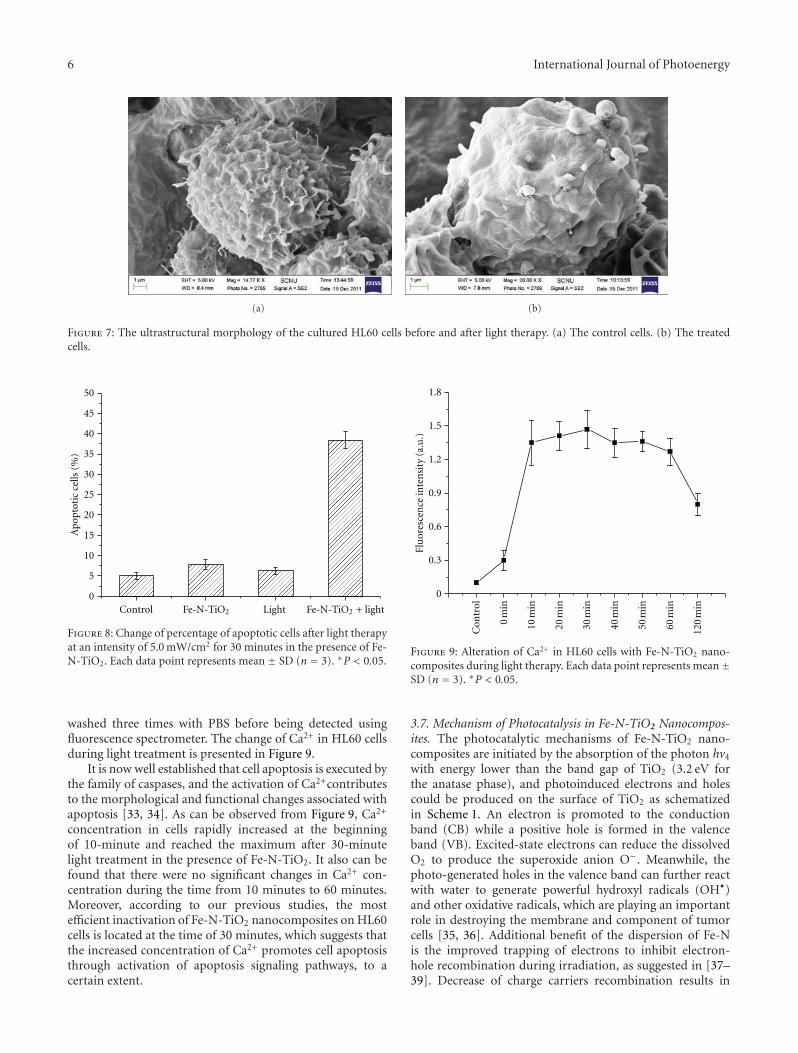
6 International Journal of Photoenergy
(a) (b)
Figure 7: The ultrastructural morphology of the cultured HL60 cells before and after light therapy. (a) The control cells. (b) The treatedcells.
Control Light 0
5
10
15
20
25
30
35
40
45
50
Ap
opto
tic
cells
(%
)
Fe-N-TiO2 Fe-N-TiO2 + light
Figure 8: Change of percentage of apoptotic cells after light therapyat an intensity of 5.0 mW/cm2 for 30 minutes in the presence of Fe-N-TiO2. Each data point represents mean ± SD (n = 3). ∗P < 0.05.
washed three times with PBS before being detected usingfluorescence spectrometer. The change of Ca2+ in HL60 cellsduring light treatment is presented in Figure 9.
It is now well established that cell apoptosis is executed bythe family of caspases, and the activation of Ca2+contributesto the morphological and functional changes associated withapoptosis [33, 34]. As can be observed from Figure 9, Ca2+
concentration in cells rapidly increased at the beginningof 10-minute and reached the maximum after 30-minutelight treatment in the presence of Fe-N-TiO2. It also can befound that there were no significant changes in Ca2+ con-centration during the time from 10 minutes to 60 minutes.Moreover, according to our previous studies, the mostefficient inactivation of Fe-N-TiO2 nanocomposites on HL60cells is located at the time of 30 minutes, which suggests thatthe increased concentration of Ca2+ promotes cell apoptosisthrough activation of apoptosis signaling pathways, to acertain extent.
Con
trol
0 m
in
10 m
in
20 m
in
30 m
in
40 m
in
50 m
in
60 m
in
120
min
0
0.3
0.6
0.9
1.2
1.5
1.8
Flu
ores
cen
ce in
ten
sity
(a.
u.)
Figure 9: Alteration of Ca2+ in HL60 cells with Fe-N-TiO2 nano-composites during light therapy. Each data point represents mean±SD (n = 3). ∗P < 0.05.
3.7. Mechanism of Photocatalysis in Fe-N-TiO2 Nanocompos-ites. The photocatalytic mechanisms of Fe-N-TiO2 nano-composites are initiated by the absorption of the photon hv4
with energy lower than the band gap of TiO2 (3.2 eV forthe anatase phase), and photoinduced electrons and holescould be produced on the surface of TiO2 as schematizedin Scheme 1. An electron is promoted to the conductionband (CB) while a positive hole is formed in the valenceband (VB). Excited-state electrons can reduce the dissolvedO2 to produce the superoxide anion O−. Meanwhile, thephoto-generated holes in the valence band can further reactwith water to generate powerful hydroxyl radicals (OH•)and other oxidative radicals, which are playing an importantrole in destroying the membrane and component of tumorcells [35, 36]. Additional benefit of the dispersion of Fe-Nis the improved trapping of electrons to inhibit electron-hole recombination during irradiation, as suggested in [37–39]. Decrease of charge carriers recombination results in
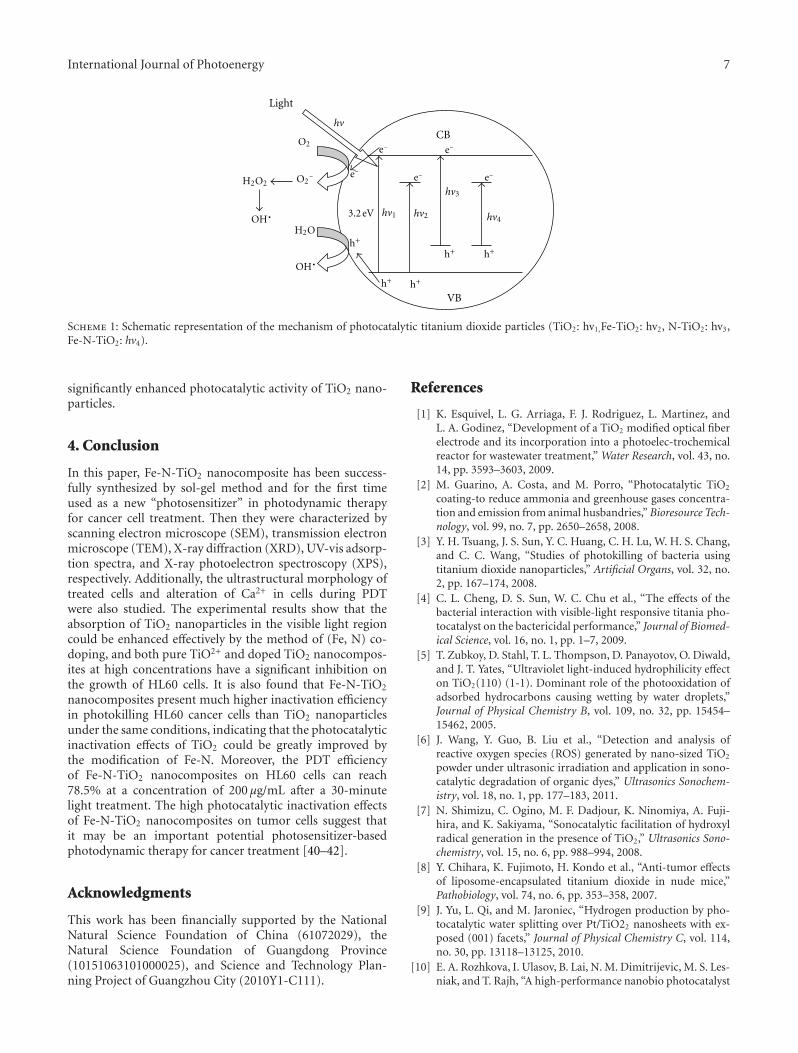
International Journal of Photoenergy 7
VB
CBhv
Light
e−
e− e−
e−
e−H2O2
H2OOH•
OH•
h+
h+
h+ h+
h+
3.2 eV hv1 hv4
hv3
hv2
O2
O2−
Scheme 1: Schematic representation of the mechanism of photocatalytic titanium dioxide particles (TiO2: hv1,Fe-TiO2: hv2, N-TiO2: hv3,Fe-N-TiO2: hv4).
significantly enhanced photocatalytic activity of TiO2 nano-particles.
4. Conclusion
In this paper, Fe-N-TiO2 nanocomposite has been success-fully synthesized by sol-gel method and for the first timeused as a new “photosensitizer” in photodynamic therapyfor cancer cell treatment. Then they were characterized byscanning electron microscope (SEM), transmission electronmicroscope (TEM), X-ray diffraction (XRD), UV-vis adsorp-tion spectra, and X-ray photoelectron spectroscopy (XPS),respectively. Additionally, the ultrastructural morphology oftreated cells and alteration of Ca2+ in cells during PDTwere also studied. The experimental results show that theabsorption of TiO2 nanoparticles in the visible light regioncould be enhanced effectively by the method of (Fe, N) co-doping, and both pure TiO2+ and doped TiO2 nanocompos-ites at high concentrations have a significant inhibition onthe growth of HL60 cells. It is also found that Fe-N-TiO2
nanocomposites present much higher inactivation efficiencyin photokilling HL60 cancer cells than TiO2 nanoparticlesunder the same conditions, indicating that the photocatalyticinactivation effects of TiO2 could be greatly improved bythe modification of Fe-N. Moreover, the PDT efficiencyof Fe-N-TiO2 nanocomposites on HL60 cells can reach78.5% at a concentration of 200 μg/mL after a 30-minutelight treatment. The high photocatalytic inactivation effectsof Fe-N-TiO2 nanocomposites on tumor cells suggest thatit may be an important potential photosensitizer-basedphotodynamic therapy for cancer treatment [40–42].
Acknowledgments
This work has been financially supported by the NationalNatural Science Foundation of China (61072029), theNatural Science Foundation of Guangdong Province(10151063101000025), and Science and Technology Plan-ning Project of Guangzhou City (2010Y1-C111).
References
[1] K. Esquivel, L. G. Arriaga, F. J. Rodriguez, L. Martinez, andL. A. Godinez, “Development of a TiO2 modified optical fiberelectrode and its incorporation into a photoelec-trochemicalreactor for wastewater treatment,” Water Research, vol. 43, no.14, pp. 3593–3603, 2009.
[2] M. Guarino, A. Costa, and M. Porro, “Photocatalytic TiO2
coating-to reduce ammonia and greenhouse gases concentra-tion and emission from animal husbandries,” Bioresource Tech-nology, vol. 99, no. 7, pp. 2650–2658, 2008.
[3] Y. H. Tsuang, J. S. Sun, Y. C. Huang, C. H. Lu, W. H. S. Chang,and C. C. Wang, “Studies of photokilling of bacteria usingtitanium dioxide nanoparticles,” Artificial Organs, vol. 32, no.2, pp. 167–174, 2008.
[4] C. L. Cheng, D. S. Sun, W. C. Chu et al., “The effects of thebacterial interaction with visible-light responsive titania pho-tocatalyst on the bactericidal performance,” Journal of Biomed-ical Science, vol. 16, no. 1, pp. 1–7, 2009.
[5] T. Zubkoy, D. Stahl, T. L. Thompson, D. Panayotov, O. Diwald,and J. T. Yates, “Ultraviolet light-induced hydrophilicity effecton TiO2(110) (1-1). Dominant role of the photooxidation ofadsorbed hydrocarbons causing wetting by water droplets,”Journal of Physical Chemistry B, vol. 109, no. 32, pp. 15454–15462, 2005.
[6] J. Wang, Y. Guo, B. Liu et al., “Detection and analysis ofreactive oxygen species (ROS) generated by nano-sized TiO2
powder under ultrasonic irradiation and application in sono-catalytic degradation of organic dyes,” Ultrasonics Sonochem-istry, vol. 18, no. 1, pp. 177–183, 2011.
[7] N. Shimizu, C. Ogino, M. F. Dadjour, K. Ninomiya, A. Fuji-hira, and K. Sakiyama, “Sonocatalytic facilitation of hydroxylradical generation in the presence of TiO2,” Ultrasonics Sono-chemistry, vol. 15, no. 6, pp. 988–994, 2008.
[8] Y. Chihara, K. Fujimoto, H. Kondo et al., “Anti-tumor effectsof liposome-encapsulated titanium dioxide in nude mice,”Pathobiology, vol. 74, no. 6, pp. 353–358, 2007.
[9] J. Yu, L. Qi, and M. Jaroniec, “Hydrogen production by pho-tocatalytic water splitting over Pt/TiO22 nanosheets with ex-posed (001) facets,” Journal of Physical Chemistry C, vol. 114,no. 30, pp. 13118–13125, 2010.
[10] E. A. Rozhkova, I. Ulasov, B. Lai, N. M. Dimitrijevic, M. S. Les-niak, and T. Rajh, “A high-performance nanobio photocatalyst
8 International Journal of Photoenergy
for targeted brain cancer therapy,” Nano Letters, vol. 9, no. 9,pp. 3337–3342, 2009.
[11] C. M. Sayes, R. Wahi, P. A. Kurian et al., “Correlating nanoscaletitania structure with toxicity: a cytotoxicity and inflammatoryresponse study with human dermal fibroblasts and humanlung epithelial cells,” Toxicological Sciences, vol. 92, no. 1, pp.174–185, 2006.
[12] J. Xu, Z. D. Chen, Y. Sun, C. M. Chen, and Y. Z. Jiang, “Photo-catalytic killing effect of gold-doped TiO2 nanocomposites onhuman colon carcinoma LoVo cells,” Acta Chimica Sinica, vol.66, no. 10, pp. 1163–1167, 2008.
[13] J. J. Wang, B. J. S. Sanderson, and H. Wang, “Cyto- and gen-otoxicity of ultrafine TiO2 particles in cultured human lym-phoblastoid cells,” Mutation Research, vol. 628, no. 2, pp. 99–106, 2007.
[14] Y. S. Lee, S. Yoon, H. J. Yoon et al., “Inhibitor of differentiation1 (Id1) expression attenuates the degree of TiO2-induced cyto-toxicity in H1299 non-small cell lung cancer cells,” ToxicologyLetters, vol. 189, no. 3, pp. 191–199, 2009.
[15] K. Q. Huang, L. Chen, M. X. Liao, and J. W. Xiong, “Thephotocatalytic inactivation effect of fe-doped TiO2 nanocom-posites on leukemic HL60 cells based photodynamic therapy,”International Journal of Photoenergy, vol. 2012, Article ID367072, 12 pages, 2012.
[16] J. Xu, Y. Sun, J. Huang et al., “Photokilling cancer cells usinghighly cell-specific antibody-TiO2 bioconjugates and electro-poration,” Bioelectrochemistry, vol. 71, no. 2, pp. 217–222,2007.
[17] H. Choi, E. Stathatos, and D. D. Dionysiou, “Sol-gel prepa-ration of mesoporous photocatalytic TiO2 films and TiO2/Al2O3 composite membranes for environmental applications,”Applied Catalysis B, vol. 63, no. 1-2, pp. 60–67, 2006.
[18] J. Yu, Y. Hai, and B. Cheng, “Enhanced photocatalytic H2-production activity of TiO2 by Ni(OH)2 cluster modification,”Journal of Physical Chemistry C, vol. 115, no. 11, pp. 4953–4958, 2010.
[19] J. Wang, J. Wu, Z. Zhang et al., “Sonocatalytic damage ofbovine serum albumin (BSA) in the presence of nanometeranatase titanium dioxide (TiO2),” Ultrasound in Medicine andBiology, vol. 32, no. 1, pp. 147–152, 2006.
[20] A. Di Paola, S. Ikeda, G. Marcı, B. Ohtani, and L. Palmisano,“Transition metal doped TiO2: physical properties and photo-catalytic behaviour,” International Journal of Photoenergy, vol.3, no. 4, pp. 171–176, 2001.
[21] H. Fu, L. Zhang, S. Zhang, Y. Zhu, and J. Zhao, “Electron spinresonance spin-trapping detection of radical intermediates inN-doped TiO2-assisted photodegradation of 4-chlorophenol,”Journal of Physical Chemistry B, vol. 110, no. 7, pp. 3061–3065,2006.
[22] V. Iliev, D. Tomova, R. Todorovska et al., “Photocatalyticproperties of TiO2 modified with gold nanoparticles in thedegradation of oxalic acid in aqueous solution,” Applied Catal-ysis A, vol. 313, no. 2, pp. 115–121, 2006.
[23] R. Bacsa, J. Kiwi, T. Ohno, P. Albers, and V. Nadtochenko,“Preparation, testing and characterization of doped TiO2
active in the peroxidation of biomolecules under visible light,”Journal of Physical Chemistry B, vol. 109, no. 12, pp. 5994–6003, 2005.
[24] X. H. Li, J. B. Lu, Y. Dai, M. Guo, and B. B. Huang,“The synthetic effects of Iron with sulfur and fluorine onphotoabsorption and photocatalytic performance in codopedTiO2 ,” International Journal of Photoenergy, vol. 2012, ArticleID 203529, 8 pages, 2012.
[25] U. G. Akpan and B. H. Hameed, “The advancements in sol-gel method of doped-TiO2 photocatalysts,” Applied CatalysisA, vol. 375, no. 1, pp. 1–11, 2010.
[26] R. S. Sonawane and M. K. Dongare, “Sol-gel synthesis of Au/TiO2 thin films for photocatalytic degradation of phenol insunlight,” Journal of Molecular Catalysis A, vol. 243, no. 1, pp.68–76, 2006.
[27] H. Li, Z. Bian, J. Zhu, Y. Huo, H. Li, and Y. Lu, “MesoporousAu/TiO2 nanocomposites with enhanced photocatalytic activ-ity,” Journal of the American Chemical Society, vol. 129, no. 15,pp. 4538–4539, 2007.
[28] R. Cai, Y. Kubota, T. Shuin, H. Sakai, K. Hashimoto, and A.Fujishima, “Induction of cytotoxicity by photoexcited TiO2
particles,” Cancer Research, vol. 52, no. 8, pp. 2346–2348, 1992.[29] E. Fabian, R. Landsiedel, L. Ma-Hock, K. Wiench, W. Wohlle-
ben, and B. van Ravenzwaay, “Tissue distribution and toxicityof intravenously administered titanium dioxide nanoparticlesin rats,” Archives of Toxicology, vol. 82, no. 3, pp. 151–157,2008.
[30] J. W. Xiong, L. Chen, M. S. Liu et al., “Optical manner forestimation viability of cells based on their morphologicalcharacteristics,” Journal of Optoelectronics Laser, vol. 16, no. 12,pp. 1514–1518, 2005.
[31] A. Kathiravan and R. Renganathan, “Photoinduced interac-tions between colloidal TiO2 nanoparticles and calf thymus-DNA,” Free Radical Biology and Medicine, vol. 28, no. 7, pp.1374–1378, 2009.
[32] A. P. Zhang and Y. P. Sun, “Photocatalytic killing effect ofTiO2 nanoparticles on Ls-174-t human colon carcinoma cells,”World Journal of Gastroenterology, vol. 10, no. 21, pp. 3191–3193, 2004.
[33] D. E. J. G. J. Dolmans, A. Kadambi, J. S. Hill et al., “Vascularaccumulation of a novel photosensitizer, MV6401, causesselective thrombosis in tumor vessels after photodynamictherapy,” Cancer Research, vol. 62, no. 7, pp. 2151–2156, 2002.
[34] H. Hui, F. Dotta, U. Di Mario, and R. Perfetti, “Role of caspasesin the regulation of apoptotic pancreatic islet beta-cells death,”Journal of Cellular Physiology, vol. 200, no. 2, pp. 177–200,2004.
[35] J. F. Reeves, S. J. Davies, N. J. F. Dodd, and A. N. Jha, “Hydroxylradicals (·OH) are associated with titanium dioxide (TiO2)nanoparticle-induced cytotoxicity and oxidative DNA damagein fish cells,” Mutation Research, vol. 640, no. 1-2, pp. 113–122,2008.
[36] K. Yang, Y. Dai, and B. Huang, “Study of the nitrogen con-centration influence on N-doped TiO2 anatase from first-principles calculations,” Journal of Physical Chemistry C, vol.111, no. 32, pp. 12086–12090, 2007.
[37] X. Chen and S. S. Mao, “Titanium dioxide nanomaterials: syn-thesis, properties, modifications and applications,” ChemicalReviews, vol. 107, no. 7, pp. 2891–2959, 2007.
[38] J. A. Rengifo-Herrera and C. Pulgarin, “Photocatalytic activ-ity of N, S co-doped and N-doped commercial anatase TiO2
powders towards phenol oxidation and E. coli inactivationunder simulated solar light irradiation,” Solar Energy, vol. 84,no. 1, pp. 37–43, 2010.
[39] Y. Kesong, D. Ying, H. Baibiao, and H. Shenghao, “Theoreticalstudy of N-doped TiO2 rutile crystals,” Journal of PhysicalChemistry B, vol. 110, no. 47, pp. 24011–24014, 2006.
[40] N. P. Huang, M. H. Xu, C. W. Yuan, and R. R. Yu, “Thestudy of the photokilling effect and mechanism of ultrafineTiO2 particles on U937 cells,” Journal of Photochemistry andPhotobiology A, vol. 108, no. 2-3, pp. 229–233, 1997.

International Journal of Photoenergy 9
[41] J. B. Lu, H. Jin, Y. Dai, K. S. Yang, and B. B. Huang, “Effectof electronegativity and charge balance on the visible-light-responsive photocatalytic activity of nonmetal doped anataseTiO2 ,” International Journal of Photoenergy, vol. 2012, ArticleID 928503, 8 pages, 2012.
[42] W. H. Suh, K. S. Suslick, G. D. Stucky, and Y. H. Suh, “Nan-otechnology, nanotoxicology, and neuroscience,” Progress inNeurobiology, vol. 87, no. 3, pp. 133–170, 2009.
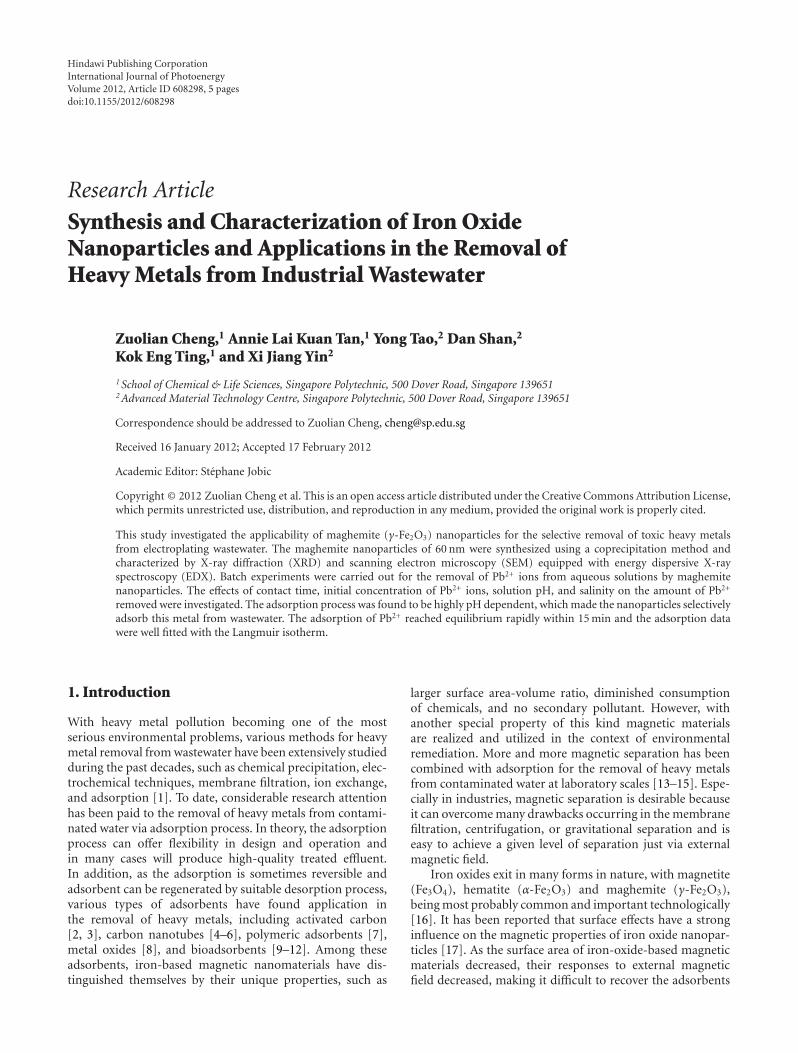
Hindawi Publishing CorporationInternational Journal of PhotoenergyVolume 2012, Article ID 608298, 5 pagesdoi:10.1155/2012/608298
Research Article
Synthesis and Characterization of Iron OxideNanoparticles and Applications in the Removal ofHeavy Metals from Industrial Wastewater
Zuolian Cheng,1 Annie Lai Kuan Tan,1 Yong Tao,2 Dan Shan,2
Kok Eng Ting,1 and Xi Jiang Yin2
1 School of Chemical & Life Sciences, Singapore Polytechnic, 500 Dover Road, Singapore 1396512 Advanced Material Technology Centre, Singapore Polytechnic, 500 Dover Road, Singapore 139651
Correspondence should be addressed to Zuolian Cheng, [email protected]
Received 16 January 2012; Accepted 17 February 2012
Academic Editor: Stephane Jobic
Copyright © 2012 Zuolian Cheng et al. This is an open access article distributed under the Creative Commons Attribution License,which permits unrestricted use, distribution, and reproduction in any medium, provided the original work is properly cited.
This study investigated the applicability of maghemite (γ-Fe2O3) nanoparticles for the selective removal of toxic heavy metalsfrom electroplating wastewater. The maghemite nanoparticles of 60 nm were synthesized using a coprecipitation method andcharacterized by X-ray diffraction (XRD) and scanning electron microscopy (SEM) equipped with energy dispersive X-rayspectroscopy (EDX). Batch experiments were carried out for the removal of Pb2+ ions from aqueous solutions by maghemitenanoparticles. The effects of contact time, initial concentration of Pb2+ ions, solution pH, and salinity on the amount of Pb2+
removed were investigated. The adsorption process was found to be highly pH dependent, which made the nanoparticles selectivelyadsorb this metal from wastewater. The adsorption of Pb2+ reached equilibrium rapidly within 15 min and the adsorption datawere well fitted with the Langmuir isotherm.
1. Introduction
With heavy metal pollution becoming one of the mostserious environmental problems, various methods for heavymetal removal from wastewater have been extensively studiedduring the past decades, such as chemical precipitation, elec-trochemical techniques, membrane filtration, ion exchange,and adsorption [1]. To date, considerable research attentionhas been paid to the removal of heavy metals from contami-nated water via adsorption process. In theory, the adsorptionprocess can offer flexibility in design and operation andin many cases will produce high-quality treated effluent.In addition, as the adsorption is sometimes reversible andadsorbent can be regenerated by suitable desorption process,various types of adsorbents have found application inthe removal of heavy metals, including activated carbon[2, 3], carbon nanotubes [4–6], polymeric adsorbents [7],metal oxides [8], and bioadsorbents [9–12]. Among theseadsorbents, iron-based magnetic nanomaterials have dis-tinguished themselves by their unique properties, such as
larger surface area-volume ratio, diminished consumptionof chemicals, and no secondary pollutant. However, withanother special property of this kind magnetic materialsare realized and utilized in the context of environmentalremediation. More and more magnetic separation has beencombined with adsorption for the removal of heavy metalsfrom contaminated water at laboratory scales [13–15]. Espe-cially in industries, magnetic separation is desirable becauseit can overcome many drawbacks occurring in the membranefiltration, centrifugation, or gravitational separation and iseasy to achieve a given level of separation just via externalmagnetic field.
Iron oxides exit in many forms in nature, with magnetite(Fe3O4), hematite (α-Fe2O3) and maghemite (γ-Fe2O3),being most probably common and important technologically[16]. It has been reported that surface effects have a stronginfluence on the magnetic properties of iron oxide nanopar-ticles [17]. As the surface area of iron-oxide-based magneticmaterials decreased, their responses to external magneticfield decreased, making it difficult to recover the adsorbents
2 International Journal of Photoenergy
after treatment has been completed [14]. On the other hand,it has also been noted that the adsorption capacities ofadsorbents rely largely on the available surface areas, andthe increase of the surface area is normally obtained bythe decrease of the particle size of adsorbents. As a result,there is a need to synthesize such absorbents with properparticles sizes for the removal of heavy metals from industrialwastewater.
Up to now, there are several methods that can beused to synthesize iron-oxide-based nanomaterials. Thesemethods include hydrothermal synthesis [18, 19], thermaldecomposition [20, 21], co-precipitation [22, 23], sol-gelmethod [15], and colloidal chemistry method [24]. Amongthese synthesis methods, coprecipitation has proven to be themost promising method for the production of nanomaterialsas the procedure is relatively simple and the particles can beobtained with controlled particle size.
The specific objective of the present study was (1) tosynthesize γ-Fe2O3 nanoparticles using a modified method,which involved urea as a uniformity precipitation reagent,(2) to characterize γ-Fe2O3 nanoparticles synthesized usingdifferent kinds of analytical instruments, and (3) to evaluatesynthesized γ-Fe2O3 nanoparticles as adsorbents to removeheavy metals such as Pb2+ from industrial wastewater.
2. Experimental
2.1. Preparation and Characterization of γ-Fe2O3 Nanopar-ticles. The synthesis of γ-Fe2O3 nanoparticles involves thefollowing steps: (1) a designated molar ratio of iron chlorideand urea was dissolved in deionized water; (2) the mixturewas continuously stirred for 45 min at 90◦C in a water bathbefore it was cooled to room temperature; (3) the producedprecipitation was centrifuged and washed by deionized waterand followed by ethanol; (4) after being dried at 75◦C for 4hours, the collected powder was slowly calcined to 650◦C inair and dwelt for 2 hours. The resultant product of γ-Fe2O3
nanoparticles was obtained for subsequent characterization.A scanning electron microscope (SEM, JEOL JEM2010,
Japan) was used to characterize the structure properties ofthe synthesized materials. The element composition of thesynthesized materials was identified by an energy dispersiveX-ray spectroscopy system (EDX) coupled to the SEM. Thecrystallization phase analysis was executed by a powderX-ray diffraction (XRD) (Philips PW-1830, Netherlands).Magnetization measurement was carried out with a vibrationsample magnetometer (VSM) at room temperature.
2.2. Removal of Heavy Metals from Wastewater. A stocksolution containing Pb2+ was prepared by dissolving aknown quantity of lead nitrate (Pb(NO3)2) in deionizedwater. Batch adsorption studies were performed by mixing0.5 g of γ-Fe2O3 with 50 mL of solutions of varying Pb2+
concentrations (50, 100, and 150 mg/L) in 100 mL glass vials.The adsorption on γ-Fe2O3 was first studied at pH valuesof 2.5 to 6.5 to investigate the effects of pH values on thePb2+ adsorption. 0.1 M HCl and 0.1 M NaOH solutions wereused to adjust the pH values of water samples. The pH
values of water samples were stable over the the experimentperiod. All the adsorption experiments were carried out ata room temperature of 22 ± 2◦C and were performed intriplicate. The total aqueous concentrations of Pb2+ weremeasured using an inductively coupled plasma-optical emis-sion spectrometer (ICP-OES, Thermo, icap 6000). Sampledilution was conducted before the ICP-OES measurement,where necessary.
3. Results and Discussion
3.1. Synthesis and Characterization of γ-Fe2O3. The crys-talline grain size is mainly determined by both the formationenergy of growth unit and the lattice energy, besides differentsynthesis conditions. In the present study, Fe2O3 nanopar-ticles were synthesized by varying pH values, ageing time,the mass ratio of FeCl3 and urea, and so forth. Figure 1(a)shows an SEM image of the synthesized γ-Fe2O3, confirmingthat the particles obtained were indeed in the nanometerrange. Upon ageing for different durations, it was observedthat the grain size increased with increasing ageing time.The smallest grain size (63.20 ± 0.928 nm) was obtainedafter ageing for 45 minutes. In addition, strong peaks forFe and O can be observed in the spectrum illustrated inFigure 1(b) for particles after ageing time of 45 min. Theinsert of Figure 1(b) reveals that the O/Fe atomic ratio of theγ-Fe2O3 analyzed was 1.56, which was relatively consistentwith the theoretical O/Fe atomic ratio of 1.50.
The magnetization with respect to applied field wasrecorded at room temperature. The hysteresis loop, shownin Figure 2, suggested a weak magnetic nature of the sampleswith little hysteresis. The weak magnetism might be causedby the presence of α-Fe2O3 as detected by XRD. FromFigure 2, the MS was calculated to be 0.025 emu/g and theHC to be 1250 Oe.
Figure 3 shows the results of XRD analysis for thesynthesized nanoparticles that were obtained with differentinitial concentrations of FeCl3. It indicates that the particlesconsist of γ-Fe2O3 (peaks denoted by∗) and α-Fe2O3 (peaksdenoted by #). It also indicates that a concentration of 0.02 Mof FeCl3 resulted in the particles with the smallest Z-averagediameter. Therefore, 0.02 M was the optimized concentrationfor FeCl3.
3.2. Effect of Adsorption Time and Initial Concentration.The adsorption of Pb2+ onto γ-Fe2O3 nanoparticles wasmonitored for 120 min. The initial Pb2+ concentrations were50, 100, and 150 mg/L, respectively. The initial pH value ofwater samples was 5.5, and the solution temperature was22 ± 2◦C. As seen in Figure 4, Pb2+ ions were adsorbedonto γ-Fe2O3 nanoparticles rapidly, and equilibrium wasestablished within 30 minutes. This could be due to the smallsize of γ-Fe2O3 nanoparticles, which was favorable for thediffusion of Pb2+ ions from bulk solution onto the activesites of the solid surface. External adsorption dominatedand no pore diffusion was observed to slow down theadsorption rate. Despite the short equilibrium time, a 24-hcontact time was adopted for the subsequent experiment to
International Journal of Photoenergy 3
(a)
Element Wt% At%
15.47 38.89
84.53 61.02
Total 100 100
2 4 6 8 10 12 14 16
(KeV)
O K
Au MFe L
Fe K
Au M
Fe K
Fe L
Au M
O K
Fe K
(b)
Figure 1: SEM image and EDX spectrum for γ-Fe2O3 nanoparticles.
0.3
0.2
0.1
0
− 0.1
− 0.2
− 0.3
H (Oe)
M(e
mu
/g)
− 10000 − 5000 0 5000 10000
Figure 2: VSM measurements for γ-Fe2O3 nanoparticles.
ensure that adsorption equilibrium was achieved. The shortequilibrium time was in agreement with that reported byother researchers for the adsorption of other metal ions ontoiron oxide nanoparticles [25–27]. This is in contrast to otherconventional porous adsorbents in which adsorption occursthrough pore diffusion steps, which in turn slow down theadsorption rate. The γ-Fe2O3 nanoparticles are nonporousadsorbents, as confirmed by the surface area and porositymeasurements, where only external adsorption occurred.This type of adsorption mass transfer requires less timeto reach the equilibrium [28]. This result is promising asequilibrium time plays a major role in economic viabilityfor wastewater treatment plant. Furthermore, as shown inFigure 4, the amount adsorbed of Pb2+ increased with theincrease in the initial concentration of Pb2+ in water samples.This can be attributed to the increase in the ion occupancynumber, which favors the adsorption process.
3.3. Effect of pH. It is well known that pH is one of the mostimportant factors that affect the adsorption process of heavymetals in water samples. The experiments were carried out
10 20 30 40 50 60 70 80 90
0
7000
14000
Inte
nsi
ty
2 (deg)
Denotes 0.005 MDenotes 0.01 M
Denotes 0.02 MDenotes 0.05 M
27.0
57 [
211]
38.7
3 [3
20]
45.6
22 [
410] 47
.686
[33
0]
63.1
82 [
440]
82.6
04 [
710]
55.9
37 [
430]
# 23
.383
[01
2]
# 69
.622
[20
8]
# 61
.17
[214
]
# 74
.855
[21
7]
# 89
.044
[22
6]
Figure 3: XRD patterns of synthesized γ-Fe2O3 nanoparticles withdifferent concentrations of FeCl3.
to find the optimum pH on the adsorption of Pb2+ ionsonto γ-Fe2O3 nanoparticles using different initial pH valuesof 2.5 to 6.5. The experimental pH values of up to 6.5 werechosen as precipitation of lead hydroxide would occur atpH values equal to or higher than 7.0, even though othervariables such as the amount of nanoparticles were fixed [29].Therefore, it was not feasible to carry out the adsorptionexperiments for Pb2+ at pH > 6.5 without introducing someuncertainties to the results. Figure 5 shows the effects of pHon the adsorption of Pb2+. As observed in the graph, theremoval efficiency of Pb2+ ions from watersamples by theγ-Fe2O3 nanoparticles was clearly pH dependent and thehighest adsorption efficiency was obtained at pH ≥5.5. Leeet al. also observed a similar pH effect for the adsorption ofPb2+ onto bulk iron oxides in water samples [30]. It indicatedthat a water sample with a higher pH value was favorablefor the deprotonation of sorbent surface [31, 32]. Increaseddeprotonation could result in the increase of negativelycharged sites, which enhanced the attractive forces betweenthe sorbent surface and the Pb2+ ions. Therefore, it will result
4 International Journal of Photoenergy
0 10 20 30 40 50 60 70 80 90 100 110 120
0
10
20
30
40
50
60
70
80
90
100
Time (min)
Rem
oval
eci
ency
(%
)
50 mg/L100 mg/L150 mg/L
Figure 4: Effect of contact time on the removal of Pb2+ atdifferent initial concentrations. Adsorbent dose: 10 g/L, shakingrate: 200 rpm, pH: 5.5, T: 22± 2oC.
0 2 4 6 80
20
40
60
80
100
pH
Rem
oval
eci
ency
(%
)
Figure 5: Effect of pH on Pb2+ adsorption onto γ-Fe2O3 nanoad-sorbents. Initial Pb2+ concentration: 50 mg/L. Adsorbent dose:10 g/L, shaking rate: 200 rpm, T: 22± 2oC.
in the increase in the adsorption capacity. On the other hand,in a water sample with lower pH, the positively chargedsites dominate and this could enhance the repulsion forcesexisting between the sorbent surface and the Pb2+ ions andtherefore decrease the adsorption of Pb2+ ions.
3.4. Effects of Salinity. Increasing NaCl salinity from 0% to3.5% (the salinity of seawater) had no effects on the removalof Pb2+ by γ-Fe2O3 nanoadsorbents. This suggested thatno interaction occurred among NaCl, Pb2+ and γ-Fe2O3
nanoadsorbents, and the complexation of Pb2+, and Cl− wasmuch weaker than the coordination between Pb2+ and theadsorptive sites on the surfaces of γ-Fe2O3 nanoadsorbents.
4. Conclusions
This study showed that the prepared γ-Fe2O3 nanoparticlescould be used as an alternate to the conventional adsorbentsfor the removal of metal ions from wastewater with highremoval efficiency within a very short time. The removalof Pb2+, as a typical metal ion commonly present inwastewater, by adsorption onto γ-Fe2O3 nanoparticles wassuccessfully accomplished. Adsorption was very rapid andequilibrium was achieved within 15 min. It also showed thatadsorption was highly dependent on the initial concentrationof Pb2+ and initial pH value. Maximum removal efficiencywas achieved at pH 5.5 at room temperature. IncreasingNaCl from 0% to 3.5% (the salinity of seawater) had noeffects on the adsorption of Pb2+ on γ-Fe2O3 nanoparticles.The adsorption isotherms were also determined and wereappropriately described by both Langmuir and Freundlichmodels, with a better fitting to the Langmuir model than theFreundlich model. Therefore, γ-Fe2O3 nanoparticles wererecommended as fast, effective, and inexpensive nanoadsor-bents for rapid removal and recovery of metal ions fromindustrial wastewater.
Acknowledgment
This work was supported by the Ministry of EducationInnovation Fund of Singapore (MOE2008-IF-1-010).
References
[1] F. Fu and Q. Wang, “Removal of heavy metal ions fromwastewaters: a review,” Journal of Environmental Management,vol. 92, no. 3, pp. 407–418, 2011.
[2] K. C. Kang, S. S. Kim, J. W. Choi, and S. H. Kwon, “Sorptionof Cu2+ and Cd2+ onto acid- and base-pretreated granularactivated carbon and activated carbon fiber samples,” Journalof Industrial and Engineering Chemistry, vol. 14, no. 1, pp. 131–135, 2008.
[3] A. Jusoh, L. Su Shiung, N. Ali, and M. J. M. M. Noor,“A simulation study of the removal efficiency of granularactivated carbon on cadmium and lead,” Desalination, vol.206, no. 1–3, pp. 9–16, 2007.
[4] Y. Li, F. Liu, B. Xia et al., “Removal of copper from aqueoussolution by carbon nanotube/calcium alginate composites,”Journal of Hazardous Materials, vol. 177, no. 1–3, pp. 876–880,2010.
[5] M. I. Kandah and J. L. Meunier, “Removal of nickel ionsfrom water by multi-walled carbon nanotubes,” Journal ofHazardous Materials, vol. 146, no. 1-2, pp. 283–288, 2007.
[6] Y. H. Li, Z. Di, J. Ding, D. Wu, Z. Luan, and Y. Zhu,“Adsorption thermodynamic, kinetic and desorption studiesof Pb2+ on carbon nanotubes,” Water Research, vol. 39, no. 4,pp. 605–609, 2005.
[7] A. Dabrowski, Z. Hubicki, P. Podkocielny, and E. Robens,“Selective removal of the heavy metal ions from waters andindustrial wastewaters by ion-exchange method,” Chemo-sphere, vol. 56, no. 2, pp. 91–106, 2004.
[8] Z. Ai, Y. Cheng, L. Zhang, and J. Qiu, “Efficient removalof Cr(VI) from aqueous solution with Fe@Fe2O3 core-shellnanowires,” Environmental Science and Technology, vol. 42, no.18, pp. 6955–6960, 2008.
International Journal of Photoenergy 5
[9] T. Aman, A. A. Kazi, M. U. Sabri, and Q. Bano, “Potato peelsas solid waste for the removal of heavy metal copper(II) fromwaste water/industrial effluent,” Colloids and Surfaces B, vol.63, no. 1, pp. 116–121, 2008.
[10] S. J. Kohler, P. Cubillas, J. D. Rodrıguez-Blanco, C. Bauer,and M. Prieto, “Removal of cadmium from wastewaters byaragonite shells and the influence of other divalent cations,”Environmental Science and Technology, vol. 41, no. 1, pp. 112–118, 2007.
[11] P. Pavasant, R. Apiratikul, V. Sungkhum, P. Suthiparinyanont,S. Wattanachira, and T. F. Marhaba, “Biosorption of Cu2+,Cd2+, Pb2+, and Zn2+ using dried marine green macroalgaCaulerpa lentillifera,” Bioresource Technology, vol. 97, no. 18,pp. 2321–2329, 2006.
[12] M. Souiri, I. Gammoudi, H. B. Ouada et al., “Escherichiacoli-functionalized magnetic nanobeads as an ultrasensitivebiosensor for heavy metals,” Procedia Chemistry, vol. 1, no. 1,pp. 1027–1030, 2009.
[13] J. T. Mayo, C. Yavuz, S. Yean et al., “The effect of nanocrys-talline magnetite size on arsenic removal,” Science and Tech-nology of Advanced Materials, vol. 8, no. 1-2, pp. 71–75, 2007.
[14] C. T. Yavuz, J. T. Mayo, W. W. Yu et al., “Low-field magneticseparation of monodisperse Fe3O4 nanocrystals,” Science, vol.314, no. 5801, pp. 964–967, 2006.
[15] J. Hu, G. Chen, and I. M. C. Lo, “Removal and recovery ofCr(VI) from wastewater by maghemite nanoparticles,” WaterResearch, vol. 39, no. 18, pp. 4528–4536, 2005.
[16] A. S. Teja and P. Y. Koh, “Synthesis, properties, and applica-tions of magnetic iron oxide nanoparticles,” Progress in CrystalGrowth and Characterization of Materials, vol. 55, no. 1-2, pp.22–45, 2009.
[17] T. Neuberger, B. Schopf, H. Hofmann, M. Hofmann, andB. Von Rechenberg, “Superparamagnetic nanoparticles forbiomedical applications: possibilities and limitations of a newdrug delivery system,” Journal of Magnetism and MagneticMaterials, vol. 293, no. 1, pp. 483–496, 2005.
[18] V. Sreeja and P. A. Joy, “Microwave-hydrothermal synthesisof γ-Fe2O3 nanoparticles and their magnetic properties,”Materials Research Bulletin, vol. 42, no. 8, pp. 1570–1576, 2007.
[19] T. J. Daou, G. Pourroy, S. Begin-Colin et al., “Hydrothermalsynthesis of monodisperse magnetite nanoparticles,” Chem-istry of Materials, vol. 18, no. 18, pp. 4399–4404, 2006.
[20] K. Simeonidis, S. Mourdikoudis, M. Moulla et al., “Controlledsynthesis and phase characterization of Fe-based nanoparticlesobtained by thermal decomposition,” Journal of Magnetismand Magnetic Materials, vol. 316, no. 2, pp. e1–e4, 2007.
[21] W. Zhou, K. Tang, S. Zeng, and Y. Qi, “Room temperaturesynthesis of rod-like FeC2O4 · 2H2O and its transition tomaghemite, magnetite and hematite nanorods through con-trolled thermal decomposition,” Nanotechnology, vol. 19, no.6, Article ID 065602, 2008.
[22] W. Yu, T. Zhang, J. Zhang, X. Qiao, L. Yang, and Y. Liu, “Thesynthesis of octahedral nanoparticles of magnetite,” MaterialsLetters, vol. 60, no. 24, pp. 2998–3001, 2006.
[23] I. Nedkov, T. Merodiiska, L. Slavov, R. E. Vandenberghe, Y.Kusano, and J. Takada, “Surface oxidation, size and shape ofnano-sized magnetite obtained by co-precipitation,” Journal ofMagnetism and Magnetic Materials, vol. 300, no. 2, pp. 358–367, 2006.
[24] P. D. Cozzoli, E. Snoeck, M. A. Garcia et al., “Colloidalsynthesis and characterization of tetrapod-shaped magneticnanocrystals,” Nano Letters, vol. 6, no. 9, pp. 1966–1972, 2006.
[25] A. Uheida, M. Iglesias, C. Fontas et al., “Sorption ofpalladium(II), rhodium(III), and platinum(IV) on Fe3O4
nanoparticles,” Journal of Colloid and Interface Science, vol.301, no. 2, pp. 402–408, 2006.
[26] A. Uheida, G. Salazar-Alvarez, E. Bjorkman, Z. Yu, andM. Muhammed, “Fe3O4 and γ-Fe2O3 nanoparticles for theadsorption of Co2+ from aqueous solution,” Journal of Colloidand Interface Science, vol. 298, no. 2, pp. 501–507, 2006.
[27] H. Sun, X. Zhang, Q. Niu, Y. Chen, and J. C. Crittenden,“Enhanced accumulation of arsenate in carp in the presence oftitanium dioxide nanoparticles,” Water, Air, and Soil Pollution,vol. 178, no. 1–4, pp. 245–254, 2007.
[28] P. K. Dutta, A. K. Ray, V. K. Sharma, and F. J. Millero,“Adsorption of arsenate and arsenite on titanium dioxidesuspensions,” Journal of Colloid and Interface Science, vol. 278,no. 2, pp. 270–275, 2004.
[29] T. K. Naiya, A. K. Bhattacharya, and S. K. Das, “Adsorptionof Pb(II) by sawdust and neem bark from aqueous solutions,”Environmental Progress, vol. 27, no. 3, pp. 313–328, 2008.
[30] S. Z. Lee, L. Chang, H. H. Yang, C. M. Chen, and M. C.Liu, “Adsorption characteristics of lead onto soils,” Journal ofHazardous Materials, vol. 63, no. 1, pp. 37–49, 1998.
[31] P. Roonasi and A. Holmgren, “An ATR-FTIR study of sulphatesorption on magnetite; rate of adsorption, surface speciation,and effect of calcium ions,” Journal of Colloid and InterfaceScience, vol. 333, no. 1, pp. 27–32, 2009.
[32] S. B. Johnson, G. V. Franks, P. J. Scales, D. V. Boger, andT. W. Healy, “Surface chemistry-rheology relationships inconcentrated mineral suspensions,” International Journal ofMineral Processing, vol. 58, no. 1–4, pp. 267–304, 2000.
Hindawi Publishing CorporationInternational Journal of PhotoenergyVolume 2012, Article ID 794207, 7 pagesdoi:10.1155/2012/794207
Research Article
Nitrogen-Doped TiO2 Nanotube Arrays withEnhanced Photoelectrochemical Property
Shipu Li, Shiwei Lin, Jianjun Liao, Nengqian Pan, Danhong Li, and Jianbao Li
Key Laboratory of Ministry of Education for Application Technology of Chemical Materials in Hainan Superior Resources,School of Materials and Chemical Engineering, Hainan University, Haikou 570228, China
Correspondence should be addressed to Shiwei Lin, [email protected]
Received 22 January 2012; Revised 22 February 2012; Accepted 27 February 2012
Academic Editor: Xuxu Wang
Copyright © 2012 Shipu Li et al. This is an open access article distributed under the Creative Commons Attribution License, whichpermits unrestricted use, distribution, and reproduction in any medium, provided the original work is properly cited.
N-doped TiO2 nanotube arrays were prepared by electrochemical anodization in glycerol electrolyte, followed by electrochemicaldeposition in NH4Cl solution. An orthogonal experiment was used to optimize the doping conditions. Electrolyte concentration,reaction voltage, and reaction time were the main factors to influence the N-doping effect which was the determinant of the visiblerange photoresponse. The optimal N-doping conditions were determined as follows: reaction voltage is 3 V, reaction time is 2 h,and electrolyte concentration is 0.5 M. The maximal photocurrent enhanced ratio was 30% under white-light irradiation. About58% improvement of photocatalytic efficiency was achieved in the Rhodamine B degradation experiment by N doping. The kineticconstant of the N-doped TNT arrays sample was almost twice higher than that of the undoped sample. Further analysis by X-rayphotoelectron spectroscopy supported that electrochemical deposition is a simple and efficient method for N doping into TiO2
nanotube arrays.
1. Introduction
Since the discovery of water photolysis on TiO2 electrodeby Fujishima and Honda in 1972 [1], TiO2 has been exten-sively studied. It is one of the most promising oxide semicon-ductors for photoelectrochemical applications, particularlydue to its low cost, nontoxicity, and stability against photo-corrosion. In contrast to nanoparticle, highly ordered TiO2
nanotube (TNT) arrays not only have high surface-to-volume ratios and adsorptive capacity, but also have goodphotocatalytic properties and high photoelectrical conver-sion efficiency. Also, the nanotubes produced by anodizationcan permit a careful control over their nanotube diameter,layer thickness, and wall thickness, obtaining structures ver-tically oriented from the surface. So the TNT arrays havewidespread application prospect in dye sensitization solarcells, sensors, hydrogen generation by water photoelec-trolysis, photocatalytic degradation of pollutants, and bio-medicines [2–11].
However, due to the comparably large bandgap (anatase,Eg∼ 3.2 eV), TiO2 can only respond to UV light irradiation(λ < 380 nm) which possesses about 4% of the solarspectrum. This greatly limits its application prospects. To
overcome this problem, two different strategies have beentypically taken: element doping and surface modification.Asahi et al. reported that improved photocatalytic activityof TiO2 under visible light irradiation can be achieved bynitrogen doping [12]. Since then, many preparation meth-ods, such as ion implantation, hydrothermal, chemical vapordeposition, chemical liquid deposition, and anodic oxida-tion of Ti/N alloy [13–19], have been reported to dope nitro-gen into TiO2 using different N-doped precursors to enhancethe photoelectrochemical properties of TiO2. However theirdoping effects are contradictory, and the underlying mecha-nisms are also lack of a consensus.
In our previous work, we reported the successful con-trollable growth of highly ordered TiO2 nanotube arrays byadjusting the anodization voltage and duration [20]. In thispaper, we investigate a simple and efficient nitrogen-dopingapproach, that is, electrochemical deposition. Despite thevast reports on TNT arrays, there is little research on the in-fluence of doping parameters on electrochemical nitrogen-doping process. Thus, we take an orthogonal experiment tooptimize the doping conditions in order to obtain an ex-cellent visible range photoresponse. Then, the N-doping
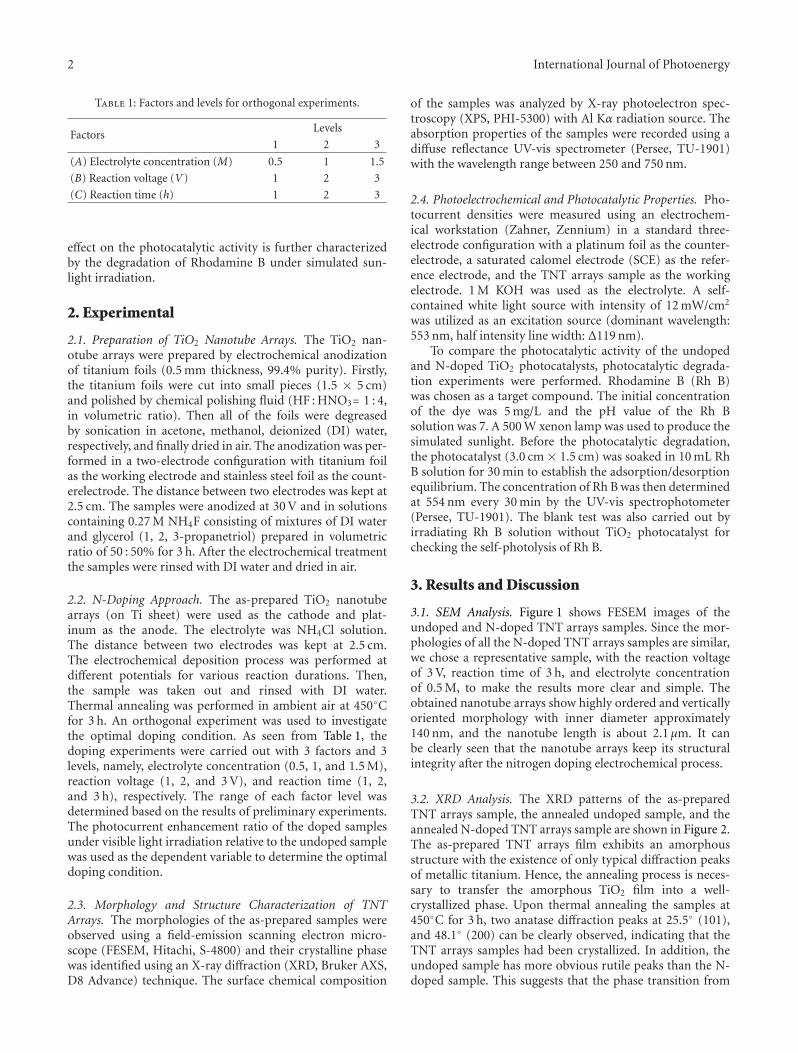
2 International Journal of Photoenergy
Table 1: Factors and levels for orthogonal experiments.
FactorsLevels
1 2 3
(A) Electrolyte concentration (M) 0.5 1 1.5
(B) Reaction voltage (V) 1 2 3
(C) Reaction time (h) 1 2 3
effect on the photocatalytic activity is further characterizedby the degradation of Rhodamine B under simulated sun-light irradiation.
2. Experimental
2.1. Preparation of TiO2 Nanotube Arrays. The TiO2 nan-otube arrays were prepared by electrochemical anodizationof titanium foils (0.5 mm thickness, 99.4% purity). Firstly,the titanium foils were cut into small pieces (1.5 × 5 cm)and polished by chemical polishing fluid (HF : HNO3= 1 : 4,in volumetric ratio). Then all of the foils were degreasedby sonication in acetone, methanol, deionized (DI) water,respectively, and finally dried in air. The anodization was per-formed in a two-electrode configuration with titanium foilas the working electrode and stainless steel foil as the count-erelectrode. The distance between two electrodes was kept at2.5 cm. The samples were anodized at 30 V and in solutionscontaining 0.27 M NH4F consisting of mixtures of DI waterand glycerol (1, 2, 3-propanetriol) prepared in volumetricratio of 50 : 50% for 3 h. After the electrochemical treatmentthe samples were rinsed with DI water and dried in air.
2.2. N-Doping Approach. The as-prepared TiO2 nanotubearrays (on Ti sheet) were used as the cathode and plat-inum as the anode. The electrolyte was NH4Cl solution.The distance between two electrodes was kept at 2.5 cm.The electrochemical deposition process was performed atdifferent potentials for various reaction durations. Then,the sample was taken out and rinsed with DI water.Thermal annealing was performed in ambient air at 450◦Cfor 3 h. An orthogonal experiment was used to investigatethe optimal doping condition. As seen from Table 1, thedoping experiments were carried out with 3 factors and 3levels, namely, electrolyte concentration (0.5, 1, and 1.5 M),reaction voltage (1, 2, and 3 V), and reaction time (1, 2,and 3 h), respectively. The range of each factor level wasdetermined based on the results of preliminary experiments.The photocurrent enhancement ratio of the doped samplesunder visible light irradiation relative to the undoped samplewas used as the dependent variable to determine the optimaldoping condition.
2.3. Morphology and Structure Characterization of TNTArrays. The morphologies of the as-prepared samples wereobserved using a field-emission scanning electron micro-scope (FESEM, Hitachi, S-4800) and their crystalline phasewas identified using an X-ray diffraction (XRD, Bruker AXS,D8 Advance) technique. The surface chemical composition
of the samples was analyzed by X-ray photoelectron spec-troscopy (XPS, PHI-5300) with Al Kα radiation source. Theabsorption properties of the samples were recorded using adiffuse reflectance UV-vis spectrometer (Persee, TU-1901)with the wavelength range between 250 and 750 nm.
2.4. Photoelectrochemical and Photocatalytic Properties. Pho-tocurrent densities were measured using an electrochem-ical workstation (Zahner, Zennium) in a standard three-electrode configuration with a platinum foil as the counter-electrode, a saturated calomel electrode (SCE) as the refer-ence electrode, and the TNT arrays sample as the workingelectrode. 1 M KOH was used as the electrolyte. A self-contained white light source with intensity of 12 mW/cm2
was utilized as an excitation source (dominant wavelength:553 nm, half intensity line width: Δ119 nm).
To compare the photocatalytic activity of the undopedand N-doped TiO2 photocatalysts, photocatalytic degrada-tion experiments were performed. Rhodamine B (Rh B)was chosen as a target compound. The initial concentrationof the dye was 5 mg/L and the pH value of the Rh Bsolution was 7. A 500 W xenon lamp was used to produce thesimulated sunlight. Before the photocatalytic degradation,the photocatalyst (3.0 cm × 1.5 cm) was soaked in 10 mL RhB solution for 30 min to establish the adsorption/desorptionequilibrium. The concentration of Rh B was then determinedat 554 nm every 30 min by the UV-vis spectrophotometer(Persee, TU-1901). The blank test was also carried out byirradiating Rh B solution without TiO2 photocatalyst forchecking the self-photolysis of Rh B.
3. Results and Discussion
3.1. SEM Analysis. Figure 1 shows FESEM images of theundoped and N-doped TNT arrays samples. Since the mor-phologies of all the N-doped TNT arrays samples are similar,we chose a representative sample, with the reaction voltageof 3 V, reaction time of 3 h, and electrolyte concentrationof 0.5 M, to make the results more clear and simple. Theobtained nanotube arrays show highly ordered and verticallyoriented morphology with inner diameter approximately140 nm, and the nanotube length is about 2.1 μm. It canbe clearly seen that the nanotube arrays keep its structuralintegrity after the nitrogen doping electrochemical process.
3.2. XRD Analysis. The XRD patterns of the as-preparedTNT arrays sample, the annealed undoped sample, and theannealed N-doped TNT arrays sample are shown in Figure 2.The as-prepared TNT arrays film exhibits an amorphousstructure with the existence of only typical diffraction peaksof metallic titanium. Hence, the annealing process is neces-sary to transfer the amorphous TiO2 film into a well-crystallized phase. Upon thermal annealing the samples at450◦C for 3 h, two anatase diffraction peaks at 25.5◦ (101),and 48.1◦ (200) can be clearly observed, indicating that theTNT arrays samples had been crystallized. In addition, theundoped sample has more obvious rutile peaks than the N-doped sample. This suggests that the phase transition from
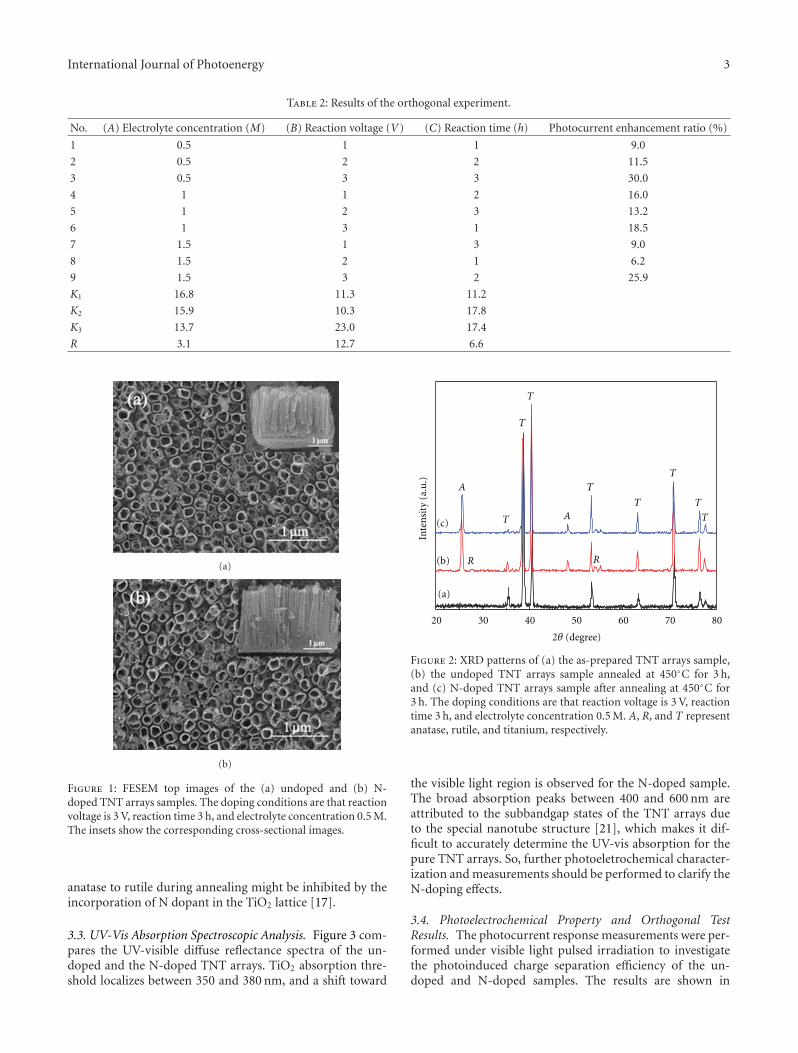
International Journal of Photoenergy 3
Table 2: Results of the orthogonal experiment.
No. (A) Electrolyte concentration (M) (B) Reaction voltage (V) (C) Reaction time (h) Photocurrent enhancement ratio (%)
1 0.5 1 1 9.0
2 0.5 2 2 11.5
3 0.5 3 3 30.0
4 1 1 2 16.0
5 1 2 3 13.2
6 1 3 1 18.5
7 1.5 1 3 9.0
8 1.5 2 1 6.2
9 1.5 3 2 25.9
K1 16.8 11.3 11.2
K2 15.9 10.3 17.8
K3 13.7 23.0 17.4
R 3.1 12.7 6.6
(a)
(b)
Figure 1: FESEM top images of the (a) undoped and (b) N-doped TNT arrays samples. The doping conditions are that reactionvoltage is 3 V, reaction time 3 h, and electrolyte concentration 0.5 M.The insets show the corresponding cross-sectional images.
anatase to rutile during annealing might be inhibited by theincorporation of N dopant in the TiO2 lattice [17].
3.3. UV-Vis Absorption Spectroscopic Analysis. Figure 3 com-pares the UV-visible diffuse reflectance spectra of the un-doped and the N-doped TNT arrays. TiO2 absorption thre-shold localizes between 350 and 380 nm, and a shift toward
20 30 40 50 60 70 80
A
R
T
T
T
T
T
T
T
A
Inte
nsi
ty (
a.u
.)
(a)
(b)
(c) T
R
2θ (degree)
Figure 2: XRD patterns of (a) the as-prepared TNT arrays sample,(b) the undoped TNT arrays sample annealed at 450◦C for 3 h,and (c) N-doped TNT arrays sample after annealing at 450◦C for3 h. The doping conditions are that reaction voltage is 3 V, reactiontime 3 h, and electrolyte concentration 0.5 M. A, R, and T representanatase, rutile, and titanium, respectively.
the visible light region is observed for the N-doped sample.The broad absorption peaks between 400 and 600 nm areattributed to the subbandgap states of the TNT arrays dueto the special nanotube structure [21], which makes it dif-ficult to accurately determine the UV-vis absorption for thepure TNT arrays. So, further photoeletrochemical character-ization and measurements should be performed to clarify theN-doping effects.
3.4. Photoelectrochemical Property and Orthogonal TestResults. The photocurrent response measurements were per-formed under visible light pulsed irradiation to investigatethe photoinduced charge separation efficiency of the un-doped and N-doped samples. The results are shown in
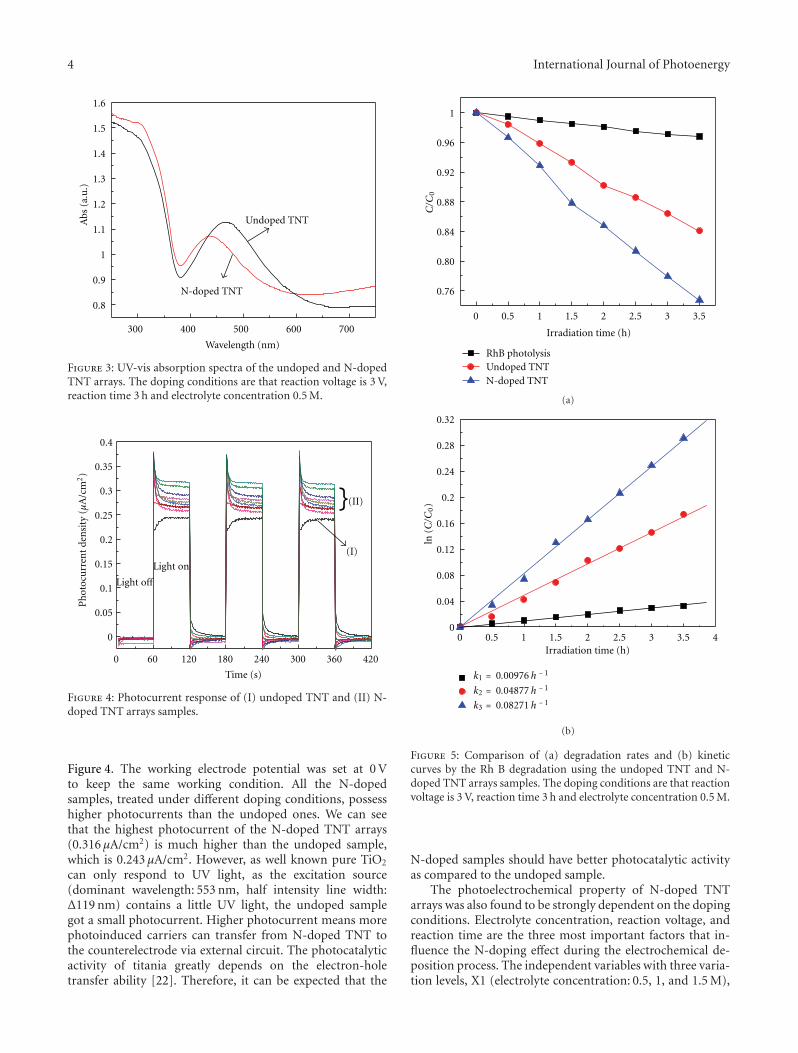
4 International Journal of Photoenergy
300 400 500 600 700
0.8
0.9
1
1.1
1.2
1.3
1.4
1.5
1.6
Abs
(a.
u.)
Wavelength (nm)
Undoped TNT
N-doped TNT
Figure 3: UV-vis absorption spectra of the undoped and N-dopedTNT arrays. The doping conditions are that reaction voltage is 3 V,reaction time 3 h and electrolyte concentration 0.5 M.
0 60 120 180 240 300 360 420
0
0.05
0.1
0.15
0.2
0.25
0.3
0.35
0.4
Light on
Time (s)
Light off
(I)
(II)
Ph
otoc
urr
ent
den
sity
(μ
A/c
m2)
}
Figure 4: Photocurrent response of (I) undoped TNT and (II) N-doped TNT arrays samples.
Figure 4. The working electrode potential was set at 0 Vto keep the same working condition. All the N-dopedsamples, treated under different doping conditions, possesshigher photocurrents than the undoped ones. We can seethat the highest photocurrent of the N-doped TNT arrays(0.316 μA/cm2) is much higher than the undoped sample,which is 0.243 μA/cm2. However, as well known pure TiO2
can only respond to UV light, as the excitation source(dominant wavelength: 553 nm, half intensity line width:Δ119 nm) contains a little UV light, the undoped samplegot a small photocurrent. Higher photocurrent means morephotoinduced carriers can transfer from N-doped TNT tothe counterelectrode via external circuit. The photocatalyticactivity of titania greatly depends on the electron-holetransfer ability [22]. Therefore, it can be expected that the
0 0.5 1 1.5 2 2.5 3 3.5
0.76
0.80
0.84
0.88
0.92
0.96
1
Irradiation time (h)
RhB photolysisUndoped TNTN-doped TNT
C/C
0
(a)
0 0.5 1 1.5 2 2.5 3 3.5 40
0.04
0.08
0.12
0.16
0.2
0.24
0.28
0.32
Irradiation time (h)
ln(C
/C0)
k1 = 0.00976 h − 1
k2 = 0.04877 h − 1
k3 = 0.08271 h − 1
(b)
Figure 5: Comparison of (a) degradation rates and (b) kineticcurves by the Rh B degradation using the undoped TNT and N-doped TNT arrays samples. The doping conditions are that reactionvoltage is 3 V, reaction time 3 h and electrolyte concentration 0.5 M.
N-doped samples should have better photocatalytic activityas compared to the undoped sample.
The photoelectrochemical property of N-doped TNTarrays was also found to be strongly dependent on the dopingconditions. Electrolyte concentration, reaction voltage, andreaction time are the three most important factors that in-fluence the N-doping effect during the electrochemical de-position process. The independent variables with three varia-tion levels, X1 (electrolyte concentration: 0.5, 1, and 1.5 M),
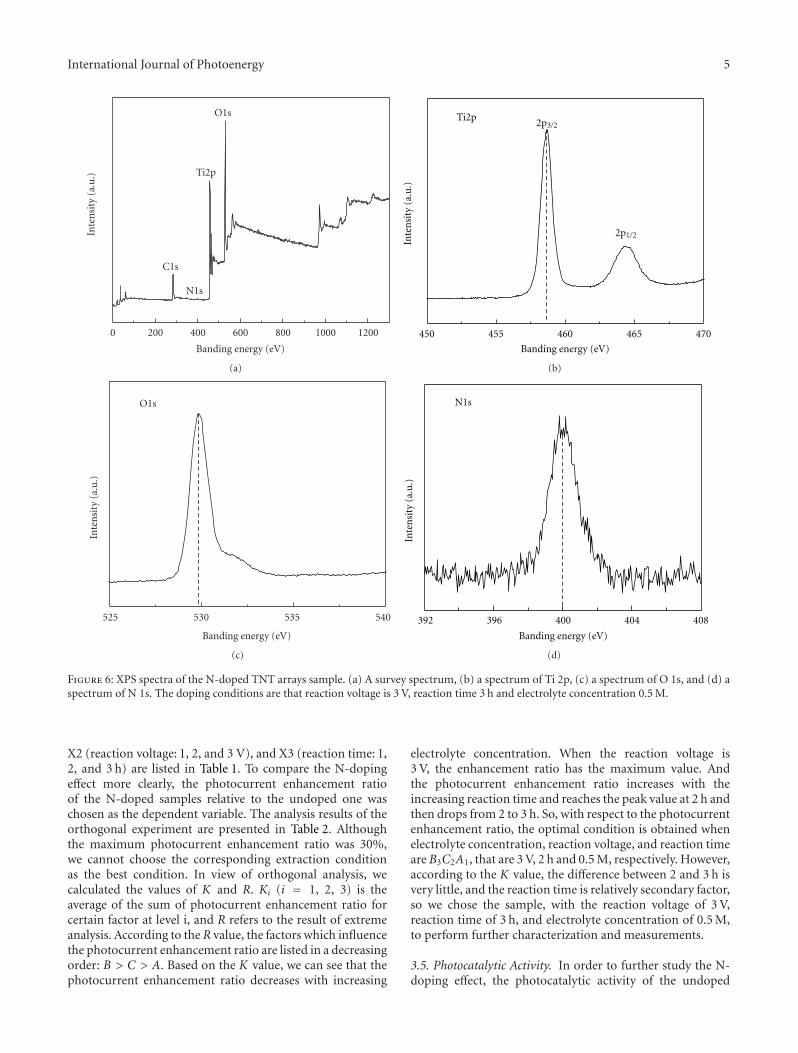
International Journal of Photoenergy 5
0 200 400 600 800 1000 1200
Inte
nsi
ty (
a.u
.)
Banding energy (eV)
O1s
Ti2p
C1s
N1s
(a)
450 455 460 465 470
Inte
nsi
ty (
a.u
.)
Banding energy (eV)
Ti2p2p3/2
2p1/2
(b)
525 530 535 540
Inte
nsi
ty (
a.u
.)
Banding energy (eV)
O1s
(c)
392 396 400 404 408
Inte
nsi
ty (
a.u
.)
Banding energy (eV)
N1s
(d)
Figure 6: XPS spectra of the N-doped TNT arrays sample. (a) A survey spectrum, (b) a spectrum of Ti 2p, (c) a spectrum of O 1s, and (d) aspectrum of N 1s. The doping conditions are that reaction voltage is 3 V, reaction time 3 h and electrolyte concentration 0.5 M.
X2 (reaction voltage: 1, 2, and 3 V), and X3 (reaction time: 1,2, and 3 h) are listed in Table 1. To compare the N-dopingeffect more clearly, the photocurrent enhancement ratioof the N-doped samples relative to the undoped one waschosen as the dependent variable. The analysis results of theorthogonal experiment are presented in Table 2. Althoughthe maximum photocurrent enhancement ratio was 30%,we cannot choose the corresponding extraction conditionas the best condition. In view of orthogonal analysis, wecalculated the values of K and R. Ki (i = 1, 2, 3) is theaverage of the sum of photocurrent enhancement ratio forcertain factor at level i, and R refers to the result of extremeanalysis. According to the R value, the factors which influencethe photocurrent enhancement ratio are listed in a decreasingorder: B > C > A. Based on the K value, we can see that thephotocurrent enhancement ratio decreases with increasing
electrolyte concentration. When the reaction voltage is3 V, the enhancement ratio has the maximum value. Andthe photocurrent enhancement ratio increases with theincreasing reaction time and reaches the peak value at 2 h andthen drops from 2 to 3 h. So, with respect to the photocurrentenhancement ratio, the optimal condition is obtained whenelectrolyte concentration, reaction voltage, and reaction timeare B3C2A1, that are 3 V, 2 h and 0.5 M, respectively. However,according to the K value, the difference between 2 and 3 h isvery little, and the reaction time is relatively secondary factor,so we chose the sample, with the reaction voltage of 3 V,reaction time of 3 h, and electrolyte concentration of 0.5 M,to perform further characterization and measurements.
3.5. Photocatalytic Activity. In order to further study the N-doping effect, the photocatalytic activity of the undoped
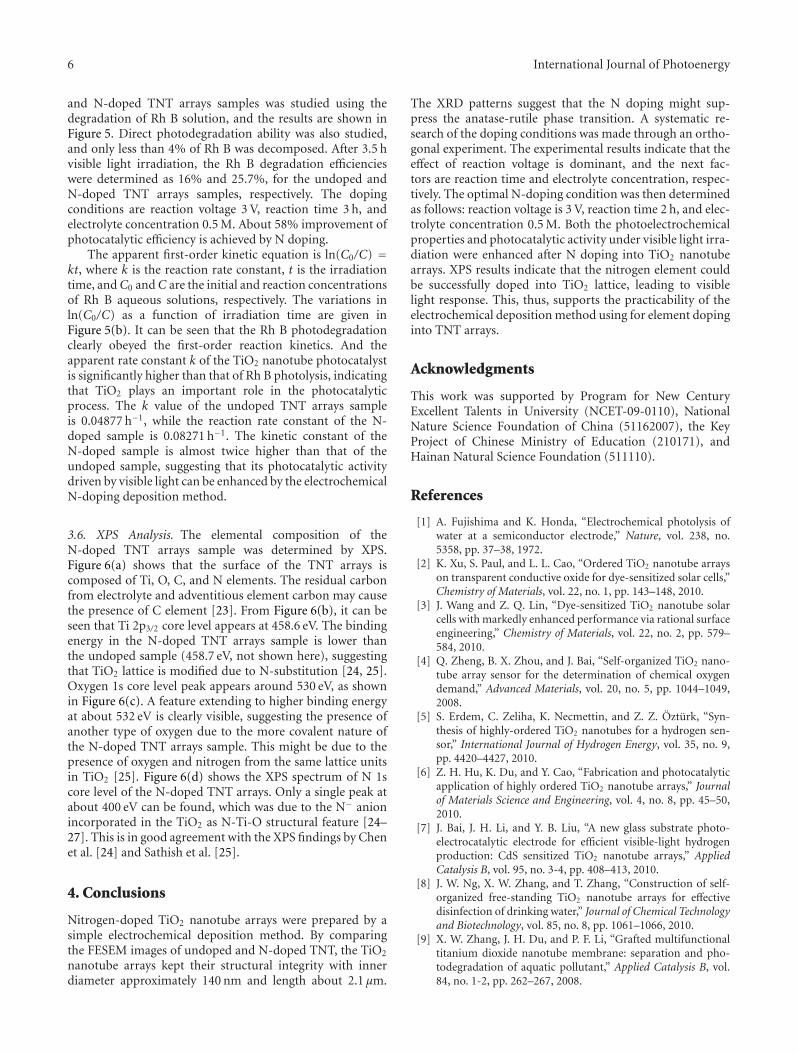
6 International Journal of Photoenergy
and N-doped TNT arrays samples was studied using thedegradation of Rh B solution, and the results are shown inFigure 5. Direct photodegradation ability was also studied,and only less than 4% of Rh B was decomposed. After 3.5 hvisible light irradiation, the Rh B degradation efficiencieswere determined as 16% and 25.7%, for the undoped andN-doped TNT arrays samples, respectively. The dopingconditions are reaction voltage 3 V, reaction time 3 h, andelectrolyte concentration 0.5 M. About 58% improvement ofphotocatalytic efficiency is achieved by N doping.
The apparent first-order kinetic equation is ln(C0/C) =kt, where k is the reaction rate constant, t is the irradiationtime, andC0 andC are the initial and reaction concentrationsof Rh B aqueous solutions, respectively. The variations inln(C0/C) as a function of irradiation time are given inFigure 5(b). It can be seen that the Rh B photodegradationclearly obeyed the first-order reaction kinetics. And theapparent rate constant k of the TiO2 nanotube photocatalystis significantly higher than that of Rh B photolysis, indicatingthat TiO2 plays an important role in the photocatalyticprocess. The k value of the undoped TNT arrays sampleis 0.04877 h−1, while the reaction rate constant of the N-doped sample is 0.08271 h−1. The kinetic constant of theN-doped sample is almost twice higher than that of theundoped sample, suggesting that its photocatalytic activitydriven by visible light can be enhanced by the electrochemicalN-doping deposition method.
3.6. XPS Analysis. The elemental composition of theN-doped TNT arrays sample was determined by XPS.Figure 6(a) shows that the surface of the TNT arrays iscomposed of Ti, O, C, and N elements. The residual carbonfrom electrolyte and adventitious element carbon may causethe presence of C element [23]. From Figure 6(b), it can beseen that Ti 2p3/2 core level appears at 458.6 eV. The bindingenergy in the N-doped TNT arrays sample is lower thanthe undoped sample (458.7 eV, not shown here), suggestingthat TiO2 lattice is modified due to N-substitution [24, 25].Oxygen 1s core level peak appears around 530 eV, as shownin Figure 6(c). A feature extending to higher binding energyat about 532 eV is clearly visible, suggesting the presence ofanother type of oxygen due to the more covalent nature ofthe N-doped TNT arrays sample. This might be due to thepresence of oxygen and nitrogen from the same lattice unitsin TiO2 [25]. Figure 6(d) shows the XPS spectrum of N 1score level of the N-doped TNT arrays. Only a single peak atabout 400 eV can be found, which was due to the N− anionincorporated in the TiO2 as N-Ti-O structural feature [24–27]. This is in good agreement with the XPS findings by Chenet al. [24] and Sathish et al. [25].
4. Conclusions
Nitrogen-doped TiO2 nanotube arrays were prepared by asimple electrochemical deposition method. By comparingthe FESEM images of undoped and N-doped TNT, the TiO2
nanotube arrays kept their structural integrity with innerdiameter approximately 140 nm and length about 2.1 μm.
The XRD patterns suggest that the N doping might sup-press the anatase-rutile phase transition. A systematic re-search of the doping conditions was made through an ortho-gonal experiment. The experimental results indicate that theeffect of reaction voltage is dominant, and the next fac-tors are reaction time and electrolyte concentration, respec-tively. The optimal N-doping condition was then determinedas follows: reaction voltage is 3 V, reaction time 2 h, and elec-trolyte concentration 0.5 M. Both the photoelectrochemicalproperties and photocatalytic activity under visible light irra-diation were enhanced after N doping into TiO2 nanotubearrays. XPS results indicate that the nitrogen element couldbe successfully doped into TiO2 lattice, leading to visiblelight response. This, thus, supports the practicability of theelectrochemical deposition method using for element dopinginto TNT arrays.
Acknowledgments
This work was supported by Program for New CenturyExcellent Talents in University (NCET-09-0110), NationalNature Science Foundation of China (51162007), the KeyProject of Chinese Ministry of Education (210171), andHainan Natural Science Foundation (511110).
References
[1] A. Fujishima and K. Honda, “Electrochemical photolysis ofwater at a semiconductor electrode,” Nature, vol. 238, no.5358, pp. 37–38, 1972.
[2] K. Xu, S. Paul, and L. L. Cao, “Ordered TiO2 nanotube arrayson transparent conductive oxide for dye-sensitized solar cells,”Chemistry of Materials, vol. 22, no. 1, pp. 143–148, 2010.
[3] J. Wang and Z. Q. Lin, “Dye-sensitized TiO2 nanotube solarcells with markedly enhanced performance via rational surfaceengineering,” Chemistry of Materials, vol. 22, no. 2, pp. 579–584, 2010.
[4] Q. Zheng, B. X. Zhou, and J. Bai, “Self-organized TiO2 nano-tube array sensor for the determination of chemical oxygendemand,” Advanced Materials, vol. 20, no. 5, pp. 1044–1049,2008.
[5] S. Erdem, C. Zeliha, K. Necmettin, and Z. Z. Ozturk, “Syn-thesis of highly-ordered TiO2 nanotubes for a hydrogen sen-sor,” International Journal of Hydrogen Energy, vol. 35, no. 9,pp. 4420–4427, 2010.
[6] Z. H. Hu, K. Du, and Y. Cao, “Fabrication and photocatalyticapplication of highly ordered TiO2 nanotube arrays,” Journalof Materials Science and Engineering, vol. 4, no. 8, pp. 45–50,2010.
[7] J. Bai, J. H. Li, and Y. B. Liu, “A new glass substrate photo-electrocatalytic electrode for efficient visible-light hydrogenproduction: CdS sensitized TiO2 nanotube arrays,” AppliedCatalysis B, vol. 95, no. 3-4, pp. 408–413, 2010.
[8] J. W. Ng, X. W. Zhang, and T. Zhang, “Construction of self-organized free-standing TiO2 nanotube arrays for effectivedisinfection of drinking water,” Journal of Chemical Technologyand Biotechnology, vol. 85, no. 8, pp. 1061–1066, 2010.
[9] X. W. Zhang, J. H. Du, and P. F. Li, “Grafted multifunctionaltitanium dioxide nanotube membrane: separation and pho-todegradation of aquatic pollutant,” Applied Catalysis B, vol.84, no. 1-2, pp. 262–267, 2008.
International Journal of Photoenergy 7
[10] Y. Y. Song, S. S. Felix, and B. Sebastian, “Amphiphilic TiO2
nanotube arrays: an actively controllable drug delivery sys-tem,” Journal of the American Chemical Society, vol. 131, no.12, pp. 4230–4232, 2009.
[11] M. Kalbacova, J. M. Macak, and S. F. Schmidt, “TiO2 nano-tubes: photocatalyst for cancer cell killing,” Physica Status Soli-di, vol. 2, no. 4, pp. 194–196, 2008.
[12] R. Asahi, T. Ohwaki, and K. Aoki, “Visible-light photocatalysisin nitrogen-doped titanium oxides,” Science, vol. 293, no.5528, pp. 269–271, 2001.
[13] A. Ghicov, J. M. Macak, and H. Tsuchiya, “Ion implantationand annealing for an efficient N-doping of TiO2 nanotubes,”Nano Letters, vol. 6, no. 5, pp. 1080–1082, 2006.
[14] Y. Y. Chen, S. M. Zhang, and Y. Yu, “Synthesis, characteriza-tion, and photocatalytic activity of N-doped TiO2 nanotubes,”Journal of Dispersion Science and Technology, vol. 29, no. 2, pp.245–249, 2008.
[15] Z. Jiang, F. Yang, and N. J. Luo, “Solvothermal synthesis of N-doped TiO2 nanotubes for visible-light-responsive photocatal-ysis,” Chemical Communications, vol. 11, no. 4, pp. 6372–6374,2008.
[16] X. Feng, Y. Wang, and Z. S. Jin, “Photoactive centers res-ponsible for visible-light photoactivity of N-doped TiO2,” NewJournal of Chemistry, vol. 32, no. 6, pp. 1038–1047, 2008.
[17] Y. K. Lai, J. Y. Huang, H. F. Zhang et al., “Nitrogen-doped TiO2
nanotube array films with enhanced photocatalytic activityunder various light sources,” Journal of Hazardous Materials,vol. 184, no. 1–3, pp. 855–863, 2010.
[18] J. Q. Geng, D. Yang, and J. H. Zhu, “Nitrogen-doped TiO2
nanotubes with enhanced photocatalytic activity synthesizedby a facile wet chemistry method,” Materials Research Bulletin,vol. 44, no. 1, pp. 146–150, 2009.
[19] D. Kim, S. Fujimoto, and P. Schmuki, “Nitrogen doped anodicTiO2 nanotubes grown from nitrogen-containing Ti alloys,”Electrochemistry Communications, vol. 10, no. 6, pp. 910–913,2008.
[20] S. P. Li, S. W. Lin, and J. J. Liao, “Effects of synthesis parameterson controllable growth of highly-ordered TiO2 nanotube ar-rays,” Advanced Materials Research, vol. 284–286, pp. 791–795,2011.
[21] Y. K. Lai, L. Sun, and C. Chen, “Optical and electrical char-acterization of TiO2 nanotube arrays on titanium substrate,”Applied Surface Science, vol. 252, no. 4, pp. 1101–1106, 2005.
[22] J. J. Xu, Y. H. Ao, and M. D. Chen, “Photoelectrochemical pro-perty and photocatalytic activity of N-doped TiO2 nanotubearrays,” Applied Surface Science, vol. 256, no. 13, pp. 4397–4401, 2010.
[23] S. Sakthivel and H. Kisch, “Daylight photocatalysis by carbon-modified titanium dioxide,” Angewandte Chemie, vol. 42, no.40, pp. 4908–4911, 2003.
[24] Y. Y. Chen, S. M. Zhang, and Y. Yu, “Synthesis, characteriza-tion, and photocatalytic activity of N-doped TiO2 nanotubes,”Journal of Dispersion Science and Technology, vol. 29, no. 2, pp.245–249, 2008.
[25] M. Sathish, B. Viswanathan, R. P. Viswanath, and C. S.Gopinath, “Synthesis, characterization, electronic structure,and photocatalytic activity of nitrogen-doped TiO2 nanocat-alyst,” Chemistry of Materials, vol. 17, no. 25, pp. 6349–6353,2005.
[26] J. W. Zhang, Y. Wang, and Z. S. Jin, “Visible-light photo-catalytic behavior of two different N-doped TiO2,” AppliedSurface Science, vol. 254, no. 15, pp. 4462–4466, 2008.
[27] J. L. Gole and J. D. Stout, “Highly efficient formationof visible light tunable TiO2-xNx photocatalysts and their
transformation at the nanoscale,” The Journal of PhysicalChemistry B, vol. 108, no. 4, pp. 1230–1240, 2004.
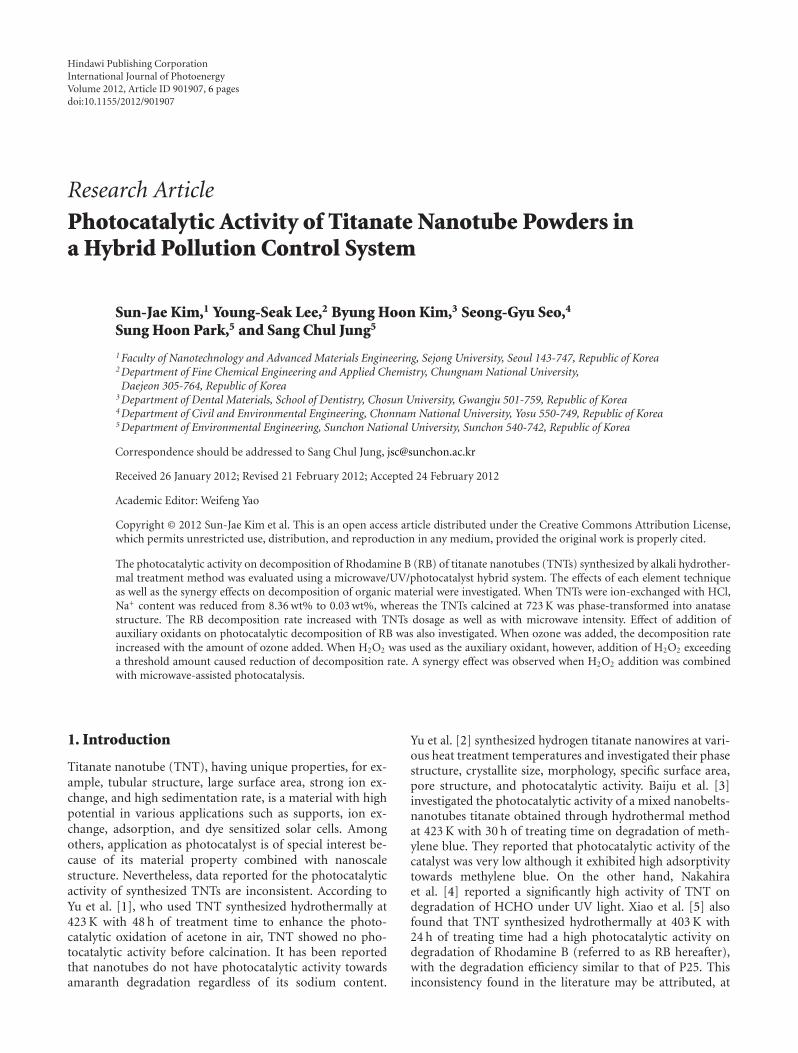
Hindawi Publishing CorporationInternational Journal of PhotoenergyVolume 2012, Article ID 901907, 6 pagesdoi:10.1155/2012/901907
Research Article
Photocatalytic Activity of Titanate Nanotube Powders ina Hybrid Pollution Control System
Sun-Jae Kim,1 Young-Seak Lee,2 Byung Hoon Kim,3 Seong-Gyu Seo,4
Sung Hoon Park,5 and Sang Chul Jung5
1 Faculty of Nanotechnology and Advanced Materials Engineering, Sejong University, Seoul 143-747, Republic of Korea2 Department of Fine Chemical Engineering and Applied Chemistry, Chungnam National University,Daejeon 305-764, Republic of Korea
3 Department of Dental Materials, School of Dentistry, Chosun University, Gwangju 501-759, Republic of Korea4 Department of Civil and Environmental Engineering, Chonnam National University, Yosu 550-749, Republic of Korea5 Department of Environmental Engineering, Sunchon National University, Sunchon 540-742, Republic of Korea
Correspondence should be addressed to Sang Chul Jung, [email protected]
Received 26 January 2012; Revised 21 February 2012; Accepted 24 February 2012
Academic Editor: Weifeng Yao
Copyright © 2012 Sun-Jae Kim et al. This is an open access article distributed under the Creative Commons Attribution License,which permits unrestricted use, distribution, and reproduction in any medium, provided the original work is properly cited.
The photocatalytic activity on decomposition of Rhodamine B (RB) of titanate nanotubes (TNTs) synthesized by alkali hydrother-mal treatment method was evaluated using a microwave/UV/photocatalyst hybrid system. The effects of each element techniqueas well as the synergy effects on decomposition of organic material were investigated. When TNTs were ion-exchanged with HCl,Na+ content was reduced from 8.36 wt% to 0.03 wt%, whereas the TNTs calcined at 723 K was phase-transformed into anatasestructure. The RB decomposition rate increased with TNTs dosage as well as with microwave intensity. Effect of addition ofauxiliary oxidants on photocatalytic decomposition of RB was also investigated. When ozone was added, the decomposition rateincreased with the amount of ozone added. When H2O2 was used as the auxiliary oxidant, however, addition of H2O2 exceedinga threshold amount caused reduction of decomposition rate. A synergy effect was observed when H2O2 addition was combinedwith microwave-assisted photocatalysis.
1. Introduction
Titanate nanotube (TNT), having unique properties, for ex-ample, tubular structure, large surface area, strong ion ex-change, and high sedimentation rate, is a material with highpotential in various applications such as supports, ion ex-change, adsorption, and dye sensitized solar cells. Amongothers, application as photocatalyst is of special interest be-cause of its material property combined with nanoscalestructure. Nevertheless, data reported for the photocatalyticactivity of synthesized TNTs are inconsistent. According toYu et al. [1], who used TNT synthesized hydrothermally at423 K with 48 h of treatment time to enhance the photo-catalytic oxidation of acetone in air, TNT showed no pho-tocatalytic activity before calcination. It has been reportedthat nanotubes do not have photocatalytic activity towardsamaranth degradation regardless of its sodium content.
Yu et al. [2] synthesized hydrogen titanate nanowires at vari-ous heat treatment temperatures and investigated their phasestructure, crystallite size, morphology, specific surface area,pore structure, and photocatalytic activity. Baiju et al. [3]investigated the photocatalytic activity of a mixed nanobelts-nanotubes titanate obtained through hydrothermal methodat 423 K with 30 h of treating time on degradation of meth-ylene blue. They reported that photocatalytic activity of thecatalyst was very low although it exhibited high adsorptivitytowards methylene blue. On the other hand, Nakahiraet al. [4] reported a significantly high activity of TNT ondegradation of HCHO under UV light. Xiao et al. [5] alsofound that TNT synthesized hydrothermally at 403 K with24 h of treating time had a high photocatalytic activity ondegradation of Rhodamine B (referred to as RB hereafter),with the degradation efficiency similar to that of P25. Thisinconsistency found in the literature may be attributed, at
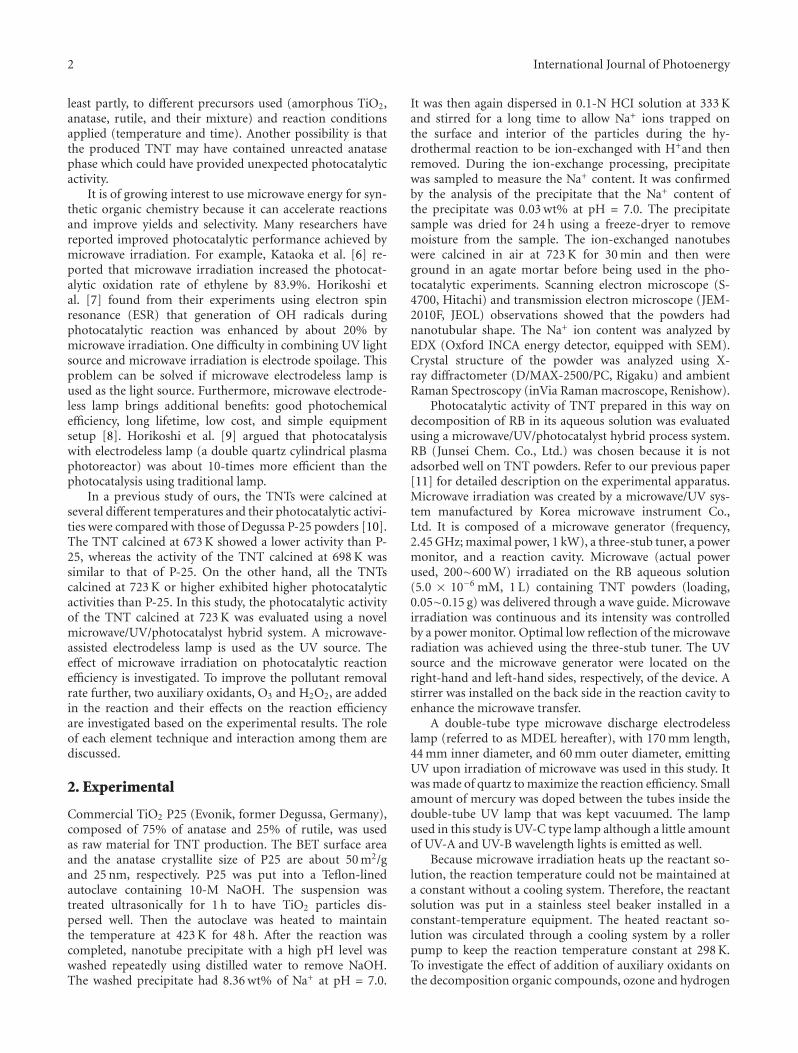
2 International Journal of Photoenergy
least partly, to different precursors used (amorphous TiO2,anatase, rutile, and their mixture) and reaction conditionsapplied (temperature and time). Another possibility is thatthe produced TNT may have contained unreacted anatasephase which could have provided unexpected photocatalyticactivity.
It is of growing interest to use microwave energy for syn-thetic organic chemistry because it can accelerate reactionsand improve yields and selectivity. Many researchers havereported improved photocatalytic performance achieved bymicrowave irradiation. For example, Kataoka et al. [6] re-ported that microwave irradiation increased the photocat-alytic oxidation rate of ethylene by 83.9%. Horikoshi etal. [7] found from their experiments using electron spinresonance (ESR) that generation of OH radicals duringphotocatalytic reaction was enhanced by about 20% bymicrowave irradiation. One difficulty in combining UV lightsource and microwave irradiation is electrode spoilage. Thisproblem can be solved if microwave electrodeless lamp isused as the light source. Furthermore, microwave electrode-less lamp brings additional benefits: good photochemicalefficiency, long lifetime, low cost, and simple equipmentsetup [8]. Horikoshi et al. [9] argued that photocatalysiswith electrodeless lamp (a double quartz cylindrical plasmaphotoreactor) was about 10-times more efficient than thephotocatalysis using traditional lamp.
In a previous study of ours, the TNTs were calcined atseveral different temperatures and their photocatalytic activi-ties were compared with those of Degussa P-25 powders [10].The TNT calcined at 673 K showed a lower activity than P-25, whereas the activity of the TNT calcined at 698 K wassimilar to that of P-25. On the other hand, all the TNTscalcined at 723 K or higher exhibited higher photocatalyticactivities than P-25. In this study, the photocatalytic activityof the TNT calcined at 723 K was evaluated using a novelmicrowave/UV/photocatalyst hybrid system. A microwave-assisted electrodeless lamp is used as the UV source. Theeffect of microwave irradiation on photocatalytic reactionefficiency is investigated. To improve the pollutant removalrate further, two auxiliary oxidants, O3 and H2O2, are addedin the reaction and their effects on the reaction efficiencyare investigated based on the experimental results. The roleof each element technique and interaction among them arediscussed.
2. Experimental
Commercial TiO2 P25 (Evonik, former Degussa, Germany),composed of 75% of anatase and 25% of rutile, was usedas raw material for TNT production. The BET surface areaand the anatase crystallite size of P25 are about 50 m2/gand 25 nm, respectively. P25 was put into a Teflon-linedautoclave containing 10-M NaOH. The suspension wastreated ultrasonically for 1 h to have TiO2 particles dis-persed well. Then the autoclave was heated to maintainthe temperature at 423 K for 48 h. After the reaction wascompleted, nanotube precipitate with a high pH level waswashed repeatedly using distilled water to remove NaOH.The washed precipitate had 8.36 wt% of Na+ at pH = 7.0.
It was then again dispersed in 0.1-N HCI solution at 333 Kand stirred for a long time to allow Na+ ions trapped onthe surface and interior of the particles during the hy-drothermal reaction to be ion-exchanged with H+and thenremoved. During the ion-exchange processing, precipitatewas sampled to measure the Na+ content. It was confirmedby the analysis of the precipitate that the Na+ content ofthe precipitate was 0.03 wt% at pH = 7.0. The precipitatesample was dried for 24 h using a freeze-dryer to removemoisture from the sample. The ion-exchanged nanotubeswere calcined in air at 723 K for 30 min and then wereground in an agate mortar before being used in the pho-tocatalytic experiments. Scanning electron microscope (S-4700, Hitachi) and transmission electron microscope (JEM-2010F, JEOL) observations showed that the powders hadnanotubular shape. The Na+ ion content was analyzed byEDX (Oxford INCA energy detector, equipped with SEM).Crystal structure of the powder was analyzed using X-ray diffractometer (D/MAX-2500/PC, Rigaku) and ambientRaman Spectroscopy (inVia Raman macroscope, Renishow).
Photocatalytic activity of TNT prepared in this way ondecomposition of RB in its aqueous solution was evaluatedusing a microwave/UV/photocatalyst hybrid process system.RB (Junsei Chem. Co., Ltd.) was chosen because it is notadsorbed well on TNT powders. Refer to our previous paper[11] for detailed description on the experimental apparatus.Microwave irradiation was created by a microwave/UV sys-tem manufactured by Korea microwave instrument Co.,Ltd. It is composed of a microwave generator (frequency,2.45 GHz; maximal power, 1 kW), a three-stub tuner, a powermonitor, and a reaction cavity. Microwave (actual powerused, 200∼600 W) irradiated on the RB aqueous solution(5.0 × 10⁻⁶ mM, 1 L) containing TNT powders (loading,0.05∼0.15 g) was delivered through a wave guide. Microwaveirradiation was continuous and its intensity was controlledby a power monitor. Optimal low reflection of the microwaveradiation was achieved using the three-stub tuner. The UVsource and the microwave generator were located on theright-hand and left-hand sides, respectively, of the device. Astirrer was installed on the back side in the reaction cavity toenhance the microwave transfer.
A double-tube type microwave discharge electrodelesslamp (referred to as MDEL hereafter), with 170 mm length,44 mm inner diameter, and 60 mm outer diameter, emittingUV upon irradiation of microwave was used in this study. Itwas made of quartz to maximize the reaction efficiency. Smallamount of mercury was doped between the tubes inside thedouble-tube UV lamp that was kept vacuumed. The lampused in this study is UV-C type lamp although a little amountof UV-A and UV-B wavelength lights is emitted as well.
Because microwave irradiation heats up the reactant so-lution, the reaction temperature could not be maintained ata constant without a cooling system. Therefore, the reactantsolution was put in a stainless steel beaker installed in aconstant-temperature equipment. The heated reactant so-lution was circulated through a cooling system by a rollerpump to keep the reaction temperature constant at 298 K.To investigate the effect of addition of auxiliary oxidants onthe decomposition organic compounds, ozone and hydrogen
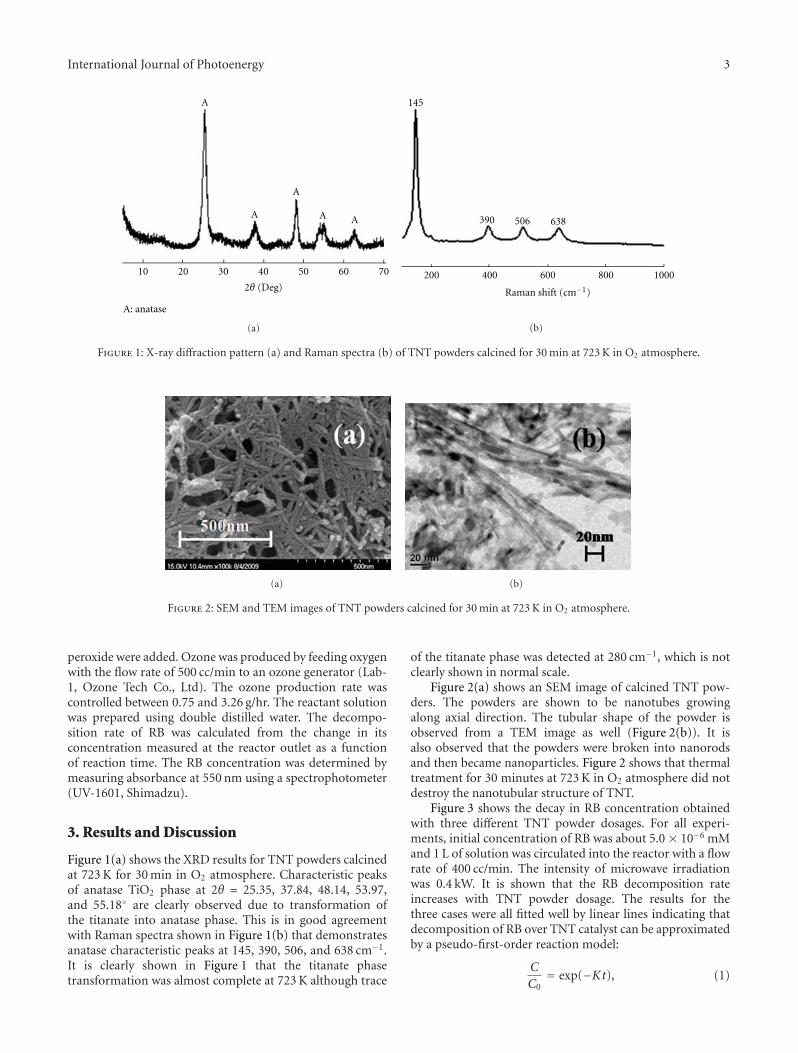
International Journal of Photoenergy 3
10 20 30 40 50 60 70
2θ (Deg)
A
A
A
A A
A: anatase
(a)
200 400 600 800 1000
Raman shift (cm−1)
145
390 506 638
(b)
Figure 1: X-ray diffraction pattern (a) and Raman spectra (b) of TNT powders calcined for 30 min at 723 K in O2 atmosphere.
(a) (b)
Figure 2: SEM and TEM images of TNT powders calcined for 30 min at 723 K in O2 atmosphere.
peroxide were added. Ozone was produced by feeding oxygenwith the flow rate of 500 cc/min to an ozone generator (Lab-1, Ozone Tech Co., Ltd). The ozone production rate wascontrolled between 0.75 and 3.26 g/hr. The reactant solutionwas prepared using double distilled water. The decompo-sition rate of RB was calculated from the change in itsconcentration measured at the reactor outlet as a functionof reaction time. The RB concentration was determined bymeasuring absorbance at 550 nm using a spectrophotometer(UV-1601, Shimadzu).
3. Results and Discussion
Figure 1(a) shows the XRD results for TNT powders calcinedat 723 K for 30 min in O2 atmosphere. Characteristic peaksof anatase TiO2 phase at 2θ = 25.35, 37.84, 48.14, 53.97,and 55.18◦ are clearly observed due to transformation ofthe titanate into anatase phase. This is in good agreementwith Raman spectra shown in Figure 1(b) that demonstratesanatase characteristic peaks at 145, 390, 506, and 638 cm−1.It is clearly shown in Figure 1 that the titanate phasetransformation was almost complete at 723 K although trace
of the titanate phase was detected at 280 cm−1, which is notclearly shown in normal scale.
Figure 2(a) shows an SEM image of calcined TNT pow-ders. The powders are shown to be nanotubes growingalong axial direction. The tubular shape of the powder isobserved from a TEM image as well (Figure 2(b)). It isalso observed that the powders were broken into nanorodsand then became nanoparticles. Figure 2 shows that thermaltreatment for 30 minutes at 723 K in O2 atmosphere did notdestroy the nanotubular structure of TNT.
Figure 3 shows the decay in RB concentration obtainedwith three different TNT powder dosages. For all experi-ments, initial concentration of RB was about 5.0 × 10⁻⁶ mMand 1 L of solution was circulated into the reactor with a flowrate of 400 cc/min. The intensity of microwave irradiationwas 0.4 kW. It is shown that the RB decomposition rateincreases with TNT powder dosage. The results for thethree cases were all fitted well by linear lines indicating thatdecomposition of RB over TNT catalyst can be approximatedby a pseudo-first-order reaction model:
C
C0= exp(−Kt), (1)
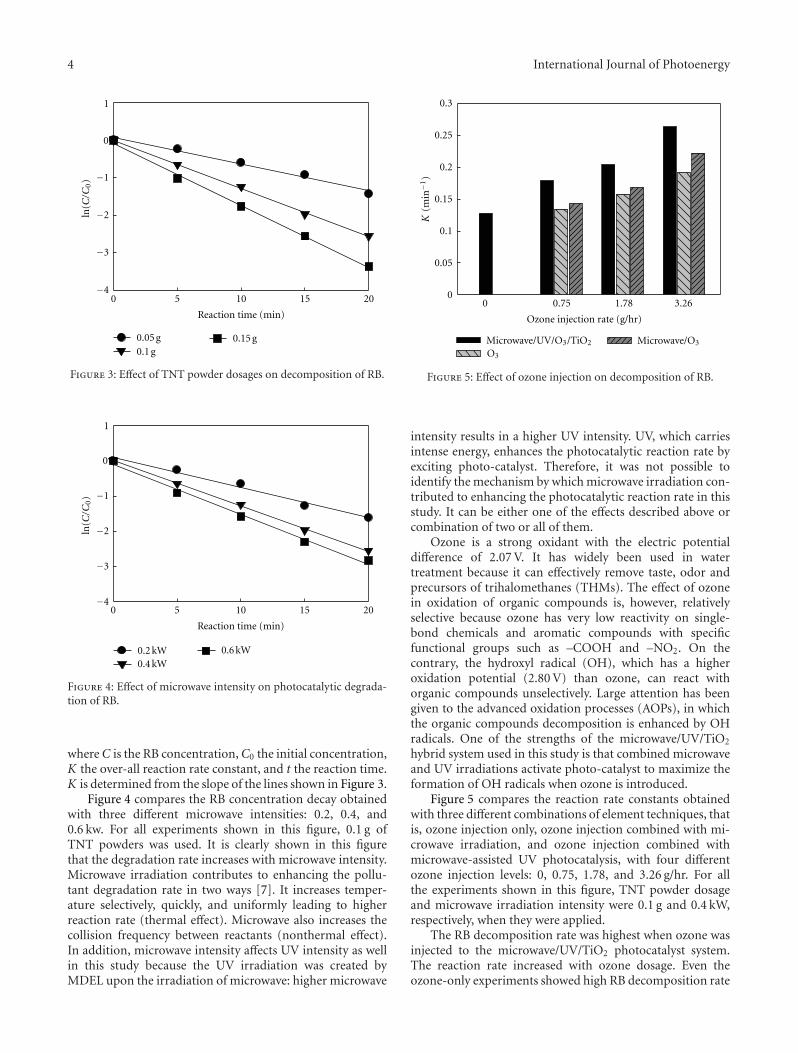
4 International Journal of Photoenergy
Reaction time (min)
0 5 10 15 20−4
−3
−2
−1
0
1
0.05 g0.1 g
0.15 g
ln(C
/C0)
Figure 3: Effect of TNT powder dosages on decomposition of RB.
Reaction time (min)
0 5 10 15 20
ln(C
/C0)
−4
−3
−2
−1
0
1
0.2 kW0.4 kW
0.6 kW
Figure 4: Effect of microwave intensity on photocatalytic degrada-tion of RB.
whereC is the RB concentration,C0 the initial concentration,K the over-all reaction rate constant, and t the reaction time.K is determined from the slope of the lines shown in Figure 3.
Figure 4 compares the RB concentration decay obtainedwith three different microwave intensities: 0.2, 0.4, and0.6 kw. For all experiments shown in this figure, 0.1 g ofTNT powders was used. It is clearly shown in this figurethat the degradation rate increases with microwave intensity.Microwave irradiation contributes to enhancing the pollu-tant degradation rate in two ways [7]. It increases temper-ature selectively, quickly, and uniformly leading to higherreaction rate (thermal effect). Microwave also increases thecollision frequency between reactants (nonthermal effect).In addition, microwave intensity affects UV intensity as wellin this study because the UV irradiation was created byMDEL upon the irradiation of microwave: higher microwave
Ozone injection rate (g/hr)
0
0.05
0.1
0.15
0.2
0.25
0.3
0 0.75 1.78 3.26
Microwave/UV/O3/TiO2
O3
Microwave/O3
K(m
in−1
)
Figure 5: Effect of ozone injection on decomposition of RB.
intensity results in a higher UV intensity. UV, which carriesintense energy, enhances the photocatalytic reaction rate byexciting photo-catalyst. Therefore, it was not possible toidentify the mechanism by which microwave irradiation con-tributed to enhancing the photocatalytic reaction rate in thisstudy. It can be either one of the effects described above orcombination of two or all of them.
Ozone is a strong oxidant with the electric potentialdifference of 2.07 V. It has widely been used in watertreatment because it can effectively remove taste, odor andprecursors of trihalomethanes (THMs). The effect of ozonein oxidation of organic compounds is, however, relativelyselective because ozone has very low reactivity on single-bond chemicals and aromatic compounds with specificfunctional groups such as –COOH and –NO2. On thecontrary, the hydroxyl radical (OH), which has a higheroxidation potential (2.80 V) than ozone, can react withorganic compounds unselectively. Large attention has beengiven to the advanced oxidation processes (AOPs), in whichthe organic compounds decomposition is enhanced by OHradicals. One of the strengths of the microwave/UV/TiO2
hybrid system used in this study is that combined microwaveand UV irradiations activate photo-catalyst to maximize theformation of OH radicals when ozone is introduced.
Figure 5 compares the reaction rate constants obtainedwith three different combinations of element techniques, thatis, ozone injection only, ozone injection combined with mi-crowave irradiation, and ozone injection combined withmicrowave-assisted UV photocatalysis, with four differentozone injection levels: 0, 0.75, 1.78, and 3.26 g/hr. For allthe experiments shown in this figure, TNT powder dosageand microwave irradiation intensity were 0.1 g and 0.4 kW,respectively, when they were applied.
The RB decomposition rate was highest when ozone wasinjected to the microwave/UV/TiO2 photocatalyst system.The reaction rate increased with ozone dosage. Even theozone-only experiments showed high RB decomposition rate
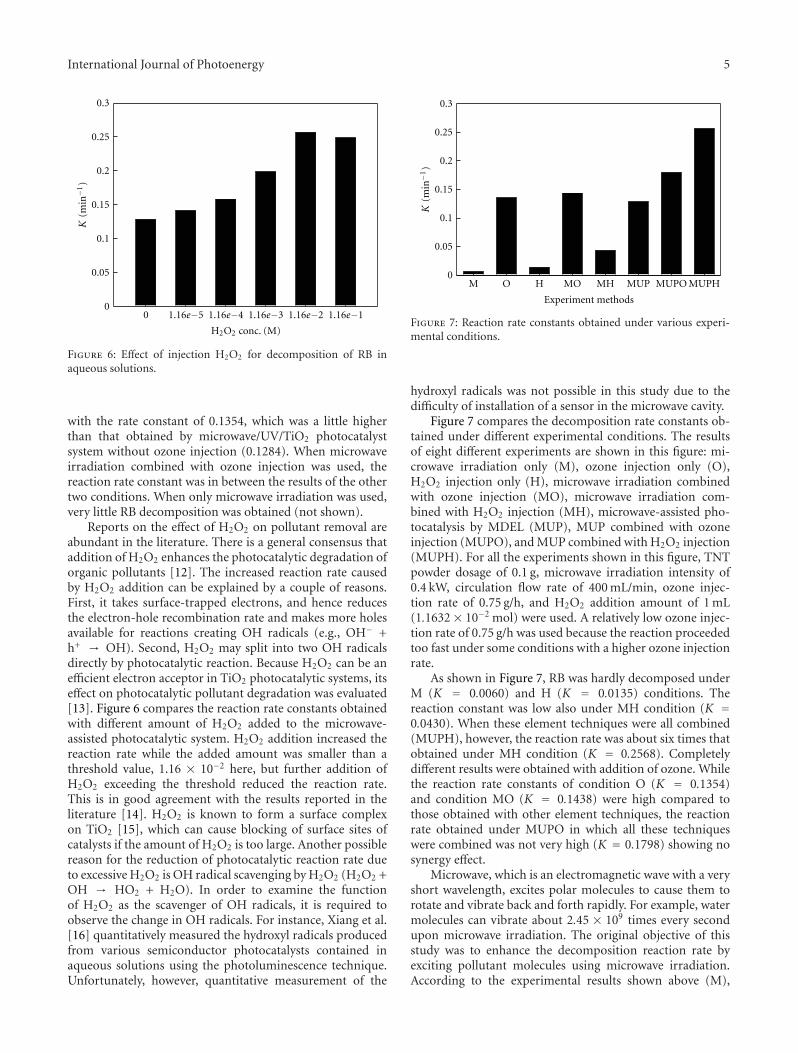
International Journal of Photoenergy 5
0
0.05
0.1
0.15
0.2
0.25
0.3
0
H2O2 conc. (M)
1.16e−5 1.16e−4 1.16e−3 1.16e−2 1.16e−1
K(m
in−1
)
Figure 6: Effect of injection H2O2 for decomposition of RB inaqueous solutions.
with the rate constant of 0.1354, which was a little higherthan that obtained by microwave/UV/TiO2 photocatalystsystem without ozone injection (0.1284). When microwaveirradiation combined with ozone injection was used, thereaction rate constant was in between the results of the othertwo conditions. When only microwave irradiation was used,very little RB decomposition was obtained (not shown).
Reports on the effect of H2O2 on pollutant removal areabundant in the literature. There is a general consensus thataddition of H2O2 enhances the photocatalytic degradation oforganic pollutants [12]. The increased reaction rate causedby H2O2 addition can be explained by a couple of reasons.First, it takes surface-trapped electrons, and hence reducesthe electron-hole recombination rate and makes more holesavailable for reactions creating OH radicals (e.g., OH− +h+ → OH). Second, H2O2 may split into two OH radicalsdirectly by photocatalytic reaction. Because H2O2 can be anefficient electron acceptor in TiO2 photocatalytic systems, itseffect on photocatalytic pollutant degradation was evaluated[13]. Figure 6 compares the reaction rate constants obtainedwith different amount of H2O2 added to the microwave-assisted photocatalytic system. H2O2 addition increased thereaction rate while the added amount was smaller than athreshold value, 1.16 × 10⁻² here, but further addition ofH2O2 exceeding the threshold reduced the reaction rate.This is in good agreement with the results reported in theliterature [14]. H2O2 is known to form a surface complexon TiO2 [15], which can cause blocking of surface sites ofcatalysts if the amount of H2O2 is too large. Another possiblereason for the reduction of photocatalytic reaction rate dueto excessive H2O2 is OH radical scavenging by H2O2 (H2O2 +OH → HO2 + H2O). In order to examine the functionof H2O2 as the scavenger of OH radicals, it is required toobserve the change in OH radicals. For instance, Xiang et al.[16] quantitatively measured the hydroxyl radicals producedfrom various semiconductor photocatalysts contained inaqueous solutions using the photoluminescence technique.Unfortunately, however, quantitative measurement of the
Experiment methods
0
0.05
0.1
0.15
0.2
0.25
0.3
M O MO MUP MUPO MUPHH MH
K(m
in−1
)
Figure 7: Reaction rate constants obtained under various experi-mental conditions.
hydroxyl radicals was not possible in this study due to thedifficulty of installation of a sensor in the microwave cavity.
Figure 7 compares the decomposition rate constants ob-tained under different experimental conditions. The resultsof eight different experiments are shown in this figure: mi-crowave irradiation only (M), ozone injection only (O),H2O2 injection only (H), microwave irradiation combinedwith ozone injection (MO), microwave irradiation com-bined with H2O2 injection (MH), microwave-assisted pho-tocatalysis by MDEL (MUP), MUP combined with ozoneinjection (MUPO), and MUP combined with H2O2 injection(MUPH). For all the experiments shown in this figure, TNTpowder dosage of 0.1 g, microwave irradiation intensity of0.4 kW, circulation flow rate of 400 mL/min, ozone injec-tion rate of 0.75 g/h, and H2O2 addition amount of 1 mL(1.1632× 10⁻² mol) were used. A relatively low ozone injec-tion rate of 0.75 g/h was used because the reaction proceededtoo fast under some conditions with a higher ozone injectionrate.
As shown in Figure 7, RB was hardly decomposed underM (K = 0.0060) and H (K = 0.0135) conditions. Thereaction constant was low also under MH condition (K =0.0430). When these element techniques were all combined(MUPH), however, the reaction rate was about six times thatobtained under MH condition (K = 0.2568). Completelydifferent results were obtained with addition of ozone. Whilethe reaction rate constants of condition O (K = 0.1354)and condition MO (K = 0.1438) were high compared tothose obtained with other element techniques, the reactionrate obtained under MUPO in which all these techniqueswere combined was not very high (K = 0.1798) showing nosynergy effect.
Microwave, which is an electromagnetic wave with a veryshort wavelength, excites polar molecules to cause them torotate and vibrate back and forth rapidly. For example, watermolecules can vibrate about 2.45 × 10⁹ times every secondupon microwave irradiation. The original objective of thisstudy was to enhance the decomposition reaction rate byexciting pollutant molecules using microwave irradiation.According to the experimental results shown above (M),
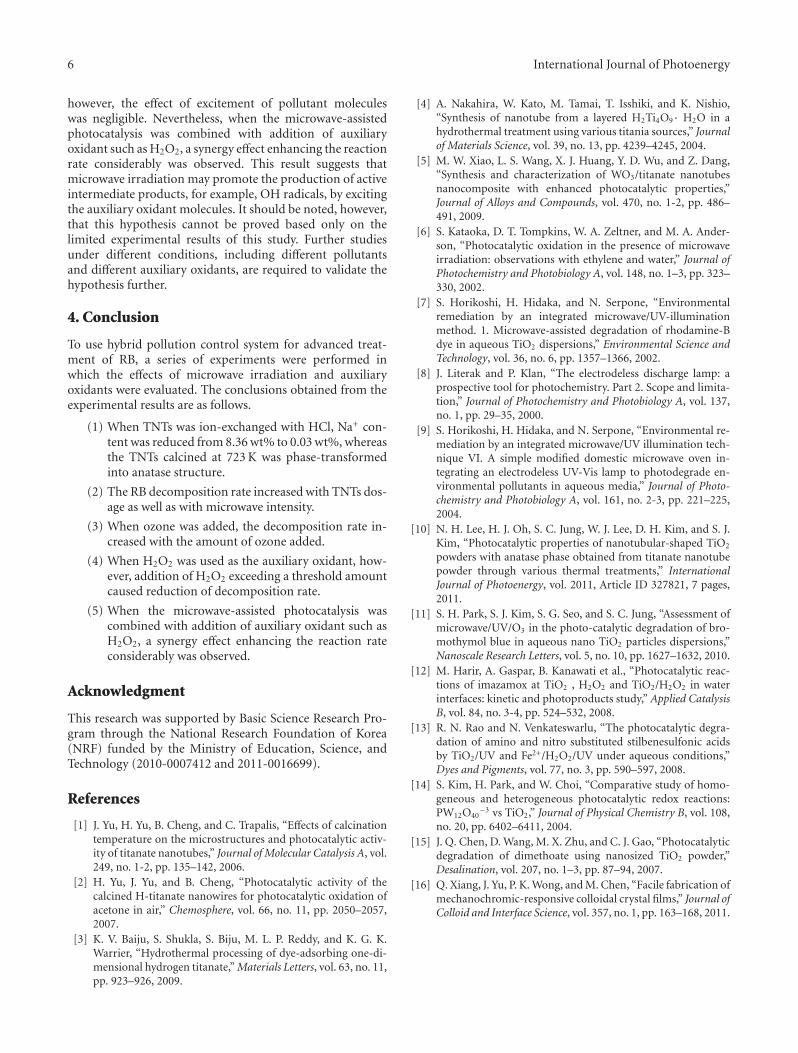
6 International Journal of Photoenergy
however, the effect of excitement of pollutant moleculeswas negligible. Nevertheless, when the microwave-assistedphotocatalysis was combined with addition of auxiliaryoxidant such as H2O2, a synergy effect enhancing the reactionrate considerably was observed. This result suggests thatmicrowave irradiation may promote the production of activeintermediate products, for example, OH radicals, by excitingthe auxiliary oxidant molecules. It should be noted, however,that this hypothesis cannot be proved based only on thelimited experimental results of this study. Further studiesunder different conditions, including different pollutantsand different auxiliary oxidants, are required to validate thehypothesis further.
4. Conclusion
To use hybrid pollution control system for advanced treat-ment of RB, a series of experiments were performed inwhich the effects of microwave irradiation and auxiliaryoxidants were evaluated. The conclusions obtained from theexperimental results are as follows.
(1) When TNTs was ion-exchanged with HCl, Na+ con-tent was reduced from 8.36 wt% to 0.03 wt%, whereasthe TNTs calcined at 723 K was phase-transformedinto anatase structure.
(2) The RB decomposition rate increased with TNTs dos-age as well as with microwave intensity.
(3) When ozone was added, the decomposition rate in-creased with the amount of ozone added.
(4) When H2O2 was used as the auxiliary oxidant, how-ever, addition of H2O2 exceeding a threshold amountcaused reduction of decomposition rate.
(5) When the microwave-assisted photocatalysis wascombined with addition of auxiliary oxidant such asH2O2, a synergy effect enhancing the reaction rateconsiderably was observed.
Acknowledgment
This research was supported by Basic Science Research Pro-gram through the National Research Foundation of Korea(NRF) funded by the Ministry of Education, Science, andTechnology (2010-0007412 and 2011-0016699).
References
[1] J. Yu, H. Yu, B. Cheng, and C. Trapalis, “Effects of calcinationtemperature on the microstructures and photocatalytic activ-ity of titanate nanotubes,” Journal of Molecular Catalysis A, vol.249, no. 1-2, pp. 135–142, 2006.
[2] H. Yu, J. Yu, and B. Cheng, “Photocatalytic activity of thecalcined H-titanate nanowires for photocatalytic oxidation ofacetone in air,” Chemosphere, vol. 66, no. 11, pp. 2050–2057,2007.
[3] K. V. Baiju, S. Shukla, S. Biju, M. L. P. Reddy, and K. G. K.Warrier, “Hydrothermal processing of dye-adsorbing one-di-mensional hydrogen titanate,” Materials Letters, vol. 63, no. 11,pp. 923–926, 2009.
[4] A. Nakahira, W. Kato, M. Tamai, T. Isshiki, and K. Nishio,“Synthesis of nanotube from a layered H2Ti4O9· H2O in ahydrothermal treatment using various titania sources,” Journalof Materials Science, vol. 39, no. 13, pp. 4239–4245, 2004.
[5] M. W. Xiao, L. S. Wang, X. J. Huang, Y. D. Wu, and Z. Dang,“Synthesis and characterization of WO3/titanate nanotubesnanocomposite with enhanced photocatalytic properties,”Journal of Alloys and Compounds, vol. 470, no. 1-2, pp. 486–491, 2009.
[6] S. Kataoka, D. T. Tompkins, W. A. Zeltner, and M. A. Ander-son, “Photocatalytic oxidation in the presence of microwaveirradiation: observations with ethylene and water,” Journal ofPhotochemistry and Photobiology A, vol. 148, no. 1–3, pp. 323–330, 2002.
[7] S. Horikoshi, H. Hidaka, and N. Serpone, “Environmentalremediation by an integrated microwave/UV-illuminationmethod. 1. Microwave-assisted degradation of rhodamine-Bdye in aqueous TiO2 dispersions,” Environmental Science andTechnology, vol. 36, no. 6, pp. 1357–1366, 2002.
[8] J. Literak and P. Klan, “The electrodeless discharge lamp: aprospective tool for photochemistry. Part 2. Scope and limita-tion,” Journal of Photochemistry and Photobiology A, vol. 137,no. 1, pp. 29–35, 2000.
[9] S. Horikoshi, H. Hidaka, and N. Serpone, “Environmental re-mediation by an integrated microwave/UV illumination tech-nique VI. A simple modified domestic microwave oven in-tegrating an electrodeless UV-Vis lamp to photodegrade en-vironmental pollutants in aqueous media,” Journal of Photo-chemistry and Photobiology A, vol. 161, no. 2-3, pp. 221–225,2004.
[10] N. H. Lee, H. J. Oh, S. C. Jung, W. J. Lee, D. H. Kim, and S. J.Kim, “Photocatalytic properties of nanotubular-shaped TiO2
powders with anatase phase obtained from titanate nanotubepowder through various thermal treatments,” InternationalJournal of Photoenergy, vol. 2011, Article ID 327821, 7 pages,2011.
[11] S. H. Park, S. J. Kim, S. G. Seo, and S. C. Jung, “Assessment ofmicrowave/UV/O3 in the photo-catalytic degradation of bro-mothymol blue in aqueous nano TiO2 particles dispersions,”Nanoscale Research Letters, vol. 5, no. 10, pp. 1627–1632, 2010.
[12] M. Harir, A. Gaspar, B. Kanawati et al., “Photocatalytic reac-tions of imazamox at TiO2 , H2O2 and TiO2/H2O2 in waterinterfaces: kinetic and photoproducts study,” Applied CatalysisB, vol. 84, no. 3-4, pp. 524–532, 2008.
[13] R. N. Rao and N. Venkateswarlu, “The photocatalytic degra-dation of amino and nitro substituted stilbenesulfonic acidsby TiO2/UV and Fe2+/H2O2/UV under aqueous conditions,”Dyes and Pigments, vol. 77, no. 3, pp. 590–597, 2008.
[14] S. Kim, H. Park, and W. Choi, “Comparative study of homo-geneous and heterogeneous photocatalytic redox reactions:PW12O40
−3 vs TiO2,” Journal of Physical Chemistry B, vol. 108,no. 20, pp. 6402–6411, 2004.
[15] J. Q. Chen, D. Wang, M. X. Zhu, and C. J. Gao, “Photocatalyticdegradation of dimethoate using nanosized TiO2 powder,”Desalination, vol. 207, no. 1–3, pp. 87–94, 2007.
[16] Q. Xiang, J. Yu, P. K. Wong, and M. Chen, “Facile fabrication ofmechanochromic-responsive colloidal crystal films,” Journal ofColloid and Interface Science, vol. 357, no. 1, pp. 163–168, 2011.
Hindawi Publishing CorporationInternational Journal of PhotoenergyVolume 2012, Article ID 202519, 6 pagesdoi:10.1155/2012/202519
Research Article
Synthesis of Core-Shell Fe3O4@SiO2@TiO2 Microspheres andTheir Application as Recyclable Photocatalysts
Zhenghua Wang, Ling Shen, and Shiyu Zhu
Anhui Key Laboratory of Functional Molecular Solids, College of Chemistry and Materials Science, Anhui Normal University,Wuhu 241000, China
Correspondence should be addressed to Zhenghua Wang, [email protected]
Received 14 January 2012; Revised 2 March 2012; Accepted 2 March 2012
Academic Editor: Xuxu Wang
Copyright © 2012 Zhenghua Wang et al. This is an open access article distributed under the Creative Commons AttributionLicense, which permits unrestricted use, distribution, and reproduction in any medium, provided the original work is properlycited.
We report the fabrication of core-shell Fe3O4@SiO2@TiO2 microspheres through a wet-chemical approach. TheFe3O4@SiO2@TiO2 microspheres possess both ferromagnetic and photocatalytic properties. The TiO2 nanoparticles on thesurfaces of microspheres can degrade organic dyes under the illumination of UV light. Furthermore, the microspheres are easilyseparated from the solution after the photocatalytic process due to the ferromagnetic Fe3O4 core. The photocatalysts can berecycled for further use with slightly lower photocatalytic efficiency.
1. Introduction
In recent years, an enormous research effort has beendedicated to the study of semiconductors in the area ofphotocatalysis. Among the semiconductor photocatalysts,TiO2 has attracted a lot of attention because of its highphotocatalytic efficiency, high stability, and low cost [1–5]. For the application of TiO2 in the area of wastewaterpurification, TiO2 slurry reactor is the most commondevice because of its high specific surface area, efficientlight absorption, and good dispersion [6–8]. However, theseparation of TiO2 particles from treated water, especiallyfrom a large volume of water, is an expensive and time-consuming work, which limited the application of TiO2
slurry reactor in industrial application. To solve this problem,many methods including titania beads [9], TiO2-basedthin film [10, 11], fiberglass loaded with titania [12], andencapsulated titania within a zeolite framework [13] havebeen developed to immobilize TiO2 in fixed beds. However,the photocatalytic activity of TiO2 is considerably reduced bythese immobilization techniques because the effective surfacearea of photocatalysts is decreased.
Recently, magnetic core-shell composites have gained agreat deal of attentions. The magnetic core has good mag-netic responsibility and can be easily magnetized. Therefore,
the magnetic composites can be conveniently separated andcollected from water by applying an external magnetic field.Many studies have been carried out on the preparation andapplication of TiO2/magnetic composites [14–20]. In thesestudies, Fe3O4 and γ-Fe2O3 nanoparticles were applied as thecore magnetic materials. However, Fe3O4 nanoparticles areeasily oxidized, even at room temperature. The TiO2 shellin the composites was usually prepared by sol-gel methods,where heat treatment was essential. After heat treatment, theferromagnetic γ-Fe2O3 may transform to paramagnetic α-Fe2O3.
In this work, through the medium of SiO2, TiO2
nanoparticles were successfully coated on Fe3O4 micro-spheres, and Fe3O4@SiO2@TiO2 microspheres with well-defined core-shell structures were obtained. The preparedFe3O4@SiO2@TiO2 microspheres are multifunctional. TheTiO2 nanoparticles are at the outmost of the core-shellmicrospheres, which can act as photocatalysts to decomposeorganic dyes in wastewater. The Fe3O4 core makes them veryeasy to be separated and recycled from water with the helpof an external magnet. Furthermore, the Fe3O4 microspheresare stable at room temperature, and are unchanged afterheat treatment under nitrogen atmosphere. Therefore, theFe3O4@SiO2@TiO2 microspheres may serve as an idealphotocatalyst for the treatment of wastewater.
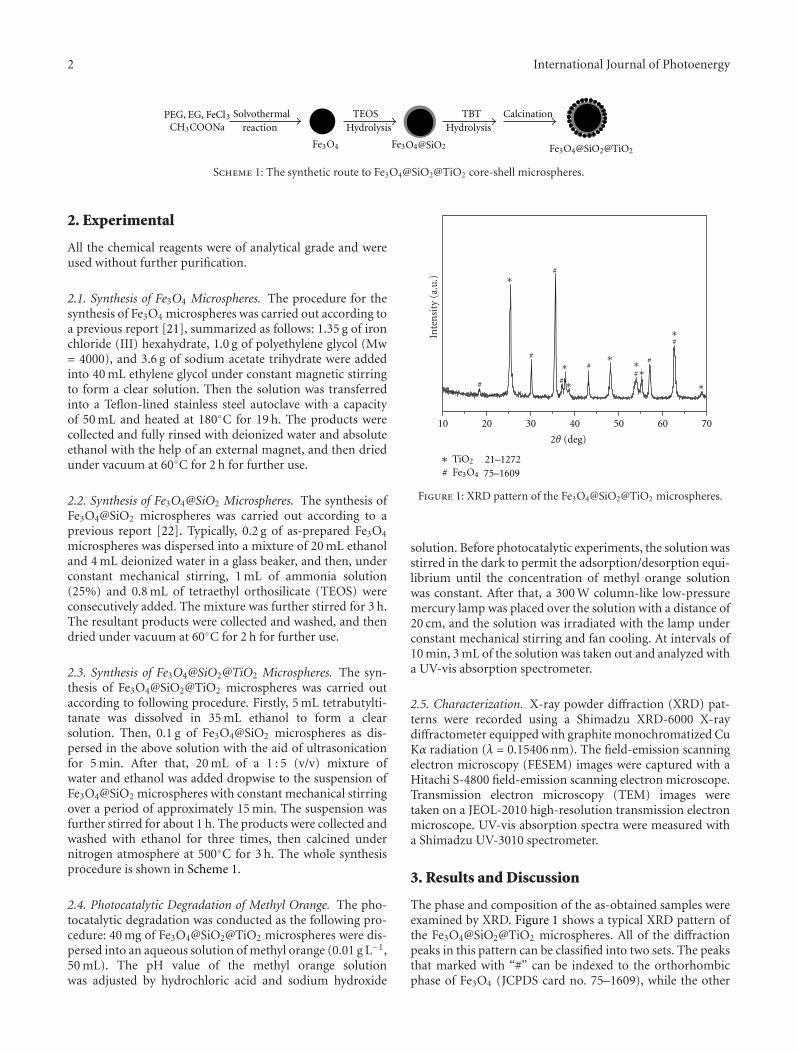
2 International Journal of Photoenergy
PEG, EG, FeCl3
CH3COONaSolvothermal
reactionTEOS
HydrolysisTBT
HydrolysisCalcination
Fe3O4@SiO2@TiO2Fe3O4@SiO2Fe3O4
Scheme 1: The synthetic route to Fe3O4@SiO2@TiO2 core-shell microspheres.
2. Experimental
All the chemical reagents were of analytical grade and wereused without further purification.
2.1. Synthesis of Fe3O4 Microspheres. The procedure for thesynthesis of Fe3O4 microspheres was carried out according toa previous report [21], summarized as follows: 1.35 g of ironchloride (III) hexahydrate, 1.0 g of polyethylene glycol (Mw= 4000), and 3.6 g of sodium acetate trihydrate were addedinto 40 mL ethylene glycol under constant magnetic stirringto form a clear solution. Then the solution was transferredinto a Teflon-lined stainless steel autoclave with a capacityof 50 mL and heated at 180◦C for 19 h. The products werecollected and fully rinsed with deionized water and absoluteethanol with the help of an external magnet, and then driedunder vacuum at 60◦C for 2 h for further use.
2.2. Synthesis of Fe3O4@SiO2 Microspheres. The synthesis ofFe3O4@SiO2 microspheres was carried out according to aprevious report [22]. Typically, 0.2 g of as-prepared Fe3O4
microspheres was dispersed into a mixture of 20 mL ethanoland 4 mL deionized water in a glass beaker, and then, underconstant mechanical stirring, 1 mL of ammonia solution(25%) and 0.8 mL of tetraethyl orthosilicate (TEOS) wereconsecutively added. The mixture was further stirred for 3 h.The resultant products were collected and washed, and thendried under vacuum at 60◦C for 2 h for further use.
2.3. Synthesis of Fe3O4@SiO2@TiO2 Microspheres. The syn-thesis of Fe3O4@SiO2@TiO2 microspheres was carried outaccording to following procedure. Firstly, 5 mL tetrabutylti-tanate was dissolved in 35 mL ethanol to form a clearsolution. Then, 0.1 g of Fe3O4@SiO2 microspheres as dis-persed in the above solution with the aid of ultrasonicationfor 5 min. After that, 20 mL of a 1 : 5 (v/v) mixture ofwater and ethanol was added dropwise to the suspension ofFe3O4@SiO2 microspheres with constant mechanical stirringover a period of approximately 15 min. The suspension wasfurther stirred for about 1 h. The products were collected andwashed with ethanol for three times, then calcined undernitrogen atmosphere at 500◦C for 3 h. The whole synthesisprocedure is shown in Scheme 1.
2.4. Photocatalytic Degradation of Methyl Orange. The pho-tocatalytic degradation was conducted as the following pro-cedure: 40 mg of Fe3O4@SiO2@TiO2 microspheres were dis-persed into an aqueous solution of methyl orange (0.01 g L−1,50 mL). The pH value of the methyl orange solutionwas adjusted by hydrochloric acid and sodium hydroxide
2θ (deg)In
ten
sity
(a.
u.)
#
#
##
#
#
#
#
#
10 20 30 40 50 60 70
Fe3O4
TiO2
∗∗
∗
∗
∗
∗
∗
∗∗
75–160921–1272
Figure 1: XRD pattern of the Fe3O4@SiO2@TiO2 microspheres.
solution. Before photocatalytic experiments, the solution wasstirred in the dark to permit the adsorption/desorption equi-librium until the concentration of methyl orange solutionwas constant. After that, a 300 W column-like low-pressuremercury lamp was placed over the solution with a distance of20 cm, and the solution was irradiated with the lamp underconstant mechanical stirring and fan cooling. At intervals of10 min, 3 mL of the solution was taken out and analyzed witha UV-vis absorption spectrometer.
2.5. Characterization. X-ray powder diffraction (XRD) pat-terns were recorded using a Shimadzu XRD-6000 X-raydiffractometer equipped with graphite monochromatized CuKα radiation (λ = 0.15406 nm). The field-emission scanningelectron microscopy (FESEM) images were captured with aHitachi S-4800 field-emission scanning electron microscope.Transmission electron microscopy (TEM) images weretaken on a JEOL-2010 high-resolution transmission electronmicroscope. UV-vis absorption spectra were measured witha Shimadzu UV-3010 spectrometer.
3. Results and Discussion
The phase and composition of the as-obtained samples wereexamined by XRD. Figure 1 shows a typical XRD pattern ofthe Fe3O4@SiO2@TiO2 microspheres. All of the diffractionpeaks in this pattern can be classified into two sets. The peaksthat marked with “#” can be indexed to the orthorhombicphase of Fe3O4 (JCPDS card no. 75–1609), while the other
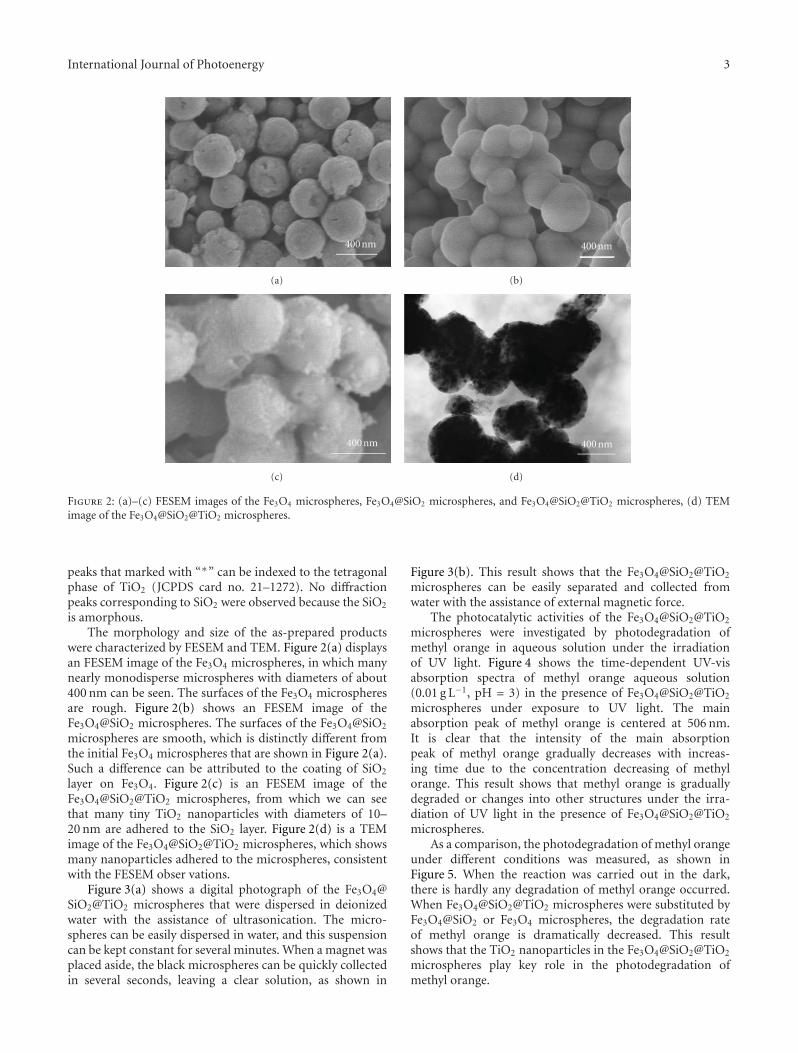
International Journal of Photoenergy 3
400 nm
(a)
400 nm
(b)
400 nm
(c)
400 nm
(d)
Figure 2: (a)–(c) FESEM images of the Fe3O4 microspheres, Fe3O4@SiO2 microspheres, and Fe3O4@SiO2@TiO2 microspheres, (d) TEMimage of the Fe3O4@SiO2@TiO2 microspheres.
peaks that marked with “∗” can be indexed to the tetragonalphase of TiO2 (JCPDS card no. 21–1272). No diffractionpeaks corresponding to SiO2 were observed because the SiO2
is amorphous.The morphology and size of the as-prepared products
were characterized by FESEM and TEM. Figure 2(a) displaysan FESEM image of the Fe3O4 microspheres, in which manynearly monodisperse microspheres with diameters of about400 nm can be seen. The surfaces of the Fe3O4 microspheresare rough. Figure 2(b) shows an FESEM image of theFe3O4@SiO2 microspheres. The surfaces of the Fe3O4@SiO2
microspheres are smooth, which is distinctly different fromthe initial Fe3O4 microspheres that are shown in Figure 2(a).Such a difference can be attributed to the coating of SiO2
layer on Fe3O4. Figure 2(c) is an FESEM image of theFe3O4@SiO2@TiO2 microspheres, from which we can seethat many tiny TiO2 nanoparticles with diameters of 10–20 nm are adhered to the SiO2 layer. Figure 2(d) is a TEMimage of the Fe3O4@SiO2@TiO2 microspheres, which showsmany nanoparticles adhered to the microspheres, consistentwith the FESEM obser vations.
Figure 3(a) shows a digital photograph of the Fe3O4@SiO2@TiO2 microspheres that were dispersed in deionizedwater with the assistance of ultrasonication. The micro-spheres can be easily dispersed in water, and this suspensioncan be kept constant for several minutes. When a magnet wasplaced aside, the black microspheres can be quickly collectedin several seconds, leaving a clear solution, as shown in
Figure 3(b). This result shows that the Fe3O4@SiO2@TiO2
microspheres can be easily separated and collected fromwater with the assistance of external magnetic force.
The photocatalytic activities of the Fe3O4@SiO2@TiO2
microspheres were investigated by photodegradation ofmethyl orange in aqueous solution under the irradiationof UV light. Figure 4 shows the time-dependent UV-visabsorption spectra of methyl orange aqueous solution(0.01 g L−1, pH = 3) in the presence of Fe3O4@SiO2@TiO2
microspheres under exposure to UV light. The mainabsorption peak of methyl orange is centered at 506 nm.It is clear that the intensity of the main absorptionpeak of methyl orange gradually decreases with increas-ing time due to the concentration decreasing of methylorange. This result shows that methyl orange is graduallydegraded or changes into other structures under the irra-diation of UV light in the presence of Fe3O4@SiO2@TiO2
microspheres.As a comparison, the photodegradation of methyl orange
under different conditions was measured, as shown inFigure 5. When the reaction was carried out in the dark,there is hardly any degradation of methyl orange occurred.When Fe3O4@SiO2@TiO2 microspheres were substituted byFe3O4@SiO2 or Fe3O4 microspheres, the degradation rateof methyl orange is dramatically decreased. This resultshows that the TiO2 nanoparticles in the Fe3O4@SiO2@TiO2
microspheres play key role in the photodegradation ofmethyl orange.
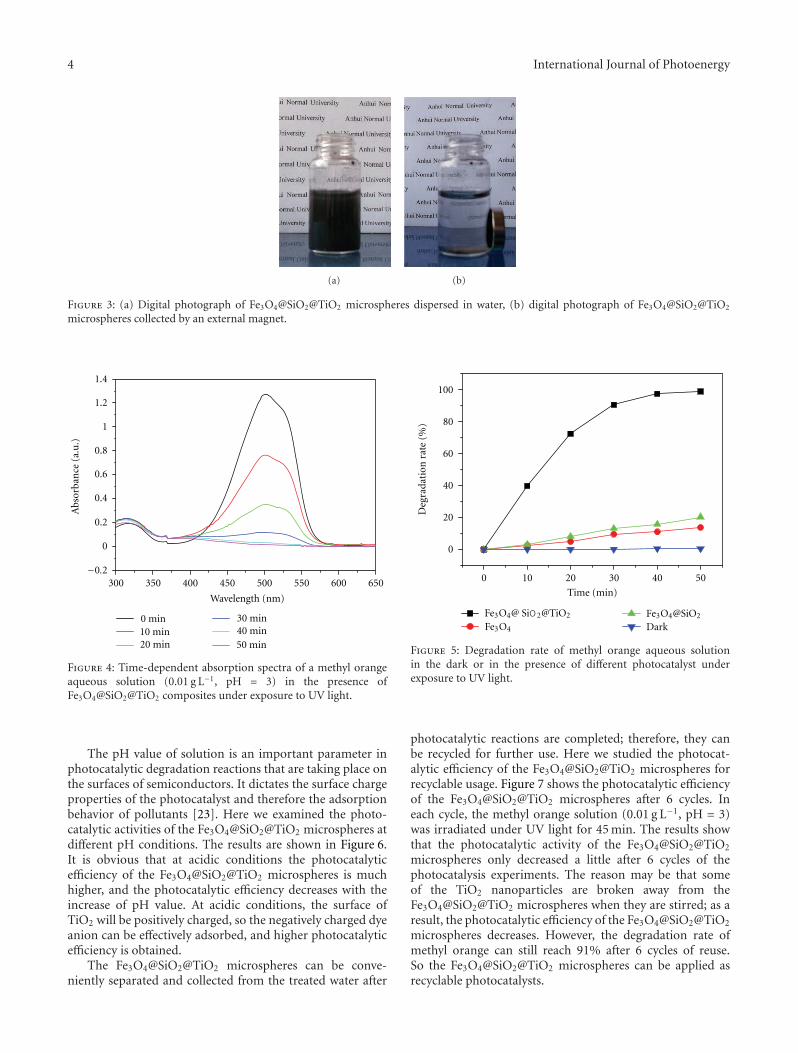
4 International Journal of Photoenergy
(a) (b)
Figure 3: (a) Digital photograph of Fe3O4@SiO2@TiO2 microspheres dispersed in water, (b) digital photograph of Fe3O4@SiO2@TiO2
microspheres collected by an external magnet.
−0.2
0
0.2
0.4
0.6
0.8
1
1.2
1.4
300 350 400 450 500 550 600 650
Wavelength (nm)
Abs
orba
nce
(a.
u.)
0 min10 min20 min
30 min40 min50 min
Figure 4: Time-dependent absorption spectra of a methyl orangeaqueous solution (0.01 g L−1, pH = 3) in the presence ofFe3O4@SiO2@TiO2 composites under exposure to UV light.
The pH value of solution is an important parameter inphotocatalytic degradation reactions that are taking place onthe surfaces of semiconductors. It dictates the surface chargeproperties of the photocatalyst and therefore the adsorptionbehavior of pollutants [23]. Here we examined the photo-catalytic activities of the Fe3O4@SiO2@TiO2 microspheres atdifferent pH conditions. The results are shown in Figure 6.It is obvious that at acidic conditions the photocatalyticefficiency of the Fe3O4@SiO2@TiO2 microspheres is muchhigher, and the photocatalytic efficiency decreases with theincrease of pH value. At acidic conditions, the surface ofTiO2 will be positively charged, so the negatively charged dyeanion can be effectively adsorbed, and higher photocatalyticefficiency is obtained.
The Fe3O4@SiO2@TiO2 microspheres can be conve-niently separated and collected from the treated water after
0
20
40
60
80
100
0 10 20 30 40 50
Time (min)
Fe3O4@ SiO 2@TiO2
Fe3O4
Fe3O4@SiO2
Dark
Deg
rada
tion
rat
e (%
)
Figure 5: Degradation rate of methyl orange aqueous solutionin the dark or in the presence of different photocatalyst underexposure to UV light.
photocatalytic reactions are completed; therefore, they canbe recycled for further use. Here we studied the photocat-alytic efficiency of the Fe3O4@SiO2@TiO2 microspheres forrecyclable usage. Figure 7 shows the photocatalytic efficiencyof the Fe3O4@SiO2@TiO2 microspheres after 6 cycles. Ineach cycle, the methyl orange solution (0.01 g L−1, pH = 3)was irradiated under UV light for 45 min. The results showthat the photocatalytic activity of the Fe3O4@SiO2@TiO2
microspheres only decreased a little after 6 cycles of thephotocatalysis experiments. The reason may be that someof the TiO2 nanoparticles are broken away from theFe3O4@SiO2@TiO2 microspheres when they are stirred; as aresult, the photocatalytic efficiency of the Fe3O4@SiO2@TiO2
microspheres decreases. However, the degradation rate ofmethyl orange can still reach 91% after 6 cycles of reuse.So the Fe3O4@SiO2@TiO2 microspheres can be applied asrecyclable photocatalysts.
International Journal of Photoenergy 5
0
20
40
60
80
100
0 10 20 30 40 50
Time (min)pH3pH12pH7
Deg
rada
tion
rat
e (%
)
Figure 6: Degradation rate of methyl orange aqueous solutionat different pH values in the presence of Fe3O4@SiO2@TiO2
composites under exposure to UV light.
0 1 2 3 4 5 6
0
20
40
60
80
100
Experiment cycles
Deg
rada
tion
rat
e (%
)
Figure 7: Relationship between the degradation efficiency ofFe3O4@SiO2@TiO2 photocatalyst and cyclic time.
4. Conclusions
In summary, we have successfully prepared Fe3O4@SiO2@TiO2 microspheres with well-defined core-shell structuresthrough a wet-chemical method. The Fe3O4@SiO2@TiO2
microspheres are multifunctional. The magnetic core makesthe microspheres very easy to be separated from solutionwith the help of an external magnet, and the titaniananoparticles at the outside can act as photocatalyst todecompose organic dyes in waste water. Photocatalyticexperiments show that the prepared Fe3O4@SiO2@TiO2
microspheres have good photocatalytic activities under theillumination of UV light and can be applied as recyclablephotocatalysts.
Acknowledgment
Financial supports from the National Natural ScienceFoundation of China (20701001, 21171006) are gratefullyacknowledged.
References
[1] A. Fujishima and K. Honda, “Electrochemical photolysis ofwater at a semiconductor electrode,” Nature, vol. 238, no.5358, pp. 37–38, 1972.
[2] M. R. Hoffmann, S. T. Martin, W. Choi, and D. W. Bahne-mann, “Environmental applications of semiconductor photo-catalysis,” Chemical Reviews, vol. 95, no. 1, pp. 69–96, 1995.
[3] A. Wold, “Photocatalytic properties of TiO2, ”Chemistry ofMaterials, vol. 5, no. 3, pp. 280–283, 1993.
[4] H. Park and W. Choi, “Effects of TiO2 surface fluorination onphotocatalytic reactions and photoelectrochemical behaviors,”Journal of Physical Chemistry B, vol. 108, no. 13, pp. 4086–4093, 2004.
[5] V. A. Sakkas, A. Dimou, K. Pitarakis, G. Mantis, and T.Albanis, “TiO2 photocatalyzed degradation of diazinon in anaqueous medium,” Environmental Chemistry Letters, vol. 3, no.2, pp. 57–61, 2005.
[6] K. W. Kim, S. H. You, S. S. Park, G. H. Kang, W. T. Bae, and D.W. Shin, “Effect of experimental conditions on photocatalyticefficiency in TiO 2 powder slurry systems,” Journal of CeramicProcessing Research, vol. 9, no. 5, pp. 530–537, 2008.
[7] I. Arslan, I. A. Balcioglu, and D. W. Bahnemann, “Het-erogeneous photocatalytic treatment of simulated dyehouseeffluents using novel TiO2-photocatalysts,” Applied CatalysisB, vol. 26, no. 3, pp. 193–206, 2000.
[8] N. Bouanimba, R. Zouaghi, N. Laid, and T. Sehili, “Factorsinfluencing the photocatalytic decolorization of Bromophenolblue in aqueous solution with different types of TiO2 asphotocatalysts,” Desalination, vol. 275, no. 1–3, pp. 224–230,2011.
[9] S. Yamazaki, S. Matsunaga, and K. Hori, “Photocatalyticdegradation of trichloroethylene in water using TiO2 pellets,”Water Research, vol. 35, no. 4, pp. 1022–1028, 2001.
[10] H. Kominami, H. Kumamoto, Y. Kera, and B. Ohtani,“Immobilization of highly active titanium(IV) oxide particlesA novel strategy of preparation of transparent photocatalyticcoatings,” Applied Catalysis B, vol. 30, no. 3-4, pp. 329–335,2001.
[11] I. M. Arabatzis, S. Antonaraki, T. Stergiopoulos et al.,“Preparation, characterization and photocatalytic activity ofnanocrystalline thin film TiO2 catalysts towards 3,5-dichlorophenol degradation,” Journal of Photochemistry andPhotobiology A, vol. 149, no. 1–3, pp. 237–245, 2002.
[12] S. Horikoshi, N. Watanabe, H. Onishi, H. Hidaka, and N. Ser-pone, “Photodecomposition of a nonylphenol polyethoxylatesurfactant in a cylindrical photoreactor with TiO2 immobi-lized fiberglass cloth,” Applied Catalysis B, vol. 37, no. 2, pp.117–129, 2002.
[13] M. Anpo, S. G. Zhang, H. Mishima, M. Matsuoka, and H.Yamashita, “Design of photocatalysts encapsulated within thezeolite framework and cavities for the decomposition of NOinto N2 and O2 at normal temperature,” Catalysis Today, vol.39, no. 3, pp. 159–168, 1997.
[14] D. Beydoun, R. Amal, G. K. C. Low, and S. McEvoy,“Novel photocatalyst: titania-coated magnetite. Activity and
6 International Journal of Photoenergy
photodissolution,” Journal of Physical Chemistry B, vol. 104,no. 18, pp. 4387–4396, 2000.
[15] D. Beydoun, R. Amal, J. Scott, G. Low, and S. McEvoy, “Studieson the mineralization and separation efficiencies of a magneticphotocatalyst,” Chemical Engineering & Technology, vol. 24,no. 7, pp. 745–748, 2001.
[16] F. Chen, Y. Xie, J. Zhao, and G. Lu, “Photocatalytic degrada-tion of dyes on a magnetically separated photocatalyst undervisible and UV irradiation,” Chemosphere, vol. 44, no. 5, pp.1159–1168, 2001.
[17] D. Beydoun and R. Amal, “Implications of heat treatmenton the properties of a magnetic iron oxide-titanium dioxidephotocatalyst,” Materials Science and Engineering B, vol. 94,no. 1, pp. 71–81, 2002.
[18] Y. Gao, B. Chen, H. Li, and Y. Ma, “Preparation andcharacterization of a magnetically separated photocatalyst andits catalytic properties,” Materials Chemistry and Physics, vol.80, no. 1, pp. 348–355, 2003.
[19] W. Wu, X. H. Xiao, S. F. Zhang, F. Ren, and C. Z. Jiang,“Facile method to synthesize magnetic iron oxides/TiO2
hybrid nanoparticles and their photodegradation applicationof methylene blue,” Nanoscale Research Letters, vol. 6, no. 1, p.533, 2011.
[20] C. F. Chang and C. Y. Man, “Titania-coated magneticcomposites as photocatalysts for phthalate photodegradation,”Industrial & Engineering Chemistry Research, vol. 50, no. 20,pp. 11620–11627, 2011.
[21] H. Deng, X. Li, Q. Peng, X. Wang, J. Chen, and Y. Li,“Monodisperse magnetic single-crystal ferrite microspheres,”Angewandte Chemie, vol. 44, no. 18, pp. 2782–2785, 2005.
[22] W. Stober, A. Fink, and E. Bohn, “Controlled growth ofmonodisperse silica spheres in the micron size range,” Journalof Colloid And Interface Science, vol. 26, no. 1, pp. 62–69, 1968.
[23] V. K. Gupta, R. Jain, A. Mittal et al., “Photo-catalyticdegradation of toxic dye amaranth on TiO2/UV in aqueoussuspensions,” Materials Science and Engineering C, vol. 32, no.1, pp. 12–17, 2012.
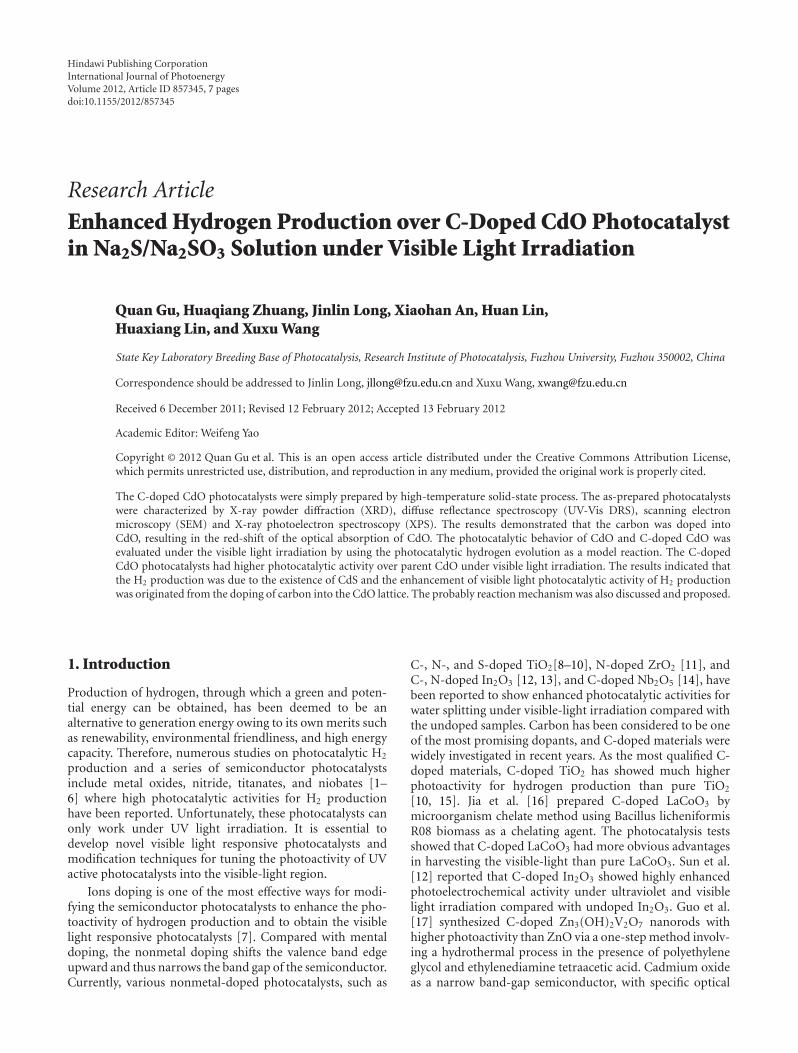
Hindawi Publishing CorporationInternational Journal of PhotoenergyVolume 2012, Article ID 857345, 7 pagesdoi:10.1155/2012/857345
Research Article
Enhanced Hydrogen Production over C-Doped CdO Photocatalystin Na2S/Na2SO3 Solution under Visible Light Irradiation
Quan Gu, Huaqiang Zhuang, Jinlin Long, Xiaohan An, Huan Lin,Huaxiang Lin, and Xuxu Wang
State Key Laboratory Breeding Base of Photocatalysis, Research Institute of Photocatalysis, Fuzhou University, Fuzhou 350002, China
Correspondence should be addressed to Jinlin Long, [email protected] and Xuxu Wang, [email protected]
Received 6 December 2011; Revised 12 February 2012; Accepted 13 February 2012
Academic Editor: Weifeng Yao
Copyright © 2012 Quan Gu et al. This is an open access article distributed under the Creative Commons Attribution License,which permits unrestricted use, distribution, and reproduction in any medium, provided the original work is properly cited.
The C-doped CdO photocatalysts were simply prepared by high-temperature solid-state process. The as-prepared photocatalystswere characterized by X-ray powder diffraction (XRD), diffuse reflectance spectroscopy (UV-Vis DRS), scanning electronmicroscopy (SEM) and X-ray photoelectron spectroscopy (XPS). The results demonstrated that the carbon was doped intoCdO, resulting in the red-shift of the optical absorption of CdO. The photocatalytic behavior of CdO and C-doped CdO wasevaluated under the visible light irradiation by using the photocatalytic hydrogen evolution as a model reaction. The C-dopedCdO photocatalysts had higher photocatalytic activity over parent CdO under visible light irradiation. The results indicated thatthe H2 production was due to the existence of CdS and the enhancement of visible light photocatalytic activity of H2 productionwas originated from the doping of carbon into the CdO lattice. The probably reaction mechanism was also discussed and proposed.
1. Introduction
Production of hydrogen, through which a green and poten-tial energy can be obtained, has been deemed to be analternative to generation energy owing to its own merits suchas renewability, environmental friendliness, and high energycapacity. Therefore, numerous studies on photocatalytic H2
production and a series of semiconductor photocatalystsinclude metal oxides, nitride, titanates, and niobates [1–6] where high photocatalytic activities for H2 productionhave been reported. Unfortunately, these photocatalysts canonly work under UV light irradiation. It is essential todevelop novel visible light responsive photocatalysts andmodification techniques for tuning the photoactivity of UVactive photocatalysts into the visible-light region.
Ions doping is one of the most effective ways for modi-fying the semiconductor photocatalysts to enhance the pho-toactivity of hydrogen production and to obtain the visiblelight responsive photocatalysts [7]. Compared with mentaldoping, the nonmetal doping shifts the valence band edgeupward and thus narrows the band gap of the semiconductor.Currently, various nonmetal-doped photocatalysts, such as
C-, N-, and S-doped TiO2[8–10], N-doped ZrO2 [11], andC-, N-doped In2O3 [12, 13], and C-doped Nb2O5 [14], havebeen reported to show enhanced photocatalytic activities forwater splitting under visible-light irradiation compared withthe undoped samples. Carbon has been considered to be oneof the most promising dopants, and C-doped materials werewidely investigated in recent years. As the most qualified C-doped materials, C-doped TiO2 has showed much higherphotoactivity for hydrogen production than pure TiO2
[10, 15]. Jia et al. [16] prepared C-doped LaCoO3 bymicroorganism chelate method using Bacillus licheniformisR08 biomass as a chelating agent. The photocatalysis testsshowed that C-doped LaCoO3 had more obvious advantagesin harvesting the visible-light than pure LaCoO3. Sun et al.[12] reported that C-doped In2O3 showed highly enhancedphotoelectrochemical activity under ultraviolet and visiblelight irradiation compared with undoped In2O3. Guo et al.[17] synthesized C-doped Zn3(OH)2V2O7 nanorods withhigher photoactivity than ZnO via a one-step method involv-ing a hydrothermal process in the presence of polyethyleneglycol and ethylenediamine tetraacetic acid. Cadmium oxideas a narrow band-gap semiconductor, with specific optical
2 International Journal of Photoenergy
and electrical properties, has been widely used specificallyin the field of optoelectronic devices including solar cells,transparent electrodes, and sensors [18–21]. However, to thebest of our knowledge, little work has been attempted topresent the photocatalytic property of nonmetal-doped CdOphotocatalysts due to special band structure [22].
In the present work, the bulk CdO and C-doped CdOphotocatalysts were prepared by the high-temperature solidstate process, and their photocatalytic activities for hydro-gen evolution from sodium sulfide/sodium sulfite aqueoussolution were then compared under visible light irradiation.The results indicated that the photocatalytic activity ofthe C-doped CdO was higher than that of pure CdO. Inaddition, these as-prepared C-doped CdO photocatalystswere characterized by X-ray powder diffraction (XRD),diffuse reflectance spectroscopy (UV-Vis DRS), infraredspectroscopy (IR), scanning electron microscopy (SEM), andX-ray photoelectron spectroscopy (XPS). The enhancementof photocatalytic activity for C-doped CdO was discussed,and the probably reaction mechanism was also discussed andproposed.
2. Experimental
2.1. Reagents and Materials. Cadmium sulfate, 8/3-hydrate(CdSO4·8/3H2O, AR grade), cadmium oxide (AR grade),and sodium sulfide (AR grade) were purchased from AladdinCompany. Graphite powder (SR grade) and a sodiumsulfite anhydrous (AR grade) were obtained from Sinopharmchemical reagent Co. Ltd. All of the reagents were usedwithout any further purification.
2.2. Preparation of Samples. The samples were preparedby the high-temperature solid state process. For a typicalexperiment, 3.0 g of CdSO4·8/3H2O was added in 50 mLof H2O with constant stirring to obtain the cadmiumsulfate solution, and then 1 g of graphite powder was addedunder vigorously magnetic stirring at room temperature.Stirring of the pravious suspension was continued for 1hour at the same temperature until the graphite powder wasdispersed uniformly in the cadmium sulfate solution. Thewell-distributed suspension was heated at 120◦C on oil bathto evaporate the water, thus the black solid was obtained.The solid was grinded and then calcined on muffle furnaceat desired temperature for 10 h.
2.3. Characterization of Samples. The X-ray powder diffrac-tion (XRD) measurements were performed on a Bruker D8Advance X-ray diffractometer using Cu Kα1 radiation (λ =1.5406 A). The accelerating voltage and the applied currentwere 40 kV and 40 mA, respectively. The UV-Vis diffusereflectance spectra were recorded on a Varian Cary 500 ScanUV-Vis-NIR spectrometer with BaSO4 as a reference sample.X-ray photoelectron spectroscopy analysis was conductedon an ESCALAB 250 photoelection spectroscopy (ThermoFisher Scientific) at 3.0 × 10⁻¹⁰ mbar using Al Kα X-raybeam (15 kv 200 W 500 μm pass energy = 20 eV). All bindingenergies were referenced to the C 1s peak at 284.6 eV
of surface adventitious carbon. The morphologies of thesamples were investigated by scanning electron microscopy(SEM) (XL30ESEM, Philips).
2.4. Photocatalytic Activity Measurements. The photocat-alytic activities of the samples for hydrogen evolution undervisible light irradiation were studied. The photocatalyticH2 evolution reaction was performed in a closed gas-recirculation system equipped with a side-irradiation Pyrexreaction vessel. 0.4 g of the catalyst was suspended in 400 mLof water containing 3.12 g sodium sulfide and 1.0 g sodiumsulfite anhydrous by a magnetic stirrer in Pyrex reactionvessel. The pravious suspension was evacuated 50 min toremove air prior to irradiation under a 300 w xenon lampwith a cutoff filter (λ > 420 nm). The evolved hydrogengas was circulated with a gas pump and quantified by gaschromatography (Shimadzu GC-8A, TCD, Ar carrier).
3. Results and Discussion
3.1. XRD Measurement. Figure 1(a) shows the XRD patternsof all samples. For the pure CdO, the peaks associated withplanes (111), (200), (220), (311), and (222) are observed,and all XRD peaks can be indexed to CdO (JCPDS 65-2908).When the mixture powders are annealed at 700◦C for 10 h,the peaks due to CdO and Cd3O2SO4 are observed as shownin Figure 1(a) curve b. The XRD results of samples obtainedat above 700◦C indicated that the C-doped CdO maintaineda cubic structure of CdO. Figure 1(b) is an enlargement ofthe (111) plane of all samples. As we can see, compared withparent CdO, the peak position of the (111) plane of C-dopedCdO is shifted slightly toward lower 2θ value, demonstratingthe distortion of the crystal lattice of doped CdO by thecarbon dopant. Interestingly, the intensity ratio of (111) and(200) plane is smaller than that of pure CdO and decreasedwith the increase of preparation temperature. Generally, thepreferred orientation could destroy the randomness of planeorientation and the normal relative intensity of plane. So, itseems that the samples synthesized at high temperature growpreferentially along (111) plane orientation.
3.2. UV-Vis DRS Measurement. Figure 2 shows the diffusereflectance spectra of the prepared samples. It is clearlyobserved that a strong absorption band exists in the rangeof 200–600 nm for parent CdO and an optical absorptionedge of pure CdO is at 620 nm. The parent CdO exhibits aweak adsorption at the range of 620–800 nm, which may bedue to the adsorbed C species as indicated in XPS results.Therefore, the corresponding value of the band-gap energyis about 2.2 eV, which is smaller about 0.1 eV than that ofthe reference value (2.3 eV) of the band-gap energy [20]. Itmay be due to the effect of CdO crystallites diameter onoptical absorption and difference of synthesis procedures[19, 20, 23]. Compared with parent CdO, the C-doped CdOadsorbed the light at the range of 200–800 nm. The broadabsorption band of C-doped CdO is probably associated withthe formation of impurity states in the band gap by thepartial substitution of O with C in the crystal lattice of CdO.
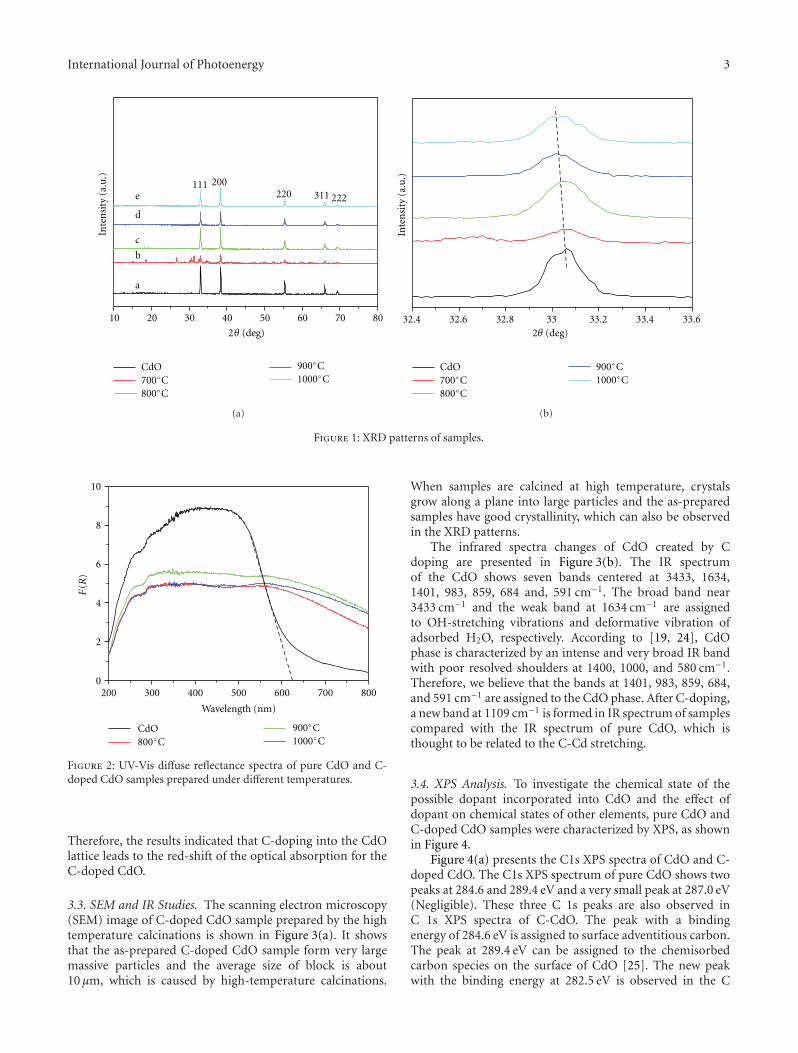
International Journal of Photoenergy 3
Inte
nsi
ty (
a.u
.)
10 20 30 40 50 60 70 80
2θ (deg)
a
b
c
d
e111 200
220 311 222
CdO700◦C800◦C
900◦C1000◦C
(a)In
ten
sity
(a.
u.)
2θ (deg)
CdO700◦C800◦C
900◦C1000◦C
32.4 32.6 32.8 33 33.2 33.4 33.6
(b)
Figure 1: XRD patterns of samples.
F(R
)
0
2
4
6
8
10
200 300 400 500 600 700 800
Wavelength (nm)
CdO800◦C
900◦C1000◦C
Figure 2: UV-Vis diffuse reflectance spectra of pure CdO and C-doped CdO samples prepared under different temperatures.
Therefore, the results indicated that C-doping into the CdOlattice leads to the red-shift of the optical absorption for theC-doped CdO.
3.3. SEM and IR Studies. The scanning electron microscopy(SEM) image of C-doped CdO sample prepared by the hightemperature calcinations is shown in Figure 3(a). It showsthat the as-prepared C-doped CdO sample form very largemassive particles and the average size of block is about10 μm, which is caused by high-temperature calcinations.
When samples are calcined at high temperature, crystalsgrow along a plane into large particles and the as-preparedsamples have good crystallinity, which can also be observedin the XRD patterns.
The infrared spectra changes of CdO created by Cdoping are presented in Figure 3(b). The IR spectrumof the CdO shows seven bands centered at 3433, 1634,1401, 983, 859, 684 and, 591 cm−1. The broad band near3433 cm−1 and the weak band at 1634 cm−1 are assignedto OH-stretching vibrations and deformative vibration ofadsorbed H2O, respectively. According to [19, 24], CdOphase is characterized by an intense and very broad IR bandwith poor resolved shoulders at 1400, 1000, and 580 cm−1.Therefore, we believe that the bands at 1401, 983, 859, 684,and 591 cm−1 are assigned to the CdO phase. After C-doping,a new band at 1109 cm−1 is formed in IR spectrum of samplescompared with the IR spectrum of pure CdO, which isthought to be related to the C-Cd stretching.
3.4. XPS Analysis. To investigate the chemical state of thepossible dopant incorporated into CdO and the effect ofdopant on chemical states of other elements, pure CdO andC-doped CdO samples were characterized by XPS, as shownin Figure 4.
Figure 4(a) presents the C1s XPS spectra of CdO and C-doped CdO. The C1s XPS spectrum of pure CdO shows twopeaks at 284.6 and 289.4 eV and a very small peak at 287.0 eV(Negligible). These three C 1s peaks are also observed inC 1s XPS spectra of C-CdO. The peak with a bindingenergy of 284.6 eV is assigned to surface adventitious carbon.The peak at 289.4 eV can be assigned to the chemisorbedcarbon species on the surface of CdO [25]. The new peakwith the binding energy at 282.5 eV is observed in the C
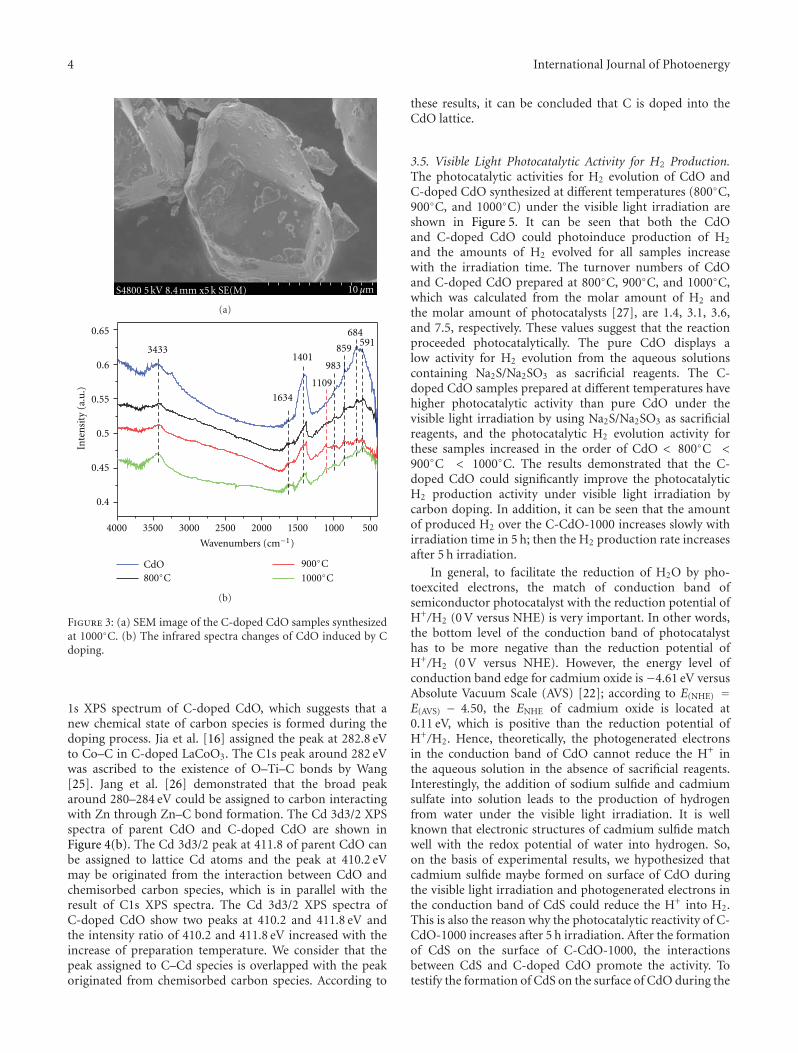
4 International Journal of Photoenergy
S4800 5 kV 8.4 mm x5 k SE(M) 10 μm
(a)
Inte
nsi
ty (
a.u
.)
0.4
0.45
0.5
0.55
0.6
0.65
4000 3500 3000 2500 2000 1500 1000 500
Wavenumbers (cm−1)
3433
1634
1401
1109
983
859
684591
CdO800◦C
900◦C
1000◦C
(b)
Figure 3: (a) SEM image of the C-doped CdO samples synthesizedat 1000◦C. (b) The infrared spectra changes of CdO induced by Cdoping.
1s XPS spectrum of C-doped CdO, which suggests that anew chemical state of carbon species is formed during thedoping process. Jia et al. [16] assigned the peak at 282.8 eVto Co–C in C-doped LaCoO3. The C1s peak around 282 eVwas ascribed to the existence of O–Ti–C bonds by Wang[25]. Jang et al. [26] demonstrated that the broad peakaround 280–284 eV could be assigned to carbon interactingwith Zn through Zn–C bond formation. The Cd 3d3/2 XPSspectra of parent CdO and C-doped CdO are shown inFigure 4(b). The Cd 3d3/2 peak at 411.8 of parent CdO canbe assigned to lattice Cd atoms and the peak at 410.2 eVmay be originated from the interaction between CdO andchemisorbed carbon species, which is in parallel with theresult of C1s XPS spectra. The Cd 3d3/2 XPS spectra ofC-doped CdO show two peaks at 410.2 and 411.8 eV andthe intensity ratio of 410.2 and 411.8 eV increased with theincrease of preparation temperature. We consider that thepeak assigned to C–Cd species is overlapped with the peakoriginated from chemisorbed carbon species. According to
these results, it can be concluded that C is doped into theCdO lattice.
3.5. Visible Light Photocatalytic Activity for H2 Production.The photocatalytic activities for H2 evolution of CdO andC-doped CdO synthesized at different temperatures (800◦C,900◦C, and 1000◦C) under the visible light irradiation areshown in Figure 5. It can be seen that both the CdOand C-doped CdO could photoinduce production of H2
and the amounts of H2 evolved for all samples increasewith the irradiation time. The turnover numbers of CdOand C-doped CdO prepared at 800◦C, 900◦C, and 1000◦C,which was calculated from the molar amount of H2 andthe molar amount of photocatalysts [27], are 1.4, 3.1, 3.6,and 7.5, respectively. These values suggest that the reactionproceeded photocatalytically. The pure CdO displays alow activity for H2 evolution from the aqueous solutionscontaining Na2S/Na2SO3 as sacrificial reagents. The C-doped CdO samples prepared at different temperatures havehigher photocatalytic activity than pure CdO under thevisible light irradiation by using Na2S/Na2SO3 as sacrificialreagents, and the photocatalytic H2 evolution activity forthese samples increased in the order of CdO < 800◦C <900◦C < 1000◦C. The results demonstrated that the C-doped CdO could significantly improve the photocatalyticH2 production activity under visible light irradiation bycarbon doping. In addition, it can be seen that the amountof produced H2 over the C-CdO-1000 increases slowly withirradiation time in 5 h; then the H2 production rate increasesafter 5 h irradiation.
In general, to facilitate the reduction of H2O by pho-toexcited electrons, the match of conduction band ofsemiconductor photocatalyst with the reduction potential ofH+/H2 (0 V versus NHE) is very important. In other words,the bottom level of the conduction band of photocatalysthas to be more negative than the reduction potential ofH+/H2 (0 V versus NHE). However, the energy level ofconduction band edge for cadmium oxide is −4.61 eV versusAbsolute Vacuum Scale (AVS) [22]; according to E(NHE) =E(AVS) − 4.50, the ENHE of cadmium oxide is located at0.11 eV, which is positive than the reduction potential ofH+/H2. Hence, theoretically, the photogenerated electronsin the conduction band of CdO cannot reduce the H+ inthe aqueous solution in the absence of sacrificial reagents.Interestingly, the addition of sodium sulfide and cadmiumsulfate into solution leads to the production of hydrogenfrom water under the visible light irradiation. It is wellknown that electronic structures of cadmium sulfide matchwell with the redox potential of water into hydrogen. So,on the basis of experimental results, we hypothesized thatcadmium sulfide maybe formed on surface of CdO duringthe visible light irradiation and photogenerated electrons inthe conduction band of CdS could reduce the H+ into H2.This is also the reason why the photocatalytic reactivity of C-CdO-1000 increases after 5 h irradiation. After the formationof CdS on the surface of C-CdO-1000, the interactionsbetween CdS and C-doped CdO promote the activity. Totestify the formation of CdS on the surface of CdO during the
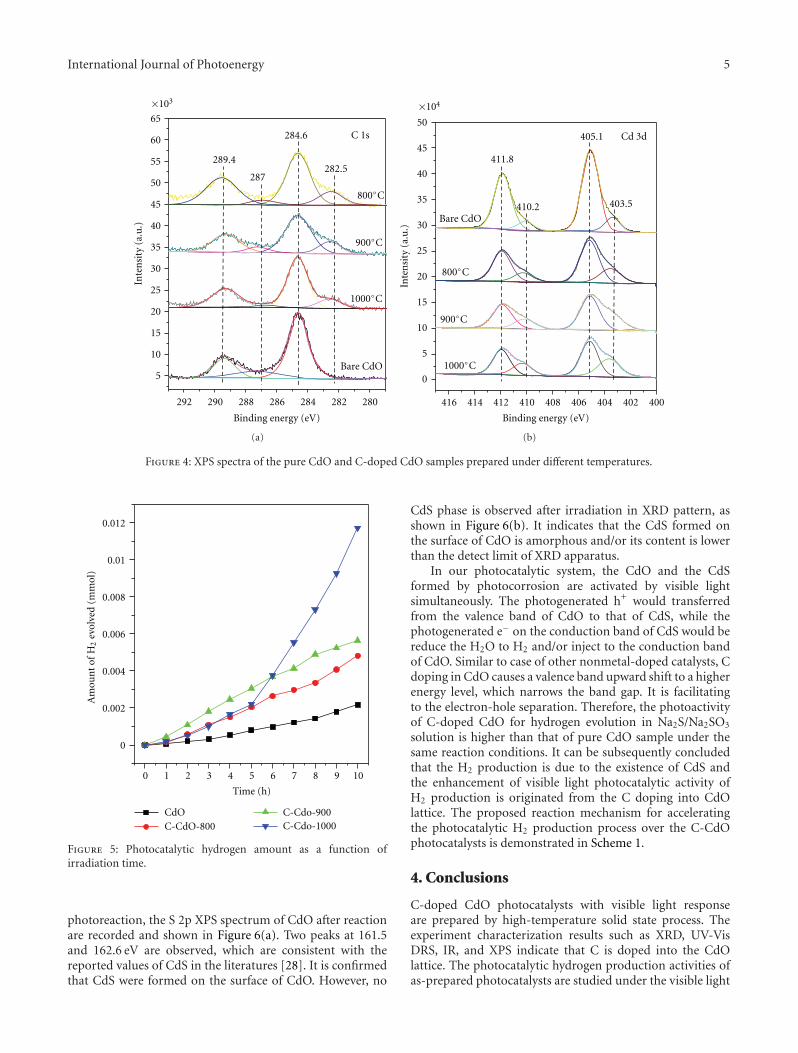
International Journal of Photoenergy 5
Inte
nsi
ty (
a.u
.)
5
10
15
20
25
30
35
40
45
50
55
60
65
292 290 288 286 284 282 280
Binding energy (eV)
C 1s
289.4
287
284.6
282.5
Bare CdO
1000◦C
900◦C
800◦C
×103
(a)
0
5
10
15
20
25
30
35
40
45
50
Inte
nsi
ty (
a.u
.)416 414 412 410 408 406 404 402 400
Binding energy (eV)
Cd 3d
Bare CdO
1000◦C
900◦C
800◦C
411.8
410.2
405.1
403.5
×104
(b)
Figure 4: XPS spectra of the pure CdO and C-doped CdO samples prepared under different temperatures.
0
0.002
0.004
0.006
0.008
0.01
0.012
Am
oun
t of
H2
evol
ved
(mm
ol)
0 1 2 3 4 5 6 7 8 9 10
Time (h)
CdOC-CdO-800
C-Cdo-900C-Cdo-1000
Figure 5: Photocatalytic hydrogen amount as a function ofirradiation time.
photoreaction, the S 2p XPS spectrum of CdO after reactionare recorded and shown in Figure 6(a). Two peaks at 161.5and 162.6 eV are observed, which are consistent with thereported values of CdS in the literatures [28]. It is confirmedthat CdS were formed on the surface of CdO. However, no
CdS phase is observed after irradiation in XRD pattern, asshown in Figure 6(b). It indicates that the CdS formed onthe surface of CdO is amorphous and/or its content is lowerthan the detect limit of XRD apparatus.
In our photocatalytic system, the CdO and the CdSformed by photocorrosion are activated by visible lightsimultaneously. The photogenerated h+ would transferredfrom the valence band of CdO to that of CdS, while thephotogenerated e− on the conduction band of CdS would bereduce the H2O to H2 and/or inject to the conduction bandof CdO. Similar to case of other nonmetal-doped catalysts, Cdoping in CdO causes a valence band upward shift to a higherenergy level, which narrows the band gap. It is facilitatingto the electron-hole separation. Therefore, the photoactivityof C-doped CdO for hydrogen evolution in Na2S/Na2SO3
solution is higher than that of pure CdO sample under thesame reaction conditions. It can be subsequently concludedthat the H2 production is due to the existence of CdS andthe enhancement of visible light photocatalytic activity ofH2 production is originated from the C doping into CdOlattice. The proposed reaction mechanism for acceleratingthe photocatalytic H2 production process over the C-CdOphotocatalysts is demonstrated in Scheme 1.
4. Conclusions
C-doped CdO photocatalysts with visible light responseare prepared by high-temperature solid state process. Theexperiment characterization results such as XRD, UV-VisDRS, IR, and XPS indicate that C is doped into the CdOlattice. The photocatalytic hydrogen production activities ofas-prepared photocatalysts are studied under the visible light
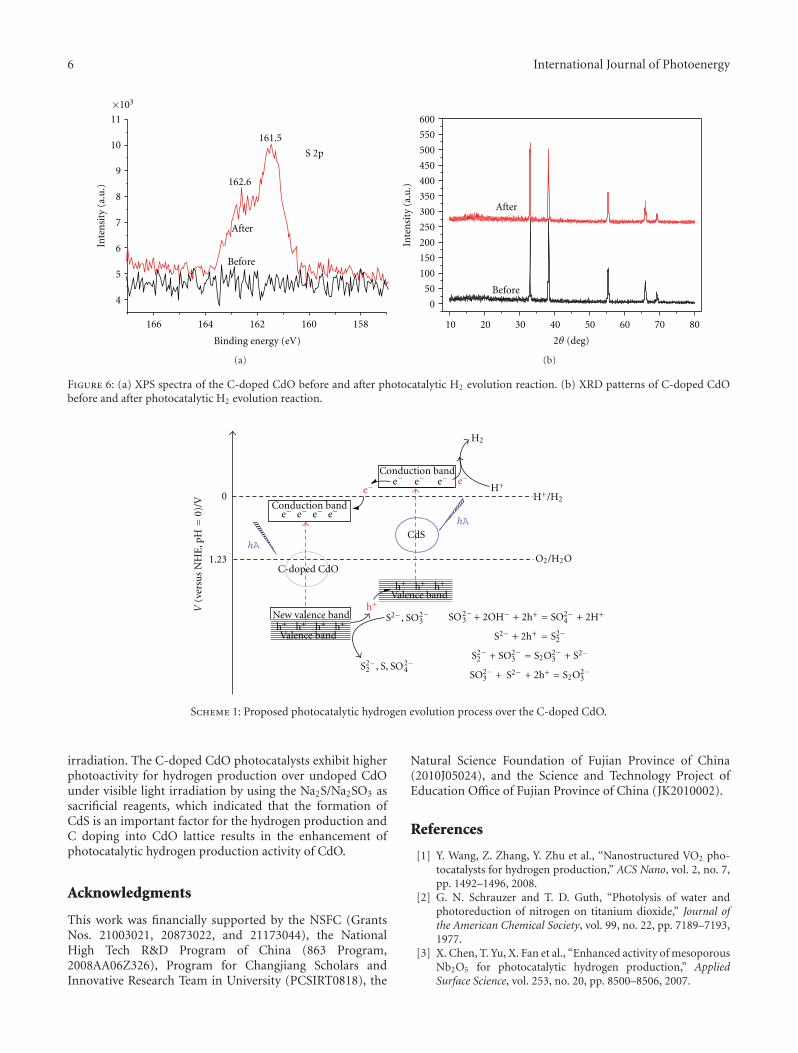
6 International Journal of Photoenergy
4
5
6
7
8
9
10
11
×103In
ten
sity
(a.
u.)
166 164 162 160 158
Binding energy (eV)
Before
After
162.6
161.5
S 2p
(a)
Inte
nsi
ty (
a.u
.)
0
50
100
150
200
250
300
350
400
450
500
550
600
10 20 30 40 50 60 70 80
2θ (deg)
After
Before
(b)
Figure 6: (a) XPS spectra of the C-doped CdO before and after photocatalytic H2 evolution reaction. (b) XRD patterns of C-doped CdObefore and after photocatalytic H2 evolution reaction.
Conduction band
Conduction band
e− e− e− e−e−
e− e− e− e−
H2
H+/H2
CdS
0
1.23
V (
vers
us
NH
E, p
H=
0)/V
C-doped CdO
New valence bandh+ h+ h+ h+
Valence band
h+ h+ h+
h+Valence band
hA
hA
O2/H2O
S2−2 , S, SO2−
4
S2−
S2−
, SO2−3 SO2−
3 + 2OH− + 2h+
+
= SO2−4 + 2H+
S2− + 2h = S2−2
S2−2 + SO2−
3 = S2O2−3 + S2−
SO2−3 + + 2h+ = S2O2−
3
H+
Scheme 1: Proposed photocatalytic hydrogen evolution process over the C-doped CdO.
irradiation. The C-doped CdO photocatalysts exhibit higherphotoactivity for hydrogen production over undoped CdOunder visible light irradiation by using the Na2S/Na2SO3 assacrificial reagents, which indicated that the formation ofCdS is an important factor for the hydrogen production andC doping into CdO lattice results in the enhancement ofphotocatalytic hydrogen production activity of CdO.
Acknowledgments
This work was financially supported by the NSFC (GrantsNos. 21003021, 20873022, and 21173044), the NationalHigh Tech R&D Program of China (863 Program,2008AA06Z326), Program for Changjiang Scholars andInnovative Research Team in University (PCSIRT0818), the
Natural Science Foundation of Fujian Province of China(2010J05024), and the Science and Technology Project ofEducation Office of Fujian Province of China (JK2010002).
References
[1] Y. Wang, Z. Zhang, Y. Zhu et al., “Nanostructured VO2 pho-tocatalysts for hydrogen production,” ACS Nano, vol. 2, no. 7,pp. 1492–1496, 2008.
[2] G. N. Schrauzer and T. D. Guth, “Photolysis of water andphotoreduction of nitrogen on titanium dioxide,” Journal ofthe American Chemical Society, vol. 99, no. 22, pp. 7189–7193,1977.
[3] X. Chen, T. Yu, X. Fan et al., “Enhanced activity of mesoporousNb2O5 for photocatalytic hydrogen production,” AppliedSurface Science, vol. 253, no. 20, pp. 8500–8506, 2007.
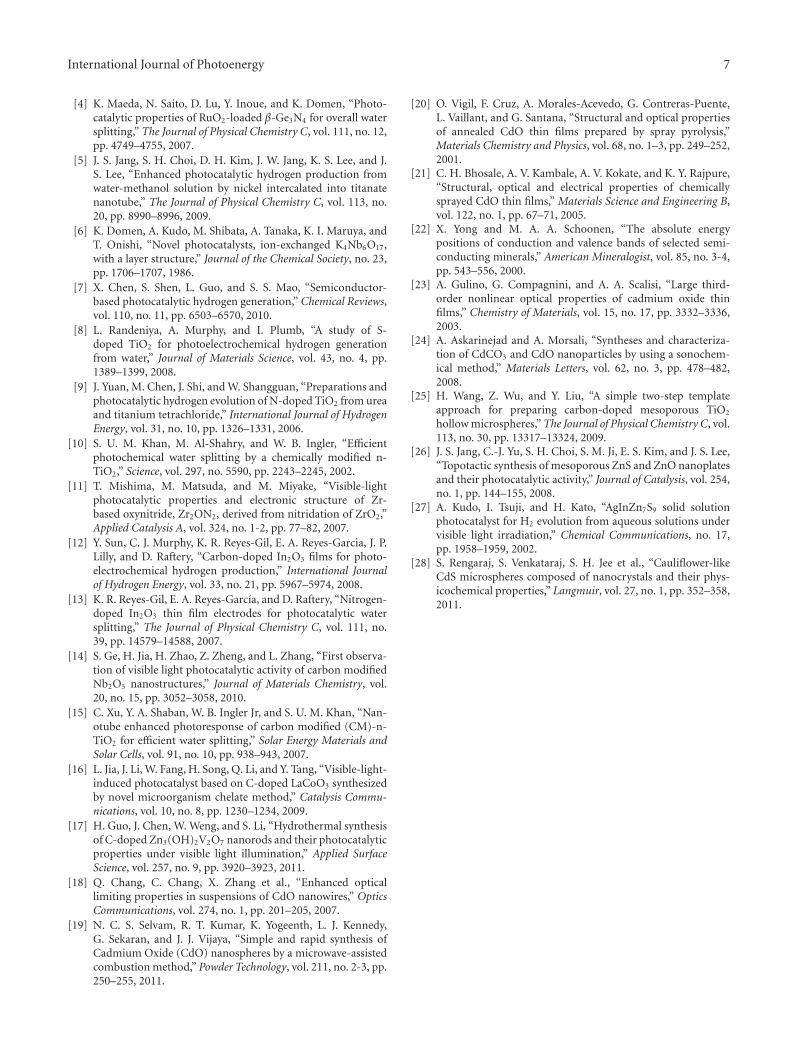
International Journal of Photoenergy 7
[4] K. Maeda, N. Saito, D. Lu, Y. Inoue, and K. Domen, “Photo-catalytic properties of RuO2-loaded β-Ge3N4 for overall watersplitting,” The Journal of Physical Chemistry C, vol. 111, no. 12,pp. 4749–4755, 2007.
[5] J. S. Jang, S. H. Choi, D. H. Kim, J. W. Jang, K. S. Lee, and J.S. Lee, “Enhanced photocatalytic hydrogen production fromwater-methanol solution by nickel intercalated into titanatenanotube,” The Journal of Physical Chemistry C, vol. 113, no.20, pp. 8990–8996, 2009.
[6] K. Domen, A. Kudo, M. Shibata, A. Tanaka, K. I. Maruya, andT. Onishi, “Novel photocatalysts, ion-exchanged K4Nb6O17,with a layer structure,” Journal of the Chemical Society, no. 23,pp. 1706–1707, 1986.
[7] X. Chen, S. Shen, L. Guo, and S. S. Mao, “Semiconductor-based photocatalytic hydrogen generation,” Chemical Reviews,vol. 110, no. 11, pp. 6503–6570, 2010.
[8] L. Randeniya, A. Murphy, and I. Plumb, “A study of S-doped TiO2 for photoelectrochemical hydrogen generationfrom water,” Journal of Materials Science, vol. 43, no. 4, pp.1389–1399, 2008.
[9] J. Yuan, M. Chen, J. Shi, and W. Shangguan, “Preparations andphotocatalytic hydrogen evolution of N-doped TiO2 from ureaand titanium tetrachloride,” International Journal of HydrogenEnergy, vol. 31, no. 10, pp. 1326–1331, 2006.
[10] S. U. M. Khan, M. Al-Shahry, and W. B. Ingler, “Efficientphotochemical water splitting by a chemically modified n-TiO2,” Science, vol. 297, no. 5590, pp. 2243–2245, 2002.
[11] T. Mishima, M. Matsuda, and M. Miyake, “Visible-lightphotocatalytic properties and electronic structure of Zr-based oxynitride, Zr2ON2, derived from nitridation of ZrO2,”Applied Catalysis A, vol. 324, no. 1-2, pp. 77–82, 2007.
[12] Y. Sun, C. J. Murphy, K. R. Reyes-Gil, E. A. Reyes-Garcia, J. P.Lilly, and D. Raftery, “Carbon-doped In2O3 films for photo-electrochemical hydrogen production,” International Journalof Hydrogen Energy, vol. 33, no. 21, pp. 5967–5974, 2008.
[13] K. R. Reyes-Gil, E. A. Reyes-Garcıa, and D. Raftery, “Nitrogen-doped In2O3 thin film electrodes for photocatalytic watersplitting,” The Journal of Physical Chemistry C, vol. 111, no.39, pp. 14579–14588, 2007.
[14] S. Ge, H. Jia, H. Zhao, Z. Zheng, and L. Zhang, “First observa-tion of visible light photocatalytic activity of carbon modifiedNb2O5 nanostructures,” Journal of Materials Chemistry, vol.20, no. 15, pp. 3052–3058, 2010.
[15] C. Xu, Y. A. Shaban, W. B. Ingler Jr, and S. U. M. Khan, “Nan-otube enhanced photoresponse of carbon modified (CM)-n-TiO2 for efficient water splitting,” Solar Energy Materials andSolar Cells, vol. 91, no. 10, pp. 938–943, 2007.
[16] L. Jia, J. Li, W. Fang, H. Song, Q. Li, and Y. Tang, “Visible-light-induced photocatalyst based on C-doped LaCoO3 synthesizedby novel microorganism chelate method,” Catalysis Commu-nications, vol. 10, no. 8, pp. 1230–1234, 2009.
[17] H. Guo, J. Chen, W. Weng, and S. Li, “Hydrothermal synthesisof C-doped Zn3(OH)2V2O7 nanorods and their photocatalyticproperties under visible light illumination,” Applied SurfaceScience, vol. 257, no. 9, pp. 3920–3923, 2011.
[18] Q. Chang, C. Chang, X. Zhang et al., “Enhanced opticallimiting properties in suspensions of CdO nanowires,” OpticsCommunications, vol. 274, no. 1, pp. 201–205, 2007.
[19] N. C. S. Selvam, R. T. Kumar, K. Yogeenth, L. J. Kennedy,G. Sekaran, and J. J. Vijaya, “Simple and rapid synthesis ofCadmium Oxide (CdO) nanospheres by a microwave-assistedcombustion method,” Powder Technology, vol. 211, no. 2-3, pp.250–255, 2011.
[20] O. Vigil, F. Cruz, A. Morales-Acevedo, G. Contreras-Puente,L. Vaillant, and G. Santana, “Structural and optical propertiesof annealed CdO thin films prepared by spray pyrolysis,”Materials Chemistry and Physics, vol. 68, no. 1–3, pp. 249–252,2001.
[21] C. H. Bhosale, A. V. Kambale, A. V. Kokate, and K. Y. Rajpure,“Structural, optical and electrical properties of chemicallysprayed CdO thin films,” Materials Science and Engineering B,vol. 122, no. 1, pp. 67–71, 2005.
[22] X. Yong and M. A. A. Schoonen, “The absolute energypositions of conduction and valence bands of selected semi-conducting minerals,” American Mineralogist, vol. 85, no. 3-4,pp. 543–556, 2000.
[23] A. Gulino, G. Compagnini, and A. A. Scalisi, “Large third-order nonlinear optical properties of cadmium oxide thinfilms,” Chemistry of Materials, vol. 15, no. 17, pp. 3332–3336,2003.
[24] A. Askarinejad and A. Morsali, “Syntheses and characteriza-tion of CdCO3 and CdO nanoparticles by using a sonochem-ical method,” Materials Letters, vol. 62, no. 3, pp. 478–482,2008.
[25] H. Wang, Z. Wu, and Y. Liu, “A simple two-step templateapproach for preparing carbon-doped mesoporous TiO2
hollow microspheres,” The Journal of Physical Chemistry C, vol.113, no. 30, pp. 13317–13324, 2009.
[26] J. S. Jang, C.-J. Yu, S. H. Choi, S. M. Ji, E. S. Kim, and J. S. Lee,“Topotactic synthesis of mesoporous ZnS and ZnO nanoplatesand their photocatalytic activity,” Journal of Catalysis, vol. 254,no. 1, pp. 144–155, 2008.
[27] A. Kudo, I. Tsuji, and H. Kato, “AgInZn7S9 solid solutionphotocatalyst for H2 evolution from aqueous solutions undervisible light irradiation,” Chemical Communications, no. 17,pp. 1958–1959, 2002.
[28] S. Rengaraj, S. Venkataraj, S. H. Jee et al., “Cauliflower-likeCdS microspheres composed of nanocrystals and their phys-icochemical properties,” Langmuir, vol. 27, no. 1, pp. 352–358,2011.
Hindawi Publishing CorporationInternational Journal of PhotoenergyVolume 2012, Article ID 907290, 5 pagesdoi:10.1155/2012/907290
Research Article
Synthesis of Hollow CdS-TiO2Microspheres withEnhanced Visible-Light Photocatalytic Activity
Yuning Huo, Jia Zhang, Xiaofang Chen, and Hexing Li
The Education Ministry Key Lab of Resource Chemistry, Shanghai Key Laboratory of Rare Earth Functional Materials,Shanghai Normal University, Shanghai 200234, China
Correspondence should be addressed to Yuning Huo, [email protected]
Received 20 January 2012; Accepted 20 February 2012
Academic Editor: Weifeng Yao
Copyright © 2012 Yuning Huo et al. This is an open access article distributed under the Creative Commons Attribution License,which permits unrestricted use, distribution, and reproduction in any medium, provided the original work is properly cited.
CdS-TiO2 composite photocatalyst in the shape of hollow microsphere was successfully synthesized via the hard-templatepreparation with polystyrene microspheres followed by ion-exchange approach. The hollow CdS-TiO2 microspheres significantlyextended the light adsorption into visible light region, comparing to TiO2 microspheres. It led to much higher photocatalyticactivities of hollow CdS-TiO2 microspheres than that of TiO2 during the photodegradation of rhodamine B under visible lightirradiations. Furthermore, the well-remained hollow structure could achieve light multireflection within the interior cavities andthe separation of photo-induced electrons and holes is efficient in CdS-TiO2, which were facilitated to improving the photoactivity.
1. Introduction
Photocatalysis has attracted considerable scientific interestowing to its potential applications in environmental purifica-tion and H2 energy production [1]. TiO2 is the most promis-ing photocatalyst owing to its various advantages includingnontoxicity, low cost, high activity, and strong stability.However, its practical application has been restricted by thewide band gap (3.2 eV) and low quantum efficiency [2]. Upto now, various methods have been developed to extend thelight absorbance of TiO2 into visible light region and thusimprove the photocatalytic efficiency, such as doping withother impurities [3], depositing noble metals on TiO2 [4],and combining TiO2 with other semiconductors [5]. Cad-mium sulfide (CdS) with band gap of 2.4 eV has been widelyused to sensitize TiO2 to realize visible-light absorbance andimprove the charge separation efficiency [6]. Meanwhile, itis well known that the design of well-defined structure isa promising way to achieve high photocatalytic activity viaincreasing specific surface area and promoting light harvest-ing [2]. Considerable efforts have been devoted to obtain theunique morphology, such as wires, tubes, core-shell micro-spheres, and hollow microspheres [7–10]. Hollow micro-spheres have attracted an immense interest for their highsurface area, low density, and large light-harvesting efficiency
[10]. Various methods have been developed for preparinghollow microspheres, including spray-drying method, pho-tochemical preparation, and hard-template method [11–13].Among these techniques, hard-template process is a generaland effective approach for preparing hollow microspheres viausing polymer, carbon, and silica microspheres as templates.As we know, the polymeric polystyrene (PS) microspheresare easy to be removed by calcination. Additionally, it is moreconvenient to achieve the uniform diameter of polystyrenemicrospheres than other microspheres.
Herein, we report the preparation of hollow CdS-TiO2
microspheres via the hard-template process with PS micro-spheres followed by the ion-exchange approach. The ion-exchange is a convenient and flexible method to convert CdOinto CdS [14, 15]. The introduction of CdS can effectivelyextend the photoresponse of TiO2 to visible-light regionand improve the photocatalytic activity of decomposition ofrhodamine B (RhB) in aqueous solution.
2. Experimental Details
2.1. Catalyst Preparation. All the chemicals were of analyticpurity and used without further purification. The syntheticapproach included two steps. (1) hollow CdO-TiO2 micro-spheres prepared using polystyrene microspheres as hard
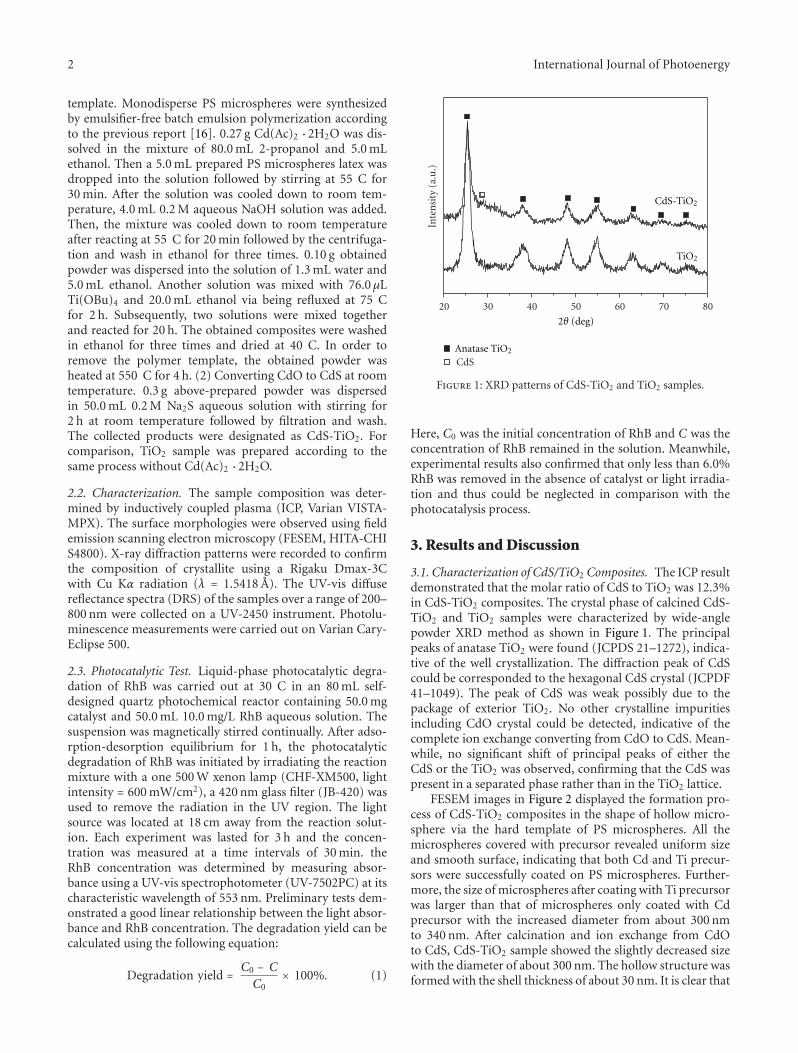
2 International Journal of Photoenergy
template. Monodisperse PS microspheres were synthesizedby emulsifier-free batch emulsion polymerization accordingto the previous report [16]. 0.27 g Cd(Ac)2 ·2H2O was dis-solved in the mixture of 80.0 mL 2-propanol and 5.0 mLethanol. Then a 5.0 mL prepared PS microspheres latex wasdropped into the solution followed by stirring at 55 C for30 min. After the solution was cooled down to room tem-perature, 4.0 mL 0.2 M aqueous NaOH solution was added.Then, the mixture was cooled down to room temperatureafter reacting at 55 C for 20 min followed by the centrifuga-tion and wash in ethanol for three times. 0.10 g obtainedpowder was dispersed into the solution of 1.3 mL water and5.0 mL ethanol. Another solution was mixed with 76.0 μLTi(OBu)4 and 20.0 mL ethanol via being refluxed at 75 Cfor 2 h. Subsequently, two solutions were mixed togetherand reacted for 20 h. The obtained composites were washedin ethanol for three times and dried at 40 C. In order toremove the polymer template, the obtained powder washeated at 550 C for 4 h. (2) Converting CdO to CdS at roomtemperature. 0.3 g above-prepared powder was dispersedin 50.0 mL 0.2 M Na2S aqueous solution with stirring for2 h at room temperature followed by filtration and wash.The collected products were designated as CdS-TiO2. Forcomparison, TiO2 sample was prepared according to thesame process without Cd(Ac)2 ·2H2O.
2.2. Characterization. The sample composition was deter-mined by inductively coupled plasma (ICP, Varian VISTA-MPX). The surface morphologies were observed using fieldemission scanning electron microscopy (FESEM, HITA-CHIS4800). X-ray diffraction patterns were recorded to confirmthe composition of crystallite using a Rigaku Dmax-3Cwith Cu Kα radiation (λ = 1.5418 A). The UV-vis diffusereflectance spectra (DRS) of the samples over a range of 200–800 nm were collected on a UV-2450 instrument. Photolu-minescence measurements were carried out on Varian Cary-Eclipse 500.
2.3. Photocatalytic Test. Liquid-phase photocatalytic degra-dation of RhB was carried out at 30 C in an 80 mL self-designed quartz photochemical reactor containing 50.0 mgcatalyst and 50.0 mL 10.0 mg/L RhB aqueous solution. Thesuspension was magnetically stirred continually. After adso-rption-desorption equilibrium for 1 h, the photocatalyticdegradation of RhB was initiated by irradiating the reactionmixture with a one 500 W xenon lamp (CHF-XM500, lightintensity = 600 mW/cm2), a 420 nm glass filter (JB-420) wasused to remove the radiation in the UV region. The lightsource was located at 18 cm away from the reaction solut-ion. Each experiment was lasted for 3 h and the concen-tration was measured at a time intervals of 30 min. theRhB concentration was determined by measuring absor-bance using a UV-vis spectrophotometer (UV-7502PC) at itscharacteristic wavelength of 553 nm. Preliminary tests dem-onstrated a good linear relationship between the light absor-bance and RhB concentration. The degradation yield can becalculated using the following equation:
Degradation yield =C0 − C
C0× 100%. (1)
20 30 40 50 60 70 80
Inte
nsi
ty (
a.u
.)
CdS
2θ (deg)
CdS-TiO2
Anatase TiO2
TiO2
Figure 1: XRD patterns of CdS-TiO2 and TiO2 samples.
Here, C0 was the initial concentration of RhB and C was theconcentration of RhB remained in the solution. Meanwhile,experimental results also confirmed that only less than 6.0%RhB was removed in the absence of catalyst or light irradia-tion and thus could be neglected in comparison with thephotocatalysis process.
3. Results and Discussion
3.1. Characterization of CdS/TiO2 Composites. The ICP resultdemonstrated that the molar ratio of CdS to TiO2 was 12.3%in CdS-TiO2 composites. The crystal phase of calcined CdS-TiO2 and TiO2 samples were characterized by wide-anglepowder XRD method as shown in Figure 1. The principalpeaks of anatase TiO2 were found (JCPDS 21–1272), indica-tive of the well crystallization. The diffraction peak of CdScould be corresponded to the hexagonal CdS crystal (JCPDF41–1049). The peak of CdS was weak possibly due to thepackage of exterior TiO2. No other crystalline impuritiesincluding CdO crystal could be detected, indicative of thecomplete ion exchange converting from CdO to CdS. Mean-while, no significant shift of principal peaks of either theCdS or the TiO2 was observed, confirming that the CdS waspresent in a separated phase rather than in the TiO2 lattice.
FESEM images in Figure 2 displayed the formation pro-cess of CdS-TiO2 composites in the shape of hollow micro-sphere via the hard template of PS microspheres. All themicrospheres covered with precursor revealed uniform sizeand smooth surface, indicating that both Cd and Ti precur-sors were successfully coated on PS microspheres. Further-more, the size of microspheres after coating with Ti precursorwas larger than that of microspheres only coated with Cdprecursor with the increased diameter from about 300 nmto 340 nm. After calcination and ion exchange from CdOto CdS, CdS-TiO2 sample showed the slightly decreased sizewith the diameter of about 300 nm. The hollow structure wasformed with the shell thickness of about 30 nm. It is clear that
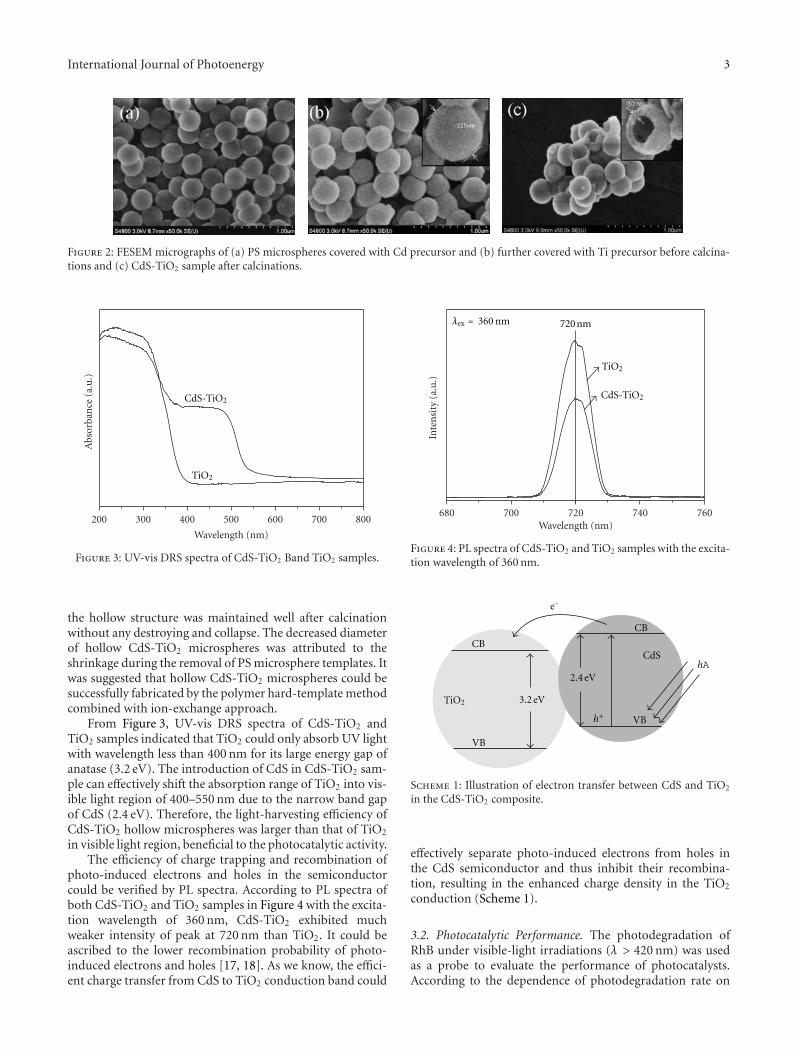
International Journal of Photoenergy 3
Figure 2: FESEM micrographs of (a) PS microspheres covered with Cd precursor and (b) further covered with Ti precursor before calcina-tions and (c) CdS-TiO2 sample after calcinations.
200 300 400 500 600 700 800
CdS-TiO2
TiO2
Abs
orba
nce
(a.
u.)
Wavelength (nm)
Figure 3: UV-vis DRS spectra of CdS-TiO2 Band TiO2 samples.
the hollow structure was maintained well after calcinationwithout any destroying and collapse. The decreased diameterof hollow CdS-TiO2 microspheres was attributed to theshrinkage during the removal of PS microsphere templates. Itwas suggested that hollow CdS-TiO2 microspheres could besuccessfully fabricated by the polymer hard-template methodcombined with ion-exchange approach.
From Figure 3, UV-vis DRS spectra of CdS-TiO2 andTiO2 samples indicated that TiO2 could only absorb UV lightwith wavelength less than 400 nm for its large energy gap ofanatase (3.2 eV). The introduction of CdS in CdS-TiO2 sam-ple can effectively shift the absorption range of TiO2 into vis-ible light region of 400–550 nm due to the narrow band gapof CdS (2.4 eV). Therefore, the light-harvesting efficiency ofCdS-TiO2 hollow microspheres was larger than that of TiO2
in visible light region, beneficial to the photocatalytic activity.The efficiency of charge trapping and recombination of
photo-induced electrons and holes in the semiconductorcould be verified by PL spectra. According to PL spectra ofboth CdS-TiO2 and TiO2 samples in Figure 4 with the excita-tion wavelength of 360 nm, CdS-TiO2 exhibited muchweaker intensity of peak at 720 nm than TiO2. It could beascribed to the lower recombination probability of photo-induced electrons and holes [17, 18]. As we know, the effici-ent charge transfer from CdS to TiO2 conduction band could
680 700 720 740 760
Inte
nsi
ty (
a.u
.)
Wavelength (nm)
CdS-TiO2
TiO2
λex = 360 nm 720 nm
Figure 4: PL spectra of CdS-TiO2 and TiO2 samples with the excita-tion wavelength of 360 nm.
CB
CB
TiO2
VB
VB
3.2 eV
2.4 eV
CdS
h+
e−
hA
Scheme 1: Illustration of electron transfer between CdS and TiO2
in the CdS-TiO2 composite.
effectively separate photo-induced electrons from holes inthe CdS semiconductor and thus inhibit their recombina-tion, resulting in the enhanced charge density in the TiO2
conduction (Scheme 1).
3.2. Photocatalytic Performance. The photodegradation ofRhB under visible-light irradiations (λ > 420 nm) was usedas a probe to evaluate the performance of photocatalysts.According to the dependence of photodegradation rate on
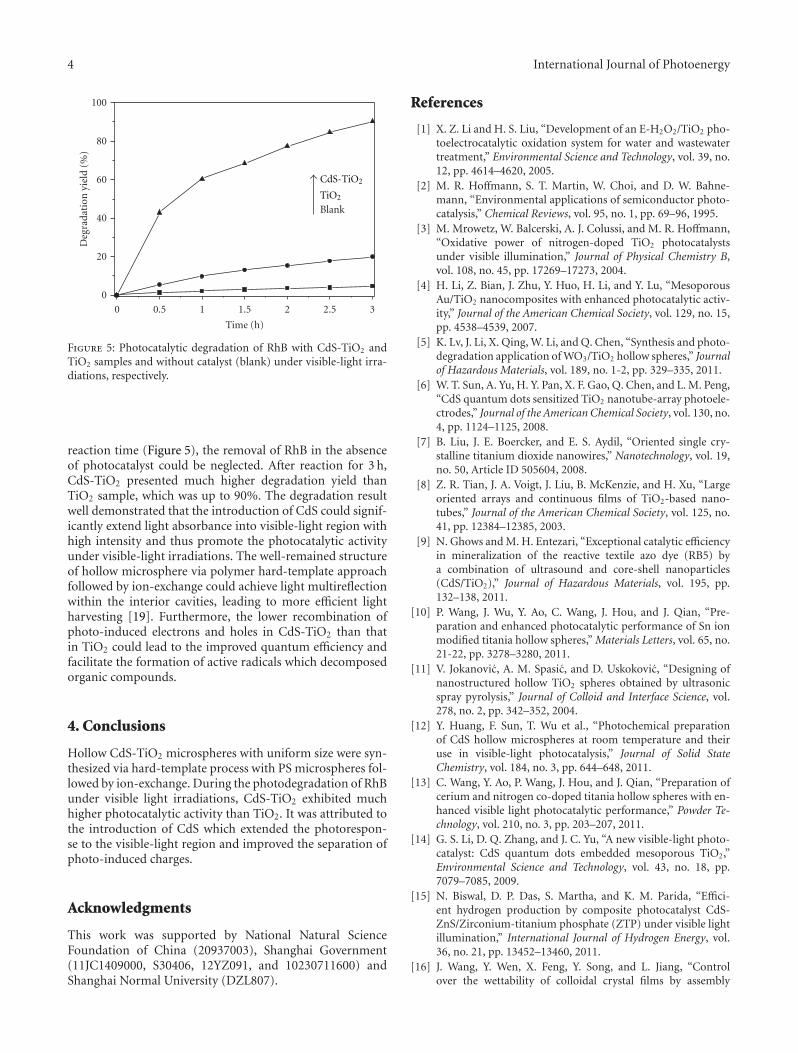
4 International Journal of Photoenergy
0 0.5 1 1.5 2 2.5 3
0
20
40
60
80
100
Deg
rada
tion
yie
ld (
%)
Time (h)
Blank
CdS-TiO2
TiO2
Figure 5: Photocatalytic degradation of RhB with CdS-TiO2 andTiO2 samples and without catalyst (blank) under visible-light irra-diations, respectively.
reaction time (Figure 5), the removal of RhB in the absenceof photocatalyst could be neglected. After reaction for 3 h,CdS-TiO2 presented much higher degradation yield thanTiO2 sample, which was up to 90%. The degradation resultwell demonstrated that the introduction of CdS could signif-icantly extend light absorbance into visible-light region withhigh intensity and thus promote the photocatalytic activityunder visible-light irradiations. The well-remained structureof hollow microsphere via polymer hard-template approachfollowed by ion-exchange could achieve light multireflectionwithin the interior cavities, leading to more efficient lightharvesting [19]. Furthermore, the lower recombination ofphoto-induced electrons and holes in CdS-TiO2 than thatin TiO2 could lead to the improved quantum efficiency andfacilitate the formation of active radicals which decomposedorganic compounds.
4. Conclusions
Hollow CdS-TiO2 microspheres with uniform size were syn-thesized via hard-template process with PS microspheres fol-lowed by ion-exchange. During the photodegradation of RhBunder visible light irradiations, CdS-TiO2 exhibited muchhigher photocatalytic activity than TiO2. It was attributed tothe introduction of CdS which extended the photorespon-se to the visible-light region and improved the separation ofphoto-induced charges.
Acknowledgments
This work was supported by National Natural ScienceFoundation of China (20937003), Shanghai Government(11JC1409000, S30406, 12YZ091, and 10230711600) andShanghai Normal University (DZL807).
References
[1] X. Z. Li and H. S. Liu, “Development of an E-H2O2/TiO2 pho-toelectrocatalytic oxidation system for water and wastewatertreatment,” Environmental Science and Technology, vol. 39, no.12, pp. 4614–4620, 2005.
[2] M. R. Hoffmann, S. T. Martin, W. Choi, and D. W. Bahne-mann, “Environmental applications of semiconductor photo-catalysis,” Chemical Reviews, vol. 95, no. 1, pp. 69–96, 1995.
[3] M. Mrowetz, W. Balcerski, A. J. Colussi, and M. R. Hoffmann,“Oxidative power of nitrogen-doped TiO2 photocatalystsunder visible illumination,” Journal of Physical Chemistry B,vol. 108, no. 45, pp. 17269–17273, 2004.
[4] H. Li, Z. Bian, J. Zhu, Y. Huo, H. Li, and Y. Lu, “MesoporousAu/TiO2 nanocomposites with enhanced photocatalytic activ-ity,” Journal of the American Chemical Society, vol. 129, no. 15,pp. 4538–4539, 2007.
[5] K. Lv, J. Li, X. Qing, W. Li, and Q. Chen, “Synthesis and photo-degradation application of WO3/TiO2 hollow spheres,” Journalof Hazardous Materials, vol. 189, no. 1-2, pp. 329–335, 2011.
[6] W. T. Sun, A. Yu, H. Y. Pan, X. F. Gao, Q. Chen, and L. M. Peng,“CdS quantum dots sensitized TiO2 nanotube-array photoele-ctrodes,” Journal of the American Chemical Society, vol. 130, no.4, pp. 1124–1125, 2008.
[7] B. Liu, J. E. Boercker, and E. S. Aydil, “Oriented single cry-stalline titanium dioxide nanowires,” Nanotechnology, vol. 19,no. 50, Article ID 505604, 2008.
[8] Z. R. Tian, J. A. Voigt, J. Liu, B. McKenzie, and H. Xu, “Largeoriented arrays and continuous films of TiO2-based nano-tubes,” Journal of the American Chemical Society, vol. 125, no.41, pp. 12384–12385, 2003.
[9] N. Ghows and M. H. Entezari, “Exceptional catalytic efficiencyin mineralization of the reactive textile azo dye (RB5) bya combination of ultrasound and core-shell nanoparticles(CdS/TiO2),” Journal of Hazardous Materials, vol. 195, pp.132–138, 2011.
[10] P. Wang, J. Wu, Y. Ao, C. Wang, J. Hou, and J. Qian, “Pre-paration and enhanced photocatalytic performance of Sn ionmodified titania hollow spheres,” Materials Letters, vol. 65, no.21-22, pp. 3278–3280, 2011.
[11] V. Jokanovic, A. M. Spasic, and D. Uskokovic, “Designing ofnanostructured hollow TiO2 spheres obtained by ultrasonicspray pyrolysis,” Journal of Colloid and Interface Science, vol.278, no. 2, pp. 342–352, 2004.
[12] Y. Huang, F. Sun, T. Wu et al., “Photochemical preparationof CdS hollow microspheres at room temperature and theiruse in visible-light photocatalysis,” Journal of Solid StateChemistry, vol. 184, no. 3, pp. 644–648, 2011.
[13] C. Wang, Y. Ao, P. Wang, J. Hou, and J. Qian, “Preparation ofcerium and nitrogen co-doped titania hollow spheres with en-hanced visible light photocatalytic performance,” Powder Te-chnology, vol. 210, no. 3, pp. 203–207, 2011.
[14] G. S. Li, D. Q. Zhang, and J. C. Yu, “A new visible-light photo-catalyst: CdS quantum dots embedded mesoporous TiO2,”Environmental Science and Technology, vol. 43, no. 18, pp.7079–7085, 2009.
[15] N. Biswal, D. P. Das, S. Martha, and K. M. Parida, “Effici-ent hydrogen production by composite photocatalyst CdS-ZnS/Zirconium-titanium phosphate (ZTP) under visible lightillumination,” International Journal of Hydrogen Energy, vol.36, no. 21, pp. 13452–13460, 2011.
[16] J. Wang, Y. Wen, X. Feng, Y. Song, and L. Jiang, “Controlover the wettability of colloidal crystal films by assembly
International Journal of Photoenergy 5
temperature,” Macromolecular Rapid Communications, vol. 27,no. 3, pp. 188–192, 2006.
[17] J. Liqiang, Q. Yichun, W. Baiqi et al., “Review of photolumi-nescence performance of nano-sized semiconductor materialsand its relationships with photocatalytic activity,” Solar EnergyMaterials and Solar Cells, vol. 90, no. 12, pp. 1773–1787, 2006.
[18] H. Zhu, B. Yang, J. Xu et al., “Construction of Z-scheme typeCdS-Au-TiO2 hollow nanorod arrays with enhanced photo-catalytic activity,” Applied Catalysis B, vol. 90, no. 3-4, pp. 463–469, 2009.
[19] H. Li, Z. Bian, J. Zhu et al., “Mesoporous titania spheres withtunable chamber stucture and enhanced photocatalytic acti-vity,” Journal of the American Chemical Society, vol. 129, no.27, pp. 8406–8407, 2007.
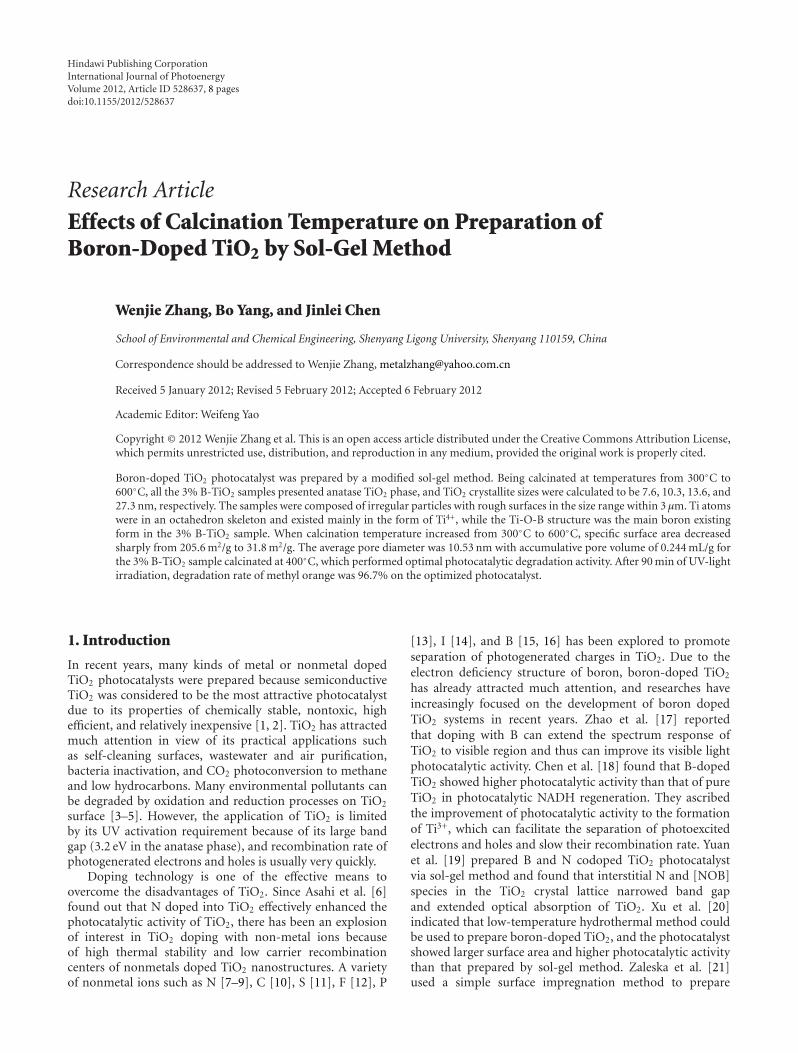
Hindawi Publishing CorporationInternational Journal of PhotoenergyVolume 2012, Article ID 528637, 8 pagesdoi:10.1155/2012/528637
Research Article
Effects of Calcination Temperature on Preparation ofBoron-Doped TiO2 by Sol-Gel Method
Wenjie Zhang, Bo Yang, and Jinlei Chen
School of Environmental and Chemical Engineering, Shenyang Ligong University, Shenyang 110159, China
Correspondence should be addressed to Wenjie Zhang, [email protected]
Received 5 January 2012; Revised 5 February 2012; Accepted 6 February 2012
Academic Editor: Weifeng Yao
Copyright © 2012 Wenjie Zhang et al. This is an open access article distributed under the Creative Commons Attribution License,which permits unrestricted use, distribution, and reproduction in any medium, provided the original work is properly cited.
Boron-doped TiO2 photocatalyst was prepared by a modified sol-gel method. Being calcinated at temperatures from 300◦C to600◦C, all the 3% B-TiO2 samples presented anatase TiO2 phase, and TiO2 crystallite sizes were calculated to be 7.6, 10.3, 13.6, and27.3 nm, respectively. The samples were composed of irregular particles with rough surfaces in the size range within 3 μm. Ti atomswere in an octahedron skeleton and existed mainly in the form of Ti4+, while the Ti-O-B structure was the main boron existingform in the 3% B-TiO2 sample. When calcination temperature increased from 300◦C to 600◦C, specific surface area decreasedsharply from 205.6 m2/g to 31.8 m2/g. The average pore diameter was 10.53 nm with accumulative pore volume of 0.244 mL/g forthe 3% B-TiO2 sample calcinated at 400◦C, which performed optimal photocatalytic degradation activity. After 90 min of UV-lightirradiation, degradation rate of methyl orange was 96.7% on the optimized photocatalyst.
1. Introduction
In recent years, many kinds of metal or nonmetal dopedTiO2 photocatalysts were prepared because semiconductiveTiO2 was considered to be the most attractive photocatalystdue to its properties of chemically stable, nontoxic, highefficient, and relatively inexpensive [1, 2]. TiO2 has attractedmuch attention in view of its practical applications suchas self-cleaning surfaces, wastewater and air purification,bacteria inactivation, and CO2 photoconversion to methaneand low hydrocarbons. Many environmental pollutants canbe degraded by oxidation and reduction processes on TiO2
surface [3–5]. However, the application of TiO2 is limitedby its UV activation requirement because of its large bandgap (3.2 eV in the anatase phase), and recombination rate ofphotogenerated electrons and holes is usually very quickly.
Doping technology is one of the effective means toovercome the disadvantages of TiO2. Since Asahi et al. [6]found out that N doped into TiO2 effectively enhanced thephotocatalytic activity of TiO2, there has been an explosionof interest in TiO2 doping with non-metal ions becauseof high thermal stability and low carrier recombinationcenters of nonmetals doped TiO2 nanostructures. A varietyof nonmetal ions such as N [7–9], C [10], S [11], F [12], P
[13], I [14], and B [15, 16] has been explored to promoteseparation of photogenerated charges in TiO2. Due to theelectron deficiency structure of boron, boron-doped TiO2
has already attracted much attention, and researches haveincreasingly focused on the development of boron dopedTiO2 systems in recent years. Zhao et al. [17] reportedthat doping with B can extend the spectrum response ofTiO2 to visible region and thus can improve its visible lightphotocatalytic activity. Chen et al. [18] found that B-dopedTiO2 showed higher photocatalytic activity than that of pureTiO2 in photocatalytic NADH regeneration. They ascribedthe improvement of photocatalytic activity to the formationof Ti3+, which can facilitate the separation of photoexcitedelectrons and holes and slow their recombination rate. Yuanet al. [19] prepared B and N codoped TiO2 photocatalystvia sol-gel method and found that interstitial N and [NOB]species in the TiO2 crystal lattice narrowed band gapand extended optical absorption of TiO2. Xu et al. [20]indicated that low-temperature hydrothermal method couldbe used to prepare boron-doped TiO2, and the photocatalystshowed larger surface area and higher photocatalytic activitythan that prepared by sol-gel method. Zaleska et al. [21]used a simple surface impregnation method to prepare
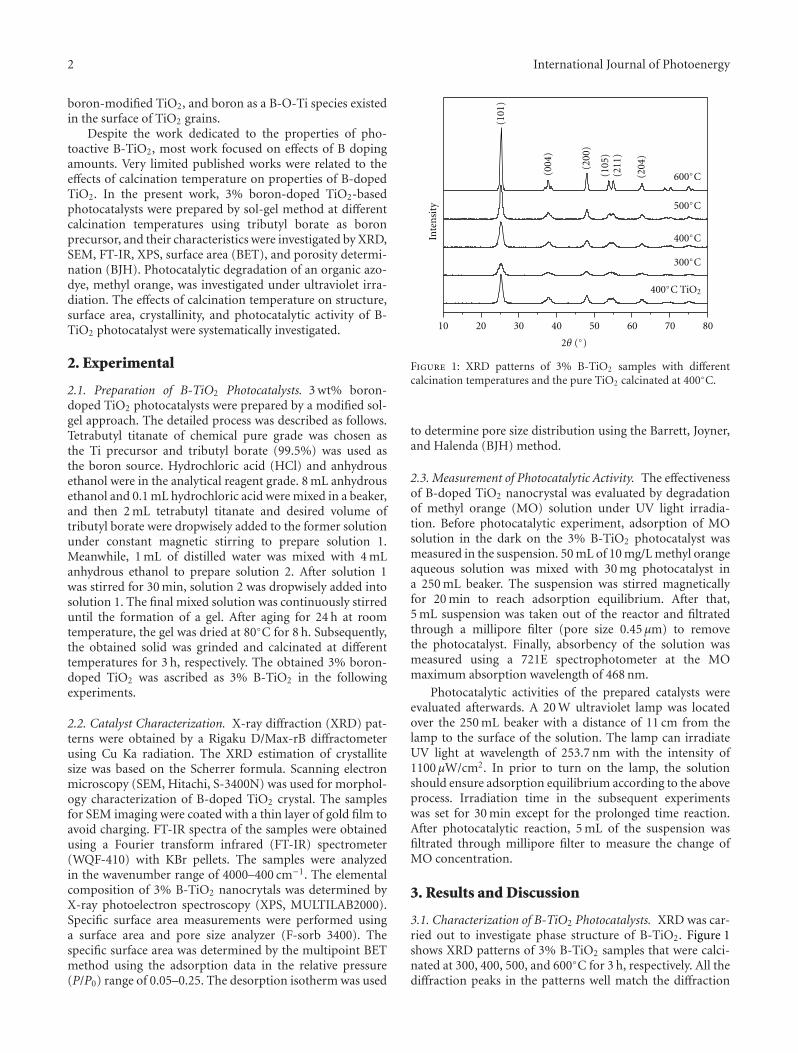
2 International Journal of Photoenergy
boron-modified TiO2, and boron as a B-O-Ti species existedin the surface of TiO2 grains.
Despite the work dedicated to the properties of pho-toactive B-TiO2, most work focused on effects of B dopingamounts. Very limited published works were related to theeffects of calcination temperature on properties of B-dopedTiO2. In the present work, 3% boron-doped TiO2-basedphotocatalysts were prepared by sol-gel method at differentcalcination temperatures using tributyl borate as boronprecursor, and their characteristics were investigated by XRD,SEM, FT-IR, XPS, surface area (BET), and porosity determi-nation (BJH). Photocatalytic degradation of an organic azo-dye, methyl orange, was investigated under ultraviolet irra-diation. The effects of calcination temperature on structure,surface area, crystallinity, and photocatalytic activity of B-TiO2 photocatalyst were systematically investigated.
2. Experimental
2.1. Preparation of B-TiO2 Photocatalysts. 3 wt% boron-doped TiO2 photocatalysts were prepared by a modified sol-gel approach. The detailed process was described as follows.Tetrabutyl titanate of chemical pure grade was chosen asthe Ti precursor and tributyl borate (99.5%) was used asthe boron source. Hydrochloric acid (HCl) and anhydrousethanol were in the analytical reagent grade. 8 mL anhydrousethanol and 0.1 mL hydrochloric acid were mixed in a beaker,and then 2 mL tetrabutyl titanate and desired volume oftributyl borate were dropwisely added to the former solutionunder constant magnetic stirring to prepare solution 1.Meanwhile, 1 mL of distilled water was mixed with 4 mLanhydrous ethanol to prepare solution 2. After solution 1was stirred for 30 min, solution 2 was dropwisely added intosolution 1. The final mixed solution was continuously stirreduntil the formation of a gel. After aging for 24 h at roomtemperature, the gel was dried at 80◦C for 8 h. Subsequently,the obtained solid was grinded and calcinated at differenttemperatures for 3 h, respectively. The obtained 3% boron-doped TiO2 was ascribed as 3% B-TiO2 in the followingexperiments.
2.2. Catalyst Characterization. X-ray diffraction (XRD) pat-terns were obtained by a Rigaku D/Max-rB diffractometerusing Cu Ka radiation. The XRD estimation of crystallitesize was based on the Scherrer formula. Scanning electronmicroscopy (SEM, Hitachi, S-3400N) was used for morphol-ogy characterization of B-doped TiO2 crystal. The samplesfor SEM imaging were coated with a thin layer of gold film toavoid charging. FT-IR spectra of the samples were obtainedusing a Fourier transform infrared (FT-IR) spectrometer(WQF-410) with KBr pellets. The samples were analyzedin the wavenumber range of 4000–400 cm−1. The elementalcomposition of 3% B-TiO2 nanocrytals was determined byX-ray photoelectron spectroscopy (XPS, MULTILAB2000).Specific surface area measurements were performed usinga surface area and pore size analyzer (F-sorb 3400). Thespecific surface area was determined by the multipoint BETmethod using the adsorption data in the relative pressure(P/P0) range of 0.05–0.25. The desorption isotherm was used
(204
)
(211
)(1
05)
(004
)
(200
)
(101
)
10 20 30 40 50 60 70 80
Inte
nsi
ty
600◦C
500◦C
400◦C
300◦C
400◦C TiO2
2θ (◦)
Figure 1: XRD patterns of 3% B-TiO2 samples with differentcalcination temperatures and the pure TiO2 calcinated at 400◦C.
to determine pore size distribution using the Barrett, Joyner,and Halenda (BJH) method.
2.3. Measurement of Photocatalytic Activity. The effectivenessof B-doped TiO2 nanocrystal was evaluated by degradationof methyl orange (MO) solution under UV light irradia-tion. Before photocatalytic experiment, adsorption of MOsolution in the dark on the 3% B-TiO2 photocatalyst wasmeasured in the suspension. 50 mL of 10 mg/L methyl orangeaqueous solution was mixed with 30 mg photocatalyst ina 250 mL beaker. The suspension was stirred magneticallyfor 20 min to reach adsorption equilibrium. After that,5 mL suspension was taken out of the reactor and filtratedthrough a millipore filter (pore size 0.45 μm) to removethe photocatalyst. Finally, absorbency of the solution wasmeasured using a 721E spectrophotometer at the MOmaximum absorption wavelength of 468 nm.
Photocatalytic activities of the prepared catalysts wereevaluated afterwards. A 20 W ultraviolet lamp was locatedover the 250 mL beaker with a distance of 11 cm from thelamp to the surface of the solution. The lamp can irradiateUV light at wavelength of 253.7 nm with the intensity of1100 μW/cm2. In prior to turn on the lamp, the solutionshould ensure adsorption equilibrium according to the aboveprocess. Irradiation time in the subsequent experimentswas set for 30 min except for the prolonged time reaction.After photocatalytic reaction, 5 mL of the suspension wasfiltrated through millipore filter to measure the change ofMO concentration.
3. Results and Discussion
3.1. Characterization of B-TiO2 Photocatalysts. XRD was car-ried out to investigate phase structure of B-TiO2. Figure 1shows XRD patterns of 3% B-TiO2 samples that were calci-nated at 300, 400, 500, and 600◦C for 3 h, respectively. All thediffraction peaks in the patterns well match the diffraction
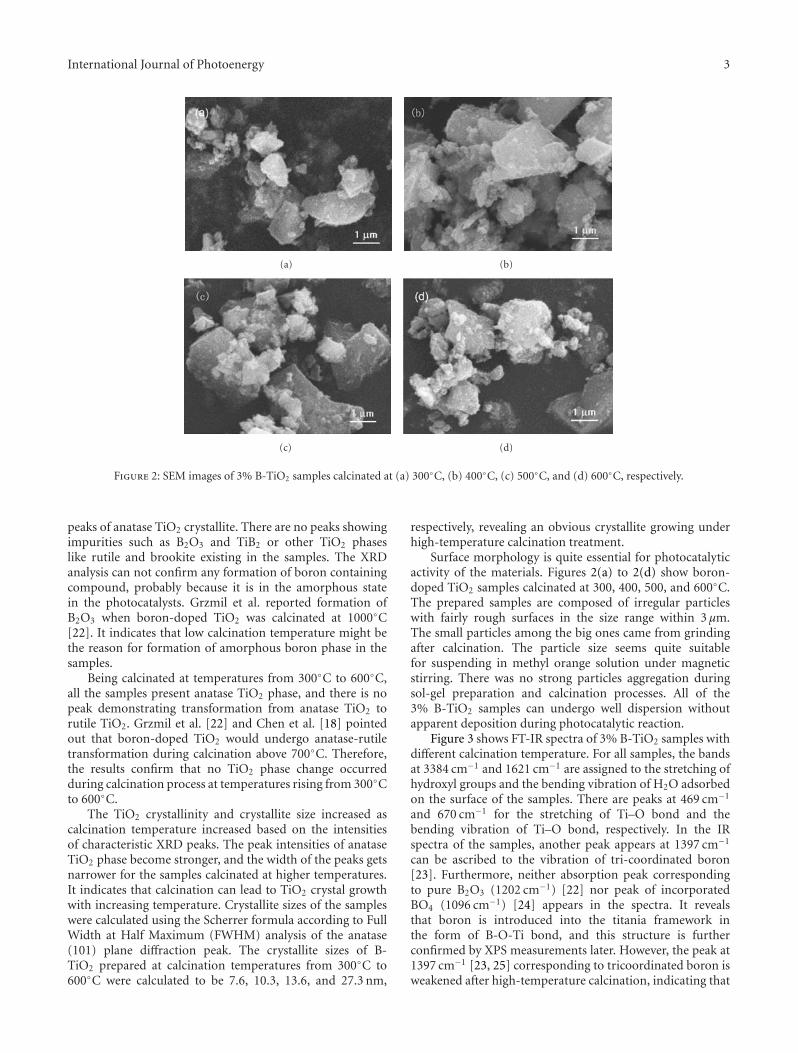
International Journal of Photoenergy 3
(a) (b)
(c) (d)
Figure 2: SEM images of 3% B-TiO2 samples calcinated at (a) 300◦C, (b) 400◦C, (c) 500◦C, and (d) 600◦C, respectively.
peaks of anatase TiO2 crystallite. There are no peaks showingimpurities such as B2O3 and TiB2 or other TiO2 phaseslike rutile and brookite existing in the samples. The XRDanalysis can not confirm any formation of boron containingcompound, probably because it is in the amorphous statein the photocatalysts. Grzmil et al. reported formation ofB2O3 when boron-doped TiO2 was calcinated at 1000◦C[22]. It indicates that low calcination temperature might bethe reason for formation of amorphous boron phase in thesamples.
Being calcinated at temperatures from 300◦C to 600◦C,all the samples present anatase TiO2 phase, and there is nopeak demonstrating transformation from anatase TiO2 torutile TiO2. Grzmil et al. [22] and Chen et al. [18] pointedout that boron-doped TiO2 would undergo anatase-rutiletransformation during calcination above 700◦C. Therefore,the results confirm that no TiO2 phase change occurredduring calcination process at temperatures rising from 300◦Cto 600◦C.
The TiO2 crystallinity and crystallite size increased ascalcination temperature increased based on the intensitiesof characteristic XRD peaks. The peak intensities of anataseTiO2 phase become stronger, and the width of the peaks getsnarrower for the samples calcinated at higher temperatures.It indicates that calcination can lead to TiO2 crystal growthwith increasing temperature. Crystallite sizes of the sampleswere calculated using the Scherrer formula according to FullWidth at Half Maximum (FWHM) analysis of the anatase(101) plane diffraction peak. The crystallite sizes of B-TiO2 prepared at calcination temperatures from 300◦C to600◦C were calculated to be 7.6, 10.3, 13.6, and 27.3 nm,
respectively, revealing an obvious crystallite growing underhigh-temperature calcination treatment.
Surface morphology is quite essential for photocatalyticactivity of the materials. Figures 2(a) to 2(d) show boron-doped TiO2 samples calcinated at 300, 400, 500, and 600◦C.The prepared samples are composed of irregular particleswith fairly rough surfaces in the size range within 3 μm.The small particles among the big ones came from grindingafter calcination. The particle size seems quite suitablefor suspending in methyl orange solution under magneticstirring. There was no strong particles aggregation duringsol-gel preparation and calcination processes. All of the3% B-TiO2 samples can undergo well dispersion withoutapparent deposition during photocatalytic reaction.
Figure 3 shows FT-IR spectra of 3% B-TiO2 samples withdifferent calcination temperature. For all samples, the bandsat 3384 cm−1 and 1621 cm−1 are assigned to the stretching ofhydroxyl groups and the bending vibration of H2O adsorbedon the surface of the samples. There are peaks at 469 cm−1
and 670 cm−1 for the stretching of Ti–O bond and thebending vibration of Ti–O bond, respectively. In the IRspectra of the samples, another peak appears at 1397 cm−1
can be ascribed to the vibration of tri-coordinated boron[23]. Furthermore, neither absorption peak correspondingto pure B2O3 (1202 cm−1) [22] nor peak of incorporatedBO4 (1096 cm−1) [24] appears in the spectra. It revealsthat boron is introduced into the titania framework inthe form of B-O-Ti bond, and this structure is furtherconfirmed by XPS measurements later. However, the peak at1397 cm−1 [23, 25] corresponding to tricoordinated boron isweakened after high-temperature calcination, indicating that
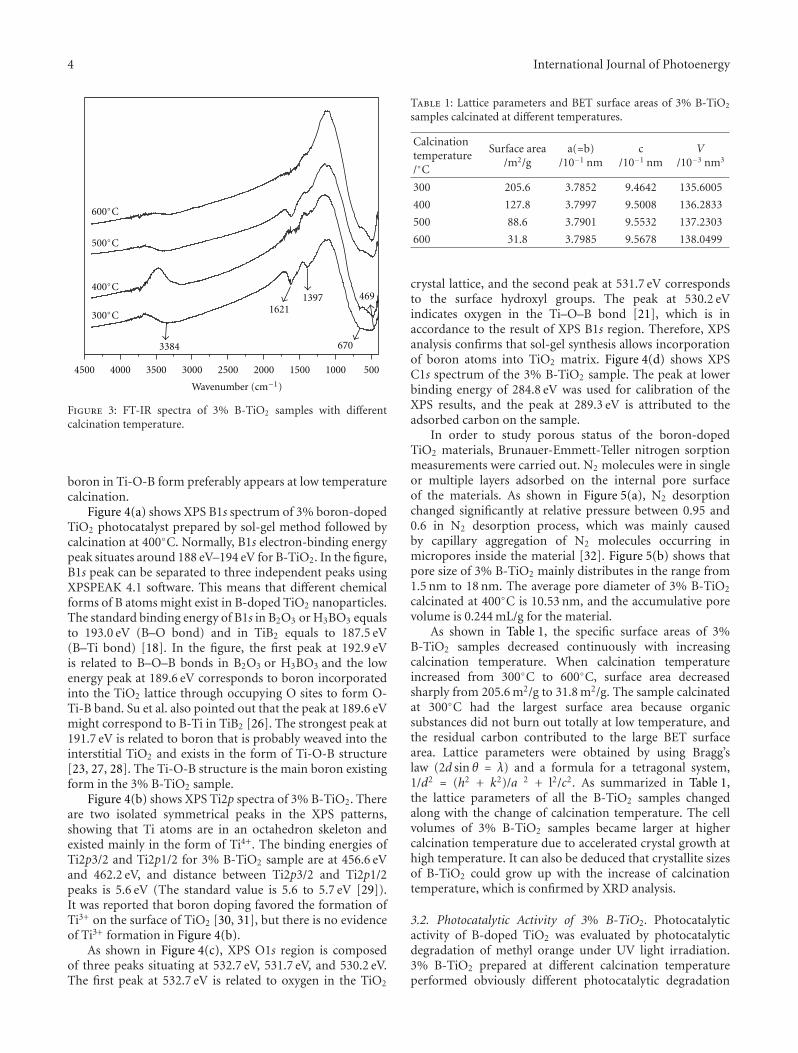
4 International Journal of Photoenergy
13971621
469
6703384
4500 4000 3500 3000 2500 2000 1500 1000 500
Wavenumber (cm−1)
600◦C
500◦C
400◦C
300◦C
Figure 3: FT-IR spectra of 3% B-TiO2 samples with differentcalcination temperature.
boron in Ti-O-B form preferably appears at low temperaturecalcination.
Figure 4(a) shows XPS B1s spectrum of 3% boron-dopedTiO2 photocatalyst prepared by sol-gel method followed bycalcination at 400◦C. Normally, B1s electron-binding energypeak situates around 188 eV–194 eV for B-TiO2. In the figure,B1s peak can be separated to three independent peaks usingXPSPEAK 4.1 software. This means that different chemicalforms of B atoms might exist in B-doped TiO2 nanoparticles.The standard binding energy of B1s in B2O3 or H3BO3 equalsto 193.0 eV (B–O bond) and in TiB2 equals to 187.5 eV(B–Ti bond) [18]. In the figure, the first peak at 192.9 eVis related to B–O–B bonds in B2O3 or H3BO3 and the lowenergy peak at 189.6 eV corresponds to boron incorporatedinto the TiO2 lattice through occupying O sites to form O-Ti-B band. Su et al. also pointed out that the peak at 189.6 eVmight correspond to B-Ti in TiB2 [26]. The strongest peak at191.7 eV is related to boron that is probably weaved into theinterstitial TiO2 and exists in the form of Ti-O-B structure[23, 27, 28]. The Ti-O-B structure is the main boron existingform in the 3% B-TiO2 sample.
Figure 4(b) shows XPS Ti2p spectra of 3% B-TiO2. Thereare two isolated symmetrical peaks in the XPS patterns,showing that Ti atoms are in an octahedron skeleton andexisted mainly in the form of Ti4+. The binding energies ofTi2p3/2 and Ti2p1/2 for 3% B-TiO2 sample are at 456.6 eVand 462.2 eV, and distance between Ti2p3/2 and Ti2p1/2peaks is 5.6 eV (The standard value is 5.6 to 5.7 eV [29]).It was reported that boron doping favored the formation ofTi3+ on the surface of TiO2 [30, 31], but there is no evidenceof Ti3+ formation in Figure 4(b).
As shown in Figure 4(c), XPS O1s region is composedof three peaks situating at 532.7 eV, 531.7 eV, and 530.2 eV.The first peak at 532.7 eV is related to oxygen in the TiO2
Table 1: Lattice parameters and BET surface areas of 3% B-TiO2
samples calcinated at different temperatures.
Calcinationtemperature/◦C
Surface area/m2/g
a(=b)/10−1 nm
c/10−1 nm
V/10−3 nm3
300 205.6 3.7852 9.4642 135.6005
400 127.8 3.7997 9.5008 136.2833
500 88.6 3.7901 9.5532 137.2303
600 31.8 3.7985 9.5678 138.0499
crystal lattice, and the second peak at 531.7 eV correspondsto the surface hydroxyl groups. The peak at 530.2 eVindicates oxygen in the Ti–O–B bond [21], which is inaccordance to the result of XPS B1s region. Therefore, XPSanalysis confirms that sol-gel synthesis allows incorporationof boron atoms into TiO2 matrix. Figure 4(d) shows XPSC1s spectrum of the 3% B-TiO2 sample. The peak at lowerbinding energy of 284.8 eV was used for calibration of theXPS results, and the peak at 289.3 eV is attributed to theadsorbed carbon on the sample.
In order to study porous status of the boron-dopedTiO2 materials, Brunauer-Emmett-Teller nitrogen sorptionmeasurements were carried out. N2 molecules were in singleor multiple layers adsorbed on the internal pore surfaceof the materials. As shown in Figure 5(a), N2 desorptionchanged significantly at relative pressure between 0.95 and0.6 in N2 desorption process, which was mainly causedby capillary aggregation of N2 molecules occurring inmicropores inside the material [32]. Figure 5(b) shows thatpore size of 3% B-TiO2 mainly distributes in the range from1.5 nm to 18 nm. The average pore diameter of 3% B-TiO2
calcinated at 400◦C is 10.53 nm, and the accumulative porevolume is 0.244 mL/g for the material.
As shown in Table 1, the specific surface areas of 3%B-TiO2 samples decreased continuously with increasingcalcination temperature. When calcination temperatureincreased from 300◦C to 600◦C, surface area decreasedsharply from 205.6 m2/g to 31.8 m2/g. The sample calcinatedat 300◦C had the largest surface area because organicsubstances did not burn out totally at low temperature, andthe residual carbon contributed to the large BET surfacearea. Lattice parameters were obtained by using Bragg’slaw (2d sin θ = λ) and a formula for a tetragonal system,1/d2 = (h2 + k2)/a 2 + l2/c2. As summarized in Table 1,the lattice parameters of all the B-TiO2 samples changedalong with the change of calcination temperature. The cellvolumes of 3% B-TiO2 samples became larger at highercalcination temperature due to accelerated crystal growth athigh temperature. It can also be deduced that crystallite sizesof B-TiO2 could grow up with the increase of calcinationtemperature, which is confirmed by XRD analysis.
3.2. Photocatalytic Activity of 3% B-TiO2. Photocatalyticactivity of B-doped TiO2 was evaluated by photocatalyticdegradation of methyl orange under UV light irradiation.3% B-TiO2 prepared at different calcination temperatureperformed obviously different photocatalytic degradation
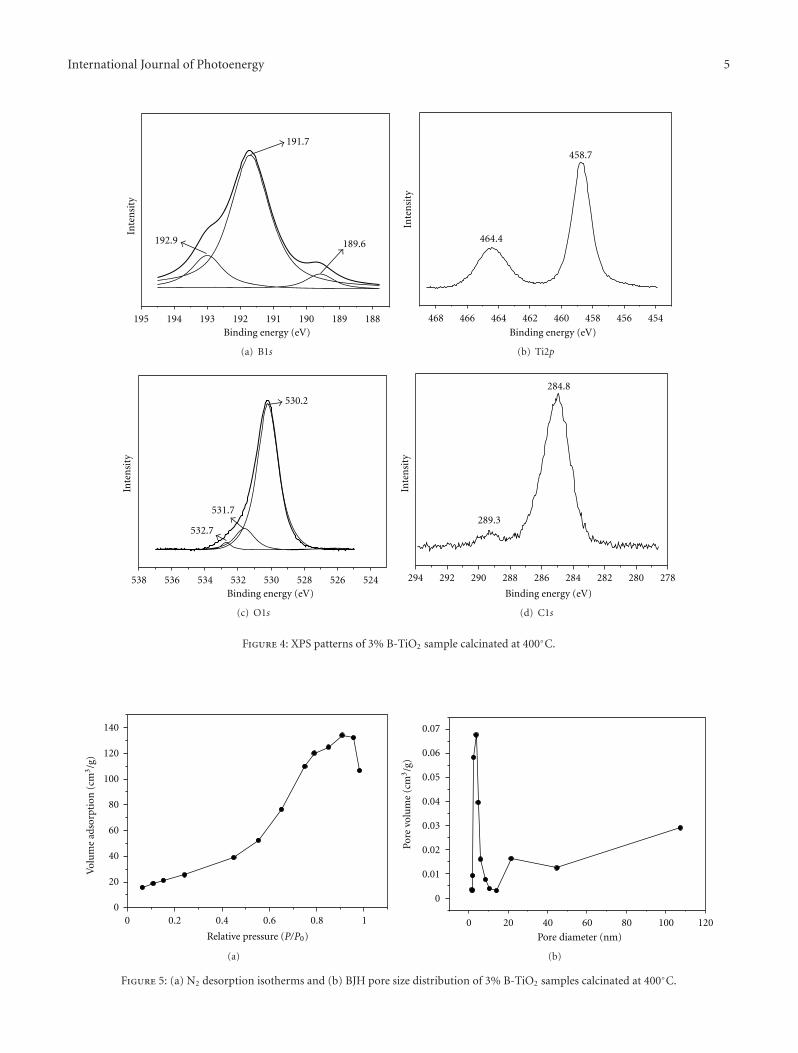
International Journal of Photoenergy 5
Inte
nsi
ty
192.9 189.6
191.7
195 194 193 192 191 190 189 188Binding energy (eV)
(a) B1s
Inte
nsi
ty
464.4
458.7
Binding energy (eV)
468 466 464 462 460 458 456 454
(b) Ti2p
Inte
nsi
ty
530.2
531.7
532.7
538 536 534 532 530 528 526 524Binding energy (eV)
(c) O1s
In
ten
sity
289.3
284.8
294 292 290 288 286 284 282 280 278
Binding energy (eV)
(d) C1s
Figure 4: XPS patterns of 3% B-TiO2 sample calcinated at 400◦C.
0
20
40
60
80
100
120
140
0 0.2 0.4 0.6 0.8 1
Vol
um
e ad
sorp
tion
(cm
3/g
)
Relative pressure (P/P0)
(a)
0
0.01
0.02
0.03
0.04
0.05
0.06
0.07
0 20 40 60 80 100 120
Pore diameter (nm)
Pore
vol
um
e (c
m3/g
)
(b)
Figure 5: (a) N2 desorption isotherms and (b) BJH pore size distribution of 3% B-TiO2 samples calcinated at 400◦C.
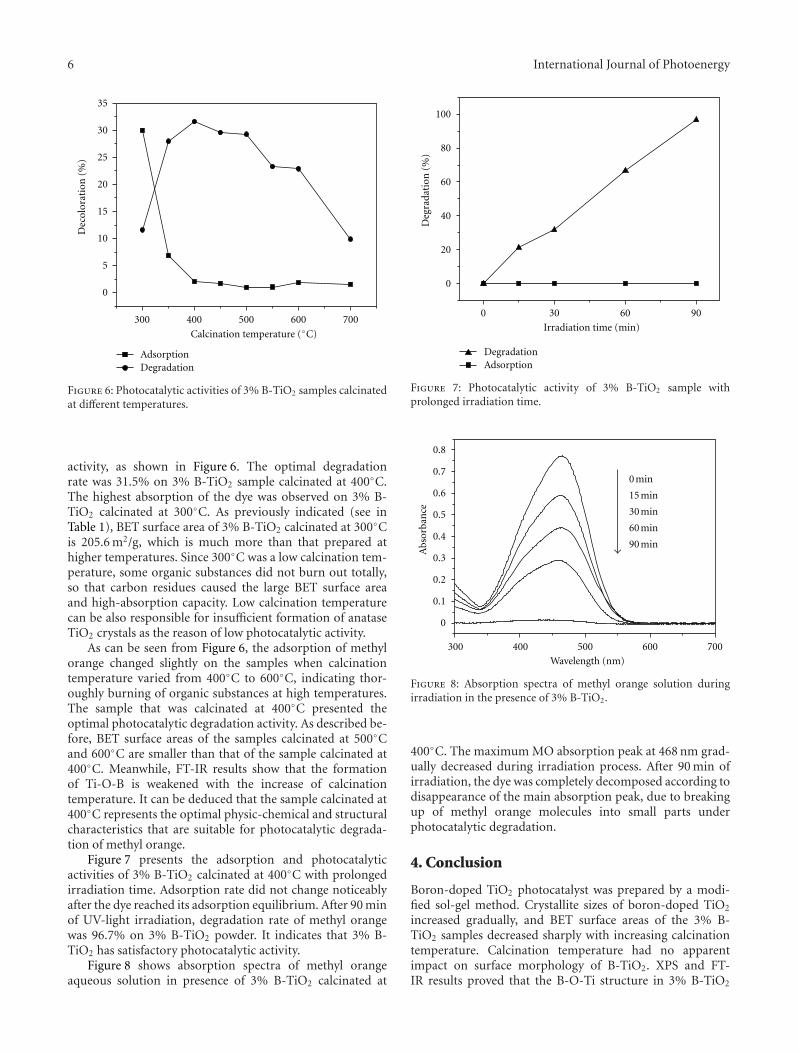
6 International Journal of Photoenergy
0
5
10
15
20
25
30
35
AdsorptionDegradation
300 400 500 600 700
Calcination temperature (◦C)
Dec
olor
atio
n (
%)
Figure 6: Photocatalytic activities of 3% B-TiO2 samples calcinatedat different temperatures.
activity, as shown in Figure 6. The optimal degradationrate was 31.5% on 3% B-TiO2 sample calcinated at 400◦C.The highest absorption of the dye was observed on 3% B-TiO2 calcinated at 300◦C. As previously indicated (see inTable 1), BET surface area of 3% B-TiO2 calcinated at 300◦Cis 205.6 m2/g, which is much more than that prepared athigher temperatures. Since 300◦C was a low calcination tem-perature, some organic substances did not burn out totally,so that carbon residues caused the large BET surface areaand high-absorption capacity. Low calcination temperaturecan be also responsible for insufficient formation of anataseTiO2 crystals as the reason of low photocatalytic activity.
As can be seen from Figure 6, the adsorption of methylorange changed slightly on the samples when calcinationtemperature varied from 400◦C to 600◦C, indicating thor-oughly burning of organic substances at high temperatures.The sample that was calcinated at 400◦C presented theoptimal photocatalytic degradation activity. As described be-fore, BET surface areas of the samples calcinated at 500◦Cand 600◦C are smaller than that of the sample calcinated at400◦C. Meanwhile, FT-IR results show that the formationof Ti-O-B is weakened with the increase of calcinationtemperature. It can be deduced that the sample calcinated at400◦C represents the optimal physic-chemical and structuralcharacteristics that are suitable for photocatalytic degrada-tion of methyl orange.
Figure 7 presents the adsorption and photocatalyticactivities of 3% B-TiO2 calcinated at 400◦C with prolongedirradiation time. Adsorption rate did not change noticeablyafter the dye reached its adsorption equilibrium. After 90 minof UV-light irradiation, degradation rate of methyl orangewas 96.7% on 3% B-TiO2 powder. It indicates that 3% B-TiO2 has satisfactory photocatalytic activity.
Figure 8 shows absorption spectra of methyl orangeaqueous solution in presence of 3% B-TiO2 calcinated at
0
20
40
60
80
100
DegradationAdsorption
0 30 60 90
Irradiation time (min)
Deg
rada
tion
(%
)
Figure 7: Photocatalytic activity of 3% B-TiO2 sample withprolonged irradiation time.
0
0.1
0.2
0.3
0.4
0.5
0.6
0.7
0.8
Abs
orba
nce
300 400 500 600 700
Wavelength (nm)
0 min
15 min
30 min
60 min
90 min
Figure 8: Absorption spectra of methyl orange solution duringirradiation in the presence of 3% B-TiO2.
400◦C. The maximum MO absorption peak at 468 nm grad-ually decreased during irradiation process. After 90 min ofirradiation, the dye was completely decomposed according todisappearance of the main absorption peak, due to breakingup of methyl orange molecules into small parts underphotocatalytic degradation.
4. Conclusion
Boron-doped TiO2 photocatalyst was prepared by a modi-fied sol-gel method. Crystallite sizes of boron-doped TiO2
increased gradually, and BET surface areas of the 3% B-TiO2 samples decreased sharply with increasing calcinationtemperature. Calcination temperature had no apparentimpact on surface morphology of B-TiO2. XPS and FT-IR results proved that the B-O-Ti structure in 3% B-TiO2
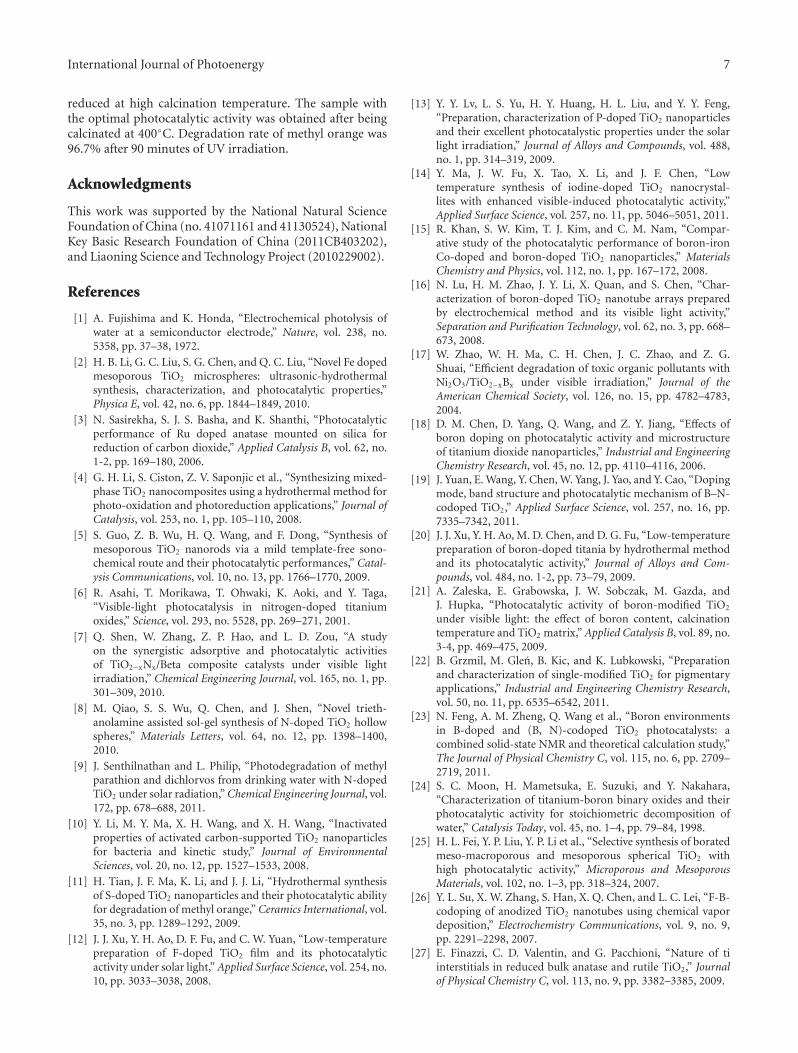
International Journal of Photoenergy 7
reduced at high calcination temperature. The sample withthe optimal photocatalytic activity was obtained after beingcalcinated at 400◦C. Degradation rate of methyl orange was96.7% after 90 minutes of UV irradiation.
Acknowledgments
This work was supported by the National Natural ScienceFoundation of China (no. 41071161 and 41130524), NationalKey Basic Research Foundation of China (2011CB403202),and Liaoning Science and Technology Project (2010229002).
References
[1] A. Fujishima and K. Honda, “Electrochemical photolysis ofwater at a semiconductor electrode,” Nature, vol. 238, no.5358, pp. 37–38, 1972.
[2] H. B. Li, G. C. Liu, S. G. Chen, and Q. C. Liu, “Novel Fe dopedmesoporous TiO2 microspheres: ultrasonic-hydrothermalsynthesis, characterization, and photocatalytic properties,”Physica E, vol. 42, no. 6, pp. 1844–1849, 2010.
[3] N. Sasirekha, S. J. S. Basha, and K. Shanthi, “Photocatalyticperformance of Ru doped anatase mounted on silica forreduction of carbon dioxide,” Applied Catalysis B, vol. 62, no.1-2, pp. 169–180, 2006.
[4] G. H. Li, S. Ciston, Z. V. Saponjic et al., “Synthesizing mixed-phase TiO2 nanocomposites using a hydrothermal method forphoto-oxidation and photoreduction applications,” Journal ofCatalysis, vol. 253, no. 1, pp. 105–110, 2008.
[5] S. Guo, Z. B. Wu, H. Q. Wang, and F. Dong, “Synthesis ofmesoporous TiO2 nanorods via a mild template-free sono-chemical route and their photocatalytic performances,” Catal-ysis Communications, vol. 10, no. 13, pp. 1766–1770, 2009.
[6] R. Asahi, T. Morikawa, T. Ohwaki, K. Aoki, and Y. Taga,“Visible-light photocatalysis in nitrogen-doped titaniumoxides,” Science, vol. 293, no. 5528, pp. 269–271, 2001.
[7] Q. Shen, W. Zhang, Z. P. Hao, and L. D. Zou, “A studyon the synergistic adsorptive and photocatalytic activitiesof TiO2−xNx/Beta composite catalysts under visible lightirradiation,” Chemical Engineering Journal, vol. 165, no. 1, pp.301–309, 2010.
[8] M. Qiao, S. S. Wu, Q. Chen, and J. Shen, “Novel trieth-anolamine assisted sol-gel synthesis of N-doped TiO2 hollowspheres,” Materials Letters, vol. 64, no. 12, pp. 1398–1400,2010.
[9] J. Senthilnathan and L. Philip, “Photodegradation of methylparathion and dichlorvos from drinking water with N-dopedTiO2 under solar radiation,” Chemical Engineering Journal, vol.172, pp. 678–688, 2011.
[10] Y. Li, M. Y. Ma, X. H. Wang, and X. H. Wang, “Inactivatedproperties of activated carbon-supported TiO2 nanoparticlesfor bacteria and kinetic study,” Journal of EnvironmentalSciences, vol. 20, no. 12, pp. 1527–1533, 2008.
[11] H. Tian, J. F. Ma, K. Li, and J. J. Li, “Hydrothermal synthesisof S-doped TiO2 nanoparticles and their photocatalytic abilityfor degradation of methyl orange,” Ceramics International, vol.35, no. 3, pp. 1289–1292, 2009.
[12] J. J. Xu, Y. H. Ao, D. F. Fu, and C. W. Yuan, “Low-temperaturepreparation of F-doped TiO2 film and its photocatalyticactivity under solar light,” Applied Surface Science, vol. 254, no.10, pp. 3033–3038, 2008.
[13] Y. Y. Lv, L. S. Yu, H. Y. Huang, H. L. Liu, and Y. Y. Feng,“Preparation, characterization of P-doped TiO2 nanoparticlesand their excellent photocatalystic properties under the solarlight irradiation,” Journal of Alloys and Compounds, vol. 488,no. 1, pp. 314–319, 2009.
[14] Y. Ma, J. W. Fu, X. Tao, X. Li, and J. F. Chen, “Lowtemperature synthesis of iodine-doped TiO2 nanocrystal-lites with enhanced visible-induced photocatalytic activity,”Applied Surface Science, vol. 257, no. 11, pp. 5046–5051, 2011.
[15] R. Khan, S. W. Kim, T. J. Kim, and C. M. Nam, “Compar-ative study of the photocatalytic performance of boron-ironCo-doped and boron-doped TiO2 nanoparticles,” MaterialsChemistry and Physics, vol. 112, no. 1, pp. 167–172, 2008.
[16] N. Lu, H. M. Zhao, J. Y. Li, X. Quan, and S. Chen, “Char-acterization of boron-doped TiO2 nanotube arrays preparedby electrochemical method and its visible light activity,”Separation and Purification Technology, vol. 62, no. 3, pp. 668–673, 2008.
[17] W. Zhao, W. H. Ma, C. H. Chen, J. C. Zhao, and Z. G.Shuai, “Efficient degradation of toxic organic pollutants withNi2O3/TiO2−xBx under visible irradiation,” Journal of theAmerican Chemical Society, vol. 126, no. 15, pp. 4782–4783,2004.
[18] D. M. Chen, D. Yang, Q. Wang, and Z. Y. Jiang, “Effects ofboron doping on photocatalytic activity and microstructureof titanium dioxide nanoparticles,” Industrial and EngineeringChemistry Research, vol. 45, no. 12, pp. 4110–4116, 2006.
[19] J. Yuan, E. Wang, Y. Chen, W. Yang, J. Yao, and Y. Cao, “Dopingmode, band structure and photocatalytic mechanism of B–N-codoped TiO2,” Applied Surface Science, vol. 257, no. 16, pp.7335–7342, 2011.
[20] J. J. Xu, Y. H. Ao, M. D. Chen, and D. G. Fu, “Low-temperaturepreparation of boron-doped titania by hydrothermal methodand its photocatalytic activity,” Journal of Alloys and Com-pounds, vol. 484, no. 1-2, pp. 73–79, 2009.
[21] A. Zaleska, E. Grabowska, J. W. Sobczak, M. Gazda, andJ. Hupka, “Photocatalytic activity of boron-modified TiO2
under visible light: the effect of boron content, calcinationtemperature and TiO2 matrix,” Applied Catalysis B, vol. 89, no.3-4, pp. 469–475, 2009.
[22] B. Grzmil, M. Glen, B. Kic, and K. Lubkowski, “Preparationand characterization of single-modified TiO2 for pigmentaryapplications,” Industrial and Engineering Chemistry Research,vol. 50, no. 11, pp. 6535–6542, 2011.
[23] N. Feng, A. M. Zheng, Q. Wang et al., “Boron environmentsin B-doped and (B, N)-codoped TiO2 photocatalysts: acombined solid-state NMR and theoretical calculation study,”The Journal of Physical Chemistry C, vol. 115, no. 6, pp. 2709–2719, 2011.
[24] S. C. Moon, H. Mametsuka, E. Suzuki, and Y. Nakahara,“Characterization of titanium-boron binary oxides and theirphotocatalytic activity for stoichiometric decomposition ofwater,” Catalysis Today, vol. 45, no. 1–4, pp. 79–84, 1998.
[25] H. L. Fei, Y. P. Liu, Y. P. Li et al., “Selective synthesis of boratedmeso-macroporous and mesoporous spherical TiO2 withhigh photocatalytic activity,” Microporous and MesoporousMaterials, vol. 102, no. 1–3, pp. 318–324, 2007.
[26] Y. L. Su, X. W. Zhang, S. Han, X. Q. Chen, and L. C. Lei, “F-B-codoping of anodized TiO2 nanotubes using chemical vapordeposition,” Electrochemistry Communications, vol. 9, no. 9,pp. 2291–2298, 2007.
[27] E. Finazzi, C. D. Valentin, and G. Pacchioni, “Nature of tiinterstitials in reduced bulk anatase and rutile TiO2,” Journalof Physical Chemistry C, vol. 113, no. 9, pp. 3382–3385, 2009.
8 International Journal of Photoenergy
[28] X. N. Lu, B. Z. Tian, F. Chen, and J. L. Zhang, “Preparationof boron-doped TiO2 films by autoclaved-sol method at lowtemperature and study on their photocatalytic activity,” ThinSolid Films, vol. 519, no. 1, pp. 111–116, 2010.
[29] X. Q. Chen, X. W. Zhang, and L. C. Lei, “Electronic structuresand photocatalysis properties under visible irradiation of F-doped TiO2 nanotube arrays,” Journal of Inorganic Materials,vol. 26, no. 4, pp. 369–374, 2011.
[30] M. Fittipaldi, V. Gombac, T. Montini, P. Fornasiero, and M.Graziani, “A high-frequency (95 GHz) electron paramagneticresonance study of B-doped TiO2 photocatalysts,” InorganicaChimica Acta, vol. 361, no. 14-15, pp. 3980–3987, 2008.
[31] Y. M. Wu, M. Y. Xing, J. L. Zhang, and F. Chen, “Effective visi-ble light-active boron and carbon modified TiO2 photocatalystfor degradation of organic pollutant,” Applied Catalysis B, vol.97, no. 1-2, pp. 182–189, 2010.
[32] J. Yuan, Y. K. Lv, Y. Li, and J. P. Li, “Preparation of mesoporousmagnetic photocatalyst and its catalytic activity for degrada-tion of nitrobenzene,” Chinese Journal of Catalysis, vol. 31, no.5, pp. 597–603, 2010.
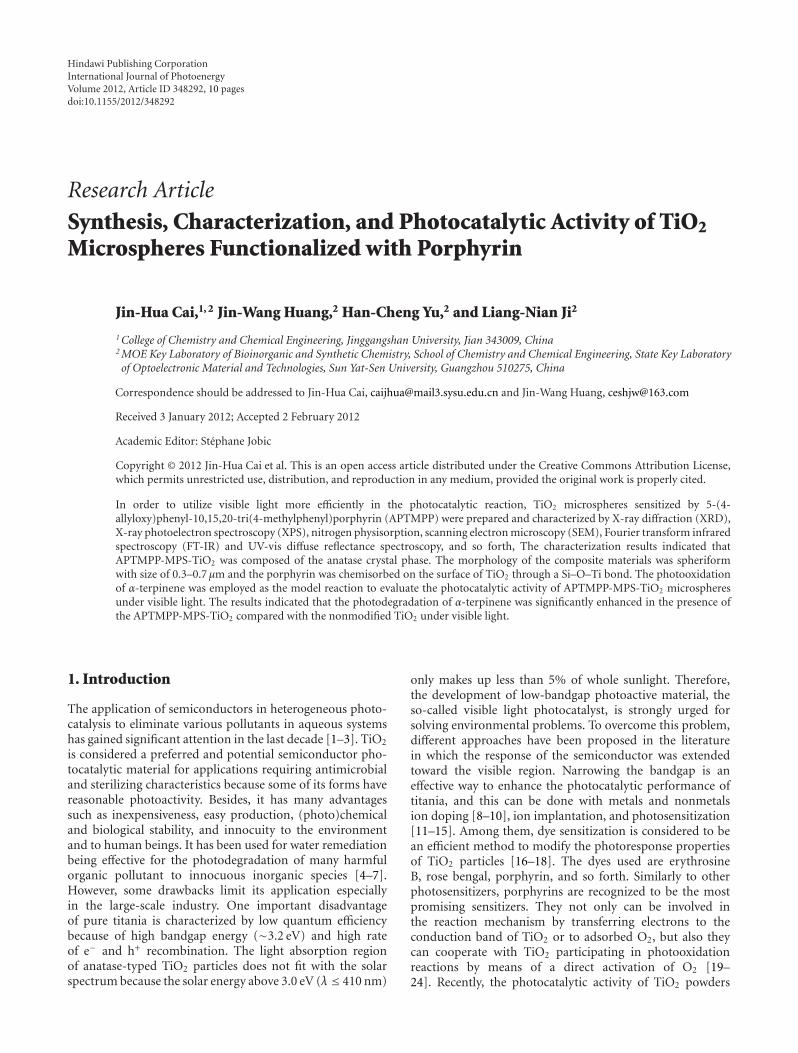
Hindawi Publishing CorporationInternational Journal of PhotoenergyVolume 2012, Article ID 348292, 10 pagesdoi:10.1155/2012/348292
Research Article
Synthesis, Characterization, and Photocatalytic Activity of TiO2
Microspheres Functionalized with Porphyrin
Jin-Hua Cai,1, 2 Jin-Wang Huang,2 Han-Cheng Yu,2 and Liang-Nian Ji2
1 College of Chemistry and Chemical Engineering, Jinggangshan University, Jian 343009, China2 MOE Key Laboratory of Bioinorganic and Synthetic Chemistry, School of Chemistry and Chemical Engineering, State Key Laboratoryof Optoelectronic Material and Technologies, Sun Yat-Sen University, Guangzhou 510275, China
Correspondence should be addressed to Jin-Hua Cai, [email protected] and Jin-Wang Huang, [email protected]
Received 3 January 2012; Accepted 2 February 2012
Academic Editor: Stephane Jobic
Copyright © 2012 Jin-Hua Cai et al. This is an open access article distributed under the Creative Commons Attribution License,which permits unrestricted use, distribution, and reproduction in any medium, provided the original work is properly cited.
In order to utilize visible light more efficiently in the photocatalytic reaction, TiO2 microspheres sensitized by 5-(4-allyloxy)phenyl-10,15,20-tri(4-methylphenyl)porphyrin (APTMPP) were prepared and characterized by X-ray diffraction (XRD),X-ray photoelectron spectroscopy (XPS), nitrogen physisorption, scanning electron microscopy (SEM), Fourier transform infraredspectroscopy (FT-IR) and UV-vis diffuse reflectance spectroscopy, and so forth, The characterization results indicated thatAPTMPP-MPS-TiO2 was composed of the anatase crystal phase. The morphology of the composite materials was spheriformwith size of 0.3–0.7 μm and the porphyrin was chemisorbed on the surface of TiO2 through a Si–O–Ti bond. The photooxidationof α-terpinene was employed as the model reaction to evaluate the photocatalytic activity of APTMPP-MPS-TiO2 microspheresunder visible light. The results indicated that the photodegradation of α-terpinene was significantly enhanced in the presence ofthe APTMPP-MPS-TiO2 compared with the nonmodified TiO2 under visible light.
1. Introduction
The application of semiconductors in heterogeneous photo-catalysis to eliminate various pollutants in aqueous systemshas gained significant attention in the last decade [1–3]. TiO2
is considered a preferred and potential semiconductor pho-tocatalytic material for applications requiring antimicrobialand sterilizing characteristics because some of its forms havereasonable photoactivity. Besides, it has many advantagessuch as inexpensiveness, easy production, (photo)chemicaland biological stability, and innocuity to the environmentand to human beings. It has been used for water remediationbeing effective for the photodegradation of many harmfulorganic pollutant to innocuous inorganic species [4–7].However, some drawbacks limit its application especiallyin the large-scale industry. One important disadvantageof pure titania is characterized by low quantum efficiencybecause of high bandgap energy (∼3.2 eV) and high rateof e− and h+ recombination. The light absorption regionof anatase-typed TiO2 particles does not fit with the solarspectrum because the solar energy above 3.0 eV (λ ≤ 410 nm)
only makes up less than 5% of whole sunlight. Therefore,the development of low-bandgap photoactive material, theso-called visible light photocatalyst, is strongly urged forsolving environmental problems. To overcome this problem,different approaches have been proposed in the literaturein which the response of the semiconductor was extendedtoward the visible region. Narrowing the bandgap is aneffective way to enhance the photocatalytic performance oftitania, and this can be done with metals and nonmetalsion doping [8–10], ion implantation, and photosensitization[11–15]. Among them, dye sensitization is considered to bean efficient method to modify the photoresponse propertiesof TiO2 particles [16–18]. The dyes used are erythrosineB, rose bengal, porphyrin, and so forth. Similarly to otherphotosensitizers, porphyrins are recognized to be the mostpromising sensitizers. They not only can be involved inthe reaction mechanism by transferring electrons to theconduction band of TiO2 or to adsorbed O2, but also theycan cooperate with TiO2 participating in photooxidationreactions by means of a direct activation of O2 [19–24]. Recently, the photocatalytic activity of TiO2 powders
2 International Journal of Photoenergy
impregnated with copper porphyrins used as sensitizers forthe decomposition of 4-nitrophenol has been investigated[25–28]. But Some of them suffer from a reversible bindingand the support is broken during the washing of the solventunder working conditions. A useful means to avoid theselimitations is to establish the stable covalent binding betweenporphyrins and TiO2 samples.
We recently reported efficient photooxidations usingheterogeneous photosensitizers prepared by the cova-lent immobilization of metal-free porphyrins on silicamicrospheres [29]. To further study the photosensitiza-tion of metal-free porphyrins, one novel metal-free por-phyrin derivatives, that is, 5-(4-allyloxy)phenyl-10,15,20-tri(4-chlorophenyl)porphyrin was synthesized and charac-terized. The catalytic activity of metal-free porphyrin com-plex covalent binding to TiO2 is studied upon irradiation thesample with visible light. The oxidation of α-terpinene hasbeen chosen as a model reaction. The purpose of this paperis to study the structural relationship between porphyrincomplex and TiO2 in the prepared composite by sol-gelprocessing. Furthermore, the stability of photocatalysts wasalso investigated and discussed.
2. Experimental Section
2.1. Materials and Chemicals. 5-(4-hydroxyl)phenyl-10,15,20-tri(4-methylphenyl)porphyrin (HPTMPP) was synth-esized in our laboratory according to [30, 31], 3-mercap-topropyltrimethoxysilane (MPS, 95.8%), tetraethyl ortho-silicate, and allyl bromide (96%) were purchased fromGuangzhou Jun-ye Chemistry plant. α-terpinene was ob-tained from Aldrich without further purification. Silica gelused to purify porphyrin by chromatograph was obtainedfrom Qingdao. Toluene and acetonitrile were dried withcalcium hydride and redistilled. All other reagents andsolvents were obtained from commercial sources and usedwithout further purification.
2.2. Physical Measurements. The scanning electron micro-scopy (SEM) was performed with a JSM-6330F FieldEmission Scanning Electron Microscope. The XRD curveswere got from Rigaku D/max 2550 VB/PC (Japan). Thesurface property of samples was characterized by X-rayphotoelectron spectroscopy (XPS) on a PerkinElmer PHI1600 ESCA system. The specific surface areas of the sampleswere measured using nitrogen adsorption method at 77 Kand the Brunauer-Emmett-Teller (BET) analysis using aFlow Sorb 2300 apparatus (Micromeritics International).The pore size distributions were calculated with the DFTPlus software (Micromeritics), applying the Barrett-Joyner-Halenda (BJH) model considering cylindrical geometry ofthe pores. Thermal analysis was performed with a NetzschTG-209 Thermogravimetric Analyzer. UV-vis and IR spectrawere recorded on a Shimadzu UV-3150 spectrophotometerand an EQUINOX 55 Fourier transformation infraredspectrometer, respectively. Diffuse reflectance spectra in the200–800 nm were obtained by using a Shimadzu UV-3150UV-vis spectrophotometer. 1H NMR spectra were recorded
on a 300 MHz Bruker-AMX spectrophotometer with tetram-ethylsilane (TMS) as internal reference. Mass spectrometryanalysis was performed on a Thermo LCQDECA-XP spec-trometer. An iodine tungsten lamp (200W, Shanghai), ITL,was used as a light source. A distance of about 5 cm betweenthe lamp and reactor was maintained.
2.3. Synthesis of TiO2 Microspheres Functionalized withAPTMPP (APTMPP-MPS-TiO2). The strategy to prepareTiO2 microspheres functionalized with APTMPP (APTMPP-MPS-TiO2) is shown in Scheme 1.
2.3.1. Synthesis of APTMPP-MPS. APTMPP-MPS was syn-thesized by the reaction of 5-(4-allyloxy)phenyl-10,15,20-tri(4-methylphenyl)porphyrin (APTMPP) with 3-Mercap-topropyltrimethoxysilane (MPS), and APTMPP was pre-pared by the method similar to a previously reportedmethod [32]. A mixture of 5-(4-hydroxyl)phenyl-10,15,20-tri(4-methylphenyl)porphyrin (HPTMPP) (0.6 mmol), allylbromide (0.8 mmol), and anhydrous K2CO3 (1.5 g) in DMF(40 mL) was stirred for 12 h at room temperature. The reac-tion mixture was poured into water (150 mL) and filtered.The residue was submitted to column chromatography onsilica gel using the chloroform as an eluent. The first bandwas collected and the solvent was evaporated. Purple solidAPTMPP was obtained in 80% yield. ES-MS [CHCl3, m/z]:713[M+]. 1H NMR (300 MHz, CDCl3), d: −2.68 (s, 2H, NHpyrrole), 8.88 (s, 8H, β-pyrroles), 8.11 (d, 8H, 2,6-phenyl),7.61(d, 6H, 3,5-phenyl), 7.29 (d, 2H, 3,5-phenyl), 6.21–6.34(t, 1H, =CH–), 5.62 (d, 1H, H–C=C–), 5.45 (1H, H–C=C–),4.81 (2H, =C–CH2–O), 2.73 (s, 9H, –CH3).
A mixture of MPS (40 mg, 0.2 mmol), APTMPP(143 mg, 0.2 mmol), toluene(15 mL), and 10 mg 2,20-azo-bis-isobutyronitrile (AIBN) was degassed and sealed undernitrogen. Then, the solution was stirring at 75◦C. Theprogress of the reaction was monitored by TLC (chloroformas eluent). After completion of the reaction, the solvent wasremoved in vacuo and the pasty residue was washed with coldhexane, then a purple oil of APTMPP-MPS was obtained. ES-MS [CHCl3, m/z]: 908[M+], 1H NMR (300 MHz, CDCl3), d:−2.71 (s, 2H, NH pyrrole), 8.87 (s, 8H, β-pyrroles), 8.10 (d,8H, 2,6-phenyl), 7.55 (d, 6H, 3,5-phenyl), 7.28 (d, 2H, 3,5-phenyl), 4.35 (2H, H7), 3.63 (9H, H1), 2.89 (2H, H5), 2.73(s,9H, –CH3), 2.35 (2H, H4), 2.27 (2H, H6), 1.30 (2H, H3), 0.89(2H, H2).
2.3.2. Synthesis of APTMPP-MPS-TiO2. TiO2 microsphereswere prepared by sol-gel processes [33]. 10 mL of Ti(OBu)4
is dissolved in 10 mL of anhydrous C2H5OH (99.7%) toproduce Ti(OBu)4-C2H5OH solution. Meanwhile, 5 mL ofwater and 3 mL ammonia were added to another 10 mLof anhydrous C2H5OH in turn to form an ethanol-NH3-water solution. After the two resulting solutions are stirredfor 30 min, respectively, the Ti(OBu)4-C2H5OH solution isslowly added dropwise to the ethanol-NH3-water solutionunder vigorously stirring to carry out a hydrolysis. Thus,a semitransparent sol is gained after continuously stirringfor 1 h. Then, 2 mL ammonia was added into the mixture
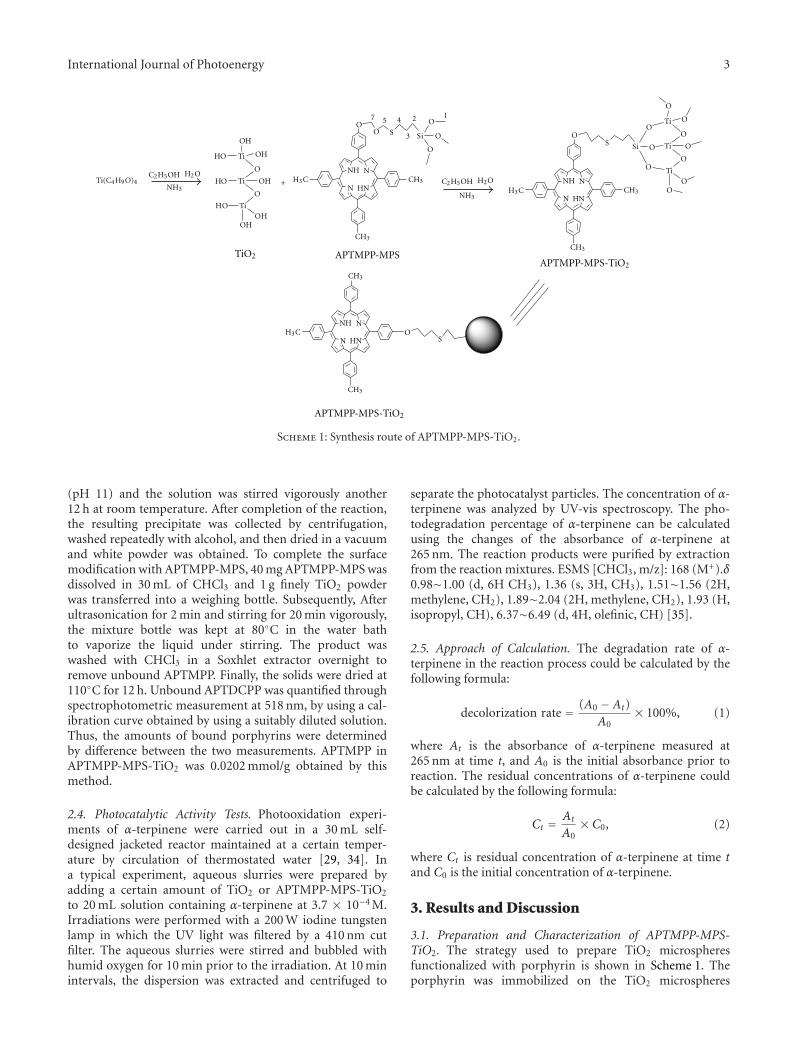
International Journal of Photoenergy 3
N
NH N
HN
OO S Si
O
O
O
12
3
457
Ti
Ti
Ti
OH
OH
O
OH
O
OH
HO
HO
HO
+
Ti
Ti
Ti
O
O
O
O
O
OO
N
NH N
HN
OS Si
O
O
O
N
NO
S
H3C
H3C
H3C
C2H5OH H2OC2H5OH H2O
Ti(C4H9O)4
CH3
CH3
CH3
CH3
CH3
CH3
NH3
NH3
HN
NH
OH
APTMPP-MPS-TiO2
APTMPP-MPS-TiO2
APTMPP-MPSTiO2
Scheme 1: Synthesis route of APTMPP-MPS-TiO2.
(pH 11) and the solution was stirred vigorously another12 h at room temperature. After completion of the reaction,the resulting precipitate was collected by centrifugation,washed repeatedly with alcohol, and then dried in a vacuumand white powder was obtained. To complete the surfacemodification with APTMPP-MPS, 40 mg APTMPP-MPS wasdissolved in 30 mL of CHCl3 and 1 g finely TiO2 powderwas transferred into a weighing bottle. Subsequently, Afterultrasonication for 2 min and stirring for 20 min vigorously,the mixture bottle was kept at 80◦C in the water bathto vaporize the liquid under stirring. The product waswashed with CHCl3 in a Soxhlet extractor overnight toremove unbound APTMPP. Finally, the solids were dried at110◦C for 12 h. Unbound APTDCPP was quantified throughspectrophotometric measurement at 518 nm, by using a cal-ibration curve obtained by using a suitably diluted solution.Thus, the amounts of bound porphyrins were determinedby difference between the two measurements. APTMPP inAPTMPP-MPS-TiO2 was 0.0202 mmol/g obtained by thismethod.
2.4. Photocatalytic Activity Tests. Photooxidation experi-ments of α-terpinene were carried out in a 30 mL self-designed jacketed reactor maintained at a certain temper-ature by circulation of thermostated water [29, 34]. Ina typical experiment, aqueous slurries were prepared byadding a certain amount of TiO2 or APTMPP-MPS-TiO2
to 20 mL solution containing α-terpinene at 3.7 × 10⁻⁴ M.Irradiations were performed with a 200 W iodine tungstenlamp in which the UV light was filtered by a 410 nm cutfilter. The aqueous slurries were stirred and bubbled withhumid oxygen for 10 min prior to the irradiation. At 10 minintervals, the dispersion was extracted and centrifuged to
separate the photocatalyst particles. The concentration of α-terpinene was analyzed by UV-vis spectroscopy. The pho-todegradation percentage of α-terpinene can be calculatedusing the changes of the absorbance of α-terpinene at265 nm. The reaction products were purified by extractionfrom the reaction mixtures. ESMS [CHCl3, m/z]: 168 (M+).δ0.98∼1.00 (d, 6H CH3), 1.36 (s, 3H, CH3), 1.51∼1.56 (2H,methylene, CH2), 1.89∼2.04 (2H, methylene, CH2), 1.93 (H,isopropyl, CH), 6.37∼6.49 (d, 4H, olefinic, CH) [35].
2.5. Approach of Calculation. The degradation rate of α-terpinene in the reaction process could be calculated by thefollowing formula:
decolorization rate = (A0 − At)A0
× 100%, (1)
where At is the absorbance of α-terpinene measured at265 nm at time t, and A0 is the initial absorbance prior toreaction. The residual concentrations of α-terpinene couldbe calculated by the following formula:
Ct = At
A0× C0, (2)
where Ct is residual concentration of α-terpinene at time tand C0 is the initial concentration of α-terpinene.
3. Results and Discussion
3.1. Preparation and Characterization of APTMPP-MPS-TiO2. The strategy used to prepare TiO2 microspheresfunctionalized with porphyrin is shown in Scheme 1. Theporphyrin was immobilized on the TiO2 microspheres
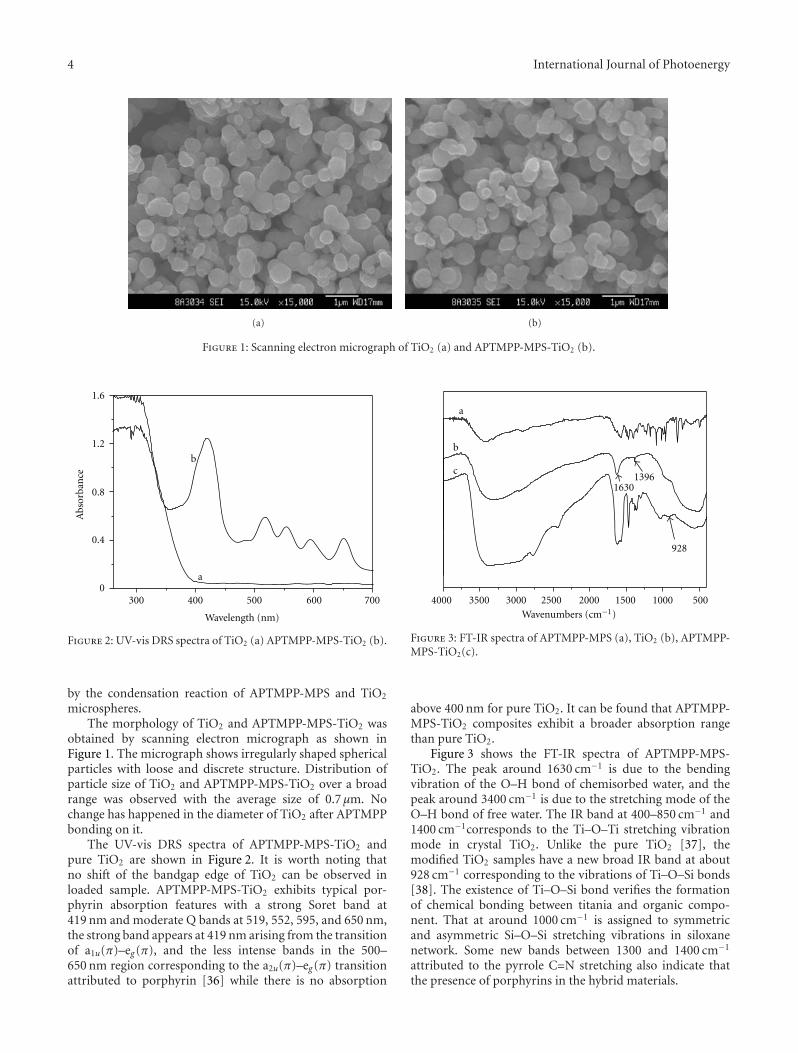
4 International Journal of Photoenergy
(a) (b)
Figure 1: Scanning electron micrograph of TiO2 (a) and APTMPP-MPS-TiO2 (b).
400300 500 600 7000
0.4
0.8
1.2
1.6
b
Abs
orba
nce
a
Wavelength (nm)
Figure 2: UV-vis DRS spectra of TiO2 (a) APTMPP-MPS-TiO2 (b).
by the condensation reaction of APTMPP-MPS and TiO2
microspheres.The morphology of TiO2 and APTMPP-MPS-TiO2 was
obtained by scanning electron micrograph as shown inFigure 1. The micrograph shows irregularly shaped sphericalparticles with loose and discrete structure. Distribution ofparticle size of TiO2 and APTMPP-MPS-TiO2 over a broadrange was observed with the average size of 0.7 μm. Nochange has happened in the diameter of TiO2 after APTMPPbonding on it.
The UV-vis DRS spectra of APTMPP-MPS-TiO2 andpure TiO2 are shown in Figure 2. It is worth noting thatno shift of the bandgap edge of TiO2 can be observed inloaded sample. APTMPP-MPS-TiO2 exhibits typical por-phyrin absorption features with a strong Soret band at419 nm and moderate Q bands at 519, 552, 595, and 650 nm,the strong band appears at 419 nm arising from the transitionof a1u(π)–eg(π), and the less intense bands in the 500–650 nm region corresponding to the a2u(π)–eg(π) transitionattributed to porphyrin [36] while there is no absorption
35004000 3000 2500 2000 1500 1000 500
928
Wavenumbers (cm−1)
a
b
c1396
1630
Figure 3: FT-IR spectra of APTMPP-MPS (a), TiO2 (b), APTMPP-MPS-TiO2(c).
above 400 nm for pure TiO2. It can be found that APTMPP-MPS-TiO2 composites exhibit a broader absorption rangethan pure TiO2.
Figure 3 shows the FT-IR spectra of APTMPP-MPS-TiO2. The peak around 1630 cm−1 is due to the bendingvibration of the O–H bond of chemisorbed water, and thepeak around 3400 cm−1 is due to the stretching mode of theO–H bond of free water. The IR band at 400–850 cm−1 and1400 cm−1corresponds to the Ti–O–Ti stretching vibrationmode in crystal TiO2. Unlike the pure TiO2 [37], themodified TiO2 samples have a new broad IR band at about928 cm−1 corresponding to the vibrations of Ti–O–Si bonds[38]. The existence of Ti–O–Si bond verifies the formationof chemical bonding between titania and organic compo-nent. That at around 1000 cm−1 is assigned to symmetricand asymmetric Si–O–Si stretching vibrations in siloxanenetwork. Some new bands between 1300 and 1400 cm−1
attributed to the pyrrole C=N stretching also indicate thatthe presence of porphyrins in the hybrid materials.
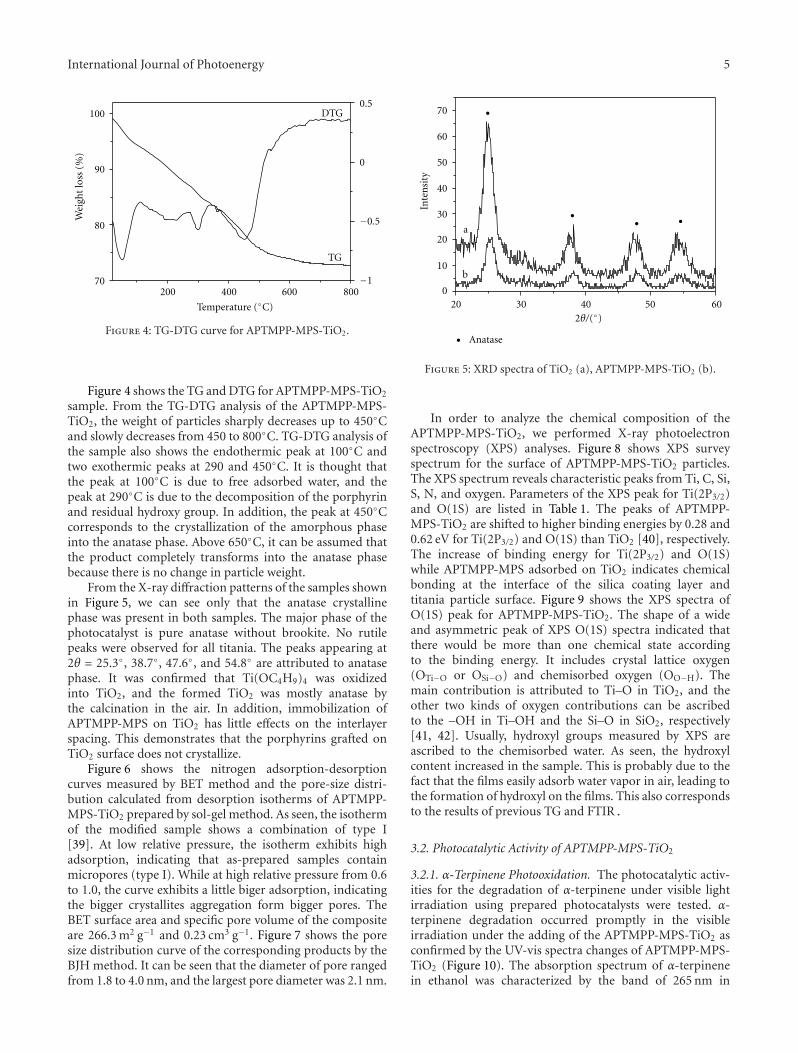
International Journal of Photoenergy 5
200 400 600 80070
80
90
100
TG
−1
DTG
Wei
ght
loss
(%
)
Temperature (◦C)
−0.5
0
0.5
Figure 4: TG-DTG curve for APTMPP-MPS-TiO2.
Figure 4 shows the TG and DTG for APTMPP-MPS-TiO2
sample. From the TG-DTG analysis of the APTMPP-MPS-TiO2, the weight of particles sharply decreases up to 450◦Cand slowly decreases from 450 to 800◦C. TG-DTG analysis ofthe sample also shows the endothermic peak at 100◦C andtwo exothermic peaks at 290 and 450◦C. It is thought thatthe peak at 100◦C is due to free adsorbed water, and thepeak at 290◦C is due to the decomposition of the porphyrinand residual hydroxy group. In addition, the peak at 450◦Ccorresponds to the crystallization of the amorphous phaseinto the anatase phase. Above 650◦C, it can be assumed thatthe product completely transforms into the anatase phasebecause there is no change in particle weight.
From the X-ray diffraction patterns of the samples shownin Figure 5, we can see only that the anatase crystallinephase was present in both samples. The major phase of thephotocatalyst is pure anatase without brookite. No rutilepeaks were observed for all titania. The peaks appearing at2θ = 25.3◦, 38.7◦, 47.6◦, and 54.8◦ are attributed to anatasephase. It was confirmed that Ti(OC4H9)4 was oxidizedinto TiO2, and the formed TiO2 was mostly anatase bythe calcination in the air. In addition, immobilization ofAPTMPP-MPS on TiO2 has little effects on the interlayerspacing. This demonstrates that the porphyrins grafted onTiO2 surface does not crystallize.
Figure 6 shows the nitrogen adsorption-desorptioncurves measured by BET method and the pore-size distri-bution calculated from desorption isotherms of APTMPP-MPS-TiO2 prepared by sol-gel method. As seen, the isothermof the modified sample shows a combination of type I[39]. At low relative pressure, the isotherm exhibits highadsorption, indicating that as-prepared samples containmicropores (type I). While at high relative pressure from 0.6to 1.0, the curve exhibits a little biger adsorption, indicatingthe bigger crystallites aggregation form bigger pores. TheBET surface area and specific pore volume of the compositeare 266.3 m2 g−1 and 0.23 cm3 g−1. Figure 7 shows the poresize distribution curve of the corresponding products by theBJH method. It can be seen that the diameter of pore rangedfrom 1.8 to 4.0 nm, and the largest pore diameter was 2.1 nm.
20 30 40 50 600
10
20
30
40
50
60
70
b
a
Anatase
Inte
nsi
ty
2θ/(◦)
•
•
• • •
Figure 5: XRD spectra of TiO2 (a), APTMPP-MPS-TiO2 (b).
In order to analyze the chemical composition of theAPTMPP-MPS-TiO2, we performed X-ray photoelectronspectroscopy (XPS) analyses. Figure 8 shows XPS surveyspectrum for the surface of APTMPP-MPS-TiO2 particles.The XPS spectrum reveals characteristic peaks from Ti, C, Si,S, N, and oxygen. Parameters of the XPS peak for Ti(2P3/2)and O(1S) are listed in Table 1. The peaks of APTMPP-MPS-TiO2 are shifted to higher binding energies by 0.28 and0.62 eV for Ti(2P3/2) and O(1S) than TiO2 [40], respectively.The increase of binding energy for Ti(2P3/2) and O(1S)while APTMPP-MPS adsorbed on TiO2 indicates chemicalbonding at the interface of the silica coating layer andtitania particle surface. Figure 9 shows the XPS spectra ofO(1S) peak for APTMPP-MPS-TiO2. The shape of a wideand asymmetric peak of XPS O(1S) spectra indicated thatthere would be more than one chemical state accordingto the binding energy. It includes crystal lattice oxygen(OTi−O or OSi−O) and chemisorbed oxygen (OO−H). Themain contribution is attributed to Ti–O in TiO2, and theother two kinds of oxygen contributions can be ascribedto the –OH in Ti–OH and the Si–O in SiO2, respectively[41, 42]. Usually, hydroxyl groups measured by XPS areascribed to the chemisorbed water. As seen, the hydroxylcontent increased in the sample. This is probably due to thefact that the films easily adsorb water vapor in air, leading tothe formation of hydroxyl on the films. This also correspondsto the results of previous TG and FTIR.
3.2. Photocatalytic Activity of APTMPP-MPS-TiO2
3.2.1. α-Terpinene Photooxidation. The photocatalytic activ-ities for the degradation of α-terpinene under visible lightirradiation using prepared photocatalysts were tested. α-terpinene degradation occurred promptly in the visibleirradiation under the adding of the APTMPP-MPS-TiO2 asconfirmed by the UV-vis spectra changes of APTMPP-MPS-TiO2 (Figure 10). The absorption spectrum of α-terpinenein ethanol was characterized by the band of 265 nm in
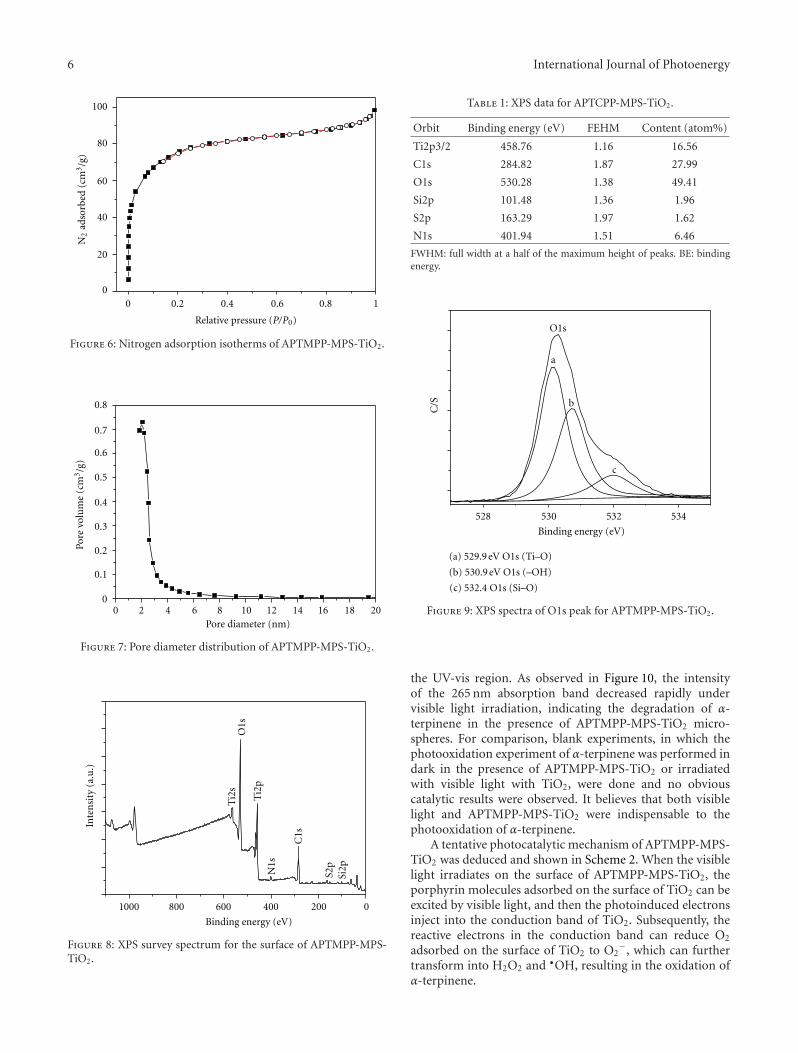
6 International Journal of Photoenergy
0.2 0.4 0.6 0.8 100
20
40
60
80
100
N2
adso
rbed
(cm
3/g
)
Relative pressure (P/P0)
Figure 6: Nitrogen adsorption isotherms of APTMPP-MPS-TiO2.
2 4 6 8 10 12 14 16 18 200
0
0.1
0.2
0.3
0.4
0.5
0.6
0.7
0.8
Pore diameter (nm)
Pore
vol
um
e (c
m3/g
)
Figure 7: Pore diameter distribution of APTMPP-MPS-TiO2.
1000 800 600 400 200 0
Si2p
S2p
C1s
N1s
Ti2
p
O1s
Ti2
s
Inte
nsi
ty (
a.u
.)
Binding energy (eV)
Figure 8: XPS survey spectrum for the surface of APTMPP-MPS-TiO2.
Table 1: XPS data for APTCPP-MPS-TiO2.
Orbit Binding energy (eV) FEHM Content (atom%)
Ti2p3/2 458.76 1.16 16.56
C1s 284.82 1.87 27.99
O1s 530.28 1.38 49.41
Si2p 101.48 1.36 1.96
S2p 163.29 1.97 1.62
N1s 401.94 1.51 6.46
FWHM: full width at a half of the maximum height of peaks. BE: bindingenergy.
528 530 532 534
c
b
C/S
O1s
Binding energy (eV)
a
(c) 532.4 O1s (Si–O)
(b) 530.9 eV O1s (–OH)
(a) 529.9 eV O1s (Ti–O)
Figure 9: XPS spectra of O1s peak for APTMPP-MPS-TiO2.
the UV-vis region. As observed in Figure 10, the intensityof the 265 nm absorption band decreased rapidly undervisible light irradiation, indicating the degradation of α-terpinene in the presence of APTMPP-MPS-TiO2 micro-spheres. For comparison, blank experiments, in which thephotooxidation experiment of α-terpinene was performed indark in the presence of APTMPP-MPS-TiO2 or irradiatedwith visible light with TiO2, were done and no obviouscatalytic results were observed. It believes that both visiblelight and APTMPP-MPS-TiO2 were indispensable to thephotooxidation of α-terpinene.
A tentative photocatalytic mechanism of APTMPP-MPS-TiO2 was deduced and shown in Scheme 2. When the visiblelight irradiates on the surface of APTMPP-MPS-TiO2, theporphyrin molecules adsorbed on the surface of TiO2 can beexcited by visible light, and then the photoinduced electronsinject into the conduction band of TiO2. Subsequently, thereactive electrons in the conduction band can reduce O2
adsorbed on the surface of TiO2 to O2−, which can further
transform into H2O2 and •OH, resulting in the oxidation ofα-terpinene.
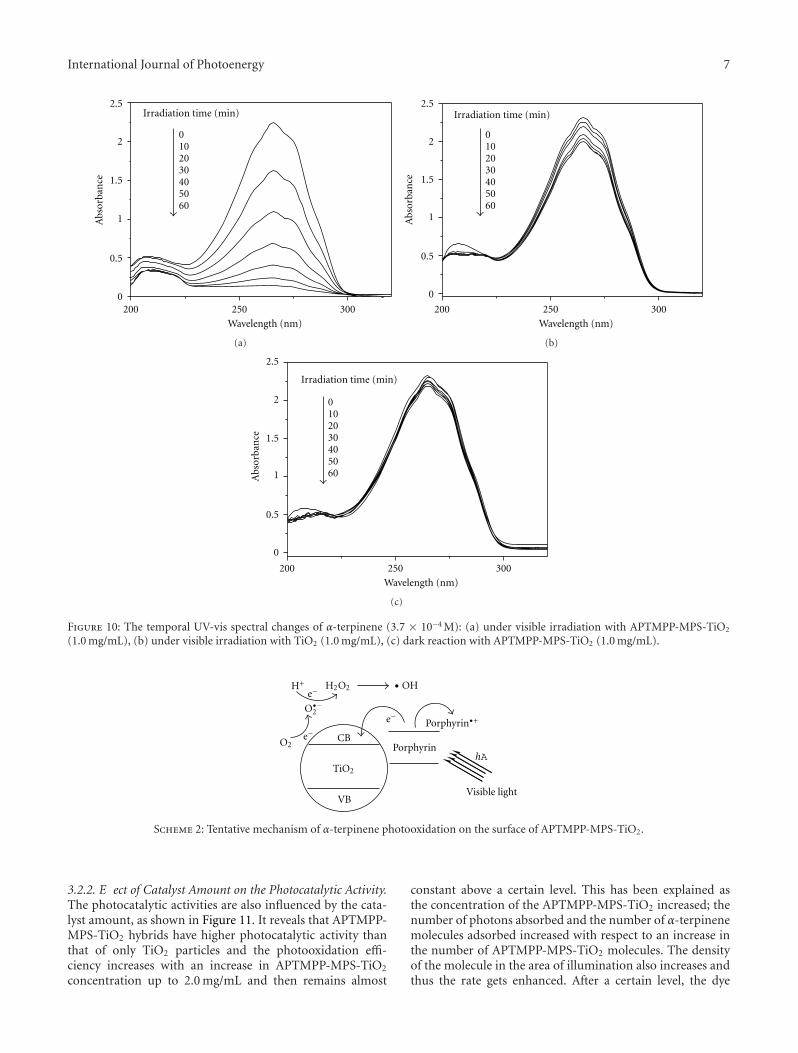
International Journal of Photoenergy 7
200 250 3000
0.5
1
1.5
2
2.5
Wavelength (nm)
Abs
orba
nce
Irradiation time (min)
0102030405060
(a)
200 250 300
0
0.5
1
1.5
2
2.5
Wavelength (nm)
Abs
orba
nce
Irradiation time (min)
0102030405060
(b)
200 250 300
0
0.5
1
1.5
2
2.5
Wavelength (nm)
Abs
orba
nce
Irradiation time (min)
0102030405060
(c)
Figure 10: The temporal UV-vis spectral changes of α-terpinene (3.7 × 10⁻⁴ M): (a) under visible irradiation with APTMPP-MPS-TiO2
(1.0 mg/mL), (b) under visible irradiation with TiO2 (1.0 mg/mL), (c) dark reaction with APTMPP-MPS-TiO2 (1.0 mg/mL).
TiO2
Porphyrin
Porphyrin
•+
Visible light
e−
e−
e−
O•−2
O2
H+ H2O2
hA
CB
VB
• OH
Scheme 2: Tentative mechanism of α-terpinene photooxidation on the surface of APTMPP-MPS-TiO2.
3.2.2. E ect of Catalyst Amount on the Photocatalytic Activity.The photocatalytic activities are also influenced by the cata-lyst amount, as shown in Figure 11. It reveals that APTMPP-MPS-TiO2 hybrids have higher photocatalytic activity thanthat of only TiO2 particles and the photooxidation effi-ciency increases with an increase in APTMPP-MPS-TiO2
concentration up to 2.0 mg/mL and then remains almost
constant above a certain level. This has been explained asthe concentration of the APTMPP-MPS-TiO2 increased; thenumber of photons absorbed and the number of α-terpinenemolecules adsorbed increased with respect to an increase inthe number of APTMPP-MPS-TiO2 molecules. The densityof the molecule in the area of illumination also increases andthus the rate gets enhanced. After a certain level, the dye
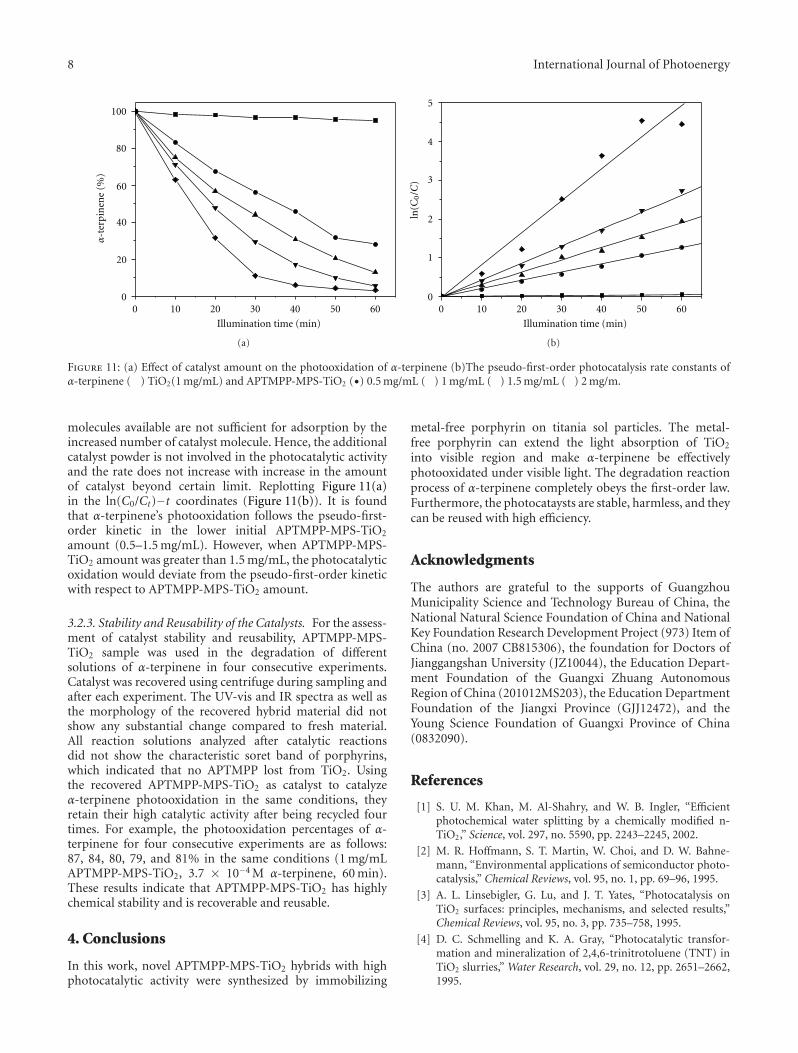
8 International Journal of Photoenergy
10 20 30 40 50 600
0
20
40
60
80
100α
-ter
pin
ene
(%)
Illumination time (min)
(a)
10 20 30 40 50 600
0
1
2
3
4
5
Illumination time (min)
ln(C
0/C
)
(b)
Figure 11: (a) Effect of catalyst amount on the photooxidation of α-terpinene (b)The pseudo-first-order photocatalysis rate constants ofα-terpinene ( ) TiO2(1 mg/mL) and APTMPP-MPS-TiO2 (•) 0.5 mg/mL ( ) 1 mg/mL ( ) 1.5 mg/mL ( ) 2 mg/m.
molecules available are not sufficient for adsorption by theincreased number of catalyst molecule. Hence, the additionalcatalyst powder is not involved in the photocatalytic activityand the rate does not increase with increase in the amountof catalyst beyond certain limit. Replotting Figure 11(a)in the ln(C0/Ct)−t coordinates (Figure 11(b)). It is foundthat α-terpinene’s photooxidation follows the pseudo-first-order kinetic in the lower initial APTMPP-MPS-TiO2
amount (0.5–1.5 mg/mL). However, when APTMPP-MPS-TiO2 amount was greater than 1.5 mg/mL, the photocatalyticoxidation would deviate from the pseudo-first-order kineticwith respect to APTMPP-MPS-TiO2 amount.
3.2.3. Stability and Reusability of the Catalysts. For the assess-ment of catalyst stability and reusability, APTMPP-MPS-TiO2 sample was used in the degradation of differentsolutions of α-terpinene in four consecutive experiments.Catalyst was recovered using centrifuge during sampling andafter each experiment. The UV-vis and IR spectra as well asthe morphology of the recovered hybrid material did notshow any substantial change compared to fresh material.All reaction solutions analyzed after catalytic reactionsdid not show the characteristic soret band of porphyrins,which indicated that no APTMPP lost from TiO2. Usingthe recovered APTMPP-MPS-TiO2 as catalyst to catalyzeα-terpinene photooxidation in the same conditions, theyretain their high catalytic activity after being recycled fourtimes. For example, the photooxidation percentages of α-terpinene for four consecutive experiments are as follows:87, 84, 80, 79, and 81% in the same conditions (1 mg/mLAPTMPP-MPS-TiO2, 3.7 × 10⁻⁴ M α-terpinene, 60 min).These results indicate that APTMPP-MPS-TiO2 has highlychemical stability and is recoverable and reusable.
4. Conclusions
In this work, novel APTMPP-MPS-TiO2 hybrids with highphotocatalytic activity were synthesized by immobilizing
metal-free porphyrin on titania sol particles. The metal-free porphyrin can extend the light absorption of TiO2
into visible region and make α-terpinene be effectivelyphotooxidated under visible light. The degradation reactionprocess of α-terpinene completely obeys the first-order law.Furthermore, the photocataysts are stable, harmless, and theycan be reused with high efficiency.
Acknowledgments
The authors are grateful to the supports of GuangzhouMunicipality Science and Technology Bureau of China, theNational Natural Science Foundation of China and NationalKey Foundation Research Development Project (973) Item ofChina (no. 2007 CB815306), the foundation for Doctors ofJianggangshan University (JZ10044), the Education Depart-ment Foundation of the Guangxi Zhuang AutonomousRegion of China (201012MS203), the Education DepartmentFoundation of the Jiangxi Province (GJJ12472), and theYoung Science Foundation of Guangxi Province of China(0832090).
References
[1] S. U. M. Khan, M. Al-Shahry, and W. B. Ingler, “Efficientphotochemical water splitting by a chemically modified n-TiO2,” Science, vol. 297, no. 5590, pp. 2243–2245, 2002.
[2] M. R. Hoffmann, S. T. Martin, W. Choi, and D. W. Bahne-mann, “Environmental applications of semiconductor photo-catalysis,” Chemical Reviews, vol. 95, no. 1, pp. 69–96, 1995.
[3] A. L. Linsebigler, G. Lu, and J. T. Yates, “Photocatalysis onTiO2 surfaces: principles, mechanisms, and selected results,”Chemical Reviews, vol. 95, no. 3, pp. 735–758, 1995.
[4] D. C. Schmelling and K. A. Gray, “Photocatalytic transfor-mation and mineralization of 2,4,6-trinitrotoluene (TNT) inTiO2 slurries,” Water Research, vol. 29, no. 12, pp. 2651–2662,1995.
International Journal of Photoenergy 9
[5] J. Hong, C. Sun, S. G. Yang, and Y. Z. Liu, “Photocatalyticdegradation of methylene blue in TiO2 aqueous suspensionsusing microwave powered electrodeless discharge lamps,”Journal of Hazardous Materials, vol. 133, no. 1–3, pp. 162–166,2006.
[6] G. Zhanqi, Y. Shaogui, T. Na, and S. Cheng, “Microwaveassisted rapid and complete degradation of atrazine usingTiO2 nanotube photocatalyst suspensions,” Journal of Haz-ardous Materials, vol. 145, no. 3, pp. 424–430, 2007.
[7] R. D. Barreto, K. A. Gray, and K. Anders, “Photocatalyticdegradation of methyl-tert-butyl ether in TiO2 slurries: aproposed reaction scheme,” Water Research, vol. 29, no. 5, pp.1243–1248, 1995.
[8] S. Yang, Y. Guo, N. Yan et al., “Remarkable effect of theincorporation of titanium on the catalytic activity and SO2
poisoning resistance of magnetic Mn-Fe spinel for elementalmercury capture,” Applied Catalysis B, vol. 101, no. 3-4, pp.698–708, 2011.
[9] Y. Xie, Y. Li, and X. Zhao, “Low-temperature preparation andvisible-light-induced catalytic activity of anatase F-N-codopedTiO2,” Journal of Molecular Catalysis A, vol. 277, no. 1-2, pp.119–126, 2007.
[10] Y. H. Xu and Z. X. Zeng, “The preparation, characterization,and photocatalytic activities of Ce-TiO2/SiO2,” Journal ofMolecular Catalysis A, vol. 279, no. 1, pp. 77–81, 2008.
[11] C. C. Yen, D. Y. Wang, M. H. Shih, L. S. Chang, and H. C.Shih, “A combined experimental and theoretical analysis of Fe-implanted TiO2 modified by metal plasma ion implantation,”Applied Surface Science, vol. 256, no. 22, pp. 6865–6870, 2010.
[12] A. Ghicov, J. M. Macak, H. Tsuchiya et al., “Ion implantationand annealing for an efficient N-doping of TiO2 nanotubes,”Nano Letters, vol. 6, no. 5, pp. 1080–1082, 2006.
[13] J. K. Park, H. R. Lee, J. Chen, H. Shinokubo, A. Osuka,and D. Kim, “Photoelectrochemical properties of dou-bly β-functionalized porphyrin sensitizers for dye-sensitizednanocrystalline-TiO2 solar cells,” Journal of Physical ChemistryC, vol. 112, no. 42, pp. 16691–16699, 2008.
[14] H. Shen, L. Mi, P. Xu, W. Shen, and P. N. Wang, “Visible-lightphotocatalysis of nitrogen-doped TiO2 nanoparticulate filmsprepared by low-energy ion implantation,” Applied SurfaceScience, vol. 253, no. 17, pp. 7024–7028, 2007.
[15] M. C. Neves, J. M. F. Nogueira, T. Trindade, M. H. Mendonca,M. I. Pereira, and O. C. Monteiro, “Photosensitization of TiO2
by Ag2S and its catalytic activity on phenol photodegradation,”Journal of Photochemistry and Photobiology A, vol. 204, no. 2-3,pp. 168–173, 2009.
[16] A. Kathiravan and R. Renganathan, “Effect of anchoring groupon the photosensitization of colloidal TiO2 nanoparticles withporphyrins,” Journal of Colloid and Interface Science, vol. 331,no. 2, pp. 401–407, 2009.
[17] O. Ozcan, F. Yukruk, E. U. Akkaya, and D. Uner, “Dyesensitized artificial photosynthesis in the gas phase over thinand thick TiO2 films under UV and visible light irradiation,”Applied Catalysis B, vol. 71, no. 3-4, pp. 291–297, 2007.
[18] D. Chatterjee and A. Mahata, “Visible light induced pho-todegradation of organic pollutants on dye adsorbed TiO2
surface,” Journal of Photochemistry and Photobiology A, vol.153, no. 1–3, pp. 199–204, 2002.
[19] D. Chen, D. Yang, J. Geng, J. Zhu, and Z. Jiang, “Improvingvisible-light photocatalytic activity of N-doped TiO2 nanopar-ticles via sensitization by Zn porphyrin,” Applied SurfaceScience, vol. 255, no. 5, pp. 2879–2884, 2008.
[20] D. Li, W. Dong, S. Sun, Z. Shi, and S. Feng, “Photocatalyticdegradation of acid chrome blue K with porphyrin-sensitizedTiO2 under visible light,” Journal of Physical Chemistry C, vol.112, no. 38, pp. 14878–14882, 2008.
[21] S.-J. Moon, E. Baranoff, S. M. Zakeeruddin et al., “Enhancedlight harvesting in mesoporous TiO2/P3HT hybrid solar cellsusing a porphyrin dye,” Chemical Communications, vol. 47, no.29, pp. 8244–8246, 2011.
[22] J. E. Kroeze, R. B. M. Koehorst, and T. J. Savenije, “Singletand triplet exciton diffusion in a self-organizing porphyrinantenna layer,” Advanced Functional Materials, vol. 14, no. 10,pp. 992–998, 2004.
[23] M. Y. Duan, J. Li, G. Mele et al., “Photocatalytic activityof novel tin porphyrin/TiO2 based composites,” Journal ofPhysical Chemistry C, vol. 114, no. 17, pp. 7857–7862, 2010.
[24] C.-L. Wang, Y.-C. Chang, C.-M. Lan, C.-F. Lo, E. W.-G. Diau,and C.-Y. Lin, “Enhanced light harvesting with π-conjugatedcyclic aromatic hydrocarbons for porphyrin-sensitized solarcells,” Energy and Environmental Science, vol. 4, no. 5, pp.1788–1795, 2011.
[25] C. Wang, G. M. Yang, J. Li et al., “Novel meso-substitutedporphyrins: synthesis, characterization and photocatalyticactivity of their TiO2-based composites,” Dyes and Pigments,vol. 80, no. 3, pp. 321–328, 2009.
[26] G. Mele, R. D. Sole, G. Vasapollo et al., “TRMC, XPS, and EPRcharacterizations of polycrystalline TiO2 porphyrin impreg-nated powders and their catalytic activity for 4-nitrophenolphotodegradation in aqueous suspension,” Journal of PhysicalChemistry B, vol. 109, no. 25, pp. 12347–12352, 2005.
[27] C. Wang, J. Li, G. Mele et al., “Efficient degradation of 4-nitrophenol by using functionalized porphyrin-TiO2 photo-catalysts under visible irradiation,” Applied Catalysis B, vol. 76,no. 3-4, pp. 218–226, 2007.
[28] G. Mele, R. Del Sole, G. Vasapollo, E. Garcıa-Lopez, L.Palmisano, and M. Schiavello, “Photocatalytic degradation of4-nitrophenol in aqueous suspension by using polycrystallineTiO2 impregnated with functionalized Cu(II) -porphyrin orCu(II)-phthalocyanine,” Journal of Catalysis, vol. 217, no. 2,pp. 334–342, 2003.
[29] J. H. Cai, J. W. Huang, P. Zhao, Y. J. Ye, H. C. Yu, and L.N. Ji, “Silica microspheres functionalized with porphyrin asa reusable and efficient catalyst for the photooxidation of 1,5-dihydroxynaphthalene in aerated aqueous solution,” Journal ofPhotochemistry and Photobiology A, vol. 207, no. 2-3, pp. 236–243, 2009.
[30] J. W. Huang, W. J. Mei, J. Liu, and L. N. Ji, “The cataly-sis of some novel polystyrene-supported porphyrinatoman-ganese(III) in hydroxylation of cyclohexane with molecularoxygen,” Journal of Molecular Catalysis A, vol. 170, no. 1-2, pp.261–265, 2001.
[31] B. Fu, H. C. Yu, J. W. Huang, P. Zhao, J. Liu, and L. N.Ji, “Mn(III) porphyrins immobilized on magnetic polymernanospheres as biomimetic catalysts hydroxylating cyclohex-ane with molecular oxygen,” Journal of Molecular Catalysis A,vol. 298, no. 1-2, pp. 74–80, 2009.
[32] J. H. Cai, J. W. Huang, P. Zhao, Y. J. Ye, H. C. Yu, and L. N. Ji,“Silica-metalloporphyrins hybrid materials: preparation andcatalysis to hydroxylate cyclohexane with molecular oxygen,”Journal of Sol-Gel Science and Technology, vol. 50, no. 3, pp.430–436, 2009.
[33] J. Yan, X. Li, S. Cheng, Y. Ke, and X. Liang, “Facile synthesis oftitania-zirconia monodisperse microspheres and application
10 International Journal of Photoenergy
for phosphopeptides enrichment,” Chemical Communications,no. 20, pp. 2929–2931, 2009.
[34] J. H. Cai, J. W. Huang, P. Zhao, Y. H. Zhou, H. C. Yu, and L. N.Ji, “Photodegradation of 1,5-dihydroxynaphthalene catalyzedby meso-tetra(4-sulfonatophenyl)porphyrin in aerated aque-ous solution,” Journal of Molecular Catalysis A, vol. 292, no.1-2, pp. 49–53, 2008.
[35] S. M. Ribeiro, A. C. Serra, and A. M. D. A. Rocha Gonsalves,“Immobilised porphyrins in monoterpene photooxidations,”Journal of Catalysis, vol. 256, no. 2, pp. 331–337, 2008.
[36] E. F. Aboelfetoh and R. Pietschnig, “Preparation and catalyticperformance of Al2O3, TiO2 and SiO2 supported vanadiumbased-catalysts for C-H activation,” Catalysis Letters, vol. 127,no. 1-2, pp. 83–94, 2009.
[37] M. Zhang, L. Shi, S. Yuan, Y. Zhao, and J. Fang, “Synthesisand photocatalytic properties of highly stable and neutralTiO2/SiO2 hydrosol,” Journal of Colloid and Interface Science,vol. 330, no. 1, pp. 113–118, 2009.
[38] M. Houmard, D. Riassetto, F. Roussel et al., “Morphologyand natural wettability properties of sol-gel derived TiO2-SiO2
composite thin films,” Applied Surface Science, vol. 254, no. 5,pp. 1405–1414, 2007.
[39] S. Zhan, D. Chen, X. Jiao, and Y. Song, “MesoporousTiO2/SiO2 composite nanofibers with selective photocatalyticproperties,” Chemical Communications, no. 20, pp. 2043–2045,2007.
[40] T. H. Meen, W. Water, W. R. Chen, S. M. Chao, L. W. Ji, and C.J. Huang, “Application of TiO2 nano-particles on the electrodeof dye-sensitized solar cells,” Journal of Physics and Chemistryof Solids, vol. 70, no. 2, pp. 472–476, 2009.
[41] J. Xu, Y. Ao, D. Fu, and C. Yuan, “A simple route for the prepa-ration of Eu, N-codoped TiO2 nanoparticles with enhancedvisible light-induced photocatalytic activity,” Journal of Colloidand Interface Science, vol. 328, no. 2, pp. 447–451, 2008.
[42] J. G. Yu, H. G. Yu, B. Cheng, X. J. Zhao, J. C. Yu, andW. K. Ho, “The effect of calcination temperature on thesurface microstructure and photocatalytic activity of TiO2 thinfilms prepared by liquid phase deposition,” Journal of PhysicalChemistry B, vol. 107, no. 50, pp. 13871–13879, 2003.
Hindawi Publishing CorporationInternational Journal of PhotoenergyVolume 2012, Article ID 536194, 8 pagesdoi:10.1155/2012/536194
Research Article
Preparation and Characterization of (I2)n SensitizedNanoporous TiO2with Enhanced Photocatalytic Activity underVisible-Light Irradiation
Juzheng Zhang,1 Xin Liu,1 Shanmin Gao,1, 2 Quanwen Liu,1 Baibiao Huang,2 and Ying Dai2
1 School of Chemistry and Materials Science, Ludong University, Yantai 264025, China2 State key labs of Crystal Materials, Shandong University, Jinan 250100, China
Correspondence should be addressed to Shanmin Gao, [email protected] and Baibiao Huang, [email protected]
Received 18 December 2011; Accepted 31 January 2012
Academic Editor: Xuxu Wang
Copyright © 2012 Juzheng Zhang et al. This is an open access article distributed under the Creative Commons Attribution License,which permits unrestricted use, distribution, and reproduction in any medium, provided the original work is properly cited.
A yellow/brown powder of (I2)n sensitized nanoporous TiO2 was obtained via an hydrolysis with TiCl4 and iodine hydrosol as rawmaterial. I2 nanoparticles in the hydrosol were used as seeds to initiate the nucleation of a precursory TiO2 shell. The hybridizedjumbles were further calcinated at different temperatures. The structure, crystallinity, morphology, and other physical-chemicalproperties of the samples are characterized by X-ray diffraction (XRD), transmission electron microscopy (TEM), N2 adsorption-desorption isotherms measurements, and UV-vis diffuse reflectance spectroscopy (DRS). The formation mechanism of these (I2)nsensitized nanoporous TiO2 is discussed. Methylene blue solutions were used as model wastewater to evaluate the visible lightphotocatalytic activity of the samples. The results indicate that iodine can exist even in high-temperature calcination for iodinebeing encapsulated in the nanocavities inside TiO2. The degradation of methylene blue (MB) accorded with the first-order reactionmodel.
1. Introduction
Semiconductor-catalyzed photooxidation using solar light asan energy source is one of the most efficient processes fora rapid and low-cost degradation of organic pollutants. Theexcellent chemical stability, nontoxicity, and photoactivity ofTiO2 has attracted much attention for its potential use asa solid photocatalyst for environmental purification [1–3].However, because of its large bandgap of 3.20 eV, only a smallUV fraction of solar light, about 2-3%, can be utilized togenerate electron-hole pairs. Hence, it is crucial to enhancethe light harvesting of TiO2 in the visible region whichaccounts for more than 43% of the total solar energy [4, 5].
In general, two methods are utilized to enhance thelight harvest of TiO2 in the visible region. One methodis to sensitize TiO2 with color centers that have properenergy levels for photoelectron transfer between the colorcenters and TiO2. A cost-effective sensitization of TiO2 istypically achieved by adding nonmetals such as I2 [6–8]and S [9, 10]. The other way is to form a doping level
through intercalation of proper atoms into anatase form.For example, by doping carbon [11, 12] and nitrogen [13–15] atoms into the TiO2 lattice, a new, weak absorptionis generated at lower energies and promising approach forinducing effective Vis-absorption.
In addition to the narrow bandgap, the enhancement ofsurface area of the TiO2 is another important aspect for theefficiency of the materials because the desired photocatalyticreactions occur at the interfaces of the catalyst-pollute solu-tion [16, 17]. Mesoporous TiO2 with high specific surfacearea can provide abundant active sites to adsorb reactantmolecules and facilitate the accessibility of reactants to thecatalysts [18, 19]. Light efficiency can also be enhanced dueto the increased specific surface area and multiple scattering[20].
As a photosensitizer, element iodine not only has theabsorption ability in the visible light region but also has lowtoxicity and can be dissolved in many solvent. Therefore,the elemental iodine can be used as a photosensitizer andprepared visible light photocatalytic materials. Titanium(IV)
2 International Journal of Photoenergy
alkoxides have been frequently studied as titanium precur-sors, but their high cost and the need to handle organicsolvents are important drawbacks. Inorganic precursors arepreferable, and TiO2 powders have been often prepared byhydrolysis of TiCl4, generally in aqueous acidic solutions [21]and in pure water [22, 23].
Based on the above state-of-the-art designing strategiesfor TiO2-based photocatalysts, this paper reports the syn-thesis of high surface area (I2)n sensitized nanoporous TiO2.The I2 sensitized is confined preferentially in the surface/nearsurface region of TiO2 structure in order to accommodatehot carriers in the surface region. The I2 nanoparticlesin the I2-hydrosol serve as seeds for nucleation of smallTiO2 particles formed from the hydrolysis of the TiCl4.This template-free soft synthetic strategy allows the dopingand pore formation to be accomplished simultaneouslyduring calcination, while the amount and position of dopingelements can be readily controlled under mild conditions.
2. Experimental
2.1. Materials and Sample Preparation. All chemicals usedin this study were reagent grade (Tianjin Ruijinte ChemicalReagent Corp.) without further purification. Water used wasdeionized and doubly distilled. The (I2)n sensitized porousTiO2 samples were synthesized via the hydrolysis of TiCl4 iniodine hydrosol without using any templates or surfactants,followed by calcination at elevated temperatures.
A typical procedure for preparing the samples isdescribed as follows. First, 0.80 g iodine powders weredissolved in 40 mL absolute ethanol and slowly added drop-wisely into 100 mL of distilled water at 60◦C with continuousstirring. The I2 hydrosol was formed after stirring for0.5 h and then cooled to room temperature. 8 mL TiCl4was carefully added into 40 mL-deionized water with gentlestirring in ice-water bath to avoid a drastic hydrolysis of TiCl4in water (designated solution A). Solution A was then addeddropwise with vigorous stirring into 100 mL of I2 hydrosol atroom temperature, then the mixture solution was heated to40◦C and keet for 2 h under closed conditions. After that, a20% (w/w) solution of ammonia was added dropwise withvigorous stirring until pH = 7, then the mixed solutionwas cooled down to room temperature and aged further toprecipitate growth. Finally, the precipitates were centrifuged,washed with distilled water three times, and dried in an ovenat 50◦C. The precipitates obtained were calcined at differenttemperatures in air for 3 h. The samples after heat treatmentwere denoted as IT-T, where the second T indicates thecalcination temperatures (in ◦C). In addition, commercialP25 (∼80% anatase and ∼20% rutile, Deguass) was used as areference.
2.2. Characterization. The phases of the final productswere identified using X-ray diffractometer (XRD) (RigakuD/max-2500VPC) with a Ni-filtered Cu Kα radiation at ascanning rate of 0.02◦ s−1 from 20◦ to 70◦. The morphologyof the samples was observed with transmission electron
microscope (TEM, Hitachi model H800) using an acceler-ating voltage of 100 kV. Ultraviolet-visible (UV-vis) diffusereflection spectra (DRS) were recorded in the range 200–800 nm at room temperature (Shimadzu UV-2550 UV-visspectrophotometer). Porous structure and BET surface areawere characterized by an N2 adsorption-desorption isotherm(ASAP-2020 Micromeritics Co.). Note that the samples weredegassed at 180◦C prior to the BET measurements. The porevolume and pore diameter distribution were derived fromdesorption branches of the isotherms by the Barrett-Joyner-Halenda (BJH) model. The BET surface area was calculatedfrom the linear part of the Brunauer-Emmett-Teller (BET)plot.
2.3. Adsorption and Photocatalytic Activity Measurements.The adsorption capability and visible light photocatalyticactivity of the (I2)n sensitized porous TiO2 were evaluatedby measuring the adsorption and decomposition rate ofmethylene blue (MB) solution at room temperature. Forcomparison, the same measurements were also performedon the commercial P25. For a typical absorption andphotocatalytic experiment, a total of a 200 mg sample wasadded to 150 mL MB aqueous solution (5.0 × 10⁻⁴ mol/L)in a custom-made quartz reactor. The MB concentrationwas monitored by the UV-vis spectroscopy during the entireexperiment. The solution was irradiated by visible lightsupplied by a 300 W tungsten-arc lamp (Zhejiang ElectricCo. Ltd.) with a glass filter (transparent for λ > 400 nm).After 5 minute intervals during adsorption and visiblelight illumination, about 3 mL aliquots were taken out andcentrifuged to remove the trace particles. The absorbanceof the centrifuged solution was measured in the range 500–800 nm using a UV-vis spectrophotometer (Shimadzu UV-2550).
3. Results and Discussions
3.1. Sample Structure. The porous nanostructures wereprepared via the hydrolysis of TiCl4 in I2 hydrosol, followedby calcinated in air at elevated temperatures for 3 h. PowderX-ray diffraction (PXRD) is used to investigate the changes ofstructure and crystallite sizes of the prepared porous samplesat different calcination temperatures. Figure 1 shows theXRD patterns of the samples after being calcinated at varioustemperatures from 200◦C to 600◦C. The XRD patternfor the sample obtained at 200◦C indicated the samplepredominantly amorphous titania besides trace amounts ofanatase. The diffraction peaks at 2θ = 31.6◦, 33.5◦ and 36.0◦
should be the iodine (JCPDS no. 71-1370). As the calcinationtemperatures increase, the XRD results show the pure anataseTiO2 phase (JCPDS file no. 21-172), indicating that thecrystallization of the samples is achieved. In addition, asthe calcination temperature increases, the peaks assignedto anatase become sharper and more intense due to theformation of larger grains as summarized in Table 1. Theaverage crystallite sizes of (I2)n sensitized nanoporous TiO2
are 4.1, 7.2, 9.8, and 13.2 nm for IT-300, IT-400, IT-500, andIT-600, respectively, which are estimated from the full width
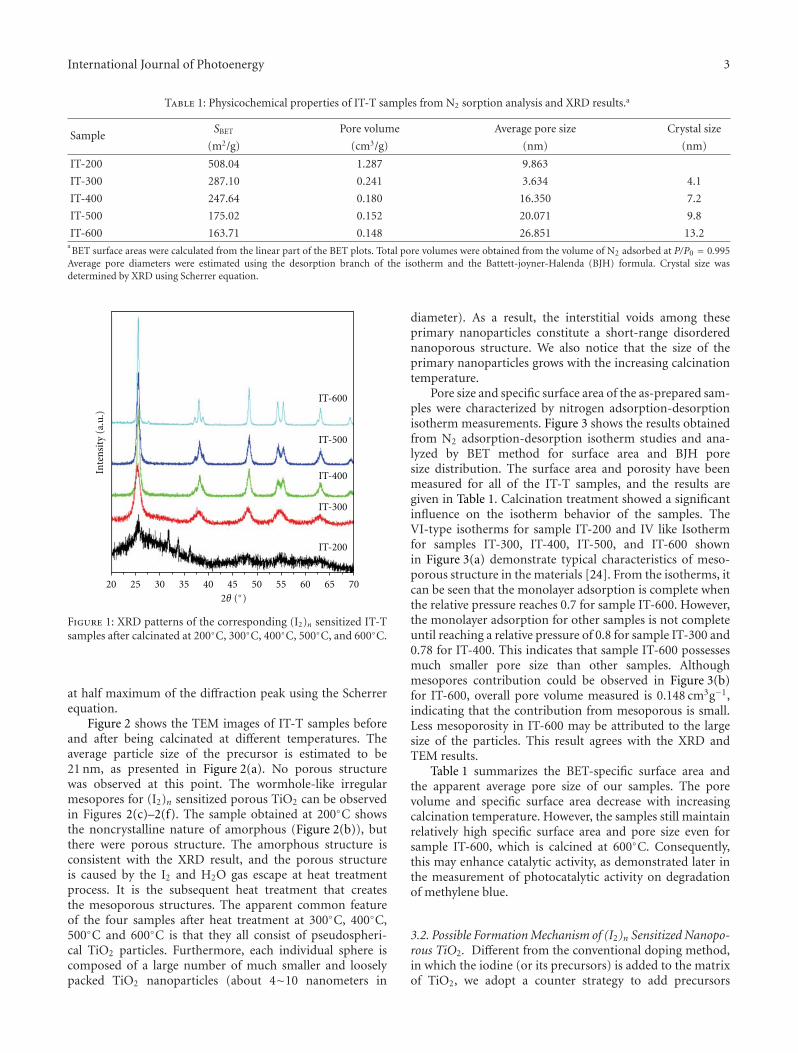
International Journal of Photoenergy 3
Table 1: Physicochemical properties of IT-T samples from N2 sorption analysis and XRD results.a
SampleSBET Pore volume Average pore size Crystal size
(m2/g) (cm3/g) (nm) (nm)
IT-200 508.04 1.287 9.863
IT-300 287.10 0.241 3.634 4.1
IT-400 247.64 0.180 16.350 7.2
IT-500 175.02 0.152 20.071 9.8
IT-600 163.71 0.148 26.851 13.2aBET surface areas were calculated from the linear part of the BET plots. Total pore volumes were obtained from the volume of N2 adsorbed at P/P0 = 0.995
Average pore diameters were estimated using the desorption branch of the isotherm and the Battett-joyner-Halenda (BJH) formula. Crystal size wasdetermined by XRD using Scherrer equation.
20 25 30 35 40 45 50 55 60 65 702θ (◦)
Inte
nsi
ty (
a.u
.)
IT-600
IT-500
IT-400
IT-300
IT-200
Figure 1: XRD patterns of the corresponding (I2)n sensitized IT-Tsamples after calcinated at 200◦C, 300◦C, 400◦C, 500◦C, and 600◦C.
at half maximum of the diffraction peak using the Scherrerequation.
Figure 2 shows the TEM images of IT-T samples beforeand after being calcinated at different temperatures. Theaverage particle size of the precursor is estimated to be21 nm, as presented in Figure 2(a). No porous structurewas observed at this point. The wormhole-like irregularmesopores for (I2)n sensitized porous TiO2 can be observedin Figures 2(c)–2(f). The sample obtained at 200◦C showsthe noncrystalline nature of amorphous (Figure 2(b)), butthere were porous structure. The amorphous structure isconsistent with the XRD result, and the porous structureis caused by the I2 and H2O gas escape at heat treatmentprocess. It is the subsequent heat treatment that createsthe mesoporous structures. The apparent common featureof the four samples after heat treatment at 300◦C, 400◦C,500◦C and 600◦C is that they all consist of pseudospheri-cal TiO2 particles. Furthermore, each individual sphere iscomposed of a large number of much smaller and looselypacked TiO2 nanoparticles (about 4∼10 nanometers in
diameter). As a result, the interstitial voids among theseprimary nanoparticles constitute a short-range disorderednanoporous structure. We also notice that the size of theprimary nanoparticles grows with the increasing calcinationtemperature.
Pore size and specific surface area of the as-prepared sam-ples were characterized by nitrogen adsorption-desorptionisotherm measurements. Figure 3 shows the results obtainedfrom N2 adsorption-desorption isotherm studies and ana-lyzed by BET method for surface area and BJH poresize distribution. The surface area and porosity have beenmeasured for all of the IT-T samples, and the results aregiven in Table 1. Calcination treatment showed a significantinfluence on the isotherm behavior of the samples. TheVI-type isotherms for sample IT-200 and IV like Isothermfor samples IT-300, IT-400, IT-500, and IT-600 shownin Figure 3(a) demonstrate typical characteristics of meso-porous structure in the materials [24]. From the isotherms, itcan be seen that the monolayer adsorption is complete whenthe relative pressure reaches 0.7 for sample IT-600. However,the monolayer adsorption for other samples is not completeuntil reaching a relative pressure of 0.8 for sample IT-300 and0.78 for IT-400. This indicates that sample IT-600 possessesmuch smaller pore size than other samples. Althoughmesopores contribution could be observed in Figure 3(b)for IT-600, overall pore volume measured is 0.148 cm3g−1,indicating that the contribution from mesoporous is small.Less mesoporosity in IT-600 may be attributed to the largesize of the particles. This result agrees with the XRD andTEM results.
Table 1 summarizes the BET-specific surface area andthe apparent average pore size of our samples. The porevolume and specific surface area decrease with increasingcalcination temperature. However, the samples still maintainrelatively high specific surface area and pore size even forsample IT-600, which is calcined at 600◦C. Consequently,this may enhance catalytic activity, as demonstrated later inthe measurement of photocatalytic activity on degradationof methylene blue.
3.2. Possible Formation Mechanism of (I2)n Sensitized Nanopo-rous TiO2. Different from the conventional doping method,in which the iodine (or its precursors) is added to the matrixof TiO2, we adopt a counter strategy to add precursors
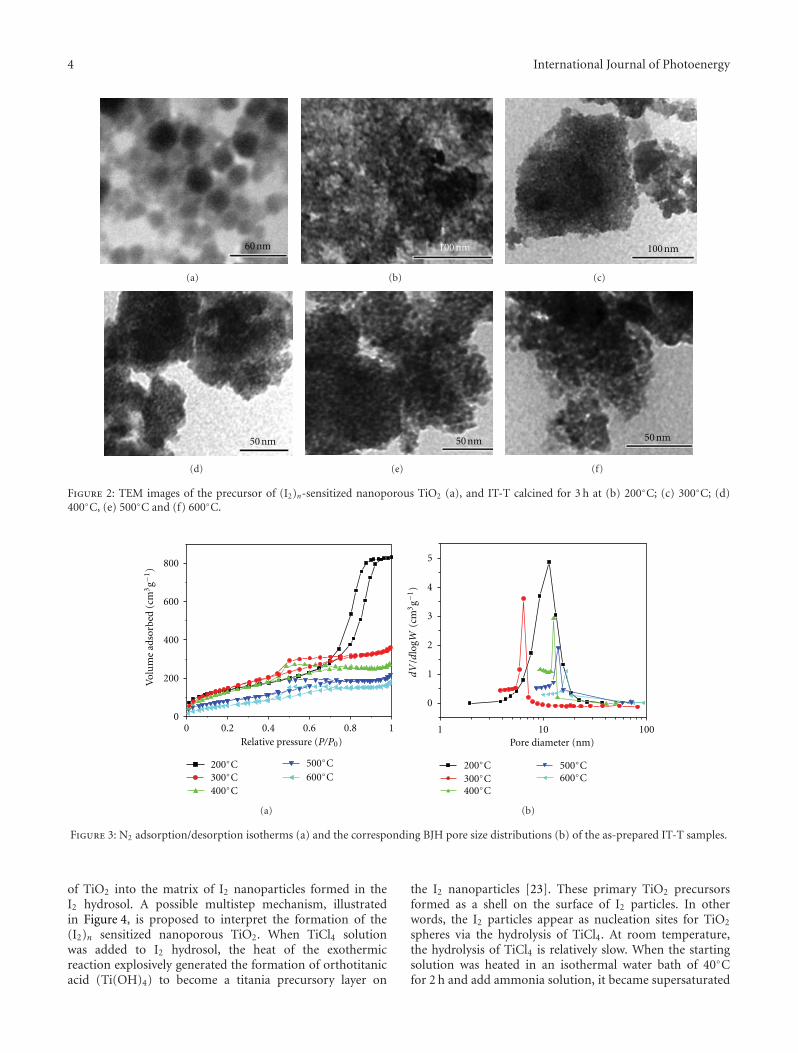
4 International Journal of Photoenergy
60 nm
(a)
100 nm
(b)
100 nm
(c)
50 nm
(d)
50 nm
(e)
50 nm
(f)
Figure 2: TEM images of the precursor of (I2)n-sensitized nanoporous TiO2 (a), and IT-T calcined for 3 h at (b) 200◦C; (c) 300◦C; (d)400◦C, (e) 500◦C and (f) 600◦C.
800
600
400
200
00 0.2 0.4 0.6 0.8 1
Relative pressure (P/P0)
200◦C300◦C400◦C
500◦C600◦C
Vol
um
e ad
sorb
ed (
cm3g−
1)
(a)
5
4
3
2
1
0
1 10 100Pore diameter (nm)
200◦C300◦C400◦C
500◦C600◦C
dV
/dlo
gW(c
m3g−
1)
(b)
Figure 3: N2 adsorption/desorption isotherms (a) and the corresponding BJH pore size distributions (b) of the as-prepared IT-T samples.
of TiO2 into the matrix of I2 nanoparticles formed in theI2 hydrosol. A possible multistep mechanism, illustratedin Figure 4, is proposed to interpret the formation of the(I2)n sensitized nanoporous TiO2. When TiCl4 solutionwas added to I2 hydrosol, the heat of the exothermicreaction explosively generated the formation of orthotitanicacid (Ti(OH)4) to become a titania precursory layer on
the I2 nanoparticles [23]. These primary TiO2 precursorsformed as a shell on the surface of I2 particles. In otherwords, the I2 particles appear as nucleation sites for TiO2
spheres via the hydrolysis of TiCl4. At room temperature,the hydrolysis of TiCl4 is relatively slow. When the startingsolution was heated in an isothermal water bath of 40◦Cfor 2 h and add ammonia solution, it became supersaturated
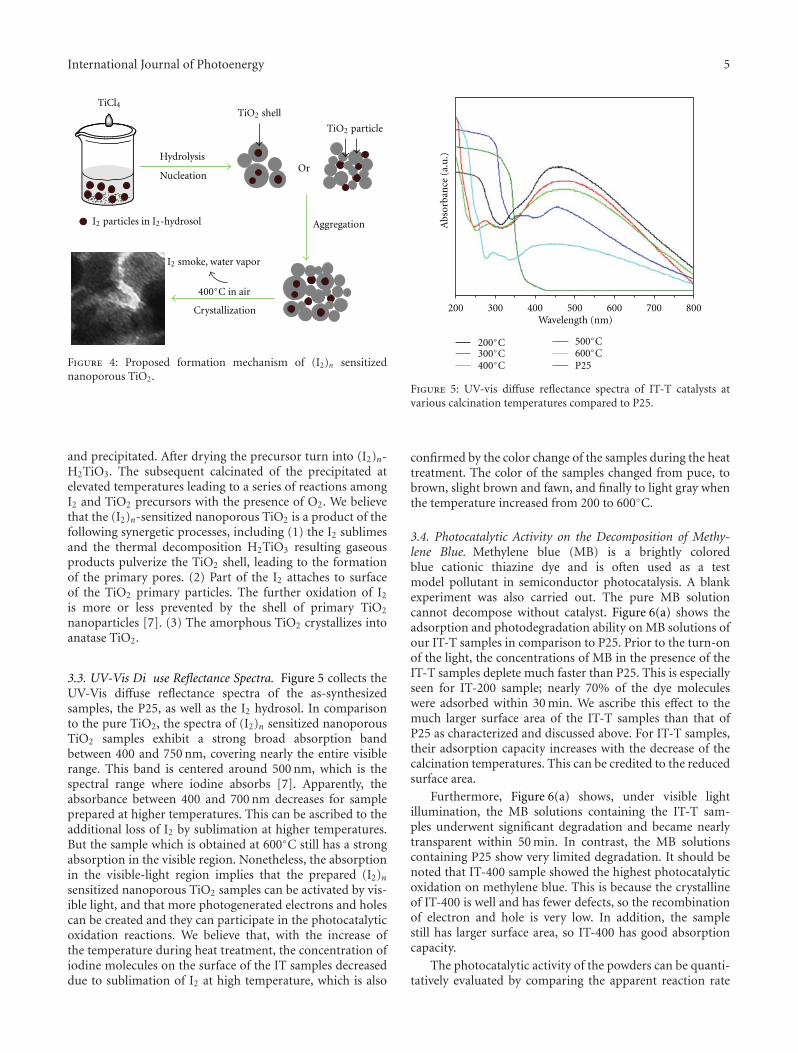
International Journal of Photoenergy 5
Hydrolysis
NucleationOr
Aggregation
Crystallization
TiCl4TiO2 shell
TiO2 particle
I2 particles in I2-hydrosol
I2 smoke, water vapor
400◦C in air
Figure 4: Proposed formation mechanism of (I2)n sensitizednanoporous TiO2.
and precipitated. After drying the precursor turn into (I2)n-H2TiO3. The subsequent calcinated of the precipitated atelevated temperatures leading to a series of reactions amongI2 and TiO2 precursors with the presence of O2. We believethat the (I2)n-sensitized nanoporous TiO2 is a product of thefollowing synergetic processes, including (1) the I2 sublimesand the thermal decomposition H2TiO3 resulting gaseousproducts pulverize the TiO2 shell, leading to the formationof the primary pores. (2) Part of the I2 attaches to surfaceof the TiO2 primary particles. The further oxidation of I2
is more or less prevented by the shell of primary TiO2
nanoparticles [7]. (3) The amorphous TiO2 crystallizes intoanatase TiO2.
3.3. UV-Vis Di use Reflectance Spectra. Figure 5 collects theUV-Vis diffuse reflectance spectra of the as-synthesizedsamples, the P25, as well as the I2 hydrosol. In comparisonto the pure TiO2, the spectra of (I2)n sensitized nanoporousTiO2 samples exhibit a strong broad absorption bandbetween 400 and 750 nm, covering nearly the entire visiblerange. This band is centered around 500 nm, which is thespectral range where iodine absorbs [7]. Apparently, theabsorbance between 400 and 700 nm decreases for sampleprepared at higher temperatures. This can be ascribed to theadditional loss of I2 by sublimation at higher temperatures.But the sample which is obtained at 600◦C still has a strongabsorption in the visible region. Nonetheless, the absorptionin the visible-light region implies that the prepared (I2)nsensitized nanoporous TiO2 samples can be activated by vis-ible light, and that more photogenerated electrons and holescan be created and they can participate in the photocatalyticoxidation reactions. We believe that, with the increase ofthe temperature during heat treatment, the concentration ofiodine molecules on the surface of the IT samples decreaseddue to sublimation of I2 at high temperature, which is also
200 300 400 500 600 700 800
Abs
orba
nce
(a.
u.)
Wavelength (nm)
200◦C300◦C400◦C
500◦C600◦CP25
Figure 5: UV-vis diffuse reflectance spectra of IT-T catalysts atvarious calcination temperatures compared to P25.
confirmed by the color change of the samples during the heattreatment. The color of the samples changed from puce, tobrown, slight brown and fawn, and finally to light gray whenthe temperature increased from 200 to 600◦C.
3.4. Photocatalytic Activity on the Decomposition of Methy-lene Blue. Methylene blue (MB) is a brightly coloredblue cationic thiazine dye and is often used as a testmodel pollutant in semiconductor photocatalysis. A blankexperiment was also carried out. The pure MB solutioncannot decompose without catalyst. Figure 6(a) shows theadsorption and photodegradation ability on MB solutions ofour IT-T samples in comparison to P25. Prior to the turn-onof the light, the concentrations of MB in the presence of theIT-T samples deplete much faster than P25. This is especiallyseen for IT-200 sample; nearly 70% of the dye moleculeswere adsorbed within 30 min. We ascribe this effect to themuch larger surface area of the IT-T samples than that ofP25 as characterized and discussed above. For IT-T samples,their adsorption capacity increases with the decrease of thecalcination temperatures. This can be credited to the reducedsurface area.
Furthermore, Figure 6(a) shows, under visible lightillumination, the MB solutions containing the IT-T sam-ples underwent significant degradation and became nearlytransparent within 50 min. In contrast, the MB solutionscontaining P25 show very limited degradation. It should benoted that IT-400 sample showed the highest photocatalyticoxidation on methylene blue. This is because the crystallineof IT-400 is well and has fewer defects, so the recombinationof electron and hole is very low. In addition, the samplestill has larger surface area, so IT-400 has good absorptioncapacity.
The photocatalytic activity of the powders can be quanti-tatively evaluated by comparing the apparent reaction rate
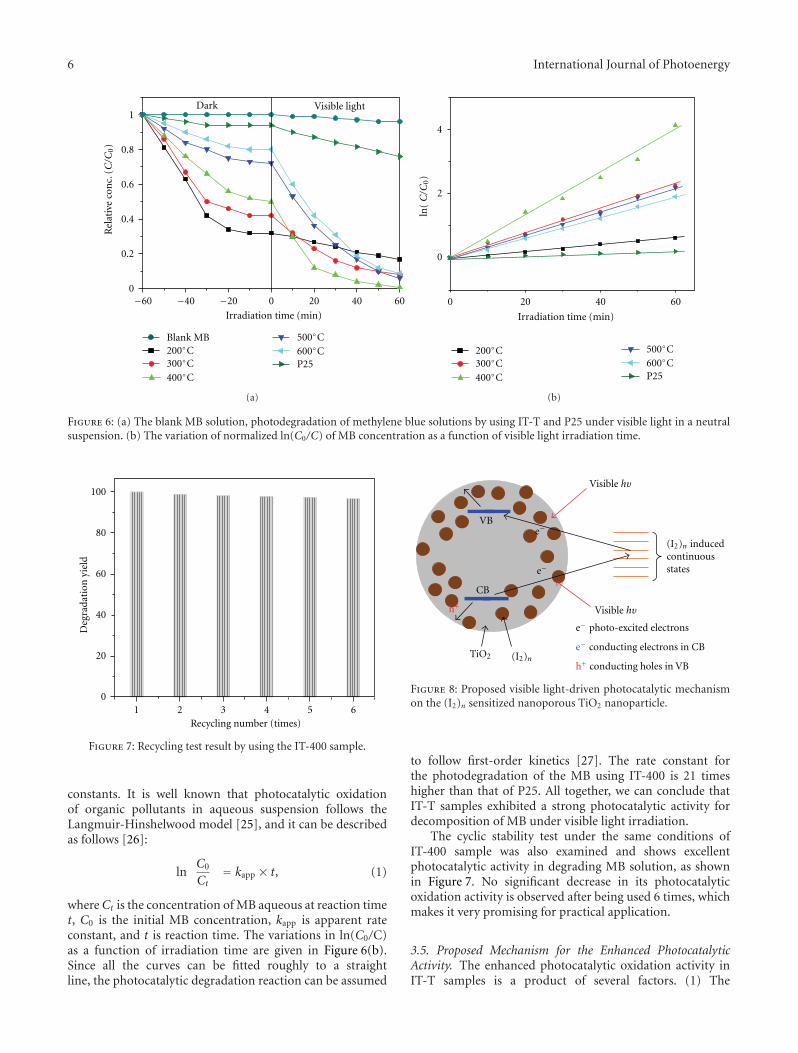
6 International Journal of Photoenergy
1
0.8
0.6
0.4
0.2
0−60 −40 −20 0 20 40 60
Irradiation time (min)
Rel
ativ
e co
nc.
(C/C
0)
Blank MB200◦C300◦C400◦C
500◦C600◦CP25
Dark Visible light
(a)
200◦C300◦C400◦C
500◦C600◦CP25
4
2
0
0 20 40 60
Irradiation time (min)
ln(C/C
0)
(b)
Figure 6: (a) The blank MB solution, photodegradation of methylene blue solutions by using IT-T and P25 under visible light in a neutralsuspension. (b) The variation of normalized ln(C0/C) of MB concentration as a function of visible light irradiation time.
100
80
60
40
20
01 2 3 4 5 6
Deg
rada
tion
yie
ld
Recycling number (times)
Figure 7: Recycling test result by using the IT-400 sample.
constants. It is well known that photocatalytic oxidationof organic pollutants in aqueous suspension follows theLangmuir-Hinshelwood model [25], and it can be describedas follows [26]:
lnC0
Ct= kapp × t, (1)
where Ct is the concentration of MB aqueous at reaction timet, C0 is the initial MB concentration, kapp is apparent rateconstant, and t is reaction time. The variations in ln(C0/C)as a function of irradiation time are given in Figure 6(b).Since all the curves can be fitted roughly to a straightline, the photocatalytic degradation reaction can be assumed
(I2)n inducedcontinuousstates
TiO2 (I2)n
VB
CB
Visible hυ
Visible hυ
e−
h+
e− photo-excited electrons
e− conducting electrons in CB
h+ conducting holes in VB
e−
e−
Figure 8: Proposed visible light-driven photocatalytic mechanismon the (I2)n sensitized nanoporous TiO2 nanoparticle.
to follow first-order kinetics [27]. The rate constant forthe photodegradation of the MB using IT-400 is 21 timeshigher than that of P25. All together, we can conclude thatIT-T samples exhibited a strong photocatalytic activity fordecomposition of MB under visible light irradiation.
The cyclic stability test under the same conditions ofIT-400 sample was also examined and shows excellentphotocatalytic activity in degrading MB solution, as shownin Figure 7. No significant decrease in its photocatalyticoxidation activity is observed after being used 6 times, whichmakes it very promising for practical application.
3.5. Proposed Mechanism for the Enhanced PhotocatalyticActivity. The enhanced photocatalytic oxidation activity inIT-T samples is a product of several factors. (1) The
International Journal of Photoenergy 7
sensitized of (I2)n introduces continuous states residing inbetween the VB and CB of TiO2 [28]. As schematicallyelucidated in Figure 8, we believe these I-induced continuousstates can either accept visible light-excited electrons fromthe VB of TiO2 and/or provide visible-light excited electronsfrom these I2-induced states to the CB of TiO2. (2) Due tothe nature of our preparing method, the sensitized I2 mustbe preferentially located in the surface region of the TiO2
nanoparticles. Consequently, the I-induced defective statesare preferentially concentrated in the surface region insteadof the bulk of the TiO2, which facilitate the trap of hot carrierin the surface region where the desired photodegradationreactions occur [6, 29]. (3) Because the photo-degradationoccurs at the surface of TiO2, the organic pollute moleculesmust be preconcentrated at the TiO2 surface in order to reactwith the trap hot carriers and the reactive radicals. Thus,the high surface areas of the nanoporous TiO2 enhance theadsorption of methylene blue molecules onto the surfaceof TiO2 particles. This is evidenced by the pronouncedmore and faster deletion of methylene blue molecules insolution under darkness (Figure 6(a)) in comparison to P25sample. In addition, large surface area can accommodatemore surface-adsorbed water and hydroxyl groups that actas photoexcited hole traps and produce hydroxyl radicals forthe degradation of organic pollute molecules [30].
4. Conclusions
In summary, a unique template-free synthetic strategy isused to prepare (I2)n sensitized nanoporous TiO2 througha hydrolysis-calcination process. I2 hydrosol is used asnucleation center and sensitizer, while the TiCl4 was usedas the precursor for TiO2. The calcination temperature hasa crucial role in the amount of (I2)n sensitized nanoporousTiO2. The calcination enhanced the phase transformation ofthe TiO2 powders form amorphous to anatase phases andcrystallization of anatase. The photocatalytic activity of theas-prepared samples was higher than that of P25 for thedegradation of MB. The sample calcined at 400◦C showsthe highest photocatalytic activity in the decomposition ofmethylene blue under visible light due to the enhancedabsorption in visible region and the large specific surfacearea.
Acknowledgments
S. Gao and B. Huang thank the National Basic ResearchProgram of China (973 Program, no. 2007CB613302), Doc-toral Foundation of Shandong Province (2007BS04040), andProject of Shandong Province Higher Educational Scienceand Technology Program (J10LF02).
References
[1] A. L. Linsebigler, G. Q Lu, and J. T. Yates, “Photocatalysis onTiO2 surfaces: principles, mechanisms, and selected results,”Chemical Reviews, vol. 95, no. 3, pp. 735–758, 1995.
[2] J. Zhang, Q. Xu, Z. C. Feng, M. J. Li, and C. Li, “Importanceof the relationship between surface phases and photocatalytic
activity of TiO2,” Angewandte Chemie, vol. 47, no. 9, pp. 1766–1769, 2008.
[3] H. F. Cheng, B. B. Huang, P. Wang et al., “In situ ionexchange synthesis of the novel Ag/AgBr/BiOBr hybrid withhighly efficient decontamination of pollutants,” ChemicalCommunications, vol. 47, no. 25, pp. 7054–7056, 2011.
[4] H. P. Li, W. Zhang, and W. Pan, “Enhanced photocat-alytic activity of electrospun TiO2 nanofibers with optimalanatase/rutile ratio,” Journal of the American Ceramic Society,vol. 94, no. 10, pp. 3184–3187, 2011.
[5] X. N. Wang, B. B. Huang, Z. Y. Wang et al., “Synthesis ofAnatase TiO2 tubular structures microcrystallites with a highpercentage of {001} facets by a simple one-step hydrothermaltemplate process,” Chemistry, vol. 16, no. 24, pp. 7106–7109,2010.
[6] P. Xu, J. Lu, T. Xu, S. M. Gao, B. B. Huang, and Y. Dai,“I2-hydrosol-seeded growth of (I2)n-C- codoped meso/nanoporous TiO2 for visible light-driven photocatalysis,”Journal of Physical Chemistry C, vol. 114, no. 20, pp. 9510–9517, 2010.
[7] S. Usseglio, A. Damin, D. Scarano, S. Bordiga, A. Zecchina, andC. Lamberti, “(I2)n encapsulation inside TiO2: a way to tunephotoactivity in the visible region,” Journal of the AmericanChemical Society, vol. 129, no. 10, pp. 2822–2828, 2007.
[8] P. C. Deng, H. Z. Wang, B. W. Sun, L. X. Fan, and L. Li,“Hydrothermal preparation and photocatalytic performanceof (I2)n Sensitized and I(V) Doped TiO2 Supported on SiO2,”Journal of Advanced Oxidation Technologies, vol. 12, no. 2, pp.226–230, 2009.
[9] P. Xu, T. Xu, J. Lu et al., “Visible-light-driven photocatalyticS- and C- codoped meso/nanoporous TiO2,” Energy andEnvironmental Science, vol. 3, no. 8, pp. 1128–1134, 2010.
[10] H. X. Li, X. Y. Zhang, Y. N. Huo, and J. Zhu, “Supercriticalpreparation of a highly active S-doped TiO2 photocatalyst formethylene blue mineralization,” Environmental Science andTechnology, vol. 41, no. 12, pp. 4410–4414, 2007.
[11] S. Sakthivel and H. Kisch, “Daylight photocatalysis by Carbon-modified Titanium Dioxide,” Angewandte Chemie, vol. 42, no.40, pp. 4908–4911, 2003.
[12] G. S. Wu, T. Nishikawa, B. Ohtani, and A. C. Chen, “Synthesisand characterization of carbon-doped TiO2 nanostructureswith enhanced visible light response,” Chemistry of Materials,vol. 19, no. 18, pp. 4530–4537, 2007.
[13] R. Asahi, T. Morikawa, T. Ohwaki, K. Aoki, and Y. Taga,“Visible-light photocatalysis in nitrogen-doped titaniumoxides,” Science, vol. 293, no. 5528, pp. 269–271, 2001.
[14] J. Wang, D. N. Tafen, J. P. Lewis et al., “Origin of photocatalyticactivity of Nitrogen-doped TiO2 nanobelts,” Journal of theAmerican Chemical Society, vol. 131, no. 34, pp. 12290–12297,2009.
[15] Q. Wang, C. C. Chen, W. H. Ma, H. Y. Zhu, and J. C.Zhao, “Pivotal role of fluorine in tuning band structure andvisible-light photocatalytic activity of nitrogen-doped TiO2,”Chemistry, vol. 15, no. 19, pp. 4765–4769, 2009.
[16] Z. Y. Liu, H. W. Bai, and D. Sun, “Facile fabrication ofhierarchical porous TiO2 hollow microspheres with high pho-tocatalytic activity for water purification,” Applied Catalysis B,vol. 104, no. 3–4, pp. 234–238, 2011.
[17] Y. Ide, Y. Nakasato, and M. Ogawa, “Molecular recognitivephotocatalysis driven by the selective adsorption on layeredtitanates,” Journal of the American Chemical Society, vol. 132,no. 10, pp. 3601–3604, 2010.
[18] Y. Shiraishi, N. Saito, and T. Hirai, “Adsorption-driven pho-tocatalytic activity of mesoporous titanium dioxide,” Journal
8 International Journal of Photoenergy
of the American Chemical Society, vol. 127, no. 37, pp. 12820–12822, 2005.
[19] P. Raveendran, M. Eswaramoorthy, U. Bindu et al., “Template-free formation of meso-structured anatase TiO2 with sphericalmorphology,” Journal of Physical Chemistry C, vol. 112, no. 50,pp. 20007–20011, 2008.
[20] J. Fang, F. Wang, K. Qian, H. Bao, Z. Q. Jiang, and W. X.Huang, “Bifunctional N-doped mesoporous TiO2 photocat-alysts,” Journal of Physical Chemistry C, vol. 112, no. 46, pp.18150–18156, 2008.
[21] C. A. Nolph, D. E. Sievers, S. Kaewgun et al., “Photocatalyticstudy of polymorphic titania synthesized by ambient condi-tion sol process,” Catalysis Letters, vol. 117, no. 3–4, pp. 102–106, 2007.
[22] Y. Z. Li, Y. N. Fan, and Y. Chen, “A novel method forpreparation of nanocrystalline rutile TiO2 powders by liquidhydrolysis of TiCl4,” Journal of Materials Chemistry, vol. 12,no. 5, pp. 1387–1390, 2002.
[23] A. D. Paola, M. Bellardita, R. Ceccato, L. Palmisano, and F.Parrino, “Highly active photocatalytic TiO2 powders obtainedby thermohydrolysis of TiCl4 in water,” Journal of PhysicalChemistry C, vol. 113, no. 34, pp. 15166–15174, 2009.
[24] K. S. W. Singh, D. H. Everett, R. A. W. Haul et al., “Reportingphysisorption data for gas/solid systems,” Pure and AppliedChemistry, vol. 57, no. 4, pp. 603–619, 1985.
[25] C.-H. Wu, H.-W. Chang, and J.-M. Chern, “Basic dyedecomposition kinetics in a photocatalytic slurry reactor,”Journal of Hazardous Materials, vol. 137, no. 1, pp. 336–343,2006.
[26] J. G. Yu, G. H. Wang, B. Cheng, and M. H. Zhou, “Effectsof hydrothermal temperature and time on the photocatalyticactivity and microstructures of bimodal mesoporous TiO2
powders,” Applied Catalysis B, vol. 69, no. 3–4, pp. 171–180,2007.
[27] J. M. Wu and T. W. Zhang, “Photodegradation of rhodamineB in water assisted by titania films prepared through a novelprocedure,” Journal of Photochemistry and Photobiology A, vol.162, no. 1, pp. 171–177, 2004.
[28] S. Tojo, T. Tachikawa, M. Fujitsuka, and T. Majima, “Iodine-doped TiO2 photocatalysts: correlation between band struc-ture and mechanism,” Journal of Physical Chemistry C, vol.112, no. 38, pp. 14948–14954, 2008.
[29] M. R. Hoffmann, S. T. Martin, W. Choi, and D. W.Bahnemann, “Environmental applications of semiconductorphotocatalysis,” Chemical Reviews, vol. 95, no. 1, pp. 69–96,1995.
[30] V. Subramanian, E. E. Wolf, and P. V. Kamat, “Catalysis withTiO2/gold nanocomposites. Effect of metal particle size on thefermi level equilibration,” Journal of the American ChemicalSociety, vol. 126, no. 15, pp. 4943–4950, 2004.
Hindawi Publishing CorporationInternational Journal of PhotoenergyVolume 2012, Article ID 682138, 6 pagesdoi:10.1155/2012/682138
Research Article
Facile Low-Temperature Synthesis of CarbonNanotube/TiO2Nanohybrids with EnhancedVisible-Light-Driven Photocatalytic Activity
Yunlong Xie,1 Huanhuan Qian,1 Yijun Zhong,1 Hangming Guo,2 and Yong Hu1
1 Institute of Physical Chemistry, Zhejiang Normal University, Jinhua 321004, China2 Department of Chemistry, Jinhua College of Vocation and Technology, Jinhua 321007, China
Correspondence should be addressed to Yong Hu, [email protected]
Received 6 December 2011; Revised 18 January 2012; Accepted 19 January 2012
Academic Editor: Baibiao Huang
Copyright © 2012 Yunlong Xie et al. This is an open access article distributed under the Creative Commons Attribution License,which permits unrestricted use, distribution, and reproduction in any medium, provided the original work is properly cited.
We demonstrate a facile and novel chemical precipitation strategy for the accurate coating of TiO2 nanoparticles on the surface ofcarbon nanotubes (CNTs) to form CNT/TiO2 nanohybrids, which only requires titanium sulfate and CNTs as starting materialsand reacts in the alkaline solution at 60◦C for 6 h. Using this process, the as-prepared hybrid structures preserved the gooddispersity and uniformity of initial CNTs. Furthermore, the CNT/TiO2 nanohybrids show a broad blue luminescence at 469 nmand exhibit significantly enhanced photocatalytic activity for the degradation of rhodamine B (RhB) under visible-light irradiation,which is about 1.5 times greater than that of commercial Degussa P25 TiO2 nanoparticles. It is believed that this facile chemicalprecipitation strategy is scalable and its application can be extended to synthesize other CNT/oxide nanohybrids for variousapplications.
1. Introduction
Titanium oxide (TiO2), with a wide bandgap of 3.2 eV, isa very promising material and has received considerableattention both in fundamental and photocatalysis due toits natural abundance, nontoxicity, photostability, low-cost,physical and chemical stability, availability, and uniqueelectronic and optical properties [1–4]. Recent studies havealso revealed that TiO2 displays excellent photocatalyticactivity toward the photodegradation of rhodamine-B (RhB)under the irradiation of ultraviolet (UV) light. Due tothe poor utilization of solar energy and the short diffu-sion length of a photogenerated electron-hole pair, TiO2
nanoparticles show low quantum efficiency in photocatalyticreactions. Therefore, it is of great importance to extend thephotoresponse of the TiO2 to the visible region. Recently,some extensive efforts to modify the electronic band struc-tures of TiO2 for visible-light harvesting have been con-ducted, including coupling with secondary semiconductors[5, 6], metal/nonmetal doping [7, 8], and photosensiti-zation with dyes [9, 10]. Additionally, the application ofTiO2 nanoparticles for wastewater treatment has a major
drawback, that is, an additional separation step is usuallyrequired to remove the adsorbent from the solution. More-over, pure TiO2 nanoparticles often show lower removalefficiencies owing to the problem of self-aggregation [11],which causes serious fast diminishment of the active surfacearea. To meet these requirements, TiO2 nanoparticles arefrequently immobilized on carbonaceous materials [12–15].Particularly, carbon nanotubes (CNTs) can act as scaffoldsto anchor light harvesting assemblies, due to their uniqueelectrical and electronic properties, wide electrochemicalstability window, and high surface area [16–18]. By virtueof their advantageous structural features to extend the light-response range and other distinctive features, such as facilecharge separation, and increased adsorption of pollutants[19–22], we design a unique hybrid structure by directlyanchoring TiO2 nanoparticles onto CNTs for degradationof RhB under visible-light irradiation. This novel strategyfor preparation of CNT/TiO2 nanohybrids only requirestitanium sulfate and CNTs as starting materials and reactsin the alkaline solution at 60◦C for 6 h. As expected, the as-prepared CNT/TiO2 nanohybrids demonstrate the excellent
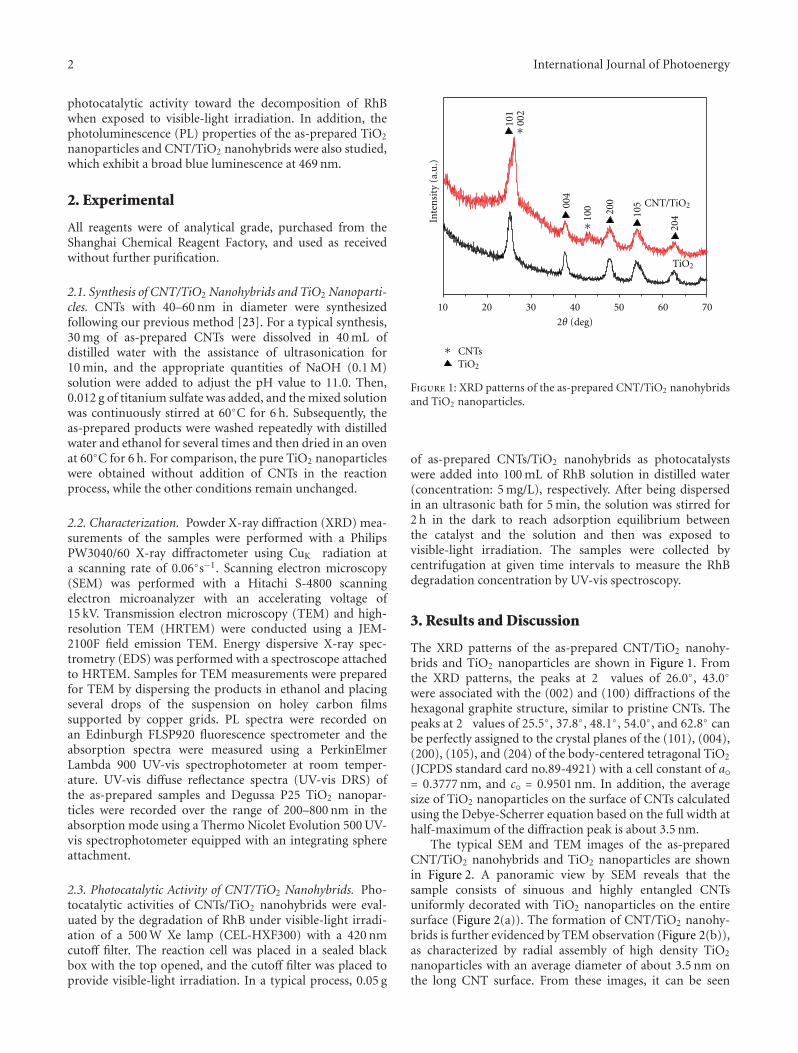
2 International Journal of Photoenergy
photocatalytic activity toward the decomposition of RhBwhen exposed to visible-light irradiation. In addition, thephotoluminescence (PL) properties of the as-prepared TiO2
nanoparticles and CNT/TiO2 nanohybrids were also studied,which exhibit a broad blue luminescence at 469 nm.
2. Experimental
All reagents were of analytical grade, purchased from theShanghai Chemical Reagent Factory, and used as receivedwithout further purification.
2.1. Synthesis of CNT/TiO2 Nanohybrids and TiO2 Nanoparti-cles. CNTs with 40–60 nm in diameter were synthesizedfollowing our previous method [23]. For a typical synthesis,30 mg of as-prepared CNTs were dissolved in 40 mL ofdistilled water with the assistance of ultrasonication for10 min, and the appropriate quantities of NaOH (0.1 M)solution were added to adjust the pH value to 11.0. Then,0.012 g of titanium sulfate was added, and the mixed solutionwas continuously stirred at 60◦C for 6 h. Subsequently, theas-prepared products were washed repeatedly with distilledwater and ethanol for several times and then dried in an ovenat 60◦C for 6 h. For comparison, the pure TiO2 nanoparticleswere obtained without addition of CNTs in the reactionprocess, while the other conditions remain unchanged.
2.2. Characterization. Powder X-ray diffraction (XRD) mea-surements of the samples were performed with a PhilipsPW3040/60 X-ray diffractometer using CuK radiation ata scanning rate of 0.06◦s−1. Scanning electron microscopy(SEM) was performed with a Hitachi S-4800 scanningelectron microanalyzer with an accelerating voltage of15 kV. Transmission electron microscopy (TEM) and high-resolution TEM (HRTEM) were conducted using a JEM-2100F field emission TEM. Energy dispersive X-ray spec-trometry (EDS) was performed with a spectroscope attachedto HRTEM. Samples for TEM measurements were preparedfor TEM by dispersing the products in ethanol and placingseveral drops of the suspension on holey carbon filmssupported by copper grids. PL spectra were recorded onan Edinburgh FLSP920 fluorescence spectrometer and theabsorption spectra were measured using a PerkinElmerLambda 900 UV-vis spectrophotometer at room temper-ature. UV-vis diffuse reflectance spectra (UV-vis DRS) ofthe as-prepared samples and Degussa P25 TiO2 nanopar-ticles were recorded over the range of 200–800 nm in theabsorption mode using a Thermo Nicolet Evolution 500 UV-vis spectrophotometer equipped with an integrating sphereattachment.
2.3. Photocatalytic Activity of CNT/TiO2 Nanohybrids. Pho-tocatalytic activities of CNTs/TiO2 nanohybrids were eval-uated by the degradation of RhB under visible-light irradi-ation of a 500 W Xe lamp (CEL-HXF300) with a 420 nmcutoff filter. The reaction cell was placed in a sealed blackbox with the top opened, and the cutoff filter was placed toprovide visible-light irradiation. In a typical process, 0.05 g
∗
∗
∗
10 20 30 40 50 60 70
Inte
nsi
ty (
a.u
.)
101
002
200
10000
4
20410
5
CNTs
2θ (deg)
TiO2
TiO2
CNT/TiO2
Figure 1: XRD patterns of the as-prepared CNT/TiO2 nanohybridsand TiO2 nanoparticles.
of as-prepared CNTs/TiO2 nanohybrids as photocatalystswere added into 100 mL of RhB solution in distilled water(concentration: 5 mg/L), respectively. After being dispersedin an ultrasonic bath for 5 min, the solution was stirred for2 h in the dark to reach adsorption equilibrium betweenthe catalyst and the solution and then was exposed tovisible-light irradiation. The samples were collected bycentrifugation at given time intervals to measure the RhBdegradation concentration by UV-vis spectroscopy.
3. Results and Discussion
The XRD patterns of the as-prepared CNT/TiO2 nanohy-brids and TiO2 nanoparticles are shown in Figure 1. Fromthe XRD patterns, the peaks at 2 values of 26.0◦, 43.0◦
were associated with the (002) and (100) diffractions of thehexagonal graphite structure, similar to pristine CNTs. Thepeaks at 2 values of 25.5◦, 37.8◦, 48.1◦, 54.0◦, and 62.8◦ canbe perfectly assigned to the crystal planes of the (101), (004),(200), (105), and (204) of the body-centered tetragonal TiO2
(JCPDS standard card no.89-4921) with a cell constant of ao= 0.3777 nm, and co = 0.9501 nm. In addition, the averagesize of TiO2 nanoparticles on the surface of CNTs calculatedusing the Debye-Scherrer equation based on the full width athalf-maximum of the diffraction peak is about 3.5 nm.
The typical SEM and TEM images of the as-preparedCNT/TiO2 nanohybrids and TiO2 nanoparticles are shownin Figure 2. A panoramic view by SEM reveals that thesample consists of sinuous and highly entangled CNTsuniformly decorated with TiO2 nanoparticles on the entiresurface (Figure 2(a)). The formation of CNT/TiO2 nanohy-brids is further evidenced by TEM observation (Figure 2(b)),as characterized by radial assembly of high density TiO2
nanoparticles with an average diameter of about 3.5 nm onthe long CNT surface. From these images, it can be seen
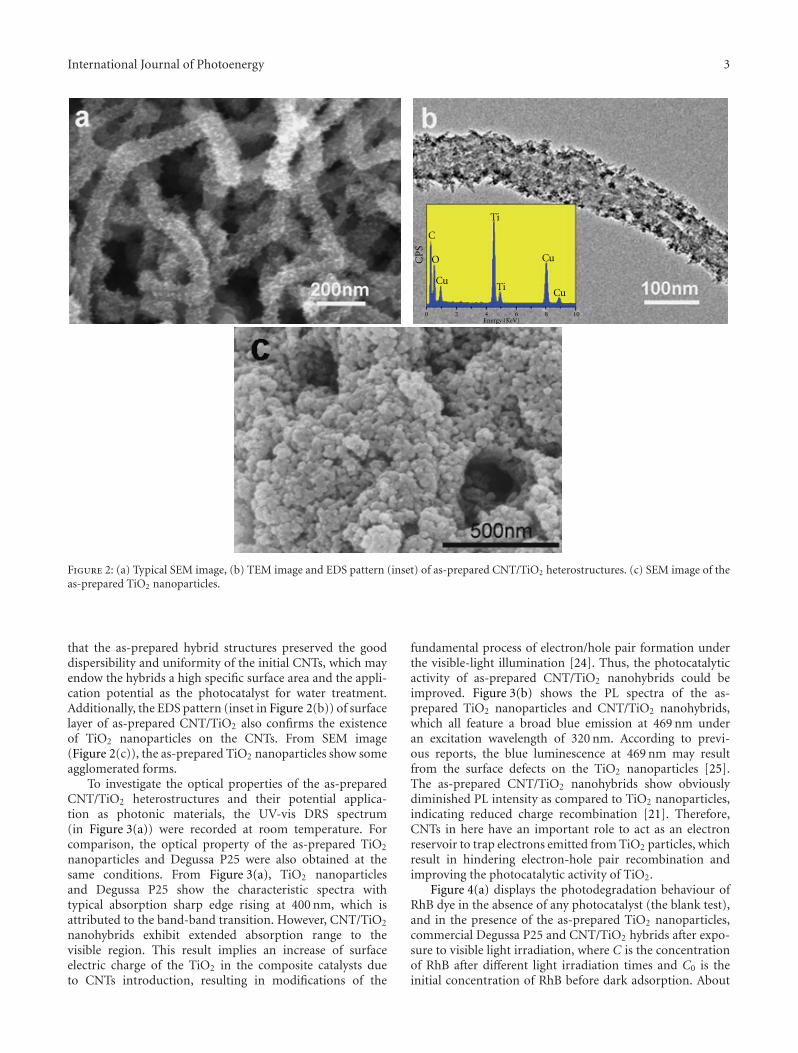
International Journal of Photoenergy 3
0 2 4 6 8 10
C
O
Cu
Cu
Cu
Energy (KeV)
CP
S
Ti
Ti
Figure 2: (a) Typical SEM image, (b) TEM image and EDS pattern (inset) of as-prepared CNT/TiO2 heterostructures. (c) SEM image of theas-prepared TiO2 nanoparticles.
that the as-prepared hybrid structures preserved the gooddispersibility and uniformity of the initial CNTs, which mayendow the hybrids a high specific surface area and the appli-cation potential as the photocatalyst for water treatment.Additionally, the EDS pattern (inset in Figure 2(b)) of surfacelayer of as-prepared CNT/TiO2 also confirms the existenceof TiO2 nanoparticles on the CNTs. From SEM image(Figure 2(c)), the as-prepared TiO2 nanoparticles show someagglomerated forms.
To investigate the optical properties of the as-preparedCNT/TiO2 heterostructures and their potential applica-tion as photonic materials, the UV-vis DRS spectrum(in Figure 3(a)) were recorded at room temperature. Forcomparison, the optical property of the as-prepared TiO2
nanoparticles and Degussa P25 were also obtained at thesame conditions. From Figure 3(a), TiO2 nanoparticlesand Degussa P25 show the characteristic spectra withtypical absorption sharp edge rising at 400 nm, which isattributed to the band-band transition. However, CNT/TiO2
nanohybrids exhibit extended absorption range to thevisible region. This result implies an increase of surfaceelectric charge of the TiO2 in the composite catalysts dueto CNTs introduction, resulting in modifications of the
fundamental process of electron/hole pair formation underthe visible-light illumination [24]. Thus, the photocatalyticactivity of as-prepared CNT/TiO2 nanohybrids could beimproved. Figure 3(b) shows the PL spectra of the as-prepared TiO2 nanoparticles and CNT/TiO2 nanohybrids,which all feature a broad blue emission at 469 nm underan excitation wavelength of 320 nm. According to previ-ous reports, the blue luminescence at 469 nm may resultfrom the surface defects on the TiO2 nanoparticles [25].The as-prepared CNT/TiO2 nanohybrids show obviouslydiminished PL intensity as compared to TiO2 nanoparticles,indicating reduced charge recombination [21]. Therefore,CNTs in here have an important role to act as an electronreservoir to trap electrons emitted from TiO2 particles, whichresult in hindering electron-hole pair recombination andimproving the photocatalytic activity of TiO2.
Figure 4(a) displays the photodegradation behaviour ofRhB dye in the absence of any photocatalyst (the blank test),and in the presence of the as-prepared TiO2 nanoparticles,commercial Degussa P25 and CNT/TiO2 hybrids after expo-sure to visible light irradiation, where C is the concentrationof RhB after different light irradiation times and C0 is theinitial concentration of RhB before dark adsorption. About
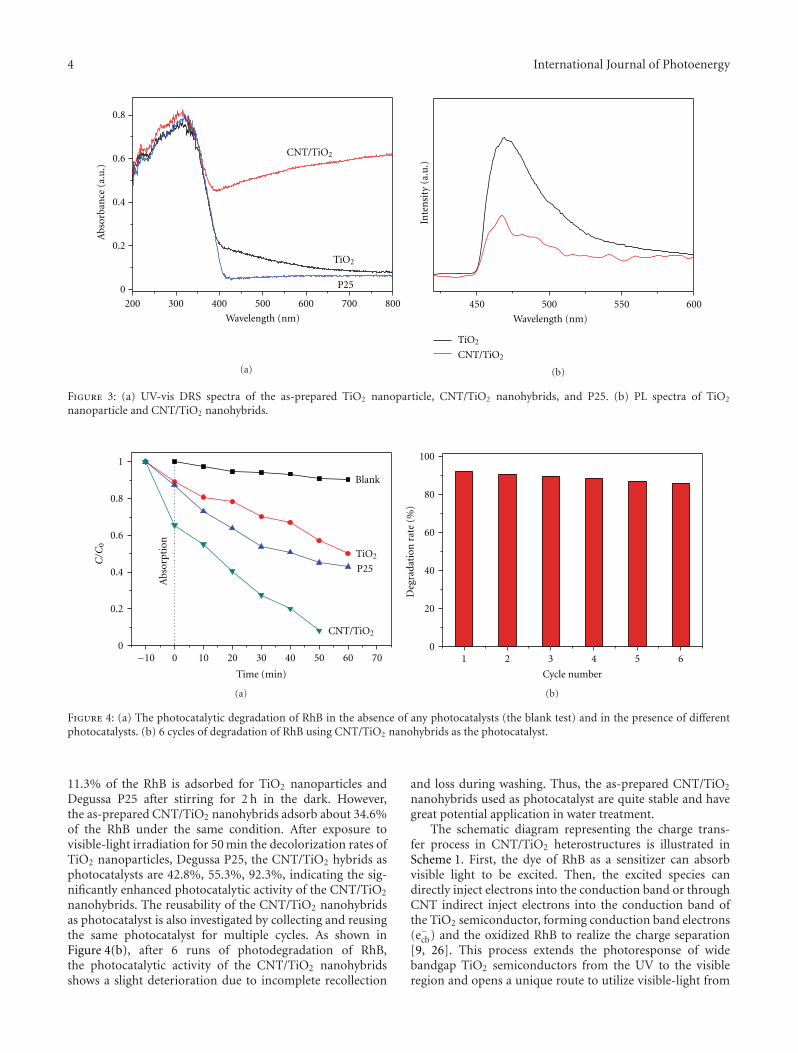
4 International Journal of Photoenergy
200 300 400 500 600 700 800
0
0.2
0.4
0.6
0.8
Abs
orba
nce
(a.
u.)
Wavelength (nm)
P25
CNT/TiO2
TiO2
(a)
450 500 550 600
Wavelength (nm)
Inte
nsi
ty (
a.u
.)
CNT/TiO2
TiO2
(b)
Figure 3: (a) UV-vis DRS spectra of the as-prepared TiO2 nanoparticle, CNT/TiO2 nanohybrids, and P25. (b) PL spectra of TiO2
nanoparticle and CNT/TiO2 nanohybrids.
10 20 30 40 50 60 700
0.2
0.4
0.6
0.8
1
Blank
Time (min)
Abs
orpt
ion
−10 0
P25
CNT/TiO2
TiO2
C/C
0
(a)
1 2 3 4 5 60
20
40
60
80
100
Deg
rada
tion
rat
e (%
)
Cycle number
(b)
Figure 4: (a) The photocatalytic degradation of RhB in the absence of any photocatalysts (the blank test) and in the presence of differentphotocatalysts. (b) 6 cycles of degradation of RhB using CNT/TiO2 nanohybrids as the photocatalyst.
11.3% of the RhB is adsorbed for TiO2 nanoparticles andDegussa P25 after stirring for 2 h in the dark. However,the as-prepared CNT/TiO2 nanohybrids adsorb about 34.6%of the RhB under the same condition. After exposure tovisible-light irradiation for 50 min the decolorization rates ofTiO2 nanoparticles, Degussa P25, the CNT/TiO2 hybrids asphotocatalysts are 42.8%, 55.3%, 92.3%, indicating the sig-nificantly enhanced photocatalytic activity of the CNT/TiO2
nanohybrids. The reusability of the CNT/TiO2 nanohybridsas photocatalyst is also investigated by collecting and reusingthe same photocatalyst for multiple cycles. As shown inFigure 4(b), after 6 runs of photodegradation of RhB,the photocatalytic activity of the CNT/TiO2 nanohybridsshows a slight deterioration due to incomplete recollection
and loss during washing. Thus, the as-prepared CNT/TiO2
nanohybrids used as photocatalyst are quite stable and havegreat potential application in water treatment.
The schematic diagram representing the charge trans-fer process in CNT/TiO2 heterostructures is illustrated inScheme 1. First, the dye of RhB as a sensitizer can absorbvisible light to be excited. Then, the excited species candirectly inject electrons into the conduction band or throughCNT indirect inject electrons into the conduction band ofthe TiO2 semiconductor, forming conduction band electrons(e−cb) and the oxidized RhB to realize the charge separation[9, 26]. This process extends the photoresponse of widebandgap TiO2 semiconductors from the UV to the visibleregion and opens a unique route to utilize visible-light from
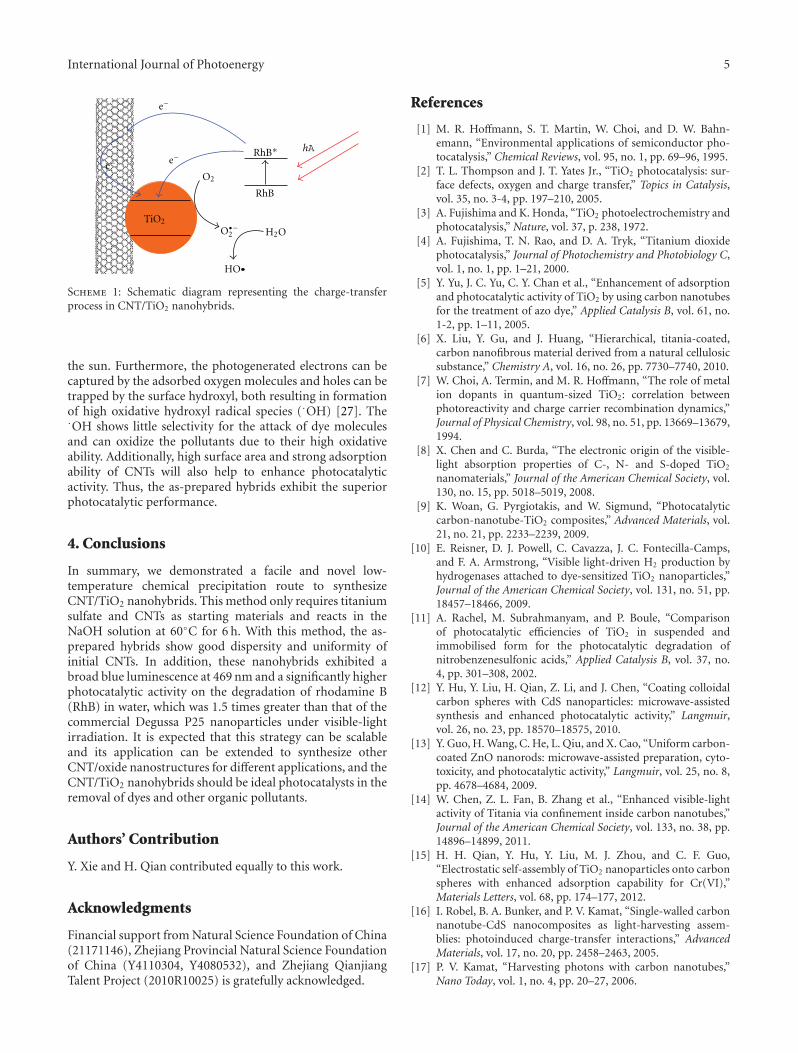
International Journal of Photoenergy 5
hARhB∗
RhB
O2
TiO2
e−
e− e−
H2O
HO
O•−2
Scheme 1: Schematic diagram representing the charge-transferprocess in CNT/TiO2 nanohybrids.
the sun. Furthermore, the photogenerated electrons can becaptured by the adsorbed oxygen molecules and holes can betrapped by the surface hydroxyl, both resulting in formationof high oxidative hydroxyl radical species (·OH) [27]. The·OH shows little selectivity for the attack of dye moleculesand can oxidize the pollutants due to their high oxidativeability. Additionally, high surface area and strong adsorptionability of CNTs will also help to enhance photocatalyticactivity. Thus, the as-prepared hybrids exhibit the superiorphotocatalytic performance.
4. Conclusions
In summary, we demonstrated a facile and novel low-temperature chemical precipitation route to synthesizeCNT/TiO2 nanohybrids. This method only requires titaniumsulfate and CNTs as starting materials and reacts in theNaOH solution at 60◦C for 6 h. With this method, the as-prepared hybrids show good dispersity and uniformity ofinitial CNTs. In addition, these nanohybrids exhibited abroad blue luminescence at 469 nm and a significantly higherphotocatalytic activity on the degradation of rhodamine B(RhB) in water, which was 1.5 times greater than that of thecommercial Degussa P25 nanoparticles under visible-lightirradiation. It is expected that this strategy can be scalableand its application can be extended to synthesize otherCNT/oxide nanostructures for different applications, and theCNT/TiO2 nanohybrids should be ideal photocatalysts in theremoval of dyes and other organic pollutants.
Authors’ Contribution
Y. Xie and H. Qian contributed equally to this work.
Acknowledgments
Financial support from Natural Science Foundation of China(21171146), Zhejiang Provincial Natural Science Foundationof China (Y4110304, Y4080532), and Zhejiang QianjiangTalent Project (2010R10025) is gratefully acknowledged.
References
[1] M. R. Hoffmann, S. T. Martin, W. Choi, and D. W. Bahn-emann, “Environmental applications of semiconductor pho-tocatalysis,” Chemical Reviews, vol. 95, no. 1, pp. 69–96, 1995.
[2] T. L. Thompson and J. T. Yates Jr., “TiO2 photocatalysis: sur-face defects, oxygen and charge transfer,” Topics in Catalysis,vol. 35, no. 3-4, pp. 197–210, 2005.
[3] A. Fujishima and K. Honda, “TiO2 photoelectrochemistry andphotocatalysis,” Nature, vol. 37, p. 238, 1972.
[4] A. Fujishima, T. N. Rao, and D. A. Tryk, “Titanium dioxidephotocatalysis,” Journal of Photochemistry and Photobiology C,vol. 1, no. 1, pp. 1–21, 2000.
[5] Y. Yu, J. C. Yu, C. Y. Chan et al., “Enhancement of adsorptionand photocatalytic activity of TiO2 by using carbon nanotubesfor the treatment of azo dye,” Applied Catalysis B, vol. 61, no.1-2, pp. 1–11, 2005.
[6] X. Liu, Y. Gu, and J. Huang, “Hierarchical, titania-coated,carbon nanofibrous material derived from a natural cellulosicsubstance,” Chemistry A, vol. 16, no. 26, pp. 7730–7740, 2010.
[7] W. Choi, A. Termin, and M. R. Hoffmann, “The role of metalion dopants in quantum-sized TiO2: correlation betweenphotoreactivity and charge carrier recombination dynamics,”Journal of Physical Chemistry, vol. 98, no. 51, pp. 13669–13679,1994.
[8] X. Chen and C. Burda, “The electronic origin of the visible-light absorption properties of C-, N- and S-doped TiO2
nanomaterials,” Journal of the American Chemical Society, vol.130, no. 15, pp. 5018–5019, 2008.
[9] K. Woan, G. Pyrgiotakis, and W. Sigmund, “Photocatalyticcarbon-nanotube-TiO2 composites,” Advanced Materials, vol.21, no. 21, pp. 2233–2239, 2009.
[10] E. Reisner, D. J. Powell, C. Cavazza, J. C. Fontecilla-Camps,and F. A. Armstrong, “Visible light-driven H2 production byhydrogenases attached to dye-sensitized TiO2 nanoparticles,”Journal of the American Chemical Society, vol. 131, no. 51, pp.18457–18466, 2009.
[11] A. Rachel, M. Subrahmanyam, and P. Boule, “Comparisonof photocatalytic efficiencies of TiO2 in suspended andimmobilised form for the photocatalytic degradation ofnitrobenzenesulfonic acids,” Applied Catalysis B, vol. 37, no.4, pp. 301–308, 2002.
[12] Y. Hu, Y. Liu, H. Qian, Z. Li, and J. Chen, “Coating colloidalcarbon spheres with CdS nanoparticles: microwave-assistedsynthesis and enhanced photocatalytic activity,” Langmuir,vol. 26, no. 23, pp. 18570–18575, 2010.
[13] Y. Guo, H. Wang, C. He, L. Qiu, and X. Cao, “Uniform carbon-coated ZnO nanorods: microwave-assisted preparation, cyto-toxicity, and photocatalytic activity,” Langmuir, vol. 25, no. 8,pp. 4678–4684, 2009.
[14] W. Chen, Z. L. Fan, B. Zhang et al., “Enhanced visible-lightactivity of Titania via confinement inside carbon nanotubes,”Journal of the American Chemical Society, vol. 133, no. 38, pp.14896–14899, 2011.
[15] H. H. Qian, Y. Hu, Y. Liu, M. J. Zhou, and C. F. Guo,“Electrostatic self-assembly of TiO2 nanoparticles onto carbonspheres with enhanced adsorption capability for Cr(VI),”Materials Letters, vol. 68, pp. 174–177, 2012.
[16] I. Robel, B. A. Bunker, and P. V. Kamat, “Single-walled carbonnanotube-CdS nanocomposites as light-harvesting assem-blies: photoinduced charge-transfer interactions,” AdvancedMaterials, vol. 17, no. 20, pp. 2458–2463, 2005.
[17] P. V. Kamat, “Harvesting photons with carbon nanotubes,”Nano Today, vol. 1, no. 4, pp. 20–27, 2006.
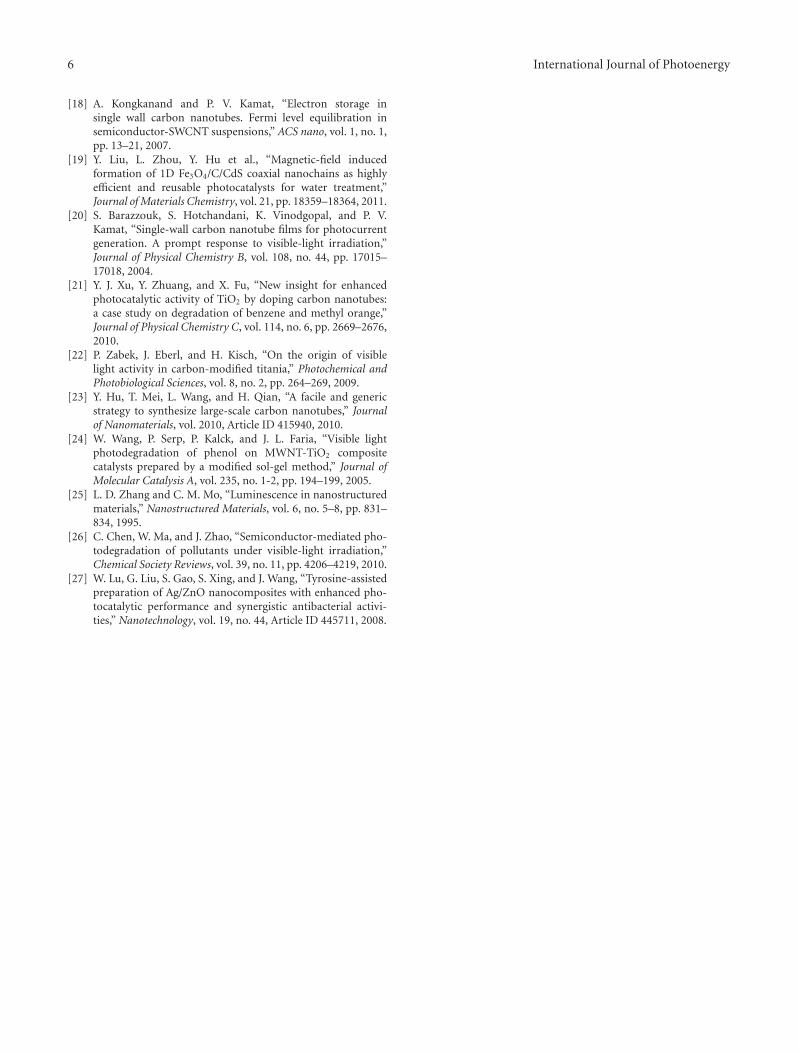
6 International Journal of Photoenergy
[18] A. Kongkanand and P. V. Kamat, “Electron storage insingle wall carbon nanotubes. Fermi level equilibration insemiconductor-SWCNT suspensions,” ACS nano, vol. 1, no. 1,pp. 13–21, 2007.
[19] Y. Liu, L. Zhou, Y. Hu et al., “Magnetic-field inducedformation of 1D Fe3O4/C/CdS coaxial nanochains as highlyefficient and reusable photocatalysts for water treatment,”Journal of Materials Chemistry, vol. 21, pp. 18359–18364, 2011.
[20] S. Barazzouk, S. Hotchandani, K. Vinodgopal, and P. V.Kamat, “Single-wall carbon nanotube films for photocurrentgeneration. A prompt response to visible-light irradiation,”Journal of Physical Chemistry B, vol. 108, no. 44, pp. 17015–17018, 2004.
[21] Y. J. Xu, Y. Zhuang, and X. Fu, “New insight for enhancedphotocatalytic activity of TiO2 by doping carbon nanotubes:a case study on degradation of benzene and methyl orange,”Journal of Physical Chemistry C, vol. 114, no. 6, pp. 2669–2676,2010.
[22] P. Zabek, J. Eberl, and H. Kisch, “On the origin of visiblelight activity in carbon-modified titania,” Photochemical andPhotobiological Sciences, vol. 8, no. 2, pp. 264–269, 2009.
[23] Y. Hu, T. Mei, L. Wang, and H. Qian, “A facile and genericstrategy to synthesize large-scale carbon nanotubes,” Journalof Nanomaterials, vol. 2010, Article ID 415940, 2010.
[24] W. Wang, P. Serp, P. Kalck, and J. L. Faria, “Visible lightphotodegradation of phenol on MWNT-TiO2 compositecatalysts prepared by a modified sol-gel method,” Journal ofMolecular Catalysis A, vol. 235, no. 1-2, pp. 194–199, 2005.
[25] L. D. Zhang and C. M. Mo, “Luminescence in nanostructuredmaterials,” Nanostructured Materials, vol. 6, no. 5–8, pp. 831–834, 1995.
[26] C. Chen, W. Ma, and J. Zhao, “Semiconductor-mediated pho-todegradation of pollutants under visible-light irradiation,”Chemical Society Reviews, vol. 39, no. 11, pp. 4206–4219, 2010.
[27] W. Lu, G. Liu, S. Gao, S. Xing, and J. Wang, “Tyrosine-assistedpreparation of Ag/ZnO nanocomposites with enhanced pho-tocatalytic performance and synergistic antibacterial activi-ties,” Nanotechnology, vol. 19, no. 44, Article ID 445711, 2008.
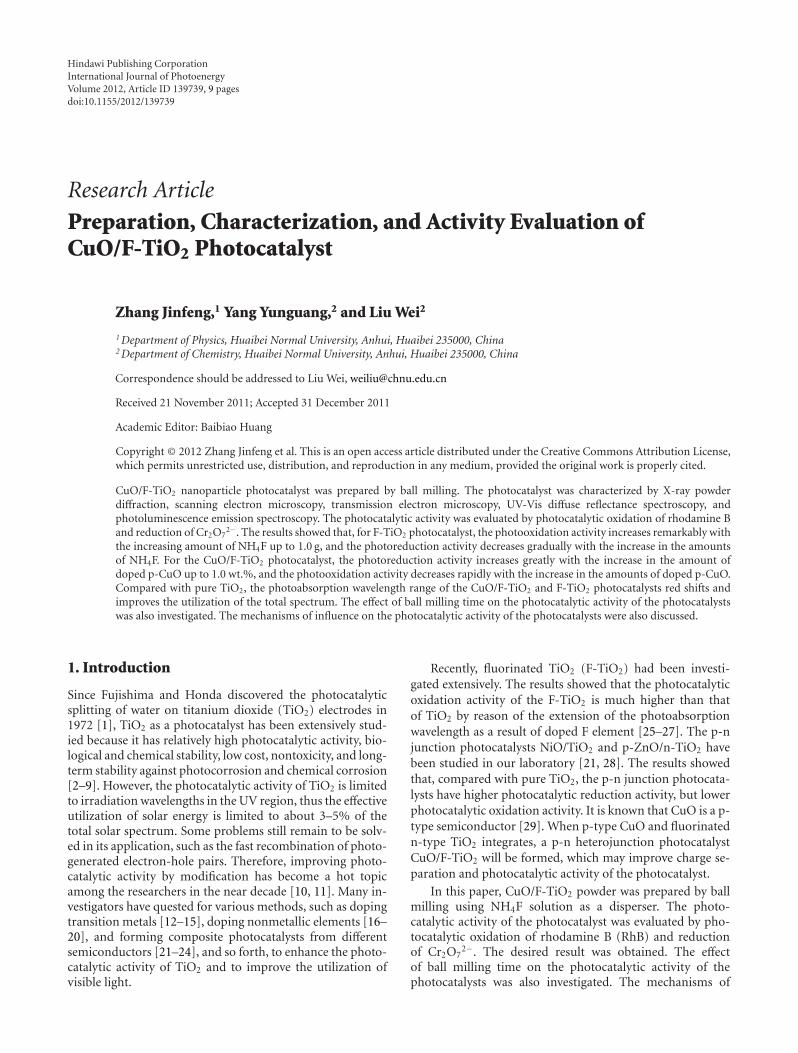
Hindawi Publishing CorporationInternational Journal of PhotoenergyVolume 2012, Article ID 139739, 9 pagesdoi:10.1155/2012/139739
Research Article
Preparation, Characterization, and Activity Evaluation ofCuO/F-TiO2 Photocatalyst
Zhang Jinfeng,1 Yang Yunguang,2 and Liu Wei2
1 Department of Physics, Huaibei Normal University, Anhui, Huaibei 235000, China2 Department of Chemistry, Huaibei Normal University, Anhui, Huaibei 235000, China
Correspondence should be addressed to Liu Wei, [email protected]
Received 21 November 2011; Accepted 31 December 2011
Academic Editor: Baibiao Huang
Copyright © 2012 Zhang Jinfeng et al. This is an open access article distributed under the Creative Commons Attribution License,which permits unrestricted use, distribution, and reproduction in any medium, provided the original work is properly cited.
CuO/F-TiO2 nanoparticle photocatalyst was prepared by ball milling. The photocatalyst was characterized by X-ray powderdiffraction, scanning electron microscopy, transmission electron microscopy, UV-Vis diffuse reflectance spectroscopy, andphotoluminescence emission spectroscopy. The photocatalytic activity was evaluated by photocatalytic oxidation of rhodamine Band reduction of Cr2O7
2−. The results showed that, for F-TiO2 photocatalyst, the photooxidation activity increases remarkably withthe increasing amount of NH4F up to 1.0 g, and the photoreduction activity decreases gradually with the increase in the amountsof NH4F. For the CuO/F-TiO2 photocatalyst, the photoreduction activity increases greatly with the increase in the amount ofdoped p-CuO up to 1.0 wt.%, and the photooxidation activity decreases rapidly with the increase in the amounts of doped p-CuO.Compared with pure TiO2, the photoabsorption wavelength range of the CuO/F-TiO2 and F-TiO2 photocatalysts red shifts andimproves the utilization of the total spectrum. The effect of ball milling time on the photocatalytic activity of the photocatalystswas also investigated. The mechanisms of influence on the photocatalytic activity of the photocatalysts were also discussed.
1. Introduction
Since Fujishima and Honda discovered the photocatalyticsplitting of water on titanium dioxide (TiO2) electrodes in1972 [1], TiO2 as a photocatalyst has been extensively stud-ied because it has relatively high photocatalytic activity, bio-logical and chemical stability, low cost, nontoxicity, and long-term stability against photocorrosion and chemical corrosion[2–9]. However, the photocatalytic activity of TiO2 is limitedto irradiation wavelengths in the UV region, thus the effectiveutilization of solar energy is limited to about 3–5% of thetotal solar spectrum. Some problems still remain to be solv-ed in its application, such as the fast recombination of photo-generated electron-hole pairs. Therefore, improving photo-catalytic activity by modification has become a hot topicamong the researchers in the near decade [10, 11]. Many in-vestigators have quested for various methods, such as dopingtransition metals [12–15], doping nonmetallic elements [16–20], and forming composite photocatalysts from differentsemiconductors [21–24], and so forth, to enhance the photo-catalytic activity of TiO2 and to improve the utilization ofvisible light.
Recently, fluorinated TiO2 (F-TiO2) had been investi-gated extensively. The results showed that the photocatalyticoxidation activity of the F-TiO2 is much higher than thatof TiO2 by reason of the extension of the photoabsorptionwavelength as a result of doped F element [25–27]. The p-njunction photocatalysts NiO/TiO2 and p-ZnO/n-TiO2 havebeen studied in our laboratory [21, 28]. The results showedthat, compared with pure TiO2, the p-n junction photocata-lysts have higher photocatalytic reduction activity, but lowerphotocatalytic oxidation activity. It is known that CuO is a p-type semiconductor [29]. When p-type CuO and fluorinatedn-type TiO2 integrates, a p-n heterojunction photocatalystCuO/F-TiO2 will be formed, which may improve charge se-paration and photocatalytic activity of the photocatalyst.
In this paper, CuO/F-TiO2 powder was prepared by ballmilling using NH4F solution as a disperser. The photo-catalytic activity of the photocatalyst was evaluated by pho-tocatalytic oxidation of rhodamine B (RhB) and reductionof Cr2O7
2−. The desired result was obtained. The effectof ball milling time on the photocatalytic activity of thephotocatalysts was also investigated. The mechanisms of
2 International Journal of Photoenergy
influence on the photocatalytic activity of the CuO/F-TiO2photocatalyst were also discussed.
2. Experimental
2.1. Materials. The TiO2 powder (Anatase 90%, Rutile 10%,with crystallite size of about 50–60 nm) used in the exper-iments was supplied by Sinopharm Chemical Reagent Co,Ltd. Cu(NO3)2 · 3H2O was supplied by Shanghai ReagentFactory (purity 99.9%). NH4F, Rhodamine B, and otherchemicals used in the experiments were purchased fromShanghai and other China Chemical Reagent Ltd. Theywere of analytically pure grade. Deionized water was usedthroughout this study.
2.2. Preparation of F-TiO2 and CuO/F-TiO2. NanoparticleCuO was synthesized by heat treatment of Cu(NO3)2 · 3H2Oat 500◦C for 6 h in air, and the crystallite size is about 80 nm.The preparation of F-TiO2 photocatalyst was carried out ina ND2-2L ball mill (made in Tianzun Electronics Co, Ltd.,Nanjing University). The procedures for the preparation ofF-TiO2 are as follows: 5.0 g TiO2 powder and three differ-ent sizes of zirconia balls were mixed in the zirconia tank,and then a certain amount of NH4F (0 g, 0.2 g, 0.5 g, 1.0 g,1.5 g, 2.0 g, 2.5 g) and H2O (5 mL) was added. After beingmilled for a certain time (0–24 h) at the speed of 550 rpm,the wet powder was dried at 110◦C in air. The final sam-ples were used for the determination of photocatalytic ac-tivity and characterization. CuO/F-TiO2 photocatalyst wasprepared in the same procedure. For each sample, 1.0 gNH4F, 5.0 g TiO2, and 5.0 mL H2O were added in a zirconiatank, varying the weight ratio of CuO(0 wt.%, 0.1 wt.%,0.3 wt.%, 0.5 wt.%, 1.0 wt.%, 3.0 wt.%, and 5.0 wt.%), andthen different CuO/F-TiO2 powder samples were prepared,respectively. The specific surface area of the different CuO/F-TiO2 photocatalysts has no obvious change and it is about24.7 m2/g. The flow chart of preparation of the CuO/F-TiO2
is given in Scheme 1.
2.3. Photoreaction Apparatus and Procedure. Experimentswere carried out in a photoreaction apparatus [21, 28]. Thephotoreaction apparatus consists of two parts. The first partis an annular quartz tube. A 375 W medium pressure mer-cury lamp (Institute of Electric Light Source, Beijing), witha maximum emission at about 365 nm, was used as lightsources. The lamp is laid in the empty chamber of the an-nular tube, and running water passes through an inner thim-ble of the annular tube. Owing to continuous cooling, thetemperature of the reaction solution is maintained at approx-imately 30◦C. The second part is an unsealed beaker witha diameter of 12 cm. At the start of the experiment, the re-action solution (volume, 300 mL) containing reactants andphotocatalyst was put in the unsealed beakers, and a mag-netic stirring device was used to stir the reaction solution.The distance between the light source and the surface of thereaction solution is 11 cm. In the experiments, the initial pHof the reaction solution was 5.0, the amount of the photo-catalyst used was 2.0 g/L, and the initial concentrations of
Cr2O72− and RhB were 1.0 × 10⁻⁴ and 1.0 × 10⁻⁵ mol/L, re-
spectively. In order to disperse the photocatalyst powder, thesuspensions were ultrasonically vibrated for 10 or 20 minprior to irradiation. After illumination, the samples takenfrom the reaction suspension were centrifuged at 7000 rpmfor 20 min and filtered through a 0.2 μm millipore filter to re-move the particles. The filtrate was then analyzed. In orderto determine the reproducibility of the results, at least dup-licated runs were carried out for each condition for averagingthe results, and the experimental error was found to bewithin ±4%.
2.4. Characterization. In order to determine the crystal phasecomposition and the crystallite size of the photocatalysts,X-ray diffraction measurement was carried out at roomtemperature using a DX-2000 X-ray powder diffractometerwith Cu Kα radiation and a scanning speed of 3◦/min. Theaccelerating voltage and emission current were 40 kV and30 mA, respectively. The crystallite size was calculated by X-ray line broadening analysis using the Scherrer equation.
The microcrystalline structure and surface characteristicsof the photocatalysts were also investigated by using (X-650Japan) scanning electron microscope.
Transmission electron microscopy and high-resolutiontransmission electron microscopy (HR-TEM) images wereperformed with a JEOL-2010 transmission electron micro-scope, using an accelerating voltage of 200 kV.
UV-Vis diffuse reflectance spectra measurements werecarried out using a Hitachi UV-365 spectrophotometerequipped with an integrating sphere attachment. The anal-ysis range was from 250 to 650 nm, and BaSO4 was used as areflectance standard.
Photoluminescence emission spectra were recorded on aJASCO FP-6500 type fluorescence spectrophotometer over awavelength range of 360–500 nm.
2.5. Analysis. The concentration of Cr2O72− in the solution
is determined spectrophotometrically using diphenylcar-bazide reagent as a developer. The concentration of rhoda-mine B (RhB) in the solution is determined spectrophoto-metrically. The photoreduction efficiency of Cr2O7
2− and thephotooxidation efficiency of rhodamine B were calculatedfrom the following expression:
η = (C0 − Ct)C0
× 100%, (1)
where η is the photocatalytic efficiency; C0 is the concentra-tion of reactant before illumination; Ct is the concentrationof reactant after illumination time t.
3. Results and Discussion
3.1. Characterization of Photocatalysts
3.1.1. XRD Analysis. The fixed ball milling time is 6 h.The XRD patterns of different photocatalysts are shown inFigure 1. It is clear that, when the amount of doped CuO isless than 5.0 wt.%, the diffraction peaks of CuO cannot be
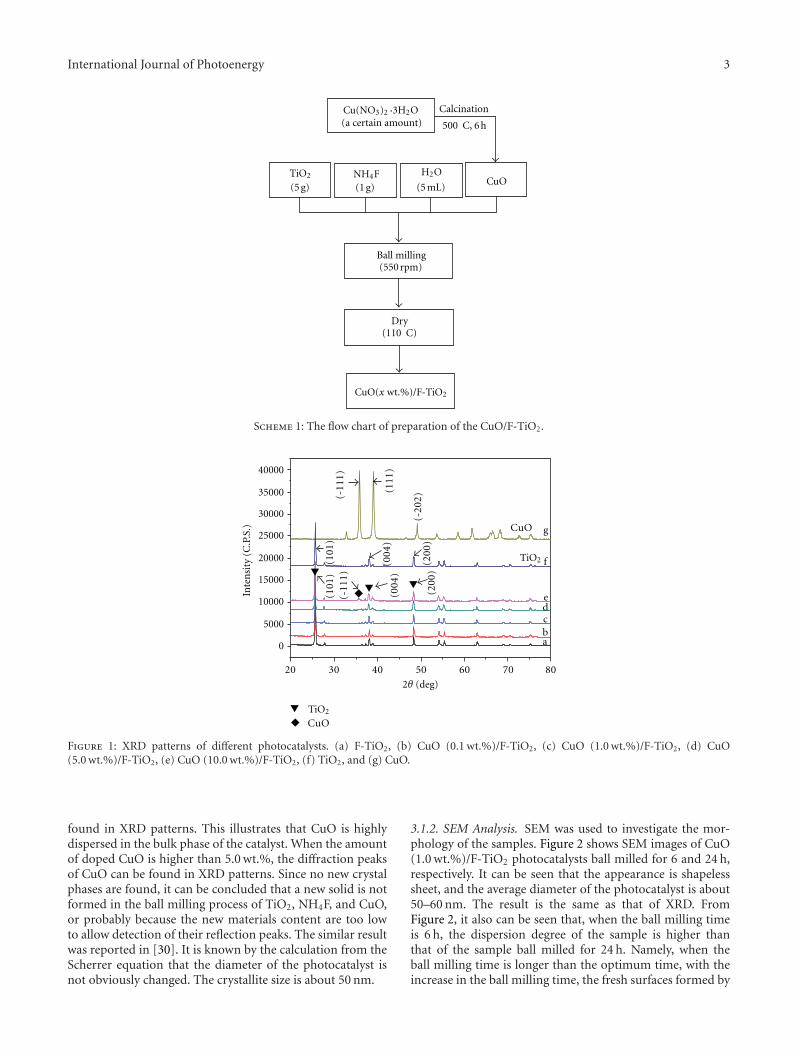
International Journal of Photoenergy 3
CalcinationCu(NO3)2·3H2O(a certain amount) 500 C, 6 h
TiO2
(5 g)NH4F(1 g)
H2O
(5 mL)CuO
Ball milling(550 rpm)
Dry(110 C)
CuO(x wt.%)/F-TiO2
Scheme 1: The flow chart of preparation of the CuO/F-TiO2.
20 30 40 50 60 70 80
0
5000
10000
15000
20000
25000
30000
35000
40000
Inte
nsi
ty (
C.P
.S.) g
f
CuO
CuO
abcde
(111
)
(-20
2)(2
00)
(004
)
(101
)(1
01)
(004
)
(200
)
(-11
1)
2θ (deg)
(-11
1)
TiO2
TiO2
Figure 1: XRD patterns of different photocatalysts. (a) F-TiO2, (b) CuO (0.1 wt.%)/F-TiO2, (c) CuO (1.0 wt.%)/F-TiO2, (d) CuO(5.0 wt.%)/F-TiO2, (e) CuO (10.0 wt.%)/F-TiO2, (f) TiO2, and (g) CuO.
found in XRD patterns. This illustrates that CuO is highlydispersed in the bulk phase of the catalyst. When the amountof doped CuO is higher than 5.0 wt.%, the diffraction peaksof CuO can be found in XRD patterns. Since no new crystalphases are found, it can be concluded that a new solid is notformed in the ball milling process of TiO2, NH4F, and CuO,or probably because the new materials content are too lowto allow detection of their reflection peaks. The similar resultwas reported in [30]. It is known by the calculation from theScherrer equation that the diameter of the photocatalyst isnot obviously changed. The crystallite size is about 50 nm.
3.1.2. SEM Analysis. SEM was used to investigate the mor-phology of the samples. Figure 2 shows SEM images of CuO(1.0 wt.%)/F-TiO2 photocatalysts ball milled for 6 and 24 h,respectively. It can be seen that the appearance is shapelesssheet, and the average diameter of the photocatalyst is about50–60 nm. The result is the same as that of XRD. FromFigure 2, it also can be seen that, when the ball milling timeis 6 h, the dispersion degree of the sample is higher thanthat of the sample ball milled for 24 h. Namely, when theball milling time is longer than the optimum time, with theincrease in the ball milling time, the fresh surfaces formed by
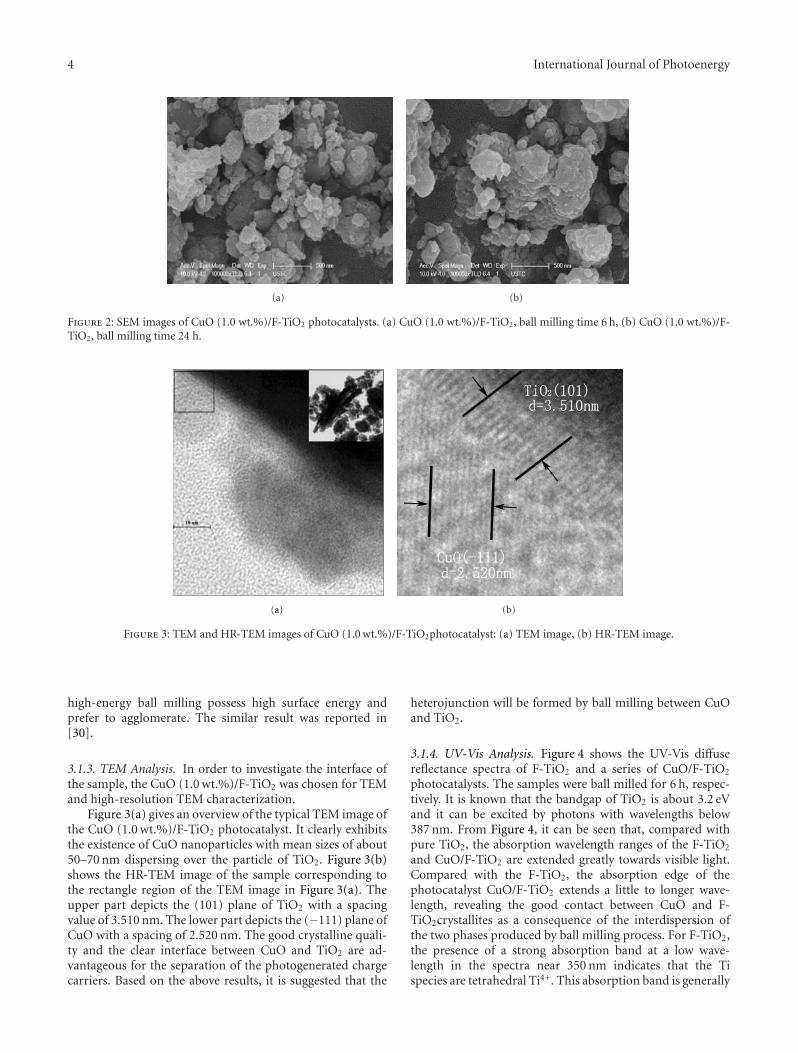
4 International Journal of Photoenergy
(a) (b)
Figure 2: SEM images of CuO (1.0 wt.%)/F-TiO2 photocatalysts. (a) CuO (1.0 wt.%)/F-TiO2, ball milling time 6 h, (b) CuO (1.0 wt.%)/F-TiO2, ball milling time 24 h.
(a) (b)
Figure 3: TEM and HR-TEM images of CuO (1.0 wt.%)/F-TiO2photocatalyst: (a) TEM image, (b) HR-TEM image.
high-energy ball milling possess high surface energy andprefer to agglomerate. The similar result was reported in[30].
3.1.3. TEM Analysis. In order to investigate the interface ofthe sample, the CuO (1.0 wt.%)/F-TiO2 was chosen for TEMand high-resolution TEM characterization.
Figure 3(a) gives an overview of the typical TEM image ofthe CuO (1.0 wt.%)/F-TiO2 photocatalyst. It clearly exhibitsthe existence of CuO nanoparticles with mean sizes of about50–70 nm dispersing over the particle of TiO2. Figure 3(b)shows the HR-TEM image of the sample corresponding tothe rectangle region of the TEM image in Figure 3(a). Theupper part depicts the (101) plane of TiO2 with a spacingvalue of 3.510 nm. The lower part depicts the (−111) plane ofCuO with a spacing of 2.520 nm. The good crystalline quali-ty and the clear interface between CuO and TiO2 are ad-vantageous for the separation of the photogenerated chargecarriers. Based on the above results, it is suggested that the
heterojunction will be formed by ball milling between CuOand TiO2.
3.1.4. UV-Vis Analysis. Figure 4 shows the UV-Vis diffusereflectance spectra of F-TiO2 and a series of CuO/F-TiO2
photocatalysts. The samples were ball milled for 6 h, respec-tively. It is known that the bandgap of TiO2 is about 3.2 eVand it can be excited by photons with wavelengths below387 nm. From Figure 4, it can be seen that, compared withpure TiO2, the absorption wavelength ranges of the F-TiO2
and CuO/F-TiO2 are extended greatly towards visible light.Compared with the F-TiO2, the absorption edge of thephotocatalyst CuO/F-TiO2 extends a little to longer wave-length, revealing the good contact between CuO and F-TiO2crystallites as a consequence of the interdispersion ofthe two phases produced by ball milling process. For F-TiO2,the presence of a strong absorption band at a low wave-length in the spectra near 350 nm indicates that the Tispecies are tetrahedral Ti4+. This absorption band is generally
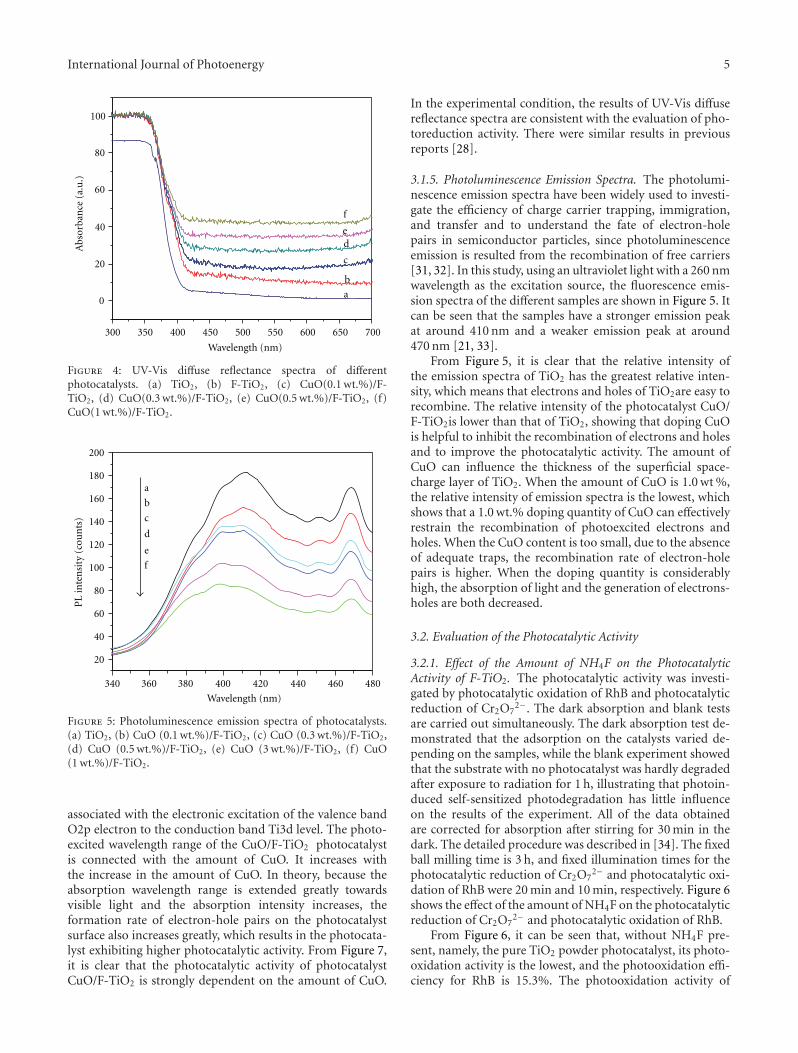
International Journal of Photoenergy 5
300 350 400 450 500 550 600 650 700
0
20
40
60
80
100
Abs
orba
nce
(a.
u.)
Wavelength (nm)
f
a
b
c
de
Figure 4: UV-Vis diffuse reflectance spectra of differentphotocatalysts. (a) TiO2, (b) F-TiO2, (c) CuO(0.1 wt.%)/F-TiO2, (d) CuO(0.3 wt.%)/F-TiO2, (e) CuO(0.5 wt.%)/F-TiO2, (f)CuO(1 wt.%)/F-TiO2.
340 360 380 400 420 440 460 480
20
40
60
80
100
120
140
160
180
200
PL
inte
nsi
ty (
cou
nts
)
Wavelength (nm)
a
b
c
d
e
f
Figure 5: Photoluminescence emission spectra of photocatalysts.(a) TiO2, (b) CuO (0.1 wt.%)/F-TiO2, (c) CuO (0.3 wt.%)/F-TiO2,(d) CuO (0.5 wt.%)/F-TiO2, (e) CuO (3 wt.%)/F-TiO2, (f) CuO(1 wt.%)/F-TiO2.
associated with the electronic excitation of the valence bandO2p electron to the conduction band Ti3d level. The photo-excited wavelength range of the CuO/F-TiO2 photocatalystis connected with the amount of CuO. It increases withthe increase in the amount of CuO. In theory, because theabsorption wavelength range is extended greatly towardsvisible light and the absorption intensity increases, theformation rate of electron-hole pairs on the photocatalystsurface also increases greatly, which results in the photocata-lyst exhibiting higher photocatalytic activity. From Figure 7,it is clear that the photocatalytic activity of photocatalystCuO/F-TiO2 is strongly dependent on the amount of CuO.
In the experimental condition, the results of UV-Vis diffusereflectance spectra are consistent with the evaluation of pho-toreduction activity. There were similar results in previousreports [28].
3.1.5. Photoluminescence Emission Spectra. The photolumi-nescence emission spectra have been widely used to investi-gate the efficiency of charge carrier trapping, immigration,and transfer and to understand the fate of electron-holepairs in semiconductor particles, since photoluminescenceemission is resulted from the recombination of free carriers[31, 32]. In this study, using an ultraviolet light with a 260 nmwavelength as the excitation source, the fluorescence emis-sion spectra of the different samples are shown in Figure 5. Itcan be seen that the samples have a stronger emission peakat around 410 nm and a weaker emission peak at around470 nm [21, 33].
From Figure 5, it is clear that the relative intensity ofthe emission spectra of TiO2 has the greatest relative inten-sity, which means that electrons and holes of TiO2are easy torecombine. The relative intensity of the photocatalyst CuO/F-TiO2is lower than that of TiO2, showing that doping CuOis helpful to inhibit the recombination of electrons and holesand to improve the photocatalytic activity. The amount ofCuO can influence the thickness of the superficial space-charge layer of TiO2. When the amount of CuO is 1.0 wt %,the relative intensity of emission spectra is the lowest, whichshows that a 1.0 wt.% doping quantity of CuO can effectivelyrestrain the recombination of photoexcited electrons andholes. When the CuO content is too small, due to the absenceof adequate traps, the recombination rate of electron-holepairs is higher. When the doping quantity is considerablyhigh, the absorption of light and the generation of electrons-holes are both decreased.
3.2. Evaluation of the Photocatalytic Activity
3.2.1. Effect of the Amount of NH4F on the PhotocatalyticActivity of F-TiO2. The photocatalytic activity was investi-gated by photocatalytic oxidation of RhB and photocatalyticreduction of Cr2O7
2−. The dark absorption and blank testsare carried out simultaneously. The dark absorption test de-monstrated that the adsorption on the catalysts varied de-pending on the samples, while the blank experiment showedthat the substrate with no photocatalyst was hardly degradedafter exposure to radiation for 1 h, illustrating that photoin-duced self-sensitized photodegradation has little influenceon the results of the experiment. All of the data obtainedare corrected for absorption after stirring for 30 min in thedark. The detailed procedure was described in [34]. The fixedball milling time is 3 h, and fixed illumination times for thephotocatalytic reduction of Cr2O7
2− and photocatalytic oxi-dation of RhB were 20 min and 10 min, respectively. Figure 6shows the effect of the amount of NH4F on the photocatalyticreduction of Cr2O7
2− and photocatalytic oxidation of RhB.From Figure 6, it can be seen that, without NH4F pre-
sent, namely, the pure TiO2 powder photocatalyst, its photo-oxidation activity is the lowest, and the photooxidation effi-ciency for RhB is 15.3%. The photooxidation activity of
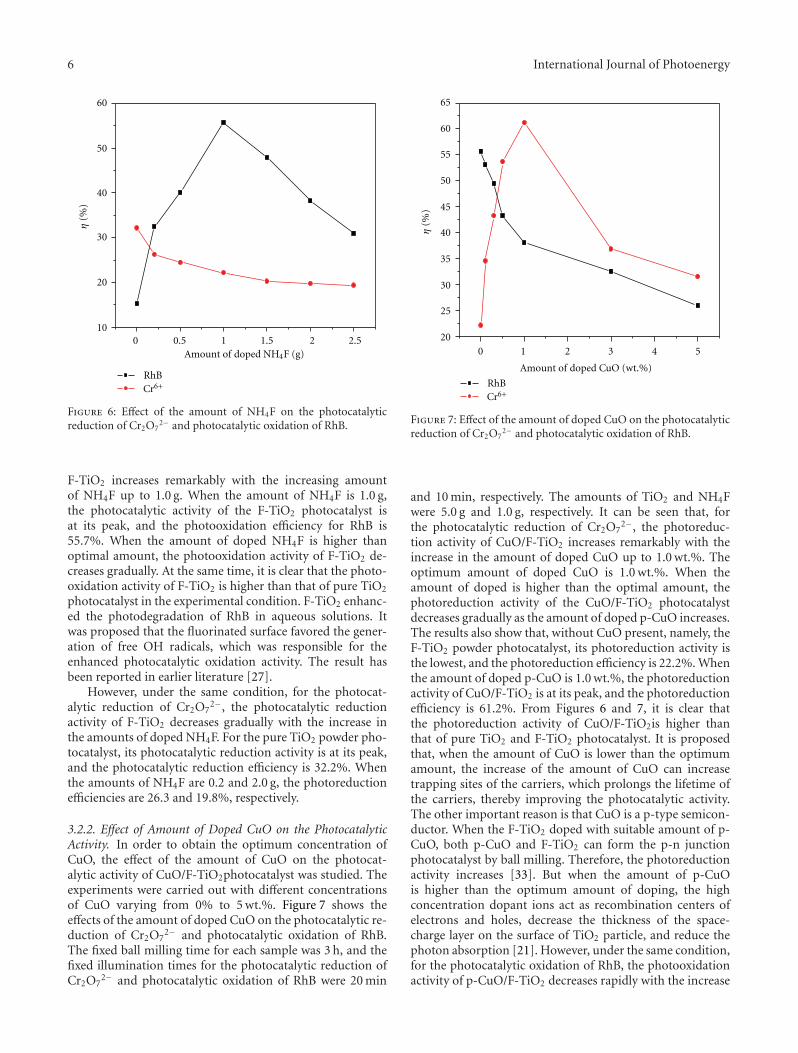
6 International Journal of Photoenergy
0 0.5 1 1.5 2 2.510
20
30
40
50
60
RhB
η(%
)
Amount of doped NH4F (g)
Cr6+
Figure 6: Effect of the amount of NH4F on the photocatalyticreduction of Cr2O7
2− and photocatalytic oxidation of RhB.
F-TiO2 increases remarkably with the increasing amountof NH4F up to 1.0 g. When the amount of NH4F is 1.0 g,the photocatalytic activity of the F-TiO2 photocatalyst isat its peak, and the photooxidation efficiency for RhB is55.7%. When the amount of doped NH4F is higher thanoptimal amount, the photooxidation activity of F-TiO2 de-creases gradually. At the same time, it is clear that the photo-oxidation activity of F-TiO2 is higher than that of pure TiO2
photocatalyst in the experimental condition. F-TiO2 enhanc-ed the photodegradation of RhB in aqueous solutions. Itwas proposed that the fluorinated surface favored the gener-ation of free OH radicals, which was responsible for theenhanced photocatalytic oxidation activity. The result hasbeen reported in earlier literature [27].
However, under the same condition, for the photocat-alytic reduction of Cr2O7
2−, the photocatalytic reductionactivity of F-TiO2 decreases gradually with the increase inthe amounts of doped NH4F. For the pure TiO2 powder pho-tocatalyst, its photocatalytic reduction activity is at its peak,and the photocatalytic reduction efficiency is 32.2%. Whenthe amounts of NH4F are 0.2 and 2.0 g, the photoreductionefficiencies are 26.3 and 19.8%, respectively.
3.2.2. Effect of Amount of Doped CuO on the PhotocatalyticActivity. In order to obtain the optimum concentration ofCuO, the effect of the amount of CuO on the photocat-alytic activity of CuO/F-TiO2photocatalyst was studied. Theexperiments were carried out with different concentrationsof CuO varying from 0% to 5 wt.%. Figure 7 shows theeffects of the amount of doped CuO on the photocatalytic re-duction of Cr2O7
2− and photocatalytic oxidation of RhB.The fixed ball milling time for each sample was 3 h, and thefixed illumination times for the photocatalytic reduction ofCr2O7
2− and photocatalytic oxidation of RhB were 20 min
0 1 2 3 4 520
25
30
35
40
45
50
55
60
65
Amount of doped CuO (wt.%)
RhB
η(%
)
Cr6+
Figure 7: Effect of the amount of doped CuO on the photocatalyticreduction of Cr2O7
2− and photocatalytic oxidation of RhB.
and 10 min, respectively. The amounts of TiO2 and NH4Fwere 5.0 g and 1.0 g, respectively. It can be seen that, forthe photocatalytic reduction of Cr2O7
2−, the photoreduc-tion activity of CuO/F-TiO2 increases remarkably with theincrease in the amount of doped CuO up to 1.0 wt.%. Theoptimum amount of doped CuO is 1.0 wt.%. When theamount of doped is higher than the optimal amount, thephotoreduction activity of the CuO/F-TiO2 photocatalystdecreases gradually as the amount of doped p-CuO increases.The results also show that, without CuO present, namely, theF-TiO2 powder photocatalyst, its photoreduction activity isthe lowest, and the photoreduction efficiency is 22.2%. Whenthe amount of doped p-CuO is 1.0 wt.%, the photoreductionactivity of CuO/F-TiO2 is at its peak, and the photoreductionefficiency is 61.2%. From Figures 6 and 7, it is clear thatthe photoreduction activity of CuO/F-TiO2is higher thanthat of pure TiO2 and F-TiO2 photocatalyst. It is proposedthat, when the amount of CuO is lower than the optimumamount, the increase of the amount of CuO can increasetrapping sites of the carriers, which prolongs the lifetime ofthe carriers, thereby improving the photocatalytic activity.The other important reason is that CuO is a p-type semicon-ductor. When the F-TiO2 doped with suitable amount of p-CuO, both p-CuO and F-TiO2 can form the p-n junctionphotocatalyst by ball milling. Therefore, the photoreductionactivity increases [33]. But when the amount of p-CuOis higher than the optimum amount of doping, the highconcentration dopant ions act as recombination centers ofelectrons and holes, decrease the thickness of the space-charge layer on the surface of TiO2 particle, and reduce thephoton absorption [21]. However, under the same condition,for the photocatalytic oxidation of RhB, the photooxidationactivity of p-CuO/F-TiO2 decreases rapidly with the increase
International Journal of Photoenergy 7
0 5 10 15 20 2530
35
40
45
50
55
60
65
70
75
80
Ball milling time (h)
RhB
η(%
)
Cr6+
Figure 8: Effect of ball milling time on the photocatalytic activity.
in the amounts of doped p-CuO. For the pure F-TiO2 photo-catalyst, its photooxidation activity is at its peak, and thephotooxidation efficiency of F-TiO2 is 55.7%. When theamounts of doped p-CuO are 0.3 and 1.0 wt.%, the photo-oxidation efficiencies are 49.5 and 38.1%, respectively.
The photocatalyst CuO/F-TiO2 has higher photocatalyticreduction activity than that of TiO2 and F-TiO2. The possiblereasons are as follows.
First, it can be explained by the p-n junction principle[21, 28]. It is known that CuO is p-type semiconductor, andTiO2 is n-type semiconductor. When p-type CuO and n-typeTiO2 integrate p-n junctions will be formed between CuOand TiO2, and the inner electric field will be also formed atthe same time in the interface. So a number of micro p-n he-terojunction CuO/F-TiO2photocatalysts will be formed afterdoping CuO powder into TiO2 granule. At the equilibrium,the inner electric field formed made p-type semiconductorCuO region have the negative charge while TiO2 regionhave the positive charge. The electron-hole pairs will becreated under UV light illumination. With the effect of theinner electric field, the holes flow into the negative fieldand the electrons move to the positive field. Therefore, thephotogenerated electron-hole pairs will be separated effec-tively by the p-n heterojunction formed in CuO/F-TiO2.
Second, compared with F-TiO2, the photoabsorptionwavelength range of the CuO/F-TiO2 photocatalyst red shiftsand extends the wavelength range of photoexcitation andenhances the utilization of the total spectrum. The resultsalso show that the photoluminescence emission intensity ofthe CuO/F-TiO2 photocatalyst is lower than that of the pureF-TiO2. It indicates that doping CuO is helpful to inhibit therecombination of electrons and holes and improve the pho-tocatalytic activity. At the same time, it was reported that p-type semiconductor is a collector of photoexcited holes [35].Therefore, there are enrichment electrons in the interface toreact with Cr2O7
2− adsorbed on the photocatalyst surface, so
the p-n heterojunction photocatalyst CuO/F-TiO2 has higherphotocatalytic reduction activity, but lower photocatalyticoxidation activity.
3.2.3. Effect of Ball Milling Time on the PhotocatalyticActivity. The effect of ball milling time on the photocatalyticactivity of CuO (1.0 wt.%)/F-TiO2 photocatalyst is shown inFigure 8. It can be seen that the ball milling time influencesthe photocatalytic activity strongly. Without ball milling,the photoreduction efficiency is 39.2%, and the photooxi-dation efficiency is 51.3%. The photoreduction efficiency ofCr2O7
2− increases gradually with the increase in ball millingtime up to 6 h. When the ball milling time is 1, 3, 6, 12, and24 h, the photoreduction efficiency is 45.5, 61.2, 76.8, 74.2,and 70.1%, respectively. For the photocatalytic oxidation ofRhB, the photooxidation efficiency decreases rapidly with theincrease in the ball milling time. When the ball milling timeis 1 h, the photooxidation efficiency is the lowest, and it is32.7%. However, when the ball milling time is longer than1 h, the photooxidation efficiency increases gradually withthe increase in ball milling time up to 6 h. When the ball mill-ing time is 6 h, the photooxidation efficiency of RhB is 40.6%.When the ball milling time is longer than 6 h, the photo-oxidation efficiency decreases gradually. The reason is that,without ball milling, F-TiO2 and p-CuO only play their ownphotocatalytic role, and the p-n junction photocatalysts arenot formed. However, after ball milling, TiO2 and p-CuOcan form p-n junction photocatalyst, which results in theincrease of the photoreduction activity and the decrease ofthe photooxidation activity rapidly. Another reason is that,with the increase in the ball milling time, the specific surfacearea of the photocatalyst increases. Correspondingly, thenumber of active sites per unit weight of photocatalyst alsoincreases [21]. But when the ball milling time is longer thanthe optimum time, it is proposed that, with the increase inthe ball milling time, the fresh surface formed by high-energyball milling possesses high surface energy and prefers toagglomerate [36, 37], resulting in the decrease of the photo-catalytic activity. The assumption is proved by the results ofSEM.
3.2.4. Hydroxyl Radical Analysis. The formation of hydroxylradicals (•OH) on the surface of CuO (1.0 wt.%)/F-TiO2
photocatalyst is detected by a photoluminescence (PL)technique with terephthalic acid as a probe molecule. Themethod is rapid, sensitive, and specific, needing only simplestandard PL instrumentation. Terephthalic acid readily reactswith •OH to produce a highly fluorescent product, 2-hydro-xyterephthalic acid, whose PL peak intensity is in proportionto the amount of OH radicals produced in water. Experimen-tal procedures were reported in earlier reports [27]. After UVirradiation for 10 min, the reaction solution was filtrated tomeasure the PL intensity at 425 nm excited by 315 nm lightof 2-hydroxyterephthalic acid.
Figure 9 shows the changes of PL spectra of differentsamples from 5 × 10⁻⁴ mol/L terephthalic acid solution in2 × 10−3 mol/L NaOH. From Figure 9, it can be seen that,when the ball milling time is 6 h, the PL peak intensity ofthe sample is the highest. It means that the formation rate of
8 International Journal of Photoenergy
380 400 420 440 460 480 500 520 540
0
50
100
150
200
250
300
350
Flu
ores
cen
ce in
ten
sity
(a.
u.)
a
b
c
d
e
f
Figure 9: Effect of ball milling time on the changes of PL spectra.(a) 6 h, (b) 3 h, (c) 12 h, (d) 24 h, (e) 1 h, (f) pure terephthalic acid.
OH radicals on its surface is much larger than that of othersamples. The PL peak intensities of the samples decreaseare as follows: ball milling time 6 h> 3 h> 12 h> 24 h> 1 h.The result of PL peak intensity is consistent with that of thephotooxidation activity.
4. Conclusions
The CuO/F-TiO2 photocatalyst was prepared by ball millingmethod. The photooxidation activity of F-TiO2 increasesgreatly with the increase in the amount of NH4F up to1.0 g. The photoreduction activity of CuO/F-TiO2 increasesremarkably with the increase in the amount of doped p-CuO up to 1.0 wt.%. The ball milling time has a significantinfluence on the photocatalytic activity of the photocatalyst.The optimum ball milling time is 6 h. Compared with pureTiO2, the photoabsorption wavelength range of the F-TiO2
and CuO/F-TiO2 photocatalysts red shifts and improves theutilization of the total spectrum. As the formation of the p-n heterojunction and p-type CuO species acts as holes trapsand collector, the photogenerated electron-hole pairs of theCuO/F-TiO2 photocatalyst are separated by the inner electricfield and the photocatalytic reduction activity is enhancedgreatly.
Acknowledgments
This study was supported by the Natural Science Foundationof China (nos. 20973071, 51172086, and 21103060) and theKey Project of Science and Technology Research of Ministryof Education of China (208062).
References
[1] A. Fujishima and K. Honda, “Electrochemical photolysis ofwater at a semiconductor electrode,” Nature, vol. 238, no.5358, pp. 37–38, 1972.
[2] T. Yan, J. Long, X. Shi, D. Wang, Z. Li, and X. Wang, “Efficientphotocatalytic degradation of volatile organic compounds by
porous indium hydroxide nanocrystals,” Environmental Sci-ence and Technology, vol. 44, no. 4, pp. 1380–1385, 2010.
[3] X. Xin, M. Scheiner, M. Ye, and Z. Lin, “Surface-treated TiO2
nanoparticles for dye-sensitized solar cells with remarkablyenhanced performance,” Langmuir, vol. 27, no. 23, pp. 14594–14598, 2011.
[4] X. Xu, X. Li, P. Lin et al., “A general templated methodto homogeneous and composition-tunable hybrid TiO2
nanocomposite fibers,” Chemical Communications, vol. 47, no.9, pp. 2538–2540, 2011.
[5] Z. J. Zhou, J. Q. Fan, X. Wang, W. H. Zhou, Z. L. Du, and S. X.Wu, “Effect of highly ordered single-crystalline TiO2 nanowirelength on the photovoltaic performance of dye-sensitized solarcells,” ACS Applied Materials & Interfaces, vol. 3, pp. 4349–4353, 2011.
[6] K. Lv, J. Yu, J. Fan, and M. Jaroniec, “Rugby-like anatase titaniahollow nanoparticles with enhanced photocatalytic activity,”CrystEngCommunity, vol. 13, no. 23, pp. 7044–7048, 2011.
[7] D. Yang, C. Chen, Z. Zheng et al., “Grafting silica species onanatase surface for visible light photocatalytic activity,” Energyand Environmental Science, vol. 4, no. 6, pp. 2279–2287, 2011.
[8] Y. Wang, D. Zhao, H. Ji et al., “Sonochemical hydrogen pro-duction efficiently catalyzed by Au/TiO2,” Journal of PhysicalChemistry C, vol. 114, no. 41, pp. 17728–17733, 2010.
[9] R. Shi, J. Lin, Y. Wang, J. Xu, and Y. Zhu, “Visible-light photo-catalytic degradation of BiTaO4 photocatalyst and mechanismof photocorrosion suppression,” Journal of Physical ChemistryC, vol. 114, no. 14, pp. 6472–6477, 2010.
[10] R. J. Wang, G. H. Jiang, Y. W. Ding et al., “Photocatalyticactivity of heterostructures based on TiO2 and halloysitenanotubes,” ACS Applied Materials & Interfaces, vol. 3, pp.4154–4158, 2011.
[11] D. Y. Wu and M. Long, “Realizing visible-light-induced self-cleaning property of cotton through coating N-TiO2 film andloading AgI particles,” ACS Applied Materials & Interfaces, vol.3, pp. 4770–4774, 2011.
[12] M. Liu, X. Qiu, M. Miyauchi, and K. Hashimoto, “Cu(II)oxide amorphous nanoclusters grafted Ti3+ self-doped TiO2:an efficient visible light photocatalyst,” Chemistry of Materials,vol. 23, no. 23, pp. 5282–5286, 2011.
[13] N. Zhang, S. Liu, X. Fu, and Y.-J. Xu, “Synthesis of M@TiO2
(M = Au, Pd, Pt) core-shell nanocomposites with tunablephotoreactivity,” Journal of Physical Chemistry C, vol. 115, no.18, pp. 9136–9145, 2011.
[14] T. A. Kandiel, A. A. Ismail, and D. W. Bahnemann, “Meso-porous TiO2 nanostructures: a route to minimize Pt loadingon titania photocatalysts for hydrogen production,” PhysicalChemistry Chemical Physics, vol. 13, no. 45, pp. 20155–20161,2011.
[15] P. Sangpour, F. Hashemi, and A. Z. Moshfegh, “Pho-toenhanced degradation of methylene blue on cosputteredM : TiO2 (M = Au, Ag, Cu) nanocomposite systems: a com-parative study,” Journal of Physical Chemistry C, vol. 114, no.33, pp. 13955–13961, 2010.
[16] K. Yang, Y. Dai, and B. Huang, “Density functional study ofboron-doped anatase TiO2,” Journal of Physical Chemistry C,vol. 114, no. 46, pp. 19830–19834, 2010.
[17] P. Xu, J. Lu, T. Xu, S. Gao, B. Huang, and Y. Dai, “I2-hydrosol-seeded growth of (I2)n-C-codoped meso/nanoporous TiO2
for visible light-driven photocatalysis,” Journal of PhysicalChemistry C, vol. 114, no. 20, pp. 9510–9517, 2010.
[18] W. Guo, Y. Shen, L. Wu, Y. Gao, and T. Ma, “Effect of N dopantamount on the performance of dye-sensitized solar cells basedon N-Doped TiO2 electrodes,” Journal of Physical Chemistry C,vol. 115, no. 43, pp. 21494–21499, 2011.
International Journal of Photoenergy 9
[19] J. Lin, J. Lin, and Y. Zhu, “Controlled synthesis of the ZnWO4
nanostructure and effects on the photocatalytic performance,”Inorganic Chemistry, vol. 46, no. 20, pp. 8372–8378, 2007.
[20] A. T. Kuvarega, R. W. M. Krause, and B. B. Mamba, “Nitro-gen/palladium-codoped TiO2 for efficient visible light photo-catalytic dye degradation,” Journal of Physical Chemistry C, vol.115, no. 45, pp. 22110–22120, 2011.
[21] S. Chen, W. Zhao, W. Liu, and S. Zhang, “Preparation, char-acterization and activity evaluation of p-n junction photocat-alyst p-ZnO/n-TiO2,” Applied Surface Science, vol. 255, no. 5,pp. 2478–2484, 2008.
[22] Z.-R. Tang, F. Li, Y. Zhang, X. Fu, and Y.-J. Xu, “Composites oftitanate nanotube and carbon nanotube as photocatalyst withhigh mineralization ratio for gas-phase degradation of volatilearomatic pollutant,” Journal of Physical Chemistry C, vol. 115,no. 16, pp. 7880–7886, 2011.
[23] V. Stengl, D. Popelkova, and P. Vlacil, “TiO2-graphene nano-composite as high performace photocatalysts,” Journal of Phy-sical Chemistry C, vol. 115, no. 51, pp. 25209–25218, 2011.
[24] J. Zhang, J. Yu, Y. Zhang, Q. Li, and J. R. Gong, “Visi-ble light photocatalytic H2-production activity of CuS/ZnSporous nanosheets based on photoinduced interfacial chargetransfer,” Nano Letters, vol. 11, no. 11, pp. 4774–4779, 2011.
[25] H. Park and W. Choi, “Effects of TiO2 surface fluorination onphotocatalytic reactions and photoelectrochemical behaviors,”Journal of Physical Chemistry B, vol. 108, no. 13, pp. 4086–4093, 2004.
[26] W. Choi, “Pure and modified TiO2 photocatalysts and theirenvironmental applications,” Catalysis Surveys from Asia, vol.10, no. 1, pp. 16–28, 2006.
[27] J. Yu, W. Wang, B. Cheng, and B. L. Su, “Enhancement ofphotocatalytic activity of Mesporous TiO2 powders by hydro-thermal surface fluorination treatment,” Journal of PhysicalChemistry C, vol. 113, no. 16, pp. 6743–6750, 2009.
[28] S. F. Chen, S. J. Zhang, W. Liu, and W. Zhao, “Preparation andactivity evaluation of p-n junction photocatalyst NiO/TiO2,”Journal of Hazardous Materials, vol. 155, no. 1-2, pp. 320–326,2008.
[29] H. Yu, J. Yu, S. Liu, and S. Mann, “Template-free hydrothermalsynthesis of CuO/Cu2O composite hollow microspheres,”Chemistry of Materials, vol. 19, no. 17, pp. 4327–4334, 2007.
[30] S. F. Chen, L. Chen, S. Gao, and G. Y. Cao, “The preparationof nitrogen-doped photocatalyst TiO2—XN x by ball milling,”Chemical Physics Letters, vol. 413, no. 4-6, pp. 404–409, 2005.
[31] T. Cai, M. Yue, X. Wang, Q. Deng, Z. Peng, and W. Zhou,“Preparation, characterization, and photocatalytic perfor-mance of NdPW12O40/TiO2 composite catalyst,” Chinese Jour-nal of Catalysis, vol. 28, no. 1, pp. 10–16, 2007.
[32] J. W. Tang, Z. G. Zou, and J. H. Ye, “Photophysical and pho-tocatalytic properties of AgInW2O8,” The Journal of PhysicalChemistry B, vol. 107, pp. 14265–14269, 2003.
[33] S. Kang, K. Shin, K. Prabakar, and C. Lee, “Optical andelectrical properties of ZnO doped with nitrogen,” PhysicaStatus Solidi B, vol. 241, no. 12, pp. 2830–2834, 2004.
[34] S. F. Chen, X. L. Yu, H. Y. Zhang, and W. Liu, “Preparation andphotocatalytic activity evaluation of composite Fe-TiO2/TiO2
photocatalyst,” Journal of the Electrochemical Society, vol. 157,no. 5, pp. K96–K102, 2010.
[35] A. Lohner, M. Woerner, T. Elsaesser, and W. Kaiser, “Picosec-ond capture of photoexcited holes by shallow acceptors in p-type GaAs,” Physical Review Letters, vol. 68, no. 26, pp. 3920–3923, 1992.
[36] S. F. Chen, L. Chen, G. Shen, and C. Gengyu, “The preparationof coupled WO3/TiO2 photocatalyst by ball milling,” PowderTechnology, vol. 160, no. 3, pp. 198–202, 2005.
[37] J. Wang, S. Yin, M. Komatsu, Q. Zhang, F. Saito, and T. Sato,“Preparation and characterization of nitrogen doped SrTiO3
photocatalyst,” Journal of Photochemistry and Photobiology A,vol. 165, no. 1–3, pp. 149–156, 2004.
Hindawi Publishing CorporationInternational Journal of PhotoenergyVolume 2012, Article ID 830321, 6 pagesdoi:10.1155/2012/830321
Research Article
Facile Preparation and PhotoinducedSuperhydrophilicity of Highly Ordered Sodium-Free TitanateNanotube Films by Electrophoretic Deposition
Minghua Zhou1, 2 and Huogen Yu2
1 Lab of Medical Chemistry, Hubei University of Medicine, Hubei, Shiyan 442000, China2 Department of Chemistry, School of Science, Wuhan University of Technology, Wuhan 430070, China
Correspondence should be addressed to Huogen Yu, [email protected]
Received 30 December 2011; Accepted 9 January 2012
Academic Editor: Baibiao Huang
Copyright © 2012 M. Zhou and H. Yu. This is an open access article distributed under the Creative Commons Attribution License,which permits unrestricted use, distribution, and reproduction in any medium, provided the original work is properly cited.
Highly ordered sodium-free titanate nanotube films were one-step prepared on F-doped SnO2-coated (FTO) glass via anelectrophoretic deposition method by using sodium titanate nanotubes as the precursor. It was found that the self-assembledformation of highly ordered sodium titanate nanotube films was accompanied with the effective removal of sodium ions inthe nanotubes during the electrophoretic deposition process, resulting in the final formation of protonated titanate nanotubefilm. With increasing calcination temperature, the amorphous TiO2 phase is formed by a dehydration process of the protonatedtitanate nanotubes at 300◦C and further transforms into anatase TiO2 when the calcination temperature is higher than 400◦C.Compared with the as-prepared titanate nanotube film, the calcined titanate nanotube film (300–600◦C) exhibits attractivephotoinduced superhydrophilicity under UV-light irradiation. In particular, 500◦C-calcined films show the best photoinducedsuperhydrophilicity, probably due to synergetic effects of enhanced crystallization, surface roughness, and ordered structures ofthe films.
1. Introduction
Among various oxide semiconductors, titania appears prom-ising and important for the use in environmental purificationdue to its strong oxidizing power, nontoxicity and long-termphotostability [1–10]. In addition to the conventional photo-catalytic activity, photoinduced superhydrophilic propertiesof two-dimensional (2D) TiO2 thin films have attractedmuch attention in recent years [11–13]. By utilizing the su-perhydrophilic surface of TiO2 thin films, we can developantifogging or self-cleaning glass, mirrors, and other eco-logical building materials [14, 15]. However, the furtherenhanced photoinduced hydrophilicity is necessary for prac-tical uses. To achieve this goal, great attentions shouldbe focused on the textural design of the 2D TiO2 thinfilms.
Recently, titanate-based films have been intensively inves-tigated due to the large specific surface areas and uniquestructural features [16–23]. For example, Tian et al. [16] re-ported a simple hydrothermal and seeded growth processto fabricate titanate nanotube film by directly immersing
Ti substrate in concentrated NaOH solution for certaintime. Tokudome and Miyauchi [17] developed a layer-by-layer growth technique to prepare thin titanate nanotubefilms. Nevertheless, the construction of the titanate nanotubefilms with controllable textures is still remained as a greatchallenge, and alternative techniques for films are highlydesirable. Recently, electrophoretic deposition (EPD) wassuccessfully developed to fabricate various thin-film mate-rials [18–20]. There are many advantages of this techniqueover other deposition methods. For example, higher depo-sition rate can be easily achieved with a quick deposition,in addition to its reproducibility of deposition. It is also anefficient technique to control the thickness and morphologyof the films by controlling current or potential. Specially, theEPD has a flexibility of depositing films on different shapesand sizes and can be extended to a large scale for commercialapplications. Another advantage of this method is that it canbe carried out at room temperature, thereby reducing thepossibility of deterioration of the surrounding.
Here, we developed the EPD method for constructingordered titanate nanotube films using preformed titanate
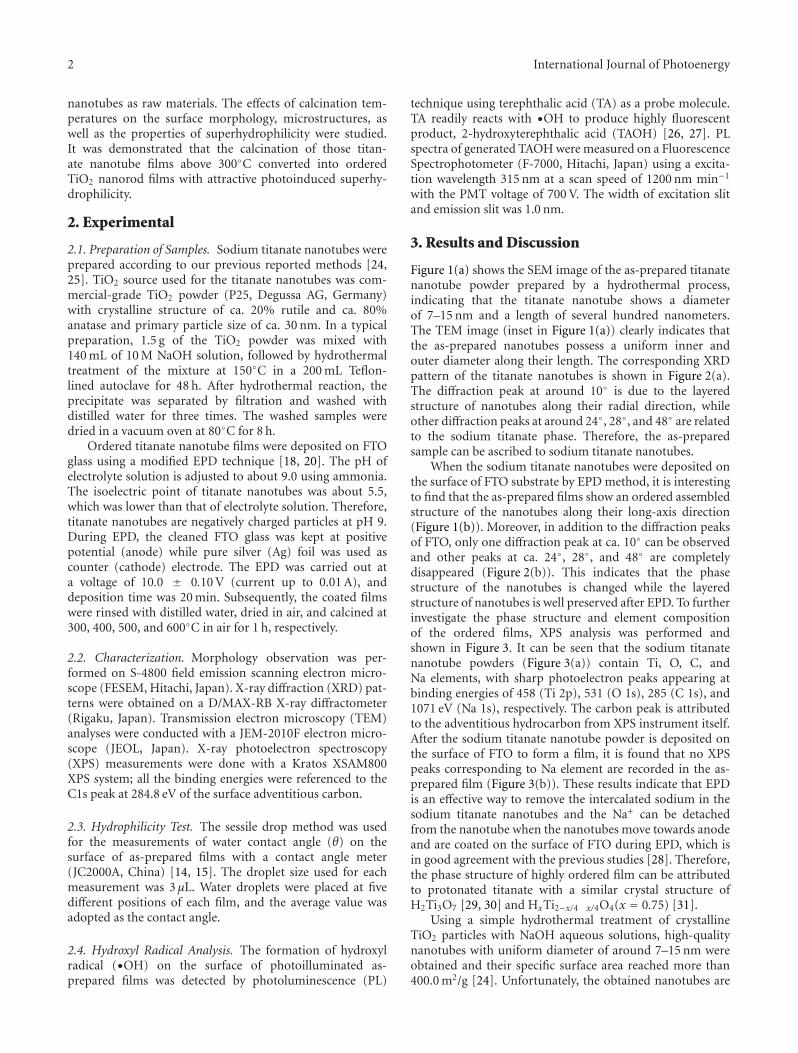
2 International Journal of Photoenergy
nanotubes as raw materials. The effects of calcination tem-peratures on the surface morphology, microstructures, aswell as the properties of superhydrophilicity were studied.It was demonstrated that the calcination of those titan-ate nanotube films above 300◦C converted into orderedTiO2 nanorod films with attractive photoinduced superhy-drophilicity.
2. Experimental
2.1. Preparation of Samples. Sodium titanate nanotubes wereprepared according to our previous reported methods [24,25]. TiO2 source used for the titanate nanotubes was com-mercial-grade TiO2 powder (P25, Degussa AG, Germany)with crystalline structure of ca. 20% rutile and ca. 80%anatase and primary particle size of ca. 30 nm. In a typicalpreparation, 1.5 g of the TiO2 powder was mixed with140 mL of 10 M NaOH solution, followed by hydrothermaltreatment of the mixture at 150◦C in a 200 mL Teflon-lined autoclave for 48 h. After hydrothermal reaction, theprecipitate was separated by filtration and washed withdistilled water for three times. The washed samples weredried in a vacuum oven at 80◦C for 8 h.
Ordered titanate nanotube films were deposited on FTOglass using a modified EPD technique [18, 20]. The pH ofelectrolyte solution is adjusted to about 9.0 using ammonia.The isoelectric point of titanate nanotubes was about 5.5,which was lower than that of electrolyte solution. Therefore,titanate nanotubes are negatively charged particles at pH 9.During EPD, the cleaned FTO glass was kept at positivepotential (anode) while pure silver (Ag) foil was used ascounter (cathode) electrode. The EPD was carried out ata voltage of 10.0 ± 0.10 V (current up to 0.01 A), anddeposition time was 20 min. Subsequently, the coated filmswere rinsed with distilled water, dried in air, and calcined at300, 400, 500, and 600◦C in air for 1 h, respectively.
2.2. Characterization. Morphology observation was per-formed on S-4800 field emission scanning electron micro-scope (FESEM, Hitachi, Japan). X-ray diffraction (XRD) pat-terns were obtained on a D/MAX-RB X-ray diffractometer(Rigaku, Japan). Transmission electron microscopy (TEM)analyses were conducted with a JEM-2010F electron micro-scope (JEOL, Japan). X-ray photoelectron spectroscopy(XPS) measurements were done with a Kratos XSAM800XPS system; all the binding energies were referenced to theC1s peak at 284.8 eV of the surface adventitious carbon.
2.3. Hydrophilicity Test. The sessile drop method was usedfor the measurements of water contact angle (θ) on thesurface of as-prepared films with a contact angle meter(JC2000A, China) [14, 15]. The droplet size used for eachmeasurement was 3 μL. Water droplets were placed at fivedifferent positions of each film, and the average value wasadopted as the contact angle.
2.4. Hydroxyl Radical Analysis. The formation of hydroxylradical (•OH) on the surface of photoilluminated as-prepared films was detected by photoluminescence (PL)
technique using terephthalic acid (TA) as a probe molecule.TA readily reacts with •OH to produce highly fluorescentproduct, 2-hydroxyterephthalic acid (TAOH) [26, 27]. PLspectra of generated TAOH were measured on a FluorescenceSpectrophotometer (F-7000, Hitachi, Japan) using a excita-tion wavelength 315 nm at a scan speed of 1200 nm min−1
with the PMT voltage of 700 V. The width of excitation slitand emission slit was 1.0 nm.
3. Results and Discussion
Figure 1(a) shows the SEM image of the as-prepared titanatenanotube powder prepared by a hydrothermal process,indicating that the titanate nanotube shows a diameterof 7–15 nm and a length of several hundred nanometers.The TEM image (inset in Figure 1(a)) clearly indicates thatthe as-prepared nanotubes possess a uniform inner andouter diameter along their length. The corresponding XRDpattern of the titanate nanotubes is shown in Figure 2(a).The diffraction peak at around 10◦ is due to the layeredstructure of nanotubes along their radial direction, whileother diffraction peaks at around 24◦, 28◦, and 48◦ are relatedto the sodium titanate phase. Therefore, the as-preparedsample can be ascribed to sodium titanate nanotubes.
When the sodium titanate nanotubes were deposited onthe surface of FTO substrate by EPD method, it is interestingto find that the as-prepared films show an ordered assembledstructure of the nanotubes along their long-axis direction(Figure 1(b)). Moreover, in addition to the diffraction peaksof FTO, only one diffraction peak at ca. 10◦ can be observedand other peaks at ca. 24◦, 28◦, and 48◦ are completelydisappeared (Figure 2(b)). This indicates that the phasestructure of the nanotubes is changed while the layeredstructure of nanotubes is well preserved after EPD. To furtherinvestigate the phase structure and element compositionof the ordered films, XPS analysis was performed andshown in Figure 3. It can be seen that the sodium titanatenanotube powders (Figure 3(a)) contain Ti, O, C, andNa elements, with sharp photoelectron peaks appearing atbinding energies of 458 (Ti 2p), 531 (O 1s), 285 (C 1s), and1071 eV (Na 1s), respectively. The carbon peak is attributedto the adventitious hydrocarbon from XPS instrument itself.After the sodium titanate nanotube powder is deposited onthe surface of FTO to form a film, it is found that no XPSpeaks corresponding to Na element are recorded in the as-prepared film (Figure 3(b)). These results indicate that EPDis an effective way to remove the intercalated sodium in thesodium titanate nanotubes and the Na+ can be detachedfrom the nanotube when the nanotubes move towards anodeand are coated on the surface of FTO during EPD, which isin good agreement with the previous studies [28]. Therefore,the phase structure of highly ordered film can be attributedto protonated titanate with a similar crystal structure ofH2Ti3O7 [29, 30] and HxTi2−x/4 x/4O4(x = 0.75) [31].
Using a simple hydrothermal treatment of crystallineTiO2 particles with NaOH aqueous solutions, high-qualitynanotubes with uniform diameter of around 7–15 nm wereobtained and their specific surface area reached more than400.0 m2/g [24]. Unfortunately, the obtained nanotubes are
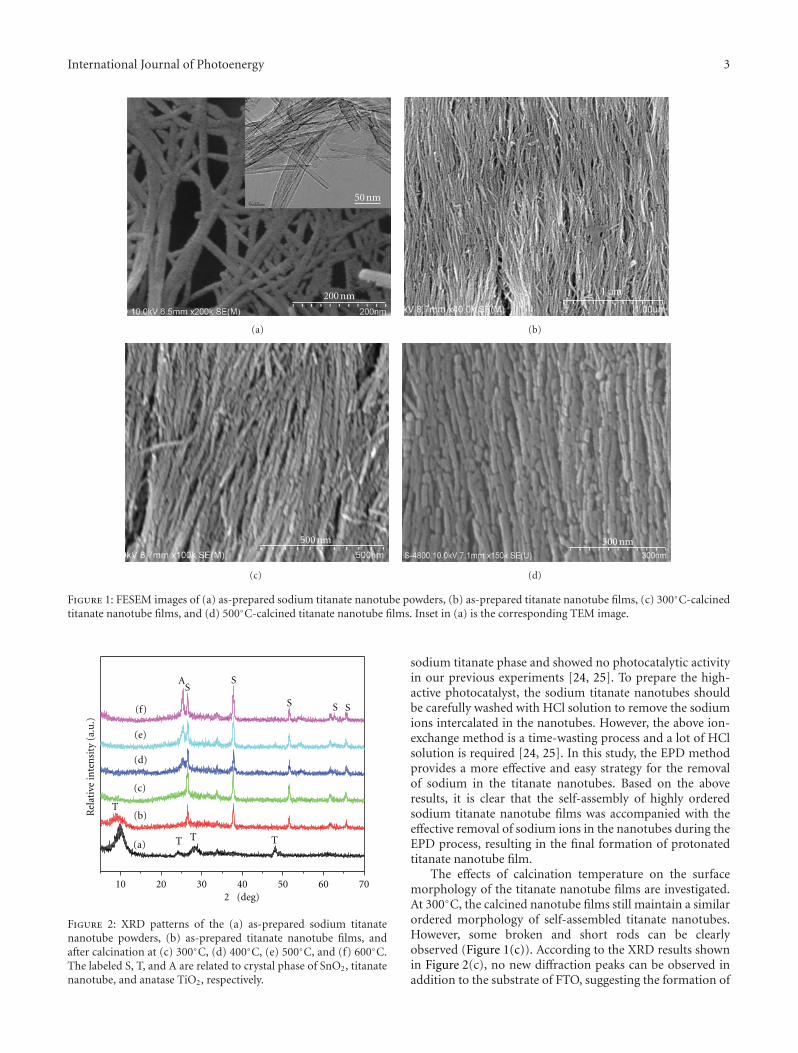
International Journal of Photoenergy 3
50 nm
200 nm
(a)
1μm
(b)
500 nm
(c)
300 nm
(d)
Figure 1: FESEM images of (a) as-prepared sodium titanate nanotube powders, (b) as-prepared titanate nanotube films, (c) 300◦C-calcinedtitanate nanotube films, and (d) 500◦C-calcined titanate nanotube films. Inset in (a) is the corresponding TEM image.
10 20 30 40 50 60 70
T TT
T
SSS
SS
A
(f)
(b)
(c)
(d)
(e)
(a)
Rel
ativ
e in
ten
sity
(a.
u.)
2 (deg)
Figure 2: XRD patterns of the (a) as-prepared sodium titanatenanotube powders, (b) as-prepared titanate nanotube films, andafter calcination at (c) 300◦C, (d) 400◦C, (e) 500◦C, and (f) 600◦C.The labeled S, T, and A are related to crystal phase of SnO2, titanatenanotube, and anatase TiO2, respectively.
sodium titanate phase and showed no photocatalytic activityin our previous experiments [24, 25]. To prepare the high-active photocatalyst, the sodium titanate nanotubes shouldbe carefully washed with HCl solution to remove the sodiumions intercalated in the nanotubes. However, the above ion-exchange method is a time-wasting process and a lot of HClsolution is required [24, 25]. In this study, the EPD methodprovides a more effective and easy strategy for the removalof sodium in the titanate nanotubes. Based on the aboveresults, it is clear that the self-assembly of highly orderedsodium titanate nanotube films was accompanied with theeffective removal of sodium ions in the nanotubes during theEPD process, resulting in the final formation of protonatedtitanate nanotube film.
The effects of calcination temperature on the surfacemorphology of the titanate nanotube films are investigated.At 300◦C, the calcined nanotube films still maintain a similarordered morphology of self-assembled titanate nanotubes.However, some broken and short rods can be clearlyobserved (Figure 1(c)). According to the XRD results shownin Figure 2(c), no new diffraction peaks can be observed inaddition to the substrate of FTO, suggesting the formation of
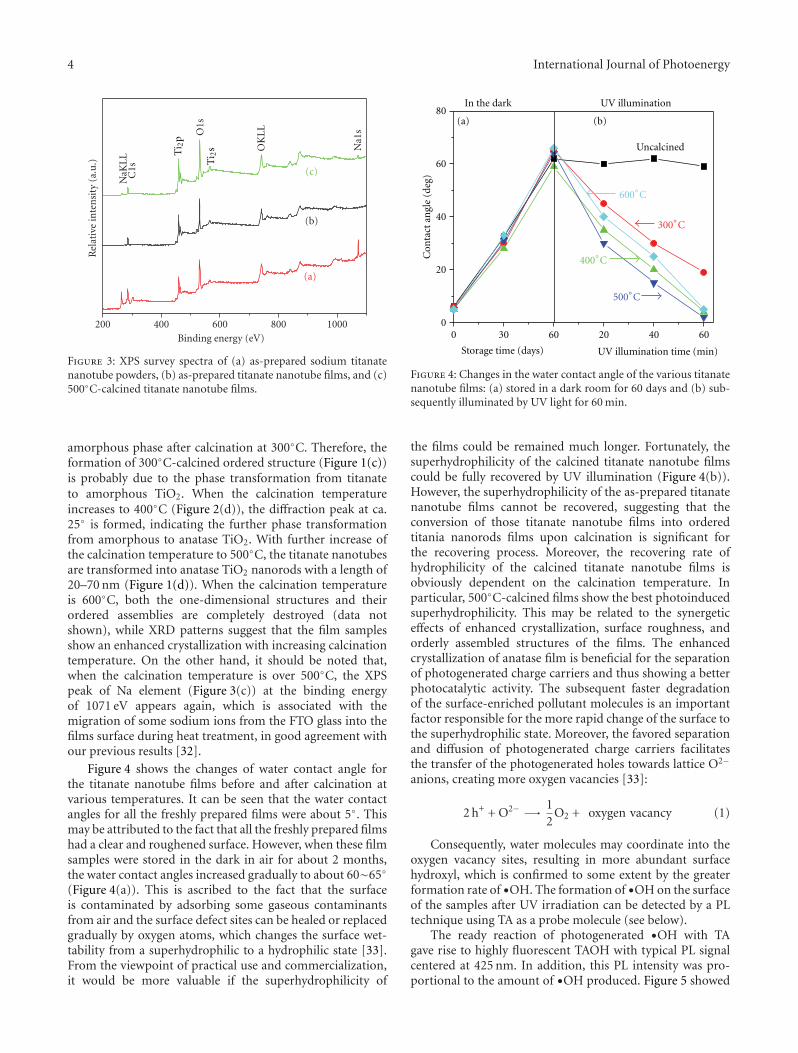
4 International Journal of Photoenergy
200 400 600 800 1000
OK
LL
NaK
LLC
1s
Rel
ativ
e in
ten
sity
(a.
u.)
Binding energy (eV)
(c)
(b)
(a)
O1s
Na1
s
Ti 2
p
Ti 2
s
Figure 3: XPS survey spectra of (a) as-prepared sodium titanatenanotube powders, (b) as-prepared titanate nanotube films, and (c)500◦C-calcined titanate nanotube films.
amorphous phase after calcination at 300◦C. Therefore, theformation of 300◦C-calcined ordered structure (Figure 1(c))is probably due to the phase transformation from titanateto amorphous TiO2. When the calcination temperatureincreases to 400◦C (Figure 2(d)), the diffraction peak at ca.25◦ is formed, indicating the further phase transformationfrom amorphous to anatase TiO2. With further increase ofthe calcination temperature to 500◦C, the titanate nanotubesare transformed into anatase TiO2 nanorods with a length of20–70 nm (Figure 1(d)). When the calcination temperatureis 600◦C, both the one-dimensional structures and theirordered assemblies are completely destroyed (data notshown), while XRD patterns suggest that the film samplesshow an enhanced crystallization with increasing calcinationtemperature. On the other hand, it should be noted that,when the calcination temperature is over 500◦C, the XPSpeak of Na element (Figure 3(c)) at the binding energyof 1071 eV appears again, which is associated with themigration of some sodium ions from the FTO glass into thefilms surface during heat treatment, in good agreement withour previous results [32].
Figure 4 shows the changes of water contact angle forthe titanate nanotube films before and after calcination atvarious temperatures. It can be seen that the water contactangles for all the freshly prepared films were about 5◦. Thismay be attributed to the fact that all the freshly prepared filmshad a clear and roughened surface. However, when these filmsamples were stored in the dark in air for about 2 months,the water contact angles increased gradually to about 60∼65◦
(Figure 4(a)). This is ascribed to the fact that the surfaceis contaminated by adsorbing some gaseous contaminantsfrom air and the surface defect sites can be healed or replacedgradually by oxygen atoms, which changes the surface wet-tability from a superhydrophilic to a hydrophilic state [33].From the viewpoint of practical use and commercialization,it would be more valuable if the superhydrophilicity of
0
20
40
60
80
30
In the dark UV illumination
604020
UV illumination time (min)
600
Storage time (days)
Uncalcined
Con
tact
an
gle
(deg
)
(b)(a)
600◦C
400◦C
300◦C
500◦C
Figure 4: Changes in the water contact angle of the various titanatenanotube films: (a) stored in a dark room for 60 days and (b) sub-sequently illuminated by UV light for 60 min.
the films could be remained much longer. Fortunately, thesuperhydrophilicity of the calcined titanate nanotube filmscould be fully recovered by UV illumination (Figure 4(b)).However, the superhydrophilicity of the as-prepared titanatenanotube films cannot be recovered, suggesting that theconversion of those titanate nanotube films into orderedtitania nanorods films upon calcination is significant forthe recovering process. Moreover, the recovering rate ofhydrophilicity of the calcined titanate nanotube films isobviously dependent on the calcination temperature. Inparticular, 500◦C-calcined films show the best photoinducedsuperhydrophilicity. This may be related to the synergeticeffects of enhanced crystallization, surface roughness, andorderly assembled structures of the films. The enhancedcrystallization of anatase film is beneficial for the separationof photogenerated charge carriers and thus showing a betterphotocatalytic activity. The subsequent faster degradationof the surface-enriched pollutant molecules is an importantfactor responsible for the more rapid change of the surface tothe superhydrophilic state. Moreover, the favored separationand diffusion of photogenerated charge carriers facilitatesthe transfer of the photogenerated holes towards lattice O2−
anions, creating more oxygen vacancies [33]:
2 h+ + O2− −→ 12
O2 + oxygen vacancy (1)
Consequently, water molecules may coordinate into theoxygen vacancy sites, resulting in more abundant surfacehydroxyl, which is confirmed to some extent by the greaterformation rate of •OH. The formation of •OH on the surfaceof the samples after UV irradiation can be detected by a PLtechnique using TA as a probe molecule (see below).
The ready reaction of photogenerated •OH with TAgave rise to highly fluorescent TAOH with typical PL signalcentered at 425 nm. In addition, this PL intensity was pro-portional to the amount of •OH produced. Figure 5 showed
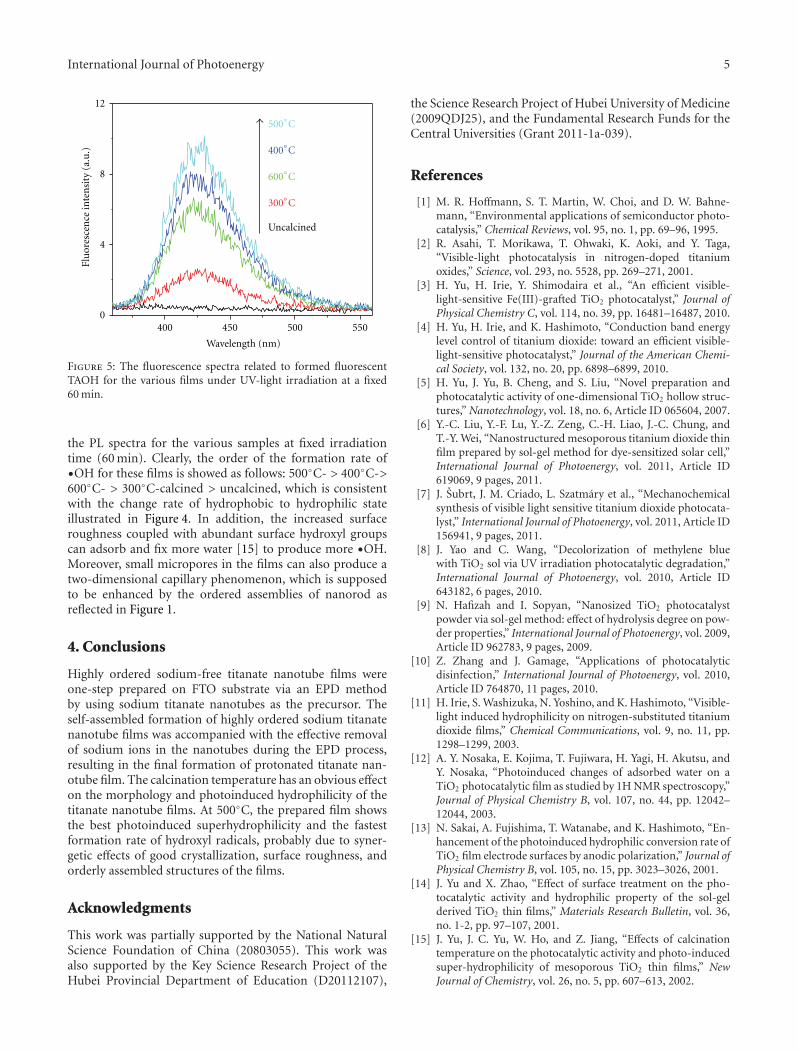
International Journal of Photoenergy 5
400 450 500 5500
4
8
12
Flu
ores
cen
ce in
ten
sity
(a.
u.)
Wavelength (nm)
Uncalcined
500◦C
400◦C
300◦C
600◦C
Figure 5: The fluorescence spectra related to formed fluorescentTAOH for the various films under UV-light irradiation at a fixed60 min.
the PL spectra for the various samples at fixed irradiationtime (60 min). Clearly, the order of the formation rate of•OH for these films is showed as follows: 500◦C- > 400◦C->600◦C- > 300◦C-calcined > uncalcined, which is consistentwith the change rate of hydrophobic to hydrophilic stateillustrated in Figure 4. In addition, the increased surfaceroughness coupled with abundant surface hydroxyl groupscan adsorb and fix more water [15] to produce more •OH.Moreover, small micropores in the films can also produce atwo-dimensional capillary phenomenon, which is supposedto be enhanced by the ordered assemblies of nanorod asreflected in Figure 1.
4. Conclusions
Highly ordered sodium-free titanate nanotube films wereone-step prepared on FTO substrate via an EPD methodby using sodium titanate nanotubes as the precursor. Theself-assembled formation of highly ordered sodium titanatenanotube films was accompanied with the effective removalof sodium ions in the nanotubes during the EPD process,resulting in the final formation of protonated titanate nan-otube film. The calcination temperature has an obvious effecton the morphology and photoinduced hydrophilicity of thetitanate nanotube films. At 500◦C, the prepared film showsthe best photoinduced superhydrophilicity and the fastestformation rate of hydroxyl radicals, probably due to syner-getic effects of good crystallization, surface roughness, andorderly assembled structures of the films.
Acknowledgments
This work was partially supported by the National NaturalScience Foundation of China (20803055). This work wasalso supported by the Key Science Research Project of theHubei Provincial Department of Education (D20112107),
the Science Research Project of Hubei University of Medicine(2009QDJ25), and the Fundamental Research Funds for theCentral Universities (Grant 2011-1a-039).
References
[1] M. R. Hoffmann, S. T. Martin, W. Choi, and D. W. Bahne-mann, “Environmental applications of semiconductor photo-catalysis,” Chemical Reviews, vol. 95, no. 1, pp. 69–96, 1995.
[2] R. Asahi, T. Morikawa, T. Ohwaki, K. Aoki, and Y. Taga,“Visible-light photocatalysis in nitrogen-doped titaniumoxides,” Science, vol. 293, no. 5528, pp. 269–271, 2001.
[3] H. Yu, H. Irie, Y. Shimodaira et al., “An efficient visible-light-sensitive Fe(III)-grafted TiO2 photocatalyst,” Journal ofPhysical Chemistry C, vol. 114, no. 39, pp. 16481–16487, 2010.
[4] H. Yu, H. Irie, and K. Hashimoto, “Conduction band energylevel control of titanium dioxide: toward an efficient visible-light-sensitive photocatalyst,” Journal of the American Chemi-cal Society, vol. 132, no. 20, pp. 6898–6899, 2010.
[5] H. Yu, J. Yu, B. Cheng, and S. Liu, “Novel preparation andphotocatalytic activity of one-dimensional TiO2 hollow struc-tures,” Nanotechnology, vol. 18, no. 6, Article ID 065604, 2007.
[6] Y.-C. Liu, Y.-F. Lu, Y.-Z. Zeng, C.-H. Liao, J.-C. Chung, andT.-Y. Wei, “Nanostructured mesoporous titanium dioxide thinfilm prepared by sol-gel method for dye-sensitized solar cell,”International Journal of Photoenergy, vol. 2011, Article ID619069, 9 pages, 2011.
[7] J. Subrt, J. M. Criado, L. Szatmary et al., “Mechanochemicalsynthesis of visible light sensitive titanium dioxide photocata-lyst,” International Journal of Photoenergy, vol. 2011, Article ID156941, 9 pages, 2011.
[8] J. Yao and C. Wang, “Decolorization of methylene bluewith TiO2 sol via UV irradiation photocatalytic degradation,”International Journal of Photoenergy, vol. 2010, Article ID643182, 6 pages, 2010.
[9] N. Hafizah and I. Sopyan, “Nanosized TiO2 photocatalystpowder via sol-gel method: effect of hydrolysis degree on pow-der properties,” International Journal of Photoenergy, vol. 2009,Article ID 962783, 9 pages, 2009.
[10] Z. Zhang and J. Gamage, “Applications of photocatalyticdisinfection,” International Journal of Photoenergy, vol. 2010,Article ID 764870, 11 pages, 2010.
[11] H. Irie, S. Washizuka, N. Yoshino, and K. Hashimoto, “Visible-light induced hydrophilicity on nitrogen-substituted titaniumdioxide films,” Chemical Communications, vol. 9, no. 11, pp.1298–1299, 2003.
[12] A. Y. Nosaka, E. Kojima, T. Fujiwara, H. Yagi, H. Akutsu, andY. Nosaka, “Photoinduced changes of adsorbed water on aTiO2 photocatalytic film as studied by 1H NMR spectroscopy,”Journal of Physical Chemistry B, vol. 107, no. 44, pp. 12042–12044, 2003.
[13] N. Sakai, A. Fujishima, T. Watanabe, and K. Hashimoto, “En-hancement of the photoinduced hydrophilic conversion rate ofTiO2 film electrode surfaces by anodic polarization,” Journal ofPhysical Chemistry B, vol. 105, no. 15, pp. 3023–3026, 2001.
[14] J. Yu and X. Zhao, “Effect of surface treatment on the pho-tocatalytic activity and hydrophilic property of the sol-gelderived TiO2 thin films,” Materials Research Bulletin, vol. 36,no. 1-2, pp. 97–107, 2001.
[15] J. Yu, J. C. Yu, W. Ho, and Z. Jiang, “Effects of calcinationtemperature on the photocatalytic activity and photo-inducedsuper-hydrophilicity of mesoporous TiO2 thin films,” NewJournal of Chemistry, vol. 26, no. 5, pp. 607–613, 2002.
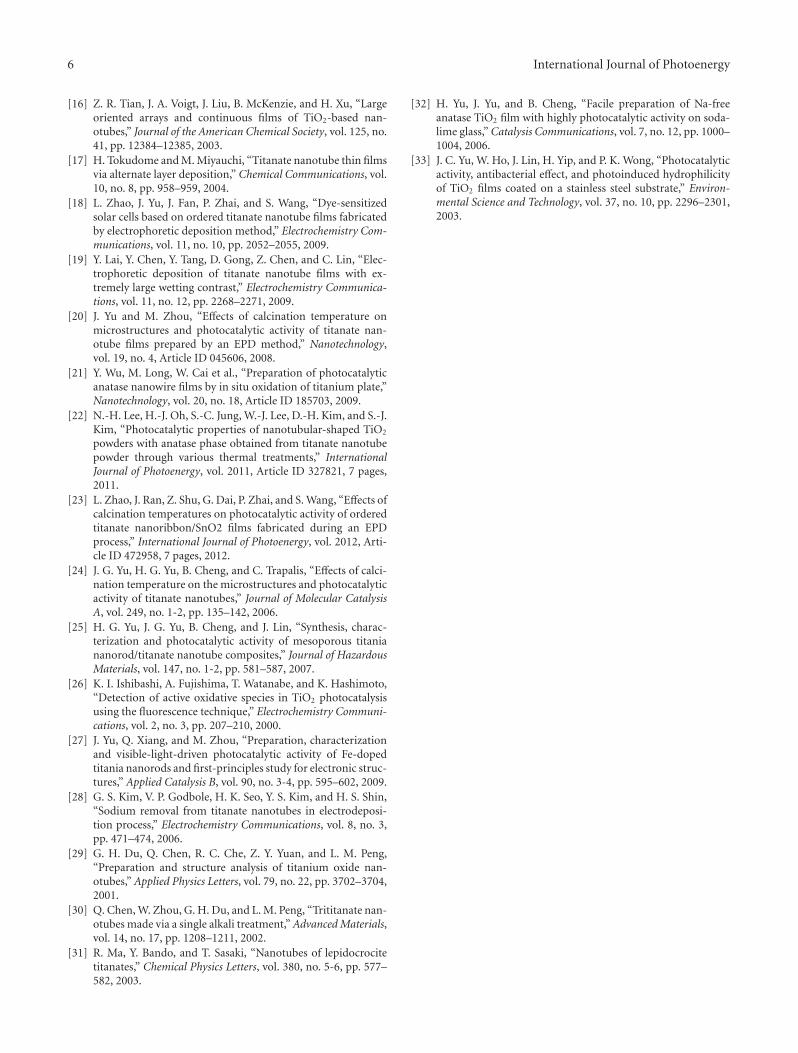
6 International Journal of Photoenergy
[16] Z. R. Tian, J. A. Voigt, J. Liu, B. McKenzie, and H. Xu, “Largeoriented arrays and continuous films of TiO2-based nan-otubes,” Journal of the American Chemical Society, vol. 125, no.41, pp. 12384–12385, 2003.
[17] H. Tokudome and M. Miyauchi, “Titanate nanotube thin filmsvia alternate layer deposition,” Chemical Communications, vol.10, no. 8, pp. 958–959, 2004.
[18] L. Zhao, J. Yu, J. Fan, P. Zhai, and S. Wang, “Dye-sensitizedsolar cells based on ordered titanate nanotube films fabricatedby electrophoretic deposition method,” Electrochemistry Com-munications, vol. 11, no. 10, pp. 2052–2055, 2009.
[19] Y. Lai, Y. Chen, Y. Tang, D. Gong, Z. Chen, and C. Lin, “Elec-trophoretic deposition of titanate nanotube films with ex-tremely large wetting contrast,” Electrochemistry Communica-tions, vol. 11, no. 12, pp. 2268–2271, 2009.
[20] J. Yu and M. Zhou, “Effects of calcination temperature onmicrostructures and photocatalytic activity of titanate nan-otube films prepared by an EPD method,” Nanotechnology,vol. 19, no. 4, Article ID 045606, 2008.
[21] Y. Wu, M. Long, W. Cai et al., “Preparation of photocatalyticanatase nanowire films by in situ oxidation of titanium plate,”Nanotechnology, vol. 20, no. 18, Article ID 185703, 2009.
[22] N.-H. Lee, H.-J. Oh, S.-C. Jung, W.-J. Lee, D.-H. Kim, and S.-J.Kim, “Photocatalytic properties of nanotubular-shaped TiO2
powders with anatase phase obtained from titanate nanotubepowder through various thermal treatments,” InternationalJournal of Photoenergy, vol. 2011, Article ID 327821, 7 pages,2011.
[23] L. Zhao, J. Ran, Z. Shu, G. Dai, P. Zhai, and S. Wang, “Effects ofcalcination temperatures on photocatalytic activity of orderedtitanate nanoribbon/SnO2 films fabricated during an EPDprocess,” International Journal of Photoenergy, vol. 2012, Arti-cle ID 472958, 7 pages, 2012.
[24] J. G. Yu, H. G. Yu, B. Cheng, and C. Trapalis, “Effects of calci-nation temperature on the microstructures and photocatalyticactivity of titanate nanotubes,” Journal of Molecular CatalysisA, vol. 249, no. 1-2, pp. 135–142, 2006.
[25] H. G. Yu, J. G. Yu, B. Cheng, and J. Lin, “Synthesis, charac-terization and photocatalytic activity of mesoporous titaniananorod/titanate nanotube composites,” Journal of HazardousMaterials, vol. 147, no. 1-2, pp. 581–587, 2007.
[26] K. I. Ishibashi, A. Fujishima, T. Watanabe, and K. Hashimoto,“Detection of active oxidative species in TiO2 photocatalysisusing the fluorescence technique,” Electrochemistry Communi-cations, vol. 2, no. 3, pp. 207–210, 2000.
[27] J. Yu, Q. Xiang, and M. Zhou, “Preparation, characterizationand visible-light-driven photocatalytic activity of Fe-dopedtitania nanorods and first-principles study for electronic struc-tures,” Applied Catalysis B, vol. 90, no. 3-4, pp. 595–602, 2009.
[28] G. S. Kim, V. P. Godbole, H. K. Seo, Y. S. Kim, and H. S. Shin,“Sodium removal from titanate nanotubes in electrodeposi-tion process,” Electrochemistry Communications, vol. 8, no. 3,pp. 471–474, 2006.
[29] G. H. Du, Q. Chen, R. C. Che, Z. Y. Yuan, and L. M. Peng,“Preparation and structure analysis of titanium oxide nan-otubes,” Applied Physics Letters, vol. 79, no. 22, pp. 3702–3704,2001.
[30] Q. Chen, W. Zhou, G. H. Du, and L. M. Peng, “Trititanate nan-otubes made via a single alkali treatment,” Advanced Materials,vol. 14, no. 17, pp. 1208–1211, 2002.
[31] R. Ma, Y. Bando, and T. Sasaki, “Nanotubes of lepidocrocitetitanates,” Chemical Physics Letters, vol. 380, no. 5-6, pp. 577–582, 2003.
[32] H. Yu, J. Yu, and B. Cheng, “Facile preparation of Na-freeanatase TiO2 film with highly photocatalytic activity on soda-lime glass,” Catalysis Communications, vol. 7, no. 12, pp. 1000–1004, 2006.
[33] J. C. Yu, W. Ho, J. Lin, H. Yip, and P. K. Wong, “Photocatalyticactivity, antibacterial effect, and photoinduced hydrophilicityof TiO2 films coated on a stainless steel substrate,” Environ-mental Science and Technology, vol. 37, no. 10, pp. 2296–2301,2003.
Hindawi Publishing CorporationInternational Journal of PhotoenergyVolume 2012, Article ID 720183, 9 pagesdoi:10.1155/2012/720183
Research Article
Light-Driven Preparation, Microstructure, and Visible-LightPhotocatalytic Property of Porous Carbon-Doped TiO2
Xiao-Xin Zou,1, 2 Guo-Dong Li,2 Jun Zhao,2 Juan Su,1, 2 Xiao Wei,1 Kai-Xue Wang,1
Yu-Ning Wang,1, 2 and Jie-Sheng Chen1
1 School of Chemistry and Chemical Engineering, Shanghai Jiao Tong University, Shanghai 200240, China2 State Key Laboratory of Inorganic Synthesis and Preparative Chemistry, College of Chemistry, Jilin University,Changchun 130012, China
Correspondence should be addressed to Guo-Dong Li, [email protected] and Jie-Sheng Chen, [email protected]
Received 12 November 2011; Accepted 19 December 2011
Academic Editor: Xuxu Wang
Copyright © 2012 Xiao-Xin Zou et al. This is an open access article distributed under the Creative Commons Attribution License,which permits unrestricted use, distribution, and reproduction in any medium, provided the original work is properly cited.
Highly porous carbon-doped TiO2 (C-TiO2) has been prepared, for the first time, through a light-driven approach using crystallinetitanium glycolate (TG) as the single-source precursor. Although the nonthermally prepared porous C-TiO2 is amorphous, itshows a remarkable visible-light photocatalytic activity higher than that of nitrogen-doped TiO2 (N-TiO2) due to its significantsurface area (530 m2/g) and pore-rich structure. X-ray photoelectron, electron paramagnetic resonance, and UV-Vis diffusereflectance spectroscopy reveal that the as-prepared porous C-TiO2 photocatalyst contains Ti–O–C bonds which result in visible-light absorption of the material at wavelengths less than 550 nm. Furthermore, it is discovered that the Ti–O–C bonds in the as-prepared C-TiO2 is easily transformed to coke-type species under mild thermal treatment (200◦C). The resulting coke-containingporous TiO2 is an even better visible-light photocatalyst, almost twice as effective as N-TiO2, because of its stronger visible-lightabsorption. The Ti–O–C and the coke-containing porous TiO2 materials follow two different mechanisms in the visible-lightphotocatalysis process for degradation of methylene blue.
1. Introduction
The elimination of hazardous organic pollutants from theenvironment has become a major and perennial issue.Heterogeneous photocatalysis proves to be a green andefficient approach to photodecompose organic pollutants bysolar energy [1]. For this application, typical photocatalystscommonly used are semiconductor metal oxides and sulfidessuch as TiO2, ZnO, CdS, and ZnS, among which titaniumdioxide is regarded as the most promising material due toits chemical stability, nontoxicity, and low cost [2]. However,the widespread use of TiO2 is limited by its wide bandgapenergy, which causes the catalyst to exploit only a very smallproportion (about 3 ∼ 5%) of solar radiation. Therefore, itis highly desired to develop strategies of shifting the photo-responsive range of TiO2 to visible spectral region. One ofthe most efficient strategies is to dope the TiO2 compoundwith nonmetals. Since the pioneering work reported by
Asahi on nitrogen-doped TiO2 (N-TiO2) [3], nonmetal-doped TiO2 has attracted a great deal of attention [4–9],for the nonmetal doping can lead to formation of intragaplocalized states or bandgap narrowing, improving the visible-light photocatalytic activity of the material considerably. Inparticular, carbon-doped TiO2 (C-TiO2) turns out to beremarkably effective under visible-light irradiation [10–21],and there has been report that C-TiO2 is even superior to N-TiO2 in visible-light photocatalysis [21].
Introduction of porous structures, which increases thesurface area of the photocatalyst to a great extent, isbelieved to be an effective approach to further enhance thephotocatalytic performance of C-TiO2. The large surfacearea in combination with the porous feature can facilitatethe diffusion and adsorption of reactant molecules [22, 23],offer more surface-active sites [24, 25], and enhance light-harvesting [24, 25]. Moreover, the transfer path of photogen-erated charges from bulk to surface can be shortened, and as
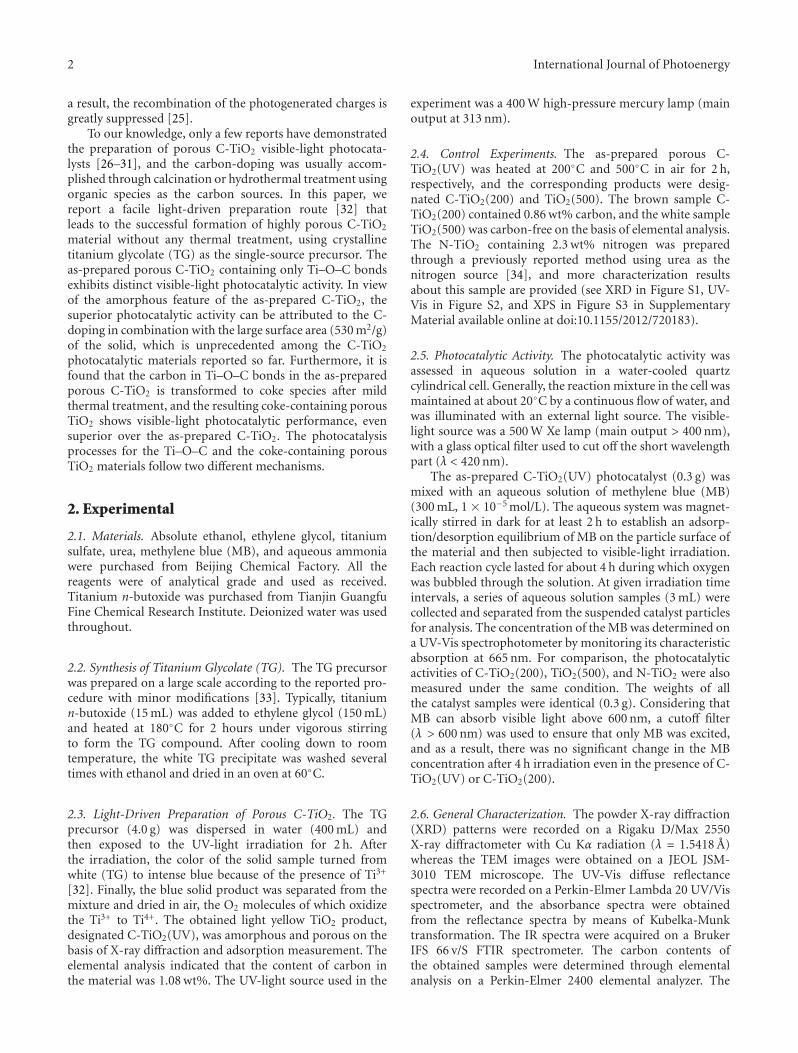
2 International Journal of Photoenergy
a result, the recombination of the photogenerated charges isgreatly suppressed [25].
To our knowledge, only a few reports have demonstratedthe preparation of porous C-TiO2 visible-light photocata-lysts [26–31], and the carbon-doping was usually accom-plished through calcination or hydrothermal treatment usingorganic species as the carbon sources. In this paper, wereport a facile light-driven preparation route [32] thatleads to the successful formation of highly porous C-TiO2
material without any thermal treatment, using crystallinetitanium glycolate (TG) as the single-source precursor. Theas-prepared porous C-TiO2 containing only Ti–O–C bondsexhibits distinct visible-light photocatalytic activity. In viewof the amorphous feature of the as-prepared C-TiO2, thesuperior photocatalytic activity can be attributed to the C-doping in combination with the large surface area (530 m2/g)of the solid, which is unprecedented among the C-TiO2
photocatalytic materials reported so far. Furthermore, it isfound that the carbon in Ti–O–C bonds in the as-preparedporous C-TiO2 is transformed to coke species after mildthermal treatment, and the resulting coke-containing porousTiO2 shows visible-light photocatalytic performance, evensuperior over the as-prepared C-TiO2. The photocatalysisprocesses for the Ti–O–C and the coke-containing porousTiO2 materials follow two different mechanisms.
2. Experimental
2.1. Materials. Absolute ethanol, ethylene glycol, titaniumsulfate, urea, methylene blue (MB), and aqueous ammoniawere purchased from Beijing Chemical Factory. All thereagents were of analytical grade and used as received.Titanium n-butoxide was purchased from Tianjin GuangfuFine Chemical Research Institute. Deionized water was usedthroughout.
2.2. Synthesis of Titanium Glycolate (TG). The TG precursorwas prepared on a large scale according to the reported pro-cedure with minor modifications [33]. Typically, titaniumn-butoxide (15 mL) was added to ethylene glycol (150 mL)and heated at 180◦C for 2 hours under vigorous stirringto form the TG compound. After cooling down to roomtemperature, the white TG precipitate was washed severaltimes with ethanol and dried in an oven at 60◦C.
2.3. Light-Driven Preparation of Porous C-TiO2. The TGprecursor (4.0 g) was dispersed in water (400 mL) andthen exposed to the UV-light irradiation for 2 h. Afterthe irradiation, the color of the solid sample turned fromwhite (TG) to intense blue because of the presence of Ti3+
[32]. Finally, the blue solid product was separated from themixture and dried in air, the O2 molecules of which oxidizethe Ti3+ to Ti4+. The obtained light yellow TiO2 product,designated C-TiO2(UV), was amorphous and porous on thebasis of X-ray diffraction and adsorption measurement. Theelemental analysis indicated that the content of carbon inthe material was 1.08 wt%. The UV-light source used in the
experiment was a 400 W high-pressure mercury lamp (mainoutput at 313 nm).
2.4. Control Experiments. The as-prepared porous C-TiO2(UV) was heated at 200◦C and 500◦C in air for 2 h,respectively, and the corresponding products were desig-nated C-TiO2(200) and TiO2(500). The brown sample C-TiO2(200) contained 0.86 wt% carbon, and the white sampleTiO2(500) was carbon-free on the basis of elemental analysis.The N-TiO2 containing 2.3 wt% nitrogen was preparedthrough a previously reported method using urea as thenitrogen source [34], and more characterization resultsabout this sample are provided (see XRD in Figure S1, UV-Vis in Figure S2, and XPS in Figure S3 in SupplementaryMaterial available online at doi:10.1155/2012/720183).
2.5. Photocatalytic Activity. The photocatalytic activity wasassessed in aqueous solution in a water-cooled quartzcylindrical cell. Generally, the reaction mixture in the cell wasmaintained at about 20◦C by a continuous flow of water, andwas illuminated with an external light source. The visible-light source was a 500 W Xe lamp (main output > 400 nm),with a glass optical filter used to cut off the short wavelengthpart (λ < 420 nm).
The as-prepared C-TiO2(UV) photocatalyst (0.3 g) wasmixed with an aqueous solution of methylene blue (MB)(300 mL, 1 × 10⁻⁵ mol/L). The aqueous system was magnet-ically stirred in dark for at least 2 h to establish an adsorp-tion/desorption equilibrium of MB on the particle surface ofthe material and then subjected to visible-light irradiation.Each reaction cycle lasted for about 4 h during which oxygenwas bubbled through the solution. At given irradiation timeintervals, a series of aqueous solution samples (3 mL) werecollected and separated from the suspended catalyst particlesfor analysis. The concentration of the MB was determined ona UV-Vis spectrophotometer by monitoring its characteristicabsorption at 665 nm. For comparison, the photocatalyticactivities of C-TiO2(200), TiO2(500), and N-TiO2 were alsomeasured under the same condition. The weights of allthe catalyst samples were identical (0.3 g). Considering thatMB can absorb visible light above 600 nm, a cutoff filter(λ > 600 nm) was used to ensure that only MB was excited,and as a result, there was no significant change in the MBconcentration after 4 h irradiation even in the presence of C-TiO2(UV) or C-TiO2(200).
2.6. General Characterization. The powder X-ray diffraction(XRD) patterns were recorded on a Rigaku D/Max 2550X-ray diffractometer with Cu Kα radiation (λ = 1.5418 A)whereas the TEM images were obtained on a JEOL JSM-3010 TEM microscope. The UV-Vis diffuse reflectancespectra were recorded on a Perkin-Elmer Lambda 20 UV/Visspectrometer, and the absorbance spectra were obtainedfrom the reflectance spectra by means of Kubelka-Munktransformation. The IR spectra were acquired on a BrukerIFS 66 v/S FTIR spectrometer. The carbon contents ofthe obtained samples were determined through elementalanalysis on a Perkin-Elmer 2400 elemental analyzer. The
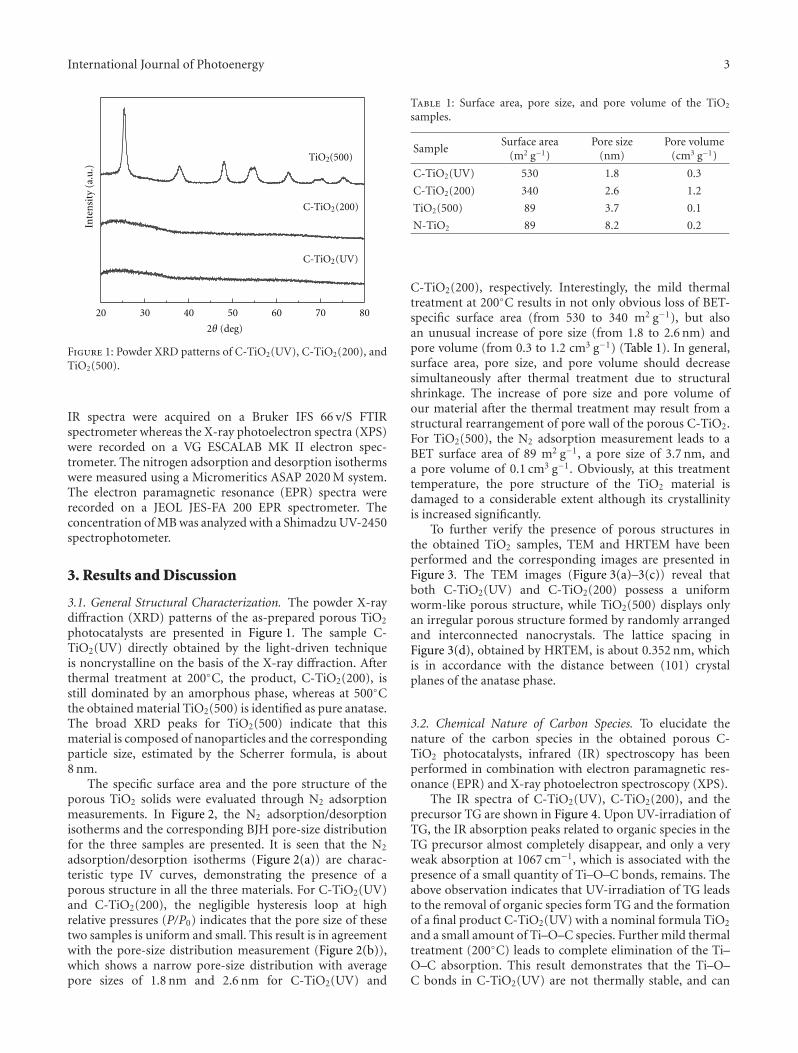
International Journal of Photoenergy 3
20 30 40 50 60 70 80
2θ (deg)
Inte
nsi
ty (
a.u
.)
C-TiO2(UV)
C-TiO2(200)
TiO2(500)
Figure 1: Powder XRD patterns of C-TiO2(UV), C-TiO2(200), andTiO2(500).
IR spectra were acquired on a Bruker IFS 66 v/S FTIRspectrometer whereas the X-ray photoelectron spectra (XPS)were recorded on a VG ESCALAB MK II electron spec-trometer. The nitrogen adsorption and desorption isothermswere measured using a Micromeritics ASAP 2020 M system.The electron paramagnetic resonance (EPR) spectra wererecorded on a JEOL JES-FA 200 EPR spectrometer. Theconcentration of MB was analyzed with a Shimadzu UV-2450spectrophotometer.
3. Results and Discussion
3.1. General Structural Characterization. The powder X-raydiffraction (XRD) patterns of the as-prepared porous TiO2
photocatalysts are presented in Figure 1. The sample C-TiO2(UV) directly obtained by the light-driven techniqueis noncrystalline on the basis of the X-ray diffraction. Afterthermal treatment at 200◦C, the product, C-TiO2(200), isstill dominated by an amorphous phase, whereas at 500◦Cthe obtained material TiO2(500) is identified as pure anatase.The broad XRD peaks for TiO2(500) indicate that thismaterial is composed of nanoparticles and the correspondingparticle size, estimated by the Scherrer formula, is about8 nm.
The specific surface area and the pore structure of theporous TiO2 solids were evaluated through N2 adsorptionmeasurements. In Figure 2, the N2 adsorption/desorptionisotherms and the corresponding BJH pore-size distributionfor the three samples are presented. It is seen that the N2
adsorption/desorption isotherms (Figure 2(a)) are charac-teristic type IV curves, demonstrating the presence of aporous structure in all the three materials. For C-TiO2(UV)and C-TiO2(200), the negligible hysteresis loop at highrelative pressures (P/P0) indicates that the pore size of thesetwo samples is uniform and small. This result is in agreementwith the pore-size distribution measurement (Figure 2(b)),which shows a narrow pore-size distribution with averagepore sizes of 1.8 nm and 2.6 nm for C-TiO2(UV) and
Table 1: Surface area, pore size, and pore volume of the TiO2
samples.
SampleSurface area
(m2 g−1)Pore size
(nm)Pore volume
(cm3 g−1)
C-TiO2(UV) 530 1.8 0.3
C-TiO2(200) 340 2.6 1.2
TiO2(500) 89 3.7 0.1
N-TiO2 89 8.2 0.2
C-TiO2(200), respectively. Interestingly, the mild thermaltreatment at 200◦C results in not only obvious loss of BET-specific surface area (from 530 to 340 m2 g−1), but alsoan unusual increase of pore size (from 1.8 to 2.6 nm) andpore volume (from 0.3 to 1.2 cm3 g−1) (Table 1). In general,surface area, pore size, and pore volume should decreasesimultaneously after thermal treatment due to structuralshrinkage. The increase of pore size and pore volume ofour material after the thermal treatment may result from astructural rearrangement of pore wall of the porous C-TiO2.For TiO2(500), the N2 adsorption measurement leads to aBET surface area of 89 m2 g−1, a pore size of 3.7 nm, anda pore volume of 0.1 cm3 g−1. Obviously, at this treatmenttemperature, the pore structure of the TiO2 material isdamaged to a considerable extent although its crystallinityis increased significantly.
To further verify the presence of porous structures inthe obtained TiO2 samples, TEM and HRTEM have beenperformed and the corresponding images are presented inFigure 3. The TEM images (Figure 3(a)–3(c)) reveal thatboth C-TiO2(UV) and C-TiO2(200) possess a uniformworm-like porous structure, while TiO2(500) displays onlyan irregular porous structure formed by randomly arrangedand interconnected nanocrystals. The lattice spacing inFigure 3(d), obtained by HRTEM, is about 0.352 nm, whichis in accordance with the distance between (101) crystalplanes of the anatase phase.
3.2. Chemical Nature of Carbon Species. To elucidate thenature of the carbon species in the obtained porous C-TiO2 photocatalysts, infrared (IR) spectroscopy has beenperformed in combination with electron paramagnetic res-onance (EPR) and X-ray photoelectron spectroscopy (XPS).
The IR spectra of C-TiO2(UV), C-TiO2(200), and theprecursor TG are shown in Figure 4. Upon UV-irradiation ofTG, the IR absorption peaks related to organic species in theTG precursor almost completely disappear, and only a veryweak absorption at 1067 cm−1, which is associated with thepresence of a small quantity of Ti–O–C bonds, remains. Theabove observation indicates that UV-irradiation of TG leadsto the removal of organic species form TG and the formationof a final product C-TiO2(UV) with a nominal formula TiO2
and a small amount of Ti–O–C species. Further mild thermaltreatment (200◦C) leads to complete elimination of the Ti–O–C absorption. This result demonstrates that the Ti–O–C bonds in C-TiO2(UV) are not thermally stable, and can
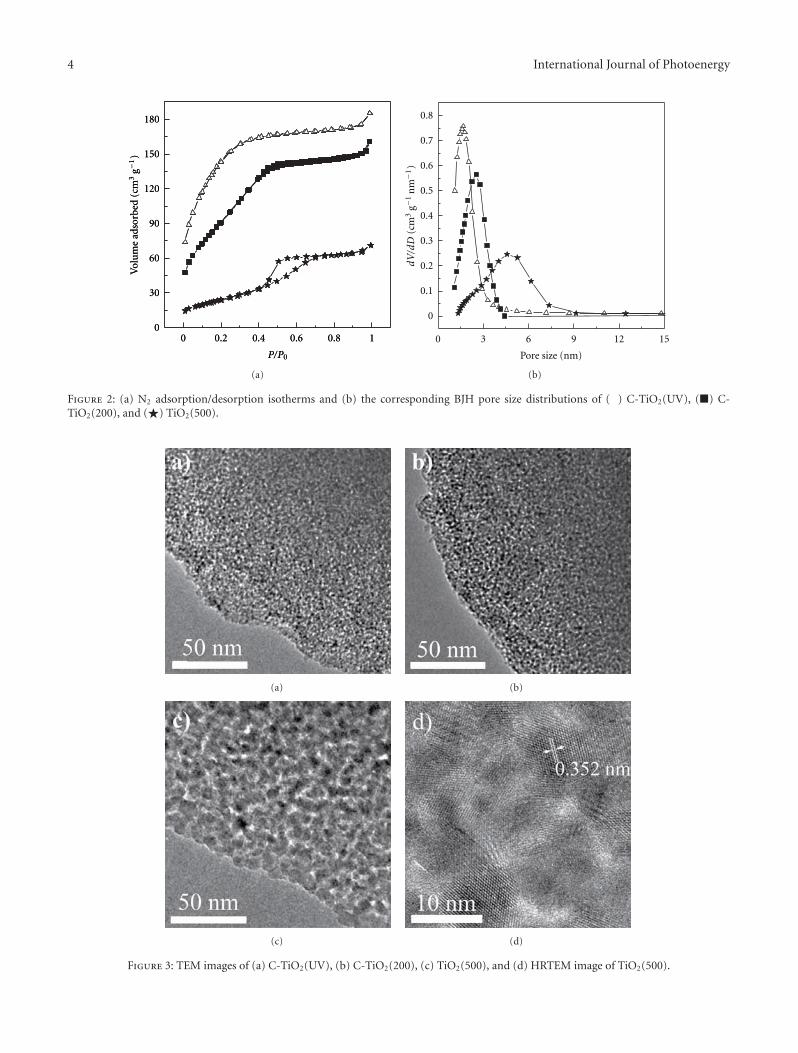
4 International Journal of Photoenergy
00
30
60
90
120
150
180
Vol
um
e ad
sorb
ed (
cm3
g−1)
0.2 0.4 0.6 0.8 1
P/P0
00
30
60
90
120
150
180
Vol
um
e ad
sorb
ed (
cm3
g−1)
0.2 0.4 0.6 0.8 1
P/P0
(a)
0 3 6 9 12 15
0
0.1
0.2
0.3
0.4
0.5
0.6
0.7
0.8
dV/dD
(cm
3g−
1n
m−1
)
Pore size (nm)
(b)
Figure 2: (a) N2 adsorption/desorption isotherms and (b) the corresponding BJH pore size distributions of ( ) C-TiO2(UV), (�) C-TiO2(200), and (�) TiO2(500).
(a) (b)
(c) (d)
Figure 3: TEM images of (a) C-TiO2(UV), (b) C-TiO2(200), (c) TiO2(500), and (d) HRTEM image of TiO2(500).
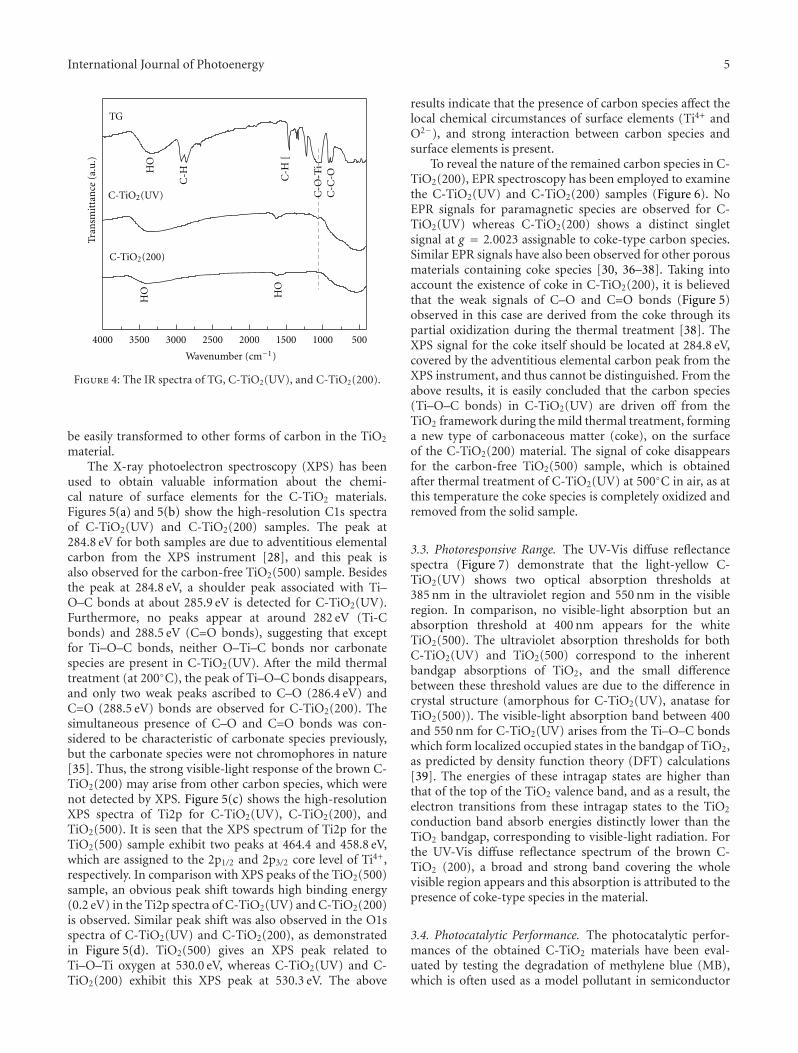
International Journal of Photoenergy 5
4000 3500 3000 2500 2000 1500 1000 500
HO
HO
HO
Tran
smit
tan
ce (
a.u
.)
TG
C-TiO2(UV)
C-TiO2(200)
C-H C-H
[
C-O
-Ti
C-C
-O
Wavenumber (cm−1)
Figure 4: The IR spectra of TG, C-TiO2(UV), and C-TiO2(200).
be easily transformed to other forms of carbon in the TiO2
material.The X-ray photoelectron spectroscopy (XPS) has been
used to obtain valuable information about the chemi-cal nature of surface elements for the C-TiO2 materials.Figures 5(a) and 5(b) show the high-resolution C1s spectraof C-TiO2(UV) and C-TiO2(200) samples. The peak at284.8 eV for both samples are due to adventitious elementalcarbon from the XPS instrument [28], and this peak isalso observed for the carbon-free TiO2(500) sample. Besidesthe peak at 284.8 eV, a shoulder peak associated with Ti–O–C bonds at about 285.9 eV is detected for C-TiO2(UV).Furthermore, no peaks appear at around 282 eV (Ti-Cbonds) and 288.5 eV (C=O bonds), suggesting that exceptfor Ti–O–C bonds, neither O–Ti–C bonds nor carbonatespecies are present in C-TiO2(UV). After the mild thermaltreatment (at 200◦C), the peak of Ti–O–C bonds disappears,and only two weak peaks ascribed to C–O (286.4 eV) andC=O (288.5 eV) bonds are observed for C-TiO2(200). Thesimultaneous presence of C–O and C=O bonds was con-sidered to be characteristic of carbonate species previously,but the carbonate species were not chromophores in nature[35]. Thus, the strong visible-light response of the brown C-TiO2(200) may arise from other carbon species, which werenot detected by XPS. Figure 5(c) shows the high-resolutionXPS spectra of Ti2p for C-TiO2(UV), C-TiO2(200), andTiO2(500). It is seen that the XPS spectrum of Ti2p for theTiO2(500) sample exhibit two peaks at 464.4 and 458.8 eV,which are assigned to the 2p1/2 and 2p3/2 core level of Ti4+,respectively. In comparison with XPS peaks of the TiO2(500)sample, an obvious peak shift towards high binding energy(0.2 eV) in the Ti2p spectra of C-TiO2(UV) and C-TiO2(200)is observed. Similar peak shift was also observed in the O1sspectra of C-TiO2(UV) and C-TiO2(200), as demonstratedin Figure 5(d). TiO2(500) gives an XPS peak related toTi–O–Ti oxygen at 530.0 eV, whereas C-TiO2(UV) and C-TiO2(200) exhibit this XPS peak at 530.3 eV. The above
results indicate that the presence of carbon species affect thelocal chemical circumstances of surface elements (Ti4+ andO2−), and strong interaction between carbon species andsurface elements is present.
To reveal the nature of the remained carbon species in C-TiO2(200), EPR spectroscopy has been employed to examinethe C-TiO2(UV) and C-TiO2(200) samples (Figure 6). NoEPR signals for paramagnetic species are observed for C-TiO2(UV) whereas C-TiO2(200) shows a distinct singletsignal at g = 2.0023 assignable to coke-type carbon species.Similar EPR signals have also been observed for other porousmaterials containing coke species [30, 36–38]. Taking intoaccount the existence of coke in C-TiO2(200), it is believedthat the weak signals of C–O and C=O bonds (Figure 5)observed in this case are derived from the coke through itspartial oxidization during the thermal treatment [38]. TheXPS signal for the coke itself should be located at 284.8 eV,covered by the adventitious elemental carbon peak from theXPS instrument, and thus cannot be distinguished. From theabove results, it is easily concluded that the carbon species(Ti–O–C bonds) in C-TiO2(UV) are driven off from theTiO2 framework during the mild thermal treatment, forminga new type of carbonaceous matter (coke), on the surfaceof the C-TiO2(200) material. The signal of coke disappearsfor the carbon-free TiO2(500) sample, which is obtainedafter thermal treatment of C-TiO2(UV) at 500◦C in air, as atthis temperature the coke species is completely oxidized andremoved from the solid sample.
3.3. Photoresponsive Range. The UV-Vis diffuse reflectancespectra (Figure 7) demonstrate that the light-yellow C-TiO2(UV) shows two optical absorption thresholds at385 nm in the ultraviolet region and 550 nm in the visibleregion. In comparison, no visible-light absorption but anabsorption threshold at 400 nm appears for the whiteTiO2(500). The ultraviolet absorption thresholds for bothC-TiO2(UV) and TiO2(500) correspond to the inherentbandgap absorptions of TiO2, and the small differencebetween these threshold values are due to the difference incrystal structure (amorphous for C-TiO2(UV), anatase forTiO2(500)). The visible-light absorption band between 400and 550 nm for C-TiO2(UV) arises from the Ti–O–C bondswhich form localized occupied states in the bandgap of TiO2,as predicted by density function theory (DFT) calculations[39]. The energies of these intragap states are higher thanthat of the top of the TiO2 valence band, and as a result, theelectron transitions from these intragap states to the TiO2
conduction band absorb energies distinctly lower than theTiO2 bandgap, corresponding to visible-light radiation. Forthe UV-Vis diffuse reflectance spectrum of the brown C-TiO2 (200), a broad and strong band covering the wholevisible region appears and this absorption is attributed to thepresence of coke-type species in the material.
3.4. Photocatalytic Performance. The photocatalytic perfor-mances of the obtained C-TiO2 materials have been eval-uated by testing the degradation of methylene blue (MB),which is often used as a model pollutant in semiconductor
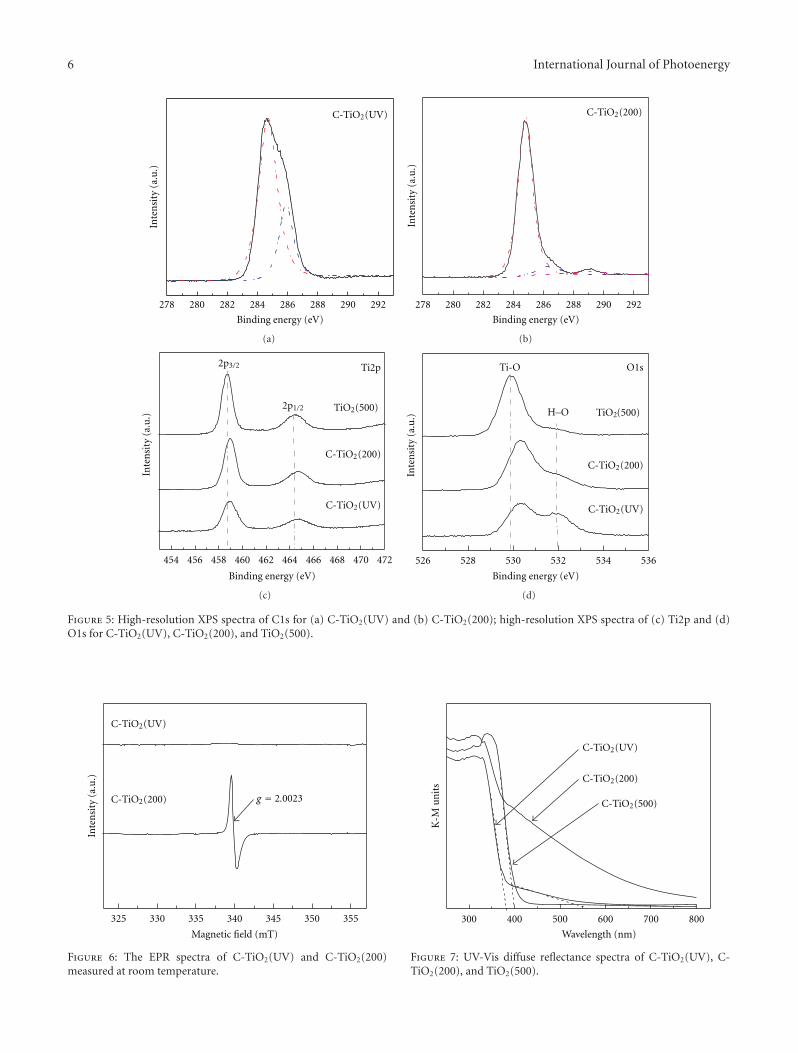
6 International Journal of Photoenergy
C-TiO2(UV)
Binding energy (eV)
Inte
nsi
ty (
a.u
.)
278 280 282 284 286 288 290 292
(a)
C-TiO2(200)
Inte
nsi
ty (
a.u
.)
Binding energy (eV)
278 280 282 284 286 288 290 292
(b)
Ti2p
Binding energy (eV)
Inte
nsi
ty (
a.u
.)
454 456 458 460 462 464 466 468 470 472
2p1/2
2p3/2
TiO2(500)
C-TiO2(UV)
C-TiO2(200)
(c)
C-TiO2(UV)
O1s
Binding energy (eV)
Inte
nsi
ty (
a.u
.)
526 528 530 532 534 536
Ti-O
TiO2(500)
C-TiO2(200)
H–O
(d)
Figure 5: High-resolution XPS spectra of C1s for (a) C-TiO2(UV) and (b) C-TiO2(200); high-resolution XPS spectra of (c) Ti2p and (d)O1s for C-TiO2(UV), C-TiO2(200), and TiO2(500).
Inte
nsi
ty (
a.u
.)
C-TiO2(UV)
C-TiO2(200)
Magnetic field (mT)
g = 2.0023
325 330 335 340 345 350 355
Figure 6: The EPR spectra of C-TiO2(UV) and C-TiO2(200)measured at room temperature.
C-TiO2(UV)
C-TiO2(200)
C-TiO2(500)
Wavelength (nm)
K-M
un
its
300 400 500 600 700 800
Figure 7: UV-Vis diffuse reflectance spectra of C-TiO2(UV), C-TiO2(200), and TiO2(500).
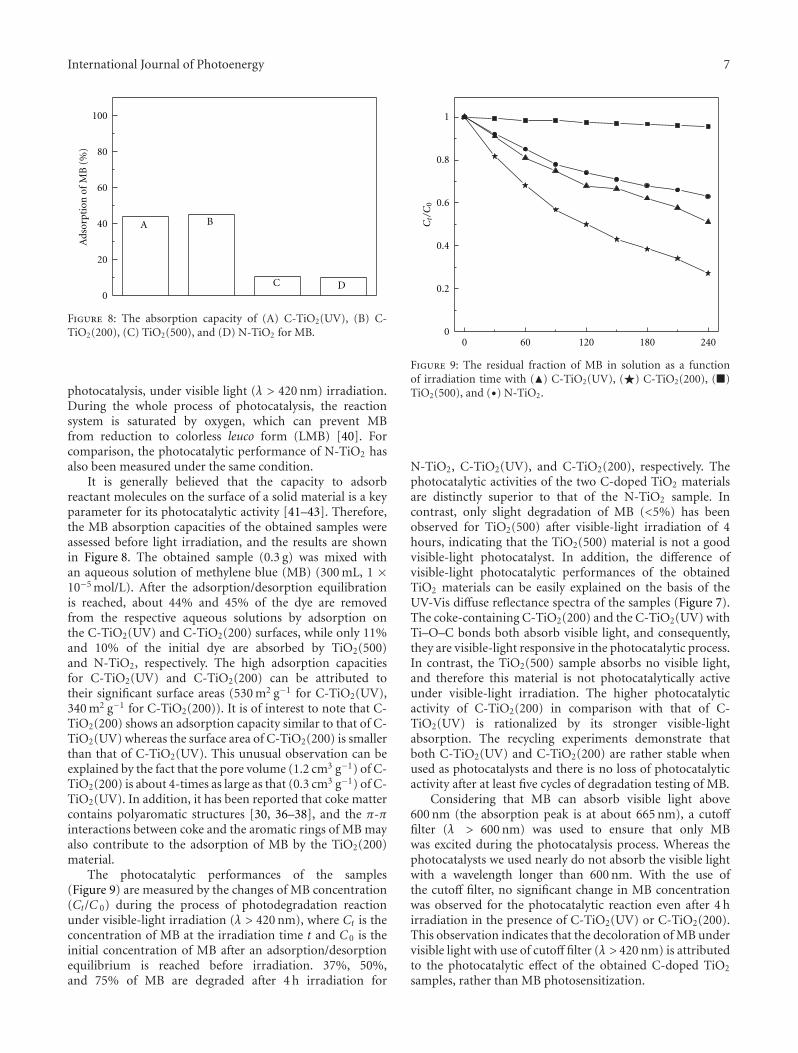
International Journal of Photoenergy 7
100
80
60
40
20
0
A B
C D
Ads
orpt
ion
of
MB
(%
)
Figure 8: The absorption capacity of (A) C-TiO2(UV), (B) C-TiO2(200), (C) TiO2(500), and (D) N-TiO2 for MB.
photocatalysis, under visible light (λ > 420 nm) irradiation.During the whole process of photocatalysis, the reactionsystem is saturated by oxygen, which can prevent MBfrom reduction to colorless leuco form (LMB) [40]. Forcomparison, the photocatalytic performance of N-TiO2 hasalso been measured under the same condition.
It is generally believed that the capacity to adsorbreactant molecules on the surface of a solid material is a keyparameter for its photocatalytic activity [41–43]. Therefore,the MB absorption capacities of the obtained samples wereassessed before light irradiation, and the results are shownin Figure 8. The obtained sample (0.3 g) was mixed withan aqueous solution of methylene blue (MB) (300 mL, 1 ×10⁻⁵ mol/L). After the adsorption/desorption equilibrationis reached, about 44% and 45% of the dye are removedfrom the respective aqueous solutions by adsorption onthe C-TiO2(UV) and C-TiO2(200) surfaces, while only 11%and 10% of the initial dye are absorbed by TiO2(500)and N-TiO2, respectively. The high adsorption capacitiesfor C-TiO2(UV) and C-TiO2(200) can be attributed totheir significant surface areas (530 m2 g−1 for C-TiO2(UV),340 m2 g−1 for C-TiO2(200)). It is of interest to note that C-TiO2(200) shows an adsorption capacity similar to that of C-TiO2(UV) whereas the surface area of C-TiO2(200) is smallerthan that of C-TiO2(UV). This unusual observation can beexplained by the fact that the pore volume (1.2 cm3 g−1) of C-TiO2(200) is about 4-times as large as that (0.3 cm3 g−1) of C-TiO2(UV). In addition, it has been reported that coke mattercontains polyaromatic structures [30, 36–38], and the π-πinteractions between coke and the aromatic rings of MB mayalso contribute to the adsorption of MB by the TiO2(200)material.
The photocatalytic performances of the samples(Figure 9) are measured by the changes of MB concentration(Ct/C 0) during the process of photodegradation reactionunder visible-light irradiation (λ > 420 nm), where Ct is theconcentration of MB at the irradiation time t and C 0 is theinitial concentration of MB after an adsorption/desorptionequilibrium is reached before irradiation. 37%, 50%,and 75% of MB are degraded after 4 h irradiation for
0 60 120 180 240
Ct/C
0
0
0.2
0.4
0.6
0.8
1
Figure 9: The residual fraction of MB in solution as a functionof irradiation time with (�) C-TiO2(UV), (�) C-TiO2(200), (�)TiO2(500), and (•) N-TiO2.
N-TiO2, C-TiO2(UV), and C-TiO2(200), respectively. Thephotocatalytic activities of the two C-doped TiO2 materialsare distinctly superior to that of the N-TiO2 sample. Incontrast, only slight degradation of MB (<5%) has beenobserved for TiO2(500) after visible-light irradiation of 4hours, indicating that the TiO2(500) material is not a goodvisible-light photocatalyst. In addition, the difference ofvisible-light photocatalytic performances of the obtainedTiO2 materials can be easily explained on the basis of theUV-Vis diffuse reflectance spectra of the samples (Figure 7).The coke-containing C-TiO2(200) and the C-TiO2(UV) withTi–O–C bonds both absorb visible light, and consequently,they are visible-light responsive in the photocatalytic process.In contrast, the TiO2(500) sample absorbs no visible light,and therefore this material is not photocatalytically activeunder visible-light irradiation. The higher photocatalyticactivity of C-TiO2(200) in comparison with that of C-TiO2(UV) is rationalized by its stronger visible-lightabsorption. The recycling experiments demonstrate thatboth C-TiO2(UV) and C-TiO2(200) are rather stable whenused as photocatalysts and there is no loss of photocatalyticactivity after at least five cycles of degradation testing of MB.
Considering that MB can absorb visible light above600 nm (the absorption peak is at about 665 nm), a cutofffilter (λ > 600 nm) was used to ensure that only MBwas excited during the photocatalysis process. Whereas thephotocatalysts we used nearly do not absorb the visible lightwith a wavelength longer than 600 nm. With the use ofthe cutoff filter, no significant change in MB concentrationwas observed for the photocatalytic reaction even after 4 hirradiation in the presence of C-TiO2(UV) or C-TiO2(200).This observation indicates that the decoloration of MB undervisible light with use of cutoff filter (λ > 420 nm) is attributedto the photocatalytic effect of the obtained C-doped TiO2
samples, rather than MB photosensitization.
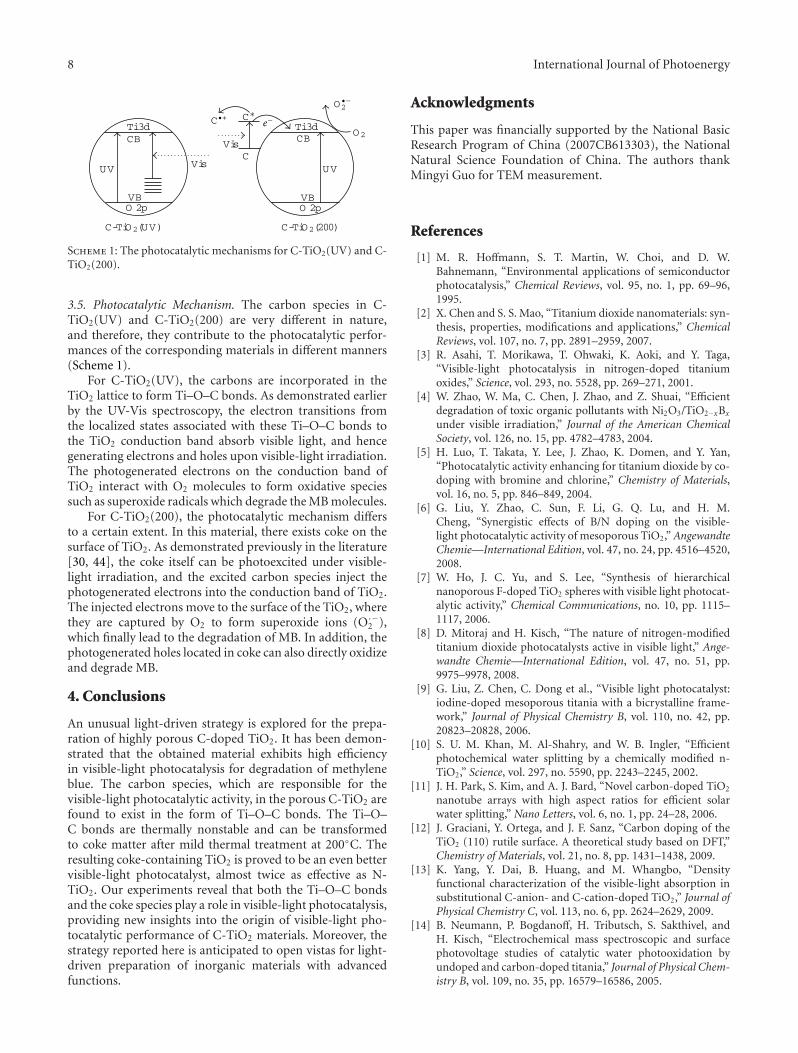
8 International Journal of Photoenergy
VB VB
UV UV
CB
O 2p O 2p
Vis
Vis
CBTi 3d Ti 3d
O2
C•+ e−
C
O •−2C∗
C-TiO2(UV) C-TiO2(200)
Scheme 1: The photocatalytic mechanisms for C-TiO2(UV) and C-TiO2(200).
3.5. Photocatalytic Mechanism. The carbon species in C-TiO2(UV) and C-TiO2(200) are very different in nature,and therefore, they contribute to the photocatalytic perfor-mances of the corresponding materials in different manners(Scheme 1).
For C-TiO2(UV), the carbons are incorporated in theTiO2 lattice to form Ti–O–C bonds. As demonstrated earlierby the UV-Vis spectroscopy, the electron transitions fromthe localized states associated with these Ti–O–C bonds tothe TiO2 conduction band absorb visible light, and hencegenerating electrons and holes upon visible-light irradiation.The photogenerated electrons on the conduction band ofTiO2 interact with O2 molecules to form oxidative speciessuch as superoxide radicals which degrade the MB molecules.
For C-TiO2(200), the photocatalytic mechanism differsto a certain extent. In this material, there exists coke on thesurface of TiO2. As demonstrated previously in the literature[30, 44], the coke itself can be photoexcited under visible-light irradiation, and the excited carbon species inject thephotogenerated electrons into the conduction band of TiO2.The injected electrons move to the surface of the TiO2, wherethey are captured by O2 to form superoxide ions (O·−
2 ),which finally lead to the degradation of MB. In addition, thephotogenerated holes located in coke can also directly oxidizeand degrade MB.
4. Conclusions
An unusual light-driven strategy is explored for the prepa-ration of highly porous C-doped TiO2. It has been demon-strated that the obtained material exhibits high efficiencyin visible-light photocatalysis for degradation of methyleneblue. The carbon species, which are responsible for thevisible-light photocatalytic activity, in the porous C-TiO2 arefound to exist in the form of Ti–O–C bonds. The Ti–O–C bonds are thermally nonstable and can be transformedto coke matter after mild thermal treatment at 200◦C. Theresulting coke-containing TiO2 is proved to be an even bettervisible-light photocatalyst, almost twice as effective as N-TiO2. Our experiments reveal that both the Ti–O–C bondsand the coke species play a role in visible-light photocatalysis,providing new insights into the origin of visible-light pho-tocatalytic performance of C-TiO2 materials. Moreover, thestrategy reported here is anticipated to open vistas for light-driven preparation of inorganic materials with advancedfunctions.
Acknowledgments
This paper was financially supported by the National BasicResearch Program of China (2007CB613303), the NationalNatural Science Foundation of China. The authors thankMingyi Guo for TEM measurement.
References
[1] M. R. Hoffmann, S. T. Martin, W. Choi, and D. W.Bahnemann, “Environmental applications of semiconductorphotocatalysis,” Chemical Reviews, vol. 95, no. 1, pp. 69–96,1995.
[2] X. Chen and S. S. Mao, “Titanium dioxide nanomaterials: syn-thesis, properties, modifications and applications,” ChemicalReviews, vol. 107, no. 7, pp. 2891–2959, 2007.
[3] R. Asahi, T. Morikawa, T. Ohwaki, K. Aoki, and Y. Taga,“Visible-light photocatalysis in nitrogen-doped titaniumoxides,” Science, vol. 293, no. 5528, pp. 269–271, 2001.
[4] W. Zhao, W. Ma, C. Chen, J. Zhao, and Z. Shuai, “Efficientdegradation of toxic organic pollutants with Ni2O3/TiO2−xBx
under visible irradiation,” Journal of the American ChemicalSociety, vol. 126, no. 15, pp. 4782–4783, 2004.
[5] H. Luo, T. Takata, Y. Lee, J. Zhao, K. Domen, and Y. Yan,“Photocatalytic activity enhancing for titanium dioxide by co-doping with bromine and chlorine,” Chemistry of Materials,vol. 16, no. 5, pp. 846–849, 2004.
[6] G. Liu, Y. Zhao, C. Sun, F. Li, G. Q. Lu, and H. M.Cheng, “Synergistic effects of B/N doping on the visible-light photocatalytic activity of mesoporous TiO2,” AngewandteChemie—International Edition, vol. 47, no. 24, pp. 4516–4520,2008.
[7] W. Ho, J. C. Yu, and S. Lee, “Synthesis of hierarchicalnanoporous F-doped TiO2 spheres with visible light photocat-alytic activity,” Chemical Communications, no. 10, pp. 1115–1117, 2006.
[8] D. Mitoraj and H. Kisch, “The nature of nitrogen-modifiedtitanium dioxide photocatalysts active in visible light,” Ange-wandte Chemie—International Edition, vol. 47, no. 51, pp.9975–9978, 2008.
[9] G. Liu, Z. Chen, C. Dong et al., “Visible light photocatalyst:iodine-doped mesoporous titania with a bicrystalline frame-work,” Journal of Physical Chemistry B, vol. 110, no. 42, pp.20823–20828, 2006.
[10] S. U. M. Khan, M. Al-Shahry, and W. B. Ingler, “Efficientphotochemical water splitting by a chemically modified n-TiO2,” Science, vol. 297, no. 5590, pp. 2243–2245, 2002.
[11] J. H. Park, S. Kim, and A. J. Bard, “Novel carbon-doped TiO2
nanotube arrays with high aspect ratios for efficient solarwater splitting,” Nano Letters, vol. 6, no. 1, pp. 24–28, 2006.
[12] J. Graciani, Y. Ortega, and J. F. Sanz, “Carbon doping of theTiO2 (110) rutile surface. A theoretical study based on DFT,”Chemistry of Materials, vol. 21, no. 8, pp. 1431–1438, 2009.
[13] K. Yang, Y. Dai, B. Huang, and M. Whangbo, “Densityfunctional characterization of the visible-light absorption insubstitutional C-anion- and C-cation-doped TiO2,” Journal ofPhysical Chemistry C, vol. 113, no. 6, pp. 2624–2629, 2009.
[14] B. Neumann, P. Bogdanoff, H. Tributsch, S. Sakthivel, andH. Kisch, “Electrochemical mass spectroscopic and surfacephotovoltage studies of catalytic water photooxidation byundoped and carbon-doped titania,” Journal of Physical Chem-istry B, vol. 109, no. 35, pp. 16579–16586, 2005.
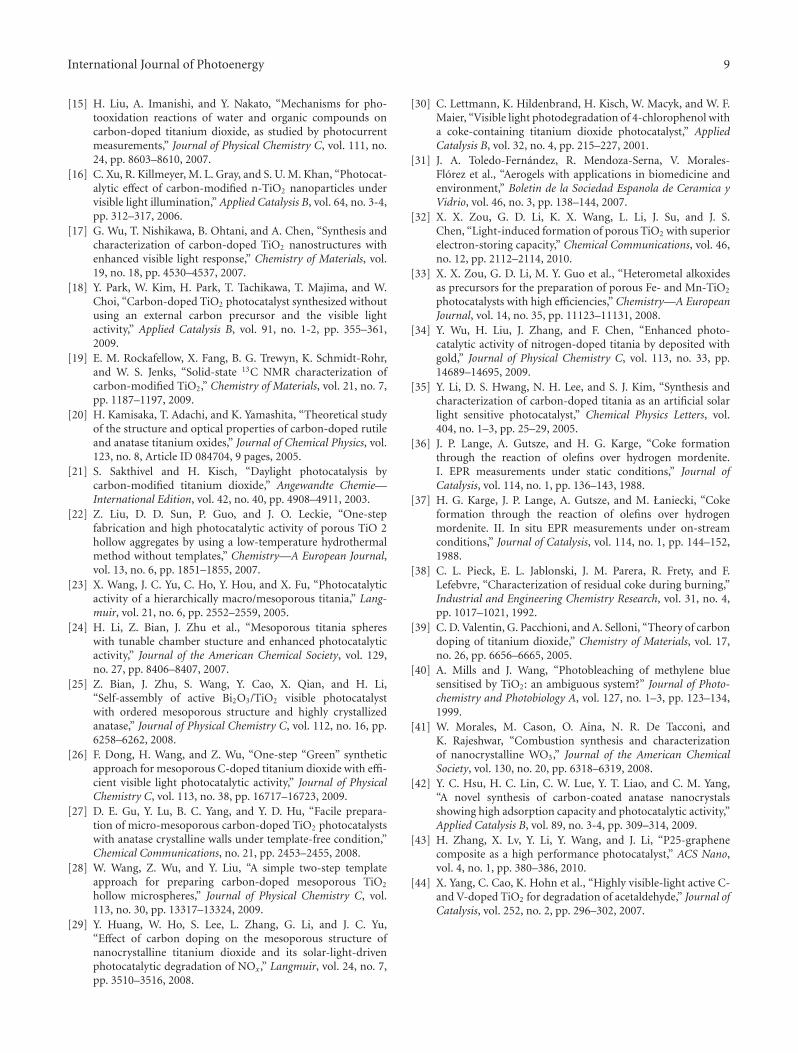
International Journal of Photoenergy 9
[15] H. Liu, A. Imanishi, and Y. Nakato, “Mechanisms for pho-tooxidation reactions of water and organic compounds oncarbon-doped titanium dioxide, as studied by photocurrentmeasurements,” Journal of Physical Chemistry C, vol. 111, no.24, pp. 8603–8610, 2007.
[16] C. Xu, R. Killmeyer, M. L. Gray, and S. U. M. Khan, “Photocat-alytic effect of carbon-modified n-TiO2 nanoparticles undervisible light illumination,” Applied Catalysis B, vol. 64, no. 3-4,pp. 312–317, 2006.
[17] G. Wu, T. Nishikawa, B. Ohtani, and A. Chen, “Synthesis andcharacterization of carbon-doped TiO2 nanostructures withenhanced visible light response,” Chemistry of Materials, vol.19, no. 18, pp. 4530–4537, 2007.
[18] Y. Park, W. Kim, H. Park, T. Tachikawa, T. Majima, and W.Choi, “Carbon-doped TiO2 photocatalyst synthesized withoutusing an external carbon precursor and the visible lightactivity,” Applied Catalysis B, vol. 91, no. 1-2, pp. 355–361,2009.
[19] E. M. Rockafellow, X. Fang, B. G. Trewyn, K. Schmidt-Rohr,and W. S. Jenks, “Solid-state 13C NMR characterization ofcarbon-modified TiO2,” Chemistry of Materials, vol. 21, no. 7,pp. 1187–1197, 2009.
[20] H. Kamisaka, T. Adachi, and K. Yamashita, “Theoretical studyof the structure and optical properties of carbon-doped rutileand anatase titanium oxides,” Journal of Chemical Physics, vol.123, no. 8, Article ID 084704, 9 pages, 2005.
[21] S. Sakthivel and H. Kisch, “Daylight photocatalysis bycarbon-modified titanium dioxide,” Angewandte Chemie—International Edition, vol. 42, no. 40, pp. 4908–4911, 2003.
[22] Z. Liu, D. D. Sun, P. Guo, and J. O. Leckie, “One-stepfabrication and high photocatalytic activity of porous TiO 2hollow aggregates by using a low-temperature hydrothermalmethod without templates,” Chemistry—A European Journal,vol. 13, no. 6, pp. 1851–1855, 2007.
[23] X. Wang, J. C. Yu, C. Ho, Y. Hou, and X. Fu, “Photocatalyticactivity of a hierarchically macro/mesoporous titania,” Lang-muir, vol. 21, no. 6, pp. 2552–2559, 2005.
[24] H. Li, Z. Bian, J. Zhu et al., “Mesoporous titania sphereswith tunable chamber stucture and enhanced photocatalyticactivity,” Journal of the American Chemical Society, vol. 129,no. 27, pp. 8406–8407, 2007.
[25] Z. Bian, J. Zhu, S. Wang, Y. Cao, X. Qian, and H. Li,“Self-assembly of active Bi2O3/TiO2 visible photocatalystwith ordered mesoporous structure and highly crystallizedanatase,” Journal of Physical Chemistry C, vol. 112, no. 16, pp.6258–6262, 2008.
[26] F. Dong, H. Wang, and Z. Wu, “One-step “Green” syntheticapproach for mesoporous C-doped titanium dioxide with effi-cient visible light photocatalytic activity,” Journal of PhysicalChemistry C, vol. 113, no. 38, pp. 16717–16723, 2009.
[27] D. E. Gu, Y. Lu, B. C. Yang, and Y. D. Hu, “Facile prepara-tion of micro-mesoporous carbon-doped TiO2 photocatalystswith anatase crystalline walls under template-free condition,”Chemical Communications, no. 21, pp. 2453–2455, 2008.
[28] W. Wang, Z. Wu, and Y. Liu, “A simple two-step templateapproach for preparing carbon-doped mesoporous TiO2
hollow microspheres,” Journal of Physical Chemistry C, vol.113, no. 30, pp. 13317–13324, 2009.
[29] Y. Huang, W. Ho, S. Lee, L. Zhang, G. Li, and J. C. Yu,“Effect of carbon doping on the mesoporous structure ofnanocrystalline titanium dioxide and its solar-light-drivenphotocatalytic degradation of NOx ,” Langmuir, vol. 24, no. 7,pp. 3510–3516, 2008.
[30] C. Lettmann, K. Hildenbrand, H. Kisch, W. Macyk, and W. F.Maier, “Visible light photodegradation of 4-chlorophenol witha coke-containing titanium dioxide photocatalyst,” AppliedCatalysis B, vol. 32, no. 4, pp. 215–227, 2001.
[31] J. A. Toledo-Fernandez, R. Mendoza-Serna, V. Morales-Florez et al., “Aerogels with applications in biomedicine andenvironment,” Boletin de la Sociedad Espanola de Ceramica yVidrio, vol. 46, no. 3, pp. 138–144, 2007.
[32] X. X. Zou, G. D. Li, K. X. Wang, L. Li, J. Su, and J. S.Chen, “Light-induced formation of porous TiO2 with superiorelectron-storing capacity,” Chemical Communications, vol. 46,no. 12, pp. 2112–2114, 2010.
[33] X. X. Zou, G. D. Li, M. Y. Guo et al., “Heterometal alkoxidesas precursors for the preparation of porous Fe- and Mn-TiO2
photocatalysts with high efficiencies,” Chemistry—A EuropeanJournal, vol. 14, no. 35, pp. 11123–11131, 2008.
[34] Y. Wu, H. Liu, J. Zhang, and F. Chen, “Enhanced photo-catalytic activity of nitrogen-doped titania by deposited withgold,” Journal of Physical Chemistry C, vol. 113, no. 33, pp.14689–14695, 2009.
[35] Y. Li, D. S. Hwang, N. H. Lee, and S. J. Kim, “Synthesis andcharacterization of carbon-doped titania as an artificial solarlight sensitive photocatalyst,” Chemical Physics Letters, vol.404, no. 1–3, pp. 25–29, 2005.
[36] J. P. Lange, A. Gutsze, and H. G. Karge, “Coke formationthrough the reaction of olefins over hydrogen mordenite.I. EPR measurements under static conditions,” Journal ofCatalysis, vol. 114, no. 1, pp. 136–143, 1988.
[37] H. G. Karge, J. P. Lange, A. Gutsze, and M. Łaniecki, “Cokeformation through the reaction of olefins over hydrogenmordenite. II. In situ EPR measurements under on-streamconditions,” Journal of Catalysis, vol. 114, no. 1, pp. 144–152,1988.
[38] C. L. Pieck, E. L. Jablonski, J. M. Parera, R. Frety, and F.Lefebvre, “Characterization of residual coke during burning,”Industrial and Engineering Chemistry Research, vol. 31, no. 4,pp. 1017–1021, 1992.
[39] C. D. Valentin, G. Pacchioni, and A. Selloni, “Theory of carbondoping of titanium dioxide,” Chemistry of Materials, vol. 17,no. 26, pp. 6656–6665, 2005.
[40] A. Mills and J. Wang, “Photobleaching of methylene bluesensitised by TiO2: an ambiguous system?” Journal of Photo-chemistry and Photobiology A, vol. 127, no. 1–3, pp. 123–134,1999.
[41] W. Morales, M. Cason, O. Aina, N. R. De Tacconi, andK. Rajeshwar, “Combustion synthesis and characterizationof nanocrystalline WO3,” Journal of the American ChemicalSociety, vol. 130, no. 20, pp. 6318–6319, 2008.
[42] Y. C. Hsu, H. C. Lin, C. W. Lue, Y. T. Liao, and C. M. Yang,“A novel synthesis of carbon-coated anatase nanocrystalsshowing high adsorption capacity and photocatalytic activity,”Applied Catalysis B, vol. 89, no. 3-4, pp. 309–314, 2009.
[43] H. Zhang, X. Lv, Y. Li, Y. Wang, and J. Li, “P25-graphenecomposite as a high performance photocatalyst,” ACS Nano,vol. 4, no. 1, pp. 380–386, 2010.
[44] X. Yang, C. Cao, K. Hohn et al., “Highly visible-light active C-and V-doped TiO2 for degradation of acetaldehyde,” Journal ofCatalysis, vol. 252, no. 2, pp. 296–302, 2007.
Hindawi Publishing CorporationInternational Journal of PhotoenergyVolume 2012, Article ID 797968, 10 pagesdoi:10.1155/2012/797968
Research Article
One-Pot Template-Free Hydrothermal Synthesis ofMonoclinic BiVO4 Hollow Microspheres and Their EnhancedVisible-Light Photocatalytic Activity
Bei Cheng,1 Wenguang Wang,1 Lei Shi,1 Jun Zhang,1 Jingrun Ran,1 and Huogen Yu2
1 State Key Laboratory of Silicate Materials for Architectures, Materials College, Wuhan University of Technology, 122 Luoshi Road,Wuhan 430070, China
2 Department of Chemistry, School of Science, Wuhan University of Technology, Wuhan 430070, China
Correspondence should be addressed to Bei Cheng, [email protected]
Received 24 October 2011; Accepted 4 November 2011
Academic Editor: Baibiao Huang
Copyright © 2012 Bei Cheng et al. This is an open access article distributed under the Creative Commons Attribution License,which permits unrestricted use, distribution, and reproduction in any medium, provided the original work is properly cited.
Monoclinic-phase BiVO4 hollow microspheres with diameters of about 2–4 μm have been successfully fabricated in high yield by aone-pot template-free hydrothermal route. The reaction duration and urea concentration are shown to play important roles in theformation of the BiVO4 hollow microspheres. X-ray diffraction, scanning electron microscopy, nitrogen adsorption-desorptionisotherms, fourier transform infrared spectrometry, and UV-visible diffuse reflectance spectroscopy are used to characterize theproducts. The results show that all the as-prepared BiVO4 samples have monoclinic phase structure and exhibit good crystallinity.A formation mechanism for the BiVO4 hollow spherical structure via a localized Ostwald ripening is proposed based on theexperimental observations. In addition, studies of the photocatalytic properties by exposure to visible light irradiation demonstratethat the as-obtained BiVO4 hollow spheres show potential photocatalytic application. Hydroxyl radicals (•OH) are not detectedon the surface of visible-light-illuminated BiVO4 by the photoluminescence technique, suggesting that •OH is not the dominantphotooxidant and photogenerated hole could directly take part in photocatalytic reaction. The prepared BiVO4 hollow spheres arealso of great interest in pigment, catalysis, separation technology, biomedical engineering, and nanotechnology.
1. Introduction
In recent years, hollow micro/nanostructures have attractedconsiderable attention because of their novel physicochem-ical properties that differ markedly from those of bulkmaterials and potential applications such as nanoscalechemical reactors, efficient catalysis, drug-delivery carriers,low dielectric constant materials, acoustic insulation, andphotonic building blocks [1–5]. Conventional methods forthe preparation of hollow spheres usually require removableor sacrificial templates, including hard ones [6–9] or softones [10–14] to direct the formation of inorganic nanopar-ticles on their surfaces via adsorption or chemical reactions.However, use of templates usually suffers from disadvantagesrelated to high cost and tedious synthetic procedures, whichmay prevent them from being used in large-scale applica-tions. Compared with these methods involving multistepprocedures, a one-pot template-free method for the con-
trolled preparation of hollow nanostructures with rationallydesigned parameters is highly attractive [15]. Currently, one-pot template-free methods for hollow structures have beendeveloped mainly based on direct solid evacuation arisingfrom Ostwald ripening, the Kirkendall effect, or chemicallyinduced self-transformation [16–19].
Bismuth vanadate (BiVO4), which has been recognized asan effective visible-light photocatalyst for photocatalytic O2
evolution from aqueous AgNO3 solutions, but also for pho-tocatalytic degradation of organic pollutants under visible-light irradiation, has received significant attention [20–27].On the other hand, the properties of BiVO4 are stronglydependent on its morphology and microstructure [24, 26,28–33]. According to previous reports, BiVO4 appears inthree main crystalline phases: monoclinic scheelite, tetrag-onal zircon, and tetragonal scheelite [34–36]. Among theabove three crystal phase, monoclinic BiVO4 is the bestvisible-light-driven photocatalyst for the degradation of
2 International Journal of Photoenergy
organic pollutants and O2 production from water splittingdue to the transition from a valence band formed by Bi6s
or a hybrid orbital of Bi6s and O2p to a conduction bandof V3d and its narrow band gap (ca. 2.4 eV), while thephotocatalytic activity of tetragonal BiVO4 is negligible [28].Moreover, BiVO4 powders with various morphologies havebeen synthesized through different templating routes. Forexample, Yin and coworkers have synthesized monoclinicBiVO4 hollow spheres with a size of about 700 nm byemploying colloidal carbon spheres (CCSs) as hard templates[37]. Recently, by using mesoporous silica KIT-6 as a hardtemplate, Yu and coworkers synthesized monoclinic BiVO4
ordered mesoporous nanocrystals [38]. Microspheric andlamellar BiVO4 powders were selectively prepared througha hydrothermal process by using cetyltrimethylammoniumbromide (CTAB) as a template-directing reagent [39]. How-ever, the template-assisted method not only increased theproduct cost but also made it more difficult to scale upproduction due to its complexity and the capability of atemplate. The template-free synthesis of well-crystallizedmonoclinic BiVO4 hollow spheres still remains a greatchallenge.
In this work, we fabricate monoclinic BiVO4 hollowmicrospheres by a one-pot template-free hydrothermalmethod using NH4VO3 and Bi(NO3)3 as precursors andurea as additive at 180◦C for 24 h. The influence of ureaconcentration on the morphology and photocatalytic activityof BiVO4 is studied and discussed. To the best of our knowl-edge, this is the first report on template-free fabrication ofBiVO4 hollow spheres. This work will provide new insightsand understanding on the control of morphology andenhancement of photocatalytic activity of BiVO4 and shouldbe of significant interest in pigment, catalysis, separationtechnology, biomedical engineering, and nanotechnology.
2. Experimental
2.1. Preparation of Sample. All chemicals used in this studywere of analytical grade and were used without furtherpurification. Deionized water was used in all experiments.1.4 g of NH4VO3, 5.8 g of Bi(NO3)3·5H2O and a certainamount of urea were dissolved in 50 mL of nitric acidaqueous solution (2.0 M). The amount of the added urea waschanged from 0, 3, 6, to 9 g, and the obtained BiVO4 powderswere labeled as samples A, B, C, and D, respectively. Afterbeing stirred for 30 min, the mixed solution was transferredinto a 100-mL teflon-lined stainless steel autoclave and keptat 180◦C for 24 h. The hydrothermal products were collected,washed with deionized water and anhydrous alcohol for threetimes, and then dried at 80◦C for 12 h.
2.2. Characterization. Morphological observations were per-formed by an S-4800 field emission scanning electron micro-scope (FESEM, Hitachi, Japan) and linked with an OxfordInstruments X-ray analysis system. X-ray diffraction (XRD)patterns obtained on a D/MAX-RB X-ray diffractometer(Rigaku, Japan) using Cu Kα radiation at a scan rate (2θ) of0.05◦ s−1 were used to determine the identity of any phase
present and their crystallite size. The accelerating voltageand applied current were 40 kV and 80 mA, respectively. Theaverage crystallite size of BiVO4 was quantitatively calculatedusing Scherrer formula (d = 0.9λ/Bcosθ, where d, λ, B,and θ are crystallite size, Cu Kα wavelength (0.15418 nm),full width at half maximum intensity (FWHM) of (121)for BiVO4 peak in radians and Bragg’s diffraction angle,resp.) after correcting the instrumental broadening. TheBrunauer-Emmett-Teller (BET) specific surface area (SBET)of the powders was analyzed by nitrogen adsorption in aMicromeritics ASAP 2020 nitrogen adsorption apparatus(USA). All the samples were degassed at 180◦C prior tonitrogen adsorption measurements. The BET surface areawas determined by a multipoint BET method using theadsorption data in the relative pressure (P/P0) range of0.05∼0.3. Infrared (IR) spectra on pellets of the samplesmixed with KBr were recorded on a IRAffinity-1 FTIRspectrometer (Shimadzu, Japan) at a resolution of 4 cm−1.The concentration of the samples was kept at about 0.25–0.3%. UV-vis diffused reflectance spectra of BiVO4 powderswere obtained for the dry-pressed disk samples using a UV-vis spectrometer (UV2550, Shimadzu, Japan). BaSO4 wasused as a reflectance standard in a UV-vis diffuse reflectanceexperiment.
2.3. Measurement of Photocatalytic Activity. The photocat-alytic activity of the BiVO4 samples was characterized bythe photocatalytic decolorization of methylene blue (MB)aqueous solution at ambient temperature. Experimentaldetails were as follows: 0.1 g of the prepared BiVO4 powderwas dispersed in a 20 mL MB aqueous solution with aconcentration of 3× 10⁻⁵ M in a 9.0 cm culture dish. Thesolution was allowed to reach an adsorption-desorptionequilibrium among the photocatalyst, MB, and water beforevisible-light irradiation. A 350 W xenon lamp with a 420 nmcutoff filter positioned 25 cm above the dish was used as avisible-light source to trigger the photocatalytic reaction. Theintegrated visible-light intensity striking on the surface of thereaction solution measured with a visible-light radiometer(model: FZ-A, China) was 95 mW/cm2 with the wavelengthrange of 420–1000 nm. The concentration of MB wasdetermined by a UV-visible spectrophotometer (UV-2550,Shimadzu, Japan). After visible-light irradiation for every30 min, the reaction solution was filtrated to measure theconcentration change of MB.
2.4. Analysis of Hydroxyl Radicals. The formation of hydroxylradicals (•OH) on the surface of BiVO4 under visible-lightirradiation was detected by PL method using terephthalicacid as a probe molecule. Terephthalic acid readily reactswith •OH to produce a highly fluorescent product, 2-hydroxyterephthalic acid [40, 41]. This technique has beenused in radiation chemistry, sonochemistry, and biochem-istry for the detection of •OH generated in water. Themethod relies on the PL signal at 425 nm arising fromthe hydroxylation of terephthalic acid with •OH generatedat the water/catalyst interface. The PL intensity of 2-hydroxyterephthalic acid is proportional to the amount of
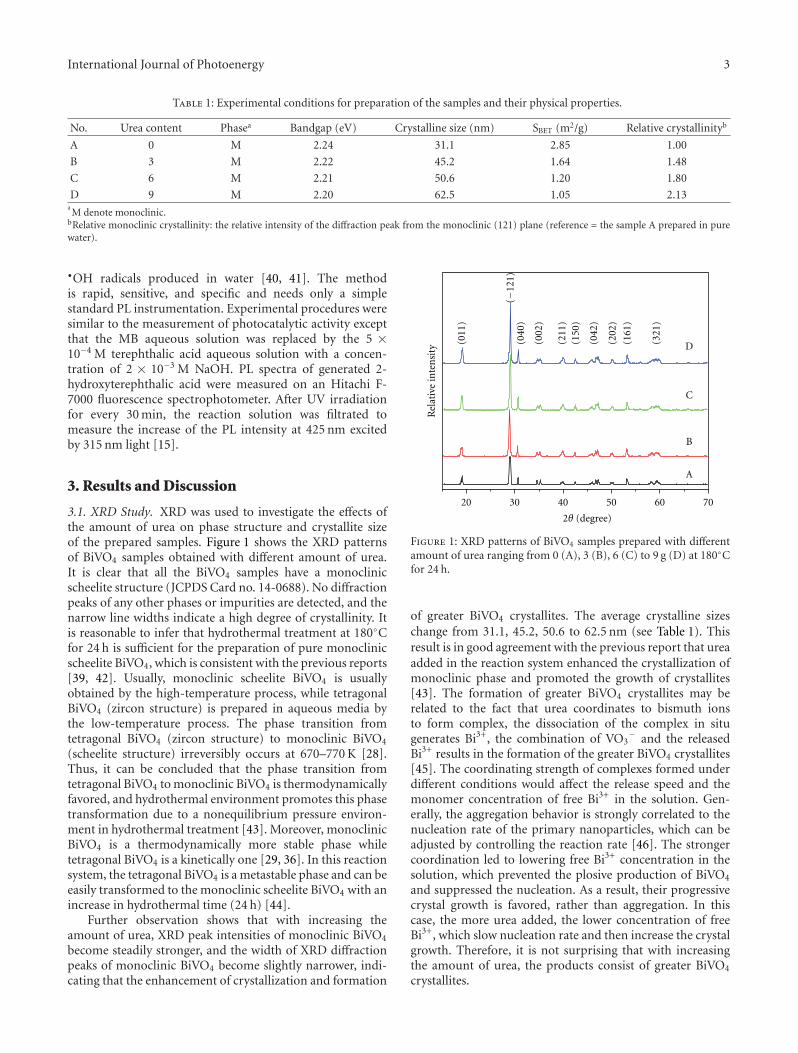
International Journal of Photoenergy 3
Table 1: Experimental conditions for preparation of the samples and their physical properties.
No. Urea content Phasea Bandgap (eV) Crystalline size (nm) SBET (m2/g) Relative crystallinityb
A 0 M 2.24 31.1 2.85 1.00
B 3 M 2.22 45.2 1.64 1.48
C 6 M 2.21 50.6 1.20 1.80
D 9 M 2.20 62.5 1.05 2.13aM denote monoclinic.
bRelative monoclinic crystallinity: the relative intensity of the diffraction peak from the monoclinic (121) plane (reference = the sample A prepared in purewater).
•OH radicals produced in water [40, 41]. The methodis rapid, sensitive, and specific and needs only a simplestandard PL instrumentation. Experimental procedures weresimilar to the measurement of photocatalytic activity exceptthat the MB aqueous solution was replaced by the 5 ×10⁻⁴ M terephthalic acid aqueous solution with a concen-tration of 2 × 10⁻³ M NaOH. PL spectra of generated 2-hydroxyterephthalic acid were measured on an Hitachi F-7000 fluorescence spectrophotometer. After UV irradiationfor every 30 min, the reaction solution was filtrated tomeasure the increase of the PL intensity at 425 nm excitedby 315 nm light [15].
3. Results and Discussion
3.1. XRD Study. XRD was used to investigate the effects ofthe amount of urea on phase structure and crystallite sizeof the prepared samples. Figure 1 shows the XRD patternsof BiVO4 samples obtained with different amount of urea.It is clear that all the BiVO4 samples have a monoclinicscheelite structure (JCPDS Card no. 14-0688). No diffractionpeaks of any other phases or impurities are detected, and thenarrow line widths indicate a high degree of crystallinity. Itis reasonable to infer that hydrothermal treatment at 180◦Cfor 24 h is sufficient for the preparation of pure monoclinicscheelite BiVO4, which is consistent with the previous reports[39, 42]. Usually, monoclinic scheelite BiVO4 is usuallyobtained by the high-temperature process, while tetragonalBiVO4 (zircon structure) is prepared in aqueous media bythe low-temperature process. The phase transition fromtetragonal BiVO4 (zircon structure) to monoclinic BiVO4
(scheelite structure) irreversibly occurs at 670–770 K [28].Thus, it can be concluded that the phase transition fromtetragonal BiVO4 to monoclinic BiVO4 is thermodynamicallyfavored, and hydrothermal environment promotes this phasetransformation due to a nonequilibrium pressure environ-ment in hydrothermal treatment [43]. Moreover, monoclinicBiVO4 is a thermodynamically more stable phase whiletetragonal BiVO4 is a kinetically one [29, 36]. In this reactionsystem, the tetragonal BiVO4 is a metastable phase and can beeasily transformed to the monoclinic scheelite BiVO4 with anincrease in hydrothermal time (24 h) [44].
Further observation shows that with increasing theamount of urea, XRD peak intensities of monoclinic BiVO4
become steadily stronger, and the width of XRD diffractionpeaks of monoclinic BiVO4 become slightly narrower, indi-cating that the enhancement of crystallization and formation
20 30 40 50 60 70
A
B
C
D(321
)
(161
)
(202
)
(042
)
(150
)(2
11)
(002
)
(040
)
(011
)
(−12
1)2θ (degree)
Rel
ativ
e in
ten
sity
Figure 1: XRD patterns of BiVO4 samples prepared with differentamount of urea ranging from 0 (A), 3 (B), 6 (C) to 9 g (D) at 180◦Cfor 24 h.
of greater BiVO4 crystallites. The average crystalline sizeschange from 31.1, 45.2, 50.6 to 62.5 nm (see Table 1). Thisresult is in good agreement with the previous report that ureaadded in the reaction system enhanced the crystallization ofmonoclinic phase and promoted the growth of crystallites[43]. The formation of greater BiVO4 crystallites may berelated to the fact that urea coordinates to bismuth ionsto form complex, the dissociation of the complex in situgenerates Bi3+, the combination of VO3
− and the releasedBi3+ results in the formation of the greater BiVO4 crystallites[45]. The coordinating strength of complexes formed underdifferent conditions would affect the release speed and themonomer concentration of free Bi3+ in the solution. Gen-erally, the aggregation behavior is strongly correlated to thenucleation rate of the primary nanoparticles, which can beadjusted by controlling the reaction rate [46]. The strongercoordination led to lowering free Bi3+ concentration in thesolution, which prevented the plosive production of BiVO4
and suppressed the nucleation. As a result, their progressivecrystal growth is favored, rather than aggregation. In thiscase, the more urea added, the lower concentration of freeBi3+, which slow nucleation rate and then increase the crystalgrowth. Therefore, it is not surprising that with increasingthe amount of urea, the products consist of greater BiVO4
crystallites.
4 International Journal of Photoenergy
3.2. UV-Vis and FTIR Spectra. Figure 2 shows the UV-visiblediffuse reflectance spectra of samples A and D. The twosamples exhibit a strong absorption in the UV-visible lightregion, and sample D with hollow structure shows theenhanced visible-light absorption. The steep shape of thespectra indicates that the visible-light absorption was not dueto the transition from impurity levels but to the bandgaptransition. The absorption edge for sample A is at ca. 550 nm,which is consistent with the characteristic absorption ofmonoclinic BiVO4 [28]. For monoclinic scheelite BiVO4, thevalence band (VB) is formed by a hybridization of the Bi6s
and O2p orbital, whereas the conduction band is composedof V3d orbital [43]. The presence of Bi6s in the top of thevalence bands results in a more negative energy level of thevalence band and then a decrease in the band gap [47]. It isapparent that the diffuse reflectance spectra of BiVO4 hollowmicrospheres exhibit a red shift and increased absorption inthe visible-light range, which is ascribed to the unique hollowconfiguration of sample D. Hollow structure allows multiplescattering of UV-vis light within their frameworks, leading toa longer optical path length for light transport and a greaterabsorbance than those for large irregular aggregates sample.It also leads to the enhanced photocatalytic activity of BiVO4
hollow structure. Similar results were also reported by Zhouet al. [36]. The bandgap of a semiconductor can be estimatedfrom a plot of (αh )2 versus photon energy (h ) [48–50]. Theestimated Eg of sample A and D from the intercept of thetangents to the plots were 2.24 eV and 2.20 eV, respectively. Inaddition, the conduction band (CB) edge of a semiconductorat the point of zero charge (pHzpc) can be predicted by (1):
ECB0 = X − Ec − 1
2Eg , (1)
where X is the absolute electronegativity of the semicon-ductor, expressed as the geometric mean of the absoluteelectronegativity of the constituent atoms, which is definedas the arithmetic mean of the atomic electron affinity andthe first ionization energy; Ec is the energy of free electronson the hydrogen scale (ca. 4.5 eV); Eg is the band gap ofthe semiconductor [21]. For BiVO4, the value of X is 6.035.According to the values of Eg estimated above and theforegoing formula, the calculated ECB and EVB of sample Awere 0.415 eV and 2.655 eV, respectively. For sample D, ECB
and EVB were 0.435 eV and 2.635 eV, respectively. These dataclearly demonstrate that the electronic structures of BiVO4
were slightly changed due to the varying pH caused by thedecomposition of urea [43].
3.3. SEM Images. The morphologies of the samples wereobserved by SEM. Figure 3 shows the SEM images of thepowder samples prepared with different amount of urea.It is clearly seen that the amount of urea has a significantinfluence on the morphologies of samples. As shown inFigure 3(a), the products are composed of large aggregateswith ill-defined shape and inhomogeneous size in theabsence of urea. With the addition of urea, hollow structuresappear in the products. When 3 g urea is added in this
Wavelength (nm)
1.2
1
0.8
0.6
0.4
0.2
0
800700600500400300
A D
A
D
Abs
orba
nce
(a.
u.)
Figure 2: UV-visible absorption spectra and corresponding colors(inset) of sample A and D.
reaction system, the as-synthesized products are hollowmicrospheres with the diameter of about 3 μm, coexistingwith solid microspheres (Figure 3(b)). Figure 3(c) clearlyillustrates that most of the microspheres appear hollow struc-tures with the wall thinness of 0.8–1.0 μm when the amountof urea increases to 6 g. As the amount of urea furtherincreases to 9 g, SEM image (Figure 3(d)) indicates that therough external shells of the hollow microspheres consist ofloosely packed nanoparticles and progressively thinned. Theabove results indicate that hollow microspheres could notform without the addition of urea, contrarily, BiVO4 hollowmicrospheres are easily produced in the presence of urea,and the hollowing rate is strongly related to the amountof urea added. With increasing the amount of urea, thehollowing rate increases. Urea enhances the dissolution ofthe interior and mass transfer from interior of the spheresto outer surface during reactive process, accompanied by anenhancement of crystallization of monoclinic BiVO4 [19].
To investigate the formation mechanism of BiVO4 hollowmicrospheres, a detailed time-dependent evolution experi-ment was carried out. Figure 4 shows the XRD patterns ofthe samples obtained with 9 g urea at 180◦C for varyinghydrothermal time. It can be seen that tetragonal BiVO4
is formed after hydrothermal reaction for 1 h, along withmonoclinic BiVO4, but tetragonal BiVO4 is completelytransformed into monoclinic as the time is prolonged to24 h. The corresponding SEM images (Figure 5(a)) show thatthe solid microspheres with the diameter of about 2.7 μmare obtained by self-assembly of precursor nanoparticlesafter 1 h reaction. After a reaction time of 6 h, hollowmicrospheres can be observed in the products (Figure 5(b)).When the hydrothermal time prolongs to 12 h, the shellof the hollow microspheres becomes thinner (Figure 5(c)).The thickness of the shell wall changes from 1.3 μm at6 h, 1 μm at 12 h to 0.6 μm at 24 h. Therefore, it can beinferred from the above results that the thickness of shellwalls of BiVO4 hollow spheres could be easily controlled bychanging hydrothermal time. The longer the reaction time,
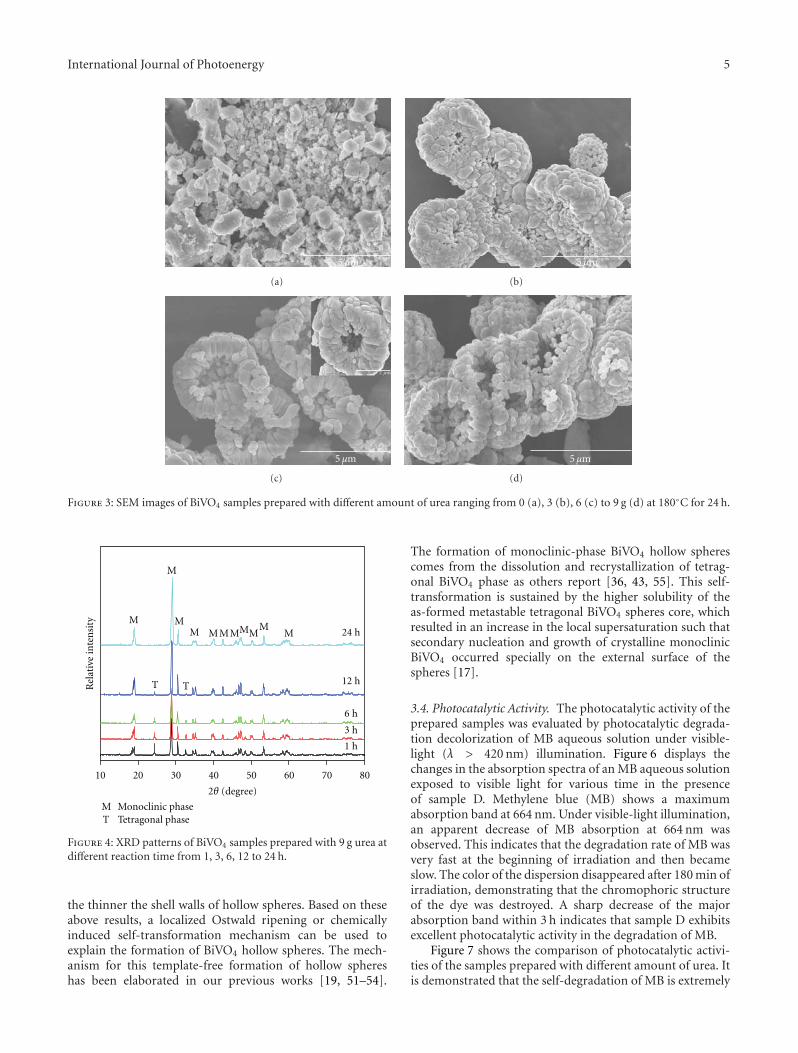
International Journal of Photoenergy 5
5 μm
(a)
5 μm
(b)
2 μm
5 μm
(c)
5 μm
(d)
Figure 3: SEM images of BiVO4 samples prepared with different amount of urea ranging from 0 (a), 3 (b), 6 (c) to 9 g (d) at 180◦C for 24 h.
10 20 30 40 50 60 70 80
1 h
3 h
6 h
12 h
24 h
Rel
ativ
e in
ten
sity M
MMM
MMMM
T
M
MM
T
M Monoclinic phaseT Tetragonal phase
2θ (degree)
Figure 4: XRD patterns of BiVO4 samples prepared with 9 g urea atdifferent reaction time from 1, 3, 6, 12 to 24 h.
the thinner the shell walls of hollow spheres. Based on theseabove results, a localized Ostwald ripening or chemicallyinduced self-transformation mechanism can be used toexplain the formation of BiVO4 hollow spheres. The mech-anism for this template-free formation of hollow sphereshas been elaborated in our previous works [19, 51–54].
The formation of monoclinic-phase BiVO4 hollow spherescomes from the dissolution and recrystallization of tetrag-onal BiVO4 phase as others report [36, 43, 55]. This self-transformation is sustained by the higher solubility of theas-formed metastable tetragonal BiVO4 spheres core, whichresulted in an increase in the local supersaturation such thatsecondary nucleation and growth of crystalline monoclinicBiVO4 occurred specially on the external surface of thespheres [17].
3.4. Photocatalytic Activity. The photocatalytic activity of theprepared samples was evaluated by photocatalytic degrada-tion decolorization of MB aqueous solution under visible-light (λ > 420 nm) illumination. Figure 6 displays thechanges in the absorption spectra of an MB aqueous solutionexposed to visible light for various time in the presenceof sample D. Methylene blue (MB) shows a maximumabsorption band at 664 nm. Under visible-light illumination,an apparent decrease of MB absorption at 664 nm wasobserved. This indicates that the degradation rate of MB wasvery fast at the beginning of irradiation and then becameslow. The color of the dispersion disappeared after 180 min ofirradiation, demonstrating that the chromophoric structureof the dye was destroyed. A sharp decrease of the majorabsorption band within 3 h indicates that sample D exhibitsexcellent photocatalytic activity in the degradation of MB.
Figure 7 shows the comparison of photocatalytic activi-ties of the samples prepared with different amount of urea. Itis demonstrated that the self-degradation of MB is extremely
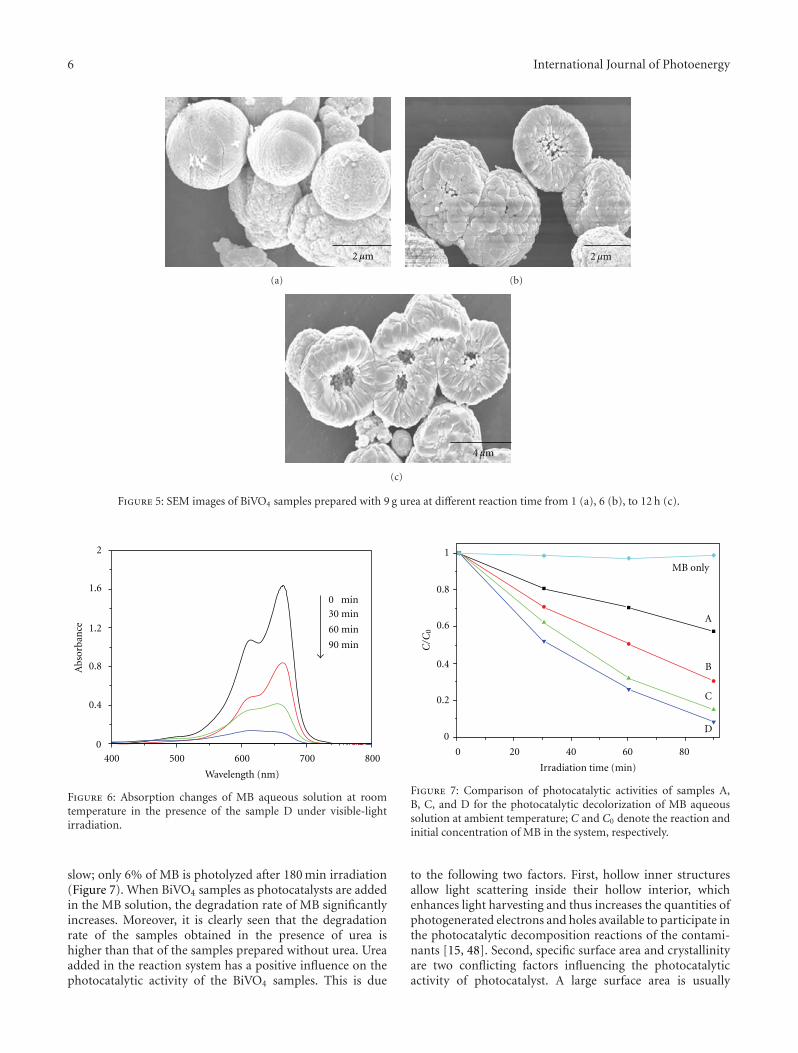
6 International Journal of Photoenergy
2 μm
(a)
2 μm
(b)
4 μm
(c)
Figure 5: SEM images of BiVO4 samples prepared with 9 g urea at different reaction time from 1 (a), 6 (b), to 12 h (c).
400 500 600 700 800
0.4
0.8
1.2
1.60 min
30 min
60 min
90 min
Wavelength (nm)
Abs
orba
nce
2
0
Figure 6: Absorption changes of MB aqueous solution at roomtemperature in the presence of the sample D under visible-lightirradiation.
slow; only 6% of MB is photolyzed after 180 min irradiation(Figure 7). When BiVO4 samples as photocatalysts are addedin the MB solution, the degradation rate of MB significantlyincreases. Moreover, it is clearly seen that the degradationrate of the samples obtained in the presence of urea ishigher than that of the samples prepared without urea. Ureaadded in the reaction system has a positive influence on thephotocatalytic activity of the BiVO4 samples. This is due
0 20 40 60 80
0.2
0.4
0.6
0.8
C
D
B
Irradiation time (min)
A
0
1
MB only
C/C
0
Figure 7: Comparison of photocatalytic activities of samples A,B, C, and D for the photocatalytic decolorization of MB aqueoussolution at ambient temperature; C and C0 denote the reaction andinitial concentration of MB in the system, respectively.
to the following two factors. First, hollow inner structuresallow light scattering inside their hollow interior, whichenhances light harvesting and thus increases the quantities ofphotogenerated electrons and holes available to participate inthe photocatalytic decomposition reactions of the contami-nants [15, 48]. Second, specific surface area and crystallinityare two conflicting factors influencing the photocatalyticactivity of photocatalyst. A large surface area is usually
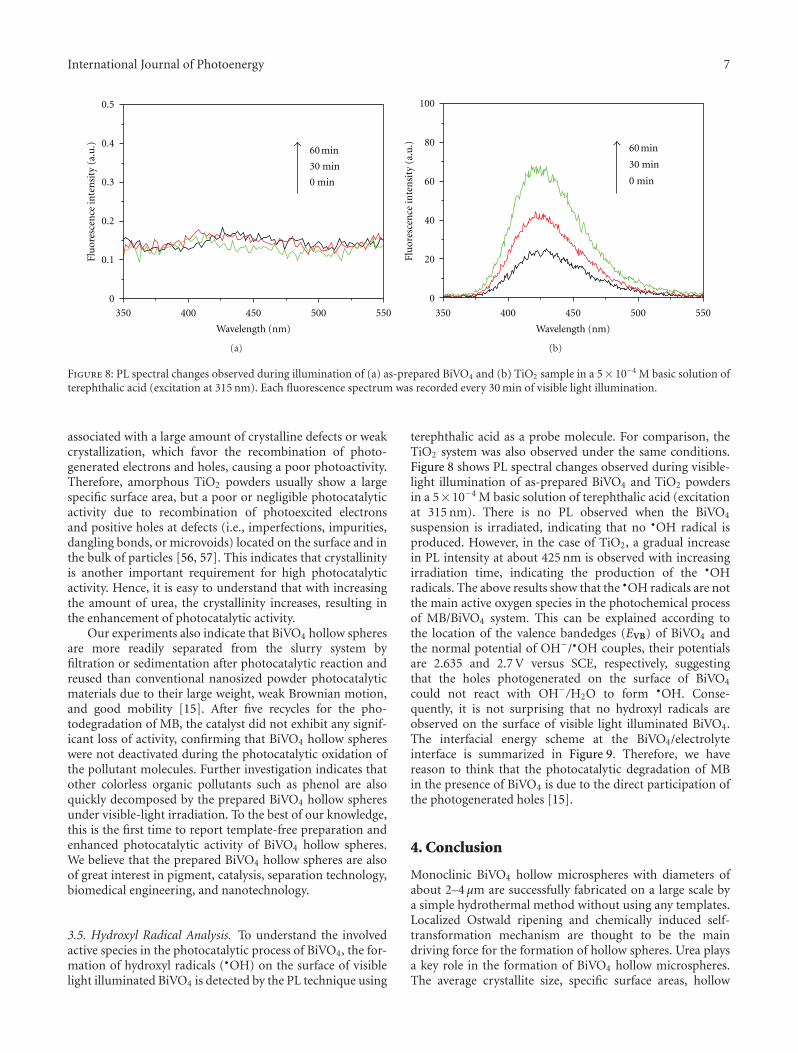
International Journal of Photoenergy 7
350 400 450 500 550
0.1
0.2
0.3
0.4
0.5
Wavelength (nm)
Flu
ores
cen
ce in
ten
sity
(a.
u.)
30 min
0 min
0
60 min
(a)
350 400 450 500 550
0
20
40
60
80
100
Flu
ores
cen
ce in
ten
sity
(a.
u.)
Wavelength (nm)
30 min
0 min
60 min
(b)
Figure 8: PL spectral changes observed during illumination of (a) as-prepared BiVO4 and (b) TiO2 sample in a 5× 10⁻⁴ M basic solution ofterephthalic acid (excitation at 315 nm). Each fluorescence spectrum was recorded every 30 min of visible light illumination.
associated with a large amount of crystalline defects or weakcrystallization, which favor the recombination of photo-generated electrons and holes, causing a poor photoactivity.Therefore, amorphous TiO2 powders usually show a largespecific surface area, but a poor or negligible photocatalyticactivity due to recombination of photoexcited electronsand positive holes at defects (i.e., imperfections, impurities,dangling bonds, or microvoids) located on the surface and inthe bulk of particles [56, 57]. This indicates that crystallinityis another important requirement for high photocatalyticactivity. Hence, it is easy to understand that with increasingthe amount of urea, the crystallinity increases, resulting inthe enhancement of photocatalytic activity.
Our experiments also indicate that BiVO4 hollow spheresare more readily separated from the slurry system byfiltration or sedimentation after photocatalytic reaction andreused than conventional nanosized powder photocatalyticmaterials due to their large weight, weak Brownian motion,and good mobility [15]. After five recycles for the pho-todegradation of MB, the catalyst did not exhibit any signif-icant loss of activity, confirming that BiVO4 hollow sphereswere not deactivated during the photocatalytic oxidation ofthe pollutant molecules. Further investigation indicates thatother colorless organic pollutants such as phenol are alsoquickly decomposed by the prepared BiVO4 hollow spheresunder visible-light irradiation. To the best of our knowledge,this is the first time to report template-free preparation andenhanced photocatalytic activity of BiVO4 hollow spheres.We believe that the prepared BiVO4 hollow spheres are alsoof great interest in pigment, catalysis, separation technology,biomedical engineering, and nanotechnology.
3.5. Hydroxyl Radical Analysis. To understand the involvedactive species in the photocatalytic process of BiVO4, the for-mation of hydroxyl radicals (•OH) on the surface of visiblelight illuminated BiVO4 is detected by the PL technique using
terephthalic acid as a probe molecule. For comparison, theTiO2 system was also observed under the same conditions.Figure 8 shows PL spectral changes observed during visible-light illumination of as-prepared BiVO4 and TiO2 powdersin a 5×10⁻⁴ M basic solution of terephthalic acid (excitationat 315 nm). There is no PL observed when the BiVO4
suspension is irradiated, indicating that no •OH radical isproduced. However, in the case of TiO2, a gradual increasein PL intensity at about 425 nm is observed with increasingirradiation time, indicating the production of the •OHradicals. The above results show that the •OH radicals are notthe main active oxygen species in the photochemical processof MB/BiVO4 system. This can be explained according tothe location of the valence bandedges (EVB) of BiVO4 andthe normal potential of OH−/•OH couples, their potentialsare 2.635 and 2.7 V versus SCE, respectively, suggestingthat the holes photogenerated on the surface of BiVO4
could not react with OH−/H2O to form •OH. Conse-quently, it is not surprising that no hydroxyl radicals areobserved on the surface of visible light illuminated BiVO4.The interfacial energy scheme at the BiVO4/electrolyteinterface is summarized in Figure 9. Therefore, we havereason to think that the photocatalytic degradation of MBin the presence of BiVO4 is due to the direct participation ofthe photogenerated holes [15].
4. Conclusion
Monoclinic BiVO4 hollow microspheres with diameters ofabout 2–4 μm are successfully fabricated on a large scale bya simple hydrothermal method without using any templates.Localized Ostwald ripening and chemically induced self-transformation mechanism are thought to be the maindriving force for the formation of hollow spheres. Urea playsa key role in the formation of BiVO4 hollow microspheres.The average crystallite size, specific surface areas, hollow
8 International Journal of Photoenergy
1
2
3
V v
ersu
s SC
E−2
−1
BiVO4
H2/H+0
OH−/•OH
Eg = 2.2 eV
Figure 9: Energy scheme at the BiVO4/electrolyte interface.
interior structures, and photocatalytic activity of BiVO4
hollow spheres could be tuned by changing the amount ofurea. With increasing the amount of urea, the crystallitesgrow to larger size, the core hollowing takes place faster,and photocatalytic activity increases. The direct hole transfer(instead of •OH radicals) plays an important role in thedegradation of MB.
Acknowledgments
This work was partially supported by the National NaturalScience Foundation of China (51072154 and 51102190), Nat-ural Science Foundation of Hubei Province (2010CDA078),National Basic Research Program of China (2009CB939704),and Self-determined and Innovative Research Funds ofSKLWUT.
References
[1] L. P. Zhu, H. M. Xiao, W. D. Zhang, G. Yang, and S. Y. Fu,“One-pot template-free synthesis of monodisperse and single-crystal magnetite hollow spheres by a simple solvothermalroute,” Crystal Growth and Design, vol. 8, no. 3, pp. 957–963,2008.
[2] Y. Zheng, Y. Cheng, Y. Wang, L. Zhou, F. Bao, and C.Jia, “Metastable γ-MnS hierarchical architectures: synthesis,characterization, and growth mechanism,” Journal of PhysicalChemistry B, vol. 110, no. 16, pp. 8284–8288, 2006.
[3] J. Yu, W. Liu, and H. Yu, “A one-pot approach to hierarchicallynanoporous titania hollow microspheres with high photocat-alytic activity,” Crystal Growth and Design, vol. 8, no. 3, pp.930–934, 2008.
[4] J. Yu, H. Yu, H. Guo, M. Li, and S. Mann, “Spontaneous for-mation of a tungsten trioxide sphere-in-shell superstructureby chemically induced self-transformation,” Small, vol. 4, no.1, pp. 87–91, 2008.
[5] J. Yu and L. Shi, “One-pot hydrothermal synthesis andenhanced photocatalytic activity of trifluoroacetic acid modi-fied TiO2 hollow microspheres,” Journal of Molecular CatalysisA, vol. 326, no. 1-2, pp. 8–14, 2010.
[6] F. Caruso, R. A. Caruso, and H. Mohwald, “Nanoengineeringof inorganic and hybrid hollow spheres by colloidal templat-ing,” Science, vol. 282, no. 5391, pp. 1111–1114, 1998.
[7] J. Yu and X. Yu, “Hydrothermal synthesis and photocatalyticactivity of zinc oxide hollow spheres,” Environmental Scienceand Technology, vol. 42, no. 13, pp. 4902–4907, 2008.
[8] S. W. Kim, M. Kim, W. Y. Lee, and T. Hyeon, “Fabricationof hollow palladium spheres and their successful applicationto the recyclable heterogeneous catalyst for suzuki couplingreactions,” Journal of the American Chemical Society, vol. 124,no. 26, pp. 7642–7643, 2002.
[9] J. Gao, B. Zhang, X. Zhang, and B. Xu, “Magnetic-dipolar-interaction-induced self-assembly affords wires ofhollow nanocrystals of cobalt selenide,” Angewandte Chemie—International Edition, vol. 45, no. 8, pp. 1220–1223, 2006.
[10] A. D. Dinsmore, M. F. Hsu, M. G. Nikolaides, M. Marquez,A. R. Bausch, and D. A. Weitz, “Colloidosomes: selectivelypermeable capsules composed of colloidal particles,” Science,vol. 298, no. 5595, pp. 1006–1009, 2002.
[11] Y. Li, J. Shi, Z. Hua, H. Chen, M. Ruan, and D. Yan,“Hollow spheres of mesoporous aluminosilicate with athree-dimensional pore network and extraordinarily highhydrothermal stability,” Nano Letters, vol. 3, no. 5, pp. 609–612, 2003.
[12] J. H. Park, C. Oh, S. I. Shin, S. K. Moon, and S. G. Oh,“Preparation of hollow silica microspheres in W/O emulsionswith polymers,” Journal of Colloid and Interface Science, vol.266, no. 1, pp. 107–114, 2003.
[13] M. Yang and J. J. Zhu, “Spherical hollow assembly composedof Cu2O nanoparticles,” Journal of Crystal Growth, vol. 256, no.1-2, pp. 134–138, 2003.
[14] D. H. M. Buchold and C. Feldmann, “Nanoscale γ-AIO(OH)hollow spheres: synthesis and container-type functionality,”Nano Letters, vol. 7, no. 11, pp. 3489–3492, 2007.
[15] X. Yu, J. Yu, B. Cheng, and B. Huang, “One-pot template-free synthesis of monodisperse zinc sulfide hollow spheresand their photocatalytic properties,” Chemistry-A EuropeanJournal, vol. 15, no. 27, pp. 6731–6739, 2009.
[16] H. G. Yang and H. C. Zeng, “Preparation of hollow anataseTiO2 nanospheres via Ostwald ripening,” Journal of PhysicalChemistry B, vol. 108, no. 11, pp. 3492–3495, 2004.
[17] Y. Yin, R. M. Rioux, C. K. Erdonmez, S. Hughes, G. A. Somor-jal, and A. P. Alivisatos, “Formation of hollow nanocrystalsthrough the nanoscale kirkendall effect,” Science, vol. 304, no.5671, pp. 711–714, 2004.
[18] H. G. Yang and H. C. Zeng, “Self-construction of hollowSnO2 octahedra based on two-dimensional aggregation ofnanocrystallites,” Angewandte Chemie—International Edition,vol. 43, no. 44, pp. 5930–5933, 2004.
[19] J. Yu, H. Guo, S. A. Davis, and S. Mann, “Fabrication ofhollow inorganic microspheres by chemically induced self-transformation,” Advanced Functional Materials, vol. 16, no.15, pp. 2035–2041, 2006.
[20] S. Kohtani, S. Makino, A. Kudo et al., “Photocatalytic degra-dation of 4-n-nonylphenol under irradiation from solar sim-ulator: comparison between BiVO4 and TiO2 photocatalysts,”Chemistry Letters, no. 7, pp. 660–661, 2002.
[21] M. Long, W. Cai, J. Cai, B. Zhou, X. Chai, and Y. Wu, “Efficientphotocatalytic degradation of phenol over Co3O 4/BiVO4composite under visible light irradiation,” Journal of PhysicalChemistry B, vol. 110, no. 41, pp. 20211–20216, 2006.
[22] H. Q. Jiang, H. Endo, H. Natori, M. Nagai, and K. Kobayashi,“Fabrication and efficient photocatalytic degradation ofmethylene blue over CuO/BiVO4 composite under visible-light irradiation,” Materials Research Bulletin, vol. 44, no. 3,pp. 700–706, 2009.
International Journal of Photoenergy 9
[23] L. Zhang, D. Chen, and X. Jiao, “Monoclinic structured BiVO4
nanosheets: hydrothermal preparation, formation mecha-nism, and coloristic and photocatalytic properties,” Journal ofPhysical Chemistry B, vol. 110, no. 6, pp. 2668–2673, 2006.
[24] L. Zhou, W. Wang, S. Liu, L. Zhang, H. Xu, and W. Zhu,“A sonochemical route to visible-light-driven high-activityBiVO4 photocatalyst,” Journal of Molecular Catalysis A, vol.252, no. 1-2, pp. 120–124, 2006.
[25] K. Sayama, A. Nomura, T. Arai et al., “Photoelectrochemicaldecomposition of water into H2 and O2 on porous BiVO4 thin-film electrodes under visible light and significant effect of AgIon treatment,” Journal of Physical Chemistry B, vol. 110, no.23, pp. 11352–11360, 2006.
[26] A. Kudo, K. Ueda, H. Kato, and I. Mikami, “Photocatalytic O2
evolution under visible light irradiation on BiVO4 in aqueousAgNO3 solution,” Catalysis Letters, vol. 53, no. 3-4, pp. 229–230, 1998.
[27] S. Kohtani, J. Hiro, N. Yamamoto, A. Kudo, K. Tokumura, andR. Nakagaki, “Adsorptive and photocatalytic properties of Ag-loaded BiVO4 on the degradation of 4-n-alkylphenols undervisible light irradiation,” Catalysis Communications, vol. 6,no. 3, pp. 185–189, 2005.
[28] A. Kudo, K. Omori, and H. Kato, “A novel aqueous process forpreparation of crystal form-controlled and highly crystallineBiVO4 powder from layered vanadates at room temperatureand its photocatalytic and photophysical properties,” Journalof the American Chemical Society, vol. 121, no. 49, pp. 11459–11467, 1999.
[29] S. Tokunaga, H. Kato, and A. Kudo, “Selective preparation ofmonoclinic and tetragonal BiVO4 with scheelite structure andtheir photocatalytic properties,” Chemistry of Materials, vol.13, no. 12, pp. 4624–4628, 2001.
[30] P. Madhusudan, J. Ran, J. Zhang, J. Yu, and G. Liu,“Novel urea assisted hydrothermal synthesis of hierarchicalBiVO4/Bi2O2CO3 nanocomposites with enhanced visible-lightphotocatalytic activity,” Applied Catalysis B, vol. 110, pp. 286–295, 2011.
[31] P. B. Avakyan, M. D. Nersesyan, and A. G. Merzhanov,“New materials for electronic engineering,” American CeramicSociety Bulletin, vol. 75, no. 2, pp. 50–55, 1996.
[32] P. Shuk, H. D. Wiemhofer, U. Guth, W. Gopel, and M.Greenblatt, “Oxide ion conducting solid electrolytes based onBi2O3,” Solid State Ionics, vol. 89, no. 3-4, pp. 179–196, 1996.
[33] K. Shantha and K. B. R. Varma, “Preparation and charac-terization of nanocrystalline powders of bismuth vanadate,”Materials Science and Engineering B, vol. 60, no. 1, pp. 66–75,1999.
[34] J. D. Bierlein and A. W. Sleight, “Ferroelasticity in BiVO4,”Solid State Communications, vol. 16, no. 1, pp. 69–70, 1975.
[35] L. Hoffart, U. Heider, R. A. Huggins, W. Witschel, R. Jooss,and A. Lentz, “Crystal growth and conductivity investigationson BiVO4 single crystals,” Ionics, vol. 2, no. 1, pp. 34–38, 1996.
[36] L. Zhou, W. Wang, L. Zhang, H. Xu, and W. Zhu, “Single-crystalline BiVO4 microtubes with square cross-sections:microstructure, growth mechanism, and photocatalytic prop-erty,” Journal of Physical Chemistry C, vol. 111, no. 37, pp.13659–13664, 2007.
[37] W. Yin, W. Wang, M. Shang, L. Zhou, S. Sun, and L. Wang,“BiVO4 hollow nanospheres: anchoring synthesis, growthmechanism, and their application in photocatalysis,” EuropeanJournal of Inorganic Chemistry, no. 29-30, pp. 4379–4384,2009.
[38] G. Li, D. Zhang, and J. C. Yu, “Ordered mesoporous BiVO4
through nanocasting: a superior visible light-driven photocat-alyst,” Chemistry of Materials, vol. 20, no. 12, pp. 3983–3992,2008.
[39] D. Ke, T. Peng, L. Ma, P. Cai, and K. Dai, “Effects ofhydrothermal temperature on the microstructures of BiVO4
and its photocatalytic O2 evolution activity under visiblelight,” Inorganic Chemistry, vol. 48, no. 11, pp. 4685–4691,2009.
[40] K. I. Ishibashi, A. Fujishima, T. Watanabe, and K. Hashimoto,“Detection of active oxidative species in TiO2 photocatalysisusing the fluorescence technique,” Electrochemistry Communi-cations, vol. 2, no. 3, pp. 207–210, 2000.
[41] Q. Xiang, J. Yu, B. Cheng, and H. C. Ong, “Microwave-hydrothermal preparation and visible-light photoactivity ofplasmonic photocatalyst Ag-TiO2 nanocomposite hollowspheres,” Chemistry-A Asian Journal, vol. 5, no. 6, pp. 1466–1474, 2010.
[42] X. Zhang, Z. Ai, F. Jia, L. Zhang, X. Fan, and Z. Zou, “Selectivesynthesis and visible-light photocatalytic activities of BiVO4
with different crystalline phases,” Materials Chemistry andPhysics, vol. 103, no. 1, pp. 162–167, 2007.
[43] J. Yu and A. Kudo, “Effects of structural variation on thephotocatalytic performance of hydrothermally synthesizedBiVO4,” Advanced Functional Materials, vol. 16, no. 16, pp.2163–2169, 2006.
[44] M. W. Stoltzfus, P. M. Woodward, R. Seshadri, J. H. Klepeis,and B. Bursten, “Structure and bonding in SnWO4, PbWO4,and BiVO4: ione pairs vs inert pairs,” Inorganic Chemistry, vol.46, no. 10, pp. 3839–3850, 2007.
[45] G. Zhu and P. Liu, “Low-temperature urea-assisted hydrother-mal synthesis of Bi2S3 nanostructures with different mor-phologies,” Crystal Research and Technology, vol. 44, no. 7, pp.713–720, 2009.
[46] S. Liu, J. Yu, and S. Mann, “Spontaneous construction ofphotoactive hollow TiO2 microspheres and chains,” Nanotech-nology, vol. 20, no. 32, Article ID 325606, 2009.
[47] M. Oshikiri, M. Boero, J. Ye, Z. Zou, and G. Kido, “Electronicstructures of promising photocatalysts InMO4 (M = V, Nb, Ta)and BiVO4 for water decomposition in the visible wavelengthregion,” Journal of Chemical Physics, vol. 117, no. 15, pp. 7313–7318, 2002.
[48] J. Yu, J. Xiong, B. Cheng, and S. Liu, “Fabrication andcharacterization of Ag-TiO2 multiphase nanocomposite thinfilms with enhanced photocatalytic activity,” Applied CatalysisB, vol. 60, no. 3-4, pp. 211–221, 2005.
[49] E. M. Patterson, C. E. Shelden, and B. H. Stockton, “Kubelka-Munk optical properties of a barium sulfate white reflectancestandard,” Applied Optics, vol. 16, no. 3, pp. 729–732, 1977.
[50] N. Serpone, D. Lawless, and R. Khairutdinov, “Size effectson the photophysical properties of colloidal anatase TiO2
particles: size quantization or direct transitions in this indirectsemiconductor?” Journal of Physical Chemistry, vol. 99, no. 45,pp. 16646–16654, 1995.
[51] J. Yu, S. Liu, and H. Yu, “Microstructures and photoactivityof mesoporous anatase hollow microspheres fabricated byfluoride-mediated self-transformation,” Journal of Catalysis,vol. 249, no. 1, pp. 59–66, 2007.
[52] J. Yu, S. Liu, and M. Zhou, “Enhanced photocalytic activity ofhollow anatase microspheres by Sn4+ incorporation,” Journalof Physical Chemistry C, vol. 112, no. 6, pp. 2050–2057, 2008.
[53] H. Yu, J. Yu, S. Liu, and S. Mann, “Template-free hydrothermalsynthesis of CuO/Cu2O composite hollow microspheres,”Chemistry of Materials, vol. 19, no. 17, pp. 4327–4334, 2007.
10 International Journal of Photoenergy
[54] W. Cai, J. Yu, and S. Mann, “Template-free hydrothermalfabrication of hierarchically organized γ-AlOOH hollowmicrospheres,” Microporous and Mesoporous Materials, vol.122, no. 1–3, pp. 42–47, 2009.
[55] A. Zhang, J. Zhang, N. Cui, X. Tie, Y. An, and L. Li, “Effectsof pH on hydrothermal synthesis and characterization ofvisible-light-driven BiVO4 photocatalyst,” Journal of MolecularCatalysis A, vol. 304, no. 1-2, pp. 28–32, 2009.
[56] J. Yu, Y. Su, and B. Cheng, “Template-free fabricationand enhanced photocatalytic activity of hierarchical macro-/mesoporous titania,” Advanced Functional Materials, vol. 17,no. 12, pp. 1984–1990, 2007.
[57] J. Yu, W. Wang, B. Cheng, B. Huang, and X. Zhang,“Preparation and photocatalytic activity of multi-modallymacro/mesoporous titania,” Research on Chemical Intermedi-ates, vol. 35, no. 6-7, pp. 653–665, 2009.