complex permittivity of sodium chloride solutions at microwave frequencies
TRANSCRIPT
Bioelectromagnetics 28:264^274 (2007)
Complex Permittivity of Sodium ChlorideSolutions at Microwave Frequencies
A. Peyman,* C. Gabriel, and E.H. GrantMCL,11Kings RoadWest, Newbury, Berkshire, RG14 5BY, UK
The complex permittivity of aqueous solutions at 20 8C has been measured at concentrations between0.001 and 5 mol/L and over a frequency range 0.13–20 GHz. The results were combined with literaturevalues to derive empirical equations to predict the dielectric behavior of sodium chloride solutionsbetween 0 and 5 mol/L and 58C–35 8C. Bioelectromagnetics 28:264–274, 2007. � 2007 Wiley-Liss, Inc.
Key words: permittivity; sodium chloride solutions; microwave frequencies
INTRODUCTION
Biological tissues typically have a high watercontent and a significant concentration of ions. Atfrequencies above about 100 MHz the interactionof microwaves with biological material is almostexclusively dependent on the aqueous and ionic contentand it is therefore very useful to have accurate values ofthe complex permittivity of salt solution at thesefrequencies. In addition, NaCl in aqueous solution isoften used as a standard liquid in experiments tomeasure the dielectric properties of biological material.
So far, it has been common to use the staticpermittivity values of NaCl, which were published byStogryn [1971]. However, these values were obtainedby extrapolation of the measurements of Lane andSaxon [1952] which were made at frequencies of 9.3,24.2, and 48.4 GHz and this can involve a significanterror, as shown by Grant [1957]. For example, if theextrapolation is carried out using a Debye relationship(which is what Stogryn used) instead of a Cole–Colerelationship (which the present work shows to exist)the error in deducing the static permittivity would bearound 5% for a 3 mol/L solution and greater at higherconcentrations. Moreover, there is considerable error inthe extrapolation process itself, and this is eliminated bymaking a direct measurement at frequencies around100–200 MHz.
Apart from the work of Nortemann et al. [1997]and Buchner et al. [1999] which had a low frequencylimit of 20 and 200 MHz respectively, there has beenlittle previous work on the dielectric properties of NaClsolutions at these frequencies. At higher frequenciesthere are many previously published data, and thesehave been incorporated with the present measurementsto obtain the various dielectric parameters and to derivethe two empirical relationships referred to above.
MATERIALS AND METHODS
The NaCl solutions were prepared by volumediluting standard solutions using deionised water toprovide a range of concentrations. Solutions in therange 0.001–0.01 mol/L were produced by dilution of0.01 mol/L standard solution (Fluka cat no 24886,chloride ion standard solution) using water (Fluka17749, ‘‘for analytical purposes’’). Solutions in therange 0.01–0.1 mol/L were produced by dilution of0.1 mol/L standard solution (Fluka cat no 24887)using water (Fluka 17749). Solutions in the range0.1–1 mol/L were produced by dilution of 1.0 mol/Lstandard solution (Fluka 71394) using water (Fluka17749). Solutions above 1.0 mol/L concentration wereproduced by single step dilution of a 5.0 mol/L solutionwhere the raw material used for preparation of 1000 mlof this solution was sodium chloride (Fluka 31434,puriss, ACS reagent, >99.8%) (58.44 g) and water(Fluka 17749). The accuracy of mass measurementwas to 0.01 g in 58.44 g that of volume was to 0.1 ml in1000 ml.
Twenty samples were prepared ranging from0.001 to 5 mol/L. The solutions were kept in cleancontainers avoiding contamination with any impuritiesand minimal exposure to air. The containers were keptin a water bath to reach a steady 20 8C temperature.
�2007Wiley-Liss, Inc.
——————*Correspondence to: A. Peyman, MCL, 11 Kings Road West,Newbury, Berkshire, RG14 5BY, UK.E-mail: [email protected]
Received for review 3 February 2006; Final revision received8 May 2006
DOI 10.1002/bem.20271Published online 3 January 2007 in Wiley InterScience(www.interscience.wiley.com).
Dielectric measurements were carried out usingan open-ended coaxial probe (2.98 mm) and a computercontrolled network analyzer (HP 8720). The dielectricproperties were obtained from S11 parameters usingan admittance model described in Gabriel et al.[1994]. This procedure was shown to be quite suitablefor dielectric measurement of liquids. When goodlaboratory practice is adhered to, in particular stricttemperature control, the stated accuracy of thisprocedure is between 1% and 2% when assessed byrepeat measurement on standard liquids of well-knowndielectric property and the reproducibility is better than1% of the average values in most frequencies. Thesefigures were confirmed in this study through anuncertainty analysis mentioned in the next section.
Measurement Uncertainty
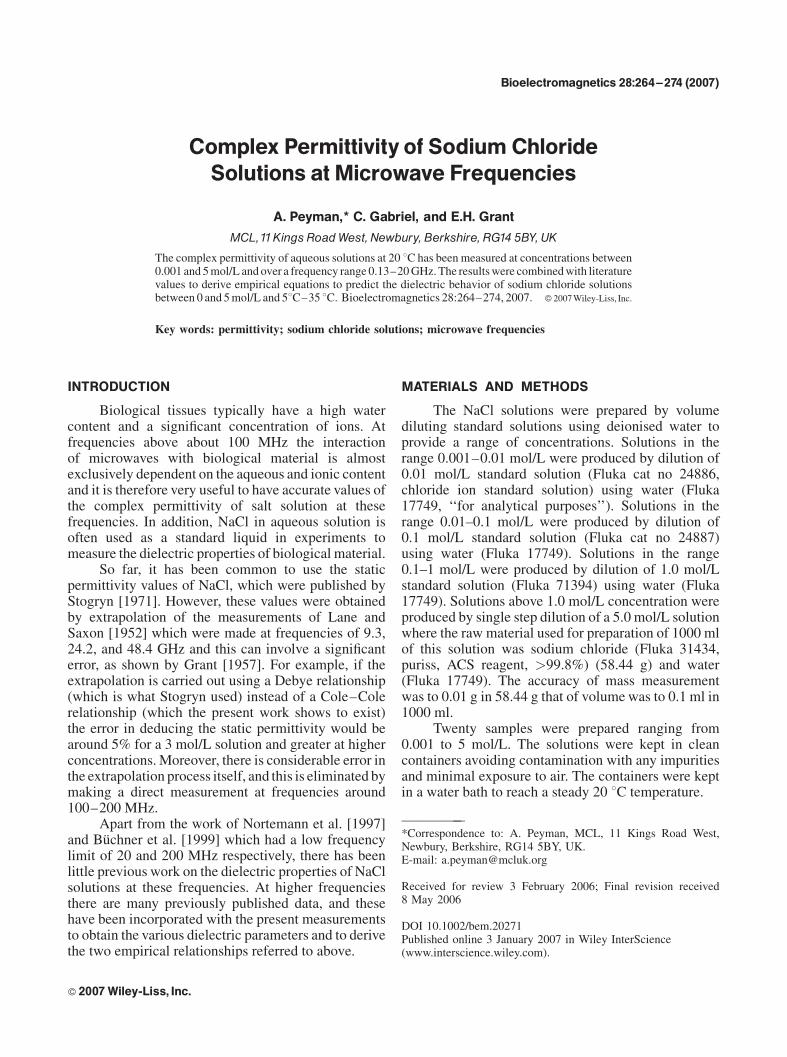
The measurement uncertainty analysis was car-ried out by performing repeated dielectric measure-ments on a reference liquid: ethanediol; this is a polar
liquid with a static permittivity about half of pure water(Fig. 1), its dielectric properties were taken from Levinand Podlovchenko [1970]. This enables us to calculaterandom and systematic errors from the repeatability andcomparison of measured and literature values. Theseare then combined with other applicable uncertaintyelements to give the total combined uncertainty(Table 1): details of the procedure are publishedelsewhere [Gabriel and Peyman, 2006].
The measurement uncertainty calculated usingethanediol is fairly typical of that observed with otherreference liquids. For example, we obtain similarresults using formamide and dimethylene sulphoxide.This is reinforced by the NaCl data reported in thispaper, which compare well with Buchner et al. [1999].
No problems were encountered in the measure-ment of NaCl solution of low and moderate concen-trations. However, at high concentration it becameincreasingly difficult to measure the permittivity inthe presence of very high conductivities. Consequently,
Fig. 1. Measureddielectricpropertiesofethanediolat20 8CcomparedwithLevinandPodlovchenko[1970].
TABLE 1. Experimentally Determined Uncertainty Elements and Total Combined Uncertainty for the Permittivity (e0) andConductivity (r) Across the Frequency Range
Frequency Region
Random error(repeatability)
Systematicerror
Drift of networkanalyser
Total combineduncertainty
%�"0rep %Dsrep %�"0sys %Dssys %�"0d %Dsd %De0 %Ds
100–300 MHz 0.35 1.72 0.41 1.90 0.11 0.10 0.42 2.04>300 MHz–10 GHz 0.26 0.30 0.81 0.99 0.07 0.24 0.53 0.66>10–20 GHz 0.09 0.30 0.19 0.80 0.16 0.17 0.17 0.56
Data based on the measurement of the dielectric properties of ethanediol at 20 8C. Weighting factors, that take into account the probabilitydistribution, are applied to the uncertainty elements prior to calculating the total uncertainty as the square root of the sum of the squares of theweighted uncertainty elements (The methodology was taken from NIST 1994 and GUM 1995).
Complex NaCl Solution Permittivites 265

we experienced some instability in the measurement ofthe permittivity at frequencies below a few hundredmegahertz.
Data Analysis
The measured dielectric data for all NaClconcentrations were fitted to the following Cole–Colemodel
" ¼ "1 þ "s � "1
1 þ ðjo�Þð1�aÞ þsi
jo"0
ð1Þ
where , "s and "1are the limit of the permittivity at lowand high frequencies, t is the relaxation time, si is theionic conductivity, "0 is the permittivity of free spaceand a is a distribution parameter. For a¼ 0, Equation 1becomes the well-known Debye equation for a single
relaxation time process. All the parameters were floatedexcept for the infinite permittivity value.
The data were fitted in turns to the Debyeand Cole–Cole models. At concentrations below0.5 mol/L, measurements over the entire frequencyrange (130 MHz–20 GHz) were used. At concen-trations above 0.5 mol/L, a more limited data set(500 MHz–20 GHz) was used.
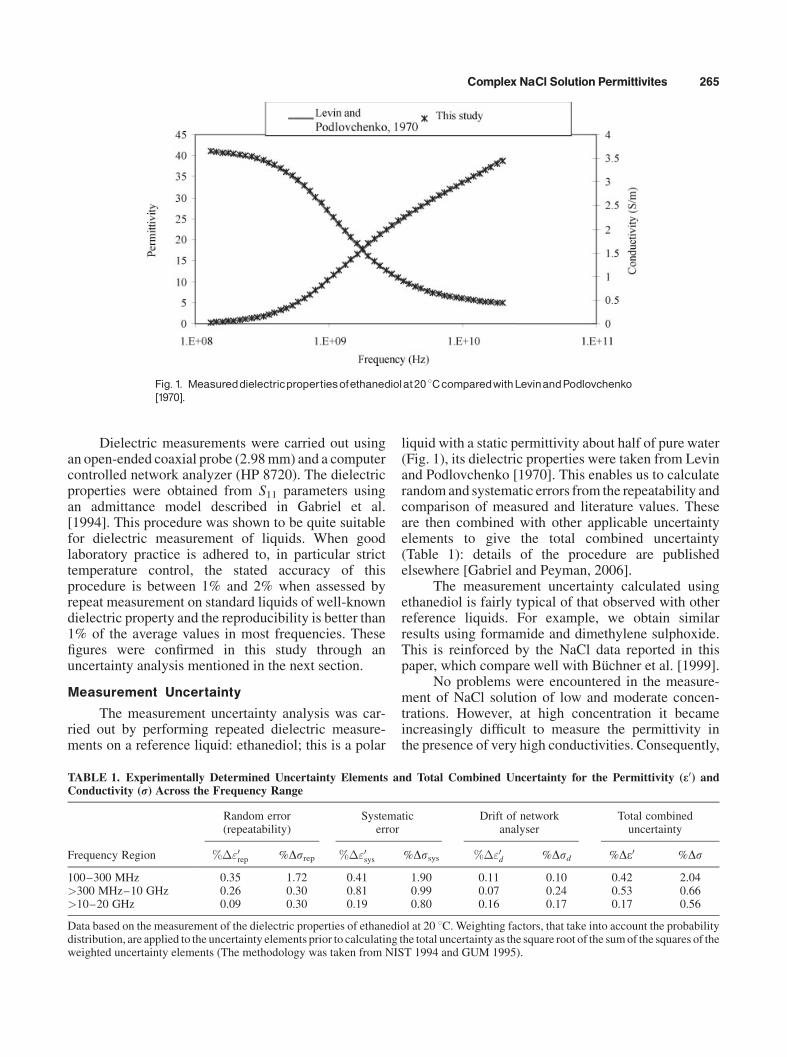
Figure 2a and b shows the measured permittivityand conductivity values together with the prediction ofthe Cole–Cole model; for clarity, not all concentrationsmeasured are shown. The fitted parameters to theDebye and Cole–Cole models and the 95% confidenceintervals associated with each parameter are shownin Tables 2 and 3 respectively. Included in thesetables are the root mean square error (RMSE) values ofeach fit.
Fig. 2. The measured (a) permittivity and (b) conductivity of selected NaCl solutions and corre-spondingCole^Cole fittedvalues.
266 Peyman et al.
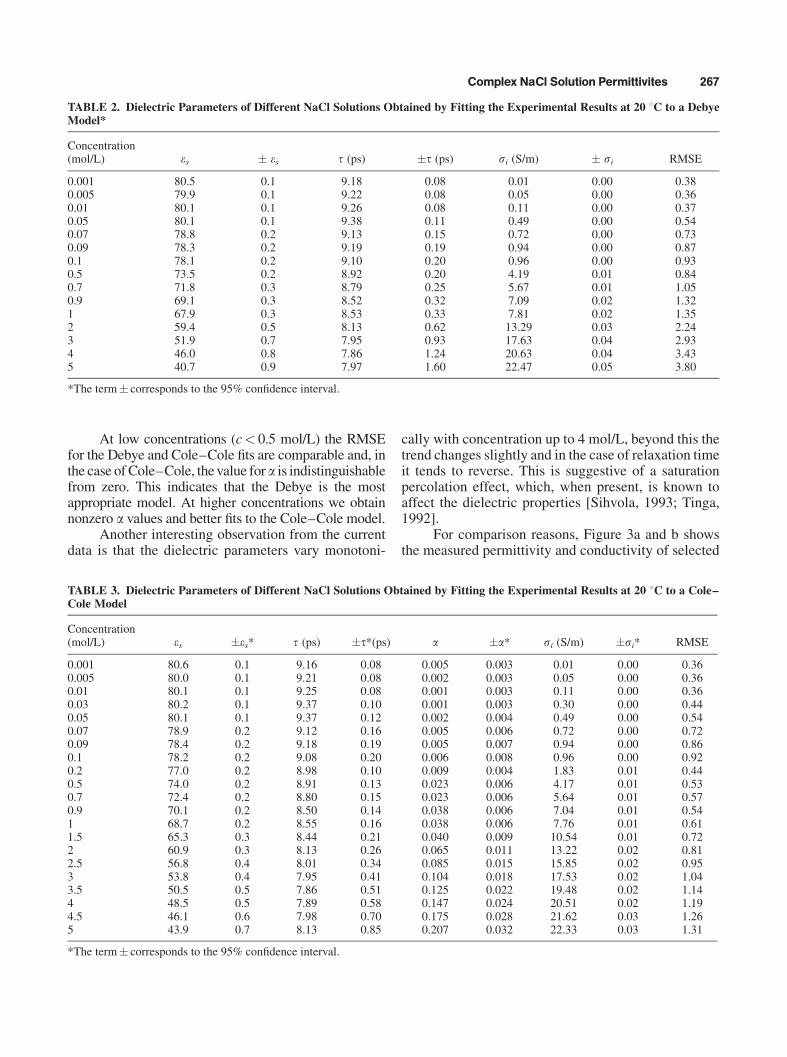
At low concentrations (c< 0.5 mol/L) the RMSEfor the Debye and Cole–Cole fits are comparable and, inthe case of Cole–Cole, the value for a is indistinguishablefrom zero. This indicates that the Debye is the mostappropriate model. At higher concentrations we obtainnonzero a values and better fits to the Cole–Cole model.
Another interesting observation from the currentdata is that the dielectric parameters vary monotoni-
cally with concentration up to 4 mol/L, beyond this thetrend changes slightly and in the case of relaxation timeit tends to reverse. This is suggestive of a saturationpercolation effect, which, when present, is known toaffect the dielectric properties [Sihvola, 1993; Tinga,1992].
For comparison reasons, Figure 3a and b showsthe measured permittivity and conductivity of selected
TABLE 2. Dielectric Parameters of Different NaCl Solutions Obtained by Fitting the Experimental Results at 20 8C to a DebyeModel*
Concentration(mol/L) es � es t (ps) �t (ps) si (S/m) � si RMSE
0.001 80.5 0.1 9.18 0.08 0.01 0.00 0.380.005 79.9 0.1 9.22 0.08 0.05 0.00 0.360.01 80.1 0.1 9.26 0.08 0.11 0.00 0.370.05 80.1 0.1 9.38 0.11 0.49 0.00 0.540.07 78.8 0.2 9.13 0.15 0.72 0.00 0.730.09 78.3 0.2 9.19 0.19 0.94 0.00 0.870.1 78.1 0.2 9.10 0.20 0.96 0.00 0.930.5 73.5 0.2 8.92 0.20 4.19 0.01 0.840.7 71.8 0.3 8.79 0.25 5.67 0.01 1.050.9 69.1 0.3 8.52 0.32 7.09 0.02 1.321 67.9 0.3 8.53 0.33 7.81 0.02 1.352 59.4 0.5 8.13 0.62 13.29 0.03 2.243 51.9 0.7 7.95 0.93 17.63 0.04 2.934 46.0 0.8 7.86 1.24 20.63 0.04 3.435 40.7 0.9 7.97 1.60 22.47 0.05 3.80
*The term� corresponds to the 95% confidence interval.
TABLE 3. Dielectric Parameters of Different NaCl Solutions Obtained by Fitting the Experimental Results at 20 8C to a Cole–Cole Model
Concentration(mol/L) es �es* t (ps) �t*(ps) a �a* si (S/m) �si* RMSE
0.001 80.6 0.1 9.16 0.08 0.005 0.003 0.01 0.00 0.360.005 80.0 0.1 9.21 0.08 0.002 0.003 0.05 0.00 0.360.01 80.1 0.1 9.25 0.08 0.001 0.003 0.11 0.00 0.360.03 80.2 0.1 9.37 0.10 0.001 0.003 0.30 0.00 0.440.05 80.1 0.1 9.37 0.12 0.002 0.004 0.49 0.00 0.540.07 78.9 0.2 9.12 0.16 0.005 0.006 0.72 0.00 0.720.09 78.4 0.2 9.18 0.19 0.005 0.007 0.94 0.00 0.860.1 78.2 0.2 9.08 0.20 0.006 0.008 0.96 0.00 0.920.2 77.0 0.2 8.98 0.10 0.009 0.004 1.83 0.01 0.440.5 74.0 0.2 8.91 0.13 0.023 0.006 4.17 0.01 0.530.7 72.4 0.2 8.80 0.15 0.023 0.006 5.64 0.01 0.570.9 70.1 0.2 8.50 0.14 0.038 0.006 7.04 0.01 0.541 68.7 0.2 8.55 0.16 0.038 0.006 7.76 0.01 0.611.5 65.3 0.3 8.44 0.21 0.040 0.009 10.54 0.01 0.722 60.9 0.3 8.13 0.26 0.065 0.011 13.22 0.02 0.812.5 56.8 0.4 8.01 0.34 0.085 0.015 15.85 0.02 0.953 53.8 0.4 7.95 0.41 0.104 0.018 17.53 0.02 1.043.5 50.5 0.5 7.86 0.51 0.125 0.022 19.48 0.02 1.144 48.5 0.5 7.89 0.58 0.147 0.024 20.51 0.02 1.194.5 46.1 0.6 7.98 0.70 0.175 0.028 21.62 0.03 1.265 43.9 0.7 8.13 0.85 0.207 0.032 22.33 0.03 1.31
*The term� corresponds to the 95% confidence interval.
Complex NaCl Solution Permittivites 267
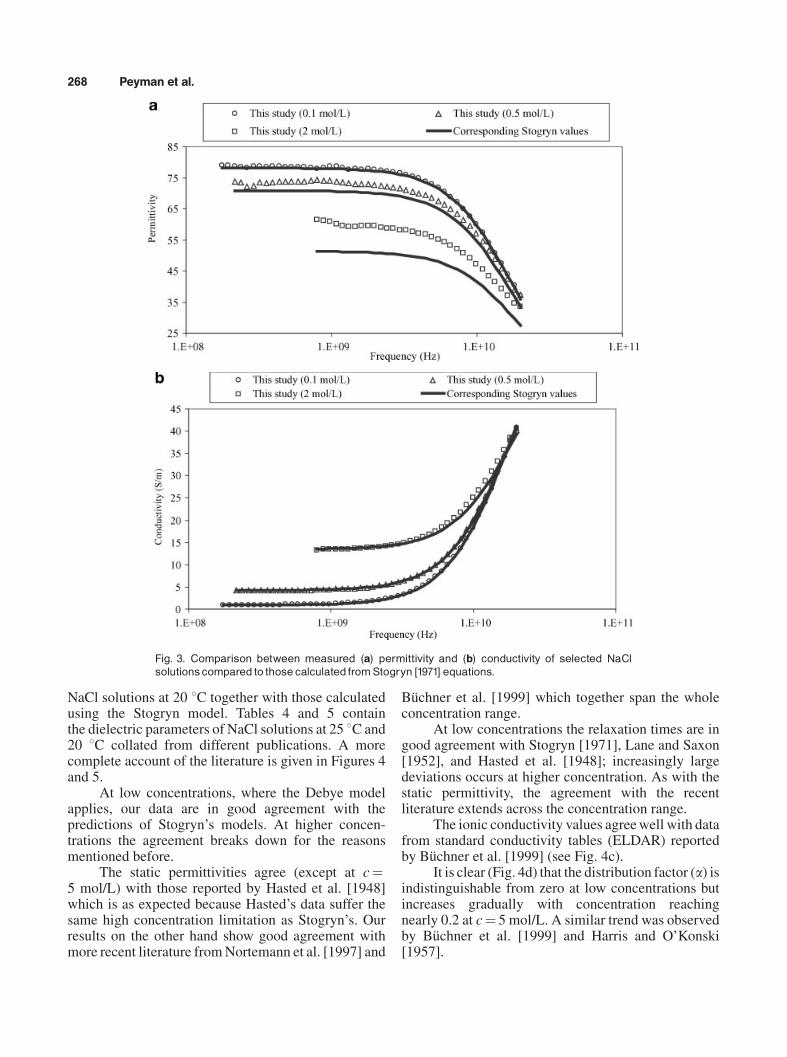
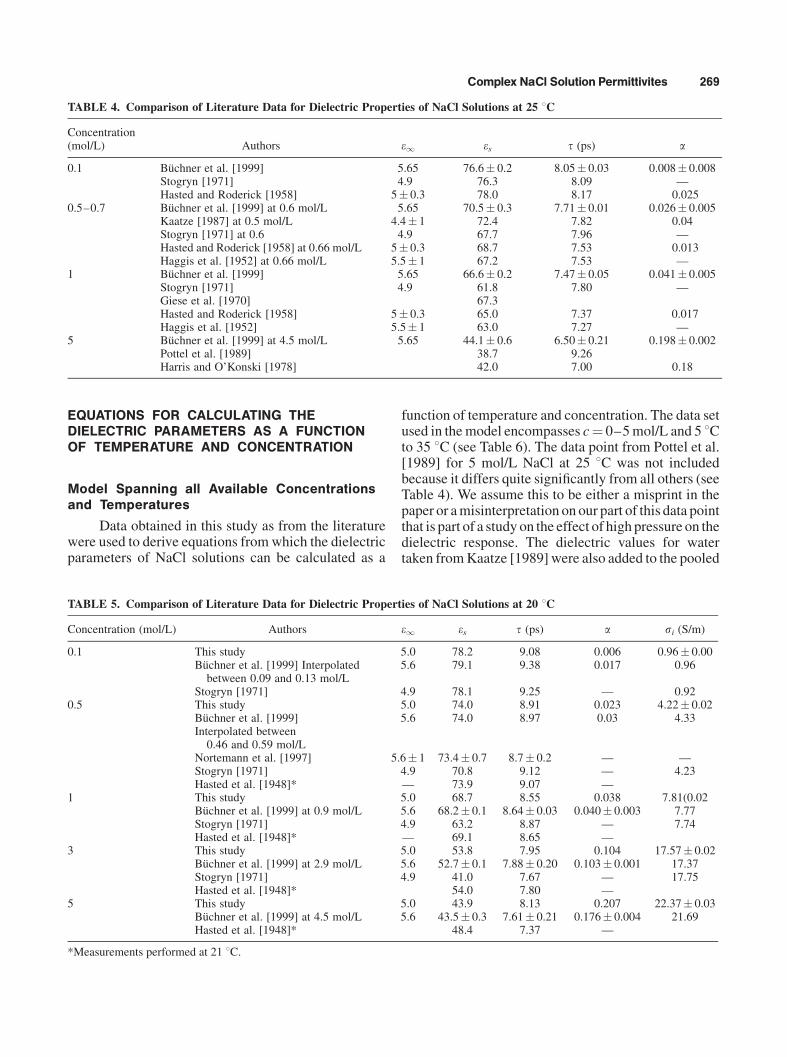
NaCl solutions at 20 8C together with those calculatedusing the Stogryn model. Tables 4 and 5 containthe dielectric parameters of NaCl solutions at 25 8C and20 8C collated from different publications. A morecomplete account of the literature is given in Figures 4and 5.
At low concentrations, where the Debye modelapplies, our data are in good agreement with thepredictions of Stogryn’s models. At higher concen-trations the agreement breaks down for the reasonsmentioned before.
The static permittivities agree (except at c¼5 mol/L) with those reported by Hasted et al. [1948]which is as expected because Hasted’s data suffer thesame high concentration limitation as Stogryn’s. Ourresults on the other hand show good agreement withmore recent literature from Nortemann et al. [1997] and
Buchner et al. [1999] which together span the wholeconcentration range.
At low concentrations the relaxation times are ingood agreement with Stogryn [1971], Lane and Saxon[1952], and Hasted et al. [1948]; increasingly largedeviations occurs at higher concentration. As with thestatic permittivity, the agreement with the recentliterature extends across the concentration range.
The ionic conductivity values agree well with datafrom standard conductivity tables (ELDAR) reportedby Buchner et al. [1999] (see Fig. 4c).
It is clear (Fig. 4d) that the distribution factor (a) isindistinguishable from zero at low concentrations butincreases gradually with concentration reachingnearly 0.2 at c¼ 5 mol/L. A similar trend was observedby Buchner et al. [1999] and Harris and O’Konski[1957].
Fig. 3. Comparison between measured (a) permittivity and (b) conductivity of selected NaClsolutionscompared to those calculated fromStogryn [1971] equations.
268 Peyman et al.
EQUATIONS FOR CALCULATING THEDIELECTRIC PARAMETERS AS A FUNCTIONOF TEMPERATURE AND CONCENTRATION
Model Spanning all Available Concentrationsand Temperatures
Data obtained in this study as from the literaturewere used to derive equations from which the dielectricparameters of NaCl solutions can be calculated as a
function of temperature and concentration. The data setused in the model encompasses c¼ 0–5 mol/L and 5 8Cto 35 8C (see Table 6). The data point from Pottel et al.[1989] for 5 mol/L NaCl at 25 8C was not includedbecause it differs quite significantly from all others (seeTable 4). We assume this to be either a misprint in thepaper or a misinterpretation on our part of this data pointthat is part of a study on the effect of high pressure on thedielectric response. The dielectric values for watertaken from Kaatze [1989] were also added to the pooled
TABLE 4. Comparison of Literature Data for Dielectric Properties of NaCl Solutions at 25 8C
Concentration(mol/L) Authors e1 es t (ps) a
0.1 Buchner et al. [1999] 5.65 76.6� 0.2 8.05� 0.03 0.008� 0.008Stogryn [1971] 4.9 76.3 8.09 —Hasted and Roderick [1958] 5� 0.3 78.0 8.17 0.025
0.5–0.7 Buchner et al. [1999] at 0.6 mol/L 5.65 70.5� 0.3 7.71� 0.01 0.026� 0.005Kaatze [1987] at 0.5 mol/L 4.4� 1 72.4 7.82 0.04Stogryn [1971] at 0.6 4.9 67.7 7.96 —Hasted and Roderick [1958] at 0.66 mol/L 5� 0.3 68.7 7.53 0.013Haggis et al. [1952] at 0.66 mol/L 5.5� 1 67.2 7.53 —
1 Buchner et al. [1999] 5.65 66.6� 0.2 7.47� 0.05 0.041� 0.005Stogryn [1971] 4.9 61.8 7.80 —Giese et al. [1970] 67.3Hasted and Roderick [1958] 5� 0.3 65.0 7.37 0.017Haggis et al. [1952] 5.5� 1 63.0 7.27 —
5 Buchner et al. [1999] at 4.5 mol/L 5.65 44.1� 0.6 6.50� 0.21 0.198� 0.002Pottel et al. [1989] 38.7 9.26Harris and O’Konski [1978] 42.0 7.00 0.18
TABLE 5. Comparison of Literature Data for Dielectric Properties of NaCl Solutions at 20 8C
Concentration (mol/L) Authors e1 es t (ps) a si (S/m)
0.1 This study 5.0 78.2 9.08 0.006 0.96� 0.00Buchner et al. [1999] Interpolated
between 0.09 and 0.13 mol/L5.6 79.1 9.38 0.017 0.96
Stogryn [1971] 4.9 78.1 9.25 — 0.920.5 This study 5.0 74.0 8.91 0.023 4.22� 0.02
Buchner et al. [1999]Interpolated between
0.46 and 0.59 mol/L
5.6 74.0 8.97 0.03 4.33
Nortemann et al. [1997] 5.6� 1 73.4� 0.7 8.7� 0.2 — —Stogryn [1971] 4.9 70.8 9.12 — 4.23Hasted et al. [1948]* — 73.9 9.07 —
1 This study 5.0 68.7 8.55 0.038 7.81(0.02Buchner et al. [1999] at 0.9 mol/L 5.6 68.2� 0.1 8.64� 0.03 0.040� 0.003 7.77Stogryn [1971] 4.9 63.2 8.87 — 7.74Hasted et al. [1948]* — 69.1 8.65 —
3 This study 5.0 53.8 7.95 0.104 17.57� 0.02Buchner et al. [1999] at 2.9 mol/L 5.6 52.7� 0.1 7.88� 0.20 0.103� 0.001 17.37Stogryn [1971] 4.9 41.0 7.67 — 17.75Hasted et al. [1948]* 54.0 7.80 —
5 This study 5.0 43.9 8.13 0.207 22.37� 0.03Buchner et al. [1999] at 4.5 mol/L 5.6 43.5� 0.3 7.61� 0.21 0.176� 0.004 21.69Hasted et al. [1948]* 48.4 7.37 —
*Measurements performed at 21 8C.
Complex NaCl Solution Permittivites 269
Fig. 4. Changesindielectricparametersasa functionof concentrations c (mol/L) fordifferent NaClsolutionsat 20 8C*(a) staticpermittivity (es), (b) relaxationtime (tpsec), (c) ionic conductivity (si) and(d) distributionparameter (a) * Hastedet al. [1948] datawereobtainedat 21 8C.
270 Peyman et al.
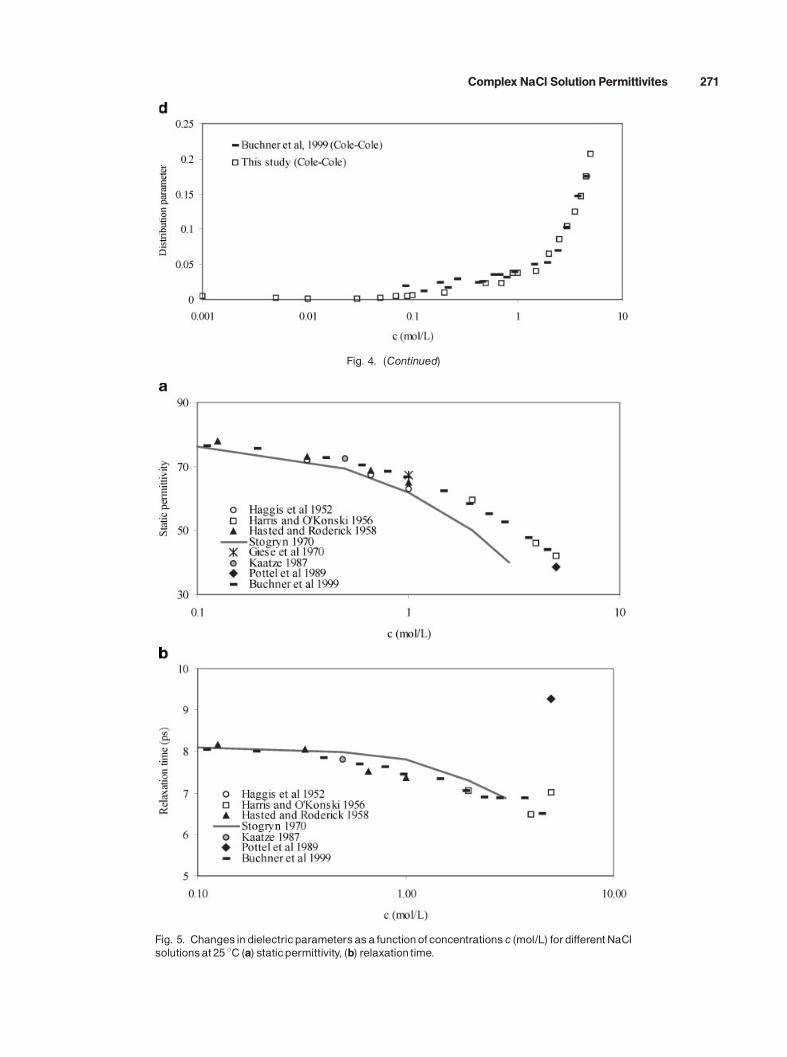
Fig. 4. (Continued)
Fig. 5. Changesindielectricparametersasa functionof concentrations c (mol/L) fordifferent NaClsolutionsat 25 8C (a) staticpermittivity, (b) relaxationtime.
Complex NaCl Solution Permittivites 271
data in order to take into account the concentration atc¼ 0 mol/L.
Polynomial equations were derived from the datarelating each of the static permittivity "s, relaxation timet (sec), ionic conductivity si (S/m) and distributionparameter a to the concentration and temperature ofNaCl solutions in water. No model was derived for highfrequency permittivity "1 as no trend could be found asa function of concentration. Instead we propose thevalues for water as a function of temperature taken fromKaatze [1989] to be used for "1
"1 ¼ 5:77 � 0:0274t ð2Þ
where t is the temperature in degrees Celsius.The static permittivity "s, relaxation time t (sec),
conductivity si (S/m) and Distribution parameter a forNaCl of 0–5 mol/L at 58C–35 8C can be obtained fromthe following equations
"s ¼"sðwÞð0:999 þ 8:521 � 10�4tcþ 0:013c2
� 0:175cþ 2:344 � 10�4t � 1:235 � 10�5t2Þ ð3Þ
tðsecÞ ¼ tðwÞð1:03 þ 9:387 � 10�5tc
þ 0:012c2 � 0:091c� 3:093 � 10�3t
þ 4:932 � 10�5t2Þð4Þ
si ¼ 0:096tc� 0:8c2 þ 6:554c ð5Þ
a ¼ 2:474 � 10�4tcþ 2:101 � 10�3c2 þ 0:021c ð6Þ
where t is the temperature of the liquid in 8C and c is theconcentration of the solution in mol/L. "s (w) and t(w)(sec) are the static permittivity and relaxation timeof water from Kaatze (1989)
"SðwÞ ¼ 10ð1:94404�1:991�10�3tÞ ð7Þ
tðwÞ ¼ 3:745 � 10�15ð1 þ ð7 � 10�5Þðt � 27:5Þ2Þexpð2:2957 � 103=ðt þ 273:15ÞÞ ð8Þ
The accuracy of the above polynomials when calculat-ing the dielectric properties of water at temperaturesbetween 58C and 35 8C are within 0%–0.7% for staticpermittivity and 0%–1.8% for relaxation time.
Equation 3 predicts the static permittivity ofdifferent concentrations and temperatures to within0%–3% for most of the literature used. The staticpermittivity reported by Hasted and Roderick [1958]and Haggis et al. [1952] for c¼ 0.1–0.6 mol/L at 25 8Cwas predicted by this equation to within 1.7%–5%increasing to 6.5% at c¼ 1 mol/L. Equation 4 fallswithin 0.1%–4% of the relaxation time data set.
Higher deviations from the model were observedfor the ionic conductivity (si) and distribution factor (a)values.
Model for Concentrations Below 1 mol/L
While fairly representative of the data, Equations(3)–(6) may not be sufficiently sensitive at lowconcentration because of the small magnitude and largedynamic range of some of the parameters. Models weretherefore derived to accommodate low and highconcentrations with an arbitrary breakpoint around1 mol/L. At low concentrations of c¼ 0–1 mol/L at58C–35 8C we obtained
"s ¼ "sðwÞð1:0 � 3:742 � 10�4tcþ 0:034c2 � 0:178c
þ 1:515 � 10�4t � 4:929 � 10�6t2Þ ð9Þ
tðsecÞ ¼ tðwÞð1:012 � 5:282 � 10�3tc
þ 0:032c2 � 0:01c� 1:724 � 10�3t
þ 3:766 � 10�5t2
ð10Þ
si ¼ 0:174tc� 1:582c2 þ 5:923c ð11Þ
a ¼ �6:348 � 10�4tc� 5:1 � 10�2c2 þ 9 � 10�2c
ð12Þ
The accuracy of the above polynomials when calculat-ing the dielectric properties of water at temperaturesbetween 58C and 35 8C are within 0%–0.1% forstatic permittivity and 0%–0.7% for relaxation time.These values are well-below the percentage errorreported by Kaatze [1989] for dielectric parametersof water in the same temperature range (0.2%–0.3%for static permittivity and 0.7%–0.9% for relaxationtime).
TABLE 6. The Sources of Data Used for Deriving thePolynomial Equations for Dielectric Properties of NaClSolutions as a Function of Temperature and Concentration
Source of dataTemperatures
(8C)Concentrations
(mol/L)
Kaatze [1989] 0–35 0This study 20 0.001–5Buchner et al. [1999] 5–35 0.1–4.5Nortemann et al. [1997] 20 0.05–0.6Hasted et al. [1948] 21 0.5–5Kaatze [1987] 25 0.5Hasted and Roderick [1958] 25 0.1–1Haggis et al. [1952] 25 0.3–1
272 Peyman et al.
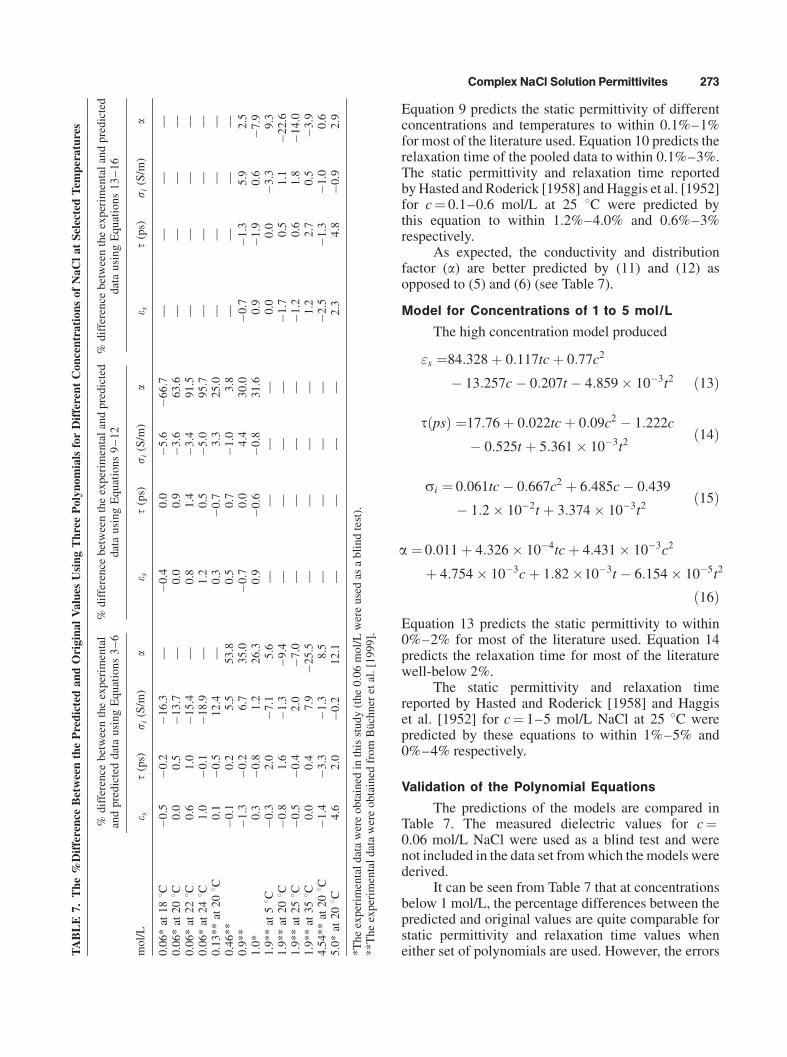
Equation 9 predicts the static permittivity of differentconcentrations and temperatures to within 0.1%–1%for most of the literature used. Equation 10 predicts therelaxation time of the pooled data to within 0.1%–3%.The static permittivity and relaxation time reportedby Hasted and Roderick [1958] and Haggis et al. [1952]for c¼ 0.1–0.6 mol/L at 25 8C were predicted bythis equation to within 1.2%–4.0% and 0.6%–3%respectively.
As expected, the conductivity and distributionfactor (a) are better predicted by (11) and (12) asopposed to (5) and (6) (see Table 7).
Model for Concentrations of 1 to 5 mol/L
The high concentration model produced
"s ¼84:328 þ 0:117tcþ 0:77c2
� 13:257c� 0:207t � 4:859 � 10�3t2 ð13Þ
tðpsÞ ¼17:76 þ 0:022tcþ 0:09c2 � 1:222c
� 0:525t þ 5:361 � 10�3t2ð14Þ
si ¼ 0:061tc� 0:667c2 þ 6:485c� 0:439
� 1:2 � 10�2t þ 3:374 � 10�3t2ð15Þ
a ¼ 0:011 þ 4:326 � 10�4tcþ 4:431 � 10�3c2
þ 4:754 � 10�3cþ 1:82 �10�3t � 6:154 � 10�5t2
ð16Þ
Equation 13 predicts the static permittivity to within0%–2% for most of the literature used. Equation 14predicts the relaxation time for most of the literaturewell-below 2%.
The static permittivity and relaxation timereported by Hasted and Roderick [1958] and Haggiset al. [1952] for c¼ 1–5 mol/L NaCl at 25 8C werepredicted by these equations to within 1%–5% and0%–4% respectively.
Validation of the Polynomial Equations
The predictions of the models are compared inTable 7. The measured dielectric values for c¼0.06 mol/L NaCl were used as a blind test and werenot included in the data set from which the models werederived.
It can be seen from Table 7 that at concentrationsbelow 1 mol/L, the percentage differences between thepredicted and original values are quite comparable forstatic permittivity and relaxation time values wheneither set of polynomials are used. However, the errorsT
ABLE
7.The%
Difference
BetweenthePredictedandOriginalValues
UsingThreePolynomialsforDifferentConcentrationsofNaClatSelectedTem
peratures
mo
l/L
%d
iffe
ren
ceb
etw
een
the
exp
erim
enta
lan
dp
red
icte
dd
ata
usi
ng
Eq
uat
ion
s3
–6
%d
iffe
ren
ceb
etw
een
the
exp
erim
enta
lan
dp
red
icte
dd
ata
usi
ng
Eq
uat
ion
s9
–1
2%
dif
fere
nce
bet
wee
nth
eex
per
imen
tal
and
pre
dic
ted
dat
au
sin
gE
qu
atio
ns
13
–1
6
e st
(ps)
s i(S
/m)
ae s
t(p
s)s i
(S/m
)a
e st
(ps)
s i(S
/m)
a
0.0
6*
at1
88C
�0
.5�
0.2
�1
6.3
—�
0.4
0.0
�5
.6�
66
.7—
——
—0
.06
*at
208C
0.0
0.5
�1
3.7
—0
.00
.9�
3.6
63
.6—
——
—0
.06
*at
228C
0.6
1.0
�1
5.4
—0
.81
.4�
3.4
91
.5—
——
—0
.06
*at
248C
1.0
�0
.1�
18
.9—
1.2
0.5
�5
.09
5.7
——
——
0.1
3*
*at
208C
0.1
�0
.51
2.4
—0
.3�
0.7
3.3
25
.0—
——
—0
.46
**
�0
.10
.25
.55
3.8
0.5
0.7
�1
.03
.8—
——
—0
.9*
*�
1.3
�0
.26
.73
5.0
�0
.70
.04
.43
0.0
�0
.7�
1.3
5.9
2.5
1.0
*0
.3�
0.8
1.2
26
.30
.9�
0.6
�0
.83
1.6
0.9
�1
.90
.6�
7.9
1.9
**
at58C
�0
.32
.0�
7.1
5.6
——
——
0.0
0.0
�3
.39
.31
.9*
*at
208C
�0
.81
.6�
1.3
�9
.4—
——
—�
1.7
0.5
1.1
�2
2.6
1.9
**
at2
58C
�0
.5�
0.4
2.0
�7
.0—
——
—�
1.2
0.6
1.8
�1
4.0
1.9
**
at3
58C
0.0
0.4
7.9
�2
5.5
——
——
1.2
2.7
0.5
�3
.94
.54
**
at2
08C
�1
.4�
3.3
�1
.38
.5—
——
—�
2.5
�1
.3�
1.0
0.6
5.0
*at
208C
4.6
2.0
�0
.21
2.1
——
——
2.3
4.8
�0
.92
.9
*T
he
exp
erim
enta
ld
ata
wer
eo
bta
ined
inth
isst
ud
y(t
he
0.0
6m
ol/
Lw
ere
use
das
ab
lin
dte
st).
**
Th
eex
per
imen
tal
dat
aw
ere
ob
tain
edfr
om
Buch
ner
etal
.[1
99
9].
Complex NaCl Solution Permittivites 273

in the predicted conductivity and distribution factor (a)values are reduced notably when the low concentrationmodel is applied. A similar trend, but to a lesser extent,can be observed at concentrations above 1 mol/L.
SUMMARY
The dielectric properties of different concentra-tions of NaCl solutions at 20 8C have been measuredand the results agree well with the relatively recentliterature. Agreement with Stogryn [1971] was limitedto concentrations below 0.5 mol/L.
Both Debye and Cole–Cole models were used todescribe the dielectric behaviour of NaCl solutions. Wefound that the Debye expression is a better model forlow concentration NaCl solutions (c< 0.5 mol/L), thewhile Cole–Cole model becomes more appropriate athigher concentrations (c> 0.5 mol/L).
The experimental results obtained in this studyand those reported in the literature were combined toderive polynomial models that predict the dielectricbehaviour of NaCl solutions between c¼ 0–5 mol/Land 58–35 8C. More accurate predictions are obtainedfor ionic conductivity (si) and distribution factor (a)when separate models are used for concentrationsbelow and above 1 mol/L.
REFERENCES
Buchner R, Hefter GT, May PM. 1999. Dielectric relaxation ofaqueous NaCl solutions. J Phys Chem A 103:1–9.
ELDAR ELectrolyte Data Regensburg is a subset of the databaseDETHERM (distributor: STN. Karlsruhe Germany)
Gabriel C, Peyman A. 2006. Dielectric measurement: error analysisand assessment of uncertainty. Phys Med Biol 51:6033–6046.
Gabriel C, Chan TY A, Grant EH. 1994. Admittance models foropen ended coaxial probes and their place in dielectricspectroscopy. Phys Med Biol 39(21):83–2200.
Giese K, Kaatze U, Pottel R. 1970. Permittivity and Dielectric andProton Magnetic Relaxation of Aqueous Solutions of theAlkali Halides. J Phys Chem 74(21):3718–3725.
Grant EH. 1957. The dielectric method of estimating proteinhydration. Phys Med Biol 2:17–28.
Haggis GH, Hasted JB, Buchanan TJ. 1952. The dielectricproperties of water in solutions. J Chem Phys 20:1452–1465.
Harris FE, O’Konski CT. 1957. Dielectric properties of aqueousionic solutions at microwave frequencies. J Phys Chem61:310–319.
Harris FE, O’Konski CT. 1978. Dielectric properties of water insolutions. Oxford, UK: Clarendon Press Oxford.
Hasted JB, Roderick GW. 1958. Dielectric properties of aqueousand alcoholic electrolytic solutions. J Chem Phys 29:17–26.
Hasted JB, Ritson D, Collie C. 1948. Dielectric properties ofaqueous ionic solutions Parts I and II. J Chem Phvs 16:1–11.
Kaatze U. 1987. Dielectric spectrum of a 0.5 M aqueous NaClsolution. J Phys Chem 91:3111–3113.
Kaatze U. 1989. Complex permittivity of water as a function offrequency and temperature. J Chem Eng 34:371–374.
Lane J, Saxon J. 1952. Dielectric dispersion in pure polar liquids atvery high frequencies III: The effect of electrolytes insolution. Proc Roy Soc A213:531–545.
Levin VV, Podlovchenko TL. 1970. Dispersion of the dielectricpermittivity of ethylene glycol. Zhurnal Strukturnoi Khimii11:766–767.
Nortemann K, Hilland J, Kaatze U. 1997. Dielectric properties ofaqueous NaCl solutions at microwave frequencies. J PhysChem A 101:6864–6869.
Pottel R, Asselborn E, Eck R, Tresp V. 1989. Dielectric relaxationrate and static dielectric permittivity of water and aqueoussolutions at high pressures. Ber Bunsen-Ges Phys Chem93:676–681.
Sihvola A. 1993. Dielectric mixture theories in permittivityprediction: Effects of water on macroscopic parameters:Workshop on electromagnetic wave interaction with waterand moist substances. MTT-11 Microwave MeasurementsTechnical Committee 21.
Stogryn A. 1971. Equations for calculating the dielectric constant ofNaCl solutions in water. IEEE Trans Microwave Theory Tech19:733–736.
Tinga WR. 1992. Mixture laws and microwave-material interac-tions. Pro in Electromag Res 1–40.
274 Peyman et al.