comparison of thermal infrared emissivities retrieved with the two-lid box and the tes methods with...
TRANSCRIPT
1012 IEEE TRANSACTIONS ON GEOSCIENCE AND REMOTE SENSING, VOL. 47, NO. 4, APRIL 2009
Comparison of Thermal Infrared EmissivitiesRetrieved With the Two-Lid Box and the TES
Methods With Laboratory SpectraMaria Mira, Thomas J. Schmugge, Fellow, IEEE, Enric Valor, Vicente Caselles, and César Coll
Abstract—Knowledge of surface emissivity in the thermal in-frared (TIR) region is critical for determining the land surfacetemperature (LST) from remote-sensing measurements. If emis-sivity is not well determined, it can cause a significant systematicerror in obtaining the LST. The main aim of this paper is tocompare different methods for measuring accurate land surfaceemissivity in the field, namely, the Box method and the Tempera-ture and Emissivity Separation (TES) algorithm. Field emissivitieswere compared with soil spectra from laboratory measurements.Emissivities were measured for the bands of a multispectralradiometer CE312-2 with effective wavelengths at 8.4, 8.7, 9.1,10.6, and 11.3 µm, similar to the Advanced Spaceborne Ther-mal Emission and Reflection Radiometer TIR bands, and a widechannel 8–13 µm. The measurements were made at two sites inNew Mexico: the White Sands National Monument and an openshrub land in the Jornada Experimental Range. The measure-ments show that for both sites the emissivities derived with theBox method agree with those derived with the TES algorithmfor the 10.6 and 11.3 µm bands. However, the emissivities forthe shorter wavelength bands are higher when derived with theBox method than those with the TES algorithm, with differencesranging from 2% to 7%. The field emissivities agree within 2%with the laboratory spectrum for the 8–13-, 11.3-, and 10.6-µmbands. However, the field and laboratory measurements in generaldiffer from 2.4% to 9% for the shorter wavelength bands, with thelarger value most likely caused by variations in soil moisture.
Index Terms—Algorithms, remote sensing, soil moisture, ther-mal infrared (TIR) emissivity.
I. INTRODUCTION
EMISSIVITY (ε) is the physical property which defines the
capability of a body to radiate and absorb energy from the
environment. It is defined as the ratio between the real emission
of an object and the emission of a black body at the object
thermodynamic (or kinetic) temperature. If the emissivity is
known, the land surface temperature (LST) can be accurately
Manuscript received September 3, 2008; revised October 14, 2008and October 23, 2008. Current version published March 27, 2009. Thiswork was supported in part by the Spanish Ministry of Education andScience (FPU Research Grant of M. Mira) and Gerald Thomas endowmentat New Mexico State University, by the Spanish Ministry of Educationand Science projects (CGL2007-64666/CLI, CGL2004-06099-C03-01/CLI,CGL2006-27067-E/CLI, CGL2007-29819-E/CLI, CGL2007-28828-E/BOS),and by FEDER funds.
M. Mira, E. Valor, V. Caselles, and C. Coll are with the Department ofEarth Physics and Thermodynamics, Faculty of Physics, University of Valencia,46100 Burjassot, Spain (e-mail: [email protected]; [email protected];[email protected]; [email protected]).
T. J. Schmugge is with the Physical Science Laboratory, New Mexico StateUniversity, Las Cruces, NM 88003 USA (e-mail: [email protected]).
Digital Object Identifier 10.1109/TGRS.2008.2008901
estimated from thermal infrared (TIR) radiance measurements.
Mira et al. [1] observed that an emissivity variation of 0.06
causes an error of 2.2 K in the LST determination (at 11 µmand for an LST of about 300 K). Emissivity data are required
as inputs of LST split-window algorithms [2], [3]. In addition,
knowledge of the emissivity spectrum is useful to map geologic
and land-cover materials based on differences in wavelength-
dependent spectral features [4]–[7].
There are several studies that present different field methods
to measure thermal emissivities [8]–[12]. The methods ana-
lyzed in this paper are the two-lid variant of the Box method
[13] and the Temperature and Emissivity Separation (TES)
algorithm [14].
The Box method, first proposed by Buettner and Kern [15]
and Dana [16], allows the in situ determination of the TIR emis-
sivities. It was improved through the two-lid variant of the Box
method, described by Rubio et al. [13]. The method was de-
veloped to estimate the directional emissivity of homogeneous
and elemental surfaces that may be part of a more complex
structure such as composite pixels. According to Mira et al. [1],
the two-lid variant of the Box method allows the determination
of the emissivity with an average experimental error of ±0.5%
at laboratory conditions.
The TES algorithm [14], [17] was developed to produce
standard products of surface temperature and emissivity from
Advanced Spaceborne Thermal Emission and Reflection ra-
diometer (ASTER) data. However, it can also be applied to in
situ measured at-ground TIR radiances when the downwelling
sky irradiance is known. This method calculates a normalized
temperature and an emissivity spectrum by means of the Nor-
malized Emissivity Method (NEM) [18], [19]. Next, the Ratio
algorithm [20] is applied to obtain the relative emissivities
(the so-called β spectrum), which preserves the shape of the
actual emissivity spectrum but not the amplitude. To obtain
the amplitude and thus a better estimate of the LST, the
maximum–minimum difference of β (MMD or spectral con-
trast) is calculated and used to predict the minimum emissivity
(εmin) with the aid of an empirical relationship [21].
The objective of this paper is to analyze the accuracy of
both field emissivity methods in the TIR domain. For this
purpose, two different test sites were chosen, the first one char-
acterized by relatively high spatial homogeneity in emissivity:
White Sands and Jornada Experimental Range, New Mexico.
A high-precision CIMEL Electronique CE 312-2 multispectral
radiometer, whose channels are similar to the ASTER TIR
0196-2892/$25.00 © 2009 IEEE
Authorized licensed use limited to: Universidad de Valencia. Downloaded on April 27, 2009 at 10:38 from IEEE Xplore. Restrictions apply.
MIRA et al.: COMPARISON OF TIR EMISSIVITIES RETRIEVED WITH THE TWO-LID BOX AND TES METHODS 1013
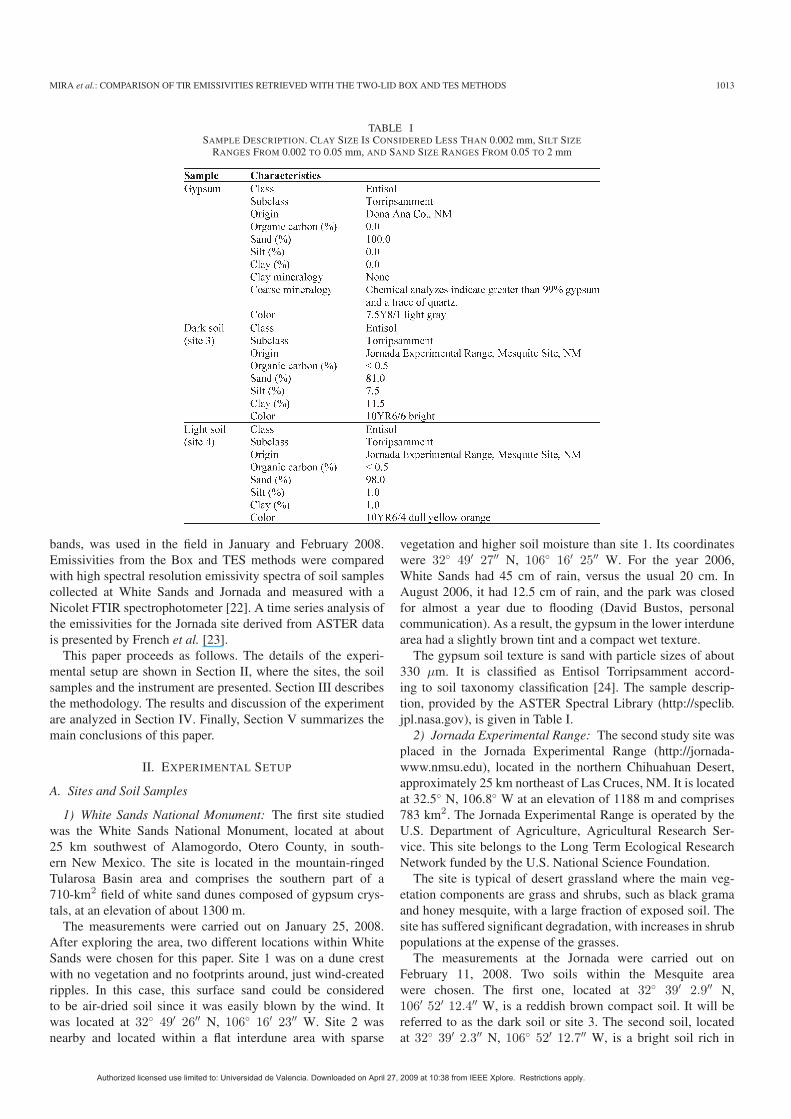
TABLE ISAMPLE DESCRIPTION. CLAY SIZE IS CONSIDERED LESS THAN 0.002 mm, SILT SIZE
RANGES FROM 0.002 TO 0.05 mm, AND SAND SIZE RANGES FROM 0.05 TO 2 mm
bands, was used in the field in January and February 2008.
Emissivities from the Box and TES methods were compared
with high spectral resolution emissivity spectra of soil samples
collected at White Sands and Jornada and measured with a
Nicolet FTIR spectrophotometer [22]. A time series analysis of
the emissivities for the Jornada site derived from ASTER data
is presented by French et al. [23].
This paper proceeds as follows. The details of the experi-
mental setup are shown in Section II, where the sites, the soil
samples and the instrument are presented. Section III describes
the methodology. The results and discussion of the experiment
are analyzed in Section IV. Finally, Section V summarizes the
main conclusions of this paper.
II. EXPERIMENTAL SETUP
A. Sites and Soil Samples
1) White Sands National Monument: The first site studied
was the White Sands National Monument, located at about
25 km southwest of Alamogordo, Otero County, in south-
ern New Mexico. The site is located in the mountain-ringed
Tularosa Basin area and comprises the southern part of a
710-km2 field of white sand dunes composed of gypsum crys-
tals, at an elevation of about 1300 m.
The measurements were carried out on January 25, 2008.
After exploring the area, two different locations within White
Sands were chosen for this paper. Site 1 was on a dune crest
with no vegetation and no footprints around, just wind-created
ripples. In this case, this surface sand could be considered
to be air-dried soil since it was easily blown by the wind. It
was located at 32◦ 49′ 26′′ N, 106◦ 16′ 23′′ W. Site 2 was
nearby and located within a flat interdune area with sparse
vegetation and higher soil moisture than site 1. Its coordinates
were 32◦ 49′ 27′′ N, 106◦ 16′ 25′′ W. For the year 2006,
White Sands had 45 cm of rain, versus the usual 20 cm. In
August 2006, it had 12.5 cm of rain, and the park was closed
for almost a year due to flooding (David Bustos, personal
communication). As a result, the gypsum in the lower interdune
area had a slightly brown tint and a compact wet texture.
The gypsum soil texture is sand with particle sizes of about
330 µm. It is classified as Entisol Torripsamment accord-
ing to soil taxonomy classification [24]. The sample descrip-
tion, provided by the ASTER Spectral Library (http://speclib.
jpl.nasa.gov), is given in Table I.
2) Jornada Experimental Range: The second study site was
placed in the Jornada Experimental Range (http://jornada-
www.nmsu.edu), located in the northern Chihuahuan Desert,
approximately 25 km northeast of Las Cruces, NM. It is located
at 32.5◦ N, 106.8◦ W at an elevation of 1188 m and comprises
783 km2. The Jornada Experimental Range is operated by the
U.S. Department of Agriculture, Agricultural Research Ser-
vice. This site belongs to the Long Term Ecological Research
Network funded by the U.S. National Science Foundation.
The site is typical of desert grassland where the main veg-
etation components are grass and shrubs, such as black grama
and honey mesquite, with a large fraction of exposed soil. The
site has suffered significant degradation, with increases in shrub
populations at the expense of the grasses.
The measurements at the Jornada were carried out on
February 11, 2008. Two soils within the Mesquite area
were chosen. The first one, located at 32◦ 39′ 2.9′′ N,
106′ 52′ 12.4′′ W, is a reddish brown compact soil. It will be
referred to as the dark soil or site 3. The second soil, located
at 32◦ 39′ 2.3′′ N, 106◦ 52′ 12.7′′ W, is a bright soil rich in
Authorized licensed use limited to: Universidad de Valencia. Downloaded on April 27, 2009 at 10:38 from IEEE Xplore. Restrictions apply.
1014 IEEE TRANSACTIONS ON GEOSCIENCE AND REMOTE SENSING, VOL. 47, NO. 4, APRIL 2009
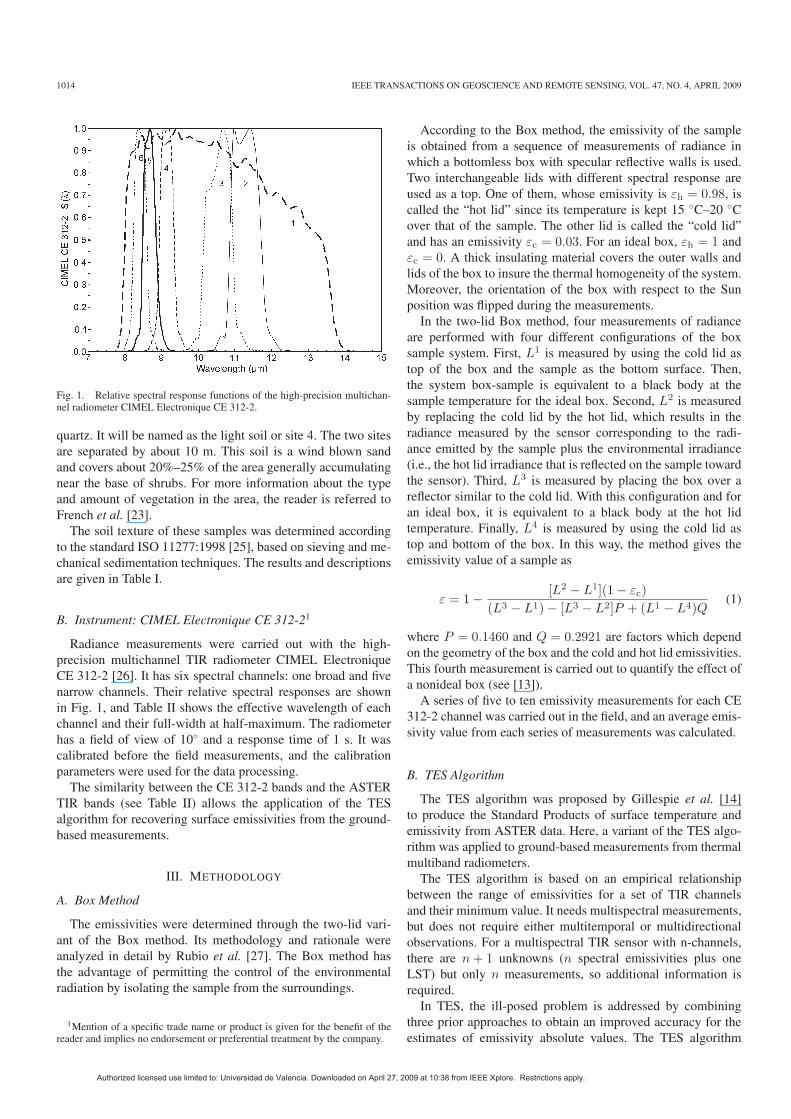
Fig. 1. Relative spectral response functions of the high-precision multichan-nel radiometer CIMEL Electronique CE 312-2.
quartz. It will be named as the light soil or site 4. The two sites
are separated by about 10 m. This soil is a wind blown sand
and covers about 20%–25% of the area generally accumulating
near the base of shrubs. For more information about the type
and amount of vegetation in the area, the reader is referred to
French et al. [23].
The soil texture of these samples was determined according
to the standard ISO 11277:1998 [25], based on sieving and me-
chanical sedimentation techniques. The results and descriptions
are given in Table I.
B. Instrument: CIMEL Electronique CE 312-21
Radiance measurements were carried out with the high-
precision multichannel TIR radiometer CIMEL Electronique
CE 312-2 [26]. It has six spectral channels: one broad and five
narrow channels. Their relative spectral responses are shown
in Fig. 1, and Table II shows the effective wavelength of each
channel and their full-width at half-maximum. The radiometer
has a field of view of 10◦ and a response time of 1 s. It was
calibrated before the field measurements, and the calibration
parameters were used for the data processing.
The similarity between the CE 312-2 bands and the ASTER
TIR bands (see Table II) allows the application of the TES
algorithm for recovering surface emissivities from the ground-
based measurements.
III. METHODOLOGY
A. Box Method
The emissivities were determined through the two-lid vari-
ant of the Box method. Its methodology and rationale were
analyzed in detail by Rubio et al. [27]. The Box method has
the advantage of permitting the control of the environmental
radiation by isolating the sample from the surroundings.
1Mention of a specific trade name or product is given for the benefit of thereader and implies no endorsement or preferential treatment by the company.
According to the Box method, the emissivity of the sample
is obtained from a sequence of measurements of radiance in
which a bottomless box with specular reflective walls is used.
Two interchangeable lids with different spectral response are
used as a top. One of them, whose emissivity is εh = 0.98, iscalled the “hot lid” since its temperature is kept 15 ◦C–20 ◦C
over that of the sample. The other lid is called the “cold lid”
and has an emissivity εc = 0.03. For an ideal box, εh = 1 and
εc = 0. A thick insulating material covers the outer walls and
lids of the box to insure the thermal homogeneity of the system.
Moreover, the orientation of the box with respect to the Sun
position was flipped during the measurements.
In the two-lid Box method, four measurements of radiance
are performed with four different configurations of the box
sample system. First, L1 is measured by using the cold lid as
top of the box and the sample as the bottom surface. Then,
the system box-sample is equivalent to a black body at the
sample temperature for the ideal box. Second, L2 is measured
by replacing the cold lid by the hot lid, which results in the
radiance measured by the sensor corresponding to the radi-
ance emitted by the sample plus the environmental irradiance
(i.e., the hot lid irradiance that is reflected on the sample toward
the sensor). Third, L3 is measured by placing the box over a
reflector similar to the cold lid. With this configuration and for
an ideal box, it is equivalent to a black body at the hot lid
temperature. Finally, L4 is measured by using the cold lid as
top and bottom of the box. In this way, the method gives the
emissivity value of a sample as
ε = 1 −[L2 − L1](1 − εc)
(L3 − L1) − [L3 − L2]P + (L1 − L4)Q(1)
where P = 0.1460 and Q = 0.2921 are factors which depend
on the geometry of the box and the cold and hot lid emissivities.
This fourth measurement is carried out to quantify the effect of
a nonideal box (see [13]).
A series of five to ten emissivity measurements for each CE
312-2 channel was carried out in the field, and an average emis-
sivity value from each series of measurements was calculated.
B. TES Algorithm
The TES algorithm was proposed by Gillespie et al. [14]
to produce the Standard Products of surface temperature and
emissivity from ASTER data. Here, a variant of the TES algo-
rithm was applied to ground-based measurements from thermal
multiband radiometers.
The TES algorithm is based on an empirical relationship
between the range of emissivities for a set of TIR channels
and their minimum value. It needs multispectral measurements,
but does not require either multitemporal or multidirectional
observations. For a multispectral TIR sensor with n-channels,
there are n + 1 unknowns (n spectral emissivities plus one
LST) but only n measurements, so additional information is
required.
In TES, the ill-posed problem is addressed by combining
three prior approaches to obtain an improved accuracy for the
estimates of emissivity absolute values. The TES algorithm
Authorized licensed use limited to: Universidad de Valencia. Downloaded on April 27, 2009 at 10:38 from IEEE Xplore. Restrictions apply.
MIRA et al.: COMPARISON OF TIR EMISSIVITIES RETRIEVED WITH THE TWO-LID BOX AND TES METHODS 1015
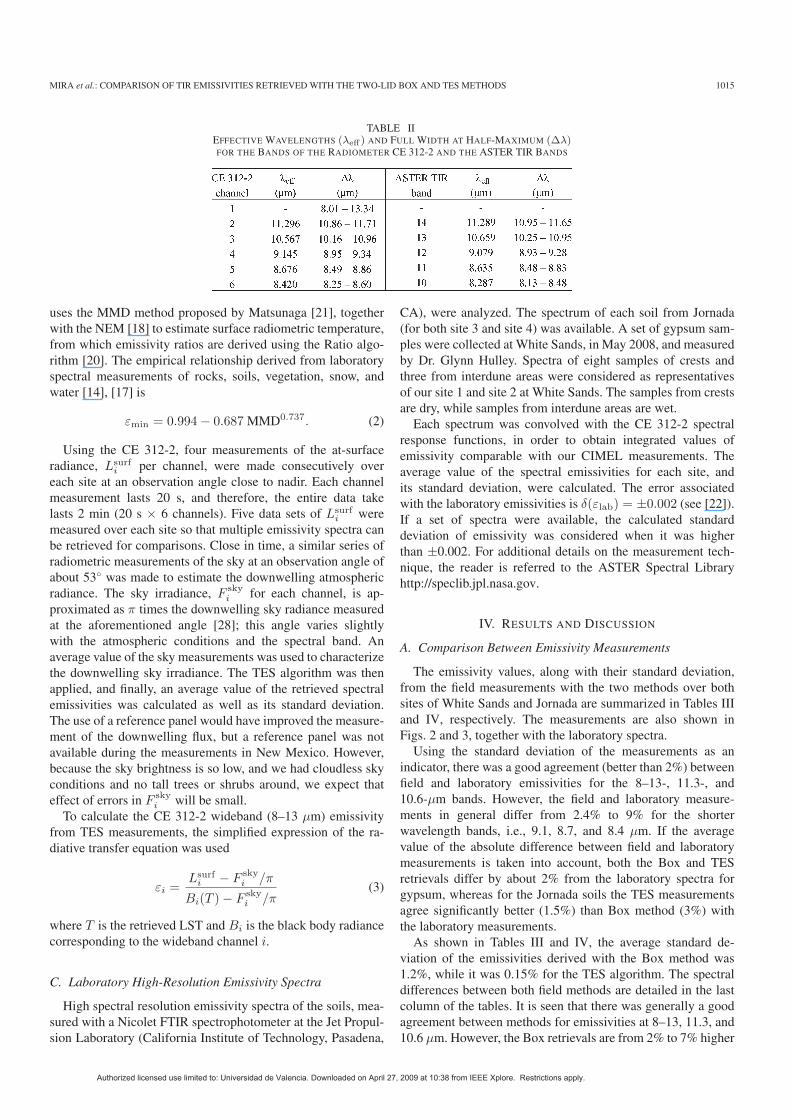
TABLE IIEFFECTIVE WAVELENGTHS (λeff) AND FULL WIDTH AT HALF-MAXIMUM (∆λ)FOR THE BANDS OF THE RADIOMETER CE 312-2 AND THE ASTER TIR BANDS
uses the MMD method proposed by Matsunaga [21], together
with the NEM [18] to estimate surface radiometric temperature,
from which emissivity ratios are derived using the Ratio algo-
rithm [20]. The empirical relationship derived from laboratory
spectral measurements of rocks, soils, vegetation, snow, and
water [14], [17] is
εmin = 0.994 − 0.687 MMD0.737. (2)
Using the CE 312-2, four measurements of the at-surface
radiance, Lsurfi
per channel, were made consecutively over
each site at an observation angle close to nadir. Each channel
measurement lasts 20 s, and therefore, the entire data take
lasts 2 min (20 s × 6 channels). Five data sets of Lsurfi
were
measured over each site so that multiple emissivity spectra can
be retrieved for comparisons. Close in time, a similar series of
radiometric measurements of the sky at an observation angle of
about 53◦ was made to estimate the downwelling atmospheric
radiance. The sky irradiance, F skyi
for each channel, is ap-
proximated as π times the downwelling sky radiance measured
at the aforementioned angle [28]; this angle varies slightly
with the atmospheric conditions and the spectral band. An
average value of the sky measurements was used to characterize
the downwelling sky irradiance. The TES algorithm was then
applied, and finally, an average value of the retrieved spectral
emissivities was calculated as well as its standard deviation.
The use of a reference panel would have improved the measure-
ment of the downwelling flux, but a reference panel was not
available during the measurements in New Mexico. However,
because the sky brightness is so low, and we had cloudless sky
conditions and no tall trees or shrubs around, we expect that
effect of errors in F skyi
will be small.
To calculate the CE 312-2 wideband (8–13 µm) emissivity
from TES measurements, the simplified expression of the ra-
diative transfer equation was used
εi =Lsurf
i− F sky
i/π
Bi(T ) − F skyi
/π(3)
where T is the retrieved LST and Bi is the black body radiance
corresponding to the wideband channel i.
C. Laboratory High-Resolution Emissivity Spectra
High spectral resolution emissivity spectra of the soils, mea-
sured with a Nicolet FTIR spectrophotometer at the Jet Propul-
sion Laboratory (California Institute of Technology, Pasadena,
CA), were analyzed. The spectrum of each soil from Jornada
(for both site 3 and site 4) was available. A set of gypsum sam-
ples were collected at White Sands, in May 2008, and measured
by Dr. Glynn Hulley. Spectra of eight samples of crests and
three from interdune areas were considered as representatives
of our site 1 and site 2 at White Sands. The samples from crests
are dry, while samples from interdune areas are wet.
Each spectrum was convolved with the CE 312-2 spectral
response functions, in order to obtain integrated values of
emissivity comparable with our CIMEL measurements. The
average value of the spectral emissivities for each site, and
its standard deviation, were calculated. The error associated
with the laboratory emissivities is δ(εlab) = ±0.002 (see [22]).
If a set of spectra were available, the calculated standard
deviation of emissivity was considered when it was higher
than ±0.002. For additional details on the measurement tech-
nique, the reader is referred to the ASTER Spectral Library
http://speclib.jpl.nasa.gov.
IV. RESULTS AND DISCUSSION
A. Comparison Between Emissivity Measurements
The emissivity values, along with their standard deviation,
from the field measurements with the two methods over both
sites of White Sands and Jornada are summarized in Tables III
and IV, respectively. The measurements are also shown in
Figs. 2 and 3, together with the laboratory spectra.
Using the standard deviation of the measurements as an
indicator, there was a good agreement (better than 2%) between
field and laboratory emissivities for the 8–13-, 11.3-, and
10.6-µm bands. However, the field and laboratory measure-
ments in general differ from 2.4% to 9% for the shorter
wavelength bands, i.e., 9.1, 8.7, and 8.4 µm. If the average
value of the absolute difference between field and laboratory
measurements is taken into account, both the Box and TES
retrievals differ by about 2% from the laboratory spectra for
gypsum, whereas for the Jornada soils the TES measurements
agree significantly better (1.5%) than Box method (3%) with
the laboratory measurements.
As shown in Tables III and IV, the average standard de-
viation of the emissivities derived with the Box method was
1.2%, while it was 0.15% for the TES algorithm. The spectral
differences between both field methods are detailed in the last
column of the tables. It is seen that there was generally a good
agreement between methods for emissivities at 8–13, 11.3, and
10.6 µm. However, the Box retrievals are from 2% to 7% higher
Authorized licensed use limited to: Universidad de Valencia. Downloaded on April 27, 2009 at 10:38 from IEEE Xplore. Restrictions apply.
1016 IEEE TRANSACTIONS ON GEOSCIENCE AND REMOTE SENSING, VOL. 47, NO. 4, APRIL 2009
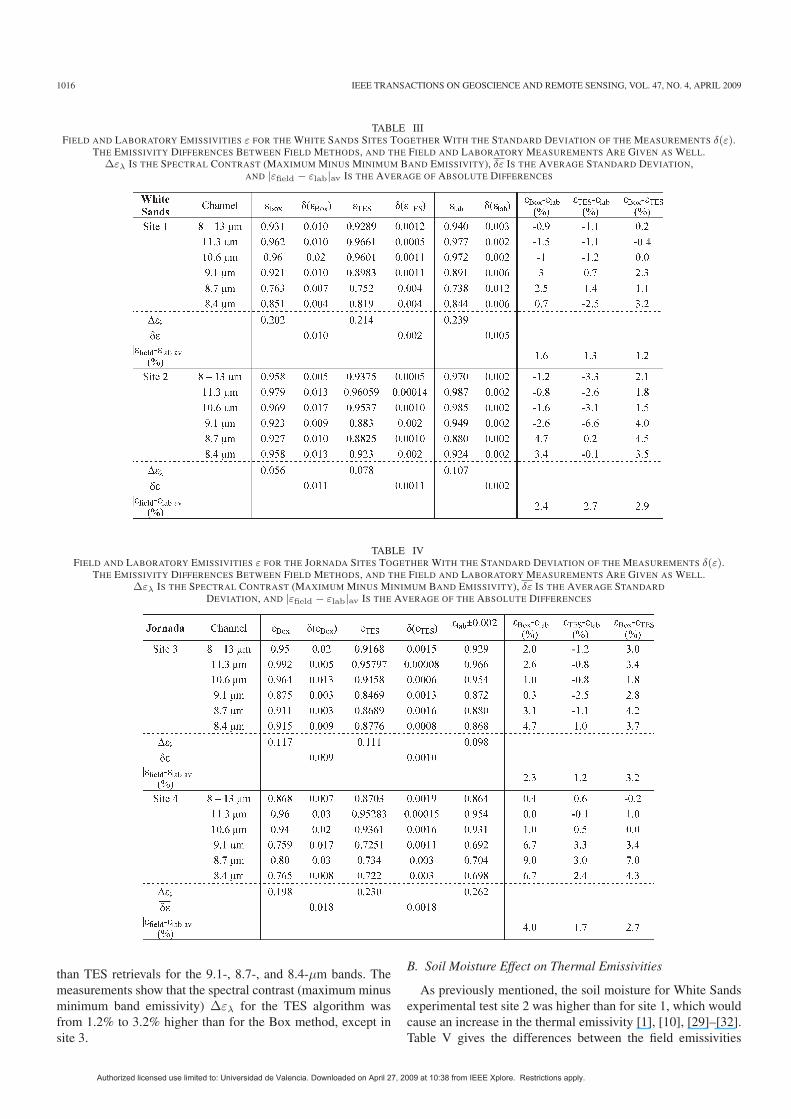
TABLE IIIFIELD AND LABORATORY EMISSIVITIES ε FOR THE WHITE SANDS SITES TOGETHER WITH THE STANDARD DEVIATION OF THE MEASUREMENTS δ(ε).
THE EMISSIVITY DIFFERENCES BETWEEN FIELD METHODS, AND THE FIELD AND LABORATORY MEASUREMENTS ARE GIVEN AS WELL.∆ελ IS THE SPECTRAL CONTRAST (MAXIMUM MINUS MINIMUM BAND EMISSIVITY), δε IS THE AVERAGE STANDARD DEVIATION,
AND |εfield − εlab|av IS THE AVERAGE OF ABSOLUTE DIFFERENCES
TABLE IVFIELD AND LABORATORY EMISSIVITIES ε FOR THE JORNADA SITES TOGETHER WITH THE STANDARD DEVIATION OF THE MEASUREMENTS δ(ε).
THE EMISSIVITY DIFFERENCES BETWEEN FIELD METHODS, AND THE FIELD AND LABORATORY MEASUREMENTS ARE GIVEN AS WELL.∆ελ IS THE SPECTRAL CONTRAST (MAXIMUM MINUS MINIMUM BAND EMISSIVITY), δε IS THE AVERAGE STANDARD
DEVIATION, AND |εfield − εlab|av IS THE AVERAGE OF THE ABSOLUTE DIFFERENCES
than TES retrievals for the 9.1-, 8.7-, and 8.4-µm bands. The
measurements show that the spectral contrast (maximum minus
minimum band emissivity) ∆ελ for the TES algorithm was
from 1.2% to 3.2% higher than for the Box method, except in
site 3.
B. Soil Moisture Effect on Thermal Emissivities
As previously mentioned, the soil moisture for White Sands
experimental test site 2 was higher than for site 1, which would
cause an increase in the thermal emissivity [1], [10], [29]–[32].
Table V gives the differences between the field emissivities
Authorized licensed use limited to: Universidad de Valencia. Downloaded on April 27, 2009 at 10:38 from IEEE Xplore. Restrictions apply.
MIRA et al.: COMPARISON OF TIR EMISSIVITIES RETRIEVED WITH THE TWO-LID BOX AND TES METHODS 1017
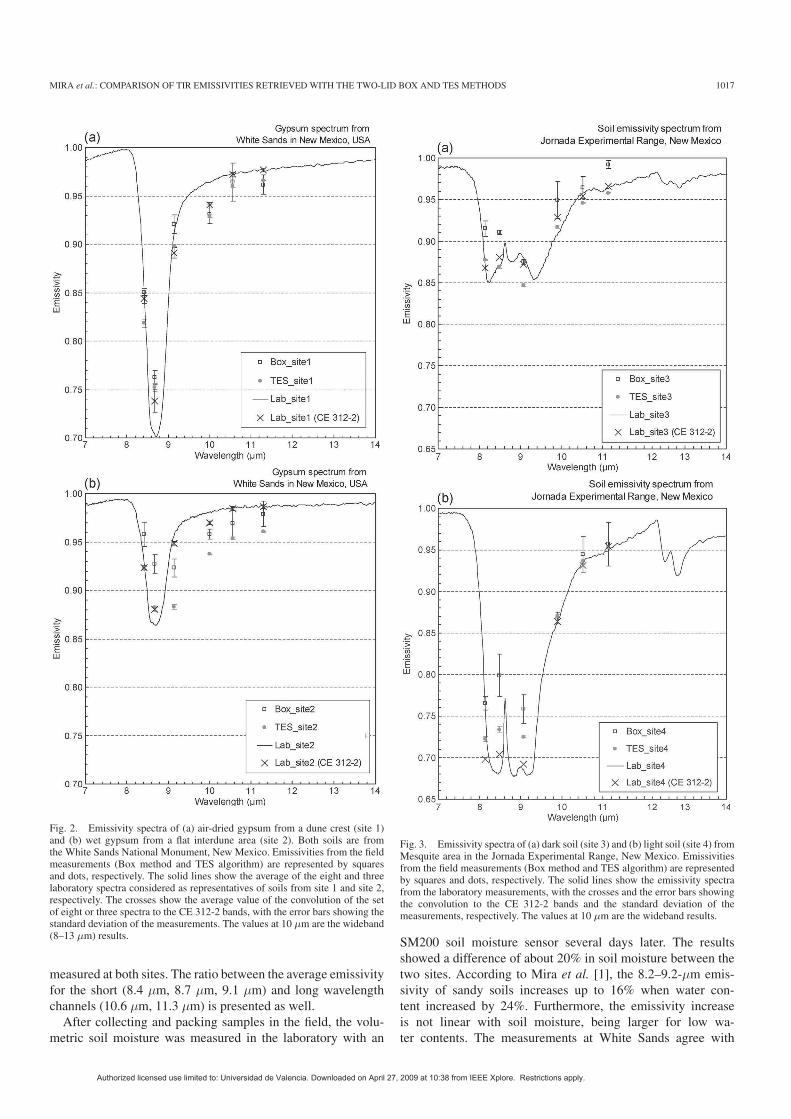
Fig. 2. Emissivity spectra of (a) air-dried gypsum from a dune crest (site 1)and (b) wet gypsum from a flat interdune area (site 2). Both soils are fromthe White Sands National Monument, New Mexico. Emissivities from the fieldmeasurements (Box method and TES algorithm) are represented by squaresand dots, respectively. The solid lines show the average of the eight and threelaboratory spectra considered as representatives of soils from site 1 and site 2,respectively. The crosses show the average value of the convolution of the setof eight or three spectra to the CE 312-2 bands, with the error bars showing thestandard deviation of the measurements. The values at 10 µm are the wideband(8–13 µm) results.
measured at both sites. The ratio between the average emissivity
for the short (8.4 µm, 8.7 µm, 9.1 µm) and long wavelength
channels (10.6 µm, 11.3 µm) is presented as well.
After collecting and packing samples in the field, the volu-
metric soil moisture was measured in the laboratory with an
Fig. 3. Emissivity spectra of (a) dark soil (site 3) and (b) light soil (site 4) fromMesquite area in the Jornada Experimental Range, New Mexico. Emissivitiesfrom the field measurements (Box method and TES algorithm) are representedby squares and dots, respectively. The solid lines show the emissivity spectrafrom the laboratory measurements, with the crosses and the error bars showingthe convolution to the CE 312-2 bands and the standard deviation of themeasurements, respectively. The values at 10 µm are the wideband results.
SM200 soil moisture sensor several days later. The results
showed a difference of about 20% in soil moisture between the
two sites. According to Mira et al. [1], the 8.2–9.2-µm emis-
sivity of sandy soils increases up to 16% when water con-
tent increased by 24%. Furthermore, the emissivity increase
is not linear with soil moisture, being larger for low wa-
ter contents. The measurements at White Sands agree with
Authorized licensed use limited to: Universidad de Valencia. Downloaded on April 27, 2009 at 10:38 from IEEE Xplore. Restrictions apply.
1018 IEEE TRANSACTIONS ON GEOSCIENCE AND REMOTE SENSING, VOL. 47, NO. 4, APRIL 2009
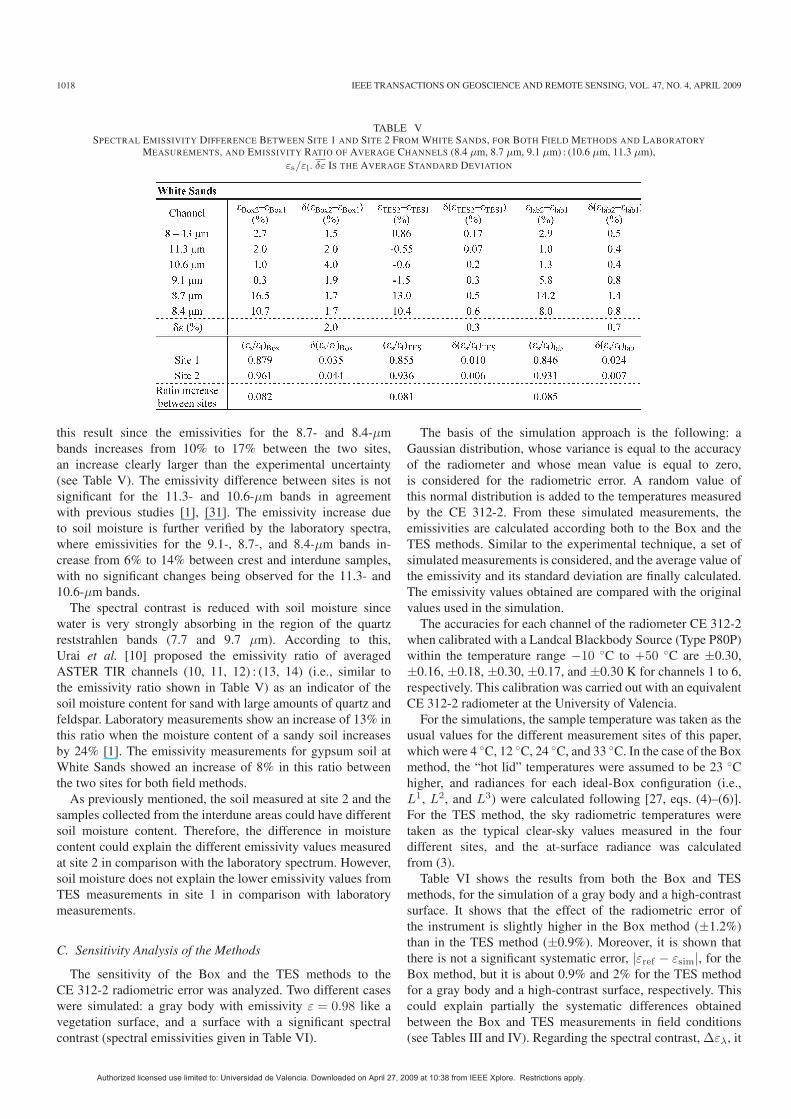
TABLE VSPECTRAL EMISSIVITY DIFFERENCE BETWEEN SITE 1 AND SITE 2 FROM WHITE SANDS, FOR BOTH FIELD METHODS AND LABORATORY
MEASUREMENTS, AND EMISSIVITY RATIO OF AVERAGE CHANNELS (8.4 µm, 8.7 µm, 9.1 µm) : (10.6 µm, 11.3 µm),
εs/εl. δε IS THE AVERAGE STANDARD DEVIATION
this result since the emissivities for the 8.7- and 8.4-µmbands increases from 10% to 17% between the two sites,
an increase clearly larger than the experimental uncertainty
(see Table V). The emissivity difference between sites is not
significant for the 11.3- and 10.6-µm bands in agreement
with previous studies [1], [31]. The emissivity increase due
to soil moisture is further verified by the laboratory spectra,
where emissivities for the 9.1-, 8.7-, and 8.4-µm bands in-
crease from 6% to 14% between crest and interdune samples,
with no significant changes being observed for the 11.3- and
10.6-µm bands.
The spectral contrast is reduced with soil moisture since
water is very strongly absorbing in the region of the quartz
reststrahlen bands (7.7 and 9.7 µm). According to this,
Urai et al. [10] proposed the emissivity ratio of averaged
ASTER TIR channels (10, 11, 12) : (13, 14) (i.e., similar to
the emissivity ratio shown in Table V) as an indicator of the
soil moisture content for sand with large amounts of quartz and
feldspar. Laboratory measurements show an increase of 13% in
this ratio when the moisture content of a sandy soil increases
by 24% [1]. The emissivity measurements for gypsum soil at
White Sands showed an increase of 8% in this ratio between
the two sites for both field methods.
As previously mentioned, the soil measured at site 2 and the
samples collected from the interdune areas could have different
soil moisture content. Therefore, the difference in moisture
content could explain the different emissivity values measured
at site 2 in comparison with the laboratory spectrum. However,
soil moisture does not explain the lower emissivity values from
TES measurements in site 1 in comparison with laboratory
measurements.
C. Sensitivity Analysis of the Methods
The sensitivity of the Box and the TES methods to the
CE 312-2 radiometric error was analyzed. Two different cases
were simulated: a gray body with emissivity ε = 0.98 like a
vegetation surface, and a surface with a significant spectral
contrast (spectral emissivities given in Table VI).
The basis of the simulation approach is the following: a
Gaussian distribution, whose variance is equal to the accuracy
of the radiometer and whose mean value is equal to zero,
is considered for the radiometric error. A random value of
this normal distribution is added to the temperatures measured
by the CE 312-2. From these simulated measurements, the
emissivities are calculated according both to the Box and the
TES methods. Similar to the experimental technique, a set of
simulated measurements is considered, and the average value of
the emissivity and its standard deviation are finally calculated.
The emissivity values obtained are compared with the original
values used in the simulation.
The accuracies for each channel of the radiometer CE 312-2
when calibrated with a Landcal Blackbody Source (Type P80P)
within the temperature range −10 ◦C to +50 ◦C are ±0.30,
±0.16, ±0.18, ±0.30, ±0.17, and ±0.30 K for channels 1 to 6,
respectively. This calibration was carried out with an equivalent
CE 312-2 radiometer at the University of Valencia.
For the simulations, the sample temperature was taken as the
usual values for the different measurement sites of this paper,
which were 4 ◦C, 12 ◦C, 24 ◦C, and 33 ◦C. In the case of the Box
method, the “hot lid” temperatures were assumed to be 23 ◦C
higher, and radiances for each ideal-Box configuration (i.e.,
L1, L2, and L3) were calculated following [27, eqs. (4)–(6)].
For the TES method, the sky radiometric temperatures were
taken as the typical clear-sky values measured in the four
different sites, and the at-surface radiance was calculated
from (3).
Table VI shows the results from both the Box and TES
methods, for the simulation of a gray body and a high-contrast
surface. It shows that the effect of the radiometric error of
the instrument is slightly higher in the Box method (±1.2%)
than in the TES method (±0.9%). Moreover, it is shown that
there is not a significant systematic error, |εref − εsim|, for theBox method, but it is about 0.9% and 2% for the TES method
for a gray body and a high-contrast surface, respectively. This
could explain partially the systematic differences obtained
between the Box and TES measurements in field conditions
(see Tables III and IV). Regarding the spectral contrast, ∆ελ, it
Authorized licensed use limited to: Universidad de Valencia. Downloaded on April 27, 2009 at 10:38 from IEEE Xplore. Restrictions apply.
MIRA et al.: COMPARISON OF TIR EMISSIVITIES RETRIEVED WITH THE TWO-LID BOX AND TES METHODS 1019
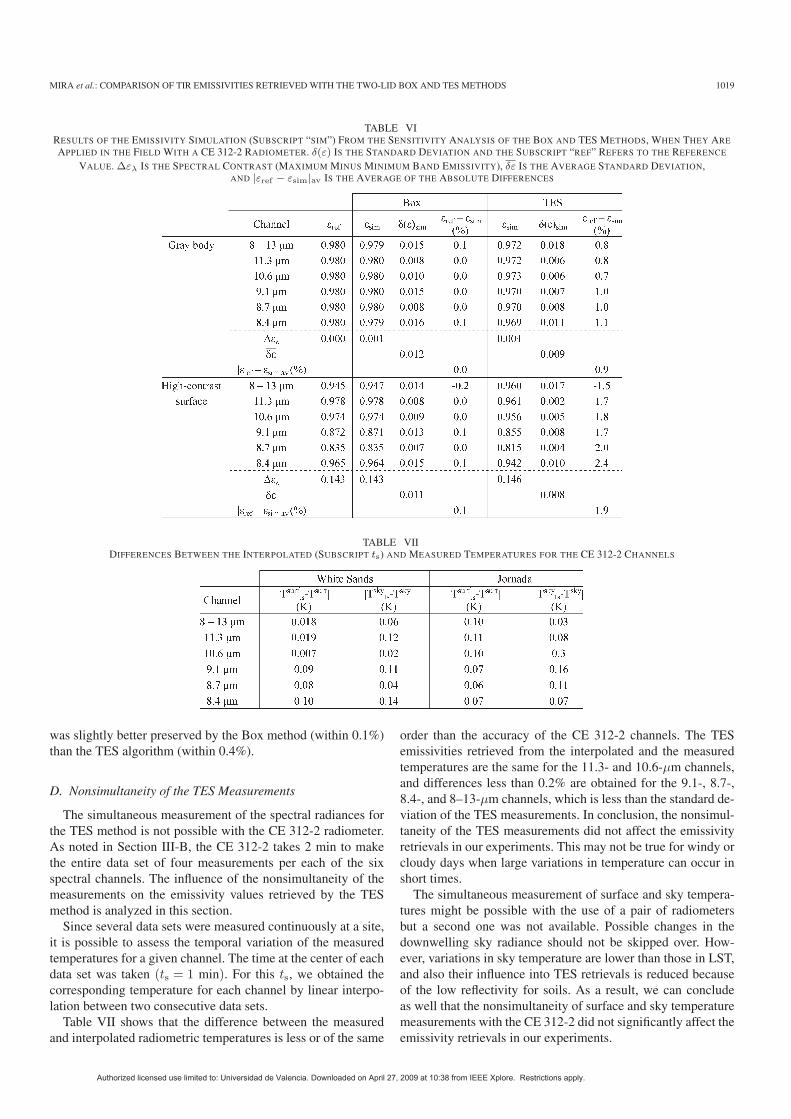
TABLE VIRESULTS OF THE EMISSIVITY SIMULATION (SUBSCRIPT “SIM”) FROM THE SENSITIVITY ANALYSIS OF THE BOX AND TES METHODS, WHEN THEY ARE
APPLIED IN THE FIELD WITH A CE 312-2 RADIOMETER. δ(ε) IS THE STANDARD DEVIATION AND THE SUBSCRIPT “REF” REFERS TO THE REFERENCE
VALUE. ∆ελ IS THE SPECTRAL CONTRAST (MAXIMUM MINUS MINIMUM BAND EMISSIVITY), δε IS THE AVERAGE STANDARD DEVIATION,AND |εref − εsim|av IS THE AVERAGE OF THE ABSOLUTE DIFFERENCES
TABLE VIIDIFFERENCES BETWEEN THE INTERPOLATED (SUBSCRIPT ts) AND MEASURED TEMPERATURES FOR THE CE 312-2 CHANNELS
was slightly better preserved by the Box method (within 0.1%)
than the TES algorithm (within 0.4%).
D. Nonsimultaneity of the TES Measurements
The simultaneous measurement of the spectral radiances for
the TES method is not possible with the CE 312-2 radiometer.
As noted in Section III-B, the CE 312-2 takes 2 min to make
the entire data set of four measurements per each of the six
spectral channels. The influence of the nonsimultaneity of the
measurements on the emissivity values retrieved by the TES
method is analyzed in this section.
Since several data sets were measured continuously at a site,
it is possible to assess the temporal variation of the measured
temperatures for a given channel. The time at the center of each
data set was taken (ts = 1 min). For this ts, we obtained the
corresponding temperature for each channel by linear interpo-
lation between two consecutive data sets.
Table VII shows that the difference between the measured
and interpolated radiometric temperatures is less or of the same
order than the accuracy of the CE 312-2 channels. The TES
emissivities retrieved from the interpolated and the measured
temperatures are the same for the 11.3- and 10.6-µm channels,
and differences less than 0.2% are obtained for the 9.1-, 8.7-,
8.4-, and 8–13-µm channels, which is less than the standard de-
viation of the TES measurements. In conclusion, the nonsimul-
taneity of the TES measurements did not affect the emissivity
retrievals in our experiments. This may not be true for windy or
cloudy days when large variations in temperature can occur in
short times.
The simultaneous measurement of surface and sky tempera-
tures might be possible with the use of a pair of radiometers
but a second one was not available. Possible changes in the
downwelling sky radiance should not be skipped over. How-
ever, variations in sky temperature are lower than those in LST,
and also their influence into TES retrievals is reduced because
of the low reflectivity for soils. As a result, we can conclude
as well that the nonsimultaneity of surface and sky temperature
measurements with the CE 312-2 did not significantly affect the
emissivity retrievals in our experiments.
Authorized licensed use limited to: Universidad de Valencia. Downloaded on April 27, 2009 at 10:38 from IEEE Xplore. Restrictions apply.
1020 IEEE TRANSACTIONS ON GEOSCIENCE AND REMOTE SENSING, VOL. 47, NO. 4, APRIL 2009
V. SUMMARY AND CONCLUSIONS
In this paper, two methods for measuring TIR emissivities in
the field were studied: the two-lid variant of the Box method
and the TES algorithm. An analysis of the comparison between
their retrievals were performed. Two areas were used to conduct
the study. The first area was the White Sands National Monu-
ment and the second the Jornada Experimental Range.
A high-precision multichannel TIR radiometer CIMEL Elec-
tronique CE 312-2 was used for the radiance measurements,
and because its bands were designed to be similar to those of
ASTER, it was possible the use of the same TES algorithm.
Additionally, high-resolution emissivity spectra of each kind of
soil measured at the laboratory were compared with the field
measurements.
When comparing field and laboratory emissivity measure-
ments, there is an agreement better than 3% for the longer
wavelength bands at 10.6-, 11.3-, and 8–13-µm band. However,
the Box method retrieves higher emissivity values than the TES
algorithm on the spectral bands at the 8- to 9-µm range, where
the studied soils have a strong emissivity minimum due to the
quartz reststrahlen band of quartz. The differences ranged from
2% to 7%, which correspond to an error in LST from 0.7 to
2.6 K. Furthermore, field emissivities differ from laboratory
spectra from 2.4% to 9% in these bands, which correspond to
an error in LST from 0.9 to 3.3 K and is most likely caused by
variations in soil moisture.
The study showed the influence of soil moisture on thermal
emissivities as well. An emissivity increase up to 17% in the
8- to 9-µm range and an increase of 8% in emissivity ratio of av-
erage channels (8.4 µm, 8.7 µm, 9.1 µm) : (10.6 µm, 11.3 µm)
were measured for two gypsum samples with different water
content.
The sensitivity analysis performed for the Box and TES
methods showed that the uncertainty introduced by the radio-
metric error of the instrument is about ±1.2% and ±0.9%, re-
spectively. Moreover, no systematic error was observed for the
Box method, but it was 0.9% and 2% for the TES method when
a gray body and a nongray body were considered, respectively.
This could explain the systematic differences observed between
the measurements of both field methods.
The results obtained for the Box and the TES methods in this
experiment show that the agreement with laboratory spectra is
better for TES method in some sites. However, there are more
aspects to take into account. We note that the measurement
time for the TES method (about 20 min) is much shorter than
that for the Box method (about 1 h). Furthermore, neither box
nor additional power is needed to carry out the TES measure-
ments, which makes this method more practical than the Box
method. Besides, the sensitivity analysis showed that there is a
systematic error (up to 2%) for the TES emissivities, which is
larger for larger MMD. Since the emissivity at the longer TIR
wavelengths shows less variability, the Box emissivity for the
11.3-µm band could be used as a reference to correct the TES
curve shape. Approximately the same emissivities are obtained
from (3) when considering the LST obtained from the reference
emissivity (Box emissivity at the 11.3-µm band). However, in
both cases, the agreement of TES with the Box emissivities
of our experiments is not as good as desirable: the differences
between their retrievals are still up to 4%, which correspond to
an error in LST up to 1.5 K.
ACKNOWLEDGMENT
The authors would like to thank Dr. G. Hulley, from the Jet
Propulsion Laboratory (Pasadena, CA), for providing us with
laboratory spectra of gypsum samples from White Sands. The
authors would also like to thank the two reviewers for their
constructive remarks and comments.
REFERENCES
[1] M. Mira, E. Valor, R. Boluda, V. Caselles, and C. Coll, “Influence of soilwater content on the thermal infrared emissivity of bare soils: Implicationfor land surface temperature determination,” J. Geophys. Res., vol. 112,no. F4, p. F04 003, 2007. DOI: 10.1029/2007JF000749.
[2] Y. Yu, J. P. Privette, and A. C. Pinheiro, “Evaluation of split-window landsurface temperature algorithms for generating climate data records,” IEEE
Trans. Geosci. Remote Sens., vol. 46, no. 1, pp. 179–192, Jan. 2008.[3] J. M. Galve, C. Coll, V. Caselles, and E. Valor, “An Atmospheric
Radiosounding database for generating land surface temperature algo-rithms,” IEEE Trans. Geosci. Remote Sens., vol. 46, no. 5, pp. 1547–1557,May 2008.
[4] L. C. Rowan, J. C. Mar, and C. J. Simpson, “Lithologic mapping of theMordor, NT, Australia ultramafic complex by using the Advanced Space-borne Thermal Emission and Reflection Radiometer (ASTER),” Remote
Sens. Environ., vol. 99, no. 1/2, pp. 105–126, Nov. 2005.[5] R. G. Vaughan, S. J. Hook, W. M. Calvin, and J. V. Taranik, “Sur-
face mineral mapping at Steamboat Springs, Nevada, USA, with multi-wavelength thermal infrared images,” Remote Sens. Environ., vol. 99,no. 1/2, pp. 140–158, Nov. 2005.
[6] I. F. Trigo, L. F. Peres, C. C. DaCamara, and S. C. Freitas, “Thermal landsurface emissivity retrieved from SEVIRI/Meteosat,” IEEE Trans. Geosci.
Remote Sens., vol. 46, no. 2, pp. 307–314, Feb. 2008.[7] K. Ogawa, T. Schmugge, and S. Rokugawa, “Estimating broadband emis-
sivity of arid regions and its seasonal variations using thermal infraredremote sensing,” IEEE Trans. Geosci. Remote Sens., vol. 46, no. 2,pp. 334–343, Feb. 2008.
[8] P. R. Christensen and S. T. Harrison, “Thermal infrared-emission spec-troscopy of natural surfaces—Application to desert varnish coatings onrocks,” J. Geophys. Res., vol. 98, no. B11, pp. 19 819–19 834, 1993.
[9] J. W. Salisbury, A. Wald, and D. M. D’Aria, “Thermal-infrared remotesensing and Kirchhoff’s law 1. Laboratory measurements,” J. Geophys.
Res., vol. 99, no. B6, pp. 11 897–11 911, 1994.[10] M. Urai, T. Matsunaga, and T. Ishii, “Relationship between soil moisture
content and thermal infrared emissivity of the sand sampled in MuusDesert, China,” J. Remote Sens. Soc. Jpn., vol. 17, no. 4, pp. 322–331,1997.
[11] Y. Ninomiya, T. Matsunaga, Y. Yamaguchi, K. Ogawa, S. Rokugawa,K. Uchida, H. Muraoka, and M. Kaku, “A comparison of thermal infraredemissivity spectra measured in situ, in the laboratory, and derived fromthermal infrared multispectral scanner (TIMS) data in Cuprite, Nevada,U.S.A.,” Int. J. Remote Sens., vol. 18, no. 7, pp. 1571–1581, May 1997.
[12] Z. Wan, “New refinements and validation of the MODIS land-surfacetemperature/emissivity products,” Remote Sens. Environ., vol. 112, no. 1,pp. 59–74, Jan. 2008.
[13] E. Rubio, V. Caselles, C. Coll, E. Valor, and F. Sospedra, “Thermal-infrared emissivities of natural surfaces: Improvements on the experimen-tal set-up and new measurements,” Int. J. Remote Sens., vol. 24, no. 24,pp. 5379–5390, Dec. 2003.
[14] A. Gillespie, S. Rokugawa, T. Matsunaga, J. S. Cothern, S. Hook, andA. B. Kahle, “A temperature and emissivity separation algorithm forAdvanced Spaceborne Thermal Emission and Reflection Radiometer(ASTER) images,” IEEE Trans. Geosci. Remote Sens., vol. 36, no. 4,pp. 1113–1126, Jul. 1998.
[15] K. J. K. Buettner and C. D. Kern, “The determination of infrared emis-sivities of terrestrial surfaces,” J. Geophys. Res., vol. 70, pp. 1329–1337,1965.
[16] R. W. Dana, “Measurement of 8–14 micron emissivity of igneous rocksand mineral surfaces,” Goddard Space Flight Center, Greenbelt, MD,NASA Sci. Rep. NSG-632, 1969.
Authorized licensed use limited to: Universidad de Valencia. Downloaded on April 27, 2009 at 10:38 from IEEE Xplore. Restrictions apply.
method. Besides, the sensitivity analysis showed that there is a
systematic error (up to 2%) for the TES emissivities, which is
larger for larger MMD. Since the emissivity at the longer TIR
methods showed that the uncertainty introduced by the radio-methods showed that the uncertainty introduced by the radio-
±methods showed that the uncertainty introduced by the radio-
±metric error of the instrument is about ±1.2% and ±0.9%, re-
spectively. Moreover, no systematic error was observed for the
of our experiments is not as good as desirable: the differences
between their retrievals are still up to 4%, which correspond to
an error in LST up to 1.5 K.
MIRA et al.: COMPARISON OF TIR EMISSIVITIES RETRIEVED WITH THE TWO-LID BOX AND TES METHODS 1021
[17] T. J. Schmugge, S. J. Hook, and C. Coll, “Recovering surface temperatureand emissivity from thermal infrared multispectral data,” Remote Sens.
Environ., vol. 65, no. 2, pp. 121–131, Aug. 1998.[18] A. R. Gillespie, “Lithologic mapping of silicate rocks using TIMS,” in
Proc. TIMS Data Users’ Workshop, Pasadena, CA, 1986, pp. 29–44.Jet Propulsion Lab. Pub. 86-38.
[19] V. J. Realmuto, “Separating the effects of temperature and emissivity:Emissivity spectrum normalization,” in Proc. 2nd TIMS Workshop,Pasadena, CA, 1990, pp. 23–27. Jet Propulsion Lab. Pub. 90–55.
[20] K. Watson, “Spectral ratio method for measuring emissivity,” Remote
Sens. Environ., vol. 42, no. 2, pp. 113–116, Nov. 1992.[21] T. Matsunaga, “A temperature-emissivity separation method using an em-
pirical relationship between the mean, the maximum and the minimumof the thermal infrared emissivity spectrum,” J. Remote Sens. Soc. Jpn.,vol. 14, no. 2, pp. 230–241, 1994.
[22] A. R. Korb, J. W. Salisbury, and D. M. D’Aria, “Thermal-infrared remotesensing and Kirchhoff’s law. 2. Field measurements,” J. Geophys. Res.,vol. 104, no. B7, pp. 15 339–15 350, 1999.
[23] A. N. French, T. J. Schmugge, J. C. Richie, A. Hsu, F. Jacob, andK. Ogawa, “Detecting land cover change at the Jornada ExperimentalRange, New Mexico with ASTER emissivities,” Remote Sens. Environ.,vol. 112, no. 4, pp. 1730–1748, Apr. 2008.
[24] “Soil taxonomy. A basic system of soil classification for making andinterpreting soil surveys,” Agriculture Handbook 436, Soil Survey Staff,U.S. Dept. Agric., Washington, DC, 1999.
[25] International Organization for Standardization, “Soil quality. Determi-nation of particle size distribution in mineral soil material. Method bysieving and sedimentation,” Geneva, Switzerland, Rep. ISO 11277:1998/TC190, 2002.
[26] G. Brogniez, C. Pietras, M. Legrand, P. Dubuisson, and M. Haeffelin, “Ahigh-accuracy multiwavelength radiometer for in situ measurements in thethermal infrared. Part II: Behavior in field experiments,” J. Atmos. Ocean
Technol., vol. 20, no. 7, pp. 1023–1033, Jul. 2003.[27] E. Rubio, V. Caselles, and C. Badenas, “Emissivity measurements of
several soils and vegetation types in the 8–14 µm wave band: Analysisof two field methods,” Remote Sens. Environ., vol. 59, no. 3, pp. 490–521,Mar. 1997.
[28] K. Y. Kondratyev, Radiation in the Atmosphere. New York: Academic,1969.
[29] J. M. Chen, B. J. Yang, and R. H. Zhang, “Soil thermal emissivity asaffected by its water content and surface treatment,” Soil Sci., vol. 148,no. 6, pp. 433–435, 1989.
[30] J. W. Salisbury and D. M. D’Aria, “Infrared (8–14 µm) remote sensingof soil particle size,” Remote Sens. Environ., vol. 42, no. 2, pp. 157–165,Nov. 1992.
[31] Q. Xiao, Q. H. Liu, X. W. Li, L. F. Chen, Q. Liu, and X. Z. Xin, “A fieldmeasurement method of spectral emissivity and research on the feature ofsoil thermal infrared emissivity,” J. Infrared Millim. Waves, vol. 22, no. 5,pp. 373–378, 2003.
[32] K. Ogawa, T. J. Schmugge, and S. Rokugawa, “Observations of soilmoisture dependence of thermal infrared emissivity on soil moisture,”Geophys. Res. Abstr., vol. 8, p. 04 996, 2006.
Maria Mira was born in Ontinyent, Spain, in 1982.She received the B.Sc. degree (first-class honors)in physics and the M.Sc. degree in environmentalphysics and thermodynamics from the Universityof Valencia, Burjassot, Spain, in 2005 and 2007,respectively, where she is currently working towardthe Ph.D. degree in physics from the University ofValencia, Spain.
From December 2007 to March 2008, she was aVisiting Student with New Mexico State University,Las Cruces. Her research interest focuses on the
physical processes of thermal infrared remote sensing, including the retrievalof surface emissivity from thermal infrared remote sensed data supplied bythe Moderate Resolution Imaging Spectroradiometer and the Advanced Space-borne Thermal Emission and Reflection Radiometer sensors, as well as by fieldradiometers.
Thomas J. Schmugge (M’83–SM’91–F’01) re-ceived the B.S. degree in physics from the Illinois In-stitute of Technology, Chicago, in 1959 and the Ph.D.degree in physics from the University of California,Berkeley, in 1965.
From 1964 to 1970, he was an Assistant Professorof physics with Trinity College, Hartford, CT. For15 years (1970–1986), he was with the Hydrolog-ical Sciences Branch, Goddard Space Flight Cen-ter, National Aeronautics and Space Administration,Greenbelt, MD. In January 2004, he retired from the
Hydrology and Remote Sensing Laboratory, Agricultural Research Service,U.S. Department of Agriculture, Beltsville, MD, where he worked on theapplication of remote-sensing techniques to the study of land surface hydrologicprocesses. From 2005 to 2008, he was the Gerald Thomas Professor of WaterResources with New Mexico State University (NMSU), Las Cruces. Currently,he is with the Physical Science Laboratory, NMSU. He has published more than250 papers on the application of remote sensing to hydrologic problems, morethan half of which appeared in peer-reviewed journals. His research interestsinclude the use of microwave and thermal infrared remote-sensing techniquesto observe such parameters as surface temperature and emissivity, soil moisture,and evapotranspiration. He is an Adjunct Member of the Joint U.S./Japan Ad-vancedSpaceborneThermalEmission andReflectionRadiometer ScienceTeam.
Dr. Schmugge is a Fellow of the American Geophysical Union (AGU). Hereceived the Robert E. Horton Medal in Hydrology from the AGU in 2006. Heis an Associate Editor for the IEEE TRANSACTIONS ON GEOSCIENCE AND
REMOTE SENSING.
Enric Valor received the B.Sc., M.Sc., andPh.D. degrees in physics from the University ofValencia, Burjassot, Spain, in 1992, 1994, and 1997,respectively.
He is currently an Associate Professor of earthphysics with the Department of Earth Physics andThermodynamics, Faculty of Physics, University ofValencia. He has published 35 papers in internationaljournals and 45 conference papers. His research in-terest focuses on the physical processes of thermalinfrared remote sensing, emissivity measurement
and characterization, atmospheric and emissivity corrections, and temperatureemissivity separation algorithms.
Vicente Caselles received the B.Sc., M.Sc., andPh.D. degrees in physics from the University ofValencia, Burjassot, Spain, in 1979, 1980, and 1983,respectively.
He is currently a Professor of applied physics andthe Head of the Thermal Remote Sensing Group,Department of Earth Physics and Thermodynam-ics, Faculty of Physics, University of Valencia.He has expertise of 30 years in the physical processesinvolved in the temperature measurement usingremote-sensing techniques, which has been docu-
mented through 10 books, 20 doctoral theses, 100 papers in internationaljournals, 60 conference papers, and 30 reports. He was collaborating withthe European Space Agency as a member of the Advisory Group for theLand-Surface Processes and Interactions Mission. He was the Chairman ofthe Spanish Remote Sensing Society, and he is currently the Manager of theSpanish Atmosphere and Climate Program.
César Coll received the B.Sc., M.Sc., and Ph.D.degrees in physics from the University of Valencia,Burjassot, Spain, in 1989, 1992, and 1994,respectively.
He is currently an Associate Professor of earthphysics with the Department of Earth Physics andThermodynamics, Faculty of Physics, University ofValencia. He has published 40 papers in internationaljournals and 50 conference papers. His researchinterest focuses on the physical processes of ther-mal infrared (TIR) remote sensing, atmospheric and
emissivity corrections, temperature emissivity separation, and ground valida-tion of Advanced Along Track Scanning Radiometer, Moderate ResolutionImaging Spectroradiometer, and Advance Spaceborne Thermal Emission andReflection Radiometer TIR products.
Authorized licensed use limited to: Universidad de Valencia. Downloaded on April 27, 2009 at 10:38 from IEEE Xplore. Restrictions apply.