comparison of methods used to measure odour at wastewater treatment plant fencelines
TRANSCRIPT
Comparison of Methods Used to Measure Odour atWastewater Treatment Plant Fencelines
Jay R. Witherspoon and Jennifer L. BarnesCH2M HILL, Inc.777 108th Avenue NE, Suite 800Bellevue, WA, USA 98004-5118
Abstract
In recent years, there have been new odour assessment tools available to help municipal
wastewater treatment plants (WWTPs) understand their off-site odour impact, such as dispersion
modelling, portable odour measurement panel equipment, electronic noses, air tracer
compounds, and odour sensors that can be used to measure ambient odours at the plant
fenceline. However, perception of odours is highly subjective, individuals might have different
responses to an odour at various concentration and duration. Many WWTPs have serious
concerns about off-site odour impacts that are causing them to look for viable odour controls to
meet community needs for an odour-free environment. This paper presents ways to
demonstrate compliance with community odour standards using dispersion modelling, direct
fenceline ambient sampling, and portable odour measurement equipment. Hand-held ambient
odour and hydrogen sulfide (H2S) measurement devices were evaluated, and they compared
favorably to odour dispersion modelling results for a mid-sized WWTP in the United States.
Other methods, such as the electronic nose, were reviewed but not included in this paper
because they are better suited for sampling at the odour emission source than for ambient
sampling. Electronic noses also tend to have high detection limits for known odourous
compounds emitted at a WWTP, which means that the typical WWTP odourous emission
concentrations emitted may not be detected by the device.
This paper provides insight into ambient sampling approaches using hand-held devices instead
of other methods or approaches, including dispersion modelling and/or direct emissions source
testing, to determine a WWTP’s off-site odour impacts. Results from this innovative approach,
which relies on recent innovations in portable, odour measurement panel equipment, show that a
simple strategy exists to prioritize odour sources for controls. The dispersion model results in
the case study, using source-measured inputs, were verified at the fenceline using data gathered

with hand-held ambient odour measurement and metering devices.
1. Introduction
Odour-related complaints from communities surrounding wastewater treatment plants (WWTPs)
have been increasing for many WWTPs. This increase is typically the result of new residential
development at and near plant fencelines, sales resulting in new residents in existing
communities, concerns about property devaluation and health impacts, and rising numbers of
violations and impacts from regulatory agencies responding to these community complaints.
More world-wide air quality regulatory agencies are setting regulations and permit conditions that
establish odour standards, in dilutions to threshold (D/T) or odour units (OU/m3) tied to allowable
frequencies, at WWTP property boundaries. In addition, WWTPs are proactively setting their
own odour standards to reduce the number of odour complaints, in order to avoid permit
conditions and regulatory standards, as well as be a good neighbor to the surrounding
community.
Currently, there are many ways to measure ambient odours at a WWTP’s fenceline. Typically,
two approaches are used: 1) direct ambient sampling using sampling containers, sampling masts
(for vertical odour impact measurements), fenceline sampling containers (for horizontal odour
impact measurements), analytical odour measurement equipment, and portable hand-held
devices; and 2) indirect ambient concentration determinations using odour-emission factors or
direct measurements from the odour source as inputs into odour dispersion models to determine
odour concentrations and frequencies at various off-site locations.
However, there are limitations to each method. Using hand-held odour sensors, it is difficult to
capture actual odour strength by relying on ambient odours because they are so transitory. Due
to dispersion and meteorological conditions, the odours perceived by residents and regulators
come and go at any given time. Dispersion modelling accounts for odour sources at the plant
and for meteorological conditions, but it is only a prediction of off-site odour impacts.
A direct comparison of dispersion modelling and hand-held odour sensor methods conducted at
a mid-size WWTP in the United States is presented and discussed in this paper. The mid-sized
WWTP set 7 D/T for 99 percent of the year for its community-based odour threshold standard,
which is consistent with its state’s Odour Nuisance Standard. Because 7 D/T is well below the

observed off-site odour concentration at which the surrounding community tends to complain
(typically around 20 D/T), this standard provides a small protection factor to the WWTP. Existing
and new residential housing and major roadways now surround the WWTP, which was originally
built in a rural setting at the lowest point in its service area, along naturally occurring rivers/flood
plains. The WWTP was isolated until five years ago, when the community and residences
expanded into areas very near the plant’s fencelines. This residential migration has caused the
WWTP to receive odour complaints and demands from the community to resolve off-site odour
impacts and to create an “odour-free” environment.
2. Methods
The air dispersion model is a tool accepted by the industry to approximate intensity, frequency,
and pathway of odour releases, but it is not an exact replication of actual off-site odour impacts.
Meteorological data from the nearest airport meteorological station was used for the dispersion
model. This meteorological data may not be identical to site conditions, but it is adequate to
provide a credible, defensible model.
In order to determine the odour strength using dispersion modelling at the plant boundary of the
WWTP, odour baseline sampling was conducted at each major and minor odour-emitting source
for hydrogen sulfide (H2S) and total odour. In some cases, H2S was used to determine total
odour emissions by developing an H2S equivalent curve to handle odour sources that have low
H2S emissions but high odours, such as solids processes. Odour and H2S emissions inputs into
the dispersion model were based on direct sampling at the emission source.
Odour samples taken from the WWTP processes, using the USEPA Flux Chamber approach,
were analyzed using the European method that included an odour panel and butanol calibration.
A presentation rate of 20 liters/minute was used during the odour panel analysis. Hydrogen
sulfide and total reduced sulfur (TRS) compounds were also analyzed using ASTM D 5504,
using Tedlar sampling bags and a GC/sulfur chemiluminescence detector (GC/SCD). USEPA
Method 15 describes Tedlar bag detection, and US EPA Method 16 describes the analysis of
sulfur compounds (without metal fittings) by GC/flame photometric detection.
For dispersion modelling, the Bowman Environmental Engineering’s BEEST modelling package,
Version 5.0, was used as an interface with a US Environmental Protection Agency (USEPA) air
dispersion computer model, Industrial Source Complex Short-Term (ISCST3), Version 96113, to
simulate off-site odour impacts in terms of D/T levels at the plant fenceline and into the
community. ISCST3 predicts 1-hour average pollutant concentrations. However, odour
nuisances are most associated with exposure times on the order of seconds or minutes, rather
than hours. Averaging over an hour has the effect of smoothing out concentration peaks. To
avoid this smoothing effect, the 1-hour concentrations predicted by ISCST3 were converted to
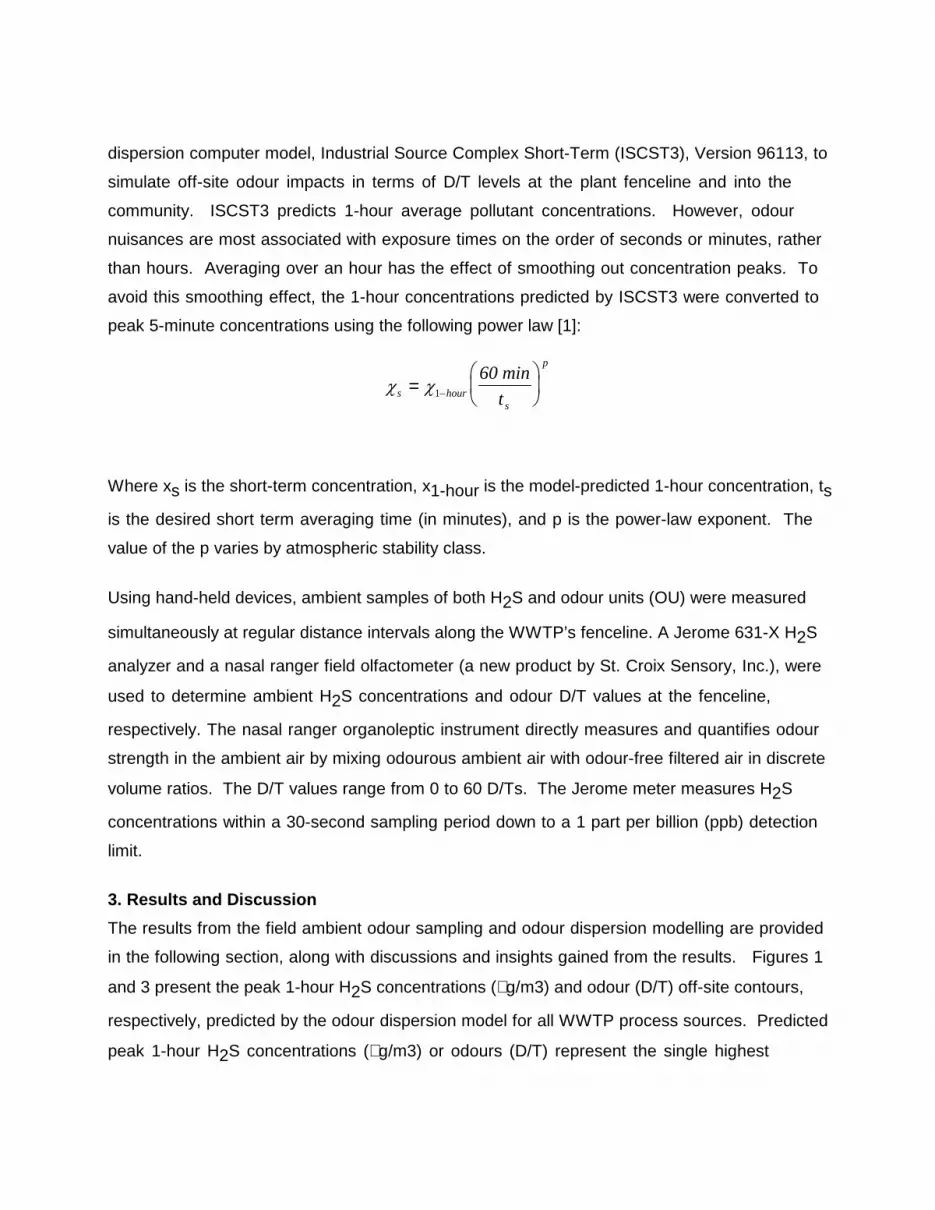
peak 5-minute concentrations using the following power law [1]:
χ χs hours
p
t=
−1
60 min
Where xs is the short-term concentration, x1-hour is the model-predicted 1-hour concentration, ts
is the desired short term averaging time (in minutes), and p is the power-law exponent. The
value of the p varies by atmospheric stability class.
Using hand-held devices, ambient samples of both H2S and odour units (OU) were measured
simultaneously at regular distance intervals along the WWTP’s fenceline. A Jerome 631-X H2S
analyzer and a nasal ranger field olfactometer (a new product by St. Croix Sensory, Inc.), were
used to determine ambient H2S concentrations and odour D/T values at the fenceline,
respectively. The nasal ranger organoleptic instrument directly measures and quantifies odour
strength in the ambient air by mixing odourous ambient air with odour-free filtered air in discrete
volume ratios. The D/T values range from 0 to 60 D/Ts. The Jerome meter measures H2S
concentrations within a 30-second sampling period down to a 1 part per billion (ppb) detection
limit.
3. Results and Discussion
The results from the field ambient odour sampling and odour dispersion modelling are provided
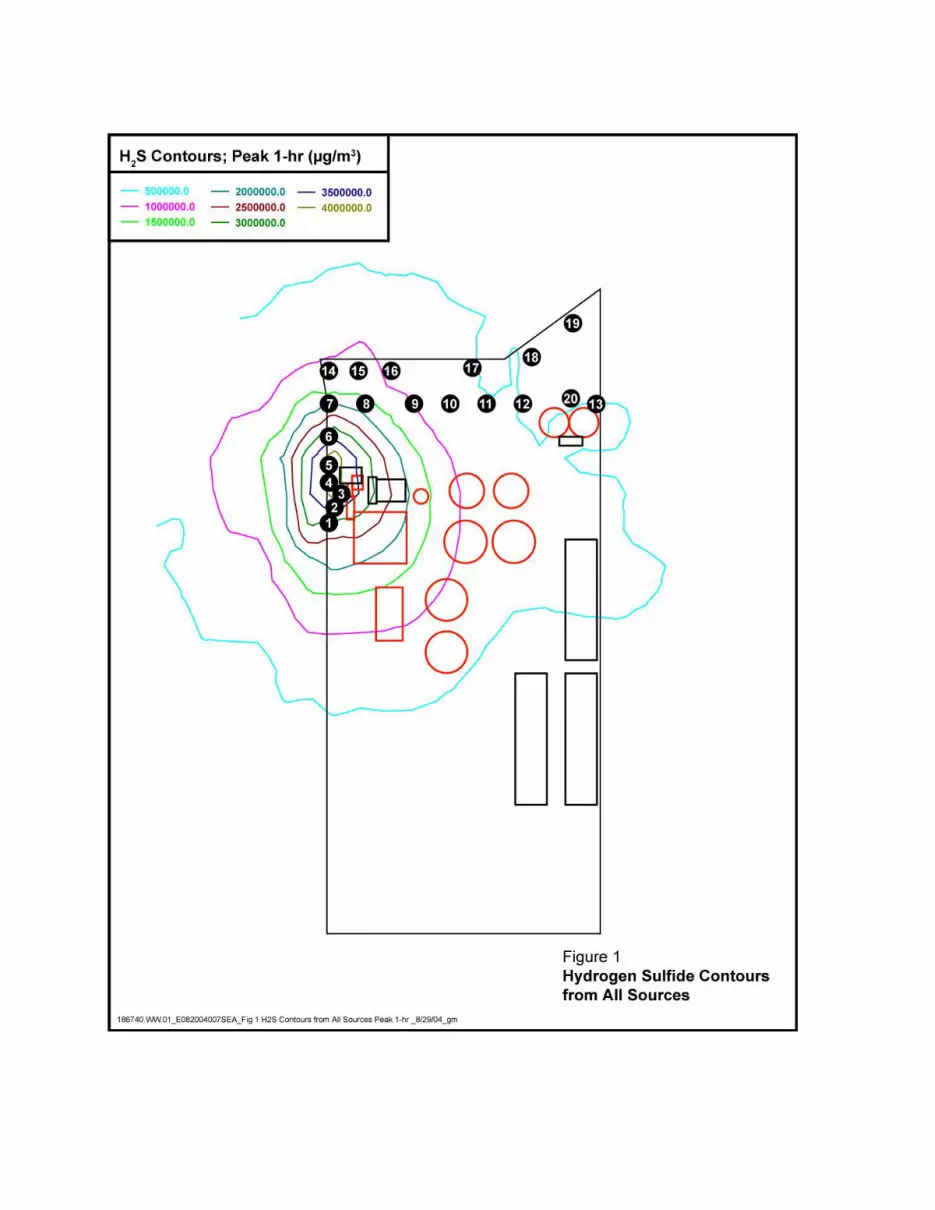
in the following section, along with discussions and insights gained from the results. Figures 1
and 3 present the peak 1-hour H2S concentrations (µg/m3) and odour (D/T) off-site contours,
respectively, predicted by the odour dispersion model for all WWTP process sources. Predicted
peak 1-hour H2S concentrations (µg/m3) or odours (D/T) represent the single highest

concentration predicted to occur over any 5-minute period in the entire year, assuming peak
odour emission rates (summer loading rates) are applied year round. This is an extremely
conservative approach, since the peak odour emission rates typically occur during warm
seasons (i.e., summer and fall) and are not present during cold weather, rain events, or winter
conditions. This approach also applies these warm-weather emission rates during the winter
when the most negative meteorological conditions for dispersion modelling potentials (low to no
air movement, inversions, etc.) occur. In the winter is also when WWTPs have the lowest odour
emission potential.
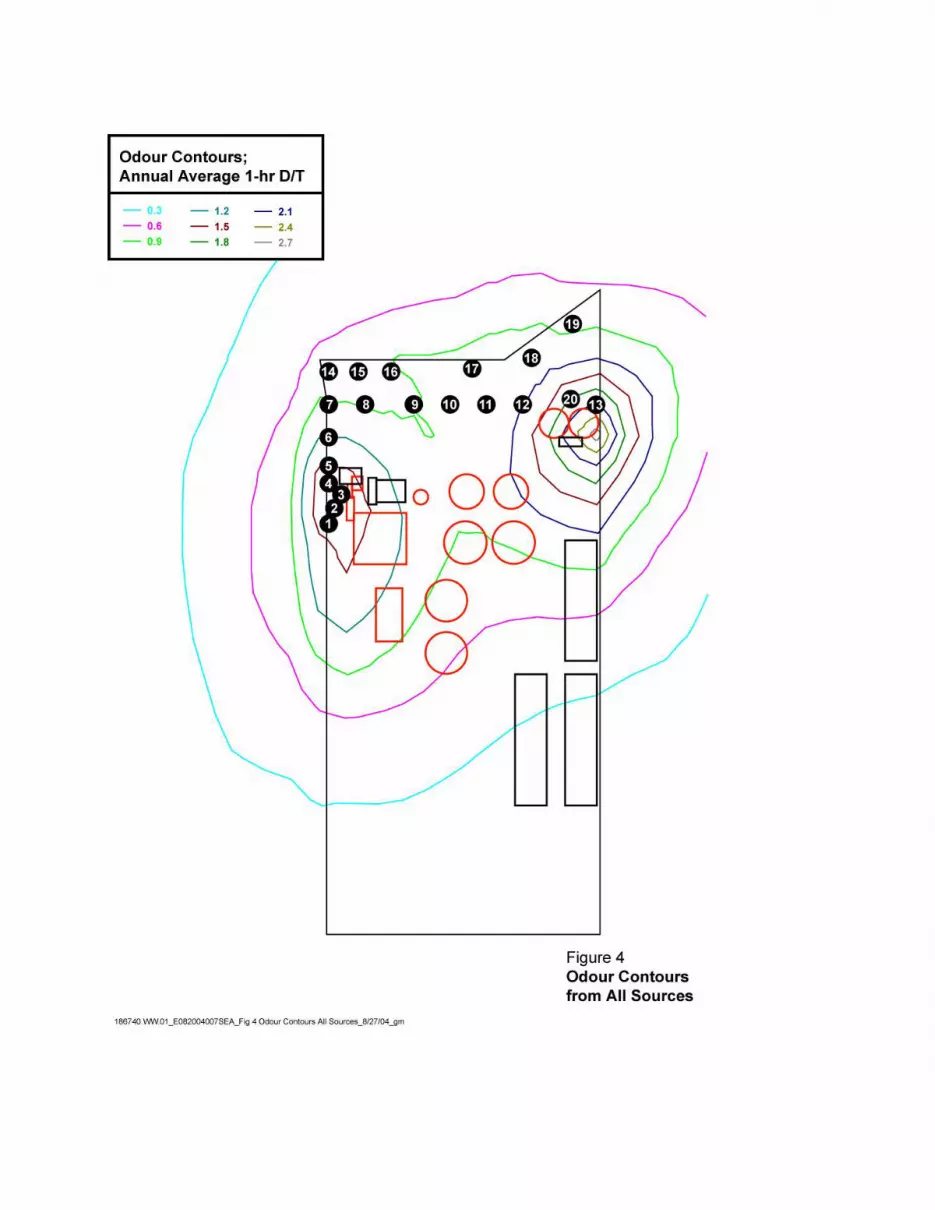
Figures 2 and 4 present the average 1-hour H2S concentrations and odour off-site contours,
respectively, predicted by the odour dispersion model for all WWTP process sources. This is a
more realistic approach for the average off-site odour impacts compared to peak loading
conditions, as well as compared to ambient odour monitoring at the fenceline. In addition, these
conditions were modelled based on actual source test data and meteorological conditions that
are most likely to occur at the WWTP.
The WWTP’s measured fenceline H2S sample results for two sampling events that captured the
two highest odour emitting periods experienced historically at the WWTP, fall and summer
conditions, are shown in Table 1. For the same locations and sampling events, the WWTP’s
odour D/Ts measurement results are shown in Table 2.
The predicted, average 1-hour contours for both H2S and odours seem to correspond very well
with the field-measured ambient odour and H2S results seen in Tables 2 and 3. For both H2S
and odour concentrations, the model predicts higher concentrations than observed during
ambient sampling at the fenceline. This is to be expected due to the conservative approach
used in the modelling combined with the fact that it is difficult to capture worst-case odour
impacts during an ambient sampling event. However, for the H2S concentration, the model
predicted concentrations that are approximately 80 times higher than measured at the fenceline,
making the odour field measurement approach more reliable. The field-measurement approach
using a Nasal Ranger is simple and easy for the operator to implement on a routine basis or
during periods of highest off-site odour impacts.

Both the average, fenceline ambient odour and H2S results correlate well with individual odour
emission sources that can be clearly defined both from the plant and along the fenceline during
ambient sampling. Several traceable or recognized odour sources were observed during the
ambient fenceline odour sampling events and were modelled to see if the identified odour source
matched the field ambient sampling results. This is an excellent approach to help prioritize
individual odour emissions sources that have the greatest off-site impacts, as well as to
determine a needed odour control requirement to bring the odour contours back to the WWTP’s
fenceline.
Table 1: Fenceline H2S Sample Results Sample
LocationLocation Description Measured Results Predicted
ResultsRatio of
PredictedAverage to
PeakMeasured
Average(ppm)
Max(ppm)
Average(µµµµg/m3)
Max (µµµµg/m3)
Average (µµµµg/m3)
1 Fenceline at SouthEntrance to Headworks
0.12 0.62 173 877 20,302 23.2
2 Fenceline at manhole indriveway
0.26 1.5 372 2,121 29,881 14.1
3 Fenceline at rock indriveway
0.08 0.39 108 552 47,583 86.3
4 Fenceline at roadsign 0.08 0.28 119 396 41,020 103.65 Main gate 0.04 0.28 55 396 32,083 81.06 ½ way up hill from gate 0.04 0.3 56 424 21,608 50.97 NW corner of fenceline 0.03 0.16 48 226 14,542 64.38 Fenceline behind power
pole0.03 0.11 42 156 15,534 99.8
9 Fenceline past last tree(from W)
0.04 0.45 51 636 17,245 27.1
10 Fenceline 1/2 way b/wtree and sludge tanks
0.02 0.14 27 198 18,670 94.3
11 Fenceline behind sludgetanks
0.01 0.063 16 89 14,729 165.3
12 Fenceline b/w sludgetanks and digesters
0.01 0.13 20 184 13,165 71.6
13 Fenceline due East ofdigester (north of flare)
0.00 0.079 7 112 13,569 121.4
14 Canal at road 0.02 0.14 34 198 11,118 56.215 Canal at 1st break in
trees0.02 0.18 23 255 10,327 40.6
16 Canal just past trees 0.02 0.119 28 168 9,903 58.8

17 Canal due N of light atsludge tanks
0.02 0.12 22 170 12,619 74.4
18 Canal b/w sludge tanks &digesters
0.01 0.066 10 93 9,412 100.8
19 Canal at NE corner ofplant
0.01 0.021 7 30 6,278 211.4
20 Fenceline behinddigesters
0.02 0.15 22 212 13,569 64.0
Average 80.4

Table 2: Fenceline Odor Sample Results
SampleLocation
Location Description Measured Results Predicted Results Ratio of Predicted toMeasured
Average(D/T)
Max (D/T)
Average(D/T)
Max (D/T) Average MAx
1 Fenceline at SouthEntrance to Headworks
4.1 15.0 1.79 62.1 0.44 4.1
2 Fenceline at manhole indriveway
4.2 30.0 1.94 84.54 0.46 2.8
3 Fenceline at rock indriveway
1.8 7.0 2.32 105 1.32 15.0
4 Fenceline at roadsign 2.7 7.0 1.98 135 0.74 19.35 Main gate 3.3 30.0 1.66 114 0.51 3.86 ½ way up hill from gate 1.3 4.0 1.27 92.51 0.99 23.17 NW corner of fenceline 1.9 7.0 0.93 67.27 0.49 9.68 Fenceline behind power
pole1.1 2.0 1.14 55.88 1.05 27.9
9 Fenceline past last tree(from W)
2.2 15.0 1.46 53.34 0.68 3.6
10 Fenceline 1/2 way b/wtree and sludge tanks
3.5 30.0 1.62 72.05 0.46 2.4
11 Fenceline behind sludgetanks
1.3 2.0 1.77 41.72 1.33 20.9
12 Fenceline b/w sludgetanks and digesters
1.9 15.0 1.8 49.11 0.96 3.3
13 Fenceline due East ofdigester (north of flare)
1.0 1.0 2.07 73.96 2.07 74.0
14 Canal at road 1.3 2.0 0.77 50.94 0.62 25.515 Canal at 1st break in
trees1.5 7.0 0.83 42.53 0.54 6.1
16 Canal just past trees 3.2 30.0 0.97 36.06 0.30 1.217 Canal due N of light at
sludge tanks1.1 2.0 1.21 46.02 1.11 23.0
18 Canal b/w sludge tanks& digesters
1.7 7.0 1.19 32.51 0.70 4.6
19 Canal at NE corner ofplant
1.3 2.0 0.75 29.58 0.60 14.8
20 Fenceline behinddigesters
4.7 30.0 2.09 54.44 0.45 1.8
Average 0.79 14.34
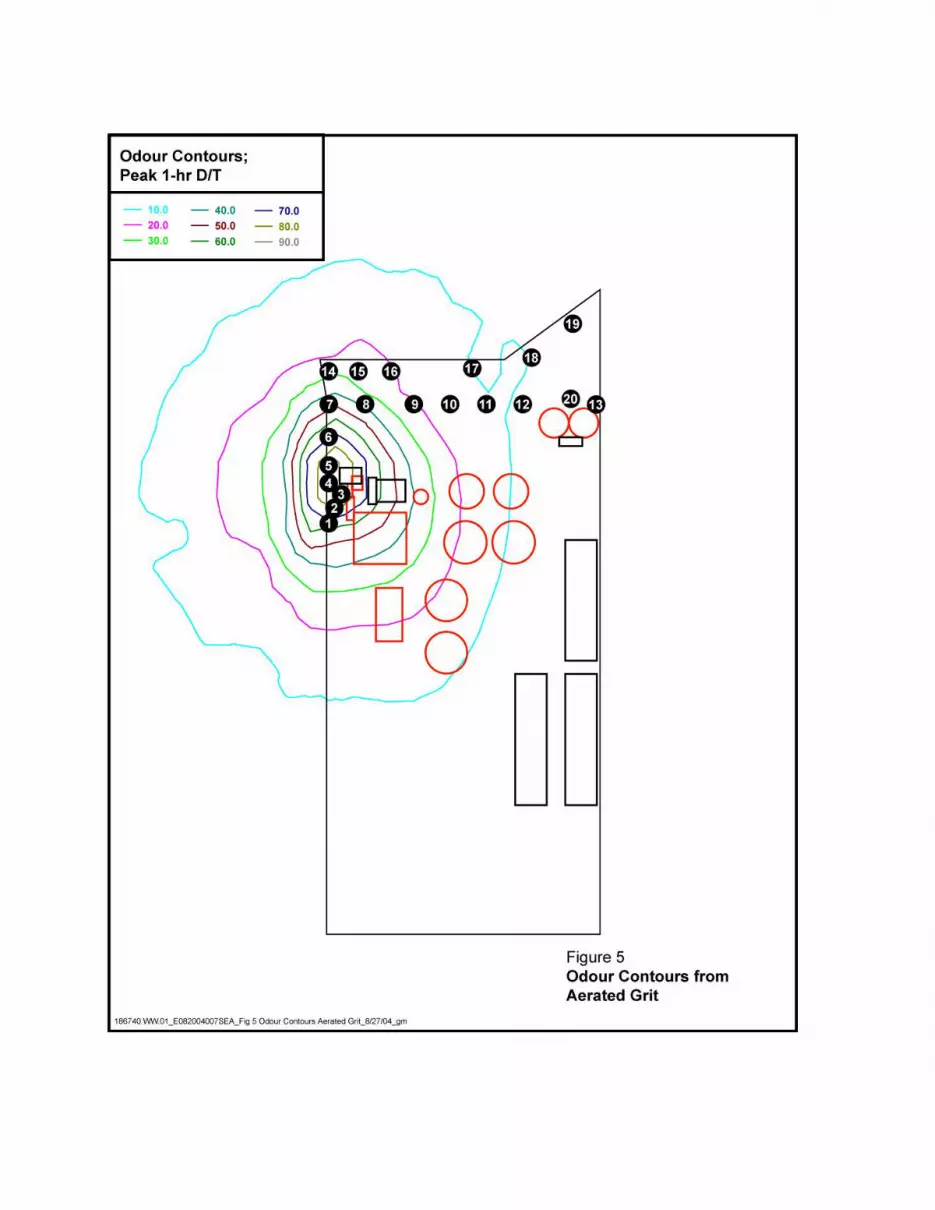
Taking a closer look at one of the WWTP’s most significant odour sources, the Aerated Grit area
captures several odourous sources, including the effluent channel leaving the headworks
building and aerated grit basin and effluent channel. The predicted, 1-hour peak odour contours
for the Aerated Grit area compared to predicted, 1-hour peak odour contours for all sources

(Figure 3), shows that the Aerated Grit area makes up over 90 percent of the off-site contribution
to the odour impact in the immediate area. Using that same relationship and comparing the
fenceline average sampling location results that are directly downwind of the Aerated Grit area to
the average odour contours from all sources (Figure 4) to, it shows that the ambient monitoring
average results closely match the modelled results, as demonstrated by the average D/T results
in Table 3 for sampling sites 1-8. The comparison results are within 30 percent of each other
and have the same general shape and profile.
Therefore, based on odour modelling and ambient measurement, the Aerated Grit area has high
potential for off-site odour impacts and will require odour control to bring the odour contours back
onto the WWTP site and reduce the off-site odour impacts. Dispersion modelling can then be
used to determine the amount of odour control needed. Alternatively, ambient odour
measurements can be scaled to determine this same amount of odour control required or used
to demonstrate that the off-site odour impact has been reduced.
4. Conclusions
As seen in this case study, using hand-held odour sampling and metering devices can result in
understanding off-site odour impacts ranges and profiles that are similar to results generated
using dispersion models with emission source testing data. This means that a simple ambient
monitoring program can be set up and calibrated using direct odour source measurements and
dispersion modelling (if available) to provide early warning of an upcoming off-site odour event,
to track current off-site odour effects and ensure that they are not getting worse, and/or to track
odour-free periods. In addition, once acceptable, ambient readings have been established at the
fenceline, this approach eliminates the need to remodel or resample at the odour sources in
order to show compliance with odour standards.
Dispersion modelling is a needed tool that greatly assists WWTPs in planning for new odour
sources and their odour control requirements, in looking at and designing for worst-case
operating and meteorological conditions, and in addressing other operating scenarios. However,
once acceptable odour emission standards have been established at a WWTP’s fenceline,
ambient odour measurement using hand-held devices should then be considered to track
ongoing compliance.
5. References

[1] Wang, Jie and Kenneth J. Skipka, Dispersion Modelling of Odorous Emissions, RTP
Environmental Associates, June 13, 1993.