a comparative assessment of biofiltration and activated sludge diffusion for odour abatement
TRANSCRIPT
Ao
RD
a
ARRAA
KABHOV
1
PuahaittabrNta
bobrm(h
0d
Journal of Hazardous Materials 190 (2011) 622–630
Contents lists available at ScienceDirect
Journal of Hazardous Materials
journa l homepage: www.e lsev ier .com/ locate / jhazmat
comparative assessment of biofiltration and activated sludge diffusion fordour abatement
aquel Lebrero, Elisa Rodríguez, Pedro A. García-Encina, Raúl Munoz ∗
epartment of Chemical Engineering and Environmental Technology. University of Valladolid. Dr. Mergelina s/n, 47011 Valladolid, Spain
r t i c l e i n f o
rticle history:eceived 10 January 2011eceived in revised form 21 February 2011ccepted 24 March 2011
a b s t r a c t
The deodorization performance of a biofilter and an activated sludge diffusion (AS) system was compar-atively evaluated in terms of removal efficiency (RE) and process stability at empty bed residence times(EBRT) ranging from 94 to 32 s. Both bioreactors were fed with a synthetic odorous emission containingH2S, butanone and toluene at 23.6–43.3, 4.3–6.3 and 0.4–0.6 mg m−3, respectively. While the outlet H2S
vailable online 31 March 2011
eywords:ctivated sludge diffusion systemiofiltrationydrophobicity
concentration was always lower than 1.4 mg m−3, the REs for butanone and toluene remained higher than95% in both bioreactors regardless of the EBRT. The continuous supply of wastewater in the AS unit did notaffect removal and appeared to be a requirement for efficient pollutant abatement. Despite the narrowcarbon source spectrum treated, the AS system maintained a large bacterial diversity over time. There-fore, the results obtained confirmed the potential of AS systems as a robust and efficient biotechnology
WTP
dour treatmentOC biodegradationfor odour treatment in W
. Introduction
Emissions of malodorous gases from Wastewater Treatmentlants (WWTPs) have a negative impact on the nearby local pop-lation. The increasing number of malodours-related complaintsnd the recent enforcement of stricter environmental regulationsave ranked minimization and abatement of malodorous emissionsmong the top priorities in the design and operation of WWTP util-ties worldwide [1,2]. The key relevance of the problem, both inerms of compliance to regulations and good public image, ini-ially triggered the implementation of physical/chemical off-gasbatement technologies such as chemical scrubbing, activated car-on filtration and incineration. However, WWTP operators becameapidly aware of the merits of biological treatment processes.owadays, biological technologies are the preferred option due
o their high efficiency, lower operating costs and absence of haz-rdous end-products [3,4].
Biofiltration is indisputably the most commonly employediotechnology for odour treatment in WWTPs [5,6]. In biofilters, thedorous emission is forced through an organic/inorganic packeded supporting the microbial community responsible for odorant
emoval. Despite their cost-effectiveness, the widespread imple-entation of biofilters is often restricted by their large footprinthigh empty bed residence times, EBRT, and low packed mediaeights in order to minimize pressure drops) and by the gradual
∗ Corresponding author. Tel.: +34 983186424; fax: +34 983423013.E-mail address: [email protected] (R. Munoz).
304-3894/$ – see front matter © 2011 Elsevier B.V. All rights reserved.oi:10.1016/j.jhazmat.2011.03.090
s.© 2011 Elsevier B.V. All rights reserved.
compaction of packing media. In addition, the technical difficul-ties to control key parameters such as pH and moisture contentwithin the packed bed, and to avoid the accumulation of inhibitoryby-products can also limit biofilter performance [7].
In this context, activated sludge diffusion (AS) system representsa cost-effective alternative to media-based odour treatment biore-actors. In AS systems, the malodorous emission is directly spargedinto the aeration tank as the air needed to satisfy the biologicaloxygen demand of the wastewater [8]. Odorants diffuse into themixed liquor together with O2, being subsequently degraded by theAS community [3,9]. AS systems possess all merits of their biolog-ical counterparts (environmental friendliness, low operating cost)while overcoming most of their major limitations (packing mediacompaction, moisture control or accumulation of toxic metabolitesin biofiltration, etc.). In addition, the use of the existing aerationtank as odour-abatement unit renders them economically attrac-tive in plants with land limitations. Despite AS systems have beenused for over 30 years with high H2S removal efficiencies (REs),their widespread implementation is still limited by the lack ofreliable data concerning its performance during the treatment ofodorous volatile organic compounds (VOCs) [9–11].
This work was conducted to systematically compare the per-formance of a conventional biofilter and an AS system for thetreatment of a model WWTP malodorous emission containing four
representative odorants with a large range of hydrophobicities.Butanone, toluene, and �-pinene were selected as model VOC odor-ants representing soluble, moderately soluble and hydrophobicVOCs associated to WWTP emissions [12]. Likewise, H2S was alsoselected as model sulphur odorant for being widely present in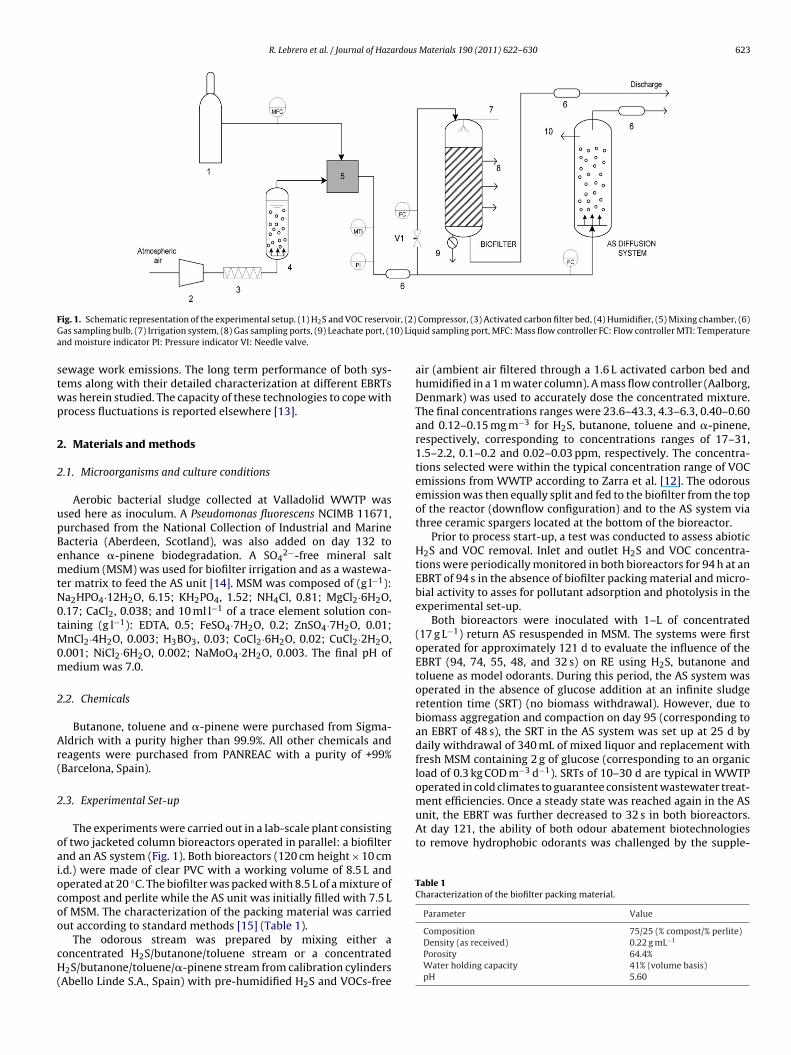
R. Lebrero et al. / Journal of Hazardous Materials 190 (2011) 622–630 623
F ir, (2)G 0) Liqa
stwp
2
2
upBemtN0tM0m
2
Ar(
2
oaiocoo
cH(
ment efficiencies. Once a steady state was reached again in the ASunit, the EBRT was further decreased to 32 s in both bioreactors.At day 121, the ability of both odour abatement biotechnologiesto remove hydrophobic odorants was challenged by the supple-
Table 1Characterization of the biofilter packing material.
Parameter Value
ig. 1. Schematic representation of the experimental setup. (1) H2S and VOC reservoas sampling bulb, (7) Irrigation system, (8) Gas sampling ports, (9) Leachate port, (1nd moisture indicator PI: Pressure indicator VI: Needle valve.
ewage work emissions. The long term performance of both sys-ems along with their detailed characterization at different EBRTsas herein studied. The capacity of these technologies to cope withrocess fluctuations is reported elsewhere [13].
. Materials and methods
.1. Microorganisms and culture conditions
Aerobic bacterial sludge collected at Valladolid WWTP wassed here as inoculum. A Pseudomonas fluorescens NCIMB 11671,urchased from the National Collection of Industrial and Marineacteria (Aberdeen, Scotland), was also added on day 132 tonhance �-pinene biodegradation. A SO4
2−-free mineral saltedium (MSM) was used for biofilter irrigation and as a wastewa-
er matrix to feed the AS unit [14]. MSM was composed of (g l−1):a2HPO4·12H2O, 6.15; KH2PO4, 1.52; NH4Cl, 0.81; MgCl2·6H2O,.17; CaCl2, 0.038; and 10 ml l−1 of a trace element solution con-aining (g l−1): EDTA, 0.5; FeSO4·7H2O, 0.2; ZnSO4·7H2O, 0.01;
nCl2·4H2O, 0.003; H3BO3, 0.03; CoCl2·6H2O, 0.02; CuCl2·2H2O,.001; NiCl2·6H2O, 0.002; NaMoO4·2H2O, 0.003. The final pH ofedium was 7.0.
.2. Chemicals
Butanone, toluene and �-pinene were purchased from Sigma-ldrich with a purity higher than 99.9%. All other chemicals andeagents were purchased from PANREAC with a purity of +99%Barcelona, Spain).
.3. Experimental Set-up
The experiments were carried out in a lab-scale plant consistingf two jacketed column bioreactors operated in parallel: a biofilternd an AS system (Fig. 1). Both bioreactors (120 cm height × 10 cm.d.) were made of clear PVC with a working volume of 8.5 L andperated at 20 ◦C. The biofilter was packed with 8.5 L of a mixture ofompost and perlite while the AS unit was initially filled with 7.5 Lf MSM. The characterization of the packing material was carried
ut according to standard methods [15] (Table 1).The odorous stream was prepared by mixing either aoncentrated H2S/butanone/toluene stream or a concentrated2S/butanone/toluene/�-pinene stream from calibration cylinders
Abello Linde S.A., Spain) with pre-humidified H2S and VOCs-free
Compressor, (3) Activated carbon filter bed, (4) Humidifier, (5) Mixing chamber, (6)uid sampling port, MFC: Mass flow controller FC: Flow controller MTI: Temperature
air (ambient air filtered through a 1.6 L activated carbon bed andhumidified in a 1 m water column). A mass flow controller (Aalborg,Denmark) was used to accurately dose the concentrated mixture.The final concentrations ranges were 23.6–43.3, 4.3–6.3, 0.40–0.60and 0.12–0.15 mg m−3 for H2S, butanone, toluene and �-pinene,respectively, corresponding to concentrations ranges of 17–31,1.5–2.2, 0.1–0.2 and 0.02–0.03 ppm, respectively. The concentra-tions selected were within the typical concentration range of VOCemissions from WWTP according to Zarra et al. [12]. The odorousemission was then equally split and fed to the biofilter from the topof the reactor (downflow configuration) and to the AS system viathree ceramic spargers located at the bottom of the bioreactor.
Prior to process start-up, a test was conducted to assess abioticH2S and VOC removal. Inlet and outlet H2S and VOC concentra-tions were periodically monitored in both bioreactors for 94 h at anEBRT of 94 s in the absence of biofilter packing material and micro-bial activity to asses for pollutant adsorption and photolysis in theexperimental set-up.
Both bioreactors were inoculated with 1–L of concentrated(17 g L−1) return AS resuspended in MSM. The systems were firstoperated for approximately 121 d to evaluate the influence of theEBRT (94, 74, 55, 48, and 32 s) on RE using H2S, butanone andtoluene as model odorants. During this period, the AS system wasoperated in the absence of glucose addition at an infinite sludgeretention time (SRT) (no biomass withdrawal). However, due tobiomass aggregation and compaction on day 95 (corresponding toan EBRT of 48 s), the SRT in the AS system was set up at 25 d bydaily withdrawal of 340 mL of mixed liquor and replacement withfresh MSM containing 2 g of glucose (corresponding to an organicload of 0.3 kg COD m−3 d−1). SRTs of 10–30 d are typical in WWTPoperated in cold climates to guarantee consistent wastewater treat-
Composition 75/25 (% compost/% perlite)Density (as received) 0.22 g mL−1
Porosity 64.4%Water holding capacity 41% (volume basis)pH 5.60
624 R. Lebrero et al. / Journal of Hazardous Materials 190 (2011) 622–630
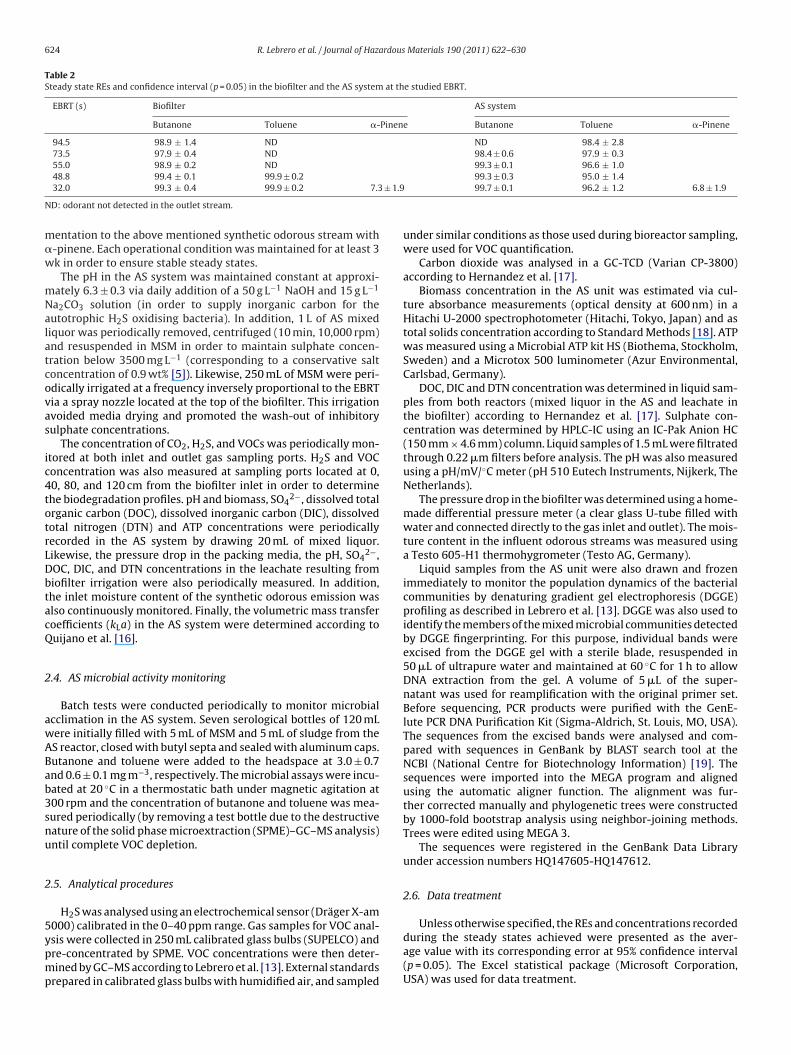
Table 2Steady state REs and confidence interval (p = 0.05) in the biofilter and the AS system at the studied EBRT.
EBRT (s) Biofilter AS system
Butanone Toluene �-Pinene Butanone Toluene �-Pinene
94.5 98.9 ± 1.4 ND ND 98.4 ± 2.873.5 97.9 ± 0.4 ND 98.4 ± 0.6 97.9 ± 0.3
± 1.9
N
m�w
mNalatcovas
ic4totrLDbtacQ
2
awABab3snu
2
5ypmp
55.0 98.9 ± 0.2 ND48.8 99.4 ± 0.1 99.9 ± 0.232.0 99.3 ± 0.4 99.9 ± 0.2 7.3
D: odorant not detected in the outlet stream.
entation to the above mentioned synthetic odorous stream with-pinene. Each operational condition was maintained for at least 3k in order to ensure stable steady states.
The pH in the AS system was maintained constant at approxi-ately 6.3 ± 0.3 via daily addition of a 50 g L−1 NaOH and 15 g L−1
a2CO3 solution (in order to supply inorganic carbon for theutotrophic H2S oxidising bacteria). In addition, 1 L of AS mixediquor was periodically removed, centrifuged (10 min, 10,000 rpm)nd resuspended in MSM in order to maintain sulphate concen-ration below 3500 mg L−1 (corresponding to a conservative saltoncentration of 0.9 wt% [5]). Likewise, 250 mL of MSM were peri-dically irrigated at a frequency inversely proportional to the EBRTia a spray nozzle located at the top of the biofilter. This irrigationvoided media drying and promoted the wash-out of inhibitoryulphate concentrations.
The concentration of CO2, H2S, and VOCs was periodically mon-tored at both inlet and outlet gas sampling ports. H2S and VOConcentration was also measured at sampling ports located at 0,0, 80, and 120 cm from the biofilter inlet in order to determinehe biodegradation profiles. pH and biomass, SO4
2−, dissolved totalrganic carbon (DOC), dissolved inorganic carbon (DIC), dissolvedotal nitrogen (DTN) and ATP concentrations were periodicallyecorded in the AS system by drawing 20 mL of mixed liquor.ikewise, the pressure drop in the packing media, the pH, SO4
2−,OC, DIC, and DTN concentrations in the leachate resulting fromiofilter irrigation were also periodically measured. In addition,he inlet moisture content of the synthetic odorous emission waslso continuously monitored. Finally, the volumetric mass transferoefficients (kLa) in the AS system were determined according touijano et al. [16].
.4. AS microbial activity monitoring
Batch tests were conducted periodically to monitor microbialcclimation in the AS system. Seven serological bottles of 120 mLere initially filled with 5 mL of MSM and 5 mL of sludge from theS reactor, closed with butyl septa and sealed with aluminum caps.utanone and toluene were added to the headspace at 3.0 ± 0.7nd 0.6 ± 0.1 mg m−3, respectively. The microbial assays were incu-ated at 20 ◦C in a thermostatic bath under magnetic agitation at00 rpm and the concentration of butanone and toluene was mea-ured periodically (by removing a test bottle due to the destructiveature of the solid phase microextraction (SPME)–GC–MS analysis)ntil complete VOC depletion.
.5. Analytical procedures
H2S was analysed using an electrochemical sensor (Dräger X-am
000) calibrated in the 0–40 ppm range. Gas samples for VOC anal-sis were collected in 250 mL calibrated glass bulbs (SUPELCO) andre-concentrated by SPME. VOC concentrations were then deter-ined by GC–MS according to Lebrero et al. [13]. External standardsrepared in calibrated glass bulbs with humidified air, and sampled
99.3 ± 0.1 96.6 ± 1.099.3 ± 0.3 95.0 ± 1.499.7 ± 0.1 96.2 ± 1.2 6.8 ± 1.9
under similar conditions as those used during bioreactor sampling,were used for VOC quantification.
Carbon dioxide was analysed in a GC-TCD (Varian CP-3800)according to Hernandez et al. [17].
Biomass concentration in the AS unit was estimated via cul-ture absorbance measurements (optical density at 600 nm) in aHitachi U-2000 spectrophotometer (Hitachi, Tokyo, Japan) and astotal solids concentration according to Standard Methods [18]. ATPwas measured using a Microbial ATP kit HS (Biothema, Stockholm,Sweden) and a Microtox 500 luminometer (Azur Environmental,Carlsbad, Germany).
DOC, DIC and DTN concentration was determined in liquid sam-ples from both reactors (mixed liquor in the AS and leachate inthe biofilter) according to Hernandez et al. [17]. Sulphate con-centration was determined by HPLC-IC using an IC-Pak Anion HC(150 mm × 4.6 mm) column. Liquid samples of 1.5 mL were filtratedthrough 0.22 �m filters before analysis. The pH was also measuredusing a pH/mV/◦C meter (pH 510 Eutech Instruments, Nijkerk, TheNetherlands).
The pressure drop in the biofilter was determined using a home-made differential pressure meter (a clear glass U-tube filled withwater and connected directly to the gas inlet and outlet). The mois-ture content in the influent odorous streams was measured usinga Testo 605-H1 thermohygrometer (Testo AG, Germany).
Liquid samples from the AS unit were also drawn and frozenimmediately to monitor the population dynamics of the bacterialcommunities by denaturing gradient gel electrophoresis (DGGE)profiling as described in Lebrero et al. [13]. DGGE was also used toidentify the members of the mixed microbial communities detectedby DGGE fingerprinting. For this purpose, individual bands wereexcised from the DGGE gel with a sterile blade, resuspended in50 �L of ultrapure water and maintained at 60 ◦C for 1 h to allowDNA extraction from the gel. A volume of 5 �L of the super-natant was used for reamplification with the original primer set.Before sequencing, PCR products were purified with the GenE-lute PCR DNA Purification Kit (Sigma-Aldrich, St. Louis, MO, USA).The sequences from the excised bands were analysed and com-pared with sequences in GenBank by BLAST search tool at theNCBI (National Centre for Biotechnology Information) [19]. Thesequences were imported into the MEGA program and alignedusing the automatic aligner function. The alignment was fur-ther corrected manually and phylogenetic trees were constructedby 1000-fold bootstrap analysis using neighbor-joining methods.Trees were edited using MEGA 3.
The sequences were registered in the GenBank Data Libraryunder accession numbers HQ147605-HQ147612.
2.6. Data treatment
Unless otherwise specified, the REs and concentrations recordedduring the steady states achieved were presented as the aver-age value with its corresponding error at 95% confidence interval(p = 0.05). The Excel statistical package (Microsoft Corporation,USA) was used for data treatment.
rdous
3
la5tp
3r
t1aRctto(hf
owatsh
iithtp1ar9(ecABowt
htdn6twtfi
Vtrt4
R. Lebrero et al. / Journal of Haza
. Results and discussion
No significant differences were recorded between inlet and out-et concentrations of H2S, butanone or toluene during the 94 hbiotic test, with maximum standard deviations of 1%, 13% and% in the biofilter and 0%, 11% and 4% in the AS system, respec-ively. These results confirmed that neither odorant adsorption norhotolysis occurred in the experimental set-up.
.1. AS system performance before glucose addition: H2S and VOCemoval
H2S outlet concentration was below the detection limits ofhe electrochemical sensor used for H2S measurement (1 ppm or.4 mg m−3) in the AS system regardless of the EBRT employed, event 32 s. Thus, H2S REs ranged from 96% to 100% (Fig. 2a). These highEs have been widely reported for AS systems treating varying H2Soncentrations. For example, Barbosa et al. [9] found H2S REs higherhan 98% in the aeration tank of a wastewater treatment pilot plantreating H2S at 5–25 ppmv (7–35 mg m−3) and up to 99.4% whenperating at inlet H2S concentrations ranging from 30 to 105 ppmv42–146 mg m−3) [10]. Similarly, Burgess et al. [3] also recorded REsigher than 99% in an AS system treating inlet H2S concentrations
rom 77 to 100 ppm (107–140 mg m−3).A steady increase of sulphate concentration up to 3500 ppm was
bserved during the first 70 d of operation, remaining stable after-ards (as a result of periodic MSM exchanges). The experimental
nd theoretical sulphate concentrations exhibited a good correla-ion ([SO4
2−]theoretical = 1.011 [SO42−]experimental; R2 = 0.96), which
uggest a complete oxidation of H2S to sulphate as a result of theigh dissolved oxygen concentrations present in the mixed liquor.
Despite H2S elimination performance has been widely mon-tored in AS systems due to its ease of measurement, scarcenformation exists about VOC treatment at trace level concentra-ions. In our particular study, process start-up was characterized byigh initial butanone and toluene REs due to VOC absorption intohe mixed liquor followed by a gradual decrease in VOC removalerformance. Butanone and toluene REs increased from 45% and1% at day 2 up to REs > 99% by day 8 and 20, respectively (Fig. 2bnd c). Butanone REs in the AS system ranged from 98 to REs > 99%egardless of the EBRT. In the case of toluene, REs of 98.4 ± 2.8% at4 and 74 s, 95 ± 1.4% at 49 s and 96 ± 1.2% at 32 s were recordedFig. 2b and c). These values represent, to the best of our knowl-dge, the highest REs ever reported for VOCs at such low inletoncentrations and residence times in AS systems. The capacity ofS processes to remove dissolved VOCs was previously studied byarbosa et al. [10], who recorded high efficiencies for the treatmentf a wide range of VOCs and volatile sulphur compounds comingith the wastewater. However, these authors only supplied H2S to
he system with the odorous stream.The high VOC abatement performance was probably due to the
igh kLa values driving odorant transfer from the emission and tohe efficient microbial pollutant uptake in the mixed liquor (no VOCiffusion limitations). Mass transfer coefficients increased expo-entially when decreasing the EBRT from 241 ± 38 h−1 at 94 s to97 ± 40 h−1 at 32 s. These kLa values are quite high compared tohose reported by Dorado et al. [20] in a biotrickling filter packedith polyurethane foam at 35 s of EBRT (kLa ≈ 43.2 h−1). However,
he kLa increased up to 700 h−1 when the EBRT of the biotricklinglter decreased to 10 s.
The performance of the AS unit for the removal of hydrophobic
OCs was challenged by the addition of �-pinene to the syn-hetic odorous stream at day 121. While this odorant was initiallyemoved at approximately 21%, its RE decreased to 6.8 ± 1.9% afterwo days of operation and remained constant for the following0 d. Despite lower REs compared to toluene and butanone were
Materials 190 (2011) 622–630 625
expected due to mass transfer limitations (low concentration gra-dient available for mass transfer as a result of its higher partitioncoefficient), this poor abatement performance was likely due to thelack of a specialized �-pinene degrading community. In this con-text, the addition of 250 mL of a Pseudomonas fluorescens culture(�-pinene degrading species [14]) after 11 days of �-pinene feed-ing did not result in significant enhancements in the removal of thisterpene. The absence of an active microbial community capable ofdegrading �-pinene at the low concentrations present in the mixedliquor (0.10-0.13 �g l−1) was confirmed by the fact that operationat low pH values triggered the development of an �-pinene degrad-ing community able to degrade up to 50% of this terpene at an EBRTof 50 s (data shown in Lebrero et al. [13]).
Batch VOC biodegradation tests showed a gradual enrichmentof bacterial communities specialized in the degradation of tracelevel concentrations of VOC (2.6 ± 0.4 mg m−3 and 0.6 ± 0.1 mg m−3
of butanone and toluene, respectively) in the AS. Figure 3 repre-sents the degradation kinetics for butanone and toluene of sludgesamples drawn at different operation times. Hence, while microor-ganisms were initially not able to completely degrade butanone andtoluene in 80 min, less than 60 min were required for its completedepletion after 58 and 27 d, respectively.
3.2. AS system performance after glucose addition: biomassgrowth
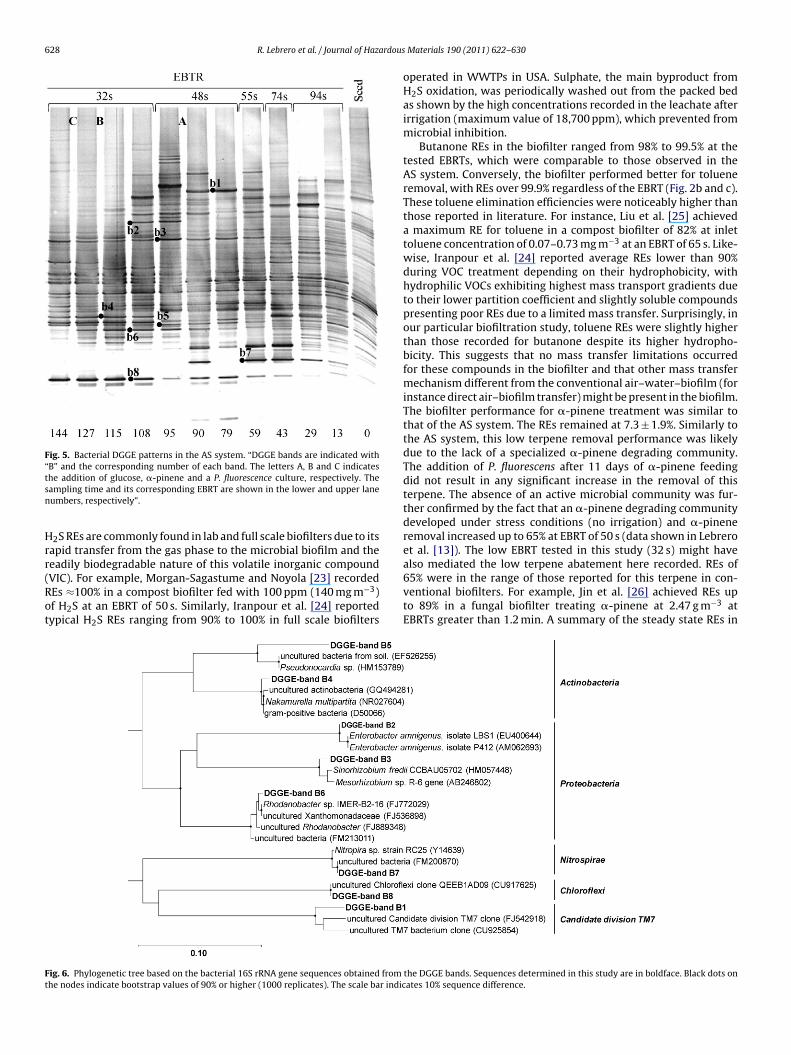
After three months of operation with butanone, toluene and H2S,the AS system collapsed due to an unexpected biomass aggregationfollowed by compaction and sedimentation at the bottom of thebioreactor. Hence, biomass concentration rapidly decreased from 1to 0.12 g L−1 (Fig. 4) concomitant with a reduction in butanone andtoluene REs (63% and 34%, respectively) as a result of the reduc-tion in the specific interfacial area biomass-cultivation broth dueto biomass compaction (Fig. 2b and c). The microbiological reasonsunderlying this phenomenon are however unknown. Glucose wasthen supplied at a rate of 0.3 kg COD m−3 d−1 along with a dailybiomass withdrawal (sludge retention time of 25 d) in order tomaintain the suspended biomass culture at 2.5 g L−1 throughoutthe rest of the experiment. The addition of an easily biodegrad-able carbon source, simulating wastewater input during real WWTPoperation, resulted in a rapid re-suspension of the compactedbiomass and in the recovery of the preceding steady state REs.Therefore, the hypothesis of a reduced VOC-degrading activity inthe presence of more easily degradable carbon sources (such asorganic matter from wastewater) can be ruled-out since the sup-ply of such a source appears to be a requirement for a successfulodour removal in AS systems. Moreover, the presence of an easilybiodegradable carbon source resulted in a more active biomass asshown by the higher specific ATP contents, which increased froman initial value of 5.0 ± 0.5 × 10⁻⁹ mol ATP (g biomass)−1 up to con-stant values of 3.7 ± 0.2 × 10⁻⁸ mol ATP (g biomass)−1 (Fig. 4). Thisincrease in the energetic level of the cells, herein quantified as spe-cific ATP content, was in agreement with the experimental findingsof Bordel et al. [21], who observed an increase in the specific ATPcontent of P. putida F1 at increasing toluene concentrations.
3.3. AS microbial analysis
Despite the acclimation and specialization of the VOC andH2S degrading community and the addition of glucose (an eas-ily biodegradable carbon source) from day 94, the biodiversity of
the microbial community present in the AS unit remained surpris-ingly constant over time, as shown by the DGGE (Fig. 5). Therefore,the addition of glucose allowed the recovery of the system due toan increase of microbial activity as shown by the increase in RE(Section 3.2), but it did not affect the biodiversity (letter A, Fig. 5).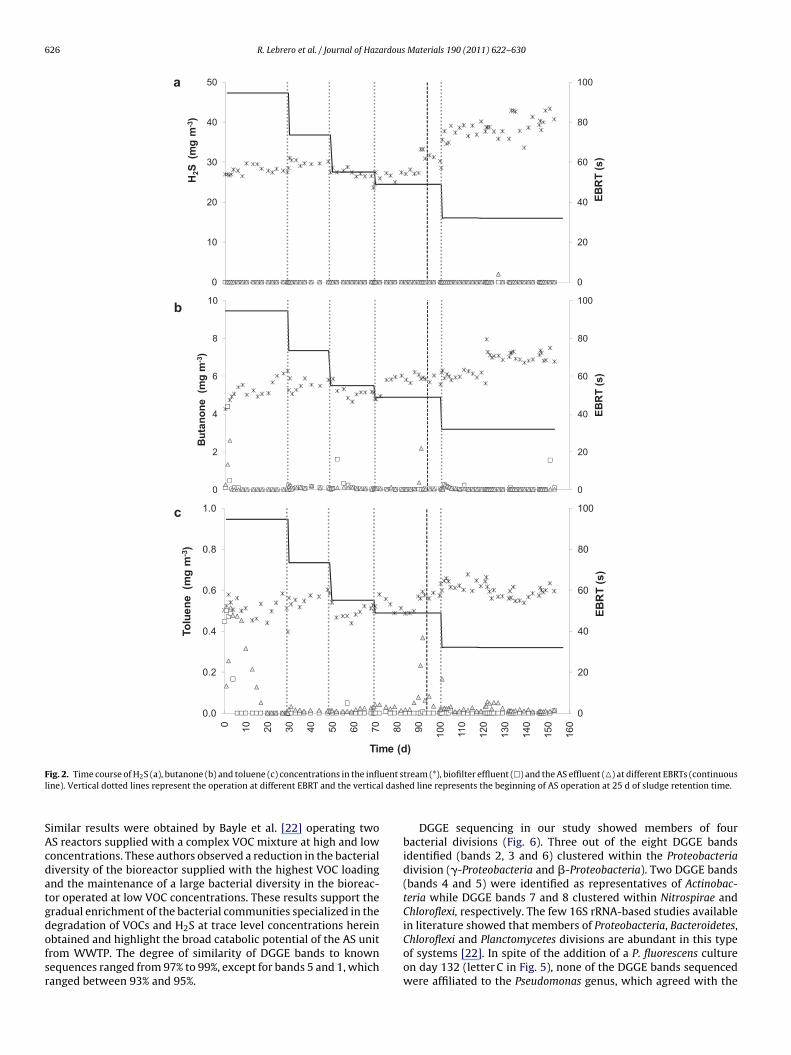
626 R. Lebrero et al. / Journal of Hazardous Materials 190 (2011) 622–630
0
20
40
60
80
100
0
10
20
30
40
50
EBR
T (s
)
H2S
(m
g m
-3)
0
20
40
60
80
100
0
2
4
6
8
10
EBR
T (s
)
But
anon
e (m
g m
-3)
0
20
40
60
80
100
0.0
0.2
0.4
0.6
0.8
1.0
0 10 20 30 40 50 60 70 80 90 100
110
120
130
140
150
160
EBR
T (s
)
Tolu
ene
(mg
m-3
)
Time (d)
c
b
a
F uent sl l dash
SAcdatgdofsr
ig. 2. Time course of H2S (a), butanone (b) and toluene (c) concentrations in the infline). Vertical dotted lines represent the operation at different EBRT and the vertica
imilar results were obtained by Bayle et al. [22] operating twoS reactors supplied with a complex VOC mixture at high and lowoncentrations. These authors observed a reduction in the bacterialiversity of the bioreactor supplied with the highest VOC loadingnd the maintenance of a large bacterial diversity in the bioreac-or operated at low VOC concentrations. These results support theradual enrichment of the bacterial communities specialized in the
egradation of VOCs and H2S at trace level concentrations hereinbtained and highlight the broad catabolic potential of the AS unitrom WWTP. The degree of similarity of DGGE bands to knownequences ranged from 97% to 99%, except for bands 5 and 1, whichanged between 93% and 95%.tream (*), biofilter effluent (�) and the AS effluent (�) at different EBRTs (continuoused line represents the beginning of AS operation at 25 d of sludge retention time.
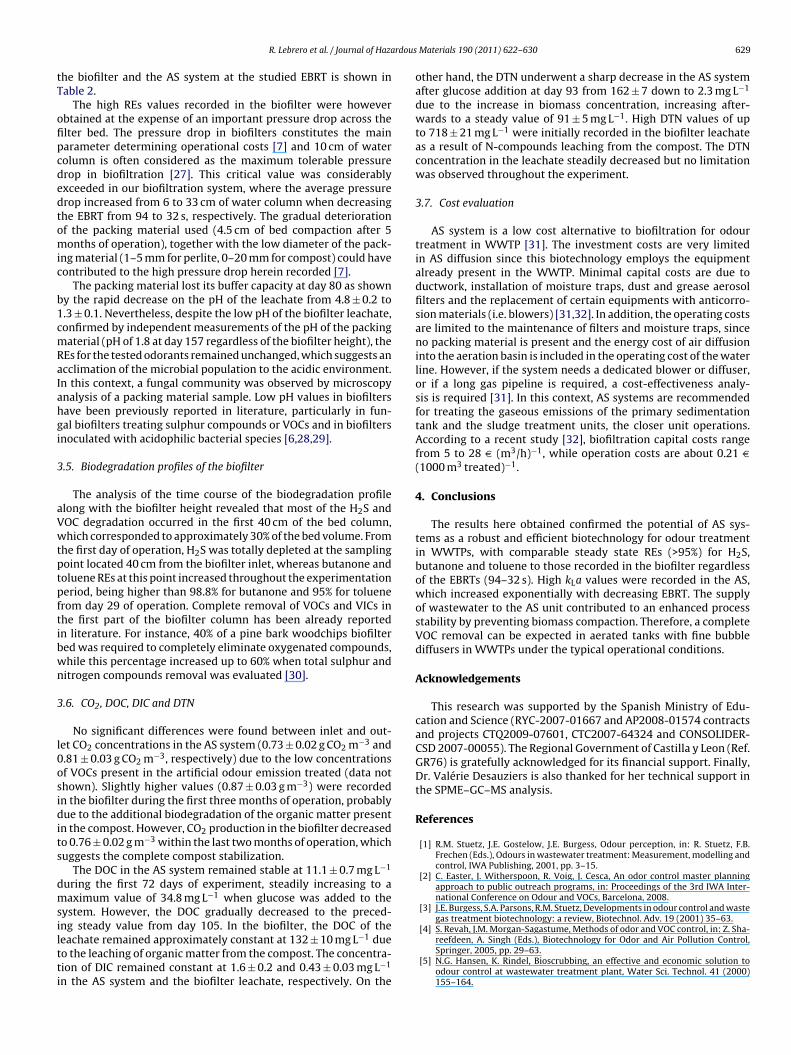
DGGE sequencing in our study showed members of fourbacterial divisions (Fig. 6). Three out of the eight DGGE bandsidentified (bands 2, 3 and 6) clustered within the Proteobacteriadivision (�-Proteobacteria and �-Proteobacteria). Two DGGE bands(bands 4 and 5) were identified as representatives of Actinobac-teria while DGGE bands 7 and 8 clustered within Nitrospirae andChloroflexi, respectively. The few 16S rRNA-based studies available
in literature showed that members of Proteobacteria, Bacteroidetes,Chloroflexi and Planctomycetes divisions are abundant in this typeof systems [22]. In spite of the addition of a P. fluorescens cultureon day 132 (letter C in Fig. 5), none of the DGGE bands sequencedwere affiliated to the Pseudomonas genus, which agreed with the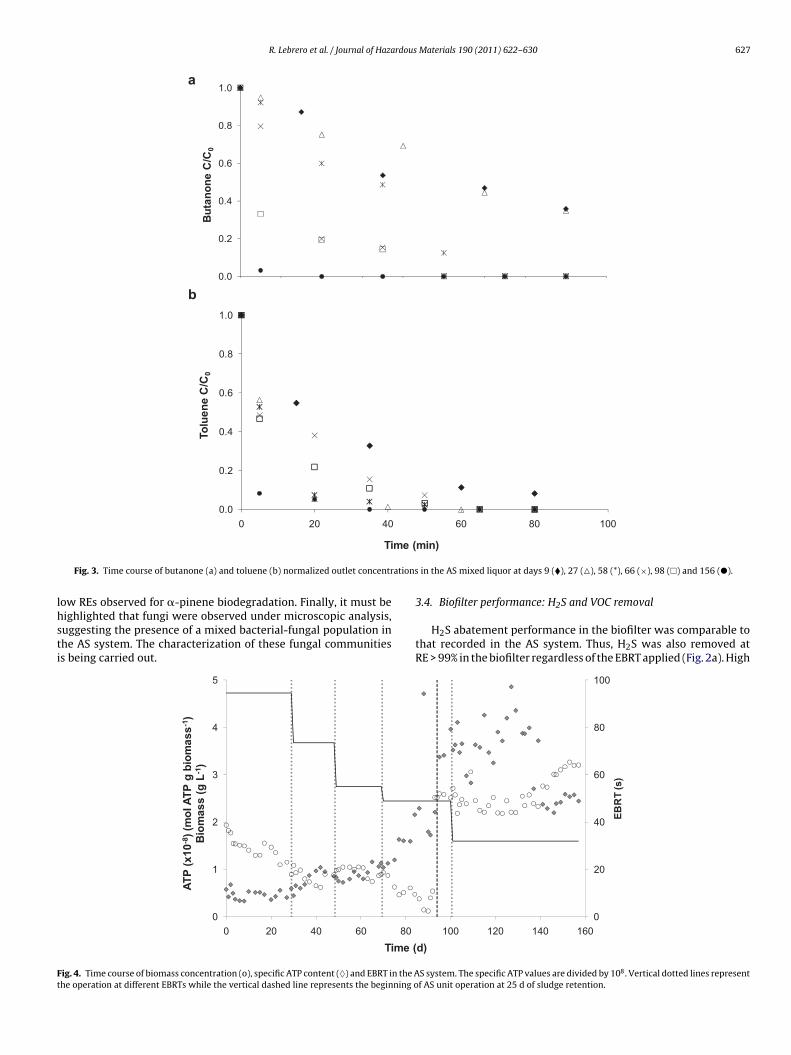
R. Lebrero et al. / Journal of Hazardous Materials 190 (2011) 622–630 627
0.0
0.2
0.4
0.6
0.8
1.0
But
anon
e C
/C0
0.0
0.2
0.4
0.6
0.8
1.0
0 20 40 60 80 100
Tolu
ene
C/C
0
me (
a
b
ations
lhsti
Ft
Ti
Fig. 3. Time course of butanone (a) and toluene (b) normalized outlet concentr
ow REs observed for �-pinene biodegradation. Finally, it must beighlighted that fungi were observed under microscopic analysis,uggesting the presence of a mixed bacterial-fungal population inhe AS system. The characterization of these fungal communitiess being carried out.
0
1
2
3
4
5
0 20 40 60 80
ATP
(x10
-8) (
mol
ATP
g b
iom
ass-1
)B
iom
ass
(g L
-1)
Time (
ig. 4. Time course of biomass concentration (o), specific ATP content (♦) and EBRT in the Ahe operation at different EBRTs while the vertical dashed line represents the beginning o
min)
in the AS mixed liquor at days 9 (�), 27 (�), 58 (*), 66 (×), 98 (�) and 156 (�).
3.4. Biofilter performance: H2S and VOC removal
H2S abatement performance in the biofilter was comparable tothat recorded in the AS system. Thus, H2S was also removed atRE > 99% in the biofilter regardless of the EBRT applied (Fig. 2a). High
0
20
40
60
80
100
100 120 140 160
EBR
T (s
)
d)
S system. The specific ATP values are divided by 108. Vertical dotted lines representf AS unit operation at 25 d of sludge retention.
628 R. Lebrero et al. / Journal of Hazardous
Fig. 5. Bacterial DGGE patterns in the AS system. “DGGE bands are indicated with“B” and the corresponding number of each band. The letters A, B and C indicatestsn
Hrr(Rot
also mediated the low terpene abatement here recorded. REs of
Ft
he addition of glucose, �-pinene and a P. fluorescence culture, respectively. Theampling time and its corresponding EBRT are shown in the lower and upper laneumbers, respectively”.
2S REs are commonly found in lab and full scale biofilters due to itsapid transfer from the gas phase to the microbial biofilm and theeadily biodegradable nature of this volatile inorganic compound
VIC). For example, Morgan-Sagastume and Noyola [23] recordedEs ≈100% in a compost biofilter fed with 100 ppm (140 mg m−3)f H2S at an EBRT of 50 s. Similarly, Iranpour et al. [24] reportedypical H2S REs ranging from 90% to 100% in full scale biofiltersig. 6. Phylogenetic tree based on the bacterial 16S rRNA gene sequences obtained fromhe nodes indicate bootstrap values of 90% or higher (1000 replicates). The scale bar indic
Materials 190 (2011) 622–630
operated in WWTPs in USA. Sulphate, the main byproduct fromH2S oxidation, was periodically washed out from the packed bedas shown by the high concentrations recorded in the leachate afterirrigation (maximum value of 18,700 ppm), which prevented frommicrobial inhibition.
Butanone REs in the biofilter ranged from 98% to 99.5% at thetested EBRTs, which were comparable to those observed in theAS system. Conversely, the biofilter performed better for tolueneremoval, with REs over 99.9% regardless of the EBRT (Fig. 2b and c).These toluene elimination efficiencies were noticeably higher thanthose reported in literature. For instance, Liu et al. [25] achieveda maximum RE for toluene in a compost biofilter of 82% at inlettoluene concentration of 0.07–0.73 mg m−3 at an EBRT of 65 s. Like-wise, Iranpour et al. [24] reported average REs lower than 90%during VOC treatment depending on their hydrophobicity, withhydrophilic VOCs exhibiting highest mass transport gradients dueto their lower partition coefficient and slightly soluble compoundspresenting poor REs due to a limited mass transfer. Surprisingly, inour particular biofiltration study, toluene REs were slightly higherthan those recorded for butanone despite its higher hydropho-bicity. This suggests that no mass transfer limitations occurredfor these compounds in the biofilter and that other mass transfermechanism different from the conventional air–water–biofilm (forinstance direct air–biofilm transfer) might be present in the biofilm.The biofilter performance for �-pinene treatment was similar tothat of the AS system. The REs remained at 7.3 ± 1.9%. Similarly tothe AS system, this low terpene removal performance was likelydue to the lack of a specialized �-pinene degrading community.The addition of P. fluorescens after 11 days of �-pinene feedingdid not result in any significant increase in the removal of thisterpene. The absence of an active microbial community was fur-ther confirmed by the fact that an �-pinene degrading communitydeveloped under stress conditions (no irrigation) and �-pineneremoval increased up to 65% at EBRT of 50 s (data shown in Lebreroet al. [13]). The low EBRT tested in this study (32 s) might have
65% were in the range of those reported for this terpene in con-ventional biofilters. For example, Jin et al. [26] achieved REs upto 89% in a fungal biofilter treating �-pinene at 2.47 g m−3 atEBRTs greater than 1.2 min. A summary of the steady state REs in
the DGGE bands. Sequences determined in this study are in boldface. Black dots onates 10% sequence difference.
rdous
tT
ofipcdedtomic
b1cmRaIahgi
3
aVwtptpftibwn
3
l0osidits
dmsiltti
R. Lebrero et al. / Journal of Haza
he biofilter and the AS system at the studied EBRT is shown inable 2.
The high REs values recorded in the biofilter were howeverbtained at the expense of an important pressure drop across thelter bed. The pressure drop in biofilters constitutes the mainarameter determining operational costs [7] and 10 cm of waterolumn is often considered as the maximum tolerable pressurerop in biofiltration [27]. This critical value was considerablyxceeded in our biofiltration system, where the average pressurerop increased from 6 to 33 cm of water column when decreasinghe EBRT from 94 to 32 s, respectively. The gradual deteriorationf the packing material used (4.5 cm of bed compaction after 5onths of operation), together with the low diameter of the pack-
ng material (1–5 mm for perlite, 0–20 mm for compost) could haveontributed to the high pressure drop herein recorded [7].
The packing material lost its buffer capacity at day 80 as showny the rapid decrease on the pH of the leachate from 4.8 ± 0.2 to.3 ± 0.1. Nevertheless, despite the low pH of the biofilter leachate,onfirmed by independent measurements of the pH of the packingaterial (pH of 1.8 at day 157 regardless of the biofilter height), the
Es for the tested odorants remained unchanged, which suggests ancclimation of the microbial population to the acidic environment.n this context, a fungal community was observed by microscopynalysis of a packing material sample. Low pH values in biofiltersave been previously reported in literature, particularly in fun-al biofilters treating sulphur compounds or VOCs and in biofiltersnoculated with acidophilic bacterial species [6,28,29].
.5. Biodegradation profiles of the biofilter
The analysis of the time course of the biodegradation profilelong with the biofilter height revealed that most of the H2S andOC degradation occurred in the first 40 cm of the bed column,hich corresponded to approximately 30% of the bed volume. From
he first day of operation, H2S was totally depleted at the samplingoint located 40 cm from the biofilter inlet, whereas butanone andoluene REs at this point increased throughout the experimentationeriod, being higher than 98.8% for butanone and 95% for toluenerom day 29 of operation. Complete removal of VOCs and VICs inhe first part of the biofilter column has been already reportedn literature. For instance, 40% of a pine bark woodchips biofiltered was required to completely eliminate oxygenated compounds,hile this percentage increased up to 60% when total sulphur anditrogen compounds removal was evaluated [30].
.6. CO2, DOC, DIC and DTN
No significant differences were found between inlet and out-et CO2 concentrations in the AS system (0.73 ± 0.02 g CO2 m−3 and.81 ± 0.03 g CO2 m−3, respectively) due to the low concentrationsf VOCs present in the artificial odour emission treated (data nothown). Slightly higher values (0.87 ± 0.03 g m−3) were recordedn the biofilter during the first three months of operation, probablyue to the additional biodegradation of the organic matter present
n the compost. However, CO2 production in the biofilter decreasedo 0.76 ± 0.02 g m−3 within the last two months of operation, whichuggests the complete compost stabilization.
The DOC in the AS system remained stable at 11.1 ± 0.7 mg L−1
uring the first 72 days of experiment, steadily increasing to aaximum value of 34.8 mg L−1 when glucose was added to the
ystem. However, the DOC gradually decreased to the preced-
ng steady value from day 105. In the biofilter, the DOC of theeachate remained approximately constant at 132 ± 10 mg L−1 dueo the leaching of organic matter from the compost. The concentra-ion of DIC remained constant at 1.6 ± 0.2 and 0.43 ± 0.03 mg L−1n the AS system and the biofilter leachate, respectively. On the
Materials 190 (2011) 622–630 629
other hand, the DTN underwent a sharp decrease in the AS systemafter glucose addition at day 93 from 162 ± 7 down to 2.3 mg L−1
due to the increase in biomass concentration, increasing after-wards to a steady value of 91 ± 5 mg L−1. High DTN values of upto 718 ± 21 mg L−1 were initially recorded in the biofilter leachateas a result of N-compounds leaching from the compost. The DTNconcentration in the leachate steadily decreased but no limitationwas observed throughout the experiment.
3.7. Cost evaluation
AS system is a low cost alternative to biofiltration for odourtreatment in WWTP [31]. The investment costs are very limitedin AS diffusion since this biotechnology employs the equipmentalready present in the WWTP. Minimal capital costs are due toductwork, installation of moisture traps, dust and grease aerosolfilters and the replacement of certain equipments with anticorro-sion materials (i.e. blowers) [31,32]. In addition, the operating costsare limited to the maintenance of filters and moisture traps, sinceno packing material is present and the energy cost of air diffusioninto the aeration basin is included in the operating cost of the waterline. However, if the system needs a dedicated blower or diffuser,or if a long gas pipeline is required, a cost-effectiveness analy-sis is required [31]. In this context, AS systems are recommendedfor treating the gaseous emissions of the primary sedimentationtank and the sludge treatment units, the closer unit operations.According to a recent study [32], biofiltration capital costs rangefrom 5 to 28 D (m3/h)−1, while operation costs are about 0.21 D(1000 m3 treated)−1.
4. Conclusions
The results here obtained confirmed the potential of AS sys-tems as a robust and efficient biotechnology for odour treatmentin WWTPs, with comparable steady state REs (>95%) for H2S,butanone and toluene to those recorded in the biofilter regardlessof the EBRTs (94–32 s). High kLa values were recorded in the AS,which increased exponentially with decreasing EBRT. The supplyof wastewater to the AS unit contributed to an enhanced processstability by preventing biomass compaction. Therefore, a completeVOC removal can be expected in aerated tanks with fine bubblediffusers in WWTPs under the typical operational conditions.
Acknowledgements
This research was supported by the Spanish Ministry of Edu-cation and Science (RYC-2007-01667 and AP2008-01574 contractsand projects CTQ2009-07601, CTC2007-64324 and CONSOLIDER-CSD 2007-00055). The Regional Government of Castilla y Leon (Ref.GR76) is gratefully acknowledged for its financial support. Finally,Dr. Valérie Desauziers is also thanked for her technical support inthe SPME–GC–MS analysis.
References
[1] R.M. Stuetz, J.E. Gostelow, J.E. Burgess, Odour perception, in: R. Stuetz, F.B.Frechen (Eds.), Odours in wastewater treatment: Measurement, modelling andcontrol, IWA Publishing, 2001, pp. 3–15.
[2] C. Easter, J. Witherspoon, R. Voig, J. Cesca, An odor control master planningapproach to public outreach programs, in: Proceedings of the 3rd IWA Inter-national Conference on Odour and VOCs, Barcelona, 2008.
[3] J.E. Burgess, S.A. Parsons, R.M. Stuetz, Developments in odour control and wastegas treatment biotechnology: a review, Biotechnol. Adv. 19 (2001) 35–63.
[4] S. Revah, J.M. Morgan-Sagastume, Methods of odor and VOC control, in: Z. Sha-reefdeen, A. Singh (Eds.), Biotechnology for Odor and Air Pollution Control,Springer, 2005, pp. 29–63.
[5] N.G. Hansen, K. Rindel, Bioscrubbing, an effective and economic solution toodour control at wastewater treatment plant, Water Sci. Technol. 41 (2000)155–164.
6 rdous
[
[
[
[
[
[
[
[
[
[
[
[
[
[
[
[
[
[
[
[
[
30 R. Lebrero et al. / Journal of Haza
[6] J.P. Maestre, X. Gamisans, D. Gabriel, J. Lafuente, Fungal biofilters for toluenebiofiltration: Evaluation of the performance with four packing materials underdifferent operating conditions, Chemosphere 67 (2007) 684–692.
[7] M.C. Delhoménie, M. Heitz, Biofiltration of air: A review, Crit. Rev. Biotechnol.25 (2005) 53–72.
[8] P. Hardy, J.E. Burgess, S. Morton, R.M. Stuetz, Simultaneous activated sludgewastewater treatment and odour control, Water Sci. Technol. 44 (2001)189–196.
[9] V.L. Barbosa, J.E. Burgess, K. Darke, R.M. Stuetz, Activated sludge biotreatmentof sulphurous waste emissions, Rev. Environ. Sci. Biotechnol. 1 (2002) 345–362.
10] V. Barbosa, P. Hobbs, R. Sneath, J. Burgess, J. Callan, R. Stuetz, Investigating thecapacity of an activated sludge process to reduce volatile organic compoundsand odor emissions, Water Environ. Res. 78 (2006) 842–851.
11] R.P.G. Bowker, Biological odour control by diffusion into activated sludgebasins, Water Sci. Technol. 41 (2000) 127–132.
12] T. Zarra, V. Naddeo, M. Belgiorno, M. Kranert, Odour monitoring of smallwastewater treatment plant located in sensitive environment, Water Sci. Tech-nol. 58 (2008) 89–94.
13] R. Lebrero, E. Rodríguez, M. Martin, P.A. García-Encina, R. Munoz, H2S and VOCsabatement robustness in Biofilters and air diffusion bioreactors: A comparativestudy, Water Res. 44 (2010) 3905–3914.
14] R. Munoz, L.P. Díaz, S. Bordel, S. Villaverde, Response of Pseudomonas putidaF1 cultures to fluctuating toluene loads and operational failures in suspendedgrowth bioreactors, Biodegradation 19 (2008) 897–908.
15] TMECC (Test Methods for the Examination of Composting and Compost), The USComposting Council Research and Education Foundation, and The US Depart-ment of Agriculture, June 2002.
16] G. Quijano, S. Revah, M. Gutiérrez-Rojas, L.B. Flores-Cotera, F. Thalasso, Oxygentransfer in three-phase airlift and stirred tank reactors using silicone oil astransfer vector, Process Biochem. 44 (2009) 619–624.
17] M. Hernandez, G. Quijano, F. Thalasso, A.J. Daugulis, S. Villaverde, R. Munoz, Acomparative study of solid and liquid non-aqueous phases for the biodegrada-tion of hexane in two-phase partitioning bioreactors, Biotechnol. Bioeng. 106(2010) 731–740.
18] A.D. Eaton, L.S. Clesceri, A.E. Greenberg, Standard Methods for the Examinationof Water and Wastewater, 21st ed., American Public Health Associa-tion/American Water Works Association/Water Environment Federation,Washington, DC, USA, 2005.
19] S. McGinnis, T.L. Madden, BLAST: At the core of a powerful and diverse set ofsequence analysis tools, Nucl. Acids Res. 32 (2004) W20–W25.
[
[
Materials 190 (2011) 622–630
20] A.D. Dorado, G. Rodríguez, G. Ribera, A. Bonsfills, D. Gabriel, J. Lafuente, X.Gamisans, Evaluation of mass transfer coefficients in biotrickling filters: Exper-imental determination and comparison to correlations, Chem. Eng. Technol. 32(2009) 1941–1950.
21] S. Bordel, R. Munoz, L.F. Díaz, S. Villaverde, New insights on toluene biodegra-dation by Pseudomonas putida F1: Influence of pollutant concentration andexcreted metabolites, Appl. Microbiol. Biotechnol. 74 (2007) 857–866.
22] S. Bayle, L. Malhautier, V. Dengrange, J.J. Godon, J.L. Fanlo, Structural and func-tional responses of sewage microbial communities used for the treatment of acomplex mixture of volatile organic compounds (VOCs), J. Appl. Microbiol. 107(2008) 85–96.
23] J.M. Morgan-Sagastume, A. Noyola, Hydrogen sulfide removal by compostbiofiltration: Effect of mixing the filter media on operational factors, Bioresour.Technol. 97 (2006) 1546–1553.
24] R. Iranpour, H.H.J. Cox, M.A. Deshusses, E.D. Schroeder, Literature review of airpollution control biofilters and biotrickling filters for odor and volatile organiccompound removal, Environ. Prog. 5 (2005) 254–267.
25] Q. Liu, M. Li, R. Chen, Z. Li, G. Qian, T. An, J. Fu, G. Sheng, Biofiltration treatment ofodors from municipal solid waste treatment plants, Waste Manage. 29 (2009)2051–2058.
26] Y. Jin, M.C. Veiga, C. Kennes, Performance optimization of the fungal biodegra-dation of �-pinene in gas-phase biofilters, Process Biochem. 41 (2006)1722–1728.
27] G. Leson, R. Chavira, A. Winer, D. Hodge, Experiences with a full scale biofilterfor control of ethanol emissions, in: Proceedings of the 88th Annual Meetingand Exhibition of the Air and Waste Management Association, Air and WasteManagement Association, Pittsburgh, PA, 1995.
28] C. Kennes, M.C. Veiga, Fungal biocatalysts in the biofiltration of VOC-pollutedair, J. Biotechnol. 113 (2004) 305–319.
29] B. Qi, W.M. Moe, K.A. Kinney, Biodegradation of volatile organic compounds byfive fungal species, Appl. Microbiol. Biotechnol. 58 (2002) 684–689.
30] L. Cabrol, L. Malhautier, F. Poly, A.S. Lepeuple, J.L. Fanlo, Shock loading in biofil-ters: impact on biodegradation activity distribution and resilience capacity,Water Sci. Technol. 59 (2009) 1307–1314.
31] R.P.G. Bowker, J.E. Burgess, Activated sludge diffusion as an odour control tech-nique, in: R. Stuetz, F.B. Frechen (Eds.), Odours in Wastewater Treatment:Measurement, Modelling and Control, IWA Publishing, 2001, pp. 415–434.
32] J.M. Estrada, N.J.R. Kraakman, R. Munoz, R. Lebrero, A sustainability analysisof odor treatment technologies in wastewater treatment plants, Environ. Sci.Technol. 45 (2011) 1100–1106.