comparing the epigenetic landscape in myonuclei purified
TRANSCRIPT
RESEARCH ARTICLE
Comparing the epigenetic landscape in
myonuclei purified with a PCM1 antibody
from a fast/glycolytic and a slow/oxidative
muscle
Mads BengtsenID1, Ivan Myhre WinjeID
1, Einar EftestølID1,2, Johannes LandskronID
3,
Chengyi SunID2, Kamilla NygårdID
1, Diana Domanska4, Douglas P. MillayID2,5, Leonardo
A. Meza-ZepedaID6, Kristian GundersenID
1*
1 Department of Biosciences, University of Oslo, Oslo, Norway, 2 Division of Molecular Cardiovascular
Biology, Cincinnati Children’s Hospital Medical Center, Cincinnati, Ohio, United States of America, 3 Centre
for Molecular Medicine Norway, University of Oslo, Oslo, Norway, 4 Department of Pathology, University of
Oslo, Oslo, Norway, 5 Department of Pediatrics, University of Cincinnati College of Medicine, Cincinnati,
Ohio, United States of America, 6 Department of Core Facilities, Institute for Cancer Research, Oslo
University Hospital, Oslo, Norway
Abstract
Muscle cells have different phenotypes adapted to different usage, and can be grossly
divided into fast/glycolytic and slow/oxidative types. While most muscles contain a mixture
of such fiber types, we aimed at providing a genome-wide analysis of the epigenetic land-
scape by ChIP-Seq in two muscle extremes, the fast/glycolytic extensor digitorum longus
(EDL) and slow/oxidative soleus muscles. Muscle is a heterogeneous tissue where up to
60% of the nuclei can be of a different origin. Since cellular homogeneity is critical in epigen-
ome-wide association studies we developed a new method for purifying skeletal muscle
nuclei from whole tissue, based on the nuclear envelope protein Pericentriolar material 1
(PCM1) being a specific marker for myonuclei. Using antibody labelling and a magnetic-
assisted sorting approach, we were able to sort out myonuclei with 95% purity in muscles
from mice, rats and humans. The sorting eliminated influence from the other cell types in the
tissue and improved the myo-specific signal. A genome-wide comparison of the epigenetic
landscape in EDL and soleus reflected the differences in the functional properties of the two
muscles, and revealed distinct regulatory programs involving distal enhancers, including a
glycolytic super-enhancer in the EDL. The two muscles were also regulated by different sets
of transcription factors; e.g. in soleus, binding sites for MEF2C, NFATC2 and PPARA were
enriched, while in EDL MYOD1 and SIX1 binding sites were found to be overrepresented. In
addition, more novel transcription factors for muscle regulation such as members of the
MAF family, ZFX and ZBTB14 were identified.
PLOS GENETICS
PLOS Genetics | https://doi.org/10.1371/journal.pgen.1009907 November 9, 2021 1 / 29
a1111111111
a1111111111
a1111111111
a1111111111
a1111111111
OPEN ACCESS
Citation: Bengtsen M, Winje IM, Eftestøl E,
Landskron J, Sun C, Nygård K, et al. (2021)
Comparing the epigenetic landscape in myonuclei
purified with a PCM1 antibody from a fast/
glycolytic and a slow/oxidative muscle. PLoS Genet
17(11): e1009907. https://doi.org/10.1371/journal.
pgen.1009907
Editor: Marnie E. Blewitt, Walter and Eliza Hall
Institute of Medical Research, AUSTRALIA
Received: May 7, 2021
Accepted: October 23, 2021
Published: November 9, 2021
Copyright: © 2021 Bengtsen et al. This is an open
access article distributed under the terms of the
Creative Commons Attribution License, which
permits unrestricted use, distribution, and
reproduction in any medium, provided the original
author and source are credited.
Data Availability Statement: The next-generation
sequencing data is deposited and made available at
the Gene Expression Omnibus under accession
number GSE182667.
Funding: The Research Council of Norway (grant
240374) to K.G, the Wedel Jarlsberg Foundation,
the Nansen Foundation and University of Oslo Life
Science initiative to M.B. The work in the Millay
laboratory was funded by grants to D.P.M. from
the Children’s Hospital Research Foundation, Pew
Author summary
Complex tissues like skeletal muscle contain a variety of cells which confound the analysis
of each cell type when based on homogenates, thus only about half of the cell nuclei in
muscles reside inside the muscle cells. We here describe a labelling and sorting technique
that allowed us to study the epigenetic landscape in purified muscle cell nuclei leaving the
other cell types out. Differences between a fast/glycolytic and a slow/oxidative muscle
were studied. While all skeletal muscle fibers have a similar make up and basic function,
they differ in their physiology and the way they are used. Thus, some fibers are fast con-
tracting but fatigable, and are used for short lasting explosive tasks such as sprinting.
Other fibers are slow and are used for more prolonged tasks such as standing or long dis-
tance running. Since fiber type correlate with metabolic profile these features can also be
related to metabolic diseases. We here show that the epigenetic landscape differed in gene
loci corresponding to the differences in functional properties, and revealed that the two
types are enriched in different gene regulatory networks. Exercise can alter muscle pheno-
type, and the epigenetic landscape might be related to how plastic different properties are.
Introduction
The phenotype of skeletal muscle fibers differs as an adaption to different tasks. Some fibers
have short twitches and rapid shortening velocities, but low endurance. Such fibers are used
for short, but explosive external work (sprinting, ballistic and corrective movements etc.), but
are easily fatigued and not very energy efficient. Other fibers have slow twitches and shorten-
ing velocities, but are fatigue resistant and have a low energy expenditure. Such fibers are used
for tasks like keeping body and limb posture [1–3].
Fibers are generally classified into “fiber types” related to the predominant myosin heavy
chain (MyHC) isoenzyme expressed in the cell. MyHC is the strongest molecular determinant
of shortening speed [2, 4]. In rodents, there are four different MyHC genes expressed in adult
limb muscles, namely Myosin Heavy Chain 7 (Myh7), Myh2, Myh1 and Myh4 giving rise to the
fiber types 1 (slowest), 2A, 2X and 2B (fastest), respectively [2]. Partly coupled to the MyHC
fiber type, the fibers display a spectrum of metabolic properties, from highly oxidative mito-
chondria-rich cells to cells that are mainly glycolytic [2, 5]. At the molecular level, the different
fiber types vary in isoform expression of various proteins such as calcium pumps, oxygen
related proteins and also sarcomere components other than MyHC [2, 3, 5].
Skeletal muscle is the most important metabolic organ in the body, and it has been known
for 40 years that differences in muscle fiber type composition are a strong individual predictor
for developing metabolic syndrome [6–10]. Metabolic syndrome is a cluster of conditions
increasing the risk of heart disease, stroke and type 2 diabetes. These conditions include
increased blood pressure, high blood sugar levels, excess body fat around the waist, and abnor-
mal cholesterol or triglyceride levels. Metabolic syndrome is on the rise, and in several coun-
tries, the prevalence is now over ¼ of the population [11]. Epigenetic mechanisms like histone
modifications and chromatin structure have been suggested to play an important role in the
development of and predisposition for metabolic syndrome [12], but data supporting this is
currently scarce.
Muscle fibers are post-mitotic and represent an interesting example of a balance between
long term phenotypic stability, yet malleability. Thus, phenotype can be changed by altering
the pattern of electrical activity elicited in their sarcolemma by the motor neurons or electrical
stimulation [3] and also by the mechanical stress created by contraction [13]. These two
PLOS GENETICS Muscle epigenetic landscape
PLOS Genetics | https://doi.org/10.1371/journal.pgen.1009907 November 9, 2021 2 / 29
Charitable Trusts, and National Institutes of Health
(R01AR068286, R01AG059605). The funders had
no role in study design, data collection and
analysis, decision to publish, or preparation of the
manuscript.
Competing interests: The authors have declared
that no competing interests exist.
external factors are the major mechanistic foundations for the effects of exercise on muscle.
However, the adult phenotype also depends on the embryonal cell lineage and this origin limits
the adaptive ranges of training effects [14]. The transition process has been studied in detail in
rats stimulated with electrical patterns mimicking extreme, but well-defined training [3]. It
appears that some traits require very long-term treatment in order to be altered, e.g. type 2 to
type 1 transformations might take more than 3 months [15]. In contrast, changes within type
2, i.e. 2B>2A>2X [16] and changes in metabolic and calcium sequestering enzymes can be
altered more rapidly [17]. Epigenetic mechanisms may play an important role in shaping such
differences [18–21].
Recently the existence of a long-term cellular memory was demonstrated in muscle cells
related to hypertrophy [22, 23], and in addition to a permanently elevated number of myonu-
clei [24, 25], epigenetic mechanisms might be involved [26]. Epigenetic mechanisms might
also be related to the observation that some individuals seem to have less malleable muscles
than others, i.e. exercise resistance [27–29].
Since the overall chromatin environment and the modifications of the histones represent
overreaching gene regulatory mechanisms with the potential of long-lasting stability [26, 30,
31], we set out to compare the chromatin environment in an extremely fast/glycolytic muscle
(the m. extensor digitorum longus, EDL) and an extremely slow/oxidative muscle (the m.
soleus) in mice.
The majority of studies on epigenetics are on tissue culture cells, and less has been done on
tissue homogenates where results seem harder to interpret. In muscle, electron microscopy
[32] and a specific marker for myonuclei [32, 33] have revealed that only approximately 40–
50% of the nuclei found in muscle tissue are myonuclei, and since accounting for cellular het-
erogeneity is critical in epigenome-wide association studies [34–37], we aimed at sorting out
the myonuclei proper for our epigenetic analysis.
We recently reported that the nuclear envelope protein Pericentriolar material 1 (PCM1)
can be used as a specific light microscopy marker to discern the skeletal muscle myonuclei in
both rodents and humans [33], and we show here that this marker can be used to sort myonu-
clei to>95% purity from mice, rats as well as human samples and be used for subsequent epi-
genetic analyses. Furthermore, we show that the purification is necessary for the epigenetic
landscape faithfully to reflect known features of muscle function, and the results indicate that
purification should be used in studies aimed at elucidating the role of epigenetic mechanisms
in muscle differentiation and plasticity.
Results
Purification of myonuclei allows a genome-wide analysis of muscle fiber
specific chromatin
PCM1 labelling is specific for myonuclei isolated from the muscle tissue. To remove
interference from non-myofiber nuclei in the tissue, we took advantage of an antibody
against Pericentriolar material 1 (PCM1) which we have previously reported to selectively
label myonuclei in skeletal muscle fibers and not satellite cells or stromal cells [33, 38]
(S1A and S1B Fig).
To further prove the specificity of PCM1 for muscle myonuclei, we used a transgenic
mouse model expressing Histone-2B coupled to GFP (H2B-GFP) under the control of the skel-etal muscle Actin Alpha 1 (ACTA1) promoter, giving specific expression of the fusion construct
in skeletal muscle fiber nuclei across fiber types [39]. Single fiber analysis showed that
H2B-GFP and PCM1 positive nuclei invariably colocalized (Figs 1A and 1B and S1C). In some
PLOS GENETICS Muscle epigenetic landscape
PLOS Genetics | https://doi.org/10.1371/journal.pgen.1009907 November 9, 2021 3 / 29

cases, DAPI labelled nuclei that were negative for both H2B-GFP and PCM1 were observed
(arrows in Fig 1A), probably representing non-myonuclei adhering to the fibers after isolation.
PCM1 can be used to isolate myonuclei for subsequent epigenetic analysis in rodents
and humans. Flow cytometry analysis of nuclei from skeletal muscle displayed a 98.0% over-
lap between GFP and PCM1 labelling of the nuclei in the transgenic mouse line (Fig 2A–2F).
Analysis by flow cytometry of the nuclear composition in the tibialis anterior (TA), EDL
and soleus showed that the number of myonuclei varied from 40%-60% with the lowest frac-
tion of myonuclei in the slow soleus (Fig 2G–2K). This confirms that without sorting, roughly
half of the nuclei isolated from muscle homogenates are from other cell types than muscle
fibers and will confound a genome-wide analysis aimed at this cell type.
To isolate the myonuclear fraction from the nuclei originating from the other cell types in
the tissue, we used a magnetic-assisted sorting approach (Fig 2G–2J). Using this method, we
were able to isolate the myonuclei with a very high purity averaging 95% for the three different
muscle types (Fig 2G–2L). The same high sorting purity was obtained when the three same
muscle types from rat and vastus lateralis biopsies from humans were analyzed (S2 Fig).
Purification of nuclei is required for a valid genome-wide analysis of the myo-specific
epigenome. To investigate the importance of nuclear purification for epigenetic analysis of
muscle cells, we performed chromatin immunoprecipitation on the PCM1 purified nuclei, fol-
lowed by next-generation sequencing (ChIP-Seq) in soleus and EDL. An antibody against His-
tone H3 acetylated at Lysine 27 (H3K27ac) was used, since its enrichment at promoter regions
follows the transcriptional activity [40, 41], and compared with previously published H3K27ac
data from whole soleus and EDL muscles [42]. In the non-sorted material, 12550 and 12243
promoters with H3K27ac peaks were identified in soleus and EDL respectively, and 27% and
14% of these did not have enrichment after purification (Fig 3A–3F). For both soleus and
EDL, gene ontology analysis of the promoters with signal only in whole tissue showed enrich-
ment for the immune system and angiogenesis (Fig 3D and 3E, and S1A and S1B Table).
Extending the analysis to the full epigenomes for whole muscle tissue and the purified myonu-
clei, showed similar results with enrichment for angiogenesis and blood related functions for
both muscles (S3A–S3D Fig and S2A–S2D Table).
Fig 1. PCM1 selectively labels myonuclei in isolated single fibers. (A) Max intensity Z projection of single fiber from transgenic mouse expressing the H2B-GFP
(Green) construct under the control of ACTA1 stained against PCM1 (magenta). Counterstained with DAPI to visualize DNA (Blue). Arrow: nucleus negative for
both PCM1 and H2B-GFP. Scale bar 50 μm (B) High resolution image of single fiber showing GFP positive and negative nuclei. Scale bar 10 μm.
https://doi.org/10.1371/journal.pgen.1009907.g001
PLOS GENETICS Muscle epigenetic landscape
PLOS Genetics | https://doi.org/10.1371/journal.pgen.1009907 November 9, 2021 4 / 29
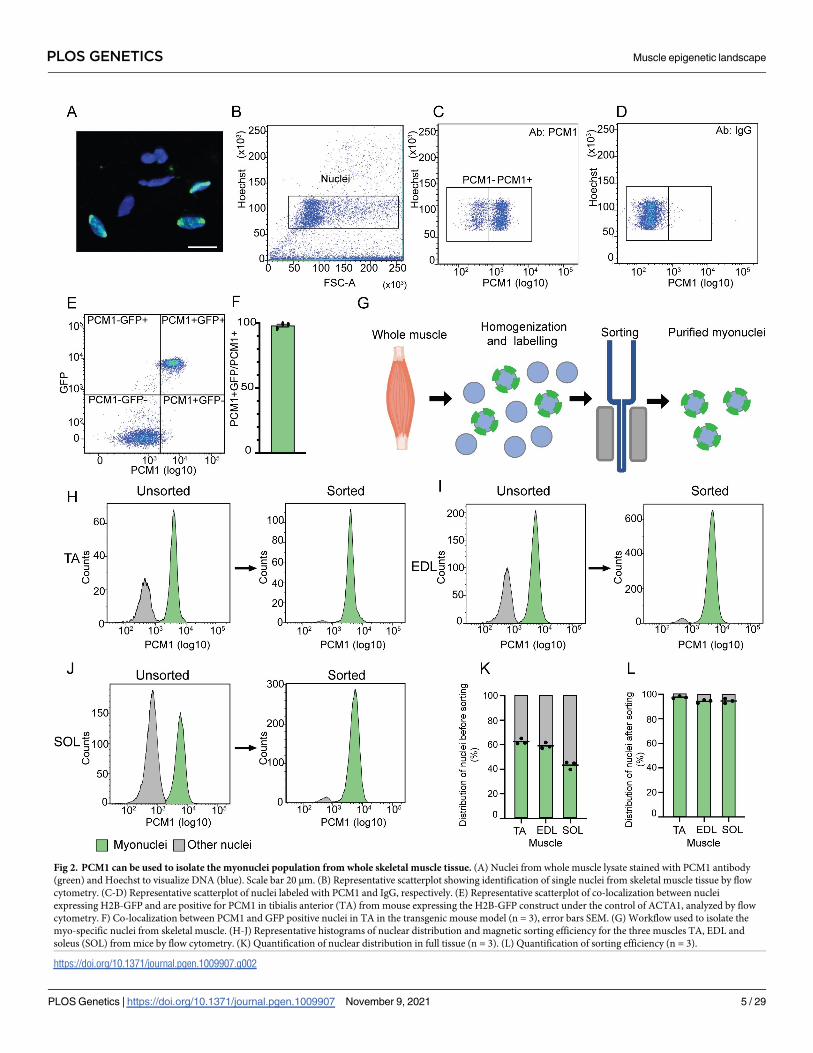
Fig 2. PCM1 can be used to isolate the myonuclei population from whole skeletal muscle tissue. (A) Nuclei from whole muscle lysate stained with PCM1 antibody
(green) and Hoechst to visualize DNA (blue). Scale bar 20 μm. (B) Representative scatterplot showing identification of single nuclei from skeletal muscle tissue by flow
cytometry. (C-D) Representative scatterplot of nuclei labeled with PCM1 and IgG, respectively. (E) Representative scatterplot of co-localization between nuclei
expressing H2B-GFP and are positive for PCM1 in tibialis anterior (TA) from mouse expressing the H2B-GFP construct under the control of ACTA1, analyzed by flow
cytometry. F) Co-localization between PCM1 and GFP positive nuclei in TA in the transgenic mouse model (n = 3), error bars SEM. (G) Workflow used to isolate the
myo-specific nuclei from skeletal muscle. (H-J) Representative histograms of nuclear distribution and magnetic sorting efficiency for the three muscles TA, EDL and
soleus (SOL) from mice by flow cytometry. (K) Quantification of nuclear distribution in full tissue (n = 3). (L) Quantification of sorting efficiency (n = 3).
https://doi.org/10.1371/journal.pgen.1009907.g002
PLOS GENETICS Muscle epigenetic landscape
PLOS Genetics | https://doi.org/10.1371/journal.pgen.1009907 November 9, 2021 5 / 29
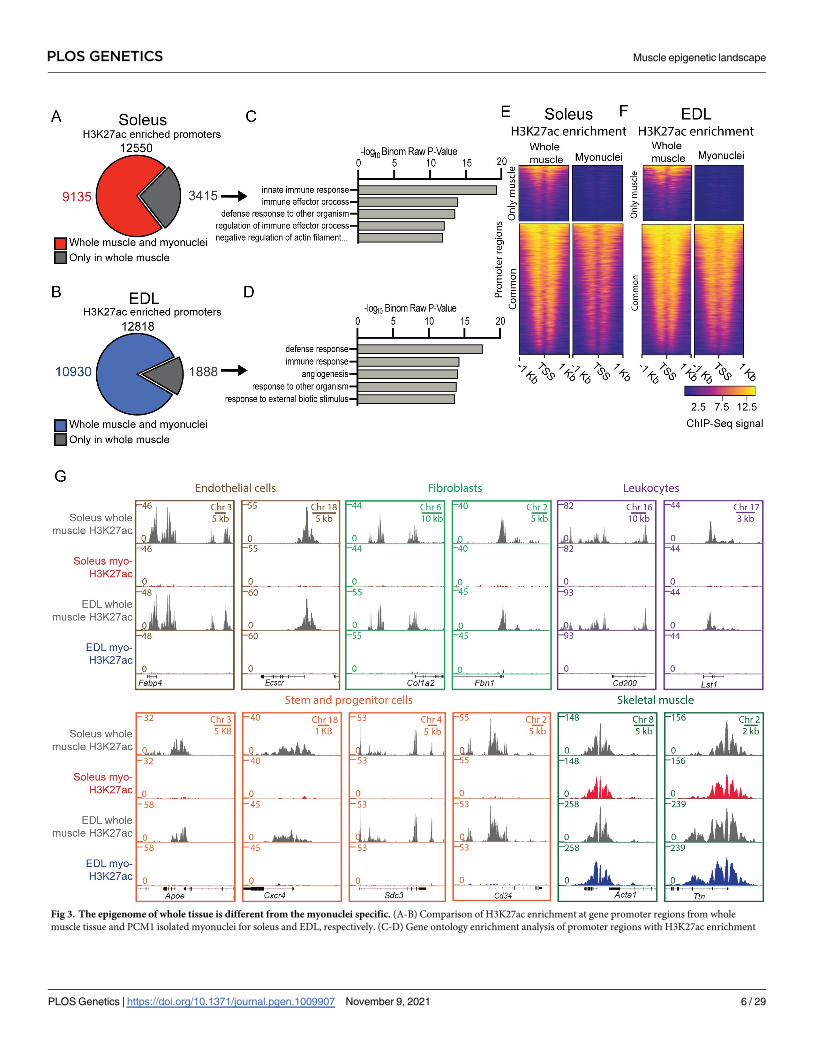
Fig 3. The epigenome of whole tissue is different from the myonuclei specific. (A-B) Comparison of H3K27ac enrichment at gene promoter regions from whole
muscle tissue and PCM1 isolated myonuclei for soleus and EDL, respectively. (C-D) Gene ontology enrichment analysis of promoter regions with H3K27ac enrichment
PLOS GENETICS Muscle epigenetic landscape
PLOS Genetics | https://doi.org/10.1371/journal.pgen.1009907 November 9, 2021 6 / 29
The effects of purification were well illustrated by the observation that genes used to iden-
tify non-muscle cells were found to be enriched for H3K27ac in non-purified nuclei, but not
after the purification, e.g. Fatty Acid Binding Protein 4 (FABP4) and Endothelial Cell-SpecificMolecule 2 (ECSCR) which are both used as marks for endothelial cells [43–47]. Concerning
fibroblasts, the two connective tissue genes, Collagen (COL1A2) [43, 48–50] and Fibrillin 1(FBN1) [51–53] were found to be enriched before purification but not after. Similar observa-
tions were made for the two leucocyte markers Leukocyte Specific Transcript 1 (LST1) and
CD200 Molecule (CD200) which play a role in the immune defense [54, 55].
The purified myonuclei did not appear to contain nuclei from satellite cells. Thus, markers
common for satellite cells, such as Apolipoprotein E (APOE) [43, 44], C-X-C Motif ChemokineReceptor 4 (CXCR4) [56, 57], Syndecan-3 (SDC3) [58–61] and the general progenitor and stem
cell marker CD34 [62–65] was enriched in the total nuclei from the whole tissue, but not after
purification of the myonuclei.
The loci for genes classically known to be a part of the skeletal muscle cell, such as the skele-
tal muscle specific version of actin (ACTA1) and Titin (TTN), displayed enrichment in both
the full tissue and PCM1-sorted population (Fig 3G).
The epigenetic landscape in purified myonuclei from EDL and soleus
reflects the differences in functional properties
To explore how the epigenome differed between the slow/oxidative soleus and fast/glycolytic
EDL muscle cells, we focused on differentially enriched (DE) peaks between the two muscles
using the histone modifications H3K4me3, a mark associated with promoter regions of
expressed genes and H3K27ac which is also associated with promoters of expressed genes as
well as distal regulatory enhancers where the chromatin is in an open and accessible configura-
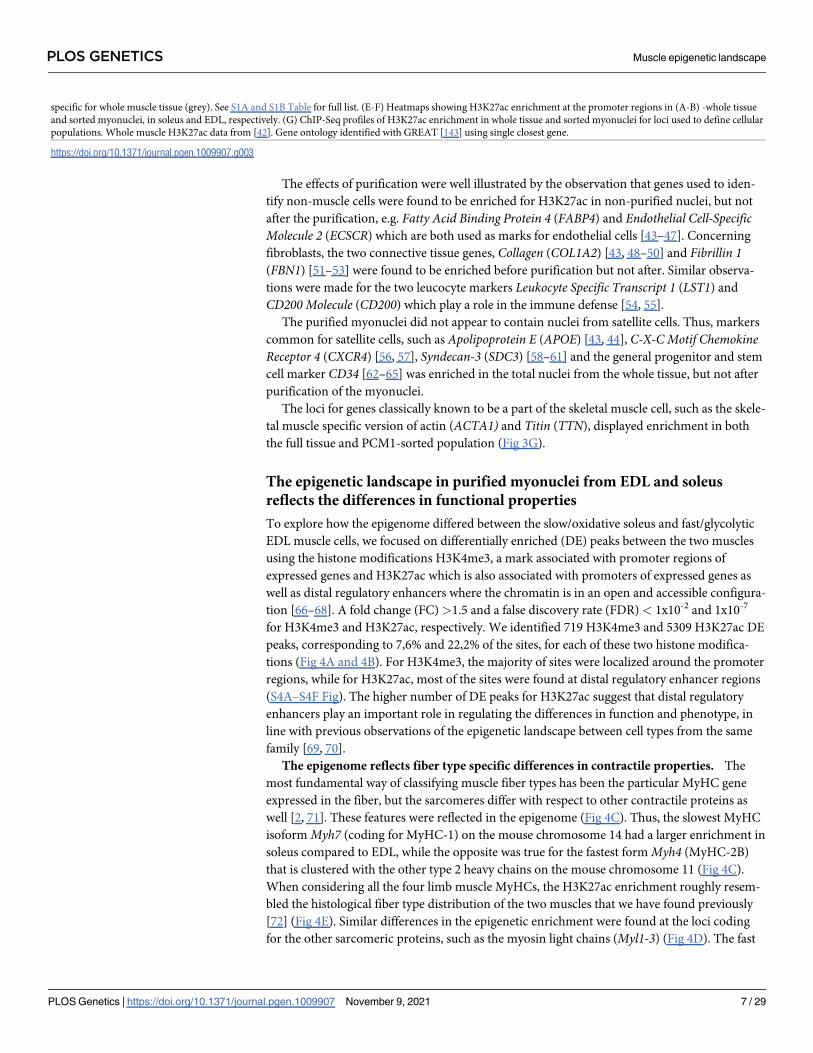
tion [66–68]. A fold change (FC)>1.5 and a false discovery rate (FDR) < 1x10⁻² and 1x10⁻⁷
for H3K4me3 and H3K27ac, respectively. We identified 719 H3K4me3 and 5309 H3K27ac DE
peaks, corresponding to 7,6% and 22,2% of the sites, for each of these two histone modifica-
tions (Fig 4A and 4B). For H3K4me3, the majority of sites were localized around the promoter
regions, while for H3K27ac, most of the sites were found at distal regulatory enhancer regions
(S4A–S4F Fig). The higher number of DE peaks for H3K27ac suggest that distal regulatory
enhancers play an important role in regulating the differences in function and phenotype, in
line with previous observations of the epigenetic landscape between cell types from the same
family [69, 70].
The epigenome reflects fiber type specific differences in contractile properties. The
most fundamental way of classifying muscle fiber types has been the particular MyHC gene
expressed in the fiber, but the sarcomeres differ with respect to other contractile proteins as
well [2, 71]. These features were reflected in the epigenome (Fig 4C). Thus, the slowest MyHC
isoform Myh7 (coding for MyHC-1) on the mouse chromosome 14 had a larger enrichment in
soleus compared to EDL, while the opposite was true for the fastest form Myh4 (MyHC-2B)
that is clustered with the other type 2 heavy chains on the mouse chromosome 11 (Fig 4C).
When considering all the four limb muscle MyHCs, the H3K27ac enrichment roughly resem-
bled the histological fiber type distribution of the two muscles that we have found previously
[72] (Fig 4E). Similar differences in the epigenetic enrichment were found at the loci coding
for the other sarcomeric proteins, such as the myosin light chains (Myl1-3) (Fig 4D). The fast
specific for whole muscle tissue (grey). See S1A and S1B Table for full list. (E-F) Heatmaps showing H3K27ac enrichment at the promoter regions in (A-B) -whole tissue
and sorted myonuclei, in soleus and EDL, respectively. (G) ChIP-Seq profiles of H3K27ac enrichment in whole tissue and sorted myonuclei for loci used to define cellular
populations. Whole muscle H3K27ac data from [42]. Gene ontology identified with GREAT [143] using single closest gene.
https://doi.org/10.1371/journal.pgen.1009907.g003
PLOS GENETICS Muscle epigenetic landscape
PLOS Genetics | https://doi.org/10.1371/journal.pgen.1009907 November 9, 2021 7 / 29
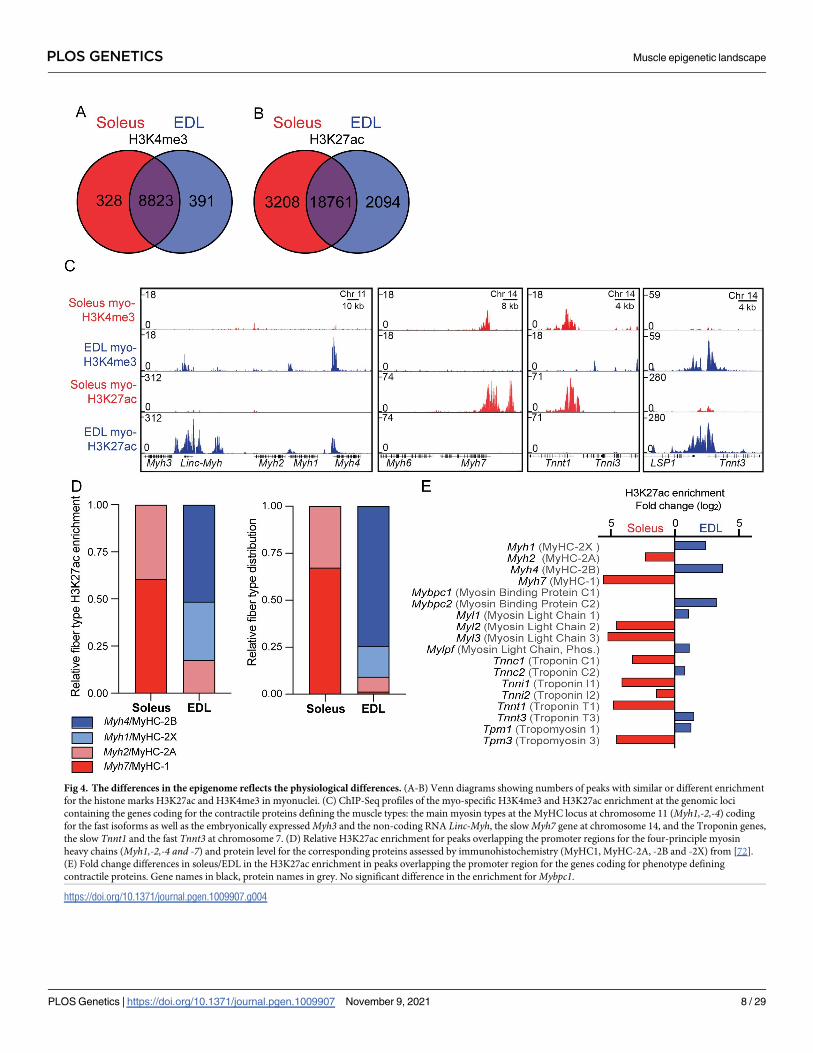
Fig 4. The differences in the epigenome reflects the physiological differences. (A-B) Venn diagrams showing numbers of peaks with similar or different enrichment
for the histone marks H3K27ac and H3K4me3 in myonuclei. (C) ChIP-Seq profiles of the myo-specific H3K4me3 and H3K27ac enrichment at the genomic loci
containing the genes coding for the contractile proteins defining the muscle types: the main myosin types at the MyHC locus at chromosome 11 (Myh1,-2,-4) coding
for the fast isoforms as well as the embryonically expressed Myh3 and the non-coding RNA Linc-Myh, the slow Myh7 gene at chromosome 14, and the Troponin genes,
the slow Tnnt1 and the fast Tnnt3 at chromosome 7. (D) Relative H3K27ac enrichment for peaks overlapping the promoter regions for the four-principle myosin
heavy chains (Myh1,-2,-4 and -7) and protein level for the corresponding proteins assessed by immunohistochemistry (MyHC1, MyHC-2A, -2B and -2X) from [72].
(E) Fold change differences in soleus/EDL in the H3K27ac enrichment in peaks overlapping the promoter region for the genes coding for phenotype defining
contractile proteins. Gene names in black, protein names in grey. No significant difference in the enrichment for Mybpc1.
https://doi.org/10.1371/journal.pgen.1009907.g004
PLOS GENETICS Muscle epigenetic landscape
PLOS Genetics | https://doi.org/10.1371/journal.pgen.1009907 November 9, 2021 8 / 29
isoform of the gene coding for the contraction regulator Myosin Binding Protein C2 (Mybpc2)was enriched in the EDL, while paradoxically, the gene coding for the slow isoform MyosinBinding Protein C1 (Mybpc1), was not enriched in the soleus, however, this is in agreement
with RNA and protein levels for the isoform [73–75].
As expected, the loci containing the genes encoding developmental isoforms of the sarco-
meric proteins Myh3 (MyHC-emb) and MYH8 (MyHC-neo) (Figs 4C and S5) or isoforms
specific for cardiac myocytes Myh6 (MyHC- alpha) and Troponin I3 (Tnni3/Troponin I), did
not have any enrichment in these adult skeletal muscles (Fig 4C).
The epigenome reflects fiber type specific differences in twitch duration. One of the
major differences between fiber types is the twitch duration, hence the EDL is a so called fast-
twitch muscle and soleus a slow-twitch muscle. A major determinant of the twitch speed is the
handling characteristics of Ca2+ [2, 3], and the expression level of relevant isoenzymes differs
between different types of muscles [17, 50, 75, 76]. Our data showed that this was also reflected
at the epigenetic level, such as for the ATPase Sarcoplasmic/Endoplasmic Reticulum Ca2+ Transporting (Atp2a)-1 and -2 (SERCA1 and -2), Casq1 and -2, coding for the two calcium
buffer proteins, Calsequestrin 1 and -2, responsible for regulating the calcium levels in fast and
slow muscle fibers respectively, and Pvalb, coding for the calcium binding protein Parvalbu-
min, highly specific for fast fibers [17] (Fig 5).
For the genes coding for contractile and calcium handling proteins, the differences in the
epigenome were not only restricted to the promoter regions, but also the inter- and intragenic
areas with H3K27ac enrichment, such as the enhancer located inside the MyHC cluster at
chromosome 11 between the long non-coding RNA Linc-Myh and Myh2 (MyHC-2A) promot-
ing fast glycolytic phenotype [77], and upstream enhancer regions at the slow isoforms of
Myh7 (MyHC-1) and Atp2a2 (SERCA2) genes [78] (Figs 4B and 5). Furthermore, we also
identified the recently discovered fast phenotype specific enhancer located in the locus coding
for the Pvalb (Parvalbumin) gene [42]. This indicates the complexity and detailed regulation of
the genes involved in contraction and calcium handling in the different muscle types.
The epigenome reflects fiber type specific differences in metabolic properties. Ontol-
ogy analysis of the H3K27ac DE peaks showed that the regions are associated with genes
involved in defining the metabolic properties for the two muscle types, such as lipid metabo-
lism and mitochondria for soleus and muscle contraction and metabolism of hexose (e.g.
Fig 5. Genes involved in the calcium signaling displayed differences in the epigenome. (A) ChIP-Seq profiles of the myo-specific H3K4me3 and H3K27ac enrichment
at the genomic loci containing the genes coding for calcium signaling proteins: ATPase Sarcoplasmic/Endoplasmic Reticulum Ca2+ Transporting (Atp2a1,SERCA1) at
chromosome 7, Atp2a2 (SERCA2) at chromosome 5, Calsequestrin 1 (Casq1) at chromosome 1, Calsequestrin 2 (Casq2) at chromosome 3 and Parvalbumin (Pvalb) at
chromosome 15, in soleus and EDL, respectively.
https://doi.org/10.1371/journal.pgen.1009907.g005
PLOS GENETICS Muscle epigenetic landscape
PLOS Genetics | https://doi.org/10.1371/journal.pgen.1009907 November 9, 2021 9 / 29
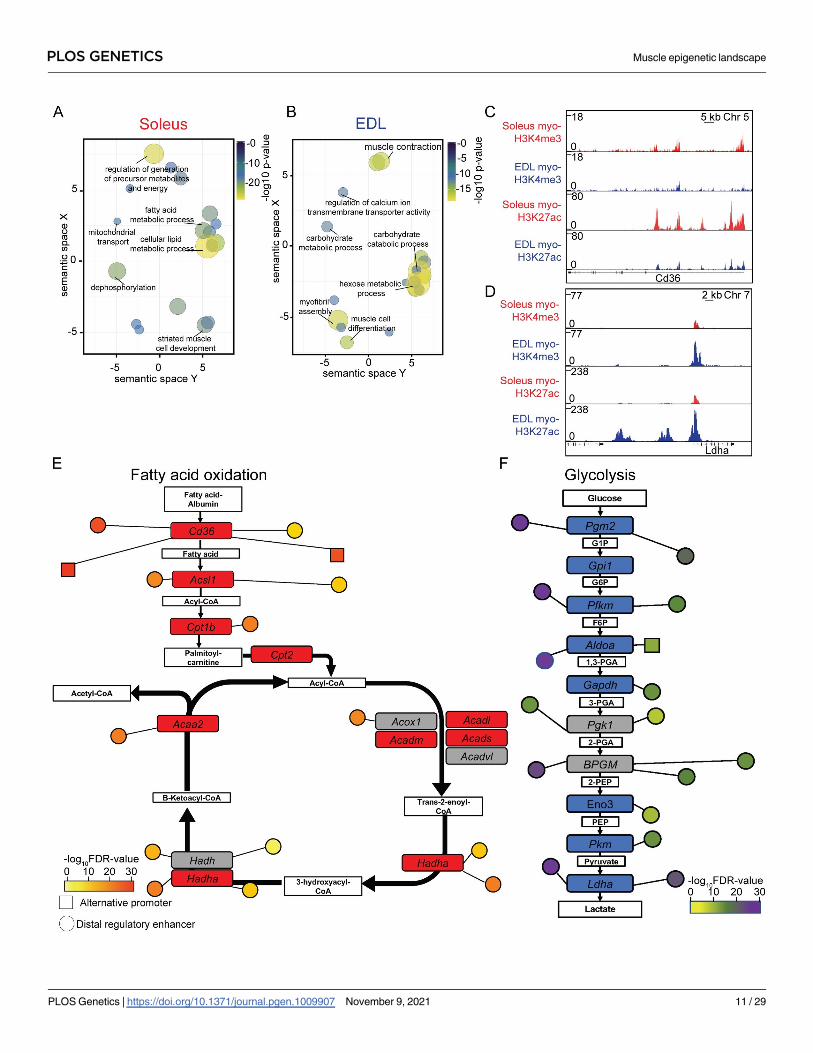
sugar) for EDL (Fig 6A and 6B, and S3A and S3B Table). Interestingly, a similar analysis car-
ried out on whole tissue identified fewer DE regions and only non-specific general functions
(S4G and S4H Fig, and S3C and S3D Table), again, underscoring the importance of sorting
out the relevant nuclei from heterogeneous tissues.
To gain further insight into how the epigenome adds to differences between the two types
of muscles, we examined the differences in enrichment using the dynamic H3K27ac mark.
The analysis identified differences in H3K27ac enrichment, both at promoters and distal regu-
latory regions of genes, such as Peroxisome proliferator-activated receptors (PPAR)- and the
Fatty acid degradation pathways in soleus and the glycolysis and mitogen-activated protein
kinase (MAPK) pathways in EDL (S4 Table). Detailed analysis of the epigenetic landscape for
two of the primary energy generating pathways, the fatty acid oxidation in soleus and glycoly-
sis in EDL, identified a complex epigenetic environment with several promoters and enhancers
with a different enrichment for the genes involved in the pathways (Fig 6C–6E). For both the
fatty acid oxidation pathway and glycolysis, none of the involved genes were associated with
DE regions for the opposite muscle type, e.g. glycolysis enriched in soleus and fatty acid oxida-
tion in EDL.
Differences in the epigenome indicates that the phenotype of fast/glycolytic
and slow/oxidative muscles are determined by different regulatory
networks
We sought to unravel the gene regulatory programs leading to the fast/glycolytic and slow/ oxi-
dative phenotypes respectively, by using the myonuclei-specific DE H3K27ac regions in com-
bination with DNase I hypersensitivity data for whole skeletal muscle [79, 80], which with a
high resolution identifies where transcription factors and other proteins are bound to the chro-
matin [81]. Motif enrichment analysis of the DE regions identified two distinct groups of tran-
scriptional regulators for the two muscles. In soleus, the SRY-Box Transcription Factor (SOX)
and Nuclear Factor of Activated T Cells (NFAT) motifs were the most overrepresented, while
in EDL, it was the E-boxes and Sine Oculis Homeobox Homolog (SIX) motifs (S5 Table).
To consolidate and specify the analysis, we used the transcription factors from the motif
enrichment analysis with the most significantly enriched promoter region and high-quality
motifs for each muscle. This revealed two distinct groups of transcription factors, one for each
muscle type. For soleus, factors such as SOX6, NFATC2, Myocyte Enhancer Factor 2C
(MEF2C), MAF BZIP Transcription Factor K (MAFK), Peroxisome Proliferator-Activated
Receptor Alpha (PPARA) and Transcription Factor 7 Like (TCF7L2) were identified, while for
EDL, factors such as Myogenic Differentiation1 (MYOD1), SIX1, MAFG, Zinc Finger and
BTB Domain Containing 14 (ZBTB14), and Zinc Finger Protein X-Linked (ZFX) (S5 Table).
The transcription factors were identified to have 4530 and 4371 predicted binding sites con-
nected to 464 and 392 DE promoter regions for soleus and EDL, respectively. Functional anal-
ysis of the genes connected to the transcription factors revealed that they are associated with
central differences in the functional phenotype between the two muscles (S6 Table). Combin-
ing the information about factors, genes and functions revealed distinct regulatory networks
for the two muscles (Fig 7). Though different, they also share similarities, such as regulation of
muscle contraction, but with a different set of factors and genes involved (S6 Fig).
Discussion
We show that PCM1 selectively marks mature myonuclei in skeletal muscle, and that this
marker can be used to isolate the myonuclei from fresh and frozen muscle tissue collected
from mice, rats and humans. The method can be ubiquitously applied, also to experimental
PLOS GENETICS Muscle epigenetic landscape
PLOS Genetics | https://doi.org/10.1371/journal.pgen.1009907 November 9, 2021 10 / 29
PLOS GENETICS Muscle epigenetic landscape
PLOS Genetics | https://doi.org/10.1371/journal.pgen.1009907 November 9, 2021 11 / 29
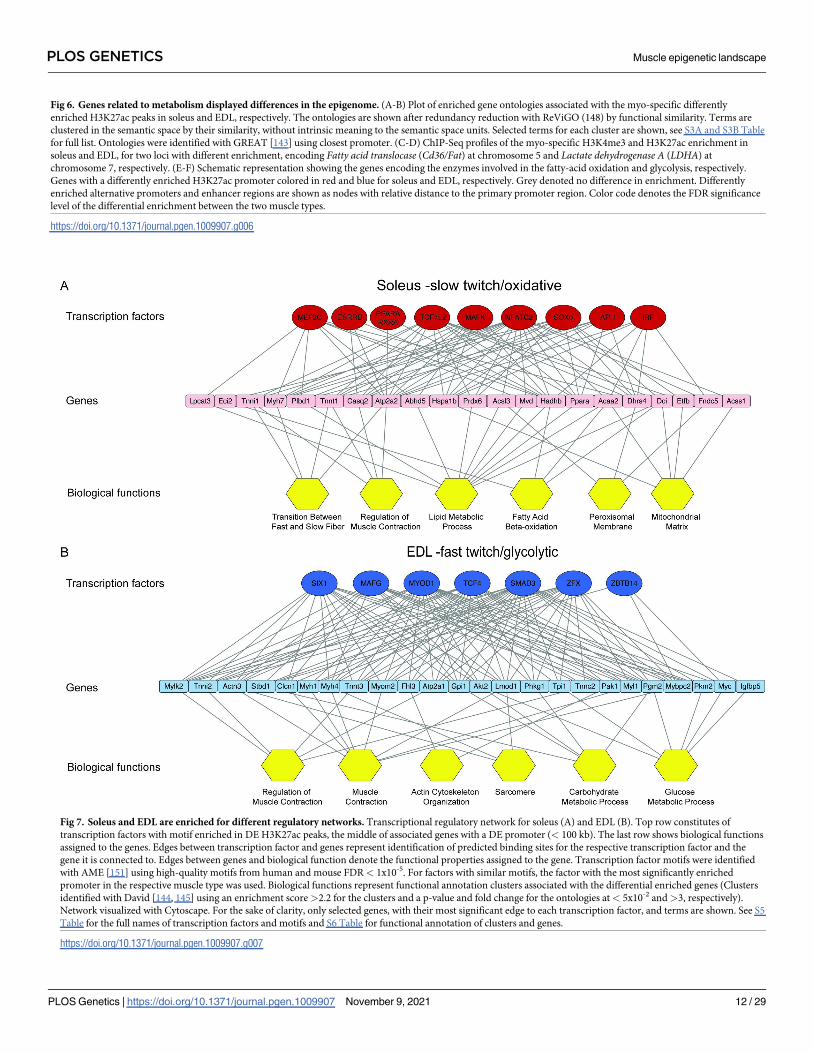
Fig 6. Genes related to metabolism displayed differences in the epigenome. (A-B) Plot of enriched gene ontologies associated with the myo-specific differently
enriched H3K27ac peaks in soleus and EDL, respectively. The ontologies are shown after redundancy reduction with ReViGO (148) by functional similarity. Terms are
clustered in the semantic space by their similarity, without intrinsic meaning to the semantic space units. Selected terms for each cluster are shown, see S3A and S3B Table
for full list. Ontologies were identified with GREAT [143] using closest promoter. (C-D) ChIP-Seq profiles of the myo-specific H3K4me3 and H3K27ac enrichment in
soleus and EDL, for two loci with different enrichment, encoding Fatty acid translocase (Cd36/Fat) at chromosome 5 and Lactate dehydrogenase A (LDHA) at
chromosome 7, respectively. (E-F) Schematic representation showing the genes encoding the enzymes involved in the fatty-acid oxidation and glycolysis, respectively.
Genes with a differently enriched H3K27ac promoter colored in red and blue for soleus and EDL, respectively. Grey denoted no difference in enrichment. Differently
enriched alternative promoters and enhancer regions are shown as nodes with relative distance to the primary promoter region. Color code denotes the FDR significance
level of the differential enrichment between the two muscle types.
https://doi.org/10.1371/journal.pgen.1009907.g006
Fig 7. Soleus and EDL are enriched for different regulatory networks. Transcriptional regulatory network for soleus (A) and EDL (B). Top row constitutes of
transcription factors with motif enriched in DE H3K27ac peaks, the middle of associated genes with a DE promoter (< 100 kb). The last row shows biological functions
assigned to the genes. Edges between transcription factor and genes represent identification of predicted binding sites for the respective transcription factor and the
gene it is connected to. Edges between genes and biological function denote the functional properties assigned to the gene. Transcription factor motifs were identified
with AME [151] using high-quality motifs from human and mouse FDR< 1x10⁻⁵. For factors with similar motifs, the factor with the most significantly enriched
promoter in the respective muscle type was used. Biological functions represent functional annotation clusters associated with the differential enriched genes (Clusters
identified with David [144, 145] using an enrichment score>2.2 for the clusters and a p-value and fold change for the ontologies at< 5x10⁻² and>3, respectively).
Network visualized with Cytoscape. For the sake of clarity, only selected genes, with their most significant edge to each transcription factor, and terms are shown. See S5
Table for the full names of transcription factors and motifs and S6 Table for functional annotation of clusters and genes.
https://doi.org/10.1371/journal.pgen.1009907.g007
PLOS GENETICS Muscle epigenetic landscape
PLOS Genetics | https://doi.org/10.1371/journal.pgen.1009907 November 9, 2021 12 / 29
conditions where transgenic markers are not feasible, such as human studies. The isolation
method does not involve any enzymatic digestions or other treatments at elevated tempera-
tures, thereby preserving the native state of the epigenome.
Propper isolation of the myonuclei is important since up to 60% of the cell-nuclei in muscle
tissue can reside in other cell types such as satellite-, stroma-, and vascular cells, and in connec-
tive tissue [32, 33]. Based on our FACS data; in mice and rats these other nuclei constituted
about 40% in the fast EDL and TA and 20% in human biopsies from vastus lateralis. The corre-
sponding numbers for the slow soleus were 60% in mice and 40% in rats. We don’t know if
this difference is a due to muscles or species variability.
The epigenetic signature of individual genes is highly cell-specific. Studies of other hetero-
geneous tissues have concluded that accounting for cellular heterogeneity is critical in epigen-
ome-wide association studies [34–36]. Mixed cell populations are prone to increase the
number of false negatives and positives [41, 82]. This point has also been addressed in skeletal
muscle by mechanically isolating single fibers preceding transcriptome [50] and methylome
[83] analyses; reducing the signal arising from non-myogenic cells residing in the tissue.
Recent studies have mapped the genome-wide landscape of whole skeletal muscles, but
without discriminating between the different cell types in the tissue [42, 84]. Compared to
analysis of the whole population of nuclei, we show that analysis of purified myonuclei gives a
more detailed profile of the myo-specific regulatory environment, also confirmed by a recent
analysis of single nuclei [85]. Purification of nuclei affected both the signal from specific gene
loci as well as the general functional ontological analysis, which agreed better with the function
of the muscle and the two muscle types.
We compared myonuclei from the soleus and EDL typifying a slow/oxidative and a fast/gly-
colytic muscle in mice, using the markers H3K4me3 and H3K27ac. The first is found in the
promoter regions of expressed genes, the latter is associated with active promoters and distal
regulatory enhancers where the chromatin is in an open and accessible configuration [66–68].
The two muscles had a large part of the epigenome in common, but important differences
were found in connection to genes coding for proteins involved in contraction, calcium han-
dling and metabolic pathways, reflecting differences at the transcriptional and protein level
between different fiber types [5, 50, 75, 86, 87].
At the genome-wide level, we revealed differences in distal enhancers at the loci reflecting
different regulatory networks in the fast and the slow muscle. The two MyHC loci provide
interesting examples of differences in such regional regulation. In both mice and humans, the
slow type 1 Myh7 (MyHC-1) gene is located on chromosome 14 head to tail with the cardiac
isoform Myh6 (MyHC-1alpha), while the fast type 2 isoforms are clustered on a 300–600 kb
segment in the order Myh2, Myh1 and Myh4, reflecting the order of increasing shortening
velocity, (MyHC-2A-2X-2B) on the mouse chromosome 11 (in humans 17) [88]. Interestingly,
by exercise, changes are relatively easily obtained within the different type 2 MyHCs of the
gene cluster, while 1,2 transformation is less common, and cannot be achieved, except under
extreme conditions [15].
In the fast locus, an intergenic SIX1 responsive enhancer is located between Myh3 (MyHC-
emb) and non-coding RNA Linc-Myh. It drives the expression of the fast myosin through
higher order chromatin interactions and locks the muscle fiber in the fast-glycolytic phenotype
[77]. Furthermore, the enhancer regulates the Linc-Myh, which might play a role in maintain-
ing the fast phenotype, presumably through trans-induced mechanisms [77]. This area, which
is one of the most differently enriched in our data for the glycolytic EDL, revealed several addi-
tional enhancer regions upstream and downstream of the Linc-Myh, further adding to the
complexity of the locus. In muscle cell culture, this area has been identified to be part of a spe-
cial group of enhancers known as super-enhancers [89]. This group of enhancers is
PLOS GENETICS Muscle epigenetic landscape
PLOS Genetics | https://doi.org/10.1371/journal.pgen.1009907 November 9, 2021 13 / 29
characterized by spanning several kb and being important for defining the identity of the cell
[90–92]. Such areas were among the most enriched in EDL, and it is possible that the chroma-
tin configuration stabilizes the fast fiber type and provides an obstacle for transformation in
the slow direction. As discussed in the introduction, it appears that some traits require very
long-term treatment, while changes between different type 2 MyHC are readily altered by
endurance exercise or high amounts of electrical stimulation. Type 2 to 1 transformations
might take more than 3 months [15]. We hypothesize that this delay is related to the epigenetic
landscape.
Several of the transcription factors identified in our analysis of regulatory networks are well
known regulators of skeletal muscle phenotype and function, such as NFAT, SOX, SIX and
MYOD1 [2, 3, 93]. Our enriched factors identified by isolating the myonuclei prior to epige-
netic analysis are largely in agreement with a recent study using an alternative bioinformatic
approach to identify and investigate the epigenetic regulatory environment in slow and fast
muscles at the single nuclei level [85].
Other factors we identified, such as MAF transcription factors and ZBTB14, are just
recently described to have a role in muscle regulation at the gene level [85, 94]. The latter is
identified to be involved in regulation of metabolism; a function also assigned to the factor in
our regulatory network. More specifically, it is found to be a negative regulator of the myo-
kines Interleukin 6 (IL6) and Leukemia inhibitory factor (LIF) by binding to the promoter
region of the two genes [94].
We identified two additional factors that are less explored in skeletal muscle, namely the
ZFX enriched in EDL and TCF7L2 in soleus, but both have previously been suggested to be a
part of skeletal muscle specific regulatory networks [75, 95]. On the molecular level, the ZFX is
identified to facilitate transcription through binding in the promoter regions just downstream
of the transcription start sites of target genes [96]. In the case of TCF7L2, it is found to be
involved in cardiac hypertrophy through the Wnt/β-catenin signaling pathway, where it mod-
ulates the chromatin environment and regulates the expression of the slow Myh7 (MyHC-1)
and the Wnt/β-catenin target, the Myc gene [97]. Interestingly, in our regulatory network, the
factor is also associated with Myh7, hence pointing towards a conserved role in oxidative mus-
cle tissues for TCF7L2 in regulating the slow-twitch myosin. To shed further light on the two
factors´ role in skeletal muscle biology with a focus on humans, we performed a meta-analysis
of their expression in muscle using the MetaMEx [98] database which focuses on the response
of human skeletal muscle to interactivity and exercise. The analysis showed that ZFX is upre-
gulated by prolonged inactivity, while TCF7L2 is upregulated during acute aerobic exercise
training. Furthermore, both factors are found to be expressed at the protein level in skeletal
muscle [99, 100]. For both factors, more research is needed to elucidate their function in skele-
tal muscle, such as if ZFX is having a similar role at promotor regions in enhancing the tran-
scription of target genes during prolonged inactivity. While in the case of TCF7L2, whether it
plays a role in Wnt/β-catenin induced hypertrophy in skeletal muscle [101] and whether the
transcription factor regulates the slow-twitch myosin expression and Wnt/β-catenin targets
such as Myc.
For the soleus, it is notable that we identified the transcription factors MEF2C, PPARA,
SOX6 and NFATC2 as they are known to influence muscle in the slow/oxidative direction [2,
102–105]. MEF2C is previously identified to be important for slow fiber development and for
their energy homeostasis [106, 107]. MEF2C and its family members are known to interact
with co-regulators that are capable of altering the epigenetic environment, such as histone
acetyltransferase P300 [108, 109] and lysine methyltransferase Myeloid/lymphoid or Mixed-
Lineage Leukemia 4 (MLL4). In the latter case, the transcription factor, together with its co-
regulator, establishes an open chromatin environment at active enhancers that enforce an
PLOS GENETICS Muscle epigenetic landscape
PLOS Genetics | https://doi.org/10.1371/journal.pgen.1009907 November 9, 2021 14 / 29
oxidative/slow muscle phenotype, e.g. by regulating sarcomeric slow genes such as Myh7(MyHC-1) and Tnnc1 (Troponin C1) through enhancers located upstream of their respective
promoters [78]. MEF2C is also participating in activity-related calcium regulation, both by
being activated by upstream regulators, such as MAPK and calmodulin-dependent protein
kinases (CaMK) [110–112], but also through regulation of the genes participating in the signal-
ing cascades [113–115]. In the cardiac tissue, MEF2C is found to regulate the expression of the
slow sarcoplasmic calcium pump, Atp2a2 (SERCA2), through an enhancer region [116], a con-
nection also identified in our soleus network.
The transcription factors PPARA and Estrogen Related Receptor Beta (ESRRB), enriched
in soleus, are mediating fatty acid degradation and oxidative metabolism [86, 117, 118]. Similar
roles are known for additional members of their respective families [119, 120]. In the case of
PPARA, it is furthermore reported to control the expression of metabolic genes in response to
changes in the environment through distal enhancers [121] and to be involved in regulation of
contraction [122, 123].
For EDL, it was notable that SIX1 and MYOD1 were enriched since there is evidence that
they drive the phenotype in the fast/glycolytic direction [3, 124, 125]. The SIX1 transcription
factor is reported to be an important regulator of key genes defining the fast-glycolytic pheno-
type, where it regulates genes mediating glycolysis (e.g. Aldoa (Aldolase A), Pfkm (Phospho-
fructokinase) and Eno3 (Enolase 3) and calcium homeostasis (Pvalb (Parvalbumin)) [126, 127]
in addition to regulating the non-coding RNA Linc-Myh and its enhancer region [127].
MYOD1 is found to be important for correct glycolytic fiber type specification and composi-
tion [125, 128], and is thought to be a master regulator working as an organizer of enhancers
[129–131]. In line with this, it is known to recruit histone modifiers and co-regulators, such as
p300 and its homologue CBP, to target sites [108, 132, 133].
In a recent muscle cell differentiation study in cell culture, MYOD1 was identified to take
part in the regulation of the super-enhancer inside the fast MyHC locus covering the Linc-Myhand its enhancer [134]. Pointing towards an interesting collaboration at the locus between
MYOD1 as a master regulator and the more specific role of SIX1 in locking the expression of
the fast myosin genes [77], thereby promoting the glycolytic phenotype.
In summary, we have shown that PCM1 can be used to isolate the myonuclei from the com-
plex whole muscle tissue and that in order to get a clear and faithful representation of the
whole epigenome, such sorting should be performed prior to analysis of nuclei from the com-
plex muscle tissue. Comparison of the myo-specific epigenomes of the two muscle extremes
soleus and EDL show, as expected, that the majority of the epigenome was common. The parts
that differed were regulatory elements and genes related to contraction speed, twitch duration,
and metabolism. In addition, our epigenetic analysis revealed that the two muscles have dis-
tinct regulatory networks associated with genes defining the disparate phenotype.
Materials and methods
Ethics statement
For animal experiments the research was conducted in accordance with the Norwegian Ani-
mal Welfare Act of 20th December 1974. The Norwegian Animal Research Committee
approved all experiments before initiation. The Norwegian Animal Research Authority pro-
vided governance to ensure that facilities and experiments were in accordance with the Act,
National Regulations of January 15th, 1996, and the European Convention for the Protection
of Vertebrate Animals Used for Experimental and Other Scientific Purposes of March 18th,
1986.
PLOS GENETICS Muscle epigenetic landscape
PLOS Genetics | https://doi.org/10.1371/journal.pgen.1009907 November 9, 2021 15 / 29
All procedures with the ACTA1rtTA; TREH2B-GFP mice were approved by the Cincinnati
Children’s Hospital Medical Center’s Institutional Animal Care and Use Committee.
Human vastus lateralis biopsies were a kind gift from Dr. Tim Snijders, Maastricht Univer-
sity. the samples were obtained as a part of a study approved by the Medical Ethical Committee
of the Maastricht University Medical Centre+ (METC 15-3-003) which conformed to the stan-
dards for the use of human subjects in research as outlined in the most recent version of the
Helsinki Declaration.
Animal procedures
Female NMRI mice (28–31 gram) and male Sprague Dawley rats weighing 210–260 g were
used. Animals were kept at the animal facility at the Department of Biosciences or Department
of Medicine, University of Oslo. Animals were housed with a 12 h light/dark cycle with ad libi-
tum access to food and water. Before surgery, animals were sedated with 2% isoflurane
(506949, Forene, Abbot) in the air. Following deep anesthesia, the hind limb muscles extensor
digitorum longus (EDL), soleus and tibialis anterior (TA) were surgically removed, directly
frozen in liquid nitrogen and transferred to cryotubes before being stored at -80˚C. Animals
were sacrificed by cervical dislocation while under deep anesthesia. The research was con-
ducted in accordance with the Norwegian Animal Welfare Act of 20th December 1974.
The ACTA1rtTA; TREH2B-GFP mice were kindly provided by Dr. John McCarthy (University
of Kentucky)[39]. To induce H2B-GFP expression, 2-month old mice were fed chow supple-
mented with Dox (625 ppm) for 1 week. The Dox chow was purchased from TestDiet (54057).
All procedures with the ACTA1rtTA; TREH2B-GFP mice were approved by the Cincinnati Chil-
dren’s Hospital Medical Center’s Institutional Animal Care and Use Committee.
Immunohistochemistry and imaging
For cross section tissue sectioning, immunohistochemical staining and subsequent image pro-
cessing were performed as previously described [33].
For single fiber imaging; EDL muscles from the ACTA1rtTA; TREH2B-GFP mice were col-
lected and incubated in high-glucose DMEM (HyClone Laboratories) with 0.3% collagenase
type I (Sigma-Aldrich) at 37˚C for 40 minutes, then washed with PBS. Muscles were gently trit-
urated using a glass pipette to loosen digested myofibers until they shed from muscle and fixed
overnight in 1% paraformaldehyde. Fibers were then put in staining buffer (0.6% Igepal-CA-
630, 5% BSA and 1% goat serum in PBS) for 1h at room temperature, followed by staining
with an antibody against PCM1 (1:1000, HPA023370, Sigma Aldrich) in staining buffer over-
night at 4˚C with gentle agitation. Next day, fibers were washed (3x 30 min in staining buffer),
incubated for 3 hours with secondary antibody (Abcam #150083) at 4˚C with gentle agitation,
washed 3x 30 min in staining buffer and mounted with Fluoromount-G with DAPI (Southern-
Biotech #0100–20). For Figs 1A and 1B and S1C, fibers were imaged on a Nikon A1 R confocal
system through NIS-Elements AR software (ver.5.10.01) with a 60x oil immersion objective
with NA of 1.4, using a Galvano scanner. For S1A and S1B Fig, fibers were imaged on a Nikon
Eclipse Ti inverted microscope with a 20x air immersion objective.
Myonuclear isolation
All samples and buffers were kept on ice during the procedure. The muscles were removed
from the -80˚C freezer and transferred to -20˚C and minced into pieces of 1–2 mm before
being transferred to gentleMACS M-tubes (Miltenyi Biotec) equilibrated to the same tempera-
ture. Samples were transferred to ice and stored for 5 minutes before homogenized in 5 ml of
lysis buffer (10 mM Tris-HCl pH 8.0 (cold adjusted), 5 mM CaCl2, 3 mM MgAc, 2 mM EDTA,
PLOS GENETICS Muscle epigenetic landscape
PLOS Genetics | https://doi.org/10.1371/journal.pgen.1009907 November 9, 2021 16 / 29

0,5 mM EGTA) on a gentleMACS Dissociator (Miltenyi Biotec) using the default homogeniza-
tion program protein_01. All buffers were supplemented with 5 mM Na-butyrate (Sigma
Aldrich), 5 mM PMSF (Sigma Aldrich) and 1x protease inhibitor (Complete Protease Inhibitor
Cocktail, Roche) immediately before use. Following homogenization, the lysate was diluted in
5 ml lysis buffer containing 0.4% Triton-X100. Samples were mixed 10 times with a 1 ml
pipette before being filtered through 100 μm and 30 μm strainers (Falcon, Sigma Aldrich) to
remove large aggregates. The homogenates were transferred to a 15 ml tube and centrifuged at
1000 g for 5 minutes in a centrifuge with a swing-out rotor at 5˚C. The pellets were resus-
pended in 1 ml nuclei staining buffer (5% BSA wt/vol, 0.2% IGEPAL–CA630, 1 mM EDTA in
Dulbecco’s Phosphate Buffered Saline (DPBS) pH 7.4) [41] containing an antibody against
PCM1 (1:1000, HPA023370, Sigma Aldrich). Samples were incubated using a tumbler (40
rpm) for 1 hour at 6˚C. Then centrifuged for 5 minutes at 800 g at 5˚C and the pellet was resus-
pended in 500 μl sorting buffer (1% BSA wt/vol, 2% skimmed milk powder (Sigma Aldrich), 1
mM EDTA in DPBS (pH 7.4) and spun down at 600 g at 5˚C for 5 minutes at slow acceleration
settings. The pellets were resuspended in 100 μl beads buffer, consisting of 80 μl sorting buffer
with 20 μl secondary Anti-rabbit IgG MicroBeads (Miltenyi Biotec), and incubated for 15 min-
utes at 4˚C. After incubation, the samples were centrifuged as above and washed once with
Sorting buffer before resuspended in 1 ml of the same buffer and incubated for 5 minutes at a
tumbler at 40 rpm at 6˚C. After incubation, the samples were carefully applied to a M column
(Miltenyi Biotec), washed 3 times with 1 ml sorting buffer and eluted with 1 ml Sorting buffer
after removal from the magnet. The eluates were applied to another M column, washed again
and eluted in 1 ml elution buffer (DPBS with 1 mM EDTA). The efficiency of sorting was
determined by staining aliquots before and after myonuclear enrichment.
Chromatin immunoprecipitation
For the chromatin immunoprecipitation, a modified version of [135, 136] was used. All buffers
were supplemented with 5 mM Na-butyrate (Sigma Aldrich), 5 mM PMSF (Sigma Aldrich)
and 1x protease inhibitor (Complete Protease Inhibitor Cocktail, Roche) immediately before
use. Nuclei, approximately 300 000, were fixated with 1% freshly prepared formaldehyde
(Pierce Cat.No.28906) in crosslinking buffer (DPBS supplemented with 50 mM HEPES, pH
7.5, 1 mM EDTA, 0.5 mM EGTA) for 2 minutes at room temperature. Reaction was stopped
by adding glycine to a final concentration of 125 mM. After 5 minutes of incubation at RT,
nuclei were transferred to ice and washed twice with ice cold DPBS and lysed in 130 μl sonica-
tion buffer (50 mM Tris-HCl pH 8.0 (cold adjusted), 1 mM EDTA, 0.1% wt/vol SDS). Samples
were sonicated for 8 minutes (30 sec on/off cycles) using a Bioruptor Pico (Diagenode) yield-
ing average DNA fragments of 200–300 bp. Lysates were diluted in an equal volume of 2x
ChIP buffer (20 mM Tris-HCl pH 8.0 (cold adjusted), 280 mM NaCl, 1 mM EDTA, 1 mM
EGTA, 2% Triton X-100, 0.2% Na-deoxycholate, 1% Igepal CA630, 0.1, % SDS), and adjusted
to 800 μl with ChIP buffer (10 mM Tris-HCl pH 7.5 (cold adjusted), 140 mM NaCl, 1 mM
EDTA, 0.5 mM EGTA, 1% Triton X-100, 0.1% Na-deoxycholate, 0.1% SDS). Samples were
centrifuged at 12 000 g for 10 minutes and the supernatant was transferred to new tubes and
precleared with 10 μl Protein A Dynabeads (Invitrogen) for 1 hour. Before immunoprecipita-
tion, a 10% input sample was removed. For each sample, ChIP assays were performed in paral-
lel with antibodies directed against H3K27ac (C15410196, Diagenode) and H3K4me3
(C15410003, Diagenode). Antibodies (2 μg per sample) were incubated with 10 μl Protein A
Dynabeads for two hours on a rotator at 40 rpm at 6˚C. Beads were transferred to PCR-tubes
and captured with a magnetic rack followed by addition of 150 μl ChIP ready chromatin. Sam-
ples were incubated at 40 rpm on a tube rotator overnight at 40 rpm at 6˚C. Next morning, the
PLOS GENETICS Muscle epigenetic landscape
PLOS Genetics | https://doi.org/10.1371/journal.pgen.1009907 November 9, 2021 17 / 29
supernatant was removed and the beads were washed with 100 μl ChIP-buffer, followed by a
washing step with Wash buffer A (20 mM Tris-HCl pH 8.0 (cold adjusted), 500 mM NaCl, 1
mM EDTA, 1 mM EGTA, 2% Triton X-100, 0.2% Na-deoxycholate, 0.1% SDS) and a washing
step with Wash buffer B´ (20 mM Tris-HCl pH 8.0 (cold adjusted), 250 mM LiCl, 1 mM
EDTA, 1 mM EGTA, 2% Triton X-100, 0.2% Na-deoxycholate, 0.1% SDS) and once with TE-
buffer (20 mM Tris-HCl pH 8.0). All washing steps were being performed for 5 minutes using
a rotor at 40 rpm and at 6˚C, with the exception of the TE-buffer washing steps which were
carried out at room temperature. After the final washing step, the beads were resuspended in
96 μl Elution buffer (20 mM Tris-HCl pH 7.5, 5 mM EDTA, 50 mM NaCl, 1% SDS) and incu-
bated on a heating block at 37˚C with 3 μl RNaseA (20 μg/μl) (Roche). After 1 hour, 1 μl Pro-
teinase K (20 μg/μl) was added and samples were incubated for 1 hour at 50˚C followed by 4
hours at 68˚C on thermoshaker at 1200 rpm. ChIP DNA was purified with Zymo ChIP DNA
Clean & Concentrator kit in 10 μl (Zymo Research).
Flow cytometry
For flow cytometry analysis, nuclei were isolated as described above. For the ACTA1rtTA;
TREH2B-GFP, TA muscles were excised, minced with a razor, and homogenized in PBS contain-
ing 0.25 M sucrose and 1% BSA using an Ultra-Turrax T25. The homogenate was then incu-
bated for 5 minutes with addition of Triton-X100 to a final concentration of 0.36% at 4˚C.
Samples were filtered through a 100 μm strainer, then filtered again through a 40 μm strainer.
The nuclei pellet was collected after centrifugation (3000 g for 5 minutes at 4˚C), and resus-
pended in sorting buffer (2% BSA/ PBS). PCM1 (HPA023370, Sigma Aldrich). Staining was
performed on ice for 1 hour (1:1000). After washing, samples were stained with the secondary
antibody Alexa Fluro 647 anti-rabbit IgG (A32795, Invitrogen) (1:1000) for 30 minutes in
combination with Hoechst 33342 (Life Technologies) added 1:5000. Stained samples were ana-
lysed on a BD FACSCanto II or a BD LSRII. Data analysis was performed utilizing BD FACS
Diva, FlowJo and Kaluza.
Next-generation sequencing
Libraries for next-generation sequencing (NGS) were created with the Swift Accel-NGS 2S
Plus DNA Library Kit (Swift Biosciences) following the recommendations from the manufac-
turer with the exception that the ratio of beads and PEG was 1.5 and 1.3 in step Repair step I
and II, respectively, and amplified with 12 PCR cycles. The libraries were sequenced on an Illu-
mina HiSeq 2500 40 bp paired-end, at the Oslo University Hospital Genomics Core Facility
(oslo.genomics.no).
Bioinformatics analysis
ChIP-Seq reads were trimmed with TrimGalore [137] and mapped to the mouse genome
(mm9) using BWA [138]. Duplicated and low-quality reads were removed (q>10) using Sam-
tools [139]. Peaks were identified with PePr for each histone modification over the respective
input samples using the following parameters—sharp for peak calling and a p-value threshold
of 0.05 [140]. Differently enriched regions were identified with PePr—diff with the histone
modification over the respective input for each sample and using threshold on foldchange 1.5
or above and an FDR-value on 1x10⁻⁵ for H3K4me3 and 1x10⁻⁷ for H3K27ac or below in addi-
tion to intersect with peaks identified in their respective sample.
For gene annotation, UCSC Known Genes (mm9) with an ensemble id were used. Promot-
ers were defined as 750 bp upstream and 250 bp downstream from transcription start site
(TSS). For visualization, samples were normalized to input and BigWig files were created as
PLOS GENETICS Muscle epigenetic landscape
PLOS Genetics | https://doi.org/10.1371/journal.pgen.1009907 November 9, 2021 18 / 29
described in [141] and visualized using the IGV browser. Heatmaps of ChIP-Seq signals were
created with deepTools version 3.3.0 [142].
Gene ontology analyzes of DE peaks were performed with GREAT v. 4.04 [143] using single
closets gene while pathway analysis was conducted with David v. 6.8 [144, 145]. Redundancy
reduction was performed with ReViGO [146].
Regulatory networks were visualized with Cytoscape [147]. DNase I hypersensitive enrich-
ment data for mouse skeletal muscle were obtained from [79, 80]. For the analysis, only middle
point of DNase I enriched areas -/+ 100 bp inside the myo-specific H3K27ac differently
enriched areas for soleus and EDL were used. Motif enrichment analysis was conducted with
AME Version 5.0.4 [148] using high quality motifs from human and mouse and threshold on
FDR< 1x10⁻⁵. For factors with similar motifs, the factor with the most significant H3K27ac
enrichment at the promoter region (FDR< 1x10-15) was included. Functional annotation clus-
tering of enriched promoters was conducted with David v. 6.8 [144, 145]. For external data
used see S7 Table. Data have been made publicly available at the GEO database [149, 150]
under accession number GSE182667.
Supporting information
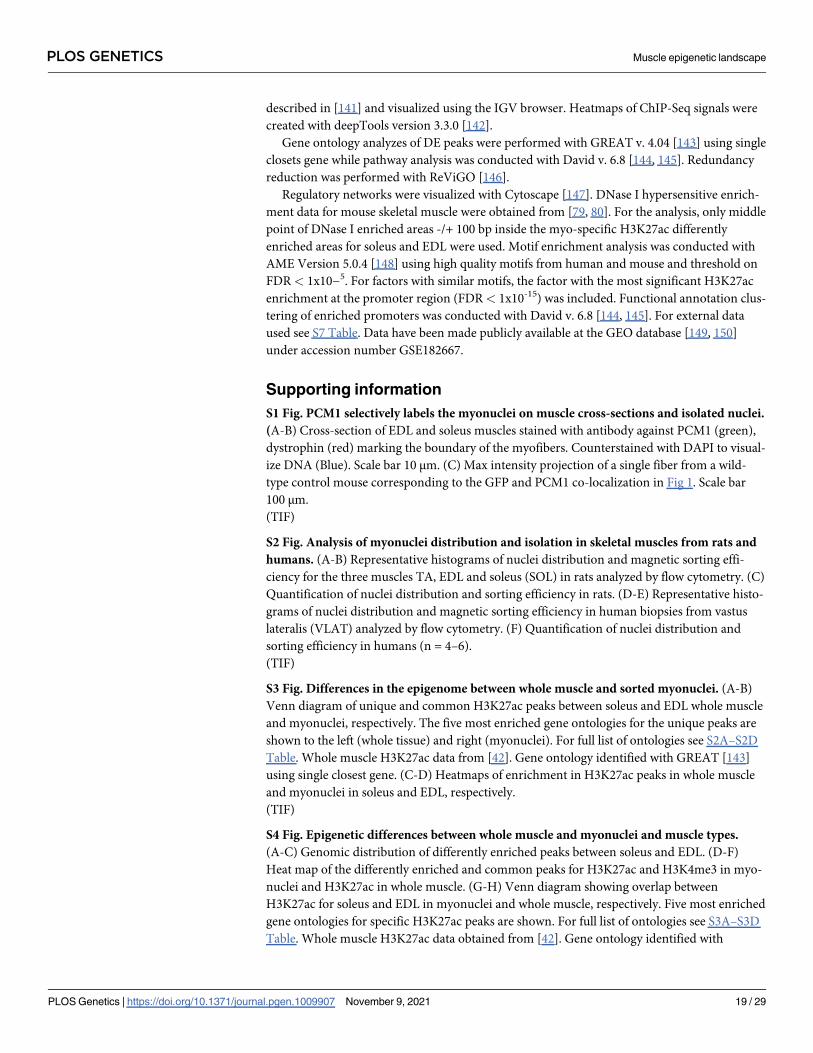
S1 Fig. PCM1 selectively labels the myonuclei on muscle cross-sections and isolated nuclei.
(A-B) Cross-section of EDL and soleus muscles stained with antibody against PCM1 (green),
dystrophin (red) marking the boundary of the myofibers. Counterstained with DAPI to visual-
ize DNA (Blue). Scale bar 10 μm. (C) Max intensity projection of a single fiber from a wild-
type control mouse corresponding to the GFP and PCM1 co-localization in Fig 1. Scale bar
100 μm.
(TIF)
S2 Fig. Analysis of myonuclei distribution and isolation in skeletal muscles from rats and
humans. (A-B) Representative histograms of nuclei distribution and magnetic sorting effi-
ciency for the three muscles TA, EDL and soleus (SOL) in rats analyzed by flow cytometry. (C)
Quantification of nuclei distribution and sorting efficiency in rats. (D-E) Representative histo-
grams of nuclei distribution and magnetic sorting efficiency in human biopsies from vastus
lateralis (VLAT) analyzed by flow cytometry. (F) Quantification of nuclei distribution and
sorting efficiency in humans (n = 4–6).
(TIF)
S3 Fig. Differences in the epigenome between whole muscle and sorted myonuclei. (A-B)
Venn diagram of unique and common H3K27ac peaks between soleus and EDL whole muscle
and myonuclei, respectively. The five most enriched gene ontologies for the unique peaks are
shown to the left (whole tissue) and right (myonuclei). For full list of ontologies see S2A–S2D
Table. Whole muscle H3K27ac data from [42]. Gene ontology identified with GREAT [143]
using single closest gene. (C-D) Heatmaps of enrichment in H3K27ac peaks in whole muscle
and myonuclei in soleus and EDL, respectively.
(TIF)
S4 Fig. Epigenetic differences between whole muscle and myonuclei and muscle types.
(A-C) Genomic distribution of differently enriched peaks between soleus and EDL. (D-F)
Heat map of the differently enriched and common peaks for H3K27ac and H3K4me3 in myo-
nuclei and H3K27ac in whole muscle. (G-H) Venn diagram showing overlap between
H3K27ac for soleus and EDL in myonuclei and whole muscle, respectively. Five most enriched
gene ontologies for specific H3K27ac peaks are shown. For full list of ontologies see S3A–S3D
Table. Whole muscle H3K27ac data obtained from [42]. Gene ontology identified with
PLOS GENETICS Muscle epigenetic landscape
PLOS Genetics | https://doi.org/10.1371/journal.pgen.1009907 November 9, 2021 19 / 29
GREAT [143] using single closest gene.
(TIF)
S5 Fig. Only the mature skeletal muscle versions of myosin are enriched in adult muscle.
ChIP-Seq profiles of the myo-specific H3K4me3 and H3K27ac enrichment at the MyHC locus
at chromosome 11 encoding the embryonic myosin Myh3 (MyHC-emb), the noncoding RNA
Linc-Myh, the adult versions Myh2 (MyHC-2A), Myh1 (MyHC-2X), Myh4 (MyHC-2B), neo-
natal myosin Myh8 (MyHC-neo) and the extraocular myosin Myh13 (MyHC-EO).
(TIF)
S6 Fig. Soleus and EDL are enriched for different regulatory networks in muscle contrac-
tion. Transcriptional regulatory network in muscle contraction for soleus (Top) and EDL
(bottom). Closest genes with DE promoter for genes involved in regulation of muscle contrac-
tion inside 100 kb of the predicted binding motif. Color of the edges, black and green, indicates
position of most significant motif prediction for factor at promotor region or distal regulatory
enhancer region, respectively.
(TIF)
S1 Table. GO analyses of promoter regions. Gene ontology analyses of unique promoters
with H3K27ac enrichment in whole soleus and EDL muscles compared to myonuclei from
same muscle type.
(XLSX)
S2 Table. GO analyses of unique peaks in whole muscle and myonuclei. Gene ontology anal-
yses of unique peaks with H3K27ac enrichment in whole soleus and EDL muscles and myonu-
clei from same muscle type.
(XLSX)
S3 Table. GO analyses of differently enriched peaks in myonuclei and whole muscle. Gene
ontology analyses of differently enriched H3K27ac peaks between soleus and EDL in myonu-
clei and whole muscle.
(XLSX)
S4 Table. Pathway analysis. Pathway analysis of H3K27ac differently enriched peaks in soleus
and EDL myonuclei, respectively. Analysis performed with David v. 6.8 using a p-value
<1x10^-4 and closets promoter < 100 kb from peak.
(XLSX)
S5 Table. Transcription factor motif enrichment. Transcription factors with motif overrep-
resented in H3K27ac differently enriched peaks in soleus and EDL myonuclei, respectively.
Analysis conducted with AME.
(XLSX)
S6 Table. Enriched clusters in regulatory networks. Functional annotation clustering of
genes with a H3K27ac differently enriched promoter connected to transcription factors with
motifs overrepresented in soleus and EDL myonuclei, respectively. Clusters having an enrich-
ment score >2.2 are listed, with biological processes and cellular components with a p-value
<0.05 and a fold change >3. Terms shown in the networks are colored in red and blue for
soleus and EDL, respectively. Analysis conducted with David bioinformatic tool v. 6.8
(XLSX)
S7 Table. External datasets used.
(XLSX)
PLOS GENETICS Muscle epigenetic landscape
PLOS Genetics | https://doi.org/10.1371/journal.pgen.1009907 November 9, 2021 20 / 29
S8 Table. Values used in article.
(XLSX)
Acknowledgments
We thank Dr. Tim Snijders, Maastricht University, for the human biopsies and Inga Juvkam
for technical assistance. Bioinformatics analyses were performed at UNINETT Sigma2-the
National Infrastructure for High Performance Computing and Data Storage in Norway (grant
NN9540K and NS9540K).
Author Contributions
Conceptualization: Mads Bengtsen, Leonardo A. Meza-Zepeda, Kristian Gundersen.
Data curation: Mads Bengtsen, Ivan Myhre Winje, Einar Eftestøl, Johannes Landskron, Chen-
gyi Sun, Kamilla Nygård, Diana Domanska.
Formal analysis: Mads Bengtsen, Einar Eftestøl, Johannes Landskron, Diana Domanska, Leo-
nardo A. Meza-Zepeda.
Funding acquisition: Mads Bengtsen, Douglas P. Millay, Kristian Gundersen.
Investigation: Mads Bengtsen, Ivan Myhre Winje, Einar Eftestøl, Kamilla Nygård.
Methodology: Mads Bengtsen, Ivan Myhre Winje, Johannes Landskron, Leonardo A. Meza-
Zepeda.
Project administration: Kristian Gundersen.
Resources: Douglas P. Millay, Kristian Gundersen.
Supervision: Douglas P. Millay, Leonardo A. Meza-Zepeda, Kristian Gundersen.
Validation: Johannes Landskron.
Visualization: Mads Bengtsen.
Writing – original draft: Mads Bengtsen, Ivan Myhre Winje.
Writing – review & editing: Mads Bengtsen, Ivan Myhre Winje, Einar Eftestøl, Johannes
Landskron, Chengyi Sun, Kamilla Nygård, Diana Domanska, Douglas P. Millay, Leonardo
A. Meza-Zepeda, Kristian Gundersen.
References1. D’Amico D, Fiore R, Caporossi D, Di Felice VD, Cappello F, Dimauro I, et al. Function and Fiber-Type
Specific Distribution of Hsp60 and alphaB-Crystallin in Skeletal Muscles: Role of Physical Exercise.
Biology (Basel). 2021; 10(2). https://doi.org/10.3390/biology10020077 PMID: 33494467
2. Schiaffino S, Reggiani C. Fiber types in mammalian skeletal muscles. Physiol Rev. 2011; 91(4):1447–
531. https://doi.org/10.1152/physrev.00031.2010 PMID: 22013216
3. Gundersen K. Excitation-transcription coupling in skeletal muscle: the molecular pathways of exercise.
Biol Rev. 2011; 86(3):564–600. https://doi.org/10.1111/j.1469-185X.2010.00161.x PMID: 21040371
4. Reiser PJ, Moss RL, Giulian GG, Greaser ML. Shortening velocity in single fibers from adult rabbit
soleus muscles is correlated with myosin heavy chain composition. J Biol Chem. 1985; 260(16):9077–
80. PMID: 4019463
5. Schiaffino S, Reggiani C, Murgia M. Fiber type diversity in skeletal muscle explored by mass spec-
trometry-based single fiber proteomics. Histol Histopathol. 2020; 35(3):239–46. https://doi.org/10.
14670/HH-18-170 PMID: 31612964
PLOS GENETICS Muscle epigenetic landscape
PLOS Genetics | https://doi.org/10.1371/journal.pgen.1009907 November 9, 2021 21 / 29
6. Juhlin-Dannfelt A, Frisk-Holmberg M, Karlsson J, Tesch P. Central and peripheral circulation in rela-
tion to muscle-fibre composition in normo- and hyper-tensive man. Clin Sci (Lond). 1979; 56(4):335–
40. https://doi.org/10.1042/cs0560335 PMID: 477218
7. Stuart CA, McCurry MP, Marino A, South MA, Howell ME, Layne AS, et al. Slow-twitch fiber proportion
in skeletal muscle correlates with insulin responsiveness. J Clin Endocrinol Metab. 2013; 98(5):2027–
36. https://doi.org/10.1210/jc.2012-3876 PMID: 23515448
8. Gaster M, Staehr P, Beck-Nielsen H, Schroder HD, Handberg A. GLUT4 is reduced in slow muscle
fibers of type 2 diabetic patients: is insulin resistance in type 2 diabetes a slow, type 1 fiber disease?
Diabetes. 2001; 50(6):1324–9. https://doi.org/10.2337/diabetes.50.6.1324 PMID: 11375332
9. Tanner CJ, Barakat HA, Dohm GL, Pories WJ, MacDonald KG, Cunningham PR, et al. Muscle fiber
type is associated with obesity and weight loss. Am J Physiol Endocrinol Metab. 2002; 282(6):E1191–
6. https://doi.org/10.1152/ajpendo.00416.2001 PMID: 12006347
10. Stuart CA, South MA, Lee ML, McCurry MP, Howell ME, Ramsey MW, et al. Insulin responsiveness in
metabolic syndrome after eight weeks of cycle training. Med Sci Sports Exerc. 2013; 45(11):2021–9.
https://doi.org/10.1249/MSS.0b013e31829a6ce8 PMID: 23669880
11. Saklayen MG. The Global Epidemic of the Metabolic Syndrome. Curr Hypertens Rep. 2018; 20(2):12.
https://doi.org/10.1007/s11906-018-0812-z PMID: 29480368
12. Kirchner H, Osler ME, Krook A, Zierath JR. Epigenetic flexibility in metabolic regulation: disease cause
and prevention? Trends Cell Biol. 2013; 23(5):203–9. https://doi.org/10.1016/j.tcb.2012.11.008 PMID:
23277089
13. Eftestøl E, Egner IM, Lunde IG, Ellefsen S, Andersen T, Sjåland C, et al. Increased hypertrophic
response with increased mechanical load in skeletal muscles receiving identical activity patterns. Am J
Physiol-cell Ph. 2016; 311(4):ajpcell.00016.2016. https://doi.org/10.1152/ajpcell.00016.2016 PMID:
27488660
14. Eken T, Gundersen K. Electrical stimulation resembling normal motor-unit activity: Effects on dener-
vated fast and slow rat muscles. J Physiol. 1988; 402(651):651–69. https://doi.org/10.1113/jphysiol.
1988.sp017227 PMID: 3236252
15. Windisch A, Gundersen K, Szabolcs MJ, Gruber H, Lomo T. Fast to slow transformation of denervated
and electrically stimulated rat muscle. J Physiol. 1998; 510(Pt 2):623–32. https://doi.org/10.1111/j.
1469-7793.1998.623bk.x PMID: 9706009
16. Gorza L, Gundersen K, Lomo T, Schiaffino S, Westgaard RH. Slow-to-fast transformation of dener-
vated soleus muscles by chronic high-frequency stimulation in the rat. J Physiol. 1988; 402:627–49.
https://doi.org/10.1113/jphysiol.1988.sp017226 PMID: 3236251
17. Gundersen K, Leberer E, Lomo T, Pette D, Staron RS. Fibre types, calcium-sequestering proteins and
metabolic enzymes in denervated and chronically stimulated muscles of the rat. J Physiol. 1988;
398:177–89. https://doi.org/10.1113/jphysiol.1988.sp017037 PMID: 2969050
18. Pandorf CE, Haddad F, Wright C, Bodell PW, Baldwin KM. Differential epigenetic modifications of his-
tones at the myosin heavy chain genes in fast and slow skeletal muscle fibers and in response to mus-
cle unloading. Am J Physiol Cell Physiol. 2009; 297(1):C6–16. https://doi.org/10.1152/ajpcell.00075.
2009 PMID: 19369448
19. Baldwin KM, Haddad F, Pandorf CE, Roy RR, Edgerton VR. Alterations in muscle mass and contrac-
tile phenotype in response to unloading models: role of transcriptional/pretranslational mechanisms.
Front Physiol. 2013; 4:284. https://doi.org/10.3389/fphys.2013.00284 PMID: 24130531
20. Kawano F, Nimura K, Ishino S, Nakai N, Nakata K, Ohira Y. Differences in histone modifications
between slow- and fast-twitch muscle of adult rats and following overload, denervation, or valproic
acid administration. Journal of applied physiology (Bethesda, Md: 1985). 2015; 119(10):1042–52.
https://doi.org/10.1152/japplphysiol.00289.2015 PMID: 26404615
21. Rasmussen M, Zierath JR, Barrès R. Dynamic epigenetic responses to muscle contraction. Drug Dis-
cov Today. 2014; 19(7):1010–4. https://doi.org/10.1016/j.drudis.2014.03.003 PMID: 24631681
22. Bruusgaard JC, Johansen IB, Egner IM, Rana ZA, Gundersen K. Myonuclei acquired by overload
exercise precede hypertrophy and are not lost on detraining. Proceedings of the National Academy of
Sciences of the United States of America. 2010; 107(34):15111–6. https://doi.org/10.1073/pnas.
0913935107 PMID: 20713720
23. Egner IM, Bruusgaard JC, Eftestol E, Gundersen K. A cellular memory mechanism aids overload
hypertrophy in muscle long after an episodic exposure to anabolic steroids. J Physiol. 2013; 591(Pt
24):6221–30. https://doi.org/10.1113/jphysiol.2013.264457 PMID: 24167222
24. Bruusgaard JC, Gundersen K. In vivo time-lapse microscopy reveals no loss of murine myonuclei dur-
ing weeks of muscle atrophy. J Clin Invest. 2008; 118(4):1450–7. https://doi.org/10.1172/JCI34022
PMID: 18317591
PLOS GENETICS Muscle epigenetic landscape
PLOS Genetics | https://doi.org/10.1371/journal.pgen.1009907 November 9, 2021 22 / 29
25. Lee H, Kin K, Kim B, Shin J, Rajan S, Wu J, et al. A cellular mechanism of muscle memory facilitates
mitochondrial remodeling following resistance training. J Physiol. 2019; https://doi.org/10.1113/
JP275308 PMID: 30099751
26. Seaborne RA, Strauss J, Cocks M, Shepherd S, O’Brien TD, Someren KAv, et al. Human Skeletal
Muscle Possesses an Epigenetic Memory of Hypertrophy. Sci Rep-uk. 2018; 8(1):1898. https://doi.
org/10.1038/s41598-018-20287-3 PMID: 29382913
27. Malin SK, Liu Z, Barrett EJ, Weltman A. Exercise resistance across the prediabetes phenotypes:
Impact on insulin sensitivity and substrate metabolism. Rev Endocr Metab Disord. 2016; 17(1):81–90.
https://doi.org/10.1007/s11154-016-9352-5 PMID: 27106830
28. Schiaffino S, Reggiani C, Akimoto T, Blaauw B. Molecular Mechanisms of Skeletal Muscle Hypertro-
phy. J Neuromuscul Dis. 2020. https://doi.org/10.3233/JND-200568 PMID: 33216041
29. Reggiani C, Schiaffino S. Muscle hypertrophy and muscle strength: dependent or independent vari-
ables? A provocative review. Eur J Transl Myol. 2020; 30(3):9311. https://doi.org/10.4081/ejtm.2020.
9311 PMID: 33117512
30. Sen P, Shah PP, Nativio R, Berger SL. Epigenetic Mechanisms of Longevity and Aging. Cell. 2016;
166(4):822–39. https://doi.org/10.1016/j.cell.2016.07.050 PMID: 27518561
31. Sharples AP, Stewart CE, Seaborne RA. Does skeletal muscle have an ’epi’-memory? The role of epi-
genetics in nutritional programming, metabolic disease, aging and exercise. Aging Cell. 2016; 15
(4):603–16. https://doi.org/10.1111/acel.12486 PMID: 27102569
32. Schmalbruch H, Hellhammer U. The number of nuclei in adult rat muscles with special reference to
satellite cells. The Anatomical record. 1977; 189(2):169–75. https://doi.org/10.1002/ar.1091890204
PMID: 911042
33. Winje IM, Bengtsen M, Eftestøl E, Juvkam I, Bruusgaard JC, Gundersen K. Specific labelling of myo-
nuclei by an antibody against Pericentriolar material 1 (PCM1) on skeletal muscle tissue sections.
Acta physiologica (Oxford, England). 2018; 9(4):e13034. https://doi.org/10.1111/apha.13034 PMID:
29330928
34. Michels KB, Binder AM, Dedeurwaerder S, Epstein CB, Greally JM, Gut I, et al. Recommendations for
the design and analysis of epigenome-wide association studies. Nat Methods. 2013; 10(10):949–55.
https://doi.org/10.1038/nmeth.2632 PMID: 24076989
35. Jaffe AE, Irizarry RA. Accounting for cellular heterogeneity is critical in epigenome-wide association
studies. Genome Biol. 2014; 15(2):R31. https://doi.org/10.1186/gb-2014-15-2-r31 PMID: 24495553
36. Cheow LF, Courtois ET, Tan Y, Viswanathan R, Xing Q, Tan RZ, et al. Single-cell multimodal profiling
reveals cellular epigenetic heterogeneity. Nat Methods. 2016; 13(10):833–6. https://doi.org/10.1038/
nmeth.3961 PMID: 27525975
37. Gundersen K, Bruusgaard JC. Nuclear domains during muscle atrophy: nuclei lost or paradigm lost? J
Physiol. 2008; 586(11):2675–81. https://doi.org/10.1113/jphysiol.2008.154369 PMID: 18440990
38. Winje IM, Sheng X, Hansson KA, Solbrå A, Tennøe S, Saatcioglu F, et al. Cachexia does not induce
loss of myonuclei or muscle fibers during xenografted prostate cancer in mice. Acta physiologica
(Oxford, England). 2018:e13204. https://doi.org/10.1111/apha.13204 PMID: 30325108
39. Iwata M, Englund DA, Wen Y, Dungan CM, Murach KA, Vechetti IJ, et al. A novel tetracycline-respon-
sive transgenic mouse strain for skeletal muscle-specific gene expression. Skeletal muscle. 2018; 8
(1):1–8. https://doi.org/10.1186/s13395-017-0147-5 PMID: 29304851
40. Karlić R, Chung H-R, Lasserre J, Vlahovicek K, Vingron M. Histone modification levels are predictive
for gene expression. Proc National Acad Sci. 2010; 107(7):2926–31. https://doi.org/10.1073/pnas.
0909344107 PMID: 20133639
41. Preissl S, Schwaderer M, Raulf A, Hesse M, Gruning BA, Kobele C, et al. Deciphering the Epigenetic
Code of Cardiac Myocyte Transcription. Circ Res. 2015; 117(5):413–23. https://doi.org/10.1161/
CIRCRESAHA.115.306337 PMID: 26105955
42. Ramachandran K, Senagolage MD, Sommars MA, Futtner CR, Omura Y, Allred AL, et al. Dynamic
enhancers control skeletal muscle identity and reprogramming. PLoS biology. 2019; 17(10):
e3000467. https://doi.org/10.1371/journal.pbio.3000467 PMID: 31589602
43. De Micheli AJ, Spector JA, Elemento O, Cosgrove BD. A reference single-cell transcriptomic atlas of
human skeletal muscle tissue reveals bifurcated muscle stem cell populations. Skelet Muscle. 2020;
10(1):19. https://doi.org/10.1186/s13395-020-00236-3 PMID: 32624006
44. Rubenstein AB, Smith GR, Raue U, Begue G, Minchev K, Ruf-Zamojski F, et al. Single-cell transcrip-
tional profiles in human skeletal muscle. Sci Rep. 2020; 10(1):229. https://doi.org/10.1038/s41598-
019-57110-6 PMID: 31937892
PLOS GENETICS Muscle epigenetic landscape
PLOS Genetics | https://doi.org/10.1371/journal.pgen.1009907 November 9, 2021 23 / 29
45. Elmasri H, Ghelfi E, Yu CW, Traphagen S, Cernadas M, Cao H, et al. Endothelial cell-fatty acid binding
protein 4 promotes angiogenesis: role of stem cell factor/c-kit pathway. Angiogenesis. 2012; 15
(3):457–68. https://doi.org/10.1007/s10456-012-9274-0 PMID: 22562362
46. Huminiecki L, Bicknell R. In Silico Cloning of Novel Endothelial-Specific Genes. Genome Res. 2000;
10(11):1796–806. https://doi.org/10.1101/gr.150700 PMID: 11076864
47. Verissimo AR, Herbert JMJ, Heath VL, Legg JA, Sheldon H, Andre M, et al. Functionally defining the
endothelial transcriptome, from Robo4 to ECSCR. Biochem Soc T. 2009; 37(Pt 6):1214–7. https://doi.
org/10.1042/BST0371214 PMID: 19909249
48. Gillies AR, Lieber RL. Structure and function of the skeletal muscle extracellular matrix. Muscle Nerve.
2011; 44(3):318–31. https://doi.org/10.1002/mus.22094 PMID: 21949456
49. Kjaer M. Role of extracellular matrix in adaptation of tendon and skeletal muscle to mechanical load-
ing. Physiol Rev. 2004; 84(2):649–98. https://doi.org/10.1152/physrev.00031.2003 PMID: 15044685
50. Chemello F, Bean C, Cancellara P, Laveder P, Reggiani C, Lanfranchi G. Microgenomic analysis in
skeletal muscle: expression signatures of individual fast and slow myofibers. Plos One. 2011; 6(2):
e16807. https://doi.org/10.1371/journal.pone.0016807 PMID: 21364935
51. De Micheli AJ, Laurilliard EJ, Heinke CL, Ravichandran H, Fraczek P, Soueid-Baumgarten S, et al.
Single-Cell Analysis of the Muscle Stem Cell Hierarchy Identifies Heterotypic Communication Signals
Involved in Skeletal Muscle Regeneration. Cell Rep. 2020; 30(10):3583–95 e5. https://doi.org/10.
1016/j.celrep.2020.02.067 PMID: 32160558
52. Sabatier L, Chen D, Fagotto-Kaufmann C, Hubmacher D, McKee MD, Annis DS, et al. Fibrillin assem-
bly requires fibronectin. Mol Biol Cell. 2009; 20(3):846–58. https://doi.org/10.1091/mbc.e08-08-0830
PMID: 19037100
53. Tran PHT, Skrba T, Wondimu E, Galatioto G, Svensson RB, Olesen AT, et al. The influence of fibrillin-
1 and physical activity upon tendon tissue morphology and mechanical properties in mice. Physiol
Rep. 2019; 7(21):e14267. https://doi.org/10.14814/phy2.14267 PMID: 31724332
54. Kawasaki BT, Farrar WL. Cancer stem cells, CD200 and immunoevasion. Trends Immunol. 2008; 29
(10):464–8. https://doi.org/10.1016/j.it.2008.07.005 PMID: 18775673
55. Draber P, Stepanek O, Hrdinka M, Drobek A, Chmatal L, Mala L, et al. LST1/A is a myeloid leukocyte-
specific transmembrane adaptor protein recruiting protein tyrosine phosphatases SHP-1 and SHP-2
to the plasma membrane. J Biol Chem. 2012; 287(27):22812–21. https://doi.org/10.1074/jbc.M112.
339143 PMID: 22589543
56. Ratajczak MZ, Majka M, Kucia M, Drukala J, Pietrzkowski Z, Peiper S, et al. Expression of functional
CXCR4 by muscle satellite cells and secretion of SDF-1 by muscle-derived fibroblasts is associated
with the presence of both muscle progenitors in bone marrow and hematopoietic stem/progenitor cells
in muscles. Stem Cells. 2003; 21(3):363–71. https://doi.org/10.1634/stemcells.21-3-363 PMID:
12743331
57. Sherwood RI, Christensen JL, Conboy IM, Conboy MJ, Rando TA, Weissman IL, et al. Isolation of
adult mouse myogenic progenitors: functional heterogeneity of cells within and engrafting skeletal
muscle. Cell. 2004; 119(4):543–54. https://doi.org/10.1016/j.cell.2004.10.021 PMID: 15537543
58. Farina NH, Hausburg M, Betta ND, Pulliam C, Srivastava D, Cornelison D, et al. A role for RNA post-
transcriptional regulation in satellite cell activation. Skelet Muscle. 2012; 2(1):21. https://doi.org/10.
1186/2044-5040-2-21 PMID: 23046558
59. Cornelison DD, Filla MS, Stanley HM, Rapraeger AC, Olwin BB. Syndecan-3 and syndecan-4 specifi-
cally mark skeletal muscle satellite cells and are implicated in satellite cell maintenance and muscle
regeneration. Dev Biol. 2001; 239(1):79–94. https://doi.org/10.1006/dbio.2001.0416 PMID: 11784020
60. Tanaka KK, Hall JK, Troy AA, Cornelison DD, Majka SM, Olwin BB. Syndecan-4-expressing muscle
progenitor cells in the SP engraft as satellite cells during muscle regeneration. Cell Stem Cell. 2009; 4
(3):217–25. https://doi.org/10.1016/j.stem.2009.01.016 PMID: 19265661
61. Fukada S, Ma Y, Ohtani T, Watanabe Y, Murakami S, Yamaguchi M. Isolation, characterization, and
molecular regulation of muscle stem cells. Front Physiol. 2013; 4:317. https://doi.org/10.3389/fphys.
2013.00317 PMID: 24273513
62. Low M, Eisner C, Rossi F. Fibro/Adipogenic Progenitors (FAPs): Isolation by FACS and Culture. Meth-
ods Mol Biol. 2017; 1556:179–89. https://doi.org/10.1007/978-1-4939-6771-1_9 PMID: 28247350
63. Kato K, Radbruch A. Isolation and characterization of CD34+ hematopoietic stem cells from human
peripheral blood by high-gradient magnetic cell sorting. Cytometry. 1993; 14(4):384–92. https://doi.
org/10.1002/cyto.990140407 PMID: 7685679
64. Berenson RJ, Andrews RG, Bensinger WI, Kalamasz D, Knitter G, Buckner CD, et al. Antigen CD34+
marrow cells engraft lethally irradiated baboons. J Clin Invest. 1988; 81(3):951–5. https://doi.org/10.
1172/JCI113409 PMID: 2893812
PLOS GENETICS Muscle epigenetic landscape
PLOS Genetics | https://doi.org/10.1371/journal.pgen.1009907 November 9, 2021 24 / 29
65. Montarras D, Morgan J, Collins C, Relaix F, Zaffran S, Cumano A, et al. Direct isolation of satellite
cells for skeletal muscle regeneration. Science. 2005; 309(5743):2064–7. https://doi.org/10.1126/
science.1114758 PMID: 16141372
66. Creyghton MP, Cheng AW, Welstead GG, Kooistra T, Carey BW, Steine EJ, et al. Histone H3K27ac
separates active from poised enhancers and predicts developmental state. Proceedings of the
National Academy of Sciences. 2010; 107(50):21931–6. https://doi.org/10.1073/pnas.1016071107
PMID: 21106759
67. Heintzman ND, Hon GC, Hawkins RD, Kheradpour P, Stark A, Harp LF, et al. Histone modifications at
human enhancers reflect global cell-type-specific gene expression. Nature. 2009; 459(7243):108–12.
https://doi.org/10.1038/nature07829 PMID: 19295514
68. Shen Y, Yue F, McCleary DF, Ye Z, Edsall L, Kuan S, et al. A map of the cis-regulatory sequences in
the mouse genome. Nature. 2012; 488(7409):116–20. https://doi.org/10.1038/nature11243 PMID:
22763441
69. Heinz S, Romanoski CE, Benner C, Glass CK. The selection and function of cell type-specific enhanc-
ers. Nat Rev Mol Cell Biol. 2015; 16(3):144–54. https://doi.org/10.1038/nrm3949 PMID: 25650801
70. Andersson R, Gebhard C, Miguel-Escalada I, Hoof I, Bornholdt J, Boyd M, et al. An atlas of active
enhancers across human cell types and tissues. Nature. 2014; 507(7493):455–61. https://doi.org/10.
1038/nature12787 PMID: 24670763
71. Schiaffino S, Reggiani C. Molecular diversity of myofibrillar proteins: gene regulation and functional
significance. Physiol Rev. 1996; 76(2):371–423. https://doi.org/10.1152/physrev.1996.76.2.371
PMID: 8618961
72. Egner IM, Bruusgaard JC, Eftestøl E, Gundersen K. A cellular memory mechanism aids overload
hypertrophy in muscle long after an episodic exposure to anabolic steroids. J Physiology. 2013; 591
(24):6221–30. https://doi.org/10.1113/jphysiol.2013.264457 PMID: 24167222
73. Li A, Nelson SR, Rahmanseresht S, Braet F, Cornachione AS, Previs SB, et al. Skeletal MyBP-C iso-
forms tune the molecular contractility of divergent skeletal muscle systems. Proc Natl Acad Sci U S A.
2019; 116(43):21882–92. https://doi.org/10.1073/pnas.1910549116 PMID: 31591218
74. Dhoot GK, Hales MC, Grail BM, Perry SV. The isoforms of C protein and their distribution in mamma-
lian skeletal muscle. J Muscle Res Cell Motil. 1985; 6(4):487–505. https://doi.org/10.1007/
BF00712585 PMID: 2933427
75. Terry EE, Zhang X, Hoffmann C, Hughes LD, Lewis SA, Li J, et al. Transcriptional profiling reveals
extraordinary diversity among skeletal muscle tissues. Elife. 2018; 7:1334. https://doi.org/10.7554/
eLife.34613 PMID: 29809149
76. Berquin A, Lebacq J. Parvalbumin, Labile Heat and Slowing of Relaxation in Mouse Soleus and Exten-
sor Digitorum Longus Muscles. J Physiol-London. 1992; 445:601–16. https://doi.org/10.1113/jphysiol.
1992.sp018942 PMID: 1501147
77. Sakakibara I, Santolini M, Ferry A, Hakim V, Maire P. Six homeoproteins and a Iinc-RNA at the fast
MYH locus lock fast myofiber terminal phenotype. Plos Genet. 2014; 10(5):e1004386. https://doi.org/
10.1371/journal.pgen.1004386 PMID: 24852826
78. Liu L, Ding C, Fu T, Feng Z, Lee JE, Xiao L, et al. Histone methyltransferase MLL4 controls myofiber
identity and muscle performance through MEF2 interaction. J Clin Invest. 2020; 130(9):4710–25.
https://doi.org/10.1172/JCI136155 PMID: 32544095
79. Davis CA, Hitz BC, Sloan CA, Chan ET, Davidson JM, Gabdank I, et al. The Encyclopedia of DNA ele-
ments (ENCODE): data portal update. Nucleic Acids Research. 2018; 46(D1):D794–D801. https://doi.
org/10.1093/nar/gkx1081 PMID: 29126249
80. Consortium EP. An integrated encyclopedia of DNA elements in the human genome. Nature. 2012;
489(7414):57–74. https://doi.org/10.1038/nature11247 PMID: 22955616
81. Neph S, Vierstra J, Stergachis AB, Reynolds AP, Haugen E, Vernot B, et al. An expansive human reg-
ulatory lexicon encoded in transcription factor footprints. Nature. 2012; 489(7414):83–90. https://doi.
org/10.1038/nature11212 PMID: 22955618
82. Bergmann O, Zdunek S, Alkass K, Druid H, Bernard S, Frisen J. Identification of cardiomyocyte nuclei
and assessment of ploidy for the analysis of cell turnover. Exp Cell Res. 2011; 317(2):188–94. https://
doi.org/10.1016/j.yexcr.2010.08.017 PMID: 20828558
83. Begue G, Raue U, Jemiolo B, Trappe S. DNA methylation assessment from human slow- and fast-
twitch skeletal muscle fibers. Journal of applied physiology (Bethesda, Md: 1985). 2017; 122(4):952–
67. https://doi.org/10.1152/japplphysiol.00867.2016 PMID: 28057818
84. Liu C, Wang M, Wei X, Wu L, Xu J, Dai X, et al. An ATAC-seq atlas of chromatin accessibility in mouse
tissues. Scientific data. 2019; 6(1):65. https://doi.org/10.1038/s41597-019-0071-0 PMID: 31110271
PLOS GENETICS Muscle epigenetic landscape
PLOS Genetics | https://doi.org/10.1371/journal.pgen.1009907 November 9, 2021 25 / 29
85. Dos Santos M, Backer S, Saintpierre B, Izac B, Andrieu M, Letourneur F, et al. Single-nucleus RNA-
seq and FISH identify coordinated transcriptional activity in mammalian myofibers. Nat Commun.
2020; 11(1):5102. https://doi.org/10.1038/s41467-020-18789-8 PMID: 33037211
86. Chemello F, Grespi F, Zulian A, Cancellara P, Hebert-Chatelain E, Martini P, et al. Transcriptomic
Analysis of Single Isolated Myofibers Identifies miR-27a-3p and miR-142-3p as Regulators of Metabo-
lism in Skeletal Muscle. Cell Reports. 2019; 26(13):3784–97.e8. https://doi.org/10.1016/j.celrep.2019.
02.105 PMID: 30917329
87. Murgia M, Nagaraj N, Deshmukh AS, Zeiler M, Cancellara P, Moretti I, et al. Single muscle fiber prote-
omics reveals unexpected mitochondrial specialization. 2015; 16(3):387–95.
88. Vikstrom KL, Seiler SH, Sohn RL, Strauss M, Weiss A, Welikson RE, et al. The vertebrate myosin
heavy chain: genetics and assembly properties. Cell Struct Funct. 1997; 22(1):123–9. https://doi.org/
10.1247/csf.22.123 PMID: 9113398
89. Peng XL, So KK, He L, Zhao Y, Zhou J, Li Y, et al. MyoD- and FoxO3-mediated hotspot interaction
orchestrates super-enhancer activity during myogenic differentiation. Nucleic Acids Res. 2017; 45
(15):8785–805. https://doi.org/10.1093/nar/gkx488 PMID: 28575289
90. Adam RC, Yang H, Rockowitz S, Larsen SB, Nikolova M, Oristian DS, et al. Pioneer factors govern
super-enhancer dynamics in stem cell plasticity and lineage choice. Nature. 2015; 521(7552):366–70.
https://doi.org/10.1038/nature14289 PMID: 25799994
91. Whyte WA, Orlando DA, Hnisz D, Abraham BJ, Lin CY, Kagey MH, et al. Master transcription factors
and mediator establish super-enhancers at key cell identity genes. Cell. 2013; 153(2):307–19. https://
doi.org/10.1016/j.cell.2013.03.035 PMID: 23582322
92. Parker SC, Stitzel ML, Taylor DL, Orozco JM, Erdos MR, Akiyama JA, et al. Chromatin stretch
enhancer states drive cell-specific gene regulation and harbor human disease risk variants. Proc Natl
Acad Sci U S A. 2013; 110(44):17921–6. https://doi.org/10.1073/pnas.1317023110 PMID: 24127591
93. Rana ZA, Gundersen K, Buonanno A. Activity-dependent repression of muscle genes by NFAT. Proc
National Acad Sci. 2008; 105(15):5921–6. https://doi.org/10.1073/pnas.0801330105 PMID: 18408153
94. Nylen C, Aoi W, Abdelmoez AM, Lassiter DG, Lundell LS, Wallberg-Henriksson H, et al. IL6 and LIF
mRNA expression in skeletal muscle is regulated by AMPK and the transcription factors NFYC,
ZBTB14, and SP1. Am J Physiol Endocrinol Metab. 2018; 315(5):E995–E1004. https://doi.org/10.
1152/ajpendo.00398.2017 PMID: 29688769
95. Neph S, Stergachis AB, Reynolds A, Sandstrom R, Borenstein E, Stamatoyannopoulos JA. Circuitry
and Dynamics of Human Transcription Factor Regulatory Networks. Cell. 2012; 150(6):1274–86.
https://doi.org/10.1016/j.cell.2012.04.040 PMID: 22959076
96. Rhie SK, Yao L, Luo Z, Witt H, Schreiner S, Guo Y, et al. ZFX acts as a transcriptional activator in mul-
tiple types of human tumors by binding downstream of transcription start sites at the majority of CpG
island promoters. Genome Res. 2018.
97. Hou N, Ye B, Li X, Margulies KB, Xu H, Wang X, et al. Transcription Factor 7-like 2 Mediates Canonical
Wnt/beta-Catenin Signaling and c-Myc Upregulation in Heart Failure. Circ Heart Fail. 2016; 9(6).
https://doi.org/10.1161/CIRCHEARTFAILURE.116.003010 PMID: 27301468
98. Pillon NJ, Gabriel BM, Dollet L, Smith JAB, Sardon Puig L, Botella J, et al. Transcriptomic profiling of
skeletal muscle adaptations to exercise and inactivity. Nat Commun. 2020; 11(1):470. https://doi.org/
10.1038/s41467-019-13869-w PMID: 31980607
99. Uhlen M, Bjorling E, Agaton C, Szigyarto CA, Amini B, Andersen E, et al. A human protein atlas for nor-
mal and cancer tissues based on antibody proteomics. Mol Cell Proteomics. 2005; 4(12):1920–32.
https://doi.org/10.1074/mcp.M500279-MCP200 PMID: 16127175
100. Uhlen M, Fagerberg L, Hallstrom BM, Lindskog C, Oksvold P, Mardinoglu A, et al. Proteomics. Tissue-
based map of the human proteome. Science. 2015; 347(6220):1260419. https://doi.org/10.1126/
science.1260419 PMID: 25613900
101. Armstrong DD, Esser KA. Wnt/beta-catenin signaling activates growth-control genes during overload-
induced skeletal muscle hypertrophy. Am J Physiol Cell Physiol. 2005; 289(4):C853–9. https://doi.org/
10.1152/ajpcell.00093.2005 PMID: 15888552
102. Taglietti V, Maroli G, Cermenati S, Monteverde S, Ferrante A, Rossi G, et al. Nfix Induces a Switch in
Sox6 Transcriptional Activity to Regulate MyHC-I Expression in Fetal Muscle. Cell Rep. 2016; 17
(9):2354–66. https://doi.org/10.1016/j.celrep.2016.10.082 PMID: 27880909
103. Piette J, Klarsfeld A, Changeux JP. Interaction of nuclear factors with the upstream region of the a-
subunit gene of chicken muscle acetylcholine receptor: variations with muscle differentiation and
denervation. Embo J. 1989; 8(687):687–94.
PLOS GENETICS Muscle epigenetic landscape
PLOS Genetics | https://doi.org/10.1371/journal.pgen.1009907 November 9, 2021 26 / 29
104. Calabria E, Ciciliot S, Moretti I, Garcia M, Picard A, Dyar KA, et al. NFAT isoforms control activity-
dependent muscle fiber type specification. Proc National Acad Sci. 2009; 106(32):13335–40. https://
doi.org/10.1073/pnas.0812911106 PMID: 19633193
105. Gundersen K. J Exp Biol. 2016; 219(2):235–42.
106. Anderson CM, Hu JX, Barnes RM, Heidt AB, Cornelissen I, Black BL. Myocyte enhancer factor 2C
function in skeletal muscle is required for normal growth and glucose metabolism in mice. Skeletal
Muscle. 2015;5. https://doi.org/10.1186/s13395-015-0030-1 PMID: 25729564
107. Potthoff MJ, Wu H, Arnold MA, Shelton JM, Backs J, McAnally J, et al. Histone deacetylase degrada-
tion and MEF2 activation promote the formation of slow-twitch myofibers. Journal of Clinical Investiga-
tion. 2007; 117(9):2459–67. https://doi.org/10.1172/JCI31960 PMID: 17786239
108. Sartorelli V, Huang J, Hamamori Y, Kedes L. Molecular mechanisms of myogenic coactivation by
p300: direct interaction with the activation domain of MyoD and with the MADS box of MEF2C. Mol
Cell Biol. 1997; 17(2):1010–26. https://doi.org/10.1128/MCB.17.2.1010 PMID: 9001254
109. He J, Ye J, Cai Y, Riquelme C, Liu JO, Liu X, et al. Structure of p300 bound to MEF2 on DNA reveals a
mechanism of enhanceosome assembly. Nucleic Acids Res. 2011; 39(10):4464–74. https://doi.org/
10.1093/nar/gkr030 PMID: 21278418
110. Wu H, Rothermel B, Kanatous S, Rosenberg P, Naya FJ, Shelton JM, et al. Activation of MEF2 by
muscle activity is mediated through a calcineurin-dependent pathway. Embo J. 2001; 20(22):6414–
23. https://doi.org/10.1093/emboj/20.22.6414 PMID: 11707412
111. Xu Q, Wu Z. The insulin-like growth factor-phosphatidylinositol 3-kinase-Akt signaling pathway regu-
lates myogenin expression in normal myogenic cells but not in rhabdomyosarcoma-derived RD cells. J
Biol Chem. 2000; 275(47):36750–7. https://doi.org/10.1074/jbc.M005030200 PMID: 10973962
112. Wu H, Naya FJ, McKinsey TA, Mercer B, Shelton JM, Chin ER, et al. MEF2 responds to multiple cal-
cium-regulated signals in the control of skeletal muscle fiber type. Embo J. 2000; 19(9):1963–73.
https://doi.org/10.1093/emboj/19.9.1963 PMID: 10790363
113. Wei X, Sun W, Fan R, Hahn J, Joetham A, Li G, et al. MEF2C regulates c-Jun but not TNF-alpha gene
expression in stimulated mast cells. Eur J Immunol. 2003; 33(10):2903–9. https://doi.org/10.1002/eji.
200324127 PMID: 14515274
114. McKinsey TA, Zhang CL, Olson EN. MEF2: a calcium-dependent regulator of cell division, differentia-
tion and death. Trends Biochem Sci. 2002; 27(1):40–7. https://doi.org/10.1016/s0968-0004(01)
02031-x PMID: 11796223
115. Potthoff MJ, Olson EN. MEF2: a central regulator of diverse developmental programs. Development.
2007; 134(23):4131–40. https://doi.org/10.1242/dev.008367 PMID: 17959722
116. Baskin KK, Makarewich CA, DeLeon SM, Ye W, Chen B, Beetz N, et al. MED12 regulates a transcrip-
tional network of calcium-handling genes in the heart. JCI Insight. 2017;2(14). https://doi.org/10.1172/
jci.insight.91920 PMID: 28724790
117. Burri L, Thoresen GH, Berge RK. The Role of PPARalpha Activation in Liver and Muscle. PPAR Res.
2010;2010. https://doi.org/10.1155/2010/542359 PMID: 20847941
118. Finck BN, Bernal-Mizrachi C, Han DH, Coleman T, Sambandam N, LaRiviere LL, et al. A potential link
between muscle peroxisome proliferator- activated receptor-alpha signaling and obesity-related diabe-
tes. Cell Metab. 2005; 1(2):133–44. https://doi.org/10.1016/j.cmet.2005.01.006 PMID: 16054054
119. Fan W, Evans R. PPARs and ERRs: molecular mediators of mitochondrial metabolism. Current Opin-
ion in Cell Biology. 2015; 33:49–54. https://doi.org/10.1016/j.ceb.2014.11.002 PMID: 25486445
120. Lunde IG, Ekmark M, Rana ZA, Buonanno A, Gundersen K. PPARdelta expression is influenced by
muscle activity and induces slow muscle properties in adult rat muscles after somatic gene transfer. J
Physiol. 2007; 582(Pt 3):1277–87. https://doi.org/10.1113/jphysiol.2007.133025 PMID: 17463039
121. Goldstein I, Baek S, Presman DM, Paakinaho V, Swinstead EE, Hager GL. Transcription factor assis-
ted loading and enhancer dynamics dictate the hepatic fasting response. Genome Res. 2017; 27
(3):427–39. https://doi.org/10.1101/gr.212175.116 PMID: 28031249
122. Karam CN, Warren CM, Henze M, Banke NH, Lewandowski ED, Solaro RJ. Peroxisome proliferator-
activated receptor-alpha expression induces alterations in cardiac myofilaments in a pressure-over-
load model of hypertrophy. American Journal of Physiology-Heart and Circulatory Physiology. 2017;
312(4):H681–H90. https://doi.org/10.1152/ajpheart.00469.2016 PMID: 28130336
123. Gan Z, Rumsey J, Hazen BC, Lai L, Leone TC, Vega RB, et al. Nuclear receptor/microRNA circuitry
links muscle fiber type to energy metabolism. J Clin Invest. 2013; 123(6):2564–75. https://doi.org/10.
1172/JCI67652 PMID: 23676496
124. Grifone R, Laclef C, Spitz F, Lopez S, Demignon J, Guidotti JE, et al. Six1 and Eya1 expression can
reprogram adult muscle from the slow-twitch phenotype into the fast-twitch phenotype. Mol Cell Biol.
2004; 24(14):6253–67. https://doi.org/10.1128/MCB.24.14.6253-6267.2004 PMID: 15226428
PLOS GENETICS Muscle epigenetic landscape
PLOS Genetics | https://doi.org/10.1371/journal.pgen.1009907 November 9, 2021 27 / 29
125. Hughes SM, Taylor JM, Tapscott SJ, Gurley CM, Carter WJ, Peterson CA. Selective accumulation of
MyoD and myogenin mRNAs in fast and slow adult skeletal muscle is controlled by innervation and
hormones. Development. 1993; 118(4):1137–47. PMID: 8269844
126. Li L, Liang Y, Kang L, Liu Y, Gao S, Chen S, et al. Transcriptional Regulation of the Warburg Effect in
Cancer by SIX1. Cancer Cell. 2018; 33(3):368–85.e7. https://doi.org/10.1016/j.ccell.2018.01.010
PMID: 29455928
127. Sakakibara I, Wurmser M, Santos MD, Santolini M, Ducommun S, Davaze R, et al. Six1 homeoprotein
drives myofiber type IIA specialization in soleus muscle. Skeletal muscle. 2016; 6(1):30. https://doi.
org/10.1186/s13395-016-0102-x PMID: 27597886
128. Ekmark M, Rana ZA, Stewart G, Hardie DG, Gundersen K. De-phosphorylation of MyoD is linking
nerve-evoked activity to fast myosin heavy chain expression in rodent adult skeletal muscle. J Physiol.
2007; 584(Pt 2):637–50. https://doi.org/10.1113/jphysiol.2007.141457 PMID: 17761773
129. Blum R. Activation of muscle enhancers by MyoD and epigenetic modifiers. J Cell Biochem. 2014; 115
(11):1855–67. https://doi.org/10.1002/jcb.24854 PMID: 24905980
130. Hernandez-Hernandez JM, Garcia-Gonzalez EG, Brun CE, Rudnicki MA. The myogenic regulatory
factors, determinants of muscle development, cell identity and regeneration. Semin Cell Dev Biol.
2017; 72:10–8. https://doi.org/10.1016/j.semcdb.2017.11.010 PMID: 29127045
131. Blum R, Dynlacht BD. The role of MyoD1 and histone modifications in the activation of muscle enhanc-
ers. Epigenetics. 2013; 8(8):778–84. https://doi.org/10.4161/epi.25441 PMID: 23880568
132. Puri PL, Avantaggiati ML, Balsano C, Sang N, Graessmann A, Giordano A, et al. p300 is required for
MyoD-dependent cell cycle arrest and muscle-specific gene transcription. Embo J. 1997; 16(2):369–
83. https://doi.org/10.1093/emboj/16.2.369 PMID: 9029156
133. Polesskaya A, Naguibneva I, Duquet A, Bengal E, Robin P, Harel-Bellan A. Interaction between acety-
lated MyoD and the bromodomain of CBP and/or p300. Mol Cell Biol. 2001; 21(16):5312–20. https://
doi.org/10.1128/MCB.21.16.5312-5320.2001 PMID: 11463815
134. Zhao Y, Zhou J, He L, Li Y, Yuan J, Sun K, et al. MyoD induced enhancer RNA interacts with hnRNPL
to activate target gene transcription during myogenic differentiation. Nat Commun. 2019; 10(1):5787.
https://doi.org/10.1038/s41467-019-13598-0 PMID: 31857580
135. Ledsaak M, Bengtsen M, Molvaersmyr A-K, Fuglerud BM, Matre V, Eskeland R, et al. PIAS1 binds
p300 and behaves as a coactivator or corepressor of the transcription factor c-Myb dependent on
SUMO-status. Biochimica et Biophysica Acta (BBA)-Gene Regulatory Mechanisms. 2016; 1859
(5):705–18. https://doi.org/10.1016/j.bbagrm.2016.03.011 PMID: 27032383
136. Stock JK, Giadrossi S, Casanova M, Brookes E, Vidal M, Koseki H, et al. Ring1-mediated ubiquitina-
tion of H2A restrains poised RNA polymerase II at bivalent genes in mouse ES cells. Nat Cell Biol.
2007; 9(12):1428–35. https://doi.org/10.1038/ncb1663 PMID: 18037880
137. Morton JJ, Bird G, Refaeli Y, Jimeno A. Humanized Mouse Xenograft Models: Narrowing the Tumor-
Microenvironment Gap. Cancer Res. 2016; 76(21):6153–8. https://doi.org/10.1158/0008-5472.CAN-
16-1260 PMID: 27587540
138. Li H, Durbin R. Fast and accurate short read alignment with Burrows-Wheeler transform. Bioinformat-
ics. 2009; 25(14):1754–60. https://doi.org/10.1093/bioinformatics/btp324 PMID: 19451168
139. Li H, Handsaker B, Wysoker A, Fennell T, Ruan J, Homer N, et al. The Sequence Alignment/Map for-
mat and SAMtools. Bioinformatics. 2009; 25(16):2078–9. https://doi.org/10.1093/bioinformatics/
btp352 PMID: 19505943
140. Zhang Y, Lin YH, Johnson TD, Rozek LS, Sartor MA. PePr: a peak-calling prioritization pipeline to
identify consistent or differential peaks from replicated ChIP-Seq data. Bioinformatics. 2014; 30
(18):2568–75. https://doi.org/10.1093/bioinformatics/btu372 PMID: 24894502
141. Rodrıguez-Castañeda F, Lemma RB, Cuervo I, Bengtsen M, Moen LM, Ledsaak M, et al. The SUMO
protease SENP1 and the chromatin remodeler CHD3 interact and jointly affect chromatin accessibility
and gene expression. J Biol Chem. 2018; 293(40):15439–54. https://doi.org/10.1074/jbc.RA118.
002844 PMID: 30082317
142. Ramırez F, Ryan DP, acids BGN. deepTools2: a next generation web server for deep-sequencing
data analysis. academicoupcom. https://doi.org/10.1093/nar/gkw257 PMID: 27079975
143. McLean CY, Bristor D, Hiller M, Clarke SL, Schaar BT, Lowe CB, et al. GREAT improves functional
interpretation of cis-regulatory regions. Nat Biotechnol. 2010; 28(5):495–501. https://doi.org/10.1038/
nbt.1630 PMID: 20436461
144. Huang da W, Sherman BT, Lempicki RA. Bioinformatics enrichment tools: paths toward the compre-
hensive functional analysis of large gene lists. Nucleic Acids Res. 2009; 37(1):1–13. https://doi.org/10.
1093/nar/gkn923 PMID: 19033363
PLOS GENETICS Muscle epigenetic landscape
PLOS Genetics | https://doi.org/10.1371/journal.pgen.1009907 November 9, 2021 28 / 29
145. Huang DW, Sherman BT, Lempicki RA. Systematic and integrative analysis of large gene lists using
DAVID bioinformatics resources. Nat Protoc. 2009; 4(1):44–57. https://doi.org/10.1038/nprot.2008.
211 PMID: 19131956
146. Supek F, Bosnjak M, Skunca N, Smuc T. REVIGO summarizes and visualizes long lists of gene ontol-
ogy terms. Plos One. 2011; 6(7):e21800. https://doi.org/10.1371/journal.pone.0021800 PMID:
21789182
147. Shannon P, Markiel A, Ozier O, Baliga NS, Wang JT, Ramage D, et al. Cytoscape: a software environ-
ment for integrated models of biomolecular interaction networks. Genome Res. 2003; 13(11):2498–
504. https://doi.org/10.1101/gr.1239303 PMID: 14597658
148. McLeay RC, Bailey TL. Motif Enrichment Analysis: a unified framework and an evaluation on ChIP
data. Bmc Bioinformatics. 2010; 11(1):1–11. https://doi.org/10.1186/1471-2105-11-165 PMID:
20356413
149. Edgar R, Domrachev M, Lash AE. Gene Expression Omnibus: NCBI gene expression and hybridiza-
tion array data repository. Nucleic Acids Res. 2002; 30(1):207–10. https://doi.org/10.1093/nar/30.1.
207 PMID: 11752295
150. Barrett T, Wilhite SE, Ledoux P, Evangelista C, Kim IF, Tomashevsky M, et al. NCBI GEO: archive for
functional genomics data sets—update. Nucleic Acids Res. 2013; 41(Database issue):D991–5.
https://doi.org/10.1093/nar/gks1193 PMID: 23193258
151. Huang J, Gurung B, Wan B, Matkar S, Veniaminova NA, Wan K, et al. The same pocket in menin
binds both MLL and JUND but has opposite effects on transcription. Nature. 2012; 482(7386):542–6.
https://doi.org/10.1038/nature10806 PMID: 22327296
PLOS GENETICS Muscle epigenetic landscape
PLOS Genetics | https://doi.org/10.1371/journal.pgen.1009907 November 9, 2021 29 / 29