integrated para-xylene & purified terephthalic acid (px-pta
TRANSCRIPT
EIA Report
1 HECS/EIA/IOCL Paradip/Final/24.06.2021/1051
ENVIRONMENTAL IMPACT ASSESSMENT REPORT
For
Integrated Para-Xylene & Purified
Terephthalic Acid (PX-PTA) Project within
the existing Refinery Complex At
IOCL Paradip Refinery & Petrochemical Complex, Paradip
Village: Abhaychandrapur
P.O. Jhimani - Kujang
Taluk: Kujang
District: Jagatsinghpur
State: Odisha
[Project termed under Schedule 5(c) Category ‘A’ – Petro-chemical
complexes (industries based on processing of petroleum fractions & natural
gas and/or reforming to aromatics” as per EIA Notification 2006 and its
Amendments]
Submitted by:
INDIAN OIL CORPORATION LIMITED, PARADIP REFINERY
EIA CONSULTANT:
M/s. Hubert Enviro Care Systems (p) Limited
June 2021
EIA Report
2 HECS/EIA/IOCL Paradip/Final/24.06.2021/1051
Declaration by the Head of the Accredited Consultant Organization
I, Dr. J. R. Moses hereby, confirm that the below mentioned experts prepared the EIA/EMP
for the “Integrated Para-Xylene & Purified Terephthalic Acid (PX-PTA) Project within
the existing Refinery Complex” at Abhaychandrapur village, Jagatsinghpur District,
Odisha State by M/s. Indian Oil Corporation Limited and also confirms that I shall be
fully accountable for any misleading information mentioned in this statement.
Signature:
Date: 24-06-2021
Name: Dr. J.R Moses
Designation: CEO
Name of the EIA Consultant Organization: Hubert Enviro Care Systems (p) Ltd., Chennai.
NABET Certificate No & Validity: NABET/EIA/1922/RA 0172 Valid up to 13/10/2022.
EIA Report
3 HECS/EIA/IOCL Paradip/Final/24.06.2021/1051
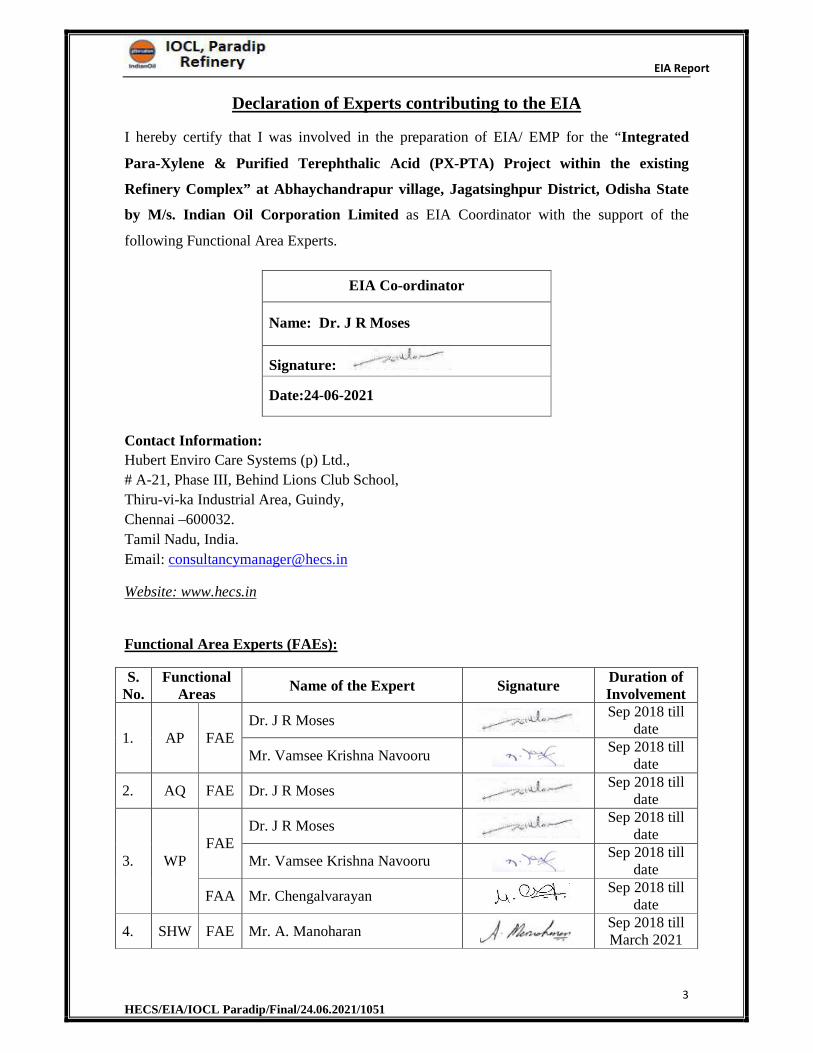
Declaration of Experts contributing to the EIA
I hereby certify that I was involved in the preparation of EIA/ EMP for the “Integrated
Para-Xylene & Purified Terephthalic Acid (PX-PTA) Project within the existing
Refinery Complex” at Abhaychandrapur village, Jagatsinghpur District, Odisha State
by M/s. Indian Oil Corporation Limited as EIA Coordinator with the support of the
following Functional Area Experts.
EIA Co-ordinator
Name: Dr. J R Moses
Signature:
Date:24-06-2021
Contact Information:
Hubert Enviro Care Systems (p) Ltd.,
# A-21, Phase III, Behind Lions Club School,
Thiru-vi-ka Industrial Area, Guindy,
Chennai –600032.
Tamil Nadu, India.
Email: [email protected]
Website: www.hecs.in
Functional Area Experts (FAEs):
S. No.
Functional Areas
Name of the Expert Signature Duration of Involvement
1. AP FAEDr. J R Moses
Sep 2018 till date
Mr. Vamsee Krishna Navooru Sep 2018 till
date
2. AQ FAE Dr. J R Moses Sep 2018 till
date
3. WP FAE
Dr. J R Moses Sep 2018 till
date
Mr. Vamsee Krishna Navooru Sep 2018 till
date
FAA Mr. Chengalvarayan Sep 2018 till
date
4. SHW FAE Mr. A. Manoharan Sep 2018 till March 2021
EIA Report
4 HECS/EIA/IOCL Paradip/Final/24.06.2021/1051
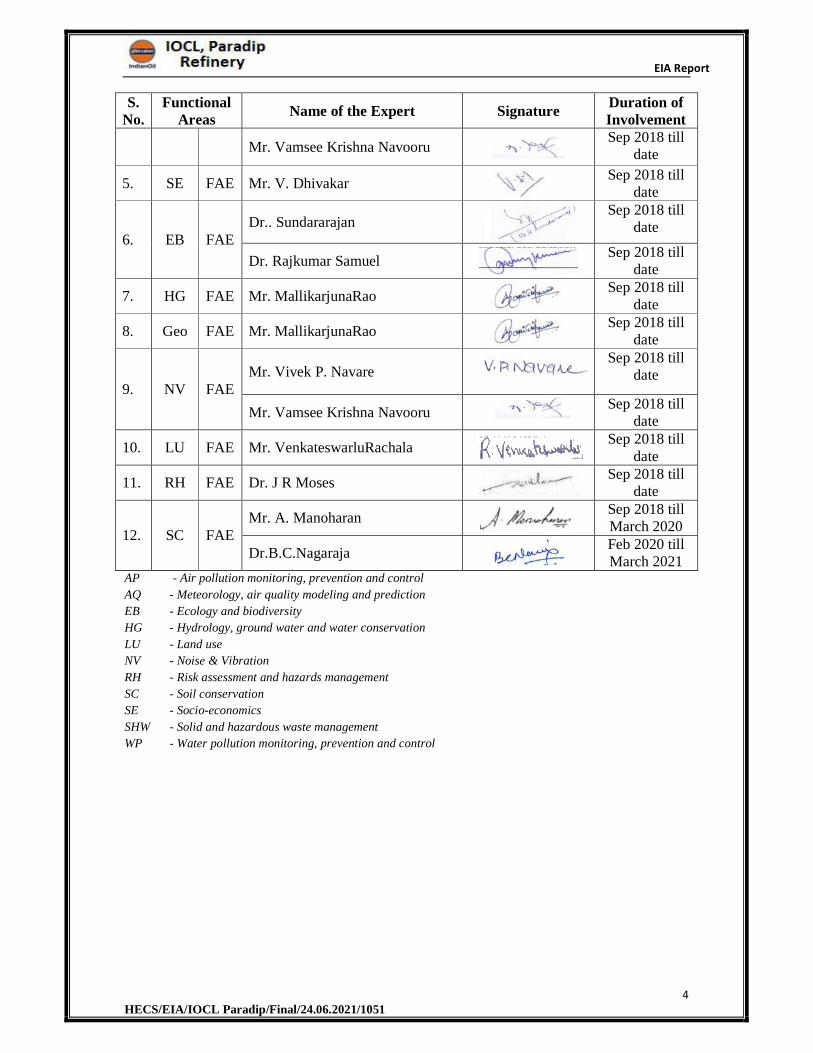
S. No.
Functional Areas
Name of the Expert Signature Duration of Involvement
Mr. Vamsee Krishna Navooru Sep 2018 till
date
5. SE FAE Mr. V. Dhivakar Sep 2018 till
date
6. EB FAEDr.. Sundararajan
Sep 2018 till date
Dr. Rajkumar Samuel Sep 2018 till
date
7. HG FAE Mr. MallikarjunaRao Sep 2018 till
date
8. Geo FAE Mr. MallikarjunaRao Sep 2018 till
date
9. NV FAEMr. Vivek P. Navare
Sep 2018 till date
Mr. Vamsee Krishna Navooru Sep 2018 till
date
10. LU FAE Mr. VenkateswarluRachala Sep 2018 till
date
11. RH FAE Dr. J R Moses Sep 2018 till
date
12. SC FAEMr. A. Manoharan
Sep 2018 till March 2020
Dr.B.C.Nagaraja Feb 2020 till March 2021
AP - Air pollution monitoring, prevention and control
AQ - Meteorology, air quality modeling and prediction
EB - Ecology and biodiversity
HG - Hydrology, ground water and water conservation
LU - Land use
NV - Noise & Vibration
RH - Risk assessment and hazards management
SC - Soil conservation
SE - Socio-economics
SHW - Solid and hazardous waste management
WP - Water pollution monitoring, prevention and control
EIA Report
5 HECS/EIA/IOCL Paradip/Final/24.06.2021/1051
Acknowledgement
The following personnel are gratefully acknowledged for their fullest support in collection,
compilation of needful data regarding the project and kind cooperation in fulfilling the report
on Environmental Impact Assessment (EIA)/EMP for “Integrated Para-Xylene & Purified
Terephthalic Acid (PX-PTA) Project within the existing Refinery Complex” at
Abhaychandrapur village, Jagatsinghpur District, Odisha State by M/s. Indian Oil
Corporation Limited
M/s. Indian Oil Corporation Limited
1) Mr. BR Malik – Chief General Manager (HSE)
2) Mr. Sarvesh Kumar – Deputy General Manager (HSE)
3) Mr. SF Hashmy – Chief Manager (HSE)
4) Mr. B.Barla – Senior Manager (HSE)
M/s Hubert Enviro Care System Private Limited
1) Dr. J R Moses (CEO and EIA Coordinator)
2) Dr. Raj Kumar Samuel (Director- Technical)
3) Mr. Vamsee Krishna Navooru (Consultancy Head)
4) Mr. Manoj Kumar (Risk Engineer)
5) Ms. S. Rekha (Trainee Engineer)
6) Mr.M. Rabik Raja (Trainee Engineer)
EIA Report
6 HECS/EIA/IOCL Paradip/Final/24.06.2021/1051
Contents
CHAPTER 1 ................................................................................................................... 26
1 INTRODUCTION ..................................................................................................... 27
1.1 Introduction to Project & Project Proponent .......................................................... 27
1.2 Purpose of the EIA report ...................................................................................... 30
1.3 Brief description of the Project .............................................................................. 30
1.4 EIA cost ................................................................................................................ 31
1.5 Scope of the study & Methodology adopted .......................................................... 31
1.5.1 Objectives of the EIA Report .......................................................................... 32
1.5.2 Scope of Work ................................................................................................ 32
1.5.3 EIA Process .................................................................................................... 34
1.6 Objectives of the Study ......................................................................................... 35
1.7 Applicable Regulatory Framework ........................................................................ 36
1.8 ToR Compliance ................................................................................................... 41
Material Handling, Storage and Transportation ................................................................ 82
CHAPTER 2 ................................................................................................................. 101
2 PROJECT DESCRIPTION ...................................................................................... 102
2.1 Project Description.............................................................................................. 102
2.1.1 Type of Project ............................................................................................. 103
2.2 Need of the project .............................................................................................. 103
2.3 Site Location ....................................................................................................... 103
2.4 Existing Environmental Setup ............................................................................. 111
2.5 Project Cost ........................................................................................................ 112
2.6 Proposed Schedule for Approval and Implementation ......................................... 112
2.7 Project Details ..................................................................................................... 112
2.7.1 Existing Facility ............................................................................................ 112
2.7.2 Size & Magnitude of Operation ..................................................................... 114
2.7.3 Existing Utilities .............................................................................................. 116
2.7.3.1 Existing Gas Monitoring System ..................................................................... 121
2.7.3.2 Existing Fire protection system ........................................................................ 122
2.7.4 Proposed Facility ............................................................................................. 125
2.7.4.1 Technology & Process Description .................................................................. 125
2.7.4.1.1 Paraxylene (PX) ........................................................................................... 125
EIA Report
7 HECS/EIA/IOCL Paradip/Final/24.06.2021/1051
2.7.4.1.2 Purified Terephthalic Acid (PTA) ................................................................. 135
2.7.4.2 Raw Material and products .............................................................................. 158
2.7.5 Proposed Offsite Facilities ............................................................................... 162
2.7.6 Proposed unit facilities and Utilities ................................................................ 164
2.7.7 Proposed Gas Monitoring System .................................................................... 168
2.7.7.1 Mitigation Measures ........................................................................................ 169
2.7.7.2 Precaution & Safety Measures against Fire Hazards ........................................ 170
2.7.7.3 Assessment of new & untested Technology ..................................................... 170
2.7.8 Sulphur Balance .............................................................................................. 171
2.8 Plot area .............................................................................................................. 171
2.8.1 Site Photographs ........................................................................................... 171
2.8.2 Land Area Breakup ....................................................................................... 175
2.9 Manpower ........................................................................................................... 180
2.10 Power and Fuel Requirements ............................................................................. 180
2.11 Water requirements ............................................................................................. 181
2.12 Source of water Supply ....................................................................................... 185
2.13 Project schedule .................................................................................................. 186
2.14 Air Pollution Control Measures ........................................................................... 186
2.15 Green Belt ........................................................................................................... 186
2.16 Water Pollution Control Measures ...................................................................... 190
2.17 Proposed Effluent Treatment Plant ...................................................................... 194
2.17.1 PX Effluent Treatment .................................................................................. 195
2.17.2 PTA Effluent Treatment ................................................................................ 195
2.18 Solid waste Management .................................................................................... 199
2.19 Hazardous Waste Management ........................................................................... 199
CHAPTER 3 ................................................................................................................. 205
3 DESCRIPTION OF ENVIRONMENT .................................................................... 206
3.1 Preamble ............................................................................................................. 206
3.2 Study Area .......................................................................................................... 206
3.3 Description of Study Area ................................................................................... 206
3.4 Environmentally/Ecologically Sensitive areas ..................................................... 210
3.5 Physical Conditions of PIA district ..................................................................... 216
3.5.1 PIA District Profile ............................................................................................... 216
EIA Report
8 HECS/EIA/IOCL Paradip/Final/24.06.2021/1051
3.5.2 Climatic Conditions .............................................................................................. 216
3.5.3 Natural Resources of PIA District ......................................................................... 217
3.5.3.1 Flora & Fauna .................................................................................................... 217
3.5.3.2 Forest Resources ................................................................................................ 217
3.5.3.3 Irrigation ............................................................................................................ 218
3.5.3.4 Agricultural Resources ....................................................................................... 219
3.5.3.5 Mineral Resources ............................................................................................. 219
3.5.4 Land Use & Land Cover ....................................................................................... 221
3.5.4.1 Land Use and Land Cover of the Study Area ...................................................... 225
3.5.5 Topography .................................................................................................. 228
3.5.6 Geomorphology of PIA district ..................................................................... 230
3.5.7 Geomorphology of the Study Area ................................................................ 230
3.5.8 Hydrogeology of PIA district ........................................................................ 235
3.5.9 Drainage Pattern in PIA district ..................................................................... 236
3.5.10 Geology ........................................................................................................ 238
3.5.11 Seismicity ..................................................................................................... 238
3.5.12 Soils in PIA District ...................................................................................... 240
3.5.13 Natural Hazards in PIA District ..................................................................... 241
3.6 Air Environment ...................................................................................................... 242
3.6.1 Meteorological Conditions ............................................................................ 243
3.6.2 Meteorological Data Collection ..................................................................... 243
3.6.3 General Meteorological Scenario based on IMD Data ................................... 243
3.6.4 Meteorological Scenario during Study Period ............................................... 245
3.6.5 Atmospheric Inversion .................................................................................. 246
3.7 Ambient Air Quality ........................................................................................... 247
3.7.1 Ambient Air Quality Monitoring Stations ..................................................... 247
3.7.2 Ambient Air Quality Monitoring Techniques and Frequency ........................ 250
3.7.3 Results and Discussions ................................................................................ 251
3.7.4 Observations ................................................................................................. 256
3.8 Noise Environment ............................................................................................. 256
3.8.1 Results and Discussions ................................................................................ 256
3.8.2 Observations ................................................................................................. 257
3.9 Water Environment ............................................................................................. 259
EIA Report
9 HECS/EIA/IOCL Paradip/Final/24.06.2021/1051
3.9.1 Surface Water Resources ...................................................................................... 259
3.9.1.1 Surface Water Quality Assessment ................................................................ 259
3.9.1.2 Results and Discussions ................................................................................ 268
3.9.2 Ground Water Resources .............................................................................. 268
3.9.2.1 Ground Water Quality ................................................................................... 269
3.9.2.2 Results and Discussions ................................................................................ 276
3.10 Soil as a resource and its quality .......................................................................... 276
3.10.1 Results and Discussions ................................................................................ 282
3.11 Biological Environment ...................................................................................... 282
3.11.1 Flora ............................................................................................................. 283
3.11.2 Fauna ............................................................................................................ 287
3.11.3 Management in and around Project area ........................................................ 293
3.11.4 Summary ...................................................................................................... 294
3.12 Socio Economic Profile ....................................................................................... 295
3.12.1 Socio Economic Profile of PIA District ......................................................... 295
3.12.1.1 Socio Economic Aspects ............................................................................... 295
3.12.1.2 Population and Household Size ..................................................................... 296
3.12.1.3 Sex Ratio ...................................................................................................... 297
3.12.1.4 Scheduled Castes and Scheduled Tribes ........................................................ 297
3.12.1.5 Education & Literacy .................................................................................... 297
3.12.1.6 Health Facilities ............................................................................................ 298
3.12.1.7 Employment and Livelihood ......................................................................... 299
3.12.2 Socio Economic Profile of study area ............................................................ 299
3.12.2.1 Employment and livelihood ............................................................................. 307
3.12.2.2 Educational infrastructure within study area ..................................................... 308
3.12.2.3 Dwelling within study area ............................................................................... 316
3.12.2.4 Health facilities within the study area ............................................................... 316
3.12.3 Observations ................................................................................................. 317
CHAPTER 4 ................................................................................................................. 318
4 ANTICIPATED ENVIRONMENTAL IMPACTS & MITIGATION MEASURES . 319
4.1 Introduction ........................................................................................................ 319
4.2 Proposed Project Activities ................................................................................. 319
4.3 Construction Phase.............................................................................................. 319
EIA Report
10 HECS/EIA/IOCL Paradip/Final/24.06.2021/1051
4.3.1 Impacts during Construction Phase .................................................................. 320
4.3.2 Mitigation Measures for Construction Phase .................................................... 320
4.3.3 Land environment............................................................................................ 321
4.3.4 Air environment .............................................................................................. 323
4.3.5 Water environment .......................................................................................... 324
4.3.6 Noise environment .......................................................................................... 324
4.3.7 Waste generation ............................................................................................. 325
4.3.8 Ecology ........................................................................................................... 326
4.3.9 Social environment .......................................................................................... 326
4.4 Operation Phase .................................................................................................. 326
4.4.1 Impacts during Operational Phase .................................................................... 326
4.5 Air Environment ................................................................................................. 327
4.5.1 Meteorological data ...................................................................................... 327
4.5.2 AERMET Process ......................................................................................... 328
4.5.3 AERMOD Process ........................................................................................ 329
4.5.4 Emissions ..................................................................................................... 330
4.5.4.1 Point Source Emission (Proposed Stack Emission) ........................................ 332
4.5.4.2 Summary on Stack Emission ......................................................................... 340
4.5.4.3 Line source emission (Transportation) .......................................................... 341
4.5.4.4 Summary on Transportation Emission ........................................................... 348
4.5.4.5 Cummulative Emission ................................................................................. 349
4.5.4.6 Summary on Cummulative Emission ............................................................ 355
4.5.4.7 Other Emission-Storage Tank vent & PX-Process vent emmission ................ 356
4.5.4.8 Summary on Other Emission-Storage Tank vent & PX-Process vent emmission363
4.5.4.9 Other Emission-PTA Process vent & Silo vent emmission ............................ 364
4.5.4.10 Summary on Other Emission- PTA Process vent & Silo vent emmission ...... 378
4.5.5 Impacts due to Traffic and Transportation ..................................................... 379
4.6 Noise Environment ............................................................................................. 379
4.6.1 Impact ........................................................................................................... 379
4.6.2 Mitigation Measure ....................................................................................... 380
4.7 Water Environment ............................................................................................. 381
4.7.1 Mitigation Measures ..................................................................................... 382
4.7.2 Waste Water Quality, Quantity and Treatment Method ................................. 382
EIA Report
11 HECS/EIA/IOCL Paradip/Final/24.06.2021/1051
4.8 Land Environment .............................................................................................. 383
4.8.1 Potential Impact Due to Location .................................................................. 383
4.8.2 Impacts Due to Changes in Land Use Pattern ................................................ 383
4.8.3 Mittigation Measures .................................................................................... 383
4.9 Marine Environment ........................................................................................... 383
4.10 Solid Waste Management .................................................................................... 384
4.10.1 Impact Due to Solid Waste Generation .......................................................... 384
4.10.2 Mitigation Measures ..................................................................................... 384
CHAPTER 5 ................................................................................................................. 385
5 ANALYSIS OF ALTERNATIVES ......................................................................... 386
5.1 Introduction ........................................................................................................ 386
5.2 Site Alternative ................................................................................................... 386
5.3 Water Supply Alternative .................................................................................... 386
5.4 Technology Alternative ....................................................................................... 386
CHAPTER 6 ................................................................................................................. 387
6 ENVIRONMENTAL MONITORING PROGRAM ................................................. 388
6.1 Introduction ........................................................................................................ 388
6.2 Environmental Effects Monitoring in EIA ........................................................... 388
6.2.1 Post Project Environment Monitoring Program ............................................. 389
6.2.2 Monitoring Methodologies ............................................................................ 390
6.3 Reporting & Documentation ............................................................................... 391
6.4 Budget for Environmental Monitoring Plan ......................................................... 391
CHAPTER 7 ................................................................................................................. 393
7 ADDITIONAL STUDIES ....................................................................................... 394
7.1 Public Consultation ............................................................................................. 394
7.1.1 Reply to the issues raised by the public during Public Hearing on 02.03.2021 398
7.2 Risk Assessment ................................................................................................. 415
7.3 Applicability of Environmental Clearance ........................................................... 416
7.4 Consent for Existing Operation ........................................................................... 416
7.5 TOR issued by MoEF ......................................................................................... 417
7.6 Copy of Standard TOR........................................................................................ 418
CHAPTER 8 ................................................................................................................. 424
8 PROJECT BENEFITS ............................................................................................. 425

EIA Report
12 HECS/EIA/IOCL Paradip/Final/24.06.2021/1051
8.1 Project Benefits ................................................................................................... 425
CHAPTER 9 ................................................................................................................. 427
9 ENVIRONMENTAL COST AND BENEFIT ANALYSIS ...................................... 428
CHAPTER 10 ................................................................................................................ 429
10 ENVIRONMENTAL MANAGEMENT PLAN ....................................................... 430
10.1 Introduction ........................................................................................................ 430
10.2 Objectives of EMP .............................................................................................. 430
10.3 EMP Structure and Organization ......................................................................... 431
10.4 EMP Roles and Responsibilities .......................................................................... 432
10.5 Environmental Management Plan for Construction Phase ................................... 434
10.5.1 Air Quality .................................................................................................... 434
10.5.2 Noise Environment ....................................................................................... 435
10.5.3 Water Quality and Water Resources .............................................................. 435
10.5.4 Solid Waste ................................................................................................... 435
10.5.5 Land Environment ........................................................................................ 436
10.5.6 Ecology ........................................................................................................ 436
10.5.7 Socio Economic ............................................................................................ 436
10.6 Environmental Management Plan for Operation Phase ........................................ 436
10.6.1 Air Pollution Management ............................................................................ 437
10.6.1.1 Gaseous Waste Emissions ............................................................................. 439
10.6.2 Waste Water Management ............................................................................ 442
10.6.3 Solid Waste Management .............................................................................. 445
10.6.4 Noise Environment ....................................................................................... 446
10.6.5 Material Handling Storage and Transportation .............................................. 446
10.6.6 Green Belt Development ............................................................................... 449
10.6.7 Rain Water Harvesting Plan .......................................................................... 451
10.7 Occupational Health and Safety .......................................................................... 454
10.7.1 Safety Measures ............................................................................................ 456
10.7.2 Precaution & Safety Measures Against Fire Hazards ..................................... 457
10.8 Environmental Management Cell ........................................................................ 458
10.9 Corporate Environmental Policy ......................................................................... 458
10.10 Budgetary Provision for Environmental Management Plan .............................. 460
10.11 Corporate Social Responsibility ....................................................................... 460
EIA Report
13 HECS/EIA/IOCL Paradip/Final/24.06.2021/1051
10.12 Corporate Environmental Responsibility (CER) .............................................. 460
CHAPTER 11 ................................................................................................................ 462
11 SUMMARY & CONCLUSION .............................................................................. 463
CHAPTER 12 ................................................................................................................ 465
12 DISCLOSURE OF CONSULTANTS ....................................................................... 466
12.1 Brief Profile of Hubert Enviro Care Systems (P) Limited (HECS) ....................... 466
12.2 QCI-NABET - EIA Accreditation ....................................................................... 468
12.3 Copy of QCI NABET Accreditation .................................................................... 469
EIA Report
14 HECS/EIA/IOCL Paradip/Final/24.06.2021/1051
List of Tables
Table 1-1 Chronology of Environmental clearances & CRZ clearance ................................ 29
Table 1-2Applicable Acts and Rules for the proposed Refinery project ............................... 37
Table 2-1Geographical coordinates of the project site ....................................................... 103
Table 2-2 Existing Environmental Setup of the study region ............................................. 111
Table 2-3List of major Industries within 10km Radius from the project site ...................... 112
Table 2-4 Time Schedule for completion of the proposed project ...................................... 112
Table 2-5 Existing /Approved/Proposed Units ................................................................... 114
Table 2-6 List of Existing utilities at PDR ......................................................................... 116
Table 2-7 Existing storage tanks ........................................................................................ 117
Table 2-8 Pipelines to South Loading Jetty ........................................................................ 120
Table 2-9 Pipeline crossing Santra Creek for the Proposed PX PTA project ...................... 120
Table 2-10 Limits of Gas Detector Type ........................................................................... 121
Table 2-11 List of firefighting facility available ................................................................ 122
Table 2-12 Equipment List- PX Process Unit .................................................................... 137
Table 2-13 Equipment List- PTA Process Unit .................................................................. 147
Table 2-14 Existing and proposed product ......................................................................... 158
Table 2-15 Details of Proposed Chemicals and Catalyst for PX and PTA .......................... 158
Table 2-16 Equipment List- Offsite & Utilities .................................................................. 162
Table 2-17 Major facilities in the proposed PX unit with Capacity .................................... 164
Table 2-18 Major facilities in the proposed PTA unit with Capacity .................................. 165
Table 2-19 Major facilities in the proposed New ETP ....................................................... 166
Table 2-20 Proposed Utilities ............................................................................................ 166
Table 2-21 Upcoming Storage Facilities ............................................................................ 167
Table 2-22 Sulphur balance for Proposed Facility ............................................................. 171
Table 2-23 Land use planning of the Project Site ............................................................... 175
Table 2-24 Manpower Requirement .................................................................................. 180
Table 2-25 Power and Fuel Requirement ........................................................................... 181
Table 2-26 Existing and Proposed Water Requirements .................................................... 182
Table 2-27 Green Belt Area Breakup................................................................................. 187
Table 2-28 Summary of Plantation for the year 2007-2020 ................................................ 189
Table 2-29 Characteristics of Effluent Generated .............................................................. 193
Table 2-30 Characteristics Final effluent discharge to sea .................................................. 193
Table 2-31 Solid Waste in Operational Phase .................................................................... 199
Table 2-32 Existing Hazardous Wastes Generation ............................................................ 200
Table 2-33 Proposed Hazardous Wastes Generation ........................................................... 200
Table 3-1 Environmentally Sensitive Areas within 15km from Project Boundary .............. 210
Table 3-2 Source wise Irrigation potential created during the year 2009-10 & 2010-11 ..... 218
Table 3-3 District land use/land cover statistics (2011-12) for Jagatsinghapurdistrict......... 221
Table 3-4 Land Use Pattern of the Study Area ................................................................... 225
Table 3-5Geomorphology of the Study Area ..................................................................... 230
Table 3-6 Climatological Summary -Paradip port (1971-2000).......................................... 244
Table 3-7 Meteorological Data for the Study Period (March - May 2019) ......................... 245
EIA Report
15 HECS/EIA/IOCL Paradip/Final/24.06.2021/1051
.Table 3-8 Details of Ambient Air Quality Monitoring Locations ...................................... 247
Table 3-9 Analytical Methods for Analysis of Ambient Air Quality Parameters ................ 250
Table 3-10 Summary of the average baseline concentrations of pollutants ......................... 252
Table 3-11 Day and Night Equivalent Noise Levels .......................................................... 257
Table 3-12 Test methods used for the analysis of water quality parameters ....................... 259
Table 3-13 Details of Surface water sampling locations ..................................................... 261
Table 3-14: Surface water Monitoring Results ................................................................... 263
Table 3-15: Dynamic ground water resources of Jagatsinghapur District ........................... 268
Table 3-16 Details of Groundwater Quality Monitoring Locations .................................... 269
Table 3-17 Ground Water Monitoring Results ................................................................... 271
Table 3-18 Soil & Sediment Quality Monitoring Locations ............................................... 276
Table 3-19 Soil & Sediment Quality Monitoring Results ................................................... 279
Table 3-20 List of flora reported/observed in the study area .............................................. 283
Table 3-21 List of Mangroves in the study area ................................................................. 286
Table 3-22 List of Fauna observed in the study area .......................................................... 287
Table 3-23 Social Indicators of Jagatsinghapur District ..................................................... 296
Table 3-24Education Infrastructures in the Jagatsinghapur District .................................... 298
Table 3-25 Medical Facilities available in JagatsinghapurDistrict ...................................... 298
Table 3-26 Population profile within study area ................................................................ 300
Table 3-27 Summary of Socioeconomic indicators within the study area ........................... 307
Table 3-28 Classification of workers within study area ...................................................... 307
Table 3-29 Details of Literacy population in the study area ............................................... 309
Table 3-30 Health facilities available in the study area ...................................................... 316
Table 4-1 Existing Stack Emission details ......................................................................... 330
Table 4-2Proposed Stack Emission details......................................................................... 334
Table 4-3 Estimated Top 10 Highest Concentrations of PM Obtained Through Modeling on
stack emission ................................................................................................................... 335
Table 4-4 Estimated Top 10 Highest Concentrations of Sulphur Dioxide obtained through
modeling on stack emission ............................................................................................... 336
Table 4-5 Estimated Top 10 Highest Concentrations of oxide of Nitrogen obtained through
modeling on stack emission ............................................................................................... 337
Table 4-6 Estimated Top 10 Highest Concentrations of Carbon Monoxide obtained through
modeling on stack emission ............................................................................................... 338
Table 4-7 Estimated Top 10 Highest Concentrations of Carbon Dioxide obtained through
modeling on stack emission ............................................................................................... 339
Table 4-8 Total Maximum GLCs from the Point Source (Stack Emissions) ....................... 340
Table 4-9 Proposed Transportation Emission details ......................................................... 344
Table 4-10 Estimated Top 10 Highest Concentrations of Particulate Matter obtained through
modeling on Transportation emission ................................................................................ 345
Table 4-11 Estimated Top 10 Highest Concentrations of oxide of Nitrogen obtained through
modeling on Transportation emission ................................................................................ 346
Table 4-12 Estimated Top 10 Highest Concentrations of Carbon Monoxide obtained through
modeling on Transportation emission ................................................................................ 347
EIA Report
16 HECS/EIA/IOCL Paradip/Final/24.06.2021/1051
Table 4-13 Total Maximum GLCs from the transportation Emissions ............................... 348
Table 4-14 Proposed Cumulative Emission details (Point source emission and Line source
emission) .......................................................................................................................... 349
Table 4-15 Estimated Top 10 Highest Concentrations of Particulate Matter obtained through
modeling on Cummulative emission .................................................................................. 350
Table 4-16 Estimated Top 10 Highest Concentrations of Sulphur Dioxide obtained through
modeling on Cummulative emission .................................................................................. 351
Table 4-17 Estimated Top 10 Highest Concentrations of oxide of Nitrogen obtained through
modeling on Cummulative emission .................................................................................. 352
Table 4-18 Estimated Top 10 Highest Concentrations of Carbon Monoxide obtained through
modeling on Cummulative emission .................................................................................. 353
Table 4-19 Estimated Top 10 Highest Concentrations of Carbon Dioxide obtained through
modeling on Cummulative emission .................................................................................. 354
Table 4-20 Total Maximum GLCs from the Cummulative Emissions (point source emission
& line source emission) ..................................................................................................... 355
Table 4-21 Proposed Storage tank vents and PX-process vent Emission details ................. 358
Table 4-22 Estimated Top 10 Highest Concentrations of VOC obtained through modeling on
other vent emission ........................................................................................................... 359
Table 4-23 Estimated Top 10 Highest Concentrations of Benzene obtained through modeling
on other vent emission....................................................................................................... 360
Table 4-24 Estimated Top 10 Highest Concentrations of Toluene obtained through modeling
on other vent emission....................................................................................................... 361
Table 4-25 Estimated Top 10 Highest Concentrations of Carbon Dioxide obtained through
modeling on other vent emission ....................................................................................... 362
Table 4-26 Total Maximum GLCs from the Storage Tank vent & PX-Process vent
emmission ......................................................................................................................... 363
Table 4-27 Proposed PTA Process vent & Silo vent emission details ................................. 366
Table 4-28 Estimated Top 10 Highest Concentrations of Benzene obtained through modeling
on other vent emission....................................................................................................... 367
Table 4-29 Estimated Top 10 Highest Concentrations of Toluene obtained through modeling
on other vent emission....................................................................................................... 368
Table 4-30 Estimated Top 10 Highest Concentrations of Xylene obtained through modeling
on other vent emission....................................................................................................... 369
Table 4-31 Estimated Top 10 Highest Concentrations of Acetic Acid obtained through
modeling on other vent emission ....................................................................................... 370
Table 4-32 Estimated Top 10 Highest Concentrations of Methanol obtained through
modeling on other vent emission ....................................................................................... 371
Table 4-33 Estimated Top 10 Highest Concentrations of MethylAcetate obtained through
modeling on other vent emission ....................................................................................... 372
Table 4-34 Estimated Top 10 Highest Concentrations of Bromide obtained through modeling
on other vent emission....................................................................................................... 373
Table 4-35 Estimated Top 10 Highest Concentrations of Methyl Bromide obtained through
modeling on other vent emission ....................................................................................... 374
EIA Report
17 HECS/EIA/IOCL Paradip/Final/24.06.2021/1051
Table 4-36 Estimated Top 10 Highest Concentrations of Carbon Monoxide obtained through
modeling on other vent emission ....................................................................................... 375
Table 4-37 Estimated Top 10 Highest Concentrations of PTA Dust obtained through
modeling on other vent emission ....................................................................................... 376
Table 4-38 Estimated Top 10 Highest Concentrations of Nitrogen obtained through modeling
on other vent emission....................................................................................................... 377
Table 4-39 Total Maximum GLCs from the Process & Silo Vent Emissions ..................... 378
Table 4-40 Existing & proposed vehicular movement per Hour (Peak Hour) ..................... 379
Table 4-41 Traffic Volume after Implementation of the Project ......................................... 379
Table 6-1 Post Project Environmental Monitoring Plan ..................................................... 389
Table 6-2 Budgetary allocation for Environmental Monitoring .......................................... 391
Table 10-1 Responsibility for EMP Implementation .......................................................... 432
Table 10-2 Proposed Pollution control scheme .................................................................. 437
Table 10-3 Standards for Emissions from Furnaces, heaters and Boilers ............................ 438
Table 10-4 Gaseous Waste Emissions from PX Plant ........................................................ 440
Table 10-5 Gaseous Waste Emissions from PTA Plant ...................................................... 441
Table 10-6 Waste Effluents from PX Plant ........................................................................ 442
Table 10-7 Waste Effluents from PTA Plant ..................................................................... 444
Table 10-8 Liquid Waste Effluents from Offsite and Utilities ............................................ 445
Table 10-9 Raw Material Storage and Dispatch Facilities ................................................... 447
EIA Report
18 HECS/EIA/IOCL Paradip/Final/24.06.2021/1051
List of Figures
Figure 1-1 EIA Process ....................................................................................................... 35
Figure 2-1 Index map of the project site ............................................................................ 107
Figure 2-2 Google image showing salient features within 0- 1 Km radius ......................... 108
Figure 2-3 Google image showing salient features within 0- 5 Km radius .......................... 109
Figure 2-4 Google image showing salient features 0- 10 Km Radius Map around the study
region ................................................................................................................................ 110
Figure 2-5 Schematic diagram of Existing Refinery .......................................................... 114
Figure 2-6 Fire Water Network South ............................................................................... 123
Figure 2-7 Fire Water Network in North............................................................................ 124
Figure 2-8 Process Flow Diagram ..................................................................................... 154
Figure 2-9 Schematic representation of Process of PX unit ................................................ 155
Figure 2-10 Schematic representation of Process of PTA Unit-Sheet 1 .............................. 156
Figure 2-11 Schematic representation of Process of PTA Unit-Sheet 2 .............................. 157
Figure 2-12Material Balance across PX Process Unit ........................................................ 161
Figure 2-13Material Balance across PTA Process Unit ...................................................... 162
Figure 2-14 Site Photographs of Existing Refinery Complex ............................................. 172
Figure 2-15 Site Photographs of Proposed facility ............................................................. 173
Figure 2-16 Photographs of Existing ETP ......................................................................... 173
Figure 2-17 Photographs of Existing STP .......................................................................... 174
Figure 2-18 Existing Refinery Layout ............................................................................... 177
Figure 2-19 Proposed Layout ............................................................................................ 178
Figure 2-20 Existing and proposed plot plan...................................................................... 179
Figure 2-21 Water Balance Diagrams of Existing Refinery ............................................... 183
Figure 2-22 Water Balance Diagrams of Proposed Refinery .............................................. 184
Figure 2-23 Water Balance Diagrams for after expansion of Refinery ............................... 185
Figure 2-24 Green Belt Layout .......................................................................................... 188
Figure 2-25 Flow diagram of Effluent Treatment plant (Existing) ..................................... 192
Figure 2-26 Flow diagram of Effluent Treatment plant (Proposed) .................................... 192
Figure 2-27 Flow Diagram of WRP Plant (Existing) ......................................................... 193
Figure 2-28 Effluent Treatment plant (Proposed Layout) ................................................... 198
Figure 2-29 Google Earth demarcation of SLF area in IOCL Paradip Refinery .................. 201
Figure 2-30 Photograph of Secured Landfill Area with Geotextile Membrane around it in
IOCL Paradip Refinery ..................................................................................................... 202
Figure 2-31 Lablelling of Hazardous waste Containers ...................................................... 202
Figure 2-32 Hazardous Waste labelsdisplayed on packaging ............................................. 203
Figure 2-33 Hazardous Waste Storage area ....................................................................... 204
Figure 3-1Map showing the Satellite Image of the study area of Project ............................ 208
Figure 3-2Topo Map of Study area .................................................................................... 209
Figure 3-3 Environmental sensitive areas covering within 15 km from project boundary ... 215
Figure 3-4 Mineral Map of Odisha (Orissa) ....................................................................... 220
Figure 3-5Land use pattern of the Jagatsinghapur District ................................................. 223
Figure 3-6Land use map of the Jagatsinghapur District ..................................................... 224
EIA Report
19 HECS/EIA/IOCL Paradip/Final/24.06.2021/1051
Figure 3-7 Land Use Pattern of the Study Area ................................................................. 226
Figure 3-8 Land Use Map of the Study Area ..................................................................... 227
Figure 3-9Physical Map of Odisha .................................................................................... 228
Figure 3-10Contour Map of Study Area ............................................................................ 229
Figure 3-11Geomorphology Pattern of the Study Area ...................................................... 232
Figure 3-12Geomorphology Map of Jagatsinghapur District ............................................. 233
Figure 3-13Geomorphology Map of the Study Area .......................................................... 234
Figure 3-14Hydrogeology Map of Jagatsinghapur District ................................................ 236
Figure 3-15Drainage map of the study area ....................................................................... 237
Figure 3-16Geology Map of Orissa ................................................................................... 238
Figure 3-17 Seismicity Map of India ................................................................................. 239
Figure 3-18 Soil map of India ............................................................................................ 241
Figure 3-19 Wind hazard Map of India .............................................................................. 242
Figure 3-20 Wind rose during study period (March - May 2019) ....................................... 246
Figure 3-21Atmospheric inversion level at the project site ................................................ 247
Figure 3-22Map showing the Air monitoring locations ...................................................... 249
Figure 3-23: Trends of Measured Ambient Concentrations in the Study Area .................... 255
Figure 3-24 Map showing the Noise Monitoring locations ................................................ 258
Figure 3-25: Map showing the surface water monitoring locations .................................... 262
Figure 3-26 Map showing the groundwater monitoring locations ...................................... 270
Figure 3-27 Map showing the soil monitoring locations .................................................... 278
Figure 4-1 Wind rose diagram of Meteorological data considered for Modelling (March to
May 2019) ........................................................................................................................ 328
Figure 4-2 Project layout with proposed stack coordinates ................................................ 332
Figure 4-3 Google earth demarcation of proposed stack with coordinates .......................... 333
Figure 4-4 Predicted 24-Hrs’ GLC’s of PM within 10 km Radius of the Study Area on stack
emission ............................................................................................................................ 335
Figure 4-5 Predicted 24-Hrs’ GLC’s of SO2within 10 km Radius of the Study Area on stack
emission ............................................................................................................................ 336
Figure 4-6 Predicted 24-Hrs’ GLC’s of NOx within 10 km Radius of the Study Area on stack
emission ............................................................................................................................ 337
Figure 4-7 Predicted 1-Hr GLC’s of CO within 10 km Radius of the Study Area on stack
emission ............................................................................................................................ 338
Figure 4-8 Predicted 24-Hrs’ GLC’s of CO2 within 10 km Radius of the Study Area on stack
emission ............................................................................................................................ 339
Figure 4-9 Project layout with PTA truck Route ................................................................ 341
Figure 4-10 Project layout with Toluene truck Route ......................................................... 342
Figure 4-11 Google earth demarcation of proposed truck route with coordinates ............... 343
Figure 4-12 Predicted 24-Hrs’ GLC’s of PM within 10 km Radius of the Study Area on
Transportation emission .................................................................................................... 345
Figure 4-13 Predicted 24-Hrs’ GLC’s of NOx within 10 km Radius of the Study Area on
Transportation emission .................................................................................................... 346
EIA Report
20 HECS/EIA/IOCL Paradip/Final/24.06.2021/1051
Figure 4-14 Predicted 1-Hr GLC’s of CO within 10 km Radius of the Study Area on
Transportation emission .................................................................................................... 347
Figure 4-15 Predicted 24-Hrs’ GLC’s of PM within 10 km Radius of the Study Area on
Cummulative emission ...................................................................................................... 350
Figure 4-16 Predicted 24-Hrs’ GLC’s of SO2 within 10 km Radius of the Study Area on
Cummulative emission ...................................................................................................... 351
Figure 4-17 Predicted 24-Hrs’ GLC’s of NOx within 10 km Radius of the Study Area on
Cummulative emission ...................................................................................................... 352
Figure 4-18 Predicted 1-Hr GLC’s of CO within 10 km Radius of the Study Area on
Cummulative emission ...................................................................................................... 353
Figure 4-19 Predicted 24-Hrs’ GLC’s of CO2 within 10 km Radius of the Study Area on
Cummulative emission ...................................................................................................... 354
Figure 4-20 Project layout with proposed storage tank vent & PX-process vent coordinates
......................................................................................................................................... 356
Figure 4-21 Google earth demarcation of proposed storage tank vent & PX-process vent
coordinates ........................................................................................................................ 357
Figure 4-22 Predicted 24-Hrs’ GLC’s of VOC within 10 km Radius of the Study Area on
other vent emissions .......................................................................................................... 359
Figure 4-23 Predicted 24-Hrs’ GLC’s of Benzene within 10 km Radius of the Study Area on
other vent emissions .......................................................................................................... 360
Figure 4-24 Predicted 24-Hrs’ GLC’s of Toluene within 10 km Radius of the Study Area on
other vent emissions .......................................................................................................... 361
Figure 4-25 Predicted 24-Hrs’ GLC’s of CO2 within 10 km Radius of the Study Area on other
vent emissions ................................................................................................................... 362
Figure 4-26 Project layout with proposed PTA Process vent & Silo vent coordinates ........ 364
Figure 4-27 Google earth demarcation of proposed PTA Process vent & Silo vent coordinates
......................................................................................................................................... 365
Figure 4-28 Predicted 24-Hrs’ GLC’s of Benzene within 10 km Radius of the Study Area on
other vent emissions .......................................................................................................... 367
Figure 4-29 Predicted 24-Hrs’ GLC’s of Toluene within 10 km Radius of the Study Area on
other vent emissions .......................................................................................................... 368
Figure 4-30 Predicted 24-Hrs’ GLC’s of Xylene within 10 km Radius of the Study Area on
other vent emissions .......................................................................................................... 369
Figure 4-31 Predicted 24-Hrs’ GLC’s of Acetic Acid within 10 km Radius of the Study Area
on other vent emissions ..................................................................................................... 370
Figure 4-32 Predicted 24-Hrs’ GLC’s of Methanol within 10 km Radius of the Study Area on
other vent emissions .......................................................................................................... 371
Figure 4-33 Predicted 24-Hrs’ GLC’s of MethylAcetate within 10 km Radius of the Study
Area on other vent emissions ............................................................................................. 372
Figure 4-34 Predicted 24-Hrs’ GLC’s of Bromide within 10 km Radius of the Study Area on
other vent emissions .......................................................................................................... 373
Figure 4-35 Predicted 24-Hrs’ GLC’s of Methyl Bromide within 10 km Radius of the Study
Area on other vent emissions ............................................................................................. 374
EIA Report
21 HECS/EIA/IOCL Paradip/Final/24.06.2021/1051
Figure 4-36 Predicted 1-Hr GLC’s of CO within 10 km Radius of the Study Area on other
vent emissions ................................................................................................................... 375
Figure 4-37 Predicted 24-Hrs’ GLC’s of PTA Dust within 10 km Radius of the Study Area on
other vent emissions .......................................................................................................... 376
Figure 4-38 Predicted 24-Hrs’ GLC’s of Nitrogen within 10 km Radius of the Study Area on
other vent emissions .......................................................................................................... 377
Figure 7-1 Public Hearing Advertisements(Odisha) ........................................................... 395
Figure 7-2 Public Hearing Advertisements(English) .......................................................... 396
Figure 7-3 Public Hearing Announcement in nearby villages ............................................ 397
Figure 7-4 Public Hearing photographs ............................................................................. 397
Figure 10-1 Typical HSE Department Organogram ........................................................... 431
Figure 10-2Mode of Transport for Product materials ......................................................... 447
Figure 10-3 Green Belt Photographs ................................................................................. 450
Figure 10-4 Ecological park in Paradip Refinery ............................................................... 451
Figure 10-5 Rain water harvesting integrated with ecological park .................................... 452
Figure 10-6 Storm water pond for collecting surface runoff inside Refinery ...................... 453
Figure 10-7 Organogram for OHC .................................................................................... 456
Figure 10-8 EHS Policy .................................................................................................... 459
EIA Report
22 HECS/EIA/IOCL Paradip/Final/24.06.2021/1051
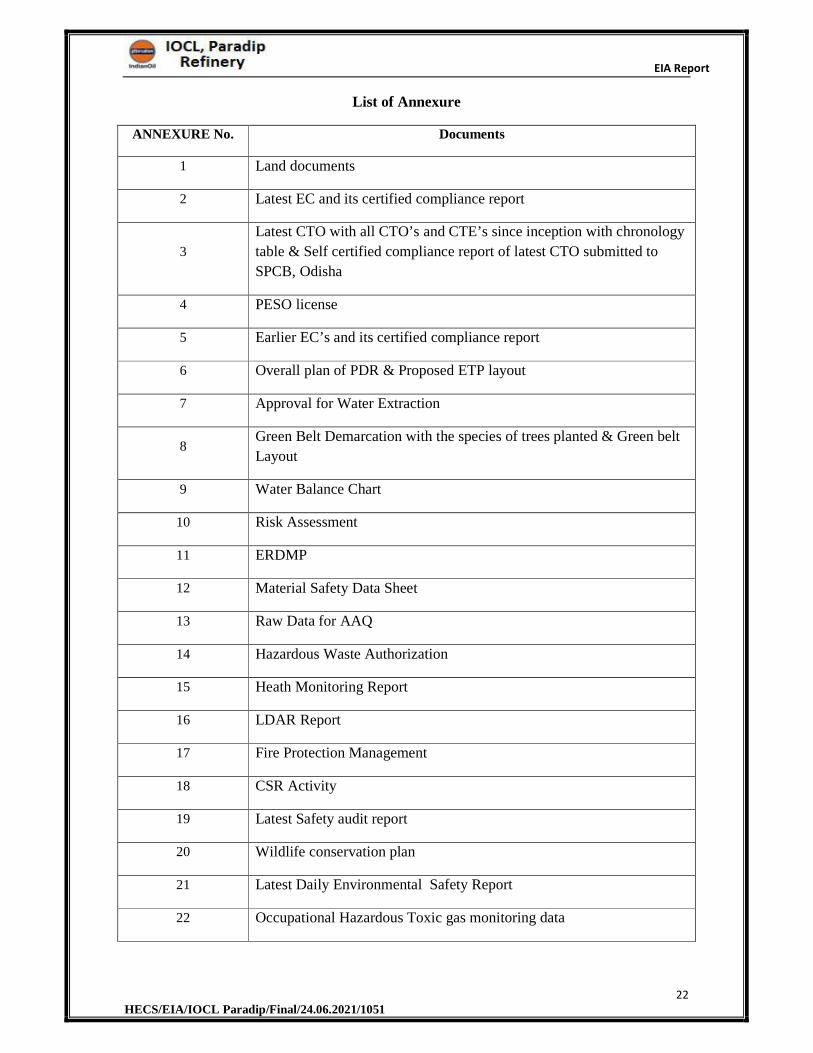
List of Annexure
ANNEXURE No. Documents
1 Land documents
2 Latest EC and its certified compliance report
3
Latest CTO with all CTO’s and CTE’s since inception with chronology
table & Self certified compliance report of latest CTO submitted to
SPCB, Odisha
4 PESO license
5 Earlier EC’s and its certified compliance report
6 Overall plan of PDR & Proposed ETP layout
7 Approval for Water Extraction
8 Green Belt Demarcation with the species of trees planted & Green belt
Layout
9 Water Balance Chart
10 Risk Assessment
11 ERDMP
12 Material Safety Data Sheet
13 Raw Data for AAQ
14 Hazardous Waste Authorization
15 Heath Monitoring Report
16 LDAR Report
17 Fire Protection Management
18 CSR Activity
19 Latest Safety audit report
20 Wildlife conservation plan
21 Latest Daily Environmental Safety Report
22 Occupational Hazardous Toxic gas monitoring data
EIA Report
23 HECS/EIA/IOCL Paradip/Final/24.06.2021/1051
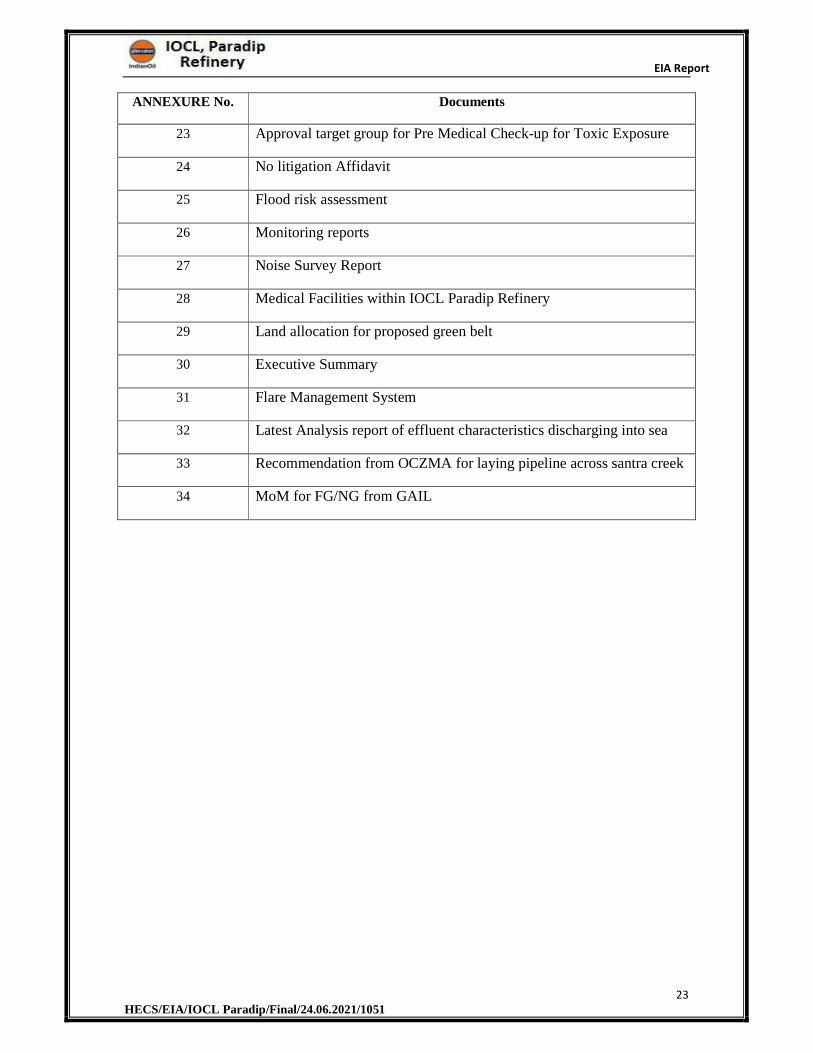
ANNEXURE No. Documents
23 Approval target group for Pre Medical Check-up for Toxic Exposure
24 No litigation Affidavit
25 Flood risk assessment
26 Monitoring reports
27 Noise Survey Report
28 Medical Facilities within IOCL Paradip Refinery
29 Land allocation for proposed green belt
30 Executive Summary
31 Flare Management System
32 Latest Analysis report of effluent characteristics discharging into sea
33 Recommendation from OCZMA for laying pipeline across santra creek
34 MoM for FG/NG from GAIL
EIA Report
24 HECS/EIA/IOCL Paradip/Final/24.06.2021/1051
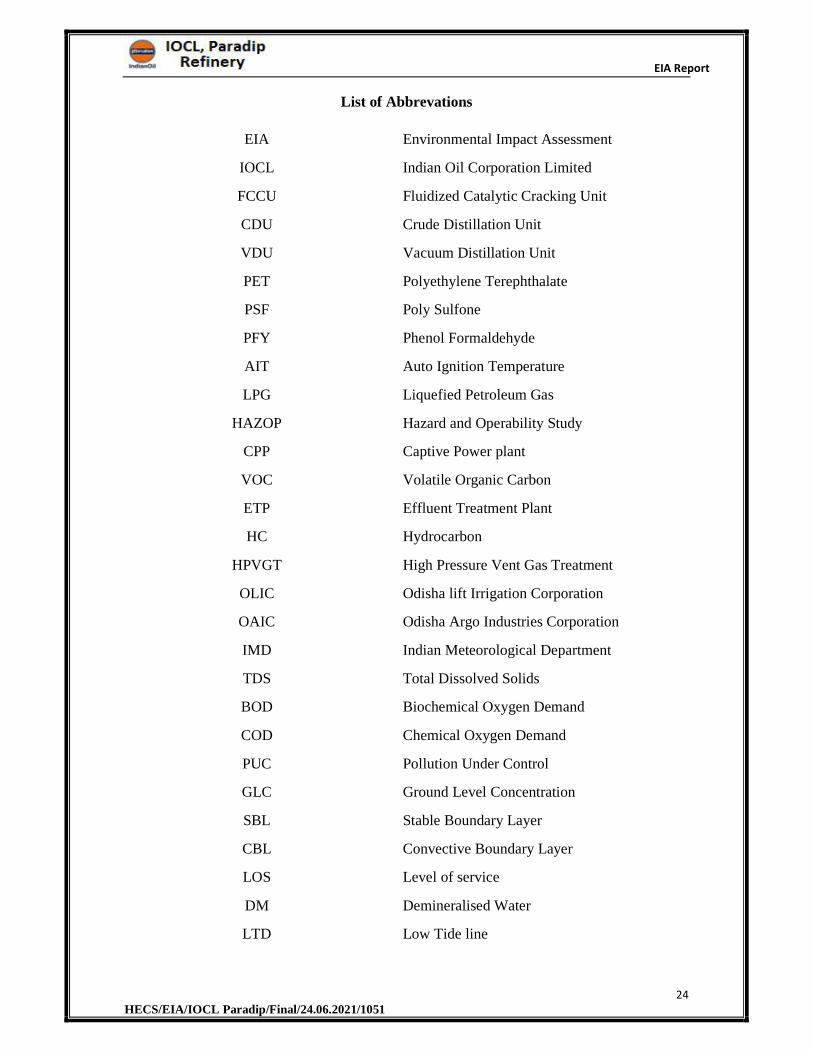
List of Abbrevations
EIA Environmental Impact Assessment
IOCL Indian Oil Corporation Limited
FCCU Fluidized Catalytic Cracking Unit
CDU Crude Distillation Unit
VDU Vacuum Distillation Unit
PET Polyethylene Terephthalate
PSF Poly Sulfone
PFY Phenol Formaldehyde
AIT Auto Ignition Temperature
LPG Liquefied Petroleum Gas
HAZOP Hazard and Operability Study
CPP Captive Power plant
VOC Volatile Organic Carbon
ETP Effluent Treatment Plant
HC Hydrocarbon
HPVGT High Pressure Vent Gas Treatment
OLIC Odisha lift Irrigation Corporation
OAIC Odisha Argo Industries Corporation
IMD Indian Meteorological Department
TDS Total Dissolved Solids
BOD Biochemical Oxygen Demand
COD Chemical Oxygen Demand
PUC Pollution Under Control
GLC Ground Level Concentration
SBL Stable Boundary Layer
CBL Convective Boundary Layer
LOS Level of service
DM Demineralised Water
LTD Low Tide line
EIA Report
25 HECS/EIA/IOCL Paradip/Final/24.06.2021/1051
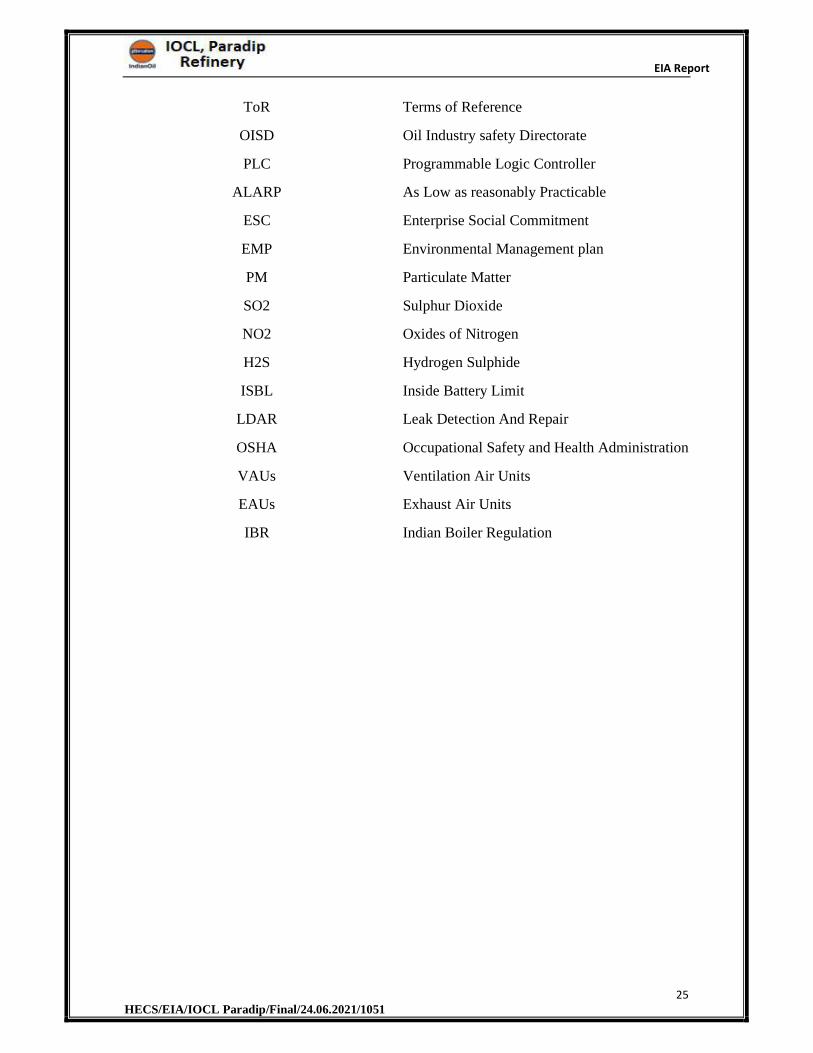
ToR Terms of Reference
OISD Oil Industry safety Directorate
PLC Programmable Logic Controller
ALARP As Low as reasonably Practicable
ESC Enterprise Social Commitment
EMP Environmental Management plan
PM Particulate Matter
SO2 Sulphur Dioxide
NO2 Oxides of Nitrogen
H2S Hydrogen Sulphide
ISBL Inside Battery Limit
LDAR Leak Detection And Repair
OSHA Occupational Safety and Health Administration
VAUs Ventilation Air Units
EAUs Exhaust Air Units
IBR Indian Boiler Regulation

EIA Report
26 HECS/EIA/IOCL Paradip/Final/24.06.2021/1051
CHAPTER 1
INTRODUCTION
EIA Report
27 HECS/EIA/IOCL Paradip/Final/24.06.2021/1051
1 INTRODUCTION
1.1 Introduction to Project & Project Proponent
Indian Oil Corporation Limited (IOCL) is India's largest commercial enterprise engaging in
the business of refining, pipeline transportation, marketing of petroleum products and also
involving in exploration production of crude oil gas, marketing of natural gas and
petrochemicals. IOCL accounts for nearly half of India’s petroleum products market share
owning 11 refineries. It is the 11th refinery of IOCL. Hon’ble Prime Minister Shri Narendra
Modi dedicated the refinery cum Petrochemical Complex to Nation on 7th Feb 2016.
The refinery was commissioned in the year 2015with a capacity of 15 MMTPA has been set
up at an estimated cost of Rs. 34,555 crores. The major processing units provided were
Fluidized Catalytic Cracking Unit (FCCU) 4.2 MMTPA, Crude/ Vacuum Distillation unit
(CDU/ VDU) 15 MMTPA, Delayed Coking unit 4.1 MMTPA, Diesel Hydro Treating Unit of
5.2 MMTPA, VGO hydro treatment Unit 5.4 MMTPA, Sulfur Recovery Unit 2 x 525 TPD +
1 TGTU.
Paradip Refinery has a unique INDMAX Unit technology, which is indigenously been
developed by Indian Oil's R&D Centre. The INDMAX (FCC) Unit has designed to produce
44% LPG, the highest yield from such plants. The commissioning of INDMAX Unit at
Paradip marks a major milestone in the history of Indian refining. With this, Indian Oil has
been recognized globally as a technology licensor. The other first-time technological features
of the Refinery include Flue Gas Desulphurisation facilities, Vapour Recovery system from
jetty loading and an alkylation process to get octane-rich low-benzene MS blend component,
etc.
The refinery can process 100% high Sulphur and heavy crude oil to produce various
petroleum products like Petrol and diesel BS-IV quality, kerosene, Aviation Turbine fuel,
Propylene, Sulphur and Petroleum Coke. The refinery has also designed to produce Euro-IV
premium quality Motor Spirit and other green auto fuel variants for export to advanced
countries. The products from the Refinery meet the energy demands of the domestic market
and partly the South-East Asia export market. The finished petroleum products from Paradip
Refinery being shipped to as far as Asia Pacific, Europe, USA, and to the demand centers in
the east of India, northeast and to some southern states like Andhra Pradesh and Telangana.
EIA Report
28 HECS/EIA/IOCL Paradip/Final/24.06.2021/1051
Paradip Refinery has spread over a total area of 3,345 acres, including about 314 acres for
Residential and about 240 acres of land for other office and buildings. The area of 355 acres
is utilized for the connecting road in the total area. Land documents enclosed as Annexure 1.
The refinery is equipped with crude oil tanks to store High-Sulphur heavy crude, with
petroleum product & intermediate tanks (including for liquid Sulphur storage tanks). Apart
from these liquid storage facilities, there are LPG storage mounded bullets, propylene storage
mounded bullets, Hydrogen and alkylation feed mounded bullets. An elaborate infrastructure
is in place for pumping crude oil to the Paradip Refinery and for smooth, safe and efficient
movement of the finished products. This includes a crude oil unloading facility at Paradip
offshore with the first Single Point Mooring (SPM) facility on the east coast of India; a
complex cross-country product pipeline network; a marketing terminal with truck loading
bays and tank-wagon gantry; and an LPG terminal with facilities for road dispatch. But the
biggest crude receipt and product dispatch infrastructure of Paradip Refinery is the captive
South Oil Jetty, the first-of-its-kind in India made for a greenfield coastal refinery. The
products are dispatched through pipelines (20-25%), rail (20-25%), road (15-20%) & coastal
(40-50%) movements.
With an aim to add more value, a 0.680 MMTPA capacity Polypropylene (PP) Plant, based
on Propylene recovered from Cracked LPG generated from INDMAX Plant, is under
implementation and is scheduled for completion by 2019. The refinery also has plans to setup
an Ethylene Recovery Unit /Mono-Ethylene Glycol (MEG) These units are expected to be
completed by 2020-21.
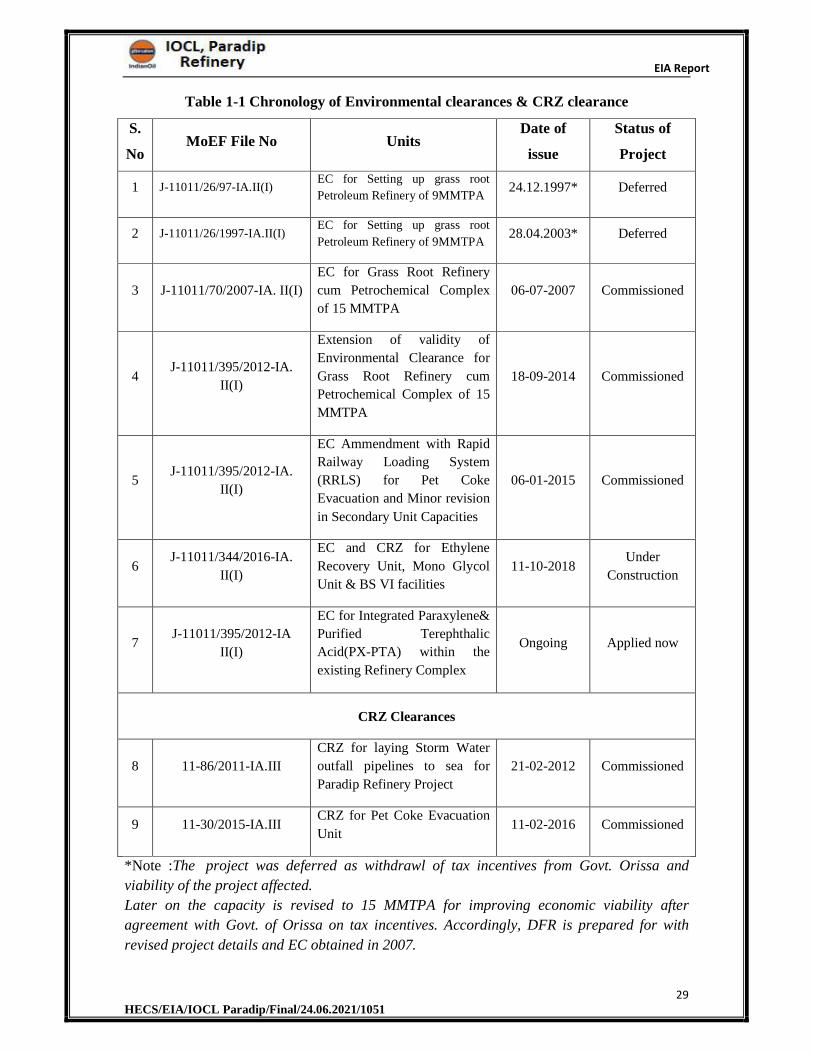
The existing refinery obtained several Environmental Clearances since 1997.Summary of
EC’s obtained enclosed as with latest EC obtained from MoEF vide: J-11011/344/2016-IA.
II(I) dated 11thOct 2018, enclosed as Annexure-2. The existing plant is under operation with
OPCB consent for Air and water obtained vide: 5543/IND-I-CON-6414 dated 31.03.2021
valid till 31.03.2022 copy enclosed as Annexure 3.
PESO license obtained vide P/HQ/OR/15/1163 (P223845) dated 29.12.2020 Valid Up to:
31.12.2023 enclosed as Annexure-4.
Mr. Sarvesh Kumar, Deputy General Manger (HSE) of IOCL Paradip Refinery is the Project
Proponent with the registered office address: IOCL Paradip Refinery P.O. Jhimani, Paradip
Dist., Jagatsinghpur- 754141.
EIA Report
29 HECS/EIA/IOCL Paradip/Final/24.06.2021/1051
Table 1-1 Chronology of Environmental clearances & CRZ clearance
S.
No MoEF File No Units
Date of
issue
Status of
Project
1 J-11011/26/97-IA.II(I) EC for Setting up grass root
Petroleum Refinery of 9MMTPA24.12.1997* Deferred
2 J-11011/26/1997-IA.II(I) EC for Setting up grass root
Petroleum Refinery of 9MMTPA28.04.2003* Deferred
3 J-11011/70/2007-IA. II(I)
EC for Grass Root Refinery
cum Petrochemical Complex
of 15 MMTPA
06-07-2007 Commissioned
4 J-11011/395/2012-IA.
II(I)
Extension of validity of
Environmental Clearance for
Grass Root Refinery cum
Petrochemical Complex of 15
MMTPA
18-09-2014 Commissioned
5 J-11011/395/2012-IA.
II(I)
EC Ammendment with Rapid
Railway Loading System
(RRLS) for Pet Coke
Evacuation and Minor revision
in Secondary Unit Capacities
06-01-2015 Commissioned
6 J-11011/344/2016-IA.
II(I)
EC and CRZ for Ethylene
Recovery Unit, Mono Glycol
Unit & BS VI facilities
11-10-2018Under
Construction
7 J-11011/395/2012-IA
II(I)
EC for Integrated Paraxylene&
Purified Terephthalic
Acid(PX-PTA) within the
existing Refinery Complex
Ongoing Applied now
CRZ Clearances
8 11-86/2011-IA.III
CRZ for laying Storm Water
outfall pipelines to sea for
Paradip Refinery Project
21-02-2012 Commissioned
9 11-30/2015-IA.IIICRZ for Pet Coke Evacuation
Unit11-02-2016 Commissioned
*Note :The project was deferred as withdrawl of tax incentives from Govt. Orissa and
viability of the project affected.
Later on the capacity is revised to 15 MMTPA for improving economic viability after
agreement with Govt. of Orissa on tax incentives. Accordingly, DFR is prepared for with
revised project details and EC obtained in 2007.
EIA Report
30 HECS/EIA/IOCL Paradip/Final/24.06.2021/1051
The proposed project warrants CRZ clearance for the pipeline transfer from south part
to north part of the refinery. Also the recommendation from OCZMA vide.,
F.No.OCZMA/37/2021143/OCZMA dt.10.05.2021 . The recommendation is attached as
Annexure 33.
1.2 Purpose of the EIA report
The Government of India, Ministry of Environment Forest and Climate Change
(MoEF&CC), New Delhi, vide notification no. S. O. 1533 dated 14th September, 2006, and
its amendments, has made it mandatory to obtain ‘Prior Environmental Clearance (EC) ’ for
New projects listed in the schedule, Expansion and Modernization of existing projects listed
in the schedule, any change in product mix in the existing manufacturing unit falling within
the schedule to that notification from MoEF&CC (for Category A projects) or from SEIAA
(for Category B projects).
The EIA submission at MoEF&CC pertains to Proposed “Integrated Para-Xylene &
Purified Terephthalic Acid (PX-PTA) Project within the existing Refinery Complex,
Odisha. The Project falls under Schedule 5 (c) - “Petro-chemical complexes (industries based
on processing of petroleum fractions & natural gas and/or reforming to aromatics” Category
A, since all the projects under this schedule falls under “A” category as per EIA Notification
2006 and its subsequent amendments.
1.3 Brief description of the Project
Nature:M/s. IOCL, Paradip Refinery and Petrochemical Complex as a part of the compliance
to the regulatory requirement i.e., to obtain Environmental Clearance from MoEF& CC has
appointed M/s. Hubert Enviro Care Systems Private Limited, as EIA Consultant who is
accredited by National Accreditation Board for Education and Training (NABET)- Quality
Council of India (QCI), New Delhi for Schedule 5(c) - “Petro-chemical complexes (industries
based on processing of petroleum fractions & natural gas and/or reforming to aromatics”
Category A.
Size:
The 15.0 MMTPA Paradip Refinery Project (PDRP) has commissioned in Fuel- Refinery
mode. The original configuration of PDRP included production of Petrochemical products,
viz. Polypropylene (PP), Paraxylene (PX) and Styrene Monomer (SM) based on Refinery
streams, in addition to fuel products. Considering the encouraging demand growth of Purified
Terephthalic Acid (PTA), IOCL planned to install Integrated Paraxylene (PX) Units of 0.8
EIA Report
31 HECS/EIA/IOCL Paradip/Final/24.06.2021/1051
MMTPA and PTA Units of 1.2 MMTPA capacity at Paradip and associated utilities and
offsite facilities at Paradip Refinery.
Location:
The existing complex is located at Abhaychandrapur village, Jagatsinghpur District, Odisha
State. The site is located 3.6 Km from Paradip city towards NNE.
Importance to the Country & Region:
Eastern India does not have any economic size of PSF, PFY or PET resin plants. The first
PTA plant at IOCL Paradip can provide steady supply of feedstock PTA to PSF, PYF and
PET resin plants. The polyester resins/chips will further have processed to produce audio/
video tapes, x-ray films, photographic films, tapes, aseptic bottles for packing mineral water,
carbonated drinks, vegetable oil, cosmetics, toiletries, tea, coffee etc. Thus using PTA from
Paradip refinery plant at Odisha, a number of secondary and tertiary downstream industries
could be set-up by entrepreneurs who could bring large investment to the state of Odisha and
to Eastern India as a whole. This in turn would also help in generating larger employment
potential in the region.
1.4 EIA cost
EIA & CRZ study was undertaken by HECS for an amount of Rs.53,00,000 Lakhs (Inclusive
of GST).
1.5 Scope of the study & Methodology adopted
EIA is the process of identifying, predicting, evaluating and mitigating the biophysical, social
and other relevant effects of development proposals prior to major decisions being taken and
commitments made. These studies integrate the environmental concerns of developmental
activities into the process of decision – making.
An Environmental Impact Assessment (EIA) is an assessment of the possible impact, whether
positive or negative, that a proposed project may have on the environment, together
consisting of the natural, social and economic aspects, i.e., aiming at “Sustainable
Development” due to the project activities.
EIA Report
32 HECS/EIA/IOCL Paradip/Final/24.06.2021/1051
1.5.1 Objectives of the EIA Report
To ensure environmental considerations are explicitly addressed and incorporated into
development and decision-making process.
To anticipate and avoid, minimize or offset the adverse significant biophysical, social
and other relevant effects of the above project proposal.
To protect the productivity and capacity of natural systems and the ecological
processes which maintain their respective functions.
To promote development that is sustainable and optimizes resource use as well as
management opportunities.
To fully recognize the scope and requirements of the Terms of Reference and comply
it.
1.5.2 Scope of Work
The scope of the work mentioned includes an assessment study of proposed refinery unit and
their impact on the region. This study puts forward the most effective ways to protect the
environment form increasing pollution caused by the burgeoning industrial development and
recommendations for environmental-friendly development initiatives in the region.
An Environmental Impact Assessment (EIA) is an assessment of the possible impact, whether
positive or negative, that a proposed project may have on the environment, together
consisting of the natural, social and economic aspects, i.e., aiming at “Sustainable
Development” due to the project activities.
This EIA report presents the existing baseline scenario and the assessment and evaluation of
the environmental impacts that may rise during the construction and operational phases of the
project. This report also highlights the Environmental Monitoring Program during the
construction and operation phases of the project and the post-project monitoring program. In
terms of the EIA Notification of the MoEF&CC dated 14th September 2006 and subsequent
amendments the generic structure of the EIA document will be as under:
Chapter 1: Introduction
Introductory information is present in this Chapter. The introduction chapter provides
background to the project, project proponent and describes the objective of this document.
The purpose and organization of the report is present in this chapter.
Chapter 2: Project Description
EIA Report
33 HECS/EIA/IOCL Paradip/Final/24.06.2021/1051
This Chapter includes Project Description and Infrastructure Facilities delineating all the
industrial and environmental aspect of the industry of Paradip Refinery expansion project as
well as process details of proposed products.
Chapter 3: Description of the Environment
This Chapter provides baseline environmental status of Environmental Components (Primary
data) delineating meteorological details of the project site and surrounding area.
Chapter 4: Anticipated Environmental Impacts & Mitigation Measures
This Chapter presents the analysis of impacts on the environmental and social aspects of the
project as a result of establishment of plan and thereby suggesting the mitigation measures.
Chapter 5: Analysis of Alternatives (Technology and Sites)
This chapter includes the justification for the selection of the project site from Environmental
point of view as well as from economic point of view.
Chapter 6: Environmental Monitoring Program
This chapter will include the technical aspects of monitoring, the effectiveness of mitigation
measures which will include the measurement methodologies, frequency, location, data
analysis, reporting schedules etc.
Chapter 7: Additional Studies
This chapter will detail about the Public Consultation sought regarding the project. It will
also identify the risks of the Project in relation to the public and the surrounding environment
during construction and operation phases of the plant and thereby presents Disaster
Management Plan, Social impact assessment and R&R action plans.
Chapter 8: Project Benefits
This chapter deals with improvement in physical and social infrastructures, employment
potential and other tangible benefits.
Chapter 9: Environmental Cost Benefit Analysis
This chapter summarizes the cost benefit analysis if it is available in scoping stage.
Chapter 10: Environmental Management Plan
This is the key Chapter of the report and presents the mitigation plan, covers the institutional
and monitoring requirements to implement environmental mitigation measures and to assess
their adequacy during project implementation.
EIA Report
34 HECS/EIA/IOCL Paradip/Final/24.06.2021/1051
Chapter 11: Summary and Conclusion
This chapter summarizes the information given in Chapters in this EIA/EMP report and the
conclusion based on the environmental study, impact identification, mitigation measures and
the environmental management plan.
Chapter 12: Disclosure of the Consultant
Names of consultants engaged in the preparation of the EIA/EMP report along with their
brief resume and nature of Consultancy rendered are included in this Chapter.
1.5.3 EIA Process
The EIA process followed for this EIA report is composed of the following stages:
1. Study of project information
2. Screening & Scoping environmental pre-feasibility study & application for approval
of ToR
3. Collection of detailed project management plan/report
4. Baseline data collection
5. Impact identification, Prediction & Evaluation
6. Mitigation measures & delineation of EMP
7. Risk assessment and safety & disaster management plan
8. Review & finalization of EIA Report based on the ToR requirements.
9. Public consultation
10. Submission of Final EIA report for implementation of mitigation measures & EMP
as well as necessary clearances from relevant Authority
The EIA Cycle based on the above stages has been illustrated as per the ToR dated 30th Sept
2018, in Figure 1.1.
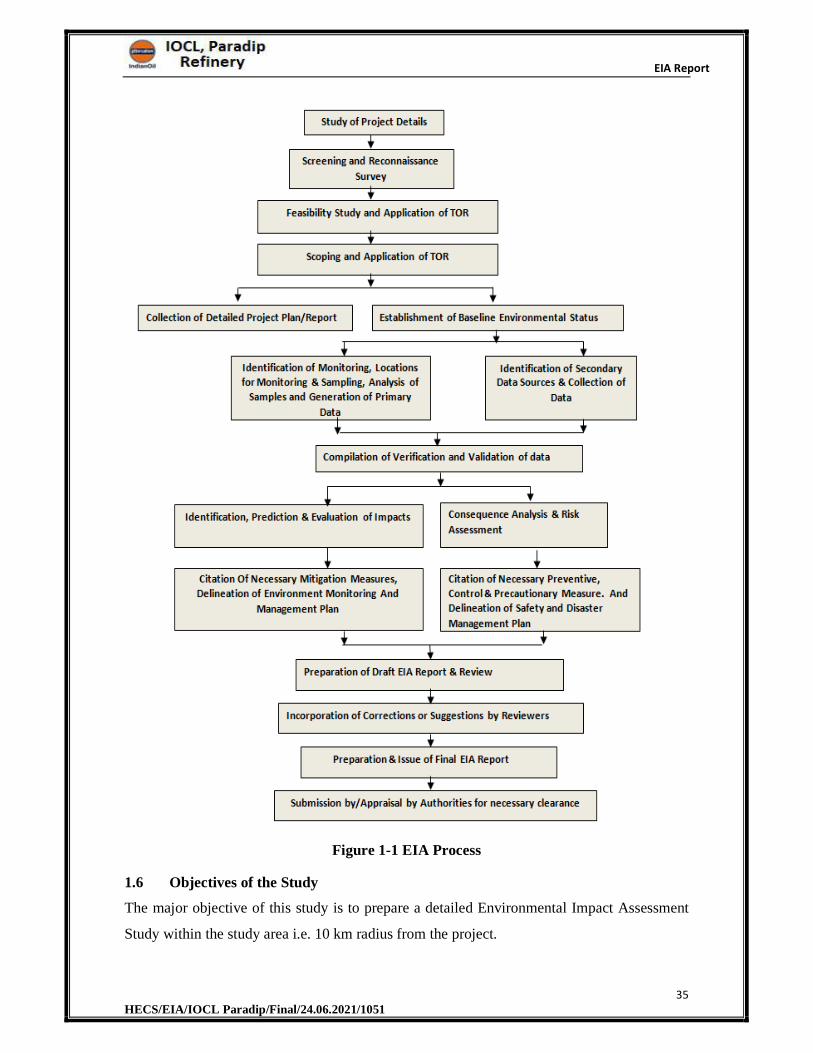
EIA Report
35 HECS/EIA/IOCL Paradip/Final/24.06.2021/1051
Figure 1-1 EIA Process
1.6 Objectives of the Study
The major objective of this study is to prepare a detailed Environmental Impact Assessment
Study within the study area i.e. 10 km radius from the project.
EIA Report
36 HECS/EIA/IOCL Paradip/Final/24.06.2021/1051
1.7 Applicable Regulatory Framework
The following are some of the acts and rules related to environment that are applicable for the
proposed project:
1. EIA Notification 2006 and its amendments
2. Manufacture Storage and Import of Hazardous Chemicals Rules,1989 and its
amendments
3. Water (Prevention and Control of Pollution) Act,1974 and its amendments
4. Air (Prevention and Control of Pollution) Act,1981 and its amendments
5. Hazardous Waste (Management, Handling and Transboundary movement)
Rules,2008 and its amendments
6. Public Liability InsuranceAct,1991 and its amendments
7. Environmental (Protection)Rules,1986 and its amendments
8. The Noise Pollution (Regulation and control) rules, 2000
9. Factories Rules 1950 and its amendments
10. Petroleum Act, 1934
11. Explosive Act,1884
12. Central Motor Vehicle Act, 1988
The details of applicable Acts and Rules and the applicability to the project is given in Table
1-2
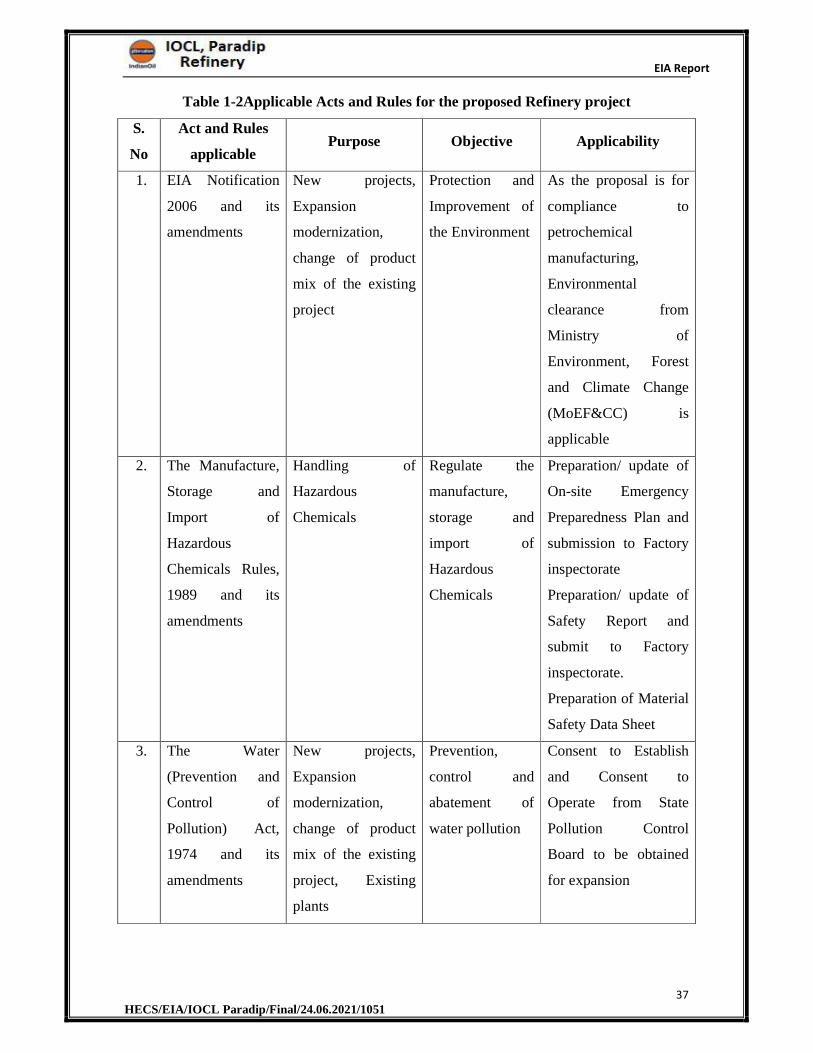
EIA Report
37 HECS/EIA/IOCL Paradip/Final/24.06.2021/1051
Table 1-2Applicable Acts and Rules for the proposed Refinery project
S.
No
Act and Rules
applicable Purpose Objective Applicability
1. EIA Notification
2006 and its
amendments
New projects,
Expansion
modernization,
change of product
mix of the existing
project
Protection and
Improvement of
the Environment
As the proposal is for
compliance to
petrochemical
manufacturing,
Environmental
clearance from
Ministry of
Environment, Forest
and Climate Change
(MoEF&CC) is
applicable
2. The Manufacture,
Storage and
Import of
Hazardous
Chemicals Rules,
1989 and its
amendments
Handling of
Hazardous
Chemicals
Regulate the
manufacture,
storage and
import of
Hazardous
Chemicals
Preparation/ update of
On-site Emergency
Preparedness Plan and
submission to Factory
inspectorate
Preparation/ update of
Safety Report and
submit to Factory
inspectorate.
Preparation of Material
Safety Data Sheet
3. The Water
(Prevention and
Control of
Pollution) Act,
1974 and its
amendments
New projects,
Expansion
modernization,
change of product
mix of the existing
project, Existing
plants
Prevention,
control and
abatement of
water pollution
Consent to Establish
and Consent to
Operate from State
Pollution Control
Board to be obtained
for expansion
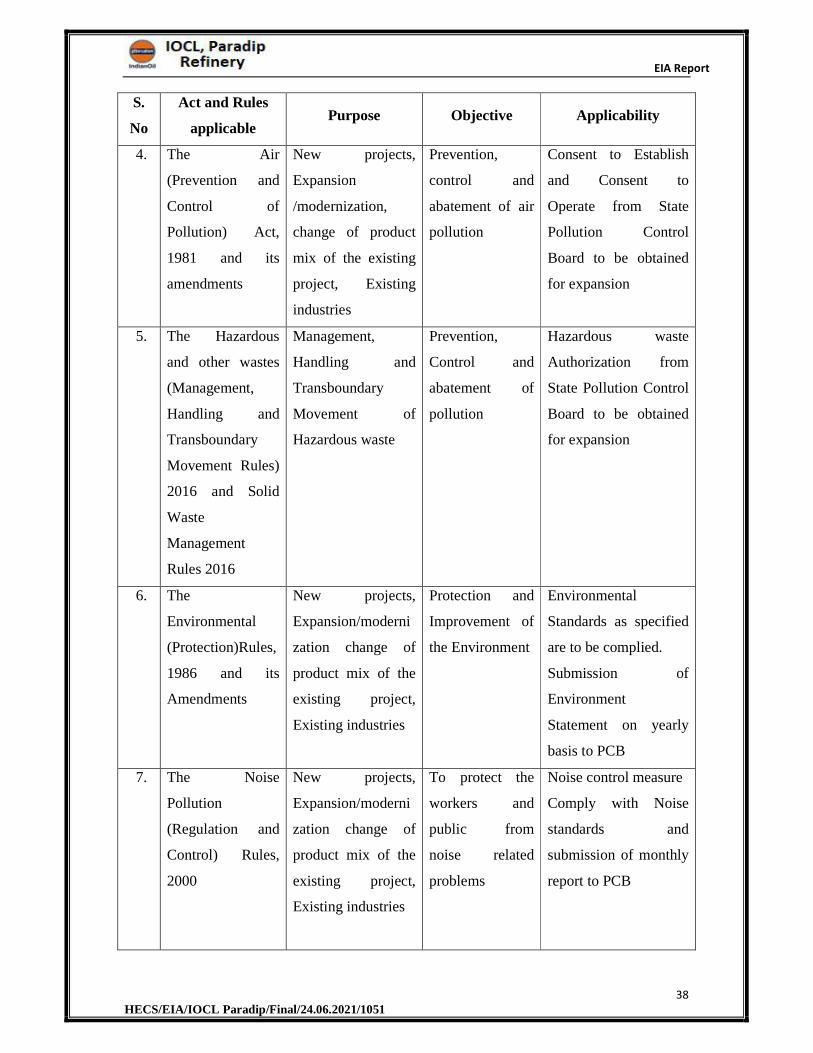
EIA Report
38 HECS/EIA/IOCL Paradip/Final/24.06.2021/1051
S.
No
Act and Rules
applicable Purpose Objective Applicability
4. The Air
(Prevention and
Control of
Pollution) Act,
1981 and its
amendments
New projects,
Expansion
/modernization,
change of product
mix of the existing
project, Existing
industries
Prevention,
control and
abatement of air
pollution
Consent to Establish
and Consent to
Operate from State
Pollution Control
Board to be obtained
for expansion
5. The Hazardous
and other wastes
(Management,
Handling and
Transboundary
Movement Rules)
2016 and Solid
Waste
Management
Rules 2016
Management,
Handling and
Transboundary
Movement of
Hazardous waste
Prevention,
Control and
abatement of
pollution
Hazardous waste
Authorization from
State Pollution Control
Board to be obtained
for expansion
6. The
Environmental
(Protection)Rules,
1986 and its
Amendments
New projects,
Expansion/moderni
zation change of
product mix of the
existing project,
Existing industries
Protection and
Improvement of
the Environment
Environmental
Standards as specified
are to be complied.
Submission of
Environment
Statement on yearly
basis to PCB
7. The Noise
Pollution
(Regulation and
Control) Rules,
2000
New projects,
Expansion/moderni
zation change of
product mix of the
existing project,
Existing industries
To protect the
workers and
public from
noise related
problems
Noise control measure
Comply with Noise
standards and
submission of monthly
report to PCB
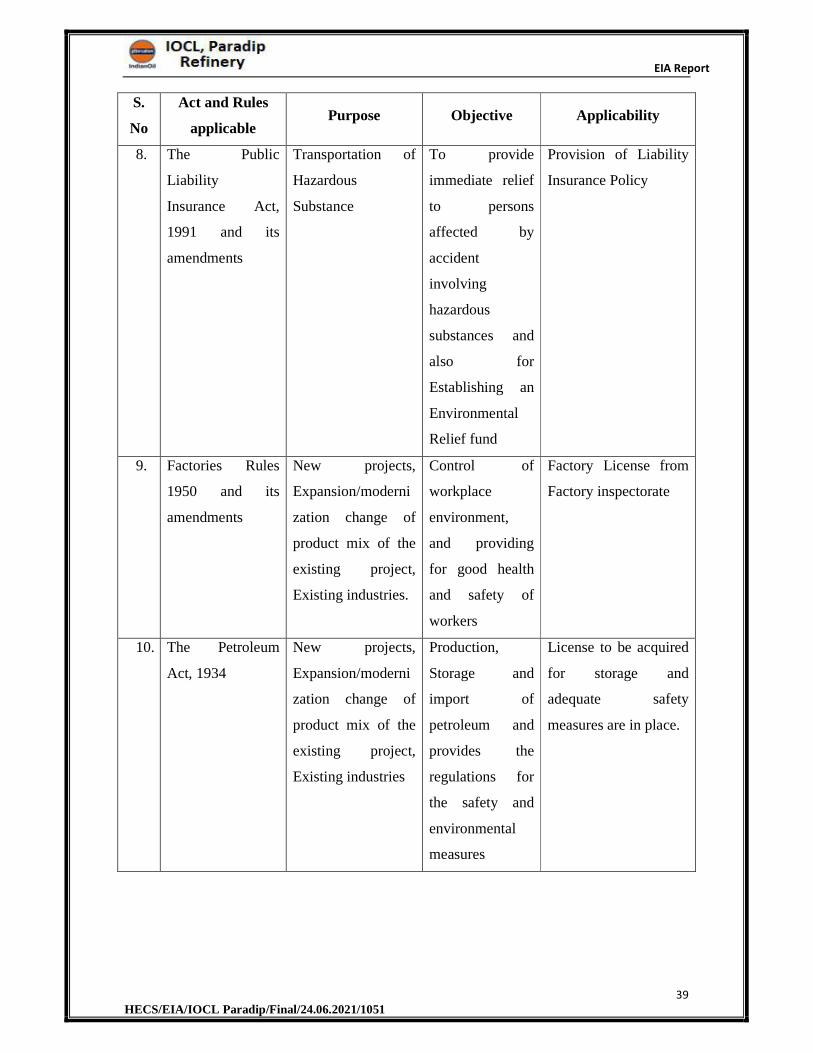
EIA Report
39 HECS/EIA/IOCL Paradip/Final/24.06.2021/1051
S.
No
Act and Rules
applicable Purpose Objective Applicability
8. The Public
Liability
Insurance Act,
1991 and its
amendments
Transportation of
Hazardous
Substance
To provide
immediate relief
to persons
affected by
accident
involving
hazardous
substances and
also for
Establishing an
Environmental
Relief fund
Provision of Liability
Insurance Policy
9. Factories Rules
1950 and its
amendments
New projects,
Expansion/moderni
zation change of
product mix of the
existing project,
Existing industries.
Control of
workplace
environment,
and providing
for good health
and safety of
workers
Factory License from
Factory inspectorate
10. The Petroleum
Act, 1934
New projects,
Expansion/moderni
zation change of
product mix of the
existing project,
Existing industries
Production,
Storage and
import of
petroleum and
provides the
regulations for
the safety and
environmental
measures
License to be acquired
for storage and
adequate safety
measures are in place.
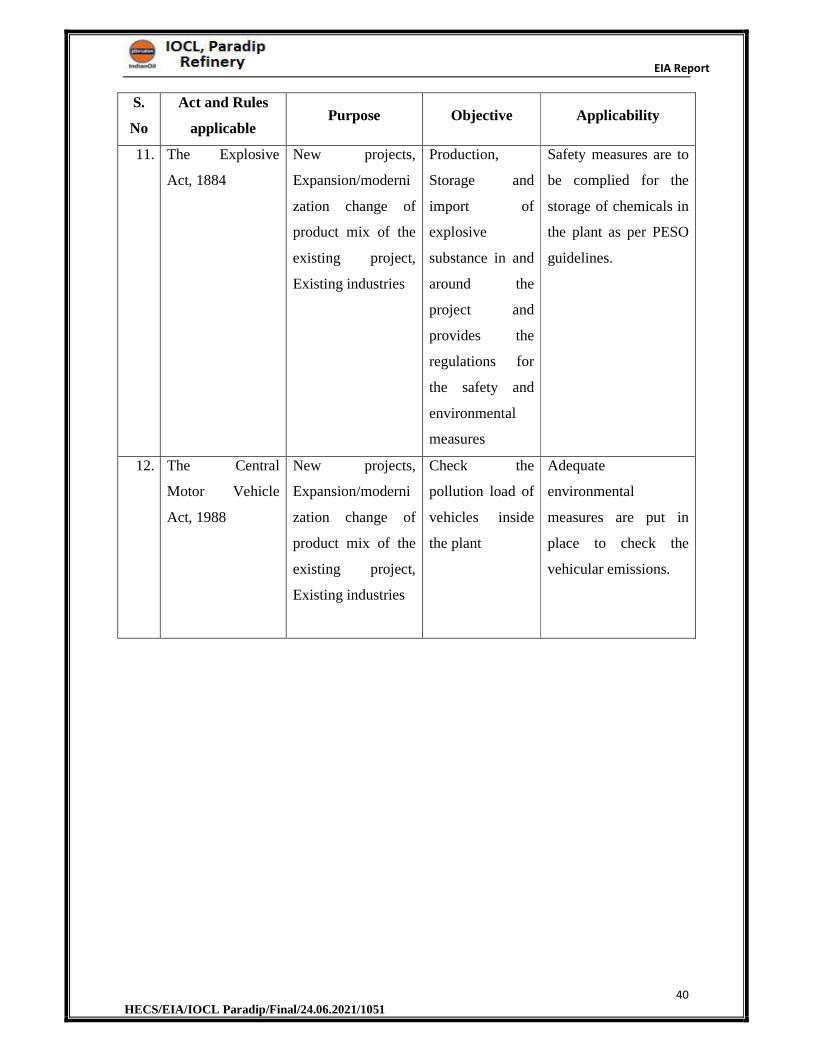
EIA Report
40 HECS/EIA/IOCL Paradip/Final/24.06.2021/1051
S.
No
Act and Rules
applicable Purpose Objective Applicability
11. The Explosive
Act, 1884
New projects,
Expansion/moderni
zation change of
product mix of the
existing project,
Existing industries
Production,
Storage and
import of
explosive
substance in and
around the
project and
provides the
regulations for
the safety and
environmental
measures
Safety measures are to
be complied for the
storage of chemicals in
the plant as per PESO
guidelines.
12. The Central
Motor Vehicle
Act, 1988
New projects,
Expansion/moderni
zation change of
product mix of the
existing project,
Existing industries
Check the
pollution load of
vehicles inside
the plant
Adequate
environmental
measures are put in
place to check the
vehicular emissions.
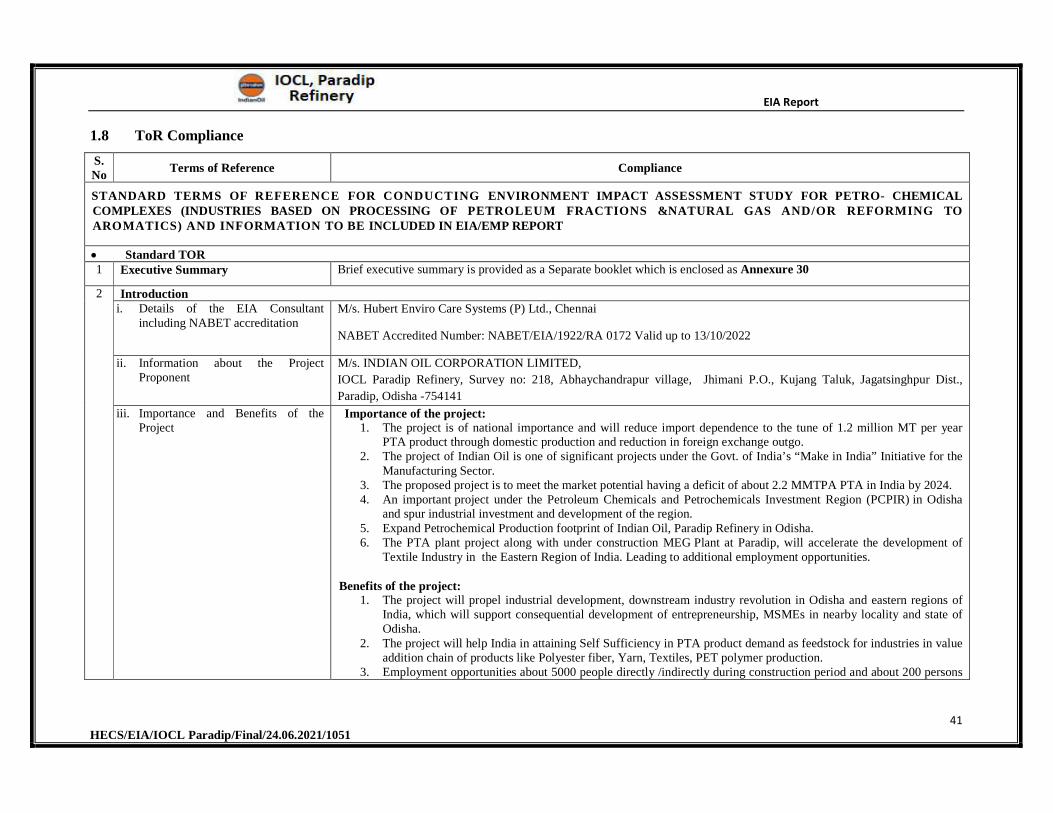
EIA Report
41 HECS/EIA/IOCL Paradip/Final/24.06.2021/1051
1.8 ToR Compliance
S. No
Terms of Reference Compliance
STANDARD TERMS OF REFERENCE FOR CONDUCTING ENVIRONMENT IMPACT ASSESSMENT STUDY FOR PETRO- CHEMICAL COMPLEXES (INDUSTRIES BASED ON PROCESSING OF PETROLEUM FRACTIONS &NATURAL GAS AND/OR REFORMING TO AROMATICS) AND INFORMATION TO BE INCLUDED IN EIA/EMP REPORT
Standard TOR 1 Executive Summary Brief executive summary is provided as a Separate booklet which is enclosed as Annexure 30
2 Introductioni. Details of the EIA Consultant
including NABET accreditation M/s. Hubert Enviro Care Systems (P) Ltd., Chennai
NABET Accredited Number: NABET/EIA/1922/RA 0172 Valid up to 13/10/2022
ii. Information about the Project Proponent
M/s. INDIAN OIL CORPORATION LIMITED,
IOCL Paradip Refinery, Survey no: 218, Abhaychandrapur village, Jhimani P.O., Kujang Taluk, Jagatsinghpur Dist.,
Paradip, Odisha -754141
iii. Importance and Benefits of the Project
Importance of the project: 1. The project is of national importance and will reduce import dependence to the tune of 1.2 million MT per year
PTA product through domestic production and reduction in foreign exchange outgo. 2. The project of Indian Oil is one of significant projects under the Govt. of India’s “Make in India” Initiative for the
Manufacturing Sector. 3. The proposed project is to meet the market potential having a deficit of about 2.2 MMTPA PTA in India by 2024. 4. An important project under the Petroleum Chemicals and Petrochemicals Investment Region (PCPIR) in Odisha
and spur industrial investment and development of the region. 5. Expand Petrochemical Production footprint of Indian Oil, Paradip Refinery in Odisha. 6. The PTA plant project along with under construction MEG Plant at Paradip, will accelerate the development of
Textile Industry in the Eastern Region of India. Leading to additional employment opportunities.
Benefits of the project: 1. The project will propel industrial development, downstream industry revolution in Odisha and eastern regions of
India, which will support consequential development of entrepreneurship, MSMEs in nearby locality and state of Odisha.
2. The project will help India in attaining Self Sufficiency in PTA product demand as feedstock for industries in value addition chain of products like Polyester fiber, Yarn, Textiles, PET polymer production.
3. Employment opportunities about 5000 people directly /indirectly during construction period and about 200 persons
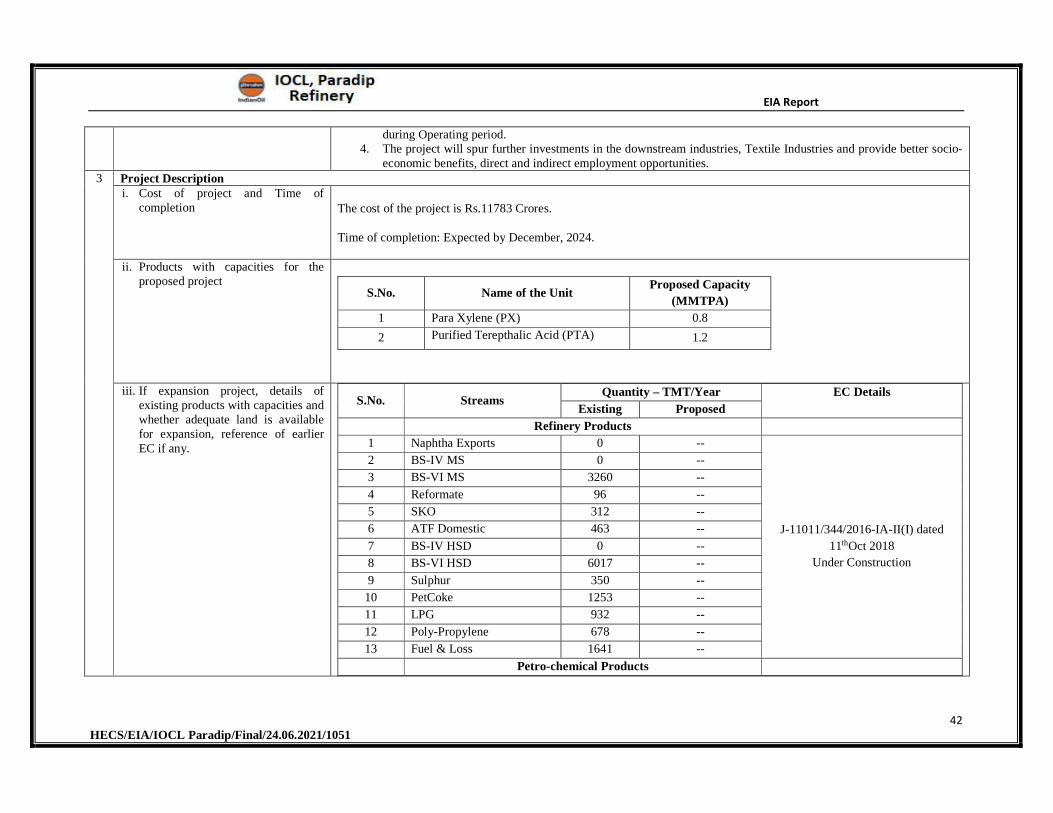
EIA Report
42 HECS/EIA/IOCL Paradip/Final/24.06.2021/1051
during Operating period. 4. The project will spur further investments in the downstream industries, Textile Industries and provide better socio-
economic benefits, direct and indirect employment opportunities. 3 Project Description
i. Cost of project and Time of completion The cost of the project is Rs.11783 Crores.
Time of completion: Expected by December, 2024.
ii. Products with capacities for the proposed project
S.No. Name of the UnitProposed Capacity
(MMTPA)
1 Para Xylene (PX) 0.8
2 Purified Terepthalic Acid (PTA) 1.2
iii. If expansion project, details of existing products with capacities and whether adequate land is available for expansion, reference of earlier EC if any.
S.No. Streams Quantity – TMT/Year EC Details
Existing Proposed
Refinery Products
1 Naphtha Exports 0 --
J-11011/344/2016-IA-II(I) dated
11thOct 2018
Under Construction
2 BS-IV MS 0 --
3 BS-VI MS 3260 --
4 Reformate 96 --
5 SKO 312 --
6 ATF Domestic 463 --
7 BS-IV HSD 0 --
8 BS-VI HSD 6017 --
9 Sulphur 350 --
10 PetCoke 1253 --
11 LPG 932 --
12 Poly-Propylene 678 --
13 Fuel & Loss 1641 --
Petro-chemical Products
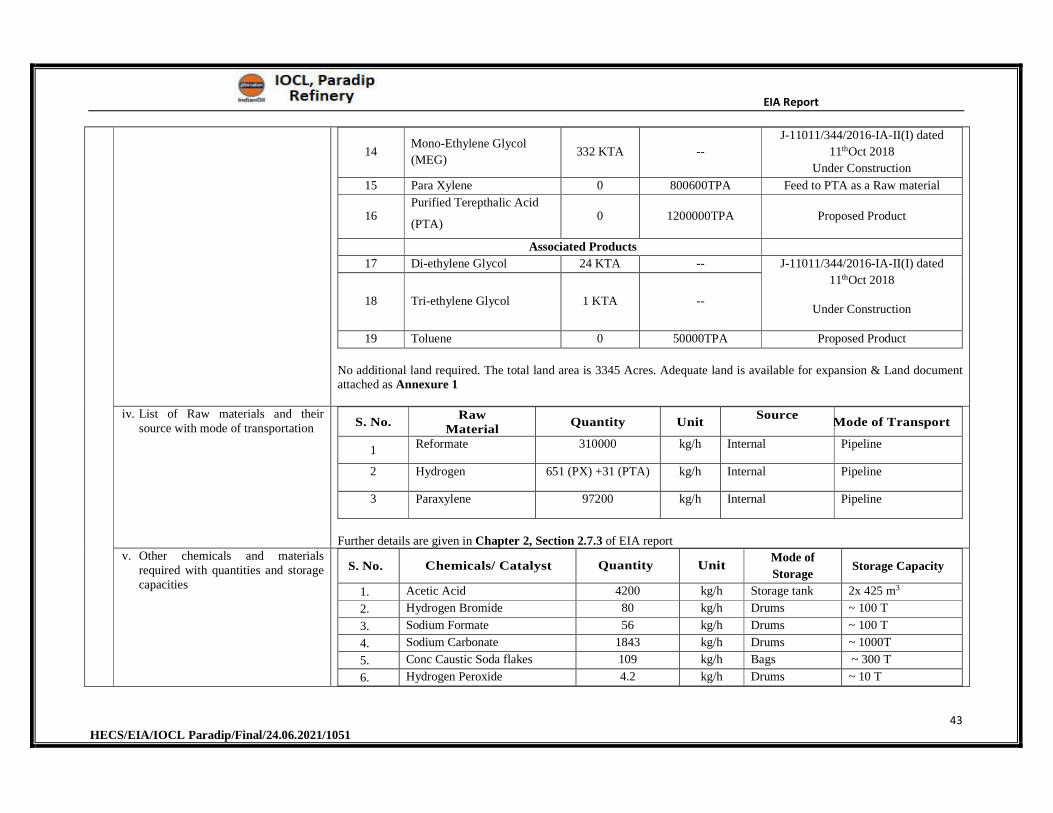
EIA Report
43 HECS/EIA/IOCL Paradip/Final/24.06.2021/1051
14 Mono-Ethylene Glycol
(MEG) 332 KTA --
J-11011/344/2016-IA-II(I) dated
11thOct 2018
Under Construction
15 Para Xylene 0 800600TPA Feed to PTA as a Raw material
16 Purified Terepthalic Acid
(PTA) 0 1200000TPA Proposed Product
Associated Products
17 Di-ethylene Glycol 24 KTA -- J-11011/344/2016-IA-II(I) dated
11thOct 2018
Under Construction 18 Tri-ethylene Glycol 1 KTA --
19 Toluene 0 50000TPA Proposed Product
No additional land required. The total land area is 3345 Acres. Adequate land is available for expansion & Land document attached as Annexure 1
iv. List of Raw materials and their source with mode of transportation
S. No. Raw
Material Quantity Unit
Source Mode of Transport
1 Reformate 310000 kg/h Internal Pipeline
2 Hydrogen 651 (PX) +31 (PTA) kg/h Internal Pipeline
3 Paraxylene 97200 kg/h Internal Pipeline
Further details are given in Chapter 2, Section 2.7.3 of EIA report v. Other chemicals and materials
required with quantities and storage capacities
S. No. Chemicals/ Catalyst Quantity UnitMode of
Storage Storage Capacity
1. Acetic Acid 4200 kg/h Storage tank 2x 425 m3
2. Hydrogen Bromide 80 kg/h Drums ~ 100 T
3. Sodium Formate 56 kg/h Drums ~ 100 T
4. Sodium Carbonate 1843 kg/h Drums ~ 1000T
5. Conc Caustic Soda flakes 109 kg/h Bags ~ 300 T
6. Hydrogen Peroxide 4.2 kg/h Drums ~ 10 T
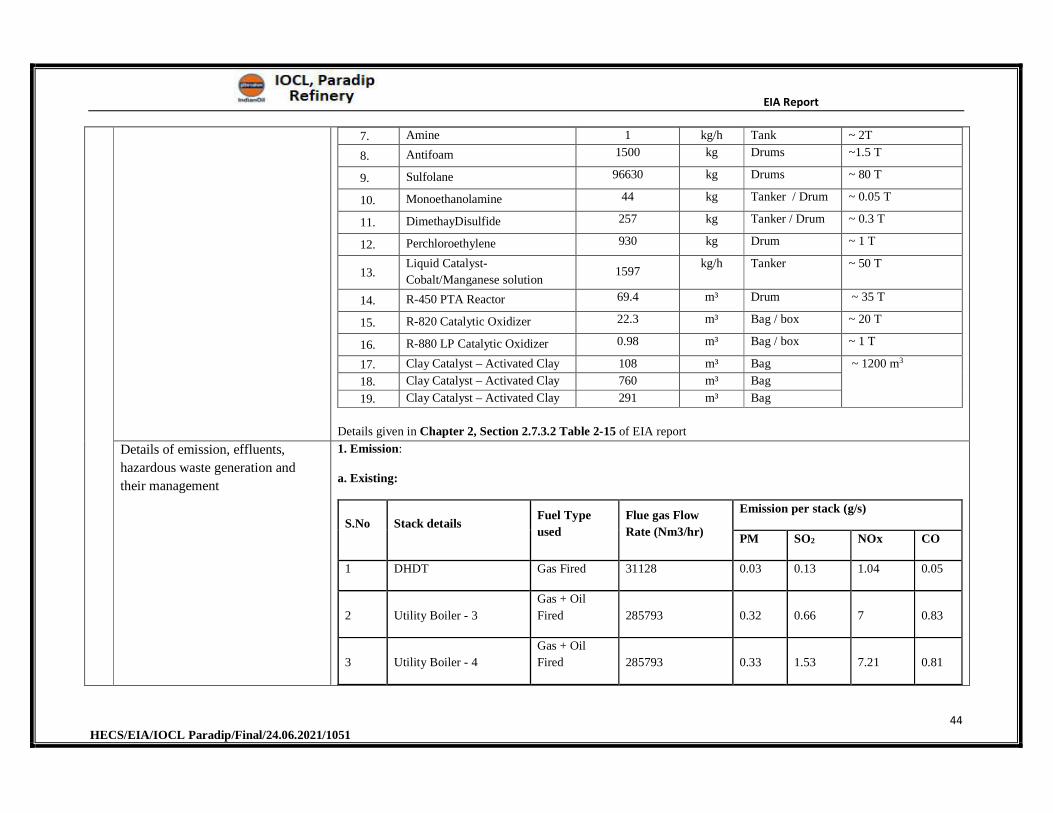
EIA Report
44 HECS/EIA/IOCL Paradip/Final/24.06.2021/1051
7. Amine 1 kg/h Tank ~ 2T
8. Antifoam 1500 kg Drums ~1.5 T
9. Sulfolane 96630 kg Drums ~ 80 T
10. Monoethanolamine 44 kg Tanker / Drum ~ 0.05 T
11. DimethayDisulfide 257 kg Tanker / Drum ~ 0.3 T
12. Perchloroethylene 930 kg Drum ~ 1 T
13.Liquid Catalyst-
Cobalt/Manganese solution 1597
kg/h Tanker ~ 50 T
14. R-450 PTA Reactor 69.4 m³ Drum ~ 35 T
15. R-820 Catalytic Oxidizer 22.3 m³ Bag / box ~ 20 T
16. R-880 LP Catalytic Oxidizer 0.98 m³ Bag / box ~ 1 T
17. Clay Catalyst – Activated Clay 108 m³ Bag ~ 1200 m3
18. Clay Catalyst – Activated Clay 760 m³ Bag
19. Clay Catalyst – Activated Clay 291 m³ Bag
Details given in Chapter 2, Section 2.7.3.2 Table 2-15 of EIA report
Details of emission, effluents,
hazardous waste generation and
their management
1. Emission:
a. Existing:
S.No Stack details Fuel Type
used
Flue gas Flow
Rate (Nm3/hr)
Emission per stack (g/s)
PM SO2 NOx CO
1 DHDT Gas Fired 31128 0.03 0.13 1.04 0.05
2 Utility Boiler - 3
Gas + Oil
Fired 285793 0.32 0.66 7 0.83
3 Utility Boiler - 4
Gas + Oil
Fired 285793 0.33 1.53 7.21 0.81
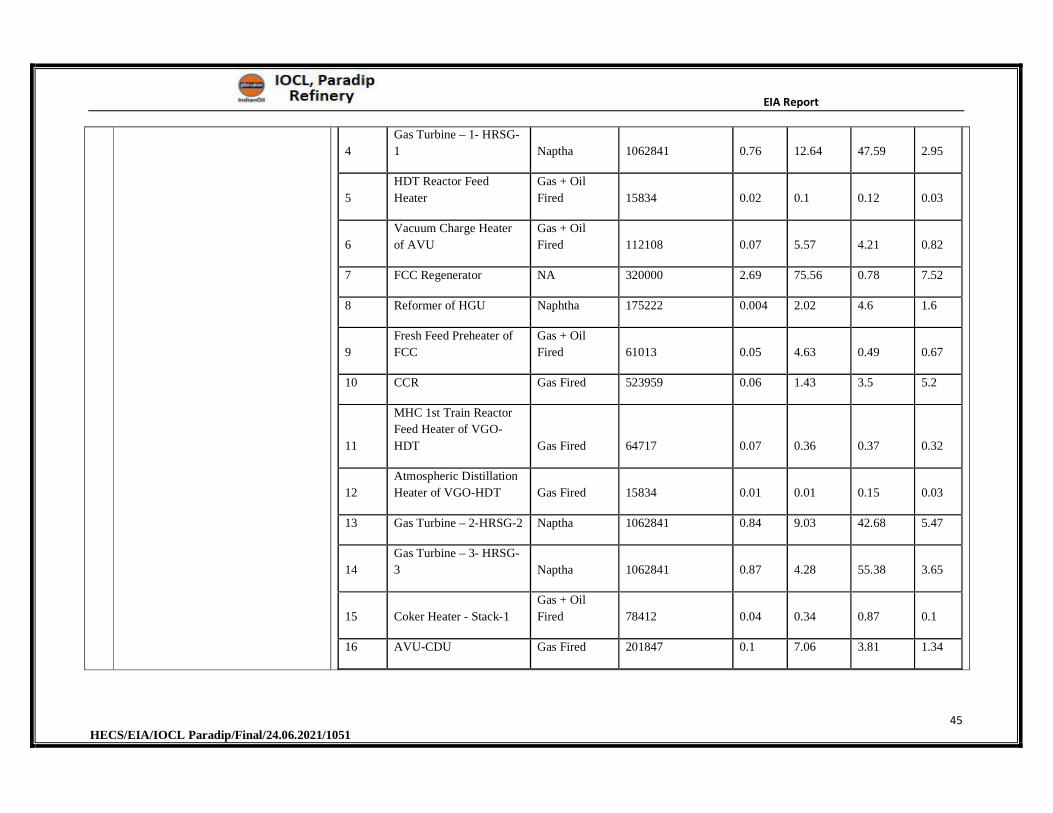
EIA Report
45 HECS/EIA/IOCL Paradip/Final/24.06.2021/1051
4
Gas Turbine – 1- HRSG-
1 Naptha 1062841 0.76 12.64 47.59 2.95
5
HDT Reactor Feed
Heater
Gas + Oil
Fired 15834 0.02 0.1 0.12 0.03
6
Vacuum Charge Heater
of AVU
Gas + Oil
Fired 112108 0.07 5.57 4.21 0.82
7 FCC Regenerator NA 320000 2.69 75.56 0.78 7.52
8 Reformer of HGU Naphtha 175222 0.004 2.02 4.6 1.6
9
Fresh Feed Preheater of
FCC
Gas + Oil
Fired 61013 0.05 4.63 0.49 0.67
10 CCR Gas Fired 523959 0.06 1.43 3.5 5.2
11
MHC 1st Train Reactor
Feed Heater of VGO-
HDT Gas Fired 64717 0.07 0.36 0.37 0.32
12
Atmospheric Distillation
Heater of VGO-HDT Gas Fired 15834 0.01 0.01 0.15 0.03
13 Gas Turbine – 2-HRSG-2 Naptha 1062841 0.84 9.03 42.68 5.47
14
Gas Turbine – 3- HRSG-
3 Naptha 1062841 0.87 4.28 55.38 3.65
15 Coker Heater - Stack-1
Gas + Oil
Fired 78412 0.04 0.34 0.87 0.1
16 AVU-CDU Gas Fired 201847 0.1 7.06 3.81 1.34
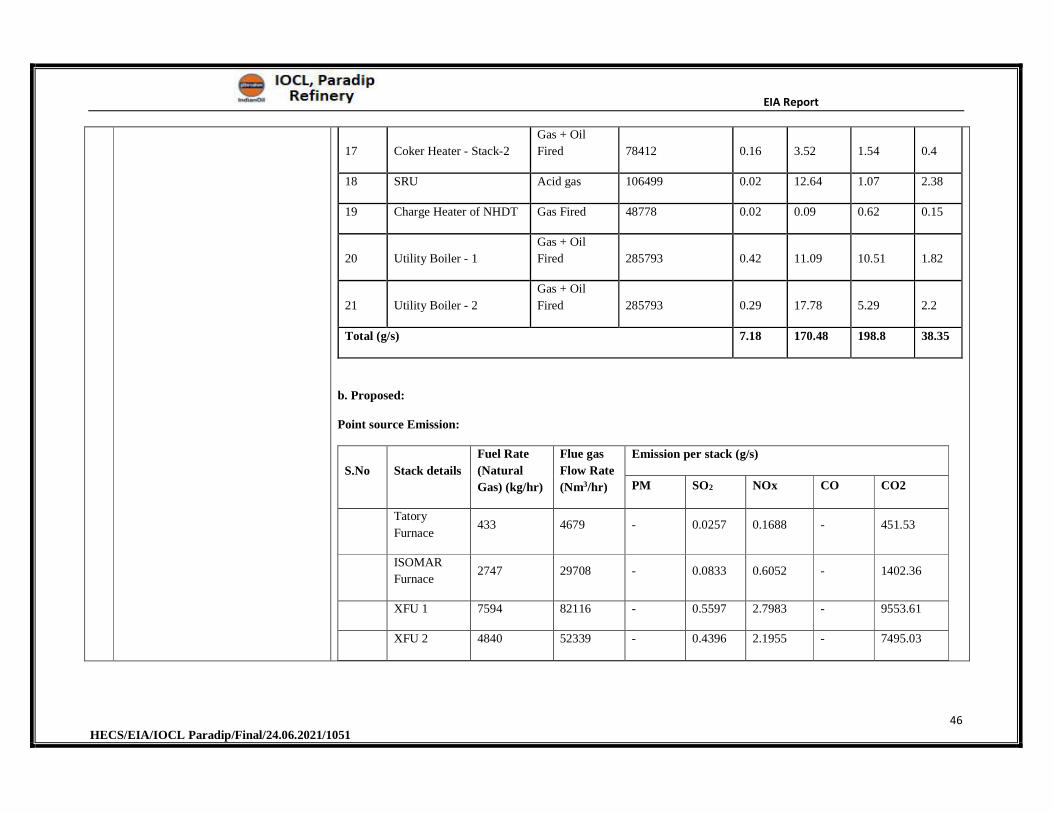
EIA Report
46 HECS/EIA/IOCL Paradip/Final/24.06.2021/1051
17 Coker Heater - Stack-2
Gas + Oil
Fired 78412 0.16 3.52 1.54 0.4
18 SRU Acid gas 106499 0.02 12.64 1.07 2.38
19 Charge Heater of NHDT Gas Fired 48778 0.02 0.09 0.62 0.15
20 Utility Boiler - 1
Gas + Oil
Fired 285793 0.42 11.09 10.51 1.82
21 Utility Boiler - 2
Gas + Oil
Fired 285793 0.29 17.78 5.29 2.2
Total (g/s) 7.18 170.48 198.8 38.35
b. Proposed:
Point source Emission:
S.No Stack details
Fuel Rate
(Natural
Gas) (kg/hr)
Flue gas
Flow Rate
(Nm3/hr)
Emission per stack (g/s)
PM SO2 NOx CO CO2
Tatory
Furnace 433 4679 - 0.0257 0.1688 - 451.53
ISOMAR
Furnace 2747 29708 - 0.0833 0.6052 - 1402.36
XFU 1 7594 82116 - 0.5597 2.7983 - 9553.61
XFU 2 4840 52339 - 0.4396 2.1955 - 7495.03
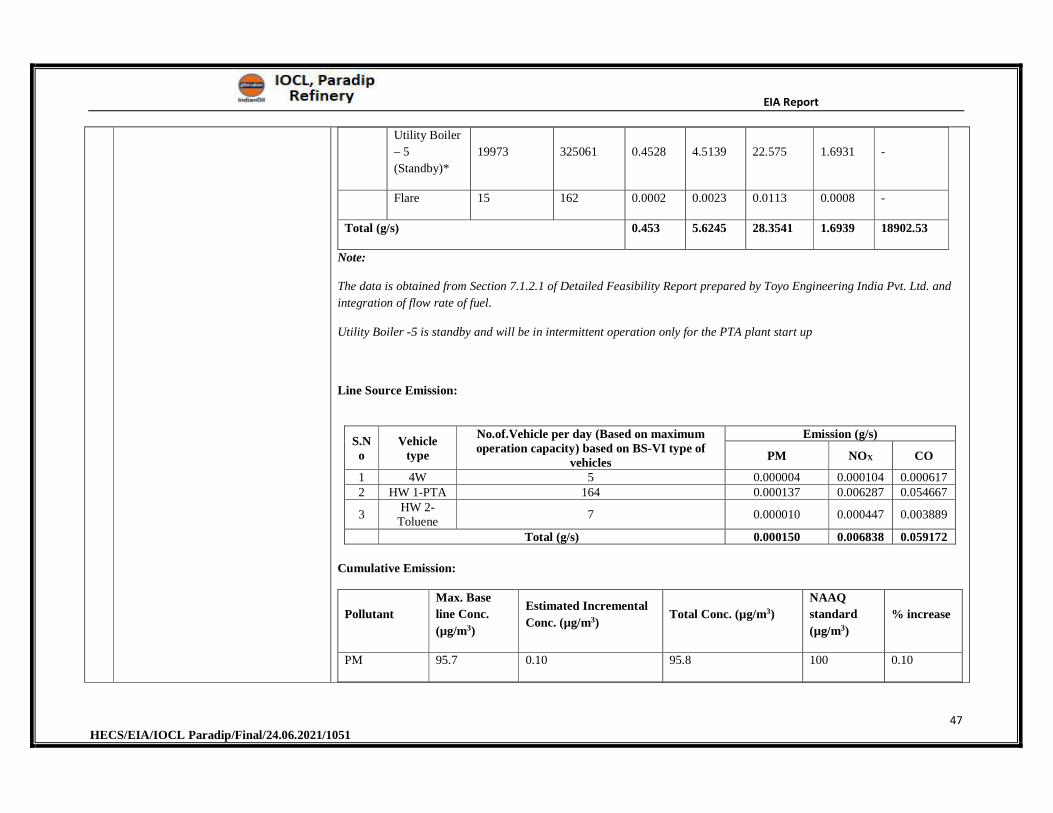
EIA Report
47 HECS/EIA/IOCL Paradip/Final/24.06.2021/1051
Utility Boiler
– 5
(Standby)*
19973 325061 0.4528 4.5139 22.575 1.6931 -
Flare 15 162 0.0002 0.0023 0.0113 0.0008 -
Total (g/s) 0.453 5.6245 28.3541 1.6939 18902.53
Note:
The data is obtained from Section 7.1.2.1 of Detailed Feasibility Report prepared by Toyo Engineering India Pvt. Ltd. and
integration of flow rate of fuel.
Utility Boiler -5 is standby and will be in intermittent operation only for the PTA plant start up
Line Source Emission:
S.No
Vehicle type
No.of.Vehicle per day (Based on maximum operation capacity) based on BS-VI type of
vehicles
Emission (g/s)
PM NOX CO
1 4W 5 0.000004 0.000104 0.000617 2 HW 1-PTA 164 0.000137 0.006287 0.054667
3 HW 2-
Toluene 7 0.000010 0.000447 0.003889
Total (g/s) 0.000150 0.006838 0.059172
Cumulative Emission:
Pollutant
Max. Base
line Conc.
(µg/m3)
Estimated Incremental
Conc. (µg/m3) Total Conc. (µg/m3)
NAAQ
standard
(µg/m3)
% increase
PM 95.7 0.10 95.8 100 0.10
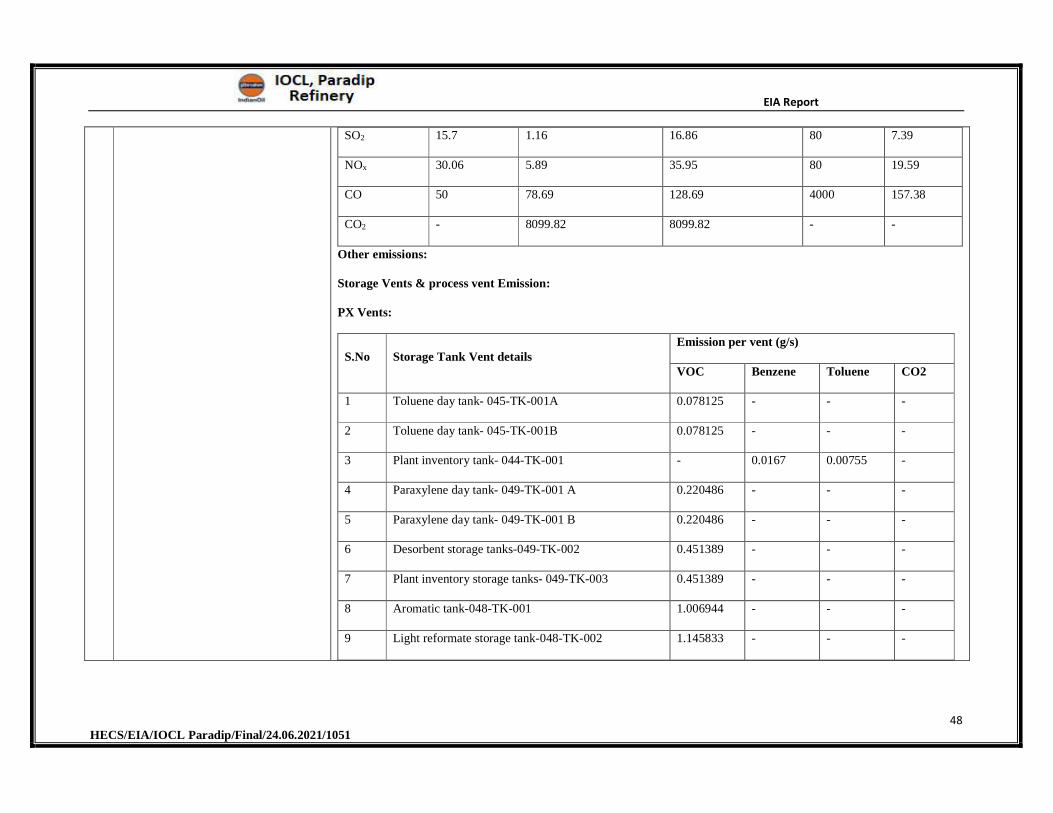
EIA Report
48 HECS/EIA/IOCL Paradip/Final/24.06.2021/1051
SO2 15.7 1.16 16.86 80 7.39
NOx 30.06 5.89 35.95 80 19.59
CO 50 78.69 128.69 4000 157.38
CO2 - 8099.82 8099.82 - -
Other emissions:
Storage Vents & process vent Emission:
PX Vents:
S.No Storage Tank Vent details Emission per vent (g/s)
VOC Benzene Toluene CO2
1 Toluene day tank- 045-TK-001A 0.078125 - - -
2 Toluene day tank- 045-TK-001B 0.078125 - - -
3 Plant inventory tank- 044-TK-001 - 0.0167 0.00755 -
4 Paraxylene day tank- 049-TK-001 A 0.220486 - - -
5 Paraxylene day tank- 049-TK-001 B 0.220486 - - -
6 Desorbent storage tanks-049-TK-002 0.451389 - - -
7 Plant inventory storage tanks- 049-TK-003 0.451389 - - -
8 Aromatic tank-048-TK-001 1.006944 - - -
9 Light reformate storage tank-048-TK-002 1.145833 - - -
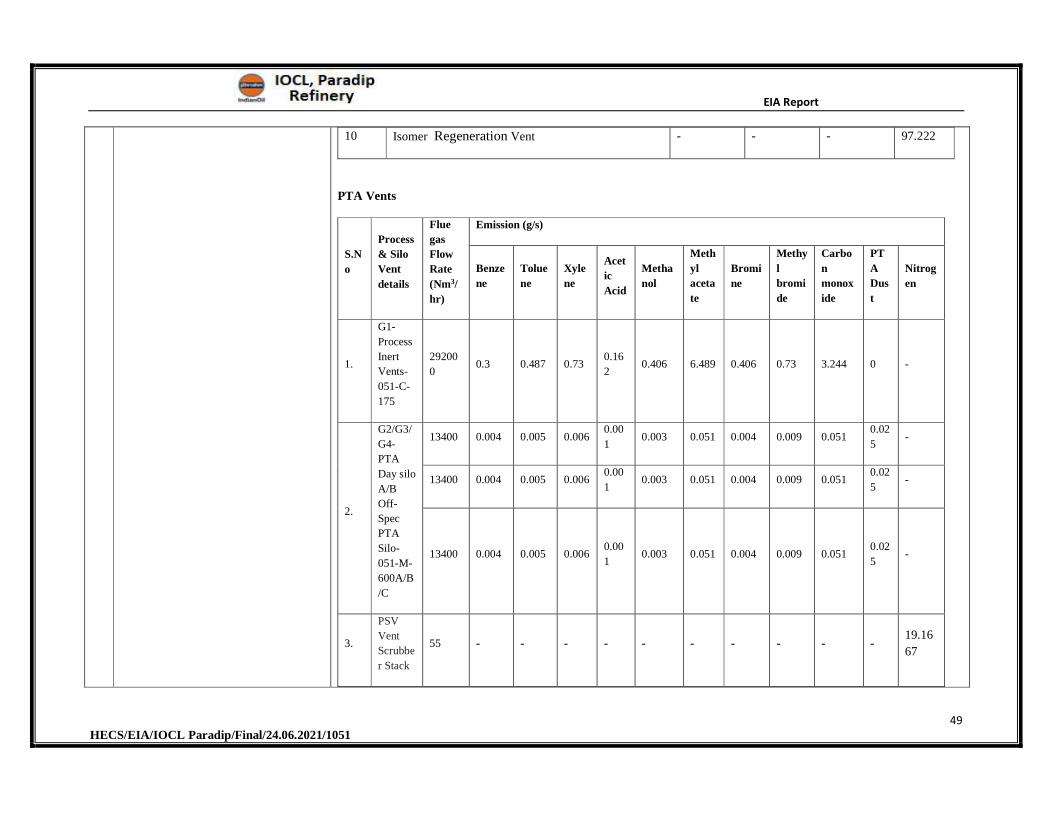
EIA Report
49 HECS/EIA/IOCL Paradip/Final/24.06.2021/1051
10 Isomer Regeneration Vent - - - 97.222
PTA Vents
S.N
o
Process
& Silo
Vent
details
Flue
gas
Flow
Rate
(Nm3/
hr)
Emission (g/s)
Benze
ne
Tolue
ne
Xyle
ne
Acet
ic
Acid
Metha
nol
Meth
yl
aceta
te
Bromi
ne
Methy
l
bromi
de
Carbo
n
monox
ide
PT
A
Dus
t
Nitrog
en
1.
G1-
Process
Inert
Vents-
051-C-
175
29200
0 0.3 0.487 0.73
0.16
2 0.406 6.489 0.406 0.73 3.244 0 -
2.
G2/G3/
G4-
PTA
Day silo
A/B
Off-
Spec
PTA
Silo-
051-M-
600A/B
/C
13400 0.004 0.005 0.006 0.00
1 0.003 0.051 0.004 0.009 0.051
0.02
5 -
13400 0.004 0.005 0.006 0.00
1 0.003 0.051 0.004 0.009 0.051
0.02
5 -
13400 0.004 0.005 0.006 0.00
1 0.003 0.051 0.004 0.009 0.051
0.02
5 -
3.
PSV
Vent
Scrubbe
r Stack
55 - - - - - - - - - - 19.16
67
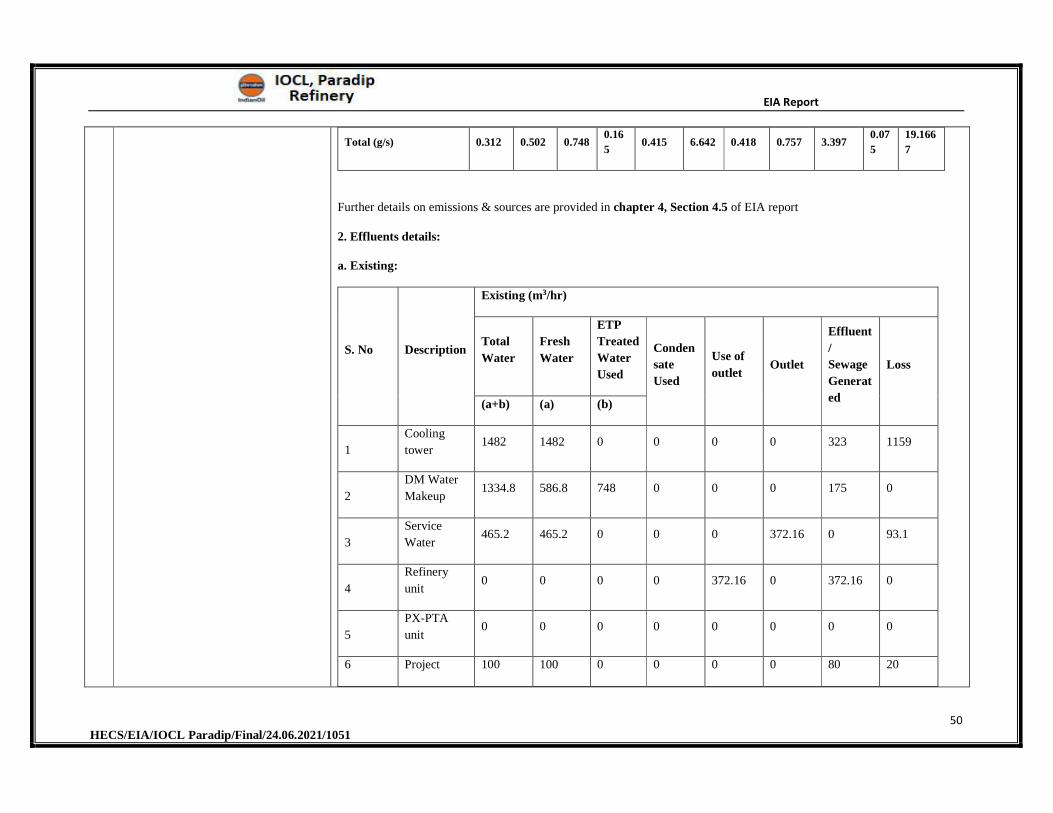
EIA Report
50 HECS/EIA/IOCL Paradip/Final/24.06.2021/1051
Total (g/s) 0.312 0.502 0.748 0.16
5 0.415 6.642 0.418 0.757 3.397
0.07
5
19.166
7
Further details on emissions & sources are provided in chapter 4, Section 4.5 of EIA report
2. Effluents details:
a. Existing:
S. No Description
Existing (m3/hr)
Total
Water
Fresh
Water
ETP
Treated
Water
Used
Conden
sate
Used
Use of
outlet Outlet
Effluent
/
Sewage
Generat
ed
Loss
(a+b) (a) (b)
1
Cooling
tower 1482 1482 0 0 0 0 323 1159
2
DM Water
Makeup 1334.8 586.8 748 0 0 0 175 0
3
Service
Water 465.2 465.2 0 0 0 372.16 0 93.1
4
Refinery
unit 0 0 0 0 372.16 0 372.16 0
5
PX-PTA
unit 0 0 0 0 0 0 0 0
6 Project 100 100 0 0 0 0 80 20
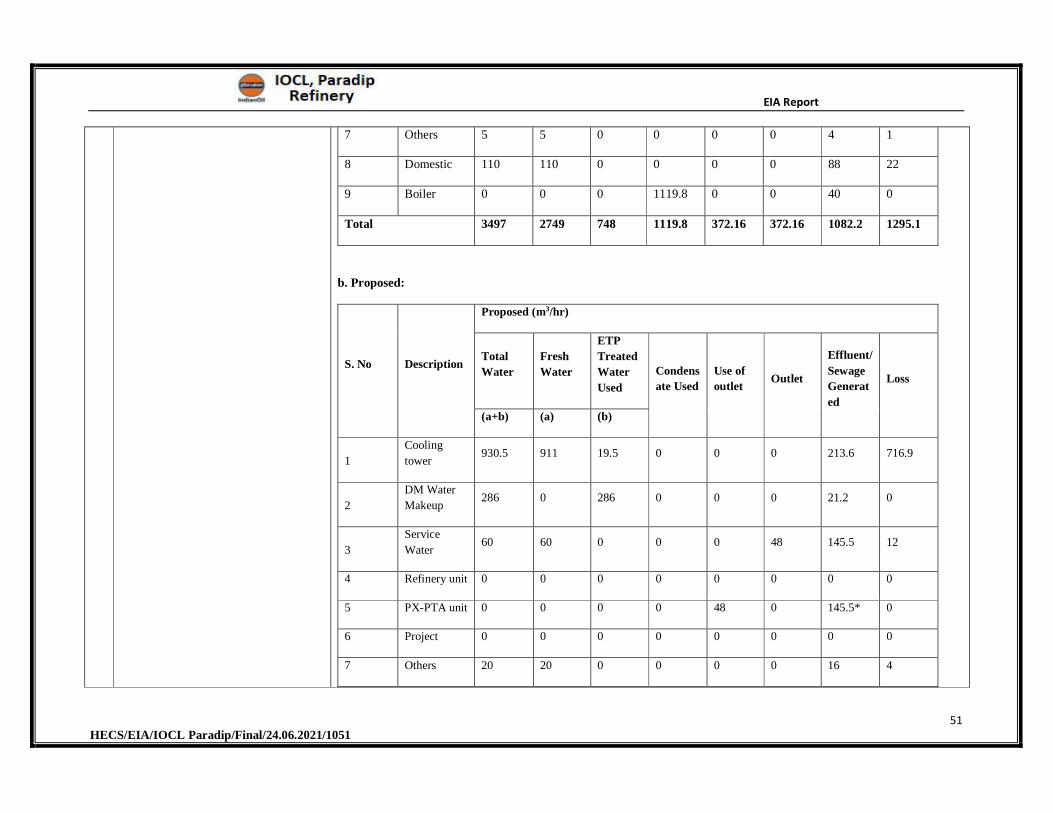
EIA Report
51 HECS/EIA/IOCL Paradip/Final/24.06.2021/1051
7 Others 5 5 0 0 0 0 4 1
8 Domestic 110 110 0 0 0 0 88 22
9 Boiler 0 0 0 1119.8 0 0 40 0
Total 3497 2749 748 1119.8 372.16 372.16 1082.2 1295.1
b. Proposed:
S. No Description
Proposed (m3/hr)
Total
Water
Fresh
Water
ETP
Treated
Water
Used
Condens
ate Used
Use of
outlet Outlet
Effluent/
Sewage
Generat
ed
Loss
(a+b) (a) (b)
1
Cooling
tower 930.5 911 19.5 0 0 0 213.6 716.9
2
DM Water
Makeup 286 0 286 0 0 0 21.2 0
3
Service
Water 60 60 0 0 0 48 145.5 12
4 Refinery unit 0 0 0 0 0 0 0 0
5 PX-PTA unit 0 0 0 0 48 0 145.5* 0
6 Project 0 0 0 0 0 0 0 0
7 Others 20 20 0 0 0 0 16 4
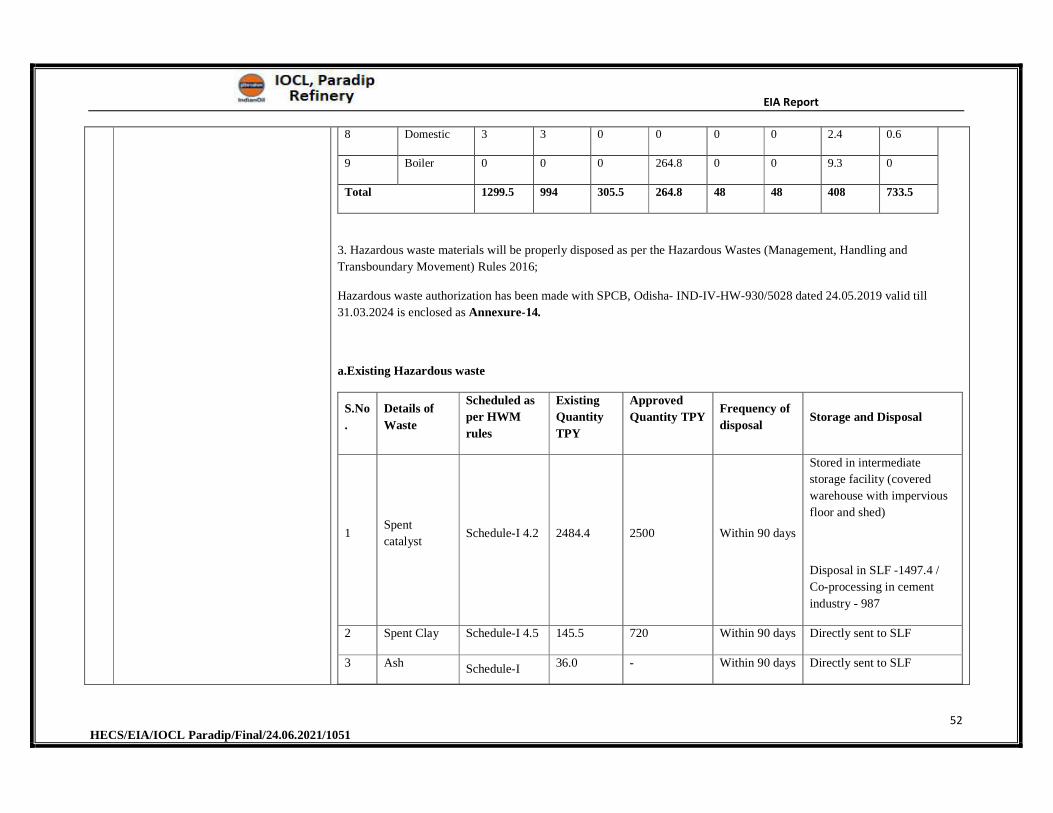
EIA Report
52 HECS/EIA/IOCL Paradip/Final/24.06.2021/1051
8 Domestic 3 3 0 0 0 0 2.4 0.6
9 Boiler 0 0 0 264.8 0 0 9.3 0
Total 1299.5 994 305.5 264.8 48 48 408 733.5
3. Hazardous waste materials will be properly disposed as per the Hazardous Wastes (Management, Handling and
Transboundary Movement) Rules 2016;
Hazardous waste authorization has been made with SPCB, Odisha- IND-IV-HW-930/5028 dated 24.05.2019 valid till
31.03.2024 is enclosed as Annexure-14.
a.Existing Hazardous waste
S.No
.
Details of
Waste
Scheduled as
per HWM
rules
Existing
Quantity
TPY
Approved
Quantity TPY Frequency of
disposal Storage and Disposal
1 Spent
catalyst Schedule-I 4.2 2484.4 2500 Within 90 days
Stored in intermediate
storage facility (covered
warehouse with impervious
floor and shed)
Disposal in SLF -1497.4 /
Co-processing in cement
industry - 987
2 Spent Clay Schedule-I 4.5 145.5 720 Within 90 days Directly sent to SLF
3 Ash Schedule-I 36.0 - Within 90 days Directly sent to SLF
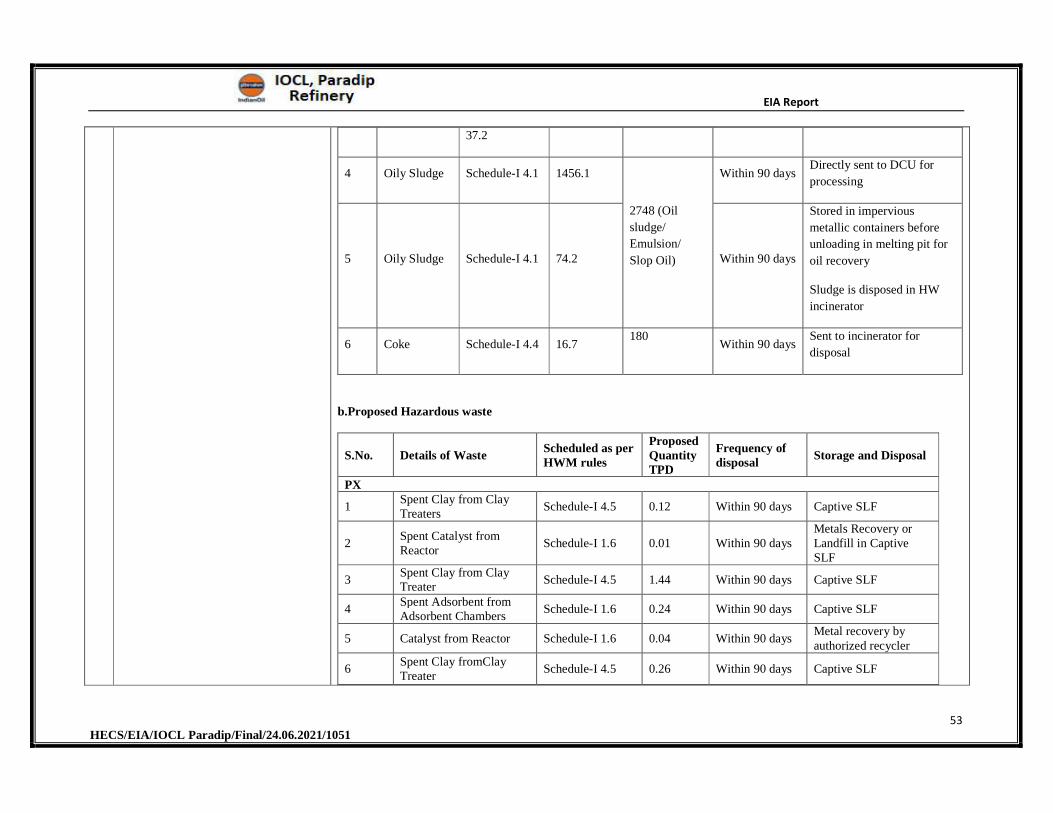
EIA Report
53 HECS/EIA/IOCL Paradip/Final/24.06.2021/1051
37.2
4 Oily Sludge Schedule-I 4.1 1456.1
2748 (Oil
sludge/
Emulsion/
Slop Oil)
Within 90 days Directly sent to DCU for
processing
5 Oily Sludge Schedule-I 4.1 74.2 Within 90 days
Stored in impervious
metallic containers before
unloading in melting pit for
oil recovery
Sludge is disposed in HW
incinerator
6 Coke Schedule-I 4.4 16.7 180
Within 90 days Sent to incinerator for
disposal
b.Proposed Hazardous waste
S.No. Details of Waste Scheduled as per HWM rules
Proposed Quantity TPD
Frequency of disposal
Storage and Disposal
PX
1 Spent Clay from Clay Treaters
Schedule-I 4.5 0.12 Within 90 days Captive SLF
2 Spent Catalyst from Reactor
Schedule-I 1.6 0.01 Within 90 days Metals Recovery or Landfill in Captive SLF
3 Spent Clay from Clay Treater
Schedule-I 4.5 1.44 Within 90 days Captive SLF
4 Spent Adsorbent from Adsorbent Chambers
Schedule-I 1.6 0.24 Within 90 days Captive SLF
5 Catalyst from Reactor Schedule-I 1.6 0.04 Within 90 days Metal recovery by authorized recycler
6 Spent Clay fromClay Treater
Schedule-I 4.5 0.26 Within 90 days Captive SLF

EIA Report
54 HECS/EIA/IOCL Paradip/Final/24.06.2021/1051
PTA
7 PTA Spent Catalyst Schedule-I 1.6 0.0438 Within 90 days Recovery by catalyst manufacturer
8 Filters, Oils Schedule-I 3.3/5.1
0.0685 Within 90 days Disposal in authorized HW incinerator / Sale to authorized users
9 Pails, Corrosion, Paint Schedule-I 21.1 0.0137 Within 90 days Sale to authorized users
10 Laboratory Solvents Schedule-I 20.2 0.0003 Within 90 days Disposal in ETP
11 Waste Solvents Schedule-I 20.2 0.0110 Within 90 days Disposal in ETP
vi. Requirement of water, power, with source of supply, status of approval, water balance diagram, man-power requirement (regular and contract)
a. Requirement of water
S. No. Water Source Required Quantity (m3/hr)
Extraction Approval Existing Proposed After Expansion
1 Mahanadi
River 2749 994 3743
Government of Odisha has approved
3950m3/hr which is issued by
Government of Odisha & valid upto:
Oct 2021 is attached as Annexure7
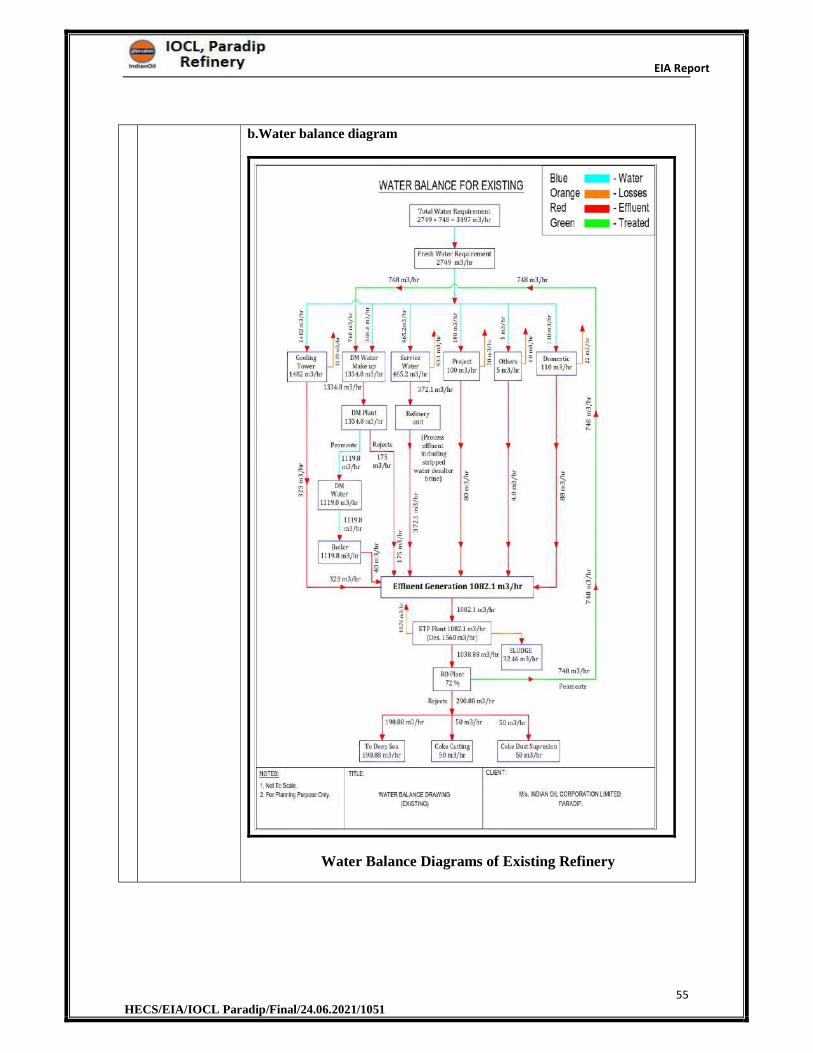
EIA Report
55 HECS/EIA/IOCL Paradip/Final/24.06.2021/1051
b.Water balance diagram
Water Balance Diagrams of Existing Refinery
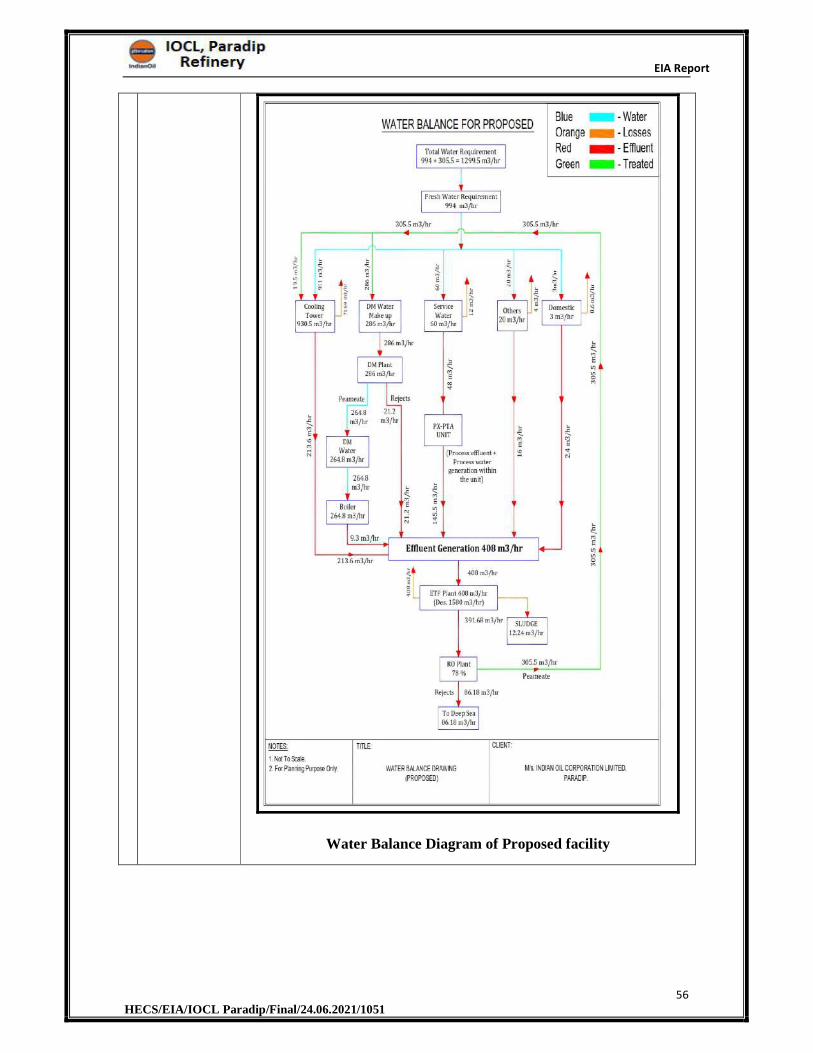
EIA Report
56 HECS/EIA/IOCL Paradip/Final/24.06.2021/1051
Water Balance Diagram of Proposed facility
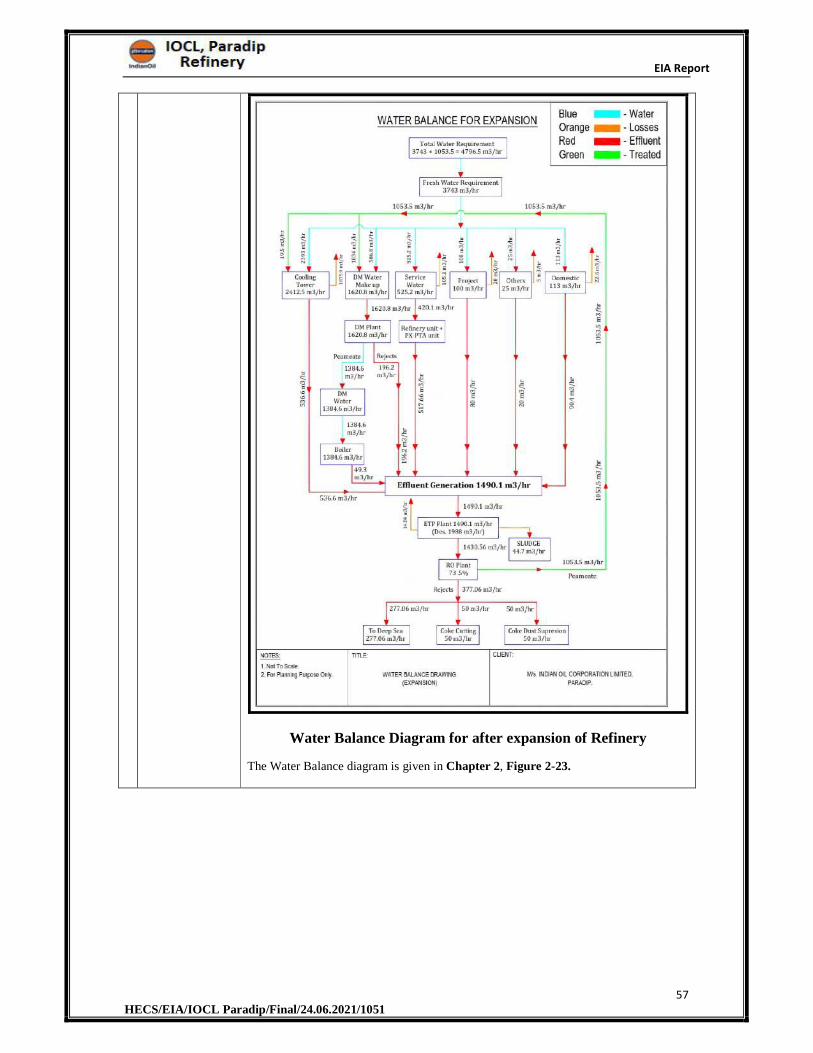
EIA Report
57 HECS/EIA/IOCL Paradip/Final/24.06.2021/1051
Water Balance Diagram for after expansion of Refinery
The Water Balance diagram is given in Chapter 2, Figure 2-23.
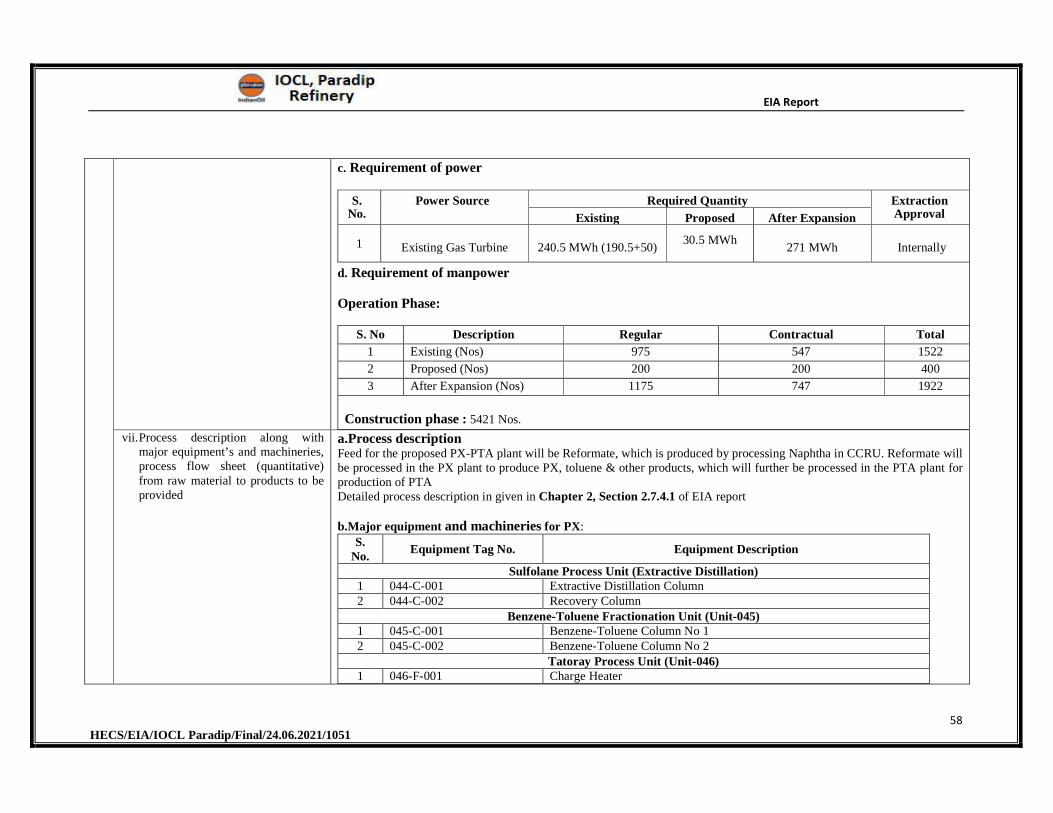
EIA Report
58 HECS/EIA/IOCL Paradip/Final/24.06.2021/1051
c. Requirement of power
S. No.
Power Source Required Quantity Extraction Approval Existing Proposed After Expansion
1 Existing Gas Turbine 240.5 MWh (190.5+50) 30.5 MWh
271 MWh Internally
d. Requirement of manpower
Operation Phase:
S. No Description Regular Contractual Total
1 Existing (Nos) 975 547 1522
2 Proposed (Nos) 200 200 400
3 After Expansion (Nos) 1175 747 1922
Construction phase : 5421 Nos.
vii.Process description along with major equipment’s and machineries, process flow sheet (quantitative) from raw material to products to be provided
a.Process descriptionFeed for the proposed PX-PTA plant will be Reformate, which is produced by processing Naphtha in CCRU. Reformate will be processed in the PX plant to produce PX, toluene & other products, which will further be processed in the PTA plant for production of PTA Detailed process description in given in Chapter 2, Section 2.7.4.1 of EIA report
b.Major equipment and machineries for PX:
S. No.
Equipment Tag No. Equipment Description
Sulfolane Process Unit (Extractive Distillation) 1 044-C-001 Extractive Distillation Column 2 044-C-002 Recovery Column
Benzene-Toluene Fractionation Unit (Unit-045) 1 045-C-001 Benzene-Toluene Column No 1 2 045-C-002 Benzene-Toluene Column No 2
Tatoray Process Unit (Unit-046) 1 046-F-001 Charge Heater
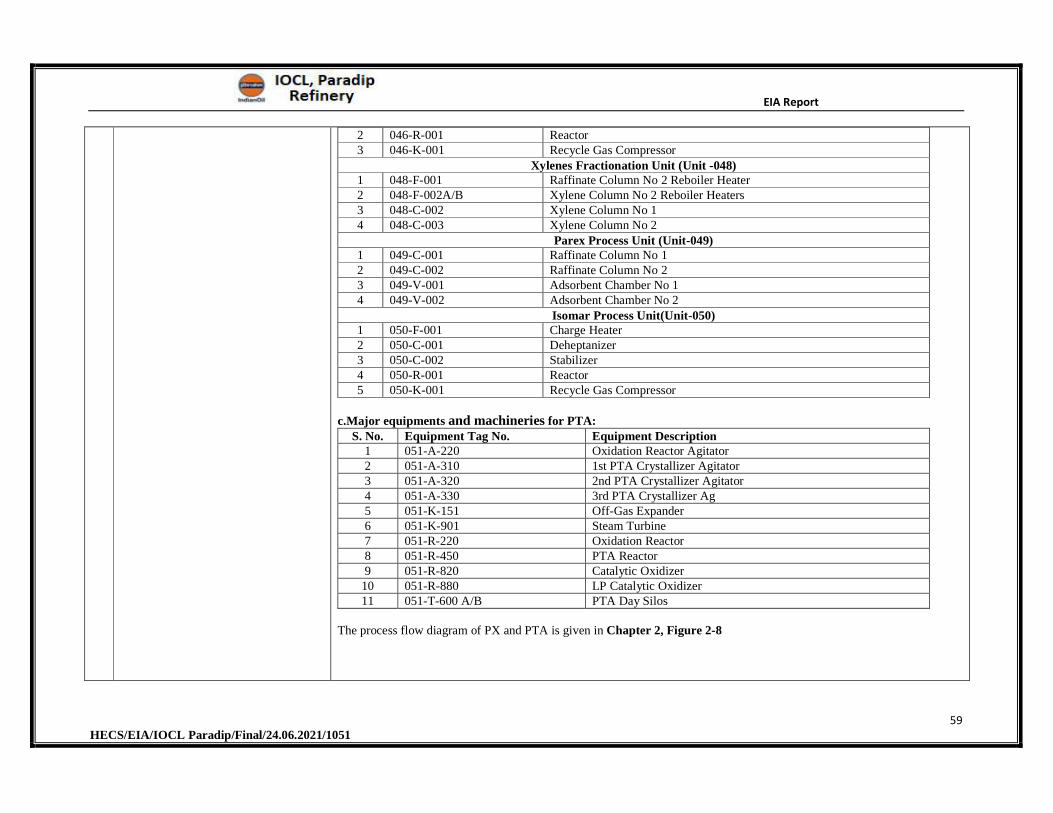
EIA Report
59 HECS/EIA/IOCL Paradip/Final/24.06.2021/1051
2 046-R-001 Reactor 3 046-K-001 Recycle Gas Compressor
Xylenes Fractionation Unit (Unit -048) 1 048-F-001 Raffinate Column No 2 Reboiler Heater 2 048-F-002A/B Xylene Column No 2 Reboiler Heaters 3 048-C-002 Xylene Column No 1 4 048-C-003 Xylene Column No 2
Parex Process Unit (Unit-049) 1 049-C-001 Raffinate Column No 1 2 049-C-002 Raffinate Column No 2 3 049-V-001 Adsorbent Chamber No 1 4 049-V-002 Adsorbent Chamber No 2
Isomar Process Unit(Unit-050) 1 050-F-001 Charge Heater 2 050-C-001 Deheptanizer 3 050-C-002 Stabilizer 4 050-R-001 Reactor 5 050-K-001 Recycle Gas Compressor
c.Major equipments and machineries for PTA:S. No. Equipment Tag No. Equipment Description
1 051-A-220 Oxidation Reactor Agitator 2 051-A-310 1st PTA Crystallizer Agitator 3 051-A-320 2nd PTA Crystallizer Agitator 4 051-A-330 3rd PTA Crystallizer Ag 5 051-K-151 Off-Gas Expander 6 051-K-901 Steam Turbine 7 051-R-220 Oxidation Reactor 8 051-R-450 PTA Reactor 9 051-R-820 Catalytic Oxidizer
10 051-R-880 LP Catalytic Oxidizer 11 051-T-600 A/B PTA Day Silos
The process flow diagram of PX and PTA is given in Chapter 2, Figure 2-8
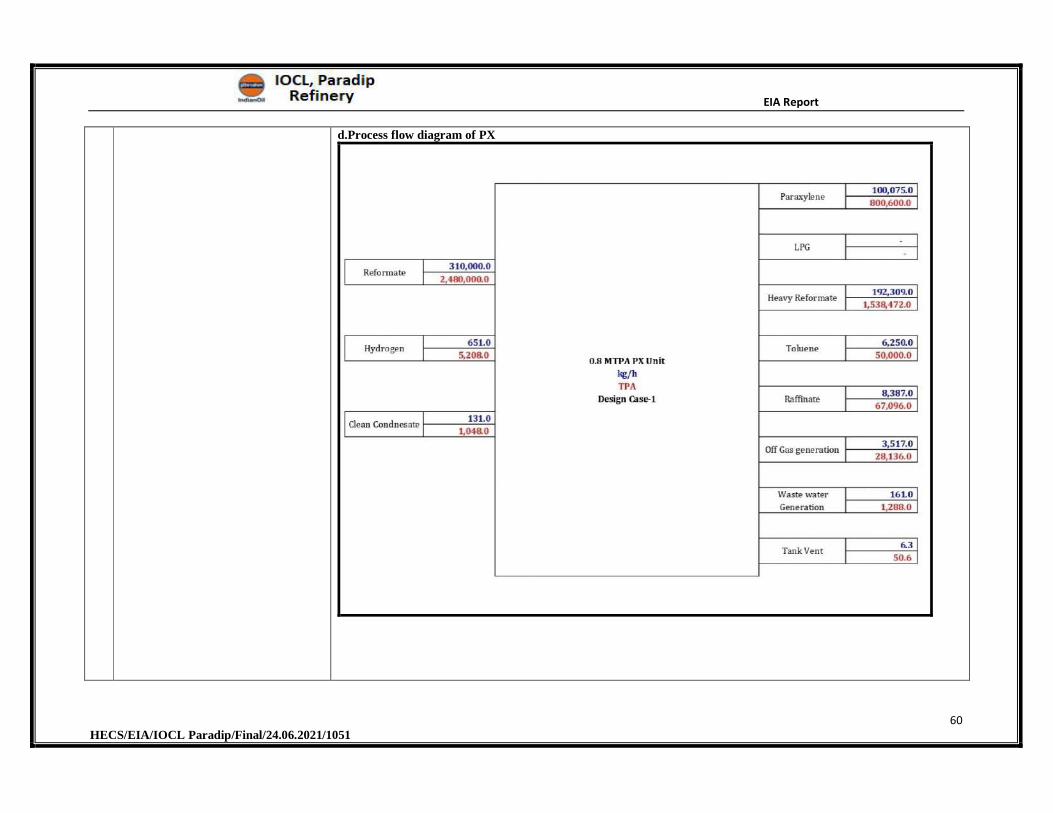
EIA Report
60 HECS/EIA/IOCL Paradip/Final/24.06.2021/1051
d.Process flow diagram of PX
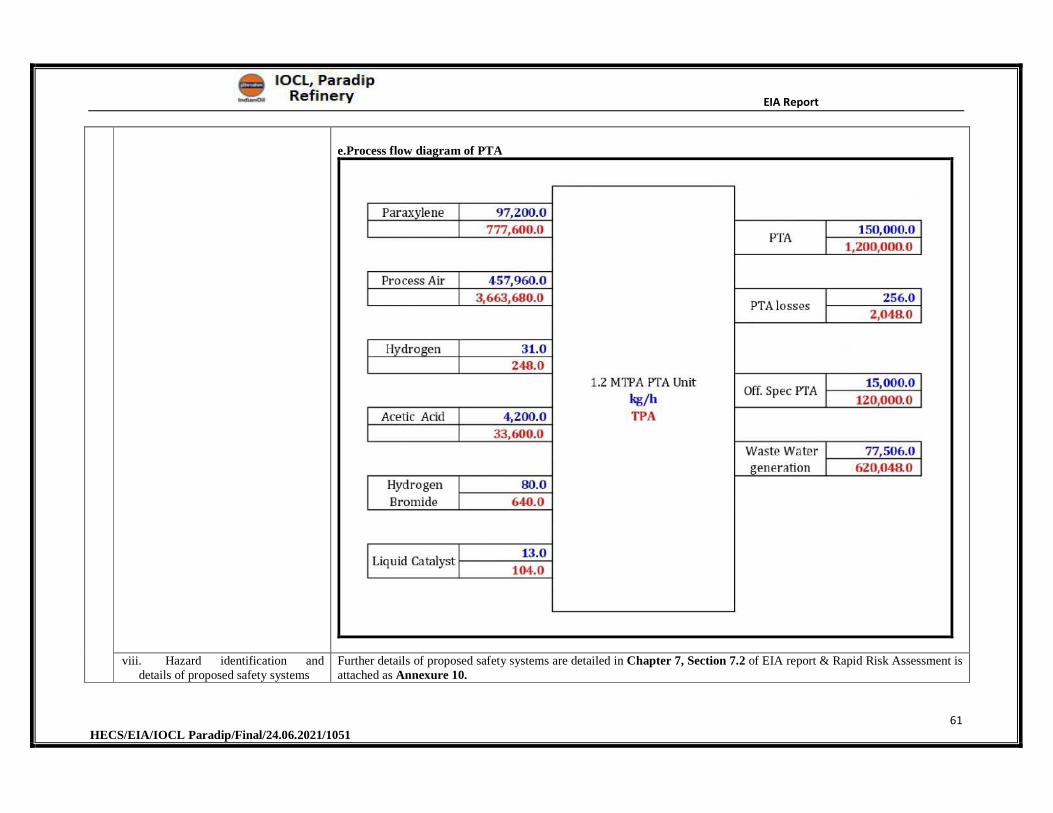
EIA Report
61 HECS/EIA/IOCL Paradip/Final/24.06.2021/1051
e.Process flow diagram of PTA
viii. Hazard identification and details of proposed safety systems
Further details of proposed safety systems are detailed in Chapter 7, Section 7.2 of EIA report & Rapid Risk Assessment is attached as Annexure 10.
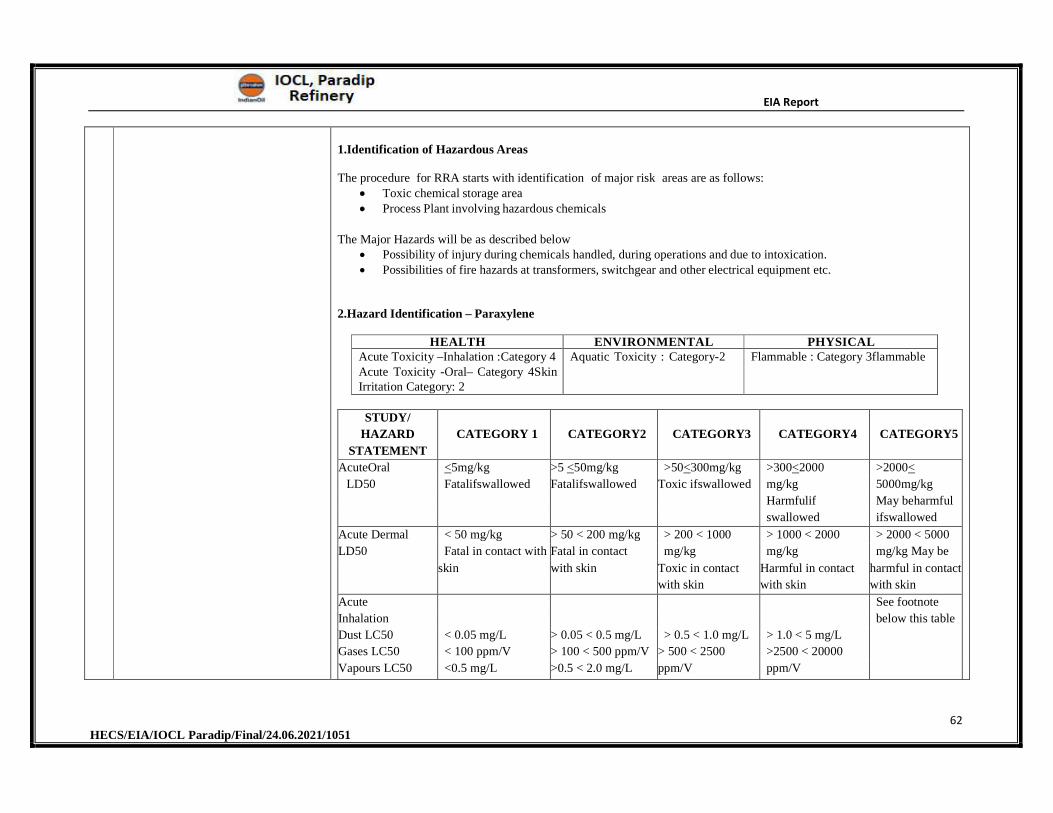
EIA Report
62 HECS/EIA/IOCL Paradip/Final/24.06.2021/1051
1.Identification of Hazardous Areas
The procedure for RRA starts with identification of major risk areas are as follows: Toxic chemical storage area Process Plant involving hazardous chemicals
The Major Hazards will be as described below Possibility of injury during chemicals handled, during operations and due to intoxication. Possibilities of fire hazards at transformers, switchgear and other electrical equipment etc.
2.Hazard Identification – Paraxylene
HEALTH ENVIRONMENTAL PHYSICALAcute Toxicity –Inhalation : Category 4 Acute Toxicity -Oral– Category 4 Skin Irritation Category: 2
Aquatic Toxicity : Category- 2 Flammable : Category 3 flammable
STUDY/
HAZARD
STATEMENT
CATEGORY 1 CATEGORY2 CATEGORY3 CATEGORY4 CATEGORY5
AcuteOral <5mg/kg >5 <50mg/kg >50<300mg/kg >300<2000 >2000<
LD50 Fatalifswallowed Fatalifswallowed Toxic ifswallowed mg/kg 5000mg/kg
Harmfulif May beharmful
swallowed ifswallowed
Acute Dermal < 50 mg/kg > 50 < 200 mg/kg > 200 < 1000 > 1000 < 2000 > 2000 < 5000
LD50 Fatal in contact with Fatal in contact mg/kg mg/kg mg/kg May be
skin with skin Toxic in contact
with skin
Harmful in contact
with skin
harmful in contact
with skin
Acute See footnote
Inhalation below this table
Dust LC50 < 0.05 mg/L > 0.05 < 0.5 mg/L > 0.5 < 1.0 mg/L > 1.0 < 5 mg/L
Gases LC50 < 100 ppm/V > 100 < 500 ppm/V > 500 < 2500 >2500 < 20000
Vapours LC50 <0.5 mg/L >0.5 < 2.0 mg/L ppm/V ppm/V
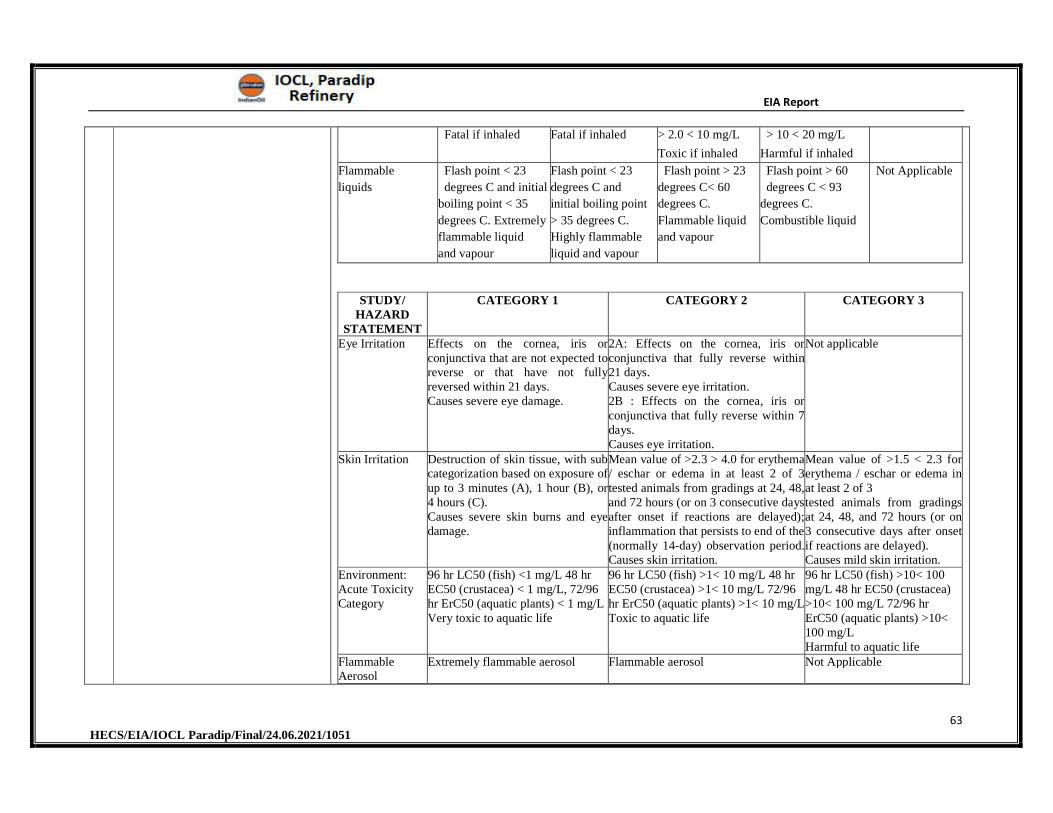
EIA Report
63 HECS/EIA/IOCL Paradip/Final/24.06.2021/1051
Fatal if inhaled Fatal if inhaled > 2.0 < 10 mg/L > 10 < 20 mg/L
Toxic if inhaled Harmful if inhaled
Flammable
liquids
Flash point < 23
degrees C and initial
Flash point < 23
degrees C and
Flash point > 23
degrees C< 60
Flash point > 60
degrees C < 93
Not Applicable
boiling point < 35 initial boiling point degrees C. degrees C.
degrees C. Extremely
flammable liquid
and vapour
> 35 degrees C.
Highly flammable
liquid and vapour
Flammable liquid
and vapour
Combustible liquid
STUDY/ HAZARD
STATEMENT
CATEGORY 1 CATEGORY 2 CATEGORY 3
Eye Irritation Effects on the cornea, iris or conjunctiva that are not expected to reverse or that have not fully reversed within 21 days. Causes severe eye damage.
2A: Effects on the cornea, iris or conjunctiva that fully reverse within 21 days. Causes severe eye irritation. 2B : Effects on the cornea, iris or conjunctiva that fully reverse within 7 days. Causes eye irritation.
Not applicable
Skin Irritation Destruction of skin tissue, with sub categorization based on exposure of up to 3 minutes (A), 1 hour (B), or 4 hours (C). Causes severe skin burns and eye damage.
Mean value of >2.3 > 4.0 for erythema / eschar or edema in at least 2 of 3 tested animals from gradings at 24, 48, and 72 hours (or on 3 consecutive days after onset if reactions are delayed); inflammation that persists to end of the(normally 14-day) observation period. Causes skin irritation.
Mean value of >1.5 < 2.3 for erythema / eschar or edema in at least 2 of 3 tested animals from gradings at 24, 48, and 72 hours (or on 3 consecutive days after onsetif reactions are delayed). Causes mild skin irritation.
Environment: Acute Toxicity Category
96 hr LC50 (fish) <1 mg/L 48 hr EC50 (crustacea) < 1 mg/L, 72/96 hr ErC50 (aquatic plants) < 1 mg/L Very toxic to aquatic life
96 hr LC50 (fish) >1< 10 mg/L 48 hr EC50 (crustacea) >1< 10 mg/L 72/96 hr ErC50 (aquatic plants) >1< 10 mg/L Toxic to aquatic life
96 hr LC50 (fish) >10< 100 mg/L 48 hr EC50 (crustacea) >10< 100 mg/L 72/96 hr ErC50 (aquatic plants) >10< 100 mg/L Harmful to aquatic life
Flammable Aerosol
Extremely flammable aerosol Flammable aerosol Not Applicable
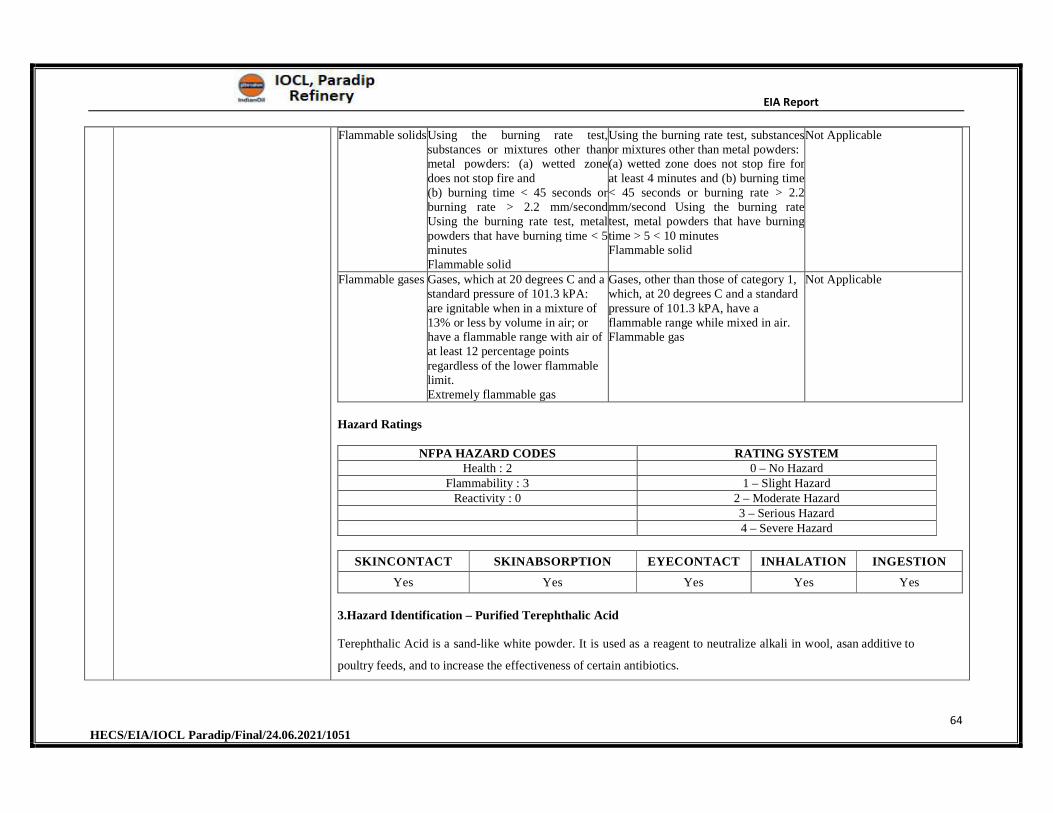
EIA Report
64 HECS/EIA/IOCL Paradip/Final/24.06.2021/1051
Flammable solidsUsing the burning rate test, substances or mixtures other than metal powders: (a) wetted zone does not stop fire and (b) burning time < 45 seconds or burning rate > 2.2 mm/secondUsing the burning rate test, metal powders that have burning time < 5 minutes Flammable solid
Using the burning rate test, substances or mixtures other than metal powders:(a) wetted zone does not stop fire for at least 4 minutes and (b) burning time < 45 seconds or burning rate > 2.2 mm/second Using the burning rate test, metal powders that have burning time > 5 < 10 minutes Flammable solid
Not Applicable
Flammable gases Gases, which at 20 degrees C and a standard pressure of 101.3 kPA: are ignitable when in a mixture of 13% or less by volume in air; or have a flammable range with air of at least 12 percentage points regardless of the lower flammable limit. Extremely flammable gas
Gases, other than those of category 1, which, at 20 degrees C and a standard pressure of 101.3 kPA, have a flammable range while mixed in air. Flammable gas
Not Applicable
Hazard Ratings
NFPA HAZARD CODES RATING SYSTEM Health : 2 0 – No Hazard
Flammability : 3 1 – Slight Hazard Reactivity : 0 2 – Moderate Hazard
3 – Serious Hazard 4 – Severe Hazard
SKINCONTACT SKINABSORPTION EYECONTACT INHALATION INGESTION
Yes Yes Yes Yes Yes
3.Hazard Identification – Purified Terephthalic Acid
Terephthalic Acid is a sand-like white powder. It is used as a reagent to neutralize alkali in wool, as an additive to
poultry feeds, and to increase the effectiveness of certain antibiotics.
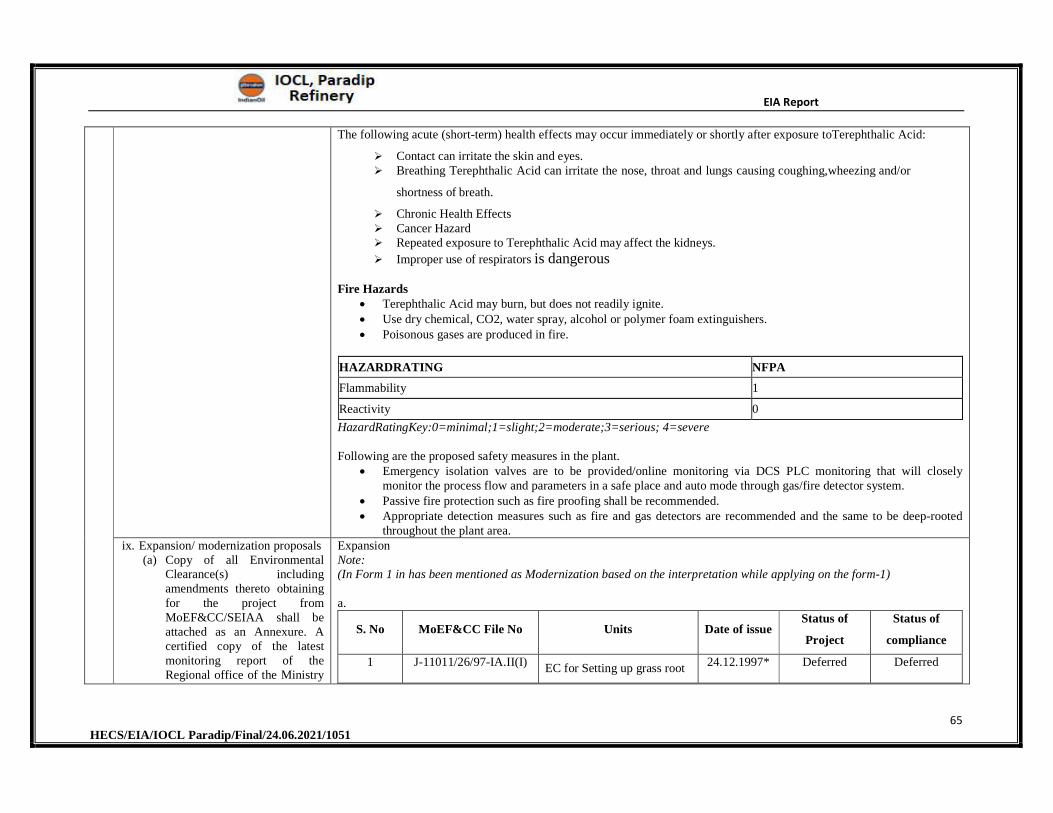
EIA Report
65 HECS/EIA/IOCL Paradip/Final/24.06.2021/1051
The following acute (short-term) health effects may occur immediately or shortly after exposure to Terephthalic Acid:
Contact can irritate the skin and eyes. Breathing Terephthalic Acid can irritate the nose, throat and lungs causing coughing, wheezing and/or
shortness of breath.
Chronic Health Effects Cancer Hazard Repeated exposure to Terephthalic Acid may affect the kidneys.
Improper use of respirators is dangerous
Fire Hazards Terephthalic Acid may burn, but does not readily ignite. Use dry chemical, CO2, water spray, alcohol or polymer foam extinguishers. Poisonous gases are produced in fire.
HAZARDRATING NFPA
Flammability 1
Reactivity 0
HazardRatingKey:0=minimal;1=slight;2=moderate;3=serious; 4=severe
Following are the proposed safety measures in the plant. Emergency isolation valves are to be provided/online monitoring via DCS PLC monitoring that will closely
monitor the process flow and parameters in a safe place and auto mode through gas/fire detector system. Passive fire protection such as fire proofing shall be recommended. Appropriate detection measures such as fire and gas detectors are recommended and the same to be deep-rooted
throughout the plant area. ix. Expansion/ modernization proposals
(a) Copy of all Environmental Clearance(s) including amendments thereto obtaining for the project from MoEF&CC/SEIAA shall be attached as an Annexure. A certified copy of the latest monitoring report of the Regional office of the Ministry
Expansion Note: (In Form 1 in has been mentioned as Modernization based on the interpretation while applying on the form-1)
a.
S. No MoEF&CC File No Units Date of issue Status of
Project
Status of
compliance
1 J-11011/26/97-IA.II(I)EC for Setting up grass root
24.12.1997* Deferred Deferred
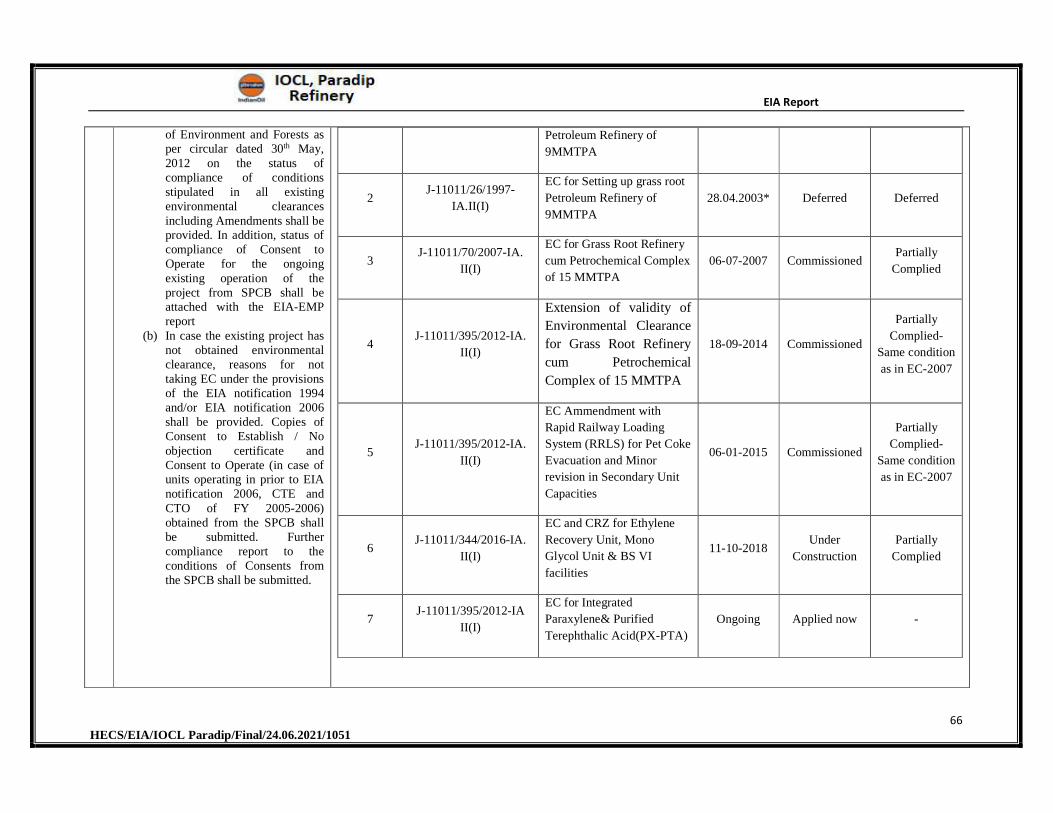
EIA Report
66 HECS/EIA/IOCL Paradip/Final/24.06.2021/1051
of Environment and Forests as per circular dated 30th May, 2012 on the status of compliance of conditions stipulated in all existing environmental clearances including Amendments shall be provided. In addition, status of compliance of Consent to Operate for the ongoing existing operation of the project from SPCB shall be attached with the EIA-EMP report
(b) In case the existing project has not obtained environmental clearance, reasons for not taking EC under the provisions of the EIA notification 1994 and/or EIA notification 2006 shall be provided. Copies of Consent to Establish / No objection certificate and Consent to Operate (in case of units operating in prior to EIA notification 2006, CTE and CTO of FY 2005-2006) obtained from the SPCB shall be submitted. Further compliance report to the conditions of Consents from the SPCB shall be submitted.
Petroleum Refinery of
9MMTPA
2 J-11011/26/1997-
IA.II(I)
EC for Setting up grass root
Petroleum Refinery of
9MMTPA
28.04.2003* Deferred Deferred
3 J-11011/70/2007-IA.
II(I)
EC for Grass Root Refinery
cum Petrochemical Complex
of 15 MMTPA
06-07-2007 CommissionedPartially
Complied
4 J-11011/395/2012-IA.
II(I)
Extension of validity of
Environmental Clearance
for Grass Root Refinery
cum Petrochemical
Complex of 15 MMTPA
18-09-2014 Commissioned
Partially
Complied-
Same condition
as in EC-2007
5 J-11011/395/2012-IA.
II(I)
EC Ammendment with
Rapid Railway Loading
System (RRLS) for Pet Coke
Evacuation and Minor
revision in Secondary Unit
Capacities
06-01-2015 Commissioned
Partially
Complied-
Same condition
as in EC-2007
6 J-11011/344/2016-IA.
II(I)
EC and CRZ for Ethylene
Recovery Unit, Mono
Glycol Unit & BS VI
facilities
11-10-2018Under
Construction
Partially
Complied
7 J-11011/395/2012-IA
II(I)
EC for Integrated
Paraxylene& Purified
Terephthalic Acid(PX-PTA)
Ongoing Applied now -
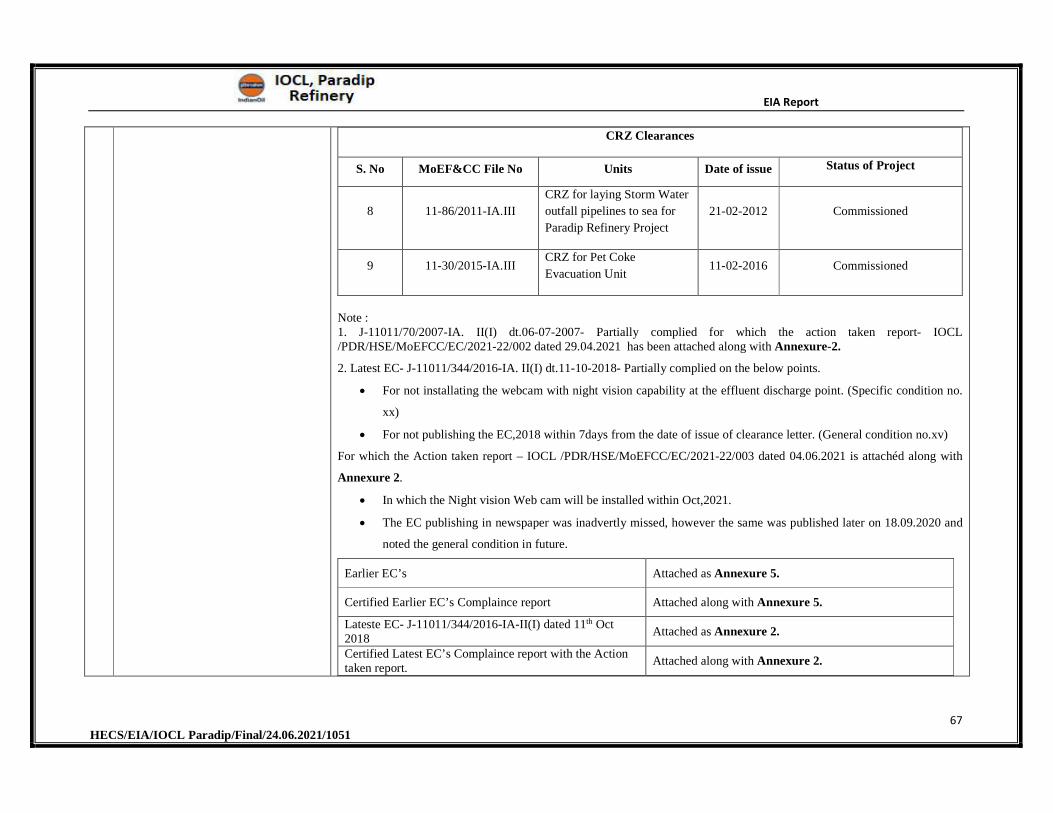
EIA Report
67 HECS/EIA/IOCL Paradip/Final/24.06.2021/1051
CRZ Clearances
S. No MoEF&CC File No Units Date of issue Status of Project
8 11-86/2011-IA.III
CRZ for laying Storm Water
outfall pipelines to sea for
Paradip Refinery Project
21-02-2012 Commissioned
9 11-30/2015-IA.IIICRZ for Pet Coke
Evacuation Unit11-02-2016 Commissioned
Note : 1. J-11011/70/2007-IA. II(I) dt.06-07-2007- Partially complied for which the action taken report- IOCL /PDR/HSE/MoEFCC/EC/2021-22/002 dated 29.04.2021 has been attached along with Annexure-2.
2. Latest EC- J-11011/344/2016-IA. II(I) dt.11-10-2018- Partially complied on the below points.
For not installating the webcam with night vision capability at the effluent discharge point. (Specific condition no.
xx)
For not publishing the EC,2018 within 7days from the date of issue of clearance letter. (General condition no.xv)
For which the Action taken report – IOCL /PDR/HSE/MoEFCC/EC/2021-22/003 dated 04.06.2021 is attachéd along with
Annexure 2.
In which the Night vision Web cam will be installed within Oct,2021.
The EC publishing in newspaper was inadvertly missed, however the same was published later on 18.09.2020 and
noted the general condition in future.
Earlier EC’s Attached as Annexure 5.
Certified Earlier EC’s Complaince report Attached along with Annexure 5.
Lateste EC- J-11011/344/2016-IA-II(I) dated 11th Oct 2018
Attached as Annexure 2.
Certified Latest EC’s Complaince report with the Action taken report.
Attached along with Annexure 2.
EIA Report
68 HECS/EIA/IOCL Paradip/Final/24.06.2021/1051
S. No Latest CTO No. Date of issue Valid till Status of compliance
1 Ref No.- 5543/IND-I-CON-6414 31.03.2021 31.03.2022 Complaied
Latest CTO- Ref No.- 5543/IND-I-CON-6414 dated 31.03.2021 valid till 31.03.2022 with all CTO’s and CTE’s since inception along with chronology table
Attached as Annexure 3.
Self certified compliance report of latest CTO submitted to SPCB,Odisha
Attached along with Annexure 3.
4 Site Detailsi. Location of the project site
covering village, Taluka/Tehsil, District and State, justification for selecting the site. Whether other sites were considered
The project site is situated at IOCL Paradip Refinery, Survey no: 218, Abhaychandrapur village, Jhimani P.O., Kujang Taluk, Jagatsinghpur Dist., Paradip, Odisha -754141.
Alternate sites were not considered since the proposed expansion is within the existing refinery complex. Adequate land is available with IOCL Paradip for the proposed expansion.
ii. A Topo sheet of the study area of radius of 10 km and site location on 1:50,000/ 1:25,000 scale on an A3/A2 sheet (including al eco-sensitive areas and environmentally sensitive places)
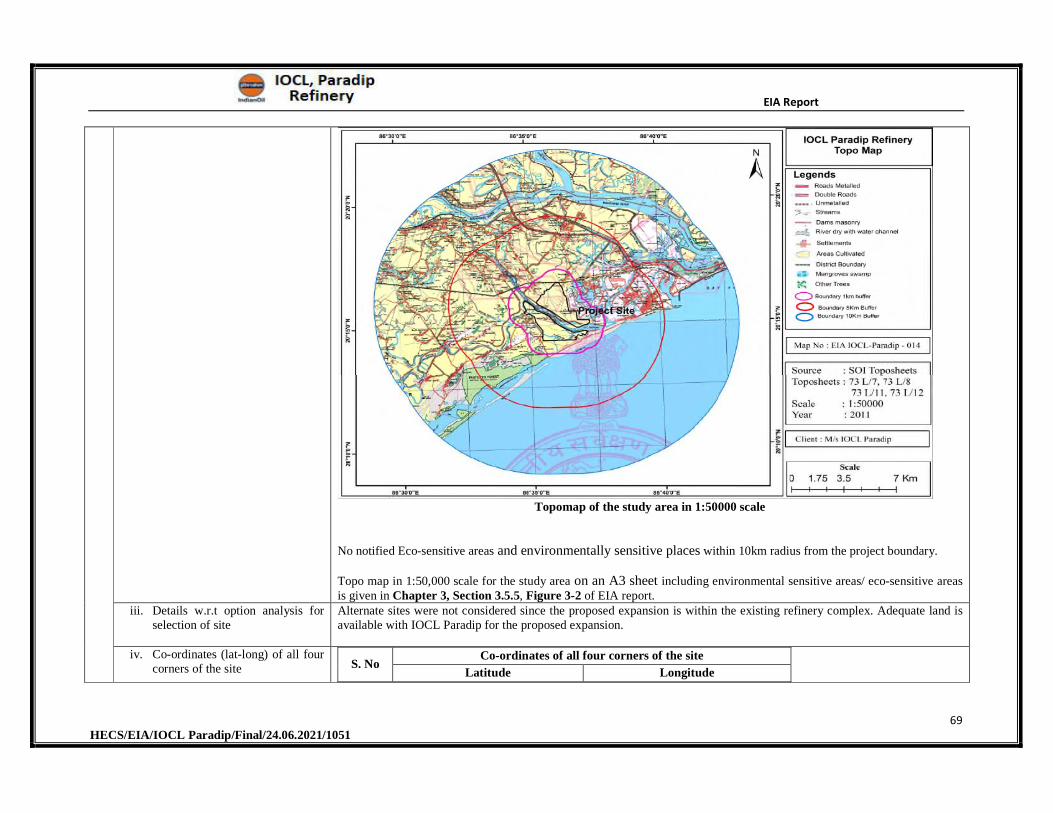
EIA Report
69 HECS/EIA/IOCL Paradip/Final/24.06.2021/1051
Topomap of the study area in 1:50000 scale
No notified Eco-sensitive areas and environmentally sensitive places within 10km radius from the project boundary.
Topo map in 1:50,000 scale for the study area on an A3 sheet including environmental sensitive areas/ eco-sensitive areas is given in Chapter 3, Section 3.5.5, Figure 3-2 of EIA report.
iii. Details w.r.t option analysis for selection of site
Alternate sites were not considered since the proposed expansion is within the existing refinery complex. Adequate land is available with IOCL Paradip for the proposed expansion.
iv. Co-ordinates (lat-long) of all four corners of the site S. No
Co-ordinates of all four corners of the site
Latitude Longitude
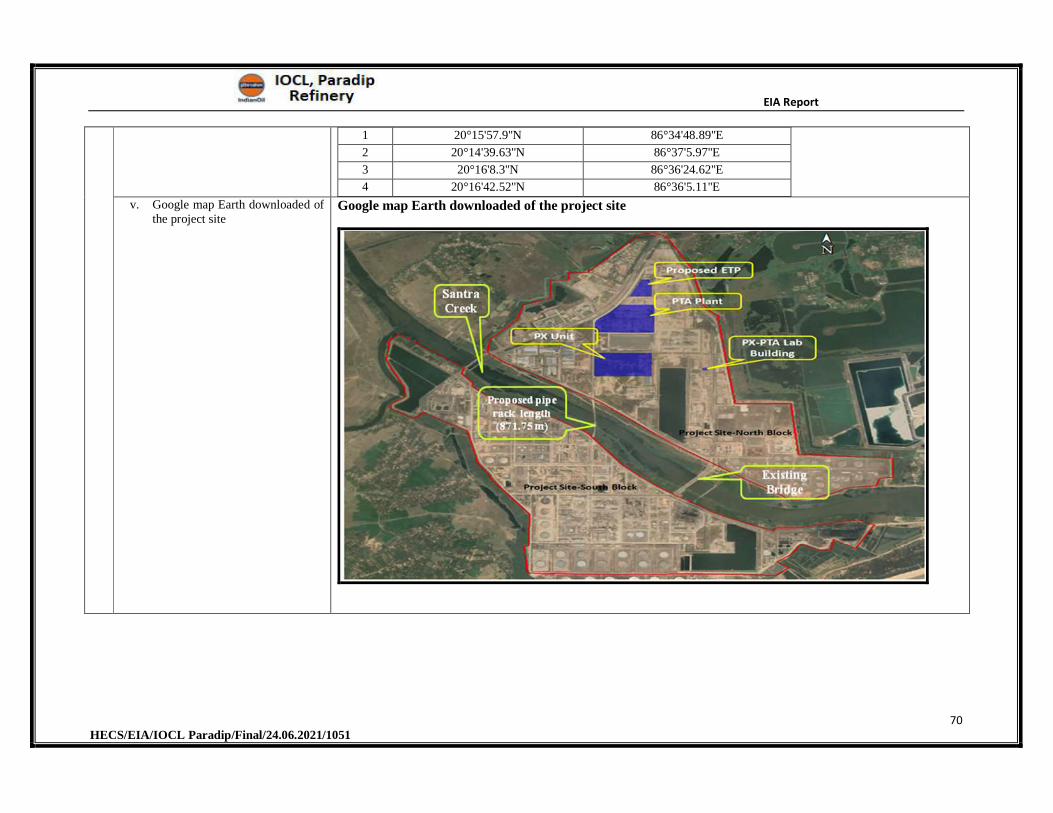
EIA Report
70 HECS/EIA/IOCL Paradip/Final/24.06.2021/1051
1 20°15'57.9''N 86°34'48.89''E
2 20°14'39.63''N 86°37'5.97''E
3 20°16'8.3''N 86°36'24.62''E
4 20°16'42.52''N 86°36'5.11''E
v. Google map Earth downloaded of the project site
Google map Earth downloaded of the project site
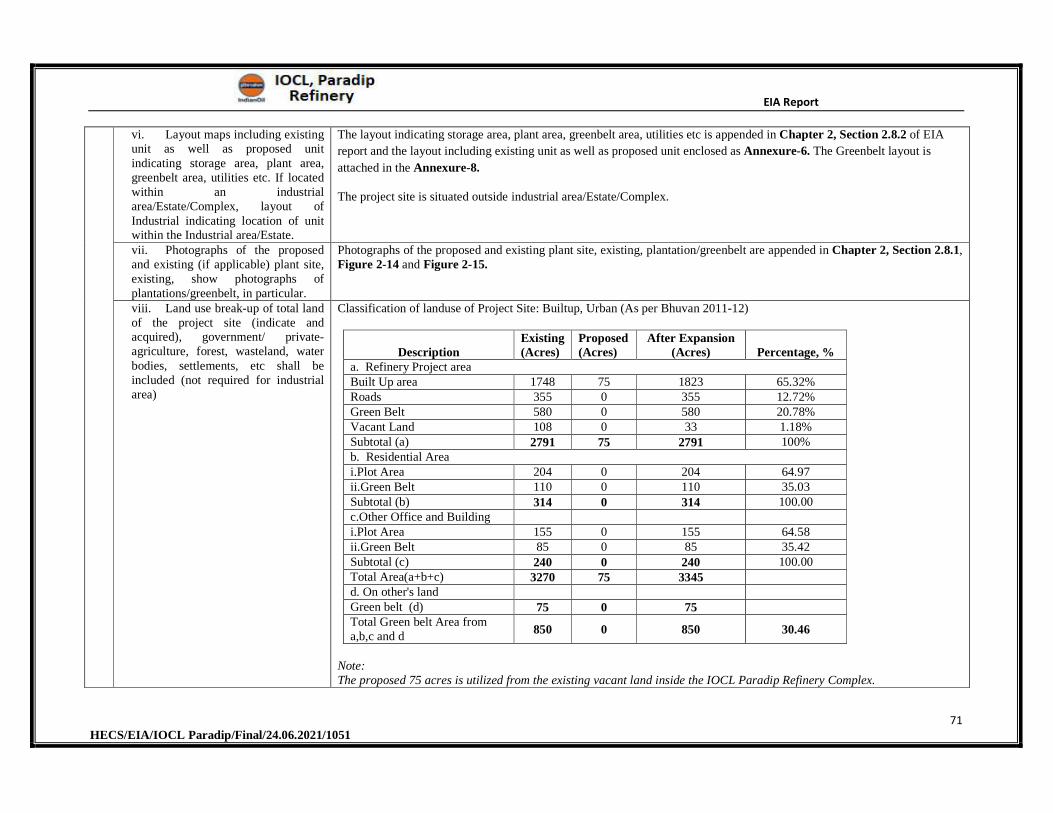
EIA Report
71 HECS/EIA/IOCL Paradip/Final/24.06.2021/1051
vi. Layout maps including existing unit as well as proposed unit indicating storage area, plant area, greenbelt area, utilities etc. If located within an industrial area/Estate/Complex, layout of Industrial indicating location of unit within the Industrial area/Estate.
The layout indicating storage area, plant area, greenbelt area, utilities etc is appended in Chapter 2, Section 2.8.2 of EIA
report and the layout including existing unit as well as proposed unit enclosed as Annexure-6. The Greenbelt layout is
attached in the Annexure-8.
The project site is situated outside industrial area/Estate/Complex.
vii. Photographs of the proposed and existing (if applicable) plant site, existing, show photographs of plantations/greenbelt, in particular.
Photographs of the proposed and existing plant site, existing, plantation/greenbelt are appended in Chapter 2, Section 2.8.1, Figure 2-14 and Figure 2-15.
viii. Land use break-up of total land of the project site (indicate and acquired), government/ private- agriculture, forest, wasteland, water bodies, settlements, etc shall be included (not required for industrial area)
Classification of landuse of Project Site: Builtup, Urban (As per Bhuvan 2011-12)
Description Existing (Acres)
Proposed (Acres)
After Expansion (Acres) Percentage, %
a. Refinery Project areaBuilt Up area 1748 75 1823 65.32%Roads 355 0 355 12.72%Green Belt 580 0 580 20.78%Vacant Land 108 0 33 1.18%Subtotal (a) 2791 75 2791 100%b. Residential Areai.Plot Area 204 0 204 64.97ii.Green Belt 110 0 110 35.03Subtotal (b) 314 0 314 100.00c.Other Office and Buildingi.Plot Area 155 0 155 64.58ii.Green Belt 85 0 85 35.42Subtotal (c) 240 0 240 100.00Total Area(a+b+c) 3270 75 3345 d. On other's land Green belt (d) 75 0 75 Total Green belt Area from a,b,c and d
850 0 850 30.46
Note: The proposed 75 acres is utilized from the existing vacant land inside the IOCL Paradip Refinery Complex.
EIA Report
72 HECS/EIA/IOCL Paradip/Final/24.06.2021/1051
Details given in Chapter 2, Section 2.8.2 of EIA report
ix. A list of major industries with name and type within the study area (10 km radius) shallbe incorporated. Land use details of the study area)
List of major industries within the study area (10 km radius)
S. No Description Distance (~km) Direction
1. Hindustan Petroleum Corporation Limited 1.68 N
2. IOCL Paradip Marketing Terminal 1.72 N
3. Paradip Power plant Limited 3.17 NNE
4. Adani Wilmar Limited (Edible oil) 3.28 NE
5. Arcelor Mittal Nippon Steel India Limited 5.24 NE
6. IFFCO Plant 6.3 NE
x. Geological features and Geo-hydrological status of the study area shall be included.
a.Geological features Geologically the study area including the site consisting of Alluvial formations of Recent geological age. These alluvial formations are developed by the action of Mahanadi river and Bay of Bengal sea. The alluvium developed due to the river action is designated as Fluvial alluvium. Similarly, the alluvium developed due to the sea action is named as Coastal Alluvium. The basement rocks are existing below 100m from the existing ground level. The geological formation of this district is entirely alluvium of recent origin. The entire district comes under Mahanadi Delta Division and Cuttack Coastal Plain.
b.Geo-hydrological status The study area including the project site is part of coastal and fluvial alluvium developed due to the deltaic nature
of Mahanadi River with Bay of Bengal. The area is covered with thick pile of younger and older alluvial formations to an extent of more than 100m bgl. Below the alluvium there are sandstone formations with intercalation of clay beds are reported which are part of
ParadeepTechtonic Depression of Mahanadi Basin. These sedimentary formations are extended more than 900m thickness which are successively underlined with
basement crystalline rocks. Groundwater occurs in semi-confined to unconfined nature in the alluvial formations within the study area. There are potential shallow fresh water aquifers existing within the study area at 10 to 20m depth from the existing
ground levels. The existing bore wells it is understood that the groundwater level is between 3 to 4 mbgl. Below the fresh water aquifers there are saline water aquifers which are present at 40 to 50m bgl within the alluvial
formations. The deeper aquifer system is also present within the Paradeep Depression in deep seated sedimentary formations.
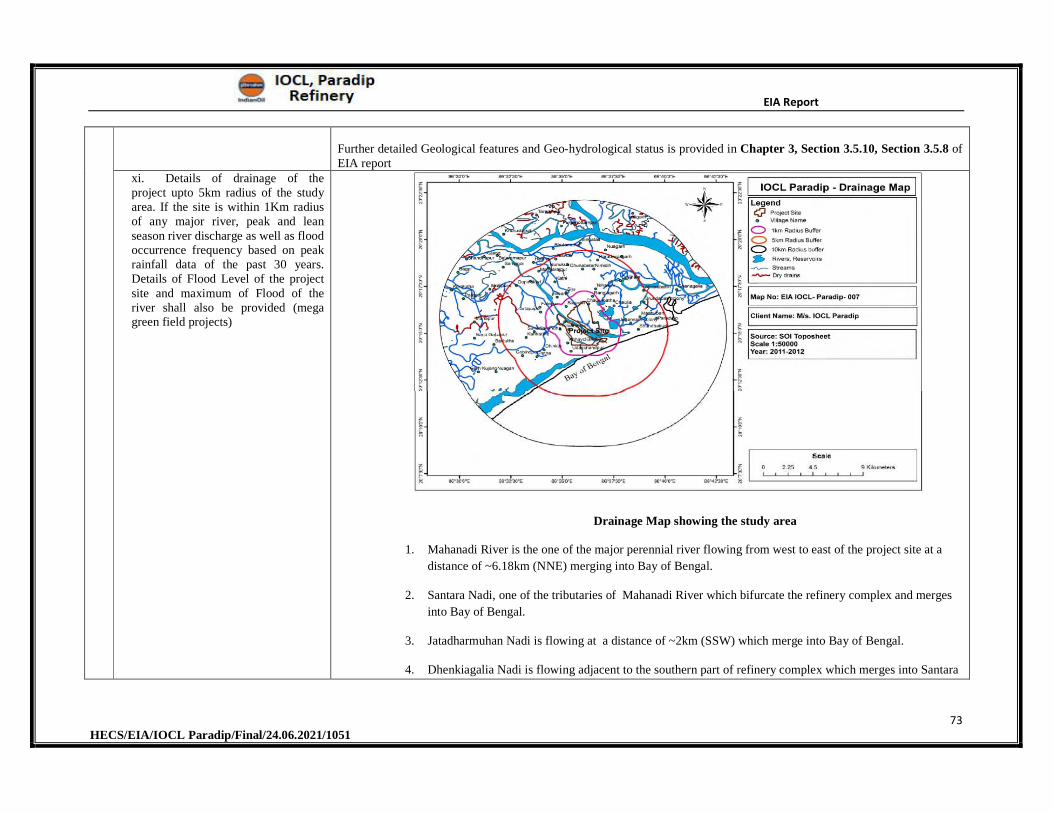
EIA Report
73 HECS/EIA/IOCL Paradip/Final/24.06.2021/1051
Further detailed Geological features and Geo-hydrological status is provided in Chapter 3, Section 3.5.10, Section 3.5.8 of EIA report
xi. Details of drainage of the project upto 5km radius of the study area. If the site is within 1Km radius of any major river, peak and lean season river discharge as well as flood occurrence frequency based on peak rainfall data of the past 30 years. Details of Flood Level of the project site and maximum of Flood of the river shall also be provided (mega green field projects)
Drainage Map showing the study area
1. Mahanadi River is the one of the major perennial river flowing from west to east of the project site at a
distance of ~6.18km (NNE) merging into Bay of Bengal.
2. Santara Nadi, one of the tributaries of Mahanadi River which bifurcate the refinery complex and merges
into Bay of Bengal.
3. Jatadharmuhan Nadi is flowing at a distance of ~2km (SSW) which merge into Bay of Bengal.
4. Dhenkiagalia Nadi is flowing adjacent to the southern part of refinery complex which merges into Santara
EIA Report
74 HECS/EIA/IOCL Paradip/Final/24.06.2021/1051
Nadi.
5. Taladanda is a lined canal, which is at a distance of ~4.87km (ENE).
Based on 30 years rainfall data, the highest HFL recorded was 3.91m MSL during 1999 Super Cyclone.
The Refinery Site itself does not flood in any of the flood scenarios tested. The HPP level of 4.06m MSL exceeds the 1999 Cyclone high water level of 3.91m MSL by 150mm.
S. No Description Distance (~km) Direction 1 Bay of Bengal 0.55 SE 2 DhenkiagaliaNadi(adjacent to project site) 0.03 W 3 Santara Nadi(adjacent to project site) 0.08 E 4 AtharabankiNadi 1.03 E 5 MahangaNadi 1.21 W 6 JatadharmuhanNadi 2 SSW 7 Taladanda canal 4.87 ENE
Flood risk assessment report prepared by URS scott wilson for IOCL Paradip Refinery is also enclosed as Annexure 25. xii. Status of acquisition of land. If acquisition is not complete, stage of the acquisition process and expected time of complete procession of the land.
Land acquisition is not required as the proposed expansion is within the existing facility.
Land Documents are enclosed as Annexure 1
Note: As per form-1 16 acre has to acquired for the proposed project based on the preliminary project feasibility study carried out. Based on the Detailed feasibility study it is identified, as the land acquisition is not required
xiii. R&R details in respect of land in line with state Government policy
Not applicable, since no land acquisition involved.
5 Forest and wildlife related issues (if applicable):i. Permission and approvals for the use of forest land (forestry clearance), if any, and recommendations of the State Forest Department (if applicable)
Not Applicable, since no forest land involved.
ii. Land use map based on High resolution satellite imagery (GPS) of
Not Applicable, since no forest land involved.
EIA Report
75 HECS/EIA/IOCL Paradip/Final/24.06.2021/1051
the proposed site delineating the forest land (in case of projects involving forest land more than 40 Ha) iii. Status of application submitted for obtaining the stage I Forestry Clearance along with latest status shall be submitted
Not Applicable, since no forest land involved.
iv. The projects to be located within 10 Km of the National parks, Sanctuaries, Biosphere Reserves, Migratory Corridors of Wild Animals, the project proponent shall submit the map duly authenticated by Chief Wildlife Warden showing these features vis-à-vis the project location and the recommendations or comments of the Chief Wildlife Warden-thereon.
Not Applicable since no National parks, Sanctuaries, Biosphere Reserves, Migratory Corridors of Wild Animals in 10km radius from the project boundary.
v. Wildlife Conservation Plan duly authenticated by the Chief Wildlife Warden of the State Government for conservation of schedule I fauna, if any exists in the study area.
There are two Schedule-I Species in study area i.e., reptiles named Nilssoniahurum (Gray 1831) and Lissemyspunctata (Bonnaterre 1789) habitats. There are two Schedule-I- Part-IV Species in study area i.e Butterfly-Hypolimnas misippus and Castalius rosimon
Action plan for conservation of Marine life including Olive Ridley Turtle has been prepared in 2013 by Mangrove Forest
Division (Wildlife), Rajnagar, Odisha and approved by Principal Cheif Conservator Forest(WL) & CheiWildlife Warden,
Odisha. The fund allocation by IOCL of INR 20.04Cr.for the conservation of Marine life over a period of implantation of
10yrs.
The Wildlife conservation plan prepared by Mangrove Forest Division (Wildlife), Rajnagar, Odisha is enclosed as
Annexure 20.
vi. Copy of application submitted for clearance under the Wildlife (Protection) Act, 1972 to the Standing Committee of the National Board for Wildlife.
Not applicable since no notified Sanctuaries/ National Parks/ Eco-sensitive zones/ areas within the 15km radius from the project boundary.
6 Environmental Status
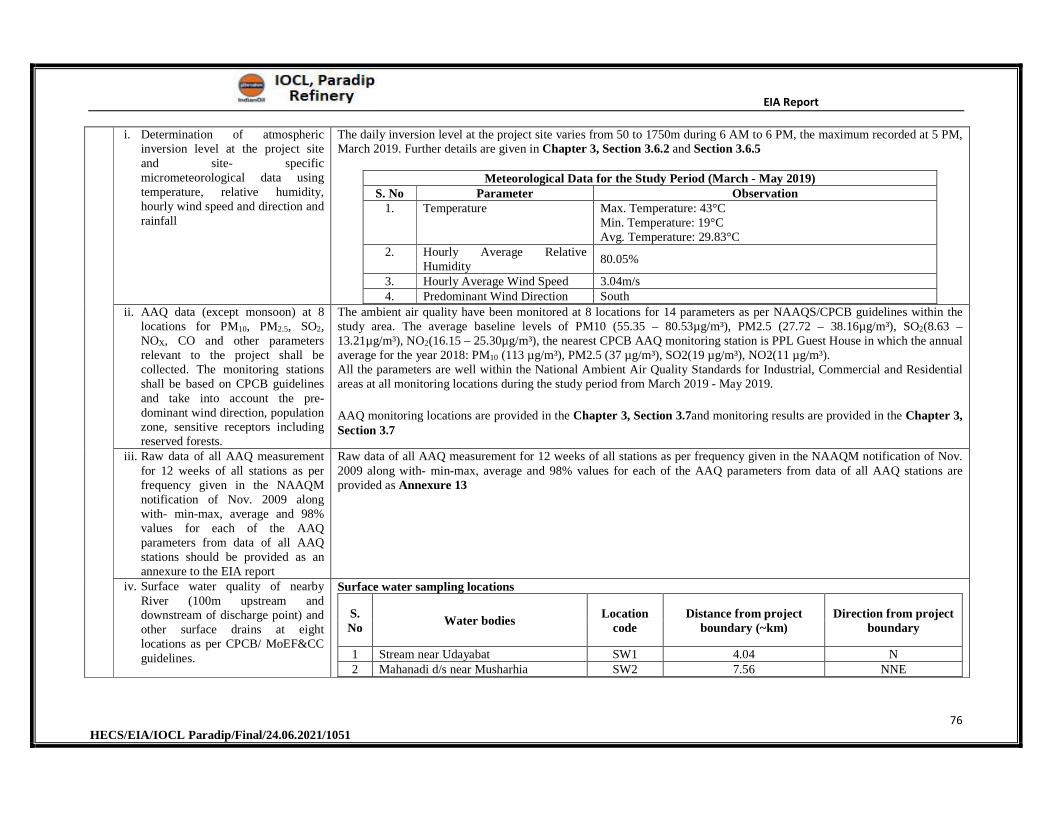
EIA Report
76 HECS/EIA/IOCL Paradip/Final/24.06.2021/1051
i. Determination of atmospheric inversion level at the project site and site- specific micrometeorological data using temperature, relative humidity, hourly wind speed and direction and rainfall
The daily inversion level at the project site varies from 50 to 1750m during 6 AM to 6 PM, the maximum recorded at 5 PM, March 2019. Further details are given in Chapter 3, Section 3.6.2 and Section 3.6.5
Meteorological Data for the Study Period (March - May 2019) S. No Parameter Observation
1. Temperature Max. Temperature: 43°C Min. Temperature: 19°C Avg. Temperature: 29.83°C
2. Hourly Average Relative Humidity
80.05%
3. Hourly Average Wind Speed 3.04m/s 4. Predominant Wind Direction South
ii. AAQ data (except monsoon) at 8 locations for PM10, PM2.5, SO2, NOX, CO and other parameters relevant to the project shall be collected. The monitoring stations shall be based on CPCB guidelines and take into account the pre-dominant wind direction, population zone, sensitive receptors including reserved forests.
The ambient air quality have been monitored at 8 locations for 14 parameters as per NAAQS/CPCB guidelines within the study area. The average baseline levels of PM10 (55.35 – 80.53µg/m³), PM2.5 (27.72 – 38.16µg/m³), SO2(8.63 – 13.21µg/m³), NO2(16.15 – 25.30µg/m³), the nearest CPCB AAQ monitoring station is PPL Guest House in which the annual average for the year 2018: PM10 (113 µg/m³), PM2.5 (37 µg/m³), SO2(19 µg/m³), NO2(11 µg/m³). All the parameters are well within the National Ambient Air Quality Standards for Industrial, Commercial and Residential areas at all monitoring locations during the study period from March 2019 - May 2019.
AAQ monitoring locations are provided in the Chapter 3, Section 3.7and monitoring results are provided in the Chapter 3,Section 3.7
iii. Raw data of all AAQ measurement for 12 weeks of all stations as per frequency given in the NAAQM notification of Nov. 2009 along with- min-max, average and 98% values for each of the AAQ parameters from data of all AAQ stations should be provided as an annexure to the EIA report
Raw data of all AAQ measurement for 12 weeks of all stations as per frequency given in the NAAQM notification of Nov. 2009 along with- min-max, average and 98% values for each of the AAQ parameters from data of all AAQ stations are provided as Annexure 13
iv. Surface water quality of nearby River (100m upstream and downstream of discharge point) and other surface drains at eight locations as per CPCB/ MoEF&CC guidelines.
Surface water sampling locations
S. No
Water bodies Location
code Distance from project
boundary (~km) Direction from project
boundary
1 Stream near Udayabat SW1 4.04 N 2 Mahanadi d/s near Musharhia SW2 7.56 NNE
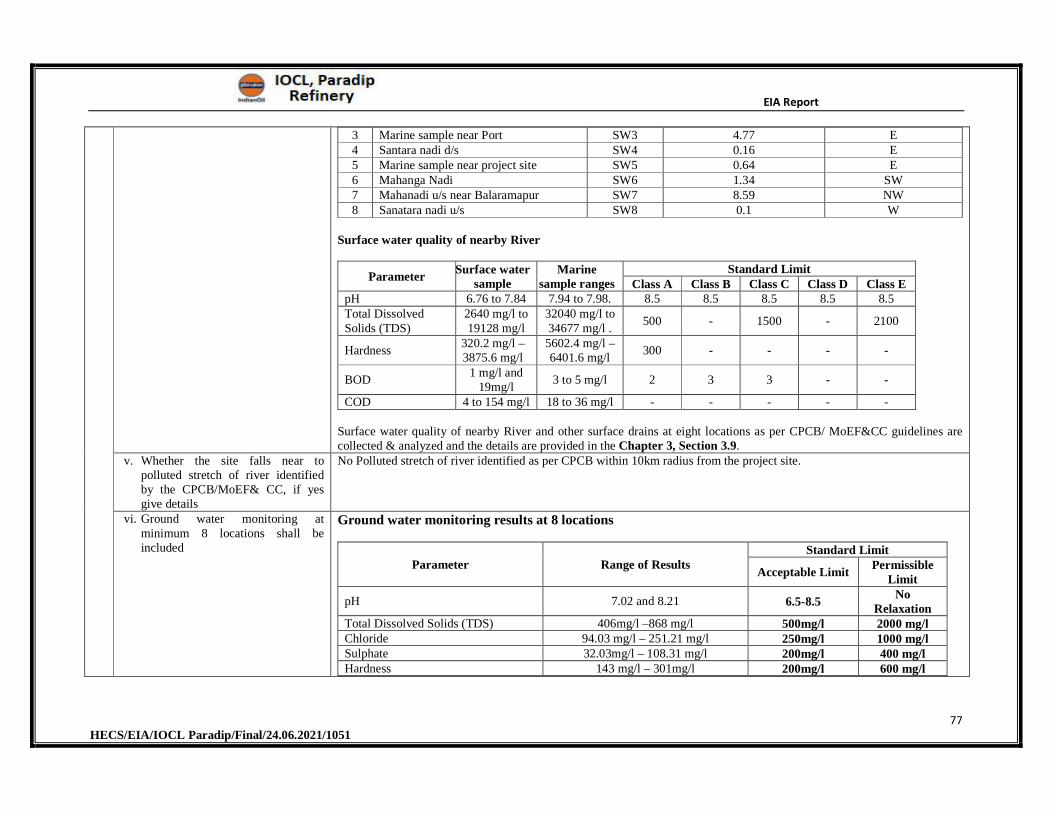
EIA Report
77 HECS/EIA/IOCL Paradip/Final/24.06.2021/1051
3 Marine sample near Port SW3 4.77 E 4 Santara nadi d/s SW4 0.16 E 5 Marine sample near project site SW5 0.64 E 6 Mahanga Nadi SW6 1.34 SW 7 Mahanadi u/s near Balaramapur SW7 8.59 NW 8 Sanatara nadi u/s SW8 0.1 W
Surface water quality of nearby River
Parameter Surface water
sample Marine
sample ranges Standard Limit
Class A Class B Class C Class D Class E pH 6.76 to 7.84 7.94 to 7.98. 8.5 8.5 8.5 8.5 8.5 Total Dissolved Solids (TDS)
2640 mg/l to 19128 mg/l
32040 mg/l to 34677 mg/l .
500 - 1500 - 2100
Hardness 320.2 mg/l – 3875.6 mg/l
5602.4 mg/l – 6401.6 mg/l
300 - - - -
BOD 1 mg/l and
19mg/l 3 to 5 mg/l 2 3 3 - -
COD 4 to 154 mg/l 18 to 36 mg/l - - - - -
Surface water quality of nearby River and other surface drains at eight locations as per CPCB/ MoEF&CC guidelines are collected & analyzed and the details are provided in the Chapter 3, Section 3.9.
v. Whether the site falls near to polluted stretch of river identified by the CPCB/MoEF& CC, if yes give details
No Polluted stretch of river identified as per CPCB within 10km radius from the project site.
vi. Ground water monitoring at minimum 8 locations shall be included
Ground water monitoring results at 8 locations
Parameter Range of Results Standard Limit
Acceptable Limit Permissible
Limit
pH 7.02 and 8.21 6.5-8.5 No
Relaxation Total Dissolved Solids (TDS) 406mg/l –868 mg/l 500mg/l 2000 mg/l Chloride 94.03 mg/l – 251.21 mg/l 250mg/l 1000 mg/l Sulphate 32.03mg/l – 108.31 mg/l 200mg/l 400 mg/l Hardness 143 mg/l – 301mg/l 200mg/l 600 mg/l
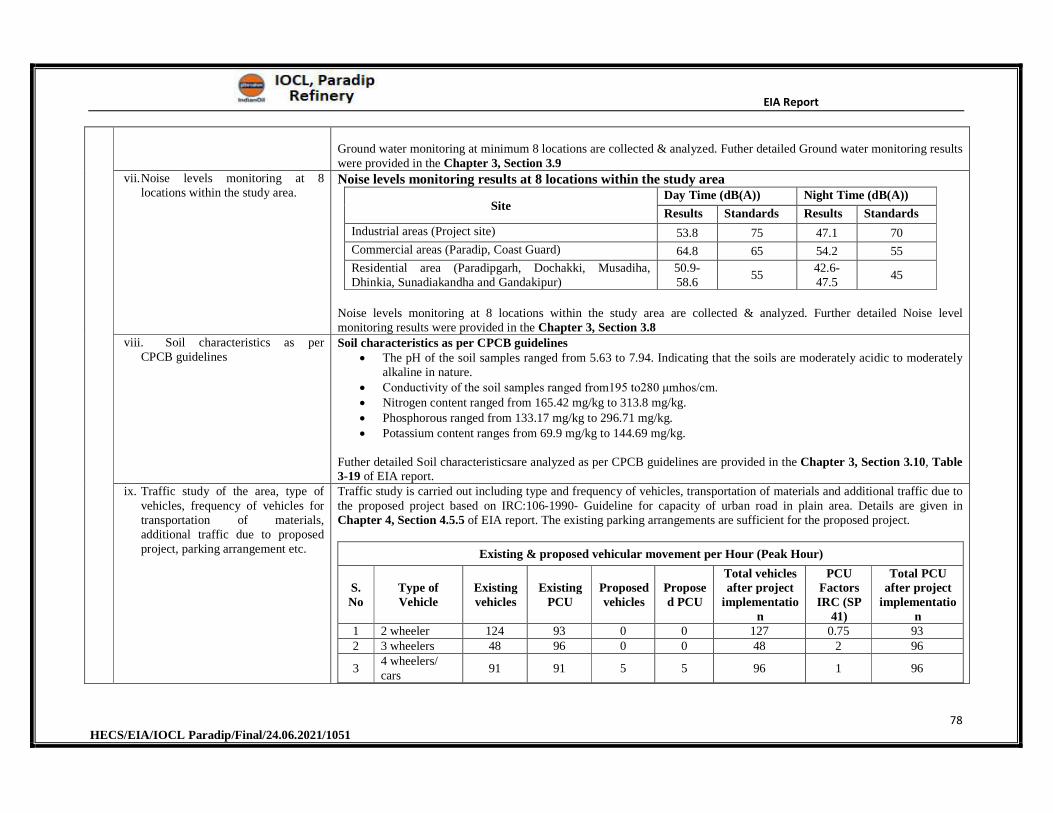
EIA Report
78 HECS/EIA/IOCL Paradip/Final/24.06.2021/1051
Ground water monitoring at minimum 8 locations are collected & analyzed. Futher detailed Ground water monitoring results were provided in the Chapter 3, Section 3.9
vii.Noise levels monitoring at 8 locations within the study area.
Noise levels monitoring results at 8 locations within the study area
Site Day Time (dB(A)) Night Time (dB(A))
Results Standards Results Standards
Industrial areas (Project site) 53.8 75 47.1 70
Commercial areas (Paradip, Coast Guard) 64.8 65 54.2 55
Residential area (Paradipgarh, Dochakki, Musadiha, Dhinkia, Sunadiakandha and Gandakipur)
50.9-58.6
55 42.6-47.5
45
Noise levels monitoring at 8 locations within the study area are collected & analyzed. Further detailed Noise level monitoring results were provided in the Chapter 3, Section 3.8
viii. Soil characteristics as per CPCB guidelines
Soil characteristics as per CPCB guidelines The pH of the soil samples ranged from 5.63 to 7.94. Indicating that the soils are moderately acidic to moderately
alkaline in nature. Conductivity of the soil samples ranged from195 to280 μmhos/cm. Nitrogen content ranged from 165.42 mg/kg to 313.8 mg/kg. Phosphorous ranged from 133.17 mg/kg to 296.71 mg/kg. Potassium content ranges from 69.9 mg/kg to 144.69 mg/kg.
Futher detailed Soil characteristicsare analyzed as per CPCB guidelines are provided in the Chapter 3, Section 3.10, Table 3-19 of EIA report.
ix. Traffic study of the area, type of vehicles, frequency of vehicles for transportation of materials, additional traffic due to proposed project, parking arrangement etc.
Traffic study is carried out including type and frequency of vehicles, transportation of materials and additional traffic due to the proposed project based on IRC:106-1990- Guideline for capacity of urban road in plain area. Details are given in Chapter 4, Section 4.5.5 of EIA report. The existing parking arrangements are sufficient for the proposed project.
Existing & proposed vehicular movement per Hour (Peak Hour)
S. No
Type of Vehicle
Existing vehicles
Existing PCU
Proposed vehicles
Proposed PCU
Total vehicles after project
implementation
PCU Factors IRC (SP
41)
Total PCU after project
implementation
1 2 wheeler 124 93 0 0 127 0.75 93 2 3 wheelers 48 96 0 0 48 2 96
3 4 wheelers/ cars
91 91 5 5 96 1 96
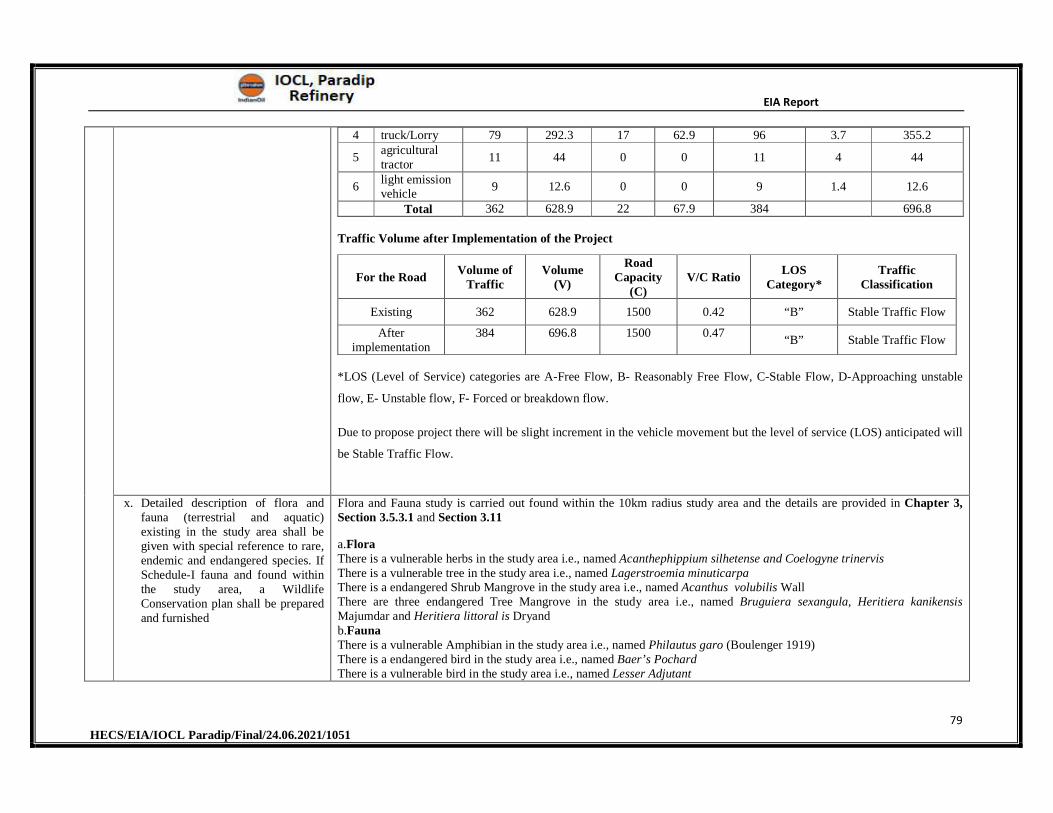
EIA Report
79 HECS/EIA/IOCL Paradip/Final/24.06.2021/1051
4 truck/Lorry 79 292.3 17 62.9 96 3.7 355.2
5 agricultural tractor
11 44 0 0 11 4 44
6 light emission vehicle
9 12.6 0 0 9 1.4 12.6
Total 362 628.9 22 67.9 384 696.8
Traffic Volume after Implementation of the Project
For the Road Volume of
Traffic Volume
(V)
Road Capacity
(C) V/C Ratio
LOS Category*
Traffic Classification
Existing 362 628.9 1500 0.42 “B” Stable Traffic Flow
After implementation
384 696.8 1500 0.47 “B” Stable Traffic Flow
*LOS (Level of Service) categories are A-Free Flow, B- Reasonably Free Flow, C-Stable Flow, D-Approaching unstable
flow, E- Unstable flow, F- Forced or breakdown flow.
Due to propose project there will be slight increment in the vehicle movement but the level of service (LOS) anticipated will
be Stable Traffic Flow.
x. Detailed description of flora and fauna (terrestrial and aquatic) existing in the study area shall be given with special reference to rare, endemic and endangered species. If Schedule-I fauna and found within the study area, a Wildlife Conservation plan shall be prepared and furnished
Flora and Fauna study is carried out found within the 10km radius study area and the details are provided in Chapter 3, Section 3.5.3.1 and Section 3.11
a.FloraThere is a vulnerable herbs in the study area i.e., named Acanthephippium silhetense and Coelogyne trinervisThere is a vulnerable tree in the study area i.e., named Lagerstroemia minuticarpaThere is a endangered Shrub Mangrove in the study area i.e., named Acanthus volubilis Wall There are three endangered Tree Mangrove in the study area i.e., named Bruguiera sexangula, Heritiera kanikensis Majumdar and Heritiera littoral is Dryand b.Fauna There is a vulnerable Amphibian in the study area i.e., named Philautus garo (Boulenger 1919) There is a endangered bird in the study area i.e., named Baer’s PochardThere is a vulnerable bird in the study area i.e., named Lesser Adjutant
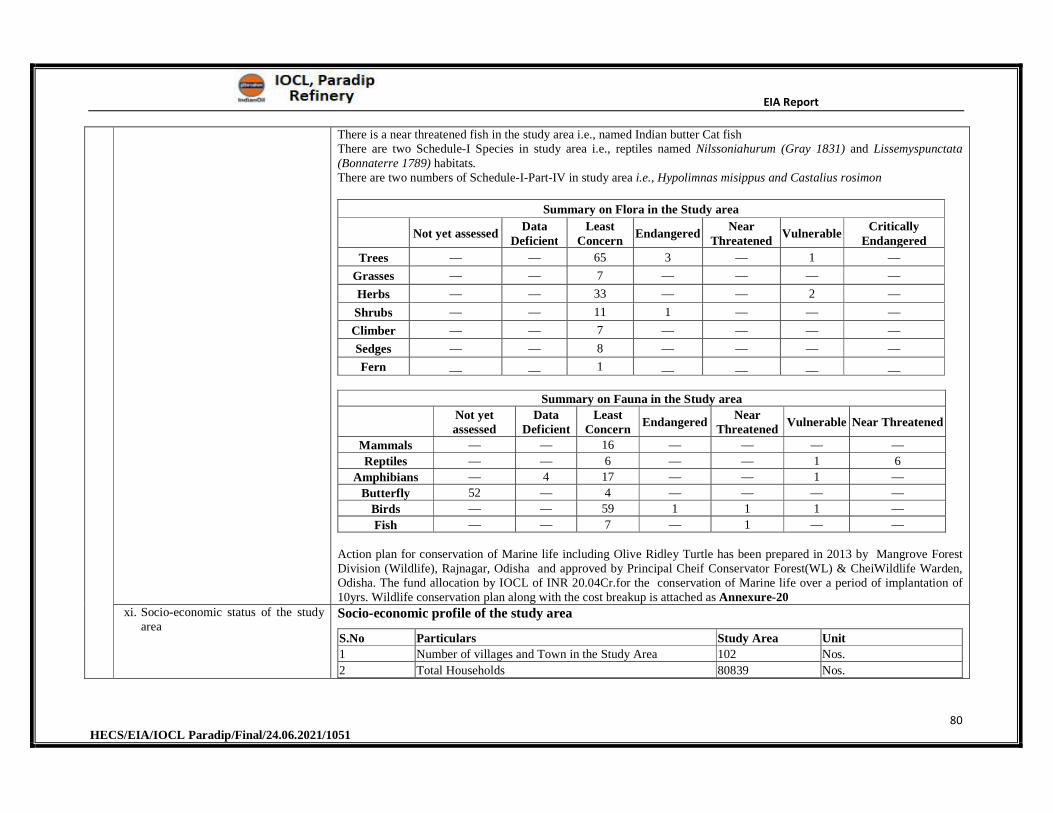
EIA Report
80 HECS/EIA/IOCL Paradip/Final/24.06.2021/1051
There is a near threatened fish in the study area i.e., named Indian butter Cat fish There are two Schedule-I Species in study area i.e., reptiles named Nilssoniahurum (Gray 1831) and Lissemyspunctata (Bonnaterre 1789) habitats.There are two numbers of Schedule-I-Part-IV in study area i.e., Hypolimnas misippus and Castalius rosimon
Summary on Flora in the Study area
Not yet assessedData
DeficientLeast
ConcernEndangered
Near Threatened
VulnerableCritically
Endangered
Trees — — 65 3 — 1 —
Grasses — — 7 — — — —
Herbs — — 33 — — 2 —
Shrubs — — 11 1 — — —
Climber — — 7 — — — —
Sedges — — 8 — — — —
Fern __ __ 1 __ __ __ __
Summary on Fauna in the Study area
Not yet assessed
Data Deficient
Least Concern
EndangeredNear
ThreatenedVulnerable Near Threatened
Mammals — — 16 — — — —
Reptiles — — 6 — — 1 6
Amphibians — 4 17 — — 1 —
Butterfly 52 — 4 — — — —
Birds — — 59 1 1 1 —
Fish — — 7 — 1 — —
Action plan for conservation of Marine life including Olive Ridley Turtle has been prepared in 2013 by Mangrove Forest Division (Wildlife), Rajnagar, Odisha and approved by Principal Cheif Conservator Forest(WL) & CheiWildlife Warden, Odisha. The fund allocation by IOCL of INR 20.04Cr.for the conservation of Marine life over a period of implantation of 10yrs. Wildlife conservation plan along with the cost breakup is attached as Annexure-20
xi. Socio-economic status of the study area
Socio-economic profile of the study area
S.No Particulars Study Area Unit
1 Number of villages and Town in the Study Area 102 Nos.
2 Total Households 80839 Nos.
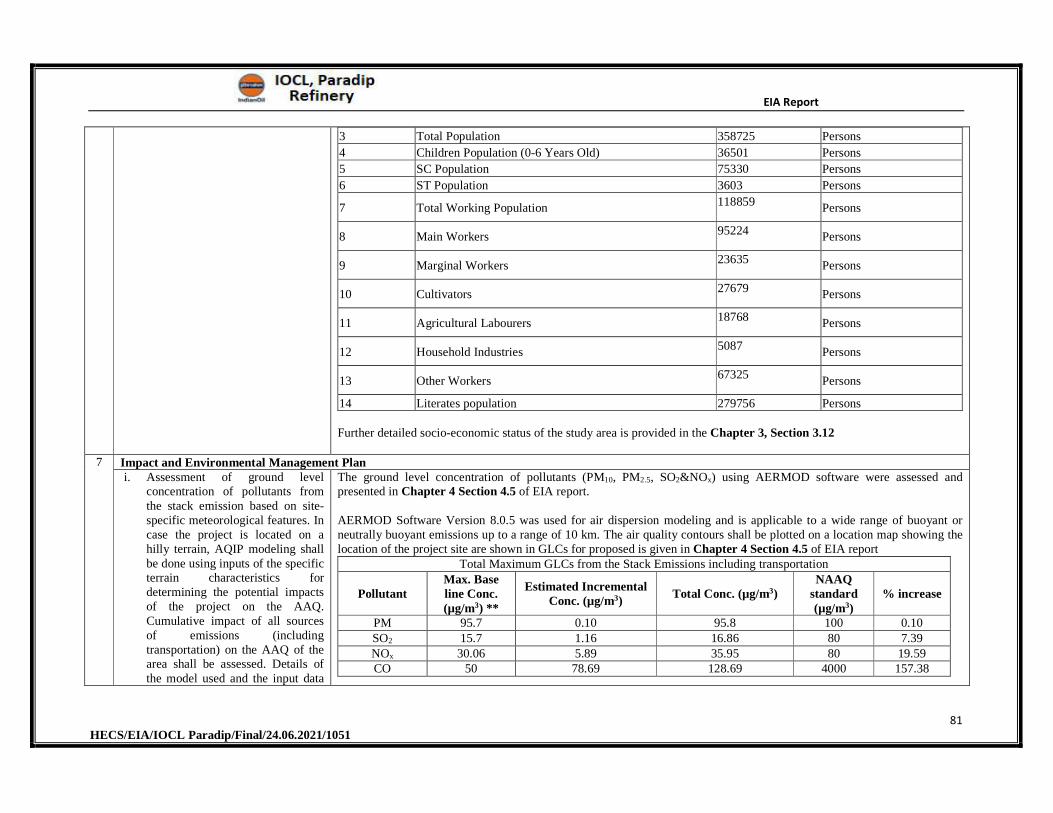
EIA Report
81 HECS/EIA/IOCL Paradip/Final/24.06.2021/1051
3 Total Population 358725 Persons
4 Children Population (0-6 Years Old) 36501 Persons
5 SC Population 75330 Persons
6 ST Population 3603 Persons
7 Total Working Population 118859
Persons
8 Main Workers 95224 Persons
9 Marginal Workers 23635
Persons
10 Cultivators 27679 Persons
11 Agricultural Labourers 18768
Persons
12 Household Industries 5087
Persons
13 Other Workers 67325
Persons
14 Literates population 279756 Persons
Further detailed socio-economic status of the study area is provided in the Chapter 3, Section 3.12
7 Impact and Environmental Management Plani. Assessment of ground level
concentration of pollutants from the stack emission based on site-specific meteorological features. In case the project is located on a hilly terrain, AQIP modeling shall be done using inputs of the specific terrain characteristics for determining the potential impacts of the project on the AAQ. Cumulative impact of all sources of emissions (including transportation) on the AAQ of the area shall be assessed. Details of the model used and the input data
The ground level concentration of pollutants (PM10, PM2.5, SO2&NOx) using AERMOD software were assessed and presented in Chapter 4 Section 4.5 of EIA report.
AERMOD Software Version 8.0.5 was used for air dispersion modeling and is applicable to a wide range of buoyant or neutrally buoyant emissions up to a range of 10 km. The air quality contours shall be plotted on a location map showing the location of the project site are shown in GLCs for proposed is given in Chapter 4 Section 4.5 of EIA report
Total Maximum GLCs from the Stack Emissions including transportation
Pollutant Max. Base line Conc. (µg/m3) **
Estimated Incremental Conc. (µg/m3)
Total Conc. (µg/m3) NAAQ
standard (µg/m3)
% increase
PM 95.7 0.10 95.8 100 0.10 SO2 15.7 1.16 16.86 80 7.39 NOx 30.06 5.89 35.95 80 19.59 CO 50 78.69 128.69 4000 157.38
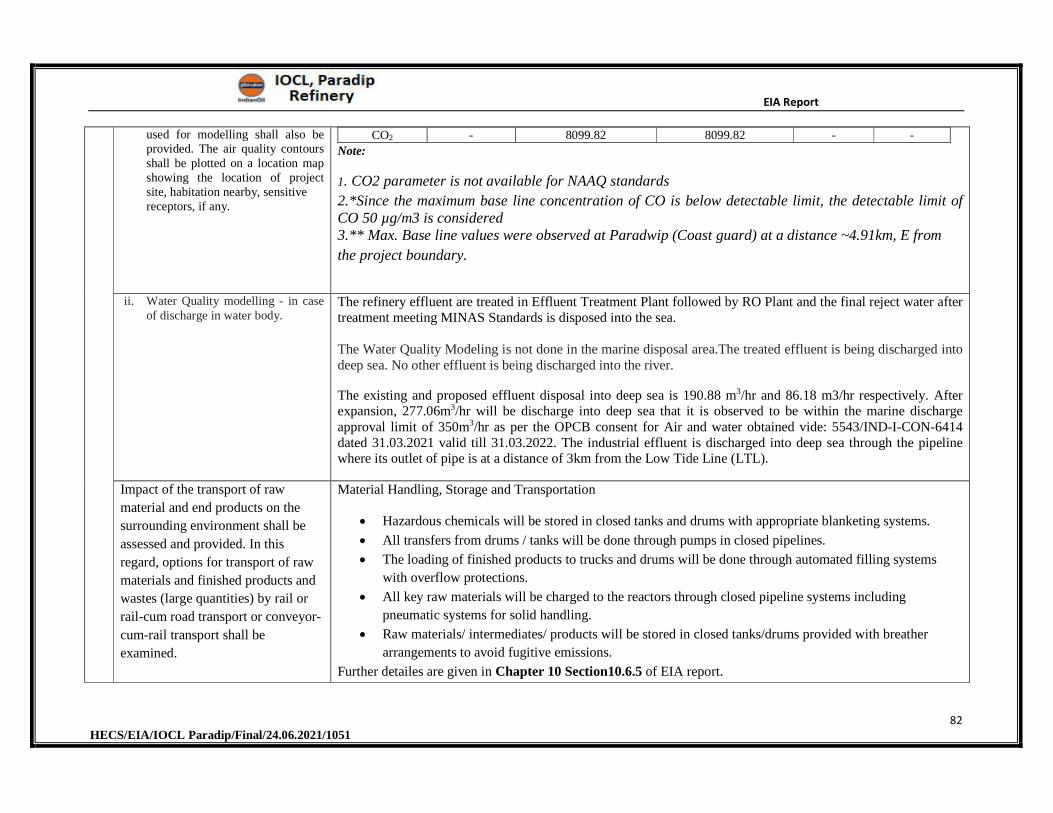
EIA Report
82 HECS/EIA/IOCL Paradip/Final/24.06.2021/1051
used for modelling shall also be provided. The air quality contours shall be plotted on a location map showing the location of project site, habitation nearby, sensitive receptors, if any.
CO2 - 8099.82 8099.82 - -
Note:
1. CO2 parameter is not available for NAAQ standards
2.*Since the maximum base line concentration of CO is below detectable limit, the detectable limit of CO 50 µg/m3 is considered 3.** Max. Base line values were observed at Paradwip (Coast guard) at a distance ~4.91km, E from
the project boundary.
ii. Water Quality modelling - in case of discharge in water body.
The refinery effluent are treated in Effluent Treatment Plant followed by RO Plant and the final reject water after treatment meeting MINAS Standards is disposed into the sea.
The Water Quality Modeling is not done in the marine disposal area.The treated effluent is being discharged into deep sea. No other effluent is being discharged into the river.
The existing and proposed effluent disposal into deep sea is 190.88 m3/hr and 86.18 m3/hr respectively. After expansion, 277.06m3/hr will be discharge into deep sea that it is observed to be within the marine discharge approval limit of 350m3/hr as per the OPCB consent for Air and water obtained vide: 5543/IND-I-CON-6414 dated 31.03.2021 valid till 31.03.2022. The industrial effluent is discharged into deep sea through the pipeline where its outlet of pipe is at a distance of 3km from the Low Tide Line (LTL).
Impact of the transport of raw
material and end products on the
surrounding environment shall be
assessed and provided. In this
regard, options for transport of raw
materials and finished products and
wastes (large quantities) by rail or
rail-cum road transport or conveyor-
cum-rail transport shall be
examined.
Material Handling, Storage and Transportation
Hazardous chemicals will be stored in closed tanks and drums with appropriate blanketing systems.
All transfers from drums / tanks will be done through pumps in closed pipelines.
The loading of finished products to trucks and drums will be done through automated filling systems
with overflow protections.
All key raw materials will be charged to the reactors through closed pipeline systems including
pneumatic systems for solid handling.
Raw materials/ intermediates/ products will be stored in closed tanks/drums provided with breather
arrangements to avoid fugitive emissions.
Further detailes are given in Chapter 10 Section10.6.5 of EIA report.
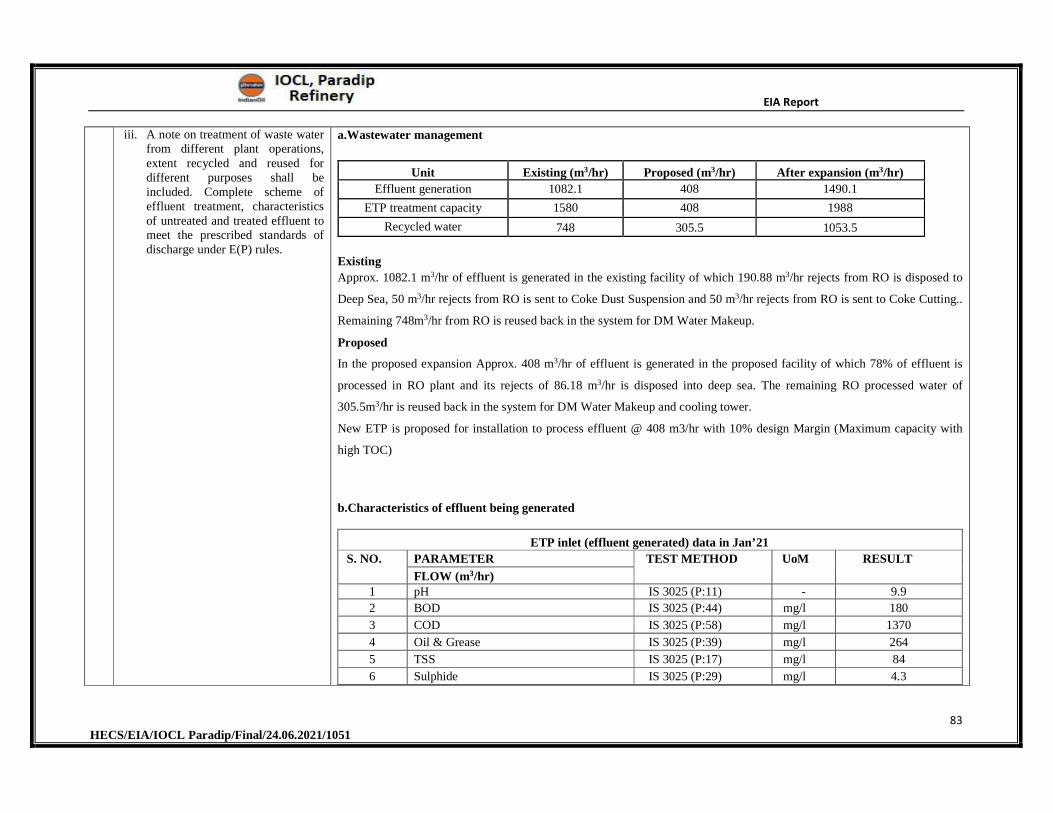
EIA Report
83 HECS/EIA/IOCL Paradip/Final/24.06.2021/1051
iii. A note on treatment of waste water from different plant operations, extent recycled and reused for different purposes shall be included. Complete scheme of effluent treatment, characteristics of untreated and treated effluent to meet the prescribed standards of discharge under E(P) rules.
a.Wastewater management
Unit Existing (m3/hr) Proposed (m3/hr) After expansion (m3/hr)
Effluent generation 1082.1 408 1490.1
ETP treatment capacity 1580 408 1988
Recycled water 748 305.5 1053.5
Existing
Approx. 1082.1 m3/hr of effluent is generated in the existing facility of which 190.88 m3/hr rejects from RO is disposed to
Deep Sea, 50 m3/hr rejects from RO is sent to Coke Dust Suspension and 50 m3/hr rejects from RO is sent to Coke Cutting..
Remaining 748m3/hr from RO is reused back in the system for DM Water Makeup.
Proposed
In the proposed expansion Approx. 408 m3/hr of effluent is generated in the proposed facility of which 78% of effluent is
processed in RO plant and its rejects of 86.18 m3/hr is disposed into deep sea. The remaining RO processed water of
305.5m3/hr is reused back in the system for DM Water Makeup and cooling tower.
New ETP is proposed for installation to process effluent @ 408 m3/hr with 10% design Margin (Maximum capacity with
high TOC)
b.Characteristics of effluent being generated
ETP inlet (effluent generated) data in Jan’21
S. NO. PARAMETER TEST METHOD UoM RESULT
FLOW (m3/hr)1 pH IS 3025 (P:11) - 9.9
2 BOD IS 3025 (P:44) mg/l 180
3 COD IS 3025 (P:58) mg/l 1370
4 Oil & Grease IS 3025 (P:39) mg/l 264
5 TSS IS 3025 (P:17) mg/l 84
6 Sulphide IS 3025 (P:29) mg/l 4.3
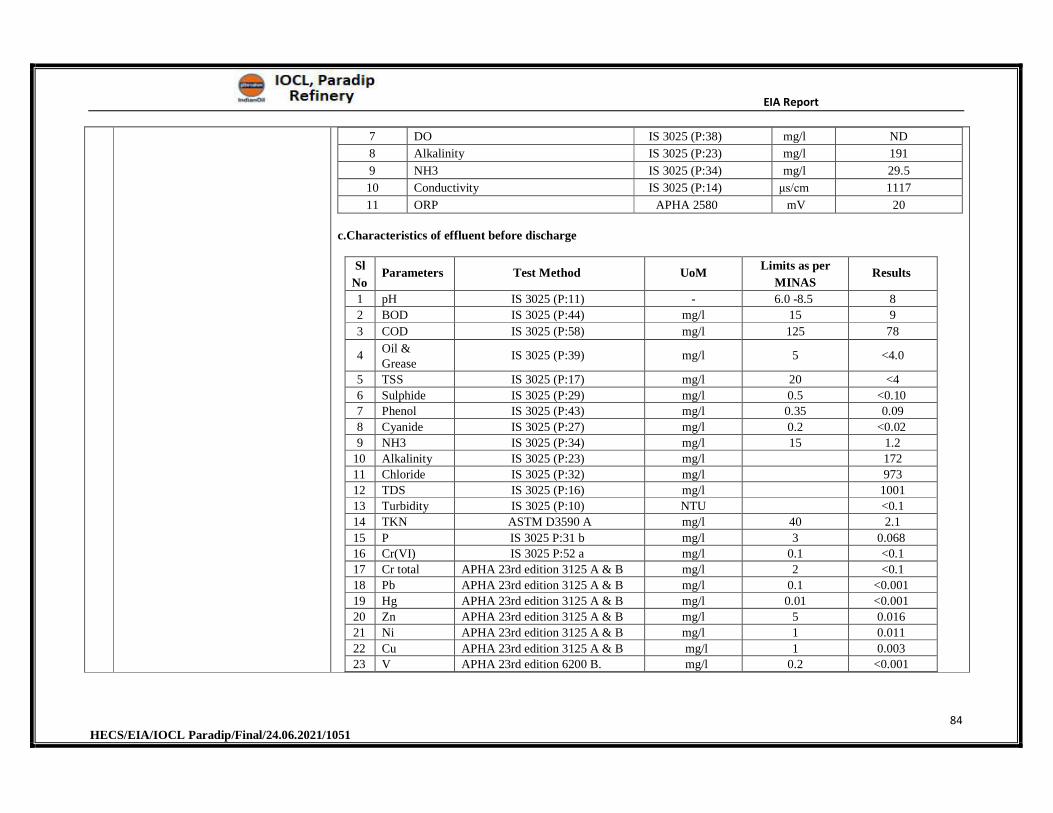
EIA Report
84 HECS/EIA/IOCL Paradip/Final/24.06.2021/1051
7 DO IS 3025 (P:38) mg/l ND
8 Alkalinity IS 3025 (P:23) mg/l 191
9 NH3 IS 3025 (P:34) mg/l 29.5
10 Conductivity IS 3025 (P:14) μs/cm 1117
11 ORP APHA 2580 mV 20
c.Characteristics of effluent before discharge
Sl
NoParameters Test Method UoM
Limits as per
MINASResults
1 pH IS 3025 (P:11) - 6.0 -8.5 8
2 BOD IS 3025 (P:44) mg/l 15 9
3 COD IS 3025 (P:58) mg/l 125 78
4 Oil &Grease
IS 3025 (P:39) mg/l 5 <4.0
5 TSS IS 3025 (P:17) mg/l 20 <4
6 Sulphide IS 3025 (P:29) mg/l 0.5 <0.10
7 Phenol IS 3025 (P:43) mg/l 0.35 0.09
8 Cyanide IS 3025 (P:27) mg/l 0.2 <0.02
9 NH3 IS 3025 (P:34) mg/l 15 1.2
10 Alkalinity IS 3025 (P:23) mg/l 172
11 Chloride IS 3025 (P:32) mg/l 973
12 TDS IS 3025 (P:16) mg/l 1001
13 Turbidity IS 3025 (P:10) NTU <0.1
14 TKN ASTM D3590 A mg/l 40 2.1
15 P IS 3025 P:31 b mg/l 3 0.068
16 Cr(VI) IS 3025 P:52 a mg/l 0.1 <0.1
17 Cr total APHA 23rd edition 3125 A & B mg/l 2 <0.1
18 Pb APHA 23rd edition 3125 A & B mg/l 0.1 <0.001
19 Hg APHA 23rd edition 3125 A & B mg/l 0.01 <0.001
20 Zn APHA 23rd edition 3125 A & B mg/l 5 0.016
21 Ni APHA 23rd edition 3125 A & B mg/l 1 0.011
22 Cu APHA 23rd edition 3125 A & B mg/l 1 0.003
23 V APHA 23rd edition 6200 B. mg/l 0.2 <0.001
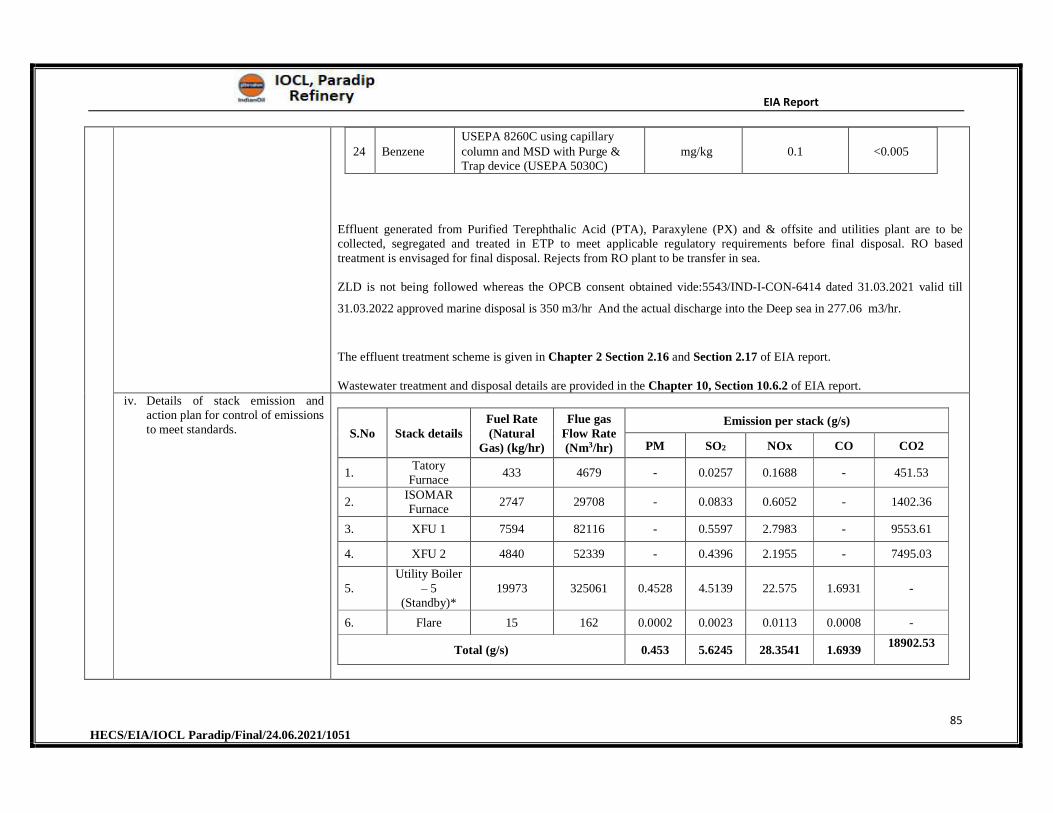
EIA Report
85 HECS/EIA/IOCL Paradip/Final/24.06.2021/1051
24 Benzene USEPA 8260C using capillarycolumn and MSD with Purge & Trap device (USEPA 5030C)
mg/kg 0.1 <0.005
Effluent generated from Purified Terephthalic Acid (PTA), Paraxylene (PX) and & offsite and utilities plant are to be collected, segregated and treated in ETP to meet applicable regulatory requirements before final disposal. RO based treatment is envisaged for final disposal. Rejects from RO plant to be transfer in sea.
ZLD is not being followed whereas the OPCB consent obtained vide:5543/IND-I-CON-6414 dated 31.03.2021 valid till
31.03.2022 approved marine disposal is 350 m3/hr And the actual discharge into the Deep sea in 277.06 m3/hr.
The effluent treatment scheme is given in Chapter 2 Section 2.16 and Section 2.17 of EIA report.
Wastewater treatment and disposal details are provided in the Chapter 10, Section 10.6.2 of EIA report.iv. Details of stack emission and
action plan for control of emissions to meet standards. S.No Stack details
Fuel Rate (Natural
Gas) (kg/hr)
Flue gas Flow Rate (Nm3/hr)
Emission per stack (g/s)
PM SO2 NOx CO CO2
1.Tatory
Furnace 433 4679 - 0.0257 0.1688 - 451.53
2.ISOMAR Furnace
2747 29708 - 0.0833 0.6052 - 1402.36
3. XFU 1 7594 82116 - 0.5597 2.7983 - 9553.61
4. XFU 2 4840 52339 - 0.4396 2.1955 - 7495.03
5.Utility Boiler
– 5 (Standby)*
19973 325061 0.4528 4.5139 22.575 1.6931 -
6. Flare 15 162 0.0002 0.0023 0.0113 0.0008 -
Total (g/s) 0.453 5.6245 28.3541 1.6939 18902.53
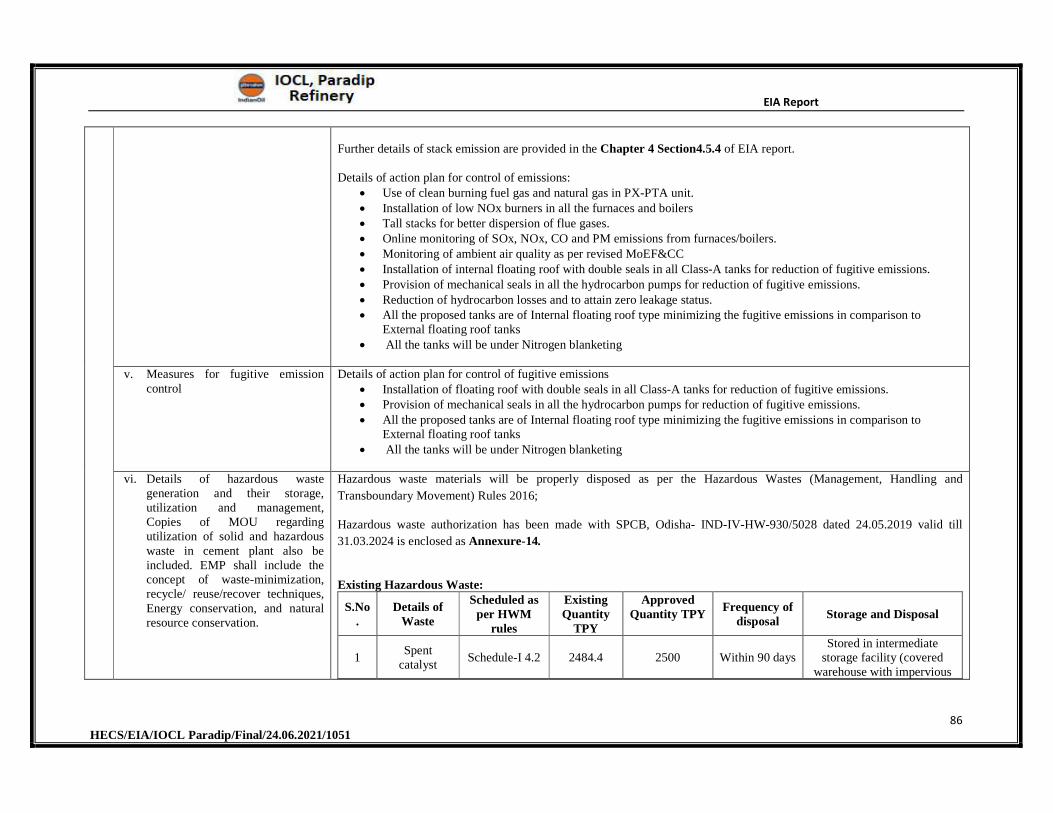
EIA Report
86 HECS/EIA/IOCL Paradip/Final/24.06.2021/1051
Further details of stack emission are provided in the Chapter 4 Section4.5.4 of EIA report.
Details of action plan for control of emissions: Use of clean burning fuel gas and natural gas in PX-PTA unit. Installation of low NOx burners in all the furnaces and boilers Tall stacks for better dispersion of flue gases. Online monitoring of SOx, NOx, CO and PM emissions from furnaces/boilers. Monitoring of ambient air quality as per revised MoEF&CC Installation of internal floating roof with double seals in all Class-A tanks for reduction of fugitive emissions. Provision of mechanical seals in all the hydrocarbon pumps for reduction of fugitive emissions. Reduction of hydrocarbon losses and to attain zero leakage status. All the proposed tanks are of Internal floating roof type minimizing the fugitive emissions in comparison to
External floating roof tanks All the tanks will be under Nitrogen blanketing
v. Measures for fugitive emission control
Details of action plan for control of fugitive emissions Installation of floating roof with double seals in all Class-A tanks for reduction of fugitive emissions. Provision of mechanical seals in all the hydrocarbon pumps for reduction of fugitive emissions. All the proposed tanks are of Internal floating roof type minimizing the fugitive emissions in comparison to
External floating roof tanks All the tanks will be under Nitrogen blanketing
vi. Details of hazardous waste generation and their storage, utilization and management, Copies of MOU regarding utilization of solid and hazardous waste in cement plant also be included. EMP shall include the concept of waste-minimization, recycle/ reuse/recover techniques, Energy conservation, and natural resource conservation.
Hazardous waste materials will be properly disposed as per the Hazardous Wastes (Management, Handling and
Transboundary Movement) Rules 2016;
Hazardous waste authorization has been made with SPCB, Odisha- IND-IV-HW-930/5028 dated 24.05.2019 valid till
31.03.2024 is enclosed as Annexure-14.
Existing Hazardous Waste:
S.No.
Details of Waste
Scheduled as per HWM
rules
Existing Quantity
TPY
Approved Quantity TPY
Frequency of disposal
Storage and Disposal
1 Spent
catalyst Schedule-I 4.2 2484.4 2500 Within 90 days
Stored in intermediate storage facility (covered
warehouse with impervious
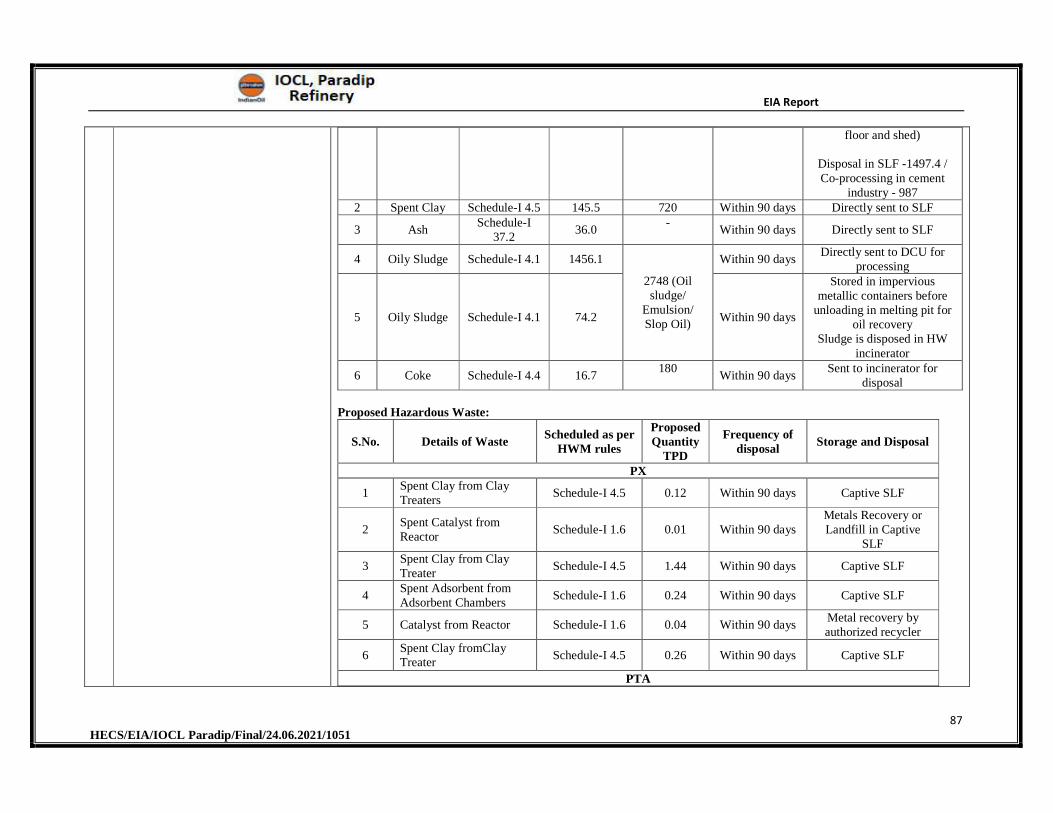
EIA Report
87 HECS/EIA/IOCL Paradip/Final/24.06.2021/1051
floor and shed)
Disposal in SLF -1497.4 / Co-processing in cement
industry - 987 2 Spent Clay Schedule-I 4.5 145.5 720 Within 90 days Directly sent to SLF
3 Ash Schedule-I
37.2 36.0
- Within 90 days Directly sent to SLF
4 Oily Sludge Schedule-I 4.1 1456.1
2748 (Oil sludge/
Emulsion/ Slop Oil)
Within 90 days Directly sent to DCU for
processing
5 Oily Sludge Schedule-I 4.1 74.2 Within 90 days
Stored in impervious metallic containers before
unloading in melting pit for oil recovery
Sludge is disposed in HW incinerator
6 Coke Schedule-I 4.4 16.7 180
Within 90 days Sent to incinerator for
disposal
Proposed Hazardous Waste:
S.No. Details of Waste Scheduled as per
HWM rules
Proposed Quantity
TPD
Frequency of disposal
Storage and Disposal
PX
1 Spent Clay from Clay Treaters
Schedule-I 4.5 0.12 Within 90 days Captive SLF
2 Spent Catalyst from Reactor
Schedule-I 1.6 0.01 Within 90 days Metals Recovery or Landfill in Captive
SLF
3 Spent Clay from Clay Treater
Schedule-I 4.5 1.44 Within 90 days Captive SLF
4 Spent Adsorbent from Adsorbent Chambers
Schedule-I 1.6 0.24 Within 90 days Captive SLF
5 Catalyst from Reactor Schedule-I 1.6 0.04 Within 90 days Metal recovery by authorized recycler
6 Spent Clay fromClay Treater
Schedule-I 4.5 0.26 Within 90 days Captive SLF
PTA
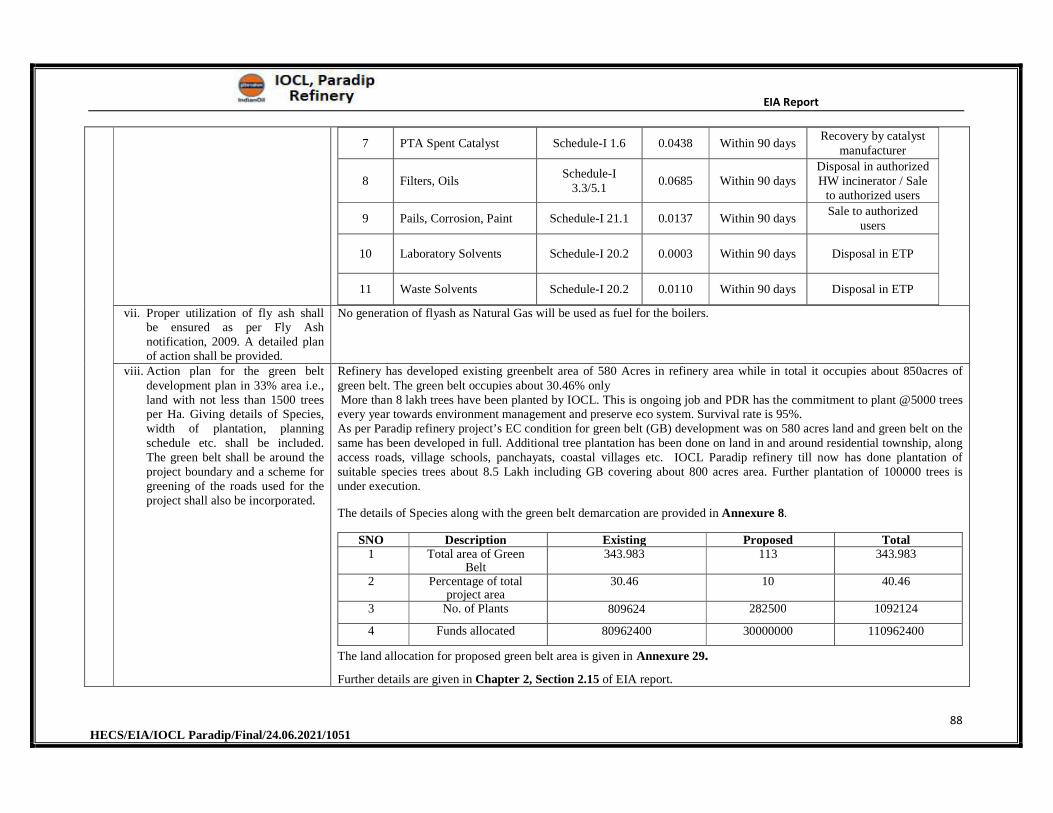
EIA Report
88 HECS/EIA/IOCL Paradip/Final/24.06.2021/1051
7 PTA Spent Catalyst Schedule-I 1.6 0.0438 Within 90 days Recovery by catalyst
manufacturer
8 Filters, Oils Schedule-I
3.3/5.1 0.0685 Within 90 days
Disposal in authorized HW incinerator / Sale
to authorized users
9 Pails, Corrosion, Paint Schedule-I 21.1 0.0137 Within 90 days Sale to authorized
users
10 Laboratory Solvents Schedule-I 20.2 0.0003 Within 90 days Disposal in ETP
11 Waste Solvents Schedule-I 20.2 0.0110 Within 90 days Disposal in ETP
vii. Proper utilization of fly ash shall be ensured as per Fly Ash notification, 2009. A detailed plan of action shall be provided.
No generation of flyash as Natural Gas will be used as fuel for the boilers.
viii. Action plan for the green belt development plan in 33% area i.e., land with not less than 1500 trees per Ha. Giving details of Species, width of plantation, planning schedule etc. shall be included. The green belt shall be around the project boundary and a scheme for greening of the roads used for the project shall also be incorporated.
Refinery has developed existing greenbelt area of 580 Acres in refinery area while in total it occupies about 850acres of green belt. The green belt occupies about 30.46% only More than 8 lakh trees have been planted by IOCL. This is ongoing job and PDR has the commitment to plant @5000 trees every year towards environment management and preserve eco system. Survival rate is 95%. As per Paradip refinery project’s EC condition for green belt (GB) development was on 580 acres land and green belt on the same has been developed in full. Additional tree plantation has been done on land in and around residential township, along access roads, village schools, panchayats, coastal villages etc. IOCL Paradip refinery till now has done plantation of suitable species trees about 8.5 Lakh including GB covering about 800 acres area. Further plantation of 100000 trees is under execution.
The details of Species along with the green belt demarcation are provided in Annexure 8.
SNO Description Existing Proposed Total1 Total area of Green
Belt343.983 113 343.983
2 Percentage of total project area
30.46 10 40.46
3 No. of Plants 809624 282500 1092124
4 Funds allocated 80962400 30000000 110962400
The land allocation for proposed green belt area is given in Annexure 29.
Further details are given in Chapter 2, Section 2.15 of EIA report.
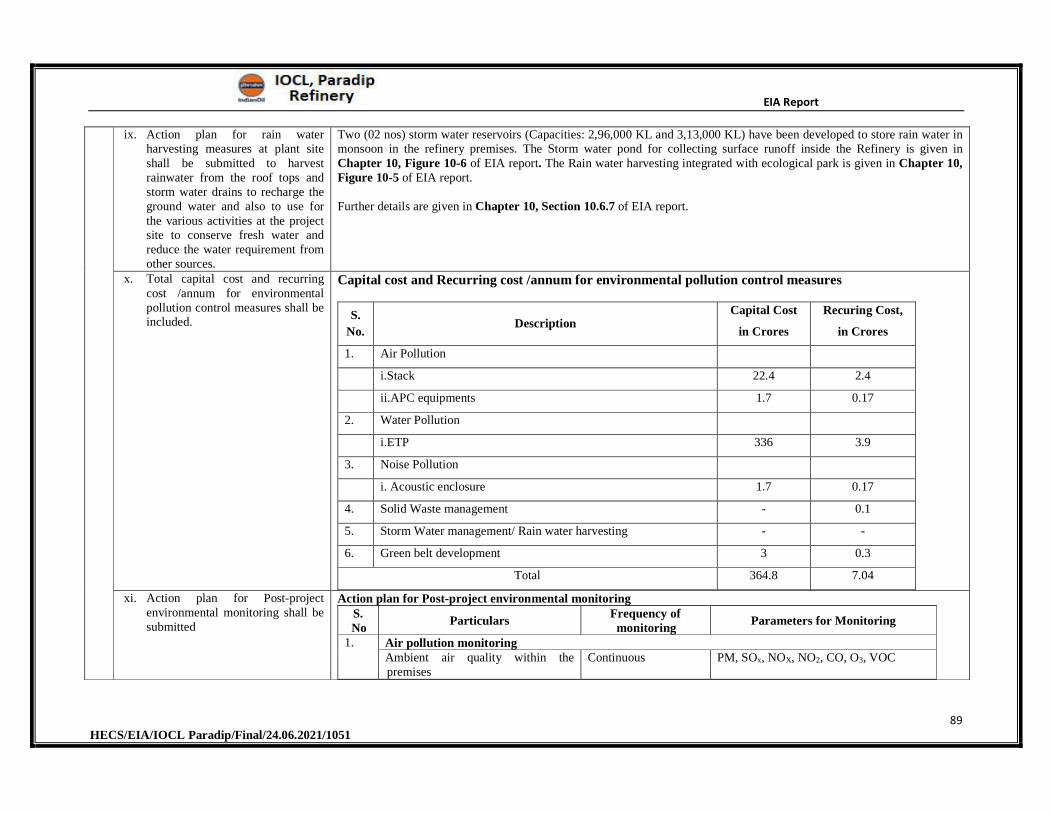
EIA Report
89 HECS/EIA/IOCL Paradip/Final/24.06.2021/1051
ix. Action plan for rain water harvesting measures at plant site shall be submitted to harvest rainwater from the roof tops and storm water drains to recharge the ground water and also to use for the various activities at the project site to conserve fresh water and reduce the water requirement from other sources.
Two (02 nos) storm water reservoirs (Capacities: 2,96,000 KL and 3,13,000 KL) have been developed to store rain water in monsoon in the refinery premises. The Storm water pond for collecting surface runoff inside the Refinery is given in Chapter 10, Figure 10-6 of EIA report. The Rain water harvesting integrated with ecological park is given in Chapter 10, Figure 10-5 of EIA report.
Further details are given in Chapter 10, Section 10.6.7 of EIA report.
x. Total capital cost and recurring cost /annum for environmental pollution control measures shall be included.
Capital cost and Recurring cost /annum for environmental pollution control measures
S.
No. Description
Capital Cost
in Crores
Recuring Cost,
in Crores
1. Air Pollution
i.Stack 22.4 2.4
ii.APC equipments 1.7 0.17
2. Water Pollution
i.ETP 336 3.9
3. Noise Pollution
i. Acoustic enclosure 1.7 0.17
4. Solid Waste management - 0.1
5. Storm Water management/ Rain water harvesting - -
6. Green belt development 3 0.3
Total 364.8 7.04
xi. Action plan for Post-project environmental monitoring shall be submitted
Action plan for Post-project environmental monitoring S. No
Particulars Frequency of
monitoring Parameters for Monitoring
1. Air pollution monitoring Ambient air quality within the premises
Continuous PM, SOx, NOX, NO2, CO, O3, VOC
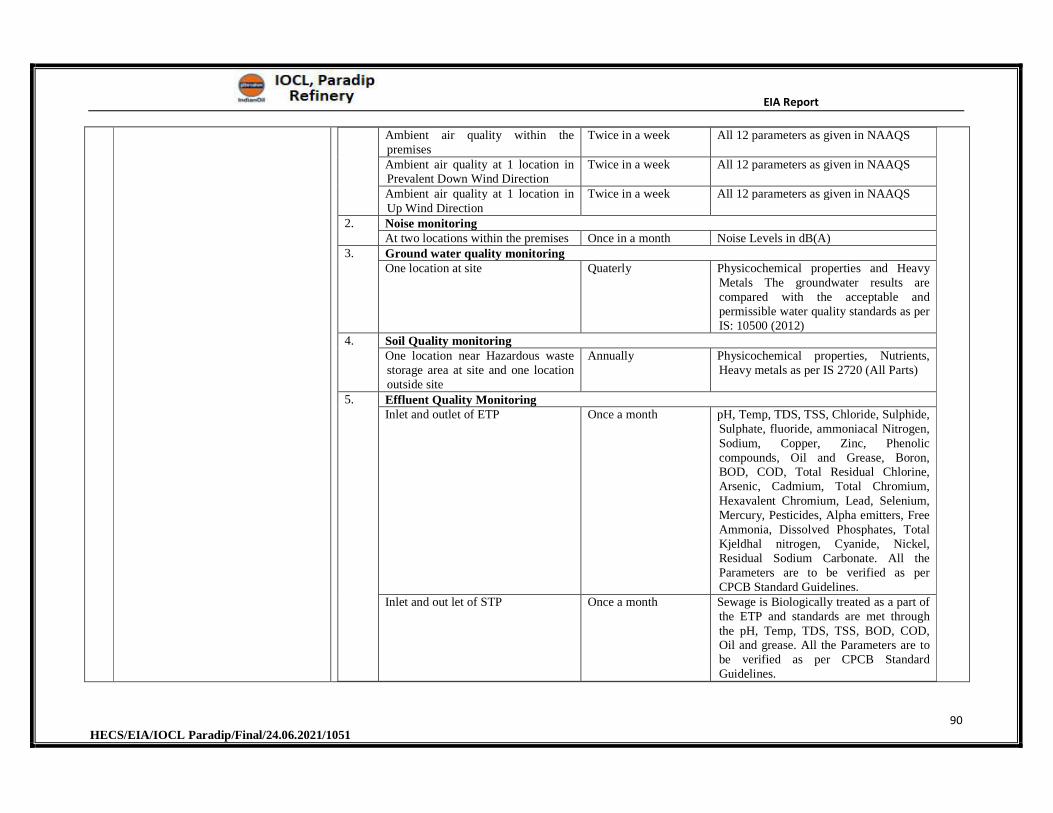
EIA Report
90 HECS/EIA/IOCL Paradip/Final/24.06.2021/1051
Ambient air quality within the premises
Twice in a week All 12 parameters as given in NAAQS
Ambient air quality at 1 location in Prevalent Down Wind Direction
Twice in a week All 12 parameters as given in NAAQS
Ambient air quality at 1 location in Up Wind Direction
Twice in a week All 12 parameters as given in NAAQS
2. Noise monitoring At two locations within the premises Once in a month Noise Levels in dB(A)
3. Ground water quality monitoring One location at site Quaterly Physicochemical properties and Heavy
Metals The groundwater results are compared with the acceptable and permissible water quality standards as per IS: 10500 (2012)
4. Soil Quality monitoring One location near Hazardous waste storage area at site and one location outside site
Annually Physicochemical properties, Nutrients, Heavy metals as per IS 2720 (All Parts)
5. Effluent Quality Monitoring Inlet and outlet of ETP Once a month pH, Temp, TDS, TSS, Chloride, Sulphide,
Sulphate, fluoride, ammoniacal Nitrogen, Sodium, Copper, Zinc, Phenolic compounds, Oil and Grease, Boron, BOD, COD, Total Residual Chlorine, Arsenic, Cadmium, Total Chromium, Hexavalent Chromium, Lead, Selenium, Mercury, Pesticides, Alpha emitters, Free Ammonia, Dissolved Phosphates, Total Kjeldhal nitrogen, Cyanide, Nickel, Residual Sodium Carbonate. All the Parameters are to be verified as per CPCB Standard Guidelines.
Inlet and out let of STP Once a month Sewage is Biologically treated as a part of the ETP and standards are met through the pH, Temp, TDS, TSS, BOD, COD, Oil and grease. All the Parameters are to be verified as per CPCB Standard Guidelines.
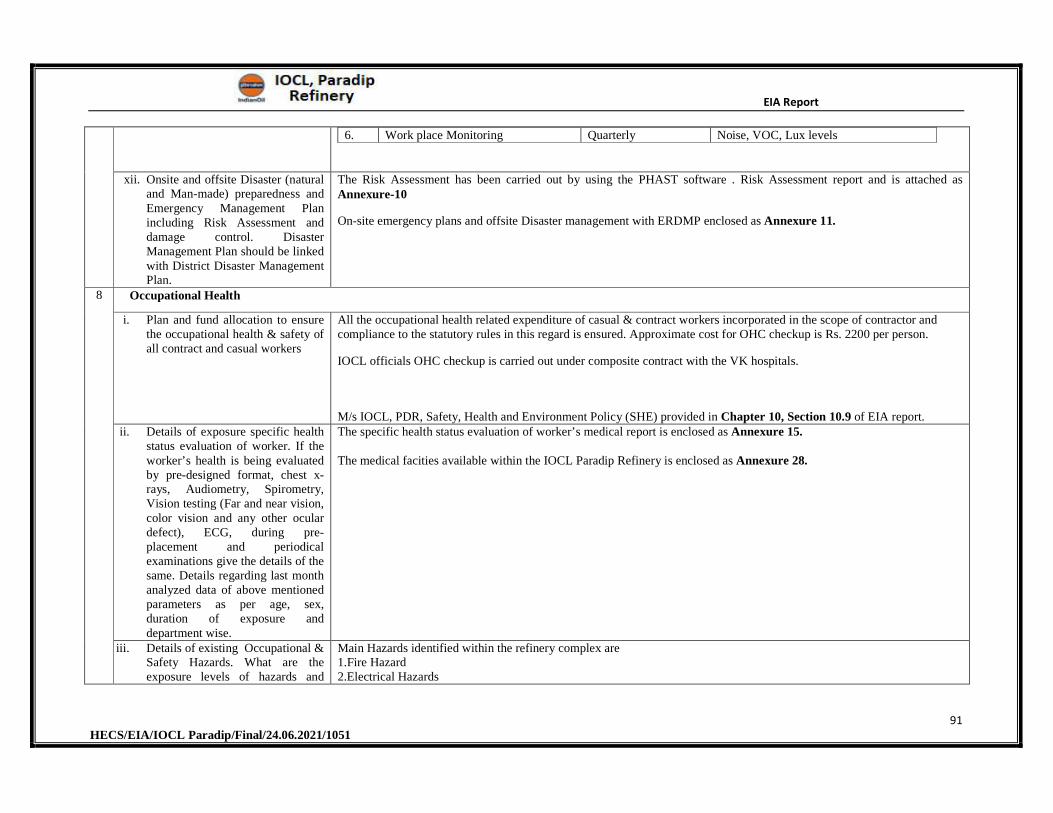
EIA Report
91 HECS/EIA/IOCL Paradip/Final/24.06.2021/1051
6. Work place Monitoring Quarterly Noise, VOC, Lux levels
xii. Onsite and offsite Disaster (natural and Man-made) preparedness and Emergency Management Plan including Risk Assessment and damage control. Disaster Management Plan should be linked with District Disaster Management Plan.
The Risk Assessment has been carried out by using the PHAST software . Risk Assessment report and is attached as Annexure-10
On-site emergency plans and offsite Disaster management with ERDMP enclosed as Annexure 11.
8 Occupational Health
i. Plan and fund allocation to ensure the occupational health & safety of all contract and casual workers
All the occupational health related expenditure of casual & contract workers incorporated in the scope of contractor and compliance to the statutory rules in this regard is ensured. Approximate cost for OHC checkup is Rs. 2200 per person.
IOCL officials OHC checkup is carried out under composite contract with the VK hospitals.
M/s IOCL, PDR, Safety, Health and Environment Policy (SHE) provided in Chapter 10, Section 10.9 of EIA report.ii. Details of exposure specific health
status evaluation of worker. If the worker’s health is being evaluated by pre-designed format, chest x-rays, Audiometry, Spirometry, Vision testing (Far and near vision, color vision and any other ocular defect), ECG, during pre-placement and periodical examinations give the details of the same. Details regarding last month analyzed data of above mentioned parameters as per age, sex, duration of exposure and department wise.
The specific health status evaluation of worker’s medical report is enclosed as Annexure 15.
The medical facities available within the IOCL Paradip Refinery is enclosed as Annexure 28.
iii. Details of existing Occupational & Safety Hazards. What are the exposure levels of hazards and
Main Hazards identified within the refinery complex are 1.Fire Hazard 2.Electrical Hazards
EIA Report
92 HECS/EIA/IOCL Paradip/Final/24.06.2021/1051
whether they are Permissible Exposure level (PEL) if these are not within PEL, what measures the company has adopted to keep them within PEL. So that health of the workers can be preserved.
3.Thermal Hazard 4.Occupational Hazards etc., Environmental monitoring is being carried out within the refinery shop floors and the parameters are mainly VOCs, H2S, CO and HCs . In addition to the above Noise and illumination levels are also being carried out on regular intervals. Same will be continued even after expansion. Occupational Hazardous Toxic gas monitoring data are attached as Annexure 22. For other prominent toxic gas hazards (NH3, Cl2, SO2), gas detectors are installed in the production blocks for early detection of any abnormal / accidental presence with audio-visual alarming systems. For rest of the chemical hazards, any exposure and subsequent adverse health effect is assessed through periodical medical check-up of employees as per the unit wise chemical hazards identification. The test consists of Blood test, urine test, PFT, KFT, urine phenol etc. The details unit wise chemicals /hazards with possible health risk and prescribed test for periodical Medical check-ups are enclosed as Annexure 23.
iv. Annual report of health status of workers with special reference to Occupational Health and Safety
Periodic medical examination is the same as the pre-employment screening and may be modified according to current conditions, such as changes in the employee's symptoms, site hazards or exposures. Medical reports of few Employees of IOCL Paradip Refinery are attached as Annexure 15.
9 Corporate Environment Policy i. Does the company have a well laid
down Environmental Policy approved by its Board of Directors? If so, it may be detailed in the EIA report
Yes, the company have a well laid down Environmental Policy approved by its Board of Directors.
M/s. IOCL, PDR, Environment, Health & Safety Policy (EHS) provided in Chapter 10, Section 10.9 of EIA report.
ii. Does the Environment Policy prescribe for standard operating process/procedures to bring into focus any infringement/ deviation/ violation of the environemnt or forest norms/ conditions? If so, it may be detailed in the EIA
Yes A dedicated Environmental Management Cell (EMC) will be in force to bring into focus of any infringement/ deviation/ violation of the environemnt. Details provided in Chapter 10, Section 10.8 of EIA report.
iii. What is the hierarchical system or Administrative order of the company to deal with the environmental issues and for ensuring compliance with the environmental clearance conditions? Details of this system may be given.
Hierarchical system or Administrative order of the company to deal with the environmental issues and for ensuring compliance is provided in Chapter 10, Section 10.3 of EIA report.
EIA Report
93 HECS/EIA/IOCL Paradip/Final/24.06.2021/1051
iv. Does the company have system of reporting of non-compliances/ violations of environemntal norms to the Board of Directors of the company and/or Stakeholders or stakeholders at large? This reporting mechanism shall be detailed in the EIA report
System of reporting of non-compliances/ violations of environemntal norms & the Board Hierarchical system or Administrative order of the company to deal with the environmental issues and for ensuring compliance is provided in Reporting mechanism detailed in Chapter 10, Section 10.3 of EIA report.
Daily report signed by Unit Head to Head Quarter on compliance to the HSE parameters are enclosed in Annexure-21
10 Details regarding infrastructure facilities such as sanitation, fuel, restroom etc. to be provided to the labour force during construction as well as to the casual workers including truck drivers during operation phase.
The site layout indicating all the facilities is enclosed as Annexure 6.
Infrastructure facilities such as sanitation, restroom etc. shall be provided to the labour force during construction as well as to the casual workers including truck drivers during operation phase.
11 Enterprise Social Commitment (ESC) i. Adequate funds (at least 2.5% of
the project cost) shall be earmarked towards the Enterprise Social Commitment based on public Hearing issues and item-wise details along with the bound action plan shall be included. Socio-Economic development activities need to be elaborated upon.
As per OM F. No: 22-65/2017-IA.III dated 1st May 2018 M/s IOCL will Allocate 0.125% of the project cost (11783 Crores) towards CER i.e. 0.125% of 11783 Crores = 14.72Crores
As per CEPI compliance for SPA 1.5 times of slab to be allotted(1.5 * 14.72)=22.093 Crores
12 Any litigation pending against the project and/ or any direction/ order passed by any Court of Law against the project, if so, details thereof shall also be included. Has the unit received any notice under the section 5 of Environment (Protection) Act, 1986 or relevant Sections of Air and Water Acts? If so, details thereof and compliance /ATR to the notice(s) and
No litigation and the affidavit is attached as Annexure
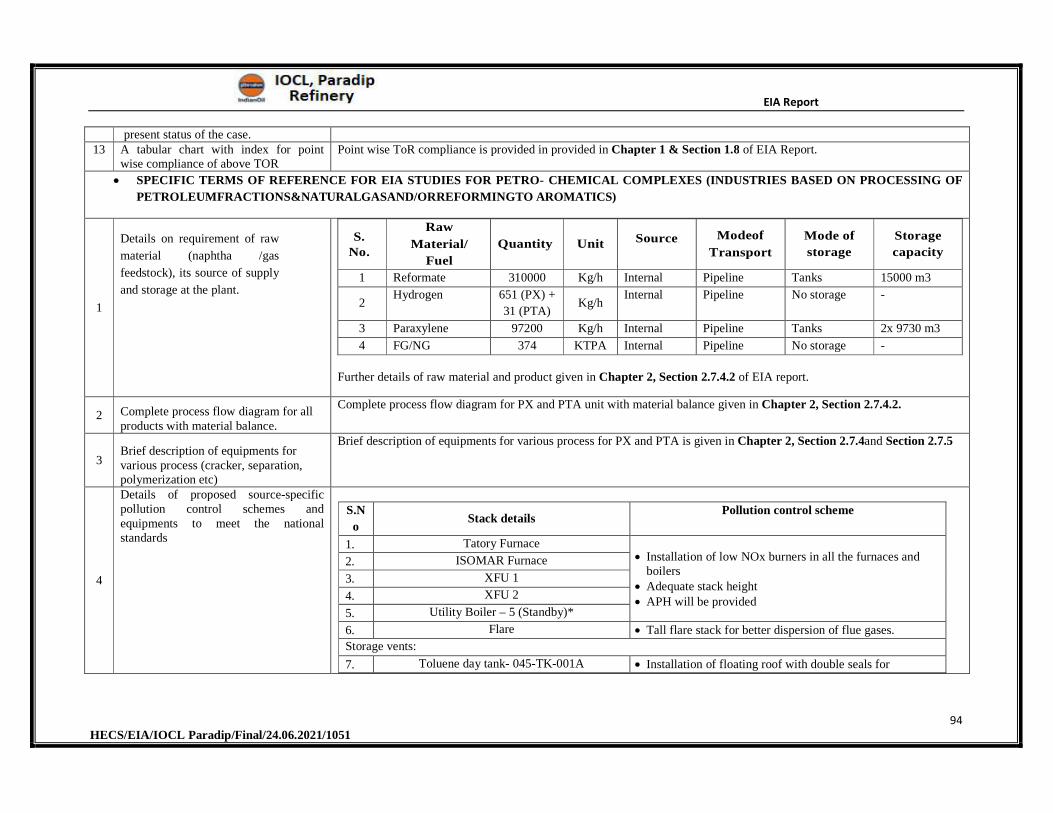
EIA Report
94 HECS/EIA/IOCL Paradip/Final/24.06.2021/1051
present status of the case. 13 A tabular chart with index for point
wise compliance of above TOR Point wise ToR compliance is provided in provided in Chapter 1 & Section 1.8 of EIA Report.
SPECIFIC TERMS OF REFERENCE FOR EIA STUDIES FOR PETRO- CHEMICAL COMPLEXES (INDUSTRIES BASED ON PROCESSING OF
PETROLEUMFRACTIONS&NATURALGASAND/ORREFORMINGTO AROMATICS)
1
Details on requirement of raw
material (naphtha /gas
feedstock), its source of supply
and storage at the plant.
S. No.
Raw
Material/
Fuel
Quantity Unit Source Modeof
Transport
Mode of
storage
Storage
capacity
1 Reformate 310000 Kg/h Internal Pipeline Tanks 15000 m3
2 Hydrogen 651 (PX) +
31 (PTA) Kg/h
Internal Pipeline No storage -
3 Paraxylene 97200 Kg/h Internal Pipeline Tanks 2x 9730 m3
4 FG/NG 374 KTPA Internal Pipeline No storage -
Further details of raw material and product given in Chapter 2, Section 2.7.4.2 of EIA report.
2 Complete process flow diagram for all products with material balance.
Complete process flow diagram for PX and PTA unit with material balance given in Chapter 2, Section 2.7.4.2.
3 Brief description of equipments for various process (cracker, separation, polymerization etc)
Brief description of equipments for various process for PX and PTA is given in Chapter 2, Section 2.7.4and Section 2.7.5
4
Details of proposed source-specific pollution control schemes and equipments to meet the national standards
S.N
o Stack details
Pollution control scheme
1. Tatory Furnace Installation of low NOx burners in all the furnaces and
boilers Adequate stack height APH will be provided
2. ISOMAR Furnace
3. XFU 1
4. XFU 2
5. Utility Boiler – 5 (Standby)*
6. Flare Tall flare stack for better dispersion of flue gases.
Storage vents:
7. Toluene day tank- 045-TK-001A Installation of floating roof with double seals for
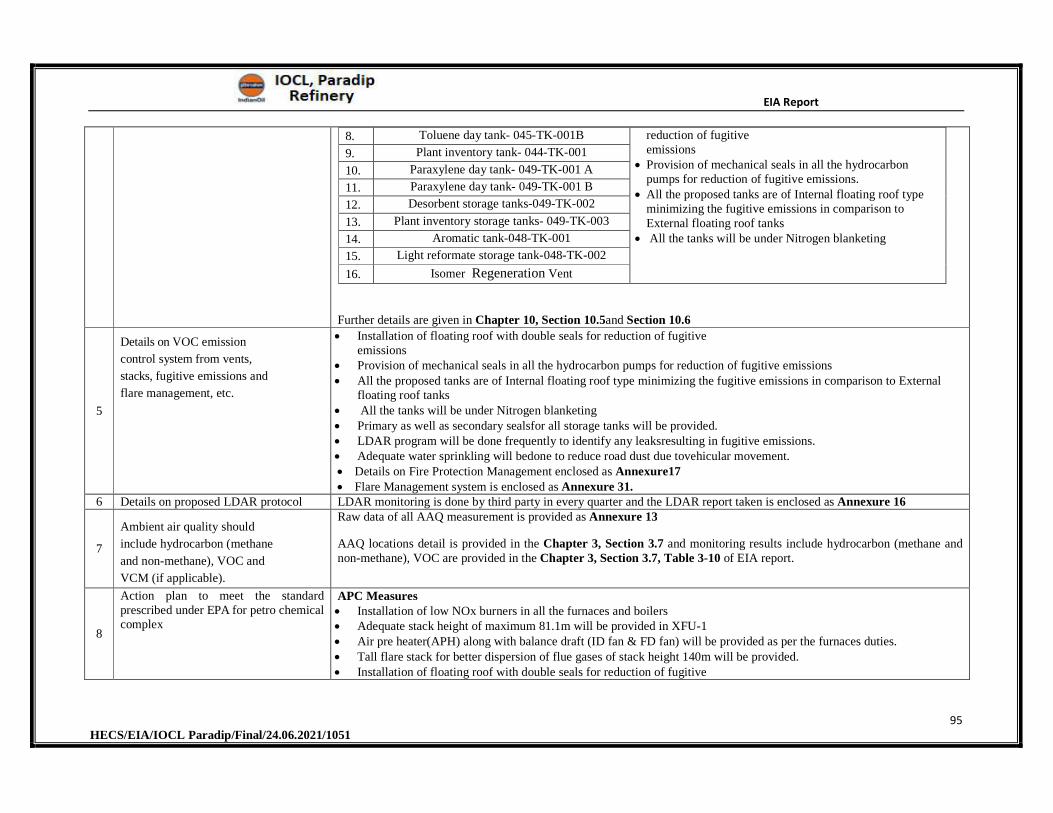
EIA Report
95 HECS/EIA/IOCL Paradip/Final/24.06.2021/1051
8. Toluene day tank- 045-TK-001B reduction of fugitive emissions
Provision of mechanical seals in all the hydrocarbon pumps for reduction of fugitive emissions.
All the proposed tanks are of Internal floating roof type minimizing the fugitive emissions in comparison to External floating roof tanks
All the tanks will be under Nitrogen blanketing
9. Plant inventory tank- 044-TK-001
10. Paraxylene day tank- 049-TK-001 A
11. Paraxylene day tank- 049-TK-001 B
12. Desorbent storage tanks-049-TK-002
13. Plant inventory storage tanks- 049-TK-003
14. Aromatic tank-048-TK-001
15. Light reformate storage tank-048-TK-002
16. Isomer Regeneration Vent
Further details are given in Chapter 10, Section 10.5and Section 10.6
5
Details on VOC emission
control system from vents,
stacks, fugitive emissions and
flare management, etc.
Installation of floating roof with double seals for reduction of fugitive emissions
Provision of mechanical seals in all the hydrocarbon pumps for reduction of fugitive emissions All the proposed tanks are of Internal floating roof type minimizing the fugitive emissions in comparison to External
floating roof tanks All the tanks will be under Nitrogen blanketing Primary as well as secondary sealsfor all storage tanks will be provided. LDAR program will be done frequently to identify any leaksresulting in fugitive emissions. Adequate water sprinkling will bedone to reduce road dust due tovehicular movement. Details on Fire Protection Management enclosed as Annexure17 Flare Management system is enclosed as Annexure 31.
6 Details on proposed LDAR protocol LDAR monitoring is done by third party in every quarter and the LDAR report taken is enclosed as Annexure 16
7
Ambient air quality should
include hydrocarbon (methane
and non-methane), VOC and
VCM (if applicable).
Raw data of all AAQ measurement is provided as Annexure 13
AAQ locations detail is provided in the Chapter 3, Section 3.7 and monitoring results include hydrocarbon (methane and non-methane), VOC are provided in the Chapter 3, Section 3.7, Table 3-10 of EIA report.
8
Action plan to meet the standard prescribed under EPA for petro chemical complex
APC Measures Installation of low NOx burners in all the furnaces and boilers Adequate stack height of maximum 81.1m will be provided in XFU-1 Air pre heater(APH) along with balance draft (ID fan & FD fan) will be provided as per the furnaces duties. Tall flare stack for better dispersion of flue gases of stack height 140m will be provided. Installation of floating roof with double seals for reduction of fugitive
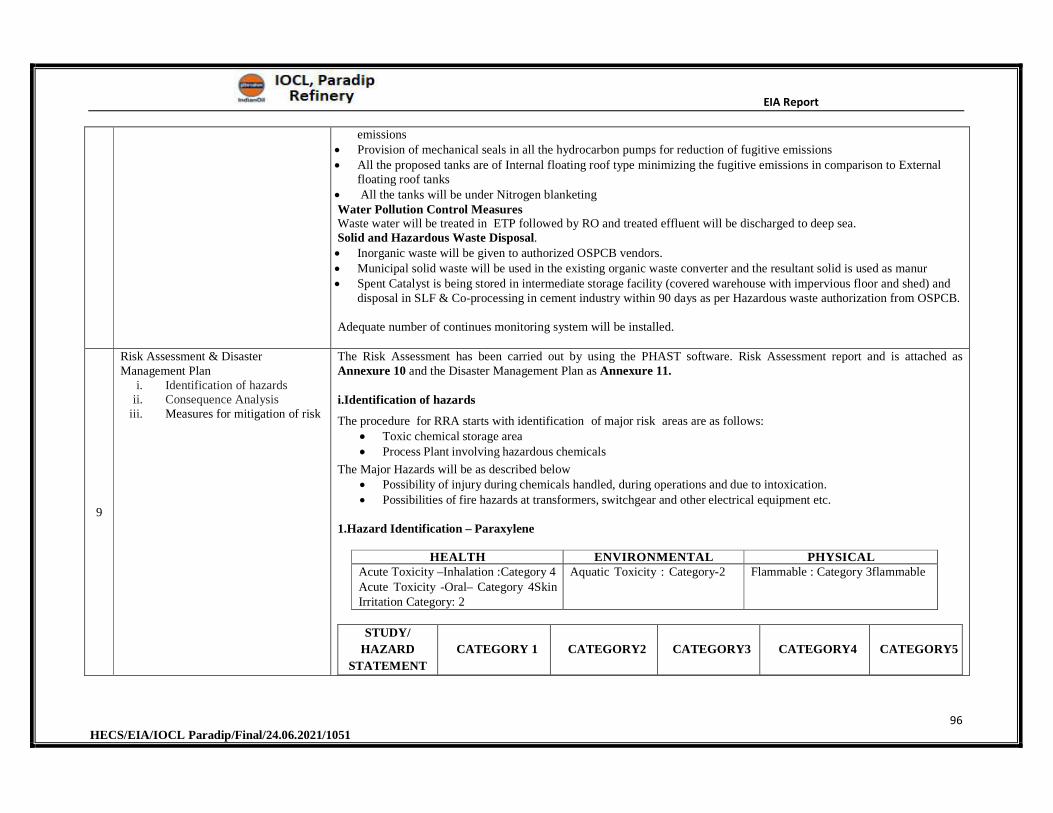
EIA Report
96 HECS/EIA/IOCL Paradip/Final/24.06.2021/1051
emissions Provision of mechanical seals in all the hydrocarbon pumps for reduction of fugitive emissions All the proposed tanks are of Internal floating roof type minimizing the fugitive emissions in comparison to External
floating roof tanks All the tanks will be under Nitrogen blanketing Water Pollution Control Measures Waste water will be treated in ETP followed by RO and treated effluent will be discharged to deep sea. Solid and Hazardous Waste Disposal. Inorganic waste will be given to authorized OSPCB vendors. Municipal solid waste will be used in the existing organic waste converter and the resultant solid is used as manur Spent Catalyst is being stored in intermediate storage facility (covered warehouse with impervious floor and shed) and
disposal in SLF & Co-processing in cement industry within 90 days as per Hazardous waste authorization from OSPCB.
Adequate number of continues monitoring system will be installed.
9
Risk Assessment & Disaster Management Plan
i. Identification of hazards ii. Consequence Analysis
iii. Measures for mitigation of risk
The Risk Assessment has been carried out by using the PHAST software. Risk Assessment report and is attached as Annexure 10 and the Disaster Management Plan as Annexure 11.
i.Identification of hazards
The procedure for RRA starts with identification of major risk areas are as follows: Toxic chemical storage area Process Plant involving hazardous chemicals
The Major Hazards will be as described below Possibility of injury during chemicals handled, during operations and due to intoxication. Possibilities of fire hazards at transformers, switchgear and other electrical equipment etc.
1.Hazard Identification – Paraxylene
HEALTH ENVIRONMENTAL PHYSICALAcute Toxicity –Inhalation : Category 4 Acute Toxicity -Oral– Category 4 Skin Irritation Category: 2
Aquatic Toxicity : Category- 2 Flammable : Category 3 flammable
STUDY/
HAZARD
STATEMENT
CATEGORY 1 CATEGORY2 CATEGORY3 CATEGORY4 CATEGORY5
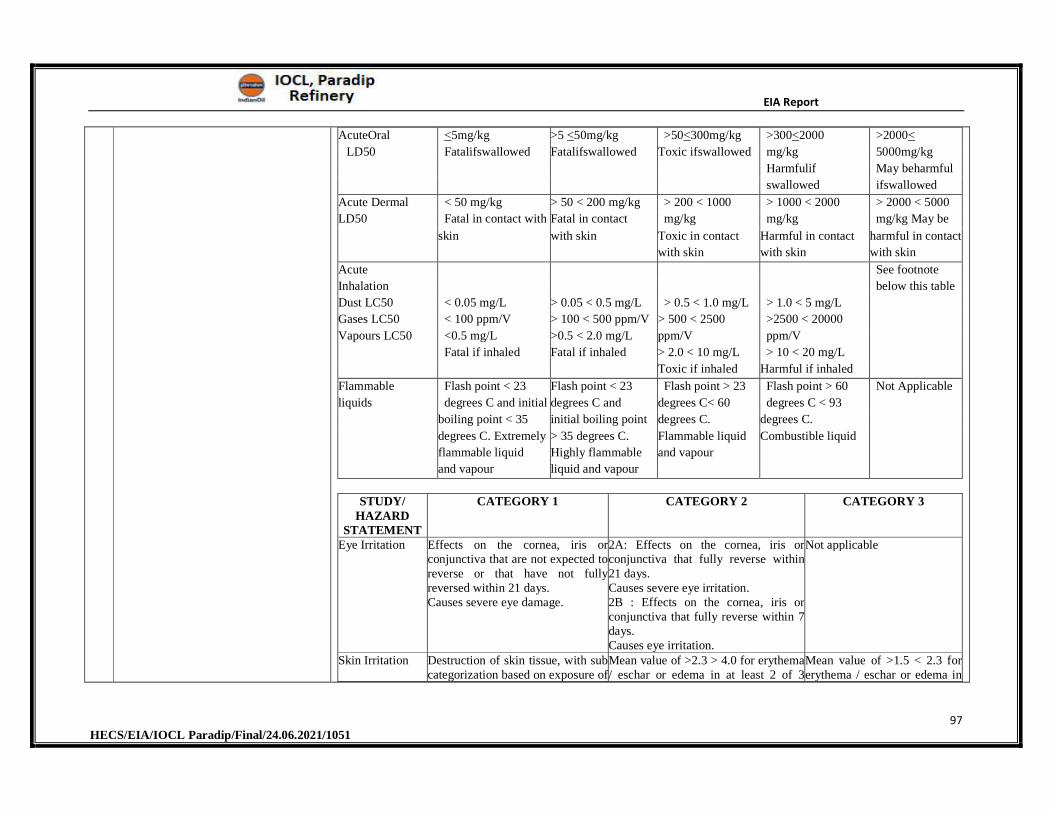
EIA Report
97 HECS/EIA/IOCL Paradip/Final/24.06.2021/1051
AcuteOral <5mg/kg >5 <50mg/kg >50<300mg/kg >300<2000 >2000<
LD50 Fatalifswallowed Fatalifswallowed Toxic ifswallowed mg/kg 5000mg/kg
Harmfulif May beharmful
swallowed ifswallowed
Acute Dermal < 50 mg/kg > 50 < 200 mg/kg > 200 < 1000 > 1000 < 2000 > 2000 < 5000
LD50 Fatal in contact with Fatal in contact mg/kg mg/kg mg/kg May be
skin with skin Toxic in contact
with skin
Harmful in contact
with skin
harmful in contact
with skin
Acute See footnote
Inhalation below this table
Dust LC50 < 0.05 mg/L > 0.05 < 0.5 mg/L > 0.5 < 1.0 mg/L > 1.0 < 5 mg/L
Gases LC50 < 100 ppm/V > 100 < 500 ppm/V > 500 < 2500 >2500 < 20000
Vapours LC50 <0.5 mg/L
Fatal if inhaled
>0.5 < 2.0 mg/L
Fatal if inhaled
ppm/V
> 2.0 < 10 mg/L
ppm/V
> 10 < 20 mg/L
Toxic if inhaled Harmful if inhaled
Flammable
liquids
Flash point < 23
degrees C and initial
Flash point < 23
degrees C and
Flash point > 23
degrees C< 60
Flash point > 60
degrees C < 93
Not Applicable
boiling point < 35 initial boiling point degrees C. degrees C.
degrees C. Extremely
flammable liquid
and vapour
> 35 degrees C.
Highly flammable
liquid and vapour
Flammable liquid
and vapour
Combustible liquid
STUDY/ HAZARD
STATEMENT
CATEGORY 1 CATEGORY 2 CATEGORY 3
Eye Irritation Effects on the cornea, iris or conjunctiva that are not expected to reverse or that have not fully reversed within 21 days. Causes severe eye damage.
2A: Effects on the cornea, iris or conjunctiva that fully reverse within 21 days. Causes severe eye irritation. 2B : Effects on the cornea, iris or conjunctiva that fully reverse within 7 days. Causes eye irritation.
Not applicable
Skin Irritation Destruction of skin tissue, with sub categorization based on exposure of
Mean value of >2.3 > 4.0 for erythema / eschar or edema in at least 2 of 3
Mean value of >1.5 < 2.3 for erythema / eschar or edema in
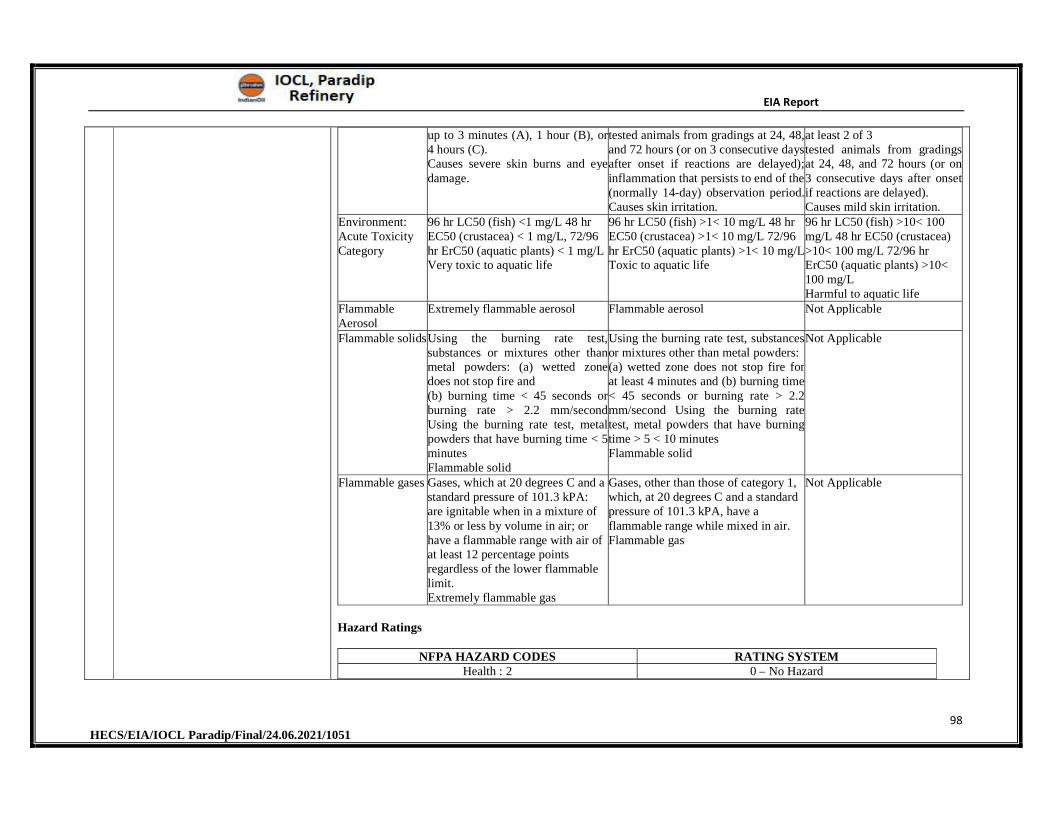
EIA Report
98 HECS/EIA/IOCL Paradip/Final/24.06.2021/1051
up to 3 minutes (A), 1 hour (B), or 4 hours (C). Causes severe skin burns and eye damage.
tested animals from gradings at 24, 48, and 72 hours (or on 3 consecutive days after onset if reactions are delayed); inflammation that persists to end of the(normally 14-day) observation period. Causes skin irritation.
at least 2 of 3 tested animals from gradings at 24, 48, and 72 hours (or on 3 consecutive days after onset if reactions are delayed). Causes mild skin irritation.
Environment: Acute Toxicity Category
96 hr LC50 (fish) <1 mg/L 48 hr EC50 (crustacea) < 1 mg/L, 72/96 hr ErC50 (aquatic plants) < 1 mg/L Very toxic to aquatic life
96 hr LC50 (fish) >1< 10 mg/L 48 hr EC50 (crustacea) >1< 10 mg/L 72/96 hr ErC50 (aquatic plants) >1< 10 mg/L Toxic to aquatic life
96 hr LC50 (fish) >10< 100 mg/L 48 hr EC50 (crustacea) >10< 100 mg/L 72/96 hr ErC50 (aquatic plants) >10< 100 mg/L Harmful to aquatic life
Flammable Aerosol
Extremely flammable aerosol Flammable aerosol Not Applicable
Flammable solidsUsing the burning rate test, substances or mixtures other than metal powders: (a) wetted zone does not stop fire and (b) burning time < 45 seconds or burning rate > 2.2 mm/second Using the burning rate test, metal powders that have burning time < 5 minutes Flammable solid
Using the burning rate test, substances or mixtures other than metal powders:(a) wetted zone does not stop fire for at least 4 minutes and (b) burning time < 45 seconds or burning rate > 2.2 mm/second Using the burning rate test, metal powders that have burning time > 5 < 10 minutes Flammable solid
Not Applicable
Flammable gases Gases, which at 20 degrees C and a standard pressure of 101.3 kPA: are ignitable when in a mixture of 13% or less by volume in air; or have a flammable range with air of at least 12 percentage points regardless of the lower flammable limit. Extremely flammable gas
Gases, other than those of category 1, which, at 20 degrees C and a standard pressure of 101.3 kPA, have a flammable range while mixed in air. Flammable gas
Not Applicable
Hazard Ratings
NFPA HAZARD CODES RATING SYSTEM Health : 2 0 – No Hazard
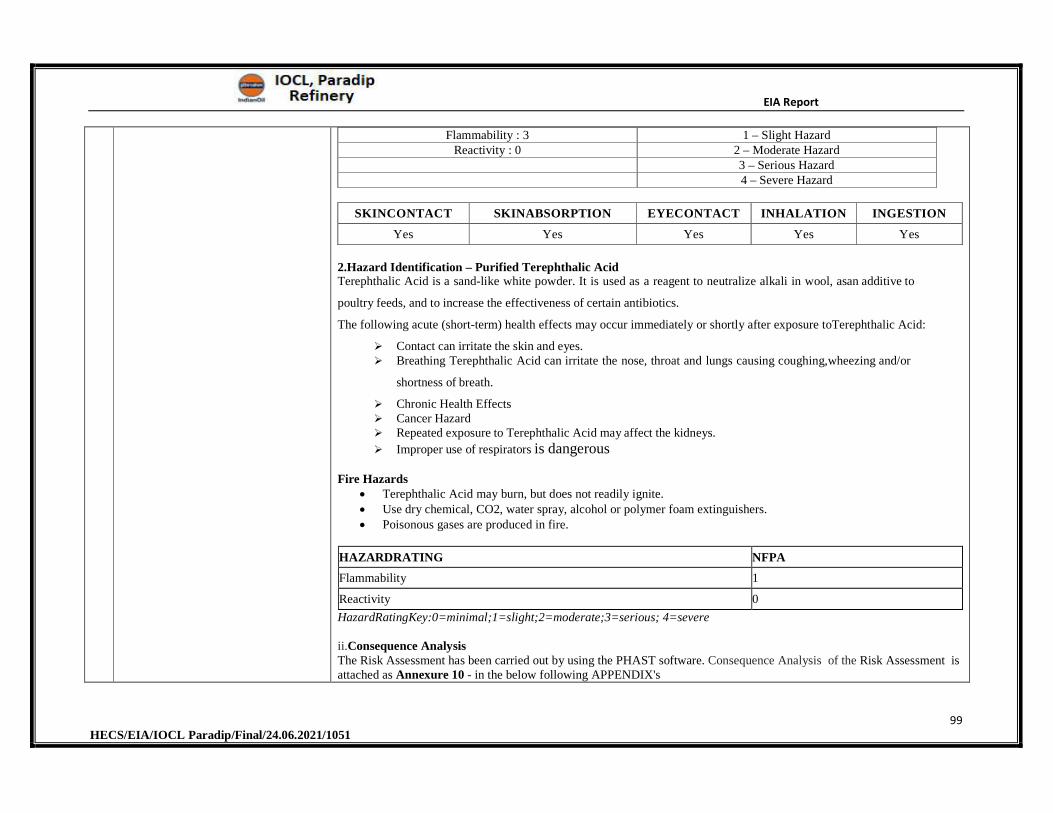
EIA Report
99 HECS/EIA/IOCL Paradip/Final/24.06.2021/1051
Flammability : 3 1 – Slight Hazard Reactivity : 0 2 – Moderate Hazard
3 – Serious Hazard 4 – Severe Hazard
SKINCONTACT SKINABSORPTION EYECONTACT INHALATION INGESTION
Yes Yes Yes Yes Yes
2.Hazard Identification – Purified Terephthalic Acid Terephthalic Acid is a sand-like white powder. It is used as a reagent to neutralize alkali in wool, as an additive to
poultry feeds, and to increase the effectiveness of certain antibiotics.
The following acute (short-term) health effects may occur immediately or shortly after exposure to Terephthalic Acid:
Contact can irritate the skin and eyes. Breathing Terephthalic Acid can irritate the nose, throat and lungs causing coughing, wheezing and/or
shortness of breath.
Chronic Health Effects Cancer Hazard Repeated exposure to Terephthalic Acid may affect the kidneys.
Improper use of respirators is dangerous
Fire Hazards Terephthalic Acid may burn, but does not readily ignite. Use dry chemical, CO2, water spray, alcohol or polymer foam extinguishers. Poisonous gases are produced in fire.
HAZARDRATING NFPA
Flammability 1
Reactivity 0
HazardRatingKey:0=minimal;1=slight;2=moderate;3=serious; 4=severe
ii.Consequence AnalysisThe Risk Assessment has been carried out by using the PHAST software. Consequence Analysis of the Risk Assessment is attached as Annexure 10 - in the below following APPENDIX's
EIA Report
100 HECS/EIA/IOCL Paradip/Final/24.06.2021/1051
APPENDIX 1 – PTA – VAPOUR CLOUD DISPERSION – CONSEQUENCE ANALYSIS APPENDIX 2 – PTA – FLASH FIRE – CONSEQUENCE ANALYSIS APPENDIX 3 – PTA – JET FIRE – CONSEQUENCE ANALYSIS APPENDIX 5 – PTA – POOL FIRE – CONSEQUENCE ANALYSIS APPENDIX 8 – PX – VAPOUR CLOUD DISPERSION – CONSEQUENCE ANALYSIS APPENDIX 9 – PX – FLASH FIRE – CONSEQUENCE ANALYSIS APPENDIX 10 – PX – JET FIRE – CONSEQUENCE ANALYSIS APPENDIX 12 – PX – POOL FIRE – CONSEQUENCE ANALYSIS
iii.Measures for mitigation of risk
Following are the proposed safety measures in the plant. Emergency isolation valves are to be provided/online monitoring via DCS PLC monitoring that will closely
monitor the process flow and parameters in a safe place and auto mode through gas/fire detector system. Passive fire protection such as fire proofing shall be recommended.
Appropriate detection measures such as fire and gas detectors are recommended and the same to be deep-rooted throughout the plant area.
EIA Report
101 HECS/EIA/IOCL Paradip/Final/24.06.2021/1051
CHAPTER 2
PROJECT DESCRIPTION
EIA Report
102 HECS/EIA/IOCL Paradip/Final/24.06.2021/1051
2 PROJECT DESCRIPTION
2.1 Project Description
Indian Oil Corporation Limited (IOCL) has set up grass root refinery at Paradip with a crude
processing capacity of 15.0 MMTPA. The 15.0 MMTPA Paradip Refinery Project (PDRP) has
commissioned in Fuel- Refinery mode. The original configuration of PDRP included production
of Petrochemical products, viz. Polypropylene (PP), Paraxylene (PX) and Styrene Monomer
(SM) based on Refinery streams, in addition to fuel products. Considering the encouraging
demand growth of Purified Terephthalic Acid (PTA), IOCL planned to install Integrated
Paraxylene (PX) Units of 0.8 MMTPA and PTA Units of 1.2 MMTPA capacity at Paradip and
associated utilities and offsite facilities at Paradip Refinery.
Paradip Refinery ventured into Petrochemical segment with inclusion of 0.680 MMTPA capacity
Polypropylene (PP) Plant, 332 KT MEG plant and the proposed 1.2 MMTPA capacity Purified
Terephthalic Acid (PTA) plant.
PTA is a non-hazardous, solid white powder, which is the preferred raw material and the basic
building block to produce Polyester Staple Fibre (PSF), Polyester Filament Yarn (PFY), bottle
and industrial grade polyester resin, polyester chips and so on. PSF and PFY are substitutes for
natural cotton and widely used for production of textiles and garments. Eastern India does not
have any economic size of PSF, PFY or PET resin plants. The first PTA plant at IOCL Paradip
can provide steady supply of feedstock PTA to PSF, PYF and PET resin plants. The polyester
resins/chips will further have processed to produce audio/ video tapes, x-ray films, photographic
films, tapes, aseptic bottles for packing mineral water, carbonated drinks, vegetable oil,
cosmetics, toiletries, tea, coffee etc. Thus using PTA from Paradip refinery plant at Odisha, a
number of secondary and tertiary downstream industries could be set-up by entrepreneurs who
could bring large investment to the state of Odisha and to Eastern India as a whole. This in turn
would also help in generating larger employment potential in the region.
Monoethylene Glycol (MEG) plant is also being set-up at Paradip Refinery and used as a raw
material to manufacture items like polyester fibre, textiles. The above PP, MEG and PTA plant
products shall be building blocks for envisaged Plastic & Textile Park respectively in Odisha.
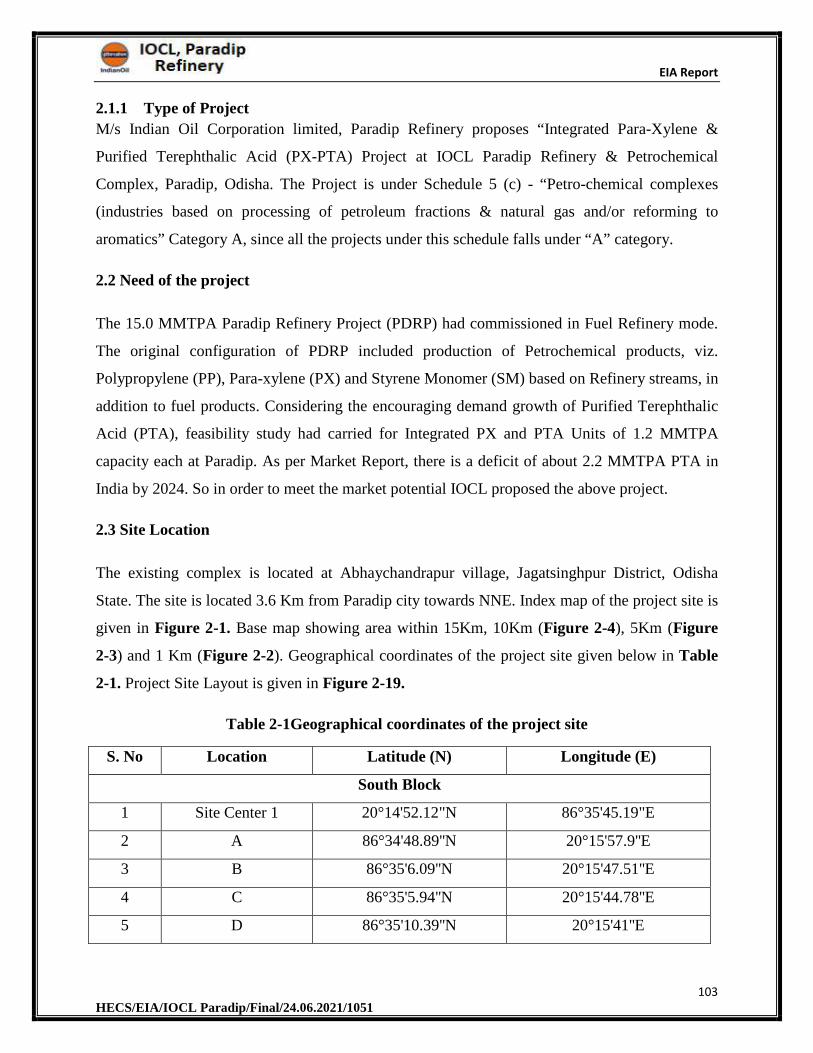
EIA Report
103 HECS/EIA/IOCL Paradip/Final/24.06.2021/1051
2.1.1 Type of Project
M/s Indian Oil Corporation limited, Paradip Refinery proposes “Integrated Para-Xylene &
Purified Terephthalic Acid (PX-PTA) Project at IOCL Paradip Refinery & Petrochemical
Complex, Paradip, Odisha. The Project is under Schedule 5 (c) - “Petro-chemical complexes
(industries based on processing of petroleum fractions & natural gas and/or reforming to
aromatics” Category A, since all the projects under this schedule falls under “A” category.
2.2 Need of the project
The 15.0 MMTPA Paradip Refinery Project (PDRP) had commissioned in Fuel Refinery mode.
The original configuration of PDRP included production of Petrochemical products, viz.
Polypropylene (PP), Para-xylene (PX) and Styrene Monomer (SM) based on Refinery streams, in
addition to fuel products. Considering the encouraging demand growth of Purified Terephthalic
Acid (PTA), feasibility study had carried for Integrated PX and PTA Units of 1.2 MMTPA
capacity each at Paradip. As per Market Report, there is a deficit of about 2.2 MMTPA PTA in
India by 2024. So in order to meet the market potential IOCL proposed the above project.
2.3 Site Location
The existing complex is located at Abhaychandrapur village, Jagatsinghpur District, Odisha
State. The site is located 3.6 Km from Paradip city towards NNE. Index map of the project site is
given in Figure 2-1. Base map showing area within 15Km, 10Km (Figure 2-4), 5Km (Figure
2-3) and 1 Km (Figure 2-2). Geographical coordinates of the project site given below in Table
2-1. Project Site Layout is given in Figure 2-19.
Table 2-1Geographical coordinates of the project site
S. No Location Latitude (N) Longitude (E)
South Block
1 Site Center 1 20°14'52.12"N 86°35'45.19"E
2 A 86°34'48.89''N 20°15'57.9''E
3 B 86°35'6.09''N 20°15'47.51''E
4 C 86°35'5.94''N 20°15'44.78''E
5 D 86°35'10.39''N 20°15'41''E
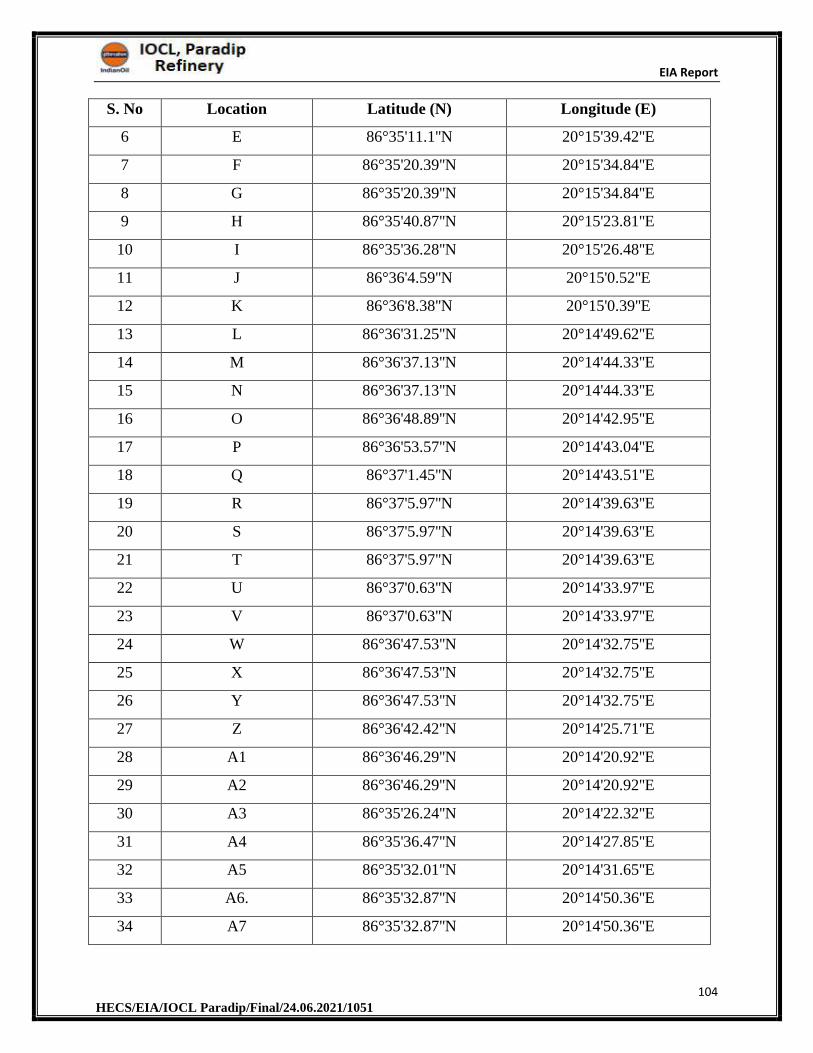
EIA Report
104 HECS/EIA/IOCL Paradip/Final/24.06.2021/1051
S. No Location Latitude (N) Longitude (E)
6 E 86°35'11.1''N 20°15'39.42''E
7 F 86°35'20.39''N 20°15'34.84''E
8 G 86°35'20.39''N 20°15'34.84''E
9 H 86°35'40.87''N 20°15'23.81''E
10 I 86°35'36.28''N 20°15'26.48''E
11 J 86°36'4.59''N 20°15'0.52''E
12 K 86°36'8.38''N 20°15'0.39''E
13 L 86°36'31.25''N 20°14'49.62''E
14 M 86°36'37.13''N 20°14'44.33''E
15 N 86°36'37.13''N 20°14'44.33''E
16 O 86°36'48.89''N 20°14'42.95''E
17 P 86°36'53.57''N 20°14'43.04''E
18 Q 86°37'1.45''N 20°14'43.51''E
19 R 86°37'5.97''N 20°14'39.63''E
20 S 86°37'5.97''N 20°14'39.63''E
21 T 86°37'5.97''N 20°14'39.63''E
22 U 86°37'0.63''N 20°14'33.97''E
23 V 86°37'0.63''N 20°14'33.97''E
24 W 86°36'47.53''N 20°14'32.75''E
25 X 86°36'47.53''N 20°14'32.75''E
26 Y 86°36'47.53''N 20°14'32.75''E
27 Z 86°36'42.42''N 20°14'25.71''E
28 A1 86°36'46.29''N 20°14'20.92''E
29 A2 86°36'46.29''N 20°14'20.92''E
30 A3 86°35'26.24''N 20°14'22.32''E
31 A4 86°35'36.47''N 20°14'27.85''E
32 A5 86°35'32.01''N 20°14'31.65''E
33 A6. 86°35'32.87''N 20°14'50.36''E
34 A7 86°35'32.87''N 20°14'50.36''E
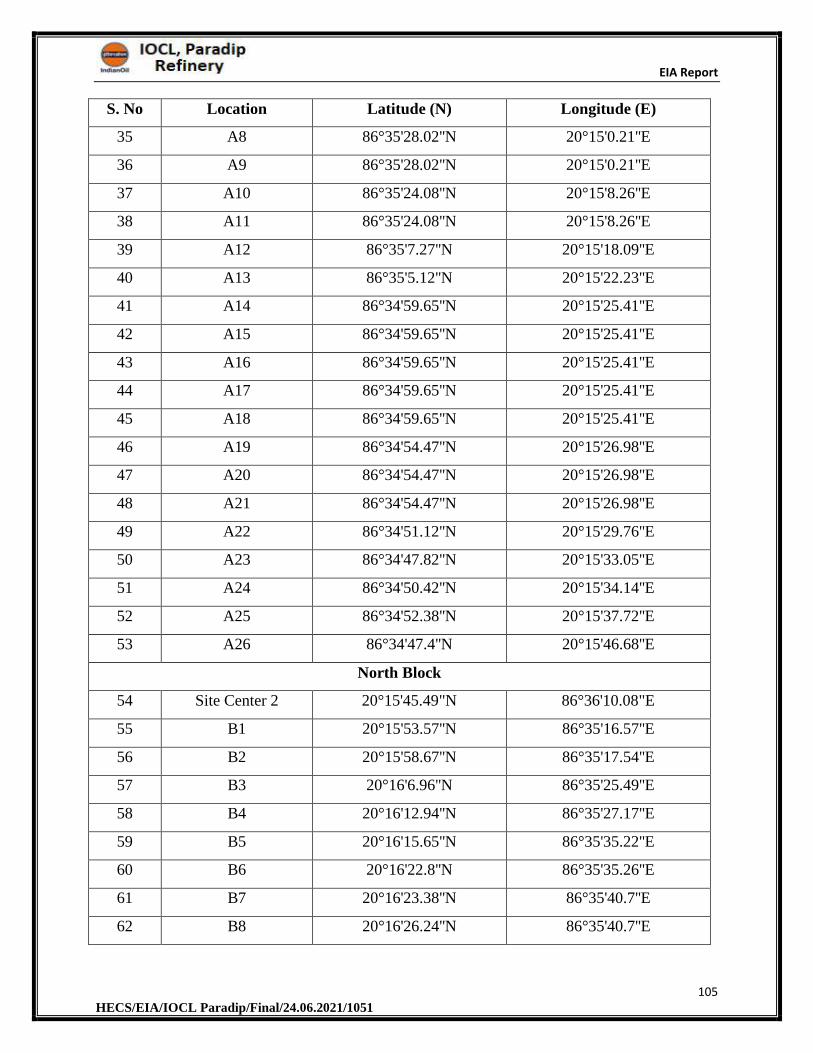
EIA Report
105 HECS/EIA/IOCL Paradip/Final/24.06.2021/1051
S. No Location Latitude (N) Longitude (E)
35 A8 86°35'28.02''N 20°15'0.21''E
36 A9 86°35'28.02''N 20°15'0.21''E
37 A10 86°35'24.08''N 20°15'8.26''E
38 A11 86°35'24.08''N 20°15'8.26''E
39 A12 86°35'7.27''N 20°15'18.09''E
40 A13 86°35'5.12''N 20°15'22.23''E
41 A14 86°34'59.65''N 20°15'25.41''E
42 A15 86°34'59.65''N 20°15'25.41''E
43 A16 86°34'59.65''N 20°15'25.41''E
44 A17 86°34'59.65''N 20°15'25.41''E
45 A18 86°34'59.65''N 20°15'25.41''E
46 A19 86°34'54.47''N 20°15'26.98''E
47 A20 86°34'54.47''N 20°15'26.98''E
48 A21 86°34'54.47''N 20°15'26.98''E
49 A22 86°34'51.12''N 20°15'29.76''E
50 A23 86°34'47.82''N 20°15'33.05''E
51 A24 86°34'50.42''N 20°15'34.14''E
52 A25 86°34'52.38''N 20°15'37.72''E
53 A26 86°34'47.4''N 20°15'46.68''E
North Block
54 Site Center 2 20°15'45.49"N 86°36'10.08"E
55 B1 20°15'53.57''N 86°35'16.57''E
56 B2 20°15'58.67''N 86°35'17.54''E
57 B3 20°16'6.96''N 86°35'25.49''E
58 B4 20°16'12.94''N 86°35'27.17''E
59 B5 20°16'15.65''N 86°35'35.22''E
60 B6 20°16'22.8''N 86°35'35.26''E
61 B7 20°16'23.38''N 86°35'40.7''E
62 B8 20°16'26.24''N 86°35'40.7''E
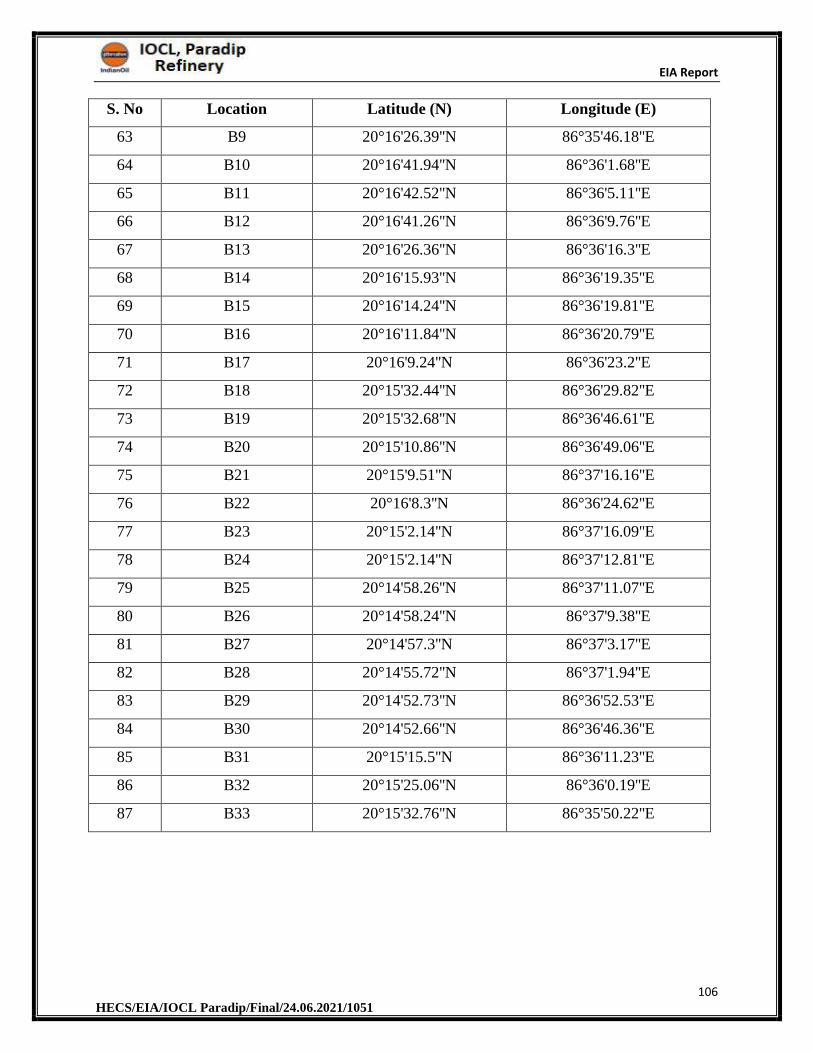
EIA Report
106 HECS/EIA/IOCL Paradip/Final/24.06.2021/1051
S. No Location Latitude (N) Longitude (E)
63 B9 20°16'26.39''N 86°35'46.18''E
64 B10 20°16'41.94''N 86°36'1.68''E
65 B11 20°16'42.52''N 86°36'5.11''E
66 B12 20°16'41.26''N 86°36'9.76''E
67 B13 20°16'26.36''N 86°36'16.3''E
68 B14 20°16'15.93''N 86°36'19.35''E
69 B15 20°16'14.24''N 86°36'19.81''E
70 B16 20°16'11.84''N 86°36'20.79''E
71 B17 20°16'9.24''N 86°36'23.2''E
72 B18 20°15'32.44''N 86°36'29.82''E
73 B19 20°15'32.68''N 86°36'46.61''E
74 B20 20°15'10.86''N 86°36'49.06''E
75 B21 20°15'9.51''N 86°37'16.16''E
76 B22 20°16'8.3''N 86°36'24.62''E
77 B23 20°15'2.14''N 86°37'16.09''E
78 B24 20°15'2.14''N 86°37'12.81''E
79 B25 20°14'58.26''N 86°37'11.07''E
80 B26 20°14'58.24''N 86°37'9.38''E
81 B27 20°14'57.3''N 86°37'3.17''E
82 B28 20°14'55.72''N 86°37'1.94''E
83 B29 20°14'52.73''N 86°36'52.53''E
84 B30 20°14'52.66''N 86°36'46.36''E
85 B31 20°15'15.5''N 86°36'11.23''E
86 B32 20°15'25.06''N 86°36'0.19''E
87 B33 20°15'32.76''N 86°35'50.22''E
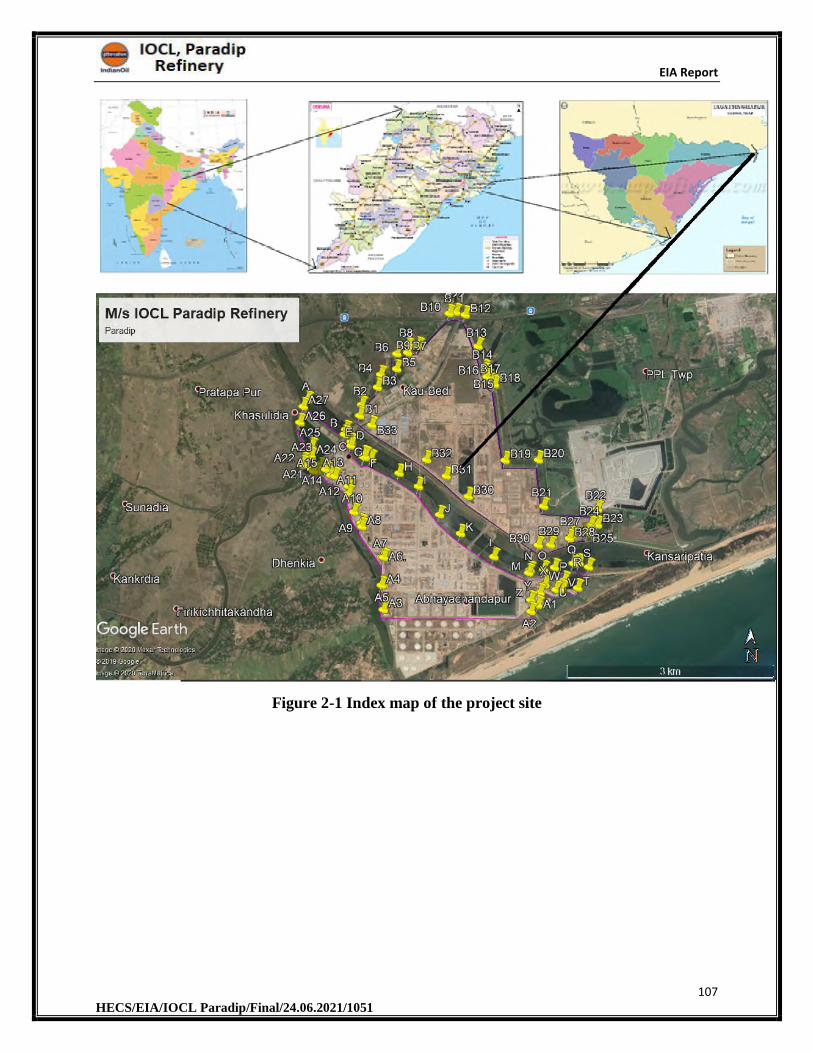
EIA Report
107 HECS/EIA/IOCL Paradip/Final/24.06.2021/1051
Figure 2-1 Index map of the project site
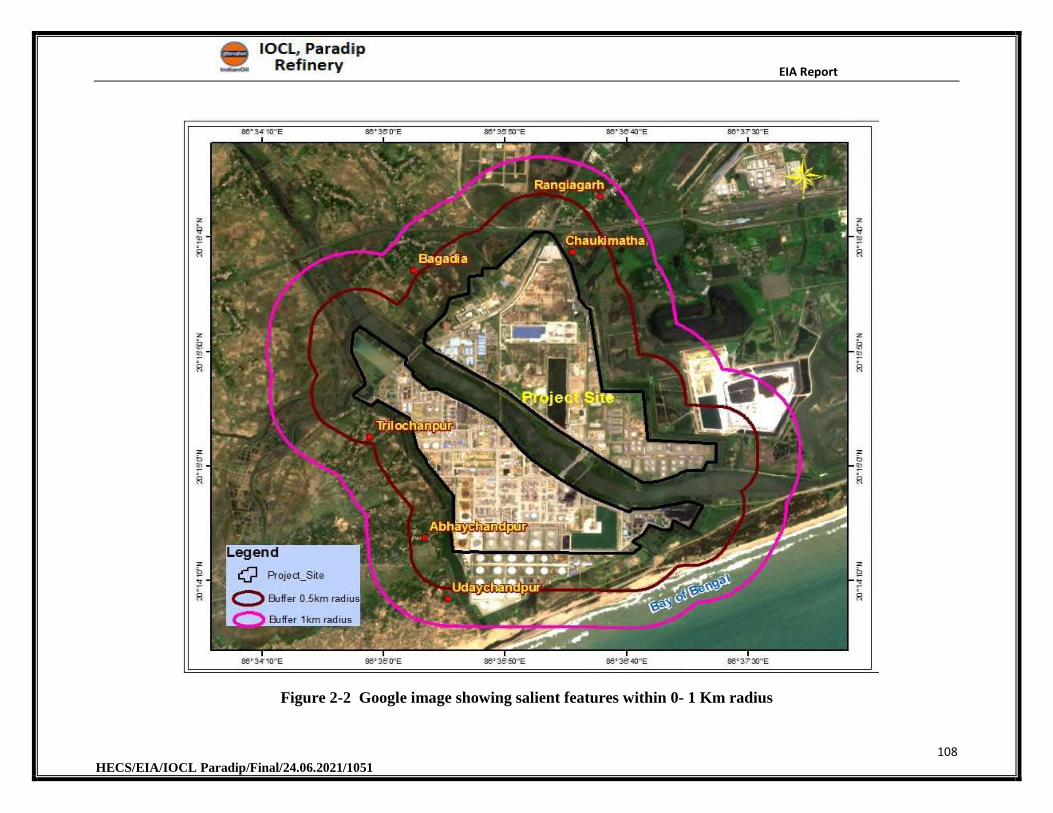
EIA Report
108 HECS/EIA/IOCL Paradip/Final/24.06.2021/1051
Figure 2-2 Google image showing salient features within 0- 1 Km radius
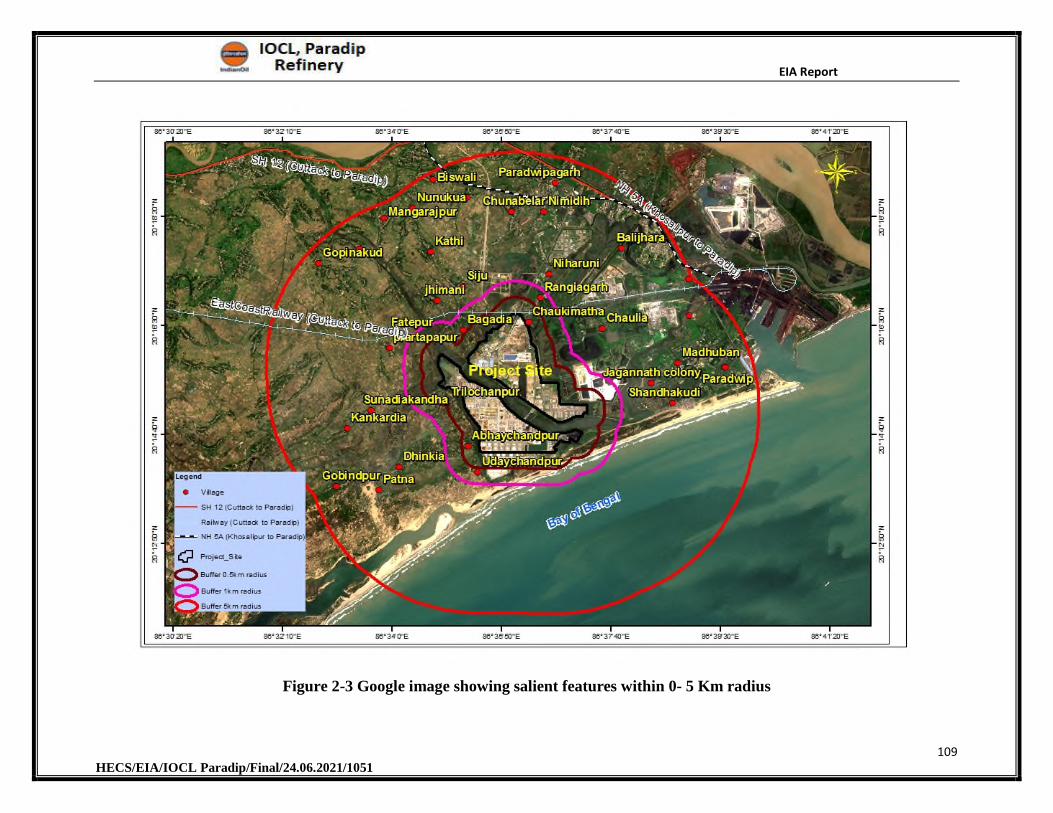
EIA Report
109 HECS/EIA/IOCL Paradip/Final/24.06.2021/1051
Figure 2-3 Google image showing salient features within 0- 5 Km radius
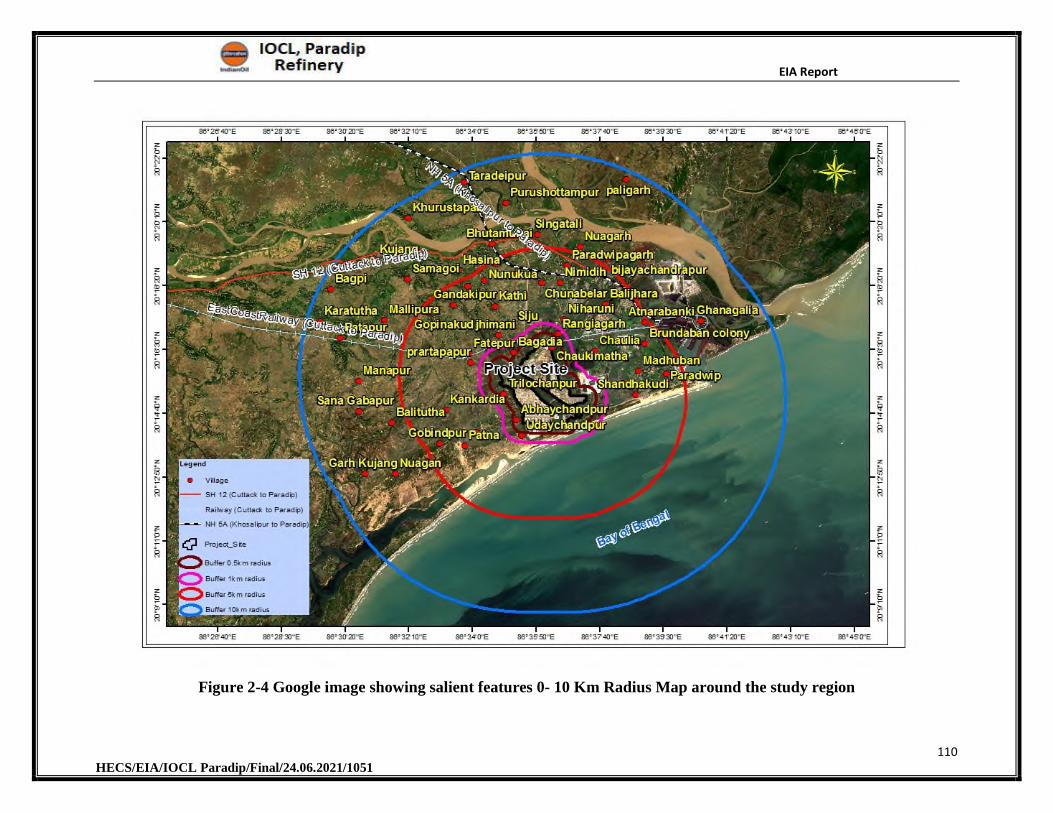
EIA Report
110 HECS/EIA/IOCL Paradip/Final/24.06.2021/1051
Figure 2-4 Google image showing salient features 0- 10 Km Radius Map around the study region
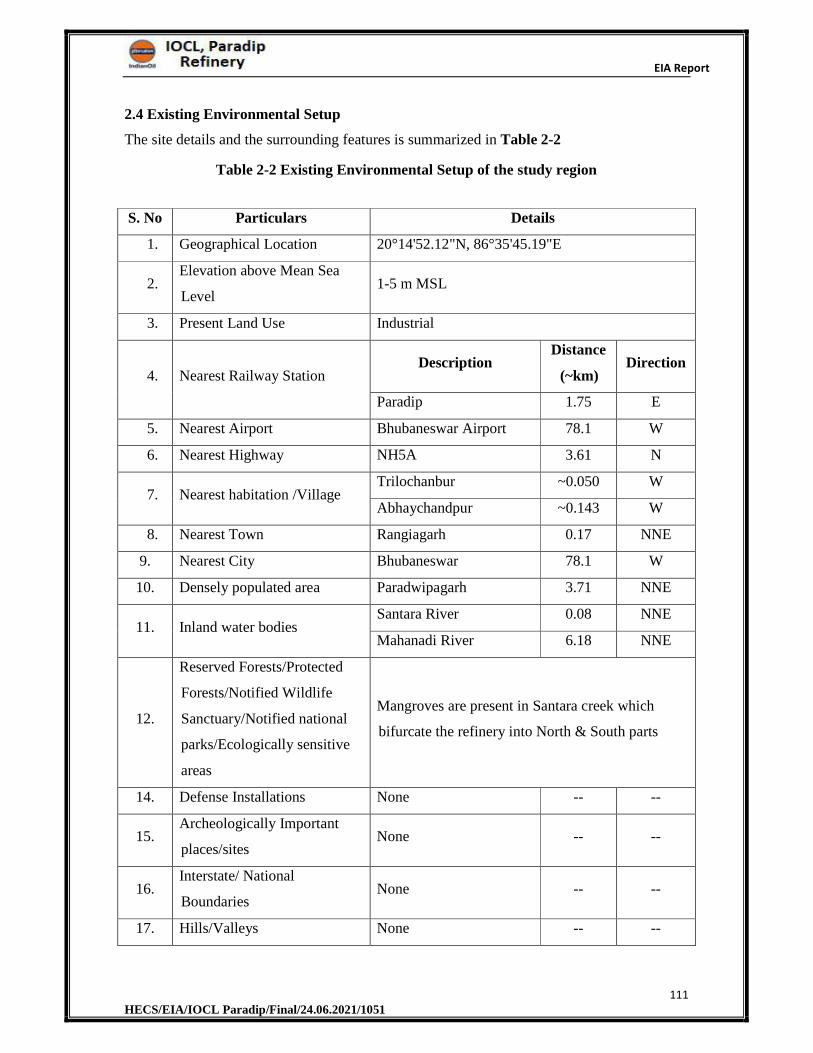
EIA Report
111 HECS/EIA/IOCL Paradip/Final/24.06.2021/1051
2.4 Existing Environmental Setup
The site details and the surrounding features is summarized in Table 2-2
Table 2-2 Existing Environmental Setup of the study region
S. No Particulars Details
1. Geographical Location 20°14'52.12"N, 86°35'45.19"E
2.Elevation above Mean Sea
Level 1-5 m MSL
3. Present Land Use Industrial
4. Nearest Railway Station Description
Distance
(~km) Direction
Paradip 1.75 E
5. Nearest Airport Bhubaneswar Airport 78.1 W
6. Nearest Highway NH5A 3.61 N
7. Nearest habitation /Village Trilochanbur ~0.050 W
Abhaychandpur ~0.143 W
8. Nearest Town Rangiagarh 0.17 NNE
9. Nearest City Bhubaneswar 78.1 W
10. Densely populated area Paradwipagarh 3.71 NNE
11. Inland water bodies Santara River 0.08 NNE
Mahanadi River 6.18 NNE
12.
Reserved Forests/Protected
Forests/Notified Wildlife
Sanctuary/Notified national
parks/Ecologically sensitive
areas
Mangroves are present in Santara creek which
bifurcate the refinery into North & South parts
14. Defense Installations None -- --
15. Archeologically Important
places/sites None -- --
16. Interstate/ National
Boundaries None -- --
17. Hills/Valleys None -- --
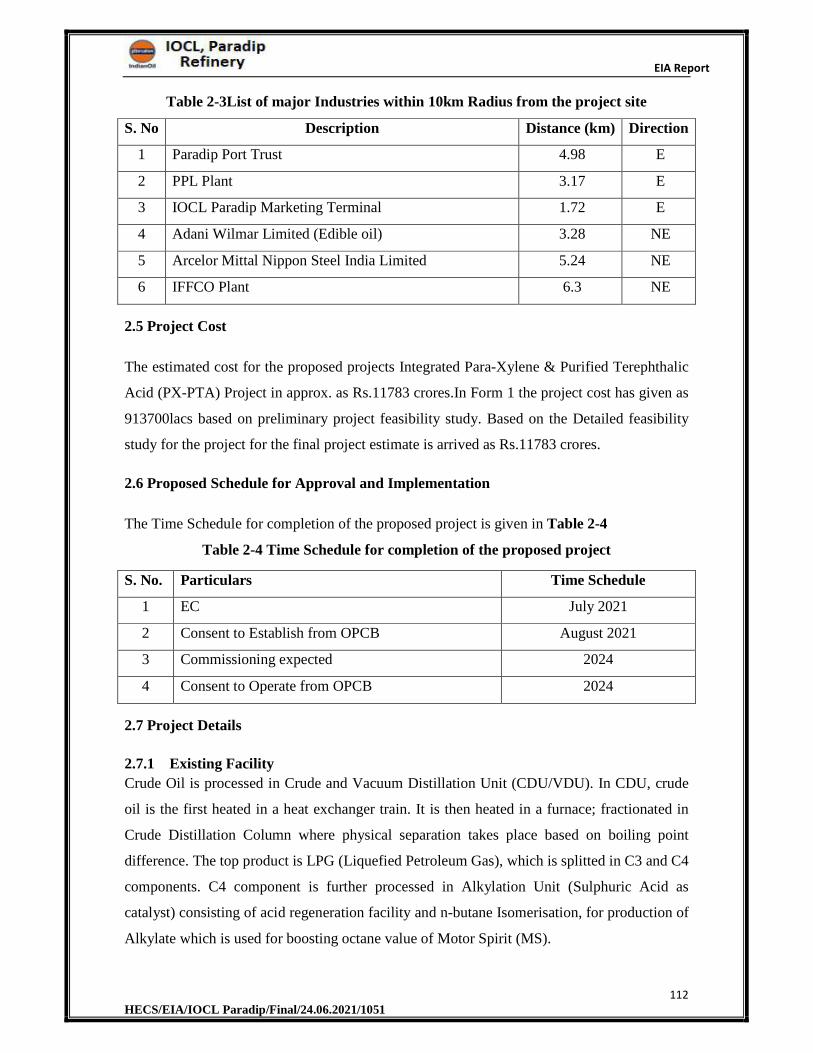
EIA Report
112 HECS/EIA/IOCL Paradip/Final/24.06.2021/1051
Table 2-3List of major Industries within 10km Radius from the project site
S. No Description Distance (km) Direction
1 Paradip Port Trust 4.98 E
2 PPL Plant 3.17 E
3 IOCL Paradip Marketing Terminal 1.72 E
4 Adani Wilmar Limited (Edible oil) 3.28 NE
5 Arcelor Mittal Nippon Steel India Limited 5.24 NE
6 IFFCO Plant 6.3 NE
2.5 Project Cost
The estimated cost for the proposed projects Integrated Para-Xylene & Purified Terephthalic
Acid (PX-PTA) Project in approx. as Rs.11783 crores.In Form 1 the project cost has given as
913700lacs based on preliminary project feasibility study. Based on the Detailed feasibility
study for the project for the final project estimate is arrived as Rs.11783 crores.
2.6 Proposed Schedule for Approval and Implementation
The Time Schedule for completion of the proposed project is given in Table 2-4
Table 2-4 Time Schedule for completion of the proposed project
S. No. Particulars Time Schedule
1 EC July 2021
2 Consent to Establish from OPCB August 2021
3 Commissioning expected 2024
4 Consent to Operate from OPCB 2024
2.7 Project Details
2.7.1 Existing Facility
Crude Oil is processed in Crude and Vacuum Distillation Unit (CDU/VDU). In CDU, crude
oil is the first heated in a heat exchanger train. It is then heated in a furnace; fractionated in
Crude Distillation Column where physical separation takes place based on boiling point
difference. The top product is LPG (Liquefied Petroleum Gas), which is splitted in C3 and C4
components. C4 component is further processed in Alkylation Unit (Sulphuric Acid as
catalyst) consisting of acid regeneration facility and n-butane Isomerisation, for production of
Alkylate which is used for boosting octane value of Motor Spirit (MS).
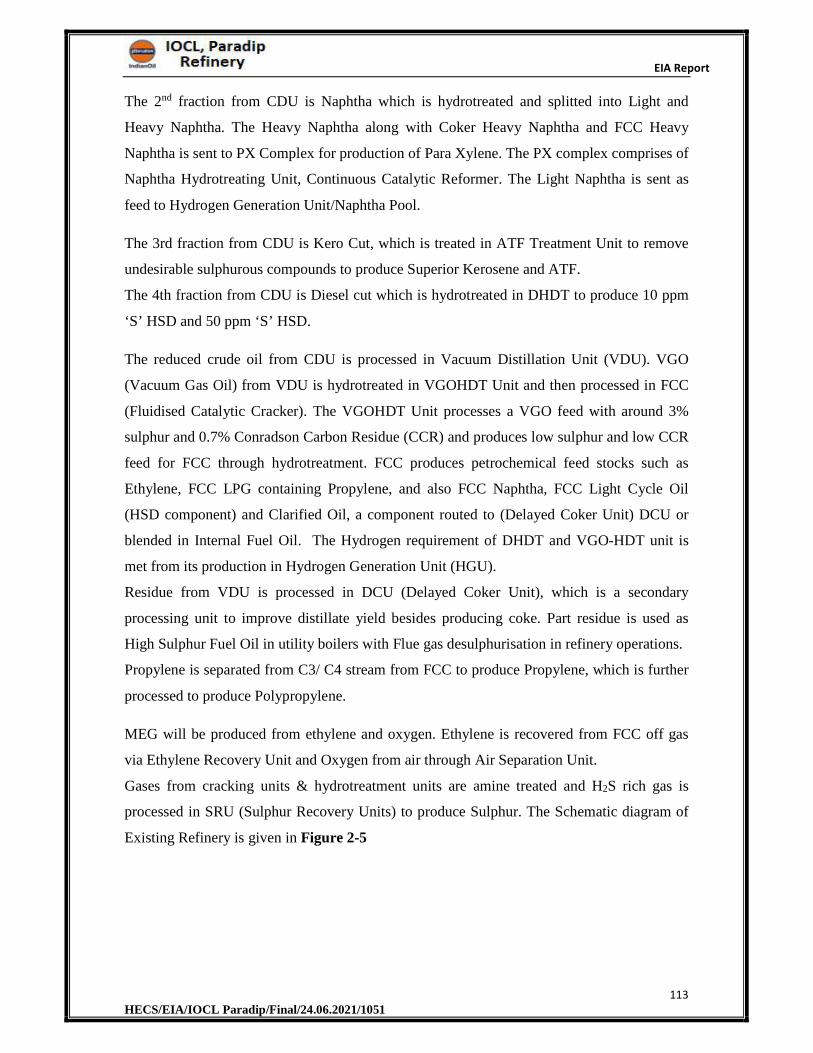
EIA Report
113 HECS/EIA/IOCL Paradip/Final/24.06.2021/1051
The 2nd fraction from CDU is Naphtha which is hydrotreated and splitted into Light and
Heavy Naphtha. The Heavy Naphtha along with Coker Heavy Naphtha and FCC Heavy
Naphtha is sent to PX Complex for production of Para Xylene. The PX complex comprises of
Naphtha Hydrotreating Unit, Continuous Catalytic Reformer. The Light Naphtha is sent as
feed to Hydrogen Generation Unit/Naphtha Pool.
The 3rd fraction from CDU is Kero Cut, which is treated in ATF Treatment Unit to remove
undesirable sulphurous compounds to produce Superior Kerosene and ATF.
The 4th fraction from CDU is Diesel cut which is hydrotreated in DHDT to produce 10 ppm
‘S’ HSD and 50 ppm ‘S’ HSD.
The reduced crude oil from CDU is processed in Vacuum Distillation Unit (VDU). VGO
(Vacuum Gas Oil) from VDU is hydrotreated in VGOHDT Unit and then processed in FCC
(Fluidised Catalytic Cracker). The VGOHDT Unit processes a VGO feed with around 3%
sulphur and 0.7% Conradson Carbon Residue (CCR) and produces low sulphur and low CCR
feed for FCC through hydrotreatment. FCC produces petrochemical feed stocks such as
Ethylene, FCC LPG containing Propylene, and also FCC Naphtha, FCC Light Cycle Oil
(HSD component) and Clarified Oil, a component routed to (Delayed Coker Unit) DCU or
blended in Internal Fuel Oil. The Hydrogen requirement of DHDT and VGO-HDT unit is
met from its production in Hydrogen Generation Unit (HGU).
Residue from VDU is processed in DCU (Delayed Coker Unit), which is a secondary
processing unit to improve distillate yield besides producing coke. Part residue is used as
High Sulphur Fuel Oil in utility boilers with Flue gas desulphurisation in refinery operations.
Propylene is separated from C3/ C4 stream from FCC to produce Propylene, which is further
processed to produce Polypropylene.
MEG will be produced from ethylene and oxygen. Ethylene is recovered from FCC off gas
via Ethylene Recovery Unit and Oxygen from air through Air Separation Unit.
Gases from cracking units & hydrotreatment units are amine treated and H2S rich gas is
processed in SRU (Sulphur Recovery Units) to produce Sulphur. The Schematic diagram of
Existing Refinery is given in Figure 2-5
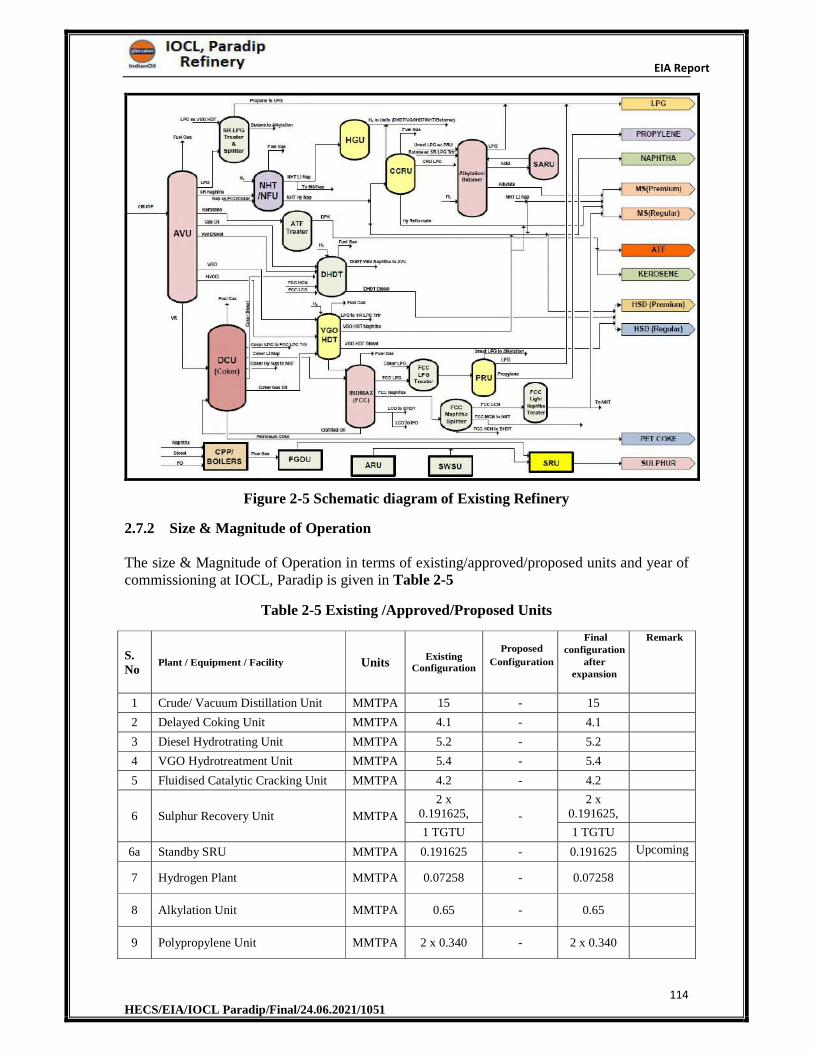
EIA Report
114 HECS/EIA/IOCL Paradip/Final/24.06.2021/1051
Figure 2-5 Schematic diagram of Existing Refinery
2.7.2 Size & Magnitude of Operation
The size & Magnitude of Operation in terms of existing/approved/proposed units and year of commissioning at IOCL, Paradip is given in Table 2-5
Table 2-5 Existing /Approved/Proposed Units
S. No
Plant / Equipment / Facility Units Existing
Configuration
Proposed
Configuration
Final configuration
after expansion
Remark
1 Crude/ Vacuum Distillation Unit MMTPA 15 - 15
2 Delayed Coking Unit MMTPA 4.1 - 4.1
3 Diesel Hydrotrating Unit MMTPA 5.2 - 5.2
4 VGO Hydrotreatment Unit MMTPA 5.4 - 5.4
5 Fluidised Catalytic Cracking Unit MMTPA 4.2 - 4.2
6 Sulphur Recovery Unit MMTPA
2 x 0.191625, -
2 x 0.191625,
1 TGTU 1 TGTU
6a Standby SRU MMTPA 0.191625 - 0.191625 Upcoming
7 Hydrogen Plant MMTPA 0.07258 - 0.07258
8 Alkylation Unit MMTPA 0.65 - 0.65
9 Polypropylene Unit MMTPA 2 x 0.340 - 2 x 0.340
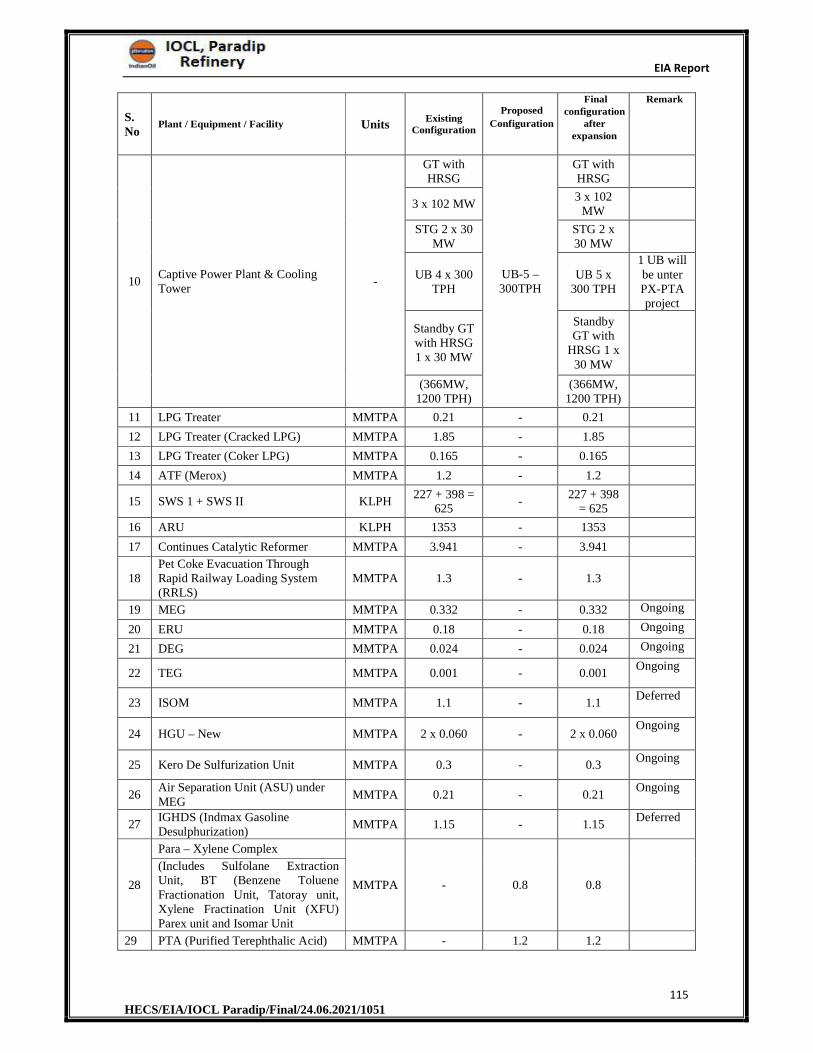
EIA Report
115 HECS/EIA/IOCL Paradip/Final/24.06.2021/1051
S. No
Plant / Equipment / Facility Units Existing
Configuration
Proposed
Configuration
Final configuration
after expansion
Remark
10 Captive Power Plant & Cooling Tower
-
GT with HRSG
UB-5 – 300TPH
GT with HRSG
3 x 10² MW 3 x 10²
MW
STG 2 x 30 MW
STG 2 x 30 MW
UB 4 x 300 TPH
UB 5 x 300 TPH
1 UB will be unter PX-PTA project
Standby GT with HRSG 1 x 30 MW
Standby GT with
HRSG 1 x 30 MW
(366MW, 1200 TPH)
(366MW, 1200 TPH)
11 LPG Treater MMTPA 0.21 - 0.21
12 LPG Treater (Cracked LPG) MMTPA 1.85 - 1.85
13 LPG Treater (Coker LPG) MMTPA 0.165 - 0.165
14 ATF (Merox) MMTPA 1.2 - 1.2
15 SWS 1 + SWS II KLPH 227 + 398 =
625 -
227 + 398 = 625
16 ARU KLPH 1353 - 1353
17 Continues Catalytic Reformer MMTPA 3.941 - 3.941
18 Pet Coke Evacuation Through Rapid Railway Loading System (RRLS)
MMTPA 1.3 - 1.3
19 MEG MMTPA 0.332 - 0.332 Ongoing
20 ERU MMTPA 0.18 - 0.18 Ongoing
21 DEG MMTPA 0.024 - 0.024 Ongoing
22 TEG MMTPA 0.001 - 0.001 Ongoing
23 ISOM MMTPA 1.1 - 1.1 Deferred
24 HGU – New MMTPA 2 x 0.060 - 2 x 0.060 Ongoing
25 Kero De Sulfurization Unit MMTPA 0.3 - 0.3 Ongoing
26 Air Separation Unit (ASU) under MEG
MMTPA 0.21 - 0.21 Ongoing
27 IGHDS (Indmax Gasoline Desulphurization)
MMTPA 1.15 - 1.15 Deferred
28
Para – Xylene Complex
MMTPA - 0.8 0.8
(Includes Sulfolane Extraction Unit, BT (Benzene Toluene Fractionation Unit, Tatoray unit, Xylene Fractination Unit (XFU) Parex unit and Isomar Unit
29 PTA (Purified Terephthalic Acid) MMTPA - 1.2 1.2
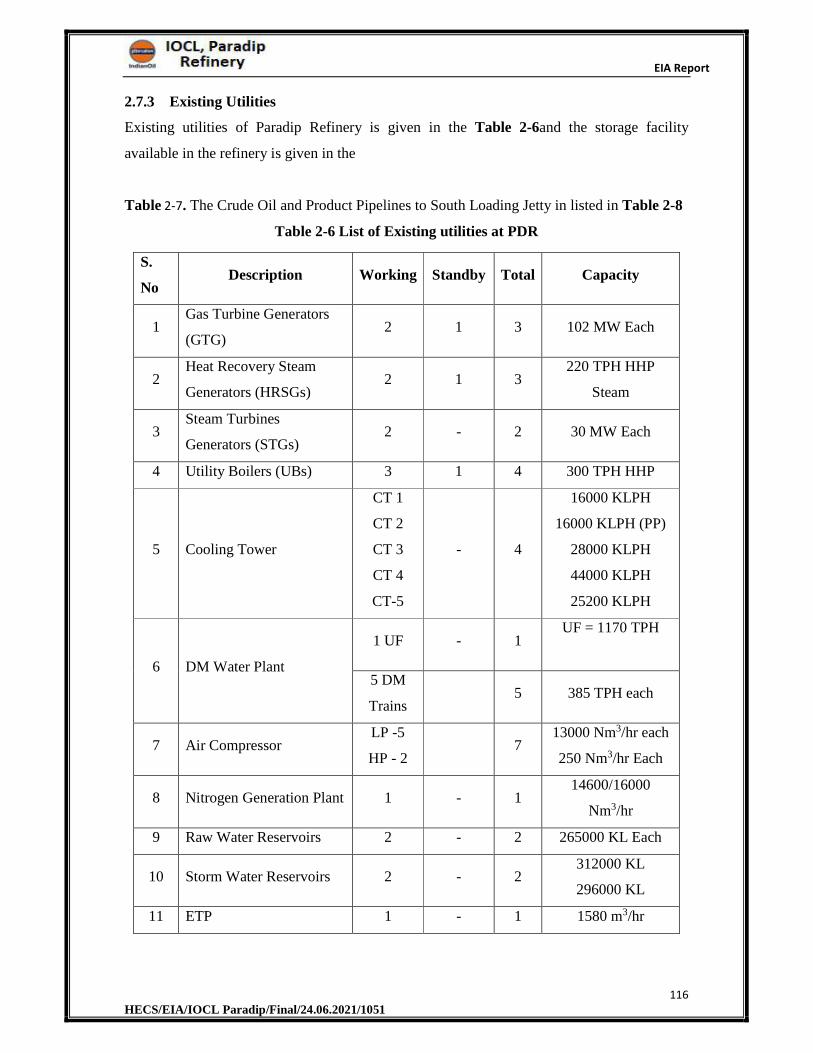
EIA Report
116 HECS/EIA/IOCL Paradip/Final/24.06.2021/1051
2.7.3 Existing Utilities
Existing utilities of Paradip Refinery is given in the Table 2-6and the storage facility
available in the refinery is given in the
Table 2-7. The Crude Oil and Product Pipelines to South Loading Jetty in listed in Table 2-8
Table 2-6 List of Existing utilities at PDR
S.
No Description Working Standby Total Capacity
1 Gas Turbine Generators
(GTG) 2 1 3 102 MW Each
2 Heat Recovery Steam
Generators (HRSGs) 2 1 3
220 TPH HHP
Steam
3 Steam Turbines
Generators (STGs) 2 - 2 30 MW Each
4 Utility Boilers (UBs) 3 1 4 300 TPH HHP
5 Cooling Tower
CT 1
CT 2
CT 3
CT 4
CT-5
- 4
16000 KLPH
16000 KLPH (PP)
28000 KLPH
44000 KLPH
25200 KLPH
6 DM Water Plant
1 UF - 1 UF = 1170 TPH
5 DM
Trains 5 385 TPH each
7 Air Compressor LP -5
HP - 2 7
13000 Nm3/hr each
250 Nm3/hr Each
8 Nitrogen Generation Plant 1 - 1 14600/16000
Nm3/hr
9 Raw Water Reservoirs 2 - 2 265000 KL Each
10 Storm Water Reservoirs 2 - 2 312000 KL
296000 KL
11 ETP 1 - 1 1580 m3/hr
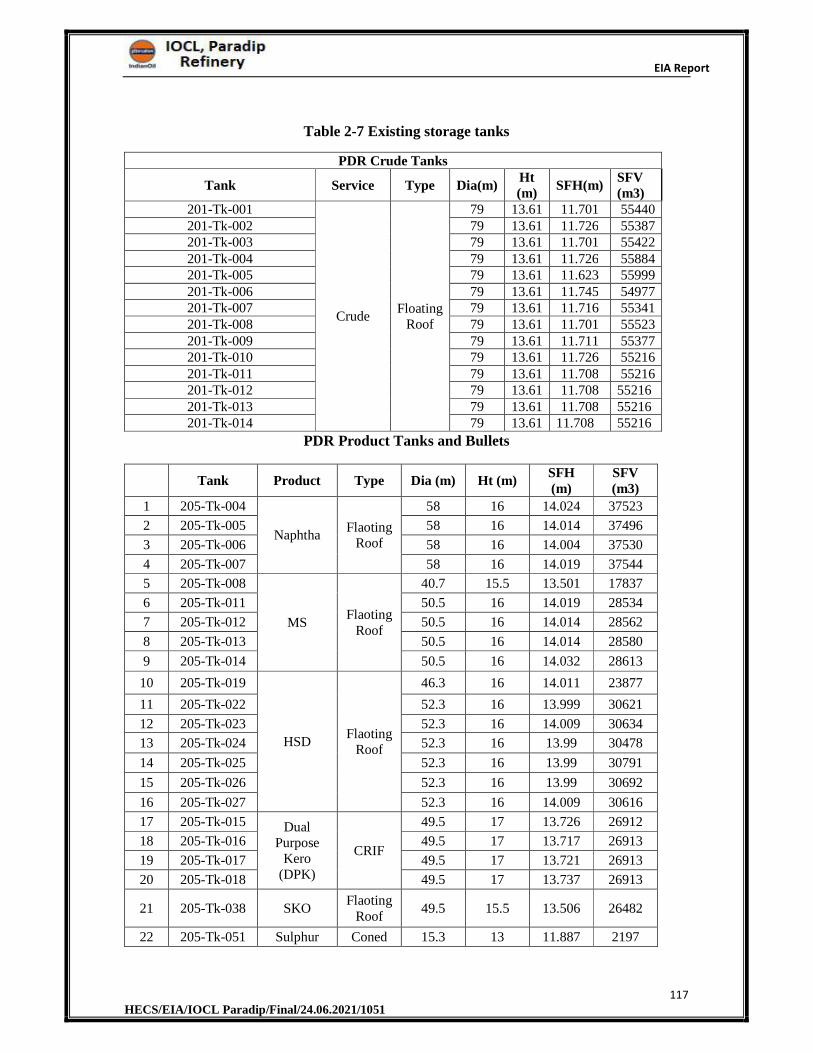
EIA Report
117 HECS/EIA/IOCL Paradip/Final/24.06.2021/1051
Table 2-7 Existing storage tanks
PDR Crude Tanks
Tank Service Type Dia(m)Ht (m)
SFH(m)SFV (m3)
201-Tk-001
Crude Floating
Roof
79 13.61 11.701 55440201-Tk-002 79 13.61 11.726 55387201-Tk-003 79 13.61 11.701 55422201-Tk-004 79 13.61 11.726 55884201-Tk-005 79 13.61 11.623 55999201-Tk-006 79 13.61 11.745 54977201-Tk-007 79 13.61 11.716 55341201-Tk-008 79 13.61 11.701 55523201-Tk-009 79 13.61 11.711 55377201-Tk-010 79 13.61 11.726 55216201-Tk-011 79 13.61 11.708 55216201-Tk-012 79 13.61 11.708 55216 201-Tk-013 79 13.61 11.708 55216201-Tk-014 79 13.61 11.708 55216
PDR Product Tanks and Bullets
Tank Product Type Dia (m) Ht (m) SFH (m)
SFV (m3)
1 205-Tk-004
Naphtha Flaoting
Roof
58 16 14.024 37523
2 205-Tk-005 58 16 14.014 37496
3 205-Tk-006 58 16 14.004 37530
4 205-Tk-007 58 16 14.019 37544
5 205-Tk-008
MS Flaoting
Roof
40.7 15.5 13.501 17837
6 205-Tk-011 50.5 16 14.019 28534
7 205-Tk-012 50.5 16 14.014 28562
8 205-Tk-013 50.5 16 14.014 28580
9 205-Tk-014 50.5 16 14.032 28613
10 205-Tk-019
HSD Flaoting
Roof
46.3 16 14.011 23877
11 205-Tk-022 52.3 16 13.999 30621
12 205-Tk-023 52.3 16 14.009 30634
13 205-Tk-024 52.3 16 13.99 30478
14 205-Tk-025 52.3 16 13.99 30791
15 205-Tk-026 52.3 16 13.99 30692
16 205-Tk-027 52.3 16 14.009 30616
17 205-Tk-015 Dual Purpose
Kero (DPK)
CRIF
49.5 17 13.726 26912
18 205-Tk-016 49.5 17 13.717 26913
19 205-Tk-017 49.5 17 13.721 26913
20 205-Tk-018 49.5 17 13.737 26913
21 205-Tk-038 SKO Flaoting
Roof 49.5 15.5 13.506 26482
22 205-Tk-051 Sulphur Coned 15.3 13 11.887 2197
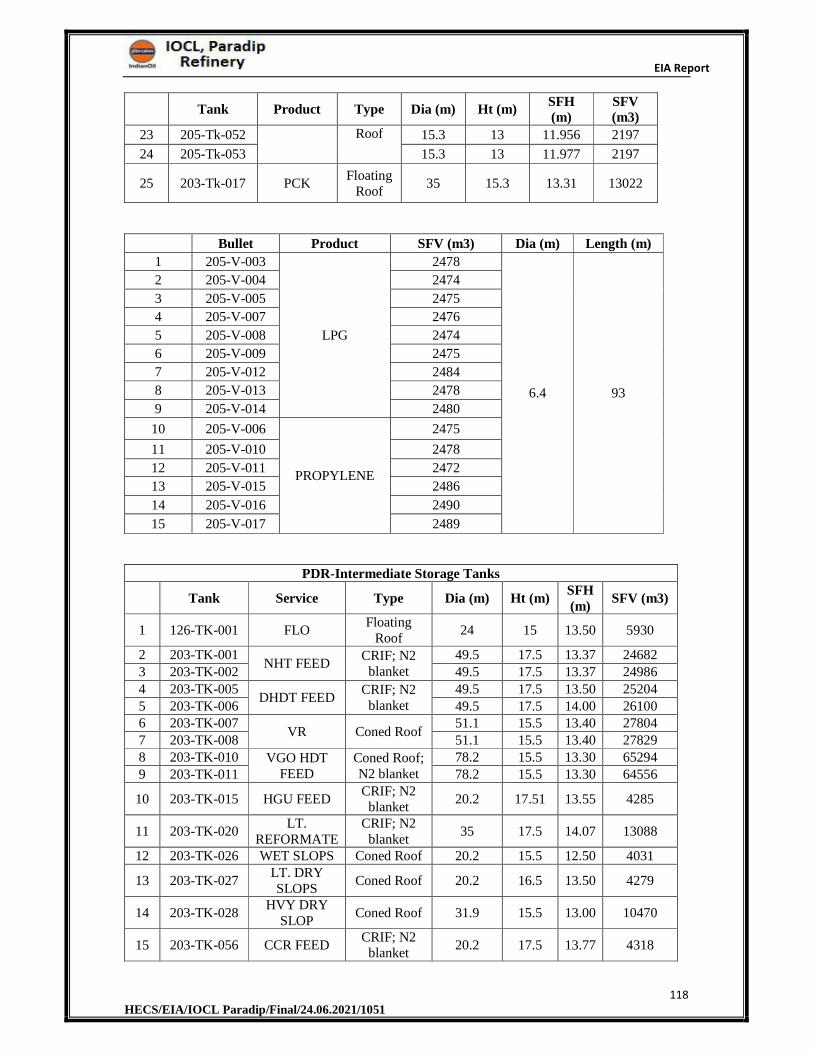
EIA Report
118 HECS/EIA/IOCL Paradip/Final/24.06.2021/1051
Tank Product Type Dia (m) Ht (m) SFH (m)
SFV (m3)
23 205-Tk-052 Roof 15.3 13 11.956 2197
24 205-Tk-053 15.3 13 11.977 2197
25 203-Tk-017 PCK Floating
Roof 35 15.3 13.31 13022
Bullet Product SFV (m3) Dia (m) Length (m)
1 205-V-003
LPG
2478
6.4 93
2 205-V-004 2474
3 205-V-005 2475
4 205-V-007 2476
5 205-V-008 2474
6 205-V-009 2475
7 205-V-012 2484
8 205-V-013 2478
9 205-V-014 2480
10 205-V-006
PROPYLENE
2475
11 205-V-010 2478
12 205-V-011 2472
13 205-V-015 2486
14 205-V-016 2490
15 205-V-017 2489
PDR-Intermediate Storage Tanks
Tank Service Type Dia (m) Ht (m) SFH (m)
SFV (m3)
1 126-TK-001 FLO Floating
Roof 24 15 13.50 5930
2 203-TK-001 NHT FEED
CRIF; N2 blanket
49.5 17.5 13.37 24682 3 203-TK-002 49.5 17.5 13.37 24986
4 203-TK-005 DHDT FEED
CRIF; N2 blanket
49.5 17.5 13.50 25204 5 203-TK-006 49.5 17.5 14.00 26100 6 203-TK-007
VR Coned Roof 51.1 15.5 13.40 27804
7 203-TK-008 51.1 15.5 13.40 27829 8 203-TK-010 VGO HDT
FEED Coned Roof; N2 blanket
78.2 15.5 13.30 65294 9 203-TK-011 78.2 15.5 13.30 64556
10 203-TK-015 HGU FEED CRIF; N2
blanket 20.2 17.51 13.55 4285
11 203-TK-020 LT.
REFORMATECRIF; N2
blanket35 17.5 14.07 13088
12 203-TK-026 WET SLOPS Coned Roof 20.2 15.5 12.50 4031
13 203-TK-027 LT. DRY SLOPS
Coned Roof 20.2 16.5 13.50 4279
14 203-TK-028 HVY DRY
SLOP Coned Roof 31.9 15.5 13.00 10470
15 203-TK-056 CCR FEED CRIF; N2
blanket 20.2 17.5 13.77 4318
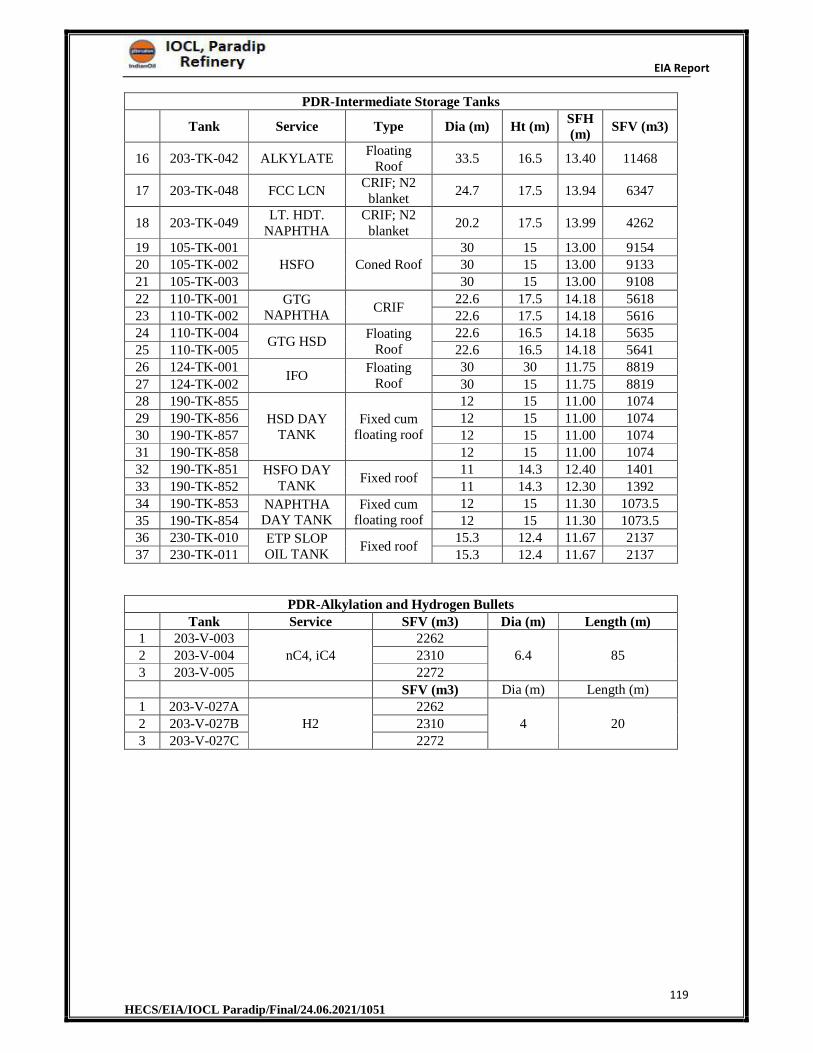
EIA Report
119 HECS/EIA/IOCL Paradip/Final/24.06.2021/1051
PDR-Intermediate Storage Tanks
Tank Service Type Dia (m) Ht (m) SFH (m)
SFV (m3)
16 203-TK-042 ALKYLATE Floating
Roof33.5 16.5 13.40 11468
17 203-TK-048 FCC LCN CRIF; N2
blanket24.7 17.5 13.94 6347
18 203-TK-049 LT. HDT.
NAPHTHA CRIF; N2
blanket 20.2 17.5 13.99 4262
19 105-TK-001 HSFO Coned Roof
30 15 13.00 9154 20 105-TK-002 30 15 13.00 9133 21 105-TK-003 30 15 13.00 9108 22 110-TK-001 GTG
NAPHTHA CRIF
22.6 17.5 14.18 5618 23 110-TK-002 22.6 17.5 14.18 5616 24 110-TK-004
GTG HSD Floating
Roof 22.6 16.5 14.18 5635
25 110-TK-005 22.6 16.5 14.18 5641 26 124-TK-001
IFO Floating
Roof 30 30 11.75 8819
27 124-TK-002 30 15 11.75 8819 28 190-TK-855
HSD DAY TANK
Fixed cum floating roof
12 15 11.00 1074 29 190-TK-856 12 15 11.00 1074 30 190-TK-857 12 15 11.00 1074 31 190-TK-858 12 15 11.00 1074 32 190-TK-851 HSFO DAY
TANK Fixed roof
11 14.3 12.40 1401 33 190-TK-852 11 14.3 12.30 1392 34 190-TK-853 NAPHTHA
DAY TANK Fixed cum
floating roof 12 15 11.30 1073.5
35 190-TK-854 12 15 11.30 1073.5 36 230-TK-010 ETP SLOP
OIL TANK Fixed roof
15.3 12.4 11.67 2137 37 230-TK-011 15.3 12.4 11.67 2137
PDR-Alkylation and Hydrogen Bullets Tank Service SFV (m3) Dia (m) Length (m)
1 203-V-003 nC4, iC4
2262 6.4 85 2 203-V-004 2310
3 203-V-005 2272
SFV (m3) Dia (m) Length (m) 1 203-V-027A
H2 2262
4 20 2 203-V-027B 2310 3 203-V-027C 2272
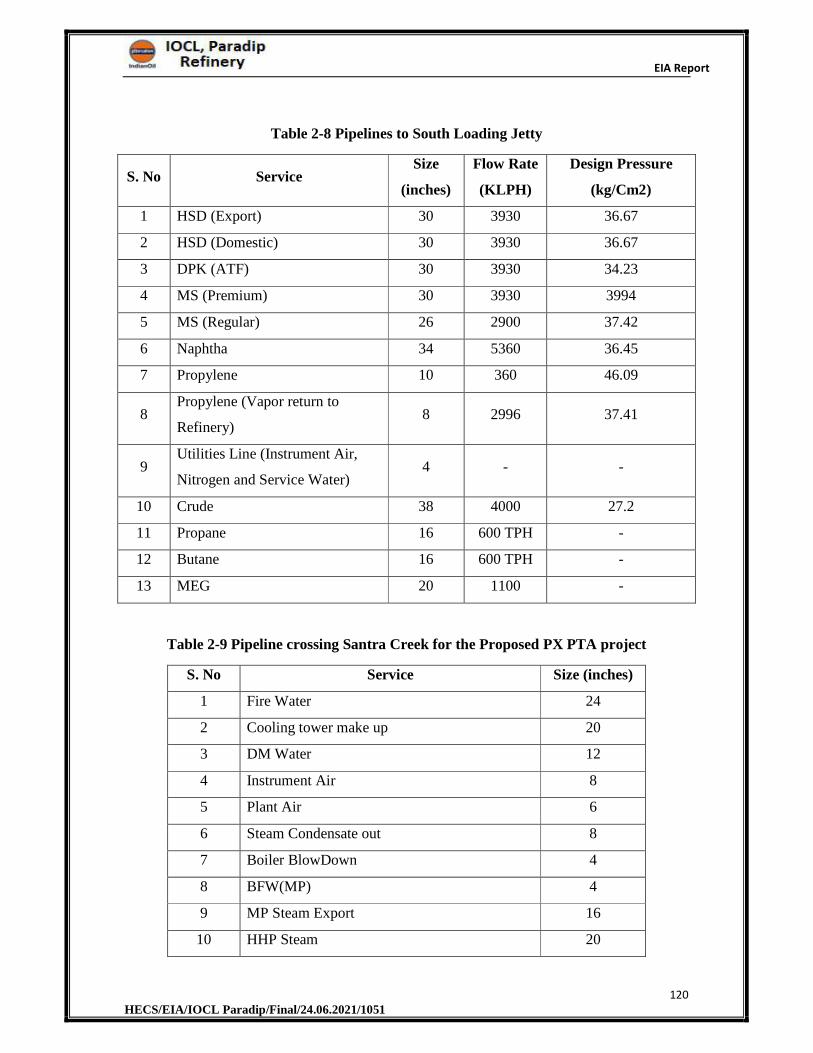
EIA Report
120 HECS/EIA/IOCL Paradip/Final/24.06.2021/1051
Table 2-8 Pipelines to South Loading Jetty
S. No Service Size
(inches)
Flow Rate
(KLPH)
Design Pressure
(kg/Cm2)
1 HSD (Export) 30 3930 36.67
2 HSD (Domestic) 30 3930 36.67
3 DPK (ATF) 30 3930 34.23
4 MS (Premium) 30 3930 3994
5 MS (Regular) 26 2900 37.42
6 Naphtha 34 5360 36.45
7 Propylene 10 360 46.09
8 Propylene (Vapor return to
Refinery) 8 2996 37.41
9 Utilities Line (Instrument Air,
Nitrogen and Service Water) 4 - -
10 Crude 38 4000 27.2
11 Propane 16 600 TPH -
12 Butane 16 600 TPH -
13 MEG 20 1100 -
Table 2-9 Pipeline crossing Santra Creek for the Proposed PX PTA project
S. No Service Size (inches)
1 Fire Water 24
2 Cooling tower make up 20
3 DM Water 12
4 Instrument Air 8
5 Plant Air 6
6 Steam Condensate out 8
7 Boiler BlowDown 4
8 BFW(MP) 4
9 MP Steam Export 16
10 HHP Steam 20
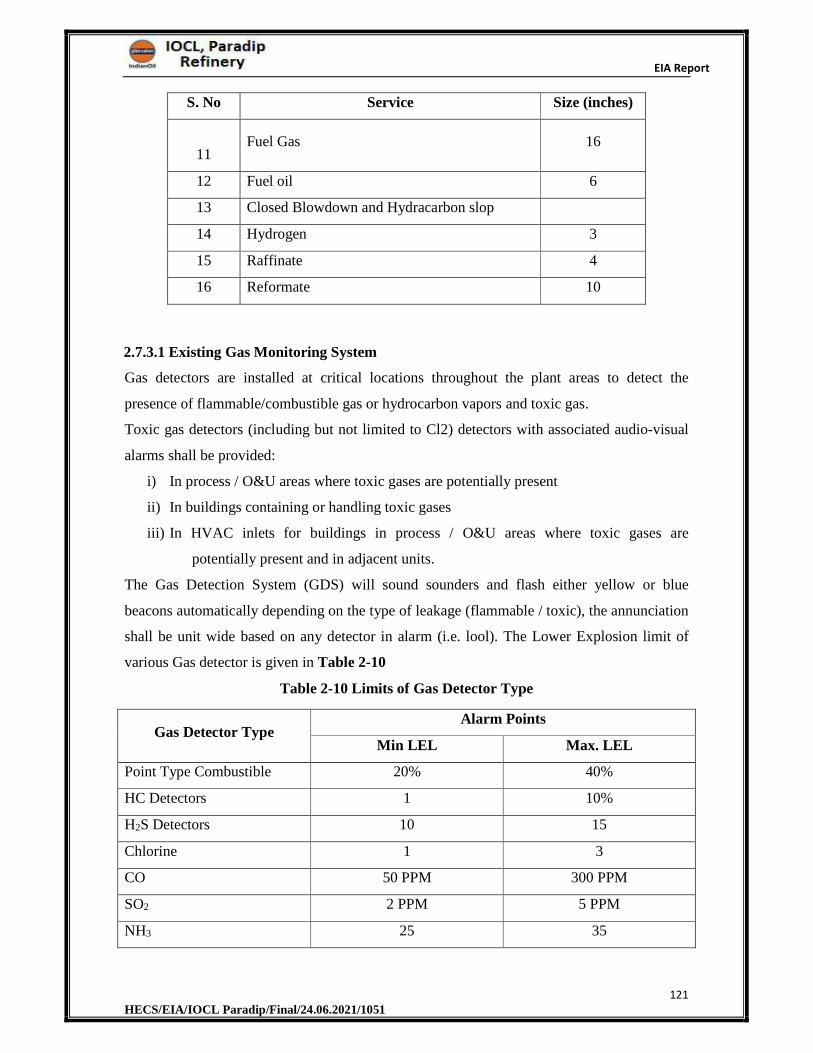
EIA Report
121 HECS/EIA/IOCL Paradip/Final/24.06.2021/1051
S. No Service Size (inches)
11 Fuel Gas 16
12 Fuel oil 6
13 Closed Blowdown and Hydracarbon slop
14 Hydrogen 3
15 Raffinate 4
16 Reformate 10
2.7.3.1 Existing Gas Monitoring System
Gas detectors are installed at critical locations throughout the plant areas to detect the
presence of flammable/combustible gas or hydrocarbon vapors and toxic gas.
Toxic gas detectors (including but not limited to Cl2) detectors with associated audio-visual
alarms shall be provided:
i) In process / O&U areas where toxic gases are potentially present
ii) In buildings containing or handling toxic gases
iii) In HVAC inlets for buildings in process / O&U areas where toxic gases are
potentially present and in adjacent units.
The Gas Detection System (GDS) will sound sounders and flash either yellow or blue
beacons automatically depending on the type of leakage (flammable / toxic), the annunciation
shall be unit wide based on any detector in alarm (i.e. lool). The Lower Explosion limit of
various Gas detector is given in Table 2-10
Table 2-10 Limits of Gas Detector Type
Gas Detector Type Alarm Points
Min LEL Max. LEL
Point Type Combustible 20% 40%
HC Detectors 1 10%
H2S Detectors 10 15
Chlorine 1 3
CO 50 PPM 300 PPM
SO2 2 PPM 5 PPM
NH3 25 35
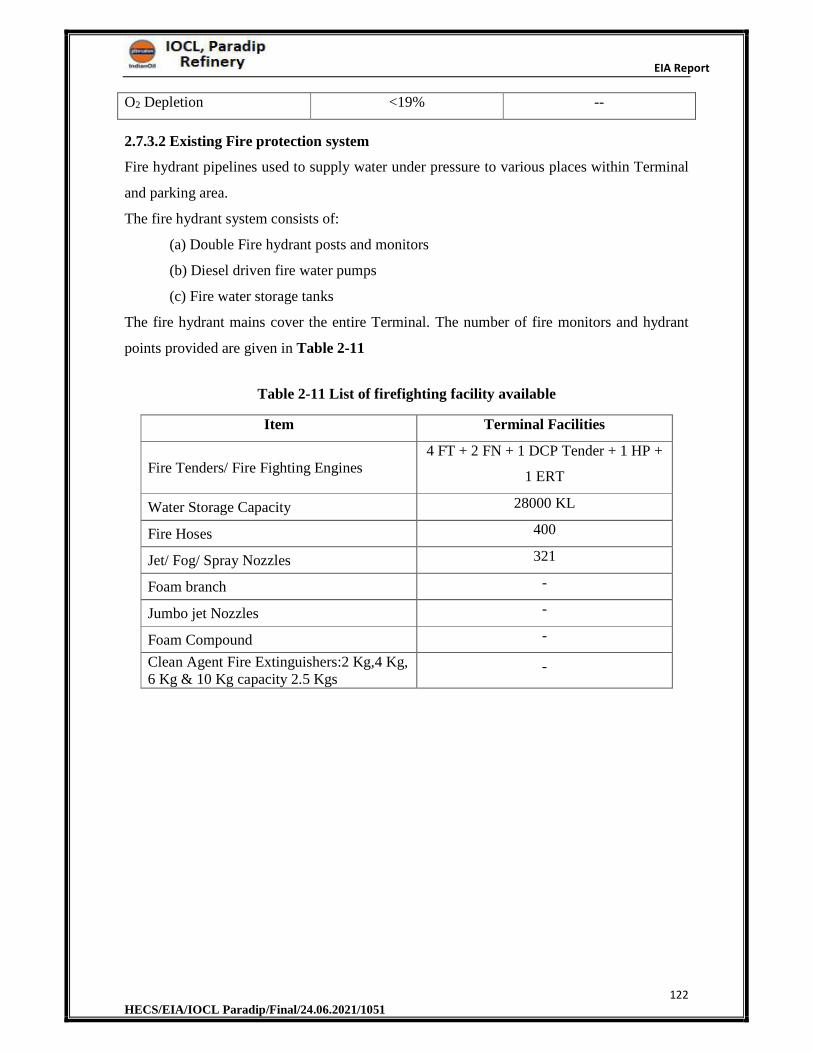
EIA Report
122 HECS/EIA/IOCL Paradip/Final/24.06.2021/1051
O2 Depletion <19% --
2.7.3.2 Existing Fire protection system
Fire hydrant pipelines used to supply water under pressure to various places within Terminal
and parking area.
The fire hydrant system consists of:
(a) Double Fire hydrant posts and monitors
(b) Diesel driven fire water pumps
(c) Fire water storage tanks
The fire hydrant mains cover the entire Terminal. The number of fire monitors and hydrant
points provided are given in Table 2-11
Table 2-11 List of firefighting facility available
Item Terminal Facilities
Fire Tenders/ Fire Fighting Engines 4 FT + 2 FN + 1 DCP Tender + 1 HP +
1 ERT
Water Storage Capacity 28000 KL
Fire Hoses 400
Jet/ Fog/ Spray Nozzles 321
Foam branch -
Jumbo jet Nozzles -
Foam Compound -
Clean Agent Fire Extinguishers:2 Kg,4 Kg, 6 Kg & 10 Kg capacity 2.5 Kgs
-
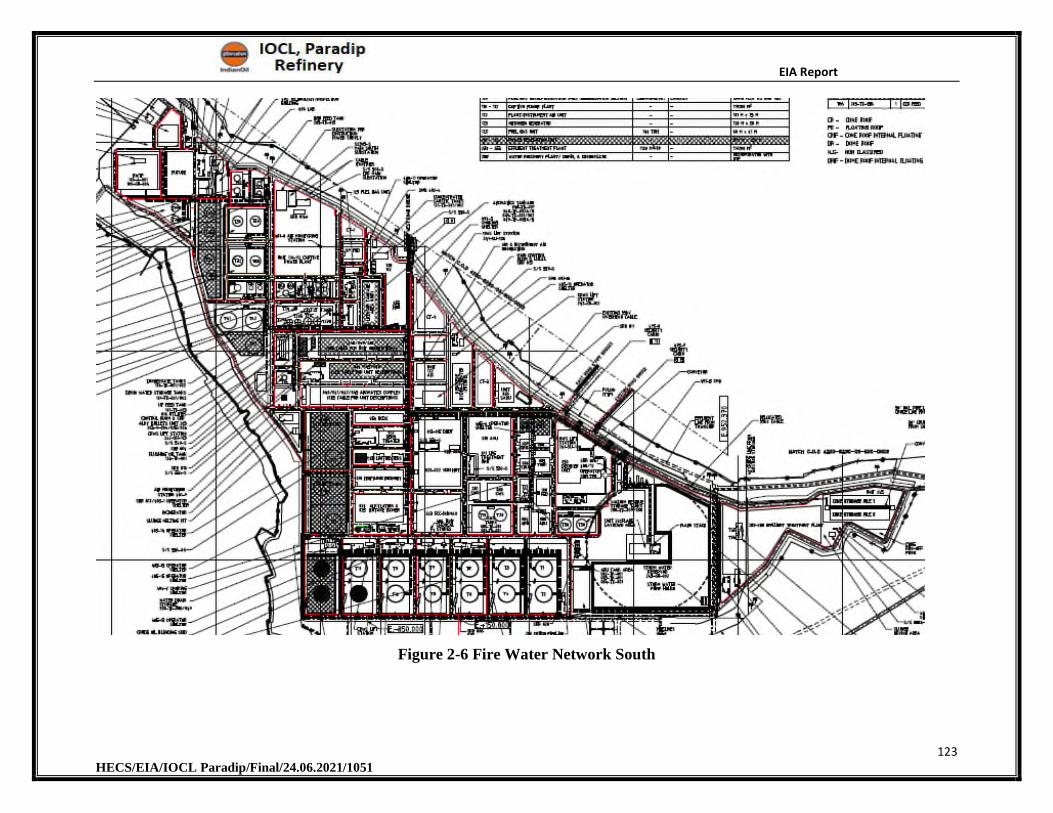
EIA Report
123 HECS/EIA/IOCL Paradip/Final/24.06.2021/1051
Figure 2-6 Fire Water Network South
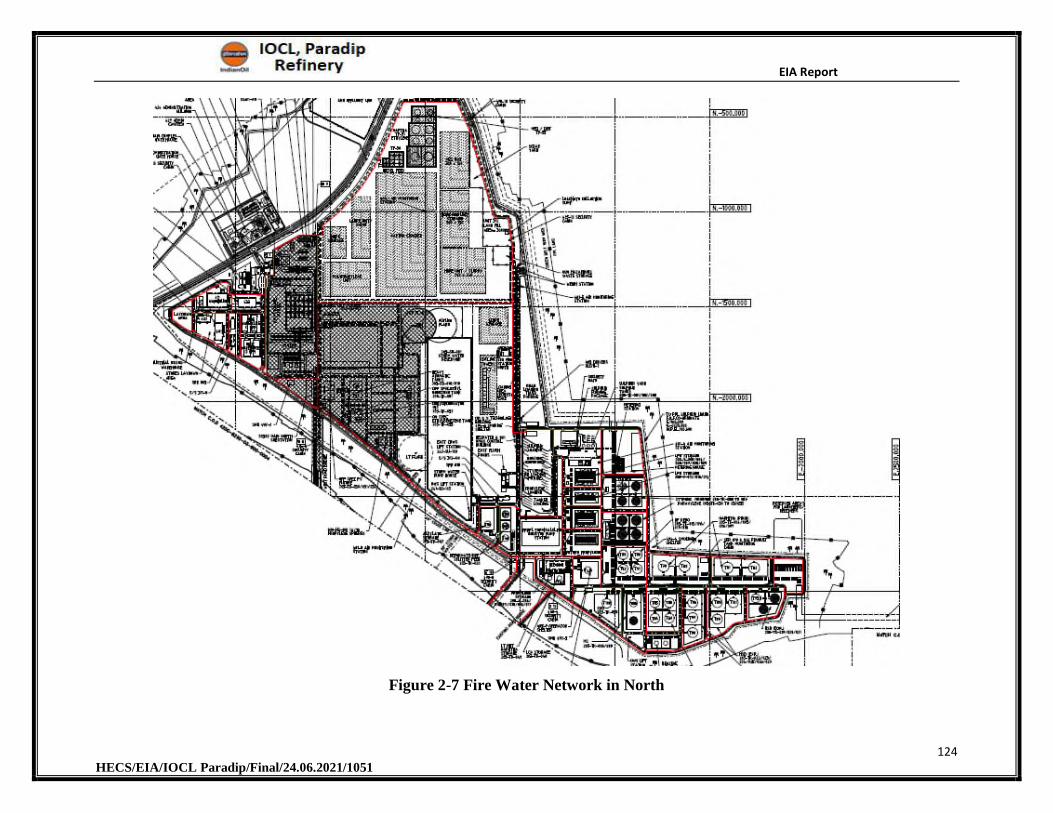
EIA Report
124 HECS/EIA/IOCL Paradip/Final/24.06.2021/1051
Figure 2-7 Fire Water Network in North
EIA Report
125 HECS/EIA/IOCL Paradip/Final/24.06.2021/1051
2.7.4 Proposed Facility
2.7.4.1 Technology & Process Description
Feed for the proposed PX-PTA plant will be Reformate, which is produced by processing
Naphtha in CCRU. Reformate will be processed in the PX plant to produce PX, which will
further be processed in the PTA plant for production of PTA.The Overall Process flow diagram
of PX-PTA unit is given in Figure 2-8
2.7.4.1.1 Paraxylene (PX)
Reformate is utilized for production of MS as well as PX. By-products of the PX plant viz.
Raffinate and Heavy Aromatics will be blend in MS/Naphtha pools. The other product, Toluene
from PX plant will be sold to merchants. The process diagram of PX unit is given in Figure 2-9
Fuel gas from the PX complex will be routed to the refinery Fuel Gas header
Paraxylene Unit has a capacity of 0.8 MMTPA. Brief description of the unit is given below:
Paraxylene Unit consists of the following blocks:
Xylene Fractionation Unit
Sulfolane Unit (Extractive Distillation)
Benzene-Toluene Fractionation Unit
Tatoray Unit
Parex Unit
Isomar Unit
a) Xylenes Fractionation Unit
Feed to the Xylenes Fractionation Unit emanates from three sources, coming in the form of
Debutanizer bottoms from the CCR Platforming Unit, Toluene Column bottoms from the
Benzene-Toluene Fractionation Unit and Deheptanizer bottoms from the Isomar Unit.
The Plat forming Unit’s Debutanizer bottoms is feed to the Reformate Splitter. The Light
Reformate, i.e. the Reformate Splitter overhead liquid product, is pumped to the Feed Surge
Drumin the ED Sulfolane Unit. The Reformate Splitter net bottoms, consisting of C8+aromatics,
EIA Report
126 HECS/EIA/IOCL Paradip/Final/24.06.2021/1051
are heated in the Clay Treater Feed Heater prior to entering the Clay Treaters. The Clay Treaters
are responsible for removing olefinic material from the feed to the Xylene Columns. The
effluent flow from the Clay Treaters is divided into two equally flowing streams; each acting as
a feed to one of the two Xylene Columns. The flow rate of each of these two streams is reset by
the level in the bottom of the Reformate Splitter.
In order to mitigate flare loads, this unit design employs the use of two identical Xylene
Columns with identical overhead systems. In addition to receiving an equal amount of
Reformate Splitter bottoms feed, each Xylene Column also receives an equal amount of
Deheptanizer bottoms feed and an equal amount of Toluene Column bottoms feed, both of
which consist primarily of mixed xylenes. The Deheptanizer bottoms are fed to the Xylene
Column at the upper feed tray location. The Toluene Column bottoms combine with the
Reformate Splitter bottoms prior to entering the Xylene Column at the lower feed tray location.
Overhead vapors from Xylene Column No 1 are condensed in the hot (shell) sides of Parex
Raffinate Column Reboiler A, Parex Extract Column Reboiler A, and Isomar Deheptanizer
Reboiler A. Similarly, overhead vapors from Xylene Column No 2 are condensed in the hot
(shell) sides of Parex Raffinate Column Reboiler B, Parex Extract Column Reboiler B, and
Isomar Deheptanizer Reboiler B. Condensed material from each train is pressured up to each
system’s respective Xylene Column Receiver. From here, the net overhead liquid is pumped
from each receiver to one of two Parex Feed Surge Drums.Each surge drum effluent stream is
fed to the Parex Unit by two pumps operating in parallel. Prior to feeding the Parex Unit,
however, the pump discharge streams combine into a single stream that is cooled by the
Deheptanizer Feed-Parex Feed Exchanger in the Isomar Unit.
Each Xylene Column employs the use of two fired heaters operating in parallel to reboil the
circulating bottoms material. There is a large degree of heat integration involved with the
Xylene Column circulating bottoms systems. During normal operation, the circulating bottoms
from Xylene Column No 1 are used as heat transfer media for the Parex Desorbent Rerun
Column Reboiler, Clay Treater Feed Heater, Heavy Aromatics Column Reboiler, and Parex
Raffinate Column Auxiliary Reboiler A. Meanwhile, the circulating bottoms from Xylene
Column No2 are used as heat transfer media for the Tatoray Stripper Reboiler and Parex
Raffinate Column Auxiliary Reboiler B. Although this describes the flow scheme during normal
EIA Report
127 HECS/EIA/IOCL Paradip/Final/24.06.2021/1051
operation, the circulating bottoms systems were designed such that each train is capable of
providing 100 percent of the duty required by any heat user, with the exception of the Parex
Raffinate Column Auxiliary Reboilers. In the case of these heat users, Auxiliary Reboiler A will
only accommodate flow from train one and Auxiliary Reboiler B will only accommodate flow
from train two.
The Xylene Column net bottoms material is comprised of C9+aromatics.Netbottoms streams
from each Xylene Column combine into a single stream prior to feeding the Heavy Aromatics
Column. Here, the C9 and C10 aromatics are taken overhead, condensed, and pumped to the
Feed Surge Drumin the Tatoray Unit. Overhead vapors from the Heavy Aromatics Column are
condensed both by an air cooler and by the Reformate Splitter Feed Heater, as hell and tube
exchanger responsible for heating the Debutanizer bottoms feed from the Plat forming Unit.
Heavier C11+aromatics are pumped from the bottom of the Heavy Aromatics Column to the
Fuel Oil System.
b) Sulfolane Process Unit (Extractive Distillation)
The Sulfolane process uses extractive distillation to recover high purity aromatics from a light
reformates feed stock.
Feed to the unit is obtained from the overhead of the Reformate Splitter in the Xylenes
Fractionation Unit, and from the bottoms stream of the Stripper in the Isomar Process unit.
Extractive distillation is the method used to separate close-boiling components using a solvent
that alters the volatility between the components. The solvent is generally a polar compound
having a boiling point higher than the mixture. When applied to extractive distillation, the
volatility of the aromatics is depressed relative to the other components in the mixture such that
the non-aromatics can be distilled overhead in the Extractive Distillation Column.
There are two primary columns in the extractive distillation unit, they are the Extractive
Distillation Column and the Recovery Column (or solvent stripper column). Aromatic feed,
typically pre-fractionated, is directed to the Extractive Distillation Column.
It exchanges heat with the lean solvent and enters a central stage of the trayed column. The lean
solvent is introduced near of top of the Extractive Distillation column.
EIA Report
128 HECS/EIA/IOCL Paradip/Final/24.06.2021/1051
Combining solvent and feed alters the relative volatilities of the components to be separated
because of the non-ideal behavior of the mixture. This is the key to the process. The selectivity
of the solvent renders aromatics relatively less volatile than the non-aromatics.
As the hydrocarbon vapor stream flows up the Extractive Distillation column, counter- current
to the descending solvent, the aromatics are selectively absorbed.
The function of the upper section of the Extractive Distillation Column is to maximize aromatic
recovery. The overhead vaporis non-aromatic and is referred to as the raffinate. These vapors
are condensed and sent to storage. A portion of the raffinate liquid is used as column reflux to
rectify entrained solvent out of the overhead product. Overhead water is collected in the
Extractive Distillation Column Receiver water boot and returned to the column. The Extractive
Distillation Column is reboiled with steam. There is are boiler preheater to recover heat from the
lean solvent to reduce steam consumption in the reboiler.
In the lower section of the Extractive Distillation Column, the non-aromatics are preferentially
stripped out of the liquid and enter the upper portion of the column as a vapor phase due to the
solvents electivity, which has made the saturates relatively more volatile than the aromatics.
Again, because of finite selectivity, some aromatics, primarily benzene, are stripped into the
upper section of the column where they must be re-absorbed. The lower section of the Extractive
Distillation Column serves the function of aromatics purification.
The Extractive Distillation Column bottoms will contain solvent and highly purified aromatics.
This material is sent to the Recovery Column (solvent stripper column). In this column,
aromatics are separated from solvent under vacuum with steam stripping. The overhead aromatic
product, depending on the composition (BorBT) is condensed and sent to storage or to clay
treating prior to product fractionation. A portion of the extract liquid is used as reflux to remove
residual solvent from the extract vapors. The Recovery Column is reboiled with steam. Water is
collected in the Recovery Column Receiver water boot and is directed to the steam generator.
This generator (heated by exchange with the Recovery Column bottoms) produces the stripping
steam that is returned to the bottom of the Recovery Column via the Solvent Regenerator.
Solvent is purified of residual hydrocarbons as it flows down the Recovery Column.At the
bottom of the Recovery Column the solvent is essentially pure Sulfolane with a small amount of
EIA Report
129 HECS/EIA/IOCL Paradip/Final/24.06.2021/1051
water. This is then returned to the Extractive Distillation Column as lean solvent. A slip stream
of lean solvent is directed to a Solvent Regenerator to remove any degradation products.
c) Benzene-Toluene Fractionation Unit
The Benzene-Toluene Fractionation Unit consists of two fractionation columns, the Benzene
Column and the Toluene Column, and a set of two Clay Treaters. The purpose of this unit is to
separate a purified benzene product from the C7+ aromatics, as well as separating toluene from
C8+ aromatics so that the toluene can be sent to the Tatoray unit and to gasoline blending and
the C8+ material can feed the Xylene Fractionation Unit. There are three separate feed streams
that enter the Benzene Toluene Fractionation Unit. They consist of the overhead material from
the ED Sulfolane Recovery Column, the overhead material from the Parex Finishing Column,
and the bottoms material from the Tatoray Stripper.
Overhead material from the ED Sulfolane Recovery Column is preheated by the Clay Treater
Charge Exchanger then heated to the Clay Treater process temperature by the Clay Treater
Charge Heater. Feed flows downward through the Clay Treaters where olefins are removed. The
effluent from the Clay Treaters is cooled in the Clay Treater Charge Exchanger before mixing
with overhead material from the Parex Finishing Column and the Stripper Bottoms product from
the Tatoray Unit. The combined feed stream then enters the Benzene Column. The Benzene
Column feed from the Clay Treater Charge Tank contains saturated water, which is removed in
the Benzene Column Receiver.
The Benzene Column produces a side-draw benzene product, which is cooled and sent to
storage. The toluene-rich Benzene Column bottoms product is heat exchanged with the Toluene
liquid from the Toluene Column Receiver and fed the Toluene Column. The Toluene Column
overhead vapor stream is condensed and the net product is sent to the Tatoray Unit and gasoline
blending. The Toluene Column bottoms stream feeds the Xylene Column in the Xylenes
Fractionation Unit.
d) Tatoray Process Unit
The Tatoray Process Unit flow scheme consists of a fixed-bed reactor and a product separation
section. The fresh feed to the Tatoray unit comes from the overhead of the Toluene Column in
the Benzene-Toluene Fractionation Unit and the overhead of the Heavy Aromatics Column in
EIA Report
130 HECS/EIA/IOCL Paradip/Final/24.06.2021/1051
the Xylenes Fractionation Unit. Feed is first combined with hydrogen-rich recycle gas in the
Combined Feed Exchanger where it is preheated and vaporized by exchange with the hot reactor
effluent. The feed is heated to reaction temperature in the Charge Heater before entering the
Reactor. Feed flows down-flow over the catalyst bed. There act or effluent is then cooled by
exchange with the combined feed, condensed, and sent the Separator.
Hydrogen-rich recycle gas leaves the top of the Separator and is compressed in the Recycle
Compressor. The recycle gas is mixed with makeup gas from the hydrogen central distribution
system. The combined recycle gas joins the liquid feed upstream of the Combined Feed
Exchanger.
A portion of the gas from the top of the Separator is vented to remove accumulated light ends
from the recycle gas loop. This vent is sent to the fuel gas header.
Liquid from the bottom of the Separator is preheated in the Stripper Feed-Overhead Exchanger
and Stripper Feed-Bottoms Exchanger before entering the Stripper. The light ends and a small
portion of the benzene go overhead from the Stripper and are cooled and separated into gas and
liquid products.
The Stripper Vent Condenser on the Stripper Receiver maximizes benzene recovery. The
Stripper overhead vapor is sent to fuel gas.
The benzene and xylene products, together with the unreacted toluene and C9/C10Aromatics,
come from the bottom of the Stripper, are cooled in the Stripper Feed- Bottoms Exchanger, and
finally go to the Benzene Column in the Benzene-
TolueneFractionationUnit.TheStrippernetoverheadliquidissenttotheIsomarStripperto remove the
light ends.
e) Parex Process Unit
The purpose of the Parex unit is to separate Paraxylene from all other C8 Aromatics. The Parex
process belongs to the UOP family of adsorption separation technologies based on the Sorbex
separation concept.
The mixed Xylenes feed from the Xylene Fractionation Unit is first heated in the Deheptanizer
Feed- Parex Feed exchanger located in the Isomar unit. A temperature controller adjusts the flow
EIA Report
131 HECS/EIA/IOCL Paradip/Final/24.06.2021/1051
through the heat exchanger to hold the temperature of the Parex feed at the desired value of 147
ºC.
This unit has two parallel adsorption trains and a common Fractionation Section.
The total feed enters the unit and then splits equally into two streams going to identical adsorbent
trains. The feed then passes through the Feed Filter. The filter, remove any particulate matter that
may damage the rotary valve or plug the adsorbent bed internals. The feed from the feed filter
passes through the feed flow controller and into the Rotary valve. The Rotary Valves control the
flow of feed, Desorbent, Extract and Raffinate streams to and from each set of Adsorbent
Chambers.
The separation takes place in the adsorbent chambers. Each adsorbent chamber is divided into
twelve adsorbent “beds”. Each bed of adsorbent is supported from below by a specialized grid,
which also contains highly engineered flow distributors to inject or withdraw liquid from the
individual adsorbent beds, or redistribute the liquid over the cross-sectional area of the adsorbent
chamber. Each flow distributor is connected to the Rotary valve by a bed line piping.
Each train has 24 adsorbent beds with grids and 24 bed lines connecting the grids to the Rotary
Valve. Due to practical construction considerations, the 24 adsorbent beds are contained in two
adsorption chambers in series with 12 beds in each chamber.
At any given time, only four of the bed lines are active, carrying the net streams into and out of
the adsorbent chamber. The Rotary Valve is used to periodically switch the positions of the
liquid feed and withdrawal points as the composition profile moves down the adsorbent chamber.
Chamber Circulation pumps provide the liquid circulation from the bottom of one adsorbent
chamber to the top of the other.
The dilute extract from the Rotary Valve is heated in the Extract Column Feed- Bottoms
exchanger before feeding the Extract Column. The overhead vapor from the Extract Column is
condensed in the Extract Column Condenser and collected in the Extract Column Receiver,
which floats on the flare header through the Parex Vent Drum.
During normal operation the pressure drop through the Extract Column Condenser, the overhead
vapor line, and the line from the condenser to the receiver will be stable enough that additional
EIA Report
132 HECS/EIA/IOCL Paradip/Final/24.06.2021/1051
control of the extract column pressure is not required. A nitrogen purge is provided to the vent
from the receiver to prevent material from returning from the vent to the receiver as the level in
the receiver changes.
The Extract Column Overhead Pumps provide reflux to the top of the column and also the net
overhead liquid, which is sent to the Finishing Column after getting preheated in the Finish
Column Feed-Bottoms exchanger. The Extract Column is reboiled using heat from the Xylene
Column overhead vapors in the Extract Column Reboiler. Desorbent from the Extract Column
Bottoms Pumps is cooled in the Extract Column Feed-Bottoms Exchanger and the Desorbent
Cooler.
A temperature differential transmitter is used between two of the Extract Column trays to
monitor the temperature profile of the column. Adjusting the flow of the net extract stream
enables the control of the composition for the extract.
An on-line analyzer monitors the overhead content of desorbent and helps in monitoring the
desorbent loss with the extract.
The net overhead liquid from the Extract Column is heated in the Finishing Column Feed-
Bottoms exchanger and passes to the Finishing Column. The column is reboiled using
desuperheated MP steam in the Finishing Column Reboiler. The para-xylene product leaves the
Finishing Column Bottoms Pumps under level control in finishing column and is cooled in the
Finishing Column Feed-Bottoms Exchanger, the Para xylene Cooler and the Para xylene Trim
Cooler and is stored in Para xylene day tank.
It would then intermittently be pumped out to Paraxylene product storage tank in offsites through
Paraxylene Transfer Pumps. The overhead vapor from the Finishing Column is condensed in the
Finishing Column Condenser. From the Finishing Column condenser, the liquid flows into the
Finishing Column Receiver.
The Finishing Column Overhead Pumps provide the reflux to the top of the column and also the
net overhead toluene, which is sent to the Benzene Column in the B-T Fractionation Unit.
EIA Report
133 HECS/EIA/IOCL Paradip/Final/24.06.2021/1051
Similar to the extract column the overhead receiver pressure floats with the relief header and a
nitrogen purge line is provided to the vent line from the receiver to prevent material from
returning from the vent to the receiver as the level in the receiver changes.
The Rotary Valves direct the raffinate from the Adsorbent Chambers to the Raffinate Column
Feed-Bottoms Exchanger where it is heated upstream of the Raffinate Column (049-C-001).
Vapors from the Desorbent Rerun Column are also directed to the feed tray of the Raffinate-
column. The column is reboiled using the Xylene Column overhead vapors in the Raffinate
Column Reboiler and circulating bottoms from Xylene column in the Raffinate Column
Auxiliary Reboiler. The desorbent leaves the Raffinate Column Bottoms Pumps and is cooled in
the Raffinate Column Feed-Bottoms Exchanger and the Desorbent Cooler and is returned to the
Adsorbent Chambers through the Rotary Valve after being filtered in the Desorbent Filter.
The overhead vapor from the Raffinate Column is condensed in the Raffinate Column Condenser
and the liquid is collected in the Raffinate Column Receiver. Any uncondensed vapor leaves the
receiver and is further cooled in the Raffinate Column Vent Condenser and the liquid is collected
in the Raffinate Column Vent Drum, which floats on the Parex Vent Drum. Liquid from the vent
drum runs back to the receiver and the total reflux is provided to the column using the Raffinate
Column Reflux Pumps. Any water collected in the receiver is sent to the wastewater treatment
plant (By others).
A Raffinate side cut is taken from near the top of the column and collected in the Raffinate
Column Sidecut Surge Drum before going to the Isomar Unit.
During operation of the unit the heavy contaminants present in the feed will accumulate in the
desorbent. To prevent this accumulation part of the desorbent leaving the Raffinate column is
directed to Desorbent Rerun Column. The column is reboiled using Circulating bottoms from
Xylene Column in the Desorbent Rerun Column Reboiler The overhead vapors are directed to
the Raffinate column. Heavy contaminants are removed from the bottom of the column.
Bottoms material from the Desorbent Rerun Column is removed on an intermittent basis. The
heavy aromatics stream will be routed to the Heavy Aromatics Column Bottoms Cooler in the
Xylene fractionation unit and then routed to the fuel oil system.
EIA Report
134 HECS/EIA/IOCL Paradip/Final/24.06.2021/1051
The Desorbent Rerun Column Bottoms Pumps, which are of proportioning type, withdraw a
fixed quantity of heavy aromatics from the Desorbent rerun column. The Desorbent Rerun
Column bottom level is maintained by regulating the duty of the Desorbent Rerun Column
Reboiler through the LIC/FIC control.
The Desorbent Storage Tank provides the storage capacity for the desorbent makeup. The
desorbent storage tank is an atmospheric tank which is nitrogen blanketed. The makeup
desorbent is routed to the Desorbent Rerun column using the Desorbent Makeup Pump.
A Plant Inventory Storage Tank is provided to store the material in the unit in the event of a
shutdown or a period of maintenance. Desorbent mixed with other process fluids are stored in the
plant inventory tank. This tank is an atmospheric tank that is nitrogen blanketed.
The Parex Sump Tank is provided to collect the material vented and drained from the equipment
during the normal operation and maintenance to conserve the valuable desorbent. The desorbent
sump tank is a horizontal vessel located below grade to facilitate draining of process equipment.
The Parex Sump Tank Pump provides the necessary hydraulic head to move the material in the
sump tank to the plant inventory tank. The Parex Sump Tank Pumpout Cooler cools the material
before being routed to the Plant Inventory Storage Tank.
The Desorbent Pumpout Cooler and Desorbent Pumpout Trim Cooler cools the material from the
Parex Unit sufficiently for storage in an atmospheric tank. This is also used during startup and
commissioning operations.
f) Isomar Process Unit
An Isomar unit is always associated with the recovery of one or more xylene isomers. In this
case the Isomar Unit is combined with the UOP Parex process for recovery of para- xylene.
Fresh mixed xylene feed is first sent to a Xylene Column in the Xylene Fractionation Unit,
which rejects C9+ aromatic components in order to meet feed specifications to the Parex unit.
The Xylene Column overhead, containing less than 500 ppm C9+ aromatics, is then directed to
the Parex unit where para-xylene is recovered. The raffinate from the Parex unit, containing less
than 1 wt% para-xylene, is then sent to the Isomar unit which produces para-xylene from the
EIA Report
135 HECS/EIA/IOCL Paradip/Final/24.06.2021/1051
other C8 aromatics. This C8 aromatics stream, Deheptanizer bottoms, is recycled back to the
Xylene Column completing the loop.
The feed to the Isomar unit is first cooled by exchange with the Deheptanizer feed. By lowering
the feed temperature, the duty on the Combined Feed Exchanger increases and the duty on the
Product Condenser is decreased, thus reducing its size. The feed is then combined with
hydrogen-rich recycle gas and make-up gas to replace the small amount of hydrogen consumed
in the Isomar reactor. The combined feed is then vaporized by exchange with reactor effluent in
the Combined Feed Exchanger and then heated to reactor operating temperature in the Charge
Heater. The hot vapor feed is then sent to the Reactor where it is passed radially through a fixed
bed of catalyst. The reactor effluent is cooled by exchange with the combined feed, condensed in
the Product Condenser and then sent to the Separator. To maintain the correct catalyst hydration
level required for optimum catalyst performance, water is injected into the reactor feed upstream
of the Combined Feed Exchanger.
Hydrogen-rich gas is taken off the top of the Separator and recycled back to the Reactor using a
motor driven Recycle Compressor. A small portion of the recycle gas is sometimes purged to
remove accumulated light ends from the recycle gas loop. Liquid from the bottom of the
Separator is heated on its way to the Deheptanizer by two exchangers: The Deheptanizer Feed
Isomar Feed Exchanger, and the Deheptanizer Feed-Parex Feed Exchanger.
The C7- overhead from the Deheptanizer is cooled and separated into gas and liquid products.
The Deheptanizer overhead gas is chilled and separated with the chilled vapor exported to a low
pressure fuel gas system while chilled liquid is returned to the column overhead receiver. The
receiver liquid, along with Tatoray Stripper overhead liquid is sent to the Stripper to remove
water and light hydrocarbons from the overhead product before it is sent to the ED Sulfolane
Unit. The C8+ fraction from the bottom of the Deheptanizer is then recycled back to the Xylene
Column.
2.7.4.1.2 Purified Terephthalic Acid (PTA)
Purified Terephthalic Acid (PTA) Unit has a capacity of 1.2 MMTPA. Brief description of the
unit is given below;
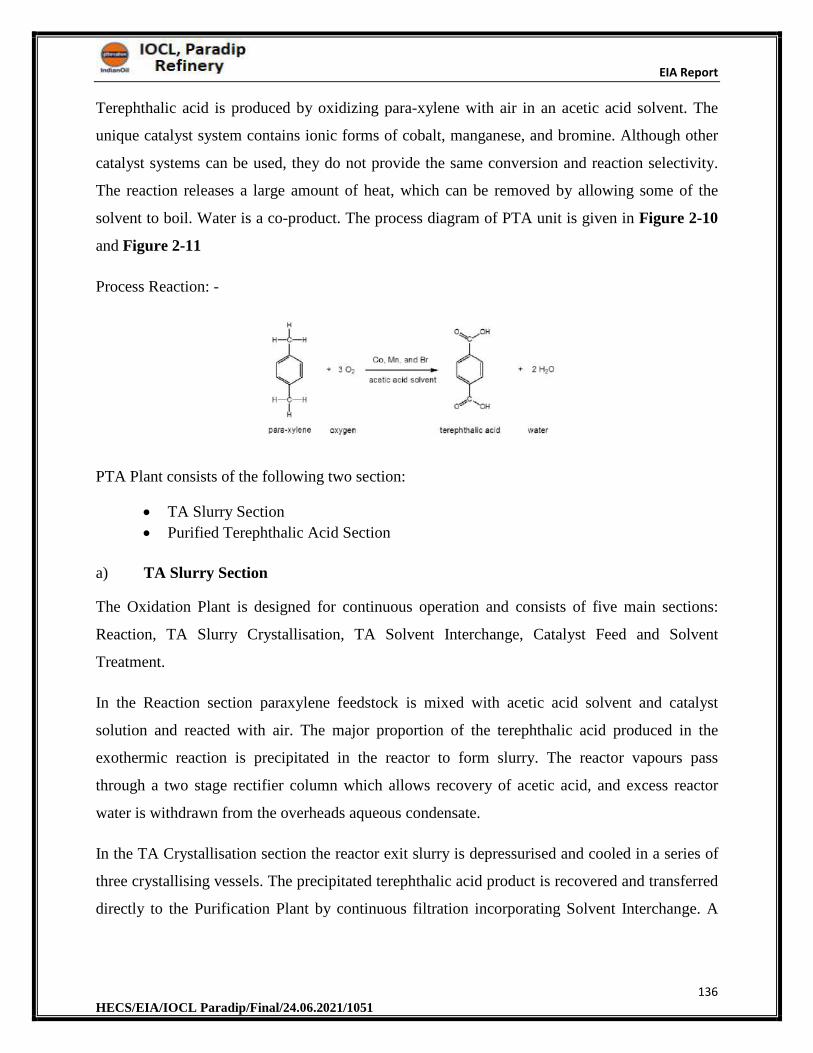
EIA Report
136 HECS/EIA/IOCL Paradip/Final/24.06.2021/1051
Terephthalic acid is produced by oxidizing para-xylene with air in an acetic acid solvent. The
unique catalyst system contains ionic forms of cobalt, manganese, and bromine. Although other
catalyst systems can be used, they do not provide the same conversion and reaction selectivity.
The reaction releases a large amount of heat, which can be removed by allowing some of the
solvent to boil. Water is a co-product. The process diagram of PTA unit is given in Figure 2-10
and Figure 2-11
Process Reaction: -
PTA Plant consists of the following two section:
TA Slurry Section
Purified Terephthalic Acid Section
a) TA Slurry Section
The Oxidation Plant is designed for continuous operation and consists of five main sections:
Reaction, TA Slurry Crystallisation, TA Solvent Interchange, Catalyst Feed and Solvent
Treatment.
In the Reaction section paraxylene feedstock is mixed with acetic acid solvent and catalyst
solution and reacted with air. The major proportion of the terephthalic acid produced in the
exothermic reaction is precipitated in the reactor to form slurry. The reactor vapours pass
through a two stage rectifier column which allows recovery of acetic acid, and excess reactor
water is withdrawn from the overheads aqueous condensate.
In the TA Crystallisation section the reactor exit slurry is depressurised and cooled in a series of
three crystallising vessels. The precipitated terephthalic acid product is recovered and transferred
directly to the Purification Plant by continuous filtration incorporating Solvent Interchange. A
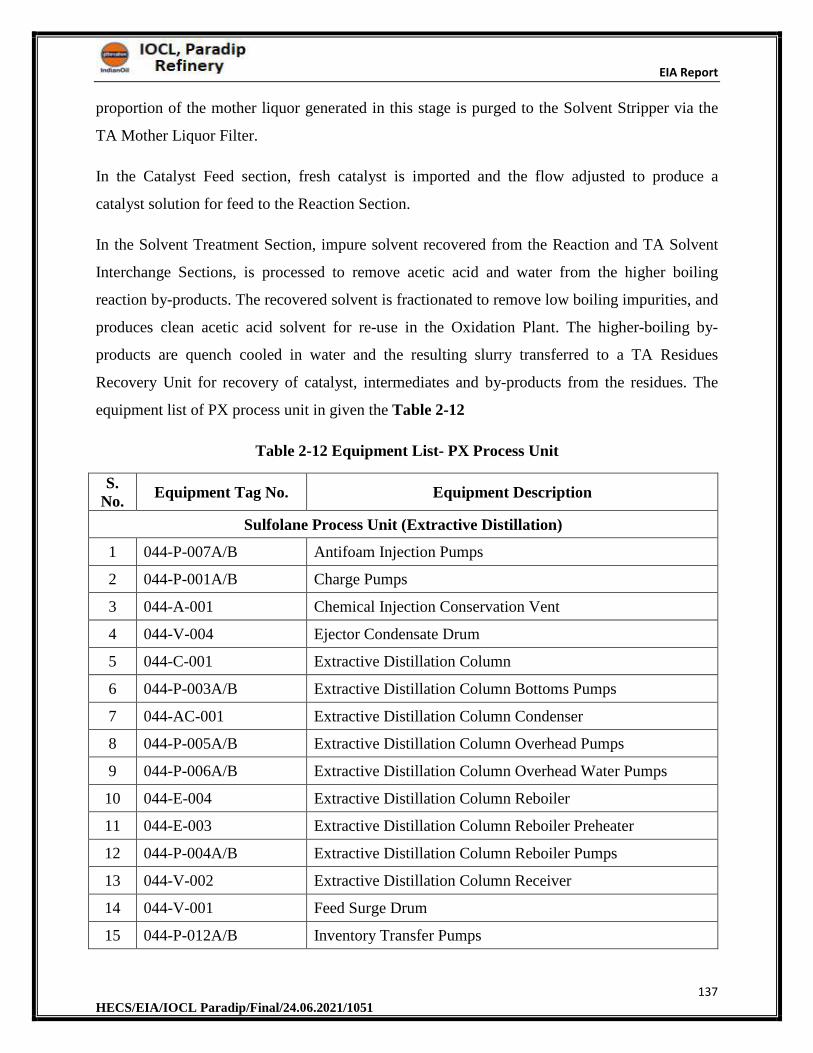
EIA Report
137 HECS/EIA/IOCL Paradip/Final/24.06.2021/1051
proportion of the mother liquor generated in this stage is purged to the Solvent Stripper via the
TA Mother Liquor Filter.
In the Catalyst Feed section, fresh catalyst is imported and the flow adjusted to produce a
catalyst solution for feed to the Reaction Section.
In the Solvent Treatment Section, impure solvent recovered from the Reaction and TA Solvent
Interchange Sections, is processed to remove acetic acid and water from the higher boiling
reaction by-products. The recovered solvent is fractionated to remove low boiling impurities, and
produces clean acetic acid solvent for re-use in the Oxidation Plant. The higher-boiling by-
products are quench cooled in water and the resulting slurry transferred to a TA Residues
Recovery Unit for recovery of catalyst, intermediates and by-products from the residues. The
equipment list of PX process unit in given the Table 2-12
Table 2-12 Equipment List- PX Process Unit
S. No.
Equipment Tag No. Equipment Description
Sulfolane Process Unit (Extractive Distillation)
1 044-P-007A/B Antifoam Injection Pumps
2 044-P-001A/B Charge Pumps
3 044-A-001 Chemical Injection Conservation Vent
4 044-V-004 Ejector Condensate Drum
5 044-C-001 Extractive Distillation Column
6 044-P-003A/B Extractive Distillation Column Bottoms Pumps
7 044-AC-001 Extractive Distillation Column Condenser
8 044-P-005A/B Extractive Distillation Column Overhead Pumps
9 044-P-006A/B Extractive Distillation Column Overhead Water Pumps
10 044-E-004 Extractive Distillation Column Reboiler
11 044-E-003 Extractive Distillation Column Reboiler Preheater
12 044-P-004A/B Extractive Distillation Column Reboiler Pumps
13 044-V-002 Extractive Distillation Column Receiver
14 044-V-001 Feed Surge Drum
15 044-P-012A/B Inventory Transfer Pumps
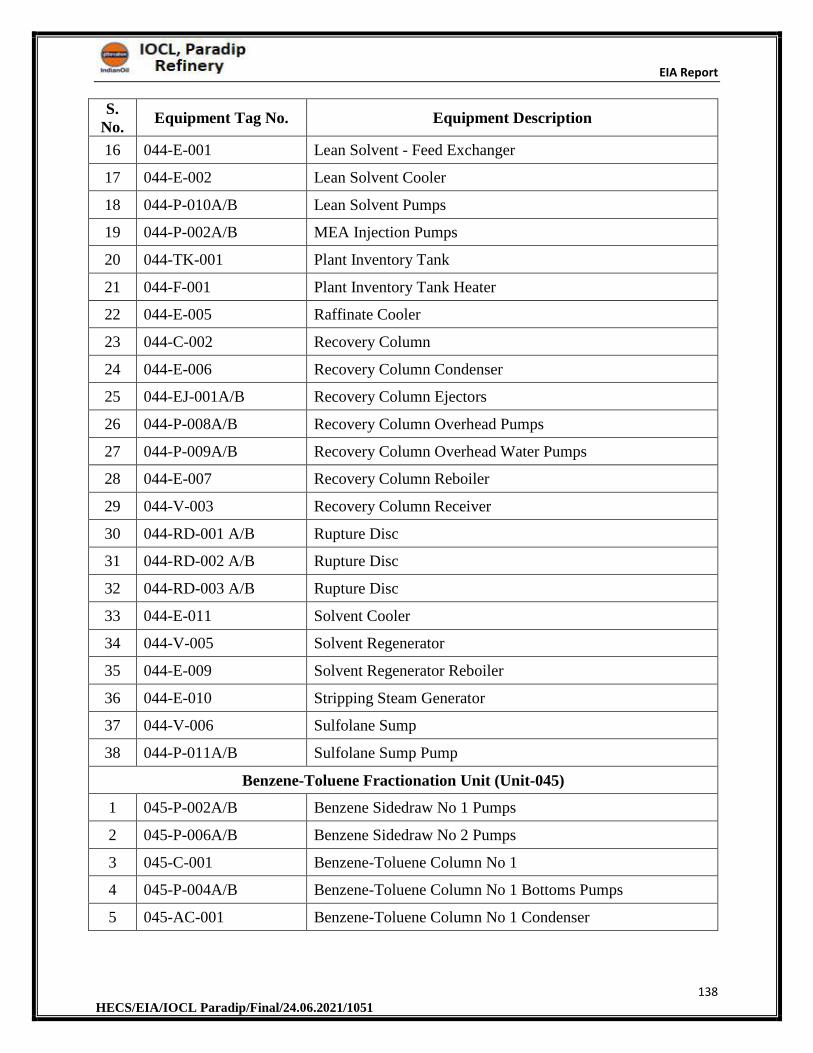
EIA Report
138 HECS/EIA/IOCL Paradip/Final/24.06.2021/1051
S. No.
Equipment Tag No. Equipment Description
16 044-E-001 Lean Solvent - Feed Exchanger
17 044-E-002 Lean Solvent Cooler
18 044-P-010A/B Lean Solvent Pumps
19 044-P-002A/B MEA Injection Pumps
20 044-TK-001 Plant Inventory Tank
21 044-F-001 Plant Inventory Tank Heater
22 044-E-005 Raffinate Cooler
23 044-C-002 Recovery Column
24 044-E-006 Recovery Column Condenser
25 044-EJ-001A/B Recovery Column Ejectors
26 044-P-008A/B Recovery Column Overhead Pumps
27 044-P-009A/B Recovery Column Overhead Water Pumps
28 044-E-007 Recovery Column Reboiler
29 044-V-003 Recovery Column Receiver
30 044-RD-001 A/B Rupture Disc
31 044-RD-002 A/B Rupture Disc
32 044-RD-003 A/B Rupture Disc
33 044-E-011 Solvent Cooler
34 044-V-005 Solvent Regenerator
35 044-E-009 Solvent Regenerator Reboiler
36 044-E-010 Stripping Steam Generator
37 044-V-006 Sulfolane Sump
38 044-P-011A/B Sulfolane Sump Pump
Benzene-Toluene Fractionation Unit (Unit-045)
1 045-P-002A/B Benzene Sidedraw No 1 Pumps
2 045-P-006A/B Benzene Sidedraw No 2 Pumps
3 045-C-001 Benzene-Toluene Column No 1
4 045-P-004A/B Benzene-Toluene Column No 1 Bottoms Pumps
5 045-AC-001 Benzene-Toluene Column No 1 Condenser
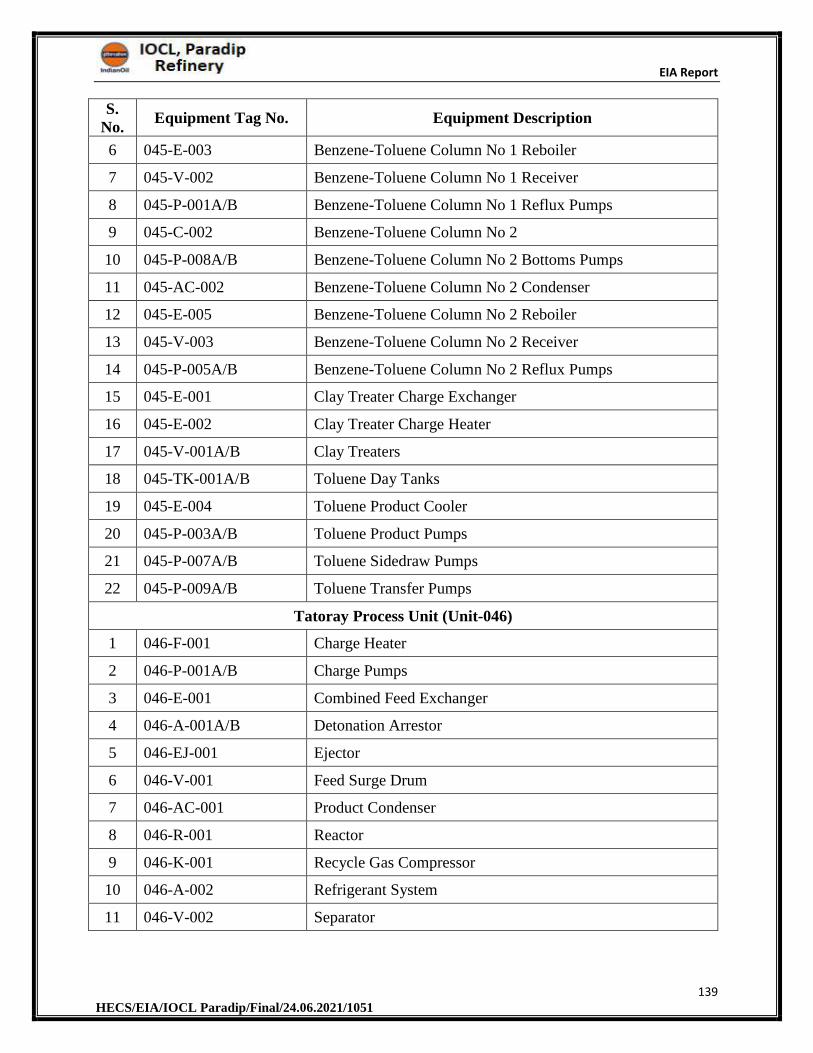
EIA Report
139 HECS/EIA/IOCL Paradip/Final/24.06.2021/1051
S. No.
Equipment Tag No. Equipment Description
6 045-E-003 Benzene-Toluene Column No 1 Reboiler
7 045-V-002 Benzene-Toluene Column No 1 Receiver
8 045-P-001A/B Benzene-Toluene Column No 1 Reflux Pumps
9 045-C-002 Benzene-Toluene Column No 2
10 045-P-008A/B Benzene-Toluene Column No 2 Bottoms Pumps
11 045-AC-002 Benzene-Toluene Column No 2 Condenser
12 045-E-005 Benzene-Toluene Column No 2 Reboiler
13 045-V-003 Benzene-Toluene Column No 2 Receiver
14 045-P-005A/B Benzene-Toluene Column No 2 Reflux Pumps
15 045-E-001 Clay Treater Charge Exchanger
16 045-E-002 Clay Treater Charge Heater
17 045-V-001A/B Clay Treaters
18 045-TK-001A/B Toluene Day Tanks
19 045-E-004 Toluene Product Cooler
20 045-P-003A/B Toluene Product Pumps
21 045-P-007A/B Toluene Sidedraw Pumps
22 045-P-009A/B Toluene Transfer Pumps
Tatoray Process Unit (Unit-046)
1 046-F-001 Charge Heater
2 046-P-001A/B Charge Pumps
3 046-E-001 Combined Feed Exchanger
4 046-A-001A/B Detonation Arrestor
5 046-EJ-001 Ejector
6 046-V-001 Feed Surge Drum
7 046-AC-001 Product Condenser
8 046-R-001 Reactor
9 046-K-001 Recycle Gas Compressor
10 046-A-002 Refrigerant System
11 046-V-002 Separator
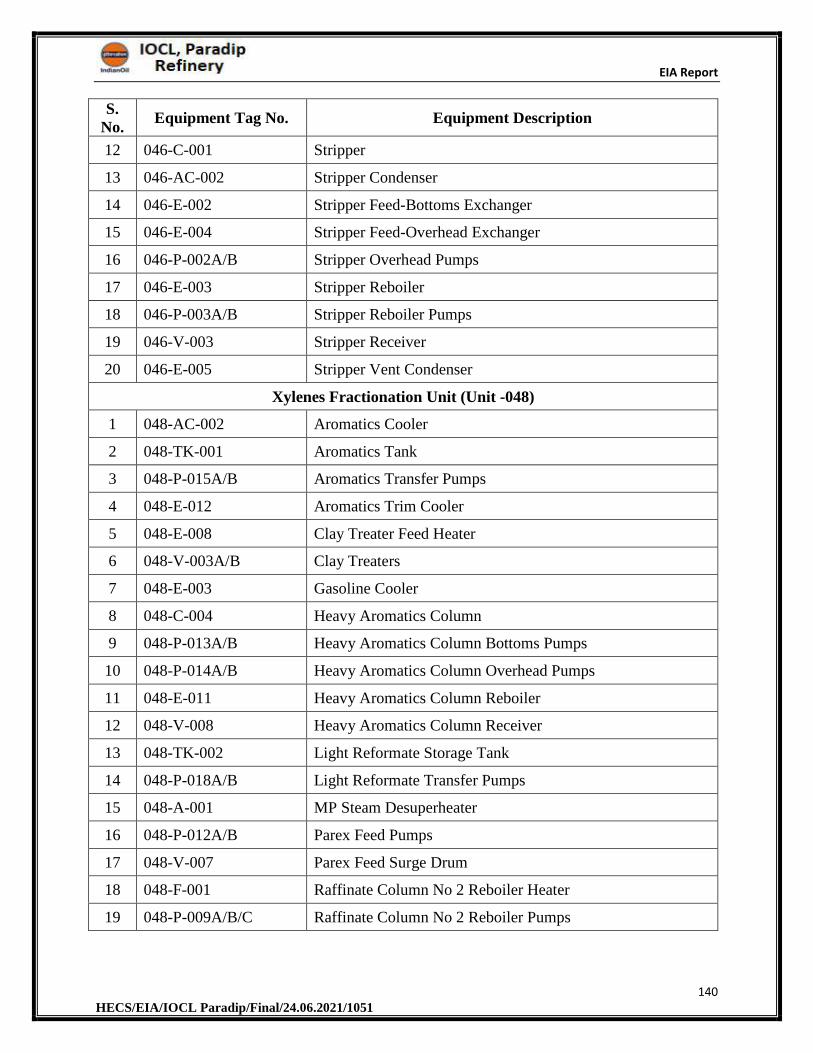
EIA Report
140 HECS/EIA/IOCL Paradip/Final/24.06.2021/1051
S. No.
Equipment Tag No. Equipment Description
12 046-C-001 Stripper
13 046-AC-002 Stripper Condenser
14 046-E-002 Stripper Feed-Bottoms Exchanger
15 046-E-004 Stripper Feed-Overhead Exchanger
16 046-P-002A/B Stripper Overhead Pumps
17 046-E-003 Stripper Reboiler
18 046-P-003A/B Stripper Reboiler Pumps
19 046-V-003 Stripper Receiver
20 046-E-005 Stripper Vent Condenser
Xylenes Fractionation Unit (Unit -048)
1 048-AC-002 Aromatics Cooler
2 048-TK-001 Aromatics Tank
3 048-P-015A/B Aromatics Transfer Pumps
4 048-E-012 Aromatics Trim Cooler
5 048-E-008 Clay Treater Feed Heater
6 048-V-003A/B Clay Treaters
7 048-E-003 Gasoline Cooler
8 048-C-004 Heavy Aromatics Column
9 048-P-013A/B Heavy Aromatics Column Bottoms Pumps
10 048-P-014A/B Heavy Aromatics Column Overhead Pumps
11 048-E-011 Heavy Aromatics Column Reboiler
12 048-V-008 Heavy Aromatics Column Receiver
13 048-TK-002 Light Reformate Storage Tank
14 048-P-018A/B Light Reformate Transfer Pumps
15 048-A-001 MP Steam Desuperheater
16 048-P-012A/B Parex Feed Pumps
17 048-V-007 Parex Feed Surge Drum
18 048-F-001 Raffinate Column No 2 Reboiler Heater
19 048-P-009A/B/C Raffinate Column No 2 Reboiler Pumps
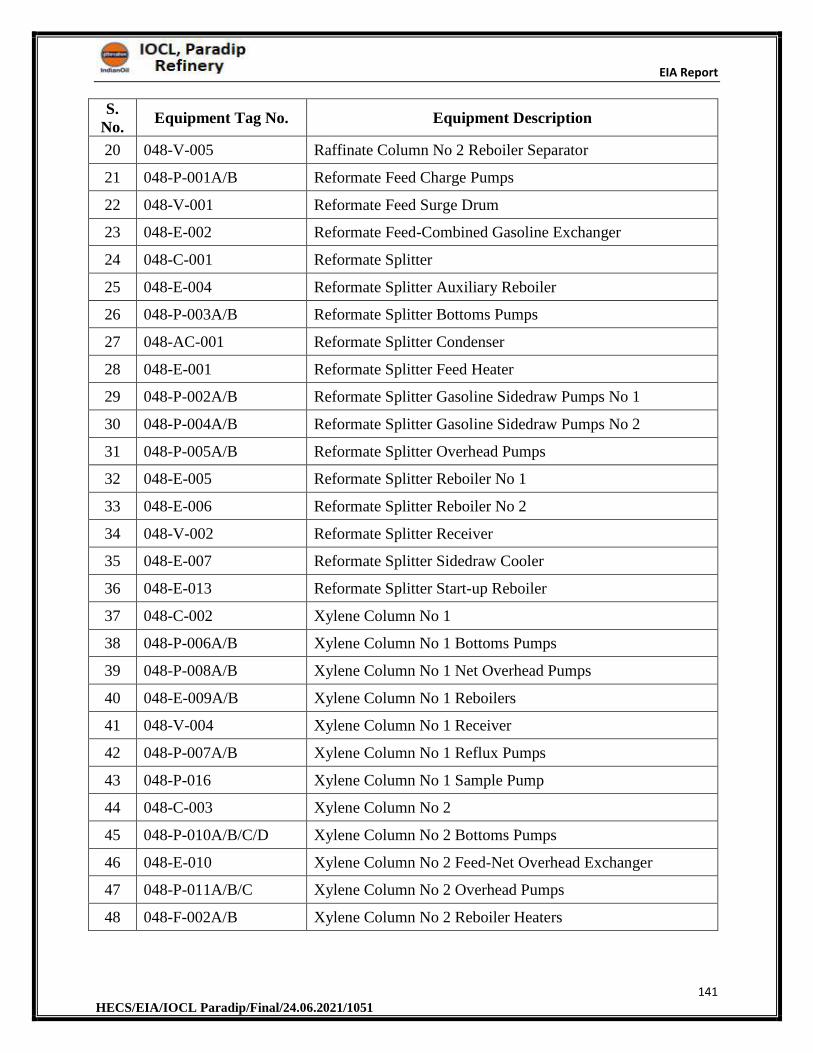
EIA Report
141 HECS/EIA/IOCL Paradip/Final/24.06.2021/1051
S. No.
Equipment Tag No. Equipment Description
20 048-V-005 Raffinate Column No 2 Reboiler Separator
21 048-P-001A/B Reformate Feed Charge Pumps
22 048-V-001 Reformate Feed Surge Drum
23 048-E-002 Reformate Feed-Combined Gasoline Exchanger
24 048-C-001 Reformate Splitter
25 048-E-004 Reformate Splitter Auxiliary Reboiler
26 048-P-003A/B Reformate Splitter Bottoms Pumps
27 048-AC-001 Reformate Splitter Condenser
28 048-E-001 Reformate Splitter Feed Heater
29 048-P-002A/B Reformate Splitter Gasoline Sidedraw Pumps No 1
30 048-P-004A/B Reformate Splitter Gasoline Sidedraw Pumps No 2
31 048-P-005A/B Reformate Splitter Overhead Pumps
32 048-E-005 Reformate Splitter Reboiler No 1
33 048-E-006 Reformate Splitter Reboiler No 2
34 048-V-002 Reformate Splitter Receiver
35 048-E-007 Reformate Splitter Sidedraw Cooler
36 048-E-013 Reformate Splitter Start-up Reboiler
37 048-C-002 Xylene Column No 1
38 048-P-006A/B Xylene Column No 1 Bottoms Pumps
39 048-P-008A/B Xylene Column No 1 Net Overhead Pumps
40 048-E-009A/B Xylene Column No 1 Reboilers
41 048-V-004 Xylene Column No 1 Receiver
42 048-P-007A/B Xylene Column No 1 Reflux Pumps
43 048-P-016 Xylene Column No 1 Sample Pump
44 048-C-003 Xylene Column No 2
45 048-P-010A/B/C/D Xylene Column No 2 Bottoms Pumps
46 048-E-010 Xylene Column No 2 Feed-Net Overhead Exchanger
47 048-P-011A/B/C Xylene Column No 2 Overhead Pumps
48 048-F-002A/B Xylene Column No 2 Reboiler Heaters
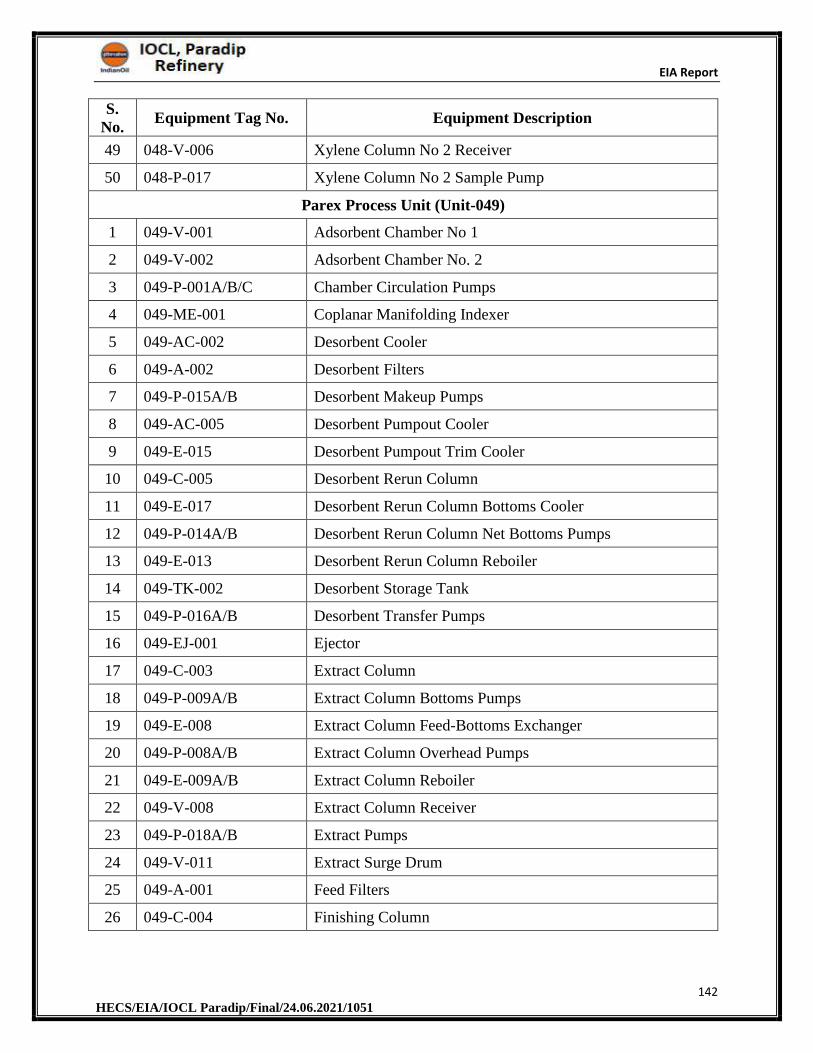
EIA Report
142 HECS/EIA/IOCL Paradip/Final/24.06.2021/1051
S. No.
Equipment Tag No. Equipment Description
49 048-V-006 Xylene Column No 2 Receiver
50 048-P-017 Xylene Column No 2 Sample Pump
Parex Process Unit (Unit-049)
1 049-V-001 Adsorbent Chamber No 1
2 049-V-002 Adsorbent Chamber No. 2
3 049-P-001A/B/C Chamber Circulation Pumps
4 049-ME-001 Coplanar Manifolding Indexer
5 049-AC-002 Desorbent Cooler
6 049-A-002 Desorbent Filters
7 049-P-015A/B Desorbent Makeup Pumps
8 049-AC-005 Desorbent Pumpout Cooler
9 049-E-015 Desorbent Pumpout Trim Cooler
10 049-C-005 Desorbent Rerun Column
11 049-E-017 Desorbent Rerun Column Bottoms Cooler
12 049-P-014A/B Desorbent Rerun Column Net Bottoms Pumps
13 049-E-013 Desorbent Rerun Column Reboiler
14 049-TK-002 Desorbent Storage Tank
15 049-P-016A/B Desorbent Transfer Pumps
16 049-EJ-001 Ejector
17 049-C-003 Extract Column
18 049-P-009A/B Extract Column Bottoms Pumps
19 049-E-008 Extract Column Feed-Bottoms Exchanger
20 049-P-008A/B Extract Column Overhead Pumps
21 049-E-009A/B Extract Column Reboiler
22 049-V-008 Extract Column Receiver
23 049-P-018A/B Extract Pumps
24 049-V-011 Extract Surge Drum
25 049-A-001 Feed Filters
26 049-C-004 Finishing Column

EIA Report
143 HECS/EIA/IOCL Paradip/Final/24.06.2021/1051
S. No.
Equipment Tag No. Equipment Description
27 049-E-011 Finishing Column Auxiliary Reboiler
28 049-P-012A/B Finishing Column Bottoms Pumps
29 049-AC-003 Finishing Column Condenser
30 049-P-011A/B Finishing Column Overhead Pumps
31 049-E-010 Finishing Column Reboiler
32 049-V-009 Finishing Column Receiver
33 049-V-006 Isomar Feed Surge Drum
34 049-P-002A/B Line Flush Pumps
35 049-AC-004 Paraxylene Cooler
36 049-TK-001 A/B Paraxylene Day Tanks
37 049-F-001A/B Paraxylene Day Tanks Heater
38 049-P-013A/B Paraxylene Transfer Pumps
39 049-E-012 Paraxylene Trim Cooler
40 049-V-010 Parex Sump
41 049-P-017A/B Parex Sump Pump
42 049-E-016 Parex Sump Pumpout Cooler
43 049-V-007 Parex Water Injection Drum
44 049-TK-003 Plant Inventory Storage Tank
45 049-C-001 Raffinate Column No 1
46 049-E-004 Raffinate Column No 1 Reboiler
47 049-C-002 Raffinate Column No 2
48 049-E-005A/B Raffinate Column No 2 Feed-Bottoms Exchanger
49 049-E-007 Raffinate Column No 2 Steam Generator
50 049-P-005A/B Raffinate Column No1 Bottoms Pumps
51 049-E-001A/B Raffinate Column No1 Cold Feed Exchanger
52 049-AC-001 Raffinate Column No1 Condenser
53 049-E-002A/B Raffinate Column No1 Hot Feed Exchanger
54 049-V-003 Raffinate Column No1 Receiver
55 049-P-003A/B Raffinate Column No1 Reflux Pumps
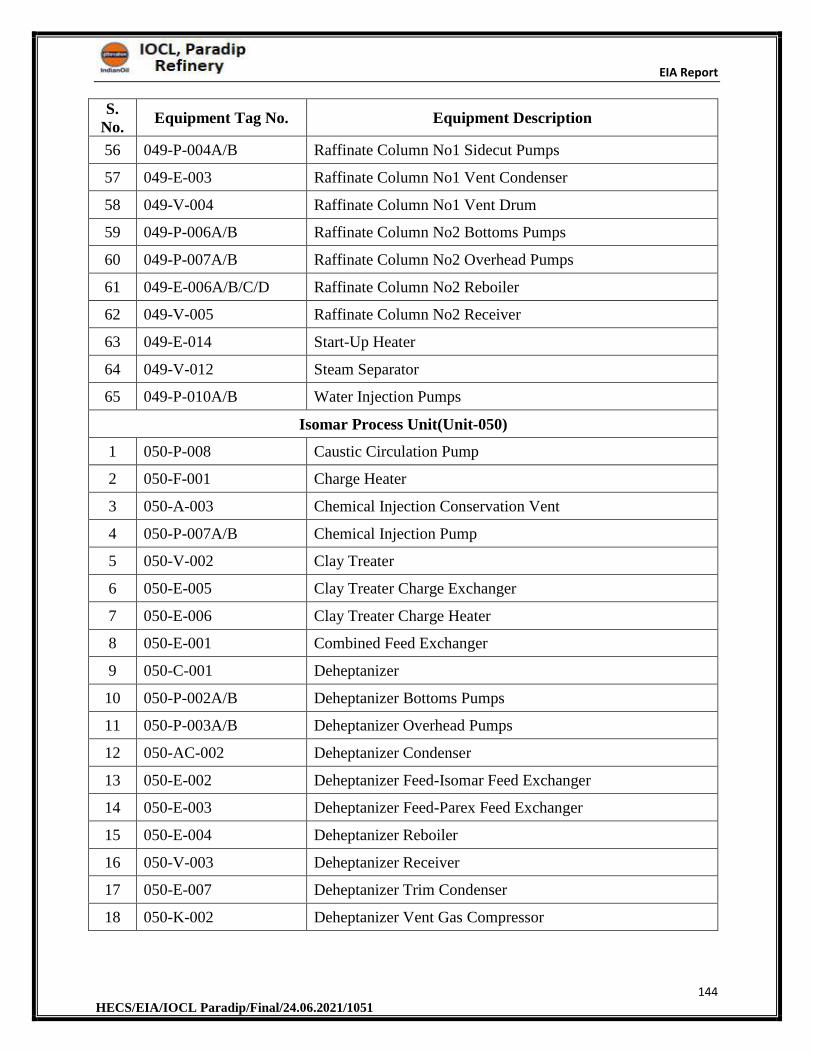
EIA Report
144 HECS/EIA/IOCL Paradip/Final/24.06.2021/1051
S. No.
Equipment Tag No. Equipment Description
56 049-P-004A/B Raffinate Column No1 Sidecut Pumps
57 049-E-003 Raffinate Column No1 Vent Condenser
58 049-V-004 Raffinate Column No1 Vent Drum
59 049-P-006A/B Raffinate Column No2 Bottoms Pumps
60 049-P-007A/B Raffinate Column No2 Overhead Pumps
61 049-E-006A/B/C/D Raffinate Column No2 Reboiler
62 049-V-005 Raffinate Column No2 Receiver
63 049-E-014 Start-Up Heater
64 049-V-012 Steam Separator
65 049-P-010A/B Water Injection Pumps
Isomar Process Unit(Unit-050)
1 050-P-008 Caustic Circulation Pump
2 050-F-001 Charge Heater
3 050-A-003 Chemical Injection Conservation Vent
4 050-P-007A/B Chemical Injection Pump
5 050-V-002 Clay Treater
6 050-E-005 Clay Treater Charge Exchanger
7 050-E-006 Clay Treater Charge Heater
8 050-E-001 Combined Feed Exchanger
9 050-C-001 Deheptanizer
10 050-P-002A/B Deheptanizer Bottoms Pumps
11 050-P-003A/B Deheptanizer Overhead Pumps
12 050-AC-002 Deheptanizer Condenser
13 050-E-002 Deheptanizer Feed-Isomar Feed Exchanger
14 050-E-003 Deheptanizer Feed-Parex Feed Exchanger
15 050-E-004 Deheptanizer Reboiler
16 050-V-003 Deheptanizer Receiver
17 050-E-007 Deheptanizer Trim Condenser
18 050-K-002 Deheptanizer Vent Gas Compressor
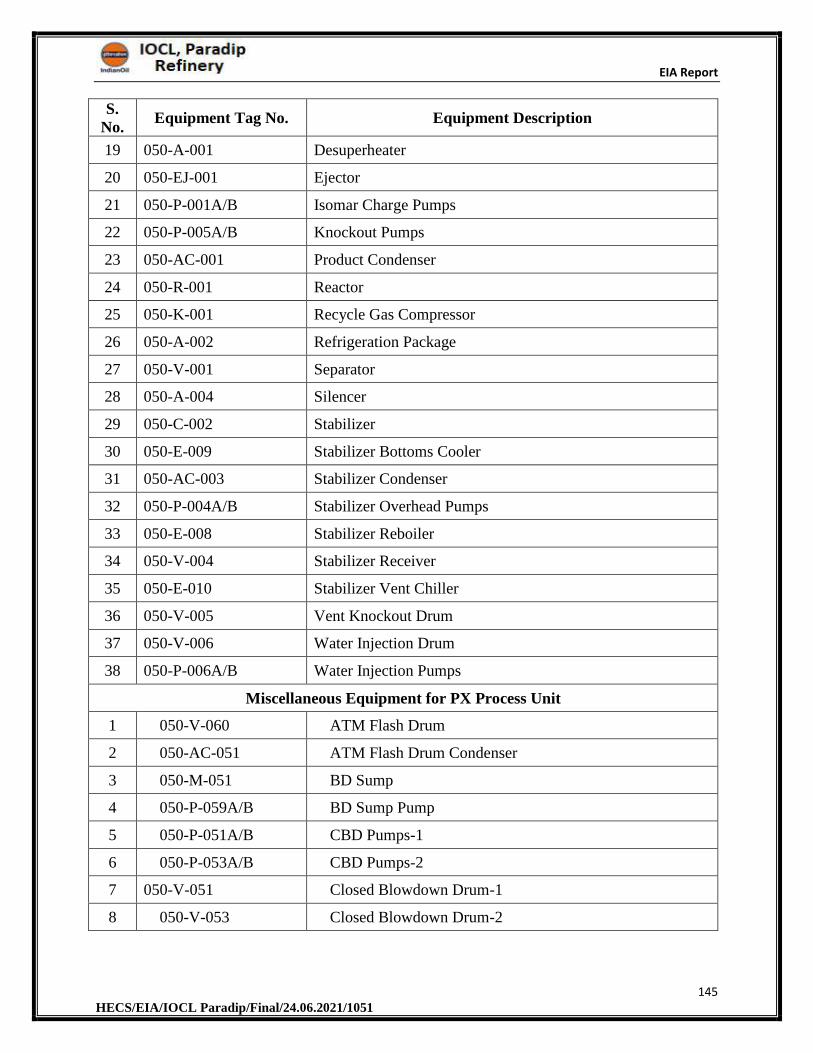
EIA Report
145 HECS/EIA/IOCL Paradip/Final/24.06.2021/1051
S. No.
Equipment Tag No. Equipment Description
19 050-A-001 Desuperheater
20 050-EJ-001 Ejector
21 050-P-001A/B Isomar Charge Pumps
22 050-P-005A/B Knockout Pumps
23 050-AC-001 Product Condenser
24 050-R-001 Reactor
25 050-K-001 Recycle Gas Compressor
26 050-A-002 Refrigeration Package
27 050-V-001 Separator
28 050-A-004 Silencer
29 050-C-002 Stabilizer
30 050-E-009 Stabilizer Bottoms Cooler
31 050-AC-003 Stabilizer Condenser
32 050-P-004A/B Stabilizer Overhead Pumps
33 050-E-008 Stabilizer Reboiler
34 050-V-004 Stabilizer Receiver
35 050-E-010 Stabilizer Vent Chiller
36 050-V-005 Vent Knockout Drum
37 050-V-006 Water Injection Drum
38 050-P-006A/B Water Injection Pumps
Miscellaneous Equipment for PX Process Unit
1 050-V-060 ATM Flash Drum
2 050-AC-051 ATM Flash Drum Condenser
3 050-M-051 BD Sump
4 050-P-059A/B BD Sump Pump
5 050-P-051A/B CBD Pumps-1
6 050-P-053A/B CBD Pumps-2
7 050-V-051 Closed Blowdown Drum-1
8 050-V-053 Closed Blowdown Drum-2
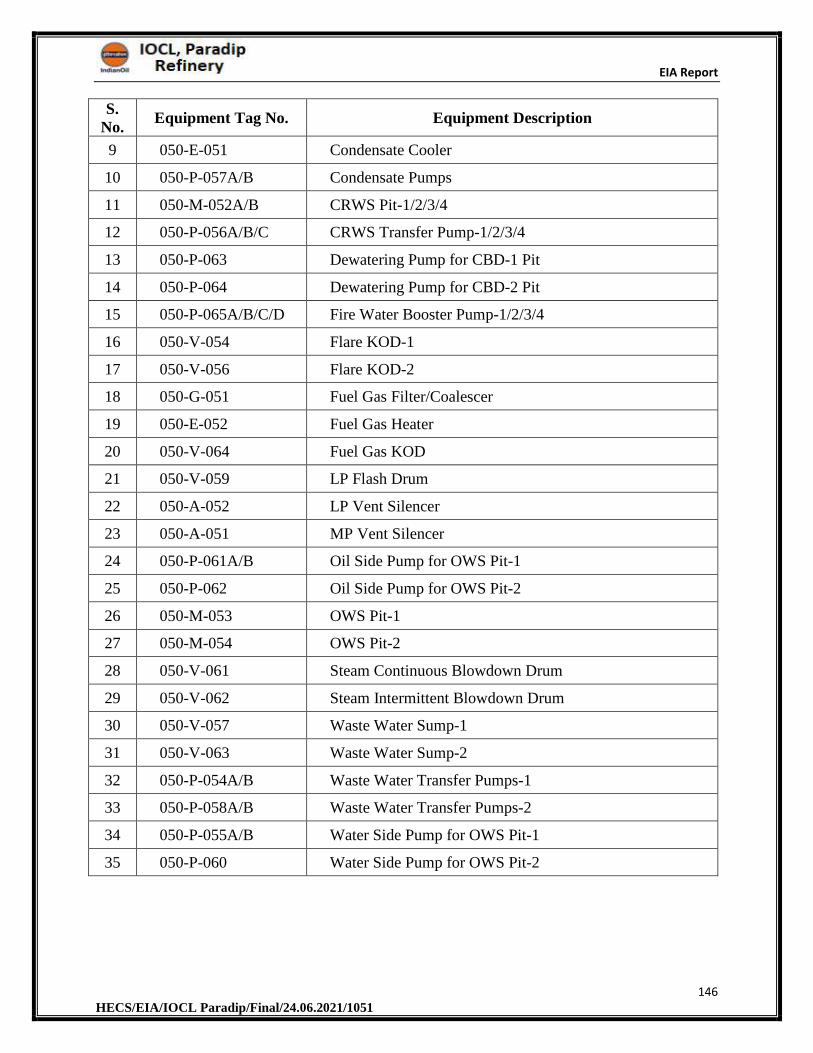
EIA Report
146 HECS/EIA/IOCL Paradip/Final/24.06.2021/1051
S. No.
Equipment Tag No. Equipment Description
9 050-E-051 Condensate Cooler
10 050-P-057A/B Condensate Pumps
11 050-M-052A/B CRWS Pit-1/2/3/4
12 050-P-056A/B/C CRWS Transfer Pump-1/2/3/4
13 050-P-063 Dewatering Pump for CBD-1 Pit
14 050-P-064 Dewatering Pump for CBD-2 Pit
15 050-P-065A/B/C/D Fire Water Booster Pump-1/2/3/4
16 050-V-054 Flare KOD-1
17 050-V-056 Flare KOD-2
18 050-G-051 Fuel Gas Filter/Coalescer
19 050-E-052 Fuel Gas Heater
20 050-V-064 Fuel Gas KOD
21 050-V-059 LP Flash Drum
22 050-A-052 LP Vent Silencer
23 050-A-051 MP Vent Silencer
24 050-P-061A/B Oil Side Pump for OWS Pit-1
25 050-P-062 Oil Side Pump for OWS Pit-2
26 050-M-053 OWS Pit-1
27 050-M-054 OWS Pit-2
28 050-V-061 Steam Continuous Blowdown Drum
29 050-V-062 Steam Intermittent Blowdown Drum
30 050-V-057 Waste Water Sump-1
31 050-V-063 Waste Water Sump-2
32 050-P-054A/B Waste Water Transfer Pumps-1
33 050-P-058A/B Waste Water Transfer Pumps-2
34 050-P-055A/B Water Side Pump for OWS Pit-1
35 050-P-060 Water Side Pump for OWS Pit-2
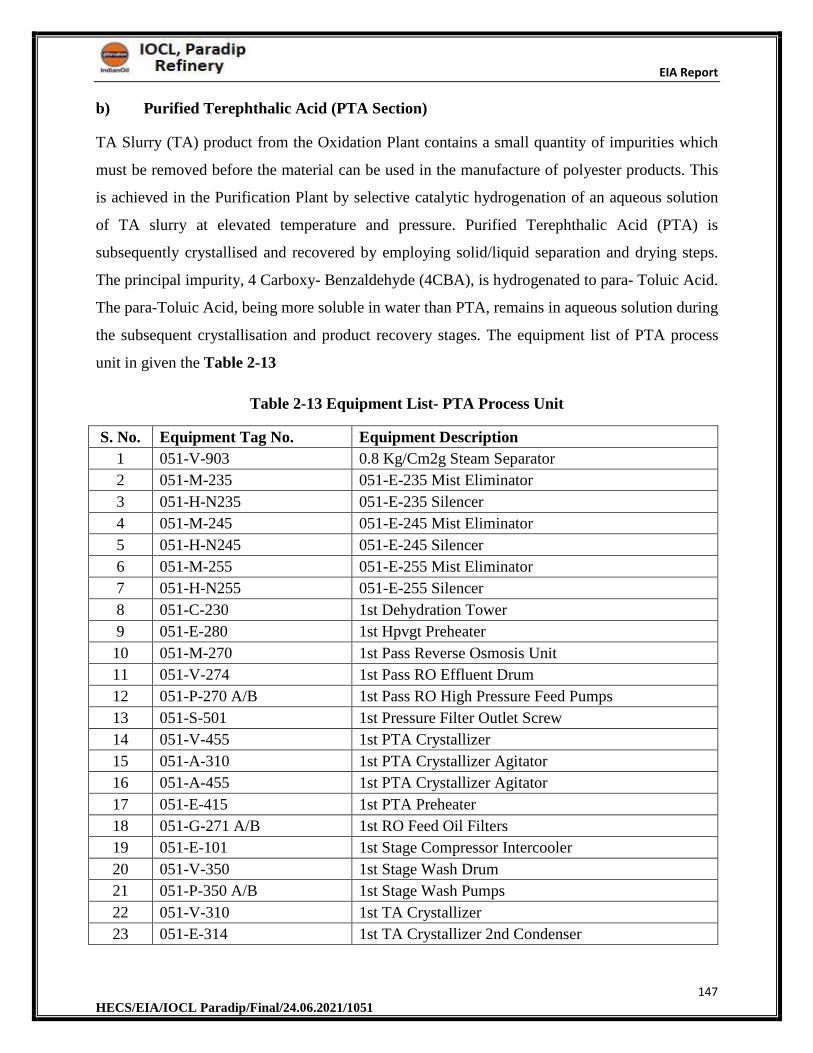
EIA Report
147 HECS/EIA/IOCL Paradip/Final/24.06.2021/1051
b) Purified Terephthalic Acid (PTA Section)
TA Slurry (TA) product from the Oxidation Plant contains a small quantity of impurities which
must be removed before the material can be used in the manufacture of polyester products. This
is achieved in the Purification Plant by selective catalytic hydrogenation of an aqueous solution
of TA slurry at elevated temperature and pressure. Purified Terephthalic Acid (PTA) is
subsequently crystallised and recovered by employing solid/liquid separation and drying steps.
The principal impurity, 4 Carboxy- Benzaldehyde (4CBA), is hydrogenated to para- Toluic Acid.
The para-Toluic Acid, being more soluble in water than PTA, remains in aqueous solution during
the subsequent crystallisation and product recovery stages. The equipment list of PTA process
unit in given the Table 2-13
Table 2-13 Equipment List- PTA Process Unit
S. No. Equipment Tag No. Equipment Description
1 051-V-903 0.8 Kg/Cm2g Steam Separator
2 051-M-235 051-E-235 Mist Eliminator
3 051-H-N235 051-E-235 Silencer
4 051-M-245 051-E-245 Mist Eliminator
5 051-H-N245 051-E-245 Silencer
6 051-M-255 051-E-255 Mist Eliminator
7 051-H-N255 051-E-255 Silencer
8 051-C-230 1st Dehydration Tower
9 051-E-280 1st Hpvgt Preheater
10 051-M-270 1st Pass Reverse Osmosis Unit
11 051-V-274 1st Pass RO Effluent Drum
12 051-P-270 A/B 1st Pass RO High Pressure Feed Pumps
13 051-S-501 1st Pressure Filter Outlet Screw
14 051-V-455 1st PTA Crystallizer
15 051-A-310 1st PTA Crystallizer Agitator
16 051-A-455 1st PTA Crystallizer Agitator
17 051-E-415 1st PTA Preheater
18 051-G-271 A/B 1st RO Feed Oil Filters
19 051-E-101 1st Stage Compressor Intercooler
20 051-V-350 1st Stage Wash Drum
21 051-P-350 A/B 1st Stage Wash Pumps
22 051-V-310 1st TA Crystallizer
23 051-E-314 1st TA Crystallizer 2nd Condenser
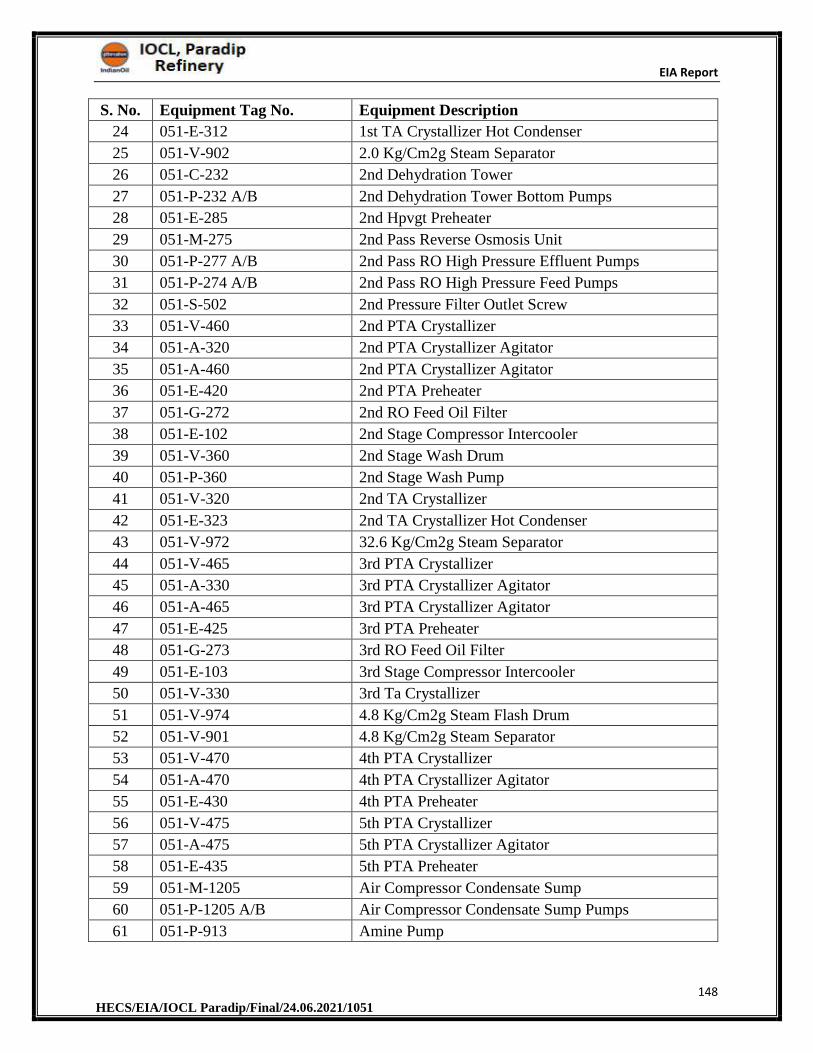
EIA Report
148 HECS/EIA/IOCL Paradip/Final/24.06.2021/1051
S. No. Equipment Tag No. Equipment Description
24 051-E-312 1st TA Crystallizer Hot Condenser
25 051-V-902 2.0 Kg/Cm2g Steam Separator
26 051-C-232 2nd Dehydration Tower
27 051-P-232 A/B 2nd Dehydration Tower Bottom Pumps
28 051-E-285 2nd Hpvgt Preheater
29 051-M-275 2nd Pass Reverse Osmosis Unit
30 051-P-277 A/B 2nd Pass RO High Pressure Effluent Pumps
31 051-P-274 A/B 2nd Pass RO High Pressure Feed Pumps
32 051-S-502 2nd Pressure Filter Outlet Screw
33 051-V-460 2nd PTA Crystallizer
34 051-A-320 2nd PTA Crystallizer Agitator
35 051-A-460 2nd PTA Crystallizer Agitator
36 051-E-420 2nd PTA Preheater
37 051-G-272 2nd RO Feed Oil Filter
38 051-E-102 2nd Stage Compressor Intercooler
39 051-V-360 2nd Stage Wash Drum
40 051-P-360 2nd Stage Wash Pump
41 051-V-320 2nd TA Crystallizer
42 051-E-323 2nd TA Crystallizer Hot Condenser
43 051-V-972 32.6 Kg/Cm2g Steam Separator
44 051-V-465 3rd PTA Crystallizer
45 051-A-330 3rd PTA Crystallizer Agitator
46 051-A-465 3rd PTA Crystallizer Agitator
47 051-E-425 3rd PTA Preheater
48 051-G-273 3rd RO Feed Oil Filter
49 051-E-103 3rd Stage Compressor Intercooler
50 051-V-330 3rd Ta Crystallizer
51 051-V-974 4.8 Kg/Cm2g Steam Flash Drum
52 051-V-901 4.8 Kg/Cm2g Steam Separator
53 051-V-470 4th PTA Crystallizer
54 051-A-470 4th PTA Crystallizer Agitator
55 051-E-430 4th PTA Preheater
56 051-V-475 5th PTA Crystallizer
57 051-A-475 5th PTA Crystallizer Agitator
58 051-E-435 5th PTA Preheater
59 051-M-1205 Air Compressor Condensate Sump
60 051-P-1205 A/B Air Compressor Condensate Sump Pumps
61 051-P-913 Amine Pump
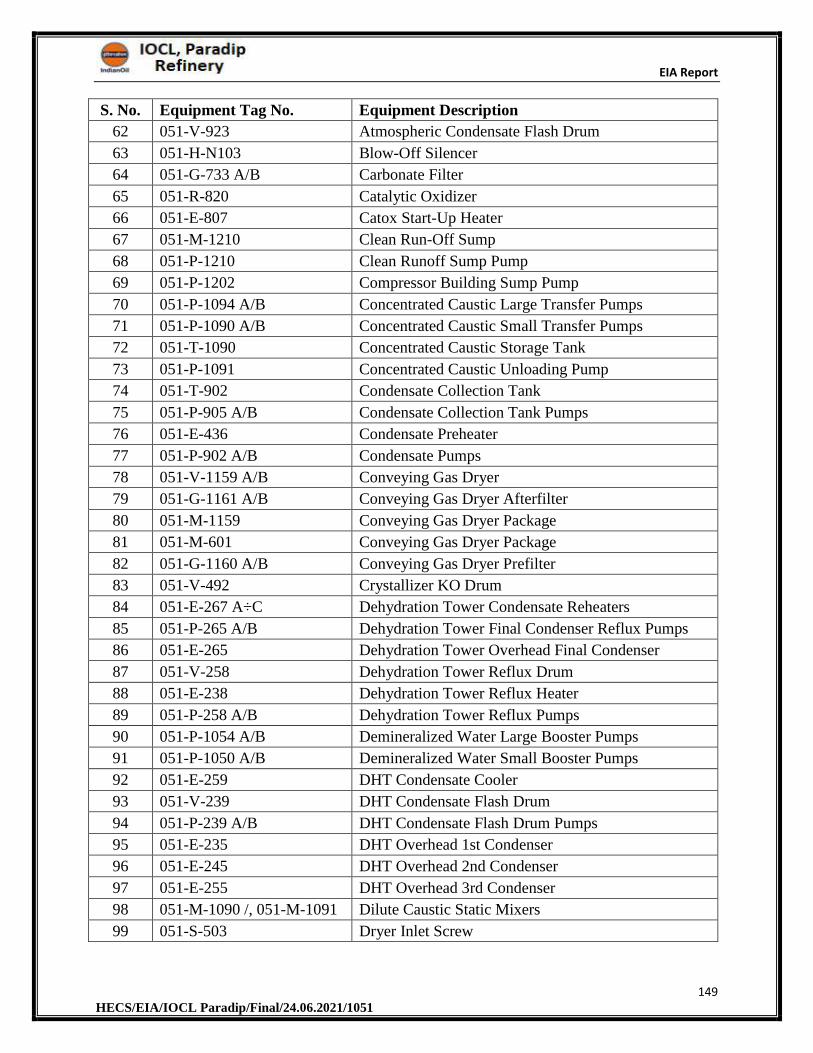
EIA Report
149 HECS/EIA/IOCL Paradip/Final/24.06.2021/1051
S. No. Equipment Tag No. Equipment Description
62 051-V-923 Atmospheric Condensate Flash Drum
63 051-H-N103 Blow-Off Silencer
64 051-G-733 A/B Carbonate Filter
65 051-R-820 Catalytic Oxidizer
66 051-E-807 Catox Start-Up Heater
67 051-M-1210 Clean Run-Off Sump
68 051-P-1210 Clean Runoff Sump Pump
69 051-P-1202 Compressor Building Sump Pump
70 051-P-1094 A/B Concentrated Caustic Large Transfer Pumps
71 051-P-1090 A/B Concentrated Caustic Small Transfer Pumps
72 051-T-1090 Concentrated Caustic Storage Tank
73 051-P-1091 Concentrated Caustic Unloading Pump
74 051-T-902 Condensate Collection Tank
75 051-P-905 A/B Condensate Collection Tank Pumps
76 051-E-436 Condensate Preheater
77 051-P-902 A/B Condensate Pumps
78 051-V-1159 A/B Conveying Gas Dryer
79 051-G-1161 A/B Conveying Gas Dryer Afterfilter
80 051-M-1159 Conveying Gas Dryer Package
81 051-M-601 Conveying Gas Dryer Package
82 051-G-1160 A/B Conveying Gas Dryer Prefilter
83 051-V-492 Crystallizer KO Drum
84 051-E-267 A÷C Dehydration Tower Condensate Reheaters
85 051-P-265 A/B Dehydration Tower Final Condenser Reflux Pumps
86 051-E-265 Dehydration Tower Overhead Final Condenser
87 051-V-258 Dehydration Tower Reflux Drum
88 051-E-238 Dehydration Tower Reflux Heater
89 051-P-258 A/B Dehydration Tower Reflux Pumps
90 051-P-1054 A/B Demineralized Water Large Booster Pumps
91 051-P-1050 A/B Demineralized Water Small Booster Pumps
92 051-E-259 DHT Condensate Cooler
93 051-V-239 DHT Condensate Flash Drum
94 051-P-239 A/B DHT Condensate Flash Drum Pumps
95 051-E-235 DHT Overhead 1st Condenser
96 051-E-245 DHT Overhead 2nd Condenser
97 051-E-255 DHT Overhead 3rd Condenser
98 051-M-1090 /, 051-M-1091 Dilute Caustic Static Mixers
99 051-S-503 Dryer Inlet Screw
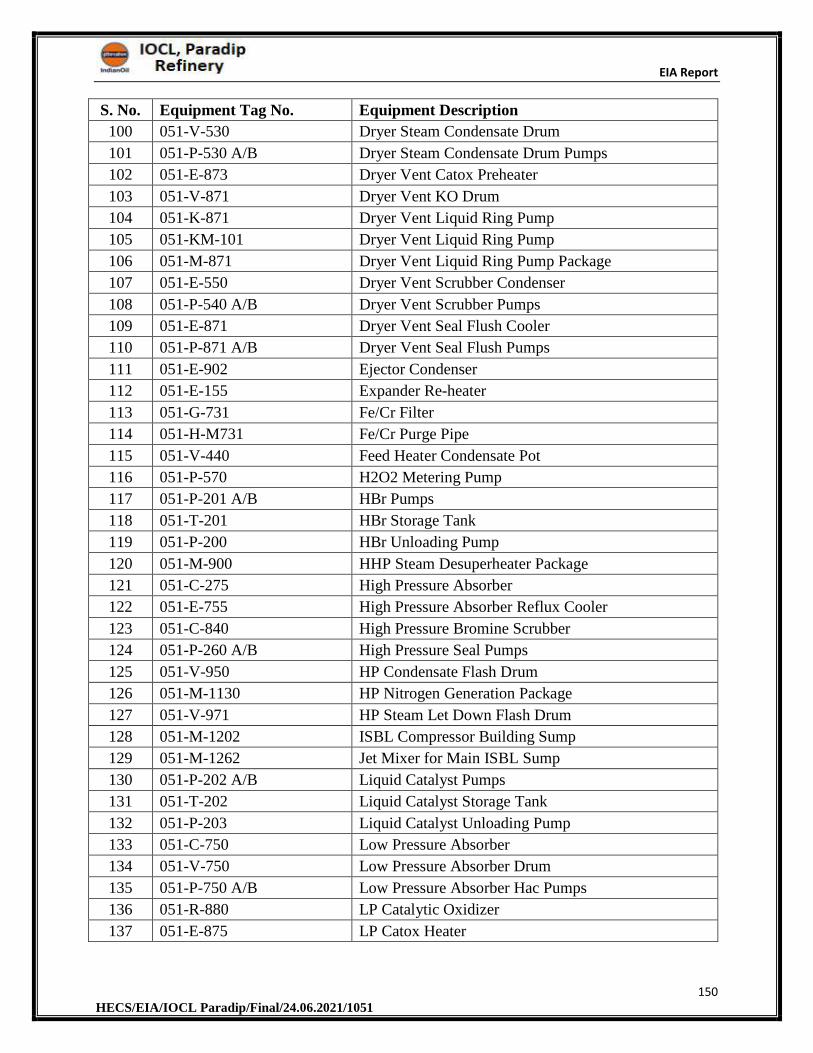
EIA Report
150 HECS/EIA/IOCL Paradip/Final/24.06.2021/1051
S. No. Equipment Tag No. Equipment Description
100 051-V-530 Dryer Steam Condensate Drum
101 051-P-530 A/B Dryer Steam Condensate Drum Pumps
102 051-E-873 Dryer Vent Catox Preheater
103 051-V-871 Dryer Vent KO Drum
104 051-K-871 Dryer Vent Liquid Ring Pump
105 051-KM-101 Dryer Vent Liquid Ring Pump
106 051-M-871 Dryer Vent Liquid Ring Pump Package
107 051-E-550 Dryer Vent Scrubber Condenser
108 051-P-540 A/B Dryer Vent Scrubber Pumps
109 051-E-871 Dryer Vent Seal Flush Cooler
110 051-P-871 A/B Dryer Vent Seal Flush Pumps
111 051-E-902 Ejector Condenser
112 051-E-155 Expander Re-heater
113 051-G-731 Fe/Cr Filter
114 051-H-M731 Fe/Cr Purge Pipe
115 051-V-440 Feed Heater Condensate Pot
116 051-P-570 H2O2 Metering Pump
117 051-P-201 A/B HBr Pumps
118 051-T-201 HBr Storage Tank
119 051-P-200 HBr Unloading Pump
120 051-M-900 HHP Steam Desuperheater Package
121 051-C-275 High Pressure Absorber
122 051-E-755 High Pressure Absorber Reflux Cooler
123 051-C-840 High Pressure Bromine Scrubber
124 051-P-260 A/B High Pressure Seal Pumps
125 051-V-950 HP Condensate Flash Drum
126 051-M-1130 HP Nitrogen Generation Package
127 051-V-971 HP Steam Let Down Flash Drum
128 051-M-1202 ISBL Compressor Building Sump
129 051-M-1262 Jet Mixer for Main ISBL Sump
130 051-P-202 A/B Liquid Catalyst Pumps
131 051-T-202 Liquid Catalyst Storage Tank
132 051-P-203 Liquid Catalyst Unloading Pump
133 051-C-750 Low Pressure Absorber
134 051-V-750 Low Pressure Absorber Drum
135 051-P-750 A/B Low Pressure Absorber Hac Pumps
136 051-R-880 LP Catalytic Oxidizer
137 051-E-875 LP Catox Heater
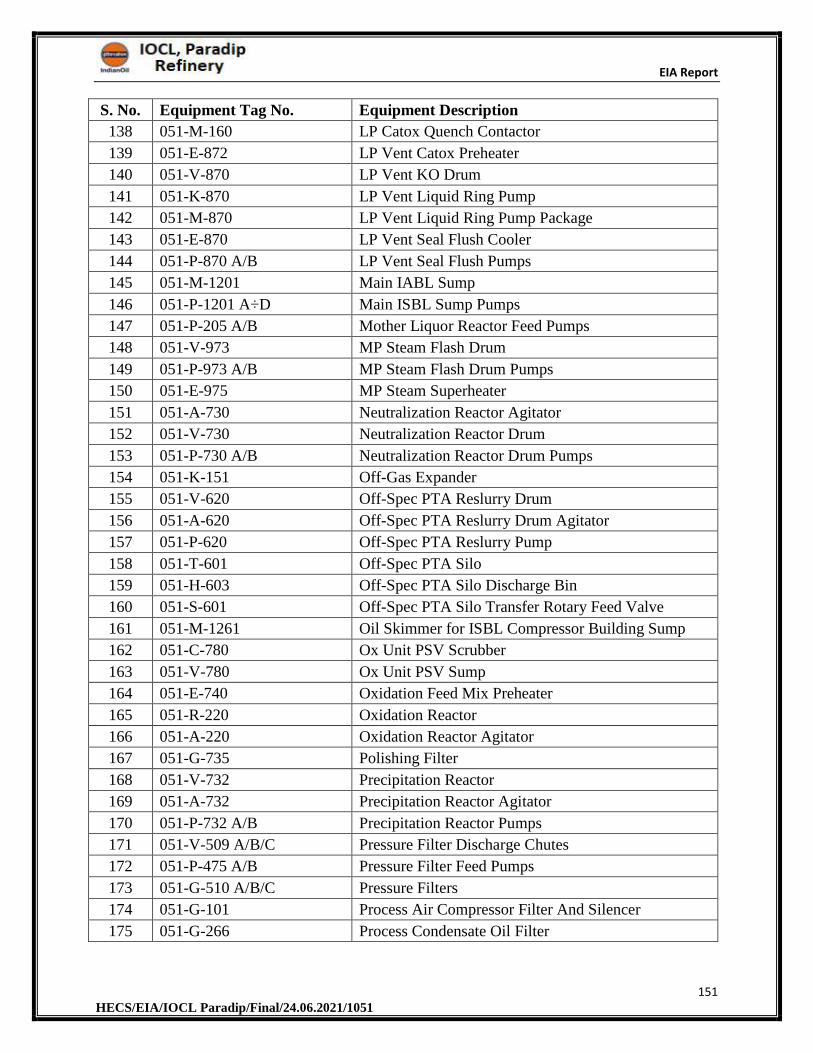
EIA Report
151 HECS/EIA/IOCL Paradip/Final/24.06.2021/1051
S. No. Equipment Tag No. Equipment Description
138 051-M-160 LP Catox Quench Contactor
139 051-E-872 LP Vent Catox Preheater
140 051-V-870 LP Vent KO Drum
141 051-K-870 LP Vent Liquid Ring Pump
142 051-M-870 LP Vent Liquid Ring Pump Package
143 051-E-870 LP Vent Seal Flush Cooler
144 051-P-870 A/B LP Vent Seal Flush Pumps
145 051-M-1201 Main IABL Sump
146 051-P-1201 A÷D Main ISBL Sump Pumps
147 051-P-205 A/B Mother Liquor Reactor Feed Pumps
148 051-V-973 MP Steam Flash Drum
149 051-P-973 A/B MP Steam Flash Drum Pumps
150 051-E-975 MP Steam Superheater
151 051-A-730 Neutralization Reactor Agitator
152 051-V-730 Neutralization Reactor Drum
153 051-P-730 A/B Neutralization Reactor Drum Pumps
154 051-K-151 Off-Gas Expander
155 051-V-620 Off-Spec PTA Reslurry Drum
156 051-A-620 Off-Spec PTA Reslurry Drum Agitator
157 051-P-620 Off-Spec PTA Reslurry Pump
158 051-T-601 Off-Spec PTA Silo
159 051-H-603 Off-Spec PTA Silo Discharge Bin
160 051-S-601 Off-Spec PTA Silo Transfer Rotary Feed Valve
161 051-M-1261 Oil Skimmer for ISBL Compressor Building Sump
162 051-C-780 Ox Unit PSV Scrubber
163 051-V-780 Ox Unit PSV Sump
164 051-E-740 Oxidation Feed Mix Preheater
165 051-R-220 Oxidation Reactor
166 051-A-220 Oxidation Reactor Agitator
167 051-G-735 Polishing Filter
168 051-V-732 Precipitation Reactor
169 051-A-732 Precipitation Reactor Agitator
170 051-P-732 A/B Precipitation Reactor Pumps
171 051-V-509 A/B/C Pressure Filter Discharge Chutes
172 051-P-475 A/B Pressure Filter Feed Pumps
173 051-G-510 A/B/C Pressure Filters
174 051-G-101 Process Air Compressor Filter And Silencer
175 051-G-266 Process Condensate Oil Filter
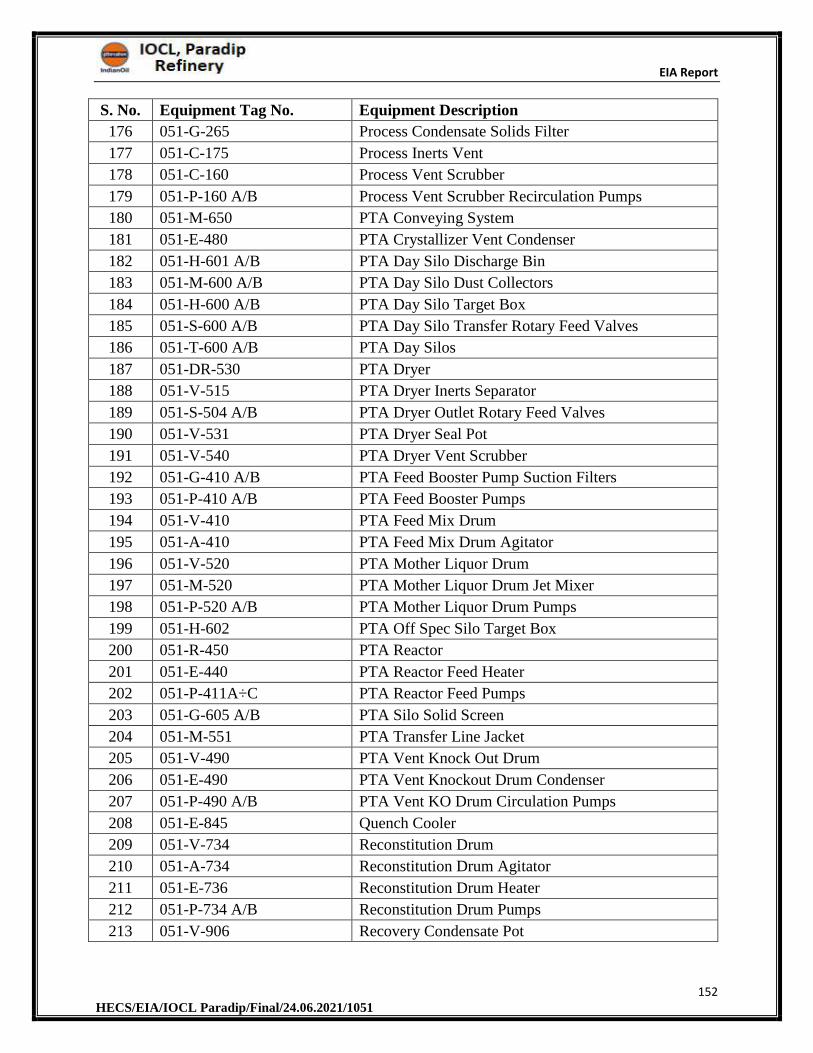
EIA Report
152 HECS/EIA/IOCL Paradip/Final/24.06.2021/1051
S. No. Equipment Tag No. Equipment Description
176 051-G-265 Process Condensate Solids Filter
177 051-C-175 Process Inerts Vent
178 051-C-160 Process Vent Scrubber
179 051-P-160 A/B Process Vent Scrubber Recirculation Pumps
180 051-M-650 PTA Conveying System
181 051-E-480 PTA Crystallizer Vent Condenser
182 051-H-601 A/B PTA Day Silo Discharge Bin
183 051-M-600 A/B PTA Day Silo Dust Collectors
184 051-H-600 A/B PTA Day Silo Target Box
185 051-S-600 A/B PTA Day Silo Transfer Rotary Feed Valves
186 051-T-600 A/B PTA Day Silos
187 051-DR-530 PTA Dryer
188 051-V-515 PTA Dryer Inerts Separator
189 051-S-504 A/B PTA Dryer Outlet Rotary Feed Valves
190 051-V-531 PTA Dryer Seal Pot
191 051-V-540 PTA Dryer Vent Scrubber
192 051-G-410 A/B PTA Feed Booster Pump Suction Filters
193 051-P-410 A/B PTA Feed Booster Pumps
194 051-V-410 PTA Feed Mix Drum
195 051-A-410 PTA Feed Mix Drum Agitator
196 051-V-520 PTA Mother Liquor Drum
197 051-M-520 PTA Mother Liquor Drum Jet Mixer
198 051-P-520 A/B PTA Mother Liquor Drum Pumps
199 051-H-602 PTA Off Spec Silo Target Box
200 051-R-450 PTA Reactor
201 051-E-440 PTA Reactor Feed Heater
202 051-P-411A÷C PTA Reactor Feed Pumps
203 051-G-605 A/B PTA Silo Solid Screen
204 051-M-551 PTA Transfer Line Jacket
205 051-V-490 PTA Vent Knock Out Drum
206 051-E-490 PTA Vent Knockout Drum Condenser
207 051-P-490 A/B PTA Vent KO Drum Circulation Pumps
208 051-E-845 Quench Cooler
209 051-V-734 Reconstitution Drum
210 051-A-734 Reconstitution Drum Agitator
211 051-E-736 Reconstitution Drum Heater
212 051-P-734 A/B Reconstitution Drum Pumps
213 051-V-906 Recovery Condensate Pot
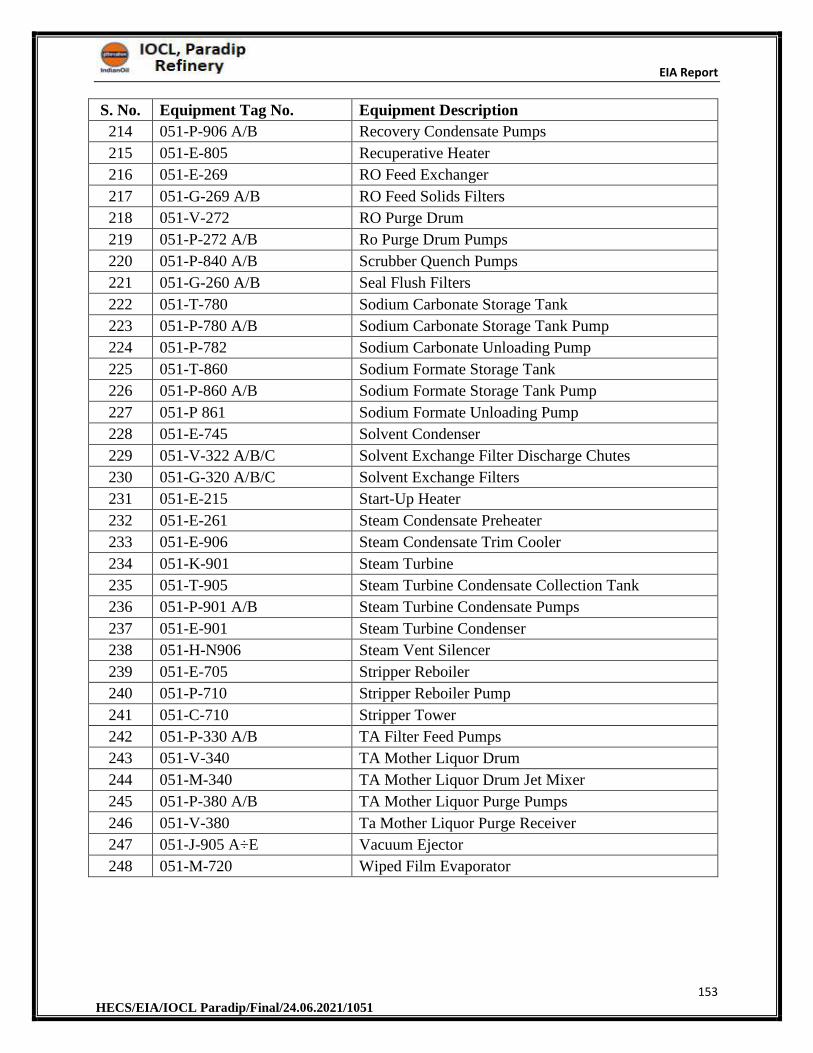
EIA Report
153 HECS/EIA/IOCL Paradip/Final/24.06.2021/1051
S. No. Equipment Tag No. Equipment Description
214 051-P-906 A/B Recovery Condensate Pumps
215 051-E-805 Recuperative Heater
216 051-E-269 RO Feed Exchanger
217 051-G-269 A/B RO Feed Solids Filters
218 051-V-272 RO Purge Drum
219 051-P-272 A/B Ro Purge Drum Pumps
220 051-P-840 A/B Scrubber Quench Pumps
221 051-G-260 A/B Seal Flush Filters
222 051-T-780 Sodium Carbonate Storage Tank
223 051-P-780 A/B Sodium Carbonate Storage Tank Pump
224 051-P-782 Sodium Carbonate Unloading Pump
225 051-T-860 Sodium Formate Storage Tank
226 051-P-860 A/B Sodium Formate Storage Tank Pump
227 051-P 861 Sodium Formate Unloading Pump
228 051-E-745 Solvent Condenser
229 051-V-322 A/B/C Solvent Exchange Filter Discharge Chutes
230 051-G-320 A/B/C Solvent Exchange Filters
231 051-E-215 Start-Up Heater
232 051-E-261 Steam Condensate Preheater
233 051-E-906 Steam Condensate Trim Cooler
234 051-K-901 Steam Turbine
235 051-T-905 Steam Turbine Condensate Collection Tank
236 051-P-901 A/B Steam Turbine Condensate Pumps
237 051-E-901 Steam Turbine Condenser
238 051-H-N906 Steam Vent Silencer
239 051-E-705 Stripper Reboiler
240 051-P-710 Stripper Reboiler Pump
241 051-C-710 Stripper Tower
242 051-P-330 A/B TA Filter Feed Pumps
243 051-V-340 TA Mother Liquor Drum
244 051-M-340 TA Mother Liquor Drum Jet Mixer
245 051-P-380 A/B TA Mother Liquor Purge Pumps
246 051-V-380 Ta Mother Liquor Purge Receiver
247 051-J-905 A÷E Vacuum Ejector
248 051-M-720 Wiped Film Evaporator
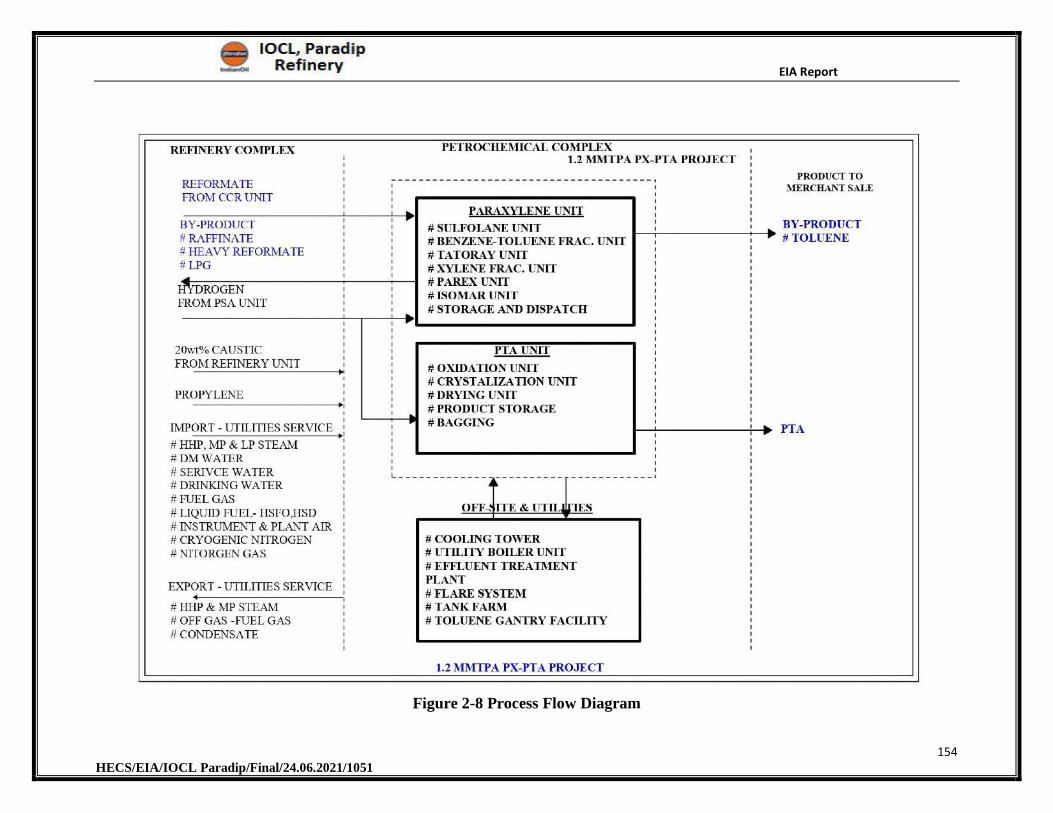
EIA Report
154 HECS/EIA/IOCL Paradip/Final/24.06.2021/1051
Figure 2-8 Process Flow Diagram
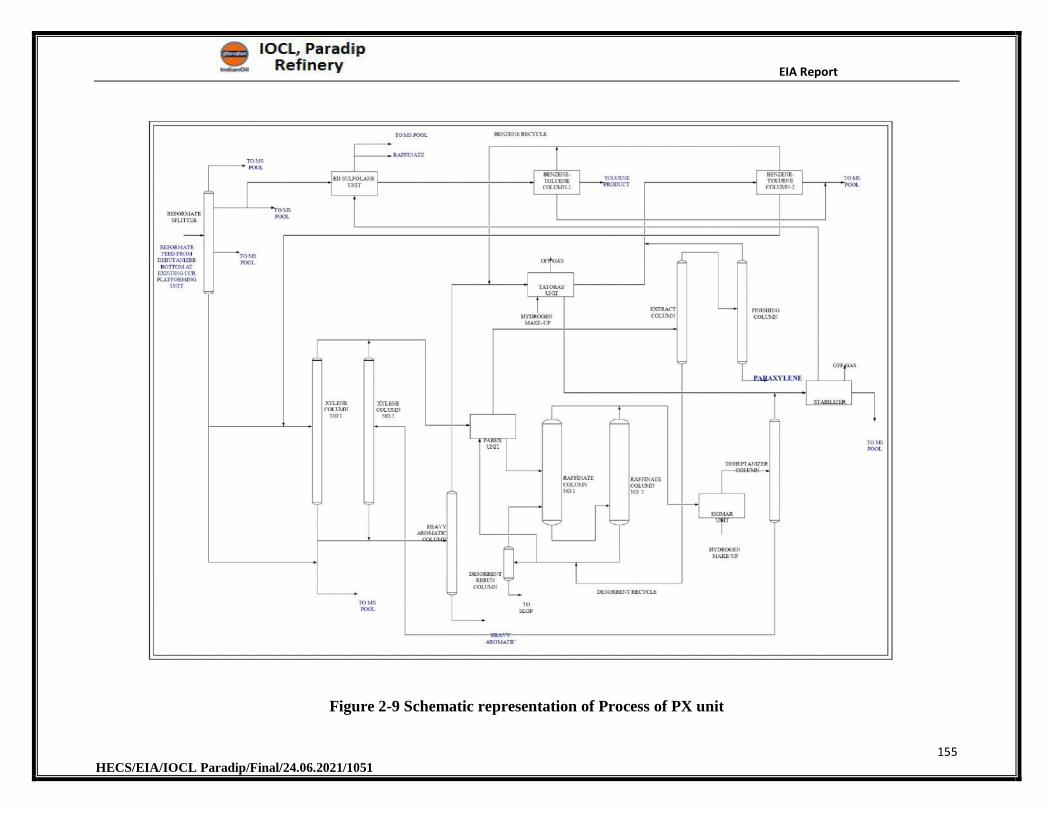
EIA Report
155 HECS/EIA/IOCL Paradip/Final/24.06.2021/1051
Figure 2-9 Schematic representation of Process of PX unit
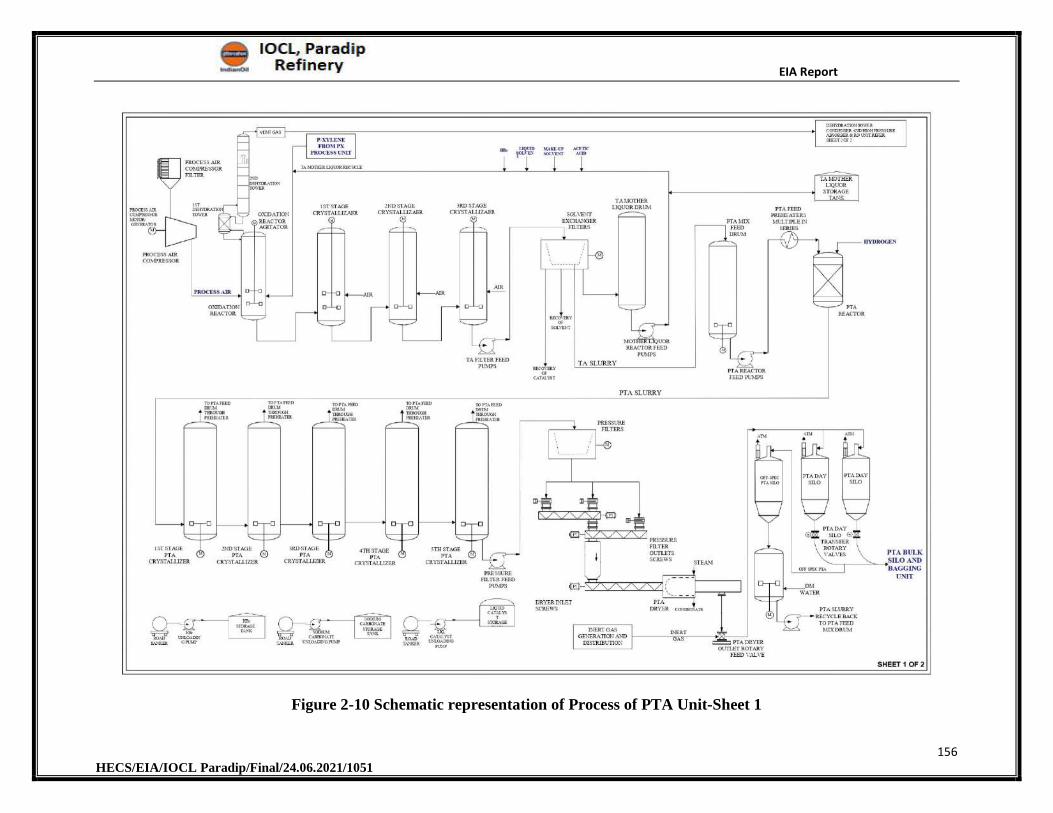
EIA Report
156 HECS/EIA/IOCL Paradip/Final/24.06.2021/1051
Figure 2-10 Schematic representation of Process of PTA Unit-Sheet 1

EIA Report
157 HECS/EIA/IOCL Paradip/Final/24.06.2021/1051
Figure 2-11 Schematic representation of Process of PTA Unit-Sheet 2
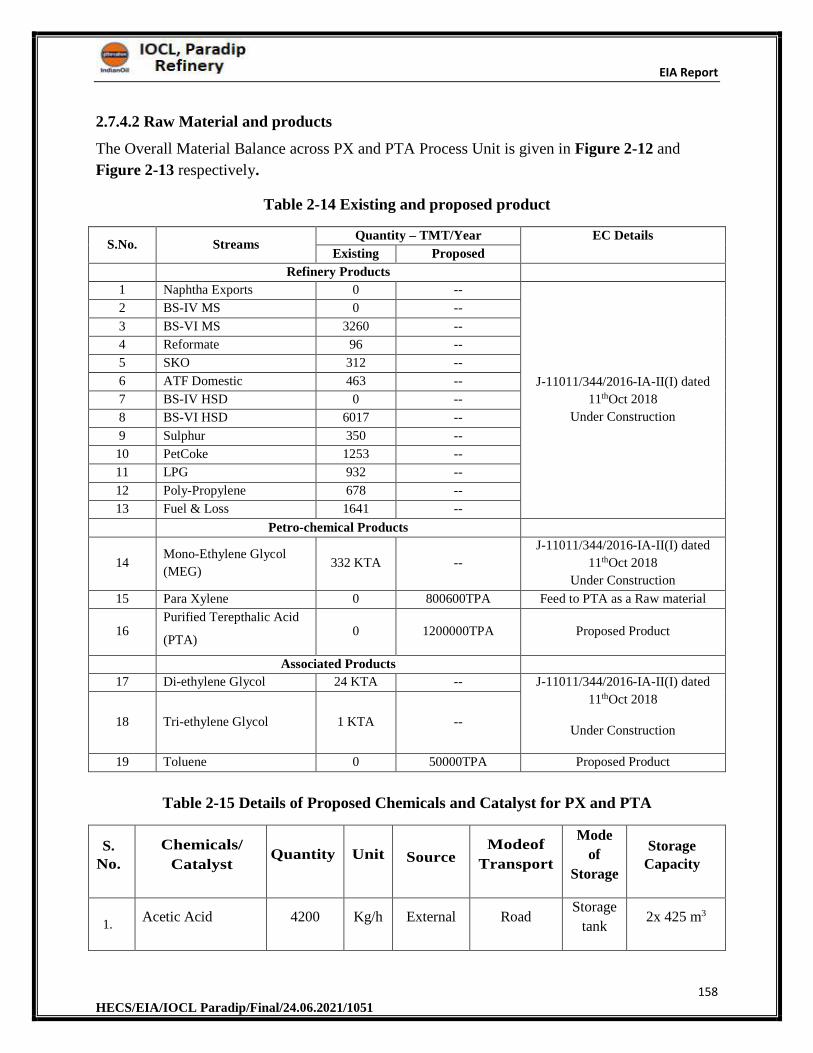
EIA Report
158 HECS/EIA/IOCL Paradip/Final/24.06.2021/1051
2.7.4.2 Raw Material and products
The Overall Material Balance across PX and PTA Process Unit is given in Figure 2-12 and
Figure 2-13 respectively.
Table 2-14 Existing and proposed product
S.No. Streams Quantity – TMT/Year EC Details
Existing Proposed
Refinery Products
1 Naphtha Exports 0 --
J-11011/344/2016-IA-II(I) dated
11thOct 2018
Under Construction
2 BS-IV MS 0 --
3 BS-VI MS 3260 --
4 Reformate 96 --
5 SKO 312 --
6 ATF Domestic 463 --
7 BS-IV HSD 0 --
8 BS-VI HSD 6017 --
9 Sulphur 350 --
10 PetCoke 1253 --
11 LPG 932 --
12 Poly-Propylene 678 --
13 Fuel & Loss 1641 --
Petro-chemical Products
14 Mono-Ethylene Glycol
(MEG) 332 KTA --
J-11011/344/2016-IA-II(I) dated
11thOct 2018
Under Construction
15 Para Xylene 0 800600TPA Feed to PTA as a Raw material
16 Purified Terepthalic Acid
(PTA) 0 1200000TPA Proposed Product
Associated Products
17 Di-ethylene Glycol 24 KTA -- J-11011/344/2016-IA-II(I) dated
11thOct 2018
Under Construction 18 Tri-ethylene Glycol 1 KTA --
19 Toluene 0 50000TPA Proposed Product
Table 2-15 Details of Proposed Chemicals and Catalyst for PX and PTA
S. No.
Chemicals/
CatalystQuantity Unit Source
Modeof
Transport
Mode
of
Storage
Storage Capacity
1.Acetic Acid 4200 Kg/h External Road
Storage
tank 2x 425 m3
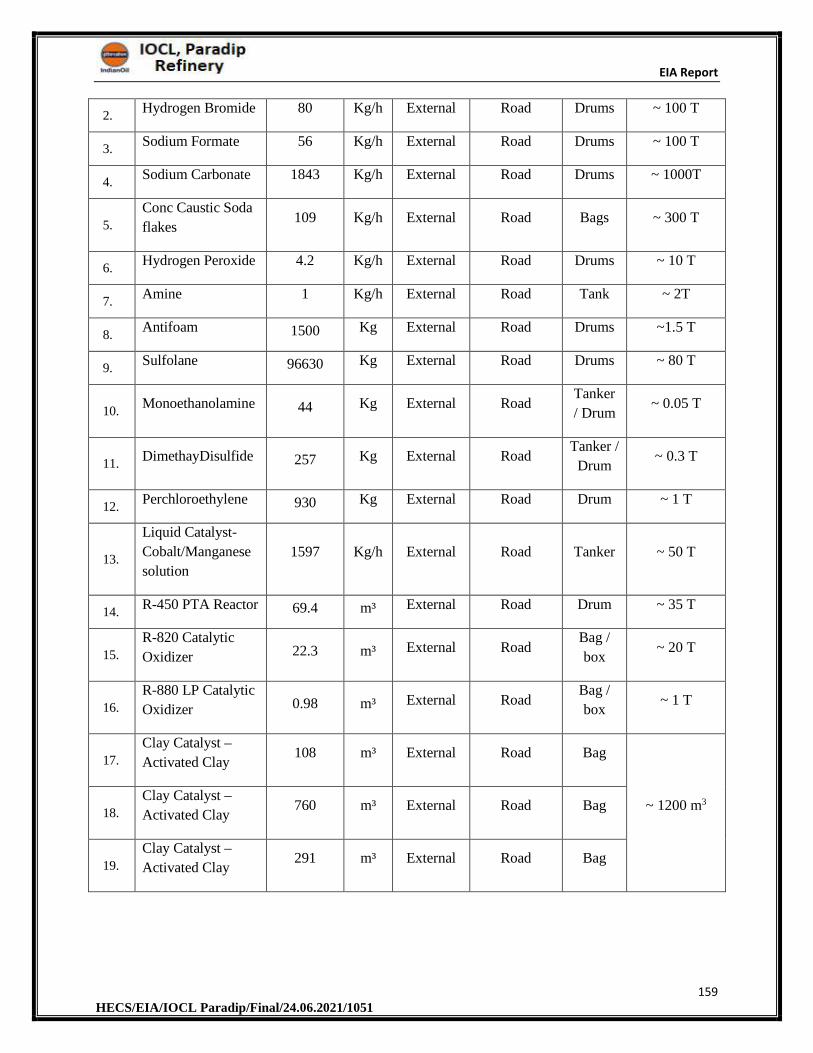
EIA Report
159 HECS/EIA/IOCL Paradip/Final/24.06.2021/1051
2.Hydrogen Bromide 80 Kg/h External Road Drums ~ 100 T
3.Sodium Formate 56 Kg/h External Road Drums ~ 100 T
4.Sodium Carbonate 1843 Kg/h External Road Drums ~ 1000T
5.
Conc Caustic Soda
flakes 109 Kg/h External Road Bags ~ 300 T
6.Hydrogen Peroxide 4.2 Kg/h External Road Drums ~ 10 T
7.Amine 1 Kg/h External Road Tank ~ 2T
8.Antifoam 1500 Kg External Road Drums ~1.5 T
9.Sulfolane 96630 Kg External Road Drums ~ 80 T
10.Monoethanolamine 44 Kg External Road
Tanker
/ Drum ~ 0.05 T
11.DimethayDisulfide 257 Kg External Road
Tanker /
Drum ~ 0.3 T
12.Perchloroethylene 930 Kg External Road Drum ~ 1 T
13.
Liquid Catalyst-
Cobalt/Manganese
solution
1597 Kg/h External Road Tanker ~ 50 T
14.R-450 PTA Reactor 69.4 m³ External Road Drum ~ 35 T
15.
R-820 Catalytic
Oxidizer 22.3 m³ External Road Bag /
box ~ 20 T
16.
R-880 LP Catalytic
Oxidizer 0.98 m³ External Road Bag /
box ~ 1 T
17.
Clay Catalyst –
Activated Clay 108 m³ External Road Bag
~ 1200 m3
18.
Clay Catalyst –
Activated Clay 760 m³ External Road Bag
19.
Clay Catalyst –
Activated Clay 291 m³ External Road Bag
EIA Report
160 HECS/EIA/IOCL Paradip/Final/24.06.2021/1051
I. Paraxylene (PX) Process Unit
a) Feed
Reformate (Existing CCR-Platforming unit)
Each unit in the Aromatic Complex will be designed for TWO (2) Design Feed Cases. Feed to
the Aromatic Complex is a depentanized reformate from the existing CCR-Platforming unit.
Hydrogen
During the start-up and normal operation, make-up hydrogen to the Tatoray Unit and Isomar
Unit will be supplied from Hydrogen Generation Unit (HGU) Source-1 or existing CCR
Platforming Unit. Aromatic Complex Units shall be designed for both quality of Make-up
hydrogen.
b) Product
Para-Xylene
The project shall also produce Toluene, Heavy Aromatics (MS Blend Stock), Raffinate.
c) Catalyst & Chemical
The catalyst and chemicals required for the operation of Para-Xylene Unit in given in Table 2-15
II.Purified Terepthalic Acid (PTA) Process Unit
a) Feed
Paraxylene from PX Unit
Acetic Acid
Cobalt Manganese Acetate Catalyst Solution
Hydrobromic Acid (HBr)
Sodium Formate
Sodium Carbonate
Sodium Hydroxide (NaOH)
Hydrogen Peroxide
Palladium On Carbon Catalyst
b) Product
Purified Terepthalic Acid (PTA)
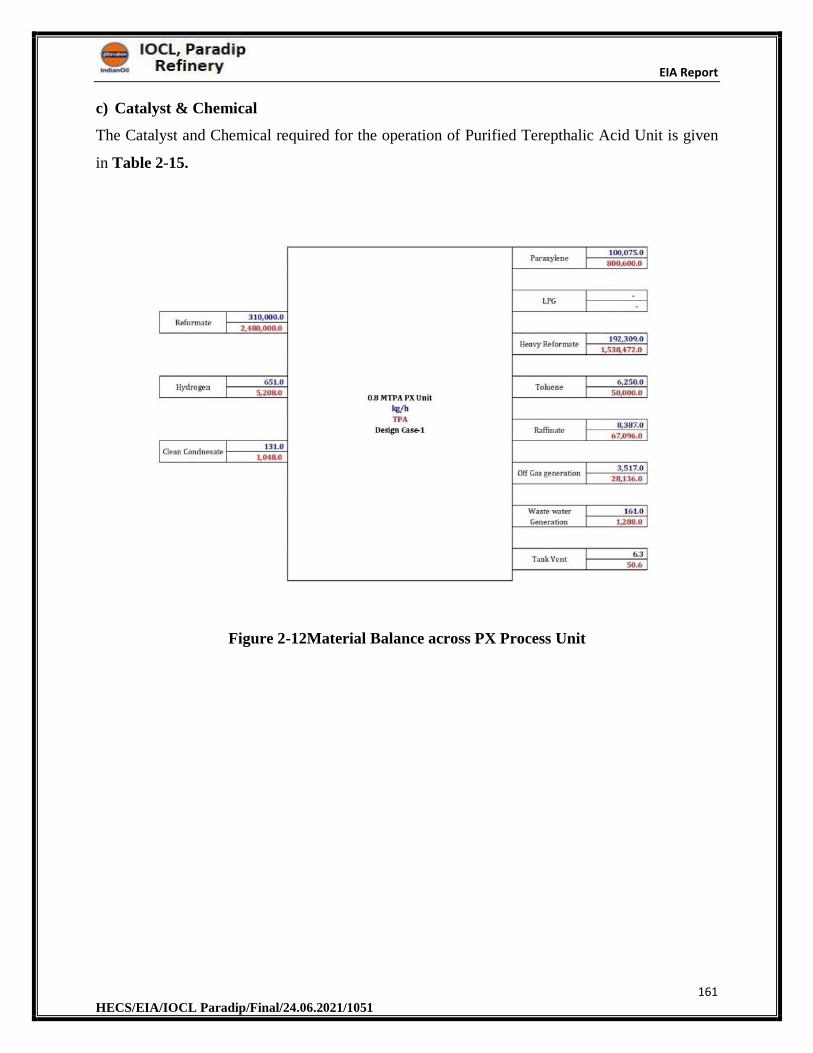
EIA Report
161 HECS/EIA/IOCL Paradip/Final/24.06.2021/1051
c) Catalyst & Chemical
The Catalyst and Chemical required for the operation of Purified Terepthalic Acid Unit is given
in Table 2-15.
Figure 2-12Material Balance across PX Process Unit
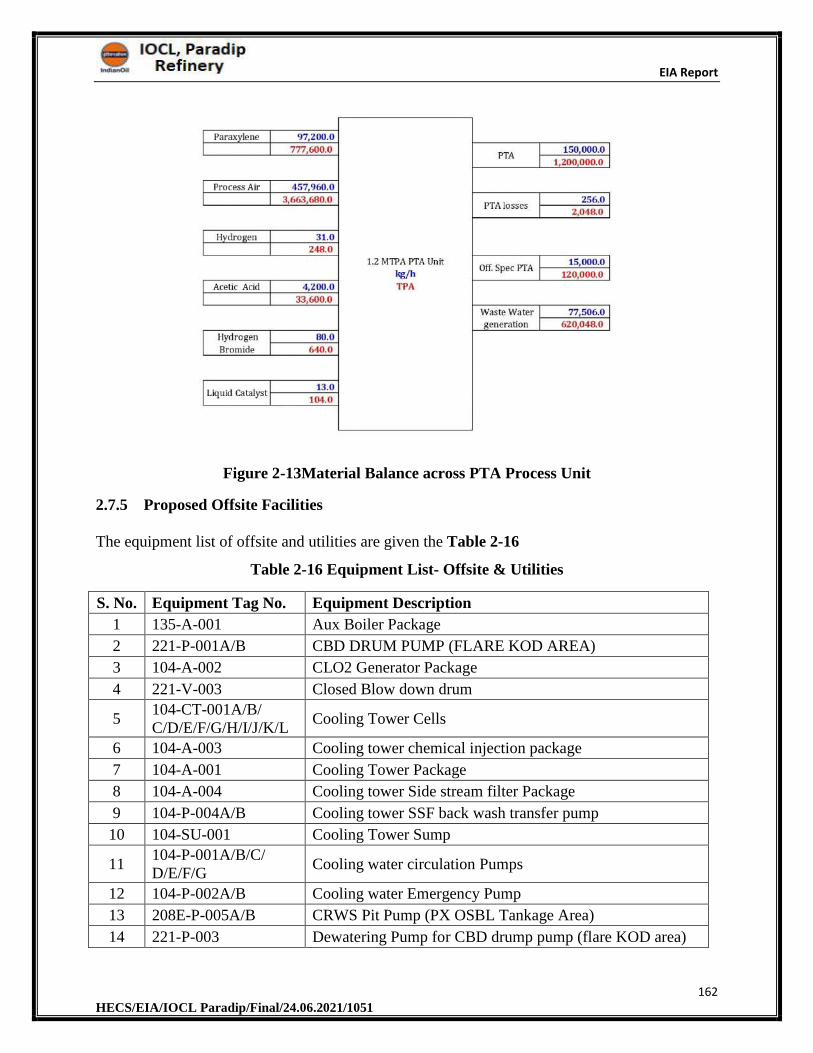
EIA Report
162 HECS/EIA/IOCL Paradip/Final/24.06.2021/1051
Figure 2-13Material Balance across PTA Process Unit
2.7.5 Proposed Offsite Facilities
The equipment list of offsite and utilities are given the Table 2-16
Table 2-16 Equipment List- Offsite & Utilities
S. No. Equipment Tag No. Equipment Description
1 135-A-001 Aux Boiler Package
2 221-P-001A/B CBD DRUM PUMP (FLARE KOD AREA)
3 104-A-002 CLO2 Generator Package
4 221-V-003 Closed Blow down drum
5 104-CT-001A/B/ C/D/E/F/G/H/I/J/K/L
Cooling Tower Cells
6 104-A-003 Cooling tower chemical injection package
7 104-A-001 Cooling Tower Package
8 104-A-004 Cooling tower Side stream filter Package
9 104-P-004A/B Cooling tower SSF back wash transfer pump
10 104-SU-001 Cooling Tower Sump
11 104-P-001A/B/C/ D/E/F/G
Cooling water circulation Pumps
12 104-P-002A/B Cooling water Emergency Pump
13 208E-P-005A/B CRWS Pit Pump (PX OSBL Tankage Area)
14 221-P-003 Dewatering Pump for CBD drump pump (flare KOD area)
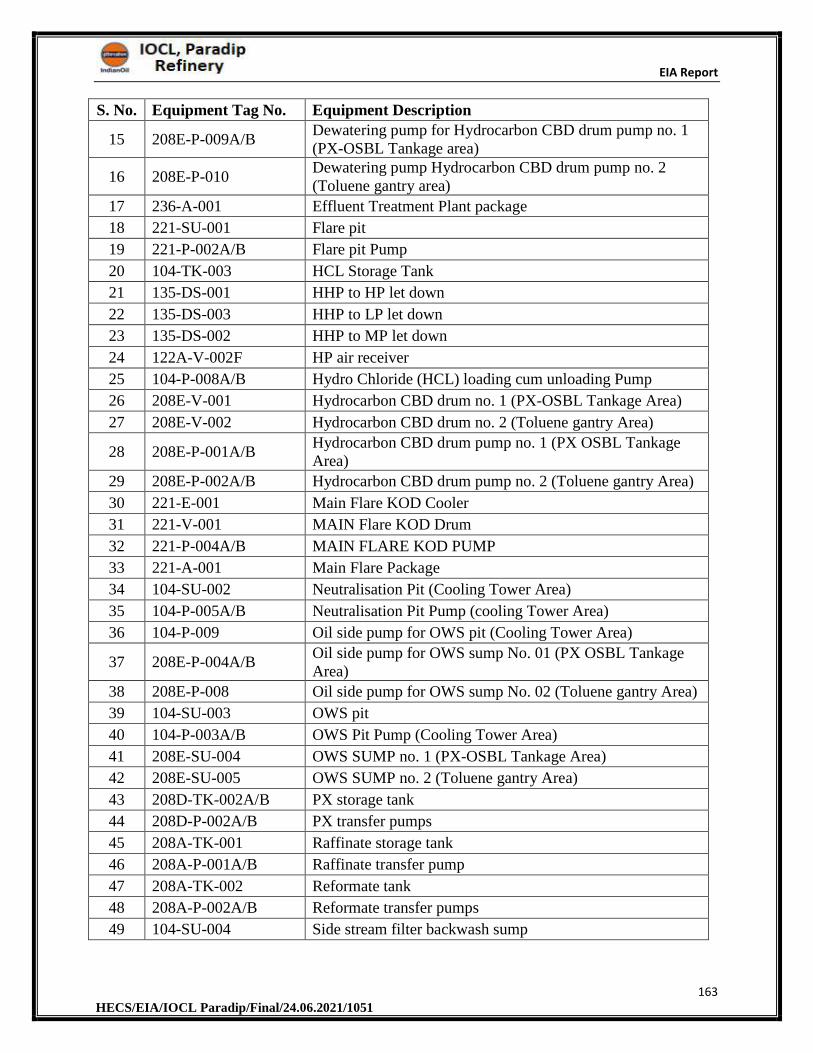
EIA Report
163 HECS/EIA/IOCL Paradip/Final/24.06.2021/1051
S. No. Equipment Tag No. Equipment Description
15 208E-P-009A/B Dewatering pump for Hydrocarbon CBD drum pump no. 1 (PX-OSBL Tankage area)
16 208E-P-010 Dewatering pump Hydrocarbon CBD drum pump no. 2 (Toluene gantry area)
17 236-A-001 Effluent Treatment Plant package
18 221-SU-001 Flare pit
19 221-P-002A/B Flare pit Pump
20 104-TK-003 HCL Storage Tank
21 135-DS-001 HHP to HP let down
22 135-DS-003 HHP to LP let down
23 135-DS-002 HHP to MP let down
24 122A-V-002F HP air receiver
25 104-P-008A/B Hydro Chloride (HCL) loading cum unloading Pump
26 208E-V-001 Hydrocarbon CBD drum no. 1 (PX-OSBL Tankage Area)
27 208E-V-002 Hydrocarbon CBD drum no. 2 (Toluene gantry Area)
28 208E-P-001A/B Hydrocarbon CBD drum pump no. 1 (PX OSBL Tankage Area)
29 208E-P-002A/B Hydrocarbon CBD drum pump no. 2 (Toluene gantry Area)
30 221-E-001 Main Flare KOD Cooler
31 221-V-001 MAIN Flare KOD Drum
32 221-P-004A/B MAIN FLARE KOD PUMP
33 221-A-001 Main Flare Package
34 104-SU-002 Neutralisation Pit (Cooling Tower Area)
35 104-P-005A/B Neutralisation Pit Pump (cooling Tower Area)
36 104-P-009 Oil side pump for OWS pit (Cooling Tower Area)
37 208E-P-004A/B Oil side pump for OWS sump No. 01 (PX OSBL Tankage Area)
38 208E-P-008 Oil side pump for OWS sump No. 02 (Toluene gantry Area)
39 104-SU-003 OWS pit
40 104-P-003A/B OWS Pit Pump (Cooling Tower Area)
41 208E-SU-004 OWS SUMP no. 1 (PX-OSBL Tankage Area)
42 208E-SU-005 OWS SUMP no. 2 (Toluene gantry Area)
43 208D-TK-002A/B PX storage tank
44 208D-P-002A/B PX transfer pumps
45 208A-TK-001 Raffinate storage tank
46 208A-P-001A/B Raffinate transfer pump
47 208A-TK-002 Reformate tank
48 208A-P-002A/B Reformate transfer pumps
49 104-SU-004 Side stream filter backwash sump
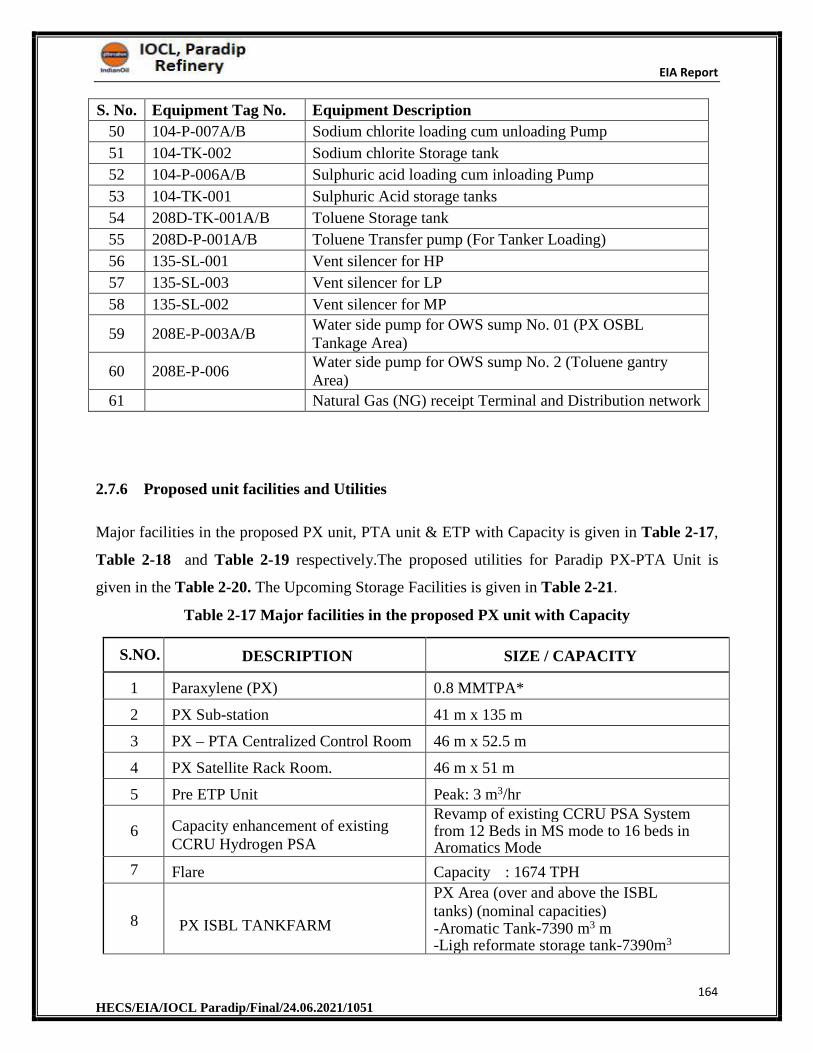
EIA Report
164 HECS/EIA/IOCL Paradip/Final/24.06.2021/1051
S. No. Equipment Tag No. Equipment Description
50 104-P-007A/B Sodium chlorite loading cum unloading Pump
51 104-TK-002 Sodium chlorite Storage tank
52 104-P-006A/B Sulphuric acid loading cum inloading Pump
53 104-TK-001 Sulphuric Acid storage tanks
54 208D-TK-001A/B Toluene Storage tank
55 208D-P-001A/B Toluene Transfer pump (For Tanker Loading)
56 135-SL-001 Vent silencer for HP
57 135-SL-003 Vent silencer for LP
58 135-SL-002 Vent silencer for MP
59 208E-P-003A/B Water side pump for OWS sump No. 01 (PX OSBL Tankage Area)
60 208E-P-006 Water side pump for OWS sump No. 2 (Toluene gantry Area)
61 Natural Gas (NG) receipt Terminal and Distribution network
2.7.6 Proposed unit facilities and Utilities
Major facilities in the proposed PX unit, PTA unit & ETP with Capacity is given in Table 2-17,
Table 2-18 and Table 2-19 respectively.The proposed utilities for Paradip PX-PTA Unit is
given in the Table 2-20. The Upcoming Storage Facilities is given in Table 2-21.
Table 2-17 Major facilities in the proposed PX unit with Capacity
S.NO. DESCRIPTION SIZE / CAPACITY
1 Paraxylene (PX) 0.8 MMTPA*
2 PX Sub-station 41 m x 135 m
3 PX – PTA Centralized Control Room 46 m x 52.5 m
4 PX Satellite Rack Room. 46 m x 51 m
5 Pre ETP Unit Peak: 3 m3/hr
6 Capacity enhancement of existing CCRU Hydrogen PSA
Revamp of existing CCRU PSA Systemfrom 12 Beds in MS mode to 16 beds in Aromatics Mode
7 Flare Capacity : 1674 TPH
8 PX ISBL TANKFARM
PX Area (over and above the ISBL tanks) (nominal capacities) -Aromatic Tank-7390 m3 m -Ligh reformate storage tank-7390m3
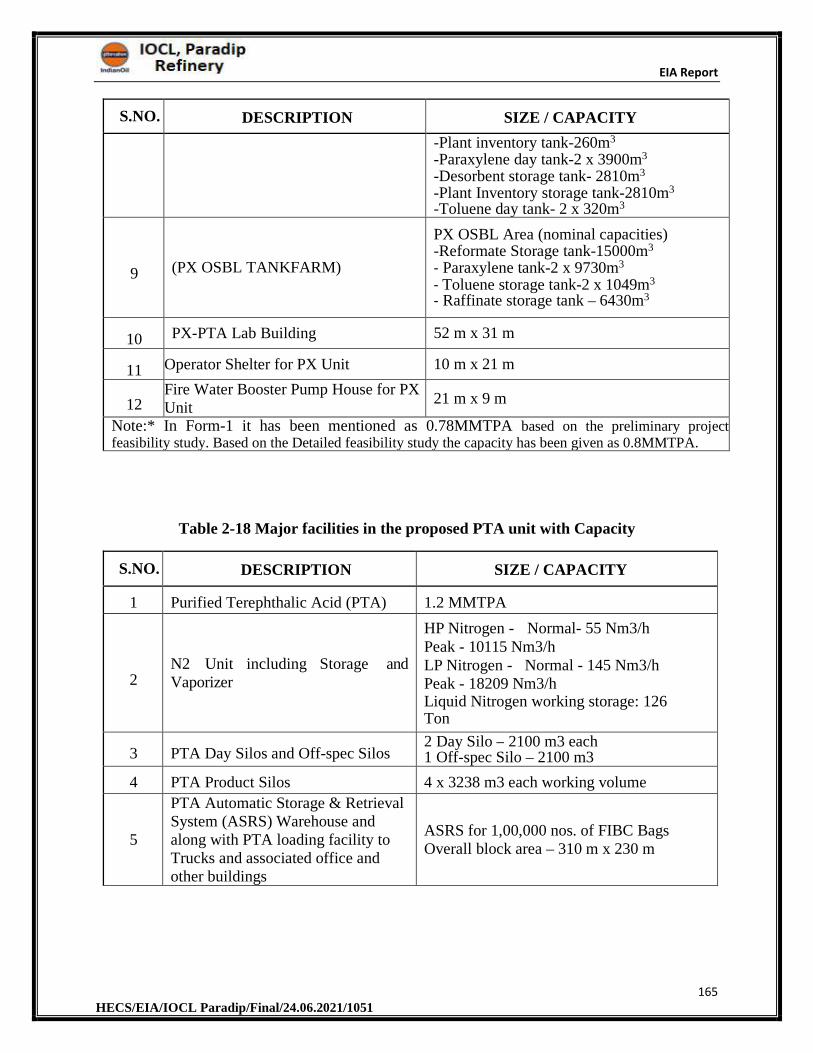
EIA Report
165 HECS/EIA/IOCL Paradip/Final/24.06.2021/1051
S.NO. DESCRIPTION SIZE / CAPACITY
-Plant inventory tank-260m3
-Paraxylene day tank-2 x 3900m3
-Desorbent storage tank- 2810m3
-Plant Inventory storage tank-2810m3
-Toluene day tank- 2 x 320m3
9 (PX OSBL TANKFARM)
PX OSBL Area (nominal capacities) -Reformate Storage tank-15000m3
- Paraxylene tank-2 x 9730m3
- Toluene storage tank-2 x 1049m3
- Raffinate storage tank – 6430m3
10 PX-PTA Lab Building 52 m x 31 m
11 Operator Shelter for PX Unit 10 m x 21 m
12 Fire Water Booster Pump House for PX Unit
21 m x 9 m
Note:* In Form-1 it has been mentioned as 0.78MMTPA based on the preliminary project feasibility study. Based on the Detailed feasibility study the capacity has been given as 0.8MMTPA.
Table 2-18 Major facilities in the proposed PTA unit with Capacity
S.NO. DESCRIPTION SIZE / CAPACITY
1 Purified Terephthalic Acid (PTA) 1.2 MMTPA
2 N2 Unit including Storage and Vaporizer
HP Nitrogen - Normal- 55 Nm3/h Peak - 10115 Nm3/h LP Nitrogen - Normal - 145 Nm3/h Peak - 18209 Nm3/h Liquid Nitrogen working storage: 126 Ton
3 PTA Day Silos and Off-spec Silos 2 Day Silo – 2100 m3 each1 Off-spec Silo – 2100 m3
4 PTA Product Silos 4 x 3238 m3 each working volume
5
PTA Automatic Storage & Retrieval System (ASRS) Warehouse and along with PTA loading facility to Trucks and associated office and other buildings
ASRS for 1,00,000 nos. of FIBC Bags Overall block area – 310 m x 230 m
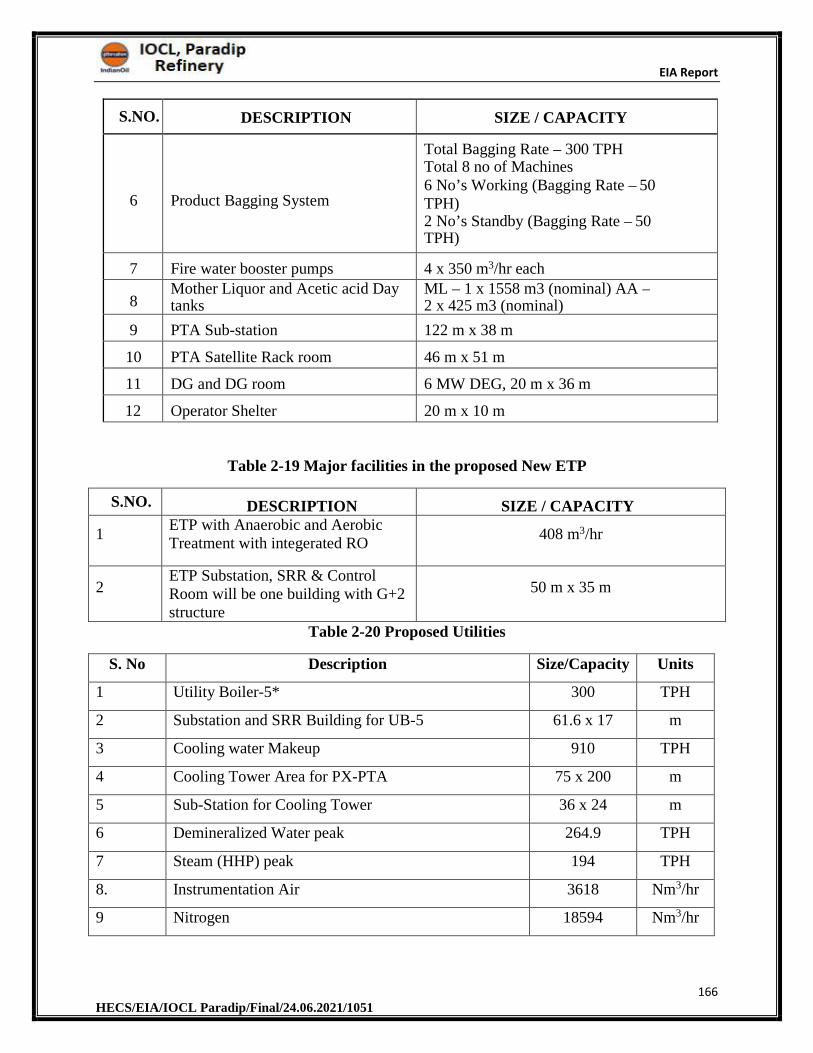
EIA Report
166 HECS/EIA/IOCL Paradip/Final/24.06.2021/1051
S.NO. DESCRIPTION SIZE / CAPACITY
6 Product Bagging System
Total Bagging Rate – 300 TPH Total 8 no of Machines 6 No’s Working (Bagging Rate – 50 TPH) 2 No’s Standby (Bagging Rate – 50 TPH)
7 Fire water booster pumps 4 x 350 m3/hr each
8 Mother Liquor and Acetic acid Day tanks
ML – 1 x 1558 m3 (nominal) AA –2 x 425 m3 (nominal)
9 PTA Sub-station 122 m x 38 m
10 PTA Satellite Rack room 46 m x 51 m
11 DG and DG room 6 MW DEG, 20 m x 36 m
12 Operator Shelter 20 m x 10 m
Table 2-19 Major facilities in the proposed New ETP
S.NO. DESCRIPTION SIZE / CAPACITY
1 ETP with Anaerobic and Aerobic Treatment with integerated RO
408 m3/hr
2 ETP Substation, SRR & Control Room will be one building with G+2 structure
50 m x 35 m
Table 2-20 Proposed Utilities
S. No Description Size/Capacity Units
1 Utility Boiler-5* 300 TPH
2 Substation and SRR Building for UB-5 61.6 x 17 m
3 Cooling water Makeup 910 TPH
4 Cooling Tower Area for PX-PTA 75 x 200 m
5 Sub-Station for Cooling Tower 36 x 24 m
6 Demineralized Water peak 264.9 TPH
7 Steam (HHP) peak 194 TPH
8. Instrumentation Air 3618 Nm3/hr
9 Nitrogen 18594 Nm3/hr
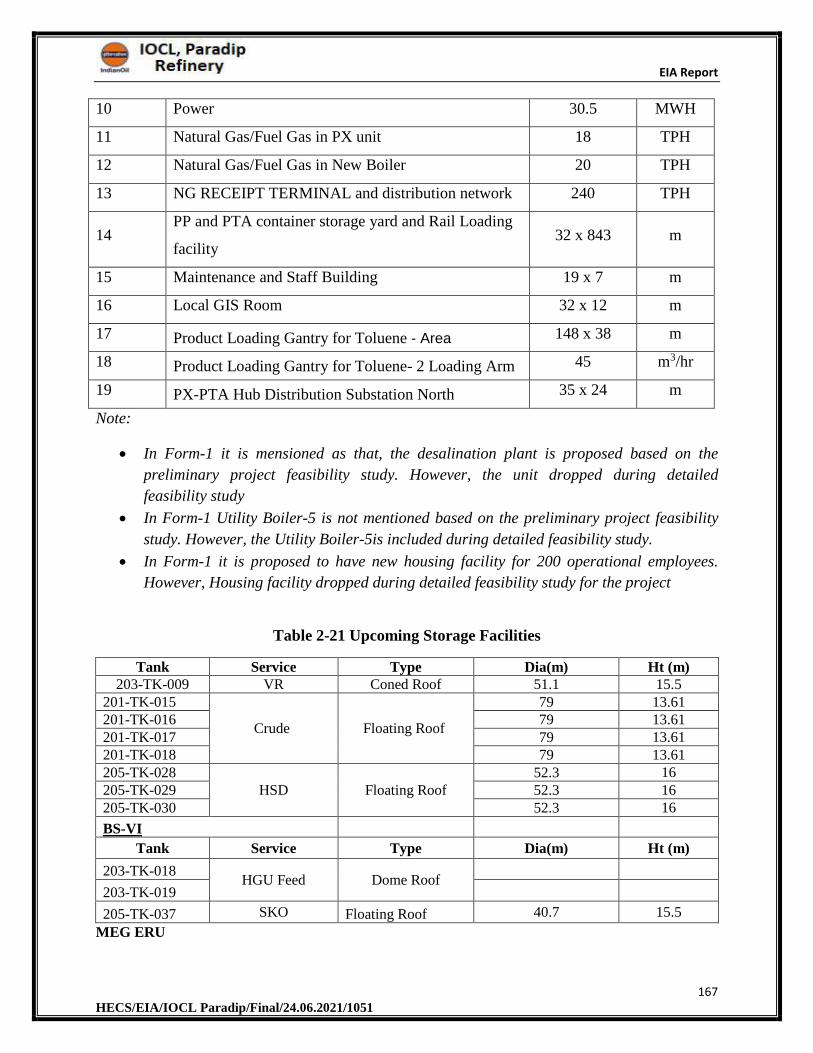
EIA Report
167 HECS/EIA/IOCL Paradip/Final/24.06.2021/1051
10 Power 30.5 MWH
11 Natural Gas/Fuel Gas in PX unit 18 TPH
12 Natural Gas/Fuel Gas in New Boiler 20 TPH
13 NG RECEIPT TERMINAL and distribution network 240 TPH
14 PP and PTA container storage yard and Rail Loading
facility 32 x 843 m
15 Maintenance and Staff Building 19 x 7 m
16 Local GIS Room 32 x 12 m
17 Product Loading Gantry for Toluene - Area 148 x 38 m
18 Product Loading Gantry for Toluene- 2 Loading Arm 45 m3/hr
19 PX-PTA Hub Distribution Substation North 35 x 24 m
Note:
In Form-1 it is mensioned as that, the desalination plant is proposed based on the
preliminary project feasibility study. However, the unit dropped during detailed
feasibility study
In Form-1 Utility Boiler-5 is not mentioned based on the preliminary project feasibility
study. However, the Utility Boiler-5is included during detailed feasibility study.
In Form-1 it is proposed to have new housing facility for 200 operational employees.
However, Housing facility dropped during detailed feasibility study for the project
Table 2-21 Upcoming Storage Facilities
Tank Service Type Dia(m) Ht (m) 203-TK-009 VR Coned Roof 51.1 15.5
201-TK-015
Crude Floating Roof
79 13.61 201-TK-016 79 13.61 201-TK-017 79 13.61 201-TK-018 79 13.61 205-TK-028
HSD Floating Roof 52.3 16
205-TK-029 52.3 16 205-TK-030 52.3 16
BS-VI
Tank Service Type Dia(m) Ht (m)
203-TK-018 HGU Feed Dome Roof
203-TK-019
205-TK-037 SKO Floating Roof 40.7 15.5
MEG ERU
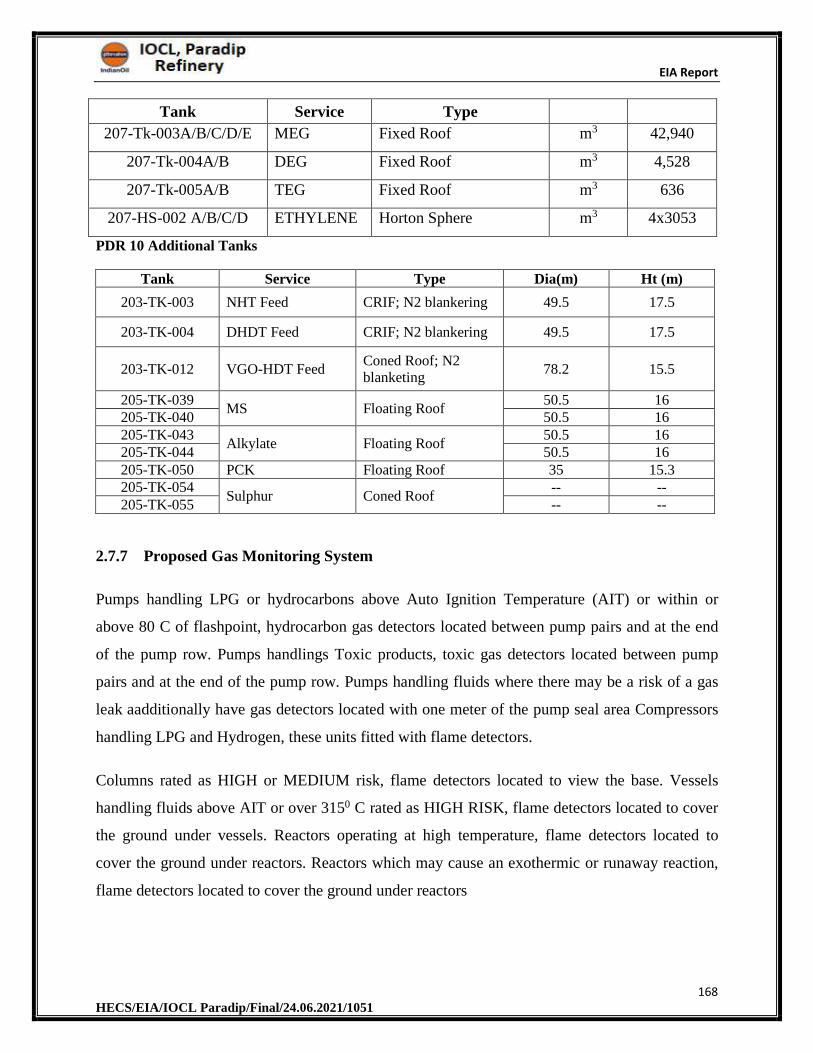
EIA Report
168 HECS/EIA/IOCL Paradip/Final/24.06.2021/1051
Tank Service Type
207-Tk-003A/B/C/D/E MEG Fixed Roof m3 42,940
207-Tk-004A/B DEG Fixed Roof m3 4,528
207-Tk-005A/B TEG Fixed Roof m3 636
207-HS-002 A/B/C/D ETHYLENE Horton Sphere m3 4x3053
PDR 10 Additional Tanks
Tank Service Type Dia(m) Ht (m)
203-TK-003 NHT Feed CRIF; N2 blankering 49.5 17.5
203-TK-004 DHDT Feed CRIF; N2 blankering 49.5 17.5
203-TK-012 VGO-HDT Feed Coned Roof; N2 blanketing
78.2 15.5
205-TK-039 MS Floating Roof
50.5 16 205-TK-040 50.5 16 205-TK-043
Alkylate Floating Roof 50.5 16
205-TK-044 50.5 16 205-TK-050 PCK Floating Roof 35 15.3 205-TK-054
Sulphur Coned Roof -- --
205-TK-055 -- --
2.7.7 Proposed Gas Monitoring System
Pumps handling LPG or hydrocarbons above Auto Ignition Temperature (AIT) or within or
above 80 C of flashpoint, hydrocarbon gas detectors located between pump pairs and at the end
of the pump row. Pumps handlings Toxic products, toxic gas detectors located between pump
pairs and at the end of the pump row. Pumps handling fluids where there may be a risk of a gas
leak aadditionally have gas detectors located with one meter of the pump seal area Compressors
handling LPG and Hydrogen, these units fitted with flame detectors.
Columns rated as HIGH or MEDIUM risk, flame detectors located to view the base. Vessels
handling fluids above AIT or over 3150 C rated as HIGH RISK, flame detectors located to cover
the ground under vessels. Reactors operating at high temperature, flame detectors located to
cover the ground under reactors. Reactors which may cause an exothermic or runaway reaction,
flame detectors located to cover the ground under reactors
EIA Report
169 HECS/EIA/IOCL Paradip/Final/24.06.2021/1051
2.7.7.1 Mitigation Measures
The highest standards of safety are being implemented by examining the potential hazards,
accessibility, constructability, operability and maintainability to ensure a safe and
environmentally sound plant and facilities.
Eye-wash and safety showers are provided in all appropriate locations.
All hazardous and hydrocarbon drains are routed to closed systems.
Definition of environmental requirements, Noise studies and associated
recommendations, Dispersion calculations and associated recommendations
Escape Routes, Accessibility, Operability and Constructability reviews and
implementation of recommendations.
All safety requirements of Indian Boiler Regulations (IBR) will be complied in the
design.
Fire water sprinkler systems will be implemented for applicable equipment, as per OISD
code requirements.
Safety insulation is provided for all pipes/surfaces operating at temperature higher than
60°C.
Pressure safety valves are provided for over-pressure protection of equipment and piping
in all applicable locations.
Double isolation valves are provided for high pressure streams and hydrogen services.
HAZOP study has been performed for PX-PTA units during FEED phase. HAZOP
recommendations from the HAZOP study shall be incorporated into the design of these
systems.
Detailed HAZOP and SIL study for all units are envisaged during detailed engineering
phase of the project. All HAZOP recommendations will be complied and
recommendations from the studies will be implemented.
Compliance to all National and Local rules and regulations by statutory bodies will be
ensured.
EIA Report
170 HECS/EIA/IOCL Paradip/Final/24.06.2021/1051
2.7.7.2 Precaution & Safety Measures against Fire Hazards
IOCL has taken lot of safety measures against Fire hazards in course of the design &operation of
two plants. They are as follows:
N2 Blanketing in flammable storage tanks
Breather Valves
Earthing Continuity
Lightening Arrester as per IS specification & monitoring of Earth Pit
Flame proof electrical fittings
Periodic Tank Inspection
Storage & handling of Bulk Chemicals & Plant Operations through DCS System
Periodic Checking of Critical Instruments
In addition to the above measures the new technology has the following measures embedded in
its design- following are the safety measures in the new unit:
Process Design and Engineering is such that it can cater to any emergency happening in
the Plant.
Provision of nitrogen blanketing of the reactor on occasion of a reactor trip
Critical trips are implemented in the system
Better Process Control System
Safety Critical Alarms are implemented for the new unit
Automated Safety Instrumented System.
Over/Under Pressure Relief Protection
Overfill Containment.
Emergency Response
2.7.7.3 Assessment of new & untested Technology
Paradip Refinery has a unique INDMAX Unit technology, which is indigenously been
developed by Indian Oil's R&D Centre. The INDMAX (FCC) Unit has designed to produce
44% LPG, the highest yield from such plants. The commissioning of INDMAX Unit at Paradip
marks a major milestone in the history of Indian refining. With this, IndianOil has now
recognized globally as a technology licensor. The other first-time technological features of the
Refinery include Flue Gas Desulphurisation facilities, Vapour Recovery system from jetty
EIA Report
171 HECS/EIA/IOCL Paradip/Final/24.06.2021/1051
loading and an alkylation process to get octane-rich low-benzene MS blend component, etc. So
no alternative technologies available.
2.7.8 Sulphur Balance
Detailed Sulphur balance is given in Table 2-22.
Table 2-22 Sulphur balance for Proposed Facility
Total crude to be Processed T/day Post BS VI &
MEG Post PX/PTA
Average sulphur content in the crude % 2.9 2.9
Total sulphur input through crude TMTPA 435 435
Total sulphur in products TMTPA 431.5 431.5
Total Sulphur emissions from process stacks and heaters
TMTPA 3.5 3.58
Total SO2 emissions into atmosphere Kg/hr 875 895.2
Total SO2 emissions into atmosphere Kg/Ton of
crude 0.467 0.477
From PX PTA, additional pollution load of SO2 emission will be 0.162 TMTPA
2.8 Plot area
The proposed project is planned within the existing facility of IOCL located at Abhaychandrapur
village, Jagatsinghpur District, Odisha State. The total land area is 3345 Acres. Plot plan is
shown below as Figure 2-18 also attached as Annexure -6 and Green Belt demarcation and the
species planted is enclosed as Annexure- 8.
2.8.1 Site Photographs
Site Photographs of Existing facility and proposed facility is enclosed as Figure 2-14 and Figure
2-15 respectively. The ETP and STP Photographs are given in Figure 2-16 and Figure 2-17
respectively.
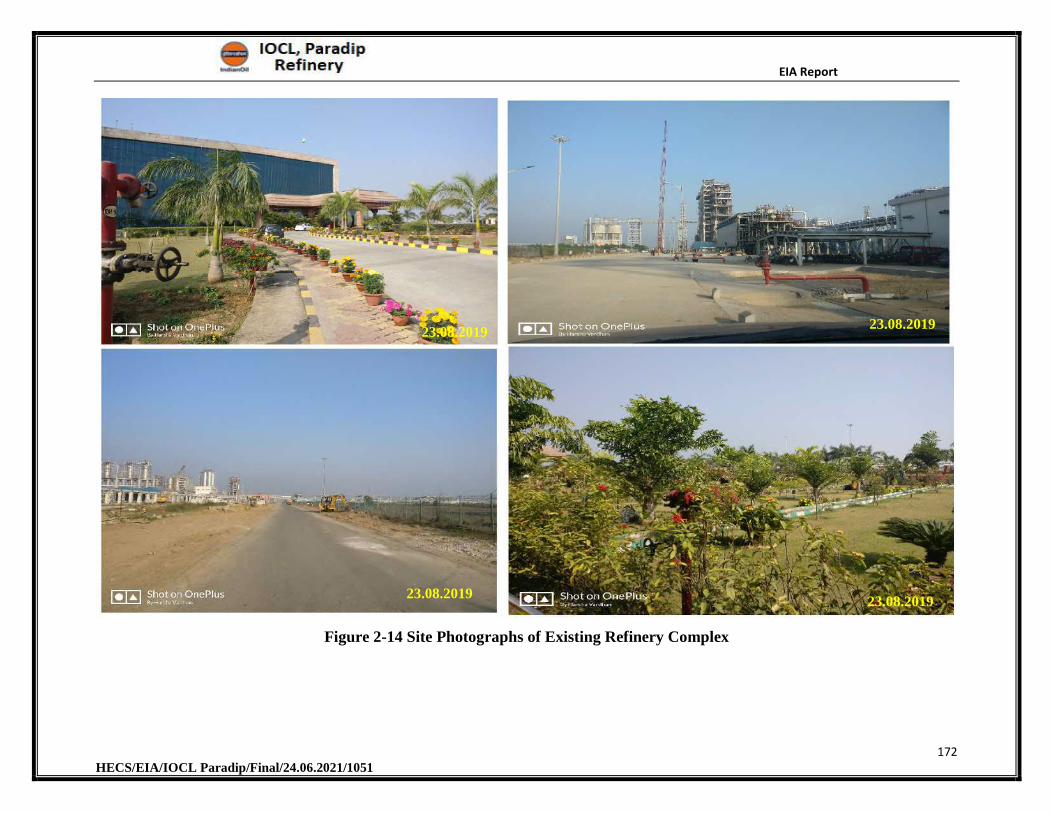
EIA Report
172 HECS/EIA/IOCL Paradip/Final/24.06.2021/1051
Figure 2-14 Site Photographs of Existing Refinery Complex
23.08.2019
23.08.2019 23.08.2019
23.08.2019
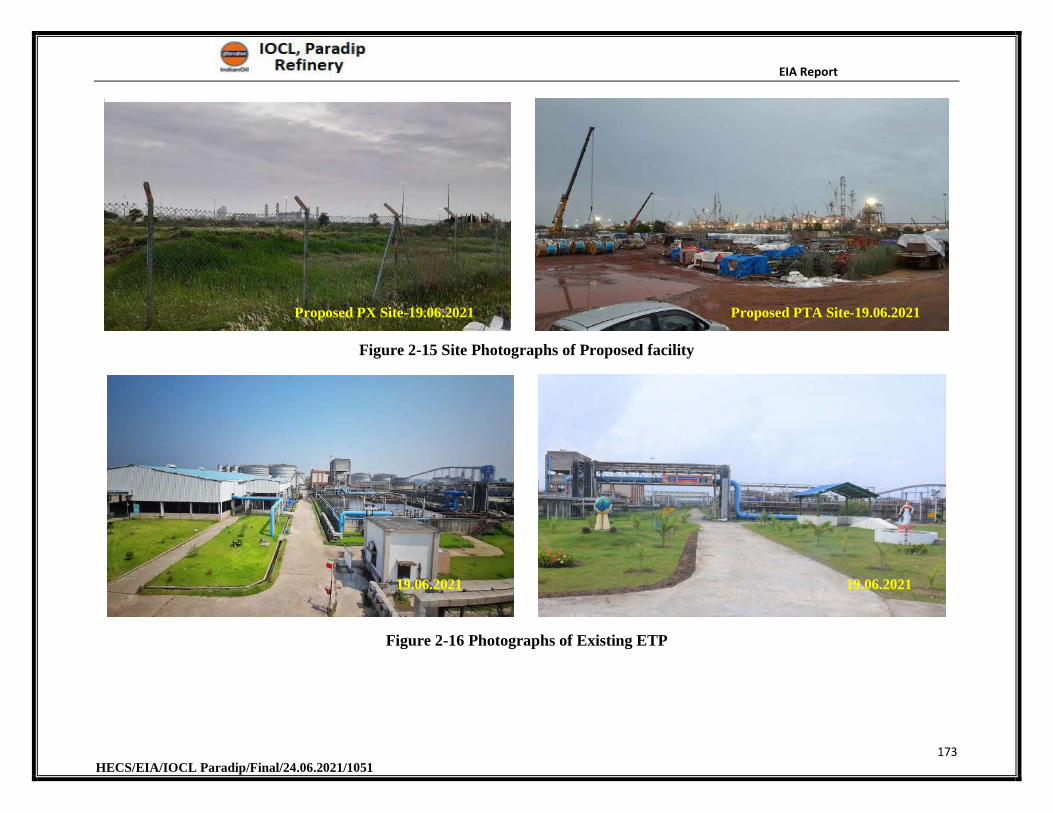
EIA Report
173 HECS/EIA/IOCL Paradip/Final/24.06.2021/1051
Figure 2-15 Site Photographs of Proposed facility
Figure 2-16 Photographs of Existing ETP
19.06.2021
Proposed PX Site-19.06.2021 Proposed PTA Site-19.06.2021
19.06.2021
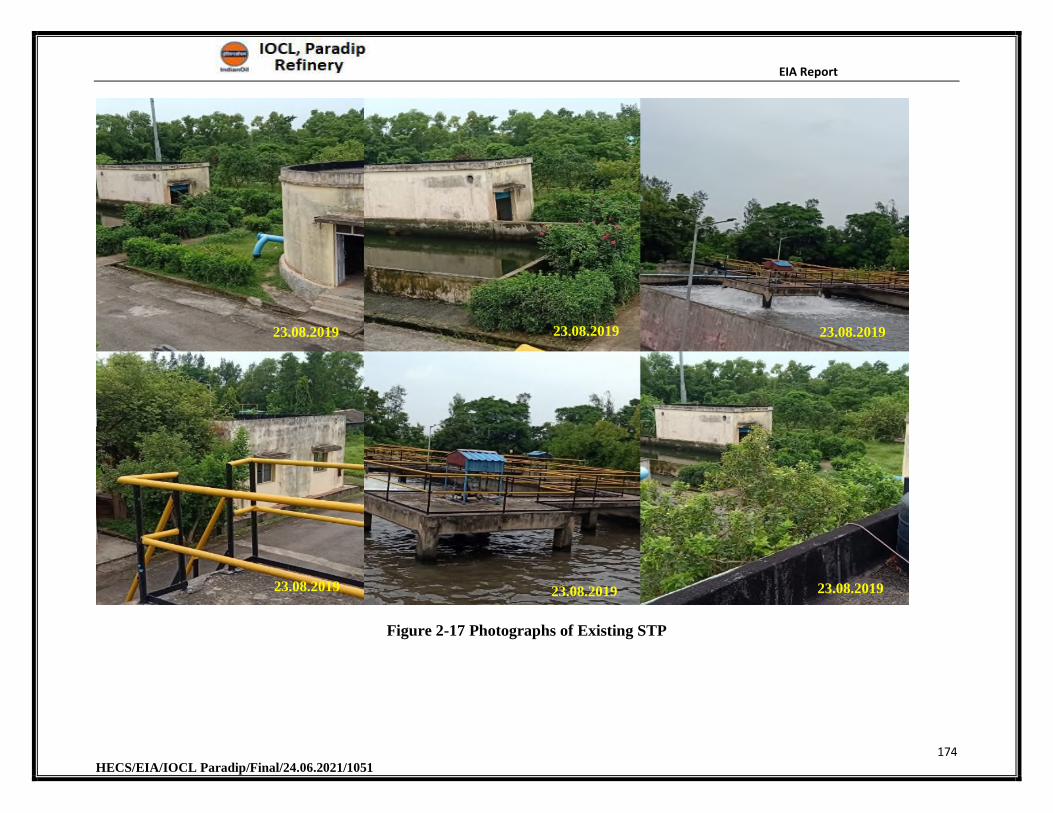
EIA Report
174 HECS/EIA/IOCL Paradip/Final/24.06.2021/1051
Figure 2-17 Photographs of Existing STP
23.08.2019 23.08.2019 23.08.2019
23.08.2019 23.08.2019 23.08.2019
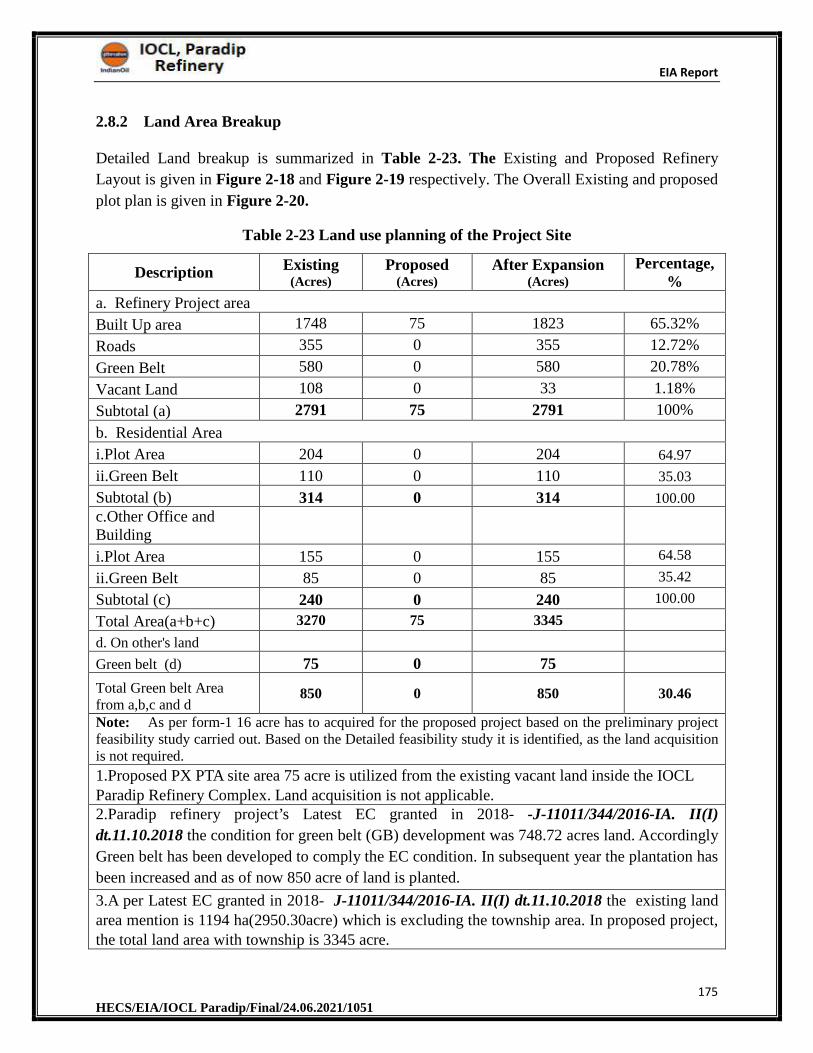
EIA Report
175 HECS/EIA/IOCL Paradip/Final/24.06.2021/1051
2.8.2 Land Area Breakup
Detailed Land breakup is summarized in Table 2-23. The Existing and Proposed Refinery
Layout is given in Figure 2-18 and Figure 2-19 respectively. The Overall Existing and proposed
plot plan is given in Figure 2-20.
Table 2-23 Land use planning of the Project Site
Description Existing (Acres)
Proposed (Acres)
After Expansion (Acres)
Percentage, %
a. Refinery Project area
Built Up area 1748 75 1823 65.32%
Roads 355 0 355 12.72%
Green Belt 580 0 580 20.78%
Vacant Land 108 0 33 1.18%
Subtotal (a) 2791 75 2791 100%
b. Residential Area
i.Plot Area 204 0 204 64.97
ii.Green Belt 110 0 110 35.03
Subtotal (b) 314 0 314 100.00
c.Other Office and Building
i.Plot Area 155 0 155 64.58
ii.Green Belt 85 0 85 35.42
Subtotal (c) 240 0 240 100.00
Total Area(a+b+c) 3270 75 3345
d. On other's land
Green belt (d) 75 0 75
Total Green belt Area from a,b,c and d
850 0 850 30.46
Note: As per form-1 16 acre has to acquired for the proposed project based on the preliminary project feasibility study carried out. Based on the Detailed feasibility study it is identified, as the land acquisition is not required.
1.Proposed PX PTA site area 75 acre is utilized from the existing vacant land inside the IOCL Paradip Refinery Complex. Land acquisition is not applicable. 2.Paradip refinery project’s Latest EC granted in 2018- -J-11011/344/2016-IA. II(I)
dt.11.10.2018 the condition for green belt (GB) development was 748.72 acres land. Accordingly
Green belt has been developed to comply the EC condition. In subsequent year the plantation has
been increased and as of now 850 acre of land is planted.
3.A per Latest EC granted in 2018- J-11011/344/2016-IA. II(I) dt.11.10.2018 the existing land area mention is 1194 ha(2950.30acre) which is excluding the township area. In proposed project, the total land area with township is 3345 acre.
EIA Report
176 HECS/EIA/IOCL Paradip/Final/24.06.2021/1051
4.IOCL Paradip refinery has already done tree plantations of suitable species about 8.5 Lakh including GB area. Further plantation of 100000 trees is under execution.
5.Pardip is industrial area and IDCO Government of Odisha do not have any land for allocating to any industry.
6.Paradip Area is under SPA CEPI 2018 (NGT order OA 1038/2018 heariing date 10.07.2019) and Greenbelt coverage is required 33% or 40 % .
7.IOCL will explore land for plantation from others e.g. District administration, Forest department of Odisha, NHAI, SH / PWD etc. to meet the balance Green belt.
8.Residential area - Township, CISF Colony etc.
9.The Green belt alloted in section d(others land) is the land area near by schools and villages
10.Additional tree plantation has been done on land in peripheral villages, along access roads,
schools, panchayats, nearby district areas etc.
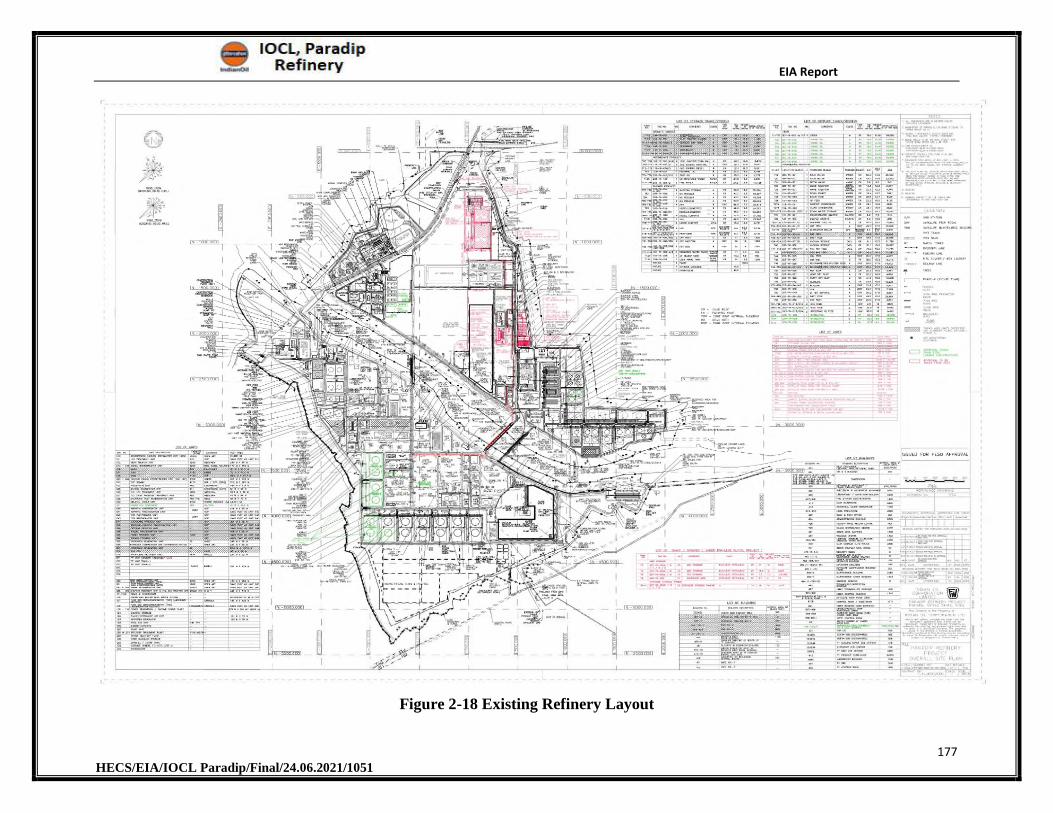
EIA Report
177 HECS/EIA/IOCL Paradip/Final/24.06.2021/1051
Figure 2-18 Existing Refinery Layout
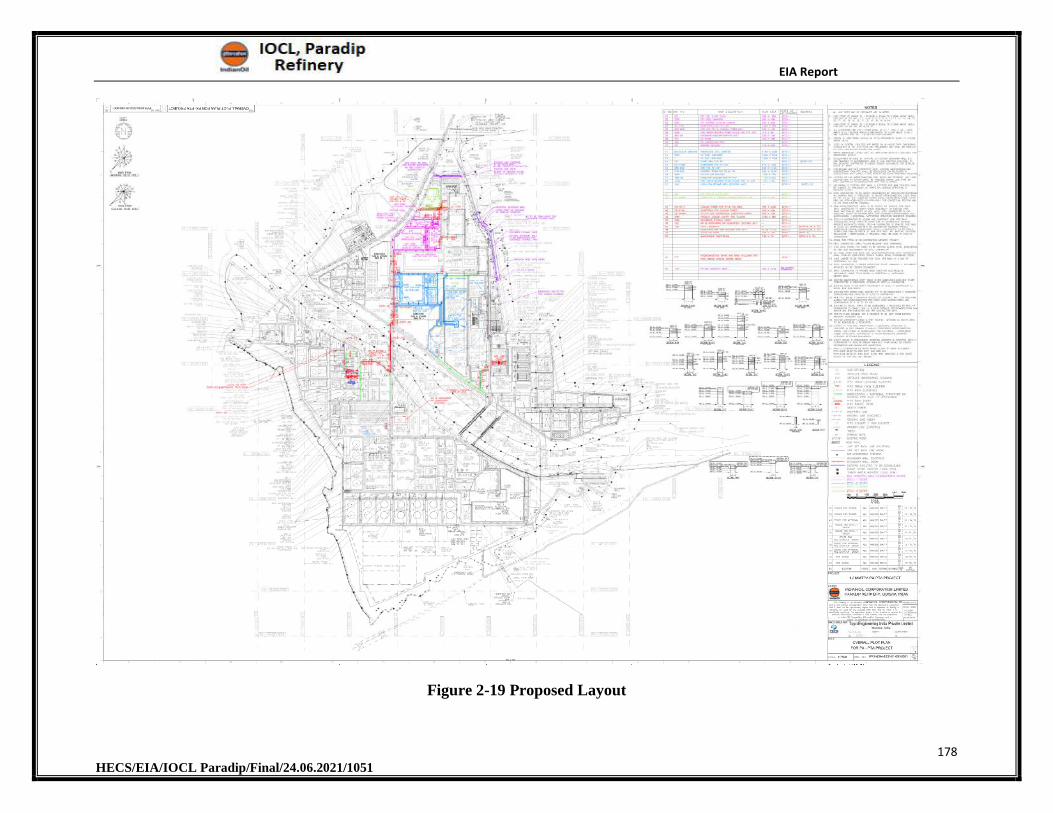
EIA Report
178 HECS/EIA/IOCL Paradip/Final/24.06.2021/1051
Figure 2-19 Proposed Layout
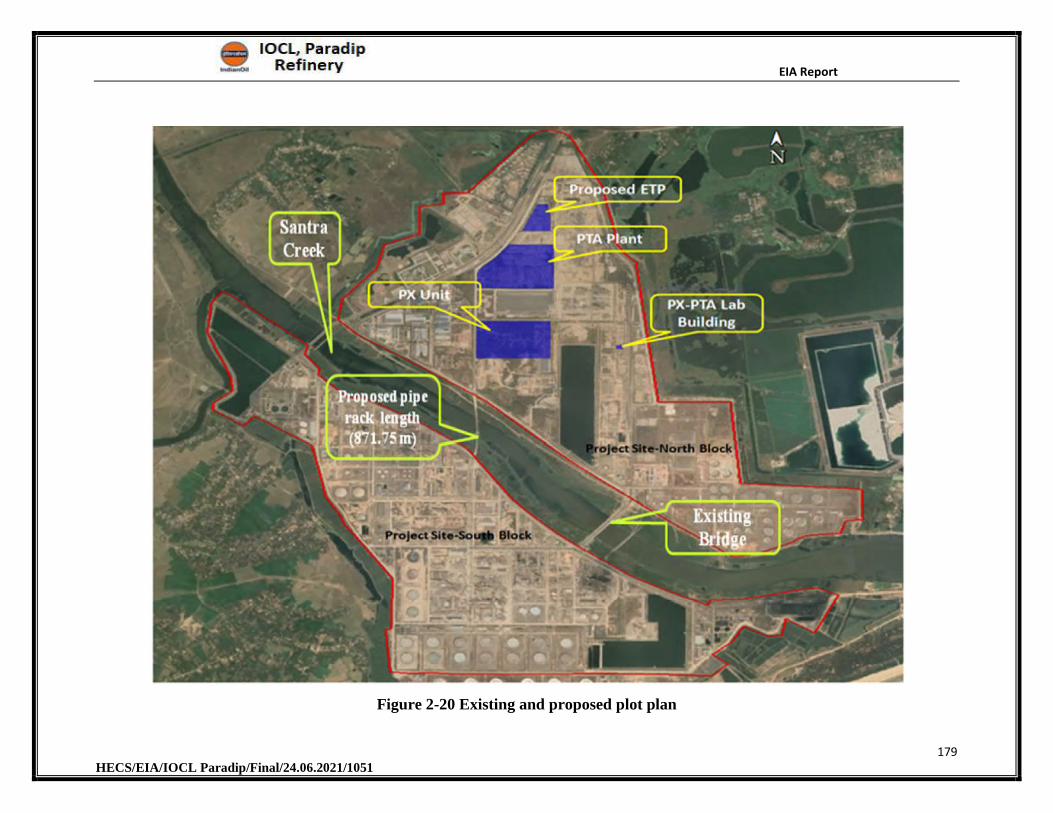
EIA Report
179 HECS/EIA/IOCL Paradip/Final/24.06.2021/1051
Figure 2-20 Existing and proposed plot plan
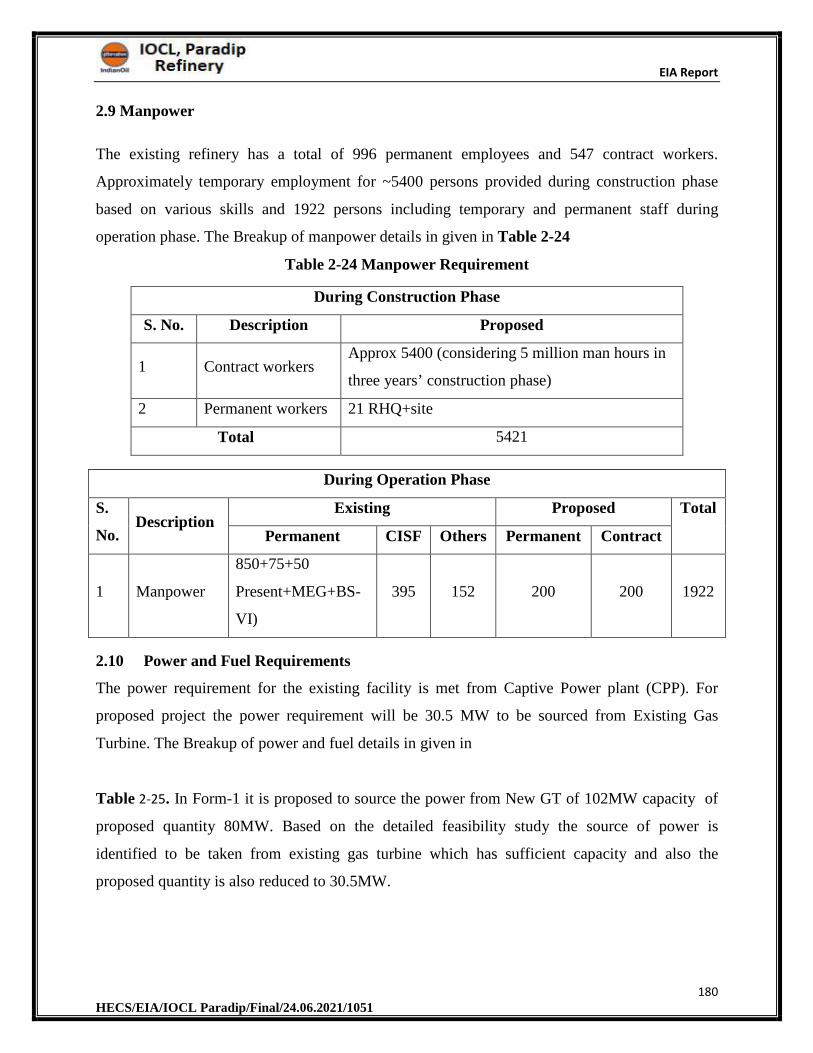
EIA Report
180 HECS/EIA/IOCL Paradip/Final/24.06.2021/1051
2.9 Manpower
The existing refinery has a total of 996 permanent employees and 547 contract workers.
Approximately temporary employment for ~5400 persons provided during construction phase
based on various skills and 1922 persons including temporary and permanent staff during
operation phase. The Breakup of manpower details in given in Table 2-24
Table 2-24 Manpower Requirement
During Construction Phase
S. No. Description Proposed
1 Contract workers Approx 5400 (considering 5 million man hours in
three years’ construction phase)
2 Permanent workers 21 RHQ+site
Total 5421
During Operation Phase
S.
No. Description
Existing Proposed Total
Permanent CISF Others Permanent Contract
1 Manpower
850+75+50
Present+MEG+BS-
VI)
395 152 200 200 1922
2.10 Power and Fuel Requirements
The power requirement for the existing facility is met from Captive Power plant (CPP). For
proposed project the power requirement will be 30.5 MW to be sourced from Existing Gas
Turbine. The Breakup of power and fuel details in given in
Table 2-25. In Form-1 it is proposed to source the power from New GT of 102MW capacity of
proposed quantity 80MW. Based on the detailed feasibility study the source of power is
identified to be taken from existing gas turbine which has sufficient capacity and also the
proposed quantity is also reduced to 30.5MW.
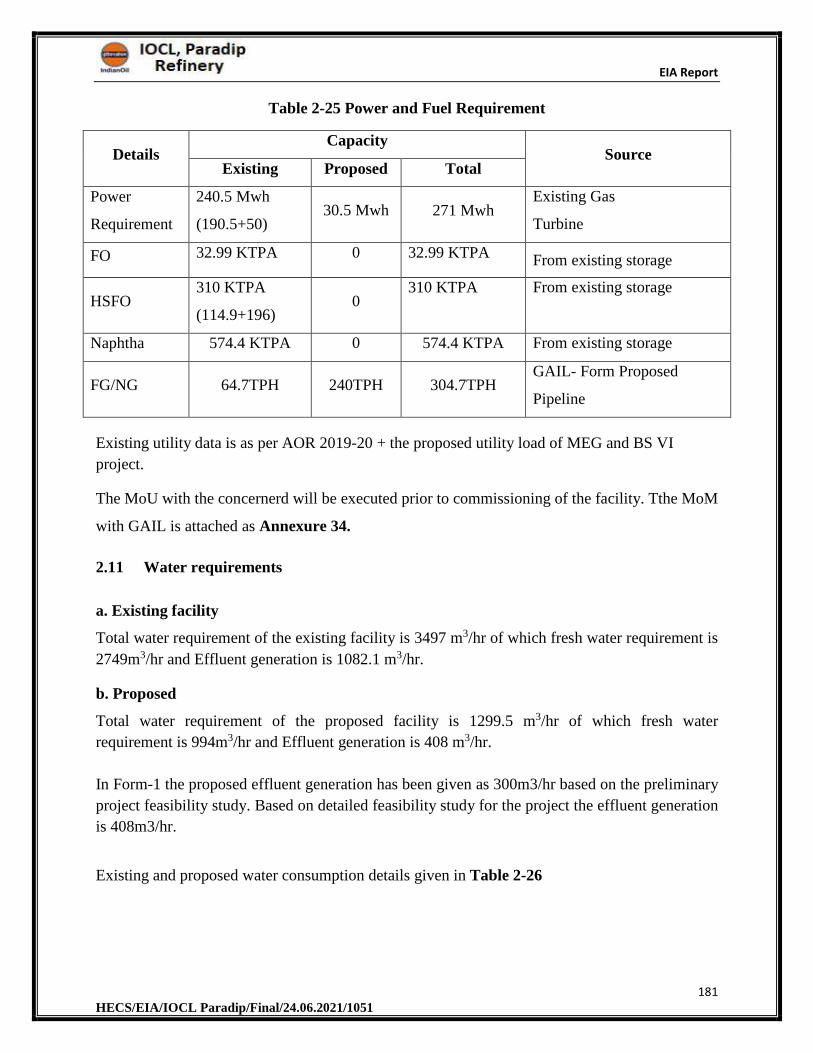
EIA Report
181 HECS/EIA/IOCL Paradip/Final/24.06.2021/1051
Table 2-25 Power and Fuel Requirement
Details Capacity
Source Existing Proposed Total
Power
Requirement
240.5 Mwh
(190.5+50) 30.5 Mwh 271 Mwh
Existing Gas
Turbine
FO 32.99 KTPA 0 32.99 KTPA From existing storage
HSFO 310 KTPA
(114.9+196) 0
310 KTPA From existing storage
Naphtha 574.4 KTPA 0 574.4 KTPA From existing storage
FG/NG 64.7TPH 240TPH 304.7TPH GAIL- Form Proposed
Pipeline
Existing utility data is as per AOR 2019-20 + the proposed utility load of MEG and BS VI
project.
The MoU with the concernerd will be executed prior to commissioning of the facility. Tthe MoM
with GAIL is attached as Annexure 34.
2.11 Water requirements
a. Existing facility
Total water requirement of the existing facility is 3497 m3/hr of which fresh water requirement is
2749m3/hr and Effluent generation is 1082.1 m3/hr.
b. Proposed
Total water requirement of the proposed facility is 1299.5 m3/hr of which fresh water
requirement is 994m3/hr and Effluent generation is 408 m3/hr.
In Form-1 the proposed effluent generation has been given as 300m3/hr based on the preliminary
project feasibility study. Based on detailed feasibility study for the project the effluent generation
is 408m3/hr.
Existing and proposed water consumption details given in Table 2-26
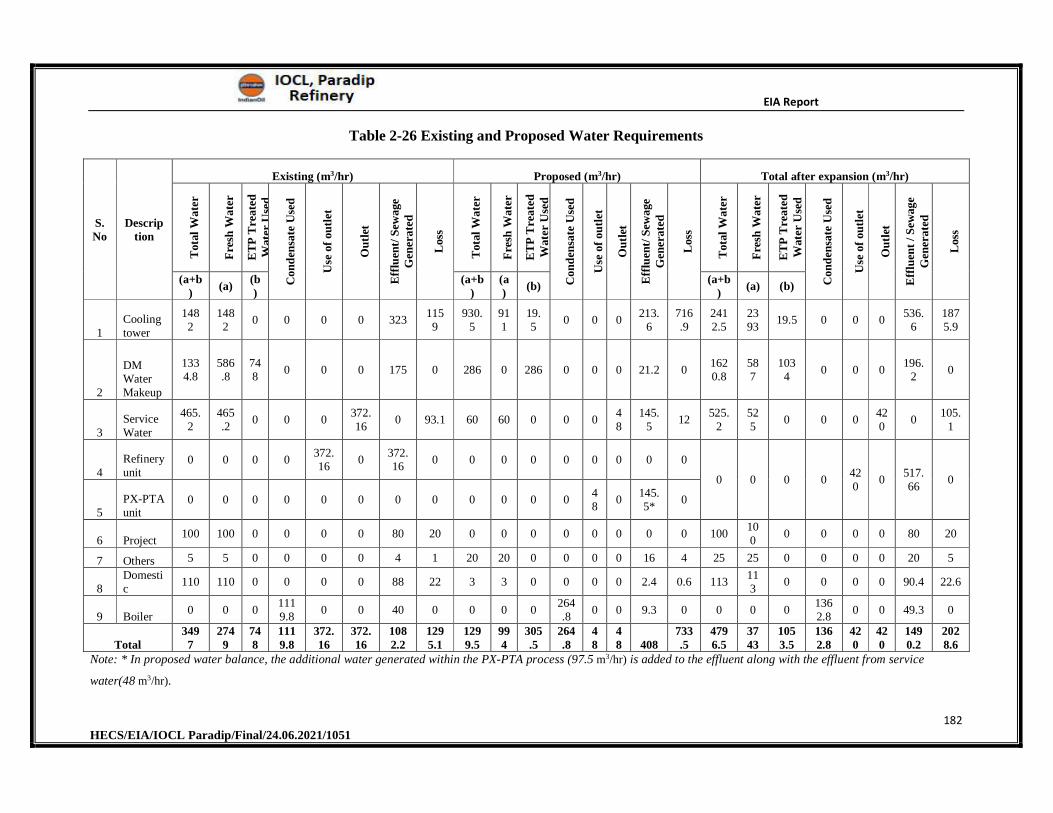
EIA Report
182 HECS/EIA/IOCL Paradip/Final/24.06.2021/1051
Table 2-26 Existing and Proposed Water Requirements
S. No
Description
Existing (m3/hr) Proposed (m3/hr) Total after expansion (m3/hr)
Tot
al W
ater
Fre
sh W
ater
ET
P T
reat
ed
Wat
er U
sed
Con
den
sate
Use
d
Use
of
outl
et
Ou
tlet
Eff
luen
t/ S
ewag
e G
ener
ated
Los
s
Tot
al W
ater
Fre
sh W
ater
ET
P T
reat
ed
Wat
er U
sed
Con
den
sate
Use
d
Use
of
outl
et
Ou
tlet
Eff
luen
t/ S
ewag
e G
ener
ated
Los
s
Tot
al W
ater
Fre
sh W
ater
ET
P T
reat
ed
Wat
er U
sed
Con
den
sate
Use
d
Use
of
outl
et
Ou
tlet
Eff
luen
t /
Sew
age
Gen
erat
ed
Los
s
(a+b)
(a) (b)
(a+b)
(a)
(b) (a+b
) (a) (b)
1 Cooling tower
1482
1482
0 0 0 0 323 1159
930.5
911
19.5
0 0 0 213.
6 716.9
2412.5
2393
19.5 0 0 0 536.
6 1875.9
2
DM Water Makeup
1334.8
586.8
748
0 0 0 175 0 286 0 286 0 0 0 21.2 0 1620.8
587
1034
0 0 0 196.
2 0
3 Service Water
465.2
465.2
0 0 0 372.16
0 93.1 60 60 0 0 0 48
145.5
12 525.
2 525
0 0 0 420
0 105.
1
4 Refinery unit
0 0 0 0 372.16
0 372.16
0 0 0 0 0 0 0 0 0
0 0 0 0 420
0 517.66
0
5 PX-PTA unit
0 0 0 0 0 0 0 0 0 0 0 0 48
0 145.5*
0
6 Project 100 100 0 0 0 0 80 20 0 0 0 0 0 0 0 0 100
100
0 0 0 0 80 20
7 Others 5 5 0 0 0 0 4 1 20 20 0 0 0 0 16 4 25 25 0 0 0 0 20 5
8 Domestic
110 110 0 0 0 0 88 22 3 3 0 0 0 0 2.4 0.6 113 113
0 0 0 0 90.4 22.6
9 Boiler 0 0 0
1119.8
0 0 40 0 0 0 0 264.8
0 0 9.3 0 0 0 0 1362.8
0 0 49.3 0
Total 3497
2749
748
1119.8
372.16
372.16
1082.2
1295.1
1299.5
994
305.5
264.8
48
48 408
733.5
4796.5
3743
1053.5
1362.8
420
420
1490.2
2028.6
Note: * In proposed water balance, the additional water generated within the PX-PTA process (97.5 m3/hr) is added to the effluent along with the effluent from service
water(48 m3/hr).
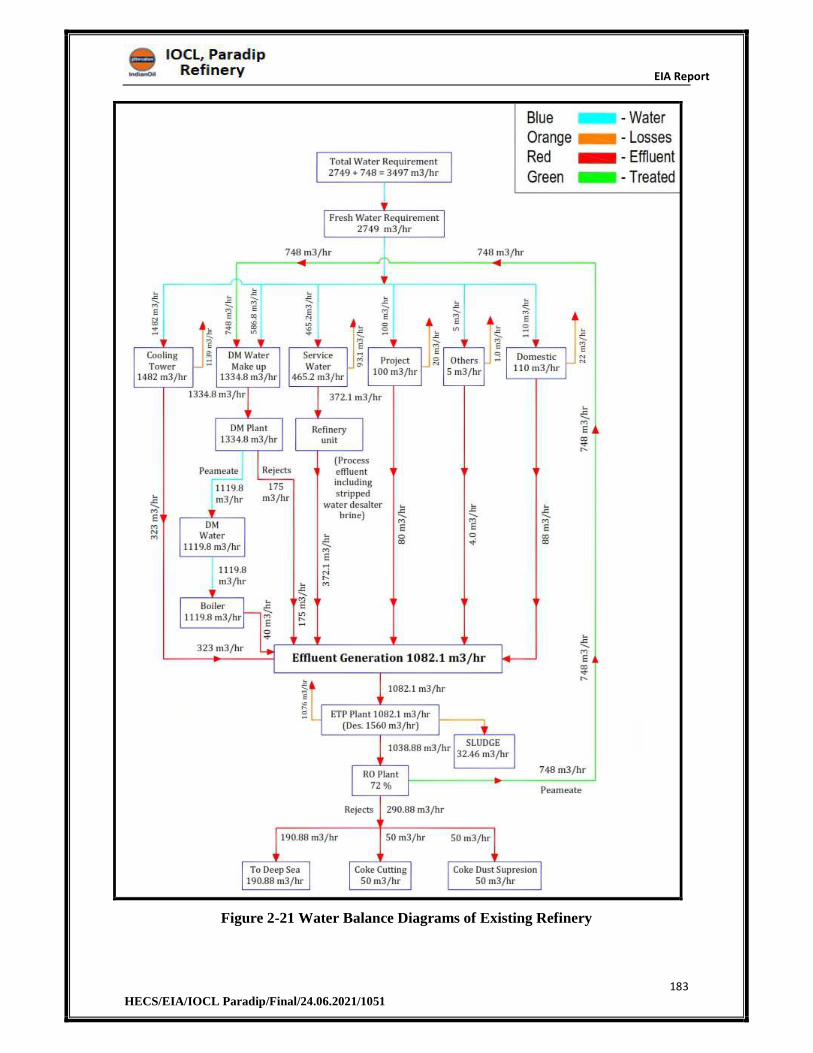
EIA Report
183 HECS/EIA/IOCL Paradip/Final/24.06.2021/1051
Figure 2-21 Water Balance Diagrams of Existing Refinery
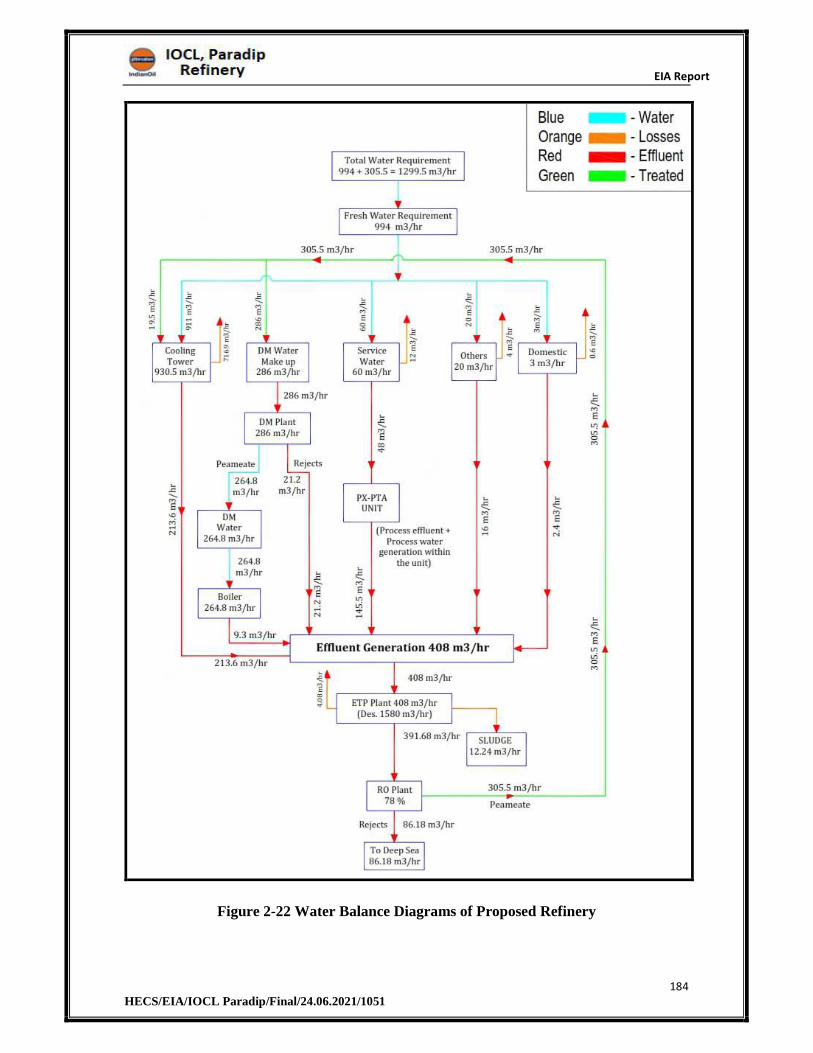
EIA Report
184 HECS/EIA/IOCL Paradip/Final/24.06.2021/1051
Figure 2-22 Water Balance Diagrams of Proposed Refinery
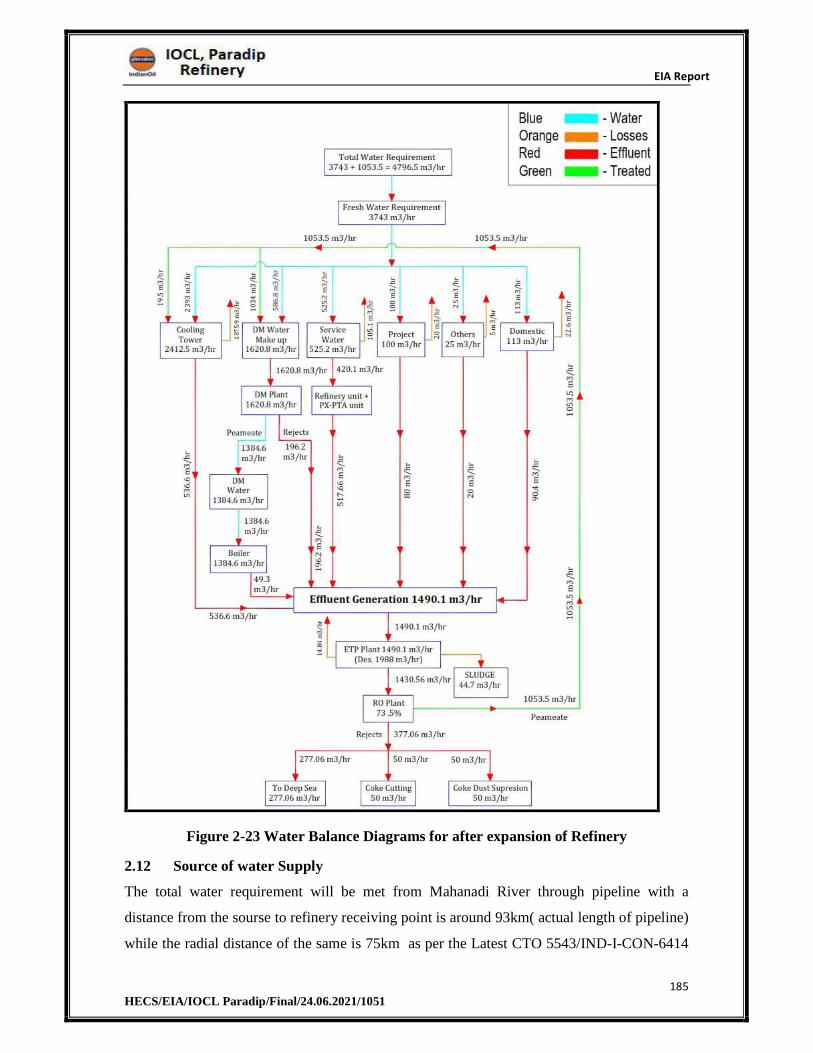
EIA Report
185 HECS/EIA/IOCL Paradip/Final/24.06.2021/1051
Figure 2-23 Water Balance Diagrams for after expansion of Refinery
2.12 Source of water Supply
The total water requirement will be met from Mahanadi River through pipeline with a
distance from the sourse to refinery receiving point is around 93km( actual length of pipeline)
while the radial distance of the same is 75km as per the Latest CTO 5543/IND-I-CON-6414
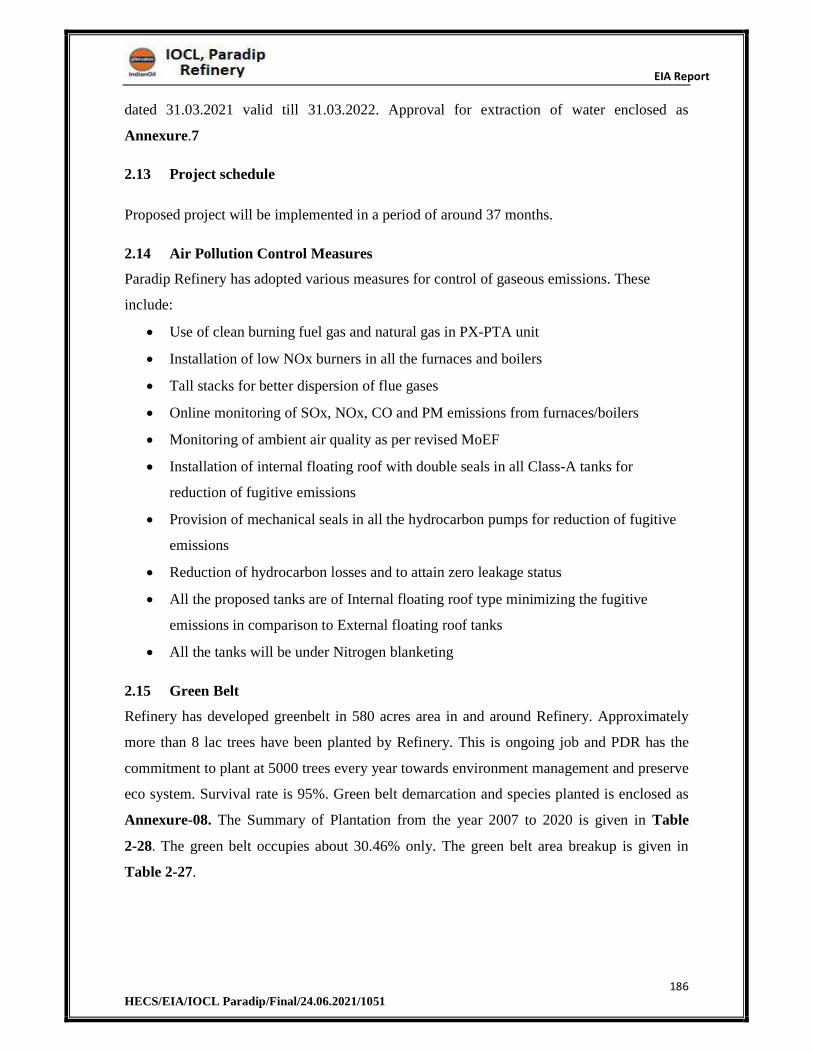
EIA Report
186 HECS/EIA/IOCL Paradip/Final/24.06.2021/1051
dated 31.03.2021 valid till 31.03.2022. Approval for extraction of water enclosed as
Annexure.7
2.13 Project schedule
Proposed project will be implemented in a period of around 37 months.
2.14 Air Pollution Control Measures
Paradip Refinery has adopted various measures for control of gaseous emissions. These
include:
Use of clean burning fuel gas and natural gas in PX-PTA unit
Installation of low NOx burners in all the furnaces and boilers
Tall stacks for better dispersion of flue gases
Online monitoring of SOx, NOx, CO and PM emissions from furnaces/boilers
Monitoring of ambient air quality as per revised MoEF
Installation of internal floating roof with double seals in all Class-A tanks for
reduction of fugitive emissions
Provision of mechanical seals in all the hydrocarbon pumps for reduction of fugitive
emissions
Reduction of hydrocarbon losses and to attain zero leakage status
All the proposed tanks are of Internal floating roof type minimizing the fugitive
emissions in comparison to External floating roof tanks
All the tanks will be under Nitrogen blanketing
2.15 Green Belt
Refinery has developed greenbelt in 580 acres area in and around Refinery. Approximately
more than 8 lac trees have been planted by Refinery. This is ongoing job and PDR has the
commitment to plant at 5000 trees every year towards environment management and preserve
eco system. Survival rate is 95%. Green belt demarcation and species planted is enclosed as
Annexure-08. The Summary of Plantation from the year 2007 to 2020 is given in Table
2-28. The green belt occupies about 30.46% only. The green belt area breakup is given in
Table 2-27.
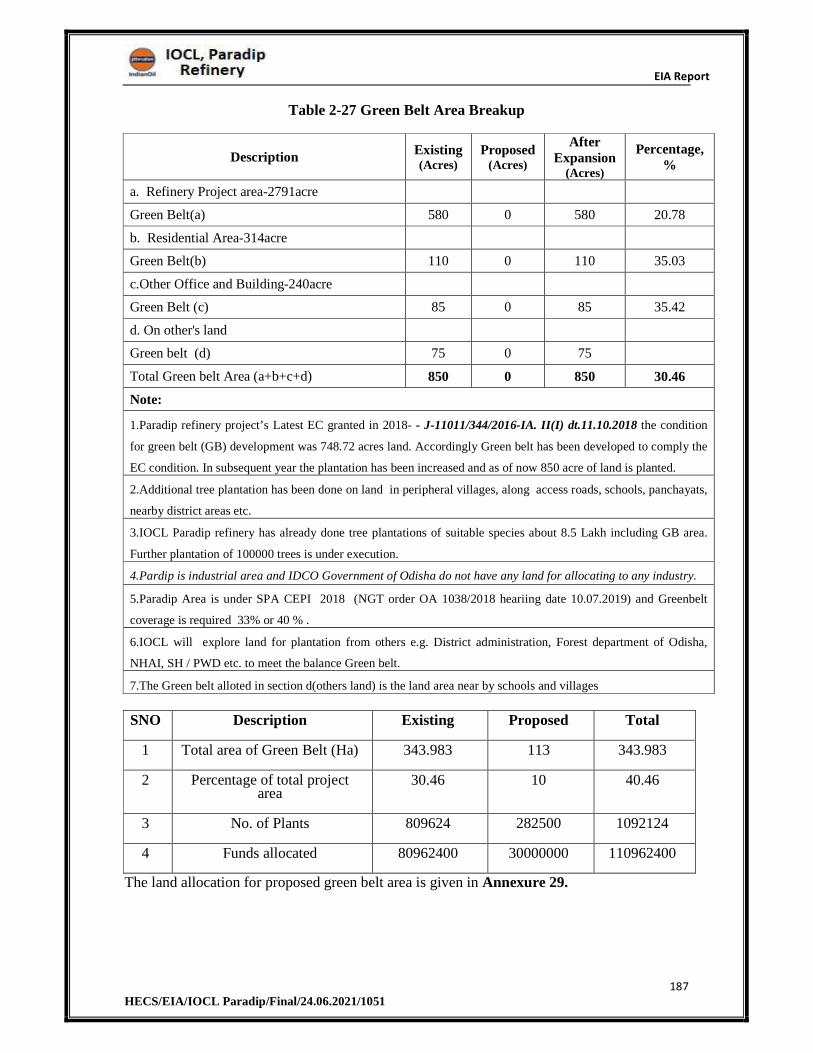
EIA Report
187 HECS/EIA/IOCL Paradip/Final/24.06.2021/1051
Table 2-27 Green Belt Area Breakup
Description Existing (Acres)
Proposed (Acres)
After Expansion
(Acres)
Percentage, %
a. Refinery Project area-2791acre
Green Belt(a) 580 0 580 20.78
b. Residential Area-314acre
Green Belt(b) 110 0 110 35.03
c.Other Office and Building-240acre
Green Belt (c) 85 0 85 35.42
d. On other's land
Green belt (d) 75 0 75
Total Green belt Area (a+b+c+d) 850 0 850 30.46
Note:
1.Paradip refinery project’s Latest EC granted in 2018- - J-11011/344/2016-IA. II(I) dt.11.10.2018 the condition
for green belt (GB) development was 748.72 acres land. Accordingly Green belt has been developed to comply the
EC condition. In subsequent year the plantation has been increased and as of now 850 acre of land is planted.
2.Additional tree plantation has been done on land in peripheral villages, along access roads, schools, panchayats,
nearby district areas etc.
3.IOCL Paradip refinery has already done tree plantations of suitable species about 8.5 Lakh including GB area.
Further plantation of 100000 trees is under execution.
4.Pardip is industrial area and IDCO Government of Odisha do not have any land for allocating to any industry.
5.Paradip Area is under SPA CEPI 2018 (NGT order OA 1038/2018 heariing date 10.07.2019) and Greenbelt
coverage is required 33% or 40 % .
6.IOCL will explore land for plantation from others e.g. District administration, Forest department of Odisha,
NHAI, SH / PWD etc. to meet the balance Green belt.
7.The Green belt alloted in section d(others land) is the land area near by schools and villages
SNO Description Existing Proposed Total
1 Total area of Green Belt (Ha) 343.983 113 343.983
2 Percentage of total project area
30.46 10 40.46
3 No. of Plants 809624 282500 1092124
4 Funds allocated 80962400 30000000 110962400
The land allocation for proposed green belt area is given in Annexure 29.
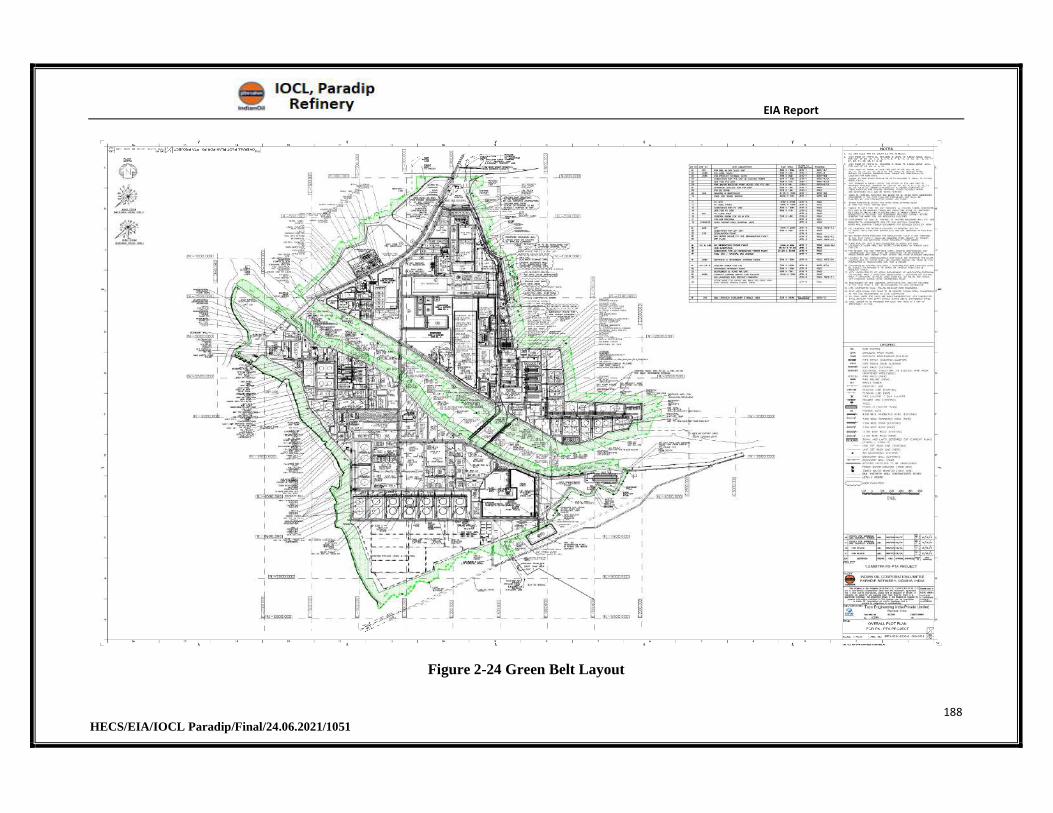
EIA Report
188 HECS/EIA/IOCL Paradip/Final/24.06.2021/1051
Figure 2-24 Green Belt Layout
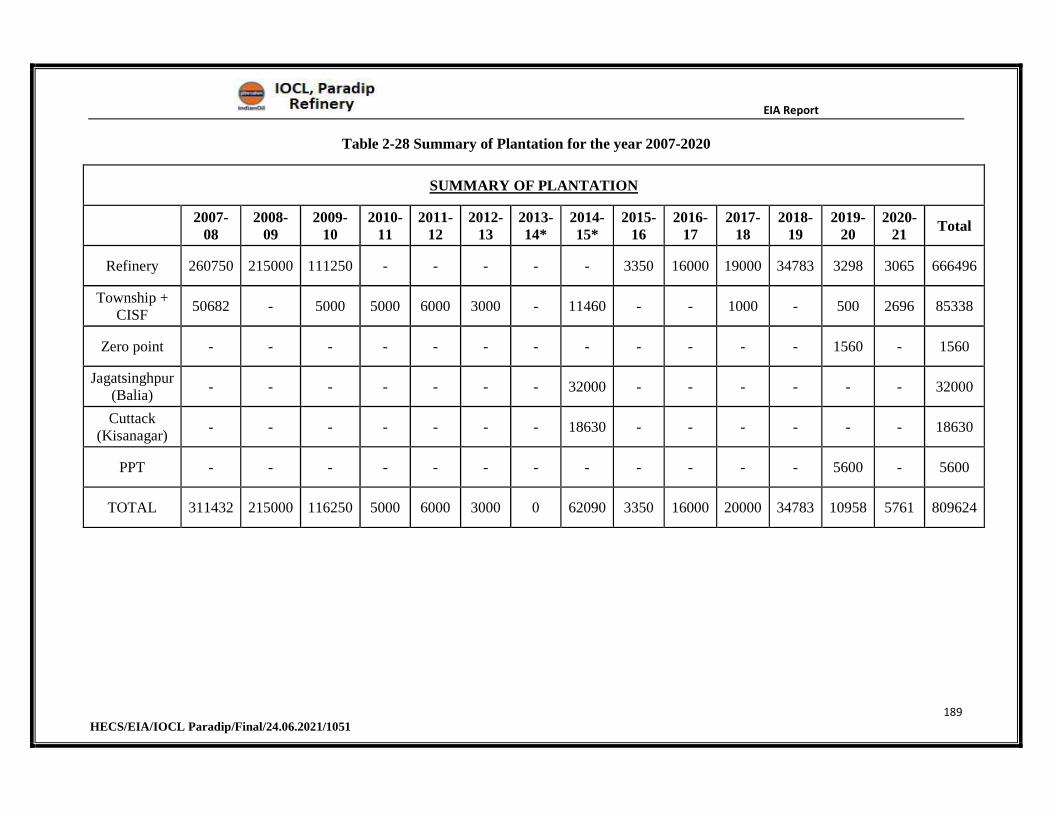
EIA Report
189 HECS/EIA/IOCL Paradip/Final/24.06.2021/1051
Table 2-28 Summary of Plantation for the year 2007-2020
SUMMARY OF PLANTATION
2007-08
2008-09
2009-10
2010-11
2011-12
2012-13
2013-14*
2014-15*
2015-16
2016-17
2017-18
2018-19
2019-20
2020-21
Total
Refinery 260750 215000 111250 - - - - - 3350 16000 19000 34783 3298 3065 666496
Township + CISF
50682 - 5000 5000 6000 3000 - 11460 - - 1000 - 500 2696 85338
Zero point - - - - - - - - - - - - 1560 - 1560
Jagatsinghpur (Balia)
- - - - - - - 32000 - - - - - - 32000
Cuttack (Kisanagar)
- - - - - - - 18630 - - - - - - 18630
PPT - - - - - - - - - - - - 5600 - 5600
TOTAL 311432 215000 116250 5000 6000 3000 0 62090 3350 16000 20000 34783 10958 5761 809624
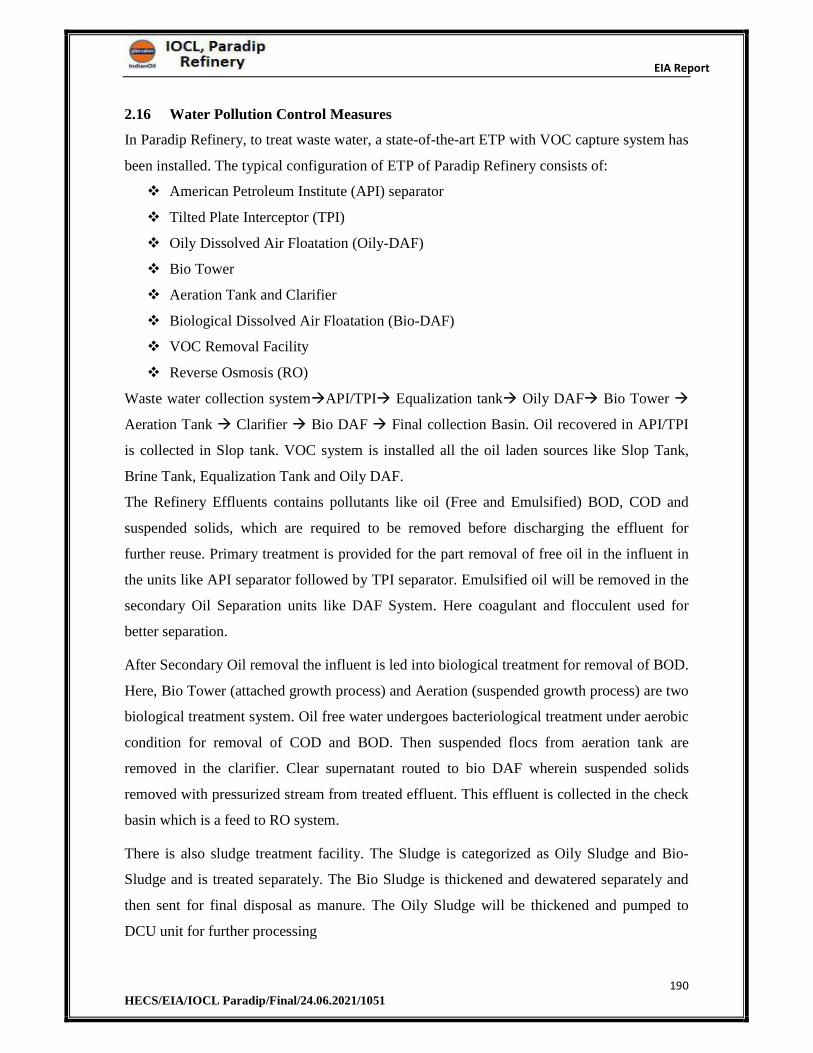
EIA Report
190 HECS/EIA/IOCL Paradip/Final/24.06.2021/1051
2.16 Water Pollution Control Measures
In Paradip Refinery, to treat waste water, a state-of-the-art ETP with VOC capture system has
been installed. The typical configuration of ETP of Paradip Refinery consists of:
American Petroleum Institute (API) separator
Tilted Plate Interceptor (TPI)
Oily Dissolved Air Floatation (Oily-DAF)
Bio Tower
Aeration Tank and Clarifier
Biological Dissolved Air Floatation (Bio-DAF)
VOC Removal Facility
Reverse Osmosis (RO)
Waste water collection systemAPI/TPI Equalization tank Oily DAF Bio Tower
Aeration Tank Clarifier Bio DAF Final collection Basin. Oil recovered in API/TPI
is collected in Slop tank. VOC system is installed all the oil laden sources like Slop Tank,
Brine Tank, Equalization Tank and Oily DAF.
The Refinery Effluents contains pollutants like oil (Free and Emulsified) BOD, COD and
suspended solids, which are required to be removed before discharging the effluent for
further reuse. Primary treatment is provided for the part removal of free oil in the influent in
the units like API separator followed by TPI separator. Emulsified oil will be removed in the
secondary Oil Separation units like DAF System. Here coagulant and flocculent used for
better separation.
After Secondary Oil removal the influent is led into biological treatment for removal of BOD.
Here, Bio Tower (attached growth process) and Aeration (suspended growth process) are two
biological treatment system. Oil free water undergoes bacteriological treatment under aerobic
condition for removal of COD and BOD. Then suspended flocs from aeration tank are
removed in the clarifier. Clear supernatant routed to bio DAF wherein suspended solids
removed with pressurized stream from treated effluent. This effluent is collected in the check
basin which is a feed to RO system.
There is also sludge treatment facility. The Sludge is categorized as Oily Sludge and Bio-
Sludge and is treated separately. The Bio Sludge is thickened and dewatered separately and
then sent for final disposal as manure. The Oily Sludge will be thickened and pumped to
DCU unit for further processing
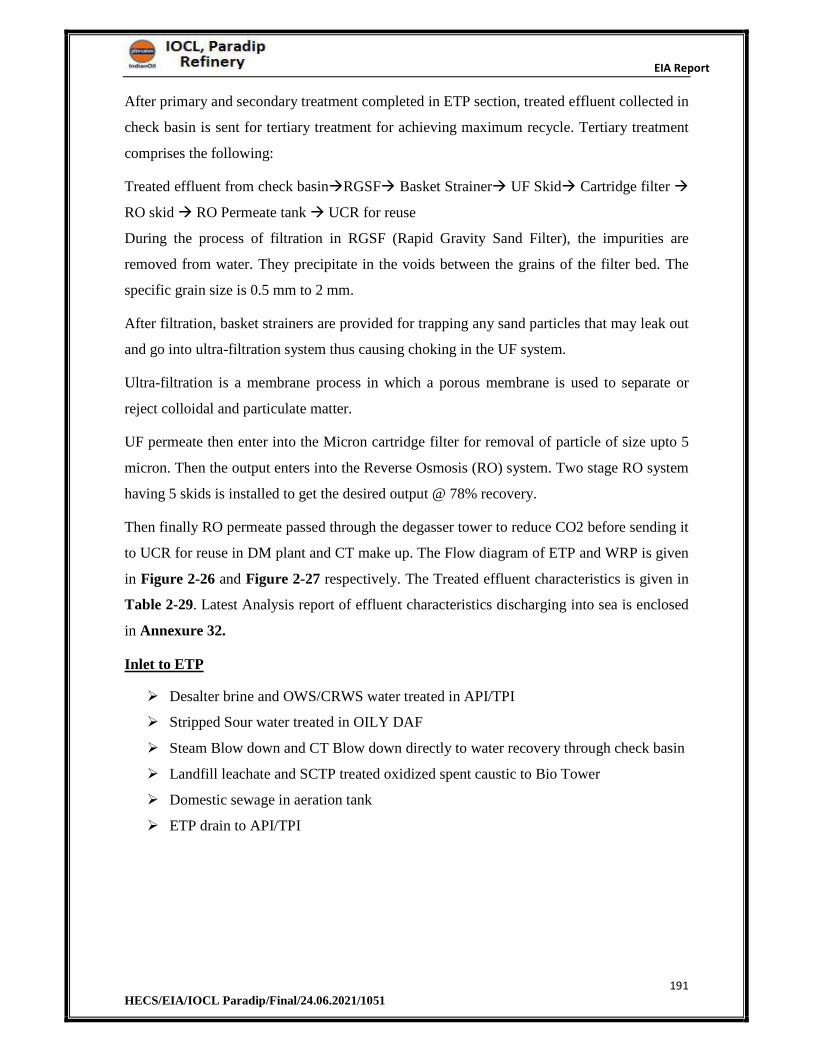
EIA Report
191 HECS/EIA/IOCL Paradip/Final/24.06.2021/1051
After primary and secondary treatment completed in ETP section, treated effluent collected in
check basin is sent for tertiary treatment for achieving maximum recycle. Tertiary treatment
comprises the following:
Treated effluent from check basinRGSF Basket Strainer UF Skid Cartridge filter
RO skid RO Permeate tank UCR for reuse
During the process of filtration in RGSF (Rapid Gravity Sand Filter), the impurities are
removed from water. They precipitate in the voids between the grains of the filter bed. The
specific grain size is 0.5 mm to 2 mm.
After filtration, basket strainers are provided for trapping any sand particles that may leak out
and go into ultra-filtration system thus causing choking in the UF system.
Ultra-filtration is a membrane process in which a porous membrane is used to separate or
reject colloidal and particulate matter.
UF permeate then enter into the Micron cartridge filter for removal of particle of size upto 5
micron. Then the output enters into the Reverse Osmosis (RO) system. Two stage RO system
having 5 skids is installed to get the desired output @ 78% recovery.
Then finally RO permeate passed through the degasser tower to reduce CO2 before sending it
to UCR for reuse in DM plant and CT make up. The Flow diagram of ETP and WRP is given
in Figure 2-26 and Figure 2-27 respectively. The Treated effluent characteristics is given in
Table 2-29. Latest Analysis report of effluent characteristics discharging into sea is enclosed
in Annexure 32.
Inlet to ETP
Desalter brine and OWS/CRWS water treated in API/TPI
Stripped Sour water treated in OILY DAF
Steam Blow down and CT Blow down directly to water recovery through check basin
Landfill leachate and SCTP treated oxidized spent caustic to Bio Tower
Domestic sewage in aeration tank
ETP drain to API/TPI
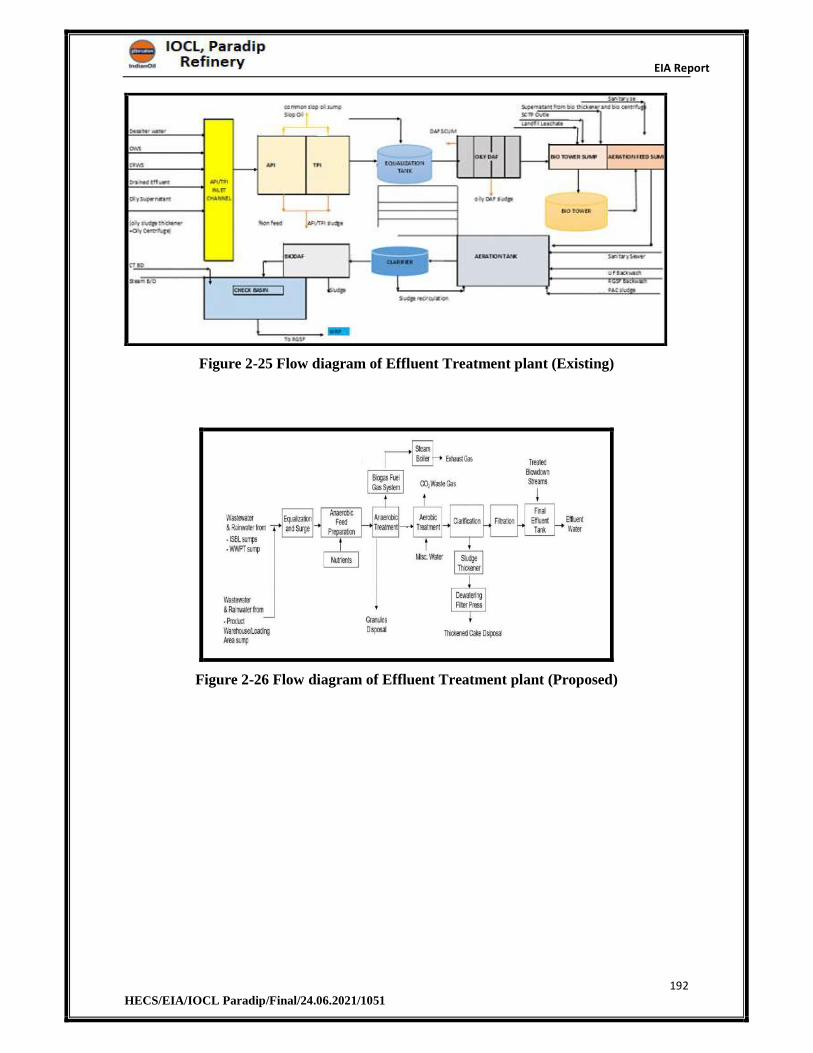
EIA Report
192 HECS/EIA/IOCL Paradip/Final/24.06.2021/1051
Figure 2-25 Flow diagram of Effluent Treatment plant (Existing)
Figure 2-26 Flow diagram of Effluent Treatment plant (Proposed)
EIA Report
193 HECS/EIA/IOCL Paradip/Final/24.06.2021/1051
Figure 2-27 Flow Diagram of WRP Plant (Existing)
Table 2-29 Characteristics of Effluent Generated
ETP inlet (effluent generated) data in Jan’21
S. NO. PARAMETER TEST METHOD UoM RESULTFLOW (m3/hr)
1 pH IS 3025 (P:11) - 9.92 BOD IS 3025 (P:44) mg/l 1803 COD IS 3025 (P:58) mg/l 13704 Oil & Grease IS 3025 (P:39) mg/l 2645 TSS IS 3025 (P:17) mg/l 846 Sulphide IS 3025 (P:29) mg/l 4.37 DO IS 3025 (P:38) mg/l ND8 Alkalinity IS 3025 (P:23) mg/l 1919 NH3 IS 3025 (P:34) mg/l 29.510 Conductivity IS 3025 (P:14) μs/cm 111711 ORP APHA 2580 mV 20
Table 2-30 Characteristics Final effluent discharge to sea
SlNo Parameter
sTest Method UoM
Limits as per MINAS Results
1 pH IS 3025 (P:11) - 6.0 -8.5 8
2 BOD IS 3025 (P:44) mg/l 15 9 3 COD IS 3025 (P:58) mg/l 125 78
4 Oil &Grease
IS 3025 (P:39) mg/l 5 <4.0
5 TSS IS 3025 (P:17) mg/l 20 <4
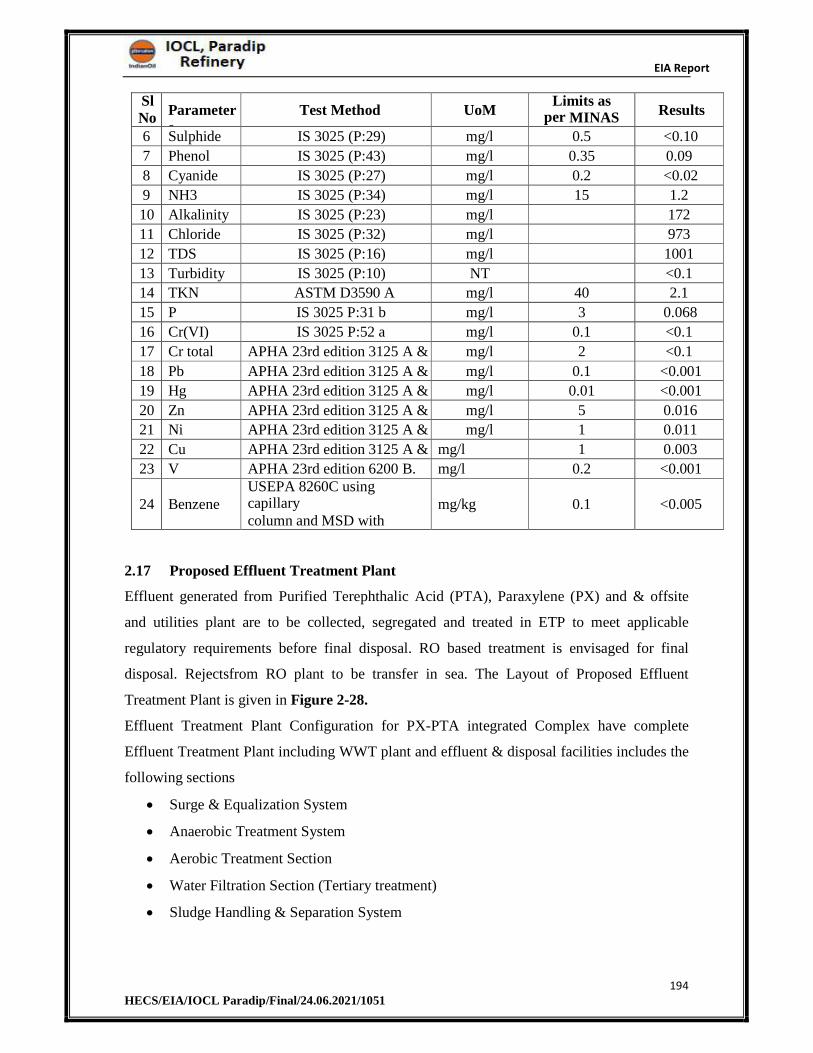
EIA Report
194 HECS/EIA/IOCL Paradip/Final/24.06.2021/1051
SlNo
Parameters
Test Method UoMLimits as
per MINAS Results
6 Sulphide IS 3025 (P:29) mg/l 0.5 <0.10
7 Phenol IS 3025 (P:43) mg/l 0.35 0.09
8 Cyanide IS 3025 (P:27) mg/l 0.2 <0.02
9 NH3 IS 3025 (P:34) mg/l 15 1.2
10 Alkalinity IS 3025 (P:23) mg/l 172
11 Chloride IS 3025 (P:32) mg/l 973
12 TDS IS 3025 (P:16) mg/l 1001
13 Turbidity IS 3025 (P:10) NTU
<0.1
14 TKN ASTM D3590 A mg/l 40 2.1
15 P IS 3025 P:31 b mg/l 3 0.068
16 Cr(VI) IS 3025 P:52 a mg/l 0.1 <0.1
17 Cr total APHA 23rd edition 3125 A &B
mg/l 2 <0.1
18 Pb APHA 23rd edition 3125 A &B
mg/l 0.1 <0.001
19 Hg APHA 23rd edition 3125 A &B
mg/l 0.01 <0.001
20 Zn APHA 23rd edition 3125 A &B
mg/l 5 0.016
21 Ni APHA 23rd edition 3125 A &B
mg/l 1 0.011
22 Cu APHA 23rd edition 3125 A &B
mg/l 1 0.003
23 V APHA 23rd edition 6200 B. mg/l 0.2 <0.001
24 Benzene USEPA 8260C usingcapillarycolumn and MSD with
mg/kg 0.1 <0.005
2.17 Proposed Effluent Treatment Plant
Effluent generated from Purified Terephthalic Acid (PTA), Paraxylene (PX) and & offsite
and utilities plant are to be collected, segregated and treated in ETP to meet applicable
regulatory requirements before final disposal. RO based treatment is envisaged for final
disposal. Rejectsfrom RO plant to be transfer in sea. The Layout of Proposed Effluent
Treatment Plant is given in Figure 2-28.
Effluent Treatment Plant Configuration for PX-PTA integrated Complex have complete
Effluent Treatment Plant including WWT plant and effluent & disposal facilities includes the
following sections
Surge & Equalization System
Anaerobic Treatment System
Aerobic Treatment Section
Water Filtration Section (Tertiary treatment)
Sludge Handling & Separation System
EIA Report
195 HECS/EIA/IOCL Paradip/Final/24.06.2021/1051
New ETP is proposed for installation to process effluent @ 408 m3/hr with 10% design
Margin (Maximum capacity with high TOC).
2.17.1 PX Effluent Treatment
PX effluent at first treated in Pre-Treatment plant due to high aromatic content. The purpose
of PRE-TREATMENT PLANT is to reduce Benzene and other Aromatics in the feed to the
effluent treatment plant.
The following effluent streams are to be routed to the Pre treatment Plant for removal of
Benzene and other Aromatics:
HC contaminated effluent shall be treated by combination of distillation operation on
continuous mode followed by carbon bed adsorption as guard bed.
The PX (ISBL) effluent streams are routed to the Pre-treatment Plant for removal of
Benzene and other Aromatics:
Distillation column diameter shall be adequate to handle the surge flow.
Downstream carbon bed adsorption system shall be designed for 5% of wastewater
feed hydrocarbon load.
Adsorption system shall act as a guard bed and shall be designed for hydraulic load
Suitable filters shall be provided for removal of grease upstream of the distillation
column.
Pre-treated effluent / Off spec Tank shall be provided downstream the carbon bed
adsorption system as a buffer tank for absorbing shock to ETP.
During normal operation of EPTP, pretreated effluent will be collected in this tank and will
be transferred to ETP for further treatment.
Treated effluent from Pre-treatment Plant shall have benzene concentration less than 10 ppm
and total Aromatics (including Benzene) less than 20 ppm
2.17.2 PTA Effluent Treatment
a) Equalization section
PTA plant process wastewater streams are piped to the Surge Tank and then to Equalization
Tank. The surge tank collects the relatively high and periodic flows from the sources. The
holding / storage provided by the surge tank allows for controlled, reduced flow transfer to
the equalization tank
EIA Report
196 HECS/EIA/IOCL Paradip/Final/24.06.2021/1051
b) Anaerobic Treatment System
The equalized effluent is pumped to a conditioning tank. Chemicals are added into the
conditioning tank (mostly neutralized chemicals and nutrients etc.). From the conditioning
tankthe neutralized effluent is then fed to the proposed Anaerobic Reactor, UASB (Upflow
Anaerobic Sludge Blanket Digester) by use of reactor feed pumps. Target COD reduction in
anaerobic reactor is >80% (After complete stabilization). The anaerobically treated
wastewaterwith reduced COD load from the reactor top is allowed to flow by gravity to the
aerobic wastewater treatment system. Methane rich biogas collected in reactor top is
conveyed to BiogasHandling System. Condensate traps to be provided at the inlet line of
Biogas Handling Systemto remove condensate from biogas. From the biogas zone of the
anaerobic reactor, the biogasis drawn through biogas compressors/ liquid ring pump
pressurized and then sent to flaresystem for flaring.
c) Aerobic Treatment Section
After treatment in anaerobic section, the process waste water will be routed to effluent
treatment & disposal facilities for final treatment. Treated wastewater from anaerobic section
iscombined with boiler; cooling tower and demineralized water blow down streams and are
routed to effluent treatment & disposal facilities for final treatment. Along with process water
effluent streams, the other liquid effluents stream like contaminated rain water streams shall
also be separately routed to effluent treatment and disposal facilities for final treatment. The
effluents pass through aeration tank and clarifier before moving to water filtration section.
Aerobic section shall be designed to handle Cooling Tower blowdown and sider stream filter
waste water.
d) Tertiary Treatment:
Water filtration section is located in downstream the Aerobic Treatment Units. The aerobic
effluent coming from aeration & clarification systems contains a significant amount of
suspended solids that need to be removed by means of a tertiary treatment. Tertiary treatment
section includes:
Filtration system through pressure sand filter
Activated carbon Filters
Ultra filtration and RO based system
EIA Report
197 HECS/EIA/IOCL Paradip/Final/24.06.2021/1051
e) Sludge Handling & Dewatering System
Dewatering system for sludge generated from plant will be done by using belt presswhich
will be a common facility for all streams. Hopper and sludge loading facilities will also be
provided. The sludge will be dewatered from inlet consistency of 3-4% solids to ~22% solids
in the belt press. The filtrate from belt press will be recycled back to aeration tank. Solid
collection with necessary trolley, handling and disposal from the RO unit will be done
suitably.
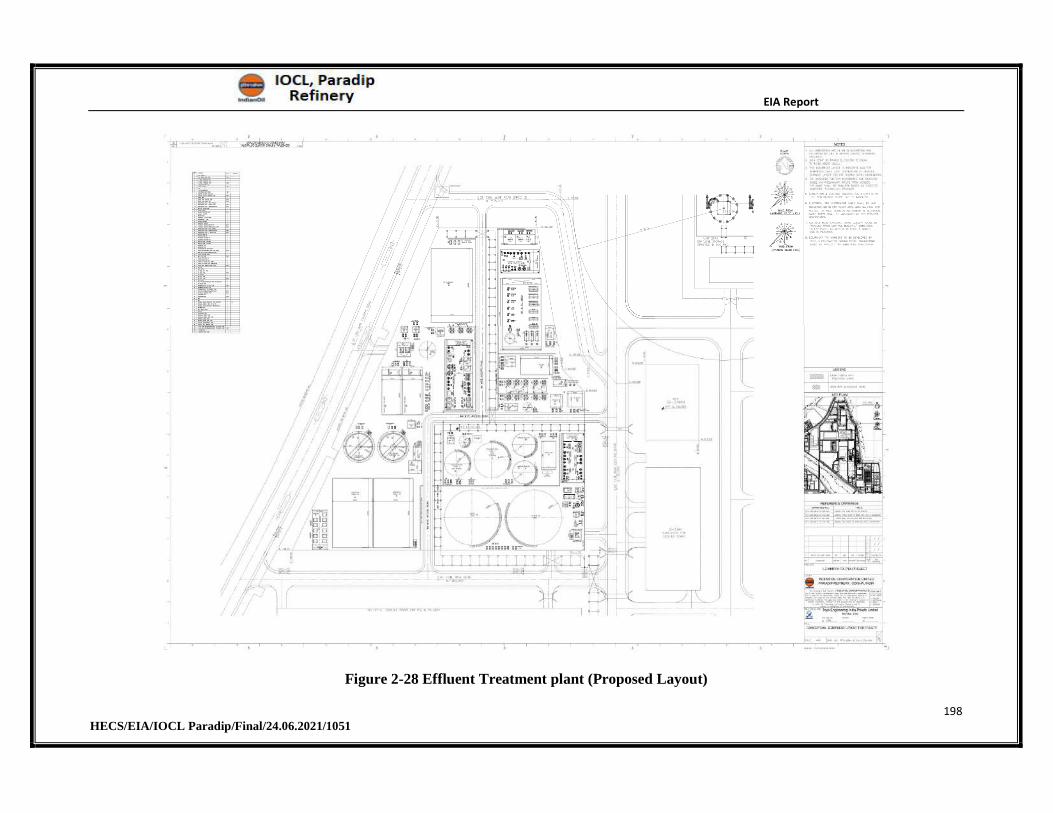
EIA Report
198 HECS/EIA/IOCL Paradip/Final/24.06.2021/1051
Figure 2-28 Effluent Treatment plant (Proposed Layout)
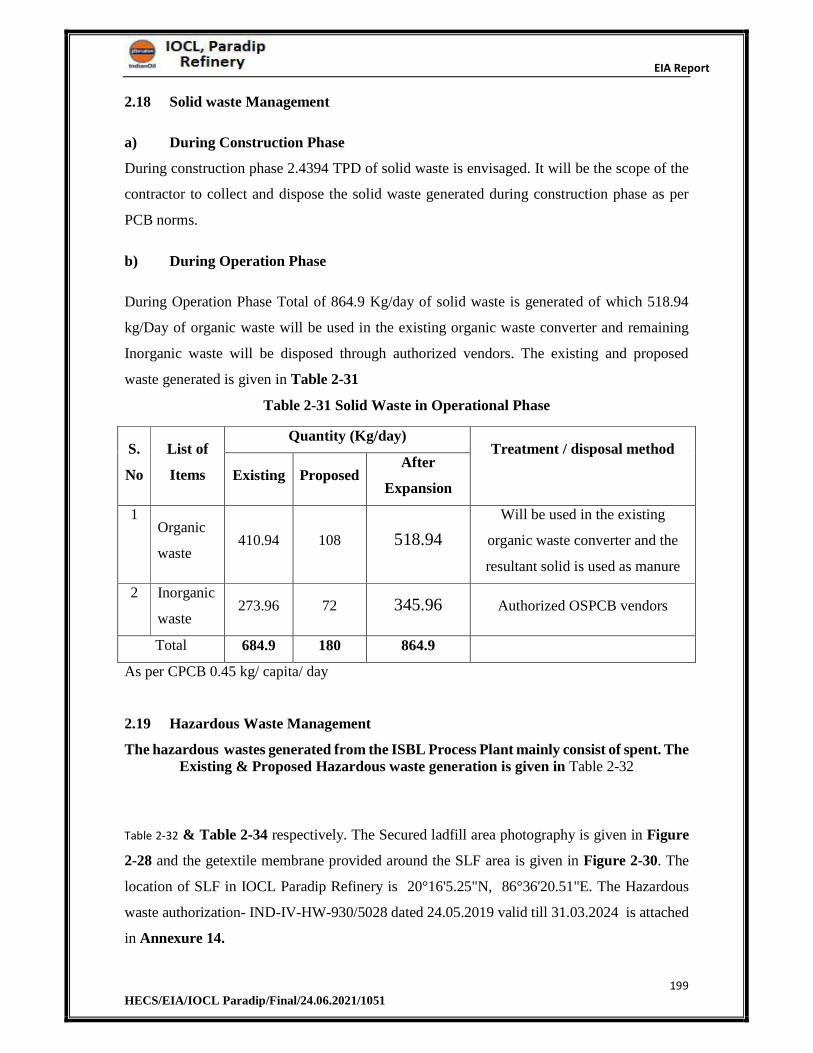
EIA Report
199 HECS/EIA/IOCL Paradip/Final/24.06.2021/1051
2.18 Solid waste Management
a) During Construction Phase
During construction phase 2.4394 TPD of solid waste is envisaged. It will be the scope of the
contractor to collect and dispose the solid waste generated during construction phase as per
PCB norms.
b) During Operation Phase
During Operation Phase Total of 864.9 Kg/day of solid waste is generated of which 518.94
kg/Day of organic waste will be used in the existing organic waste converter and remaining
Inorganic waste will be disposed through authorized vendors. The existing and proposed
waste generated is given in Table 2-31
Table 2-31 Solid Waste in Operational Phase
S.
No
List of
Items
Quantity (Kg/day) Treatment / disposal method
Existing ProposedAfter
Expansion
1 Organic
waste 410.94 108 518.94
Will be used in the existing
organic waste converter and the
resultant solid is used as manure
2 Inorganic
waste 273.96 72 345.96 Authorized OSPCB vendors
Total 684.9 180 864.9
As per CPCB 0.45 kg/ capita/ day
2.19 Hazardous Waste Management
The hazardous wastes generated from the ISBL Process Plant mainly consist of spent. The Existing & Proposed Hazardous waste generation is given in Table 2-32
Table 2-32 & Table 2-34 respectively. The Secured ladfill area photography is given in Figure
2-28 and the getextile membrane provided around the SLF area is given in Figure 2-30. The
location of SLF in IOCL Paradip Refinery is 20°16'5.25"N, 86°36'20.51"E. The Hazardous
waste authorization- IND-IV-HW-930/5028 dated 24.05.2019 valid till 31.03.2024 is attached
in Annexure 14.
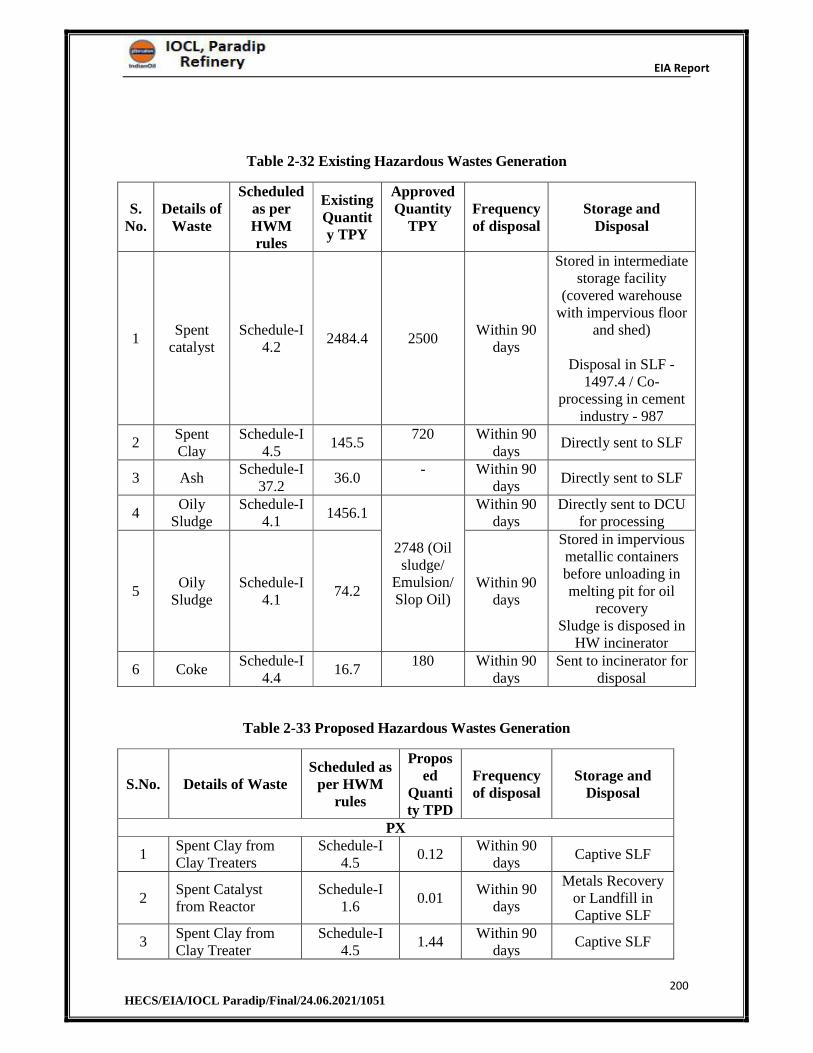
EIA Report
200 HECS/EIA/IOCL Paradip/Final/24.06.2021/1051
Table 2-32 Existing Hazardous Wastes Generation
S.No.
Details of Waste
Scheduled as per HWM rules
Existing Quantity TPY
Approved Quantity
TPY Frequency of disposal
Storage and Disposal
1 Spent
catalyst Schedule-I
4.2 2484.4 2500
Within 90 days
Stored in intermediate storage facility
(covered warehouse with impervious floor
and shed)
Disposal in SLF -1497.4 / Co-
processing in cement industry - 987
2 Spent Clay
Schedule-I 4.5
145.5 720 Within 90
daysDirectly sent to SLF
3 Ash Schedule-I
37.2 36.0
- Within 90 days
Directly sent to SLF
4 Oily
Sludge Schedule-I
4.1 1456.1
2748 (Oil sludge/
Emulsion/ Slop Oil)
Within 90 days
Directly sent to DCU for processing
5 Oily
Sludge Schedule-I
4.1 74.2
Within 90 days
Stored in impervious metallic containers before unloading in melting pit for oil
recovery Sludge is disposed in
HW incinerator
6 Coke Schedule-I
4.416.7
180 Within 90 days
Sent to incinerator for disposal
Table 2-33 Proposed Hazardous Wastes Generation
S.No. Details of Waste Scheduled as
per HWM rules
Proposed
Quantity TPD
Frequency of disposal
Storage and Disposal
PX
1 Spent Clay from Clay Treaters
Schedule-I 4.5
0.12 Within 90
daysCaptive SLF
2 Spent Catalyst from Reactor
Schedule-I 1.6
0.01 Within 90
days
Metals Recovery or Landfill in Captive SLF
3 Spent Clay from Clay Treater
Schedule-I 4.5
1.44 Within 90
daysCaptive SLF
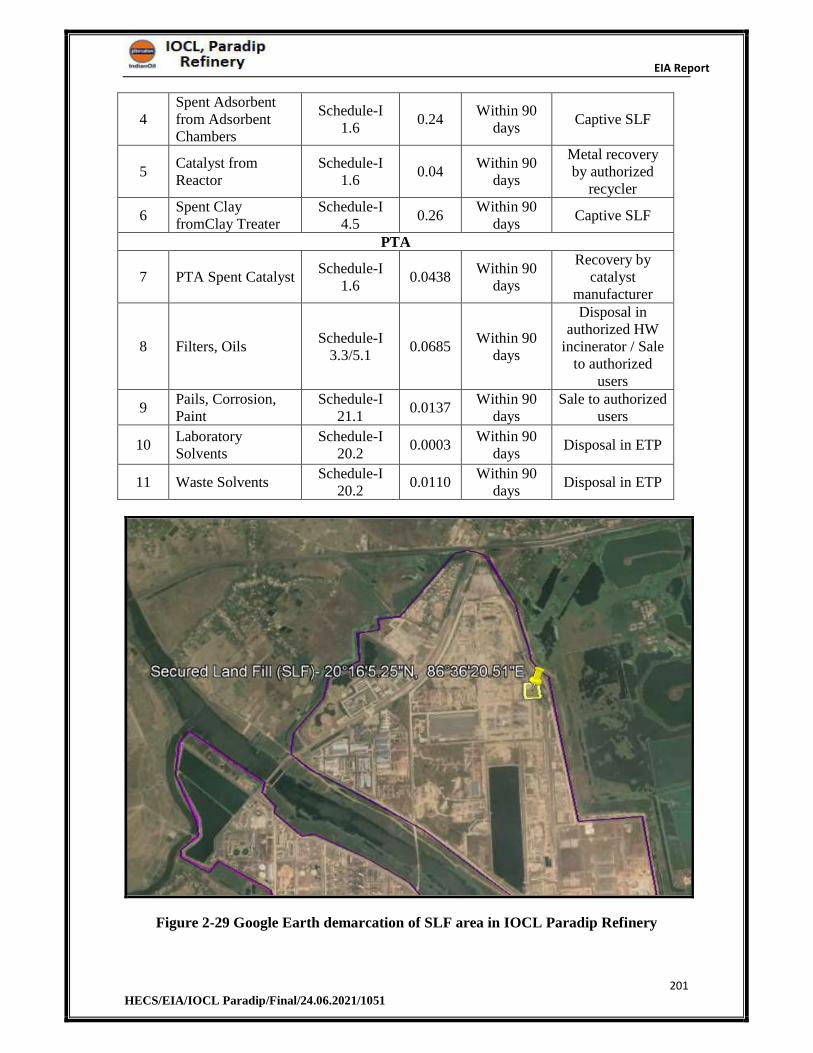
EIA Report
201 HECS/EIA/IOCL Paradip/Final/24.06.2021/1051
4 Spent Adsorbent from Adsorbent Chambers
Schedule-I 1.6
0.24 Within 90
days Captive SLF
5 Catalyst from Reactor
Schedule-I 1.6
0.04 Within 90
days
Metal recovery by authorized
recycler
6 Spent Clay fromClay Treater
Schedule-I 4.5
0.26 Within 90
days Captive SLF
PTA
7 PTA Spent CatalystSchedule-I
1.6 0.0438
Within 90 days
Recovery by catalyst
manufacturer
8 Filters, Oils Schedule-I
3.3/5.1 0.0685
Within 90 days
Disposal in authorized HW
incinerator / Sale to authorized
users
9 Pails, Corrosion, Paint
Schedule-I 21.1
0.0137 Within 90
days Sale to authorized
users
10 Laboratory Solvents
Schedule-I 20.2
0.0003 Within 90
days Disposal in ETP
11 Waste Solvents Schedule-I
20.20.0110
Within 90 days
Disposal in ETP
Figure 2-29 Google Earth demarcation of SLF area in IOCL Paradip Refinery
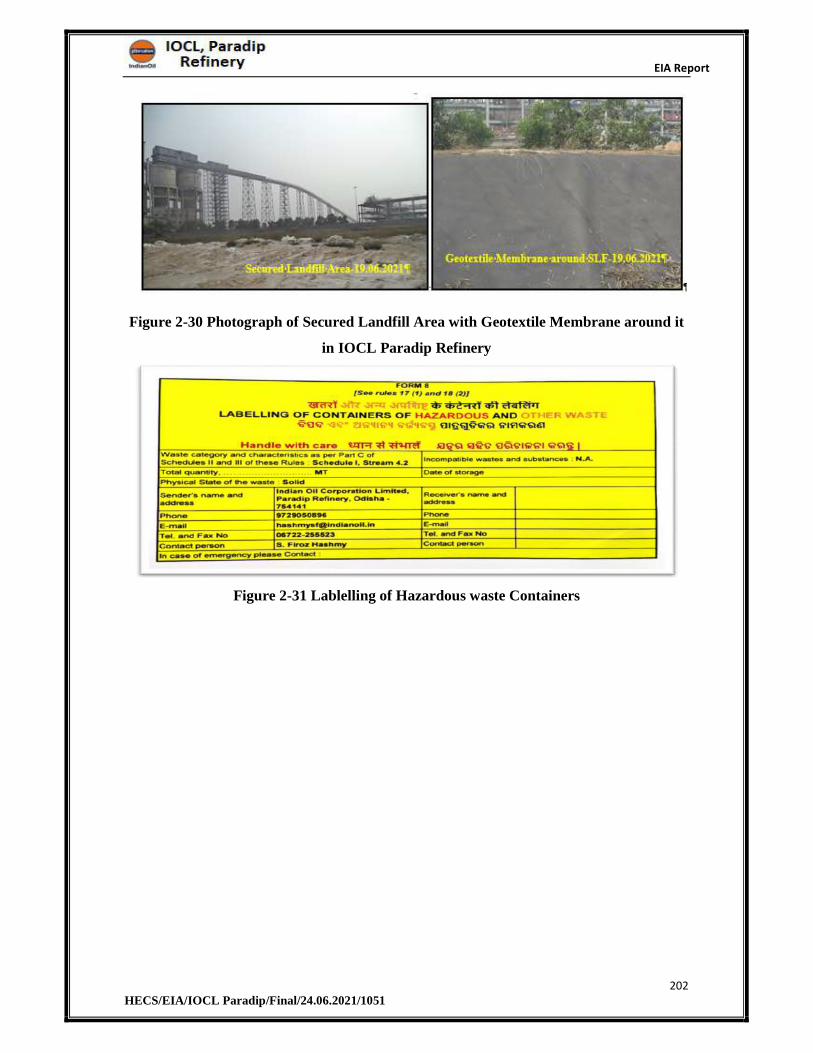
EIA Report
202 HECS/EIA/IOCL Paradip/Final/24.06.2021/1051
Figure 2-30 Photograph of Secured Landfill Area with Geotextile Membrane around it
in IOCL Paradip Refinery
Figure 2-31 Lablelling of Hazardous waste Containers
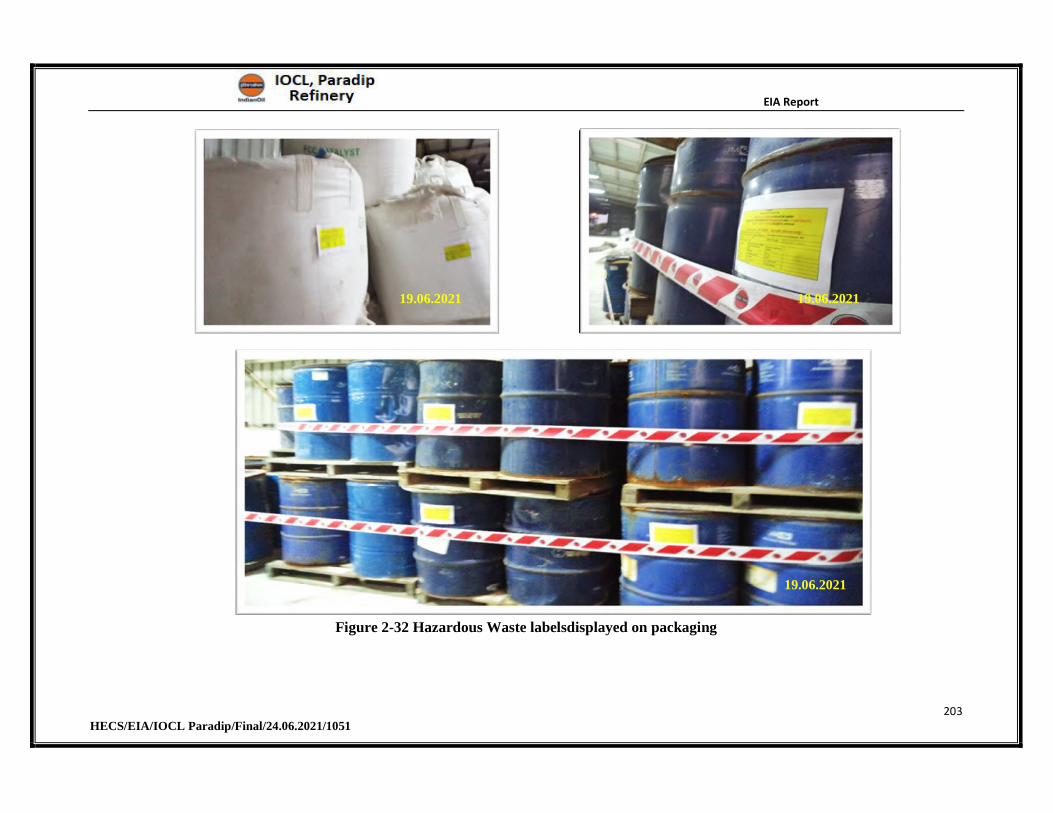
EIA Report
203 HECS/EIA/IOCL Paradip/Final/24.06.2021/1051
Figure 2-32 Hazardous Waste labelsdisplayed on packaging
19.06.2021 19.06.2021
19.06.2021
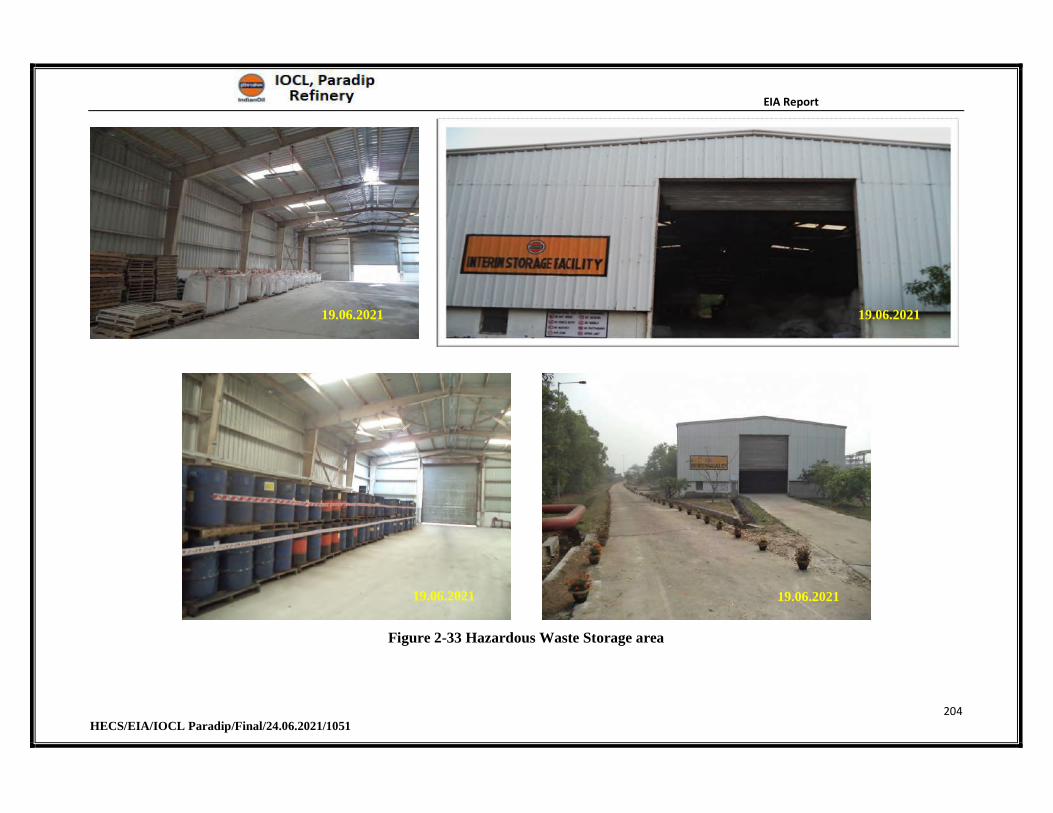
EIA Report
204 HECS/EIA/IOCL Paradip/Final/24.06.2021/1051
Figure 2-33 Hazardous Waste Storage area
19.06.2021 19.06.2021
19.06.2021 19.06.2021
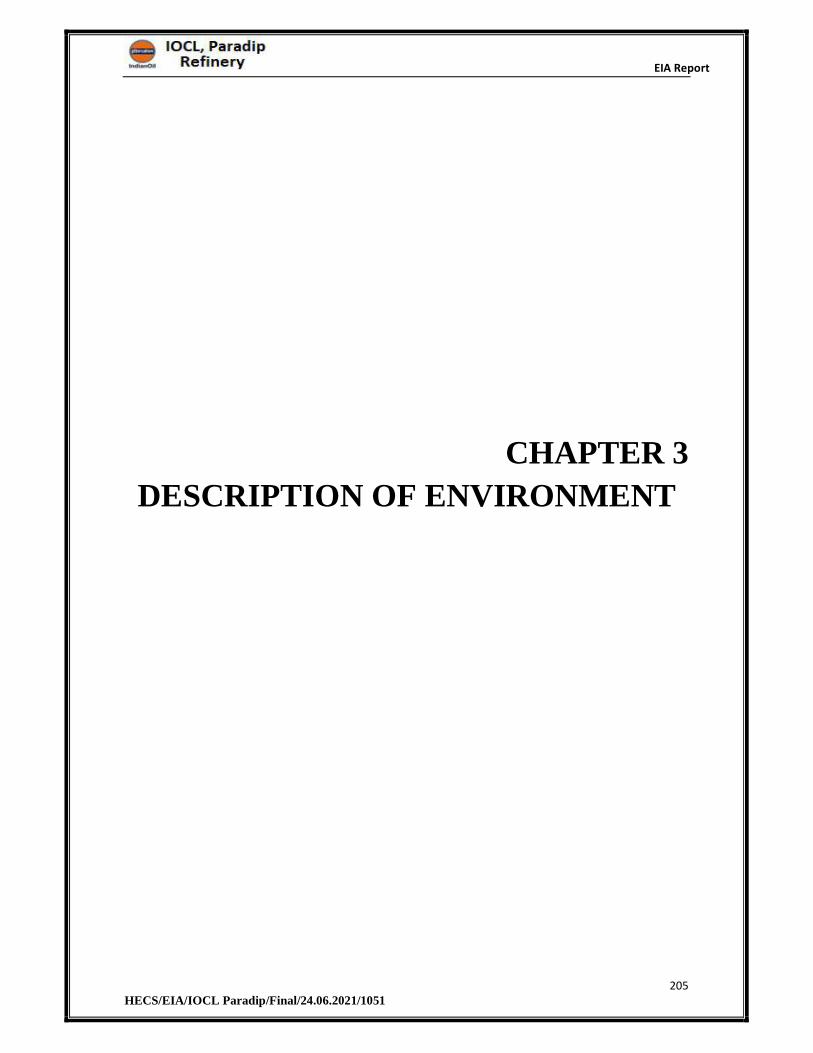
EIA Report
205 HECS/EIA/IOCL Paradip/Final/24.06.2021/1051
CHAPTER 3
DESCRIPTION OF ENVIRONMENT
EIA Report
206 HECS/EIA/IOCL Paradip/Final/24.06.2021/1051
3 DESCRIPTION OF ENVIRONMENT
3.1 Preamble
This chapter depicts the establishment of baseline for valued environmental
components, as identified in and around the proposed project with an area of 3,345 Acres
(1353.673 Hectare) located at IOCL Paradip Refinery, Paradip, Jagatsinghapur District,
Odisha state. The primary baseline data monitored covered three (3) months i.e., from March
to May 2019, and secondary data was collected from government and semi-government
organizations published data. The primary baseline data has been generated by m/s. Hubert
Enviro Care Systems (p) ltd, Chennai, a MoEF&CC approved environmental testing
laboratory for the following terrestrial environmental components.
Meteorology: Temperature, Relative Humidity, Rainfall, Wind Speed & Direction-
Refer Section - 3.6.1
Ambient Air Quality: Particulate matter <10-micron size (PM10), Particulate matter
<2.5-micron size (PM2.5), Sulphur Dioxide (SO2), Nitrogen Dioxide (NO2), Carbon
Monoxide (CO), Lead (Pb), Ozone (O3), Benzene (C6H6), Benzo (a) pyrene (C20H12),
Arsenic (As), Nickel (Ni), Ammonia (NH3) & VOC- Refer Section - 3.7
Ambient Noise Levels: Day equivalent noise levels, Night equivalent noise levels -
Refer Section - 3.8
Inland Water Quality: Groundwater Quality, Surface Water Quality - Refer Section
- 3.9
Soil Quality - Refer Section - 3.10
Biological Environment - Refer Section - 3.11
Social Economic Status - Refer Section - 3.12
3.2 Study Area
A 10 Km radial distance with the project site boundary as the epicentre has been identified as
the General study area for assessing the baseline environmental status. The core study area is
the project area and its immediate surroundings to the tune of 1.0 Km radius from the
boundary. Further the Project Impact/Influence Area (PIA) is 10Km from the boundary of the
core area covering IOCL Paradip Refinery, Paradip, Jagatsinghapur District, Odisha State.
3.3 Description of Study Area
As Described in Chapter 1, M/s IOCL Paradip Refinery project site is located at Paradip,
Jagatsinghapur district, Odisha state. The project site is well connected with road, rail and
EIA Report
207 HECS/EIA/IOCL Paradip/Final/24.06.2021/1051
water ways, where Paradip Railway station is located at a distance0.54 Km WNW from the
project boundary and Biju Patnaik International Airport, Bhubaneshwar is located at a
distance of 79.03 Km towards W from project boundary and Paradip Port is located at a
distance of 5.77 Km towards E from project boundary. An overall idea of the study area
with reference to the physical conditions are presented for better understanding in the
following sections before proceeding into the section on the prevailing environmental
conditions of the study area. The map showing the satellite image of the study area is given
in Figure 3-1and Topo Map of the study area is given in Figure 3-2.
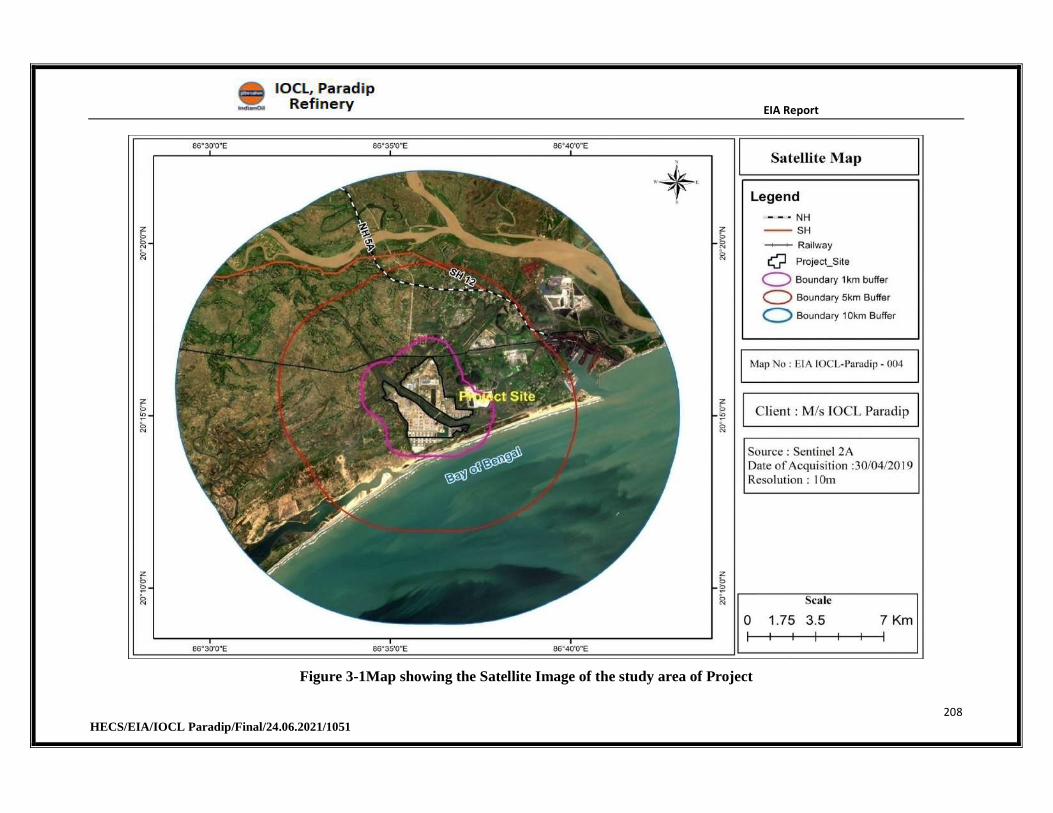
EIA Report
208 HECS/EIA/IOCL Paradip/Final/24.06.2021/1051
Figure 3-1Map showing the Satellite Image of the study area of Project
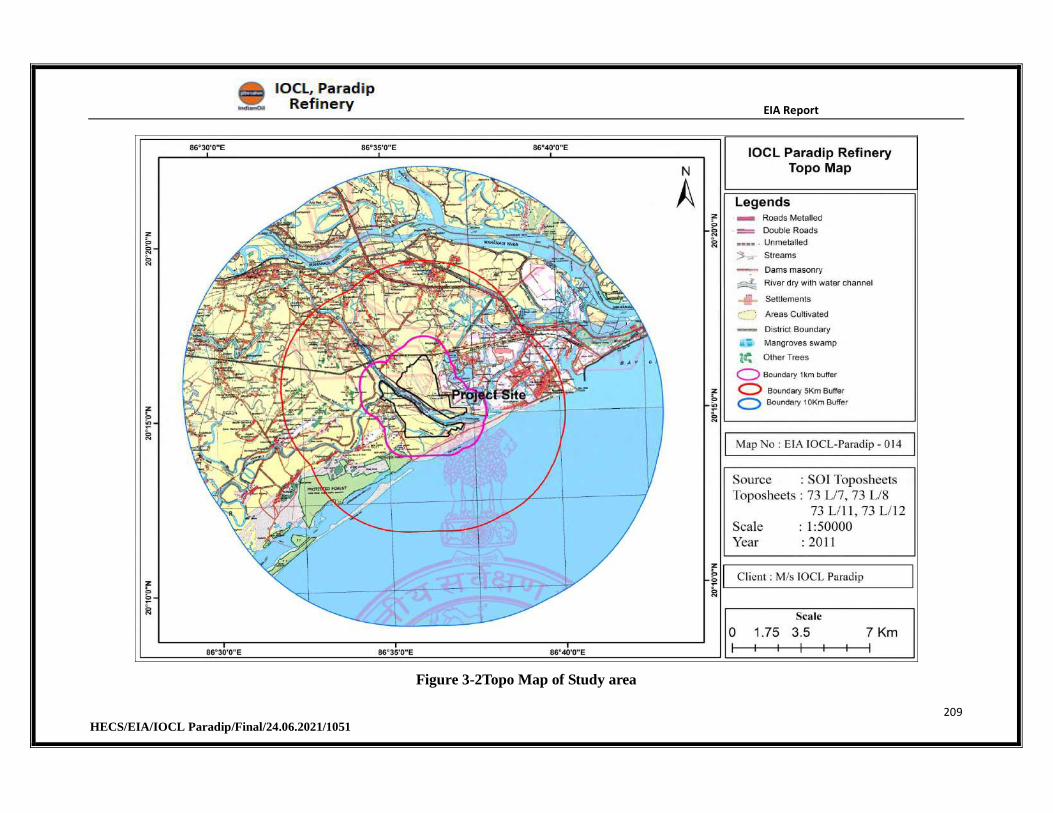
EIA Report
209 HECS/EIA/IOCL Paradip/Final/24.06.2021/1051
Figure 3-2Topo Map of Study area
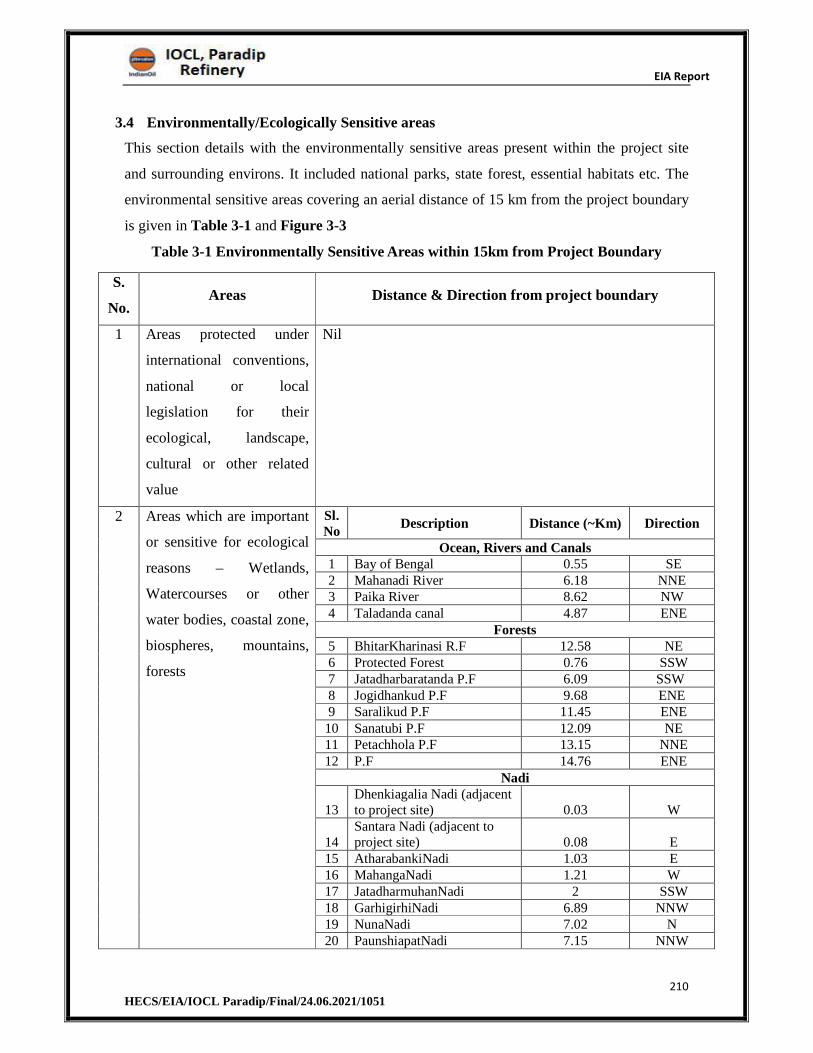
EIA Report
210 HECS/EIA/IOCL Paradip/Final/24.06.2021/1051
3.4 Environmentally/Ecologically Sensitive areas
This section details with the environmentally sensitive areas present within the project site
and surrounding environs. It included national parks, state forest, essential habitats etc. The
environmental sensitive areas covering an aerial distance of 15 km from the project boundary
is given in Table 3-1 and Figure 3-3
Table 3-1 Environmentally Sensitive Areas within 15km from Project Boundary
S.
No. Areas Distance & Direction from project boundary
1 Areas protected under
international conventions,
national or local
legislation for their
ecological, landscape,
cultural or other related
value
Nil
2 Areas which are important
or sensitive for ecological
reasons – Wetlands,
Watercourses or other
water bodies, coastal zone,
biospheres, mountains,
forests
Sl. No
Description Distance (~Km) Direction
Ocean, Rivers and Canals 1 Bay of Bengal 0.55 SE 2 Mahanadi River 6.18 NNE 3 Paika River 8.62 NW 4 Taladanda canal 4.87 ENE
Forests 5 BhitarKharinasi R.F 12.58 NE6 Protected Forest 0.76 SSW 7 Jatadharbaratanda P.F 6.09 SSW 8 Jogidhankud P.F 9.68 ENE 9 Saralikud P.F 11.45 ENE
10 Sanatubi P.F 12.09 NE 11 Petachhola P.F 13.15 NNE 12 P.F 14.76 ENE
Nadi
13 Dhenkiagalia Nadi (adjacent to project site) 0.03 W
14 Santara Nadi (adjacent to project site) 0.08 E
15 AtharabankiNadi 1.03 E 16 MahangaNadi 1.21 W 17 JatadharmuhanNadi 2 SSW 18 GarhigirhiNadi 6.89 NNW 19 NunaNadi 7.02 N 20 PaunshiapatNadi 7.15 NNW
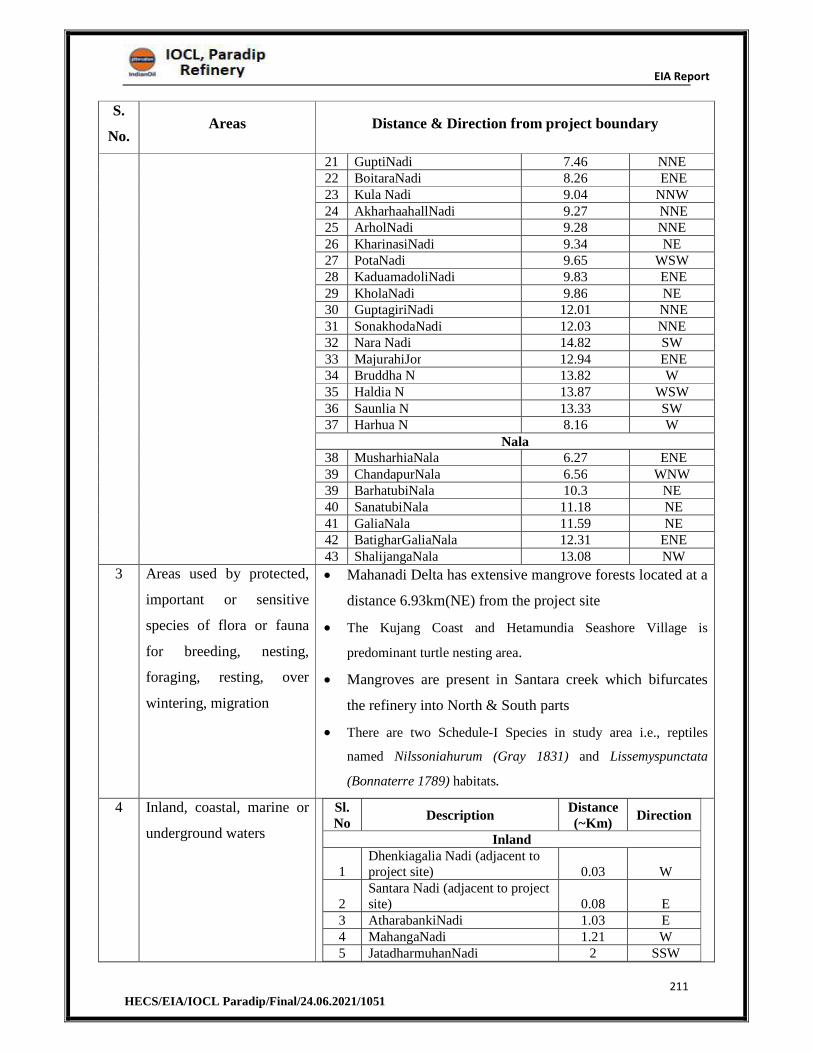
EIA Report
211 HECS/EIA/IOCL Paradip/Final/24.06.2021/1051
S.
No. Areas Distance & Direction from project boundary
21 GuptiNadi 7.46 NNE 22 BoitaraNadi 8.26 ENE 23 Kula Nadi 9.04 NNW 24 AkharhaahallNadi 9.27 NNE25 ArholNadi 9.28 NNE 26 KharinasiNadi 9.34 NE27 PotaNadi 9.65 WSW 28 KaduamadoliNadi 9.83 ENE 29 KholaNadi 9.86 NE30 GuptagiriNadi 12.01 NNE 31 SonakhodaNadi 12.03 NNE32 Nara Nadi 14.82 SW 33 MajurahiJor 12.94 ENE34 Bruddha N 13.82 W 35 Haldia N 13.87 WSW 36 Saunlia N 13.33 SW37 Harhua N 8.16 W
Nala38 MusharhiaNala 6.27 ENE 39 ChandapurNala 6.56 WNW39 BarhatubiNala 10.3 NE 40 SanatubiNala 11.18 NE 41 GaliaNala 11.59 NE42 BatigharGaliaNala 12.31 ENE 43 ShalijangaNala 13.08 NW
3 Areas used by protected,
important or sensitive
species of flora or fauna
for breeding, nesting,
foraging, resting, over
wintering, migration
Mahanadi Delta has extensive mangrove forests located at a
distance 6.93km(NE) from the project site
The Kujang Coast and Hetamundia Seashore Village is
predominant turtle nesting area.
Mangroves are present in Santara creek which bifurcates
the refinery into North & South parts
There are two Schedule-I Species in study area i.e., reptiles
named Nilssoniahurum (Gray 1831) and Lissemyspunctata
(Bonnaterre 1789) habitats.
4 Inland, coastal, marine or
underground waters
Sl. No
Description Distance (~Km)
Direction
Inland
1Dhenkiagalia Nadi (adjacent to project site) 0.03 W
2Santara Nadi (adjacent to project site) 0.08 E
3 AtharabankiNadi 1.03 E 4 MahangaNadi 1.21 W 5 JatadharmuhanNadi 2 SSW
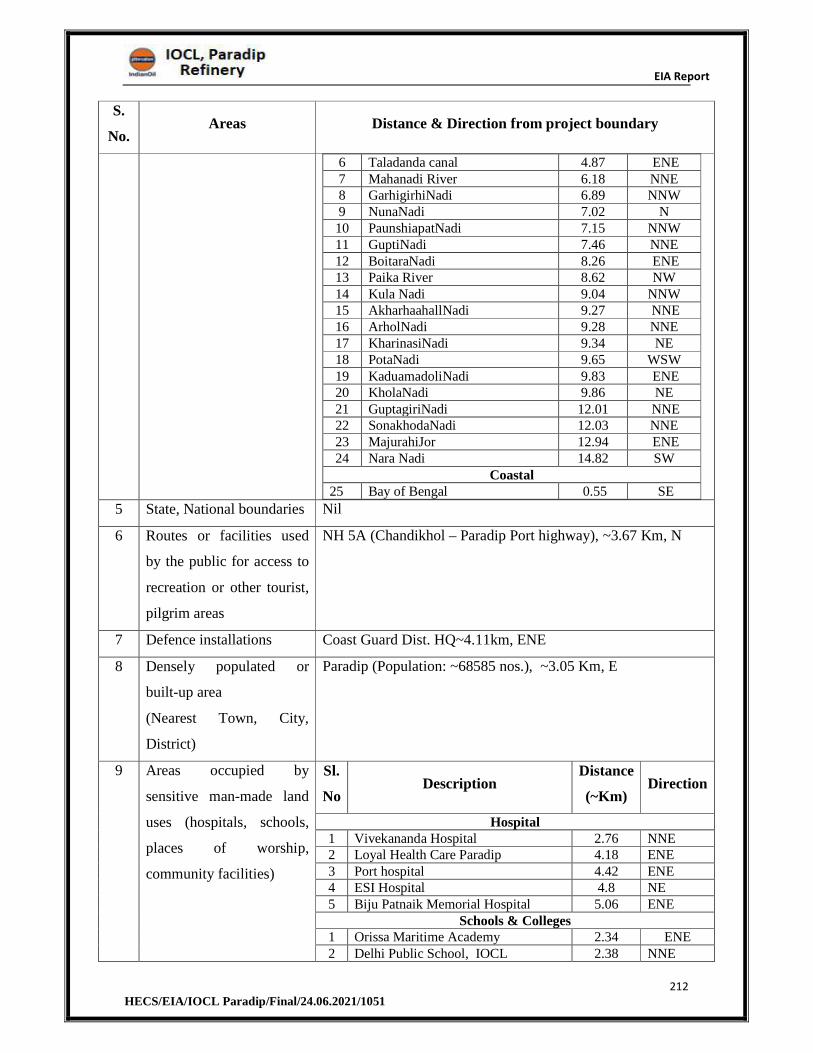
EIA Report
212 HECS/EIA/IOCL Paradip/Final/24.06.2021/1051
S.
No. Areas Distance & Direction from project boundary
6 Taladanda canal 4.87 ENE 7 Mahanadi River 6.18 NNE8 GarhigirhiNadi 6.89 NNW 9 NunaNadi 7.02 N 10 PaunshiapatNadi 7.15 NNW 11 GuptiNadi 7.46 NNE 12 BoitaraNadi 8.26 ENE13 Paika River 8.62 NW 14 Kula Nadi 9.04 NNW15 AkharhaahallNadi 9.27 NNE 16 ArholNadi 9.28 NNE 17 KharinasiNadi 9.34 NE 18 PotaNadi 9.65 WSW 19 KaduamadoliNadi 9.83 ENE20 KholaNadi 9.86 NE 21 GuptagiriNadi 12.01 NNE22 SonakhodaNadi 12.03 NNE 23 MajurahiJor 12.94 ENE 24 Nara Nadi 14.82 SW
Coastal 25 Bay of Bengal 0.55 SE
5 State, National boundaries Nil
6 Routes or facilities used
by the public for access to
recreation or other tourist,
pilgrim areas
NH 5A (Chandikhol – Paradip Port highway), ~3.67 Km, N
7 Defence installations Coast Guard Dist. HQ~4.11km, ENE
8 Densely populated or
built-up area
(Nearest Town, City,
District)
Paradip (Population: ~68585 nos.), ~3.05 Km, E
9 Areas occupied by
sensitive man-made land
uses (hospitals, schools,
places of worship,
community facilities)
Sl.
NoDescription
Distance
(~Km) Direction
Hospital1 Vivekananda Hospital 2.76 NNE 2 Loyal Health Care Paradip 4.18 ENE 3 Port hospital 4.42 ENE4 ESI Hospital 4.8 NE 5 Biju Patnaik Memorial Hospital 5.06 ENE
Schools & Colleges1 Orissa Maritime Academy 2.34 ENE 2 Delhi Public School, IOCL 2.38 NNE
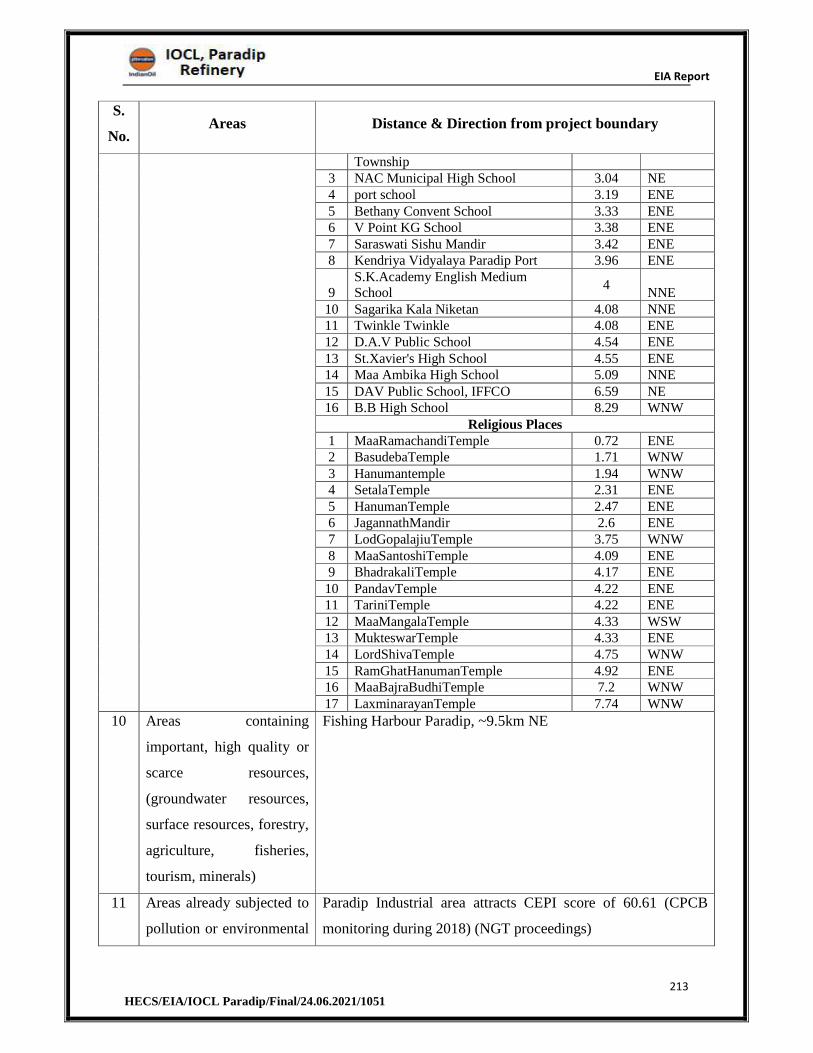
EIA Report
213 HECS/EIA/IOCL Paradip/Final/24.06.2021/1051
S.
No. Areas Distance & Direction from project boundary
Township 3 NAC Municipal High School 3.04 NE 4 port school 3.19 ENE 5 Bethany Convent School 3.33 ENE6 V Point KG School 3.38 ENE 7 Saraswati Sishu Mandir 3.42 ENE8 Kendriya Vidyalaya Paradip Port 3.96 ENE
9 S.K.Academy English Medium School
4 NNE
10 Sagarika Kala Niketan 4.08 NNE11 Twinkle Twinkle 4.08 ENE 12 D.A.V Public School 4.54 ENE 13 St.Xavier's High School 4.55 ENE14 Maa Ambika High School 5.09 NNE 15 DAV Public School, IFFCO 6.59 NE16 B.B High School 8.29 WNW
Religious Places1 MaaRamachandiTemple 0.72 ENE 2 BasudebaTemple 1.71 WNW 3 Hanumantemple 1.94 WNW4 SetalaTemple 2.31 ENE 5 HanumanTemple 2.47 ENE6 JagannathMandir 2.6 ENE 7 LodGopalajiuTemple 3.75 WNW 8 MaaSantoshiTemple 4.09 ENE 9 BhadrakaliTemple 4.17 ENE
10 PandavTemple 4.22 ENE11 TariniTemple 4.22 ENE 12 MaaMangalaTemple 4.33 WSW13 MukteswarTemple 4.33 ENE 14 LordShivaTemple 4.75 WNW 15 RamGhatHanumanTemple 4.92 ENE 16 MaaBajraBudhiTemple 7.2 WNW 17 LaxminarayanTemple 7.74 WNW
10 Areas containing
important, high quality or
scarce resources,
(groundwater resources,
surface resources, forestry,
agriculture, fisheries,
tourism, minerals)
Fishing Harbour Paradip, ~9.5km NE
11 Areas already subjected to
pollution or environmental
Paradip Industrial area attracts CEPI score of 60.61 (CPCB
monitoring during 2018) (NGT proceedings)
EIA Report
214 HECS/EIA/IOCL Paradip/Final/24.06.2021/1051
S.
No. Areas Distance & Direction from project boundary
damage (those where
existing legal
environmental standards
are exceeded)
12 Areas susceptible to
natural hazard which could
cause the project to
present environmental
problems, (earthquakes,
subsidence, landslides,
erosion or extreme or
adverse climatic
conditions)
Project site is located at seismic zone-III,
Paradip coast is prone to Cyclone and Tsunami.
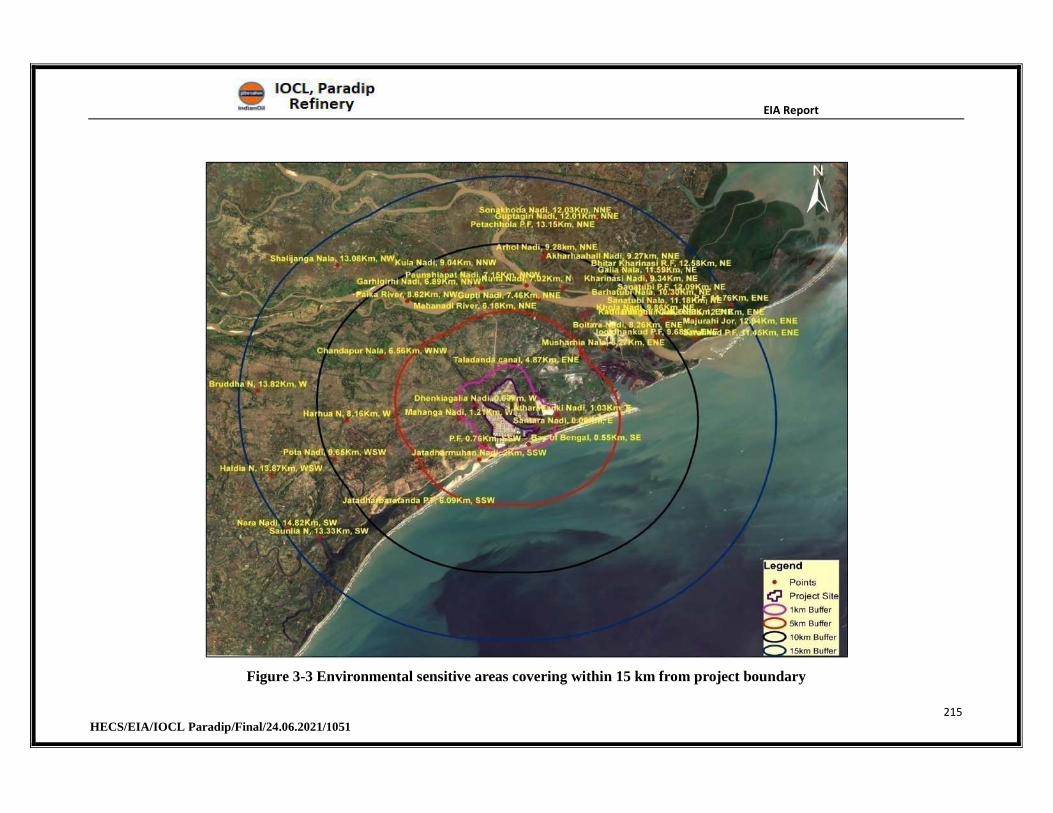
EIA Report
215 HECS/EIA/IOCL Paradip/Final/24.06.2021/1051
Figure 3-3 Environmental sensitive areas covering within 15 km from project boundary
EIA Report
216 HECS/EIA/IOCL Paradip/Final/24.06.2021/1051
3.5 Physical Conditions of PIA district
In this section, the physical conditions of PIA district are discussed in general and
wherever possible references to the conditions prevailing in the study area in particular are
also provided. The physical conditions are discussed as under:
District profile
Drainage, land use, geology, Physiographic profile
Natural resources
Climatic conditions, seismic zone characteristics and natural hazard
3.5.1 PIA District Profile
Jagatsinghapur District is one of the coastal district of Odisha. It lies between 19°58’ and
20°23’N latitude and 86°30’ and 86°45’E longitude. The district is surrounded by the Bay of
Bengal in the East, Kendrapada District in the North, Cuttack District in the West and Puri
District in the South. It occupies an area of 1668 sq.kms which accounts for 1.07% of the
total area of the state.
This district is situated in the delta region of the river Mahanadi. The district comprises two
district tracts. The first being marshy and swampy stripes along with the coast covered with
wild growth of reeds and tropical jungle. The second tract covers fertile plain land. Since
1870, two big canals were built which supply water to this area. Also in the year 1960, a
natural sea port i.e., Paradip port was built on the Bay of Bengal.
Source:http://censusindia.gov.in/2011census/dchb/DCHB_A/21/2111_PART_A_DCHB_JAG
ATSINGHAPUR.pdf
3.5.2 Climatic Conditions
The south-west monsoon is the principal source of rainfall in the district. The district is
characterized by a Topical monsoon climate having three distinct seasons in a year viz.
winter, summer and rainy seasons. The Bay of Bengal, which forms the eastern boundary of
the district, plays a vital role in controlling the climate of the district. The Normal rainfall of
the district is 1501.3 mm. The annual average rainfall in last seven years is 1436 mm. About
75% of the total rainfall occurs during the period from June to September. In the period
between April and May 3 to 4 cyclonic rains generally occur in the district that causes a drop
in the temperature. The temperature varies from 15 to 37ºC. The relative humidity varies
from 74 to 86 percent during the year.
Source: http://cgwb.gov.in/District_Profile/Orissa/jagasingpur.pdf
EIA Report
217 HECS/EIA/IOCL Paradip/Final/24.06.2021/1051
3.5.3 Natural Resources of PIA District
3.5.3.1 Flora & Fauna
The forest area is only 8% of total geographical area. There is no natural forest worth
its name in this district. Hental (phoenix paludosa) grows here abundantly in clusters, which
is scattered and confined to the sea-coast. The mangrove forests are locally called ‘Hental
Van’ or Hental forests. Rich vegetation accounts for widespread of wildlife. Among the
animal’s crocodiles are common. Also varieties of birds are seen along the coastal areas.
Flora and Fauna of PIA are discussed in Section 3.11.
Source:
http://censusindia.gov.in/2011census/dchb/DCHB_A/21/2111_PART_A_DCHB_JAGATSING
HAPUR.pdf
3.5.3.2 Forest Resources
The little forests found in Jagatsinghapur District are of moist mixed deciduous Forests,
North tropical deciduous forest. Forest Type prevalent in this district is the Sal dominated
mixed deciduous forest. The forest cover area of the district is 133 Sq.Km., out of
geographical area of 1668 sq.km which is a moderately dense forest, and 127 sq.km is open
forest. The district is having 132.92 km of DLC forest area. However, on introduction of
Forest Rights Act, 2006, 47 titles have been distributed to the forest dwellers involving about
31.83 acres of forest land. The Dhartang Garh PRF comprising an area of 112.92 ha. of forest
stands for scenic beauty and an excellent habitat for wildlife. Its radius is 07 Km. This forest
is surrounded by Gopalpur G.P of Jagatsinghapur district. This forest consists of variety of
flora and fauna and some rare species of medicinal plants such as Satabari, bishalyakarani,
Patalgaruda, kochila, Karanja, Ashok, Amla, Bela and tree species like Teak, Bamboo,
Mahagani, Deodaru, Panasa etc. and wildlife like deer, monkey, jungle mouse, fox, hyna and
different types of birds such as, koel, chilla, jhinka, pecha, Rajamani, Haladibasanta,
Kumbhatua, Badudi etc. Visitor immunity and recreational facilities have been developed for
casual visitors to the forest and for wild life lovers. Local villagers have been motivated to
help forest people immensely in tracking down the poachers to control the wildlife crime and
ensure forest protection. Hence a VSS has been formed comprising local inhabitants from
Goplapur village and Pandra village. The Kilipal PRF comprises an area of 161.98 ha of
forest. Its radius is 11.60km. This forest is protected by Paruna VSS. They keep a constant
watch on the forest arranging roster duty, as a result of which, forest density is showing an
upward trend.
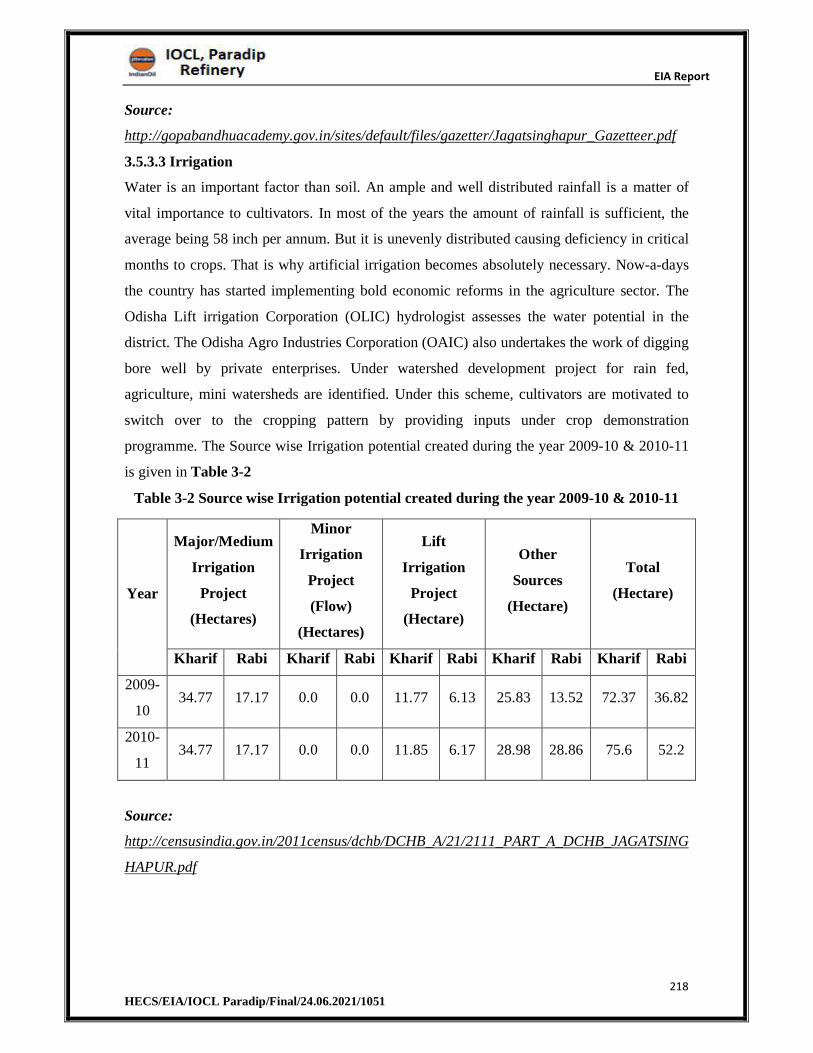
EIA Report
218 HECS/EIA/IOCL Paradip/Final/24.06.2021/1051
Source:
http://gopabandhuacademy.gov.in/sites/default/files/gazetter/Jagatsinghapur_Gazetteer.pdf
3.5.3.3 Irrigation
Water is an important factor than soil. An ample and well distributed rainfall is a matter of
vital importance to cultivators. In most of the years the amount of rainfall is sufficient, the
average being 58 inch per annum. But it is unevenly distributed causing deficiency in critical
months to crops. That is why artificial irrigation becomes absolutely necessary. Now-a-days
the country has started implementing bold economic reforms in the agriculture sector. The
Odisha Lift irrigation Corporation (OLIC) hydrologist assesses the water potential in the
district. The Odisha Agro Industries Corporation (OAIC) also undertakes the work of digging
bore well by private enterprises. Under watershed development project for rain fed,
agriculture, mini watersheds are identified. Under this scheme, cultivators are motivated to
switch over to the cropping pattern by providing inputs under crop demonstration
programme. The Source wise Irrigation potential created during the year 2009-10 & 2010-11
is given in Table 3-2
Table 3-2 Source wise Irrigation potential created during the year 2009-10 & 2010-11
Year
Major/Medium
Irrigation
Project
(Hectares)
Minor
Irrigation
Project
(Flow)
(Hectares)
Lift
Irrigation
Project
(Hectare)
Other
Sources
(Hectare)
Total
(Hectare)
Kharif Rabi Kharif Rabi Kharif Rabi Kharif Rabi Kharif Rabi
2009-
10 34.77 17.17 0.0 0.0 11.77 6.13 25.83 13.52 72.37 36.82
2010-
11 34.77 17.17 0.0 0.0 11.85 6.17 28.98 28.86 75.6 52.2
Source:
http://censusindia.gov.in/2011census/dchb/DCHB_A/21/2111_PART_A_DCHB_JAGATSING
HAPUR.pdf
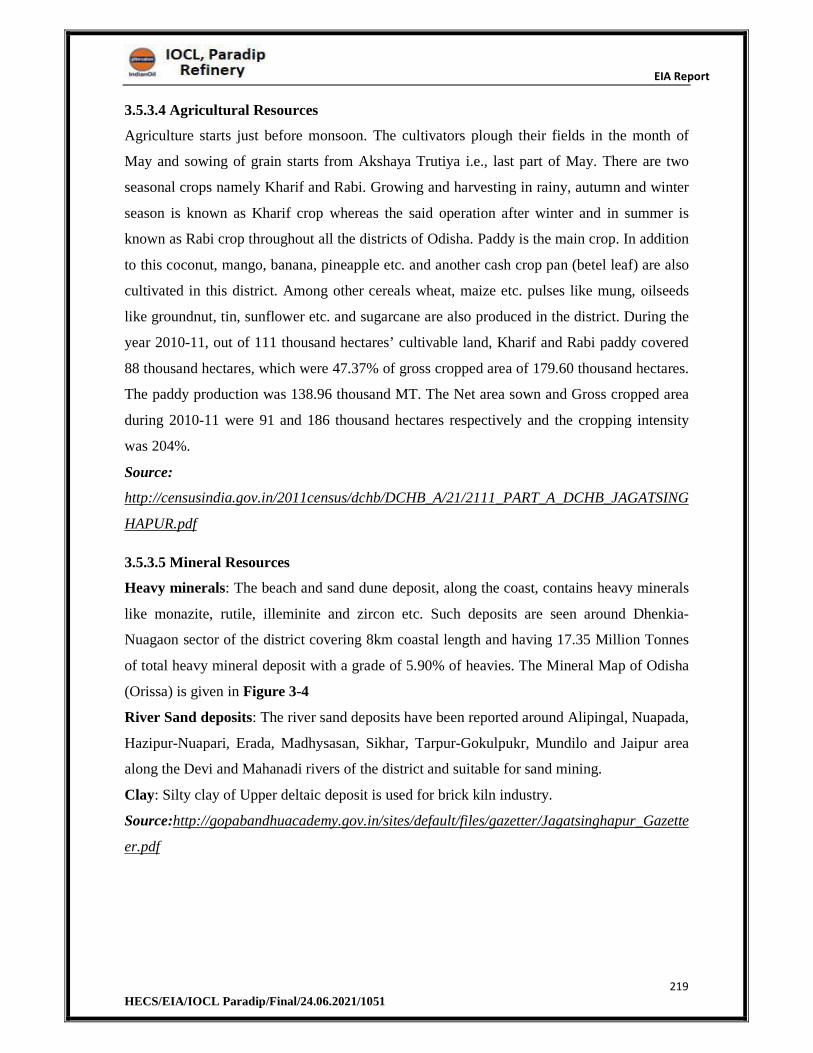
EIA Report
219 HECS/EIA/IOCL Paradip/Final/24.06.2021/1051
3.5.3.4 Agricultural Resources
Agriculture starts just before monsoon. The cultivators plough their fields in the month of
May and sowing of grain starts from Akshaya Trutiya i.e., last part of May. There are two
seasonal crops namely Kharif and Rabi. Growing and harvesting in rainy, autumn and winter
season is known as Kharif crop whereas the said operation after winter and in summer is
known as Rabi crop throughout all the districts of Odisha. Paddy is the main crop. In addition
to this coconut, mango, banana, pineapple etc. and another cash crop pan (betel leaf) are also
cultivated in this district. Among other cereals wheat, maize etc. pulses like mung, oilseeds
like groundnut, tin, sunflower etc. and sugarcane are also produced in the district. During the
year 2010-11, out of 111 thousand hectares’ cultivable land, Kharif and Rabi paddy covered
88 thousand hectares, which were 47.37% of gross cropped area of 179.60 thousand hectares.
The paddy production was 138.96 thousand MT. The Net area sown and Gross cropped area
during 2010-11 were 91 and 186 thousand hectares respectively and the cropping intensity
was 204%.
Source:
http://censusindia.gov.in/2011census/dchb/DCHB_A/21/2111_PART_A_DCHB_JAGATSING
HAPUR.pdf
3.5.3.5 Mineral Resources
Heavy minerals: The beach and sand dune deposit, along the coast, contains heavy minerals
like monazite, rutile, illeminite and zircon etc. Such deposits are seen around Dhenkia-
Nuagaon sector of the district covering 8km coastal length and having 17.35 Million Tonnes
of total heavy mineral deposit with a grade of 5.90% of heavies. The Mineral Map of Odisha
(Orissa) is given in Figure 3-4
River Sand deposits: The river sand deposits have been reported around Alipingal, Nuapada,
Hazipur-Nuapari, Erada, Madhysasan, Sikhar, Tarpur-Gokulpukr, Mundilo and Jaipur area
along the Devi and Mahanadi rivers of the district and suitable for sand mining.
Clay: Silty clay of Upper deltaic deposit is used for brick kiln industry.
Source:http://gopabandhuacademy.gov.in/sites/default/files/gazetter/Jagatsinghapur_Gazette
er.pdf
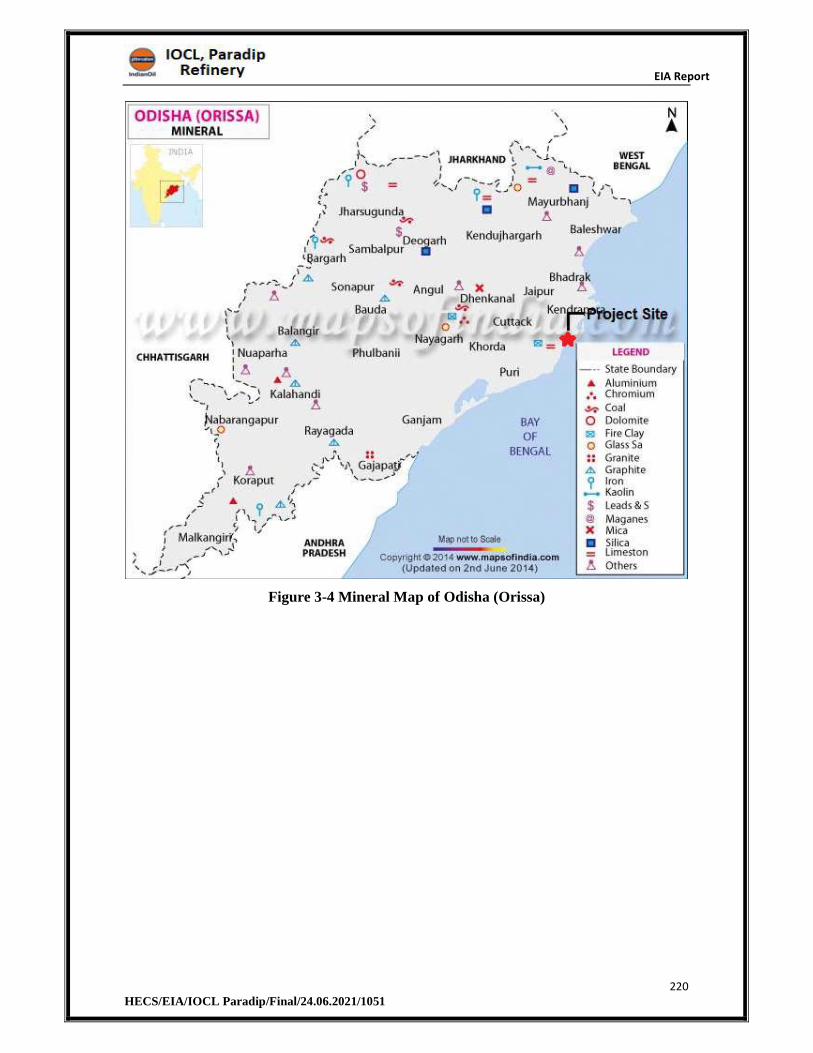
EIA Report
220 HECS/EIA/IOCL Paradip/Final/24.06.2021/1051
Figure 3-4 Mineral Map of Odisha (Orissa)
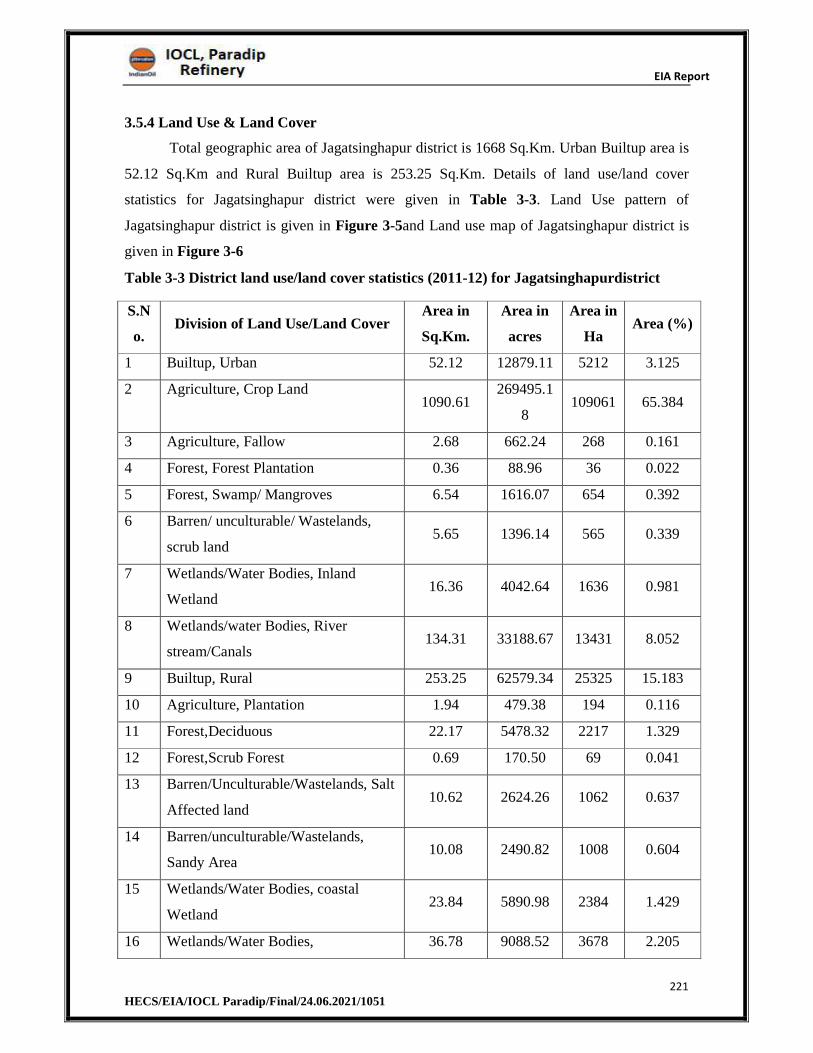
EIA Report
221 HECS/EIA/IOCL Paradip/Final/24.06.2021/1051
3.5.4 Land Use & Land Cover
Total geographic area of Jagatsinghapur district is 1668 Sq.Km. Urban Builtup area is
52.12 Sq.Km and Rural Builtup area is 253.25 Sq.Km. Details of land use/land cover
statistics for Jagatsinghapur district were given in Table 3-3. Land Use pattern of
Jagatsinghapur district is given in Figure 3-5and Land use map of Jagatsinghapur district is
given in Figure 3-6
Table 3-3 District land use/land cover statistics (2011-12) for Jagatsinghapurdistrict
S.N
o. Division of Land Use/Land Cover
Area in
Sq.Km.
Area in
acres
Area in
Ha Area (%)
1 Builtup, Urban 52.12 12879.11 5212 3.125
2 Agriculture, Crop Land 1090.61
269495.1
8 109061 65.384
3 Agriculture, Fallow 2.68 662.24 268 0.161
4 Forest, Forest Plantation 0.36 88.96 36 0.022
5 Forest, Swamp/ Mangroves 6.54 1616.07 654 0.392
6 Barren/ unculturable/ Wastelands,
scrub land 5.65 1396.14 565 0.339
7 Wetlands/Water Bodies, Inland
Wetland 16.36 4042.64 1636 0.981
8 Wetlands/water Bodies, River
stream/Canals 134.31 33188.67 13431 8.052
9 Builtup, Rural 253.25 62579.34 25325 15.183
10 Agriculture, Plantation 1.94 479.38 194 0.116
11 Forest,Deciduous 22.17 5478.32 2217 1.329
12 Forest,Scrub Forest 0.69 170.50 69 0.041
13 Barren/Unculturable/Wastelands, Salt
Affected land 10.62 2624.26 1062 0.637
14 Barren/unculturable/Wastelands,
Sandy Area 10.08 2490.82 1008 0.604
15 Wetlands/Water Bodies, coastal
Wetland 23.84 5890.98 2384 1.429
16 Wetlands/Water Bodies, 36.78 9088.52 3678 2.205
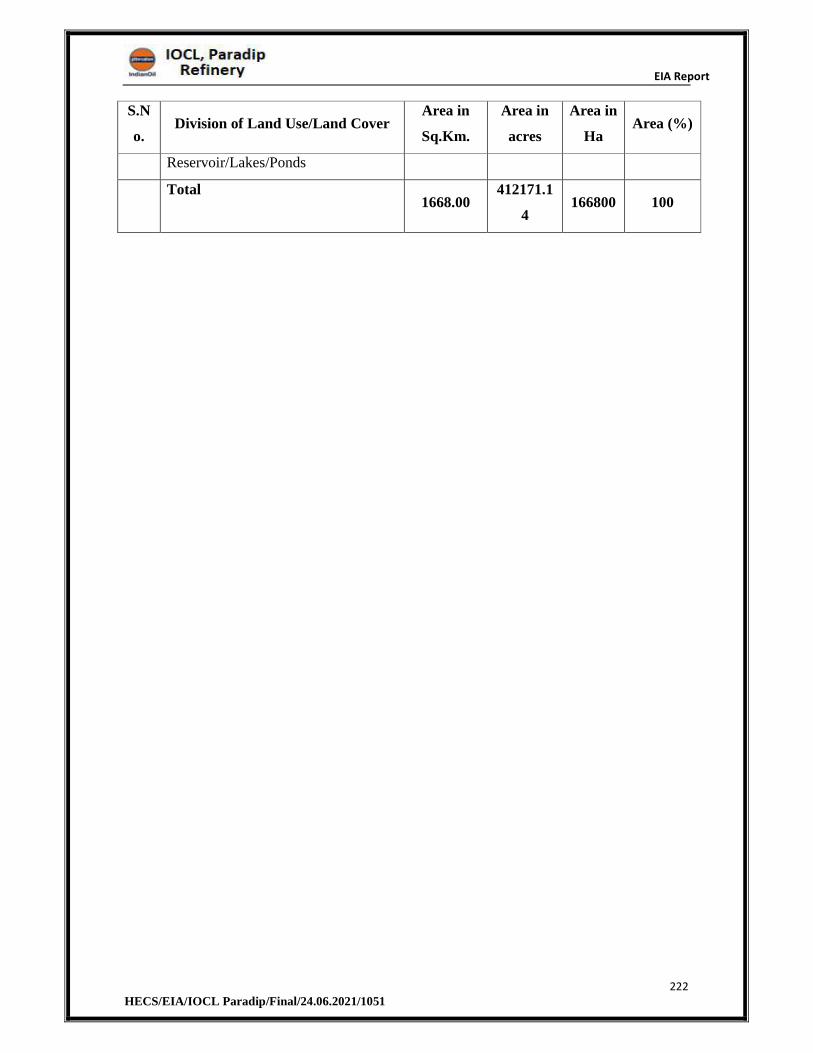
EIA Report
222 HECS/EIA/IOCL Paradip/Final/24.06.2021/1051
S.N
o. Division of Land Use/Land Cover
Area in
Sq.Km.
Area in
acres
Area in
Ha Area (%)
Reservoir/Lakes/Ponds
Total1668.00
412171.1
4 166800 100
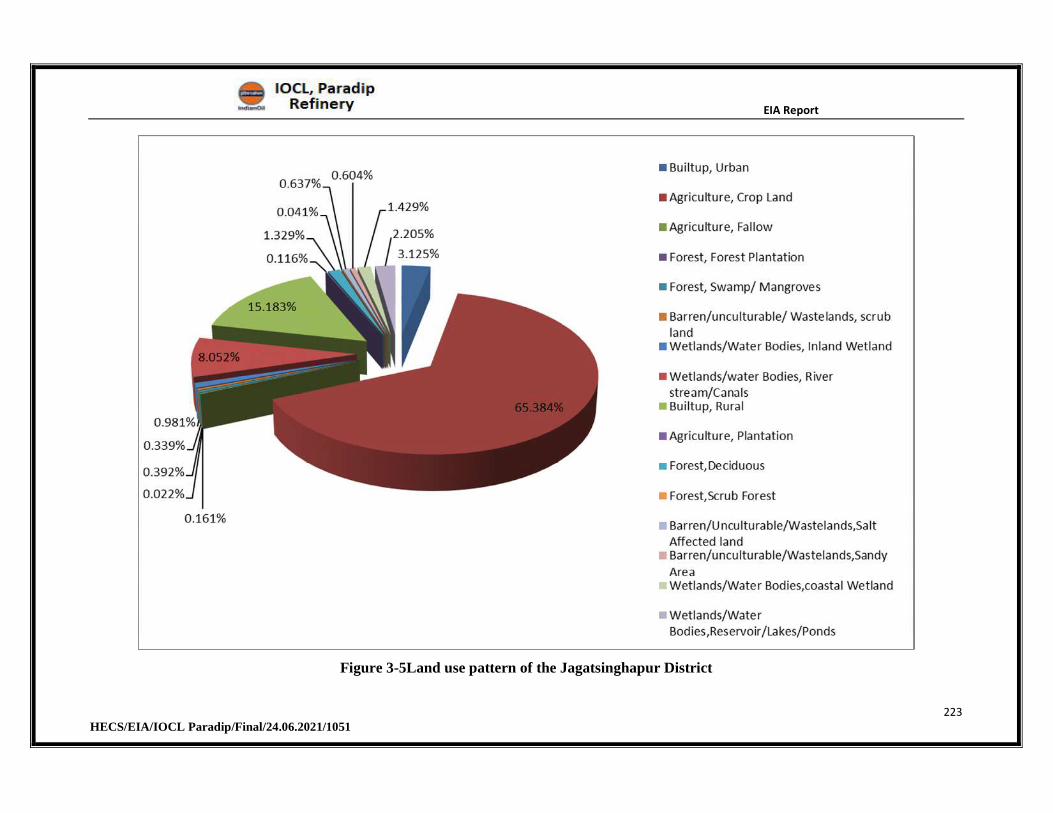
EIA Report
223 HECS/EIA/IOCL Paradip/Final/24.06.2021/1051
Figure 3-5Land use pattern of the Jagatsinghapur District
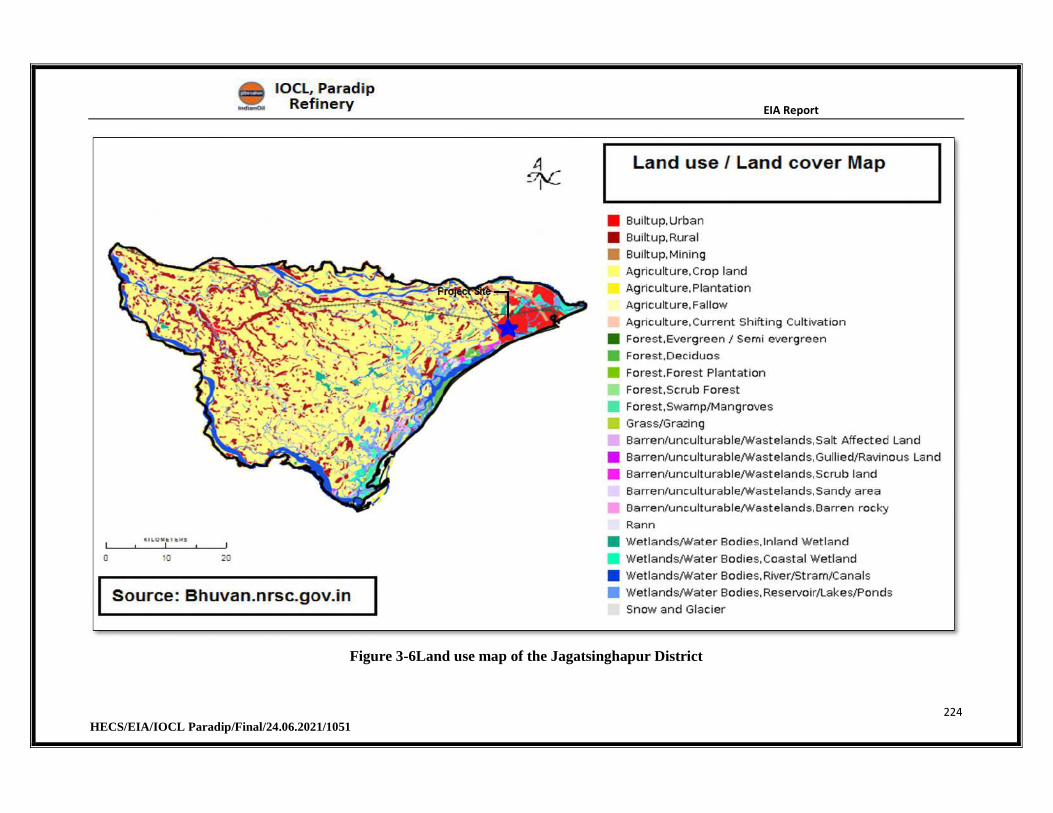
EIA Report
224 HECS/EIA/IOCL Paradip/Final/24.06.2021/1051
Figure 3-6Land use map of the Jagatsinghapur District
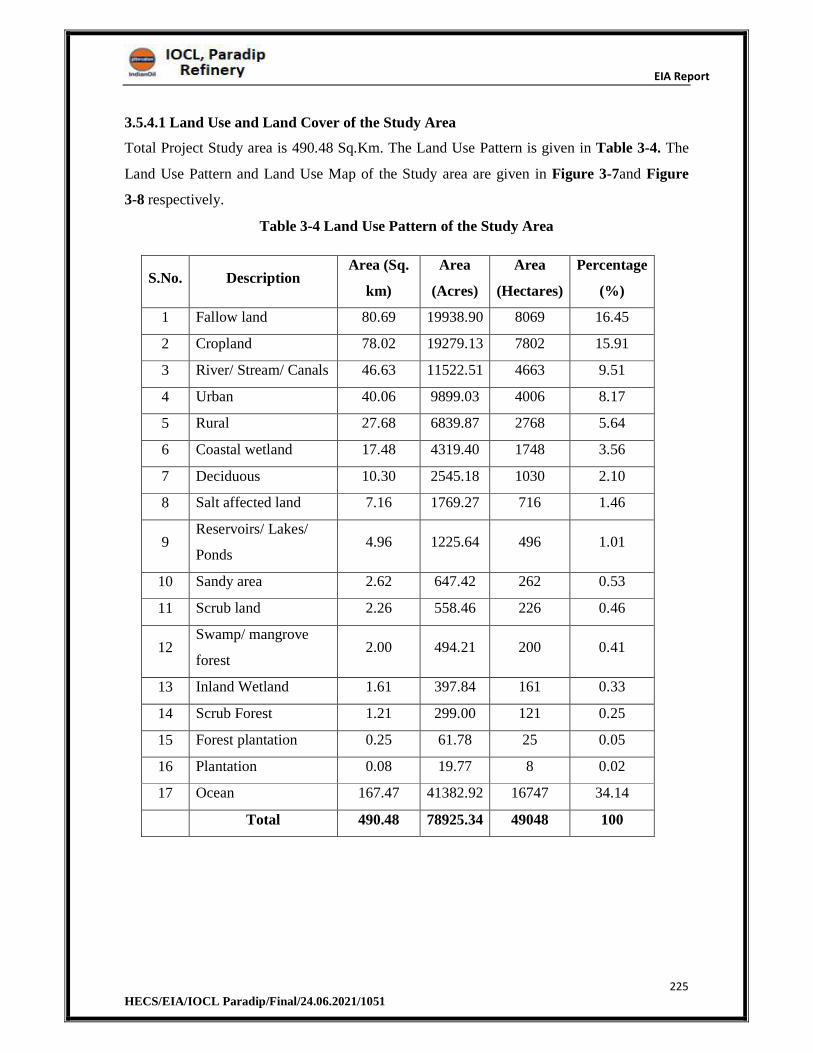
EIA Report
225 HECS/EIA/IOCL Paradip/Final/24.06.2021/1051
3.5.4.1 Land Use and Land Cover of the Study Area
Total Project Study area is 490.48 Sq.Km. The Land Use Pattern is given in Table 3-4. The
Land Use Pattern and Land Use Map of the Study area are given in Figure 3-7and Figure
3-8 respectively.
Table 3-4 Land Use Pattern of the Study Area
S.No. Description Area (Sq.
km)
Area
(Acres)
Area
(Hectares)
Percentage
(%)
1 Fallow land 80.69 19938.90 8069 16.45
2 Cropland 78.02 19279.13 7802 15.91
3 River/ Stream/ Canals 46.63 11522.51 4663 9.51
4 Urban 40.06 9899.03 4006 8.17
5 Rural 27.68 6839.87 2768 5.64
6 Coastal wetland 17.48 4319.40 1748 3.56
7 Deciduous 10.30 2545.18 1030 2.10
8 Salt affected land 7.16 1769.27 716 1.46
9 Reservoirs/ Lakes/
Ponds 4.96 1225.64 496 1.01
10 Sandy area 2.62 647.42 262 0.53
11 Scrub land 2.26 558.46 226 0.46
12 Swamp/ mangrove
forest 2.00 494.21 200 0.41
13 Inland Wetland 1.61 397.84 161 0.33
14 Scrub Forest 1.21 299.00 121 0.25
15 Forest plantation 0.25 61.78 25 0.05
16 Plantation 0.08 19.77 8 0.02
17 Ocean 167.47 41382.92 16747 34.14
Total 490.48 78925.34 49048 100
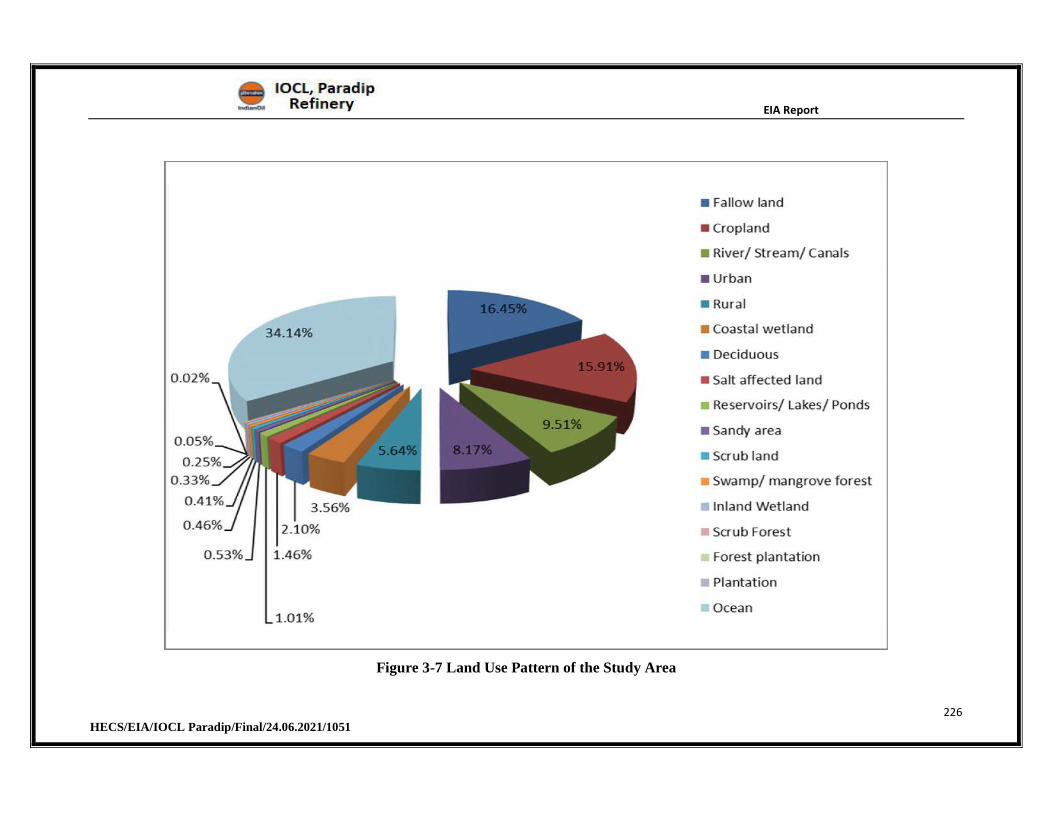
EIA Report
226 HECS/EIA/IOCL Paradip/Final/24.06.2021/1051
Figure 3-7 Land Use Pattern of the Study Area
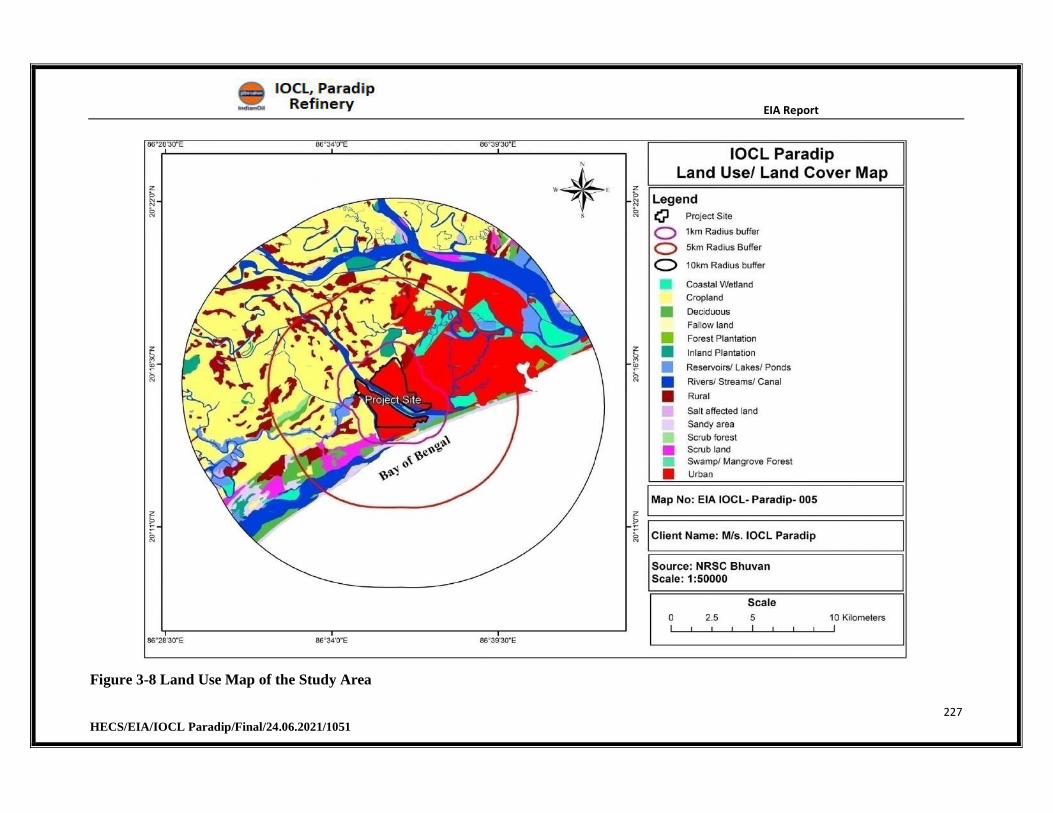
EIA Report
227 HECS/EIA/IOCL Paradip/Final/24.06.2021/1051
Figure 3-8 Land Use Map of the Study Area
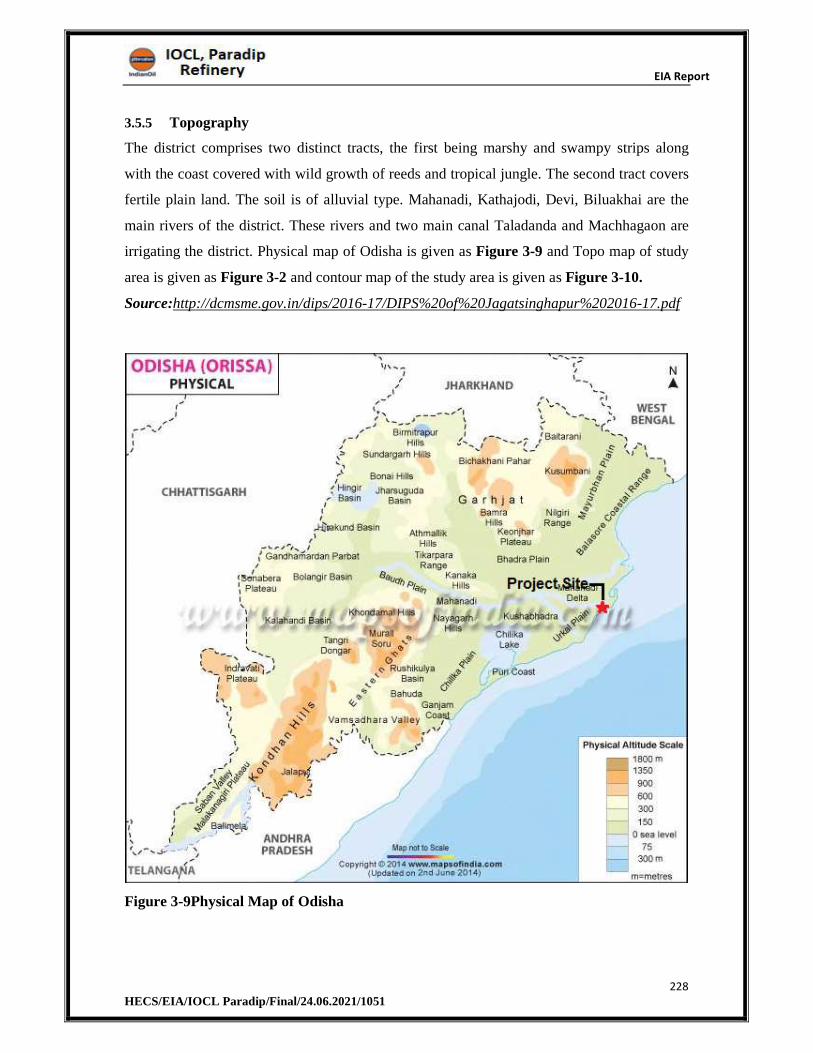
EIA Report
228 HECS/EIA/IOCL Paradip/Final/24.06.2021/1051
3.5.5 Topography
The district comprises two distinct tracts, the first being marshy and swampy strips along
with the coast covered with wild growth of reeds and tropical jungle. The second tract covers
fertile plain land. The soil is of alluvial type. Mahanadi, Kathajodi, Devi, Biluakhai are the
main rivers of the district. These rivers and two main canal Taladanda and Machhagaon are
irrigating the district. Physical map of Odisha is given as Figure 3-9 and Topo map of study
area is given as Figure 3-2 and contour map of the study area is given as Figure 3-10.
Source:http://dcmsme.gov.in/dips/2016-17/DIPS%20of%20Jagatsinghapur%202016-17.pdf
Figure 3-9Physical Map of Odisha
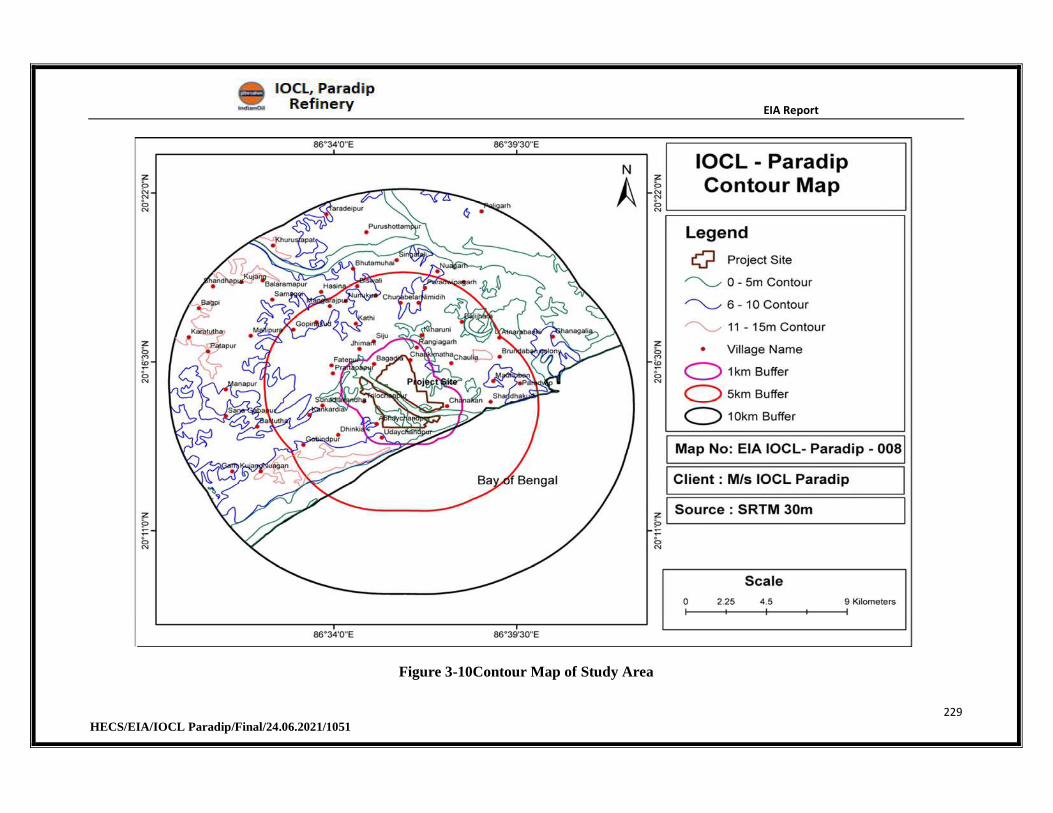
EIA Report
229 HECS/EIA/IOCL Paradip/Final/24.06.2021/1051
Figure 3-10Contour Map of Study Area
EIA Report
230 HECS/EIA/IOCL Paradip/Final/24.06.2021/1051
3.5.6 Geomorphology of PIA district
Physiographically the district can broadly have divided into two distinct units, viz. i. The
saline marshy tract along the coast ii. The very gently sloping plain
(i). The saline marshy tract forms a long and narrow strip along the coast. The width of this
tract varies from 3 to 15 km and is intersected by tidal streams and shrubby vegetation. Sand
dunes of varied relief extend continuously for kilometres parallel to the coast. These sand
dunes usually forming 5 to 6 chains are gently sloping on the bay side and steeply sloping on
the inland side, due to their Aeolian origin. The gently sloping alluvial plain occurs to the
west of the saline marshy tract and forms the most fertile part of the district.
(ii). The general slope of this tract is towards east and southeast and varies from 0.50 to 1.60
m/km. The distribution of different soil types in the district depends much on its
physiographic and lithologic variations. The Geomorphology Map of the Jagatsinghapur
District is shown as Figure 3-12.
Source:http://cgwb.gov.in/District_Profile/Orissa/jagasingpur.pdf
3.5.7 Geomorphology of the Study Area
Geomorphologically the study area within 10km radius of the site consisting three major
units such as Coastal Plains, Flood Plains and Estuarine zone. Based on the nature and age of
deposition the first two units viz., Coastal Plains & Flood Plains are divided into three and
two sub-units respectively. The coastal plains are classified as Younger coastal plains, older
coastal plains and Younger deltaic plains. The flood plains, which are developed due to the
impact of Mahanadi and its tributaries on the pre-existing landforms, are classified as
Younger flood plain, which is currently in active development stage and an older flood plain.
There is a zone of estuarine plains, where the Mahanadi river merges with sea, existing in the
northeastern part of the study area, which is typically, express the intermixing nature of beach
sands with river sands
The total Geographical area of the study area is 490.48 Sq.Km. The Geomorphology of the
study area is given in Table 3-5 and Geomorphology pattern and Geomorphology Map of the
study area is given in Figure 3-11and Figure 3-13respectively.
Table 3-5Geomorphology of the Study Area
S.No. Geomorphology Area in Sq.KmArea in
Acres
Area in
HectaresTotal Area %
1 Coastal Origin - Younger Coastal plain 91.86 22699.07 9186 18.73
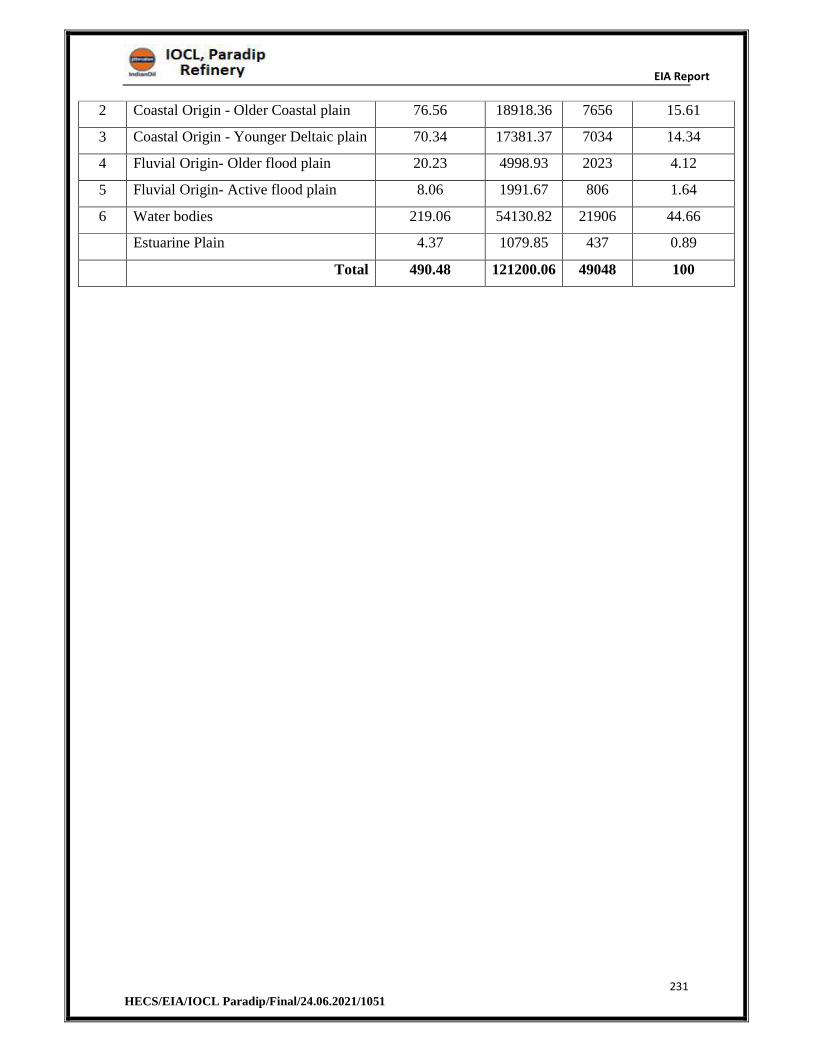
EIA Report
231 HECS/EIA/IOCL Paradip/Final/24.06.2021/1051
2 Coastal Origin - Older Coastal plain 76.56 18918.36 7656 15.61
3 Coastal Origin - Younger Deltaic plain 70.34 17381.37 7034 14.34
4 Fluvial Origin- Older flood plain 20.23 4998.93 2023 4.12
5 Fluvial Origin- Active flood plain 8.06 1991.67 806 1.64
6 Water bodies 219.06 54130.82 21906 44.66
Estuarine Plain 4.37 1079.85 437 0.89
Total 490.48 121200.06 49048 100
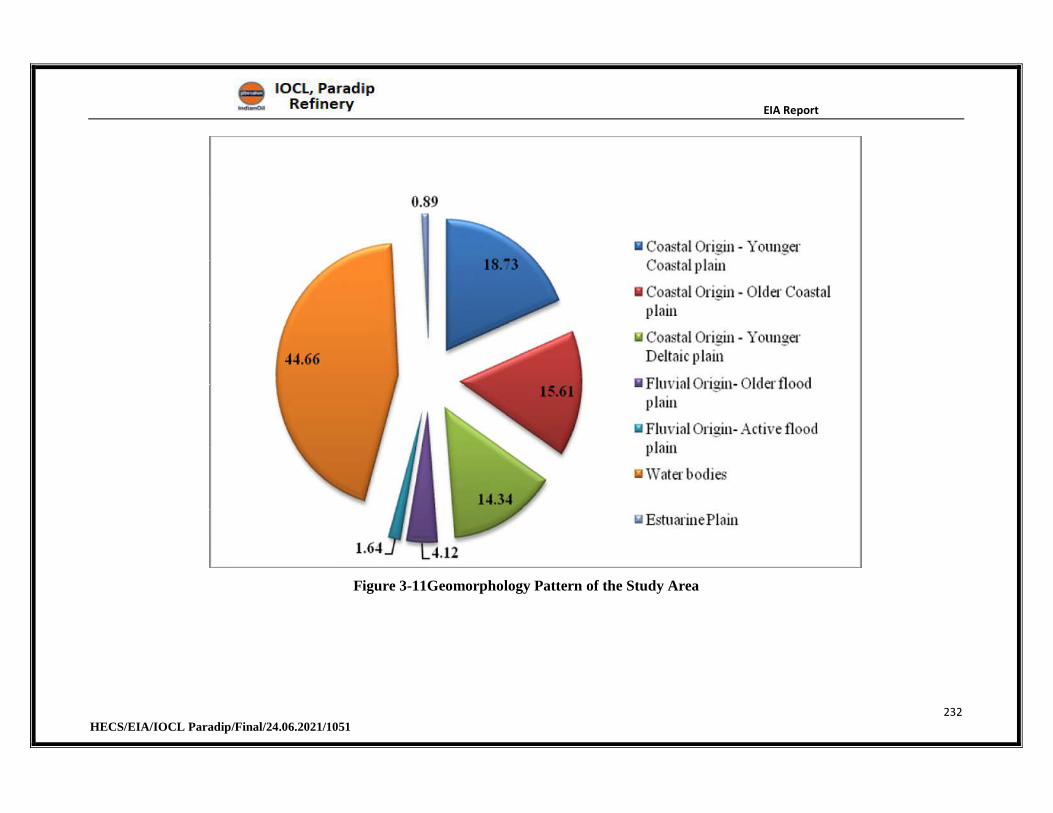
EIA Report
232 HECS/EIA/IOCL Paradip/Final/24.06.2021/1051
Figure 3-11Geomorphology Pattern of the Study Area
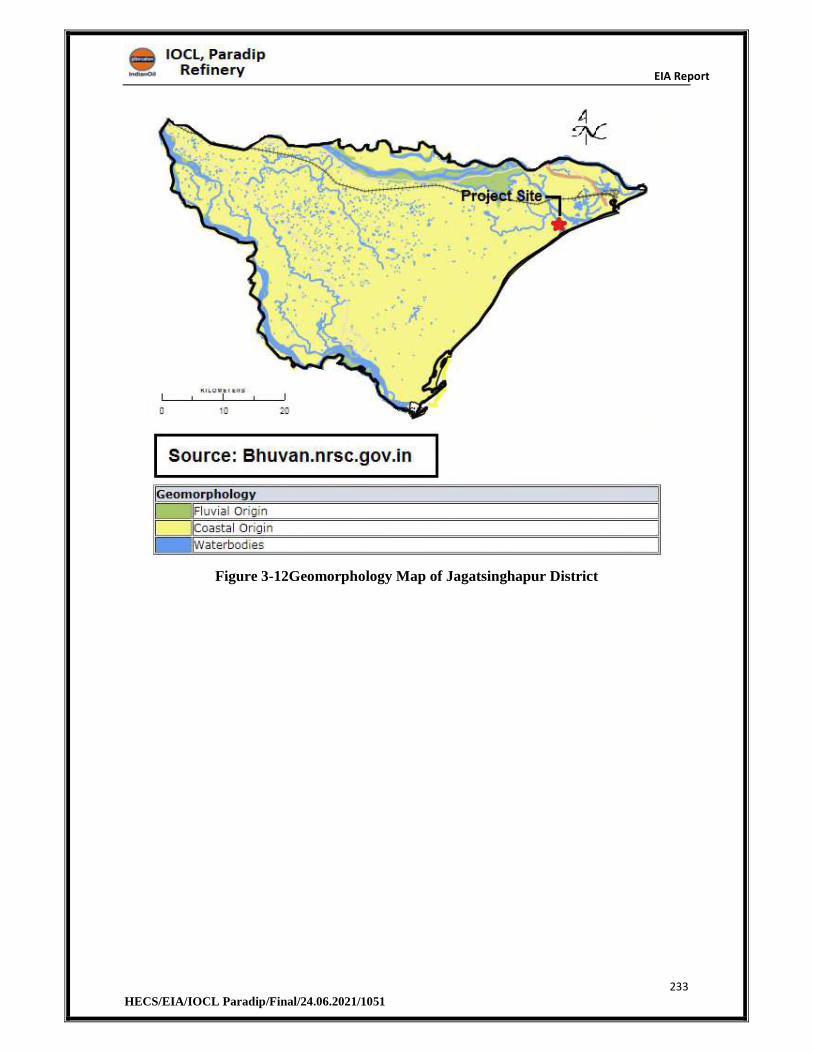
EIA Report
233 HECS/EIA/IOCL Paradip/Final/24.06.2021/1051
Figure 3-12Geomorphology Map of Jagatsinghapur District
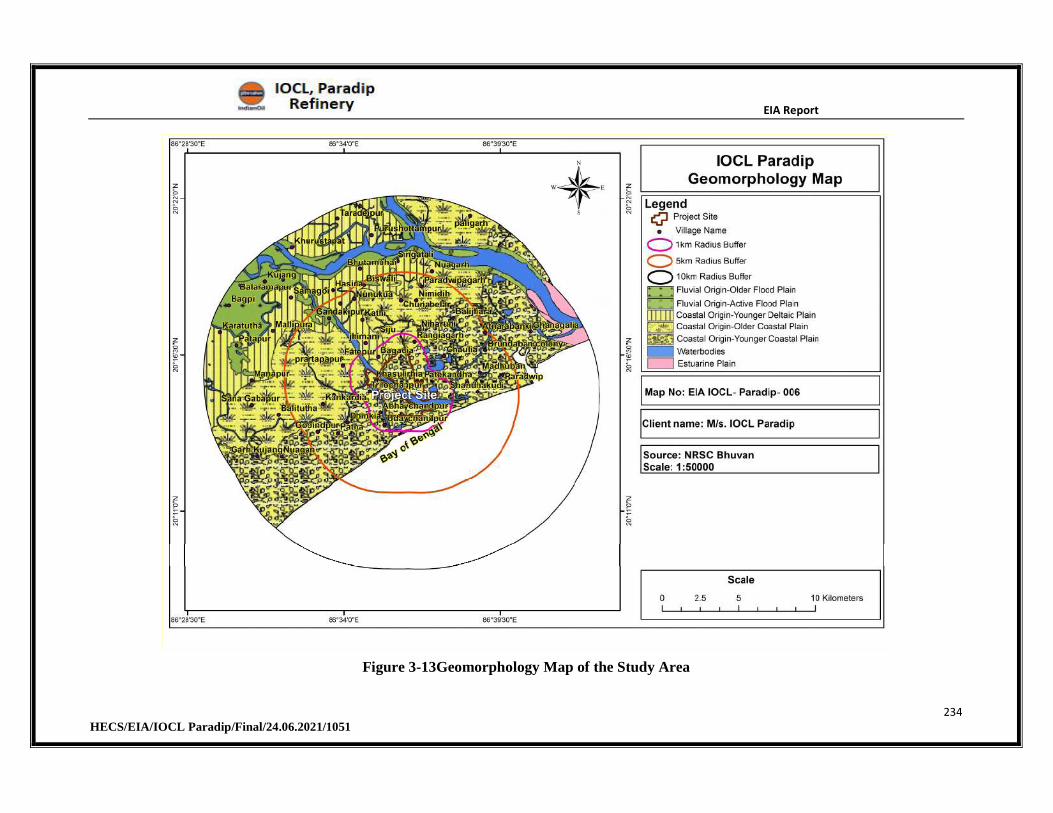
EIA Report
234 HECS/EIA/IOCL Paradip/Final/24.06.2021/1051
Figure 3-13Geomorphology Map of the Study Area
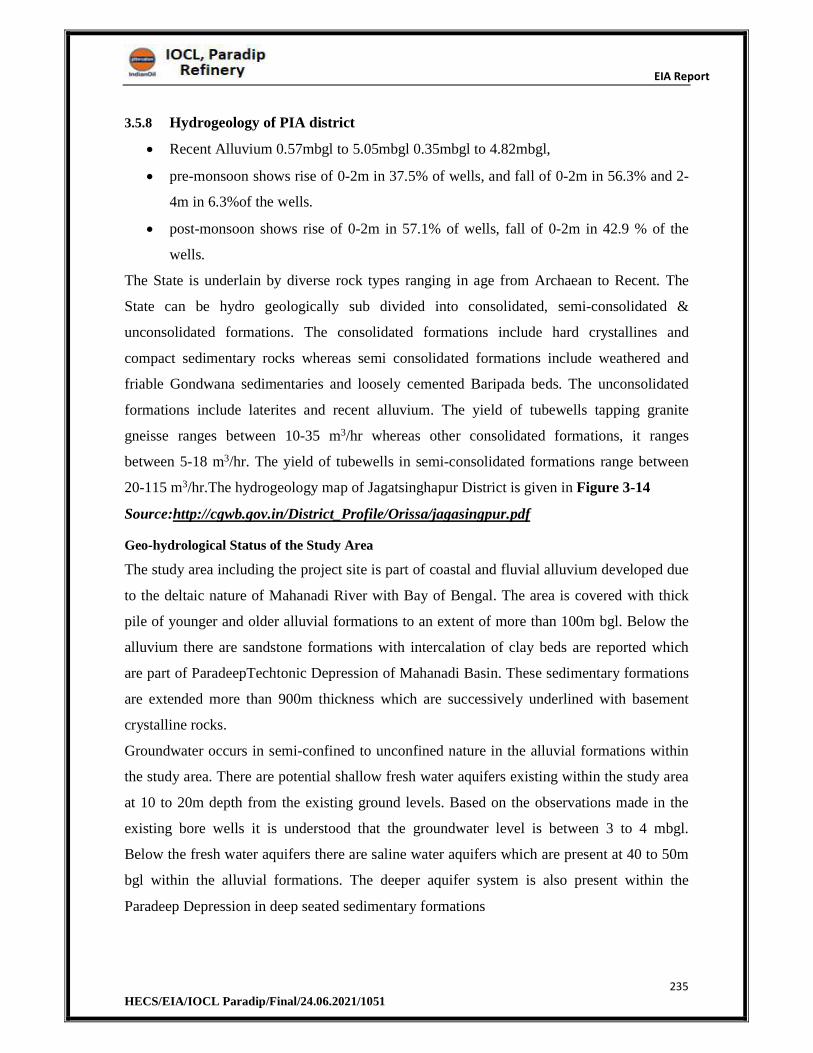
EIA Report
235 HECS/EIA/IOCL Paradip/Final/24.06.2021/1051
3.5.8 Hydrogeology of PIA district
Recent Alluvium 0.57mbgl to 5.05mbgl 0.35mbgl to 4.82mbgl,
pre-monsoon shows rise of 0-2m in 37.5% of wells, and fall of 0-2m in 56.3% and 2-
4m in 6.3%of the wells.
post-monsoon shows rise of 0-2m in 57.1% of wells, fall of 0-2m in 42.9 % of the
wells.
The State is underlain by diverse rock types ranging in age from Archaean to Recent. The
State can be hydro geologically sub divided into consolidated, semi-consolidated &
unconsolidated formations. The consolidated formations include hard crystallines and
compact sedimentary rocks whereas semi consolidated formations include weathered and
friable Gondwana sedimentaries and loosely cemented Baripada beds. The unconsolidated
formations include laterites and recent alluvium. The yield of tubewells tapping granite
gneisse ranges between 10-35 m3/hr whereas other consolidated formations, it ranges
between 5-18 m3/hr. The yield of tubewells in semi-consolidated formations range between
20-115 m3/hr.The hydrogeology map of Jagatsinghapur District is given in Figure 3-14
Source:http://cgwb.gov.in/District_Profile/Orissa/jagasingpur.pdf
Geo-hydrological Status of the Study Area
The study area including the project site is part of coastal and fluvial alluvium developed due
to the deltaic nature of Mahanadi River with Bay of Bengal. The area is covered with thick
pile of younger and older alluvial formations to an extent of more than 100m bgl. Below the
alluvium there are sandstone formations with intercalation of clay beds are reported which
are part of ParadeepTechtonic Depression of Mahanadi Basin. These sedimentary formations
are extended more than 900m thickness which are successively underlined with basement
crystalline rocks.
Groundwater occurs in semi-confined to unconfined nature in the alluvial formations within
the study area. There are potential shallow fresh water aquifers existing within the study area
at 10 to 20m depth from the existing ground levels. Based on the observations made in the
existing bore wells it is understood that the groundwater level is between 3 to 4 mbgl.
Below the fresh water aquifers there are saline water aquifers which are present at 40 to 50m
bgl within the alluvial formations. The deeper aquifer system is also present within the
Paradeep Depression in deep seated sedimentary formations
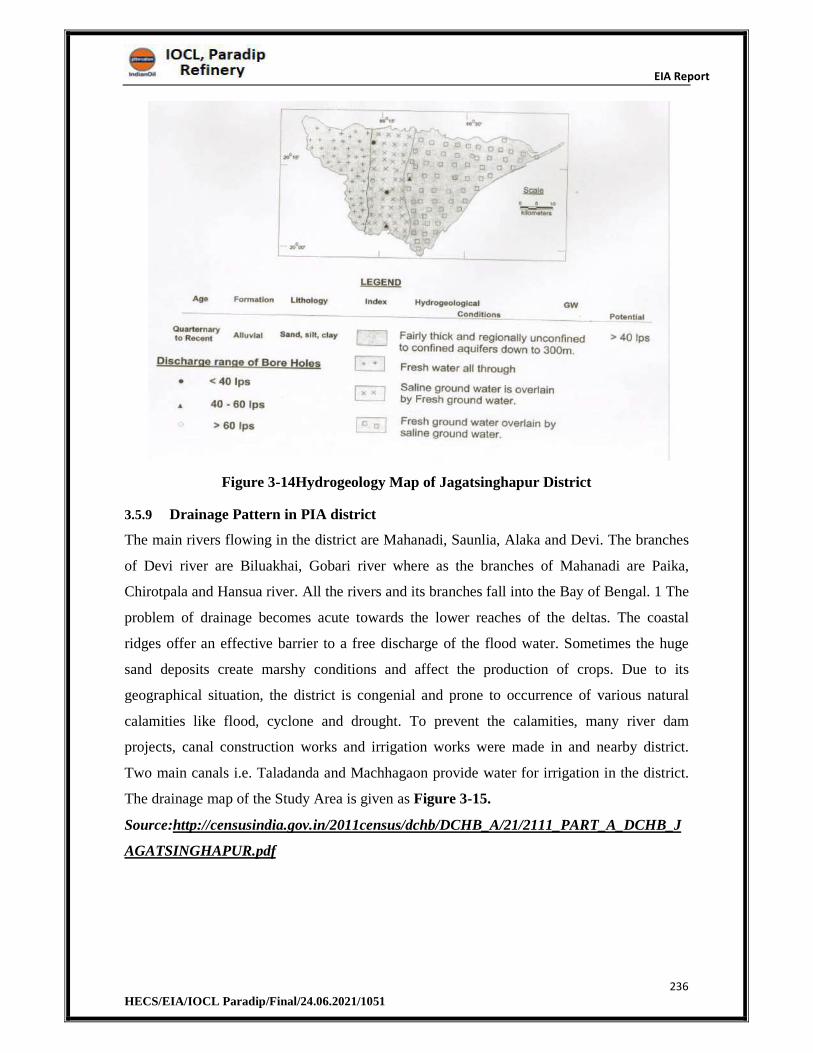
EIA Report
236 HECS/EIA/IOCL Paradip/Final/24.06.2021/1051
Figure 3-14Hydrogeology Map of Jagatsinghapur District
3.5.9 Drainage Pattern in PIA district
The main rivers flowing in the district are Mahanadi, Saunlia, Alaka and Devi. The branches
of Devi river are Biluakhai, Gobari river where as the branches of Mahanadi are Paika,
Chirotpala and Hansua river. All the rivers and its branches fall into the Bay of Bengal. 1 The
problem of drainage becomes acute towards the lower reaches of the deltas. The coastal
ridges offer an effective barrier to a free discharge of the flood water. Sometimes the huge
sand deposits create marshy conditions and affect the production of crops. Due to its
geographical situation, the district is congenial and prone to occurrence of various natural
calamities like flood, cyclone and drought. To prevent the calamities, many river dam
projects, canal construction works and irrigation works were made in and nearby district.
Two main canals i.e. Taladanda and Machhagaon provide water for irrigation in the district.
The drainage map of the Study Area is given as Figure 3-15.
Source:http://censusindia.gov.in/2011census/dchb/DCHB_A/21/2111_PART_A_DCHB_J
AGATSINGHAPUR.pdf
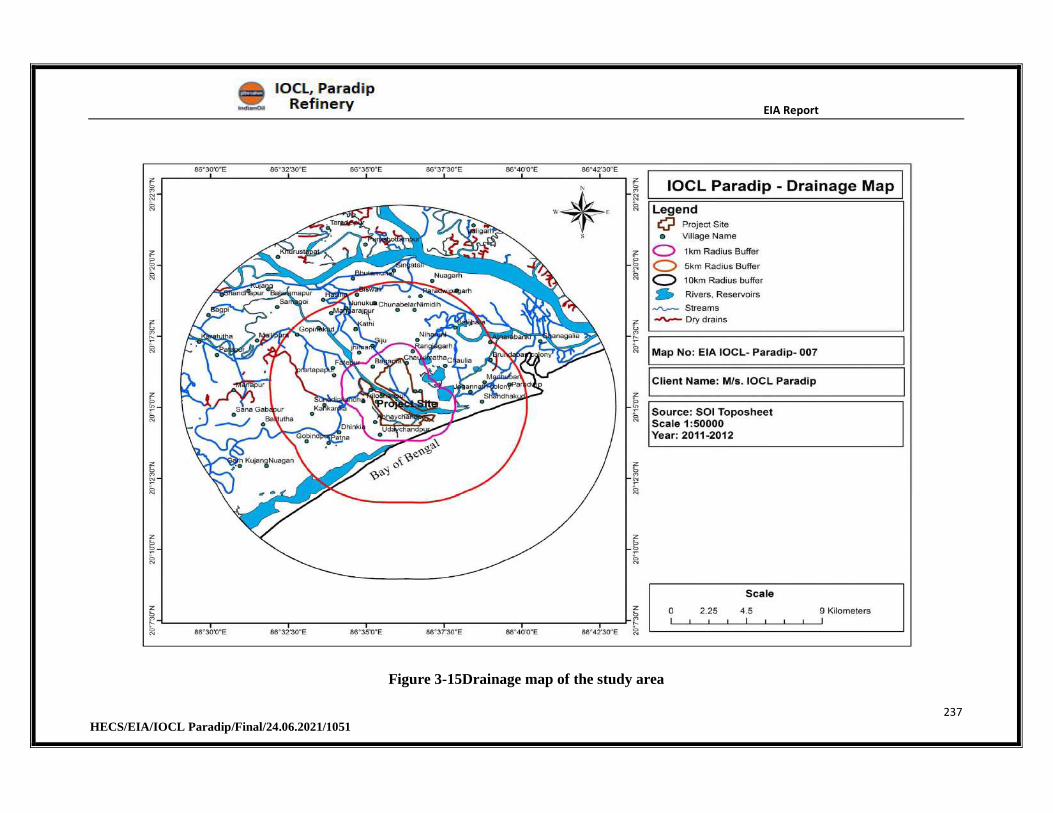
EIA Report
237 HECS/EIA/IOCL Paradip/Final/24.06.2021/1051
Figure 3-15Drainage map of the study area

3.5.10 Geology
Geologically the study area including the site consisting of Alluvial formations of Recent
geological age. These alluvial formations are developed by the action of Mahanadi river and
Bay of Bengal sea. The alluvium developed due to the river action is designated as Fluvial
alluvium. Similarly, the alluvium developed due to the sea action is named as Coastal
Alluvium. The basement rocks are existing below 100m from the existing ground level. The
geological formation of this district is entirely alluvium of recent origin. The entire district
comes under Mahanadi Delta Division and Cuttack Coastal Plain. The region is formed over
the estuary of the Mahanadi. Geological map of Orissa is given as Figure 3-16.
Source:http://censusindia.gov.in/2011census/dchb/DCHB_A/21/2111_PART_A_DCHB_J
AGATSINGHAPUR.pdf
Figure 3-16Geology Map of Orissa
3.5.11 Seismicity
As per Vulnerability Atlas of India- 3rd Edition, the project location/study area falls in Zone
III, which is categorized as a Moderate Risk Zone. The seismicity map of India is shown in
Figure 3-17
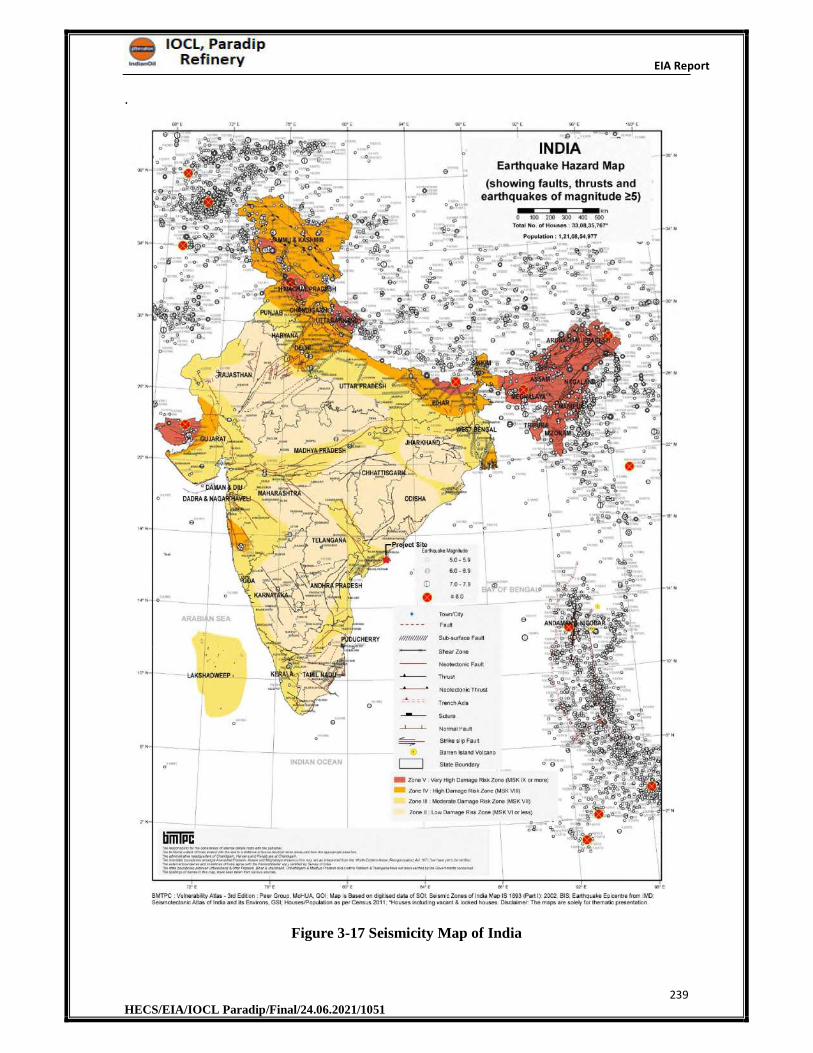
EIA Report
239 HECS/EIA/IOCL Paradip/Final/24.06.2021/1051
.
Figure 3-17 Seismicity Map of India
EIA Report
240 HECS/EIA/IOCL Paradip/Final/24.06.2021/1051
3.5.12 Soils in PIA District
Based on the physical and chemical characteristics, mode of origin and occurrence, soils of
the district may be classified into three groups namely Alfisols, Aridisols and Entisols.
i.Alfisols: This includes deltaic alluvial soils and this type of soils occupies nearly 90% of the
entire district area. The deltaic alluvial soils are generally deficient in phosphate (P2O5) and
nitrogen (N). Both the total and available potassium are fairly adequate and PH varies
between 7.38 and 8.16.
ii.Aridisols: These are saline and saline alkali soils and occur in small pockets in the north
eastern and south eastern corner of the district near coast. These are rich in calcium,
magnesium and also consist of half decomposed organic matter.
iii.Entisols: This includes coastal sandy soils and occurs as narrow elongated ridge along the
coast line. The soils are deficient in nitrogen, phosphoric acid and humus, but not in potash
and lime.
Soil map of India is given in Figure 3-18.
Source: http://cgwb.gov.in/District_Profile/Orissa/jagasingpur.pdf
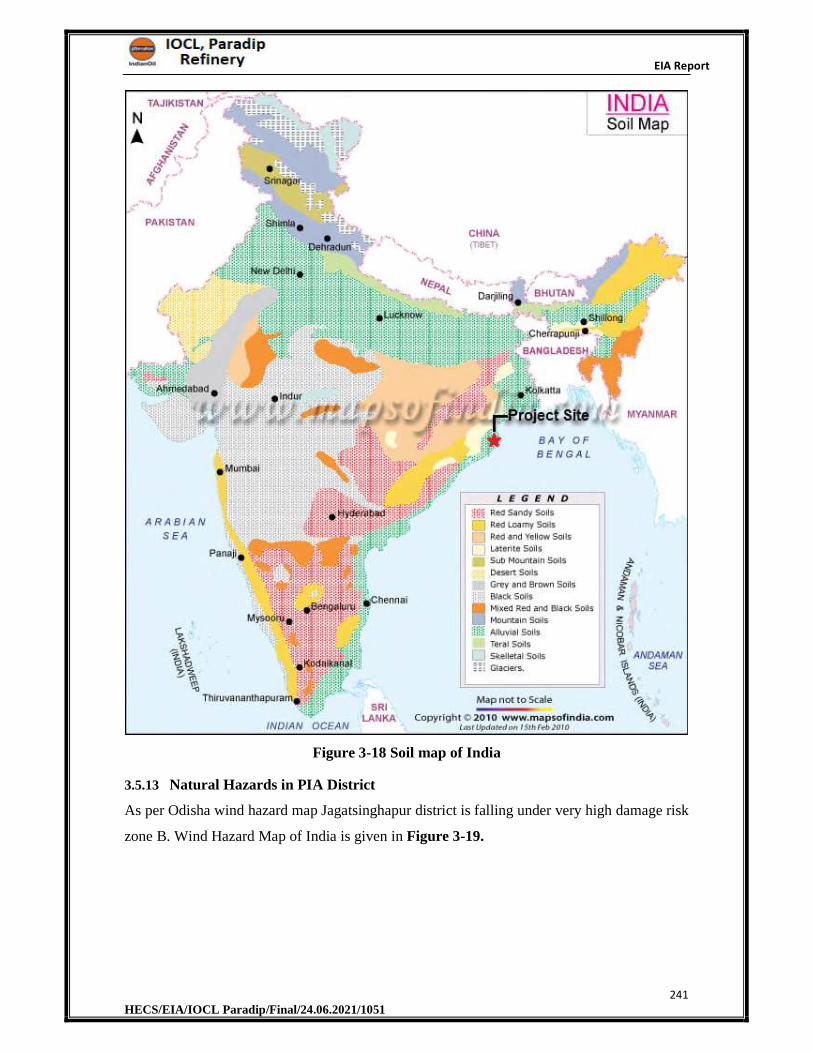
EIA Report
241 HECS/EIA/IOCL Paradip/Final/24.06.2021/1051
Figure 3-18 Soil map of India
3.5.13 Natural Hazards in PIA District
As per Odisha wind hazard map Jagatsinghapur district is falling under very high damage risk
zone B. Wind Hazard Map of India is given in Figure 3-19.
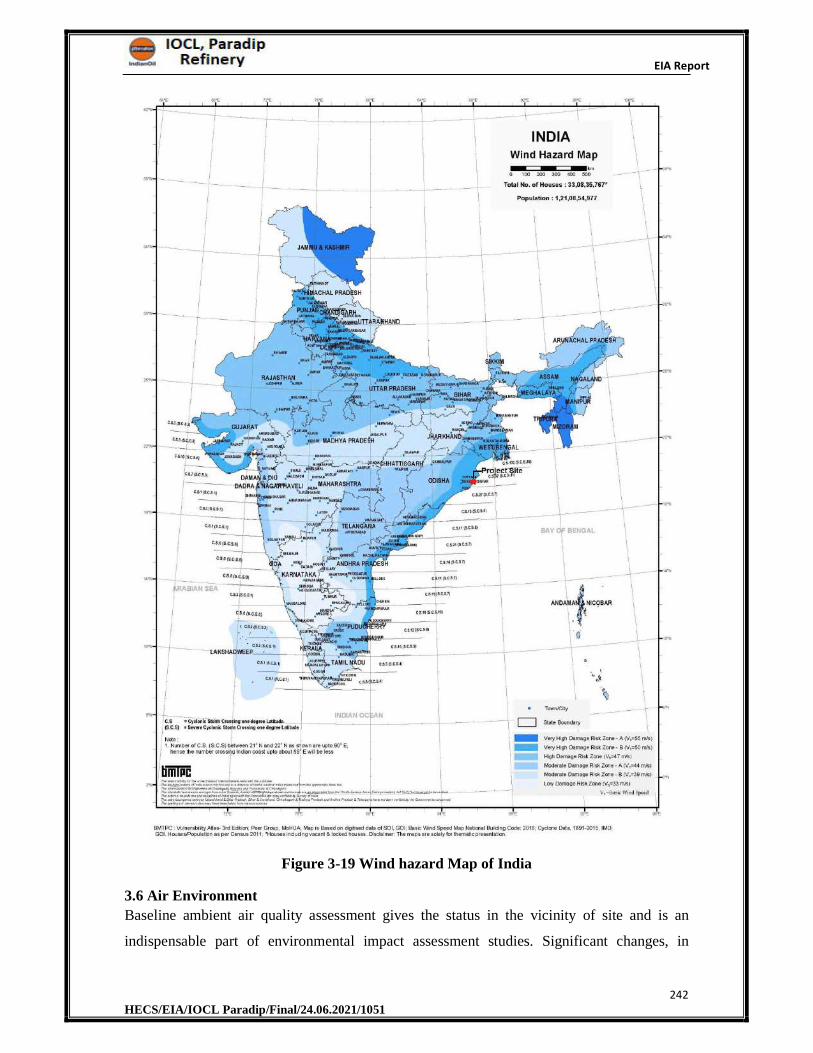
EIA Report
242 HECS/EIA/IOCL Paradip/Final/24.06.2021/1051
Figure 3-19 Wind hazard Map of India
3.6 Air Environment
Baseline ambient air quality assessment gives the status in the vicinity of site and is an
indispensable part of environmental impact assessment studies. Significant changes, in
EIA Report
243 HECS/EIA/IOCL Paradip/Final/24.06.2021/1051
predominant winds and weather conditions are observed in winter, summer and post-
monsoon seasons apart from the local topographic influences. The baseline status of air
environment in the study area is assessed through a systematic air quality surveillance
programme.
3.6.1 Meteorological Conditions
The regional air quality is influenced by the meteorology of that region. The principal
weather parameters that influence the concentration of the air pollutants in the surroundings
are wind speed, wind direction and temperature. The meteorological data is useful for proper
interpretation of the baseline data. It is used as input for air quality dispersion models for
predicting the post project environmental scenario i.e. ground level concentrations due to
proposed utilities like Boilers &DG sets etc.
3.6.2 Meteorological Data Collection
Available secondary data pertaining to the meteorological parameters was obtained from the
IMD Climatological tables. In addition, baseline meteorological data (primary data) was
generated during the study period (March to May 2019). The methodology adopted for
monitoring surface observations is as per the standard norms laid down by Bureau of Indian
Standards (BIS) i.e. IS:8829 and Indian Meteorological Department (IMD).
3.6.3 General Meteorological Scenario based on IMD Data
The nearest Indian Meteorological Department (IMD) station located to project site is Paradip
port. The Climatological data of Paradip port (20 18’ N and 86o 41’ E), published by the
IMD, based on daily observations at 08:30 and 17:30 hour IST for a 30 year period (1971-
2000), is presented in the following sections on the meteorological conditions of the region.
The monthly variations of the relevant meteorological parameters are reproduced in Table
3-6.
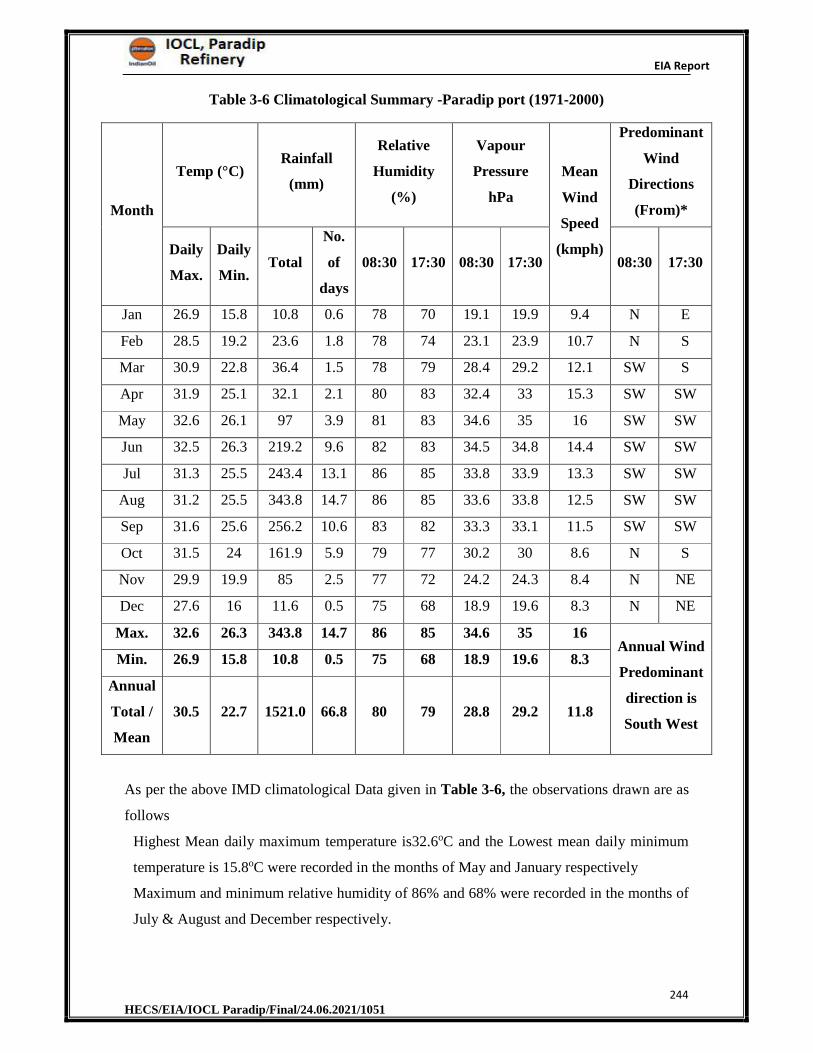
EIA Report
244 HECS/EIA/IOCL Paradip/Final/24.06.2021/1051
Table 3-6 Climatological Summary -Paradip port (1971-2000)
Month
Temp (°C) Rainfall
(mm)
Relative
Humidity
(%)
Vapour
Pressure
hPa
Mean
Wind
Speed
(kmph)
Predominant
Wind
Directions
(From)*
Daily
Max.
Daily
Min. Total
No.
of
days
08:30 17:30 08:30 17:30 08:30 17:30
Jan 26.9 15.8 10.8 0.6 78 70 19.1 19.9 9.4 N E
Feb 28.5 19.2 23.6 1.8 78 74 23.1 23.9 10.7 N S
Mar 30.9 22.8 36.4 1.5 78 79 28.4 29.2 12.1 SW S
Apr 31.9 25.1 32.1 2.1 80 83 32.4 33 15.3 SW SW
May 32.6 26.1 97 3.9 81 83 34.6 35 16 SW SW
Jun 32.5 26.3 219.2 9.6 82 83 34.5 34.8 14.4 SW SW
Jul 31.3 25.5 243.4 13.1 86 85 33.8 33.9 13.3 SW SW
Aug 31.2 25.5 343.8 14.7 86 85 33.6 33.8 12.5 SW SW
Sep 31.6 25.6 256.2 10.6 83 82 33.3 33.1 11.5 SW SW
Oct 31.5 24 161.9 5.9 79 77 30.2 30 8.6 N S
Nov 29.9 19.9 85 2.5 77 72 24.2 24.3 8.4 N NE
Dec 27.6 16 11.6 0.5 75 68 18.9 19.6 8.3 N NE
Max. 32.6 26.3 343.8 14.7 86 85 34.6 35 16 Annual Wind
Predominant
direction is
South West
Min. 26.9 15.8 10.8 0.5 75 68 18.9 19.6 8.3
Annual
Total /
Mean
30.5 22.7 1521.0 66.8 80 79 28.8 29.2 11.8
As per the above IMD climatological Data given in Table 3-6, the observations drawn are as
follows
Highest Mean daily maximum temperature is32.6oC and the Lowest mean daily minimum
temperature is 15.8oC were recorded in the months of May and January respectively
Maximum and minimum relative humidity of 86% and 68% were recorded in the months of
July & August and December respectively.
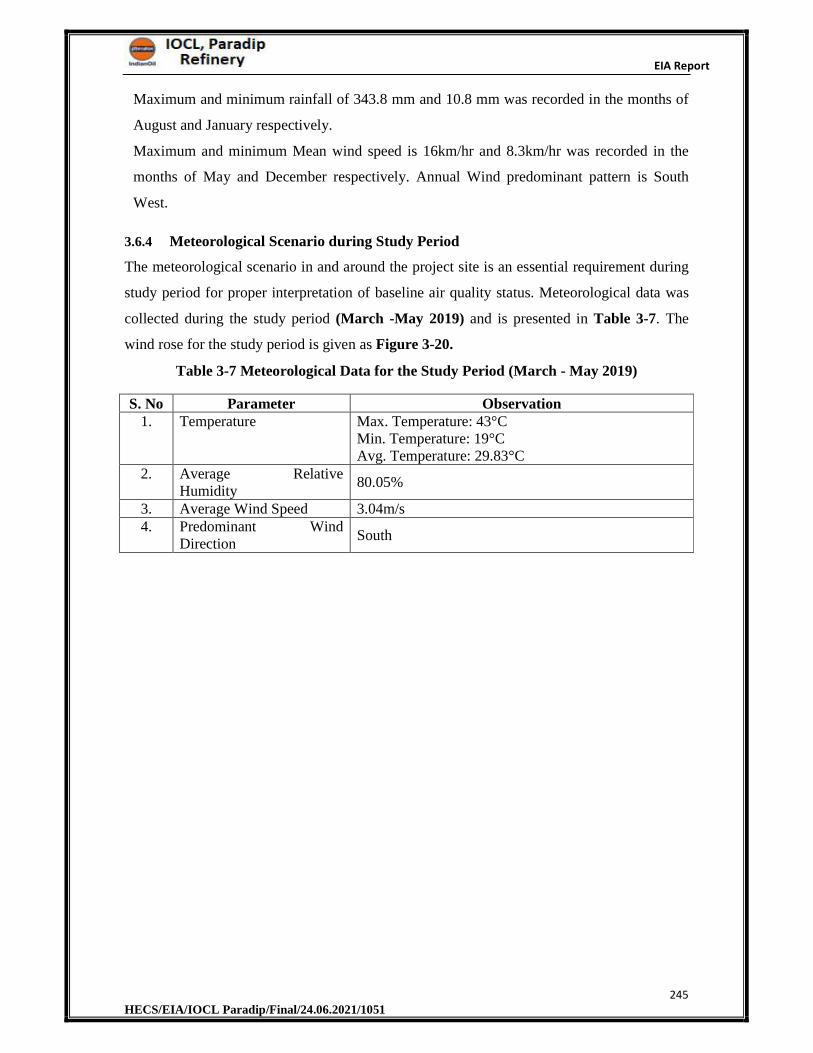
EIA Report
245 HECS/EIA/IOCL Paradip/Final/24.06.2021/1051
Maximum and minimum rainfall of 343.8 mm and 10.8 mm was recorded in the months of
August and January respectively.
Maximum and minimum Mean wind speed is 16km/hr and 8.3km/hr was recorded in the
months of May and December respectively. Annual Wind predominant pattern is South
West.
3.6.4 Meteorological Scenario during Study Period
The meteorological scenario in and around the project site is an essential requirement during
study period for proper interpretation of baseline air quality status. Meteorological data was
collected during the study period (March -May 2019) and is presented in Table 3-7. The
wind rose for the study period is given as Figure 3-20.
Table 3-7 Meteorological Data for the Study Period (March - May 2019)
S. No Parameter Observation 1. Temperature Max. Temperature: 43°C
Min. Temperature: 19°C Avg. Temperature: 29.83°C
2. Average Relative Humidity
80.05%
3. Average Wind Speed 3.04m/s4. Predominant Wind
Direction South
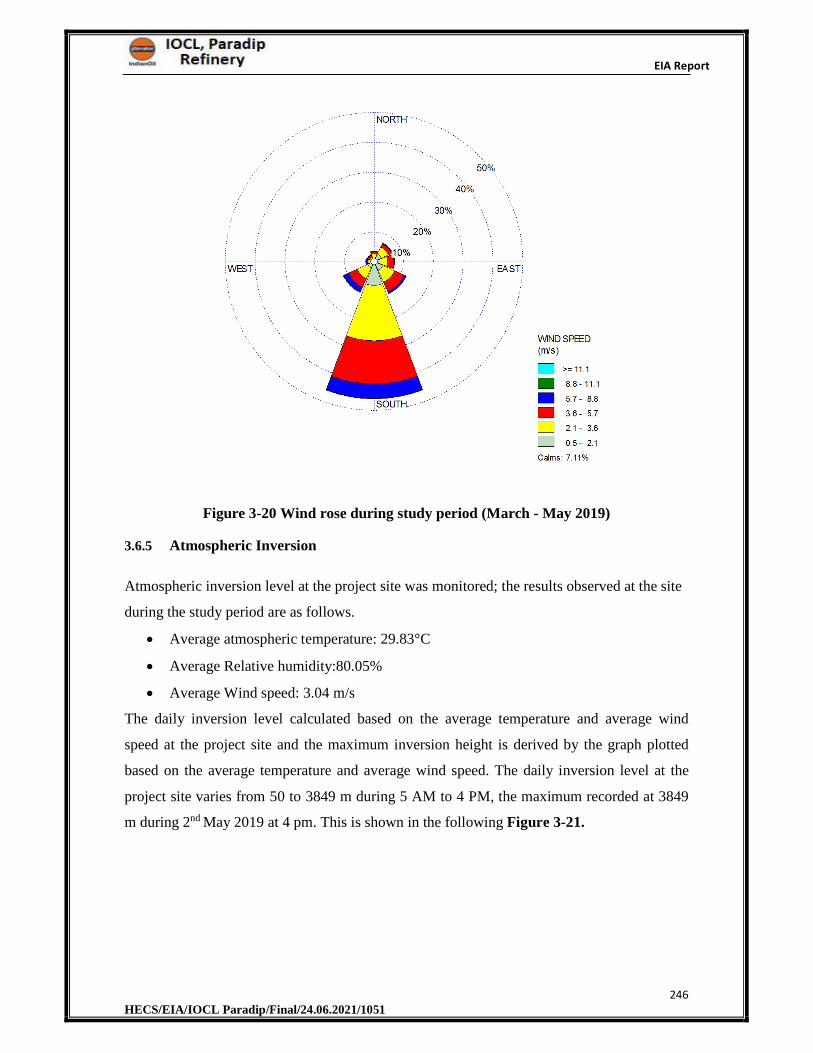
EIA Report
246 HECS/EIA/IOCL Paradip/Final/24.06.2021/1051
Figure 3-20 Wind rose during study period (March - May 2019)
3.6.5 Atmospheric Inversion
Atmospheric inversion level at the project site was monitored; the results observed at the site
during the study period are as follows.
Average atmospheric temperature: 29.83°C
Average Relative humidity:80.05%
Average Wind speed: 3.04 m/s
The daily inversion level calculated based on the average temperature and average wind
speed at the project site and the maximum inversion height is derived by the graph plotted
based on the average temperature and average wind speed. The daily inversion level at the
project site varies from 50 to 3849 m during 5 AM to 4 PM, the maximum recorded at 3849
m during 2nd May 2019 at 4 pm. This is shown in the following Figure 3-21.
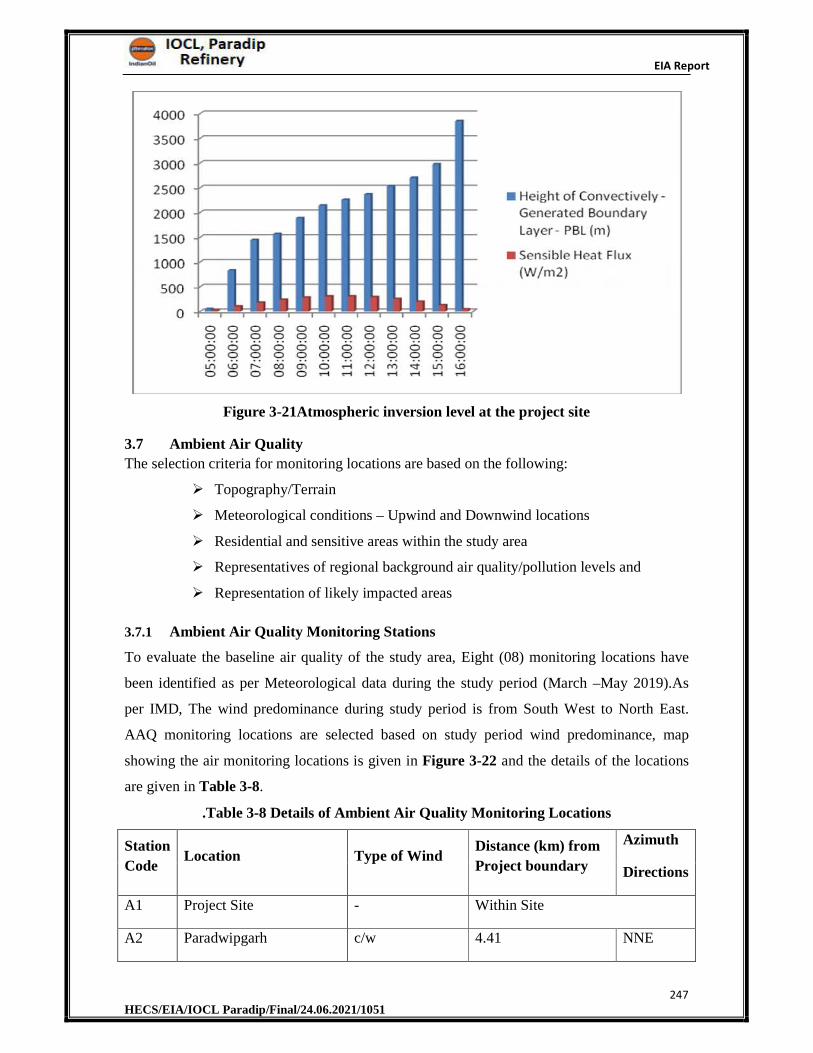
EIA Report
247 HECS/EIA/IOCL Paradip/Final/24.06.2021/1051
Figure 3-21Atmospheric inversion level at the project site
3.7 Ambient Air Quality
The selection criteria for monitoring locations are based on the following:
Topography/Terrain
Meteorological conditions – Upwind and Downwind locations
Residential and sensitive areas within the study area
Representatives of regional background air quality/pollution levels and
Representation of likely impacted areas
3.7.1 Ambient Air Quality Monitoring Stations
To evaluate the baseline air quality of the study area, Eight (08) monitoring locations have
been identified as per Meteorological data during the study period (March –May 2019).As
per IMD, The wind predominance during study period is from South West to North East.
AAQ monitoring locations are selected based on study period wind predominance, map
showing the air monitoring locations is given in Figure 3-22 and the details of the locations
are given in Table 3-8.
.Table 3-8 Details of Ambient Air Quality Monitoring Locations
Station
Code Location Type of Wind
Distance (km) from
Project boundary
Azimuth
Directions
A1 Project Site - Within Site
A2 Paradwipgarh c/w 4.41 NNE
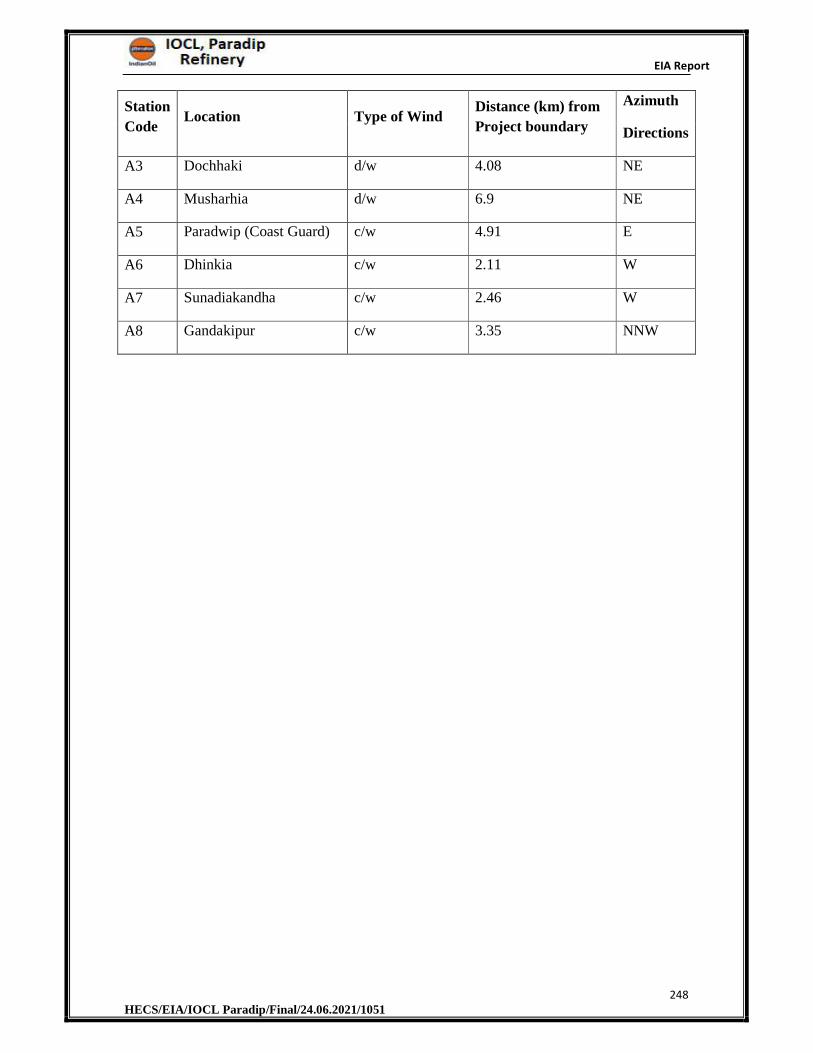
EIA Report
248 HECS/EIA/IOCL Paradip/Final/24.06.2021/1051
Station
Code Location Type of Wind
Distance (km) from
Project boundary
Azimuth
Directions
A3 Dochhaki d/w 4.08 NE
A4 Musharhia d/w 6.9 NE
A5 Paradwip (Coast Guard) c/w 4.91 E
A6 Dhinkia c/w 2.11 W
A7 Sunadiakandha c/w 2.46 W
A8 Gandakipur c/w 3.35 NNW
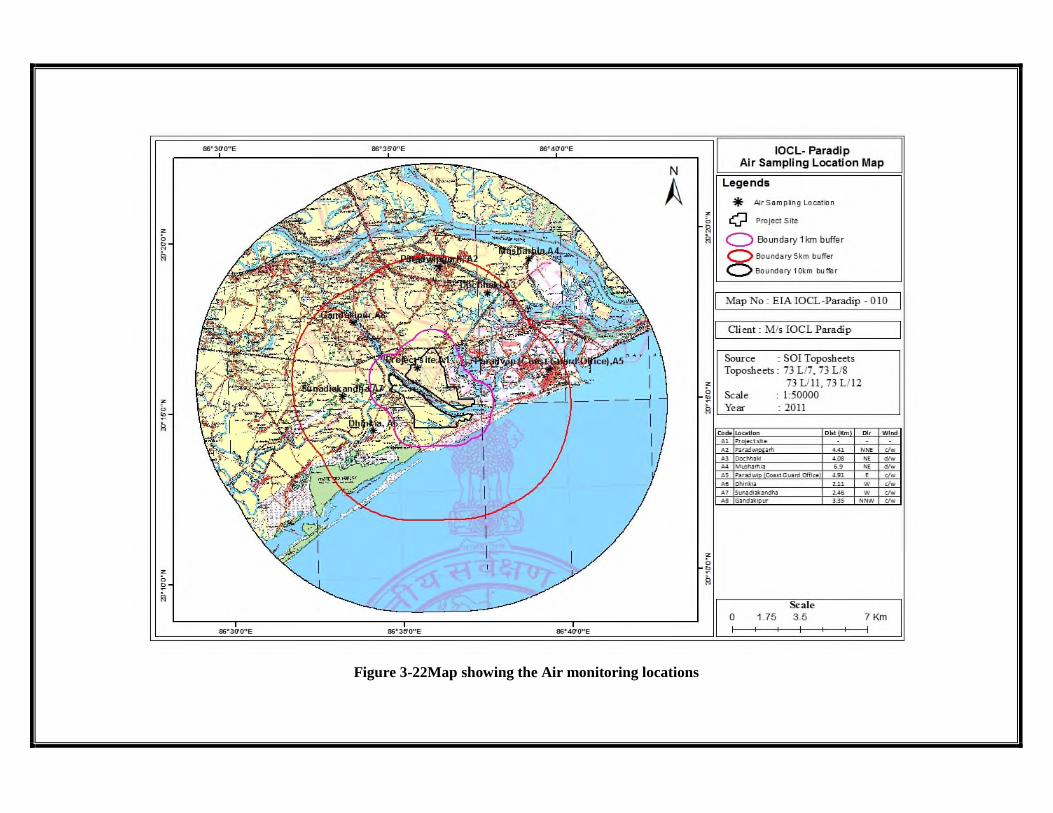
Figure 3-22Map showing the Air monitoring locations
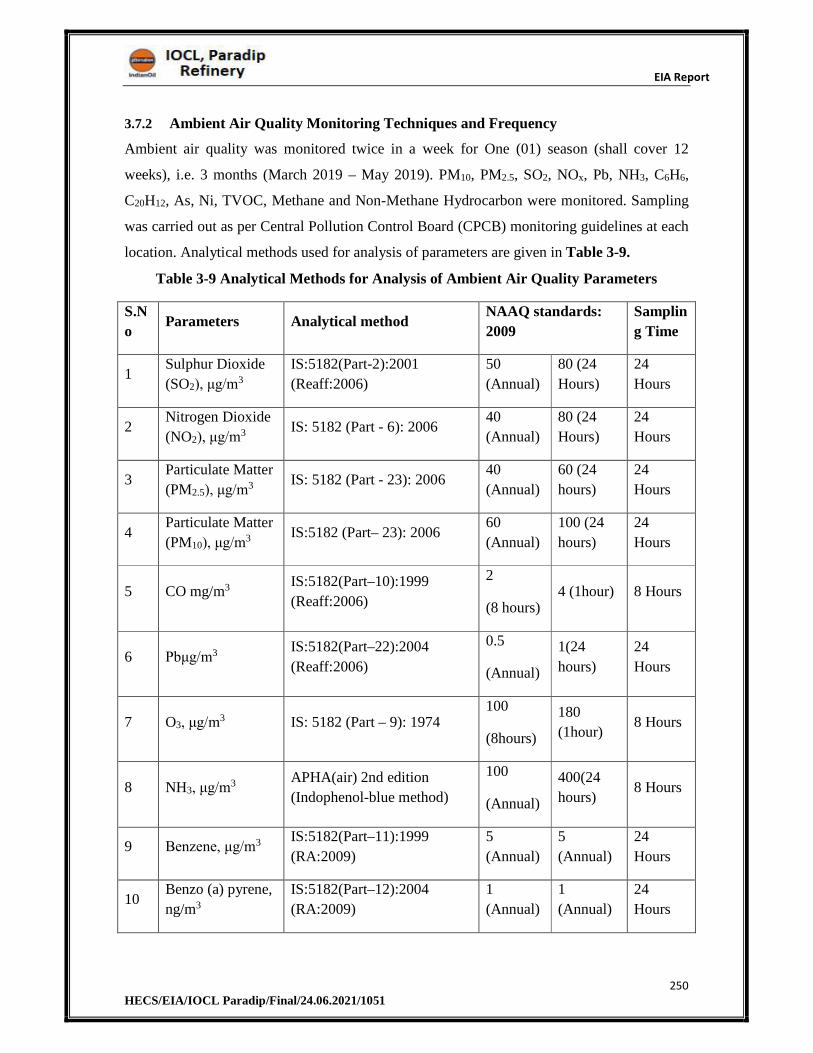
EIA Report
250 HECS/EIA/IOCL Paradip/Final/24.06.2021/1051
3.7.2 Ambient Air Quality Monitoring Techniques and Frequency
Ambient air quality was monitored twice in a week for One (01) season (shall cover 12
weeks), i.e. 3 months (March 2019 – May 2019). PM10, PM2.5, SO2, NOx, Pb, NH3, C6H6,
C20H12, As, Ni, TVOC, Methane and Non-Methane Hydrocarbon were monitored. Sampling
was carried out as per Central Pollution Control Board (CPCB) monitoring guidelines at each
location. Analytical methods used for analysis of parameters are given in Table 3-9.
Table 3-9 Analytical Methods for Analysis of Ambient Air Quality Parameters
S.N
o Parameters Analytical method
NAAQ standards:
2009
Samplin
g Time
1 Sulphur Dioxide
(SO2), μg/m3
IS:5182(Part-2):2001
(Reaff:2006)
50
(Annual)
80 (24
Hours)
24
Hours
2 Nitrogen Dioxide
(NO2), μg/m3 IS: 5182 (Part - 6): 2006 40
(Annual)
80 (24
Hours)
24
Hours
3 Particulate Matter
(PM2.5), μg/m3 IS: 5182 (Part - 23): 2006 40
(Annual)
60 (24
hours)
24
Hours
4 Particulate Matter
(PM10), μg/m3 IS:5182 (Part– 23): 2006 60
(Annual)
100 (24
hours)
24
Hours
5 CO mg/m3 IS:5182(Part–10):1999
(Reaff:2006)
2
(8 hours) 4 (1hour) 8 Hours
6 Pbμg/m3 IS:5182(Part–22):2004
(Reaff:2006)
0.5
(Annual)
1(24
hours)
24
Hours
7 O3, μg/m3 IS: 5182 (Part – 9): 1974 100
(8hours)
180
(1hour) 8 Hours
8 NH3, μg/m3 APHA(air) 2nd edition
(Indophenol-blue method)
100
(Annual)
400(24
hours) 8 Hours
9 Benzene, μg/m3 IS:5182(Part–11):1999
(RA:2009)
5
(Annual)
5
(Annual)
24
Hours
10 Benzo (a) pyrene,
ng/m3
IS:5182(Part–12):2004
(RA:2009)
1
(Annual)
1
(Annual)
24
Hours
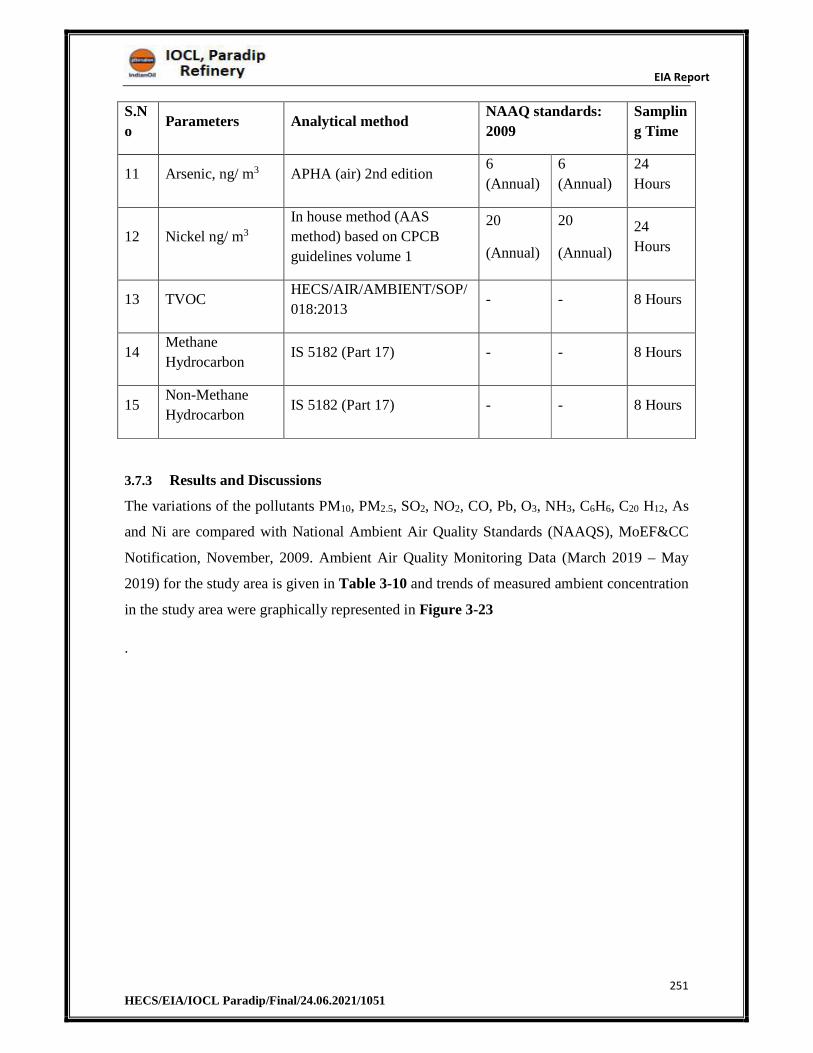
EIA Report
251 HECS/EIA/IOCL Paradip/Final/24.06.2021/1051
S.N
o Parameters Analytical method
NAAQ standards:
2009
Samplin
g Time
11 Arsenic, ng/ m3 APHA (air) 2nd edition 6
(Annual)
6
(Annual)
24
Hours
12 Nickel ng/ m3
In house method (AAS
method) based on CPCB
guidelines volume 1
20
(Annual)
20
(Annual)
24
Hours
13 TVOC HECS/AIR/AMBIENT/SOP/
018:2013 - - 8 Hours
14 Methane
Hydrocarbon IS 5182 (Part 17) - - 8 Hours
15 Non-Methane
Hydrocarbon IS 5182 (Part 17) - - 8 Hours
3.7.3 Results and Discussions
The variations of the pollutants PM10, PM2.5, SO2, NO2, CO, Pb, O3, NH3, C6H6, C20 H12, As
and Ni are compared with National Ambient Air Quality Standards (NAAQS), MoEF&CC
Notification, November, 2009. Ambient Air Quality Monitoring Data (March 2019 – May
2019) for the study area is given in Table 3-10 and trends of measured ambient concentration
in the study area were graphically represented in Figure 3-23
.
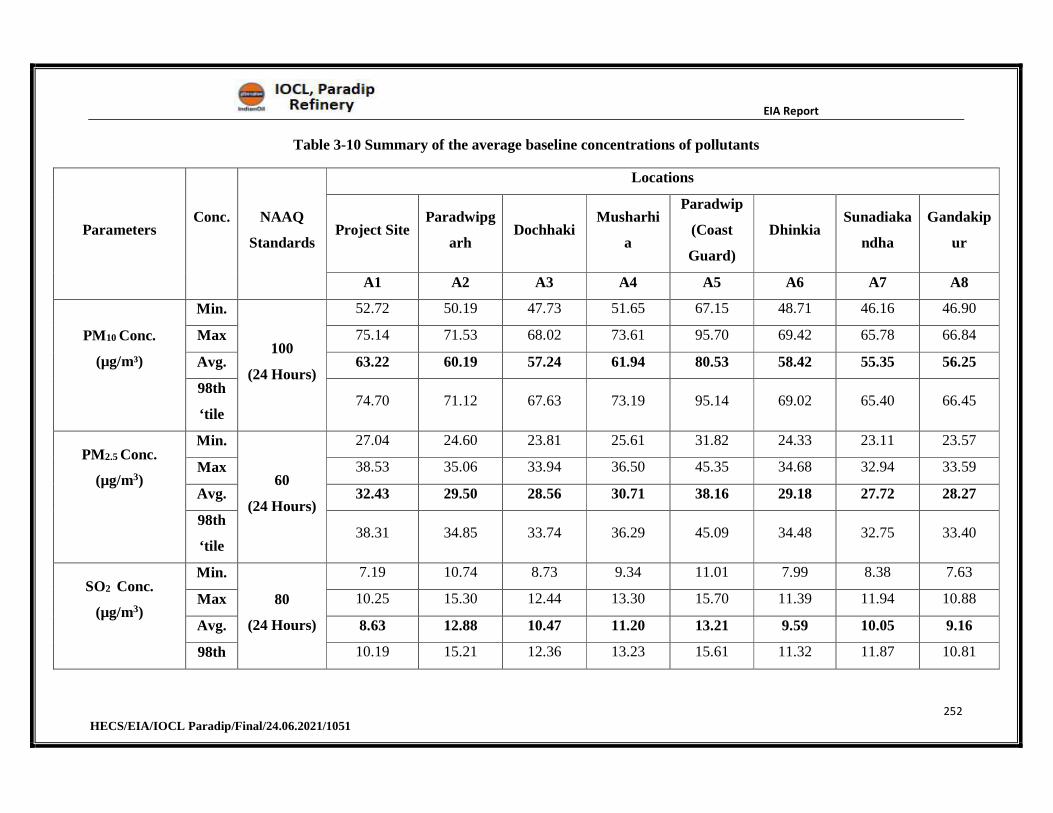
EIA Report
252 HECS/EIA/IOCL Paradip/Final/24.06.2021/1051
Table 3-10 Summary of the average baseline concentrations of pollutants
Parameters Conc. NAAQ
Standards
Locations
Project Site Paradwipg
arh Dochhaki
Musharhi
a
Paradwip
(Coast
Guard)
Dhinkia Sunadiaka
ndha
Gandakip
ur
A1 A2 A3 A4 A5 A6 A7 A8
PM10 Conc.
(µg/m³)
Min.
100
(24 Hours)
52.72 50.19 47.73 51.65 67.15 48.71 46.16 46.90
Max 75.14 71.53 68.02 73.61 95.70 69.42 65.78 66.84
Avg. 63.22 60.19 57.24 61.94 80.53 58.42 55.35 56.25
98th
‘tile 74.70 71.12 67.63 73.19 95.14 69.02 65.40 66.45
PM2.5 Conc.
(µg/m3)
Min.
60
(24 Hours)
27.04 24.60 23.81 25.61 31.82 24.33 23.11 23.57
Max 38.53 35.06 33.94 36.50 45.35 34.68 32.94 33.59
Avg. 32.43 29.50 28.56 30.71 38.16 29.18 27.72 28.27
98th
‘tile 38.31 34.85 33.74 36.29 45.09 34.48 32.75 33.40
SO2 Conc.
(µg/m3)
Min.
80
(24 Hours)
7.19 10.74 8.73 9.34 11.01 7.99 8.38 7.63
Max 10.25 15.30 12.44 13.30 15.70 11.39 11.94 10.88
Avg. 8.63 12.88 10.47 11.20 13.21 9.59 10.05 9.16
98th 10.19 15.21 12.36 13.23 15.61 11.32 11.87 10.81
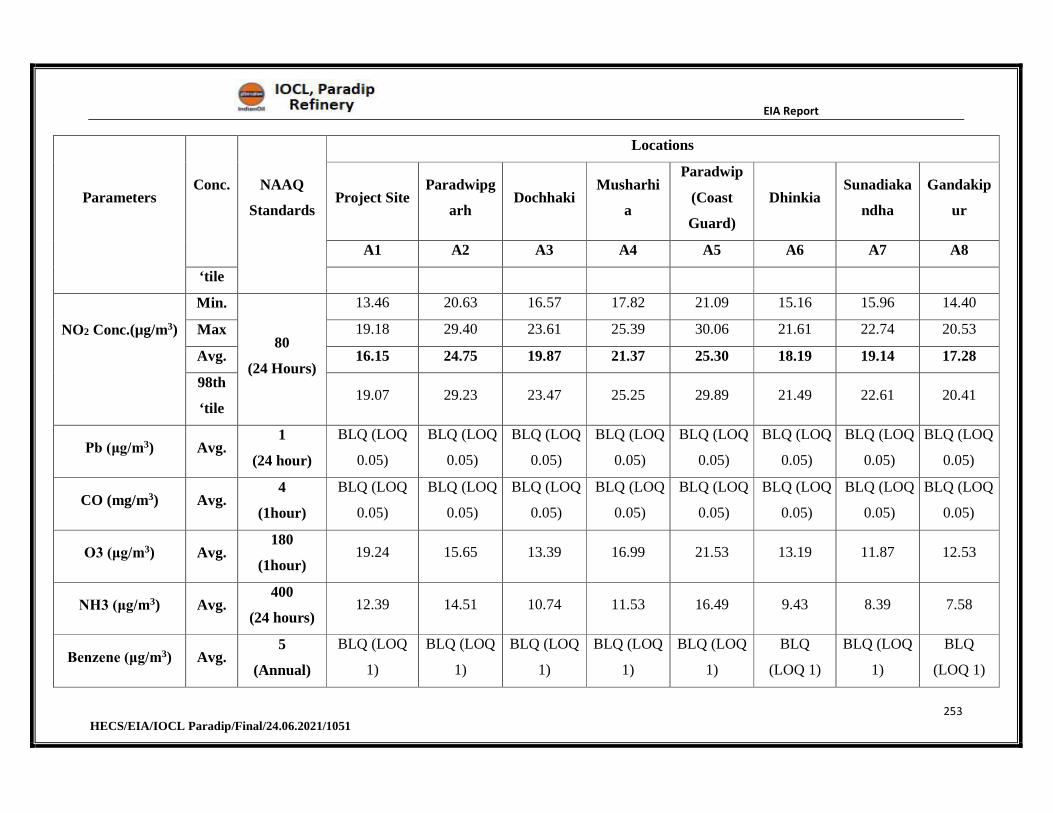
EIA Report
253 HECS/EIA/IOCL Paradip/Final/24.06.2021/1051
Parameters Conc. NAAQ
Standards
Locations
Project Site Paradwipg
arh Dochhaki
Musharhi
a
Paradwip
(Coast
Guard)
Dhinkia Sunadiaka
ndha
Gandakip
ur
A1 A2 A3 A4 A5 A6 A7 A8
‘tile
NO2 Conc.(µg/m3)
Min.
80
(24 Hours)
13.46 20.63 16.57 17.82 21.09 15.16 15.96 14.40
Max 19.18 29.40 23.61 25.39 30.06 21.61 22.74 20.53
Avg. 16.15 24.75 19.87 21.37 25.30 18.19 19.14 17.28
98th
‘tile 19.07 29.23 23.47 25.25 29.89 21.49 22.61 20.41
Pb (μg/m3) Avg. 1
(24 hour)
BLQ (LOQ
0.05)
BLQ (LOQ
0.05)
BLQ (LOQ
0.05)
BLQ (LOQ
0.05)
BLQ (LOQ
0.05)
BLQ (LOQ
0.05)
BLQ (LOQ
0.05)
BLQ (LOQ
0.05)
CO (mg/m3) Avg. 4
(1hour)
BLQ (LOQ
0.05)
BLQ (LOQ
0.05)
BLQ (LOQ
0.05)
BLQ (LOQ
0.05)
BLQ (LOQ
0.05)
BLQ (LOQ
0.05)
BLQ (LOQ
0.05)
BLQ (LOQ
0.05)
O3 (μg/m3) Avg. 180
(1hour) 19.24 15.65 13.39 16.99 21.53 13.19 11.87 12.53
NH3 (μg/m3) Avg. 400
(24 hours) 12.39 14.51 10.74 11.53 16.49 9.43 8.39 7.58
Benzene (μg/m3) Avg. 5
(Annual)
BLQ (LOQ
1)
BLQ (LOQ
1)
BLQ (LOQ
1)
BLQ (LOQ
1)
BLQ (LOQ
1)
BLQ
(LOQ 1)
BLQ (LOQ
1)
BLQ
(LOQ 1)
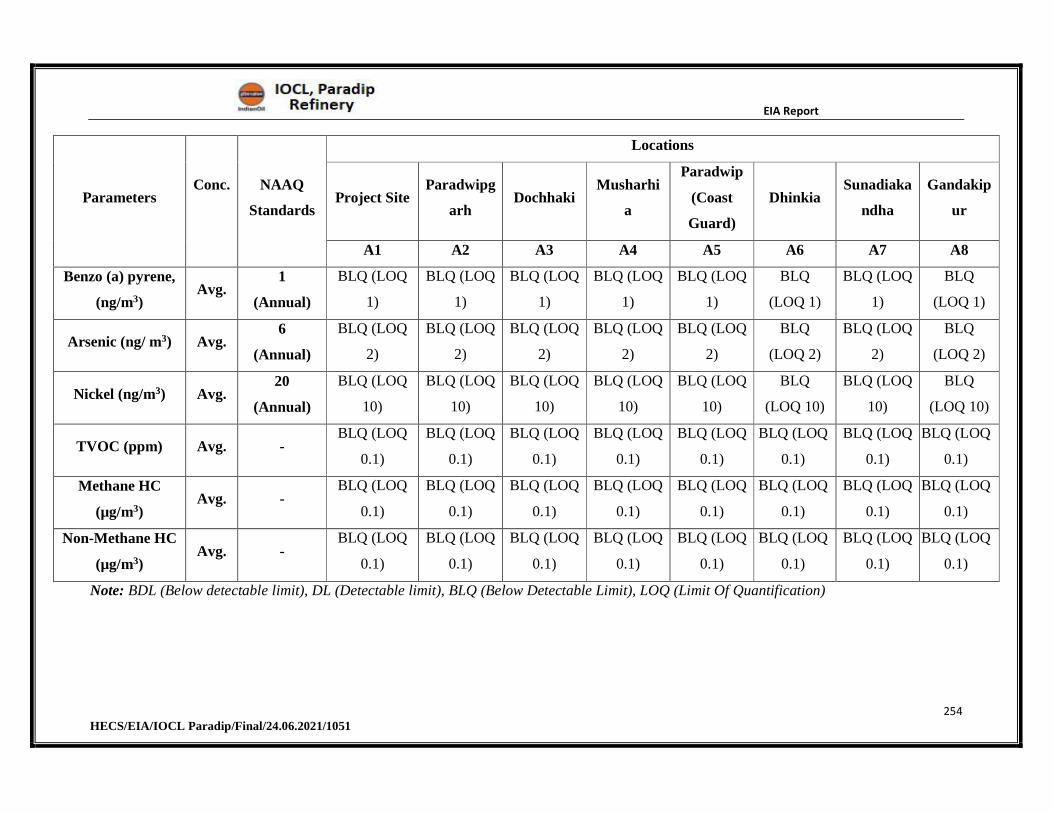
EIA Report
254 HECS/EIA/IOCL Paradip/Final/24.06.2021/1051
Parameters Conc. NAAQ
Standards
Locations
Project Site Paradwipg
arh Dochhaki
Musharhi
a
Paradwip
(Coast
Guard)
Dhinkia Sunadiaka
ndha
Gandakip
ur
A1 A2 A3 A4 A5 A6 A7 A8
Benzo (a) pyrene,
(ng/m3) Avg.
1
(Annual)
BLQ (LOQ
1)
BLQ (LOQ
1)
BLQ (LOQ
1)
BLQ (LOQ
1)
BLQ (LOQ
1)
BLQ
(LOQ 1)
BLQ (LOQ
1)
BLQ
(LOQ 1)
Arsenic (ng/ m3) Avg. 6
(Annual)
BLQ (LOQ
2)
BLQ (LOQ
2)
BLQ (LOQ
2)
BLQ (LOQ
2)
BLQ (LOQ
2)
BLQ
(LOQ 2)
BLQ (LOQ
2)
BLQ
(LOQ 2)
Nickel (ng/m3) Avg. 20
(Annual)
BLQ (LOQ
10)
BLQ (LOQ
10)
BLQ (LOQ
10)
BLQ (LOQ
10)
BLQ (LOQ
10)
BLQ
(LOQ 10)
BLQ (LOQ
10)
BLQ
(LOQ 10)
TVOC (ppm) Avg. - BLQ (LOQ
0.1)
BLQ (LOQ
0.1)
BLQ (LOQ
0.1)
BLQ (LOQ
0.1)
BLQ (LOQ
0.1)
BLQ (LOQ
0.1)
BLQ (LOQ
0.1)
BLQ (LOQ
0.1)
Methane HC
(µg/m3) Avg. -
BLQ (LOQ
0.1)
BLQ (LOQ
0.1)
BLQ (LOQ
0.1)
BLQ (LOQ
0.1)
BLQ (LOQ
0.1)
BLQ (LOQ
0.1)
BLQ (LOQ
0.1)
BLQ (LOQ
0.1)
Non-Methane HC
(µg/m3) Avg. -
BLQ (LOQ
0.1)
BLQ (LOQ
0.1)
BLQ (LOQ
0.1)
BLQ (LOQ
0.1)
BLQ (LOQ
0.1)
BLQ (LOQ
0.1)
BLQ (LOQ
0.1)
BLQ (LOQ
0.1)
Note: BDL (Below detectable limit), DL (Detectable limit), BLQ (Below Detectable Limit), LOQ (Limit Of Quantification)
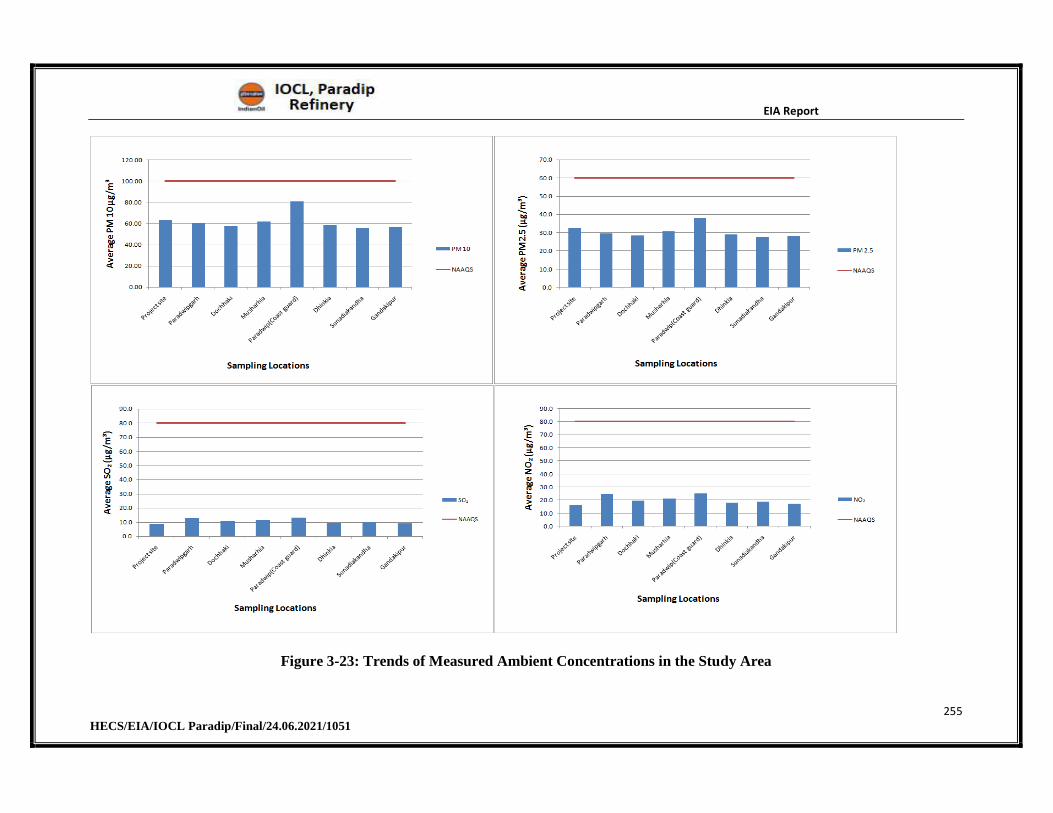
EIA Report
255 HECS/EIA/IOCL Paradip/Final/24.06.2021/1051
Figure 3-23: Trends of Measured Ambient Concentrations in the Study Area
EIA Report
256 HECS/EIA/IOCL Paradip/Final/24.06.2021/1051
3.7.4 Observations
The ambient air quality has been monitored at 8 locations for 14 parameters as per
NAAQS/CPCB guidelines within the study area. The average baseline levels of PM10 (55.35
– 80.53µg/m³), PM2.5 (27.72 – 38.16µg/m³), SO2(8.63 – 13.21µg/m³), NO2(16.15 –
25.30µg/m³), the nearest CPCB AAQ monitoring station is PPL Guest House in which the
annual average for the year 2018: PM10 (113 µg/m³), PM2.5 (37 µg/m³), SO2(19 µg/m³),
NO2(11 µg/m³).
All the parameters are well within the National Ambient Air Quality Standards for Industrial,
Commercial and Residential areas at all monitoring locations during the study period from
March 2019 - May 2019.
3.8 Noise Environment
The prevailing ambient noise level at a particular location is nothing but the resultant (total)
of all kinds of noise sources existing at various distances around that location. The ambient
noise level at a location varies continuously depending on the type of surrounding activities.
Ambient noise levels have been established by monitoring noise levels at Eight(08) locations
in and around 10Km distance from project area during the study period using precision noise
level meter. The noise monitoring locations in the study area were selected after giving due
consideration to the various land use categories. The land use categories include commercial,
residential, rural and sensitive areas. Noise levels were recorded on an hourly basis for one
complete day at each location using pre- calibrated noise levels. A map noise showing the
noise monitoring locations is given in Figure 3-24.
3.8.1 Results and Discussions
Based on the recorded hourly noise levels at each monitoring location, the day equivalent
(Ld) and night equivalent (Ln) were calculated;
Ld: Average noise levels between 6:00 hours to 22.00 hours.
Ln: Average noise levels between 22:00 hours to 6.00 hours.
The comparison of day equivalent noise levels (Ld) and night equivalent noise levels (Ln)
with the respective CPCB stipulated noise standards for various land use categories are
shown in the Table 3-11.
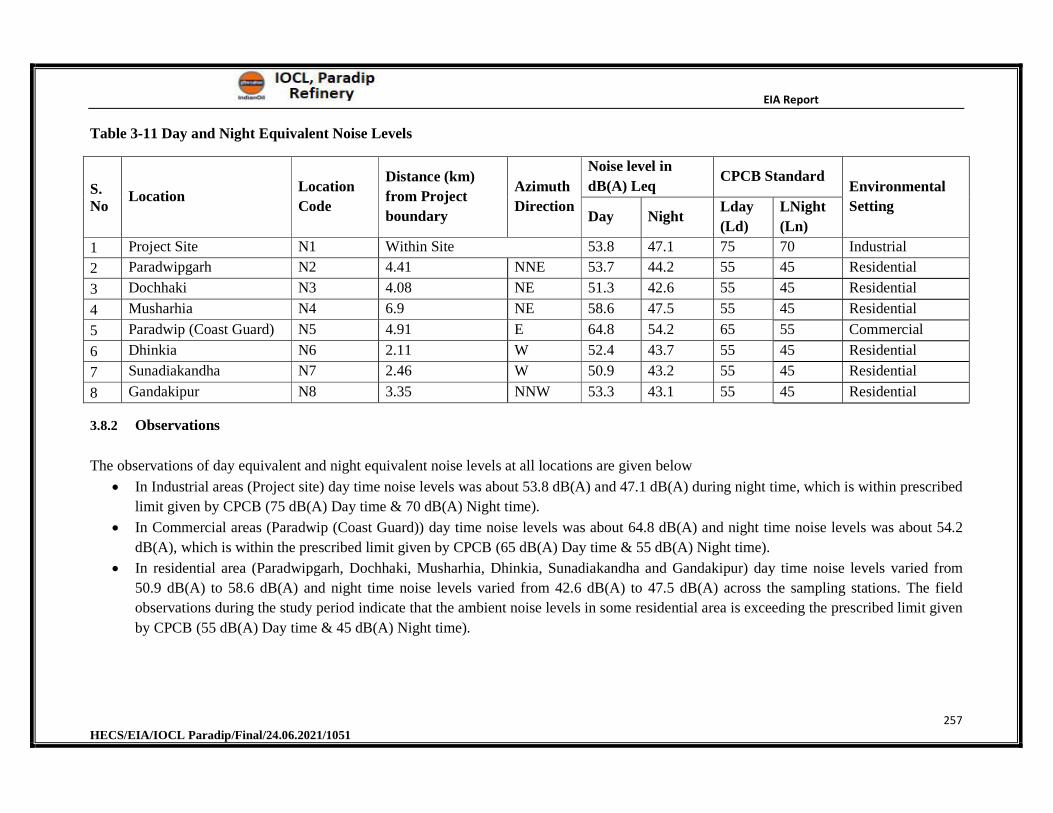
EIA Report
257 HECS/EIA/IOCL Paradip/Final/24.06.2021/1051
Table 3-11 Day and Night Equivalent Noise Levels
S. No
Location Location
Code
Distance (km)
from Project
boundary
Azimuth
Direction
Noise level in
dB(A) Leq CPCB Standard
Environmental
Setting Day Night
Lday
(Ld)
LNight
(Ln)
1 Project Site N1 Within Site 53.8 47.1 75 70 Industrial
2 Paradwipgarh N2 4.41 NNE 53.7 44.2 55 45 Residential
3 Dochhaki N3 4.08 NE 51.3 42.6 55 45 Residential
4 Musharhia N4 6.9 NE 58.6 47.5 55 45 Residential
5 Paradwip (Coast Guard) N5 4.91 E 64.8 54.2 65 55 Commercial
6 Dhinkia N6 2.11 W 52.4 43.7 55 45 Residential
7 Sunadiakandha N7 2.46 W 50.9 43.2 55 45 Residential
8 Gandakipur N8 3.35 NNW 53.3 43.1 55 45 Residential
3.8.2 Observations
The observations of day equivalent and night equivalent noise levels at all locations are given below
In Industrial areas (Project site) day time noise levels was about 53.8 dB(A) and 47.1 dB(A) during night time, which is within prescribed
limit given by CPCB (75 dB(A) Day time & 70 dB(A) Night time).
In Commercial areas (Paradwip (Coast Guard)) day time noise levels was about 64.8 dB(A) and night time noise levels was about 54.2
dB(A), which is within the prescribed limit given by CPCB (65 dB(A) Day time & 55 dB(A) Night time).
In residential area (Paradwipgarh, Dochhaki, Musharhia, Dhinkia, Sunadiakandha and Gandakipur) day time noise levels varied from
50.9 dB(A) to 58.6 dB(A) and night time noise levels varied from 42.6 dB(A) to 47.5 dB(A) across the sampling stations. The field
observations during the study period indicate that the ambient noise levels in some residential area is exceeding the prescribed limit given
by CPCB (55 dB(A) Day time & 45 dB(A) Night time).
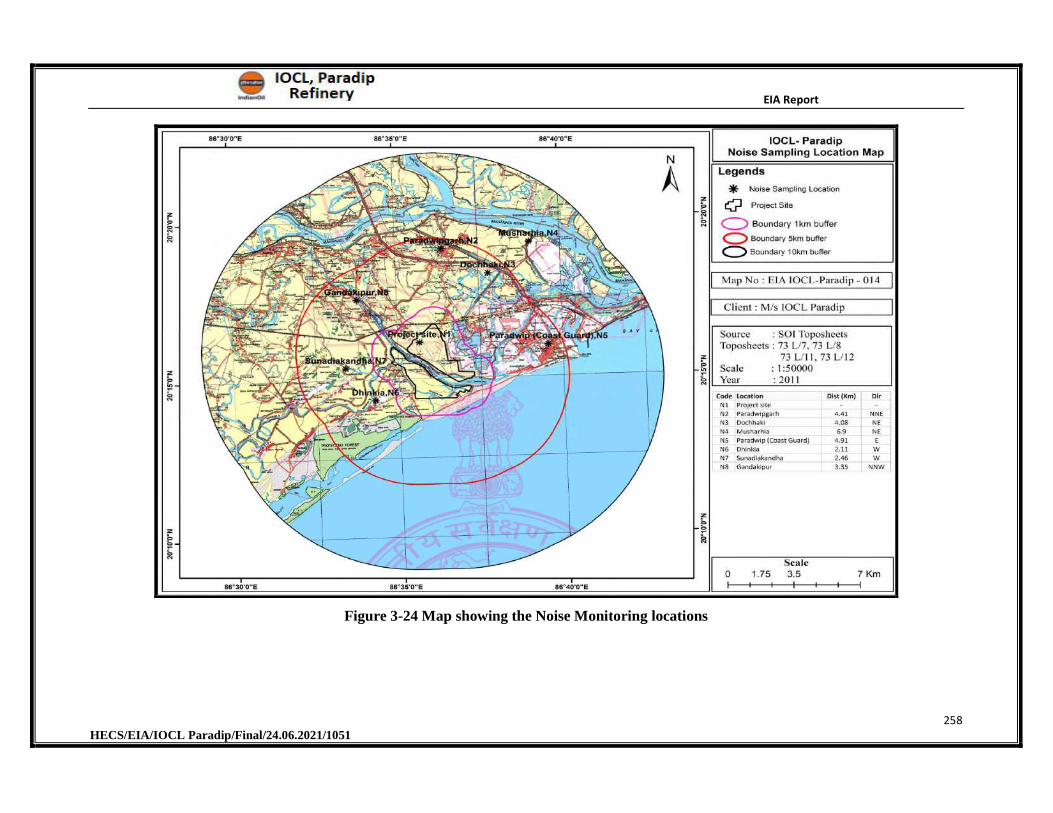
EIA Report
258 HECS/EIA/IOCL Paradip/Final/24.06.2021/1051
Figure 3-24 Map showing the Noise Monitoring locations
EIA Report
259 HECS/EIA/IOCL Paradip/Final/24.06.2021/1051
3.9 Water Environment
3.9.1 Surface Water Resources
The main rivers flowing in the district are Mahanadi, Saunlia, Alaka and Devi. The branches
of Devi River are Biluakhai, Gobari River where as the branches of Mahanadi are Paika,
Chirotpala and Hansua River. All the rivers and its branches fall into the Bay of Bengal. The
problem of drainage becomes acute towards the lower reaches of the deltas. The coastal
ridges offer an effective barrier to a free discharge of the flood water. Sometimes the huge
sand deposits create marshy conditions and affect the production of crops. Due to its
geographical situation, the district is congenial and prone to occurrence of various natural
calamities like flood, cyclone and drought. To prevent the calamities, many river dam
projects, canal construction works and irrigation works were made in and nearby district.
Two main canals i.e. Taladanda and Machhagaon provide water for irrigation in the district.
Source:
http://censusindia.gov.in/2011census/dchb/DCHB_A/21/2111_PART_A_DCHB_JAGATSING
HAPUR.pdf
3.9.1.1 Surface Water Quality Assessment
To establish the baseline status of water environment, the representative sampling locations
for surface water within a radial distance of 10Km from project site have been selected as per
CPCB guidelines of Water Quality Monitoring through an adequate survey of the project
area. Test methods used for the analysis of water quality parameters is given in Table 3-12.
Table 3-12 Test methods used for the analysis of water quality parameters
Sl. No Parameter Measured Test Method
1 Colour IS:3025 (Part- 4) 1983 (Reaff 2006)
2 Turbidity IS 3025(Part - 10):1984
3 pH IS:3025 (Part - 11): 1983 (Reaff: 2006)
4 Conductivity IS:3025 (Part - 14): 1983 (Reaff: 2006)
5 Total Dissolve Solids IS: 3025:1(Part - 16) 1984 (Reaff 2006)
6 Total Suspended Solids IS 3025 (Part - 17) 1984 (Reaff 1996)
7 Alkalinity as CaCO3 IS:3025,1 (Part - 23) 1986 (Reaff 2009)
8
Total Hardness as
CaCo3 IS:3025 (Part - 21) 1983 (Reaff 2006)
EIA Report
260 HECS/EIA/IOCL Paradip/Final/24.06.2021/1051
Sl. No Parameter Measured Test Method
11 Sodium IS:3025,5(Part - 45) 1993 (Reaff 2006)
12 Potassium IS:3025,5(Part - 45) 1993 (Reaff 2006)
9 Calcium as Ca IS 3025 (Part - 40):1991
10 Magnesium as Mg IS 3025 (Part - 46) 1994
13 Carbonate IS 3025, (Pt 23) 1986 (R 2006)
14 Bi carbonate IS 3025, (Pt 23) 1986 (R 2006)
15 Chloride IS 3025 (Part - 32):1988
16 Sulphate SO4 IS 3025(Part - 24):1986
17 Nitrate as NO3 ASTM (Part - 31)1978
18 Phosphate IS 3025 (Pt 45) 1993 (R 2006)
19 Fluorides as F IS 3025 (Part - 60):2008
20 Cyanide IS 3025 (Part-27):1986
21 Arsenic IS 3025:(Part-37):1988(Reaff 2009)
22 Boron IS:3025 (Part - 57):2003
23 Cadmium IS 3025 (Part - 41)1991
24 Chromium, Total IS:3025 (Part - 52) 2003 (Reaff 2009)
25 Copper IS:3025 (Part - 42)1992 (Reaff: 2009)
26 Iron IS 3025 (Part - 53):2003
27 Lead IS:3025 (Part - 47) 1994 (Reaff 2009)
28 Manganese IS 3025:(Part - 59):2006
29 Mercury IS 3025 (Part48):1994 RA 1999
30 Nickel IS 3025:(Part-54):2003(Reaff 2009)
31 Selenium IS 3025 Part (56)2003
32 Zinc IS:3025 (Part - 49) 1994 (Reaff 2009)
33 Dissolved Oxygen IS:3025 (Part - 38)1989 (Reaff 2009)
34 BOD 5210B APHA22nd Edn 2012
35 COD IS:3025 (Part-58)-2006
The prevailing status of surface water quality has been assessed during the study period.
Surface water quality results are provided in Table 3-14. A map showing the surface water
monitoring locations is given in Figure 3-25. The Details of the surface water monitoring
locations is given in Table 3-13
EIA Report
261 HECS/EIA/IOCL Paradip/Final/24.06.2021/1051
Table 3-13 Details of Surface water sampling locations
S.
NoWater bodies
Location
code
Distance from
project boundary
(~Km)
Direction from
project boundary
1 Stream near Udayabat SW1 4.04 N
2 Mahanadi d/s near Musharhia SW2 7.56 NNE
3 Marine sample near Port SW3 4.77 E
4 Santara nadi d/s SW4 0.16 E
5 Marine sample near project
site SW5 0.64 E
6 Mahanga Nadi SW6 1.34 SW
7 Mahanadi u/s near
Balaramapur SW7 8.59 NW
8 Sanatara nadi u/s SW8 0.1 W
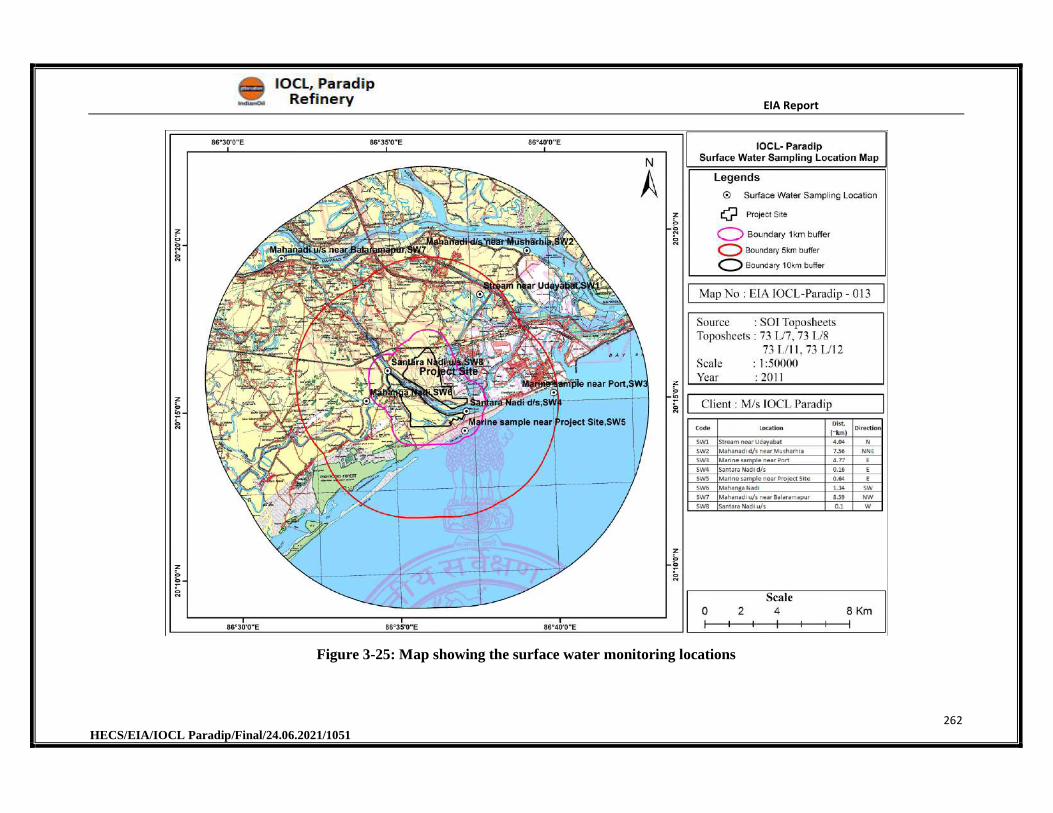
EIA Report
262 HECS/EIA/IOCL Paradip/Final/24.06.2021/1051
Figure 3-25: Map showing the surface water monitoring locations
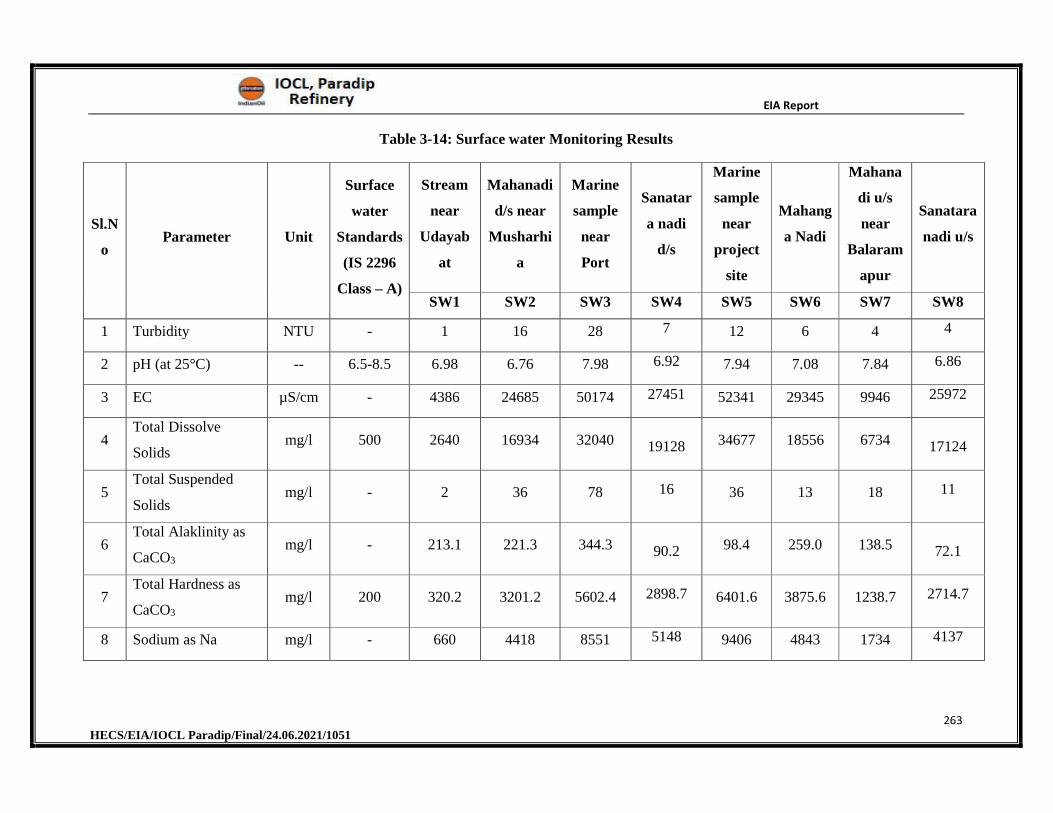
EIA Report
263 HECS/EIA/IOCL Paradip/Final/24.06.2021/1051
Table 3-14: Surface water Monitoring Results
Sl.N
o Parameter Unit
Surface
water
Standards
(IS 2296
Class – A)
Stream
near
Udayab
at
Mahanadi
d/s near
Musharhi
a
Marine
sample
near
Port
Sanatar
a nadi
d/s
Marine
sample
near
project
site
Mahang
a Nadi
Mahana
di u/s
near
Balaram
apur
Sanatara
nadi u/s
SW1 SW2 SW3 SW4 SW5 SW6 SW7 SW8
1 Turbidity NTU - 1 16 28 7 12 6 4 4
2 pH (at 25°C) -- 6.5-8.5 6.98 6.76 7.98 6.92 7.94 7.08 7.84 6.86
3 EC µS/cm - 4386 24685 50174 27451 52341 29345 9946 25972
4 Total Dissolve
Solids mg/l 500 2640 16934 32040 19128 34677 18556 6734 17124
5 Total Suspended
Solids mg/l - 2 36 78 16 36 13 18 11
6 Total Alaklinity as
CaCO3
mg/l - 213.1 221.3 344.3 90.2 98.4 259.0 138.5 72.1
7 Total Hardness as
CaCO3
mg/l 200 320.2 3201.2 5602.4 2898.7 6401.6 3875.6 1238.7 2714.7
8 Sodium as Na mg/l - 660 4418 8551 5148 9406 4843 1734 4137
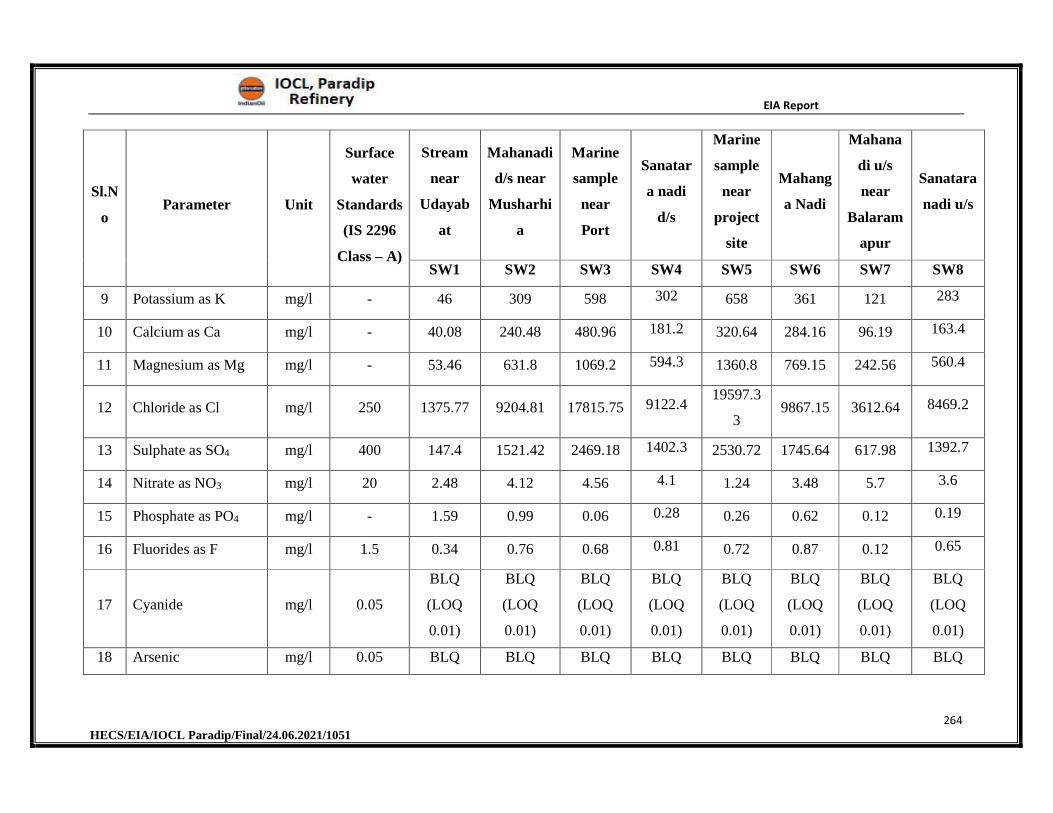
EIA Report
264 HECS/EIA/IOCL Paradip/Final/24.06.2021/1051
Sl.N
o Parameter Unit
Surface
water
Standards
(IS 2296
Class – A)
Stream
near
Udayab
at
Mahanadi
d/s near
Musharhi
a
Marine
sample
near
Port
Sanatar
a nadi
d/s
Marine
sample
near
project
site
Mahang
a Nadi
Mahana
di u/s
near
Balaram
apur
Sanatara
nadi u/s
SW1 SW2 SW3 SW4 SW5 SW6 SW7 SW8
9 Potassium as K mg/l - 46 309 598 302 658 361 121 283
10 Calcium as Ca mg/l - 40.08 240.48 480.96 181.2 320.64 284.16 96.19 163.4
11 Magnesium as Mg mg/l - 53.46 631.8 1069.2 594.3 1360.8 769.15 242.56 560.4
12 Chloride as Cl mg/l 250 1375.77 9204.81 17815.75 9122.4 19597.3
3 9867.15 3612.64 8469.2
13 Sulphate as SO4 mg/l 400 147.4 1521.42 2469.18 1402.3 2530.72 1745.64 617.98 1392.7
14 Nitrate as NO3 mg/l 20 2.48 4.12 4.56 4.1 1.24 3.48 5.7 3.6
15 Phosphate as PO4 mg/l - 1.59 0.99 0.06 0.28 0.26 0.62 0.12 0.19
16 Fluorides as F mg/l 1.5 0.34 0.76 0.68 0.81 0.72 0.87 0.12 0.65
17 Cyanide mg/l 0.05
BLQ
(LOQ
0.01)
BLQ
(LOQ
0.01)
BLQ
(LOQ
0.01)
BLQ
(LOQ
0.01)
BLQ
(LOQ
0.01)
BLQ
(LOQ
0.01)
BLQ
(LOQ
0.01)
BLQ
(LOQ
0.01)
18 Arsenic mg/l 0.05 BLQ BLQ BLQ BLQ BLQ BLQ BLQ BLQ
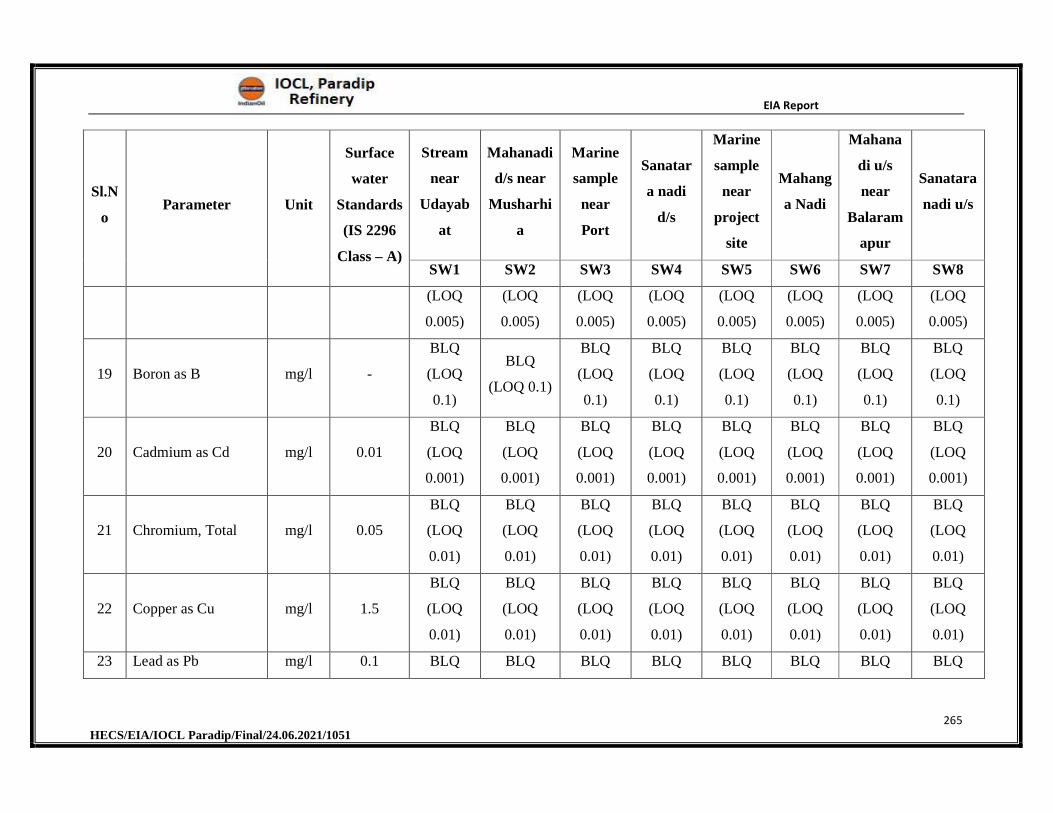
EIA Report
265 HECS/EIA/IOCL Paradip/Final/24.06.2021/1051
Sl.N
o Parameter Unit
Surface
water
Standards
(IS 2296
Class – A)
Stream
near
Udayab
at
Mahanadi
d/s near
Musharhi
a
Marine
sample
near
Port
Sanatar
a nadi
d/s
Marine
sample
near
project
site
Mahang
a Nadi
Mahana
di u/s
near
Balaram
apur
Sanatara
nadi u/s
SW1 SW2 SW3 SW4 SW5 SW6 SW7 SW8
(LOQ
0.005)
(LOQ
0.005)
(LOQ
0.005)
(LOQ
0.005)
(LOQ
0.005)
(LOQ
0.005)
(LOQ
0.005)
(LOQ
0.005)
19 Boron as B mg/l -
BLQ
(LOQ
0.1)
BLQ
(LOQ 0.1)
BLQ
(LOQ
0.1)
BLQ
(LOQ
0.1)
BLQ
(LOQ
0.1)
BLQ
(LOQ
0.1)
BLQ
(LOQ
0.1)
BLQ
(LOQ
0.1)
20 Cadmium as Cd mg/l 0.01
BLQ
(LOQ
0.001)
BLQ
(LOQ
0.001)
BLQ
(LOQ
0.001)
BLQ
(LOQ
0.001)
BLQ
(LOQ
0.001)
BLQ
(LOQ
0.001)
BLQ
(LOQ
0.001)
BLQ
(LOQ
0.001)
21 Chromium, Total mg/l 0.05
BLQ
(LOQ
0.01)
BLQ
(LOQ
0.01)
BLQ
(LOQ
0.01)
BLQ
(LOQ
0.01)
BLQ
(LOQ
0.01)
BLQ
(LOQ
0.01)
BLQ
(LOQ
0.01)
BLQ
(LOQ
0.01)
22 Copper as Cu mg/l 1.5
BLQ
(LOQ
0.01)
BLQ
(LOQ
0.01)
BLQ
(LOQ
0.01)
BLQ
(LOQ
0.01)
BLQ
(LOQ
0.01)
BLQ
(LOQ
0.01)
BLQ
(LOQ
0.01)
BLQ
(LOQ
0.01)
23 Lead as Pb mg/l 0.1 BLQ BLQ BLQ BLQ BLQ BLQ BLQ BLQ
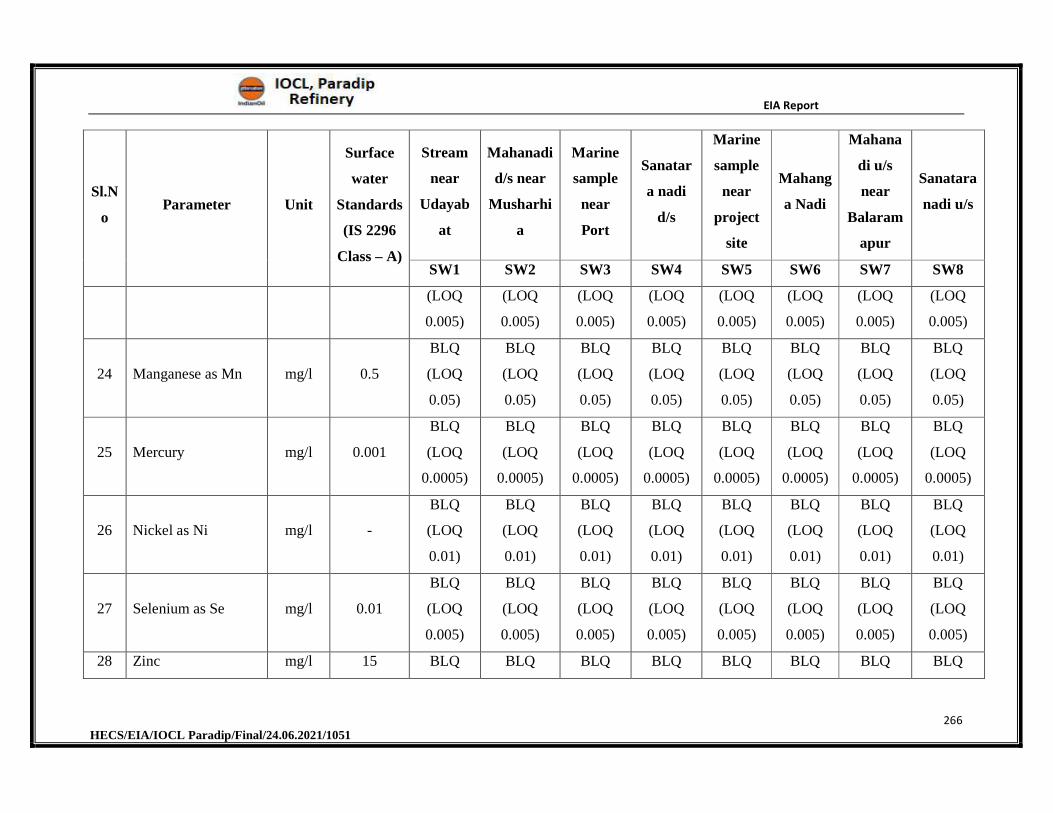
EIA Report
266 HECS/EIA/IOCL Paradip/Final/24.06.2021/1051
Sl.N
o Parameter Unit
Surface
water
Standards
(IS 2296
Class – A)
Stream
near
Udayab
at
Mahanadi
d/s near
Musharhi
a
Marine
sample
near
Port
Sanatar
a nadi
d/s
Marine
sample
near
project
site
Mahang
a Nadi
Mahana
di u/s
near
Balaram
apur
Sanatara
nadi u/s
SW1 SW2 SW3 SW4 SW5 SW6 SW7 SW8
(LOQ
0.005)
(LOQ
0.005)
(LOQ
0.005)
(LOQ
0.005)
(LOQ
0.005)
(LOQ
0.005)
(LOQ
0.005)
(LOQ
0.005)
24 Manganese as Mn mg/l 0.5
BLQ
(LOQ
0.05)
BLQ
(LOQ
0.05)
BLQ
(LOQ
0.05)
BLQ
(LOQ
0.05)
BLQ
(LOQ
0.05)
BLQ
(LOQ
0.05)
BLQ
(LOQ
0.05)
BLQ
(LOQ
0.05)
25 Mercury mg/l 0.001
BLQ
(LOQ
0.0005)
BLQ
(LOQ
0.0005)
BLQ
(LOQ
0.0005)
BLQ
(LOQ
0.0005)
BLQ
(LOQ
0.0005)
BLQ
(LOQ
0.0005)
BLQ
(LOQ
0.0005)
BLQ
(LOQ
0.0005)
26 Nickel as Ni mg/l -
BLQ
(LOQ
0.01)
BLQ
(LOQ
0.01)
BLQ
(LOQ
0.01)
BLQ
(LOQ
0.01)
BLQ
(LOQ
0.01)
BLQ
(LOQ
0.01)
BLQ
(LOQ
0.01)
BLQ
(LOQ
0.01)
27 Selenium as Se mg/l 0.01
BLQ
(LOQ
0.005)
BLQ
(LOQ
0.005)
BLQ
(LOQ
0.005)
BLQ
(LOQ
0.005)
BLQ
(LOQ
0.005)
BLQ
(LOQ
0.005)
BLQ
(LOQ
0.005)
BLQ
(LOQ
0.005)
28 Zinc mg/l 15 BLQ BLQ BLQ BLQ BLQ BLQ BLQ BLQ
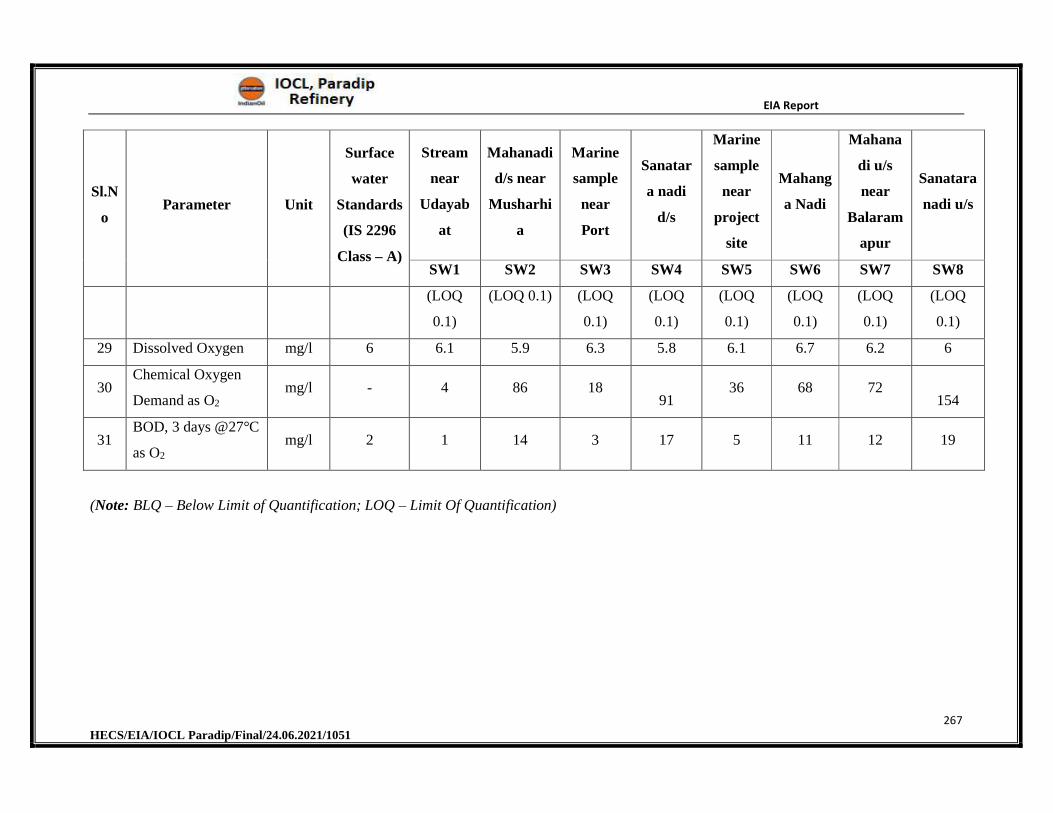
EIA Report
267 HECS/EIA/IOCL Paradip/Final/24.06.2021/1051
Sl.N
o Parameter Unit
Surface
water
Standards
(IS 2296
Class – A)
Stream
near
Udayab
at
Mahanadi
d/s near
Musharhi
a
Marine
sample
near
Port
Sanatar
a nadi
d/s
Marine
sample
near
project
site
Mahang
a Nadi
Mahana
di u/s
near
Balaram
apur
Sanatara
nadi u/s
SW1 SW2 SW3 SW4 SW5 SW6 SW7 SW8
(LOQ
0.1)
(LOQ 0.1) (LOQ
0.1)
(LOQ
0.1)
(LOQ
0.1)
(LOQ
0.1)
(LOQ
0.1)
(LOQ
0.1)
29 Dissolved Oxygen mg/l 6 6.1 5.9 6.3 5.8 6.1 6.7 6.2 6
30 Chemical Oxygen
Demand as O2
mg/l - 4 86 18 91
36 68 72 154
31 BOD, 3 days @27°C
as O2
mg/l 2 1 14 3 17 5 11 12 19
(Note: BLQ – Below Limit of Quantification; LOQ – Limit Of Quantification)
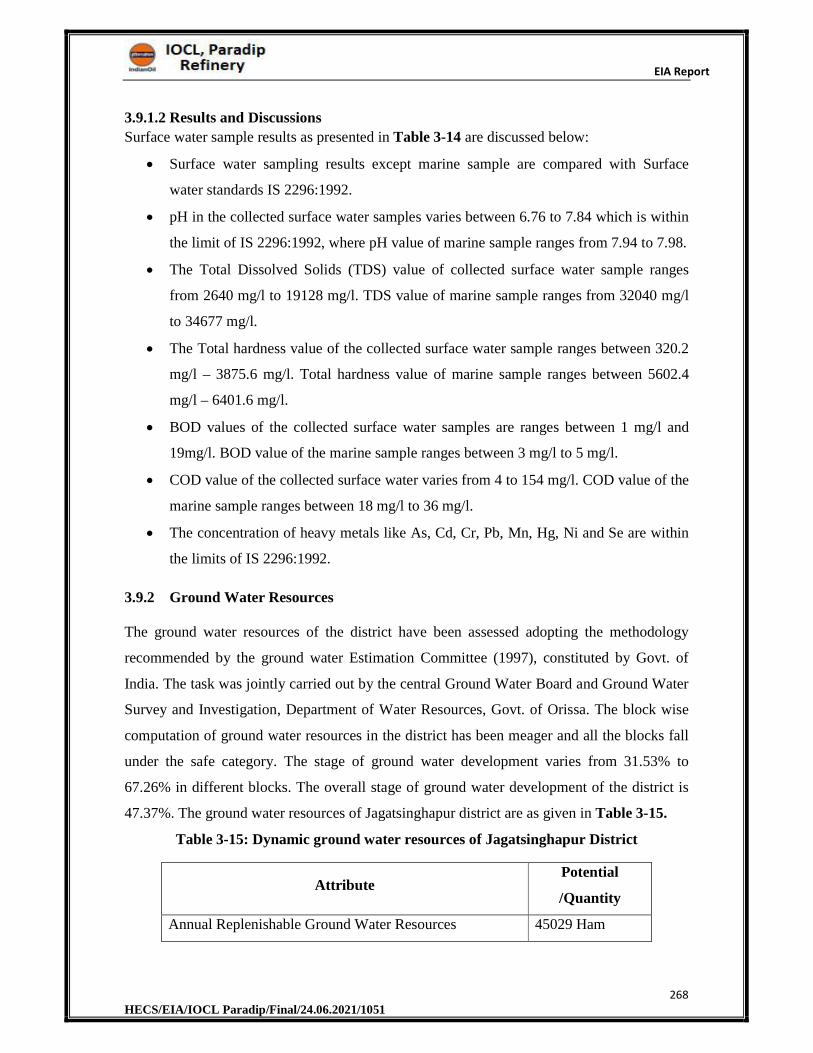
EIA Report
268 HECS/EIA/IOCL Paradip/Final/24.06.2021/1051
3.9.1.2 Results and Discussions
Surface water sample results as presented in Table 3-14 are discussed below:
Surface water sampling results except marine sample are compared with Surface
water standards IS 2296:1992.
pH in the collected surface water samples varies between 6.76 to 7.84 which is within
the limit of IS 2296:1992, where pH value of marine sample ranges from 7.94 to 7.98.
The Total Dissolved Solids (TDS) value of collected surface water sample ranges
from 2640 mg/l to 19128 mg/l. TDS value of marine sample ranges from 32040 mg/l
to 34677 mg/l.
The Total hardness value of the collected surface water sample ranges between 320.2
mg/l – 3875.6 mg/l. Total hardness value of marine sample ranges between 5602.4
mg/l – 6401.6 mg/l.
BOD values of the collected surface water samples are ranges between 1 mg/l and
19mg/l. BOD value of the marine sample ranges between 3 mg/l to 5 mg/l.
COD value of the collected surface water varies from 4 to 154 mg/l. COD value of the
marine sample ranges between 18 mg/l to 36 mg/l.
The concentration of heavy metals like As, Cd, Cr, Pb, Mn, Hg, Ni and Se are within
the limits of IS 2296:1992.
3.9.2 Ground Water Resources
The ground water resources of the district have been assessed adopting the methodology
recommended by the ground water Estimation Committee (1997), constituted by Govt. of
India. The task was jointly carried out by the central Ground Water Board and Ground Water
Survey and Investigation, Department of Water Resources, Govt. of Orissa. The block wise
computation of ground water resources in the district has been meager and all the blocks fall
under the safe category. The stage of ground water development varies from 31.53% to
67.26% in different blocks. The overall stage of ground water development of the district is
47.37%. The ground water resources of Jagatsinghapur district are as given in Table 3-15.
Table 3-15: Dynamic ground water resources of Jagatsinghapur District
Attribute Potential
/Quantity
Annual Replenishable Ground Water Resources 45029 Ham
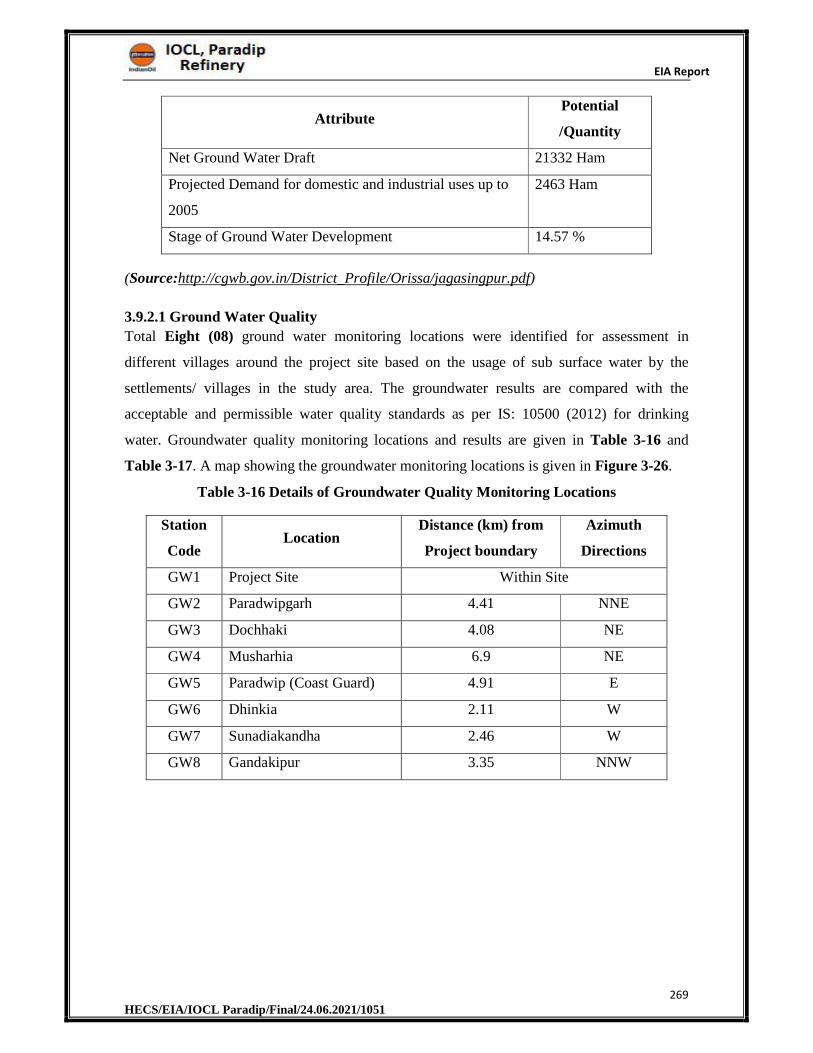
EIA Report
269 HECS/EIA/IOCL Paradip/Final/24.06.2021/1051
Attribute Potential
/Quantity
Net Ground Water Draft 21332 Ham
Projected Demand for domestic and industrial uses up to
2005
2463 Ham
Stage of Ground Water Development 14.57 %
(Source:http://cgwb.gov.in/District_Profile/Orissa/jagasingpur.pdf)
3.9.2.1 Ground Water Quality
Total Eight (08) ground water monitoring locations were identified for assessment in
different villages around the project site based on the usage of sub surface water by the
settlements/ villages in the study area. The groundwater results are compared with the
acceptable and permissible water quality standards as per IS: 10500 (2012) for drinking
water. Groundwater quality monitoring locations and results are given in Table 3-16 and
Table 3-17. A map showing the groundwater monitoring locations is given in Figure 3-26.
Table 3-16 Details of Groundwater Quality Monitoring Locations
Station
Code Location
Distance (km) from
Project boundary
Azimuth
Directions
GW1 Project Site Within Site
GW2 Paradwipgarh 4.41 NNE
GW3 Dochhaki 4.08 NE
GW4 Musharhia 6.9 NE
GW5 Paradwip (Coast Guard) 4.91 E
GW6 Dhinkia 2.11 W
GW7 Sunadiakandha 2.46 W
GW8 Gandakipur 3.35 NNW
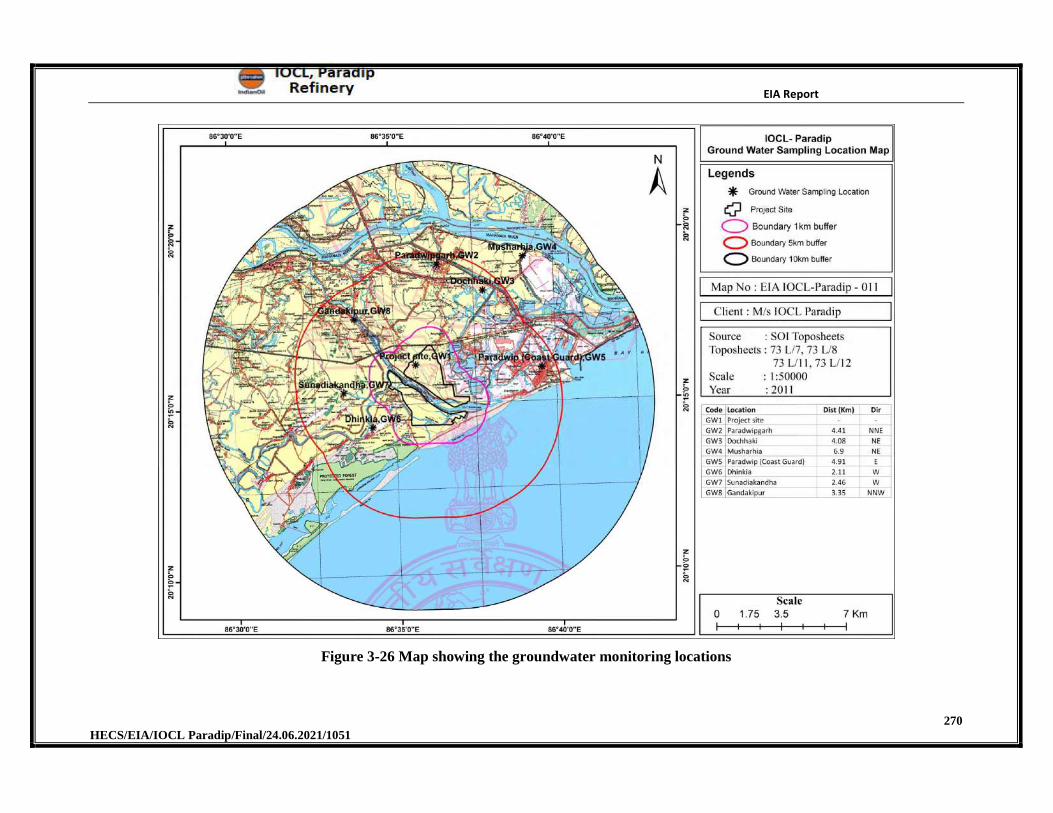
EIA Report
270 HECS/EIA/IOCL Paradip/Final/24.06.2021/1051
Figure 3-26 Map showing the groundwater monitoring locations
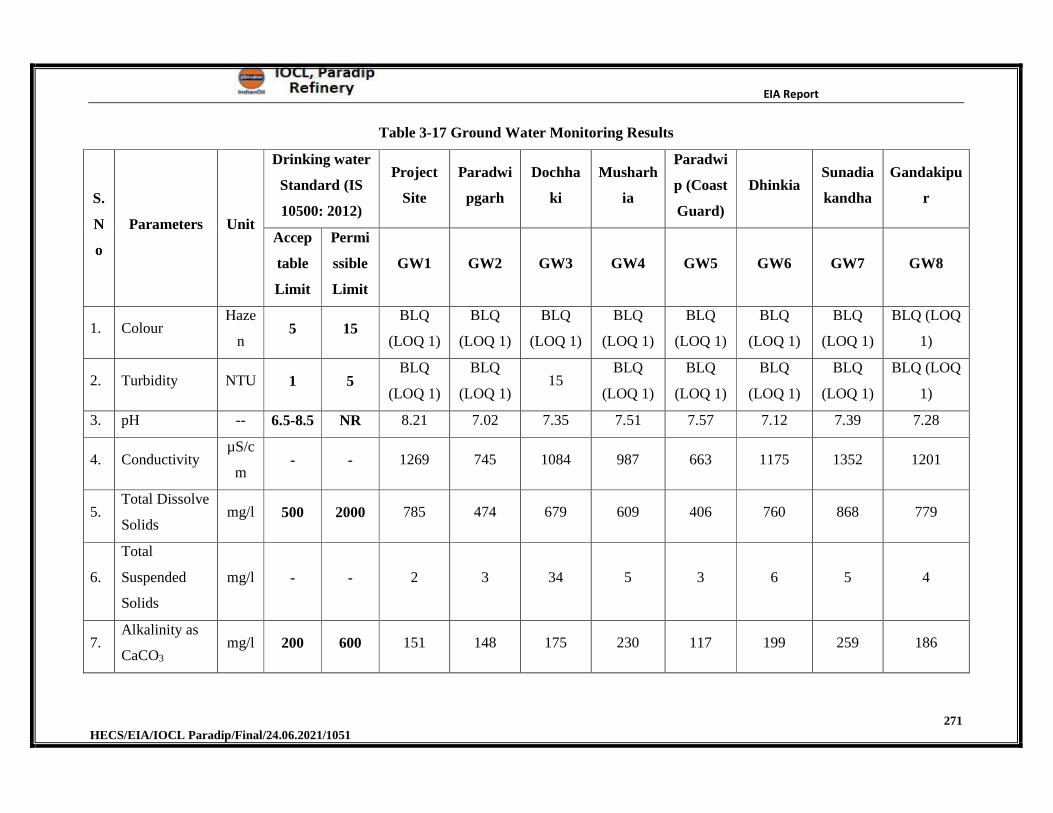
EIA Report
271 HECS/EIA/IOCL Paradip/Final/24.06.2021/1051
Table 3-17 Ground Water Monitoring Results
S.
N
o
Parameters Unit
Drinking water
Standard (IS
10500: 2012)
Project
Site
Paradwi
pgarh
Dochha
ki
Musharh
ia
Paradwi
p (Coast
Guard)
Dhinkia Sunadia
kandha
Gandakipu
r
Accep
table
Limit
Permi
ssible
Limit
GW1 GW2 GW3 GW4 GW5 GW6 GW7 GW8
1. Colour Haze
n 5 15
BLQ
(LOQ 1)
BLQ
(LOQ 1)
BLQ
(LOQ 1)
BLQ
(LOQ 1)
BLQ
(LOQ 1)
BLQ
(LOQ 1)
BLQ
(LOQ 1)
BLQ (LOQ
1)
2. Turbidity NTU 1 5 BLQ
(LOQ 1)
BLQ
(LOQ 1) 15
BLQ
(LOQ 1)
BLQ
(LOQ 1)
BLQ
(LOQ 1)
BLQ
(LOQ 1)
BLQ (LOQ
1)
3. pH -- 6.5-8.5 NR 8.21 7.02 7.35 7.51 7.57 7.12 7.39 7.28
4. Conductivity µS/c
m - - 1269 745 1084 987 663 1175 1352 1201
5.Total Dissolve
Solids mg/l 500 2000 785 474 679 609 406 760 868 779
6.
Total
Suspended
Solids
mg/l - - 2 3 34 5 3 6 5 4
7.Alkalinity as
CaCO3
mg/l 200 600 151 148 175 230 117 199 259 186
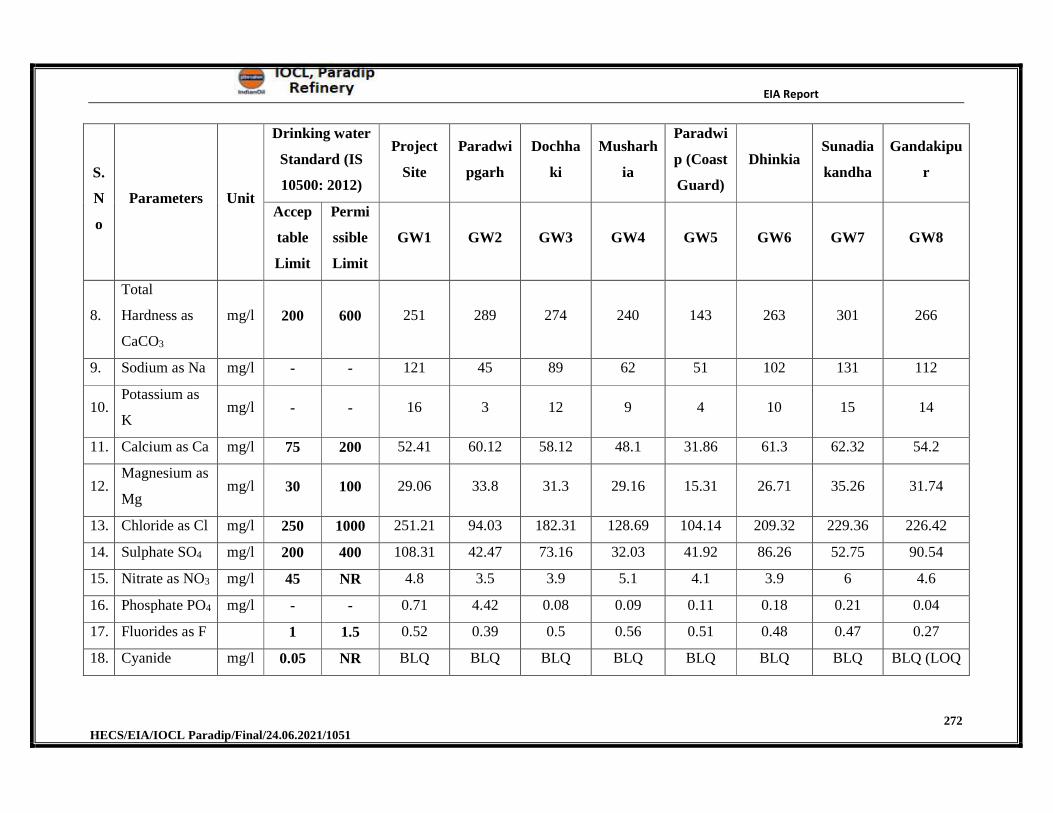
EIA Report
272 HECS/EIA/IOCL Paradip/Final/24.06.2021/1051
S.
N
o
Parameters Unit
Drinking water
Standard (IS
10500: 2012)
Project
Site
Paradwi
pgarh
Dochha
ki
Musharh
ia
Paradwi
p (Coast
Guard)
Dhinkia Sunadia
kandha
Gandakipu
r
Accep
table
Limit
Permi
ssible
Limit
GW1 GW2 GW3 GW4 GW5 GW6 GW7 GW8
8.
Total
Hardness as
CaCO3
mg/l 200 600 251 289 274 240 143 263 301 266
9. Sodium as Na mg/l - - 121 45 89 62 51 102 131 112
10.Potassium as
K mg/l - - 16 3 12 9 4 10 15 14
11. Calcium as Ca mg/l 75 200 52.41 60.12 58.12 48.1 31.86 61.3 62.32 54.2
12.Magnesium as
Mg mg/l 30 100 29.06 33.8 31.3 29.16 15.31 26.71 35.26 31.74
13. Chloride as Cl mg/l 250 1000 251.21 94.03 182.31 128.69 104.14 209.32 229.36 226.42
14. Sulphate SO4 mg/l 200 400 108.31 42.47 73.16 32.03 41.92 86.26 52.75 90.54
15. Nitrate as NO3 mg/l 45 NR 4.8 3.5 3.9 5.1 4.1 3.9 6 4.6
16. Phosphate PO4 mg/l - - 0.71 4.42 0.08 0.09 0.11 0.18 0.21 0.04
17. Fluorides as F 1 1.5 0.52 0.39 0.5 0.56 0.51 0.48 0.47 0.27
18. Cyanide mg/l 0.05 NR BLQ BLQ BLQ BLQ BLQ BLQ BLQ BLQ (LOQ
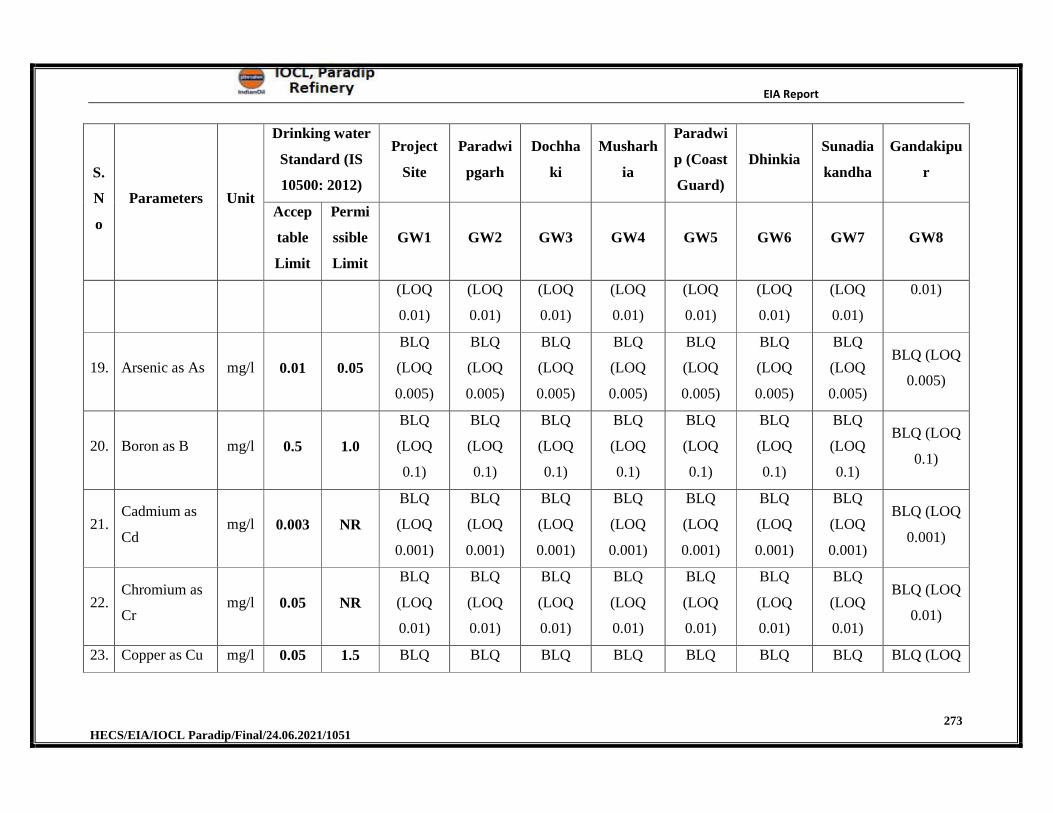
EIA Report
273 HECS/EIA/IOCL Paradip/Final/24.06.2021/1051
S.
N
o
Parameters Unit
Drinking water
Standard (IS
10500: 2012)
Project
Site
Paradwi
pgarh
Dochha
ki
Musharh
ia
Paradwi
p (Coast
Guard)
Dhinkia Sunadia
kandha
Gandakipu
r
Accep
table
Limit
Permi
ssible
Limit
GW1 GW2 GW3 GW4 GW5 GW6 GW7 GW8
(LOQ
0.01)
(LOQ
0.01)
(LOQ
0.01)
(LOQ
0.01)
(LOQ
0.01)
(LOQ
0.01)
(LOQ
0.01)
0.01)
19. Arsenic as As mg/l 0.01 0.05
BLQ
(LOQ
0.005)
BLQ
(LOQ
0.005)
BLQ
(LOQ
0.005)
BLQ
(LOQ
0.005)
BLQ
(LOQ
0.005)
BLQ
(LOQ
0.005)
BLQ
(LOQ
0.005)
BLQ (LOQ
0.005)
20. Boron as B mg/l 0.5 1.0
BLQ
(LOQ
0.1)
BLQ
(LOQ
0.1)
BLQ
(LOQ
0.1)
BLQ
(LOQ
0.1)
BLQ
(LOQ
0.1)
BLQ
(LOQ
0.1)
BLQ
(LOQ
0.1)
BLQ (LOQ
0.1)
21.Cadmium as
Cd mg/l 0.003 NR
BLQ
(LOQ
0.001)
BLQ
(LOQ
0.001)
BLQ
(LOQ
0.001)
BLQ
(LOQ
0.001)
BLQ
(LOQ
0.001)
BLQ
(LOQ
0.001)
BLQ
(LOQ
0.001)
BLQ (LOQ
0.001)
22.Chromium as
Cr mg/l 0.05 NR
BLQ
(LOQ
0.01)
BLQ
(LOQ
0.01)
BLQ
(LOQ
0.01)
BLQ
(LOQ
0.01)
BLQ
(LOQ
0.01)
BLQ
(LOQ
0.01)
BLQ
(LOQ
0.01)
BLQ (LOQ
0.01)
23. Copper as Cu mg/l 0.05 1.5 BLQ BLQ BLQ BLQ BLQ BLQ BLQ BLQ (LOQ
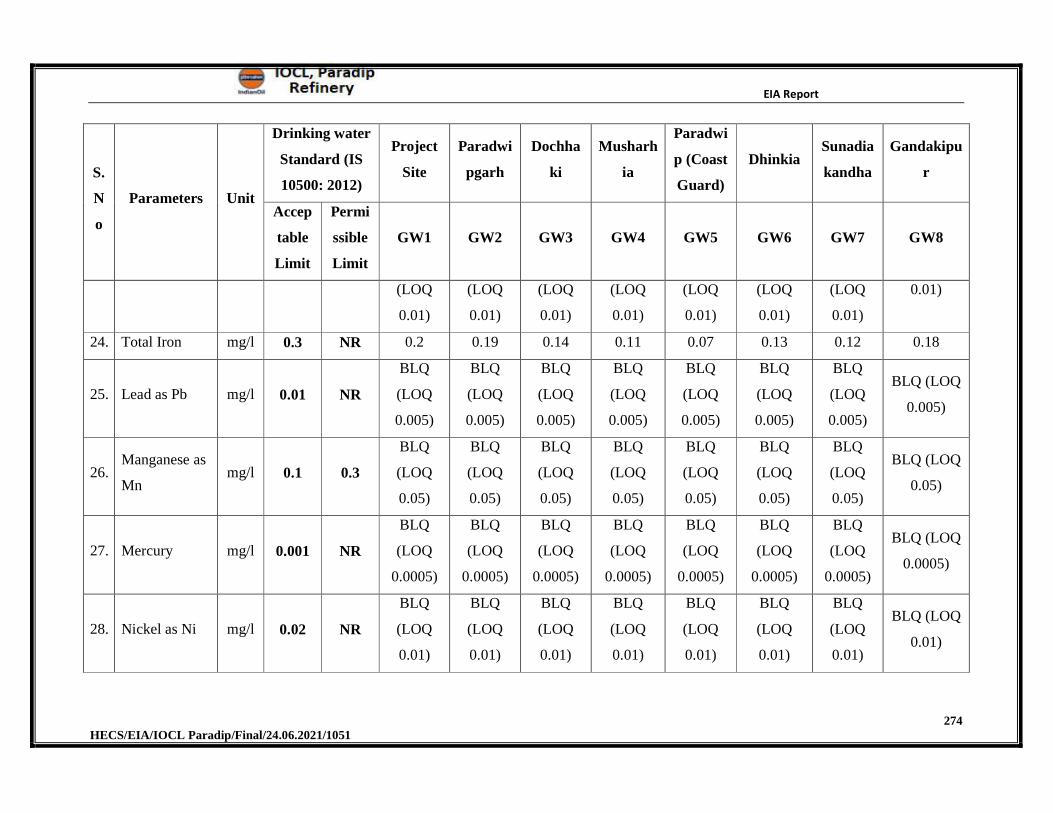
EIA Report
274 HECS/EIA/IOCL Paradip/Final/24.06.2021/1051
S.
N
o
Parameters Unit
Drinking water
Standard (IS
10500: 2012)
Project
Site
Paradwi
pgarh
Dochha
ki
Musharh
ia
Paradwi
p (Coast
Guard)
Dhinkia Sunadia
kandha
Gandakipu
r
Accep
table
Limit
Permi
ssible
Limit
GW1 GW2 GW3 GW4 GW5 GW6 GW7 GW8
(LOQ
0.01)
(LOQ
0.01)
(LOQ
0.01)
(LOQ
0.01)
(LOQ
0.01)
(LOQ
0.01)
(LOQ
0.01)
0.01)
24. Total Iron mg/l 0.3 NR 0.2 0.19 0.14 0.11 0.07 0.13 0.12 0.18
25. Lead as Pb mg/l 0.01 NR
BLQ
(LOQ
0.005)
BLQ
(LOQ
0.005)
BLQ
(LOQ
0.005)
BLQ
(LOQ
0.005)
BLQ
(LOQ
0.005)
BLQ
(LOQ
0.005)
BLQ
(LOQ
0.005)
BLQ (LOQ
0.005)
26.Manganese as
Mn mg/l 0.1 0.3
BLQ
(LOQ
0.05)
BLQ
(LOQ
0.05)
BLQ
(LOQ
0.05)
BLQ
(LOQ
0.05)
BLQ
(LOQ
0.05)
BLQ
(LOQ
0.05)
BLQ
(LOQ
0.05)
BLQ (LOQ
0.05)
27. Mercury mg/l 0.001 NR
BLQ
(LOQ
0.0005)
BLQ
(LOQ
0.0005)
BLQ
(LOQ
0.0005)
BLQ
(LOQ
0.0005)
BLQ
(LOQ
0.0005)
BLQ
(LOQ
0.0005)
BLQ
(LOQ
0.0005)
BLQ (LOQ
0.0005)
28. Nickel as Ni mg/l 0.02 NR
BLQ
(LOQ
0.01)
BLQ
(LOQ
0.01)
BLQ
(LOQ
0.01)
BLQ
(LOQ
0.01)
BLQ
(LOQ
0.01)
BLQ
(LOQ
0.01)
BLQ
(LOQ
0.01)
BLQ (LOQ
0.01)
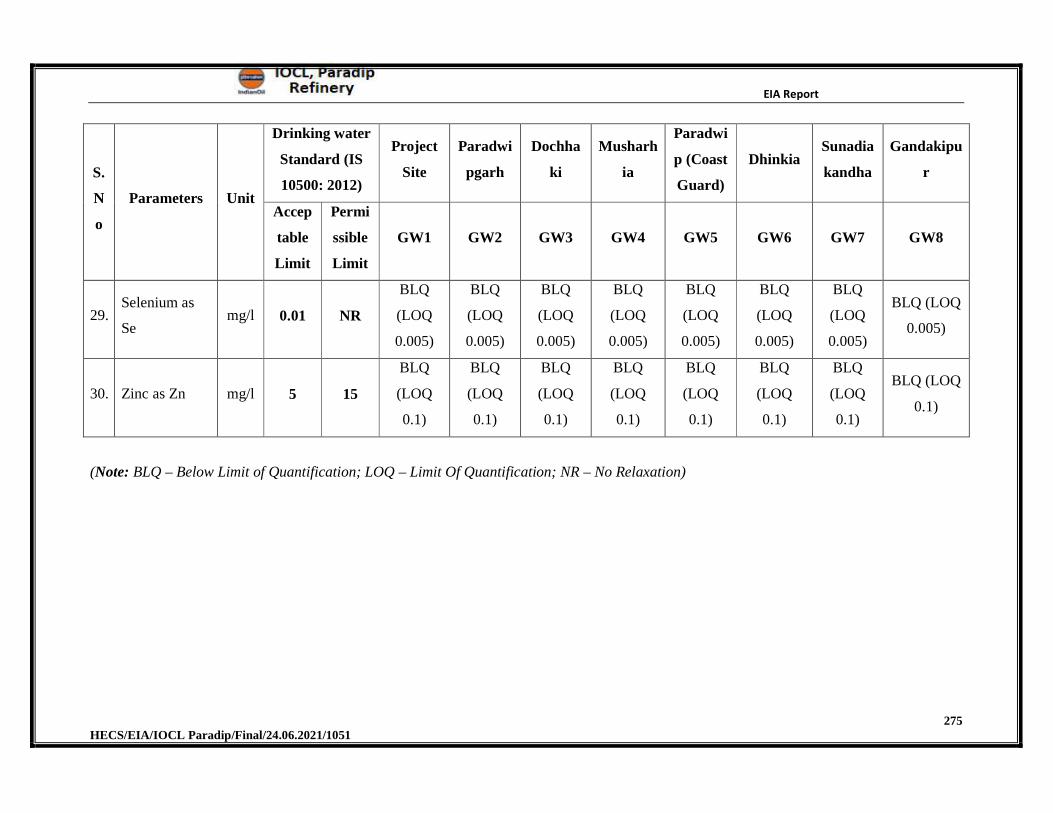
EIA Report
275 HECS/EIA/IOCL Paradip/Final/24.06.2021/1051
S.
N
o
Parameters Unit
Drinking water
Standard (IS
10500: 2012)
Project
Site
Paradwi
pgarh
Dochha
ki
Musharh
ia
Paradwi
p (Coast
Guard)
Dhinkia Sunadia
kandha
Gandakipu
r
Accep
table
Limit
Permi
ssible
Limit
GW1 GW2 GW3 GW4 GW5 GW6 GW7 GW8
29.Selenium as
Se mg/l 0.01 NR
BLQ
(LOQ
0.005)
BLQ
(LOQ
0.005)
BLQ
(LOQ
0.005)
BLQ
(LOQ
0.005)
BLQ
(LOQ
0.005)
BLQ
(LOQ
0.005)
BLQ
(LOQ
0.005)
BLQ (LOQ
0.005)
30. Zinc as Zn mg/l 5 15
BLQ
(LOQ
0.1)
BLQ
(LOQ
0.1)
BLQ
(LOQ
0.1)
BLQ
(LOQ
0.1)
BLQ
(LOQ
0.1)
BLQ
(LOQ
0.1)
BLQ
(LOQ
0.1)
BLQ (LOQ
0.1)
(Note: BLQ – Below Limit of Quantification; LOQ – Limit Of Quantification; NR – No Relaxation)
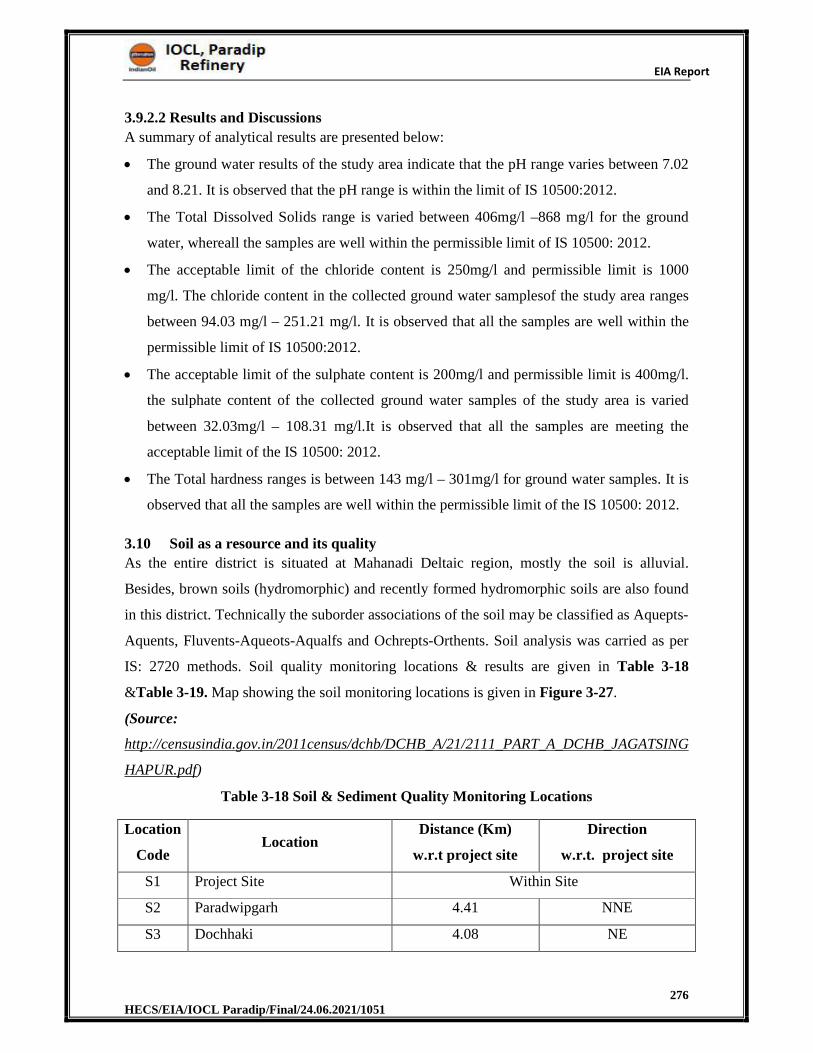
EIA Report
276 HECS/EIA/IOCL Paradip/Final/24.06.2021/1051
3.9.2.2 Results and Discussions
A summary of analytical results are presented below:
The ground water results of the study area indicate that the pH range varies between 7.02
and 8.21. It is observed that the pH range is within the limit of IS 10500:2012.
The Total Dissolved Solids range is varied between 406mg/l –868 mg/l for the ground
water, whereall the samples are well within the permissible limit of IS 10500: 2012.
The acceptable limit of the chloride content is 250mg/l and permissible limit is 1000
mg/l. The chloride content in the collected ground water samplesof the study area ranges
between 94.03 mg/l – 251.21 mg/l. It is observed that all the samples are well within the
permissible limit of IS 10500:2012.
The acceptable limit of the sulphate content is 200mg/l and permissible limit is 400mg/l.
the sulphate content of the collected ground water samples of the study area is varied
between 32.03mg/l – 108.31 mg/l.It is observed that all the samples are meeting the
acceptable limit of the IS 10500: 2012.
The Total hardness ranges is between 143 mg/l – 301mg/l for ground water samples. It is
observed that all the samples are well within the permissible limit of the IS 10500: 2012.
3.10 Soil as a resource and its quality
As the entire district is situated at Mahanadi Deltaic region, mostly the soil is alluvial.
Besides, brown soils (hydromorphic) and recently formed hydromorphic soils are also found
in this district. Technically the suborder associations of the soil may be classified as Aquepts-
Aquents, Fluvents-Aqueots-Aqualfs and Ochrepts-Orthents. Soil analysis was carried as per
IS: 2720 methods. Soil quality monitoring locations & results are given in Table 3-18
&Table 3-19. Map showing the soil monitoring locations is given in Figure 3-27.
(Source:
http://censusindia.gov.in/2011census/dchb/DCHB_A/21/2111_PART_A_DCHB_JAGATSING
HAPUR.pdf)
Table 3-18 Soil & Sediment Quality Monitoring Locations
Location
Code Location
Distance (Km)
w.r.t project site
Direction
w.r.t. project site
S1 Project Site Within Site
S2 Paradwipgarh 4.41 NNE
S3 Dochhaki 4.08 NE
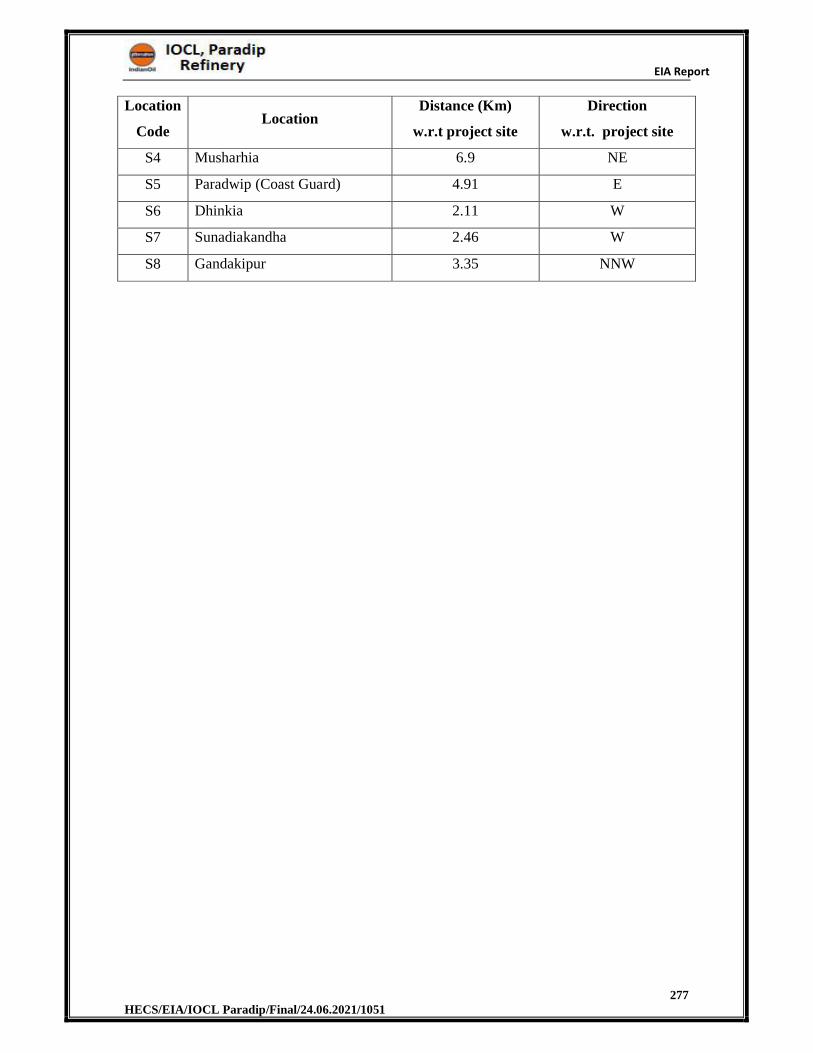
EIA Report
277 HECS/EIA/IOCL Paradip/Final/24.06.2021/1051
Location
Code Location
Distance (Km)
w.r.t project site
Direction
w.r.t. project site
S4 Musharhia 6.9 NE
S5 Paradwip (Coast Guard) 4.91 E
S6 Dhinkia 2.11 W
S7 Sunadiakandha 2.46 W
S8 Gandakipur 3.35 NNW
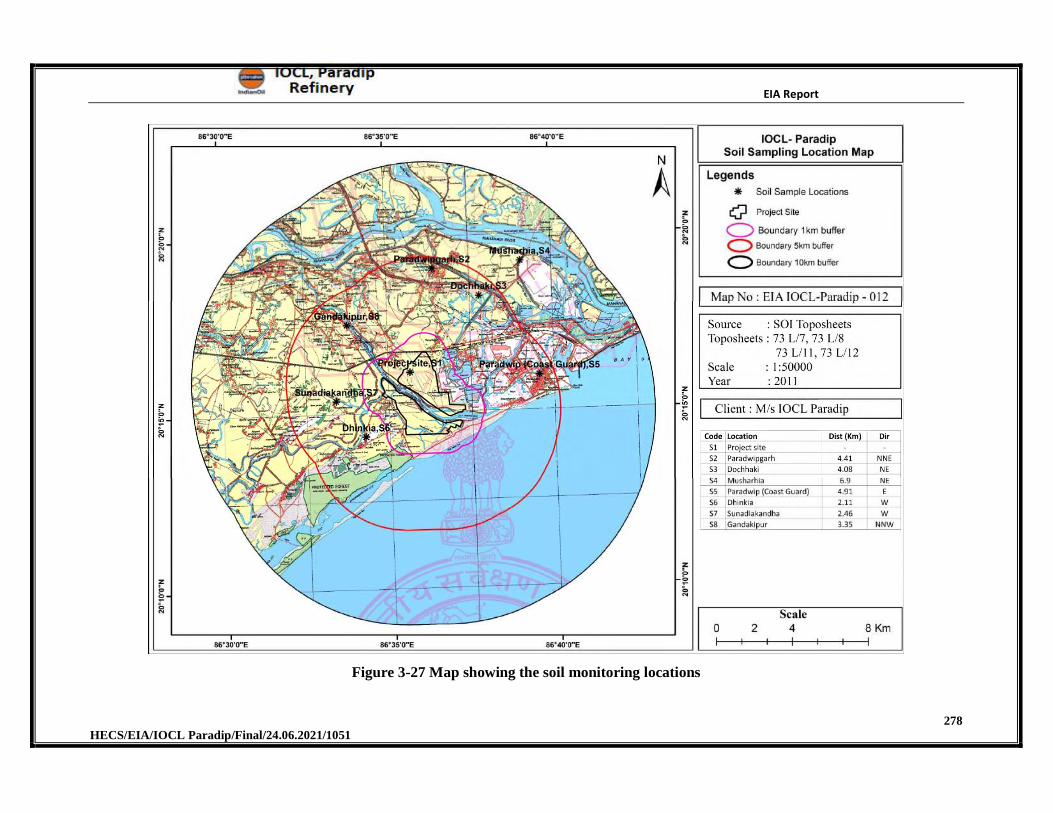
EIA Report
278 HECS/EIA/IOCL Paradip/Final/24.06.2021/1051
Figure 3-27 Map showing the soil monitoring locations
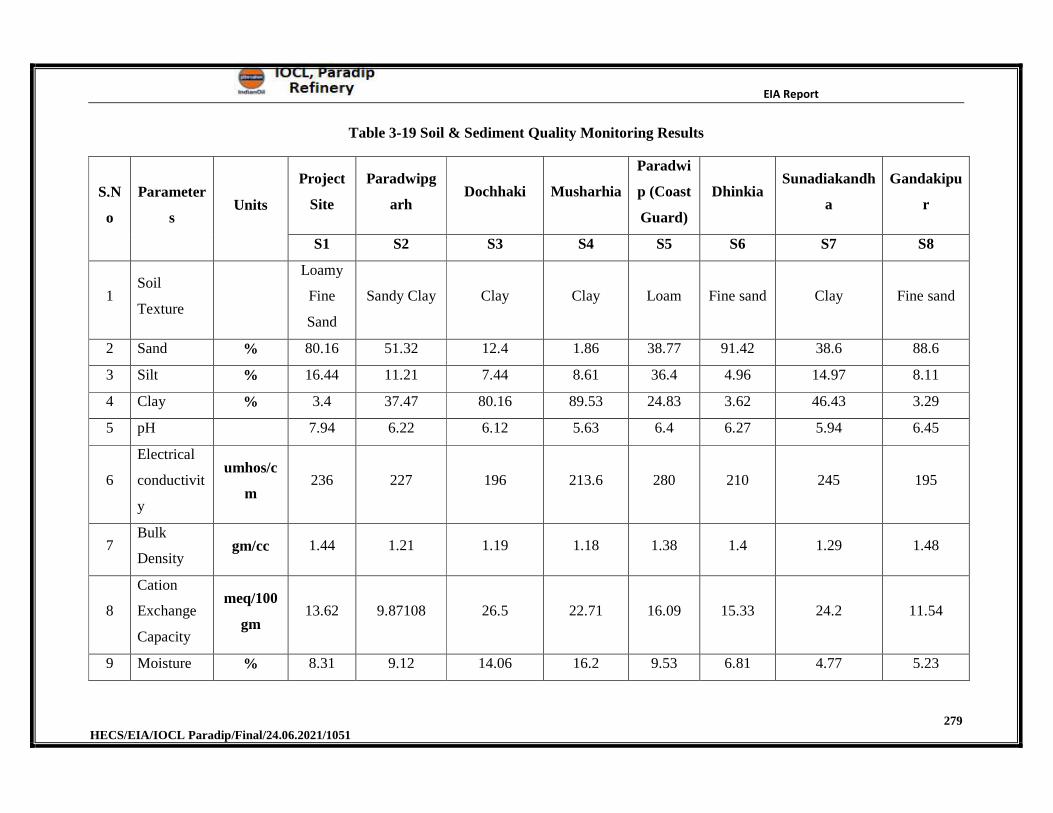
EIA Report
279 HECS/EIA/IOCL Paradip/Final/24.06.2021/1051
Table 3-19 Soil & Sediment Quality Monitoring Results
S.N
o
Parameter
s Units
Project
Site
Paradwipg
arh Dochhaki Musharhia
Paradwi
p (Coast
Guard)
Dhinkia Sunadiakandh
a
Gandakipu
r
S1 S2 S3 S4 S5 S6 S7 S8
1 Soil
Texture
Loamy
Fine
Sand
Sandy Clay Clay Clay Loam Fine sand Clay Fine sand
2 Sand % 80.16 51.32 12.4 1.86 38.77 91.42 38.6 88.6
3 Silt % 16.44 11.21 7.44 8.61 36.4 4.96 14.97 8.11
4 Clay % 3.4 37.47 80.16 89.53 24.83 3.62 46.43 3.29
5 pH 7.94 6.22 6.12 5.63 6.4 6.27 5.94 6.45
6
Electrical
conductivit
y
umhos/c
m 236 227 196 213.6 280 210 245 195
7 Bulk
Density gm/cc 1.44 1.21 1.19 1.18 1.38 1.4 1.29 1.48
8
Cation
Exchange
Capacity
meq/100
gm 13.62 9.87108 26.5 22.71 16.09 15.33 24.2 11.54
9 Moisture % 8.31 9.12 14.06 16.2 9.53 6.81 4.77 5.23
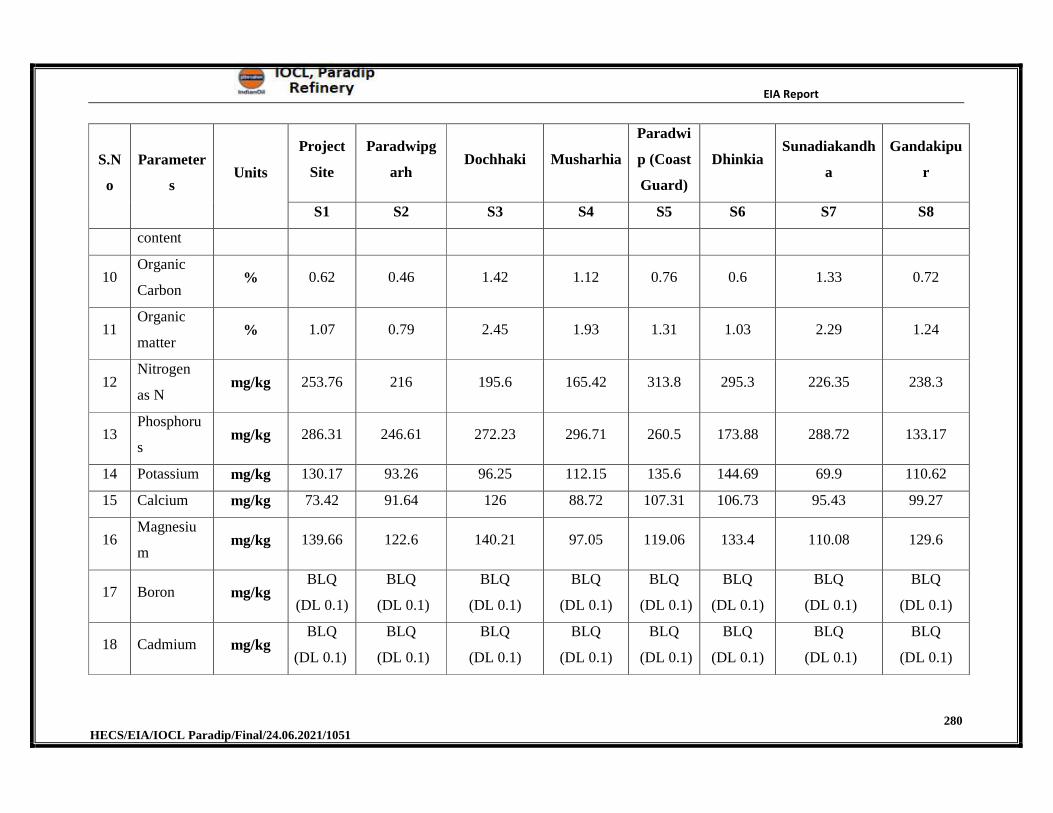
EIA Report
280 HECS/EIA/IOCL Paradip/Final/24.06.2021/1051
S.N
o
Parameter
s Units
Project
Site
Paradwipg
arh Dochhaki Musharhia
Paradwi
p (Coast
Guard)
Dhinkia Sunadiakandh
a
Gandakipu
r
S1 S2 S3 S4 S5 S6 S7 S8
content
10 Organic
Carbon % 0.62 0.46 1.42 1.12 0.76 0.6 1.33 0.72
11 Organic
matter % 1.07 0.79 2.45 1.93 1.31 1.03 2.29 1.24
12 Nitrogen
as N mg/kg 253.76 216 195.6 165.42 313.8 295.3 226.35 238.3
13 Phosphoru
s mg/kg 286.31 246.61 272.23 296.71 260.5 173.88 288.72 133.17
14 Potassium mg/kg 130.17 93.26 96.25 112.15 135.6 144.69 69.9 110.62
15 Calcium mg/kg 73.42 91.64 126 88.72 107.31 106.73 95.43 99.27
16 Magnesiu
m mg/kg 139.66 122.6 140.21 97.05 119.06 133.4 110.08 129.6
17 Boron mg/kg BLQ
(DL 0.1)
BLQ
(DL 0.1)
BLQ
(DL 0.1)
BLQ
(DL 0.1)
BLQ
(DL 0.1)
BLQ
(DL 0.1)
BLQ
(DL 0.1)
BLQ
(DL 0.1)
18 Cadmium mg/kg BLQ
(DL 0.1)
BLQ
(DL 0.1)
BLQ
(DL 0.1)
BLQ
(DL 0.1)
BLQ
(DL 0.1)
BLQ
(DL 0.1)
BLQ
(DL 0.1)
BLQ
(DL 0.1)
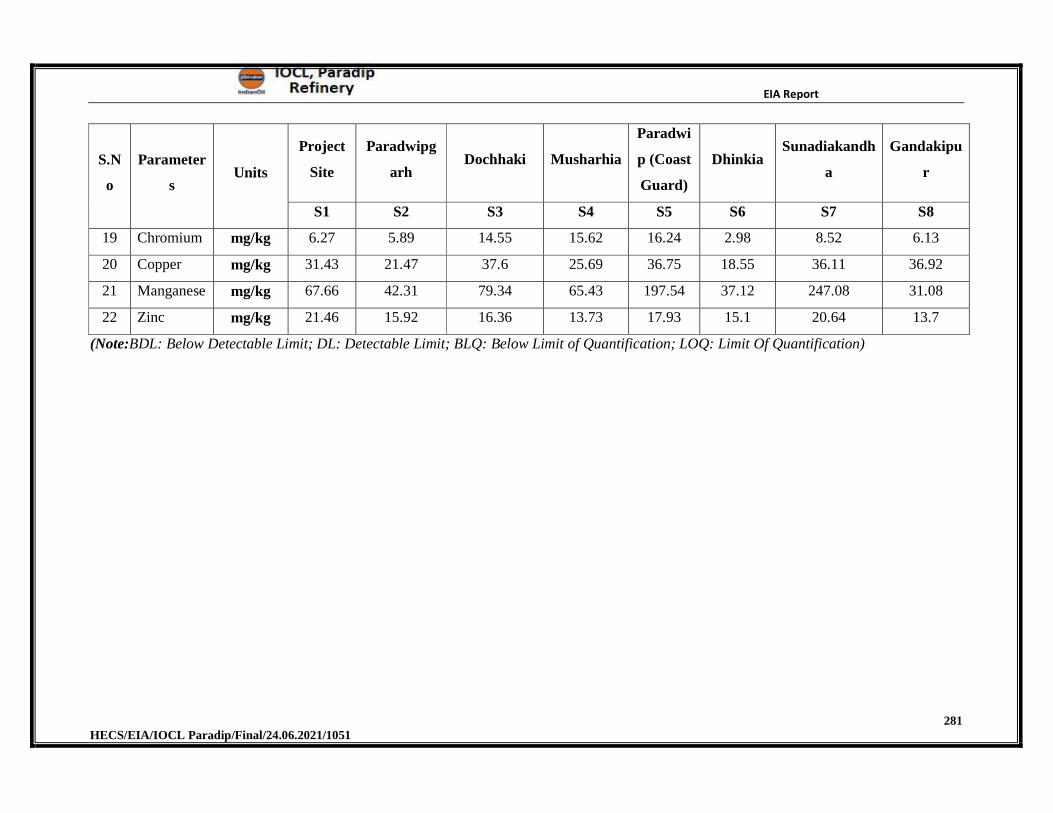
EIA Report
281 HECS/EIA/IOCL Paradip/Final/24.06.2021/1051
S.N
o
Parameter
s Units
Project
Site
Paradwipg
arh Dochhaki Musharhia
Paradwi
p (Coast
Guard)
Dhinkia Sunadiakandh
a
Gandakipu
r
S1 S2 S3 S4 S5 S6 S7 S8
19 Chromium mg/kg 6.27 5.89 14.55 15.62 16.24 2.98 8.52 6.13
20 Copper mg/kg 31.43 21.47 37.6 25.69 36.75 18.55 36.11 36.92
21 Manganese mg/kg 67.66 42.31 79.34 65.43 197.54 37.12 247.08 31.08
22 Zinc mg/kg 21.46 15.92 16.36 13.73 17.93 15.1 20.64 13.7
(Note:BDL: Below Detectable Limit; DL: Detectable Limit; BLQ: Below Limit of Quantification; LOQ: Limit Of Quantification)
EIA Report
282 HECS/EIA/IOCL Paradip/Final/24.06.2021/1051
3.10.1 Results and Discussions
Summary of analytical results
The pH of the soil samples ranged from 5.63 to 7.94. It shows that the soils are
moderately acidic to moderately alkaline in nature.
Conductivity of the soil samples ranged from195 to280 μmhos/cm.
Nitrogen content ranged from 165.42 mg/kg to 313.8 mg/kg.
Phosphorous ranged from 133.17 mg/kg to 296.71 mg/kg.
Potassium content ranges from 69.9 mg/kg to 144.69 mg/kg.
3.11 Biological Environment
An ecological study of the ecosystem is essential to understand the impact of industrialization
and urbanization on existing flora and fauna of the study area. Studies on various aspects of
ecosystem play an important role in identifying sensitive issues for under taking appropriate
action to mitigate the impact, if any. The biological study was under taken as a part of the
EIA study report to understand the present status of ecosystem prevailing in the study area, to
compare it with past condition with the help of available data, to predict changes in the
biological environment as a result of present activities and to suggest measures for
maintaining its health. Secondary information was collected to list the flora & fauna in 10 km
radius.
During secondary survey, following aspects were considered for ecological studies:
Assessment of present status of flora and fauna;
Identification of rare and endangered species of plants and animals (if any);
Identification of ecologically sensitive areas within the study area;
Assessment of migratory route of wildlife (if any); and
Assessment of Aquatic Ecology with specific reference to aquatic birds.
Project site is situated near Dhenkia. In this region comprises of deciduous type forests, along
the Mahanadhi river, numerous wetland and human population area. There is Mangrove
forest situated towards North east of the project site but from 8.5 km from the plant area. The
project area is considered as core area, whereas, 10 km radial distance for the project site is
being considered as buffer area
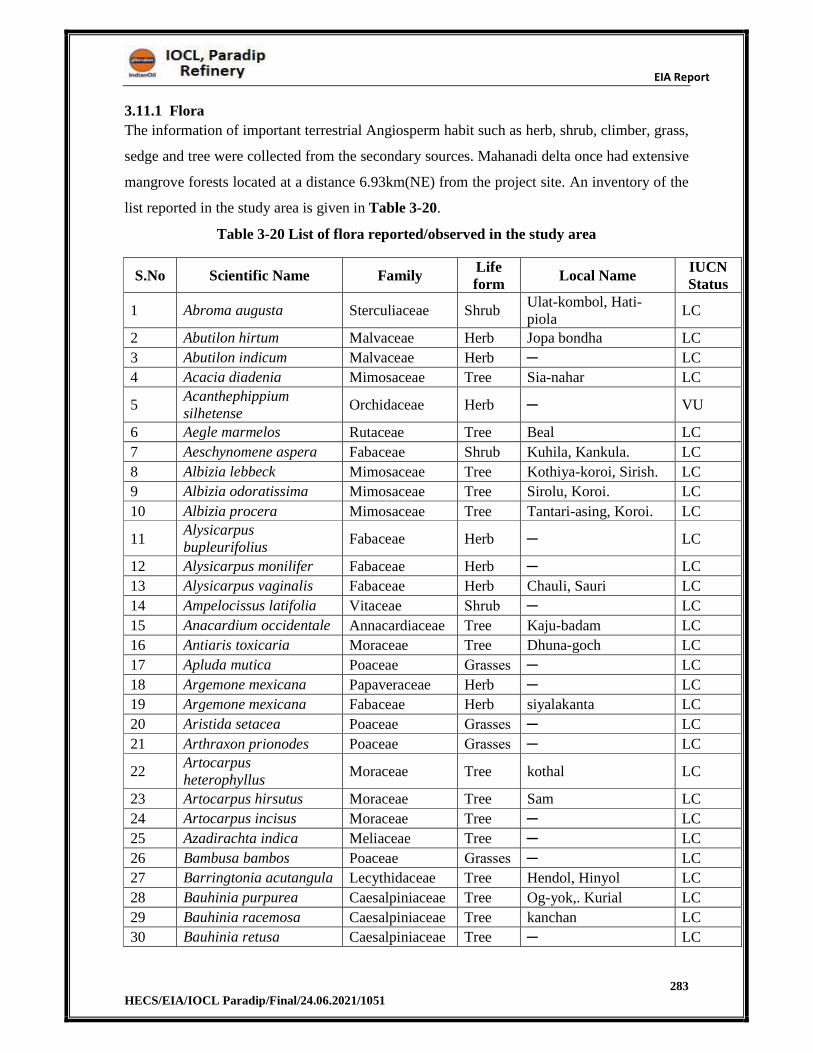
EIA Report
283 HECS/EIA/IOCL Paradip/Final/24.06.2021/1051
3.11.1 Flora
The information of important terrestrial Angiosperm habit such as herb, shrub, climber, grass,
sedge and tree were collected from the secondary sources. Mahanadi delta once had extensive
mangrove forests located at a distance 6.93km(NE) from the project site. An inventory of the
list reported in the study area is given in Table 3-20.
Table 3-20 List of flora reported/observed in the study area
S.No Scientific Name Family Life form
Local Name IUCN Status
1 Abroma augusta Sterculiaceae Shrub Ulat-kombol, Hati-piola
LC
2 Abutilon hirtum Malvaceae Herb Jopa bondha LC
3 Abutilon indicum Malvaceae Herb ─ LC
4 Acacia diadenia Mimosaceae Tree Sia-nahar LC
5 Acanthephippium silhetense
Orchidaceae Herb ─ VU
6 Aegle marmelos Rutaceae Tree Beal LC
7 Aeschynomene aspera Fabaceae Shrub Kuhila, Kankula. LC
8 Albizia lebbeck Mimosaceae Tree Kothiya-koroi, Sirish. LC
9 Albizia odoratissima Mimosaceae Tree Sirolu, Koroi. LC
10 Albizia procera Mimosaceae Tree Tantari-asing, Koroi. LC
11 Alysicarpus bupleurifolius
Fabaceae Herb ─ LC
12 Alysicarpus monilifer Fabaceae Herb ─ LC
13 Alysicarpus vaginalis Fabaceae Herb Chauli, Sauri LC
14 Ampelocissus latifolia Vitaceae Shrub ─ LC
15 Anacardium occidentale Annacardiaceae Tree Kaju-badam LC
16 Antiaris toxicaria Moraceae Tree Dhuna-goch LC
17 Apluda mutica Poaceae Grasses ─ LC
18 Argemone mexicana Papaveraceae Herb ─ LC
19 Argemone mexicana Fabaceae Herb siyalakanta LC
20 Aristida setacea Poaceae Grasses ─ LC
21 Arthraxon prionodes Poaceae Grasses ─ LC
22 Artocarpus heterophyllus
Moraceae Tree kothal LC
23 Artocarpus hirsutus Moraceae Tree Sam LC
24 Artocarpus incisus Moraceae Tree ─ LC
25 Azadirachta indica Meliaceae Tree ─ LC
26 Bambusa bambos Poaceae Grasses ─ LC
27 Barringtonia acutangula Lecythidaceae Tree Hendol, Hinyol LC
28 Bauhinia purpurea Caesalpiniaceae Tree Og-yok,. Kurial LC
29 Bauhinia racemosa Caesalpiniaceae Tree kanchan LC
30 Bauhinia retusa Caesalpiniaceae Tree ─ LC
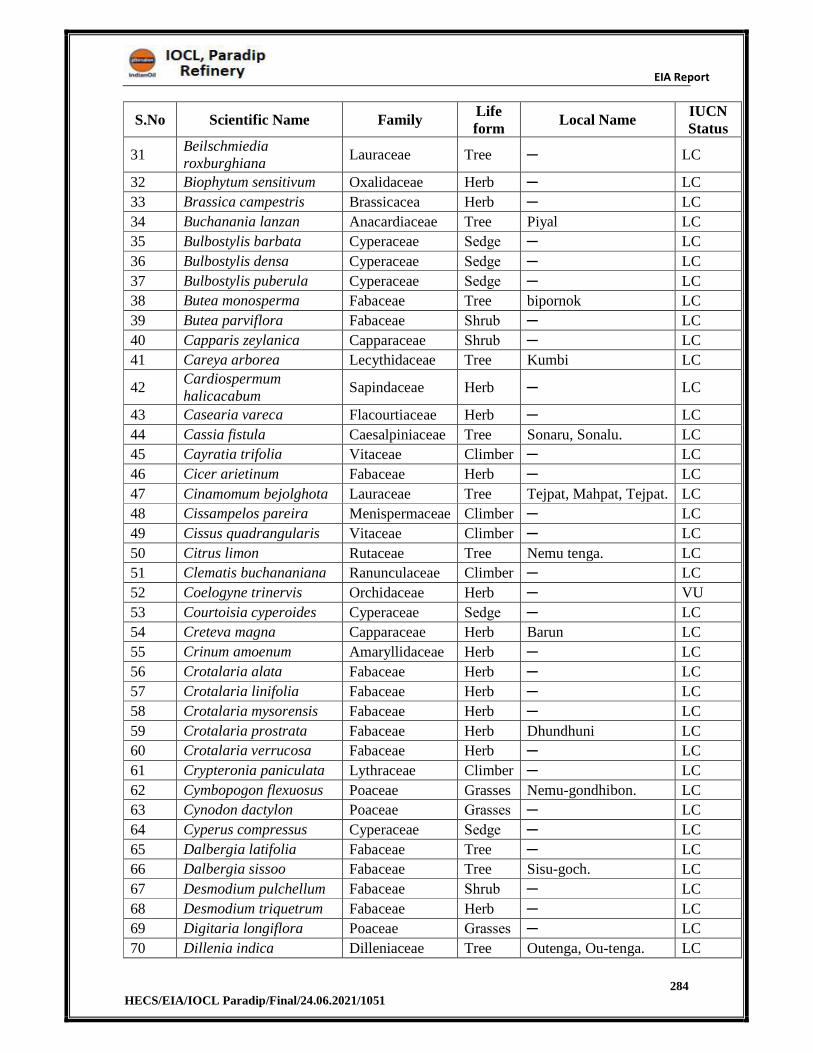
EIA Report
284 HECS/EIA/IOCL Paradip/Final/24.06.2021/1051
S.No Scientific Name Family Life form
Local Name IUCN Status
31 Beilschmiedia roxburghiana
Lauraceae Tree ─ LC
32 Biophytum sensitivum Oxalidaceae Herb ─ LC
33 Brassica campestris Brassicacea Herb ─ LC
34 Buchanania lanzan Anacardiaceae Tree Piyal LC
35 Bulbostylis barbata Cyperaceae Sedge ─ LC
36 Bulbostylis densa Cyperaceae Sedge ─ LC
37 Bulbostylis puberula Cyperaceae Sedge ─ LC
38 Butea monosperma Fabaceae Tree bipornok LC
39 Butea parviflora Fabaceae Shrub ─ LC
40 Capparis zeylanica Capparaceae Shrub ─ LC
41 Careya arborea Lecythidaceae Tree Kumbi LC
42 Cardiospermum halicacabum
Sapindaceae Herb ─ LC
43 Casearia vareca Flacourtiaceae Herb ─ LC
44 Cassia fistula Caesalpiniaceae Tree Sonaru, Sonalu. LC
45 Cayratia trifolia Vitaceae Climber ─ LC
46 Cicer arietinum Fabaceae Herb ─ LC
47 Cinamomum bejolghota Lauraceae Tree Tejpat, Mahpat, Tejpat. LC
48 Cissampelos pareira Menispermaceae Climber ─ LC
49 Cissus quadrangularis Vitaceae Climber ─ LC
50 Citrus limon Rutaceae Tree Nemu tenga. LC
51 Clematis buchananiana Ranunculaceae Climber ─ LC
52 Coelogyne trinervis Orchidaceae Herb ─ VU
53 Courtoisia cyperoides Cyperaceae Sedge ─ LC
54 Creteva magna Capparaceae Herb Barun LC
55 Crinum amoenum Amaryllidaceae Herb ─ LC
56 Crotalaria alata Fabaceae Herb ─ LC
57 Crotalaria linifolia Fabaceae Herb ─ LC
58 Crotalaria mysorensis Fabaceae Herb ─ LC
59 Crotalaria prostrata Fabaceae Herb Dhundhuni LC
60 Crotalaria verrucosa Fabaceae Herb ─ LC
61 Crypteronia paniculata Lythraceae Climber ─ LC
62 Cymbopogon flexuosus Poaceae Grasses Nemu-gondhibon. LC
63 Cynodon dactylon Poaceae Grasses ─ LC
64 Cyperus compressus Cyperaceae Sedge ─ LC
65 Dalbergia latifolia Fabaceae Tree ─ LC
66 Dalbergia sissoo Fabaceae Tree Sisu-goch. LC
67 Desmodium pulchellum Fabaceae Shrub ─ LC
68 Desmodium triquetrum Fabaceae Herb ─ LC
69 Digitaria longiflora Poaceae Grasses ─ LC
70 Dillenia indica Dilleniaceae Tree Outenga, Ou-tenga. LC
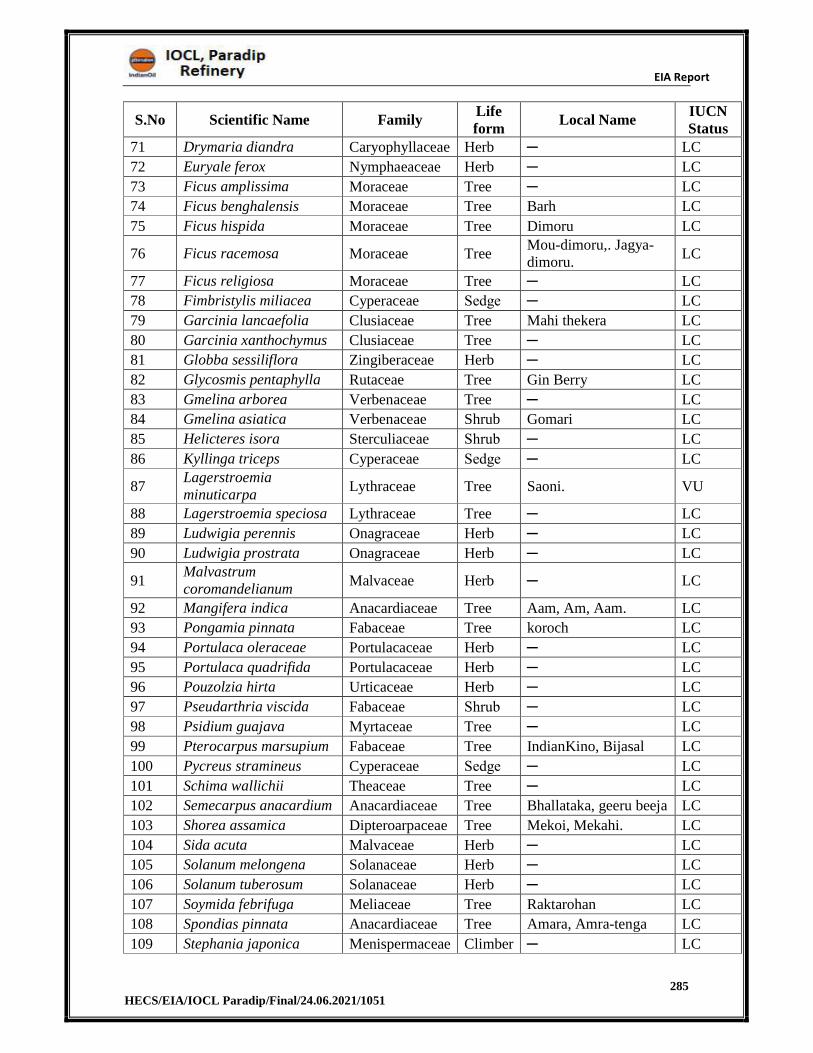
EIA Report
285 HECS/EIA/IOCL Paradip/Final/24.06.2021/1051
S.No Scientific Name Family Life form
Local Name IUCN Status
71 Drymaria diandra Caryophyllaceae Herb ─ LC
72 Euryale ferox Nymphaeaceae Herb ─ LC
73 Ficus amplissima Moraceae Tree ─ LC
74 Ficus benghalensis Moraceae Tree Barh LC
75 Ficus hispida Moraceae Tree Dimoru LC
76 Ficus racemosa Moraceae Tree Mou-dimoru,. Jagya-dimoru.
LC
77 Ficus religiosa Moraceae Tree ─ LC
78 Fimbristylis miliacea Cyperaceae Sedge ─ LC
79 Garcinia lancaefolia Clusiaceae Tree Mahi thekera LC
80 Garcinia xanthochymus Clusiaceae Tree ─ LC
81 Globba sessiliflora Zingiberaceae Herb ─ LC
82 Glycosmis pentaphylla Rutaceae Tree Gin Berry LC
83 Gmelina arborea Verbenaceae Tree ─ LC
84 Gmelina asiatica Verbenaceae Shrub Gomari LC
85 Helicteres isora Sterculiaceae Shrub ─ LC
86 Kyllinga triceps Cyperaceae Sedge ─ LC
87 Lagerstroemia minuticarpa
Lythraceae Tree Saoni. VU
88 Lagerstroemia speciosa Lythraceae Tree ─ LC
89 Ludwigia perennis Onagraceae Herb ─ LC
90 Ludwigia prostrata Onagraceae Herb ─ LC
91 Malvastrum coromandelianum
Malvaceae Herb ─ LC
92 Mangifera indica Anacardiaceae Tree Aam, Am, Aam. LC
93 Pongamia pinnata Fabaceae Tree koroch LC
94 Portulaca oleraceae Portulacaceae Herb ─ LC
95 Portulaca quadrifida Portulacaceae Herb ─ LC
96 Pouzolzia hirta Urticaceae Herb ─ LC
97 Pseudarthria viscida Fabaceae Shrub ─ LC
98 Psidium guajava Myrtaceae Tree ─ LC
99 Pterocarpus marsupium Fabaceae Tree IndianKino, Bijasal LC
100 Pycreus stramineus Cyperaceae Sedge ─ LC
101 Schima wallichii Theaceae Tree ─ LC
102 Semecarpus anacardium Anacardiaceae Tree Bhallataka, geeru beeja LC
103 Shorea assamica Dipteroarpaceae Tree Mekoi, Mekahi. LC
104 Sida acuta Malvaceae Herb ─ LC
105 Solanum melongena Solanaceae Herb ─ LC
106 Solanum tuberosum Solanaceae Herb ─ LC
107 Soymida febrifuga Meliaceae Tree Raktarohan LC
108 Spondias pinnata Anacardiaceae Tree Amara, Amra-tenga LC
109 Stephania japonica Menispermaceae Climber ─ LC
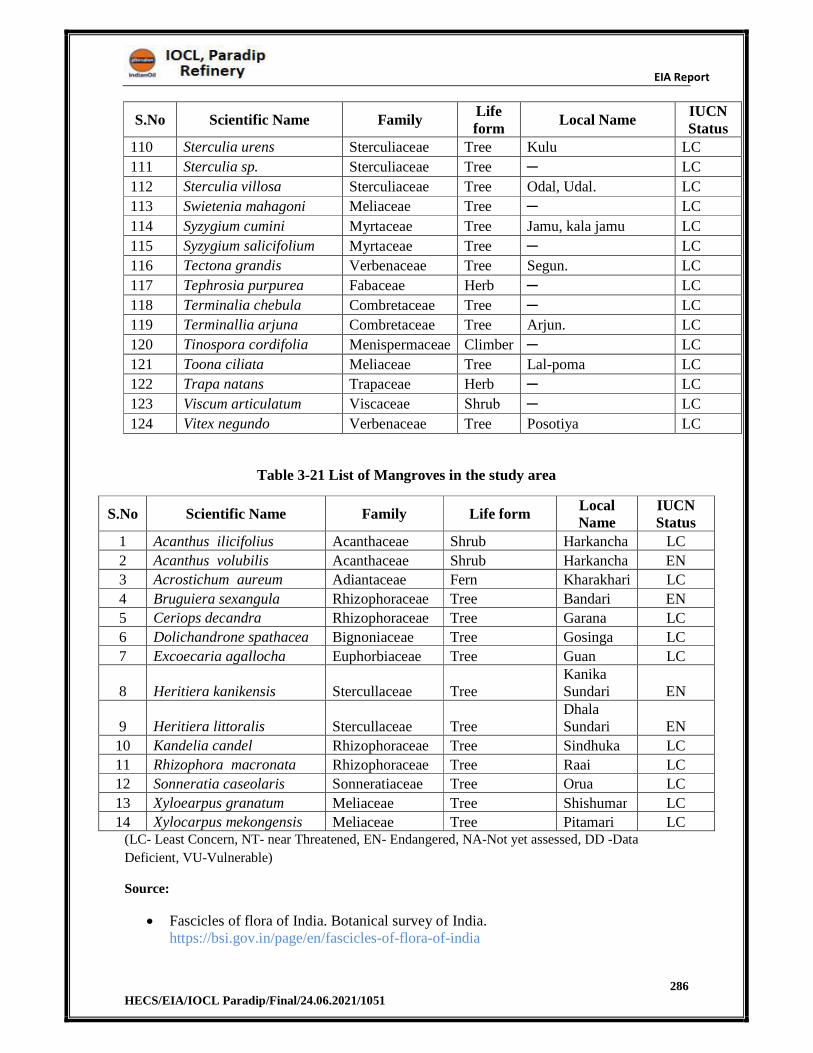
EIA Report
286 HECS/EIA/IOCL Paradip/Final/24.06.2021/1051
S.No Scientific Name Family Life form
Local Name IUCN Status
110 Sterculia urens Sterculiaceae Tree Kulu LC
111 Sterculia sp. Sterculiaceae Tree ─ LC
112 Sterculia villosa Sterculiaceae Tree Odal, Udal. LC
113 Swietenia mahagoni Meliaceae Tree ─ LC
114 Syzygium cumini Myrtaceae Tree Jamu, kala jamu LC
115 Syzygium salicifolium Myrtaceae Tree ─ LC
116 Tectona grandis Verbenaceae Tree Segun. LC
117 Tephrosia purpurea Fabaceae Herb ─ LC
118 Terminalia chebula Combretaceae Tree ─ LC
119 Terminallia arjuna Combretaceae Tree Arjun. LC
120 Tinospora cordifolia Menispermaceae Climber ─ LC
121 Toona ciliata Meliaceae Tree Lal-poma LC
122 Trapa natans Trapaceae Herb ─ LC
123 Viscum articulatum Viscaceae Shrub ─ LC
124 Vitex negundo Verbenaceae Tree Posotiya LC
Table 3-21 List of Mangroves in the study area
S.No Scientific Name Family Life form Local Name
IUCN Status
1 Acanthus ilicifolius Acanthaceae Shrub Harkancha LC
2 Acanthus volubilis Acanthaceae Shrub Harkancha EN
3 Acrostichum aureum Adiantaceae Fern Kharakhari LC
4 Bruguiera sexangula Rhizophoraceae Tree Bandari EN
5 Ceriops decandra Rhizophoraceae Tree Garana LC
6 Dolichandrone spathacea Bignoniaceae Tree Gosinga LC
7 Excoecaria agallocha Euphorbiaceae Tree Guan LC
8 Heritiera kanikensis Stercullaceae Tree Kanika Sundari EN
9 Heritiera littoralis Stercullaceae Tree Dhala Sundari EN
10 Kandelia candel Rhizophoraceae Tree Sindhuka LC
11 Rhizophora macronata Rhizophoraceae Tree Raai LC
12 Sonneratia caseolaris Sonneratiaceae Tree Orua LC
13 Xyloearpus granatum Meliaceae Tree Shishumar LC
14 Xylocarpus mekongensis Meliaceae Tree Pitamari LC (LC- Least Concern, NT- near Threatened, EN- Endangered, NA-Not yet assessed, DD -Data
Deficient, VU-Vulnerable)
Source:
Fascicles of flora of India. Botanical survey of India. https://bsi.gov.in/page/en/fascicles-of-flora-of-india
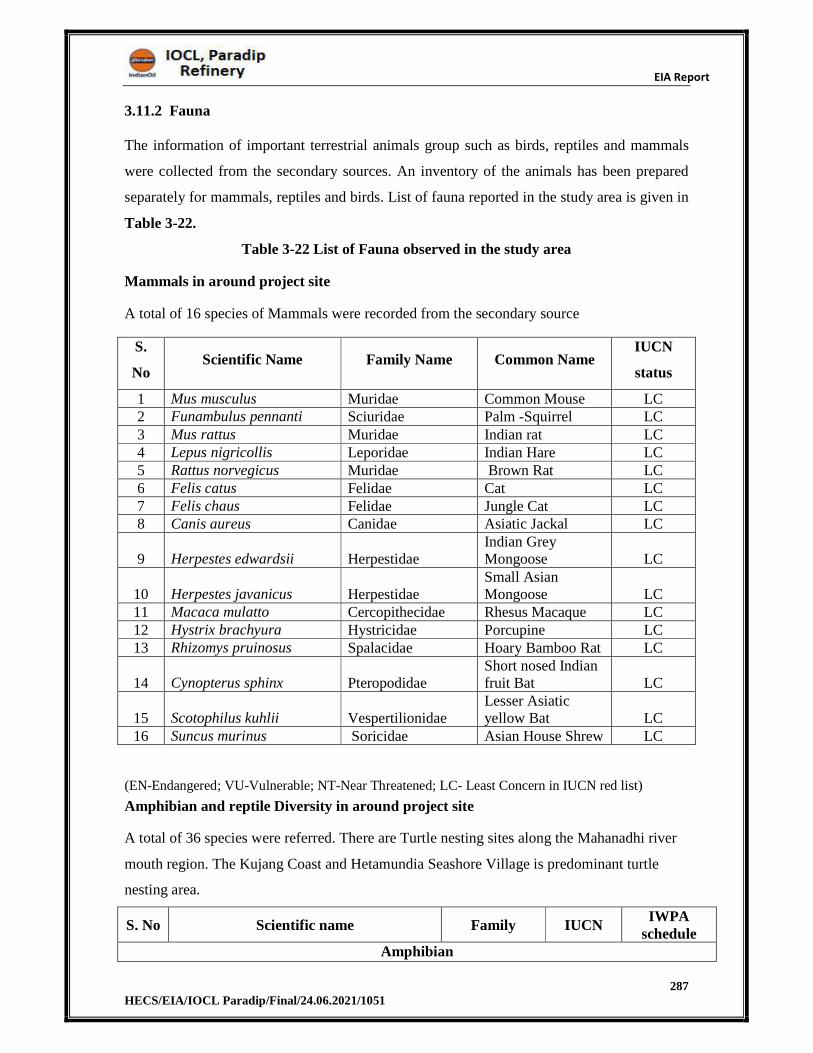
EIA Report
287 HECS/EIA/IOCL Paradip/Final/24.06.2021/1051
3.11.2 Fauna
The information of important terrestrial animals group such as birds, reptiles and mammals
were collected from the secondary sources. An inventory of the animals has been prepared
separately for mammals, reptiles and birds. List of fauna reported in the study area is given in
Table 3-22.
Table 3-22 List of Fauna observed in the study area
Mammals in around project site
A total of 16 species of Mammals were recorded from the secondary source
(EN-Endangered; VU-Vulnerable; NT-Near Threatened; LC- Least Concern in IUCN red list)
Amphibian and reptile Diversity in around project site
A total of 36 species were referred. There are Turtle nesting sites along the Mahanadhi river
mouth region. The Kujang Coast and Hetamundia Seashore Village is predominant turtle
nesting area.
S. No Scientific name Family IUCN IWPA
schedule Amphibian
S.
No Scientific Name Family Name Common Name
IUCN
status
1 Mus musculus Muridae Common Mouse LC2 Funambulus pennanti Sciuridae Palm -Squirrel LC 3 Mus rattus Muridae Indian rat LC 4 Lepus nigricollis Leporidae Indian Hare LC 5 Rattus norvegicus Muridae Brown Rat LC6 Felis catus Felidae Cat LC7 Felis chaus Felidae Jungle Cat LC8 Canis aureus Canidae Asiatic Jackal LC
9 Herpestes edwardsii Herpestidae Indian Grey Mongoose LC
10 Herpestes javanicus Herpestidae Small Asian Mongoose LC
11 Macaca mulatto Cercopithecidae Rhesus Macaque LC 12 Hystrix brachyura Hystricidae Porcupine LC 13 Rhizomys pruinosus Spalacidae Hoary Bamboo Rat LC
14 Cynopterus sphinx PteropodidaeShort nosed Indian fruit Bat LC
15 Scotophilus kuhlii VespertilionidaeLesser Asiatic yellow Bat LC
16 Suncus murinus Soricidae Asian House Shrew LC
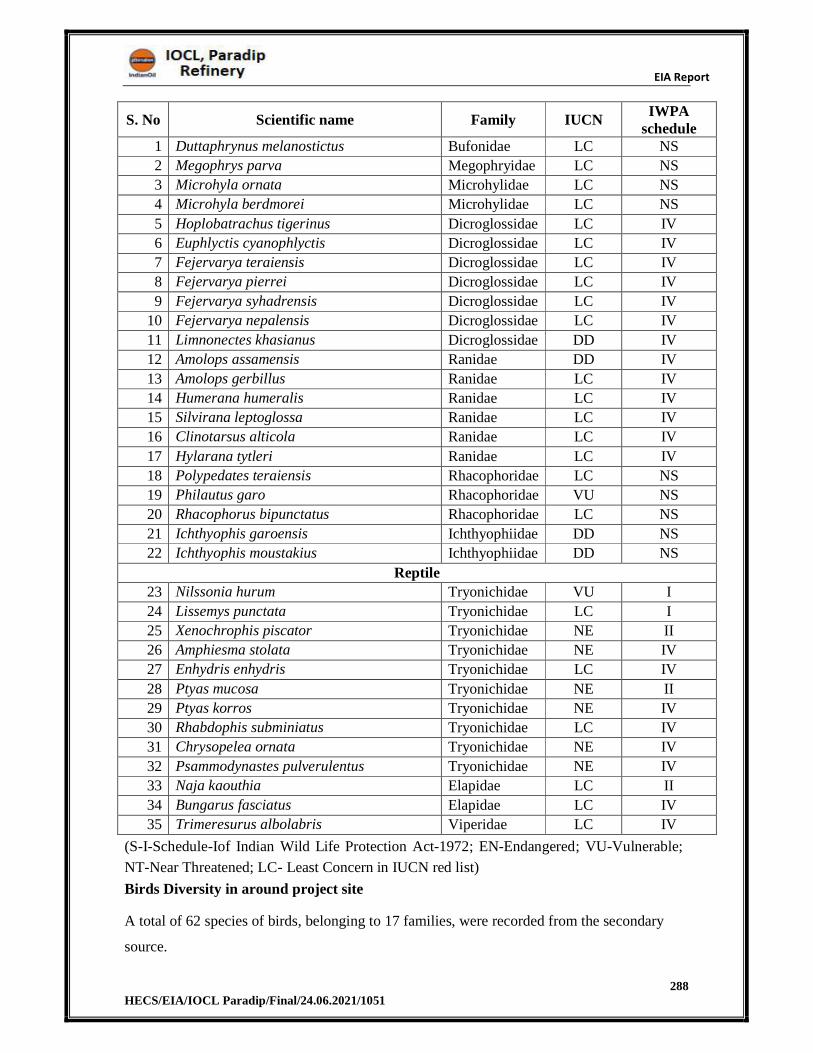
EIA Report
288 HECS/EIA/IOCL Paradip/Final/24.06.2021/1051
S. No Scientific name Family IUCN IWPA
schedule 1 Duttaphrynus melanostictus Bufonidae LC NS
2 Megophrys parva Megophryidae LC NS
3 Microhyla ornata Microhylidae LC NS
4 Microhyla berdmorei Microhylidae LC NS
5 Hoplobatrachus tigerinus Dicroglossidae LC IV
6 Euphlyctis cyanophlyctis Dicroglossidae LC IV
7 Fejervarya teraiensis Dicroglossidae LC IV
8 Fejervarya pierrei Dicroglossidae LC IV
9 Fejervarya syhadrensis Dicroglossidae LC IV
10 Fejervarya nepalensis Dicroglossidae LC IV
11 Limnonectes khasianus Dicroglossidae DD IV
12 Amolops assamensis Ranidae DD IV
13 Amolops gerbillus Ranidae LC IV
14 Humerana humeralis Ranidae LC IV
15 Silvirana leptoglossa Ranidae LC IV
16 Clinotarsus alticola Ranidae LC IV
17 Hylarana tytleri Ranidae LC IV
18 Polypedates teraiensis Rhacophoridae LC NS
19 Philautus garo Rhacophoridae VU NS
20 Rhacophorus bipunctatus Rhacophoridae LC NS
21 Ichthyophis garoensis Ichthyophiidae DD NS
22 Ichthyophis moustakius Ichthyophiidae DD NS
Reptile
23 Nilssonia hurum Tryonichidae VU I
24 Lissemys punctata Tryonichidae LC I
25 Xenochrophis piscator Tryonichidae NE II
26 Amphiesma stolata Tryonichidae NE IV
27 Enhydris enhydris Tryonichidae LC IV
28 Ptyas mucosa Tryonichidae NE II
29 Ptyas korros Tryonichidae NE IV
30 Rhabdophis subminiatus Tryonichidae LC IV
31 Chrysopelea ornata Tryonichidae NE IV
32 Psammodynastes pulverulentus Tryonichidae NE IV
33 Naja kaouthia Elapidae LC II
34 Bungarus fasciatus Elapidae LC IV
35 Trimeresurus albolabris Viperidae LC IV
(S-I-Schedule-Iof Indian Wild Life Protection Act-1972; EN-Endangered; VU-Vulnerable;
NT-Near Threatened; LC- Least Concern in IUCN red list)
Birds Diversity in around project site
A total of 62 species of birds, belonging to 17 families, were recorded from the secondary
source.
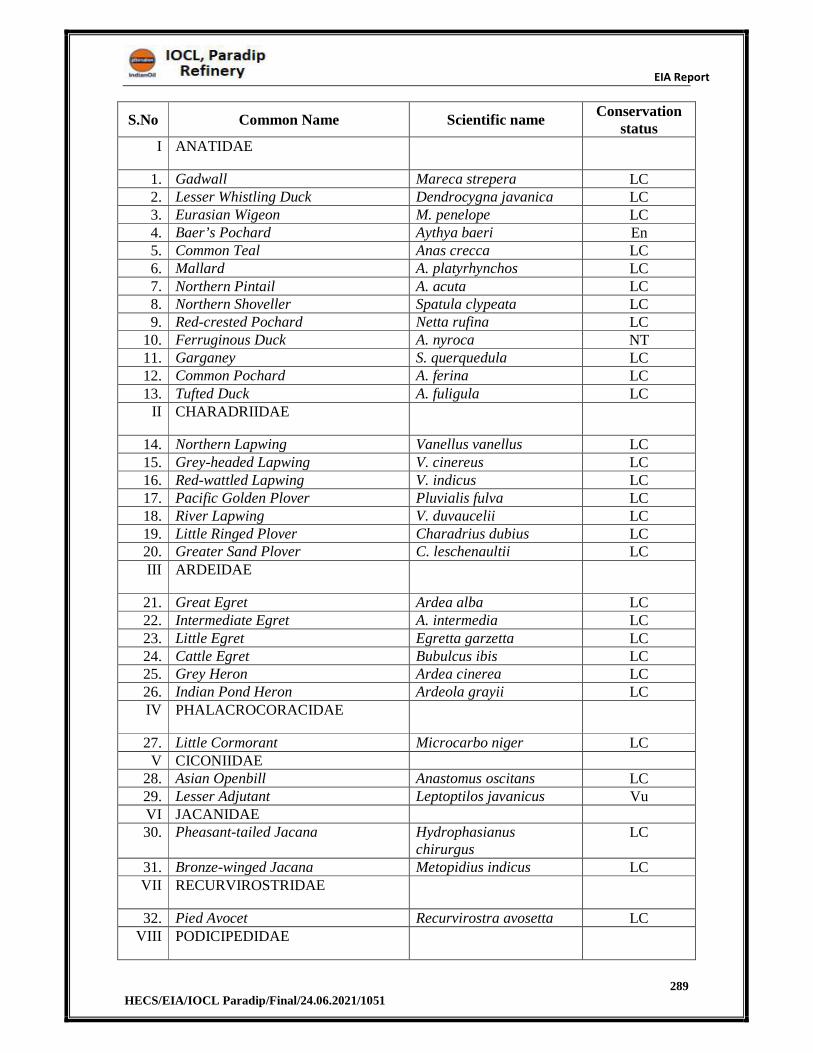
EIA Report
289 HECS/EIA/IOCL Paradip/Final/24.06.2021/1051
S.No Common Name Scientific name Conservation
status I ANATIDAE
1. Gadwall Mareca strepera LC 2. Lesser Whistling Duck Dendrocygna javanica LC 3. Eurasian Wigeon M. penelope LC 4. Baer’s Pochard Aythya baeri En5. Common Teal Anas crecca LC6. Mallard A. platyrhynchos LC7. Northern Pintail A. acuta LC 8. Northern Shoveller Spatula clypeata LC 9. Red-crested Pochard Netta rufina LC
10. Ferruginous Duck A. nyroca NT 11. Garganey S. querquedula LC12. Common Pochard A. ferina LC13. Tufted Duck A. fuligula LC
II CHARADRIIDAE
14. Northern Lapwing Vanellus vanellus LC 15. Grey-headed Lapwing V. cinereus LC 16. Red-wattled Lapwing V. indicus LC17. Pacific Golden Plover Pluvialis fulva LC18. River Lapwing V. duvaucelii LC19. Little Ringed Plover Charadrius dubius LC20. Greater Sand Plover C. leschenaultii LC III ARDEIDAE
21. Great Egret Ardea alba LC 22. Intermediate Egret A. intermedia LC23. Little Egret Egretta garzetta LC24. Cattle Egret Bubulcus ibis LC25. Grey Heron Ardea cinerea LC 26. Indian Pond Heron Ardeola grayii LC IV PHALACROCORACIDAE
27. Little Cormorant Microcarbo niger LCV CICONIIDAE
28. Asian Openbill Anastomus oscitans LC29. Lesser Adjutant Leptoptilos javanicus VuVI JACANIDAE 30. Pheasant-tailed Jacana Hydrophasianus
chirurgus LC
31. Bronze-winged Jacana Metopidius indicus LC VII RECURVIROSTRIDAE
32. Pied Avocet Recurvirostra avosetta LCVIII PODICIPEDIDAE
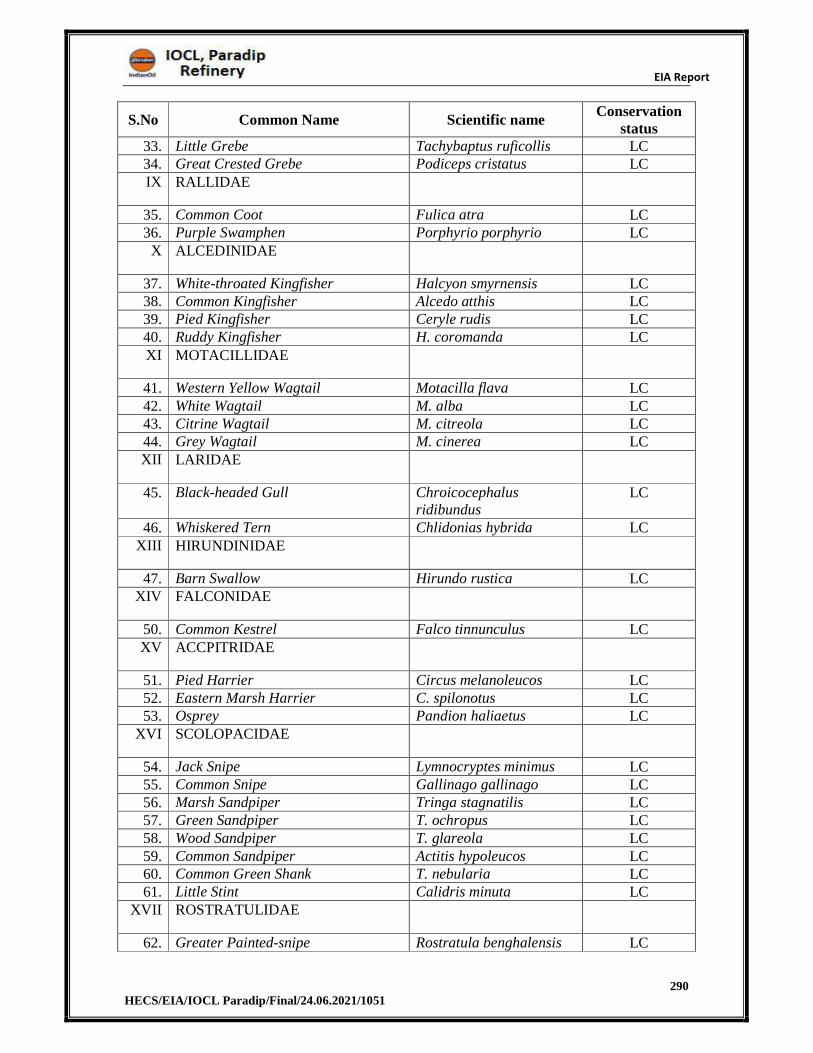
EIA Report
290 HECS/EIA/IOCL Paradip/Final/24.06.2021/1051
S.No Common Name Scientific name Conservation
status 33. Little Grebe Tachybaptus ruficollis LC34. Great Crested Grebe Podiceps cristatus LC IX RALLIDAE
35. Common Coot Fulica atra LC 36. Purple Swamphen Porphyrio porphyrio LC
X ALCEDINIDAE
37. White-throated Kingfisher Halcyon smyrnensis LC38. Common Kingfisher Alcedo atthis LC 39. Pied Kingfisher Ceryle rudis LC 40. Ruddy Kingfisher H. coromanda LC XI MOTACILLIDAE
41. Western Yellow Wagtail Motacilla flava LC42. White Wagtail M. alba LC43. Citrine Wagtail M. citreola LC 44. Grey Wagtail M. cinerea LC XII LARIDAE
45. Black-headed Gull Chroicocephalus ridibundus
LC
46. Whiskered Tern Chlidonias hybrida LC XIII HIRUNDINIDAE
47. Barn Swallow Hirundo rustica LCXIV FALCONIDAE
50. Common Kestrel Falco tinnunculus LC XV ACCPITRIDAE
51. Pied Harrier Circus melanoleucos LC 52. Eastern Marsh Harrier C. spilonotus LC53. Osprey Pandion haliaetus LC
XVI SCOLOPACIDAE
54. Jack Snipe Lymnocryptes minimus LC 55. Common Snipe Gallinago gallinago LC 56. Marsh Sandpiper Tringa stagnatilis LC 57. Green Sandpiper T. ochropus LC58. Wood Sandpiper T. glareola LC59. Common Sandpiper Actitis hypoleucos LC60. Common Green Shank T. nebularia LC 61. Little Stint Calidris minuta LC
XVII ROSTRATULIDAE
62. Greater Painted-snipe Rostratula benghalensis LC
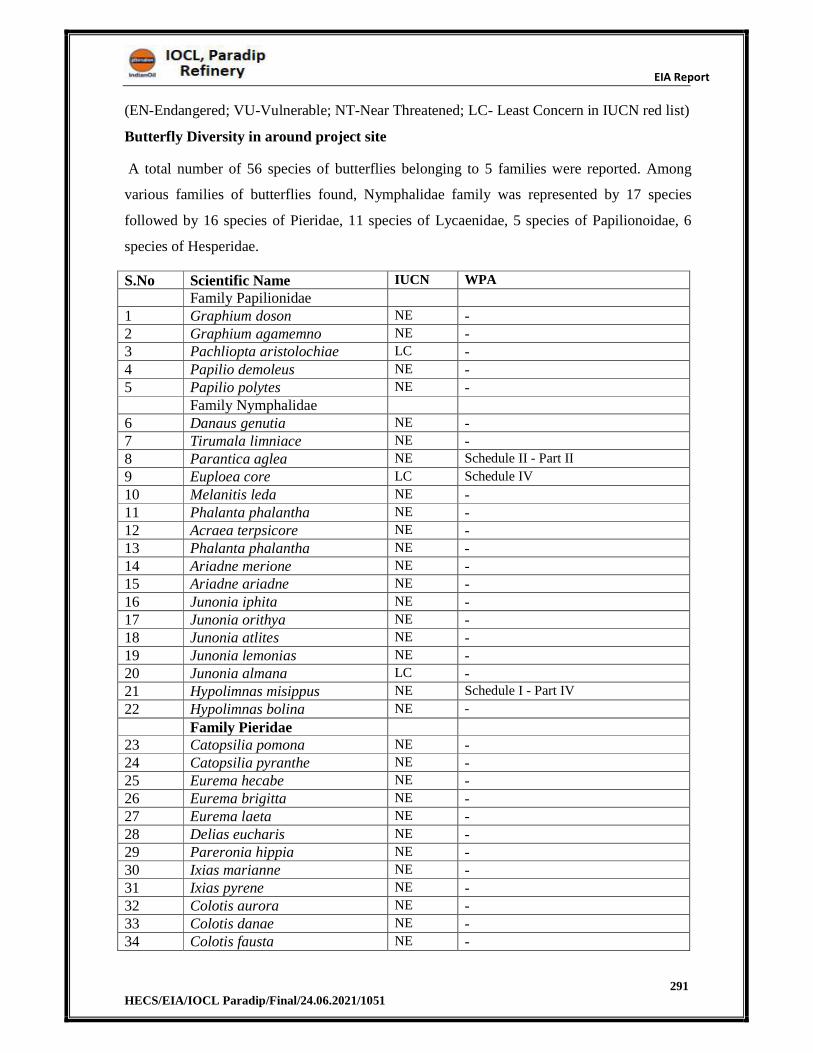
EIA Report
291 HECS/EIA/IOCL Paradip/Final/24.06.2021/1051
(EN-Endangered; VU-Vulnerable; NT-Near Threatened; LC- Least Concern in IUCN red list)
Butterfly Diversity in around project site
A total number of 56 species of butterflies belonging to 5 families were reported. Among
various families of butterflies found, Nymphalidae family was represented by 17 species
followed by 16 species of Pieridae, 11 species of Lycaenidae, 5 species of Papilionoidae, 6
species of Hesperidae.
S.No Scientific Name IUCN WPA
Family Papilionidae 1 Graphium doson NE -2 Graphium agamemno NE - 3 Pachliopta aristolochiae LC - 4 Papilio demoleus NE - 5 Papilio polytes NE -
Family Nymphalidae 6 Danaus genutia NE -7 Tirumala limniace NE -8 Parantica aglea NE Schedule II - Part II
9 Euploea core LC Schedule IV
10 Melanitis leda NE - 11 Phalanta phalantha NE - 12 Acraea terpsicore NE -13 Phalanta phalantha NE -14 Ariadne merione NE -15 Ariadne ariadne NE - 16 Junonia iphita NE - 17 Junonia orithya NE - 18 Junonia atlites NE -19 Junonia lemonias NE -20 Junonia almana LC -21 Hypolimnas misippus NE Schedule I - Part IV
22 Hypolimnas bolina NE -
Family Pieridae 23 Catopsilia pomona NE - 24 Catopsilia pyranthe NE -25 Eurema hecabe NE -26 Eurema brigitta NE -27 Eurema laeta NE - 28 Delias eucharis NE - 29 Pareronia hippia NE - 30 Ixias marianne NE - 31 Ixias pyrene NE -32 Colotis aurora NE -33 Colotis danae NE -34 Colotis fausta NE -
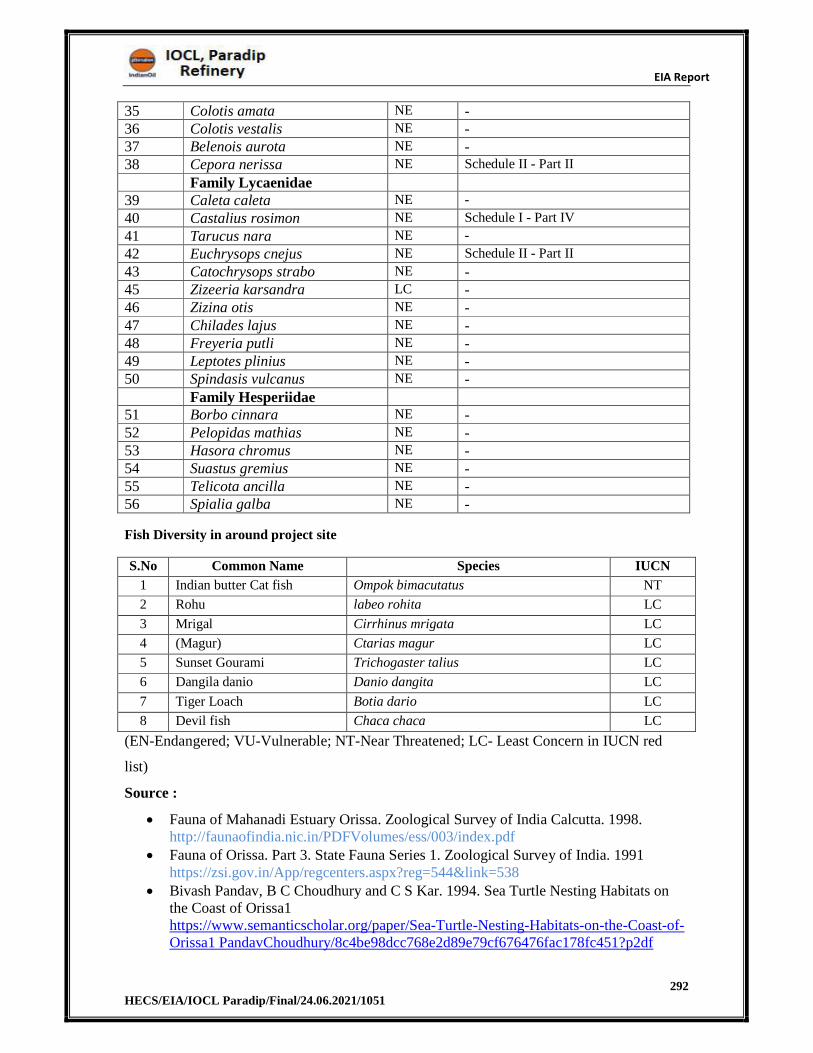
EIA Report
292 HECS/EIA/IOCL Paradip/Final/24.06.2021/1051
35 Colotis amata NE -36 Colotis vestalis NE - 37 Belenois aurota NE - 38 Cepora nerissa NE Schedule II - Part II
Family Lycaenidae 39 Caleta caleta NE -
40 Castalius rosimon NE Schedule I - Part IV
41 Tarucus nara NE -
42 Euchrysops cnejus NE Schedule II - Part II
43 Catochrysops strabo NE - 45 Zizeeria karsandra LC - 46 Zizina otis NE - 47 Chilades lajus NE -48 Freyeria putli NE -49 Leptotes plinius NE -50 Spindasis vulcanus NE -
Family Hesperiidae 51 Borbo cinnara NE - 52 Pelopidas mathias NE -53 Hasora chromus NE -54 Suastus gremius NE -55 Telicota ancilla NE - 56 Spialia galba NE -
Fish Diversity in around project site
S.No Common Name Species IUCN
1 Indian butter Cat fish Ompok bimacutatus NT
2 Rohu labeo rohita LC
3 Mrigal Cirrhinus mrigata LC
4 (Magur) Ctarias magur LC
5 Sunset Gourami Trichogaster talius LC
6 Dangila danio Danio dangita LC
7 Tiger Loach Botia dario LC
8 Devil fish Chaca chaca LC
(EN-Endangered; VU-Vulnerable; NT-Near Threatened; LC- Least Concern in IUCN red
list)
Source :
Fauna of Mahanadi Estuary Orissa. Zoological Survey of India Calcutta. 1998. http://faunaofindia.nic.in/PDFVolumes/ess/003/index.pdf
Fauna of Orissa. Part 3. State Fauna Series 1. Zoological Survey of India. 1991 https://zsi.gov.in/App/regcenters.aspx?reg=544&link=538
Bivash Pandav, B C Choudhury and C S Kar. 1994. Sea Turtle Nesting Habitats on the Coast of Orissa1 https://www.semanticscholar.org/paper/Sea-Turtle-Nesting-Habitats-on-the-Coast-of-Orissa1 PandavChoudhury/8c4be98dcc768e2d89e79cf676476fac178fc451?p2df
EIA Report
293 HECS/EIA/IOCL Paradip/Final/24.06.2021/1051
3.11.3 Management in and around Project area
Environmental problems in the state of Odisha have been influenced partly by the increasing
population, survival needs of the poor and the economic greed of the commercial interests.
They are also aggravated by prevalent economic disparities and unemployment, which are
deeply embedded in unsustainable patterns of production and consumption; ill-informed
policies and programs; and inappropriate developing strategies. As far as the forest resources
of the Near Brahmaputra valley is concerned, gap in scientific knowledge, increasing
demands, lack of value addition are the main causes for which the vast potential is yet to be
tapped properly and in some cases over exploited. Gap in scientific knowledge on various
forest resources and products is a major problem for management of resources in the state.
Although considerable amounts of revenue have been collected from forest products where
local people are also directly or indirectly involved in gathering and in some cases marketing
as well, but they have hardly any knowledge on the silvicultural management of various
minor forest products. Except for some well-known commercial species, the information on
distribution of various forest products, their density, regeneration status, yield estimate and
harvesting levels are lacking. There is need to formulate sound management plan that
addresses the knowledge about the life cycle pattern of the species, productivity and yield
estimation techniques.
Monitoring and maintaining of the complex ecosystem is important aspect of bioresource
management. Technical aspects include choice between different methods and techniques and
development of appropriate harvesting and processing technologies. There is also social
aspect of resource management that deal with people, cultures, belief systems, attitudes and
behaviour, ethics, aspirations and social values. As far as the state of Odisha is concerned, all
these aspects should be taken into consideration prior to the formulation of management
strategies. Finally, exercise of administrative power in another important aspect to hold
control over users of resources and decision-making.
For reclamation of degraded forest lands and riparian sites, plantation and ecorestoration
programme may be initiated with prioritize species in relation to ecoregion/ agro-climatic
zones. In riparian sites plantation of bamboo and various species of grass can be initiated to
check erosion. Eco-sensitive zones in the valley should be demarcated and regulations may
be imposed on developmental projects like mega dams, industrial activities, 34 quarrying and
mining in such areas are other important measures of conservation may be initiated.
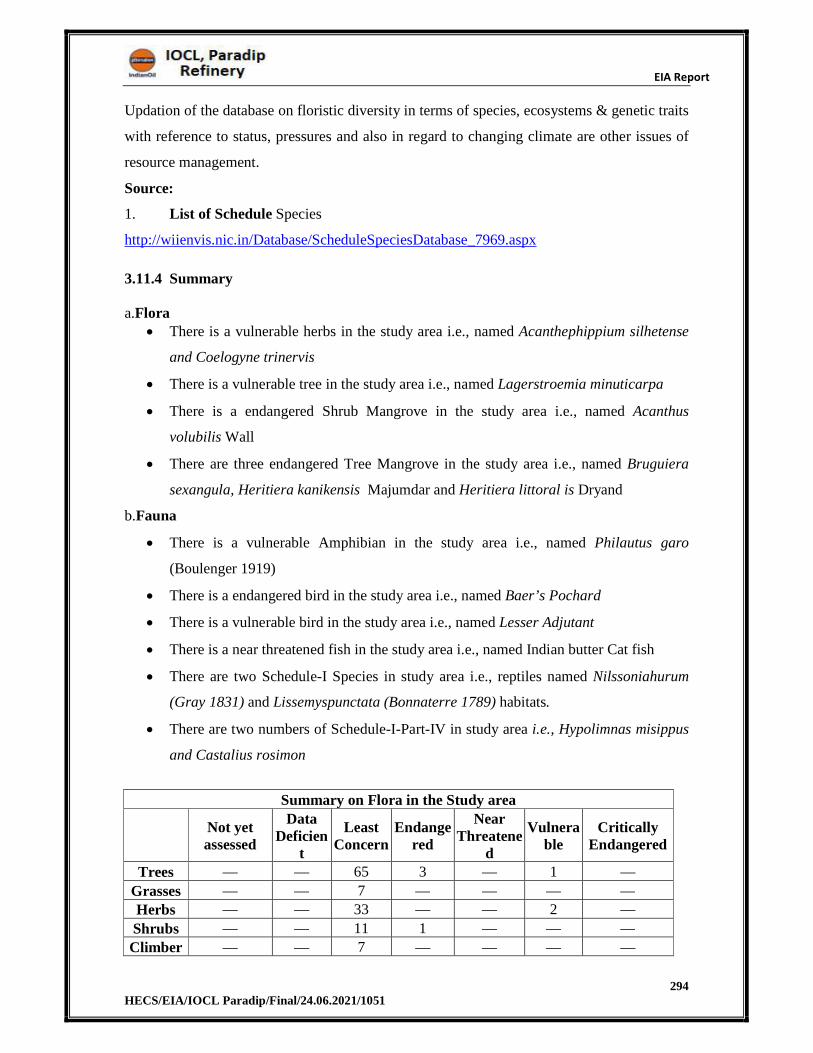
EIA Report
294 HECS/EIA/IOCL Paradip/Final/24.06.2021/1051
Updation of the database on floristic diversity in terms of species, ecosystems & genetic traits
with reference to status, pressures and also in regard to changing climate are other issues of
resource management.
Source:
1. List of Schedule Species
http://wiienvis.nic.in/Database/ScheduleSpeciesDatabase_7969.aspx
3.11.4 Summary
a.Flora There is a vulnerable herbs in the study area i.e., named Acanthephippium silhetense
and Coelogyne trinervis
There is a vulnerable tree in the study area i.e., named Lagerstroemia minuticarpa
There is a endangered Shrub Mangrove in the study area i.e., named Acanthus
volubilis Wall
There are three endangered Tree Mangrove in the study area i.e., named Bruguiera
sexangula, Heritiera kanikensis Majumdar and Heritiera littoral is Dryand
b.Fauna
There is a vulnerable Amphibian in the study area i.e., named Philautus garo
(Boulenger 1919)
There is a endangered bird in the study area i.e., named Baer’s Pochard
There is a vulnerable bird in the study area i.e., named Lesser Adjutant
There is a near threatened fish in the study area i.e., named Indian butter Cat fish
There are two Schedule-I Species in study area i.e., reptiles named Nilssoniahurum
(Gray 1831) and Lissemyspunctata (Bonnaterre 1789) habitats.
There are two numbers of Schedule-I-Part-IV in study area i.e., Hypolimnas misippus
and Castalius rosimon
Summary on Flora in the Study area
Not yet assessed
Data Deficien
t
Least Concern
Endangered
Near Threatene
d
Vulnerable
Critically Endangered
Trees — — 65 3 — 1 —
Grasses — — 7 — — — —
Herbs — — 33 — — 2 —
Shrubs — — 11 1 — — —
Climber — — 7 — — — —
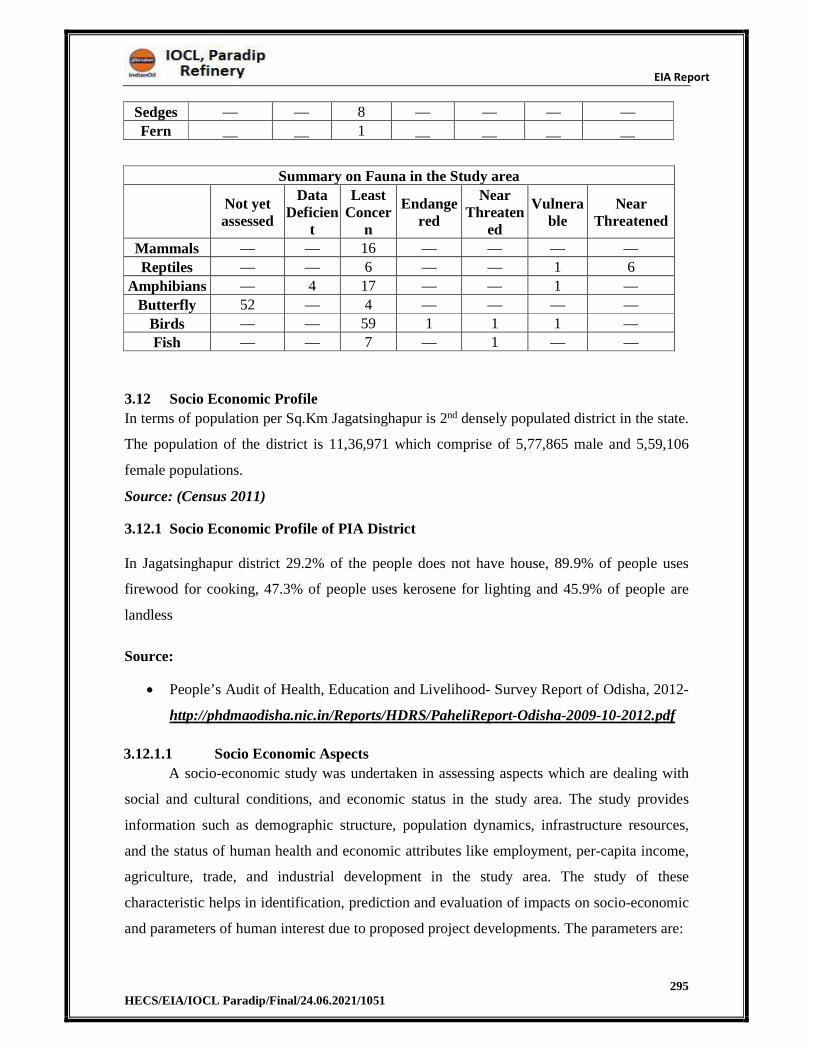
EIA Report
295 HECS/EIA/IOCL Paradip/Final/24.06.2021/1051
Sedges — — 8 — — — —
Fern __ __ 1 __ __ __ __
Summary on Fauna in the Study area
Not yet assessed
Data Deficien
t
Least Concer
n
Endangered
Near Threaten
ed
Vulnerable
Near Threatened
Mammals — — 16 — — — —
Reptiles — — 6 — — 1 6
Amphibians — 4 17 — — 1 —
Butterfly 52 — 4 — — — —
Birds — — 59 1 1 1 —
Fish — — 7 — 1 — —
3.12 Socio Economic Profile
In terms of population per Sq.Km Jagatsinghapur is 2nd densely populated district in the state.
The population of the district is 11,36,971 which comprise of 5,77,865 male and 5,59,106
female populations.
Source: (Census 2011)
3.12.1 Socio Economic Profile of PIA District
In Jagatsinghapur district 29.2% of the people does not have house, 89.9% of people uses
firewood for cooking, 47.3% of people uses kerosene for lighting and 45.9% of people are
landless
Source:
People’s Audit of Health, Education and Livelihood- Survey Report of Odisha, 2012-
http://phdmaodisha.nic.in/Reports/HDRS/PaheliReport-Odisha-2009-10-2012.pdf
3.12.1.1 Socio Economic Aspects
A socio-economic study was undertaken in assessing aspects which are dealing with
social and cultural conditions, and economic status in the study area. The study provides
information such as demographic structure, population dynamics, infrastructure resources,
and the status of human health and economic attributes like employment, per-capita income,
agriculture, trade, and industrial development in the study area. The study of these
characteristic helps in identification, prediction and evaluation of impacts on socio-economic
and parameters of human interest due to proposed project developments. The parameters are:
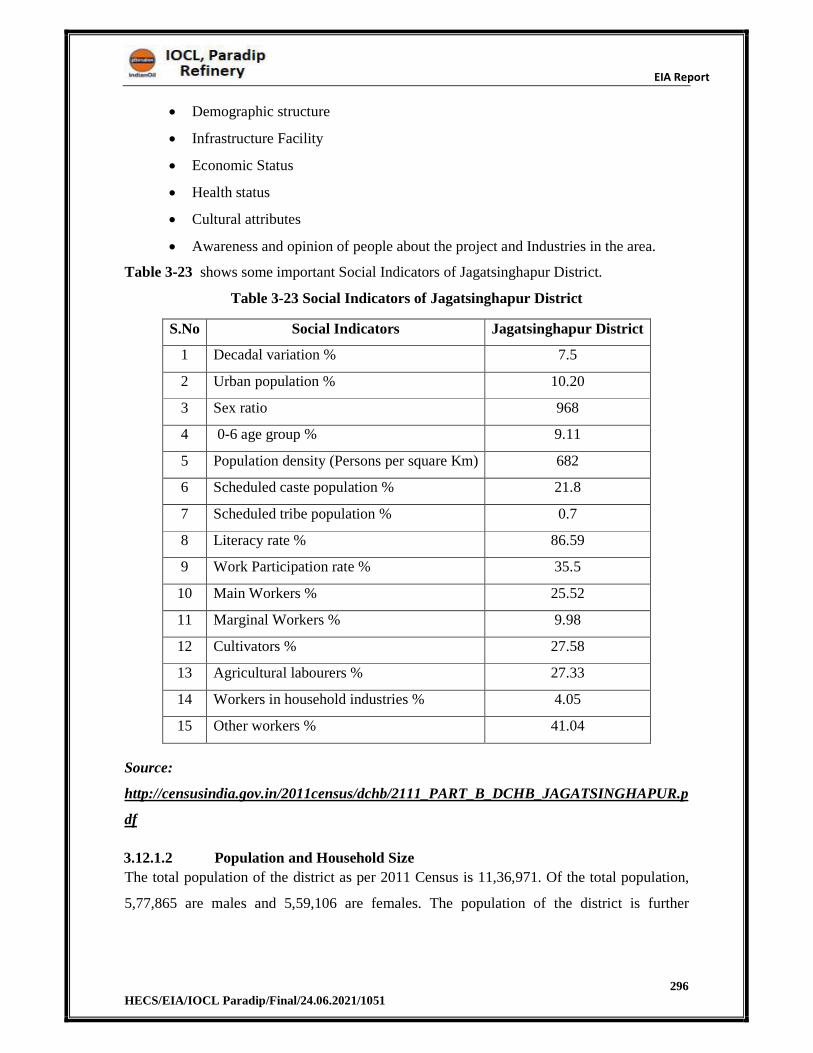
EIA Report
296 HECS/EIA/IOCL Paradip/Final/24.06.2021/1051
Demographic structure
Infrastructure Facility
Economic Status
Health status
Cultural attributes
Awareness and opinion of people about the project and Industries in the area.
Table 3-23 shows some important Social Indicators of Jagatsinghapur District.
Table 3-23 Social Indicators of Jagatsinghapur District
S.No Social Indicators Jagatsinghapur District
1 Decadal variation % 7.5
2 Urban population % 10.20
3 Sex ratio 968
4 0-6 age group % 9.11
5 Population density (Persons per square Km) 682
6 Scheduled caste population % 21.8
7 Scheduled tribe population % 0.7
8 Literacy rate % 86.59
9 Work Participation rate % 35.5
10 Main Workers % 25.52
11 Marginal Workers % 9.98
12 Cultivators % 27.58
13 Agricultural labourers % 27.33
14 Workers in household industries % 4.05
15 Other workers % 41.04
Source:
http://censusindia.gov.in/2011census/dchb/2111_PART_B_DCHB_JAGATSINGHAPUR.p
df
3.12.1.2 Population and Household Size
The total population of the district as per 2011 Census is 11,36,971. Of the total population,
5,77,865 are males and 5,59,106 are females. The population of the district is further
EIA Report
297 HECS/EIA/IOCL Paradip/Final/24.06.2021/1051
distributed as 10,20,991 living in rural areas and 1,15,980 living in urban areas. The total
number of households in the Jagatsinghapur district is 2,60,846.
Source:
http://censusindia.gov.in/2011census/dchb/2111_PART_B_DCHB_JAGATSINGHAPUR.p
df
3.12.1.3 Sex Ratio
The sex ratio is defined as number of females to 1000males. According to 2011 Census, the
sex ratio of the district is 968. The sex ratio of the rural and urban areas of Jagatsinghapur
district is 976 and 900 respectively. The 0-6 age group sex ratio is 9.11 for the district.
Source:
http://censusindia.gov.in/2011census/dchb/2111_PART_B_DCHB_JAGATSINGHAPUR.p
df
3.12.1.4 Scheduled Castes and Scheduled Tribes
Total Scheduled Castes (SCs) population reported in the district is 2,48,152 persons,
constituting about 21.83 percent of total population of the district. Total Scheduled tribe
population reported in the district is 7,862 persons constituting about 0.69 percent of total
population.
Source:
http://censusindia.gov.in/2011census/dchb/2111_PART_B_DCHB_JAGATSINGHAPUR.p
df
3.12.1.5 Education & Literacy
The study of the education and literacy profile in the region is relevant in order to have an
understanding whether the proposed project can utilize skilled human resources available
within the area. According to 2011 census data, the literacy rate in the Jagatsinghapur district
is 86.59 %. The literacy rate has been the major determinant of the rise or fall of the other
indicators. The accessibility of Primary and Upper Primary education has increased the
literacy rate as well as reducing the dropout rate. Table 3-24 Shows the details of education
infrastructures in Jagatsinghapur District.
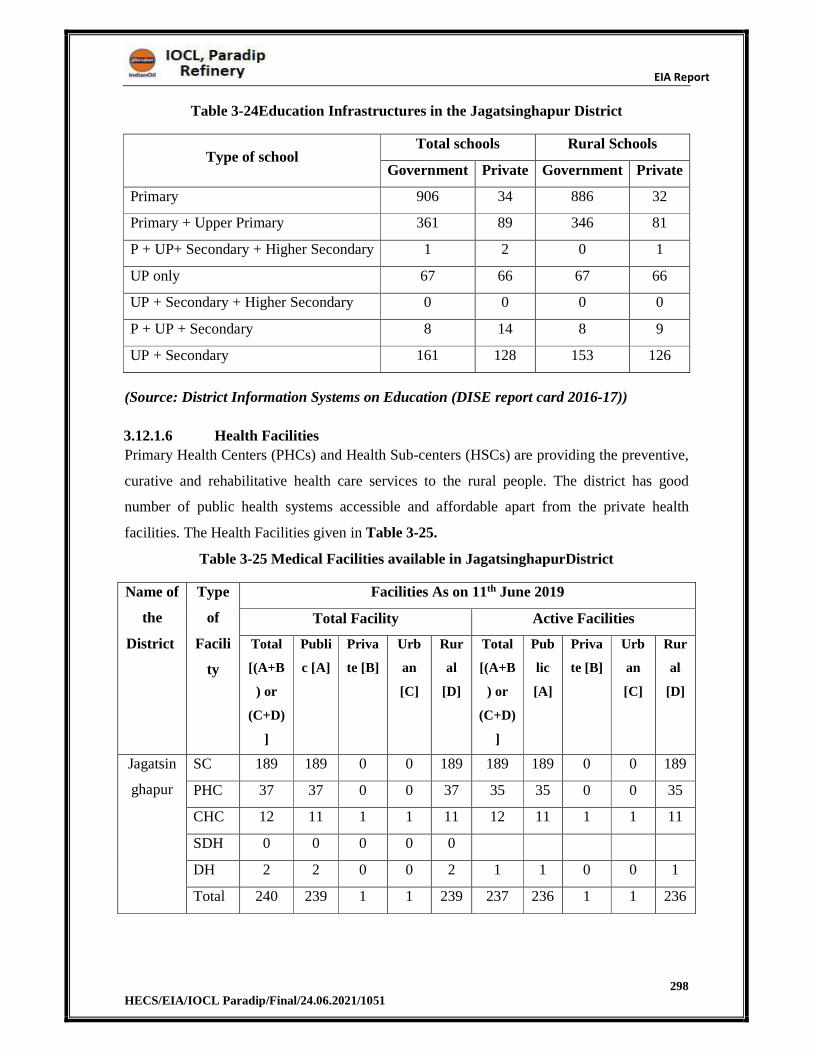
EIA Report
298 HECS/EIA/IOCL Paradip/Final/24.06.2021/1051
Table 3-24Education Infrastructures in the Jagatsinghapur District
Type of school Total schools Rural Schools
Government Private Government Private
Primary 906 34 886 32
Primary + Upper Primary 361 89 346 81
P + UP+ Secondary + Higher Secondary 1 2 0 1
UP only 67 66 67 66
UP + Secondary + Higher Secondary 0 0 0 0
P + UP + Secondary 8 14 8 9
UP + Secondary 161 128 153 126
(Source: District Information Systems on Education (DISE report card 2016-17))
3.12.1.6 Health Facilities
Primary Health Centers (PHCs) and Health Sub-centers (HSCs) are providing the preventive,
curative and rehabilitative health care services to the rural people. The district has good
number of public health systems accessible and affordable apart from the private health
facilities. The Health Facilities given in Table 3-25.
Table 3-25 Medical Facilities available in JagatsinghapurDistrict
Name of
the
District
Type
of
Facili
ty
Facilities As on 11th June 2019
Total Facility Active Facilities
Total
[(A+B
) or
(C+D)
]
Publi
c [A]
Priva
te [B]
Urb
an
[C]
Rur
al
[D]
Total
[(A+B
) or
(C+D)
]
Pub
lic
[A]
Priva
te [B]
Urb
an
[C]
Rur
al
[D]
Jagatsin
ghapur
SC 189 189 0 0 189 189 189 0 0 189
PHC 37 37 0 0 37 35 35 0 0 35
CHC 12 11 1 1 11 12 11 1 1 11
SDH 0 0 0 0 0
DH 2 2 0 0 2 1 1 0 0 1
Total 240 239 1 1 239 237 236 1 1 236
EIA Report
299 HECS/EIA/IOCL Paradip/Final/24.06.2021/1051
(Note: SC – Sub Center; PHC – Primary Health Center; CHC – Community Health Center;
SDH – Sub District Hospital; DH – District Hospital)
(Source: National Health Mission, as on June 11, 2019)
3.12.1.7 Employment and Livelihood
The relevance of economic activity and livelihood pattern is important in the context of the
study
since depending on the existing situation one can predict the impact of the project activity on
the economy of the region. In Jagatsinghapur district, as per the Census 2011, there were a
total of 4,03,649 workers, comprising 1,11,320 cultivators, 1,10,323 agricultural labourers,
16,357 house hold Industry workers and 1,65,649 other workers. A vast majority of the
people living in rural areas mainly depend on agriculture and animal husbandry for their
livelihood.
Source:
http://censusindia.gov.in/2011census/dchb/2111_PART_B_DCHB_JAGATSINGHAPUR.p
df
3.12.2 Socio Economic Profile of study area
Social Economic Profile of the study area
The project area comes under the Jagatsinghapur District of Odisha. Table 3-26 provides the
details on population profile within study area. Table 3-27 show the socio-economic
indicator within the study area.
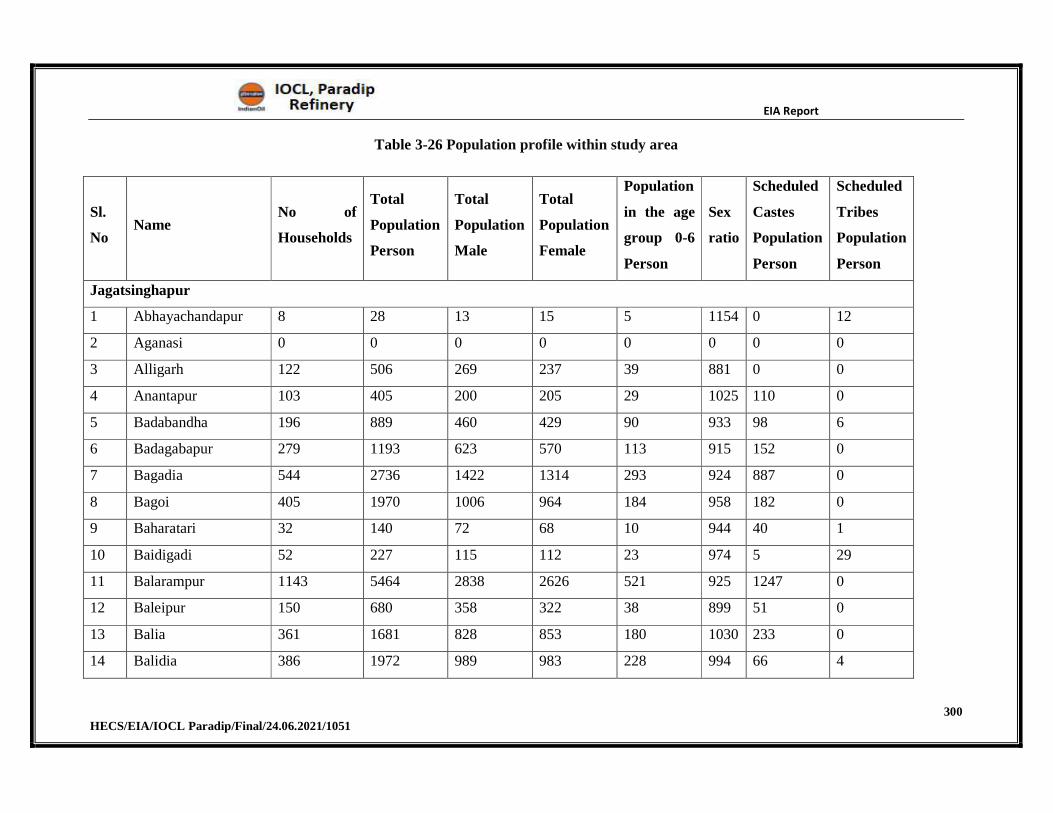
EIA Report
300 HECS/EIA/IOCL Paradip/Final/24.06.2021/1051
Table 3-26 Population profile within study area
Sl.
No Name
No of
Households
Total
Population
Person
Total
Population
Male
Total
Population
Female
Population
in the age
group 0-6
Person
Sex
ratio
Scheduled
Castes
Population
Person
Scheduled
Tribes
Population
Person
Jagatsinghapur
1 Abhayachandapur 8 28 13 15 5 1154 0 12
2 Aganasi 0 0 0 0 0 0 0 0
3 Alligarh 122 506 269 237 39 881 0 0
4 Anantapur 103 405 200 205 29 1025 110 0
5 Badabandha 196 889 460 429 90 933 98 6
6 Badagabapur 279 1193 623 570 113 915 152 0
7 Bagadia 544 2736 1422 1314 293 924 887 0
8 Bagoi 405 1970 1006 964 184 958 182 0
9 Baharatari 32 140 72 68 10 944 40 1
10 Baidigadi 52 227 115 112 23 974 5 29
11 Balarampur 1143 5464 2838 2626 521 925 1247 0
12 Baleipur 150 680 358 322 38 899 51 0
13 Balia 361 1681 828 853 180 1030 233 0
14 Balidia 386 1972 989 983 228 994 66 4
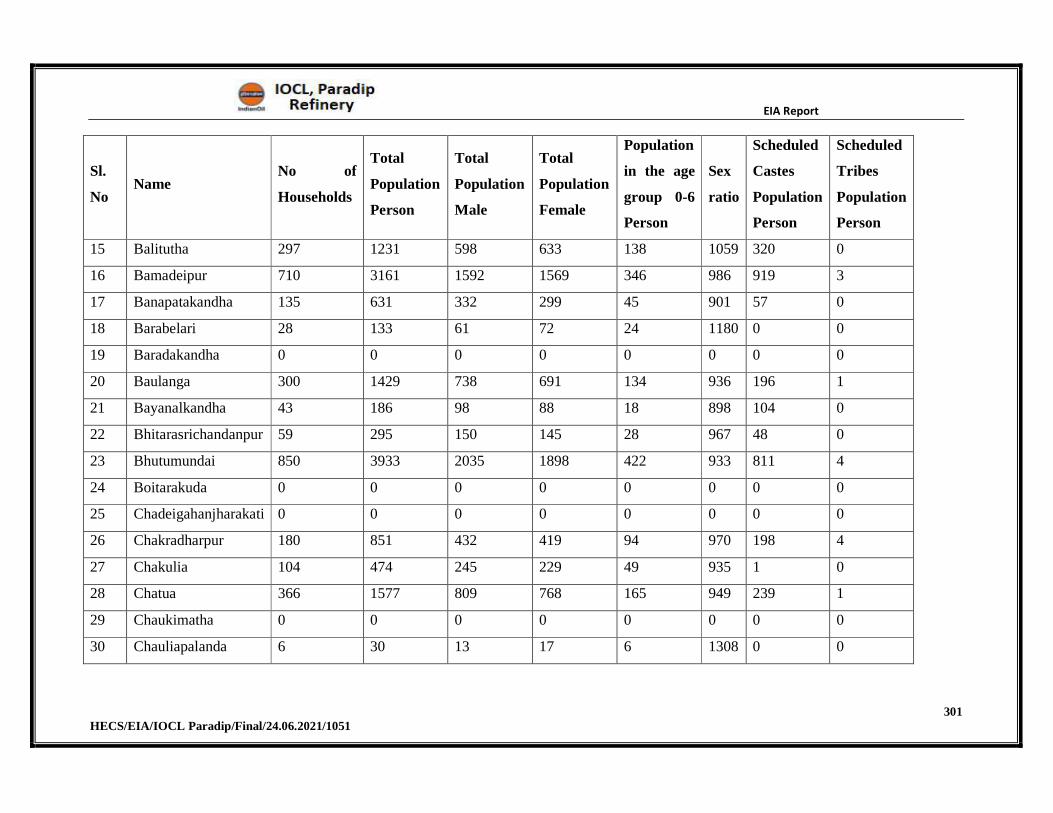
EIA Report
301 HECS/EIA/IOCL Paradip/Final/24.06.2021/1051
Sl.
No Name
No of
Households
Total
Population
Person
Total
Population
Male
Total
Population
Female
Population
in the age
group 0-6
Person
Sex
ratio
Scheduled
Castes
Population
Person
Scheduled
Tribes
Population
Person
15 Balitutha 297 1231 598 633 138 1059 320 0
16 Bamadeipur 710 3161 1592 1569 346 986 919 3
17 Banapatakandha 135 631 332 299 45 901 57 0
18 Barabelari 28 133 61 72 24 1180 0 0
19 Baradakandha 0 0 0 0 0 0 0 0
20 Baulanga 300 1429 738 691 134 936 196 1
21 Bayanalkandha 43 186 98 88 18 898 104 0
22 Bhitarasrichandanpur 59 295 150 145 28 967 48 0
23 Bhutumundai 850 3933 2035 1898 422 933 811 4
24 Boitarakuda 0 0 0 0 0 0 0 0
25 Chadeigahanjharakati 0 0 0 0 0 0 0 0
26 Chakradharpur 180 851 432 419 94 970 198 4
27 Chakulia 104 474 245 229 49 935 1 0
28 Chatua 366 1577 809 768 165 949 239 1
29 Chaukimatha 0 0 0 0 0 0 0 0
30 Chauliapalanda 6 30 13 17 6 1308 0 0
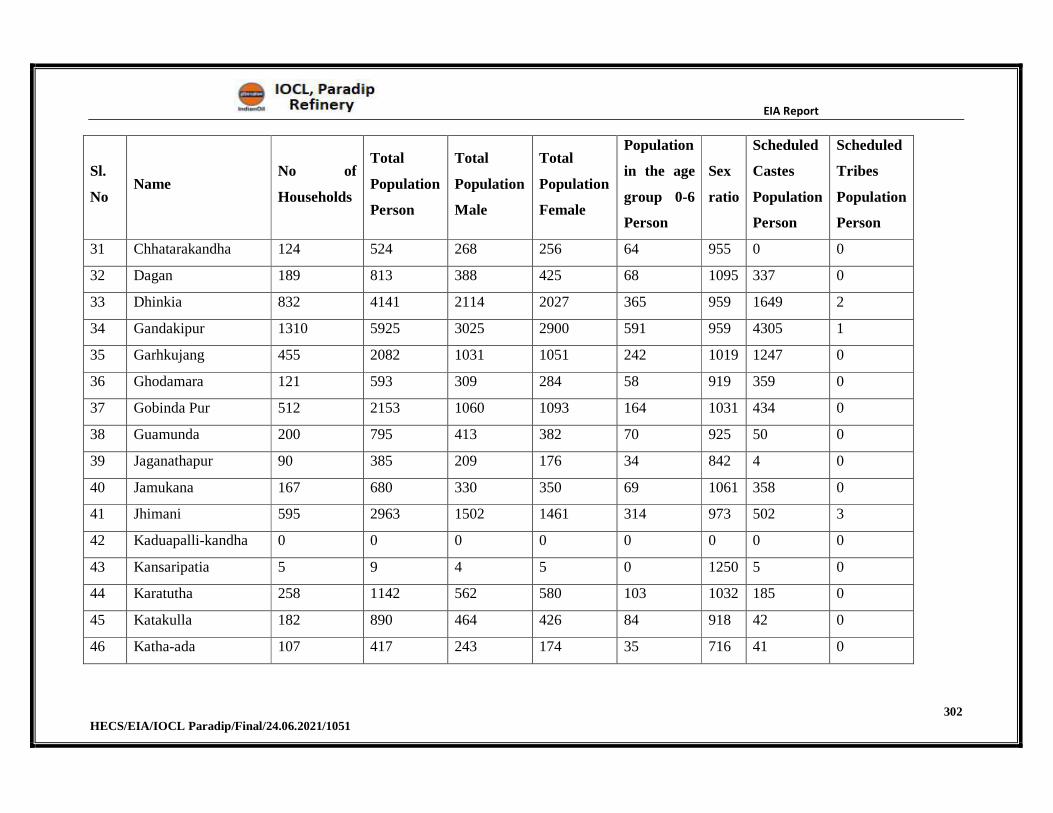
EIA Report
302 HECS/EIA/IOCL Paradip/Final/24.06.2021/1051
Sl.
No Name
No of
Households
Total
Population
Person
Total
Population
Male
Total
Population
Female
Population
in the age
group 0-6
Person
Sex
ratio
Scheduled
Castes
Population
Person
Scheduled
Tribes
Population
Person
31 Chhatarakandha 124 524 268 256 64 955 0 0
32 Dagan 189 813 388 425 68 1095 337 0
33 Dhinkia 832 4141 2114 2027 365 959 1649 2
34 Gandakipur 1310 5925 3025 2900 591 959 4305 1
35 Garhkujang 455 2082 1031 1051 242 1019 1247 0
36 Ghodamara 121 593 309 284 58 919 359 0
37 Gobinda Pur 512 2153 1060 1093 164 1031 434 0
38 Guamunda 200 795 413 382 70 925 50 0
39 Jaganathapur 90 385 209 176 34 842 4 0
40 Jamukana 167 680 330 350 69 1061 358 0
41 Jhimani 595 2963 1502 1461 314 973 502 3
42 Kaduapalli-kandha 0 0 0 0 0 0 0 0
43 Kansaripatia 5 9 4 5 0 1250 5 0
44 Karatutha 258 1142 562 580 103 1032 185 0
45 Katakulla 182 890 464 426 84 918 42 0
46 Katha-ada 107 417 243 174 35 716 41 0
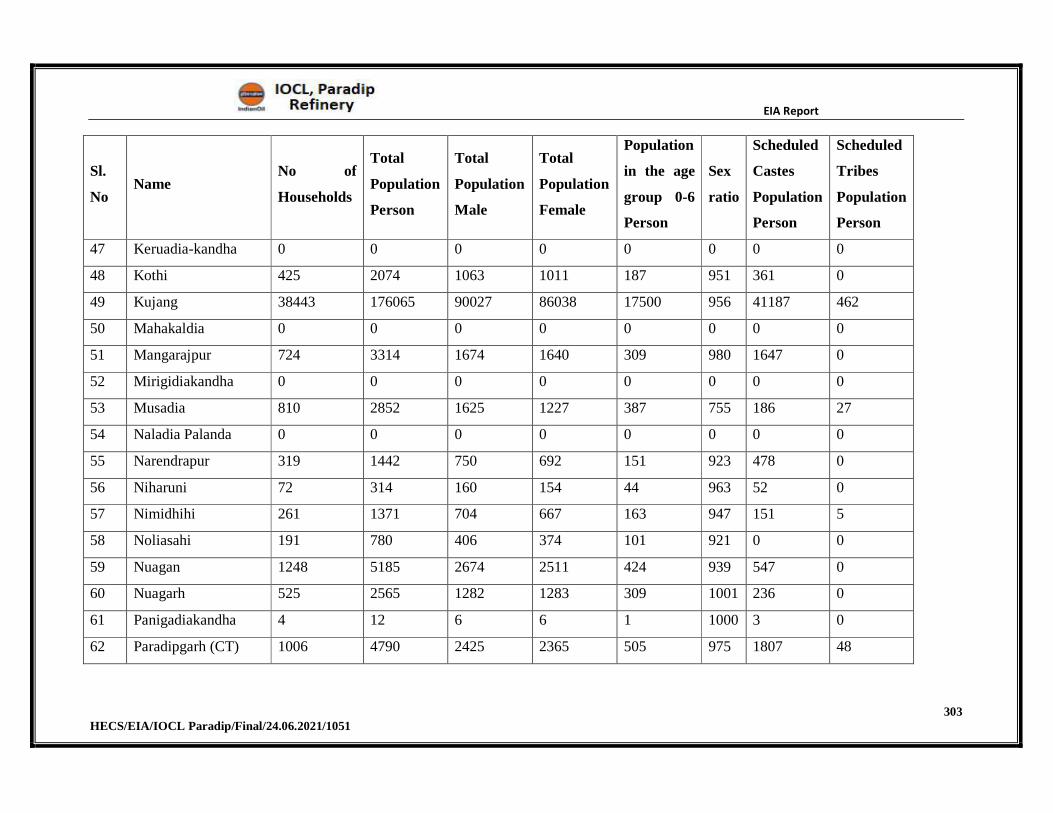
EIA Report
303 HECS/EIA/IOCL Paradip/Final/24.06.2021/1051
Sl.
No Name
No of
Households
Total
Population
Person
Total
Population
Male
Total
Population
Female
Population
in the age
group 0-6
Person
Sex
ratio
Scheduled
Castes
Population
Person
Scheduled
Tribes
Population
Person
47 Keruadia-kandha 0 0 0 0 0 0 0 0
48 Kothi 425 2074 1063 1011 187 951 361 0
49 Kujang 38443 176065 90027 86038 17500 956 41187 462
50 Mahakaldia 0 0 0 0 0 0 0 0
51 Mangarajpur 724 3314 1674 1640 309 980 1647 0
52 Mirigidiakandha 0 0 0 0 0 0 0 0
53 Musadia 810 2852 1625 1227 387 755 186 27
54 Naladia Palanda 0 0 0 0 0 0 0 0
55 Narendrapur 319 1442 750 692 151 923 478 0
56 Niharuni 72 314 160 154 44 963 52 0
57 Nimidhihi 261 1371 704 667 163 947 151 5
58 Noliasahi 191 780 406 374 101 921 0 0
59 Nuagan 1248 5185 2674 2511 424 939 547 0
60 Nuagarh 525 2565 1282 1283 309 1001 236 0
61 Panigadiakandha 4 12 6 6 1 1000 3 0
62 Paradipgarh (CT) 1006 4790 2425 2365 505 975 1807 48
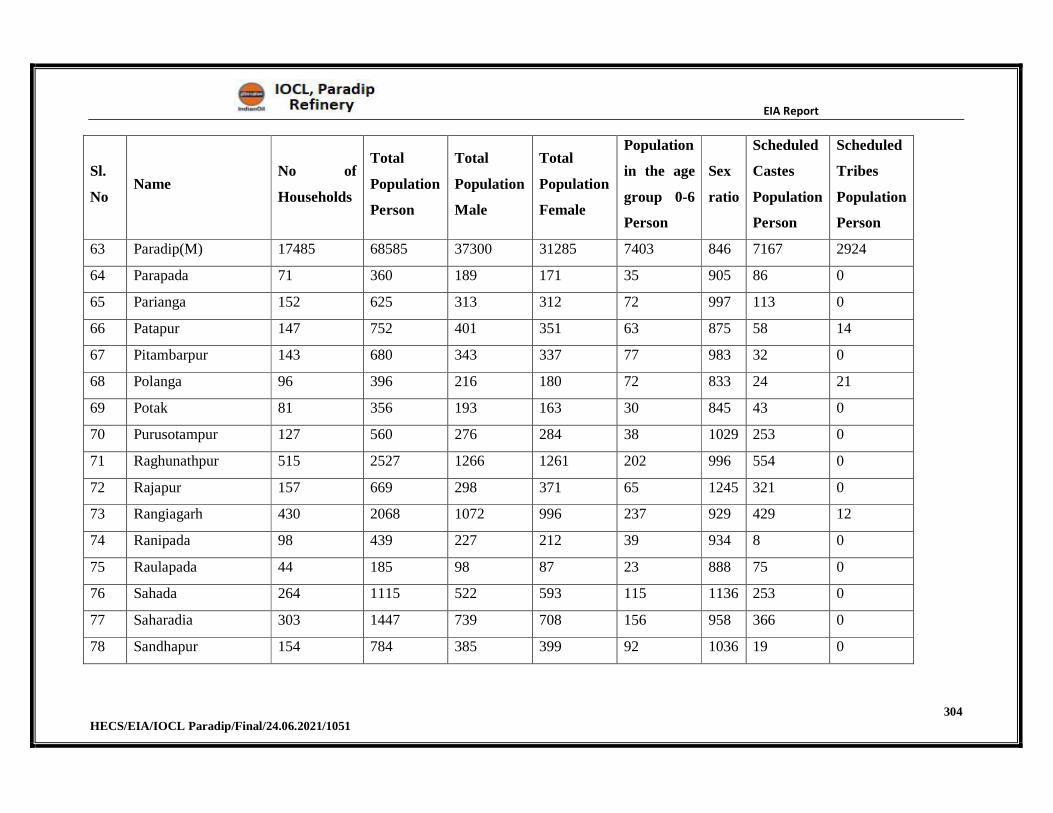
EIA Report
304 HECS/EIA/IOCL Paradip/Final/24.06.2021/1051
Sl.
No Name
No of
Households
Total
Population
Person
Total
Population
Male
Total
Population
Female
Population
in the age
group 0-6
Person
Sex
ratio
Scheduled
Castes
Population
Person
Scheduled
Tribes
Population
Person
63 Paradip(M) 17485 68585 37300 31285 7403 846 7167 2924
64 Parapada 71 360 189 171 35 905 86 0
65 Parianga 152 625 313 312 72 997 113 0
66 Patapur 147 752 401 351 63 875 58 14
67 Pitambarpur 143 680 343 337 77 983 32 0
68 Polanga 96 396 216 180 72 833 24 21
69 Potak 81 356 193 163 30 845 43 0
70 Purusotampur 127 560 276 284 38 1029 253 0
71 Raghunathpur 515 2527 1266 1261 202 996 554 0
72 Rajapur 157 669 298 371 65 1245 321 0
73 Rangiagarh 430 2068 1072 996 237 929 429 12
74 Ranipada 98 439 227 212 39 934 8 0
75 Raulapada 44 185 98 87 23 888 75 0
76 Sahada 264 1115 522 593 115 1136 253 0
77 Saharadia 303 1447 739 708 156 958 366 0
78 Sandhapur 154 784 385 399 92 1036 19 0
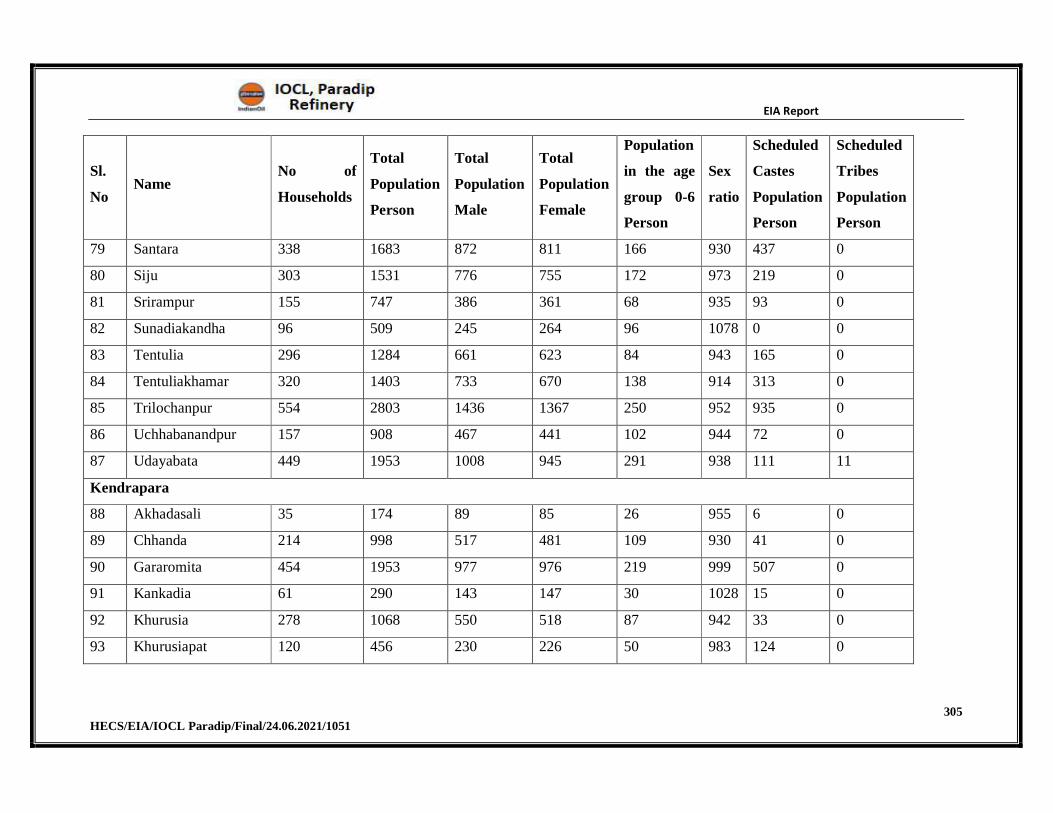
EIA Report
305 HECS/EIA/IOCL Paradip/Final/24.06.2021/1051
Sl.
No Name
No of
Households
Total
Population
Person
Total
Population
Male
Total
Population
Female
Population
in the age
group 0-6
Person
Sex
ratio
Scheduled
Castes
Population
Person
Scheduled
Tribes
Population
Person
79 Santara 338 1683 872 811 166 930 437 0
80 Siju 303 1531 776 755 172 973 219 0
81 Srirampur 155 747 386 361 68 935 93 0
82 Sunadiakandha 96 509 245 264 96 1078 0 0
83 Tentulia 296 1284 661 623 84 943 165 0
84 Tentuliakhamar 320 1403 733 670 138 914 313 0
85 Trilochanpur 554 2803 1436 1367 250 952 935 0
86 Uchhabanandpur 157 908 467 441 102 944 72 0
87 Udayabata 449 1953 1008 945 291 938 111 11
Kendrapara
88 Akhadasali 35 174 89 85 26 955 6 0
89 Chhanda 214 998 517 481 109 930 41 0
90 Gararomita 454 1953 977 976 219 999 507 0
91 Kankadia 61 290 143 147 30 1028 15 0
92 Khurusia 278 1068 550 518 87 942 33 0
93 Khurusiapat 120 456 230 226 50 983 124 0
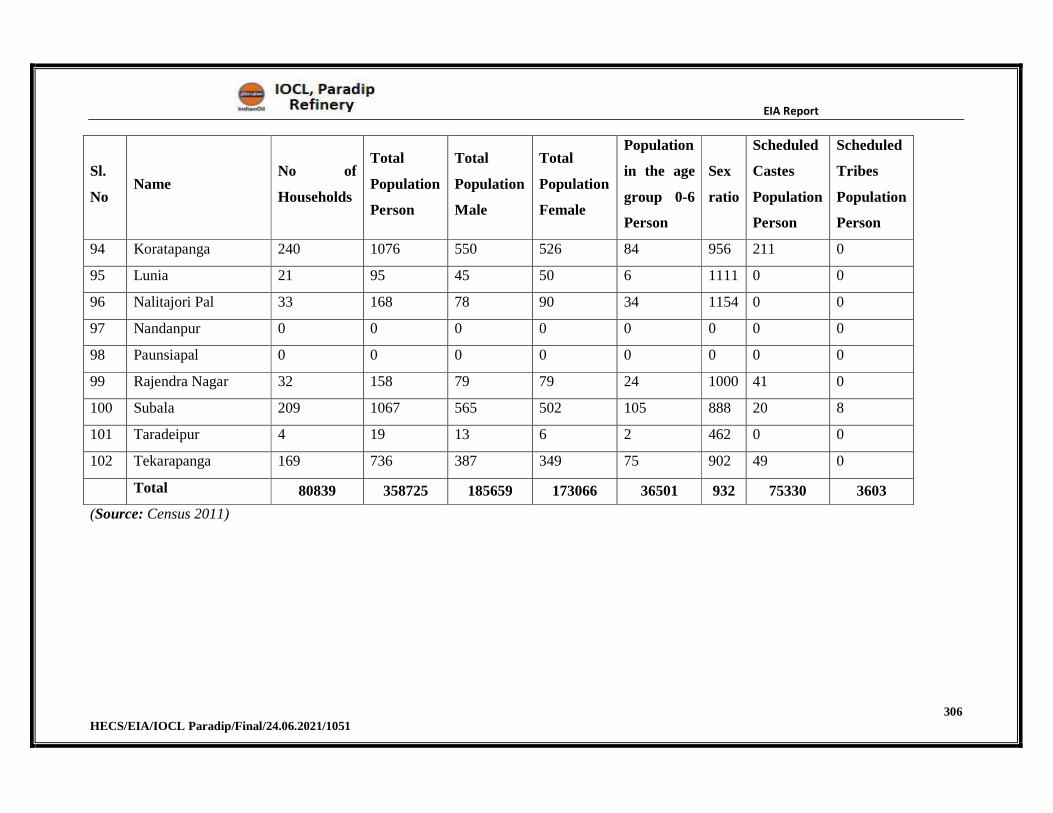
EIA Report
306 HECS/EIA/IOCL Paradip/Final/24.06.2021/1051
Sl.
No Name
No of
Households
Total
Population
Person
Total
Population
Male
Total
Population
Female
Population
in the age
group 0-6
Person
Sex
ratio
Scheduled
Castes
Population
Person
Scheduled
Tribes
Population
Person
94 Koratapanga 240 1076 550 526 84 956 211 0
95 Lunia 21 95 45 50 6 1111 0 0
96 Nalitajori Pal 33 168 78 90 34 1154 0 0
97 Nandanpur 0 0 0 0 0 0 0 0
98 Paunsiapal 0 0 0 0 0 0 0 0
99 Rajendra Nagar 32 158 79 79 24 1000 41 0
100 Subala 209 1067 565 502 105 888 20 8
101 Taradeipur 4 19 13 6 2 462 0 0
102 Tekarapanga 169 736 387 349 75 902 49 0
Total 80839 358725 185659 173066 36501 932 75330 3603
(Source: Census 2011)
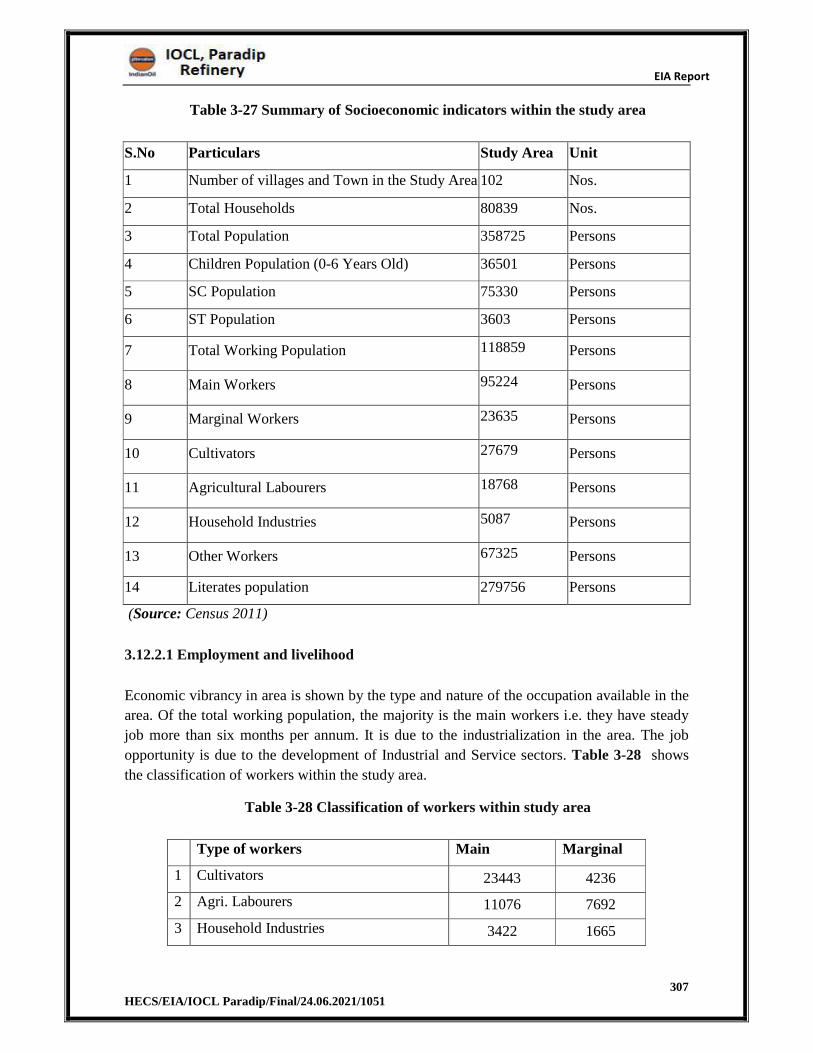
EIA Report
307 HECS/EIA/IOCL Paradip/Final/24.06.2021/1051
Table 3-27 Summary of Socioeconomic indicators within the study area
S.No Particulars Study Area Unit
1 Number of villages and Town in the Study Area 102 Nos.
2 Total Households 80839 Nos.
3 Total Population 358725 Persons
4 Children Population (0-6 Years Old) 36501 Persons
5 SC Population 75330 Persons
6 ST Population 3603 Persons
7 Total Working Population 118859 Persons
8 Main Workers 95224 Persons
9 Marginal Workers 23635 Persons
10 Cultivators 27679 Persons
11 Agricultural Labourers 18768 Persons
12 Household Industries 5087 Persons
13 Other Workers 67325 Persons
14 Literates population 279756 Persons
(Source: Census 2011)
3.12.2.1 Employment and livelihood
Economic vibrancy in area is shown by the type and nature of the occupation available in the
area. Of the total working population, the majority is the main workers i.e. they have steady
job more than six months per annum. It is due to the industrialization in the area. The job
opportunity is due to the development of Industrial and Service sectors. Table 3-28 shows
the classification of workers within the study area.
Table 3-28 Classification of workers within study area
Type of workers Main Marginal
1 Cultivators 23443 4236
2 Agri. Labourers 11076 7692
3 Household Industries 3422 1665
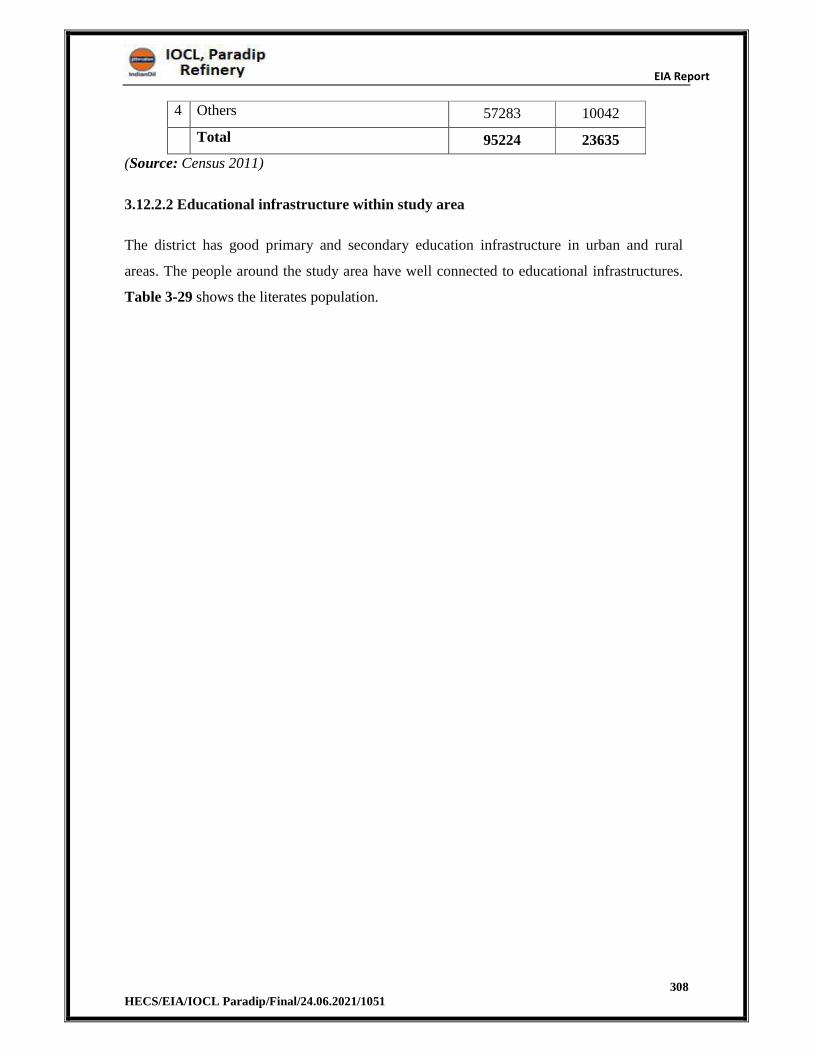
EIA Report
308 HECS/EIA/IOCL Paradip/Final/24.06.2021/1051
4 Others 57283 10042
Total 95224 23635
(Source: Census 2011)
3.12.2.2 Educational infrastructure within study area
The district has good primary and secondary education infrastructure in urban and rural
areas. The people around the study area have well connected to educational infrastructures.
Table 3-29 shows the literates population.
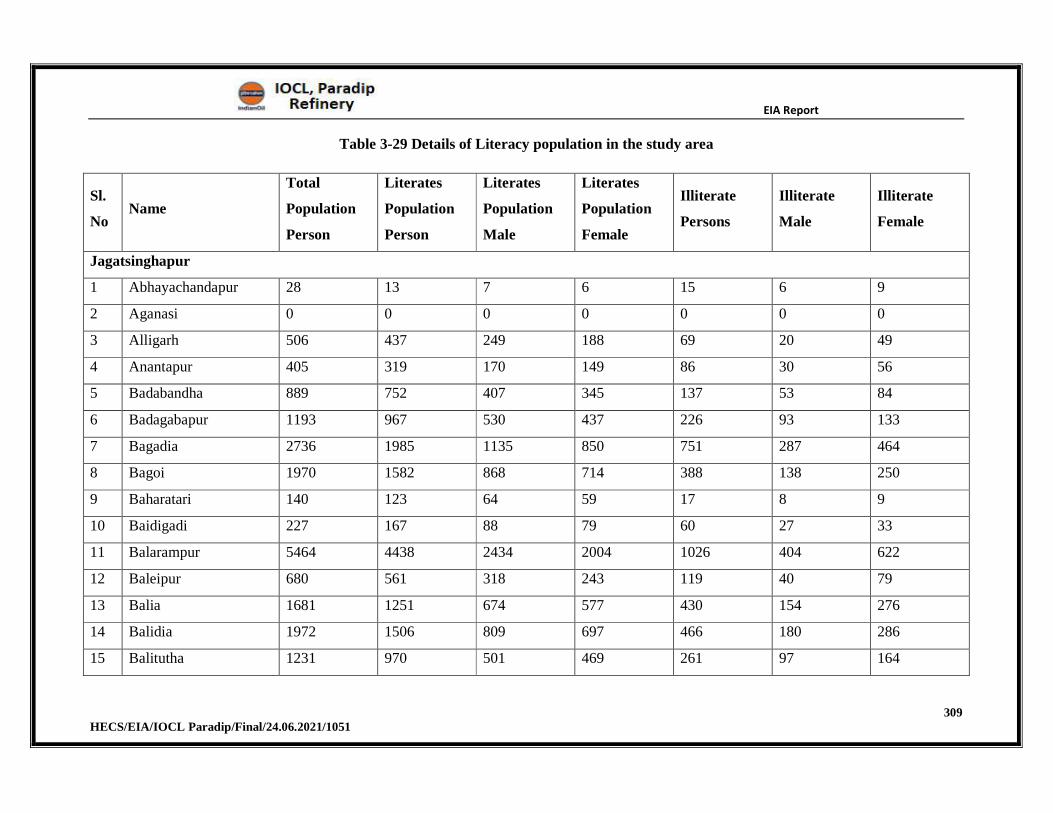
EIA Report
309 HECS/EIA/IOCL Paradip/Final/24.06.2021/1051
Table 3-29 Details of Literacy population in the study area
Sl.
No Name
Total
Population
Person
Literates
Population
Person
Literates
Population
Male
Literates
Population
Female
Illiterate
Persons
Illiterate
Male
Illiterate
Female
Jagatsinghapur
1 Abhayachandapur 28 13 7 6 15 6 9
2 Aganasi 0 0 0 0 0 0 0
3 Alligarh 506 437 249 188 69 20 49
4 Anantapur 405 319 170 149 86 30 56
5 Badabandha 889 752 407 345 137 53 84
6 Badagabapur 1193 967 530 437 226 93 133
7 Bagadia 2736 1985 1135 850 751 287 464
8 Bagoi 1970 1582 868 714 388 138 250
9 Baharatari 140 123 64 59 17 8 9
10 Baidigadi 227 167 88 79 60 27 33
11 Balarampur 5464 4438 2434 2004 1026 404 622
12 Baleipur 680 561 318 243 119 40 79
13 Balia 1681 1251 674 577 430 154 276
14 Balidia 1972 1506 809 697 466 180 286
15 Balitutha 1231 970 501 469 261 97 164

EIA Report
310 HECS/EIA/IOCL Paradip/Final/24.06.2021/1051
Sl.
No Name
Total
Population
Person
Literates
Population
Person
Literates
Population
Male
Literates
Population
Female
Illiterate
Persons
Illiterate
Male
Illiterate
Female
16 Bamadeipur 3161 2362 1282 1080 799 310 489
17 Banapatakandha 631 538 296 242 93 36 57
18 Barabelari 133 87 52 35 46 9 37
19 Baradakandha 0 0 0 0 0 0 0
20 Baulanga 1429 1148 618 530 281 120 161
21 Bayanalkandha 186 130 75 55 56 23 33
22 Bhitarasrichandanpur 295 231 126 105 64 24 40
23 Bhutumundai 3933 3001 1676 1325 932 359 573
24 Boitarakuda 0 0 0 0 0 0 0
25 Chadeigahanjharakati 0 0 0 0 0 0 0
26 Chakradharpur 851 720 383 337 131 49 82
27 Chakulia 474 410 219 191 64 26 38
28 Chatua 1577 1220 665 555 357 144 213
29 Chaukimatha 0 0 0 0 0 0 0
30 Chauliapalanda 30 22 10 12 8 3 5
31 Chhatarakandha 524 407 226 181 117 42 75
32 Dagan 813 597 299 298 216 89 127
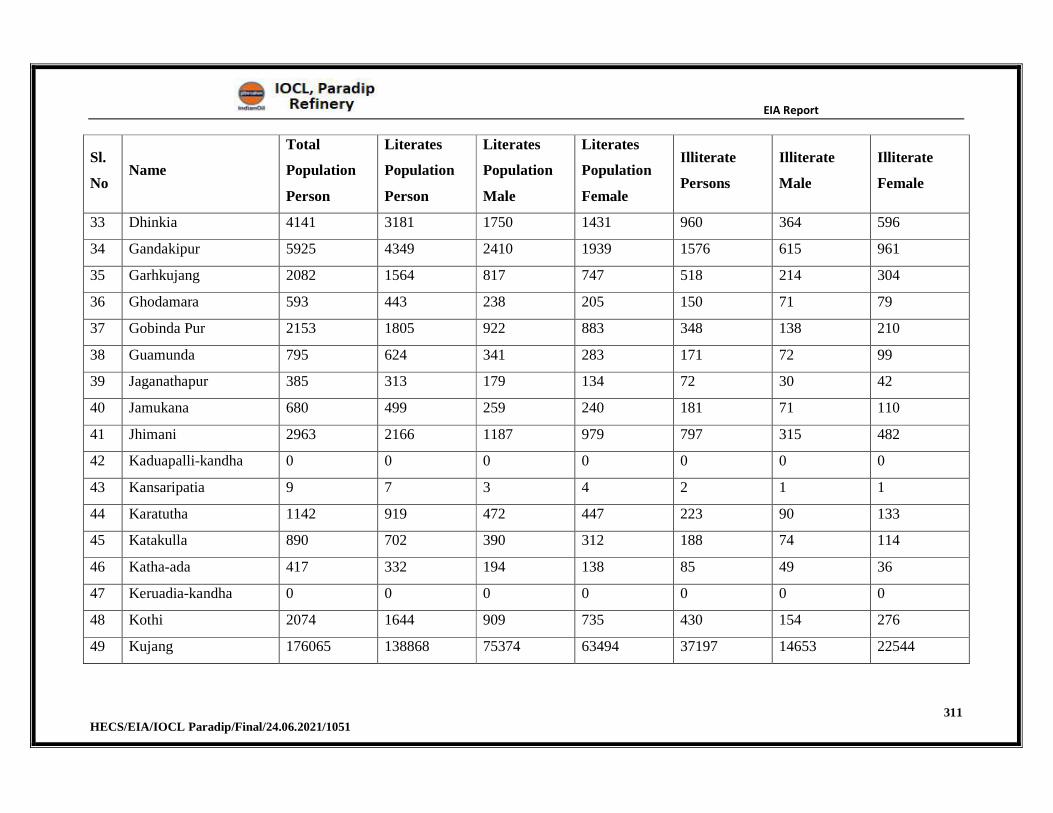
EIA Report
311 HECS/EIA/IOCL Paradip/Final/24.06.2021/1051
Sl.
No Name
Total
Population
Person
Literates
Population
Person
Literates
Population
Male
Literates
Population
Female
Illiterate
Persons
Illiterate
Male
Illiterate
Female
33 Dhinkia 4141 3181 1750 1431 960 364 596
34 Gandakipur 5925 4349 2410 1939 1576 615 961
35 Garhkujang 2082 1564 817 747 518 214 304
36 Ghodamara 593 443 238 205 150 71 79
37 Gobinda Pur 2153 1805 922 883 348 138 210
38 Guamunda 795 624 341 283 171 72 99
39 Jaganathapur 385 313 179 134 72 30 42
40 Jamukana 680 499 259 240 181 71 110
41 Jhimani 2963 2166 1187 979 797 315 482
42 Kaduapalli-kandha 0 0 0 0 0 0 0
43 Kansaripatia 9 7 3 4 2 1 1
44 Karatutha 1142 919 472 447 223 90 133
45 Katakulla 890 702 390 312 188 74 114
46 Katha-ada 417 332 194 138 85 49 36
47 Keruadia-kandha 0 0 0 0 0 0 0
48 Kothi 2074 1644 909 735 430 154 276
49 Kujang 176065 138868 75374 63494 37197 14653 22544
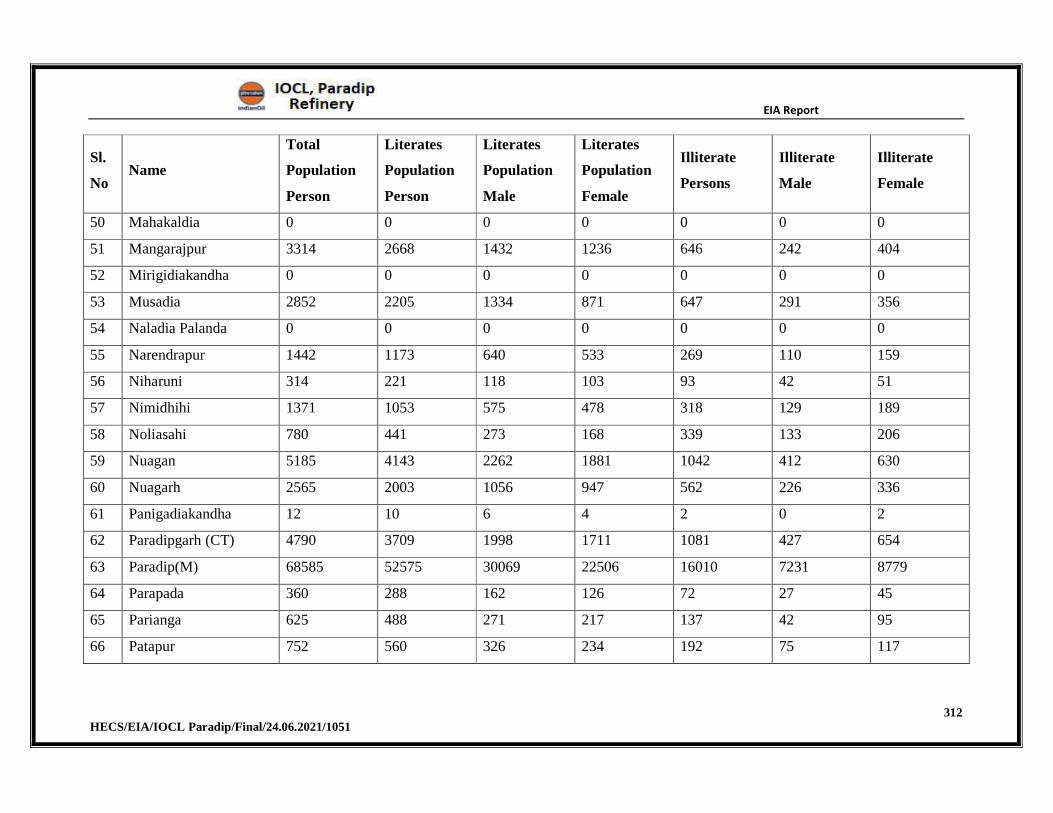
EIA Report
312 HECS/EIA/IOCL Paradip/Final/24.06.2021/1051
Sl.
No Name
Total
Population
Person
Literates
Population
Person
Literates
Population
Male
Literates
Population
Female
Illiterate
Persons
Illiterate
Male
Illiterate
Female
50 Mahakaldia 0 0 0 0 0 0 0
51 Mangarajpur 3314 2668 1432 1236 646 242 404
52 Mirigidiakandha 0 0 0 0 0 0 0
53 Musadia 2852 2205 1334 871 647 291 356
54 Naladia Palanda 0 0 0 0 0 0 0
55 Narendrapur 1442 1173 640 533 269 110 159
56 Niharuni 314 221 118 103 93 42 51
57 Nimidhihi 1371 1053 575 478 318 129 189
58 Noliasahi 780 441 273 168 339 133 206
59 Nuagan 5185 4143 2262 1881 1042 412 630
60 Nuagarh 2565 2003 1056 947 562 226 336
61 Panigadiakandha 12 10 6 4 2 0 2
62 Paradipgarh (CT) 4790 3709 1998 1711 1081 427 654
63 Paradip(M) 68585 52575 30069 22506 16010 7231 8779
64 Parapada 360 288 162 126 72 27 45
65 Parianga 625 488 271 217 137 42 95
66 Patapur 752 560 326 234 192 75 117
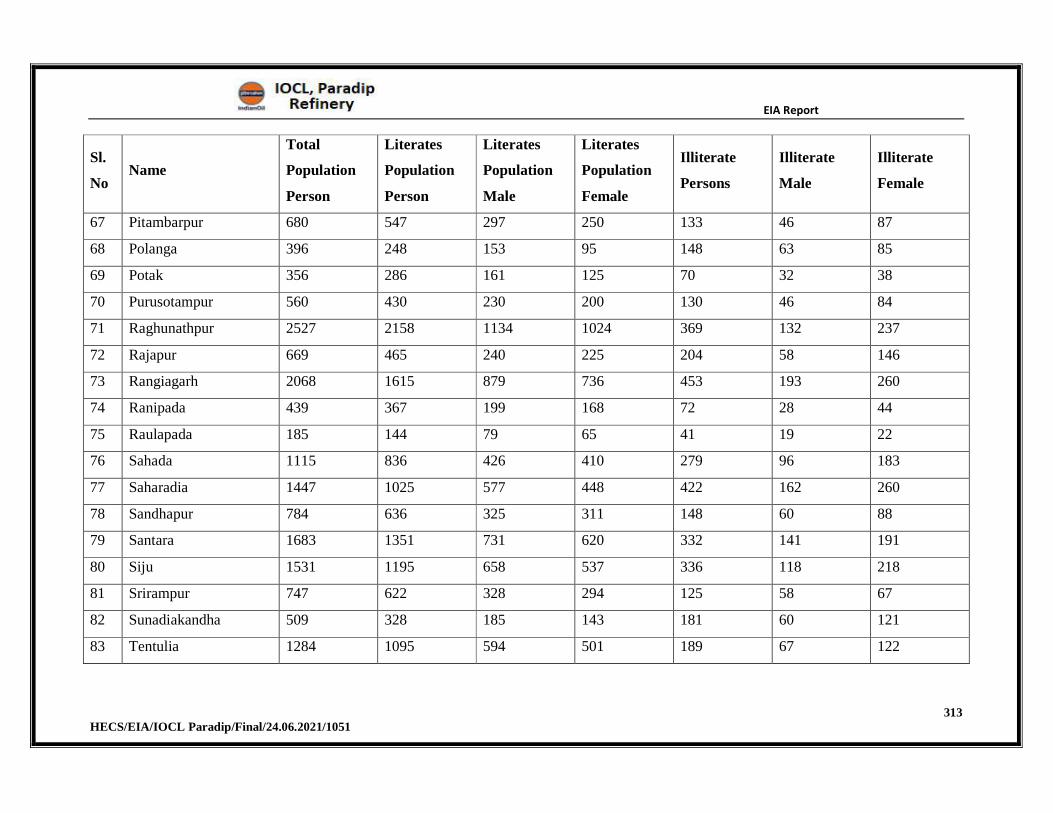
EIA Report
313 HECS/EIA/IOCL Paradip/Final/24.06.2021/1051
Sl.
No Name
Total
Population
Person
Literates
Population
Person
Literates
Population
Male
Literates
Population
Female
Illiterate
Persons
Illiterate
Male
Illiterate
Female
67 Pitambarpur 680 547 297 250 133 46 87
68 Polanga 396 248 153 95 148 63 85
69 Potak 356 286 161 125 70 32 38
70 Purusotampur 560 430 230 200 130 46 84
71 Raghunathpur 2527 2158 1134 1024 369 132 237
72 Rajapur 669 465 240 225 204 58 146
73 Rangiagarh 2068 1615 879 736 453 193 260
74 Ranipada 439 367 199 168 72 28 44
75 Raulapada 185 144 79 65 41 19 22
76 Sahada 1115 836 426 410 279 96 183
77 Saharadia 1447 1025 577 448 422 162 260
78 Sandhapur 784 636 325 311 148 60 88
79 Santara 1683 1351 731 620 332 141 191
80 Siju 1531 1195 658 537 336 118 218
81 Srirampur 747 622 328 294 125 58 67
82 Sunadiakandha 509 328 185 143 181 60 121
83 Tentulia 1284 1095 594 501 189 67 122
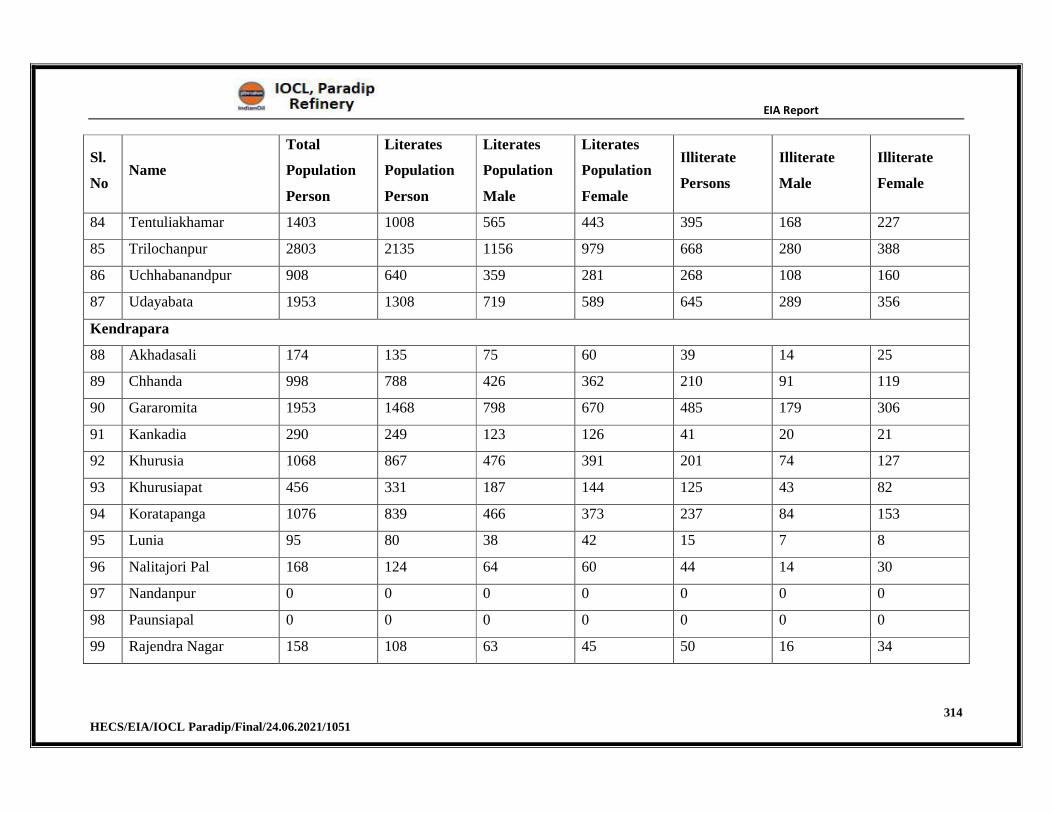
EIA Report
314 HECS/EIA/IOCL Paradip/Final/24.06.2021/1051
Sl.
No Name
Total
Population
Person
Literates
Population
Person
Literates
Population
Male
Literates
Population
Female
Illiterate
Persons
Illiterate
Male
Illiterate
Female
84 Tentuliakhamar 1403 1008 565 443 395 168 227
85 Trilochanpur 2803 2135 1156 979 668 280 388
86 Uchhabanandpur 908 640 359 281 268 108 160
87 Udayabata 1953 1308 719 589 645 289 356
Kendrapara
88 Akhadasali 174 135 75 60 39 14 25
89 Chhanda 998 788 426 362 210 91 119
90 Gararomita 1953 1468 798 670 485 179 306
91 Kankadia 290 249 123 126 41 20 21
92 Khurusia 1068 867 476 391 201 74 127
93 Khurusiapat 456 331 187 144 125 43 82
94 Koratapanga 1076 839 466 373 237 84 153
95 Lunia 95 80 38 42 15 7 8
96 Nalitajori Pal 168 124 64 60 44 14 30
97 Nandanpur 0 0 0 0 0 0 0
98 Paunsiapal 0 0 0 0 0 0 0
99 Rajendra Nagar 158 108 63 45 50 16 34
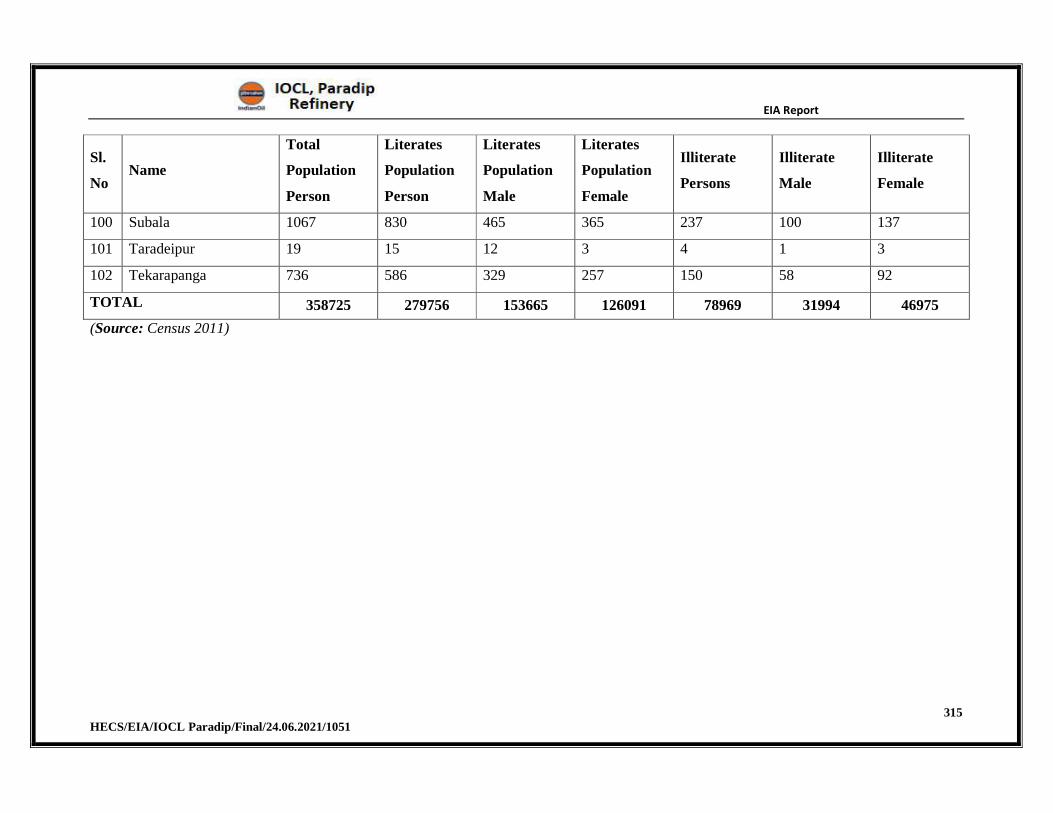
EIA Report
315 HECS/EIA/IOCL Paradip/Final/24.06.2021/1051
Sl.
No Name
Total
Population
Person
Literates
Population
Person
Literates
Population
Male
Literates
Population
Female
Illiterate
Persons
Illiterate
Male
Illiterate
Female
100 Subala 1067 830 465 365 237 100 137
101 Taradeipur 19 15 12 3 4 1 3
102 Tekarapanga 736 586 329 257 150 58 92
TOTAL 358725 279756 153665 126091 78969 31994 46975
(Source: Census 2011)
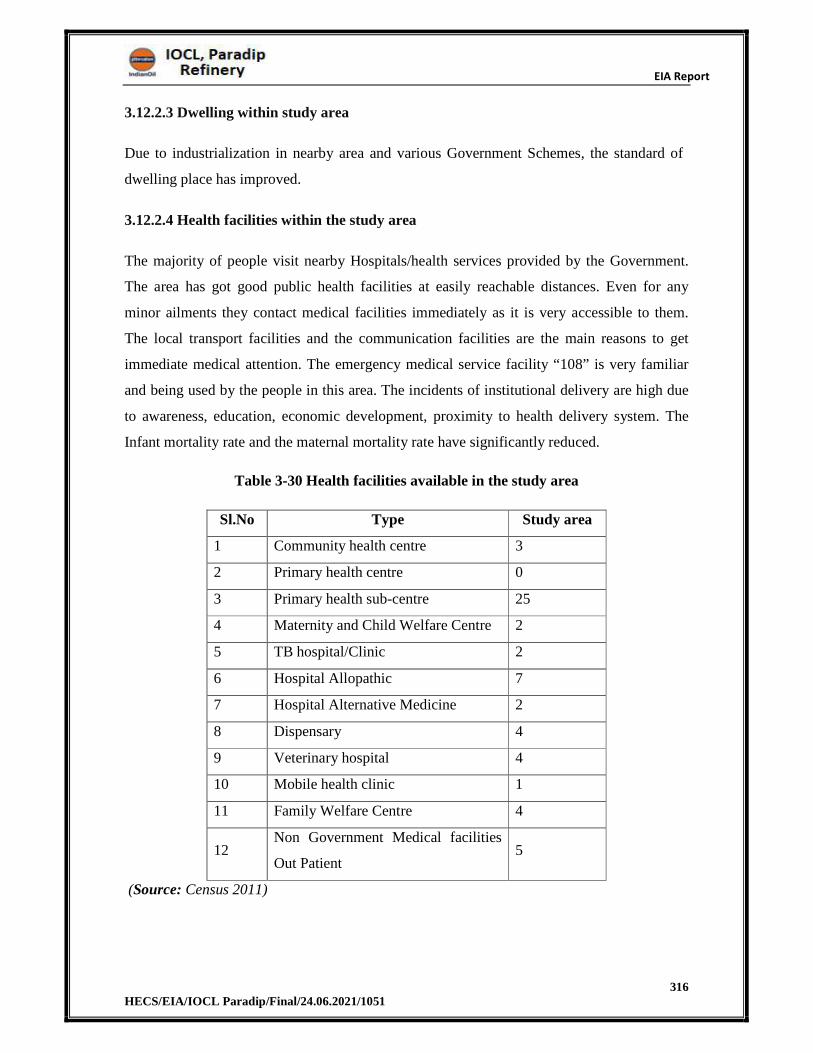
EIA Report
316 HECS/EIA/IOCL Paradip/Final/24.06.2021/1051
3.12.2.3 Dwelling within study area
Due to industrialization in nearby area and various Government Schemes, the standard of
dwelling place has improved.
3.12.2.4 Health facilities within the study area
The majority of people visit nearby Hospitals/health services provided by the Government.
The area has got good public health facilities at easily reachable distances. Even for any
minor ailments they contact medical facilities immediately as it is very accessible to them.
The local transport facilities and the communication facilities are the main reasons to get
immediate medical attention. The emergency medical service facility “108” is very familiar
and being used by the people in this area. The incidents of institutional delivery are high due
to awareness, education, economic development, proximity to health delivery system. The
Infant mortality rate and the maternal mortality rate have significantly reduced.
Table 3-30 Health facilities available in the study area
Sl.No Type Study area
1 Community health centre 3
2 Primary health centre 0
3 Primary health sub-centre 25
4 Maternity and Child Welfare Centre 2
5 TB hospital/Clinic 2
6 Hospital Allopathic 7
7 Hospital Alternative Medicine 2
8 Dispensary 4
9 Veterinary hospital 4
10 Mobile health clinic 1
11 Family Welfare Centre 4
12 Non Government Medical facilities
Out Patient 5
(Source: Census 2011)
EIA Report
317 HECS/EIA/IOCL Paradip/Final/24.06.2021/1051
3.12.3 Observations
The public has mixed responses of industrialization in the study area. The people near to the
site are very apprehensive about the developments of refinery. The people of villages away
from the site are welcoming the industrialization as it provides job opportunities and good
infrastructure developments.
The total population of the district as per 2011 Census is 11,36,971. Of the total population,
5,77,865 are males and 5,59,106 are females. The population of the district is further
distributed as 10,20,991 living in rural areas and 1,15,980 living in urban areas. The total
number of households in the Jagatsinghapur district is 2,60,846.According to 2011 census
data, the literacy rate in the Jagatsinghapur district is 86.59 %.According to 2011 Census, the
sex ratio of the district is 968.The 0-6 age group sex ratio is 9.11 for the district.
In Jagatsinghapur district, 29.2% of the people do not have houses, 89.9% of people uses
firewood for cooking, 47.3% of people uses kerosene for lighting and 45.9% of people are
landless.
This project will provide better socio-economic benefits by providing direct and indirect
employment.
EIA Report
318 HECS/EIA/IOCL Paradip/Final/24.06.2021/1051
CHAPTER 4
ANTICIPATED ENVIRONMENTAL
IMPACTS AND MITIGATION
MEASURES
EIA Report
319 HECS/EIA/IOCL Paradip/Final/24.06.2021/1051
4 ANTICIPATED ENVIRONMENTAL IMPACTS & MITIGATION
MEASURES4.1 Introduction
One of the important components in the process of environmental impact assessment is
identification of significant impacts as it leads to other elements such as quantification and
evaluation of impacts. Any change in environment whether adverse or beneficial, wholly or
partially, resulting from impacting activity is called Environmental Impact. Each individual
activity with respect to each environmental parameter will have its own impact potential.
Proposed project activities will be carried out in such a way so that potential adverse/negative
impacts are avoided, wherever possible. While for remaining impacts which are inevitable,
practicable mitigation measures will be recommended to minimize the adverse impacts.
The prediction of impacts helps to develop and implement mitigation measures/environment
management plan in such a way that the developmental activity will minimize the
deterioration of environmental quality.
4.2 Proposed Project Activities
The proposed project will have impacts on environment during the tenure of two phases; i.e.
construction phase and operation phase.
4.3 Construction Phase
Construction phase of the proposed project is temporary and will mainly involve the
following generic construction activities
Excavation
Formwork & concreting
Material handling and Transportation
Use of Tools and Potable power tools
Scaffolding
Crane Usage
Mechanical Equipment’s
Working in confined space
EIA Report
320 HECS/EIA/IOCL Paradip/Final/24.06.2021/1051
4.3.1 Impacts during Construction Phase
As the main impacts of the construction phase are envisaged in terms of air pollution only,
this natural mitigation would be significantly helpful in elimination of predicted impacts of
the phase. The overall impact of the pollution on the environment during construction phase
is localised in nature, reversible and is for a short period . However, the following principal
major impacts to the environment are considered for further planning of mitigation measures:
The use of automobiles and machinery during construction can deteriorate the air
quality and generate temporary emission.
The use of automobiles and machinery generates noise pollution from construction
activities.
The irregular working hours, & traffic, night-working, flood-lighting and
transportation damage the socioeconomic balance of surrounding region.
Effects may occur due to the accumulation of the contaminant in water resources &
soil due to uptake of construction material.
Short term heavy construction might cause increase in noise level
Effects on work place condition & human health due to the accidents during the
construction works.
Effects on the socio-economic activity due to direct impacts or indirect impacts on
socio-economic activities.
4.3.2 Mitigation Measures for Construction Phase
The entire construction activities will be confined with the designated area inside the
existing premises.
The small amount of unused construction material shall be stored in proper area to
utilise further in construction activities and surplus excavated material shall be
disposed of in suitable pre-identified areas.
Construction material shall be stored at adequate distance from the water storage in
order to prevent any chances of accidental leakage or spillage which could pollute the
water storage
Wherever required impervious lining shall be provided to the storage premises to
avoid accidental mixing or mixing due to fugitive losses.
To reduce the dust generation on site wherever & whenever required water shall be
EIA Report
321 HECS/EIA/IOCL Paradip/Final/24.06.2021/1051
sprinkled on ground or stock pile of excavated soil.
Equipments / machineries shall be used efficiently and shall be kept shut in order to
reduce air emission, noise pollution and consumption of energy resource
Emission from the equipments/machineries shall be monitored on regular basis and
possible implementation shall be provided on site
Transport vehicles shall be monitored & maintained regularly to control the emission
quality and fuel consumption
Provision of necessary PPEs like face mask & eye-glasses to employees /labours
engaged in construction activities.
The machineries/equipment used on site shall be maintained so they do work with
optimum efficiency generating less noise pollution
Operation of machineries/equipment causing high noise level shall be stopped during
the night time and all such operations shall be planned for day time only.
Transportation activities shall not be conducted during the night (other than in case of
emergency) to avoid high noise level in nearby villages/locality.
4.3.3 Land environment
a) Impacts
The proposed process units under the PX PTA project will be implemented within M/s IOCL,
PDR premises. The proposed project will be done in land area, which is identified as
appropriate location based on environmental and engineering requirements. The activities
carried out during the construction phase will involve a change in the land use from vacant
industrial land to a built up industrial land, which will pose the following impacts on the land
environment.
1. Compaction of soil and a change in the soil structure due to the use of heavy
construction vehicles and machineries.
2. Removal of soil from the site.
3. Mixing of the topsoil and subsoil.
4. Dispersion of dust.
Transportation of construction material (quarry material, cement &steel, paint, bricks etc)
during construction phase of the project results in use of public infrastructure like roads,
railways, drainage, water and power supply which in turn results in extra burden.
EIA Report
322 HECS/EIA/IOCL Paradip/Final/24.06.2021/1051
During the construction phase of the project there will be short term employment generation
in the form of skilled and semiskilled labours. This could be for a period of maximum 2 to 3
years but the daily wage unskilled labours employed locally. Also majority of the works will
be sub-contracted. There could be several impacts due to the location of construction camp in
the area where in local area will receive people from most part of the country.
b) Mitigation Measures
1. Employing techniques such as restricting access during wet conditions, using
protective boarding and low ground pressure machineries to minimize compaction of
soil.
2. The removed soil will be properly stored for subsequent reinstatement.
3. Reuse of excess excavated material for road development, green belt development and
landscaping.
4. A well designed closed depository for storage of construction materials to prevent
land/soil pollution.
5. Effective stabilization of altered landforms to minimize soil erosion and the potential
for water pollution (e.g. Vegetation).
6. Reuse of construction wastes such as sand, brick, gravel, cement for developing
internal road and project structures.
7. Trucks with construction material susceptible for fugitive suspension will be covered
with tarpaulin covers during transport of construction materials
8. Transportation management will be adopted for movement of vehicles transporting
construction materials and traffic will be regulated.
9. Vehicles deployed will confirm to emission norms (air/noise) of CPCB and have
validPollution Under Control(PUC) certificates
10. Very old vehicles (more than 20 years) will not be allowed at site
11. Trucks will comply with standards for exhaust emissions and noise levels.
12. To avoid/minimise impact/strain on the existing infrastructure, the worker camps will
be self-sufficient and would not rely on any local resource. This would help to avoid
any conflict with the local population. To mitigate impacts from health hazards,
sanitation facilities will be provided
EIA Report
323 HECS/EIA/IOCL Paradip/Final/24.06.2021/1051
4.3.4 Air environment
In order to predict the impact of constructional and operational activities on the ambient air
quality, the data on emission, micrometeorology and from Indian meteorological department
(IMD)were collected. All these data will be used to predict ground level concentration of
(GLCs) of SO2, NOX and PM10 for different temporal variations.
In the construction phase, activities like site clearance, site leveling, movements of workers
and material, construction of road, transportation activities will generate dust, gaseous
pollutants and particulate matter and affect the air quality. Other impacts include -
1. Site Preparation-fencing, boundary and clearing of site will cause disturbance to the
surroundings.
2. Excavation, backfilling and leveling.
3. Hauling and dumping of earth materials and construction spoils.
4. Foundation works can cause dust generation which will decrease the air quality and it
can impact the labors working.
5. Fabrication, erection of steel structures such as tanks, pipelines and sheds.
6. Construction of internal roads drains and water supply.
7. Cleaning and landscaping.
8. Emission from Construction DG & Construction Equipment’s.
a) Mitigation Measures
1. Barricading the construction area and minimizing exposed areas to reduce dust
generation.
2. Areas generating dust during dry weather will be sprayed with water.
3. Creation of vegetation screens to act as a barrier to dust.
4. Appropriate enclosed areas for storage of construction materials.
5. Facilitating the workers with the required personal protective equipment’s.
6. Efficient usage and maintenance of equipment’s/machineries to lower air emissions,
noise pollution and consumption of energy resource.
7. Exhaust vent of DG set will be provided with adequate stack height to ensure quick
dispersal of gaseous emissions.
8. Periodic monitoring and maintenance of transport vehicles to check on the quality of
emission to be within permissible limits and consumption of fuel.
EIA Report
324 HECS/EIA/IOCL Paradip/Final/24.06.2021/1051
9. Regular inspection of construction site to ensure timely removal and disposal of
construction debris to the dumping sites or for recycle/reuse.
4.3.5 Water environment
a) Impacts
1. Contamination of watercourses by leakage from fuel and materials storage areas.
2. Oil and suspended solids in run-off from vehicles and access roads.
3. Use of heavy machineries and vehicles causes compaction of topsoil due to which a
change in the surface water drainage pattern may occur.
4. Generation of sewage / process effluent and blow down.
b) Mitigation measures
1. The water demand during the construction phase will be met from the existing
Refinery water source(Mahanadi River)
2. Storehouse will be located at a distance away from the water storage area to prevent
accidental release or spillage.
3. Proper management of rain water run-off during monsoon and creating bunds to
utilize the rain water for construction purpose.
4. An appropriate water management system will be implemented.
4.3.6 Noise environment
a) Impacts
During construction phase, the noise will mostly be produced because of building activities
and machineries used for carrying out construction. Construction activities mainly involve
diesel generators, laying of foundation, erection of superstructure, clearing of obstruction and
trees if any from the proposed area. Activities such as construction of labor camps, onsite
office, pneumatic hammers, compressors, concrete mixers, construction material plants
however, do not cause significant noise pollution. But if the work continuous for longer
duration, it can affect the health of local people and workers involved in the project work.
b) Mitigation Measures
1. Barricading the construction site.
EIA Report
325 HECS/EIA/IOCL Paradip/Final/24.06.2021/1051
2. The green belt will help in reducing the noise nuisance.
3. Selection of equipment’s of high quality.
4. Proper planning and organizing of construction activities which will help in avoiding loud
verbal exchanges between the intervening parties.
5. Transportation activities will be carried out only during the day and only in case of
emergency, the transportation activities will be permitted in night time.
6. The vehicles used for construction activities and transportation of materials will be
provided with the horn of low noise level as recommended by RTO/ concerned
authorities.
7. Minimization of operation time of noisy equipment and operation of
machineries/equipment that generate high levels of noise only during day time.
8. Inadequate use of plant and equipment, namely, running on full power when the work
does not necessitate it will be avoided.
9. Personal protective equipment’s, education and public awareness and exposure control
through rotation of work will be provided to the workers engaged in construction
activities in the area generating high levels of noise.
4.3.7 Waste generation
The source of waste are metal pieces, cardboards, wooden scrap, sand gravels etc., generation
of chemical waste by general site practices (e.g. vehicle and plant maintenance/servicing),
municipal waste generated by site workers.
a) Mitigation measures
1. Recycling/reusing/recovering materials where possible and thereby neglecting or
reducing the disposal requirements.
2. Separation of construction material for reuses either to be used on onsite filling or can
be used as public fill.
3. Training the staff in waste minimizing practices.
4. Chemical waste should be stored in a locked area so as to avoid leaching of harmful
chemicals in the soil or nearby water bodies (If any).
EIA Report
326 HECS/EIA/IOCL Paradip/Final/24.06.2021/1051
4.3.8 Ecology
Except for the removal of weeds, the ecological status of the site will be well maintained by
conserving/ developing the greenbelt at the site.
4.3.9 Social environment
A socio-economic study was undertaken with the help of secondary sources in assessing
aspects, which are dealing with social and cultural conditions, and economic status in the
study area. The study provides information such as demographic structure, population
dynamics, infrastructure resources, and the status of human health and economic attributes
like employment, per-capita income, agriculture, trade, and industrial development in the
study area. There will be temporary employment for manpower required during construction
phase available from local communities. Overall, socioeconomic effect of construction phase
will be positive due to direct and indirect employment opportunities for the local population
4.4 Operation Phase
From an Environmental perspective, this phase is of paramount significance due to its
potential to invoke long-term impacts. The adverse effects that are likely to occur during this
operational phase of the project are Air pollution (gaseous Emissions), Effluent generation,
Noise Generation, Solid waste Generation etc.
4.4.1 Impacts during Operational Phase
Because of its potential to create long-term impacts, this phase is very important from the
environmental impact point of view. The basic impacts like gaseous emissions, water
consumption/ pollution and solid waste will have the potential to adversely affect air, water
and land / soil in the vicinity of the project site.
This phase will broadly include the following direct and indirect activities / actions:
Storage and transportation of raw materials and finished products.
Gaseous emissions
Effluent Generation, treatment and disposal
Noise Generation
Solid waste generation
EIA Report
327 HECS/EIA/IOCL Paradip/Final/24.06.2021/1051
4.5 Air Environment
Base line data reveals that the ambient air quality has been monitored at 8 locations for 14
parameters as per NAAQS/CPCB guidelines within the study area. The average baseline
levels of PM10 (55.35 – 80.53µg/m³), PM2.5 (27.72 – 38.16µg/m³), SO2 (8.63 – 13.21µg/m³),
NO2(16.15 – 25.30µg/m³).
The nearest CPCB AAQ monitoring station is PPL Guest House in which the annual average
for the year 2018: PM10 (113 µg/m³), PM2.5 (37 µg/m³), SO2(19 µg/m³), NO2(11 µg/m³).
Source:
https://cpcb.nic.in/displaypdf.php?id=bWFudWFsLW1vbml0b3JpbmcvTG9jYXRpb25fZGF
0YV8yMDE4LnBkZg==
All the parameters are well within the National Ambient Air Quality Standards for Industrial,
Commercial and Residential areas at all monitoring locations during the study period from
March 2019 - May 2019. Stack emission of PM, SOx & NOx are due to process units, Flare
and DG. Adequate measures will be taken to control Air Pollution.
4.5.1 Meteorological data
The meteorological data for a month, i.e. from 01/03/2019 to 31/05/2019 was considered for
the study. Data included for AERMET were daily wind speed, wind direction, temperature,
relative humidity, air pressure, precipitation, and solar radiation recorded during the period.
AERMET reformats meteorological data so that it can be used as input for AERMOD model.
The wind rose for the study period is given as Figure 4-1
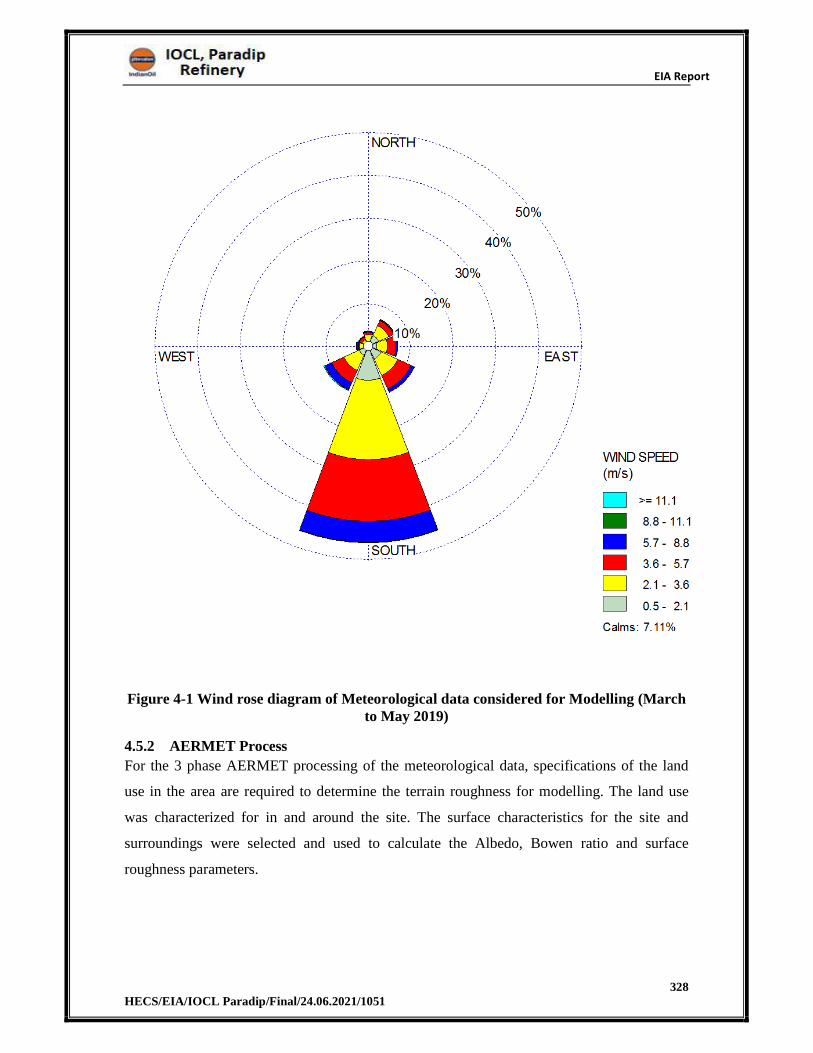
EIA Report
328 HECS/EIA/IOCL Paradip/Final/24.06.2021/1051
Figure 4-1 Wind rose diagram of Meteorological data considered for Modelling (March to May 2019)
4.5.2 AERMET Process
For the 3 phase AERMET processing of the meteorological data, specifications of the land
use in the area are required to determine the terrain roughness for modelling. The land use
was characterized for in and around the site. The surface characteristics for the site and
surroundings were selected and used to calculate the Albedo, Bowen ratio and surface
roughness parameters.
EIA Report
329 HECS/EIA/IOCL Paradip/Final/24.06.2021/1051
4.5.3 AERMOD Process
AERMOD Software Version 8.0.5 was used for air dispersion modelling and is applicable to
a wide range of buoyant or neutrally buoyant emissions up to a range of 50 km. In addition to
more straight forward cases, AERMOD is also suitable for complex terrain and urban
dispersion scenarios.
AERMOD is a steady-state plume model. In the stable boundary layer (SBL), it assumes the
concentration distribution to be Gaussian in both the vertical and horizontal. In the convective
boundary layer (CBL), the horizontal distribution is also assumed to be Gaussian, but the
vertical distribution is described with a bi-Gaussian probability density function (pdf). This
behavior of the concentration distributions in the CBL was demonstrated by Willis and
Deardorff (1981) and Briggs (1993). Additionally, in the CBL, AERMOD treats “plume
lofting,” whereby a portion of plume mass, released from a buoyant source, rises to and
remains near the top of the boundary layer before becoming mixed into the CBL. AERMOD
also tracks any plume mass that penetrates into the elevated stable layer, and then allows it to
re-enter the boundary layer when and if appropriate. For sources in both the CBL and the
SBL AERMOD treats the enhancement of lateral dispersion resulting from plume meander.
The emissions from proposed stacks are estimated and used for the air dispersion modeling as
shown in Table 4-2.
Maximum incremental values for PM, SO2, NOx and CO have been represented as pictorial
concentration contours and as tabular concentration values in following sections
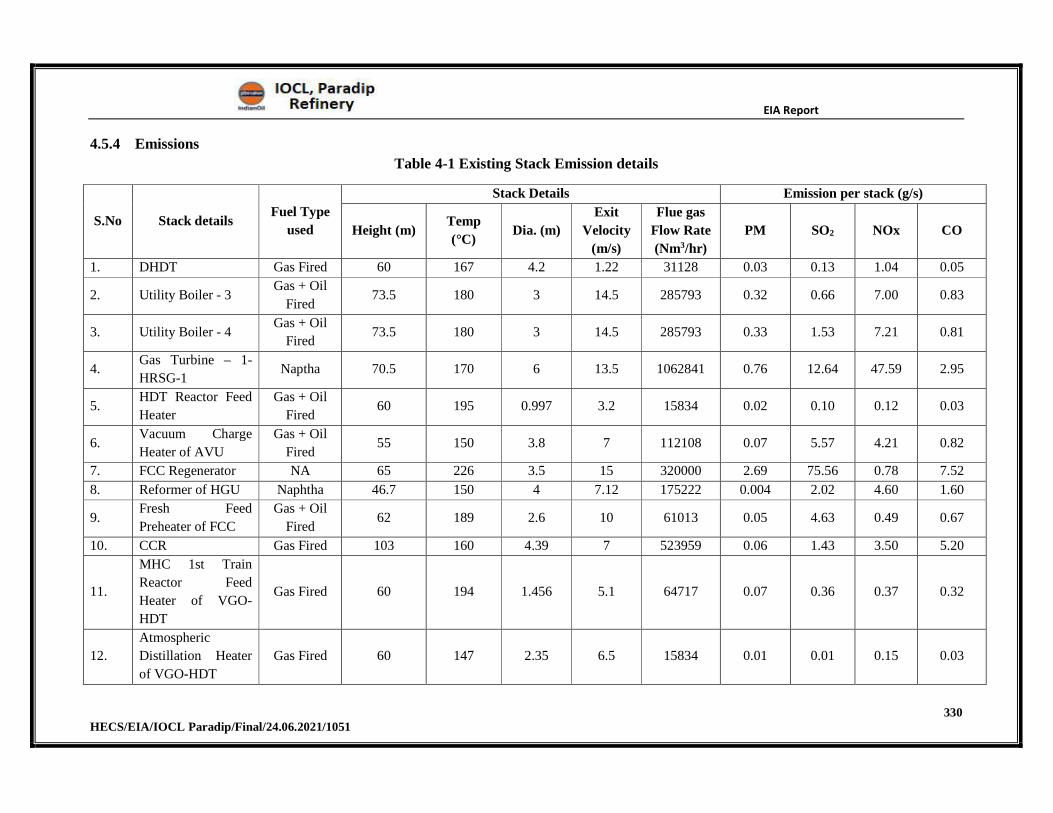
EIA Report
330 HECS/EIA/IOCL Paradip/Final/24.06.2021/1051
4.5.4 Emissions
Table 4-1 Existing Stack Emission details
S.No Stack details Fuel Type
used
Stack Details Emission per stack (g/s)
Height (m) Temp
(°C) Dia. (m)
Exit
Velocity
(m/s)
Flue gas
Flow Rate
(Nm3/hr)
PM SO2 NOx CO
1. DHDT Gas Fired 60 167 4.2 1.22 31128 0.03 0.13 1.04 0.05
2. Utility Boiler - 3 Gas + Oil
Fired 73.5 180 3 14.5 285793 0.32 0.66 7.00 0.83
3. Utility Boiler - 4 Gas + Oil
Fired 73.5 180 3 14.5 285793 0.33 1.53 7.21 0.81
4.Gas Turbine – 1-
HRSG-1 Naptha 70.5 170 6 13.5 1062841 0.76 12.64 47.59 2.95
5.HDT Reactor Feed
Heater
Gas + Oil
Fired 60 195 0.997 3.2 15834 0.02 0.10 0.12 0.03
6.Vacuum Charge
Heater of AVU
Gas + Oil
Fired 55 150 3.8 7 112108 0.07 5.57 4.21 0.82
7. FCC Regenerator NA 65 226 3.5 15 320000 2.69 75.56 0.78 7.52
8. Reformer of HGU Naphtha 46.7 150 4 7.12 175222 0.004 2.02 4.60 1.60
9.Fresh Feed
Preheater of FCC
Gas + Oil
Fired 62 189 2.6 10 61013 0.05 4.63 0.49 0.67
10. CCR Gas Fired 103 160 4.39 7 523959 0.06 1.43 3.50 5.20
11.
MHC 1st Train
Reactor Feed
Heater of VGO-
HDT
Gas Fired 60 194 1.456 5.1 64717 0.07 0.36 0.37 0.32
12.
Atmospheric
Distillation Heater
of VGO-HDT
Gas Fired 60 147 2.35 6.5 15834 0.01 0.01 0.15 0.03
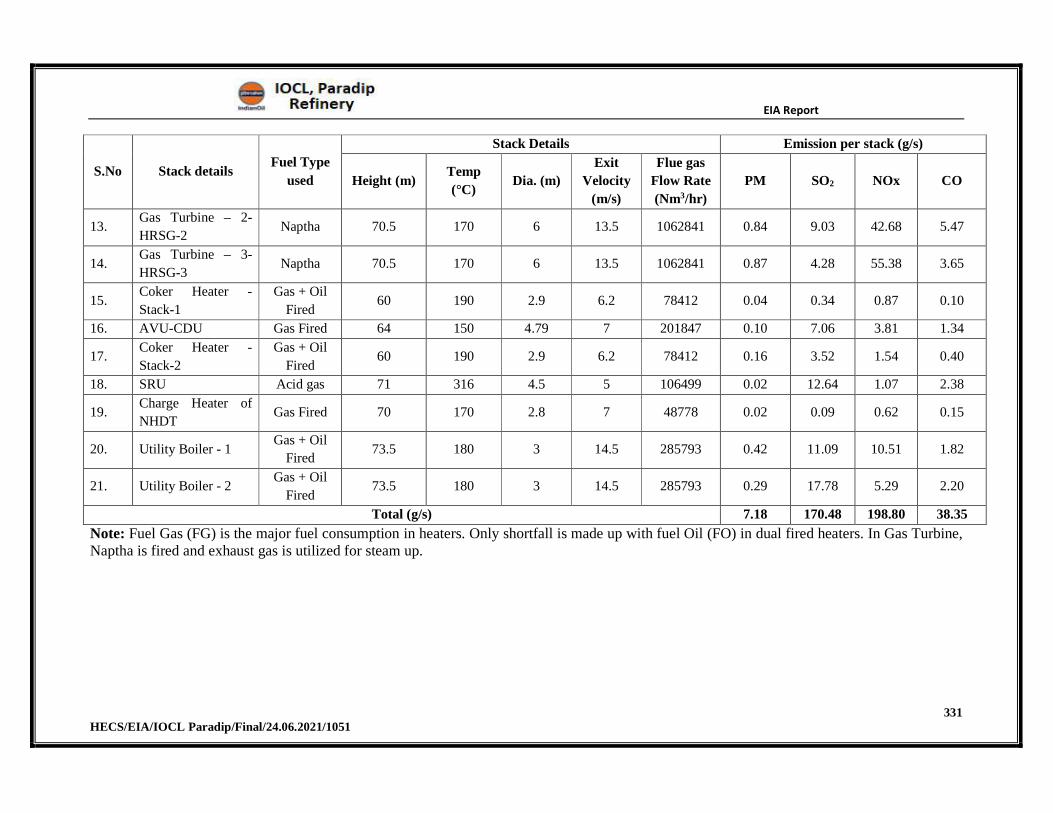
EIA Report
331 HECS/EIA/IOCL Paradip/Final/24.06.2021/1051
S.No Stack details Fuel Type
used
Stack Details Emission per stack (g/s)
Height (m) Temp
(°C) Dia. (m)
Exit
Velocity
(m/s)
Flue gas
Flow Rate
(Nm3/hr)
PM SO2 NOx CO
13.Gas Turbine – 2-
HRSG-2 Naptha 70.5 170 6 13.5 1062841 0.84 9.03 42.68 5.47
14.Gas Turbine – 3-
HRSG-3 Naptha 70.5 170 6 13.5 1062841 0.87 4.28 55.38 3.65
15.Coker Heater -
Stack-1
Gas + Oil
Fired 60 190 2.9 6.2 78412 0.04 0.34 0.87 0.10
16. AVU-CDU Gas Fired 64 150 4.79 7 201847 0.10 7.06 3.81 1.34
17.Coker Heater -
Stack-2
Gas + Oil
Fired 60 190 2.9 6.2 78412 0.16 3.52 1.54 0.40
18. SRU Acid gas 71 316 4.5 5 106499 0.02 12.64 1.07 2.38
19.Charge Heater of
NHDT Gas Fired 70 170 2.8 7 48778 0.02 0.09 0.62 0.15
20. Utility Boiler - 1 Gas + Oil
Fired 73.5 180 3 14.5 285793 0.42 11.09 10.51 1.82
21. Utility Boiler - 2 Gas + Oil
Fired 73.5 180 3 14.5 285793 0.29 17.78 5.29 2.20
Total (g/s) 7.18 170.48 198.80 38.35
Note: Fuel Gas (FG) is the major fuel consumption in heaters. Only shortfall is made up with fuel Oil (FO) in dual fired heaters. In Gas Turbine, Naptha is fired and exhaust gas is utilized for steam up.
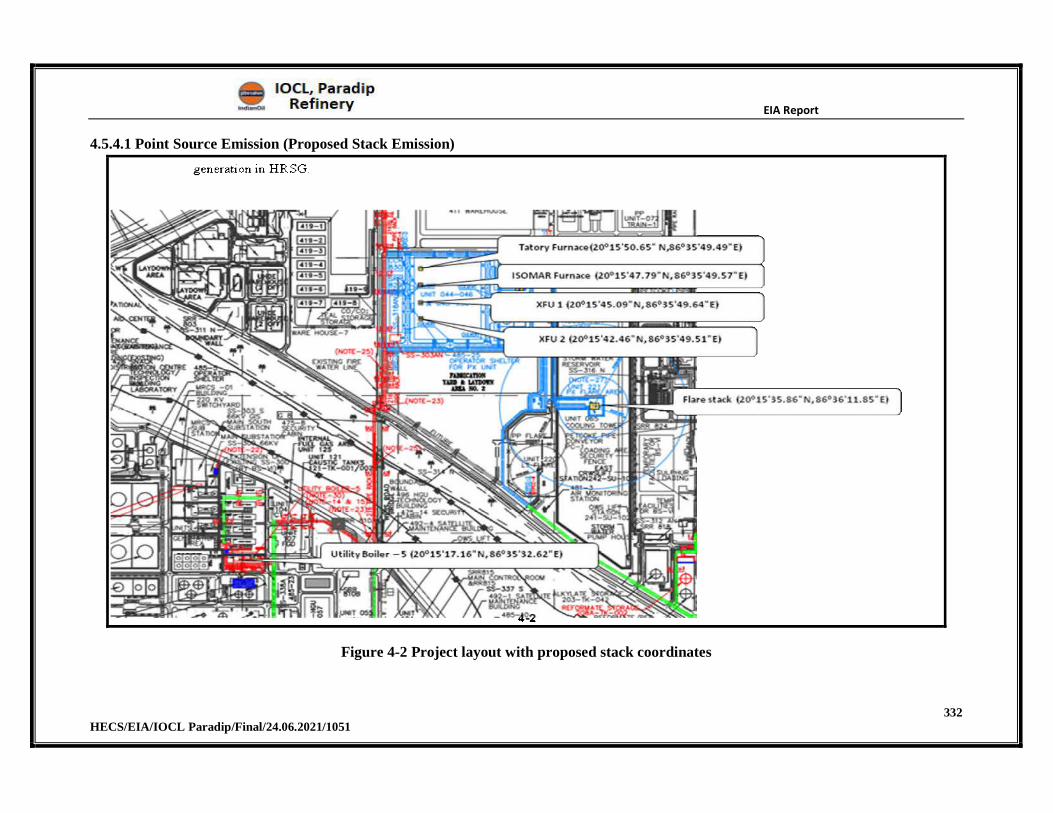
EIA Report
332 HECS/EIA/IOCL Paradip/Final/24.06.2021/1051
4.5.4.1 Point Source Emission (Proposed Stack Emission)
Figure 4-2 Project layout with proposed stack coordinates
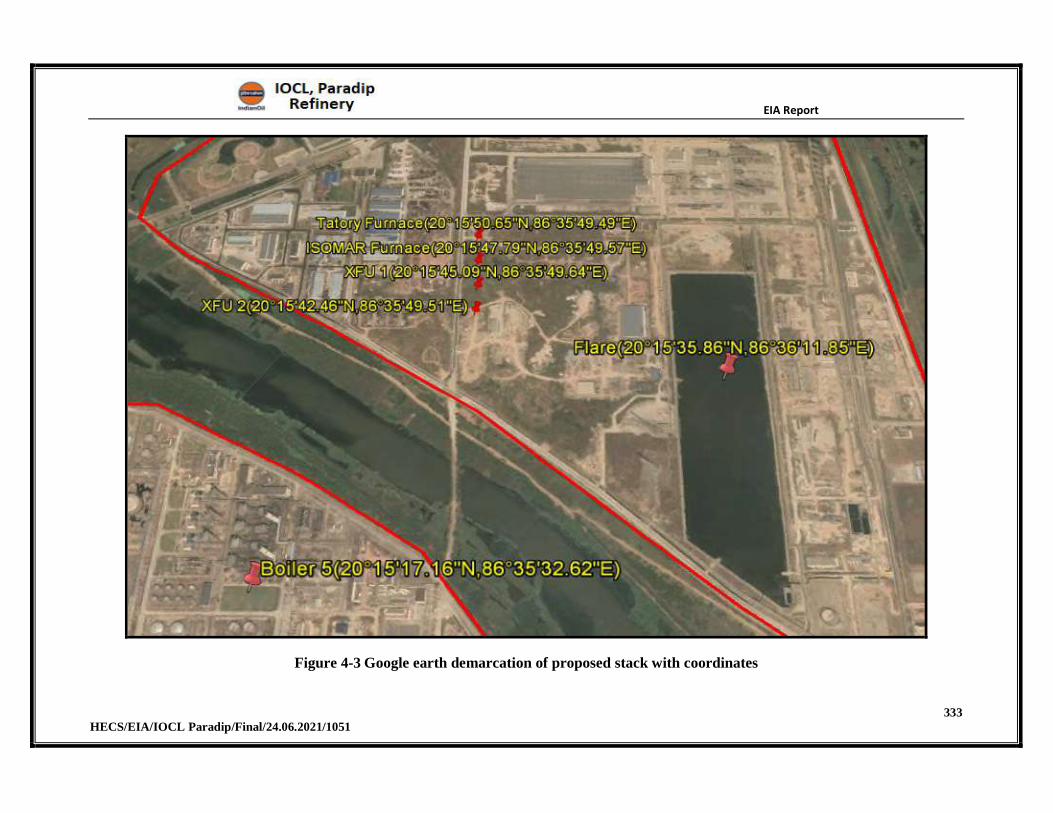
EIA Report
333 HECS/EIA/IOCL Paradip/Final/24.06.2021/1051
Figure 4-3 Google earth demarcation of proposed stack with coordinates
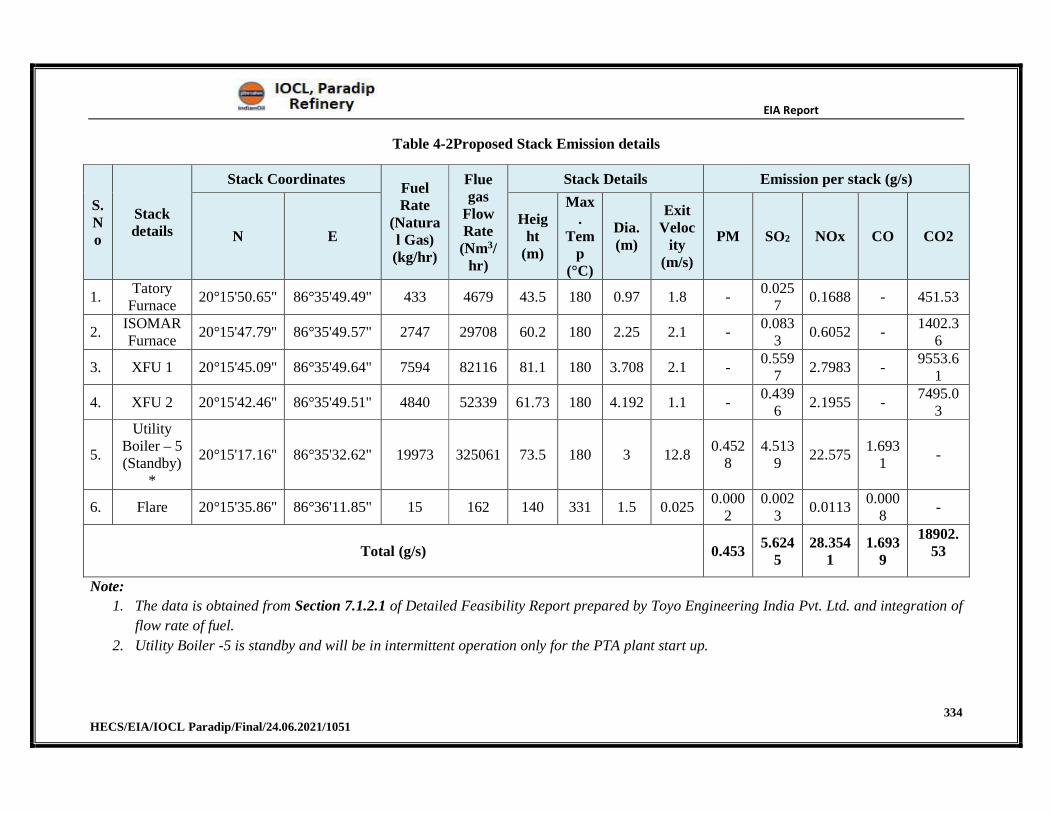
EIA Report
334 HECS/EIA/IOCL Paradip/Final/24.06.2021/1051
Table 4-2Proposed Stack Emission details
S.No
Stack details
Stack Coordinates Fuel Rate
(Natural Gas) (kg/hr)
Flue gas
Flow Rate
(Nm3/hr)
Stack Details Emission per stack (g/s)
N E Heig
ht (m)
Max.
Temp
(°C)
Dia. (m)
Exit Veloc
ity (m/s)
PM SO2 NOx CO CO2
1.Tatory
Furnace 20°15'50.65" 86°35'49.49" 433 4679 43.5 180 0.97 1.8 -
0.0257
0.1688 - 451.53
2.ISOMAR Furnace
20°15'47.79" 86°35'49.57" 2747 29708 60.2 180 2.25 2.1 - 0.083
3 0.6052 -
1402.36
3. XFU 1 20°15'45.09" 86°35'49.64" 7594 82116 81.1 180 3.708 2.1 - 0.559
7 2.7983 -
9553.61
4. XFU 2 20°15'42.46" 86°35'49.51" 4840 52339 61.73 180 4.192 1.1 - 0.439
6 2.1955 -
7495.03
5.
Utility Boiler – 5 (Standby)
*
20°15'17.16" 86°35'32.62" 19973 325061 73.5 180 3 12.8 0.452
8 4.513
9 22.575
1.6931
-
6. Flare 20°15'35.86" 86°36'11.85" 15 162 140 331 1.5 0.025 0.000
2 0.002
3 0.0113
0.0008
-
Total (g/s) 0.453 5.624
5 28.354
1 1.693
9
18902.53
Note:
1. The data is obtained from Section 7.1.2.1 of Detailed Feasibility Report prepared by Toyo Engineering India Pvt. Ltd. and integration of
flow rate of fuel.
2. Utility Boiler -5 is standby and will be in intermittent operation only for the PTA plant start up.
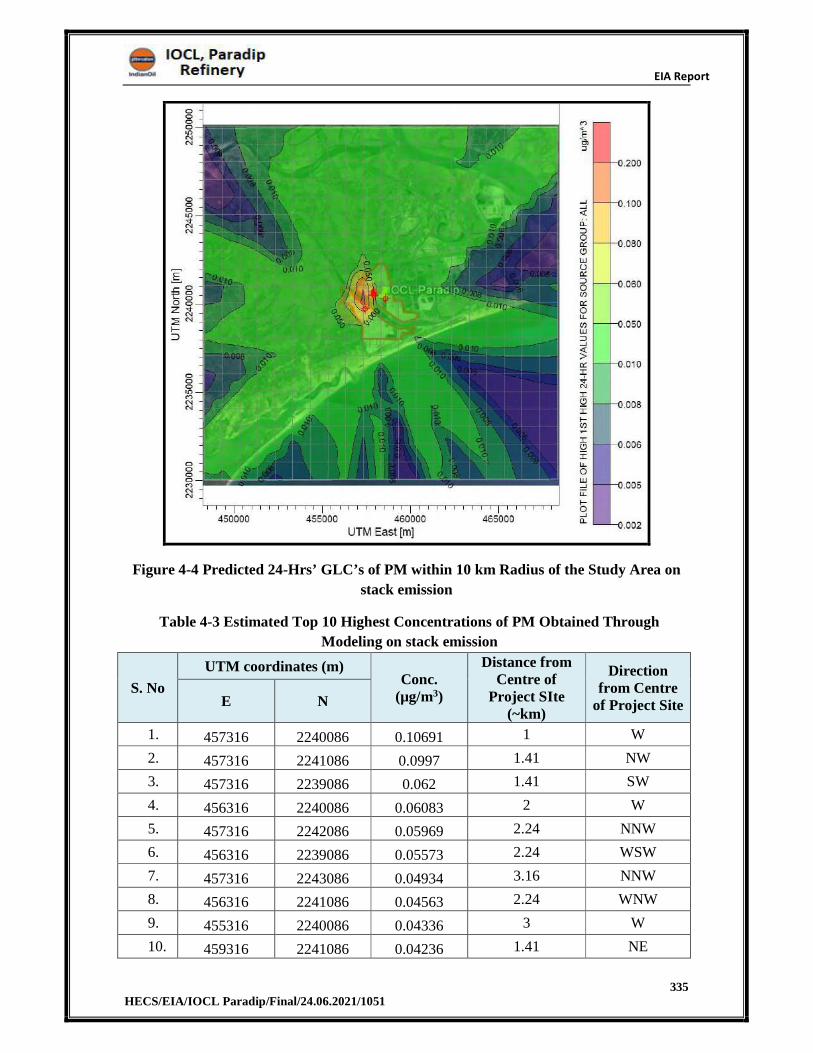
EIA Report
335 HECS/EIA/IOCL Paradip/Final/24.06.2021/1051
Figure 4-4 Predicted 24-Hrs’ GLC’s of PM within 10 km Radius of the Study Area on
stack emission
Table 4-3 Estimated Top 10 Highest Concentrations of PM Obtained Through
Modeling on stack emission
S. No
UTM coordinates (m) Conc.
(µg/m3)
Distance from Centre of
Project SIte (~km)
Direction from Centre
of Project SiteE N
1. 457316 2240086 0.10691 1 W
2. 457316 2241086 0.0997 1.41 NW
3. 457316 2239086 0.062 1.41 SW
4. 456316 2240086 0.06083 2 W
5. 457316 2242086 0.05969 2.24 NNW
6. 456316 2239086 0.05573 2.24 WSW
7. 457316 2243086 0.04934 3.16 NNW
8. 456316 2241086 0.04563 2.24 WNW
9. 455316 2240086 0.04336 3 W
10. 459316 2241086 0.04236 1.41 NE
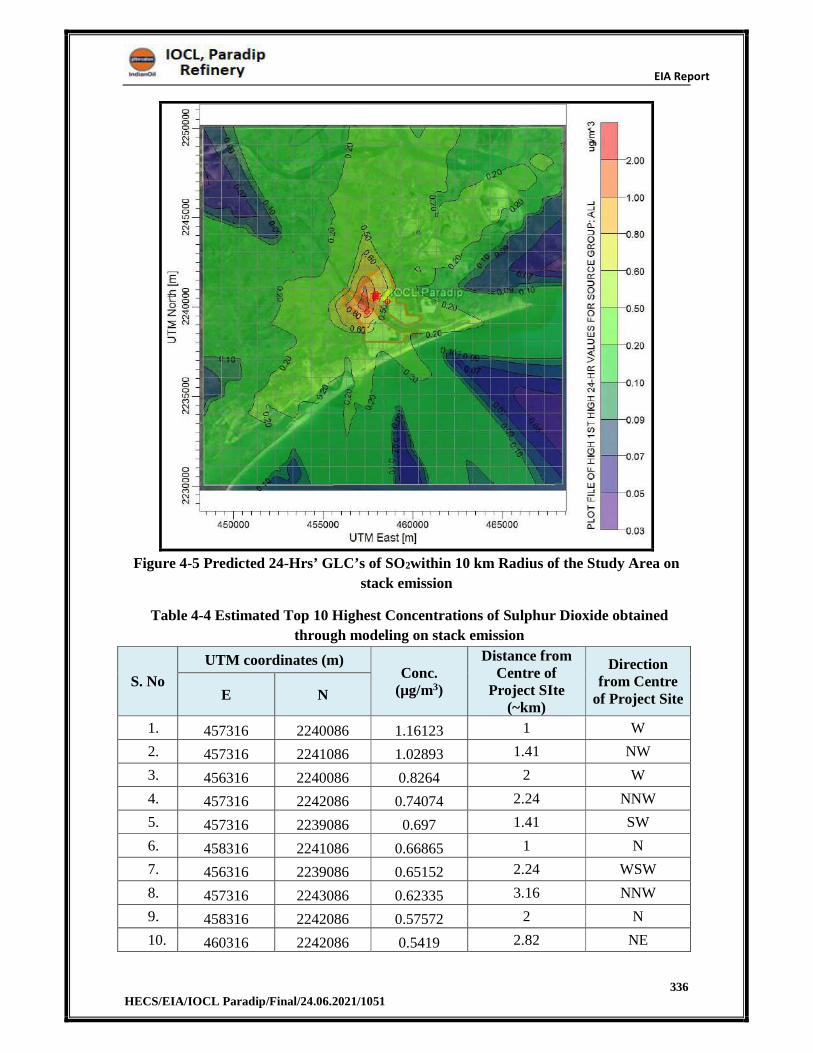
EIA Report
336 HECS/EIA/IOCL Paradip/Final/24.06.2021/1051
Figure 4-5 Predicted 24-Hrs’ GLC’s of SO2within 10 km Radius of the Study Area on
stack emission
Table 4-4 Estimated Top 10 Highest Concentrations of Sulphur Dioxide obtained
through modeling on stack emission
S. No
UTM coordinates (m) Conc.
(µg/m3)
Distance from Centre of
Project SIte (~km)
Direction from Centre
of Project SiteE N
1. 457316 2240086 1.16123 1 W
2. 457316 2241086 1.02893 1.41 NW
3. 456316 2240086 0.8264 2 W
4. 457316 2242086 0.74074 2.24 NNW
5. 457316 2239086 0.697 1.41 SW
6. 458316 2241086 0.66865 1 N
7. 456316 2239086 0.65152 2.24 WSW
8. 457316 2243086 0.62335 3.16 NNW
9. 458316 2242086 0.57572 2 N
10. 460316 2242086 0.5419 2.82 NE
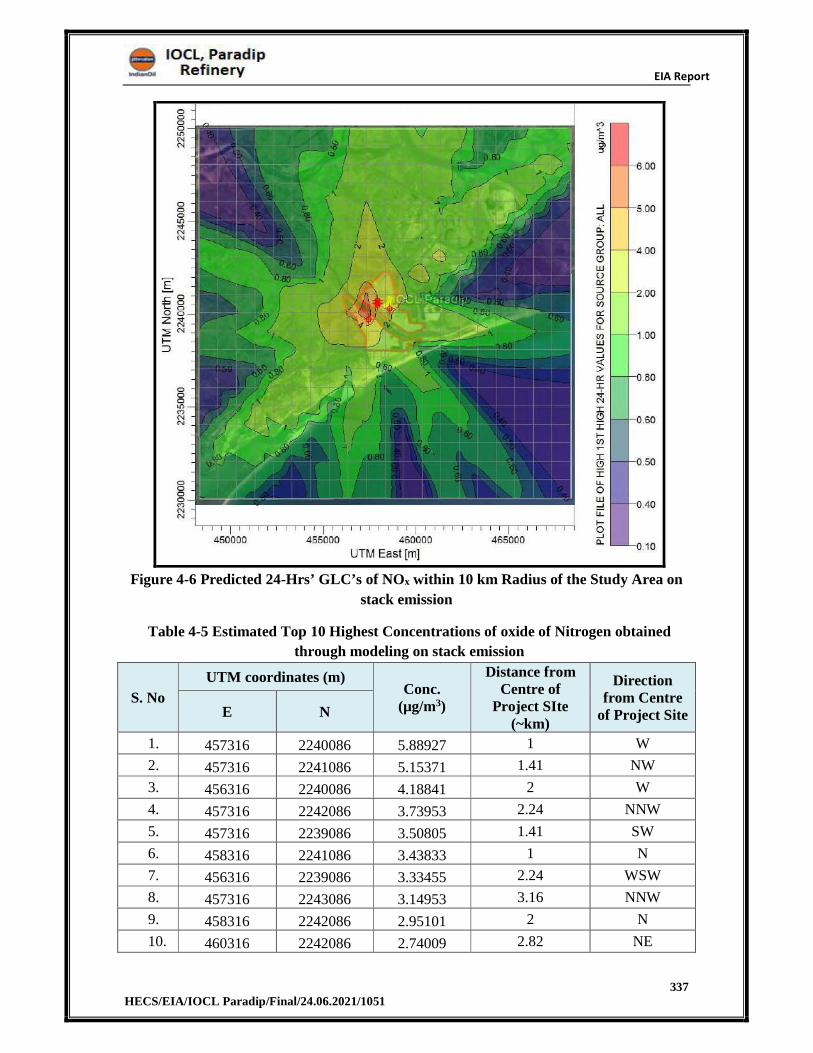
EIA Report
337 HECS/EIA/IOCL Paradip/Final/24.06.2021/1051
Figure 4-6 Predicted 24-Hrs’ GLC’s of NOx within 10 km Radius of the Study Area on
stack emission
Table 4-5 Estimated Top 10 Highest Concentrations of oxide of Nitrogen obtained
through modeling on stack emission
S. No
UTM coordinates (m) Conc.
(µg/m3)
Distance from Centre of
Project SIte (~km)
Direction from Centre
of Project SiteE N
1. 457316 2240086 5.88927 1 W
2. 457316 2241086 5.15371 1.41 NW
3. 456316 2240086 4.18841 2 W
4. 457316 2242086 3.73953 2.24 NNW
5. 457316 2239086 3.50805 1.41 SW
6. 458316 2241086 3.43833 1 N
7. 456316 2239086 3.33455 2.24 WSW
8. 457316 2243086 3.14953 3.16 NNW
9. 458316 2242086 2.95101 2 N
10. 460316 2242086 2.74009 2.82 NE
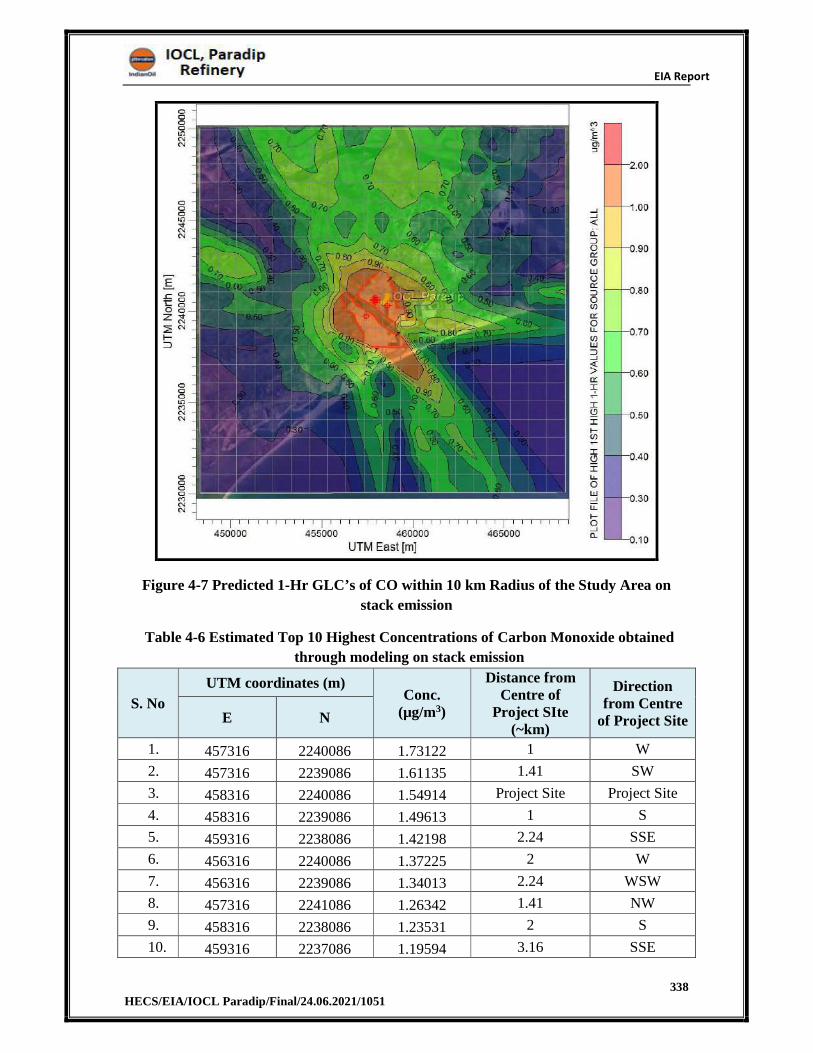
EIA Report
338 HECS/EIA/IOCL Paradip/Final/24.06.2021/1051
Figure 4-7 Predicted 1-Hr GLC’s of CO within 10 km Radius of the Study Area on
stack emission
Table 4-6 Estimated Top 10 Highest Concentrations of Carbon Monoxide obtained
through modeling on stack emission
S. No
UTM coordinates (m) Conc.
(µg/m3)
Distance from Centre of
Project SIte (~km)
Direction from Centre
of Project SiteE N
1. 457316 2240086 1.73122 1 W
2. 457316 2239086 1.61135 1.41 SW
3. 458316 2240086 1.54914 Project Site Project Site
4. 458316 2239086 1.49613 1 S
5. 459316 2238086 1.42198 2.24 SSE
6. 456316 2240086 1.37225 2 W
7. 456316 2239086 1.34013 2.24 WSW
8. 457316 2241086 1.26342 1.41 NW
9. 458316 2238086 1.23531 2 S
10. 459316 2237086 1.19594 3.16 SSE
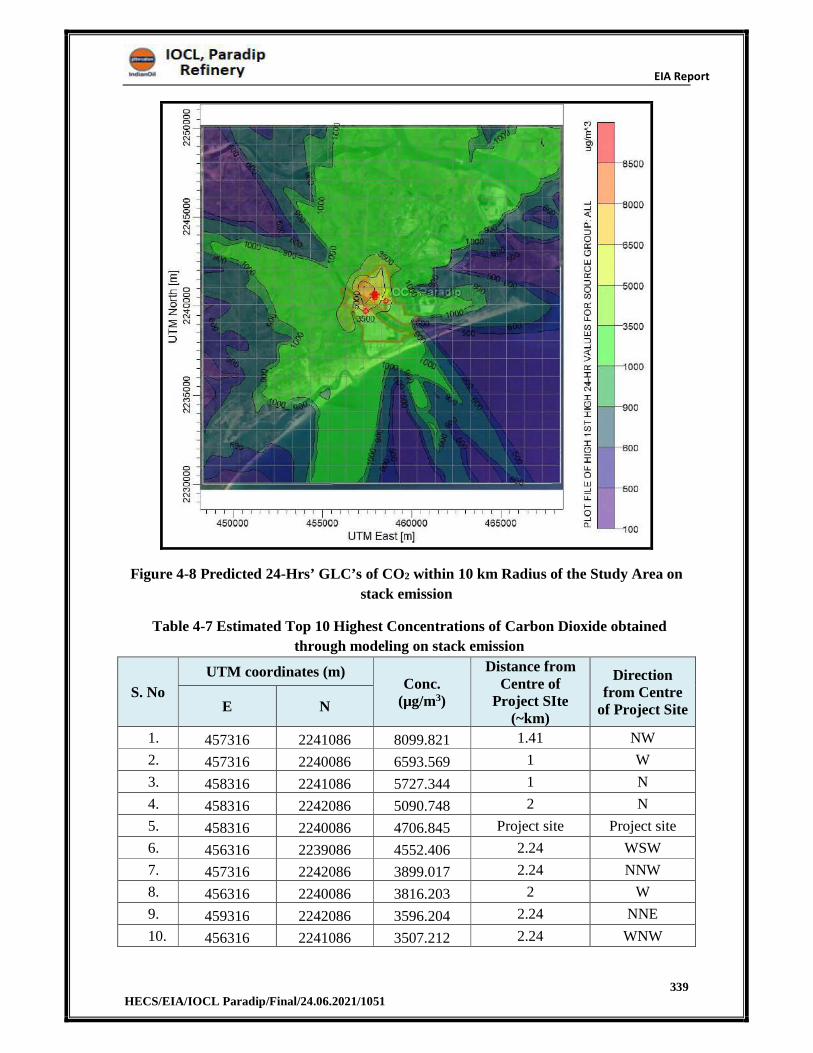
EIA Report
339 HECS/EIA/IOCL Paradip/Final/24.06.2021/1051
Figure 4-8 Predicted 24-Hrs’ GLC’s of CO2 within 10 km Radius of the Study Area on
stack emission
Table 4-7 Estimated Top 10 Highest Concentrations of Carbon Dioxide obtained
through modeling on stack emission
S. No
UTM coordinates (m) Conc.
(µg/m3)
Distance from Centre of
Project SIte (~km)
Direction from Centre
of Project SiteE N
1. 457316 2241086 8099.821 1.41 NW
2. 457316 2240086 6593.569 1 W
3. 458316 2241086 5727.344 1 N
4. 458316 2242086 5090.748 2 N
5. 458316 2240086 4706.845 Project site Project site
6. 456316 2239086 4552.406 2.24 WSW
7. 457316 2242086 3899.017 2.24 NNW
8. 456316 2240086 3816.203 2 W
9. 459316 2242086 3596.204 2.24 NNE
10. 456316 2241086 3507.212 2.24 WNW
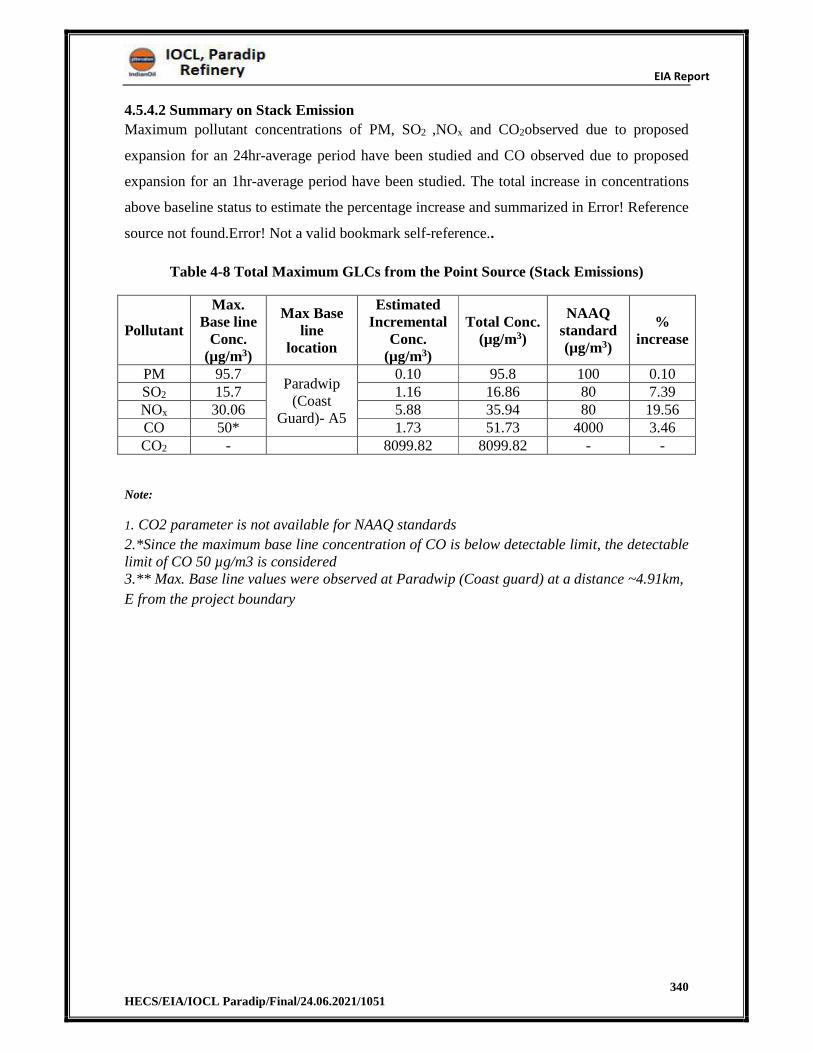
EIA Report
340 HECS/EIA/IOCL Paradip/Final/24.06.2021/1051
4.5.4.2 Summary on Stack Emission
Maximum pollutant concentrations of PM, SO2 ,NOx and CO2observed due to proposed
expansion for an 24hr-average period have been studied and CO observed due to proposed
expansion for an 1hr-average period have been studied. The total increase in concentrations
above baseline status to estimate the percentage increase and summarized in Error! Reference
source not found.Error! Not a valid bookmark self-reference..
Table 4-8 Total Maximum GLCs from the Point Source (Stack Emissions)
Pollutant
Max. Base line
Conc. (µg/m3)
Max Base line
location
Estimated Incremental
Conc. (µg/m3)
Total Conc. (µg/m3)
NAAQ standard (µg/m3)
% increase
PM 95.7 Paradwip
(Coast Guard)- A5
0.10 95.8 100 0.10 SO2 15.7 1.16 16.86 80 7.39 NOx 30.06 5.88 35.94 80 19.56 CO 50* 1.73 51.73 4000 3.46 CO2 - 8099.82 8099.82 - -
Note:
1. CO2 parameter is not available for NAAQ standards
3.** Max. Base line values were observed at Paradwip (Coast guard) at a distance ~4.91km,
E from the project boundary
2.*Since the maximum base line concentration of CO is below detectable limit, the detectable limit of CO 50 µg/m3 is considered
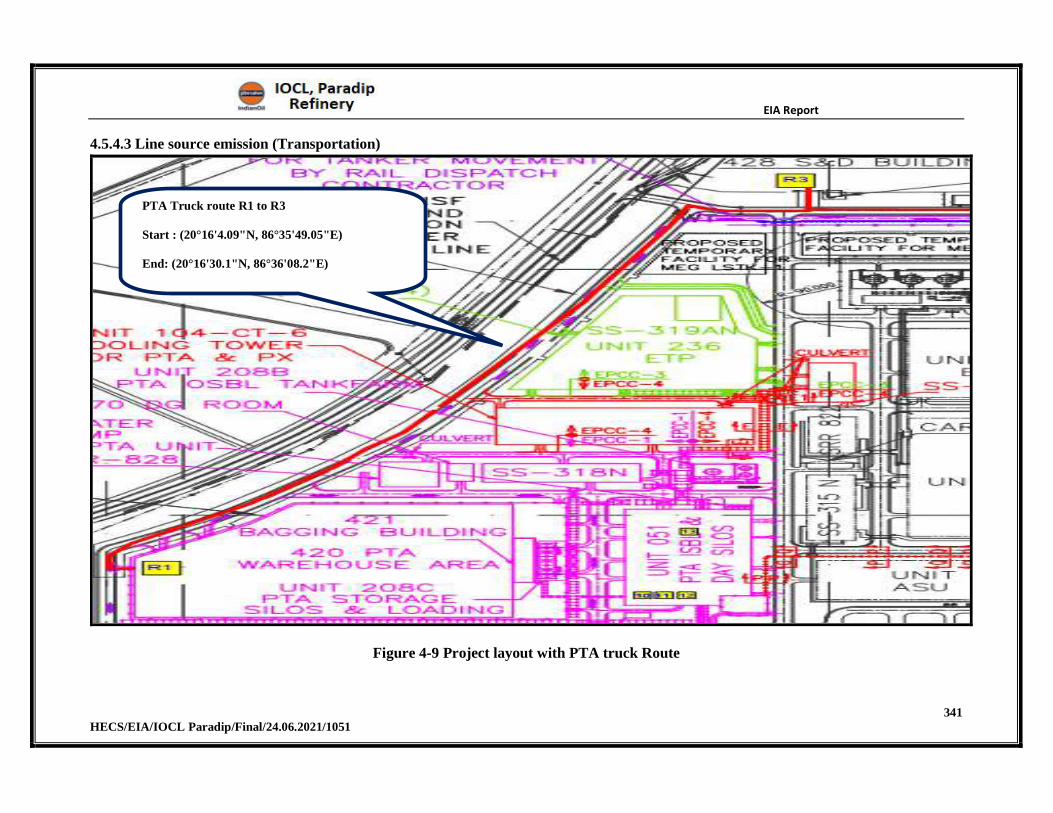
EIA Report
341 HECS/EIA/IOCL Paradip/Final/24.06.2021/1051
4.5.4.3 Line source emission (Transportation)
Figure 4-9 Project layout with PTA truck Route
PTA Truck route R1 to R3
Start : (20°16'4.09"N, 86°35'49.05"E)
End: (20°16'30.1"N, 86°36'08.2"E)
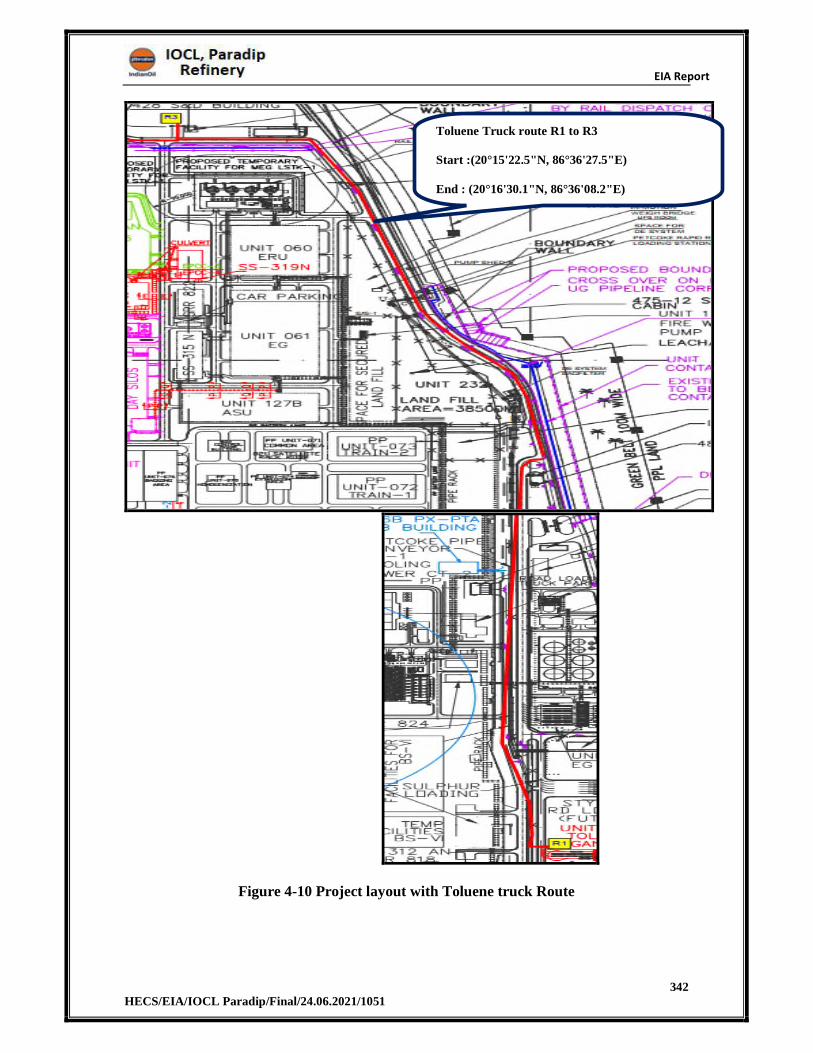
EIA Report
342 HECS/EIA/IOCL Paradip/Final/24.06.2021/1051
Figure 4-10 Project layout with Toluene truck Route
Toluene Truck route R1 to R3
Start :(20°15'22.5"N, 86°36'27.5"E)
End : (20°16'30.1"N, 86°36'08.2"E)
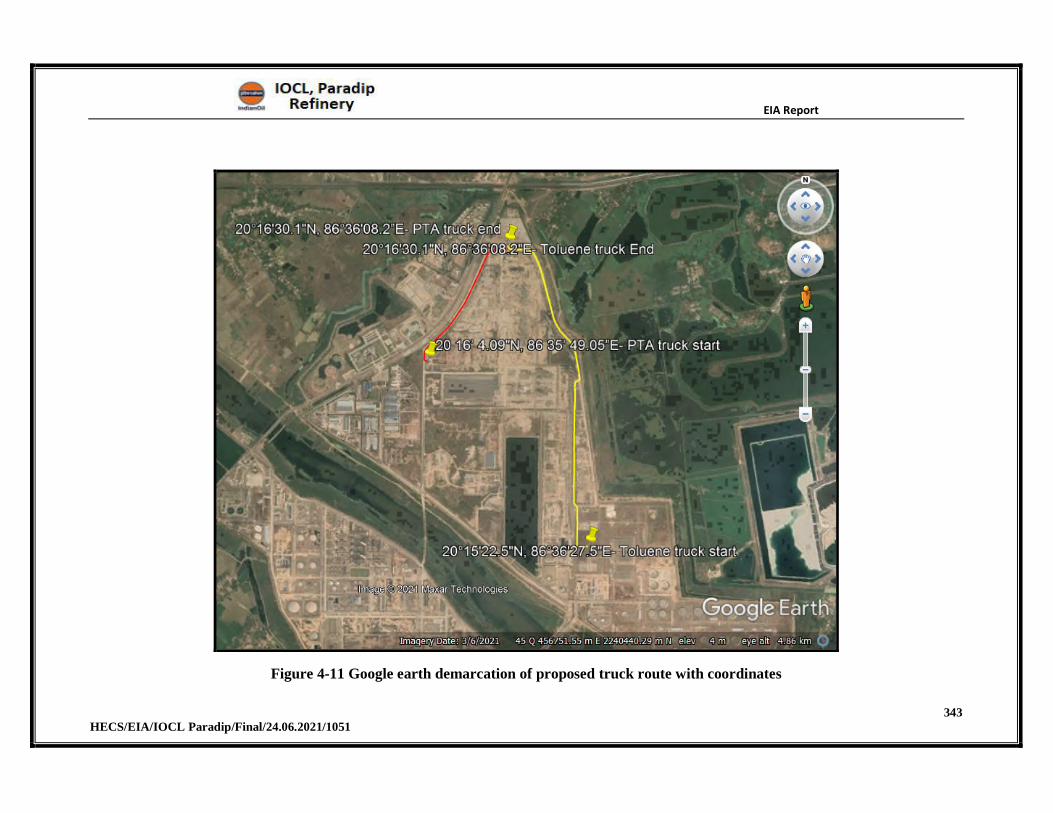
EIA Report
343 HECS/EIA/IOCL Paradip/Final/24.06.2021/1051
Figure 4-11 Google earth demarcation of proposed truck route with coordinates
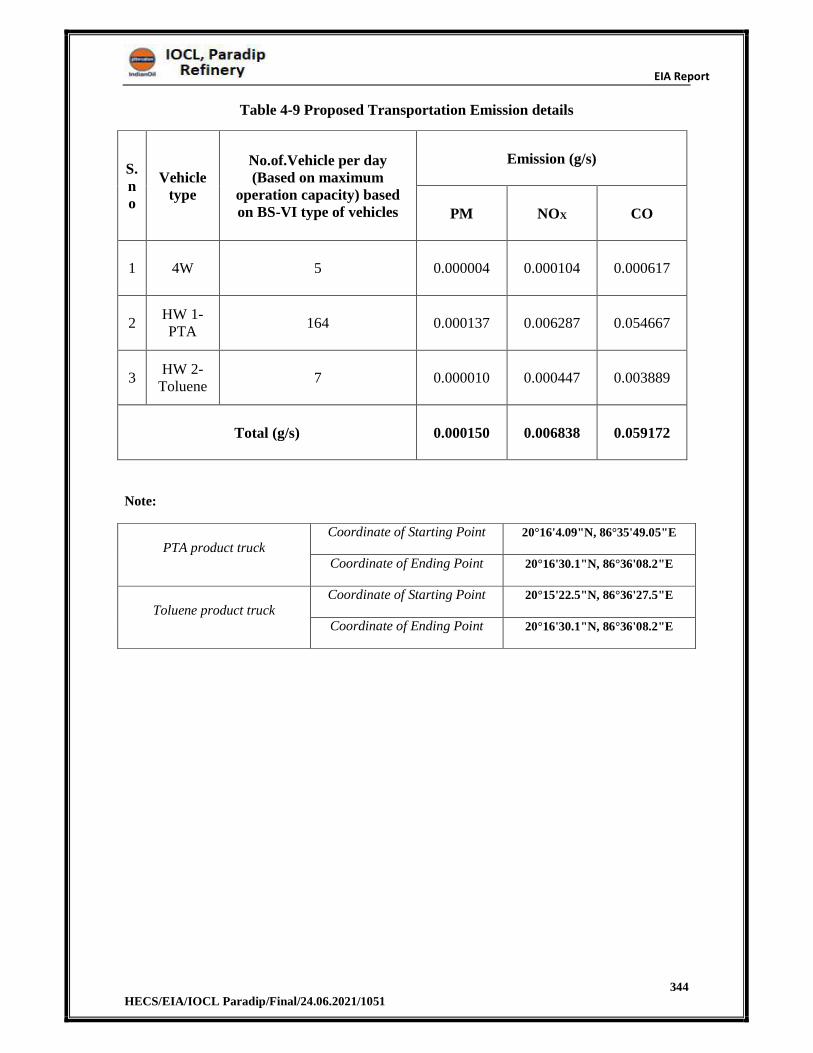
EIA Report
344 HECS/EIA/IOCL Paradip/Final/24.06.2021/1051
Table 4-9 Proposed Transportation Emission details
S.no
Vehicle type
No.of.Vehicle per day (Based on maximum
operation capacity) based on BS-VI type of vehicles
Emission (g/s)
PM NOX CO
1 4W 5 0.000004 0.000104 0.000617
2 HW 1-PTA
164 0.000137 0.006287 0.054667
3 HW 2-
Toluene 7 0.000010 0.000447 0.003889
Total (g/s) 0.000150 0.006838 0.059172
Note:
PTA product truck Coordinate of Starting Point 20°16'4.09"N, 86°35'49.05"E
Coordinate of Ending Point 20°16'30.1"N, 86°36'08.2"E
Toluene product truck Coordinate of Starting Point 20°15'22.5"N, 86°36'27.5"E
Coordinate of Ending Point 20°16'30.1"N, 86°36'08.2"E
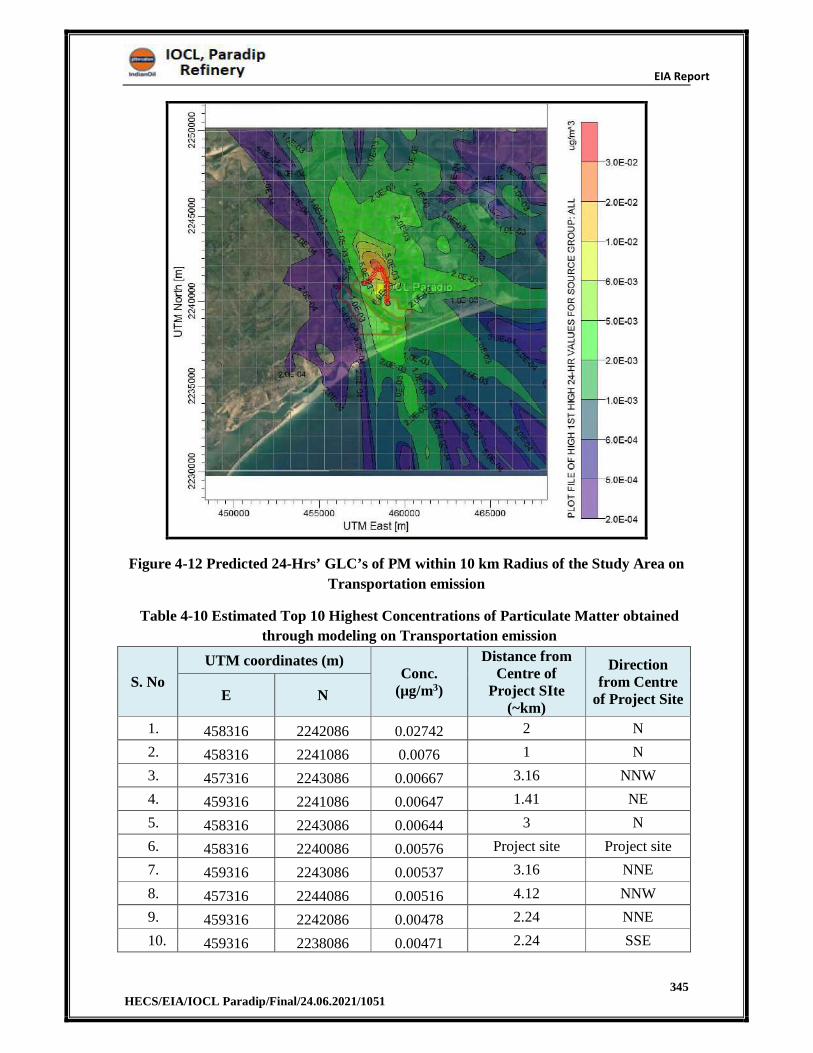
EIA Report
345 HECS/EIA/IOCL Paradip/Final/24.06.2021/1051
Figure 4-12 Predicted 24-Hrs’ GLC’s of PM within 10 km Radius of the Study Area on
Transportation emission
Table 4-10 Estimated Top 10 Highest Concentrations of Particulate Matter obtained
through modeling on Transportation emission
S. No
UTM coordinates (m) Conc.
(µg/m3)
Distance from Centre of
Project SIte (~km)
Direction from Centre
of Project SiteE N
1. 458316 2242086 0.02742 2 N
2. 458316 2241086 0.0076 1 N
3. 457316 2243086 0.00667 3.16 NNW
4. 459316 2241086 0.00647 1.41 NE
5. 458316 2243086 0.00644 3 N
6. 458316 2240086 0.00576 Project site Project site
7. 459316 2243086 0.00537 3.16 NNE
8. 457316 2244086 0.00516 4.12 NNW
9. 459316 2242086 0.00478 2.24 NNE
10. 459316 2238086 0.00471 2.24 SSE
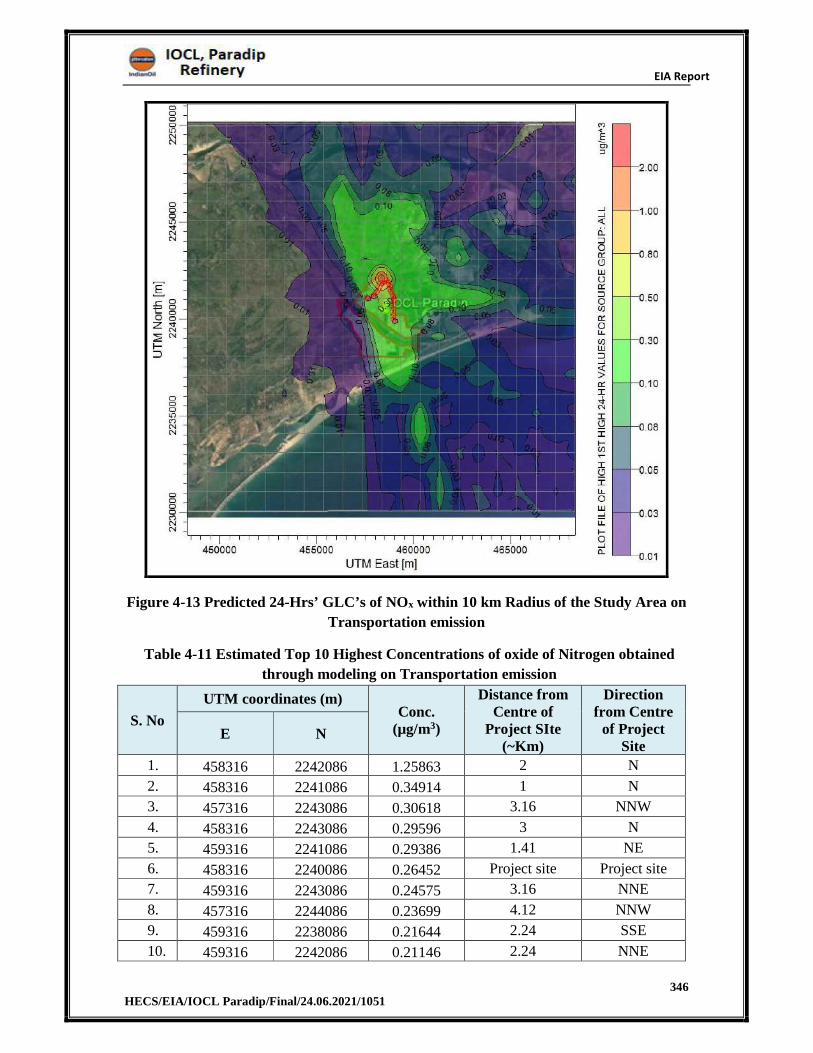
EIA Report
346 HECS/EIA/IOCL Paradip/Final/24.06.2021/1051
Figure 4-13 Predicted 24-Hrs’ GLC’s of NOx within 10 km Radius of the Study Area on
Transportation emission
Table 4-11 Estimated Top 10 Highest Concentrations of oxide of Nitrogen obtained
through modeling on Transportation emission
S. No
UTM coordinates (m) Conc.
(µg/m3)
Distance from Centre of
Project SIte (~Km)
Direction from Centre
of Project Site
E N
1. 458316 2242086 1.25863 2 N
2. 458316 2241086 0.34914 1 N
3. 457316 2243086 0.30618 3.16 NNW
4. 458316 2243086 0.29596 3 N
5. 459316 2241086 0.29386 1.41 NE
6. 458316 2240086 0.26452 Project site Project site
7. 459316 2243086 0.24575 3.16 NNE
8. 457316 2244086 0.23699 4.12 NNW
9. 459316 2238086 0.21644 2.24 SSE
10. 459316 2242086 0.21146 2.24 NNE
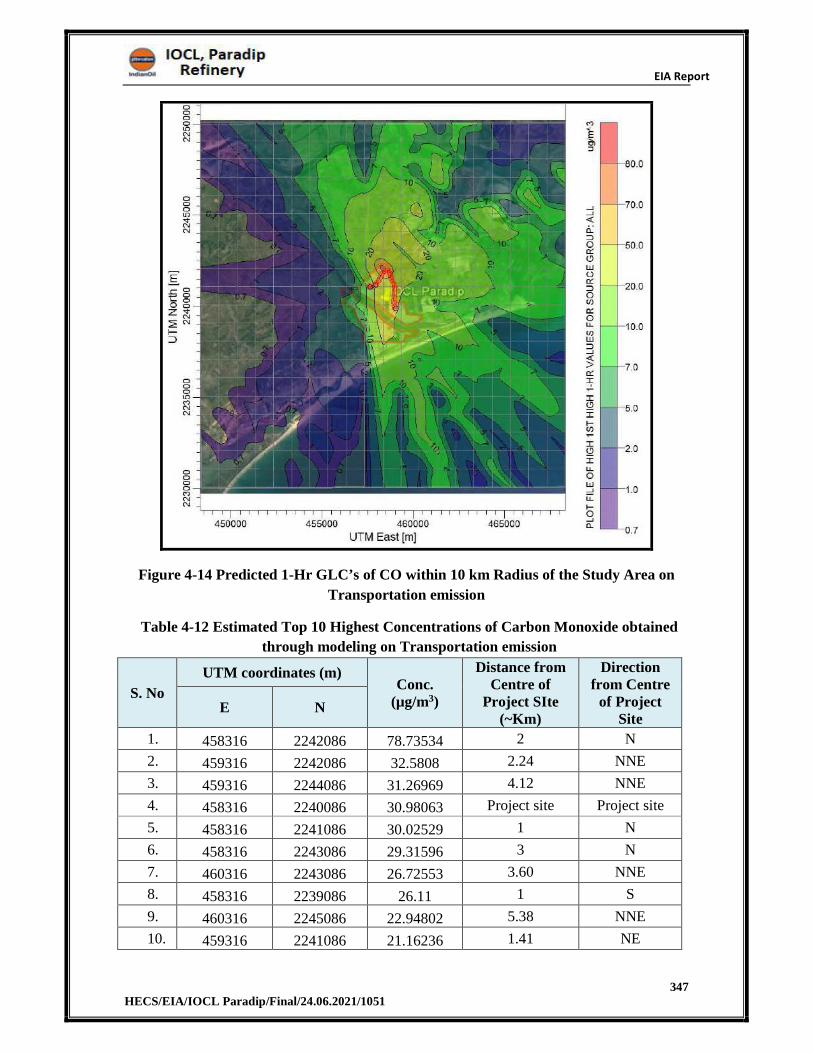
EIA Report
347 HECS/EIA/IOCL Paradip/Final/24.06.2021/1051
Figure 4-14 Predicted 1-Hr GLC’s of CO within 10 km Radius of the Study Area on
Transportation emission
Table 4-12 Estimated Top 10 Highest Concentrations of Carbon Monoxide obtained
through modeling on Transportation emission
S. No
UTM coordinates (m) Conc.
(µg/m3)
Distance from Centre of
Project SIte (~Km)
Direction from Centre
of Project Site
E N
1. 458316 2242086 78.73534 2 N
2. 459316 2242086 32.5808 2.24 NNE
3. 459316 2244086 31.26969 4.12 NNE
4. 458316 2240086 30.98063 Project site Project site
5. 458316 2241086 30.02529 1 N
6. 458316 2243086 29.31596 3 N
7. 460316 2243086 26.72553 3.60 NNE
8. 458316 2239086 26.11 1 S
9. 460316 2245086 22.94802 5.38 NNE
10. 459316 2241086 21.16236 1.41 NE
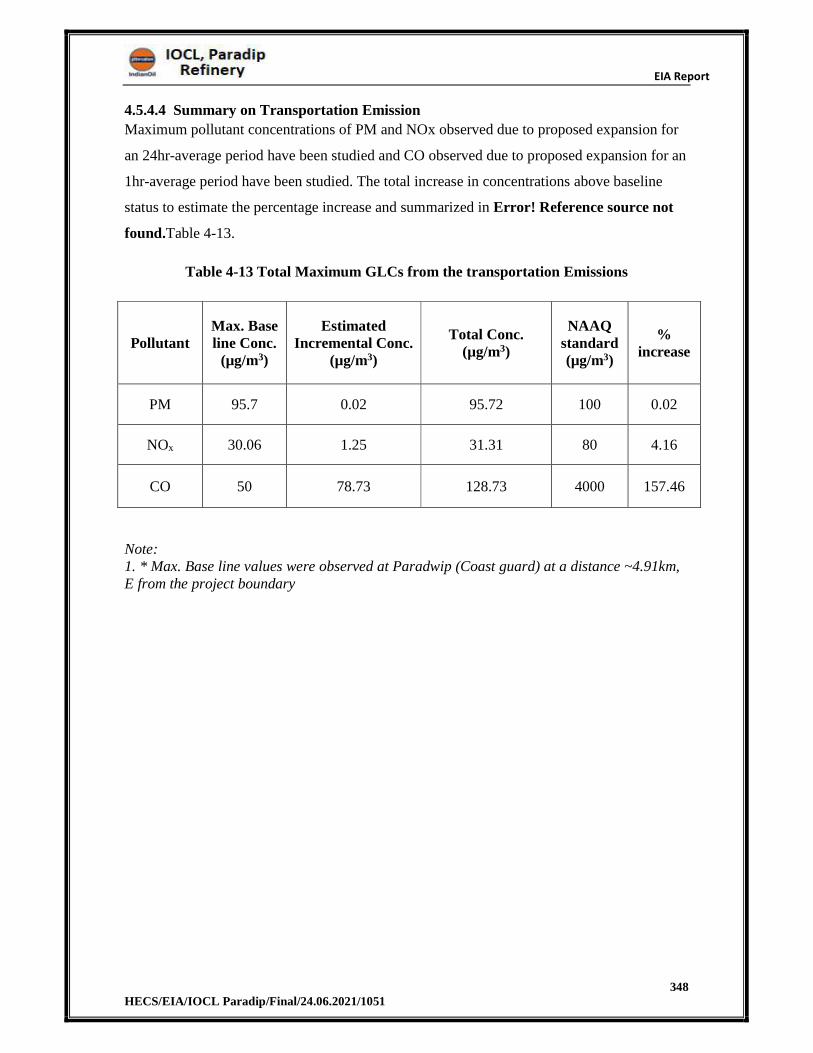
EIA Report
348 HECS/EIA/IOCL Paradip/Final/24.06.2021/1051
4.5.4.4 Summary on Transportation Emission
Maximum pollutant concentrations of PM and NOx observed due to proposed expansion for
an 24hr-average period have been studied and CO observed due to proposed expansion for an
1hr-average period have been studied. The total increase in concentrations above baseline
status to estimate the percentage increase and summarized in Error! Reference source not
found.Table 4-13.
Table 4-13 Total Maximum GLCs from the transportation Emissions
Pollutant Max. Base line Conc.
(µg/m3)
Estimated Incremental Conc.
(µg/m3)
Total Conc. (µg/m3)
NAAQ standard (µg/m3)
% increase
PM 95.7 0.02 95.72 100 0.02
NOx 30.06 1.25 31.31 80 4.16
CO 50 78.73 128.73 4000 157.46
Note: 1. * Max. Base line values were observed at Paradwip (Coast guard) at a distance ~4.91km, E from the project boundary
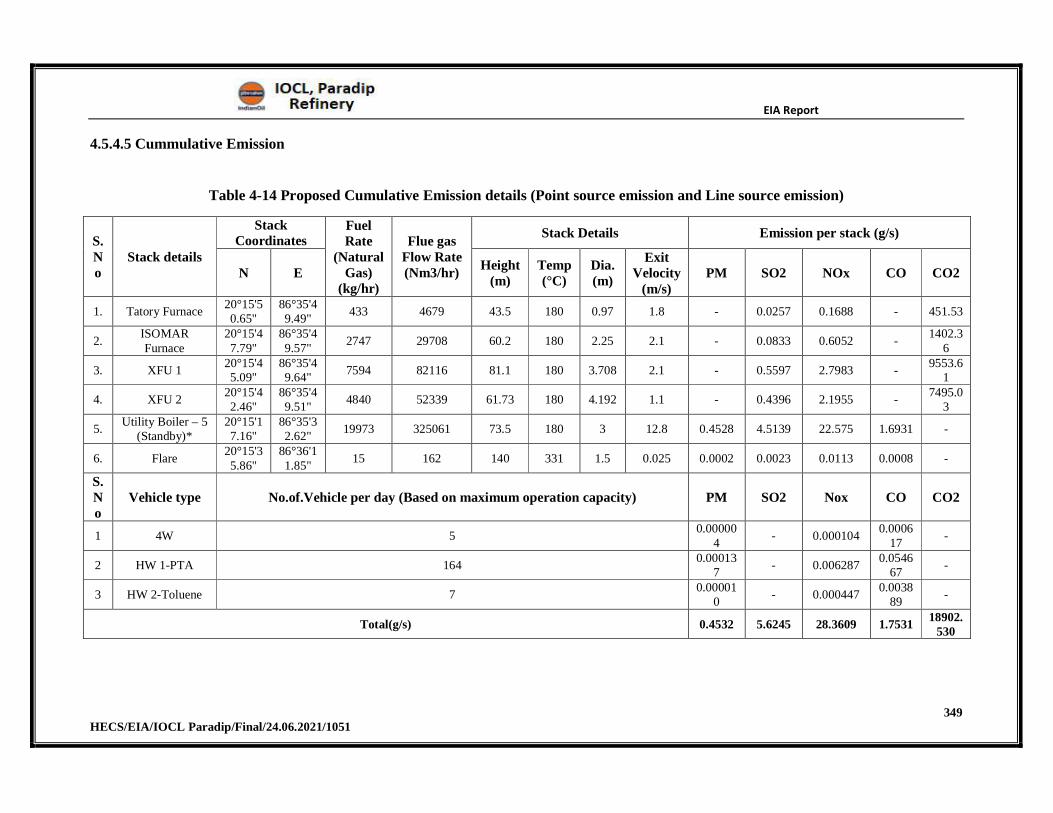
EIA Report
349 HECS/EIA/IOCL Paradip/Final/24.06.2021/1051
4.5.4.5 Cummulative Emission
Table 4-14 Proposed Cumulative Emission details (Point source emission and Line source emission)
S.No
Stack details
Stack Coordinates
Fuel Rate
(Natural Gas)
(kg/hr)
Flue gas Flow Rate (Nm3/hr)
Stack Details Emission per stack (g/s)
N E Height
(m) Temp (°C)
Dia. (m)
Exit Velocity
(m/s) PM SO2 NOx CO CO2
1. Tatory Furnace 20°15'50.65"
86°35'49.49"
433 4679 43.5 180 0.97 1.8 - 0.0257 0.1688 - 451.53
2. ISOMAR Furnace
20°15'47.79"
86°35'49.57"
2747 29708 60.2 180 2.25 2.1 - 0.0833 0.6052 - 1402.3
6
3. XFU 1 20°15'45.09"
86°35'49.64"
7594 82116 81.1 180 3.708 2.1 - 0.5597 2.7983 - 9553.6
1
4. XFU 2 20°15'42.46"
86°35'49.51"
4840 52339 61.73 180 4.192 1.1 - 0.4396 2.1955 - 7495.0
3
5. Utility Boiler – 5
(Standby)* 20°15'17.16"
86°35'32.62"
19973 325061 73.5 180 3 12.8 0.4528 4.5139 22.575 1.6931 -
6. Flare 20°15'35.86"
86°36'11.85"
15 162 140 331 1.5 0.025 0.0002 0.0023 0.0113 0.0008 -
S.No
Vehicle type No.of.Vehicle per day (Based on maximum operation capacity) PM SO2 Nox CO CO2
1 4W 5 0.00000
4 - 0.000104
0.000617
-
2 HW 1-PTA 164 0.00013
7 - 0.006287
0.054667
-
3 HW 2-Toluene 7 0.00001
0 - 0.000447
0.003889
-
Total(g/s) 0.4532 5.6245 28.3609 1.7531 18902.
530
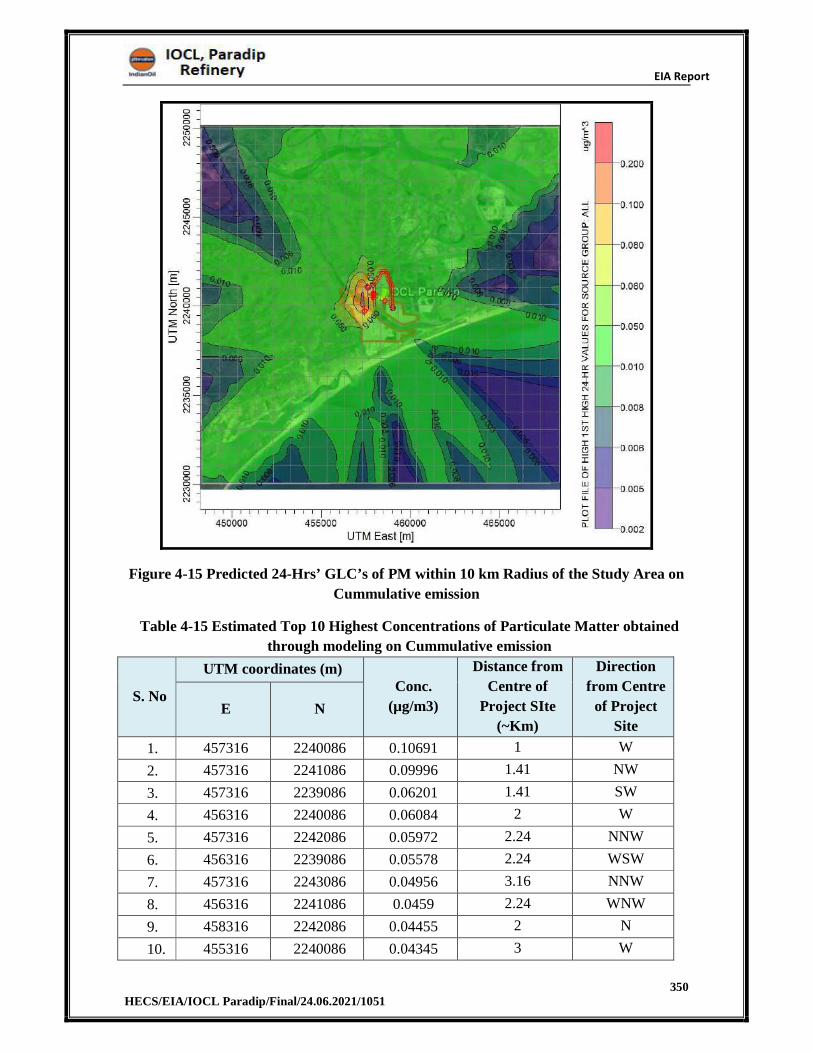
EIA Report
350 HECS/EIA/IOCL Paradip/Final/24.06.2021/1051
Figure 4-15 Predicted 24-Hrs’ GLC’s of PM within 10 km Radius of the Study Area on
Cummulative emission
Table 4-15 Estimated Top 10 Highest Concentrations of Particulate Matter obtained
through modeling on Cummulative emission
S. No
UTM coordinates (m) Conc.
(µg/m3)
Distance from
Centre of
Project SIte
(~Km)
Direction
from Centre
of Project
Site E N
1. 457316 2240086 0.10691 1 W
2. 457316 2241086 0.09996 1.41 NW
3. 457316 2239086 0.06201 1.41 SW
4. 456316 2240086 0.06084 2 W
5. 457316 2242086 0.05972 2.24 NNW
6. 456316 2239086 0.05578 2.24 WSW
7. 457316 2243086 0.04956 3.16 NNW
8. 456316 2241086 0.0459 2.24 WNW
9. 458316 2242086 0.04455 2 N
10. 455316 2240086 0.04345 3 W
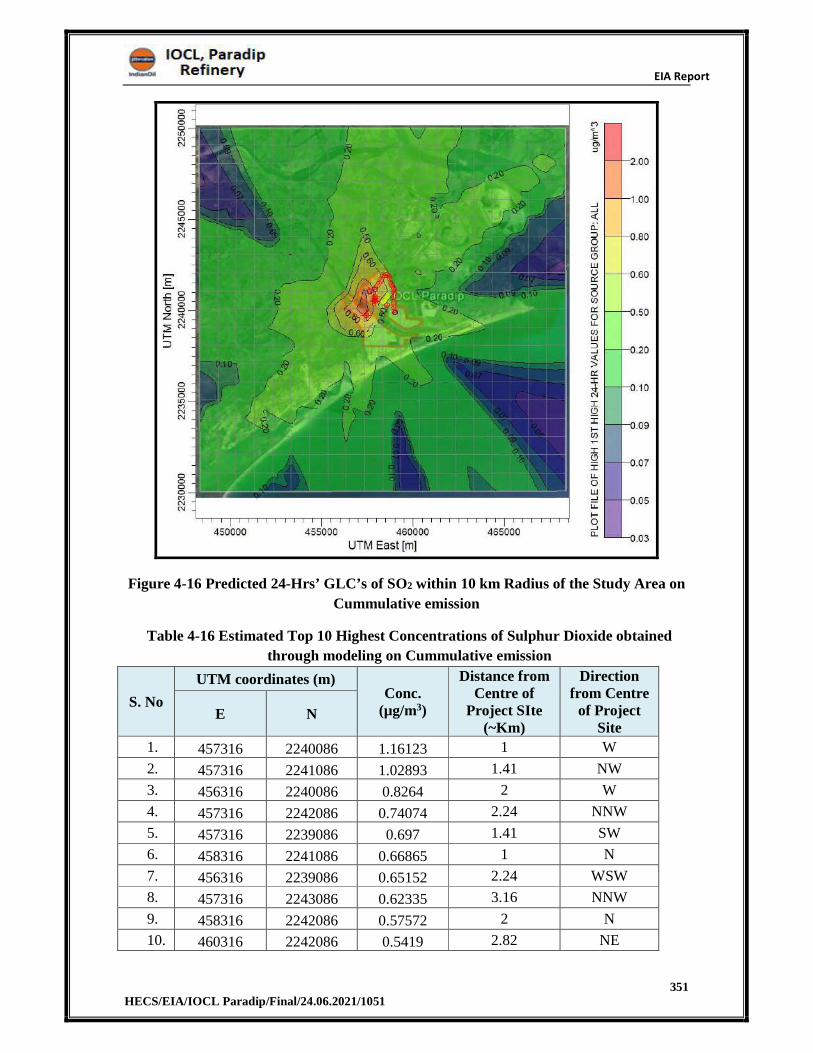
EIA Report
351 HECS/EIA/IOCL Paradip/Final/24.06.2021/1051
Figure 4-16 Predicted 24-Hrs’ GLC’s of SO2 within 10 km Radius of the Study Area on
Cummulative emission
Table 4-16 Estimated Top 10 Highest Concentrations of Sulphur Dioxide obtained
through modeling on Cummulative emission
S. No
UTM coordinates (m) Conc.
(µg/m3)
Distance from Centre of
Project SIte (~Km)
Direction from Centre
of Project Site
E N
1. 457316 2240086 1.16123 1 W
2. 457316 2241086 1.02893 1.41 NW
3. 456316 2240086 0.8264 2 W
4. 457316 2242086 0.74074 2.24 NNW
5. 457316 2239086 0.697 1.41 SW
6. 458316 2241086 0.66865 1 N
7. 456316 2239086 0.65152 2.24 WSW
8. 457316 2243086 0.62335 3.16 NNW
9. 458316 2242086 0.57572 2 N
10. 460316 2242086 0.5419 2.82 NE
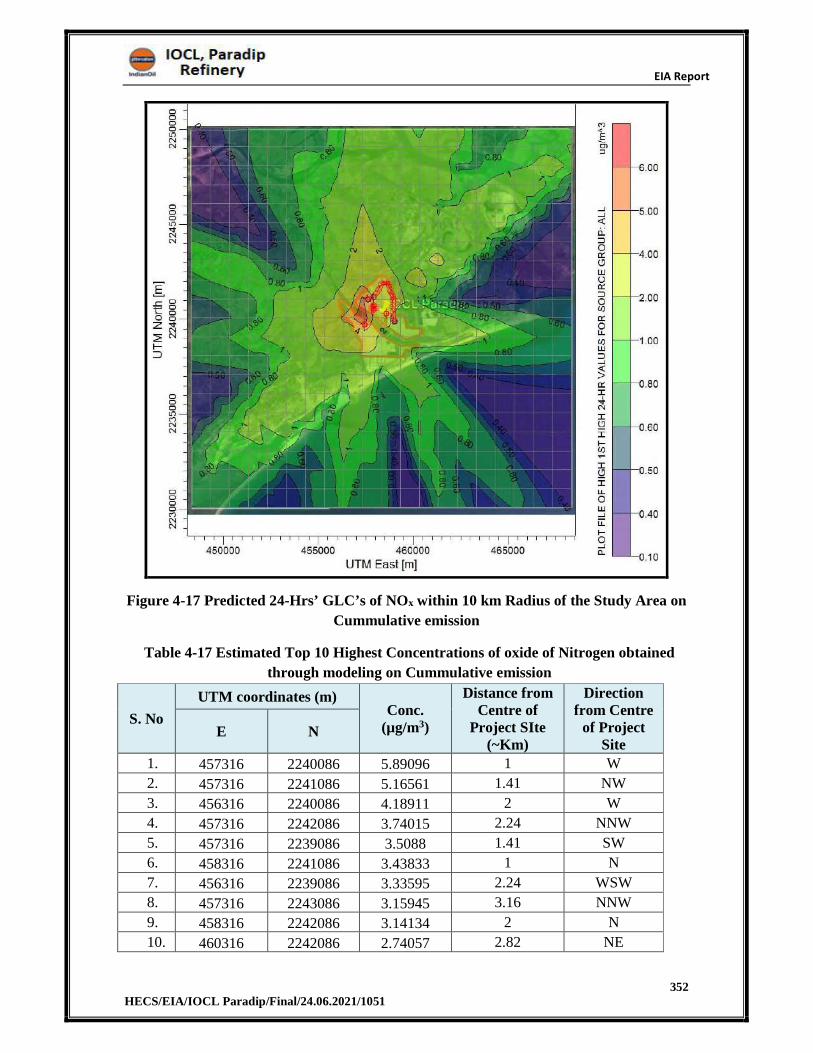
EIA Report
352 HECS/EIA/IOCL Paradip/Final/24.06.2021/1051
Figure 4-17 Predicted 24-Hrs’ GLC’s of NOx within 10 km Radius of the Study Area on
Cummulative emission
Table 4-17 Estimated Top 10 Highest Concentrations of oxide of Nitrogen obtained
through modeling on Cummulative emission
S. No
UTM coordinates (m) Conc.
(µg/m3)
Distance from Centre of
Project SIte (~Km)
Direction from Centre
of Project Site
E N
1. 457316 2240086 5.89096 1 W
2. 457316 2241086 5.16561 1.41 NW
3. 456316 2240086 4.18911 2 W
4. 457316 2242086 3.74015 2.24 NNW
5. 457316 2239086 3.5088 1.41 SW
6. 458316 2241086 3.43833 1 N
7. 456316 2239086 3.33595 2.24 WSW
8. 457316 2243086 3.15945 3.16 NNW
9. 458316 2242086 3.14134 2 N
10. 460316 2242086 2.74057 2.82 NE
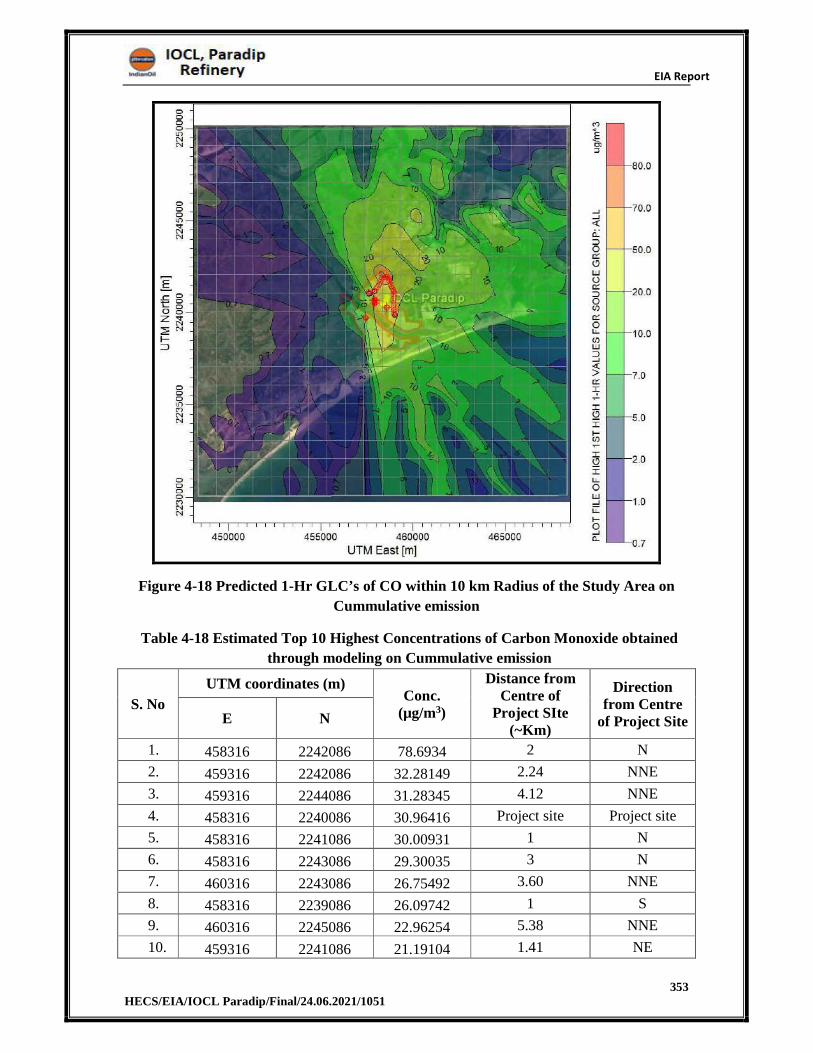
EIA Report
353 HECS/EIA/IOCL Paradip/Final/24.06.2021/1051
Figure 4-18 Predicted 1-Hr GLC’s of CO within 10 km Radius of the Study Area on
Cummulative emission
Table 4-18 Estimated Top 10 Highest Concentrations of Carbon Monoxide obtained
through modeling on Cummulative emission
S. No
UTM coordinates (m) Conc.
(µg/m3)
Distance from Centre of
Project SIte (~Km)
Direction from Centre
of Project SiteE N
1. 458316 2242086 78.6934 2 N
2. 459316 2242086 32.28149 2.24 NNE
3. 459316 2244086 31.28345 4.12 NNE
4. 458316 2240086 30.96416 Project site Project site
5. 458316 2241086 30.00931 1 N
6. 458316 2243086 29.30035 3 N
7. 460316 2243086 26.75492 3.60 NNE
8. 458316 2239086 26.09742 1 S
9. 460316 2245086 22.96254 5.38 NNE
10. 459316 2241086 21.19104 1.41 NE
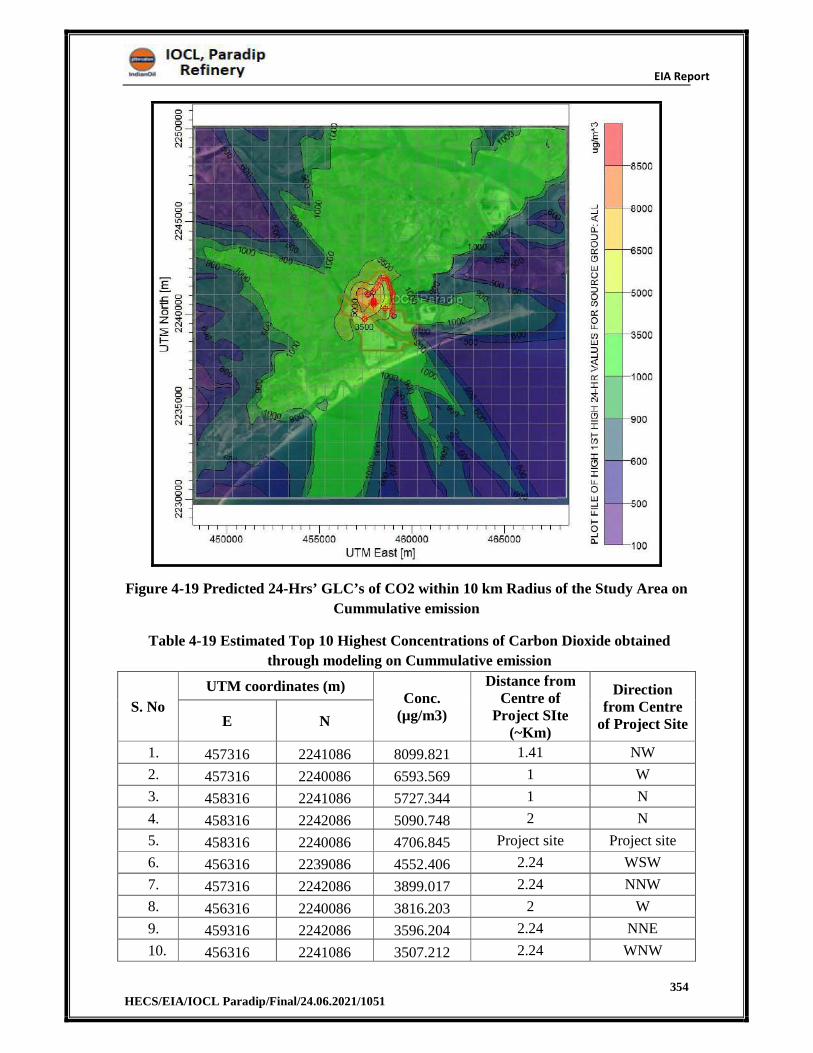
EIA Report
354 HECS/EIA/IOCL Paradip/Final/24.06.2021/1051
Figure 4-19 Predicted 24-Hrs’ GLC’s of CO2 within 10 km Radius of the Study Area on
Cummulative emission
Table 4-19 Estimated Top 10 Highest Concentrations of Carbon Dioxide obtained
through modeling on Cummulative emission
S. No
UTM coordinates (m) Conc.
(µg/m3)
Distance from Centre of
Project SIte (~Km)
Direction from Centre
of Project SiteE N
1. 457316 2241086 8099.821 1.41 NW
2. 457316 2240086 6593.569 1 W
3. 458316 2241086 5727.344 1 N
4. 458316 2242086 5090.748 2 N
5. 458316 2240086 4706.845 Project site Project site
6. 456316 2239086 4552.406 2.24 WSW
7. 457316 2242086 3899.017 2.24 NNW
8. 456316 2240086 3816.203 2 W
9. 459316 2242086 3596.204 2.24 NNE
10. 456316 2241086 3507.212 2.24 WNW
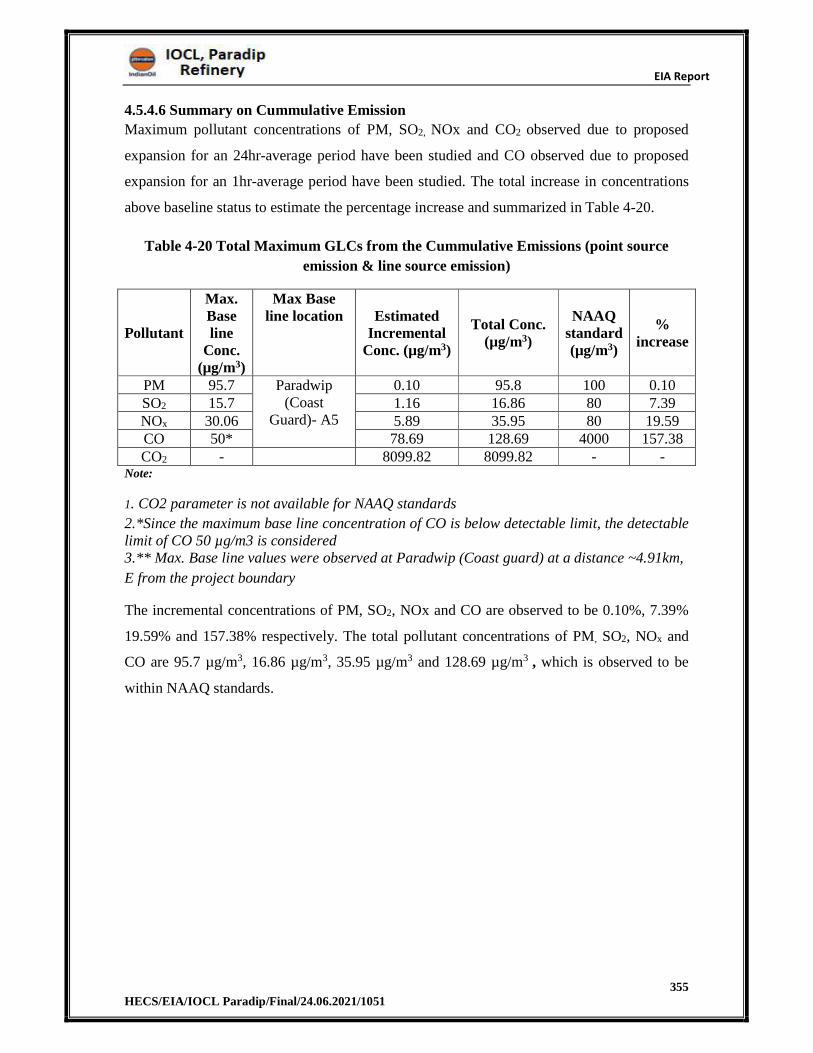
EIA Report
355 HECS/EIA/IOCL Paradip/Final/24.06.2021/1051
4.5.4.6 Summary on Cummulative Emission
Maximum pollutant concentrations of PM, SO2, NOx and CO2 observed due to proposed
expansion for an 24hr-average period have been studied and CO observed due to proposed
expansion for an 1hr-average period have been studied. The total increase in concentrations
above baseline status to estimate the percentage increase and summarized in Table 4-20.
Table 4-20 Total Maximum GLCs from the Cummulative Emissions (point source
emission & line source emission)
Pollutant
Max. Base line
Conc. (µg/m3)
Max Base line location Estimated
Incremental Conc. (µg/m3)
Total Conc. (µg/m3)
NAAQ standard (µg/m3)
% increase
PM 95.7 Paradwip (Coast
Guard)- A5
0.10 95.8 100 0.10SO2 15.7 1.16 16.86 80 7.39NOx 30.06 5.89 35.95 80 19.59CO 50* 78.69 128.69 4000 157.38 CO2 - 8099.82 8099.82 - -
Note:
1. CO2 parameter is not available for NAAQ standards
3.** Max. Base line values were observed at Paradwip (Coast guard) at a distance ~4.91km,
E from the project boundary
The incremental concentrations of PM, SO2, NOx and CO are observed to be 0.10%, 7.39%
19.59% and 157.38% respectively. The total pollutant concentrations of PM, SO2, NOx and
CO are 95.7 µg/m3, 16.86 µg/m3, 35.95 µg/m3 and 128.69 µg/m3 , which is observed to be
within NAAQ standards.
2.*Since the maximum base line concentration of CO is below detectable limit, the detectable limit of CO 50 µg/m3 is considered
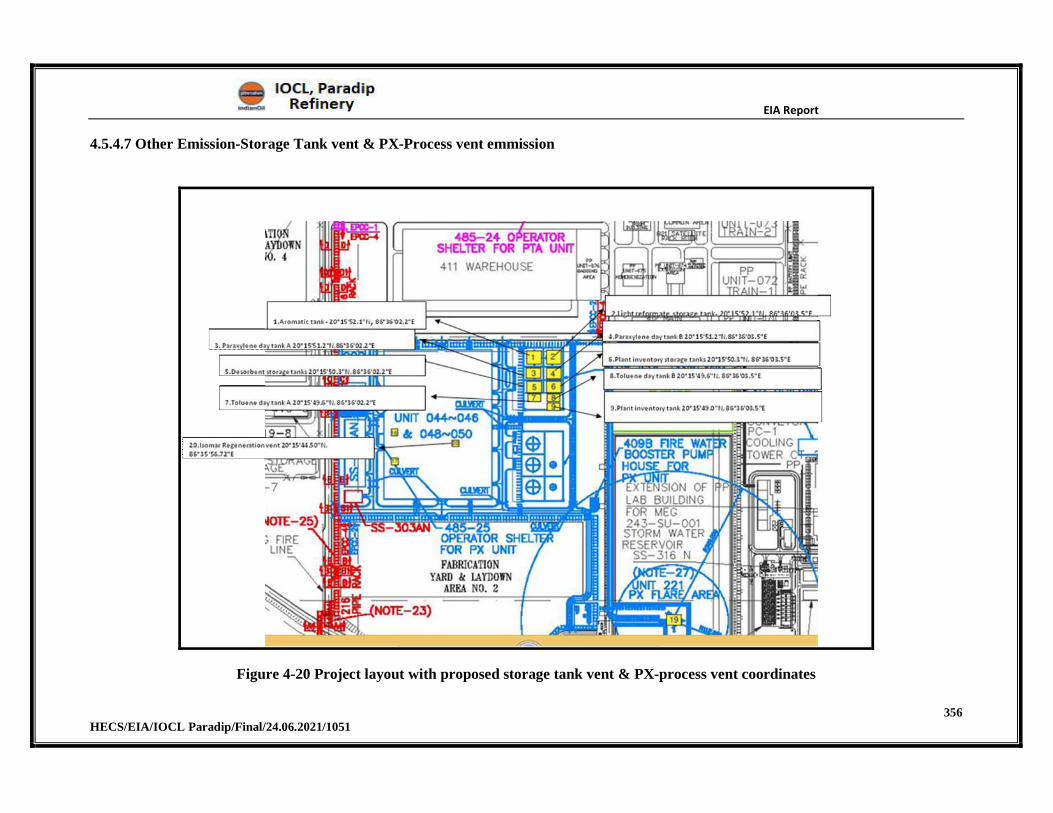
EIA Report
356 HECS/EIA/IOCL Paradip/Final/24.06.2021/1051
4.5.4.7 Other Emission-Storage Tank vent & PX-Process vent emmission
Figure 4-20 Project layout with proposed storage tank vent & PX-process vent coordinates
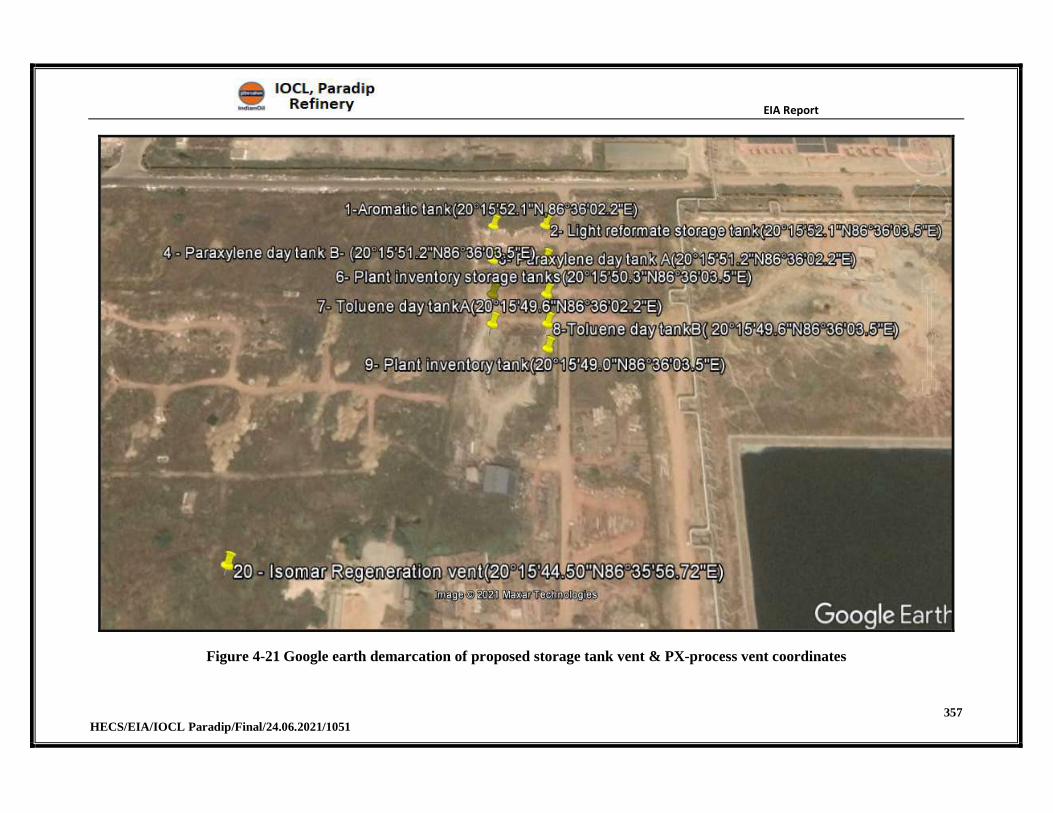
EIA Report
357 HECS/EIA/IOCL Paradip/Final/24.06.2021/1051
Figure 4-21 Google earth demarcation of proposed storage tank vent & PX-process vent coordinates
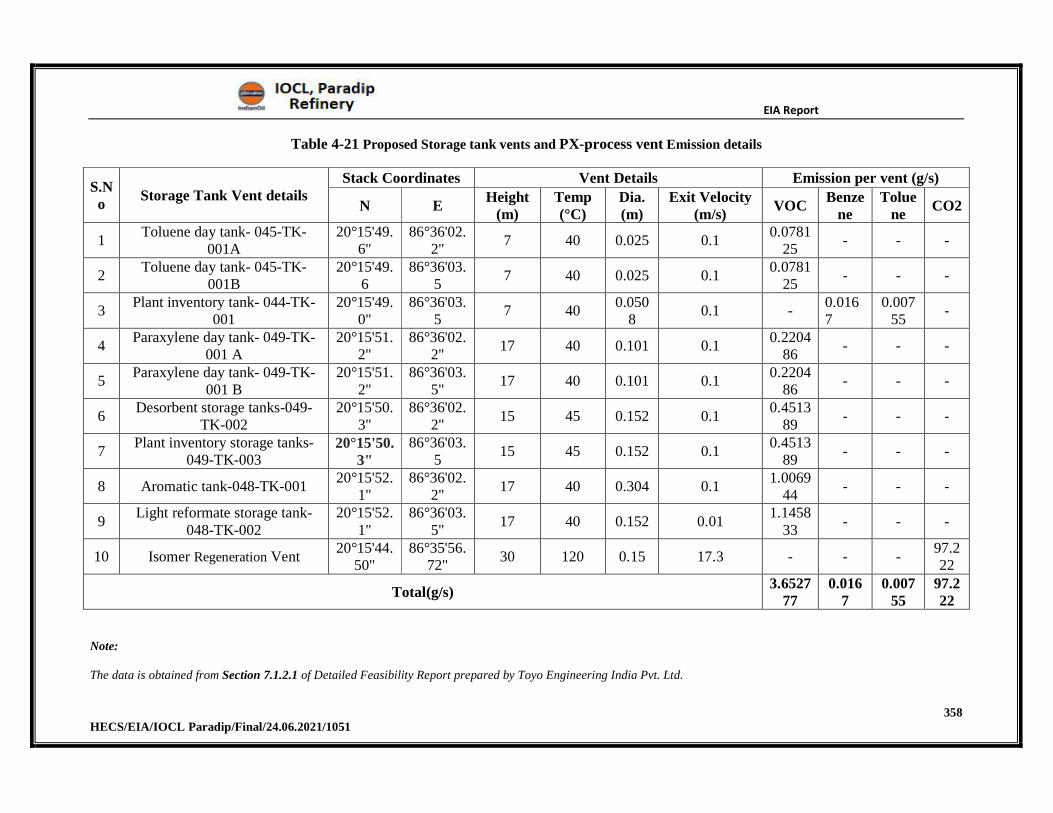
EIA Report
358 HECS/EIA/IOCL Paradip/Final/24.06.2021/1051
Table 4-21 Proposed Storage tank vents and PX-process vent Emission details
S.No
Storage Tank Vent details Stack Coordinates Vent Details Emission per vent (g/s)
N E Height
(m) Temp (°C)
Dia. (m)
Exit Velocity (m/s)
VOC Benze
ne Tolue
ne CO2
1 Toluene day tank- 045-TK-
001A 20°15'49.
6" 86°36'02.
2" 7 40 0.025 0.1
0.078125
- - -
2 Toluene day tank- 045-TK-
001B 20°15'49.
6 86°36'03.
5 7 40 0.025 0.1
0.078125
- - -
3 Plant inventory tank- 044-TK-
001 20°15'49.
0" 86°36'03.
5 7 40
0.0508
0.1 - 0.0167
0.00755
-
4 Paraxylene day tank- 049-TK-
001 A 20°15'51.
2" 86°36'02.
2" 17 40 0.101 0.1
0.220486
- - -
5 Paraxylene day tank- 049-TK-
001 B 20°15'51.
2" 86°36'03.
5" 17 40 0.101 0.1
0.220486
- - -
6 Desorbent storage tanks-049-
TK-002 20°15'50.
3" 86°36'02.
2" 15 45 0.152 0.1
0.451389
- - -
7 Plant inventory storage tanks-
049-TK-003 20°15'50.
3" 86°36'03.
5 15 45 0.152 0.1
0.451389
- - -
8 Aromatic tank-048-TK-001 20°15'52.
1" 86°36'02.
2" 17 40 0.304 0.1
1.006944
- - -
9 Light reformate storage tank-
048-TK-002 20°15'52.
1" 86°36'03.
5" 17 40 0.152 0.01
1.145833
- - -
10 Isomer Regeneration Vent 20°15'44.
50" 86°35'56.
72" 30 120 0.15 17.3 - - -
97.222
Total(g/s) 3.6527
77 0.016
7 0.007
55 97.222
Note:
The data is obtained from Section 7.1.2.1 of Detailed Feasibility Report prepared by Toyo Engineering India Pvt. Ltd.
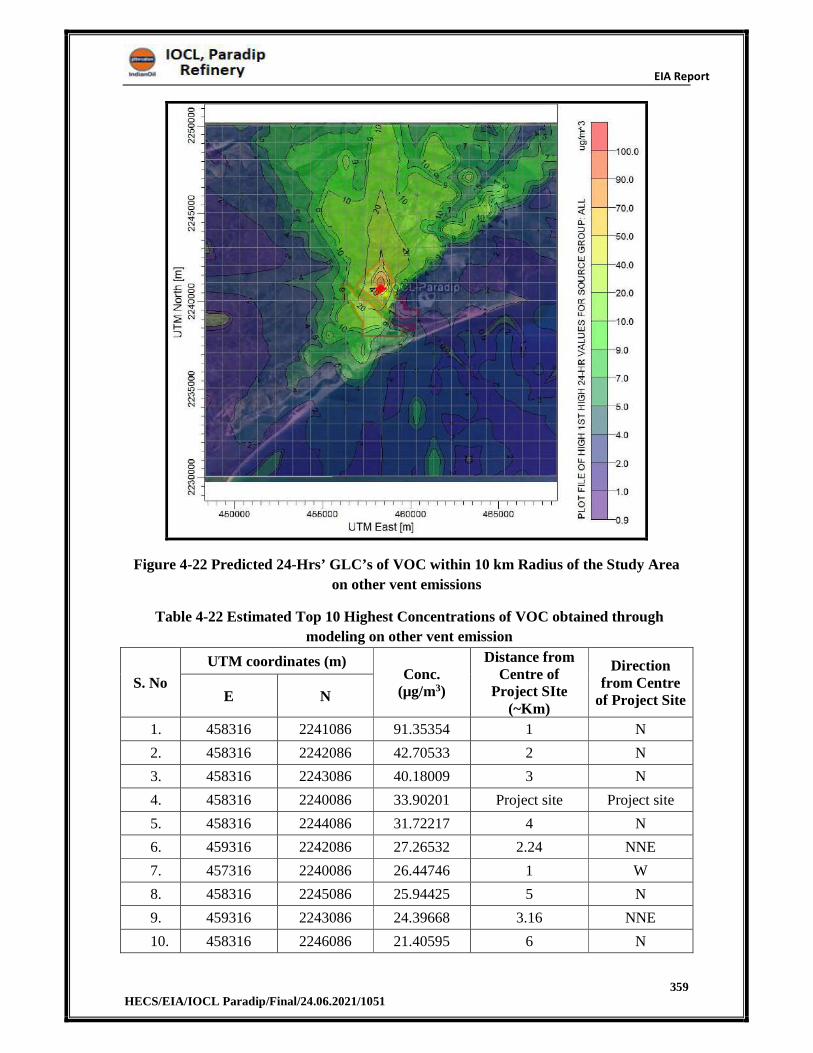
EIA Report
359 HECS/EIA/IOCL Paradip/Final/24.06.2021/1051
Figure 4-22 Predicted 24-Hrs’ GLC’s of VOC within 10 km Radius of the Study Area
on other vent emissions
Table 4-22 Estimated Top 10 Highest Concentrations of VOC obtained through
modeling on other vent emission
S. No
UTM coordinates (m) Conc.
(µg/m3)
Distance from Centre of
Project SIte (~Km)
Direction from Centre
of Project SiteE N
1. 458316 2241086 91.35354 1 N
2. 458316 2242086 42.70533 2 N
3. 458316 2243086 40.18009 3 N
4. 458316 2240086 33.90201 Project site Project site
5. 458316 2244086 31.72217 4 N
6. 459316 2242086 27.26532 2.24 NNE
7. 457316 2240086 26.44746 1 W
8. 458316 2245086 25.94425 5 N
9. 459316 2243086 24.39668 3.16 NNE
10. 458316 2246086 21.40595 6 N
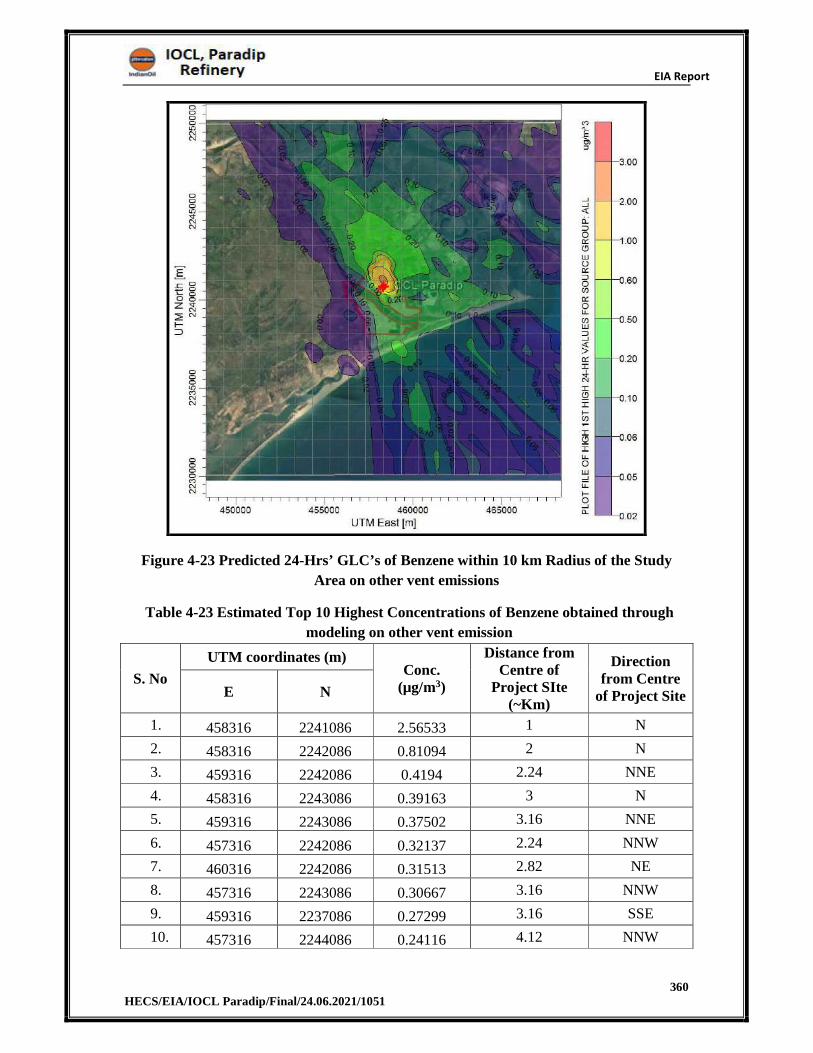
EIA Report
360 HECS/EIA/IOCL Paradip/Final/24.06.2021/1051
Figure 4-23 Predicted 24-Hrs’ GLC’s of Benzene within 10 km Radius of the Study
Area on other vent emissions
Table 4-23 Estimated Top 10 Highest Concentrations of Benzene obtained through
modeling on other vent emission
S. No
UTM coordinates (m) Conc.
(µg/m3)
Distance from Centre of
Project SIte (~Km)
Direction from Centre
of Project SiteE N
1. 458316 2241086 2.56533 1 N
2. 458316 2242086 0.81094 2 N
3. 459316 2242086 0.4194 2.24 NNE
4. 458316 2243086 0.39163 3 N
5. 459316 2243086 0.37502 3.16 NNE
6. 457316 2242086 0.32137 2.24 NNW
7. 460316 2242086 0.31513 2.82 NE
8. 457316 2243086 0.30667 3.16 NNW
9. 459316 2237086 0.27299 3.16 SSE
10. 457316 2244086 0.24116 4.12 NNW

EIA Report
361 HECS/EIA/IOCL Paradip/Final/24.06.2021/1051
Figure 4-24 Predicted 24-Hrs’ GLC’s of Toluene within 10 km Radius of the Study Area
on other vent emissions
Table 4-24 Estimated Top 10 Highest Concentrations of Toluene obtained through
modeling on other vent emission
S. No
UTM coordinates (m) Conc.
(µg/m3)
Distance from Centre of
Project SIte (~Km)
Direction from Centre
of Project SiteE N
1. 458316 2241086 1.15977 1 N
2. 458316 2242086 0.36662 2 N
3. 459316 2242086 0.18961 2.24 NNE
4. 458316 2243086 0.17705 3 N
5. 459316 2243086 0.16955 3.16 NNE
6. 457316 2242086 0.14529 2.24 NNW
7. 460316 2242086 0.14247 2.82 NE
8. 457316 2243086 0.13864 3.16 NNW
9. 459316 2237086 0.12342 3.16 SSE
10. 457316 2244086 0.10903 4.12 NNW
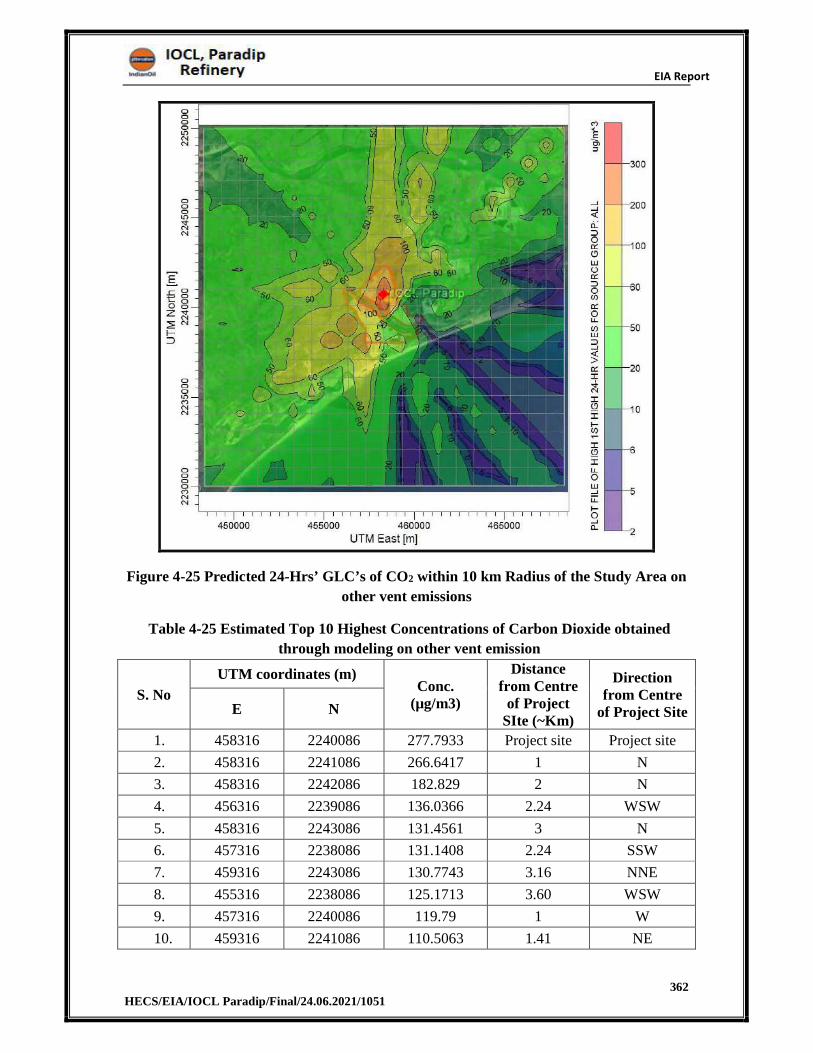
EIA Report
362 HECS/EIA/IOCL Paradip/Final/24.06.2021/1051
Figure 4-25 Predicted 24-Hrs’ GLC’s of CO2 within 10 km Radius of the Study Area on
other vent emissions
Table 4-25 Estimated Top 10 Highest Concentrations of Carbon Dioxide obtained
through modeling on other vent emission
S. No
UTM coordinates (m) Conc.
(µg/m3)
Distance from Centre
of Project SIte (~Km)
Direction from Centre
of Project SiteE N
1. 458316 2240086 277.7933 Project site Project site
2. 458316 2241086 266.6417 1 N
3. 458316 2242086 182.829 2 N
4. 456316 2239086 136.0366 2.24 WSW
5. 458316 2243086 131.4561 3 N
6. 457316 2238086 131.1408 2.24 SSW
7. 459316 2243086 130.7743 3.16 NNE
8. 455316 2238086 125.1713 3.60 WSW
9. 457316 2240086 119.79 1 W
10. 459316 2241086 110.5063 1.41 NE
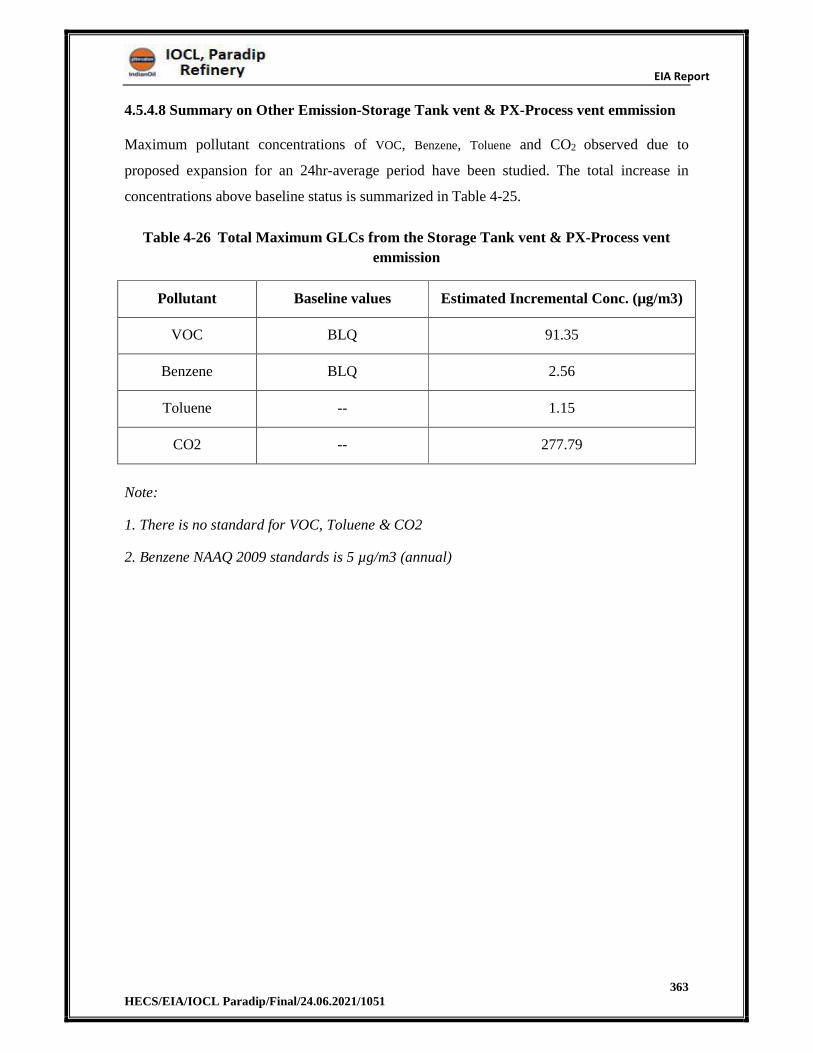
EIA Report
363 HECS/EIA/IOCL Paradip/Final/24.06.2021/1051
4.5.4.8 Summary on Other Emission-Storage Tank vent & PX-Process vent emmission
Maximum pollutant concentrations of VOC, Benzene, Toluene and CO2 observed due to
proposed expansion for an 24hr-average period have been studied. The total increase in
concentrations above baseline status is summarized in Table 4-25.
Table 4-26 Total Maximum GLCs from the Storage Tank vent & PX-Process vent
emmission
Pollutant Baseline values Estimated Incremental Conc. (µg/m3)
VOC BLQ 91.35
Benzene BLQ 2.56
Toluene -- 1.15
CO2 -- 277.79
Note:
1. There is no standard for VOC, Toluene & CO2
2. Benzene NAAQ 2009 standards is 5 µg/m3 (annual)
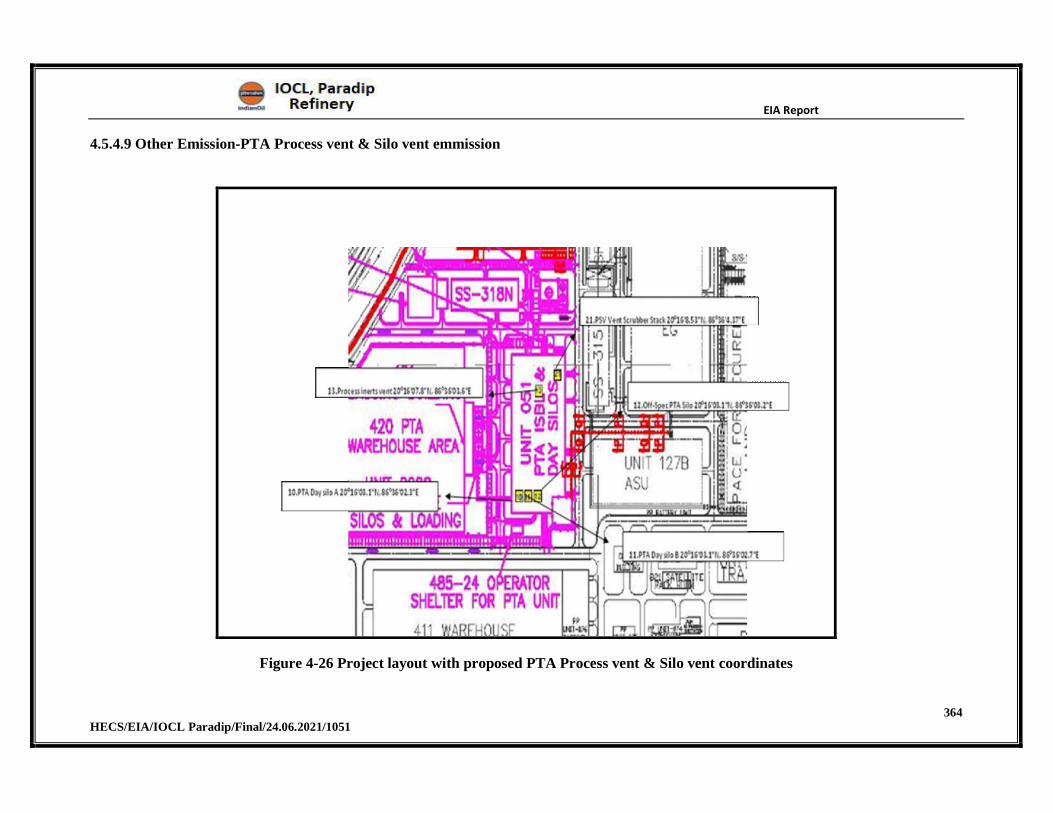
EIA Report
364 HECS/EIA/IOCL Paradip/Final/24.06.2021/1051
4.5.4.9 Other Emission-PTA Process vent & Silo vent emmission
Figure 4-26 Project layout with proposed PTA Process vent & Silo vent coordinates
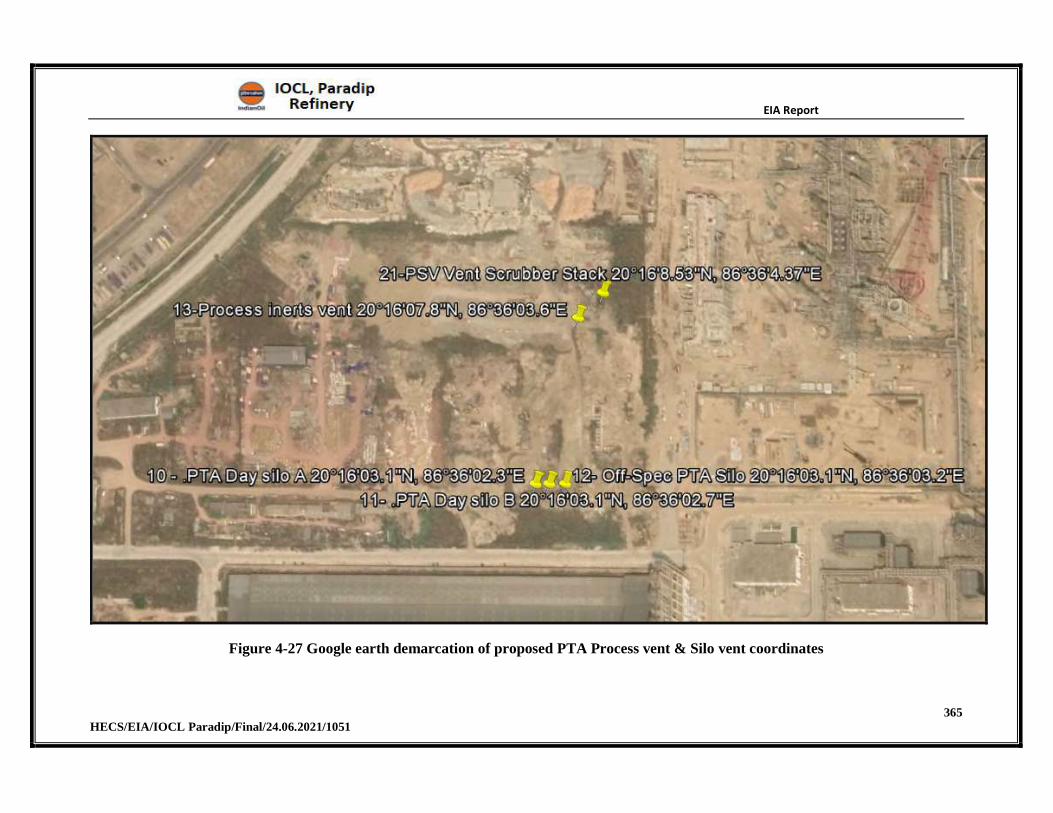
EIA Report
365 HECS/EIA/IOCL Paradip/Final/24.06.2021/1051
Figure 4-27 Google earth demarcation of proposed PTA Process vent & Silo vent coordinates
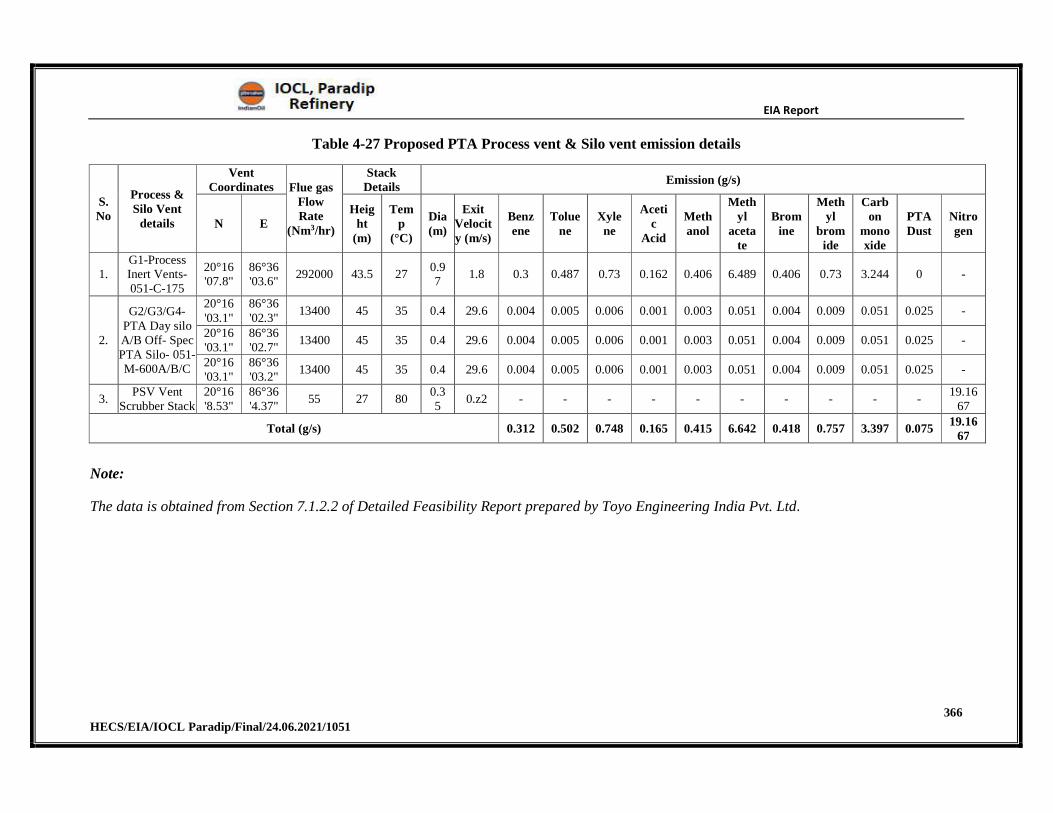
EIA Report
366 HECS/EIA/IOCL Paradip/Final/24.06.2021/1051
Table 4-27 Proposed PTA Process vent & Silo vent emission details
S.No
Process & Silo Vent
details
Vent Coordinates Flue gas
Flow Rate
(Nm3/hr)
Stack Details
Emission (g/s)
N E Heig
ht (m)
Temp
(°C)
Dia(m)
Exit Velocity (m/s)
Benzene
Toluene
Xylene
Acetic
Acid
Methanol
Methyl
acetate
Bromine
Methyl
bromide
Carbon
monoxide
PTA Dust
Nitrogen
1. G1-Process Inert Vents- 051-C-175
20°16'07.8"
86°36'03.6"
292000 43.5 27 0.97
1.8 0.3 0.487 0.73 0.162 0.406 6.489 0.406 0.73 3.244 0 -
2.
G2/G3/G4-PTA Day silo A/B Off- Spec PTA Silo- 051-M-600A/B/C
20°16'03.1"
86°36'02.3"
13400 45 35 0.4 29.6 0.004 0.005 0.006 0.001 0.003 0.051 0.004 0.009 0.051 0.025 -
20°16'03.1"
86°36'02.7"
13400 45 35 0.4 29.6 0.004 0.005 0.006 0.001 0.003 0.051 0.004 0.009 0.051 0.025 -
20°16'03.1"
86°36'03.2"
13400 45 35 0.4 29.6 0.004 0.005 0.006 0.001 0.003 0.051 0.004 0.009 0.051 0.025 -
3. PSV Vent
Scrubber Stack20°16'8.53"
86°36'4.37"
55 27 80 0.35
0.z2 - - - - - - - - - - 19.16
67
Total (g/s) 0.312 0.502 0.748 0.165 0.415 6.642 0.418 0.757 3.397 0.075 19.16
67
Note:
The data is obtained from Section 7.1.2.2 of Detailed Feasibility Report prepared by Toyo Engineering India Pvt. Ltd.
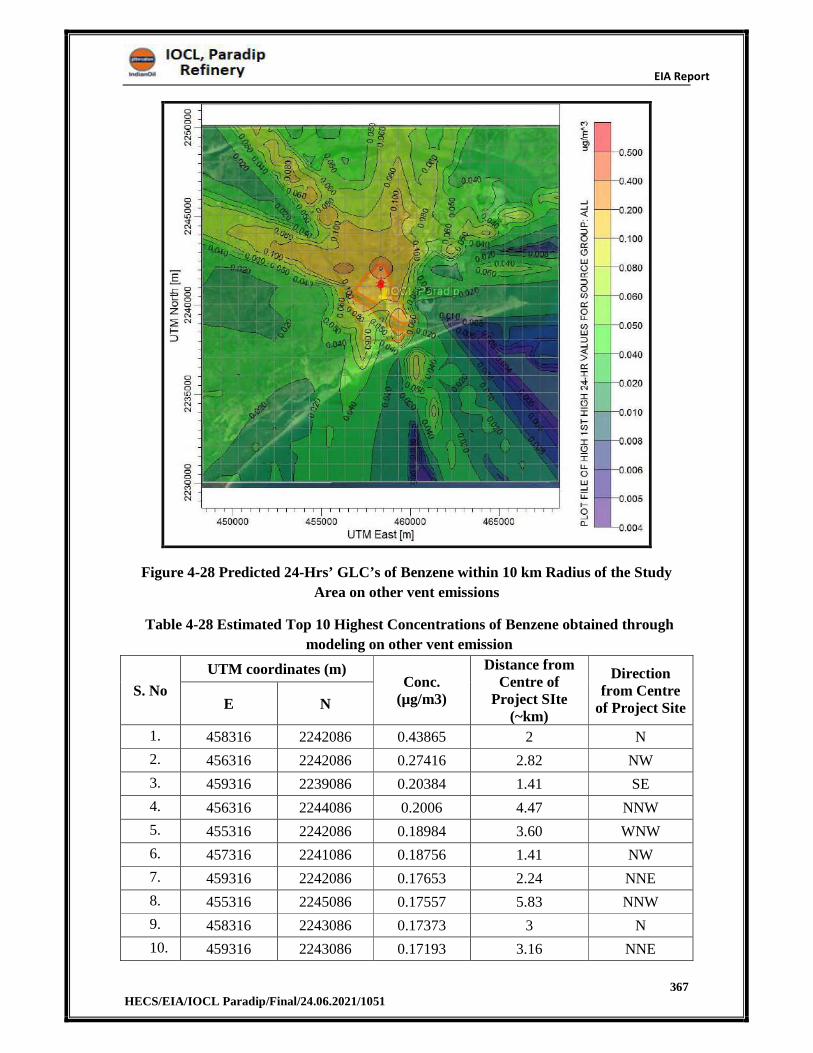
EIA Report
367 HECS/EIA/IOCL Paradip/Final/24.06.2021/1051
Figure 4-28 Predicted 24-Hrs’ GLC’s of Benzene within 10 km Radius of the Study
Area on other vent emissions
Table 4-28 Estimated Top 10 Highest Concentrations of Benzene obtained through
modeling on other vent emission
S. No
UTM coordinates (m) Conc.
(µg/m3)
Distance from Centre of
Project SIte (~km)
Direction from Centre
of Project SiteE N
1. 458316 2242086 0.43865 2 N
2. 456316 2242086 0.27416 2.82 NW
3. 459316 2239086 0.20384 1.41 SE
4. 456316 2244086 0.2006 4.47 NNW
5. 455316 2242086 0.18984 3.60 WNW
6. 457316 2241086 0.18756 1.41 NW
7. 459316 2242086 0.17653 2.24 NNE
8. 455316 2245086 0.17557 5.83 NNW
9. 458316 2243086 0.17373 3 N
10. 459316 2243086 0.17193 3.16 NNE
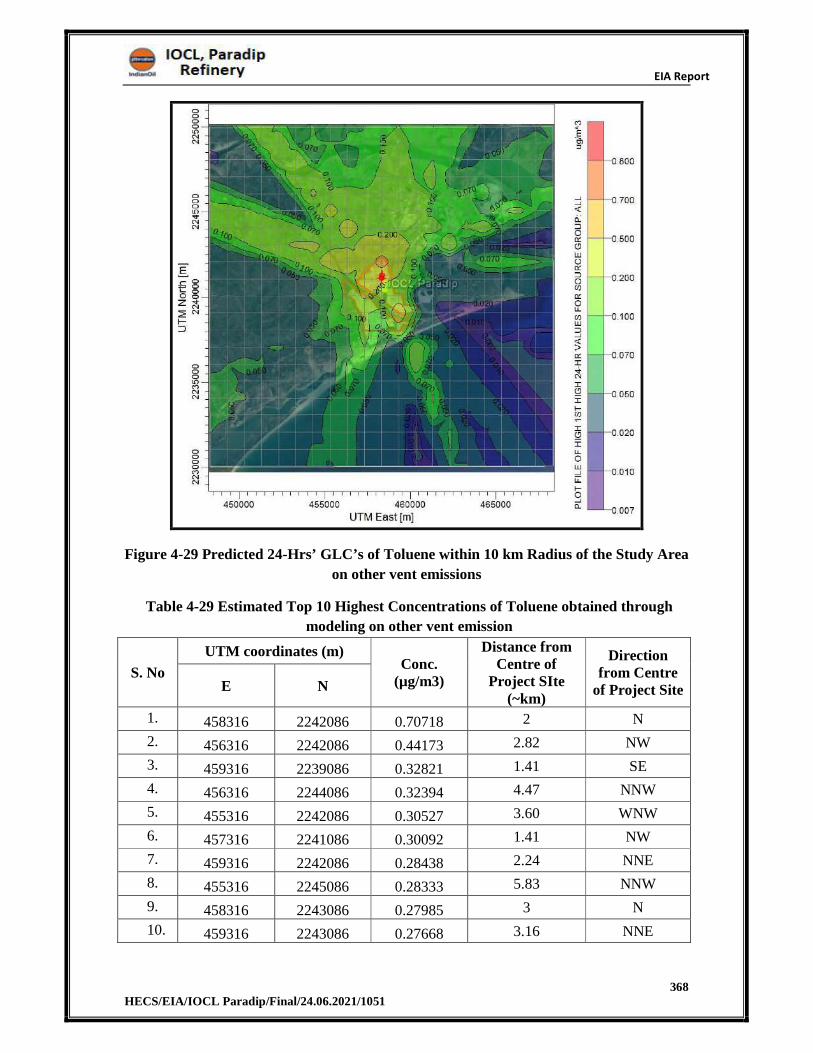
EIA Report
368 HECS/EIA/IOCL Paradip/Final/24.06.2021/1051
Figure 4-29 Predicted 24-Hrs’ GLC’s of Toluene within 10 km Radius of the Study Area
on other vent emissions
Table 4-29 Estimated Top 10 Highest Concentrations of Toluene obtained through
modeling on other vent emission
S. No
UTM coordinates (m) Conc.
(µg/m3)
Distance from Centre of
Project SIte (~km)
Direction from Centre
of Project SiteE N
1. 458316 2242086 0.70718 2 N
2. 456316 2242086 0.44173 2.82 NW
3. 459316 2239086 0.32821 1.41 SE
4. 456316 2244086 0.32394 4.47 NNW
5. 455316 2242086 0.30527 3.60 WNW
6. 457316 2241086 0.30092 1.41 NW
7. 459316 2242086 0.28438 2.24 NNE
8. 455316 2245086 0.28333 5.83 NNW
9. 458316 2243086 0.27985 3 N
10. 459316 2243086 0.27668 3.16 NNE
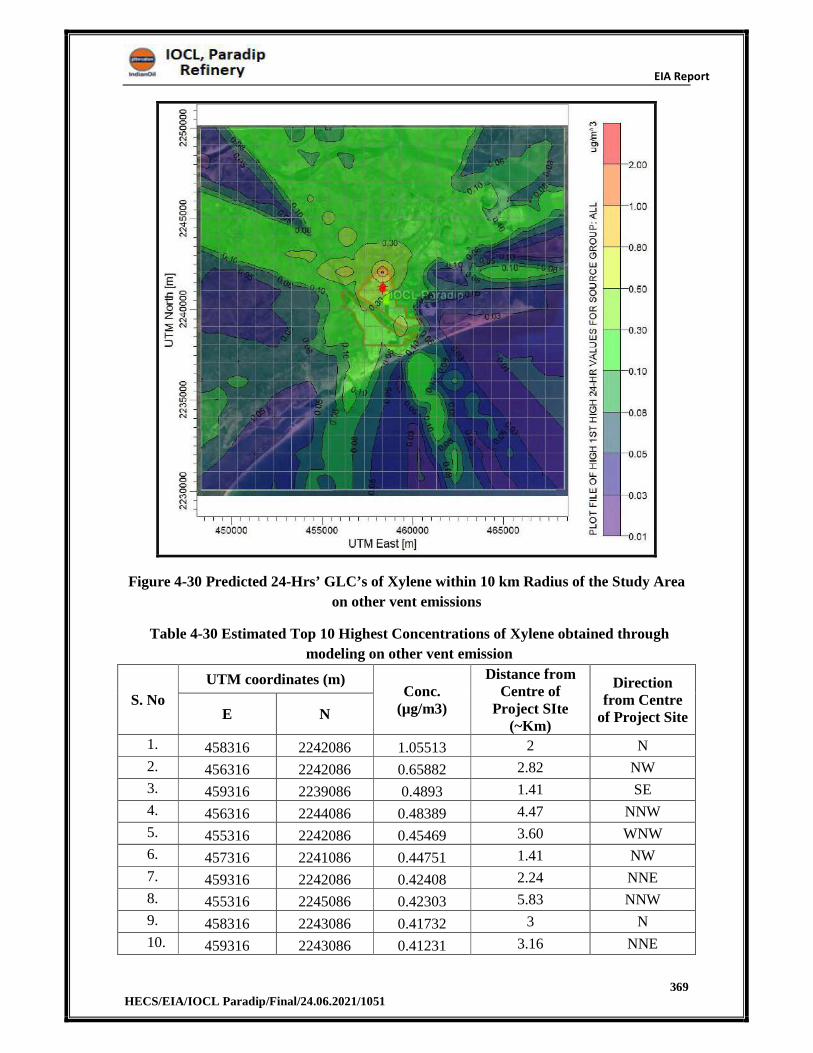
EIA Report
369 HECS/EIA/IOCL Paradip/Final/24.06.2021/1051
Figure 4-30 Predicted 24-Hrs’ GLC’s of Xylene within 10 km Radius of the Study Area
on other vent emissions
Table 4-30 Estimated Top 10 Highest Concentrations of Xylene obtained through
modeling on other vent emission
S. No
UTM coordinates (m) Conc.
(µg/m3)
Distance from Centre of
Project SIte (~Km)
Direction from Centre
of Project SiteE N
1. 458316 2242086 1.05513 2 N
2. 456316 2242086 0.65882 2.82 NW
3. 459316 2239086 0.4893 1.41 SE
4. 456316 2244086 0.48389 4.47 NNW
5. 455316 2242086 0.45469 3.60 WNW
6. 457316 2241086 0.44751 1.41 NW
7. 459316 2242086 0.42408 2.24 NNE
8. 455316 2245086 0.42303 5.83 NNW
9. 458316 2243086 0.41732 3 N
10. 459316 2243086 0.41231 3.16 NNE
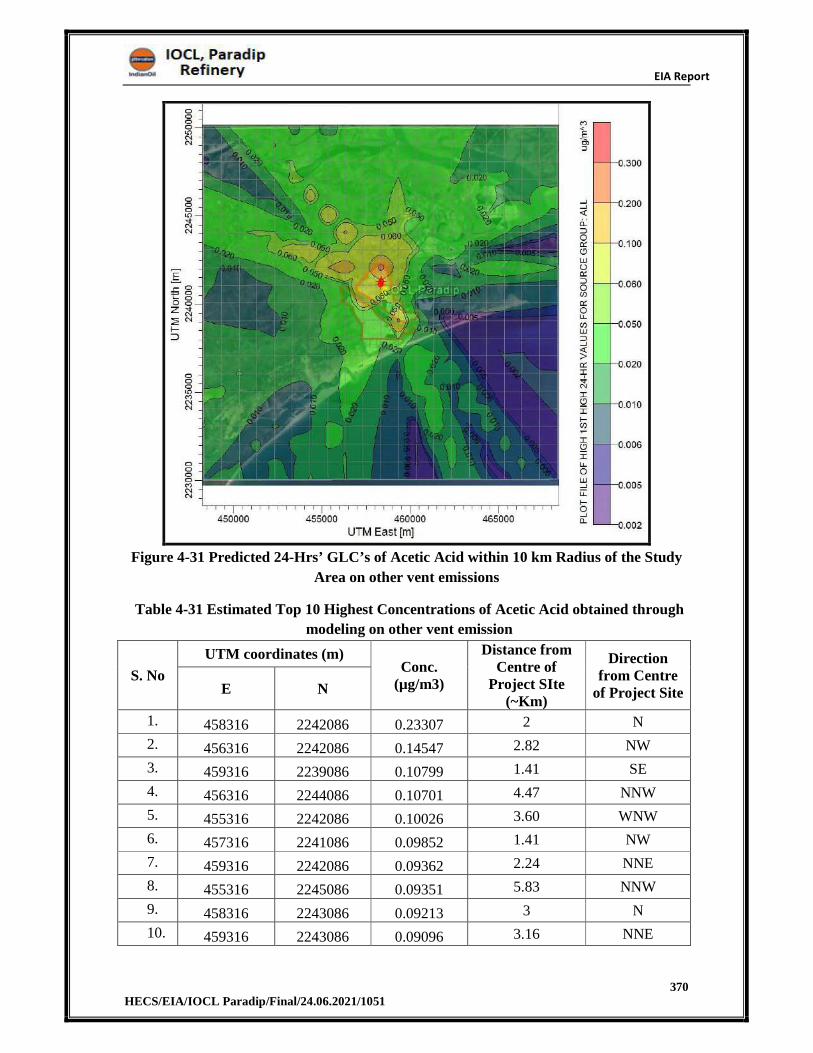
EIA Report
370 HECS/EIA/IOCL Paradip/Final/24.06.2021/1051
Figure 4-31 Predicted 24-Hrs’ GLC’s of Acetic Acid within 10 km Radius of the Study
Area on other vent emissions
Table 4-31 Estimated Top 10 Highest Concentrations of Acetic Acid obtained through
modeling on other vent emission
S. No
UTM coordinates (m) Conc.
(µg/m3)
Distance from Centre of
Project SIte (~Km)
Direction from Centre
of Project SiteE N
1. 458316 2242086 0.23307 2 N
2. 456316 2242086 0.14547 2.82 NW
3. 459316 2239086 0.10799 1.41 SE
4. 456316 2244086 0.10701 4.47 NNW
5. 455316 2242086 0.10026 3.60 WNW
6. 457316 2241086 0.09852 1.41 NW
7. 459316 2242086 0.09362 2.24 NNE
8. 455316 2245086 0.09351 5.83 NNW
9. 458316 2243086 0.09213 3 N
10. 459316 2243086 0.09096 3.16 NNE
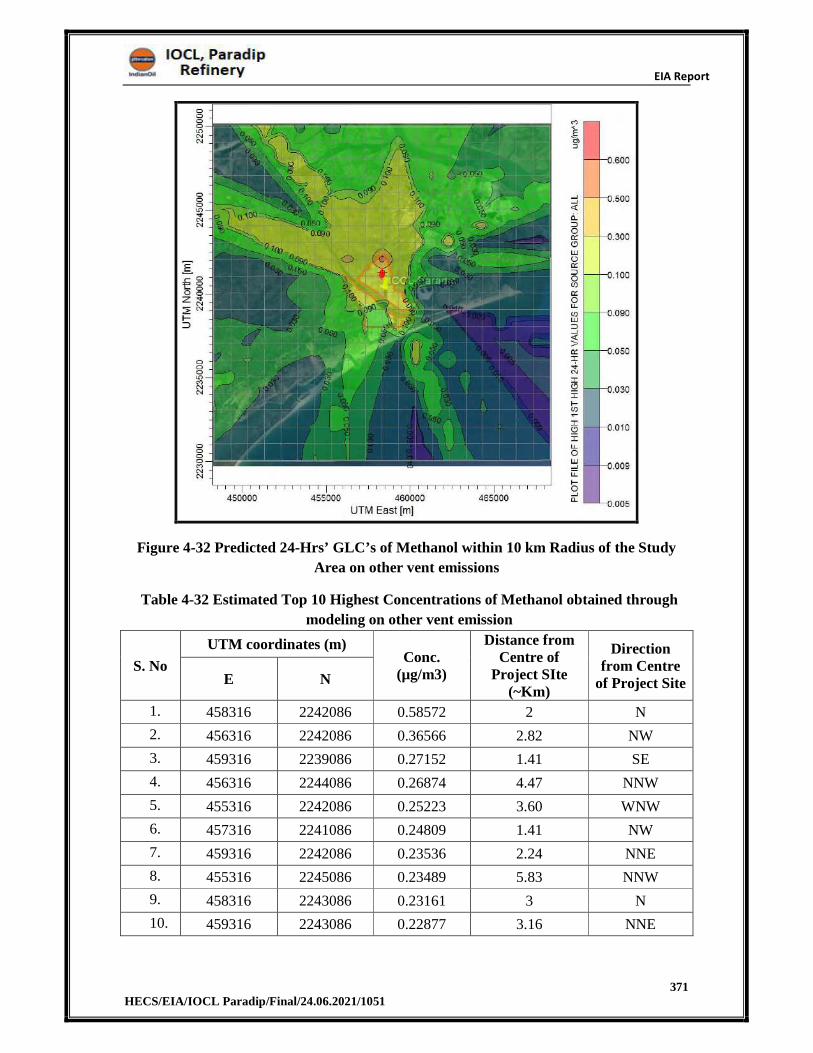
EIA Report
371 HECS/EIA/IOCL Paradip/Final/24.06.2021/1051
Figure 4-32 Predicted 24-Hrs’ GLC’s of Methanol within 10 km Radius of the Study
Area on other vent emissions
Table 4-32 Estimated Top 10 Highest Concentrations of Methanol obtained through
modeling on other vent emission
S. No
UTM coordinates (m) Conc.
(µg/m3)
Distance from Centre of
Project SIte (~Km)
Direction from Centre
of Project SiteE N
1. 458316 2242086 0.58572 2 N
2. 456316 2242086 0.36566 2.82 NW
3. 459316 2239086 0.27152 1.41 SE
4. 456316 2244086 0.26874 4.47 NNW
5. 455316 2242086 0.25223 3.60 WNW
6. 457316 2241086 0.24809 1.41 NW
7. 459316 2242086 0.23536 2.24 NNE
8. 455316 2245086 0.23489 5.83 NNW
9. 458316 2243086 0.23161 3 N
10. 459316 2243086 0.22877 3.16 NNE
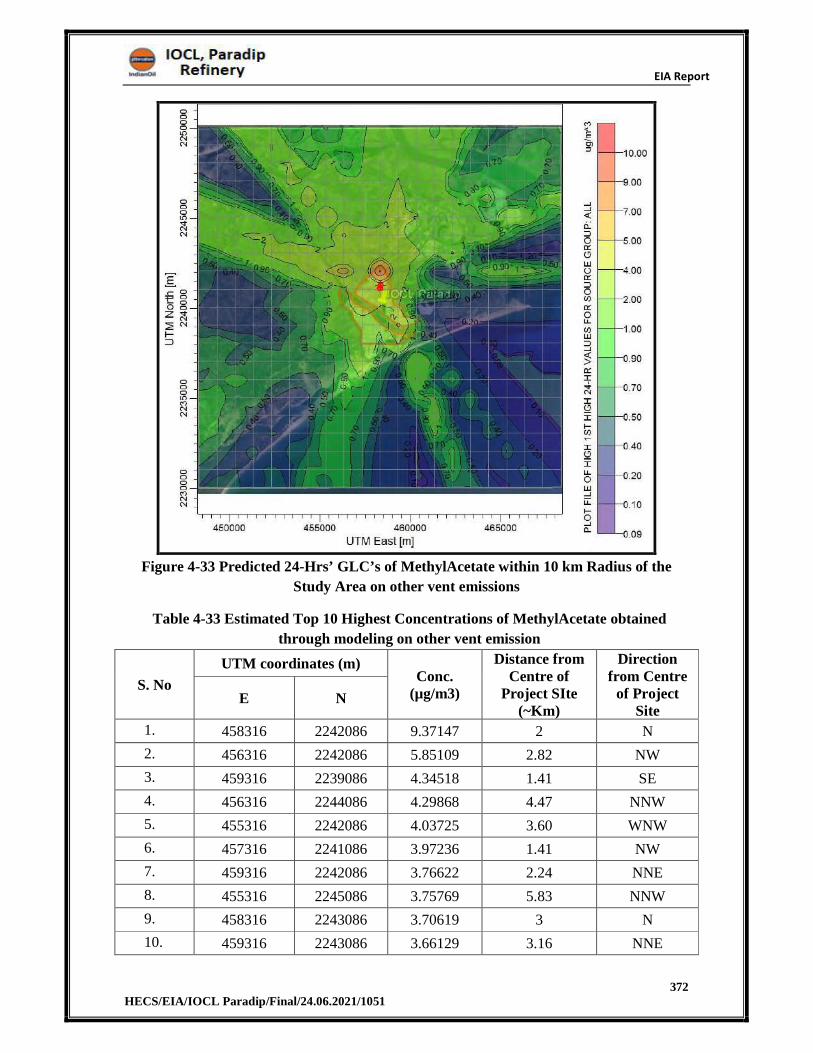
EIA Report
372 HECS/EIA/IOCL Paradip/Final/24.06.2021/1051
Figure 4-33 Predicted 24-Hrs’ GLC’s of MethylAcetate within 10 km Radius of the
Study Area on other vent emissions
Table 4-33 Estimated Top 10 Highest Concentrations of MethylAcetate obtained
through modeling on other vent emission
S. No
UTM coordinates (m) Conc.
(µg/m3)
Distance from Centre of
Project SIte (~Km)
Direction from Centre
of Project Site
E N
1. 458316 2242086 9.37147 2 N
2. 456316 2242086 5.85109 2.82 NW
3. 459316 2239086 4.34518 1.41 SE
4. 456316 2244086 4.29868 4.47 NNW
5. 455316 2242086 4.03725 3.60 WNW
6. 457316 2241086 3.97236 1.41 NW
7. 459316 2242086 3.76622 2.24 NNE
8. 455316 2245086 3.75769 5.83 NNW
9. 458316 2243086 3.70619 3 N
10. 459316 2243086 3.66129 3.16 NNE
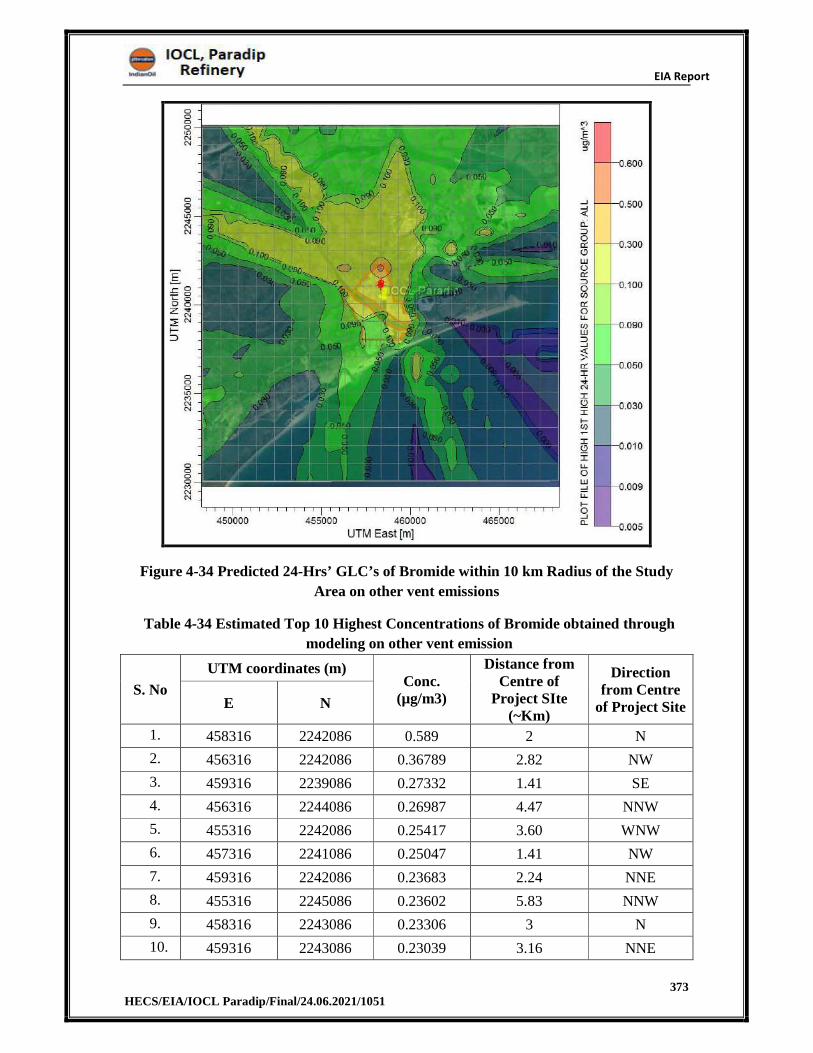
EIA Report
373 HECS/EIA/IOCL Paradip/Final/24.06.2021/1051
Figure 4-34 Predicted 24-Hrs’ GLC’s of Bromide within 10 km Radius of the Study
Area on other vent emissions
Table 4-34 Estimated Top 10 Highest Concentrations of Bromide obtained through
modeling on other vent emission
S. No
UTM coordinates (m) Conc.
(µg/m3)
Distance from Centre of
Project SIte (~Km)
Direction from Centre
of Project SiteE N
1. 458316 2242086 0.589 2 N
2. 456316 2242086 0.36789 2.82 NW
3. 459316 2239086 0.27332 1.41 SE
4. 456316 2244086 0.26987 4.47 NNW
5. 455316 2242086 0.25417 3.60 WNW
6. 457316 2241086 0.25047 1.41 NW
7. 459316 2242086 0.23683 2.24 NNE
8. 455316 2245086 0.23602 5.83 NNW
9. 458316 2243086 0.23306 3 N
10. 459316 2243086 0.23039 3.16 NNE
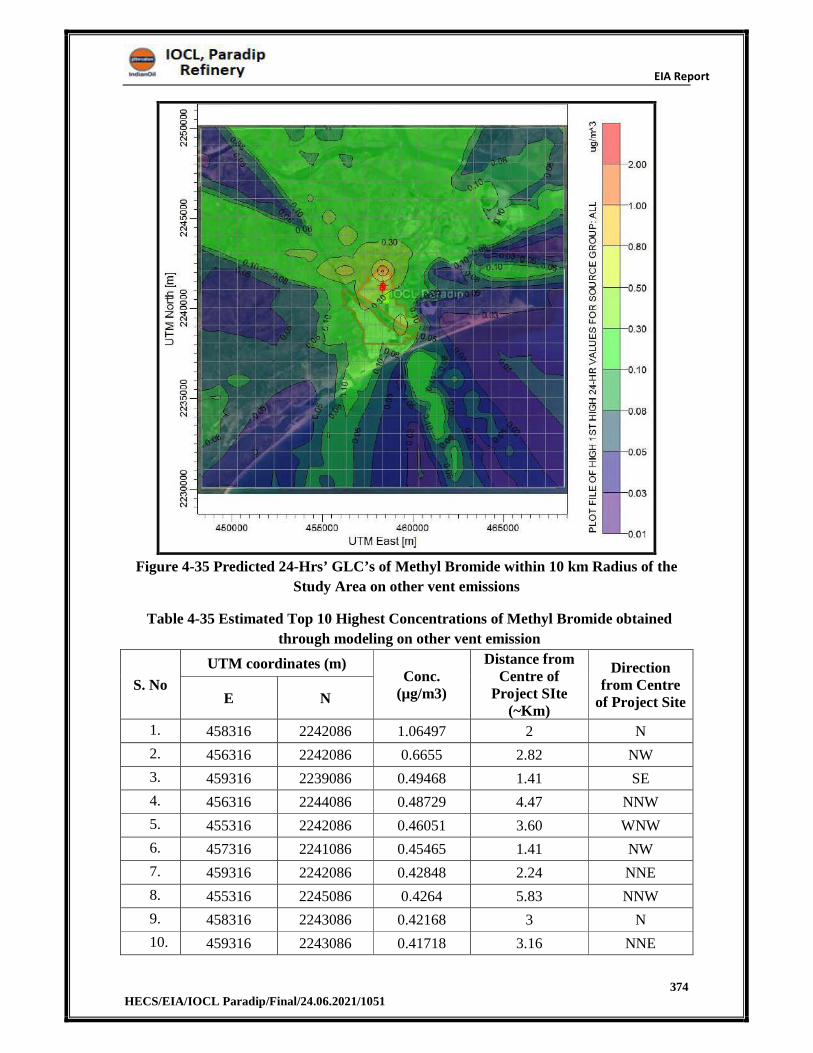
EIA Report
374 HECS/EIA/IOCL Paradip/Final/24.06.2021/1051
Figure 4-35 Predicted 24-Hrs’ GLC’s of Methyl Bromide within 10 km Radius of the
Study Area on other vent emissions
Table 4-35 Estimated Top 10 Highest Concentrations of Methyl Bromide obtained
through modeling on other vent emission
S. No
UTM coordinates (m) Conc.
(µg/m3)
Distance from Centre of
Project SIte (~Km)
Direction from Centre
of Project SiteE N
1. 458316 2242086 1.06497 2 N
2. 456316 2242086 0.6655 2.82 NW
3. 459316 2239086 0.49468 1.41 SE
4. 456316 2244086 0.48729 4.47 NNW
5. 455316 2242086 0.46051 3.60 WNW
6. 457316 2241086 0.45465 1.41 NW
7. 459316 2242086 0.42848 2.24 NNE
8. 455316 2245086 0.4264 5.83 NNW
9. 458316 2243086 0.42168 3 N
10. 459316 2243086 0.41718 3.16 NNE
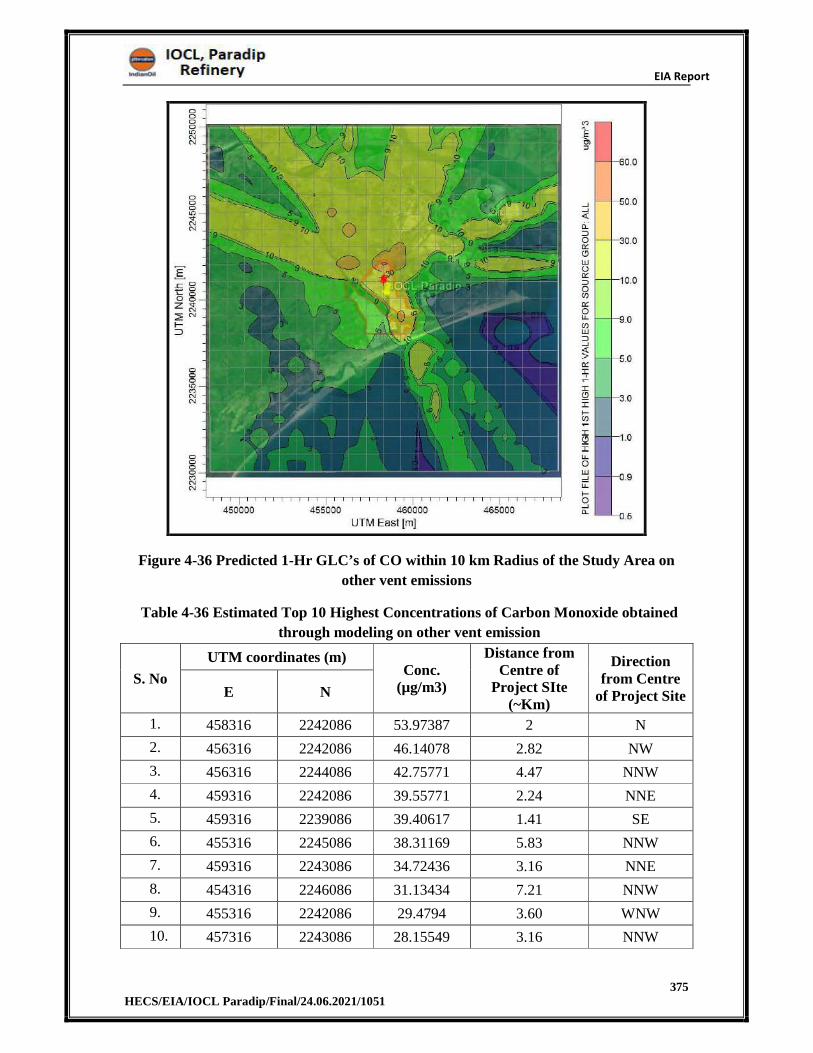
EIA Report
375 HECS/EIA/IOCL Paradip/Final/24.06.2021/1051
Figure 4-36 Predicted 1-Hr GLC’s of CO within 10 km Radius of the Study Area on
other vent emissions
Table 4-36 Estimated Top 10 Highest Concentrations of Carbon Monoxide obtained
through modeling on other vent emission
S. No
UTM coordinates (m) Conc.
(µg/m3)
Distance from Centre of
Project SIte (~Km)
Direction from Centre
of Project SiteE N
1. 458316 2242086 53.97387 2 N
2. 456316 2242086 46.14078 2.82 NW
3. 456316 2244086 42.75771 4.47 NNW
4. 459316 2242086 39.55771 2.24 NNE
5. 459316 2239086 39.40617 1.41 SE
6. 455316 2245086 38.31169 5.83 NNW
7. 459316 2243086 34.72436 3.16 NNE
8. 454316 2246086 31.13434 7.21 NNW
9. 455316 2242086 29.4794 3.60 WNW
10. 457316 2243086 28.15549 3.16 NNW
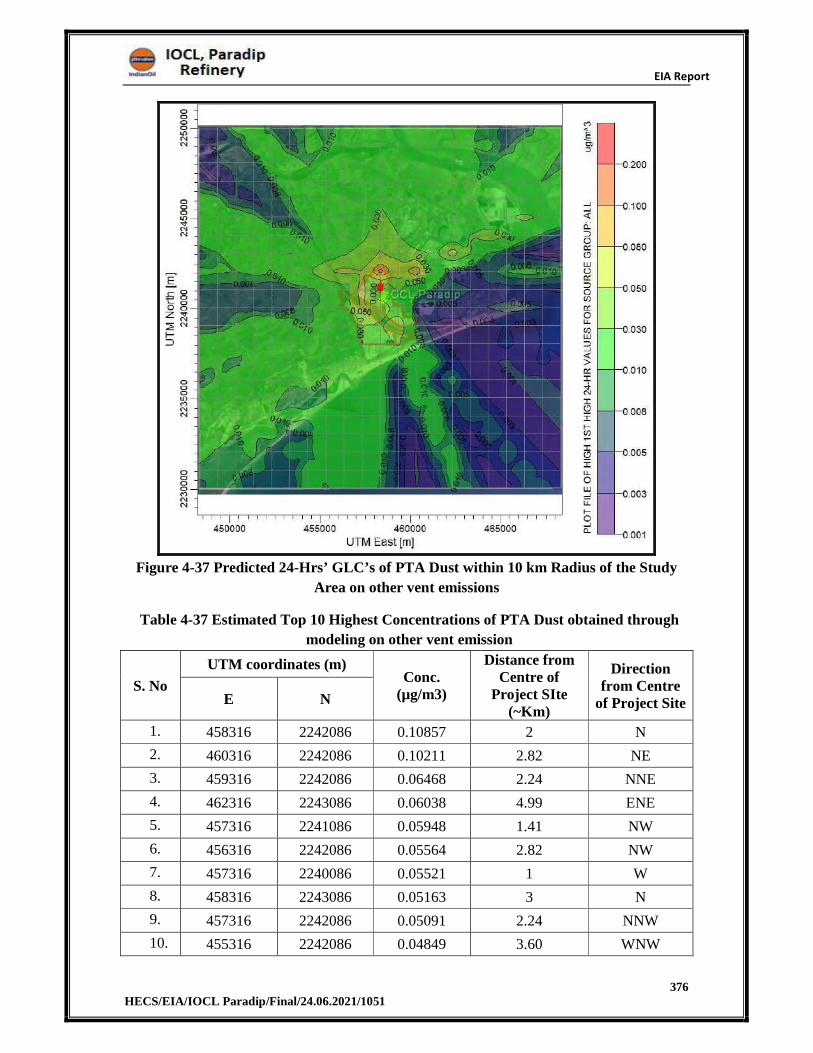
EIA Report
376 HECS/EIA/IOCL Paradip/Final/24.06.2021/1051
Figure 4-37 Predicted 24-Hrs’ GLC’s of PTA Dust within 10 km Radius of the Study
Area on other vent emissions
Table 4-37 Estimated Top 10 Highest Concentrations of PTA Dust obtained through
modeling on other vent emission
S. No
UTM coordinates (m) Conc.
(µg/m3)
Distance from Centre of
Project SIte (~Km)
Direction from Centre
of Project SiteE N
1. 458316 2242086 0.10857 2 N
2. 460316 2242086 0.10211 2.82 NE
3. 459316 2242086 0.06468 2.24 NNE
4. 462316 2243086 0.06038 4.99 ENE
5. 457316 2241086 0.05948 1.41 NW
6. 456316 2242086 0.05564 2.82 NW
7. 457316 2240086 0.05521 1 W
8. 458316 2243086 0.05163 3 N
9. 457316 2242086 0.05091 2.24 NNW
10. 455316 2242086 0.04849 3.60 WNW
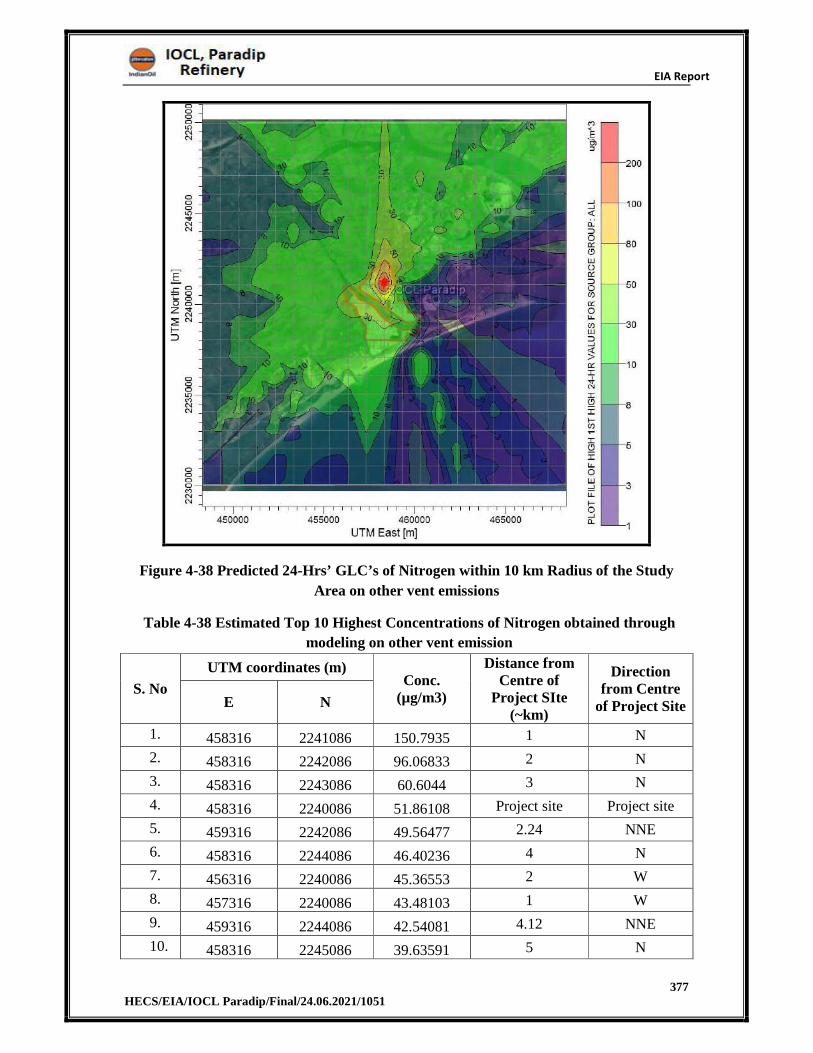
EIA Report
377 HECS/EIA/IOCL Paradip/Final/24.06.2021/1051
Figure 4-38 Predicted 24-Hrs’ GLC’s of Nitrogen within 10 km Radius of the Study
Area on other vent emissions
Table 4-38 Estimated Top 10 Highest Concentrations of Nitrogen obtained through
modeling on other vent emission
S. No
UTM coordinates (m) Conc.
(µg/m3)
Distance from Centre of
Project SIte (~km)
Direction from Centre
of Project SiteE N
1. 458316 2241086 150.7935 1 N
2. 458316 2242086 96.06833 2 N
3. 458316 2243086 60.6044 3 N
4. 458316 2240086 51.86108 Project site Project site
5. 459316 2242086 49.56477 2.24 NNE
6. 458316 2244086 46.40236 4 N
7. 456316 2240086 45.36553 2 W
8. 457316 2240086 43.48103 1 W
9. 459316 2244086 42.54081 4.12 NNE
10. 458316 2245086 39.63591 5 N
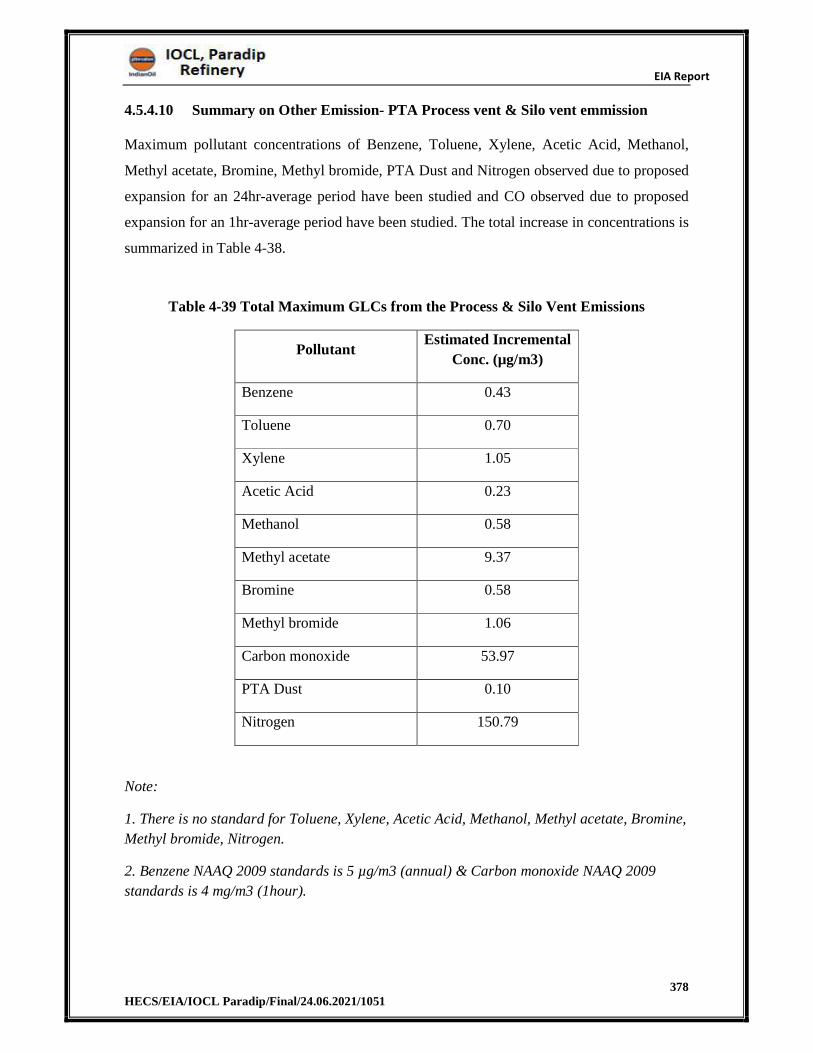
EIA Report
378 HECS/EIA/IOCL Paradip/Final/24.06.2021/1051
4.5.4.10 Summary on Other Emission- PTA Process vent & Silo vent emmission
Maximum pollutant concentrations of Benzene, Toluene, Xylene, Acetic Acid, Methanol,
Methyl acetate, Bromine, Methyl bromide, PTA Dust and Nitrogen observed due to proposed
expansion for an 24hr-average period have been studied and CO observed due to proposed
expansion for an 1hr-average period have been studied. The total increase in concentrations is
summarized in Table 4-38.
Table 4-39 Total Maximum GLCs from the Process & Silo Vent Emissions
Pollutant Estimated Incremental
Conc. (µg/m3)
Benzene 0.43
Toluene 0.70
Xylene 1.05
Acetic Acid 0.23
Methanol 0.58
Methyl acetate 9.37
Bromine 0.58
Methyl bromide 1.06
Carbon monoxide 53.97
PTA Dust 0.10
Nitrogen 150.79
Note:
1. There is no standard for Toluene, Xylene, Acetic Acid, Methanol, Methyl acetate, Bromine,
Methyl bromide, Nitrogen.
2. Benzene NAAQ 2009 standards is 5 µg/m3 (annual) & Carbon monoxide NAAQ 2009
standards is 4 mg/m3 (1hour).
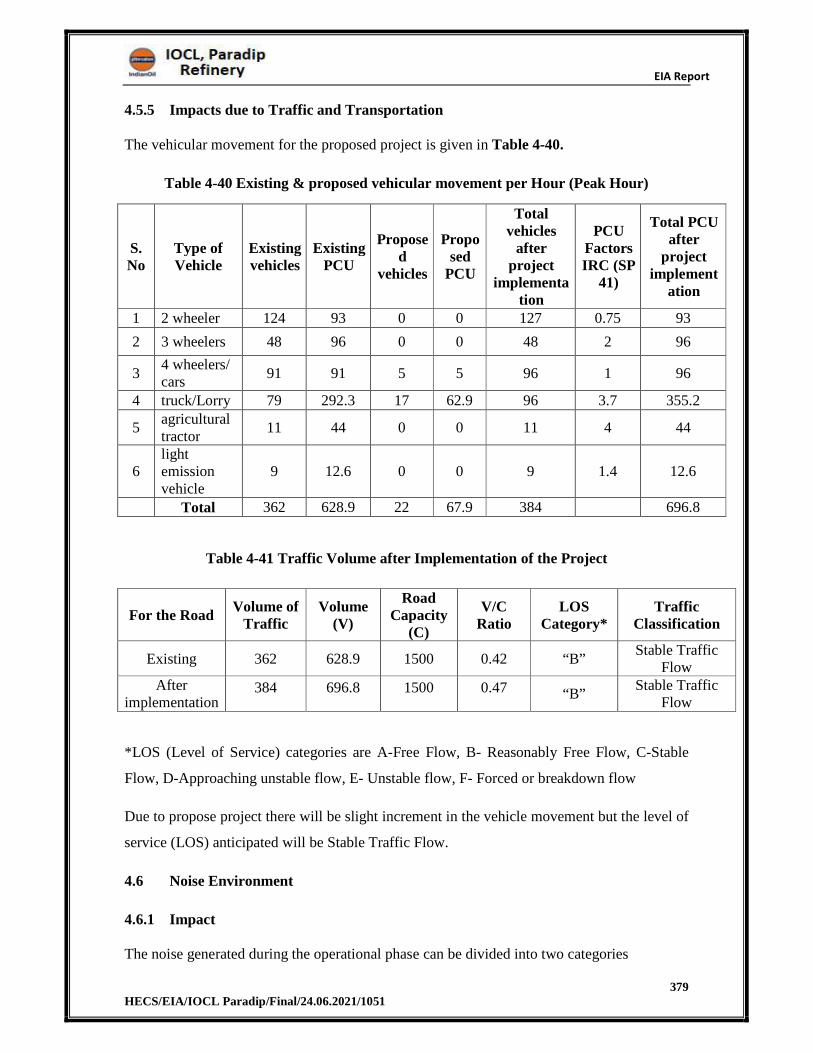
EIA Report
379 HECS/EIA/IOCL Paradip/Final/24.06.2021/1051
4.5.5 Impacts due to Traffic and Transportation
The vehicular movement for the proposed project is given in Table 4-40.
Table 4-40 Existing & proposed vehicular movement per Hour (Peak Hour)
S. No
Type of Vehicle
Existing vehicles
Existing PCU
Proposed
vehicles
Proposed
PCU
Total vehicles
after project
implementation
PCU Factors IRC (SP
41)
Total PCU after
project implement
ation
1 2 wheeler 124 93 0 0 127 0.75 93
2 3 wheelers 48 96 0 0 48 2 96
3 4 wheelers/ cars
91 91 5 5 96 1 96
4 truck/Lorry 79 292.3 17 62.9 96 3.7 355.2
5 agricultural tractor
11 44 0 0 11 4 44
6 light emission vehicle
9 12.6 0 0 9 1.4 12.6
Total 362 628.9 22 67.9 384 696.8
Table 4-41 Traffic Volume after Implementation of the Project
*LOS (Level of Service) categories are A-Free Flow, B- Reasonably Free Flow, C-Stable
Flow, D-Approaching unstable flow, E- Unstable flow, F- Forced or breakdown flow
Due to propose project there will be slight increment in the vehicle movement but the level of
service (LOS) anticipated will be Stable Traffic Flow.
4.6 Noise Environment
4.6.1 Impact
The noise generated during the operational phase can be divided into two categories
For the Road Volume of
Traffic Volume
(V)
Road Capacity
(C)
V/C Ratio
LOS Category*
Traffic Classification
Existing 362 628.9 1500 0.42 “B” Stable Traffic
Flow After
implementation384 696.8 1500 0.47 “B”
Stable Traffic Flow
EIA Report
380 HECS/EIA/IOCL Paradip/Final/24.06.2021/1051
A) Stationary source due to heavy duty machineries at the project site such as compressors,
DG sets, pumps etc.
B) Mobile source corresponding to mainly vehicular traffic for staff mobilization, materials,
material transportation, liquid fuel transportation to project site, etc.
Vibrations are expected to be generated by various activities associated with the proposed
project during operational phase. The impact of vibrations beyond the site would be
negligible during normal operation phase. However, the impacts on workers engaged in the
plant area would be considerable due to occupational exposure. The proposed fixed major
equipment/units such as compressors, pumps, DG sets etc., also generate vibrations during
operational phase and may cause exposures to the workers/operators engaged at these units.
All equipment’s in the plant produce 40 to 55 dB(A) after control measures and equipment’s
are designed/operated to have a noise level not exceeding 85 to 90 dB(A) as per the
requirement of Occupational Safety and Health Administration Standard (OSHA). In
addition, since most of the noise generating equipment would be in closed structures, the
noise transmitted outside would be still lower and for any other case of higher noise sufficient
safety ear plugs and ear muffs will be provided to the employees.
4.6.2 Mitigation Measure
The major noise generating equipment like Compressors, DG sets, pumps etc. will be
enclosed in an acoustic enclosure designed for an insertion loss of 25 dB (A) and
silencers to other equipment etc.
Major noise generating equipment will be designed with 85 dB (A) ensuring
cumulative noise at 1.0 m remains at 85 dB (A).
The occupational noise exposure to the workers in the form of eight hourly time
weighted average will be maintained well within the prescribed Occupational Safety
and Health Administration (OSHA) standard limits.
Acoustic design with sound proof glass paneling will be provided for critical operator
cabins / control rooms of individual modules as well as central control facilities.
Use of personal protective equipment’s/devices such as ear-muffs, ear plugs etc. will
be strictly enforced for the workers engaged in high noise areas.
EIA Report
381 HECS/EIA/IOCL Paradip/Final/24.06.2021/1051
Periodic maintenance of the equipment to be used in the developmental works will be
carried out. Worn out parts will be replaced and rotating parts will be lubricated to
minimize noise emissions.
Implementation of greenbelt for noise attenuation will be undertaken: shrub
plantation; landscaping with horticulture; and Tree plantation at vehicle parking areas
and along approach roads.
Ambient noise levels will be monitored at regular intervals during operational phase
of the project.
Low vibration generating machines/equipment will be selected to meet international
standards and foundations will be so designed to minimize vibrations and secured
properly.
Vibration generating sources and their platforms should be maintained properly to
minimize vibrations and related impacts.
Various standards pertaining to vibrations are formulated by statutory bodies like
Bureau of Indian Standards (BIS) and Director General of Mines Safety (DGMS),
which is being practiced would be continued to mitigate the workers’ health effects
due to vibrations.
Vibration dampers will be provided around the source of generation.
Transportation Management Plan will be prepared and the transportation of
construction materials will be planned in line with the same.
4.7 Water Environment
No water will be extracted from ground water sources. The total raw water requirement for
existing facility is 3497 m3/hr and for proposed operation phase total requirement will be
1299.5 m3/hr. On total after expansion 4796.5 m3/hr of raw water of which the fresh water of
3743 m3/hr will be taken from existing water source (Mahanadi River). New ETP is proposed
for installation to process effluent @ 408 m3/hr with 10% design Margin (Maximum capacity
with high TOC).
The source of water will be from Existing Refinery water source i.e., Mahanadi River. Hence
there will be no separate permission is required for the proposed projects
EIA Report
382 HECS/EIA/IOCL Paradip/Final/24.06.2021/1051
4.7.1 Mitigation Measures
Various mitigation measures are proposed to be adopted to minimize the impact if any on the
water environment due to the wastewater/runoff generation during the operation phase of the
project.
Institutional arrangement for monitoring of water pollution.
Corrective and preventive measures if any contamination happens.
Monitoring should ensure early determination of any threats to water resources in
terms of contamination.
If contaminated, proper expertise will be brought to schematize the various recharge
mechanism to reduce or nullify the impact effects.
4.7.2 Waste Water Quality, Quantity and Treatment Method
a) Existing
Approx. 1082.1 m3/hr of effluent is generated in the existing facility of which 190.88 m3/hr
rejects from RO is disposed to Deep Sea, 50 m3/hr rejects from RO is sent to Coke Dust
Suspension and 50 m3/hr rejects from RO is sent to Coke Cutting. The Sludge created during
the treatment of about 32.46 m3/hr along with a water loss of about 10.76 m3/hr. Remaining
748m3/hr from RO is reused back in the system for DM Water Makeup.
b) Proposed
In the proposed expansion Approx. 408 m3/hr of effluent is generated in the proposed facility
of which 78% of effluent is processed in RO plant and its rejects of 86.18 m3/hr is disposed
into deep sea. The Sludge created during the treatment of about 12.24 m3/hr along with a
water loss of about 4.08 m3/hr. The remaining RO processed water of 305.5 m3/hr is reused
back in the system for DM Water Makeup and cooling tower. New ETP is proposed for
installation to process effluent @ 408 m3/hr with 10% design Margin (Maximum capacity
with high TOC)
The existing and proposed effluent disposal into deep sea is 190.88 m3/hr and 86.18 m3/hr
respectively. On total, 277.06m3/hr will be discharge into deep sea and it is observed to be
within the discharge approval limit of 350 m3/hr as per the OPCB consent for Air and water
obtained vide:5543/IND-I-CON-6414 dated 31.03.2021 valid till 31.03.2022 copy enclosed
as Annexure 3. The industrial effluent is discharged into deep sea through the pipeline where
its outlet of pipe is at a distance of 3km from the Low Tide Line (LTL).
EIA Report
383 HECS/EIA/IOCL Paradip/Final/24.06.2021/1051
4.8 Land Environment
During operational phase the impact shall be due to disposal of solid and hazardous waste
generated during operation of the plant. Spent Catalyst after every 4-5 years will be duly
recovered by PCB approved agencies
4.8.1 Potential Impact Due to Location
The proposed expansion is within the IOCL existing facility, there will be no additional land
acquisition and resettlement or Rehabilitation required. Therefore, there will not be any direct
impacts.
4.8.2 Impacts Due to Changes in Land Use Pattern
One of the factor that is usually considered as a major impact from any project is the land use
change. But since the proposed expansion will be established within the existing IOCL site,
no land use change is foreseen, as the current land use is that of industrial.
4.8.3 Mittigation Measures
The following mitigation measures may be explored:
Periodic maintenance and check of wastewater conveyance pipelines
Attempt to restore by replacing a part or putting together the torn or broken parts
of the conveyance pipeline in case of any leakage is detected.
Necessary preventive measures for spillage from pipelines, such as surface RCC
channels along the pipelines shall be adopted.
Treated wastewater quality shall be ensured as per standards before using internal
use.
4.9 Marine Environment
The impact in the context of biota and fishery resources in the area is not considered to be
significant as the construction in the creek is for minimal period. The impact of closed
conveyor passing through the creek would have least impact on the aquatic ecological status
as there will be no spillage in this area.
The project proponent shall adopt preventive practices like leak monitoring of existing
effluent discharge pipelines in the sea, surveillance to prevent any liquid hydrocarbon falling
on the water body of the creek from the hydrocarbon pipelines passing over the bridge of
Santa Creek. The project proponent shall have mitigation plan with Oil spill contaminant
EIA Report
384 HECS/EIA/IOCL Paradip/Final/24.06.2021/1051
boom under the new pipe bridge to take care of any inadvertent oil spills and suitable
skimmers for recovering of any accidental oil spill over the creek water.
The existing and proposed effluent disposal into deep sea is 190.88 m3/hr and 86.18 m3/hr
respectively. On total, 277.06m3/hr will be discharge into deep sea that it is observed to be
within the marine discharge approval limit of 350 m3/hr as per the OPCB consent for Air and
water obtained vide: 3946/IND-I-CON-6414 dated 27.03.2020 valid till 31.03.2021 copy
enclosed as Annexure 3. The industrial effluent is discharged into deep sea through the
pipeline where its outlet of pipe is at a distance of 3km from the Low Tide Line(LTL).
4.10 Solid Waste Management
4.10.1 Impact Due to Solid Waste Generation
During operation phase, various types of solid waste are likely to be generated which can be
broadly categorized as Hazardous Waste and Non-hazardous Waste. Further, the generated
solid waste generation may include Biodegradable, Recyclable and Inert compounds. The
details of solid waste generation and its management proposed are discussed in Chapter 2,
Section 2.18.
4.10.2 Mitigation Measures
The hazardous waste generated can be processed by bioremediation techniques or with proper
disposal to the authorities. The biodegradable waste generated can be composted and used as
manure. The other waste can be disposed in municipal bins.
EIA Report
385 HECS/EIA/IOCL Paradip/Final/24.06.2021/1051
CHAPTER 5
ANALYSIS OF ALTERNATIVES
EIA Report
386 HECS/EIA/IOCL Paradip/Final/24.06.2021/1051
5 ANALYSIS OF ALTERNATIVES 5.1 Introduction
Indian Oil Corporation Limited (IOCL), Paradip Refinery Proposes “Integrated Para-Xylene
& Purified Terephthalic Acid (PX-PTA) Project at IOCL Paradip Refinery & Petrochemical
Complex, Paradip
The range of alternatives selected for the purpose of analysis includes:
Site alternative
Water supply alternative
Technology alternative
5.2 Site Alternative
Paradip Refinery, has spread over a total area of 3,345 acres, including about 314 acres for
Residential and about 240 acres of land for other office and buildings. The area of 355 acres
is utilized for the connecting road in the total area. Since the proposed project is expansion
within the existing facility there is no new site/ alternative sites considered.
5.3 Water Supply Alternative
The total fresh water requirement of 2749 m3/hr for the existing refinery is met from water
from Mahanadi River. Since the proposed project uses the existing water source there is no
alternative water supply considered
5.4 Technology Alternative
Paradip Refinery has a unique INDMAX Unit technology, which is indigenously been
developed by Indian Oil's R&D Centre. The INDMAX (FCC) Unit has designed to produce
44% LPG, the highest yield from such plants. The commissioning of INDMAX Unit at
Paradip marks a major milestone in the history of Indian refining. With this, IndianOil has
now recognized globally as a technology licensor. The other first-time technological features
of the Refinery include Flue Gas Desulphurisation facilities, Vapour Recovery system from
jetty loading and an alkylation process to get octane-rich low-benzene MS blend component,
etc. So no alternative technologies available.
EIA Report
387 HECS/EIA/IOCL Paradip/Final/24.06.2021/1051
CHAPTER 6
ENVIRONMENTAL MONITORING
PROGRAM
EIA Report
388 HECS/EIA/IOCL Paradip/Final/24.06.2021/1051
6 ENVIRONMENTAL MONITORING PROGRAM 6.1 Introduction
Environmental monitoring is an essential tool for sustainable development & ensuring
effective implementation of environmental management plan & mitigation measures adopted.
Environmental monitoring will undertake primarily to determine the environmental effects of
human activities and secondarily to increase understanding of cause – effect relationships
between human activity and environmental change. Environment monitoring is a repetitive &
systematic measurement of the characteristics of environmental components to test specific
hypotheses of the effect of human activities on the environment. Environmental monitoring
program enables the proponent to identify the deviation of environmental quality due to the
proposed project activities.
6.2 Environmental Effects Monitoring in EIA
Environmental effects monitoring programs provide the necessary information to:
Verify the accuracy of EIA predictions;
Determine the effectiveness of measures to mitigate adverse effects of projects
on the environment.
Environmental monitoring program is a vital process of any management plan of the
development project. This helps in signalling the potential problems resulting from the
proposed project and will allow for prompt implementation of effective corrective measures.
The environmental monitoring will be required for the construction and operational phases.
The main objectives of environmental monitoring area:
i. To assess the changes in environmental conditions,
ii. To monitor the effective implementation of mitigation measures,
iii. Warn significant deteriorations in environmental quality for further prevention
action.
iv. In order to meet the above objectives, the following parameters need to be
monitored:
v. Afforestation,
vi. Water Quality and Public Health,
vii. Air and Noise quality,
viii. Soil Conservation, and
ix. Sanitation and Waste Disposal
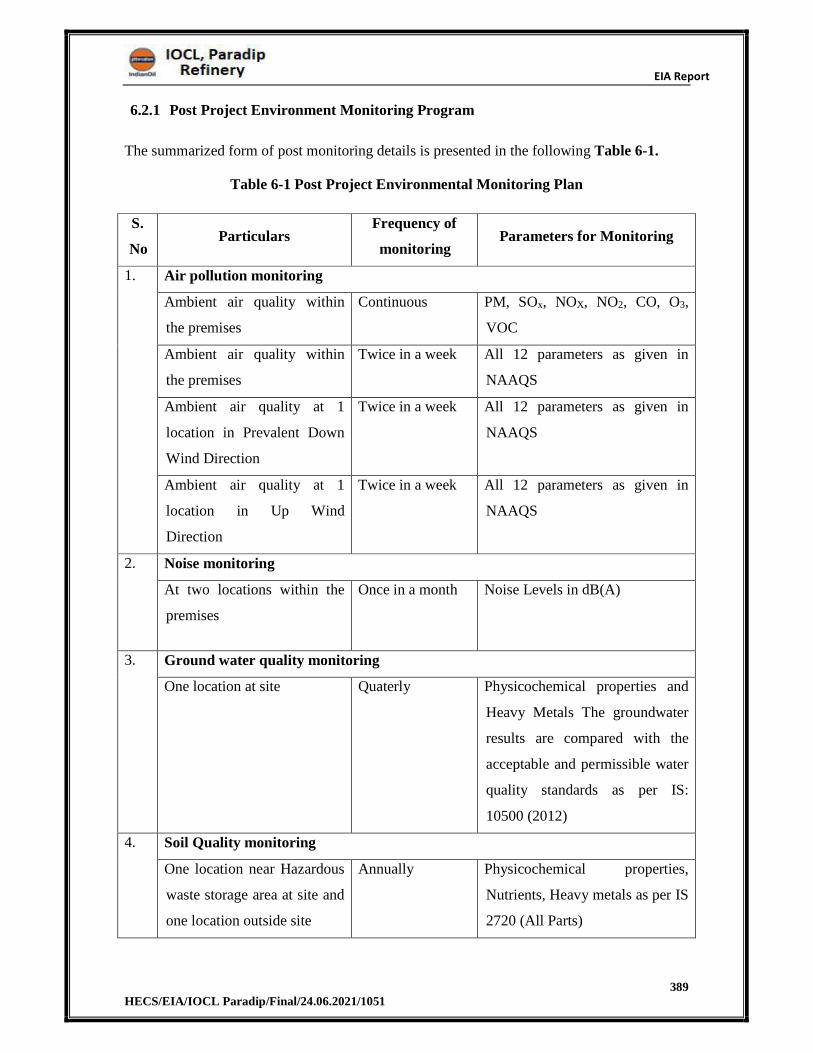
EIA Report
389 HECS/EIA/IOCL Paradip/Final/24.06.2021/1051
6.2.1 Post Project Environment Monitoring Program
The summarized form of post monitoring details is presented in the following Table 6-1.
Table 6-1 Post Project Environmental Monitoring Plan
S.
No Particulars
Frequency of
monitoring Parameters for Monitoring
1. Air pollution monitoring
Ambient air quality within
the premises
Continuous PM, SOx, NOX, NO2, CO, O3,
VOC
Ambient air quality within
the premises
Twice in a week All 12 parameters as given in
NAAQS
Ambient air quality at 1
location in Prevalent Down
Wind Direction
Twice in a week All 12 parameters as given in
NAAQS
Ambient air quality at 1
location in Up Wind
Direction
Twice in a week All 12 parameters as given in
NAAQS
2. Noise monitoring
At two locations within the
premises
Once in a month Noise Levels in dB(A)
3. Ground water quality monitoring
One location at site Quaterly Physicochemical properties and
Heavy Metals The groundwater
results are compared with the
acceptable and permissible water
quality standards as per IS:
10500 (2012)
4. Soil Quality monitoring
One location near Hazardous
waste storage area at site and
one location outside site
Annually Physicochemical properties,
Nutrients, Heavy metals as per IS
2720 (All Parts)
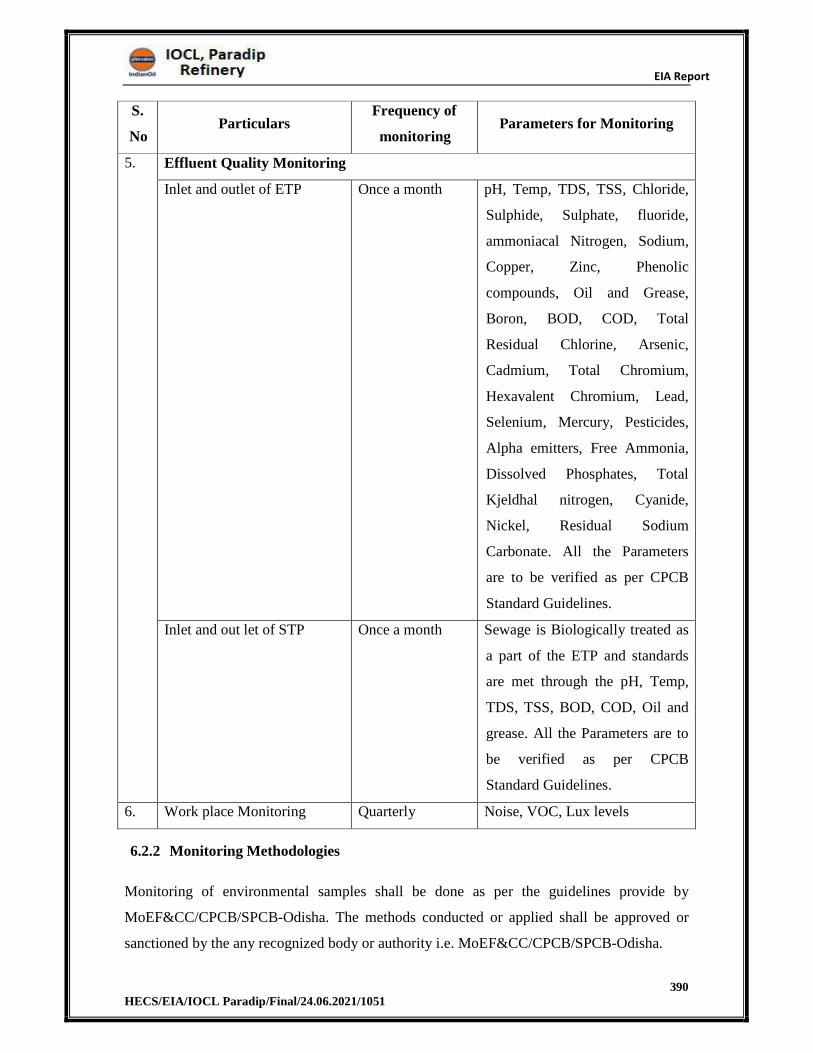
EIA Report
390 HECS/EIA/IOCL Paradip/Final/24.06.2021/1051
S.
No Particulars
Frequency of
monitoring Parameters for Monitoring
5. Effluent Quality Monitoring
Inlet and outlet of ETP Once a month pH, Temp, TDS, TSS, Chloride,
Sulphide, Sulphate, fluoride,
ammoniacal Nitrogen, Sodium,
Copper, Zinc, Phenolic
compounds, Oil and Grease,
Boron, BOD, COD, Total
Residual Chlorine, Arsenic,
Cadmium, Total Chromium,
Hexavalent Chromium, Lead,
Selenium, Mercury, Pesticides,
Alpha emitters, Free Ammonia,
Dissolved Phosphates, Total
Kjeldhal nitrogen, Cyanide,
Nickel, Residual Sodium
Carbonate. All the Parameters
are to be verified as per CPCB
Standard Guidelines.
Inlet and out let of STP Once a month Sewage is Biologically treated as
a part of the ETP and standards
are met through the pH, Temp,
TDS, TSS, BOD, COD, Oil and
grease. All the Parameters are to
be verified as per CPCB
Standard Guidelines.
6. Work place Monitoring Quarterly Noise, VOC, Lux levels
6.2.2 Monitoring Methodologies
Monitoring of environmental samples shall be done as per the guidelines provide by
MoEF&CC/CPCB/SPCB-Odisha. The methods conducted or applied shall be approved or
sanctioned by the any recognized body or authority i.e. MoEF&CC/CPCB/SPCB-Odisha.
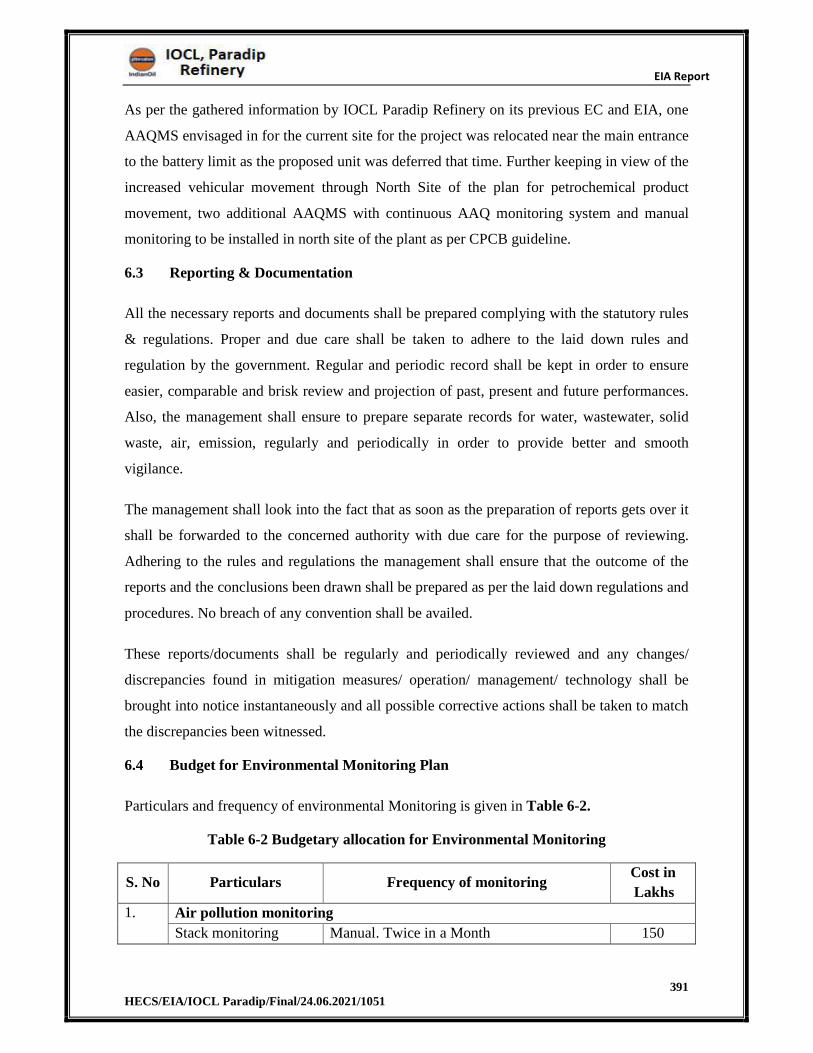
EIA Report
391 HECS/EIA/IOCL Paradip/Final/24.06.2021/1051
As per the gathered information by IOCL Paradip Refinery on its previous EC and EIA, one
AAQMS envisaged in for the current site for the project was relocated near the main entrance
to the battery limit as the proposed unit was deferred that time. Further keeping in view of the
increased vehicular movement through North Site of the plan for petrochemical product
movement, two additional AAQMS with continuous AAQ monitoring system and manual
monitoring to be installed in north site of the plant as per CPCB guideline.
6.3 Reporting & Documentation
All the necessary reports and documents shall be prepared complying with the statutory rules
& regulations. Proper and due care shall be taken to adhere to the laid down rules and
regulation by the government. Regular and periodic record shall be kept in order to ensure
easier, comparable and brisk review and projection of past, present and future performances.
Also, the management shall ensure to prepare separate records for water, wastewater, solid
waste, air, emission, regularly and periodically in order to provide better and smooth
vigilance.
The management shall look into the fact that as soon as the preparation of reports gets over it
shall be forwarded to the concerned authority with due care for the purpose of reviewing.
Adhering to the rules and regulations the management shall ensure that the outcome of the
reports and the conclusions been drawn shall be prepared as per the laid down regulations and
procedures. No breach of any convention shall be availed.
These reports/documents shall be regularly and periodically reviewed and any changes/
discrepancies found in mitigation measures/ operation/ management/ technology shall be
brought into notice instantaneously and all possible corrective actions shall be taken to match
the discrepancies been witnessed.
6.4 Budget for Environmental Monitoring Plan
Particulars and frequency of environmental Monitoring is given in Table 6-2.
Table 6-2 Budgetary allocation for Environmental Monitoring
S. No Particulars Frequency of monitoring Cost in
Lakhs
1. Air pollution monitoring
Stack monitoring Manual. Twice in a Month 150
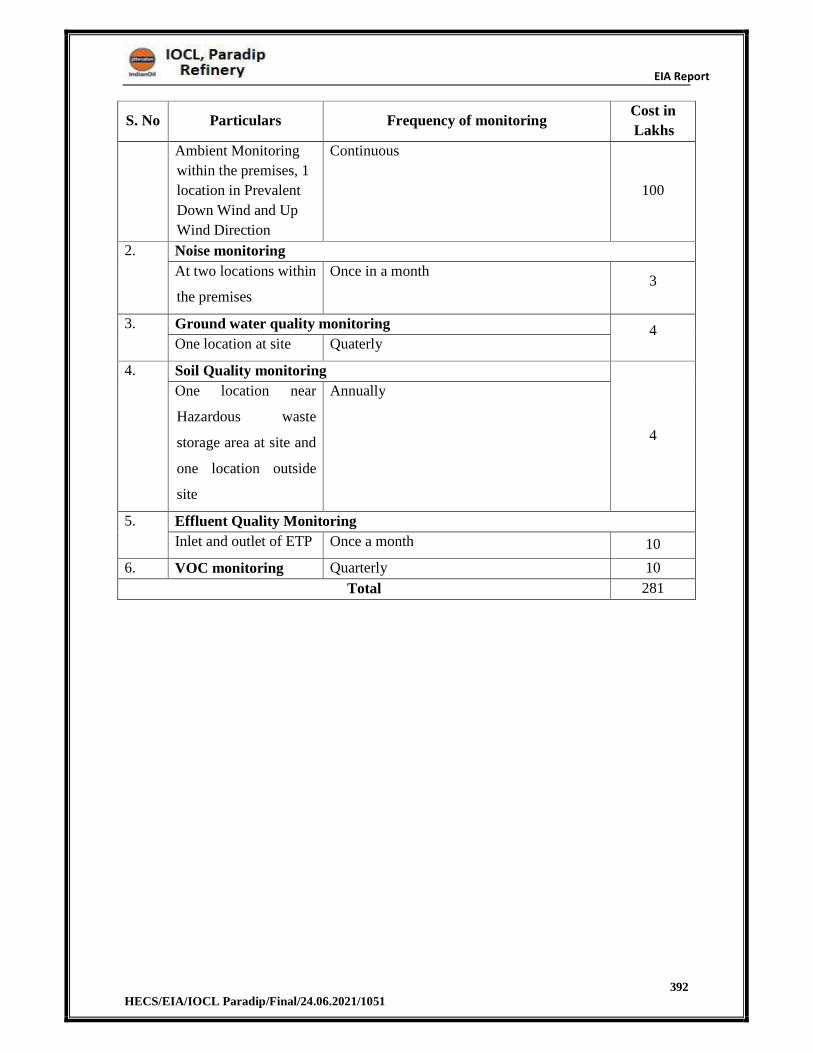
EIA Report
392 HECS/EIA/IOCL Paradip/Final/24.06.2021/1051
S. No Particulars Frequency of monitoring Cost in
Lakhs
Ambient Monitoring
within the premises, 1
location in Prevalent
Down Wind and Up
Wind Direction
Continuous
100
2. Noise monitoring
At two locations within
the premises
Once in a month 3
3. Ground water quality monitoring 4 One location at site Quaterly
4. Soil Quality monitoring
4
One location near
Hazardous waste
storage area at site and
one location outside
site
Annually
5. Effluent Quality Monitoring
Inlet and outlet of ETP Once a month 10
6. VOC monitoring Quarterly 10
Total 281
EIA Report
393 HECS/EIA/IOCL Paradip/Final/24.06.2021/1051
CHAPTER 7
ADDITIONAL STUDIES
EIA Report
394 HECS/EIA/IOCL Paradip/Final/24.06.2021/1051
7 ADDITIONAL STUDIES 7.1 Public Consultation
The project is falling under ‘A’ category as per EIA Notification 2006 and Public Hearing is
mandatory as per ToR obtained. Hence draft EIA report has been prepared as per the No: J-
11011/395/2012-IA.II(I) dated 30th September 2018 and submitted for Public Hearing.
Public Hearing paper advertisement was published in The New Indian Express and The
Pramaya newspapers on 30.01.2021.
Public hearing was conducted by OSPCB on 02-03-2021 at 10.30am at Municipality Kalyan
Mandap, Madhuban, Paradeep and Sri Kanhu Charan Dhir, Additional District Magistrate,
Paradip presided over the meeting along with Er. Dillip Kumar Dash, Regional Officer, State
Pollution Control Board, Odisha, Paradip. Newspaper Publication details and Public Hearing
minutes are enclosed as Appendix 3. The newspaper advertisement details are shown in
Figure 7-1 & Figure 7-2. Notice issued for public hearing is enclosed as Figure 7-3. Public
Hearing photographs are shown in Figure 7-4. The total fund allotted for the commitment
made on the requirement of public during public hearing is INR 6.64Cr.
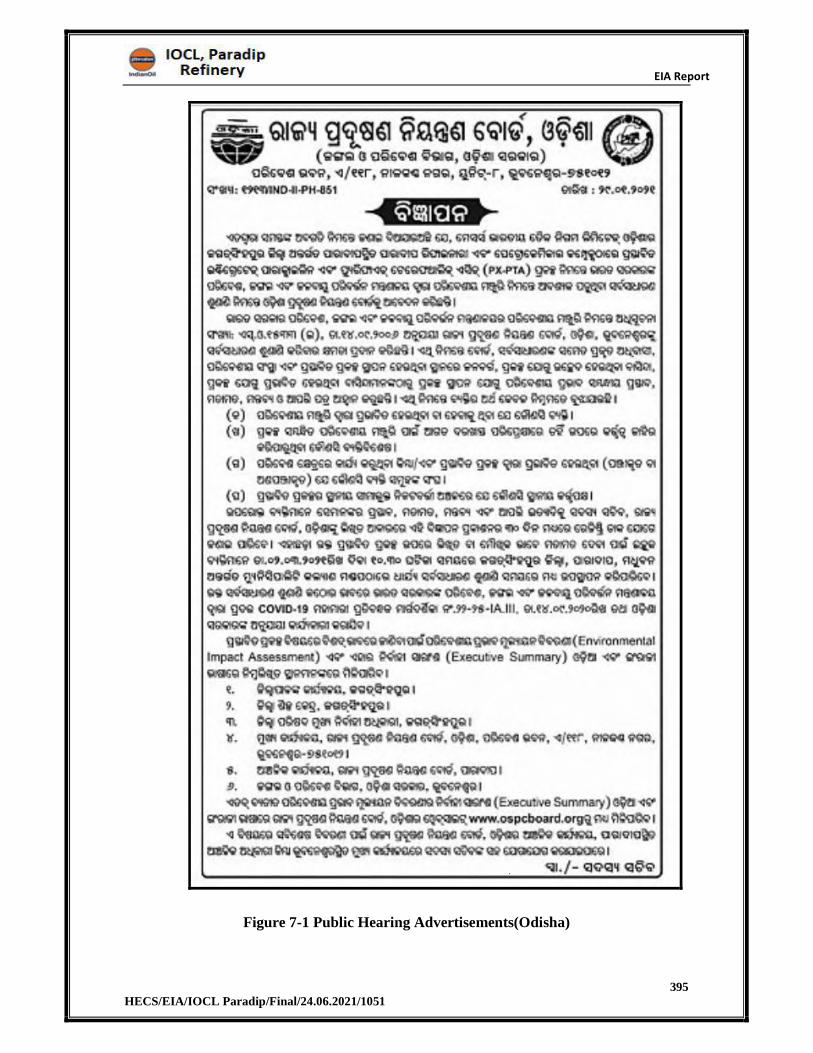
EIA Report
395 HECS/EIA/IOCL Paradip/Final/24.06.2021/1051
Figure 7-1 Public Hearing Advertisements(Odisha)
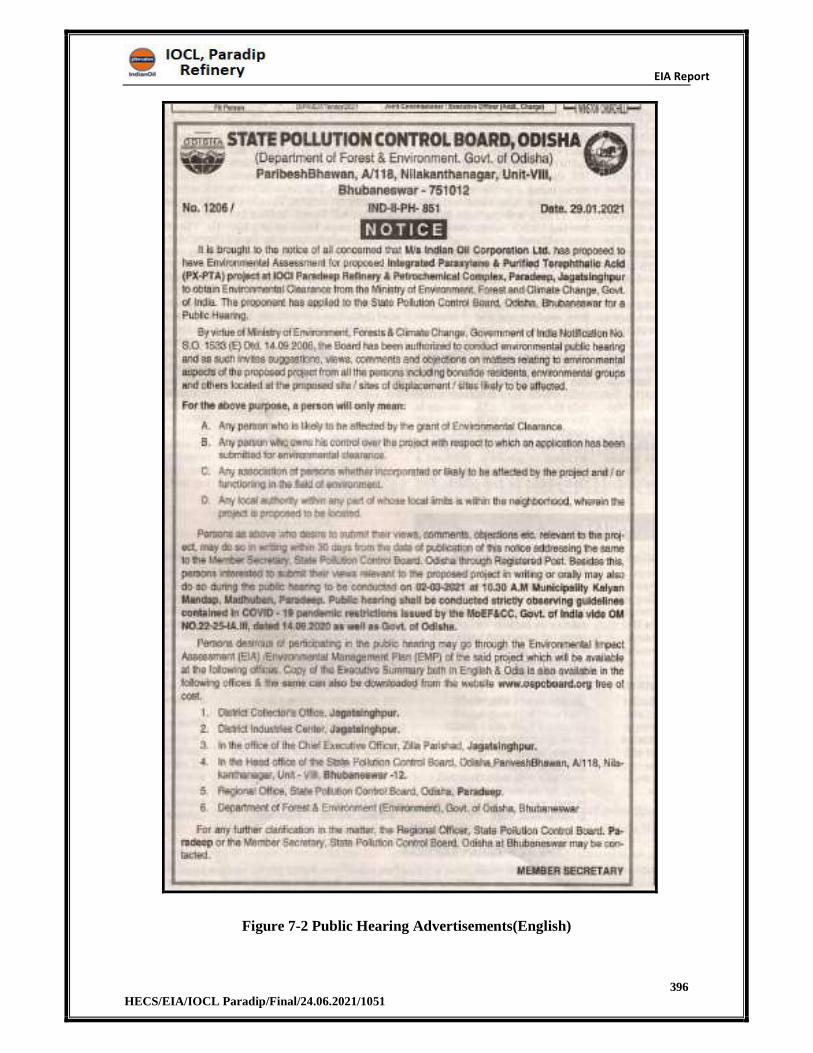
EIA Report
396 HECS/EIA/IOCL Paradip/Final/24.06.2021/1051
Figure 7-2 Public Hearing Advertisements(English)
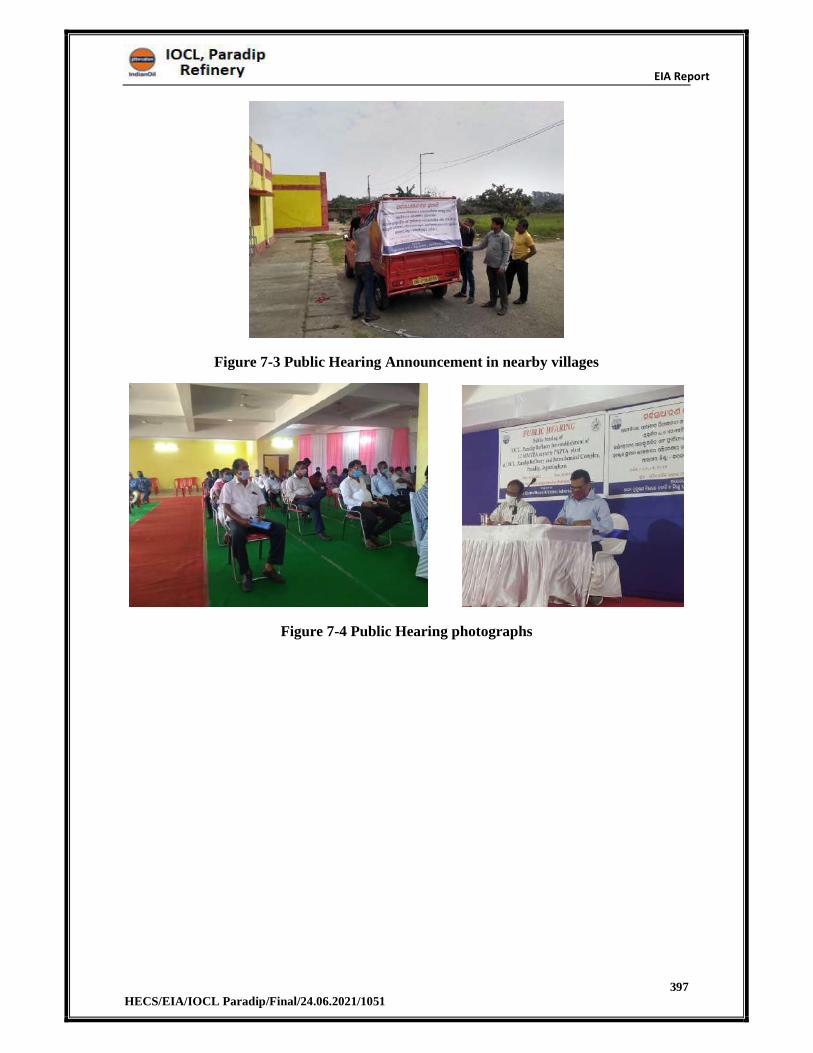
EIA Report
397 HECS/EIA/IOCL Paradip/Final/24.06.2021/1051
Figure 7-3 Public Hearing Announcement in nearby villages
Figure 7-4 Public Hearing photographs
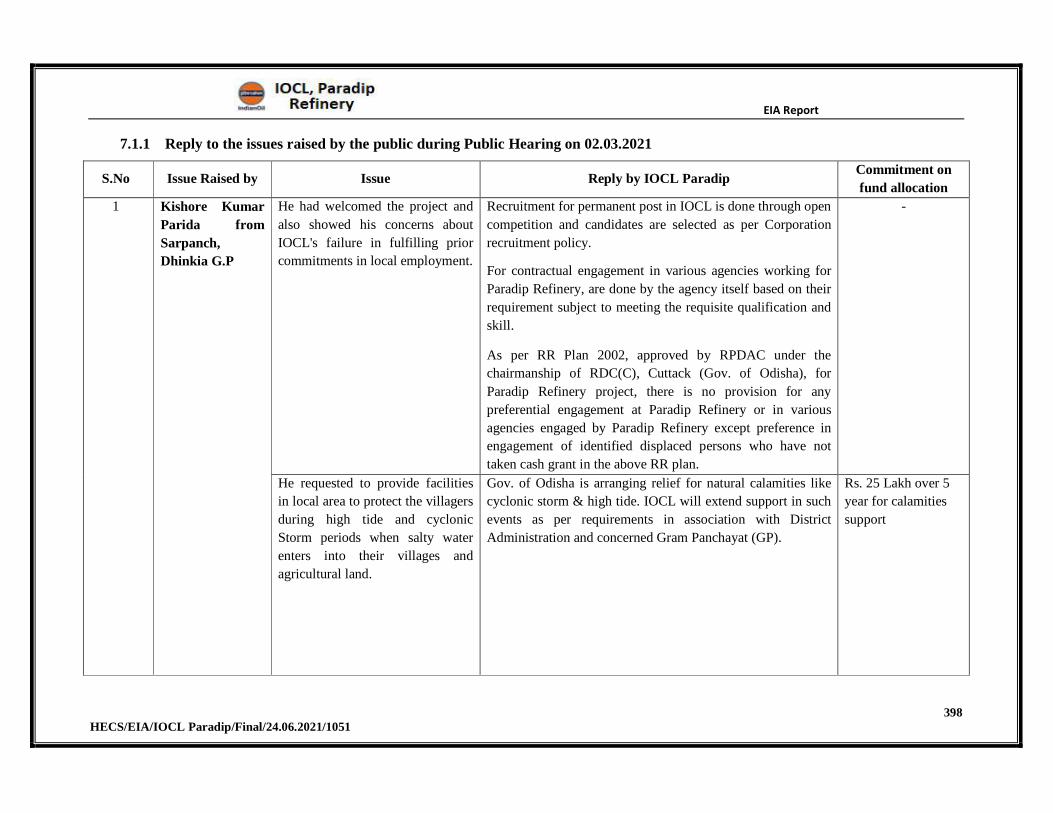
EIA Report
398 HECS/EIA/IOCL Paradip/Final/24.06.2021/1051
7.1.1 Reply to the issues raised by the public during Public Hearing on 02.03.2021
S.No Issue Raised by Issue Reply by IOCL Paradip Commitment on
fund allocation
1 Kishore Kumar
Parida from
Sarpanch,
Dhinkia G.P
He had welcomed the project and
also showed his concerns about
IOCL's failure in fulfilling prior
commitments in local employment.
Recruitment for permanent post in IOCL is done through open
competition and candidates are selected as per Corporation
recruitment policy.
For contractual engagement in various agencies working for
Paradip Refinery, are done by the agency itself based on their
requirement subject to meeting the requisite qualification and
skill.
As per RR Plan 2002, approved by RPDAC under the
chairmanship of RDC(C), Cuttack (Gov. of Odisha), for
Paradip Refinery project, there is no provision for any
preferential engagement at Paradip Refinery or in various
agencies engaged by Paradip Refinery except preference in
engagement of identified displaced persons who have not
taken cash grant in the above RR plan.
-
He requested to provide facilities
in local area to protect the villagers
during high tide and cyclonic
Storm periods when salty water
enters into their villages and
agricultural land.
Gov. of Odisha is arranging relief for natural calamities like
cyclonic storm & high tide. IOCL will extend support in such
events as per requirements in association with District
Administration and concerned Gram Panchayat (GP).
Rs. 25 Lakh over 5
year for calamities
support
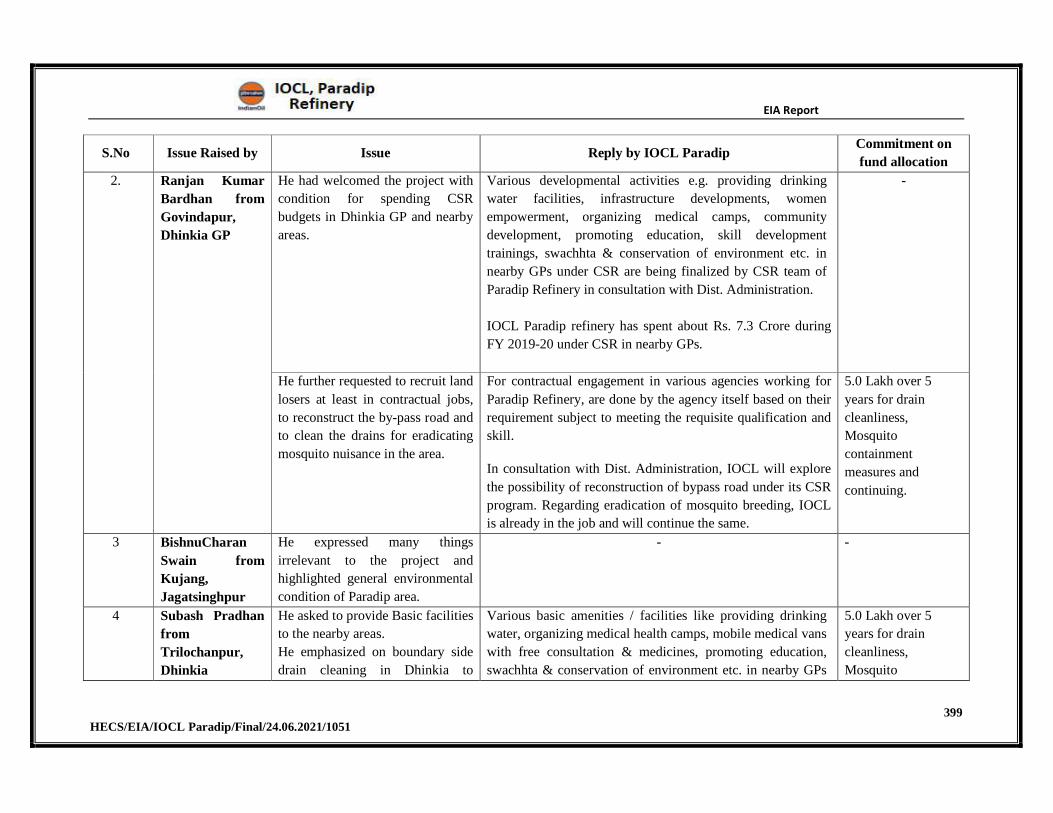
EIA Report
399 HECS/EIA/IOCL Paradip/Final/24.06.2021/1051
S.No Issue Raised by Issue Reply by IOCL Paradip Commitment on
fund allocation
2. Ranjan Kumar
Bardhan from
Govindapur,
Dhinkia GP
He had welcomed the project with
condition for spending CSR
budgets in Dhinkia GP and nearby
areas.
Various developmental activities e.g. providing drinking
water facilities, infrastructure developments, women
empowerment, organizing medical camps, community
development, promoting education, skill development
trainings, swachhta & conservation of environment etc. in
nearby GPs under CSR are being finalized by CSR team of
Paradip Refinery in consultation with Dist. Administration.
IOCL Paradip refinery has spent about Rs. 7.3 Crore during
FY 2019-20 under CSR in nearby GPs.
-
He further requested to recruit land
losers at least in contractual jobs,
to reconstruct the by-pass road and
to clean the drains for eradicating
mosquito nuisance in the area.
For contractual engagement in various agencies working for
Paradip Refinery, are done by the agency itself based on their
requirement subject to meeting the requisite qualification and
skill.
In consultation with Dist. Administration, IOCL will explore
the possibility of reconstruction of bypass road under its CSR
program. Regarding eradication of mosquito breeding, IOCL
is already in the job and will continue the same.
5.0 Lakh over 5
years for drain
cleanliness,
Mosquito
containment
measures and
continuing.
3 BishnuCharan
Swain from
Kujang,
Jagatsinghpur
He expressed many things
irrelevant to the project and
highlighted general environmental
condition of Paradip area.
- -
4 Subash Pradhan
from
Trilochanpur,
Dhinkia
He asked to provide Basic facilities
to the nearby areas.
He emphasized on boundary side
drain cleaning in Dhinkia to
Various basic amenities / facilities like providing drinking
water, organizing medical health camps, mobile medical vans
with free consultation & medicines, promoting education,
swachhta & conservation of environment etc. in nearby GPs
5.0 Lakh over 5
years for drain
cleanliness,
Mosquito
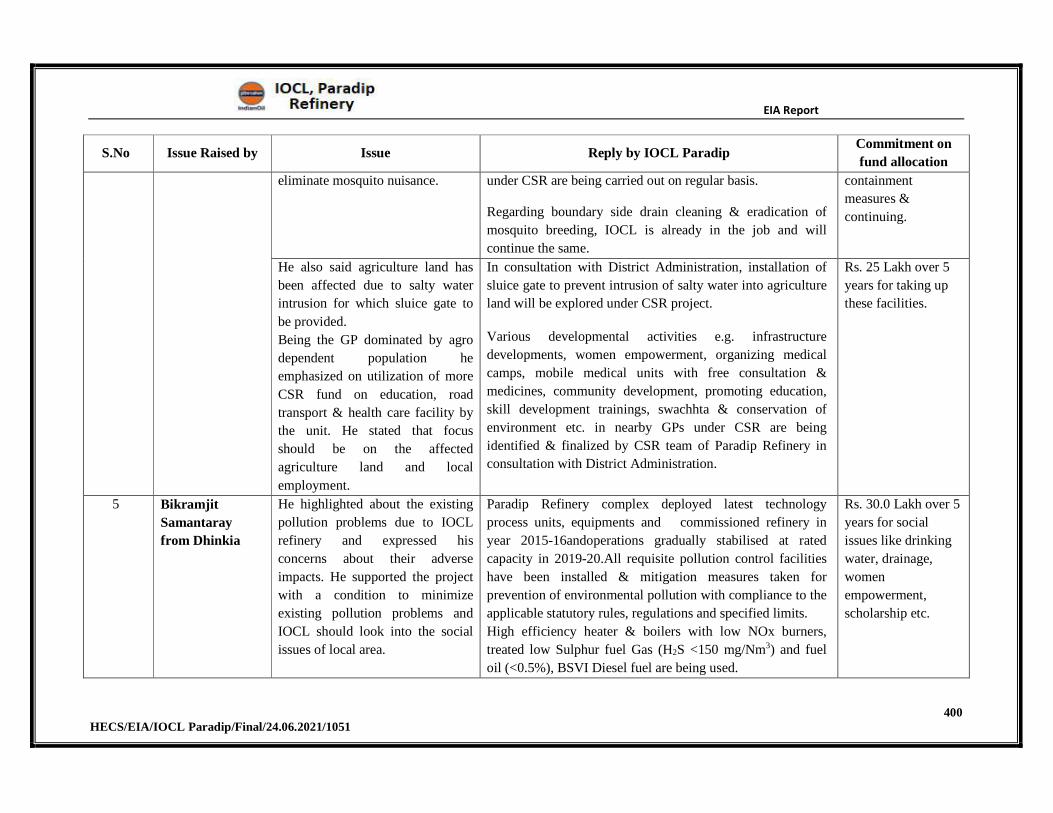
EIA Report
400 HECS/EIA/IOCL Paradip/Final/24.06.2021/1051
S.No Issue Raised by Issue Reply by IOCL Paradip Commitment on
fund allocation
eliminate mosquito nuisance. under CSR are being carried out on regular basis.
Regarding boundary side drain cleaning & eradication of
mosquito breeding, IOCL is already in the job and will
continue the same.
containment
measures &
continuing.
He also said agriculture land has
been affected due to salty water
intrusion for which sluice gate to
be provided.
Being the GP dominated by agro
dependent population he
emphasized on utilization of more
CSR fund on education, road
transport & health care facility by
the unit. He stated that focus
should be on the affected
agriculture land and local
employment.
In consultation with District Administration, installation of
sluice gate to prevent intrusion of salty water into agriculture
land will be explored under CSR project.
Various developmental activities e.g. infrastructure
developments, women empowerment, organizing medical
camps, mobile medical units with free consultation &
medicines, community development, promoting education,
skill development trainings, swachhta & conservation of
environment etc. in nearby GPs under CSR are being
identified & finalized by CSR team of Paradip Refinery in
consultation with District Administration.
Rs. 25 Lakh over 5
years for taking up
these facilities.
5 Bikramjit
Samantaray
from Dhinkia
He highlighted about the existing
pollution problems due to IOCL
refinery and expressed his
concerns about their adverse
impacts. He supported the project
with a condition to minimize
existing pollution problems and
IOCL should look into the social
issues of local area.
Paradip Refinery complex deployed latest technology
process units, equipments and commissioned refinery in
year 2015-16andoperations gradually stabilised at rated
capacity in 2019-20.All requisite pollution control facilities
have been installed & mitigation measures taken for
prevention of environmental pollution with compliance to the
applicable statutory rules, regulations and specified limits.
High efficiency heater & boilers with low NOx burners,
treated low Sulphur fuel Gas (H2S <150 mg/Nm3) and fuel
oil (<0.5%), BSVI Diesel fuel are being used.
Rs. 30.0 Lakh over 5
years for social
issues like drinking
water, drainage,
women
empowerment,
scholarship etc.
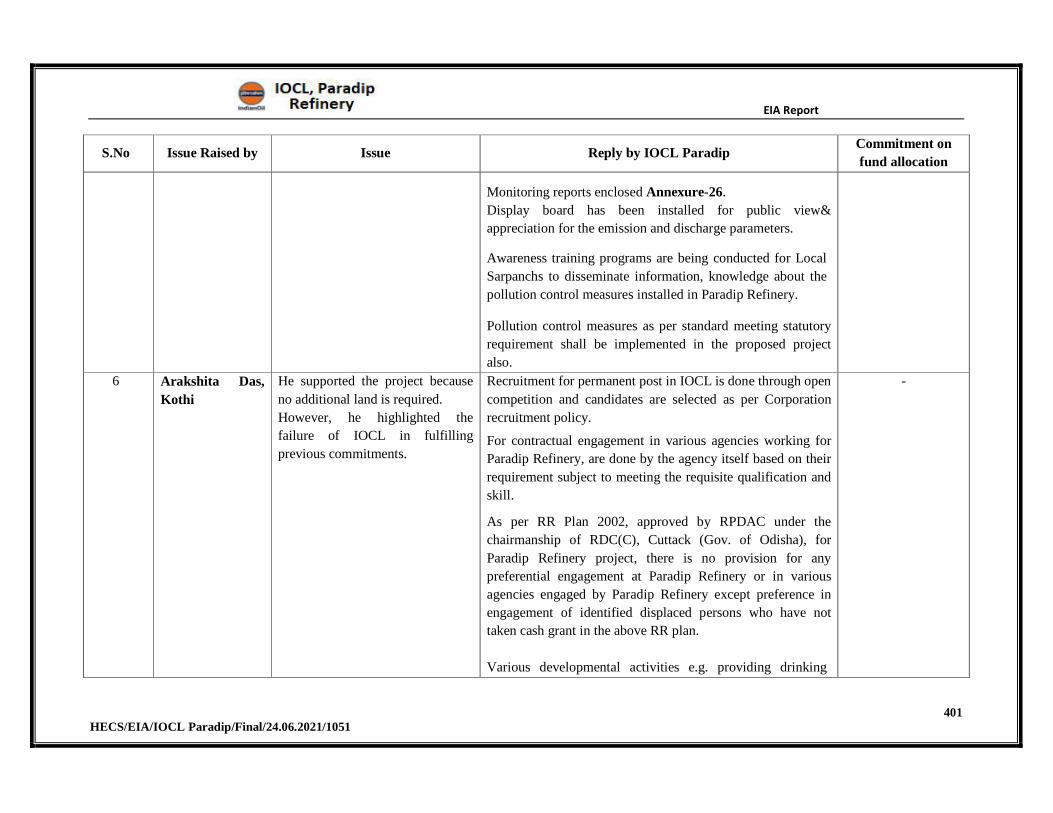
EIA Report
401 HECS/EIA/IOCL Paradip/Final/24.06.2021/1051
S.No Issue Raised by Issue Reply by IOCL Paradip Commitment on
fund allocation
Monitoring reports enclosed Annexure-26.
Display board has been installed for public view&
appreciation for the emission and discharge parameters.
Awareness training programs are being conducted for Local
Sarpanchs to disseminate information, knowledge about the
pollution control measures installed in Paradip Refinery.
Pollution control measures as per standard meeting statutory
requirement shall be implemented in the proposed project
also.
6 Arakshita Das,
Kothi
He supported the project because
no additional land is required.
However, he highlighted the
failure of IOCL in fulfilling
previous commitments.
Recruitment for permanent post in IOCL is done through open
competition and candidates are selected as per Corporation
recruitment policy.
For contractual engagement in various agencies working for
Paradip Refinery, are done by the agency itself based on their
requirement subject to meeting the requisite qualification and
skill.
As per RR Plan 2002, approved by RPDAC under the
chairmanship of RDC(C), Cuttack (Gov. of Odisha), for
Paradip Refinery project, there is no provision for any
preferential engagement at Paradip Refinery or in various
agencies engaged by Paradip Refinery except preference in
engagement of identified displaced persons who have not
taken cash grant in the above RR plan.
Various developmental activities e.g. providing drinking
-
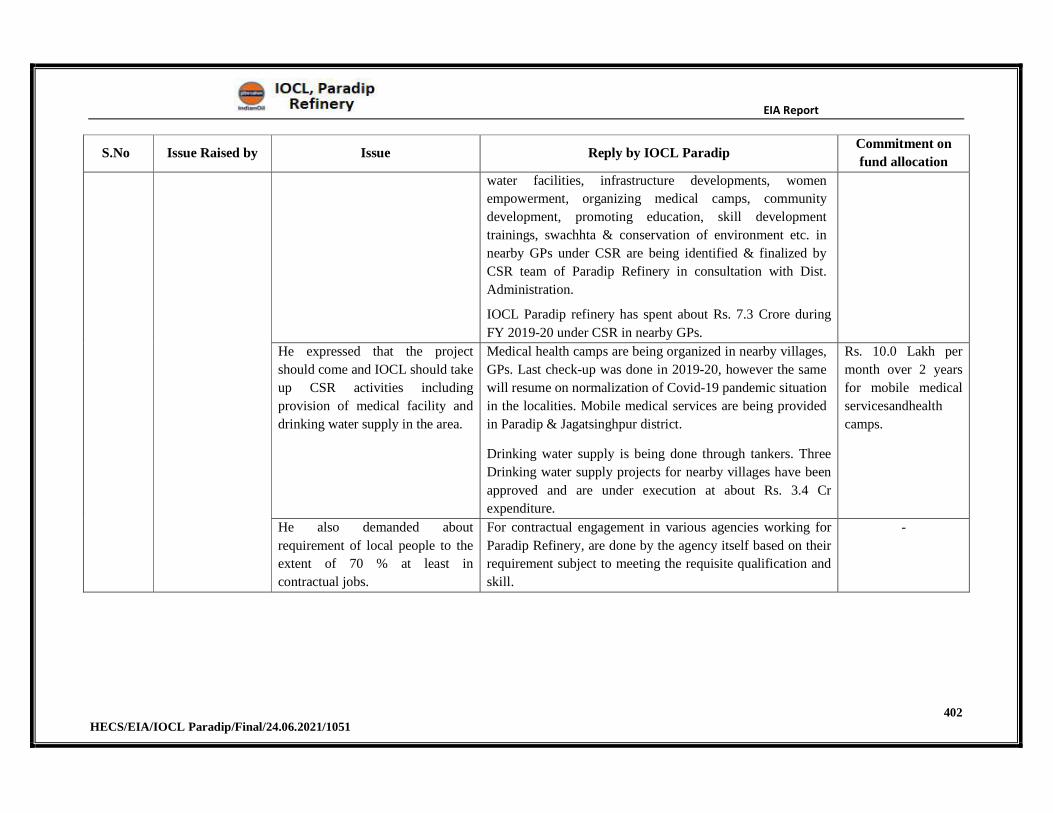
EIA Report
402 HECS/EIA/IOCL Paradip/Final/24.06.2021/1051
S.No Issue Raised by Issue Reply by IOCL Paradip Commitment on
fund allocation
water facilities, infrastructure developments, women
empowerment, organizing medical camps, community
development, promoting education, skill development
trainings, swachhta & conservation of environment etc. in
nearby GPs under CSR are being identified & finalized by
CSR team of Paradip Refinery in consultation with Dist.
Administration.
IOCL Paradip refinery has spent about Rs. 7.3 Crore during
FY 2019-20 under CSR in nearby GPs.
He expressed that the project
should come and IOCL should take
up CSR activities including
provision of medical facility and
drinking water supply in the area.
Medical health camps are being organized in nearby villages,
GPs. Last check-up was done in 2019-20, however the same
will resume on normalization of Covid-19 pandemic situation
in the localities. Mobile medical services are being provided
in Paradip & Jagatsinghpur district.
Drinking water supply is being done through tankers. Three
Drinking water supply projects for nearby villages have been
approved and are under execution at about Rs. 3.4 Cr
expenditure.
Rs. 10.0 Lakh per
month over 2 years
for mobile medical
servicesandhealth
camps.
He also demanded about
requirement of local people to the
extent of 70 % at least in
contractual jobs.
For contractual engagement in various agencies working for
Paradip Refinery, are done by the agency itself based on their
requirement subject to meeting the requisite qualification and
skill.
-
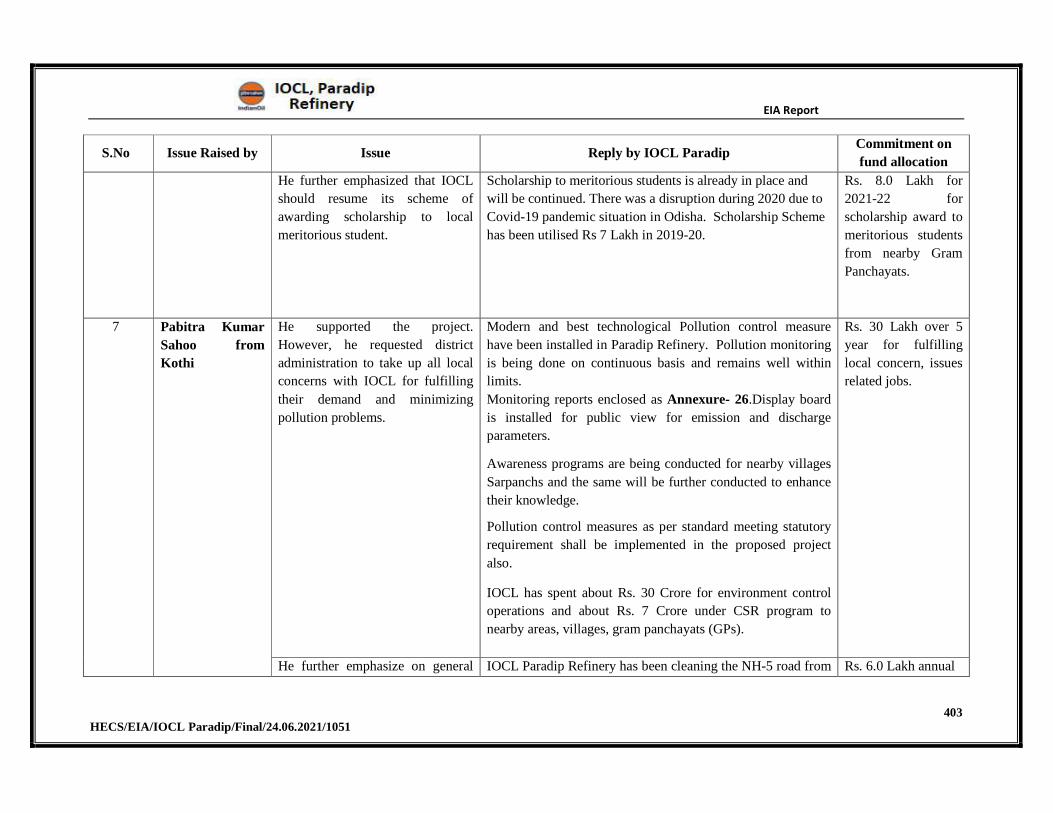
EIA Report
403 HECS/EIA/IOCL Paradip/Final/24.06.2021/1051
S.No Issue Raised by Issue Reply by IOCL Paradip Commitment on
fund allocation
He further emphasized that IOCL
should resume its scheme of
awarding scholarship to local
meritorious student.
Scholarship to meritorious students is already in place and
will be continued. There was a disruption during 2020 due to
Covid-19 pandemic situation in Odisha. Scholarship Scheme
has been utilised Rs 7 Lakh in 2019-20.
Rs. 8.0 Lakh for
2021-22 for
scholarship award to
meritorious students
from nearby Gram
Panchayats.
7 Pabitra Kumar
Sahoo from
Kothi
He supported the project.
However, he requested district
administration to take up all local
concerns with IOCL for fulfilling
their demand and minimizing
pollution problems.
Modern and best technological Pollution control measure
have been installed in Paradip Refinery. Pollution monitoring
is being done on continuous basis and remains well within
limits.
Monitoring reports enclosed as Annexure- 26.Display board
is installed for public view for emission and discharge
parameters.
Awareness programs are being conducted for nearby villages
Sarpanchs and the same will be further conducted to enhance
their knowledge.
Pollution control measures as per standard meeting statutory
requirement shall be implemented in the proposed project
also.
IOCL has spent about Rs. 30 Crore for environment control
operations and about Rs. 7 Crore under CSR program to
nearby areas, villages, gram panchayats (GPs).
Rs. 30 Lakh over 5
year for fulfilling
local concern, issues
related jobs.
He further emphasize on general IOCL Paradip Refinery has been cleaning the NH-5 road from Rs. 6.0 Lakh annual
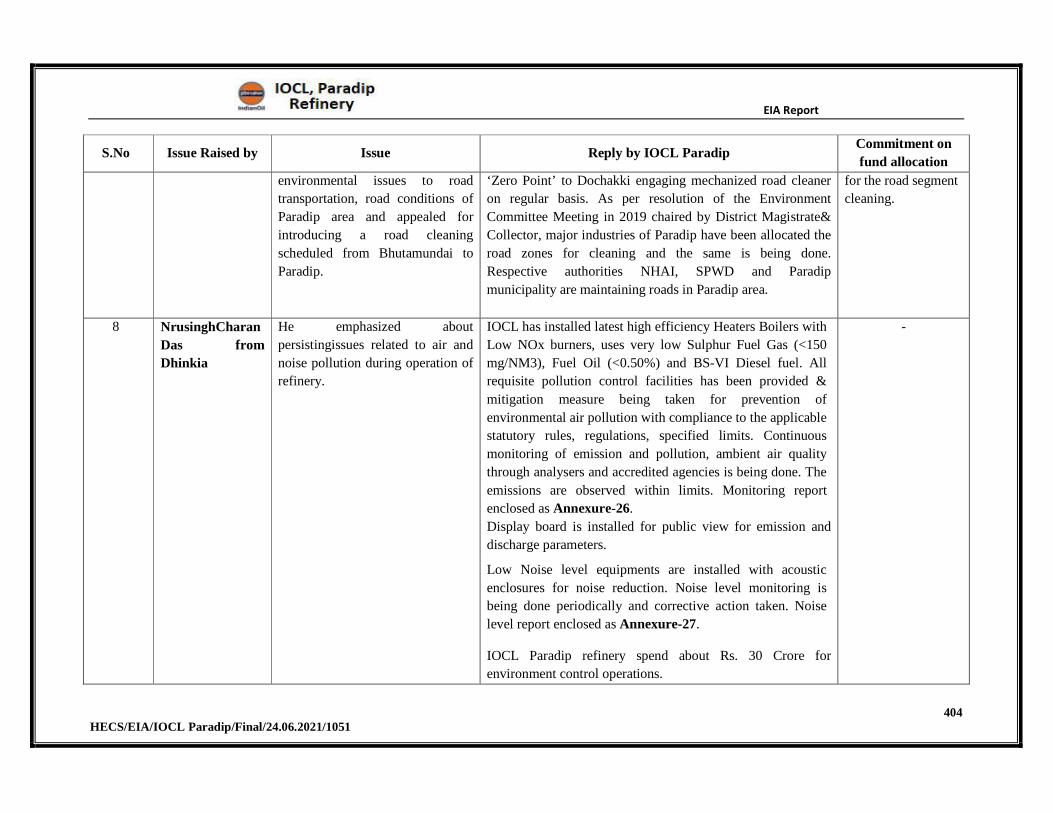
EIA Report
404 HECS/EIA/IOCL Paradip/Final/24.06.2021/1051
S.No Issue Raised by Issue Reply by IOCL Paradip Commitment on
fund allocation
environmental issues to road
transportation, road conditions of
Paradip area and appealed for
introducing a road cleaning
scheduled from Bhutamundai to
Paradip.
‘Zero Point’ to Dochakki engaging mechanized road cleaner
on regular basis. As per resolution of the Environment
Committee Meeting in 2019 chaired by District Magistrate&
Collector, major industries of Paradip have been allocated the
road zones for cleaning and the same is being done.
Respective authorities NHAI, SPWD and Paradip
municipality are maintaining roads in Paradip area.
for the road segment
cleaning.
8 NrusinghCharan
Das from
Dhinkia
He emphasized about
persistingissues related to air and
noise pollution during operation of
refinery.
IOCL has installed latest high efficiency Heaters Boilers with
Low NOx burners, uses very low Sulphur Fuel Gas (<150
mg/NM3), Fuel Oil (<0.50%) and BS-VI Diesel fuel. All
requisite pollution control facilities has been provided &
mitigation measure being taken for prevention of
environmental air pollution with compliance to the applicable
statutory rules, regulations, specified limits. Continuous
monitoring of emission and pollution, ambient air quality
through analysers and accredited agencies is being done. The
emissions are observed within limits. Monitoring report
enclosed as Annexure-26.
Display board is installed for public view for emission and
discharge parameters.
Low Noise level equipments are installed with acoustic
enclosures for noise reduction. Noise level monitoring is
being done periodically and corrective action taken. Noise
level report enclosed as Annexure-27.
IOCL Paradip refinery spend about Rs. 30 Crore for
environment control operations.
-
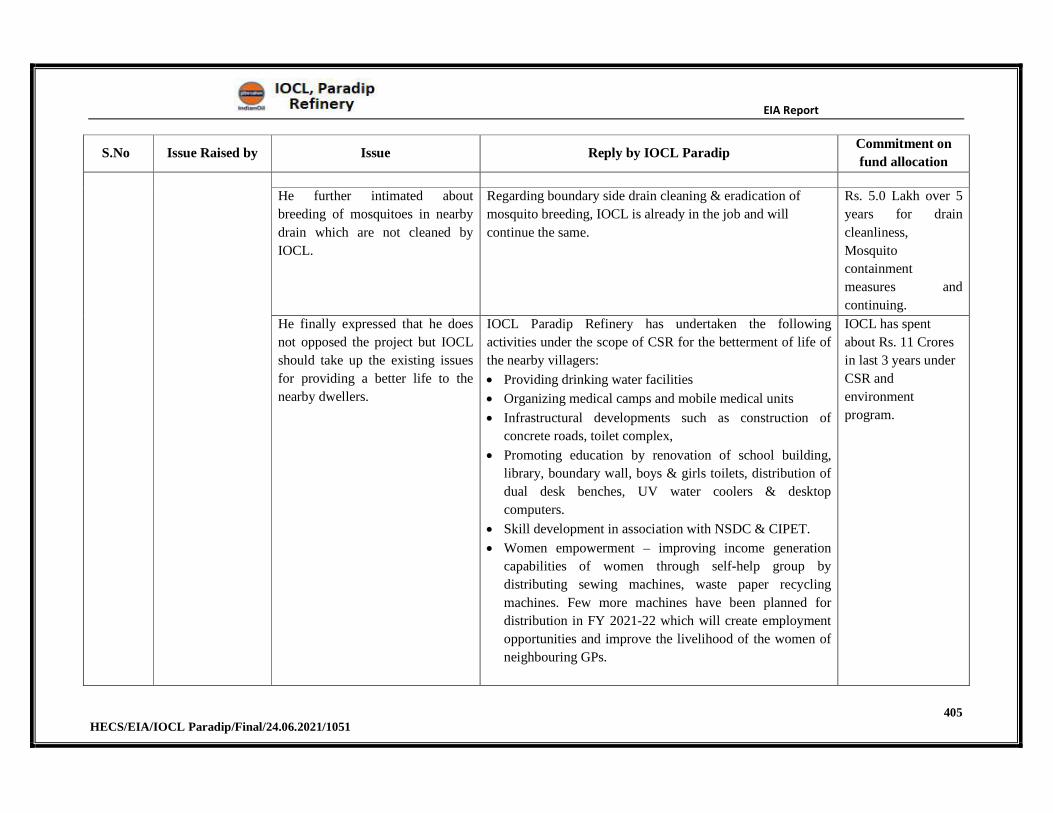
EIA Report
405 HECS/EIA/IOCL Paradip/Final/24.06.2021/1051
S.No Issue Raised by Issue Reply by IOCL Paradip Commitment on
fund allocation
He further intimated about
breeding of mosquitoes in nearby
drain which are not cleaned by
IOCL.
Regarding boundary side drain cleaning & eradication of
mosquito breeding, IOCL is already in the job and will
continue the same.
Rs. 5.0 Lakh over 5
years for drain
cleanliness,
Mosquito
containment
measures and
continuing.
He finally expressed that he does
not opposed the project but IOCL
should take up the existing issues
for providing a better life to the
nearby dwellers.
IOCL Paradip Refinery has undertaken the following
activities under the scope of CSR for the betterment of life of
the nearby villagers:
Providing drinking water facilities
Organizing medical camps and mobile medical units
Infrastructural developments such as construction of
concrete roads, toilet complex,
Promoting education by renovation of school building,
library, boundary wall, boys & girls toilets, distribution of
dual desk benches, UV water coolers & desktop
computers.
Skill development in association with NSDC & CIPET.
Women empowerment – improving income generation
capabilities of women through self-help group by
distributing sewing machines, waste paper recycling
machines. Few more machines have been planned for
distribution in FY 2021-22 which will create employment
opportunities and improve the livelihood of the women of
neighbouring GPs.
IOCL has spent
about Rs. 11 Crores
in last 3 years under
CSR and
environment
program.
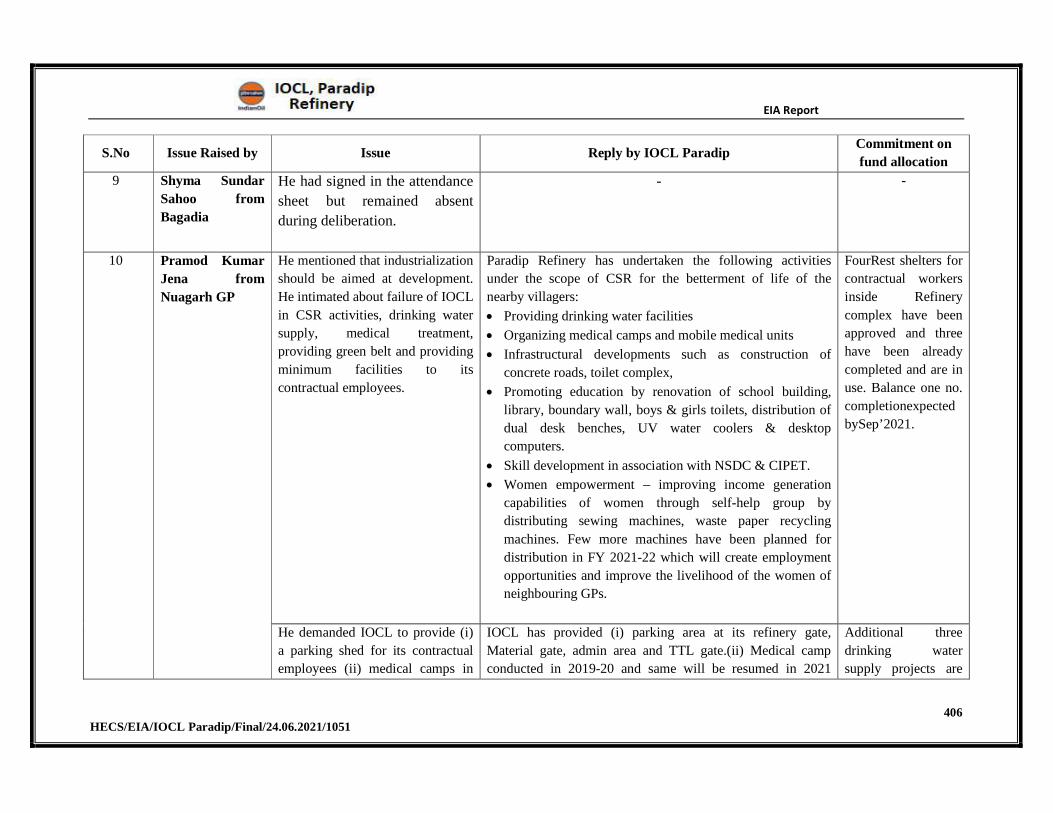
EIA Report
406 HECS/EIA/IOCL Paradip/Final/24.06.2021/1051
S.No Issue Raised by Issue Reply by IOCL Paradip Commitment on
fund allocation
9 Shyma Sundar
Sahoo from
Bagadia
He had signed in the attendance
sheet but remained absent
during deliberation.
- -
10 Pramod Kumar
Jena from
Nuagarh GP
He mentioned that industrialization
should be aimed at development.
He intimated about failure of IOCL
in CSR activities, drinking water
supply, medical treatment,
providing green belt and providing
minimum facilities to its
contractual employees.
Paradip Refinery has undertaken the following activities
under the scope of CSR for the betterment of life of the
nearby villagers:
Providing drinking water facilities
Organizing medical camps and mobile medical units
Infrastructural developments such as construction of
concrete roads, toilet complex,
Promoting education by renovation of school building,
library, boundary wall, boys & girls toilets, distribution of
dual desk benches, UV water coolers & desktop
computers.
Skill development in association with NSDC & CIPET.
Women empowerment – improving income generation
capabilities of women through self-help group by
distributing sewing machines, waste paper recycling
machines. Few more machines have been planned for
distribution in FY 2021-22 which will create employment
opportunities and improve the livelihood of the women of
neighbouring GPs.
FourRest shelters for
contractual workers
inside Refinery
complex have been
approved and three
have been already
completed and are in
use. Balance one no.
completionexpected
bySep’2021.
He demanded IOCL to provide (i)
a parking shed for its contractual
employees (ii) medical camps in
IOCL has provided (i) parking area at its refinery gate,
Material gate, admin area and TTL gate.(ii) Medical camp
conducted in 2019-20 and same will be resumed in 2021
Additional three
drinking water
supply projects are
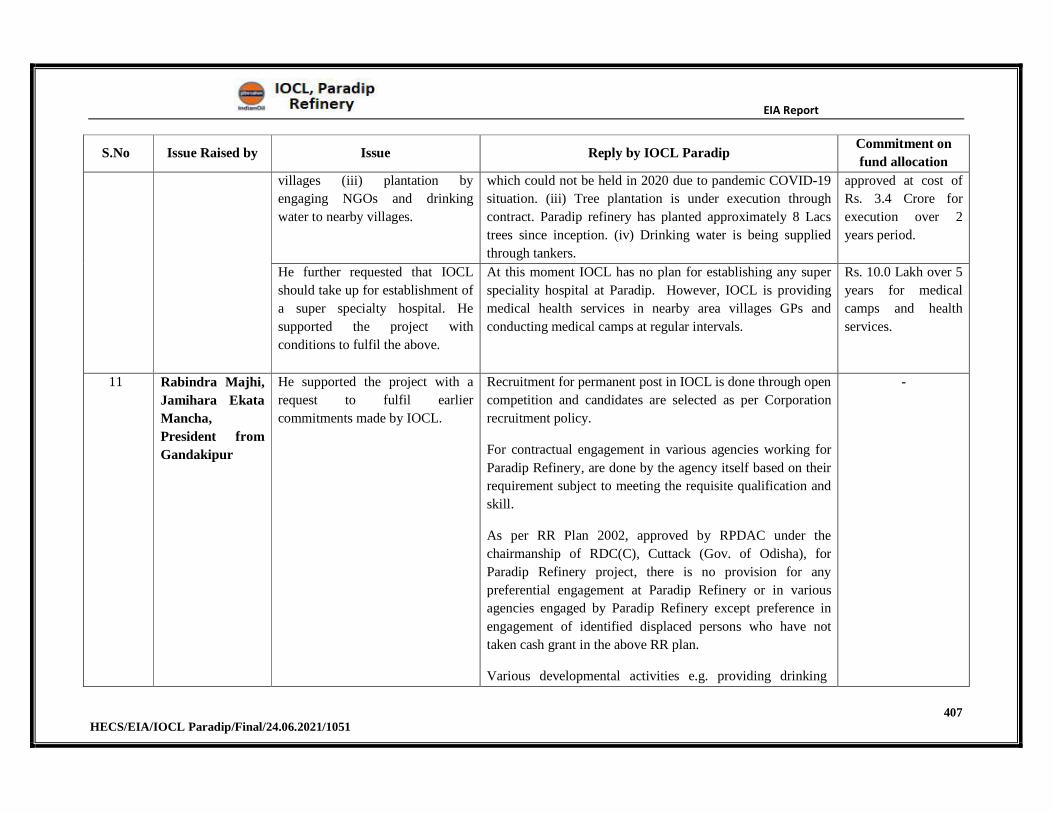
EIA Report
407 HECS/EIA/IOCL Paradip/Final/24.06.2021/1051
S.No Issue Raised by Issue Reply by IOCL Paradip Commitment on
fund allocation
villages (iii) plantation by
engaging NGOs and drinking
water to nearby villages.
which could not be held in 2020 due to pandemic COVID-19
situation. (iii) Tree plantation is under execution through
contract. Paradip refinery has planted approximately 8 Lacs
trees since inception. (iv) Drinking water is being supplied
through tankers.
approved at cost of
Rs. 3.4 Crore for
execution over 2
years period.
He further requested that IOCL
should take up for establishment of
a super specialty hospital. He
supported the project with
conditions to fulfil the above.
At this moment IOCL has no plan for establishing any super
speciality hospital at Paradip. However, IOCL is providing
medical health services in nearby area villages GPs and
conducting medical camps at regular intervals.
Rs. 10.0 Lakh over 5
years for medical
camps and health
services.
11 Rabindra Majhi,
Jamihara Ekata
Mancha,
President from
Gandakipur
He supported the project with a
request to fulfil earlier
commitments made by IOCL.
Recruitment for permanent post in IOCL is done through open
competition and candidates are selected as per Corporation
recruitment policy.
For contractual engagement in various agencies working for
Paradip Refinery, are done by the agency itself based on their
requirement subject to meeting the requisite qualification and
skill.
As per RR Plan 2002, approved by RPDAC under the
chairmanship of RDC(C), Cuttack (Gov. of Odisha), for
Paradip Refinery project, there is no provision for any
preferential engagement at Paradip Refinery or in various
agencies engaged by Paradip Refinery except preference in
engagement of identified displaced persons who have not
taken cash grant in the above RR plan.
Various developmental activities e.g. providing drinking
-
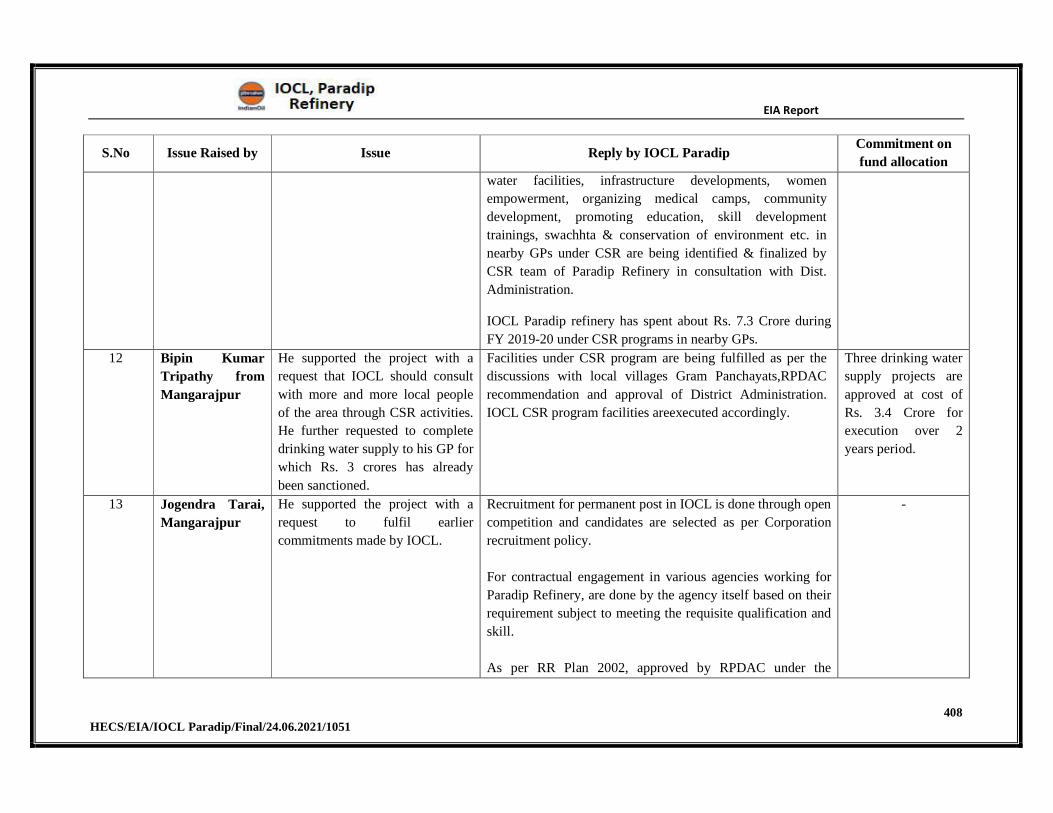
EIA Report
408 HECS/EIA/IOCL Paradip/Final/24.06.2021/1051
S.No Issue Raised by Issue Reply by IOCL Paradip Commitment on
fund allocation
water facilities, infrastructure developments, women
empowerment, organizing medical camps, community
development, promoting education, skill development
trainings, swachhta & conservation of environment etc. in
nearby GPs under CSR are being identified & finalized by
CSR team of Paradip Refinery in consultation with Dist.
Administration.
IOCL Paradip refinery has spent about Rs. 7.3 Crore during
FY 2019-20 under CSR programs in nearby GPs.
12 Bipin Kumar
Tripathy from
Mangarajpur
He supported the project with a
request that IOCL should consult
with more and more local people
of the area through CSR activities.
He further requested to complete
drinking water supply to his GP for
which Rs. 3 crores has already
been sanctioned.
Facilities under CSR program are being fulfilled as per the
discussions with local villages Gram Panchayats,RPDAC
recommendation and approval of District Administration.
IOCL CSR program facilities areexecuted accordingly.
Three drinking water
supply projects are
approved at cost of
Rs. 3.4 Crore for
execution over 2
years period.
13 Jogendra Tarai,
Mangarajpur
He supported the project with a
request to fulfil earlier
commitments made by IOCL.
Recruitment for permanent post in IOCL is done through open
competition and candidates are selected as per Corporation
recruitment policy.
For contractual engagement in various agencies working for
Paradip Refinery, are done by the agency itself based on their
requirement subject to meeting the requisite qualification and
skill.
As per RR Plan 2002, approved by RPDAC under the
-
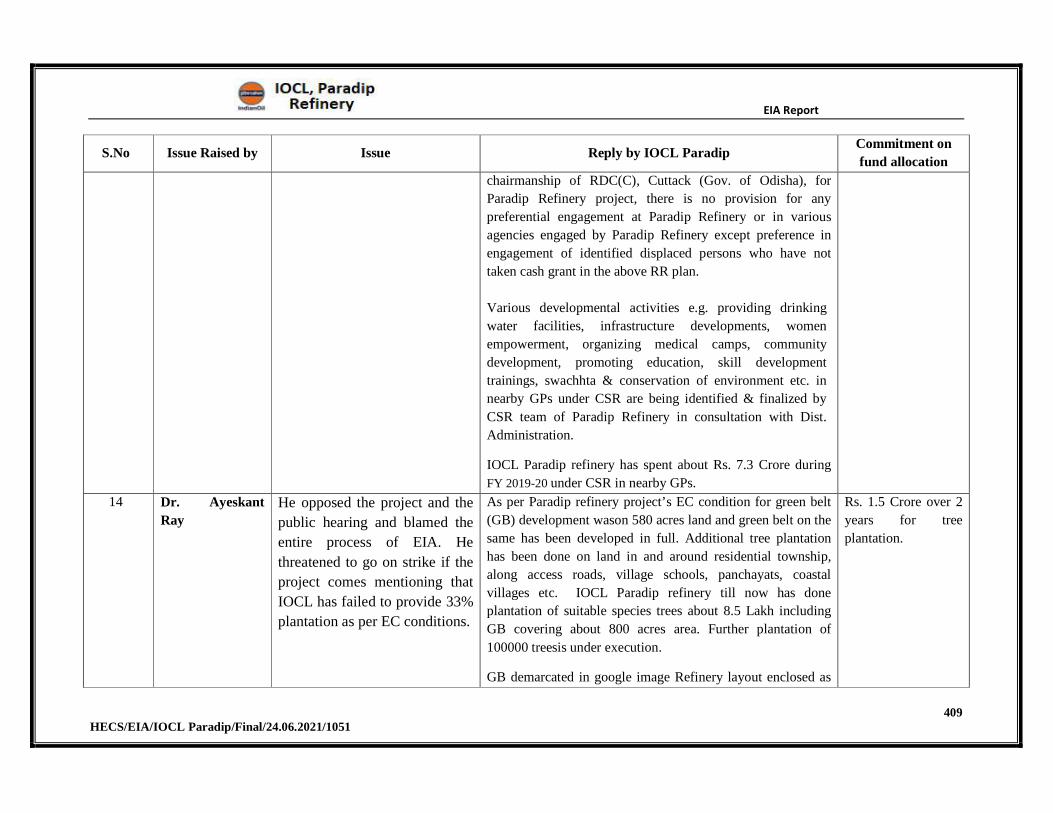
EIA Report
409 HECS/EIA/IOCL Paradip/Final/24.06.2021/1051
S.No Issue Raised by Issue Reply by IOCL Paradip Commitment on
fund allocation
chairmanship of RDC(C), Cuttack (Gov. of Odisha), for
Paradip Refinery project, there is no provision for any
preferential engagement at Paradip Refinery or in various
agencies engaged by Paradip Refinery except preference in
engagement of identified displaced persons who have not
taken cash grant in the above RR plan.
Various developmental activities e.g. providing drinking
water facilities, infrastructure developments, women
empowerment, organizing medical camps, community
development, promoting education, skill development
trainings, swachhta & conservation of environment etc. in
nearby GPs under CSR are being identified & finalized by
CSR team of Paradip Refinery in consultation with Dist.
Administration.
IOCL Paradip refinery has spent about Rs. 7.3 Crore during
FY 2019-20 under CSR in nearby GPs.
14 Dr. Ayeskant
Ray
He opposed the project and the
public hearing and blamed the
entire process of EIA. He
threatened to go on strike if the
project comes mentioning that
IOCL has failed to provide 33%
plantation as per EC conditions.
As per Paradip refinery project’s EC condition for green belt
(GB) development wason 580 acres land and green belt on the
same has been developed in full. Additional tree plantation
has been done on land in and around residential township,
along access roads, village schools, panchayats, coastal
villages etc. IOCL Paradip refinery till now has done
plantation of suitable species trees about 8.5 Lakh including
GB covering about 800 acres area. Further plantation of
100000 treesis under execution.
GB demarcated in google image Refinery layout enclosed as
Rs. 1.5 Crore over 2
years for tree
plantation.
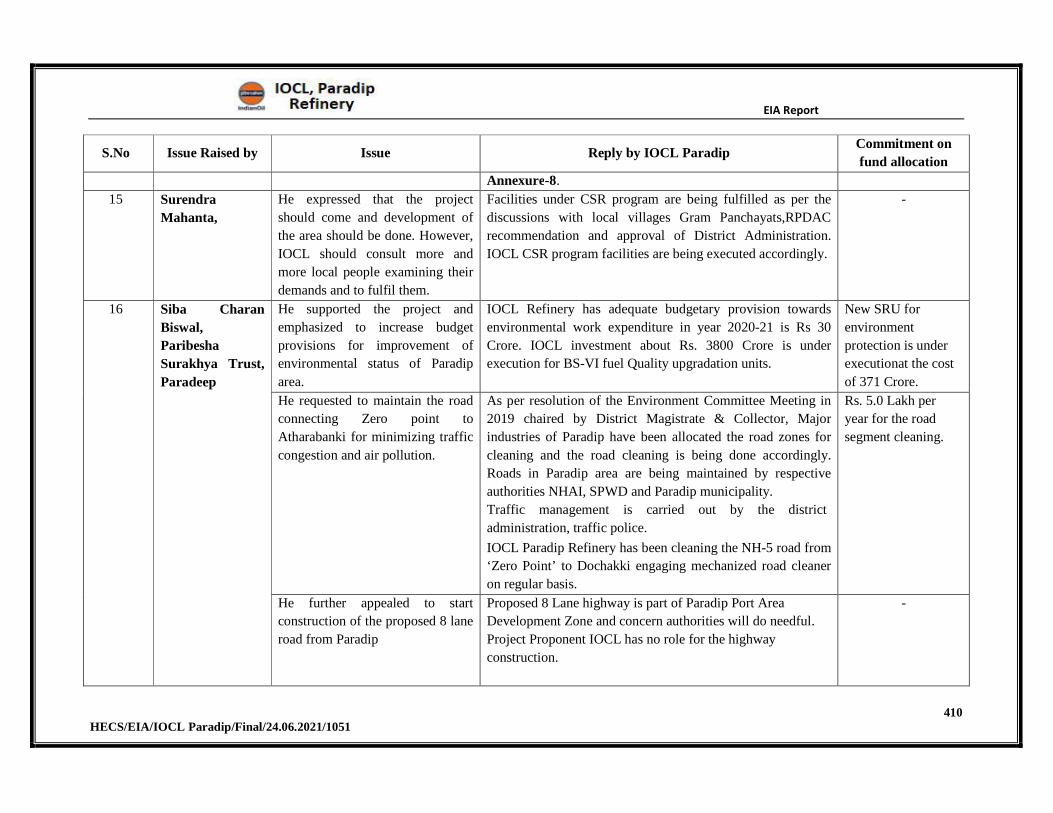
EIA Report
410 HECS/EIA/IOCL Paradip/Final/24.06.2021/1051
S.No Issue Raised by Issue Reply by IOCL Paradip Commitment on
fund allocation
Annexure-8.
15 Surendra
Mahanta,
He expressed that the project
should come and development of
the area should be done. However,
IOCL should consult more and
more local people examining their
demands and to fulfil them.
Facilities under CSR program are being fulfilled as per the
discussions with local villages Gram Panchayats,RPDAC
recommendation and approval of District Administration.
IOCL CSR program facilities are being executed accordingly.
-
16 Siba Charan
Biswal,
Paribesha
Surakhya Trust,
Paradeep
He supported the project and
emphasized to increase budget
provisions for improvement of
environmental status of Paradip
area.
IOCL Refinery has adequate budgetary provision towards
environmental work expenditure in year 2020-21 is Rs 30
Crore. IOCL investment about Rs. 3800 Crore is under
execution for BS-VI fuel Quality upgradation units.
New SRU for
environment
protection is under
executionat the cost
of 371 Crore.
He requested to maintain the road
connecting Zero point to
Atharabanki for minimizing traffic
congestion and air pollution.
As per resolution of the Environment Committee Meeting in
2019 chaired by District Magistrate & Collector, Major
industries of Paradip have been allocated the road zones for
cleaning and the road cleaning is being done accordingly.
Roads in Paradip area are being maintained by respective
authorities NHAI, SPWD and Paradip municipality.
Traffic management is carried out by the district
administration, traffic police.
IOCL Paradip Refinery has been cleaning the NH-5 road from
‘Zero Point’ to Dochakki engaging mechanized road cleaner
on regular basis.
Rs. 5.0 Lakh per
year for the road
segment cleaning.
He further appealed to start
construction of the proposed 8 lane
road from Paradip
Proposed 8 Lane highway is part of Paradip Port Area
Development Zone and concern authorities will do needful.
Project Proponent IOCL has no role for the highway
construction.
-
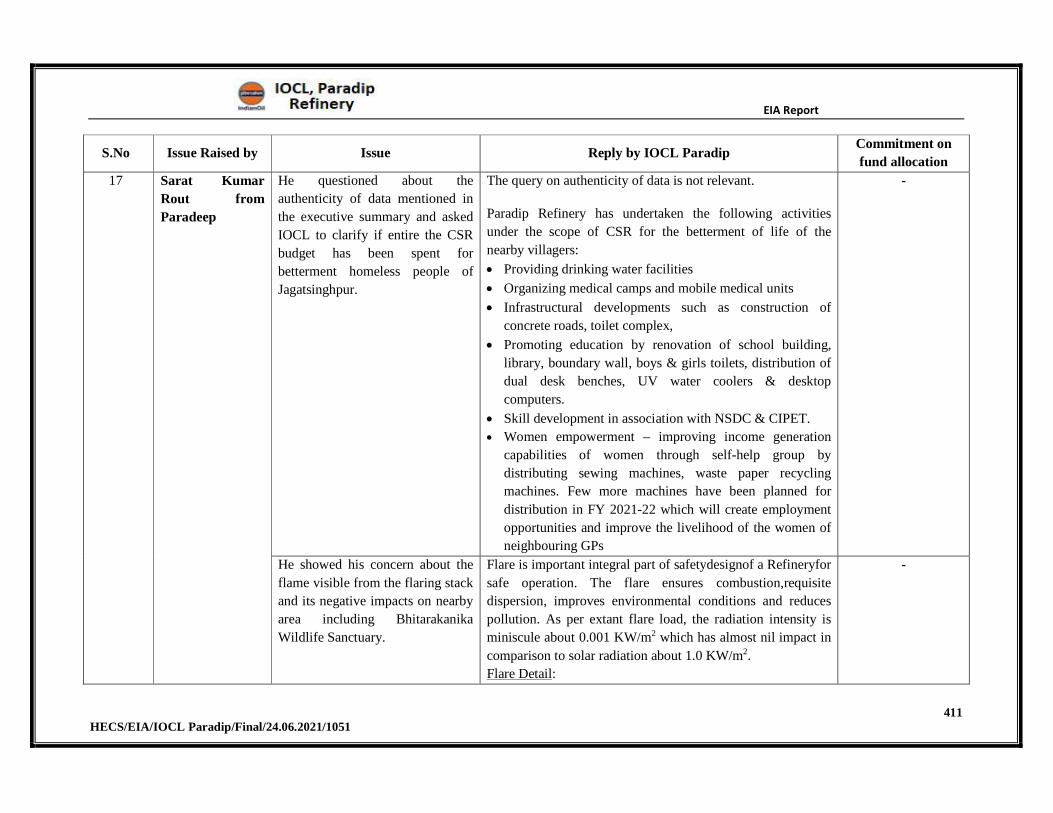
EIA Report
411 HECS/EIA/IOCL Paradip/Final/24.06.2021/1051
S.No Issue Raised by Issue Reply by IOCL Paradip Commitment on
fund allocation
17 Sarat Kumar
Rout from
Paradeep
He questioned about the
authenticity of data mentioned in
the executive summary and asked
IOCL to clarify if entire the CSR
budget has been spent for
betterment homeless people of
Jagatsinghpur.
The query on authenticity of data is not relevant.
Paradip Refinery has undertaken the following activities
under the scope of CSR for the betterment of life of the
nearby villagers:
Providing drinking water facilities
Organizing medical camps and mobile medical units
Infrastructural developments such as construction of
concrete roads, toilet complex,
Promoting education by renovation of school building,
library, boundary wall, boys & girls toilets, distribution of
dual desk benches, UV water coolers & desktop
computers.
Skill development in association with NSDC & CIPET.
Women empowerment – improving income generation
capabilities of women through self-help group by
distributing sewing machines, waste paper recycling
machines. Few more machines have been planned for
distribution in FY 2021-22 which will create employment
opportunities and improve the livelihood of the women of
neighbouring GPs
-
He showed his concern about the
flame visible from the flaring stack
and its negative impacts on nearby
area including Bhitarakanika
Wildlife Sanctuary.
Flare is important integral part of safetydesignof a Refineryfor
safe operation. The flare ensures combustion,requisite
dispersion, improves environmental conditions and reduces
pollution. As per extant flare load, the radiation intensity is
miniscule about 0.001 KW/m2 which has almost nil impact in
comparison to solar radiation about 1.0 KW/m2.
Flare Detail:
-
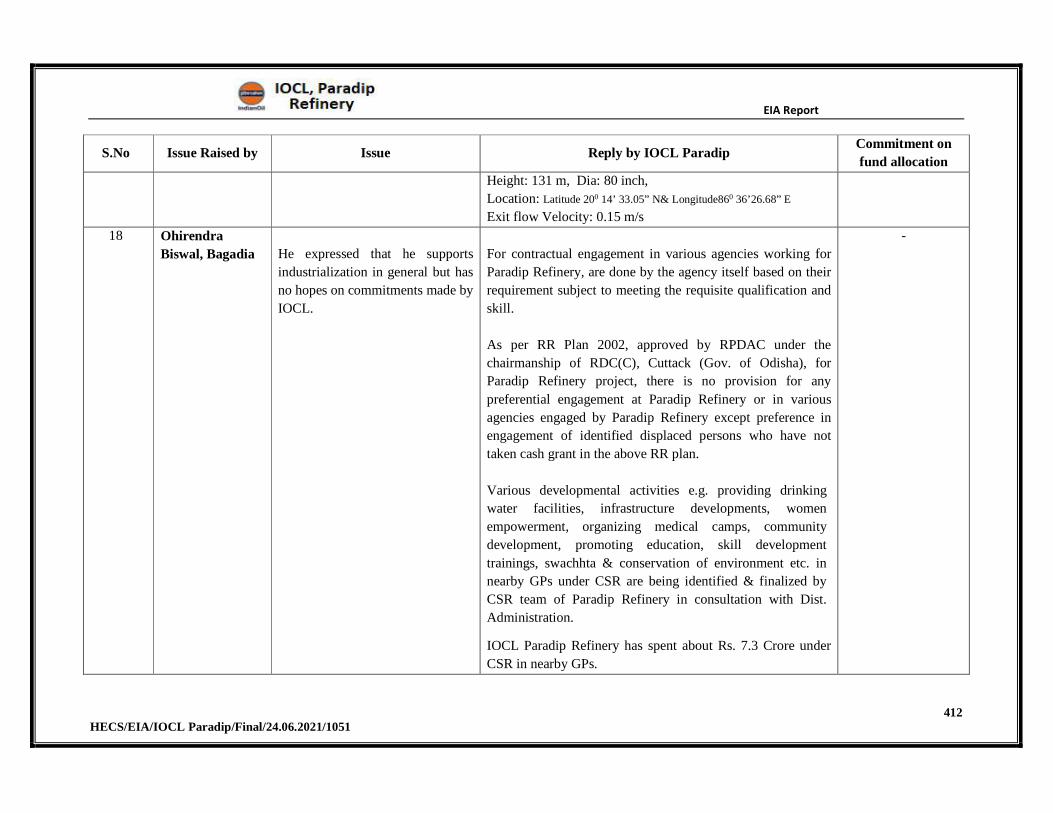
EIA Report
412 HECS/EIA/IOCL Paradip/Final/24.06.2021/1051
S.No Issue Raised by Issue Reply by IOCL Paradip Commitment on
fund allocation
Height: 131 m, Dia: 80 inch,
Location: Latitude 200 14’ 33.05” N& Longitude860 36’26.68” E
Exit flow Velocity: 0.15 m/s
18 Ohirendra
Biswal, Bagadia He expressed that he supports
industrialization in general but has
no hopes on commitments made by
IOCL.
For contractual engagement in various agencies working for
Paradip Refinery, are done by the agency itself based on their
requirement subject to meeting the requisite qualification and
skill.
As per RR Plan 2002, approved by RPDAC under the
chairmanship of RDC(C), Cuttack (Gov. of Odisha), for
Paradip Refinery project, there is no provision for any
preferential engagement at Paradip Refinery or in various
agencies engaged by Paradip Refinery except preference in
engagement of identified displaced persons who have not
taken cash grant in the above RR plan.
Various developmental activities e.g. providing drinking
water facilities, infrastructure developments, women
empowerment, organizing medical camps, community
development, promoting education, skill development
trainings, swachhta & conservation of environment etc. in
nearby GPs under CSR are being identified & finalized by
CSR team of Paradip Refinery in consultation with Dist.
Administration.
IOCL Paradip Refinery has spent about Rs. 7.3 Crore under
CSR in nearby GPs.
-
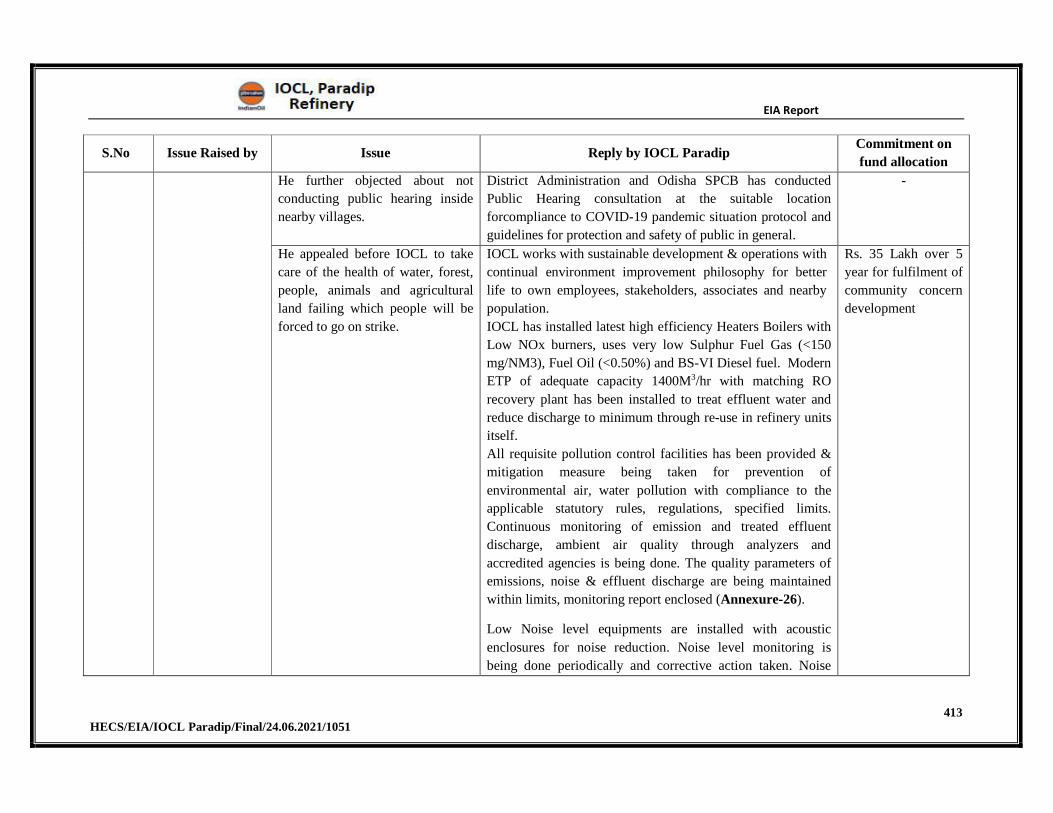
EIA Report
413 HECS/EIA/IOCL Paradip/Final/24.06.2021/1051
S.No Issue Raised by Issue Reply by IOCL Paradip Commitment on
fund allocation
He further objected about not
conducting public hearing inside
nearby villages.
District Administration and Odisha SPCB has conducted
Public Hearing consultation at the suitable location
forcompliance to COVID-19 pandemic situation protocol and
guidelines for protection and safety of public in general.
-
He appealed before IOCL to take
care of the health of water, forest,
people, animals and agricultural
land failing which people will be
forced to go on strike.
IOCL works with sustainable development & operations with
continual environment improvement philosophy for better
life to own employees, stakeholders, associates and nearby
population.
IOCL has installed latest high efficiency Heaters Boilers with
Low NOx burners, uses very low Sulphur Fuel Gas (<150
mg/NM3), Fuel Oil (<0.50%) and BS-VI Diesel fuel. Modern
ETP of adequate capacity 1400M3/hr with matching RO
recovery plant has been installed to treat effluent water and
reduce discharge to minimum through re-use in refinery units
itself.
All requisite pollution control facilities has been provided &
mitigation measure being taken for prevention of
environmental air, water pollution with compliance to the
applicable statutory rules, regulations, specified limits.
Continuous monitoring of emission and treated effluent
discharge, ambient air quality through analyzers and
accredited agencies is being done. The quality parameters of
emissions, noise & effluent discharge are being maintained
within limits, monitoring report enclosed (Annexure-26).
Low Noise level equipments are installed with acoustic
enclosures for noise reduction. Noise level monitoring is
being done periodically and corrective action taken. Noise
Rs. 35 Lakh over 5
year for fulfilment of
community concern
development

EIA Report
414 HECS/EIA/IOCL Paradip/Final/24.06.2021/1051
S.No Issue Raised by Issue Reply by IOCL Paradip Commitment on
fund allocation
level report enclosed (Annexure-27).
IOCL is aware of corporate citizen’s role & responsibilities
take care of its surroundings. IOCL provide drinking water
supply, medical & health amenities, sanitation, education &
scholarship, skill development, self-employment assistance,
environment pollution control operations and monitoring etc.
to nearby population.
IOCL has spent about Rs. 30 Crore for environment control
operations and about Rs. 7.3 Crore under CSR program to
nearby areas, villages,gram panchayats (GPs).
EIA Report
415 HECS/EIA/IOCL Paradip/Final/24.06.2021/1051
7.2 Risk Assessment
The recommendations and mitigation measures of Risk Assessment will be implemented. The
impact contours will be kept within the refinery limit. Continuous onsite and offsite
emergency plan will be done in accordance with local district authorities. Periodic mock
drills will be conducted and any gaps if found will be addressed. Risk Assessment report is
attached as Annexure 10. Material Safety Data Sheet is enclosed in Annexure 12.and the
Disaster Management Plan is enclosed in Annexure 11. The certified EC compliance to
environmental conditions is provided in Annexure 2.
The following audits is being carried out periodically for environmental safety ,
Internal System Audit on Yearly Basis.
Internal & External Audit for OHSAS on Yearly Basis
Cross refinery safety & Environment Audit Yearly Basis.
External Safety Audit by OISD team once in Three Years.
Pre-commissioning Safety Audit for each New Facility.
Adequate ventilation will be maintained in the control room with a minimum of five to six air
changes per hour. Air intake to be properly located in line with OISD-STD 163. The latest
Cross-refinery safety & Environment Audit report is enclosed as Annexure 19 and the Latest
Daily Environmental Safety Report is enclosed as Annexure 21.
Following are the safety measures have been adopted in the plant.
1. Emergency isolation valves are provided with manual mode that will close them
immediately through push button located at a safe place and auto mode that will close them
immediately through gas/fire detector system.
2. The Vessels/ tanks are designed as per standards and corrosion protection is accounted in
the design.
3. Material of Construction of vessels is assumed to be suitable for the process conditions.
4. The facilities are well designed as per acceptable Indian / International codes & standards.
5. Inherent safety like appropriate equipment spacing as per OISD-118, Hazardous area
classification is considered.
6. Passive fire protection such as fire proofing shall be provided.
7. Appropriate detection measures such as fire and gas detectors are to be provided and
verified throughout the plant area.
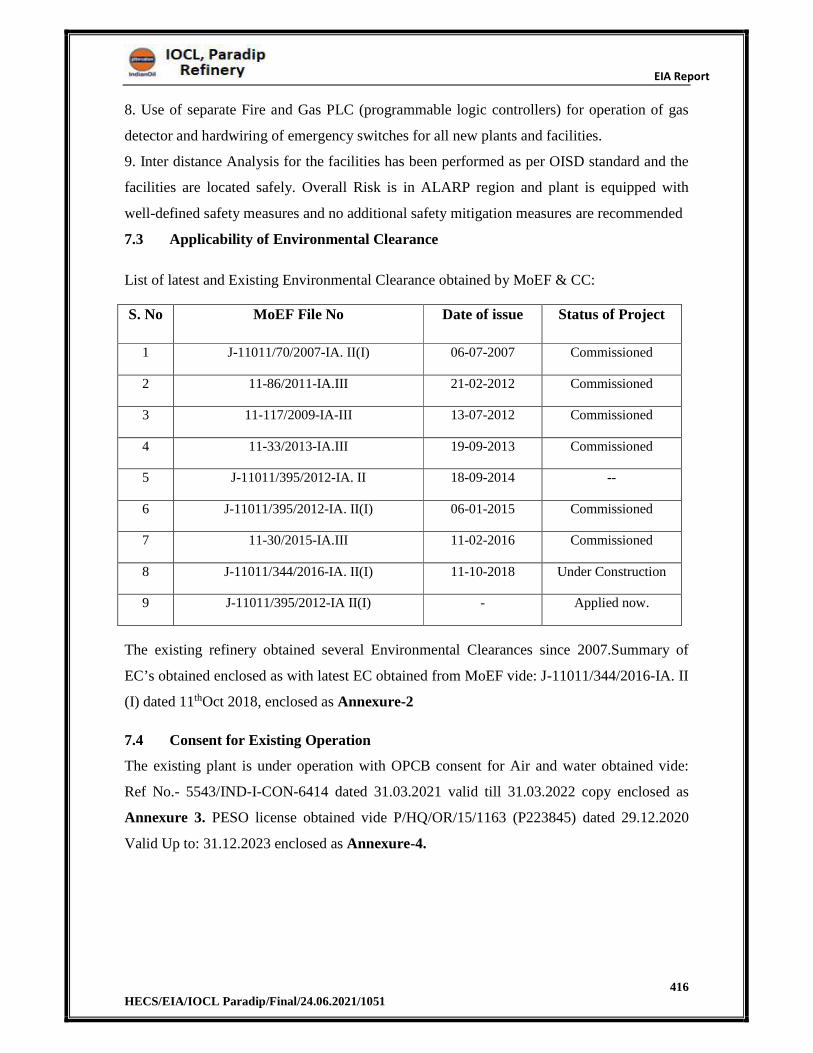
EIA Report
416 HECS/EIA/IOCL Paradip/Final/24.06.2021/1051
8. Use of separate Fire and Gas PLC (programmable logic controllers) for operation of gas
detector and hardwiring of emergency switches for all new plants and facilities.
9. Inter distance Analysis for the facilities has been performed as per OISD standard and the
facilities are located safely. Overall Risk is in ALARP region and plant is equipped with
well-defined safety measures and no additional safety mitigation measures are recommended
7.3 Applicability of Environmental Clearance
List of latest and Existing Environmental Clearance obtained by MoEF & CC:
S. No MoEF File No Date of issue Status of Project
1 J-11011/70/2007-IA. II(I) 06-07-2007 Commissioned
2 11-86/2011-IA.III 21-02-2012 Commissioned
3 11-117/2009-IA-III 13-07-2012 Commissioned
4 11-33/2013-IA.III 19-09-2013 Commissioned
5 J-11011/395/2012-IA. II 18-09-2014 --
6 J-11011/395/2012-IA. II(I) 06-01-2015 Commissioned
7 11-30/2015-IA.III 11-02-2016 Commissioned
8 J-11011/344/2016-IA. II(I) 11-10-2018 Under Construction
9 J-11011/395/2012-IA II(I) - Applied now.
The existing refinery obtained several Environmental Clearances since 2007.Summary of
EC’s obtained enclosed as with latest EC obtained from MoEF vide: J-11011/344/2016-IA. II
(I) dated 11thOct 2018, enclosed as Annexure-2
7.4 Consent for Existing Operation
The existing plant is under operation with OPCB consent for Air and water obtained vide:
Ref No.- 5543/IND-I-CON-6414 dated 31.03.2021 valid till 31.03.2022 copy enclosed as
Annexure 3. PESO license obtained vide P/HQ/OR/15/1163 (P223845) dated 29.12.2020
Valid Up to: 31.12.2023 enclosed as Annexure-4.
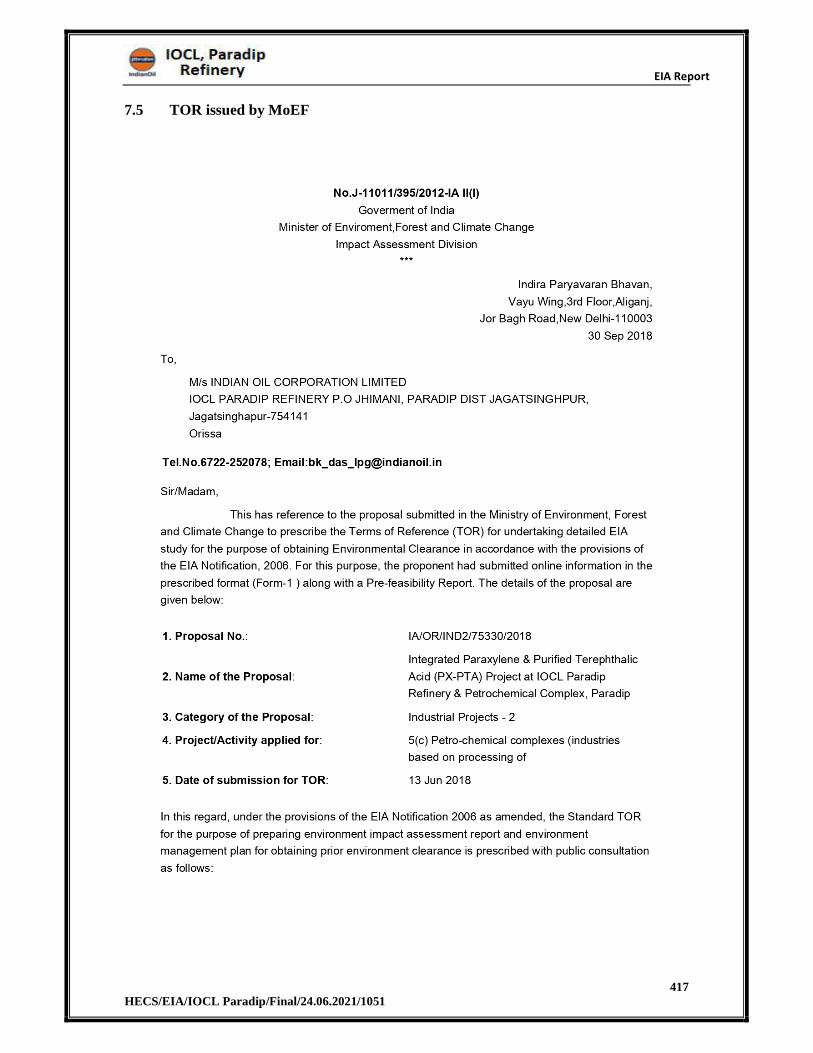
EIA Report
417 HECS/EIA/IOCL Paradip/Final/24.06.2021/1051
7.5 TOR issued by MoEF
EIA Report
418 HECS/EIA/IOCL Paradip/Final/24.06.2021/1051
7.6 Copy of Standard TOR
EIA Report
419 HECS/EIA/IOCL Paradip/Final/24.06.2021/1051
EIA Report
420 HECS/EIA/IOCL Paradip/Final/24.06.2021/1051
EIA Report
421 HECS/EIA/IOCL Paradip/Final/24.06.2021/1051
EIA Report
422 HECS/EIA/IOCL Paradip/Final/24.06.2021/1051
EIA Report
423 HECS/EIA/IOCL Paradip/Final/24.06.2021/1051
EIA Report
424 HECS/EIA/IOCL Paradip/Final/24.06.2021/1051
CHAPTER 8
PROJECT BENEFITS
EIA Report
425 HECS/EIA/IOCL Paradip/Final/24.06.2021/1051
8 PROJECT BENEFITS
8.1 Project Benefits
Importance of the project:
1. The project is of national importance and will reduce import dependence to the tune
of 1.2 million MT per year PTA product through domestic production and reduction
in foreign exchange outgo.
2. The project of Indian Oil is one of significant projects under the Govt. of India’s
“Make in India” Initiative for the Manufacturing Sector.
3. The proposed project is to meet the market potential having a deficit of about 2.2
MMTPA PTA in India by 2024.
4. An important project under the Petroleum Chemicals and Petrochemicals Investment
Region (PCPIR) in Odisha and spur industrial investment and development of the
region.
5. Expand Petrochemical Production footprint of Indian Oil, Paradip Refinery in Odisha.
6. The PTA plant project along with under construction MEG Plant at Paradip, will
accelerate the development of Textile Industry in the Eastern Region of India.
Leading to additional employment opportunities.
Benefits of the project:
1. The project will propel industrial development, downstream industry revolution in
Odisha and eastern regions of India, which will support consequential development of
entrepreneurship, MSMEs in nearby locality and state of Odisha.
2. The project will help India in attaining Self Sufficiency in PTA product demand as
feedstock for industries in value addition chain of products like Polyester fiber, Yarn,
Textiles, PET polymer production.
3. Employment opportunities about 5000 people directly /indirectly during construction
period and about 200 persons during Operating period.
4. The project will spur further investments in the downstream industries, Textile
Industries and provide better socio-economic benefits, direct and indirect employment
opportunities.
EIA Report
426 HECS/EIA/IOCL Paradip/Final/24.06.2021/1051
5. PTA is a non-hazardous, solid white powder, which is the preferred raw material and
the basic building block to produce Polyester Staple Fibre (PSF), Polyester Filament
Yarn (PFY), bottle and industrial grade polyester resin, polyester chips and so on.
6. PSF and PFY are substitutes for natural cotton and widely used for production of
textiles and garments. Eastern India does not have any economic size of PSF, PFY or
PET resin plants.
7. The first PTA plant at IOCL Paradip can provide steady supply of feedstock PTA to
PSF, PYF and PET resin plants. The polyester resins/chips can further be processed to
produce audio/ video tapes, x-ray films, photographic films, tapes, aseptic bottles for
packing mineral water, carborated drinks, vegetable oil, cosmetics, toiletries, tea,
coffee etc.
8. The above PP and PTA plant products shall be building blocks for envisaged Plastic
& Textile Park respectively in Odisha.
EIA Report
427 HECS/EIA/IOCL Paradip/Final/24.06.2021/1051
CHAPTER 9
ENVIRONMENTAL COST AND
BENEFIT ANALYSIS

EIA Report
428 HECS/EIA/IOCL Paradip/Final/24.06.2021/1051
9 ENVIRONMENTAL COST AND BENEFIT ANALYSIS
This Chapter is not in Scoping Stage
EIA Report
429 HECS/EIA/IOCL Paradip/Final/24.06.2021/1051
CHAPTER 10
ENVIRONMENTAL MANAGEMENT
PLAN
EIA Report
430 HECS/EIA/IOCL Paradip/Final/24.06.2021/1051
10 ENVIRONMENTAL MANAGEMENT PLAN
10.1 Introduction
This Environmental Management Plan (EMP) for Indian Oil Corporation Limited identifies
the principles, procedures and methods that will be used to control and minimize the
environmental impacts of the proposed minor construction and operational activities
associated with the revamp project. It is intended to ensure that commitments made by IOCL
to minimize project related environmental and social impacts are upheld throughout all
project phases.
As part of our ongoing commitment to excellence in environmental and social performance
we will ensure the following:
Fulfill all environmental conditions associated with project approvals.
Develop, promote and foster a shared sense of responsibility for environmental and
performance of the project.
Promote environmental awareness and understanding among employees and
contractors through training, identification of roles and responsibilities towards
environmental management and linking project performance to overall
environmental performance.
Monitor environmental performance throughout the project and implement an
adaptive management approach to continuous improvement and to meet the future
regulations.
10.2 Objectives of EMP
To suggest the formation of a core group (Environment Management Cell)
responsible for implementation of environmental control & protective measures as
well as monitoring of such implementation.
To ensure project components are compliant with all laws and approval conditions
Continue baseline monitoring
Facilitate a continual review of post construction and operation activities.
To suggest preventive and mitigation measures to minimize adverse impact and to
maximize beneficial impacts like
Preparation of afforestation or Greenbelt Development scheme.
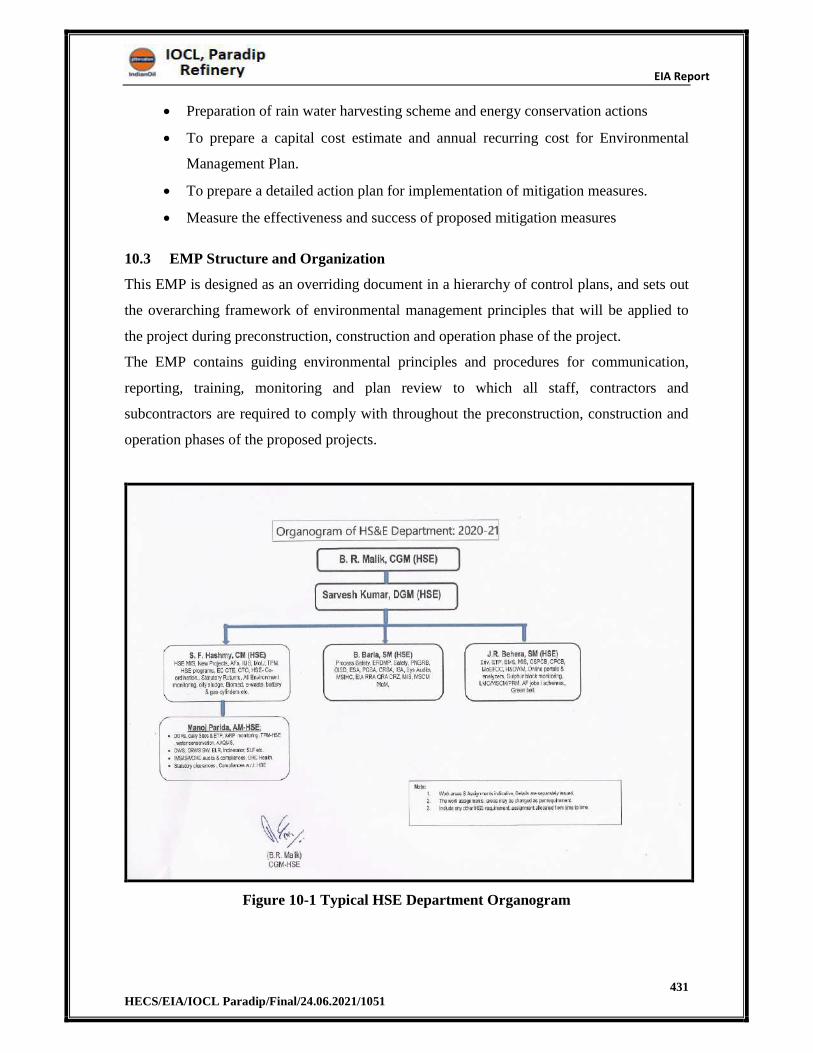
EIA Report
431 HECS/EIA/IOCL Paradip/Final/24.06.2021/1051
Preparation of rain water harvesting scheme and energy conservation actions
To prepare a capital cost estimate and annual recurring cost for Environmental
Management Plan.
To prepare a detailed action plan for implementation of mitigation measures.
Measure the effectiveness and success of proposed mitigation measures
10.3 EMP Structure and Organization
This EMP is designed as an overriding document in a hierarchy of control plans, and sets out
the overarching framework of environmental management principles that will be applied to
the project during preconstruction, construction and operation phase of the project.
The EMP contains guiding environmental principles and procedures for communication,
reporting, training, monitoring and plan review to which all staff, contractors and
subcontractors are required to comply with throughout the preconstruction, construction and
operation phases of the proposed projects.
Figure 10-1 Typical HSE Department Organogram
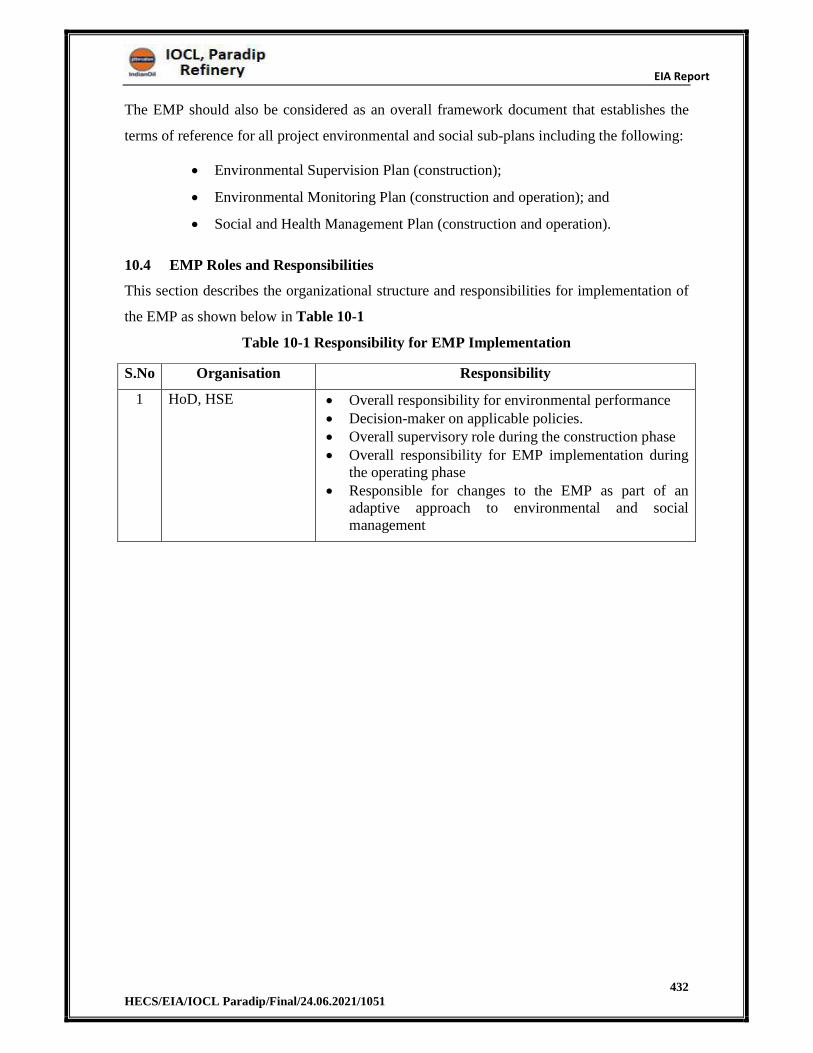
EIA Report
432 HECS/EIA/IOCL Paradip/Final/24.06.2021/1051
The EMP should also be considered as an overall framework document that establishes the
terms of reference for all project environmental and social sub-plans including the following:
Environmental Supervision Plan (construction);
Environmental Monitoring Plan (construction and operation); and
Social and Health Management Plan (construction and operation).
10.4 EMP Roles and Responsibilities
This section describes the organizational structure and responsibilities for implementation of
the EMP as shown below in Table 10-1
Table 10-1 Responsibility for EMP Implementation
S.No Organisation Responsibility
1 HoD, HSE Overall responsibility for environmental performance Decision-maker on applicable policies. Overall supervisory role during the construction phase Overall responsibility for EMP implementation during
the operating phase Responsible for changes to the EMP as part of an
adaptive approach to environmental and social management
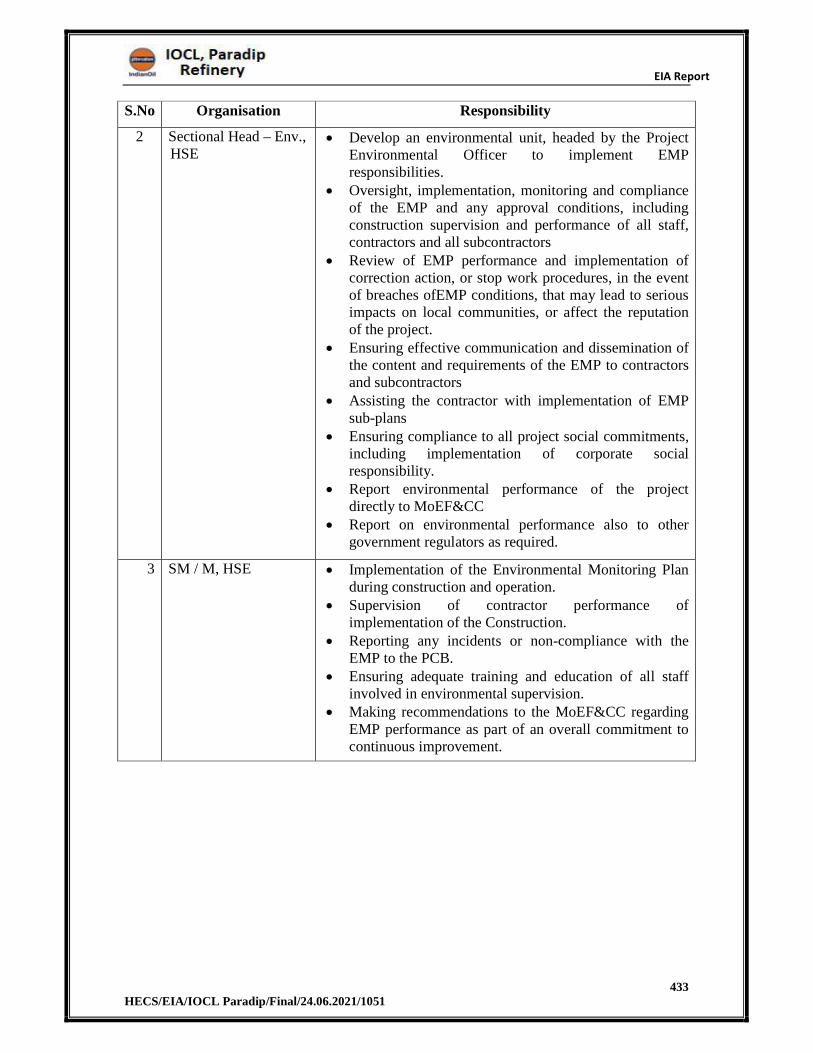
EIA Report
433 HECS/EIA/IOCL Paradip/Final/24.06.2021/1051
S.No Organisation Responsibility
2 Sectional Head – Env., HSE
Develop an environmental unit, headed by the Project Environmental Officer to implement EMP responsibilities.
Oversight, implementation, monitoring and compliance of the EMP and any approval conditions, including construction supervision and performance of all staff, contractors and all subcontractors
Review of EMP performance and implementation of correction action, or stop work procedures, in the event of breaches ofEMP conditions, that may lead to serious impacts on local communities, or affect the reputation of the project.
Ensuring effective communication and dissemination of the content and requirements of the EMP to contractors and subcontractors
Assisting the contractor with implementation of EMP sub-plans
Ensuring compliance to all project social commitments, including implementation of corporate social responsibility.
Report environmental performance of the project directly to MoEF&CC
Report on environmental performance also to other government regulators as required.
3 SM / M, HSE Implementation of the Environmental Monitoring Plan during construction and operation.
Supervision of contractor performance of implementation of the Construction.
Reporting any incidents or non-compliance with the EMP to the PCB.
Ensuring adequate training and education of all staff involved in environmental supervision.
Making recommendations to the MoEF&CC regarding EMP performance as part of an overall commitment to continuous improvement.
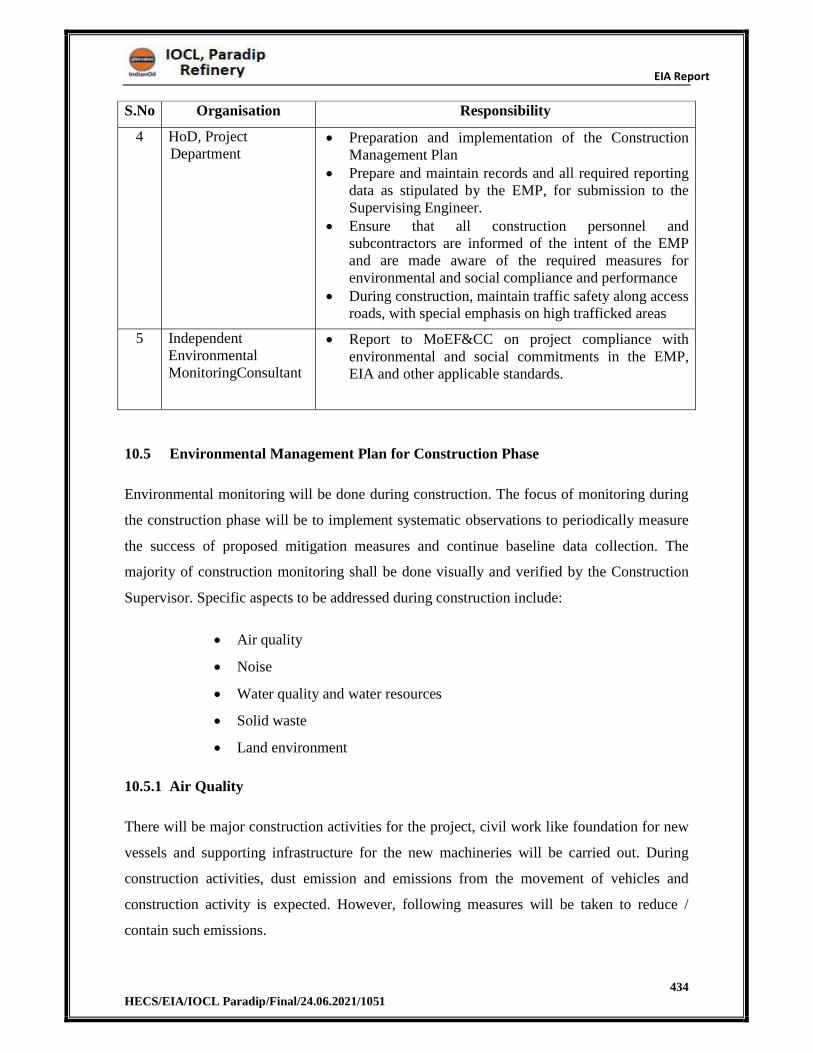
EIA Report
434 HECS/EIA/IOCL Paradip/Final/24.06.2021/1051
S.No Organisation Responsibility
4 HoD, Project Department
Preparation and implementation of the Construction Management Plan
Prepare and maintain records and all required reporting data as stipulated by the EMP, for submission to the Supervising Engineer.
Ensure that all construction personnel and subcontractors are informed of the intent of the EMP and are made aware of the required measures for environmental and social compliance and performance
During construction, maintain traffic safety along access roads, with special emphasis on high trafficked areas
5 Independent Environmental MonitoringConsultant
Report to MoEF&CC on project compliance with environmental and social commitments in the EMP, EIA and other applicable standards.
10.5 Environmental Management Plan for Construction Phase
Environmental monitoring will be done during construction. The focus of monitoring during
the construction phase will be to implement systematic observations to periodically measure
the success of proposed mitigation measures and continue baseline data collection. The
majority of construction monitoring shall be done visually and verified by the Construction
Supervisor. Specific aspects to be addressed during construction include:
Air quality
Noise
Water quality and water resources
Solid waste
Land environment
10.5.1 Air Quality
There will be major construction activities for the project, civil work like foundation for new
vessels and supporting infrastructure for the new machineries will be carried out. During
construction activities, dust emission and emissions from the movement of vehicles and
construction activity is expected. However, following measures will be taken to reduce /
contain such emissions.
EIA Report
435 HECS/EIA/IOCL Paradip/Final/24.06.2021/1051
Water will be sprinkled on inner roads to prevent re-suspension of dust into ambient
air due to movement of heavy vehicles etc.
Roads shall be kept free from mud, debris and other obstacles.
Separate civil construction material storage yard will be created within the site and it
will be enclosed.
Cement bags will be separately stored under cover in bales. Sand will be stacked
under tarpaulin cover.
Transport vehicles and construction equipment’s/ machineries will be properly
maintained to reduce air emissions.
All construction workers will be provided appropriate PPEs like dust mask, ear plug,
helmet, safety belt etc. and it will be mandatory for them to wear while entering the
site itself.
Increase signage and speed limit postings
10.5.2Noise Environment
Following measures are proposed during construction period to mitigate adverse impacts of
noise:
Construction activities will be done on round the clock basis.
All machineries to be used for construction purpose will be of highest standard of
reputed make and compliance of noise pollution control norms by this equipment’s
will be emphasized.
All construction workers working in high noise areas will be provided appropriate PPEs like
ear muffs and made to wear them during working hours.
10.5.3 Water Quality and Water Resources
Proper and sufficient sanitary facility will be created at the site in the form of Toilets
& existing ETP will be used for treatment of sewage generated.
The water resource will be provided from the existing facility.
10.5.4Solid Waste
Main solid waste generation during construction phase will be construction debris like
rubble, brick bats, debris, steel scrap, wooden scrap, sand, gravel etc. However, these
materials are inert in nature and will not result into leaching of any substance or its
constituent.
EIA Report
436 HECS/EIA/IOCL Paradip/Final/24.06.2021/1051
These materials will be carefully sorted and will be used within premises for filling of
low lying areas.
Wooden scrap, steel scrap will be given to authorized scrap dealers.
On completion of civil work, all debris etc. will be completely removed from site to
avoid any incompatibility with future use.
All the wastes will be stored at a designated site within the premises to prevent
scattered discharge on land.
10.5.5Land Environment
Top soil layers shall be stored for reclamation and re-vegetation and reforestation at
approved locations.
Existing storm water drainage facility will be used for disposal of storm water.
10.5.6Ecology
The Project site is present in existing area, there will not be clearance of land envisaged for
proposed projects and adequate measures will be taken to maintain the existing greenbelt area
of 580 Acres in refinery area while in total it occupies about 850acres of green belt. The
green belt occupies about 30.46% only.
10.5.7Socio Economic
There will be temporary employment for manpower required during construction phase
available from local communities. Overall socioeconomic effect of construction phase will be
positive due to direct and indirect employment opportunity and preference will be given to
the local communities as per IOCL Rules.
10.6 Environmental Management Plan for Operation Phase
Monitoring during the operation phase shall reflect those environmental and socio-economic
issues that may persist upon completion of construction activities. Monitoring shall focus on
evaluating the effectiveness of project mitigation measures and continue baseline monitoring
and sampling. The mitigation measures to prevent adverse impact during the operation phase
of the project shall focus on the following:
Air quality
Noise environment
EIA Report
437 HECS/EIA/IOCL Paradip/Final/24.06.2021/1051
Solid and hazardous waste
Land environment
10.6.1Air Pollution Management
The air emission is controlled in PX-PTA complex by installing Online continuous emission
monitoring systems, use of clean burning fuel gas and natural gas, increased stacks heights,
installation of low NOx burners and floating roof in storage tanks for reduction of fugitive
emissions & hydrocarbon losses and to attain zero leakage status. For the proposed project,
IOCL Paradip allocates capital cost of INR 24.1 crores budget towards expenditure on stack
and APC equipments, along with the recurring cost of INR 2.57 crores for the same. Ambient
Air Quality is monitored both manually and continuous monitoring at AAQM stations in line
with the CPCB/MoEF&CC guideline
The gaseous emissions from the PX-PTA complex will be controlled to meet all the relevant
standards stipulated by the regulatory authorities. The Standards for Emissions from
Furnaces, heaters and Boilers is given in Table 10-3.
The flare losses will be minimized and monitored regularly.
PX-PTA Complex will install continuous emission monitoring systems for SOx NOx
CO and PM in major stacks with proper calibration facilities.
Paradip Refinery has adopted various measures for control of gaseous emissions. These
include:
Use of clean burning fuel gas and natural gas in PX-PTA unit.
Installation of low NOx burners in all the furnaces and boilers
Tall stacks for better dispersion of flue gases.
Online monitoring of SOx, NOx, CO and PM emissions from furnaces/boilers.
Monitoring of ambient air quality as per revised MoEF
Installation of internal floating roof with double seals in all Class-A tanks for
reduction of fugitive emissions.
Provision of mechanical seals in all the hydrocarbon pumps for reduction of fugitive
emissions.
Reduction of hydrocarbon losses and to attain zero leakage status.
Table 10-2 Proposed Pollution control scheme
S. Stack details Pollution control scheme
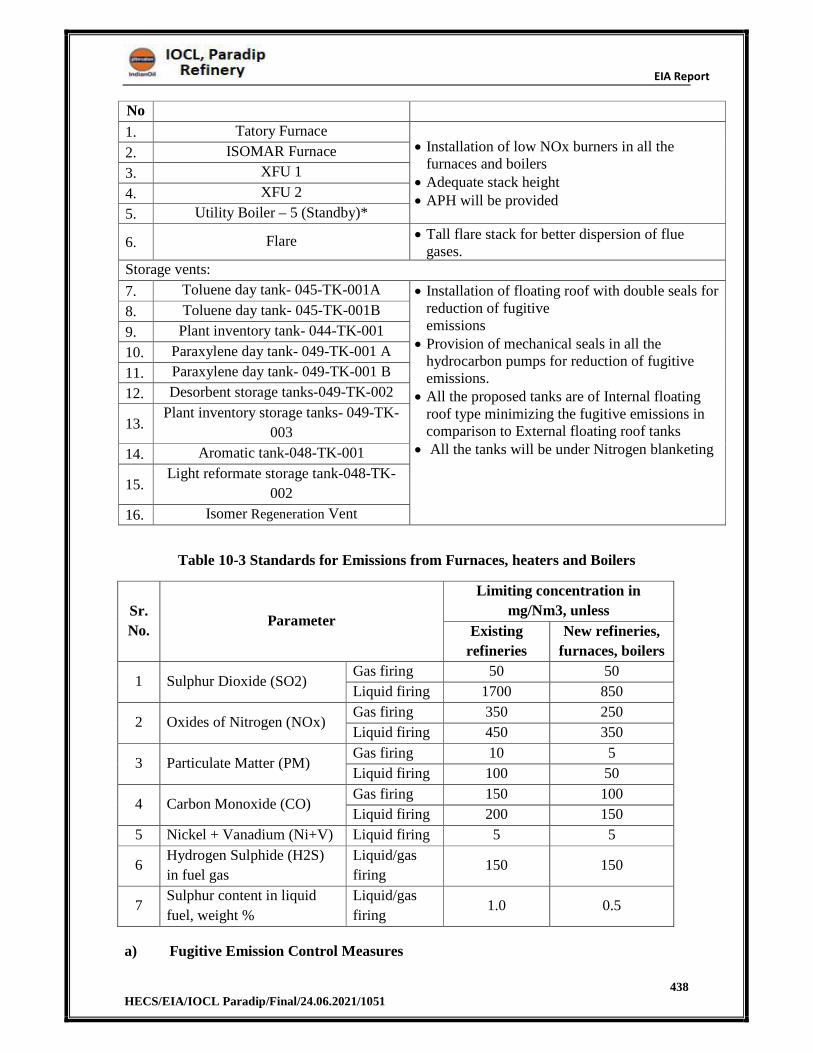
EIA Report
438 HECS/EIA/IOCL Paradip/Final/24.06.2021/1051
No
1. Tatory Furnace Installation of low NOx burners in all the
furnaces and boilers Adequate stack height APH will be provided
2. ISOMAR Furnace
3. XFU 1
4. XFU 2
5. Utility Boiler – 5 (Standby)*
6. Flare Tall flare stack for better dispersion of flue gases.
Storage vents:
7. Toluene day tank- 045-TK-001A Installation of floating roof with double seals for reduction of fugitive emissions
Provision of mechanical seals in all the hydrocarbon pumps for reduction of fugitive emissions.
All the proposed tanks are of Internal floating roof type minimizing the fugitive emissions in comparison to External floating roof tanks
All the tanks will be under Nitrogen blanketing
8. Toluene day tank- 045-TK-001B
9. Plant inventory tank- 044-TK-001
10. Paraxylene day tank- 049-TK-001 A
11. Paraxylene day tank- 049-TK-001 B
12. Desorbent storage tanks-049-TK-002
13.Plant inventory storage tanks- 049-TK-
003
14. Aromatic tank-048-TK-001
15.Light reformate storage tank-048-TK-
002
16. Isomer Regeneration Vent
Table 10-3 Standards for Emissions from Furnaces, heaters and Boilers
Sr.
No. Parameter
Limiting concentration in
mg/Nm3, unless
Existing
refineries
New refineries,
furnaces, boilers
1 Sulphur Dioxide (SO2) Gas firing 50 50
Liquid firing 1700 850
2 Oxides of Nitrogen (NOx) Gas firing 350 250
Liquid firing 450 350
3 Particulate Matter (PM) Gas firing 10 5
Liquid firing 100 50
4 Carbon Monoxide (CO) Gas firing 150 100
Liquid firing 200 150
5 Nickel + Vanadium (Ni+V) Liquid firing 5 5
6 Hydrogen Sulphide (H2S)
in fuel gas
Liquid/gas
firing 150 150
7 Sulphur content in liquid
fuel, weight %
Liquid/gas
firing 1.0 0.5
a) Fugitive Emission Control Measures
EIA Report
439 HECS/EIA/IOCL Paradip/Final/24.06.2021/1051
Monitoring of fugitive emissions from IOCL, PDR complex with the help of VOC (Volatile
Organic Carbon), LDAR (Leak Detection and Repair) program is being done monthly with
the help of an external agency. Thus observed leaks are identified and rectified. And the
same will be continued after the proposed expansion.
10.6.1.1 Gaseous Waste Emissions
The atmospheric pollution generated from the ISBL Process Plant mainly comes from the
Process Inerts Vent (G1), PTA Day Silo A exhaust (G2), PTA Day Silo B exhaust (G3),
Offspec PTA silo exhaust (G4), and ISBL PSV Vent Scrubber Stack (G5). There are two
main exhaust treatments used in the PTA plant: catalytic oxidation and bag filtration. G1:
Process Inerts Vent The off-gas to the process vent stack comes from the oxidation reactor,
which contains various volatile organics such as benzene, methylbenzene, methanol, methyl
acetate, methyl bromide, and other volatile organic substances. After the dimethylbenzene
and acetic acid are recovered, most of the organic substances and methyl bromide contained
by the waste gas will be oxidized and decomposed via the high pressure catalytic oxidation
(CATOX) reactor. Low pressure vents requiring treatment, which include vent streams from
the Low Pressure Absorber, the PTA Vent Knock Out Drum, and the PTA Dryer Scrubber
vent, are treated in the Low Pressure catalytic oxidation system. The off-gas from the
CATOX reactor and the Low Pressure catalytic oxidation system is scrubbed for bromine
removal in the Process Vent Scrubber and combined in the Process Inerts Vent with the vent
of the Reverse Osmosis Purge Drum, and the vent of the liquid catalyst tank.
G2/G3/G4: Exhaust Gas from PTA Day Silo A, PTA Day Silo B, and PTA Off-Spec Silo
Off-gas after catalytic oxidation and bromine scrubbing is used for the conveying of PTA
product into the PTA day silos, and the off-spec silo. Because treated off gas is used for
conveying, it does not contain any volatile organic substances. The vent of the silos is treated
by a pulse bag-type dust removal system prior to discharging to the atmosphere, as it contains
a small quantity of PTA powder.
G5: ISBL PSV Vent Scrubber Stack
Many oxidation section relief valves are sent to the Ox unit PSV scrubber to reduce acetic
acid concentration of the streams that are sent to the scrubber during a release event. The vent
from the Ox Unit PSV Scrubber contains nitrogen sweep gas at a normal flow rate of 55
Nm3/h. The normal vent is pure Nitrogen, which contains no organic compounds. The
Gaseous Waste Emissions from PX and PTA Plant is given in Table 10-4 and Table 10-4
respectively.
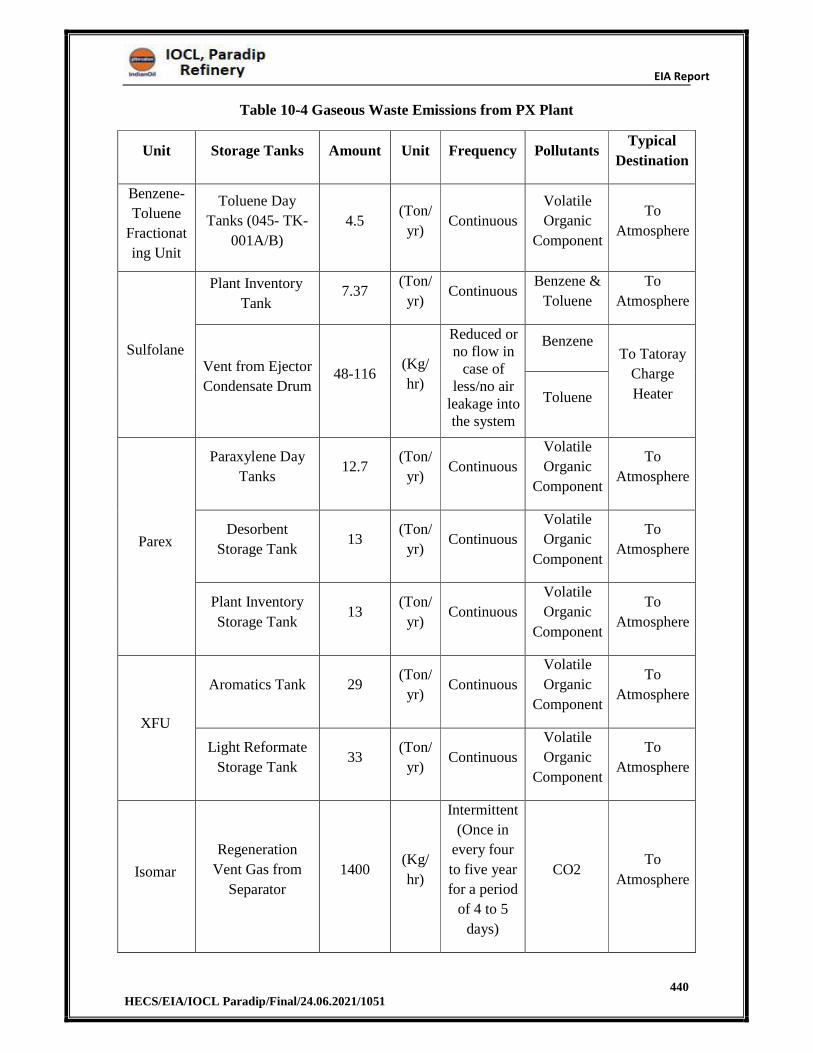
EIA Report
440 HECS/EIA/IOCL Paradip/Final/24.06.2021/1051
Table 10-4 Gaseous Waste Emissions from PX Plant
Unit Storage Tanks Amount Unit Frequency Pollutants Typical
Destination
Benzene-
Toluene
Fractionat
ing Unit
Toluene Day
Tanks (045- TK-
001A/B)
4.5 (Ton/
yr) Continuous
Volatile
Organic
Component
To
Atmosphere
Sulfolane
Plant Inventory
Tank 7.37
(Ton/
yr) Continuous
Benzene &
Toluene
To
Atmosphere
Vent from Ejector
Condensate Drum48-116
(Kg/
hr)
Reduced or no flow in
case of less/no air
leakage into the system
Benzene To Tatoray
Charge
Heater Toluene
Parex
Paraxylene Day
Tanks 12.7
(Ton/
yr) Continuous
Volatile
Organic
Component
To
Atmosphere
Desorbent
Storage Tank 13
(Ton/
yr) Continuous
Volatile
Organic
Component
To
Atmosphere
Plant Inventory
Storage Tank 13
(Ton/
yr) Continuous
Volatile
Organic
Component
To
Atmosphere
XFU
Aromatics Tank 29 (Ton/
yr) Continuous
Volatile
Organic
Component
To
Atmosphere
Light Reformate
Storage Tank 33
(Ton/
yr) Continuous
Volatile
Organic
Component
To
Atmosphere
Isomar
Regeneration
Vent Gas from
Separator
1400 (Kg/
hr)
Intermittent
(Once in
every four
to five year
for a period
of 4 to 5
days)
CO2 To
Atmosphere
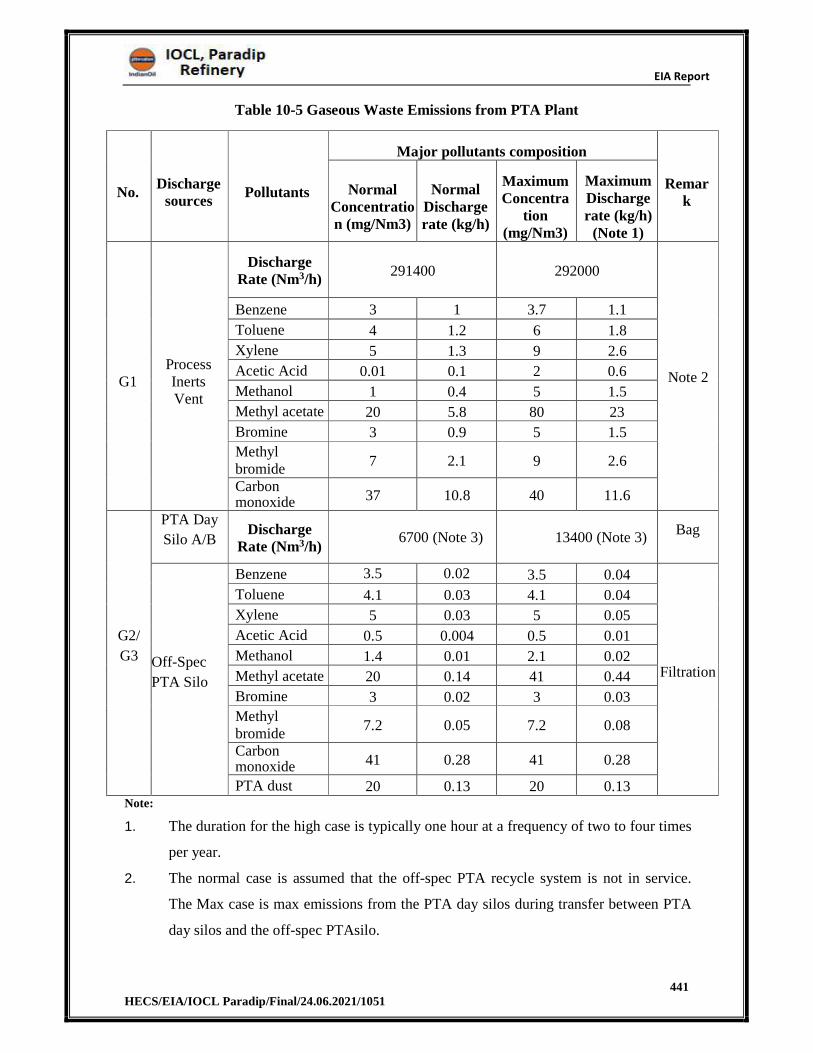
EIA Report
441 HECS/EIA/IOCL Paradip/Final/24.06.2021/1051
Table 10-5 Gaseous Waste Emissions from PTA Plant
No. Discharge
sources Pollutants
Major pollutants composition
Remark
Normal Concentration (mg/Nm3)
Normal Discharge rate (kg/h)
Maximum Concentra
tion (mg/Nm3)
Maximum Discharge rate (kg/h)
(Note 1)
G1 Process Inerts Vent
Discharge Rate (Nm3/h)
291400 292000
Note 2
Benzene 3 1 3.7 1.1
Toluene 4 1.2 6 1.8
Xylene 5 1.3 9 2.6
Acetic Acid 0.01 0.1 2 0.6
Methanol 1 0.4 5 1.5
Methyl acetate 20 5.8 80 23
Bromine 3 0.9 5 1.5
Methyl bromide
7 2.1 9 2.6
Carbon monoxide 37 10.8 40 11.6
G2/
G3
PTA Day
Silo A/B Discharge
Rate (Nm3/h)6700 (Note 3) 13400 (Note 3)
Bag
Off-Spec
PTA Silo
Benzene 3.5 0.02 3.5 0.04
Filtration
Toluene 4.1 0.03 4.1 0.04
Xylene 5 0.03 5 0.05
Acetic Acid 0.5 0.004 0.5 0.01
Methanol 1.4 0.01 2.1 0.02
Methyl acetate 20 0.14 41 0.44
Bromine 3 0.02 3 0.03
Methyl bromide
7.2 0.05 7.2 0.08
Carbon monoxide 41 0.28 41 0.28
PTA dust 20 0.13 20 0.13 Note:
1. The duration for the high case is typically one hour at a frequency of two to four times
per year.
2. The normal case is assumed that the off-spec PTA recycle system is not in service.
The Max case is max emissions from the PTA day silos during transfer between PTA
day silos and the off-spec PTAsilo.
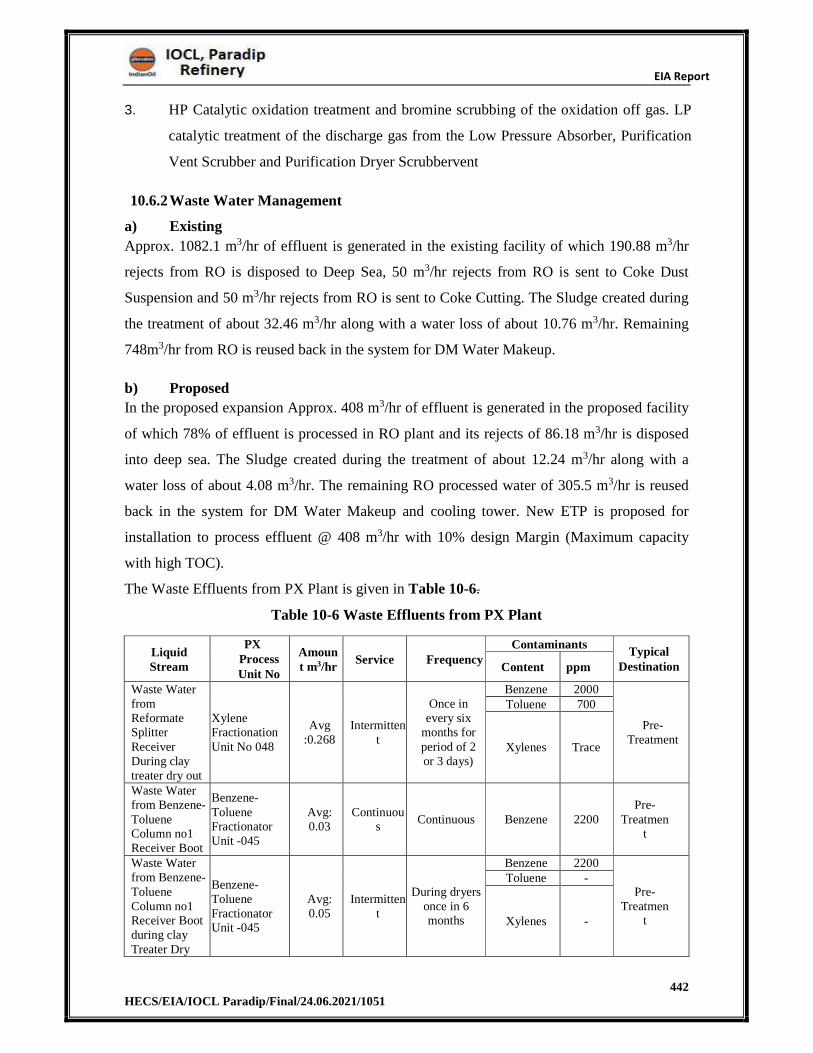
EIA Report
442 HECS/EIA/IOCL Paradip/Final/24.06.2021/1051
3. HP Catalytic oxidation treatment and bromine scrubbing of the oxidation off gas. LP
catalytic treatment of the discharge gas from the Low Pressure Absorber, Purification
Vent Scrubber and Purification Dryer Scrubbervent
10.6.2Waste Water Management
a) Existing
Approx. 1082.1 m3/hr of effluent is generated in the existing facility of which 190.88 m3/hr
rejects from RO is disposed to Deep Sea, 50 m3/hr rejects from RO is sent to Coke Dust
Suspension and 50 m3/hr rejects from RO is sent to Coke Cutting. The Sludge created during
the treatment of about 32.46 m3/hr along with a water loss of about 10.76 m3/hr. Remaining
748m3/hr from RO is reused back in the system for DM Water Makeup.
b) Proposed
In the proposed expansion Approx. 408 m3/hr of effluent is generated in the proposed facility
of which 78% of effluent is processed in RO plant and its rejects of 86.18 m3/hr is disposed
into deep sea. The Sludge created during the treatment of about 12.24 m3/hr along with a
water loss of about 4.08 m3/hr. The remaining RO processed water of 305.5 m3/hr is reused
back in the system for DM Water Makeup and cooling tower. New ETP is proposed for
installation to process effluent @ 408 m3/hr with 10% design Margin (Maximum capacity
with high TOC).
The Waste Effluents from PX Plant is given in Table 10-6.
Table 10-6 Waste Effluents from PX Plant
Liquid Stream
PX Process Unit No
Amount m3/hr
Service FrequencyContaminants
Typical Destination Content ppm
Waste Water from Reformate Splitter Receiver During clay treater dry out
Xylene Fractionation Unit No 048
Avg :0.268
Intermittent
Once in every six
months for period of 2 or 3 days)
Benzene 2000
Pre- Treatment
Toluene 700
Xylenes Trace
Waste Water from Benzene- Toluene Column no1 Receiver Boot
Benzene- Toluene Fractionator Unit -045
Avg: 0.03
Continuous
Continuous Benzene 2200 Pre-
Treatment
Waste Water from Benzene- Toluene Column no1 Receiver Boot during clay Treater Dry
Benzene- Toluene Fractionator Unit -045
Avg: 0.05
Intermittent
During dryers once in 6 months
Benzene 2200
Pre- Treatmen
t
Toluene -
Xylenes -
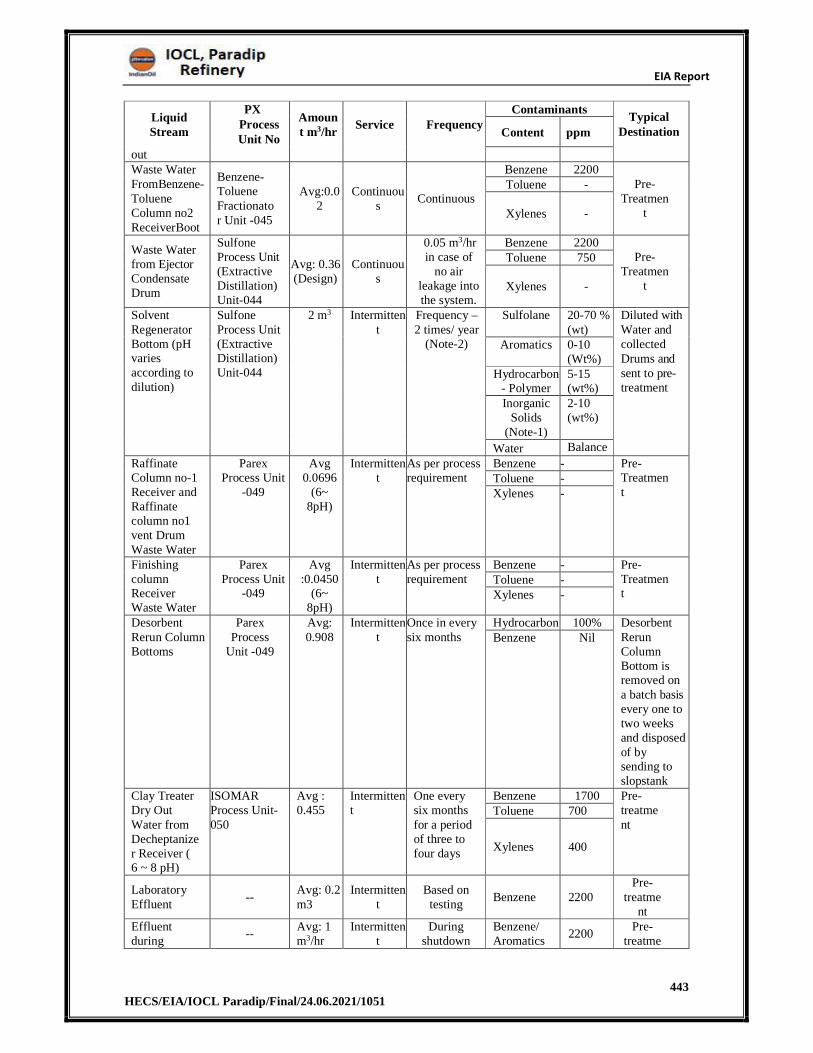
EIA Report
443 HECS/EIA/IOCL Paradip/Final/24.06.2021/1051
Liquid Stream
PX Process Unit No
Amount m3/hr
Service FrequencyContaminants
Typical Destination Content ppm
out Waste Water FromBenzene- Toluene Column no2 ReceiverBoot
Benzene- Toluene Fractionator Unit -045
Avg:0.02
Continuous
Continuous
Benzene 2200 Pre-
Treatment
Toluene -
Xylenes -
Waste Water from Ejector Condensate Drum
Sulfone Process Unit (Extractive Distillation) Unit-044
Avg: 0.36 (Design)
Continuous
0.05 m3/hr in case of
no air leakage into the system.
Benzene 2200 Pre-
Treatment
Toluene 750
Xylenes -
Solvent Regenerator Bottom (pH varies according to dilution)
Sulfone Process Unit (Extractive Distillation) Unit-044
2 m3 Intermittent
Frequency –2 times/ year
(Note-2)
Sulfolane 20-70 % (wt)
Diluted with Water and collected Drums and sent to pre- treatment
Aromatics 0-10 (Wt%)
Hydrocarbon- Polymer
5-15 (wt%)
Inorganic Solids
(Note-1)
2-10 (wt%)
Water Balance
Raffinate Column no-1 Receiver and Raffinate column no1 vent Drum Waste Water
Parex Process Unit
-049
Avg 0.0696
(6~ 8pH)
Intermittent
As per process requirement
Benzene - Pre- Treatment
Toluene - Xylenes -
Finishing column Receiver Waste Water
Parex Process Unit
-049
Avg :0.0450
(6~ 8pH)
Intermittent
As per process requirement
Benzene - Pre- Treatment
Toluene - Xylenes -
Desorbent Rerun Column Bottoms
Parex Process
Unit -049
Avg: 0.908
Intermittent
Once in every six months
Hydrocarbon 100% Desorbent Rerun Column Bottom is removed on a batch basis every one to two weeks and disposed of by sending to slopstank
Benzene Nil
Clay Treater Dry Out Water from Decheptanizer Receiver ( 6 ~ 8 pH)
ISOMAR Process Unit- 050
Avg : 0.455
Intermittent
One every six months for a period of three to four days
Benzene 1700 Pre- treatment
Toluene 700
Xylenes 400
Laboratory Effluent
-- Avg: 0.2 m3
Intermittent
Based on testing
Benzene 2200 Pre-
treatment
Effluent during
-- Avg: 1 m3/hr
Intermittent
During shutdown
Benzene/ Aromatics
2200 Pre-
treatme
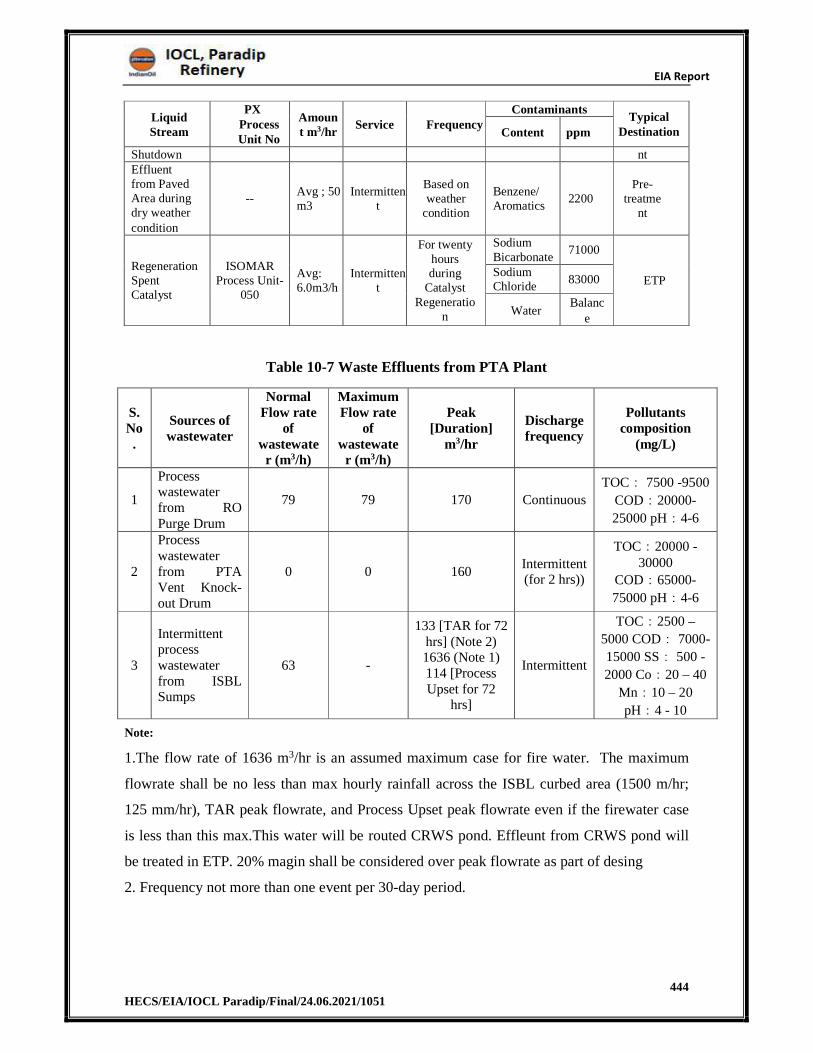
EIA Report
444 HECS/EIA/IOCL Paradip/Final/24.06.2021/1051
Liquid Stream
PX Process Unit No
Amount m3/hr
Service FrequencyContaminants
Typical Destination Content ppm
Shutdown nt Effluent from Paved Area during dry weather condition
-- Avg ; 50 m3
Intermittent
Based on weather
condition
Benzene/ Aromatics
2200 Pre-
treatment
Regeneration Spent Catalyst
ISOMAR Process Unit-
050
Avg: 6.0m3/h
Intermittent
For twenty hours during
Catalyst Regeneratio
n
Sodium Bicarbonate
71000
ETP Sodium Chloride
83000
Water Balanc
e
Table 10-7 Waste Effluents from PTA Plant
S.No.
Sources of wastewater
Normal Flow rate
of wastewate
r (m3/h)
Maximum Flow rate
of wastewate
r (m3/h)
Peak [Duration]
m3/hr
Discharge frequency
Pollutants composition
(mg/L)
1
Process wastewater from RO Purge Drum
79 79 170 Continuous
TOC: 7500 -9500
COD:20000-
25000 pH:4-6
2
Process wastewater from PTA Vent Knock-out Drum
0 0 160 Intermittent (for 2 hrs))
TOC:20000 -30000
COD:65000-
75000 pH:4-6
3
Intermittent process wastewater from ISBL Sumps
63 -
133 [TAR for 72 hrs] (Note 2) 1636 (Note 1) 114 [Process Upset for 72
hrs]
Intermittent
TOC:2500 –
5000 COD: 7000-
15000 SS: 500 -
2000 Co:20 – 40
Mn:10 – 20
pH:4 - 10
Note:
1.The flow rate of 1636 m3/hr is an assumed maximum case for fire water. The maximum
flowrate shall be no less than max hourly rainfall across the ISBL curbed area (1500 m/hr;
125 mm/hr), TAR peak flowrate, and Process Upset peak flowrate even if the firewater case
is less than this max.This water will be routed CRWS pond. Effleunt from CRWS pond will
be treated in ETP. 20% magin shall be considered over peak flowrate as part of desing
2. Frequency not more than one event per 30-day period.
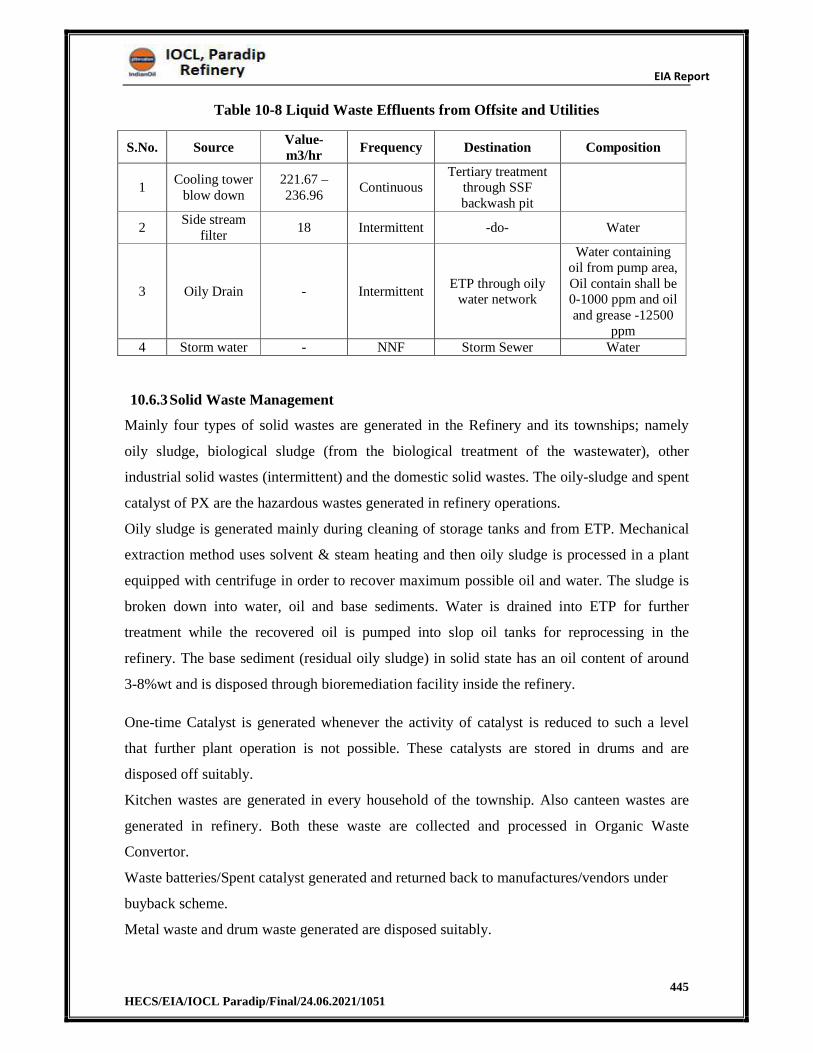
EIA Report
445 HECS/EIA/IOCL Paradip/Final/24.06.2021/1051
Table 10-8 Liquid Waste Effluents from Offsite and Utilities
S.No. Source Value-m3/hr
Frequency Destination Composition
1 Cooling tower
blow down 221.67 – 236.96
Continuous Tertiary treatment
through SSF backwash pit
2 Side stream
filter 18 Intermittent -do- Water
3 Oily Drain - Intermittent ETP through oily
water network
Water containing oil from pump area, Oil contain shall be 0-1000 ppm and oil and grease -12500
ppm4 Storm water - NNF Storm Sewer Water
10.6.3Solid Waste Management
Mainly four types of solid wastes are generated in the Refinery and its townships; namely
oily sludge, biological sludge (from the biological treatment of the wastewater), other
industrial solid wastes (intermittent) and the domestic solid wastes. The oily-sludge and spent
catalyst of PX are the hazardous wastes generated in refinery operations.
Oily sludge is generated mainly during cleaning of storage tanks and from ETP. Mechanical
extraction method uses solvent & steam heating and then oily sludge is processed in a plant
equipped with centrifuge in order to recover maximum possible oil and water. The sludge is
broken down into water, oil and base sediments. Water is drained into ETP for further
treatment while the recovered oil is pumped into slop oil tanks for reprocessing in the
refinery. The base sediment (residual oily sludge) in solid state has an oil content of around
3-8%wt and is disposed through bioremediation facility inside the refinery.
One-time Catalyst is generated whenever the activity of catalyst is reduced to such a level
that further plant operation is not possible. These catalysts are stored in drums and are
disposed off suitably.
Kitchen wastes are generated in every household of the township. Also canteen wastes are
generated in refinery. Both these waste are collected and processed in Organic Waste
Convertor.
Waste batteries/Spent catalyst generated and returned back to manufactures/vendors under
buyback scheme.
Metal waste and drum waste generated are disposed suitably.
EIA Report
446 HECS/EIA/IOCL Paradip/Final/24.06.2021/1051
For the proposed project, IOCL Paradip allocates the recurring cost of INR 0.1crores budget
towards expenditure on solid waste management. Spent Catalyst after every 4-5 years will be
duly recovered by PCB approved agencies
10.6.4Noise Environment
To contain to the sound pollution in the vicinity of the plant site, all noise making equipment
are specified with maximum noise generation upto 85 db (A). Only in some areas like
Process Air Compressor House, where the sound level is expected to be higher (>90 dbA),
suitable acoustic treatment will be provided along with mandatory use of ear plugs.
Comprehensive measures for noise control will be followed at the design stage in terms of
Noise level specification of various rotating equipment as per Occupational Safety
and Health Administration (OSHA) standards.
Equipment layout considering segregation of high noise generating sources.
Erecting suitable enclosures, if required, to minimize the impact of high noise
generating sources.
Sizing the flare lines with low Mach number to have lower noise levels.
Green belt of appropriate width all around the refinery towards noise attenuation
10.6.5Material Handling Storage and Transportation
Hazardous chemicals are stored in closed tanks and drums with appropriate
blanketing systems.
All transfers from drums / tanks are being done through pumps in closed pipelines.
The loading of finished products to trucks and drums is done through automated
filling systems with overflow protections.
All key raw materials are charged to the reactors through closed pipeline systems
including pneumatic systems for solid handling.
Raw materials/ intermediates/ products are stored in closed tanks/drums provided with
breather arrangements to avoid fugitive emissions.
The Mode of Transport for Product materials is given in Figure 10-2 and the Raw Material
Storage and Dispatch Facilities is given in Table 10-9.
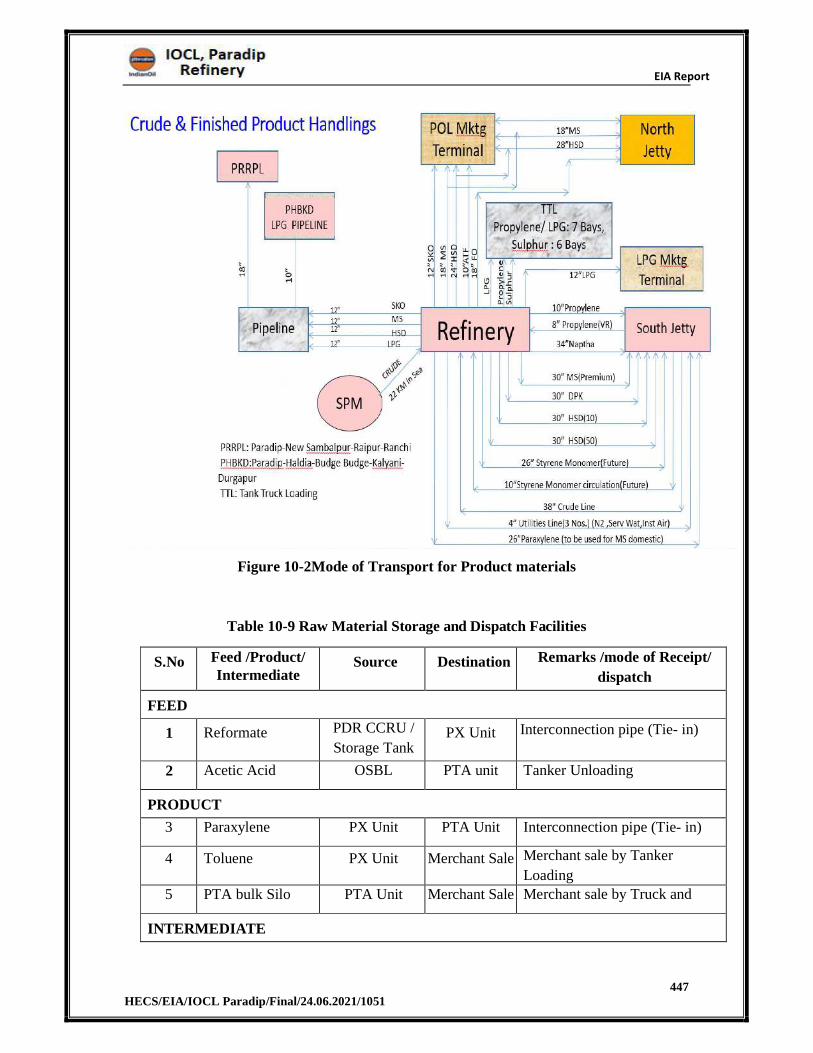
EIA Report
447 HECS/EIA/IOCL Paradip/Final/24.06.2021/1051
Figure 10-2Mode of Transport for Product materials
Table 10-9 Raw Material Storage and Dispatch Facilities
S.No Feed /Product/ Intermediate
Source Destination Remarks /mode of Receipt/
dispatch
FEED
1 Reformate PDR CCRU /
Storage Tank PX Unit Interconnection pipe (Tie- in)
2 Acetic Acid OSBL PTA unit Tanker Unloading
PRODUCT
3 Paraxylene PX Unit PTA Unit Interconnection pipe (Tie- in)
4 Toluene PX Unit Merchant Sale Merchant sale by Tanker
Loading
5 PTA bulk Silo PTA Unit Merchant Sale Merchant sale by Truck and
wagon LoadingINTERMEDIATE
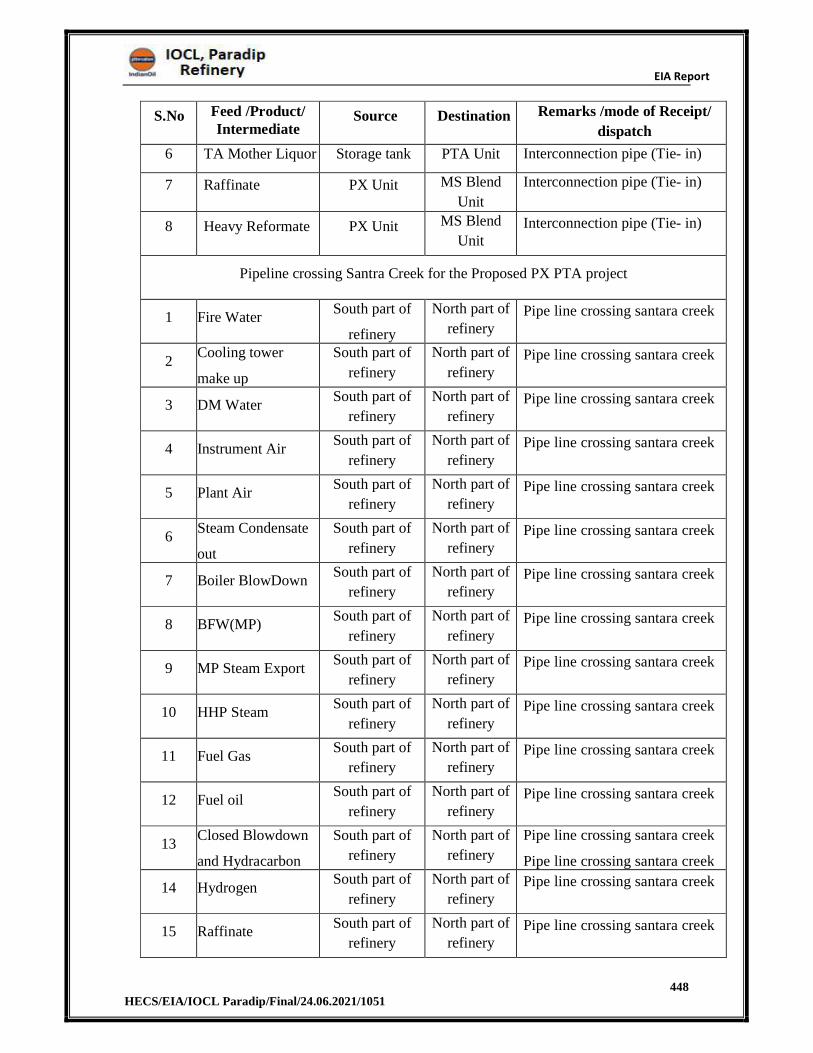
EIA Report
448 HECS/EIA/IOCL Paradip/Final/24.06.2021/1051
S.No Feed /Product/ Intermediate
Source Destination Remarks /mode of Receipt/
dispatch
6 TA Mother Liquor Storage tank PTA Unit Interconnection pipe (Tie- in)
7 Raffinate PX Unit MS Blend
Unit
Interconnection pipe (Tie- in)
8 Heavy Reformate PX Unit MS Blend
Unit Interconnection pipe (Tie- in)
Pipeline crossing Santra Creek for the Proposed PX PTA project
1 Fire Water South part of
refinery
North part of
refinery Pipe line crossing santara creek
2 Cooling tower
make up
South part of
refinery
North part of
refineryPipe line crossing santara creek
3 DM Water South part of
refinery
North part of
refineryPipe line crossing santara creek
4 Instrument Air South part of
refinery
North part of
refineryPipe line crossing santara creek
5 Plant Air South part of
refinery
North part of
refineryPipe line crossing santara creek
6 Steam Condensate
out
South part of
refinery
North part of
refineryPipe line crossing santara creek
7 Boiler BlowDown South part of
refinery
North part of
refineryPipe line crossing santara creek
8 BFW(MP) South part of
refinery
North part of
refineryPipe line crossing santara creek
9 MP Steam Export South part of
refinery
North part of
refineryPipe line crossing santara creek
10 HHP Steam South part of
refinery
North part of
refineryPipe line crossing santara creek
11 Fuel Gas South part of
refinery
North part of
refineryPipe line crossing santara creek
12 Fuel oil South part of
refinery
North part of
refineryPipe line crossing santara creek
13 Closed Blowdown
and Hydracarbon
South part of
refinery
North part of
refinery
Pipe line crossing santara creek
Pipe line crossing santara creek
14 Hydrogen South part of
refinery
North part of
refineryPipe line crossing santara creek
15 Raffinate South part of
refinery
North part of
refineryPipe line crossing santara creek
EIA Report
449 HECS/EIA/IOCL Paradip/Final/24.06.2021/1051
S.No Feed /Product/ Intermediate
Source Destination Remarks /mode of Receipt/
dispatch
16 Reformate South part of
refinery
North part of
refineryPipe line crossing santara creek
10.6.6Green Belt Development
A comprehensive green belt development plan was prepared for the refinery in consultation
with eminent ecologist and consequently, a large number of trees were planted inside the
refinery premises to enhance the aesthetic look of the refinery as well as to serve the purpose
of a pollution sink. Utmost priority is given to the Tree plantation activity, which is
undertaken on a regular basis both inside the refinery premises and in township.
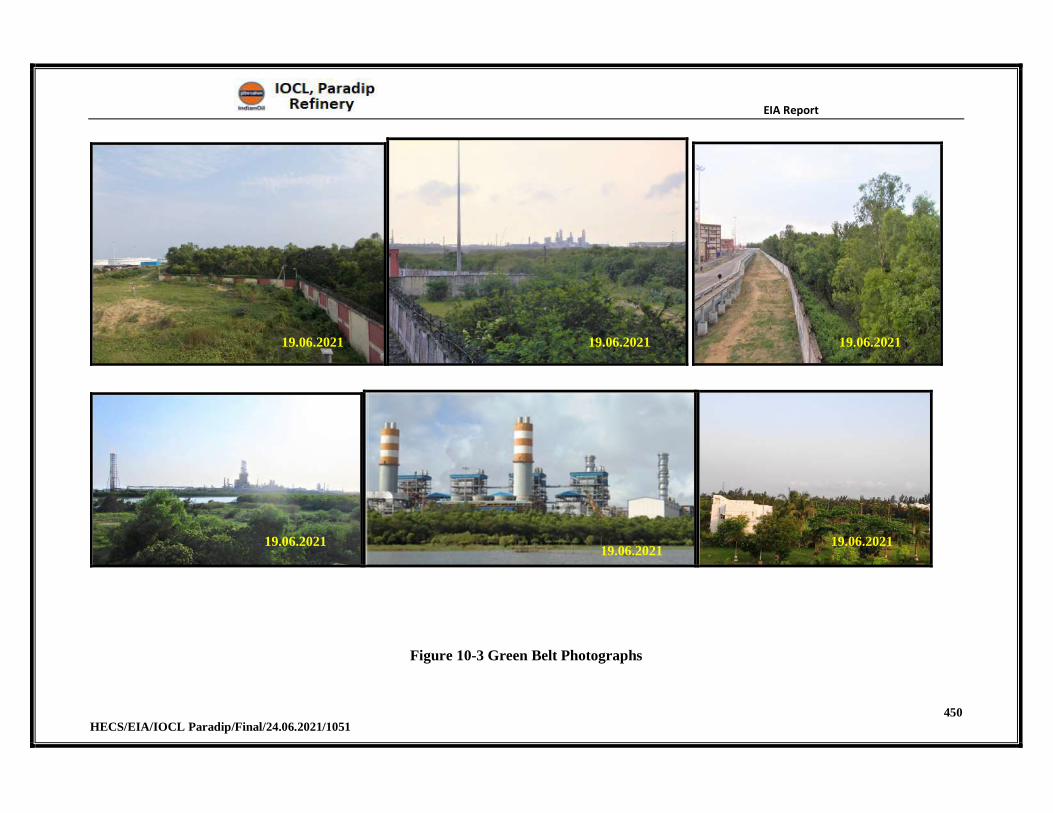
EIA Report
450 HECS/EIA/IOCL Paradip/Final/24.06.2021/1051
Figure 10-3 Green Belt Photographs
19.06.2021 19.06.2021 19.06.2021
19.06.202119.06.2021
19.06.2021
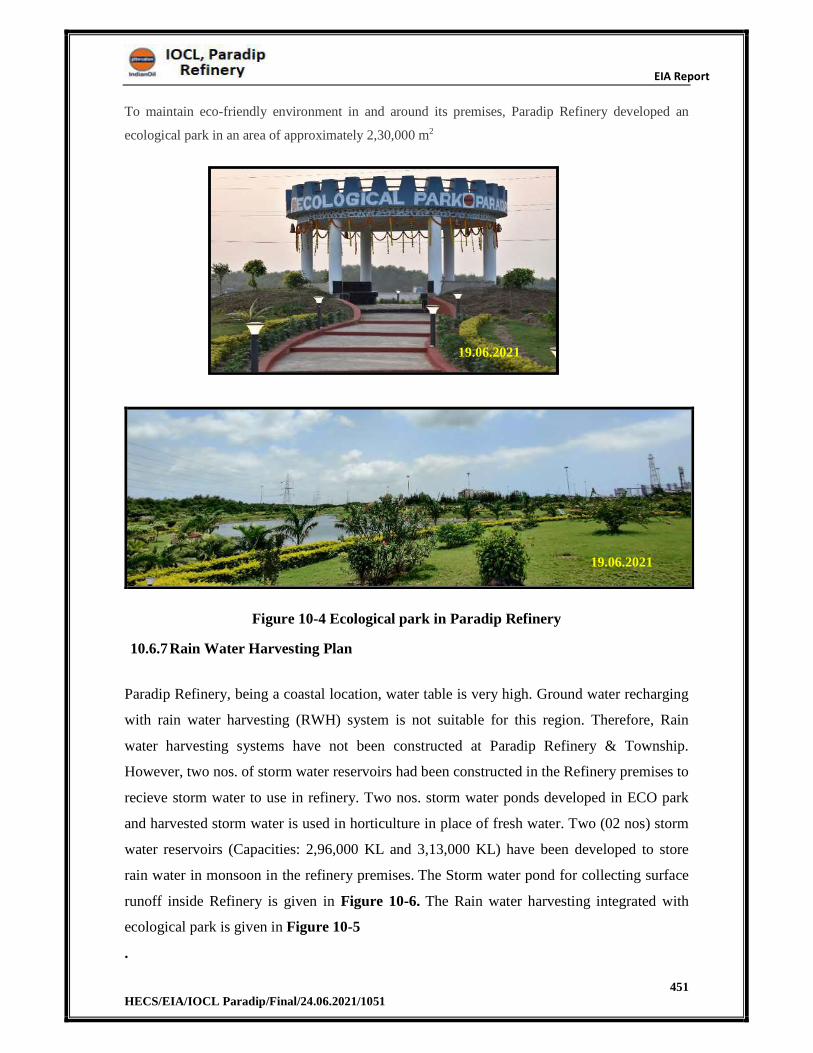
EIA Report
451 HECS/EIA/IOCL Paradip/Final/24.06.2021/1051
To maintain eco-friendly environment in and around its premises, Paradip Refinery developed an
ecological park in an area of approximately 2,30,000 m2
Figure 10-4 Ecological park in Paradip Refinery
10.6.7Rain Water Harvesting Plan
Paradip Refinery, being a coastal location, water table is very high. Ground water recharging
with rain water harvesting (RWH) system is not suitable for this region. Therefore, Rain
water harvesting systems have not been constructed at Paradip Refinery & Township.
However, two nos. of storm water reservoirs had been constructed in the Refinery premises to
recieve storm water to use in refinery. Two nos. storm water ponds developed in ECO park
and harvested storm water is used in horticulture in place of fresh water. Two (02 nos) storm
water reservoirs (Capacities: 2,96,000 KL and 3,13,000 KL) have been developed to store
rain water in monsoon in the refinery premises. The Storm water pond for collecting surface
runoff inside Refinery is given in Figure 10-6. The Rain water harvesting integrated with
ecological park is given in Figure 10-5
.
19.06.2021
19.06.2021
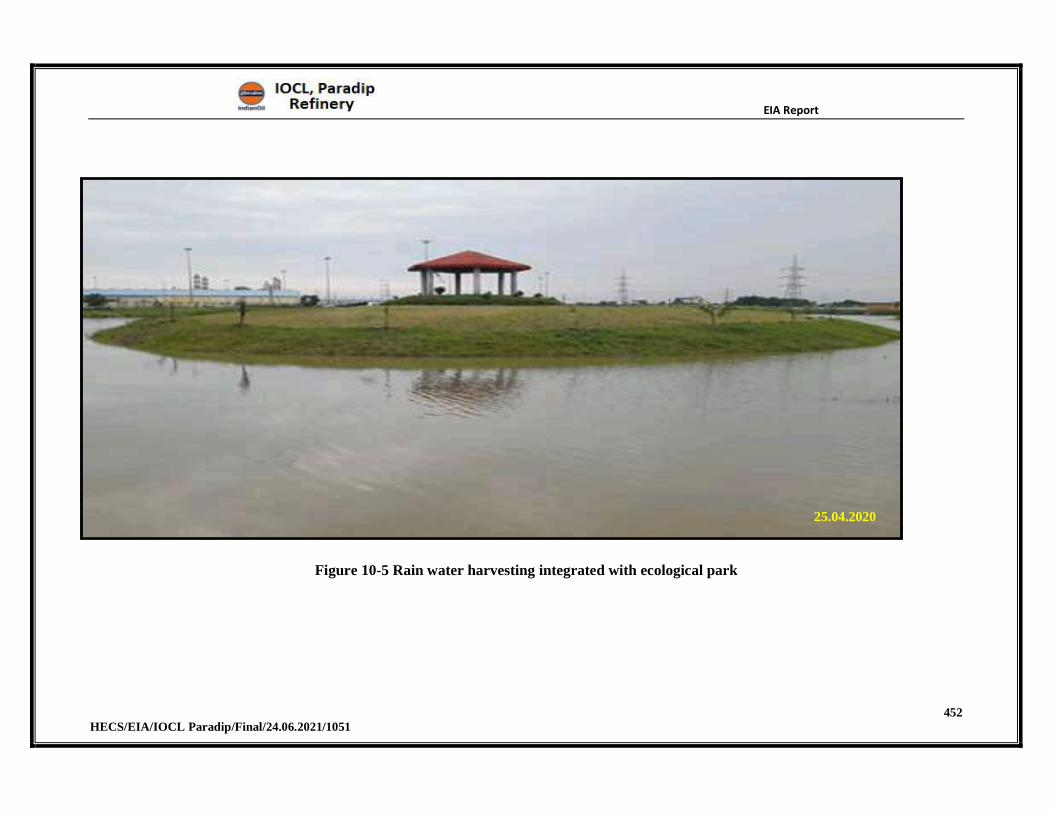
EIA Report
452 HECS/EIA/IOCL Paradip/Final/24.06.2021/1051
Figure 10-5 Rain water harvesting integrated with ecological park
25.04.2020
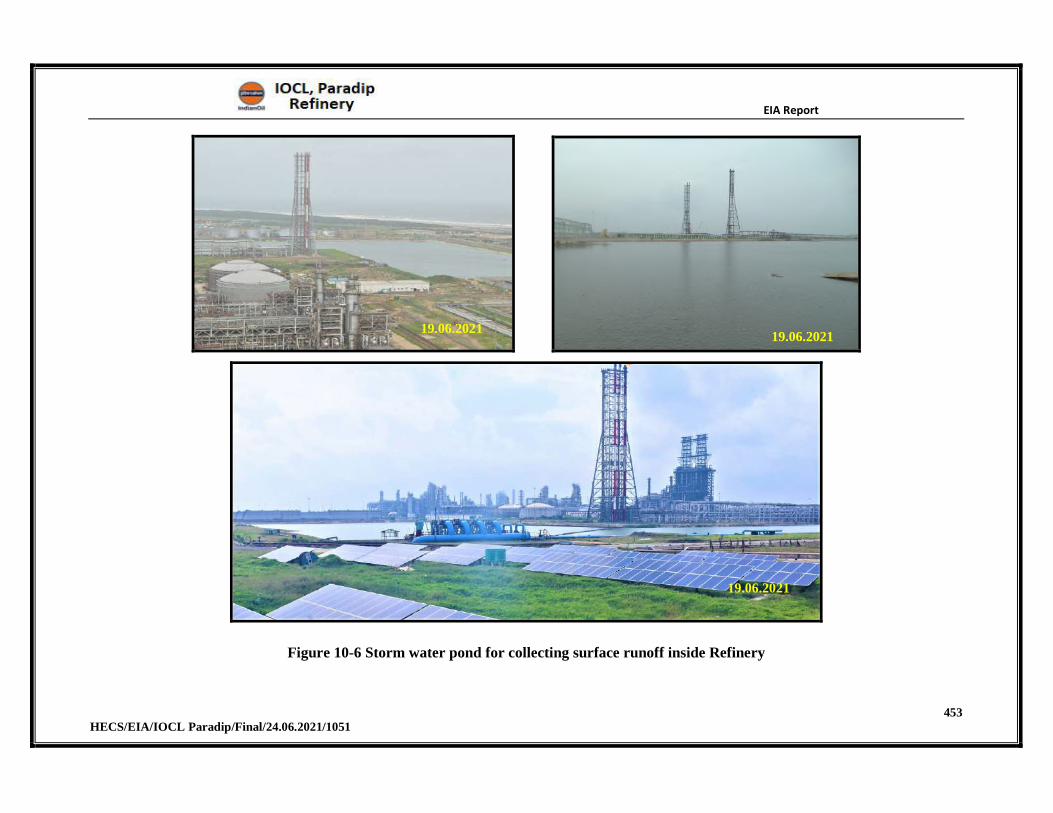
EIA Report
453 HECS/EIA/IOCL Paradip/Final/24.06.2021/1051
Figure 10-6 Storm water pond for collecting surface runoff inside Refinery
19.06.2021
19.06.202119.06.2021
EIA Report
454 HECS/EIA/IOCL Paradip/Final/24.06.2021/1051
10.7 Occupational Health and Safety
The workers are provided with proper health and safety measures. Personal protection
equipment’s are given to the employers and made sure they wear it during the work. Regular
health camps are conducted for all the workers alike. The Health & Safety department makes
sure all the workers are not exposed to any kind of toxicity and is within the prescribed limit.
Copy of EHS policy enclosed as Figure 10-8; Organogram for OHC is given in Figure 10-7.
The main objectives are
1. Maintenance and promotion of workers’ health and working capacity.
2. Improvement of working environment by following well-being program for its
employees.
3. Monitor the workplace to maintain industrial hygiene practices.
4. Development of work culture in a direction which will support health and safety at work
and thereby promoting positive social climate for smooth operation that will enhance
productivity.
5. Area monitoring.
6. Employees to undergo annual health check-up.
7. All personnel will be provided with personal protective equipment’s individually as
required.
a) Construction Phase
During the construction phase the following measures will be employed;
1. Personal Protective equipment’s will be provided to the workers.
2. Occupational Health Centre will be facilitated to address the emergencies that may arise.
3. Personnel will be trained about firefighting systems and first aid practices.
4. Regular monitoring of occupational health of employees.
b) Operational phase
General functions of the safety committee will be;
1. Conduct routine workplace inspections.
2. Provide Personal Protective Equipment.
3. Develop and implement safe work procedures and rules.
4. Provide on-going safety training & Enforce safety rules and appropriate discipline.
EIA Report
455 HECS/EIA/IOCL Paradip/Final/24.06.2021/1051
5. Promote safety awareness and reduce the potential for injury/loss.
6. Identify workplace hazards.
7. Enforce of safety rules, measure safety performance & reduce frequency/severity of
injuries.
c) First aid Boxes
A first aid kit is a collection of supplies and equipment for use in giving first aid. First Aid
boxes will be kept available in Security Room, Admin Block and at OHC. First Aid items
will be issued to injure only by authorized persons.
Following are the contents of First Aid Box,
a.Dettol – Antiseptic solution
b. Ciplox – Eye Drops
c.Soframycin – Skin ointment
d. Silverex – Burn ointment
e.Betadine – Microbicidal solution
f. Iodex – Pain reliever
g. Sterilized Cotton Wool
h. Surgical Paper Tape
i. Small Sterilized Dressings
j. Medium Sterilized Dressings
k. Roller Bandage – 5 cm wide
l. Roller Bandage – 10cm wide
m. Band Aid
n. Crocin / Paracetamol Tablet
Along with the above safety systems, company also ensured the below safety features to
ensure Zero Accident.
1. No ignitable zones are declared and marked so.
2. Work permit system with strict compliance.
3. Dedicated chemical storage area with good ventilation and exhaust system and all
chemical are stored as per compatibility.
4. Dyke walls provided for the day storage chemical tanks.
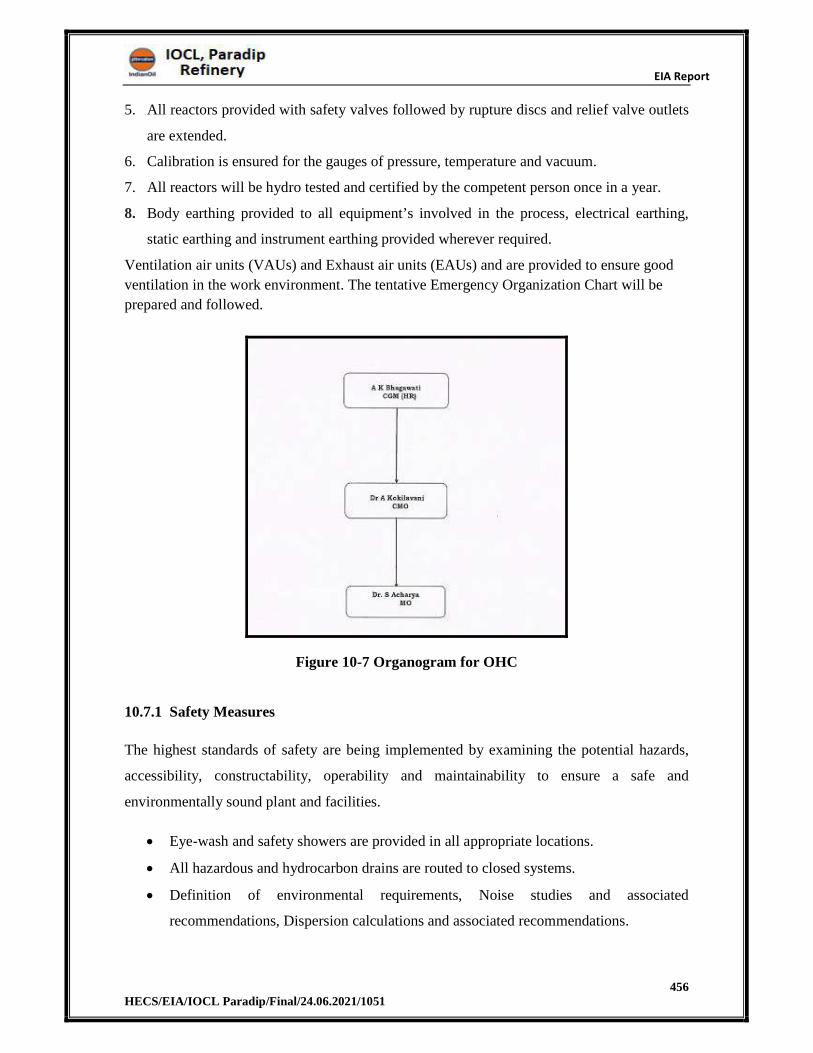
EIA Report
456 HECS/EIA/IOCL Paradip/Final/24.06.2021/1051
5. All reactors provided with safety valves followed by rupture discs and relief valve outlets
are extended.
6. Calibration is ensured for the gauges of pressure, temperature and vacuum.
7. All reactors will be hydro tested and certified by the competent person once in a year.
8. Body earthing provided to all equipment’s involved in the process, electrical earthing,
static earthing and instrument earthing provided wherever required.
Ventilation air units (VAUs) and Exhaust air units (EAUs) and are provided to ensure good
ventilation in the work environment. The tentative Emergency Organization Chart will be
prepared and followed.
Figure 10-7 Organogram for OHC
10.7.1 Safety Measures
The highest standards of safety are being implemented by examining the potential hazards,
accessibility, constructability, operability and maintainability to ensure a safe and
environmentally sound plant and facilities.
Eye-wash and safety showers are provided in all appropriate locations.
All hazardous and hydrocarbon drains are routed to closed systems.
Definition of environmental requirements, Noise studies and associated
recommendations, Dispersion calculations and associated recommendations.
EIA Report
457 HECS/EIA/IOCL Paradip/Final/24.06.2021/1051
Escape Routes, Accessibility, Operability and Constructability reviews and
implementation of recommendations.
All safety requirements of Indian Boiler Regulations (IBR) will be complied in the
design.
Fire water sprinkler systems will be implemented for applicable equipment, as per
OISD code requirements.
Safety insulation is provided for all pipes/surfaces operating at temperature higher
than 60°C.
Pressure safety valves are provided for over-pressure protection of equipment and
piping in all applicable locations.
Double isolation valves are provided for high pressure streams and hydrogen services.
HAZOP study has been performed for PX-PTA units during FEED phase. HAZOP
recommendations from the HAZOP study shall be incorporated into the design of
these systems.
Detailed HAZOP and SIL study for all units are envisaged during detailed
engineering phase of the project. All HAZOP recommendations will be complied and
recommendations from the studies will be implemented.
Compliance to all National and Local rules and regulations by statutory bodies will be
ensured.
10.7.2 Precaution & Safety Measures Against Fire Hazards
IOCL has taken lot of safety measures against Fire hazards in course of the design &
operation of two plants. They are as follows:
N2 Blanketing in flammable storage tanks.
Breather Valves.
Earthing Continuity.
Lightening Arrester as per IS specification & monitoring of Earth Pit.
Flame proof electrical fittings.
Periodic Tank Inspection.
Storage & handling of Bulk Chemicals & Plant Operations through DCS System.
Periodic Checking of Critical Instruments.
In addition to the above measures the new technology has the following measures embedded
in its design- following are the safety measures in the proposed PX-PTA unit:
EIA Report
458 HECS/EIA/IOCL Paradip/Final/24.06.2021/1051
Process Design and Engineering is such that it can cater to any emergency
happening in the Plant.
Provision of nitrogen blanketing of the reactor on occasion of a reactor trip.
Critical trips are implemented in the system
Better Process Control System.
Safety Critical Alarms are implemented for the new unit.
Automated Safety Instrumented System.
Over/Under Pressure Relief Protection.
Overfill Containment.
Emergency Response.
10.8 Environmental Management Cell
A separate environment management cell, HSE department consisting of qualified engineers
is in place which monitors all aspects of environmental impacts being caused due to process
units at IOCL, Paradip Refinery.
10.9 Corporate Environmental Policy
The safety policy of PDR is given in Figure 10-8
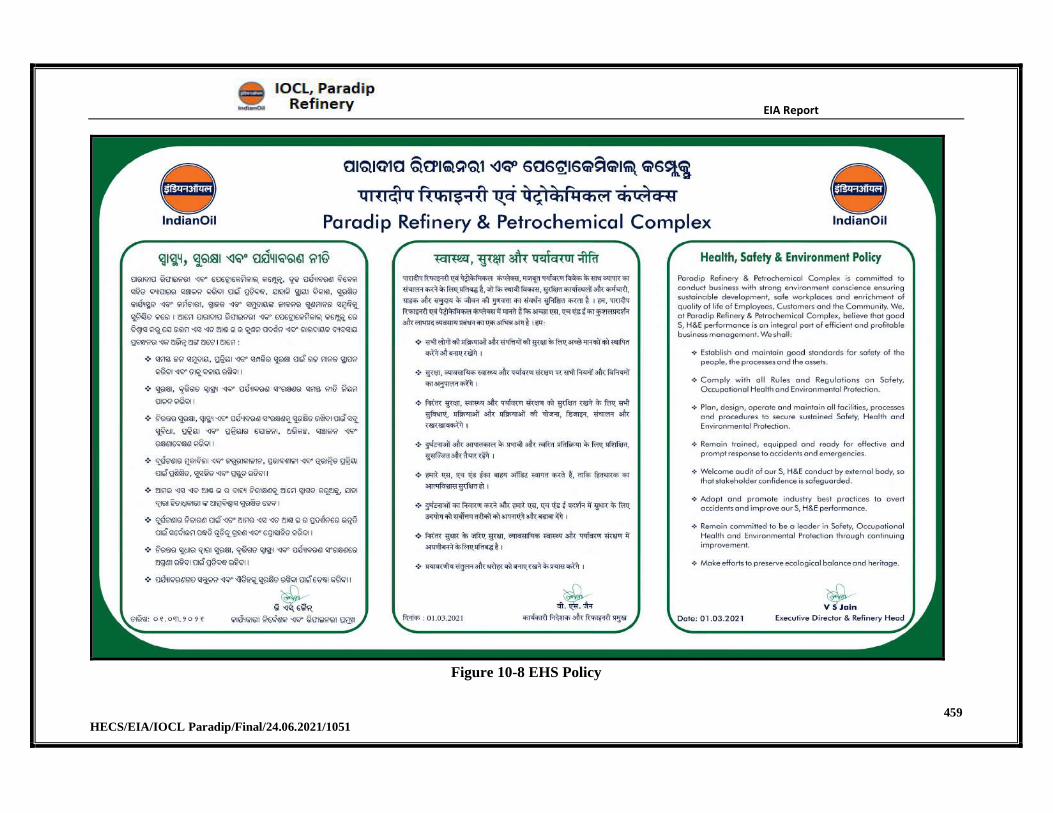
EIA Report
459 HECS/EIA/IOCL Paradip/Final/24.06.2021/1051
Figure 10-8 EHS Policy
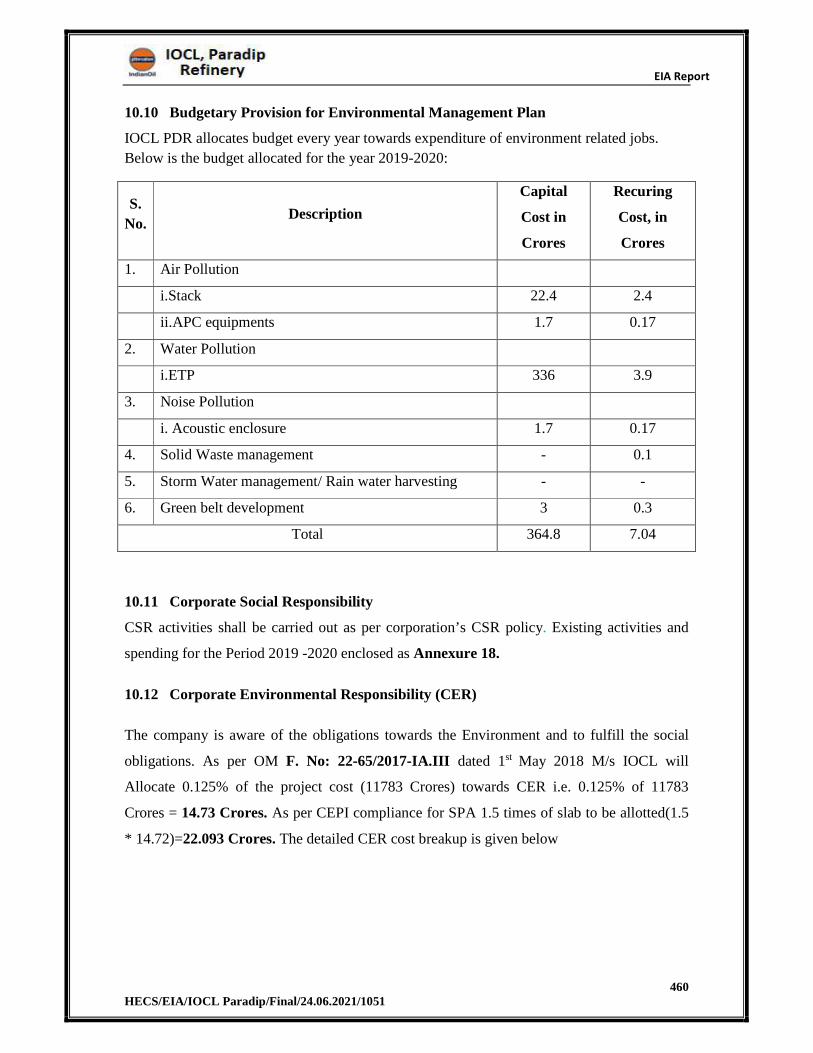
EIA Report
460 HECS/EIA/IOCL Paradip/Final/24.06.2021/1051
10.10 Budgetary Provision for Environmental Management Plan
IOCL PDR allocates budget every year towards expenditure of environment related jobs.
Below is the budget allocated for the year 2019-2020:
S.
No.Description
Capital
Cost in
Crores
Recuring
Cost, in
Crores
1. Air Pollution
i.Stack 22.4 2.4
ii.APC equipments 1.7 0.17
2. Water Pollution
i.ETP 336 3.9
3. Noise Pollution
i. Acoustic enclosure 1.7 0.17
4. Solid Waste management - 0.1
5. Storm Water management/ Rain water harvesting - -
6. Green belt development 3 0.3
Total 364.8 7.04
10.11 Corporate Social Responsibility
CSR activities shall be carried out as per corporation’s CSR policy. Existing activities and
spending for the Period 2019 -2020 enclosed as Annexure 18.
10.12 Corporate Environmental Responsibility (CER)
The company is aware of the obligations towards the Environment and to fulfill the social
obligations. As per OM F. No: 22-65/2017-IA.III dated 1st May 2018 M/s IOCL will
Allocate 0.125% of the project cost (11783 Crores) towards CER i.e. 0.125% of 11783
Crores = 14.73 Crores. As per CEPI compliance for SPA 1.5 times of slab to be allotted(1.5
* 14.72)=22.093 Crores. The detailed CER cost breakup is given below
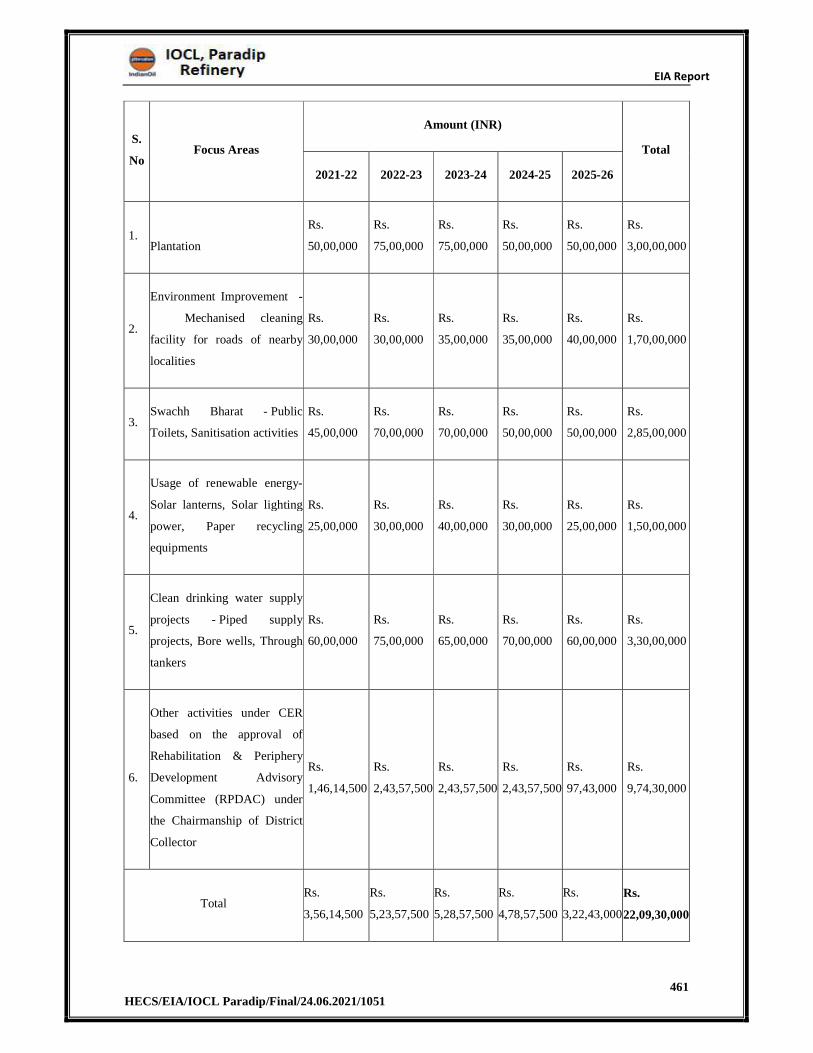
EIA Report
461 HECS/EIA/IOCL Paradip/Final/24.06.2021/1051
S.
NoFocus Areas
Amount (INR)
Total
2021-22 2022-23 2023-24 2024-25 2025-26
1. Plantation
Rs.
50,00,000
Rs.
75,00,000
Rs.
75,00,000
Rs.
50,00,000
Rs.
50,00,000
Rs.
3,00,00,000
2.
Environment Improvement -
Mechanised cleaning
facility for roads of nearby
localities
Rs.
30,00,000
Rs.
30,00,000
Rs.
35,00,000
Rs.
35,00,000
Rs.
40,00,000
Rs.
1,70,00,000
3. Swachh Bharat - Public
Toilets, Sanitisation activities
Rs.
45,00,000
Rs.
70,00,000
Rs.
70,00,000
Rs.
50,00,000
Rs.
50,00,000
Rs.
2,85,00,000
4.
Usage of renewable energy-
Solar lanterns, Solar lighting
power, Paper recycling
equipments
Rs.
25,00,000
Rs.
30,00,000
Rs.
40,00,000
Rs.
30,00,000
Rs.
25,00,000
Rs.
1,50,00,000
5.
Clean drinking water supply
projects - Piped supply
projects, Bore wells, Through
tankers
Rs.
60,00,000
Rs.
75,00,000
Rs.
65,00,000
Rs.
70,00,000
Rs.
60,00,000
Rs.
3,30,00,000
6.
Other activities under CER
based on the approval of
Rehabilitation & Periphery
Development Advisory
Committee (RPDAC) under
the Chairmanship of District
Collector
Rs.
1,46,14,500
Rs.
2,43,57,500
Rs.
2,43,57,500
Rs.
2,43,57,500
Rs.
97,43,000
Rs.
9,74,30,000
Total Rs.
3,56,14,500
Rs.
5,23,57,500
Rs.
5,28,57,500
Rs.
4,78,57,500
Rs.
3,22,43,000
Rs.
22,09,30,000
EIA Report
462 HECS/EIA/IOCL Paradip/Final/24.06.2021/1051
CHAPTER 11
SUMMARY & CONCLUSION
EIA Report
463 HECS/EIA/IOCL Paradip/Final/24.06.2021/1051
11 SUMMARY & CONCLUSION
An Environmental Impact Assessment Study has been carried out and assessed for the
proposed project based on the ToR and baseline quality data collected for the study area.
Identification and anticipation of the potential environmental impacts due to the proposed
project with a delineation of appropriate impact mitigation measures in an Environmental
Management plan during both construction and operation phases is provided in the EIA
report prepared
Based on the above evaluation the significance, value addition, impact on various
components of environment during construction and operation phases is summarized below;
Paradip Industrial area attracts CEPI score of 60.61(SPA) and IOCL will comply the
CEPI guidelines by MoEF&CC.
The Project Proponent will follow all the statutory norms and guidelines as per
CPCB/MoEF&CC to safeguard environment.
No land acquisition is carried out since the existing land area is used for proposed
expansion.
The incremental concentrations of PM, SO2, NOx and CO are observed to be 0.10%,
7.39% 19.59% and 157.38% respectively. The total pollutant concentrations of PM,
SO2, NOx and CO are 95.7 µg/m3, 16.86 µg/m3, 35.95 µg/m3 and 128.69 µg/m3 ,
which is observed to be within NAAQ standards
On total 3743 m3/hr of fresh water requirement for the project which is sourced from
Mahanadi River. The approval for extraction of fresh water is 3950m3/hr which is
issued by Government of Odisha & valid upto: Oct 2021.
The wastewater generated in the Refinery complex will be treated in ETP, part of
treated effluent will be reused in the process and the balance will be disposed to
marine with compliance to CPCB/MoEF&CC norms for marine disposal.
On total, 277.06m3/hr will be discharge into deep sea and it is observed to be within
the discharge approval limit of 350 m3/hr as per the OPCB consent for Air and water
obtained vide:5543/IND-I-CON-6414 dated 31.03.2021 valid till 31.03.2022.
The Hazardous waste generated like Spent Catalyst is being stored in intermediate
storage facility (covered warehouse with impervious floor and shed) and disposal in
SLF & Co-processing in cement industry within 90 days.
EIA Report
464 HECS/EIA/IOCL Paradip/Final/24.06.2021/1051
Project site is located at seismic zone-III and Paradip coast is prone to Cyclone and
Tsunami and IOCL will ensure all these scenarios are considered in designing.
There are two Schedule-I sensitive Species in study area i.e., reptiles named
Nilssoniahurum(Gray 1831) and Lissemyspunctata (Bonnaterre 1789) habitats and
IOCL will develop biodiversity management plan in accordance with local forest
department recommendations and ensure there is no impacts on this species.
Action plan for conservation of Marine life including Olive Ridley Turtle has been
prepared in 2013 by Mangrove Forest Division (Wildlife), Rajnagar, Odisha and
approved by Principal Cheif Conservator Forest(WL) & CheiWildlife Warden,
Odisha. The fund allocation by IOCl of INR 20.04Cr.for the conservation of Marine
life over a period of implantation of 10yrs
The protected area Mahanadi Delta has extensive mangrove forests located at a
distance ~6.93km (NE) from the project site and IOCL will develop biodiversity
management plan in accordance with local forest department recommendations and
ensure there is no impacts on mangroves.
The Kujang Coast and Hetamundia Seashore Village is predominant turtle nesting
area and IOCL will develop biodiversity management plan in accordance with local
forest department recommendations and ensure there is no impacts on this species.
Mangroves are present in Santara creek which bifurcates the refinery into North &
South parts and IOCL will develop biodiversity management plan in accordance with
local forest department recommendations and ensure there is no impacts on
mangroves.
Defence installation of Coast Guard Dist. HQ is present at a distance of ~4.11km from
the project site in ENE direction and if required NOC will be obtained from them.
The above project is proposed to meet the market potential having a deficit of about
2.2 MMTPA PTA in India by 2024.
The project will propel industrial development, downstream industry revolution in
Odisha and eastern regions of India, which will support consequential development of
entrepreneurship, MSMEs in nearby locality and state of Odisha.
The project will induce direct & indirect employment generation for local
communities as well as state & region as a whole and preference will be given to the
local communities within IOCL Rules/Policy.
EIA Report
465 HECS/EIA/IOCL Paradip/Final/24.06.2021/1051
CHAPTER 12
DISCLOSURE OF CONSULTANTS
EIA Report
466 HECS/EIA/IOCL Paradip/Final/24.06.2021/1051
12 DISCLOSURE OF CONSULTANTS
In order to assess the potential environmental impacts due to the proposed Integrated Para-
Xylene & Purified Terephthalic Acid (PX-PTA) Project, M/s IOCL, PDR has engaged
Hubert Enviro Care Systems (P) Limited, Chennai to undertake EIA study. The nature of
consultancy service rendered covers terrestrial environmental assessment.
12.1 Brief Profile of Hubert Enviro Care Systems (P) Limited (HECS)
Enviro Care Systems was started in the year of 1997 by Dr. J.R.Moses with the vision to
serve the world in all environmental related problems by completing the latest technological
advancements available.
In the year 2004, Enviro Care Systems became Hubert Enviro Care Systems (P) Ltd after
having collaboration with Hubert Stavoren B.V. for higher Technology.
The company provides total pollution control solutions to several industries like Thermal
Power Plant, Pharma, R&D Facilities, Electroplating and Manufacturing, IT Parks,
Residential Complexes, Dairies, Food Processing, Textile mills, Breweries, etc.
The company is specialized in executing projects right from concept development, supply,
erection, commissioning and operation on turnkey basis. HECS has successfully executed
more than 200 environmental engineering projects for various industrial sectors both in India
and overseas.
HECS has state-of-art facilities to provide quality environmental consultancy and engineering
solutions.
Strengths of HECS
Number of Employees as on May 2021
Total No of Employees 1096
Consultancy 43
Laboratory 125
Projects 34
Operation & Maintenance 894
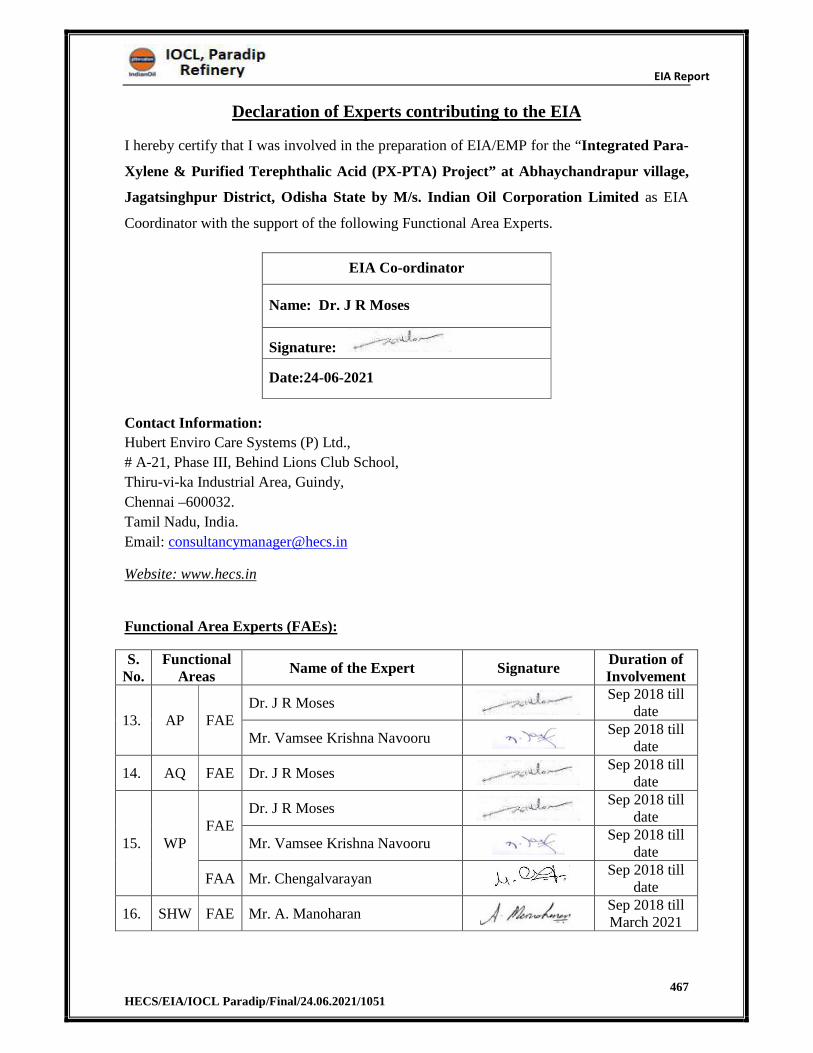
EIA Report
467 HECS/EIA/IOCL Paradip/Final/24.06.2021/1051
Declaration of Experts contributing to the EIA
I hereby certify that I was involved in the preparation of EIA/EMP for the “Integrated Para-
Xylene & Purified Terephthalic Acid (PX-PTA) Project” at Abhaychandrapur village,
Jagatsinghpur District, Odisha State by M/s. Indian Oil Corporation Limited as EIA
Coordinator with the support of the following Functional Area Experts.
EIA Co-ordinator
Name: Dr. J R Moses
Signature:
Date:24-06-2021
Contact Information:
Hubert Enviro Care Systems (P) Ltd.,
# A-21, Phase III, Behind Lions Club School,
Thiru-vi-ka Industrial Area, Guindy,
Chennai –600032.
Tamil Nadu, India.
Email: [email protected]
Website: www.hecs.in
Functional Area Experts (FAEs):
S. No.
Functional Areas
Name of the Expert Signature Duration of Involvement
13. AP FAEDr. J R Moses
Sep 2018 till date
Mr. Vamsee Krishna Navooru Sep 2018 till
date
14. AQ FAE Dr. J R Moses Sep 2018 till
date
15. WP FAE
Dr. J R Moses Sep 2018 till
date
Mr. Vamsee Krishna Navooru Sep 2018 till
date
FAA Mr. Chengalvarayan Sep 2018 till
date
16. SHW FAE Mr. A. Manoharan Sep 2018 till March 2021
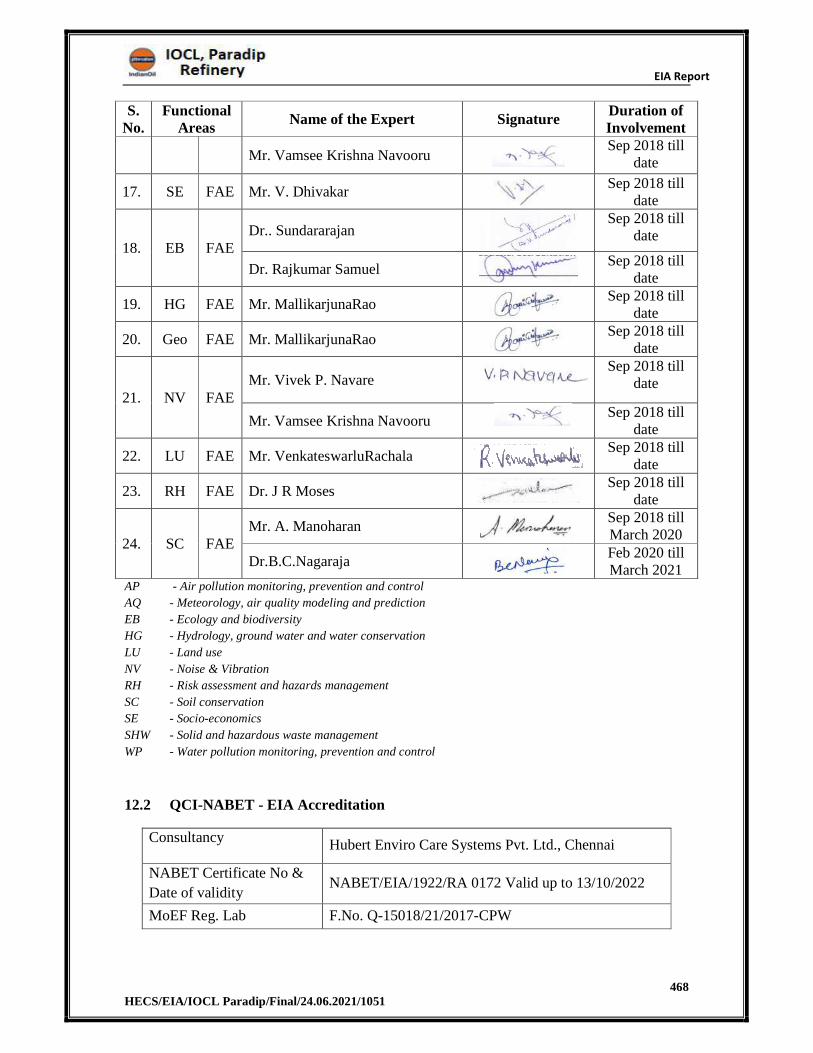
EIA Report
468 HECS/EIA/IOCL Paradip/Final/24.06.2021/1051
S. No.
Functional Areas
Name of the Expert Signature Duration of Involvement
Mr. Vamsee Krishna Navooru Sep 2018 till
date
17. SE FAE Mr. V. Dhivakar Sep 2018 till
date
18. EB FAEDr.. Sundararajan
Sep 2018 till date
Dr. Rajkumar Samuel Sep 2018 till
date
19. HG FAE Mr. MallikarjunaRao Sep 2018 till
date
20. Geo FAE Mr. MallikarjunaRao Sep 2018 till
date
21. NV FAEMr. Vivek P. Navare
Sep 2018 till date
Mr. Vamsee Krishna Navooru Sep 2018 till
date
22. LU FAE Mr. VenkateswarluRachala Sep 2018 till
date
23. RH FAE Dr. J R Moses Sep 2018 till
date
24. SC FAEMr. A. Manoharan
Sep 2018 till March 2020
Dr.B.C.Nagaraja Feb 2020 till March 2021
AP - Air pollution monitoring, prevention and control
AQ - Meteorology, air quality modeling and prediction
EB - Ecology and biodiversity
HG - Hydrology, ground water and water conservation
LU - Land use
NV - Noise & Vibration
RH - Risk assessment and hazards management
SC - Soil conservation
SE - Socio-economics
SHW - Solid and hazardous waste management
WP - Water pollution monitoring, prevention and control
12.2 QCI-NABET - EIA Accreditation
Consultancy Hubert Enviro Care Systems Pvt. Ltd., Chennai
NABET Certificate No &
Date of validity NABET/EIA/1922/RA 0172 Valid up to 13/10/2022
MoEF Reg. Lab F.No. Q-15018/21/2017-CPW
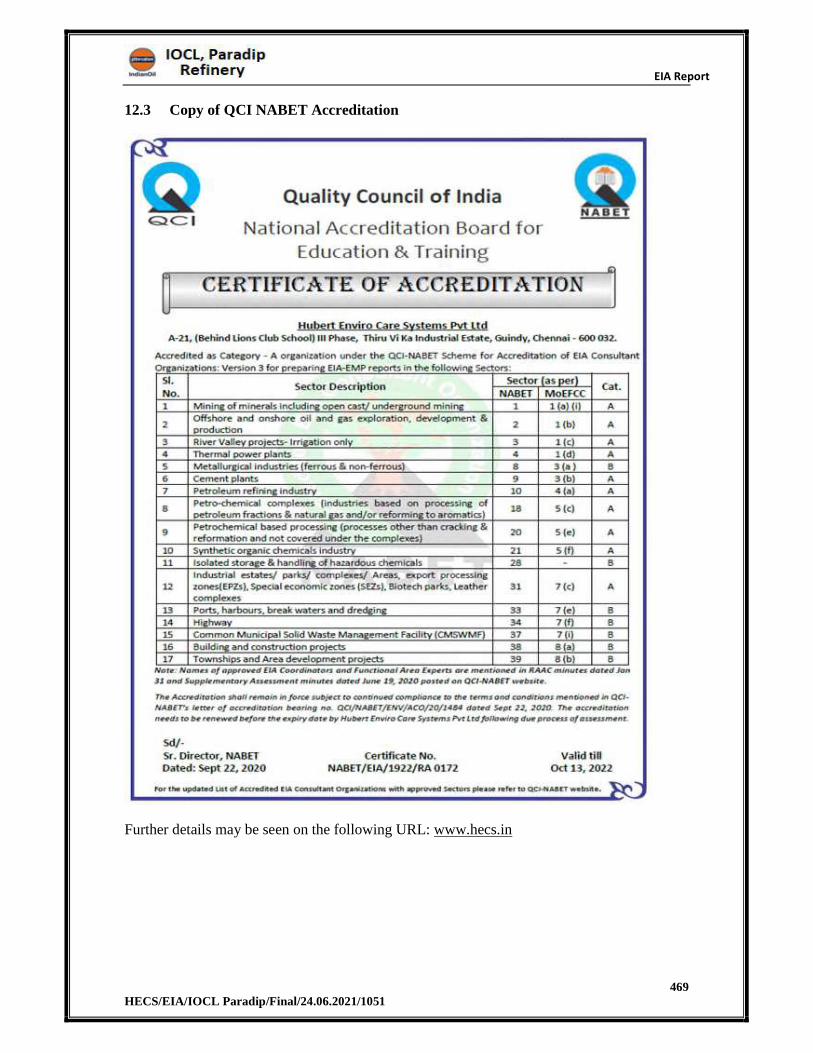
EIA Report
469 HECS/EIA/IOCL Paradip/Final/24.06.2021/1051
12.3 Copy of QCI NABET Accreditation
Further details may be seen on the following URL: www.hecs.in
EIA Report
470 HECS/EIA/IOCL Paradip/Final/24.06.2021/1051
HUBERT ENVIRO CARE SYSTEMS (P) LIMITED
A-21, III-Phase, Behind Lions Club School,Thiru vi ka Industrial Estate, Guindy, Chennai – 600 032
Ph: +91-44-43635555; Fax: +91-44-43635500