comparative response of different broiler genotypes to
TRANSCRIPT
University of Arkansas, Fayetteville University of Arkansas, Fayetteville
ScholarWorks@UARK ScholarWorks@UARK
Graduate Theses and Dissertations
8-2012
Comparative Response of Different Broiler Genotypes to Dietary Comparative Response of Different Broiler Genotypes to Dietary
Nutrient Levels Nutrient Levels
Franco Javier Mussini University of Arkansas, Fayetteville
Follow this and additional works at: https://scholarworks.uark.edu/etd
Part of the Animal Studies Commons, and the Poultry or Avian Science Commons
Citation Citation Mussini, F. J. (2012). Comparative Response of Different Broiler Genotypes to Dietary Nutrient Levels. Graduate Theses and Dissertations Retrieved from https://scholarworks.uark.edu/etd/471
This Dissertation is brought to you for free and open access by ScholarWorks@UARK. It has been accepted for inclusion in Graduate Theses and Dissertations by an authorized administrator of ScholarWorks@UARK. For more information, please contact [email protected].

COMPARATIVE RESPONSE OF DIFFERENT BROILER GENOTYPES TO DIETARY
NUTRIENT LEVELS
COMPARATIVE RESPONSE OF DIFFERENT BROILER GENOTYPES TO DIETARY
NUTRIENT LEVELS
A dissertation submitted in partial fulfillment
of the requirements for the degree of
Doctor of Philosophy in Poultry Science
By
Franco Javier Mussini
Universidad de Buenos Aires
Doctor of Veterinary Medicine, 2004
Universidad Católica Argentina
Master of Science in Gestión de la Empresa Agro Alimentaria, 2008
August 2012
University of Arkansas
ABSTRACT
Three studies were conducted to evaluate how the broiler has changed over the years due
to intense genetic selection. Four different broiler genotypes, one unselected since the 1950’s
(HER) representing the old meat-type bird and three current strains (Ross 308, Ross 708, and a
test product (TY)) were studied. Differences in growth, morphometry, and response in
performance and processing yield to different nutrient levels were studied.
Experiment 1 evaluated growth and morphometric analysis. Birds of each strain were
killed weekly from day 7 to day 56, necropsied and cut up parts and organs weighed.
Measurement of small intestine segments was also done. Results show that current strains have
significantly increased body weight (BW) and muscle accretion, especially breast meat. Jejunum
and ileum segments are longer in the current genotypes but shorter when related to body weight.
Heart and gizzard relative weight has reduced and tibia breaking strength has increased as a side
effect of selection.
Experiment 2 evaluated performance and processing yield at four different energy levels.
Results show that the HER bird is able to regulate feed intake (FI) in order to regulate energy
intake. Increasing energy levels did not affect its performance. The Ross 308 bird is not able to
modify FI in order to regulate energy intake. Also, Ross 308 responded to increasing levels of
energy by increasing BW while Ross 708 and TY did not. Current genotypes increased caloric
conversion ratio with higher levels of energy.
Experiment 3 evaluated performance and processing yield at six different amino acid
(AA) levels (80, 85, 90, 95, 100, and 105% of the recommended levels). Results show that HER
bird response to increasing levels of AA was moderate to absent while the response of the three
current genotypes was similar increasing BW, FI, and breast meat yield, reducing feed
conversion ratio.
In conclusion, results show that a substantial change has occurred in the broiler due to
selection, modifying anatomy, and its responses to different nutrient levels. These changes need
to be considered when formulating diets for the different broiler genotypes used in the US
industry in order to get the best economic return.
This dissertation is approved for recommendation
to the Graduate Council.
Dissertation Director:
_____________________________
Dr. Park Waldroup
Dissertation Committee:
_____________________________
Dr. Dustan Clark
_____________________________
Dr. William Huff
____________________________
Dr. Charles Rosenkrans Jr.
DISSERTATION DUPLICATION RELEASE
I hereby authorize the University of Arkansas Libraries to duplicate this dissertation when
needed for research and/or scholarship.
Agreed __________________________
Franco J. Mussini
Refused __________________________
Franco J. Mussini
ACKNOLEDGEMENTS
First of all I need to express my gratitude to my advisor, Dr. Park Waldroup who guided me
through this extraordinary experience.
At the same time I want to thank Aviagen for granting me the Aviagen fellowship and providing
the funds to conduct the research needed for this dissertation.
To finish, I need to express my deep gratitude to my fellow graduate students who through their
great help allowed me conduct my research.

DEDICATION
I want to dedicate this dissertation to my wife, who sparks my desire to be a better professional
and human being every day; and to my family, who always encouraged me to reach my goals in
life.
TABLE OF CONTENTS
I. INTRODUCTION 1
A. Genetic selection impact in the broiler industry 1
Origins of the domestic chicken 1
Modern genetics beginnings 2
Performance influenced by intensive genetic selection in poultry 2
Body weight 2
Feed intake 4
Feed conversion ratio 5
Breast meat yield 7
Undesirable side effects of intense genetic selection 8
Reproductive traits 8
Immune system 9
Ascites syndrome 10
Skeletal problems 10
Deep pectoral myopathy (DPM) and other muscular lesions 11
Fat depositions 11
Allometric changes due to intense genetic selection in broilers 12
Heart 12
Lungs 13
Liver 13
Proventriculus 14
Gizzard 14
Small intestine 15
Abdominal fat pad 15
B. Performance influenced by dietary nutrient levels 16
Performance influenced by dietary energy level 18
Early studies 18
Pellet quality and it effect in energy studies with broilers 20
Modern strains responses to energy levels 21
Processing yield affected by dietary energy levels 22
Performance influenced by dietary protein levels 23
Lysine level influence in performance 24
Crude protein and AA level influence in different genotypes performance 25
Processing 26
Lysine effect in processing yield of birds 26
References 27
II. JOURNAL ARTICLE ENTITLED:
Comparative growth response of different broiler genotypes and morphometric analysis 40
Abstract 40
Introduction 41
Materials and methods 42
Results and discussion 44
References 48
III. JOURNAL ARTICLE ENTITLED:
Comparative growth response of different broiler genotypes to energy nutrient levels 63
Abstract 63
Introduction 64
Materials and methods 65
Results 66
Discussion 68
References 71
IV. JOURNAL ARTICLE ENTITLED:
Comparative response of different broiler genotypes to dietary amino acid levels 86
Introduction 87
Materials and methods 88
Results 89
Discussion 91
References 93
V. CONCLUSION 116
1
INTRODUCTION
Genetic selection impact in the broiler industry
Origins of the domestic chicken
Remains found in different parts of China dating more than 7500 years ago are the oldest proof
of chickens being domesticated in South East Asia (West and Zhou, 1988) with the Jungle Fowl
the first bird to undergo this process. There is some controversy on which species was the first
one to be domesticated. Fumihito et al., (1994) compared mitochondrial DNA of jungle fowl
with domestic breeds and concluded that the Red Jungle Fowl (Gallus gallus) was the original
species from where all domestic breeds descend. This is in accordance with West and Zhou
(1988) but in contradiction with Liu et al., (2006) who through the same mitochondrial analysis
concluded that different species of different geographical origin contributed to the modern
domestic breeds.
In the past, chickens were used for religious (sacrificial animal) and entertainment (cock
fighting) purposes as well as for food or decorative uses (Wood-Gush, 1959). Romans seem to
have been the first ones to emphasize the food aspect of chicken breeding. Detailed descriptions
of husbandry techniques as well as different breeds and specialist branches within the poultry
industry can be found in Columella’s work (cited in Wood-Gush, 1959). After that, poultry
farming disappeared as an industry and only in nineteenth century England did a new poultry
industry forms that set the basis of modern poultry production.
Broiler production in the US began as a commercial industry in the 1930’s. The first broilers
were Barred Plymouth Rocks. This changed in the early 1940’s when almost all the broilers
placed in the country were crossbreds of the Barred Plymouth Rock male with either the New
2
Hampshire or Rhode Island Red female. In the 1950’s the use of pure New Hampshire broilers
generalized (Warren, 1958).
Modern genetics beginnings
In the early 1900’s Thomas Hunt Morgan rediscovered the Mendelian Laws and, based on his
fundamental work with Drosophila flies, stated that the basis of inheritance lay in the
chromosomes, setting the basis of modern genetics. Based on this work, Fisher was the first one
to partition genetic variation into dominant, additive, and epistatic components developing the
concept of quantitative genetics (Fisher, 1918). The concept of quantitative genetics was first
studied practically by J.L. Lush (Lush and Hubbs, 1945) in animal breeding.
Performance influenced by intensive genetic selection in poultry
Body Weight (BW)
Meat-type bird performance in the 1950’s was significantly poor compared to performance
achieved today. In 1955, a cross of New Hampshire with Barred Columbian weighed 1,082 Kg at
56 days and around 1.3 Kg at 10 weeks (Schoettle et al., 1956). Thomas et al., (1958) studied
New Hampshire performance and obtained male weights of 1,488 Kg and female weights of
1,189 at ten weeks.
Genetic selection led to significant improvements in performance. Body weight gain increased
significantly together with feed intake while feed efficiency was reduced significantly as well.
Different authors have compared old strains with modern ones in order to establish the
improvement obtained through genetic selection. Sherwood (1977) compared a random bred
3
strain, the Athens-Canadian Randombred Control (ACRBC) with a modern line from 1976. At
the same time, for the purposes of establishing if the progress obtained was due to genetics or to
a nutritionally improved diet, two diets were used, a diet from 1953 and a diet from 1976. A
225% increase in growth rate was observed when the two strains were compared. Ninety percent
of this increment was calculated to be due to genetics.
Chambers et al., (1981) conducted a similar experiment but with a diet representative of 1978.
The authors used as a control the Ottawa Meat Control strain and compared it with two
commercial strains. The results showed an increment of 230% in carcass weight. In the same line
of experiments, in 1991, Havenstein started a series of experiments (Havenstein et al., 1994a;
Havenstein et al., 1994b) that would conclude in 2001 (Havenstein et al., 2003a; Havenstein et
al., 2003b) comparing the ACRBC strain previously mentioned to commercial broilers of those
years using diets representative of 1957 and 1991 (in the first two experiments) and 2001 (in the
last two). In 1991, the results showed that the modern Arbor Acres male was 3.92 times heavier
than the ACRBC male at 56 days of age. Over 90% of this difference was due to genetics. Feed
conversion for the Arbor Acres male was 2.40 and 2.59 for the ACRBC male at 56 days.
Regarding carcass composition and yield, the carcass of the Arbor Acres male was 4.41 times
heavier than the ACRBC male carcass at 43 days. Again, over 90% of the difference was due to
genetics. For the 2001 experiments, ACRBC was compared with Ross 308. The Ross 308 male
was 4.77 times heavier than ACRBC male. Over 95% of this difference was accounted for by
genetics this time. Feed conversion for Ross 308 male was 1.94, and 2.23 for the ACRBC male
at 56 days with the 2001 diet. Processing results showed that Ross 308 male carcass was 6.11
times heavier than ACRBC male. Over 95% of the progress reported was due to genetics. In
2009, Schmidt et al., (2009) compared a heritage line,cross of New Hampshire with Columbian
4
Barred, unselected since the 1950’s with Ross 708 for 5 weeks. At 35 days, Ross 708 weighed
1.72 times more than the heritage. Today, a male broiler can achieve 2.867 Kgs at 42 days with a
FCR of 1.701 and 4.162 Kgs with a FCR of 1.958 (Ross breeders, 2007). Historic data from
Aviagen show how the time needed for the broiler to reach 2.3 Kg has decreased due to genetic
selection from 1995 to 2005 (Figure 1).
Feed intake (FI)
Intense genetic selection for high BW has come together with significant changes in correlated
traits such as the increase in voluntary FI. Birds have been under selection for high BW for over
60 years now, and in order to obtain higher BW it sounds reasonable that the animal needs to
consume more feed. Siegel and Wisman (1966) observed that selection for high BW resulted in
increased FI. Growth and FI have been estimated to have a correlation of 0.7 (Pym and Nicholls,
1979). In other words, 70% of genetic variation in growth is associated with FI. At the same
time, the idea that an animal will eat in order to meet its requirements has always sounded
reasonable. Early studies assessing performance with different energy levels utilizing
commercial strains from the 1950’s showed that broilers efficiently regulate their feed intake to
maintain energy intake when energy levels were changed in the diets (Hill and Dansky, 1954;
Donaldson et al., 1956; Donaldson et al., 1958). Recent studies with modern lines show
divergent results. According to Summers et al., (1964) broilers are still able to regulate feed
intake in order to regulate energy intake. On the contrary Saleh et al., (2004a) reported that feed
intake was not directly affected by energy levels. Other studies (Cheng et al., 1997; Dozier III et
al., 2006; Dozier III et al., 2007) show reduced feed intake as energy increases but it has to be
taken into account that pelleted diets were used in these trials and as fats or oil is added to
increase energy levels, pellet quality is reduced. A reduction in pellet quality could affect feed
5
intake. Nir et al., (1978) utilized two strains, a heavy breed (White Rock) and a light breed (New
Hampshire x White Leghorn) to study the propensity of these birds to be overfed. Results
showed that the light breed could be force fed 70% more over their ad libitum daily intake
whereas the heavy breed could only be force fed 13% more. As a result of overfeeding in the
light breed, BW gain increased 35%, and crop, proventriculus, small intestine, pancreas and
liver, together with fat pad increased its weight significantly. Overfeeding in the heavy breed
increased BW gain 5%, mainly due to increments in organ weights. Results indicate that light
breeds do not gain more weight because the bird do not eat more even when the organism could
grow more if FI would increase. Based on the concept that the ventromedial hypothalamus
inhibits hunger through a feedback mechanism, Burkhart et al., (1983) used two lines of White
Plymouth Rocks that had been divergently selected for BW for 22 generations, to study how the
chemical lesion of this part of the hypothalamus would affect feeding behavior. The line selected
for low weight responded by increasing FI while the high weight did not react to the lesion
suggesting that this mechanism is inhibited or reduced in heavy birds. It would seem that at some
point, artificial selection has resulted in a reduction or disappearance of satiety mechanisms.
Feed conversion ratio (FCR)
In the 1950’s when intense genetic selection was being applied to poultry selection for the first
time, a New Hampshire male broiler would need 2.69 kg of feed to generate 1 Kg of BW, while
a female would need 2.88 Kg of feed for the same purpose (Thomas et al., 1958). Siegel and
Wisman (1962) compared two lines divergently selected for high and low BW and, although
there was a significant difference in BW, FCR was the same for both lines. Since then, FCR has
been reported to have improved in modern lines in every paper where a modern and an old line
were compared (Siegel and Wisman, 1962; Havenstein et al., 1994a; Siegel and Dunnington,
6
1997; Havenstein et al., 2003b; Siegel and Wolford, 2003; Schmidt et al., 2009) There are two
main reasons for this. First, after several generations of selection, difference in time to achieve
the same BW gain was great enough to affect FCR positively in high BW selected lines. Second,
it was only in the 1970’s when direct selection for lower FCR was implemented (Emmerson,
1997). Birds started to be selected not only for BW gain but for more efficient FCR as well,
improving this parameter faster than before.
Feed conversion ratio is composed of different traits such as appetite, digestibility, basal
metabolism, protein accretion, etc. (Emmerson, 1997). If the bird needs fewer days to reach
market weight, the energy spent in maintenance is smaller compared to an unselected bird that
takes more days to reach the same weight making it more efficient (Pym and Nicholls, 1979). In
other words, as BW gain increases, nutrients utilized for gain increase, and nutrients utilized for
maintenance reduce as a percentage, making the bird more efficient. Consequently, caloric
conversion ratio decreased as well over time when the amount of calories to reach a specific
weight target is studied Figure 2.
At the same time, the gastrointestinal tract of the modern broiler has changed, presumably in
order to digest and absorb increased amounts of feed consumed. It has been found in high BW
selected birds that small intestine (SI) segments were longer. Jejunum and Ileum, segments of SI,
where nutrient absorption takes place, had increased total and relative to BW length, increasing
nutrient absorptive surface (Katanbaf et al., 1988a; Katanbaf et al, 1988b). Mott et al., (2008)
reported increased number of nutrient transporters Pept1 at 20 days of embryonic age in high
BW selected birds compared to low BW birds. Jackson and Diamond, (1996) reported higher
intestinal uptakes of glucose and proline in commercial broilers compared to the Jungle Fowl.
7
Other organ weights such as proventriculus, pancreas and liver have been reported to have
increased in high BW birds in order to accommodate increased feed consumption.
Improvement in FCR has been attributed to genetic selection but feed formulation has also
helped to get better performance through years of research. Proof of this is the study by
Havenstein et al., (2003b) where the same ACRBC line used by Sherwood (1977) was fed a
1957 diet and a 2001 diet. The ACRBC male at 56 days had a FCR of 2.23 with the 2001 diet
and 2.37 with the 1957 one. Diets from 2001 had more energy, protein, lysine, methionine and
total sulfur amino acids. Other differences between the two diets are the addition to the 2001 diet
of Zinc, Selenium, Vit E, Folic acid, and Thiamin among others. At the same time, 2001 diets
were crumbled and pelleted while 1957 diets were fed as mash to the birds. Mash feed could
have affected FI reducing it compared to pelleted feed.
Breast meat yield (BMY)
Broilers were first selected for growth, and after initial success, selection was oriented to feed
efficiency since feed accounted for around 65% of live production costs. When consumer habits
changed and poultry started to be deboned and sold in parts, selection focused on BMY since for
many years this has been the most preferred cut by consumers in the U.S. and, consequently, the
most expensive cut of the bird.
Chambers et al., (1981) assessed growth and carcass composition of a 1958 strain and a 1978
line selected for high body weight and observed no difference in BMY between the lines. Closer
in time, with primary breeder companies focusing selection in getting increased BMY,
Havenstein et al., (1994b) reported BMY 1.35 times higher for the Arbor Acres male compared
to ACRBC. In this case, 28.2 % of the improvement was accounted for by genetics. In 2001,
8
BMY was 1.68 times higher for Ross 308 male (Havenstein et al., 2003a). One hundred per cent
of the progress in BMYwas accounted for by genetics in this trial. Reddish and Lilburn (2004)
reported a significant increase in total and relative weight of both Pectoralis major and
Pectoralis minor in modern lines compared with an unselected one, observing an increase of
34.4% in BMY. Konarzewski et al., (2000) reported that as early as at 80 grams of body weight,
a significant difference in BMY could be observed between a 1997 Ross 308 and a Euribrid
Hisex. In agreement with this, Schmidt et al., (2009), observed that the BMY of Ross 708 was
already significantly higher at 14 days than the New Hampshire x Columbian Barred line from
the University of Illinois. By day 35 breast muscle had increased 3.8 times faster in Ross 308.
O’Sullivan et al., (1991) reported differences in BMY as early as 8 days of age between high and
low BW lines. Sandercock et al., (2009) also reported similar differences between broilers and
layers at ten weeks of age.
Undesirable side effects of intense genetic selection
When selection is focused on specific traits like high BW, FCR and BMY some undesirable
effects can be expressed in the animal as a side effect affecting overall performance. The most
important traits detected in poultry that can reduce performance and compromise animal welfare
are classified as physiological, reproductive and immunological.
Reproductive traits
Selection for high juvenile BW has affected reproductive traits in males and females. According
to Marks (1985), high juvenile BW is negatively correlated to spermatozoa motility, and when
9
low and high BW lines were compared, the high BW line had more dead and abnormal
spermatozoa with a lower concentration of spermatozoa in semen.
Immune system
The immune system has also been compromised by genetic selection. In 1992, Miller et al.,
inoculated two lines divergently selected for high and low BW with sheep red blood cells
(SRBC) and studied bird immune response through quantitative presence of antibody titers to
SRBC. The low BW line showed a prolonged response to SRBC compared to the high BW line.
These results are in agreement with Martin et al., (1988) and Liu et al., (1995). Qureshi and
Havenstein (1994) compared the immune response of Ross 308 and ACRBC. Results showed
higher IgG and IgM antibody production in the ACRBC line. There was no difference in
macrophage or natural killer cell activities. Similar results are reported due to genetic selection
for growth in turkeys. In 1996 Nestor et al., (1996) inoculated a randombred control (RBC) and
three commercial lines of turkeys selected for growth with Pasteurella multocida. Mortality for
RBC was 26% while it ranged from 54 to 65% in the commercial lines in two trials. Bayyari et
al., (1997) assessed the immune response of an unselected line and another selected for high 16-
week-BW. The selected line had lower toe web response to phytohemagglutinin-P (PHA)
inoculation, lower lymphocyte counts and lower relative spleen weights. Li et al., (2001)
challenged a RBC line and a high 16-week-BW line with Newcastle disease and Pasteurella
multocida vaccines and reported lower phagocytic activity for the selected line but no differences
for antibody response for both Newcastle disease and P. multocida.
10
Ascites syndrome
Pulmonary hypertension is the consequence of increased blood flow or resistance in the lung.
This results in hypertrophy of the right ventricule, valvular insufficiency, increased venous
pressure and ascites (Julian, 1993). Pulmonary hypertension syndrome (PHS) has been related to
metabolic oxygen requirement independent of altitude so that any factor that increases oxygen
requirement increases ascites incidence caused by PHS (Julian et al., 1987; Julian et al., 1989).
Cold or hot environments, increased feed intake of high energy diets, and rapid growth have
been signaled as causes for increased ascites during the 1980’s and 90’s (Scheele et al., 1991;
Scheele et al., 1992; Julian, 1993; Currie, 1999). At the same time genetic selection has not only
led to higher BW but to smaller lung relative weight (Havenstein et al., 2003b) and volume
(Julian, 1989) and heart relative weights (HRW) (Havenstein et al., 1994b; McEnteé et al., 2000;
Sandercock et al., 2009).
Scheele et al., (1991) observed that broilers selected for high BW and lower FCR were less
flexible in metabolic adaptation to a changing environment and that this could be a cause for
ascites. Julian, (1998) proposed that large and heavy breast of modern broiler together with the
pressure of abdominal contents on air sacs could also be involved in the development of PHS
that leads to ascites. Modern broilers need to be reared paying more attention to environmental
conditions in order to minimize ascites expression in the flock (Currie, 1999).
Skeletal problems
Different skeletal problems have been associated with rapid growth of birds selected for high
BW (Lilburn, 1994; Julian, 1998) such as Tibial Dyschondroplasia and Spondylolisthesis (Kinky
Back).
11
Deep pectoral myopathy (DPM) and other muscular lesions
Degenerative myopathy of Musculus supracoracoides is a disease that affects both turkeys and
broilers. It has its origin in the increased internal pressure in the muscle that prevents the blood
from reaching the muscle tissue; as a consequence a necrotic lesion is developed (Siller et al.,
1979). Assessment of 23 different meat-type chicken strains for DPM showed that the 20
commercial lines selected for high BW had an incidence of DPM ranging from 0 to 43% while
the three unselected lines had 0% prevalence of the disease Grunder et al., (1983).
Macrae et al., (2006) assessed Pectoralis major lesions in broilers and layers. It was reported
that there was an important presence of necrotic fibers in broilers muscle while no presence of
abnormal muscle fibers could be detected in the muscle of layers. At the same time, three
different plasma markers for muscle damage were measured at different ages in both lines.
Creatine kinase, lactate dehydrogenase and aspartate aminotransaminase levels were
significantly higher for broilers than from layers with the biggest difference at 9 and 13 weeks of
age, meaning that the muscle was damaged at some point during this time in broilers.
Fat deposition
Together with increased BW, fat deposition has increased as well, affecting carcass composition
(Havenstein et al., 1994b; Havenstein et al., 2003a) and slightly reducing feed efficiency due to
the energetic cost of synthesizing adipose tissue. This fat deposition could be a consequence of
increased concentrations of insulin and glucagon in plasma together with insulin resistance
(Sinsigalli et al., 1987).
12
Allometric changes due to intense genetic selection in broilers
Allometry is defined as the study of the growth of organs or parts of an organism in relation to
the growth of the whole organism and is another tool to compare how birds have changed over
the years.
Heart
Genetic selection has increased muscle accretion, significantly increasing body weight; however
although heart weight has increased in modern lines, it has not maintained the same ratio to body
weight. Heart weight and its ratio to body weight in broilers have been widely studied. Katanbaf
et al. conducted two experiments to compare organ growth in birds selected for high and low
juvenile body weight. When both lines were compared at the same BW (180 g), heart weight was
no different but when the comparison was done at 56 days of age, birds selected for high juvenile
body weight had smaller heart relative weight (HRW) (Katanbaf et al., 1988a). To the contrary,
Katanbaf et al (1988b) reported no differences in HRW between two lines also selected for high
or low juvenile BW. In agreement with this, O’Sullivan et al., (1991) reports similar HRW at 21
days in lines divergently selected for low and high BW. Havenstein et al., (1994b) reported
reduced HRW in the Arbor Acres male when this strain was compared with the ACRBC male
(Havenstein et al., 1994b) and ten years later reported an even smaller HRW when the same
unselected line was compared to Ross 308 (Havenstein et al., 2003a). McEnteé et al., (2000)
studied internal organ morphology comparing a modern strain of broilers with a broiler strain
unselected since the 1970’s finding similar results. Researchers also reported HRW reduced in
the modern line at 42 days of age. Sandercock et al., (2009) conducted a unique experiment
comparing 37 different lines of birds. Broilers showed a significantly reduced HRW when
13
compared with layers and traditional chickens at ten weeks of age. Gaya et al., (2007) analyzed
information of 42,912 individuals from pedigree broilers of three consecutive years and found
that the genetic trend for heart relative weight was -0.004% per hatch-year. In the same line of
research, Schmidt et al., (2009) compared a Heritage line (New Hampshire X Columbian Barred)
unselected since the 1950’s with Ross 708. Researchers killed and necropsied birds on a weekly
basis from day 7 to 35 and studied organ morphology reporting a reduced relative growth of
heart after 14 days. This is in agreement with Konarzewski et al., (2000) who found no
differences at 14 days when compared a broiler strain was compared with a layer one. Moreover,
Jackson and Diamond (1996) found no differences between old and modern strains when body
mass was the same.
Lungs
Julian (1989) reported smaller relative volume in high BW selected birds. Havenstein et al.,
(1994b) and Havenstein et al., (2003a) reported lighter relative weight of lungs in commercial
lines selected for high growth. O’ Sullivan et al., (1991) found that, although smaller, there was
no significant difference in lung relative weights between high and low BW lines at 21 days of
age.
Liver
Reports on liver relative weight (LRW) are contradictory. Katanbaf et al., (1988a) reported
heavier LRW for low BW lines. O’Sullivan et al., (1991) also observed increased LRW in the
line selected for low BW compared to the high BW selected line. On the contrary, McEnteé et
al., (2000) reported no difference in LRW at 42 days of age between a commercial line and an
unselected one from the 1970’s. Schmidt et al., (2009) found no difference in LRW from day 7
14
to 35 between HER and Ross 708. Konarzewski et al., (2000) reported that when birds weighed
over 80 grams the line selected for high BW had higher LRW when the ratio was calculated for
lean body mass. Nir et al., (1993) also reported increased LRW in a high BW line compared to a
low BW line.
Proventriculus
Two lines selected for high and low BW for 27 generations were compared at the same weight
(180 grams) and at 56 days of age. Proventriculus weight was higher for high BW birds at the
same weight but at 56 days proventriculus relative weight (PRW) was similar for both lines
(Katanbaf et al, 1988b). Similar results are reported by McEnteé et al., (2000) who observed
similar PRW between two lines 30 years apart in genetic selection for BW at 42 days. Broilers
had higher proventriuclus weight than jungle fowl at the same BW (Jackson and Diamond,
1996). O’Sullivan et al., (1991) assessed PRW at hatch, 8 and 21 days on the 28 generation of
high and low BW selected birds, finding differences only at 21 days.
Gizzard
A reduction in Gizzard relative weight (GRW) has been reported when lines of different final
BW are compared. Katanbaf et al., (1988a) and Katanbaf et al., (1988b) reported reduced GRW
for broilers selected for high juvenile BW. The same results are reported by O’Sullivan et al.,
(1991) when two lines, divergently selected for high and low BW, were compared at 21 days of
age though GRW was similar at hatch and 8 days. McEnteé et al., (2000) reported similar results
when a commercial line was compared with an unselected one from the 1970’s.
15
Small Intestine (SI)
Together with an incremease in BW, SI has changed significantly with genetic selection for high
performance. Data analysis from Katanbaf et al., (1988a) and Katanbaf et al., (1988b) shows
higher relative length for lines selected for high BW compared to lines selected for low BW. In
1993, Nir et al., compared a meat type strain bird with an egg strain one. At day 8, small intestine
and small intestinal contents were significantly heavier, related to body weight, for the broiler
strain. Jackson and Diamond (1996) reported increased SI relative length to body mass when
compared to the domestic bird’s ancestor, the Jungle Fowl. Konarzewski et al., (2000) also
reported an incremease in SI relative weight when Ross 308 was compared to an Euribrid Hisex
strain selected for egg laying at 14 days of age. McEnteé et al., (2000) reported higher relative
mass for duodenum, jejunum, and ileum at 42 days when broilers from a commercial line were
compared with an unselected line from the 1970’s. At the same time SI relative length for the
three segments was longer for the commercial broiler strain. Schmidt et al., (2009) reports
similar results when Ross 708 was compared with a New Hampshire X Columbian Barred Rock
from the 1950’s were compared. At same age SI relative length was significantly longer for Ross
708. When similar weight birds were compared there was no difference before birds reached 400
grams. After that weight, duodenum length remained unchanged in both strains but jejunum and
ileum showed significantly longer lengths in Ross 708 and when all segments were added, total
SI length was significantly longer for Ross 708.
Abdominal fat pad
Abdominal fat pad has been the object of study in lines selected for high BW. Katanbaf et al.,
(1988a) reported an increase in fat pad relative to body weight in broilers selected for high or
low body weight. Similar differences were observed when the comparison was done between
16
birds of similar weights of 180 grams (Katanbaf et al 1988b). Havenstein et al., (1994b) and
Havenstein et al., (2003a) found similar differences for fat pad and for carcass fat in 1991 and
2001. The same response for genetic selection was reported by Chambers et al., (1981),
Sandercock et al., (2009), and Reddish and Lilburn, (2004) but are in disagreement with de Beer
(2010), who reported decreased absolute fat when a modern strain was compared to a control,
unselected line.
PERFORMANCE INFLUENCED BY DIETARY NUTRIENT LEVELS
The effect of dietary ingredients and nutrients on bird performance and carcass characteristics
has been an object of study for many years. Fraps and Carlyle (1941, 1942) were among the first
to study how different feed ingredients affected growth and carcass composition while Scott et
al., (1947) was able to prove that combinations of high levels of energy and protein improved
both growth and feed efficiency. In this trial, the diet that got the best performance was reported
to have 40 calories per pound for every 1% of protein. Hill and Dansky (1950) observed that
birds would not improve performance with crude protein (CP) levels higher than 20% if energy
levels were not raised as well. Even more, when energy was dropped together with CP, birds
would grow as well as birds with higher energy and CP levels. In 1954, Biely and March (1954)
combined different levels of protein and tallow to discover that combined increasess of CP and
energy improved body weight gain in chicks. Peterson et al., (1954), Matterson et al., (1955), and
Scott et al., (1955) reached the same conclusion. Until that time, birds were thought to have a
limited tolerance to fat (Henderson and Irwin, 1940). The following step was finding the proper
ratio between calories and protein in order to obtain the best performance. The concept of
17
energy:protein ratio was first developed in 1955-56 by Combs, Romoser and Donaldson at the
university of Maryland (Combs and Rosmoser 1955; Donaldson et al., 1956; Donaldson et al.,
1958). This concept was developed as a tool to calculate the amount of protein in the feed in
relationship to dietary energy levels necessary for obtaining the best performance. In accordance
with previous findings, Scott et al., (1955) reported reduced efficiency when the ratio went over
47:1 while Donaldson et al., (1956) observed an increase in energy intake and carcass fat as the
Calorie:Protein widened.
Once it was clear that a specific ratio between energy and protein was needed in order to achieve
maximum performance, researchers focused on the relationship between energy and different
amino acids. Baldini and Rosenberg (1955) studied the relationship between energy and
methionine, concluding that methionine requirements increase with dietary energy increases,
suggesting that this could be the same for other nutrients. Experiments studying the ratio of
energy to tryptophan and arginine (Griminger et al., 1957), lysine (Schwartz et al., 1958), and
arginine (Scott and Forbes, 1958) showed similar results. Leong et al., (1959) found that calorie
to protein ratio could be widened if methionine and arginine were increased simultaneously with
energy increments.
Since then, energy to amino acid ratio has been widely studied and the aim of these studies
changed with time. First, the objective was to obtain the proper balance between energy and
crude protein to achieve the best body weight gain (Scott et al., 1955; Donaldson et al., 1956;
Donaldson et al., 1958). By providing the best nutrient balance, the bird’s genetic potential could
be expressed. After that, with feedstuff prices increasing dramatically, research focused in
getting the best FCR and caloric conversion ratio (Emmerson, 1997). In the last few years, with
broilers being selected for breast meat yield, the objective changed to obtain maximum breast
18
accretion (Moran and Bilgili, 1990; Kerr et al., 1999; Kidd et al.,2004). At the same time,
broilers have been undergoing changes in their anatomy, physiology and behavior for the last
sixty years due to an intense genetic selection in order to achieve maximum performance. Due to
this change in the broiler, its response to varying levels of energy and protein has changed as
well over the years (de Beer, 2010).
Performance influenced by dietary energy level
Energy is the most expensive nutrient in a chicken diet, and the correct level of energy needed to
obtain the best performance at the lowest cost has been an object of many studies for the past
sixty years.
Early studies
In an elegant study, Hill and Dansky, (1954) formulated three diets, one with 18.1% CP and 994
PE Kcal/lb, another one with 16.1% CP and 1,008 PE Kcal/lb and a basal diet with 20.1% CP
and 975 PE Kcal/lb. The basal diet was diluted with different percentages of oat hulls (10 to
50%) reducing the level of energy and protein and, at the same time, oat hulls were included in
the basal diet (10 to 40%) at the expense of corn and wheat obtaining diets where protein
remained constant while energy decreased in the diet. Results are shown in Table 1. All the diets
were fed to Rhode Island Red x Plymouth Rock crossbred chicks. A decrease in performance
(body weight and feed conversion) was observed as the inclusion level of oat hulls increased in
the diluted diets. Feed consumption increased with increasing levels of oat hulls but performance
levels of the basal diet could not be achieved. Performance results of the other two diets (18.1%
CP and 16.1% CP) showed that birds did not increase feed intake to compensate for the low
19
protein and BW gain was lower than the one achieved with the basal diet. Performance analysis
of constant protein and reduced levels of energy diets showed that feed intake increased while
inclusion levels of oat hulls increased as well, but BW gain remained the same as with the basal
diet. These results indicated that the bird could adjust its feed intake to compensate for
differences in the energy content of the diet but could not do the same for reduced levels of CP
when energy remained constant.
Donaldson et al., (1956) combined different levels of CP with two different energy sources and
observed that the best weight gains and feed conversions were achieved when the calorie to
protein ratios were no wider than 43.9, 48.6 and 53.7 for low, medium and high inclusions of
yellow animal grease respectively. In this study, FI decreased with increasing levels of energy
independently of the protein level. In agreement with Hill and Dansky, (1954) energy levels
modulated FI. In a similar experiment but using poults, the same group of investigators
(Donaldson et al., 1958) observed an improvement in BW gain and FCR when energy was
increased together with crude protein. This time, calorie to protein ratios differed from the ratios
calculated for broilers. Ratios obtained were 27, 45.5 and 47.2 for 1050, 1170 and 1300 PE
calories/lb respectively. In this study, FI decreased with increasing levels of energy
independently of the protein level. Williams and Grau (1956) replaced cellulose for glucose in
lysine deficient diets and observed an improvement in performance due to an increase in feed
intake as the level of energy in the diets was reduced due to the increase of cellulose. Griminger
et al., (1957) performed a similar study replacing fiber for dextrin and using different levels of
tryptophan and arginine. In agreement with the previous studies, BW gain improved with the
decrease in the energy content of the diet by the inclusion of fiber, and birds consumed more
feed as the energy decreased. In 1959 Leong et al., (1959) combined three levels of energy (950,
20
1210 and 1450 PE cal/lb) with five levels of crude protein ranging from 17% to 42% at 5%
intervals. In accordance with the studies cited previously, it was observed that with increasing
levels of energy the best performance was achieved by increasing the levels of CP as well.
In the same line of experiments, Summers et al., (1964) using four levels of energy (2.5, 2.78,
3.05 and 3.33 Kcal ME/g) and five levels of CP (10, 14, 18, 22, and 26%) reported that FI
increased with decreasing levels of energy independently of protein levels supporting the idea
that the bird from 1960’s was capable of adjusting FI to compensate for deficiencies in dietary
energy.
Farrell et al., (1973) reported increased BWG and decreased FI with increasing levels of energy
in the diet. Similar results were reported by Farrell (1974), and Waldroup et al., (1976). It is
important to mention that all these studies were conducted using mash feed since pellet quality
can affect performance significantly especially when dietary energy is increased by addition of
some type of animal fat.
Pellet quality and it effect in energy studies with broilers
McKinney and Teeter (2004) conducted an experiment where broilers were fed the same energy
diets presented with different percentages of pellets from 0 to 100% from 31 to 38 days (Table
2).
Pellets percentage significantly affected BW gain and FCR. As percentage of pellets increased,
performance improved increasing BW gain and reducing FCR. Though it was not significant, FI
showed a numerical reduction as pellet percentage decreased.
21
Pellet quality is negatively affected by fat addition prior to pelleting (Jensen and Falen, 1973;
Richardson and Day, 1976; Briggs et al., 1999). Dozier III et al., (2006) reported a reduction of
pellets from 91.3% (3175 Kcal/Kg and 0.82% poultry oil) to 57.8% (3310 Kcal/Kg and 4.12%
poultry oil). At the same time pellet durability index (PDI) decreased from 95.5 to 76.5%. In
another trial, the same author (Dozier III et al., 2007) reported a decrease in percentage of pellets
of 23.6% and a reduction of 8.4% PDI between two diets with poultry oil inclusion levels of 1.34
and 3.67%.
In recent studies on broiler performance responses to different energy levels, pelleted diets were
used to feed experimental birds (Skinner et al., 1992; Cheng et al., 1997; Hidalgo et al., 2004;
Saleh et al., 2004a; Saleh et al., 2004b; Dozier III et al., 2006; Dozier III et al., 2007; Dozier III
et al., 2008; Dozier III et al., 2011). Common to all these trials, energy was increased in the
experimental diets by addition of poultry oil or tallow to the diets with an effect on the pellet
quality (Skinner et al., 1992; Cheng et al., 1997; Hidalgo et al., 2004; Saleh et al., 2004a; Saleh
et al., 2004b; Dozier III et al., 2006; Dozier III et al., 2007; Dozier III et al., 2008; Dozier III et
al., 2011). It is to be expected then that pellet quality affects performance (BWG, FCR, FI, and
caloric conversion ratio (CCR)).
Modern strains responses to energy levels
Skinner et al., (1992) studied the effect of dietary nutrient density on performance from 42 to 49
days using diets that ranged from 3080 Kcal/Kg with 16.83% CP to 3465 Kcal/Kg with 18.30 %
CP. Increasing levels of energy in the diet decreased BWG and FI but improved FCR. Cheng et
al., (1997) reported similar BWG but reduced FI and CCR with increasing levels of energy (3050
and 3250 Kcal/Kg). On the contrary, Dozier et al., (2011) observed increased BWG and similar
22
FI with increasing levels of energy. Caloric conversion was not affected by energy increments.
This is in agreement with Saleh et al., (2004b) for 42 days performance, but at 63 days BWG and
FI was similar among treatments with a higher caloric conversion for the higher density diets. A
second study by the same researchers (Saleh et al., 2004a) showed significant increment in BWG
at 42 and 49 days with dietary energy increments. Energy increments resulted in reduced FI from
42 to 63 days. CCR was higher for the higher energy diets from 42 to 63 days.
Hidalgo et al., (2004) reported improved BWG and FCR but no differences in CCR and FI with
increasing levels of energy when studying broiler performance from 1 to 38 days. Dozier et al
reported reduced FI, improved CCR with similar BWG when broiler performance was studied
from 30 to 59 (Dozier III et al., 2006), 42 to 56 (Dozier III et al., 2007), and 36 to 47 days
(Dozier III et al., 2011).
Results are contradictory but it seems that modern broilers continue to perform better with high
energy levels improving BWG. CCR results are mixed but it would improve with high energy
diets at early stages. At later stages CCR deteriorates as dietary energy increases. It seems that
modern birds do not adjust FI to compensate for differences in energy levels anymore or at least
this adjustment in FI is not linear to the variation of dietary energy. Though it is not clear to what
extent, it appears that higher inclusions of poultry oil would affect pellet quality reducing feed
consumption and hiding an unrestricted appetite of the bird that would be eating to maximum
fill.
Processing Yield affected by dietary energy levels
Energy effect on processing parameters has been studied. Leeson et al., (1996) reported no effect
in BMY but increased fat pad of birds fed increasing levels of energy with constant CP. Similar
23
results were reported by Dozier III et al., (2011) though previous studies by the same researchers
showed no effect in BMY nor abdominal fat pad (Dozier III et al., 2006; Dozier III et al., 2007).
Results will be affected depending upon whether CP or amino acids are increased proportionally
to ME.
Performance influenced by dietary protein levels
Intense genetic selection has changed the meat type bird used sixty years ago. A gradual but
unstoppable change took place in the bird changing carcass composition at the same time.
Substantial research has been done in order to determine if protein requirements have changed
for the changing bird. In 1964, Summers et al studied the effects of different levels of energy and
protein on male broilers performance reporting improved BW with increasing levels of CP up to
26%. Jackson et al., (1982) reported improved performance with increasing levels of protein up
to 24% CP in male broilers with no effect in FI. Similar results have been reported by Fancher
and Jensen, (1989a); Fancher and Jensen, (1989b); Smith and Pesti, (1998) and Smith et al.,
(1998).
Optimal level of dietary crude protein for maximum BW has been reported to be lower than the
level of protein required for improved feed efficiency (Fancher and Jensen 1989a; Moran et al.,
1992; Bartov and Plavnik , 1998).
It has been demonstrated that CP levels can be reduced in broiler diets if essential amino acids
are supplemented to a certain point (Lipstein and Bornstein, 1975; Moran Jr et al., 1992; Si et al.,
2004). Below that point, birds fed low CP diets do not perform as good as birds fed
recommended CP even when all essential amino acids are supplemented reducing BWG and
24
increasing FCR (Fancher and Jensen, 1989a; Fancher and Jensen, 1989b; Kerr and Kidd, 1999;
Corzo et al., 2005; Waldroup et al., 2005).
Baker and Han, (1994) reported improved BWG and FCR with higher levels of AA when levels
80% and 112% of 1994 NRC recommendations while maintaining the ratio of AA to lysine, for
the three to six week period were tested in broilers. Similar results were reported by Kidd et al.,
(2004) and Corzo et al., (2005). Skinner et al., (1992) observed a reduction in BW during the 42
to 49 days period when birds were fed levels below 90% recommended AA levels with FCR
deteriorating below 90% AA levels. Raising levels of arginine, tryptophan, and glycine related to
Lysine also improved BW and FCR in birds from 1 to 18 days (Corzo, 2012).
Lysine level influence in performance
Of all the Essential amino acids, lysine (Lys) is the one on which more investigation has been
conducted. It has been reported that increasing Lys levels improve different parameters of
performance. Body weight is the first parameter to be affected followed by BMY and FCR
(Moran Jr and Bilgili, 1990; Han and Baker 1993;Leclercq, 1998; Kerr et al., 1999). In 1955,
Williams and Grau, (1956) already showed the importance of Lysine supplementation improving
BWG and FCR from 14 to 32 days of age in broilers. Kidd et al., (1997) reported improved BW
and FCR with higher levels of Lys when 1.1 and 1.2% Lys levels were fed to chicks from 1 to 18
days of age. Similar results for 1 to 18 days are reported by Kidd et al., (1998) and Kerr et al.,
(1999). Further research by Kidd and Fancher, (2001) resulted in lysine requirements to be
estimated between 1.18 and 1.22% lysine for this period. Han and Baker, (1994) reported
increased BWG and reduced FCR with Lysine increments when 0.51, 0.61, 0.71, 0.81, 0.91,
1.01, and 1.11% of digestible Lysine were fed to broilers from three to six weeks of age. Broken
25
line analysis indicated a digestible lysine requirement of 0.85% for males and 0.78% for females
in this age period. Renden et al., (1994) compared two levels of lysine (1% and 1.15%) for
grower and 0.85% and 1% for finisher reporting improved BWG and FCR for the high Lysine
diets. Kidd et al., (1997) observed reduced FCR but no effect in BW when comparing 100% to
105% NRC level of Lysine from 18 to 54 days of age. Kerr et al., (1999) observed improved
BWG with Lys levels up to 1.23% Lys, after that BWG deteriorated with higher Lys inclusions
for age 21 to 42. On the contrary, Moran and Bilgili (1990) found no differences in performance
between 0.95 and 1.05% Lys levels for the 28 to 42 days of age period and Mendes et al., (1997)
found no differences between Lys levels (1.0, 1.1, 1.2%) when birds were exposed to heat or
cold stress.
Crude protein and AA level influence in different genotypes performance
The effect of varying levels of CP and AA on different bird genotypes has been studied. Leclercq
(1983) studied the effect of different levels of CP in two different strains selected for high or low
lean or fat carcass composition. Fast growing selected birds performed better with low levels of
CP while at higher levels, lean and fat bird performance was similar. Smith and Pesti, (1998) and
Smith et al., (1998) compared a high yield strain (Ross 508) with a fast growing strain cross
(Peterson x Arbor Acres) at three different CP levels (16, 20 and 24%) keeping energy constant.
The high yield bird responded to increasing levels of CP while the fast growing strain did not.
Accordingly, FCR reduction was more pronounced in the high yield strain. Feed intake was
reduced in both strains with increasing levels of CP. Corzo et al., (2005b) reported no
interactions between high and low AA density diets and a high yield and multi-purpose strain.
Sterling et al., (2006) found no interactions between lysine levels and genotypes (high yield and
multipurpose strain) on live performance from 17 to 42 days of age.
26
Processing
Dietary CP levels affect processing though results vary. Fancher and Jensen (1989a) reported
decreased fat deposition but no effect in BMY with increasing levels of CP. Bartov and Plavnik
(1998) observed increased carcass yield, BMY and reduced fat deposition at 57 days of age in
similar conditions. This is in partial agreement with Holsheimer and Veerkamp (1992) who
observed reduced fat deposition and reduced breast meat with higher levels of CP.
When CP level is reduced below NRC recommendations, carcass yield and BMY are reduced
(Moran et al., 1992). This is in agreement with Rezaei et al., (2004) who reported similar results
together with an increase in fat pad yield. Sterling et al., (2006) only observed increased fat pad
when CP was reduced from 23 to 17%.
Dietary amino acid levels also affect processing yield. A reduction in AA levels 7 days prior to
processing (42 to 49 days) increased abdominal fat pad though dressing percentage was not
affected (Skinner et al. 1992). Feeding high AA dense diets compared to low AA dense diets was
reported to increase BMY and reduce abdominal fat pad yield (Kidd et al., 2004; Corzo et al.,
2005b).
Lysine effect in processing yield of birds
Lysine inclusion levels and it effect on yield has been studied thoroughly with different results.
According to Tesseraud et al., (1996), the major effect of increasing lysine takes place in the
Pectoralis minor. Moran and Bilgili, (1990) reported no effect on breast meat when three
different dietary levels of Lys (0.85, 0.95, and 1.05%) were compared at 42 days with total
carcass fat decreasing with increasing levels of Lys. Holsheimer and Veerkamp, (1992) reported
significant increments in BM and wing yield at 56 days with a high Lys level compared to a
27
normal level. In a follow up study (Holsheimer and Ruesink, 1993) the same results were
obtained.
Renden et al., (1994) observed an improvement in carcass weight, BMY and a reduction in
abdominal fat pad at 56 days with high levels of Lys. Similar results are reported by Kidd et al.,
(1998) and Kerr et al., (1999). Corzo et al., (2006) reported a similar response in high yield
males but a lack of response in females suggesting that lower levels of Lys could be fed without
loosing performance.
It has been reported that different bird genotypes respond different to diets varying in CP or AA
levels. In 1992, Moran et al., (1992) compared eight different broiler strains using 0.85 and
0.95% Lys in the finisher phase but reported no strain x Lys level interaction. Smith et al.,
(1998) found no interaction in yield between the high yield and the multi-purpose strain fed
different levels of CP. Corzo et al., (2005b) observed significant interaction for fillets yield at 42
days but no effect at 56 days of age. Sterling et al., (2006) reported no interactions between CP
and lysine levels at a processing age of 42 days.
References
Baker, D. H., and Y. Han. 1994. Ideal amino acid profile for chicks during the first three weeks
posthatching. Poult. Sci. 73:1441-1447.
Baldini, J., and H. R. Rosenberg. 1955. The effect of productive energy level of the diet on the
methionine requirement of the chick. Poult. Sci. 34:1301-1307.
Bartov, I., and I. Plavnik. 1998. Moderate excess of dietary protein increases breast meat yield of
broiler chicks. Poult. Sci. 77:680-688.
28
Bayyari, G., W. Huff, N. Rath, J. Balog, L. Newberry, J. Villines, J. Skeeles, N. Anthony, and K.
Nestor. 1997. Effect of the genetic selection of turkeys for increased body weight and egg
production on immune and physiological responses. Poult. Sci. 76:289-296.
Biely, J., and B. March. 1954. Fat Studies in Poultry: 2. Fat Supplements in Chick and Poult
Rations. Poult. Sci. 33:1220.
Briggs, J., D. Maier, B. Watkins, and K. Behnke. 1999. Effect of ingredients and processing
parameters on pellet quality. Poult. Sci. 78:1464-1471.
Burkhart, C., J. A. Cherry, H. Van Krey, and P. Siegel. 1983. Genetic selection for growth rate
alters hypothalamic satiety mechanisms in chickens. Behav. Genet. 13:295-300.
Chambers, J., J. Gavora, and A. Fortin. 1981. Genetic changes in meat-type chickens in the last
twenty years. Canadian Journal of Animal Science 61:555-563.
Cheng, T. K., M. L. Hamre, and C. N. Coon. 1997. Effect of environmental temperature, dietary
protein, and energy levels on broiler performance. The Journal of Applied Poultry Research 6:1.
Combs, G.F., Romoser G.L. A new approach to poultry feed formulation. Maryland Agr. Exp.
Sta. Misc. Pub, 1955
Corzo, A. 2012. Determination of the arginine, tryptophan, and glycine ideal-protein ratios in
high-yield broiler chicks. The Journal of Applied Poultry Research 21:79-87.
Corzo, A., W. Dozier, and M. Kidd. 2006. Dietary lysine needs of late-developing heavy
broilers. Poult. Sci. 85:457-461.
Corzo, A., C. A. Fritts, M. T. Kidd, and B. J. Kerr. 2005a. Response of broiler chicks to essential
and non-essential amino acid supplementation of low crude protein diets. Anim. Feed Sci.
Technol. 118:319-327.
Corzo, A., M. Kidd, D. Burnham, E. Miller, S. Branton, and R. G. E. Gonzalez-Esquerra. 2005b.
Dietary amino acid density effects on growth and carcass of broilers differing in strain cross and
sex. J. Appl. Poult. Res. 14:1-9.
Currie, R. J. W. 1999. Ascites in poultry: recent investigations. Avian Pathol. 28:313-326.
Donaldson, W., G. Combs, and G. Romoser. 1958. Studies on Energy Levels in Poultry Rations:
3. Effect of Calorie-Protein Ratio of the Ration on Growth, Nutrient Utilization and Body
Composition of Poults. Poult. Sci. 37:614.
Donaldson, W., G. Combs, and G. Romoser. 1956. Studies on energy levels in poultry rations. 1.
The effect of calorie-protein ratio of the ration on growth, nutrient utilization and body
composition of chicks. Poult. Sci. 35:1100.
29
deBeer, Marc. 2010. Poultry Beyond 2015: Proceeedings 4th
New Zealand International Broiler
Nutritionist's Conference.
Dozier III, W. A., B. J. Kerr, A. Corzo, M. T. Kidd, T. E. Weber, and K. Bregendahl. 2008.
Apparent metabolizable energy of glycerin for broiler chickens. Poult. Sci. 87:317.
Dozier III, W., C. Gehring, A. Corzo, and H. Olanrewaju. 2011. Apparent metabolizable energy
needs of male and female broilers from 36 to 47 days of age. Poult. Sci. 90:804-814.
Dozier III, W., A. Corzo, M. Kidd, and S. Branton. 2007. Dietary apparent metabolizable energy
and amino acid density effects on growth and carcass traits of heavy broilers. J. Appl. Poult. Res.
16:192-205.
Dozier III, W., C. Price, M. Kidd, A. Corzo, J. Anderson, and S. Branton. 2006. Growth
performance, meat yield, and economic responses of broilers fed diets varying in metabolizable
energy from thirty to fifty-nine days of age. J. Appl. Poult. Res. 15:367-382.
Emmerson, D. 1997. Commercial approaches to genetic selection for growth and feed
conversion in domestic poultry. Poult. Sci. 76:1121-1125.
Fancher, B. I., and L. E. O. S. Jensen. 1989a. Influence on performance of three to six-week-old
broilers of varying dietary protein contents with supplementation of essential amino acid
requirements. Poult. Sci. 68:113-123.
Fancher, B. I., and L. S. Jensen. 1989b. Dietary protein level and essential amino acid content:
influence upon female broiler performance during the grower period. Poult. Sci. 68:897-908.
Farrell, D. 1974. Effects of dietary energy concentration on utilisation of energy by broiler
chickens and on body composition determined by carcass analysis and predicted using tritium.
Br. Poult. Sci. 15:25-41.
Farrell, D., R. Cumming, and J. Hardaker. 1973. The effects of dietary energy concentration on
growth rate and conversion of energy to weight gain in broiler chickens. Br. Poult. Sci. 14:329-
340.
Fisher, R. A. 1918. The correlation between relatives on the supposition of Mendelian
inheritance. Trans. R. Soc. Edinb. 52:399-433.
Fraps, G. S. and E. C. Carlyle. 1941. Productive energy of corn meal, alfalfa leaf meal, dried
buttermilk, casein, cottonseed meal, and tankage as measured by production of fat and flesh by
growing chickens. Texas Agr. Expt. Sta. Bull 600
Fraps, G. S. and E. C. Carlyle. 1942. Productive energy of some feeds and foods as measured by
gains of energy by growing chickens. Texas Agr. Expt. Sta. Bull 625
30
Fumihito, A., T. Miyake, S. Sumi, M. Takada, S. Ohno, and N. Kondo. 1994. One subspecies of
the red junglefowl (Gallus gallus gallus) suffices as the matriarchic ancestor of all domestic
breeds. Proceedings of the National Academy of Sciences 91:12505.
Gaya, L. G., A. Costa, J. B. S. Ferraz, F. M. Rezende, E. C. Mattos, J. P. Eler, T. M. Filho, G. B.
Mourão, and L. G. G. Figueiredo. 2007. Genetic trends of absolute and relative heart weight in a
male broiler line. Genet.Mol.Res 6:1091-1096.
Griminger, P., H. Scott, and R. Forbes. 1957. Dietary bulk and amino acid requirements. J. Nutr.
62:61.
Grunder, A. A., K. G. Hollands, J. S. Gavora, J. R. Chambers, and N. A. G. Gave. 1983.
Degenerative myopathy of the Musculus supracoracoideus and production traits in strains of
meat-type chickens. Poult. Sci. 63: 781-785
Han, Y., and D. H. Baker. 1994. Digestible lysine requirement of male and female broiler chicks
during the period three to six weeks posthatching. Poult. Sci. 73:1739-1745.
Han, Y., and D. H. Baker. 1993. Effects of sex, heat stress, body weight, and genetic strain on
the dietary lysine requirement of broiler chicks. Poult. Sci. 72:701-708.
Havenstein, G. B., P. R. Ferket, and M. A. Qureshi. 2003a. Carcass composition and yield of
1957 versus 2001 broilers when fed representative 1957 and 2001 broiler diets. Poult. Sci.
82:1509.
Havenstein, G. B., P. R. Ferket, and M. A. Qureshi. 2003b. Growth, livability, and feed
conversion of 1957 versus 2001 broilers when fed representative 1957 and 2001 broiler diets.
Poult. Sci. 82:1500.
Havenstein, G. B., P. R. Ferket, S. E. Scheideler, and B. T. Larson. 1994a. Growth, livability,
and feed conversion of 1957 vs 1991 broilers when fed "typical" 1957 and 1991 broiler diets.
Poult. Sci. 73:1785-1794.
Havenstein, G. B., P. R. Ferket, S. E. Scheideler, and D. V. Rives. 1994b. Carcass composition
and yield of 1991 vs 1957 broilers when fed "typical" 1957 and 1991 broiler diets. Poult. Sci.
73:1795-1804.
Henderson, E. W., and W. Irwin. 1940. The tolerance of growing chicks for soybean oil in their
ration. Poult. Sci. 19:389.
Hidalgo, M., W. Dozier III, A. Davis, and R. Gordon. 2004. Live performance and meat yield
responses of broilers to progressive concentrations of dietary energy maintained at a constant
metabolizable energy-to-crude protein ratio. J. Appl. Poult. Res. 13:319.
Hill, F. W., and L. M. Dansky. 1950. Studies on the protein requirements of chicks and its
relation to dietary energy level. Poult. Sci. 29:763
31
Hill, F., and L. Dansky. 1954. Studies of the Energy Requirements of Chickens: 1. The Effect of
Dietary Energy Level on Growth and Feed Comsumption. Poult. Sci. 33:112.
Holsheimer, J., and E. Ruesink. 1993. Effect on performance, carcass composition, yield, and
financial return of dietary energy and lysine levels in starter and finisher diets fed to broilers.
Poult. Sci. 72:806.
Holsheimer, J., and C. Veerkamp. 1992. Effect of dietary energy, protein, and lysine content on
performance and yields of two strains of male broiler chicks. Poult. Sci. 71:872-879.
Jackson, S., and J. Diamond. 1996. Metabolic and digestive responses to artificial selection in
chickens. Evolution:1638-1650.
Jackson, S., J. Summers, and S. Leeson. 1982. Effect of dietary protein and energy on broiler
performance and production costs. Poult. Sci. 61:2232.
Jensen, L., and L. Falen. 1973. Effect of pelleting on the “extra caloric” effect of dietary fat for
developing turkeys. Poult. Sci. 52:2342-2344.
Julian, R. J. 1993. Ascites in poultry. Avian Pathol. 22:419-454.
Julian, R. J., I. McMillan, and M. Quinton. 1989. The effect of cold and dietary energy on right
ventricular hypertrophy, right ventricular failure and ascites in meat‐type chickens. Avian Pathol.
18:675-684.
Julian, R. 1998. Rapid growth problems: ascites and skeletal deformities in broilers. Poult. Sci.
77:1773-1780.
Julian, R. 1989. Lung volume of meat-type chickens. Avian Dis.:174-176.
Julian, R., G. Friars, H. French, and M. Quinton. 1987. The relationship of right ventricular
hypertrophy, right ventricular failure, and ascites to weight gain in broiler and roaster chickens.
Avian Dis.:130-135.
Katanbaf, M. N., E. A. Dunnington, and P. B. Siegel. 1988a. Allomorphic relationships from
hatching to 56 days in parental lines and F1 crosses of chickens selected 27 generations for high
or low body weight. Growth Dev. Aging 52:11-21.
Katanbaf M. N., P. B. Siegel, and E.A. Dunington. 1988b. Organ growth of selected lines of
chicken and their F1 to a common body weight or age. Theoretical and applied genetics 76: 540-
544
Kerr, B., and M. Kidd. 1999. Amino acid supplementation of low-protein broiler diets: 1.
Glutamic acid and indispensable amino acid supplementation. J. Appl. Poult. Res. 8:298-309.
32
Kerr, B., M. Kidd, K. Halpin, G. McWard, and C. Quarles. 1999. Lysine level increases live
performance and breast yield in male broilers. J. Appl. Poult. Res. 8:381-390.
Kidd, M., C. McDaniel, S. Branton, E. Miller, B. Boren, and B. Fancher. 2004. Increasing amino
acid density improves live performance and carcass yields of commercial broilers. J. Appl. Poult.
Res. 13:593-604.
Kidd, M., and B. Fancher. 2001. Lysine needs of starting chicks and subsequent effects during
the growing period. J. Appl. Poult. Res. 10:385-393.
Kidd, M., B. Kerr, K. Halpin, G. McWard, and C. Quarles. 1998. Lysine levels in starter and
grower-finisher diets affect broiler performance and carcass traits. J. Appl. Poult. Res. 7:351-
358.
Kidd, M., B. Kerr, and N. Anthony. 1997. Dietary interactions between lysine and threonine in
broilers. Poult. Sci. 76:608-614.
Konarzewski, M., A. Gavin, R. McDevitt, and I. R. Wallis. 2000. Metabolic and organ mass
responses to selection for high growth rates in the domestic chicken (Gallus domesticus).
Physiological and Biochemical Zoology 73:237-248.
Leclercq, B. 1998. Lysine: Specific effects of lysine on broiler production: comparison with
threonine and valine. Poult. Sci. 77:118-123.
Leclercq, B. 1983. The influence of dietary protein content on the performance of genetically
lean or fat growing chickens. Br. Poult. Sci. 24:581-587.
Leeson, S., L. Caston, and J. Summers. 1996. Broiler response to diet energy. Poult. Sci. 75:529.
Leong, K. C., M. Sunde, H. Bird, and C. Elvehjem. 1959. Interrelationships among dietary
energy, protein, and amino acids for chickens. Poult. Sci. 38:1267-1285.
Li, Z., K. Nestor, Y. Saif, J. Anderson, and R. Patterson. 2001. Effect of selection for increased
body weight in turkeys on lymphoid organ weights, phagocytosis, and antibody responses to
fowl cholera and Newcastle disease-inactivated vaccines. Poult. Sci. 80:689-694.
Lilburn, M. S. 1994. Skeletal growth of commercial poultry species. Poult. Sci. 73:897-903.
Lipstein, B., and S. Bornstein. 1975. The replacement of some of the soybean meal by the first
limiting amino acids in practical broiler diets. Br. Poult. Sci. 16:189-200.
Liu, G., E. Dunnington, and P. Siegel. 1995. Growth related traits in body weight selected lines
and their crosses reared under different nutritional regimens. Br. Poult. Sci. 36:209-219.
33
Liu, Y. P., G. S. Wu, Y. G. Yao, Y. W. Miao, G. Luikart, M. Baig, A. Beja-Pereira, Z. L. Ding,
M. G. Palanichamy, and Y. P. Zhang. 2006. Multiple maternal origins of chickens: out of the
Asian jungles. Mol. Phylogenet. Evol. 38:12-19.
Lush, J. L., and C. L. Hubbs. 1945. Animal breeding plans. Collegiate Press.
Macrae, D. V. E., M. Mahon, S. Gilpin, D. Sandercock, and M. Mitchell. 2006. Skeletal muscle
fibre growth and growth associated myopathy in the domestic chicken (Gallus domesticus). Br.
Poult. Sci. 47:264-272.
Marks, H. 1985. Direct and correlated responses to selection for growth. Poultry Genetics and
Breeding.Hill, WG, JM Manson and D.Hewitt editors.
Martin, A., F. McNabb, and P. Siegel. 1988. Thyroid hormones and antibody response to sheep
erythrocytes of dwarf and normal chickens selected for juvenile body weight. Genetics Selection
Evolution 20:1-11.
Matterson, L. D., L. M. Potter, L. D. Stinson and E. P. Singsen. 1955. Studies on the effect of
varying protein and energy levels in poultry rations on growth and feed efficiency. Poult. Sci.
34:1210
McEnteé, G. M., K. Rance, R. M. McDevitt, R. Crowe, J. M. Forbes, R. Freire, F. Short, C. J.
Nicol, J. A. McLean, and C. J. Savory. 2000. SPRING MEETING OF THE WPSA (UK
BRANCH). Br. Poult. Sci. 41:667-707.
McKinney, L. J., and R. G. Teeter. 2004. Predicting effective caloric value of nonnutritive
factors: I. Pellet quality and II. Prediction of consequential formulation dead zones. Poult. Sci.
83:1165.
Mendes, A., S. Watkins, J. England, E. Saleh, A. Waldroup, and P. Waldroup. 1997. Influence of
dietary lysine levels and arginine: lysine ratios on performance of broilers exposed to heat or
cold stress during the period of three to six weeks of age. Poult. Sci. 76:472-481.
Miller, L., P. Siegel, and E. Dunnington. 1992. Inheritance of Antibody Response to Sheep
Erythrocytes in Lines of Chickens Divergently Selected for Fifty-Six–Day Body Weight and
Their Crosses. Poult. Sci. 71:47-52.
Moran Jr, E., R. Bushong, and S. Bilgili. 1992. Reducing dietary crude protein for broilers while
satisfying amino acid requirements by least-cost formulation: live performance, litter
composition, and yield of fast-food carcass cuts at six weeks. Poult. Sci. 71:1687-1694.
Moran Jr, E., and S. Bilgili. 1990. Processing losses, carcass quality, and meat yields of broiler
chickens receiving diets marginally deficient to adequate in lysine prior to marketing. Poult. Sci.
69:702-710.
34
Mott, C. R., P. B. Siegel, K. E. Webb Jr, and E. A. Wong. 2008. Gene expression of nutrient
transporters in the small intestine of chickens from lines divergently selected for high or low
juvenile body weight. Poult. Sci. 87:2215.
Nestor, K., Y. Saif, J. Zhu, and D. Noble. 1996. Influence of growth selection in turkeys on
resistance to Pasteurella multocida. Poult. Sci. 75:1161-1163.
Nir, I., Z. Nitsan, and M. Mahagna. 1993. Comparative growth and development of the digestive
organs and of some enzymes in broiler and egg type chicks after hatching. Br. Poult. Sci. 34:523-
532.
Nir, I., Z. Nitsan, Y. Dror, and N. Shapira. 1978. Influence of overfeeding on growth, obesity
and intestinal tract in young chicks of light and heavy breeds. Br. J. Nutr. 39:27-35.
O’Sullivan N. P., E. A. Dunnnington, A. S. Larsen, and P. B. Siegel. 1991. Correlated responses
in lines of chickens divergently selected for fifty-six-day body weight. 2. Organ growth,
deoxyribonucleic acid, ribonucleic acid, and protein content. Poult. Sci. 71: 598-609
Peterson, D. W., C. R. Grau and N. F. Peek. 1954. Growth and food consumption in relation to
dietary levels of protein and fibrous bulk. J. Nutr. 52:241-257
Pym, R., and P. Nicholls. 1979. Selection for food conversion in broilers: Direct and correlated
responses to selection for body‐weight gain, food consumption and food conversion ratio. Br.
Poult. Sci. 20:73-86.
Qureshi, M., and G. Havenstein. 1994. A comparison of the immune performance of a 1991
commercial broiler with a 1957 randombred strain when fed “typical” 1957 and 1991 broiler
diets. Poult. Sci. 73:1805-1812.
Reddish, J. M., and M. S. Lilburn. 2004. A comparison of growth and development patterns in
diverse genotypes of broilers. 1. Male broiler growth. Poult. Sci. 83:1067.
Renden, J., E. Moran Jr, and S. Kincaid. 1994. Lack of interactions between dietary lysine or
strain cross and photoschedule for male broiler performance and carcass yield. Poult. Sci.
73:1651-1662.
Rezaei, M., H. N. Moghaddam, J. P. Reza, and H. Kermanshahi. 2004. The effects of dietary
protein and lysine levels on broiler performance, carcass characteristics and N excretion. Int. J.
Poult. Sci. 3:148-152.
Richardson, W., and E. J. Day. 1976. Effect of varying levels of added fat in broiler diets on
pellet quality. Feedstuffs (May 17):24
Ross Breeders. 2007. Ross 308 Broiler performance objectives 2007.
35
Saleh, E., S. Watkins, A. Waldroup, and P. Waldroup. 2004a. Effects of dietary nutrient density
on performance and carcass quality of male broilers grown for further processing. Int.J.Poult.Sci
3:1-10.
Saleh, E., S. Watkins, A. Waldroup, and P. Waldroup. 2004b. Consideration for dietary nutrient
density and energy feeding programs for growing large male broiler chickens for further
processing. Int.J.Poult.Sci 3:11-16.
Sandercock, D. A., G. R. Nute, and P. M. Hocking. 2009. Quantifying the effects of genetic
selection and genetic variation for body size, carcass composition, and meat quality in the
domestic fowl (Gallus domesticus). Poult. Sci. 88:923.
Scheele, C., E. Decuypere, P. Vereiken, and F. Schreurs. 1992. Ascites in Broilers. Poult. Sci.
71:1971-1984.
Scheele, C., W. De Wit, M. Frankenhuis, and P. Vereijken. 1991. Ascites in Broilers. Poult. Sci.
70:1069-1083.
Schmidt, C. J., M. E. Persia, E. Feierstein, B. Kingham, and W. W. Saylor. 2009. Comparison of
a modern broiler line and a heritage line unselected since the 1950s. Poult. Sci. 88:2610.
Schoettle, C., E. Reber, J. Alberts, and H. Scott. 1956. A Study of New Hampshire× Barred
Columbian Chicks from Two Days of Age to Ten Weeks of Age. Poult. Sci. 35:95-98.
Schwartz, H. G., M. W. Taylor, and H. Fisher. 1958. The effect of dietary energy concentration
and age on the lysine requirement of growing chicks. J. Nutr. 65:25-37.
Scott, H. M., L. D. Matterson and E.P. Singsen. 1947. Nutritional factors influencing growth and
efficiency of feed utilization. 1. The effect of the source of the carbohydrates. Poult. Sci. 26:554
Scott, H. M., L . C. Sims and D. L. Staheli. 1955. The effect of varying protein and energy on the
performance of chicks. Poult. Sci. 34:1220
Scott, H., and R. Forbes. 1958. The arginine requirement of chicks in relation to diet
composition. Poult. Sci. 37:1347-1349.
Sherwood, D. H. 1977. Modern broiler feeds and strains: what two decades of improvement
have done. Feedstuffs 49:70
Si, J., C. A. Fritts, D. J. Burnham, and P. W. Waldroup. 2004. Extent to which crude protein may
be reduced in corn-soybean meal broiler diets through amino acid supplementation.
Int.J.Poult.Sci 3:46-50.
Siegel, P. and Wisman, E. 1966. Selection for body weight at eight weeks of age. 6. Changes in
appetite and feed utilization. Poult. Sci. 45: 1391-1397
36
Siegel, P., and E. Dunnington. 1997. Genetic selection strategies--population genetics. Poult. Sci.
76:1062-1065.
Siegel, P., and E. Wisman. 1962. Protein and energy requirements of chicks selected for high and
low body weight. Poult. Sci. 41:1225-1232.
Siegel, P. B., and J. H. Wolford. 2003. A review of some results of selection for juvenile body
weight in chickens. J. of Poult. Sci. 40:81-91.
Siller, W., L. Martindale, and P. Wight. 1979. The prevention of experimental deep pectoral
myopathy of the fowl by fasciotomy. Avian Pathol. 8:301-307.
Sinsigalli, N. A., J. P. McMurtry, J. A. Cherry, and P. B. Siegel. 1987. Glucose tolerance, plasma
insulin and immunoreactive glucagon in chickens selected for high and low body weight. J. Nutr.
117:941-947.
Skinner, J. T., A. L. Waldroup, and P. W. Waldroup. 1992. Effects of dietary nutrient density on
performance and carcass quality of broilers 42 to 49 days of age. J. Appl. Poult. Res. 1:367.
Smith, E., and G. Pesti. 1998. Influence of broiler strain cross and dietary protein on the
performance of broilers. Poult. Sci. 77:276-281.
Smith, E., G. Pesti, R. Bakalli, G. Ware, and J. Menten. 1998. Further studies on the influence of
genotype and dietary protein on the performance of broilers. Poult. Sci. 77:1678-1687.
Sterling, K., G. Pesti, and R. Bakalli. 2006. Performance of different broiler genotypes fed diets
with varying levels of dietary crude protein and lysine. Poult. Sci. 85:1045-1054.
Summers, J., S. Slinger, I. Sibbald, and W. Pepper. 1964. Influence of protein and energy and
growth and protein utilization in the growing chicken. J. Nutr. 82:463.
Tesseraud, S., N. Maaa, R. Peresson, and A. Chagneau. 1996. Relative responses of protein
turnover in three different skeletal muscles to dietary lysine deficiency in chicks 1. Br. Poult. Sci.
37:641-650.
Thomas, C., W. Blow, C. C. Cockerham, and E. Glazener. 1958. The heritability of body weight,
gain, feed consumption, and feed conversion in broilers. Poult. Sci. 37:862-869.
Waldroup, P. W., Q. Jiang, and C. A. Fritts. 2005. Effects of supplementing broiler diets low in
crude protein with essential and nonessential amino acids. Int.J.Poult.Sci 4:425-431.
Waldroup, P. W., R. J. Mitchell, J. R. Payne, and Z. B. Johnson. 1976. Characterization of the
response of broiler chickens to diets varying in nutrient density content. Poult. Sci. 55:130.
Warren, D. C. 1958. A half century of advances in the genetics and breeding improvement of
poultry. Poult. Sci. 37:3-20.
37
West, B., and B. X. Zhou. 1988. Did chickens go north? New evidence for domestication.
Journal of archaeological science 15:515-533.
Williams, M. A., and C. R. Grau. 1956. Food intake and utilization of lysine-deficient protein by
the chick in relation to the digestible energy concentration of the diet. J. Nutr. 59:243.
Wood-Gush, D. 1959. A history of the domestic chicken from antiquity to the 19th century.
Poult. Sci. 38:321-326.
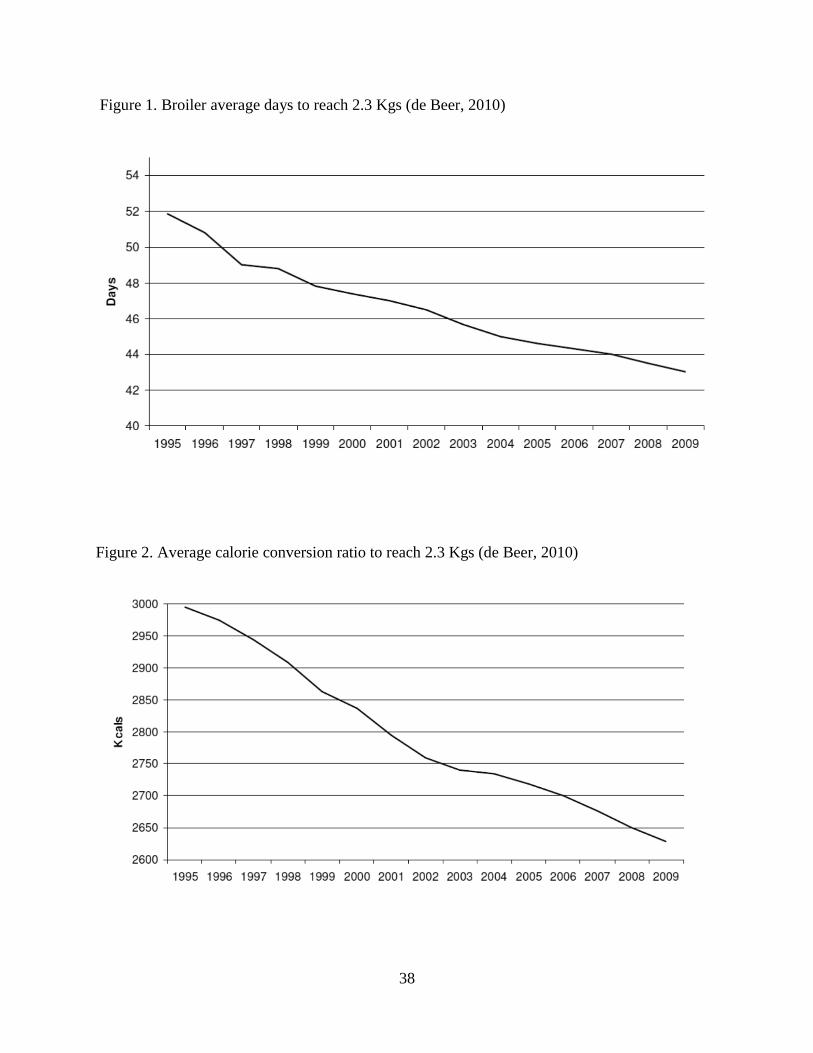
38
Figure 1. Broiler average days to reach 2.3 Kgs (de Beer, 2010)
Figure 2. Average calorie conversion ratio to reach 2.3 Kgs (de Beer, 2010)
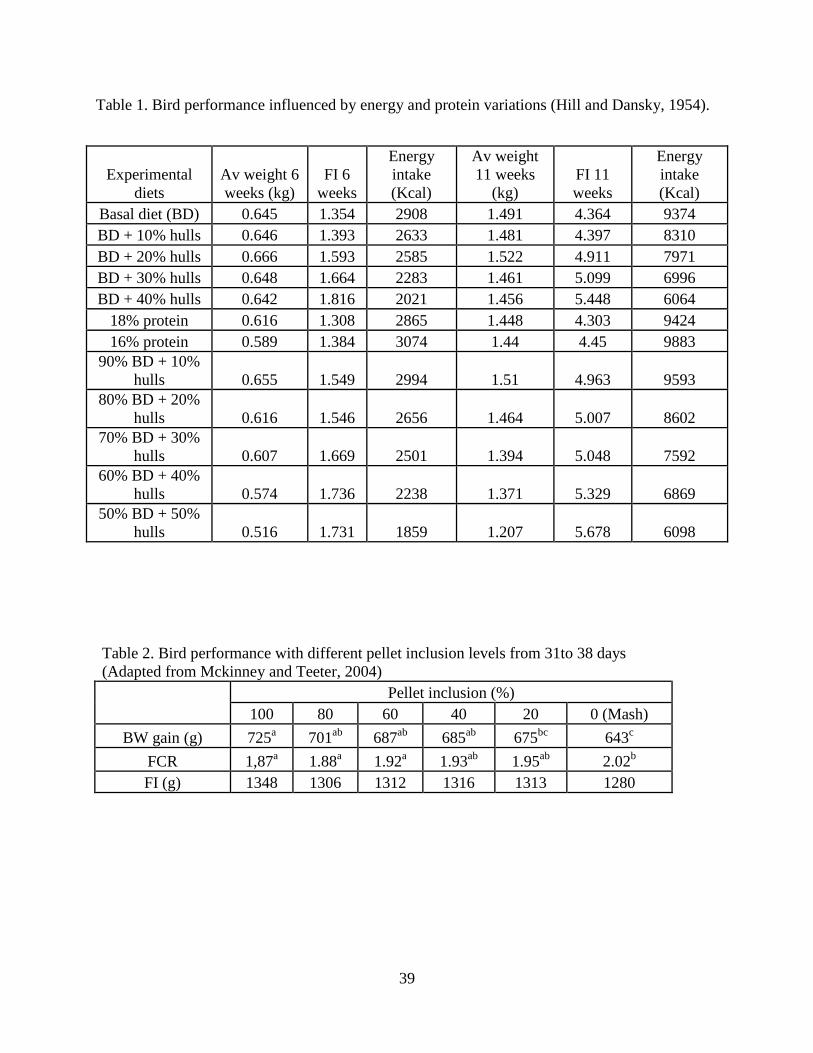
39
Table 1. Bird performance influenced by energy and protein variations (Hill and Dansky, 1954).
Experimental
diets
Av weight 6
weeks (kg)
FI 6
weeks
Energy
intake
(Kcal)
Av weight
11 weeks
(kg)
FI 11
weeks
Energy
intake
(Kcal)
Basal diet (BD) 0.645 1.354 2908 1.491 4.364 9374
BD + 10% hulls 0.646 1.393 2633 1.481 4.397 8310
BD + 20% hulls 0.666 1.593 2585 1.522 4.911 7971
BD + 30% hulls 0.648 1.664 2283 1.461 5.099 6996
BD + 40% hulls 0.642 1.816 2021 1.456 5.448 6064
18% protein 0.616 1.308 2865 1.448 4.303 9424
16% protein 0.589 1.384 3074 1.44 4.45 9883
90% BD + 10%
hulls 0.655 1.549 2994 1.51 4.963 9593
80% BD + 20%
hulls 0.616 1.546 2656 1.464 5.007 8602
70% BD + 30%
hulls 0.607 1.669 2501 1.394 5.048 7592
60% BD + 40%
hulls 0.574 1.736 2238 1.371 5.329 6869
50% BD + 50%
hulls 0.516 1.731 1859 1.207 5.678 6098
Table 2. Bird performance with different pellet inclusion levels from 31to 38 days
(Adapted from Mckinney and Teeter, 2004)
Pellet inclusion (%)
100 80 60 40 20 0 (Mash)
BW gain (g) 725a 701
ab 687
ab 685
ab 675
bc 643
c
FCR 1,87a 1.88
a 1.92
a 1.93
ab 1.95
ab 2.02
b
FI (g) 1348 1306 1312 1316 1313 1280
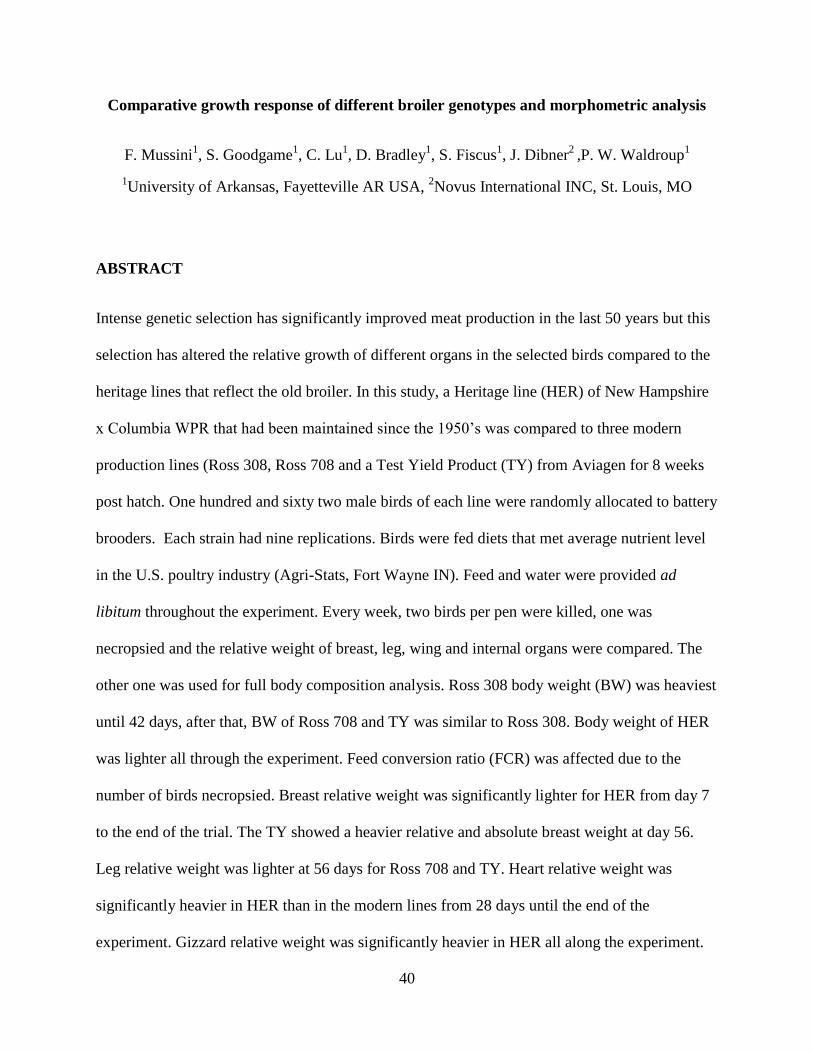
40
Comparative growth response of different broiler genotypes and morphometric analysis
F. Mussini1, S. Goodgame
1, C. Lu
1, D. Bradley
1, S. Fiscus
1, J. Dibner
2 ,P. W. Waldroup
1
1University of Arkansas, Fayetteville AR USA,
2Novus International INC, St. Louis, MO
ABSTRACT
Intense genetic selection has significantly improved meat production in the last 50 years but this
selection has altered the relative growth of different organs in the selected birds compared to the
heritage lines that reflect the old broiler. In this study, a Heritage line (HER) of New Hampshire
x Columbia WPR that had been maintained since the 1950’s was compared to three modern
production lines (Ross 308, Ross 708 and a Test Yield Product (TY) from Aviagen for 8 weeks
post hatch. One hundred and sixty two male birds of each line were randomly allocated to battery
brooders. Each strain had nine replications. Birds were fed diets that met average nutrient level
in the U.S. poultry industry (Agri-Stats, Fort Wayne IN). Feed and water were provided ad
libitum throughout the experiment. Every week, two birds per pen were killed, one was
necropsied and the relative weight of breast, leg, wing and internal organs were compared. The
other one was used for full body composition analysis. Ross 308 body weight (BW) was heaviest
until 42 days, after that, BW of Ross 708 and TY was similar to Ross 308. Body weight of HER
was lighter all through the experiment. Feed conversion ratio (FCR) was affected due to the
number of birds necropsied. Breast relative weight was significantly lighter for HER from day 7
to the end of the trial. The TY showed a heavier relative and absolute breast weight at day 56.
Leg relative weight was lighter at 56 days for Ross 708 and TY. Heart relative weight was
significantly heavier in HER than in the modern lines from 28 days until the end of the
experiment. Gizzard relative weight was significantly heavier in HER all along the experiment.
41
When HER was compared with a modern line of the same weight, gizzard relative weight was
still heavier than the modern ones. Tibia breaking force was higher in modern lines than in
HER, though tibia diameter was smaller in modern lines than in HER when birds with similar
weight were compared. These data indicate that modern breeds have changed in different aspects
from the older strains as a secondary effect to genetic selection. At the same time breast meat
yield continues to increase with continuing selection.
Key words: Broiler Genotypes, morphometric, broiler, relative weight.
INTRODUCTION
Primary breeders have used intense genetic selection to change the old meat-type bird from the
1950’s into the modern broiler widely used in the poultry industry today. Quantitative genetics
have been applied to obtain a heavier, more efficient bird with higher yield (Havenstein et al.,
1994a; Havenstein et al., 1994b; Havenstein et al., 2003a; Havenstein et al., 2003b; Schmidt et
al., 2009). From obtaining a 1.488 Kg male bird with a FCR of 2.69 in ten weeks (Thomas et al.,
1958) in 1958, today a male broiler can reach 4.16 Kg with 1.958 FCR in 8 weeks (Ross
breeders, 2007).
This outstanding improvement in performance has come with anatomical and physiological
changes in the broiler (Jackson and Diamond, 1996; Konarzewski et al., 2000; McEnteé et al.,
2000; Havenstein et al., 2003a; Schmidt et al., 2009) the consequences of which are not clear.
Some of these changes could be responsible for metabolic or skeletal disorders that have been
related to the fast growth of the modern broiler (Lilburn, 1994; Julian, 1998). Even more, it is not
42
clear if, genetic selection for high yield broilers has produced more changes in the bird and if so,
how this could affect performance in the future.
The objective of this study was to compare the performance of an old unselected line from the
1950’s with three modern strains selected for high growth and for high breast meat yield (BMY)
and at the same time, assess differences in allometry, and histological properties of small
intestine (SI).
MATERIALS AND METHODS
In this study, a Heritage line of New Hampshire x Columbia White Plymouth Rock from the
University of Illinois (HER) that had been maintained unselected since the 1950’s, Ross 308,
Ross 708, and a Ross Test Yield product (TY) were compared. One hundred and sixty two one-
day-old male chicks of each line were randomly allocated to wire floor batteries in a temperature
controlled room. At 14 days the birds were transferred to wire floor grow out batteries. Eighteen
birds were allocated to each cage with nine replications per line. Light was continuous
throughout the trial.
Birds were provided with a starter diet from day 1 to 21, a grower diet from day 22 to 35 and a
finisher diet from 36 to 56 days of age. Diets were formulated that met the average nutrient level
in the U.S. poultry industry (Agri-stats, Fort Wayne IN) (Table 1). All diets were fed as mash.
Feed and water was provided ad libitum all along the experiment. Body weight and FCR were
calculated weekly. Every seven days, two birds from each cage were sacrificed by cervical
dislocation, one was frozen for full body composition analysis and the other one was dissected to
study morphometric differences between the genetic lines. Individual weights for heart, spleen,
proventriculus, gizzard, pancreas, liver, breast, wing, and leg were collected. Duodenum,
43
jejunum, and ileum lengths were also measured and samples from each segment collected at 28
days of age to measure villus length and width. Organ relative weights to body weight were
calculated weekly. In some cases, when data of birds of similar BW from different strains was
available, organ weights were compared. At 56 days the last set of birds was dissected and the
experiment terminated.
At 22 days, 18 birds from each line were divided into six replications, allocated randomly to wire
floor grow out batteries, and fed with feed previously prepared with Titanium Dioxide (5 gr/Kg)
as a tracer. After five days of acclimation to the new diet, birds were sacrificed and ileal content
collected. Digestibility was calculated according to the method of Short et al. (1996).
At 21, 35 and 49 days, one tibia was collected from a bird of each cage. Tibias were cleaned of
adherent tissues and the biomechanical strength of each bone was measured using an Instron
4502 material testing machine with a 100 kg load cell (Instron Inc.825 University Avenue,
Norwood MA 02062-2643). Bones were held in identical positions and the mid-diaphyseal
diameter of the bone at the site of impact was measured using a dial caliper. The maximum load
at failure was determined using a three-point flexural bend fixture with a total distance of 30 mm
between the two lower supporting ends. The load, defined as force in kilograms per square
millimeter of cross-sectional area (kilograms per square millimeter), represents bone strength.
The rate of loading was kept constant at 20 mm/min collecting 10 data points per second. The
data were automatically calculated using Instron Series IX Software.
Statistical analysis of data was performed using JMP Pro (SAS Institute Inc., Cary, NC, USA).
Data were analyzed by a one-way analysis of variance (ANOVA) and comparison of means was
done using the student t test (α = 0.05).
44
RESULTS AND DISCUSSION
Body weight
Results for BW are presented in Table 2. Strains presented different BW from day 7 to the end of
the trial. Ross 308 had the highest BW until 49 days of age when Ross 708 and TY achieved
similar body weights as Ross 308 through 56 days. Heritage had the lowest body weight
throughout the experiment. Ross 308 BW was 2.25 times larger than HER at 42 days and 2.15
times larger at 56 days.
Feed intake and feed conversion ratio
Feed intake was higher for current lines but this parameter was affected by weekly necropsied
birds and consequently feed conversion ratio was also affected. For that reason these two
parameters are not analyzed in this paper and will be extensively analyzed in accompanying
papers.
Breast meat Yield (BMY)
Results for Breast Meat Yield (BMY) are presented in Table 3. Breast meat yield was
significantly lower for HER throughout the experiment. The BMY was the same for Ross 308,
Ross 708, and TY until 49 days when TY and Ross 708 showed a significantly higher yield than
Ross 308. At 56 days, TY had the highest BMY followed by Ross 708, Ross 308, and HER.
Wing relative weight was heavier for HER since its body weight was significantly smaller than
current lines (data not shown). At 56 days TY BMY was 2.75 times larger than HER and TY
total breast was 4.33 times larger than HER.
Carcass composition
45
Carcass composition results are expressed as percentages in Tabel 4, 5, and 6. Significant results
for protein (Table 4) and fat (Table 5) were found at different ages though no explanation or
trend could be found for this. Ash content was significantly higher for HER throughout the trial.
This indicates that the skeleton is a greater proportion of the total body weight with less
musculature than in modern strains.
Allometry
Results for heart relative weights (HRW) are presented in Table 5. The HRW of modern strains
were significantly lighter than HER from 28 days on. This is in agreement with Katanbaf et al.
(1988), O’Sullivan et al. (1991), Sandercock et al., (2009), Konarzewski et al., (2000), and
McEnteé et al.,(2000) who found similar results when old strains were compared to modern
ones. Havenstein also reported smaller heart relative weights for Arbor Acres male (Havenstein
et al., 1994b) and for Ross 708 (Havenstein et al., 2003a) when compared with the Athens-
Canadian Randombred control (ACRBC). Schmidt et al., (2009), who observed heavier relative
weights for HER hearts from day 14 until the end the trial at 35 days when the same HER strain
used in this trial was compared with Ross 708. Gaya et al., (2007) analyzed information of
42,912 individuals from pedigree broilers of three different years and found that the genetic trend
for heart relative weight was -0.004% per hatch-year. Sandercock et al., (2009) assessed the
difference between modern broilers and layers and reported heavier HRW for layers. When HER
birds were compared with birds from a modern line of the same weight the relative weight of the
heart remained the same (Table 6). It would seem that extreme growth of breast disrupts the ratio
between heart and BW reducing HRW in modern lines. Smaller HRW have been related to
ascites in poultry (Julian, 1993; Closter et al., 2012).
46
Liver relative weight (LRW) remained constant among the different strains throughout the trial
(data not shown). This is in agreement with McEnteé et al., (2000), and Schmidt et al., (2009)
and in contradiction with Katanbaf et al., (1988), Nir et al., (1993), and O’Sullivan et al. (1991)
who reported higher LRW in lines selected for low BW against lines selected for high BW. On
the other hand, , Konarzewski et al., (2000) reported higher LRW for birds selected for high BW
when ratio was calculated for lean body mass.
Pancreas and spleen relative weights were similar all along the trial for the four lines studied
(data not shown). Proventriculus relative weight was similar for all strains until 28 days when
Ross 308 showed a heavier relative weight than the rest of the strains (data not shown). At 35
and 42 days, Ross 308 and HER showed a significantly higher proventriculus relative weight. At
49 and 56 days, HER maintained the difference with the three modern lines that showed similar
relative weights. Results are not clear but it is possible that increasingly higher BW in modern
lines reduced PRW. These observations are in partial agreement with O’Sullivan et al., (1991)
who reported Higher PRW for low BW lines at 21 days but in disagreement with other studies
where high BW broilers had higher PRW than ‘old lines’ (Jackson and Diamond, 1996).
Katanbaf (1988) reported higher PRW for high BW birds at 180 grams but similar PRW at 56
days of age. McEnteé et al., (2000) reported similar PRW at 42 days.
Gizzard relative weight (GRW) was significantly heavier in HER all along the experiment (data
not shown). When similar BW birds were compared, HER gizzard weight was still heavier than
Ross TY (Table 7). This is in agreement with Katanbaf et al., (1988), O’Sulliva et al. (1991) and
McEnteé et al., (2000). It is possible that since broiler selection has been done using mash or
pelleted feed with small particles, gizzard function was not necessary for grinding particles and
gizzard weight reduced with time.
47
Small intestine (SI) segments measurements showed that duodenum length remained constant for
the four strains throughout the trial (49 days data shown in Table 8). On the contrary, Jejunum
and ileum segments were significantly longer in the current strains compared to HER from 21
days on (49 days data shown in Table 9 and 10). This is in agreement with Katanbaf et al.,
(1988), and Schmidt et al., (2009) who compared Ross 708 with the same HER strain used in this
study and found the same results. Jackson and Diamond (1996) compared modern broilers with
Red Jungle Fowls and observed that small intestine was significantly longer in broilers. McEnteé
et al., (2000) also observed not only longer Jejunum and Ileum segments but also longer
duodenum segments. At the same time, Nir et al., (1993), and Konarzewski et al.( 2000) reported
heavier SI segments in broilers when Ross 308 was compared with a layer strain.
These data show that in modern lines each centimeter of SI segment accounts for more grams of
BW than in HER (Table 8, 9, and 10). In other words, each cm of SI, in modern lines, supports
more mass of body than HER. Analysis of data from similar BW birds comparing Ross 708 and
TY with HER strains shows total length of Jejunum and Ileum to be significantly longer in these
two lines (Table 11).
Histological analysis of SI sections
Results for histological analysis are shown in Table 12. Small intestine villus length analysis at
28 days of age showed TY and Ross 708 to have significantly longer villus. Jejunum analysis
showed that TY and Ross 708 also had longer villus followed by Ross 308 and HER. Longer
villus together with longer sections of jejunum and duodenum could explain the capability of
current lines to absorb nutrients present in the augmented feed intake compared to HER.
48
Moreover, Mott et al. (Mott et al., 2008) found more intestinal nutrient transporters in embryos
of current strains compared to low BW lines.
Digestibility
Results for protein and energy digestibility (Table 13) showed no differences between the four
strains studied. Current lines have increased feed intake but are not more efficient digesting and
absorbing nutrients than HER.
Tibia breaking strength
Tibia break force at 21, 35, and 49 days was significantly higher for the modern lines compared
to HER (Table 14). When HER tibias were compared to tibias from a modern strain of similar
body weight, tibia diameter was significantly larger for HER even when break force was higher
for TY (Table 15). These results show that genetic selection for high BW has resulted in changes
in bone structure. Different skeletal disorders have been related to fast growth (Julian, 1998) and
this could partially explain it.
This study confirms that intense genetic selection has changed the current broiler from the ‘old’
broiler not only in performance but anatomically and histologically as well. It is still not clear
how these changes affect or could affect broiler performance in the future.
References
Closter, A., P. van As, M. Elferink, R. Crooijmanns, M. Groenen, A. Vereijken, J. Van
Arendonk, and H. Bovenhuis. 2012. Genetic correlation between heart ratio and body weight as a
function of ascites frequency in broilers split up into sex and health status. Poult. Sci. 91:556-
564.
49
Gaya, L. G., A. Costa, J. B. S. Ferraz, F. M. Rezende, E. C. Mattos, J. P. Eler, T. M. Filho, G. B.
Mourão, and L. G. G. Figueiredo. 2007. Genetic trends of absolute and relative heart weight in a
male broiler line. Genet.Mol.Res 6:1091-1096.
Havenstein, G. B., P. R. Ferket, and M. A. Qureshi. 2003a. Carcass composition and yield of
1957 versus 2001 broilers when fed representative 1957 and 2001 broiler diets. Poult. Sci.
82:1509.
Havenstein, G. B., P. R. Ferket, and M. A. Qureshi. 2003b. Growth, livability, and feed
conversion of 1957 versus 2001 broilers when fed representative 1957 and 2001 broiler diets.
Poult. Sci. 82:1500.
Havenstein, G. B., P. R. Ferket, S. E. Scheideler, and B. T. Larson. 1994a. Growth, livability,
and feed conversion of 1957 vs 1991 broilers when fed "typical" 1957 and 1991 broiler diets.
Poult. Sci. 73:1785-1794.
Havenstein, G. B., P. R. Ferket, S. E. Scheideler, and D. V. Rives. 1994b. Carcass composition
and yield of 1991 vs 1957 broilers when fed "typical" 1957 and 1991 broiler diets. Poult. Sci.
73:1795-1804.
Jackson, S., and J. Diamond. 1996. Metabolic and digestive responses to artificial selection in
chickens. Evolution:1638-1650.
Julian, R. J. 1993. Ascites in poultry. Avian Pathol. 22:419-454.
Julian, R. 1998. Rapid growth problems: ascites and skeletal deformities in broilers. Poult. Sci.
77:1773-1780.
Katanbaf, M. N., E. A. Dunnington, and P. B. Siegel. 1988. Allomorphic relationships from
hatching to 56 days in parental lines and F1 crosses of chickens selected 27 generations for high
or low body weight. Growth Dev. Aging 52:11-21.
Konarzewski, M., A. Gavin, R. McDevitt, and I. R. Wallis. 2000. Metabolic and organ mass
responses to selection for high growth rates in the domestic chicken (Gallus domesticus).
Physiological and Biochemical Zoology 73:237-248.
Lilburn, M. S. 1994. Skeletal growth of commercial poultry species. Poult. Sci. 73:897-903.
McEnteé, G. M., K. Rance, R. M. McDevitt, R. Crowe, J. M. Forbes, R. Freire, F. Short, C. J.
Nicol, J. A. McLean, and C. J. Savory. 2000. SPRING MEETING OF THE WPSA (UK
BRANCH). Br. Poult. Sci. 41:667-707.
Mott, C. R., P. B. Siegel, K. E. Webb Jr, and E. A. Wong. 2008. Gene expression of nutrient
transporters in the small intestine of chickens from lines divergently selected for high or low
juvenile body weight. Poult. Sci. 87:2215.
50
Nir, I., Z. Nitsan, and M. Mahagna. 1993. Comparative growth and development of the digestive
organs and of some enzymes in broiler and egg type chicks after hatching. Br. Poult. Sci. 34:523-
532.
O’Sullivan, N. P., E. A. Dunnnington, A. S. Larsen, and P. B. Siegel. 1991. Correlated responses
in lines of chickens divergently selected for fifty-six-day body weight. 2. Organ growth,
deoxyribonucleic acid, ribonucleic acid, and protein content. Poult. Sci. 71: 598-609
Ross Breeders. 2007. Ross 308 Broiler performance objectives 2007.
Sandercock, D. A., G. R. Nute, and P. M. Hocking. 2009. Quantifying the effects of genetic
selection and genetic variation for body size, carcass composition, and meat quality in the
domestic fowl (Gallus domesticus). Poult. Sci. 88:923.
Schmidt, C. J., M. E. Persia, E. Feierstein, B. Kingham, and W. W. Saylor. 2009. Comparison of
a modern broiler line and a heritage line unselected since the 1950s. Poult. Sci. 88:2610.
Short, F., P. Gorton, J. Wiseman, and K. Boorman. 1996. Determination of titanium dioxide
added as an inert marker in chicken digestibility studies. Anim. Feed Sci. Technol. 59:215-221.
Thomas, C., W. Blow, C. C. Cockerham, and E. Glazener. 1958. The heritability of body weight,
gain, feed consumption, and feed conversion in broilers. Poult. Sci. 37:862-869.
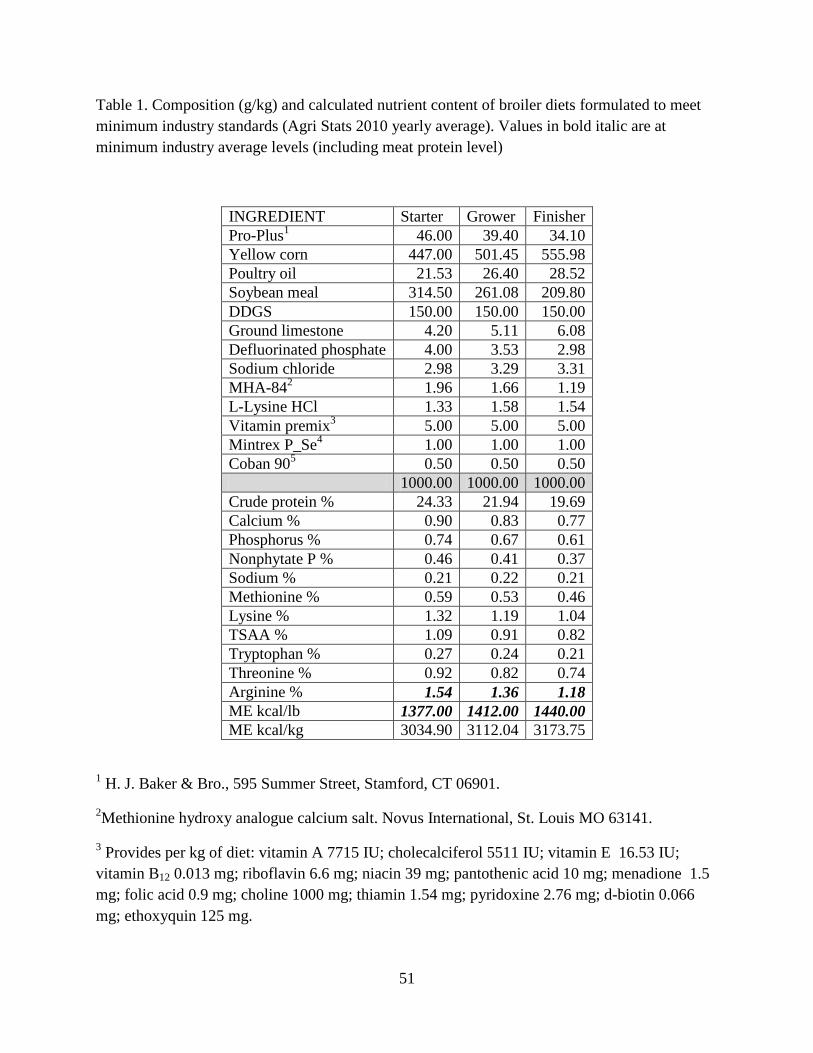
51
Table 1. Composition (g/kg) and calculated nutrient content of broiler diets formulated to meet
minimum industry standards (Agri Stats 2010 yearly average). Values in bold italic are at
minimum industry average levels (including meat protein level)
INGREDIENT Starter Grower Finisher
Pro-Plus1
46.00 39.40 34.10
Yellow corn 447.00 501.45 555.98
Poultry oil 21.53 26.40 28.52
Soybean meal 314.50 261.08 209.80
DDGS 150.00 150.00 150.00
Ground limestone 4.20 5.11 6.08
Defluorinated phosphate 4.00 3.53 2.98
Sodium chloride 2.98 3.29 3.31
MHA-842
1.96 1.66 1.19
L-Lysine HCl 1.33 1.58 1.54
Vitamin premix3
5.00 5.00 5.00
Mintrex P_Se4
1.00 1.00 1.00
Coban 905
0.50 0.50 0.50
1000.00 1000.00 1000.00
Crude protein % 24.33 21.94 19.69
Calcium % 0.90 0.83 0.77
Phosphorus % 0.74 0.67 0.61
Nonphytate P % 0.46 0.41 0.37
Sodium % 0.21 0.22 0.21
Methionine % 0.59 0.53 0.46
Lysine % 1.32 1.19 1.04
TSAA % 1.09 0.91 0.82
Tryptophan % 0.27 0.24 0.21
Threonine % 0.92 0.82 0.74
Arginine % 1.54 1.36 1.18
ME kcal/lb 1377.00 1412.00 1440.00
ME kcal/kg 3034.90 3112.04 3173.75
1 H. J. Baker & Bro., 595 Summer Street, Stamford, CT 06901.
2Methionine hydroxy analogue calcium salt. Novus International, St. Louis MO 63141.
3 Provides per kg of diet: vitamin A 7715 IU; cholecalciferol 5511 IU; vitamin E 16.53 IU;
vitamin B12 0.013 mg; riboflavin 6.6 mg; niacin 39 mg; pantothenic acid 10 mg; menadione 1.5
mg; folic acid 0.9 mg; choline 1000 mg; thiamin 1.54 mg; pyridoxine 2.76 mg; d-biotin 0.066
mg; ethoxyquin 125 mg.
52
4Provides per kg of diet: Mn (as manganese methionine hydroxy analogue complex) 40 mg; Zn
(as zinc methionine hydroxy analogue complex) 40 mg; Cu (as copper methionine hydroxy
analogue complex) 20 mg; Se (as selenium yeast) 0.3 mg. Novus International, Inc., St. Louis
MO 63141.
5 Elanco Animal Health division of Eli Lilly & Co., Indianapolis, IN 46825.
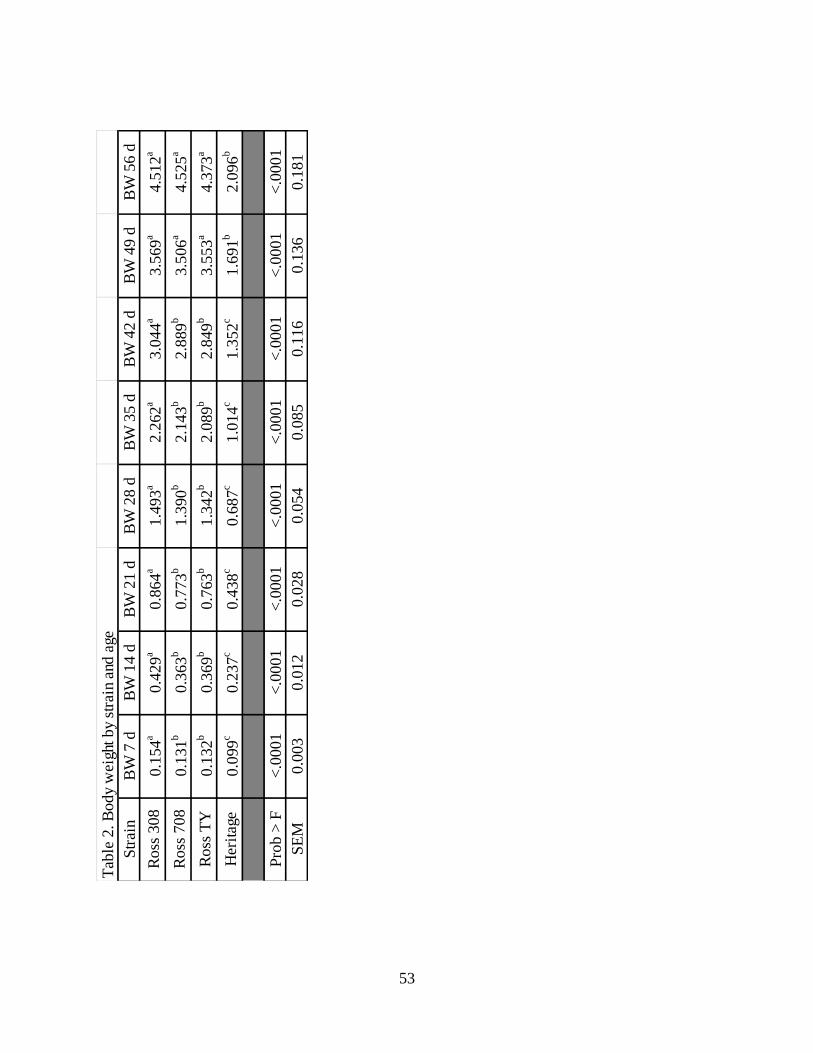
53
Tab
le 2
. B
ody
wei
ght by
stra
in a
nd a
ge
Str
ain
BW
7 d
BW
14 d
BW
21 d
BW
28 d
BW
35 d
BW
42 d
BW
49 d
BW
56 d
Ross
308
0.1
54
a0.4
29
a0.8
64
a1.4
93
a2.2
62
a3.0
44
a3.5
69
a4.5
12
a
Ross
708
0.1
31
b0.3
63
b0.7
73
b1.3
90
b2.1
43
b2.8
89
b3.5
06
a4.5
25
a
Ross
TY
0.1
32
b0.3
69
b0.7
63
b1.3
42
b2.0
89
b2.8
49
b3.5
53
a4.3
73
a
Her
itag
e0.0
99
c0.2
37
c0.4
38
c0.6
87
c1.0
14
c1.3
52
c1.6
91
b2.0
96
b
Pro
b >
F<
.0001
<.0
001
<.0
001
<.0
001
<.0
001
<.0
001
<.0
001
<.0
001
SE
M0.0
03
0.0
12
0.0
28
0.0
54
0.0
85
0.1
16
0.1
36
0.1
81
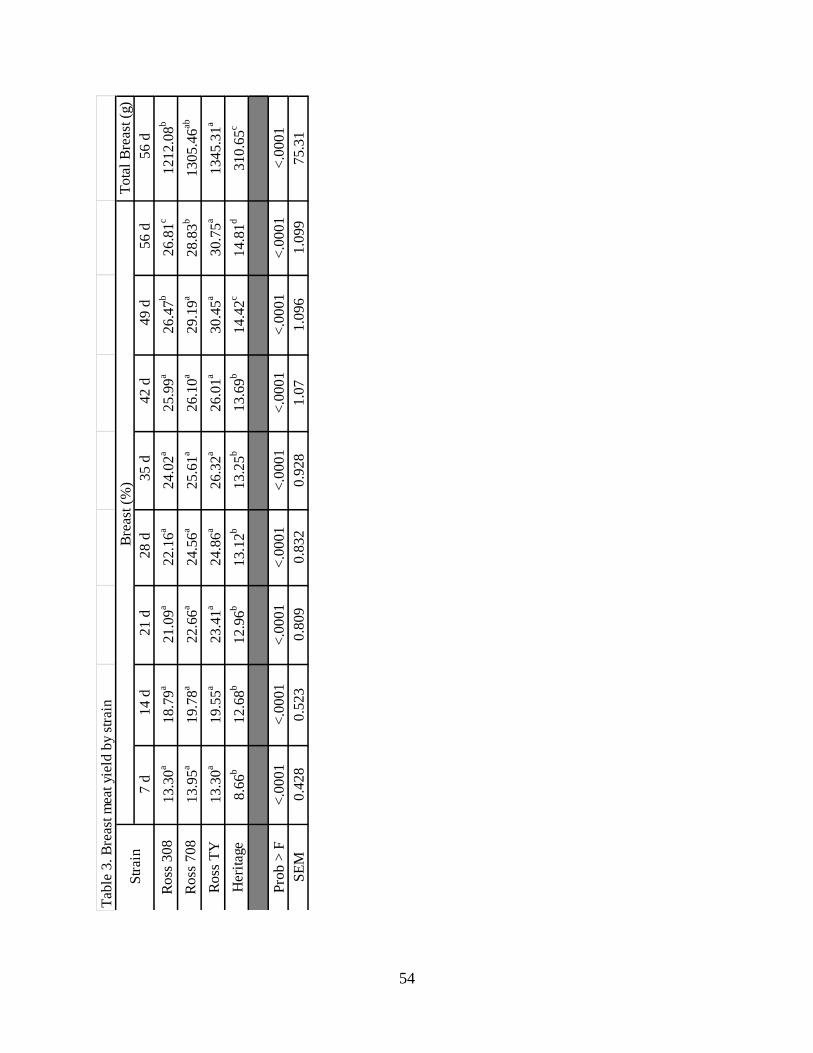
54
Tab
le 3
. B
reas
t m
eat yi
eld b
y st
rain
Tota
l B
reas
t (g
)
7 d
14 d
21 d
28 d
35 d
42 d
49 d
56 d
56 d
Ross
308
13.3
0a
18.7
9a
21.0
9a
22.1
6a
24.0
2a
25.9
9a
26.4
7b
26.8
1c
1212.0
8b
Ross
708
13.9
5a
19.7
8a
22.6
6a
24.5
6a
25.6
1a
26.1
0a
29.1
9a
28.8
3b
1305.4
6ab
Ross
TY
13.3
0a
19.5
5a
23.4
1a
24.8
6a
26.3
2a
26.0
1a
30.4
5a
30.7
5a
1345.3
1a
Her
itag
e8.6
6b
12.6
8b
12.9
6b
13.1
2b
13.2
5b
13.6
9b
14.4
2c
14.8
1d
310.6
5c
Pro
b >
F<
.0001
<.0
001
<.0
001
<.0
001
<.0
001
<.0
001
<.0
001
<.0
001
<.0
001
SE
M0.4
28
0.5
23
0.8
09
0.8
32
0.9
28
1.0
71.0
96
1.0
99
75.3
1
Str
ain
Bre
ast (%
)
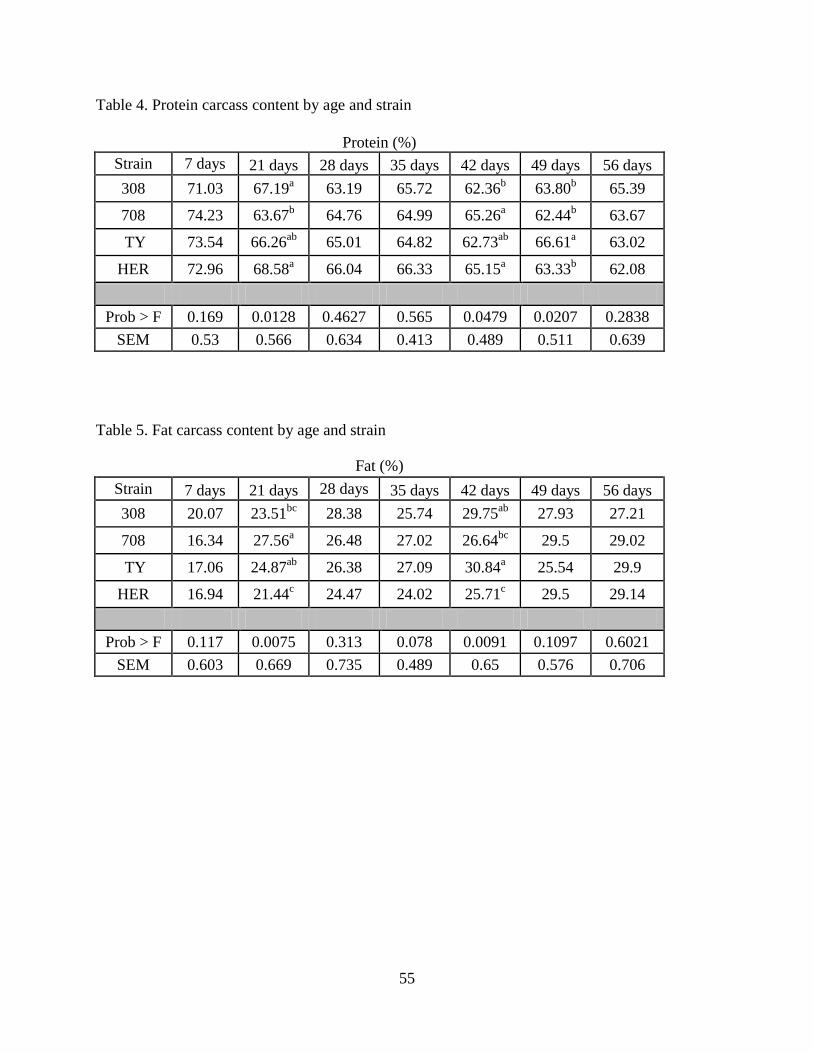
55
Table 4. Protein carcass content by age and strain
Protein (%)
Strain 7 days 21 days 28 days 35 days 42 days 49 days 56 days
308 71.03 67.19a 63.19 65.72 62.36
b 63.80
b 65.39
708 74.23 63.67b 64.76 64.99 65.26
a 62.44
b 63.67
TY 73.54 66.26ab
65.01 64.82 62.73ab
66.61a 63.02
HER 72.96 68.58a 66.04 66.33 65.15
a 63.33
b 62.08
Prob > F 0.169 0.0128 0.4627 0.565 0.0479 0.0207 0.2838
SEM 0.53 0.566 0.634 0.413 0.489 0.511 0.639
Table 5. Fat carcass content by age and strain
Fat (%)
Strain 7 days 21 days 28 days 35 days 42 days 49 days 56 days
308 20.07 23.51bc
28.38 25.74 29.75ab
27.93 27.21
708 16.34 27.56a 26.48 27.02 26.64
bc 29.5 29.02
TY 17.06 24.87ab
26.38 27.09 30.84a 25.54 29.9
HER 16.94 21.44c 24.47 24.02 25.71
c 29.5 29.14
Prob > F 0.117 0.0075 0.313 0.078 0.0091 0.1097 0.6021
SEM 0.603 0.669 0.735 0.489 0.65 0.576 0.706
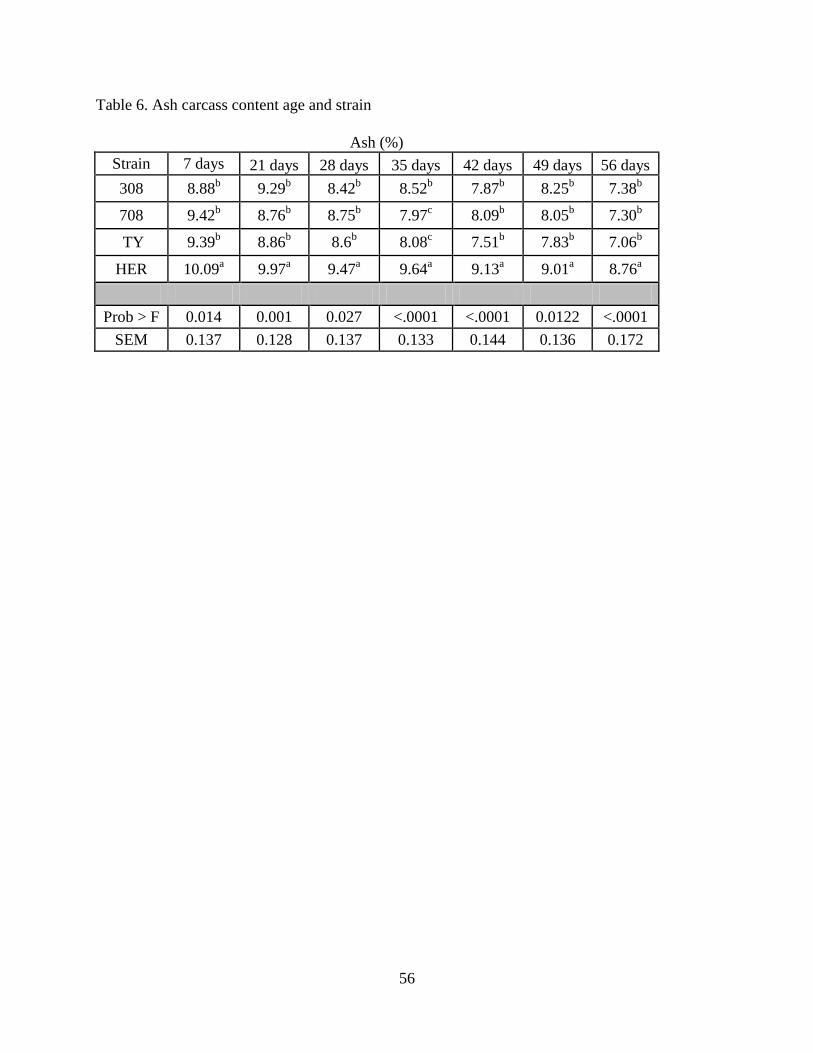
56
Table 6. Ash carcass content age and strain
Ash (%)
Strain 7 days 21 days 28 days 35 days 42 days 49 days 56 days
308 8.88b 9.29
b 8.42
b 8.52
b 7.87
b 8.25
b 7.38
b
708 9.42b 8.76
b 8.75
b 7.97
c 8.09
b 8.05
b 7.30
b
TY 9.39b 8.86
b 8.6
b 8.08
c 7.51
b 7.83
b 7.06
b
HER 10.09a 9.97
a 9.47
a 9.64
a 9.13
a 9.01
a 8.76
a
Prob > F 0.014 0.001 0.027 <.0001 <.0001 0.0122 <.0001
SEM 0.137 0.128 0.137 0.133 0.144 0.136 0.172
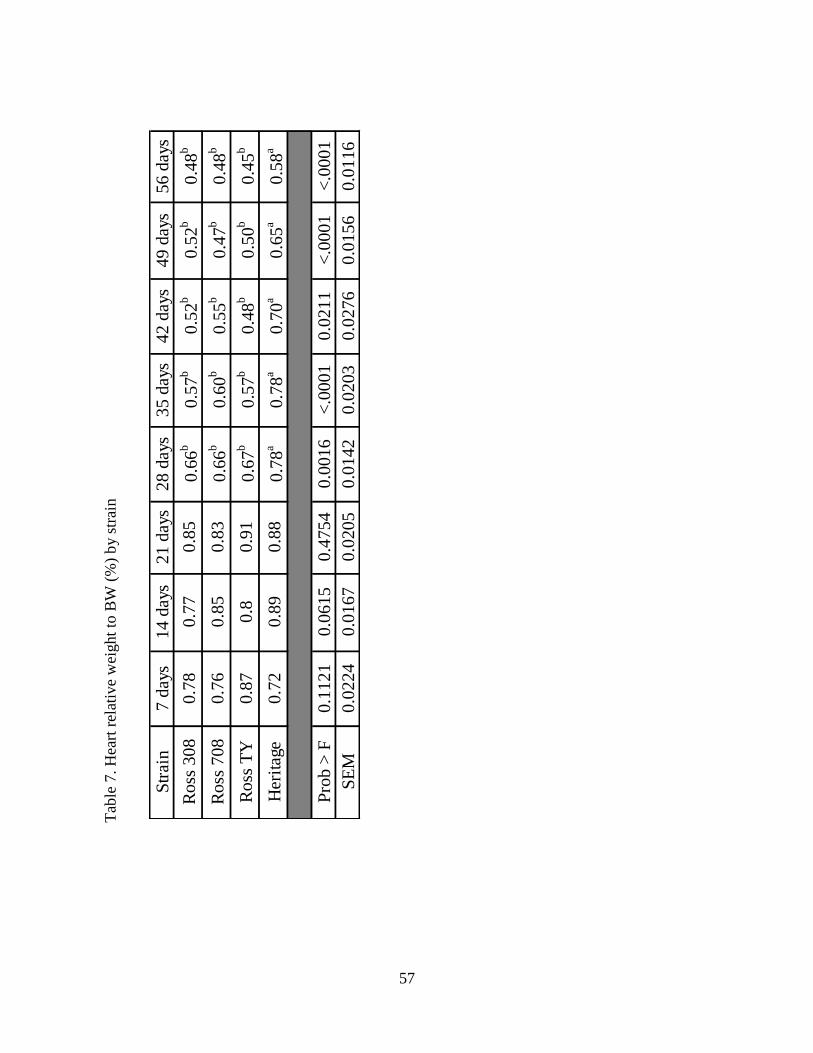
57
Str
ain
7 d
ays
14 d
ays
21 d
ays
28 d
ays
35 d
ays
42 d
ays
49 d
ays
56 d
ays
Ro
ss 3
08
0.7
80
.77
0.8
50
.66
b0
.57
b0
.52
b0
.52
b0
.48
b
Ro
ss 7
08
0.7
60
.85
0.8
30
.66
b0
.60
b0
.55
b0
.47
b0
.48
b
Ro
ss T
Y0
.87
0.8
0.9
10
.67
b0
.57
b0
.48
b0
.50
b0
.45
b
Her
itag
e0
.72
0.8
90
.88
0.7
8a
0.7
8a
0.7
0a
0.6
5a
0.5
8a
Pro
b >
F0
.112
10
.061
50
.475
40
.001
6<
.00
01
0.0
21
1<
.00
01
<.0
001
SE
M0
.022
40
.016
70
.020
50
.014
20
.020
30
.027
60
.015
60
.011
6
Tab
le 7
. H
eart
rel
ativ
e w
eight
to B
W (
%)
by s
trai
n
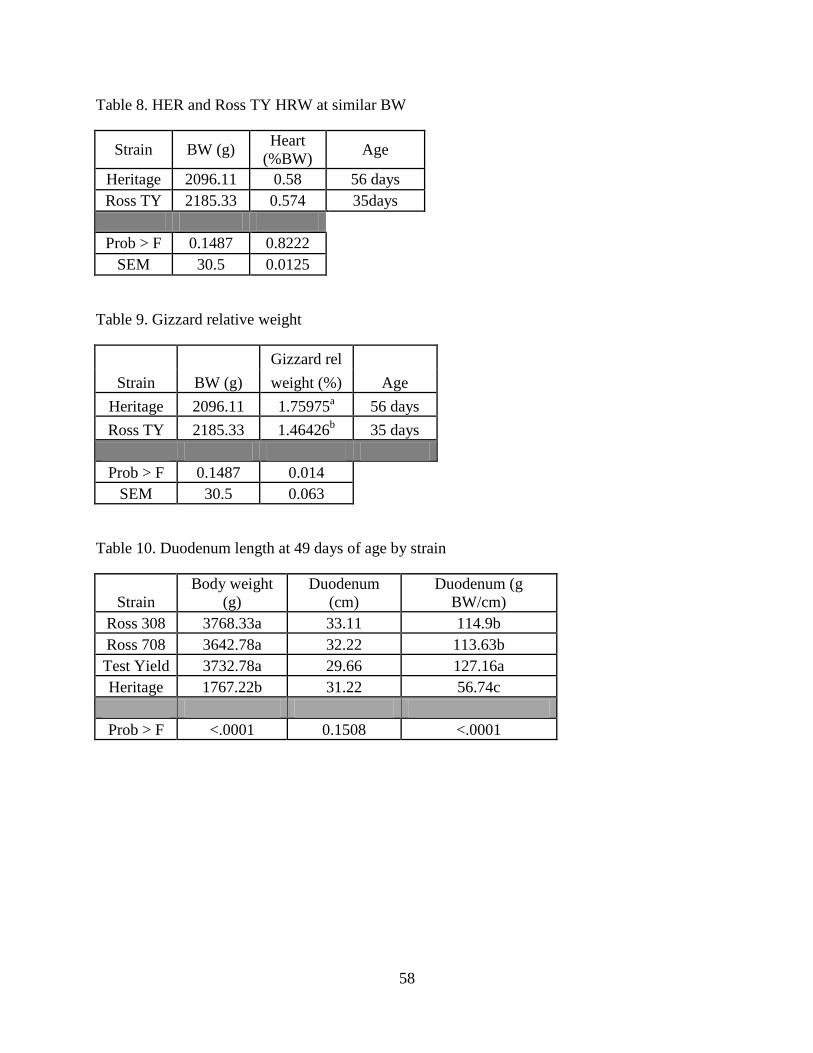
58
Table 8. HER and Ross TY HRW at similar BW
Strain BW (g) Heart
(%BW) Age
Heritage 2096.11 0.58 56 days
Ross TY 2185.33 0.574 35days
Prob > F 0.1487 0.8222
SEM 30.5 0.0125
Table 9. Gizzard relative weight
Strain BW (g)
Gizzard rel
Age weight (%)
Heritage 2096.11 1.75975a 56 days
Ross TY 2185.33 1.46426b 35 days
Prob > F 0.1487 0.014
SEM 30.5 0.063
Table 10. Duodenum length at 49 days of age by strain
Strain
Body weight
(g)
Duodenum
(cm)
Duodenum (g
BW/cm)
Ross 308 3768.33a 33.11 114.9b
Ross 708 3642.78a 32.22 113.63b
Test Yield 3732.78a 29.66 127.16a
Heritage 1767.22b 31.22 56.74c
Prob > F <.0001 0.1508 <.0001
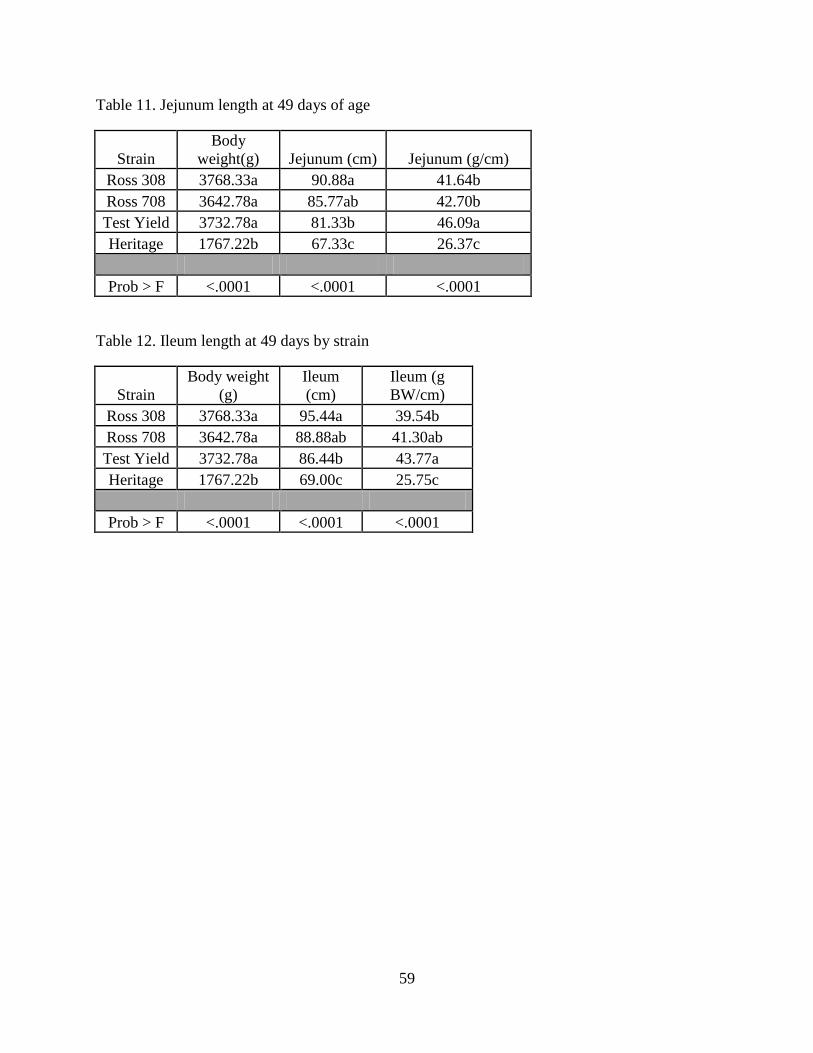
59
Table 11. Jejunum length at 49 days of age
Strain
Body
weight(g) Jejunum (cm) Jejunum (g/cm)
Ross 308 3768.33a 90.88a 41.64b
Ross 708 3642.78a 85.77ab 42.70b
Test Yield 3732.78a 81.33b 46.09a
Heritage 1767.22b 67.33c 26.37c
Prob > F <.0001 <.0001 <.0001
Table 12. Ileum length at 49 days by strain
Strain
Body weight
(g)
Ileum
(cm)
Ileum (g
BW/cm)
Ross 308 3768.33a 95.44a 39.54b
Ross 708 3642.78a 88.88ab 41.30ab
Test Yield 3732.78a 86.44b 43.77a
Heritage 1767.22b 69.00c 25.75c
Prob > F <.0001 <.0001 <.0001
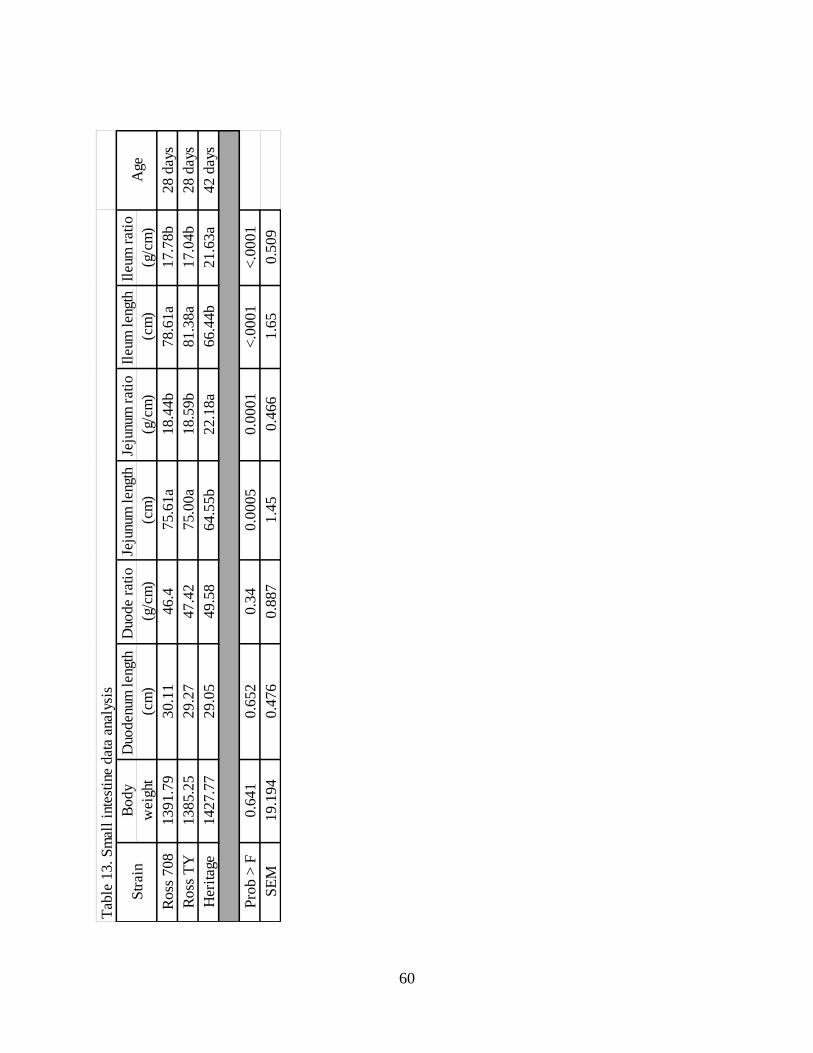
60
Bo
dy
Duo
den
um l
engt
h D
uode
rati
o
Jeju
num
len
gth
Jeju
num
rat
io
Ileu
m l
engt
h Il
eum
rat
io
wei
ght
(cm
)(g
/cm
)(c
m)
(g/c
m)
(cm
)(g
/cm
)
Ro
ss 7
08
139
1.7
93
0.1
14
6.4
75.6
1a
18.4
4b
78.6
1a
17.7
8b
28 d
ays
Ro
ss T
Y1
38
5.2
52
9.2
74
7.4
27
5.0
0a
18.5
9b
81.3
8a
17.0
4b
28 d
ays
Her
itag
e1
42
7.7
72
9.0
54
9.5
86
4.5
5b
22.1
8a
66.4
4b
21.6
3a
42 d
ays
Pro
b >
F0
.641
0.6
52
0.3
40
.000
50
.000
1<
.00
01
<.0
001
SE
M1
9.1
94
0.4
76
0.8
87
1.4
50
.466
1.6
50
.509
Str
ain
Age
Tab
le 1
3. S
mal
l in
test
ine
dat
a an
alys
is
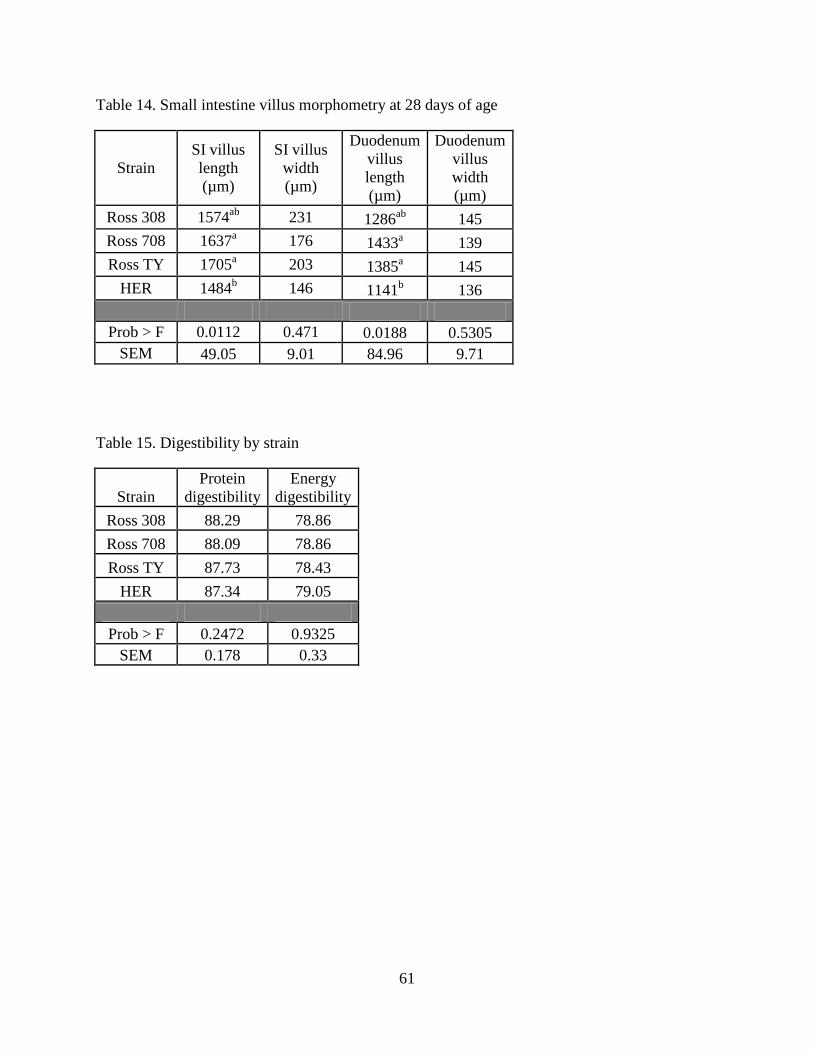
61
Table 14. Small intestine villus morphometry at 28 days of age
Strain
SI villus
length
(µm)
SI villus
width
(µm)
Duodenum
villus
length
(µm)
Duodenum
villus
width
(µm)
Ross 308 1574ab
231 1286ab
145
Ross 708 1637a 176 1433
a 139
Ross TY 1705a 203 1385
a 145
HER 1484b 146 1141
b 136
Prob > F 0.0112 0.471 0.0188 0.5305
SEM 49.05 9.01 84.96 9.71
Table 15. Digestibility by strain
Strain
Protein
digestibility
Energy
digestibility
Ross 308 88.29 78.86
Ross 708 88.09 78.86
Ross TY 87.73 78.43
HER 87.34 79.05
Prob > F 0.2472 0.9325
SEM 0.178 0.33
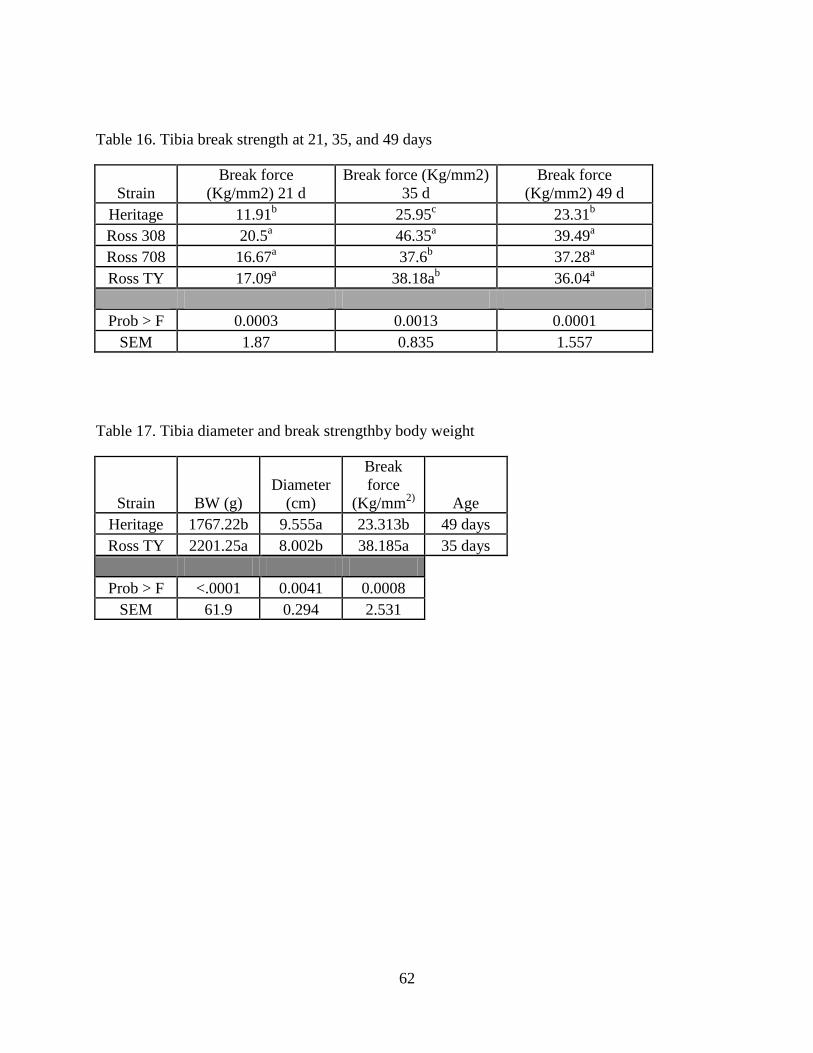
62
Table 16. Tibia break strength at 21, 35, and 49 days
Strain
Break force
(Kg/mm2) 21 d
Break force (Kg/mm2)
35 d
Break force
(Kg/mm2) 49 d
Heritage 11.91b 25.95
c 23.31
b
Ross 308 20.5a 46.35
a 39.49
a
Ross 708 16.67a 37.6
b 37.28
a
Ross TY 17.09a 38.18a
b 36.04
a
Prob > F 0.0003 0.0013 0.0001
SEM 1.87 0.835 1.557
Table 17. Tibia diameter and break strengthby body weight
Strain BW (g)
Diameter
(cm)
Break
force
(Kg/mm2)
Age
Heritage 1767.22b 9.555a 23.313b 49 days
Ross TY 2201.25a 8.002b 38.185a 35 days
Prob > F <.0001 0.0041 0.0008
SEM 61.9 0.294 2.531
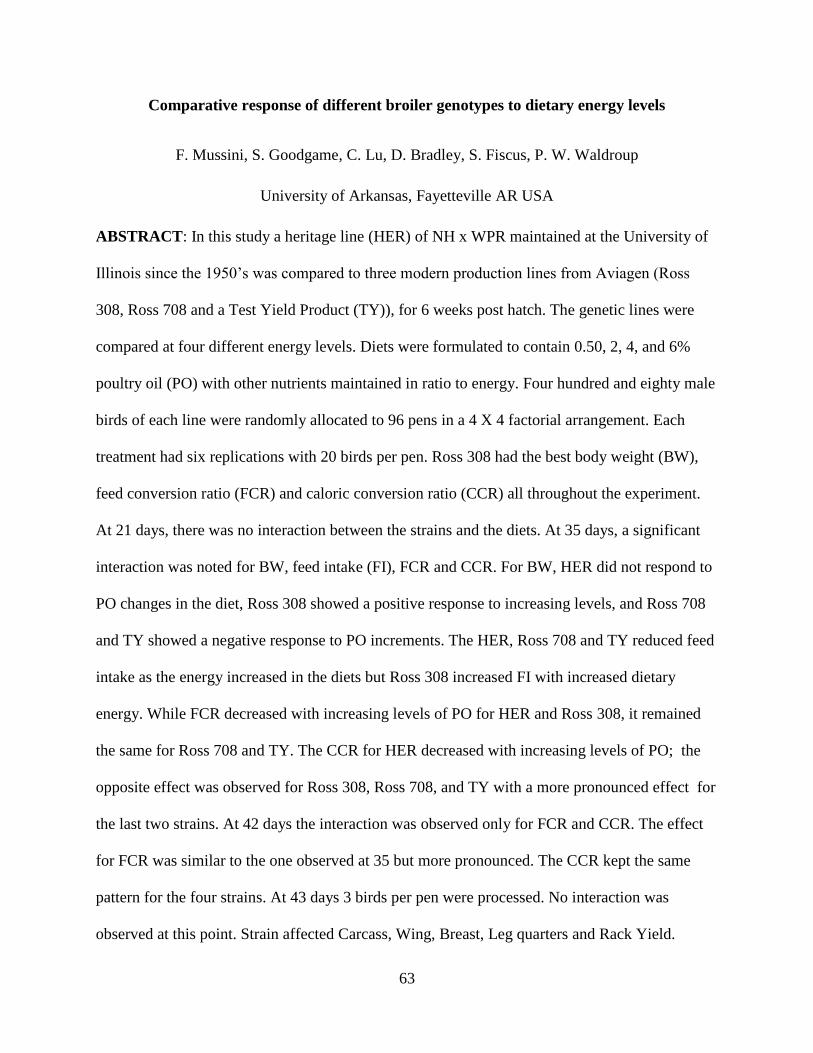
63
Comparative response of different broiler genotypes to dietary energy levels
F. Mussini, S. Goodgame, C. Lu, D. Bradley, S. Fiscus, P. W. Waldroup
University of Arkansas, Fayetteville AR USA
ABSTRACT: In this study a heritage line (HER) of NH x WPR maintained at the University of
Illinois since the 1950’s was compared to three modern production lines from Aviagen (Ross
308, Ross 708 and a Test Yield Product (TY)), for 6 weeks post hatch. The genetic lines were
compared at four different energy levels. Diets were formulated to contain 0.50, 2, 4, and 6%
poultry oil (PO) with other nutrients maintained in ratio to energy. Four hundred and eighty male
birds of each line were randomly allocated to 96 pens in a 4 X 4 factorial arrangement. Each
treatment had six replications with 20 birds per pen. Ross 308 had the best body weight (BW),
feed conversion ratio (FCR) and caloric conversion ratio (CCR) all throughout the experiment.
At 21 days, there was no interaction between the strains and the diets. At 35 days, a significant
interaction was noted for BW, feed intake (FI), FCR and CCR. For BW, HER did not respond to
PO changes in the diet, Ross 308 showed a positive response to increasing levels, and Ross 708
and TY showed a negative response to PO increments. The HER, Ross 708 and TY reduced feed
intake as the energy increased in the diets but Ross 308 increased FI with increased dietary
energy. While FCR decreased with increasing levels of PO for HER and Ross 308, it remained
the same for Ross 708 and TY. The CCR for HER decreased with increasing levels of PO; the
opposite effect was observed for Ross 308, Ross 708, and TY with a more pronounced effect for
the last two strains. At 42 days the interaction was observed only for FCR and CCR. The effect
for FCR was similar to the one observed at 35 but more pronounced. The CCR kept the same
pattern for the four strains. At 43 days 3 birds per pen were processed. No interaction was
observed at this point. Strain affected Carcass, Wing, Breast, Leg quarters and Rack Yield.
64
Poultry oil affected carcass yield, decreasing it as the energy level increased. Strains seem to be
affected in different ways by different levels of PO. The HER reduced FI and did not respond to
energy increments; Ross 708 and TY responded the same way. Ross 308 responded positively to
incremental levels of PO by increasing FI and BW. These data indicate that different broiler
strains may respond differently to changes in dietary nutrient density
Key words: broilers, genotype, strain differences, dietary energy
INTRODUCTION
Intense genetic selection during the last sixty years has improved broiler performance
dramatically. At the beginning, selection addressed rapid growth to market age, then, it was feed
efficiency and, finally breast meat yield (Emmerson, 1997). Along with the changes in selection
programs, the broiler has changed as well resulting in a different final product (Havenstein et al.,
1994a; Havenstein et al., 1994b; Havenstein et al., 2003a; Havenstein et al., 2003b; Schmidt et
al., 2009)
In the past, broilers were fed diets with low levels of energy (Robertson et al., 1948; Panda and
Combs, 1950). Later it was discovered that broilers would perform better by raising energy
levels up to a certain point and that broilers would consume feed to meet its energy requirements
(Hill and Dansky, 1954). It was observed that broiler performance improved when energy
increased together with protein levels. The concept of energy:protein ratio was first developed in
the 1950’s (Donaldson et al., 1956; Donaldson et al., 1957; Donaldson et al., 1958) and it has
been the object of study over the years to learn how to obtain the best performance.
65
Little is known of how different strains have changed its response to different energy levels
along the years due to genetic selection. The objective of this study was to evaluate response of
different strains to increasing dietary energy levels and its effect at processing. Since energy is
the most expensive nutrient in the broiler diet, a better understanding on how energy affects
modern strains could help increase economic returns in the poultry industry.
MATERIALS AND METHODS
In this study, a Heritage line (HER) of New Hampshire x Columbia White Plymouth Rock from
the University of Illinois that had been maintained unselected since the 1950’s, Ross 308, Ross
708, and a Ross test yield product (TY) were studied. Four hundred and eighty, one-day-old male
birds of each strain were allocated to floor pens in a temperature controlled room. A series of
diets (starter, grower and finisher) were formulated to meet the nutrient requirements for average
performance of broiler males suggested by Rostagno et al., (2005). The first diet was formulated
to contain 0.50% PO to provide sufficient Essential Fatty Acid content while the remaining diets
were formulated to contain 2, 4, and 6% supplemental poultry oil (Table 1, 2, and 3). Mash diets
were fed to the different strains resulting in a 4 X 4 factorial arrangement. Each treatment had six
replications of 20 birds each. Mean pen weights were taken at one day of age and at 21, 35, and
42 days of age. Feed consumption was determined during the same time periods. Calculations
were made of feed conversion ratio (FCR) (kg of feed per kg of gain) and caloric conversion
(CCR) (Kcal per Kg of gain). Water and feed were provided ad libitum all throughout the
experiment. At 43 days, three birds from each pen were tagged, fasted for eight hours,
66
individually weighed, and processed at a pilot processing plant to determine dressing percentage
and parts yield.
Statistical analysis of data was performed using JMP Pro software (Statistical Analysis System,
SAS Institute Inc., Cary, NC, USA). Data were analyzed by a one-way analysis of variance
(ANOVA) and comparison of means was done using the student’s t test. All statements of
significance are based on P<0.05. Pen means served as the experimental unit for performance
data while individual birds were the experimental units for processing data as birds were
processed randomly and not in pen order.
RESULTS
Performance
Performance data for 21 days is shown in Table 4. At 21 days, Ross 308 broilers showed the
highest BW and lowest FCR and CCR followed by Ross 708, TY and HER. Poultry oil levels
did not affect BW or FI. Chicks fed the two percent level of PO showed the lowest FCR and
CCR. Ross 308 had the highest FI followed by Ross 708 TY and HER. There was no interaction
between the strains and the diets at this age.
Performance data for 35 days is shown in Table 5 and Figures 1 to 4. At 35 days, Ross 308 had
significantly higher BW and lower FCR and CCR followed by Ross 708, TY and HER. Poultry
oil level did not affect BW. Chicks fed poultry oil level of 0.5% showed a significantly higher
FCR than other levels. Chicks fed the six percent PO level had the highest CCR. A significant
interaction was noted for BW, FI, FCR and CCR at this age. For BW, HER did not respond to
67
PO changes in the diet, Ross 308 showed a positive response to increasing levels of PO, and
Ross 708 and TY showed a negative response to the energy increments in the diet. Heritage
reduced feed intake as the energy increased in the diets with the same behavior observed for
Ross 708 and TY. On the contrary, Ross 308 increased FI with increased energy. While FCR
decreased with increasing levels of PO for HER and Ross 308, it remained the same for Ross 708
and TY. The CCR of HER remained the same with increasing levels of PO while CCR increased
for Ross 308, Ross 708, and TY with a more pronounced effect for the last two strains.
Performance data for 42 days is shown in Table 5 and Figures 5 and 6. At 42 days, Ross 308 kept
the highest BW. Heritage had the highest FCR and CCR. Ross 308, Ross 708 and TY showed
similar FCR and CCR. Body weight was not affected by PO levels. Chicks fed the poultry oil
level of 0.5 % had the highest FCR, and together with those fed the 2% PO level, the lowest
CCR. Interactions were observed only for FCR and CCR. The effect of PO on FCR was similar
to the one observed at 35 but more pronounced. Caloric conversion ratio kept the same
significant pattern for the four strains. Ross 308 had the highest FI followed by TY, Ross 708
and HER. Feed intake was not affected by PO at this age.
Processing
Results for processing are presented in Table 7. No interaction between strain and PO was
observed at this time. Strain affected Carcass, Wing, Breast, Leg quarters and Rack Yield. Ross
708 and TY had the highest carcass yield followed by Ross 308 and HER. Heritage had the
highest Wing Yield. Test Yield presented significantly higher breast meat yield (BMY) than the
other strains followed by Ross 708, Ross 308 and HER. Ross 308, Ross 708 and TY had higher
leg yield than HER. Rack Yield was higher for HER followed by Ross 308, Ross 708 and TY.
68
When total breast was analyzed, TY had the heaviest breast followed by Ross 708, Ross 308 and
HER. Poultry oil only affected carcass yield decreasing it as the energy level increased. Because
the birds were mechanically eviscerated, abdominal fat content was not determined. Increased
abdominal fat may have been associated with the higher energy levels.
DISCUSSION
Ross 308, a bird selected for fast growth and high efficiency, had the best growth, followed by
Ross 708 and TY which are birds selected for high yield and present a slower growth at this age
(Ross Breeders, 2012a; Ross Breeders 2012b). Heritage performance was in accordance with
Baker and Han (1994) and Schmidt et al., (2009) who used the same strain over the years.
Strain x PO interactions were significant only at 35 days, probably because the growth curve is
steeper at this age for the four strains and any dietary effect in performance is going to be more
pronounced in this period. Poultry oil effect in HER is in agreement with Hill and Dansky,
(1954), Donaldson et al., (1956), Donaldson et al., (1957), and Summers et al., (1964) who
reported reduced FI and FCR with increasing levels of dietary energy using broilers from the
1950’s and 1960’s. The HER bird, unselected since the 1950’s, used in this trial reduced FI in
order to regulate energy intake. On the contrary, Ross 308 responded positively to increments in
dietary energy increasing FI and BW. Results for BW are in agreement with Saleh et al., (2004a),
Saleh et al.,( 2004b), and Hidalgo et al., (2004) who reported increased BWG with increasing
levels of energy by poultry oil inclusion, at 42 days of age, though in this cases, FI was similar or
decreased with higher energy levels. These cited trials were conducted using Ross 308 or Cobb
500 birds, fast growing, highly efficient strains, and fed pelleted diets. It is known that high
inclusion levels of fat can reduce pellet quality (Jensen and Falen, 1973; Briggs et al., 1999;
69
Richardson and Day, 1976). Dozier III et al., (2006) and Dozier III et al., (2007) reported pellet
reductions of over 20% together with significant reductions in pellet durability index when diets
were added increasing levels of PO. It is also known that a low pellet quality can affect
performance reducing FI and BWG ((McKinney and Teeter, 2004; Skinner-Noble et al., 2005) so
pellet quality could have affected performance by affecting FI and BWG. Ross 708 and TY,
birds selected for high breast meat yield, behaved different than Ross 308 reducing FI and BW
with increasing energy levels in the diet. In agreement with these results, Dozier III et al., (2011)
studied Ross 708 response to energy from 36 to 47 days of age and reported similar BW and
reduced FI with increasing levels of energy. It appears that during the process of intense genetic
selection for fast growth represented by the Ross 308 line the capability of the bird to reduce FI
to regulate energy intake has been lost. It is possible that, due to the fact that high yield birds
were not selected for growth as fast as Ross 308, FI could not have been affected. Siegel and
Wisman (1966) observed that selection for high BW resulted in increased FI. Body weight and
FI have a very high correlation (0.7) (Pym and Nicholls, 1979). Burkhart et al., (1983) proposed
that artificial selection for growth has resulted in a reduction or disappearance of satiety
mechanisms.
Increased CCR with increasing levels of energy has been reported (Dozier III et al., 2007;
Skinner et al., 1992; Saleh et al., 2004a;Saleh et al., 2004b) but some researchers report reduced
CCR with higher energy levels (Dozier III et al., 2006; Dozier III et al., 2011). Lack of effect in
FCR in modern strains is in contradiction with Lei and Van Beek, 1997,Saleh et al., 2004b; Saleh
et al., 2004a; Dozier III et al., 2006; Dozier III et al., 2007; Skinner et al., 1992; Leeson et al.,
1996a) that report reduced FCR with increments in dietary energy. Again, these results could
have been affected by variations among treatments in pellet quality. In the present experiment,
70
Ross 308 gained more weight with increased dietary energy and increased FI maintaining similar
FCR. At the same time high yield strains reduced FI reducing BWG while maintaining similar
FCR. Heritage reduced FI translated into a reduced FCR and constant CCR while Ross 308
increased FI increased CCR with a constant FCR. Increased energy affected Ross 708 and TY in
a more pronounced CCR with energy increments probably due to the lower requirements at that
point for the high yield strains.
Regression analysis of current genotypes data show significant differences between the
multipurpose line (308) and high yield lines (708 and TY) for body weight at 35 days (Figure 7)
and caloric conversion at 35 days (Figure 8) as well as body weight at 42 days (Figure 9).
Processing
Processing results are shown in Table 7. Differences between HER and current strains are in
accordance with Chambers et al., (1981), Havenstein et al., (1994b), Havenstein et al., (2003a),
Sandercock et al., (2009), and Schmidt et al., (2009). All these authors reported increased BMY
in modern strains compared to ‘old’ strains. Heritage highest wing yield was due presumably to
relative lower weight of the rest of the parts compared to modern strains. Unfortunately there is
not a lot of published work on the differences between modern genotypes. Scheuermann et al.,
(2004) compared BMY between a modern strain selected for high yield and another one selected
for fast growth. In agreement with results of this trial, at 35 days the high yield strain had
significantly higher BMY than the other one. Reddish and Lilburn (2004) also reported higher
BMY for strains selected for this purpose compared to a strain unselected for conformation.
Poultry oil effect on carcass yield is probably due to increased fat pad in birds fed high energy
diets as reported by Leeson et al., (1996a), Saleh et al., (2004a), and Dozier III et al., (2007)
71
when high and moderate energy diets were compared but in contradiction with Skinner et al.,
(1992), Hidalgo et al., (2004), Saleh et al., (2004b), Dozier III et al., (2007)) when a low and
moderate energy diets were compared. Poultry oil lack of effect on any other carcass part is in
agreement with Saleh et al., (2004a), Saleh et al., (2004b), Dozier III et al., (2006), Dozier III et
al., (2007), Hidalgo et al., (2004), Leeson et al., (1996b), and Lei and Van Beek, (1997).
Genetic selection for different objectives has affected strain response to dietary energy in
different ways. Different nutritional recommendations should be considered for strains selected
for different purposes in order to maximize performance and increase economic returns.
References
Baker, D. H., and Y. Han. 1994. Ideal amino acid profile for chicks during the first three weeks
posthatching. Poult. Sci. 73:1441-1447.
Briggs, J., D. Maier, B. Watkins, and K. Behnke. 1999. Effect of ingredients and processing
parameters on pellet quality. Poult. Sci. 78:1464-1471.
Burkhart, C., J. A. Cherry, H. Van Krey, and P. Siegel. 1983. Genetic selection for growth rate
alters hypothalamic satiety mechanisms in chickens. Behav. Genet. 13:295-300.
Chambers, J. R., J. S. Gavora, A. Fortin. 1981. Genetic changes in meat-type chickens in the last
twenty years. Can. Jnl. An. Sci. 61 3:555-563.
Donaldson, W., G. Combs, and G. Romoser. 1958. Studies on Energy Levels in Poultry Rations:
3. Effect of Calorie-Protein Ratio of the Ration on Growth, Nutrient Utilization and Body
Composition of Poults. Poult. Sci. 37:614.
Donaldson, W., G. Combs, G. Romoser, and W. Supplee. 1957. Studies on Energy Levels in
Poultry Rations: 2. Tolerance of Growing Chicks to Dietary Fat. Poult. Sci. 36:807.
Donaldson, W., G. Combs, and G. Romoser. 1956. Studies on energy levels in poultry rations. 1.
The effect of calorie-protein ratio of the ration on growth, nutrient utilization and body
composition of chicks. Poult. Sci. 35:1100.
72
Dozier III, W., C. Gehring, A. Corzo, and H. Olanrewaju. 2011. Apparent metabolizable energy
needs of male and female broilers from 36 to 47 days of age. Poult. Sci. 90:804.
Dozier III, W., A. Corzo, M. Kidd, and S. Branton. 2007. Dietary apparent metabolizable energy
and amino acid density effects on growth and carcass traits of heavy broilers. J. Appl. Poult. Res.
16:192.
Dozier III, W., C. Price, M. Kidd, A. Corzo, J. Anderson, and S. Branton. 2006. Growth
performance, meat yield, and economic responses of broilers fed diets varying in metabolizable
energy from thirty to fifty-nine days of age. J. Appl. Poult. Res. 15:367.
Emmerson, D. 1997. Commercial approaches to genetic selection for growth and feed
conversion in domestic poultry. Poult. Sci. 76:1121-1125.
Havenstein, G. B., P. R. Ferket, and M. A. Qureshi. 2003a. Carcass composition and yield of
1957 versus 2001 broilers when fed representative 1957 and 2001 broiler diets. Poult. Sci.
82:1509.
Havenstein, G. B., P. R. Ferket, and M. A. Qureshi. 2003b. Growth, livability, and feed
conversion of 1957 versus 2001 broilers when fed representative 1957 and 2001 broiler diets.
Poult. Sci. 82:1500.
Havenstein, G. B., P. R. Ferket, S. E. Scheideler, and B. T. Larson. 1994a. Growth, livability,
and feed conversion of 1957 vs 1991 broilers when fed "typical" 1957 and 1991 broiler diets.
Poult. Sci. 73:1785-1794.
Havenstein, G. B., P. R. Ferket, S. E. Scheideler, and D. V. Rives. 1994b. Carcass composition
and yield of 1991 vs 1957 broilers when fed "typical" 1957 and 1991 broiler diets. Poult. Sci.
73:1795-1804.
Hidalgo, M., W. Dozier III, A. Davis, and R. Gordon. 2004. Live performance and meat yield
responses of broilers to progressive concentrations of dietary energy maintained at a constant
metabolizable energy-to-crude protein ratio. J. Appl. Poult. Res.13:319.
Hill, F., and L. Dansky. 1954. Studies of the Energy Requirements of Chickens: 1. The Effect of
Dietary Energy Level on Growth and Feed Comsumption. Poult. Sci. 33:112.
Jensen, L., and L. Falen. 1973. Effect of pelleting on the “extra caloric” effect of dietary fat for
developing turkeys. Poult. Sci. 52:2342-2344.
Leeson, S., L. Caston, and J. Summers. 1996a. Broiler response to diet energy. Poult. Sci.
75:529.
Leeson, S., L. Caston, and J. Summers. 1996b. Broiler response to energy or energy and protein
dilution in the finisher diet. Poult. Sci. 75:522.
73
Lei, S., and G. Van Beek. 1997. Influence of activity and dietary energy on broiler performance,
carcase yield and sensory quality. Br. Poult. Sci. 38:183-189.
McKinney, L. J., and R. G. Teeter. 2004. Predicting effective caloric value of nonnutritive
factors: I. Pellet quality and II. Prediction of consequential formulation dead zones. Poult. Sci.
83:1165.
Panda, J. N., and G. F. Combs. 1950. Studies on the energy requirement of the chick for rapid
growth. Poult. Sci. 29:774-775
Pym, R., and P. Nicholls. 1979. Selection for food conversion in broilers: Direct and correlated
responses to selection for body‐weight gain, food consumption and food conversion ratio. Br.
Poult. Sci. 20:73-86.
Reddish, J. M., and M. S. Lilburn. 2004. A comparison of growth and development patterns in
diverse genotypes of broilers. 1. Male broiler growth. Poult. Sci. 83:1067.
Richardson, W., and E. J. Day. 1976. Effect of varying levels of added fat in broiler diets on
pellet quality. Feedstuffs (May 17):24
Robertson, E. I., R. F. Miller and G. F. Heuser, 1948. The relation of energy to fiber in chick
rations. Poult. Sci 27:736-741
Ross Breeders. 2012a. Ross 308 Broiler performance objectives 2012.
Ross Breeders. 2012b. Ross 708 Broiler performance objectives 2012.
Rostagno, H. R., Albino, L. F. T., Donzele, J. L., Gomes, P. C., dee Oliveira, R. F., Lopes, D. C.,
Firiera, A. S., and Barreto, S. L. de T. 2005. Brazilian Tables for Poultry and Swine.
Composition of feedstuffs and nutritional requirements. 2nd
ed. H. S. Rostagno, ed. Universidade
Federal de Vocsa, Dept Zootecnia, Viscosa, MG, Brazil.
Saleh, E., S. Watkins, A. Waldroup, and P. Waldroup. 2004a. Effects of dietary nutrient density
on performance and carcass quality of male broilers grown for further processing. Int.J.Poult.Sci
3:1-10.
Saleh, E., S. Watkins, A. Waldroup, and P. Waldroup. 2004b. Consideration for dietary nutrient
density and energy feeding programs for growing large male broiler chickens for further
processing. Int.J.Poult.Sci 3:11-16.
Sandercock, D. A., G. R. Nute, and P. M. Hocking. 2009. Quantifying the effects of genetic
selection and genetic variation for body size, carcass composition, and meat quality in the
domestic fowl (Gallus domesticus). Poult. Sci. 88:923.
74
Scheuermann, G., S. Bilgili, S. Tuzun, and D. Mulvaney. 2004. Comparison of chicken
genotypes: myofiber number in pectoralis muscle and myostatin ontogeny. Poult. Sci. 83:1404-
1412.
Schmidt, C. J., M. E. Persia, E. Feierstein, B. Kingham, and W. W. Saylor. 2009. Comparison of
a modern broiler line and a heritage line unselected since the 1950s. Poult. Sci. 88:2610.
Siegel, P. and Wisman, E. 1966. Selection for body weight at eight weeks of age. 6. Changes in
appetite and feed utilization. Poult. Sci. 45: 1391-1397
Skinner, J. T., A. L. Waldroup, and P. W. Waldroup. 1992. Effects of dietary nutrient density on
performance and carcass quality of broilers 42 to 49 days of age. J. Appl. Poult. Res. 1:367.
Skinner-Noble, D., L. McKinney, and R. Teeter. 2005. Predicting effective caloric value of
nonnutritive factors: III. Feed form affects broiler performance by modifying behavior patterns.
Poult. Sci. 84:403-411.
Summers, J., S. Slinger, I. Sibbald, and W. Pepper. 1964. Influence of protein and energy and
growth and protein utilization in the growing chicken. J. Nutr. 82:463.
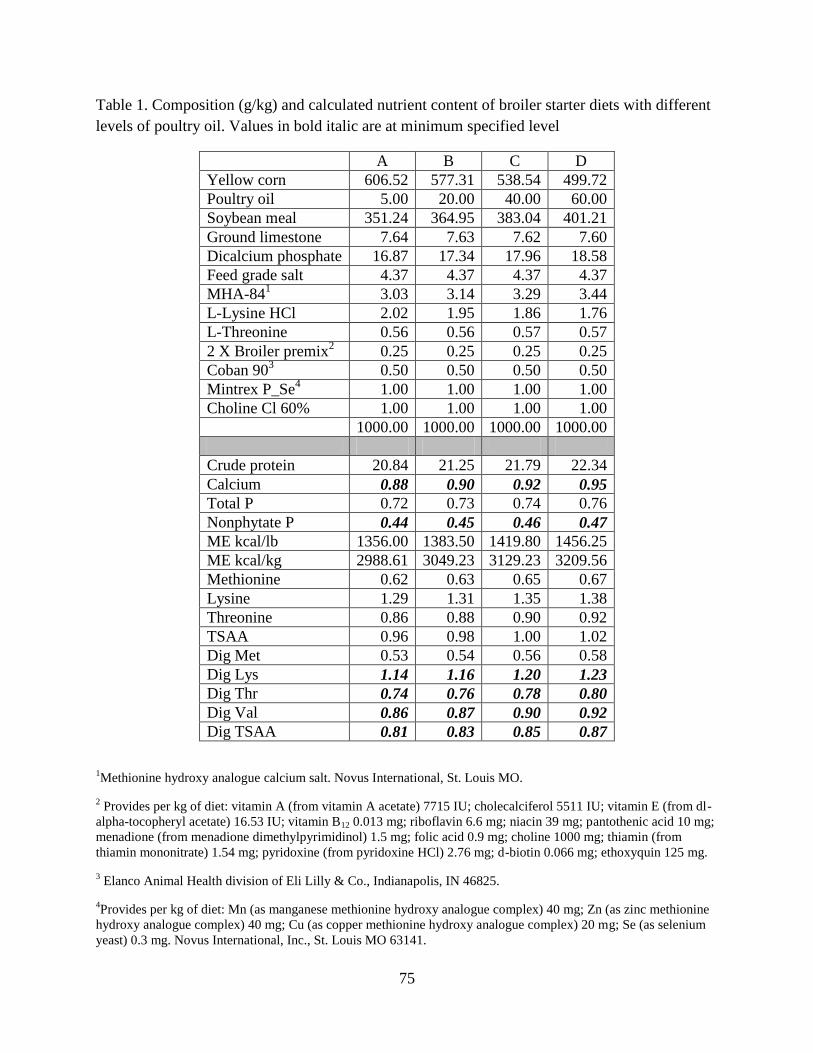
75
Table 1. Composition (g/kg) and calculated nutrient content of broiler starter diets with different
levels of poultry oil. Values in bold italic are at minimum specified level
A B C D
Yellow corn 606.52 577.31 538.54 499.72
Poultry oil 5.00 20.00 40.00 60.00
Soybean meal 351.24 364.95 383.04 401.21
Ground limestone 7.64 7.63 7.62 7.60
Dicalcium phosphate 16.87 17.34 17.96 18.58
Feed grade salt 4.37 4.37 4.37 4.37
MHA-841
3.03 3.14 3.29 3.44
L-Lysine HCl 2.02 1.95 1.86 1.76
L-Threonine 0.56 0.56 0.57 0.57
2 X Broiler premix2
0.25 0.25 0.25 0.25
Coban 903
0.50 0.50 0.50 0.50
Mintrex P_Se4
1.00 1.00 1.00 1.00
Choline Cl 60% 1.00 1.00 1.00 1.00
1000.00 1000.00 1000.00 1000.00
Crude protein 20.84 21.25 21.79 22.34
Calcium 0.88 0.90 0.92 0.95
Total P 0.72 0.73 0.74 0.76
Nonphytate P 0.44 0.45 0.46 0.47
ME kcal/lb 1356.00 1383.50 1419.80 1456.25
ME kcal/kg 2988.61 3049.23 3129.23 3209.56
Methionine 0.62 0.63 0.65 0.67
Lysine 1.29 1.31 1.35 1.38
Threonine 0.86 0.88 0.90 0.92
TSAA 0.96 0.98 1.00 1.02
Dig Met 0.53 0.54 0.56 0.58
Dig Lys 1.14 1.16 1.20 1.23
Dig Thr 0.74 0.76 0.78 0.80
Dig Val 0.86 0.87 0.90 0.92
Dig TSAA 0.81 0.83 0.85 0.87
1Methionine hydroxy analogue calcium salt. Novus International, St. Louis MO.
2 Provides per kg of diet: vitamin A (from vitamin A acetate) 7715 IU; cholecalciferol 5511 IU; vitamin E (from dl-
alpha-tocopheryl acetate) 16.53 IU; vitamin B12 0.013 mg; riboflavin 6.6 mg; niacin 39 mg; pantothenic acid 10 mg;
menadione (from menadione dimethylpyrimidinol) 1.5 mg; folic acid 0.9 mg; choline 1000 mg; thiamin (from
thiamin mononitrate) 1.54 mg; pyridoxine (from pyridoxine HCl) 2.76 mg; d-biotin 0.066 mg; ethoxyquin 125 mg.
3 Elanco Animal Health division of Eli Lilly & Co., Indianapolis, IN 46825.
4Provides per kg of diet: Mn (as manganese methionine hydroxy analogue complex) 40 mg; Zn (as zinc methionine
hydroxy analogue complex) 40 mg; Cu (as copper methionine hydroxy analogue complex) 20 mg; Se (as selenium
yeast) 0.3 mg. Novus International, Inc., St. Louis MO 63141.
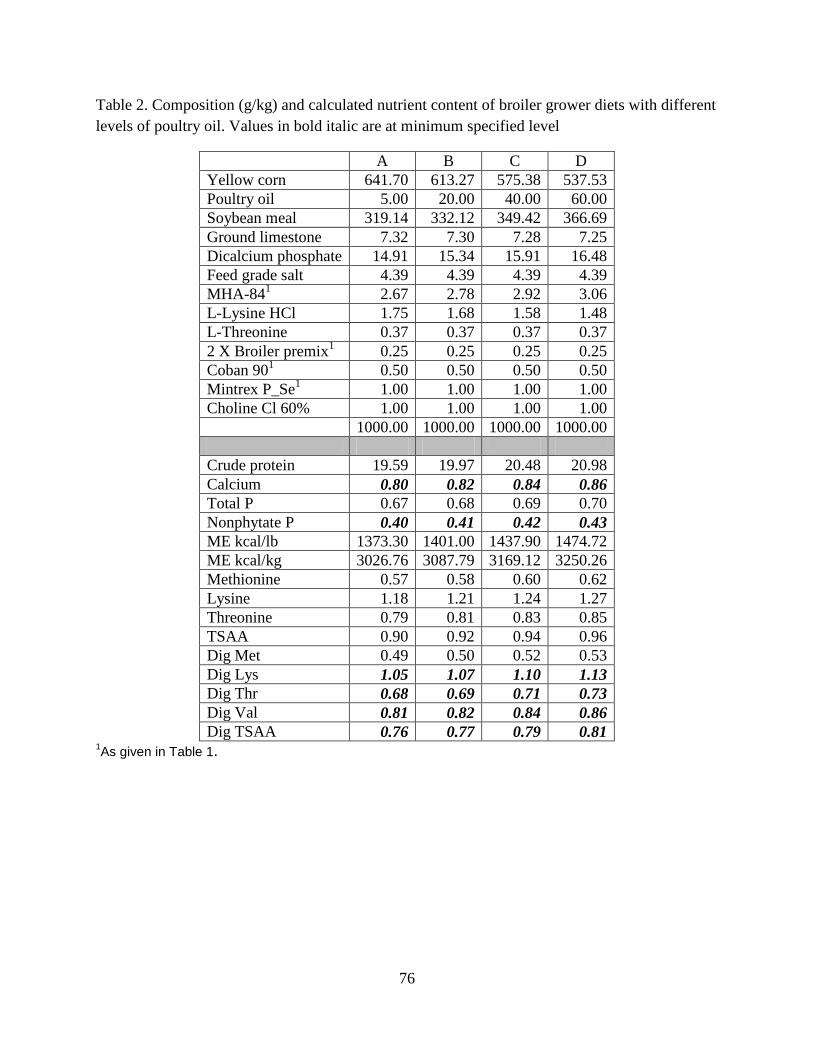
76
Table 2. Composition (g/kg) and calculated nutrient content of broiler grower diets with different
levels of poultry oil. Values in bold italic are at minimum specified level
A B C D
Yellow corn 641.70 613.27 575.38 537.53
Poultry oil 5.00 20.00 40.00 60.00
Soybean meal 319.14 332.12 349.42 366.69
Ground limestone 7.32 7.30 7.28 7.25
Dicalcium phosphate 14.91 15.34 15.91 16.48
Feed grade salt 4.39 4.39 4.39 4.39
MHA-841
2.67 2.78 2.92 3.06
L-Lysine HCl 1.75 1.68 1.58 1.48
L-Threonine 0.37 0.37 0.37 0.37
2 X Broiler premix1
0.25 0.25 0.25 0.25
Coban 901
0.50 0.50 0.50 0.50
Mintrex P_Se1
1.00 1.00 1.00 1.00
Choline Cl 60% 1.00 1.00 1.00 1.00
1000.00 1000.00 1000.00 1000.00
Crude protein 19.59 19.97 20.48 20.98
Calcium 0.80 0.82 0.84 0.86
Total P 0.67 0.68 0.69 0.70
Nonphytate P 0.40 0.41 0.42 0.43
ME kcal/lb 1373.30 1401.00 1437.90 1474.72
ME kcal/kg 3026.76 3087.79 3169.12 3250.26
Methionine 0.57 0.58 0.60 0.62
Lysine 1.18 1.21 1.24 1.27
Threonine 0.79 0.81 0.83 0.85
TSAA 0.90 0.92 0.94 0.96
Dig Met 0.49 0.50 0.52 0.53
Dig Lys 1.05 1.07 1.10 1.13
Dig Thr 0.68 0.69 0.71 0.73
Dig Val 0.81 0.82 0.84 0.86
Dig TSAA 0.76 0.77 0.79 0.81 1As given in Table 1.
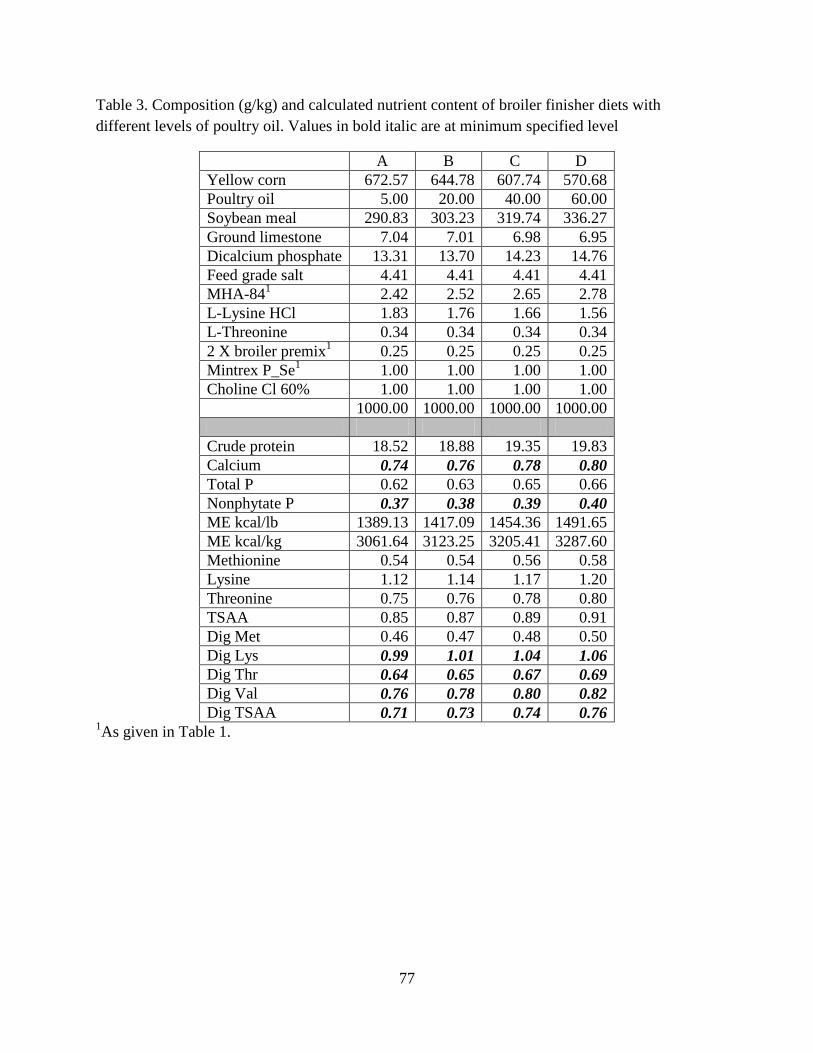
77
Table 3. Composition (g/kg) and calculated nutrient content of broiler finisher diets with
different levels of poultry oil. Values in bold italic are at minimum specified level
A B C D
Yellow corn 672.57 644.78 607.74 570.68
Poultry oil 5.00 20.00 40.00 60.00
Soybean meal 290.83 303.23 319.74 336.27
Ground limestone 7.04 7.01 6.98 6.95
Dicalcium phosphate 13.31 13.70 14.23 14.76
Feed grade salt 4.41 4.41 4.41 4.41
MHA-841
2.42 2.52 2.65 2.78
L-Lysine HCl 1.83 1.76 1.66 1.56
L-Threonine 0.34 0.34 0.34 0.34
2 X broiler premix1
0.25 0.25 0.25 0.25
Mintrex P_Se1
1.00 1.00 1.00 1.00
Choline Cl 60% 1.00 1.00 1.00 1.00
1000.00 1000.00 1000.00 1000.00
Crude protein 18.52 18.88 19.35 19.83
Calcium 0.74 0.76 0.78 0.80
Total P 0.62 0.63 0.65 0.66
Nonphytate P 0.37 0.38 0.39 0.40
ME kcal/lb 1389.13 1417.09 1454.36 1491.65
ME kcal/kg 3061.64 3123.25 3205.41 3287.60
Methionine 0.54 0.54 0.56 0.58
Lysine 1.12 1.14 1.17 1.20
Threonine 0.75 0.76 0.78 0.80
TSAA 0.85 0.87 0.89 0.91
Dig Met 0.46 0.47 0.48 0.50
Dig Lys 0.99 1.01 1.04 1.06
Dig Thr 0.64 0.65 0.67 0.69
Dig Val 0.76 0.78 0.80 0.82
Dig TSAA 0.71 0.73 0.74 0.76 1As given in Table 1.
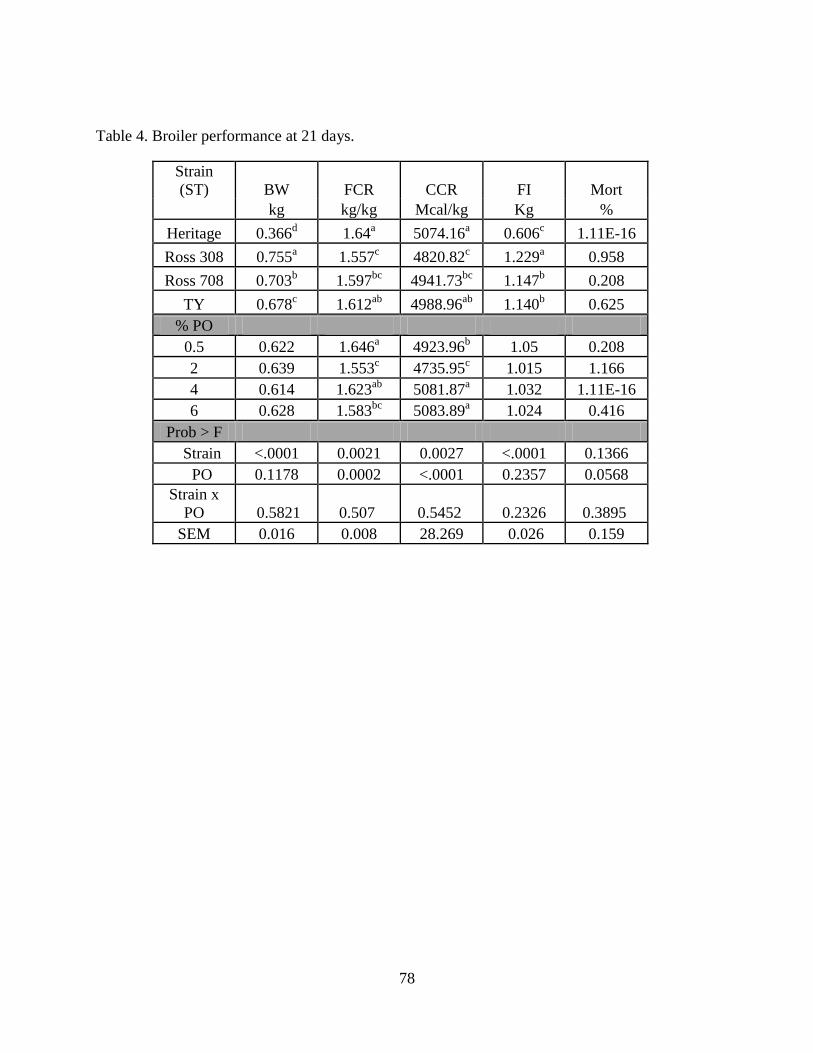
78
Table 4. Broiler performance at 21 days.
Strain
(ST) BW FCR CCR FI Mort
kg kg/kg Mcal/kg Kg %
Heritage 0.366d 1.64
a 5074.16
a 0.606
c 1.11E-16
Ross 308 0.755a 1.557
c 4820.82
c 1.229
a 0.958
Ross 708 0.703b 1.597
bc 4941.73
bc 1.147
b 0.208
TY 0.678c 1.612
ab 4988.96
ab 1.140
b 0.625
% PO
0.5 0.622 1.646a 4923.96
b 1.05 0.208
2 0.639 1.553c 4735.95
c 1.015 1.166
4 0.614 1.623ab
5081.87a 1.032 1.11E-16
6 0.628 1.583bc
5083.89a 1.024 0.416
Prob > F
Strain <.0001 0.0021 0.0027 <.0001 0.1366
PO 0.1178 0.0002 <.0001 0.2357 0.0568
Strain x
PO 0.5821 0.507 0.5452 0.2326 0.3895
SEM 0.016 0.008 28.269 0.026 0.159
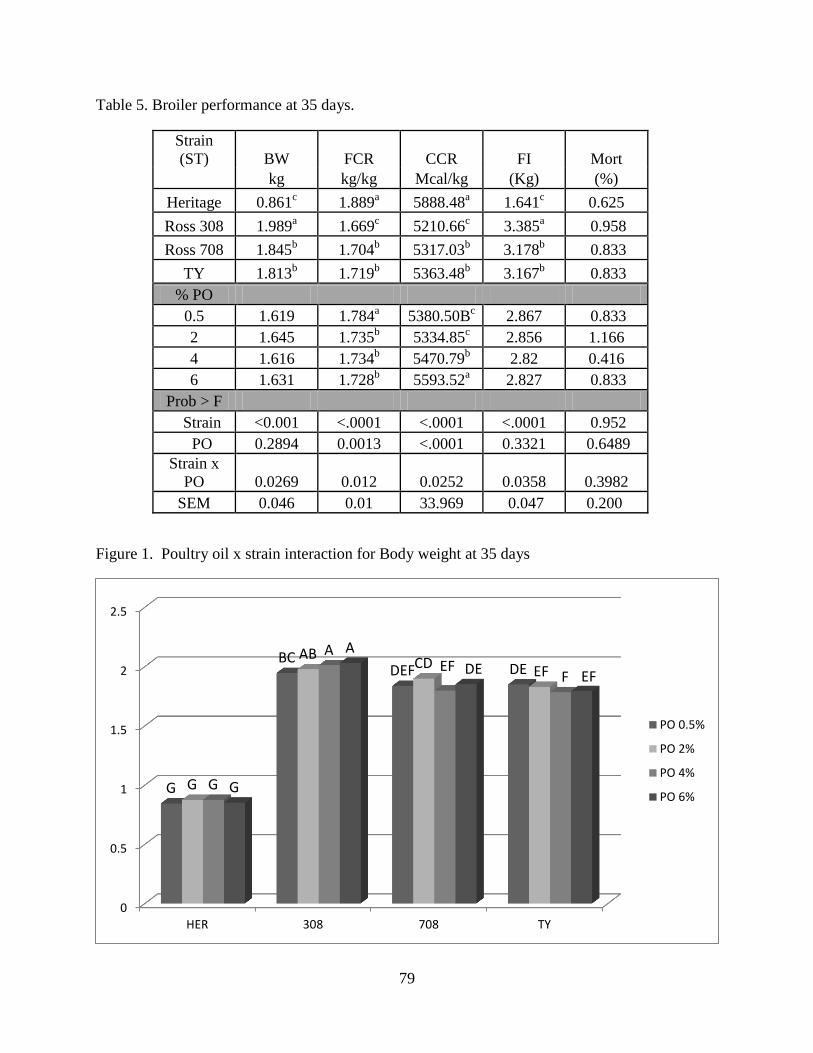
79
Table 5. Broiler performance at 35 days.
Strain
(ST) BW FCR CCR FI Mort
kg kg/kg Mcal/kg (Kg) (%)
Heritage 0.861c 1.889
a 5888.48
a 1.641
c 0.625
Ross 308 1.989a 1.669
c 5210.66
c 3.385
a 0.958
Ross 708 1.845b 1.704
b 5317.03
b 3.178
b 0.833
TY 1.813b 1.719
b 5363.48
b 3.167
b 0.833
% PO
0.5 1.619 1.784a 5380.50B
c 2.867 0.833
2 1.645 1.735b 5334.85
c 2.856 1.166
4 1.616 1.734b 5470.79
b 2.82 0.416
6 1.631 1.728b 5593.52
a 2.827 0.833
Prob > F
Strain <0.001 <.0001 <.0001 <.0001 0.952
PO 0.2894 0.0013 <.0001 0.3321 0.6489
Strain x
PO 0.0269 0.012 0.0252 0.0358 0.3982
SEM 0.046 0.01 33.969 0.047 0.200
Figure 1. Poultry oil x strain interaction for Body weight at 35 days
0
0.5
1
1.5
2
2.5
HER 308 708 TY
G
BC DEF DE
G
AB CD
EF
G
A EF
F
G
A
DE EF
PO 0.5%
PO 2%
PO 4%
PO 6%
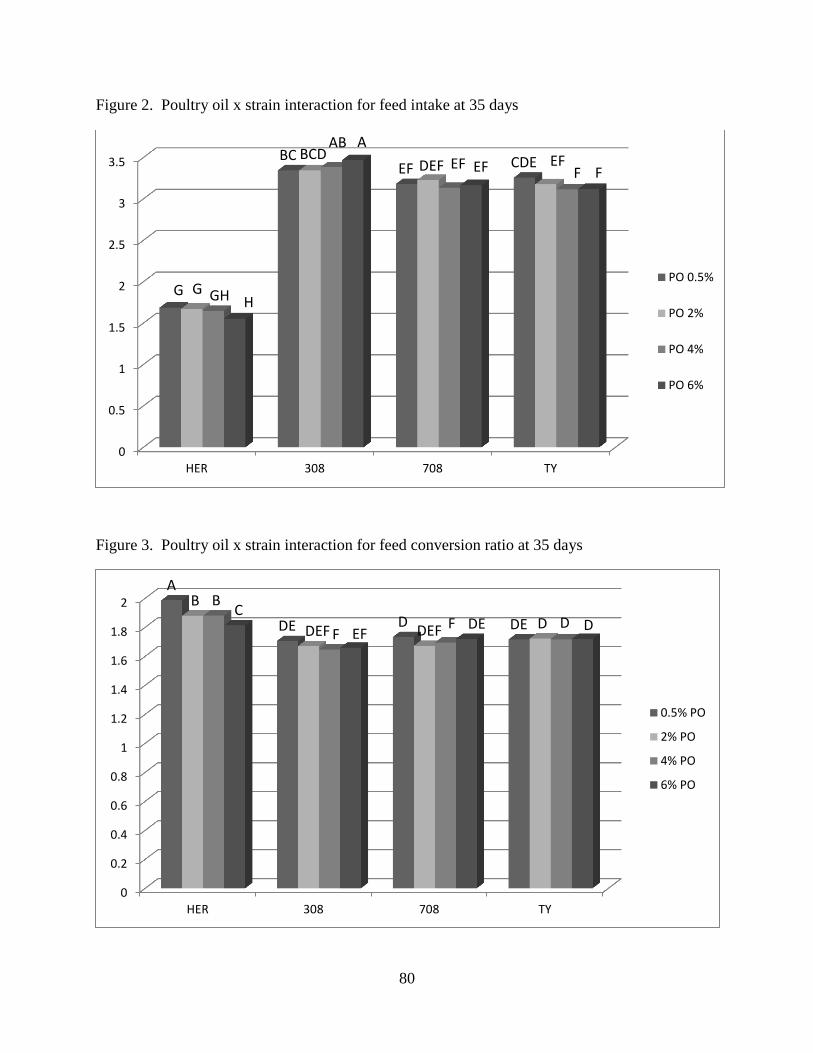
80
Figure 2. Poultry oil x strain interaction for feed intake at 35 days
Figure 3. Poultry oil x strain interaction for feed conversion ratio at 35 days
0
0.5
1
1.5
2
2.5
3
3.5
HER 308 708 TY
G
BC EF CDE
G
BCD DEF EF
GH
AB
EF F
H
A
EF F
PO 0.5%
PO 2%
PO 4%
PO 6%
0
0.2
0.4
0.6
0.8
1
1.2
1.4
1.6
1.8
2
HER 308 708 TY
A
DE D DE
B
DEF DEF D
B
F F D
C
EF DE D
0.5% PO
2% PO
4% PO
6% PO
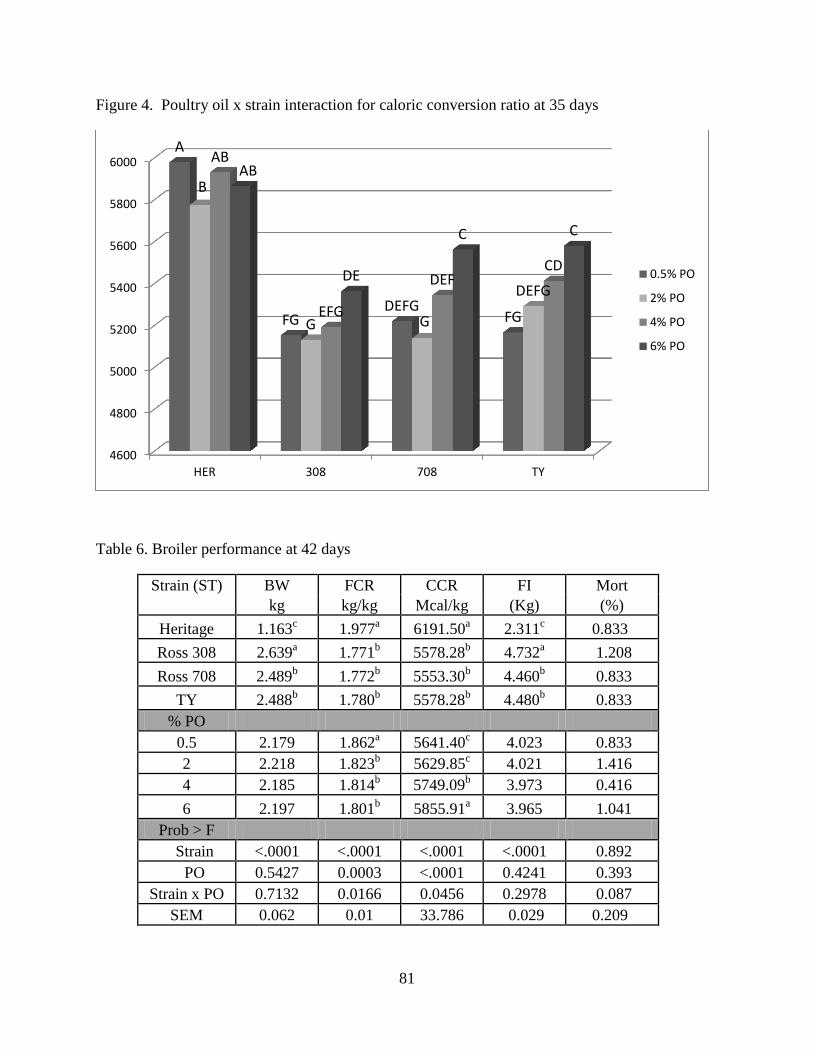
81
Figure 4. Poultry oil x strain interaction for caloric conversion ratio at 35 days
Table 6. Broiler performance at 42 days
Strain (ST) BW FCR CCR FI Mort
kg kg/kg Mcal/kg (Kg) (%)
Heritage 1.163c 1.977
a 6191.50
a 2.311
c 0.833
Ross 308 2.639a 1.771
b 5578.28
b 4.732
a 1.208
Ross 708 2.489b 1.772
b 5553.30
b 4.460
b 0.833
TY 2.488b 1.780
b 5578.28
b 4.480
b 0.833
% PO
0.5 2.179 1.862a 5641.40
c 4.023 0.833
2 2.218 1.823b 5629.85
c 4.021 1.416
4 2.185 1.814b 5749.09
b 3.973 0.416
6 2.197 1.801b 5855.91
a 3.965 1.041
Prob > F
Strain <.0001 <.0001 <.0001 <.0001 0.892
PO 0.5427 0.0003 <.0001 0.4241 0.393
Strain x PO 0.7132 0.0166 0.0456 0.2978 0.087
SEM 0.062 0.01 33.786 0.029 0.209
4600
4800
5000
5200
5400
5600
5800
6000
HER 308 708 TY
A
FG DEFG
FG
B
G G
DEFG
AB
EFG
DEF CD
AB
DE
C C
0.5% PO
2% PO
4% PO
6% PO
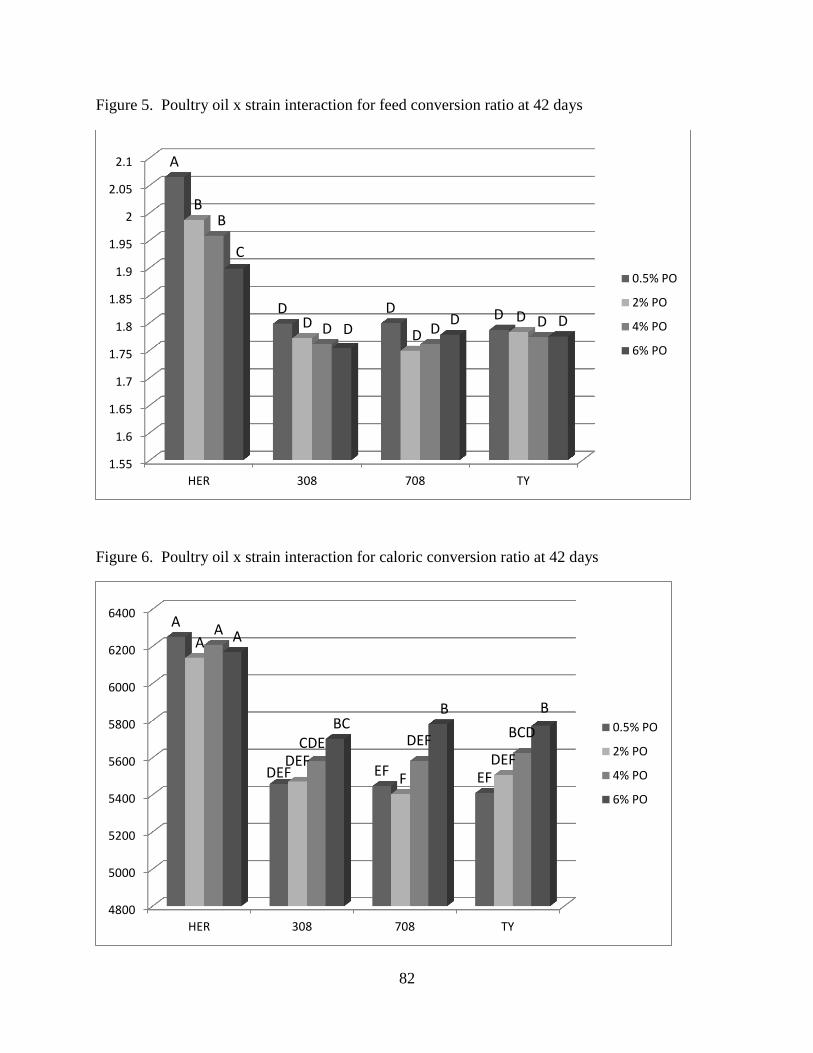
82
Figure 5. Poultry oil x strain interaction for feed conversion ratio at 42 days
Figure 6. Poultry oil x strain interaction for caloric conversion ratio at 42 days
1.55
1.6
1.65
1.7
1.75
1.8
1.85
1.9
1.95
2
2.05
2.1
HER 308 708 TY
A
D D D
B
D D
D
B
D D D
C
D D D
0.5% PO
2% PO
4% PO
6% PO
4800
5000
5200
5400
5600
5800
6000
6200
6400
HER 308 708 TY
A
DEF EF EF
A
DEF F
DEF
A
CDE DEF BCD
A
BC B B
0.5% PO
2% PO
4% PO
6% PO
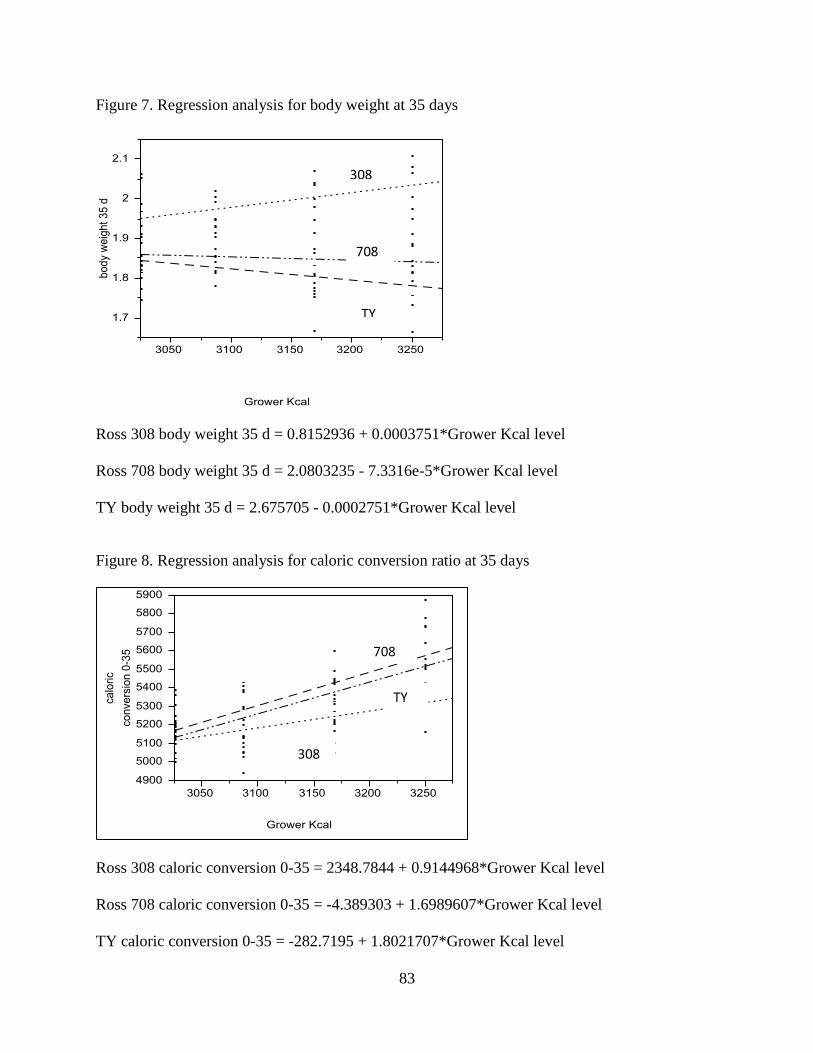
83
Figure 7. Regression analysis for body weight at 35 days
Ross 308 body weight 35 d = 0.8152936 + 0.0003751*Grower Kcal level
Ross 708 body weight 35 d = 2.0803235 - 7.3316e-5*Grower Kcal level
TY body weight 35 d = 2.675705 - 0.0002751*Grower Kcal level
Figure 8. Regression analysis for caloric conversion ratio at 35 days
Ross 308 caloric conversion 0-35 = 2348.7844 + 0.9144968*Grower Kcal level
Ross 708 caloric conversion 0-35 = -4.389303 + 1.6989607*Grower Kcal level
TY caloric conversion 0-35 = -282.7195 + 1.8021707*Grower Kcal level
308
708
TY
308
708
TY
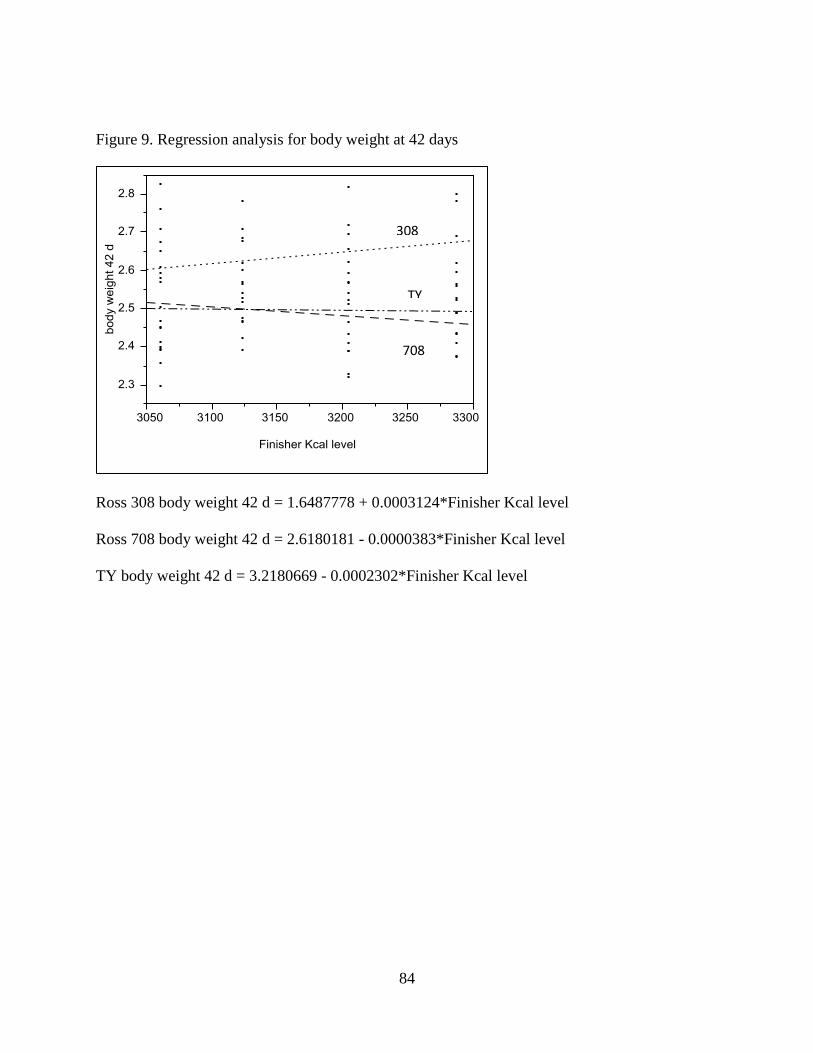
84
Figure 9. Regression analysis for body weight at 42 days
Ross 308 body weight 42 d = 1.6487778 + 0.0003124*Finisher Kcal level
Ross 708 body weight 42 d = 2.6180181 - 0.0000383*Finisher Kcal level
TY body weight 42 d = 3.2180669 - 0.0002302*Finisher Kcal level
308
708
TY
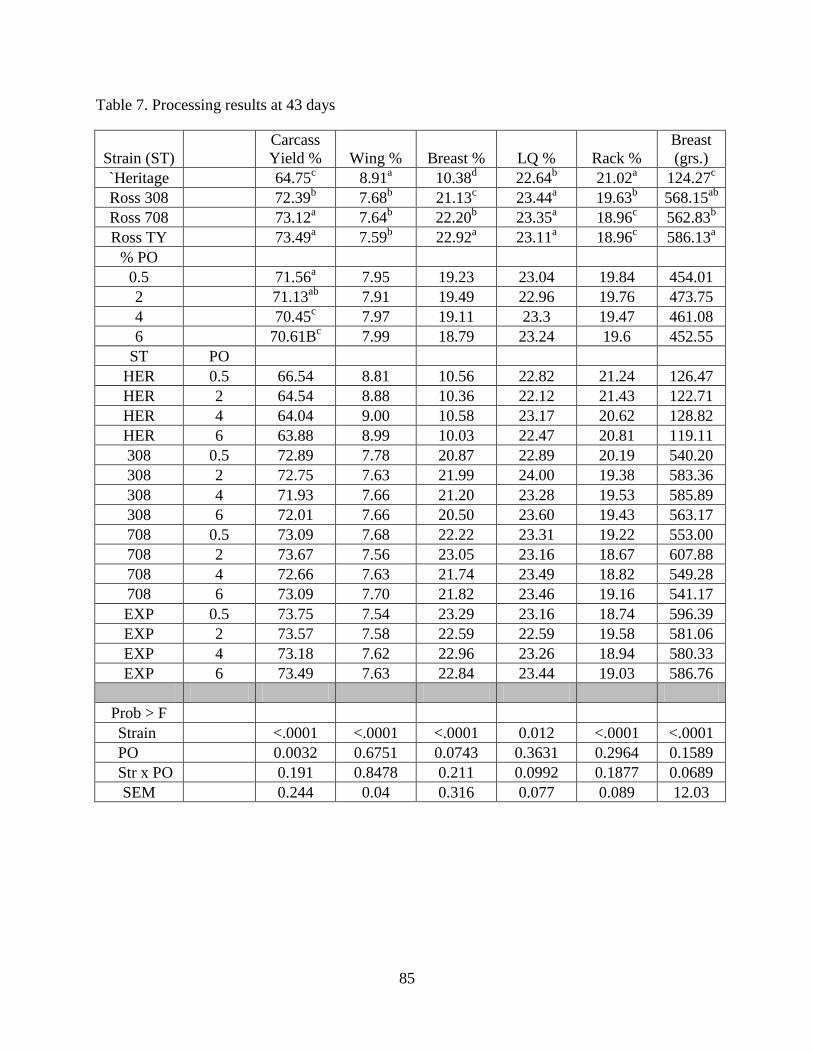
85
Table 7. Processing results at 43 days
Strain (ST)
Carcass
Yield % Wing % Breast % LQ % Rack %
Breast
(grs.)
`Heritage 64.75c 8.91
a 10.38
d 22.64
b 21.02
a 124.27
c
Ross 308 72.39b 7.68
b 21.13
c 23.44
a 19.63
b 568.15
ab
Ross 708 73.12a 7.64
b 22.20
b 23.35
a 18.96
c 562.83
b
Ross TY 73.49a 7.59
b 22.92
a 23.11
a 18.96
c 586.13
a
% PO
0.5 71.56a 7.95 19.23 23.04 19.84 454.01
2 71.13ab
7.91 19.49 22.96 19.76 473.75
4 70.45c 7.97 19.11 23.3 19.47 461.08
6 70.61Bc 7.99 18.79 23.24 19.6 452.55
ST PO
HER 0.5 66.54 8.81 10.56 22.82 21.24 126.47
HER 2 64.54 8.88 10.36 22.12 21.43 122.71
HER 4 64.04 9.00 10.58 23.17 20.62 128.82
HER 6 63.88 8.99 10.03 22.47 20.81 119.11
308 0.5 72.89 7.78 20.87 22.89 20.19 540.20
308 2 72.75 7.63 21.99 24.00 19.38 583.36
308 4 71.93 7.66 21.20 23.28 19.53 585.89
308 6 72.01 7.66 20.50 23.60 19.43 563.17
708 0.5 73.09 7.68 22.22 23.31 19.22 553.00
708 2 73.67 7.56 23.05 23.16 18.67 607.88
708 4 72.66 7.63 21.74 23.49 18.82 549.28
708 6 73.09 7.70 21.82 23.46 19.16 541.17
EXP 0.5 73.75 7.54 23.29 23.16 18.74 596.39
EXP 2 73.57 7.58 22.59 22.59 19.58 581.06
EXP 4 73.18 7.62 22.96 23.26 18.94 580.33
EXP 6 73.49 7.63 22.84 23.44 19.03 586.76
Prob > F
Strain <.0001 <.0001 <.0001 0.012 <.0001 <.0001
PO 0.0032 0.6751 0.0743 0.3631 0.2964 0.1589
Str x PO 0.191 0.8478 0.211 0.0992 0.1877 0.0689
SEM 0.244 0.04 0.316 0.077 0.089 12.03
86
Comparative response of different broiler genotypes to dietary amino acid levels
F. Mussini, S. Goodgame, C. Lu, D. Bradley, S. Fiscus, P. W. Waldroup
University of Arkansas, Fayetteville AR USA
ABSTRACT: In this study a heritage line (HER) of NH x WPR maintained at the University of
Illinois since the 1950’s was compared to three modern production lines (Ross 308, Ross 708
and a Test Yield Product (TY) from Aviagen) for 6 weeks post hatch. At 42 days, 3 birds per pen
were processed at a pilot processing plant and results studied for interactions. The genetic lines
were compared at six different amino acid levels. Diets were formulated to contain 80, 85, 90,
95, 100, and 105% of suggested amino acid needs at a constant energy level. Four hundred and
eighty one-day-old male birds of each line were randomly allocated to 96 pens in a 4 X 6
factorial arrangement. Each treatment had four replications with 20 birds per pen. Ross 308 had
the highest BW and feed intake all through the experiment, followed by Ross 708, TY and HER.
Mortality was not affected by genotype or AA level throughout the trial. At 20 days an
interaction was noted for body weight. Current genotypes responded to increasing AA levels by
gaining more weight while HER response was moderate. At 35 days a similar interaction was
observed. At 41 days the same interaction was observed. Processing results showed genotype x
AA interactions for carcass yield, wing yield and total breast. Heritage parameters were not
affected by AA levels while current strains increased carcass yield and total breast with
increasing levels of AA, reducing wing yield at the same time. These data indicate that current
broiler genotypes respond different to amino acid levels than broilers used in the past.
Key words: Genotype, amino acid density, breast meat yield, performance.
87
INTRODUCTION
Primary breeders have modified the bird used for meat production sixty years ago into new
genotypes through intense genetic selection. Current genotypes grow faster, are more feed
efficient, and have increased protein deposition; especially in the breast muscle (Havenstein et
al., 1994a; Havenstein et al., 1994b; Havenstein et al., 2003a; Havenstein et al., 2003b; Schmidt
et al., 2009). Different selection criteria have changed the broiler; and will continue to change it,
into different genotypes to fit specific market needs. Genotypes have been developed for high
yield at processing or for fast growth and feed efficiency (multi-purpose) with different
processing ages.
At the same time, the effect of varying levels of dietary crude protein (CP) on live performance
and processing yield in broilers has been the object of study for many years. Increasing levels of
CP or amino acid (AA) density have been shown to increase performance (Baker and Han, 1994;
Kidd et al., 1998; Kerr et al., 1999; Kidd et al., 2004; Rezaei et al., 2004; Waldroup et al., 2005)
and breast meat yield up to a certain point while reducing fat deposition at the same time
(Fancher and Jensen, 1989; Moran et al., 1992; Bartov and Plavnik, 1998; Holsheimer and
Veerkamp, 1992), but how different genotypes performance and yield are affected by amino acid
density is not yet clear. Since high-yield and multipurpose birds grow differently, body weight,
feed intake, feed efficiency, and carcass characteristics are different (Smith and Pesti, 1998;
Smith et al., 1998; Corzo et al., 2005). Accordingly, nutrient recommendations for the different
phases could be different as well (Gous, 1998; Gous, 2010). When feed cost and retail price for
valuable cut up parts like breast meat are taken into account for calculating the economic return
88
for US poultry integrators, a proper understanding of each genotypes amino acid requirement
could provide an extra tool to make decisions in order to obtain the maximum profit.
The objective of this trial was to determine how an old line and three current genotypes selected
for different purposes respond to varying levels of dietary amino acid density on live
performance and processing yield.
MATERIALS AND METHODS
In this study a Heritage line (HER) of New Hampshire x Columbia WPR from the University of
Illinois (that had been maintained unselected since the 1950’s) was compared to Ross 308, Ross
708, and a Ross test yield product (TY). Four hundred and eighty, one-day-old male birds of
each strain were allocated to floor pens in a temperature controlled room. A series of diets were
formulated to meet the nutrient requirements for high performing broiler males suggested by
Rostagno et al. (2011). Starter, grower, and finisher diets were formulated to contain 80, 85, 90,
95, 100, and 105% of the amino acid needs at a constant energy level (Tables 1, 2 and 3). Corn
and soybean meal of known protein and moisture content were used as intact sources of protein
with supplemental methionine, lysine, threonine and valine available. All mixed diets were
assayed for crude protein, calcium, total P, and sodium by commercial laboratories specializing
in these assays. Diets with 80, 90, and 100% levels were assayed for total amino acid content
and results were in good agreement with calculated levels. Mash diets were fed to the different
strains resulting in a 6 X 4 factorial arrangement. Each treatment had four replications of 20
birds each. Mean pen weights were taken at one day of age and at 20, 35, and 41 d of age. Feed
consumption was determined during the same time periods and calculations were made of feed
89
conversion (kg of feed per kg of gain). Water and feed was provided for ad libitum consumption
all along the experiment. At 42 days three birds from each pen were tagged, fasted for eight
hours, individually weighed and processed at a pilot processing plant to determine dressing
percentage and parts yield.
Statistical analysis of data was performed using the software JMP Pro (Statistical Analysis
System, SAS Institute Inc., Cary, NC, USA). Data were analyzed by a one-way analysis of
variance (ANOVA) and comparison of means was done using the student’s t test. All statements
of significance are based on P<0.05. Pen means served as the experimental unit for performance
data while individual birds were the experimental units for processing data as birds were
processed randomly and not in pen order.
RESULTS
Performance
Performance data is shown in Table 4. At 20 days, Ross 308 broilers showed the highest body
weight (BW) followed by Ross 708, TY and HER. The same pattern was observed for feed
intake (FI). Ross 308 had significantly better feed efficiency together with Ross 708 and TY than
HER. Birds fed amino acid levels of 105, 100, and 95% had the highest BW followed by those
fed 90, 85, and 80% (Figure 1). For FI, birds fed diets with higher levels of AA showed higher
feed consumption (Figure 3). Birds fed amino acid levels of 105 and 100% were the most
efficient followed by those fed 95, 90, 85 and 80%. Feed efficiency improved together with
increasing levels of AA (Figure 2). Strain x AA level interaction was significant only for BW
(Figure 1). While the three modern strains increased BW with increasing levels of AA, HER
90
BW response was minimal to AA density increments. Mortality was not affected by strain or AA
level throughout the trial.
At 35 days, Ross 308 continued to show the highest BW followed by Ross 708, TY and HER
(Figure 4). Test Yield and Ross 708 showed the lowest FCR followed by Ross 308 and HER
(Table 4, Figure 5). Ross 308 continued to have the highest FI followed by Ross 708, TY, and
HER (Figure 6). Body weight was positively affected by increasing levels of AA with birds fed
105, 100, and 95% showing the highest BW. Birds fed higher levels of AA (105, 100, and 95%)
continued to have the best feed efficiency while FI increased with increasing levels of AA. Body
weight showed a significant strain x AA level interaction (Figure 4). While modern strains
reacted positively to increasing levels of AA improving BW, HER had a moderate response
slightly increasing BW with increasing AA levels. Other interactions at this point were not
significant.
At 41 days, Ross 308 still had the highest BW followed by Ross 708, TY, and HER (Figure 7).
Feed intake had the same pattern while FCR was lower for Ross 308, Ross 708, and TY followed
by HER (Figures 8 and 9). Strain x AA level interaction was significant at this point for BW
(Figure 7).
Processing
Processing results are shown in Table 5. Strain x AA interactions were significant for carcass
yield, wing yield, and total breast (Figures 10, 11 and 15). Strain affected carcass, wing, leg,
breast, rack yield, and total breast. Heritage strain had the lowest carcass, breast meat yield and
total breast (Figures 10, 12, and 15). At the same time, HER showed the highest wing and rack
yield (Figures 11, 14). Ross TY had the highest BMY, and together with Ross 708 it had the
91
highest carcass yield (Figures 10 and 12). Total breast was similar for all three current lines
(Figure 15). Ross 308 showed higher leg yield than the rest of the genotypes (Figure 13). Amino
acid density also affected processing results. Increasing levels of AA increased carcass and BMY
together with total breast weight. Strain x AA level interactions were detected for carcass (Figure
10) and wing yield (Figure 11), and total breast weight (Figure 15). While HER carcass yield
was not affected by increasing levels of AA, all three current lines increased it together with
increments in AA levels. A similar effect was observed for total breast weight, HER was not
affected by AA levels while the other three genotypes studied increased its breast weight with
higher levels of AA. On the contrary, increasing levels of AA reduced wing yield in current lines
while HER was not affected.
DISCUSSION
Performance
Performance responses to AA levels are in agreement with Skinner et al., (1992), Baker and Han
(1994), Kidd et al., (2004), and Corzo et al., (2005), and. The increased feed intake increment
with AA levels increments is in agreement with Sterling et al., (2006) who studied three different
Lys levels but in disagreement with Smith and Pesti (1998) and Smith et al., (1998). The
differences in FI could be explained by the low levels of AA in this trial and the low levels of
Lys used by Sterling et al while AA levels used in Smith et al., (1998) trials were not mentioned
though CP levels used were not marginal.
Strain performances are in agreement with previous trials utilizing high yield and multi-purpose
genotypes (Corzo et al., 2005; Sterling et al., 2006) and other studies comparing old and current
genotypes, (Havenstein et al., 1994a; Havenstein et al., 2003b; Schmidt et al., 2009). Through
92
genetic selection, broilers achieve significantly higher body weights compared to body weights
achieved in the past. Ross 308 is a fast growing strain that outgrows high yield strains at
processing ages of 42 days (Ross Breeders, 2012)
Strain x AA interactions are in partial agreement with literature. Baker and Han (1994), showed
moderate response of HER to AA levels above NRC recommendations at 21 days, though the
lack of response of this genotype at 41 days has not been reported before to our knowledge.
Response of current strains to increasing levels of AA are in agreement with Corzo et al., (2005),
and Sterling et al., (2006) but in disagreement with Smith and Pesti, (1998), and Smith et al.,
(1998). The differences between the old and the new genotypes could be explained by the AA
effect on muscle accretion. Since muscle content of modern strain bird is significantly higher
than in old strains, an AA effect in muscle increases BW significantly. Different current
genotypes seem to have the same response to AA increments at this age.
Processing
Amino acid effects on processing parameters are in agreement with literature. Increasing levels
of CP or AA density reduces abdominal fat pad deposition (Fancher and Jensen, 1989;
Holsheimer and Veerkamp, 1992; Sterling et al., 2006) and increases carcass weight and BMY
(Moran et al., 1992; Bartov and Plavnik, 1998; Kidd et al., 2004; and Corzo et al., 2005). In this
study, since the birds were mechanically eviscerated, abdominal fat content was not determined.
Increased carcass yield with increasing levels of AA could be associated with a reduction in
abdominal fat pad.
Differences in processing parameters between current genotypes and old genotypes has been
reported in the past (Havenstein et al., 1994b; Havenstein et al., 2003a; Schmidt et al., 2009) and
93
are in agreement with results from this study. Higher carcass yield from Ross 708 and TY and
higher BMY than Ross 308 is explained by the fact that these are high yield birds and the latter is
a multipurpose bird. Similar results have been reported by Corzo et al., (2005), Smith and Pesti,
(1998), and Smith et al., (1998). For the same reason, Ross 708 had the highest total breast meat.
Ross Test Yield has a different growth curve and at this point has not reached its maximum BW
and breast weight (Mussini et al, in press). Strain x AA interactions could be explained by the
AA effect on BW. Since AA has no effect at 41 days in HER BW there is no effect in carcass
yield while the current strains respond positively to higher AA levels increasing carcass yield. A
similar effect is appreciated in total breast meat. Wing yield strain x AA interaction could be
linked to variations in BMY as increasing BMY reduces wing yield.
Intense genetic selection has modified broiler genotypes anatomically and in its responses to
dietary nutrient levels. These changes have improved live performance and processing yield and
will probably continue to do it in the future. Considering that both Ross 708 and TY genotypes
have been developed for processing weights of around 4 Kgs and that increases its body weight
gain at later stages, AA effects during these stages should be studied in the future.
References
Baker, D. H., and Y. Han. 1994. Ideal amino acid profile for chicks during the first three weeks
posthatching. Poult. Sci. 73:1441-1447.
Bartov, I., and I. Plavnik. 1998. Moderate excess of dietary protein increases breast meat yield of
broiler chicks. Poult. Sci. 77:680-688.
Corzo, A., M. Kidd, D. Burnham, E. Miller, S. Branton, and R. G. E. Gonzalez-Esquerra. 2005.
Dietary amino acid density effects on growth and carcass of broilers differing in strain cross and
sex. J. App. Poult. Res. 14:1-9.
94
Fancher, B. I., and L. S. Jensen. 1989. Dietary protein level and essential amino acid content:
influence upon female broiler performance during the grower period. Poult. Sci. 68:897-908.
Gous, R. 2010. Nutritional limitations on growth and development in poultry. Livestock Science
130:25-32.
Gous, R. 1998. Lysine: Making progress in the nutrition of broilers. Poult. Sci. 77:111-117.
Havenstein, G. B., P. R. Ferket, and M. A. Qureshi. 2003a. Carcass composition and yield of
1957 versus 2001 broilers when fed representative 1957 and 2001 broiler diets. Poult. Sci.
82:1509.
Havenstein, G. B., P. R. Ferket, and M. A. Qureshi. 2003b. Growth, livability, and feed
conversion of 1957 versus 2001 broilers when fed representative 1957 and 2001 broiler diets.
Poult. Sci. 82:1500.
Havenstein, G. B., P. R. Ferket, S. E. Scheideler, and B. T. Larson. 1994a. Growth, livability,
and feed conversion of 1957 vs 1991 broilers when fed "typical" 1957 and 1991 broiler diets.
Poult. Sci. 73:1785-1794.
Havenstein, G. B., P. R. Ferket, S. E. Scheideler, and D. V. Rives. 1994b. Carcass composition
and yield of 1991 vs 1957 broilers when fed "typical" 1957 and 1991 broiler diets. Poult. Sci.
73:1795-1804.
Holsheimer, J., and C. Veerkamp. 1992. Effect of dietary energy, protein, and lysine content on
performance and yields of two strains of male broiler chicks. Poult. Sci. 71:872-879.
Kerr, B., M. Kidd, K. Halpin, G. McWard, and C. Quarles. 1999. Lysine level increases live
performance and breast yield in male broilers. J. App. Poult. Res. 8:381-390.
Kidd, M., C. McDaniel, S. Branton, E. Miller, B. Boren, and B. Fancher. 2004. Increasing amino
acid density improves live performance and carcass yields of commercial broilers. The Journal of
Applied Poultry Research 13:593-604.
Kidd, M., B. Kerr, K. Halpin, G. McWard, and C. Quarles. 1998. Lysine levels in starter and
grower-finisher diets affect broiler performance and carcass traits. J. App. Poult. Res. 7:351-358.
Moran Jr, E., R. Bushong, and S. Bilgili. 1992. Reducing dietary crude protein for broilers while
satisfying amino acid requirements by least-cost formulation: live performance, litter
composition, and yield of fast-food carcass cuts at six weeks. Poult. Sci. 71:1687-1694.
Rezaei, M., H. N. Moghaddam, J. P. Reza, and H. Kermanshahi. 2004. The effects of dietary
protein and lysine levels on broiler performance, carcass characteristics and N excretion. Int. J.
Poult. Sci. 3:148-152.
Ross Breeders. 2012. Ross 308 Broiler performance objectives 2012.
95
Rostagno, H. R., Albino, L. F. T., Donzele, J. L., Gomes, P. C., dee Oliveira, R. F., Lopes, D. C.,
Firiera, A. S., and Barreto, S. L. de T. 2011. Brazilian Tables for Poultry and Swine.
Composition of feedstuffs and nutritional requirements. 3rd
ed. H. S. Rostagno, ed. Universidade
Federal de Vocsa, Dept Zootecnia, Viscosa, MG, Brazil.
Schmidt, C. J., M. E. Persia, E. Feierstein, B. Kingham, and W. W. Saylor. 2009. Comparison of
a modern broiler line and a heritage line unselected since the 1950s. Poult. Sci. 88:2610.
Skinner, J. T., A. L. Waldroup, and P. W. Waldroup. 1992. Effects of dietary nutrient density on
performance and carcass quality of broilers 42 to 49 days of age. J. App. Poult. Res.1:367.
Smith, E., and G. Pesti. 1998. Influence of broiler strain cross and dietary protein on the
performance of broilers. Poult. Sci. 77:276-281.
Smith, E., G. Pesti, R. Bakalli, G. Ware, and J. Menten. 1998. Further studies on the influence of
genotype and dietary protein on the performance of broilers. Poult. Sci. 77:1678-1687.
Sterling, K., G. Pesti, and R. Bakalli. 2006. Performance of different broiler genotypes fed diets
with varying levels of dietary crude protein and lysine. Poult. Sci. 85:1045-1054.
Waldroup, P. W., Q. Jiang, and C. A. Fritts. 2005. Effects of supplementing broiler diets low in
crude protein with essential and nonessential amino acids. Int.J.Poult.Sci 4:425-431.
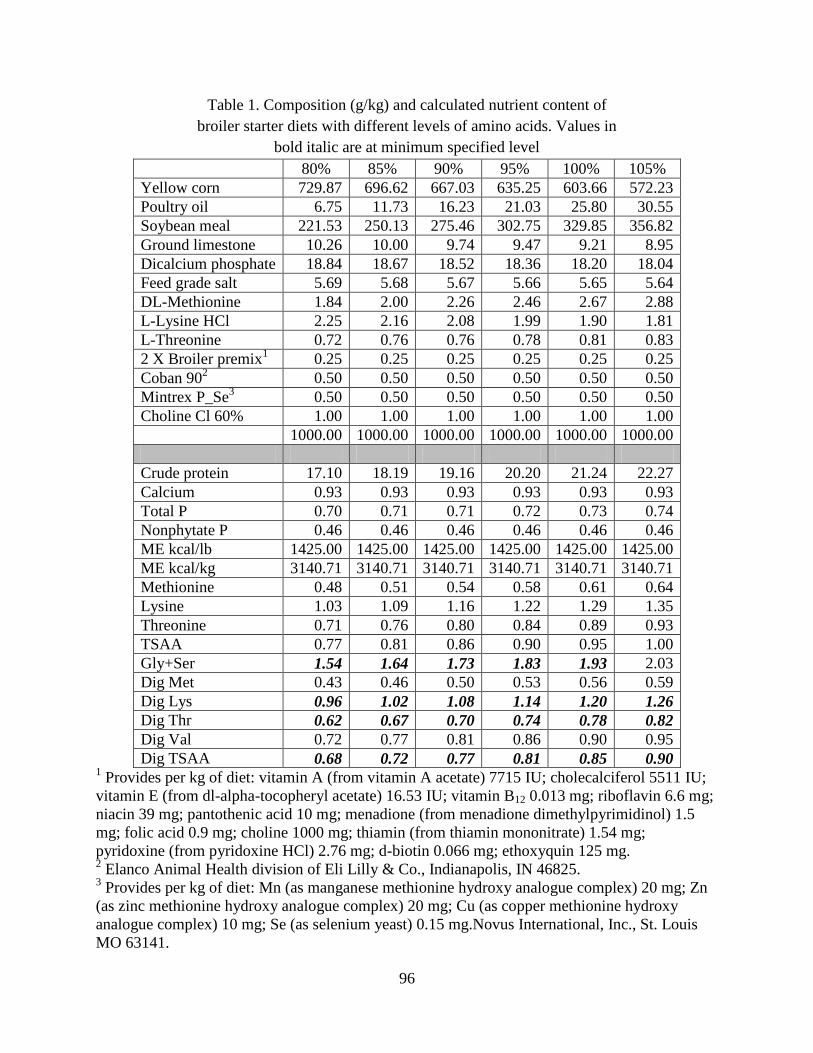
96
Table 1. Composition (g/kg) and calculated nutrient content of
broiler starter diets with different levels of amino acids. Values in
bold italic are at minimum specified level
80% 85% 90% 95% 100% 105%
Yellow corn 729.87 696.62 667.03 635.25 603.66 572.23
Poultry oil 6.75 11.73 16.23 21.03 25.80 30.55
Soybean meal 221.53 250.13 275.46 302.75 329.85 356.82
Ground limestone 10.26 10.00 9.74 9.47 9.21 8.95
Dicalcium phosphate 18.84 18.67 18.52 18.36 18.20 18.04
Feed grade salt 5.69 5.68 5.67 5.66 5.65 5.64
DL-Methionine 1.84 2.00 2.26 2.46 2.67 2.88
L-Lysine HCl 2.25 2.16 2.08 1.99 1.90 1.81
L-Threonine 0.72 0.76 0.76 0.78 0.81 0.83
2 X Broiler premix1
0.25 0.25 0.25 0.25 0.25 0.25
Coban 902
0.50 0.50 0.50 0.50 0.50 0.50
Mintrex P_Se3
0.50 0.50 0.50 0.50 0.50 0.50
Choline Cl 60% 1.00 1.00 1.00 1.00 1.00 1.00
1000.00 1000.00 1000.00 1000.00 1000.00 1000.00
Crude protein 17.10 18.19 19.16 20.20 21.24 22.27
Calcium 0.93 0.93 0.93 0.93 0.93 0.93
Total P 0.70 0.71 0.71 0.72 0.73 0.74
Nonphytate P 0.46 0.46 0.46 0.46 0.46 0.46
ME kcal/lb 1425.00 1425.00 1425.00 1425.00 1425.00 1425.00
ME kcal/kg 3140.71 3140.71 3140.71 3140.71 3140.71 3140.71
Methionine 0.48 0.51 0.54 0.58 0.61 0.64
Lysine 1.03 1.09 1.16 1.22 1.29 1.35
Threonine 0.71 0.76 0.80 0.84 0.89 0.93
TSAA 0.77 0.81 0.86 0.90 0.95 1.00
Gly+Ser 1.54 1.64 1.73 1.83 1.93 2.03
Dig Met 0.43 0.46 0.50 0.53 0.56 0.59
Dig Lys 0.96 1.02 1.08 1.14 1.20 1.26
Dig Thr 0.62 0.67 0.70 0.74 0.78 0.82
Dig Val 0.72 0.77 0.81 0.86 0.90 0.95
Dig TSAA 0.68 0.72 0.77 0.81 0.85 0.90 1 Provides per kg of diet: vitamin A (from vitamin A acetate) 7715 IU; cholecalciferol 5511 IU;
vitamin E (from dl-alpha-tocopheryl acetate) 16.53 IU; vitamin B12 0.013 mg; riboflavin 6.6 mg;
niacin 39 mg; pantothenic acid 10 mg; menadione (from menadione dimethylpyrimidinol) 1.5
mg; folic acid 0.9 mg; choline 1000 mg; thiamin (from thiamin mononitrate) 1.54 mg;
pyridoxine (from pyridoxine HCl) 2.76 mg; d-biotin 0.066 mg; ethoxyquin 125 mg. 2 Elanco Animal Health division of Eli Lilly & Co., Indianapolis, IN 46825.
3 Provides per kg of diet: Mn (as manganese methionine hydroxy analogue complex) 20 mg; Zn
(as zinc methionine hydroxy analogue complex) 20 mg; Cu (as copper methionine hydroxy
analogue complex) 10 mg; Se (as selenium yeast) 0.15 mg.Novus International, Inc., St. Louis
MO 63141.
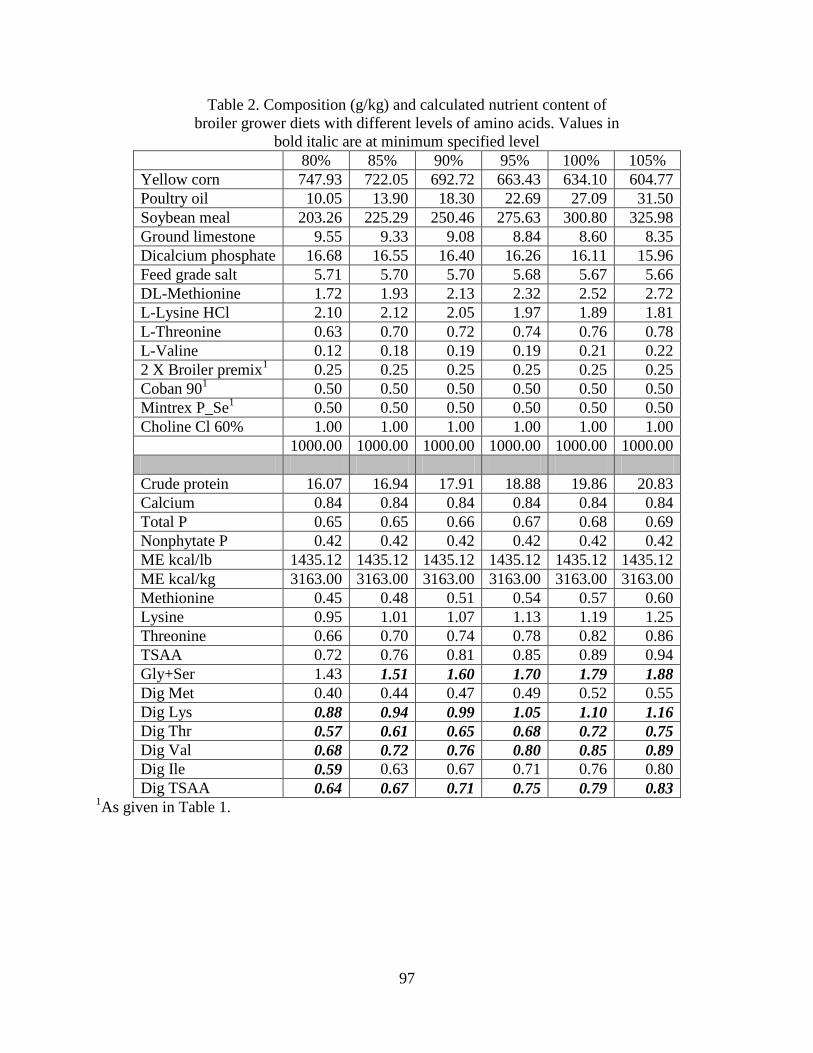
97
Table 2. Composition (g/kg) and calculated nutrient content of
broiler grower diets with different levels of amino acids. Values in
bold italic are at minimum specified level
80% 85% 90% 95% 100% 105%
Yellow corn 747.93 722.05 692.72 663.43 634.10 604.77
Poultry oil 10.05 13.90 18.30 22.69 27.09 31.50
Soybean meal 203.26 225.29 250.46 275.63 300.80 325.98
Ground limestone 9.55 9.33 9.08 8.84 8.60 8.35
Dicalcium phosphate 16.68 16.55 16.40 16.26 16.11 15.96
Feed grade salt 5.71 5.70 5.70 5.68 5.67 5.66
DL-Methionine
1.72 1.93 2.13 2.32 2.52 2.72
L-Lysine HCl 2.10 2.12 2.05 1.97 1.89 1.81
L-Threonine 0.63 0.70 0.72 0.74 0.76 0.78
L-Valine 0.12 0.18 0.19 0.19 0.21 0.22
2 X Broiler premix1
0.25 0.25 0.25 0.25 0.25 0.25
Coban 901
0.50 0.50 0.50 0.50 0.50 0.50
Mintrex P_Se1
0.50 0.50 0.50 0.50 0.50 0.50
Choline Cl 60% 1.00 1.00 1.00 1.00 1.00 1.00
1000.00 1000.00 1000.00 1000.00 1000.00 1000.00
Crude protein 16.07 16.94 17.91 18.88 19.86 20.83
Calcium 0.84 0.84 0.84 0.84 0.84 0.84
Total P 0.65 0.65 0.66 0.67 0.68 0.69
Nonphytate P 0.42 0.42 0.42 0.42 0.42 0.42
ME kcal/lb 1435.12 1435.12 1435.12 1435.12 1435.12 1435.12
ME kcal/kg 3163.00 3163.00 3163.00 3163.00 3163.00 3163.00
Methionine 0.45 0.48 0.51 0.54 0.57 0.60
Lysine 0.95 1.01 1.07 1.13 1.19 1.25
Threonine 0.66 0.70 0.74 0.78 0.82 0.86
TSAA 0.72 0.76 0.81 0.85 0.89 0.94
Gly+Ser 1.43 1.51 1.60 1.70 1.79 1.88
Dig Met 0.40 0.44 0.47 0.49 0.52 0.55
Dig Lys 0.88 0.94 0.99 1.05 1.10 1.16
Dig Thr 0.57 0.61 0.65 0.68 0.72 0.75
Dig Val 0.68 0.72 0.76 0.80 0.85 0.89
Dig Ile 0.59 0.63 0.67 0.71 0.76 0.80
Dig TSAA 0.64 0.67 0.71 0.75 0.79 0.83 1As given in Table 1.
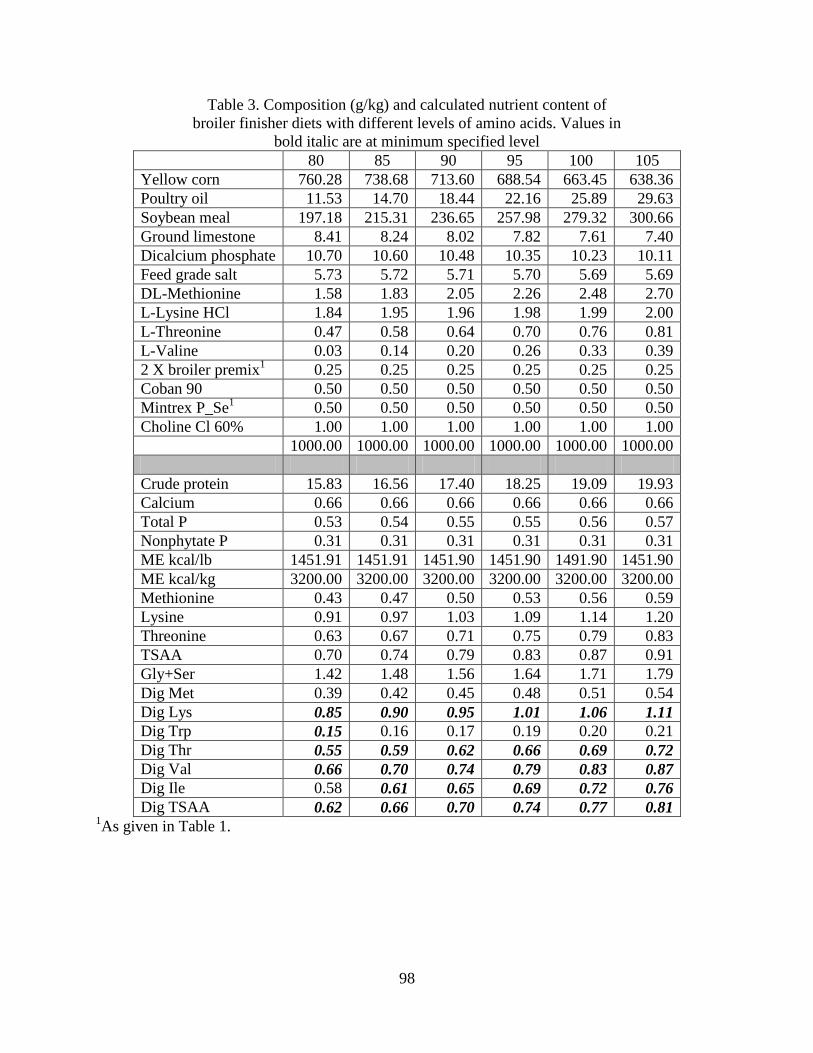
98
Table 3. Composition (g/kg) and calculated nutrient content of
broiler finisher diets with different levels of amino acids. Values in
bold italic are at minimum specified level
80 85 90 95 100 105
Yellow corn 760.28 738.68 713.60 688.54 663.45 638.36
Poultry oil 11.53 14.70 18.44 22.16 25.89 29.63
Soybean meal 197.18 215.31 236.65 257.98 279.32 300.66
Ground limestone 8.41 8.24 8.02 7.82 7.61 7.40
Dicalcium phosphate 10.70 10.60 10.48 10.35 10.23 10.11
Feed grade salt 5.73 5.72 5.71 5.70 5.69 5.69
DL-Methionine
1.58 1.83 2.05 2.26 2.48 2.70
L-Lysine HCl 1.84 1.95 1.96 1.98 1.99 2.00
L-Threonine 0.47 0.58 0.64 0.70 0.76 0.81
L-Valine 0.03 0.14 0.20 0.26 0.33 0.39
2 X broiler premix1
0.25 0.25 0.25 0.25 0.25 0.25
Coban 90 0.50 0.50 0.50 0.50 0.50 0.50
Mintrex P_Se1
0.50 0.50 0.50 0.50 0.50 0.50
Choline Cl 60% 1.00 1.00 1.00 1.00 1.00 1.00
1000.00 1000.00 1000.00 1000.00 1000.00 1000.00
Crude protein 15.83 16.56 17.40 18.25 19.09 19.93
Calcium 0.66 0.66 0.66 0.66 0.66 0.66
Total P 0.53 0.54 0.55 0.55 0.56 0.57
Nonphytate P 0.31 0.31 0.31 0.31 0.31 0.31
ME kcal/lb 1451.91 1451.91 1451.90 1451.90 1491.90 1451.90
ME kcal/kg 3200.00 3200.00 3200.00 3200.00 3200.00 3200.00
Methionine 0.43 0.47 0.50 0.53 0.56 0.59
Lysine 0.91 0.97 1.03 1.09 1.14 1.20
Threonine 0.63 0.67 0.71 0.75 0.79 0.83
TSAA 0.70 0.74 0.79 0.83 0.87 0.91
Gly+Ser 1.42 1.48 1.56 1.64 1.71 1.79
Dig Met 0.39 0.42 0.45 0.48 0.51 0.54
Dig Lys 0.85 0.90 0.95 1.01 1.06 1.11
Dig Trp 0.15 0.16 0.17 0.19 0.20 0.21
Dig Thr 0.55 0.59 0.62 0.66 0.69 0.72
Dig Val 0.66 0.70 0.74 0.79 0.83 0.87
Dig Ile 0.58 0.61 0.65 0.69 0.72 0.76
Dig TSAA 0.62 0.66 0.70 0.74 0.77 0.81 1As given in Table 1.
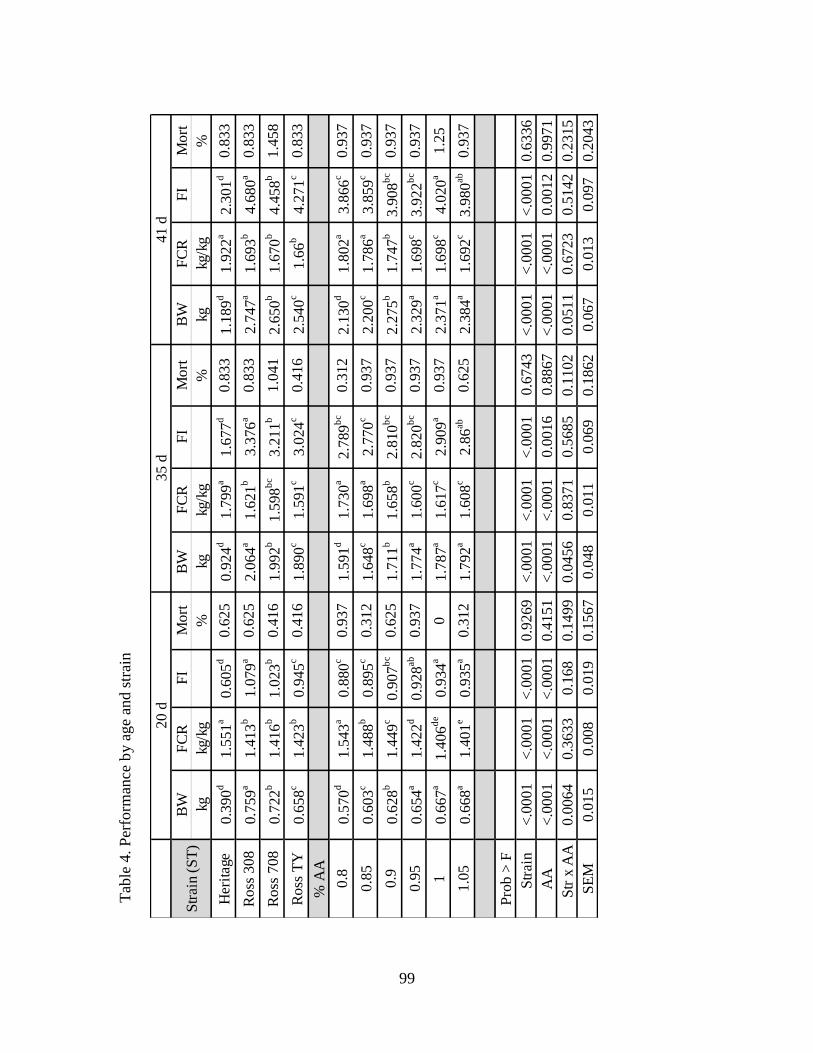
99
BW
FC
RF
IM
ort
BW
FC
RF
IM
ort
BW
FC
RF
IM
ort
kgkg
/kg
%kg
kg/k
g%
kgkg
/kg
%
Her
itag
e0.3
90
d1.5
51
a0.6
05
d0.6
25
0.9
24
d1.7
99
a1.6
77
d0.8
33
1.1
89
d1.9
22
a2.3
01
d0.8
33
Ro
ss 3
08
0.7
59
a1.4
13
b1.0
79
a0.6
25
2.0
64
a1.6
21
b3.3
76
a0.8
33
2.7
47
a1.6
93
b4.6
80
a0.8
33
Ro
ss 7
08
0.7
22
b1.4
16
b1.0
23
b0.4
16
1.9
92
b1.5
98
bc
3.2
11
b1.0
41
2.6
50
b1.6
70
b4.4
58
b1.4
58
Ro
ss T
Y0.6
58
c1.4
23
b0.9
45
c0.4
16
1.8
90
c1.5
91
c3.0
24
c0.4
16
2.5
40
c1.6
6b
4.2
71
c0.8
33
% A
A
0.8
0.5
70
d1.5
43
a0.8
80
c0.9
37
1.5
91
d1.7
30
a2.7
89
bc
0.3
12
2.1
30
d1.8
02
a3.8
66
c0.9
37
0.8
50.6
03
c1.4
88
b0.8
95
c0.3
12
1.6
48
c1.6
98
a2.7
70
c0.9
37
2.2
00
c1.7
86
a3.8
59
c0.9
37
0.9
0.6
28
b1.4
49
c0.9
07
bc
0.6
25
1.7
11
b1.6
58
b2.8
10
bc
0.9
37
2.2
75
b1.7
47
b3.9
08
bc
0.9
37
0.9
50.6
54
a1.4
22
d0.9
28
ab
0.9
37
1.7
74
a1.6
00
c2.8
20
bc
0.9
37
2.3
29
a1.6
98
c3.9
22
bc
0.9
37
10.6
67
a1.4
06
de
0.9
34
a0
1.7
87
a1.6
17
c2.9
09
a0.9
37
2.3
71
a1.6
98
c4.0
20
a1.2
5
1.0
50.6
68
a1.4
01
e0.9
35
a0.3
12
1.7
92
a1.6
08
c2.8
6ab
0.6
25
2.3
84
a1.6
92
c3.9
80
ab
0.9
37
Pro
b >
F
Str
ain
<.0
001
<.0
001
<.0
001
0.9
269
<.0
001
<.0
001
<.0
001
0.6
743
<.0
001
<.0
001
<.0
001
0.6
336
AA
<.0
001
<.0
001
<.0
001
0.4
151
<.0
001
<.0
001
0.0
016
0.8
867
<.0
001
<.0
001
0.0
012
0.9
971
Str
x A
A0.0
064
0.3
633
0.1
68
0.1
499
0.0
456
0.8
371
0.5
685
0.1
102
0.0
511
0.6
723
0.5
142
0.2
315
SE
M0.0
15
0.0
08
0.0
19
0.1
567
0.0
48
0.0
11
0.0
69
0.1
862
0.0
67
0.0
13
0.0
97
0.2
043
20 d
35 d
41 d
Str
ain
(ST
)
Tab
le 4
. P
erfo
rman
ce b
y a
ge
and s
trai
n
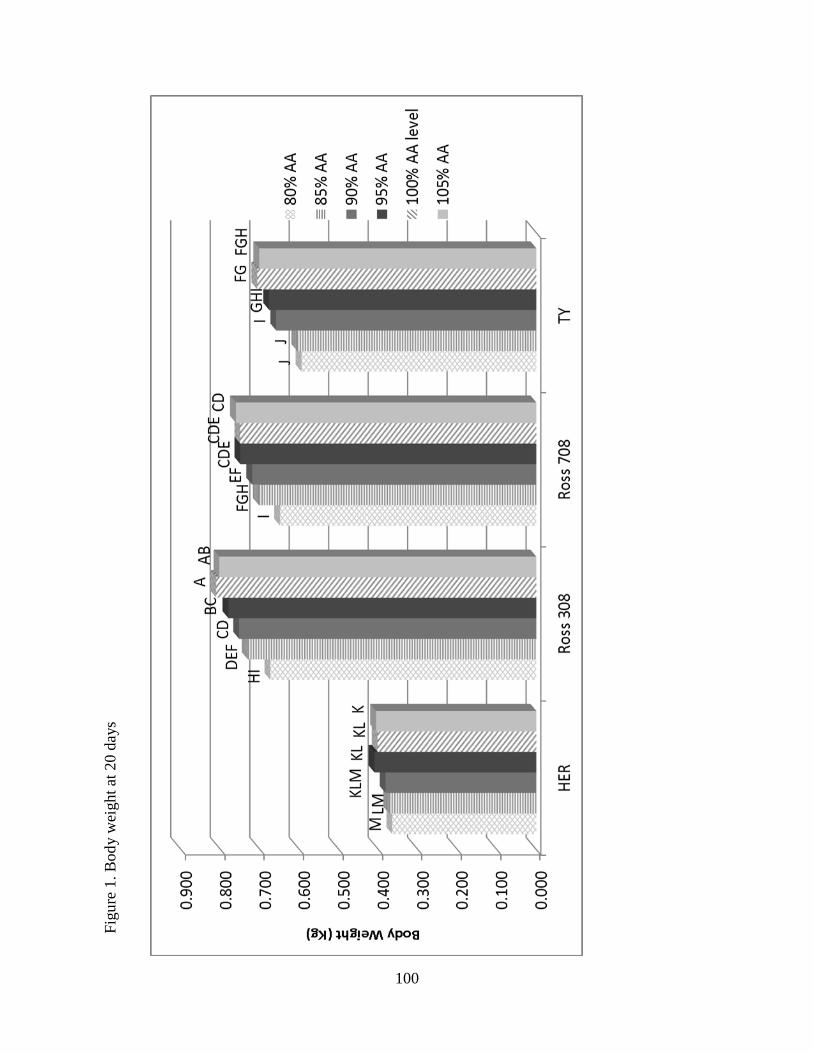
100
Fig
ure
1.
Bod
y w
eight
at 2
0 d
ays
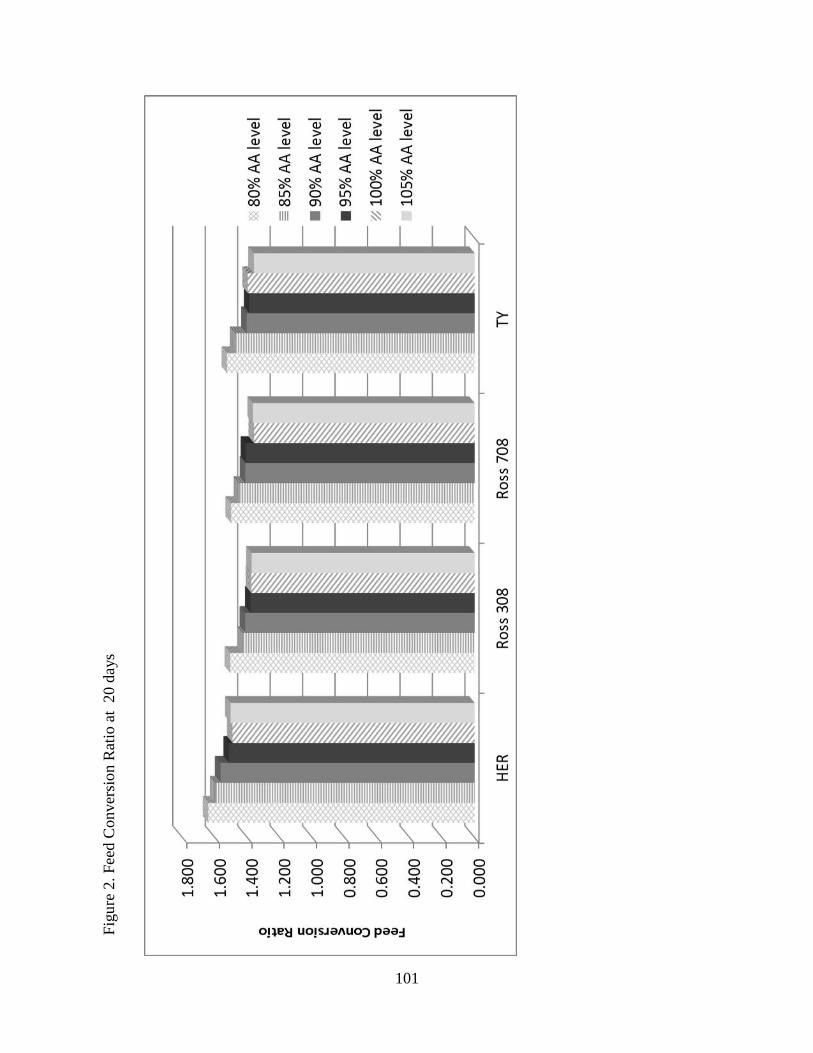
101
Fig
ure
2.
Fee
d C
onver
sio
n R
atio
at
20 d
ays
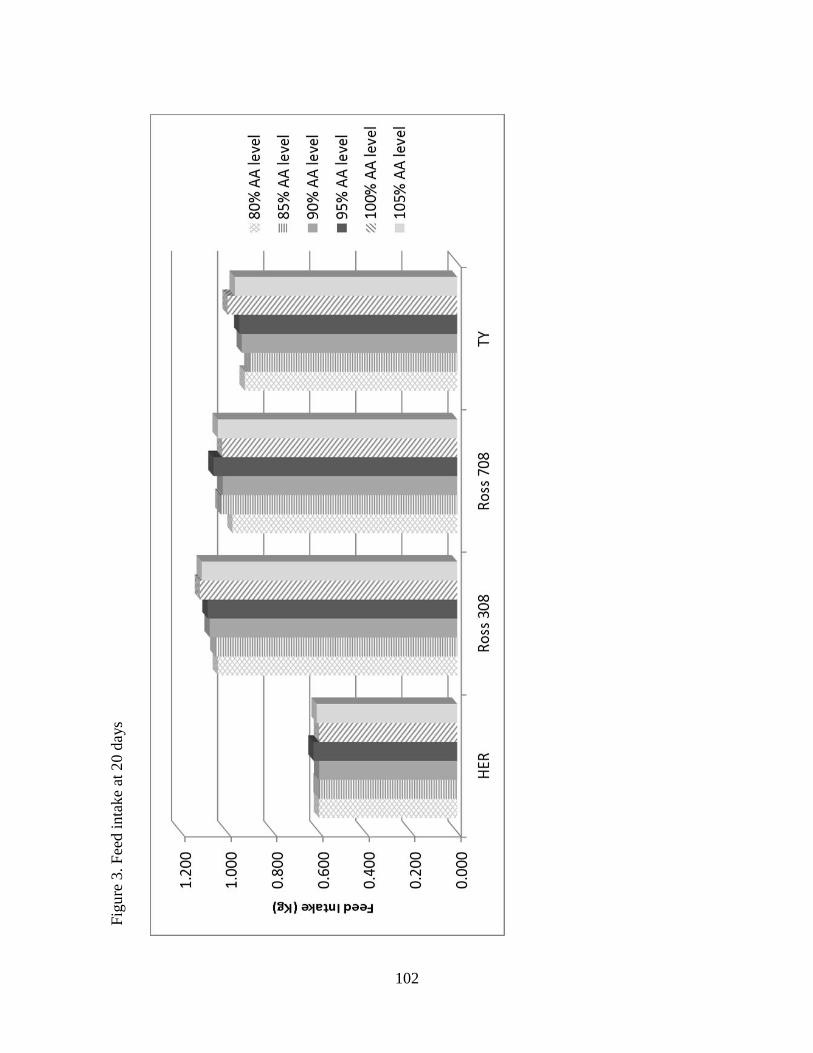
102
Fig
ure
3.
Fee
d i
nta
ke
at 2
0 d
ays
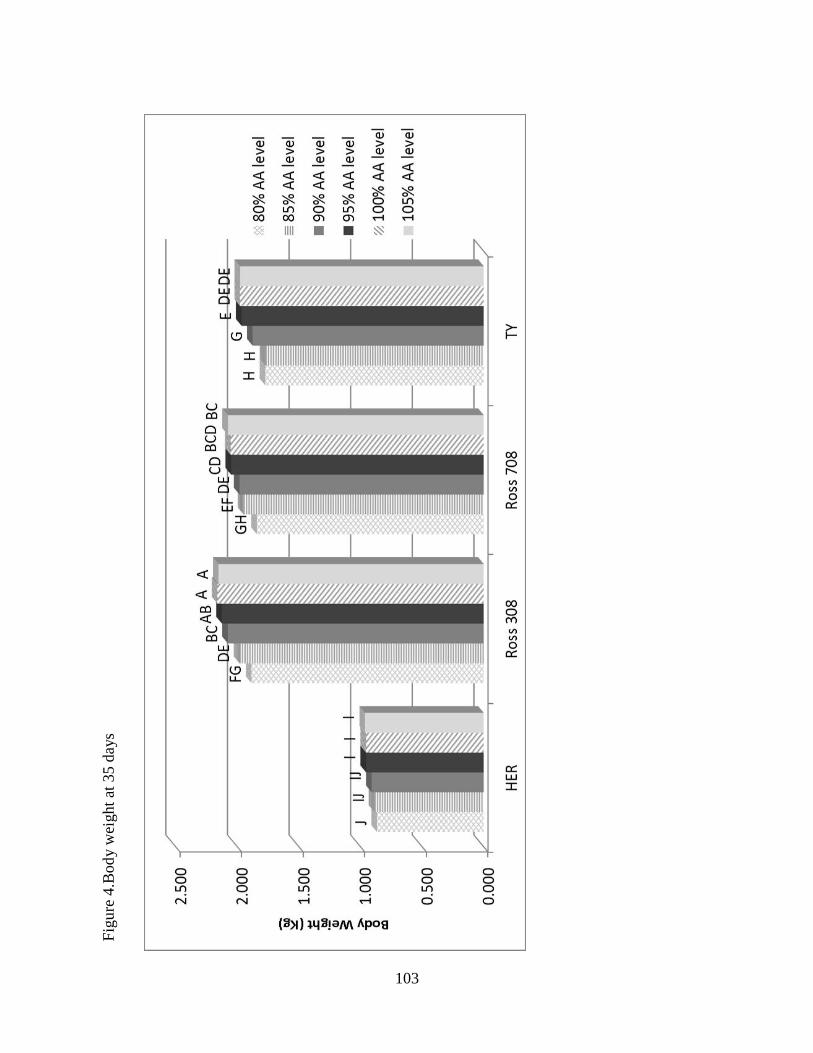
103
Fig
ure
4.B
od
y w
eight
at 3
5 d
ays
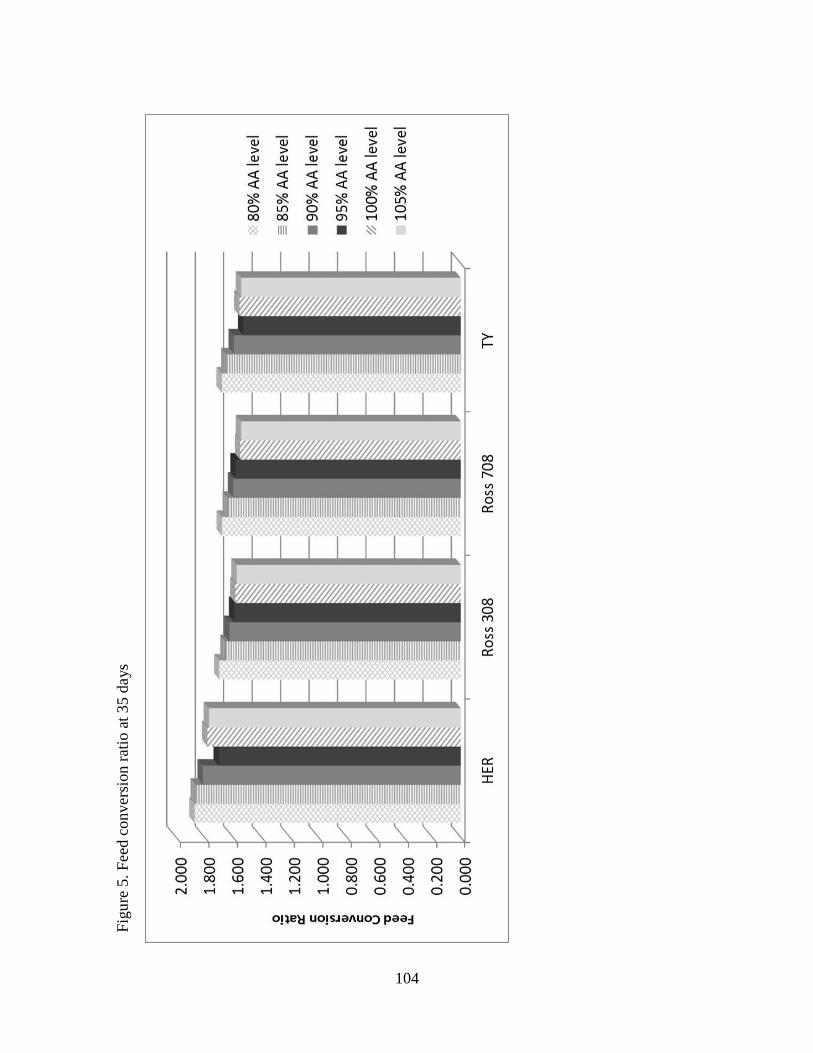
104
Fig
ure
5.
Fee
d c
onver
sion r
atio
at
35 d
ays
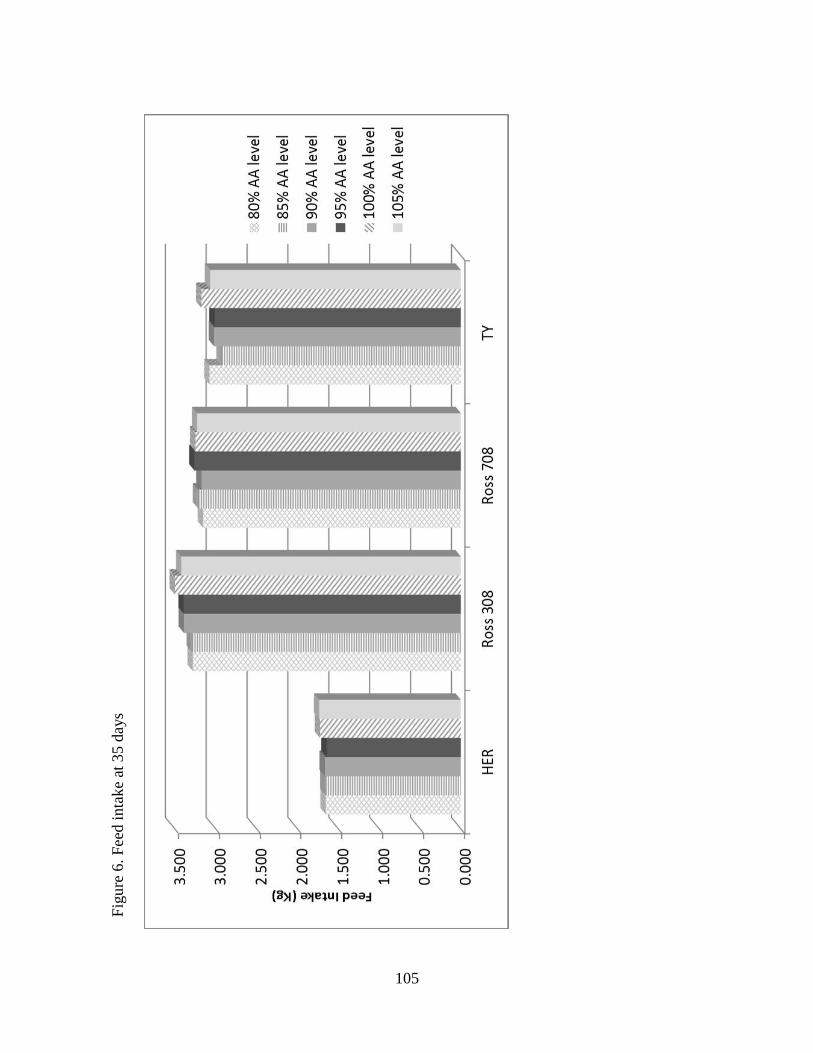
105
Fig
ure
6.
Fee
d i
nta
ke
at 3
5 d
ays
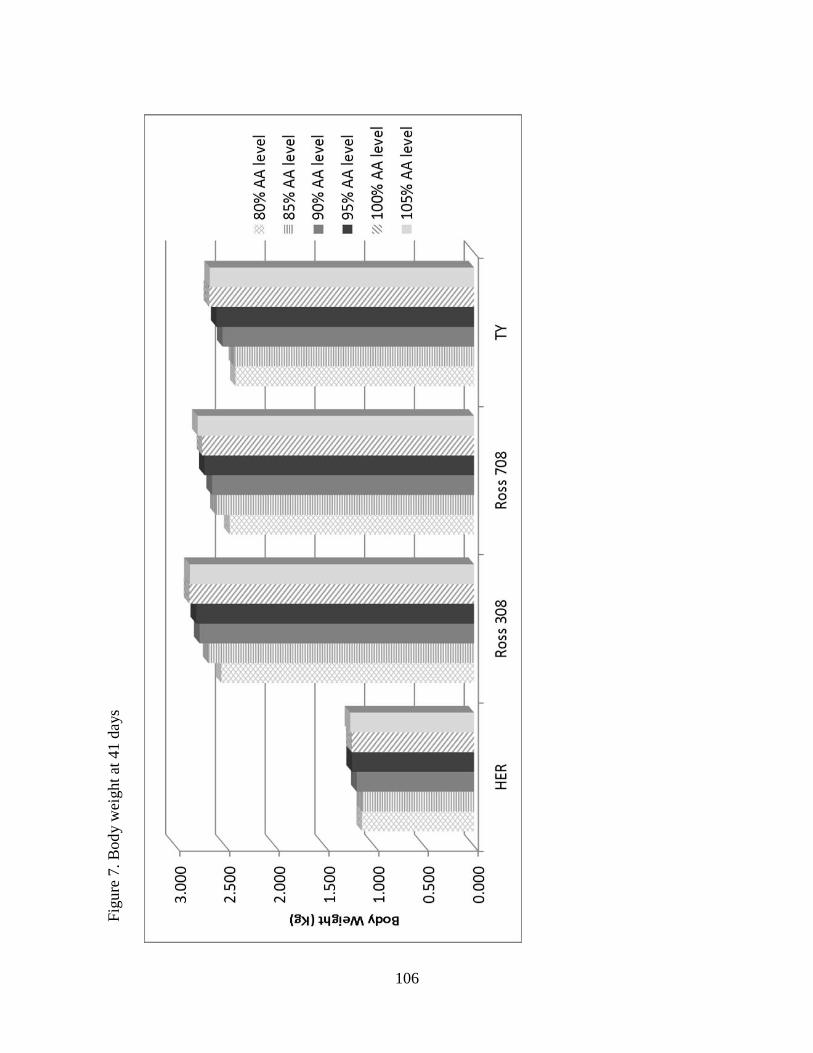
106
Fig
ure
7.
Bod
y w
eight
at 4
1 d
ays
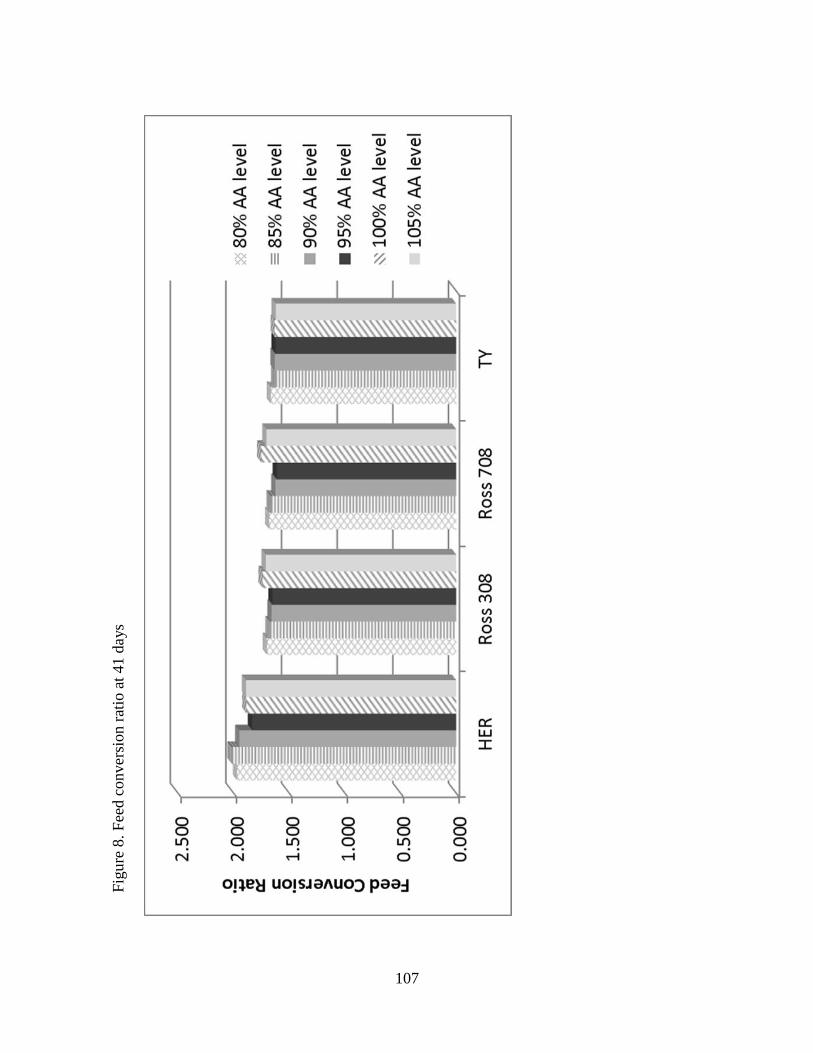
107
Fig
ure
8.
Fee
d c
onver
sion r
atio
at
41 d
ays
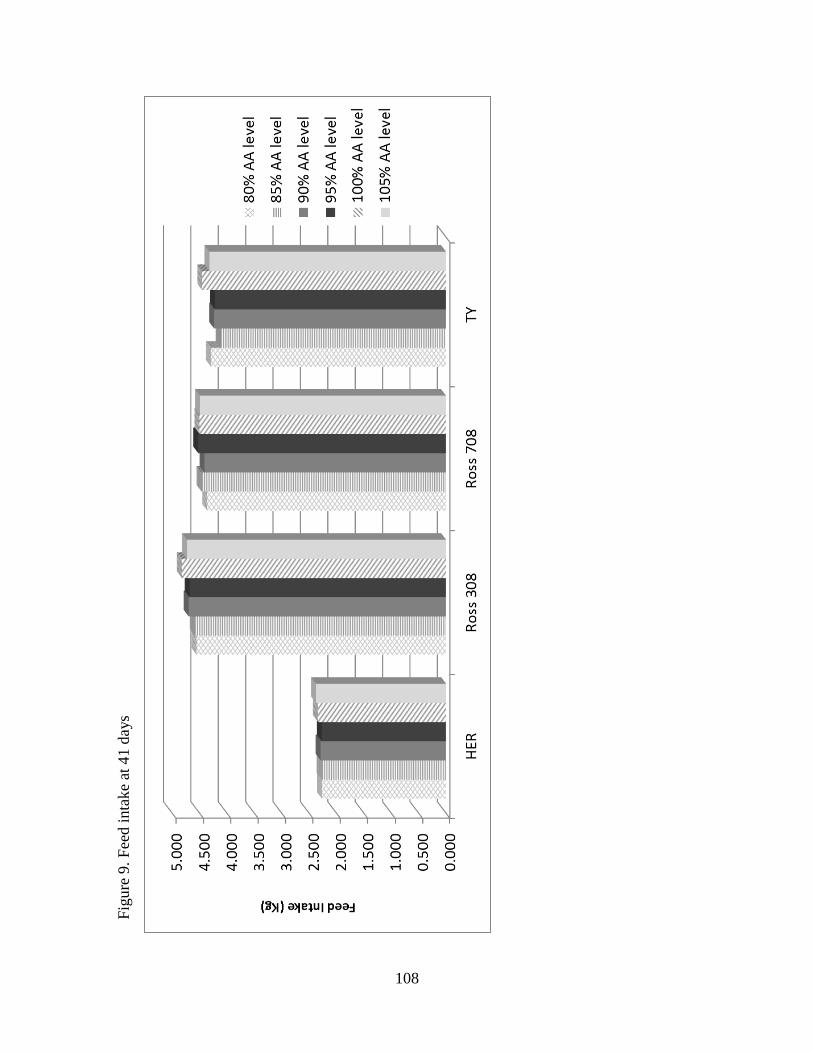
108
Fig
ure
9.
Fee
d i
nta
ke
at 4
1 d
ays
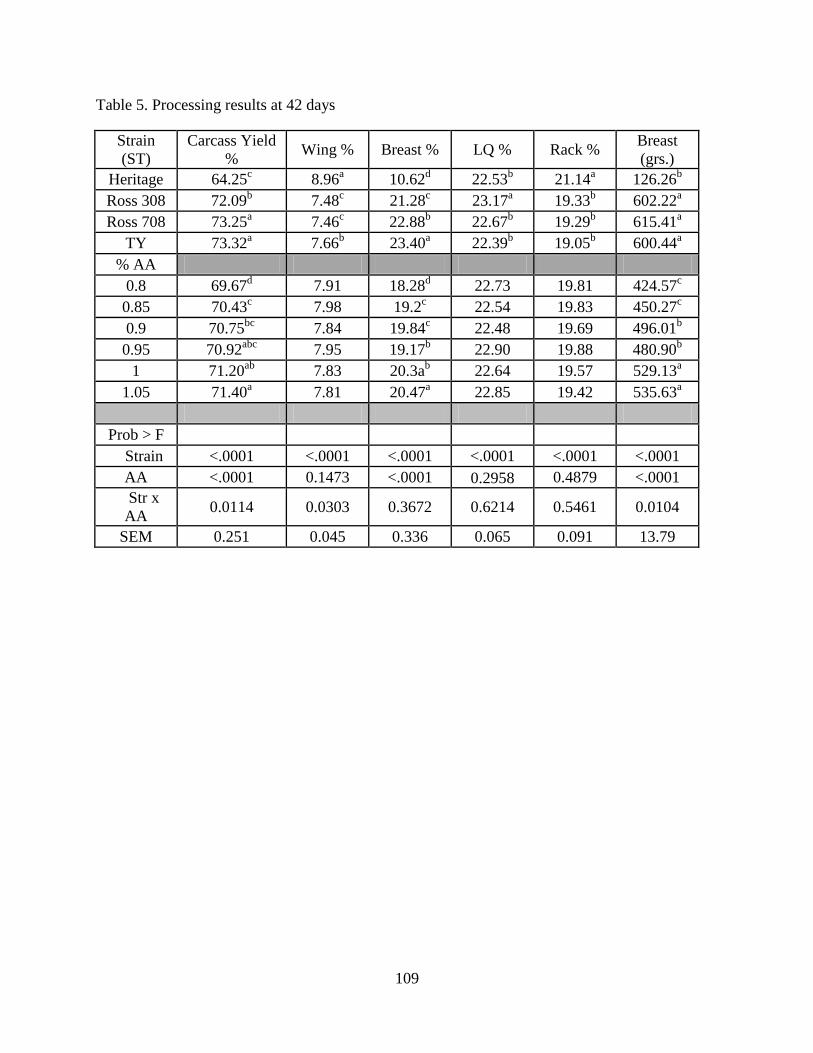
109
Table 5. Processing results at 42 days
Strain
(ST)
Carcass Yield
% Wing % Breast % LQ % Rack %
Breast
(grs.)
Heritage 64.25c 8.96
a 10.62
d 22.53
b 21.14
a 126.26
b
Ross 308 72.09b 7.48
c 21.28
c 23.17
a 19.33
b 602.22
a
Ross 708 73.25a 7.46
c 22.88
b 22.67
b 19.29
b 615.41
a
TY 73.32a 7.66
b 23.40
a 22.39
b 19.05
b 600.44
a
% AA
0.8 69.67d 7.91 18.28
d 22.73 19.81 424.57
c
0.85 70.43c 7.98 19.2
c 22.54 19.83 450.27
c
0.9 70.75bc
7.84 19.84c 22.48 19.69 496.01
b
0.95 70.92abc
7.95 19.17b 22.90 19.88 480.90
b
1 71.20ab
7.83 20.3ab 22.64 19.57 529.13
a
1.05 71.40a 7.81 20.47
a 22.85 19.42 535.63
a
Prob > F
Strain <.0001 <.0001 <.0001 <.0001 <.0001 <.0001
AA <.0001 0.1473 <.0001 0.2958 0.4879 <.0001
Str x
AA 0.0114 0.0303 0.3672 0.6214 0.5461 0.0104
SEM 0.251 0.045 0.336 0.065 0.091 13.79
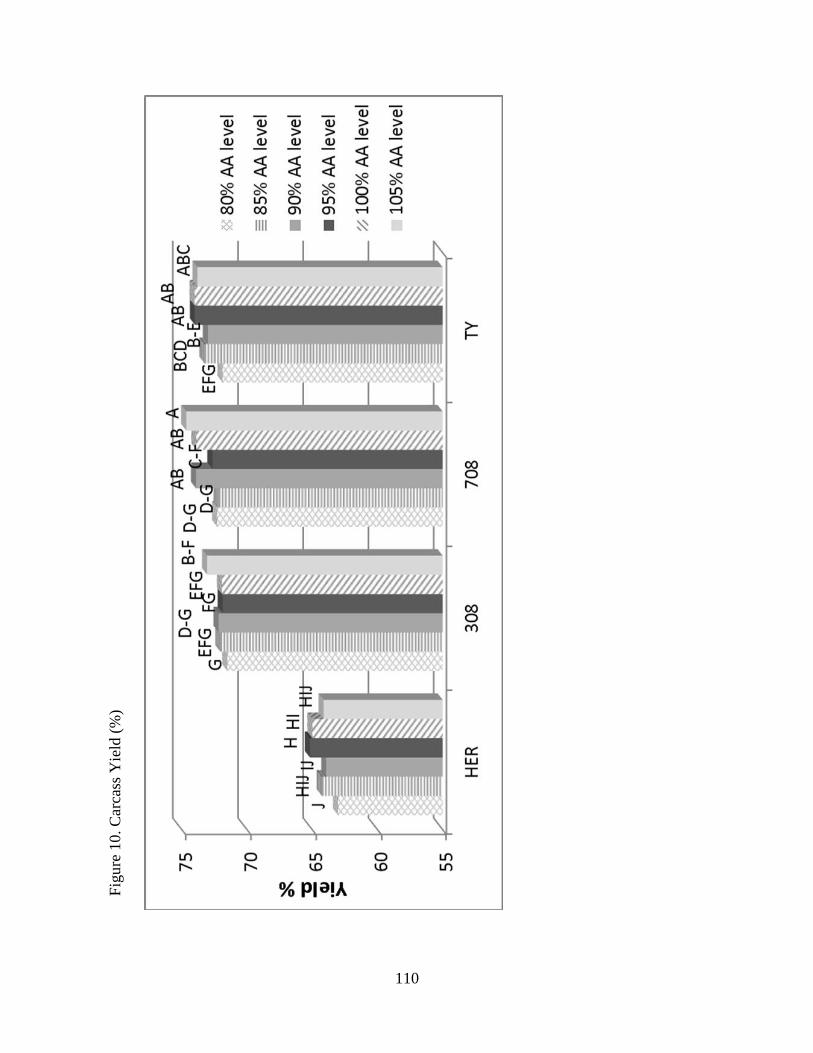
110
Fig
ure
10. C
arca
ss Y
ield
(%
)
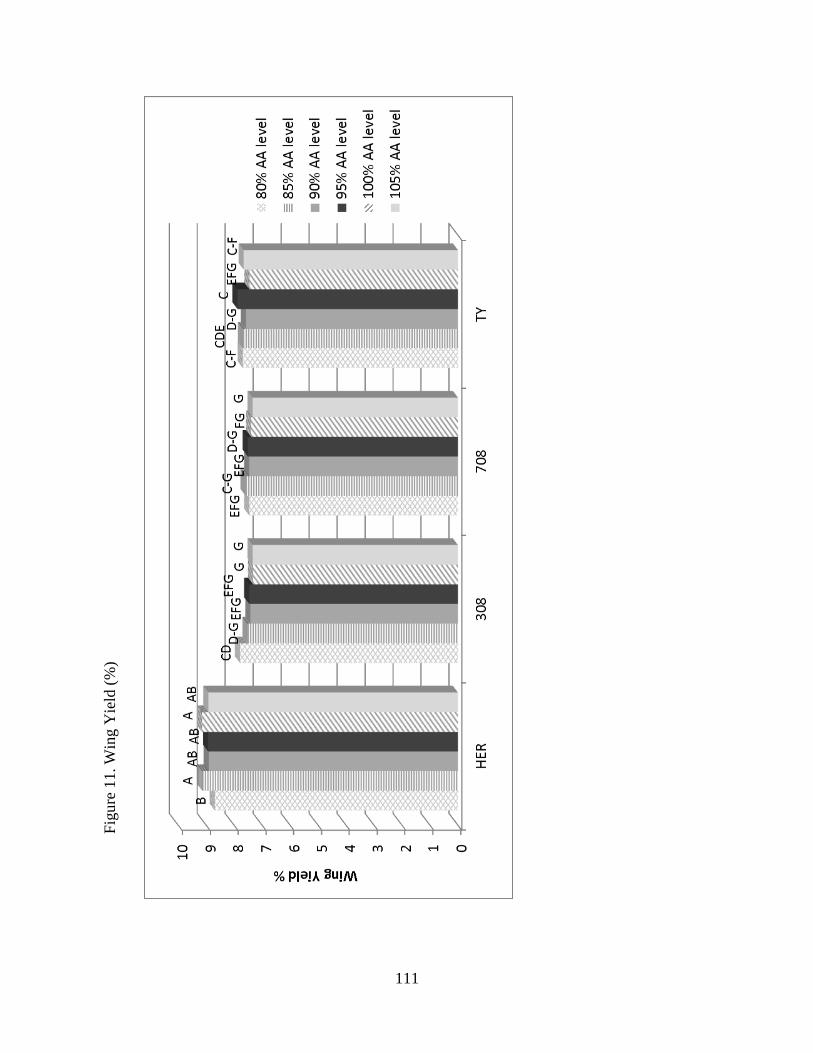
111
Fig
ure
11. W
ing Y
ield
(%
)
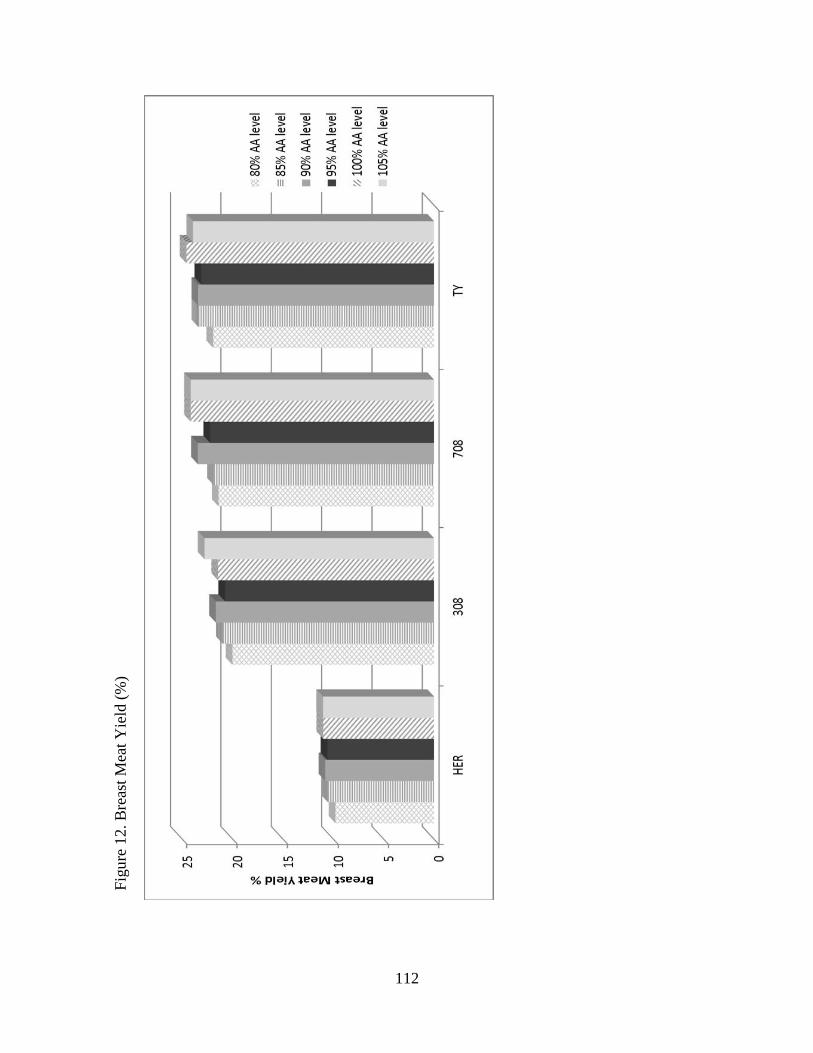
112
Fig
ure
12.
Bre
ast
Mea
t Y
ield
(%
)
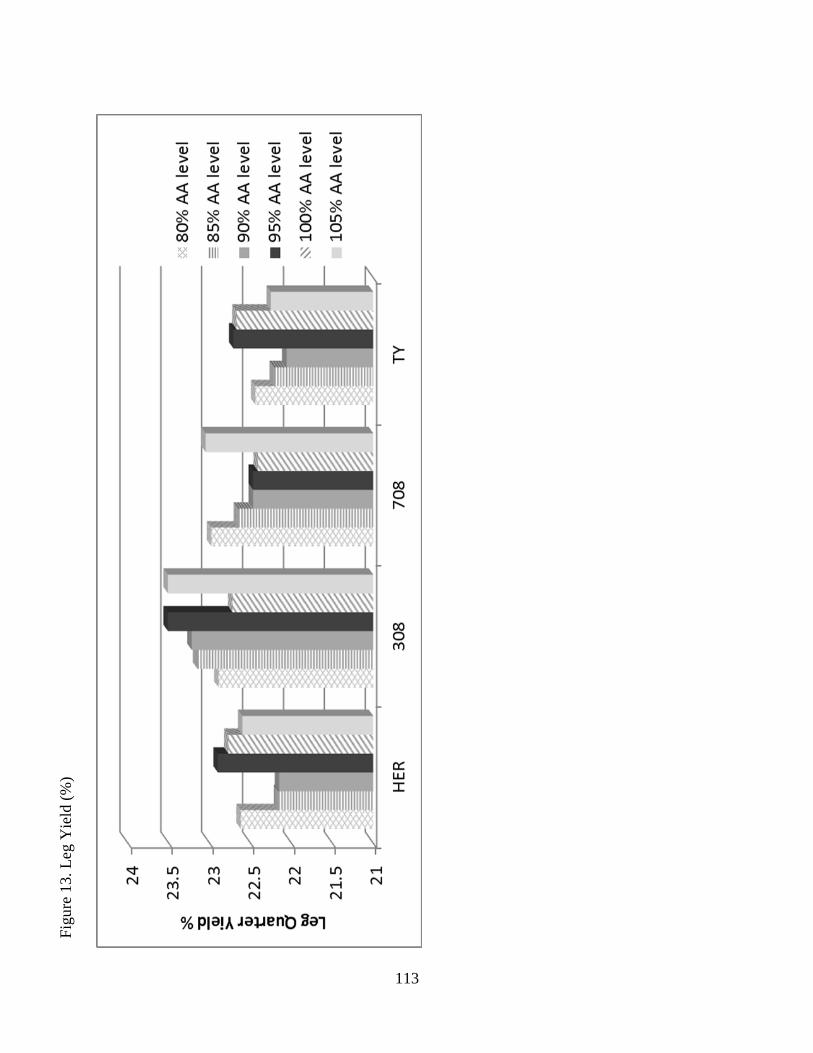
113
Fig
ure
13.
Leg
Yie
ld (
%)
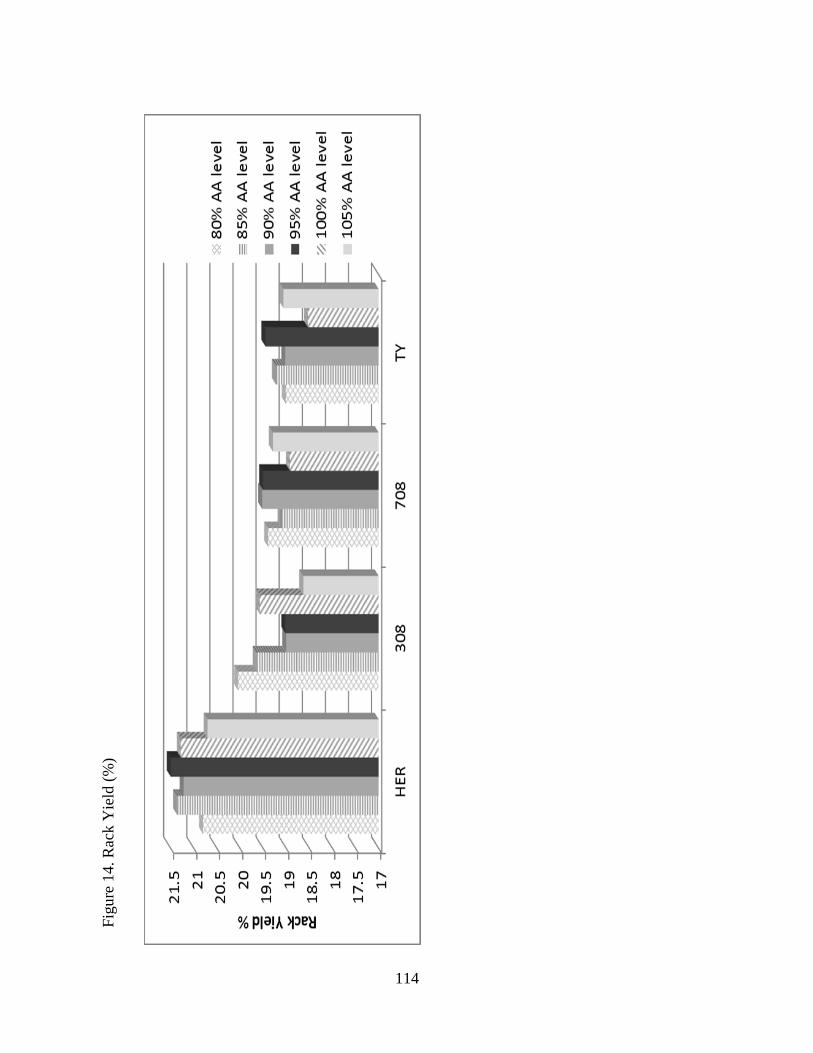
114
Fig
ure
14. R
ack Y
ield
(%
)
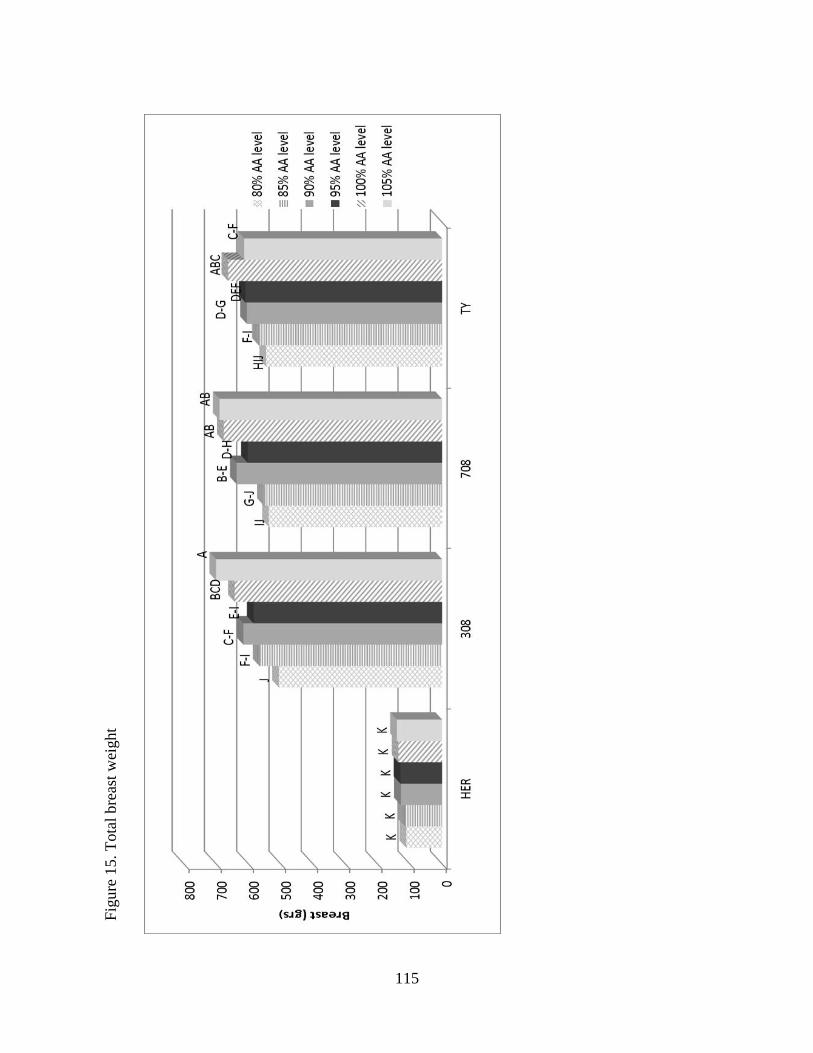
115
Fig
ure
15. T
ota
l bre
ast
wei
ght
116
CONCLUSION
The changes in different broiler genotypes due to intense genetic selection, together with the
response of these genotypes to different dietary nutrient levels, were evaluated in three different
studies. Current genotypes (high yield and multipurpose strains) used
widely in the poultry industry and an old strain (Heritage) unselected since the 1950’s were
compared. A strong difference in performance was observed in the three studies, with the current
genotypes growing faster and utilizing feed more efficiently than the old one. At the same time
numerous morphometric differences were observed in the first study. Current genotypes had
much higher breast meat yield compared to the old one. In modern strains, jejunum and ileum
segments of the small intestine had higher relative length as well as total villi length, increasing
digestive and absorptive surface area. Gizzard and heart relative weights were reduced in current
strains. Tibia break force increased in modern strains, though tibia diameter decreased.
Genotypes responded differently to different dietary energy levels. Heritage birds reduced feed
intake to regulate energy intake and its performance was not affected by the energy levels. High
yield modern strains reduced feed intake reducing body weight gain and increasing caloric
conversion ratio. The multipurpose strain increased feed intake with increasing levels of energy
increasing caloric conversion ratio and slightly increasing body weight. No effect was observed
in processing parameters due to the different energy levels.
Response to different levels of dietary amino acids was different between the heritage and the
modern strains. The old strain did not respond to increases in amino acids levels while the
modern strains increased body weight gain, decreased feed conversion and increased breast meat
yield.
117
In summary, significant differences between the heritage line and the current lines have been
detected as a consequence of intense genetic selection. Morphometric differences should be
considered when continuing genetic selection since these could have negative effects in the
broiler performance. At the same time, differences between modern genotypes could be used to
formulate specific feed programs for each strain maximizing performance and economic return
of broilers.

118