combined analysis of nuclear and mitochondrial markers provide new insight into the genetic...
TRANSCRIPT

ORIGINAL ARTICLE
Combined analysis of nuclear and mitochondrialmarkers provide new insight into the geneticstructure of North European Picea abies
MM Tollefsrud1,2, JH S�nsteb�2,4, C Brochmann2, Ø Johnsen1, T Skr�ppa1 and GG Vendramin3
1Norwegian Forest and Landscape Institute, As, Norway; 2National Centre for Biosystematics, Natural History Museum, University ofOslo, Oslo, Norway and 3Plant Genetics Institute, Florence Division, National Research Council, Sesto Fiorentino, Florence, Italy
Norway spruce of northern Europe expanded at the end ofthe last glacial out of one refugium in Russia. To provide adetailed insight into how the genetic structure in the northernEuropean lineage of this species has been shaped bypostglacial migration, recurrent pollen flow and marginality,we here compare variation at seven highly variablenuclear microsatellite loci in 37 populations (1715 trees)with mitochondrial DNA variation. Microsatellite diversitywas high (HE¼ 0.640) and genetic differentiation was low(FST¼ 0.029). The microsatellite structure supported amitochondrial DNA (mtDNA)-based hypothesis of two migra-tion routes out of a single Russian refugium; one north-western over Finland to northern Scandinavia, and onesouthwestern across the Baltic Sea into southern Scandina-
via. Microsatellite diversity was maintained along the south-western migration routes, whereas a significant decreasewas observed towards the north. In contrast, the mtDNAdiversity suggested higher amounts of historical gene flowtowards the north than along the southwestern migrationroute. This suggests that the loss of nuclear diversity afterpostglacial colonization has been efficiently replenished bypollen-mediated gene flow in the south. Towards the north,smaller effective population size because of more limitedseed and pollen production may have caused decreasednuclear diversity and increased inbreeding, reflecting theecological marginality of the species in the north.Heredity (2009) 102, 549–562; doi:10.1038/hdy.2009.16;published online 4 March 2009
Keywords: Picea abies; nuclear microsatellites; phylogeography; postglacial recolonization; landscape shape interpolation;peripheral populations
Introduction
Phylogeographical inferences have in earlier workstypically relied on organelle markers representing singlegene histories. To fully address the population history ofan organism, several distinct genealogies from indepen-dent genetic markers are needed (Ballard and Whitlock,2004). By combining mitochondrial (mt) or chloroplast(cp) DNA sequences with nuclear markers, demographicprocesses acting on different time scales will be capturedbecause of organelle and different modes of inheritanceof nuclear markers, effective population size and muta-tion rate (Hewitt, 2001; Semerikov and Lascoux, 2003).
A number of recent studies contrasting geneticpopulation structures at organelle and nuclear loci havegained an improved understanding of past and presentpopulation demographic events for many species(Gamache et al., 2003; Heuertz et al., 2004a, b; Magriet al., 2006). In these studies, maternally inherited seed-dispersed organelle markers typically revealed distinctgenetic groups associated with glacial refugia and
colonization routes. The increased information contentthat resulted from the use of multiple nuclear markers inthese studies, did indeed provide a better resolutionthan maternally inherited markers alone, and facilitatedthe detection of additional refugia and meeting zones.Moreover, differentiation identified with maternallyinherited markers and nuclear markers has often beenfound to be independent (Petit et al., 2005), andpopulations fixed for a single organelle haplotype donot necessarily show low diversity at nuclear markers(Heuertz et al., 2004b; Magri et al., 2006).
For Norway spruce (Picea abies L. Karst), a compre-hensive data set of the maternally inherited mtDNAmarker, nad1, and palaeoecological data, were recentlycombined to infer glacial refugia, primary routes ofpostglacial colonization and genetic consequences ofpostglacial colonization (Tollefsrud et al., 2008b). Norwayspruce, one of the most important ecological andeconomical forest tree species in Europe, occurs in twodisjunct natural ranges, a northern and a southern(Schmidt-Vogt, 1977). These disjunct ranges correspondto two divergent genetic lineages that have likely beenseparated over several periods of glaciation (Lagercrantzand Ryman, 1990; Vendramin et al., 2000; Heuertz et al.,2006; Tollefsrud et al., 2008b). As inferred from bothpalaeo and mtDNA data, postglacial colonization of thesouthern range took place from several distinct refugia,whereas the northern range was colonized from a single,
Received 6 July 2008; revised 9 January 2009; accepted 12 January2009; published online 4 March 2009
Correspondence: Dr MM Tollefsrud, Norwegian Forest and LandscapeInstitute, PO Box 115, NO-1431 As, Norway.E-mail: [email protected] address: Norwegian Institute for Water Research (NIVA)Gaustadalleen 21, NO-0349 Oslo, Norway
Heredity (2009) 102, 549–562& 2009 Macmillan Publishers Limited All rights reserved 0018-067X/09 $32.00
www.nature.com/hdy

large refugium situated in Russia (Terhurne-Berson,2005; Latalowa and van der Knaap, 2006; Tollefsrudet al., 2008b).
On the basis of mtDNA results, the northern lineage ofNorway spruce consists of a single, large gene pool(Tollefsrud et al., 2008b). A shallow substructuring of thisgene pool indicates that postglacial colonization fol-lowed two main migration routes: one northwesternroute from Russia to Finland, following the mainlandnorth of the Gulf of Bothnia and further to Norway andSweden, and one southwestern route over the Baltics,crossing directly over the Baltic Sea into southernScandinavia (Tollefsrud et al., 2008b). Today, the Russianplain populations of Norway spruce exhibit highmtDNA gene diversity and are little differentiated.During postglacial colonization, mtDNA diversity gen-erally decreased away from the Russian refugium, butsubstantial diversity was nevertheless maintained overlarge distances, suggesting phalanx colonization inconcordance with the pollen data (Giesecke and Bennett,2004). Severe bottlenecks seem to have occurred mainlyin the northernmost part of Scandinavia and in westernFinland, where the populations typically hold a singlemtDNA haplotype (Tollefsrud et al., 2008b).
Mitochondrial diversity in Norway spruce does notseem to be influenced by its interfertile congener,Siberian spruce (Picea obovata Lebed.). Sizing andsequence analysis of nad1 from Siberian spruce samplesshow a distinct division between Norway spruce andSiberian spruce east of the Ural Mountains, following theriver Ob (Tollefsrud et al., 2008a). On the other hand,pollen flow from Siberian spruce may have influencedthe nuclear diversity in Norway spruce as Siberianspruce cp haplotypes are found at low frequencies inNorway spruce stands (Tollefsrud et al., 2008a).
To obtain deeper insights into the past and presentprocesses shaping the genetic structuring that has takenplace in the northern lineage of Norway spruce, we hereinvestigate nuclear microsatellite variation and contrastit with the earlier reported mtDNA variation (Tollefsrudet al., 2008b). This will give a better understanding of therelative effects of postglacial colonization versus the pastand present pollen flow, as the diversity of highlyvariable microsatellites will recover more quickly fromfounder events owing to larger effective population sizeand spread by both seeds and pollen. We first examinewhether nuclear microsatellite variation provides addi-tional and complementary information regarding themigration routes. Second, we investigate how nucleardiversity and differentiation is distributed in relation todistance from the refugium and to peripheral popula-tions.
Materials and methods
Population samplingTwigs from Picea abies were collected from an average of46 trees, each separated by at least 20 m, from each of 37putatively autochthonous stands (Figure 1), and sub-jected to microsatellite analysis (in total 1715 trees; seeAppendix A). Mitochondrial DNA variation was ob-tained from an average of 17 trees per stand (Tollefsrudet al., 2008b and Appendix A; in total 644 trees). Thissample covered the North European distribution area
(Schmidt-Vogt, 1977) and the West coast of Norway,which is outside the continuous range (Fægri, 1950). Toensure collection from natural stands as far as possible,we gathered information on stand history from localforesters’ offices and only included stands with mtDNAhaplotypes belonging to the northern European lineage,as reported in Tollefsrud et al. (2008b).
Test for null allelesTo empirically test for the presence of null alleles atmicrosatellite loci, trees along with their seeds werecollected from a seed orchard of northern Europeanorigin. Conifer seeds have haploid megagametophytestorage tissue with the same genotype as the correspond-ing ovule. For trees showing a homozygote profile for anallele, DNA from eight endosperms was isolated andtested for the potential presence of null alleles. Null alleleheterozygotes were able to be detected because thehaploid megagametophytes of a tree segregate for thepresence and absence of the corresponding microsatelliteband.
DNA extraction, amplification and sizingDNA was extracted from frozen needles sampled fromadult trees and from endosperm tissue for the null alleletest, using the DNeasy 96 Plant Kit or the DNeasy PlantMini Kit (Qiagen, Hilden, Germany). A total of 30microsatellite primers from Pfeiffer et al. (1997) and Scottiet al. (2002a, b) were tested for variation and peak quality.Seven primers, EATC1D02A, EATC1B01, EATC2B02,EATC1E3, EATC2G05 (Scotti et al., 2002a), EAC2C08(Scotti et al., 2002b), SPAC1F7 (Pfeiffer et al., 1997), wereselected for further screening. These loci were variableand provided a high quality amplification product with aminimum of slippage. The loci EATC1D02A, EATC1B01,EATC2B02, EAC2C08 and SPAC1F7 were amplified in25ml containing 1�PCR buffer (GE Healthcare, Piscat-away, NJ, USA), 2.5 mM MgCl2, 0.2 mM of each dNTP,0.2mM of each primer, 1 U Taq DNA polymerase T.aquaticus (GE Healthcare) and ca. 30 ng DNA template.The loci EATC1D2A, EATC1B01, EATC2B02 andEAC2C08 were amplified with the touchdown profiledescribed in Scotti et al. (2002a). The profile used forSPAC1F7 followed Pfeiffer et al. (1997). The loci EATC1E3and EATC2G05 were amplified together in 20 ml contain-ing a 1�Qiagen multiplexing kit, 0.2mM of each primerand ca. 20 ng DNA template using the followingprotocol: 15 min at 95 1C, 28 cycles of 94 1C for 30 s,58 1C for 90 s, 72 1C for 60 s and a final extension at 60 1Cfor 30 min. DNA from endosperm tissue was amplifiedtwice to ensure that non-amplified products werebecause of null alleles and not because of PCR failure.PCR products labelled with various fluorescent dyes(FAM, HEX and TAMRA) were loaded on the capillarysystem sequencer, MegaBACE1000 (GE Healthcare), withthe size standard MegaBACE ET400 (GE Healthcare).Peaks were analysed and fragment lengths determinedwith the MegaBACE FRAGMENT PROFILER softwareversion 1.2 (GE Healthcare). All peaks and binning weremanually checked.
The mt marker used in this study comprises afragment of the second intron of the nad1 gene includingtwo highly variable minisatellites of 32 and 34 basepairs (bp) and insertion/deletions and mutations in the
Combined analysis of nuclear and mitochondrial markersMM Tollefsrud et al
550
Heredity

flanking regions of the tandem repeats. Variation inthe minisatellite-flanking sequences separates northernpopulations from the southern ones, whereas copy–number variation in the two minisatellites is veryvariable on a regional scale. Populations in the northernrange mainly show variation in the 34 bp repeat(Sperisen et al., 2001; Tollefsrud et al., 2008b).
Variation in the nad1 fragment from 30 of the standsused in this study had been screened earlier from at least13 trees per stand (Tollefsrud et al., 2008b). For the sevenremaining stands, each represented by at least 14 trees,variation in nad1 was screened for this study. The nad1fragment was amplified and cut with the restriction
enzyme, EcoRV, following Tollefsrud et al. (2008b). Partsof the samples were sized on an ABI 310 geneticanalyzer (Applied Biosystems, Foster City, CA, USA)as described in Tollefsrud et al. (2008b). The remainingsamples were run on a MegaBACE1000 (GE Healthcare)using the size standard MegaBACE ET900 (GE Health-care). Peaks were analysed and fragment lengthswere determined using the MegaBACE FRAGMENTPROFILER software version 1.2 (GE Healthcare).Sixteen samples with known size were used ascontrol samples on the MegaBACE1000 to calibratedifferences in size resolution between the two sizingsystems.
60 90
65
Southwestern Norway, SN37
Northern Norway, NN17
Central Sweden
Southern Scandinavia
Russia, Baltic States, Finland and northern Sweden
Southwestern Norway, SN360.1
RUS1RUS3
RUS4
RUS5RUS6
RUS7
RUS8
BAL9
BAL10
BAL11
FIN12
FIN13
FIN14
FIN15
FIN16
NS18CS19
CS20CS21
SS23SS24
SS25SN28
SN29
SN31
SN34
SN35SN36
RUS2
SN30
SN33
SN37
SS27
NN17
CS22
SS26
SN32
Figure 1 Geographical distribution of the six genetic (BAPS) groups inferred from variation at seven nuclear microsatellite loci in 37 Piceaabies populations (a). The green outline illustrates the distribution of the northern lineage of Norway spruce (after Schmidt-Vogt, 1977). Theneighbour-joining tree (b) is based on Cavallia-Sforza and Edwards chord distances between the BAPS groups. Bootstrap values are given inpercentages and are based on 1000 replications. Stand numbers are according to Appendix A.
Combined analysis of nuclear and mitochondrial markersMM Tollefsrud et al
551
Heredity

Genetic diversity and differentiationLinkage disequilibrium for all microsatellite loci pairs ineach population was tested in the programme FSTAT(Goudet, 2001), using randomization. Microsatellitediversity was measured as gene diversity (expectedheterozygosity, HE) (Nei, 1987) and allelic richness (AS)using FSTAT. Allelic richness was calculated usingrarefaction (Hurlbert, 1971) standardized to the mini-mum sample size of 25 diploid individuals. The totalnumber of alleles and the allele range per locus were alsorecorded. Conformity to Hardy–Weinberg (HW) propor-tions was tested using the exact test (Guo and Thomp-son, 1992) based on Markov chain iterations asimplemented in GENEPOP v4.0 (Rousset, 2008). Theextent of deviation from HW proportions was evaluatedusing FIS estimates across loci for each stand. Theinfluence of each locus on the stand level of FIS wasexamined to test whether some loci influenced the FIS
level more than others.Null allele frequencies for each microsatellite locus
and each stand were estimated following the expectationmaximum algorithm of Dempster et al. (1977) usingFREENA (Chapuis and Estoup, 2007). This algorithmwas chosen because it provided the most accurateestimate of several algorithms tested in Chapuis andEstoup (2007).
For the microsatellite data, an unbiased estimate ofWright’s fixation index theta (FST) (Weir and Cockerham,1984) was calculated as a measure of genetic differentia-tion in FSTAT. The significance of genetic differentiationamong pairs of stands was tested by permutating thegenotypes a 1000 times among samples. FST may beoverestimated in the case of null alleles (Chapuis andEstoup, 2007) and underestimated when within-popula-tion heterozygosity is high (Hedrick, 2005; Jost, 2008). Wecontrolled for the potential effect of null alleles on geneticdifferentiation by calculating FST values using theexcluding null allele (ENA) method by Chapuis andEstoup (2007) in FREENA. To take high levels ofheterozygosity into account, standardized FST (F‘ST)values following Hedrick (2005) were calculateddividing the uncorrected FST values by its upper limits(F0
ST¼FST/FST max). To calculate FST max, we usedRecodeData version 0.1 (Meirmans, 2006) to create anFSTAT file with maximally differentiated populations(that is, the data file was recoded such that all alleleswere population specific). Mantel tests between pairwiseFST values, pairwise ENA-corrected FST values andpairwise F‘ST values were performed in ARLEQUIN3.11 (Excoffier et al., 2005) using 1000 random permuta-tions to evaluate whether the different FST calculationswere significantly correlated.
Analyses of molecular variance (AMOVA) partitioningvariation among genetic groups, among populations andwithin populations were carried out using ARLEQUIN3.11. Critical significance levels of multiple tests wereadjusted for by sequential Bonferroni correction (Rice,1989).
For the mt data, within population genetic diversity(HS), total genetic diversity (HT) and genetic differentia-tion among populations (GST) were calculated accordingto Pons and Petit (1995) using the programme, CON-TRIB. Allelic richness (AS) based on a rarefaction factorof 13 was calculated in FSTAT. Taking the different levelsof variation obtained from the mt and nuclear markers
into account, standardized GST values (G0ST) following
Hedrick (2005) were calculated using RecodeData ver-sion 0.1 in conjunction with FSTAT.
Population genetic structureThe population structure determined using microsatel-lite data was initially analysed adopting three statisticalapproaches: the Bayesian methods implemented in theprogramme BAPS 4.14 (Corander et al., 2003, 2004) andSTRUCTURE 2.2 (Pritchard et al., 2000; Falush et al., 2003,2007), and Genetic Landscape Shape analysis (Miller,2005). The population structure based on mt data hasbeen presented by Tollefsrud et al. (2008b); here, we onlyperformed Genetic Landscape Shape analysis of themtDNA data to facilitate direct comparison between thegeographical patterns of differentiation observed be-tween the two marker types.
BAPS and STRUCTURE attempt to reveal the popula-tion genetic structure by placing individuals or prede-fined groups in K numbers of clusters with optimal HWand gametic phase equilibrium among clusters. K is notchosen in advance, but is varied within a reasonablerange. BAPS 4.14 was first run using individual cluster-ing, but this resulted in an unreasonably high number ofclusters. Because of this, we used our predefined standsas units in the analysis. The number of clusters, K, wasset from 1 to 37 with ten replicates for each K in fiveindependent runs. We ran STRUCTURE 2.2 using boththe admixture model and the dominant marker modelusing the option ‘recessive alleles’ to deal with nullalleles. We used a burn-in period of 5� 105 and 2� 106
iterations with correlated allele frequencies under anadmixture model. K was set from 1 to 10, and 10replicates were run for each K-value. Similarity amongthe runs for the same K was calculated according toNordborg et al. (2005), using an R script written by DEhrich available at http://www.nhm.uio.no. We identi-fied the number of groups as the value of K, in which theincrease in likelihood began to flatten out and the resultsof replicate runs were identical.
The Genetic Landscape Shapes analyses were pro-duced using the programme, Alleles In Space (AIS;Miller, 2005). The procedure was initiated by construct-ing a Delaunay triangulation network among all thesampling coordinates. Average interindividual geneticdistances were calculated between the stands connectedin the network. Considering that there was substantialvariation in geographical distances between the sam-pling areas, we used distance-corrected genetic dis-tances. Next, a simple interpolation procedure wasused to infer genetic distances at locations on auniformly spaced grid overlaying the entire samplelandscape (for a more detailed description, see Milleret al., 2006). A three-dimensional surface plot of the set ofinterpolated genetic distances was produced, where Xand Y coordinates corresponded to geographical loca-tions within the Delaunay network and surface plotheights (Z) to genetic distance. We used sequences asinput matrix for the nad1 data set, with coding of theinsertion/deletions and the repeated sequences follow-ing Tollefsrud et al. (2008b). Gaps were treated as a fifthcharacter in AIS.
Genetic distances (DCE, Cavallia-Sforza and Edwards)among stands or genetic clusters obtained from the
Combined analysis of nuclear and mitochondrial markersMM Tollefsrud et al
552
Heredity

Bayesian cluster analysis were calculated in the MICRO-SATELLITE ANALYSER (MSA 4.05) programme (Dier-inger and Schlotterer, 2003). For statistical support, lociwere bootstrapped a 1000 times. A neighbour-joining(NJ) tree was constructed on the basis of DCE distancesusing NEIGHBOR and TREEVIEW in the PHYLIPSoftware package (Felsenstein, 2004).
We traced the patterns of changes in diversityparameters within stands following postglacial expan-sion out of the Russian plain (Latalowa and van derKnaap, 2006; Tollefsrud et al., 2008b) by calculating thecorrelations (Pearson’s r) for the genetic parametersobtained from the microsatellites (HE NUC, AS NUC, andFIS NUC), mtDNA (HS MT, HT MT, and AS MT), longitude,latitude and distance from the refugial gene pool. Therefugial gene pool was represented by the stand, RUS3(41.001 E, 57.581 N; Tollefsrud et al., 2008b). Pearson’s rwas calculated using R version 2.5.0 (R DevelopmentCore Team, 2007).
To test whether the genetic differentiation followedisolation by distance (IBD), the correlation between FST/(1-FST) and the natural logarithm of geographicaldistances was calculated with the Mantel test suggestedby Rousset (1997), using ARLEQUIN 3.11, with 10 000random permutations.
We tested whether the populations departed frommutation-drift equilibrium using the BOTTLENECKprogramme (Cornuet and Luikart, 1996; Luikart andCornuet, 1998; Piry et al., 1999). The significance ofpotential bottlenecks was assessed using the Sign and theWilcoxon tests for heterozygosity excess, of which theWilcoxon test is considered the most powerful androbust (Piry et al., 1999).
Results
Genetic diversity and differentiationSignificant linkage disequilibrium between the pairs ofmicrosatellite loci within stands was only detected in fiveout of 777 tests (a¼ 0.05) after sequential Bonferronicorrection (k¼ 37). All loci were thus considered to begenetically independent when analysed further.
The nuclear genetic variation was high overall(Table 1). The mean gene diversity over loci was 0.640and the mean number of alleles per locus was 22. Thegene diversity (HE) showed high variation among loci,ranging from 0.279 at EATC1E3 to 0.903 at EAC2C08. Thenumber of alleles per locus ranged from 9 (EATC1E3) to40 (EAC2C08). A total of 154 different alleles weredetected, of which 31 occurred at an overall frequency40.05. Twenty-seven private alleles were found, dis-tributed over 19 stands. The private alleles were mostlyat the extremes of the allele size distribution andoccurred at very low frequencies. Nuclear gene diversityand allelic richness per stand ranged from 0.492 to 0.688and from 4.967 to 9.586, respectively (Appendix A).
The single-locus tests for HW proportions over standsshowed significant departure (a¼ 0.05) in 163 out of 259cases, distributed over all seven loci. One hundredand thirty of them were significant after sequentialBonferroni correction (a¼ 0.05, k¼ 7; Appendix A).Significant multilocus deviation from Hardy-WeinbergEquilibrium (HWE) was observed in all stands aftersequential Bonferroni correction (a¼ 0.05, k¼ 37). Ta
ble
1C
har
acte
rist
ics
of
the
sev
enm
icro
sate
llit
elo
ciin
Pic
eaab
ies
use
din
this
stu
dy
Loc
us
LG
Rep
eat
mot
ifN
ull
hom
ozyg
otes
All
ele
size
ran
geN
alle
les
HO
HE
FIS
FS
TF
ST
(EN
A)
Pn
(Pn
)2*N
EA
TC
1D2A
9a
(TC
C) 4
N15
(TC
A) 1
6T
CC
(TC
A) 5
(TC
C) 4
(TC
A) 4
124
124–
239
230.
385
0.80
50.
489*
0.04
50.
028
0.28
814
2E
AT
C1B
0211
a(A
TC
) 7(A
T) 3
918
2–26
615
0.24
30.
453
0.54
5*0.
037
0.03
80.
147
37E
AT
C2B
02—
(CA
T) 8
617
2–24
425
0.55
60.
681
0.16
4*0.
018
0.01
70.
069
8E
AT
C1E
311
a(C
AT
) 4C
GT
(CA
T) 8
CG
T(C
AT
) 4C
GT
(CA
T) 4
CG
T(C
AT
) 416
121–
148
90.
233
0.27
90.
178*
0.01
70.
022
0.06
16
EA
TC
2G05
1b(A
AT
) 5(C
AT
) 16C
AA
(CA
T) 4
1019
3–26
222
0.71
80.
889
0.16
8*0.
031
0.02
70.
076
10S
PA
C1F
75b
(AC
) 12
591
–127
200.
327
0.47
30.
315*
0.01
90.
024
0.11
322
EA
C2C
08—
(AC
) 25
411
7–22
940
0.79
00.
903
0.13
1*0.
026
0.02
60.
042
3M
ean
—22
0.46
50.
640
0.25
1*0.
029
0.02
6—
LG
,li
nk
age
gro
up
rep
ort
edb
yA
cher
eet
al.
(200
4)a,
htt
p:/
/w
ww
.pie
rro
ton
.in
ra.f
r/g
enet
ics/
Pic
ea/
b,
(—n
ot
kn
ow
n);
Rep
eat
mo
tif
of
the
mic
rosa
tell
ite
loci
;N
ull
ho
mo
zyg
ote
sre
fer
toth
en
um
ber
of
ind
ivid
ual
DN
As
ou
to
f17
15(N
)p
oss
ible
that
wer
en
ot
amp
lifi
edaf
ter
thre
eat
tem
pts
;All
ele
size
ran
ge;
Nal
lele
s,to
tal
nu
mb
ero
fal
lele
so
bse
rved
;HO
,ob
serv
edh
eter
ozy
go
sity
;HE,
gen
ed
iver
sity
;*F
ISsi
gn
ifica
ntl
yg
reat
erth
anze
roaf
ter
seq
uen
tial
Bo
nfe
rro
ni
corr
ecti
on
s(a
¼0.
05);
FS
To
fW
eir
and
Co
cker
ham
(198
4)an
dF
ST
usi
ng
EN
Aco
rrec
tio
n(C
hap
uis
and
Est
ou
p,2
007)
;P
n,c
alcu
late
dn
ull
alle
lefr
equ
ency
usi
ng
the
EM
alg
ori
thm
of
Dem
pst
eret
al.(
1977
);(P
n)2
*N,e
xp
ecte
dfr
equ
ency
of
ho
mo
zyg
ou
sn
ull
,th
atis
,th
eex
pec
ted
freq
uen
cyo
fn
on
-am
pli
fied
sam
ple
s.
Combined analysis of nuclear and mitochondrial markersMM Tollefsrud et al
553
Heredity

Assuming HWE, the estimated null allele frequenciesover stands varied from 0.288 at EATC1D2A to 0.042 atEAC2C08 (Table 1). At four of the loci, the null allelefrequency estimates were very low (0.076–0.042; Table 1).The expected number of null homozygotes ((Pn)2 * n;Table 1) was lower than the observed value for four loci.In the direct ‘count’ of null alleles in the endospermtissue from homozygous mother trees, null alleles wereobserved for the five loci EATC1D2A, EATC1B02,EATC1E3, EATC2G05 and SPAC1F7. Unfortunately,because the number of homozygote trees for which wehad endosperms was low (n ranging from 2–13 perlocus) and because only a fraction of the potential alleleswere detected (n ranging from 2–7), no reliable empiricalestimate of the null allele frequencies could be deter-mined. In the data set obtained, EATC1D2A had six nullalleles, EATC1B02 and EATC1E3 had two each andSPAC1F7 and EATC2G05 had one each. All loci that hada null allele showed a 1:1 segregation (determined by thew2-test, data not shown).
The overall genetic differentiation at the microsatelliteloci was low (FST¼ 0.029, s.d.¼ 0.004), though highlysignificant (Po0.001). After ENA correction, the overallFST was slightly lower (FST ENA¼ 0.026), and thestandardized FST was slightly higher (F0
ST¼ 0.071). Thepairwise FST values ranged from 0.000 to 0.147. Thehighest values were obtained for the northernmost stand(NN17) and for two stands outside the continuum on theWest coast of Norway (SN36 and SN37). Significant(Po0.05) genetic differentiation was found in 518 out of666 pairs after sequential Bonferroni correction. TheENA-corrected pairwise FST estimates were very similarand strongly correlated with the uncorrected pairwiseFST values (R2¼ 0.935, Po0.00001) in the Mantel test,suggesting that all stands were similarly affected bynull alleles. The pairwise standardized Hedrick (2005)F0
ST estimates were generally elevated, but stronglycorrelated with the uncorrected pairwise FST values(R2¼ 0.899, Po0.00001) in the Mantel test.
In the 37 stands, we detected 10 mt haplotypes (721,754, 755, 789, 819, 823, 857, 891, 925 and 959; AppendixA). None of these haplotypes was new compared withTollefsrud et al. (2008b), and they all belonged to thenorthern lineage of Norway spruce (Tollefsrud et al.,2008b). In the present data set, mt mean gene diversity(HS) was 0.238, mean allelic richness (AS) was 2.426, totalgene diversity (HT) was 0.349 and differentiation amongpopulations (GST) was 0.317. G0
ST for the mt data wasabout five times higher than that for the nuclear data(G0
ST MT¼ 0.400, G0ST NUC¼ 0.081).
Genetic subdivisionThe BAPS analysis of the microsatellite data identifiedsix clusters (Figure 1). The largest group contained allstands from Russia, the Baltics and Finland, and onestand from northern Sweden. The second largest groupcontained most of the stands from southern Scandinavia.These two groups clustered together with high supportin the NJ tree of the BAPS groups (Figure 1b). The thirdlargest BAPS group contained four stands from centralSweden. The three remaining BAPS groups containedsingle stands located at the northern and western rangemargins of the Norway spruce. These three single standswere the most divergent ones within the NJ tree of the
BAPS groups (Figure 1b). In the AMOVA analysis, only1.44% was explained by the BAPS groups, 1.77% wasexplained by variation among stands within the groupsand 96.84% of the variation was explained by within-stand variation (Po0.001). All of the variance compo-nents were highly significant (Po0.001).
STRUCTURE failed to reveal any biologically reason-able groups. Under both the admixture model and thedominant marker model, three groups were chosen, asthe increase in the likelihood flattened out at K43 andsimilarity among the runs for K¼ 3 was close to 1. Allpopulations were however almost equally partitionedamong the three groups.
The NJ tree of individual stands (Figure 2) showed astructure that was similar to the BAPS groups, but littlesupport was obtained. One large cluster consisted ofstands from southern Scandinavia and the Baltics, andtwo stands from western Russia. A second large clusterconsisted of Russian, Finnish and northern Scandinavianstands. An additional cluster, not observed in the BAPSanalysis, consisted of the northernmost stand, NN17,together with NS18, FIN16 and one stand from thesouthern Russian Urals (RUS1).
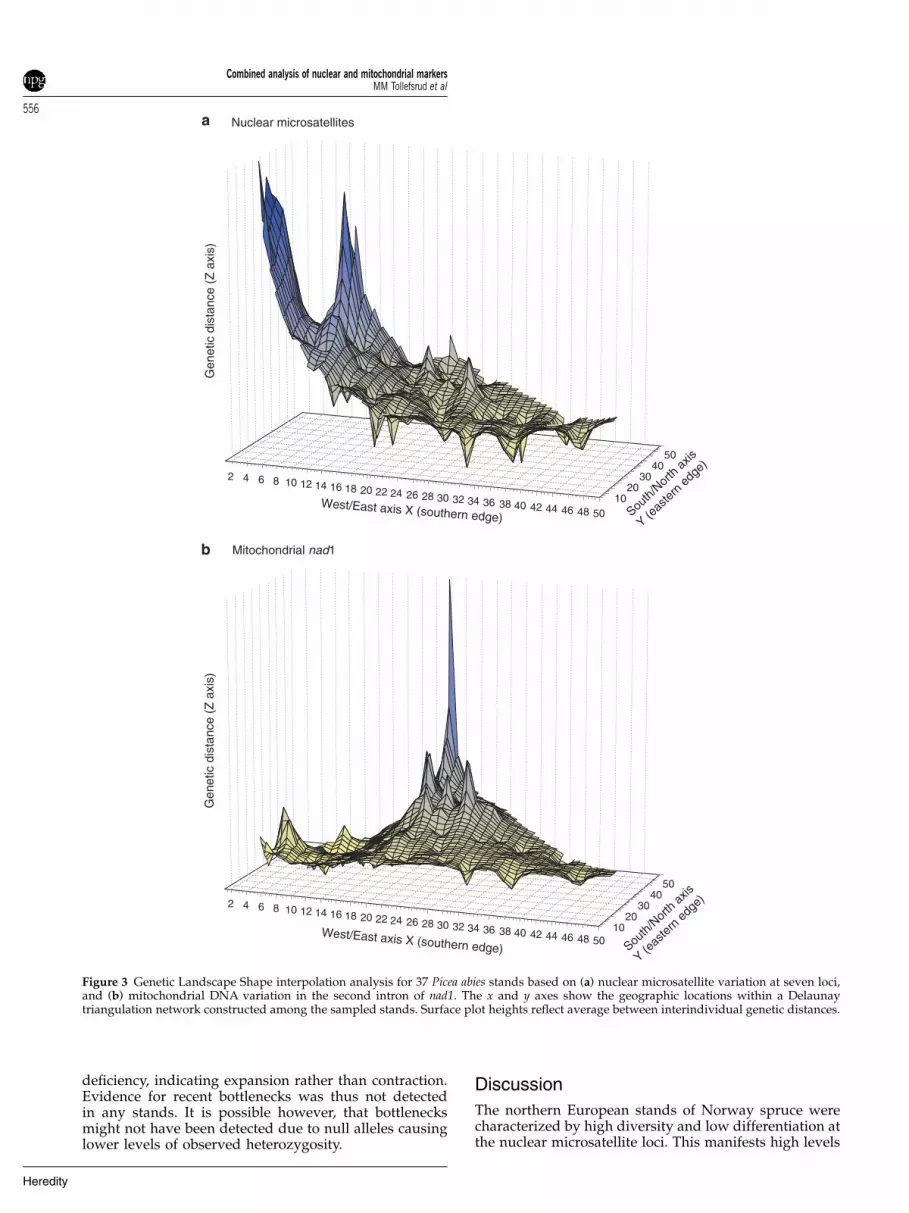
Overall, the genetic landscape shape analysis of themicrosatellite data was consistent with the BAPS and NJanalyses (Figure 3a). The eastern populations showedlittle differentiation. Along the southern edge from eastto west, there was a largely smooth genetic surfaceindicating low barriers to gene flow. Two primaryregions of elevated genetic distances were revealed inthe west, one along the northern edge (central Sweden)and one in the westernmost part of the range (south-western Norway). By contrast, the genetic landscapeshape analysis of the mtDNA data (Figure 3b) revealed ahigh peak in northern Finland and northern Norway(Figure 3b). For the mtDNA data, as for the microsatellitedata, a smooth surface of genetic distances was evidentalong the southern edge from east to west.
Geographic trendsWe found clear geographical trends in genetic diversityfor both the nuclear DNA (Table 2 and Figure 4) andmtDNA (Table 2). The correlations between the nuclearparameter AS NUC and the three mtDNA parameterswere positive and significant, indicating a generalcoherence among the nuclear and the mtDNA diversitypatterns. The mtDNA parameters and the nuclearparameter AS NUC decreased significantly with distancefrom the oldest region as identified by pollen data(Tollefsrud et al., 2008b). Still, with respect to longitudeand latitude, different trends in the mtDNA and thenuclear DNA diversity were evident. Although the mtparameters were significantly negatively correlated withincreasing distance from the oldest population (RUS3)and with decreasing longitude, nuclear gene diversity(HE NUC) and allelic richness (AS NUC) did not changesignificantly with longitude (Table 2). With increasinglatitude, both HE NUC and AS NUC decreased significantly,whereas only HT MT decreased significantly northwards.Negative correlations between latitude and AS NUC wereobserved at all loci, and for HE NUC at five loci (resultsnot shown).
FIS NUC over all loci significantly increased withlatitude, suggesting increased mating within stands
Combined analysis of nuclear and mitochondrial markersMM Tollefsrud et al
554
Heredity

northwards (assuming that the occurrence of null allelesaffected the stands similarly, as shown in the Mantel testof pairwise FST and ENA corrected FST values). Con-sidering that significant positive correlations wereobserved at only three out of seven loci (EATC1D02A,r¼ 0.417**, EATC2G05 r¼ 0.621*** and SPAC1F7r¼ 0.428**), the increase in FIS northward should beinterpreted with caution.
Stands with high nuclear gene diversity typicallyoccurred in the south, including the western part of theRussian plains, the Baltics and southern Scandinavia(Figure 4b; HE). Allelic richness largely followed thesame pattern, except that the stands from central Finlandalso had above-average allelic richness (Figure 4a; AS).Most stands in the northernmost part of the range as wellas in central Sweden had below-average gene diversityand allelic richness. In the most recently colonized areas
in southern and southwestern Norway, allelic richnesswas below average (Figure 4a), whereas the genediversity in several of these stands was above average(Figure 4b).
Weak IBD and no population bottlenecks
for the nuclear microsatellitesThe correlation between nuclear genetic differentiationand geographical distance showed that the IBD patternwas very weak (R2¼ 0.032, P¼ 0.043). In the BOTTLE-NECK analysis, all populations showed heterozygotedeficiency at 450% of the loci in the Sign test. Nopopulations had significant heterozygote excess in theWilcoxon test performed under the infinite, the twophase or the stepwise mutation model. All populationswere thus characterized by significant heterozygote
BAL9
RUS7
BAL11
BAL10
RUS8
SS23
SS26
SN33
SN34
SN35SN28SS27SS24SN31
SN29SN25
SN32
SN30
SN36
SN37
RUS5RUS4
RUS2FIN14
RUS6
RUS3FIN12
FIN13
FIN15CS21
CS22CS19
CS20
NS18FIN16
NN17
RUS1
59 7960
87
CENTRAL SWEDEN
RUSSIA, FINLAND AND NORTHERN SCANDINAVIA
SOUTHERN SCANDINAVIA,THE BALTICS AND RUSSIA
NORTHERN FENNOSCANDIA AND RUSSIA - URALS
Figure 2 Neighbour-joining tree for 37 Picea abies stands based on nuclear microsatellite variation at seven loci. Distances betweenpopulations are based on Cavallia-Sforza and Edwards chord distances. The lines drawn around the two main clusters are based ongeographical origins of the stands. BAL: Baltic States and Belarus, CS: central Sweden, FIN: Finland, NN: northern Norway, NS: northernSweden, RUS: Russia, SN: southern Norway, SS: southern Sweden. Bootstrap values 450% based on 1000 replications are given. Standnumbers are according to Appendix A and Figure 1.
Combined analysis of nuclear and mitochondrial markersMM Tollefsrud et al
555
Heredity
deficiency, indicating expansion rather than contraction.Evidence for recent bottlenecks was thus not detectedin any stands. It is possible however, that bottlenecksmight not have been detected due to null alleles causinglower levels of observed heterozygosity.
Discussion
The northern European stands of Norway spruce werecharacterized by high diversity and low differentiation atthe nuclear microsatellite loci. This manifests high levels
5048464442403836343230282624222018161412108642
5040
3020
10West/East axis X (southern edge) South/
North
axis
Y (eas
tern e
dge)
5048464442403836343230282624222018161412108642
5040
3020
10West/East axis X (southern edge) South/
North
axis
Y (eas
tern e
dge)
Gen
etic
dis
tanc
e (Z
axi
s)G
enet
ic d
ista
nce
(Z a
xis)
Mitochondrial nad1
Nuclear microsatellites
Figure 3 Genetic Landscape Shape interpolation analysis for 37 Picea abies stands based on (a) nuclear microsatellite variation at seven loci,and (b) mitochondrial DNA variation in the second intron of nad1. The x and y axes show the geographic locations within a Delaunaytriangulation network constructed among the sampled stands. Surface plot heights reflect average between interindividual genetic distances.
Combined analysis of nuclear and mitochondrial markersMM Tollefsrud et al
556
Heredity

Table 2 Matrix of correlations between geographical variables (latitude, longitude and distance to the oldest stand on the Russian plain;RUS3, which represents parts of the oldest gene pool (Tollefsrud et al., 2008b)) and diversity parameters based on seven nuclear microsatellitemarkers (NUC) and the mitochondrial (MT) nad1 marker
Latitude Longitude Distance AS NUC HE NUC FIS NUC AS MT HS MT HT MT
AS NUC �0.606*** 0.091 �0.403** —HE NUC �0.541*** �0.136 �0.155 0.774*** —FIS NUC 0.424** 0.196 �0.053 �0.145 �0.298 —AS MT �0.111 0.542*** �0.684*** 0.384* 0.172 �0.111 —HS MT �0.161 0.512*** �0.674*** 0.414* 0.172 �0.174 0.984*** —HT MT �0.348* 0.428** �0.472** 0.418** 0.189 �0.021 0.613*** 0.578*** —
The diversity parameters are allelic richness (AS), gene diversity (expected heterozygosity for the nuclear microsatellites HE NUC, and within-population gene diversity for the mt nad1 HS MT), inbreeding coefficient for the nuclear microsatellites (FIS NUC), and total gene diversity forthe mitochondrial nad1 (HT MT). *, **, ***, significant correlation coefficient at the 5, 1 and 0.1% levels, respectively.
-0.298 - -2.218-2.218 - -1.448-1.448 - -0.678-0.678 - 0.0920.092 - 0.8620.862 - 1.631
As mean 7.954
-0.127 - -0.095-0.095 - -0.062-0.062 - -0.029-0.029 - 0.0030.003 - 0.0360.036 - 0.069
HE mean 0.619
Figure 4 Population gene diversity (a; HE) and allelic richness (b; AS) in Picea abies based on nuclear microsatellites, plotted as deviation fromthe mean values. Higher than average values are represented by grey circles, lower than average values are represented by white circles. Thegreen outline illustrates the distribution of the northern lineage of Norway spruce (after Schmidt-Vogt, 1977).
Combined analysis of nuclear and mitochondrial markersMM Tollefsrud et al
557
Heredity

of past and present gene flow over the northernEuropean range of the species, corroborating earlierresults (Lagercrantz and Ryman, 1990; Vendramin et al.,2000; Tollefsrud et al., 2008b). The overall congruencebetween the structure at the nuclear loci and the mtDNAis likely to mirror common historical events in thepopulations. The deeper genetic structure observed inthe seed-dispersed mt genome suggests that postglacialcolonization through seeds established an underlyinggenetic structure that is still present and detectable in thenuclear genome, despite extensive pollen flow over largedistances. Postglacial colonization nevertheless affectedmt and nuclear diversity differently, owing to thedifferent mode of transmission and dispersal of thesemarkers as well as to the difference in their effectivepopulation size.
Congruent and refined structure at nuclear microsatellites
compared with mt nad1In the oldest regions of Norway spruce in northernEurope, as inferred from the pollen record (Tollefsrudet al., 2008b), microsatellite diversity was high anddifferentiation was very low. This is in agreement withthe results of the earlier mtDNA analysis (Tollefsrudet al., 2008b). Large refugia are expected to exhibit such agenetic structure ( Hewitt, 2001) and strongly support thehypothesis that Norway spruce survived in a single largerefugium in Russia during the last glacial maximum.
The statistically significant differences in nuclear allelefrequencies, as reflected in the BAPS groups and partlyin the NJ trees of the stands, provide independentsupport for the mtDNA-based hypothesis of a north-western and a southwestern migration route out of theRussian refugium. A geographical subdivision on ac-count of allele frequency differences (and not geogra-phical differences in heterozygosity levels) is alsosupported by the high correlation among uncorrectedand standardized FST values, evident from the Manteltest. Although only a small fraction of the total geneticvariation was explained by the BAPS groups, the NJ treeof the BAPS groups (Figure 1b) provides additionalsupport for the hypothesised migration routes, especiallythe southwestern route. Moreover, genetic landscapeshape analysis revealed a smooth surface of geneticdistances from Russia to southern Scandinavia, indicatinglow barriers to gene flow across the Baltic Sea. The finingsof macrofossils dated to the early Holocene, as well as thatof a living tree dated to be 9500 years old in southernSweden (Kullman, 2008), suggest that the migration alongthe southwestern route across the Baltic Sea was initiatedearly. Dispersal could either have taken place throughhave taken place frequent long-distance trans-oceanicdispersal or possibly across land during the Ancylusregression of the Baltic Sea (9000–8000 years beforepresent) when there was a mainland connection betweensouthern Sweden and the Baltic coast (Bjorck, 1995).
From the microsatellite data, an additional migrationfrom the eastern Urals to northern Fennoscandia may beinferred from a cluster in which a stand from thesouthern Urals grouped together with three northernFennoscandian stands. This pattern may be because ofpollen-mediated introgression from the Siberian spruce,as pollen flow from the Siberian spruce to the Norwayspruce is suggested by paternally inherited cp haplo-types (Tollefsrud et al., 2008a).
Our microsatellite data for Norway spruce showed noevidence of bottlenecks. This is largely consistent withthe pollen record, except for the northernmost popula-tions where the pollen record has suggested significantbottlenecking (Giesecke and Bennett, 2004). Drift orfounder events may still explain some of the geneticsubstructure that we find within northern EuropeanNorway spruce. For example, the divergence of thecentral Swedish stands as revealed in the NJ and BAPSanalyses may be because of drift after early establish-ments. Macrofossil evidence from the Scandes Moun-tains of central Sweden suggests that Norway sprucealready arrived in the early Holocene (Kullman, 1995;Kullman, 2002). As these early established populationsprobably expanded before a later colonization wavereached them (Giesecke and Bennett, 2004), their nuclearallele frequencies may have changed enough to maintaindivergence from other stands. Founder events may alsoexplain the high divergences of the peripheral popula-tions, NN17 in northernmost Norway and that of SN36and SN37 on the west coast of Norway, where sprucewas established less than 1500 years ago (Fægri, 1950).
In contrast to the BAPS analysis, we did not find anymeaningful nuclear genetic structure in the STRUCTUREanalysis of Norway spruce. Both STRUCTURE and BAPShave been shown to perform poorly for data sets with FST
values lower than 0.020 (Latch et al., 2006). In our study,in which the overall FST value was 0.029, lower and ofteninsignificant genetic differentiation was found betweenmany pairs of stands. In model-based clustering meth-ods, such as STRUCTURE and BAPS, which definegroups based on HW and linkage equilibrium, thepresence of inbreeding or null alleles may furtherhamper the inference of the population structure (Falushet al., 2007). In the BAPS analysis, we constrained theindividuals in each stand to belong to the same BAPSgroup, facilitating the detection of a structure.
Geographical trends of nuclear and mt diversityNuclear allelic richness decreased significantly withincreasing distance from the Russian refugium, asexpected from the general prediction of Hewitt (1999).Nuclear gene diversity did not, however, decrease withincreasing distance from the refugium. This discrepancycan be explained by the fact that allelic richness isstronger affected by genetic drift than gene diversity asallelic richness is sensitive to the loss of rare alleles,whereas gene diversity depends more on the frequenciesof the most common alleles (Nei et al., 1975). The clearloss of mtDNA diversity is, on the other hand, associatedto the dispersal by seeds only and the lower effectivepopulation size (that is, higher genetic drift) of thehaploid mt genome.
The high levels of nuclear diversity that we observedin southern Scandinavia can be explained by repeateddispersal events across the Baltic Sea. Furthermore,temporary increase in pollen flow during colonizationfrom older, genetically more diverse populations toyounger populations may also have counteracted theloss of nuclear diversity (Gamache et al., 2003; Heuertzet al., 2004b). In the presence of high levels of pollen flow,gene diversity is also expected to decrease less relative toallelic richness (Comps et al., 2001), in concordance withthe pattern that we observed in southern Scandinavia.
Combined analysis of nuclear and mitochondrial markersMM Tollefsrud et al
558
Heredity

Pollen flow from non-autochthonous Norway sprucestands or even pollen flow from stands in the centralEuropean distribution range, may also have acted toincrease the nuclear diversity level in southern parts ofScandinavia. Planting of non-autochthonous prove-nances is, however, common throughout the range (seeLaikre et al., 2006 for Sweden) and could be expected toinfluence the diversity similarly over the range.
We found clear and significant decrease in both allelicrichness and gene diversity towards the north as well asan increase in genetic differentiation based on themicrosatellites. Such a pattern is often observed atspecies’ range margins where smaller effective popula-tion sizes and stronger geographical isolation make thepopulations more susceptible to the loss of geneticvariation (Ouborg et al., 2006; Eckert et al., 2008). In thenorth, Norway spruce flowers infrequently (Schmidt-Vogt, 1977), and unfavourable conditions for seedripening as well as an increased selection pressure arelikely to reduce the effective population size. In Norwayspruce, it has also been shown that pollen productiondecreases with latitude (Sarvas, 1957; Luomajoki, 1993).Reduced pollen availability towards the north may leadto increased inbreeding towards the north. The relativedifferences in FIS over all loci may thus reflect thedifferences in inbreeding. It should be stressed that thehigh correlation obtained in the Mantel test amongpairwise FST and the ENA-corrected pairwise FST valuesindicates that all populations have been similarlyaffected by potential null alleles. Increased inbreedingtowards the north was also evident in the outcrossing,wind-pollinated Picea sitchensis, in which populationsizes and densities decreased towards the northern rangemargins (Mimura and Aitken, 2007).
In Norway spruce, mt diversity did not decreasetowards the north, and particularly high mtDNAdiversity was observed in the northern Finnish stands.Moreover, the increased differentiation towards Finland(as reflected in the genetic landscape shape analysis,Figure 3b) can be interpreted as a result of frequent long-distance dispersal events that supplement the migratingfronts with new variants maintaining diversity (Tollefs-rud et al., 2008b). We, therefore, suggest that the loss ofnuclear diversity towards the north rather reflects thenorthern climatic constraints of Norway spruce than theloss of diversity during postglacial colonization. Anopposite trend was found in the north-American speciesPicea marina, in which postglacial colonization north-wards induced a loss in mtDNA diversity whereaspollen flow maintained the nuclear microsatellite diver-sity towards the north. On the other hand, this speciesmay be better adapted to cold climatic constraints as it isfrequently found on tundra frost sites (Farjon, 1990).
A very weak pattern of IBD was found among standsin the northern range of Norway spruce. IBD will be atits maximum at an equilibrium between genetic drift andgene flow and will depend on the time since thepopulations were established and the distance from theancestral population (Slatkin, 1993). Therefore, when theradiation time is short, only populations in closeproximity to the ancestral population will show signsof IBD (Crispo and Hendry, 2005). The time to reachequilibrium between genetic drift and gene flow will alsodepend on the effective population size of the involvedpopulations and the generation time of the organism
(that is, longer time to equilibrium when the populationsare large and when the generation time is long). AsNorway spruce fulfilled its present northern range only1500–2000 years ago (Fægri, 1950; Giesecke and Bennett,2004; Latalowa and van der Knaap, 2006) and its averagegeneration time is 40 years, spruce have thus experi-enced only 25–50 generations in its most recent regions,which, according to theory, can explain the lack ofisolation by distance.
Mating within standsThe heterozygote deficiency that we detected in theNorway spruce stands seems to be in accordance withstudies from other parts of its distribution range, both atisozyme loci (Lagercrantz and Ryman, 1990) and atdifferent sets of microsatellite loci (Maghuly et al., 2006;Scotti et al., 2006; Meloni et al., 2007). Deviation from HWproportions was found within stands, frequently at locilargely unaffected by null alleles (Table 1, Appendix A).Inbreeding, in addition to null alleles, should thus beconsidered to explain the heterozygote deficiency. Nor-way spruce is a largely outcrossing species (Burczyket al., 2004), and inbreeding in Norway spruce is thusmost likely because of mating among relatives withinstands. Although the proportion of self-pollination wasestimated by Koski (1973) to average 10–20%, a strongselection was observed against seedlings resulting fromselfing (Koski, 1973). Another factor explaining thedeviation from HWE may be the very few effectiveoutcross males contributing to pollination in the Norwayspruce (Burczyk et al., 2004). Fertility components thatare known to vary strongly from year to year for trees(Finkeldey and Ziehe, 2004) may possibly explain suchan uneven contribution from outcrossing trees.
ConclusionsWe found that the earlier inference of two migrationroutes out of the Russian refugium (Tollefsrud et al.,2008b) is consistent with the structuring at independentmicrosatellite loci. We found contrasting diversity pat-terns between mtDNA and nuclear DNA, suggestingthat even if historical gene flow was high, present-dayclimatic constraints may reduce nuclear diversity in thenorth, primarily because of reduced pollen production.Considering a future scenario with a warmer and morehumid climate in the north, Norway spruce may increaseits propagation potential in the northernmost part of itsrange and recover from its present-day constraints.
Acknowledgements
We acknowledge our colleagues who have collectedspruce samples: Darius Danusevicius, Bo Ekenas, BengtEriksson, Hans Gustavsson, Gjert Heiberg, Igor Yakov-lev, Risto Jalkanen, Christian Kierulf, Tiiu Koff, MereteLarsmon, Raine Larsson, Bo Leijon, Tore L�fgren, TeijoNikkanen, Tommy Nordmark, Hans Nyeggen, ClaesOlsson, Andrey Prokazin, Boris Raevsky, Jan Sotkajervi,Anders Uusitalo, Anders Vikstrom, Sigbj�rn Øen, GeirØstereng, Age Østgaard. Skogsstyrelsen in Sweden byJonas Bergquist kindly organized sampling frommany locations in Sweden and their collectors areacknowledged. Mari Mette Tollefsrud did the micro-satellite analysis in the GenExpress laboratory, Univer-sity of Florence, Italy, and we greatly acknowledge
Combined analysis of nuclear and mitochondrial markersMM Tollefsrud et al
559
Heredity

Federico Sebastiani and Anna Buonamici for their help.At the Norwegian Forest and Landscape Institute, IngerHeldal, Helene Haug Pagander, Veronica Yakovleva,Anne Nilsen and Merethe Fredhall are acknowledged fortheir help with DNA isolation. Two anonymous re-viewers are acknowledged for their constructive com-ments on the manuscript. This research was supportedby the Research Council of Norway Grant no. 143276/140 and Grant no. 155041\140 and by the NorwegianForest and Landscape Institute.
References
Achere V, Faivre-Rampant P, Jeandroz S, Besnard G, MarkussenT, Aragones A et al. (2004). A full saturated linkage map ofPicea abies including AFLP, SSR, ESTP, 5S rDNA andmorphological markers. Theor Appl Genet 108: 1602–1613.
Ballard JWO, Whitlock MC (2004). The incomplete naturalhistory of mitochondria. Mol Ecol 13: 729–744.
Bjorck S (1995). A review of the history of the Baltic Sea, 13.0–8.9 ka BP. Quat Int 27: 19–44.
Burczyk J, Lewandowski A, Chalupka W (2004). Local pollendispersal and distant gene flow in Norway spruce (Picea abiesL.) Karst.). For Ecol Manage 197: 39–48.
Chapuis MP, Estoup A (2007). Microsatellite null alleles andestimation of population differentiation. Mol Biol Evol 24:621–631.
Comps B, Gomory D, Letouzey J, Thiebaut B, Petit RJ (2001).Diverging trends between heterozygosity and allelic richnessduring postglacial colonization in the European beech.Genetics 157: 389–397.
Corander J, Waldmann P, Marttinen P, Sillanpaa MJ (2004).BAPS 2: enhanced possibilities for the analysis of geneticpopulation structure. Bioinformatics 20: 2363–2369.
Corander J, Waldmann P, Sillanpaa MJ (2003). Bayesian analysisof genetic differentiation between populations. Genetics 163:367–374.
Cornuet JM, Luikart G (1996). Description and power analysisof two tests for detecting recent population bottlenecks fromallele frequency data. Genetics 144: 2001–2014.
Crispo E, Hendry AP (2005). Does time since colonizationinfluence isolation by distance? A meta-analysis. ConservGenet 6: 665–682.
Dempster AP, Laird NM, Rubin DB (1977). Maximum like-lihood from incomplete data via Em-algorithm. J R Stat SocSeries B-Methodol 39: 1–38.
Dieringer D, Schlotterer C (2003). MICROSATELLITE ANALY-SER (MSA): a platform independent analysis tool for largemicrosatellite data sets. Mol Ecol Notes 3: 167–169.
Eckert CG, Samis KE, Lougheed SC (2008). Genetic variationacross species geographical ranges: the central-marginalhypothesis and beyond. Mol Ecol 17: 1170–1188.
Excoffier L, Laval G, Schneider S (2005). Arlequin ver. 3.0: Anintegrated software package for population genetics dataanalysis. Evol Bioinf Online 1: 47–50.
Falush D, Stephens M, Pritchard JK (2003). Inference ofpopulation structure using multilocus genotype data: Linkedloci and correlated allele frequencies. Genetics 164: 1567–1587.
Falush D, Stephens M, Pritchard JK (2007). Inference ofpopulation structure using multilocus genotype data: domi-nant markers and null alleles. Mol Ecol Notes 7: 574–578.
Farjon A (1990). Pinaceae: drawings and descriptions of the generaAbies, Cedrus, Pseudolarix, Keteleeria, Nothotsuga, Tsuga, Cath-aya, Pseudotsuga, Larix and Picea. Koeltz, Konigstein.
Felsenstein J (2004). PHYLIP (Phylogeny Inference Package).Department of Genome Sciences, University of Washington:Seattle, WA, USA.
Finkeldey R, Ziehe M (2004). Genetic implications of silvicul-tural regimes. For Ecol Manage 197: 231–244.
Fægri K (1950). Omkring granens innvandring i Vest-Norge(The immigration of Norway spruce to West-Norway).Tidsskrift for skogbruk 58: 292–301.
Gamache I, Jaramillo-Correa JP, Payette S, Bousquet J (2003).Diverging patterns of mitochondrial and nuclear DNAdiversity in subarctic black spruce: imprint of a founder effectassociated with postglacial colonization. Mol Ecol 12: 891–901.
Giesecke T, Bennett KD (2004). The Holocene spread of Piceaabies (L.) Karst. in Fennoscandia and adjacent areas. J Biogeogr31: 1523–1548.
Goudet J (2001). FSTAT(version 2.9.3.): A program to estimateand test gene diversities and fixation indices. www.unil.ch/izea/softwares/fstat.html.
Guo SW, Thompson EA (1992). Performing the exact test ofHardy-Weinberg proportion for multiple alleles. Biometrics48: 361–372.
Hedrick PW (2005). A standardized genetic differentiationmeasure. Evolution 59: 1633–1638.
Heuertz M, De Paoli E, Kallman T, Larsson H, Jurman I,Morgante M et al. (2006). Multilocus patterns of nucleotidediversity, linkage disequilibrium and demographic history ofNorway spruce [Picea abies (L.) Karst]. Genetics 174: 2095–2105.
Heuertz M, Fineschi S, Anzidei M, Pastorelli R, Salvini D, PauleL et al. (2004a). Chloroplast DNA variation and postglacialrecolonization of common ash (Fraxinus excelsior) in Europe.Mol Ecol 13: 3437–3452.
Heuertz M, Hausman JF, Hardy OJ, Vendramin GG, Frascaria-Lacoste N, Vekemans X (2004b). Nuclear microsatellitesreveal contrasting patterns of genetic structure betweenwestern and southeastern European populations of thecommon ash (Fraxinus excelsior L.). Evolution 58: 976–988.
Hewitt GM (1999). Post-glacial re-colonization of Europeanbiota. Biol J Linn Soc 68: 87–112.
Hewitt GM (2001). Speciation, hybrid zones and phylogeogra-phy—or seeing genes in space and time. Mol Ecol 10: 537–549.
Hurlbert SH (1971). The nonconcept of species diversity: acritique and alternative parameters. Ecology 52: 577–586.
Jost L (2008). GST and its relatives do not measure differentia-tion. Mol Ecol 17: 4015–4026.
Koski V (1973). On self-pollination, genetic load, and subsequentinbreeding in some conifers. Commun Inst For Fenn 78: 1–40.
Kullman L (1995). New and firm evidence for midholoceneappearance of Picea abies in the Scandes Mountains, Sweden.J Ecol 83: 439–447.
Kullman L (2002). Boreal tree taxa in the central Scandes duringthe Late-Glacial: implications for Late-Quaternary foresthistory. J Biogeogr 29: 1117–1124.
Kullman L (2008). Press release. http://www.info.umu.se/Nyheter/Pressmeddelande.aspx?id¼ 3061.
Lagercrantz U, Ryman N (1990). Genetic structure of Norwayspruce (Picea abies): Concordance of morphological andallozymic variation. Evolution 44: 38–53.
Laikre L, Palme A, Josefsson M, Utter F, Ryman N (2006).Release of alien populations in Sweden. Ambio 35: 255–261.
Latalowa M, van der Knaap WO (2006). Late Quaternaryexpansion of Norway spruce Picea abies (L.) Karst. in Europeaccording to pollen data. Qua Sci Rev 25: 2780–2805.
Latch EK, Dharmarajan G, Glaubitz JC, Rhodes OE (2006).Relative performance of Bayesian clustering software forinferring population substructure and individual assignmentat low levels of population differentiation. Conserv Genet 7:295–302.
Luikart G, Cornuet JM (1998). Empirical evaluation of a test foridentifying recently bottlenecked populations from allelefrequency data. Conserv Biol 12: 228–237.
Luomajoki A (1993). Climatic adaptation of Norway spruce(Picea abies (L.) Karsten) in Finland based on male floweringphenology. Acta For Fenn 242: 1–26.
Maghuly F, Pinsker W, Praznik W, Fluch S (2006). Geneticdiversity in managed subpopulations of Norway sprucePicea abies (L.) Karst. For Ecol Manage 222: 266–271.
Combined analysis of nuclear and mitochondrial markersMM Tollefsrud et al
560
Heredity

Magri D, Vendramin GG, Comps B, Dupanloup I, Geburek T,Gomory D et al. (2006). A new scenario for the Quaternaryhistory of European beech populations: palaeobotanicalevidence and genetic consequences. New Phytol 171: 199–221.
Meirmans PG (2006). Using the AMOVA framework to estimatea standardized genetic differentiation measure. Evolution 60:2399–2402.
Meloni M, Perini D, Binelli G (2007). The distribution of geneticvariation in Norway spruce (Picea abies Karst.) populations inthe western Alps. J Biogeogr 34: 929–938.
Miller MP (2005). Alleles In Space (AIS): Computer software forthe joint analysis of interindividual spatial and geneticinformation. J Hered 96: 722–724.
Miller MP, Bellinger MR, Forsman ED, Haig SM (2006). Effectsof historical climate change, habitat connectivity, andvicariance on genetic structure and diversity across therange of the red tree vole (Phenacomys longicaudus) in thePacific Northwestern United States. Mol Ecol 15: 145–159.
Mimura M, Aitken SN (2007). Increased selfing and decreasedeffective pollen donor number in peripheral relative to centralpopulations in Picea sitchensis (Pinaceae). Am J Bot 94: 991–998.
Nei M (1987). Molecular Evolutionary Genetics. Columbia Uni-versity Press: New York, USA.
Nei M, Maruyama T, Chakraborty R (1975). Bottleneck effectand genetic-variability in populations. Evolution 29: 1–10.
Nordborg M, Hu TT, Ishino Y, Jhaveri J, Toomajian C, ZhengHG et al. (2005). The pattern of polymorphism in Arabidopsisthaliana. Plos Biol 3: 1289–1299.
Ouborg NJ, Vergeer P, Mix C (2006). The rough edges ofthe conservation genetics paradigm for plants. J Ecol 94:1233–1248.
Petit RJ, Duminil J, Fineschi S, Hampe A, Salvini D, VendraminGG (2005). Comparative organization of chloroplast, mito-chondrial and nuclear diversity in plant populations.Mol Ecol 14: 689–701.
Pfeiffer A, Olivieri AM, Morgante M (1997). Identificationand characterization of microsatellites in Norway spruce(Picea abies K). Genome 40: 411–419.
Piry S, Luikart G, Cornuet JM (1999). BOTTLENECK: Acomputer program for detecting recent reductions in theeffective population size using allele frequency data. J Hered90: 502–503.
Pons O, Petit RJ (1995). Estimation, variance and optimalsampling of gene diversity. I. Haploid locus. Theor Appl Genet90: 462–470.
Pritchard JK, Stephens M, Donnelly P (2000). Inferenceof population structure using multilocus genotype data.Genetics 155: 945–959.
R Development Core Team (2007). R: A Language and Environ-ment for Statistical Computing. R foundation for StatisticalComputing, Vienna, Austria.
Rice WR (1989). Analysing tables of statistical tests. Evolution 43:223–225.
Rousset F (1997). Genetic differentiation and estimation of geneflow from F-statistics under isolation by distance. Genetics145: 1219–1228.
Rousset F (2008). GENEPOP 0007: a complete re-implementationof the GENEPOP software for Windows and Linux. Mol EcolRes 8: 103–106.
Sarvas R (1957). Studies on the seed setting of Norway spruce.In: Mork E, Bonnevie-Svendsen C (eds). Studies on the seedsetting of Norway Spruce. J.Chr. Gundersen boktrykkeri ogbokbinderi: Oslo. pp 533–556.
Schmidt-Vogt H (1977). Die Fichte. Verlag Paul Parey: Hamburgand Berlin.
Scotti I, Magni F, Paglia GP, Morgante M (2002a). Trinucleotidemicrosatellites in Norway spruce (Picea abies): their featuresand the development of molecular markers. Theor Appl Genet106: 40–50.
Scotti I, Paglia G, Magni F, Morgante M (2006). Populationgenetics of Norway spruce (Picea abies Karst.) at regionalscale: sensitivity of different microsatellite motif classes indetecting differentiation. Ann For Sci 63: 485–491.
Scotti I, Paglia GP, Magni F, Morgante M (2002b). Efficientdevelopment of dinucleotide microsatellite markers inNorway spruce (Picea abies Karst.) through dot-blot selection.Theor Appl Genet 104: 1035–1041.
Semerikov VL, Lascoux M (2003). Nuclear and cytoplasmicvariation within and between Eurasian Larix (Pinaceae)species. Am J Bot 90: 1113–1123.
Slatkin M (1993). Isolation by distance in equilibrium andnonequilibrium populations. Evolution 47: 264–279.
Sperisen C, Buchler U, Gugerli F, Matyas G, Geburek T,Vendramin GG (2001). Tandem repeats in plant mitochondrialgenomes: application to the analysis of population differentia-tion in the conifer Norway spruce. Mol Ecol 10: 257–263.
Terhurne-Berson R (2005). Changing distribution patterns ofselected conifers in the Quaternary of Europe caused byclimatic variations. PhD Thesis, Rheinischen Friedrich-Wilhelms-Universitat Bonn: Germany.
Tollefsrud MM, Brochmann C, Sperisen C (2008a). Paternalintrogression from Siberian spruce (Picea obovata) to Norwayspruce (P. abies): tracing pollen and seed flow withchloroplast and mitochondrial DNA. In: Tollefsrud MM‘sPhD Thesis: Phylogeography, diversity and hybridization inNorway spruce. University of Oslo, Norway.
Tollefsrud MM, Kissling R, Gugerli F, Johnsen Ø, Skr�ppa T,Rachid C et al. (2008b). Genetic consequences of glacialsurvival and postglacial colonization in Norway spruce:combined analysis of mitochondrial DNA and fossil pollen.Mol Ecol 17: 4134–4150.
Vendramin GG, Anzidei M, Madaghiele A, Sperisen C, Bucci G(2000). Chloroplast microsatellite analysis reveals the pre-sence of population subdivision in Norway spruce (Piceaabies K.). Genome 43: 68–78.
Weir BS, Cockerham CC (1984). Estimating F-statistics for theanalysis of population structure. Evolution 38: 1358–1370.
Appendix A
Mitochondrial haplotype (nad1) data and nuclear micro-satellite data for seven loci in Picea abies. Mitochondrialdata are taken from Tollefsrud et al. (2008b), except forseven stands, for which data were obtained for this study(marked with *). Population abbreviations: RUS: Russia,BAL: Baltic States and Belarus, FIN: Finland, NN:Northern Norway, CS: Central Sweden, SS: SouthernSweden, SN: Southern Norway. For the mitochondrialdata: NMT: sample size per stand, HS MT: mean geneticdiversity, HT MT: total genetic diversity, AS MT: allelicrichness. For the nuclear microsatellite data: NNUC:sample size per stand, HE NUC: gene diversity, AS NUC:
allelic richness, FIS NUC: inbreeding coefficient estimatedover all loci. * in the FIS NUC column indicates significantdeviation from Hardy Weinberg equilibrium (HWE) aftersequential Bonferroni correction. The loci which deviatedfrom HW in the single locus exact test per stand arerepresented by A: EATC1D2A, B: EATC1B02, C:EATC2B02, D: EATC1E3, E: EATC2G05, F: SPAC1F7, G:EATC2C08; bold letters represent significant departurefrom HWE after sequential Bonferroni correction, greyletters represent significant departure from HWE afterstrict Bonferroni correction. The genetic (BAPS) group ofthe stand is given.
Combined analysis of nuclear and mitochondrial markersMM Tollefsrud et al
561
Heredity

Stand Long Lat NMT HS MT HT MT AS MT NNUC HE NUC AS NUC FIS NUC Deviation from HWE at single loci BAPS
RUS1* 60.60 56.80 18 0.111 0.096 1.929 26 0.590 6.906 0.314* A E 3RUS2* 48.58 57.10 16 0.525 0.137 3.969 48 0.586 8.186 0.208* A B C E F G 3RUS3 41.00 57.58 16 0.733 0.079 4.939 48 0.666 8.510 0.212* A B C F G 3RUS4 40.00 64.58 15 0.648 0.134 5.945 48 0.584 7.666 0.259* A B E 3RUS5 36.72 62.25 30 0.800 0.046 5.801 48 0.606 8.562 0.266* A C D E F 3RUS6 34.42 62.88 14 0.857 0.056 5.995 48 0.653 8.604 0.284* A B F G 3RUS7 30.03 60.18 15 0.133 0.112 1.986 47 0.639 9.485 0.301* A B C D F G 3RUS8 30.00 57.83 13 0.295 0.156 3.000 48 0.632 8.554 0.298* A B C D E F G 3BAL9 31.25 53.50 16 0.125 0.106 1.970 48 0.640 8.732 0.208* A B C D 3BAL10* 24.05 54.51 16 0.642 0.103 3.969 46 0.647 9.586 0.174* A B C D G 3BAL11* 26.51 58.06 16 0.667 0.099 3.986 48 0.664 9.158 0.193* A B C G 3FIN12* 24.65 62.00 16 0.000 0.000 1.000 48 0.643 7.942 0.276* A B C E F 3FIN13 29.81 63.10 13 0.795 0.076 5.000 48 0.607 8.201 0.235* A B C E 3FIN14 28.05 64.66 23 0.692 0.086 5.573 48 0.609 8.289 0.275* A B E F 3FIN15 27.80 65.89 14 0.275 0.148 2.995 48 0.609 8.252 0.315* A B C E G 3FIN16 27.42 68.40 16 0.000 0.000 1.000 46 0.574 6.891 0.330* A B E F 3NN17 30.07 69.45 15 0.000 0.000 1.000 34 0.492 4.967 0.285* A D E F 5NS18 19.92 66.70 16 0.000 0.000 1.000 48 0.600 6.654 0.237* A E 3CS19 17.33 66.00 15 0.000 0.000 1.000 48 0.590 7.163 0.346* A B D E F G 4CS20 16.13 65.56 16 0.000 0.000 1.000 48 0.604 7.171 0.257* A B E F 4CS21 16.31 64.79 16 0.125 0.106 1.970 48 0.601 7.104 0.292* A B E F G 4CS22 15.47 64.67 16 0.000 0.000 1.000 48 0.626 7.064 0.302* A B E F 4SS23 13.20 61.40 15 0.000 0.000 1.000 48 0.602 8.243 0.239* A B C G 1SS24* 17.10 60.80 15 0.000 0.000 1.000 48 0.688 9.044 0.252* A B C F G 1SS25 15.20 60.33 21 0.267 0.120 2.844 36 0.647 8.107 0.250* A B E F G 1SS26 17.74 59.94 15 0.000 0.000 1.000 48 0.653 9.137 0.197* A B C D G 1SS27* 15.60 57.76 14 0.133 0.112 1.986 40 0.677 9.543 0.299* A B E G 1SN28 10.52 60.09 18 0.000 0.000 1.000 48 0.641 8.433 0.287* A B C 1SN29 9.88 61.19 16 0.442 0.145 3.939 48 0.631 8.022 0.185* A C F G 1SN30 8.91 61.09 28 0.254 0.095 1.996 48 0.631 8.399 0.244* A B C D E G 1SN31 8.11 60.36 26 0.000 0.000 1.000 48 0.673 7.729 0.161* B D 1SN32 7.42 59.30 24 0.304 0.115 2.925 48 0.632 7.671 0.226* A B C F G 1SN33 8.30 58.78 15 0.000 0.000 1.000 48 0.634 7.888 0.192* A B E G 1SN34 5.76 60.82 30 0.000 0.000 1.000 48 0.545 7.241 0.290* A B D F G 1SN35 6.34 59.45 15 0.000 0.000 1.000 48 0.598 7.467 0.321* A B C F 1SN36 6.54 60.60 17 0.000 0.000 1.000 48 0.620 7.612 0.235* A B E F 2SN37 7.34 61.26 14 0.000 0.000 1.000 48 0.585 6.127 0.121* A B E F G 6
Combined
analysisofnuclearand
mitochondrialm
arkersM
MTollefsrud
etal
562
Here
dity