color image processing
TRANSCRIPT
1
1
COLOR IMAGE PROCESSINGCOLOR IMAGE PROCESSING
Why do we use color image (motivation):Why do we use color image (motivation):– In automated image analysis, color is a powerful
descriptor simplify object identification and extraction from a scene
– For human vision human eye can discern thousands of color shades and intensities (only two dozen shades of gray)
•• Two major areas:Two major areas:– Full color processing images are acquired with a
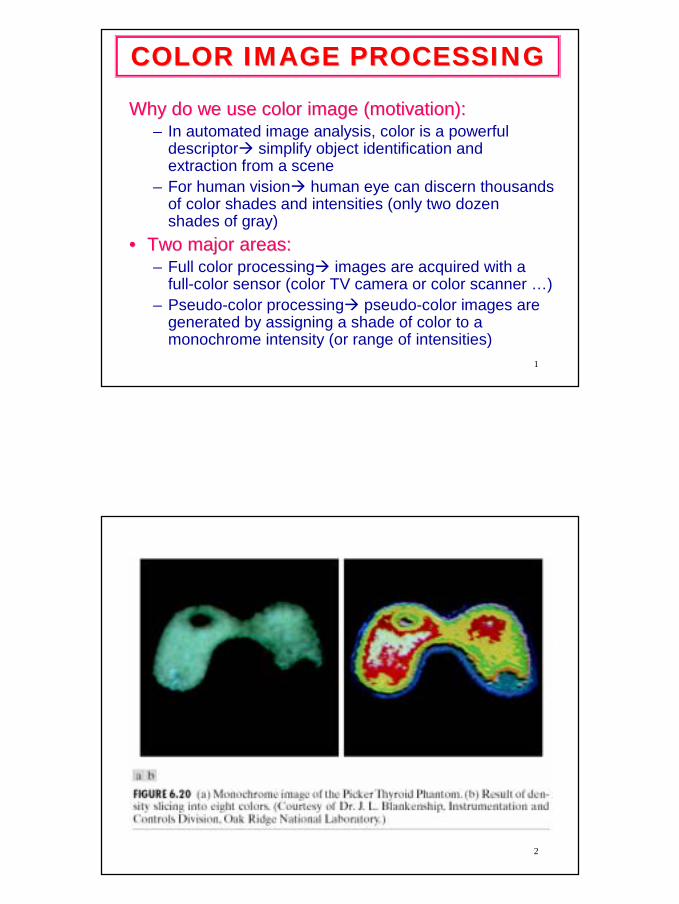
full-color sensor (color TV camera or color scanner …)– Pseudo-color processing pseudo-color images are
generated by assigning a shade of color to a monochrome intensity (or range of intensities)
2
2
3
OutlinesOutlines
• Color Fundamentals• Color Models• Pseudocolor Image Processing• Basics of Full-Color Image Processing• Color Transformation
4
Color FundamentalsColor Fundamentals
3
5
Achromatic versus chromaticAchromatic versus chromatic– achromatic light: void of color, only attribute is its
intensity measured by gray levels , e.g., black-and-white TV (the kind of images that we discussed so far)
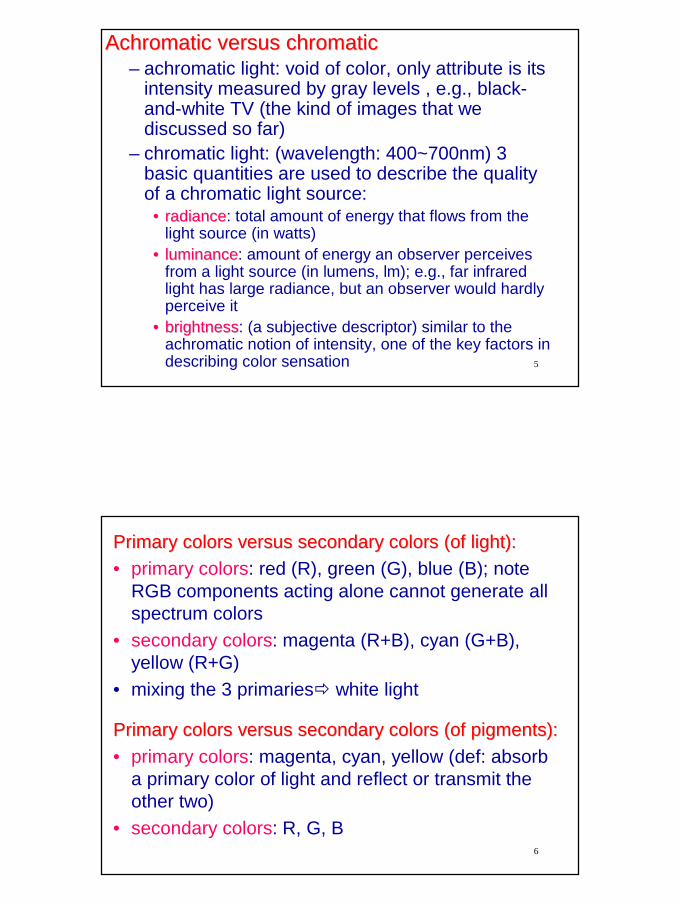
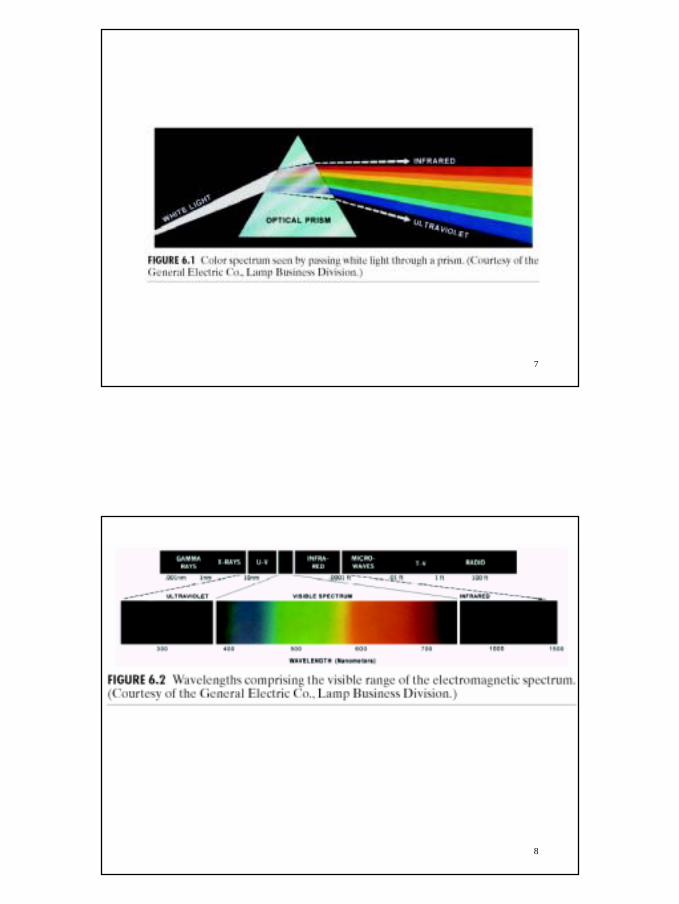
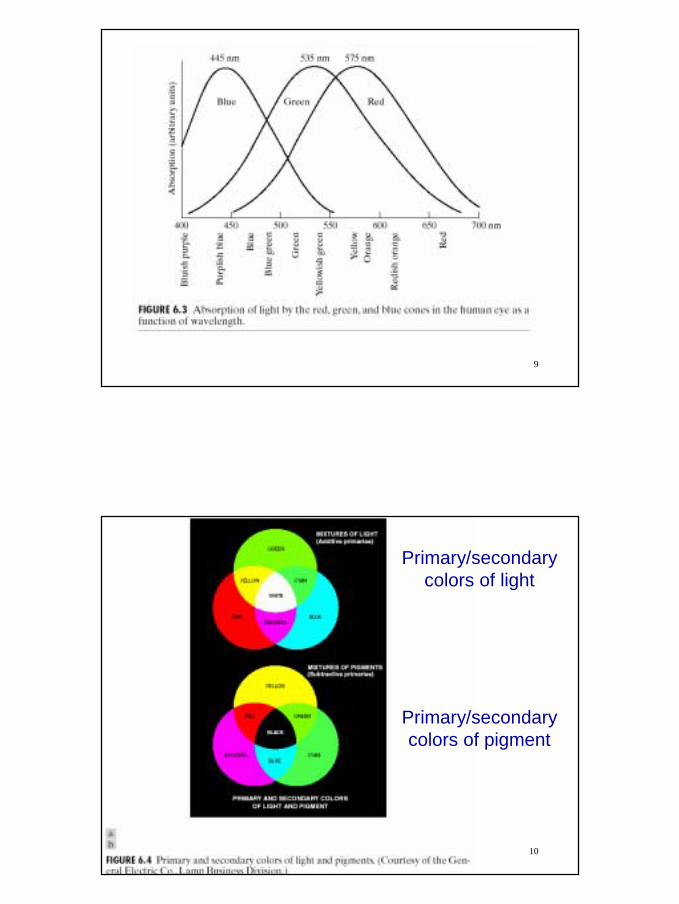
– chromatic light: (wavelength: 400~700nm) 3 basic quantities are used to describe the quality of a chromatic light source:
•• radianceradiance: total amount of energy that flows from the light source (in watts)
•• luminanceluminance: amount of energy an observer perceives from a light source (in lumens, lm); e.g., far infrared light has large radiance, but an observer would hardly perceive it
•• brightnessbrightness: (a subjective descriptor) similar to the achromatic notion of intensity, one of the key factors in describing color sensation
6
Primary colors versus secondary colors (of light):Primary colors versus secondary colors (of light):• primary colors: red (R), green (G), blue (B); note
RGB components acting alone cannot generate all spectrum colors
• secondary colors: magenta (R+B), cyan (G+B), yellow (R+G)
• mixing the 3 primaries white light
Primary colors versus secondary colors (of pigments):Primary colors versus secondary colors (of pigments):• primary colors: magenta, cyan, yellow (def: absorb
a primary color of light and reflect or transmit the other two)
• secondary colors: R, G, B
4
7
8
5
9
10
Primary/secondary colors of light
Primary/secondary colors of pigment
6
11
3 characteristics used to distinguish one color from 3 characteristics used to distinguish one color from another: brightness, hue, saturationanother: brightness, hue, saturation
• brightness: chromatic notion of intensity• hue: attribute associated with the dominant
wavelength in a mixture of light waves (dominant color perceived by an observer); e.g., we call an object red or yellow we specify its hue
• saturation: relative purity (e.g., the pure spectrum colors, red, orange, yellow, green, blue, and violet, are fully saturated); pink is less saturated
• hue+saturation chromaticity• tristimulus values: amounts of R, G, and B needed
to form a particular color (X, Y, Z)
12
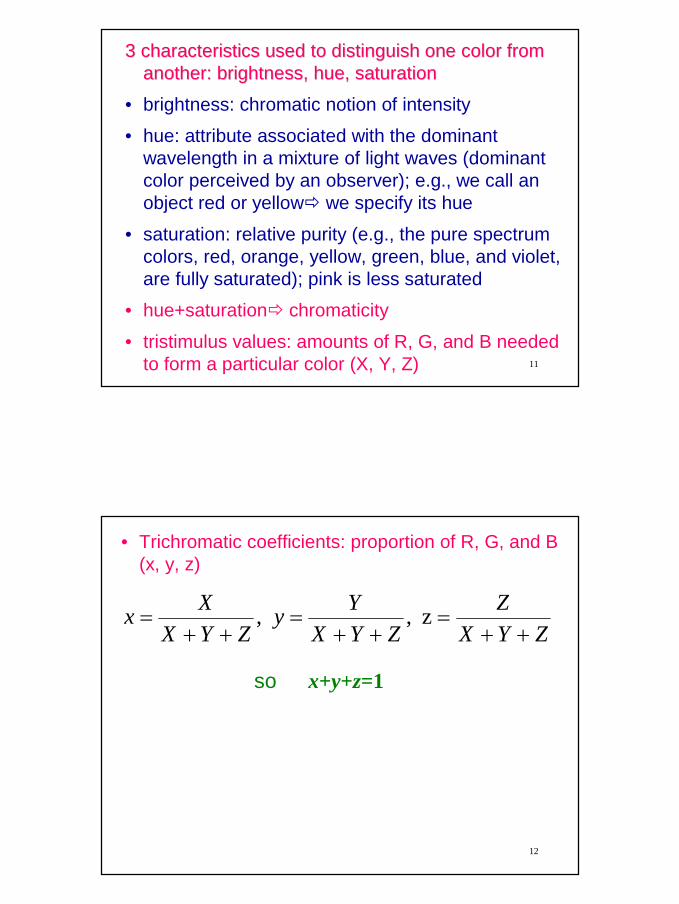
• Trichromatic coefficients: proportion of R, G, and B (x, y, z)
so x+y+z=1
z , ,ZYX
ZZYX
YyZYX
Xx++
=++
=++
=
7
13
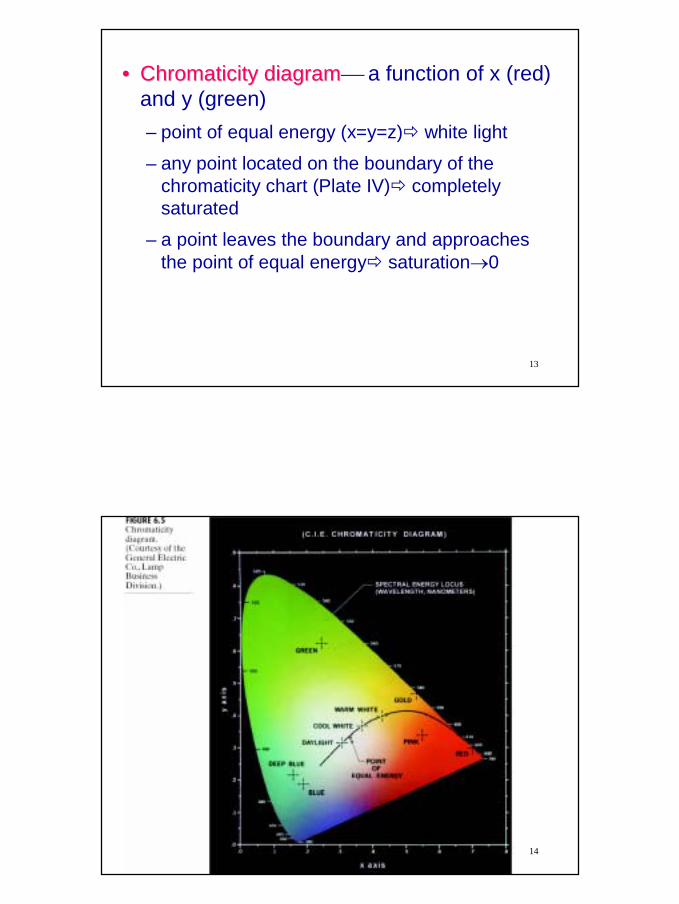
•• Chromaticity diagramChromaticity diagram a function of x (red) and y (green)– point of equal energy (x=y=z) white light– any point located on the boundary of the
chromaticity chart (Plate IV) completely saturated
– a point leaves the boundary and approaches the point of equal energy saturation→0
14
8
15
Color ModelsColor Models
16
• Color models: to facilitate the specification of colors, a color model is used to specify a 3D coordinate system for color representation – Hardware-oriented color models: RGB model for
color monitors and color video cameras, CMY model for color printers; YIQ model for color TV broadcast
9
17
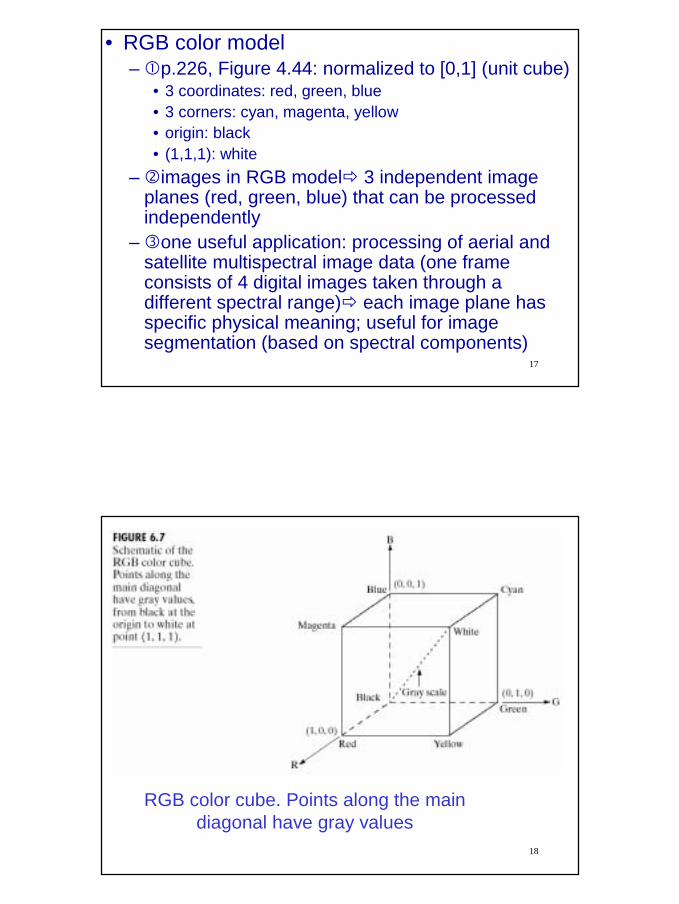
• RGB color model– p.226, Figure 4.44: normalized to [0,1] (unit cube)
• 3 coordinates: red, green, blue• 3 corners: cyan, magenta, yellow• origin: black• (1,1,1): white
– images in RGB model 3 independent image planes (red, green, blue) that can be processed independently
– one useful application: processing of aerial and satellite multispectral image data (one frame consists of 4 digital images taken through a different spectral range) each image plane has specific physical meaning; useful for image segmentation (based on spectral components)
18
RGB color cube. Points along the main diagonal have gray values
10
19
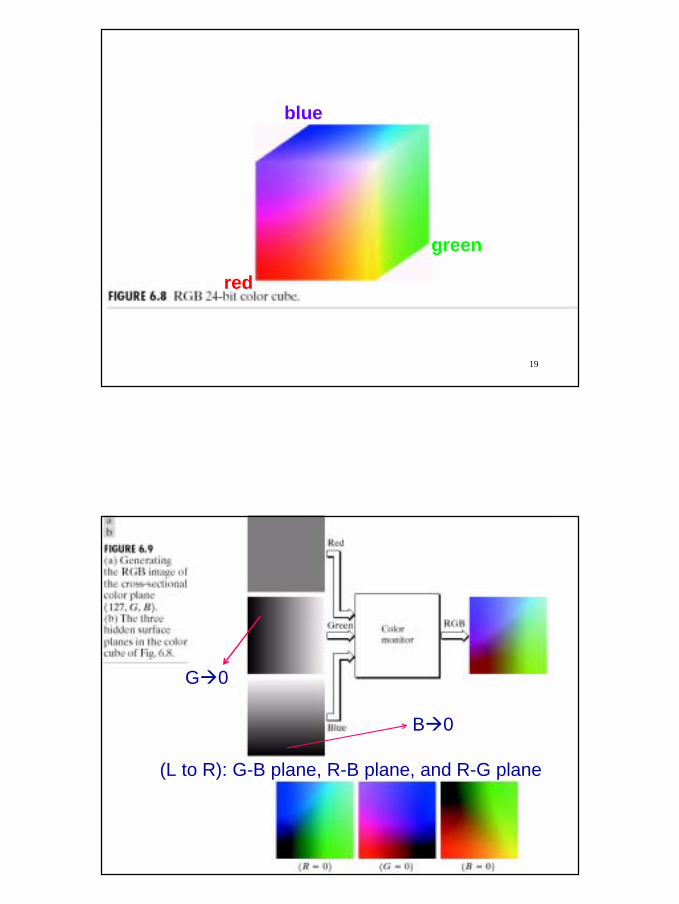
red
green
blue
20
(L to R): G-B plane, R-B plane, and R-G plane
G 0
B 0
11
21
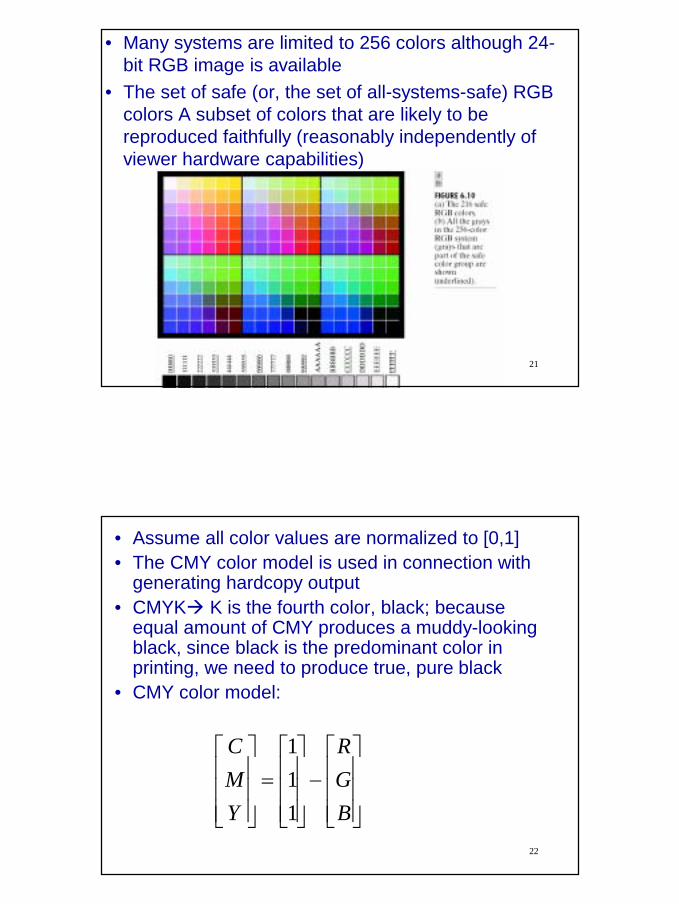
• Many systems are limited to 256 colors although 24-bit RGB image is available
• The set of safe (or, the set of all-systems-safe) RGB colors A subset of colors that are likely to be reproduced faithfully (reasonably independently of viewer hardware capabilities)
22
• Assume all color values are normalized to [0,1]• The CMY color model is used in connection with
generating hardcopy output• CMYK K is the fourth color, black; because
equal amount of CMY produces a muddy-looking black, since black is the predominant color in printing, we need to produce true, pure black
• CMY color model:
−
=
BGR
YMC
111
12
23
HSI color modelHSI color model• RGB and CMY are not well suited for
describing colors for human interpretation• Hue (H), saturation (S), and intensity (I)
– Hue color attribute that describes a pure color (e.g., pure yellow or red)
– Saturation a measurement of the degree to which a pure color is diluted by white light
– Intensity can be decoupled from the color information (H and S)
• HSI is ideal for processing color image based on the color sensing properties of the human visual system
24
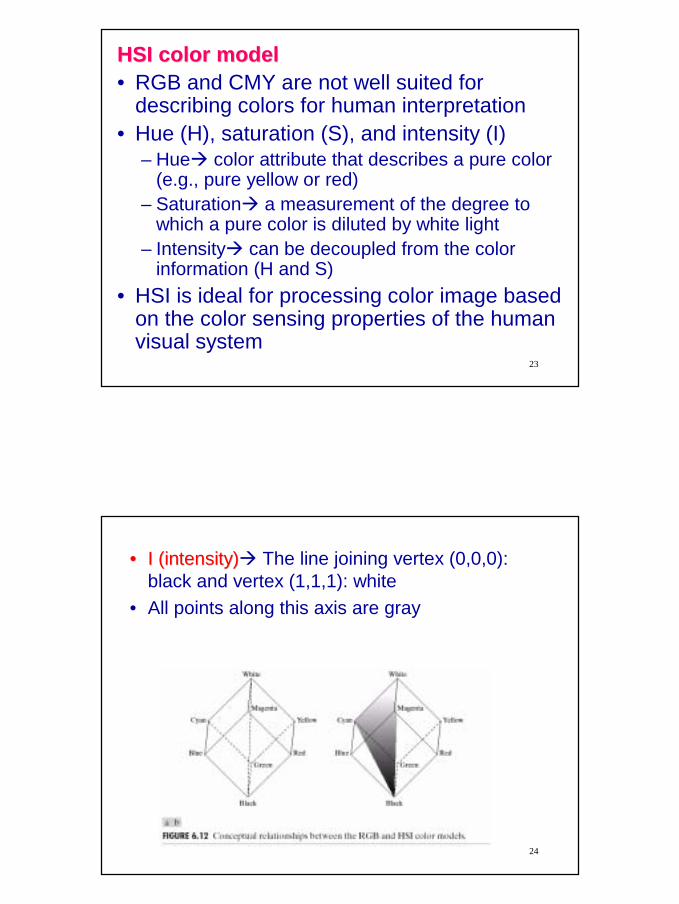
•• I (intensity)I (intensity) The line joining vertex (0,0,0): black and vertex (1,1,1): white
• All points along this axis are gray
13
25
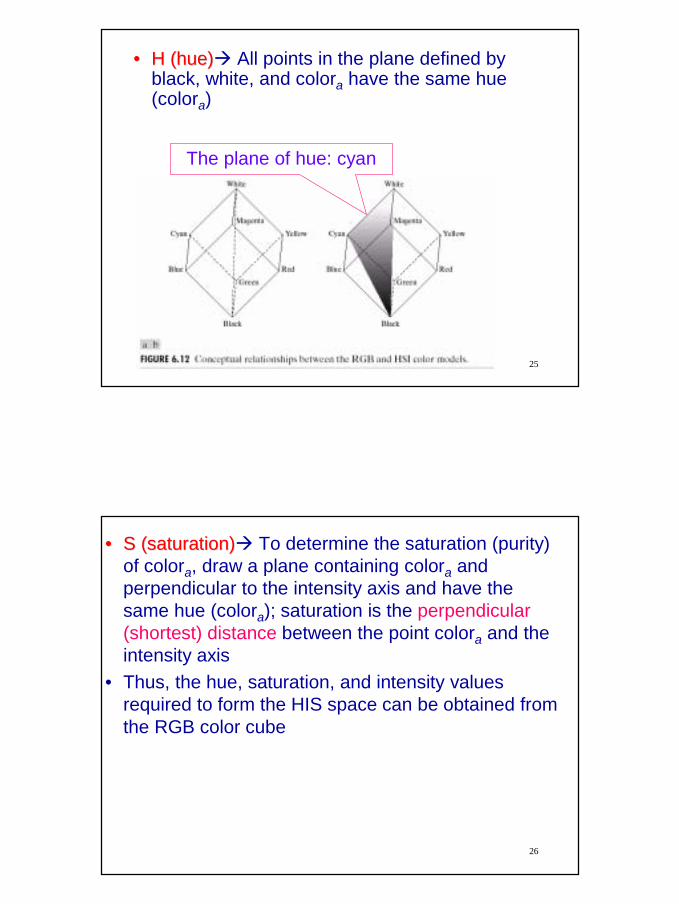
•• H (hue)H (hue) All points in the plane defined by black, white, and colora have the same hue (colora)
The plane of hue: cyan
26
•• S (saturation)S (saturation) To determine the saturation (purity) of colora, draw a plane containing colora and perpendicular to the intensity axis and have the same hue (colora); saturation is the perpendicular (shortest) distance between the point colora and the intensity axis
• Thus, the hue, saturation, and intensity values required to form the HIS space can be obtained from the RGB color cube
14
27
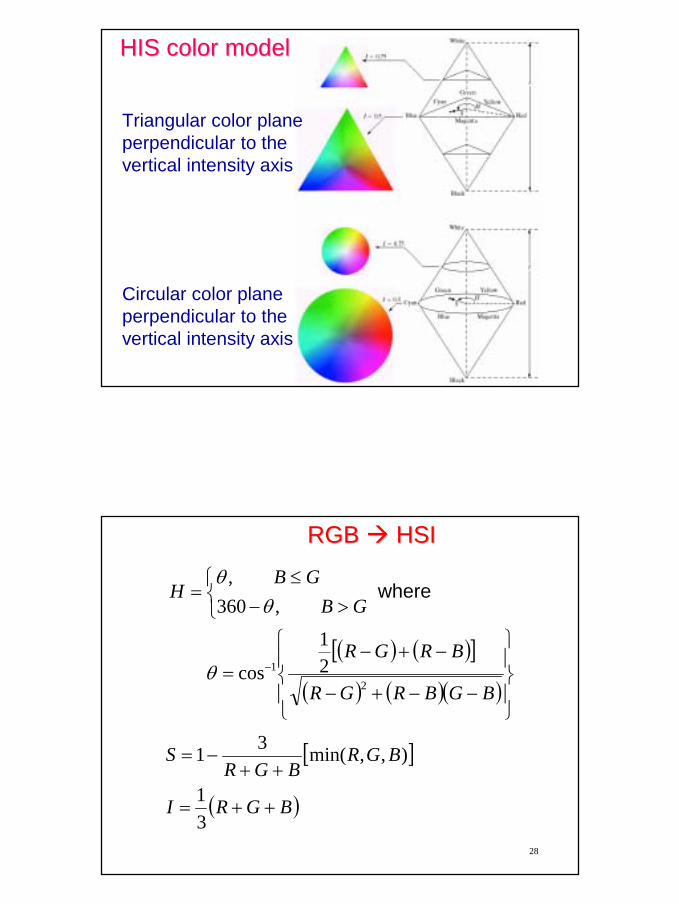
HIS color modelHIS color model
Triangular color plane perpendicular to the vertical intensity axis
Circular color plane perpendicular to the vertical intensity axis
28
RGBRGB HSIHSI
( ) ( )[ ]
( ) ( )( )
−−+−
−+−=
>−≤
=
−
BGBRGR
BRGR
GBGB
H
2
1 21
cos
,360,
θ
θθ
where
[ ]
( )BGRI
BGRBGR
S
++=
++−=
31
),,min(31
15
29
RGBRGB HSIHSI
)(1)60cos(
cos1
)1(
BRGH
HSIR
SIB
+−=
−
+=
−=
o
30
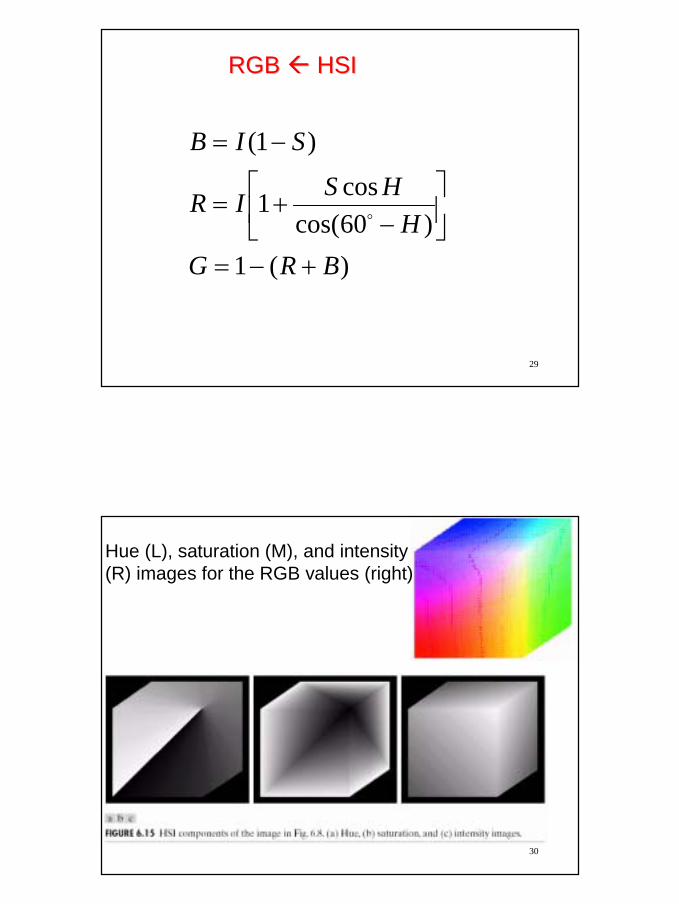
Hue (L), saturation (M), and intensity (R) images for the RGB values (right)
16
31
PseudocolorPseudocolor Image ProcessingImage Processing
32
•• PseudoPseudo--color image processingcolor image processing approaches for assigning color to monochrome images based on properties of gray-level content
• Discuss three approaches:– Intensity slicing and color coding– Gray-level to color transformations– Filtering approach
17
33
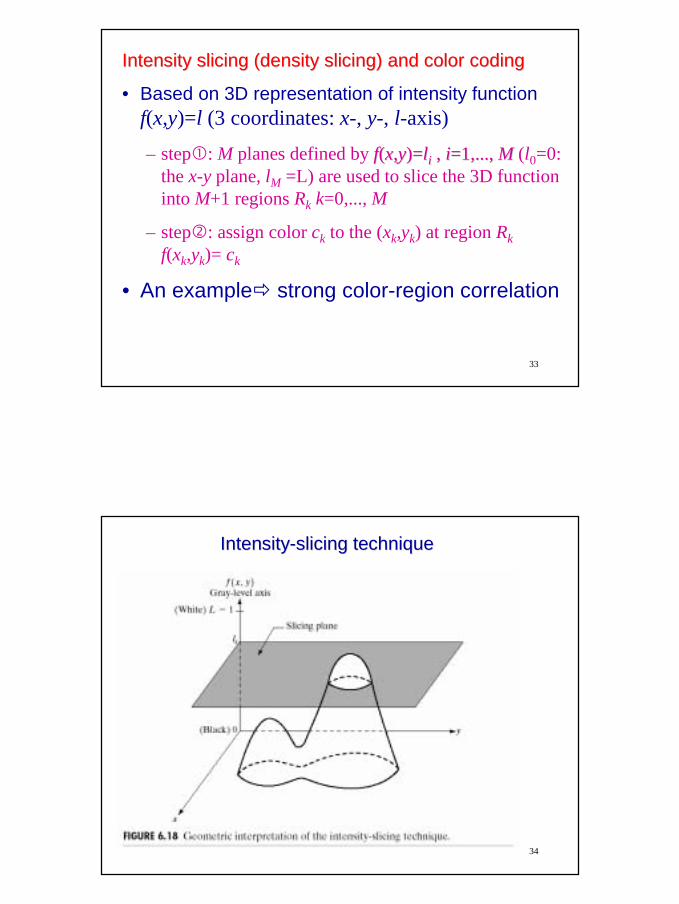
Intensity slicing (density slicing) and color codingIntensity slicing (density slicing) and color coding
• Based on 3D representation of intensity function f(x,y)=l (3 coordinates: x-, y-, l-axis)
– step : M planes defined by ff((xx,,yy)=)=llii , , ii=1,..., =1,..., MM (l0=0: the x-y plane, lM =L) are used to slice the 3D function into M+1 regions Rk k=0,..., M
– step : assign color ck to the (xk,yk) at region Rkf(xk,yk)= ck
• An example strong color-region correlation
34
IntensityIntensity--slicing techniqueslicing technique
18
35
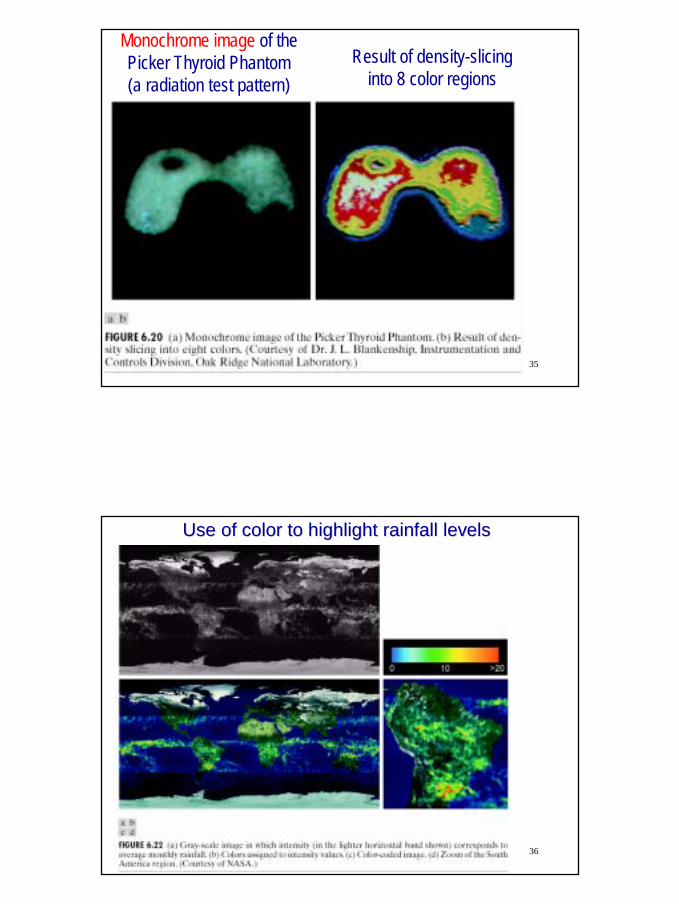
Monochrome image of the Picker Thyroid Phantom(a radiation test pattern)
Result of density-slicing into 8 color regions
36
Use of color to highlight rainfall levelsUse of color to highlight rainfall levels
19
37
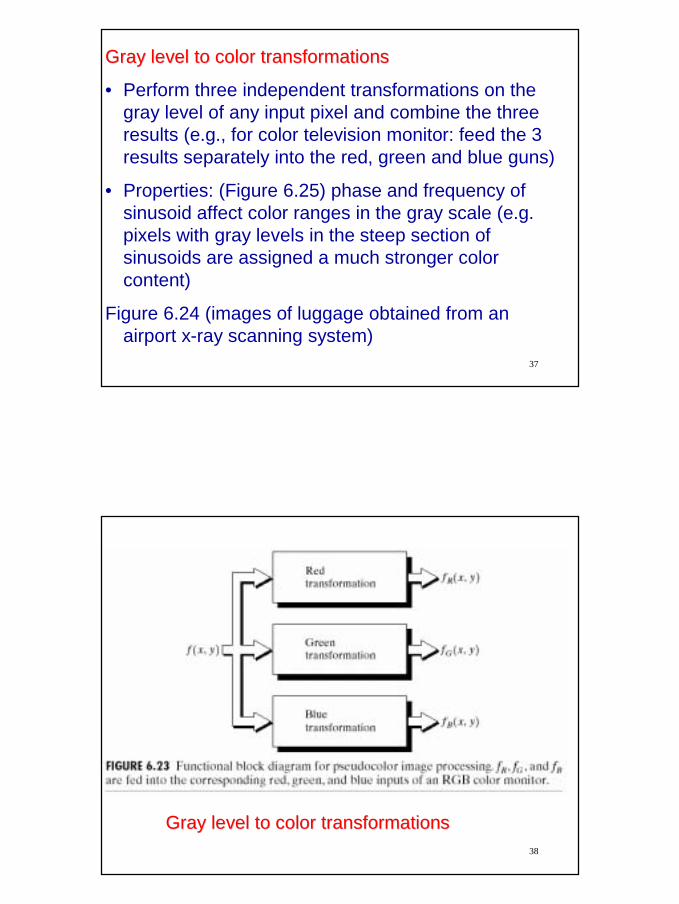
Gray level to color transformationsGray level to color transformations
• Perform three independent transformations on the gray level of any input pixel and combine the three results (e.g., for color television monitor: feed the 3 results separately into the red, green and blue guns)
• Properties: (Figure 6.25) phase and frequency of sinusoid affect color ranges in the gray scale (e.g. pixels with gray levels in the steep section of sinusoids are assigned a much stronger color content)
Figure 6.24 (images of luggage obtained from an airport x-ray scanning system)
38
Gray level to color transformationsGray level to color transformations
20
39
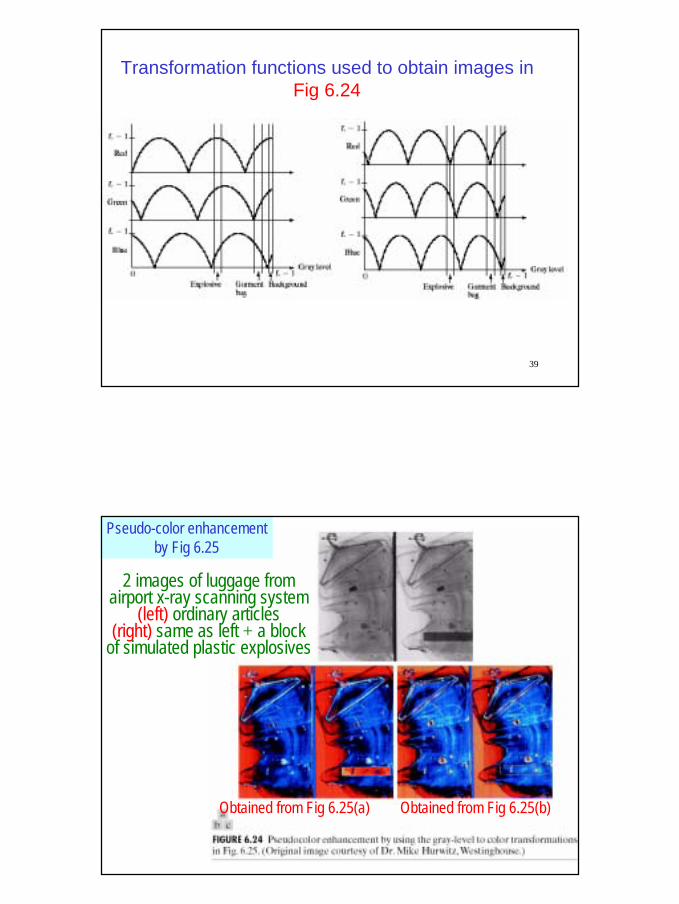
Transformation functions used to obtain images in Fig 6.24
40
Pseudo-color enhancement by Fig 6.25
2 images of luggage from airport x-ray scanning system
(left) ordinary articles(right) same as left + a block
of simulated plastic explosives
Obtained from Fig 6.25(a) Obtained from Fig 6.25(b)
21
41
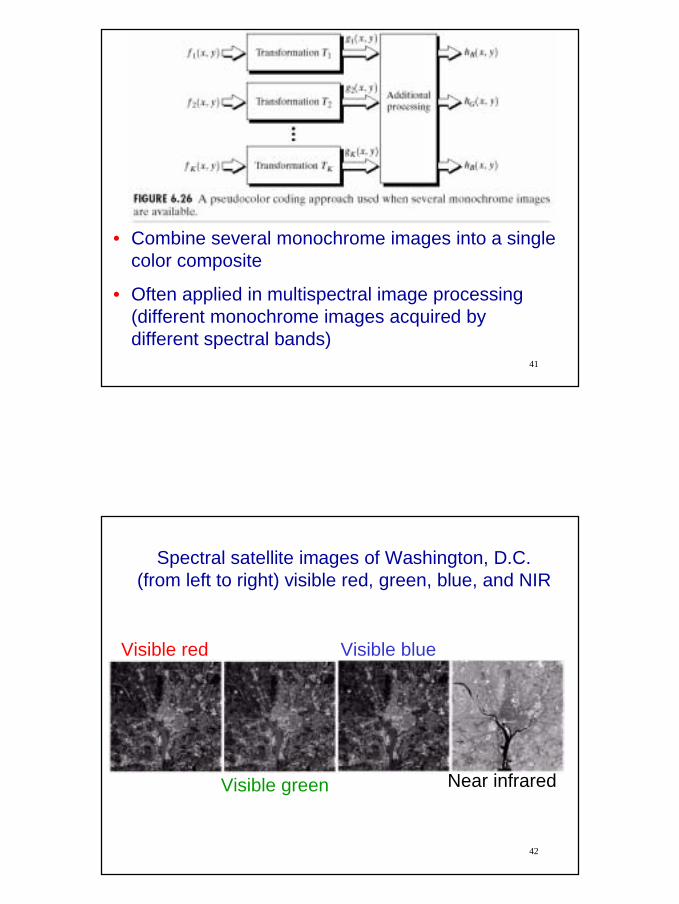
• Combine several monochrome images into a single color composite
• Often applied in multispectral image processing (different monochrome images acquired by different spectral bands)
42
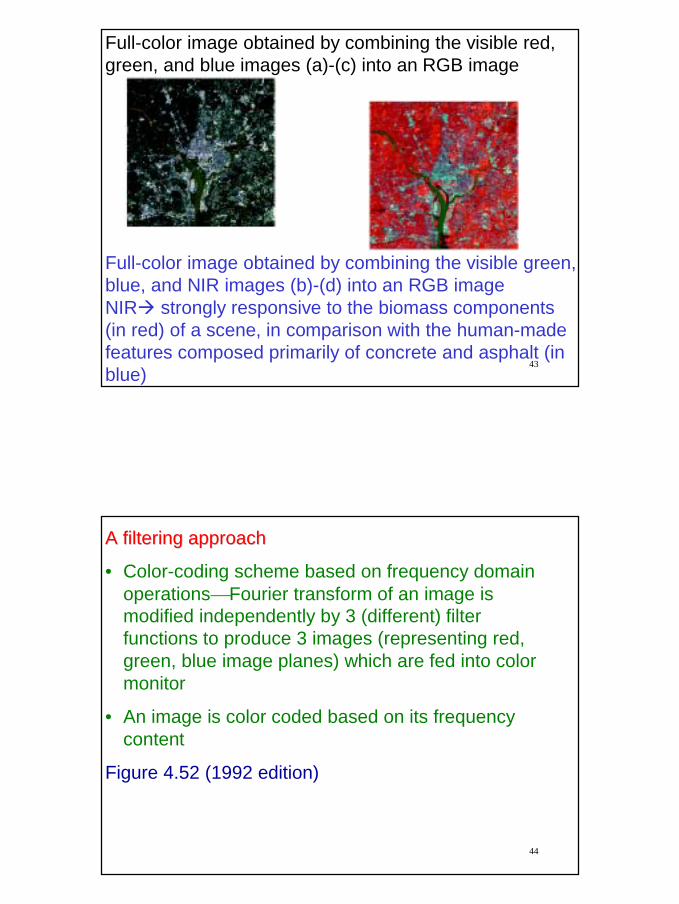
Spectral satellite images of Washington, D.C.(from left to right) visible red, green, blue, and NIR
Visible red
Visible green
Visible blue
Near infrared
22
43
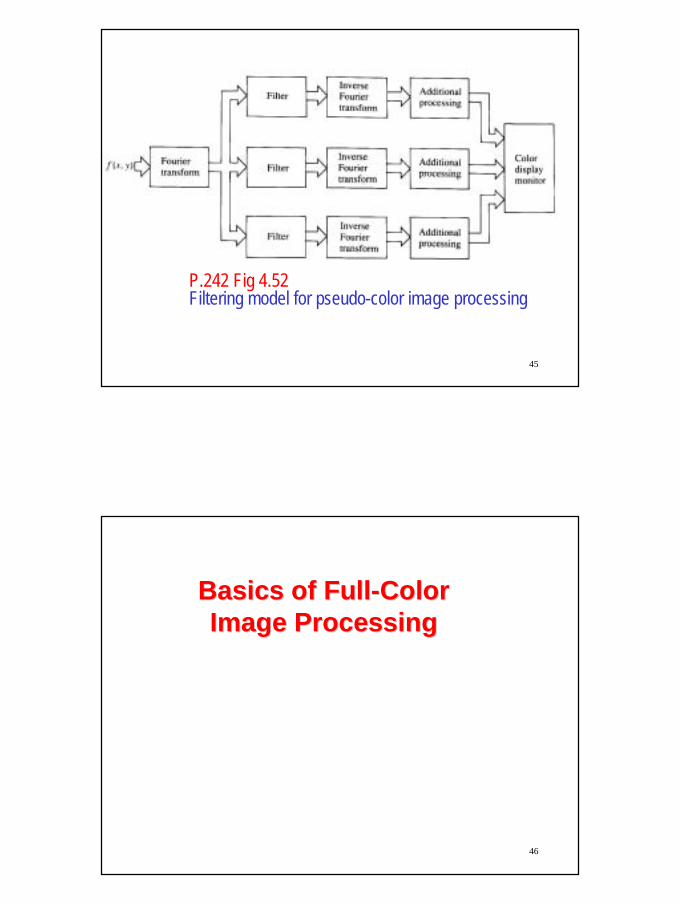
Full-color image obtained by combining the visible red, green, and blue images (a)-(c) into an RGB image
Full-color image obtained by combining the visible green, blue, and NIR images (b)-(d) into an RGB imageNIR strongly responsive to the biomass components (in red) of a scene, in comparison with the human-made features composed primarily of concrete and asphalt (in blue)
44
A filtering approachA filtering approach
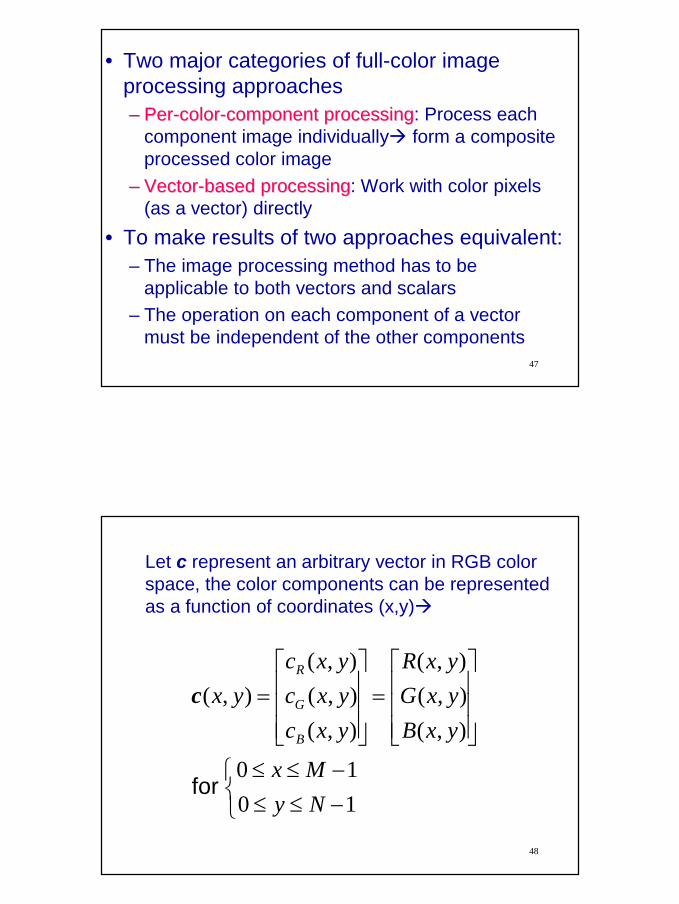
• Color-coding scheme based on frequency domain operationsFourier transform of an image is modified independently by 3 (different) filter functions to produce 3 images (representing red, green, blue image planes) which are fed into color monitor
• An image is color coded based on its frequency content
Figure 4.52 (1992 edition)
23
45
P.242 Fig 4.52Filtering model for pseudo-color image processing
46
Basics of FullBasics of Full--Color Color Image ProcessingImage Processing
24
47
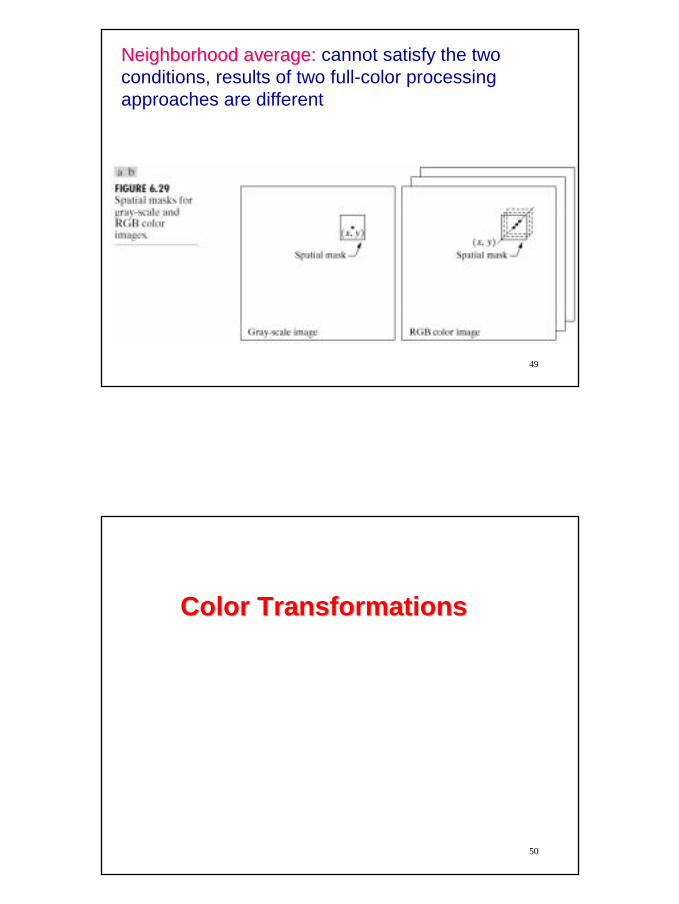
• Two major categories of full-color image processing approaches–– PerPer--colorcolor--component processingcomponent processing: Process each
component image individually form a composite processed color image
–– VectorVector--based processingbased processing: Work with color pixels (as a vector) directly
• To make results of two approaches equivalent:– The image processing method has to be
applicable to both vectors and scalars– The operation on each component of a vector
must be independent of the other components
48
−≤≤−≤≤
=
=
1010
),(),(),(
),(),(),(
),(
NyMx
yxByxGyxR
yxcyxcyxc
yx
B
G
R
for
c
Let c represent an arbitrary vector in RGB color space, the color components can be represented as a function of coordinates (x,y)
25
49
Neighborhood average:Neighborhood average: cannot satisfy the two conditions, results of two full-color processing approaches are different
50
Color TransformationsColor Transformations
26
51
•• Color transformationsColor transformations process the components of a color image within the context of a single color model
• Formulation is similar to the gray-level transformation: g(x,y)=T[f(x,y)]– f(x,y): color input image– g(x,y): transformed (processed) color output
image• Pixel values are triplets (RGB, CMY, HSI)
or quartets (CMYK)
52
( ) nirrrTs nii ,,2,1,,,, 21 KK ==
ri color component of f(x,y) at point (x,y)
si color component of g(x,y) at point (x,y)
n number of color components (n=3 for RGB, HSI; n=4 for CMYK)
T:{T1, T2,…, Tn} a set of n transformation (or, color mapping) functions to perform ri si
27
53
Full-color image
Cyan image Magenta image Yellow image Black image
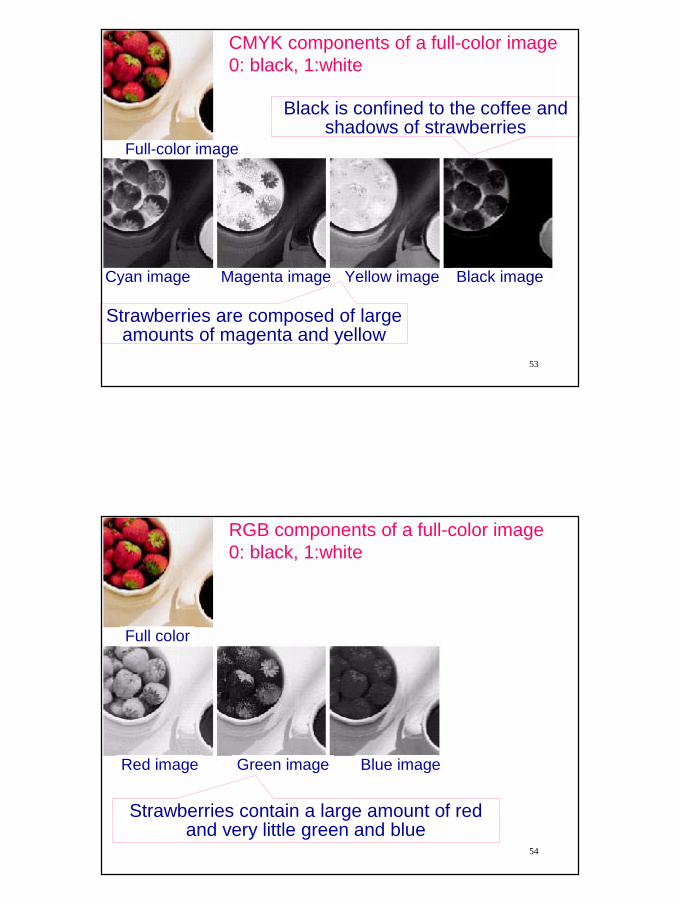
CMYK components of a full-color image0: black, 1:white
Strawberries are composed of large amounts of magenta and yellow
Black is confined to the coffee and shadows of strawberries
54
Full color
Red image Green image Blue image
RGB components of a full-color image0: black, 1:white
Strawberries contain a large amount of red and very little green and blue
28
55
Full color
Hue Saturation Intensity
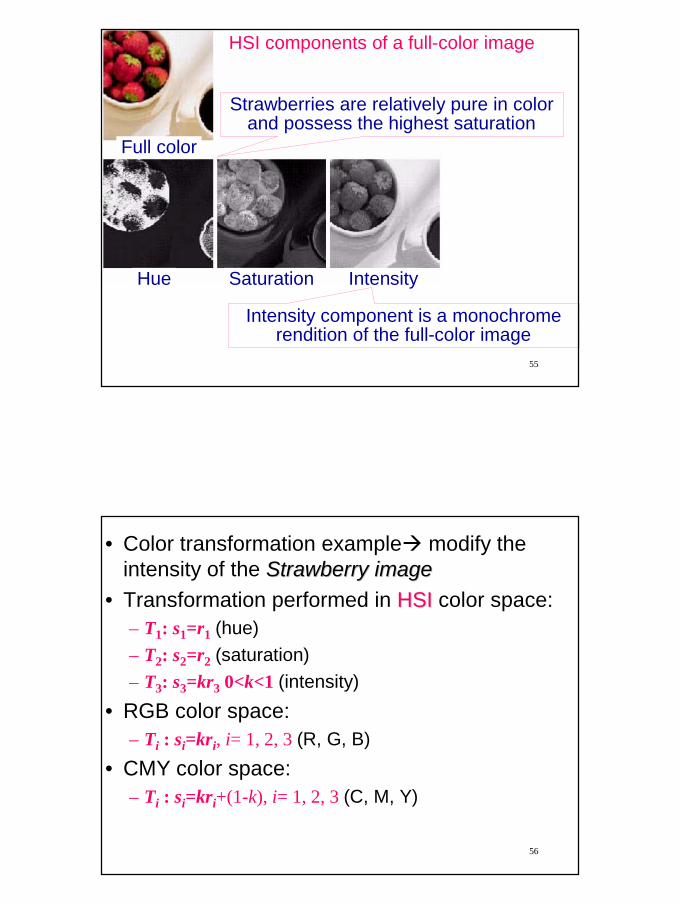
HSI components of a full-color image
Intensity component is a monochrome rendition of the full-color image
Strawberries are relatively pure in color and possess the highest saturation
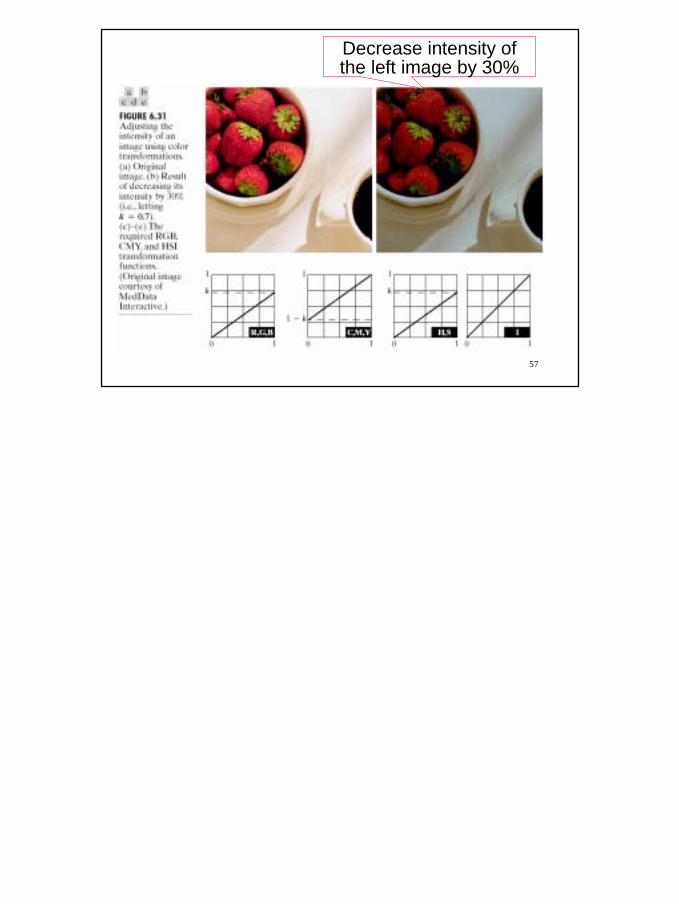
56
• Color transformation example modify the intensity of the Strawberry imageStrawberry image
• Transformation performed in HSI HSI color space: – T1: s1=r1 (hue)– T2: s2=r2 (saturation)– T3: s3=kr3 0<k<1 (intensity)
• RGB color space:– Ti : si=kri, i= 1, 2, 3 (R, G, B)
• CMY color space:– Ti : si=kri+(1-k), i= 1, 2, 3 (C, M, Y)
29
57
Decrease intensity of the left image by 30%