color chart development by computer vision for flue-cured
TRANSCRIPT

2843Sensors and Materials, Vol. 30, No. 12 (2018) 2843–2864MYU Tokyo
S & M 1722
*Corresponding author: e-mail: [email protected]://doi.org/10.18494/SAM.2018.2045
ISSN 0914-4935 © MYU K.K.https://myukk.org/
Color Chart Development by Computer Visionfor Flue-cured Tobacco Leaf
Ruicong Zhi,1,2* Mingxuan Gao,1,2 Zhengling Liu,3 Yongping Yang,3 Zhixin Zheng,3 and Bolin Shi4
1School of Computer and Communication Engineering, University of Science and Technology Beijing, Beijing 100083, P. R. China
2Beijing Key Laboratory of Knowledge Engineering for Materials Science, Beijing 100083, P. R. China3Kunming Branch, Yunnan Province Tobacco Company, Kunming 650051, P. R. China
4Food and Agriculture Standardization Institute, China National Institute of Standardization, Beijing 100191, P. R. China
(Received July 4, 2018; accepted October 19, 2018)
Keywords: acquisition device, machine vision, tobacco leaf, proportional threshold, color chart system (CCS)
Currently, the quality of flue-cured tobacco leaves is evaluated manually, which relies on subjective experience and inevitably affected by personal, physical, and environmental factors. However, the subjective evaluation fails to meet the automatic and precise requirements of tobacco production. The quality of tobacco leaves is affected by a variety of factors, such as color, oil content, maturity, and surface texture, among which color is one of the most important factors. Color evaluation is critical for quality management in the agricultural field. However, there is no specific standard color chart for flue-cured tobacco leaves, and there are few studies focusing the development of such a color chart. In this work, a framework for the development of a color chart was established by computer vision techniques and it was applied to flue-cured tobacco leaves. The color chart system (CCS) consisted of data acquisition, color representation for a single leaf, and the development of the color chart for flue-cured tobacco leaves. Firstly, an acquisition device was developed to collect digital color images of flue-cured tobacco leaves, which was equipped with CCD sensors that detect color information accurately. Secondly, a proportional threshold method was proposed to represent a feature color from the acquired images by taking into consideration the overall color information of a single leaf. Finally, color discrimination techniques were used to create digital color charts depicting synthetic, standard-color tobacco leaves at various degrees. The color charts established in this work faithfully express the flue-cured tobacco leaves color information, and the framework of CCS based on computer vision can be applied to other agricultural situations where color estimation is required.
2844 Sensors and Materials, Vol. 30, No. 12 (2018)
1. Introduction
Tobacco is a commercial crop in many countries owing to its low-cost, short growth cycle, and economic value. The history and status of the world’s tobacco industry signify that tobacco and its products will persist for a long time.(1) The tobacco industry plays an important role, especially in China where it has about 500 billion assets and 60 million employees and contributes to 1/10 of the state’s revenue each year. Furthermore, the national planting area has reached 21180000 acres, which has become the main means of increasing peasants’ income.(2) As the major material of cigarettes, the features of tobacco leaves such as flavor, aroma, and physical characteristics greatly affect the quality of cigarettes. High-quality cigarettes are expected to offer consumers with positive taste experience, optimum smoke yield, and less harm to health. The economic effect of the price of cigarettes is highly determined by the quality of the tobacco used.(3) Thus, the quality of the tobacco leaves is considered as a highly significant factor that affects cigarette quality. The quality of tobacco is also highly affected by climatic and cultivation environmental factors, including rainfall, temperature, soil, and geographical position. Therefore, it is important to evaluate its quality to obtain reliable and accurate grading results of different tobacco leaves. However, the quality evaluation of flue-cured tobacco leaves is a rigorous task. The quality evaluation of flue-cured tobacco leaves may vary from one country or even one tobacco strain to another, but the general method and the external features of interest for tobacco leaves are quite similar.(4,5) Most of the evaluation standards have been established mainly through human vision, which has strong subjectivity and fussiness. The quality evaluation criteria for f lue-cured tobacco leaves usually include color, size, shape, and disfigurement of the leaves. While color is a very common feature of the tobacco leaves, it is considered an important element, either for the grouping in the national tobacco classification standard or the evaluation of flue-cured tobacco appearance quality. Despite this important role, it has been a difficult task to give it an accurate and universal definition to understand the differences between tobacco leaf colors. The subjectivity and error caused by the involvement of human beings have been problems, making the color evaluation of tobacco leaves unclear. Furthermore, it is expensive to train experts to discriminate color. In view of these circumstances, color charts provide a simple, relatively inexpensive, and easily portable means of color appraisal of tobacco leaves. Thus, it is necessary to develop a color chart for the color evaluation of tobacco leaves. Employing a color chart for color evaluation can not only ensure the consistency of color evaluation by grass-roots staff but also make the traditional method of quality evaluation more objective and credible.
1.1 Related work
In the last few years, image analysis methods have become an important tool for the automatic inspection and quality evaluation of agricultural products. Computer vision has several advantages over chroma meters, such as lower cost, and the possibility of being used for in-line inspection, and the capability of analyzing a larger area to provide spatial data, thus eliminating the subjectivity of human criteria. Furferi et al.(6) described a method for the rapid,
Sensors and Materials, Vol. 30, No. 12 (2018) 2845
automatic, and objective prediction of the Ripening Index (RI) of an olive lot. The method integrated a machine vision system, capable of performing a color-based raw prediction of RI, with an artificial neural network (ANN)-based algorithm to refine it. In this study, some disadvantages of the RI evaluation technique, which are time-consuming, subjective (dependent on expert skill), and dependent on environmental conditions, have been solved. At the same time, modern instruments and technologies have been widely applied in the tobacco industry. Specifically, image processing and computer vision for tobacco leaves quality control have been significantly applied during the past few decades.(7–9) These applications showed that the use of modern methods for the qualitative or quantitative analysis of tobacco leaves color is essential for establishing an effective color chart. Color analysis is one of the most effective approaches to the quality inspection of tobacco leaves. This is because leaf color is closely associated with leaf pigments including the green pigment (chlorophyll) and yellow pigment (lutein and carotene).(10) The variation in leaf color thus reflects the change in internal leaf components and provides clues for the evaluation of leaf quality. Up to date, many color-related research studies have been reported. However, most of them focused on utilizing color as a technical feature for tobacco leaf classification. For example, a two-dimensional feature space was proposed to express the color feature distribution of tobacco leaves, and a ‘nearest-neighbor’ method was employed to classify tobacco leaves.(11) Ma and Wu(12) employed fuzzy recognition methods to grade the tobacco by utilizing both color and shape features. Garcia et al.(13) introduced the development of a virtual expert for the color classification of tobacco leaves. Furthermore, some researchers focused on the quantitative analysis of surface color for flue-cured tobacco leaves and its relationship with colorimetric indices.(14) A correlation equation between the color value of tobacco leaves and the positions of leaf growth was established by analyzing color values and the appearance color variation of tobacco leaves.(15) Many methods have been presented to extract the color features. For example, Jian et al.(16) presented a method whereby color feature values are quantified and extracted by employing a color histogram. There are also some other works that have been reported,(17–22) such as the automatic classification of flue-cured tobacco leaves based on different algorithms and the feature analysis of different tobacco varieties of tobacco according to different influential factors. To the best of our knowledge, only a few research studies were related to the color chart development of tobacco leaves. Although Japanese researchers used the color chart for colorimetric comparison to decide the maturity of tobacco leaves,(23) this was still a qualitative method. The color chart is an important tool for the evaluation of tobacco leaf color corresponding to a certain level. The color can be standardized and expressed in a way similar to human vision using the color chart, and the color chart can solve the problem of color reproducibility. However, until now, no such systematic method has been developed to design a color chart system (CCS) for the tobacco industry. Therefore, a CCS is urgently needed to achieve tobacco color quantification. In fact, the color chart has been applied in other industries; for example, in Japan, fruit color charts were created by skillful craftsmen, which were not quantized.(24) A method of creating digital fruit color charts with shape and color analyses was developed.(25) Singh and Singh(26) presented a method of comparing the crop leaf color with the leaf color chart (LCC), but they did not explain how the color charts
2846 Sensors and Materials, Vol. 30, No. 12 (2018)
were designed. In this paper, we present a framework of CCS for flue-cured tobacco leaves developed by employing an original leaf color from digital color images, which has three characteristics: standardization, objectification, and quantification. The framework of CCS developed in this paper can be applied to other industrial situations where color estimation is required, such as in the food, agriculture, textile, construction, and jewelry industries.
1.2 Contribution
In this paper, a framework of the automatic color chart development system is proposed to obtain a quantitative color chart and it is verified with flue-cured tobacco leaves. The CCS is developed mainly to include three major parts, namely, the design of image acquisition equipment, the color eigenvalue extraction, and the development of a color chart for tobacco leaves. The design of each part of the CCS has its own characteristics and advantages, which is explained in detail.(1) The high-precision image acquisition equipment used for flue-cured tobacco leaves is
designed in this paper, which is different from traditional acquisition equipment. It was equipped with CCD sensors that detect color information accurately. The acquisition equipment improves the color accuracy by analyzing the color characteristics of flue-cured tobacco leaves. The equipment has also been improved in terms of illumination robustness and leaf stretch acquisition. In addition, the desired image can also be flexibly adjusted or improved.
(2) A proportional threshold method is presented for feature color extraction, which has three distinguishing advantages. Firstly, the measurement accuracy of characterizing digital color eigenvalues is improved by reducing the impact of outliers. Secondly, it can reduce the error caused by the uneven color of the tobacco surface, stems, and other factors. Thirdly, it ensures that the real pixels of a flue-cured tobacco leaf are obtained by eliminating the color values with less probability of occurrence and the image color is quantified.
(3) A digital color chart is created by employing the technology of color discrimination. In this process, color grade analysis is conducted by employing the method of human visual perception of the color of flue-cured tobacco leaves. Then, the difference between two similar colors with low-level variations is determined according to the color difference equation. Finally, a quantifiable objective characterization color charts is developed. The color chart can express the color characteristics of tobacco leaves very well and guarantee consistency of evaluation. Moreover, the color can be quantified with the color chart that is helpful for a human to understand the tobacco color of different grades.
On the whole, the computer-vision-based CCS development method proposed in this paper provides a novel way of designing a color chart, which can be extended to other industries. Moreover, the advantages of CCS make it an effective tool for color characterization in research fields such as cultivation technology, color classification, and quality evaluation. Meanwhile, the color chart provides a new tool for the quantification of evaluation criteria of the flue-cured tobacco leaves to facilitate the formation of an efficient and precise tobacco evaluation system.

Sensors and Materials, Vol. 30, No. 12 (2018) 2847
2. Materials and Methods
2.1 Sample and equipment
2.1.1 Equipment
The image acquisition system is an important part of CCS. It directly affects the measurement accuracy. To reduce the color distortions in the image acquisition process for flue-cured tobacco leaves, we proposed a single-chip implementation method based on computer vision technology. The structure is shown in Fig. 1. Figure 1(a) shows the internal structure and Fig. 1(b) shows the external structure of the image collection device. As shown in Fig. 1(a), the scanner uses a CCD as a photosensitive element and the information obtained needs to be transmitted to a CCD chip by an optical system consisting of a series of lenses, mirrors, and a mobile light source. The advantage of the CCD is that the quality of the scanned image is high, it has a certain depth of field, and it can scan uneven objects. This allows clear scanning of the wrinkled tobacco. Moreover, the CCD has a low-temperature coefficient, and the influence of ambient temperature changes can be neglected in the image collection process for tobacco leaves. At the same time, the flatbed scanner adopts light-emitting diodes (LEDs) as even and steady light sources, and it can not only enhance the robustness of the lighting but also eliminate the need for special maintenance. Moreover, the even scanning speed of the flatbed scanner ensures the uniformity of image quality. In addition, the scanner provides many powerful, professional-level scanning capabilities through the ScanWizard Pro control program. The Microtek Scanner international color consortium (ICC) Profiler (MSP) program
Fig. 1. (Color online) Structure diagram of image acquisition equipment. (a) Internal and (b) external.
(a) (b)
2848 Sensors and Materials, Vol. 30, No. 12 (2018)
allows users to calibrate the scanner and produce appropriate ICC color profiles to ensure color consistency and accuracy. ScanWizard Pro also has a batch scanning feature that can generate and manage “up-and-down” batch scanning tasks, which greatly improves the working process. The image acquisition process mainly consists of five parts: sample rewetting and flattening pressure, scanner device connection, scanner parameter setting, image acquisition, and picture saving. To facilitate the smooth operation of the batch work, it is necessary to do some preparatory work before the image collection of tobacco samples, such as removing the badly damaged samples and returning the samples to their original moisture and flattening pressure. Furthermore, the image acquisition was conducted in the laboratory with constant temperature and humidity. There are several advantages of flatbed scanner for digital image acquirement are as follows:(1) The flatbed scanner adopts LEDs as even and steady light sources, and it can enhance the
robustness of the lighting without any special maintenance. At the same time, the even scanning speed of the flatbed scanner ensures the uniformity of the image quality.
(2) The pedestal device of the flatbed scanner has been used to improve the stretchability of the leaves, so that we can collect more useful information. The scanner with stable specifications improves the reproducibility of the image.
(3) The flatbed scanner is specially developed with high resolution. It is not only good for capturing the true-color image of the leaf but can also better preserve the leaf information.
2.1.2 Sample Information
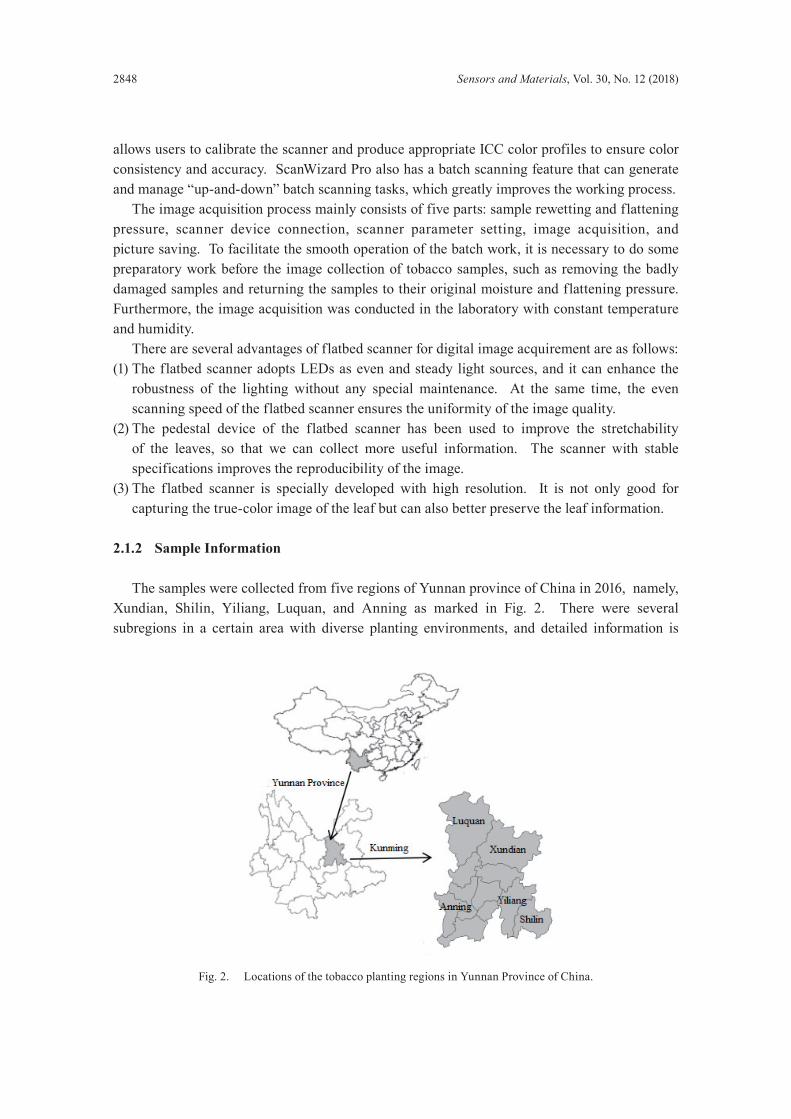
The samples were collected from five regions of Yunnan province of China in 2016, namely, Xundian, Shilin, Yiliang, Luquan, and Anning as marked in Fig. 2. There were several subregions in a certain area with diverse planting environments, and detailed information is
Fig. 2. Locations of the tobacco planting regions in Yunnan Province of China.
Sensors and Materials, Vol. 30, No. 12 (2018) 2849
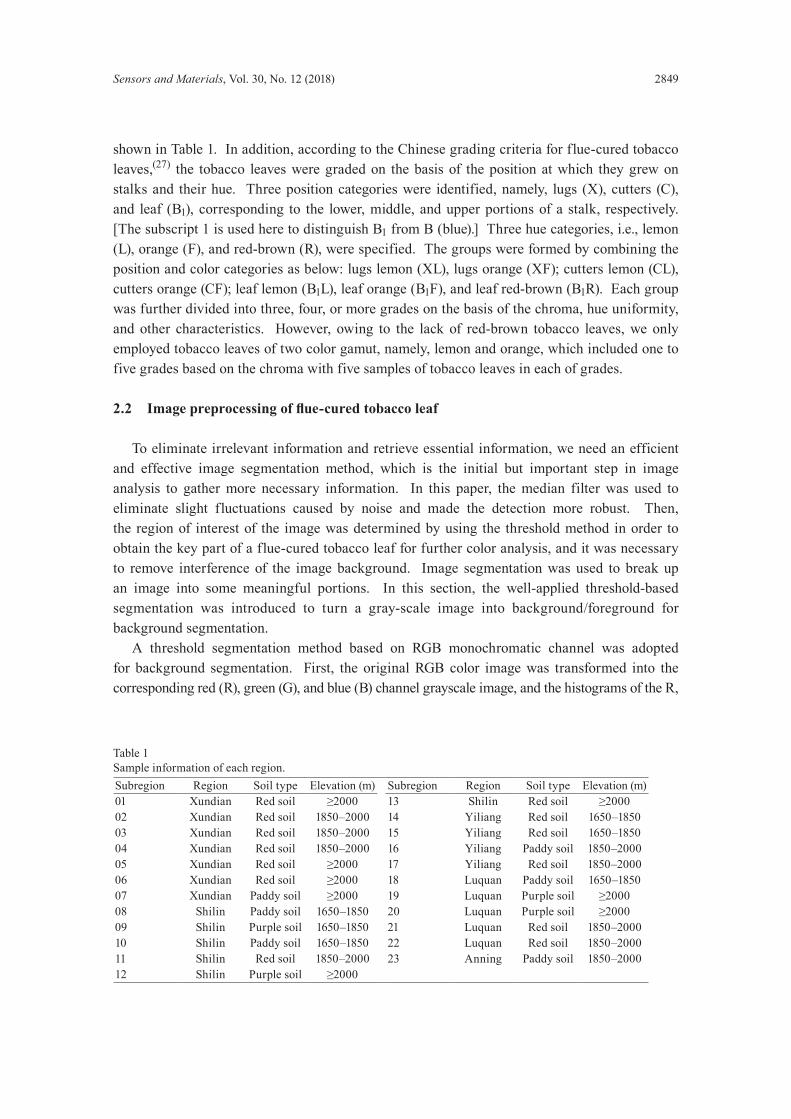
shown in Table 1. In addition, according to the Chinese grading criteria for flue-cured tobacco leaves,(27) the tobacco leaves were graded on the basis of the position at which they grew on stalks and their hue. Three position categories were identified, namely, lugs (X), cutters (C), and leaf (B1), corresponding to the lower, middle, and upper portions of a stalk, respectively. [The subscript 1 is used here to distinguish B1 from B (blue).] Three hue categories, i.e., lemon (L), orange (F), and red-brown (R), were specified. The groups were formed by combining the position and color categories as below: lugs lemon (XL), lugs orange (XF); cutters lemon (CL), cutters orange (CF); leaf lemon (B1L), leaf orange (B1F), and leaf red-brown (B1R). Each group was further divided into three, four, or more grades on the basis of the chroma, hue uniformity, and other characteristics. However, owing to the lack of red-brown tobacco leaves, we only employed tobacco leaves of two color gamut, namely, lemon and orange, which included one to five grades based on the chroma with five samples of tobacco leaves in each of grades.
2.2 Imagepreprocessingofflue-curedtobaccoleaf
To eliminate irrelevant information and retrieve essential information, we need an efficient and effective image segmentation method, which is the initial but important step in image analysis to gather more necessary information. In this paper, the median filter was used to eliminate slight fluctuations caused by noise and made the detection more robust. Then, the region of interest of the image was determined by using the threshold method in order to obtain the key part of a flue-cured tobacco leaf for further color analysis, and it was necessary to remove interference of the image background. Image segmentation was used to break up an image into some meaningful portions. In this section, the well-applied threshold-based segmentation was introduced to turn a gray-scale image into background/foreground for background segmentation. A threshold segmentation method based on RGB monochromatic channel was adopted for background segmentation. First, the original RGB color image was transformed into the corresponding red (R), green (G), and blue (B) channel grayscale image, and the histograms of the R,
Table 1Sample information of each region.Subregion Region Soil type Elevation (m) Subregion Region Soil type Elevation (m)01 Xundian Red soil ≥2000 13 Shilin Red soil ≥200002 Xundian Red soil 1850–2000 14 Yiliang Red soil 1650–185003 Xundian Red soil 1850–2000 15 Yiliang Red soil 1650–185004 Xundian Red soil 1850–2000 16 Yiliang Paddy soil 1850–200005 Xundian Red soil ≥2000 17 Yiliang Red soil 1850–200006 Xundian Red soil ≥2000 18 Luquan Paddy soil 1650–185007 Xundian Paddy soil ≥2000 19 Luquan Purple soil ≥200008 Shilin Paddy soil 1650–1850 20 Luquan Purple soil ≥200009 Shilin Purple soil 1650–1850 21 Luquan Red soil 1850–200010 Shilin Paddy soil 1650–1850 22 Luquan Red soil 1850–200011 Shilin Red soil 1850–2000 23 Anning Paddy soil 1850–200012 Shilin Purple soil ≥2000
2850 Sensors and Materials, Vol. 30, No. 12 (2018)
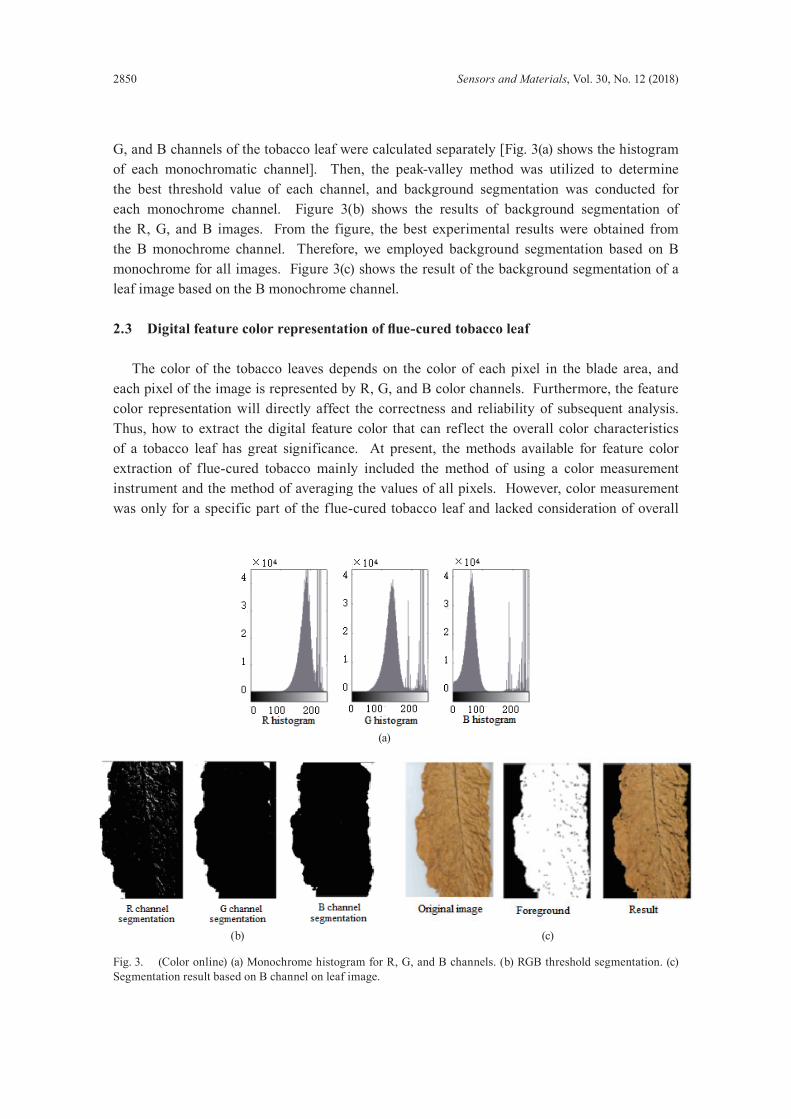
G, and B channels of the tobacco leaf were calculated separately [Fig. 3(a) shows the histogram of each monochromatic channel]. Then, the peak-valley method was utilized to determine the best threshold value of each channel, and background segmentation was conducted for each monochrome channel. Figure 3(b) shows the results of background segmentation of the R, G, and B images. From the figure, the best experimental results were obtained from the B monochrome channel. Therefore, we employed background segmentation based on B monochrome for all images. Figure 3(c) shows the result of the background segmentation of a leaf image based on the B monochrome channel.
2.3 Digitalfeaturecolorrepresentationofflue-curedtobaccoleaf
The color of the tobacco leaves depends on the color of each pixel in the blade area, and each pixel of the image is represented by R, G, and B color channels. Furthermore, the feature color representation will directly affect the correctness and reliability of subsequent analysis. Thus, how to extract the digital feature color that can reflect the overall color characteristics of a tobacco leaf has great significance. At present, the methods available for feature color extraction of flue-cured tobacco mainly included the method of using a color measurement instrument and the method of averaging the values of all pixels. However, color measurement was only for a specific part of the flue-cured tobacco leaf and lacked consideration of overall
Fig. 3. (Color online) (a) Monochrome histogram for R, G, and B channels. (b) RGB threshold segmentation. (c) Segmentation result based on B channel on leaf image.
(a)
(b) (c)
Sensors and Materials, Vol. 30, No. 12 (2018) 2851
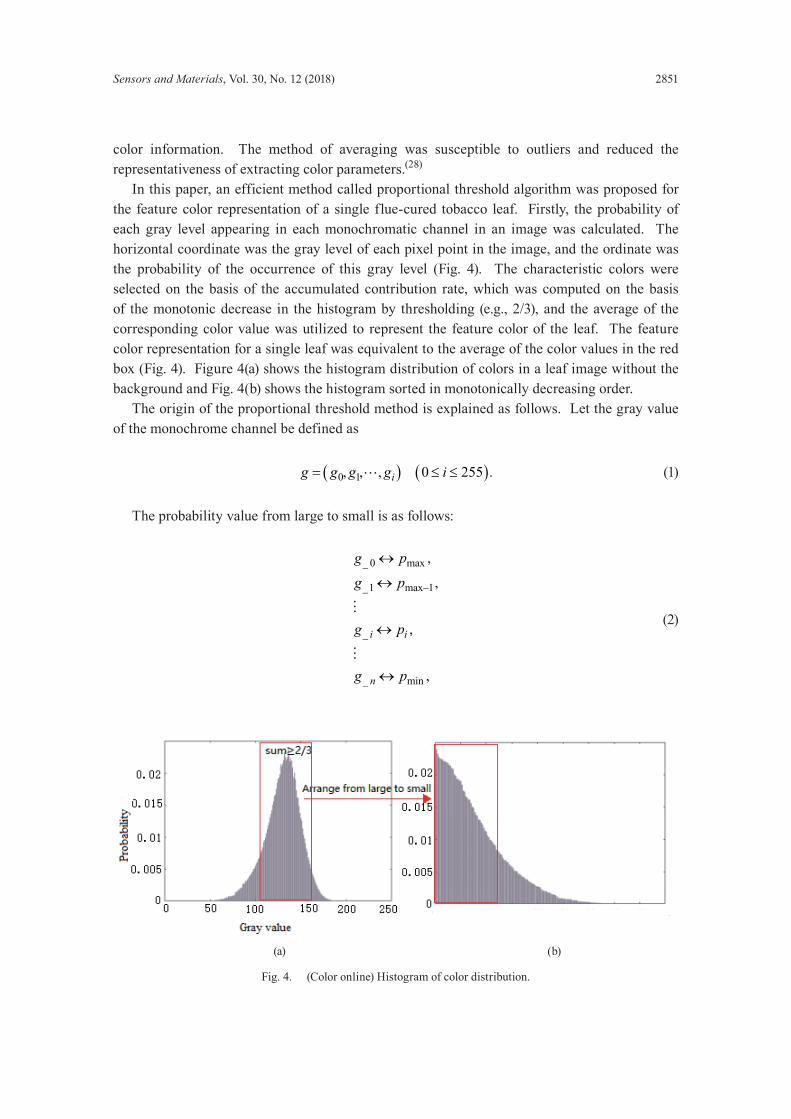
color information. The method of averaging was susceptible to outliers and reduced the representativeness of extracting color parameters.(28) In this paper, an efficient method called proportional threshold algorithm was proposed for the feature color representation of a single flue-cured tobacco leaf. Firstly, the probability of each gray level appearing in each monochromatic channel in an image was calculated. The horizontal coordinate was the gray level of each pixel point in the image, and the ordinate was the probability of the occurrence of this gray level (Fig. 4). The characteristic colors were selected on the basis of the accumulated contribution rate, which was computed on the basis of the monotonic decrease in the histogram by thresholding (e.g., 2/3), and the average of the corresponding color value was utilized to represent the feature color of the leaf. The feature color representation for a single leaf was equivalent to the average of the color values in the red box (Fig. 4). Figure 4(a) shows the histogram distribution of colors in a leaf image without the background and Fig. 4(b) shows the histogram sorted in monotonically decreasing order. The origin of the proportional threshold method is explained as follows. Let the gray value of the monochrome channel be defined as
( ) ( )0 1, , , 0 255ig g g g i= ≤ ≤� . (1)
The probability value from large to small is as follows:
_ 0 max
_1 max 1
_
_ min
,
,
,
,
i i
n
g p
g p
g p
g p
−
↔
↔
↔
↔
�
�
(2)
Fig. 4. (Color online) Histogram of color distribution.
(a) (b)
2852 Sensors and Materials, Vol. 30, No. 12 (2018)
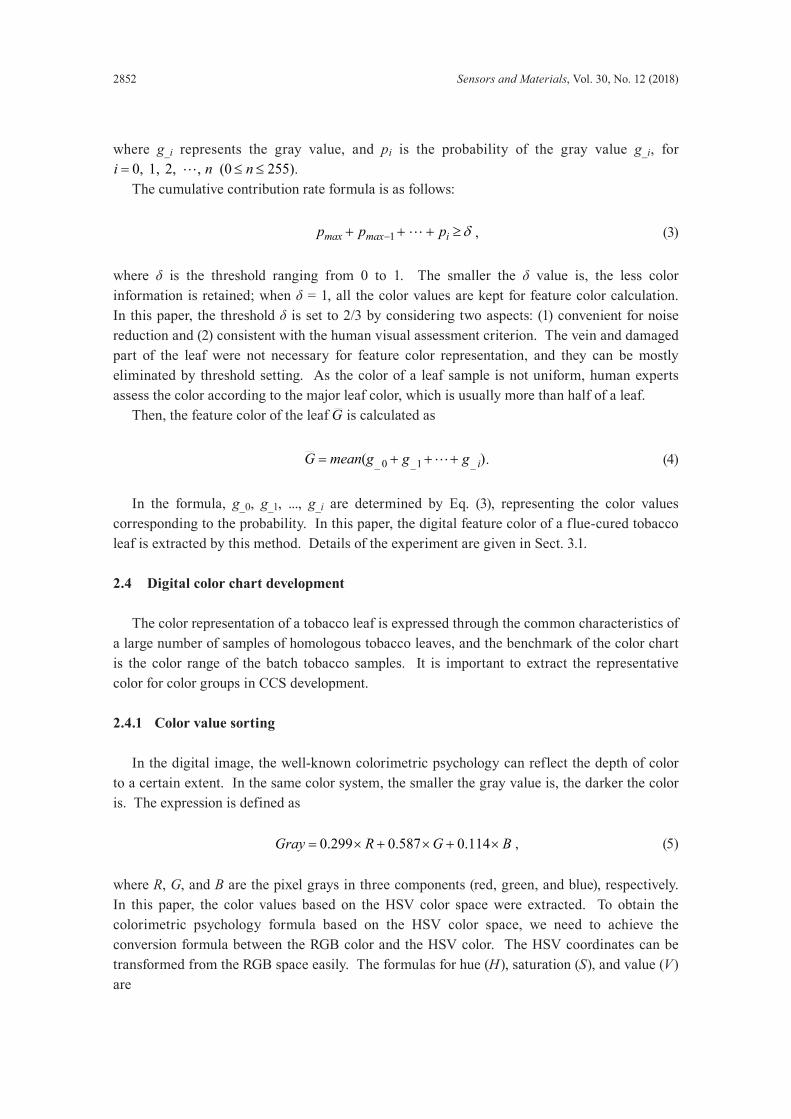
where g_i represents the gray value, and pi is the probability of the gray value g_i, for 0, 1, 2, , (0 255)i n n= ≤ ≤� .
The cumulative contribution rate formula is as follows:
1max max ip p p δ−+ + + ≥� , (3)
where δ is the threshold ranging from 0 to 1. The smaller the δ value is, the less color information is retained; when δ = 1, all the color values are kept for feature color calculation. In this paper, the threshold δ is set to 2/3 by considering two aspects: (1) convenient for noise reduction and (2) consistent with the human visual assessment criterion. The vein and damaged part of the leaf were not necessary for feature color representation, and they can be mostly eliminated by threshold setting. As the color of a leaf sample is not uniform, human experts assess the color according to the major leaf color, which is usually more than half of a leaf. Then, the feature color of the leaf G is calculated as
_ 0 _1 _( )iG mean g g g= + + +� . (4)
In the formula, g_0, g_1, ..., g_i are determined by Eq. (3), representing the color values corresponding to the probability. In this paper, the digital feature color of a flue-cured tobacco leaf is extracted by this method. Details of the experiment are given in Sect. 3.1.
2.4 Digital color chart development
The color representation of a tobacco leaf is expressed through the common characteristics of a large number of samples of homologous tobacco leaves, and the benchmark of the color chart is the color range of the batch tobacco samples. It is important to extract the representative color for color groups in CCS development.
2.4.1 Color value sorting
In the digital image, the well-known colorimetric psychology can reflect the depth of color to a certain extent. In the same color system, the smaller the gray value is, the darker the color is. The expression is defined as
0.299 0.587 0.114Gray R G B= × + × + × , (5)
where R, G, and B are the pixel grays in three components (red, green, and blue), respectively. In this paper, the color values based on the HSV color space were extracted. To obtain the colorimetric psychology formula based on the HSV color space, we need to achieve the conversion formula between the RGB color and the HSV color. The HSV coordinates can be transformed from the RGB space easily. The formulas for hue (H), saturation (S), and value (V) are
Sensors and Materials, Vol. 30, No. 12 (2018) 2853
( ) ( )( )( ) ( )( )
( )
( ) ( )( )( ) ( )( )
( )
( ) ( )( )
( )
2
2
2arccos ,
2360 arccos ,
max min,
max
max,
255
R G R B /if B G
R G R B G BH
R G R B /if B G
R G R B G B
R,G,B R,G,BS
R,G,B
R,G,BV
− + − ≤ − + − − =
− + − − > − + − − −
=
=
(6)
where max(R,G,B) is the maximum value of R, G, and B and min(R,G,B) is the minimum value of R, G, and B. The colorimetric psychology based on HSV color space is obtained by combining Eqs. (5) and (6):
( )* 255 1 0.701 3.522Gray V S H S= × × − × − × × . (7)
According to the color characteristics of the sample of flue-cured tobacco leaf, the color was mainly limited to the range of lemon and orange. Therefore, the synthetic color blocks derived from the flue-cured tobacco samples were sorted in order from light to dark according to the colorimetric psychology formula [Eq. (7)].
2.4.2 Colordifferencediscrimination
Evidence supports that the color discrimination ability of the human visual system is different among individuals, owing to the different cognitions of different color gamuts.(29) Therefore, it is necessary to determine the color difference threshold that can be resolved visually for human vision between two adjacent patches in the color range of lemon and orange. To quantitatively evaluate the difference in color perception, a color difference formula was designed to calculate the difference between similar colors with low-level variations, which had strong agreement with human perception. The Lab color space was utilized for color difference measurement. Lab color space can describe existing colors well and achieve uniform color distribution. The color differences can be measured on the basis of distance. The total color difference between two samples can be calculated as
Brightness difference: * * *1 2L L L∆ = − ,
Chromaticity difference: * * *1 2a a a∆ = − , (8)
* * *1 2b b b∆ = − ,
2854 Sensors and Materials, Vol. 30, No. 12 (2018)
Total color difference: ( ) ( ) ( )2 2 2* * * *abE L a b∆ = ∆ + ∆ + ∆ , (9)
where L⁎1 and L⁎
2 represent the brightness values of two flue-cured tobacco samples. a⁎1 and
a⁎2 represent the chroma values ranging from red to green of two flue-cured tobacco samples.
Similarly, b⁎1 and b⁎
2 represent the chroma values ranging from yellow to blue of two flue-cured tobacco samples. It can be found from Eq. (9) that the total color difference varies with the changes in ∆a⁎, ∆b⁎, and ∆L⁎. Since the color range of flue-cured tobacco in this paper had been limited to lemon and orange, it was less affected by ∆a⁎ and ∆b⁎, while ∆L⁎ has greater influence. We will confirm the color threshold from two aspects of the simultaneous changes in ∆a⁎ and ∆b⁎, or the change in ∆L⁎ alone. More importantly, in this process, we need to obtain the L, a, and b values from the H, S, and V values by using the conversion of color space. Then, the color threshold was determined according to Eq. (9). The color difference threshold was the basis of color discrimination, and it was applied to the sorted color blocks obtained in Sect. 2.4.1.
3. Results and Discussion
3.1 Tobacco leaf color synthesis
The HSV system is a perception-oriented nonlinear color space. Color information is represented by hue and saturation values in the HSV color space. The extent of the color brightness of an image is determined by the amount of light. Hue represents basic colors and is determined by the dominant wavelength in the spectral distribution of light wavelengths. It is the location of the peak in the spectral distribution. Saturation refers to the color depth, which is indicated by a fraction, ranging from 0 to 1, and signifies the amount of white light mixed with the hue. It is the height of the peak relative to the entire spectral distribution. Color brightness is also indicated by a fraction, ranging from 0 to 1. The human vision system can distinguish different hues easily, whereas the perception of different intensities or saturation does not mean the recognition of different colors. The HSV color space is more intuitive to the human vision owing to its good capability of representing the colors of human perception. HSV can sense the change in color channel independently, and more information can be retrieved from the HSV color space. Therefore, the color of the HSV color space is adopted in the experiments. Moreover, the color synthesis results of different subregions, different positions of the leaf, and different color grades were evaluated. In this part, samples of the leaf (B1) were collected from six subregions in Shilin. The original images and the color of the synthesis results are shown in Table 2. The last row in the table is represented by the hexadecimal color code. It is generally prescribed that each color intensity in RGB has a minimum of 0 and a maximum of 255, and it is expressed in the form of six hexadecimal digits; each pair represents a color channel. 255 corresponds to the hexadecimal FF and puts the values of three color channels at the beginning of “#”, which is the hexadecimal color code. For example, the color value “#FF0000” is red, because red has

Sensors and Materials, Vol. 30, No. 12 (2018) 2855
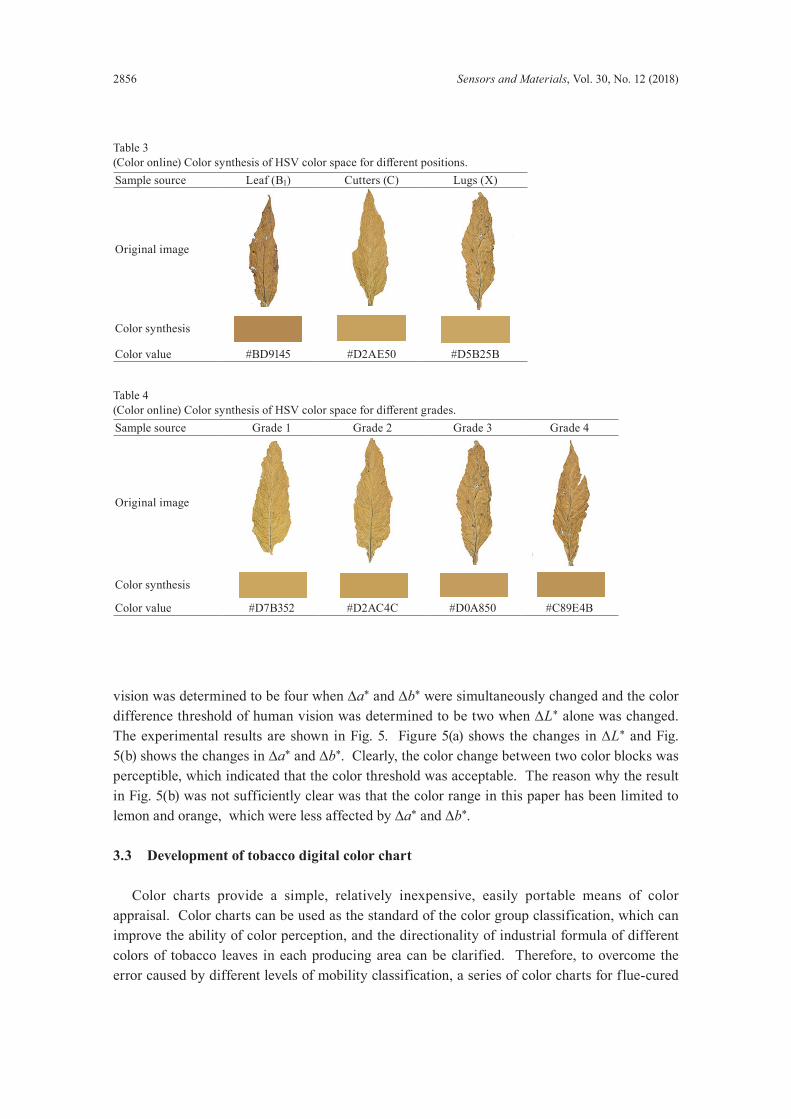
reached the highest “FF” value (255 in decimal), and the remaining two color intensities are zero. The results showed that the color of the synthesis in the HSV color space was similar to the physical color of the tobacco leaves in each subregion (as shown in Table 2), and the subregion played a significant role in the color change of tobacco. To gain insight into the reliability of the color values, samples from different positions were selected and the color synthesis was conducted. Table 3 indicates the color synthesis results of different positions of tobacco leaves. It can be seen from Table 3 that the color synthesis of tobacco leaves in different positions also obtained good results. Each position of the color synthesis effects can be a genuine and reliable reflection of the physical color of the original sample. Different grades of flue-cured tobacco leaves reflect the degree of color depth. In this section of the experiment, the samples of flue-cured tobacco leaves that are consistent with all factors other than the color grade varied from light to dark. The comparison results are given in Table 4. Obviously, as grade changes from one to four, the corresponding colors also varied from light to dark. The synthesis results of feature color also reflected the gradual change in color and the grades had a comparatively weak impact on the color of tobacco. The observed results are summarized in three points: (1) The scanned leaf images are represented quantitatively by certain color values, which made color analysis more convenient. (2) It was practical to apply the 2/3 proportional threshold method in the HSV color space for feature color extraction, which can improve the accuracy and the authenticity. (3) The results of the color synthesis also truly expressed the color of the original samples, and the effect of each factor on the color change can also be well reflected in the color synthesis.
3.2 Color threshold setting
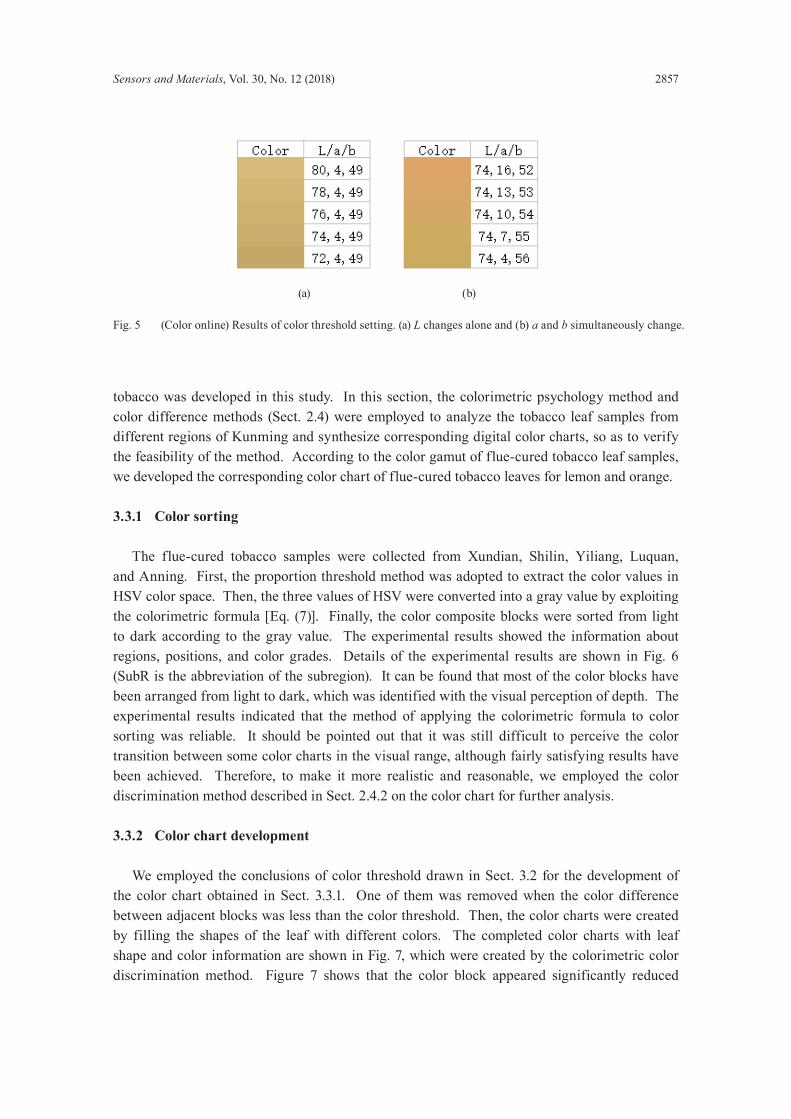
In this section, the minimum chromatic aberration of human visual discrimination between adjacent leaves in the color gamut of flue-cured tobacco leaves was embedded from two aspects of the simultaneous changes in ∆a⁎ and ∆b⁎ or the change in ∆L⁎ alone.(29) In order to conform to the acceptable color difference of most people, the color difference threshold of human
Table 2(Color online) Color synthesis of HSV color space for different subregions.Sample source Subregion 8 Subregion 9 Subregion 10 Subregion 11 Subregion 12 Subregion 13
Original image
Color synthesis
Color value #BD9145 #CFAF55 #D2AC4C #C39545 #DDB756 #D3A949
2856 Sensors and Materials, Vol. 30, No. 12 (2018)
vision was determined to be four when ∆a⁎ and ∆b⁎ were simultaneously changed and the color difference threshold of human vision was determined to be two when ∆L⁎ alone was changed. The experimental results are shown in Fig. 5. Figure 5(a) shows the changes in ∆L⁎ and Fig. 5(b) shows the changes in ∆a⁎ and ∆b⁎. Clearly, the color change between two color blocks was perceptible, which indicated that the color threshold was acceptable. The reason why the result in Fig. 5(b) was not sufficiently clear was that the color range in this paper has been limited to lemon and orange, which were less affected by ∆a⁎ and ∆b⁎.
3.3 Development of tobacco digital color chart
Color charts provide a simple, relatively inexpensive, easily portable means of color appraisal. Color charts can be used as the standard of the color group classification, which can improve the ability of color perception, and the directionality of industrial formula of different colors of tobacco leaves in each producing area can be clarified. Therefore, to overcome the error caused by different levels of mobility classification, a series of color charts for flue-cured
Table 3(Color online) Color synthesis of HSV color space for different positions.Sample source Leaf (B1) Cutters (C) Lugs (X)
Original image
Color synthesis
Color value #BD9145 #D2AE50 #D5B25B
Table 4(Color online) Color synthesis of HSV color space for different grades.Sample source Grade 1 Grade 2 Grade 3 Grade 4
Original image
Color synthesis
Color value #D7B352 #D2AC4C #D0A850 #C89E4B
Sensors and Materials, Vol. 30, No. 12 (2018) 2857
Fig. 5 (Color online) Results of color threshold setting. (a) L changes alone and (b) a and b simultaneously change.
(a) (b)
tobacco was developed in this study. In this section, the colorimetric psychology method and color difference methods (Sect. 2.4) were employed to analyze the tobacco leaf samples from different regions of Kunming and synthesize corresponding digital color charts, so as to verify the feasibility of the method. According to the color gamut of flue-cured tobacco leaf samples, we developed the corresponding color chart of flue-cured tobacco leaves for lemon and orange.
3.3.1 Color sorting
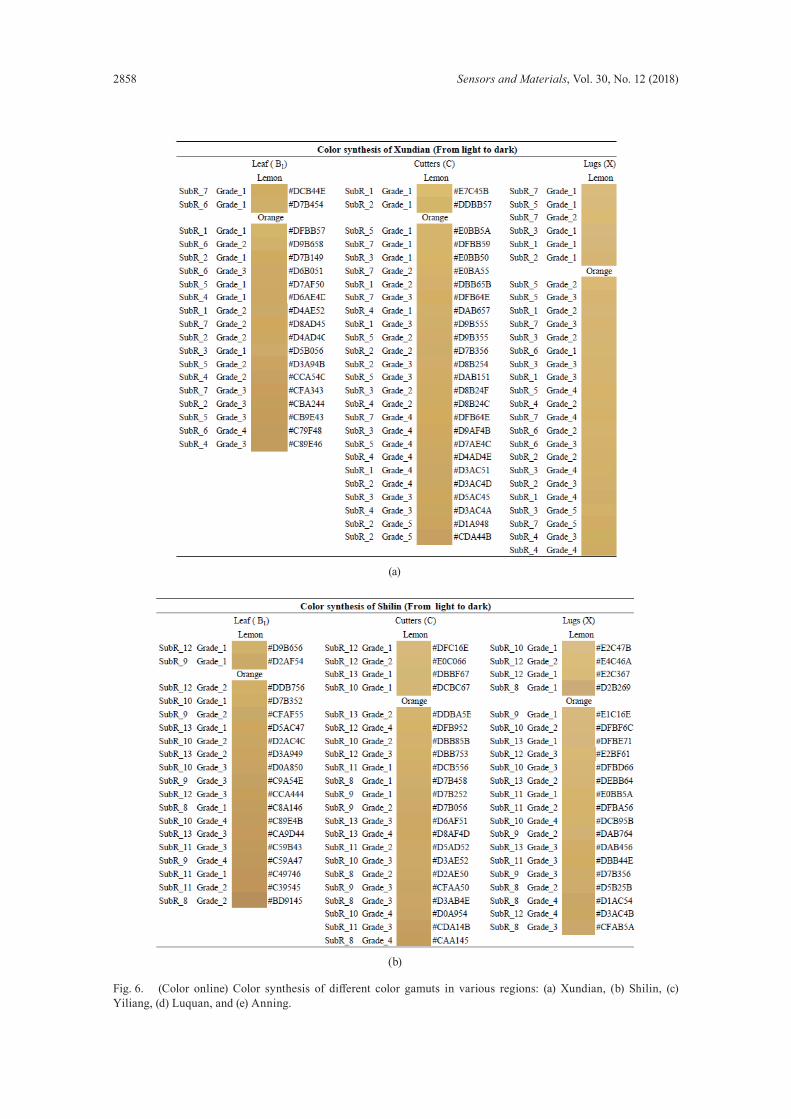
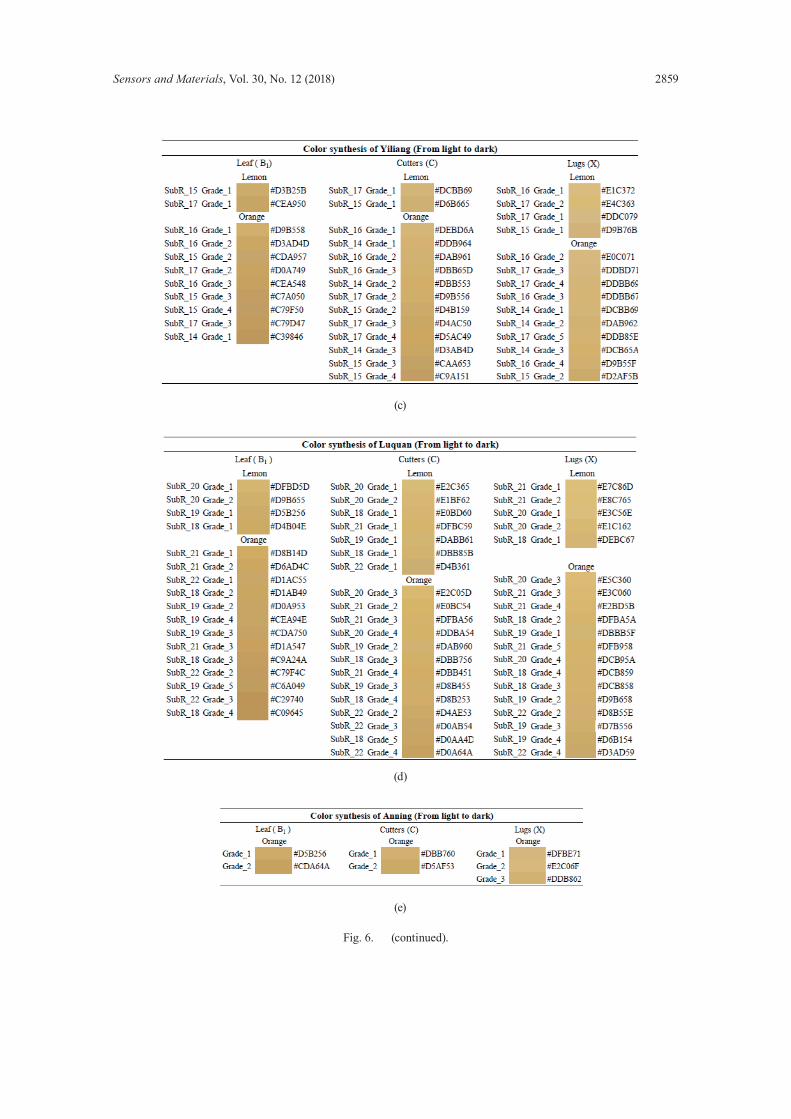
The flue-cured tobacco samples were collected from Xundian, Shilin, Yiliang, Luquan, and Anning. First, the proportion threshold method was adopted to extract the color values in HSV color space. Then, the three values of HSV were converted into a gray value by exploiting the colorimetric formula [Eq. (7)]. Finally, the color composite blocks were sorted from light to dark according to the gray value. The experimental results showed the information about regions, positions, and color grades. Details of the experimental results are shown in Fig. 6 (SubR is the abbreviation of the subregion). It can be found that most of the color blocks have been arranged from light to dark, which was identified with the visual perception of depth. The experimental results indicated that the method of applying the colorimetric formula to color sorting was reliable. It should be pointed out that it was still difficult to perceive the color transition between some color charts in the visual range, although fairly satisfying results have been achieved. Therefore, to make it more realistic and reasonable, we employed the color discrimination method described in Sect. 2.4.2 on the color chart for further analysis.
3.3.2 Color chart development
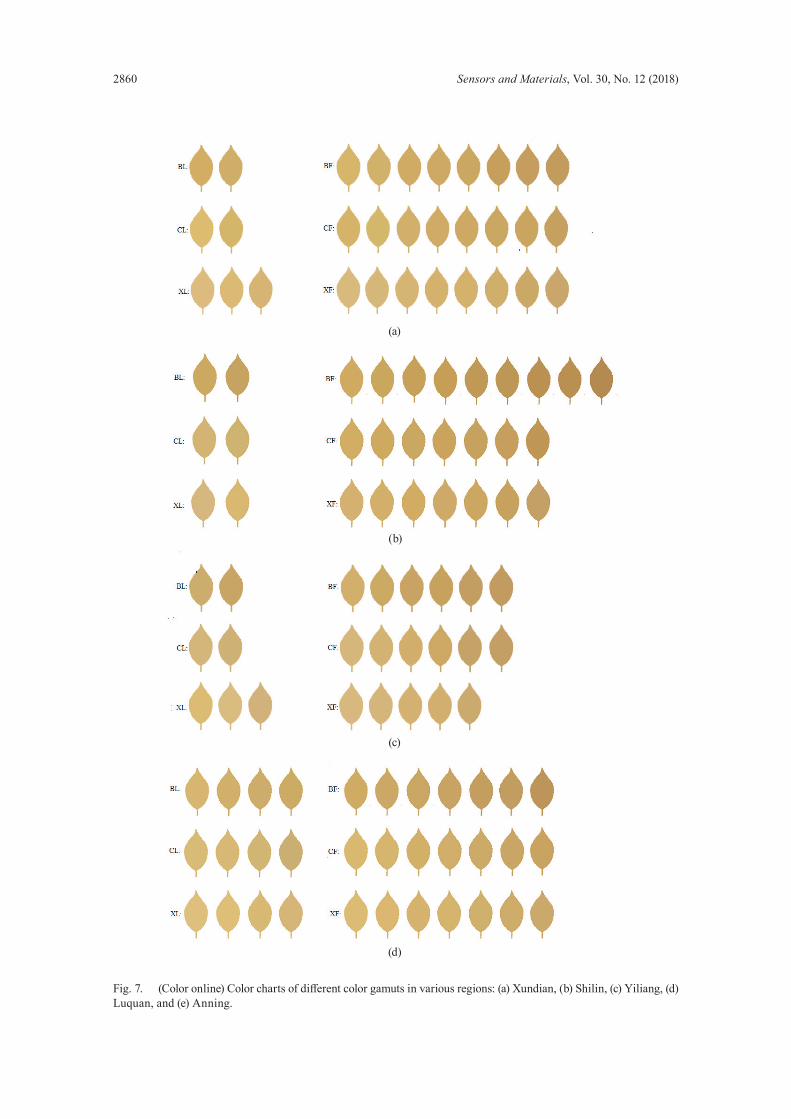
We employed the conclusions of color threshold drawn in Sect. 3.2 for the development of the color chart obtained in Sect. 3.3.1. One of them was removed when the color difference between adjacent blocks was less than the color threshold. Then, the color charts were created by filling the shapes of the leaf with different colors. The completed color charts with leaf shape and color information are shown in Fig. 7, which were created by the colorimetric color discrimination method. Figure 7 shows that the color block appeared significantly reduced
2858 Sensors and Materials, Vol. 30, No. 12 (2018)
Fig. 6. (Color online) Color synthesis of different color gamuts in various regions: (a) Xundian, (b) Shilin, (c) Yiliang, (d) Luquan, and (e) Anning.
(a)
(b)
Sensors and Materials, Vol. 30, No. 12 (2018) 2859
(c)
(d)
(e)
Fig. 6. (continued).
2860 Sensors and Materials, Vol. 30, No. 12 (2018)
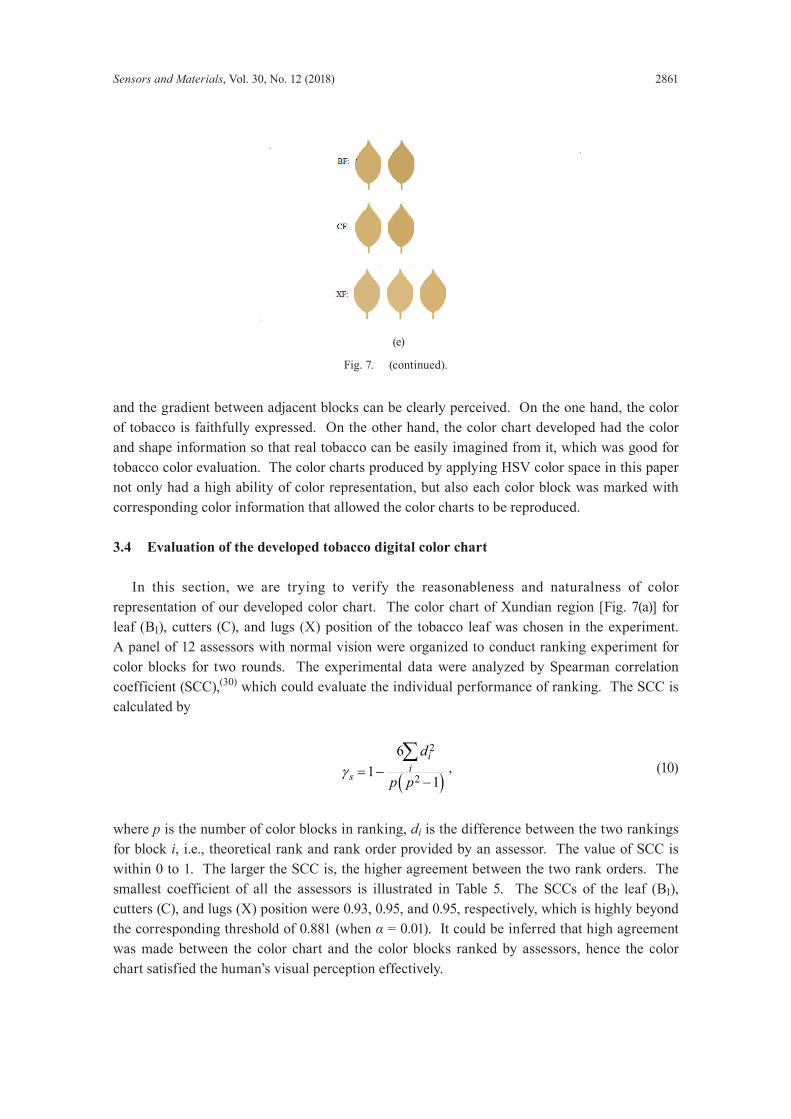
Fig. 7. (Color online) Color charts of different color gamuts in various regions: (a) Xundian, (b) Shilin, (c) Yiliang, (d) Luquan, and (e) Anning.
(a)
(b)
(c)
(d)
Sensors and Materials, Vol. 30, No. 12 (2018) 2861
and the gradient between adjacent blocks can be clearly perceived. On the one hand, the color of tobacco is faithfully expressed. On the other hand, the color chart developed had the color and shape information so that real tobacco can be easily imagined from it, which was good for tobacco color evaluation. The color charts produced by applying HSV color space in this paper not only had a high ability of color representation, but also each color block was marked with corresponding color information that allowed the color charts to be reproduced.
3.4 Evaluation of the developed tobacco digital color chart
In this section, we are trying to verify the reasonableness and naturalness of color representation of our developed color chart. The color chart of Xundian region [Fig. 7(a)] for leaf (B1), cutters (C), and lugs (X) position of the tobacco leaf was chosen in the experiment. A panel of 12 assessors with normal vision were organized to conduct ranking experiment for color blocks for two rounds. The experimental data were analyzed by Spearman correlation coefficient (SCC),(30) which could evaluate the individual performance of ranking. The SCC is calculated by
( )
2
2
61
1
ii
s
d
p pγ = −
−
∑, (10)
where p is the number of color blocks in ranking, di is the difference between the two rankings for block i, i.e., theoretical rank and rank order provided by an assessor. The value of SCC is within 0 to 1. The larger the SCC is, the higher agreement between the two rank orders. The smallest coefficient of all the assessors is illustrated in Table 5. The SCCs of the leaf (B1), cutters (C), and lugs (X) position were 0.93, 0.95, and 0.95, respectively, which is highly beyond the corresponding threshold of 0.881 (when α = 0.01). It could be inferred that high agreement was made between the color chart and the color blocks ranked by assessors, hence the color chart satisfied the human’s visual perception effectively.
(e)
Fig. 7. (continued).
2862 Sensors and Materials, Vol. 30, No. 12 (2018)
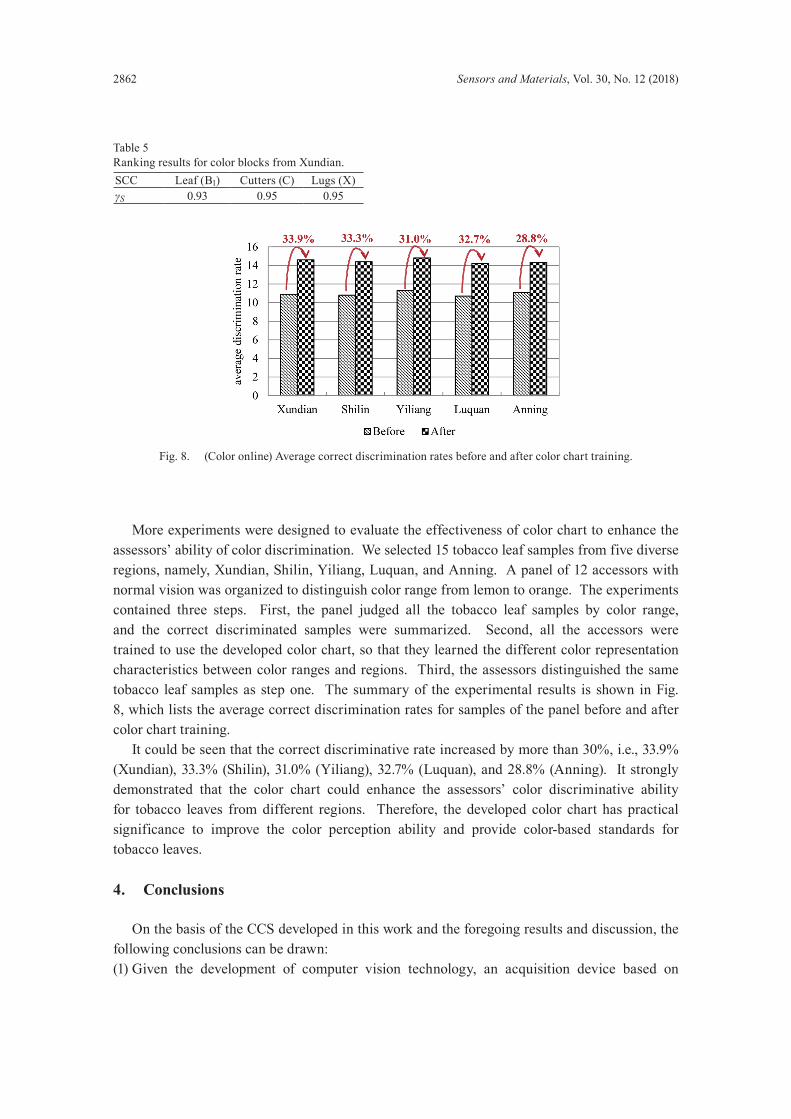
More experiments were designed to evaluate the effectiveness of color chart to enhance the assessors’ ability of color discrimination. We selected 15 tobacco leaf samples from five diverse regions, namely, Xundian, Shilin, Yiliang, Luquan, and Anning. A panel of 12 accessors with normal vision was organized to distinguish color range from lemon to orange. The experiments contained three steps. First, the panel judged all the tobacco leaf samples by color range, and the correct discriminated samples were summarized. Second, all the accessors were trained to use the developed color chart, so that they learned the different color representation characteristics between color ranges and regions. Third, the assessors distinguished the same tobacco leaf samples as step one. The summary of the experimental results is shown in Fig. 8, which lists the average correct discrimination rates for samples of the panel before and after color chart training. It could be seen that the correct discriminative rate increased by more than 30%, i.e., 33.9% (Xundian), 33.3% (Shilin), 31.0% (Yiliang), 32.7% (Luquan), and 28.8% (Anning). It strongly demonstrated that the color chart could enhance the assessors’ color discriminative ability for tobacco leaves from different regions. Therefore, the developed color chart has practical significance to improve the color perception ability and provide color-based standards for tobacco leaves.
4. Conclusions
On the basis of the CCS developed in this work and the foregoing results and discussion, the following conclusions can be drawn:(1) Given the development of computer vision technology, an acquisition device based on
Table 5Ranking results for color blocks from Xundian.SCC Leaf (B1) Cutters (C) Lugs (X)γS 0.93 0.95 0.95
Fig. 8. (Color online) Average correct discrimination rates before and after color chart training.
Sensors and Materials, Vol. 30, No. 12 (2018) 2863
electronic sensors has been developed, which can improve not only the illumination robustness and leaf stretch acquisition, but also the image quality.
(2) The traditional method of feature color extraction is hard to fully represent the color information of tobacco leaves. We proposed a proportional threshold method, and then three monochromatic channel values of HSV color space were selected to represent the color of flue-cured tobacco leaves. The results demonstrated that the HSV color space was suitable for expressing the color of flue-cured tobacco leaves. At the same time, the proportional threshold method showed its superiority and reliability.
(3) The color charts in this paper can highly represent colors; thus, they can provide color-based standards. The color chart of flue-cured tobacco is beneficial for improving the perception of different grades of color and reduce the grading training of a professional panel, which has certain economic significance and practical value for the development of the tobacco industry. In addition, the color chart of flue-cured tobacco is a novel tool in the field of agriculture for the tobacco industry.
Acknowledgments
This work was supported by the National Research and Development Major Project (No. 2017YFD0400100), National Natural Science Foundation of China (No. 61673052), and the Science and Technology Planning Project of Yunnan Province Tobacco Company (No. 2016YN02).
References
1 X. Ma, J. Shen, R. Liu, and H. Zhai: Chinese Control and Decision Conf. (2016) 3041. 2 T. X. Yang, Y. F. Wang, and J. Wu: J. Anhui Agric. Sci. 34 (2006) 267. ht tps://doi.org/10.3969/
j.issn.0517-6611.2006.02.032 3 N. A. Karaivazoglou, N. C. Tsotsolis, and C. D. Tsadilas: Field Crops Res. 100 (2007) 52. https://doi.
org/10.1016/j.fcr.2006.05.006 4 United States Department of Agriculture: Official Standard Grades for Flue-Cured Tobacco U.S. (1989). 5 L. Guo: Training Handbook of Chinese Grading Criteria of Flue-cured Tobacco Leaves (China Standards
Publishing House, Beijing, 1992). 6 R. Furferi, L. Governi, and Y. Volpe: J. Food Eng. 101 (2010) 318. https://doi.org/10.1016/j.jfoodeng.2010.07.016 7 H. K. Cho and K. H. Paek: J. Korean Soc. Agric. Mach. 22 (1997) 30. 8 T. George and F. Keith: Proc. Annu. Symp. Pattern Recognit. Assoc. South Afr. (1998) 174. 9 J. Zhang, S. Sokhansanj, S. Wu, R. Fang, W. Yang, and P. Winter: Comput. Electron. Agric. 19 (1998) 155.
https://doi.org/10.1016/S0168-1699(97)00041-0 10 S. R. Ghate, M. D. Evans, C. K. Kvien, and K. S. Rucker: Trans. ASAE 36 (1993) 1941. https://doi.
org/10.13031/2013.28546 11 J. Zhang, S. Sokhansanj, S. Wu, R. Fang, W. Yang, and P. Winter: Comput. Electron. Agric. 16 (1997) 231.
https://doi.org/10.1016/S0168-1699(96)00040-3 12 J. Y. Ma and T. Wu: Mach. Build. Autom. 40 (2011) 90. 13 M. Garcia, P. Barreiro, A. M. Ruiz, R. Alonso, and L. Judez: Proc. Sens. Decis. Support Syst. Agric. Food Ind.
Env. (1998) 105. 14 G. S. Ding, Q. M. Zhang, B. A. Jinsha, Y. P. Wang, and H. Yang: Chin. Tob. Sci. 32 (2011) 14. 15 Y. Li, Y. P. Fu, H. Zhen, C. Y. Wei, G. L. Wang, and H. Tang: Chin. Tob. Sci. 38 (2017) 78. 16 T. Jian, M. L. Deng, Z. T. He, S. T. Jia, and X. W. Du: Appl. Mech. Mater. 651 (2014) 2424. https://doi.
org/10.4028/www.scientific.net/AMM.651-653.2424 17 Z. Liu, W. Chen, Y. Zou, and C. Hu: IEEE Int. Conf. Ind. Inform. (2012) 481. https://doi.org/10.1109/
INDIN.2012.6301214
2864 Sensors and Materials, Vol. 30, No. 12 (2018)
18 L. M. Zhang, J. Y. Shen, and R. J. Liu: J. Agric. Mech. Res. 12 (2011) 32. 19 J. Liu, J. Shen, Z. Shen, and R. Liu: IEEE Int. Conf. Intell. Contr. Autom. Detect. Equip. (2012) 89. https://doi.
org/10.1109/ICADE.2012.6330105 20 R. J. Amir, Z. Somayeh, A. Mojtaba, and C. S. Meredith: Chem. Rev. 117 (2017) 12227. https://doi.org/10.1021/
acs.chemrev.7b00001 21 G. Xiang, H. Y. Yang, L. Yang, X. Zhang, Q. Cao, and M. M. Miao: Microchem. J. 95 (2010) 198. https://doi.
org/10.1016/j.microc.2009.12.001 22 R. F. Severson, R. F. Arrendale, O. T. Chortyk, A. W. Johnson, D. M. Jackson, G. R. Gwynn, J. F. Chaplin, and M.
G. Stephenson: J. Agric. Food Chem. 32 (1984) 566. https://doi.org/10.1021/jf00123a037 23 E. K. Walker: J. Tob. Sci. 12 (1968) 58. 24 Y. Motonaga, H. Kondou, A. Hashimoto, and T. Kameoka: Agric. Inf. Res. 8 (1999) 69. https://doi.org/10.3173/
air.8.69 25 Y. Motonaga, H. Kondou, A. Hashimoto, and T. Kameoka: Int. J. Food Agric. Env. 2 (2004) 160. 26 A. Singh and M. L. Singh: IEEE Technol. Innov. ICT Agric. Rural Dev. (2015) 24. 27 China National Tobacco Corporation: Training Handbook of Chinese Grading Criteria of Flue-cured Tobacco
Leaves (1992) (Unpublished material). 28 Y. Zhang, Q. Cong, Y. Xie, J. X. Yang, and B. Zhao: Spectrochimica. Acta, A 71 (2008) 1408. https://doi.
org/10.1016/j.saa.2008.04.020 29 H. Wang, R. Wang, and G. F. Guo: J. Guangdong Univ. Tech. 26 (2009) 60. 30 ISO 8587: 2006, Sensory Analysis—Methodology—Ranking (2006).