legend ove chart line ad
TRANSCRIPT
1
Salient Capital Markets Transactions Major Indices & Exchange Rates
Interest Rates
Source: Capital IQ. *Historical data has been adjusted from previous versions to account for a change in the data source to accurately reflect the comparison of current and historical periods
Note: Large Cap FT Index considers all public companies covered in this newsletter that have a market capitalization of over $300M as of the publication date
Disclosure: KeyBanc Capital Markets is a trade name under which corporate and investment banking products and services of KeyCorp and its subsidiaries, KeyBanc Capital Markets Inc., member
NYSE/FINRA/SIPC ("KBCMI"), and KeyBank National Association ("KeyBank N.A."), are marketed. Pacific Crest Securities is a division of KBCMI. Securities products and services are offered by KeyBanc Capital
Markets Inc. and its licensed securities representatives, who may also be employees of KeyBank N.A. Banking products and services are offered by KeyBank N.A.
This report was not issued by our research department. The information contained in this report has been obtained from sources deemed to be reliable but is not represented to be complete, and it should not be
relied upon as such. This report does not purport to be a complete analysis of any security, issuer, or industry and is not an offer or a solicitation of an offer to buy or sell any securities. This report is prepared for
general information purposes only and does not consider the specific investment objectives, financial situation, or particular needs of any individual person or entity.
Markets Indexed Prices
(25%)
(20%)
(15%)
(10%)
(5%)
0%
5%
10%
15%
20%
25%
11-Mar-15 11-Jun-15 11-Sep-15 11-Dec-15 11-Mar-16
Russell 2000
S&P 500 Index
Dow Jones Industrial
NASDAQ Composite
Large Cap FT Index
3.9%
Inde
xed
Pric
e (%
)
(0.9%)
(10.5%)
Ind
ex
ed
Pri
ce
(%
)
(2.4%)(2.1%)
As of
3/11/2016 1 Month 12 Month
U.S. Prime Rate 3.500% 0.00 25.00
U.S. Treasury - 10 years 1.977% 33.60 (13.50)
ICE LIBOR - USD - 3 Month 0.634% 1.67 36.40
Federal Funds Overnight Rate 0.370% 1.00 29.00
Bps Change
Close as of
3/11/2016 1 Month 12 Month
Dow Jones Industrial Average 17,213.31 9.9% (2.4%)
NYSE Composite Index 10,104.19 11.9% (5.4%)
NASDAQ Composite Index 4,748.46 11.3% (2.1%)
AMEX Composite Index 2,246.46 12.1% (5.5%)
S&P 500 Index 2,022.19 10.6% (0.9%)
Russell 2000 Index 1,087.56 14.0% (10.5%)
Euro / USD 0.9440 7.2% (0.0%)
Japanese Yen / USD 122.8450 9.6% 1.2%
British Pound / USD 0.6645 (4.0%) (0.6%)
Bitcoin / USD 416.0000 10.1% 65.1%
% ChangeMergers and Acquisitions
Deutsche Börse Acquires London Stock Exchange for $15.8B
• Merger expected to produce $330M to $375M of cost synergies and larger capital
savings of $5B to $7B for banks and investors from "compressing" overlapping
trades on the two exchanges
Tibet Tourism Acquires Beijing-based Lakala Payment for $1.7B
• Acquisition of online payment and POS provider for the convenience consumer
financial service industry in China enables backdoor listing on Shanghai Exchange
Insight Venture Partners Acquires Diligent Corporation for $505M
• Develops an online software application allowing board members, management,
and admin staff to produce, deliver, review, and vote on board materials
Wipro Acquires HealthPlan for $460M
• Leading independent technology and Business Process as a Service (BPaaS)
provider in the US health insurance market
Web.com Acquires Yodle for $342M
• Leading provider of local, vertically-focused digital marketing solutions enabling
CRM for small businesses through cloud-based marketing platforms
Nasdaq Acquires Marketwired for $108M
• Acquisition expected to significantly enhance Nasdaq's corporate services and
product suite with Marketwired's media analytics and targeting capabilities
Wirecard Acquires MoIP Pagamentos for $41M
• Wirecard takes over a team of more than 150 employees at the site in Sao Paulo
and continues its global expansion with this market entry in Brazil
Amazon Acquires EmVantage Payments
• Acquisition of leading payments platform as a service for merchants (fully integrated
online payment platform) to support focus on convenient and safe UX
BluePay (TA Associates) Acquires Billhighway
• Billhighway's proprietary software, integrated with BluePay’s advanced payment
technology, will deliver streamlined services for associations and not-for-profits
Private Placements
Xignite – $20.5M Series C ($55M pre-money) led by QUICK (financial market data)
RealtyShares – $20M Series B led by Union Square Ventures (real estate marketplace)
UniRush – $20M round of funding led by Main Street Capital (prepaid Visa debit cards)
Nvoicepay – $10M PP (electronic B2B payment and invoicing solutions)
Trusona – $8M Series A led by Kleiner Perkins (hardware-integrated authentication)
Payward – Undisclosed Series B led by SBI Investment (Bitcoin exchange)
Special Announcements
Pacific Crest Securities utilizes
expertise in SaaS and fintech to
advise Social Money on sale to Q2
Aptexx and KeyBank partner on
mobile-first solution for property
management and rent payments.
Financial Technology Capital Markets Update
Legend overlapping with
chart lines – please
adjust
2
Financial Technology Headlines
02/25 Fannie Mae is planning to add a new data element to its automated underwriting process soon that is designed to give
lenders a clearer picture of how consumers pay their bills over time. So-called trended data provides a 24-month
snapshot of an applicant's credit card payments. It can show if borrowers are "revolvers" who make at least the
minimum payment each month and carry a balance, or "transactors" who pay their credit card bill in full each month.
"Prior to trended data, there was no way to distinguish between a transactor and a revolver," according to John
Ulzheimer, a credit expert based in Atlanta who has written several books on consumer issues. "It is very valuable and
powerful information." For example, transactors who pay their credit card bill in full each month are considered three to
five times less risky than revolvers who are current but do not pay in full. Ulzheimer said he expects transactors to get
better pricing on their mortgages. Trended data can also show if a balance is growing and whether monthly payments
are increasing or decreasing. If consumers are choosing to pay less while balances are growing, it may signal an
applicant is becoming more risky and could become delinquent before their credit score changes. "It provides insight
into each borrower's use of credit and provides a more complete picture of their eligibility for mortgage loans as well as
the risks inherent in their creditworthiness," Timothy Mayopoulos, Fannie's president and chief executive, said in a
recent interview. Fannie is slated to update Desktop Underwriter in the second quarter with trended data supplied by
the credit reporting bureaus TransUnion and Equifax. Lenders should be able to access trended data sometime this
summer. The introduction of trended data is not expected, however, to expand Fannie's credit criteria (American
Banker, 02/25/16).
02/25 In the short history of mobile wallets, the most self-destructive thing a company could do was restrict a user's payment
or loyalty options. This was the downfall of Softcard, which was operated by mobile carriers that barred the rival
Google Wallet from their handsets. It was the downfall of Bling Nation, which demanded that retailers use its own
loyalty system. Even Apple has struggled to convince consumers to regularly use Apple Pay, the iPhone's exclusive
contactless mobile wallet. So what makes Chase Pay so different? Chase Pay is tied to the issuer's 94M credit, debit
and prepaid card accounts, representing half of US households. Depending on the perspective, this means Chase's
wallet either starts with — or excludes — half of the market. But it also has the flexibility to work in the foreground or
background of any partner's digital wallet, bringing its massive cardholder base along with it. Chase Pay is flexing its
muscles only five months after it was created as part of the closed-loop ChaseNet payment network by landing a role
with Starbucks, which has long been the marquee player in mobile payments with its own successful wallet app.
Chase Pay also has a place in the Merchant Customer Exchange's upcoming CurrentC mobile wallet, which is
expected to be supported by the venture's mega-merchant backers. Chase also wants its Quick Pay person-to-person
technology to be part of the MCX wallet over time (American Banker, 02/25/16).
02/24 Moven, one of the most talked-about startups of the fintech boom, is looking to spread financial education to the self-
employed. The digital-only "neobank" announced a partnership with the Freelancers Union, a group that represents
300,000 freelancers across the United States. Freelancers often struggle to access mainstream banking services
because they lack a specific employer, make inconsistent incomes and may not have a permanent address. Those are
conventional indicators of risk for traditional institutions, Moven said in a press release Wednesday. Through the
partnership, Moven will host free monthly events intended to provide support, education and tools to freelancers.
"Banks look at freelancers as second-class citizens, when in fact they are a highly educated, upwardly mobile,
valuable group of individuals," said Alex Sion, a Moven co-founder and its president. Moven has struck several
partnerships recently. In January it announced an alliance with the marketplace lender CommonBond and the credit
card consolidator Payoff to provide financial incentives to customers for using multiple fintech services. The strategic
move parallels President Obama's new budget proposal including about $30M to support the connection between
youth employment programs, financial literacy and the responsible use of financial products, according to Treasury
officials (American Banker, 02/24/16).
3
Financial Technology Headlines
02/24 After Congress passed the Durbin amendment — which was authored by Sen. Dick Durbin as part of the 2010 Dodd-
Frank Act — merchants promised to pass the savings on to consumers in the form of lower prices. The price controls
lawmakers were able to impose on those providing electronic payment options have resulted in an $8B annual
handout to retailers that they have not passed on to consumers. Five years after the Federal Reserve issued a rule to
implement the amendment, retailers have kept most of this revenue — an estimated $32B — for themselves. While
Congress may have thought this legislation would provide a benefit to consumers, data from a survey of merchants
contained in a recent Federal Reserve Bank of Richmond study indicates that the amendment is simply not working as
intended. The report found that "few merchants are found to reduce prices or debit restrictions as debit costs
decrease." This just reinforces the argument that the Durbin amendment is essentially a merchant handout from
Congress (American Banker, 02/24/16).
02/24 Mobile payments are often described as a problem in search of a solution, but there is one niche that is gaining
traction: virtual corporate cards for employees with infrequent business expenses. Several banks say that corporate
clients are embracing single-use virtual cards, as they make it easier for companies to monitor spending, limit the
number of physical cards issued and reduce paperwork in expense reporting. "Virtual will continue to accelerate and
will be much more meaningful in terms of total volumes," said Kevin Phalen, head of commercial cards and
comprehensive payables at Bank of America Merrill Lynch. "Clients are very interested and are widely adopting virtual
accounts." The increasing adoption of single-use virtual cards is a tangible example of an in-demand mobile payment
solution at a time when other mobile wallets' use cases struggle to get users. Banks, card companies and mobile
phone companies clearly see mobile payments as the way people will pay for things in the future but are still searching
for a catalyst for adoption. Companies like JPMorgan Chase see tying rewards to its mobile wallet as the way to
increase usage, for instance. Observers say the world of corporate mobile payments is perhaps even more uncertain,
given the considerably slower pace of innovation at the corporate banking level (American Banker, 02/24/16).
02/22 It would be hard to find two people more qualified to start a security company than Frank Abagnale and Ori Eisen.
Abagnale, the onetime con artist and check forger portrayed by Leonardo DiCaprio in the movie "Catch Me If You
Can," has been working with the FBI for the past 40 years to investigate fraudsters and scam artists. Eisen was the
worldwide director of antifraud efforts at American Express. In 2004 he founded his own security company, 41st
Parameter, at the suggestion of Abagnale, who served on its board of advisers. Their new project is a security startup
called Trusona. It has created a heavy-duty authentication scheme designed to check, beyond a shadow of a doubt,
that a person is who she says she is. The service is being marketed to banks, large companies and government
agencies for use by their customers or employees. "41st Parameter provided 99% fraud detection, because the main
tenet was not to disturb customers — everything was passive," Eisen said. "It works really well, but it doesn't solve for
the last mile." By "last mile," he means authenticating the user's identity every time they log in — on the online banking
site, on the mobile banking app or in the call center. Whereas 41st Parameter does all its work in the background,
Trusona requires effort on the user's part. It's meant for private banking clients, corporate customers and VIPs, in
situations where security needs to come before convenience. At the heart of the service is a hardware token that
Eisen refers to as "the baby" (the official name is TruToken). It's a small magnetic stripe card reader that can be
plugged into a smartphone and used to scan an identification card or credit card and capture not only the information
on the magnetic stripe, but also the patterns of the barium ferrite particles in the composition of the stripe. (No two are
alike, according to Eisen, so the device can identify fake cards). This piece of hardware has been tested for the past
six years inside ATMs in Chile, where it was used to prevent EMV chip-card fraud. To create the token, the technology
was taken out of the ATM and put on an ASIC chip. To sign up for the service, a prospective user needs to photograph
or scan her passport or driver's license. Then she needs to go to the post office or have a postal delivery person come
to her home to verify that piece of identification before receiving the token. (Trusona says it has a partnership with the
US Postal Service to do this). Alternatively, a corporate customer could have someone in accounting or HR play the
role of "true notary," and check employees' IDs, or a bank could have its private bankers serve this function (American
Banker, 02/22/16).
4
Financial Technology Headlines
02/22 As Samsung prepares to roll out its mobile payments to more international markets, the company reveals that the
product has picked up five million registered users and processed over $500M in transactions in the first six months
since its launch in South Korea and the US. The company says it now supports eligible credit and debit cards from
more than 70 major and regional banks in South Korea and the US. Global expansion will being next month, as the
company introduces Samsung Pay in China. This will bring the firm head-to-head with Apple, which made its debut in
China last week, alongside local tech giants Alibaba and Tencent. Other market set for roll out include Australia,
Brazil, Singapore, Spain, and the UK (Finextra, 02/22/16).
02/19 Powa Technologies has gone into administration after the payments startup's largest investor, Wellington
Management, called in loans. The news comes days after it emerged that Powa has recently held back staff salaries
and payments to suppliers, leaving some employees locked out of offices. Despite having raised a hefty $175M in
funding, Powa had just $250,000 in cash available to it at the start of February. Business Insider recently revealed that
late last year the firm had to take out a loan – the size of which is not known – from Wellington Management that
required the startup to put up the entire company as security (Finextra, 02/19/16).
02/19 European and African leaders gathered in Valletta, Malta, last November set a goal of lowering the cost of remittances
to 3% of the transaction value by 2020. Innovative technology combined with policy changes could make this happen.
The World Bank estimates there are 250M migrants who have left their home countries mainly for economic reasons
(only 6% are refugees from strife- and war-torn places like Syria; the rest are simply looking for work). Those migrants
typically earn about $180 a month and send home $140 or $160. These payments will add up to more than $600B this
year, the organization says. The number grows every year. These small payments are expensive — on average, they
cost 8% of the payment amount, according to the World Bank (in the US, it's 5%). This is due, industry observers say,
to inefficient and paper-bound processes, oligopolies that can charge high prices, the networks of banks and money
transfer operators involved in an international payment that each take a cut from the transaction, and excessive
regulation. Despite a flurry of startup activity in the space, technology remains a big part of the answer (American
Banker, 02/19/16)
02/19 MasterCard is bidding to help banks cut down the number of false declines on card transactions with the roll out of
more precise behavioral fraud analytics. With one out of every six cardholders experiencing at least one decline
because of suspected fraud in the past year, MasterCard says its new technology bundle will provide deeper insights
into cardholder spending habits in a split-second. Dubbed MasterCard IQ, the core products include an authorization
and assurance tool. Authorization IQ uses the unique and historical behavior of the card to predict and assess risk
against a current transaction. The Assurance kit enables the exchange of information from the merchant about the
particular circumstances of a transaction to help provide a more nuanced risk score. Research by Javelin shows that
the value of false declines per year has hit $118B, more than 13 times the total amount lost annually to actual card
fraud ($9B). Not only are such refusals more likely to hit more affluent consumers who spend more on big ticket items,
they also have a negative rebound in customer attitude towards the bank and merchant. “While the industry has
relentlessly worked to reduce fraud, some of these efforts have resulted in an increase in transactions being
needlessly declined,” says Ajay Bhalla, president of Enterprise Security Solutions, MasterCard (Finextra, 02/19/16).
02/17 The classic board game Monopoly is entering the 21st Century, going digital and ditching its iconic paper money for
contactless payment cards. The new 'Ultimate Banking' edition, which arrives in the US later this year, will see players
use cards and a mini-reader to buy property and pay rent. Toy giant Hasbro first introduced a paperless version of the
famous free-market celebrating game a couple of years ago but it faced criticism for requiring player to enter
transactions on a PIN pad. The latest iteration sees players tap and swipe their payment cards, as well as property
and chance cards, with funds automatically paid. The reader also tracks wealth and the value of properties, which see
their rents fluctuate. As in the real world, the decision to phase out cash is designed to save time and cut fraud by
eliminating the much abused position of banker (Finextra, 02/17/16).
5
Financial Technology Headlines (continued)
02/17 Top tier banks are increasingly open to the adoption of utility-based shared service models to drive down costs and
increase efficiency in back office and compliance functions, according to research conducted by Finextra. The survey
of 102 financial services professionals from 69 financial institutions across 26 countries found that three main areas
noted as ripe for growth include: market and reference data management, reconciliation and exception management,
and regulatory and compliance-related reporting. As many as 73% of respondents are prepared to use a utility model
in the data management space, while 61% see it as a driver for straight-through processing in reconciliation and
exception management. Banks polled believe the third party utility approach can help to cut costs, cope with variable
volumes and achieve predictable service and quality levels (Finextra, 02/17/16).
02/16 For the last nine months, marketplace lenders have been hoping the Supreme Court would save them from a lower-
court ruling that raised fundamental questions about their business model. But following the unexpected death of
Justice Antonin Scalia, the nation's highest court suddenly appears less likely to come to the industry's aid. "His
passing marks a potential blow to the chances of the case being heard and ultimately overturned," said Brian Korn, a
lawyer at Manatt, Phelps & Phillips. It's largely a matter of simple arithmetic. In order to shake off the effects of a ruling
that has hurt some lenders' ability to operate in New York, Connecticut, and Vermont, the industry needs two things to
happen. First, four Supreme Court justices must vote in favor of hearing the case, Madden v. Midland Funding. Back
in December, the Supreme Court asked the plaintiffs, who won at the appeals court level, to respond in writing to the
losing side's arguments. That request made industry officials more optimistic that the court would decide to accept the
case. But Scalia's death leaves the Supreme Court with only eight members, rather than nine, which provides a
smaller pool of justices to supply four votes in favor of hearing the case. Second, even if the Supreme Court hears the
case, the votes of five out of the eight remaining justices would be necessary to overturn a May 2015 ruling by the 2nd
Circuit Court of Appeals. Prior to Scalia's death, five votes out of nine would have been needed. In a scenario where
the Supreme Court decides to hear the case, and then splits 4-4 on whether to overturn the appeals court ruling, the
earlier decision would remain binding in New York, Connecticut and Vermont (American Banker, 02/16/16).
02/16 Swift may lose its status as the sole network supplier to the European Central Bank's (ECB) Target2 real-time gross
settlement (RTGS) platform as the Eurosystem enters consultation on the future for payments and settlement across
the Eurozone. The ECB is contemplating a merger of the Target2 real-time gross payment system with the T2S
securities settlement mechanism, providing a single platform for the processing of cash and securities across the
Eurosystem. In the consultation paper, the ECB says that bringing the two platforms together could allow Target2 to
benefit from the multi-currency capability of T2S, the possibility of accessing the platform via different network service
providers or the extensive and systematic usage of ISO20022 standards. The Central Bank says that the decision to
select Swift as the sole network provider for Target2 in 2004 was motivated by time constraints and the preference of
market participants for a system to which they were already connected. "As a consequence Target2 relied heavily on a
number of specific/proprietary solutions developed by Swift (e.g. InterAct, FileAct, RBAC roles)," notes the ECB. For
T2S, the ECB went to public tender to select two network providers - ultimately won by Swift and SIA/Colt - in order to
provide a network agnostic solution and drive competition in the market. Technical consolidation of the two platforms
would enable a similar outcome, suggests the ECB, eliminating Swift’s monopoly status and introducing further
competition between network providers and improved resilience (Finextra, 02/16/16).
02/16 While the real estate field may have been slow to adapt to new technology, that has begun to change in the last few
years, and there is now a strong demand for new technology within the industry. A rising number of startups are now
filling that void, encouraging the traditional world of real estate to make the changes necessary to enter a new age. To
a large degree, the real estate industry has now entered what could be termed as none other than a competitive tech
race. Last year, investors funneled approximately $1.5B into real estate-related tech startups. That represents an
increase from $1.1B in venture funding capital for real estate tech startups in 2014, and a 350% increase from four
years prior. Many of the top tech real estate fundraisers make their home in New York (RealEstate Tech News,
02/16/16).
6
Financial Technology Headlines (continued)
02/11 By putting some distance between itself and its venture capitalists, BBVA is hoping to get closer to fintech. The
Spanish bank announced Thursday it would take the $100M backing its internal Ventures effort, add an extra $150M
and create Propel Venture Partners, an independent firm that will invest in fintech startups in various stages of
development. At the heart of this effort is the autonomy granted to Propel. Bank venture arms, despite the clout they
carry by having the brand of a major global bank in their name, are often hamstrung by the complexities of being part
of such an institution. Those complexities include the bureaucracy of any large organization, the limits put in place by
regulation and the trepidation entrepreneurs may have about pairing with an incumbent they are looking to displace.
"This makes us a much more attractive investor," said Jay Reinemann, a managing partner of Propel, who also co-
managed BBVA Ventures. "The hard-to-get deals are the ones we want. It's easy to make investments, but it's hard to
make good investments." BBVA Ventures had made some major fintech plays since its 2013 launch, including:
acquiring neobank Simple in 2014; taking a 29.5% stake in Atom, the UK's first mobile bank; and investing in
marketplace lender Prosper. At the same time the BBVA Group continued to launch digital products and incorporate
new digital businesses. BBVA has also highlighted the role played by its digital transformation strategy in pushing the
bank's earnings potential, saying that 19.2% of consumer loans in Spain last year were made purely through digital
channels, double the number sold in the previous year. Reporting a 10.9% rise in gross income for 2015, the Spanish
bank put its digital program front and center of its full year results (American Banker, 02/11/16).
02/09 Markit has acquired syndicated loan technology from JPMorgan in a bid to ease third party connectivity issues for
market participants and shorten loan settlement timeframes. Financial terms were not disclosed. Markit says it will
make the middleware available to sellside and buyside institutions seeking to integrate with major systems used in the
syndicated loan market, including agent servicing platforms and Markit’s trade settlement services. It currently takes
up to 20 days to close out a loan deal, a process which has led to criticism from market regulators concerned about
the temporal risks presented by mismatched deals. Markit made its first foray into the loans market in 2008, with the
acquisition of FCS, a unit of JPMorgan Chase that provides portfolio and risk management software to syndicated loan
market participants. This was followed in 2010 by the buyout of the technology assets of Storm Networks, in an effort
to improve trade settlement workflow and connectivity with counterparties. Scott Kostyra, managing director and head
of Loan Settlement in Markit’s Processing division, says of the current transaction: “Acquiring this software allows
Markit to provide the global syndicated loan market with a proven solution for integrating with the newest technology
for straight through processing of loan transactions and lifecycle events. We are offering an alternative to expensive
and risky internal software builds and helping expedite industry adoption of risk and cost reducing initiatives such as
Markit Clear for trade settlement and FpML for electronic communication of loan information.” Customer deployments
of the software are expected to begin in the second half of 2016, he says (Finextra, 02/09/16).
02/09 There's a fresh undercurrent of worry among security experts that the US payments infrastructure is a prime target for
nation-state attackers. The payments network is an alluring target because while an attack on it could wreak a lot of
havoc, it wouldn't necessarily trigger a military response from the US government. It wouldn't be considered as
threatening as an attack on our electric or communications grids, for instance. And the network itself is fragmented,
with widely varying levels of security at each point. One reason the US payments infrastructure is vulnerable is its
fragmented nature — often compared to a "spaghetti bowl." There's the automated clearing house network; debit card
networks; four major credit card networks; the Federal Reserve, which clears and settles paper and electronic checks;
the large processors that process debit and credit card transactions (First Data, TSYS, et al.); the banks themselves,
which each have their own payment systems; and retailers that accept payments at their point of sale terminals. But
fragmentation can be an advantage as well. "You have multiple targets, and if you lose access or have issues with one
payments system we have redundancy," said Al Pascual, senior vice president, research director and head of fraud
and security at Javelin Strategy & Research. "It's not as though you could target one system and we couldn't render
payments in a comparable way." The older technology in some cogs of the payments infrastructure is also an
advantage, he said. "These systems are not publicly accessible and they're very much legacy," Pascual said. "You'd
have to have intimate knowledge of the platforms on which these systems are built" to infiltrate them. How many
hooded young hackers know COBOL or the AS/400? (American Banker, 02/09/16).
7
Financial Technology Headlines (continued)
02/08 The shareholder base in once high flying online lending companies is turning over as technology investors sell and
financial institution investors move in to take advantage of lower valuations. Pitched as scalable Internet companies,
industry bellwethers LendingClub (NYSE:LC) and OnDeck Capital (ONDK) secured tech-style revenue multiples in
their December 2014 IPOs on hopes they were set to disrupt banks' lending businesses. The stocks have since been
on near-constant slides downward as the market reassesses the companies and debates how they should be valued.
Shares in both groups are down close to 70%. Sector advisers, investors, and analysts said they have noticed the
change in investor composition that has accompanied the decline, which puts LendingClub and OnDeck’s stocks at
values closer to financial technology firms and banks, respectively. With no follow-on offerings to the IPOs, many early
backers continue to hold shares but paper gains have been cut and late stage investors are underwater. Waiting on
the side lines of public markets are hundreds of competitors that aim to use technology to inexpensively offer loans to
consumers and small businesses via the internet. Most of these start-ups have followed a technology model of
focusing on revenue over earnings. One industry debt investor compared the situation to the late 1990s boom in online
brokerages that offered consumers much cheaper trading than established firms. The industry ultimately rationalized
and a handful of businesses emerged. Subprime consumer lender Elevate Credit cancelled an IPO mid-roadshow in
January, weeks after mortgage company loanDepot aborted its listing. The fast growing companies positioned
themselves as technology firms, only to find investors were looking at them as much lower valued specialty finance
institutions (MergerMarket, 02/08/16).
02/04 As insurance technology (InsuranceTech) becomes one of the hottest FinTech sectors around the world, the growing
numbers of bright entrepreneurs are looking to enter the race for a trillion-dollar industry disruption. Although January
2016 wasn’t particularly fruitful for InsuranceTech startups in terms of funds raised (1% of all funds raised within
FinTech), in 2016, may see more InsuranceTech startups expanding the presence and gathering more attention and
funding given that InsuranceTech demonstrated its amazing potential with some recent exciting news on an AI bot
replacing humans. Healthcare is not the only trillion-dollar industry that has developed into a complex and
cumbersome system around the world. Car insurance sector is another one where bright entrepreneurs are actively
looking for ways to improve customer experience and reduce the costs of necessities like insurance for a personal
vehicle (Lets Talk Payments, 02/04/16).
02/04 The mPOS space is rapidly evolving into mobile capability far beyond mobile payments. And the restaurant industry is
a hotbed for mobile, which is having a profound and transformative effect on the space. Mobility in restaurants has the
potential to improve everyone’s restaurant experience, from customers to staffers to owners. And it’s not just about
paying with a mobile tablet — it is an experiential and operational overhaul. PYMNTS interviewed Steve Fredette, co-
founder and president of Toast, an all-in-one, cloud-based, POS and restaurant management system. The discussion
dives into the evolving restaurant experience, and how technology is catalyzing the evolution. Here’s a sneak peek:
“Adoption, Fredette said, is driven by the ease of use of the mobile tablet system. Older, Web-based POS systems, he
said, were “a little bit clunky,” not to mention time-consuming to train staff on. And, in a high-turnover business like the
restaurant industry, those hours of training can add up quickly. “I tend to believe that one of the big things that has
allowed software as a service to really disrupt the point-of-sale market, in particular in restaurants, is app platforms like
Android and iOS,” Fredette said. Toast is Android-based, which, Fredette said, allows for flexibility to build for multiple
screen sizes. “We’ve built everything mobile-first,” he said. “Older POS systems’ technology was built for systems like
Windows,” he said, “where mobile was more of a bolt-on or an afterthought” (Pymnts.com, 02/04/16).
8
Financial Technology Headlines (continued)
02/04 Visa is vowing to transform from a payments network to an open platform through the launch of a developer portal that
gives banks, merchants, and tech firms access to its technology, products, and services. At launch, the new Visa
Developer platform will offer access, via APIs, to some of the card network's most popular payment technologies and
services, including account holder identification, P2P payment capabilities, in-store, and online payment services such
as Visa Checkout, currency conversion, and transaction alerts. Developers get access to a portal for searching Visa’s
suite of payment products and services; an open platform that provides access to hundreds of Visa APIs and software
development kits; a testing sandbox that offers application developers a plug and play experience, as well as access
to Visa test data; and engagement centers designed to foster collaboration and co-creation with application developers
in key markets like San Francisco, Dubai, Singapore, Miami, and São Paulo. "As the leader in payments we have an
opportunity to transform global commerce by opening-up access to our global network and supporting our clients,
industry partners and innovators in their pursuit of creating new, easier and more secure ways to pay," says Charlie
Scharf, CEO, Visa. "Visa Developer represents not only a new access point to our network, but a new distribution
platform for Visa products and services globally" (Finextra, 02/04/16).
02/04 The House passed a bill Thursday 250-169 that would limit regulators' ability to force banks to cut ties with certain
businesses despite Democratic fears that it could hamstring the Justice Department's ability to prosecute bankers
responsible for the financial crisis. The legislation by Rep. Blaine Luetkemeyer, R-Mo., stemmed from the Justice
Department's Operation Choke Point program, which sought to cut off fraudsters from the financial system. Critics in
the industry and beyond have argued the program exceeds the Justice Department's authority and forced banks to cut
ties with legitimate businesses. "My job is to stop the nonsense of Choke Point, to stop the administration's runaway
activities of Choke Point, which I think is illegal," Luetkemeyer said in an interview Thursday. "Our efforts are starting
to take hold. There is enough pushback from all the industries that are being affected and the banks are realizing they
can push back" against federal regulators. But the legislation only garnered support from 10 Democrats — and is
opposed by the White House, which threatened to veto it. That raises questions about whether it can be taken up by
the Senate. Even if it did pass that chamber, there does not appear to be enough support to override a veto (American
Banker, 02/04/16).
02/03 Tighter regulations in MiFID II mean all trading firms using any form of trading algorithm (which includes most forms of
electronic trading) need to invest in a new way of testing their algorithms or face ceasing trading, with senior
management being held responsible for any lack of testing that results in their trading causing or contributing to market
disorder. With the advent of MiFID II, stringent algorithm testing requirements are to be placed on both buy and sell
side investment firms with senior management carrying explicit responsibility for compliance (Bobsguide, 02/03/16).
02/02 Incidents of new account fraud in the US doubled last year, as criminals switched tactics in response to the
introduction of EMV chip cards. The 2016 Identity Fraud Study released by Javelin Strategy & Research, revealed that
the number of identity fraud victims increased by 3% (13.1M consumers) in the US last year, but that the amount
stolen decreased by 6% to $15B. The number of identity fraud victims was at its second highest level in six years, but
the amount stolen was at its lowest point in the past six years. Nonetheless, $112B in total has been lost to ID
fraudsters during that timeframe. In 2015, the US began its migration to EMV, in a bid to crack down on in-person
fraud and the profitability of counterfeit card operations. Fraudsters have reacted by moving away from existing card
fraud, says Javelin, instead driving a 113% increase in incidence of new account fraud, which now accounts for 20%
of all fraud losses (Finextra, 02/02/16).
9
Financial Technology Headlines (continued)
02/01 JP Morgan has begun a trial project to test the use of blockchain technology in its loan trading operations. The bank is
working with Digital Asset Holdings (DAH) , the firm set up by its former head of commodities Blythe Masters, to
address liquidity matches in its loan funds. JP Morgan was among group of top banks to join a $50M funding round in
Digital Asset Holdings last month. The startup is attempting to build a portfolio of blockchain-related financial services
products aimed at improving efficiency, security, compliance, and settlement speed. The bank is also involved in the
bank-backed consortium effort run by R3 CEV and the Linux Foundation's Open Ledger Project. Daniel Pinto, head of
JPMorgan's investment bank, and a widely-touted successor to CEO Jamie Dimon, stated that loans were a good
place to start trialing blockchain technology, because “the settlement process is complex with lots of manual
intervention and multiple parties.” “Blockchain will be big in everything related to settlement, and not just loans," he
continued. "While it is still early days, the technology looks very good." All in, the round captured some level of
investment from 13 firms that run the gamut when it comes to finance functions. Also participating: ABN Amro, BNP
Paribas, JPMorgan Chase and PNC Financial Services Group; exchange operator fund CME Ventures; tech firms
Accenture and Broadridge; and ICAP and Depository Trust & Clearing Corporation (DTCC). And DAH took more than
just investment from the round. Investor ASX also awarded DAH a contract to create a post-trade settlement system
using distributed ledger tech. The Australian exchange operator is seeking a new system to provide clearing and
settlement for the cash equities market that could replace the current CHESS clearing system (Finextra, 02/01/16).
02/01 Trade association Payments UK has launched a directory designed to make it simpler for anyone making cross-border
payments into the UK to check routing data. The new rule means that Eurozone banks and Payment Service
Providers (PSPs) can process SEPA payments using only a customer's IBAN, meaning that they no longer need the
Business Identifier Code (BIC) of the PSP they are intending to pay. Although the rule does not apply to the UK until
October, Payments UK has worked with Swift to build a SEPA IBAN-only directory that provides PSPs with a way of
deriving the BIC from the IBAN, ensuring Eurozone firms have the information they need to route SEPA payments to
British beneficiaries. The directory can either be downloaded, integrated for access via an API into the end user’s back
office systems, or accessed through the individual lookup facility, which is free to use from swift.com. According to
Maurice Cleaves, Chief Executive at Payments UK, "Our directory, which includes data for over 95% of UK SEPA-
reachable BICs, goes truly above and beyond, boasting a technologically superior offering. By incorporating open API
criteria into the software, we are demonstrating the emphasis we place on making payments efficient – streamlining
and simplifying processes for the end user – and harnessing the latest technology to help us in that regard." (Finextra,
02/01/16).
01/31 A dispute over technology could pose a new threat to Wall Street’s plumbing by severing a link that allows big banks to
borrow freely from one another, according to market participants. A unit of Depository Trust & Clearing Corp., the
dominant processor of repurchase agreements, or repos, between securities dealers, has told traders it will stop
facilitating certain interbank repos as of July 15. The roadblock affects an estimated $45B in daily repo loans, short-
term loans through which banks and other financial firms exchange cash and securities to raise funds for their trading
activities. A clearing bank confirms the identity of parties to a trade and their terms, before processing the transaction.
In settlement, a third party ensures the quantities agreed upon in the trade are transferred. The suspension would
mean the DTCC unit could not match up trades between dealers that have cleared their interbank repos through Bank
of New York Mellon Corp., a large clearing bank, and dealers that clear through BNY’s distant competitor in repo
clearing, JP Morgan Chase. Since a unit of DTCC will no longer bridge the divide, dealers will only be able to trade
with firms that process their trades through the same clearing bank (Wall Street Journal, 01/31/16).
Valuation Multiples Growth Rates PEG
EV / Revenue EV / EBITDA P/E Revenue (%) EPS (%) Ratio
CY2015P CY2016E CY2015P CY2016E CY2015P CY2016E CY2016E CY2017E CY2016E CY2017E CY2016E
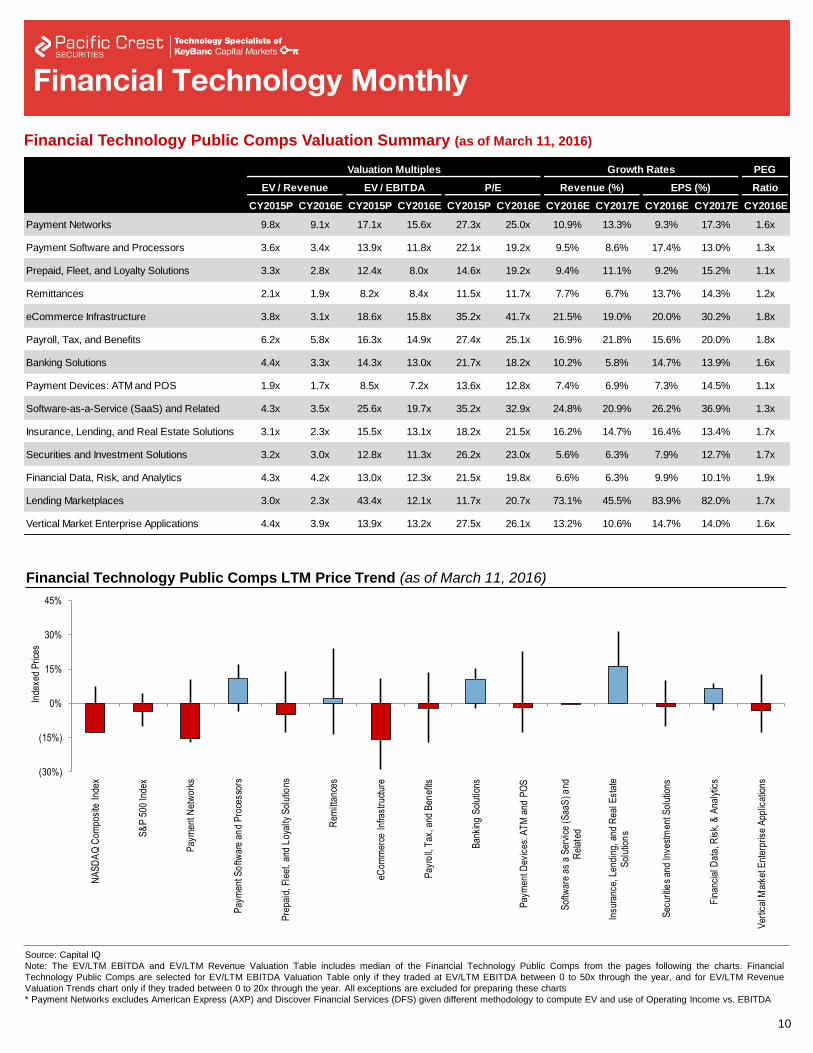
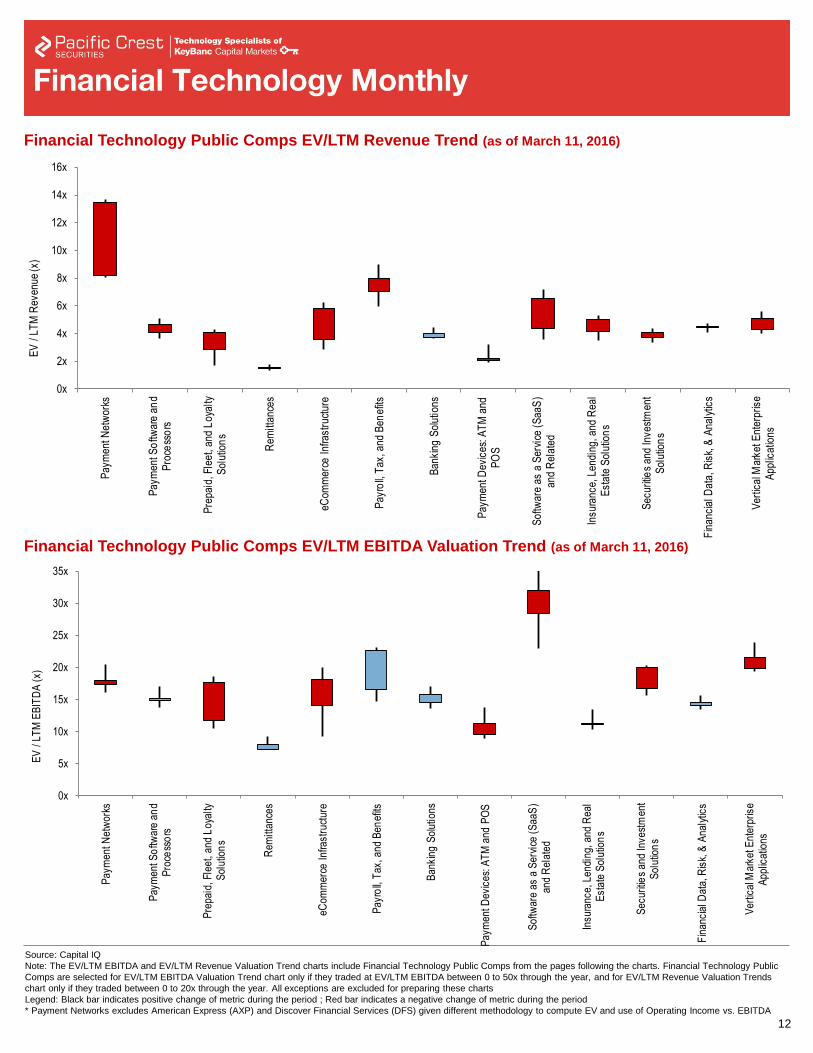
Payment Networks 9.8x 9.1x 17.1x 15.6x 27.3x 25.0x 10.9% 13.3% 9.3% 17.3% 1.6x
Payment Software and Processors 3.6x 3.4x 13.9x 11.8x 22.1x 19.2x 9.5% 8.6% 17.4% 13.0% 1.3x
Prepaid, Fleet, and Loyalty Solutions 3.3x 2.8x 12.4x 8.0x 14.6x 19.2x 9.4% 11.1% 9.2% 15.2% 1.1x
Remittances 2.1x 1.9x 8.2x 8.4x 11.5x 11.7x 7.7% 6.7% 13.7% 14.3% 1.2x
eCommerce Infrastructure 3.8x 3.1x 18.6x 15.8x 35.2x 41.7x 21.5% 19.0% 20.0% 30.2% 1.8x
Payroll, Tax, and Benefits 6.2x 5.8x 16.3x 14.9x 27.4x 25.1x 16.9% 21.8% 15.6% 20.0% 1.8x
Banking Solutions 4.4x 3.3x 14.3x 13.0x 21.7x 18.2x 10.2% 5.8% 14.7% 13.9% 1.6x
Payment Devices: ATM and POS 1.9x 1.7x 8.5x 7.2x 13.6x 12.8x 7.4% 6.9% 7.3% 14.5% 1.1x
Software-as-a-Service (SaaS) and Related 4.3x 3.5x 25.6x 19.7x 35.2x 32.9x 24.8% 20.9% 26.2% 36.9% 1.3x
Insurance, Lending, and Real Estate Solutions 3.1x 2.3x 15.5x 13.1x 18.2x 21.5x 16.2% 14.7% 16.4% 13.4% 1.7x
Securities and Investment Solutions 3.2x 3.0x 12.8x 11.3x 26.2x 23.0x 5.6% 6.3% 7.9% 12.7% 1.7x
Financial Data, Risk, and Analytics 4.3x 4.2x 13.0x 12.3x 21.5x 19.8x 6.6% 6.3% 9.9% 10.1% 1.9x
Lending Marketplaces 3.0x 2.3x 43.4x 12.1x 11.7x 20.7x 73.1% 45.5% 83.9% 82.0% 1.7x
Vertical Market Enterprise Applications 4.4x 3.9x 13.9x 13.2x 27.5x 26.1x 13.2% 10.6% 14.7% 14.0% 1.6x
10
Source: Capital IQ
Note: The EV/LTM EBITDA and EV/LTM Revenue Valuation Table includes median of the Financial Technology Public Comps from the pages following the charts. Financial
Technology Public Comps are selected for EV/LTM EBITDA Valuation Table only if they traded at EV/LTM EBITDA between 0 to 50x through the year, and for EV/LTM Revenue
Valuation Trends chart only if they traded between 0 to 20x through the year. All exceptions are excluded for preparing these charts
* Payment Networks excludes American Express (AXP) and Discover Financial Services (DFS) given different methodology to compute EV and use of Operating Income vs. EBITDA
(30%)
(15%)
0%
15%
30%
45%
NA
SD
AQ
Com
posi
te I
ndex
S&
P 5
00 In
dex
Pay
men
t Net
wor
ks
Pay
men
t So
ftwar
e an
d P
roce
ssor
s
Pre
paid
, Fle
et, a
nd L
oyal
ty S
olut
ions
Rem
ittan
ces
eCom
mer
ce In
frast
ruct
ure
Pay
roll,
Tax
, and
Ben
efits
Ban
king
Sol
utio
ns
Pay
men
t Dev
ices
: AT
M a
nd P
OS
Sof
twar
e as
a S
ervi
ce (
Saa
S) a
ndR
elat
ed
Insu
ranc
e, L
endi
ng, a
nd R
eal E
stat
eS
olut
ion
s
Sec
uriti
es
and
Inve
stm
ent S
olut
ions
Fin
anci
al D
ata,
Ris
k, &
Ana
lytic
s
Ver
tical
Mar
ket E
nter
pris
e A
pplic
atio
ns
Inde
xed
Pric
es
Financial Technology Public Comps Valuation Summary (as of March 11, 2016)
Financial Technology Public Comps LTM Price Trend (as of March 11, 2016)
This summary tables shows comp
medians for 2016E and 2017E,
while the comp groups in the back
show revenue and ebitda and P/E
figures for 15P and 16E. Change
this table to show 15P and 16E
numbers so that they match the
comp groups in the back
Changed tables for P/E and other
figures to CY2015P and CY2016E
(20%)
0%
20%
40%
60%
11-Mar-15 11-May-15 11-Jul-15 11-Sep-15 11-Nov-15 11-Jan-16 11-Mar-16
S&P 500 Index Large Cap FT IndexTech Sector S&P 500 Index Payment Networks
Prepaid, Fleet, and Loyalty Solutions Payment Software and Processors
Banking Solutions Software as a Service (SaaS) and Related
Financial Data, Risk, & Analytics
Inde
xed
Pric
e (%
)
3.9%
0.7%
12.9%
(2.5%)
15.1%
6.5%9.5%
3.4%
(0.6%)
11
Source: Capital IQ
Note: The EV/LTM EBITDA and EV/LTM Revenue Valuation Table includes median of the Financial Technology Public Comps from the pages following the charts. Financial
Technology Public Comps are selected for EV/LTM EBITDA Valuation Table only if they traded at EV/LTM EBITDA between 0 to 50x through the year, and for EV/LTM Revenue
Valuation Trends chart only if they traded between 0 to 20x through the year. All exceptions are excluded for preparing these charts
* Payment Networks excludes American Express (AXP) and Discover Financial Services (DFS) given different methodology to compute EV and use of Operating Income vs. EBITDA
Index 1 Month 12 Month
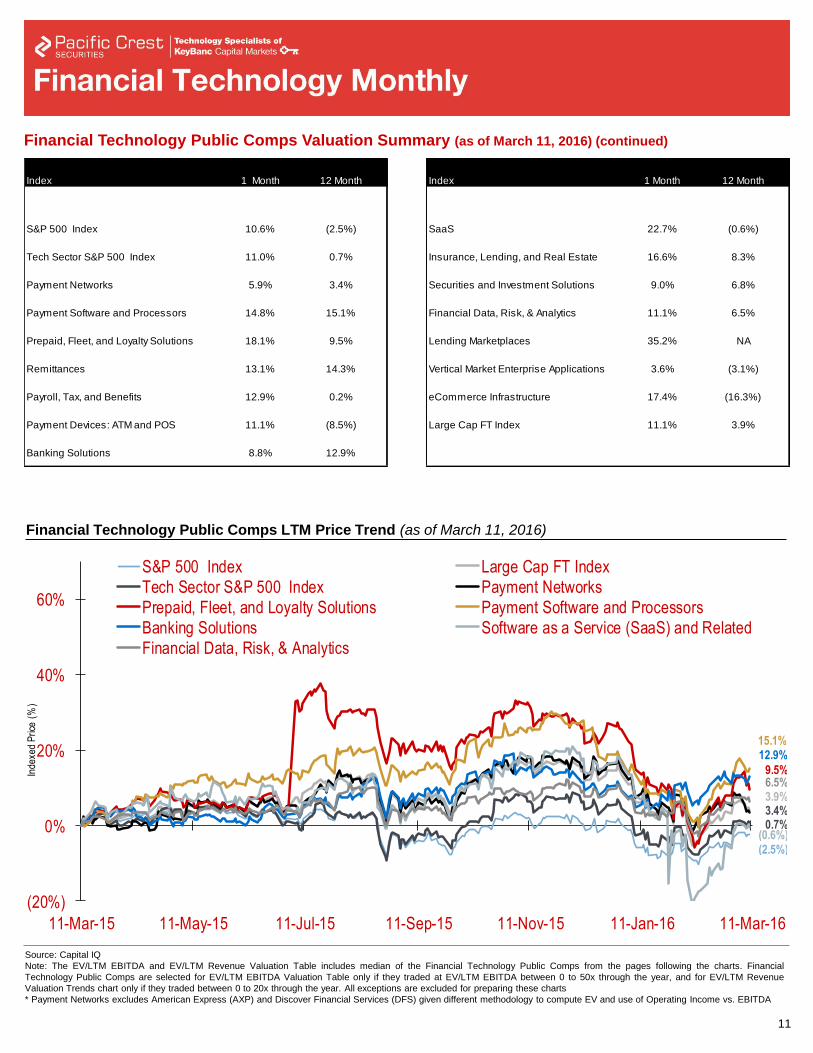
S&P 500 Index 10.6% (2.5%)
Tech Sector S&P 500 Index 11.0% 0.7%
Payment Networks 5.9% 3.4%
Payment Software and Processors 14.8% 15.1%
Prepaid, Fleet, and Loyalty Solutions 18.1% 9.5%
Remittances 13.1% 14.3%
Payroll, Tax, and Benefits 12.9% 0.2%
Payment Devices: ATM and POS 11.1% (8.5%)
Banking Solutions 8.8% 12.9%
Index 1 Month 12 Month
SaaS 22.7% (0.6%)
Insurance, Lending, and Real Estate 16.6% 8.3%
Securities and Investment Solutions 9.0% 6.8%
Financial Data, Risk, & Analytics 11.1% 6.5%
Lending Marketplaces 35.2% NA
Vertical Market Enterprise Applications 3.6% (3.1%)
eCommerce Infrastructure 17.4% (16.3%)
Large Cap FT Index 11.1% 3.9%
Take out "Solution" at end of "Insurance, Lending, and
Real Estate" category in top right chart (take it out
ONLY in this chart)
Vertical axis title on bottom comps chart looks
strange?
Financial Technology Public Comps Valuation Summary (as of March 11, 2016) (continued)
Financial Technology Public Comps LTM Price Trend (as of March 11, 2016)
Gap in chart – please
change dates in axis to
3/11/2015 and 3/11/2016
respectively
I am assuming the NA for
lending marketplaces is
because of Yirendai’s
recent IPO – please
calculate the 12 month
return excluding Yirendai,
and perhaps footnote at
the bottom
12
Source: Capital IQ
Note: The EV/LTM EBITDA and EV/LTM Revenue Valuation Trend charts include Financial Technology Public Comps from the pages following the charts. Financial Technology Public
Comps are selected for EV/LTM EBITDA Valuation Trend chart only if they traded at EV/LTM EBITDA between 0 to 50x through the year, and for EV/LTM Revenue Valuation Trends
chart only if they traded between 0 to 20x through the year. All exceptions are excluded for preparing these charts
Legend: Black bar indicates positive change of metric during the period ; Red bar indicates a negative change of metric during the period
* Payment Networks excludes American Express (AXP) and Discover Financial Services (DFS) given different methodology to compute EV and use of Operating Income vs. EBITDA
0x
5x
10x
15x
20x
25x
30x
35x
Pay
men
t Net
wor
ks
Pay
men
t So
ftwar
e an
dP
roce
sso
rs
Pre
paid
, Fle
et, a
nd L
oyal
tyS
olut
ion
s
Rem
ittan
ces
eCom
mer
ce In
frast
ruct
ure
Pay
roll,
Tax
, and
Ben
efits
Ban
king
Sol
utio
ns
Pay
men
t Dev
ices
: AT
M a
nd P
OS
Sof
twar
e as
a S
ervi
ce (
Saa
S)
and
Rel
ated
Insu
ranc
e, L
endi
ng, a
nd R
eal
Est
ate
Sol
utio
ns
Sec
uriti
es
and
Inve
stm
ent
Sol
utio
ns
Fin
anci
al D
ata,
Ris
k, &
Ana
lytic
s
Ver
tical
Mar
ket E
nter
pris
eA
pplic
atio
ns
EV
/ L
TM
EB
ITD
A (
x)
0x
2x
4x
6x
8x
10x
12x
14x
16x
Pay
men
t Net
wor
ks
Pay
men
t So
ftwar
e an
dP
roce
sso
rs
Pre
paid
, Fle
et, a
nd L
oyal
tyS
olut
ion
s
Rem
ittan
ces
eCom
mer
ce In
frast
ruct
ure
Pay
roll,
Tax
, and
Ben
efits
Ban
king
Sol
utio
ns
Pay
men
t Dev
ices
: AT
M a
ndP
OS
Sof
twar
e as
a S
ervi
ce (
Saa
S)
and
Rel
ated
Insu
ranc
e, L
endi
ng, a
nd R
eal
Est
ate
Sol
utio
ns
Sec
uriti
es
and
Inve
stm
ent
Sol
utio
ns
Fin
anci
al D
ata,
Ris
k, &
Ana
lytic
s
Ver
tical
Mar
ket E
nter
pris
eA
pplic
atio
ns
EV
/ L
TM
Rev
enue
(x)
Financial Technology Public Comps EV/LTM Revenue Trend (as of March 11, 2016)
Financial Technology Public Comps EV/LTM EBITDA Valuation Trend (as of March 11, 2016)
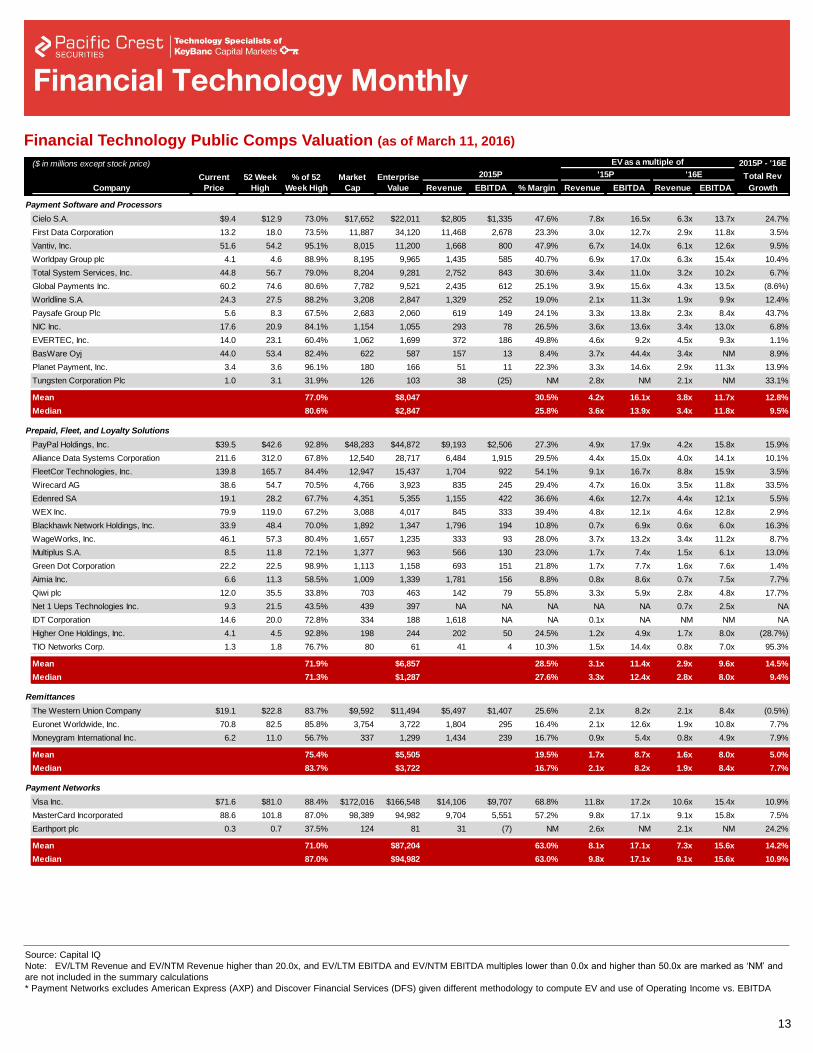
13
Source: Capital IQ
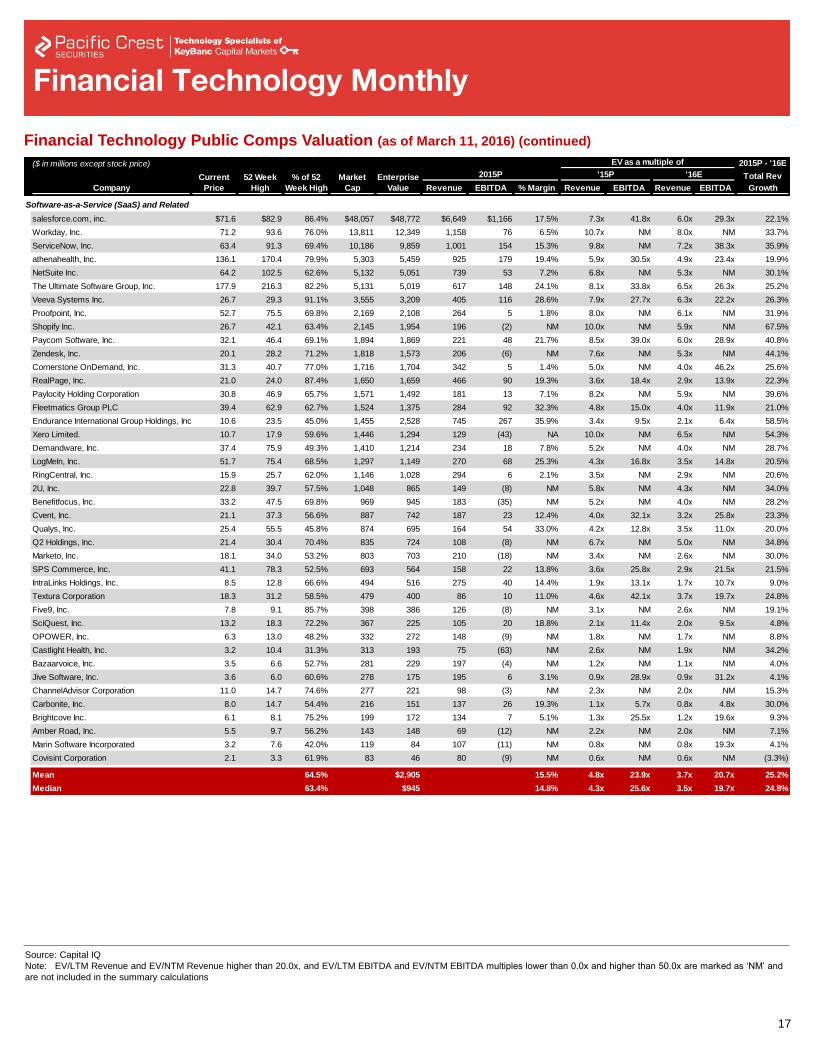
Note: EV/LTM Revenue and EV/NTM Revenue higher than 20.0x, and EV/LTM EBITDA and EV/NTM EBITDA multiples lower than 0.0x and higher than 50.0x are marked as ‘NM’ and
are not included in the summary calculations
* Payment Networks excludes American Express (AXP) and Discover Financial Services (DFS) given different methodology to compute EV and use of Operating Income vs. EBITDA
($ in millions except stock price) EV as a multiple of 2015P - '16E
Current 52 Week % of 52 Market Enterprise 2015P '15P '16E Total Rev
Company Price High Week High Cap Value Revenue EBITDA % Margin Revenue EBITDA Revenue EBITDA Growth
For Net1Ueps and IDT, if estimates are not available,
Revenue and EBITDA and margin should be NA, not
NM – please change these throughout. If EBITDA is 0,
the estimate is likely unavailable, so please recheck
the numbers on Thomson One. If indeed unavailable,
please put NA.
Financial Technology Public Comps Valuation (as of March 11, 2016)
Payment Software and Processors
Cielo S.A. $9.4 $12.9 73.0% $17,652 $22,011 $2,805 $1,335 47.6% 7.8x 16.5x 6.3x 13.7x 24.7%
First Data Corporation 13.2 18.0 73.5% 11,887 34,120 11,468 2,678 23.3% 3.0x 12.7x 2.9x 11.8x 3.5%
Vantiv, Inc. 51.6 54.2 95.1% 8,015 11,200 1,668 800 47.9% 6.7x 14.0x 6.1x 12.6x 9.5%
Worldpay Group plc 4.1 4.6 88.9% 8,195 9,965 1,435 585 40.7% 6.9x 17.0x 6.3x 15.4x 10.4%
Total System Services, Inc. 44.8 56.7 79.0% 8,204 9,281 2,752 843 30.6% 3.4x 11.0x 3.2x 10.2x 6.7%
Global Payments Inc. 60.2 74.6 80.6% 7,782 9,521 2,435 612 25.1% 3.9x 15.6x 4.3x 13.5x (8.6%)
Worldline S.A. 24.3 27.5 88.2% 3,208 2,847 1,329 252 19.0% 2.1x 11.3x 1.9x 9.9x 12.4%
Paysafe Group Plc 5.6 8.3 67.5% 2,683 2,060 619 149 24.1% 3.3x 13.8x 2.3x 8.4x 43.7%
NIC Inc. 17.6 20.9 84.1% 1,154 1,055 293 78 26.5% 3.6x 13.6x 3.4x 13.0x 6.8%
EVERTEC, Inc. 14.0 23.1 60.4% 1,062 1,699 372 186 49.8% 4.6x 9.2x 4.5x 9.3x 1.1%
BasWare Oyj 44.0 53.4 82.4% 622 587 157 13 8.4% 3.7x 44.4x 3.4x NM 8.9%
Planet Payment, Inc. 3.4 3.6 96.1% 180 166 51 11 22.3% 3.3x 14.6x 2.9x 11.3x 13.9%
Tungsten Corporation Plc 1.0 3.1 31.9% 126 103 38 (25) NM 2.8x NM 2.1x NM 33.1%
Mean $22.5 $27.8 77.0% $5,444 $8,047 $1,955 $578 30.5% 4.2x 16.1x 3.8x 11.7x 12.8%
Median $14.0 $20.9 80.6% $3,208 $2,847 $1,329 $252 25.8% 3.6x 13.9x 3.4x 11.8x 9.5%
Prepaid, Fleet, and Loyalty Solutions
PayPal Holdings, Inc. $39.5 $42.6 92.8% $48,283 $44,872 $9,193 $2,506 27.3% 4.9x 17.9x 4.2x 15.8x 15.9%
Alliance Data Systems Corporation 211.6 312.0 67.8% 12,540 28,717 6,484 1,915 29.5% 4.4x 15.0x 4.0x 14.1x 10.1%
FleetCor Technologies, Inc. 139.8 165.7 84.4% 12,947 15,437 1,704 922 54.1% 9.1x 16.7x 8.8x 15.9x 3.5%
Wirecard AG 38.6 54.7 70.5% 4,766 3,923 835 245 29.4% 4.7x 16.0x 3.5x 11.8x 33.5%
Edenred SA 19.1 28.2 67.7% 4,351 5,355 1,155 422 36.6% 4.6x 12.7x 4.4x 12.1x 5.5%
WEX Inc. 79.9 119.0 67.2% 3,088 4,017 845 333 39.4% 4.8x 12.1x 4.6x 12.8x 2.9%
Blackhawk Network Holdings, Inc. 33.9 48.4 70.0% 1,892 1,347 1,796 194 10.8% 0.7x 6.9x 0.6x 6.0x 16.3%
WageWorks, Inc. 46.1 57.3 80.4% 1,657 1,235 333 93 28.0% 3.7x 13.2x 3.4x 11.2x 8.7%
Multiplus S.A. 8.5 11.8 72.1% 1,377 963 566 130 23.0% 1.7x 7.4x 1.5x 6.1x 13.0%
Green Dot Corporation 22.2 22.5 98.9% 1,113 1,158 693 151 21.8% 1.7x 7.7x 1.6x 7.6x 1.4%
Aimia Inc. 6.6 11.3 58.5% 1,009 1,339 1,781 156 8.8% 0.8x 8.6x 0.7x 7.5x 7.7%
Qiwi plc 12.0 35.5 33.8% 703 463 142 79 55.8% 3.3x 5.9x 2.8x 4.8x 17.7%
Net 1 Ueps Technologies Inc. 9.3 21.5 43.5% 439 397 NA NA NA NA NA 0.7x 2.5x NA
IDT Corporation 14.6 20.0 72.8% 334 188 1,618 NA NA 0.1x NA NM NM NA
Higher One Holdings, Inc. 4.1 4.5 92.8% 198 244 202 50 24.5% 1.2x 4.9x 1.7x 8.0x (28.7%)
TIO Networks Corp. 1.3 1.8 76.7% 80 61 41 4 10.3% 1.5x 14.4x 0.8x 7.0x 95.3%
Mean $42.9 $59.8 71.9% $5,923 $6,857 $1,826 $514 28.5% 3.1x 11.4x 2.9x 9.6x 14.5%
Median $20.6 $31.8 71.3% $1,517 $1,287 $845 $175 27.6% 3.3x 12.4x 2.8x 8.0x 9.4%
Remittances
The Western Union Company $19.1 $22.8 83.7% $9,592 $11,494 $5,497 $1,407 25.6% 2.1x 8.2x 2.1x 8.4x (0.5%)
Euronet Worldwide, Inc. 70.8 82.5 85.8% 3,754 3,722 1,804 295 16.4% 2.1x 12.6x 1.9x 10.8x 7.7%
Moneygram International Inc. 6.2 11.0 56.7% 337 1,299 1,434 239 16.7% 0.9x 5.4x 0.8x 4.9x 7.9%
Mean $44.9 $52.7 75.4% $6,673 $5,505 $3,651 $851 19.5% 1.7x 8.7x 1.6x 8.0x 5.0%
Median $44.9 $52.7 83.7% $6,673 $3,722 $3,651 $851 16.7% 2.1x 8.2x 1.9x 8.4x 7.7%
Payment Networks
Visa Inc. $71.6 $81.0 88.4% $172,016 $166,548 $14,106 $9,707 68.8% 11.8x 17.2x 10.6x 15.4x 10.9%
MasterCard Incorporated 88.6 101.8 87.0% 98,389 94,982 9,704 5,551 57.2% 9.8x 17.1x 9.1x 15.8x 7.5%
Earthport plc 0.3 0.7 37.5% 124 81 31 (7) NM 2.6x NM 2.1x NM 24.2%
Mean $53.5 $61.2 71.0% $90,176 $87,204 $7,947 $5,084 63.0% 8.1x 17.1x 7.3x 15.6x 14.2%
Median $71.6 $81.0 87.0% $98,389 $94,982 $9,704 $5,551 63.0% 9.8x 17.1x 9.1x 15.6x 10.9%
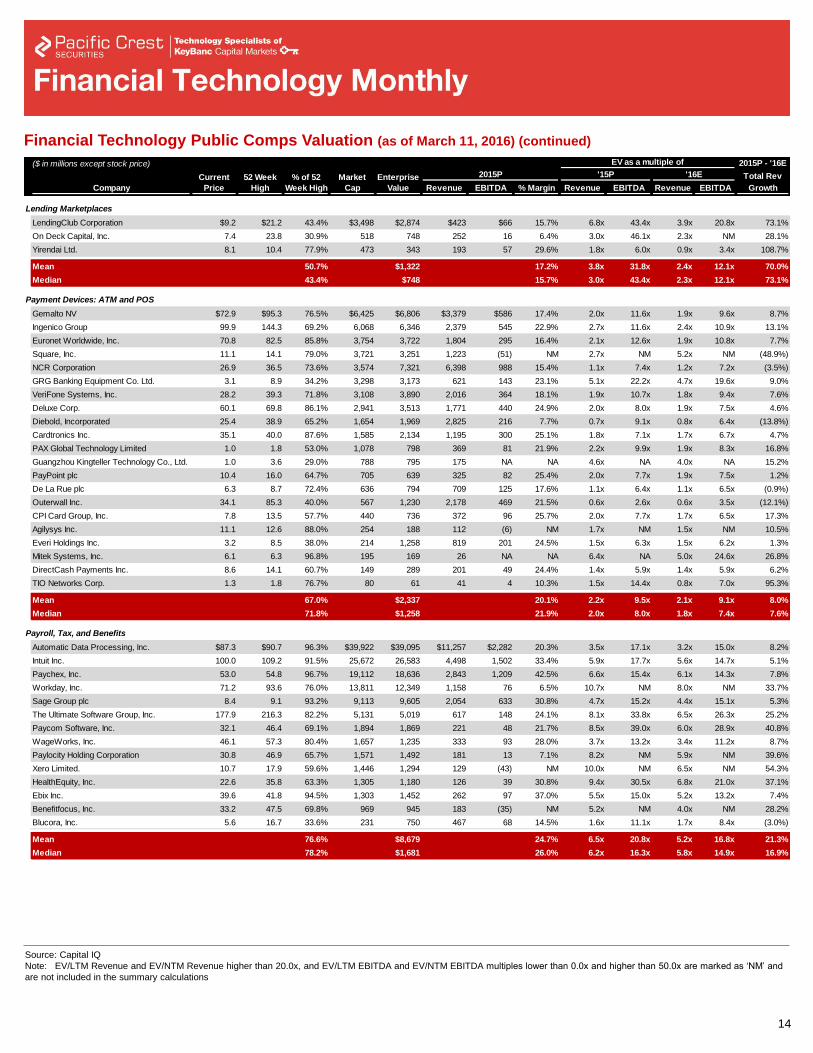
14
Source: Capital IQ
Note: EV/LTM Revenue and EV/NTM Revenue higher than 20.0x, and EV/LTM EBITDA and EV/NTM EBITDA multiples lower than 0.0x and higher than 50.0x are marked as ‘NM’ and
are not included in the summary calculations
($ in millions except stock price) EV as a multiple of 2015P - '16E
Current 52 Week % of 52 Market Enterprise 2015P '15P '16E Total Rev
Company Price High Week High Cap Value Revenue EBITDA % Margin Revenue EBITDA Revenue EBITDA Growth
Please double check numbers for Mitek – revenue
growth for 2016 is not (100%), and expected EBITDA
should not be 0, and EBITDA margin should not be
0%. The estimates are likely unavailable, and so these
cells should be "NA"
For Agilysys, Please input an expected EBITDA of (6)
for 2015 and 3 for 2016
Same comment for Guangzhou Kingteller as for IDT
on previous page
Financial Technology Public Comps Valuation (as of March 11, 2016) (continued)
Lending Marketplaces
LendingClub Corporation $9.2 $21.2 43.4% $3,498 $2,874 $423 $66 15.7% 6.8x 43.4x 3.9x 20.8x 73.1%
On Deck Capital, Inc. 7.4 23.8 30.9% 518 748 252 16 6.4% 3.0x 46.1x 2.3x NM 28.1%
Yirendai Ltd. 8.1 10.4 77.9% 473 343 193 57 29.6% 1.8x 6.0x 0.9x 3.4x 108.7%
Mean $8.2 $18.5 50.7% $1,496 $1,322 $289 $47 17.2% 3.8x 31.8x 2.4x 12.1x 70.0%
Median $8.1 $21.2 43.4% $518 $748 $252 $57 15.7% 3.0x 43.4x 2.3x 12.1x 73.1%
Payment Devices: ATM and POS
Gemalto NV $72.9 $95.3 76.5% $6,425 $6,806 $3,379 $586 17.4% 2.0x 11.6x 1.9x 9.6x 8.7%
Ingenico Group 99.9 144.3 69.2% 6,068 6,346 2,379 545 22.9% 2.7x 11.6x 2.4x 10.9x 13.1%
Euronet Worldwide, Inc. 70.8 82.5 85.8% 3,754 3,722 1,804 295 16.4% 2.1x 12.6x 1.9x 10.8x 7.7%
Square, Inc. 11.1 14.1 79.0% 3,721 3,251 1,223 (51) NM 2.7x NM 5.2x NM (48.9%)
NCR Corporation 26.9 36.5 73.6% 3,574 7,321 6,398 988 15.4% 1.1x 7.4x 1.2x 7.2x (3.5%)
GRG Banking Equipment Co. Ltd. 3.1 8.9 34.2% 3,298 3,173 621 143 23.1% 5.1x 22.2x 4.7x 19.6x 9.0%
VeriFone Systems, Inc. 28.2 39.3 71.8% 3,108 3,890 2,016 364 18.1% 1.9x 10.7x 1.8x 9.4x 7.6%
Deluxe Corp. 60.1 69.8 86.1% 2,941 3,513 1,771 440 24.9% 2.0x 8.0x 1.9x 7.5x 4.6%
Diebold, Incorporated 25.4 38.9 65.2% 1,654 1,969 2,825 216 7.7% 0.7x 9.1x 0.8x 6.4x (13.8%)
Cardtronics Inc. 35.1 40.0 87.6% 1,585 2,134 1,195 300 25.1% 1.8x 7.1x 1.7x 6.7x 4.7%
PAX Global Technology Limited 1.0 1.8 53.0% 1,078 798 369 81 21.9% 2.2x 9.9x 1.9x 8.3x 16.8%
Guangzhou Kingteller Technology Co., Ltd. 1.0 3.6 29.0% 788 795 175 NA NA 4.6x NA 4.0x NA 15.2%
PayPoint plc 10.4 16.0 64.7% 705 639 325 82 25.4% 2.0x 7.7x 1.9x 7.5x 1.2%
De La Rue plc 6.3 8.7 72.4% 636 794 709 125 17.6% 1.1x 6.4x 1.1x 6.5x (0.9%)
Outerwall Inc. 34.1 85.3 40.0% 567 1,230 2,178 469 21.5% 0.6x 2.6x 0.6x 3.5x (12.1%)
CPI Card Group, Inc. 7.8 13.5 57.7% 440 736 372 96 25.7% 2.0x 7.7x 1.7x 6.5x 17.3%
Agilysys Inc. 11.1 12.6 88.0% 254 188 112 (6) NM 1.7x NM 1.5x NM 10.5%
Everi Holdings Inc. 3.2 8.5 38.0% 214 1,258 819 201 24.5% 1.5x 6.3x 1.5x 6.2x 1.3%
Mitek Systems, Inc. 6.1 6.3 96.8% 195 169 26 NA NA 6.4x NA 5.0x 24.6x 26.8%
DirectCash Payments Inc. 8.6 14.1 60.7% 149 289 201 49 24.4% 1.4x 5.9x 1.4x 5.9x 6.2%
TIO Networks Corp. 1.3 1.8 76.7% 80 61 41 4 10.3% 1.5x 14.4x 0.8x 7.0x 95.3%
Mean $25.0 $35.3 67.0% $1,963 $2,337 $1,378 $259 20.1% 2.2x 9.5x 2.1x 9.1x 8.0%
Median $11.1 $14.1 71.8% $1,078 $1,258 $819 $201 21.9% 2.0x 8.0x 1.8x 7.4x 7.6%
Payroll, Tax, and Benefits
Automatic Data Processing, Inc. $87.3 $90.7 96.3% $39,922 $39,095 $11,257 $2,282 20.3% 3.5x 17.1x 3.2x 15.0x 8.2%
Intuit Inc. 100.0 109.2 91.5% 25,672 26,583 4,498 1,502 33.4% 5.9x 17.7x 5.6x 14.7x 5.1%
Paychex, Inc. 53.0 54.8 96.7% 19,112 18,636 2,843 1,209 42.5% 6.6x 15.4x 6.1x 14.3x 7.8%
Workday, Inc. 71.2 93.6 76.0% 13,811 12,349 1,158 76 6.5% 10.7x NM 8.0x NM 33.7%
Sage Group plc 8.4 9.1 93.2% 9,113 9,605 2,054 633 30.8% 4.7x 15.2x 4.4x 15.1x 5.3%
The Ultimate Software Group, Inc. 177.9 216.3 82.2% 5,131 5,019 617 148 24.1% 8.1x 33.8x 6.5x 26.3x 25.2%
Paycom Software, Inc. 32.1 46.4 69.1% 1,894 1,869 221 48 21.7% 8.5x 39.0x 6.0x 28.9x 40.8%
WageWorks, Inc. 46.1 57.3 80.4% 1,657 1,235 333 93 28.0% 3.7x 13.2x 3.4x 11.2x 8.7%
Paylocity Holding Corporation 30.8 46.9 65.7% 1,571 1,492 181 13 7.1% 8.2x NM 5.9x NM 39.6%
Xero Limited. 10.7 17.9 59.6% 1,446 1,294 129 (43) NM 10.0x NM 6.5x NM 54.3%
HealthEquity, Inc. 22.6 35.8 63.3% 1,305 1,180 126 39 30.8% 9.4x 30.5x 6.8x 21.0x 37.1%
Ebix Inc. 39.6 41.8 94.5% 1,303 1,452 262 97 37.0% 5.5x 15.0x 5.2x 13.2x 7.4%
Benefitfocus, Inc. 33.2 47.5 69.8% 969 945 183 (35) NM 5.2x NM 4.0x NM 28.2%
Blucora, Inc. 5.6 16.7 33.6% 231 750 467 68 14.5% 1.6x 11.1x 1.7x 8.4x (3.0%)
Mean $51.3 $63.1 76.6% $8,795 $8,679 $1,738 $438 24.7% 6.5x 20.8x 5.2x 16.8x 21.3%
Median $36.4 $47.2 78.2% $1,775 $1,681 $400 $85 26.0% 6.2x 16.3x 5.8x 14.9x 16.9%
Please delete Wincor
Nixdorf from Payment
Devices. It has been
made an acquisition offer
by Diebold.
Deleted
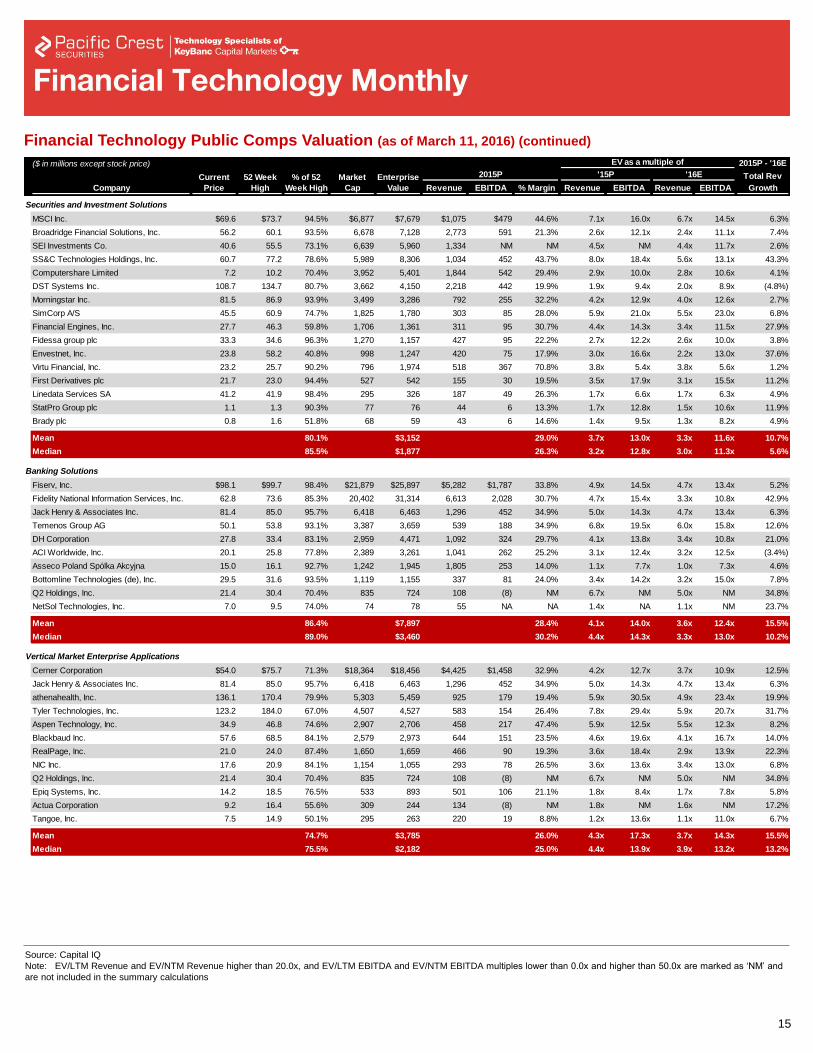
15
Source: Capital IQ
Note: EV/LTM Revenue and EV/NTM Revenue higher than 20.0x, and EV/LTM EBITDA and EV/NTM EBITDA multiples lower than 0.0x and higher than 50.0x are marked as ‘NM’ and
are not included in the summary calculations
($ in millions except stock price) EV as a multiple of 2015P - '16E
Current 52 Week % of 52 Market Enterprise 2015P '15P '16E Total Rev
Company Price High Week High Cap Value Revenue EBITDA % Margin Revenue EBITDA Revenue EBITDA Growth
Same comment for Netsol as for IDT
Financial Technology Public Comps Valuation (as of March 11, 2016) (continued)
Securities and Investment Solutions
MSCI Inc. $69.6 $73.7 94.5% $6,877 $7,679 $1,075 $479 44.6% 7.1x 16.0x 6.7x 14.5x 6.3%
Broadridge Financial Solutions, Inc. 56.2 60.1 93.5% 6,678 7,128 2,773 591 21.3% 2.6x 12.1x 2.4x 11.1x 7.4%
SEI Investments Co. 40.6 55.5 73.1% 6,639 5,960 1,334 NM NM 4.5x NM 4.4x 11.7x 2.6%
SS&C Technologies Holdings, Inc. 60.7 77.2 78.6% 5,989 8,306 1,034 452 43.7% 8.0x 18.4x 5.6x 13.1x 43.3%
Computershare Limited 7.2 10.2 70.4% 3,952 5,401 1,844 542 29.4% 2.9x 10.0x 2.8x 10.6x 4.1%
DST Systems Inc. 108.7 134.7 80.7% 3,662 4,150 2,218 442 19.9% 1.9x 9.4x 2.0x 8.9x (4.8%)
Morningstar Inc. 81.5 86.9 93.9% 3,499 3,286 792 255 32.2% 4.2x 12.9x 4.0x 12.6x 2.7%
SimCorp A/S 45.5 60.9 74.7% 1,825 1,780 303 85 28.0% 5.9x 21.0x 5.5x 23.0x 6.8%
Financial Engines, Inc. 27.7 46.3 59.8% 1,706 1,361 311 95 30.7% 4.4x 14.3x 3.4x 11.5x 27.9%
Fidessa group plc 33.3 34.6 96.3% 1,270 1,157 427 95 22.2% 2.7x 12.2x 2.6x 10.0x 3.8%
Envestnet, Inc. 23.8 58.2 40.8% 998 1,247 420 75 17.9% 3.0x 16.6x 2.2x 13.0x 37.6%
Virtu Financial, Inc. 23.2 25.7 90.2% 796 1,974 518 367 70.8% 3.8x 5.4x 3.8x 5.6x 1.2%
First Derivatives plc 21.7 23.0 94.4% 527 542 155 30 19.5% 3.5x 17.9x 3.1x 15.5x 11.2%
Linedata Services SA 41.2 41.9 98.4% 295 326 187 49 26.3% 1.7x 6.6x 1.7x 6.3x 4.9%
StatPro Group plc 1.1 1.3 90.3% 77 76 44 6 13.3% 1.7x 12.8x 1.5x 10.6x 11.9%
Brady plc 0.8 1.6 51.8% 68 59 43 6 14.6% 1.4x 9.5x 1.3x 8.2x 4.9%
Mean $40.2 $49.5 80.1% $2,804 $3,152 $842 $238 29.0% 3.7x 13.0x 3.3x 11.6x 10.7%
Median $36.9 $50.9 85.5% $1,766 $1,877 $473 $95 26.3% 3.2x 12.8x 3.0x 11.3x 5.6%
Banking Solutions
Fiserv, Inc. $98.1 $99.7 98.4% $21,879 $25,897 $5,282 $1,787 33.8% 4.9x 14.5x 4.7x 13.4x 5.2%
Fidelity National Information Services, Inc. 62.8 73.6 85.3% 20,402 31,314 6,613 2,028 30.7% 4.7x 15.4x 3.3x 10.8x 42.9%
Jack Henry & Associates Inc. 81.4 85.0 95.7% 6,418 6,463 1,296 452 34.9% 5.0x 14.3x 4.7x 13.4x 6.3%
Temenos Group AG 50.1 53.8 93.1% 3,387 3,659 539 188 34.9% 6.8x 19.5x 6.0x 15.8x 12.6%
DH Corporation 27.8 33.4 83.1% 2,959 4,471 1,092 324 29.7% 4.1x 13.8x 3.4x 10.8x 21.0%
ACI Worldwide, Inc. 20.1 25.8 77.8% 2,389 3,261 1,041 262 25.2% 3.1x 12.4x 3.2x 12.5x (3.4%)
Asseco Poland Spólka Akcyjna 15.0 16.1 92.7% 1,242 1,945 1,805 253 14.0% 1.1x 7.7x 1.0x 7.3x 4.6%
Bottomline Technologies (de), Inc. 29.5 31.6 93.5% 1,119 1,155 337 81 24.0% 3.4x 14.2x 3.2x 15.0x 7.8%
Q2 Holdings, Inc. 21.4 30.4 70.4% 835 724 108 (8) NM 6.7x NM 5.0x NM 34.8%
NetSol Technologies, Inc. 7.0 9.5 74.0% 74 78 55 NA NA 1.4x NA 1.1x NM 23.7%
Mean $41.3 $45.9 86.4% $6,070 $7,897 $1,817 $596 28.4% 4.1x 14.0x 3.6x 12.4x 15.5%
Median $28.7 $32.5 89.0% $2,674 $3,460 $1,067 $262 30.2% 4.4x 14.3x 3.3x 13.0x 10.2%
Vertical Market Enterprise Applications
Cerner Corporation $54.0 $75.7 71.3% $18,364 $18,456 $4,425 $1,458 32.9% 4.2x 12.7x 3.7x 10.9x 12.5%
Jack Henry & Associates Inc. 81.4 85.0 95.7% 6,418 6,463 1,296 452 34.9% 5.0x 14.3x 4.7x 13.4x 6.3%
athenahealth, Inc. 136.1 170.4 79.9% 5,303 5,459 925 179 19.4% 5.9x 30.5x 4.9x 23.4x 19.9%
Tyler Technologies, Inc. 123.2 184.0 67.0% 4,507 4,527 583 154 26.4% 7.8x 29.4x 5.9x 20.7x 31.7%
Aspen Technology, Inc. 34.9 46.8 74.6% 2,907 2,706 458 217 47.4% 5.9x 12.5x 5.5x 12.3x 8.2%
Blackbaud Inc. 57.6 68.5 84.1% 2,579 2,973 644 151 23.5% 4.6x 19.6x 4.1x 16.7x 14.0%
RealPage, Inc. 21.0 24.0 87.4% 1,650 1,659 466 90 19.3% 3.6x 18.4x 2.9x 13.9x 22.3%
NIC Inc. 17.6 20.9 84.1% 1,154 1,055 293 78 26.5% 3.6x 13.6x 3.4x 13.0x 6.8%
Q2 Holdings, Inc. 21.4 30.4 70.4% 835 724 108 (8) NM 6.7x NM 5.0x NM 34.8%
Epiq Systems, Inc. 14.2 18.5 76.5% 533 893 501 106 21.1% 1.8x 8.4x 1.7x 7.8x 5.8%
Actua Corporation 9.2 16.4 55.6% 309 244 134 (8) NM 1.8x NM 1.6x NM 17.2%
Tangoe, Inc. 7.5 14.9 50.1% 295 263 220 19 8.8% 1.2x 13.6x 1.1x 11.0x 6.7%
Mean $48.2 $63.0 74.7% $3,738 $3,785 $838 $241 26.0% 4.3x 17.3x 3.7x 14.3x 15.5%
Median $28.1 $38.6 75.5% $2,114 $2,182 $484 $129 25.0% 4.4x 13.9x 3.9x 13.2x 13.2%
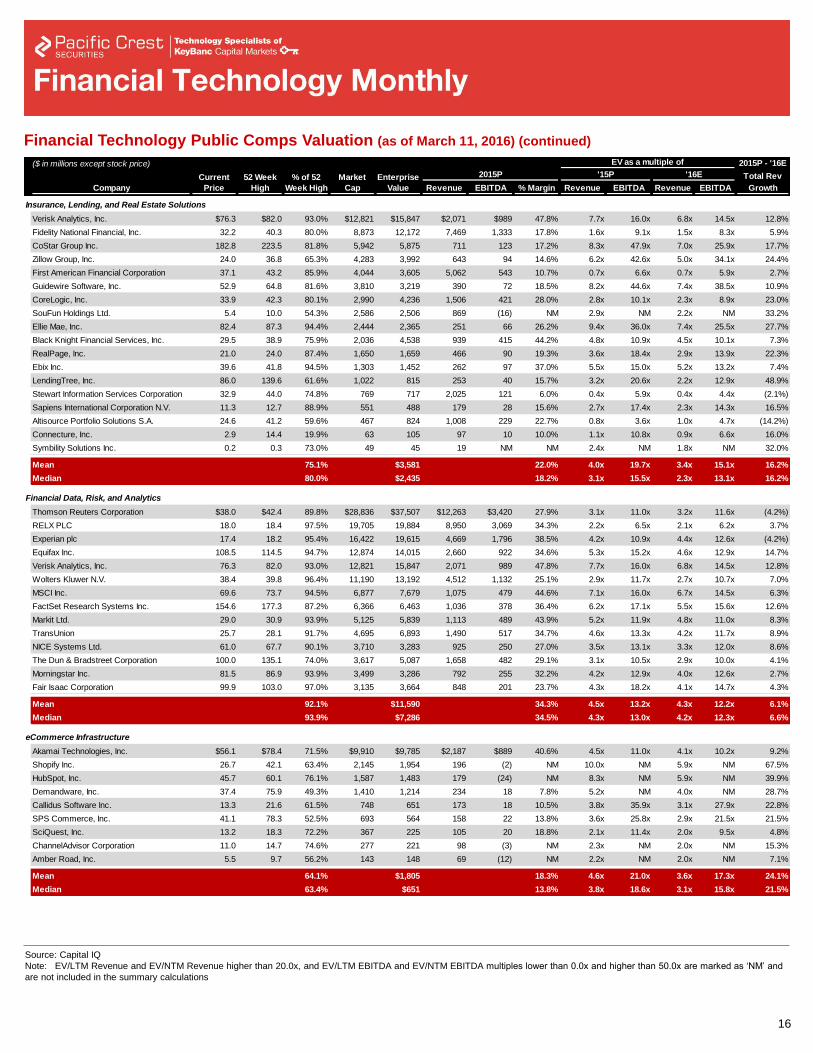
16
Source: Capital IQ
Note: EV/LTM Revenue and EV/NTM Revenue higher than 20.0x, and EV/LTM EBITDA and EV/NTM EBITDA multiples lower than 0.0x and higher than 50.0x are marked as ‘NM’ and
are not included in the summary calculations
($ in millions except stock price) EV as a multiple of 2015P - '16E
Current 52 Week % of 52 Market Enterprise 2015P '15P '16E Total Rev
Company Price High Week High Cap Value Revenue EBITDA % Margin Revenue EBITDA Revenue EBITDA Growth
Make 16E EBITDA multiples for SPS and Callidus
"NM"
Financial Technology Public Comps Valuation (as of March 11, 2016) (continued)
Insurance, Lending, and Real Estate Solutions
Verisk Analytics, Inc. $76.3 $82.0 93.0% $12,821 $15,847 $2,071 $989 47.8% 7.7x 16.0x 6.8x 14.5x 12.8%
Fidelity National Financial, Inc. 32.2 40.3 80.0% 8,873 12,172 7,469 1,333 17.8% 1.6x 9.1x 1.5x 8.3x 5.9%
CoStar Group Inc. 182.8 223.5 81.8% 5,942 5,875 711 123 17.2% 8.3x 47.9x 7.0x 25.9x 17.7%
Zillow Group, Inc. 24.0 36.8 65.3% 4,283 3,992 643 94 14.6% 6.2x 42.6x 5.0x 34.1x 24.4%
First American Financial Corporation 37.1 43.2 85.9% 4,044 3,605 5,062 543 10.7% 0.7x 6.6x 0.7x 5.9x 2.7%
Guidewire Software, Inc. 52.9 64.8 81.6% 3,810 3,219 390 72 18.5% 8.2x 44.6x 7.4x 38.5x 10.9%
CoreLogic, Inc. 33.9 42.3 80.1% 2,990 4,236 1,506 421 28.0% 2.8x 10.1x 2.3x 8.9x 23.0%
SouFun Holdings Ltd. 5.4 10.0 54.3% 2,586 2,506 869 (16) NM 2.9x NM 2.2x NM 33.2%
Ellie Mae, Inc. 82.4 87.3 94.4% 2,444 2,365 251 66 26.2% 9.4x 36.0x 7.4x 25.5x 27.7%
Black Knight Financial Services, Inc. 29.5 38.9 75.9% 2,036 4,538 939 415 44.2% 4.8x 10.9x 4.5x 10.1x 7.3%
RealPage, Inc. 21.0 24.0 87.4% 1,650 1,659 466 90 19.3% 3.6x 18.4x 2.9x 13.9x 22.3%
Ebix Inc. 39.6 41.8 94.5% 1,303 1,452 262 97 37.0% 5.5x 15.0x 5.2x 13.2x 7.4%
LendingTree, Inc. 86.0 139.6 61.6% 1,022 815 253 40 15.7% 3.2x 20.6x 2.2x 12.9x 48.9%
Stewart Information Services Corporation 32.9 44.0 74.8% 769 717 2,025 121 6.0% 0.4x 5.9x 0.4x 4.4x (2.1%)
Sapiens International Corporation N.V. 11.3 12.7 88.9% 551 488 179 28 15.6% 2.7x 17.4x 2.3x 14.3x 16.5%
Altisource Portfolio Solutions S.A. 24.6 41.2 59.6% 467 824 1,008 229 22.7% 0.8x 3.6x 1.0x 4.7x (14.2%)
Connecture, Inc. 2.9 14.4 19.9% 63 105 97 10 10.0% 1.1x 10.8x 0.9x 6.6x 16.0%
Symbility Solutions Inc. 0.2 0.3 73.0% 49 45 19 NM NM 2.4x NM 1.8x NM 32.0%
Mean $43.0 $54.8 75.1% $3,094 $3,581 $1,346 $274 22.0% 4.0x 19.7x 3.4x 15.1x 16.2%
Median $32.6 $41.5 80.0% $2,240 $2,435 $677 $97 18.2% 3.1x 15.5x 2.3x 13.1x 16.2%
Financial Data, Risk, and Analytics
Thomson Reuters Corporation $38.0 $42.4 89.8% $28,836 $37,507 $12,263 $3,420 27.9% 3.1x 11.0x 3.2x 11.6x (4.2%)
RELX PLC 18.0 18.4 97.5% 19,705 19,884 8,950 3,069 34.3% 2.2x 6.5x 2.1x 6.2x 3.7%
Experian plc 17.4 18.2 95.4% 16,422 19,615 4,669 1,796 38.5% 4.2x 10.9x 4.4x 12.6x (4.2%)
Equifax Inc. 108.5 114.5 94.7% 12,874 14,015 2,660 922 34.6% 5.3x 15.2x 4.6x 12.9x 14.7%
Verisk Analytics, Inc. 76.3 82.0 93.0% 12,821 15,847 2,071 989 47.8% 7.7x 16.0x 6.8x 14.5x 12.8%
Wolters Kluwer N.V. 38.4 39.8 96.4% 11,190 13,192 4,512 1,132 25.1% 2.9x 11.7x 2.7x 10.7x 7.0%
MSCI Inc. 69.6 73.7 94.5% 6,877 7,679 1,075 479 44.6% 7.1x 16.0x 6.7x 14.5x 6.3%
FactSet Research Systems Inc. 154.6 177.3 87.2% 6,366 6,463 1,036 378 36.4% 6.2x 17.1x 5.5x 15.6x 12.6%
Markit Ltd. 29.0 30.9 93.9% 5,125 5,839 1,113 489 43.9% 5.2x 11.9x 4.8x 11.0x 8.3%
TransUnion 25.7 28.1 91.7% 4,695 6,893 1,490 517 34.7% 4.6x 13.3x 4.2x 11.7x 8.9%
NICE Systems Ltd. 61.0 67.7 90.1% 3,710 3,283 925 250 27.0% 3.5x 13.1x 3.3x 12.0x 8.6%
The Dun & Bradstreet Corporation 100.0 135.1 74.0% 3,617 5,087 1,658 482 29.1% 3.1x 10.5x 2.9x 10.0x 4.1%
Morningstar Inc. 81.5 86.9 93.9% 3,499 3,286 792 255 32.2% 4.2x 12.9x 4.0x 12.6x 2.7%
Fair Isaac Corporation 99.9 103.0 97.0% 3,135 3,664 848 201 23.7% 4.3x 18.2x 4.1x 14.7x 4.3%
Mean $65.6 $72.7 92.1% $9,919 $11,590 $3,147 $1,027 34.3% 4.5x 13.2x 4.3x 12.2x 6.1%
Median $65.3 $70.7 93.9% $6,622 $7,286 $1,574 $503 34.5% 4.3x 13.0x 4.2x 12.3x 6.6%
eCommerce Infrastructure
Akamai Technologies, Inc. $56.1 $78.4 71.5% $9,910 $9,785 $2,187 $889 40.6% 4.5x 11.0x 4.1x 10.2x 9.2%
Shopify Inc. 26.7 42.1 63.4% 2,145 1,954 196 (2) NM 10.0x NM 5.9x NM 67.5%
HubSpot, Inc. 45.7 60.1 76.1% 1,587 1,483 179 (24) NM 8.3x NM 5.9x NM 39.9%
Demandware, Inc. 37.4 75.9 49.3% 1,410 1,214 234 18 7.8% 5.2x NM 4.0x NM 28.7%
Callidus Software Inc. 13.3 21.6 61.5% 748 651 173 18 10.5% 3.8x 35.9x 3.1x 27.9x 22.8%
SPS Commerce, Inc. 41.1 78.3 52.5% 693 564 158 22 13.8% 3.6x 25.8x 2.9x 21.5x 21.5%
SciQuest, Inc. 13.2 18.3 72.2% 367 225 105 20 18.8% 2.1x 11.4x 2.0x 9.5x 4.8%
ChannelAdvisor Corporation 11.0 14.7 74.6% 277 221 98 (3) NM 2.3x NM 2.0x NM 15.3%
Amber Road, Inc. 5.5 9.7 56.2% 143 148 69 (12) NM 2.2x NM 2.0x NM 7.1%
Mean $27.8 $44.4 64.1% $1,920 $1,805 $378 $103 18.3% 4.6x 21.0x 3.6x 17.3x 24.1%
Median $26.7 $42.1 63.4% $748 $651 $173 $18 13.8% 3.8x 18.6x 3.1x 15.8x 21.5%
17
Source: Capital IQ
Note: EV/LTM Revenue and EV/NTM Revenue higher than 20.0x, and EV/LTM EBITDA and EV/NTM EBITDA multiples lower than 0.0x and higher than 50.0x are marked as ‘NM’ and
are not included in the summary calculations
($ in millions except stock price) EV as a multiple of 2015P - '16E
Current 52 Week % of 52 Market Enterprise 2015P '15P '16E Total Rev
Company Price High Week High Cap Value Revenue EBITDA % Margin Revenue EBITDA Revenue EBITDA Growth
Financial Technology Public Comps Valuation (as of March 11, 2016) (continued)
Software-as-a-Service (SaaS) and Related
salesforce.com, inc. $71.6 $82.9 86.4% $48,057 $48,772 $6,649 $1,166 17.5% 7.3x 41.8x 6.0x 29.3x 22.1%
Workday, Inc. 71.2 93.6 76.0% 13,811 12,349 1,158 76 6.5% 10.7x NM 8.0x NM 33.7%
ServiceNow, Inc. 63.4 91.3 69.4% 10,186 9,859 1,001 154 15.3% 9.8x NM 7.2x 38.3x 35.9%
athenahealth, Inc. 136.1 170.4 79.9% 5,303 5,459 925 179 19.4% 5.9x 30.5x 4.9x 23.4x 19.9%
NetSuite Inc. 64.2 102.5 62.6% 5,132 5,051 739 53 7.2% 6.8x NM 5.3x NM 30.1%
The Ultimate Software Group, Inc. 177.9 216.3 82.2% 5,131 5,019 617 148 24.1% 8.1x 33.8x 6.5x 26.3x 25.2%
Veeva Systems Inc. 26.7 29.3 91.1% 3,555 3,209 405 116 28.6% 7.9x 27.7x 6.3x 22.2x 26.3%
Proofpoint, Inc. 52.7 75.5 69.8% 2,169 2,108 264 5 1.8% 8.0x NM 6.1x NM 31.9%
Shopify Inc. 26.7 42.1 63.4% 2,145 1,954 196 (2) NM 10.0x NM 5.9x NM 67.5%
Paycom Software, Inc. 32.1 46.4 69.1% 1,894 1,869 221 48 21.7% 8.5x 39.0x 6.0x 28.9x 40.8%
Zendesk, Inc. 20.1 28.2 71.2% 1,818 1,573 206 (6) NM 7.6x NM 5.3x NM 44.1%
Cornerstone OnDemand, Inc. 31.3 40.7 77.0% 1,716 1,704 342 5 1.4% 5.0x NM 4.0x 46.2x 25.6%
RealPage, Inc. 21.0 24.0 87.4% 1,650 1,659 466 90 19.3% 3.6x 18.4x 2.9x 13.9x 22.3%
Paylocity Holding Corporation 30.8 46.9 65.7% 1,571 1,492 181 13 7.1% 8.2x NM 5.9x NM 39.6%
Fleetmatics Group PLC 39.4 62.9 62.7% 1,524 1,375 284 92 32.3% 4.8x 15.0x 4.0x 11.9x 21.0%
Endurance International Group Holdings, Inc. 10.6 23.5 45.0% 1,455 2,528 745 267 35.9% 3.4x 9.5x 2.1x 6.4x 58.5%
Xero Limited. 10.7 17.9 59.6% 1,446 1,294 129 (43) NA 10.0x NM 6.5x NM 54.3%
Demandware, Inc. 37.4 75.9 49.3% 1,410 1,214 234 18 7.8% 5.2x NM 4.0x NM 28.7%
LogMeIn, Inc. 51.7 75.4 68.5% 1,297 1,149 270 68 25.3% 4.3x 16.8x 3.5x 14.8x 20.5%
RingCentral, Inc. 15.9 25.7 62.0% 1,146 1,028 294 6 2.1% 3.5x NM 2.9x NM 20.6%
2U, Inc. 22.8 39.7 57.5% 1,048 865 149 (8) NM 5.8x NM 4.3x NM 34.0%
Benefitfocus, Inc. 33.2 47.5 69.8% 969 945 183 (35) NM 5.2x NM 4.0x NM 28.2%
Cvent, Inc. 21.1 37.3 56.6% 887 742 187 23 12.4% 4.0x 32.1x 3.2x 25.8x 23.3%
Qualys, Inc. 25.4 55.5 45.8% 874 695 164 54 33.0% 4.2x 12.8x 3.5x 11.0x 20.0%
Q2 Holdings, Inc. 21.4 30.4 70.4% 835 724 108 (8) NM 6.7x NM 5.0x NM 34.8%
Marketo, Inc. 18.1 34.0 53.2% 803 703 210 (18) NM 3.4x NM 2.6x NM 30.0%
SPS Commerce, Inc. 41.1 78.3 52.5% 693 564 158 22 13.8% 3.6x 25.8x 2.9x 21.5x 21.5%
IntraLinks Holdings, Inc. 8.5 12.8 66.6% 494 516 275 40 14.4% 1.9x 13.1x 1.7x 10.7x 9.0%
Textura Corporation 18.3 31.2 58.5% 479 400 86 10 11.0% 4.6x 42.1x 3.7x 19.7x 24.8%
Five9, Inc. 7.8 9.1 85.7% 398 386 126 (8) NM 3.1x NM 2.6x NM 19.1%
SciQuest, Inc. 13.2 18.3 72.2% 367 225 105 20 18.8% 2.1x 11.4x 2.0x 9.5x 4.8%
OPOWER, Inc. 6.3 13.0 48.2% 332 272 148 (9) NM 1.8x NM 1.7x NM 8.8%
Castlight Health, Inc. 3.2 10.4 31.3% 313 193 75 (63) NM 2.6x NM 1.9x NM 34.2%
Bazaarvoice, Inc. 3.5 6.6 52.7% 281 229 197 (4) NM 1.2x NM 1.1x NM 4.0%
Jive Software, Inc. 3.6 6.0 60.6% 278 175 195 6 3.1% 0.9x 28.9x 0.9x 31.2x 4.1%
ChannelAdvisor Corporation 11.0 14.7 74.6% 277 221 98 (3) NM 2.3x NM 2.0x NM 15.3%
Carbonite, Inc. 8.0 14.7 54.4% 216 151 137 26 19.3% 1.1x 5.7x 0.8x 4.8x 30.0%
Brightcove Inc. 6.1 8.1 75.2% 199 172 134 7 5.1% 1.3x 25.5x 1.2x 19.6x 9.3%
Amber Road, Inc. 5.5 9.7 56.2% 143 148 69 (12) NM 2.2x NM 2.0x NM 7.1%
Marin Software Incorporated 3.2 7.6 42.0% 119 84 107 (11) NM 0.8x NM 0.8x 19.3x 4.1%
Covisint Corporation 2.1 3.3 61.9% 83 46 80 (9) NM 0.6x NM 0.6x NM (3.3%)
Mean $31.1 $45.3 64.5% $2,988 $2,905 $447 $60 15.5% 4.8x 23.9x 3.7x 20.7x 25.2%
Median $21.1 $31.2 63.4% $1,048 $945 $196 $10 14.8% 4.3x 25.6x 3.5x 19.7x 24.8%
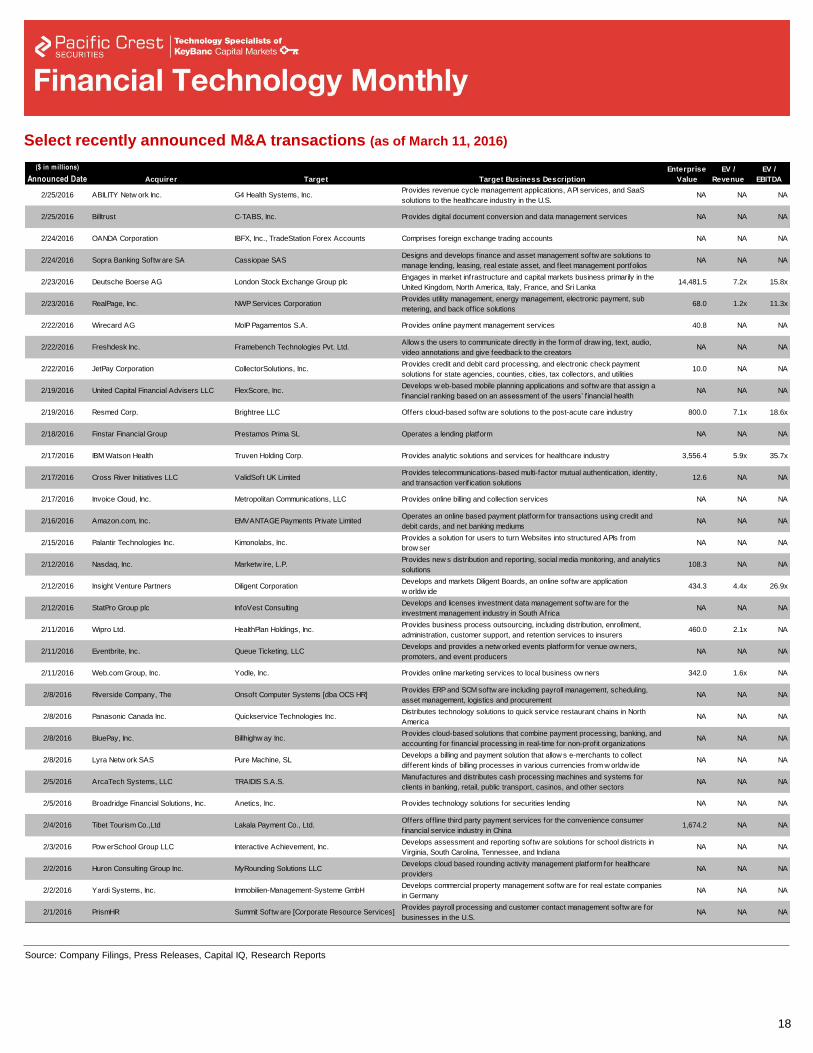
18
Source: Company Filings, Press Releases, Capital IQ, Research Reports
($ in millions)
Announced Date Acquirer Target Target Business Description
Enterprise
Value
EV /
Revenue
EV /
EBITDA
2/25/2016 ABILITY Netw ork Inc. G4 Health Systems, Inc.Provides revenue cycle management applications, API services, and SaaS
solutions to the healthcare industry in the U.S.NA NA NA
2/25/2016 Billtrust C-TABS, Inc. Provides digital document conversion and data management services NA NA NA
2/24/2016 OANDA Corporation IBFX, Inc., TradeStation Forex Accounts Comprises foreign exchange trading accounts NA NA NA
2/24/2016 Sopra Banking Softw are SA Cassiopae SASDesigns and develops f inance and asset management softw are solutions to
manage lending, leasing, real estate asset, and f leet management portfoliosNA NA NA
2/23/2016 Deutsche Boerse AG London Stock Exchange Group plcEngages in market infrastructure and capital markets business primarily in the
United Kingdom, North America, Italy, France, and Sri Lanka14,481.5 7.2x 15.8x
2/23/2016 RealPage, Inc. NWP Services CorporationProvides utility management, energy management, electronic payment, sub
metering, and back off ice solutions68.0 1.2x 11.3x
2/22/2016 Wirecard AG MoIP Pagamentos S.A. Provides online payment management services 40.8 NA NA
2/22/2016 Freshdesk Inc. Framebench Technologies Pvt. Ltd.Allow s the users to communicate directly in the form of draw ing, text, audio,
video annotations and give feedback to the creatorsNA NA NA
2/22/2016 JetPay Corporation CollectorSolutions, Inc.Provides credit and debit card processing, and electronic check payment
solutions for state agencies, counties, cities, tax collectors, and utilities10.0 NA NA
2/19/2016 United Capital Financial Advisers LLC FlexScore, Inc.Develops w eb-based mobile planning applications and softw are that assign a
f inancial ranking based on an assessment of the users’ f inancial healthNA NA NA
2/19/2016 Resmed Corp. Brightree LLC Offers cloud-based softw are solutions to the post-acute care industry 800.0 7.1x 18.6x
2/18/2016 Finstar Financial Group Prestamos Prima SL Operates a lending platform NA NA NA
2/17/2016 IBM Watson Health Truven Holding Corp. Provides analytic solutions and services for healthcare industry 3,556.4 5.9x 35.7x
2/17/2016 Cross River Initiatives LLC ValidSoft UK LimitedProvides telecommunications-based multi-factor mutual authentication, identity,
and transaction verif ication solutions12.6 NA NA
2/17/2016 Invoice Cloud, Inc. Metropolitan Communications, LLC Provides online billing and collection services NA NA NA
2/16/2016 Amazon.com, Inc. EMVANTAGE Payments Private LimitedOperates an online based payment platform for transactions using credit and
debit cards, and net banking mediumsNA NA NA
2/15/2016 Palantir Technologies Inc. Kimonolabs, Inc.Provides a solution for users to turn Websites into structured APIs from
brow serNA NA NA
2/12/2016 Nasdaq, Inc. Marketw ire, L.P.Provides new s distribution and reporting, social media monitoring, and analytics
solutions108.3 NA NA
2/12/2016 Insight Venture Partners Diligent CorporationDevelops and markets Diligent Boards, an online softw are application
w orldw ide434.3 4.4x 26.9x
2/12/2016 StatPro Group plc InfoVest ConsultingDevelops and licenses investment data management softw are for the
investment management industry in South AfricaNA NA NA
2/11/2016 Wipro Ltd. HealthPlan Holdings, Inc.Provides business process outsourcing, including distribution, enrollment,
administration, customer support, and retention services to insurers460.0 2.1x NA
2/11/2016 Eventbrite, Inc. Queue Ticketing, LLCDevelops and provides a netw orked events platform for venue ow ners,
promoters, and event producersNA NA NA
2/11/2016 Web.com Group, Inc. Yodle, Inc. Provides online marketing services to local business ow ners 342.0 1.6x NA
2/8/2016 Riverside Company, The Onsoft Computer Systems [dba OCS HR]Provides ERP and SCM softw are including payroll management, scheduling,
asset management, logistics and procurementNA NA NA
2/8/2016 Panasonic Canada Inc. Quickservice Technologies Inc.Distributes technology solutions to quick service restaurant chains in North
AmericaNA NA NA
2/8/2016 BluePay, Inc. Billhighw ay Inc.Provides cloud-based solutions that combine payment processing, banking, and
accounting for f inancial processing in real-time for non-profit organizationsNA NA NA
2/8/2016 Lyra Netw ork SAS Pure Machine, SLDevelops a billing and payment solution that allow s e-merchants to collect
different kinds of billing processes in various currencies from w orldw ideNA NA NA
2/5/2016 ArcaTech Systems, LLC TRAIDIS S.A.S.Manufactures and distributes cash processing machines and systems for
clients in banking, retail, public transport, casinos, and other sectorsNA NA NA
2/5/2016 Broadridge Financial Solutions, Inc. Anetics, Inc. Provides technology solutions for securities lending NA NA NA
2/4/2016 Tibet Tourism Co.,Ltd Lakala Payment Co., Ltd.Offers off line third party payment services for the convenience consumer
f inancial service industry in China1,674.2 NA NA
2/3/2016 Pow erSchool Group LLC Interactive Achievement, Inc.Develops assessment and reporting softw are solutions for school districts in
Virginia, South Carolina, Tennessee, and IndianaNA NA NA
2/2/2016 Huron Consulting Group Inc. MyRounding Solutions LLCDevelops cloud based rounding activity management platform for healthcare
providersNA NA NA
2/2/2016 Yardi Systems, Inc. Immobilien-Management-Systeme GmbHDevelops commercial property management softw are for real estate companies
in GermanyNA NA NA
2/1/2016 PrismHR Summit Softw are [Corporate Resource Services]Provides payroll processing and customer contact management softw are for
businesses in the U.S.NA NA NA
Select recently announced M&A transactions (as of March 11, 2016)
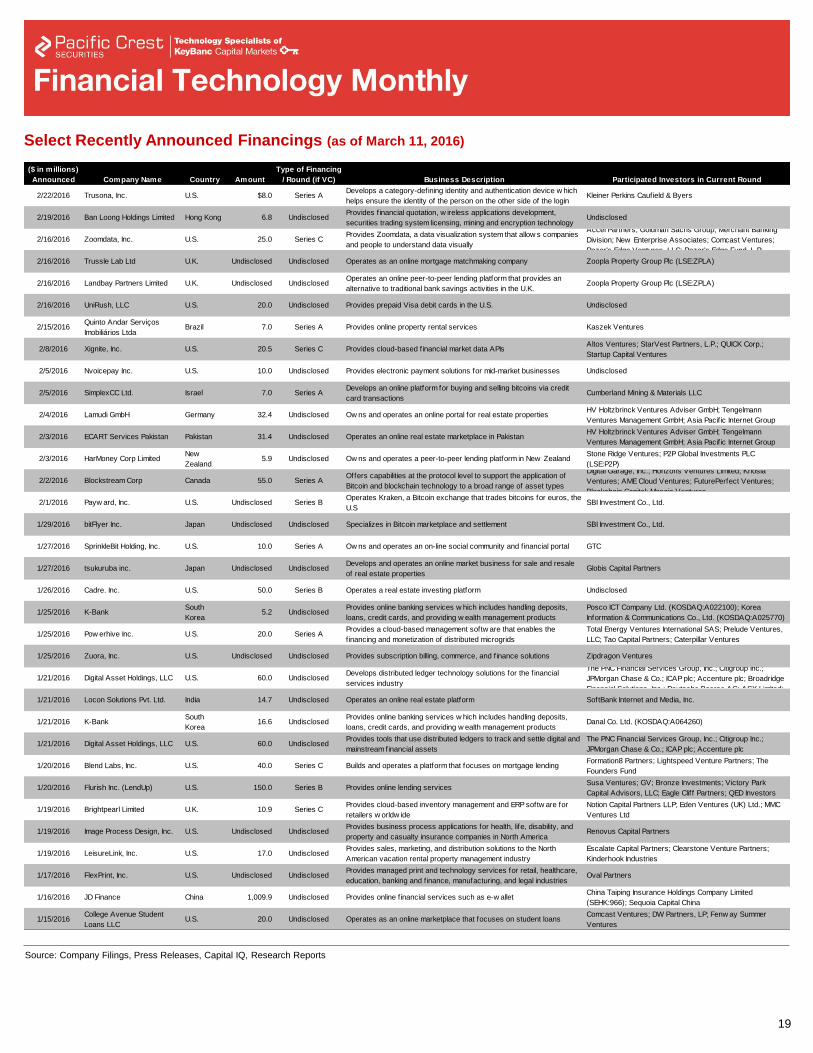
19
Source: Company Filings, Press Releases, Capital IQ, Research Reports
Adjust spacing for Digital Asset
Holdings description
($ in millions)
Announced Company Name Country Amount
Type of Financing
/ Round (if VC) Business Description Participated Investors in Current Round
2/22/2016 Trusona, Inc. U.S. $8.0 Series ADevelops a category-defining identity and authentication device w hich
helps ensure the identity of the person on the other side of the loginKleiner Perkins Caufield & Byers
2/19/2016 Ban Loong Holdings Limited Hong Kong 6.8 UndisclosedProvides f inancial quotation, w ireless applications development,
securities trading system licensing, mining and encryption technologyUndisclosed
2/16/2016 Zoomdata, Inc. U.S. 25.0 Series CProvides Zoomdata, a data visualization system that allow s companies
and people to understand data visually
Accel Partners; Goldman Sachs Group, Merchant Banking
Division; New Enterprise Associates; Comcast Ventures;
Razor's Edge Ventures, LLC; Razor's Edge Fund, L.P.
2/16/2016 Trussle Lab Ltd U.K. Undisclosed Undisclosed Operates as an online mortgage matchmaking company Zoopla Property Group Plc (LSE:ZPLA)
2/16/2016 Landbay Partners Limited U.K. Undisclosed UndisclosedOperates an online peer-to-peer lending platform that provides an
alternative to traditional bank savings activities in the U.K.Zoopla Property Group Plc (LSE:ZPLA)
2/16/2016 UniRush, LLC U.S. 20.0 Undisclosed Provides prepaid Visa debit cards in the U.S. Undisclosed
2/15/2016Quinto Andar Serviços
Imobiliários LtdaBrazil 7.0 Series A Provides online property rental services Kaszek Ventures
2/8/2016 Xignite, Inc. U.S. 20.5 Series C Provides cloud-based financial market data APIsAltos Ventures; StarVest Partners, L.P.; QUICK Corp.;
Startup Capital Ventures
2/5/2016 Nvoicepay Inc. U.S. 10.0 Undisclosed Provides electronic payment solutions for mid-market businesses Undisclosed
2/5/2016 SimplexCC Ltd. Israel 7.0 Series ADevelops an online platform for buying and selling bitcoins via credit
card transactionsCumberland Mining & Materials LLC
2/4/2016 Lamudi GmbH Germany 32.4 Undisclosed Ow ns and operates an online portal for real estate propertiesHV Holtzbrinck Ventures Adviser GmbH; Tengelmann
Ventures Management GmbH; Asia Pacif ic Internet Group
2/3/2016 ECART Services Pakistan Pakistan 31.4 Undisclosed Operates an online real estate marketplace in PakistanHV Holtzbrinck Ventures Adviser GmbH; Tengelmann
Ventures Management GmbH; Asia Pacif ic Internet Group
2/3/2016 HarMoney Corp LimitedNew
Zealand5.9 Undisclosed Ow ns and operates a peer-to-peer lending platform in New Zealand
Stone Ridge Ventures; P2P Global Investments PLC
(LSE:P2P)
2/2/2016 Blockstream Corp Canada 55.0 Series AOffers capabilities at the protocol level to support the application of
Bitcoin and blockchain technology to a broad range of asset types
Digital Garage, Inc.; Horizons Ventures Limited; Khosla
Ventures; AME Cloud Ventures; FuturePerfect Ventures;
Blockchain Capital; Mosaic Ventures
2/1/2016 Payw ard, Inc. U.S. Undisclosed Series BOperates Kraken, a Bitcoin exchange that trades bitcoins for euros, the
U.SSBI Investment Co., Ltd.
1/29/2016 bitFlyer Inc. Japan Undisclosed Undisclosed Specializes in Bitcoin marketplace and settlement SBI Investment Co., Ltd.
1/27/2016 SprinkleBit Holding, Inc. U.S. 10.0 Series A Ow ns and operates an on-line social community and f inancial portal GTC
1/27/2016 tsukuruba inc. Japan Undisclosed UndisclosedDevelops and operates an online market business for sale and resale
of real estate propertiesGlobis Capital Partners
1/26/2016 Cadre. Inc. U.S. 50.0 Series B Operates a real estate investing platform Undisclosed
1/25/2016 K-BankSouth
Korea5.2 Undisclosed
Provides online banking services w hich includes handling deposits,
loans, credit cards, and providing w ealth management products
Posco ICT Company Ltd. (KOSDAQ:A022100); Korea
Information & Communications Co., Ltd. (KOSDAQ:A025770)
1/25/2016 Pow erhive Inc. U.S. 20.0 Series AProvides a cloud-based management softw are that enables the
f inancing and monetization of distributed microgrids
Total Energy Ventures International SAS; Prelude Ventures,
LLC; Tao Capital Partners; Caterpillar Ventures
1/25/2016 Zuora, Inc. U.S. Undisclosed Undisclosed Provides subscription billing, commerce, and f inance solutions Zipdragon Ventures
1/21/2016 Digital Asset Holdings, LLC U.S. 60.0 UndisclosedDevelops distributed ledger technology solutions for the f inancial
services industry
The PNC Financial Services Group, Inc.; Citigroup Inc.;
JPMorgan Chase & Co.; ICAP plc; Accenture plc; Broadridge
Financial Solutions, Inc.; Deutsche Boerse AG; ASX Limited;
1/21/2016 Locon Solutions Pvt. Ltd. India 14.7 Undisclosed Operates an online real estate platform SoftBank Internet and Media, Inc.
1/21/2016 K-BankSouth
Korea16.6 Undisclosed
Provides online banking services w hich includes handling deposits,
loans, credit cards, and providing w ealth management productsDanal Co. Ltd. (KOSDAQ:A064260)
1/21/2016 Digital Asset Holdings, LLC U.S. 60.0 UndisclosedProvides tools that use distributed ledgers to track and settle digital and
mainstream financial assets
The PNC Financial Services Group, Inc.; Citigroup Inc.;
JPMorgan Chase & Co.; ICAP plc; Accenture plc
1/20/2016 Blend Labs, Inc. U.S. 40.0 Series C Builds and operates a platform that focuses on mortgage lendingFormation8 Partners; Lightspeed Venture Partners; The
Founders Fund
1/20/2016 Flurish Inc. (LendUp) U.S. 150.0 Series B Provides online lending servicesSusa Ventures; GV; Bronze Investments; Victory Park
Capital Advisors, LLC; Eagle Cliff Partners; QED Investors
1/19/2016 Brightpearl Limited U.K. 10.9 Series CProvides cloud-based inventory management and ERP softw are for
retailers w orldw ide
Notion Capital Partners LLP; Eden Ventures (UK) Ltd.; MMC
Ventures Ltd
1/19/2016 Image Process Design, Inc. U.S. Undisclosed UndisclosedProvides business process applications for health, life, disability, and
property and casualty insurance companies in North AmericaRenovus Capital Partners
1/19/2016 LeisureLink, Inc. U.S. 17.0 UndisclosedProvides sales, marketing, and distribution solutions to the North
American vacation rental property management industry
Escalate Capital Partners; Clearstone Venture Partners;
Kinderhook Industries
1/17/2016 FlexPrint, Inc. U.S. Undisclosed UndisclosedProvides managed print and technology services for retail, healthcare,
education, banking and f inance, manufacturing, and legal industriesOval Partners
1/16/2016 JD Finance China 1,009.9 Undisclosed Provides online f inancial services such as e-w alletChina Taiping Insurance Holdings Company Limited
(SEHK:966); Sequoia Capital China
1/15/2016College Avenue Student
Loans LLCU.S. 20.0 Undisclosed Operates as an online marketplace that focuses on student loans
Comcast Ventures; DW Partners, LP; Fenw ay Summer
Ventures
Select Recently Announced Financings (as of March 11, 2016)
Please include the
RealtyShares PP by
Union Square Ventures I
mentioned in the e-mail
Realty Shares was
announced on Jan 05
but closed last month.
It doesn’t reflect as we
take only the top 34
transactions by
Announced date ( till
Jan 15th in this mailer)
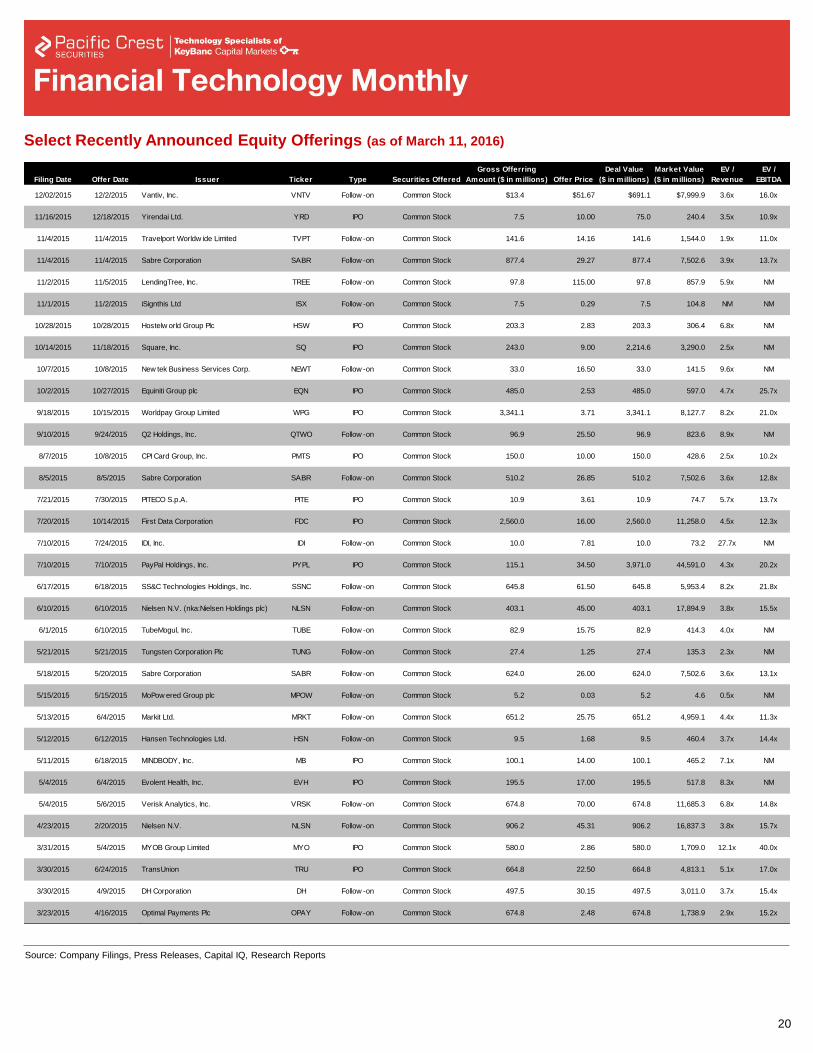
20
Source: Company Filings, Press Releases, Capital IQ, Research Reports
Replace offer size column with Gross Offering Amount
(i.e., should be $243M for Square).
The Square IPO is also not pending. Change Closed
Date column to Offer Date and sort all the transactions
by Offer Date.
Include $ in front of 243 Gross Offering Amount for
Square.
The filing date for Square was October 14th, 2015, not
11/19/2015
Changed "Closed Date" column title to "Offer Date"
Filing Date Offer Date Issuer Ticker Type Securities Offered
Gross Offerring
Amount ($ in millions) Offer Price
Deal Value
($ in millions)
Market Value
($ in millions)
EV /
Revenue
EV /
EBITDA
12/02/2015 12/2/2015 Vantiv, Inc. VNTV Follow -on Common Stock $13.4 $51.67 $691.1 $7,999.9 3.6x 16.0x
11/16/2015 12/18/2015 Yirendai Ltd. YRD IPO Common Stock 7.5 10.00 75.0 240.4 3.5x 10.9x
11/4/2015 11/4/2015 Travelport Worldw ide Limited TVPT Follow -on Common Stock 141.6 14.16 141.6 1,544.0 1.9x 11.0x
11/4/2015 11/4/2015 Sabre Corporation SABR Follow -on Common Stock 877.4 29.27 877.4 7,502.6 3.9x 13.7x
11/2/2015 11/5/2015 LendingTree, Inc. TREE Follow -on Common Stock 97.8 115.00 97.8 857.9 5.9x NM
11/1/2015 11/2/2015 iSignthis Ltd ISX Follow -on Common Stock 7.5 0.29 7.5 104.8 NM NM
10/28/2015 10/28/2015 Hostelw orld Group Plc HSW IPO Common Stock 203.3 2.83 203.3 306.4 6.8x NM
10/14/2015 11/18/2015 Square, Inc. SQ IPO Common Stock 243.0 9.00 2,214.6 3,290.0 2.5x NM
10/7/2015 10/8/2015 New tek Business Services Corp. NEWT Follow -on Common Stock 33.0 16.50 33.0 141.5 9.6x NM
10/2/2015 10/27/2015 Equiniti Group plc EQN IPO Common Stock 485.0 2.53 485.0 597.0 4.7x 25.7x
9/18/2015 10/15/2015 Worldpay Group Limited WPG IPO Common Stock 3,341.1 3.71 3,341.1 8,127.7 8.2x 21.0x
9/10/2015 9/24/2015 Q2 Holdings, Inc. QTWO Follow -on Common Stock 96.9 25.50 96.9 823.6 8.9x NM
8/7/2015 10/8/2015 CPI Card Group, Inc. PMTS IPO Common Stock 150.0 10.00 150.0 428.6 2.5x 10.2x
8/5/2015 8/5/2015 Sabre Corporation SABR Follow -on Common Stock 510.2 26.85 510.2 7,502.6 3.6x 12.8x
7/21/2015 7/30/2015 PITECO S.p.A. PITE IPO Common Stock 10.9 3.61 10.9 74.7 5.7x 13.7x
7/20/2015 10/14/2015 First Data Corporation FDC IPO Common Stock 2,560.0 16.00 2,560.0 11,258.0 4.5x 12.3x
7/10/2015 7/24/2015 IDI, Inc. IDI Follow -on Common Stock 10.0 7.81 10.0 73.2 27.7x NM
7/10/2015 7/10/2015 PayPal Holdings, Inc. PYPL IPO Common Stock 115.1 34.50 3,971.0 44,591.0 4.3x 20.2x
6/17/2015 6/18/2015 SS&C Technologies Holdings, Inc. SSNC Follow -on Common Stock 645.8 61.50 645.8 5,953.4 8.2x 21.8x
6/10/2015 6/10/2015 Nielsen N.V. (nka:Nielsen Holdings plc) NLSN Follow -on Common Stock 403.1 45.00 403.1 17,894.9 3.8x 15.5x
6/1/2015 6/10/2015 TubeMogul, Inc. TUBE Follow -on Common Stock 82.9 15.75 82.9 414.3 4.0x NM
5/21/2015 5/21/2015 Tungsten Corporation Plc TUNG Follow -on Common Stock 27.4 1.25 27.4 135.3 2.3x NM
5/18/2015 5/20/2015 Sabre Corporation SABR Follow -on Common Stock 624.0 26.00 624.0 7,502.6 3.6x 13.1x
5/15/2015 5/15/2015 MoPow ered Group plc MPOW Follow -on Common Stock 5.2 0.03 5.2 4.6 0.5x NM
5/13/2015 6/4/2015 Markit Ltd. MRKT Follow -on Common Stock 651.2 25.75 651.2 4,959.1 4.4x 11.3x
5/12/2015 6/12/2015 Hansen Technologies Ltd. HSN Follow -on Common Stock 9.5 1.68 9.5 460.4 3.7x 14.4x
5/11/2015 6/18/2015 MINDBODY, Inc. MB IPO Common Stock 100.1 14.00 100.1 465.2 7.1x NM
5/4/2015 6/4/2015 Evolent Health, Inc. EVH IPO Common Stock 195.5 17.00 195.5 517.8 8.3x NM
5/4/2015 5/6/2015 Verisk Analytics, Inc. VRSK Follow -on Common Stock 674.8 70.00 674.8 11,685.3 6.8x 14.8x
4/23/2015 2/20/2015 Nielsen N.V. NLSN Follow -on Common Stock 906.2 45.31 906.2 16,837.3 3.8x 15.7x
3/31/2015 5/4/2015 MYOB Group Limited MYO IPO Common Stock 580.0 2.86 580.0 1,709.0 12.1x 40.0x
3/30/2015 6/24/2015 TransUnion TRU IPO Common Stock 664.8 22.50 664.8 4,813.1 5.1x 17.0x
3/30/2015 4/9/2015 DH Corporation DH Follow -on Common Stock 497.5 30.15 497.5 3,011.0 3.7x 15.4x
3/23/2015 4/16/2015 Optimal Payments Plc OPAY Follow -on Common Stock 674.8 2.48 674.8 1,738.9 2.9x 15.2x
Select Recently Announced Equity Offerings (as of March 11, 2016)
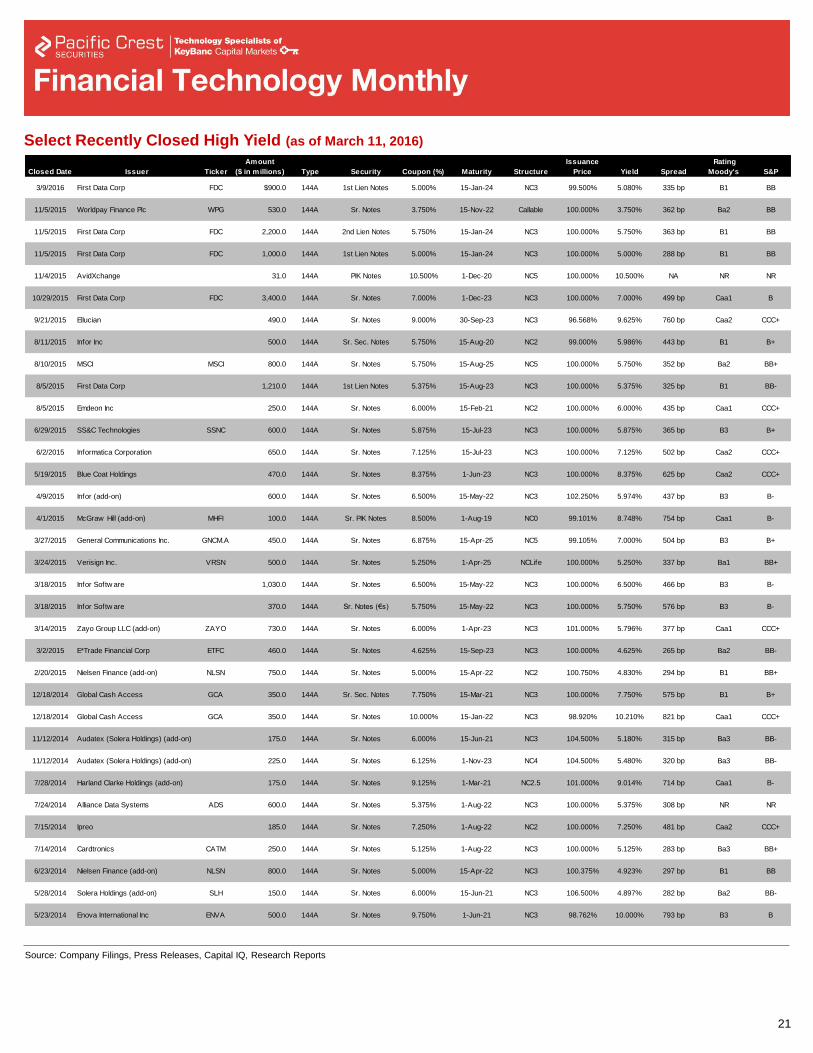
21
Source: Company Filings, Press Releases, Capital IQ, Research Reports
Add transactions from e-mail attachments
Delete ticker for First Data transaction on 8/5/2015 (it
was NOT public then)
Include ticker for E-trade financial group, Verisign, and
Enova International
Please check all the other companies on this page
likewise
Closed Date Issuer Ticker
Amount
($ in millions) Type Security Coupon (%) Maturity Structure
Issuance
Price Yield Spread
Rating
Moody's S&P
3/9/2016 First Data Corp FDC $900.0 144A 1st Lien Notes 5.000% 15-Jan-24 NC3 99.500% 5.080% 335 bp B1 BB
11/5/2015 Worldpay Finance Plc WPG 530.0 144A Sr. Notes 3.750% 15-Nov-22 Callable 100.000% 3.750% 362 bp Ba2 BB
11/5/2015 First Data Corp FDC 2,200.0 144A 2nd Lien Notes 5.750% 15-Jan-24 NC3 100.000% 5.750% 363 bp B1 BB
11/5/2015 First Data Corp FDC 1,000.0 144A 1st Lien Notes 5.000% 15-Jan-24 NC3 100.000% 5.000% 288 bp B1 BB
11/4/2015 AvidXchange 31.0 144A PIK Notes 10.500% 1-Dec-20 NC5 100.000% 10.500% NA NR NR
10/29/2015 First Data Corp FDC 3,400.0 144A Sr. Notes 7.000% 1-Dec-23 NC3 100.000% 7.000% 499 bp Caa1 B
9/21/2015 Ellucian 490.0 144A Sr. Notes 9.000% 30-Sep-23 NC3 96.568% 9.625% 760 bp Caa2 CCC+
8/11/2015 Infor Inc 500.0 144A Sr. Sec. Notes 5.750% 15-Aug-20 NC2 99.000% 5.986% 443 bp B1 B+
8/10/2015 MSCI MSCI 800.0 144A Sr. Notes 5.750% 15-Aug-25 NC5 100.000% 5.750% 352 bp Ba2 BB+
8/5/2015 First Data Corp 1,210.0 144A 1st Lien Notes 5.375% 15-Aug-23 NC3 100.000% 5.375% 325 bp B1 BB-
8/5/2015 Emdeon Inc 250.0 144A Sr. Notes 6.000% 15-Feb-21 NC2 100.000% 6.000% 435 bp Caa1 CCC+
6/29/2015 SS&C Technologies SSNC 600.0 144A Sr. Notes 5.875% 15-Jul-23 NC3 100.000% 5.875% 365 bp B3 B+
6/2/2015 Informatica Corporation 650.0 144A Sr. Notes 7.125% 15-Jul-23 NC3 100.000% 7.125% 502 bp Caa2 CCC+
5/19/2015 Blue Coat Holdings 470.0 144A Sr. Notes 8.375% 1-Jun-23 NC3 100.000% 8.375% 625 bp Caa2 CCC+
4/9/2015 Infor (add-on) 600.0 144A Sr. Notes 6.500% 15-May-22 NC3 102.250% 5.974% 437 bp B3 B-
4/1/2015 McGraw Hill (add-on) MHFI 100.0 144A Sr. PIK Notes 8.500% 1-Aug-19 NC0 99.101% 8.748% 754 bp Caa1 B-
3/27/2015 General Communications Inc. GNCM.A 450.0 144A Sr. Notes 6.875% 15-Apr-25 NC5 99.105% 7.000% 504 bp B3 B+
3/24/2015 Verisign Inc. VRSN 500.0 144A Sr. Notes 5.250% 1-Apr-25 NCLife 100.000% 5.250% 337 bp Ba1 BB+
3/18/2015 Infor Softw are 1,030.0 144A Sr. Notes 6.500% 15-May-22 NC3 100.000% 6.500% 466 bp B3 B-
3/18/2015 Infor Softw are 370.0 144A Sr. Notes (€s) 5.750% 15-May-22 NC3 100.000% 5.750% 576 bp B3 B-
3/14/2015 Zayo Group LLC (add-on) ZAYO 730.0 144A Sr. Notes 6.000% 1-Apr-23 NC3 101.000% 5.796% 377 bp Caa1 CCC+
3/2/2015 E*Trade Financial Corp ETFC 460.0 144A Sr. Notes 4.625% 15-Sep-23 NC3 100.000% 4.625% 265 bp Ba2 BB-
2/20/2015 Nielsen Finance (add-on) NLSN 750.0 144A Sr. Notes 5.000% 15-Apr-22 NC2 100.750% 4.830% 294 bp B1 BB+
12/18/2014 Global Cash Access GCA 350.0 144A Sr. Sec. Notes 7.750% 15-Mar-21 NC3 100.000% 7.750% 575 bp B1 B+
12/18/2014 Global Cash Access GCA 350.0 144A Sr. Notes 10.000% 15-Jan-22 NC3 98.920% 10.210% 821 bp Caa1 CCC+
11/12/2014 Audatex (Solera Holdings) (add-on) 175.0 144A Sr. Notes 6.000% 15-Jun-21 NC3 104.500% 5.180% 315 bp Ba3 BB-
11/12/2014 Audatex (Solera Holdings) (add-on) 225.0 144A Sr. Notes 6.125% 1-Nov-23 NC4 104.500% 5.480% 320 bp Ba3 BB-
7/28/2014 Harland Clarke Holdings (add-on) 175.0 144A Sr. Notes 9.125% 1-Mar-21 NC2.5 101.000% 9.014% 714 bp Caa1 B-
7/24/2014 Alliance Data Systems ADS 600.0 144A Sr. Notes 5.375% 1-Aug-22 NC3 100.000% 5.375% 308 bp NR NR
7/15/2014 Ipreo 185.0 144A Sr. Notes 7.250% 1-Aug-22 NC2 100.000% 7.250% 481 bp Caa2 CCC+
7/14/2014 Cardtronics CATM 250.0 144A Sr. Notes 5.125% 1-Aug-22 NC3 100.000% 5.125% 283 bp Ba3 BB+
6/23/2014 Nielsen Finance (add-on) NLSN 800.0 144A Sr. Notes 5.000% 15-Apr-22 NC3 100.375% 4.923% 297 bp B1 BB
5/28/2014 Solera Holdings (add-on) SLH 150.0 144A Sr. Notes 6.000% 15-Jun-21 NC3 106.500% 4.897% 282 bp Ba2 BB-
5/23/2014 Enova International Inc ENVA 500.0 144A Sr. Notes 9.750% 1-Jun-21 NC3 98.762% 10.000% 793 bp B3 B
Select Recently Closed High Yield (as of March 11, 2016)
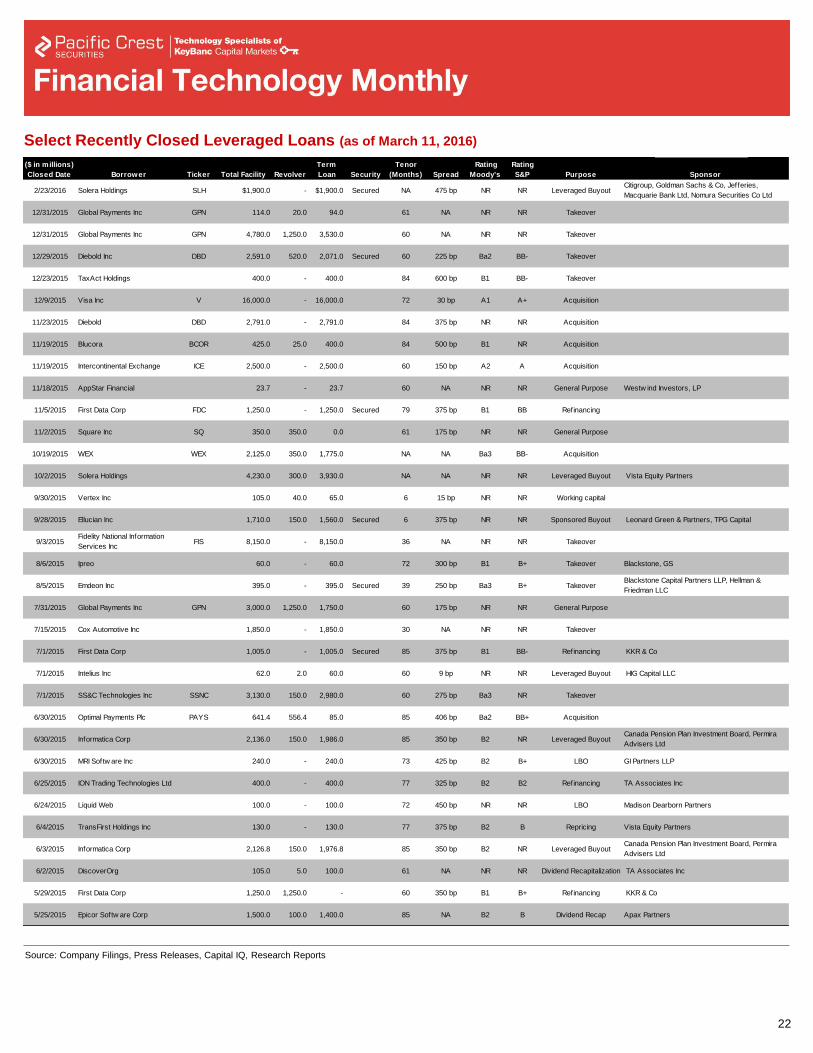
22
Source: Company Filings, Press Releases, Capital IQ, Research Reports
Delete 0’s next to GPN and DBD
Looks like an extra space next to
Blackstone in 8/5/2015
Add Blucora – TaxACT
Visa Europe
Intercontinental Exchange
($ in millions)
Closed Date Borrower Ticker Total Facility Revolver
Term
Loan Security
Tenor
(Months) Spread
Rating
Moody's
Rating
S&P Purpose Sponsor
2/23/2016 Solera Holdings SLH $1,900.0 - $1,900.0 Secured NA 475 bp NR NR Leveraged BuyoutCitigroup, Goldman Sachs & Co, Jefferies,
Macquarie Bank Ltd, Nomura Securities Co Ltd
12/31/2015 Global Payments Inc GPN 114.0 20.0 94.0 61 NA NR NR Takeover
12/31/2015 Global Payments Inc GPN 4,780.0 1,250.0 3,530.0 60 NA NR NR Takeover
12/29/2015 Diebold Inc DBD 2,591.0 520.0 2,071.0 Secured 60 225 bp Ba2 BB- Takeover
12/23/2015 TaxAct Holdings 400.0 - 400.0 84 600 bp B1 BB- Takeover
12/9/2015 Visa Inc V 16,000.0 - 16,000.0 72 30 bp A1 A+ Acquisition
11/23/2015 Diebold DBD 2,791.0 - 2,791.0 84 375 bp NR NR Acquisition
11/19/2015 Blucora BCOR 425.0 25.0 400.0 84 500 bp B1 NR Acquisition
11/19/2015 Intercontinental Exchange ICE 2,500.0 - 2,500.0 60 150 bp A2 A Acquisition
11/18/2015 AppStar Financial 23.7 - 23.7 60 NA NR NR General Purpose Westw ind Investors, LP
11/5/2015 First Data Corp FDC 1,250.0 - 1,250.0 Secured 79 375 bp B1 BB Refinancing
11/2/2015 Square Inc SQ 350.0 350.0 0.0 61 175 bp NR NR General Purpose
10/19/2015 WEX WEX 2,125.0 350.0 1,775.0 NA NA Ba3 BB- Acquisition
10/2/2015 Solera Holdings 4,230.0 300.0 3,930.0 NA NA NR NR Leveraged Buyout Vista Equity Partners
9/30/2015 Vertex Inc 105.0 40.0 65.0 6 15 bp NR NR Working capital
9/28/2015 Ellucian Inc 1,710.0 150.0 1,560.0 Secured 6 375 bp NR NR Sponsored Buyout Leonard Green & Partners, TPG Capital
9/3/2015Fidelity National Information
Services IncFIS 8,150.0 - 8,150.0 36 NA NR NR Takeover
8/6/2015 Ipreo 60.0 - 60.0 72 300 bp B1 B+ Takeover Blackstone, GS
8/5/2015 Emdeon Inc 395.0 - 395.0 Secured 39 250 bp Ba3 B+ TakeoverBlackstone Capital Partners LLP, Hellman &
Friedman LLC
7/31/2015 Global Payments Inc GPN 3,000.0 1,250.0 1,750.0 60 175 bp NR NR General Purpose
7/15/2015 Cox Automotive Inc 1,850.0 - 1,850.0 30 NA NR NR Takeover
7/1/2015 First Data Corp 1,005.0 - 1,005.0 Secured 85 375 bp B1 BB- Refinancing KKR & Co
7/1/2015 Intelius Inc 62.0 2.0 60.0 60 9 bp NR NR Leveraged Buyout HIG Capital LLC
7/1/2015 SS&C Technologies Inc SSNC 3,130.0 150.0 2,980.0 60 275 bp Ba3 NR Takeover
6/30/2015 Optimal Payments Plc PAYS 641.4 556.4 85.0 85 406 bp Ba2 BB+ Acquisition
6/30/2015 Informatica Corp 2,136.0 150.0 1,986.0 85 350 bp B2 NR Leveraged BuyoutCanada Pension Plan Investment Board, Permira
Advisers Ltd
6/30/2015 MRI Softw are Inc 240.0 - 240.0 73 425 bp B2 B+ LBO GI Partners LLP
6/25/2015 ION Trading Technologies Ltd 400.0 - 400.0 77 325 bp B2 B2 Refinancing TA Associates Inc
6/24/2015 Liquid Web 100.0 - 100.0 72 450 bp NR NR LBO Madison Dearborn Partners
6/4/2015 TransFirst Holdings Inc 130.0 - 130.0 77 375 bp B2 B Repricing Vista Equity Partners
6/3/2015 Informatica Corp 2,126.8 150.0 1,976.8 85 350 bp B2 NR Leveraged BuyoutCanada Pension Plan Investment Board, Permira
Advisers Ltd
6/2/2015 DiscoverOrg 105.0 5.0 100.0 61 NA NR NR Dividend Recapitalization TA Associates Inc
5/29/2015 First Data Corp 1,250.0 1,250.0 - 60 350 bp B1 B+ Refinancing KKR & Co
5/25/2015 Epicor Softw are Corp 1,500.0 100.0 1,400.0 85 NA B2 B Dividend Recap Apax Partners
Export to NewsletterSelect Recently Closed Leveraged Loans (as of March 11, 2016)
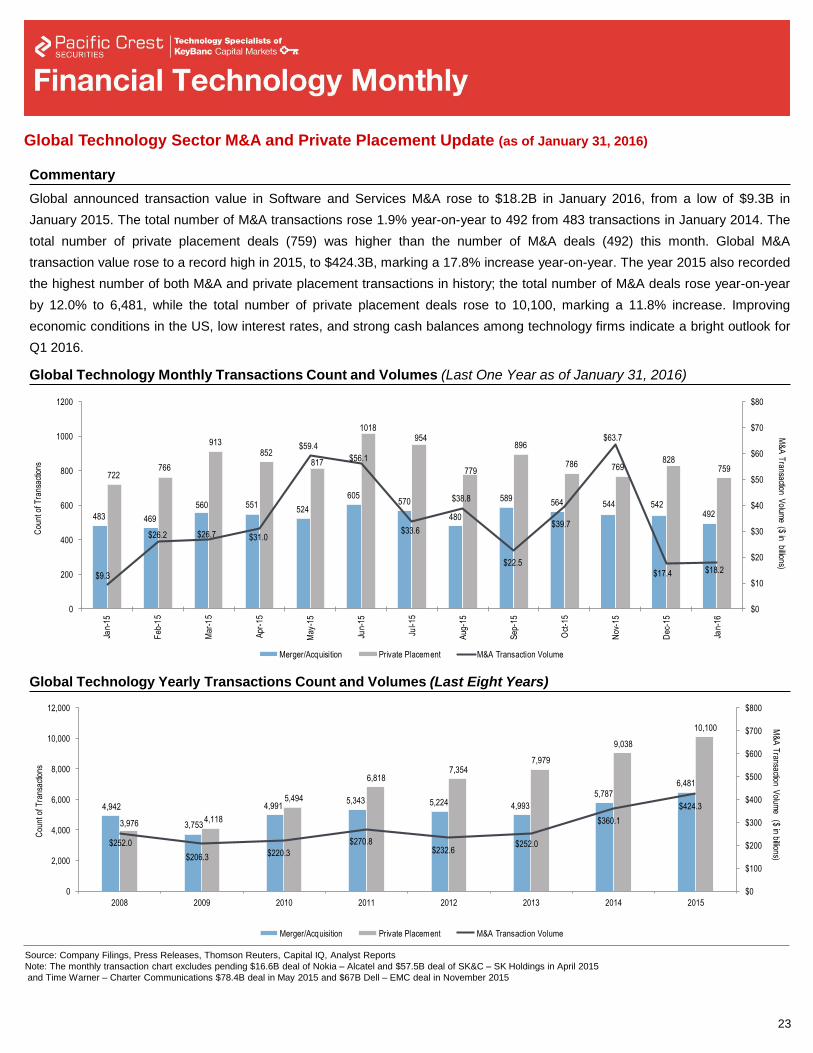
4,942
3,753
4,991 5,343 5,224 4,993
5,787 6,481
3,976 4,118
5,494
6,818 7,354
7,979
9,038
10,100
$252.0
$206.3 $220.3
$270.8$232.6
$252.0
$360.1
$424.3
$0
$100
$200
$300
$400
$500
$600
$700
$800
0
2,000
4,000
6,000
8,000
10,000
12,000
2008 2009 2010 2011 2012 2013 2014 2015
M&
A T
ransaction Volum
e ($ in billions)C
ount
of T
rans
actio
ns
Merger/Acquisition Private Placement M&A Transaction Volume
Global Technology Yearly Transactions Count and Volumes (Last Eight Years)
23
Source: Company Filings, Press Releases, Thomson Reuters, Capital IQ, Analyst Reports
Note: The monthly transaction chart excludes pending $16.6B deal of Nokia – Alcatel and $57.5B deal of SK&C – SK Holdings in April 2015
and Time Warner – Charter Communications $78.4B deal in May 2015 and $67B Dell – EMC deal in November 2015
Commentary
Global Technology Monthly Transactions Count and Volumes (Last One Year as of January 31, 2016)
Global announced transaction value in Software and Services M&A rose to $18.2B in January 2016, from a low of $9.3B in
January 2015. The total number of M&A transactions rose 1.9% year-on-year to 492 from 483 transactions in January 2014. The
total number of private placement deals (759) was higher than the number of M&A deals (492) this month. Global M&A
transaction value rose to a record high in 2015, to $424.3B, marking a 17.8% increase year-on-year. The year 2015 also recorded
the highest number of both M&A and private placement transactions in history; the total number of M&A deals rose year-on-year
by 12.0% to 6,481, while the total number of private placement deals rose to 10,100, marking a 11.8% increase. Improving
economic conditions in the US, low interest rates, and strong cash balances among technology firms indicate a bright outlook for
Q1 2016.
483 469
560 551524
605570
480
589564 544 542
492
722766
913852
817
1018954
779
896
786 769828
759
$9.3
$26.2 $26.7 $31.0
$59.4
$56.1
$33.6
$38.8
$22.5
$39.7
$63.7
$17.4 $18.2
$0
$10
$20
$30
$40
$50
$60
$70
$80
0
200
400
600
800
1000
1200
Jan-
15
Feb
-15
Mar
-15
Apr
-15
May
-15
Jun-
15
Jul-1
5
Aug
-15
Sep
-15
Oct
-15
Nov
-15
Dec
-15
Jan-
16
M&
A T
ransaction Volum
e ($ in billions)C
ount
of T
rans
actio
ns
Merger/Acquisition Private Placement M&A Transaction Volume
Global Technology Sector M&A and Private Placement Update (as of January 31, 2016)
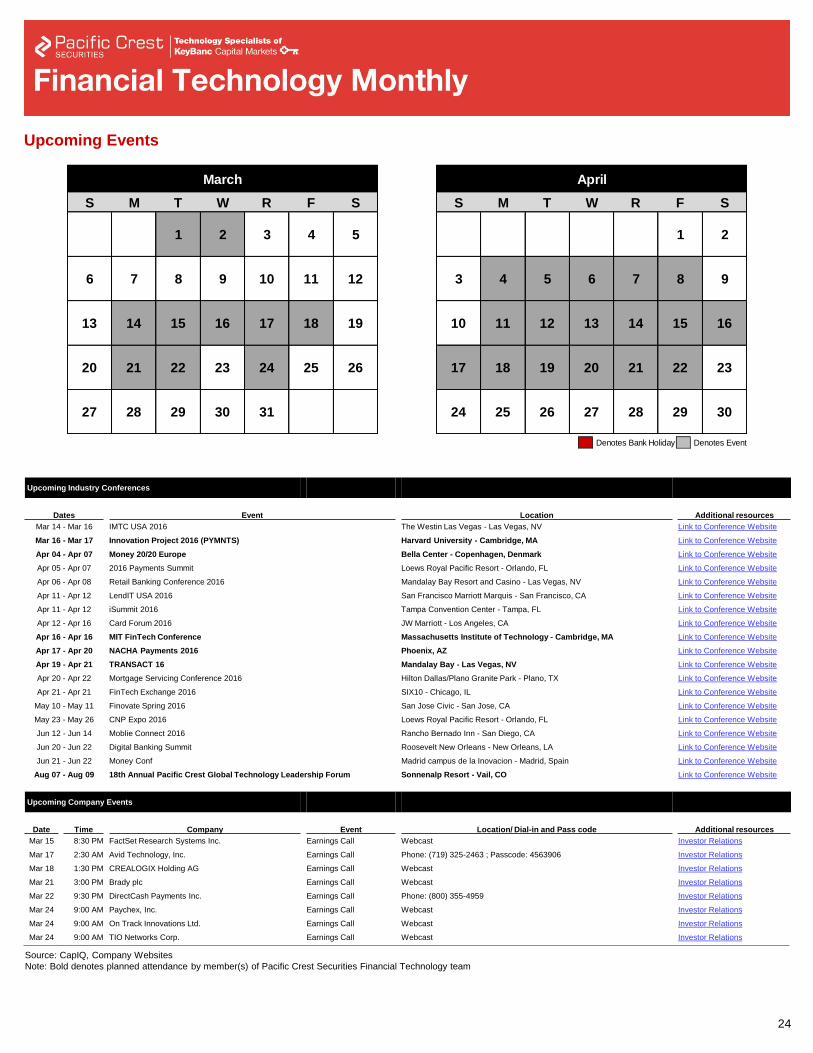
24
Source: CapIQ, Company Websites
Note: Bold denotes planned attendance by member(s) of Pacific Crest Securities Financial Technology team
Denotes Bank Holiday Denotes Event
March
S M T W R F S
1 2 3 4 5
6 7 8 9 10 11 12
13 14 15 16 17 18 19
20 21 22 23 24 25 26
27 28 29 30 31
April
S M T W R F S
1 2
3 4 5 6 7 8 9
10 11 12 13 14 15 16
17 18 19 20 21 22 23
24 25 26 27 28 29 30
Upcoming Industry Conferences
Dates Event Location Additional resources
Oct 25 - Oct 28 Money 2020 Expo The Venetian Hotel & Casino- Las Vegas, NV Link to Conference Website
Oct 28 - Oct 29 NFC Solutions Summit 2015 Arizona Grand Resort - Phoenix, AZ Link to Conference Website
Oct 28 - Oct 29 2015 Western States Acquirers Association Annual Conference M Resort - Henderson, NV Link to Conference Website
Nov 04 - Nov 06 RDC Summit 2015 Omni Orlando Resort - ChampionsGate, FL Link to Conference Website
Nov 08 - Nov 10 2015 ABA Annual Convention JW Marriott - Los Angeles, CA Link to Conference Website
Nov 16 - Nov 18 Small Business Banking 2015 Renaissance Nashville - Nashville, TN Link to Conference Website
Feb 02 - Feb 04 LegalTech Trade Show The Hilton New York – New York, NY Link to Conference Website
Mar 14 - Mar 16 IMTC US 2016 The Westin Las Vegas - Las Vegas, NV Link to Conference Website
Apr 05 - Apr 07 2016 Payments Summit Loews Royal Pacific Resort - Orlando, FL Link to Conference Website
Apr 12 - Apr 16 Card Forum 2016 JW Marriott - Los Angeles, CA Link to Conference Website
Apr 17 - Apr 20 NACHA Payments 2016 Phoenix, AZ Link to Conference Website
Apr 19 - Apr 21 TRANSACT 16 Mandalay Bay - Las Vegas, NV Link to Conference Website
Jun 20 - Jun 22 Digital Banking Summit Roosevelt New Orleans - New Orleans, LA Link to Conference Website
Upcoming Company Events
Date Time Company Event Location/ Dial-in and Pass code Additional resources
Oct 02 6:00 PM Global Payments Inc. Earnings Call Dail-in: (877) 407-3982 Investor Relations
Oct 08 9:00 AM Blackhawk Network Holdings, Inc. Earnings Call TBA Investor Relations
Oct 13 2:30 AM Quindell Plc Earnings Call Dail-in: (855) 419-6600 Investor Relations
Oct 14 2:00 AM Alliance Data Systems Corporation Earnings Call Webcast Investor Relations
Oct 15 9:00 AM Lombard Risk Management plc Earnings Call TBA Investor Relations
Oct 16 9:00 AM The Western Union Company Earnings Call TBA Investor Relations
Oct 21 9:00 AM American Express Company Earnings Call Webcast Investor Relations
Oct 21 9:00 AM Morningstar Inc. Earnings Call TBA Investor Relations
Update events
(Waters US in
December 2015)
Unshade December 11th and December 14th (or shade
ALL the days on which company events occur if that is
the way the calendars were originally intended)
Not sure what happened, but the industry conferences
I added in V4 (Money2020 Europe, etc.) were deleted.
Please do not change that section.
Upcoming Events
Upcoming Industry Conferences
Dates Event Location Additional resources
Mar 14 - Mar 16 IMTC USA 2016 The Westin Las Vegas - Las Vegas, NV Link to Conference Website
Mar 16 - Mar 17 Innovation Project 2016 (PYMNTS) Harvard University - Cambridge, MA Link to Conference Website
Apr 04 - Apr 07 Money 20/20 Europe Bella Center - Copenhagen, Denmark Link to Conference Website
Apr 05 - Apr 07 2016 Payments Summit Loews Royal Pacific Resort - Orlando, FL Link to Conference Website
Apr 06 - Apr 08 Retail Banking Conference 2016 Mandalay Bay Resort and Casino - Las Vegas, NV Link to Conference Website
Apr 11 - Apr 12 LendIT USA 2016 San Francisco Marriott Marquis - San Francisco, CA Link to Conference Website
Apr 11 - Apr 12 iSummit 2016 Tampa Convention Center - Tampa, FL Link to Conference Website
Apr 12 - Apr 16 Card Forum 2016 JW Marriott - Los Angeles, CA Link to Conference Website
Apr 16 - Apr 16 MIT FinTech Conference Massachusetts Institute of Technology - Cambridge, MA Link to Conference Website
Apr 17 - Apr 20 NACHA Payments 2016 Phoenix, AZ Link to Conference Website
Apr 19 - Apr 21 TRANSACT 16 Mandalay Bay - Las Vegas, NV Link to Conference Website
Apr 20 - Apr 22 Mortgage Servicing Conference 2016 Hilton Dallas/Plano Granite Park - Plano, TX Link to Conference Website
Apr 21 - Apr 21 FinTech Exchange 2016 SIX10 - Chicago, IL Link to Conference Website
May 10 - May 11 Finovate Spring 2016 San Jose Civic - San Jose, CA Link to Conference Website
May 23 - May 26 CNP Expo 2016 Loews Royal Pacific Resort - Orlando, FL Link to Conference Website
Jun 12 - Jun 14 Moblie Connect 2016 Rancho Bernado Inn - San Diego, CA Link to Conference Website
Jun 20 - Jun 22 Digital Banking Summit Roosevelt New Orleans - New Orleans, LA Link to Conference Website
Jun 21 - Jun 22 Money Conf Madrid campus de la Inovacion - Madrid, Spain Link to Conference Website
Aug 07 - Aug 09 18th Annual Pacific Crest Global Technology Leadership Forum Sonnenalp Resort - Vail, CO Link to Conference Website
Upcoming Company Events
Date Time Company Event Location/ Dial-in and Pass code Additional resources
Mar 15 8:30 PM FactSet Research Systems Inc. Earnings Call Webcast Investor Relations
Mar 17 2:30 AM Avid Technology, Inc. Earnings Call Phone: (719) 325-2463 ; Passcode: 4563906 Investor Relations
Mar 18 1:30 PM CREALOGIX Holding AG Earnings Call Webcast Investor Relations
Mar 21 3:00 PM Brady plc Earnings Call Webcast Investor Relations
Mar 22 9:30 PM DirectCash Payments Inc. Earnings Call Phone: (800) 355-4959 Investor Relations
Mar 24 9:00 AM Paychex, Inc. Earnings Call Webcast Investor Relations
Mar 24 9:00 AM On Track Innovations Ltd. Earnings Call Webcast Investor Relations
Mar 24 9:00 AM TIO Networks Corp. Earnings Call Webcast Investor Relations
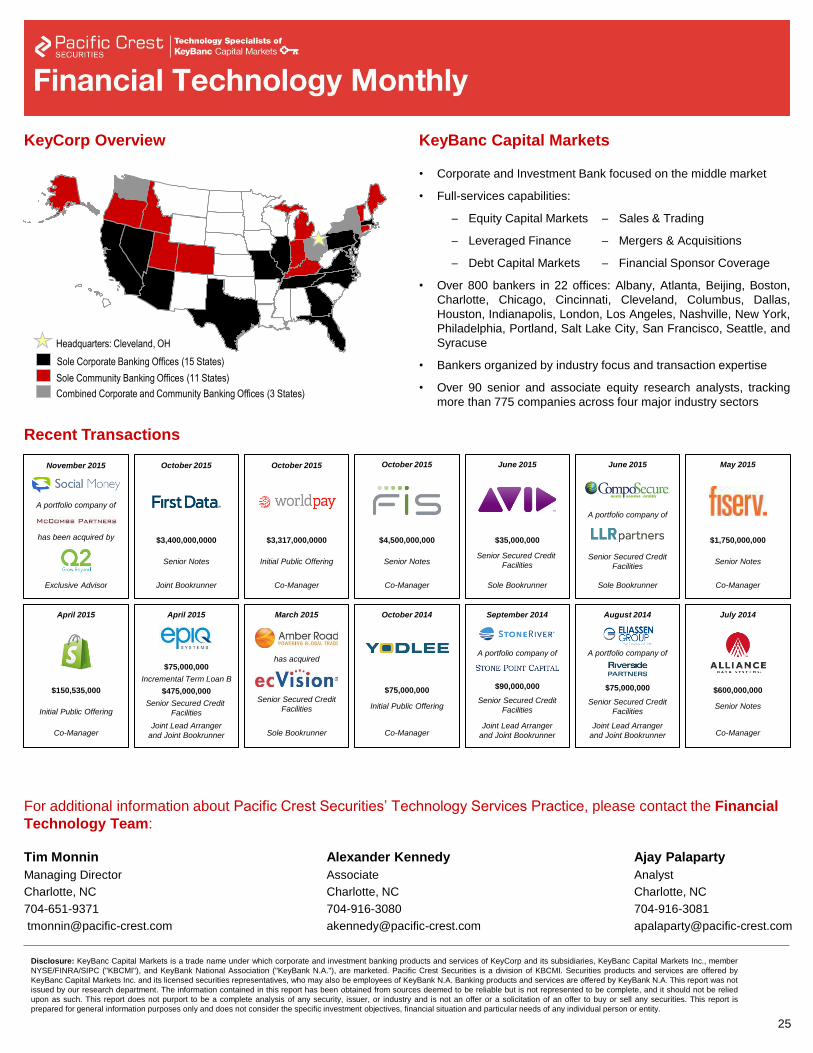
25
Disclosure: KeyBanc Capital Markets is a trade name under which corporate and investment banking products and services of KeyCorp and its subsidiaries, KeyBanc Capital Markets Inc., member
NYSE/FINRA/SIPC ("KBCMI"), and KeyBank National Association ("KeyBank N.A."), are marketed. Pacific Crest Securities is a division of KBCMI. Securities products and services are offered by
KeyBanc Capital Markets Inc. and its licensed securities representatives, who may also be employees of KeyBank N.A. Banking products and services are offered by KeyBank N.A. This report was not
issued by our research department. The information contained in this report has been obtained from sources deemed to be reliable but is not represented to be complete, and it should not be relied
upon as such. This report does not purport to be a complete analysis of any security, issuer, or industry and is not an offer or a solicitation of an offer to buy or sell any securities. This report is
prepared for general information purposes only and does not consider the specific investment objectives, financial situation and particular needs of any individual person or entity.
Sole Community Banking Offices (11 States)
Sole Corporate Banking Offices (15 States)
Headquarters: Cleveland, OH
Combined Corporate and Community Banking Offices (3 States)
Pending
October 2013
Joint Lead Arranger,
Joint Bookrunner &
Syndication Agent
$350,000,000
Credit Facility
$2,629,900,000
Senior Secured Credit
Facilities
Participant
April 2015
Co-Manager
$150,535,000
Initial Public Offering
June 2015
Sole Bookrunner
$35,000,000
Senior Secured Credit
Facilities
June 2015
Senior Secured Credit
Facilities
Sole Bookrunner
A portfolio company of
October 2015
Co-Manager
$3,317,000,0000
Initial Public Offering
May 2015
$1,750,000,000
Senior Notes
Co-Manager
October 2015
Co-Manager
$4,500,000,000
Senior Notes
October 2015
Joint Bookrunner
$3,400,000,0000
Senior Notes
August 2014
Joint Lead Arranger
and Joint Bookrunner
$75,000,000
Senior Secured Credit
Facilities
A portfolio company of
July 2014
Co-Manager
$600,000,000
Senior Notes
September 2014
Joint Lead Arranger
and Joint Bookrunner
$90,000,000
Senior Secured Credit
Facilities
A portfolio company of
April 2015
Joint Lead Arranger
and Joint Bookrunner
$75,000,000
Incremental Term Loan B
$475,000,000
Senior Secured Credit
Facilities
March 2015
has acquired
Senior Secured Credit
Facilities
Sole Bookrunner Co-Manager
$75,000,000
Initial Public Offering
October 2014
November 2015
Exclusive Advisor
A portfolio company of
has been acquired by
For additional information about Pacific Crest Securities’ Technology Services Practice, please contact the Financial
Technology Team:
Tim Monnin
Managing Director
Charlotte, NC
704-651-9371
Alexander Kennedy
Associate
Charlotte, NC
704-916-3080
Ajay Palaparty
Analyst
Charlotte, NC
704-916-3081
KeyCorp Overview KeyBanc Capital Markets
Recent Transactions
• Corporate and Investment Bank focused on the middle market
• Full-services capabilities:
─ Equity Capital Markets
─ Leveraged Finance
─ Debt Capital Markets
• Over 800 bankers in 22 offices: Albany, Atlanta, Beijing, Boston,
Charlotte, Chicago, Cincinnati, Cleveland, Columbus, Dallas,
Houston, Indianapolis, London, Los Angeles, Nashville, New York,
Philadelphia, Portland, Salt Lake City, San Francisco, Seattle, and
Syracuse
• Bankers organized by industry focus and transaction expertise
• Over 90 senior and associate equity research analysts, tracking
more than 775 companies across four major industry sectors
─ Sales & Trading
─ Mergers & Acquisitions
─ Financial Sponsor Coverage