coastal sand dunes under siege: a guide to conservation for environmental managers
TRANSCRIPT
Agricultural and Forest Meteorology 110 (2001) 27–43
Spatial and temporal variation in respiration in a youngponderosa pine forest during a summer drought
B.E. Lawa,∗, F.M. Kelliherb, D.D. Baldocchic, P.M. Anthonid,J. Irvinee, D. Mooree, S. Van Tuyle
a Department of Forest Science, College of Forestry, Oregon State University, 328 Richardson Hall, Corvallis, OR 97331, USAb Manaaki Whenua—Landcare Research, P.O. Box 69, Lincoln, New Zealand
c Department of Environmental Science, Policy& Management, University of California, Berkeley, CA 94720, USAd College of Oceanic and Atmospheric Sciences, Oregon State University, Corvallis, OR 97331, USA
e College of Forestry, Oregon State University, Corvallis, OR 97331, USA
Received 7 May 2001; received in revised form 4 September 2001; accepted 7 September 2001
Abstract
Respiration rates of heterogeneous forest canopies arise from needles, stems, roots and soil microbes. To assess the tem-poral and spatial variation in respiration rates of these components in a heterogeneous ponderosa pine forest canopy, andthe processes that control these fluxes, we conducted an intensive field study during the summer of 2000. We employeda combination of biological and micrometeorological measurements to assess carbon respiratory fluxes at the soil surface,within and above a 4-m-tall ponderosa pine forest. We also conducted manipulation studies to examine the carbon fluxes fromthe roots and heteorotrophs.
Spatial variation in soil CO2 efflux was large, averaging 40% of the mean, which varied by nearly a factor of two betweenminima for bare soil to maxima beneath dense patches of understorey vegetation. The estimated vertical profile of respirationfrom chamber data, and the profile of nocturnal fluxes measured by the three eddy flux systems suggested that >70% ofthe ecosystem respiration was coming from below the 1.75-m measurement height of one of the flux systems, and 71% ofphotosynthetic carbon uptake in July was released by soil processes, thus there was a strong vertical gradient in respirationrelatively close to the soil surface in this young forest. These results stress the importance of understanding spatial andtemporal variation in soil processes when interpreting nocturnal eddy covariance data. © 2001 Elsevier Science B.V. Allrights reserved.
Keywords:Respiration; Eddy covariance; Soil CO2 efflux; AmeriFlux; Soil chambers
1. Introduction
Respiration by a plant canopy represents about 50%of the carbon fixed by the vegetation (Waring et al.,1998; Gifford, 1994; Amthor and Baldocchi, 2001).
∗ Corresponding author. Tel.:+1-541-737-6111;fax: +1-541-737-1393.E-mail address:[email protected] (B.E. Law).
At the ecosystem scale, we also have to considercarbon losses by soil respiration. Soil respiration, asreferred to here, includes respiratory losses by hete-ortrophs,Rh and by roots,Ra. Soil respiration is by farthe largest component of forest respiration (e.g. Lawet al., 1999a; Janssens et al., 2000). Exact partitioningis difficult because of methodological differences inthe measurements involved. For example, methods forpartitioning include stable isotopes (Flanagan et al.,
0168-1923/01/$ – see front matter © 2001 Elsevier Science B.V. All rights reserved.PII: S0168-1923(01)00279-9
28 B.E. Law et al. / Agricultural and Forest Meteorology 110 (2001) 27–43
1999; Phillips and Gregg, 2001), radiocarbon dating(Trumbore et al., 1990), and physical separation ofroots from soil (Hanson et al., 2000).
There is much need to assess respiration separatelyfrom conventional net CO2 exchange measurements,NEE. Together, data on respiration and NEE can pro-duce information on gross primary production, whichin turn can be used to validate calculations produced byecosystem models and satellite-based indices of GPP.Consequently, we use a physical separation methodto estimate respiration loss from different plant com-ponents relative to gross ecosystem production (eddycovariance estimate of GEP= |NEEd| + Red, whered is the daytime).
Micrometeorological systems have advanced ourability to spatially integrate and quantify net ecosys-tem CO2 exchange (NEE) half-hourly above vege-tation canopies, yet these studies require additionalsmaller scale information for understanding the fac-tors regulating photosynthesis and respiration, whichare the two large fluxes that determine NEE. At night,NEE is strictly ecosystem respiration (Re), allowingcloser examination of the respiration components andresponses to environment.
Successfully capturing spatial and temporal vari-ability using chamber measurements of respirationrates and then scaling them up to the stand level forcomparison with eddy covariance measurements is nottrivial. Nocturnal eddy covariance measurements areproblematic under calm wind conditions, and oftenunderestimate ecosystem respiration when comparedwith scaled-up chamber estimates from measurementson soils, foliage and woody tissue. In prior studies,nocturnal eddy covariance estimates of respiration av-eraged 23% lower than scaled-up chamber estimatesin a tall ponderosa pine forest (Law et al., 1999b),35% lower than chamber estimates in a mixed temper-ate forest (Goulden et al., 1996), and 27% lower thanchamber estimates in six boreal coniferous forests(Lavigne et al., 1997). On the other hand, scaling-uphas been done for evaporation from a 30-m-tallforest of complex architecture (Kelliher et al.,1992).
We also need to quantify how respiration respondsto environmental drivers at the stand scale. For ex-ample, Hogberg et al. (2001) recently reported astrong correlation between photosynthesis and soilrespiration. Other studies report that respiration rate
is very responsive to temperature under well-wateredconditions (e.g. Lloyd and Taylor, 1994). Conse-quently, we expect much temporal variability in soilrespiration, as there is a wide range of temperaturesin a forest (e.g. Hollinger et al., 1994). Moreover,there is also controversy about nocturnal eddy co-variance measurements over forests related to siteterrain (Finnigan, 1999) and the measurement of soilCO2 efflux using chambers (Le Dantec et al., 1999;Janssens et al., 2000; but also see Arneth et al., 1998and Kelliher et al., 1999).
In this paper, our objectives are: (1) to assess spatialand temporal variation in respiration rates in a forestutilizing chamber and eddy covariance measurements;(2) evaluate the influence of different environmentalconditions on nocturnal CO2 flux profiles and (3) ex-plore the response of respiration rates to key environ-mental variables. To make the exercise tractable andfocus much of our attention on soil CO2 efflux, wechose a relatively open 4-m-tall ponderosa pine forestwith broadleaved shrub understorey in central Oregon,USA. Our interest in the young pine forest also reflectshow it is regenerating following clearcutting of anold-growth forest. The tree canopy is heterogeneousand sparse with a significant shrub component typicalof natural regeneration in ponderosa pine. Because ofthe presence of nitrogen fixing shrubs, clumping ofvegetation, and exposed sandy soils with a large varia-tion in surface temperature, we anticipate that the hor-izontal spatial variation in soil CO2 effluxes and soilconditions is large. Likewise, we anticipate a strongvertical gradient in respiration rate because of themulti-layered canopy and large expected contributionof the soil. A comparison of the chamber estimates ofthe vertical profile of nocturnal CO2 fluxes with eddycovariance measurements at several heights is con-ducted to examine controls on fluxes, and to determinehow this might influence flux measurements undervarying environmental conditions, such as low frictionvelocity.
2. Methods
2.1. Site description
Measurements were made in a young ponderosapine forest (Pinus ponderosaVar. Laws) in central
B.E. Law et al. / Agricultural and Forest Meteorology 110 (2001) 27–43 29
Oregon, USA (44◦26′N, 121◦34′W, elevation 1188 m)during July 2000. The semi-arid climate is char-acterized by annual photosynthetically active irra-diance, mean air temperature and precipitation of2481 MJ m−2, 7.5◦C and 552 mm, respectively (Lawet al., 2001a). The site was previously an old-growthforest clearcut in 1978, and naturally regenerated. Theaverage age of trees in 2000, 22 years after cutting,was 15± 1 years old. On average, they were 4 m tall(S.E. = 0.2 m). There were two size classes basedon stem diameter at a height of 1.3 m, > or<0.05 m.The larger size class of 280 trees ha−1 had an av-erage stem diameter of 0.1 m at a height of 1.3 m,while the others of density 975 trees ha−1 averaged0.064 m at ground level. The broadleaved understorey,including the evergreen manzanita (Arctostaphylospatula) and deciduous bitterbrush (Purshia triden-tata), accounts for about 40% of the stand leaf area.The understorey shrubs averaged 1 m tall. The soilis classified as Ultic haploxeralf, and the soil textureis sandy loam, with increasing silt and clay fractionwith depth (69% sand, 26% silt, 5% clay in the top0.2 m, and 54% sand, 35% silt, 11% clay for the0.5–1-m depth). Thus, the soil is very porous and itsrelatively low bulk density (1.18 kg dry soil per literat 0.0–0.2 m depth and 1.44 kg dry soil per liter at0.2–0.5 m depths; Law et al., 2001a) implies that apredominance of large pores emptying with relativelylittle suction facilitating rapid drying by drainage andevaporation.
2.2. Environmental measurements
Half-hourly measurements of air temperature, pho-tosynthetically active radiation, and relative humiditywere made at the 12-m height, and rainfall was mea-sured in a clearing at 1 m above the ground with atipping bucket (Campbell Scientific Inc., Logan, UT).At the automated soil chambers,∼100 m east of thesub-canopy flux systems, half-hourly measurementsof soil water content were made at 0.1 and 0.3 mdepths (horizontally placed CS615 sensors, CampbellScientific, Logan, UT), soil temperature (Tsoil) at0.02, 0.08, and 0.15 m depths. We also measuredsoil temperature at 0.08 m depth with a temperatureprobe at 16 locations in conjunction with measure-ments using a portable soil chamber system (seeSection 2.3).
2.3. Respiration from chamber measurements
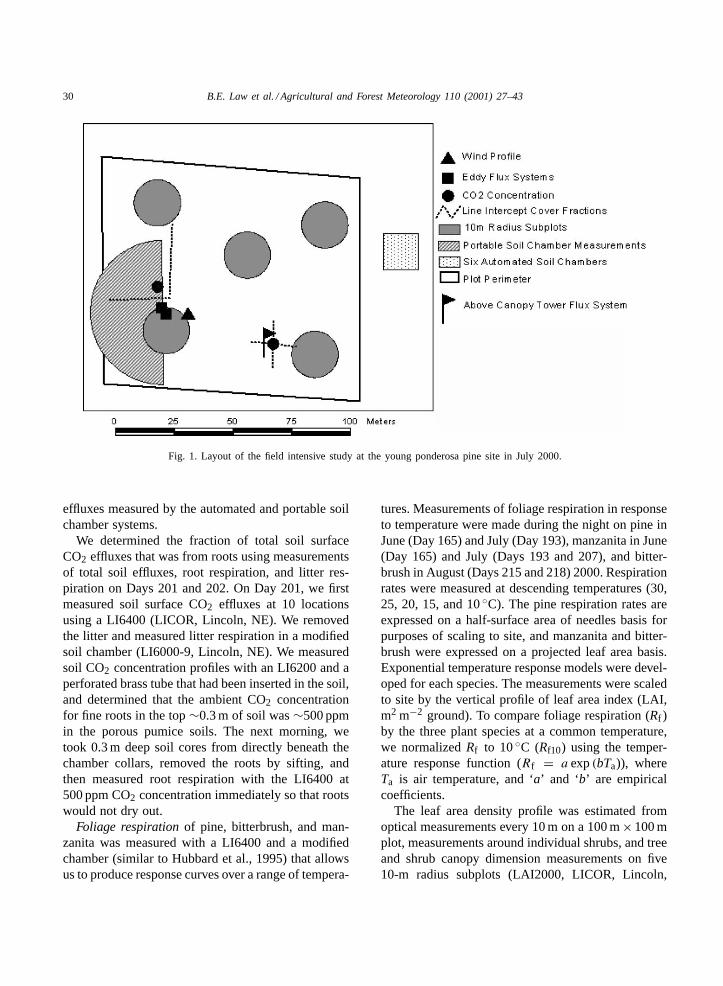
Using the two portable infrared gas analyzers witha sampling area of 0.007 m2, soil CO2 effluxes weremeasured at 32 locations throughout a 300-m2 area.The area was to the west and within 30 m of the 1.75and 3.6-m heightFc measurement systems (Fig. 1).The LI6400 (LICOR, Lincoln, NE) measurementswere made near four pine trees (Pipo), four bitter-brush shrubs (Putr), four manzanita shrubs (Arpa),and four were located in open areas devoid of plants,referred to here as bare soil. The PP Systems (coupledSRC-1 and EGM-1, Hitchin, Hertfordshire, England,UK) measurements were made nearby and at thesame time at 08:00 and 14:00 h on 13 July but at 10bare soil locations, and beneath six bitterbrush shrubsthereafter so that the combination of the 32 mea-surements was distributed approximately accordingto the fractional surface cover in shrubs, trees, andbare soil. The percentage cover was determined fromline intercept measurements along two 40 m tran-sects, one to the north and one to the west from thesub-canopy flux systems in a spoke pattern followingthe primary wind direction (W–SW; Fig. 1). Errorsassociated with disturbance of the soil and roots wereminimized by placing soil collars∼0.3 m into the sur-face at least 24 h before measurements were initiated,and errors associated with pressure build-up withinchambers were assumed to be minimized by makingmeasurements within 3 min. The comparisons of thetwo portable systems at the same locations allowedus to assess differences in flux rates measured bythe systems.
Soil surface CO2 effluxes were also measured about100 m to the east of the sub-canopy flux systems and50 m to the northeast of the flux tower at three loca-tions with an automated system with a continuous,sequential closed sampling cycle of 1.5 h. The sam-pling area of each chamber was 25 times larger at0.21 m2 and the three chambers were located within a300-m2 area. A closed-path infrared gas analyzer wasused to measure headspace CO2 concentration over a10-min period (LI6262, LICOR, Lincoln, NE). SoilCO2 effluxes from the three chambers were averagedover the 1.5-h cycle. A linear interpolation with timewas used to obtain half-hourly estimates that wouldcorrespond withFc data. Probability density functionswere calculated for the spatial variation in soil CO2
30 B.E. Law et al. / Agricultural and Forest Meteorology 110 (2001) 27–43
Fig. 1. Layout of the field intensive study at the young ponderosa pine site in July 2000.
effluxes measured by the automated and portable soilchamber systems.
We determined the fraction of total soil surfaceCO2 effluxes that was from roots using measurementsof total soil effluxes, root respiration, and litter res-piration on Days 201 and 202. On Day 201, we firstmeasured soil surface CO2 effluxes at 10 locationsusing a LI6400 (LICOR, Lincoln, NE). We removedthe litter and measured litter respiration in a modifiedsoil chamber (LI6000-9, Lincoln, NE). We measuredsoil CO2 concentration profiles with an LI6200 and aperforated brass tube that had been inserted in the soil,and determined that the ambient CO2 concentrationfor fine roots in the top∼0.3 m of soil was∼500 ppmin the porous pumice soils. The next morning, wetook 0.3 m deep soil cores from directly beneath thechamber collars, removed the roots by sifting, andthen measured root respiration with the LI6400 at500 ppm CO2 concentration immediately so that rootswould not dry out.
Foliage respirationof pine, bitterbrush, and man-zanita was measured with a LI6400 and a modifiedchamber (similar to Hubbard et al., 1995) that allowsus to produce response curves over a range of tempera-
tures. Measurements of foliage respiration in responseto temperature were made during the night on pine inJune (Day 165) and July (Day 193), manzanita in June(Day 165) and July (Days 193 and 207), and bitter-brush in August (Days 215 and 218) 2000. Respirationrates were measured at descending temperatures (30,25, 20, 15, and 10◦C). The pine respiration rates areexpressed on a half-surface area of needles basis forpurposes of scaling to site, and manzanita and bitter-brush were expressed on a projected leaf area basis.Exponential temperature response models were devel-oped for each species. The measurements were scaledto site by the vertical profile of leaf area index (LAI,m2 m−2 ground). To compare foliage respiration (Rf )by the three plant species at a common temperature,we normalizedRf to 10◦C (Rf10) using the temper-ature response function (Rf = a exp(bTa)), whereTa is air temperature, and ‘a’ and ‘b’ are empiricalcoefficients.
The leaf area density profile was estimated fromoptical measurements every 10 m on a 100 m×100 mplot, measurements around individual shrubs, and treeand shrub canopy dimension measurements on five10-m radius subplots (LAI2000, LICOR, Lincoln,
B.E. Law et al. / Agricultural and Forest Meteorology 110 (2001) 27–43 31
NE). We used these data in a model that we devel-oped, CANLAD, which distributes leaf area in thecanopy volume in 0.1 m layers. Details of the modeland correction of optical data for clumping withinshoot and at scales larger than shoot are provided inLaw et al. (2001b,c) and Treuhaft et al. (2001).
Photosynthetic response to CO2 response (A–cicurves) was also measured on trees and shrubs in themorning hours before vapor pressure deficits werelarge to determine if species differences in foliagerespiration were associated with maximum carboxy-lation efficiency (Vcmax).
Woody tissue respirationof stems and branches wascalculated from an exponential temperature responsefunction that we developed in an earlier study (Lawet al., 1999a). The measurements were scaled to siteusing tree dimension data from the five 10-m radiussubplots, and wood core estimates of total sapwoodvolume per square meter ground (trees and shrubs),as in Law et al. (2001a). We harvested five shrubs ofeach species to determine wood biomass for a range ofshrub canopy volumes, and we combined this informa-tion with shrub canopy volume on the subplots to de-termine shrub woody tissue per square meter ground.Air temperature was used in the equations, assumingthat sapwood temperature of the vegetation followedair temperature. The ponderosa pine woody tissue res-piration equation was used for shrubs, assuming sim-ilar respiration rates for sapwood. We do not believethat this will result in a large error in the estimate ofwoody tissue respiration, because in an earlier study onponderosa pine with a much larger amount of sapwoodpresent, we found that woody tissue contributed lessthan 10% of total ecosystem respiration. Data from theportable chamber measurements of soil effluxes, andmodeled foliage and woody tissue respiration wereused to estimate ecosystem respiration for comparisonwith nocturnal fluxes measured at the three heights.
2.4. Micrometeorological measurementof respiration
The eddy covariance method was used to determinehalf-hourly fluxes of sensible heat (FH) and CO2 (Fc)at heights 1.75, 3.6, and 12 m. The two lower mea-surements are hereafter known as sub-canopy eddyflux systems. Vertical flux densities of CO2 (Fc), la-tent (λE) and sensible heat (H) between vegetation
and the atmosphere are proportional to the meancovariance between vertical velocity (w′) and therespective scalar (c′) fluctuations (e.g. CO2, watervapor, and temperature). Positive flux densities rep-resent mass and energy transfer into the atmosphereand away from the surface and negative values denotethe reverse; ecologist use an opposite sign conven-tion where the uptake of carbon by the biosphere ispositive. Turbulent fluctuations were computed as thedifference between instantaneous and mean scalarquantities.
A sampling rate of 10 Hz ensured complete sam-pling of the high frequency portion of the fluxco-spectrum. The sampling duration (30 min) waslong enough to capture low frequency contributionsto flux covariances, but was not too long to be af-fected by diurnal changes in temperature, humidityand CO2. Coordinate rotation calculations of theorthogonal wind vectors (w, u, v) are performed tocorrect for instrument misalignment and non-levelterrain. The vertical velocity,w, is rotated to 0, al-lowing flux covariances to be computed orthogonalto the mean streamlines. Open-path infrared gas an-alyzers were used to measure CO2 concentrations(LAI7500, LICOR Inc., Lincoln, NE). Wind speed andtemperature were measured with three-dimensionalsonic anemometers (Solent Windmaster, Gill instru-ments, Lymington, England, UK; CSAT-3 CampbellScientific, Inc., UT). Corrections for cross-wind con-tamination of virtual temperature (Schotanus et al.,1983) and air density fluctuations (Webb et al., 1980)were applied. The latter correction was minimal atnight whenFH is near zero. The data were screenedfor possible instrumentation and sampling problemsfollowing Anthoni et al. (1999).
A closed-path infrared gas analyzer, tubing andswitching system determined half-hourly CO2 con-centration profiles at 1, 3, and 12 m heights to esti-mate rates of storage (Fstor) and NEE (F c + F stor)at 12 m height. Details on the instrumentation, fluxcorrection methods and calculations are reported inAnthoni et al. (1999), and Baldocchi et al. (1997a,2001). We summarize methods here to briefly explainprocessing of the flux data.
Calibration of the CO2 sensors was referenced tostandards produced by NOAA/CMDL, with accura-cies of±0.1 ppm. Water vapor sensors were calibratedagainst a dewpoint generator (LICOR, Lincoln, NE).
32 B.E. Law et al. / Agricultural and Forest Meteorology 110 (2001) 27–43
3. Results and discussion
3.1. Vegetation properties
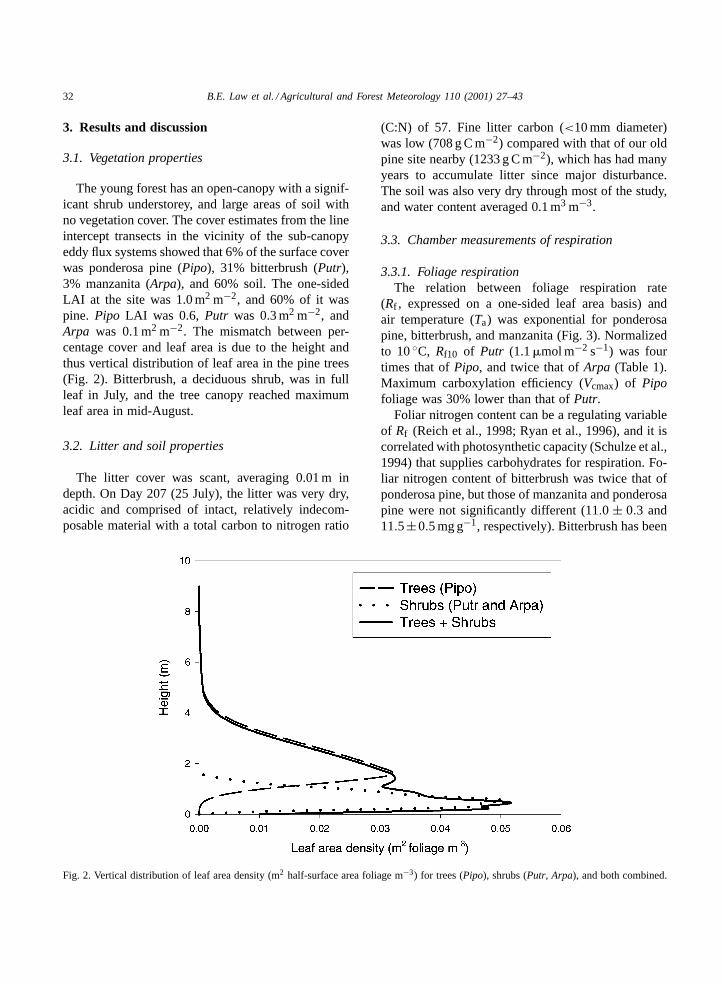
The young forest has an open-canopy with a signif-icant shrub understorey, and large areas of soil withno vegetation cover. The cover estimates from the lineintercept transects in the vicinity of the sub-canopyeddy flux systems showed that 6% of the surface coverwas ponderosa pine (Pipo), 31% bitterbrush (Putr),3% manzanita (Arpa), and 60% soil. The one-sidedLAI at the site was 1.0 m2 m−2, and 60% of it waspine. Pipo LAI was 0.6, Putr was 0.3 m2 m−2, andArpa was 0.1 m2 m−2. The mismatch between per-centage cover and leaf area is due to the height andthus vertical distribution of leaf area in the pine trees(Fig. 2). Bitterbrush, a deciduous shrub, was in fullleaf in July, and the tree canopy reached maximumleaf area in mid-August.
3.2. Litter and soil properties
The litter cover was scant, averaging 0.01 m indepth. On Day 207 (25 July), the litter was very dry,acidic and comprised of intact, relatively indecom-posable material with a total carbon to nitrogen ratio
Fig. 2. Vertical distribution of leaf area density (m2 half-surface area foliage m−3) for trees (Pipo), shrubs (Putr, Arpa), and both combined.
(C:N) of 57. Fine litter carbon (<10 mm diameter)was low (708 g C m−2) compared with that of our oldpine site nearby (1233 g C m−2), which has had manyyears to accumulate litter since major disturbance.The soil was also very dry through most of the study,and water content averaged 0.1 m3 m−3.
3.3. Chamber measurements of respiration
3.3.1. Foliage respirationThe relation between foliage respiration rate
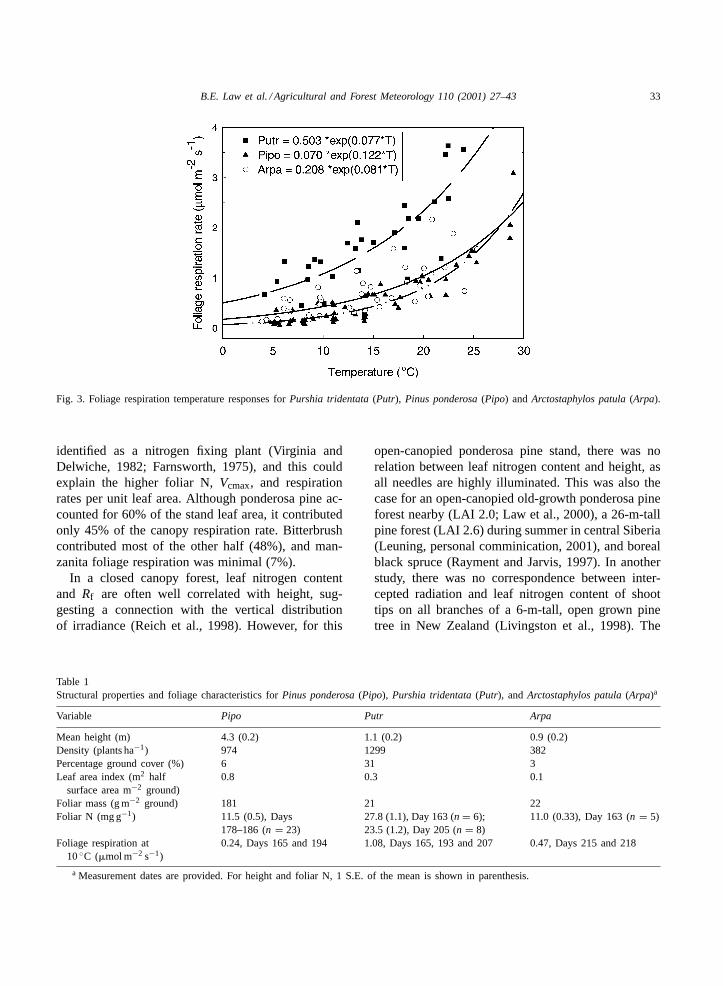
(Rf , expressed on a one-sided leaf area basis) andair temperature (Ta) was exponential for ponderosapine, bitterbrush, and manzanita (Fig. 3). Normalizedto 10◦C, Rf10 of Putr (1.1�mol m−2 s−1) was fourtimes that ofPipo, and twice that ofArpa (Table 1).Maximum carboxylation efficiency (Vcmax) of Pipofoliage was 30% lower than that ofPutr.
Foliar nitrogen content can be a regulating variableof Rf (Reich et al., 1998; Ryan et al., 1996), and it iscorrelated with photosynthetic capacity (Schulze et al.,1994) that supplies carbohydrates for respiration. Fo-liar nitrogen content of bitterbrush was twice that ofponderosa pine, but those of manzanita and ponderosapine were not significantly different (11.0 ± 0.3 and11.5±0.5 mg g−1, respectively). Bitterbrush has been
B.E. Law et al. / Agricultural and Forest Meteorology 110 (2001) 27–43 33
Fig. 3. Foliage respiration temperature responses forPurshia tridentata(Putr), Pinus ponderosa(Pipo) and Arctostaphylos patula(Arpa).
identified as a nitrogen fixing plant (Virginia andDelwiche, 1982; Farnsworth, 1975), and this couldexplain the higher foliar N,Vcmax, and respirationrates per unit leaf area. Although ponderosa pine ac-counted for 60% of the stand leaf area, it contributedonly 45% of the canopy respiration rate. Bitterbrushcontributed most of the other half (48%), and man-zanita foliage respiration was minimal (7%).
In a closed canopy forest, leaf nitrogen contentand Rf are often well correlated with height, sug-gesting a connection with the vertical distributionof irradiance (Reich et al., 1998). However, for this
Table 1Structural properties and foliage characteristics forPinus ponderosa(Pipo), Purshia tridentata(Putr), andArctostaphylos patula(Arpa)a
Variable Pipo Putr Arpa
Mean height (m) 4.3 (0.2) 1.1 (0.2) 0.9 (0.2)Density (plants ha−1) 974 1299 382Percentage ground cover (%) 6 31 3Leaf area index (m2 half
surface area m−2 ground)0.8 0.3 0.1
Foliar mass (g m−2 ground) 181 21 22Foliar N (mg g−1) 11.5 (0.5), Days
178–186 (n = 23)27.8 (1.1), Day 163 (n = 6);23.5 (1.2), Day 205 (n = 8)
11.0 (0.33), Day 163 (n = 5)
Foliage respiration at10◦C (�mol m−2 s−1)
0.24, Days 165 and 194 1.08, Days 165, 193 and 207 0.47, Days 215 and 218
a Measurement dates are provided. For height and foliar N, 1 S.E. of the mean is shown in parenthesis.
open-canopied ponderosa pine stand, there was norelation between leaf nitrogen content and height, asall needles are highly illuminated. This was also thecase for an open-canopied old-growth ponderosa pineforest nearby (LAI 2.0; Law et al., 2000), a 26-m-tallpine forest (LAI 2.6) during summer in central Siberia(Leuning, personal comminication, 2001), and borealblack spruce (Rayment and Jarvis, 1997). In anotherstudy, there was no correspondence between inter-cepted radiation and leaf nitrogen content of shoottips on all branches of a 6-m-tall, open grown pinetree in New Zealand (Livingston et al., 1998). The
34 B.E. Law et al. / Agricultural and Forest Meteorology 110 (2001) 27–43
positive linear correlation between leaf nitrogen con-tent and height was interpreted to reflect the influenceof strong apical control on nutrient concentration andphotosynthesis (i.e. proximity to the tree top).
3.3.2. Soil CO2 effluxDuring the morning (a.m.) and afternoon (p.m.) of
Day 195 (13 July), soil CO2 efflux rate was measuredat 16 locations in a side-by-side comparison of the twoportable chamber systems to determine whether or notit was appropriate to combine measurements from thetwo portable systems for further analyses. Other stud-ies have shown that the fluxes were overestimated bythe PP-Systems compared with other portable infraredgas analyzers (e.g. Le Dantec et al., 1999). Therewas no significant difference between the two setsof measurements including locations near pine, bitter-brush, and manzanita, and bare soil (mean± S.E. in�mol m−2 s−1 were LI6400: 1.8± 0.1 a.m., 2.0± 0.2p.m.; PP-Systems: 1.9±0.2 a.m., 2.1±0.2 p.m.). Therewas also a similar ranking and consistency of the datafor the two systems at individual locations. Thus, wecombined measurements from the two portable sys-tems in further analyses.
We could not statistically distinguish betweenmorning and afternoon soil CO2 efflux measurementsmade with the portable infrared gas analyzers, despitea ∼10◦C difference in mean soil temperature at themeasurement depth of 0.08 m (Table 2). This prob-ably reflected the constant limitation of soil waterdeficit on a daily basis.
For the nine occasions that we measured soil CO2efflux rates with the portable chambers, including five
Table 2Variation in soil surface CO2 effluxes (Fs) measured with portable soil chamber systems, and soil temperature measured at 0.08 m depthwith the analyzer temperature probes (Tsoil) over 1 h on several occasions within 30 m of the sub-canopy flux systemsa
Day Standard time (h) MeanFs S.E. n Tsoil (0.08 m depth) S.E. n
193 08:00 1.9 0.12 16 13.6 0.8 16193 15:00 2.1 0.14 16 38.4 3.3 16195 07:30 1.86 0.02 32 15.18 0.28 16195 13:50 2.04 0.09 32 23.95 1.11 16199 13:15 1.78 0.11 32 21.37 0.66 16200 08:30 3.02 0.14 32 15.86 0.39 16200 16:00 1.95 0.14 32 24.65 1.03 16207 08:30 1.61 0.11 32 16.86 0.32 16208 08:30 1.71 0.12 32 16.01 0.31 16
a It rained 1.8 mm on Day 189 at 16:00–17:00 h, and 1.5 mm on Day 199 at 15:30–17:30 h.
early morning and four afternoon sets of measure-ments, the overall mean rate was 2.0�mol m−2 s−1
(n = 256) and the coefficient of variation was 40%(Table 2). Because of the large sample size (n = 32),we believe this relatively large coefficient of varia-tion is a property of the forest indicative of signifi-cant spatial variation at a length scale less than 0.5 m,based on an exponential decline in soil CO2 effluxfrom 0.5 to 1, 2 and 4 m from the stems of isolatedtrees at the site. Mean tree crown and shrub diameteris also 0.5 m. A 0.1-m length scale was determined forthe exponential decline in soil CO2 efflux with radialdistance from the stem of an isolated 4-m-tall pinetree grown in New Zealand for 2 years in otherwisecarbon-free sand (Cook et al., 1998). With larger spa-tial averaging, we found no significant difference inaverage soil respiration rates between the 30 m×30 mstudy area and two 25 m long transects 70 m North ofthe tower.
To determine if the micro-scale spatial variabilitywas associated with cover type, we conducted analysisof variance for pooled data (eight measurements percover type) from the morning and afternoon of Day195. This showed that cover types had significantlydifferent (P < 0.01) soil surface CO2 effluxes, withbare soils (mean 1.4 ± 0.04) < Pipo(1.8 ± 0.1) <
Putr(2.1 ± 0.2) < Arpa(mean 2.5 ± 0.2) (Table 3).Thus, soil surface CO2 effluxes were lowest for baresoil, reflecting the likely paucity of roots, and highestnear the shrubs, some of which are nitrogen fixersthat have higher photosynthesis rates, and conse-quently, may provide more photosynthate to roots andmicrobes.
B.E. Law et al. / Agricultural and Forest Meteorology 110 (2001) 27–43 35
Table 3Comparison of soil surface CO2 effluxes near ponderosa pine(Pipo), bitterbrush (Putr), manzanita (Arpa), and in open areas ofbare soil (open) on Day 195 (07:22 h)
Cover Mean CO2 efflux(�mol m−2 s−1)
S.E. n
Open 1.36 0.04 16Pipo 1.82 0.19 16Putr 2.10 0.19 16Arpa 2.53 0.20 16
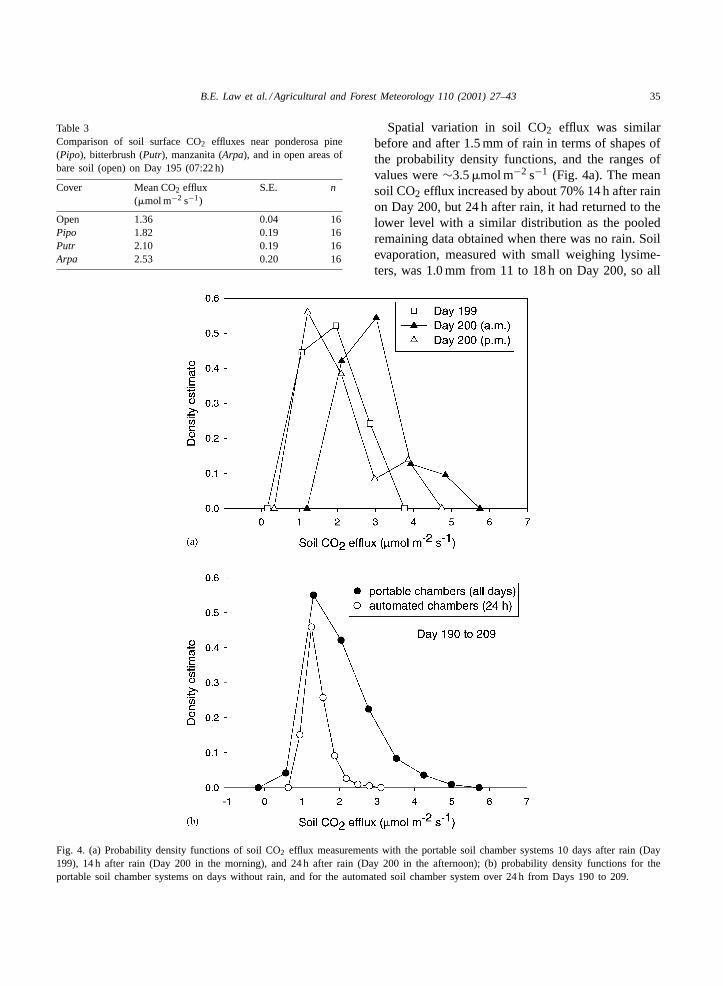
Fig. 4. (a) Probability density functions of soil CO2 efflux measurements with the portable soil chamber systems 10 days after rain (Day199), 14 h after rain (Day 200 in the morning), and 24 h after rain (Day 200 in the afternoon); (b) probability density functions for theportable soil chamber systems on days without rain, and for the automated soil chamber system over 24 h from Days 190 to 209.
Spatial variation in soil CO2 efflux was similarbefore and after 1.5 mm of rain in terms of shapes ofthe probability density functions, and the ranges ofvalues were∼3.5�mol m−2 s−1 (Fig. 4a). The meansoil CO2 efflux increased by about 70% 14 h after rainon Day 200, but 24 h after rain, it had returned to thelower level with a similar distribution as the pooledremaining data obtained when there was no rain. Soilevaporation, measured with small weighing lysime-ters, was 1.0 mm from 11 to 18 h on Day 200, so all
36 B.E. Law et al. / Agricultural and Forest Meteorology 110 (2001) 27–43
of the rain had evaporated within a day. Kelliher et al.(1999) also report only a 24-h effect of rain increas-ing soil CO2 efflux by 52% for a sandy soil beneatha central Siberian pine forest (Kelliher et al., 2001).These data from semi-arid climates suggest rainfallfrequency may be more important that quantity inaffecting soil CO2 efflux in pine forests. Moreover,the short duration of the effect means frequent mea-surements or monitoring with automated systems isneeded to capture it.
For three operational automated soil chambers,using the 1.5-h means (for Days 189–207), the prob-ability distribution is narrow (range: 0.9–2.8; mean:1.4, median: 1.3�mol m−2 s−1; n = 295) com-pared with that of the portable chamber data (Days193–208, Fig. 4b, range: 0.6–5.0; mean: 2.0; median:1.8�mol m−2 s−1). The coefficient of variation forthe automated chamber measurements of soil CO2efflux was 22% of the mean, about half that of spa-tial variation determined with the portable chambersystems. This supports our findings that except whenthere was rainfall, morning and afternoon measure-ments by the portable soil chamber systems werestatistically indistinguishable.
A t-test showed that automated chamber soil CO2effluxes were significantly lower than for the portablechamber data (P < 0.01, 95% CI). Part of the rea-son is that the automated chambers were locatedin a relatively open area of the forest∼100 m tothe east of the portable chamber sampling area, andthe lowest soil CO2 effluxes were obtained for baresoil.
Table 4Mean fluxes on a windy night in July (night of Days 206 and 207), from 19:30 to 04:30 h standard timea
Flux Mean nocturnal flux(�mol m−2 s−1)
Friction velocity (m s−1)
Soil CO2 efflux 1.61 (0.11)Foliage respiration 0.79 (0.06)Woody tissue respiration 0.01 (0.004)Re chamber (sum) 2.41 (0.17) aEddy flux (Fc) 1.75 m 2.09 (0.10) b 0.31 (0.01)Eddy flux (Fc) 3.6 m 2.64 (0.14) ac 0.43 (0.02)Eddy flux (Fc) 12 m 2.85 (0.15) c 0.48 (0.02)NEE (Fc + Fstor) 12 m 3.04 (0.16) c 0.48 (0.02)
a Ecosystem respiration calculated from chamber data (Re chamber) is compared with ecosystem respiration from nocturnal fluxes (eddyflux, NEE). Ta is air temperature. One standard error is shown in parenthesis. The error associated with soil CO2 effluxes is attributedto spatial variation, and the remaining errors indicate temporal variation. The letters a, b and c denote statistical differences between themean nocturnal fluxes measured.
We assumed that the soil surface CO2 effluxmeasured at the 32 locations in the early morningof Day 207 (only 4 h after sunrise) was a good ap-proximation of the mean nocturnal soil efflux. Forexample, mean nocturnal soil CO2 efflux from the sixautomated chambers was only 8% less than duringthe timing of the portable gas analyzer measure-ments on Day 207. For the scaled-up chamber data,on the night of Days 206 and 207, soil, foliage andstem and branch wood accounted for 67, 33 and 1%,respectively, of nocturnal ecosystem respiration rate(Table 4).
To put our summertime values of soil and ecosystemrespiration into a seasonal perspective, we combinedthe 12-m height eddy covariance data and mean valuesof the portable chambers using measurements madebefore 08:00 h PST for the nights in July, and foundthat soil contributed 63% of the nocturnal ecosystemrespiration rate. On an annual basis, we found thatsoil accounted for∼75% of ecosystem respiration rate(Law et al., 1999a, 2001a).
3.3.3. Root contribution to soil CO2 effluxesBecause soil CO2 efflux was significantly greater
near plants than in open areas where there was baresoil, we examined the contributions of roots. Themean fine root density was 5 kg m−3 (S.E. = 0.7,n = 10), surprisingly similar to that of an old-growthpine forest nearby (4.23 kg m−3, S.E. = 0.95,n = 9).Fine roots occupied the 0.05–0.20-m zone of the0.30-m deep cores taken from the soil. Respirationrate of the sifted roots was 53% (S.E. = 0.08,n = 10)
B.E. Law et al. / Agricultural and Forest Meteorology 110 (2001) 27–43 37
of the total soil CO2 effluxes. The litter was dry, andits contribution was nil using our measurement sys-tem. Thus, by difference, microbes in the bulk soilaccounted for∼47% of soil CO2 efflux.
3.3.4. Autotrophic respiration and GEPWe used our estimate of root respiration rate to
examine autotrophic respiration in relation to GEP.This included the 12-m height eddy flux measurements(for Days 190–209,|NEEd| = 3.8�mol m−2 s−1) plusthe sum of the foliage respiration (1.3�mol m−2 s−1),wood respiration (0.02�mol m−2 s−1), and soil CO2effluxes measured with the portable soil chamber sys-tems (2.0�mol m−2 s−1). By this calculation, GEPwas 7.1�mol m−2 s−1.
The ratio Ra:GEP is commonly used in simpleforest process models, and is believed to be fairlyconservative at 0.53 ± 0.04 across forest ecosys-tems (Waring et al., 1998). Autotrophic respiration,the sum of foliage, wood and root respiration, was2.4�mol m−2 s−1 or 34% of GEP. This percent-age during summer drought was significantly lessthan our annual estimate of 55%, calculated fromRa/(NPP+ Ra), where NPP is annual net primaryproduction, andRa was estimated in a similar mannerusing our site-specific temperature response equations(Law et al., 2001a).
Drought effects included reduced photosynthesis,soil CO2 efflux, and root respiration, in agreementwith the Hogberg et al. (2001) assertion that currentphotosynthate is used for root respiration, althoughfoliage respiration normalized to 10◦C increased 36%from May to July, similar to results in old-growthpine (Law et al., 1999a). Foliage was still expandinguntil mid-August, during drought, so perhaps growthrespiration became a larger fraction of total foliagerespiration during this period (Amthor and Baldocchi,2001). Foliage respiration was high relative to pho-tosynthesis, as found for trees on a dry site comparedwith a wet site (Turnbull et al., 2001). Consequently,the ratio Ra:GEP changes seasonally due to above-and below-ground phenology of the trees and shrubs(e.g. carbon allocation and growth respiration dur-ing cell division; Kramer, 1995; Lyr and Hoffmann,1967; Ryan et al., 1997), as suggested by the relativechanges in maximum ecosystem respiration and GEPfrom eddy flux measurements at a suite of FLUXNETsites (Falge et al., 2001). Calculation of rootRa
from soil CO2 efflux measurements, thus should beconducted several times during the year to produceannual estimates ofRa and GEP. This information isneeded to convert NEE to GEP for testing modelsand remotely sensed estimates of fluxes.
3.4. Micrometeorological measurementsof respiration
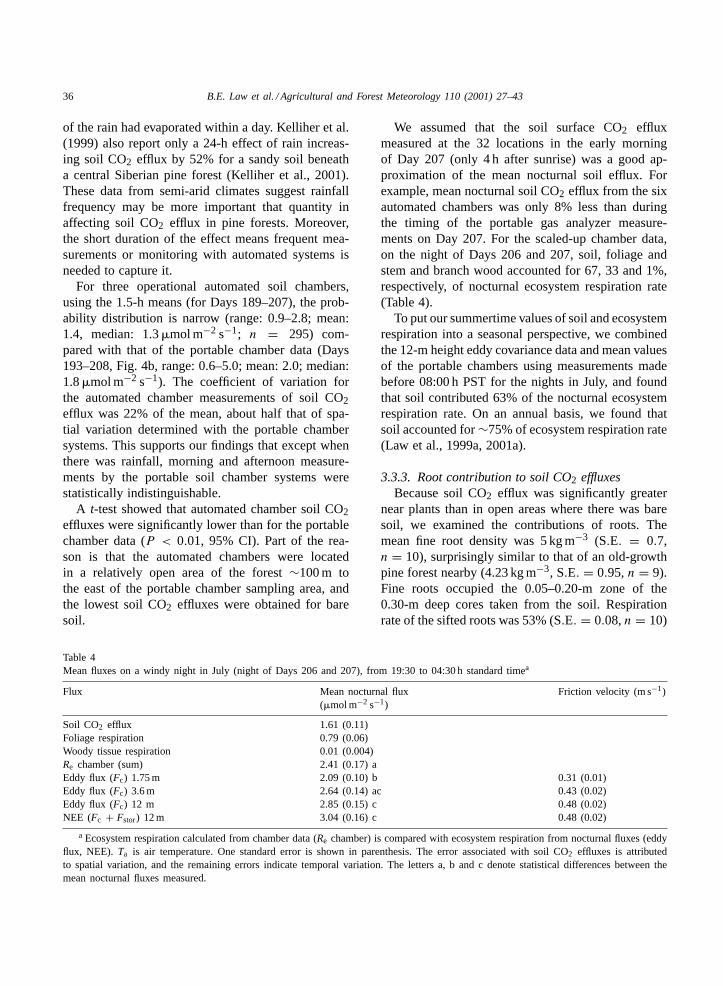
We examined the eddy fluxes measured at 12 mheight and CO2 storage rates over the range of windspeed to ensure there were no lateral fluxes involvedat our measurement site (Grace et al., 1996). Fluxeswere bin-averaged byu∗ and compared at the differ-ent measurement heights to detect potential biasesin the data. We confine our analysis to 361 rain-freehalf-hourly periods with a W–SW wind directionso that our nearby portable chamber locations wereupwind. For u∗ > 0.1 m s−1, bin-averaged eddyfluxes did not vary systematically between 2.5 and3.0�mol m−2 s−1 (Fig. 5), and the associated standarddeviations were relatively small, so that these datawere generally conservative as would be expected inthe absence of lateral fluxes. However, whenu∗ was0.1 m s−1, the bin-averaged eddy flux (Fc) declinedsharply to 2�mol m−2 s−1 and variability in the dataincreased significantly (Fig. 5). A similar trend wasnoted in the sub-canopy flux measurements at 2.56 mmeasurement height. Including the relatively largestorage rate in the above-canopy estimates of netecosystem exchange (F c +F stor), then eliminated theapparent change in the mean ecosystem respirationrate, but we exclude these data (u∗ ≤ 0.1 m s−1) here-after because of concern about the variability. Thesummed respiration components should be similar tothe nocturnal NEE values.
3.5. Comparison of chamber andmicrometeorological estimates of respiration
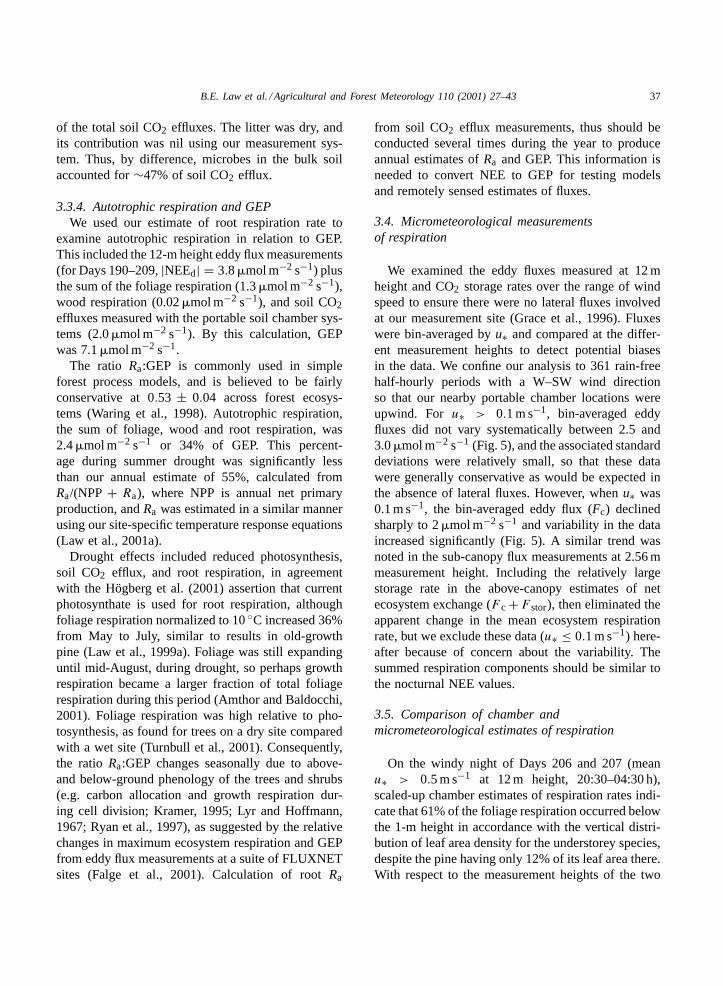
On the windy night of Days 206 and 207 (meanu∗ > 0.5 m s−1 at 12 m height, 20:30–04:30 h),scaled-up chamber estimates of respiration rates indi-cate that 61% of the foliage respiration occurred belowthe 1-m height in accordance with the vertical distri-bution of leaf area density for the understorey species,despite the pine having only 12% of its leaf area there.With respect to the measurement heights of the two
38 B.E. Law et al. / Agricultural and Forest Meteorology 110 (2001) 27–43
Fig. 5. The relation between nocturnal CO2 flux measured at several heights (Fc), NEE (F c + change in storage of CO2 in the canopy airspace,Fstor), and friction velocity for Days 190–209, excluding two nights of Days 189, 190 and 199, 200 due to rain, and only usingdata for the wind direction of 180–300◦ (south to west). Data were bin-averaged by friction velocity, and error bars indicate variationabout the mean rate over the measurement period.
Fig. 6. Vertical profile of foliage respiration, estimated from the temperature response equations and the leaf area density profile modeledfor the site from canopy dimension and optical data. Bitterbrush accounts for most of the foliage respiration below 1 m height, and thetotal foliage respiration changes little above the 3-m measurement height of one of the flux systems.
B.E. Law et al. / Agricultural and Forest Meteorology 110 (2001) 27–43 39
sub-canopy eddy flux systems, the scaled-up chamberestimates indicate that 79 and 97% of foliage respira-tion occurred below the 1.75 and 3.6 m heights on thenight of Days 206 and 207 (Fig. 6). Thus, chamberdata suggested that∼90% of ecosystem respirationcame from below 1.75 m (Table 4). On this night, thetwo sub-canopy CO2 flux measurements were signifi-cantly different from each other with the 1.75-m heightmean being 79% of that at 3.6 m (2.6�mol m−2 s−1).
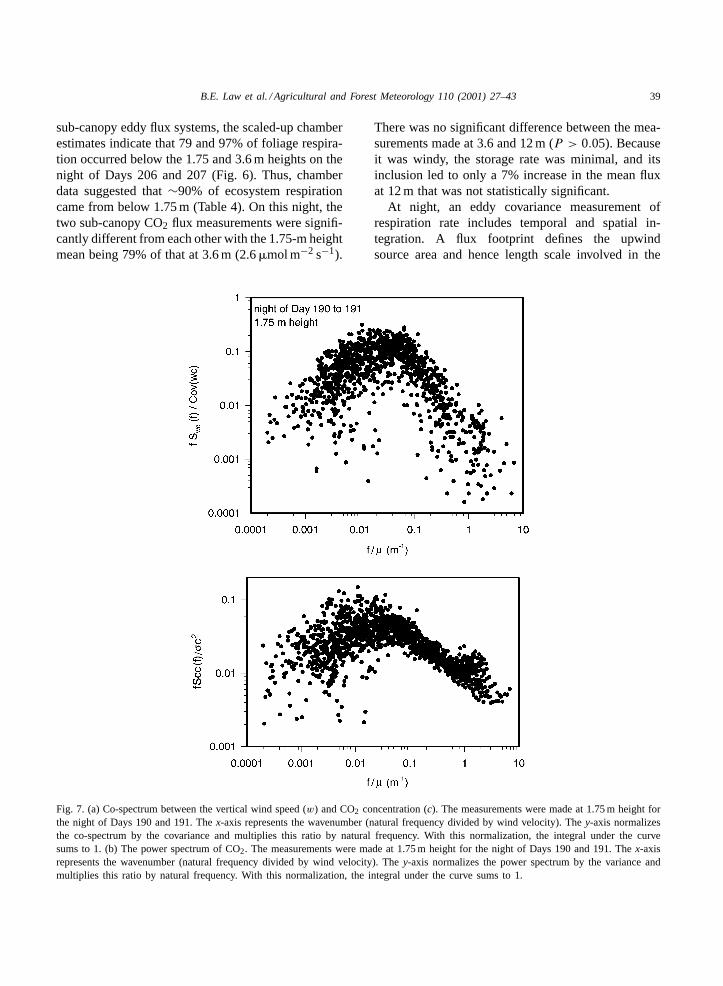
Fig. 7. (a) Co-spectrum between the vertical wind speed (w) and CO2 concentration (c). The measurements were made at 1.75 m height forthe night of Days 190 and 191. Thex-axis represents the wavenumber (natural frequency divided by wind velocity). They-axis normalizesthe co-spectrum by the covariance and multiplies this ratio by natural frequency. With this normalization, the integral under the curvesums to 1. (b) The power spectrum of CO2. The measurements were made at 1.75 m height for the night of Days 190 and 191. Thex-axisrepresents the wavenumber (natural frequency divided by wind velocity). They-axis normalizes the power spectrum by the variance andmultiplies this ratio by natural frequency. With this normalization, the integral under the curve sums to 1.
There was no significant difference between the mea-surements made at 3.6 and 12 m (P > 0.05). Becauseit was windy, the storage rate was minimal, and itsinclusion led to only a 7% increase in the mean fluxat 12 m that was not statistically significant.
At night, an eddy covariance measurement ofrespiration rate includes temporal and spatial in-tegration. A flux footprint defines the upwindsource area and hence length scale involved in the
40 B.E. Law et al. / Agricultural and Forest Meteorology 110 (2001) 27–43
measurements. Assuming neutral atmospheric con-ditions, a two-dimensional Lagrangian random walkmodel (Baldocchi, 1997b) was used to estimate theflux footprint by determining the probability that airparcels, released at various distances upwind, crossthe flux measurement plane. For the two sub-canopysystems, 90% of the parcels or flux originated 1–12and 1–32 m upwind for the 1.75 and 3.6 m measure-ment heights, respectively. For measurements made atthe 12-m height, 90% of the flux emanated from 1 to200 m upwind. The calculations thus suggest that thesub-canopy flux footprints are much contracted com-pared with that above the canopy, reflecting the higherwind speed and different turbulence there. Hence,noise in the sub-canopy flux measurements likelyreflects the variation in source air from bare patchesand vegetation.
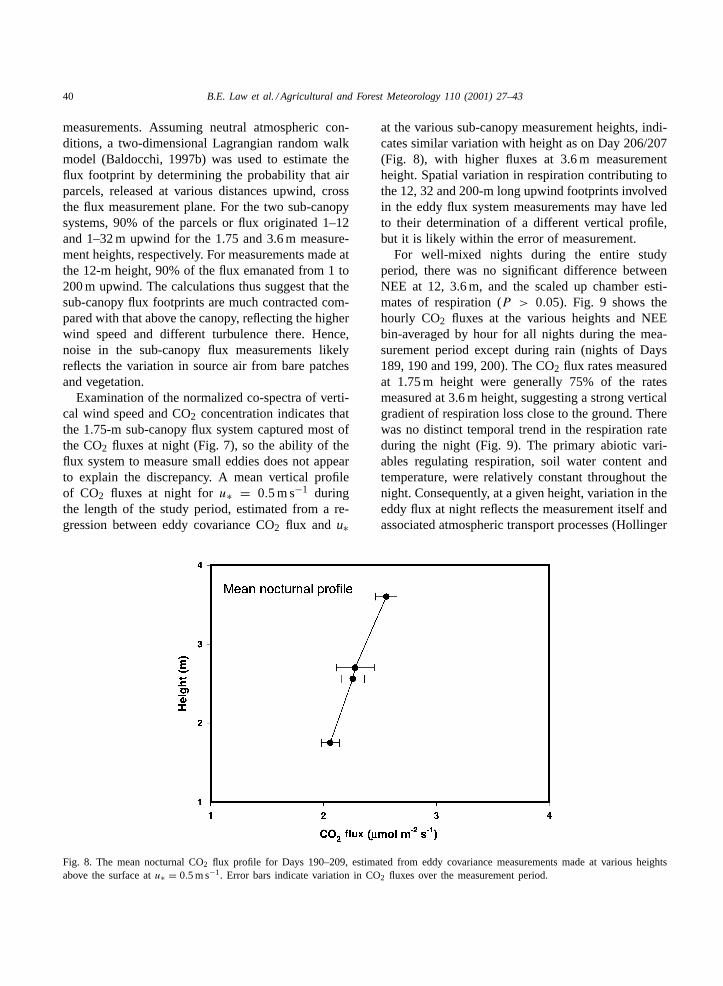
Examination of the normalized co-spectra of verti-cal wind speed and CO2 concentration indicates thatthe 1.75-m sub-canopy flux system captured most ofthe CO2 fluxes at night (Fig. 7), so the ability of theflux system to measure small eddies does not appearto explain the discrepancy. A mean vertical profileof CO2 fluxes at night foru∗ = 0.5 m s−1 duringthe length of the study period, estimated from a re-gression between eddy covariance CO2 flux and u∗
Fig. 8. The mean nocturnal CO2 flux profile for Days 190–209, estimated from eddy covariance measurements made at various heightsabove the surface atu∗ = 0.5 m s−1. Error bars indicate variation in CO2 fluxes over the measurement period.
at the various sub-canopy measurement heights, indi-cates similar variation with height as on Day 206/207(Fig. 8), with higher fluxes at 3.6 m measurementheight. Spatial variation in respiration contributing tothe 12, 32 and 200-m long upwind footprints involvedin the eddy flux system measurements may have ledto their determination of a different vertical profile,but it is likely within the error of measurement.
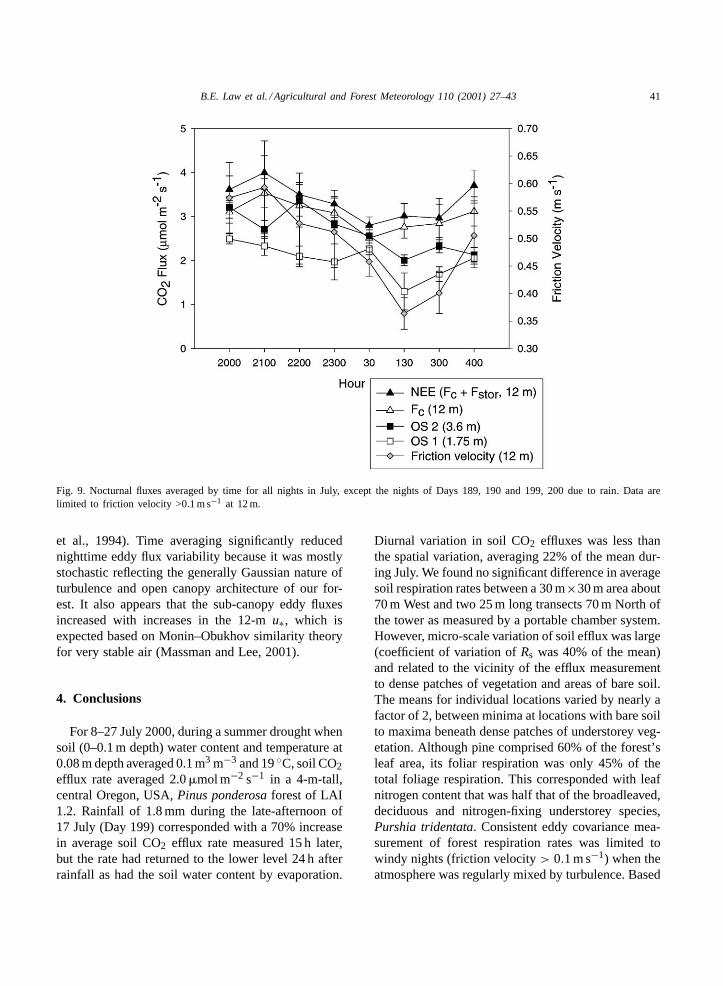
For well-mixed nights during the entire studyperiod, there was no significant difference betweenNEE at 12, 3.6 m, and the scaled up chamber esti-mates of respiration (P > 0.05). Fig. 9 shows thehourly CO2 fluxes at the various heights and NEEbin-averaged by hour for all nights during the mea-surement period except during rain (nights of Days189, 190 and 199, 200). The CO2 flux rates measuredat 1.75 m height were generally 75% of the ratesmeasured at 3.6 m height, suggesting a strong verticalgradient of respiration loss close to the ground. Therewas no distinct temporal trend in the respiration rateduring the night (Fig. 9). The primary abiotic vari-ables regulating respiration, soil water content andtemperature, were relatively constant throughout thenight. Consequently, at a given height, variation in theeddy flux at night reflects the measurement itself andassociated atmospheric transport processes (Hollinger
B.E. Law et al. / Agricultural and Forest Meteorology 110 (2001) 27–43 41
Fig. 9. Nocturnal fluxes averaged by time for all nights in July, except the nights of Days 189, 190 and 199, 200 due to rain. Data arelimited to friction velocity >0.1 m s−1 at 12 m.
et al., 1994). Time averaging significantly reducednighttime eddy flux variability because it was mostlystochastic reflecting the generally Gaussian nature ofturbulence and open canopy architecture of our for-est. It also appears that the sub-canopy eddy fluxesincreased with increases in the 12-mu∗, which isexpected based on Monin–Obukhov similarity theoryfor very stable air (Massman and Lee, 2001).
4. Conclusions
For 8–27 July 2000, during a summer drought whensoil (0–0.1 m depth) water content and temperature at0.08 m depth averaged 0.1 m3 m−3 and 19◦C, soil CO2efflux rate averaged 2.0�mol m−2 s−1 in a 4-m-tall,central Oregon, USA,Pinus ponderosaforest of LAI1.2. Rainfall of 1.8 mm during the late-afternoon of17 July (Day 199) corresponded with a 70% increasein average soil CO2 efflux rate measured 15 h later,but the rate had returned to the lower level 24 h afterrainfall as had the soil water content by evaporation.
Diurnal variation in soil CO2 effluxes was less thanthe spatial variation, averaging 22% of the mean dur-ing July. We found no significant difference in averagesoil respiration rates between a 30 m×30 m area about70 m West and two 25 m long transects 70 m North ofthe tower as measured by a portable chamber system.However, micro-scale variation of soil efflux was large(coefficient of variation ofRs was 40% of the mean)and related to the vicinity of the efflux measurementto dense patches of vegetation and areas of bare soil.The means for individual locations varied by nearly afactor of 2, between minima at locations with bare soilto maxima beneath dense patches of understorey veg-etation. Although pine comprised 60% of the forest’sleaf area, its foliar respiration was only 45% of thetotal foliage respiration. This corresponded with leafnitrogen content that was half that of the broadleaved,deciduous and nitrogen-fixing understorey species,Purshia tridentata. Consistent eddy covariance mea-surement of forest respiration rates was limited towindy nights (friction velocity> 0.1 m s−1) when theatmosphere was regularly mixed by turbulence. Based
42 B.E. Law et al. / Agricultural and Forest Meteorology 110 (2001) 27–43
on eddy covariance measurements made at threeheights and chamber measurements of respirationrates, most of the fluxes coming from within<2 mof the ground, with soil surface CO2 flux dominatingrespiration in this relatively short, open canopy forest.
Acknowledgements
This study was funded by NASA (Grant nos.NAG5-7531 and NAG5-8510), and DOE (Grant no.FG0300ER63014). The salary of Frank Kelliher wasfunded by the New Zealand Foundation for Research,Science and Technology. We thank Willamette In-dustries for allowing us to conduct this research ontheir land, and Tucker Williamson for responding todesperate phone calls about sheep, poachers, and awayward flamingo.
References
Amthor, J., Baldocchi, D.D., 2001. Terrestrial higher plantrespiration and net primary production. In: Roy, J., Saugier,B., Mooney, H.A. (Eds.), Terrestrial Global Productivity.Academic Press, New York.
Anthoni, P.M., Law, B.E., Unsworth, M.H., 1999. Carbon andwater vapor exchange of an open-canopied ponderosa pineecosystem. Agric. For. Meteorol. 95, 151–168.
Arneth, A., Kelliher, F.M., Gower, S.T., Scott, N.A., Byers, J.N.,McSeveny, T.M., 1998. Evironmental variables regulating soilcarbon dioxide efflux following clear-cutting of aPinus radiataD. Don plantation. J. Geophys. Res. 103, 5695–5705.
Baldocchi, D.D., 1997b. Flux footprints within and over forestcanopies. Boundary Layer Meteorol. 85, 273–292.
Baldocchi, D.D., Vogel, C.A., Hall, B., 1997a. Seasonal variation ofenergy and water vapor exchange rates above and below a borealjack pine forest canopy. J. Geophys. Res. 102, 28939–28952.
Baldocchi, D.D., Falge, E., Wilson, K., 2001. A spectralanalysis of biosphere–atmosphere trace gas flux densities andmeteorological variables across hour to multi-year time scales.Agric. For. Meteorol. 107, 1–27.
Cook, F.J., Thomas, S.M., Kelliher, F.M., Whitehead, D., 1998. Amodel of one-dimensional steady-state carbon dioxide diffusionfrom soil. Ecol. Model. 109, 155–164.
Falge, E., Tenhunen, J., Baldocchi, D.D., Aubinet, M., Bakwin,P., Berbigier, P., Bernhofer, C., Bonnefond, J.M., Burba, G.,Clement, R., Davis, K.J., Elbers, J.A., Falk, M., Goldstein,A.H., Grelle, A., Granier, A., Grunwald, T., Guðmundsson,J., Hollinger, D., Janssens, I.A., Keronen, P., Kowalski, A.S.,Katul, G., Law, B.E., Malhi, Y., Meyers, T., Monson, R.K.,Moors, E., Munger, J.W., Oechel, W., Paw U, K.T., Pilegaard,K., Rannik, U., Rebmann, C., Suyker, A., Thorgeirsson, H.,
Tirone, G., Turnipseed, A., Wilson, K., Wofsy, S., 2001.Phase and amplitude of ecosystem carbon release and uptakepotentials as derived from FLUXNET measurements. Agric.For. Meteorol., in press.
Farnsworth, R.B., 1975. Nitrogen fixation in shrubs. In:Proceedings of the U.S. Department of Agriculture Workshopand Symposium at the Shrub Sciences Laboratory Dedication.Brigham Young University, Provo, UT, USA, pp. 33–71.
Finnigan, J., 1999. A comment on the paper by Lee (1998): onmicrometeorological observations of surface-air exchange overtall vegetation. Agric. For. Meteorol. 97, 55–64.
Flanagan, L.B., Kubien, D.S., Ehleringer, J.R., 1999. Spatial andtemporal variation in the carbon and oxygen stable isotoperatio of respired CO2 in a boreal forest ecosystem. Tellus 51B,367–384.
Gifford, R.M., 1994. The global carbon cycle: a viewpoint on themissing sink. Aust. J. Plant Physiol. 21, 1–15.
Goulden, M.L., Munger, J.W., Fan, S.-M., Daube, B.C., Wofsy,S.C., 1996. Measurements of carbon sequestration by long-termeddy covariance: methods and a critical evaluation of accuracy.Global Change Biol. 2, 169–182.
Grace, J., Malhi, Y., Lloyd, J., McIntyre, J., Miranda, A.C., Meir,P., Miranda, H.S., 1996. The use of eddy covariance to inferthe net carbon dioxide uptake of Brazilian rain forest. GlobalChange Biol. 2, 209–217.
Hanson, P.J., Edwards, N.T., Garten, C.T., Andrews, J.A.,2000. Separating root and soil microbial contributions tosoil respiration: a review of methods and observations.Biogeochemistry 48, 115–146.
Hogberg, P., Nordgren, A., Buchmann, N., Taylor, A.F.S., Ekblad,A., Hogberg, M.N., Nyberg, G., Ottosson-Lofvenius, M., Read,D.J., 2001. Large-scale forest girdling shows that currentphotosynthesis drives soil respiration. Nature 411, 789–792.
Hollinger, D.Y., Kelliher, F.M., Byers, J.N., Hunt, J.E., McSeveny,T.M., Weir, P.L., 1994. Carbon dioxide exchange between anundisturbed old-growth temperate forest and the atmosphere.Ecology 75, 134–150.
Hubbard, R.M., Ryan, M.G., Lukens, D.L., 1995. A simple,battery-operated, temperature-controlled cuvette for respirationmeasurements. Tree Physiol. 15, 175–179.
Janssens, I.A., Kowalski, A.S., Longdoz, B., Ceulemans, R.,2000. Assessing forest soil CO2 efflux: an in situ comparisonof four techniques. Tree Physiol. 20, 23–32.
Kelliher, F.M., Koster, B.M.M., Hollinger, D.Y., Byers, J.N., Hunt,J.E., 1992. Evaporation, xylem sap flow, and tree transpirationin a New Zealand broad-leaved forest. Agric. For. Meteorol.62, 53–73.
Kelliher, F.M., Lloyd, J., Arneth, A., Luhker, B., Byers, J.N.,McSeveny, T.M., Milukova, I., Grigoriev, S., Panfyorov, M.,Sogatchev, A., Varlargin, A., Ziegler, W., Bauer, G., Wong,S.-C., Schulze, E.-D., 1999. Carbon dioxide efflux densityfrom the floor of a central Siberian pine forest. Agric. For.Meteorol. 94, 217–232.
Kelliher, F.M., Lloyd, J., Rebmann, C., Wirth, Ch., Schulze,E.-D., Baldocchi, D.D., 2001. Evaporation in the boreal zoneduring summer—physics and vegetation. In: Schulze, E.-D.,Prentice, I.C., Schimel, D.S. (Eds.), Global BiogeochemicalCycles in the Climate System. Academic Press, New York.
B.E. Law et al. / Agricultural and Forest Meteorology 110 (2001) 27–43 43
Kramer, K., 1995. Phenotypic plasticity of the phenology of sevenEuropean tree species in relation to climatic warming. PlantCell Environ. 18, 93–104.
Lavigne, M.B., Ryan, M.G., Anderson, D.E., Baldocchi, D.D.,Crill, P.M., Fitzjarrald, D.R., Goulden, M.L., Gower, S.T.,Massheder, J.M., McCaughey, J.H., Rayment, M., Striegl, R.G.,1997. Comparing nocturnal eddy covariance measurements toestimates of ecosystem respiration made by scaling chambermeasurements at six coniferous boreal sites. J. Geophys. Res.102, 28977–28985.
Law, B.E., Ryan, M.G., Anthoni, P.M., 1999a. Seasonal andannual respiration of a ponderosa pine ecosystem. GlobalChange Biol. 5, 169–182.
Law, B.E., Baldocchi, D.D., Anthoni, P.M., 1999b. Below-canopyand soil CO2 fluxes in a ponderosa pine forest. Agric. For.Meteorol. 94, 171–188.
Law, B.E., Williams, M., Anthoni, P., Baldocchi, D.D., Unsworth,M.H., 2000. Measuring and modeling seasonal variation ofcarbon dioxide and water vapor exchange of aPinus ponderosaforest subject to soil water deficit. Global Change Biol. 6,613–630.
Law, B.E., Cescatti, A., Baldocchi, D.D., 2001a. Leaf areadistribution and radiative transfer in open-canopy forests:implications to mass and energy exchange. Tree Physiol. 21,777–787.
Law, B.E., Thornton, P., Irvine, J., Anthoni, P.M., Van Tuyl, S.,2001b. Carbon storage and fluxes in ponderosa pine forests atdifferent developmental stages. Global Change Biol., in press.
Law, B.E., Van Tuyl, S., Cescatti, A., Baldocchi, D.D., 2001c.Estimation of leaf area index in open-canopy ponderosapine forests at different successional stages and managementregimes in Oregon. Agric. For. Meteorol. 108, 1–14.
Le Dantec, V., Epron, D., Dufrene, E., 1999. Soil CO2 efflux ina beech forest: comparison of two closed dynamic systems.Plant and Soil 214, 125–132.
Livingston, N.J., Whitehead, D., Kelliher, F.M., Wang, Y.P., Grace,J.C., Walcroft, A.S., Byers, J.N., McSeveny, T.M., Millard, P.,1998. Nitrogen allocation and carbon isotope fractionation inrelation to intercepted radiation and position in a youngPinusradiata D. Don tree. Plant Cell Environ. 21, 795–803.
Lloyd, J., Taylor, J.A., 1994. On the temperature dependence ofsoil respiration. Funct. Ecol. 8, 315–323.
Lyr, H., Hoffmann, G., 1967. Growth rates and growth periodicityof tree roots. Int. Rev. For. Res. 2, 181–235.
Massman, W.J., Lee, X., 2001. Eddy covariance flux correctionsand uncertainties in long term studies of carbon and energyexchanges. Agric. For. Meteorol., in press.
Phillips, D.L., Gregg, J., 2001. Uncertainty in source partitioningusing stable isotopes. Oecologia 127, 171–179.
Rayment, M., Jarvis, P., 1997. An improved open chamber systemfor measuring soil CO2 effluxes in the field. J. Geophys. Res.102, 28779–28784.
Reich, P.B., Walters, M.B., Ellsworth, D.S., 1998. Relationshipsof leaf dark respiration to leaf nitrogen, specific leaf area andleaf life-span: a test across biomes and functional groups.Oecologia 114, 471–482.
Ryan, M.G., Hubbard, R.M., Pongracic, S., Raison, R.J.,McMurtie, R.E., 1996. Autotrophic respiration inPinus radiatain relation to nutrient status. Tree Physiol. 16, 333–343.
Ryan, M.G., Lavigne, M.B., Gower, S.T., 1997. Annual carboncost of autotrophic respiration in boreal forest ecosystems inrelation to species and climate. J. Geophys. Res. 102 (D24),28871–28883.
Schotanus, P., Nieuwstadt, F.T.M., de Bruin, H.A.R., 1983.Temperature measurement with a sonic anemometer and itsapplication to heat and moisture fluxes. Boundary LayerMeteorol. 26, 81–93.
Schulze, E.-D., Kelliher, F.M., Koerner, Ch., Lloyd, J., Leuning,R., 1994. Relationships among maximum stomatal conductance,ecosystem surface conductance, carbon assimilation rate, andplant nutrition: a global ecology scaling exercise. Ann. Rev.Ecol. Systematics 25, 629–660.
Treuhaft, R.N., Asner, G.P., Law, B.E., Van Tuyl, S., 2001. Forestdensity profiles from the quantitative fusion of radar andhyperspectral data. J. Geophys. Res., in press.
Trumbore, S.E., Bonani, G., Wolfli, W, 1990. The rates ofcarbon cycling in several soils from AMS14C measurementsof fractionated soil organic matter. In: Bouwman, A.F.(Ed.), Soils and the Greenhouse Effect. Wiley, New York,pp. 405–414.
Turnbull, M.H., Whitehead, D., Tissue, D.T., Schuster, W.S.F.,Brown, K.J., Griffin, K.L., 2001. Responses of leaf respirationto temperature and leaf characteristics in three deciduous treespecies vary with site water availability. Tree Physiol. 21,571–578.
Virginia, R.A., Delwiche, C.C., 1982. Natural15N abundance ofpresumed N2-fixing and non-N2-fixing plants from selectedecosystems. Oecologia 54, 317–325.
Waring, R.H., Landsberg, J.J., Williams, M., 1998. Net primaryproduction of forests: a constant fraction of gross primaryproduction? Tree Physiol. 18, 129–134.
Webb, E.K., Pearman, G.I., Leuning, R., 1980. Correction of fluxmeasurements for density effects due to heat and water vaportransfer. Q. J. Roy. Meteorol. Soc. 106, 85–100.