printmgr file - natixis investment managers
TRANSCRIPT
SemiannualJune 30, 2021
Loomis Sayles High Income Fund
Loomis Sayles Intermediate Municipal Bond Fund
Loomis Sayles Investment Grade Bond Fund
Loomis Sayles Strategic Alpha Fund
Loomis Sayles Strategic Income Fund
Table of Contents
Portfolio Review 1
Portfolio of Investments 14
Financial Statements 64
Notes to Financial Statements 92
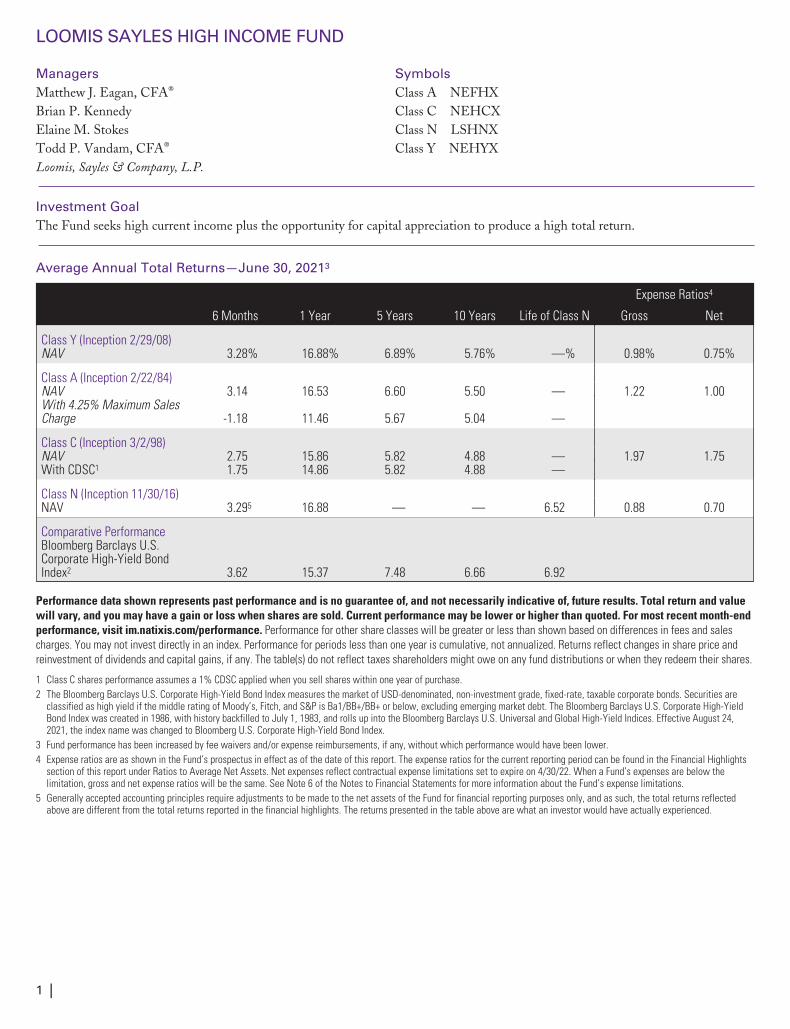
LOOMIS SAYLES HIGH INCOME FUND
Managers SymbolsMatthew J. Eagan, CFA® Class A NEFHXBrian P. Kennedy Class C NEHCXElaine M. Stokes Class N LSHNXTodd P. Vandam, CFA® Class Y NEHYXLoomis, Sayles & Company, L.P.
Investment GoalThe Fund seeks high current income plus the opportunity for capital appreciation to produce a high total return.
Average Annual Total Returns—June 30, 20213
Expense Ratios4
6 Months 1 Year 5 Years 10 Years Life of Class N Gross Net
Class Y (Inception 2/29/08)NAV 3.28% 16.88% 6.89% 5.76% —% 0.98% 0.75%
Class A (Inception 2/22/84)NAV 3.14 16.53 6.60 5.50 — 1.22 1.00With 4.25% Maximum SalesCharge -1.18 11.46 5.67 5.04 —
Class C (Inception 3/2/98)NAV 2.75 15.86 5.82 4.88 — 1.97 1.75With CDSC1 1.75 14.86 5.82 4.88 —
Class N (Inception 11/30/16)NAV 3.295 16.88 — — 6.52 0.88 0.70
Comparative PerformanceBloomberg Barclays U.S.Corporate High-Yield BondIndex2 3.62 15.37 7.48 6.66 6.92
Performance data shown represents past performance and is no guarantee of, and not necessarily indicative of, future results. Total return and valuewill vary, and you may have a gain or loss when shares are sold. Current performance may be lower or higher than quoted. For most recent month-endperformance, visit im.natixis.com/performance. Performance for other share classes will be greater or less than shown based on differences in fees and salescharges. You may not invest directly in an index. Performance for periods less than one year is cumulative, not annualized. Returns reflect changes in share price andreinvestment of dividends and capital gains, if any. The table(s) do not reflect taxes shareholders might owe on any fund distributions or when they redeem their shares.
1 Class C shares performance assumes a 1% CDSC applied when you sell shares within one year of purchase.2 The Bloomberg Barclays U.S. Corporate High-Yield Bond Index measures the market of USD-denominated, non-investment grade, fixed-rate, taxable corporate bonds. Securities are
classified as high yield if the middle rating of Moody’s, Fitch, and S&P is Ba1/BB+/BB+ or below, excluding emerging market debt. The Bloomberg Barclays U.S. Corporate High-YieldBond Index was created in 1986, with history backfilled to July 1, 1983, and rolls up into the Bloomberg Barclays U.S. Universal and Global High-Yield Indices. Effective August 24,2021, the index name was changed to Bloomberg U.S. Corporate High-Yield Bond Index.
3 Fund performance has been increased by fee waivers and/or expense reimbursements, if any, without which performance would have been lower.4 Expense ratios are as shown in the Fund’s prospectus in effect as of the date of this report. The expense ratios for the current reporting period can be found in the Financial Highlights
section of this report under Ratios to Average Net Assets. Net expenses reflect contractual expense limitations set to expire on 4/30/22. When a Fund’s expenses are below thelimitation, gross and net expense ratios will be the same. See Note 6 of the Notes to Financial Statements for more information about the Fund’s expense limitations.
5 Generally accepted accounting principles require adjustments to be made to the net assets of the Fund for financial reporting purposes only, and as such, the total returns reflectedabove are different from the total returns reported in the financial highlights. The returns presented in the table above are what an investor would have actually experienced.
1 |
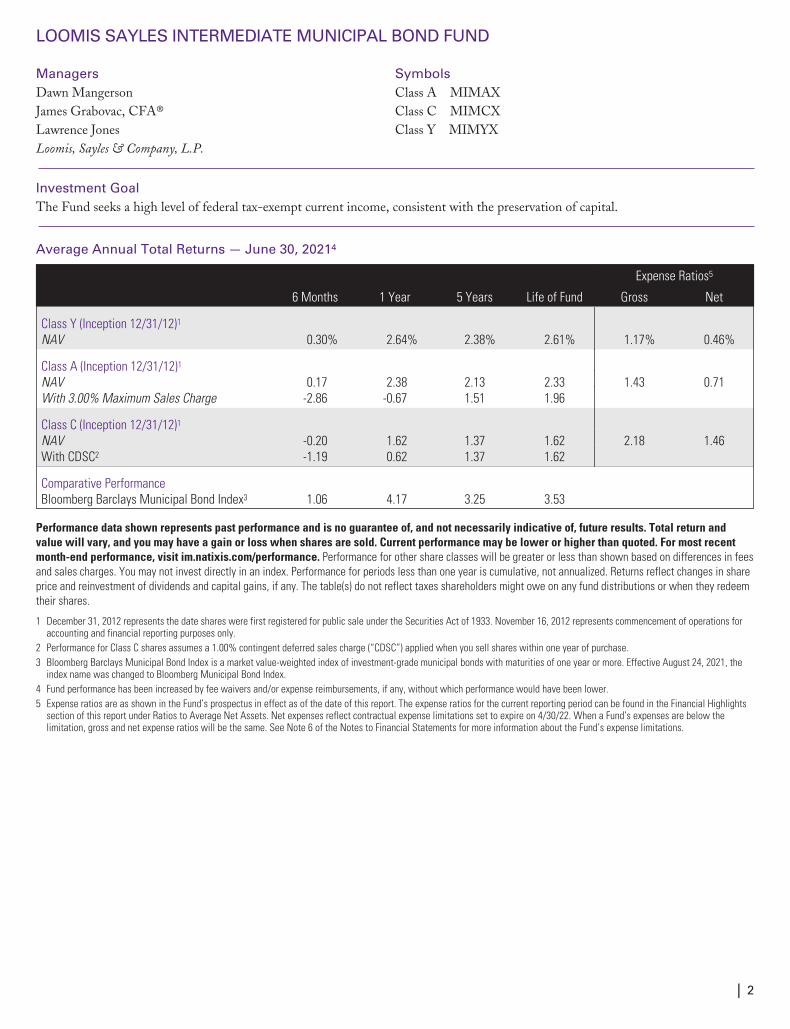
LOOMIS SAYLES INTERMEDIATE MUNICIPAL BOND FUND
Managers SymbolsDawn Mangerson Class A MIMAXJames Grabovac, CFA® Class C MIMCXLawrence Jones Class Y MIMYXLoomis, Sayles & Company, L.P.
Investment GoalThe Fund seeks a high level of federal tax-exempt current income, consistent with the preservation of capital.
Average Annual Total Returns — June 30, 20214
Expense Ratios5
6 Months 1 Year 5 Years Life of Fund Gross Net
Class Y (Inception 12/31/12)1NAV 0.30% 2.64% 2.38% 2.61% 1.17% 0.46%
Class A (Inception 12/31/12)1NAV 0.17 2.38 2.13 2.33 1.43 0.71With 3.00% Maximum Sales Charge -2.86 -0.67 1.51 1.96
Class C (Inception 12/31/12)1NAV -0.20 1.62 1.37 1.62 2.18 1.46With CDSC2 -1.19 0.62 1.37 1.62
Comparative PerformanceBloomberg Barclays Municipal Bond Index3 1.06 4.17 3.25 3.53
Performance data shown represents past performance and is no guarantee of, and not necessarily indicative of, future results. Total return andvalue will vary, and you may have a gain or loss when shares are sold. Current performance may be lower or higher than quoted. For most recentmonth-end performance, visit im.natixis.com/performance. Performance for other share classes will be greater or less than shown based on differences in feesand sales charges. You may not invest directly in an index. Performance for periods less than one year is cumulative, not annualized. Returns reflect changes in shareprice and reinvestment of dividends and capital gains, if any. The table(s) do not reflect taxes shareholders might owe on any fund distributions or when they redeemtheir shares.
1 December 31, 2012 represents the date shares were first registered for public sale under the Securities Act of 1933. November 16, 2012 represents commencement of operations foraccounting and financial reporting purposes only.
2 Performance for Class C shares assumes a 1.00% contingent deferred sales charge (“CDSC”) applied when you sell shares within one year of purchase.3 Bloomberg Barclays Municipal Bond Index is a market value-weighted index of investment-grade municipal bonds with maturities of one year or more. Effective August 24, 2021, the
index name was changed to Bloomberg Municipal Bond Index.4 Fund performance has been increased by fee waivers and/or expense reimbursements, if any, without which performance would have been lower.5 Expense ratios are as shown in the Fund’s prospectus in effect as of the date of this report. The expense ratios for the current reporting period can be found in the Financial Highlights
section of this report under Ratios to Average Net Assets. Net expenses reflect contractual expense limitations set to expire on 4/30/22. When a Fund’s expenses are below thelimitation, gross and net expense ratios will be the same. See Note 6 of the Notes to Financial Statements for more information about the Fund’s expense limitations.
| 2
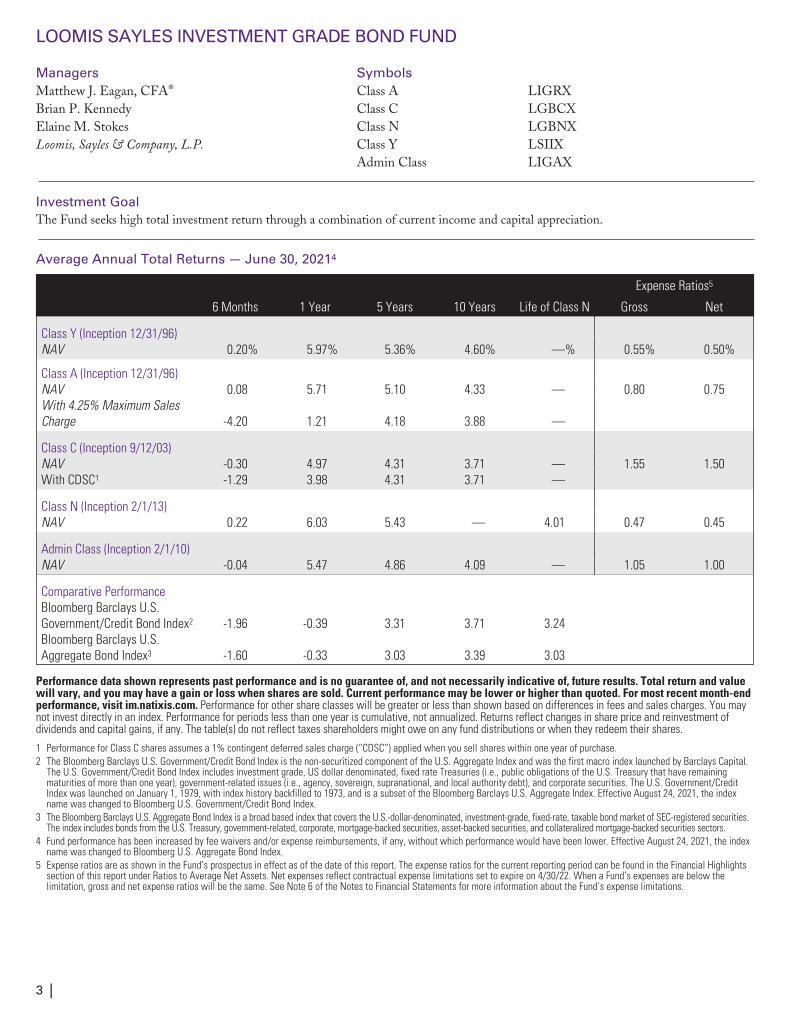
LOOMIS SAYLES INVESTMENT GRADE BOND FUND
Managers SymbolsMatthew J. Eagan, CFA® Class A LIGRXBrian P. Kennedy Class C LGBCXElaine M. Stokes Class N LGBNXLoomis, Sayles & Company, L.P. Class Y LSIIX
Admin Class LIGAX
Investment GoalThe Fund seeks high total investment return through a combination of current income and capital appreciation.
Average Annual Total Returns — June 30, 20214
Expense Ratios5
6 Months 1 Year 5 Years 10 Years Life of Class N Gross Net
Class Y (Inception 12/31/96)NAV 0.20% 5.97% 5.36% 4.60% —% 0.55% 0.50%
Class A (Inception 12/31/96)NAV 0.08 5.71 5.10 4.33 — 0.80 0.75With 4.25% Maximum SalesCharge -4.20 1.21 4.18 3.88 —
Class C (Inception 9/12/03)NAV -0.30 4.97 4.31 3.71 — 1.55 1.50With CDSC1 -1.29 3.98 4.31 3.71 —
Class N (Inception 2/1/13)NAV 0.22 6.03 5.43 — 4.01 0.47 0.45
Admin Class (Inception 2/1/10)NAV -0.04 5.47 4.86 4.09 — 1.05 1.00
Comparative PerformanceBloomberg Barclays U.S.Government/Credit Bond Index2 -1.96 -0.39 3.31 3.71 3.24Bloomberg Barclays U.S.Aggregate Bond Index3 -1.60 -0.33 3.03 3.39 3.03
Performance data shown represents past performance and is no guarantee of, and not necessarily indicative of, future results. Total return and valuewill vary, and you may have a gain or loss when shares are sold. Current performance may be lower or higher than quoted. For most recent month-endperformance, visit im.natixis.com. Performance for other share classes will be greater or less than shown based on differences in fees and sales charges. You maynot invest directly in an index. Performance for periods less than one year is cumulative, not annualized. Returns reflect changes in share price and reinvestment ofdividends and capital gains, if any. The table(s) do not reflect taxes shareholders might owe on any fund distributions or when they redeem their shares.
1 Performance for Class C shares assumes a 1% contingent deferred sales charge (“CDSC”) applied when you sell shares within one year of purchase.2 The Bloomberg Barclays U.S. Government/Credit Bond Index is the non-securitized component of the U.S. Aggregate Index and was the first macro index launched by Barclays Capital.
The U.S. Government/Credit Bond Index includes investment grade, US dollar denominated, fixed rate Treasuries (i.e., public obligations of the U.S. Treasury that have remainingmaturities of more than one year), government-related issues (i.e., agency, sovereign, supranational, and local authority debt), and corporate securities. The U.S. Government/CreditIndex was launched on January 1, 1979, with index history backfilled to 1973, and is a subset of the Bloomberg Barclays U.S. Aggregate Index. Effective August 24, 2021, the indexname was changed to Bloomberg U.S. Government/Credit Bond Index.
3 The Bloomberg Barclays U.S. Aggregate Bond Index is a broad based index that covers the U.S.-dollar-denominated, investment-grade, fixed-rate, taxable bond market of SEC-registered securities.The index includes bonds from the U.S. Treasury, government-related, corporate, mortgage-backed securities, asset-backed securities, and collateralized mortgage-backed securities sectors.
4 Fund performance has been increased by fee waivers and/or expense reimbursements, if any, without which performance would have been lower. Effective August 24, 2021, the indexname was changed to Bloomberg U.S. Aggregate Bond Index.
5 Expense ratios are as shown in the Fund’s prospectus in effect as of the date of this report. The expense ratios for the current reporting period can be found in the Financial Highlightssection of this report under Ratios to Average Net Assets. Net expenses reflect contractual expense limitations set to expire on 4/30/22. When a Fund’s expenses are below thelimitation, gross and net expense ratios will be the same. See Note 6 of the Notes to Financial Statements for more information about the Fund’s expense limitations.
3 |
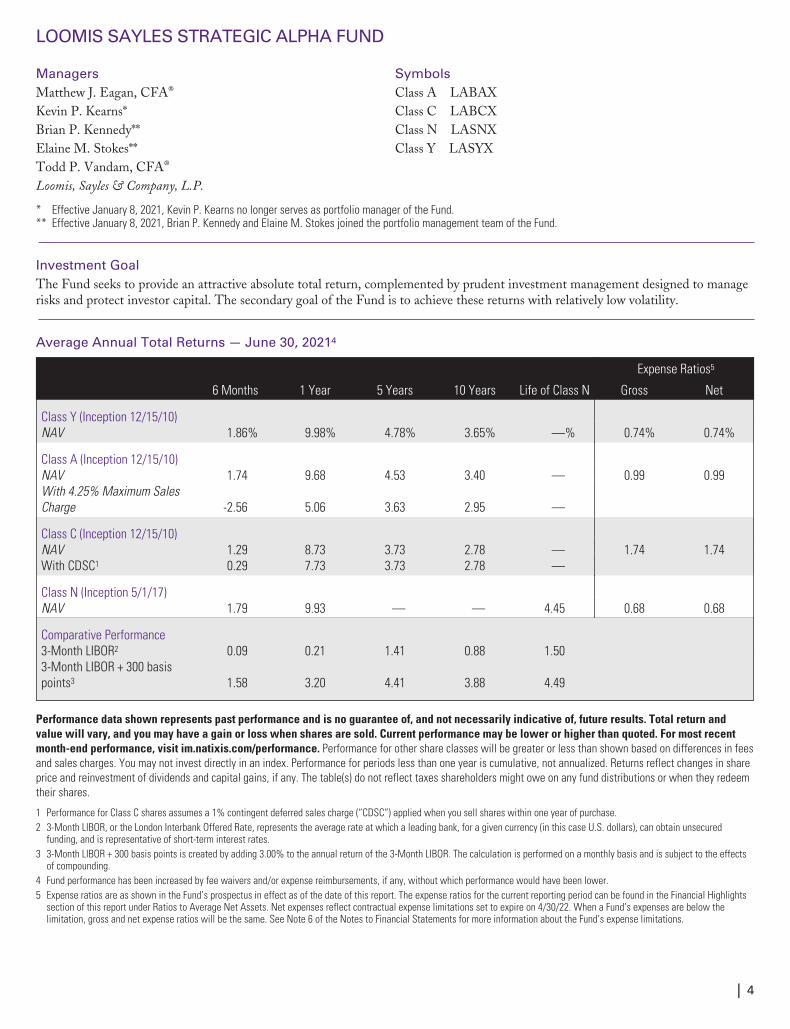
LOOMIS SAYLES STRATEGIC ALPHA FUND
Managers SymbolsMatthew J. Eagan, CFA® Class A LABAXKevin P. Kearns* Class C LABCXBrian P. Kennedy** Class N LASNXElaine M. Stokes** Class Y LASYXTodd P. Vandam, CFA®
Loomis, Sayles & Company, L.P.
* Effective January 8, 2021, Kevin P. Kearns no longer serves as portfolio manager of the Fund.** Effective January 8, 2021, Brian P. Kennedy and Elaine M. Stokes joined the portfolio management team of the Fund.
Investment GoalThe Fund seeks to provide an attractive absolute total return, complemented by prudent investment management designed to managerisks and protect investor capital. The secondary goal of the Fund is to achieve these returns with relatively low volatility.
Average Annual Total Returns — June 30, 20214
Expense Ratios5
6 Months 1 Year 5 Years 10 Years Life of Class N Gross Net
Class Y (Inception 12/15/10)NAV 1.86% 9.98% 4.78% 3.65% —% 0.74% 0.74%
Class A (Inception 12/15/10)NAV 1.74 9.68 4.53 3.40 — 0.99 0.99With 4.25% Maximum SalesCharge -2.56 5.06 3.63 2.95 —
Class C (Inception 12/15/10)NAV 1.29 8.73 3.73 2.78 — 1.74 1.74With CDSC1 0.29 7.73 3.73 2.78 —
Class N (Inception 5/1/17)NAV 1.79 9.93 — — 4.45 0.68 0.68
Comparative Performance3-Month LIBOR2 0.09 0.21 1.41 0.88 1.503-Month LIBOR + 300 basispoints3 1.58 3.20 4.41 3.88 4.49
Performance data shown represents past performance and is no guarantee of, and not necessarily indicative of, future results. Total return andvalue will vary, and you may have a gain or loss when shares are sold. Current performance may be lower or higher than quoted. For most recentmonth-end performance, visit im.natixis.com/performance. Performance for other share classes will be greater or less than shown based on differences in feesand sales charges. You may not invest directly in an index. Performance for periods less than one year is cumulative, not annualized. Returns reflect changes in shareprice and reinvestment of dividends and capital gains, if any. The table(s) do not reflect taxes shareholders might owe on any fund distributions or when they redeemtheir shares.
1 Performance for Class C shares assumes a 1% contingent deferred sales charge (“CDSC”) applied when you sell shares within one year of purchase.2 3-Month LIBOR, or the London Interbank Offered Rate, represents the average rate at which a leading bank, for a given currency (in this case U.S. dollars), can obtain unsecured
funding, and is representative of short-term interest rates.3 3-Month LIBOR + 300 basis points is created by adding 3.00% to the annual return of the 3-Month LIBOR. The calculation is performed on a monthly basis and is subject to the effects
of compounding.4 Fund performance has been increased by fee waivers and/or expense reimbursements, if any, without which performance would have been lower.5 Expense ratios are as shown in the Fund’s prospectus in effect as of the date of this report. The expense ratios for the current reporting period can be found in the Financial Highlights
section of this report under Ratios to Average Net Assets. Net expenses reflect contractual expense limitations set to expire on 4/30/22. When a Fund’s expenses are below thelimitation, gross and net expense ratios will be the same. See Note 6 of the Notes to Financial Statements for more information about the Fund’s expense limitations.
| 4
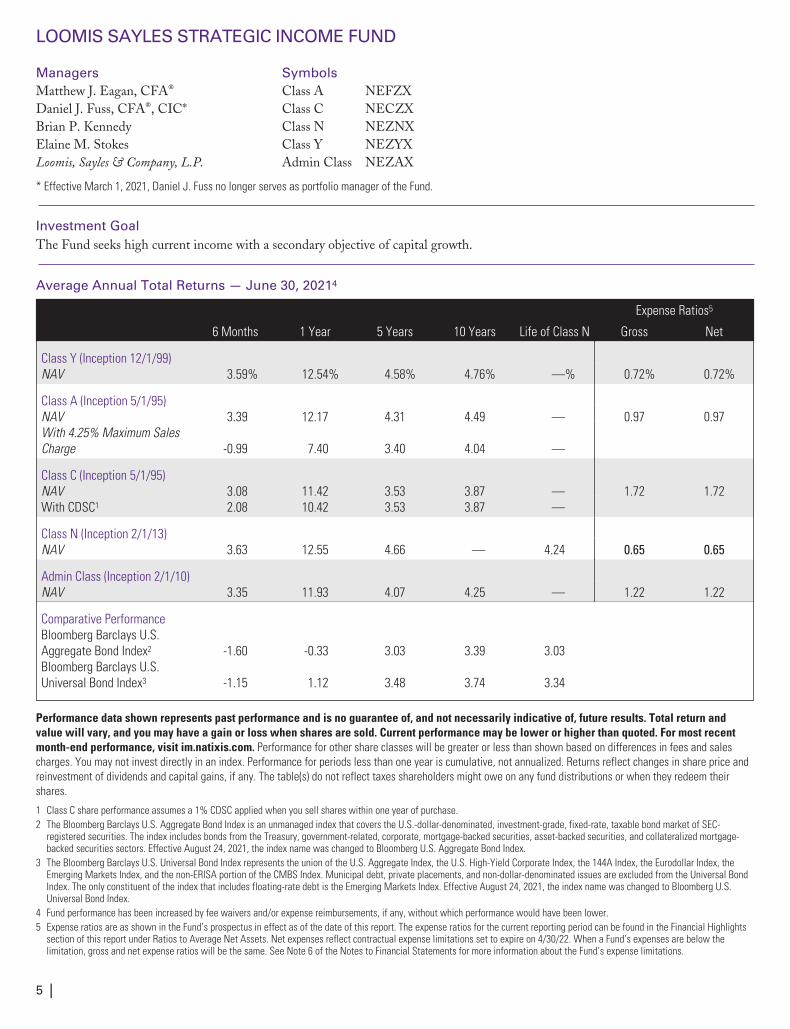
LOOMIS SAYLES STRATEGIC INCOME FUND
Managers SymbolsMatthew J. Eagan, CFA® Class A NEFZXDaniel J. Fuss, CFA®, CIC* Class C NECZXBrian P. Kennedy Class N NEZNXElaine M. Stokes Class Y NEZYXLoomis, Sayles & Company, L.P. Admin Class NEZAX
* Effective March 1, 2021, Daniel J. Fuss no longer serves as portfolio manager of the Fund.
Investment GoalThe Fund seeks high current income with a secondary objective of capital growth.
Average Annual Total Returns — June 30, 20214
Expense Ratios5
6 Months 1 Year 5 Years 10 Years Life of Class N Gross Net
Class Y (Inception 12/1/99)NAV 3.59% 12.54% 4.58% 4.76% —% 0.72% 0.72%
Class A (Inception 5/1/95)NAV 3.39 12.17 4.31 4.49 — 0.97 0.97With 4.25% Maximum SalesCharge -0.99 7.40 3.40 4.04 —
Class C (Inception 5/1/95)NAV 3.08 11.42 3.53 3.87 — 1.72 1.72With CDSC1 2.08 10.42 3.53 3.87 —
Class N (Inception 2/1/13)NAV 3.63 12.55 4.66 — 4.24 0.65 0.65
Admin Class (Inception 2/1/10)NAV 3.35 11.93 4.07 4.25 — 1.22 1.22
Comparative PerformanceBloomberg Barclays U.S.Aggregate Bond Index2 -1.60 -0.33 3.03 3.39 3.03Bloomberg Barclays U.S.Universal Bond Index3 -1.15 1.12 3.48 3.74 3.34
Performance data shown represents past performance and is no guarantee of, and not necessarily indicative of, future results. Total return andvalue will vary, and you may have a gain or loss when shares are sold. Current performance may be lower or higher than quoted. For most recentmonth-end performance, visit im.natixis.com. Performance for other share classes will be greater or less than shown based on differences in fees and salescharges. You may not invest directly in an index. Performance for periods less than one year is cumulative, not annualized. Returns reflect changes in share price andreinvestment of dividends and capital gains, if any. The table(s) do not reflect taxes shareholders might owe on any fund distributions or when they redeem theirshares.
1 Class C share performance assumes a 1% CDSC applied when you sell shares within one year of purchase.2 The Bloomberg Barclays U.S. Aggregate Bond Index is an unmanaged index that covers the U.S.-dollar-denominated, investment-grade, fixed-rate, taxable bond market of SEC-
registered securities. The index includes bonds from the Treasury, government-related, corporate, mortgage-backed securities, asset-backed securities, and collateralized mortgage-backed securities sectors. Effective August 24, 2021, the index name was changed to Bloomberg U.S. Aggregate Bond Index.
3 The Bloomberg Barclays U.S. Universal Bond Index represents the union of the U.S. Aggregate Index, the U.S. High-Yield Corporate Index, the 144A Index, the Eurodollar Index, theEmerging Markets Index, and the non-ERISA portion of the CMBS Index. Municipal debt, private placements, and non-dollar-denominated issues are excluded from the Universal BondIndex. The only constituent of the index that includes floating-rate debt is the Emerging Markets Index. Effective August 24, 2021, the index name was changed to Bloomberg U.S.Universal Bond Index.
4 Fund performance has been increased by fee waivers and/or expense reimbursements, if any, without which performance would have been lower.5 Expense ratios are as shown in the Fund’s prospectus in effect as of the date of this report. The expense ratios for the current reporting period can be found in the Financial Highlights
section of this report under Ratios to Average Net Assets. Net expenses reflect contractual expense limitations set to expire on 4/30/22. When a Fund’s expenses are below thelimitation, gross and net expense ratios will be the same. See Note 6 of the Notes to Financial Statements for more information about the Fund’s expense limitations.
5 |
ADDITIONAL INFORMATION
All investing involves risk, including the risk of loss. There is no assurance that any investment will meet its performance objectivesor that losses will be avoided.
ADDITIONAL INDEX INFORMATIONThis document may contain references to third party copyrights, indexes, and trademarks, each of which is the property of itsrespective owner. Such owner is not affiliated with Natixis Investment Managers or any of its related or affiliated companies(collectively “Natixis affiliates”) and does not sponsor, endorse or participate in the provision of any Natixis affiliates services, funds orother financial products.
The index information contained herein is derived from third parties and is provided on an “as is” basis. The user of this informationassumes the entire risk of use of this information. Each of the third party entities involved in compiling, computing or creating indexinformation, disclaims all warranties (including, without limitation, any warranties of originality, accuracy, completeness, timeliness,non-infringement, merchantability and fitness for a particular purpose) with respect to such information.
PROXY VOTING INFORMATIONA description of the Natixis Funds’ proxy voting policies and procedures is available without charge, upon request, by calling NatixisFunds at 800-225-5478; on Natixis Funds’ website at im.natixis.com; and on the Securities and Exchange Commission’s (SEC)website at www.sec.gov. Information regarding how the Natixis Funds voted proxies relating to portfolio securities during the mostrecent 12-month period ended June 30 is available from Natixis Funds’ website and the SEC’s website.
QUARTERLY PORTFOLIO SCHEDULESThe Natixis Funds file a complete schedule of portfolio holdings with the SEC for the first and third quarters of each fiscal year as anexhibit to its reports on Form N-PORT. The Funds’ Form N-PORT reports are available on the SEC’s website at www.sec.gov. Firstand third quarter schedules of portfolio holdings are also available at im.natixis.com/funddocuments. A hard copy may be requestedfrom the Fund at no charge by calling 800-225-5478.
CFA® and Chartered Financial Analyst® are registered trademarks owned by the CFA Institute.
| 6
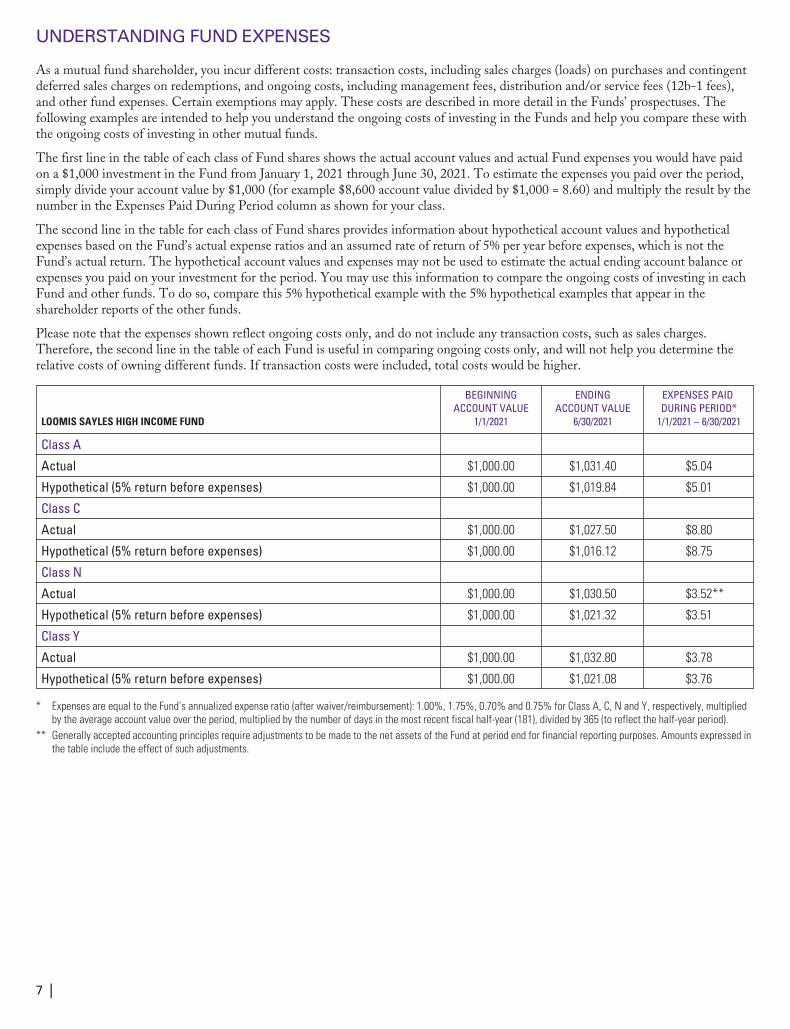
UNDERSTANDING FUND EXPENSES
As a mutual fund shareholder, you incur different costs: transaction costs, including sales charges (loads) on purchases and contingentdeferred sales charges on redemptions, and ongoing costs, including management fees, distribution and/or service fees (12b-1 fees),and other fund expenses. Certain exemptions may apply. These costs are described in more detail in the Funds’ prospectuses. Thefollowing examples are intended to help you understand the ongoing costs of investing in the Funds and help you compare these withthe ongoing costs of investing in other mutual funds.
The first line in the table of each class of Fund shares shows the actual account values and actual Fund expenses you would have paidon a $1,000 investment in the Fund from January 1, 2021 through June 30, 2021. To estimate the expenses you paid over the period,simply divide your account value by $1,000 (for example $8,600 account value divided by $1,000 = 8.60) and multiply the result by thenumber in the Expenses Paid During Period column as shown for your class.
The second line in the table for each class of Fund shares provides information about hypothetical account values and hypotheticalexpenses based on the Fund’s actual expense ratios and an assumed rate of return of 5% per year before expenses, which is not theFund’s actual return. The hypothetical account values and expenses may not be used to estimate the actual ending account balance orexpenses you paid on your investment for the period. You may use this information to compare the ongoing costs of investing in eachFund and other funds. To do so, compare this 5% hypothetical example with the 5% hypothetical examples that appear in theshareholder reports of the other funds.
Please note that the expenses shown reflect ongoing costs only, and do not include any transaction costs, such as sales charges.Therefore, the second line in the table of each Fund is useful in comparing ongoing costs only, and will not help you determine therelative costs of owning different funds. If transaction costs were included, total costs would be higher.
LOOMIS SAYLES HIGH INCOME FUND
BEGINNINGACCOUNT VALUE
1/1/2021
ENDINGACCOUNT VALUE
6/30/2021
EXPENSES PAIDDURING PERIOD*
1/1/2021 – 6/30/2021
Class A
Actual $1,000.00 $1,031.40 $5.04
Hypothetical (5% return before expenses) $1,000.00 $1,019.84 $5.01
Class C
Actual $1,000.00 $1,027.50 $8.80
Hypothetical (5% return before expenses) $1,000.00 $1,016.12 $8.75
Class N
Actual $1,000.00 $1,030.50 $3.52**
Hypothetical (5% return before expenses) $1,000.00 $1,021.32 $3.51
Class Y
Actual $1,000.00 $1,032.80 $3.78
Hypothetical (5% return before expenses) $1,000.00 $1,021.08 $3.76
* Expenses are equal to the Fund’s annualized expense ratio (after waiver/reimbursement): 1.00%, 1.75%, 0.70% and 0.75% for Class A, C, N and Y, respectively, multipliedby the average account value over the period, multiplied by the number of days in the most recent fiscal half-year (181), divided by 365 (to reflect the half-year period).
** Generally accepted accounting principles require adjustments to be made to the net assets of the Fund at period end for financial reporting purposes. Amounts expressed inthe table include the effect of such adjustments.
7 |
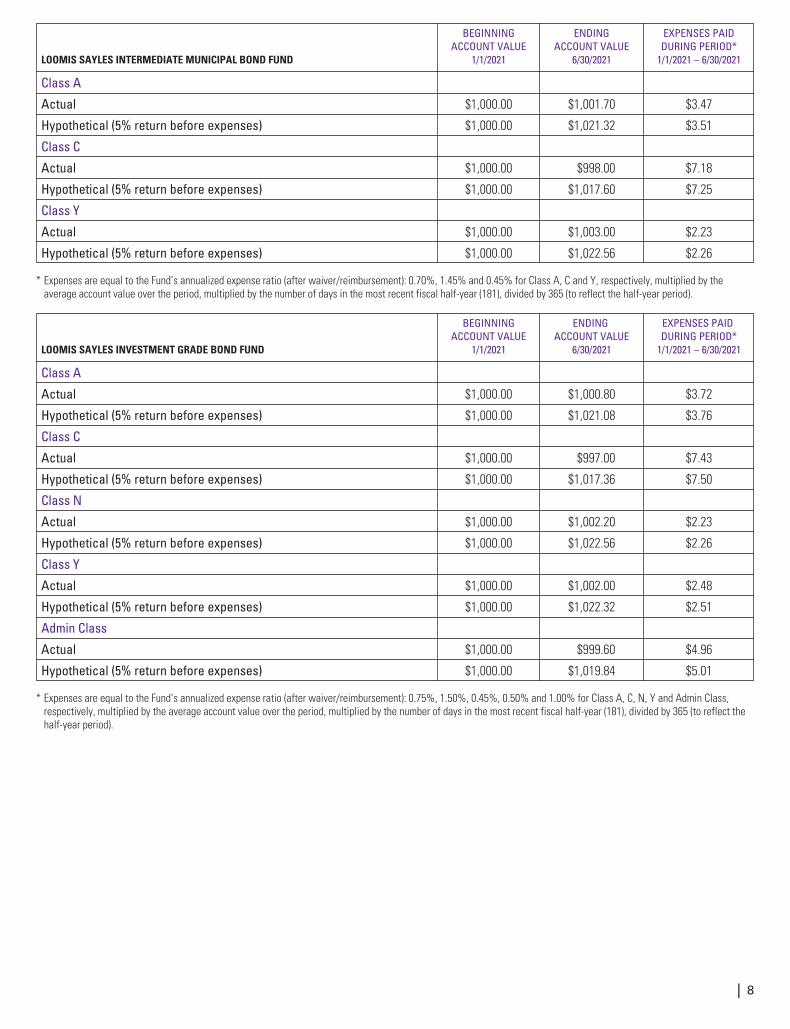
LOOMIS SAYLES INTERMEDIATE MUNICIPAL BOND FUND
BEGINNINGACCOUNT VALUE
1/1/2021
ENDINGACCOUNT VALUE
6/30/2021
EXPENSES PAIDDURING PERIOD*
1/1/2021 – 6/30/2021
Class A
Actual $1,000.00 $1,001.70 $3.47
Hypothetical (5% return before expenses) $1,000.00 $1,021.32 $3.51
Class C
Actual $1,000.00 $998.00 $7.18
Hypothetical (5% return before expenses) $1,000.00 $1,017.60 $7.25
Class Y
Actual $1,000.00 $1,003.00 $2.23
Hypothetical (5% return before expenses) $1,000.00 $1,022.56 $2.26
* Expenses are equal to the Fund’s annualized expense ratio (after waiver/reimbursement): 0.70%, 1.45% and 0.45% for Class A, C and Y, respectively, multiplied by theaverage account value over the period, multiplied by the number of days in the most recent fiscal half-year (181), divided by 365 (to reflect the half-year period).
LOOMIS SAYLES INVESTMENT GRADE BOND FUND
BEGINNINGACCOUNT VALUE
1/1/2021
ENDINGACCOUNT VALUE
6/30/2021
EXPENSES PAIDDURING PERIOD*
1/1/2021 – 6/30/2021
Class A
Actual $1,000.00 $1,000.80 $3.72
Hypothetical (5% return before expenses) $1,000.00 $1,021.08 $3.76
Class C
Actual $1,000.00 $997.00 $7.43
Hypothetical (5% return before expenses) $1,000.00 $1,017.36 $7.50
Class N
Actual $1,000.00 $1,002.20 $2.23
Hypothetical (5% return before expenses) $1,000.00 $1,022.56 $2.26
Class Y
Actual $1,000.00 $1,002.00 $2.48
Hypothetical (5% return before expenses) $1,000.00 $1,022.32 $2.51
Admin Class
Actual $1,000.00 $999.60 $4.96
Hypothetical (5% return before expenses) $1,000.00 $1,019.84 $5.01
* Expenses are equal to the Fund’s annualized expense ratio (after waiver/reimbursement): 0.75%, 1.50%, 0.45%, 0.50% and 1.00% for Class A, C, N, Y and Admin Class,respectively, multiplied by the average account value over the period, multiplied by the number of days in the most recent fiscal half-year (181), divided by 365 (to reflect thehalf-year period).
| 8
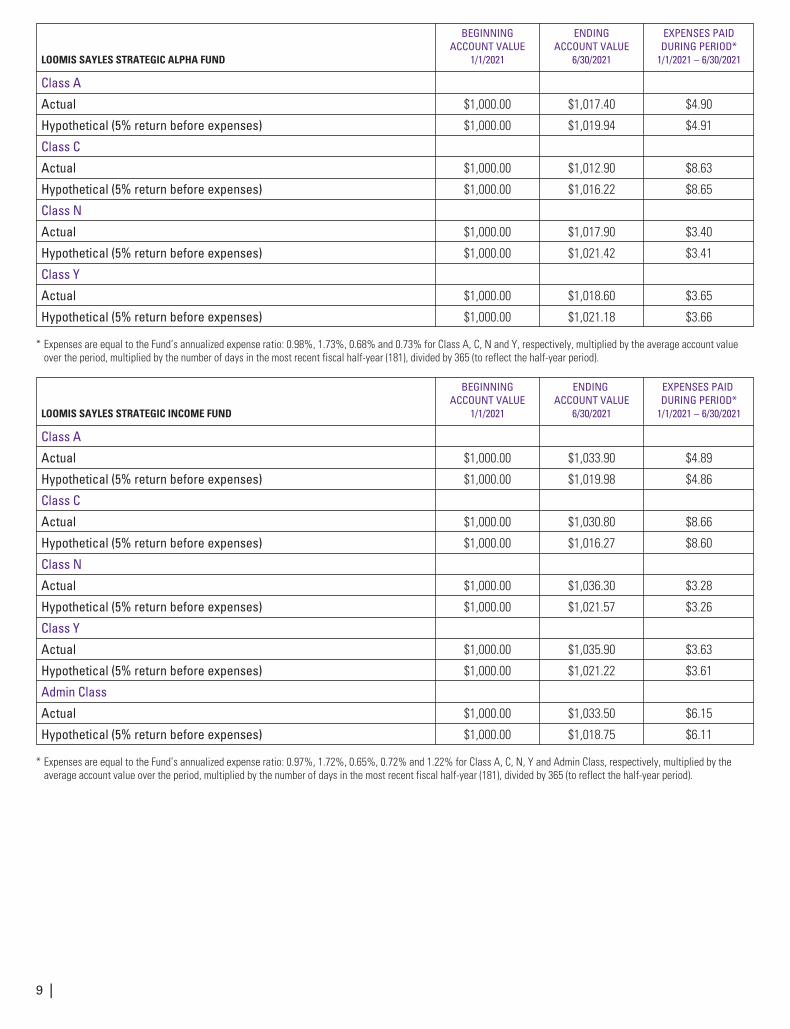
LOOMIS SAYLES STRATEGIC ALPHA FUND
BEGINNINGACCOUNT VALUE
1/1/2021
ENDINGACCOUNT VALUE
6/30/2021
EXPENSES PAIDDURING PERIOD*
1/1/2021 – 6/30/2021
Class A
Actual $1,000.00 $1,017.40 $4.90
Hypothetical (5% return before expenses) $1,000.00 $1,019.94 $4.91
Class C
Actual $1,000.00 $1,012.90 $8.63
Hypothetical (5% return before expenses) $1,000.00 $1,016.22 $8.65
Class N
Actual $1,000.00 $1,017.90 $3.40
Hypothetical (5% return before expenses) $1,000.00 $1,021.42 $3.41
Class Y
Actual $1,000.00 $1,018.60 $3.65
Hypothetical (5% return before expenses) $1,000.00 $1,021.18 $3.66
* Expenses are equal to the Fund’s annualized expense ratio: 0.98%, 1.73%, 0.68% and 0.73% for Class A, C, N and Y, respectively, multiplied by the average account valueover the period, multiplied by the number of days in the most recent fiscal half-year (181), divided by 365 (to reflect the half-year period).
LOOMIS SAYLES STRATEGIC INCOME FUND
BEGINNINGACCOUNT VALUE
1/1/2021
ENDINGACCOUNT VALUE
6/30/2021
EXPENSES PAIDDURING PERIOD*
1/1/2021 – 6/30/2021
Class A
Actual $1,000.00 $1,033.90 $4.89
Hypothetical (5% return before expenses) $1,000.00 $1,019.98 $4.86
Class C
Actual $1,000.00 $1,030.80 $8.66
Hypothetical (5% return before expenses) $1,000.00 $1,016.27 $8.60
Class N
Actual $1,000.00 $1,036.30 $3.28
Hypothetical (5% return before expenses) $1,000.00 $1,021.57 $3.26
Class Y
Actual $1,000.00 $1,035.90 $3.63
Hypothetical (5% return before expenses) $1,000.00 $1,021.22 $3.61
Admin Class
Actual $1,000.00 $1,033.50 $6.15
Hypothetical (5% return before expenses) $1,000.00 $1,018.75 $6.11
* Expenses are equal to the Fund’s annualized expense ratio: 0.97%, 1.72%, 0.65%, 0.72% and 1.22% for Class A, C, N, Y and Admin Class, respectively, multiplied by theaverage account value over the period, multiplied by the number of days in the most recent fiscal half-year (181), divided by 365 (to reflect the half-year period).
9 |
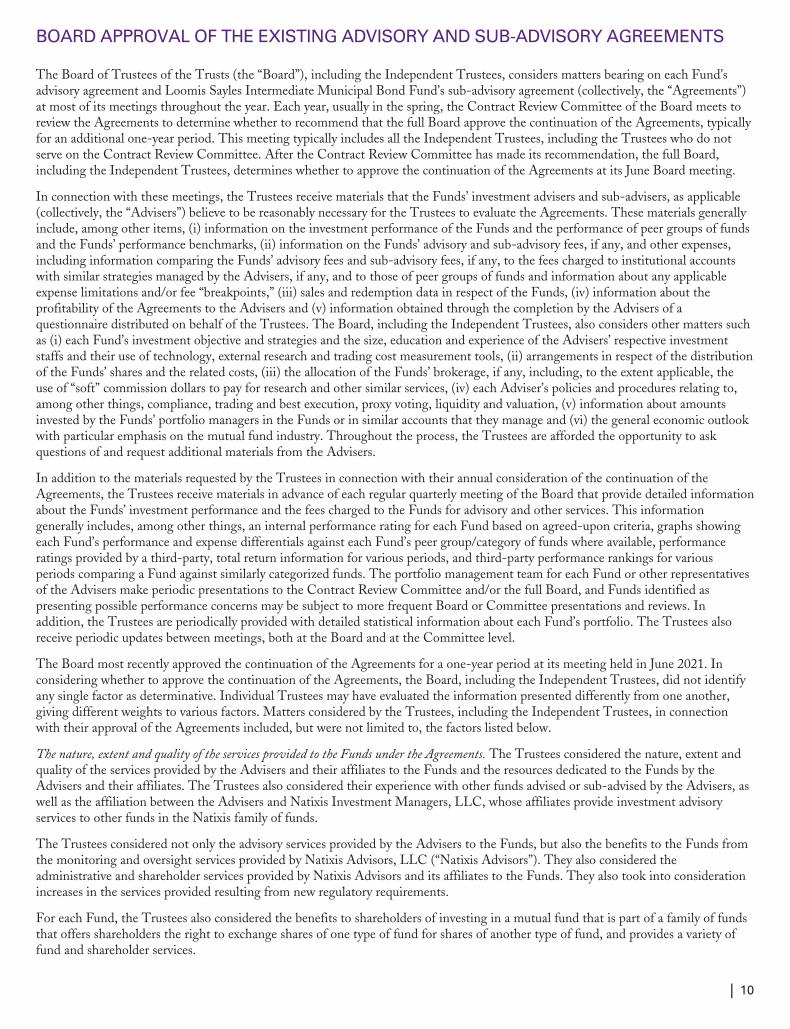
BOARD APPROVAL OF THE EXISTING ADVISORY AND SUB-ADVISORY AGREEMENTS
The Board of Trustees of the Trusts (the “Board”), including the Independent Trustees, considers matters bearing on each Fund’sadvisory agreement and Loomis Sayles Intermediate Municipal Bond Fund’s sub-advisory agreement (collectively, the “Agreements”)at most of its meetings throughout the year. Each year, usually in the spring, the Contract Review Committee of the Board meets toreview the Agreements to determine whether to recommend that the full Board approve the continuation of the Agreements, typicallyfor an additional one-year period. This meeting typically includes all the Independent Trustees, including the Trustees who do notserve on the Contract Review Committee. After the Contract Review Committee has made its recommendation, the full Board,including the Independent Trustees, determines whether to approve the continuation of the Agreements at its June Board meeting.
In connection with these meetings, the Trustees receive materials that the Funds’ investment advisers and sub-advisers, as applicable(collectively, the “Advisers”) believe to be reasonably necessary for the Trustees to evaluate the Agreements. These materials generallyinclude, among other items, (i) information on the investment performance of the Funds and the performance of peer groups of fundsand the Funds’ performance benchmarks, (ii) information on the Funds’ advisory and sub-advisory fees, if any, and other expenses,including information comparing the Funds’ advisory fees and sub-advisory fees, if any, to the fees charged to institutional accountswith similar strategies managed by the Advisers, if any, and to those of peer groups of funds and information about any applicableexpense limitations and/or fee “breakpoints,” (iii) sales and redemption data in respect of the Funds, (iv) information about theprofitability of the Agreements to the Advisers and (v) information obtained through the completion by the Advisers of aquestionnaire distributed on behalf of the Trustees. The Board, including the Independent Trustees, also considers other matters suchas (i) each Fund’s investment objective and strategies and the size, education and experience of the Advisers’ respective investmentstaffs and their use of technology, external research and trading cost measurement tools, (ii) arrangements in respect of the distributionof the Funds’ shares and the related costs, (iii) the allocation of the Funds’ brokerage, if any, including, to the extent applicable, theuse of “soft” commission dollars to pay for research and other similar services, (iv) each Adviser’s policies and procedures relating to,among other things, compliance, trading and best execution, proxy voting, liquidity and valuation, (v) information about amountsinvested by the Funds’ portfolio managers in the Funds or in similar accounts that they manage and (vi) the general economic outlookwith particular emphasis on the mutual fund industry. Throughout the process, the Trustees are afforded the opportunity to askquestions of and request additional materials from the Advisers.
In addition to the materials requested by the Trustees in connection with their annual consideration of the continuation of theAgreements, the Trustees receive materials in advance of each regular quarterly meeting of the Board that provide detailed informationabout the Funds’ investment performance and the fees charged to the Funds for advisory and other services. This informationgenerally includes, among other things, an internal performance rating for each Fund based on agreed-upon criteria, graphs showingeach Fund’s performance and expense differentials against each Fund’s peer group/category of funds where available, performanceratings provided by a third-party, total return information for various periods, and third-party performance rankings for variousperiods comparing a Fund against similarly categorized funds. The portfolio management team for each Fund or other representativesof the Advisers make periodic presentations to the Contract Review Committee and/or the full Board, and Funds identified aspresenting possible performance concerns may be subject to more frequent Board or Committee presentations and reviews. Inaddition, the Trustees are periodically provided with detailed statistical information about each Fund’s portfolio. The Trustees alsoreceive periodic updates between meetings, both at the Board and at the Committee level.
The Board most recently approved the continuation of the Agreements for a one-year period at its meeting held in June 2021. Inconsidering whether to approve the continuation of the Agreements, the Board, including the Independent Trustees, did not identifyany single factor as determinative. Individual Trustees may have evaluated the information presented differently from one another,giving different weights to various factors. Matters considered by the Trustees, including the Independent Trustees, in connectionwith their approval of the Agreements included, but were not limited to, the factors listed below.
The nature, extent and quality of the services provided to the Funds under the Agreements. The Trustees considered the nature, extent andquality of the services provided by the Advisers and their affiliates to the Funds and the resources dedicated to the Funds by theAdvisers and their affiliates. The Trustees also considered their experience with other funds advised or sub-advised by the Advisers, aswell as the affiliation between the Advisers and Natixis Investment Managers, LLC, whose affiliates provide investment advisoryservices to other funds in the Natixis family of funds.
The Trustees considered not only the advisory services provided by the Advisers to the Funds, but also the benefits to the Funds fromthe monitoring and oversight services provided by Natixis Advisors, LLC (“Natixis Advisors”). They also considered theadministrative and shareholder services provided by Natixis Advisors and its affiliates to the Funds. They also took into considerationincreases in the services provided resulting from new regulatory requirements.
For each Fund, the Trustees also considered the benefits to shareholders of investing in a mutual fund that is part of a family of fundsthat offers shareholders the right to exchange shares of one type of fund for shares of another type of fund, and provides a variety offund and shareholder services.
| 10
After reviewing these and related factors, the Trustees concluded, within the context of their overall conclusions regarding each of theAgreements, that the nature, extent and quality of services provided supported the renewal of the Agreements.
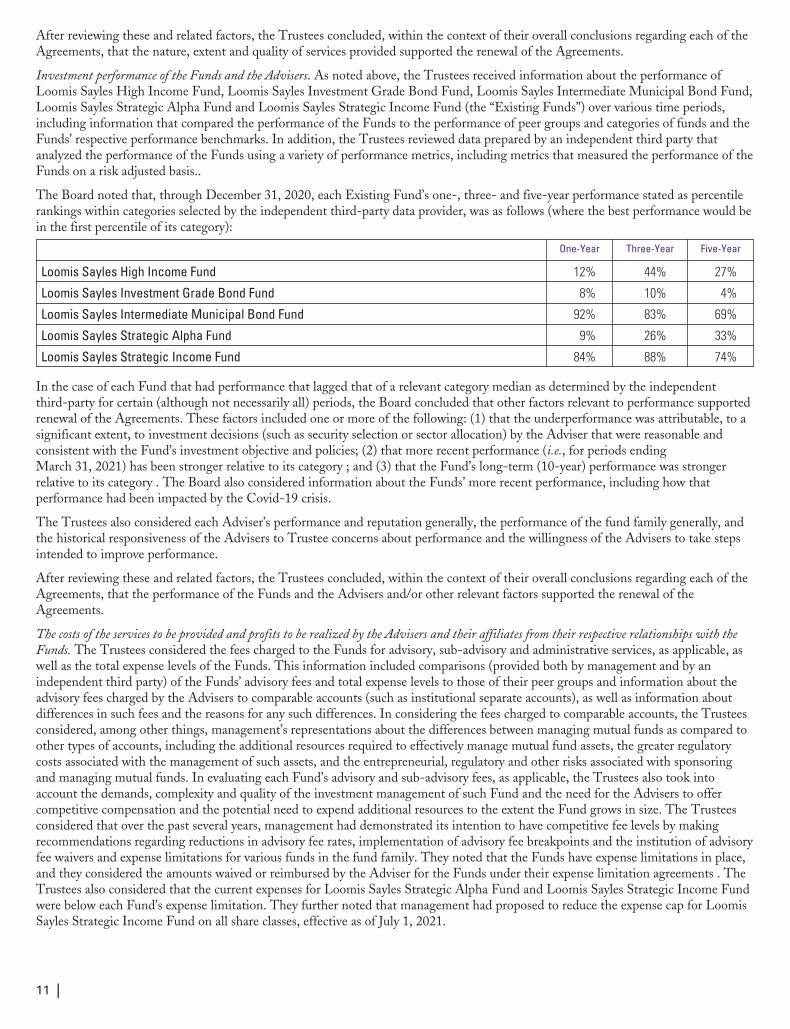
Investment performance of the Funds and the Advisers. As noted above, the Trustees received information about the performance ofLoomis Sayles High Income Fund, Loomis Sayles Investment Grade Bond Fund, Loomis Sayles Intermediate Municipal Bond Fund,Loomis Sayles Strategic Alpha Fund and Loomis Sayles Strategic Income Fund (the “Existing Funds”) over various time periods,including information that compared the performance of the Funds to the performance of peer groups and categories of funds and theFunds’ respective performance benchmarks. In addition, the Trustees reviewed data prepared by an independent third party thatanalyzed the performance of the Funds using a variety of performance metrics, including metrics that measured the performance of theFunds on a risk adjusted basis..
The Board noted that, through December 31, 2020, each Existing Fund’s one-, three- and five-year performance stated as percentilerankings within categories selected by the independent third-party data provider, was as follows (where the best performance would bein the first percentile of its category):
One-Year Three-Year Five-Year
Loomis Sayles High Income Fund 12% 44% 27%
Loomis Sayles Investment Grade Bond Fund 8% 10% 4%
Loomis Sayles Intermediate Municipal Bond Fund 92% 83% 69%
Loomis Sayles Strategic Alpha Fund 9% 26% 33%
Loomis Sayles Strategic Income Fund 84% 88% 74%
In the case of each Fund that had performance that lagged that of a relevant category median as determined by the independentthird-party for certain (although not necessarily all) periods, the Board concluded that other factors relevant to performance supportedrenewal of the Agreements. These factors included one or more of the following: (1) that the underperformance was attributable, to asignificant extent, to investment decisions (such as security selection or sector allocation) by the Adviser that were reasonable andconsistent with the Fund’s investment objective and policies; (2) that more recent performance (i.e., for periods endingMarch 31, 2021) has been stronger relative to its category ; and (3) that the Fund’s long-term (10-year) performance was strongerrelative to its category . The Board also considered information about the Funds’ more recent performance, including how thatperformance had been impacted by the Covid-19 crisis.
The Trustees also considered each Adviser’s performance and reputation generally, the performance of the fund family generally, andthe historical responsiveness of the Advisers to Trustee concerns about performance and the willingness of the Advisers to take stepsintended to improve performance.
After reviewing these and related factors, the Trustees concluded, within the context of their overall conclusions regarding each of theAgreements, that the performance of the Funds and the Advisers and/or other relevant factors supported the renewal of theAgreements.
The costs of the services to be provided and profits to be realized by the Advisers and their affiliates from their respective relationships with theFunds. The Trustees considered the fees charged to the Funds for advisory, sub-advisory and administrative services, as applicable, aswell as the total expense levels of the Funds. This information included comparisons (provided both by management and by anindependent third party) of the Funds’ advisory fees and total expense levels to those of their peer groups and information about theadvisory fees charged by the Advisers to comparable accounts (such as institutional separate accounts), as well as information aboutdifferences in such fees and the reasons for any such differences. In considering the fees charged to comparable accounts, the Trusteesconsidered, among other things, management’s representations about the differences between managing mutual funds as compared toother types of accounts, including the additional resources required to effectively manage mutual fund assets, the greater regulatorycosts associated with the management of such assets, and the entrepreneurial, regulatory and other risks associated with sponsoringand managing mutual funds. In evaluating each Fund’s advisory and sub-advisory fees, as applicable, the Trustees also took intoaccount the demands, complexity and quality of the investment management of such Fund and the need for the Advisers to offercompetitive compensation and the potential need to expend additional resources to the extent the Fund grows in size. The Trusteesconsidered that over the past several years, management had demonstrated its intention to have competitive fee levels by makingrecommendations regarding reductions in advisory fee rates, implementation of advisory fee breakpoints and the institution of advisoryfee waivers and expense limitations for various funds in the fund family. They noted that the Funds have expense limitations in place,and they considered the amounts waived or reimbursed by the Adviser for the Funds under their expense limitation agreements . TheTrustees also considered that the current expenses for Loomis Sayles Strategic Alpha Fund and Loomis Sayles Strategic Income Fundwere below each Fund’s expense limitation. They further noted that management had proposed to reduce the expense cap for LoomisSayles Strategic Income Fund on all share classes, effective as of July 1, 2021.
11 |
The Trustees noted that each of Loomis Sayles Investment Grade Bond Fund and Loomis Sayles Strategic Income Fund had a totaladvisory fee rate that was above the median of a peer group of funds. In this regard, the Trustees considered the factors thatmanagement believed justified such relatively higher advisory fee rate, including that: (1) the advisory fee was only one basis pointhigher than the median of a peer group of funds for Loomis Sayles Investment Grade Bond Fund and (2) management had proposedto further reduce the expense limitation of the Loomis Sayles Strategic Income Fund, which had also been reduced last year.
The Trustees also considered the compensation directly or indirectly received by the Advisers and their affiliates from theirrelationships with the Funds. The Trustees reviewed information provided by management as to the profitability of the Advisers’ andtheir affiliates’ relationships with the Funds, and information about how expenses are determined and allocated for purposes ofprofitability calculations. They also reviewed information provided by management about the effect of distribution costs and changesin asset levels on Adviser profitability, including information regarding resources spent on distribution activities. When reviewingprofitability, the Trustees also considered information about court cases in which adviser compensation or profitability were issues, theperformance of the relevant Funds, the expense levels of the Funds, whether the Advisers had implemented breakpoints and/orexpense limitations with respect to such Funds and the overall profit margin of Natixis Investment Managers, LLC compared to thatof certain other investment managers for which such data was available.
After reviewing these and related factors, the Trustees concluded, within the context of their overall conclusions regarding each of theAgreements, that the advisory fees charged to each of the Funds were fair and reasonable, and that the costs of these services generallyand the related profitability of the Advisers and their affiliates in respect of their relationships with the Funds supported the renewal ofthe Agreements.
Economies of Scale. The Trustees considered the existence of any economies of scale in the provision of services by the Advisers andwhether those economies are shared with the Funds through breakpoints in their investment advisory fees or other means, such asexpense limitations. The Trustees also considered management’s explanation of the factors that are taken into account with respect tothe implementation of breakpoints in investment advisory fees or expense limitations. With respect to economies of scale, the Trusteesnoted that each of Loomis Sayles Investment Grade Bond Fund, Loomis Sayles Strategic Alpha Fund and Loomis Sayles StrategicIncome Fund has breakpoints in its advisory fee and that each of the Funds was subject to an expense limitation. The Trustees alsoconsidered management’s proposal to reduce the expense limitation for Loomis Sayles Strategic Income Fund. In considering theseissues, the Trustees also took note of the costs of the services provided (both on an absolute and on a relative basis) and theprofitability to the Advisers and their affiliates of their relationships with the Funds, as discussed above. The Trustees also consideredthat the Funds have benefitted from the substantial reinvestment each Adviser has made into its business.
After reviewing these and related factors, the Trustees concluded, within the context of their overall conclusions regarding each of theAgreements, that the extent to which economies of scale were shared with the Funds supported the renewal of the Agreements.
The Trustees also considered other factors, which included but were not limited to the following:
• The effect of recent market and economic events, including but not limited to the Covid-19 crisis and its significant disruptions tothe economy and business operations, on the performance, asset levels and expense ratios of each Fund.
• Whether each Fund has operated in accordance with its investment objective and the Fund’s record of compliance with itsinvestment restrictions, and the compliance programs of the Funds and the Advisers. They also considered the compliance-relatedresources the Advisers and their affiliates were providing to the Funds.
• So-called “fallout benefits” to the Advisers, such as the engagement of affiliates of the Advisers to provide distribution andadministrative services to the Funds, and the benefits of research made available to the Advisers by reason of brokeragecommissions (if any) generated by the Funds’ securities transactions. The Trustees also considered the benefits to the parentcompany of Natixis Advisors from the retention of the Adviser. The Trustees considered the possible conflicts of interest associatedwith these fallout and other benefits, and the reporting, disclosure and other processes in place to disclose and monitor suchpossible conflicts of interest.
• The Trustees’ review and discussion of the Funds’ advisory arrangements in prior years, and management’s record of responding toTrustee concerns raised during the year and in prior years.
Based on their evaluation of all factors that they deemed to be material, including those factors described above, and assisted by theadvice of independent counsel, the Trustees, including the Independent Trustees, concluded that each of the existing Agreementsshould be continued through June 30, 2022.
| 12
LIQUIDITY RISK MANAGEMENT PROGRAM
Annual Report for the Period Commencing on January 1, 2020 and ending December 31, 2020(including updates through June 30, 2021)
Effective December 1, 2018, the Funds adopted a liquidity risk management program (the “Program”) pursuant to the requirements ofRule 22e-4 under the Investment Company Act of 1940, as amended (the “Rule”). The Rule requires registered open-end funds,including mutual funds and exchange-traded funds to establish liquidity risk management programs in order to effectively managefund liquidity and mitigate the risk that a fund could not meet redemption requests without significantly diluting the interests ofremaining investors.
The rule requires the Funds to assess, manage and review their liquidity risk considering applicable factors during normal andforeseeable stressed conditions. In fulfilling this requirement, each Fund assesses and reviews (where applicable and amongst othermatters) its investment strategy, portfolio holdings, possible investment concentrations, use of derivatives, short-term and long-termcash flow projections, use of cash and cash equivalents, as well as borrowing arrangements and other funding sources. Each Programhas established a Program Administrator (“Administrator”) which is the adviser or sub-adviser of the Fund.
In accordance with the Program, each of the Funds’ portfolio investments is classified into one of four liquidity categories based on adetermination of a reasonable expectation for how long it would take to convert the investment to cash (or sell or dispose of theinvestment) without significantly changing its market value.
Each Fund is prohibited from acquiring an investment if, after the acquisition, its holdings of illiquid assets will exceed 15% of its netassets. If a Fund does not hold a majority of highly liquid investments in its portfolio, then the Fund is required to establish a highlyliquid investment minimum (“HLIM”). Loomis Sayles High Income Fund, Loomis Sayles Investment Grade Bond Fund, LoomisSayles Strategic Alpha Fund and Loomis Sayles Strategic Income Fund have established an HLIM.
During the period from January 1, 2020 to December 31, 2020, there were no material changes to the Programs and no materialevents that impacted the operation of the Funds’ Programs. During the period, the Funds held sufficient liquid assets to meetredemptions on a timely basis and did not have any HLIM or illiquid security violations during the period.
During the period January 1, 2021 through June 30, 2021, the Funds held sufficient liquid assets to meet redemptions on a timelybasis and did not have any HLIM or illiquid security violations.
Annual Program Assessment and Conclusion
In the opinion of the Program Administrators, the Program of each Fund approved by the Funds’ Board is operating effectively. TheProgram Administrators have also monitored, assessed and managed each Fund’s liquidity risk regularly throughout the period.
Pursuant to the Rule’s requirements, the Board has received and reviewed a written report prepared by each Fund’s ProgramAdministrator that addressed the operation of the Programs, assessed their adequacy and effectiveness and described any materialchanges made to the Programs.
13 |
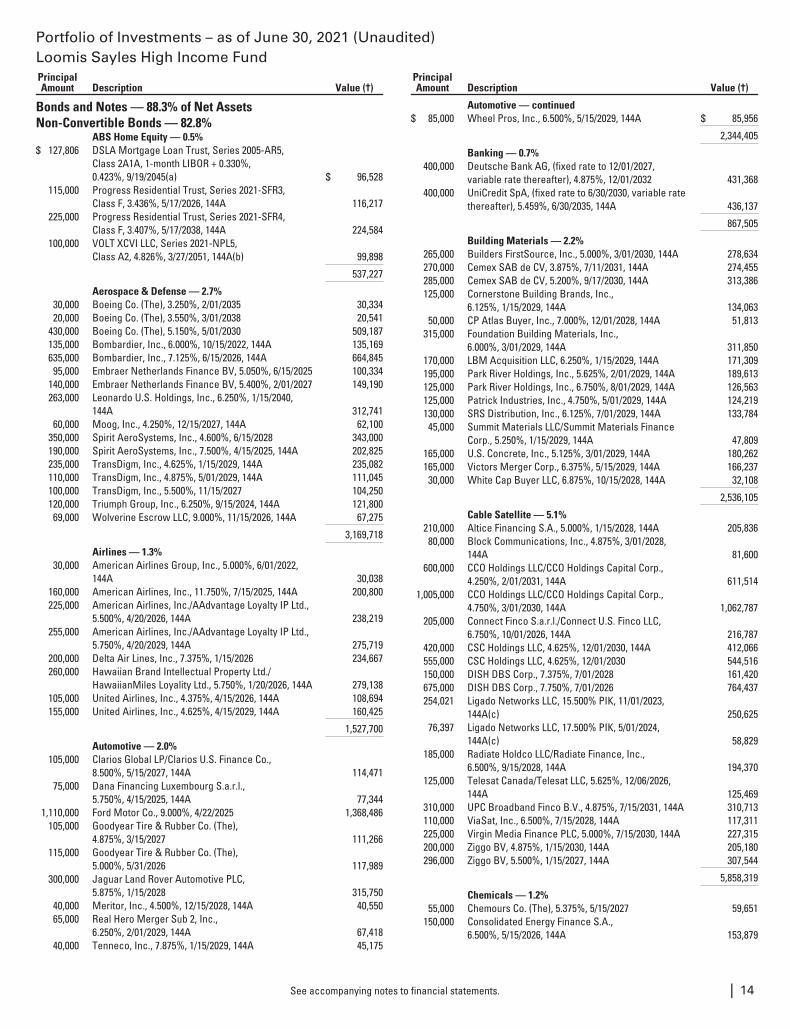
Portfolio of Investments – as of June 30, 2021 (Unaudited)Loomis Sayles High Income FundPrincipalAmount Description Value (†)
Bonds and Notes — 88.3% of Net AssetsNon-Convertible Bonds — 82.8%
ABS Home Equity — 0.5%$ 127,806 DSLA Mortgage Loan Trust, Series 2005-AR5,
Class 2A1A, 1-month LIBOR + 0.330%,0.423%, 9/19/2045(a) $ 96,528
115,000 Progress Residential Trust, Series 2021-SFR3,Class F, 3.436%, 5/17/2026, 144A 116,217
225,000 Progress Residential Trust, Series 2021-SFR4,Class F, 3.407%, 5/17/2038, 144A 224,584
100,000 VOLT XCVI LLC, Series 2021-NPL5,Class A2, 4.826%, 3/27/2051, 144A(b) 99,898
537,227
Aerospace & Defense — 2.7%30,000 Boeing Co. (The), 3.250%, 2/01/2035 30,33420,000 Boeing Co. (The), 3.550%, 3/01/2038 20,541
430,000 Boeing Co. (The), 5.150%, 5/01/2030 509,187135,000 Bombardier, Inc., 6.000%, 10/15/2022, 144A 135,169635,000 Bombardier, Inc., 7.125%, 6/15/2026, 144A 664,84595,000 Embraer Netherlands Finance BV, 5.050%, 6/15/2025 100,334
140,000 Embraer Netherlands Finance BV, 5.400%, 2/01/2027 149,190263,000 Leonardo U.S. Holdings, Inc., 6.250%, 1/15/2040,
144A 312,74160,000 Moog, Inc., 4.250%, 12/15/2027, 144A 62,100
350,000 Spirit AeroSystems, Inc., 4.600%, 6/15/2028 343,000190,000 Spirit AeroSystems, Inc., 7.500%, 4/15/2025, 144A 202,825235,000 TransDigm, Inc., 4.625%, 1/15/2029, 144A 235,082110,000 TransDigm, Inc., 4.875%, 5/01/2029, 144A 111,045100,000 TransDigm, Inc., 5.500%, 11/15/2027 104,250120,000 Triumph Group, Inc., 6.250%, 9/15/2024, 144A 121,80069,000 Wolverine Escrow LLC, 9.000%, 11/15/2026, 144A 67,275
3,169,718
Airlines — 1.3%30,000 American Airlines Group, Inc., 5.000%, 6/01/2022,
144A 30,038160,000 American Airlines, Inc., 11.750%, 7/15/2025, 144A 200,800225,000 American Airlines, Inc./AAdvantage Loyalty IP Ltd.,
5.500%, 4/20/2026, 144A 238,219255,000 American Airlines, Inc./AAdvantage Loyalty IP Ltd.,
5.750%, 4/20/2029, 144A 275,719200,000 Delta Air Lines, Inc., 7.375%, 1/15/2026 234,667260,000 Hawaiian Brand Intellectual Property Ltd./
HawaiianMiles Loyality Ltd., 5.750%, 1/20/2026, 144A 279,138105,000 United Airlines, Inc., 4.375%, 4/15/2026, 144A 108,694155,000 United Airlines, Inc., 4.625%, 4/15/2029, 144A 160,425
1,527,700
Automotive — 2.0%105,000 Clarios Global LP/Clarios U.S. Finance Co.,
8.500%, 5/15/2027, 144A 114,47175,000 Dana Financing Luxembourg S.a.r.l.,
5.750%, 4/15/2025, 144A 77,3441,110,000 Ford Motor Co., 9.000%, 4/22/2025 1,368,486
105,000 Goodyear Tire & Rubber Co. (The),4.875%, 3/15/2027 111,266
115,000 Goodyear Tire & Rubber Co. (The),5.000%, 5/31/2026 117,989
300,000 Jaguar Land Rover Automotive PLC,5.875%, 1/15/2028 315,750
40,000 Meritor, Inc., 4.500%, 12/15/2028, 144A 40,55065,000 Real Hero Merger Sub 2, Inc.,
6.250%, 2/01/2029, 144A 67,41840,000 Tenneco, Inc., 7.875%, 1/15/2029, 144A 45,175
PrincipalAmount Description Value (†)
Automotive — continued$ 85,000 Wheel Pros, Inc., 6.500%, 5/15/2029, 144A $ 85,956
2,344,405
Banking — 0.7%400,000 Deutsche Bank AG, (fixed rate to 12/01/2027,
variable rate thereafter), 4.875%, 12/01/2032 431,368400,000 UniCredit SpA, (fixed rate to 6/30/2030, variable rate
thereafter), 5.459%, 6/30/2035, 144A 436,137
867,505
Building Materials — 2.2%265,000 Builders FirstSource, Inc., 5.000%, 3/01/2030, 144A 278,634270,000 Cemex SAB de CV, 3.875%, 7/11/2031, 144A 274,455285,000 Cemex SAB de CV, 5.200%, 9/17/2030, 144A 313,386125,000 Cornerstone Building Brands, Inc.,
6.125%, 1/15/2029, 144A 134,06350,000 CP Atlas Buyer, Inc., 7.000%, 12/01/2028, 144A 51,813
315,000 Foundation Building Materials, Inc.,6.000%, 3/01/2029, 144A 311,850
170,000 LBM Acquisition LLC, 6.250%, 1/15/2029, 144A 171,309195,000 Park River Holdings, Inc., 5.625%, 2/01/2029, 144A 189,613125,000 Park River Holdings, Inc., 6.750%, 8/01/2029, 144A 126,563125,000 Patrick Industries, Inc., 4.750%, 5/01/2029, 144A 124,219130,000 SRS Distribution, Inc., 6.125%, 7/01/2029, 144A 133,78445,000 Summit Materials LLC/Summit Materials Finance
Corp., 5.250%, 1/15/2029, 144A 47,809165,000 U.S. Concrete, Inc., 5.125%, 3/01/2029, 144A 180,262165,000 Victors Merger Corp., 6.375%, 5/15/2029, 144A 166,23730,000 White Cap Buyer LLC, 6.875%, 10/15/2028, 144A 32,108
2,536,105
Cable Satellite — 5.1%210,000 Altice Financing S.A., 5.000%, 1/15/2028, 144A 205,83680,000 Block Communications, Inc., 4.875%, 3/01/2028,
144A 81,600600,000 CCO Holdings LLC/CCO Holdings Capital Corp.,
4.250%, 2/01/2031, 144A 611,5141,005,000 CCO Holdings LLC/CCO Holdings Capital Corp.,
4.750%, 3/01/2030, 144A 1,062,787205,000 Connect Finco S.a.r.l./Connect U.S. Finco LLC,
6.750%, 10/01/2026, 144A 216,787420,000 CSC Holdings LLC, 4.625%, 12/01/2030, 144A 412,066555,000 CSC Holdings LLC, 4.625%, 12/01/2030 544,516150,000 DISH DBS Corp., 7.375%, 7/01/2028 161,420675,000 DISH DBS Corp., 7.750%, 7/01/2026 764,437254,021 Ligado Networks LLC, 15.500% PIK, 11/01/2023,
144A(c) 250,62576,397 Ligado Networks LLC, 17.500% PIK, 5/01/2024,
144A(c) 58,829185,000 Radiate Holdco LLC/Radiate Finance, Inc.,
6.500%, 9/15/2028, 144A 194,370125,000 Telesat Canada/Telesat LLC, 5.625%, 12/06/2026,
144A 125,469310,000 UPC Broadband Finco B.V., 4.875%, 7/15/2031, 144A 310,713110,000 ViaSat, Inc., 6.500%, 7/15/2028, 144A 117,311225,000 Virgin Media Finance PLC, 5.000%, 7/15/2030, 144A 227,315200,000 Ziggo BV, 4.875%, 1/15/2030, 144A 205,180296,000 Ziggo BV, 5.500%, 1/15/2027, 144A 307,544
5,858,319
Chemicals — 1.2%55,000 Chemours Co. (The), 5.375%, 5/15/2027 59,651
150,000 Consolidated Energy Finance S.A.,6.500%, 5/15/2026, 144A 153,879
See accompanying notes to financial statements. | 14
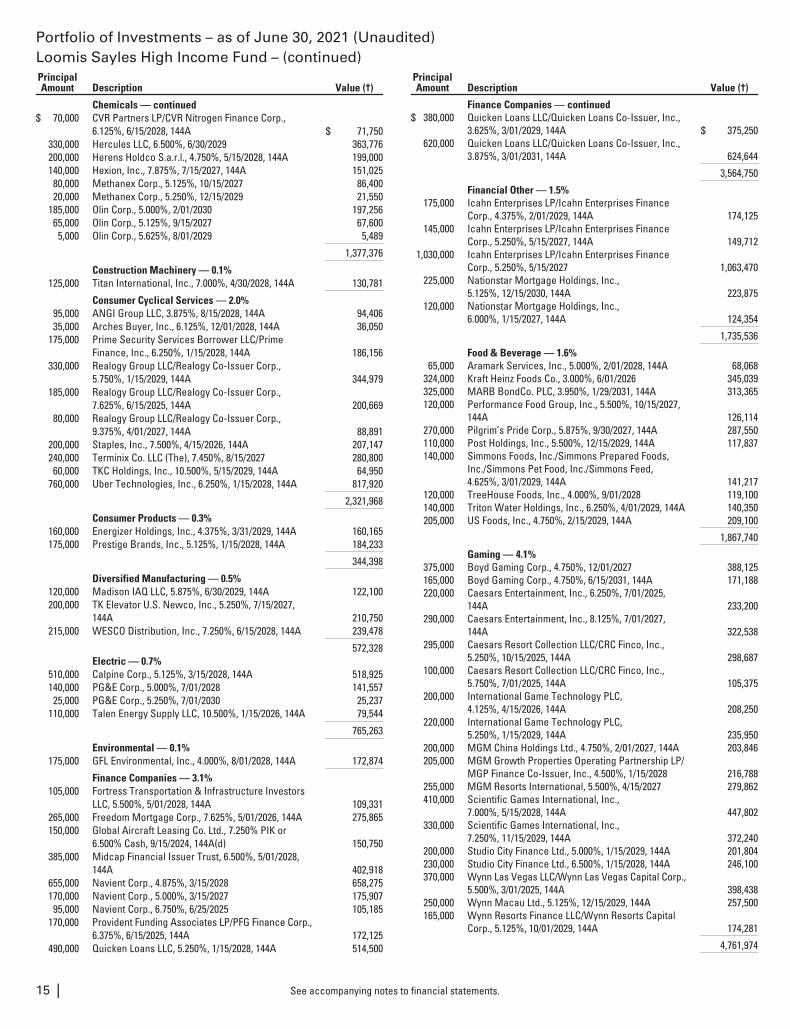
Portfolio of Investments – as of June 30, 2021 (Unaudited)Loomis Sayles High Income Fund – (continued)PrincipalAmount Description Value (†)
Chemicals — continued$ 70,000 CVR Partners LP/CVR Nitrogen Finance Corp.,
6.125%, 6/15/2028, 144A $ 71,750330,000 Hercules LLC, 6.500%, 6/30/2029 363,776200,000 Herens Holdco S.a.r.l., 4.750%, 5/15/2028, 144A 199,000140,000 Hexion, Inc., 7.875%, 7/15/2027, 144A 151,02580,000 Methanex Corp., 5.125%, 10/15/2027 86,40020,000 Methanex Corp., 5.250%, 12/15/2029 21,550
185,000 Olin Corp., 5.000%, 2/01/2030 197,25665,000 Olin Corp., 5.125%, 9/15/2027 67,6005,000 Olin Corp., 5.625%, 8/01/2029 5,489
1,377,376
Construction Machinery — 0.1%125,000 Titan International, Inc., 7.000%, 4/30/2028, 144A 130,781
Consumer Cyclical Services — 2.0%95,000 ANGI Group LLC, 3.875%, 8/15/2028, 144A 94,40635,000 Arches Buyer, Inc., 6.125%, 12/01/2028, 144A 36,050
175,000 Prime Security Services Borrower LLC/PrimeFinance, Inc., 6.250%, 1/15/2028, 144A 186,156
330,000 Realogy Group LLC/Realogy Co-Issuer Corp.,5.750%, 1/15/2029, 144A 344,979
185,000 Realogy Group LLC/Realogy Co-Issuer Corp.,7.625%, 6/15/2025, 144A 200,669
80,000 Realogy Group LLC/Realogy Co-Issuer Corp.,9.375%, 4/01/2027, 144A 88,891
200,000 Staples, Inc., 7.500%, 4/15/2026, 144A 207,147240,000 Terminix Co. LLC (The), 7.450%, 8/15/2027 280,80060,000 TKC Holdings, Inc., 10.500%, 5/15/2029, 144A 64,950
760,000 Uber Technologies, Inc., 6.250%, 1/15/2028, 144A 817,920
2,321,968
Consumer Products — 0.3%160,000 Energizer Holdings, Inc., 4.375%, 3/31/2029, 144A 160,165175,000 Prestige Brands, Inc., 5.125%, 1/15/2028, 144A 184,233
344,398
Diversified Manufacturing — 0.5%120,000 Madison IAQ LLC, 5.875%, 6/30/2029, 144A 122,100200,000 TK Elevator U.S. Newco, Inc., 5.250%, 7/15/2027,
144A 210,750215,000 WESCO Distribution, Inc., 7.250%, 6/15/2028, 144A 239,478
572,328Electric — 0.7%
510,000 Calpine Corp., 5.125%, 3/15/2028, 144A 518,925140,000 PG&E Corp., 5.000%, 7/01/2028 141,55725,000 PG&E Corp., 5.250%, 7/01/2030 25,237
110,000 Talen Energy Supply LLC, 10.500%, 1/15/2026, 144A 79,544
765,263
Environmental — 0.1%175,000 GFL Environmental, Inc., 4.000%, 8/01/2028, 144A 172,874
Finance Companies — 3.1%105,000 Fortress Transportation & Infrastructure Investors
LLC, 5.500%, 5/01/2028, 144A 109,331265,000 Freedom Mortgage Corp., 7.625%, 5/01/2026, 144A 275,865150,000 Global Aircraft Leasing Co. Ltd., 7.250% PIK or
6.500% Cash, 9/15/2024, 144A(d) 150,750385,000 Midcap Financial Issuer Trust, 6.500%, 5/01/2028,
144A 402,918655,000 Navient Corp., 4.875%, 3/15/2028 658,275170,000 Navient Corp., 5.000%, 3/15/2027 175,90795,000 Navient Corp., 6.750%, 6/25/2025 105,185
170,000 Provident Funding Associates LP/PFG Finance Corp.,6.375%, 6/15/2025, 144A 172,125
490,000 Quicken Loans LLC, 5.250%, 1/15/2028, 144A 514,500
PrincipalAmount Description Value (†)
Finance Companies — continued$ 380,000 Quicken Loans LLC/Quicken Loans Co-Issuer, Inc.,
3.625%, 3/01/2029, 144A $ 375,250620,000 Quicken Loans LLC/Quicken Loans Co-Issuer, Inc.,
3.875%, 3/01/2031, 144A 624,644
3,564,750
Financial Other — 1.5%175,000 Icahn Enterprises LP/Icahn Enterprises Finance
Corp., 4.375%, 2/01/2029, 144A 174,125145,000 Icahn Enterprises LP/Icahn Enterprises Finance
Corp., 5.250%, 5/15/2027, 144A 149,7121,030,000 Icahn Enterprises LP/Icahn Enterprises Finance
Corp., 5.250%, 5/15/2027 1,063,470225,000 Nationstar Mortgage Holdings, Inc.,
5.125%, 12/15/2030, 144A 223,875120,000 Nationstar Mortgage Holdings, Inc.,
6.000%, 1/15/2027, 144A 124,354
1,735,536
Food & Beverage — 1.6%65,000 Aramark Services, Inc., 5.000%, 2/01/2028, 144A 68,068
324,000 Kraft Heinz Foods Co., 3.000%, 6/01/2026 345,039325,000 MARB BondCo. PLC, 3.950%, 1/29/2031, 144A 313,365120,000 Performance Food Group, Inc., 5.500%, 10/15/2027,
144A 126,114270,000 Pilgrim’s Pride Corp., 5.875%, 9/30/2027, 144A 287,550110,000 Post Holdings, Inc., 5.500%, 12/15/2029, 144A 117,837140,000 Simmons Foods, Inc./Simmons Prepared Foods,
Inc./Simmons Pet Food, Inc./Simmons Feed,4.625%, 3/01/2029, 144A 141,217
120,000 TreeHouse Foods, Inc., 4.000%, 9/01/2028 119,100140,000 Triton Water Holdings, Inc., 6.250%, 4/01/2029, 144A 140,350205,000 US Foods, Inc., 4.750%, 2/15/2029, 144A 209,100
1,867,740
Gaming — 4.1%375,000 Boyd Gaming Corp., 4.750%, 12/01/2027 388,125165,000 Boyd Gaming Corp., 4.750%, 6/15/2031, 144A 171,188220,000 Caesars Entertainment, Inc., 6.250%, 7/01/2025,
144A 233,200290,000 Caesars Entertainment, Inc., 8.125%, 7/01/2027,
144A 322,538295,000 Caesars Resort Collection LLC/CRC Finco, Inc.,
5.250%, 10/15/2025, 144A 298,687100,000 Caesars Resort Collection LLC/CRC Finco, Inc.,
5.750%, 7/01/2025, 144A 105,375200,000 International Game Technology PLC,
4.125%, 4/15/2026, 144A 208,250220,000 International Game Technology PLC,
5.250%, 1/15/2029, 144A 235,950200,000 MGM China Holdings Ltd., 4.750%, 2/01/2027, 144A 203,846205,000 MGM Growth Properties Operating Partnership LP/
MGP Finance Co-Issuer, Inc., 4.500%, 1/15/2028 216,788255,000 MGM Resorts International, 5.500%, 4/15/2027 279,862410,000 Scientific Games International, Inc.,
7.000%, 5/15/2028, 144A 447,802330,000 Scientific Games International, Inc.,
7.250%, 11/15/2029, 144A 372,240200,000 Studio City Finance Ltd., 5.000%, 1/15/2029, 144A 201,804230,000 Studio City Finance Ltd., 6.500%, 1/15/2028, 144A 246,100370,000 Wynn Las Vegas LLC/Wynn Las Vegas Capital Corp.,
5.500%, 3/01/2025, 144A 398,438250,000 Wynn Macau Ltd., 5.125%, 12/15/2029, 144A 257,500165,000 Wynn Resorts Finance LLC/Wynn Resorts Capital
Corp., 5.125%, 10/01/2029, 144A 174,281
4,761,974
See accompanying notes to financial statements.15 |
Portfolio of Investments – as of June 30, 2021 (Unaudited)Loomis Sayles High Income Fund – (continued)PrincipalAmount Description Value (†)
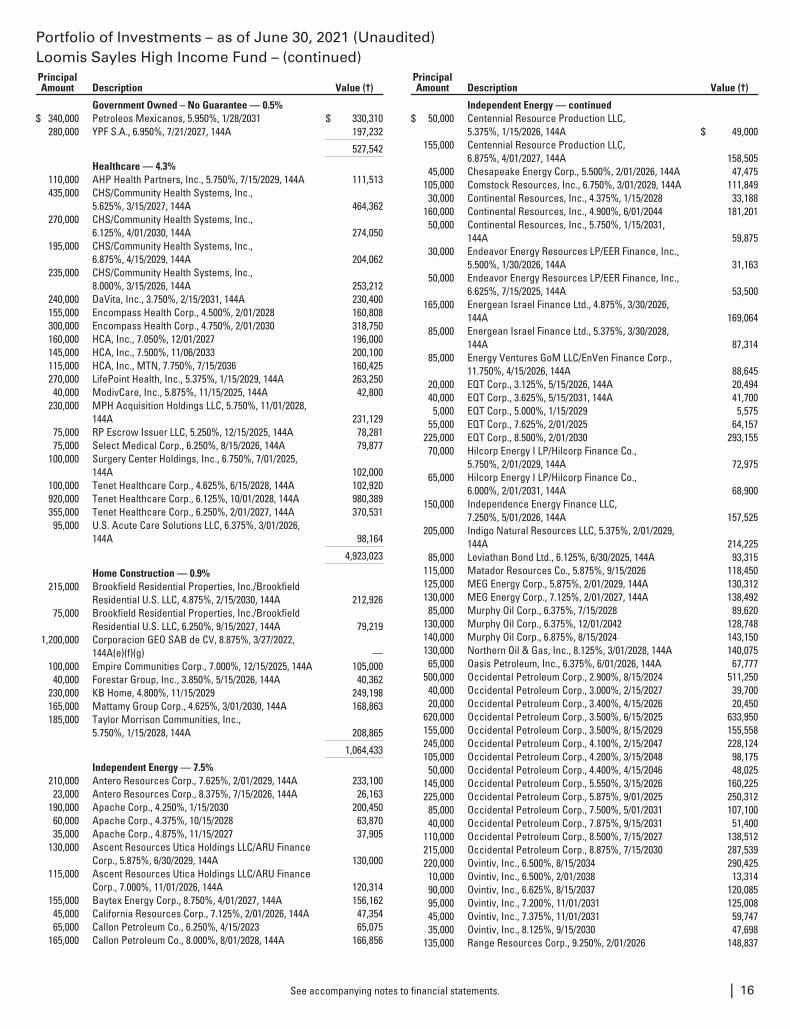
Government Owned – No Guarantee — 0.5%$ 340,000 Petroleos Mexicanos, 5.950%, 1/28/2031 $ 330,310
280,000 YPF S.A., 6.950%, 7/21/2027, 144A 197,232
527,542
Healthcare — 4.3%110,000 AHP Health Partners, Inc., 5.750%, 7/15/2029, 144A 111,513435,000 CHS/Community Health Systems, Inc.,
5.625%, 3/15/2027, 144A 464,362270,000 CHS/Community Health Systems, Inc.,
6.125%, 4/01/2030, 144A 274,050195,000 CHS/Community Health Systems, Inc.,
6.875%, 4/15/2029, 144A 204,062235,000 CHS/Community Health Systems, Inc.,
8.000%, 3/15/2026, 144A 253,212240,000 DaVita, Inc., 3.750%, 2/15/2031, 144A 230,400155,000 Encompass Health Corp., 4.500%, 2/01/2028 160,808300,000 Encompass Health Corp., 4.750%, 2/01/2030 318,750160,000 HCA, Inc., 7.050%, 12/01/2027 196,000145,000 HCA, Inc., 7.500%, 11/06/2033 200,100115,000 HCA, Inc., MTN, 7.750%, 7/15/2036 160,425270,000 LifePoint Health, Inc., 5.375%, 1/15/2029, 144A 263,25040,000 ModivCare, Inc., 5.875%, 11/15/2025, 144A 42,800
230,000 MPH Acquisition Holdings LLC, 5.750%, 11/01/2028,144A 231,129
75,000 RP Escrow Issuer LLC, 5.250%, 12/15/2025, 144A 78,28175,000 Select Medical Corp., 6.250%, 8/15/2026, 144A 79,877
100,000 Surgery Center Holdings, Inc., 6.750%, 7/01/2025,144A 102,000
100,000 Tenet Healthcare Corp., 4.625%, 6/15/2028, 144A 102,920920,000 Tenet Healthcare Corp., 6.125%, 10/01/2028, 144A 980,389355,000 Tenet Healthcare Corp., 6.250%, 2/01/2027, 144A 370,53195,000 U.S. Acute Care Solutions LLC, 6.375%, 3/01/2026,
144A 98,164
4,923,023
Home Construction — 0.9%215,000 Brookfield Residential Properties, Inc./Brookfield
Residential U.S. LLC, 4.875%, 2/15/2030, 144A 212,92675,000 Brookfield Residential Properties, Inc./Brookfield
Residential U.S. LLC, 6.250%, 9/15/2027, 144A 79,2191,200,000 Corporacion GEO SAB de CV, 8.875%, 3/27/2022,
144A(e)(f)(g) —100,000 Empire Communities Corp., 7.000%, 12/15/2025, 144A 105,00040,000 Forestar Group, Inc., 3.850%, 5/15/2026, 144A 40,362
230,000 KB Home, 4.800%, 11/15/2029 249,198165,000 Mattamy Group Corp., 4.625%, 3/01/2030, 144A 168,863185,000 Taylor Morrison Communities, Inc.,
5.750%, 1/15/2028, 144A 208,865
1,064,433
Independent Energy — 7.5%210,000 Antero Resources Corp., 7.625%, 2/01/2029, 144A 233,10023,000 Antero Resources Corp., 8.375%, 7/15/2026, 144A 26,163
190,000 Apache Corp., 4.250%, 1/15/2030 200,45060,000 Apache Corp., 4.375%, 10/15/2028 63,87035,000 Apache Corp., 4.875%, 11/15/2027 37,905
130,000 Ascent Resources Utica Holdings LLC/ARU FinanceCorp., 5.875%, 6/30/2029, 144A 130,000
115,000 Ascent Resources Utica Holdings LLC/ARU FinanceCorp., 7.000%, 11/01/2026, 144A 120,314
155,000 Baytex Energy Corp., 8.750%, 4/01/2027, 144A 156,16245,000 California Resources Corp., 7.125%, 2/01/2026, 144A 47,35465,000 Callon Petroleum Co., 6.250%, 4/15/2023 65,075
165,000 Callon Petroleum Co., 8.000%, 8/01/2028, 144A 166,856
PrincipalAmount Description Value (†)
Independent Energy — continued$ 50,000 Centennial Resource Production LLC,
5.375%, 1/15/2026, 144A $ 49,000155,000 Centennial Resource Production LLC,
6.875%, 4/01/2027, 144A 158,50545,000 Chesapeake Energy Corp., 5.500%, 2/01/2026, 144A 47,475
105,000 Comstock Resources, Inc., 6.750%, 3/01/2029, 144A 111,84930,000 Continental Resources, Inc., 4.375%, 1/15/2028 33,188
160,000 Continental Resources, Inc., 4.900%, 6/01/2044 181,20150,000 Continental Resources, Inc., 5.750%, 1/15/2031,
144A 59,87530,000 Endeavor Energy Resources LP/EER Finance, Inc.,
5.500%, 1/30/2026, 144A 31,16350,000 Endeavor Energy Resources LP/EER Finance, Inc.,
6.625%, 7/15/2025, 144A 53,500165,000 Energean Israel Finance Ltd., 4.875%, 3/30/2026,
144A 169,06485,000 Energean Israel Finance Ltd., 5.375%, 3/30/2028,
144A 87,31485,000 Energy Ventures GoM LLC/EnVen Finance Corp.,
11.750%, 4/15/2026, 144A 88,64520,000 EQT Corp., 3.125%, 5/15/2026, 144A 20,49440,000 EQT Corp., 3.625%, 5/15/2031, 144A 41,7005,000 EQT Corp., 5.000%, 1/15/2029 5,575
55,000 EQT Corp., 7.625%, 2/01/2025 64,157225,000 EQT Corp., 8.500%, 2/01/2030 293,15570,000 Hilcorp Energy I LP/Hilcorp Finance Co.,
5.750%, 2/01/2029, 144A 72,97565,000 Hilcorp Energy I LP/Hilcorp Finance Co.,
6.000%, 2/01/2031, 144A 68,900150,000 Independence Energy Finance LLC,
7.250%, 5/01/2026, 144A 157,525205,000 Indigo Natural Resources LLC, 5.375%, 2/01/2029,
144A 214,22585,000 Leviathan Bond Ltd., 6.125%, 6/30/2025, 144A 93,315
115,000 Matador Resources Co., 5.875%, 9/15/2026 118,450125,000 MEG Energy Corp., 5.875%, 2/01/2029, 144A 130,312130,000 MEG Energy Corp., 7.125%, 2/01/2027, 144A 138,49285,000 Murphy Oil Corp., 6.375%, 7/15/2028 89,620
130,000 Murphy Oil Corp., 6.375%, 12/01/2042 128,748140,000 Murphy Oil Corp., 6.875%, 8/15/2024 143,150130,000 Northern Oil & Gas, Inc., 8.125%, 3/01/2028, 144A 140,07565,000 Oasis Petroleum, Inc., 6.375%, 6/01/2026, 144A 67,777
500,000 Occidental Petroleum Corp., 2.900%, 8/15/2024 511,25040,000 Occidental Petroleum Corp., 3.000%, 2/15/2027 39,70020,000 Occidental Petroleum Corp., 3.400%, 4/15/2026 20,450
620,000 Occidental Petroleum Corp., 3.500%, 6/15/2025 633,950155,000 Occidental Petroleum Corp., 3.500%, 8/15/2029 155,558245,000 Occidental Petroleum Corp., 4.100%, 2/15/2047 228,124105,000 Occidental Petroleum Corp., 4.200%, 3/15/2048 98,17550,000 Occidental Petroleum Corp., 4.400%, 4/15/2046 48,025
145,000 Occidental Petroleum Corp., 5.550%, 3/15/2026 160,225225,000 Occidental Petroleum Corp., 5.875%, 9/01/2025 250,31285,000 Occidental Petroleum Corp., 7.500%, 5/01/2031 107,10040,000 Occidental Petroleum Corp., 7.875%, 9/15/2031 51,400
110,000 Occidental Petroleum Corp., 8.500%, 7/15/2027 138,512215,000 Occidental Petroleum Corp., 8.875%, 7/15/2030 287,539220,000 Ovintiv, Inc., 6.500%, 8/15/2034 290,42510,000 Ovintiv, Inc., 6.500%, 2/01/2038 13,31490,000 Ovintiv, Inc., 6.625%, 8/15/2037 120,08595,000 Ovintiv, Inc., 7.200%, 11/01/2031 125,00845,000 Ovintiv, Inc., 7.375%, 11/01/2031 59,74735,000 Ovintiv, Inc., 8.125%, 9/15/2030 47,698
135,000 Range Resources Corp., 9.250%, 2/01/2026 148,837
See accompanying notes to financial statements. | 16
Portfolio of Investments – as of June 30, 2021 (Unaudited)Loomis Sayles High Income Fund – (continued)PrincipalAmount Description Value (†)
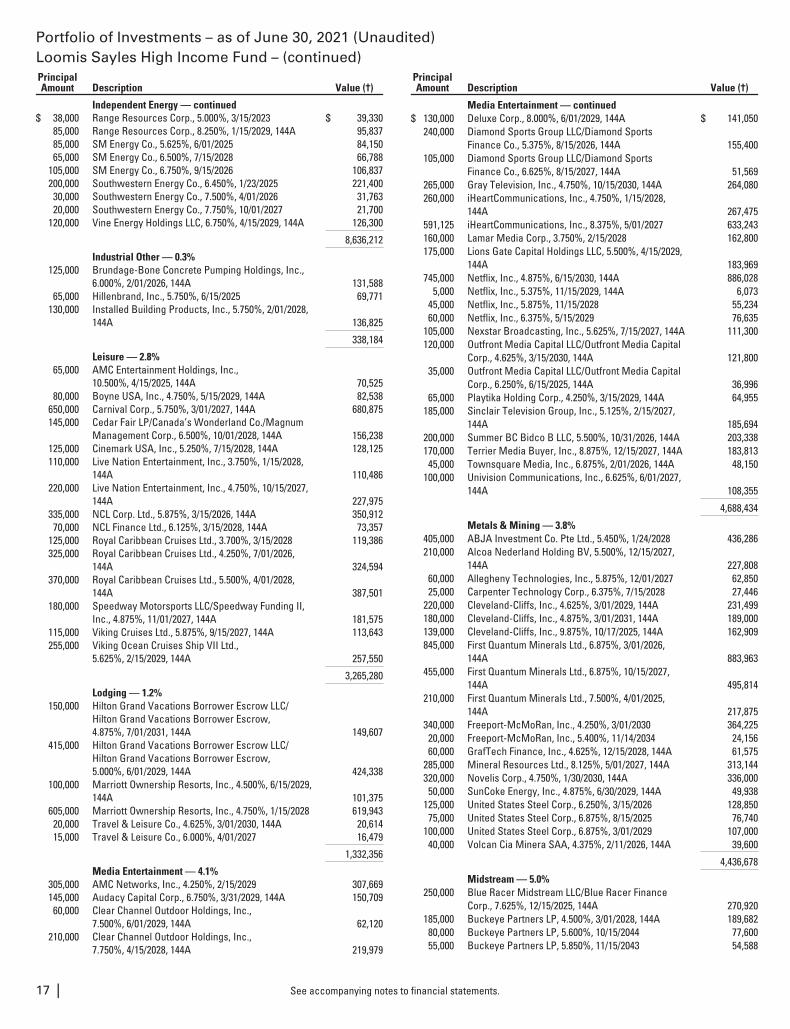
Independent Energy — continued$ 38,000 Range Resources Corp., 5.000%, 3/15/2023 $ 39,330
85,000 Range Resources Corp., 8.250%, 1/15/2029, 144A 95,83785,000 SM Energy Co., 5.625%, 6/01/2025 84,15065,000 SM Energy Co., 6.500%, 7/15/2028 66,788
105,000 SM Energy Co., 6.750%, 9/15/2026 106,837200,000 Southwestern Energy Co., 6.450%, 1/23/2025 221,40030,000 Southwestern Energy Co., 7.500%, 4/01/2026 31,76320,000 Southwestern Energy Co., 7.750%, 10/01/2027 21,700
120,000 Vine Energy Holdings LLC, 6.750%, 4/15/2029, 144A 126,300
8,636,212
Industrial Other — 0.3%125,000 Brundage-Bone Concrete Pumping Holdings, Inc.,
6.000%, 2/01/2026, 144A 131,58865,000 Hillenbrand, Inc., 5.750%, 6/15/2025 69,771
130,000 Installed Building Products, Inc., 5.750%, 2/01/2028,144A 136,825
338,184
Leisure — 2.8%65,000 AMC Entertainment Holdings, Inc.,
10.500%, 4/15/2025, 144A 70,52580,000 Boyne USA, Inc., 4.750%, 5/15/2029, 144A 82,538
650,000 Carnival Corp., 5.750%, 3/01/2027, 144A 680,875145,000 Cedar Fair LP/Canada’s Wonderland Co./Magnum
Management Corp., 6.500%, 10/01/2028, 144A 156,238125,000 Cinemark USA, Inc., 5.250%, 7/15/2028, 144A 128,125110,000 Live Nation Entertainment, Inc., 3.750%, 1/15/2028,
144A 110,486220,000 Live Nation Entertainment, Inc., 4.750%, 10/15/2027,
144A 227,975335,000 NCL Corp. Ltd., 5.875%, 3/15/2026, 144A 350,91270,000 NCL Finance Ltd., 6.125%, 3/15/2028, 144A 73,357
125,000 Royal Caribbean Cruises Ltd., 3.700%, 3/15/2028 119,386325,000 Royal Caribbean Cruises Ltd., 4.250%, 7/01/2026,
144A 324,594370,000 Royal Caribbean Cruises Ltd., 5.500%, 4/01/2028,
144A 387,501180,000 Speedway Motorsports LLC/Speedway Funding II,
Inc., 4.875%, 11/01/2027, 144A 181,575115,000 Viking Cruises Ltd., 5.875%, 9/15/2027, 144A 113,643255,000 Viking Ocean Cruises Ship VII Ltd.,
5.625%, 2/15/2029, 144A 257,550
3,265,280
Lodging — 1.2%150,000 Hilton Grand Vacations Borrower Escrow LLC/
Hilton Grand Vacations Borrower Escrow,4.875%, 7/01/2031, 144A 149,607
415,000 Hilton Grand Vacations Borrower Escrow LLC/Hilton Grand Vacations Borrower Escrow,5.000%, 6/01/2029, 144A 424,338
100,000 Marriott Ownership Resorts, Inc., 4.500%, 6/15/2029,144A 101,375
605,000 Marriott Ownership Resorts, Inc., 4.750%, 1/15/2028 619,94320,000 Travel & Leisure Co., 4.625%, 3/01/2030, 144A 20,61415,000 Travel & Leisure Co., 6.000%, 4/01/2027 16,479
1,332,356
Media Entertainment — 4.1%305,000 AMC Networks, Inc., 4.250%, 2/15/2029 307,669145,000 Audacy Capital Corp., 6.750%, 3/31/2029, 144A 150,70960,000 Clear Channel Outdoor Holdings, Inc.,
7.500%, 6/01/2029, 144A 62,120210,000 Clear Channel Outdoor Holdings, Inc.,
7.750%, 4/15/2028, 144A 219,979
PrincipalAmount Description Value (†)
Media Entertainment — continued$ 130,000 Deluxe Corp., 8.000%, 6/01/2029, 144A $ 141,050
240,000 Diamond Sports Group LLC/Diamond SportsFinance Co., 5.375%, 8/15/2026, 144A 155,400
105,000 Diamond Sports Group LLC/Diamond SportsFinance Co., 6.625%, 8/15/2027, 144A 51,569
265,000 Gray Television, Inc., 4.750%, 10/15/2030, 144A 264,080260,000 iHeartCommunications, Inc., 4.750%, 1/15/2028,
144A 267,475591,125 iHeartCommunications, Inc., 8.375%, 5/01/2027 633,243160,000 Lamar Media Corp., 3.750%, 2/15/2028 162,800175,000 Lions Gate Capital Holdings LLC, 5.500%, 4/15/2029,
144A 183,969745,000 Netflix, Inc., 4.875%, 6/15/2030, 144A 886,028
5,000 Netflix, Inc., 5.375%, 11/15/2029, 144A 6,07345,000 Netflix, Inc., 5.875%, 11/15/2028 55,23460,000 Netflix, Inc., 6.375%, 5/15/2029 76,635
105,000 Nexstar Broadcasting, Inc., 5.625%, 7/15/2027, 144A 111,300120,000 Outfront Media Capital LLC/Outfront Media Capital
Corp., 4.625%, 3/15/2030, 144A 121,80035,000 Outfront Media Capital LLC/Outfront Media Capital
Corp., 6.250%, 6/15/2025, 144A 36,99665,000 Playtika Holding Corp., 4.250%, 3/15/2029, 144A 64,955
185,000 Sinclair Television Group, Inc., 5.125%, 2/15/2027,144A 185,694
200,000 Summer BC Bidco B LLC, 5.500%, 10/31/2026, 144A 203,338170,000 Terrier Media Buyer, Inc., 8.875%, 12/15/2027, 144A 183,81345,000 Townsquare Media, Inc., 6.875%, 2/01/2026, 144A 48,150
100,000 Univision Communications, Inc., 6.625%, 6/01/2027,144A 108,355
4,688,434
Metals & Mining — 3.8%405,000 ABJA Investment Co. Pte Ltd., 5.450%, 1/24/2028 436,286210,000 Alcoa Nederland Holding BV, 5.500%, 12/15/2027,
144A 227,80860,000 Allegheny Technologies, Inc., 5.875%, 12/01/2027 62,85025,000 Carpenter Technology Corp., 6.375%, 7/15/2028 27,446
220,000 Cleveland-Cliffs, Inc., 4.625%, 3/01/2029, 144A 231,499180,000 Cleveland-Cliffs, Inc., 4.875%, 3/01/2031, 144A 189,000139,000 Cleveland-Cliffs, Inc., 9.875%, 10/17/2025, 144A 162,909845,000 First Quantum Minerals Ltd., 6.875%, 3/01/2026,
144A 883,963455,000 First Quantum Minerals Ltd., 6.875%, 10/15/2027,
144A 495,814210,000 First Quantum Minerals Ltd., 7.500%, 4/01/2025,
144A 217,875340,000 Freeport-McMoRan, Inc., 4.250%, 3/01/2030 364,22520,000 Freeport-McMoRan, Inc., 5.400%, 11/14/2034 24,15660,000 GrafTech Finance, Inc., 4.625%, 12/15/2028, 144A 61,575
285,000 Mineral Resources Ltd., 8.125%, 5/01/2027, 144A 313,144320,000 Novelis Corp., 4.750%, 1/30/2030, 144A 336,00050,000 SunCoke Energy, Inc., 4.875%, 6/30/2029, 144A 49,938
125,000 United States Steel Corp., 6.250%, 3/15/2026 128,85075,000 United States Steel Corp., 6.875%, 8/15/2025 76,740
100,000 United States Steel Corp., 6.875%, 3/01/2029 107,00040,000 Volcan Cia Minera SAA, 4.375%, 2/11/2026, 144A 39,600
4,436,678
Midstream — 5.0%250,000 Blue Racer Midstream LLC/Blue Racer Finance
Corp., 7.625%, 12/15/2025, 144A 270,920185,000 Buckeye Partners LP, 4.500%, 3/01/2028, 144A 189,68280,000 Buckeye Partners LP, 5.600%, 10/15/2044 77,60055,000 Buckeye Partners LP, 5.850%, 11/15/2043 54,588
See accompanying notes to financial statements.17 |
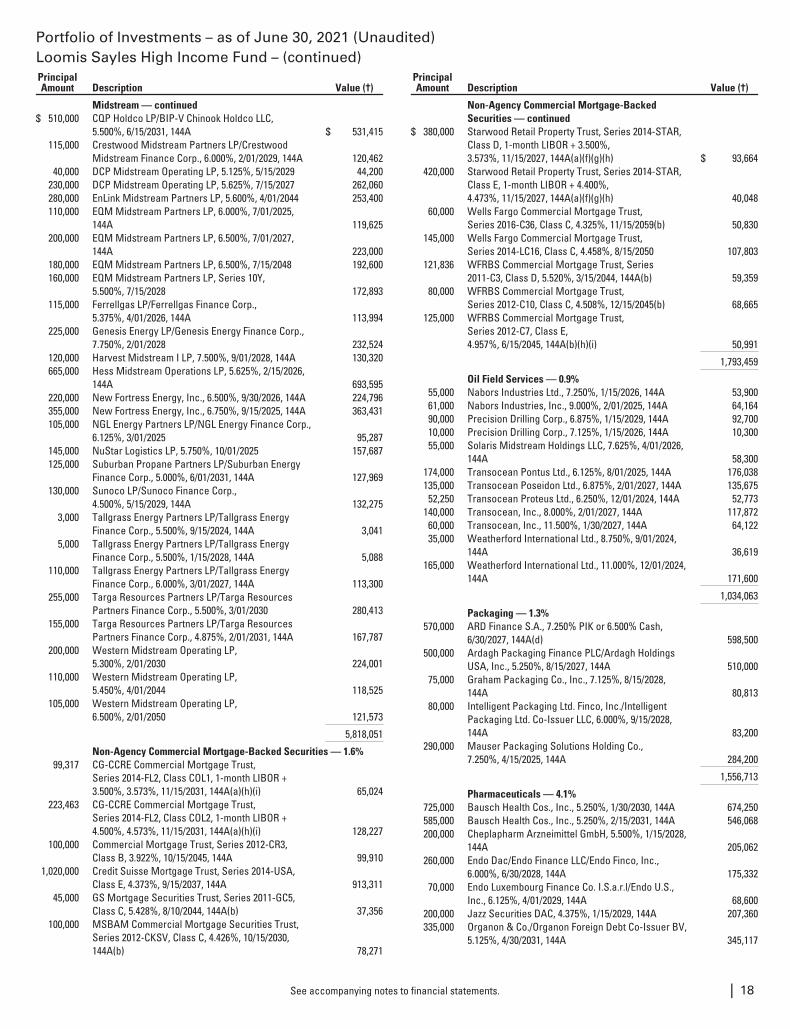
Portfolio of Investments – as of June 30, 2021 (Unaudited)Loomis Sayles High Income Fund – (continued)PrincipalAmount Description Value (†)
Midstream — continued$ 510,000 CQP Holdco LP/BIP-V Chinook Holdco LLC,
5.500%, 6/15/2031, 144A $ 531,415115,000 Crestwood Midstream Partners LP/Crestwood
Midstream Finance Corp., 6.000%, 2/01/2029, 144A 120,46240,000 DCP Midstream Operating LP, 5.125%, 5/15/2029 44,200
230,000 DCP Midstream Operating LP, 5.625%, 7/15/2027 262,060280,000 EnLink Midstream Partners LP, 5.600%, 4/01/2044 253,400110,000 EQM Midstream Partners LP, 6.000%, 7/01/2025,
144A 119,625200,000 EQM Midstream Partners LP, 6.500%, 7/01/2027,
144A 223,000180,000 EQM Midstream Partners LP, 6.500%, 7/15/2048 192,600160,000 EQM Midstream Partners LP, Series 10Y,
5.500%, 7/15/2028 172,893115,000 Ferrellgas LP/Ferrellgas Finance Corp.,
5.375%, 4/01/2026, 144A 113,994225,000 Genesis Energy LP/Genesis Energy Finance Corp.,
7.750%, 2/01/2028 232,524120,000 Harvest Midstream I LP, 7.500%, 9/01/2028, 144A 130,320665,000 Hess Midstream Operations LP, 5.625%, 2/15/2026,
144A 693,595220,000 New Fortress Energy, Inc., 6.500%, 9/30/2026, 144A 224,796355,000 New Fortress Energy, Inc., 6.750%, 9/15/2025, 144A 363,431105,000 NGL Energy Partners LP/NGL Energy Finance Corp.,
6.125%, 3/01/2025 95,287145,000 NuStar Logistics LP, 5.750%, 10/01/2025 157,687125,000 Suburban Propane Partners LP/Suburban Energy
Finance Corp., 5.000%, 6/01/2031, 144A 127,969130,000 Sunoco LP/Sunoco Finance Corp.,
4.500%, 5/15/2029, 144A 132,2753,000 Tallgrass Energy Partners LP/Tallgrass Energy
Finance Corp., 5.500%, 9/15/2024, 144A 3,0415,000 Tallgrass Energy Partners LP/Tallgrass Energy
Finance Corp., 5.500%, 1/15/2028, 144A 5,088110,000 Tallgrass Energy Partners LP/Tallgrass Energy
Finance Corp., 6.000%, 3/01/2027, 144A 113,300255,000 Targa Resources Partners LP/Targa Resources
Partners Finance Corp., 5.500%, 3/01/2030 280,413155,000 Targa Resources Partners LP/Targa Resources
Partners Finance Corp., 4.875%, 2/01/2031, 144A 167,787200,000 Western Midstream Operating LP,
5.300%, 2/01/2030 224,001110,000 Western Midstream Operating LP,
5.450%, 4/01/2044 118,525105,000 Western Midstream Operating LP,
6.500%, 2/01/2050 121,573
5,818,051
Non-Agency Commercial Mortgage-Backed Securities — 1.6%99,317 CG-CCRE Commercial Mortgage Trust,
Series 2014-FL2, Class COL1, 1-month LIBOR +3.500%, 3.573%, 11/15/2031, 144A(a)(h)(i) 65,024
223,463 CG-CCRE Commercial Mortgage Trust,Series 2014-FL2, Class COL2, 1-month LIBOR +4.500%, 4.573%, 11/15/2031, 144A(a)(h)(i) 128,227
100,000 Commercial Mortgage Trust, Series 2012-CR3,Class B, 3.922%, 10/15/2045, 144A 99,910
1,020,000 Credit Suisse Mortgage Trust, Series 2014-USA,Class E, 4.373%, 9/15/2037, 144A 913,311
45,000 GS Mortgage Securities Trust, Series 2011-GC5,Class C, 5.428%, 8/10/2044, 144A(b) 37,356
100,000 MSBAM Commercial Mortgage Securities Trust,Series 2012-CKSV, Class C, 4.426%, 10/15/2030,144A(b) 78,271
PrincipalAmount Description Value (†)
Non-Agency Commercial Mortgage-BackedSecurities — continued
$ 380,000 Starwood Retail Property Trust, Series 2014-STAR,Class D, 1-month LIBOR + 3.500%,3.573%, 11/15/2027, 144A(a)(f)(g)(h) $ 93,664
420,000 Starwood Retail Property Trust, Series 2014-STAR,Class E, 1-month LIBOR + 4.400%,4.473%, 11/15/2027, 144A(a)(f)(g)(h) 40,048
60,000 Wells Fargo Commercial Mortgage Trust,Series 2016-C36, Class C, 4.325%, 11/15/2059(b) 50,830
145,000 Wells Fargo Commercial Mortgage Trust,Series 2014-LC16, Class C, 4.458%, 8/15/2050 107,803
121,836 WFRBS Commercial Mortgage Trust, Series2011-C3, Class D, 5.520%, 3/15/2044, 144A(b) 59,359
80,000 WFRBS Commercial Mortgage Trust,Series 2012-C10, Class C, 4.508%, 12/15/2045(b) 68,665
125,000 WFRBS Commercial Mortgage Trust,Series 2012-C7, Class E,4.957%, 6/15/2045, 144A(b)(h)(i) 50,991
1,793,459
Oil Field Services — 0.9%55,000 Nabors Industries Ltd., 7.250%, 1/15/2026, 144A 53,90061,000 Nabors Industries, Inc., 9.000%, 2/01/2025, 144A 64,16490,000 Precision Drilling Corp., 6.875%, 1/15/2029, 144A 92,70010,000 Precision Drilling Corp., 7.125%, 1/15/2026, 144A 10,30055,000 Solaris Midstream Holdings LLC, 7.625%, 4/01/2026,
144A 58,300174,000 Transocean Pontus Ltd., 6.125%, 8/01/2025, 144A 176,038135,000 Transocean Poseidon Ltd., 6.875%, 2/01/2027, 144A 135,67552,250 Transocean Proteus Ltd., 6.250%, 12/01/2024, 144A 52,773
140,000 Transocean, Inc., 8.000%, 2/01/2027, 144A 117,87260,000 Transocean, Inc., 11.500%, 1/30/2027, 144A 64,12235,000 Weatherford International Ltd., 8.750%, 9/01/2024,
144A 36,619165,000 Weatherford International Ltd., 11.000%, 12/01/2024,
144A 171,600
1,034,063
Packaging — 1.3%570,000 ARD Finance S.A., 7.250% PIK or 6.500% Cash,
6/30/2027, 144A(d) 598,500500,000 Ardagh Packaging Finance PLC/Ardagh Holdings
USA, Inc., 5.250%, 8/15/2027, 144A 510,00075,000 Graham Packaging Co., Inc., 7.125%, 8/15/2028,
144A 80,81380,000 Intelligent Packaging Ltd. Finco, Inc./Intelligent
Packaging Ltd. Co-Issuer LLC, 6.000%, 9/15/2028,144A 83,200
290,000 Mauser Packaging Solutions Holding Co.,7.250%, 4/15/2025, 144A 284,200
1,556,713
Pharmaceuticals — 4.1%725,000 Bausch Health Cos., Inc., 5.250%, 1/30/2030, 144A 674,250585,000 Bausch Health Cos., Inc., 5.250%, 2/15/2031, 144A 546,068200,000 Cheplapharm Arzneimittel GmbH, 5.500%, 1/15/2028,
144A 205,062260,000 Endo Dac/Endo Finance LLC/Endo Finco, Inc.,
6.000%, 6/30/2028, 144A 175,33270,000 Endo Luxembourg Finance Co. I.S.a.r.l/Endo U.S.,
Inc., 6.125%, 4/01/2029, 144A 68,600200,000 Jazz Securities DAC, 4.375%, 1/15/2029, 144A 207,360335,000 Organon & Co./Organon Foreign Debt Co-Issuer BV,
5.125%, 4/30/2031, 144A 345,117
See accompanying notes to financial statements. | 18
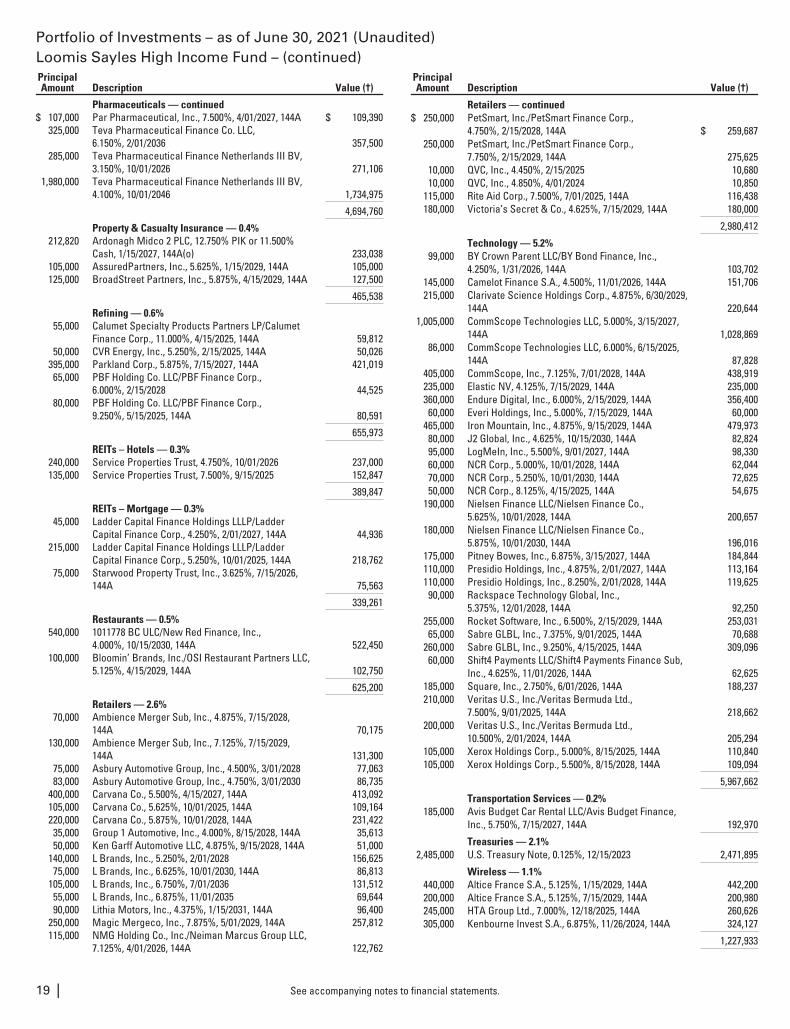
Portfolio of Investments – as of June 30, 2021 (Unaudited)Loomis Sayles High Income Fund – (continued)PrincipalAmount Description Value (†)
Pharmaceuticals — continued$ 107,000 Par Pharmaceutical, Inc., 7.500%, 4/01/2027, 144A $ 109,390
325,000 Teva Pharmaceutical Finance Co. LLC,6.150%, 2/01/2036 357,500
285,000 Teva Pharmaceutical Finance Netherlands III BV,3.150%, 10/01/2026 271,106
1,980,000 Teva Pharmaceutical Finance Netherlands III BV,4.100%, 10/01/2046 1,734,975
4,694,760
Property & Casualty Insurance — 0.4%212,820 Ardonagh Midco 2 PLC, 12.750% PIK or 11.500%
Cash, 1/15/2027, 144A(o) 233,038105,000 AssuredPartners, Inc., 5.625%, 1/15/2029, 144A 105,000125,000 BroadStreet Partners, Inc., 5.875%, 4/15/2029, 144A 127,500
465,538
Refining — 0.6%55,000 Calumet Specialty Products Partners LP/Calumet
Finance Corp., 11.000%, 4/15/2025, 144A 59,81250,000 CVR Energy, Inc., 5.250%, 2/15/2025, 144A 50,026
395,000 Parkland Corp., 5.875%, 7/15/2027, 144A 421,01965,000 PBF Holding Co. LLC/PBF Finance Corp.,
6.000%, 2/15/2028 44,52580,000 PBF Holding Co. LLC/PBF Finance Corp.,
9.250%, 5/15/2025, 144A 80,591
655,973
REITs – Hotels — 0.3%240,000 Service Properties Trust, 4.750%, 10/01/2026 237,000135,000 Service Properties Trust, 7.500%, 9/15/2025 152,847
389,847
REITs – Mortgage — 0.3%45,000 Ladder Capital Finance Holdings LLLP/Ladder
Capital Finance Corp., 4.250%, 2/01/2027, 144A 44,936215,000 Ladder Capital Finance Holdings LLLP/Ladder
Capital Finance Corp., 5.250%, 10/01/2025, 144A 218,76275,000 Starwood Property Trust, Inc., 3.625%, 7/15/2026,
144A 75,563
339,261
Restaurants — 0.5%540,000 1011778 BC ULC/New Red Finance, Inc.,
4.000%, 10/15/2030, 144A 522,450100,000 Bloomin’ Brands, Inc./OSI Restaurant Partners LLC,
5.125%, 4/15/2029, 144A 102,750
625,200
Retailers — 2.6%70,000 Ambience Merger Sub, Inc., 4.875%, 7/15/2028,
144A 70,175130,000 Ambience Merger Sub, Inc., 7.125%, 7/15/2029,
144A 131,30075,000 Asbury Automotive Group, Inc., 4.500%, 3/01/2028 77,06383,000 Asbury Automotive Group, Inc., 4.750%, 3/01/2030 86,735
400,000 Carvana Co., 5.500%, 4/15/2027, 144A 413,092105,000 Carvana Co., 5.625%, 10/01/2025, 144A 109,164220,000 Carvana Co., 5.875%, 10/01/2028, 144A 231,42235,000 Group 1 Automotive, Inc., 4.000%, 8/15/2028, 144A 35,61350,000 Ken Garff Automotive LLC, 4.875%, 9/15/2028, 144A 51,000
140,000 L Brands, Inc., 5.250%, 2/01/2028 156,62575,000 L Brands, Inc., 6.625%, 10/01/2030, 144A 86,813
105,000 L Brands, Inc., 6.750%, 7/01/2036 131,51255,000 L Brands, Inc., 6.875%, 11/01/2035 69,64490,000 Lithia Motors, Inc., 4.375%, 1/15/2031, 144A 96,400
250,000 Magic Mergeco, Inc., 7.875%, 5/01/2029, 144A 257,812115,000 NMG Holding Co., Inc./Neiman Marcus Group LLC,
7.125%, 4/01/2026, 144A 122,762
PrincipalAmount Description Value (†)
Retailers — continued$ 250,000 PetSmart, Inc./PetSmart Finance Corp.,
4.750%, 2/15/2028, 144A $ 259,687250,000 PetSmart, Inc./PetSmart Finance Corp.,
7.750%, 2/15/2029, 144A 275,62510,000 QVC, Inc., 4.450%, 2/15/2025 10,68010,000 QVC, Inc., 4.850%, 4/01/2024 10,850
115,000 Rite Aid Corp., 7.500%, 7/01/2025, 144A 116,438180,000 Victoria’s Secret & Co., 4.625%, 7/15/2029, 144A 180,000
2,980,412
Technology — 5.2%99,000 BY Crown Parent LLC/BY Bond Finance, Inc.,
4.250%, 1/31/2026, 144A 103,702145,000 Camelot Finance S.A., 4.500%, 11/01/2026, 144A 151,706215,000 Clarivate Science Holdings Corp., 4.875%, 6/30/2029,
144A 220,6441,005,000 CommScope Technologies LLC, 5.000%, 3/15/2027,
144A 1,028,86986,000 CommScope Technologies LLC, 6.000%, 6/15/2025,
144A 87,828405,000 CommScope, Inc., 7.125%, 7/01/2028, 144A 438,919235,000 Elastic NV, 4.125%, 7/15/2029, 144A 235,000360,000 Endure Digital, Inc., 6.000%, 2/15/2029, 144A 356,40060,000 Everi Holdings, Inc., 5.000%, 7/15/2029, 144A 60,000
465,000 Iron Mountain, Inc., 4.875%, 9/15/2029, 144A 479,97380,000 J2 Global, Inc., 4.625%, 10/15/2030, 144A 82,82495,000 LogMeIn, Inc., 5.500%, 9/01/2027, 144A 98,33060,000 NCR Corp., 5.000%, 10/01/2028, 144A 62,04470,000 NCR Corp., 5.250%, 10/01/2030, 144A 72,62550,000 NCR Corp., 8.125%, 4/15/2025, 144A 54,675
190,000 Nielsen Finance LLC/Nielsen Finance Co.,5.625%, 10/01/2028, 144A 200,657
180,000 Nielsen Finance LLC/Nielsen Finance Co.,5.875%, 10/01/2030, 144A 196,016
175,000 Pitney Bowes, Inc., 6.875%, 3/15/2027, 144A 184,844110,000 Presidio Holdings, Inc., 4.875%, 2/01/2027, 144A 113,164110,000 Presidio Holdings, Inc., 8.250%, 2/01/2028, 144A 119,62590,000 Rackspace Technology Global, Inc.,
5.375%, 12/01/2028, 144A 92,250255,000 Rocket Software, Inc., 6.500%, 2/15/2029, 144A 253,03165,000 Sabre GLBL, Inc., 7.375%, 9/01/2025, 144A 70,688
260,000 Sabre GLBL, Inc., 9.250%, 4/15/2025, 144A 309,09660,000 Shift4 Payments LLC/Shift4 Payments Finance Sub,
Inc., 4.625%, 11/01/2026, 144A 62,625185,000 Square, Inc., 2.750%, 6/01/2026, 144A 188,237210,000 Veritas U.S., Inc./Veritas Bermuda Ltd.,
7.500%, 9/01/2025, 144A 218,662200,000 Veritas U.S., Inc./Veritas Bermuda Ltd.,
10.500%, 2/01/2024, 144A 205,294105,000 Xerox Holdings Corp., 5.000%, 8/15/2025, 144A 110,840105,000 Xerox Holdings Corp., 5.500%, 8/15/2028, 144A 109,094
5,967,662
Transportation Services — 0.2%185,000 Avis Budget Car Rental LLC/Avis Budget Finance,
Inc., 5.750%, 7/15/2027, 144A 192,970
Treasuries — 2.1%2,485,000 U.S. Treasury Note, 0.125%, 12/15/2023 2,471,895
Wireless — 1.1%440,000 Altice France S.A., 5.125%, 1/15/2029, 144A 442,200200,000 Altice France S.A., 5.125%, 7/15/2029, 144A 200,980245,000 HTA Group Ltd., 7.000%, 12/18/2025, 144A 260,626305,000 Kenbourne Invest S.A., 6.875%, 11/26/2024, 144A 324,127
1,227,933
See accompanying notes to financial statements.19 |
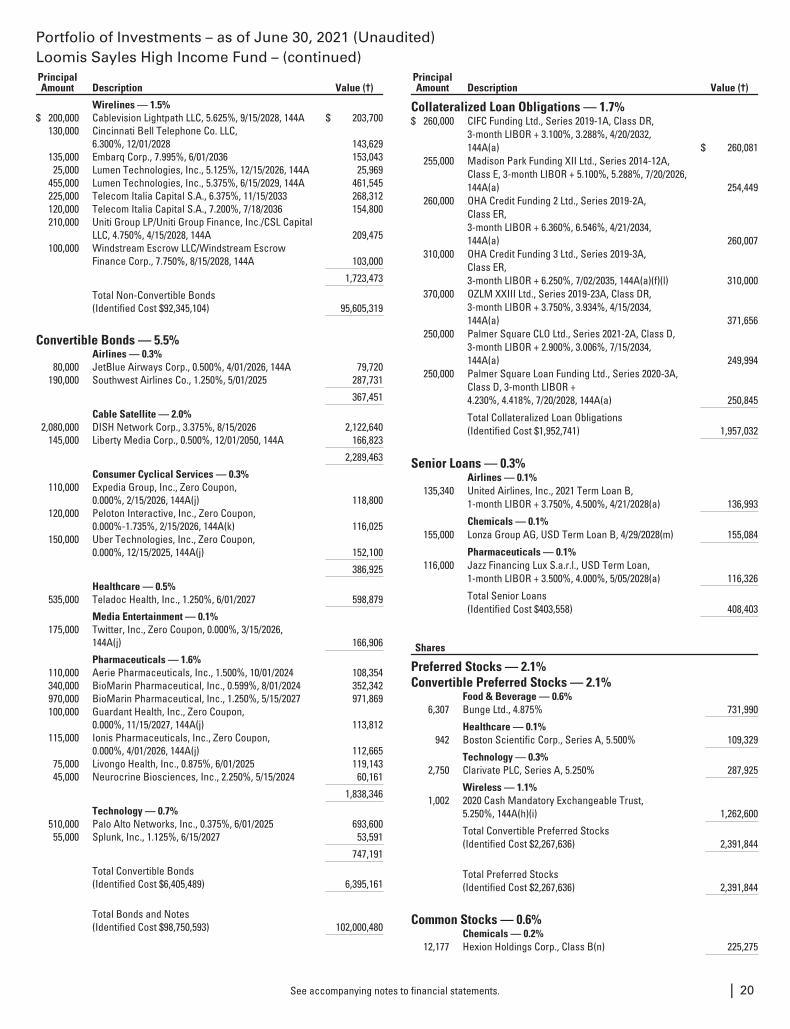
Portfolio of Investments – as of June 30, 2021 (Unaudited)Loomis Sayles High Income Fund – (continued)PrincipalAmount Description Value (†)
Wirelines — 1.5%$ 200,000 Cablevision Lightpath LLC, 5.625%, 9/15/2028, 144A $ 203,700
130,000 Cincinnati Bell Telephone Co. LLC,6.300%, 12/01/2028 143,629
135,000 Embarq Corp., 7.995%, 6/01/2036 153,04325,000 Lumen Technologies, Inc., 5.125%, 12/15/2026, 144A 25,969
455,000 Lumen Technologies, Inc., 5.375%, 6/15/2029, 144A 461,545225,000 Telecom Italia Capital S.A., 6.375%, 11/15/2033 268,312120,000 Telecom Italia Capital S.A., 7.200%, 7/18/2036 154,800210,000 Uniti Group LP/Uniti Group Finance, Inc./CSL Capital
LLC, 4.750%, 4/15/2028, 144A 209,475100,000 Windstream Escrow LLC/Windstream Escrow
Finance Corp., 7.750%, 8/15/2028, 144A 103,000
1,723,473
Total Non-Convertible Bonds(Identified Cost $92,345,104) 95,605,319
Convertible Bonds — 5.5%Airlines — 0.3%
80,000 JetBlue Airways Corp., 0.500%, 4/01/2026, 144A 79,720190,000 Southwest Airlines Co., 1.250%, 5/01/2025 287,731
367,451
Cable Satellite — 2.0%2,080,000 DISH Network Corp., 3.375%, 8/15/2026 2,122,640
145,000 Liberty Media Corp., 0.500%, 12/01/2050, 144A 166,823
2,289,463
Consumer Cyclical Services — 0.3%110,000 Expedia Group, Inc., Zero Coupon,
0.000%, 2/15/2026, 144A(j) 118,800120,000 Peloton Interactive, Inc., Zero Coupon,
0.000%-1.735%, 2/15/2026, 144A(k) 116,025150,000 Uber Technologies, Inc., Zero Coupon,
0.000%, 12/15/2025, 144A(j) 152,100
386,925
Healthcare — 0.5%535,000 Teladoc Health, Inc., 1.250%, 6/01/2027 598,879
Media Entertainment — 0.1%175,000 Twitter, Inc., Zero Coupon, 0.000%, 3/15/2026,
144A(j) 166,906
Pharmaceuticals — 1.6%110,000 Aerie Pharmaceuticals, Inc., 1.500%, 10/01/2024 108,354340,000 BioMarin Pharmaceutical, Inc., 0.599%, 8/01/2024 352,342970,000 BioMarin Pharmaceutical, Inc., 1.250%, 5/15/2027 971,869100,000 Guardant Health, Inc., Zero Coupon,
0.000%, 11/15/2027, 144A(j) 113,812115,000 Ionis Pharmaceuticals, Inc., Zero Coupon,
0.000%, 4/01/2026, 144A(j) 112,66575,000 Livongo Health, Inc., 0.875%, 6/01/2025 119,14345,000 Neurocrine Biosciences, Inc., 2.250%, 5/15/2024 60,161
1,838,346
Technology — 0.7%510,000 Palo Alto Networks, Inc., 0.375%, 6/01/2025 693,60055,000 Splunk, Inc., 1.125%, 6/15/2027 53,591
747,191
Total Convertible Bonds(Identified Cost $6,405,489) 6,395,161
Total Bonds and Notes(Identified Cost $98,750,593) 102,000,480
PrincipalAmount Description Value (†)
Collateralized Loan Obligations — 1.7%$ 260,000 CIFC Funding Ltd., Series 2019-1A, Class DR,
3-month LIBOR + 3.100%, 3.288%, 4/20/2032,144A(a) $ 260,081
255,000 Madison Park Funding XII Ltd., Series 2014-12A,Class E, 3-month LIBOR + 5.100%, 5.288%, 7/20/2026,144A(a) 254,449
260,000 OHA Credit Funding 2 Ltd., Series 2019-2A,Class ER,3-month LIBOR + 6.360%, 6.546%, 4/21/2034,144A(a) 260,007
310,000 OHA Credit Funding 3 Ltd., Series 2019-3A,Class ER,3-month LIBOR + 6.250%, 7/02/2035, 144A(a)(f)(l) 310,000
370,000 OZLM XXIII Ltd., Series 2019-23A, Class DR,3-month LIBOR + 3.750%, 3.934%, 4/15/2034,144A(a) 371,656
250,000 Palmer Square CLO Ltd., Series 2021-2A, Class D,3-month LIBOR + 2.900%, 3.006%, 7/15/2034,144A(a) 249,994
250,000 Palmer Square Loan Funding Ltd., Series 2020-3A,Class D, 3-month LIBOR +4.230%, 4.418%, 7/20/2028, 144A(a) 250,845
Total Collateralized Loan Obligations(Identified Cost $1,952,741) 1,957,032
Senior Loans — 0.3%Airlines — 0.1%
135,340 United Airlines, Inc., 2021 Term Loan B,1-month LIBOR + 3.750%, 4.500%, 4/21/2028(a) 136,993
Chemicals — 0.1%155,000 Lonza Group AG, USD Term Loan B, 4/29/2028(m) 155,084
Pharmaceuticals — 0.1%116,000 Jazz Financing Lux S.a.r.l., USD Term Loan,
1-month LIBOR + 3.500%, 4.000%, 5/05/2028(a) 116,326
Total Senior Loans(Identified Cost $403,558) 408,403
Shares
Preferred Stocks — 2.1%Convertible Preferred Stocks — 2.1%
Food & Beverage — 0.6%6,307 Bunge Ltd., 4.875% 731,990
Healthcare — 0.1%942 Boston Scientific Corp., Series A, 5.500% 109,329
Technology — 0.3%2,750 Clarivate PLC, Series A, 5.250% 287,925
Wireless — 1.1%1,002 2020 Cash Mandatory Exchangeable Trust,
5.250%, 144A(h)(i) 1,262,600
Total Convertible Preferred Stocks(Identified Cost $2,267,636) 2,391,844
Total Preferred Stocks(Identified Cost $2,267,636) 2,391,844
Common Stocks — 0.6%Chemicals — 0.2%
12,177 Hexion Holdings Corp., Class B(n) 225,275
See accompanying notes to financial statements. | 20
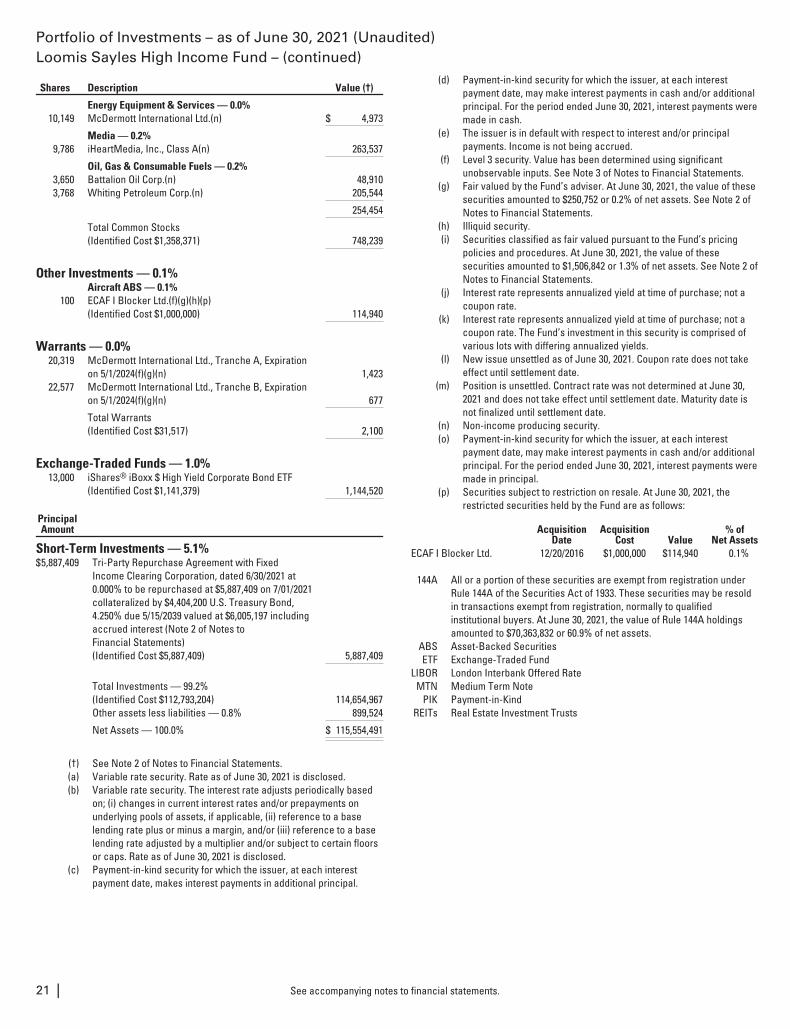
Portfolio of Investments – as of June 30, 2021 (Unaudited)Loomis Sayles High Income Fund – (continued)
Shares Description Value (†)
Energy Equipment & Services — 0.0%10,149 McDermott International Ltd.(n) $ 4,973
Media — 0.2%9,786 iHeartMedia, Inc., Class A(n) 263,537
Oil, Gas & Consumable Fuels — 0.2%3,650 Battalion Oil Corp.(n) 48,9103,768 Whiting Petroleum Corp.(n) 205,544
254,454
Total Common Stocks(Identified Cost $1,358,371) 748,239
Other Investments — 0.1%Aircraft ABS — 0.1%
100 ECAF I Blocker Ltd.(f)(g)(h)(p)(Identified Cost $1,000,000) 114,940
Warrants — 0.0%20,319 McDermott International Ltd., Tranche A, Expiration
on 5/1/2024(f)(g)(n) 1,42322,577 McDermott International Ltd., Tranche B, Expiration
on 5/1/2024(f)(g)(n) 677
Total Warrants(Identified Cost $31,517) 2,100
Exchange-Traded Funds — 1.0%13,000 iShares® iBoxx $ High Yield Corporate Bond ETF
(Identified Cost $1,141,379) 1,144,520
PrincipalAmount
Short-Term Investments — 5.1%$5,887,409 Tri-Party Repurchase Agreement with Fixed
Income Clearing Corporation, dated 6/30/2021 at0.000% to be repurchased at $5,887,409 on 7/01/2021collateralized by $4,404,200 U.S. Treasury Bond,4.250% due 5/15/2039 valued at $6,005,197 includingaccrued interest (Note 2 of Notes toFinancial Statements)(Identified Cost $5,887,409) 5,887,409
Total Investments — 99.2%(Identified Cost $112,793,204) 114,654,967Other assets less liabilities — 0.8% 899,524
Net Assets — 100.0% $ 115,554,491
(†) See Note 2 of Notes to Financial Statements.(a) Variable rate security. Rate as of June 30, 2021 is disclosed.(b) Variable rate security. The interest rate adjusts periodically based
on; (i) changes in current interest rates and/or prepayments onunderlying pools of assets, if applicable, (ii) reference to a baselending rate plus or minus a margin, and/or (iii) reference to a baselending rate adjusted by a multiplier and/or subject to certain floorsor caps. Rate as of June 30, 2021 is disclosed.
(c) Payment-in-kind security for which the issuer, at each interestpayment date, makes interest payments in additional principal.
(d) Payment-in-kind security for which the issuer, at each interestpayment date, may make interest payments in cash and/or additionalprincipal. For the period ended June 30, 2021, interest payments weremade in cash.
(e) The issuer is in default with respect to interest and/or principalpayments. Income is not being accrued.
(f) Level 3 security. Value has been determined using significantunobservable inputs. See Note 3 of Notes to Financial Statements.
(g) Fair valued by the Fund’s adviser. At June 30, 2021, the value of thesesecurities amounted to $250,752 or 0.2% of net assets. See Note 2 ofNotes to Financial Statements.
(h) Illiquid security.(i) Securities classified as fair valued pursuant to the Fund’s pricing
policies and procedures. At June 30, 2021, the value of thesesecurities amounted to $1,506,842 or 1.3% of net assets. See Note 2 ofNotes to Financial Statements.
(j) Interest rate represents annualized yield at time of purchase; not acoupon rate.
(k) Interest rate represents annualized yield at time of purchase; not acoupon rate. The Fund’s investment in this security is comprised ofvarious lots with differing annualized yields.
(l) New issue unsettled as of June 30, 2021. Coupon rate does not takeeffect until settlement date.
(m) Position is unsettled. Contract rate was not determined at June 30,2021 and does not take effect until settlement date. Maturity date isnot finalized until settlement date.
(n) Non-income producing security.(o) Payment-in-kind security for which the issuer, at each interest
payment date, may make interest payments in cash and/or additionalprincipal. For the period ended June 30, 2021, interest payments weremade in principal.
(p) Securities subject to restriction on resale. At June 30, 2021, therestricted securities held by the Fund are as follows:
AcquisitionDate
AcquisitionCost Value
% ofNet Assets
ECAF I Blocker Ltd. 12/20/2016 $1,000,000 $114,940 0.1%
144A All or a portion of these securities are exempt from registration underRule 144A of the Securities Act of 1933. These securities may be resoldin transactions exempt from registration, normally to qualifiedinstitutional buyers. At June 30, 2021, the value of Rule 144A holdingsamounted to $70,363,832 or 60.9% of net assets.
ABS Asset-Backed SecuritiesETF Exchange-Traded Fund
LIBOR London Interbank Offered RateMTN Medium Term Note
PIK Payment-in-KindREITs Real Estate Investment Trusts
See accompanying notes to financial statements.21 |
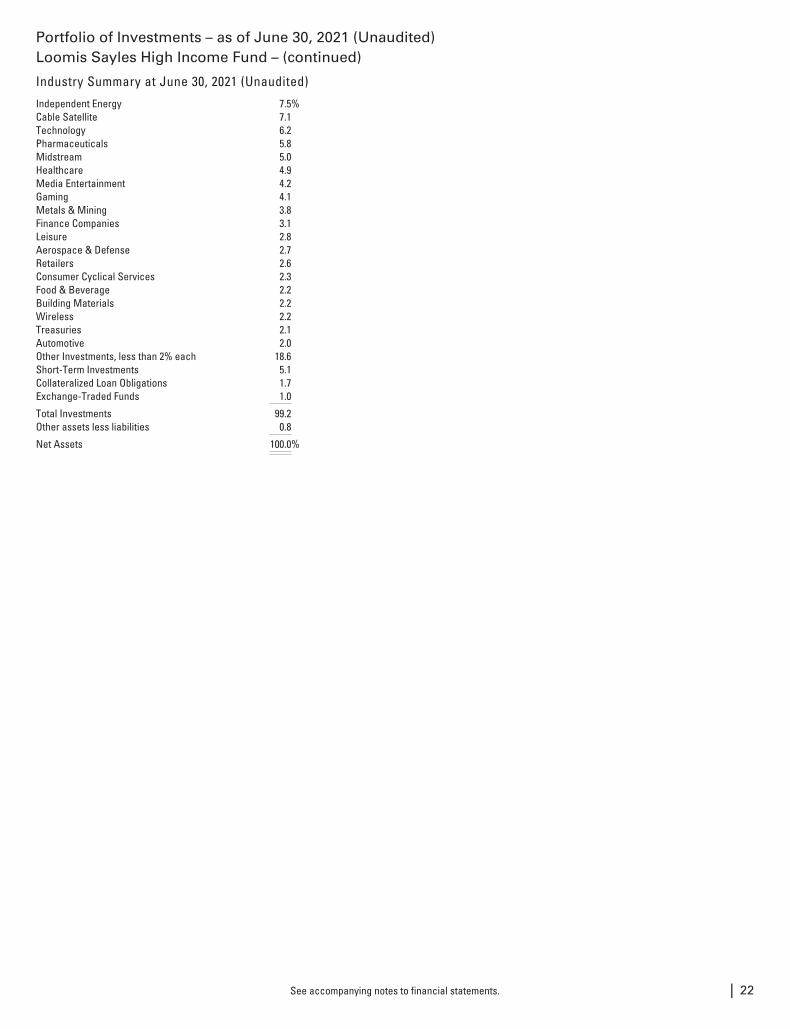
Portfolio of Investments – as of June 30, 2021 (Unaudited)Loomis Sayles High Income Fund – (continued)
Industry Summary at June 30, 2021 (Unaudited)
Independent Energy 7.5%Cable Satellite 7.1Technology 6.2Pharmaceuticals 5.8Midstream 5.0Healthcare 4.9Media Entertainment 4.2Gaming 4.1Metals & Mining 3.8Finance Companies 3.1Leisure 2.8Aerospace & Defense 2.7Retailers 2.6Consumer Cyclical Services 2.3Food & Beverage 2.2Building Materials 2.2Wireless 2.2Treasuries 2.1Automotive 2.0Other Investments, less than 2% each 18.6Short-Term Investments 5.1Collateralized Loan Obligations 1.7Exchange-Traded Funds 1.0
Total Investments 99.2Other assets less liabilities 0.8
Net Assets 100.0%
See accompanying notes to financial statements. | 22
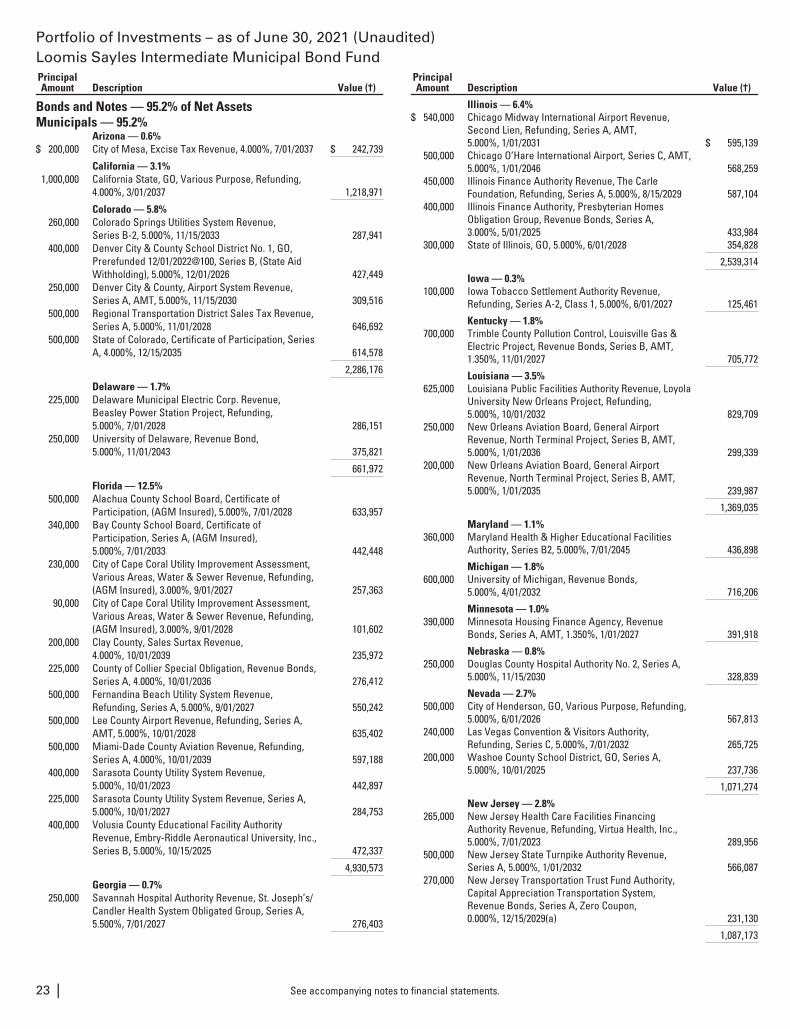
Portfolio of Investments – as of June 30, 2021 (Unaudited)Loomis Sayles Intermediate Municipal Bond FundPrincipalAmount Description Value (†)
Bonds and Notes — 95.2% of Net AssetsMunicipals — 95.2%
Arizona — 0.6%$ 200,000 City of Mesa, Excise Tax Revenue, 4.000%, 7/01/2037 $ 242,739
California — 3.1%1,000,000 California State, GO, Various Purpose, Refunding,
4.000%, 3/01/2037 1,218,971
Colorado — 5.8%260,000 Colorado Springs Utilities System Revenue,
Series B-2, 5.000%, 11/15/2033 287,941400,000 Denver City & County School District No. 1, GO,
Prerefunded 12/01/2022@100, Series B, (State AidWithholding), 5.000%, 12/01/2026 427,449
250,000 Denver City & County, Airport System Revenue,Series A, AMT, 5.000%, 11/15/2030 309,516
500,000 Regional Transportation District Sales Tax Revenue,Series A, 5.000%, 11/01/2028 646,692
500,000 State of Colorado, Certificate of Participation, SeriesA, 4.000%, 12/15/2035 614,578
2,286,176
Delaware — 1.7%225,000 Delaware Municipal Electric Corp. Revenue,
Beasley Power Station Project, Refunding,5.000%, 7/01/2028 286,151
250,000 University of Delaware, Revenue Bond,5.000%, 11/01/2043 375,821
661,972
Florida — 12.5%500,000 Alachua County School Board, Certificate of
Participation, (AGM Insured), 5.000%, 7/01/2028 633,957340,000 Bay County School Board, Certificate of
Participation, Series A, (AGM Insured),5.000%, 7/01/2033 442,448
230,000 City of Cape Coral Utility Improvement Assessment,Various Areas, Water & Sewer Revenue, Refunding,(AGM Insured), 3.000%, 9/01/2027 257,363
90,000 City of Cape Coral Utility Improvement Assessment,Various Areas, Water & Sewer Revenue, Refunding,(AGM Insured), 3.000%, 9/01/2028 101,602
200,000 Clay County, Sales Surtax Revenue,4.000%, 10/01/2039 235,972
225,000 County of Collier Special Obligation, Revenue Bonds,Series A, 4.000%, 10/01/2036 276,412
500,000 Fernandina Beach Utility System Revenue,Refunding, Series A, 5.000%, 9/01/2027 550,242
500,000 Lee County Airport Revenue, Refunding, Series A,AMT, 5.000%, 10/01/2028 635,402
500,000 Miami-Dade County Aviation Revenue, Refunding,Series A, 4.000%, 10/01/2039 597,188
400,000 Sarasota County Utility System Revenue,5.000%, 10/01/2023 442,897
225,000 Sarasota County Utility System Revenue, Series A,5.000%, 10/01/2027 284,753
400,000 Volusia County Educational Facility AuthorityRevenue, Embry-Riddle Aeronautical University, Inc.,Series B, 5.000%, 10/15/2025 472,337
4,930,573
Georgia — 0.7%250,000 Savannah Hospital Authority Revenue, St. Joseph’s/
Candler Health System Obligated Group, Series A,5.500%, 7/01/2027 276,403
PrincipalAmount Description Value (†)
Illinois — 6.4%$ 540,000 Chicago Midway International Airport Revenue,
Second Lien, Refunding, Series A, AMT,5.000%, 1/01/2031 $ 595,139
500,000 Chicago O’Hare International Airport, Series C, AMT,5.000%, 1/01/2046 568,259
450,000 Illinois Finance Authority Revenue, The CarleFoundation, Refunding, Series A, 5.000%, 8/15/2029 587,104
400,000 Illinois Finance Authority, Presbyterian HomesObligation Group, Revenue Bonds, Series A,3.000%, 5/01/2025 433,984
300,000 State of Illinois, GO, 5.000%, 6/01/2028 354,828
2,539,314
Iowa — 0.3%100,000 Iowa Tobacco Settlement Authority Revenue,
Refunding, Series A-2, Class 1, 5.000%, 6/01/2027 125,461
Kentucky — 1.8%700,000 Trimble County Pollution Control, Louisville Gas &
Electric Project, Revenue Bonds, Series B, AMT,1.350%, 11/01/2027 705,772
Louisiana — 3.5%625,000 Louisiana Public Facilities Authority Revenue, Loyola
University New Orleans Project, Refunding,5.000%, 10/01/2032 829,709
250,000 New Orleans Aviation Board, General AirportRevenue, North Terminal Project, Series B, AMT,5.000%, 1/01/2036 299,339
200,000 New Orleans Aviation Board, General AirportRevenue, North Terminal Project, Series B, AMT,5.000%, 1/01/2035 239,987
1,369,035
Maryland — 1.1%360,000 Maryland Health & Higher Educational Facilities
Authority, Series B2, 5.000%, 7/01/2045 436,898
Michigan — 1.8%600,000 University of Michigan, Revenue Bonds,
5.000%, 4/01/2032 716,206
Minnesota — 1.0%390,000 Minnesota Housing Finance Agency, Revenue
Bonds, Series A, AMT, 1.350%, 1/01/2027 391,918
Nebraska — 0.8%250,000 Douglas County Hospital Authority No. 2, Series A,
5.000%, 11/15/2030 328,839
Nevada — 2.7%500,000 City of Henderson, GO, Various Purpose, Refunding,
5.000%, 6/01/2026 567,813240,000 Las Vegas Convention & Visitors Authority,
Refunding, Series C, 5.000%, 7/01/2032 265,725200,000 Washoe County School District, GO, Series A,
5.000%, 10/01/2025 237,736
1,071,274
New Jersey — 2.8%265,000 New Jersey Health Care Facilities Financing
Authority Revenue, Refunding, Virtua Health, Inc.,5.000%, 7/01/2023 289,956
500,000 New Jersey State Turnpike Authority Revenue,Series A, 5.000%, 1/01/2032 566,087
270,000 New Jersey Transportation Trust Fund Authority,Capital Appreciation Transportation System,Revenue Bonds, Series A, Zero Coupon,0.000%, 12/15/2029(a) 231,130
1,087,173
See accompanying notes to financial statements.23 |
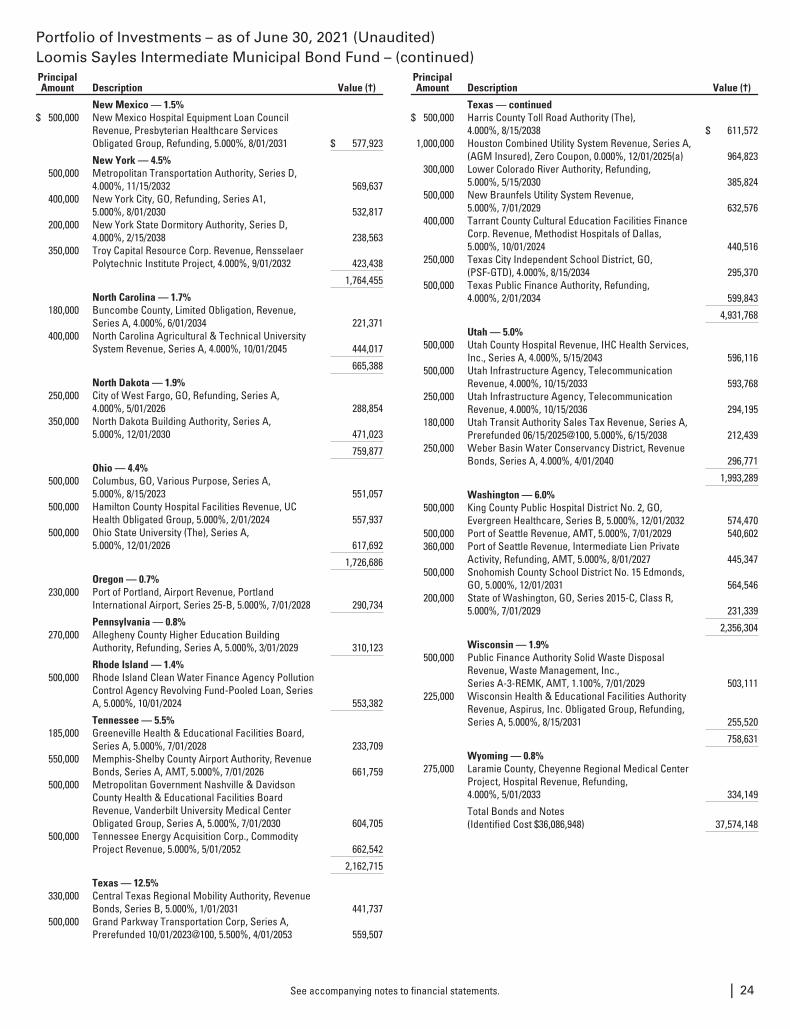
Portfolio of Investments – as of June 30, 2021 (Unaudited)Loomis Sayles Intermediate Municipal Bond Fund – (continued)PrincipalAmount Description Value (†)
New Mexico — 1.5%$ 500,000 New Mexico Hospital Equipment Loan Council
Revenue, Presbyterian Healthcare ServicesObligated Group, Refunding, 5.000%, 8/01/2031 $ 577,923
New York — 4.5%500,000 Metropolitan Transportation Authority, Series D,
4.000%, 11/15/2032 569,637400,000 New York City, GO, Refunding, Series A1,
5.000%, 8/01/2030 532,817200,000 New York State Dormitory Authority, Series D,
4.000%, 2/15/2038 238,563350,000 Troy Capital Resource Corp. Revenue, Rensselaer
Polytechnic Institute Project, 4.000%, 9/01/2032 423,438
1,764,455
North Carolina — 1.7%180,000 Buncombe County, Limited Obligation, Revenue,
Series A, 4.000%, 6/01/2034 221,371400,000 North Carolina Agricultural & Technical University
System Revenue, Series A, 4.000%, 10/01/2045 444,017
665,388
North Dakota — 1.9%250,000 City of West Fargo, GO, Refunding, Series A,
4.000%, 5/01/2026 288,854350,000 North Dakota Building Authority, Series A,
5.000%, 12/01/2030 471,023
759,877
Ohio — 4.4%500,000 Columbus, GO, Various Purpose, Series A,
5.000%, 8/15/2023 551,057500,000 Hamilton County Hospital Facilities Revenue, UC
Health Obligated Group, 5.000%, 2/01/2024 557,937500,000 Ohio State University (The), Series A,
5.000%, 12/01/2026 617,692
1,726,686
Oregon — 0.7%230,000 Port of Portland, Airport Revenue, Portland
International Airport, Series 25-B, 5.000%, 7/01/2028 290,734
Pennsylvania — 0.8%270,000 Allegheny County Higher Education Building
Authority, Refunding, Series A, 5.000%, 3/01/2029 310,123
Rhode Island — 1.4%500,000 Rhode Island Clean Water Finance Agency Pollution
Control Agency Revolving Fund-Pooled Loan, SeriesA, 5.000%, 10/01/2024 553,382
Tennessee — 5.5%185,000 Greeneville Health & Educational Facilities Board,
Series A, 5.000%, 7/01/2028 233,709550,000 Memphis-Shelby County Airport Authority, Revenue
Bonds, Series A, AMT, 5.000%, 7/01/2026 661,759500,000 Metropolitan Government Nashville & Davidson
County Health & Educational Facilities BoardRevenue, Vanderbilt University Medical CenterObligated Group, Series A, 5.000%, 7/01/2030 604,705
500,000 Tennessee Energy Acquisition Corp., CommodityProject Revenue, 5.000%, 5/01/2052 662,542
2,162,715
Texas — 12.5%330,000 Central Texas Regional Mobility Authority, Revenue
Bonds, Series B, 5.000%, 1/01/2031 441,737500,000 Grand Parkway Transportation Corp, Series A,
Prerefunded 10/01/2023@100, 5.500%, 4/01/2053 559,507
PrincipalAmount Description Value (†)
Texas — continued$ 500,000 Harris County Toll Road Authority (The),
4.000%, 8/15/2038 $ 611,5721,000,000 Houston Combined Utility System Revenue, Series A,
(AGM Insured), Zero Coupon, 0.000%, 12/01/2025(a) 964,823300,000 Lower Colorado River Authority, Refunding,
5.000%, 5/15/2030 385,824500,000 New Braunfels Utility System Revenue,
5.000%, 7/01/2029 632,576400,000 Tarrant County Cultural Education Facilities Finance
Corp. Revenue, Methodist Hospitals of Dallas,5.000%, 10/01/2024 440,516
250,000 Texas City Independent School District, GO,(PSF-GTD), 4.000%, 8/15/2034 295,370
500,000 Texas Public Finance Authority, Refunding,4.000%, 2/01/2034 599,843
4,931,768
Utah — 5.0%500,000 Utah County Hospital Revenue, IHC Health Services,
Inc., Series A, 4.000%, 5/15/2043 596,116500,000 Utah Infrastructure Agency, Telecommunication
Revenue, 4.000%, 10/15/2033 593,768250,000 Utah Infrastructure Agency, Telecommunication
Revenue, 4.000%, 10/15/2036 294,195180,000 Utah Transit Authority Sales Tax Revenue, Series A,
Prerefunded 06/15/2025@100, 5.000%, 6/15/2038 212,439250,000 Weber Basin Water Conservancy District, Revenue
Bonds, Series A, 4.000%, 4/01/2040 296,771
1,993,289
Washington — 6.0%500,000 King County Public Hospital District No. 2, GO,
Evergreen Healthcare, Series B, 5.000%, 12/01/2032 574,470500,000 Port of Seattle Revenue, AMT, 5.000%, 7/01/2029 540,602360,000 Port of Seattle Revenue, Intermediate Lien Private
Activity, Refunding, AMT, 5.000%, 8/01/2027 445,347500,000 Snohomish County School District No. 15 Edmonds,
GO, 5.000%, 12/01/2031 564,546200,000 State of Washington, GO, Series 2015-C, Class R,
5.000%, 7/01/2029 231,339
2,356,304
Wisconsin — 1.9%500,000 Public Finance Authority Solid Waste Disposal
Revenue, Waste Management, Inc.,Series A-3-REMK, AMT, 1.100%, 7/01/2029 503,111
225,000 Wisconsin Health & Educational Facilities AuthorityRevenue, Aspirus, Inc. Obligated Group, Refunding,Series A, 5.000%, 8/15/2031 255,520
758,631
Wyoming — 0.8%275,000 Laramie County, Cheyenne Regional Medical Center
Project, Hospital Revenue, Refunding,4.000%, 5/01/2033 334,149
Total Bonds and Notes(Identified Cost $36,086,948) 37,574,148
See accompanying notes to financial statements. | 24
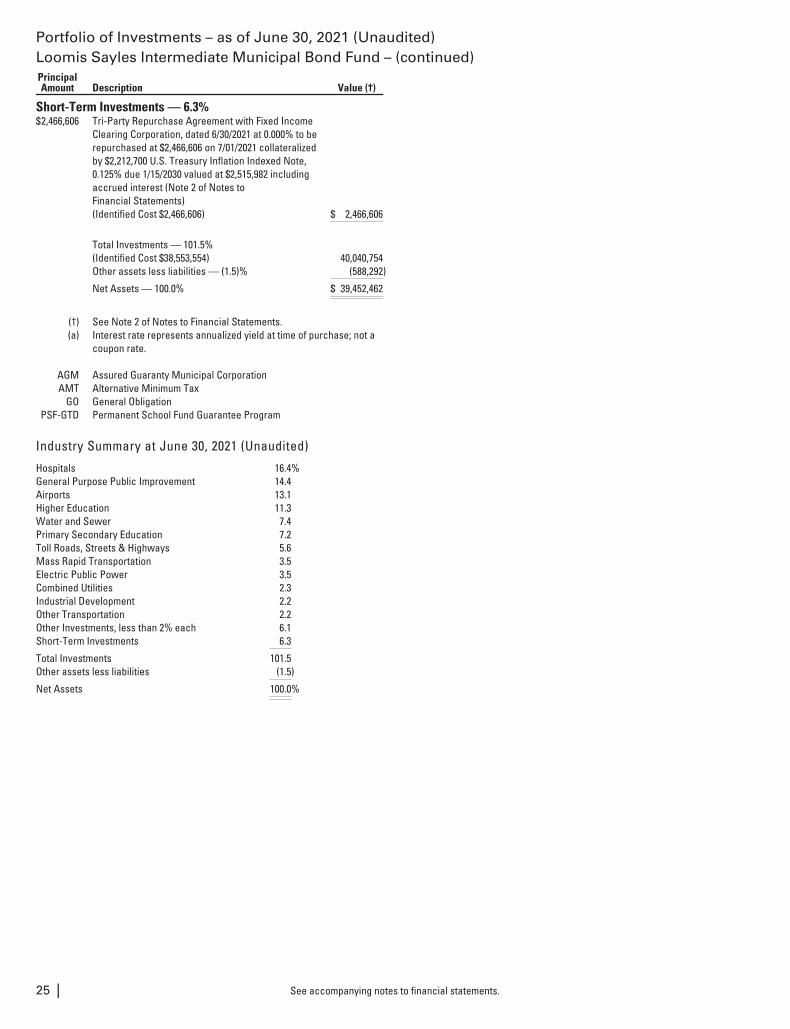
Portfolio of Investments – as of June 30, 2021 (Unaudited)Loomis Sayles Intermediate Municipal Bond Fund – (continued)PrincipalAmount Description Value (†)
Short-Term Investments — 6.3%$2,466,606 Tri-Party Repurchase Agreement with Fixed Income
Clearing Corporation, dated 6/30/2021 at 0.000% to berepurchased at $2,466,606 on 7/01/2021 collateralizedby $2,212,700 U.S. Treasury Inflation Indexed Note,0.125% due 1/15/2030 valued at $2,515,982 includingaccrued interest (Note 2 of Notes toFinancial Statements)(Identified Cost $2,466,606) $ 2,466,606
Total Investments — 101.5%(Identified Cost $38,553,554) 40,040,754Other assets less liabilities — (1.5)% (588,292)
Net Assets — 100.0% $ 39,452,462
(†) See Note 2 of Notes to Financial Statements.(a) Interest rate represents annualized yield at time of purchase; not a
coupon rate.
AGM Assured Guaranty Municipal CorporationAMT Alternative Minimum Tax
GO General ObligationPSF-GTD Permanent School Fund Guarantee Program
Industry Summary at June 30, 2021 (Unaudited)
Hospitals 16.4%General Purpose Public Improvement 14.4Airports 13.1Higher Education 11.3Water and Sewer 7.4Primary Secondary Education 7.2Toll Roads, Streets & Highways 5.6Mass Rapid Transportation 3.5Electric Public Power 3.5Combined Utilities 2.3Industrial Development 2.2Other Transportation 2.2Other Investments, less than 2% each 6.1Short-Term Investments 6.3
Total Investments 101.5Other assets less liabilities (1.5)
Net Assets 100.0%
See accompanying notes to financial statements.25 |
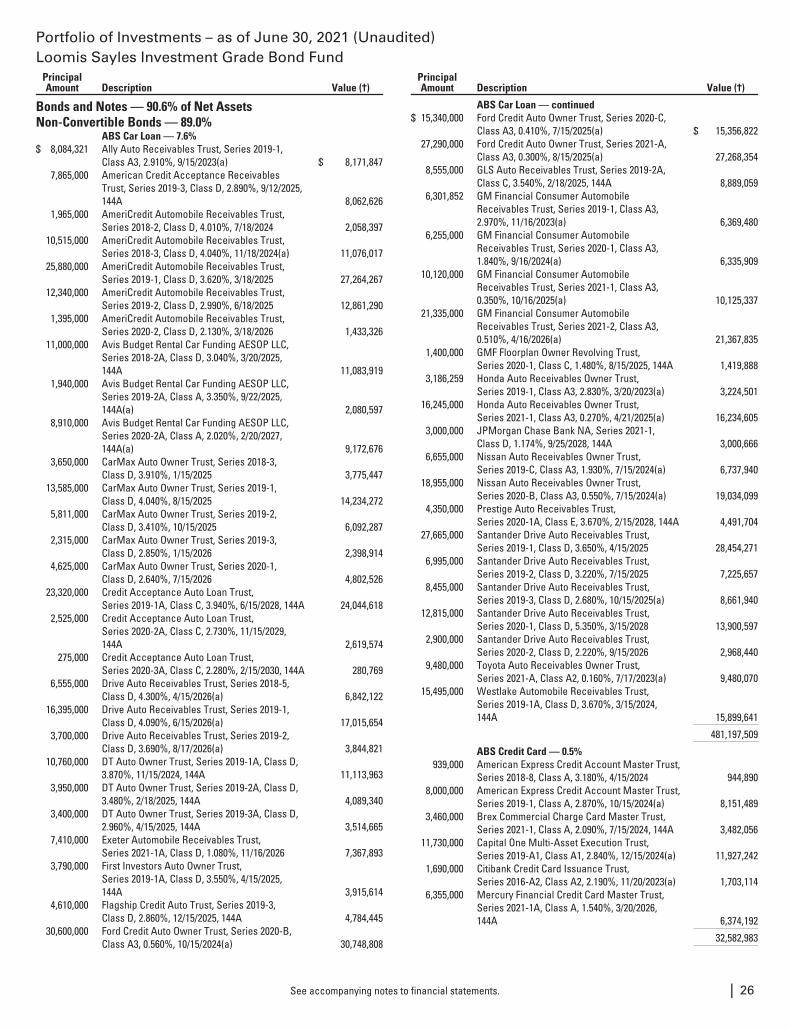
Portfolio of Investments – as of June 30, 2021 (Unaudited)Loomis Sayles Investment Grade Bond Fund
PrincipalAmount Description Value (†)
Bonds and Notes — 90.6% of Net AssetsNon-Convertible Bonds — 89.0%
ABS Car Loan — 7.6%$ 8,084,321 Ally Auto Receivables Trust, Series 2019-1,
Class A3, 2.910%, 9/15/2023(a) $ 8,171,8477,865,000 American Credit Acceptance Receivables
Trust, Series 2019-3, Class D, 2.890%, 9/12/2025,144A 8,062,626
1,965,000 AmeriCredit Automobile Receivables Trust,Series 2018-2, Class D, 4.010%, 7/18/2024 2,058,397
10,515,000 AmeriCredit Automobile Receivables Trust,Series 2018-3, Class D, 4.040%, 11/18/2024(a) 11,076,017
25,880,000 AmeriCredit Automobile Receivables Trust,Series 2019-1, Class D, 3.620%, 3/18/2025 27,264,267
12,340,000 AmeriCredit Automobile Receivables Trust,Series 2019-2, Class D, 2.990%, 6/18/2025 12,861,290
1,395,000 AmeriCredit Automobile Receivables Trust,Series 2020-2, Class D, 2.130%, 3/18/2026 1,433,326
11,000,000 Avis Budget Rental Car Funding AESOP LLC,Series 2018-2A, Class D, 3.040%, 3/20/2025,144A 11,083,919
1,940,000 Avis Budget Rental Car Funding AESOP LLC,Series 2019-2A, Class A, 3.350%, 9/22/2025,144A(a) 2,080,597
8,910,000 Avis Budget Rental Car Funding AESOP LLC,Series 2020-2A, Class A, 2.020%, 2/20/2027,144A(a) 9,172,676
3,650,000 CarMax Auto Owner Trust, Series 2018-3,Class D, 3.910%, 1/15/2025 3,775,447
13,585,000 CarMax Auto Owner Trust, Series 2019-1,Class D, 4.040%, 8/15/2025 14,234,272
5,811,000 CarMax Auto Owner Trust, Series 2019-2,Class D, 3.410%, 10/15/2025 6,092,287
2,315,000 CarMax Auto Owner Trust, Series 2019-3,Class D, 2.850%, 1/15/2026 2,398,914
4,625,000 CarMax Auto Owner Trust, Series 2020-1,Class D, 2.640%, 7/15/2026 4,802,526
23,320,000 Credit Acceptance Auto Loan Trust,Series 2019-1A, Class C, 3.940%, 6/15/2028, 144A 24,044,618
2,525,000 Credit Acceptance Auto Loan Trust,Series 2020-2A, Class C, 2.730%, 11/15/2029,144A 2,619,574
275,000 Credit Acceptance Auto Loan Trust,Series 2020-3A, Class C, 2.280%, 2/15/2030, 144A 280,769
6,555,000 Drive Auto Receivables Trust, Series 2018-5,Class D, 4.300%, 4/15/2026(a) 6,842,122
16,395,000 Drive Auto Receivables Trust, Series 2019-1,Class D, 4.090%, 6/15/2026(a) 17,015,654
3,700,000 Drive Auto Receivables Trust, Series 2019-2,Class D, 3.690%, 8/17/2026(a) 3,844,821
10,760,000 DT Auto Owner Trust, Series 2019-1A, Class D,3.870%, 11/15/2024, 144A 11,113,963
3,950,000 DT Auto Owner Trust, Series 2019-2A, Class D,3.480%, 2/18/2025, 144A 4,089,340
3,400,000 DT Auto Owner Trust, Series 2019-3A, Class D,2.960%, 4/15/2025, 144A 3,514,665
7,410,000 Exeter Automobile Receivables Trust,Series 2021-1A, Class D, 1.080%, 11/16/2026 7,367,893
3,790,000 First Investors Auto Owner Trust,Series 2019-1A, Class D, 3.550%, 4/15/2025,144A 3,915,614
4,610,000 Flagship Credit Auto Trust, Series 2019-3,Class D, 2.860%, 12/15/2025, 144A 4,784,445
30,600,000 Ford Credit Auto Owner Trust, Series 2020-B,Class A3, 0.560%, 10/15/2024(a) 30,748,808
PrincipalAmount Description Value (†)
ABS Car Loan — continued$ 15,340,000 Ford Credit Auto Owner Trust, Series 2020-C,
Class A3, 0.410%, 7/15/2025(a) $ 15,356,82227,290,000 Ford Credit Auto Owner Trust, Series 2021-A,
Class A3, 0.300%, 8/15/2025(a) 27,268,3548,555,000 GLS Auto Receivables Trust, Series 2019-2A,
Class C, 3.540%, 2/18/2025, 144A 8,889,0596,301,852 GM Financial Consumer Automobile
Receivables Trust, Series 2019-1, Class A3,2.970%, 11/16/2023(a) 6,369,480
6,255,000 GM Financial Consumer AutomobileReceivables Trust, Series 2020-1, Class A3,1.840%, 9/16/2024(a) 6,335,909
10,120,000 GM Financial Consumer AutomobileReceivables Trust, Series 2021-1, Class A3,0.350%, 10/16/2025(a) 10,125,337
21,335,000 GM Financial Consumer AutomobileReceivables Trust, Series 2021-2, Class A3,0.510%, 4/16/2026(a) 21,367,835
1,400,000 GMF Floorplan Owner Revolving Trust,Series 2020-1, Class C, 1.480%, 8/15/2025, 144A 1,419,888
3,186,259 Honda Auto Receivables Owner Trust,Series 2019-1, Class A3, 2.830%, 3/20/2023(a) 3,224,501
16,245,000 Honda Auto Receivables Owner Trust,Series 2021-1, Class A3, 0.270%, 4/21/2025(a) 16,234,605
3,000,000 JPMorgan Chase Bank NA, Series 2021-1,Class D, 1.174%, 9/25/2028, 144A 3,000,666
6,655,000 Nissan Auto Receivables Owner Trust,Series 2019-C, Class A3, 1.930%, 7/15/2024(a) 6,737,940
18,955,000 Nissan Auto Receivables Owner Trust,Series 2020-B, Class A3, 0.550%, 7/15/2024(a) 19,034,099
4,350,000 Prestige Auto Receivables Trust,Series 2020-1A, Class E, 3.670%, 2/15/2028, 144A 4,491,704
27,665,000 Santander Drive Auto Receivables Trust,Series 2019-1, Class D, 3.650%, 4/15/2025 28,454,271
6,995,000 Santander Drive Auto Receivables Trust,Series 2019-2, Class D, 3.220%, 7/15/2025 7,225,657
8,455,000 Santander Drive Auto Receivables Trust,Series 2019-3, Class D, 2.680%, 10/15/2025(a) 8,661,940
12,815,000 Santander Drive Auto Receivables Trust,Series 2020-1, Class D, 5.350%, 3/15/2028 13,900,597
2,900,000 Santander Drive Auto Receivables Trust,Series 2020-2, Class D, 2.220%, 9/15/2026 2,968,440
9,480,000 Toyota Auto Receivables Owner Trust,Series 2021-A, Class A2, 0.160%, 7/17/2023(a) 9,480,070
15,495,000 Westlake Automobile Receivables Trust,Series 2019-1A, Class D, 3.670%, 3/15/2024,144A 15,899,641
481,197,509
ABS Credit Card — 0.5%939,000 American Express Credit Account Master Trust,
Series 2018-8, Class A, 3.180%, 4/15/2024 944,8908,000,000 American Express Credit Account Master Trust,
Series 2019-1, Class A, 2.870%, 10/15/2024(a) 8,151,4893,460,000 Brex Commercial Charge Card Master Trust,
Series 2021-1, Class A, 2.090%, 7/15/2024, 144A 3,482,05611,730,000 Capital One Multi-Asset Execution Trust,
Series 2019-A1, Class A1, 2.840%, 12/15/2024(a) 11,927,2421,690,000 Citibank Credit Card Issuance Trust,
Series 2016-A2, Class A2, 2.190%, 11/20/2023(a) 1,703,1146,355,000 Mercury Financial Credit Card Master Trust,
Series 2021-1A, Class A, 1.540%, 3/20/2026,144A 6,374,192
32,582,983
See accompanying notes to financial statements. | 26
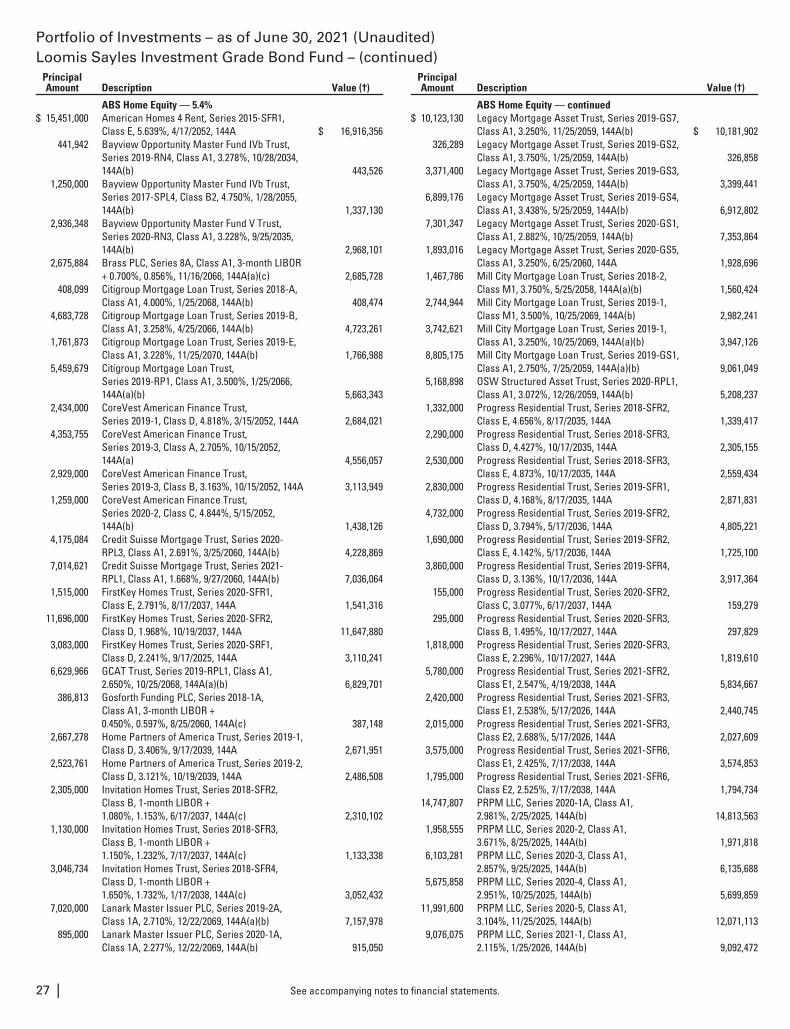
Portfolio of Investments – as of June 30, 2021 (Unaudited)Loomis Sayles Investment Grade Bond Fund – (continued)
PrincipalAmount Description Value (†)
ABS Home Equity — 5.4%$ 15,451,000 American Homes 4 Rent, Series 2015-SFR1,
Class E, 5.639%, 4/17/2052, 144A $ 16,916,356441,942 Bayview Opportunity Master Fund IVb Trust,
Series 2019-RN4, Class A1, 3.278%, 10/28/2034,144A(b) 443,526
1,250,000 Bayview Opportunity Master Fund IVb Trust,Series 2017-SPL4, Class B2, 4.750%, 1/28/2055,144A(b) 1,337,130
2,936,348 Bayview Opportunity Master Fund V Trust,Series 2020-RN3, Class A1, 3.228%, 9/25/2035,144A(b) 2,968,101
2,675,884 Brass PLC, Series 8A, Class A1, 3-month LIBOR+ 0.700%, 0.856%, 11/16/2066, 144A(a)(c) 2,685,728
408,099 Citigroup Mortgage Loan Trust, Series 2018-A,Class A1, 4.000%, 1/25/2068, 144A(b) 408,474
4,683,728 Citigroup Mortgage Loan Trust, Series 2019-B,Class A1, 3.258%, 4/25/2066, 144A(b) 4,723,261
1,761,873 Citigroup Mortgage Loan Trust, Series 2019-E,Class A1, 3.228%, 11/25/2070, 144A(b) 1,766,988
5,459,679 Citigroup Mortgage Loan Trust,Series 2019-RP1, Class A1, 3.500%, 1/25/2066,144A(a)(b) 5,663,343
2,434,000 CoreVest American Finance Trust,Series 2019-1, Class D, 4.818%, 3/15/2052, 144A 2,684,021
4,353,755 CoreVest American Finance Trust,Series 2019-3, Class A, 2.705%, 10/15/2052,144A(a) 4,556,057
2,929,000 CoreVest American Finance Trust,Series 2019-3, Class B, 3.163%, 10/15/2052, 144A 3,113,949
1,259,000 CoreVest American Finance Trust,Series 2020-2, Class C, 4.844%, 5/15/2052,144A(b) 1,438,126
4,175,084 Credit Suisse Mortgage Trust, Series 2020-RPL3, Class A1, 2.691%, 3/25/2060, 144A(b) 4,228,869
7,014,621 Credit Suisse Mortgage Trust, Series 2021-RPL1, Class A1, 1.668%, 9/27/2060, 144A(b) 7,036,064
1,515,000 FirstKey Homes Trust, Series 2020-SFR1,Class E, 2.791%, 8/17/2037, 144A 1,541,316
11,696,000 FirstKey Homes Trust, Series 2020-SFR2,Class D, 1.968%, 10/19/2037, 144A 11,647,880
3,083,000 FirstKey Homes Trust, Series 2020-SRF1,Class D, 2.241%, 9/17/2025, 144A 3,110,241
6,629,966 GCAT Trust, Series 2019-RPL1, Class A1,2.650%, 10/25/2068, 144A(a)(b) 6,829,701
386,813 Gosforth Funding PLC, Series 2018-1A,Class A1, 3-month LIBOR +0.450%, 0.597%, 8/25/2060, 144A(c) 387,148
2,667,278 Home Partners of America Trust, Series 2019-1,Class D, 3.406%, 9/17/2039, 144A 2,671,951
2,523,761 Home Partners of America Trust, Series 2019-2,Class D, 3.121%, 10/19/2039, 144A 2,486,508
2,305,000 Invitation Homes Trust, Series 2018-SFR2,Class B, 1-month LIBOR +1.080%, 1.153%, 6/17/2037, 144A(c) 2,310,102
1,130,000 Invitation Homes Trust, Series 2018-SFR3,Class B, 1-month LIBOR +1.150%, 1.232%, 7/17/2037, 144A(c) 1,133,338
3,046,734 Invitation Homes Trust, Series 2018-SFR4,Class D, 1-month LIBOR +1.650%, 1.732%, 1/17/2038, 144A(c) 3,052,432
7,020,000 Lanark Master Issuer PLC, Series 2019-2A,Class 1A, 2.710%, 12/22/2069, 144A(a)(b) 7,157,978
895,000 Lanark Master Issuer PLC, Series 2020-1A,Class 1A, 2.277%, 12/22/2069, 144A(b) 915,050
PrincipalAmount Description Value (†)
ABS Home Equity — continued$ 10,123,130 Legacy Mortgage Asset Trust, Series 2019-GS7,
Class A1, 3.250%, 11/25/2059, 144A(b) $ 10,181,902326,289 Legacy Mortgage Asset Trust, Series 2019-GS2,
Class A1, 3.750%, 1/25/2059, 144A(b) 326,8583,371,400 Legacy Mortgage Asset Trust, Series 2019-GS3,
Class A1, 3.750%, 4/25/2059, 144A(b) 3,399,4416,899,176 Legacy Mortgage Asset Trust, Series 2019-GS4,
Class A1, 3.438%, 5/25/2059, 144A(b) 6,912,8027,301,347 Legacy Mortgage Asset Trust, Series 2020-GS1,
Class A1, 2.882%, 10/25/2059, 144A(b) 7,353,8641,893,016 Legacy Mortgage Asset Trust, Series 2020-GS5,
Class A1, 3.250%, 6/25/2060, 144A 1,928,6961,467,786 Mill City Mortgage Loan Trust, Series 2018-2,
Class M1, 3.750%, 5/25/2058, 144A(a)(b) 1,560,4242,744,944 Mill City Mortgage Loan Trust, Series 2019-1,
Class M1, 3.500%, 10/25/2069, 144A(b) 2,982,2413,742,621 Mill City Mortgage Loan Trust, Series 2019-1,
Class A1, 3.250%, 10/25/2069, 144A(a)(b) 3,947,1268,805,175 Mill City Mortgage Loan Trust, Series 2019-GS1,
Class A1, 2.750%, 7/25/2059, 144A(a)(b) 9,061,0495,168,898 OSW Structured Asset Trust, Series 2020-RPL1,
Class A1, 3.072%, 12/26/2059, 144A(b) 5,208,2371,332,000 Progress Residential Trust, Series 2018-SFR2,
Class E, 4.656%, 8/17/2035, 144A 1,339,4172,290,000 Progress Residential Trust, Series 2018-SFR3,
Class D, 4.427%, 10/17/2035, 144A 2,305,1552,530,000 Progress Residential Trust, Series 2018-SFR3,
Class E, 4.873%, 10/17/2035, 144A 2,559,4342,830,000 Progress Residential Trust, Series 2019-SFR1,
Class D, 4.168%, 8/17/2035, 144A 2,871,8314,732,000 Progress Residential Trust, Series 2019-SFR2,
Class D, 3.794%, 5/17/2036, 144A 4,805,2211,690,000 Progress Residential Trust, Series 2019-SFR2,
Class E, 4.142%, 5/17/2036, 144A 1,725,1003,860,000 Progress Residential Trust, Series 2019-SFR4,
Class D, 3.136%, 10/17/2036, 144A 3,917,364155,000 Progress Residential Trust, Series 2020-SFR2,
Class C, 3.077%, 6/17/2037, 144A 159,279295,000 Progress Residential Trust, Series 2020-SFR3,
Class B, 1.495%, 10/17/2027, 144A 297,8291,818,000 Progress Residential Trust, Series 2020-SFR3,
Class E, 2.296%, 10/17/2027, 144A 1,819,6105,780,000 Progress Residential Trust, Series 2021-SFR2,
Class E1, 2.547%, 4/19/2038, 144A 5,834,6672,420,000 Progress Residential Trust, Series 2021-SFR3,
Class E1, 2.538%, 5/17/2026, 144A 2,440,7452,015,000 Progress Residential Trust, Series 2021-SFR3,
Class E2, 2.688%, 5/17/2026, 144A 2,027,6093,575,000 Progress Residential Trust, Series 2021-SFR6,
Class E1, 2.425%, 7/17/2038, 144A 3,574,8531,795,000 Progress Residential Trust, Series 2021-SFR6,
Class E2, 2.525%, 7/17/2038, 144A 1,794,73414,747,807 PRPM LLC, Series 2020-1A, Class A1,
2.981%, 2/25/2025, 144A(b) 14,813,5631,958,555 PRPM LLC, Series 2020-2, Class A1,
3.671%, 8/25/2025, 144A(b) 1,971,8186,103,281 PRPM LLC, Series 2020-3, Class A1,
2.857%, 9/25/2025, 144A(b) 6,135,6885,675,858 PRPM LLC, Series 2020-4, Class A1,
2.951%, 10/25/2025, 144A(b) 5,699,85911,991,600 PRPM LLC, Series 2020-5, Class A1,
3.104%, 11/25/2025, 144A(b) 12,071,1139,076,075 PRPM LLC, Series 2021-1, Class A1,
2.115%, 1/25/2026, 144A(b) 9,092,472
See accompanying notes to financial statements.27 |
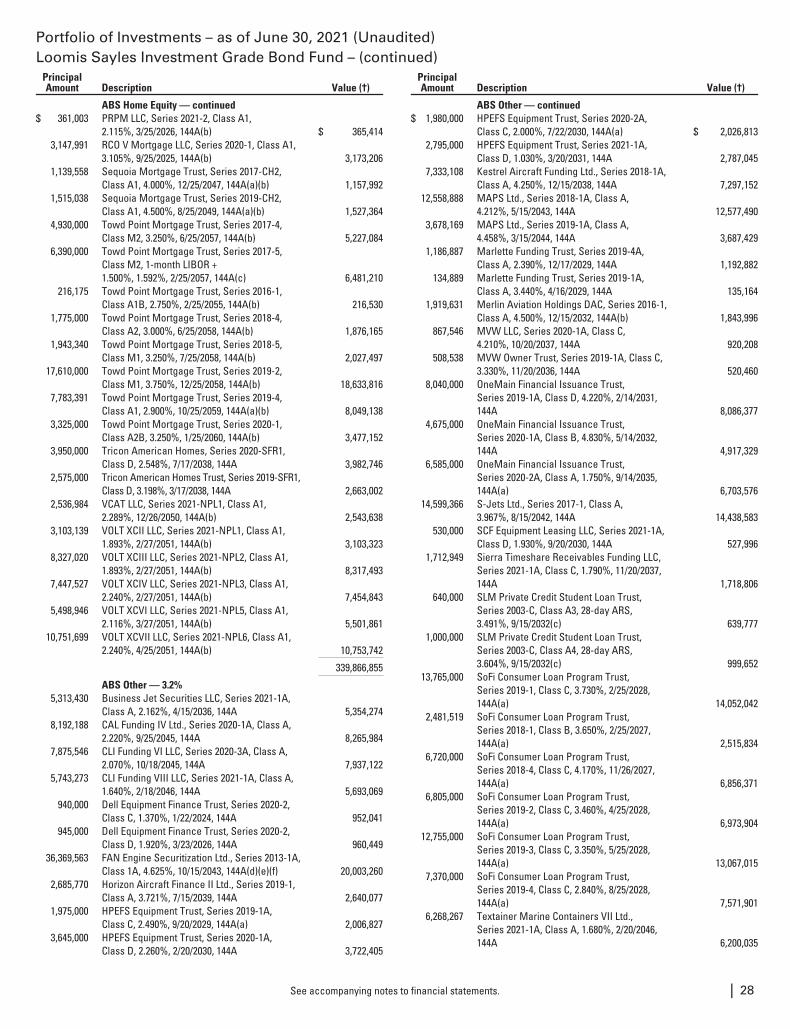
Portfolio of Investments – as of June 30, 2021 (Unaudited)Loomis Sayles Investment Grade Bond Fund – (continued)
PrincipalAmount Description Value (†)
ABS Home Equity — continued$ 361,003 PRPM LLC, Series 2021-2, Class A1,
2.115%, 3/25/2026, 144A(b) $ 365,4143,147,991 RCO V Mortgage LLC, Series 2020-1, Class A1,
3.105%, 9/25/2025, 144A(b) 3,173,2061,139,558 Sequoia Mortgage Trust, Series 2017-CH2,
Class A1, 4.000%, 12/25/2047, 144A(a)(b) 1,157,9921,515,038 Sequoia Mortgage Trust, Series 2019-CH2,
Class A1, 4.500%, 8/25/2049, 144A(a)(b) 1,527,3644,930,000 Towd Point Mortgage Trust, Series 2017-4,
Class M2, 3.250%, 6/25/2057, 144A(b) 5,227,0846,390,000 Towd Point Mortgage Trust, Series 2017-5,
Class M2, 1-month LIBOR +1.500%, 1.592%, 2/25/2057, 144A(c) 6,481,210
216,175 Towd Point Mortgage Trust, Series 2016-1,Class A1B, 2.750%, 2/25/2055, 144A(b) 216,530
1,775,000 Towd Point Mortgage Trust, Series 2018-4,Class A2, 3.000%, 6/25/2058, 144A(b) 1,876,165
1,943,340 Towd Point Mortgage Trust, Series 2018-5,Class M1, 3.250%, 7/25/2058, 144A(b) 2,027,497
17,610,000 Towd Point Mortgage Trust, Series 2019-2,Class M1, 3.750%, 12/25/2058, 144A(b) 18,633,816
7,783,391 Towd Point Mortgage Trust, Series 2019-4,Class A1, 2.900%, 10/25/2059, 144A(a)(b) 8,049,138
3,325,000 Towd Point Mortgage Trust, Series 2020-1,Class A2B, 3.250%, 1/25/2060, 144A(b) 3,477,152
3,950,000 Tricon American Homes, Series 2020-SFR1,Class D, 2.548%, 7/17/2038, 144A 3,982,746
2,575,000 Tricon American Homes Trust, Series 2019-SFR1,Class D, 3.198%, 3/17/2038, 144A 2,663,002
2,536,984 VCAT LLC, Series 2021-NPL1, Class A1,2.289%, 12/26/2050, 144A(b) 2,543,638
3,103,139 VOLT XCII LLC, Series 2021-NPL1, Class A1,1.893%, 2/27/2051, 144A(b) 3,103,323
8,327,020 VOLT XCIII LLC, Series 2021-NPL2, Class A1,1.893%, 2/27/2051, 144A(b) 8,317,493
7,447,527 VOLT XCIV LLC, Series 2021-NPL3, Class A1,2.240%, 2/27/2051, 144A(b) 7,454,843
5,498,946 VOLT XCVI LLC, Series 2021-NPL5, Class A1,2.116%, 3/27/2051, 144A(b) 5,501,861
10,751,699 VOLT XCVII LLC, Series 2021-NPL6, Class A1,2.240%, 4/25/2051, 144A(b) 10,753,742
339,866,855
ABS Other — 3.2%5,313,430 Business Jet Securities LLC, Series 2021-1A,
Class A, 2.162%, 4/15/2036, 144A 5,354,2748,192,188 CAL Funding IV Ltd., Series 2020-1A, Class A,
2.220%, 9/25/2045, 144A 8,265,9847,875,546 CLI Funding VI LLC, Series 2020-3A, Class A,
2.070%, 10/18/2045, 144A 7,937,1225,743,273 CLI Funding VIII LLC, Series 2021-1A, Class A,
1.640%, 2/18/2046, 144A 5,693,069940,000 Dell Equipment Finance Trust, Series 2020-2,
Class C, 1.370%, 1/22/2024, 144A 952,041945,000 Dell Equipment Finance Trust, Series 2020-2,
Class D, 1.920%, 3/23/2026, 144A 960,44936,369,563 FAN Engine Securitization Ltd., Series 2013-1A,
Class 1A, 4.625%, 10/15/2043, 144A(d)(e)(f) 20,003,2602,685,770 Horizon Aircraft Finance II Ltd., Series 2019-1,
Class A, 3.721%, 7/15/2039, 144A 2,640,0771,975,000 HPEFS Equipment Trust, Series 2019-1A,
Class C, 2.490%, 9/20/2029, 144A(a) 2,006,8273,645,000 HPEFS Equipment Trust, Series 2020-1A,
Class D, 2.260%, 2/20/2030, 144A 3,722,405
PrincipalAmount Description Value (†)
ABS Other — continued$ 1,980,000 HPEFS Equipment Trust, Series 2020-2A,
Class C, 2.000%, 7/22/2030, 144A(a) $ 2,026,8132,795,000 HPEFS Equipment Trust, Series 2021-1A,
Class D, 1.030%, 3/20/2031, 144A 2,787,0457,333,108 Kestrel Aircraft Funding Ltd., Series 2018-1A,
Class A, 4.250%, 12/15/2038, 144A 7,297,15212,558,888 MAPS Ltd., Series 2018-1A, Class A,
4.212%, 5/15/2043, 144A 12,577,4903,678,169 MAPS Ltd., Series 2019-1A, Class A,
4.458%, 3/15/2044, 144A 3,687,4291,186,887 Marlette Funding Trust, Series 2019-4A,
Class A, 2.390%, 12/17/2029, 144A 1,192,882134,889 Marlette Funding Trust, Series 2019-1A,
Class A, 3.440%, 4/16/2029, 144A 135,1641,919,631 Merlin Aviation Holdings DAC, Series 2016-1,
Class A, 4.500%, 12/15/2032, 144A(b) 1,843,996867,546 MVW LLC, Series 2020-1A, Class C,
4.210%, 10/20/2037, 144A 920,208508,538 MVW Owner Trust, Series 2019-1A, Class C,
3.330%, 11/20/2036, 144A 520,4608,040,000 OneMain Financial Issuance Trust,
Series 2019-1A, Class D, 4.220%, 2/14/2031,144A 8,086,377
4,675,000 OneMain Financial Issuance Trust,Series 2020-1A, Class B, 4.830%, 5/14/2032,144A 4,917,329
6,585,000 OneMain Financial Issuance Trust,Series 2020-2A, Class A, 1.750%, 9/14/2035,144A(a) 6,703,576
14,599,366 S-Jets Ltd., Series 2017-1, Class A,3.967%, 8/15/2042, 144A 14,438,583
530,000 SCF Equipment Leasing LLC, Series 2021-1A,Class D, 1.930%, 9/20/2030, 144A 527,996
1,712,949 Sierra Timeshare Receivables Funding LLC,Series 2021-1A, Class C, 1.790%, 11/20/2037,144A 1,718,806
640,000 SLM Private Credit Student Loan Trust,Series 2003-C, Class A3, 28-day ARS,3.491%, 9/15/2032(c) 639,777
1,000,000 SLM Private Credit Student Loan Trust,Series 2003-C, Class A4, 28-day ARS,3.604%, 9/15/2032(c) 999,652
13,765,000 SoFi Consumer Loan Program Trust,Series 2019-1, Class C, 3.730%, 2/25/2028,144A(a) 14,052,042
2,481,519 SoFi Consumer Loan Program Trust,Series 2018-1, Class B, 3.650%, 2/25/2027,144A(a) 2,515,834
6,720,000 SoFi Consumer Loan Program Trust,Series 2018-4, Class C, 4.170%, 11/26/2027,144A(a) 6,856,371
6,805,000 SoFi Consumer Loan Program Trust,Series 2019-2, Class C, 3.460%, 4/25/2028,144A(a) 6,973,904
12,755,000 SoFi Consumer Loan Program Trust,Series 2019-3, Class C, 3.350%, 5/25/2028,144A(a) 13,067,015
7,370,000 SoFi Consumer Loan Program Trust,Series 2019-4, Class C, 2.840%, 8/25/2028,144A(a) 7,571,901
6,268,267 Textainer Marine Containers VII Ltd.,Series 2021-1A, Class A, 1.680%, 2/20/2046,144A 6,200,035
See accompanying notes to financial statements. | 28
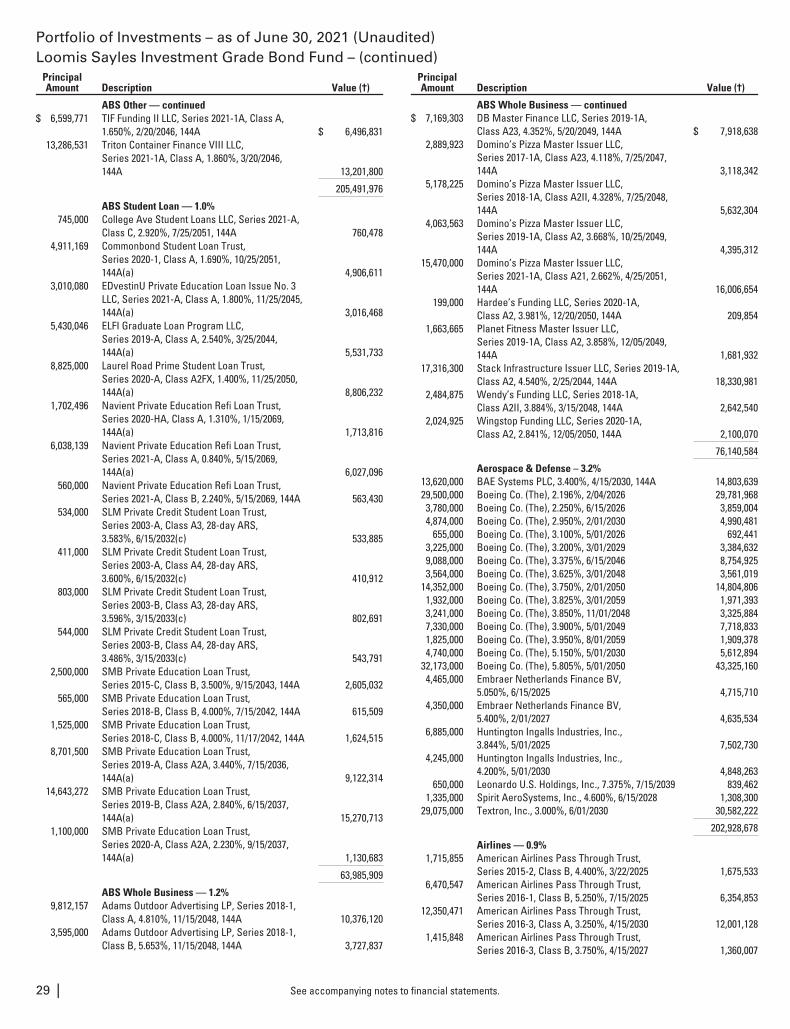
Portfolio of Investments – as of June 30, 2021 (Unaudited)Loomis Sayles Investment Grade Bond Fund – (continued)
PrincipalAmount Description Value (†)
ABS Other — continued$ 6,599,771 TIF Funding II LLC, Series 2021-1A, Class A,
1.650%, 2/20/2046, 144A $ 6,496,83113,286,531 Triton Container Finance VIII LLC,
Series 2021-1A, Class A, 1.860%, 3/20/2046,144A 13,201,800
205,491,976
ABS Student Loan — 1.0%745,000 College Ave Student Loans LLC, Series 2021-A,
Class C, 2.920%, 7/25/2051, 144A 760,4784,911,169 Commonbond Student Loan Trust,
Series 2020-1, Class A, 1.690%, 10/25/2051,144A(a) 4,906,611
3,010,080 EDvestinU Private Education Loan Issue No. 3LLC, Series 2021-A, Class A, 1.800%, 11/25/2045,144A(a) 3,016,468
5,430,046 ELFI Graduate Loan Program LLC,Series 2019-A, Class A, 2.540%, 3/25/2044,144A(a) 5,531,733
8,825,000 Laurel Road Prime Student Loan Trust,Series 2020-A, Class A2FX, 1.400%, 11/25/2050,144A(a) 8,806,232
1,702,496 Navient Private Education Refi Loan Trust,Series 2020-HA, Class A, 1.310%, 1/15/2069,144A(a) 1,713,816
6,038,139 Navient Private Education Refi Loan Trust,Series 2021-A, Class A, 0.840%, 5/15/2069,144A(a) 6,027,096
560,000 Navient Private Education Refi Loan Trust,Series 2021-A, Class B, 2.240%, 5/15/2069, 144A 563,430
534,000 SLM Private Credit Student Loan Trust,Series 2003-A, Class A3, 28-day ARS,3.583%, 6/15/2032(c) 533,885
411,000 SLM Private Credit Student Loan Trust,Series 2003-A, Class A4, 28-day ARS,3.600%, 6/15/2032(c) 410,912
803,000 SLM Private Credit Student Loan Trust,Series 2003-B, Class A3, 28-day ARS,3.596%, 3/15/2033(c) 802,691
544,000 SLM Private Credit Student Loan Trust,Series 2003-B, Class A4, 28-day ARS,3.486%, 3/15/2033(c) 543,791
2,500,000 SMB Private Education Loan Trust,Series 2015-C, Class B, 3.500%, 9/15/2043, 144A 2,605,032
565,000 SMB Private Education Loan Trust,Series 2018-B, Class B, 4.000%, 7/15/2042, 144A 615,509
1,525,000 SMB Private Education Loan Trust,Series 2018-C, Class B, 4.000%, 11/17/2042, 144A 1,624,515
8,701,500 SMB Private Education Loan Trust,Series 2019-A, Class A2A, 3.440%, 7/15/2036,144A(a) 9,122,314
14,643,272 SMB Private Education Loan Trust,Series 2019-B, Class A2A, 2.840%, 6/15/2037,144A(a) 15,270,713
1,100,000 SMB Private Education Loan Trust,Series 2020-A, Class A2A, 2.230%, 9/15/2037,144A(a) 1,130,683
63,985,909
ABS Whole Business — 1.2%9,812,157 Adams Outdoor Advertising LP, Series 2018-1,
Class A, 4.810%, 11/15/2048, 144A 10,376,1203,595,000 Adams Outdoor Advertising LP, Series 2018-1,
Class B, 5.653%, 11/15/2048, 144A 3,727,837
PrincipalAmount Description Value (†)
ABS Whole Business — continued$ 7,169,303 DB Master Finance LLC, Series 2019-1A,
Class A23, 4.352%, 5/20/2049, 144A $ 7,918,6382,889,923 Domino’s Pizza Master Issuer LLC,
Series 2017-1A, Class A23, 4.118%, 7/25/2047,144A 3,118,342
5,178,225 Domino’s Pizza Master Issuer LLC,Series 2018-1A, Class A2II, 4.328%, 7/25/2048,144A 5,632,304
4,063,563 Domino’s Pizza Master Issuer LLC,Series 2019-1A, Class A2, 3.668%, 10/25/2049,144A 4,395,312
15,470,000 Domino’s Pizza Master Issuer LLC,Series 2021-1A, Class A21, 2.662%, 4/25/2051,144A 16,006,654
199,000 Hardee’s Funding LLC, Series 2020-1A,Class A2, 3.981%, 12/20/2050, 144A 209,854
1,663,665 Planet Fitness Master Issuer LLC,Series 2019-1A, Class A2, 3.858%, 12/05/2049,144A 1,681,932
17,316,300 Stack Infrastructure Issuer LLC, Series 2019-1A,Class A2, 4.540%, 2/25/2044, 144A 18,330,981
2,484,875 Wendy’s Funding LLC, Series 2018-1A,Class A2II, 3.884%, 3/15/2048, 144A 2,642,540
2,024,925 Wingstop Funding LLC, Series 2020-1A,Class A2, 2.841%, 12/05/2050, 144A 2,100,070
76,140,584
Aerospace & Defense – 3.2%13,620,000 BAE Systems PLC, 3.400%, 4/15/2030, 144A 14,803,63929,500,000 Boeing Co. (The), 2.196%, 2/04/2026 29,781,9683,780,000 Boeing Co. (The), 2.250%, 6/15/2026 3,859,0044,874,000 Boeing Co. (The), 2.950%, 2/01/2030 4,990,481
655,000 Boeing Co. (The), 3.100%, 5/01/2026 692,4413,225,000 Boeing Co. (The), 3.200%, 3/01/2029 3,384,6329,088,000 Boeing Co. (The), 3.375%, 6/15/2046 8,754,9253,564,000 Boeing Co. (The), 3.625%, 3/01/2048 3,561,019
14,352,000 Boeing Co. (The), 3.750%, 2/01/2050 14,804,8061,932,000 Boeing Co. (The), 3.825%, 3/01/2059 1,971,3933,241,000 Boeing Co. (The), 3.850%, 11/01/2048 3,325,8847,330,000 Boeing Co. (The), 3.900%, 5/01/2049 7,718,8331,825,000 Boeing Co. (The), 3.950%, 8/01/2059 1,909,3784,740,000 Boeing Co. (The), 5.150%, 5/01/2030 5,612,894
32,173,000 Boeing Co. (The), 5.805%, 5/01/2050 43,325,1604,465,000 Embraer Netherlands Finance BV,
5.050%, 6/15/2025 4,715,7104,350,000 Embraer Netherlands Finance BV,
5.400%, 2/01/2027 4,635,5346,885,000 Huntington Ingalls Industries, Inc.,
3.844%, 5/01/2025 7,502,7304,245,000 Huntington Ingalls Industries, Inc.,
4.200%, 5/01/2030 4,848,263650,000 Leonardo U.S. Holdings, Inc., 7.375%, 7/15/2039 839,462
1,335,000 Spirit AeroSystems, Inc., 4.600%, 6/15/2028 1,308,30029,075,000 Textron, Inc., 3.000%, 6/01/2030 30,582,222
202,928,678
Airlines — 0.9%1,715,855 American Airlines Pass Through Trust,
Series 2015-2, Class B, 4.400%, 3/22/2025 1,675,5336,470,547 American Airlines Pass Through Trust,
Series 2016-1, Class B, 5.250%, 7/15/2025 6,354,85312,350,471 American Airlines Pass Through Trust,
Series 2016-3, Class A, 3.250%, 4/15/2030 12,001,1281,415,848 American Airlines Pass Through Trust,
Series 2016-3, Class B, 3.750%, 4/15/2027 1,360,007
See accompanying notes to financial statements.29 |
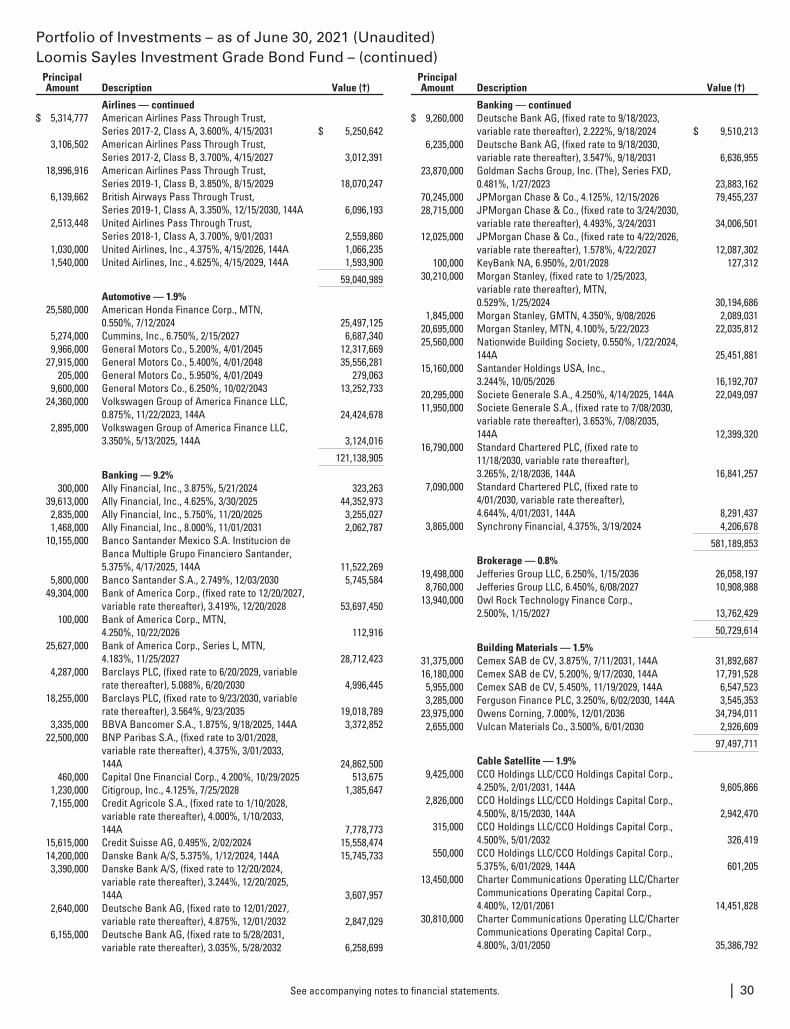
Portfolio of Investments – as of June 30, 2021 (Unaudited)Loomis Sayles Investment Grade Bond Fund – (continued)
PrincipalAmount Description Value (†)
Airlines — continued$ 5,314,777 American Airlines Pass Through Trust,
Series 2017-2, Class A, 3.600%, 4/15/2031 $ 5,250,6423,106,502 American Airlines Pass Through Trust,
Series 2017-2, Class B, 3.700%, 4/15/2027 3,012,39118,996,916 American Airlines Pass Through Trust,
Series 2019-1, Class B, 3.850%, 8/15/2029 18,070,2476,139,662 British Airways Pass Through Trust,
Series 2019-1, Class A, 3.350%, 12/15/2030, 144A 6,096,1932,513,448 United Airlines Pass Through Trust,
Series 2018-1, Class A, 3.700%, 9/01/2031 2,559,8601,030,000 United Airlines, Inc., 4.375%, 4/15/2026, 144A 1,066,2351,540,000 United Airlines, Inc., 4.625%, 4/15/2029, 144A 1,593,900
59,040,989
Automotive — 1.9%25,580,000 American Honda Finance Corp., MTN,
0.550%, 7/12/2024 25,497,1255,274,000 Cummins, Inc., 6.750%, 2/15/2027 6,687,3409,966,000 General Motors Co., 5.200%, 4/01/2045 12,317,669
27,915,000 General Motors Co., 5.400%, 4/01/2048 35,556,281205,000 General Motors Co., 5.950%, 4/01/2049 279,063
9,600,000 General Motors Co., 6.250%, 10/02/2043 13,252,73324,360,000 Volkswagen Group of America Finance LLC,
0.875%, 11/22/2023, 144A 24,424,6782,895,000 Volkswagen Group of America Finance LLC,
3.350%, 5/13/2025, 144A 3,124,016
121,138,905
Banking — 9.2%300,000 Ally Financial, Inc., 3.875%, 5/21/2024 323,263
39,613,000 Ally Financial, Inc., 4.625%, 3/30/2025 44,352,9732,835,000 Ally Financial, Inc., 5.750%, 11/20/2025 3,255,0271,468,000 Ally Financial, Inc., 8.000%, 11/01/2031 2,062,787
10,155,000 Banco Santander Mexico S.A. Institucion deBanca Multiple Grupo Financiero Santander,5.375%, 4/17/2025, 144A 11,522,269
5,800,000 Banco Santander S.A., 2.749%, 12/03/2030 5,745,58449,304,000 Bank of America Corp., (fixed rate to 12/20/2027,
variable rate thereafter), 3.419%, 12/20/2028 53,697,450100,000 Bank of America Corp., MTN,
4.250%, 10/22/2026 112,91625,627,000 Bank of America Corp., Series L, MTN,
4.183%, 11/25/2027 28,712,4234,287,000 Barclays PLC, (fixed rate to 6/20/2029, variable
rate thereafter), 5.088%, 6/20/2030 4,996,44518,255,000 Barclays PLC, (fixed rate to 9/23/2030, variable
rate thereafter), 3.564%, 9/23/2035 19,018,7893,335,000 BBVA Bancomer S.A., 1.875%, 9/18/2025, 144A 3,372,852
22,500,000 BNP Paribas S.A., (fixed rate to 3/01/2028,variable rate thereafter), 4.375%, 3/01/2033,144A 24,862,500
460,000 Capital One Financial Corp., 4.200%, 10/29/2025 513,6751,230,000 Citigroup, Inc., 4.125%, 7/25/2028 1,385,6477,155,000 Credit Agricole S.A., (fixed rate to 1/10/2028,
variable rate thereafter), 4.000%, 1/10/2033,144A 7,778,773
15,615,000 Credit Suisse AG, 0.495%, 2/02/2024 15,558,47414,200,000 Danske Bank A/S, 5.375%, 1/12/2024, 144A 15,745,7333,390,000 Danske Bank A/S, (fixed rate to 12/20/2024,
variable rate thereafter), 3.244%, 12/20/2025,144A 3,607,957
2,640,000 Deutsche Bank AG, (fixed rate to 12/01/2027,variable rate thereafter), 4.875%, 12/01/2032 2,847,029
6,155,000 Deutsche Bank AG, (fixed rate to 5/28/2031,variable rate thereafter), 3.035%, 5/28/2032 6,258,699
PrincipalAmount Description Value (†)
Banking — continued$ 9,260,000 Deutsche Bank AG, (fixed rate to 9/18/2023,
variable rate thereafter), 2.222%, 9/18/2024 $ 9,510,2136,235,000 Deutsche Bank AG, (fixed rate to 9/18/2030,
variable rate thereafter), 3.547%, 9/18/2031 6,636,95523,870,000 Goldman Sachs Group, Inc. (The), Series FXD,
0.481%, 1/27/2023 23,883,16270,245,000 JPMorgan Chase & Co., 4.125%, 12/15/2026 79,455,23728,715,000 JPMorgan Chase & Co., (fixed rate to 3/24/2030,
variable rate thereafter), 4.493%, 3/24/2031 34,006,50112,025,000 JPMorgan Chase & Co., (fixed rate to 4/22/2026,
variable rate thereafter), 1.578%, 4/22/2027 12,087,302100,000 KeyBank NA, 6.950%, 2/01/2028 127,312
30,210,000 Morgan Stanley, (fixed rate to 1/25/2023,variable rate thereafter), MTN,0.529%, 1/25/2024 30,194,686
1,845,000 Morgan Stanley, GMTN, 4.350%, 9/08/2026 2,089,03120,695,000 Morgan Stanley, MTN, 4.100%, 5/22/2023 22,035,81225,560,000 Nationwide Building Society, 0.550%, 1/22/2024,
144A 25,451,88115,160,000 Santander Holdings USA, Inc.,
3.244%, 10/05/2026 16,192,70720,295,000 Societe Generale S.A., 4.250%, 4/14/2025, 144A 22,049,09711,950,000 Societe Generale S.A., (fixed rate to 7/08/2030,
variable rate thereafter), 3.653%, 7/08/2035,144A 12,399,320
16,790,000 Standard Chartered PLC, (fixed rate to11/18/2030, variable rate thereafter),3.265%, 2/18/2036, 144A 16,841,257
7,090,000 Standard Chartered PLC, (fixed rate to4/01/2030, variable rate thereafter),4.644%, 4/01/2031, 144A 8,291,437
3,865,000 Synchrony Financial, 4.375%, 3/19/2024 4,206,678
581,189,853
Brokerage — 0.8%19,498,000 Jefferies Group LLC, 6.250%, 1/15/2036 26,058,1978,760,000 Jefferies Group LLC, 6.450%, 6/08/2027 10,908,988
13,940,000 Owl Rock Technology Finance Corp.,2.500%, 1/15/2027 13,762,429
50,729,614
Building Materials — 1.5%31,375,000 Cemex SAB de CV, 3.875%, 7/11/2031, 144A 31,892,68716,180,000 Cemex SAB de CV, 5.200%, 9/17/2030, 144A 17,791,5285,955,000 Cemex SAB de CV, 5.450%, 11/19/2029, 144A 6,547,5233,285,000 Ferguson Finance PLC, 3.250%, 6/02/2030, 144A 3,545,353
23,975,000 Owens Corning, 7.000%, 12/01/2036 34,794,0112,655,000 Vulcan Materials Co., 3.500%, 6/01/2030 2,926,609
97,497,711
Cable Satellite — 1.9%9,425,000 CCO Holdings LLC/CCO Holdings Capital Corp.,
4.250%, 2/01/2031, 144A 9,605,8662,826,000 CCO Holdings LLC/CCO Holdings Capital Corp.,
4.500%, 8/15/2030, 144A 2,942,470315,000 CCO Holdings LLC/CCO Holdings Capital Corp.,
4.500%, 5/01/2032 326,419550,000 CCO Holdings LLC/CCO Holdings Capital Corp.,
5.375%, 6/01/2029, 144A 601,20513,450,000 Charter Communications Operating LLC/Charter
Communications Operating Capital Corp.,4.400%, 12/01/2061 14,451,828
30,810,000 Charter Communications Operating LLC/CharterCommunications Operating Capital Corp.,4.800%, 3/01/2050 35,386,792
See accompanying notes to financial statements. | 30
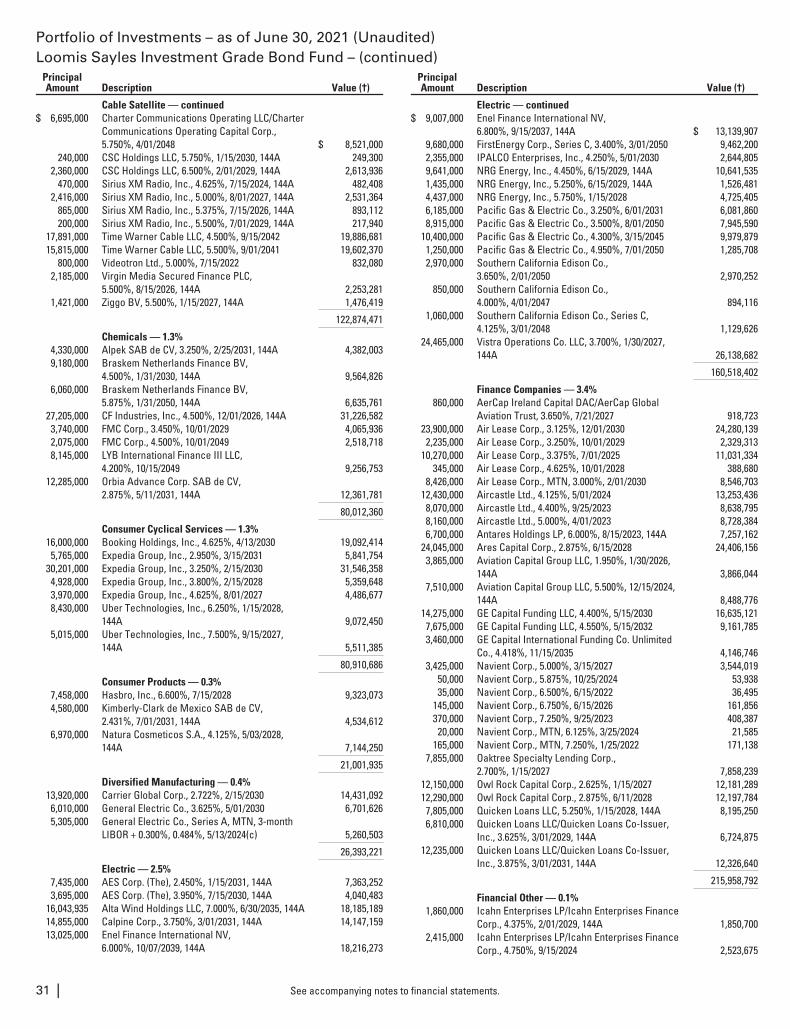
Portfolio of Investments – as of June 30, 2021 (Unaudited)Loomis Sayles Investment Grade Bond Fund – (continued)
PrincipalAmount Description Value (†)
Cable Satellite — continued$ 6,695,000 Charter Communications Operating LLC/Charter
Communications Operating Capital Corp.,5.750%, 4/01/2048 $ 8,521,000
240,000 CSC Holdings LLC, 5.750%, 1/15/2030, 144A 249,3002,360,000 CSC Holdings LLC, 6.500%, 2/01/2029, 144A 2,613,936
470,000 Sirius XM Radio, Inc., 4.625%, 7/15/2024, 144A 482,4082,416,000 Sirius XM Radio, Inc., 5.000%, 8/01/2027, 144A 2,531,364
865,000 Sirius XM Radio, Inc., 5.375%, 7/15/2026, 144A 893,112200,000 Sirius XM Radio, Inc., 5.500%, 7/01/2029, 144A 217,940
17,891,000 Time Warner Cable LLC, 4.500%, 9/15/2042 19,886,68115,815,000 Time Warner Cable LLC, 5.500%, 9/01/2041 19,602,370
800,000 Videotron Ltd., 5.000%, 7/15/2022 832,0802,185,000 Virgin Media Secured Finance PLC,
5.500%, 8/15/2026, 144A 2,253,2811,421,000 Ziggo BV, 5.500%, 1/15/2027, 144A 1,476,419
122,874,471
Chemicals — 1.3%4,330,000 Alpek SAB de CV, 3.250%, 2/25/2031, 144A 4,382,0039,180,000 Braskem Netherlands Finance BV,
4.500%, 1/31/2030, 144A 9,564,8266,060,000 Braskem Netherlands Finance BV,
5.875%, 1/31/2050, 144A 6,635,76127,205,000 CF Industries, Inc., 4.500%, 12/01/2026, 144A 31,226,5823,740,000 FMC Corp., 3.450%, 10/01/2029 4,065,9362,075,000 FMC Corp., 4.500%, 10/01/2049 2,518,7188,145,000 LYB International Finance III LLC,
4.200%, 10/15/2049 9,256,75312,285,000 Orbia Advance Corp. SAB de CV,
2.875%, 5/11/2031, 144A 12,361,781
80,012,360
Consumer Cyclical Services — 1.3%16,000,000 Booking Holdings, Inc., 4.625%, 4/13/2030 19,092,4145,765,000 Expedia Group, Inc., 2.950%, 3/15/2031 5,841,754
30,201,000 Expedia Group, Inc., 3.250%, 2/15/2030 31,546,3584,928,000 Expedia Group, Inc., 3.800%, 2/15/2028 5,359,6483,970,000 Expedia Group, Inc., 4.625%, 8/01/2027 4,486,6778,430,000 Uber Technologies, Inc., 6.250%, 1/15/2028,
144A 9,072,4505,015,000 Uber Technologies, Inc., 7.500%, 9/15/2027,
144A 5,511,385
80,910,686
Consumer Products — 0.3%7,458,000 Hasbro, Inc., 6.600%, 7/15/2028 9,323,0734,580,000 Kimberly-Clark de Mexico SAB de CV,
2.431%, 7/01/2031, 144A 4,534,6126,970,000 Natura Cosmeticos S.A., 4.125%, 5/03/2028,
144A 7,144,250
21,001,935
Diversified Manufacturing — 0.4%13,920,000 Carrier Global Corp., 2.722%, 2/15/2030 14,431,0926,010,000 General Electric Co., 3.625%, 5/01/2030 6,701,6265,305,000 General Electric Co., Series A, MTN, 3-month
LIBOR + 0.300%, 0.484%, 5/13/2024(c) 5,260,503
26,393,221
Electric — 2.5%7,435,000 AES Corp. (The), 2.450%, 1/15/2031, 144A 7,363,2523,695,000 AES Corp. (The), 3.950%, 7/15/2030, 144A 4,040,483
16,043,935 Alta Wind Holdings LLC, 7.000%, 6/30/2035, 144A 18,185,18914,855,000 Calpine Corp., 3.750%, 3/01/2031, 144A 14,147,15913,025,000 Enel Finance International NV,
6.000%, 10/07/2039, 144A 18,216,273
PrincipalAmount Description Value (†)
Electric — continued$ 9,007,000 Enel Finance International NV,
6.800%, 9/15/2037, 144A $ 13,139,9079,680,000 FirstEnergy Corp., Series C, 3.400%, 3/01/2050 9,462,2002,355,000 IPALCO Enterprises, Inc., 4.250%, 5/01/2030 2,644,8059,641,000 NRG Energy, Inc., 4.450%, 6/15/2029, 144A 10,641,5351,435,000 NRG Energy, Inc., 5.250%, 6/15/2029, 144A 1,526,4814,437,000 NRG Energy, Inc., 5.750%, 1/15/2028 4,725,4056,185,000 Pacific Gas & Electric Co., 3.250%, 6/01/2031 6,081,8608,915,000 Pacific Gas & Electric Co., 3.500%, 8/01/2050 7,945,590
10,400,000 Pacific Gas & Electric Co., 4.300%, 3/15/2045 9,979,8791,250,000 Pacific Gas & Electric Co., 4.950%, 7/01/2050 1,285,7082,970,000 Southern California Edison Co.,
3.650%, 2/01/2050 2,970,252850,000 Southern California Edison Co.,
4.000%, 4/01/2047 894,1161,060,000 Southern California Edison Co., Series C,
4.125%, 3/01/2048 1,129,62624,465,000 Vistra Operations Co. LLC, 3.700%, 1/30/2027,
144A 26,138,682
160,518,402
Finance Companies — 3.4%860,000 AerCap Ireland Capital DAC/AerCap Global
Aviation Trust, 3.650%, 7/21/2027 918,72323,900,000 Air Lease Corp., 3.125%, 12/01/2030 24,280,1392,235,000 Air Lease Corp., 3.250%, 10/01/2029 2,329,313
10,270,000 Air Lease Corp., 3.375%, 7/01/2025 11,031,334345,000 Air Lease Corp., 4.625%, 10/01/2028 388,680
8,426,000 Air Lease Corp., MTN, 3.000%, 2/01/2030 8,546,70312,430,000 Aircastle Ltd., 4.125%, 5/01/2024 13,253,4368,070,000 Aircastle Ltd., 4.400%, 9/25/2023 8,638,7958,160,000 Aircastle Ltd., 5.000%, 4/01/2023 8,728,3846,700,000 Antares Holdings LP, 6.000%, 8/15/2023, 144A 7,257,162
24,045,000 Ares Capital Corp., 2.875%, 6/15/2028 24,406,1563,865,000 Aviation Capital Group LLC, 1.950%, 1/30/2026,
144A 3,866,0447,510,000 Aviation Capital Group LLC, 5.500%, 12/15/2024,
144A 8,488,77614,275,000 GE Capital Funding LLC, 4.400%, 5/15/2030 16,635,1217,675,000 GE Capital Funding LLC, 4.550%, 5/15/2032 9,161,7853,460,000 GE Capital International Funding Co. Unlimited
Co., 4.418%, 11/15/2035 4,146,7463,425,000 Navient Corp., 5.000%, 3/15/2027 3,544,019
50,000 Navient Corp., 5.875%, 10/25/2024 53,93835,000 Navient Corp., 6.500%, 6/15/2022 36,495
145,000 Navient Corp., 6.750%, 6/15/2026 161,856370,000 Navient Corp., 7.250%, 9/25/2023 408,38720,000 Navient Corp., MTN, 6.125%, 3/25/2024 21,585
165,000 Navient Corp., MTN, 7.250%, 1/25/2022 171,1387,855,000 Oaktree Specialty Lending Corp.,
2.700%, 1/15/2027 7,858,23912,150,000 Owl Rock Capital Corp., 2.625%, 1/15/2027 12,181,28912,290,000 Owl Rock Capital Corp., 2.875%, 6/11/2028 12,197,7847,805,000 Quicken Loans LLC, 5.250%, 1/15/2028, 144A 8,195,2506,810,000 Quicken Loans LLC/Quicken Loans Co-Issuer,
Inc., 3.625%, 3/01/2029, 144A 6,724,87512,235,000 Quicken Loans LLC/Quicken Loans Co-Issuer,
Inc., 3.875%, 3/01/2031, 144A 12,326,640
215,958,792
Financial Other — 0.1%1,860,000 Icahn Enterprises LP/Icahn Enterprises Finance
Corp., 4.375%, 2/01/2029, 144A 1,850,7002,415,000 Icahn Enterprises LP/Icahn Enterprises Finance
Corp., 4.750%, 9/15/2024 2,523,675
See accompanying notes to financial statements.31 |
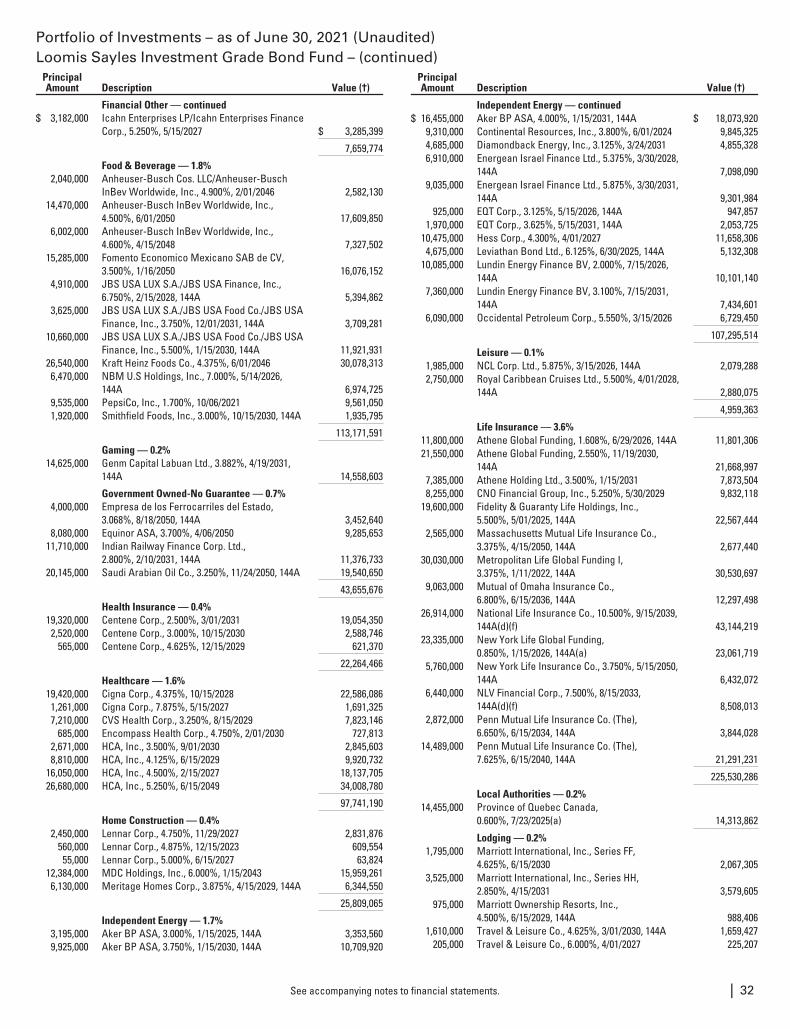
Portfolio of Investments – as of June 30, 2021 (Unaudited)Loomis Sayles Investment Grade Bond Fund – (continued)
PrincipalAmount Description Value (†)
Financial Other — continued$ 3,182,000 Icahn Enterprises LP/Icahn Enterprises Finance
Corp., 5.250%, 5/15/2027 $ 3,285,399
7,659,774
Food & Beverage — 1.8%2,040,000 Anheuser-Busch Cos. LLC/Anheuser-Busch
InBev Worldwide, Inc., 4.900%, 2/01/2046 2,582,13014,470,000 Anheuser-Busch InBev Worldwide, Inc.,
4.500%, 6/01/2050 17,609,8506,002,000 Anheuser-Busch InBev Worldwide, Inc.,
4.600%, 4/15/2048 7,327,50215,285,000 Fomento Economico Mexicano SAB de CV,
3.500%, 1/16/2050 16,076,1524,910,000 JBS USA LUX S.A./JBS USA Finance, Inc.,
6.750%, 2/15/2028, 144A 5,394,8623,625,000 JBS USA LUX S.A./JBS USA Food Co./JBS USA
Finance, Inc., 3.750%, 12/01/2031, 144A 3,709,28110,660,000 JBS USA LUX S.A./JBS USA Food Co./JBS USA
Finance, Inc., 5.500%, 1/15/2030, 144A 11,921,93126,540,000 Kraft Heinz Foods Co., 4.375%, 6/01/2046 30,078,3136,470,000 NBM U.S Holdings, Inc., 7.000%, 5/14/2026,
144A 6,974,7259,535,000 PepsiCo, Inc., 1.700%, 10/06/2021 9,561,0501,920,000 Smithfield Foods, Inc., 3.000%, 10/15/2030, 144A 1,935,795
113,171,591
Gaming — 0.2%14,625,000 Genm Capital Labuan Ltd., 3.882%, 4/19/2031,
144A 14,558,603
Government Owned-No Guarantee — 0.7%4,000,000 Empresa de los Ferrocarriles del Estado,
3.068%, 8/18/2050, 144A 3,452,6408,080,000 Equinor ASA, 3.700%, 4/06/2050 9,285,653
11,710,000 Indian Railway Finance Corp. Ltd.,2.800%, 2/10/2031, 144A 11,376,733
20,145,000 Saudi Arabian Oil Co., 3.250%, 11/24/2050, 144A 19,540,650
43,655,676
Health Insurance — 0.4%19,320,000 Centene Corp., 2.500%, 3/01/2031 19,054,3502,520,000 Centene Corp., 3.000%, 10/15/2030 2,588,746
565,000 Centene Corp., 4.625%, 12/15/2029 621,370
22,264,466
Healthcare — 1.6%19,420,000 Cigna Corp., 4.375%, 10/15/2028 22,586,0861,261,000 Cigna Corp., 7.875%, 5/15/2027 1,691,3257,210,000 CVS Health Corp., 3.250%, 8/15/2029 7,823,146
685,000 Encompass Health Corp., 4.750%, 2/01/2030 727,8132,671,000 HCA, Inc., 3.500%, 9/01/2030 2,845,6038,810,000 HCA, Inc., 4.125%, 6/15/2029 9,920,732
16,050,000 HCA, Inc., 4.500%, 2/15/2027 18,137,70526,680,000 HCA, Inc., 5.250%, 6/15/2049 34,008,780
97,741,190
Home Construction — 0.4%2,450,000 Lennar Corp., 4.750%, 11/29/2027 2,831,876
560,000 Lennar Corp., 4.875%, 12/15/2023 609,55455,000 Lennar Corp., 5.000%, 6/15/2027 63,824
12,384,000 MDC Holdings, Inc., 6.000%, 1/15/2043 15,959,2616,130,000 Meritage Homes Corp., 3.875%, 4/15/2029, 144A 6,344,550
25,809,065
Independent Energy — 1.7%3,195,000 Aker BP ASA, 3.000%, 1/15/2025, 144A 3,353,5609,925,000 Aker BP ASA, 3.750%, 1/15/2030, 144A 10,709,920
PrincipalAmount Description Value (†)
Independent Energy — continued$ 16,455,000 Aker BP ASA, 4.000%, 1/15/2031, 144A $ 18,073,920
9,310,000 Continental Resources, Inc., 3.800%, 6/01/2024 9,845,3254,685,000 Diamondback Energy, Inc., 3.125%, 3/24/2031 4,855,3286,910,000 Energean Israel Finance Ltd., 5.375%, 3/30/2028,
144A 7,098,0909,035,000 Energean Israel Finance Ltd., 5.875%, 3/30/2031,
144A 9,301,984925,000 EQT Corp., 3.125%, 5/15/2026, 144A 947,857
1,970,000 EQT Corp., 3.625%, 5/15/2031, 144A 2,053,72510,475,000 Hess Corp., 4.300%, 4/01/2027 11,658,3064,675,000 Leviathan Bond Ltd., 6.125%, 6/30/2025, 144A 5,132,308
10,085,000 Lundin Energy Finance BV, 2.000%, 7/15/2026,144A 10,101,140
7,360,000 Lundin Energy Finance BV, 3.100%, 7/15/2031,144A 7,434,601
6,090,000 Occidental Petroleum Corp., 5.550%, 3/15/2026 6,729,450
107,295,514
Leisure — 0.1%1,985,000 NCL Corp. Ltd., 5.875%, 3/15/2026, 144A 2,079,2882,750,000 Royal Caribbean Cruises Ltd., 5.500%, 4/01/2028,
144A 2,880,075
4,959,363
Life Insurance — 3.6%11,800,000 Athene Global Funding, 1.608%, 6/29/2026, 144A 11,801,30621,550,000 Athene Global Funding, 2.550%, 11/19/2030,
144A 21,668,9977,385,000 Athene Holding Ltd., 3.500%, 1/15/2031 7,873,5048,255,000 CNO Financial Group, Inc., 5.250%, 5/30/2029 9,832,118
19,600,000 Fidelity & Guaranty Life Holdings, Inc.,5.500%, 5/01/2025, 144A 22,567,444
2,565,000 Massachusetts Mutual Life Insurance Co.,3.375%, 4/15/2050, 144A 2,677,440
30,030,000 Metropolitan Life Global Funding I,3.375%, 1/11/2022, 144A 30,530,697
9,063,000 Mutual of Omaha Insurance Co.,6.800%, 6/15/2036, 144A 12,297,498
26,914,000 National Life Insurance Co., 10.500%, 9/15/2039,144A(d)(f) 43,144,219
23,335,000 New York Life Global Funding,0.850%, 1/15/2026, 144A(a) 23,061,719
5,760,000 New York Life Insurance Co., 3.750%, 5/15/2050,144A 6,432,072
6,440,000 NLV Financial Corp., 7.500%, 8/15/2033,144A(d)(f) 8,508,013
2,872,000 Penn Mutual Life Insurance Co. (The),6.650%, 6/15/2034, 144A 3,844,028
14,489,000 Penn Mutual Life Insurance Co. (The),7.625%, 6/15/2040, 144A 21,291,231
225,530,286
Local Authorities — 0.2%14,455,000 Province of Quebec Canada,
0.600%, 7/23/2025(a) 14,313,862
Lodging — 0.2%1,795,000 Marriott International, Inc., Series FF,
4.625%, 6/15/2030 2,067,3053,525,000 Marriott International, Inc., Series HH,
2.850%, 4/15/2031 3,579,605975,000 Marriott Ownership Resorts, Inc.,
4.500%, 6/15/2029, 144A 988,4061,610,000 Travel & Leisure Co., 4.625%, 3/01/2030, 144A 1,659,427
205,000 Travel & Leisure Co., 6.000%, 4/01/2027 225,207
See accompanying notes to financial statements. | 32
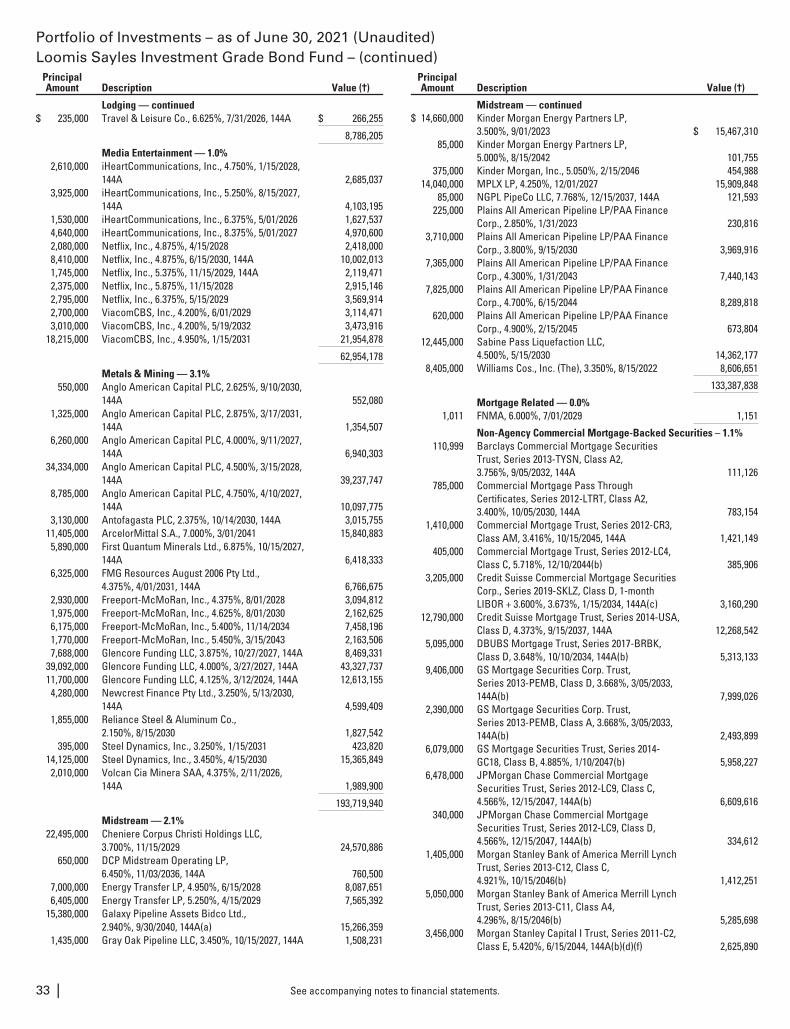
Portfolio of Investments – as of June 30, 2021 (Unaudited)Loomis Sayles Investment Grade Bond Fund – (continued)
PrincipalAmount Description Value (†)
Lodging — continued$ 235,000 Travel & Leisure Co., 6.625%, 7/31/2026, 144A $ 266,255
8,786,205
Media Entertainment — 1.0%2,610,000 iHeartCommunications, Inc., 4.750%, 1/15/2028,
144A 2,685,0373,925,000 iHeartCommunications, Inc., 5.250%, 8/15/2027,
144A 4,103,1951,530,000 iHeartCommunications, Inc., 6.375%, 5/01/2026 1,627,5374,640,000 iHeartCommunications, Inc., 8.375%, 5/01/2027 4,970,6002,080,000 Netflix, Inc., 4.875%, 4/15/2028 2,418,0008,410,000 Netflix, Inc., 4.875%, 6/15/2030, 144A 10,002,0131,745,000 Netflix, Inc., 5.375%, 11/15/2029, 144A 2,119,4712,375,000 Netflix, Inc., 5.875%, 11/15/2028 2,915,1462,795,000 Netflix, Inc., 6.375%, 5/15/2029 3,569,9142,700,000 ViacomCBS, Inc., 4.200%, 6/01/2029 3,114,4713,010,000 ViacomCBS, Inc., 4.200%, 5/19/2032 3,473,916
18,215,000 ViacomCBS, Inc., 4.950%, 1/15/2031 21,954,878
62,954,178
Metals & Mining — 3.1%550,000 Anglo American Capital PLC, 2.625%, 9/10/2030,
144A 552,0801,325,000 Anglo American Capital PLC, 2.875%, 3/17/2031,
144A 1,354,5076,260,000 Anglo American Capital PLC, 4.000%, 9/11/2027,
144A 6,940,30334,334,000 Anglo American Capital PLC, 4.500%, 3/15/2028,
144A 39,237,7478,785,000 Anglo American Capital PLC, 4.750%, 4/10/2027,
144A 10,097,7753,130,000 Antofagasta PLC, 2.375%, 10/14/2030, 144A 3,015,755
11,405,000 ArcelorMittal S.A., 7.000%, 3/01/2041 15,840,8835,890,000 First Quantum Minerals Ltd., 6.875%, 10/15/2027,
144A 6,418,3336,325,000 FMG Resources August 2006 Pty Ltd.,
4.375%, 4/01/2031, 144A 6,766,6752,930,000 Freeport-McMoRan, Inc., 4.375%, 8/01/2028 3,094,8121,975,000 Freeport-McMoRan, Inc., 4.625%, 8/01/2030 2,162,6256,175,000 Freeport-McMoRan, Inc., 5.400%, 11/14/2034 7,458,1961,770,000 Freeport-McMoRan, Inc., 5.450%, 3/15/2043 2,163,5067,688,000 Glencore Funding LLC, 3.875%, 10/27/2027, 144A 8,469,331
39,092,000 Glencore Funding LLC, 4.000%, 3/27/2027, 144A 43,327,73711,700,000 Glencore Funding LLC, 4.125%, 3/12/2024, 144A 12,613,1554,280,000 Newcrest Finance Pty Ltd., 3.250%, 5/13/2030,
144A 4,599,4091,855,000 Reliance Steel & Aluminum Co.,
2.150%, 8/15/2030 1,827,542395,000 Steel Dynamics, Inc., 3.250%, 1/15/2031 423,820
14,125,000 Steel Dynamics, Inc., 3.450%, 4/15/2030 15,365,8492,010,000 Volcan Cia Minera SAA, 4.375%, 2/11/2026,
144A 1,989,900
193,719,940
Midstream — 2.1%22,495,000 Cheniere Corpus Christi Holdings LLC,
3.700%, 11/15/2029 24,570,886650,000 DCP Midstream Operating LP,
6.450%, 11/03/2036, 144A 760,5007,000,000 Energy Transfer LP, 4.950%, 6/15/2028 8,087,6516,405,000 Energy Transfer LP, 5.250%, 4/15/2029 7,565,392
15,380,000 Galaxy Pipeline Assets Bidco Ltd.,2.940%, 9/30/2040, 144A(a) 15,266,359
1,435,000 Gray Oak Pipeline LLC, 3.450%, 10/15/2027, 144A 1,508,231
PrincipalAmount Description Value (†)
Midstream — continued$ 14,660,000 Kinder Morgan Energy Partners LP,
3.500%, 9/01/2023 $ 15,467,31085,000 Kinder Morgan Energy Partners LP,
5.000%, 8/15/2042 101,755375,000 Kinder Morgan, Inc., 5.050%, 2/15/2046 454,988
14,040,000 MPLX LP, 4.250%, 12/01/2027 15,909,84885,000 NGPL PipeCo LLC, 7.768%, 12/15/2037, 144A 121,593
225,000 Plains All American Pipeline LP/PAA FinanceCorp., 2.850%, 1/31/2023 230,816
3,710,000 Plains All American Pipeline LP/PAA FinanceCorp., 3.800%, 9/15/2030 3,969,916
7,365,000 Plains All American Pipeline LP/PAA FinanceCorp., 4.300%, 1/31/2043 7,440,143
7,825,000 Plains All American Pipeline LP/PAA FinanceCorp., 4.700%, 6/15/2044 8,289,818
620,000 Plains All American Pipeline LP/PAA FinanceCorp., 4.900%, 2/15/2045 673,804
12,445,000 Sabine Pass Liquefaction LLC,4.500%, 5/15/2030 14,362,177
8,405,000 Williams Cos., Inc. (The), 3.350%, 8/15/2022 8,606,651
133,387,838
Mortgage Related — 0.0%1,011 FNMA, 6.000%, 7/01/2029 1,151
Non-Agency Commercial Mortgage-Backed Securities – 1.1%110,999 Barclays Commercial Mortgage Securities
Trust, Series 2013-TYSN, Class A2,3.756%, 9/05/2032, 144A 111,126
785,000 Commercial Mortgage Pass ThroughCertificates, Series 2012-LTRT, Class A2,3.400%, 10/05/2030, 144A 783,154
1,410,000 Commercial Mortgage Trust, Series 2012-CR3,Class AM, 3.416%, 10/15/2045, 144A 1,421,149
405,000 Commercial Mortgage Trust, Series 2012-LC4,Class C, 5.718%, 12/10/2044(b) 385,906
3,205,000 Credit Suisse Commercial Mortgage SecuritiesCorp., Series 2019-SKLZ, Class D, 1-monthLIBOR + 3.600%, 3.673%, 1/15/2034, 144A(c) 3,160,290
12,790,000 Credit Suisse Mortgage Trust, Series 2014-USA,Class D, 4.373%, 9/15/2037, 144A 12,268,542
5,095,000 DBUBS Mortgage Trust, Series 2017-BRBK,Class D, 3.648%, 10/10/2034, 144A(b) 5,313,133
9,406,000 GS Mortgage Securities Corp. Trust,Series 2013-PEMB, Class D, 3.668%, 3/05/2033,144A(b) 7,999,026
2,390,000 GS Mortgage Securities Corp. Trust,Series 2013-PEMB, Class A, 3.668%, 3/05/2033,144A(b) 2,493,899
6,079,000 GS Mortgage Securities Trust, Series 2014-GC18, Class B, 4.885%, 1/10/2047(b) 5,958,227
6,478,000 JPMorgan Chase Commercial MortgageSecurities Trust, Series 2012-LC9, Class C,4.566%, 12/15/2047, 144A(b) 6,609,616
340,000 JPMorgan Chase Commercial MortgageSecurities Trust, Series 2012-LC9, Class D,4.566%, 12/15/2047, 144A(b) 334,612
1,405,000 Morgan Stanley Bank of America Merrill LynchTrust, Series 2013-C12, Class C,4.921%, 10/15/2046(b) 1,412,251
5,050,000 Morgan Stanley Bank of America Merrill LynchTrust, Series 2013-C11, Class A4,4.296%, 8/15/2046(b) 5,285,698
3,456,000 Morgan Stanley Capital I Trust, Series 2011-C2,Class E, 5.420%, 6/15/2044, 144A(b)(d)(f) 2,625,890
See accompanying notes to financial statements.33 |
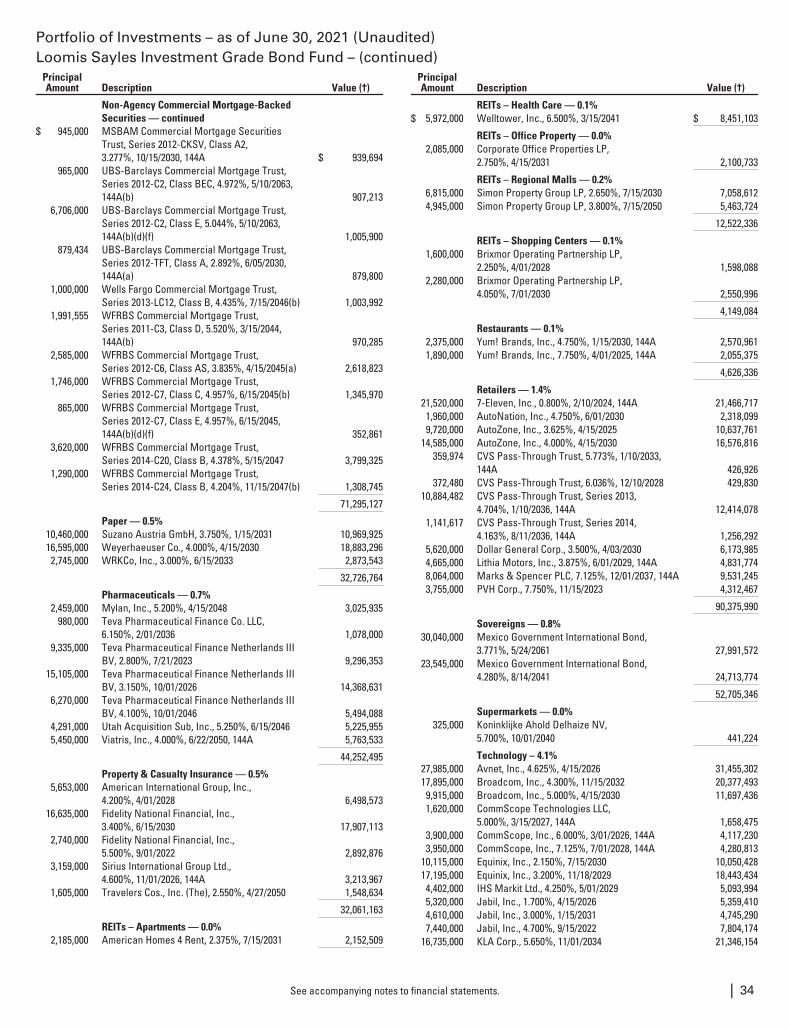
Portfolio of Investments – as of June 30, 2021 (Unaudited)Loomis Sayles Investment Grade Bond Fund – (continued)
PrincipalAmount Description Value (†)
Non-Agency Commercial Mortgage-BackedSecurities — continued
$ 945,000 MSBAM Commercial Mortgage SecuritiesTrust, Series 2012-CKSV, Class A2,3.277%, 10/15/2030, 144A $ 939,694
965,000 UBS-Barclays Commercial Mortgage Trust,Series 2012-C2, Class BEC, 4.972%, 5/10/2063,144A(b) 907,213
6,706,000 UBS-Barclays Commercial Mortgage Trust,Series 2012-C2, Class E, 5.044%, 5/10/2063,144A(b)(d)(f) 1,005,900
879,434 UBS-Barclays Commercial Mortgage Trust,Series 2012-TFT, Class A, 2.892%, 6/05/2030,144A(a) 879,800
1,000,000 Wells Fargo Commercial Mortgage Trust,Series 2013-LC12, Class B, 4.435%, 7/15/2046(b) 1,003,992
1,991,555 WFRBS Commercial Mortgage Trust,Series 2011-C3, Class D, 5.520%, 3/15/2044,144A(b) 970,285
2,585,000 WFRBS Commercial Mortgage Trust,Series 2012-C6, Class AS, 3.835%, 4/15/2045(a) 2,618,823
1,746,000 WFRBS Commercial Mortgage Trust,Series 2012-C7, Class C, 4.957%, 6/15/2045(b) 1,345,970
865,000 WFRBS Commercial Mortgage Trust,Series 2012-C7, Class E, 4.957%, 6/15/2045,144A(b)(d)(f) 352,861
3,620,000 WFRBS Commercial Mortgage Trust,Series 2014-C20, Class B, 4.378%, 5/15/2047 3,799,325
1,290,000 WFRBS Commercial Mortgage Trust,Series 2014-C24, Class B, 4.204%, 11/15/2047(b) 1,308,745
71,295,127
Paper — 0.5%10,460,000 Suzano Austria GmbH, 3.750%, 1/15/2031 10,969,92516,595,000 Weyerhaeuser Co., 4.000%, 4/15/2030 18,883,2962,745,000 WRKCo, Inc., 3.000%, 6/15/2033 2,873,543
32,726,764
Pharmaceuticals — 0.7%2,459,000 Mylan, Inc., 5.200%, 4/15/2048 3,025,935
980,000 Teva Pharmaceutical Finance Co. LLC,6.150%, 2/01/2036 1,078,000
9,335,000 Teva Pharmaceutical Finance Netherlands IIIBV, 2.800%, 7/21/2023 9,296,353
15,105,000 Teva Pharmaceutical Finance Netherlands IIIBV, 3.150%, 10/01/2026 14,368,631
6,270,000 Teva Pharmaceutical Finance Netherlands IIIBV, 4.100%, 10/01/2046 5,494,088
4,291,000 Utah Acquisition Sub, Inc., 5.250%, 6/15/2046 5,225,9555,450,000 Viatris, Inc., 4.000%, 6/22/2050, 144A 5,763,533
44,252,495
Property & Casualty Insurance — 0.5%5,653,000 American International Group, Inc.,
4.200%, 4/01/2028 6,498,57316,635,000 Fidelity National Financial, Inc.,
3.400%, 6/15/2030 17,907,1132,740,000 Fidelity National Financial, Inc.,
5.500%, 9/01/2022 2,892,8763,159,000 Sirius International Group Ltd.,
4.600%, 11/01/2026, 144A 3,213,9671,605,000 Travelers Cos., Inc. (The), 2.550%, 4/27/2050 1,548,634
32,061,163
REITs – Apartments — 0.0%2,185,000 American Homes 4 Rent, 2.375%, 7/15/2031 2,152,509
PrincipalAmount Description Value (†)
REITs – Health Care — 0.1%$ 5,972,000 Welltower, Inc., 6.500%, 3/15/2041 $ 8,451,103
REITs – Office Property — 0.0%2,085,000 Corporate Office Properties LP,
2.750%, 4/15/2031 2,100,733
REITs – Regional Malls — 0.2%6,815,000 Simon Property Group LP, 2.650%, 7/15/2030 7,058,6124,945,000 Simon Property Group LP, 3.800%, 7/15/2050 5,463,724
12,522,336
REITs – Shopping Centers — 0.1%1,600,000 Brixmor Operating Partnership LP,
2.250%, 4/01/2028 1,598,0882,280,000 Brixmor Operating Partnership LP,
4.050%, 7/01/2030 2,550,996
4,149,084
Restaurants — 0.1%2,375,000 Yum! Brands, Inc., 4.750%, 1/15/2030, 144A 2,570,9611,890,000 Yum! Brands, Inc., 7.750%, 4/01/2025, 144A 2,055,375
4,626,336
Retailers — 1.4%21,520,000 7-Eleven, Inc., 0.800%, 2/10/2024, 144A 21,466,7171,960,000 AutoNation, Inc., 4.750%, 6/01/2030 2,318,0999,720,000 AutoZone, Inc., 3.625%, 4/15/2025 10,637,761
14,585,000 AutoZone, Inc., 4.000%, 4/15/2030 16,576,816359,974 CVS Pass-Through Trust, 5.773%, 1/10/2033,
144A 426,926372,480 CVS Pass-Through Trust, 6.036%, 12/10/2028 429,830
10,884,482 CVS Pass-Through Trust, Series 2013,4.704%, 1/10/2036, 144A 12,414,078
1,141,617 CVS Pass-Through Trust, Series 2014,4.163%, 8/11/2036, 144A 1,256,292
5,620,000 Dollar General Corp., 3.500%, 4/03/2030 6,173,9854,665,000 Lithia Motors, Inc., 3.875%, 6/01/2029, 144A 4,831,7748,064,000 Marks & Spencer PLC, 7.125%, 12/01/2037, 144A 9,531,2453,755,000 PVH Corp., 7.750%, 11/15/2023 4,312,467
90,375,990
Sovereigns — 0.8%30,040,000 Mexico Government International Bond,
3.771%, 5/24/2061 27,991,57223,545,000 Mexico Government International Bond,
4.280%, 8/14/2041 24,713,774
52,705,346
Supermarkets — 0.0%325,000 Koninklijke Ahold Delhaize NV,
5.700%, 10/01/2040 441,224
Technology – 4.1%27,985,000 Avnet, Inc., 4.625%, 4/15/2026 31,455,30217,895,000 Broadcom, Inc., 4.300%, 11/15/2032 20,377,4939,915,000 Broadcom, Inc., 5.000%, 4/15/2030 11,697,4361,620,000 CommScope Technologies LLC,
5.000%, 3/15/2027, 144A 1,658,4753,900,000 CommScope, Inc., 6.000%, 3/01/2026, 144A 4,117,2303,950,000 CommScope, Inc., 7.125%, 7/01/2028, 144A 4,280,813
10,115,000 Equinix, Inc., 2.150%, 7/15/2030 10,050,42817,195,000 Equinix, Inc., 3.200%, 11/18/2029 18,443,4344,402,000 IHS Markit Ltd., 4.250%, 5/01/2029 5,093,9945,320,000 Jabil, Inc., 1.700%, 4/15/2026 5,359,4104,610,000 Jabil, Inc., 3.000%, 1/15/2031 4,745,2907,440,000 Jabil, Inc., 4.700%, 9/15/2022 7,804,174
16,735,000 KLA Corp., 5.650%, 11/01/2034 21,346,154
See accompanying notes to financial statements. | 34
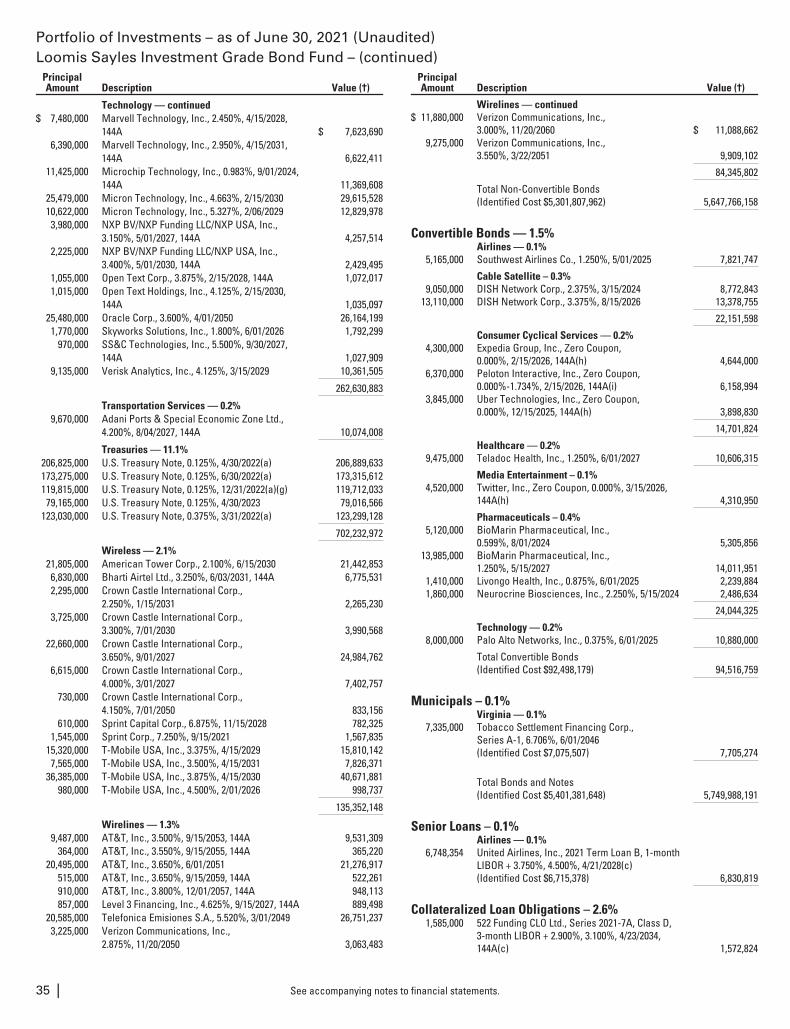
Portfolio of Investments – as of June 30, 2021 (Unaudited)Loomis Sayles Investment Grade Bond Fund – (continued)
PrincipalAmount Description Value (†)
Technology — continued$ 7,480,000 Marvell Technology, Inc., 2.450%, 4/15/2028,
144A $ 7,623,6906,390,000 Marvell Technology, Inc., 2.950%, 4/15/2031,
144A 6,622,41111,425,000 Microchip Technology, Inc., 0.983%, 9/01/2024,
144A 11,369,60825,479,000 Micron Technology, Inc., 4.663%, 2/15/2030 29,615,52810,622,000 Micron Technology, Inc., 5.327%, 2/06/2029 12,829,9783,980,000 NXP BV/NXP Funding LLC/NXP USA, Inc.,
3.150%, 5/01/2027, 144A 4,257,5142,225,000 NXP BV/NXP Funding LLC/NXP USA, Inc.,
3.400%, 5/01/2030, 144A 2,429,4951,055,000 Open Text Corp., 3.875%, 2/15/2028, 144A 1,072,0171,015,000 Open Text Holdings, Inc., 4.125%, 2/15/2030,
144A 1,035,09725,480,000 Oracle Corp., 3.600%, 4/01/2050 26,164,1991,770,000 Skyworks Solutions, Inc., 1.800%, 6/01/2026 1,792,299
970,000 SS&C Technologies, Inc., 5.500%, 9/30/2027,144A 1,027,909
9,135,000 Verisk Analytics, Inc., 4.125%, 3/15/2029 10,361,505
262,630,883
Transportation Services — 0.2%9,670,000 Adani Ports & Special Economic Zone Ltd.,
4.200%, 8/04/2027, 144A 10,074,008
Treasuries — 11.1%206,825,000 U.S. Treasury Note, 0.125%, 4/30/2022(a) 206,889,633173,275,000 U.S. Treasury Note, 0.125%, 6/30/2022(a) 173,315,612119,815,000 U.S. Treasury Note, 0.125%, 12/31/2022(a)(g) 119,712,03379,165,000 U.S. Treasury Note, 0.125%, 4/30/2023 79,016,566
123,030,000 U.S. Treasury Note, 0.375%, 3/31/2022(a) 123,299,128
702,232,972
Wireless — 2.1%21,805,000 American Tower Corp., 2.100%, 6/15/2030 21,442,8536,830,000 Bharti Airtel Ltd., 3.250%, 6/03/2031, 144A 6,775,5312,295,000 Crown Castle International Corp.,
2.250%, 1/15/2031 2,265,2303,725,000 Crown Castle International Corp.,
3.300%, 7/01/2030 3,990,56822,660,000 Crown Castle International Corp.,
3.650%, 9/01/2027 24,984,7626,615,000 Crown Castle International Corp.,
4.000%, 3/01/2027 7,402,757730,000 Crown Castle International Corp.,
4.150%, 7/01/2050 833,156610,000 Sprint Capital Corp., 6.875%, 11/15/2028 782,325
1,545,000 Sprint Corp., 7.250%, 9/15/2021 1,567,83515,320,000 T-Mobile USA, Inc., 3.375%, 4/15/2029 15,810,1427,565,000 T-Mobile USA, Inc., 3.500%, 4/15/2031 7,826,371
36,385,000 T-Mobile USA, Inc., 3.875%, 4/15/2030 40,671,881980,000 T-Mobile USA, Inc., 4.500%, 2/01/2026 998,737
135,352,148
Wirelines — 1.3%9,487,000 AT&T, Inc., 3.500%, 9/15/2053, 144A 9,531,309
364,000 AT&T, Inc., 3.550%, 9/15/2055, 144A 365,22020,495,000 AT&T, Inc., 3.650%, 6/01/2051 21,276,917
515,000 AT&T, Inc., 3.650%, 9/15/2059, 144A 522,261910,000 AT&T, Inc., 3.800%, 12/01/2057, 144A 948,113857,000 Level 3 Financing, Inc., 4.625%, 9/15/2027, 144A 889,498
20,585,000 Telefonica Emisiones S.A., 5.520%, 3/01/2049 26,751,2373,225,000 Verizon Communications, Inc.,
2.875%, 11/20/2050 3,063,483
PrincipalAmount Description Value (†)
Wirelines — continued$ 11,880,000 Verizon Communications, Inc.,
3.000%, 11/20/2060 $ 11,088,6629,275,000 Verizon Communications, Inc.,
3.550%, 3/22/2051 9,909,102
84,345,802
Total Non-Convertible Bonds(Identified Cost $5,301,807,962) 5,647,766,158
Convertible Bonds — 1.5%Airlines — 0.1%
5,165,000 Southwest Airlines Co., 1.250%, 5/01/2025 7,821,747
Cable Satellite – 0.3%9,050,000 DISH Network Corp., 2.375%, 3/15/2024 8,772,843
13,110,000 DISH Network Corp., 3.375%, 8/15/2026 13,378,755
22,151,598
Consumer Cyclical Services — 0.2%4,300,000 Expedia Group, Inc., Zero Coupon,
0.000%, 2/15/2026, 144A(h) 4,644,0006,370,000 Peloton Interactive, Inc., Zero Coupon,
0.000%-1.734%, 2/15/2026, 144A(i) 6,158,9943,845,000 Uber Technologies, Inc., Zero Coupon,
0.000%, 12/15/2025, 144A(h) 3,898,830
14,701,824
Healthcare — 0.2%9,475,000 Teladoc Health, Inc., 1.250%, 6/01/2027 10,606,315
Media Entertainment – 0.1%4,520,000 Twitter, Inc., Zero Coupon, 0.000%, 3/15/2026,
144A(h) 4,310,950
Pharmaceuticals – 0.4%5,120,000 BioMarin Pharmaceutical, Inc.,
0.599%, 8/01/2024 5,305,85613,985,000 BioMarin Pharmaceutical, Inc.,
1.250%, 5/15/2027 14,011,9511,410,000 Livongo Health, Inc., 0.875%, 6/01/2025 2,239,8841,860,000 Neurocrine Biosciences, Inc., 2.250%, 5/15/2024 2,486,634
24,044,325
Technology — 0.2%8,000,000 Palo Alto Networks, Inc., 0.375%, 6/01/2025 10,880,000
Total Convertible Bonds(Identified Cost $92,498,179) 94,516,759
Municipals – 0.1%Virginia — 0.1%
7,335,000 Tobacco Settlement Financing Corp.,Series A-1, 6.706%, 6/01/2046(Identified Cost $7,075,507) 7,705,274
Total Bonds and Notes(Identified Cost $5,401,381,648) 5,749,988,191
Senior Loans – 0.1%Airlines — 0.1%
6,748,354 United Airlines, Inc., 2021 Term Loan B, 1-monthLIBOR + 3.750%, 4.500%, 4/21/2028(c)(Identified Cost $6,715,378) 6,830,819
Collateralized Loan Obligations – 2.6%1,585,000 522 Funding CLO Ltd., Series 2021-7A, Class D,
3-month LIBOR + 2.900%, 3.100%, 4/23/2034,144A(c) 1,572,824
See accompanying notes to financial statements.35 |
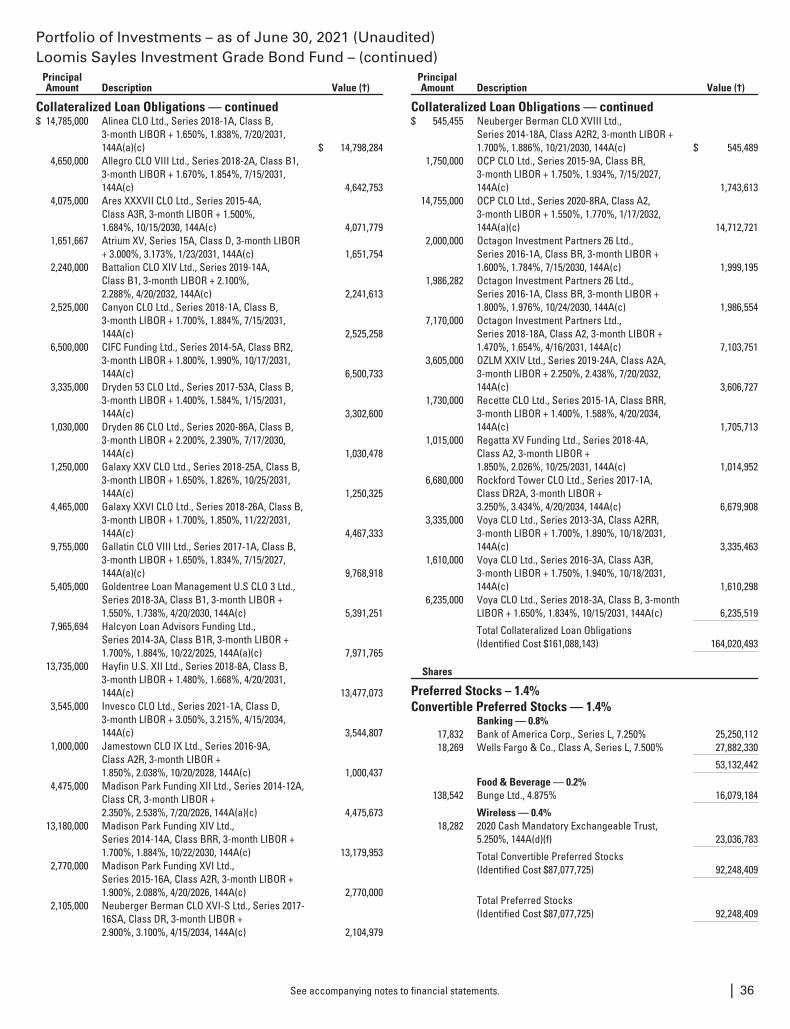
Portfolio of Investments – as of June 30, 2021 (Unaudited)Loomis Sayles Investment Grade Bond Fund – (continued)
PrincipalAmount Description Value (†)
Collateralized Loan Obligations — continued$ 14,785,000 Alinea CLO Ltd., Series 2018-1A, Class B,
3-month LIBOR + 1.650%, 1.838%, 7/20/2031,144A(a)(c) $ 14,798,284
4,650,000 Allegro CLO VIII Ltd., Series 2018-2A, Class B1,3-month LIBOR + 1.670%, 1.854%, 7/15/2031,144A(c) 4,642,753
4,075,000 Ares XXXVII CLO Ltd., Series 2015-4A,Class A3R, 3-month LIBOR + 1.500%,1.684%, 10/15/2030, 144A(c) 4,071,779
1,651,667 Atrium XV, Series 15A, Class D, 3-month LIBOR+ 3.000%, 3.173%, 1/23/2031, 144A(c) 1,651,754
2,240,000 Battalion CLO XIV Ltd., Series 2019-14A,Class B1, 3-month LIBOR + 2.100%,2.288%, 4/20/2032, 144A(c) 2,241,613
2,525,000 Canyon CLO Ltd., Series 2018-1A, Class B,3-month LIBOR + 1.700%, 1.884%, 7/15/2031,144A(c) 2,525,258
6,500,000 CIFC Funding Ltd., Series 2014-5A, Class BR2,3-month LIBOR + 1.800%, 1.990%, 10/17/2031,144A(c) 6,500,733
3,335,000 Dryden 53 CLO Ltd., Series 2017-53A, Class B,3-month LIBOR + 1.400%, 1.584%, 1/15/2031,144A(c) 3,302,600
1,030,000 Dryden 86 CLO Ltd., Series 2020-86A, Class B,3-month LIBOR + 2.200%, 2.390%, 7/17/2030,144A(c) 1,030,478
1,250,000 Galaxy XXV CLO Ltd., Series 2018-25A, Class B,3-month LIBOR + 1.650%, 1.826%, 10/25/2031,144A(c) 1,250,325
4,465,000 Galaxy XXVI CLO Ltd., Series 2018-26A, Class B,3-month LIBOR + 1.700%, 1.850%, 11/22/2031,144A(c) 4,467,333
9,755,000 Gallatin CLO VIII Ltd., Series 2017-1A, Class B,3-month LIBOR + 1.650%, 1.834%, 7/15/2027,144A(a)(c) 9,768,918
5,405,000 Goldentree Loan Management U.S CLO 3 Ltd.,Series 2018-3A, Class B1, 3-month LIBOR +1.550%, 1.738%, 4/20/2030, 144A(c) 5,391,251
7,965,694 Halcyon Loan Advisors Funding Ltd.,Series 2014-3A, Class B1R, 3-month LIBOR +1.700%, 1.884%, 10/22/2025, 144A(a)(c) 7,971,765
13,735,000 Hayfin U.S. XII Ltd., Series 2018-8A, Class B,3-month LIBOR + 1.480%, 1.668%, 4/20/2031,144A(c) 13,477,073
3,545,000 Invesco CLO Ltd., Series 2021-1A, Class D,3-month LIBOR + 3.050%, 3.215%, 4/15/2034,144A(c) 3,544,807
1,000,000 Jamestown CLO IX Ltd., Series 2016-9A,Class A2R, 3-month LIBOR +1.850%, 2.038%, 10/20/2028, 144A(c) 1,000,437
4,475,000 Madison Park Funding XII Ltd., Series 2014-12A,Class CR, 3-month LIBOR +2.350%, 2.538%, 7/20/2026, 144A(a)(c) 4,475,673
13,180,000 Madison Park Funding XIV Ltd.,Series 2014-14A, Class BRR, 3-month LIBOR +1.700%, 1.884%, 10/22/2030, 144A(c) 13,179,953
2,770,000 Madison Park Funding XVI Ltd.,Series 2015-16A, Class A2R, 3-month LIBOR +1.900%, 2.088%, 4/20/2026, 144A(c) 2,770,000
2,105,000 Neuberger Berman CLO XVI-S Ltd., Series 2017-16SA, Class DR, 3-month LIBOR +2.900%, 3.100%, 4/15/2034, 144A(c) 2,104,979
PrincipalAmount Description Value (†)
Collateralized Loan Obligations — continued$ 545,455 Neuberger Berman CLO XVIII Ltd.,
Series 2014-18A, Class A2R2, 3-month LIBOR +1.700%, 1.886%, 10/21/2030, 144A(c) $ 545,489
1,750,000 OCP CLO Ltd., Series 2015-9A, Class BR,3-month LIBOR + 1.750%, 1.934%, 7/15/2027,144A(c) 1,743,613
14,755,000 OCP CLO Ltd., Series 2020-8RA, Class A2,3-month LIBOR + 1.550%, 1.770%, 1/17/2032,144A(a)(c) 14,712,721
2,000,000 Octagon Investment Partners 26 Ltd.,Series 2016-1A, Class BR, 3-month LIBOR +1.600%, 1.784%, 7/15/2030, 144A(c) 1,999,195
1,986,282 Octagon Investment Partners 26 Ltd.,Series 2016-1A, Class BR, 3-month LIBOR +1.800%, 1.976%, 10/24/2030, 144A(c) 1,986,554
7,170,000 Octagon Investment Partners Ltd.,Series 2018-18A, Class A2, 3-month LIBOR +1.470%, 1.654%, 4/16/2031, 144A(c) 7,103,751
3,605,000 OZLM XXIV Ltd., Series 2019-24A, Class A2A,3-month LIBOR + 2.250%, 2.438%, 7/20/2032,144A(c) 3,606,727
1,730,000 Recette CLO Ltd., Series 2015-1A, Class BRR,3-month LIBOR + 1.400%, 1.588%, 4/20/2034,144A(c) 1,705,713
1,015,000 Regatta XV Funding Ltd., Series 2018-4A,Class A2, 3-month LIBOR +1.850%, 2.026%, 10/25/2031, 144A(c) 1,014,952
6,680,000 Rockford Tower CLO Ltd., Series 2017-1A,Class DR2A, 3-month LIBOR +3.250%, 3.434%, 4/20/2034, 144A(c) 6,679,908
3,335,000 Voya CLO Ltd., Series 2013-3A, Class A2RR,3-month LIBOR + 1.700%, 1.890%, 10/18/2031,144A(c) 3,335,463
1,610,000 Voya CLO Ltd., Series 2016-3A, Class A3R,3-month LIBOR + 1.750%, 1.940%, 10/18/2031,144A(c) 1,610,298
6,235,000 Voya CLO Ltd., Series 2018-3A, Class B, 3-monthLIBOR + 1.650%, 1.834%, 10/15/2031, 144A(c) 6,235,519
Total Collateralized Loan Obligations(Identified Cost $161,088,143) 164,020,493
Shares
Preferred Stocks – 1.4%Convertible Preferred Stocks — 1.4%
Banking — 0.8%17,832 Bank of America Corp., Series L, 7.250% 25,250,11218,269 Wells Fargo & Co., Class A, Series L, 7.500% 27,882,330
53,132,442
Food & Beverage — 0.2%138,542 Bunge Ltd., 4.875% 16,079,184
Wireless — 0.4%18,282 2020 Cash Mandatory Exchangeable Trust,
5.250%, 144A(d)(f) 23,036,783
Total Convertible Preferred Stocks(Identified Cost $87,077,725) 92,248,409
Total Preferred Stocks(Identified Cost $87,077,725) 92,248,409
See accompanying notes to financial statements. | 36
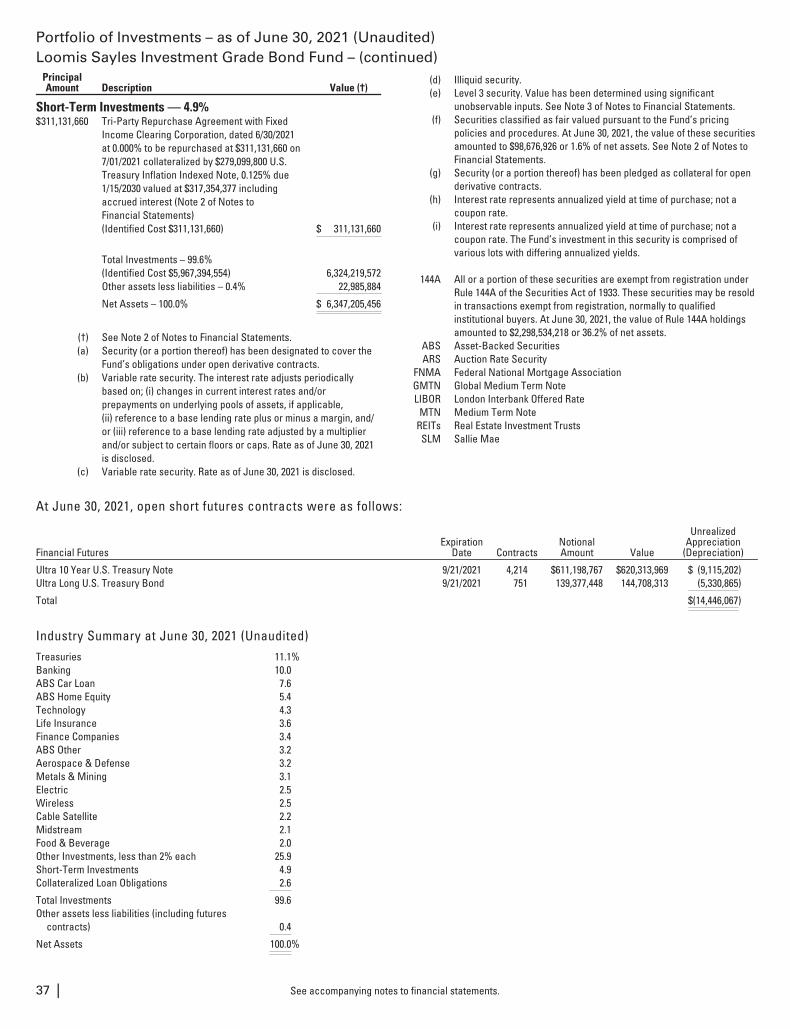
Portfolio of Investments – as of June 30, 2021 (Unaudited)Loomis Sayles Investment Grade Bond Fund – (continued)
PrincipalAmount Description Value (†)
Short-Term Investments — 4.9%$311,131,660 Tri-Party Repurchase Agreement with Fixed
Income Clearing Corporation, dated 6/30/2021at 0.000% to be repurchased at $311,131,660 on7/01/2021 collateralized by $279,099,800 U.S.Treasury Inflation Indexed Note, 0.125% due1/15/2030 valued at $317,354,377 includingaccrued interest (Note 2 of Notes toFinancial Statements)(Identified Cost $311,131,660) $ 311,131,660
Total Investments – 99.6%(Identified Cost $5,967,394,554) 6,324,219,572Other assets less liabilities – 0.4% 22,985,884
Net Assets – 100.0% $ 6,347,205,456
(†) See Note 2 of Notes to Financial Statements.(a) Security (or a portion thereof) has been designated to cover the
Fund’s obligations under open derivative contracts.(b) Variable rate security. The interest rate adjusts periodically
based on; (i) changes in current interest rates and/orprepayments on underlying pools of assets, if applicable,(ii) reference to a base lending rate plus or minus a margin, and/or (iii) reference to a base lending rate adjusted by a multiplierand/or subject to certain floors or caps. Rate as of June 30, 2021is disclosed.
(c) Variable rate security. Rate as of June 30, 2021 is disclosed.
(d) Illiquid security.(e) Level 3 security. Value has been determined using significant
unobservable inputs. See Note 3 of Notes to Financial Statements.(f) Securities classified as fair valued pursuant to the Fund’s pricing
policies and procedures. At June 30, 2021, the value of these securitiesamounted to $98,676,926 or 1.6% of net assets. See Note 2 of Notes toFinancial Statements.
(g) Security (or a portion thereof) has been pledged as collateral for openderivative contracts.
(h) Interest rate represents annualized yield at time of purchase; not acoupon rate.
(i) Interest rate represents annualized yield at time of purchase; not acoupon rate. The Fund’s investment in this security is comprised ofvarious lots with differing annualized yields.
144A All or a portion of these securities are exempt from registration underRule 144A of the Securities Act of 1933. These securities may be resoldin transactions exempt from registration, normally to qualifiedinstitutional buyers. At June 30, 2021, the value of Rule 144A holdingsamounted to $2,298,534,218 or 36.2% of net assets.
ABS Asset-Backed SecuritiesARS Auction Rate Security
FNMA Federal National Mortgage AssociationGMTN Global Medium Term NoteLIBOR London Interbank Offered Rate
MTN Medium Term NoteREITs Real Estate Investment TrustsSLM Sallie Mae
At June 30, 2021, open short futures contracts were as follows:
Financial FuturesExpiration
Date ContractsNotionalAmount Value
UnrealizedAppreciation
(Depreciation)
Ultra 10 Year U.S. Treasury Note 9/21/2021 4,214 $611,198,767 $620,313,969 $ (9,115,202)Ultra Long U.S. Treasury Bond 9/21/2021 751 139,377,448 144,708,313 (5,330,865)
Total $(14,446,067)
Industry Summary at June 30, 2021 (Unaudited)Treasuries 11.1%Banking 10.0ABS Car Loan 7.6ABS Home Equity 5.4Technology 4.3Life Insurance 3.6Finance Companies 3.4ABS Other 3.2Aerospace & Defense 3.2Metals & Mining 3.1Electric 2.5Wireless 2.5Cable Satellite 2.2Midstream 2.1Food & Beverage 2.0Other Investments, less than 2% each 25.9Short-Term Investments 4.9Collateralized Loan Obligations 2.6
Total Investments 99.6Other assets less liabilities (including futures
contracts) 0.4
Net Assets 100.0%
See accompanying notes to financial statements.37 |
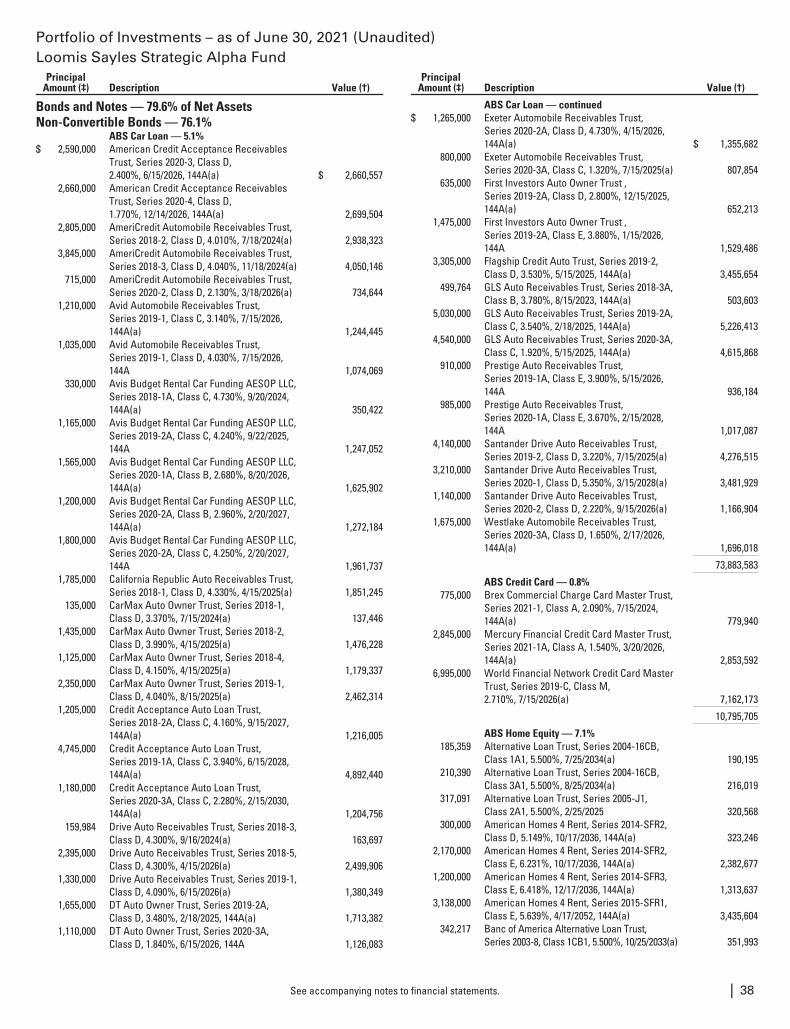
Portfolio of Investments – as of June 30, 2021 (Unaudited)Loomis Sayles Strategic Alpha Fund
PrincipalAmount (‡) Description Value (†)
Bonds and Notes — 79.6% of Net AssetsNon-Convertible Bonds — 76.1%
ABS Car Loan — 5.1%$ 2,590,000 American Credit Acceptance Receivables
Trust, Series 2020-3, Class D,2.400%, 6/15/2026, 144A(a) $ 2,660,557
2,660,000 American Credit Acceptance ReceivablesTrust, Series 2020-4, Class D,1.770%, 12/14/2026, 144A(a) 2,699,504
2,805,000 AmeriCredit Automobile Receivables Trust,Series 2018-2, Class D, 4.010%, 7/18/2024(a) 2,938,323
3,845,000 AmeriCredit Automobile Receivables Trust,Series 2018-3, Class D, 4.040%, 11/18/2024(a) 4,050,146
715,000 AmeriCredit Automobile Receivables Trust,Series 2020-2, Class D, 2.130%, 3/18/2026(a) 734,644
1,210,000 Avid Automobile Receivables Trust,Series 2019-1, Class C, 3.140%, 7/15/2026,144A(a) 1,244,445
1,035,000 Avid Automobile Receivables Trust,Series 2019-1, Class D, 4.030%, 7/15/2026,144A 1,074,069
330,000 Avis Budget Rental Car Funding AESOP LLC,Series 2018-1A, Class C, 4.730%, 9/20/2024,144A(a) 350,422
1,165,000 Avis Budget Rental Car Funding AESOP LLC,Series 2019-2A, Class C, 4.240%, 9/22/2025,144A 1,247,052
1,565,000 Avis Budget Rental Car Funding AESOP LLC,Series 2020-1A, Class B, 2.680%, 8/20/2026,144A(a) 1,625,902
1,200,000 Avis Budget Rental Car Funding AESOP LLC,Series 2020-2A, Class B, 2.960%, 2/20/2027,144A(a) 1,272,184
1,800,000 Avis Budget Rental Car Funding AESOP LLC,Series 2020-2A, Class C, 4.250%, 2/20/2027,144A 1,961,737
1,785,000 California Republic Auto Receivables Trust,Series 2018-1, Class D, 4.330%, 4/15/2025(a) 1,851,245
135,000 CarMax Auto Owner Trust, Series 2018-1,Class D, 3.370%, 7/15/2024(a) 137,446
1,435,000 CarMax Auto Owner Trust, Series 2018-2,Class D, 3.990%, 4/15/2025(a) 1,476,228
1,125,000 CarMax Auto Owner Trust, Series 2018-4,Class D, 4.150%, 4/15/2025(a) 1,179,337
2,350,000 CarMax Auto Owner Trust, Series 2019-1,Class D, 4.040%, 8/15/2025(a) 2,462,314
1,205,000 Credit Acceptance Auto Loan Trust,Series 2018-2A, Class C, 4.160%, 9/15/2027,144A(a) 1,216,005
4,745,000 Credit Acceptance Auto Loan Trust,Series 2019-1A, Class C, 3.940%, 6/15/2028,144A(a) 4,892,440
1,180,000 Credit Acceptance Auto Loan Trust,Series 2020-3A, Class C, 2.280%, 2/15/2030,144A(a) 1,204,756
159,984 Drive Auto Receivables Trust, Series 2018-3,Class D, 4.300%, 9/16/2024(a) 163,697
2,395,000 Drive Auto Receivables Trust, Series 2018-5,Class D, 4.300%, 4/15/2026(a) 2,499,906
1,330,000 Drive Auto Receivables Trust, Series 2019-1,Class D, 4.090%, 6/15/2026(a) 1,380,349
1,655,000 DT Auto Owner Trust, Series 2019-2A,Class D, 3.480%, 2/18/2025, 144A(a) 1,713,382
1,110,000 DT Auto Owner Trust, Series 2020-3A,Class D, 1.840%, 6/15/2026, 144A 1,126,083
PrincipalAmount (‡) Description Value (†)
ABS Car Loan — continued$ 1,265,000 Exeter Automobile Receivables Trust,
Series 2020-2A, Class D, 4.730%, 4/15/2026,144A(a) $ 1,355,682
800,000 Exeter Automobile Receivables Trust,Series 2020-3A, Class C, 1.320%, 7/15/2025(a) 807,854
635,000 First Investors Auto Owner Trust ,Series 2019-2A, Class D, 2.800%, 12/15/2025,144A(a) 652,213
1,475,000 First Investors Auto Owner Trust ,Series 2019-2A, Class E, 3.880%, 1/15/2026,144A 1,529,486
3,305,000 Flagship Credit Auto Trust, Series 2019-2,Class D, 3.530%, 5/15/2025, 144A(a) 3,455,654
499,764 GLS Auto Receivables Trust, Series 2018-3A,Class B, 3.780%, 8/15/2023, 144A(a) 503,603
5,030,000 GLS Auto Receivables Trust, Series 2019-2A,Class C, 3.540%, 2/18/2025, 144A(a) 5,226,413
4,540,000 GLS Auto Receivables Trust, Series 2020-3A,Class C, 1.920%, 5/15/2025, 144A(a) 4,615,868
910,000 Prestige Auto Receivables Trust,Series 2019-1A, Class E, 3.900%, 5/15/2026,144A 936,184
985,000 Prestige Auto Receivables Trust,Series 2020-1A, Class E, 3.670%, 2/15/2028,144A 1,017,087
4,140,000 Santander Drive Auto Receivables Trust,Series 2019-2, Class D, 3.220%, 7/15/2025(a) 4,276,515
3,210,000 Santander Drive Auto Receivables Trust,Series 2020-1, Class D, 5.350%, 3/15/2028(a) 3,481,929
1,140,000 Santander Drive Auto Receivables Trust,Series 2020-2, Class D, 2.220%, 9/15/2026(a) 1,166,904
1,675,000 Westlake Automobile Receivables Trust,Series 2020-3A, Class D, 1.650%, 2/17/2026,144A(a) 1,696,018
73,883,583
ABS Credit Card — 0.8%775,000 Brex Commercial Charge Card Master Trust,
Series 2021-1, Class A, 2.090%, 7/15/2024,144A(a) 779,940
2,845,000 Mercury Financial Credit Card Master Trust,Series 2021-1A, Class A, 1.540%, 3/20/2026,144A(a) 2,853,592
6,995,000 World Financial Network Credit Card MasterTrust, Series 2019-C, Class M,2.710%, 7/15/2026(a) 7,162,173
10,795,705
ABS Home Equity — 7.1%185,359 Alternative Loan Trust, Series 2004-16CB,
Class 1A1, 5.500%, 7/25/2034(a) 190,195210,390 Alternative Loan Trust, Series 2004-16CB,
Class 3A1, 5.500%, 8/25/2034(a) 216,019317,091 Alternative Loan Trust, Series 2005-J1,
Class 2A1, 5.500%, 2/25/2025 320,568300,000 American Homes 4 Rent, Series 2014-SFR2,
Class D, 5.149%, 10/17/2036, 144A(a) 323,2462,170,000 American Homes 4 Rent, Series 2014-SFR2,
Class E, 6.231%, 10/17/2036, 144A(a) 2,382,6771,200,000 American Homes 4 Rent, Series 2014-SFR3,
Class E, 6.418%, 12/17/2036, 144A(a) 1,313,6373,138,000 American Homes 4 Rent, Series 2015-SFR1,
Class E, 5.639%, 4/17/2052, 144A(a) 3,435,604342,217 Banc of America Alternative Loan Trust,
Series 2003-8, Class 1CB1, 5.500%, 10/25/2033(a) 351,993
See accompanying notes to financial statements. | 38
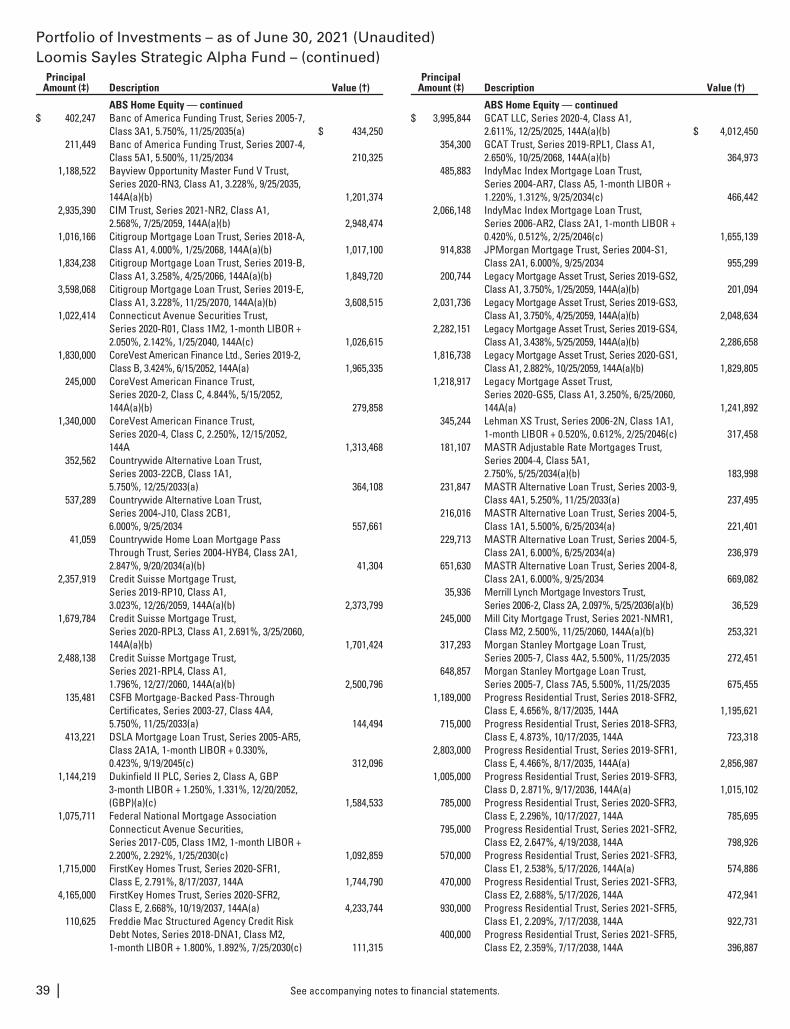
Portfolio of Investments – as of June 30, 2021 (Unaudited)Loomis Sayles Strategic Alpha Fund – (continued)
PrincipalAmount (‡) Description Value (†)
ABS Home Equity — continued$ 402,247 Banc of America Funding Trust, Series 2005-7,
Class 3A1, 5.750%, 11/25/2035(a) $ 434,250211,449 Banc of America Funding Trust, Series 2007-4,
Class 5A1, 5.500%, 11/25/2034 210,3251,188,522 Bayview Opportunity Master Fund V Trust,
Series 2020-RN3, Class A1, 3.228%, 9/25/2035,144A(a)(b) 1,201,374
2,935,390 CIM Trust, Series 2021-NR2, Class A1,2.568%, 7/25/2059, 144A(a)(b) 2,948,474
1,016,166 Citigroup Mortgage Loan Trust, Series 2018-A,Class A1, 4.000%, 1/25/2068, 144A(a)(b) 1,017,100
1,834,238 Citigroup Mortgage Loan Trust, Series 2019-B,Class A1, 3.258%, 4/25/2066, 144A(a)(b) 1,849,720
3,598,068 Citigroup Mortgage Loan Trust, Series 2019-E,Class A1, 3.228%, 11/25/2070, 144A(a)(b) 3,608,515
1,022,414 Connecticut Avenue Securities Trust,Series 2020-R01, Class 1M2, 1-month LIBOR +2.050%, 2.142%, 1/25/2040, 144A(c) 1,026,615
1,830,000 CoreVest American Finance Ltd., Series 2019-2,Class B, 3.424%, 6/15/2052, 144A(a) 1,965,335
245,000 CoreVest American Finance Trust,Series 2020-2, Class C, 4.844%, 5/15/2052,144A(a)(b) 279,858
1,340,000 CoreVest American Finance Trust,Series 2020-4, Class C, 2.250%, 12/15/2052,144A 1,313,468
352,562 Countrywide Alternative Loan Trust,Series 2003-22CB, Class 1A1,5.750%, 12/25/2033(a) 364,108
537,289 Countrywide Alternative Loan Trust,Series 2004-J10, Class 2CB1,6.000%, 9/25/2034 557,661
41,059 Countrywide Home Loan Mortgage PassThrough Trust, Series 2004-HYB4, Class 2A1,2.847%, 9/20/2034(a)(b) 41,304
2,357,919 Credit Suisse Mortgage Trust,Series 2019-RP10, Class A1,3.023%, 12/26/2059, 144A(a)(b) 2,373,799
1,679,784 Credit Suisse Mortgage Trust,Series 2020-RPL3, Class A1, 2.691%, 3/25/2060,144A(a)(b) 1,701,424
2,488,138 Credit Suisse Mortgage Trust,Series 2021-RPL4, Class A1,1.796%, 12/27/2060, 144A(a)(b) 2,500,796
135,481 CSFB Mortgage-Backed Pass-ThroughCertificates, Series 2003-27, Class 4A4,5.750%, 11/25/2033(a) 144,494
413,221 DSLA Mortgage Loan Trust, Series 2005-AR5,Class 2A1A, 1-month LIBOR + 0.330%,0.423%, 9/19/2045(c) 312,096
1,144,219 Dukinfield II PLC, Series 2, Class A, GBP3-month LIBOR + 1.250%, 1.331%, 12/20/2052,(GBP)(a)(c) 1,584,533
1,075,711 Federal National Mortgage AssociationConnecticut Avenue Securities,Series 2017-C05, Class 1M2, 1-month LIBOR +2.200%, 2.292%, 1/25/2030(c) 1,092,859
1,715,000 FirstKey Homes Trust, Series 2020-SFR1,Class E, 2.791%, 8/17/2037, 144A 1,744,790
4,165,000 FirstKey Homes Trust, Series 2020-SFR2,Class E, 2.668%, 10/19/2037, 144A(a) 4,233,744
110,625 Freddie Mac Structured Agency Credit RiskDebt Notes, Series 2018-DNA1, Class M2,1-month LIBOR + 1.800%, 1.892%, 7/25/2030(c) 111,315
PrincipalAmount (‡) Description Value (†)
ABS Home Equity — continued$ 3,995,844 GCAT LLC, Series 2020-4, Class A1,
2.611%, 12/25/2025, 144A(a)(b) $ 4,012,450354,300 GCAT Trust, Series 2019-RPL1, Class A1,
2.650%, 10/25/2068, 144A(a)(b) 364,973485,883 IndyMac Index Mortgage Loan Trust,
Series 2004-AR7, Class A5, 1-month LIBOR +1.220%, 1.312%, 9/25/2034(c) 466,442
2,066,148 IndyMac Index Mortgage Loan Trust,Series 2006-AR2, Class 2A1, 1-month LIBOR +0.420%, 0.512%, 2/25/2046(c) 1,655,139
914,838 JPMorgan Mortgage Trust, Series 2004-S1,Class 2A1, 6.000%, 9/25/2034 955,299
200,744 Legacy Mortgage Asset Trust, Series 2019-GS2,Class A1, 3.750%, 1/25/2059, 144A(a)(b) 201,094
2,031,736 Legacy Mortgage Asset Trust, Series 2019-GS3,Class A1, 3.750%, 4/25/2059, 144A(a)(b) 2,048,634
2,282,151 Legacy Mortgage Asset Trust, Series 2019-GS4,Class A1, 3.438%, 5/25/2059, 144A(a)(b) 2,286,658
1,816,738 Legacy Mortgage Asset Trust, Series 2020-GS1,Class A1, 2.882%, 10/25/2059, 144A(a)(b) 1,829,805
1,218,917 Legacy Mortgage Asset Trust,Series 2020-GS5, Class A1, 3.250%, 6/25/2060,144A(a) 1,241,892
345,244 Lehman XS Trust, Series 2006-2N, Class 1A1,1-month LIBOR + 0.520%, 0.612%, 2/25/2046(c) 317,458
181,107 MASTR Adjustable Rate Mortgages Trust,Series 2004-4, Class 5A1,2.750%, 5/25/2034(a)(b) 183,998
231,847 MASTR Alternative Loan Trust, Series 2003-9,Class 4A1, 5.250%, 11/25/2033(a) 237,495
216,016 MASTR Alternative Loan Trust, Series 2004-5,Class 1A1, 5.500%, 6/25/2034(a) 221,401
229,713 MASTR Alternative Loan Trust, Series 2004-5,Class 2A1, 6.000%, 6/25/2034(a) 236,979
651,630 MASTR Alternative Loan Trust, Series 2004-8,Class 2A1, 6.000%, 9/25/2034 669,082
35,936 Merrill Lynch Mortgage Investors Trust,Series 2006-2, Class 2A, 2.097%, 5/25/2036(a)(b) 36,529
245,000 Mill City Mortgage Trust, Series 2021-NMR1,Class M2, 2.500%, 11/25/2060, 144A(a)(b) 253,321
317,293 Morgan Stanley Mortgage Loan Trust,Series 2005-7, Class 4A2, 5.500%, 11/25/2035 272,451
648,857 Morgan Stanley Mortgage Loan Trust,Series 2005-7, Class 7A5, 5.500%, 11/25/2035 675,455
1,189,000 Progress Residential Trust, Series 2018-SFR2,Class E, 4.656%, 8/17/2035, 144A 1,195,621
715,000 Progress Residential Trust, Series 2018-SFR3,Class E, 4.873%, 10/17/2035, 144A 723,318
2,803,000 Progress Residential Trust, Series 2019-SFR1,Class E, 4.466%, 8/17/2035, 144A(a) 2,856,987
1,005,000 Progress Residential Trust, Series 2019-SFR3,Class D, 2.871%, 9/17/2036, 144A(a) 1,015,102
785,000 Progress Residential Trust, Series 2020-SFR3,Class E, 2.296%, 10/17/2027, 144A 785,695
795,000 Progress Residential Trust, Series 2021-SFR2,Class E2, 2.647%, 4/19/2038, 144A 798,926
570,000 Progress Residential Trust, Series 2021-SFR3,Class E1, 2.538%, 5/17/2026, 144A(a) 574,886
470,000 Progress Residential Trust, Series 2021-SFR3,Class E2, 2.688%, 5/17/2026, 144A 472,941
930,000 Progress Residential Trust, Series 2021-SFR5,Class E1, 2.209%, 7/17/2038, 144A 922,731
400,000 Progress Residential Trust, Series 2021-SFR5,Class E2, 2.359%, 7/17/2038, 144A 396,887
See accompanying notes to financial statements.39 |
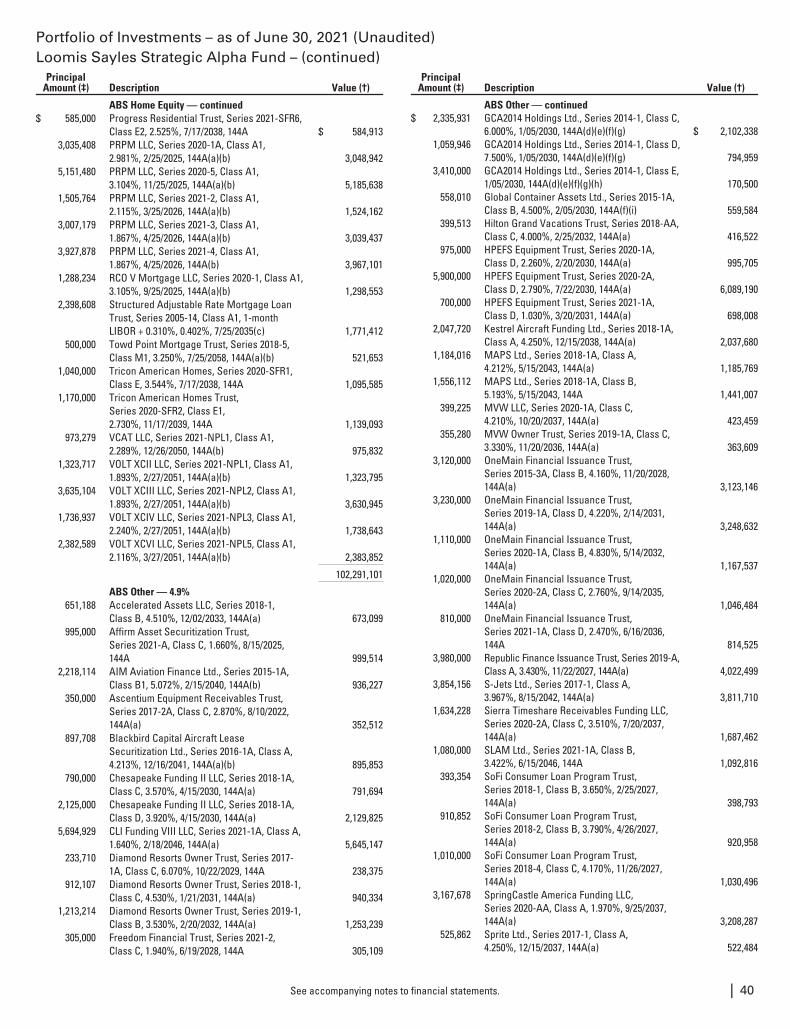
Portfolio of Investments – as of June 30, 2021 (Unaudited)Loomis Sayles Strategic Alpha Fund – (continued)
PrincipalAmount (‡) Description Value (†)
ABS Home Equity — continued$ 585,000 Progress Residential Trust, Series 2021-SFR6,
Class E2, 2.525%, 7/17/2038, 144A $ 584,9133,035,408 PRPM LLC, Series 2020-1A, Class A1,
2.981%, 2/25/2025, 144A(a)(b) 3,048,9425,151,480 PRPM LLC, Series 2020-5, Class A1,
3.104%, 11/25/2025, 144A(a)(b) 5,185,6381,505,764 PRPM LLC, Series 2021-2, Class A1,
2.115%, 3/25/2026, 144A(a)(b) 1,524,1623,007,179 PRPM LLC, Series 2021-3, Class A1,
1.867%, 4/25/2026, 144A(a)(b) 3,039,4373,927,878 PRPM LLC, Series 2021-4, Class A1,
1.867%, 4/25/2026, 144A(b) 3,967,1011,288,234 RCO V Mortgage LLC, Series 2020-1, Class A1,
3.105%, 9/25/2025, 144A(a)(b) 1,298,5532,398,608 Structured Adjustable Rate Mortgage Loan
Trust, Series 2005-14, Class A1, 1-monthLIBOR + 0.310%, 0.402%, 7/25/2035(c) 1,771,412
500,000 Towd Point Mortgage Trust, Series 2018-5,Class M1, 3.250%, 7/25/2058, 144A(a)(b) 521,653
1,040,000 Tricon American Homes, Series 2020-SFR1,Class E, 3.544%, 7/17/2038, 144A 1,095,585
1,170,000 Tricon American Homes Trust,Series 2020-SFR2, Class E1,2.730%, 11/17/2039, 144A 1,139,093
973,279 VCAT LLC, Series 2021-NPL1, Class A1,2.289%, 12/26/2050, 144A(b) 975,832
1,323,717 VOLT XCII LLC, Series 2021-NPL1, Class A1,1.893%, 2/27/2051, 144A(a)(b) 1,323,795
3,635,104 VOLT XCIII LLC, Series 2021-NPL2, Class A1,1.893%, 2/27/2051, 144A(a)(b) 3,630,945
1,736,937 VOLT XCIV LLC, Series 2021-NPL3, Class A1,2.240%, 2/27/2051, 144A(a)(b) 1,738,643
2,382,589 VOLT XCVI LLC, Series 2021-NPL5, Class A1,2.116%, 3/27/2051, 144A(a)(b) 2,383,852
102,291,101
ABS Other — 4.9%651,188 Accelerated Assets LLC, Series 2018-1,
Class B, 4.510%, 12/02/2033, 144A(a) 673,099995,000 Affirm Asset Securitization Trust,
Series 2021-A, Class C, 1.660%, 8/15/2025,144A 999,514
2,218,114 AIM Aviation Finance Ltd., Series 2015-1A,Class B1, 5.072%, 2/15/2040, 144A(b) 936,227
350,000 Ascentium Equipment Receivables Trust,Series 2017-2A, Class C, 2.870%, 8/10/2022,144A(a) 352,512
897,708 Blackbird Capital Aircraft LeaseSecuritization Ltd., Series 2016-1A, Class A,4.213%, 12/16/2041, 144A(a)(b) 895,853
790,000 Chesapeake Funding II LLC, Series 2018-1A,Class C, 3.570%, 4/15/2030, 144A(a) 791,694
2,125,000 Chesapeake Funding II LLC, Series 2018-1A,Class D, 3.920%, 4/15/2030, 144A(a) 2,129,825
5,694,929 CLI Funding VIII LLC, Series 2021-1A, Class A,1.640%, 2/18/2046, 144A(a) 5,645,147
233,710 Diamond Resorts Owner Trust, Series 2017-1A, Class C, 6.070%, 10/22/2029, 144A 238,375
912,107 Diamond Resorts Owner Trust, Series 2018-1,Class C, 4.530%, 1/21/2031, 144A(a) 940,334
1,213,214 Diamond Resorts Owner Trust, Series 2019-1,Class B, 3.530%, 2/20/2032, 144A(a) 1,253,239
305,000 Freedom Financial Trust, Series 2021-2,Class C, 1.940%, 6/19/2028, 144A 305,109
PrincipalAmount (‡) Description Value (†)
ABS Other — continued$ 2,335,931 GCA2014 Holdings Ltd., Series 2014-1, Class C,
6.000%, 1/05/2030, 144A(d)(e)(f)(g) $ 2,102,3381,059,946 GCA2014 Holdings Ltd., Series 2014-1, Class D,
7.500%, 1/05/2030, 144A(d)(e)(f)(g) 794,9593,410,000 GCA2014 Holdings Ltd., Series 2014-1, Class E,
1/05/2030, 144A(d)(e)(f)(g)(h) 170,500558,010 Global Container Assets Ltd., Series 2015-1A,
Class B, 4.500%, 2/05/2030, 144A(f)(i) 559,584399,513 Hilton Grand Vacations Trust, Series 2018-AA,
Class C, 4.000%, 2/25/2032, 144A(a) 416,522975,000 HPEFS Equipment Trust, Series 2020-1A,
Class D, 2.260%, 2/20/2030, 144A(a) 995,7055,900,000 HPEFS Equipment Trust, Series 2020-2A,
Class D, 2.790%, 7/22/2030, 144A(a) 6,089,190700,000 HPEFS Equipment Trust, Series 2021-1A,
Class D, 1.030%, 3/20/2031, 144A(a) 698,0082,047,720 Kestrel Aircraft Funding Ltd., Series 2018-1A,
Class A, 4.250%, 12/15/2038, 144A(a) 2,037,6801,184,016 MAPS Ltd., Series 2018-1A, Class A,
4.212%, 5/15/2043, 144A(a) 1,185,7691,556,112 MAPS Ltd., Series 2018-1A, Class B,
5.193%, 5/15/2043, 144A 1,441,007399,225 MVW LLC, Series 2020-1A, Class C,
4.210%, 10/20/2037, 144A(a) 423,459355,280 MVW Owner Trust, Series 2019-1A, Class C,
3.330%, 11/20/2036, 144A(a) 363,6093,120,000 OneMain Financial Issuance Trust,
Series 2015-3A, Class B, 4.160%, 11/20/2028,144A(a) 3,123,146
3,230,000 OneMain Financial Issuance Trust,Series 2019-1A, Class D, 4.220%, 2/14/2031,144A(a) 3,248,632
1,110,000 OneMain Financial Issuance Trust,Series 2020-1A, Class B, 4.830%, 5/14/2032,144A(a) 1,167,537
1,020,000 OneMain Financial Issuance Trust,Series 2020-2A, Class C, 2.760%, 9/14/2035,144A(a) 1,046,484
810,000 OneMain Financial Issuance Trust,Series 2021-1A, Class D, 2.470%, 6/16/2036,144A 814,525
3,980,000 Republic Finance Issuance Trust, Series 2019-A,Class A, 3.430%, 11/22/2027, 144A(a) 4,022,499
3,854,156 S-Jets Ltd., Series 2017-1, Class A,3.967%, 8/15/2042, 144A(a) 3,811,710
1,634,228 Sierra Timeshare Receivables Funding LLC,Series 2020-2A, Class C, 3.510%, 7/20/2037,144A(a) 1,687,462
1,080,000 SLAM Ltd., Series 2021-1A, Class B,3.422%, 6/15/2046, 144A 1,092,816
393,354 SoFi Consumer Loan Program Trust,Series 2018-1, Class B, 3.650%, 2/25/2027,144A(a) 398,793
910,852 SoFi Consumer Loan Program Trust,Series 2018-2, Class B, 3.790%, 4/26/2027,144A(a) 920,958
1,010,000 SoFi Consumer Loan Program Trust,Series 2018-4, Class C, 4.170%, 11/26/2027,144A(a) 1,030,496
3,167,678 SpringCastle America Funding LLC,Series 2020-AA, Class A, 1.970%, 9/25/2037,144A(a) 3,208,287
525,862 Sprite Ltd., Series 2017-1, Class A,4.250%, 12/15/2037, 144A(a) 522,484
See accompanying notes to financial statements. | 40
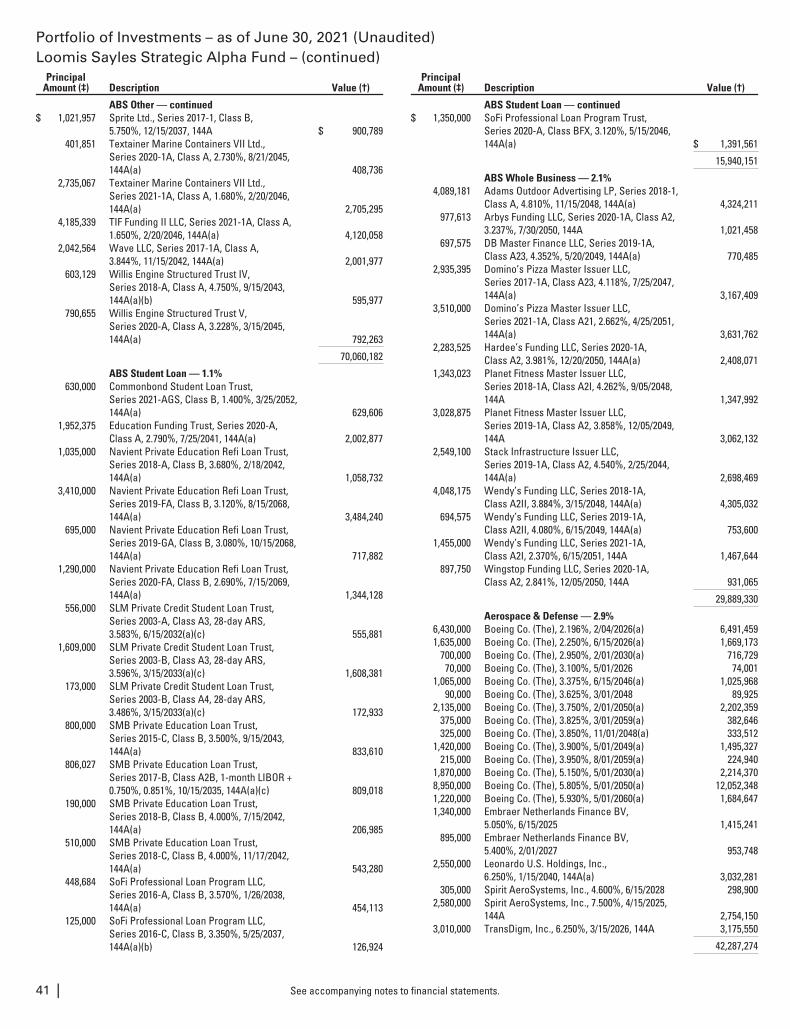
Portfolio of Investments – as of June 30, 2021 (Unaudited)Loomis Sayles Strategic Alpha Fund – (continued)
PrincipalAmount (‡) Description Value (†)
ABS Other — continued$ 1,021,957 Sprite Ltd., Series 2017-1, Class B,
5.750%, 12/15/2037, 144A $ 900,789401,851 Textainer Marine Containers VII Ltd.,
Series 2020-1A, Class A, 2.730%, 8/21/2045,144A(a) 408,736
2,735,067 Textainer Marine Containers VII Ltd.,Series 2021-1A, Class A, 1.680%, 2/20/2046,144A(a) 2,705,295
4,185,339 TIF Funding II LLC, Series 2021-1A, Class A,1.650%, 2/20/2046, 144A(a) 4,120,058
2,042,564 Wave LLC, Series 2017-1A, Class A,3.844%, 11/15/2042, 144A(a) 2,001,977
603,129 Willis Engine Structured Trust IV,Series 2018-A, Class A, 4.750%, 9/15/2043,144A(a)(b) 595,977
790,655 Willis Engine Structured Trust V,Series 2020-A, Class A, 3.228%, 3/15/2045,144A(a) 792,263
70,060,182
ABS Student Loan — 1.1%630,000 Commonbond Student Loan Trust,
Series 2021-AGS, Class B, 1.400%, 3/25/2052,144A(a) 629,606
1,952,375 Education Funding Trust, Series 2020-A,Class A, 2.790%, 7/25/2041, 144A(a) 2,002,877
1,035,000 Navient Private Education Refi Loan Trust,Series 2018-A, Class B, 3.680%, 2/18/2042,144A(a) 1,058,732
3,410,000 Navient Private Education Refi Loan Trust,Series 2019-FA, Class B, 3.120%, 8/15/2068,144A(a) 3,484,240
695,000 Navient Private Education Refi Loan Trust,Series 2019-GA, Class B, 3.080%, 10/15/2068,144A(a) 717,882
1,290,000 Navient Private Education Refi Loan Trust,Series 2020-FA, Class B, 2.690%, 7/15/2069,144A(a) 1,344,128
556,000 SLM Private Credit Student Loan Trust,Series 2003-A, Class A3, 28-day ARS,3.583%, 6/15/2032(a)(c) 555,881
1,609,000 SLM Private Credit Student Loan Trust,Series 2003-B, Class A3, 28-day ARS,3.596%, 3/15/2033(a)(c) 1,608,381
173,000 SLM Private Credit Student Loan Trust,Series 2003-B, Class A4, 28-day ARS,3.486%, 3/15/2033(a)(c) 172,933
800,000 SMB Private Education Loan Trust,Series 2015-C, Class B, 3.500%, 9/15/2043,144A(a) 833,610
806,027 SMB Private Education Loan Trust,Series 2017-B, Class A2B, 1-month LIBOR +0.750%, 0.851%, 10/15/2035, 144A(a)(c) 809,018
190,000 SMB Private Education Loan Trust,Series 2018-B, Class B, 4.000%, 7/15/2042,144A(a) 206,985
510,000 SMB Private Education Loan Trust,Series 2018-C, Class B, 4.000%, 11/17/2042,144A(a) 543,280
448,684 SoFi Professional Loan Program LLC,Series 2016-A, Class B, 3.570%, 1/26/2038,144A(a) 454,113
125,000 SoFi Professional Loan Program LLC,Series 2016-C, Class B, 3.350%, 5/25/2037,144A(a)(b) 126,924
PrincipalAmount (‡) Description Value (†)
ABS Student Loan — continued$ 1,350,000 SoFi Professional Loan Program Trust,
Series 2020-A, Class BFX, 3.120%, 5/15/2046,144A(a) $ 1,391,561
15,940,151
ABS Whole Business — 2.1%4,089,181 Adams Outdoor Advertising LP, Series 2018-1,
Class A, 4.810%, 11/15/2048, 144A(a) 4,324,211977,613 Arbys Funding LLC, Series 2020-1A, Class A2,
3.237%, 7/30/2050, 144A 1,021,458697,575 DB Master Finance LLC, Series 2019-1A,
Class A23, 4.352%, 5/20/2049, 144A(a) 770,4852,935,395 Domino’s Pizza Master Issuer LLC,
Series 2017-1A, Class A23, 4.118%, 7/25/2047,144A(a) 3,167,409
3,510,000 Domino’s Pizza Master Issuer LLC,Series 2021-1A, Class A21, 2.662%, 4/25/2051,144A(a) 3,631,762
2,283,525 Hardee’s Funding LLC, Series 2020-1A,Class A2, 3.981%, 12/20/2050, 144A(a) 2,408,071
1,343,023 Planet Fitness Master Issuer LLC,Series 2018-1A, Class A2I, 4.262%, 9/05/2048,144A 1,347,992
3,028,875 Planet Fitness Master Issuer LLC,Series 2019-1A, Class A2, 3.858%, 12/05/2049,144A 3,062,132
2,549,100 Stack Infrastructure Issuer LLC,Series 2019-1A, Class A2, 4.540%, 2/25/2044,144A(a) 2,698,469
4,048,175 Wendy’s Funding LLC, Series 2018-1A,Class A2II, 3.884%, 3/15/2048, 144A(a) 4,305,032
694,575 Wendy’s Funding LLC, Series 2019-1A,Class A2II, 4.080%, 6/15/2049, 144A(a) 753,600
1,455,000 Wendy’s Funding LLC, Series 2021-1A,Class A2I, 2.370%, 6/15/2051, 144A 1,467,644
897,750 Wingstop Funding LLC, Series 2020-1A,Class A2, 2.841%, 12/05/2050, 144A 931,065
29,889,330
Aerospace & Defense — 2.9%6,430,000 Boeing Co. (The), 2.196%, 2/04/2026(a) 6,491,4591,635,000 Boeing Co. (The), 2.250%, 6/15/2026(a) 1,669,173
700,000 Boeing Co. (The), 2.950%, 2/01/2030(a) 716,72970,000 Boeing Co. (The), 3.100%, 5/01/2026 74,001
1,065,000 Boeing Co. (The), 3.375%, 6/15/2046(a) 1,025,96890,000 Boeing Co. (The), 3.625%, 3/01/2048 89,925
2,135,000 Boeing Co. (The), 3.750%, 2/01/2050(a) 2,202,359375,000 Boeing Co. (The), 3.825%, 3/01/2059(a) 382,646325,000 Boeing Co. (The), 3.850%, 11/01/2048(a) 333,512
1,420,000 Boeing Co. (The), 3.900%, 5/01/2049(a) 1,495,327215,000 Boeing Co. (The), 3.950%, 8/01/2059(a) 224,940
1,870,000 Boeing Co. (The), 5.150%, 5/01/2030(a) 2,214,3708,950,000 Boeing Co. (The), 5.805%, 5/01/2050(a) 12,052,3481,220,000 Boeing Co. (The), 5.930%, 5/01/2060(a) 1,684,6471,340,000 Embraer Netherlands Finance BV,
5.050%, 6/15/2025 1,415,241895,000 Embraer Netherlands Finance BV,
5.400%, 2/01/2027 953,7482,550,000 Leonardo U.S. Holdings, Inc.,
6.250%, 1/15/2040, 144A(a) 3,032,281305,000 Spirit AeroSystems, Inc., 4.600%, 6/15/2028 298,900
2,580,000 Spirit AeroSystems, Inc., 7.500%, 4/15/2025,144A 2,754,150
3,010,000 TransDigm, Inc., 6.250%, 3/15/2026, 144A 3,175,550
42,287,274
See accompanying notes to financial statements.41 |
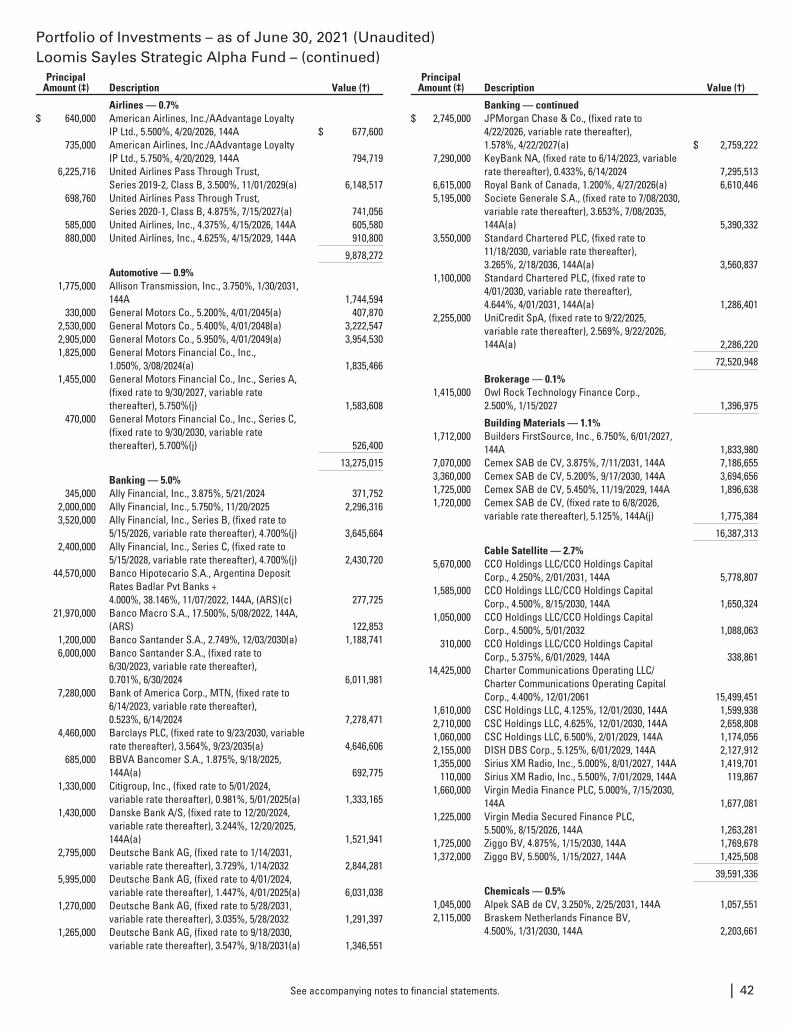
Portfolio of Investments – as of June 30, 2021 (Unaudited)Loomis Sayles Strategic Alpha Fund – (continued)
PrincipalAmount (‡) Description Value (†)
Airlines — 0.7%$ 640,000 American Airlines, Inc./AAdvantage Loyalty
IP Ltd., 5.500%, 4/20/2026, 144A $ 677,600735,000 American Airlines, Inc./AAdvantage Loyalty
IP Ltd., 5.750%, 4/20/2029, 144A 794,7196,225,716 United Airlines Pass Through Trust,
Series 2019-2, Class B, 3.500%, 11/01/2029(a) 6,148,517698,760 United Airlines Pass Through Trust,
Series 2020-1, Class B, 4.875%, 7/15/2027(a) 741,056585,000 United Airlines, Inc., 4.375%, 4/15/2026, 144A 605,580880,000 United Airlines, Inc., 4.625%, 4/15/2029, 144A 910,800
9,878,272
Automotive — 0.9%1,775,000 Allison Transmission, Inc., 3.750%, 1/30/2031,
144A 1,744,594330,000 General Motors Co., 5.200%, 4/01/2045(a) 407,870
2,530,000 General Motors Co., 5.400%, 4/01/2048(a) 3,222,5472,905,000 General Motors Co., 5.950%, 4/01/2049(a) 3,954,5301,825,000 General Motors Financial Co., Inc.,
1.050%, 3/08/2024(a) 1,835,4661,455,000 General Motors Financial Co., Inc., Series A,
(fixed rate to 9/30/2027, variable ratethereafter), 5.750%(j) 1,583,608
470,000 General Motors Financial Co., Inc., Series C,(fixed rate to 9/30/2030, variable ratethereafter), 5.700%(j) 526,400
13,275,015
Banking — 5.0%345,000 Ally Financial, Inc., 3.875%, 5/21/2024 371,752
2,000,000 Ally Financial, Inc., 5.750%, 11/20/2025 2,296,3163,520,000 Ally Financial, Inc., Series B, (fixed rate to
5/15/2026, variable rate thereafter), 4.700%(j) 3,645,6642,400,000 Ally Financial, Inc., Series C, (fixed rate to
5/15/2028, variable rate thereafter), 4.700%(j) 2,430,72044,570,000 Banco Hipotecario S.A., Argentina Deposit
Rates Badlar Pvt Banks +4.000%, 38.146%, 11/07/2022, 144A, (ARS)(c) 277,725
21,970,000 Banco Macro S.A., 17.500%, 5/08/2022, 144A,(ARS) 122,853
1,200,000 Banco Santander S.A., 2.749%, 12/03/2030(a) 1,188,7416,000,000 Banco Santander S.A., (fixed rate to
6/30/2023, variable rate thereafter),0.701%, 6/30/2024 6,011,981
7,280,000 Bank of America Corp., MTN, (fixed rate to6/14/2023, variable rate thereafter),0.523%, 6/14/2024 7,278,471
4,460,000 Barclays PLC, (fixed rate to 9/23/2030, variablerate thereafter), 3.564%, 9/23/2035(a) 4,646,606
685,000 BBVA Bancomer S.A., 1.875%, 9/18/2025,144A(a) 692,775
1,330,000 Citigroup, Inc., (fixed rate to 5/01/2024,variable rate thereafter), 0.981%, 5/01/2025(a) 1,333,165
1,430,000 Danske Bank A/S, (fixed rate to 12/20/2024,variable rate thereafter), 3.244%, 12/20/2025,144A(a) 1,521,941
2,795,000 Deutsche Bank AG, (fixed rate to 1/14/2031,variable rate thereafter), 3.729%, 1/14/2032 2,844,281
5,995,000 Deutsche Bank AG, (fixed rate to 4/01/2024,variable rate thereafter), 1.447%, 4/01/2025(a) 6,031,038
1,270,000 Deutsche Bank AG, (fixed rate to 5/28/2031,variable rate thereafter), 3.035%, 5/28/2032 1,291,397
1,265,000 Deutsche Bank AG, (fixed rate to 9/18/2030,variable rate thereafter), 3.547%, 9/18/2031(a) 1,346,551
PrincipalAmount (‡) Description Value (†)
Banking — continued$ 2,745,000 JPMorgan Chase & Co., (fixed rate to
4/22/2026, variable rate thereafter),1.578%, 4/22/2027(a) $ 2,759,222
7,290,000 KeyBank NA, (fixed rate to 6/14/2023, variablerate thereafter), 0.433%, 6/14/2024 7,295,513
6,615,000 Royal Bank of Canada, 1.200%, 4/27/2026(a) 6,610,4465,195,000 Societe Generale S.A., (fixed rate to 7/08/2030,
variable rate thereafter), 3.653%, 7/08/2035,144A(a) 5,390,332
3,550,000 Standard Chartered PLC, (fixed rate to11/18/2030, variable rate thereafter),3.265%, 2/18/2036, 144A(a) 3,560,837
1,100,000 Standard Chartered PLC, (fixed rate to4/01/2030, variable rate thereafter),4.644%, 4/01/2031, 144A(a) 1,286,401
2,255,000 UniCredit SpA, (fixed rate to 9/22/2025,variable rate thereafter), 2.569%, 9/22/2026,144A(a) 2,286,220
72,520,948
Brokerage — 0.1%1,415,000 Owl Rock Technology Finance Corp.,
2.500%, 1/15/2027 1,396,975
Building Materials — 1.1%1,712,000 Builders FirstSource, Inc., 6.750%, 6/01/2027,
144A 1,833,9807,070,000 Cemex SAB de CV, 3.875%, 7/11/2031, 144A 7,186,6553,360,000 Cemex SAB de CV, 5.200%, 9/17/2030, 144A 3,694,6561,725,000 Cemex SAB de CV, 5.450%, 11/19/2029, 144A 1,896,6381,720,000 Cemex SAB de CV, (fixed rate to 6/8/2026,
variable rate thereafter), 5.125%, 144A(j) 1,775,384
16,387,313
Cable Satellite — 2.7%5,670,000 CCO Holdings LLC/CCO Holdings Capital
Corp., 4.250%, 2/01/2031, 144A 5,778,8071,585,000 CCO Holdings LLC/CCO Holdings Capital
Corp., 4.500%, 8/15/2030, 144A 1,650,3241,050,000 CCO Holdings LLC/CCO Holdings Capital
Corp., 4.500%, 5/01/2032 1,088,063310,000 CCO Holdings LLC/CCO Holdings Capital
Corp., 5.375%, 6/01/2029, 144A 338,86114,425,000 Charter Communications Operating LLC/
Charter Communications Operating CapitalCorp., 4.400%, 12/01/2061 15,499,451
1,610,000 CSC Holdings LLC, 4.125%, 12/01/2030, 144A 1,599,9382,710,000 CSC Holdings LLC, 4.625%, 12/01/2030, 144A 2,658,8081,060,000 CSC Holdings LLC, 6.500%, 2/01/2029, 144A 1,174,0562,155,000 DISH DBS Corp., 5.125%, 6/01/2029, 144A 2,127,9121,355,000 Sirius XM Radio, Inc., 5.000%, 8/01/2027, 144A 1,419,701
110,000 Sirius XM Radio, Inc., 5.500%, 7/01/2029, 144A 119,8671,660,000 Virgin Media Finance PLC, 5.000%, 7/15/2030,
144A 1,677,0811,225,000 Virgin Media Secured Finance PLC,
5.500%, 8/15/2026, 144A 1,263,2811,725,000 Ziggo BV, 4.875%, 1/15/2030, 144A 1,769,6781,372,000 Ziggo BV, 5.500%, 1/15/2027, 144A 1,425,508
39,591,336
Chemicals — 0.5%1,045,000 Alpek SAB de CV, 3.250%, 2/25/2031, 144A 1,057,5512,115,000 Braskem Netherlands Finance BV,
4.500%, 1/31/2030, 144A 2,203,661
See accompanying notes to financial statements. | 42
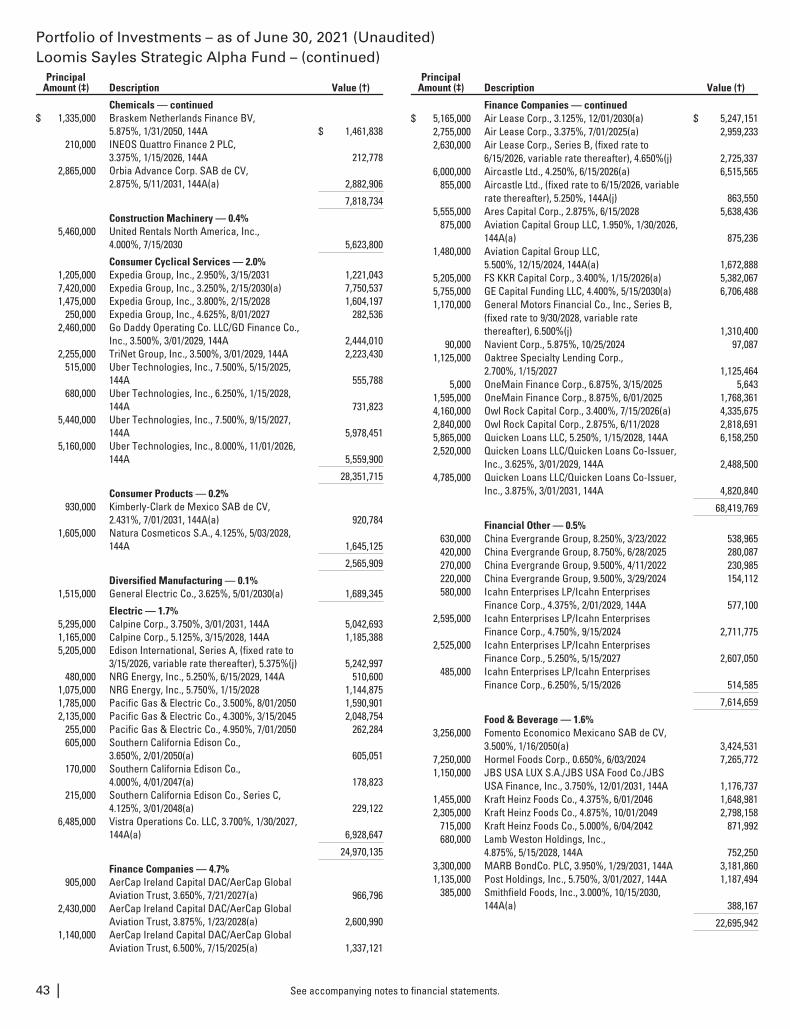
Portfolio of Investments – as of June 30, 2021 (Unaudited)Loomis Sayles Strategic Alpha Fund – (continued)
PrincipalAmount (‡) Description Value (†)
Chemicals — continued$ 1,335,000 Braskem Netherlands Finance BV,
5.875%, 1/31/2050, 144A $ 1,461,838210,000 INEOS Quattro Finance 2 PLC,
3.375%, 1/15/2026, 144A 212,7782,865,000 Orbia Advance Corp. SAB de CV,
2.875%, 5/11/2031, 144A(a) 2,882,906
7,818,734
Construction Machinery — 0.4%5,460,000 United Rentals North America, Inc.,
4.000%, 7/15/2030 5,623,800
Consumer Cyclical Services — 2.0%1,205,000 Expedia Group, Inc., 2.950%, 3/15/2031 1,221,0437,420,000 Expedia Group, Inc., 3.250%, 2/15/2030(a) 7,750,5371,475,000 Expedia Group, Inc., 3.800%, 2/15/2028 1,604,197
250,000 Expedia Group, Inc., 4.625%, 8/01/2027 282,5362,460,000 Go Daddy Operating Co. LLC/GD Finance Co.,
Inc., 3.500%, 3/01/2029, 144A 2,444,0102,255,000 TriNet Group, Inc., 3.500%, 3/01/2029, 144A 2,223,430
515,000 Uber Technologies, Inc., 7.500%, 5/15/2025,144A 555,788
680,000 Uber Technologies, Inc., 6.250%, 1/15/2028,144A 731,823
5,440,000 Uber Technologies, Inc., 7.500%, 9/15/2027,144A 5,978,451
5,160,000 Uber Technologies, Inc., 8.000%, 11/01/2026,144A 5,559,900
28,351,715
Consumer Products — 0.2%930,000 Kimberly-Clark de Mexico SAB de CV,
2.431%, 7/01/2031, 144A(a) 920,7841,605,000 Natura Cosmeticos S.A., 4.125%, 5/03/2028,
144A 1,645,125
2,565,909
Diversified Manufacturing — 0.1%1,515,000 General Electric Co., 3.625%, 5/01/2030(a) 1,689,345
Electric — 1.7%5,295,000 Calpine Corp., 3.750%, 3/01/2031, 144A 5,042,6931,165,000 Calpine Corp., 5.125%, 3/15/2028, 144A 1,185,3885,205,000 Edison International, Series A, (fixed rate to
3/15/2026, variable rate thereafter), 5.375%(j) 5,242,997480,000 NRG Energy, Inc., 5.250%, 6/15/2029, 144A 510,600
1,075,000 NRG Energy, Inc., 5.750%, 1/15/2028 1,144,8751,785,000 Pacific Gas & Electric Co., 3.500%, 8/01/2050 1,590,9012,135,000 Pacific Gas & Electric Co., 4.300%, 3/15/2045 2,048,754
255,000 Pacific Gas & Electric Co., 4.950%, 7/01/2050 262,284605,000 Southern California Edison Co.,
3.650%, 2/01/2050(a) 605,051170,000 Southern California Edison Co.,
4.000%, 4/01/2047(a) 178,823215,000 Southern California Edison Co., Series C,
4.125%, 3/01/2048(a) 229,1226,485,000 Vistra Operations Co. LLC, 3.700%, 1/30/2027,
144A(a) 6,928,647
24,970,135
Finance Companies — 4.7%905,000 AerCap Ireland Capital DAC/AerCap Global
Aviation Trust, 3.650%, 7/21/2027(a) 966,7962,430,000 AerCap Ireland Capital DAC/AerCap Global
Aviation Trust, 3.875%, 1/23/2028(a) 2,600,9901,140,000 AerCap Ireland Capital DAC/AerCap Global
Aviation Trust, 6.500%, 7/15/2025(a) 1,337,121
PrincipalAmount (‡) Description Value (†)
Finance Companies — continued$ 5,165,000 Air Lease Corp., 3.125%, 12/01/2030(a) $ 5,247,151
2,755,000 Air Lease Corp., 3.375%, 7/01/2025(a) 2,959,2332,630,000 Air Lease Corp., Series B, (fixed rate to
6/15/2026, variable rate thereafter), 4.650%(j) 2,725,3376,000,000 Aircastle Ltd., 4.250%, 6/15/2026(a) 6,515,565
855,000 Aircastle Ltd., (fixed rate to 6/15/2026, variablerate thereafter), 5.250%, 144A(j) 863,550
5,555,000 Ares Capital Corp., 2.875%, 6/15/2028 5,638,436875,000 Aviation Capital Group LLC, 1.950%, 1/30/2026,
144A(a) 875,2361,480,000 Aviation Capital Group LLC,
5.500%, 12/15/2024, 144A(a) 1,672,8885,205,000 FS KKR Capital Corp., 3.400%, 1/15/2026(a) 5,382,0675,755,000 GE Capital Funding LLC, 4.400%, 5/15/2030(a) 6,706,4881,170,000 General Motors Financial Co., Inc., Series B,
(fixed rate to 9/30/2028, variable ratethereafter), 6.500%(j) 1,310,400
90,000 Navient Corp., 5.875%, 10/25/2024 97,0871,125,000 Oaktree Specialty Lending Corp.,
2.700%, 1/15/2027 1,125,4645,000 OneMain Finance Corp., 6.875%, 3/15/2025 5,643
1,595,000 OneMain Finance Corp., 8.875%, 6/01/2025 1,768,3614,160,000 Owl Rock Capital Corp., 3.400%, 7/15/2026(a) 4,335,6752,840,000 Owl Rock Capital Corp., 2.875%, 6/11/2028 2,818,6915,865,000 Quicken Loans LLC, 5.250%, 1/15/2028, 144A 6,158,2502,520,000 Quicken Loans LLC/Quicken Loans Co-Issuer,
Inc., 3.625%, 3/01/2029, 144A 2,488,5004,785,000 Quicken Loans LLC/Quicken Loans Co-Issuer,
Inc., 3.875%, 3/01/2031, 144A 4,820,840
68,419,769
Financial Other — 0.5%630,000 China Evergrande Group, 8.250%, 3/23/2022 538,965420,000 China Evergrande Group, 8.750%, 6/28/2025 280,087270,000 China Evergrande Group, 9.500%, 4/11/2022 230,985220,000 China Evergrande Group, 9.500%, 3/29/2024 154,112580,000 Icahn Enterprises LP/Icahn Enterprises
Finance Corp., 4.375%, 2/01/2029, 144A 577,1002,595,000 Icahn Enterprises LP/Icahn Enterprises
Finance Corp., 4.750%, 9/15/2024 2,711,7752,525,000 Icahn Enterprises LP/Icahn Enterprises
Finance Corp., 5.250%, 5/15/2027 2,607,050485,000 Icahn Enterprises LP/Icahn Enterprises
Finance Corp., 6.250%, 5/15/2026 514,585
7,614,659
Food & Beverage — 1.6%3,256,000 Fomento Economico Mexicano SAB de CV,
3.500%, 1/16/2050(a) 3,424,5317,250,000 Hormel Foods Corp., 0.650%, 6/03/2024 7,265,7721,150,000 JBS USA LUX S.A./JBS USA Food Co./JBS
USA Finance, Inc., 3.750%, 12/01/2031, 144A 1,176,7371,455,000 Kraft Heinz Foods Co., 4.375%, 6/01/2046 1,648,9812,305,000 Kraft Heinz Foods Co., 4.875%, 10/01/2049 2,798,158
715,000 Kraft Heinz Foods Co., 5.000%, 6/04/2042 871,992680,000 Lamb Weston Holdings, Inc.,
4.875%, 5/15/2028, 144A 752,2503,300,000 MARB BondCo. PLC, 3.950%, 1/29/2031, 144A 3,181,8601,135,000 Post Holdings, Inc., 5.750%, 3/01/2027, 144A 1,187,494
385,000 Smithfield Foods, Inc., 3.000%, 10/15/2030,144A(a) 388,167
22,695,942
See accompanying notes to financial statements.43 |
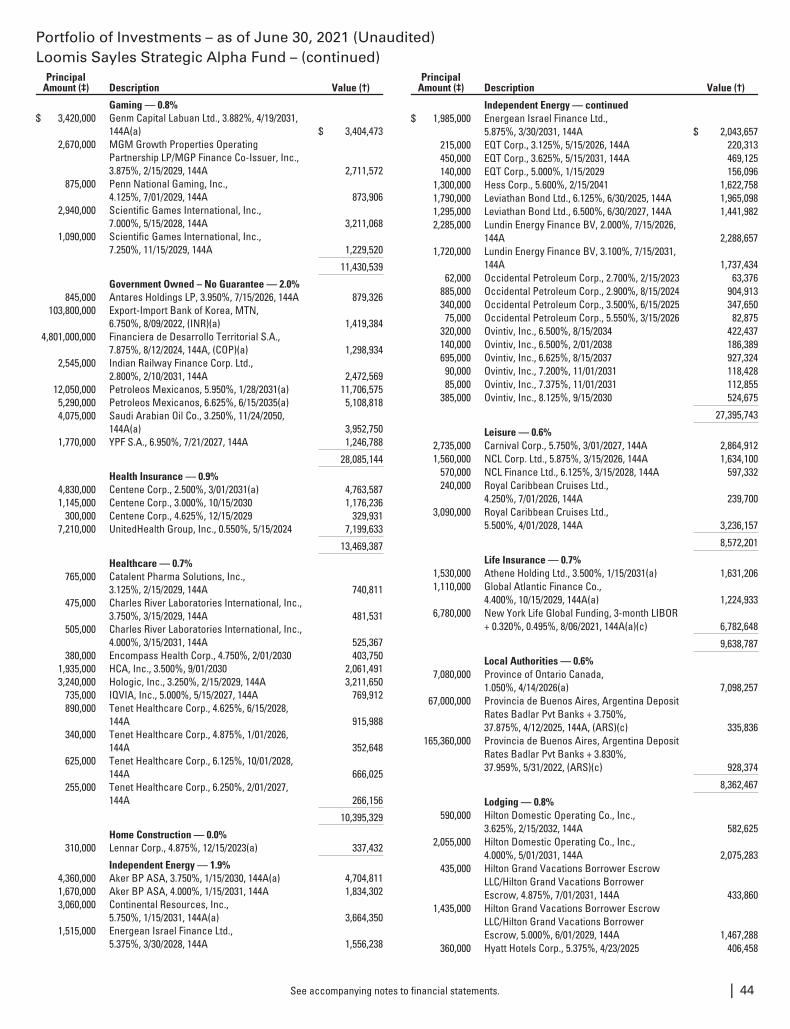
Portfolio of Investments – as of June 30, 2021 (Unaudited)Loomis Sayles Strategic Alpha Fund – (continued)
PrincipalAmount (‡) Description Value (†)
Gaming — 0.8%$ 3,420,000 Genm Capital Labuan Ltd., 3.882%, 4/19/2031,
144A(a) $ 3,404,4732,670,000 MGM Growth Properties Operating
Partnership LP/MGP Finance Co-Issuer, Inc.,3.875%, 2/15/2029, 144A 2,711,572
875,000 Penn National Gaming, Inc.,4.125%, 7/01/2029, 144A 873,906
2,940,000 Scientific Games International, Inc.,7.000%, 5/15/2028, 144A 3,211,068
1,090,000 Scientific Games International, Inc.,7.250%, 11/15/2029, 144A 1,229,520
11,430,539
Government Owned – No Guarantee — 2.0%845,000 Antares Holdings LP, 3.950%, 7/15/2026, 144A 879,326
103,800,000 Export-Import Bank of Korea, MTN,6.750%, 8/09/2022, (INR)(a) 1,419,384
4,801,000,000 Financiera de Desarrollo Territorial S.A.,7.875%, 8/12/2024, 144A, (COP)(a) 1,298,934
2,545,000 Indian Railway Finance Corp. Ltd.,2.800%, 2/10/2031, 144A 2,472,569
12,050,000 Petroleos Mexicanos, 5.950%, 1/28/2031(a) 11,706,5755,290,000 Petroleos Mexicanos, 6.625%, 6/15/2035(a) 5,108,8184,075,000 Saudi Arabian Oil Co., 3.250%, 11/24/2050,
144A(a) 3,952,7501,770,000 YPF S.A., 6.950%, 7/21/2027, 144A 1,246,788
28,085,144
Health Insurance — 0.9%4,830,000 Centene Corp., 2.500%, 3/01/2031(a) 4,763,5871,145,000 Centene Corp., 3.000%, 10/15/2030 1,176,236
300,000 Centene Corp., 4.625%, 12/15/2029 329,9317,210,000 UnitedHealth Group, Inc., 0.550%, 5/15/2024 7,199,633
13,469,387
Healthcare — 0.7%765,000 Catalent Pharma Solutions, Inc.,
3.125%, 2/15/2029, 144A 740,811475,000 Charles River Laboratories International, Inc.,
3.750%, 3/15/2029, 144A 481,531505,000 Charles River Laboratories International, Inc.,
4.000%, 3/15/2031, 144A 525,367380,000 Encompass Health Corp., 4.750%, 2/01/2030 403,750
1,935,000 HCA, Inc., 3.500%, 9/01/2030 2,061,4913,240,000 Hologic, Inc., 3.250%, 2/15/2029, 144A 3,211,650
735,000 IQVIA, Inc., 5.000%, 5/15/2027, 144A 769,912890,000 Tenet Healthcare Corp., 4.625%, 6/15/2028,
144A 915,988340,000 Tenet Healthcare Corp., 4.875%, 1/01/2026,
144A 352,648625,000 Tenet Healthcare Corp., 6.125%, 10/01/2028,
144A 666,025255,000 Tenet Healthcare Corp., 6.250%, 2/01/2027,
144A 266,156
10,395,329
Home Construction — 0.0%310,000 Lennar Corp., 4.875%, 12/15/2023(a) 337,432
Independent Energy — 1.9%4,360,000 Aker BP ASA, 3.750%, 1/15/2030, 144A(a) 4,704,8111,670,000 Aker BP ASA, 4.000%, 1/15/2031, 144A 1,834,3023,060,000 Continental Resources, Inc.,
5.750%, 1/15/2031, 144A(a) 3,664,3501,515,000 Energean Israel Finance Ltd.,
5.375%, 3/30/2028, 144A 1,556,238
PrincipalAmount (‡) Description Value (†)
Independent Energy — continued$ 1,985,000 Energean Israel Finance Ltd.,
5.875%, 3/30/2031, 144A $ 2,043,657215,000 EQT Corp., 3.125%, 5/15/2026, 144A 220,313450,000 EQT Corp., 3.625%, 5/15/2031, 144A 469,125140,000 EQT Corp., 5.000%, 1/15/2029 156,096
1,300,000 Hess Corp., 5.600%, 2/15/2041 1,622,7581,790,000 Leviathan Bond Ltd., 6.125%, 6/30/2025, 144A 1,965,0981,295,000 Leviathan Bond Ltd., 6.500%, 6/30/2027, 144A 1,441,9822,285,000 Lundin Energy Finance BV, 2.000%, 7/15/2026,
144A 2,288,6571,720,000 Lundin Energy Finance BV, 3.100%, 7/15/2031,
144A 1,737,43462,000 Occidental Petroleum Corp., 2.700%, 2/15/2023 63,376
885,000 Occidental Petroleum Corp., 2.900%, 8/15/2024 904,913340,000 Occidental Petroleum Corp., 3.500%, 6/15/2025 347,65075,000 Occidental Petroleum Corp., 5.550%, 3/15/2026 82,875
320,000 Ovintiv, Inc., 6.500%, 8/15/2034 422,437140,000 Ovintiv, Inc., 6.500%, 2/01/2038 186,389695,000 Ovintiv, Inc., 6.625%, 8/15/2037 927,32490,000 Ovintiv, Inc., 7.200%, 11/01/2031 118,42885,000 Ovintiv, Inc., 7.375%, 11/01/2031 112,855
385,000 Ovintiv, Inc., 8.125%, 9/15/2030 524,675
27,395,743
Leisure — 0.6%2,735,000 Carnival Corp., 5.750%, 3/01/2027, 144A 2,864,9121,560,000 NCL Corp. Ltd., 5.875%, 3/15/2026, 144A 1,634,100
570,000 NCL Finance Ltd., 6.125%, 3/15/2028, 144A 597,332240,000 Royal Caribbean Cruises Ltd.,
4.250%, 7/01/2026, 144A 239,7003,090,000 Royal Caribbean Cruises Ltd.,
5.500%, 4/01/2028, 144A 3,236,157
8,572,201
Life Insurance — 0.7%1,530,000 Athene Holding Ltd., 3.500%, 1/15/2031(a) 1,631,2061,110,000 Global Atlantic Finance Co.,
4.400%, 10/15/2029, 144A(a) 1,224,9336,780,000 New York Life Global Funding, 3-month LIBOR
+ 0.320%, 0.495%, 8/06/2021, 144A(a)(c) 6,782,648
9,638,787
Local Authorities — 0.6%7,080,000 Province of Ontario Canada,
1.050%, 4/14/2026(a) 7,098,25767,000,000 Provincia de Buenos Aires, Argentina Deposit
Rates Badlar Pvt Banks + 3.750%,37.875%, 4/12/2025, 144A, (ARS)(c) 335,836
165,360,000 Provincia de Buenos Aires, Argentina DepositRates Badlar Pvt Banks + 3.830%,37.959%, 5/31/2022, (ARS)(c) 928,374
8,362,467
Lodging — 0.8%590,000 Hilton Domestic Operating Co., Inc.,
3.625%, 2/15/2032, 144A 582,6252,055,000 Hilton Domestic Operating Co., Inc.,
4.000%, 5/01/2031, 144A 2,075,283435,000 Hilton Grand Vacations Borrower Escrow
LLC/Hilton Grand Vacations BorrowerEscrow, 4.875%, 7/01/2031, 144A 433,860
1,435,000 Hilton Grand Vacations Borrower EscrowLLC/Hilton Grand Vacations BorrowerEscrow, 5.000%, 6/01/2029, 144A 1,467,288
360,000 Hyatt Hotels Corp., 5.375%, 4/23/2025 406,458
See accompanying notes to financial statements. | 44
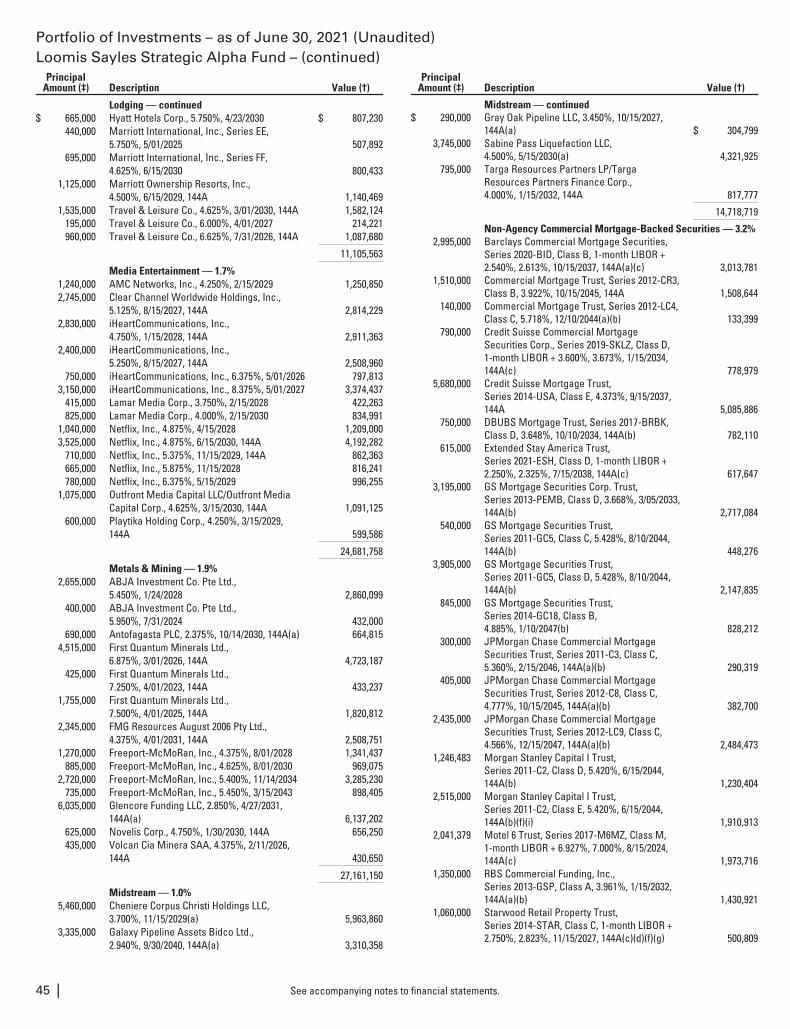
Portfolio of Investments – as of June 30, 2021 (Unaudited)Loomis Sayles Strategic Alpha Fund – (continued)
PrincipalAmount (‡) Description Value (†)
Lodging — continued$ 665,000 Hyatt Hotels Corp., 5.750%, 4/23/2030 $ 807,230
440,000 Marriott International, Inc., Series EE,5.750%, 5/01/2025 507,892
695,000 Marriott International, Inc., Series FF,4.625%, 6/15/2030 800,433
1,125,000 Marriott Ownership Resorts, Inc.,4.500%, 6/15/2029, 144A 1,140,469
1,535,000 Travel & Leisure Co., 4.625%, 3/01/2030, 144A 1,582,124195,000 Travel & Leisure Co., 6.000%, 4/01/2027 214,221960,000 Travel & Leisure Co., 6.625%, 7/31/2026, 144A 1,087,680
11,105,563
Media Entertainment — 1.7%1,240,000 AMC Networks, Inc., 4.250%, 2/15/2029 1,250,8502,745,000 Clear Channel Worldwide Holdings, Inc.,
5.125%, 8/15/2027, 144A 2,814,2292,830,000 iHeartCommunications, Inc.,
4.750%, 1/15/2028, 144A 2,911,3632,400,000 iHeartCommunications, Inc.,
5.250%, 8/15/2027, 144A 2,508,960750,000 iHeartCommunications, Inc., 6.375%, 5/01/2026 797,813
3,150,000 iHeartCommunications, Inc., 8.375%, 5/01/2027 3,374,437415,000 Lamar Media Corp., 3.750%, 2/15/2028 422,263825,000 Lamar Media Corp., 4.000%, 2/15/2030 834,991
1,040,000 Netflix, Inc., 4.875%, 4/15/2028 1,209,0003,525,000 Netflix, Inc., 4.875%, 6/15/2030, 144A 4,192,282
710,000 Netflix, Inc., 5.375%, 11/15/2029, 144A 862,363665,000 Netflix, Inc., 5.875%, 11/15/2028 816,241780,000 Netflix, Inc., 6.375%, 5/15/2029 996,255
1,075,000 Outfront Media Capital LLC/Outfront MediaCapital Corp., 4.625%, 3/15/2030, 144A 1,091,125
600,000 Playtika Holding Corp., 4.250%, 3/15/2029,144A 599,586
24,681,758
Metals & Mining — 1.9%2,655,000 ABJA Investment Co. Pte Ltd.,
5.450%, 1/24/2028 2,860,099400,000 ABJA Investment Co. Pte Ltd.,
5.950%, 7/31/2024 432,000690,000 Antofagasta PLC, 2.375%, 10/14/2030, 144A(a) 664,815
4,515,000 First Quantum Minerals Ltd.,6.875%, 3/01/2026, 144A 4,723,187
425,000 First Quantum Minerals Ltd.,7.250%, 4/01/2023, 144A 433,237
1,755,000 First Quantum Minerals Ltd.,7.500%, 4/01/2025, 144A 1,820,812
2,345,000 FMG Resources August 2006 Pty Ltd.,4.375%, 4/01/2031, 144A 2,508,751
1,270,000 Freeport-McMoRan, Inc., 4.375%, 8/01/2028 1,341,437885,000 Freeport-McMoRan, Inc., 4.625%, 8/01/2030 969,075
2,720,000 Freeport-McMoRan, Inc., 5.400%, 11/14/2034 3,285,230735,000 Freeport-McMoRan, Inc., 5.450%, 3/15/2043 898,405
6,035,000 Glencore Funding LLC, 2.850%, 4/27/2031,144A(a) 6,137,202
625,000 Novelis Corp., 4.750%, 1/30/2030, 144A 656,250435,000 Volcan Cia Minera SAA, 4.375%, 2/11/2026,
144A 430,650
27,161,150
Midstream — 1.0%5,460,000 Cheniere Corpus Christi Holdings LLC,
3.700%, 11/15/2029(a) 5,963,8603,335,000 Galaxy Pipeline Assets Bidco Ltd.,
2.940%, 9/30/2040, 144A(a) 3,310,358
PrincipalAmount (‡) Description Value (†)
Midstream — continued$ 290,000 Gray Oak Pipeline LLC, 3.450%, 10/15/2027,
144A(a) $ 304,7993,745,000 Sabine Pass Liquefaction LLC,
4.500%, 5/15/2030(a) 4,321,925795,000 Targa Resources Partners LP/Targa
Resources Partners Finance Corp.,4.000%, 1/15/2032, 144A 817,777
14,718,719
Non-Agency Commercial Mortgage-Backed Securities — 3.2%2,995,000 Barclays Commercial Mortgage Securities,
Series 2020-BID, Class B, 1-month LIBOR +2.540%, 2.613%, 10/15/2037, 144A(a)(c) 3,013,781
1,510,000 Commercial Mortgage Trust, Series 2012-CR3,Class B, 3.922%, 10/15/2045, 144A 1,508,644
140,000 Commercial Mortgage Trust, Series 2012-LC4,Class C, 5.718%, 12/10/2044(a)(b) 133,399
790,000 Credit Suisse Commercial MortgageSecurities Corp., Series 2019-SKLZ, Class D,1-month LIBOR + 3.600%, 3.673%, 1/15/2034,144A(c) 778,979
5,680,000 Credit Suisse Mortgage Trust,Series 2014-USA, Class E, 4.373%, 9/15/2037,144A 5,085,886
750,000 DBUBS Mortgage Trust, Series 2017-BRBK,Class D, 3.648%, 10/10/2034, 144A(b) 782,110
615,000 Extended Stay America Trust,Series 2021-ESH, Class D, 1-month LIBOR +2.250%, 2.325%, 7/15/2038, 144A(c) 617,647
3,195,000 GS Mortgage Securities Corp. Trust,Series 2013-PEMB, Class D, 3.668%, 3/05/2033,144A(b) 2,717,084
540,000 GS Mortgage Securities Trust,Series 2011-GC5, Class C, 5.428%, 8/10/2044,144A(b) 448,276
3,905,000 GS Mortgage Securities Trust,Series 2011-GC5, Class D, 5.428%, 8/10/2044,144A(b) 2,147,835
845,000 GS Mortgage Securities Trust,Series 2014-GC18, Class B,4.885%, 1/10/2047(b) 828,212
300,000 JPMorgan Chase Commercial MortgageSecurities Trust, Series 2011-C3, Class C,5.360%, 2/15/2046, 144A(a)(b) 290,319
405,000 JPMorgan Chase Commercial MortgageSecurities Trust, Series 2012-C8, Class C,4.777%, 10/15/2045, 144A(a)(b) 382,700
2,435,000 JPMorgan Chase Commercial MortgageSecurities Trust, Series 2012-LC9, Class C,4.566%, 12/15/2047, 144A(a)(b) 2,484,473
1,246,483 Morgan Stanley Capital I Trust,Series 2011-C2, Class D, 5.420%, 6/15/2044,144A(b) 1,230,404
2,515,000 Morgan Stanley Capital I Trust,Series 2011-C2, Class E, 5.420%, 6/15/2044,144A(b)(f)(i) 1,910,913
2,041,379 Motel 6 Trust, Series 2017-M6MZ, Class M,1-month LIBOR + 6.927%, 7.000%, 8/15/2024,144A(c) 1,973,716
1,350,000 RBS Commercial Funding, Inc.,Series 2013-GSP, Class A, 3.961%, 1/15/2032,144A(a)(b) 1,430,921
1,060,000 Starwood Retail Property Trust,Series 2014-STAR, Class C, 1-month LIBOR +2.750%, 2.823%, 11/15/2027, 144A(c)(d)(f)(g) 500,809
See accompanying notes to financial statements.45 |
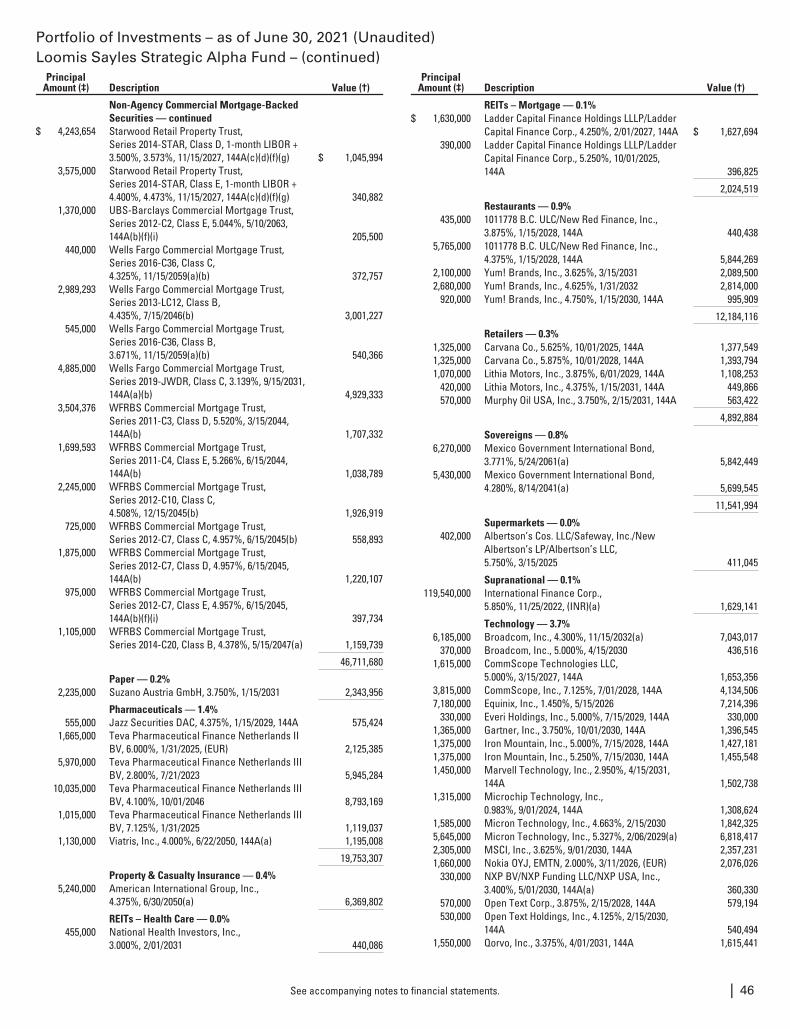
Portfolio of Investments – as of June 30, 2021 (Unaudited)Loomis Sayles Strategic Alpha Fund – (continued)
PrincipalAmount (‡) Description Value (†)
Non-Agency Commercial Mortgage-BackedSecurities — continued
$ 4,243,654 Starwood Retail Property Trust,Series 2014-STAR, Class D, 1-month LIBOR +3.500%, 3.573%, 11/15/2027, 144A(c)(d)(f)(g) $ 1,045,994
3,575,000 Starwood Retail Property Trust,Series 2014-STAR, Class E, 1-month LIBOR +4.400%, 4.473%, 11/15/2027, 144A(c)(d)(f)(g) 340,882
1,370,000 UBS-Barclays Commercial Mortgage Trust,Series 2012-C2, Class E, 5.044%, 5/10/2063,144A(b)(f)(i) 205,500
440,000 Wells Fargo Commercial Mortgage Trust,Series 2016-C36, Class C,4.325%, 11/15/2059(a)(b) 372,757
2,989,293 Wells Fargo Commercial Mortgage Trust,Series 2013-LC12, Class B,4.435%, 7/15/2046(b) 3,001,227
545,000 Wells Fargo Commercial Mortgage Trust,Series 2016-C36, Class B,3.671%, 11/15/2059(a)(b) 540,366
4,885,000 Wells Fargo Commercial Mortgage Trust,Series 2019-JWDR, Class C, 3.139%, 9/15/2031,144A(a)(b) 4,929,333
3,504,376 WFRBS Commercial Mortgage Trust,Series 2011-C3, Class D, 5.520%, 3/15/2044,144A(b) 1,707,332
1,699,593 WFRBS Commercial Mortgage Trust,Series 2011-C4, Class E, 5.266%, 6/15/2044,144A(b) 1,038,789
2,245,000 WFRBS Commercial Mortgage Trust,Series 2012-C10, Class C,4.508%, 12/15/2045(b) 1,926,919
725,000 WFRBS Commercial Mortgage Trust,Series 2012-C7, Class C, 4.957%, 6/15/2045(b) 558,893
1,875,000 WFRBS Commercial Mortgage Trust,Series 2012-C7, Class D, 4.957%, 6/15/2045,144A(b) 1,220,107
975,000 WFRBS Commercial Mortgage Trust,Series 2012-C7, Class E, 4.957%, 6/15/2045,144A(b)(f)(i) 397,734
1,105,000 WFRBS Commercial Mortgage Trust,Series 2014-C20, Class B, 4.378%, 5/15/2047(a) 1,159,739
46,711,680
Paper — 0.2%2,235,000 Suzano Austria GmbH, 3.750%, 1/15/2031 2,343,956
Pharmaceuticals — 1.4%555,000 Jazz Securities DAC, 4.375%, 1/15/2029, 144A 575,424
1,665,000 Teva Pharmaceutical Finance Netherlands IIBV, 6.000%, 1/31/2025, (EUR) 2,125,385
5,970,000 Teva Pharmaceutical Finance Netherlands IIIBV, 2.800%, 7/21/2023 5,945,284
10,035,000 Teva Pharmaceutical Finance Netherlands IIIBV, 4.100%, 10/01/2046 8,793,169
1,015,000 Teva Pharmaceutical Finance Netherlands IIIBV, 7.125%, 1/31/2025 1,119,037
1,130,000 Viatris, Inc., 4.000%, 6/22/2050, 144A(a) 1,195,008
19,753,307
Property & Casualty Insurance — 0.4%5,240,000 American International Group, Inc.,
4.375%, 6/30/2050(a) 6,369,802
REITs – Health Care — 0.0%455,000 National Health Investors, Inc.,
3.000%, 2/01/2031 440,086
PrincipalAmount (‡) Description Value (†)
REITs – Mortgage — 0.1%$ 1,630,000 Ladder Capital Finance Holdings LLLP/Ladder
Capital Finance Corp., 4.250%, 2/01/2027, 144A $ 1,627,694390,000 Ladder Capital Finance Holdings LLLP/Ladder
Capital Finance Corp., 5.250%, 10/01/2025,144A 396,825
2,024,519
Restaurants — 0.9%435,000 1011778 B.C. ULC/New Red Finance, Inc.,
3.875%, 1/15/2028, 144A 440,4385,765,000 1011778 B.C. ULC/New Red Finance, Inc.,
4.375%, 1/15/2028, 144A 5,844,2692,100,000 Yum! Brands, Inc., 3.625%, 3/15/2031 2,089,5002,680,000 Yum! Brands, Inc., 4.625%, 1/31/2032 2,814,000
920,000 Yum! Brands, Inc., 4.750%, 1/15/2030, 144A 995,909
12,184,116
Retailers — 0.3%1,325,000 Carvana Co., 5.625%, 10/01/2025, 144A 1,377,5491,325,000 Carvana Co., 5.875%, 10/01/2028, 144A 1,393,7941,070,000 Lithia Motors, Inc., 3.875%, 6/01/2029, 144A 1,108,253
420,000 Lithia Motors, Inc., 4.375%, 1/15/2031, 144A 449,866570,000 Murphy Oil USA, Inc., 3.750%, 2/15/2031, 144A 563,422
4,892,884
Sovereigns — 0.8%6,270,000 Mexico Government International Bond,
3.771%, 5/24/2061(a) 5,842,4495,430,000 Mexico Government International Bond,
4.280%, 8/14/2041(a) 5,699,545
11,541,994
Supermarkets — 0.0%402,000 Albertson’s Cos. LLC/Safeway, Inc./New
Albertson’s LP/Albertson’s LLC,5.750%, 3/15/2025 411,045
Supranational — 0.1%119,540,000 International Finance Corp.,
5.850%, 11/25/2022, (INR)(a) 1,629,141
Technology — 3.7%6,185,000 Broadcom, Inc., 4.300%, 11/15/2032(a) 7,043,017
370,000 Broadcom, Inc., 5.000%, 4/15/2030 436,5161,615,000 CommScope Technologies LLC,
5.000%, 3/15/2027, 144A 1,653,3563,815,000 CommScope, Inc., 7.125%, 7/01/2028, 144A 4,134,5067,180,000 Equinix, Inc., 1.450%, 5/15/2026 7,214,396
330,000 Everi Holdings, Inc., 5.000%, 7/15/2029, 144A 330,0001,365,000 Gartner, Inc., 3.750%, 10/01/2030, 144A 1,396,5451,375,000 Iron Mountain, Inc., 5.000%, 7/15/2028, 144A 1,427,1811,375,000 Iron Mountain, Inc., 5.250%, 7/15/2030, 144A 1,455,5481,450,000 Marvell Technology, Inc., 2.950%, 4/15/2031,
144A 1,502,7381,315,000 Microchip Technology, Inc.,
0.983%, 9/01/2024, 144A 1,308,6241,585,000 Micron Technology, Inc., 4.663%, 2/15/2030 1,842,3255,645,000 Micron Technology, Inc., 5.327%, 2/06/2029(a) 6,818,4172,305,000 MSCI, Inc., 3.625%, 9/01/2030, 144A 2,357,2311,660,000 Nokia OYJ, EMTN, 2.000%, 3/11/2026, (EUR) 2,076,026
330,000 NXP BV/NXP Funding LLC/NXP USA, Inc.,3.400%, 5/01/2030, 144A(a) 360,330
570,000 Open Text Corp., 3.875%, 2/15/2028, 144A 579,194530,000 Open Text Holdings, Inc., 4.125%, 2/15/2030,
144A 540,4941,550,000 Qorvo, Inc., 3.375%, 4/01/2031, 144A 1,615,441
See accompanying notes to financial statements. | 46
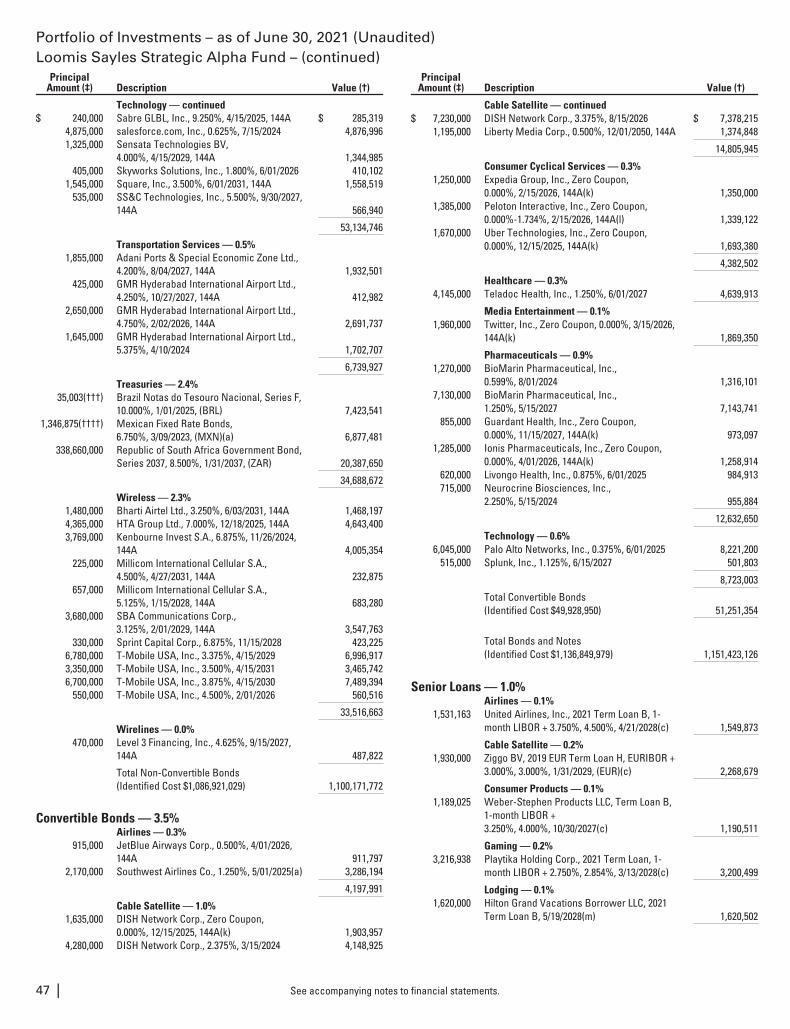
Portfolio of Investments – as of June 30, 2021 (Unaudited)Loomis Sayles Strategic Alpha Fund – (continued)
PrincipalAmount (‡) Description Value (†)
Technology — continued$ 240,000 Sabre GLBL, Inc., 9.250%, 4/15/2025, 144A $ 285,319
4,875,000 salesforce.com, Inc., 0.625%, 7/15/2024 4,876,9961,325,000 Sensata Technologies BV,
4.000%, 4/15/2029, 144A 1,344,985405,000 Skyworks Solutions, Inc., 1.800%, 6/01/2026 410,102
1,545,000 Square, Inc., 3.500%, 6/01/2031, 144A 1,558,519535,000 SS&C Technologies, Inc., 5.500%, 9/30/2027,
144A 566,940
53,134,746
Transportation Services — 0.5%1,855,000 Adani Ports & Special Economic Zone Ltd.,
4.200%, 8/04/2027, 144A 1,932,501425,000 GMR Hyderabad International Airport Ltd.,
4.250%, 10/27/2027, 144A 412,9822,650,000 GMR Hyderabad International Airport Ltd.,
4.750%, 2/02/2026, 144A 2,691,7371,645,000 GMR Hyderabad International Airport Ltd.,
5.375%, 4/10/2024 1,702,707
6,739,927
Treasuries — 2.4%35,003(†††) Brazil Notas do Tesouro Nacional, Series F,
10.000%, 1/01/2025, (BRL) 7,423,5411,346,875(††††) Mexican Fixed Rate Bonds,
6.750%, 3/09/2023, (MXN)(a) 6,877,481338,660,000 Republic of South Africa Government Bond,
Series 2037, 8.500%, 1/31/2037, (ZAR) 20,387,650
34,688,672
Wireless — 2.3%1,480,000 Bharti Airtel Ltd., 3.250%, 6/03/2031, 144A 1,468,1974,365,000 HTA Group Ltd., 7.000%, 12/18/2025, 144A 4,643,4003,769,000 Kenbourne Invest S.A., 6.875%, 11/26/2024,
144A 4,005,354225,000 Millicom International Cellular S.A.,
4.500%, 4/27/2031, 144A 232,875657,000 Millicom International Cellular S.A.,
5.125%, 1/15/2028, 144A 683,2803,680,000 SBA Communications Corp.,
3.125%, 2/01/2029, 144A 3,547,763330,000 Sprint Capital Corp., 6.875%, 11/15/2028 423,225
6,780,000 T-Mobile USA, Inc., 3.375%, 4/15/2029 6,996,9173,350,000 T-Mobile USA, Inc., 3.500%, 4/15/2031 3,465,7426,700,000 T-Mobile USA, Inc., 3.875%, 4/15/2030 7,489,394
550,000 T-Mobile USA, Inc., 4.500%, 2/01/2026 560,516
33,516,663
Wirelines — 0.0%470,000 Level 3 Financing, Inc., 4.625%, 9/15/2027,
144A 487,822
Total Non-Convertible Bonds(Identified Cost $1,086,921,029) 1,100,171,772
Convertible Bonds — 3.5%Airlines — 0.3%
915,000 JetBlue Airways Corp., 0.500%, 4/01/2026,144A 911,797
2,170,000 Southwest Airlines Co., 1.250%, 5/01/2025(a) 3,286,194
4,197,991
Cable Satellite — 1.0%1,635,000 DISH Network Corp., Zero Coupon,
0.000%, 12/15/2025, 144A(k) 1,903,9574,280,000 DISH Network Corp., 2.375%, 3/15/2024 4,148,925
PrincipalAmount (‡) Description Value (†)
Cable Satellite — continued$ 7,230,000 DISH Network Corp., 3.375%, 8/15/2026 $ 7,378,215
1,195,000 Liberty Media Corp., 0.500%, 12/01/2050, 144A 1,374,848
14,805,945
Consumer Cyclical Services — 0.3%1,250,000 Expedia Group, Inc., Zero Coupon,
0.000%, 2/15/2026, 144A(k) 1,350,0001,385,000 Peloton Interactive, Inc., Zero Coupon,
0.000%-1.734%, 2/15/2026, 144A(l) 1,339,1221,670,000 Uber Technologies, Inc., Zero Coupon,
0.000%, 12/15/2025, 144A(k) 1,693,380
4,382,502
Healthcare — 0.3%4,145,000 Teladoc Health, Inc., 1.250%, 6/01/2027 4,639,913
Media Entertainment — 0.1%1,960,000 Twitter, Inc., Zero Coupon, 0.000%, 3/15/2026,
144A(k) 1,869,350
Pharmaceuticals — 0.9%1,270,000 BioMarin Pharmaceutical, Inc.,
0.599%, 8/01/2024 1,316,1017,130,000 BioMarin Pharmaceutical, Inc.,
1.250%, 5/15/2027 7,143,741855,000 Guardant Health, Inc., Zero Coupon,
0.000%, 11/15/2027, 144A(k) 973,0971,285,000 Ionis Pharmaceuticals, Inc., Zero Coupon,
0.000%, 4/01/2026, 144A(k) 1,258,914620,000 Livongo Health, Inc., 0.875%, 6/01/2025 984,913715,000 Neurocrine Biosciences, Inc.,
2.250%, 5/15/2024 955,884
12,632,650
Technology — 0.6%6,045,000 Palo Alto Networks, Inc., 0.375%, 6/01/2025 8,221,200
515,000 Splunk, Inc., 1.125%, 6/15/2027 501,803
8,723,003
Total Convertible Bonds(Identified Cost $49,928,950) 51,251,354
Total Bonds and Notes(Identified Cost $1,136,849,979) 1,151,423,126
Senior Loans — 1.0%Airlines — 0.1%
1,531,163 United Airlines, Inc., 2021 Term Loan B, 1-month LIBOR + 3.750%, 4.500%, 4/21/2028(c) 1,549,873
Cable Satellite — 0.2%1,930,000 Ziggo BV, 2019 EUR Term Loan H, EURIBOR +
3.000%, 3.000%, 1/31/2029, (EUR)(c) 2,268,679
Consumer Products — 0.1%1,189,025 Weber-Stephen Products LLC, Term Loan B,
1-month LIBOR +3.250%, 4.000%, 10/30/2027(c) 1,190,511
Gaming — 0.2%3,216,938 Playtika Holding Corp., 2021 Term Loan, 1-
month LIBOR + 2.750%, 2.854%, 3/13/2028(c) 3,200,499
Lodging — 0.1%1,620,000 Hilton Grand Vacations Borrower LLC, 2021
Term Loan B, 5/19/2028(m) 1,620,502
See accompanying notes to financial statements.47 |
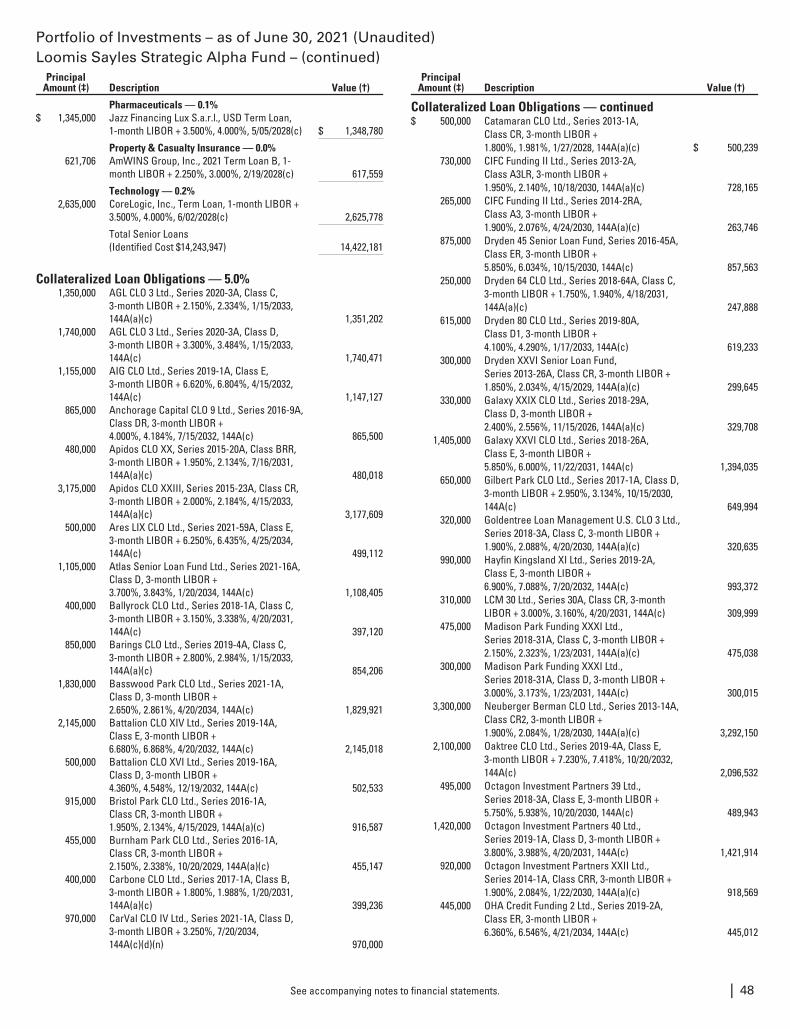
Portfolio of Investments – as of June 30, 2021 (Unaudited)Loomis Sayles Strategic Alpha Fund – (continued)
PrincipalAmount (‡) Description Value (†)
Pharmaceuticals — 0.1%$ 1,345,000 Jazz Financing Lux S.a.r.l., USD Term Loan,
1-month LIBOR + 3.500%, 4.000%, 5/05/2028(c) $ 1,348,780
Property & Casualty Insurance — 0.0%621,706 AmWINS Group, Inc., 2021 Term Loan B, 1-
month LIBOR + 2.250%, 3.000%, 2/19/2028(c) 617,559
Technology — 0.2%2,635,000 CoreLogic, Inc., Term Loan, 1-month LIBOR +
3.500%, 4.000%, 6/02/2028(c) 2,625,778
Total Senior Loans(Identified Cost $14,243,947) 14,422,181
Collateralized Loan Obligations — 5.0%1,350,000 AGL CLO 3 Ltd., Series 2020-3A, Class C,
3-month LIBOR + 2.150%, 2.334%, 1/15/2033,144A(a)(c) 1,351,202
1,740,000 AGL CLO 3 Ltd., Series 2020-3A, Class D,3-month LIBOR + 3.300%, 3.484%, 1/15/2033,144A(c) 1,740,471
1,155,000 AIG CLO Ltd., Series 2019-1A, Class E,3-month LIBOR + 6.620%, 6.804%, 4/15/2032,144A(c) 1,147,127
865,000 Anchorage Capital CLO 9 Ltd., Series 2016-9A,Class DR, 3-month LIBOR +4.000%, 4.184%, 7/15/2032, 144A(c) 865,500
480,000 Apidos CLO XX, Series 2015-20A, Class BRR,3-month LIBOR + 1.950%, 2.134%, 7/16/2031,144A(a)(c) 480,018
3,175,000 Apidos CLO XXIII, Series 2015-23A, Class CR,3-month LIBOR + 2.000%, 2.184%, 4/15/2033,144A(a)(c) 3,177,609
500,000 Ares LIX CLO Ltd., Series 2021-59A, Class E,3-month LIBOR + 6.250%, 6.435%, 4/25/2034,144A(c) 499,112
1,105,000 Atlas Senior Loan Fund Ltd., Series 2021-16A,Class D, 3-month LIBOR +3.700%, 3.843%, 1/20/2034, 144A(c) 1,108,405
400,000 Ballyrock CLO Ltd., Series 2018-1A, Class C,3-month LIBOR + 3.150%, 3.338%, 4/20/2031,144A(c) 397,120
850,000 Barings CLO Ltd., Series 2019-4A, Class C,3-month LIBOR + 2.800%, 2.984%, 1/15/2033,144A(a)(c) 854,206
1,830,000 Basswood Park CLO Ltd., Series 2021-1A,Class D, 3-month LIBOR +2.650%, 2.861%, 4/20/2034, 144A(c) 1,829,921
2,145,000 Battalion CLO XIV Ltd., Series 2019-14A,Class E, 3-month LIBOR +6.680%, 6.868%, 4/20/2032, 144A(c) 2,145,018
500,000 Battalion CLO XVI Ltd., Series 2019-16A,Class D, 3-month LIBOR +4.360%, 4.548%, 12/19/2032, 144A(c) 502,533
915,000 Bristol Park CLO Ltd., Series 2016-1A,Class CR, 3-month LIBOR +1.950%, 2.134%, 4/15/2029, 144A(a)(c) 916,587
455,000 Burnham Park CLO Ltd., Series 2016-1A,Class CR, 3-month LIBOR +2.150%, 2.338%, 10/20/2029, 144A(a)(c) 455,147
400,000 Carbone CLO Ltd., Series 2017-1A, Class B,3-month LIBOR + 1.800%, 1.988%, 1/20/2031,144A(a)(c) 399,236
970,000 CarVal CLO IV Ltd., Series 2021-1A, Class D,3-month LIBOR + 3.250%, 7/20/2034,144A(c)(d)(n) 970,000
PrincipalAmount (‡) Description Value (†)
Collateralized Loan Obligations — continued$ 500,000 Catamaran CLO Ltd., Series 2013-1A,
Class CR, 3-month LIBOR +1.800%, 1.981%, 1/27/2028, 144A(a)(c) $ 500,239
730,000 CIFC Funding II Ltd., Series 2013-2A,Class A3LR, 3-month LIBOR +1.950%, 2.140%, 10/18/2030, 144A(a)(c) 728,165
265,000 CIFC Funding II Ltd., Series 2014-2RA,Class A3, 3-month LIBOR +1.900%, 2.076%, 4/24/2030, 144A(a)(c) 263,746
875,000 Dryden 45 Senior Loan Fund, Series 2016-45A,Class ER, 3-month LIBOR +5.850%, 6.034%, 10/15/2030, 144A(c) 857,563
250,000 Dryden 64 CLO Ltd., Series 2018-64A, Class C,3-month LIBOR + 1.750%, 1.940%, 4/18/2031,144A(a)(c) 247,888
615,000 Dryden 80 CLO Ltd., Series 2019-80A,Class D1, 3-month LIBOR +4.100%, 4.290%, 1/17/2033, 144A(c) 619,233
300,000 Dryden XXVI Senior Loan Fund,Series 2013-26A, Class CR, 3-month LIBOR +1.850%, 2.034%, 4/15/2029, 144A(a)(c) 299,645
330,000 Galaxy XXIX CLO Ltd., Series 2018-29A,Class D, 3-month LIBOR +2.400%, 2.556%, 11/15/2026, 144A(a)(c) 329,708
1,405,000 Galaxy XXVI CLO Ltd., Series 2018-26A,Class E, 3-month LIBOR +5.850%, 6.000%, 11/22/2031, 144A(c) 1,394,035
650,000 Gilbert Park CLO Ltd., Series 2017-1A, Class D,3-month LIBOR + 2.950%, 3.134%, 10/15/2030,144A(c) 649,994
320,000 Goldentree Loan Management U.S. CLO 3 Ltd.,Series 2018-3A, Class C, 3-month LIBOR +1.900%, 2.088%, 4/20/2030, 144A(a)(c) 320,635
990,000 Hayfin Kingsland XI Ltd., Series 2019-2A,Class E, 3-month LIBOR +6.900%, 7.088%, 7/20/2032, 144A(c) 993,372
310,000 LCM 30 Ltd., Series 30A, Class CR, 3-monthLIBOR + 3.000%, 3.160%, 4/20/2031, 144A(c) 309,999
475,000 Madison Park Funding XXXI Ltd.,Series 2018-31A, Class C, 3-month LIBOR +2.150%, 2.323%, 1/23/2031, 144A(a)(c) 475,038
300,000 Madison Park Funding XXXI Ltd.,Series 2018-31A, Class D, 3-month LIBOR +3.000%, 3.173%, 1/23/2031, 144A(c) 300,015
3,300,000 Neuberger Berman CLO Ltd., Series 2013-14A,Class CR2, 3-month LIBOR +1.900%, 2.084%, 1/28/2030, 144A(a)(c) 3,292,150
2,100,000 Oaktree CLO Ltd., Series 2019-4A, Class E,3-month LIBOR + 7.230%, 7.418%, 10/20/2032,144A(c) 2,096,532
495,000 Octagon Investment Partners 39 Ltd.,Series 2018-3A, Class E, 3-month LIBOR +5.750%, 5.938%, 10/20/2030, 144A(c) 489,943
1,420,000 Octagon Investment Partners 40 Ltd.,Series 2019-1A, Class D, 3-month LIBOR +3.800%, 3.988%, 4/20/2031, 144A(c) 1,421,914
920,000 Octagon Investment Partners XXII Ltd.,Series 2014-1A, Class CRR, 3-month LIBOR +1.900%, 2.084%, 1/22/2030, 144A(a)(c) 918,569
445,000 OHA Credit Funding 2 Ltd., Series 2019-2A,Class ER, 3-month LIBOR +6.360%, 6.546%, 4/21/2034, 144A(c) 445,012
See accompanying notes to financial statements. | 48
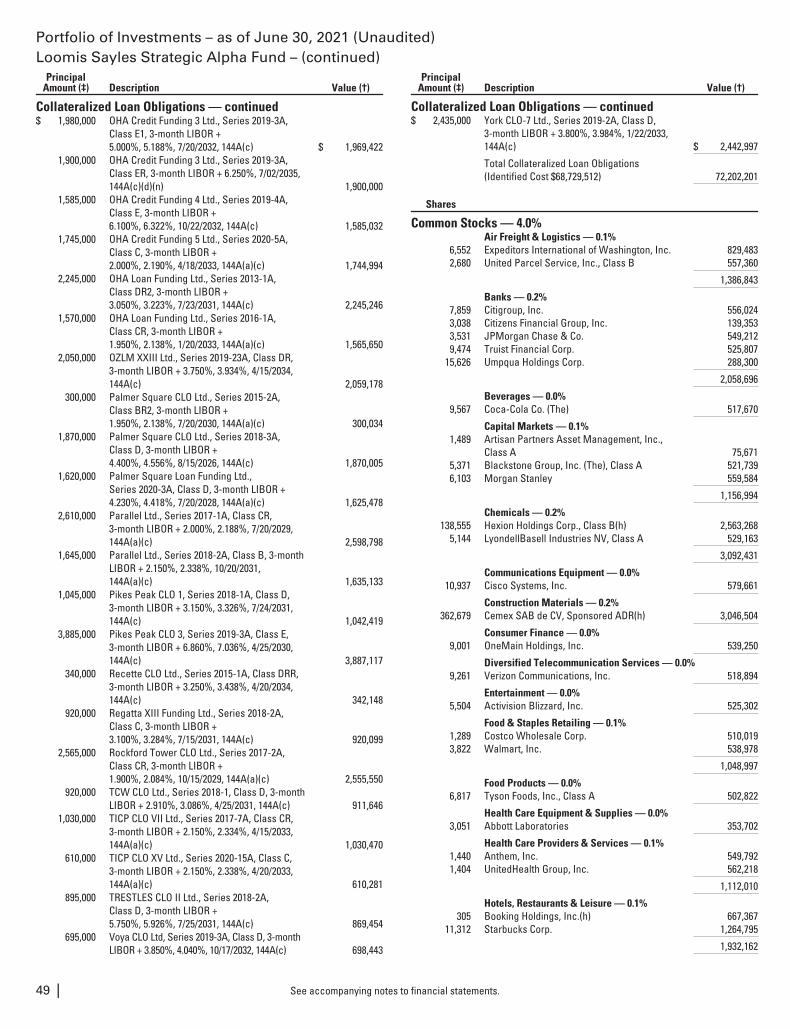
Portfolio of Investments – as of June 30, 2021 (Unaudited)Loomis Sayles Strategic Alpha Fund – (continued)
PrincipalAmount (‡) Description Value (†)
Collateralized Loan Obligations — continued$ 1,980,000 OHA Credit Funding 3 Ltd., Series 2019-3A,
Class E1, 3-month LIBOR +5.000%, 5.188%, 7/20/2032, 144A(c) $ 1,969,422
1,900,000 OHA Credit Funding 3 Ltd., Series 2019-3A,Class ER, 3-month LIBOR + 6.250%, 7/02/2035,144A(c)(d)(n) 1,900,000
1,585,000 OHA Credit Funding 4 Ltd., Series 2019-4A,Class E, 3-month LIBOR +6.100%, 6.322%, 10/22/2032, 144A(c) 1,585,032
1,745,000 OHA Credit Funding 5 Ltd., Series 2020-5A,Class C, 3-month LIBOR +2.000%, 2.190%, 4/18/2033, 144A(a)(c) 1,744,994
2,245,000 OHA Loan Funding Ltd., Series 2013-1A,Class DR2, 3-month LIBOR +3.050%, 3.223%, 7/23/2031, 144A(c) 2,245,246
1,570,000 OHA Loan Funding Ltd., Series 2016-1A,Class CR, 3-month LIBOR +1.950%, 2.138%, 1/20/2033, 144A(a)(c) 1,565,650
2,050,000 OZLM XXIII Ltd., Series 2019-23A, Class DR,3-month LIBOR + 3.750%, 3.934%, 4/15/2034,144A(c) 2,059,178
300,000 Palmer Square CLO Ltd., Series 2015-2A,Class BR2, 3-month LIBOR +1.950%, 2.138%, 7/20/2030, 144A(a)(c) 300,034
1,870,000 Palmer Square CLO Ltd., Series 2018-3A,Class D, 3-month LIBOR +4.400%, 4.556%, 8/15/2026, 144A(c) 1,870,005
1,620,000 Palmer Square Loan Funding Ltd.,Series 2020-3A, Class D, 3-month LIBOR +4.230%, 4.418%, 7/20/2028, 144A(a)(c) 1,625,478
2,610,000 Parallel Ltd., Series 2017-1A, Class CR,3-month LIBOR + 2.000%, 2.188%, 7/20/2029,144A(a)(c) 2,598,798
1,645,000 Parallel Ltd., Series 2018-2A, Class B, 3-monthLIBOR + 2.150%, 2.338%, 10/20/2031,144A(a)(c) 1,635,133
1,045,000 Pikes Peak CLO 1, Series 2018-1A, Class D,3-month LIBOR + 3.150%, 3.326%, 7/24/2031,144A(c) 1,042,419
3,885,000 Pikes Peak CLO 3, Series 2019-3A, Class E,3-month LIBOR + 6.860%, 7.036%, 4/25/2030,144A(c) 3,887,117
340,000 Recette CLO Ltd., Series 2015-1A, Class DRR,3-month LIBOR + 3.250%, 3.438%, 4/20/2034,144A(c) 342,148
920,000 Regatta XIII Funding Ltd., Series 2018-2A,Class C, 3-month LIBOR +3.100%, 3.284%, 7/15/2031, 144A(c) 920,099
2,565,000 Rockford Tower CLO Ltd., Series 2017-2A,Class CR, 3-month LIBOR +1.900%, 2.084%, 10/15/2029, 144A(a)(c) 2,555,550
920,000 TCW CLO Ltd., Series 2018-1, Class D, 3-monthLIBOR + 2.910%, 3.086%, 4/25/2031, 144A(c) 911,646
1,030,000 TICP CLO VII Ltd., Series 2017-7A, Class CR,3-month LIBOR + 2.150%, 2.334%, 4/15/2033,144A(a)(c) 1,030,470
610,000 TICP CLO XV Ltd., Series 2020-15A, Class C,3-month LIBOR + 2.150%, 2.338%, 4/20/2033,144A(a)(c) 610,281
895,000 TRESTLES CLO II Ltd., Series 2018-2A,Class D, 3-month LIBOR +5.750%, 5.926%, 7/25/2031, 144A(c) 869,454
695,000 Voya CLO Ltd, Series 2019-3A, Class D, 3-monthLIBOR + 3.850%, 4.040%, 10/17/2032, 144A(c) 698,443
PrincipalAmount (‡) Description Value (†)
Collateralized Loan Obligations — continued$ 2,435,000 York CLO-7 Ltd., Series 2019-2A, Class D,
3-month LIBOR + 3.800%, 3.984%, 1/22/2033,144A(c) $ 2,442,997
Total Collateralized Loan Obligations(Identified Cost $68,729,512) 72,202,201
Shares
Common Stocks — 4.0%Air Freight & Logistics — 0.1%
6,552 Expeditors International of Washington, Inc. 829,4832,680 United Parcel Service, Inc., Class B 557,360
1,386,843
Banks — 0.2%7,859 Citigroup, Inc. 556,0243,038 Citizens Financial Group, Inc. 139,3533,531 JPMorgan Chase & Co. 549,2129,474 Truist Financial Corp. 525,807
15,626 Umpqua Holdings Corp. 288,300
2,058,696
Beverages — 0.0%9,567 Coca-Cola Co. (The) 517,670
Capital Markets — 0.1%1,489 Artisan Partners Asset Management, Inc.,
Class A 75,6715,371 Blackstone Group, Inc. (The), Class A 521,7396,103 Morgan Stanley 559,584
1,156,994
Chemicals — 0.2%138,555 Hexion Holdings Corp., Class B(h) 2,563,268
5,144 LyondellBasell Industries NV, Class A 529,163
3,092,431
Communications Equipment — 0.0%10,937 Cisco Systems, Inc. 579,661
Construction Materials — 0.2%362,679 Cemex SAB de CV, Sponsored ADR(h) 3,046,504
Consumer Finance — 0.0%9,001 OneMain Holdings, Inc. 539,250
Diversified Telecommunication Services — 0.0%9,261 Verizon Communications, Inc. 518,894
Entertainment — 0.0%5,504 Activision Blizzard, Inc. 525,302
Food & Staples Retailing — 0.1%1,289 Costco Wholesale Corp. 510,0193,822 Walmart, Inc. 538,978
1,048,997
Food Products — 0.0%6,817 Tyson Foods, Inc., Class A 502,822
Health Care Equipment & Supplies — 0.0%3,051 Abbott Laboratories 353,702
Health Care Providers & Services — 0.1%1,440 Anthem, Inc. 549,7921,404 UnitedHealth Group, Inc. 562,218
1,112,010
Hotels, Restaurants & Leisure — 0.1%305 Booking Holdings, Inc.(h) 667,367
11,312 Starbucks Corp. 1,264,795
1,932,162
See accompanying notes to financial statements.49 |
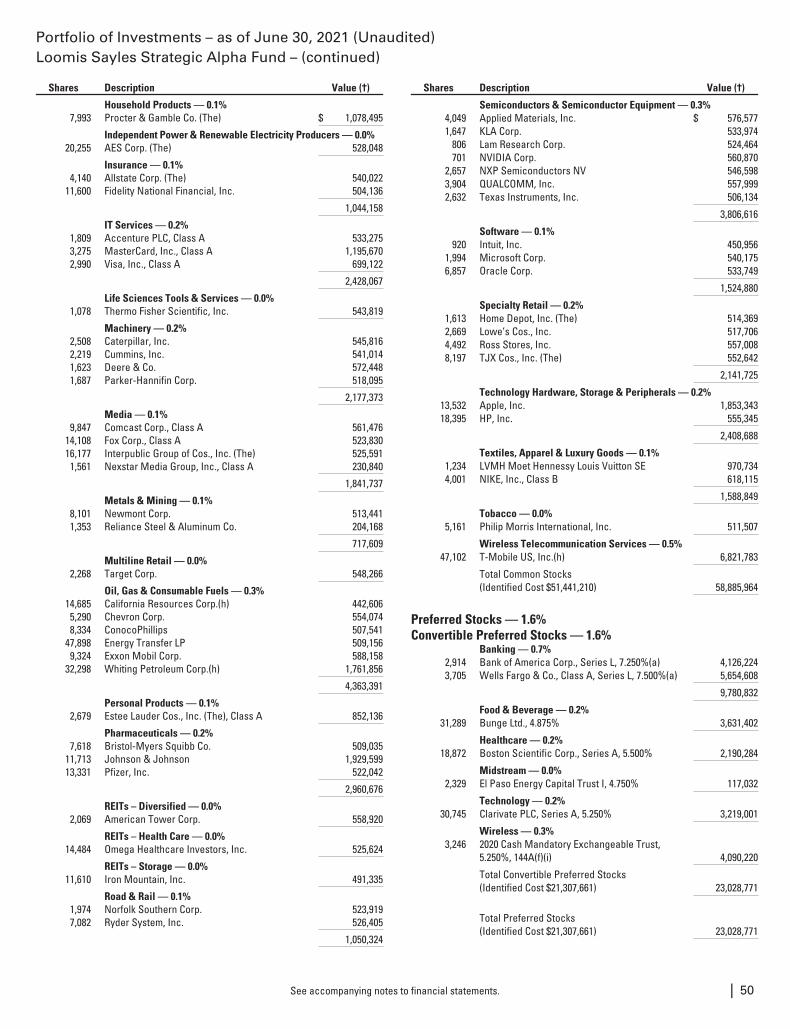
Portfolio of Investments – as of June 30, 2021 (Unaudited)Loomis Sayles Strategic Alpha Fund – (continued)
Shares Description Value (†)
Household Products — 0.1%7,993 Procter & Gamble Co. (The) $ 1,078,495
Independent Power & Renewable Electricity Producers — 0.0%20,255 AES Corp. (The) 528,048
Insurance — 0.1%4,140 Allstate Corp. (The) 540,022
11,600 Fidelity National Financial, Inc. 504,136
1,044,158
IT Services — 0.2%1,809 Accenture PLC, Class A 533,2753,275 MasterCard, Inc., Class A 1,195,6702,990 Visa, Inc., Class A 699,122
2,428,067
Life Sciences Tools & Services — 0.0%1,078 Thermo Fisher Scientific, Inc. 543,819
Machinery — 0.2%2,508 Caterpillar, Inc. 545,8162,219 Cummins, Inc. 541,0141,623 Deere & Co. 572,4481,687 Parker-Hannifin Corp. 518,095
2,177,373
Media — 0.1%9,847 Comcast Corp., Class A 561,476
14,108 Fox Corp., Class A 523,83016,177 Interpublic Group of Cos., Inc. (The) 525,5911,561 Nexstar Media Group, Inc., Class A 230,840
1,841,737
Metals & Mining — 0.1%8,101 Newmont Corp. 513,4411,353 Reliance Steel & Aluminum Co. 204,168
717,609
Multiline Retail — 0.0%2,268 Target Corp. 548,266
Oil, Gas & Consumable Fuels — 0.3%14,685 California Resources Corp.(h) 442,6065,290 Chevron Corp. 554,0748,334 ConocoPhillips 507,541
47,898 Energy Transfer LP 509,1569,324 Exxon Mobil Corp. 588,158
32,298 Whiting Petroleum Corp.(h) 1,761,856
4,363,391
Personal Products — 0.1%2,679 Estee Lauder Cos., Inc. (The), Class A 852,136
Pharmaceuticals — 0.2%7,618 Bristol-Myers Squibb Co. 509,035
11,713 Johnson & Johnson 1,929,59913,331 Pfizer, Inc. 522,042
2,960,676
REITs – Diversified — 0.0%2,069 American Tower Corp. 558,920
REITs – Health Care — 0.0%14,484 Omega Healthcare Investors, Inc. 525,624
REITs – Storage — 0.0%11,610 Iron Mountain, Inc. 491,335
Road & Rail — 0.1%1,974 Norfolk Southern Corp. 523,9197,082 Ryder System, Inc. 526,405
1,050,324
Shares Description Value (†)
Semiconductors & Semiconductor Equipment — 0.3%4,049 Applied Materials, Inc. $ 576,5771,647 KLA Corp. 533,974
806 Lam Research Corp. 524,464701 NVIDIA Corp. 560,870
2,657 NXP Semiconductors NV 546,5983,904 QUALCOMM, Inc. 557,9992,632 Texas Instruments, Inc. 506,134
3,806,616
Software — 0.1%920 Intuit, Inc. 450,956
1,994 Microsoft Corp. 540,1756,857 Oracle Corp. 533,749
1,524,880
Specialty Retail — 0.2%1,613 Home Depot, Inc. (The) 514,3692,669 Lowe’s Cos., Inc. 517,7064,492 Ross Stores, Inc. 557,0088,197 TJX Cos., Inc. (The) 552,642
2,141,725
Technology Hardware, Storage & Peripherals — 0.2%13,532 Apple, Inc. 1,853,34318,395 HP, Inc. 555,345
2,408,688
Textiles, Apparel & Luxury Goods — 0.1%1,234 LVMH Moet Hennessy Louis Vuitton SE 970,7344,001 NIKE, Inc., Class B 618,115
1,588,849
Tobacco — 0.0%5,161 Philip Morris International, Inc. 511,507
Wireless Telecommunication Services — 0.5%47,102 T-Mobile US, Inc.(h) 6,821,783
Total Common Stocks(Identified Cost $51,441,210) 58,885,964
Preferred Stocks — 1.6%Convertible Preferred Stocks — 1.6%
Banking — 0.7%2,914 Bank of America Corp., Series L, 7.250%(a) 4,126,2243,705 Wells Fargo & Co., Class A, Series L, 7.500%(a) 5,654,608
9,780,832
Food & Beverage — 0.2%31,289 Bunge Ltd., 4.875% 3,631,402
Healthcare — 0.2%18,872 Boston Scientific Corp., Series A, 5.500% 2,190,284
Midstream — 0.0%2,329 El Paso Energy Capital Trust I, 4.750% 117,032
Technology — 0.2%30,745 Clarivate PLC, Series A, 5.250% 3,219,001
Wireless — 0.3%3,246 2020 Cash Mandatory Exchangeable Trust,
5.250%, 144A(f)(i) 4,090,220
Total Convertible Preferred Stocks(Identified Cost $21,307,661) 23,028,771
Total Preferred Stocks(Identified Cost $21,307,661) 23,028,771
See accompanying notes to financial statements. | 50
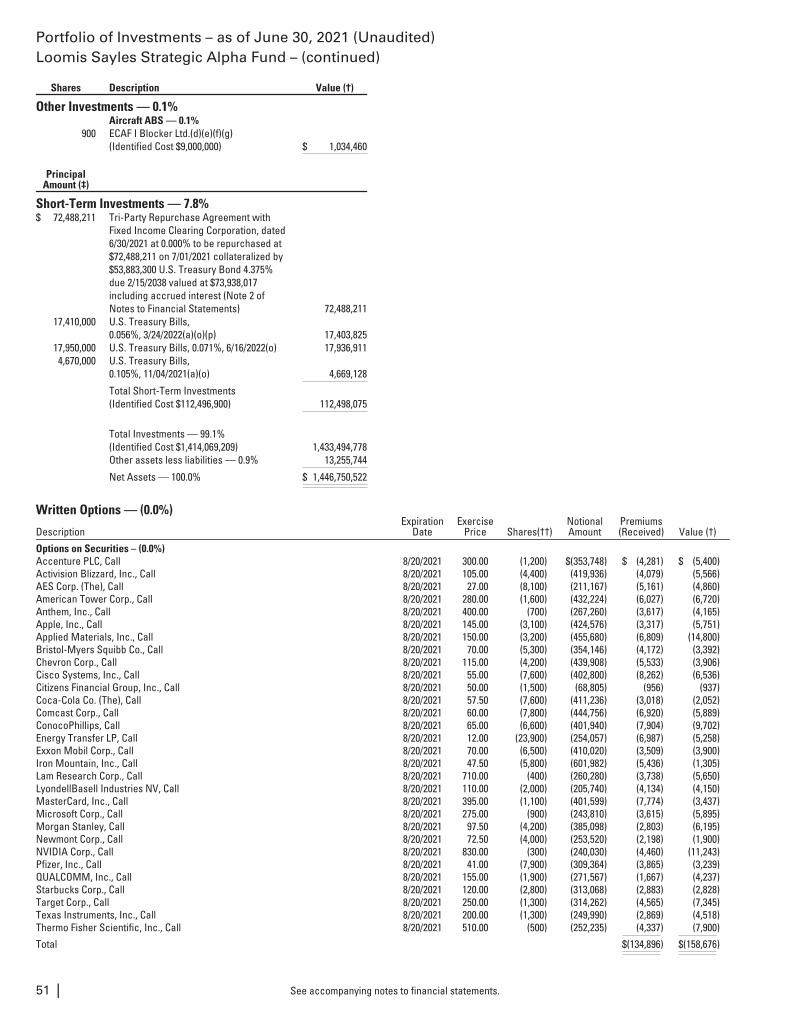
Portfolio of Investments – as of June 30, 2021 (Unaudited)Loomis Sayles Strategic Alpha Fund – (continued)
Shares Description Value (†)
Other Investments — 0.1%Aircraft ABS — 0.1%
900 ECAF I Blocker Ltd.(d)(e)(f)(g)(Identified Cost $9,000,000) $ 1,034,460
PrincipalAmount (‡)
Short-Term Investments — 7.8%$ 72,488,211 Tri-Party Repurchase Agreement with
Fixed Income Clearing Corporation, dated6/30/2021 at 0.000% to be repurchased at$72,488,211 on 7/01/2021 collateralized by$53,883,300 U.S. Treasury Bond 4.375%due 2/15/2038 valued at $73,938,017including accrued interest (Note 2 ofNotes to Financial Statements) 72,488,211
17,410,000 U.S. Treasury Bills,0.056%, 3/24/2022(a)(o)(p) 17,403,825
17,950,000 U.S. Treasury Bills, 0.071%, 6/16/2022(o) 17,936,9114,670,000 U.S. Treasury Bills,
0.105%, 11/04/2021(a)(o) 4,669,128
Total Short-Term Investments(Identified Cost $112,496,900) 112,498,075
Total Investments — 99.1%(Identified Cost $1,414,069,209) 1,433,494,778Other assets less liabilities — 0.9% 13,255,744
Net Assets — 100.0% $ 1,446,750,522
Written Options — (0.0%)
DescriptionExpiration
DateExercise
Price Shares(††)NotionalAmount
Premiums(Received) Value (†)
Options on Securities – (0.0%)Accenture PLC, Call 8/20/2021 300.00 (1,200) $(353,748) $ (4,281) $ (5,400)Activision Blizzard, Inc., Call 8/20/2021 105.00 (4,400) (419,936) (4,079) (5,566)AES Corp. (The), Call 8/20/2021 27.00 (8,100) (211,167) (5,161) (4,860)American Tower Corp., Call 8/20/2021 280.00 (1,600) (432,224) (6,027) (6,720)Anthem, Inc., Call 8/20/2021 400.00 (700) (267,260) (3,617) (4,165)Apple, Inc., Call 8/20/2021 145.00 (3,100) (424,576) (3,317) (5,751)Applied Materials, Inc., Call 8/20/2021 150.00 (3,200) (455,680) (6,809) (14,800)Bristol-Myers Squibb Co., Call 8/20/2021 70.00 (5,300) (354,146) (4,172) (3,392)Chevron Corp., Call 8/20/2021 115.00 (4,200) (439,908) (5,533) (3,906)Cisco Systems, Inc., Call 8/20/2021 55.00 (7,600) (402,800) (8,262) (6,536)Citizens Financial Group, Inc., Call 8/20/2021 50.00 (1,500) (68,805) (956) (937)Coca-Cola Co. (The), Call 8/20/2021 57.50 (7,600) (411,236) (3,018) (2,052)Comcast Corp., Call 8/20/2021 60.00 (7,800) (444,756) (6,920) (5,889)ConocoPhillips, Call 8/20/2021 65.00 (6,600) (401,940) (7,904) (9,702)Energy Transfer LP, Call 8/20/2021 12.00 (23,900) (254,057) (6,987) (5,258)Exxon Mobil Corp., Call 8/20/2021 70.00 (6,500) (410,020) (3,509) (3,900)Iron Mountain, Inc., Call 8/20/2021 47.50 (5,800) (601,982) (5,436) (1,305)Lam Research Corp., Call 8/20/2021 710.00 (400) (260,280) (3,738) (5,650)LyondellBasell Industries NV, Call 8/20/2021 110.00 (2,000) (205,740) (4,134) (4,150)MasterCard, Inc., Call 8/20/2021 395.00 (1,100) (401,599) (7,774) (3,437)Microsoft Corp., Call 8/20/2021 275.00 (900) (243,810) (3,615) (5,895)Morgan Stanley, Call 8/20/2021 97.50 (4,200) (385,098) (2,803) (6,195)Newmont Corp., Call 8/20/2021 72.50 (4,000) (253,520) (2,198) (1,900)NVIDIA Corp., Call 8/20/2021 830.00 (300) (240,030) (4,460) (11,243)Pfizer, Inc., Call 8/20/2021 41.00 (7,900) (309,364) (3,865) (3,239)QUALCOMM, Inc., Call 8/20/2021 155.00 (1,900) (271,567) (1,667) (4,237)Starbucks Corp., Call 8/20/2021 120.00 (2,800) (313,068) (2,883) (2,828)Target Corp., Call 8/20/2021 250.00 (1,300) (314,262) (4,565) (7,345)Texas Instruments, Inc., Call 8/20/2021 200.00 (1,300) (249,990) (2,869) (4,518)Thermo Fisher Scientific, Inc., Call 8/20/2021 510.00 (500) (252,235) (4,337) (7,900)
Total $(134,896) $(158,676)
See accompanying notes to financial statements.51 |
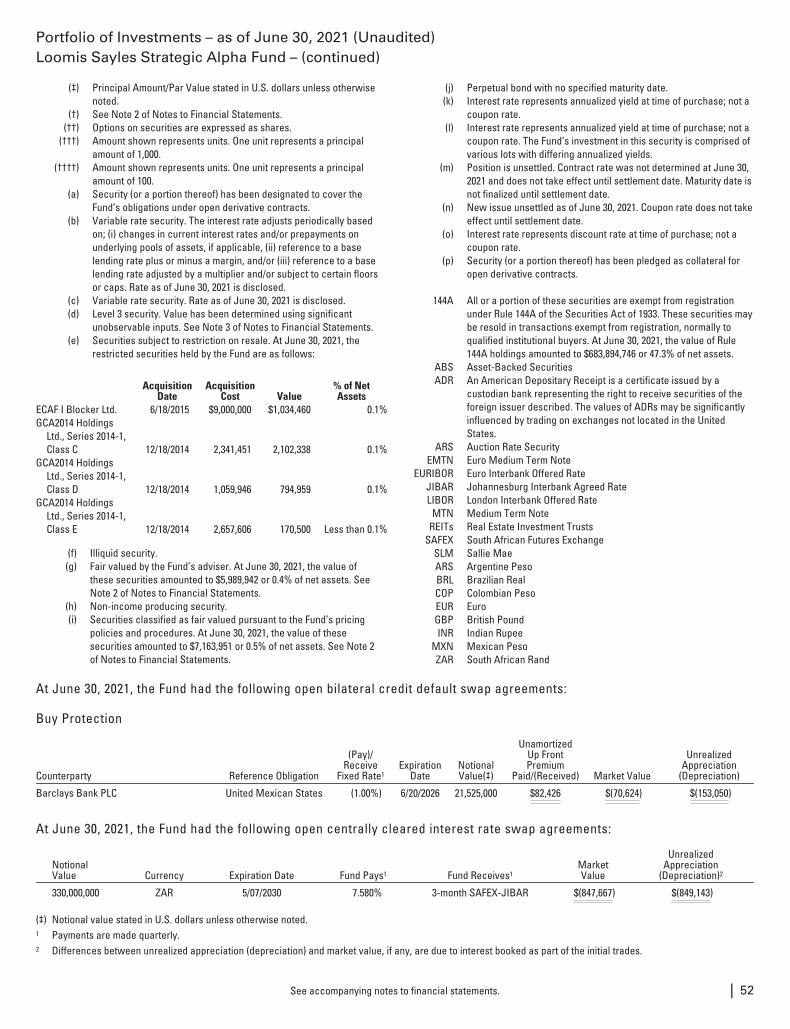
Portfolio of Investments – as of June 30, 2021 (Unaudited)Loomis Sayles Strategic Alpha Fund – (continued)
(‡) Principal Amount/Par Value stated in U.S. dollars unless otherwisenoted.
(†) See Note 2 of Notes to Financial Statements.(††) Options on securities are expressed as shares.
(†††) Amount shown represents units. One unit represents a principalamount of 1,000.
(††††) Amount shown represents units. One unit represents a principalamount of 100.
(a) Security (or a portion thereof) has been designated to cover theFund’s obligations under open derivative contracts.
(b) Variable rate security. The interest rate adjusts periodically basedon; (i) changes in current interest rates and/or prepayments onunderlying pools of assets, if applicable, (ii) reference to a baselending rate plus or minus a margin, and/or (iii) reference to a baselending rate adjusted by a multiplier and/or subject to certain floorsor caps. Rate as of June 30, 2021 is disclosed.
(c) Variable rate security. Rate as of June 30, 2021 is disclosed.(d) Level 3 security. Value has been determined using significant
unobservable inputs. See Note 3 of Notes to Financial Statements.(e) Securities subject to restriction on resale. At June 30, 2021, the
restricted securities held by the Fund are as follows:
AcquisitionDate
AcquisitionCost Value
% of NetAssets
ECAF I Blocker Ltd. 6/18/2015 $9,000,000 $1,034,460 0.1%GCA2014 Holdings
Ltd., Series 2014-1,Class C 12/18/2014 2,341,451 2,102,338 0.1%
GCA2014 HoldingsLtd., Series 2014-1,Class D 12/18/2014 1,059,946 794,959 0.1%
GCA2014 HoldingsLtd., Series 2014-1,Class E 12/18/2014 2,657,606 170,500 Less than 0.1%
(f) Illiquid security.(g) Fair valued by the Fund’s adviser. At June 30, 2021, the value of
these securities amounted to $5,989,942 or 0.4% of net assets. SeeNote 2 of Notes to Financial Statements.
(h) Non-income producing security.(i) Securities classified as fair valued pursuant to the Fund’s pricing
policies and procedures. At June 30, 2021, the value of thesesecurities amounted to $7,163,951 or 0.5% of net assets. See Note 2of Notes to Financial Statements.
(j) Perpetual bond with no specified maturity date.(k) Interest rate represents annualized yield at time of purchase; not a
coupon rate.(l) Interest rate represents annualized yield at time of purchase; not a
coupon rate. The Fund’s investment in this security is comprised ofvarious lots with differing annualized yields.
(m) Position is unsettled. Contract rate was not determined at June 30,2021 and does not take effect until settlement date. Maturity date isnot finalized until settlement date.
(n) New issue unsettled as of June 30, 2021. Coupon rate does not takeeffect until settlement date.
(o) Interest rate represents discount rate at time of purchase; not acoupon rate.
(p) Security (or a portion thereof) has been pledged as collateral foropen derivative contracts.
144A All or a portion of these securities are exempt from registrationunder Rule 144A of the Securities Act of 1933. These securities maybe resold in transactions exempt from registration, normally toqualified institutional buyers. At June 30, 2021, the value of Rule144A holdings amounted to $683,894,746 or 47.3% of net assets.
ABS Asset-Backed SecuritiesADR An American Depositary Receipt is a certificate issued by a
custodian bank representing the right to receive securities of theforeign issuer described. The values of ADRs may be significantlyinfluenced by trading on exchanges not located in the UnitedStates.
ARS Auction Rate SecurityEMTN Euro Medium Term Note
EURIBOR Euro Interbank Offered RateJIBAR Johannesburg Interbank Agreed RateLIBOR London Interbank Offered Rate
MTN Medium Term NoteREITs Real Estate Investment Trusts
SAFEX South African Futures ExchangeSLM Sallie MaeARS Argentine PesoBRL Brazilian RealCOP Colombian PesoEUR EuroGBP British PoundINR Indian Rupee
MXN Mexican PesoZAR South African Rand
At June 30, 2021, the Fund had the following open bilateral credit default swap agreements:
Buy Protection
Counterparty Reference Obligation
(Pay)/Receive
Fixed Rate1Expiration
DateNotionalValue(‡)
UnamortizedUp FrontPremium
Paid/(Received) Market Value
UnrealizedAppreciation
(Depreciation)
Barclays Bank PLC United Mexican States (1.00%) 6/20/2026 21,525,000 $82,426 $(70,624) $(153,050)
At June 30, 2021, the Fund had the following open centrally cleared interest rate swap agreements:
NotionalValue Currency Expiration Date Fund Pays1 Fund Receives1
MarketValue
UnrealizedAppreciation
(Depreciation)2
330,000,000 ZAR 5/07/2030 7.580% 3-month SAFEX-JIBAR $(847,667) $(849,143)
(‡) Notional value stated in U.S. dollars unless otherwise noted.1 Payments are made quarterly.2 Differences between unrealized appreciation (depreciation) and market value, if any, are due to interest booked as part of the initial trades.
See accompanying notes to financial statements. | 52
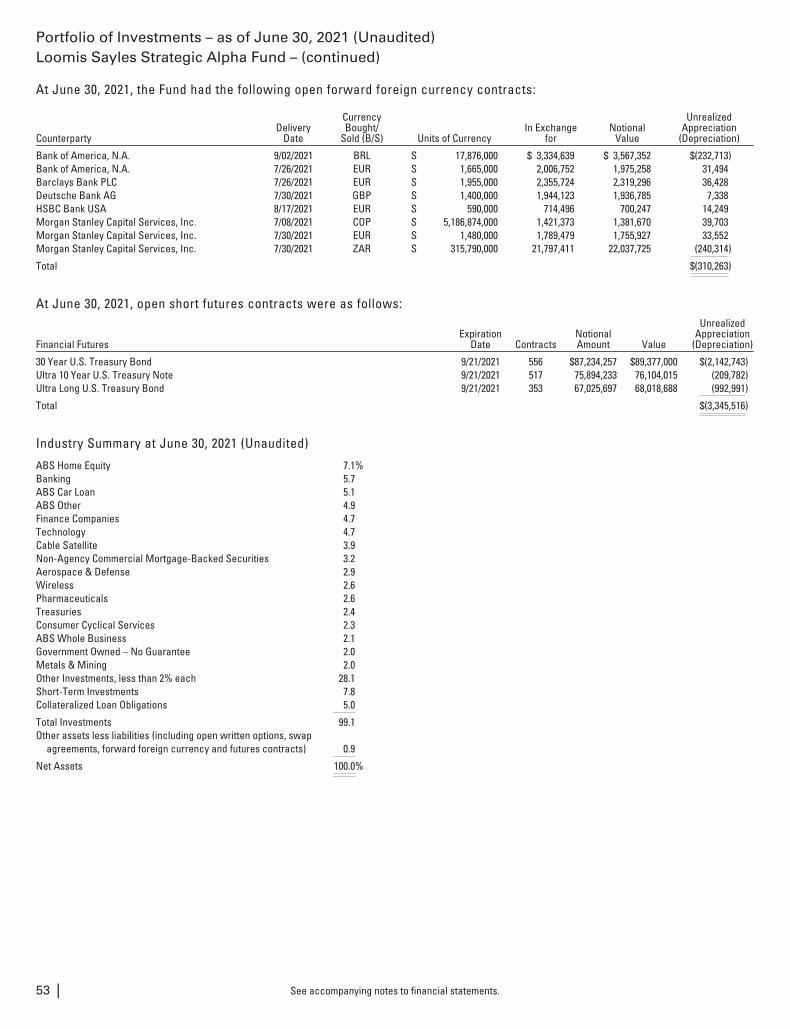
Portfolio of Investments – as of June 30, 2021 (Unaudited)Loomis Sayles Strategic Alpha Fund – (continued)
At June 30, 2021, the Fund had the following open forward foreign currency contracts:
CounterpartyDelivery
Date
CurrencyBought/
Sold (B/S) Units of CurrencyIn Exchange
forNotional
Value
UnrealizedAppreciation
(Depreciation)
Bank of America, N.A. 9/02/2021 BRL S 17,876,000 $ 3,334,639 $ 3,567,352 $(232,713)Bank of America, N.A. 7/26/2021 EUR S 1,665,000 2,006,752 1,975,258 31,494Barclays Bank PLC 7/26/2021 EUR S 1,955,000 2,355,724 2,319,296 36,428Deutsche Bank AG 7/30/2021 GBP S 1,400,000 1,944,123 1,936,785 7,338HSBC Bank USA 8/17/2021 EUR S 590,000 714,496 700,247 14,249Morgan Stanley Capital Services, Inc. 7/08/2021 COP S 5,186,874,000 1,421,373 1,381,670 39,703Morgan Stanley Capital Services, Inc. 7/30/2021 EUR S 1,480,000 1,789,479 1,755,927 33,552Morgan Stanley Capital Services, Inc. 7/30/2021 ZAR S 315,790,000 21,797,411 22,037,725 (240,314)
Total $(310,263)
At June 30, 2021, open short futures contracts were as follows:
Financial FuturesExpiration
Date ContractsNotionalAmount Value
UnrealizedAppreciation
(Depreciation)
30 Year U.S. Treasury Bond 9/21/2021 556 $87,234,257 $89,377,000 $(2,142,743)Ultra 10 Year U.S. Treasury Note 9/21/2021 517 75,894,233 76,104,015 (209,782)Ultra Long U.S. Treasury Bond 9/21/2021 353 67,025,697 68,018,688 (992,991)
Total $(3,345,516)
Industry Summary at June 30, 2021 (Unaudited)
ABS Home Equity 7.1%Banking 5.7ABS Car Loan 5.1ABS Other 4.9Finance Companies 4.7Technology 4.7Cable Satellite 3.9Non-Agency Commercial Mortgage-Backed Securities 3.2Aerospace & Defense 2.9Wireless 2.6Pharmaceuticals 2.6Treasuries 2.4Consumer Cyclical Services 2.3ABS Whole Business 2.1Government Owned – No Guarantee 2.0Metals & Mining 2.0Other Investments, less than 2% each 28.1Short-Term Investments 7.8Collateralized Loan Obligations 5.0
Total Investments 99.1Other assets less liabilities (including open written options, swap
agreements, forward foreign currency and futures contracts) 0.9
Net Assets 100.0%
See accompanying notes to financial statements.53 |
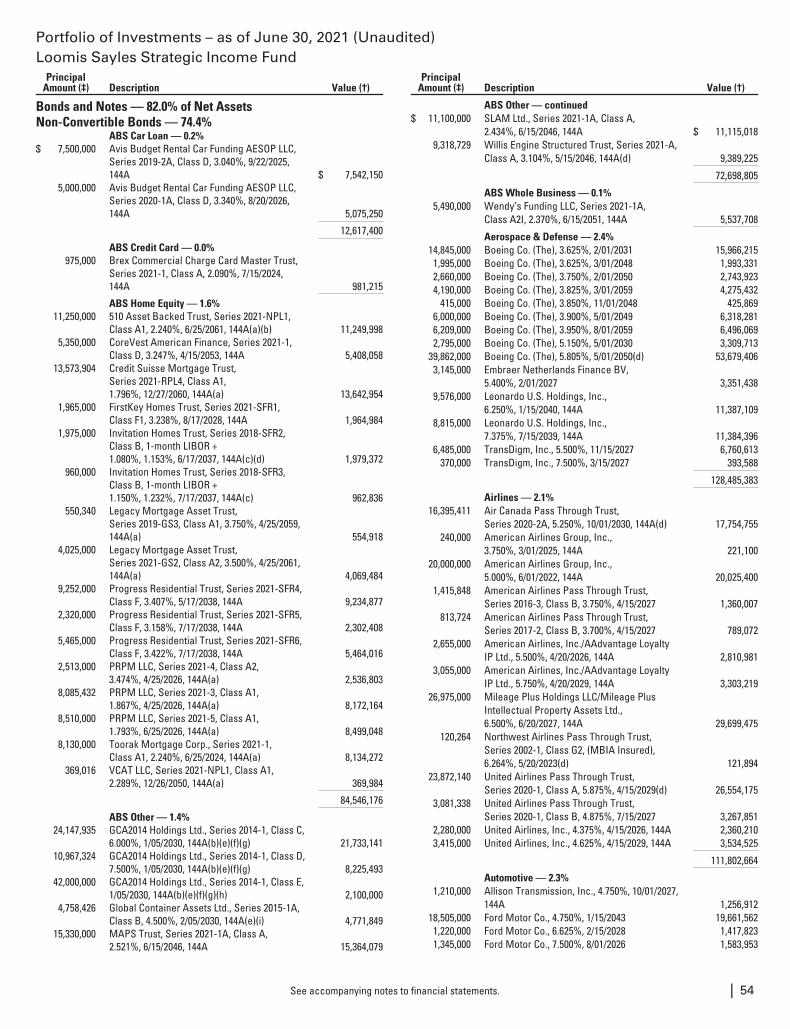
Portfolio of Investments – as of June 30, 2021 (Unaudited)Loomis Sayles Strategic Income Fund
PrincipalAmount (‡) Description Value (†)
Bonds and Notes — 82.0% of Net AssetsNon-Convertible Bonds — 74.4%
ABS Car Loan — 0.2%$ 7,500,000 Avis Budget Rental Car Funding AESOP LLC,
Series 2019-2A, Class D, 3.040%, 9/22/2025,144A $ 7,542,150
5,000,000 Avis Budget Rental Car Funding AESOP LLC,Series 2020-1A, Class D, 3.340%, 8/20/2026,144A 5,075,250
12,617,400
ABS Credit Card — 0.0%975,000 Brex Commercial Charge Card Master Trust,
Series 2021-1, Class A, 2.090%, 7/15/2024,144A 981,215
ABS Home Equity — 1.6%11,250,000 510 Asset Backed Trust, Series 2021-NPL1,
Class A1, 2.240%, 6/25/2061, 144A(a)(b) 11,249,9985,350,000 CoreVest American Finance, Series 2021-1,
Class D, 3.247%, 4/15/2053, 144A 5,408,05813,573,904 Credit Suisse Mortgage Trust,
Series 2021-RPL4, Class A1,1.796%, 12/27/2060, 144A(a) 13,642,954
1,965,000 FirstKey Homes Trust, Series 2021-SFR1,Class F1, 3.238%, 8/17/2028, 144A 1,964,984
1,975,000 Invitation Homes Trust, Series 2018-SFR2,Class B, 1-month LIBOR +1.080%, 1.153%, 6/17/2037, 144A(c)(d) 1,979,372
960,000 Invitation Homes Trust, Series 2018-SFR3,Class B, 1-month LIBOR +1.150%, 1.232%, 7/17/2037, 144A(c) 962,836
550,340 Legacy Mortgage Asset Trust,Series 2019-GS3, Class A1, 3.750%, 4/25/2059,144A(a) 554,918
4,025,000 Legacy Mortgage Asset Trust,Series 2021-GS2, Class A2, 3.500%, 4/25/2061,144A(a) 4,069,484
9,252,000 Progress Residential Trust, Series 2021-SFR4,Class F, 3.407%, 5/17/2038, 144A 9,234,877
2,320,000 Progress Residential Trust, Series 2021-SFR5,Class F, 3.158%, 7/17/2038, 144A 2,302,408
5,465,000 Progress Residential Trust, Series 2021-SFR6,Class F, 3.422%, 7/17/2038, 144A 5,464,016
2,513,000 PRPM LLC, Series 2021-4, Class A2,3.474%, 4/25/2026, 144A(a) 2,536,803
8,085,432 PRPM LLC, Series 2021-3, Class A1,1.867%, 4/25/2026, 144A(a) 8,172,164
8,510,000 PRPM LLC, Series 2021-5, Class A1,1.793%, 6/25/2026, 144A(a) 8,499,048
8,130,000 Toorak Mortgage Corp., Series 2021-1,Class A1, 2.240%, 6/25/2024, 144A(a) 8,134,272
369,016 VCAT LLC, Series 2021-NPL1, Class A1,2.289%, 12/26/2050, 144A(a) 369,984
84,546,176
ABS Other — 1.4%24,147,935 GCA2014 Holdings Ltd., Series 2014-1, Class C,
6.000%, 1/05/2030, 144A(b)(e)(f)(g) 21,733,14110,967,324 GCA2014 Holdings Ltd., Series 2014-1, Class D,
7.500%, 1/05/2030, 144A(b)(e)(f)(g) 8,225,49342,000,000 GCA2014 Holdings Ltd., Series 2014-1, Class E,
1/05/2030, 144A(b)(e)(f)(g)(h) 2,100,0004,758,426 Global Container Assets Ltd., Series 2015-1A,
Class B, 4.500%, 2/05/2030, 144A(e)(i) 4,771,84915,330,000 MAPS Trust, Series 2021-1A, Class A,
2.521%, 6/15/2046, 144A 15,364,079
PrincipalAmount (‡) Description Value (†)
ABS Other — continued$ 11,100,000 SLAM Ltd., Series 2021-1A, Class A,
2.434%, 6/15/2046, 144A $ 11,115,0189,318,729 Willis Engine Structured Trust, Series 2021-A,
Class A, 3.104%, 5/15/2046, 144A(d) 9,389,225
72,698,805
ABS Whole Business — 0.1%5,490,000 Wendy’s Funding LLC, Series 2021-1A,
Class A2I, 2.370%, 6/15/2051, 144A 5,537,708
Aerospace & Defense — 2.4%14,845,000 Boeing Co. (The), 3.625%, 2/01/2031 15,966,2151,995,000 Boeing Co. (The), 3.625%, 3/01/2048 1,993,3312,660,000 Boeing Co. (The), 3.750%, 2/01/2050 2,743,9234,190,000 Boeing Co. (The), 3.825%, 3/01/2059 4,275,432
415,000 Boeing Co. (The), 3.850%, 11/01/2048 425,8696,000,000 Boeing Co. (The), 3.900%, 5/01/2049 6,318,2816,209,000 Boeing Co. (The), 3.950%, 8/01/2059 6,496,0692,795,000 Boeing Co. (The), 5.150%, 5/01/2030 3,309,713
39,862,000 Boeing Co. (The), 5.805%, 5/01/2050(d) 53,679,4063,145,000 Embraer Netherlands Finance BV,
5.400%, 2/01/2027 3,351,4389,576,000 Leonardo U.S. Holdings, Inc.,
6.250%, 1/15/2040, 144A 11,387,1098,815,000 Leonardo U.S. Holdings, Inc.,
7.375%, 7/15/2039, 144A 11,384,3966,485,000 TransDigm, Inc., 5.500%, 11/15/2027 6,760,613
370,000 TransDigm, Inc., 7.500%, 3/15/2027 393,588
128,485,383
Airlines — 2.1%16,395,411 Air Canada Pass Through Trust,
Series 2020-2A, 5.250%, 10/01/2030, 144A(d) 17,754,755240,000 American Airlines Group, Inc.,
3.750%, 3/01/2025, 144A 221,10020,000,000 American Airlines Group, Inc.,
5.000%, 6/01/2022, 144A 20,025,4001,415,848 American Airlines Pass Through Trust,
Series 2016-3, Class B, 3.750%, 4/15/2027 1,360,007813,724 American Airlines Pass Through Trust,
Series 2017-2, Class B, 3.700%, 4/15/2027 789,0722,655,000 American Airlines, Inc./AAdvantage Loyalty
IP Ltd., 5.500%, 4/20/2026, 144A 2,810,9813,055,000 American Airlines, Inc./AAdvantage Loyalty
IP Ltd., 5.750%, 4/20/2029, 144A 3,303,21926,975,000 Mileage Plus Holdings LLC/Mileage Plus
Intellectual Property Assets Ltd.,6.500%, 6/20/2027, 144A 29,699,475
120,264 Northwest Airlines Pass Through Trust,Series 2002-1, Class G2, (MBIA Insured),6.264%, 5/20/2023(d) 121,894
23,872,140 United Airlines Pass Through Trust,Series 2020-1, Class A, 5.875%, 4/15/2029(d) 26,554,175
3,081,338 United Airlines Pass Through Trust,Series 2020-1, Class B, 4.875%, 7/15/2027 3,267,851
2,280,000 United Airlines, Inc., 4.375%, 4/15/2026, 144A 2,360,2103,415,000 United Airlines, Inc., 4.625%, 4/15/2029, 144A 3,534,525
111,802,664
Automotive — 2.3%1,210,000 Allison Transmission, Inc., 4.750%, 10/01/2027,
144A 1,256,91218,505,000 Ford Motor Co., 4.750%, 1/15/2043 19,661,5621,220,000 Ford Motor Co., 6.625%, 2/15/2028 1,417,8231,345,000 Ford Motor Co., 7.500%, 8/01/2026 1,583,953
See accompanying notes to financial statements. | 54
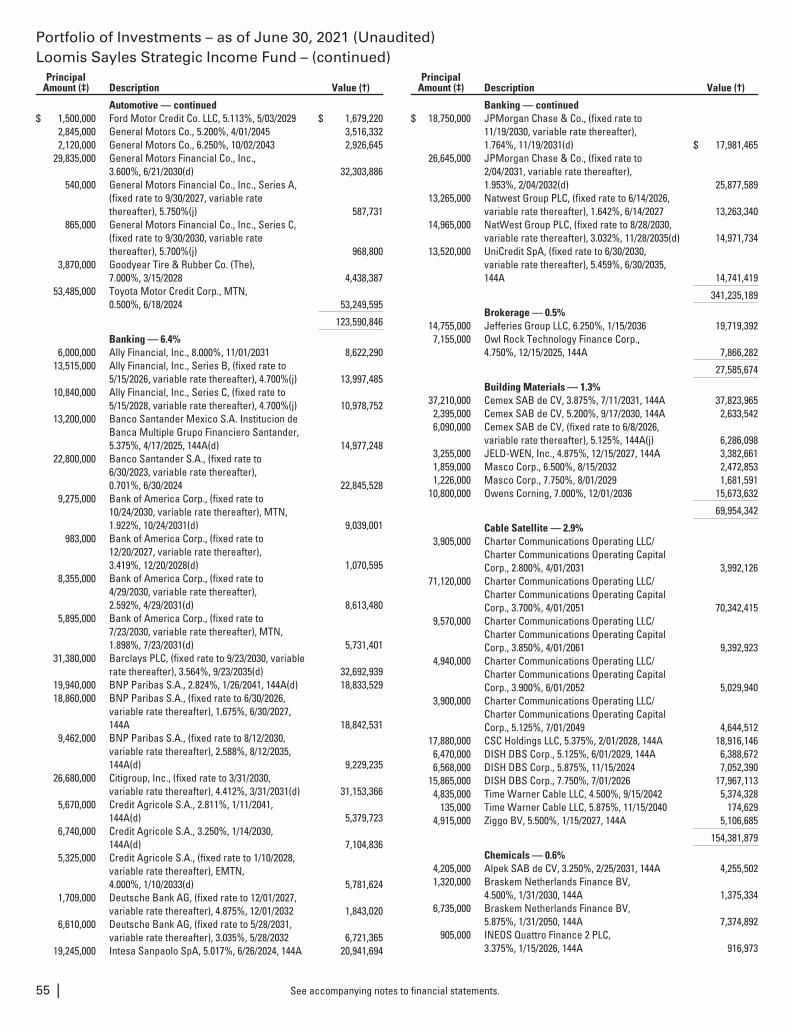
Portfolio of Investments – as of June 30, 2021 (Unaudited)Loomis Sayles Strategic Income Fund – (continued)
PrincipalAmount (‡) Description Value (†)
Automotive — continued$ 1,500,000 Ford Motor Credit Co. LLC, 5.113%, 5/03/2029 $ 1,679,220
2,845,000 General Motors Co., 5.200%, 4/01/2045 3,516,3322,120,000 General Motors Co., 6.250%, 10/02/2043 2,926,645
29,835,000 General Motors Financial Co., Inc.,3.600%, 6/21/2030(d) 32,303,886
540,000 General Motors Financial Co., Inc., Series A,(fixed rate to 9/30/2027, variable ratethereafter), 5.750%(j) 587,731
865,000 General Motors Financial Co., Inc., Series C,(fixed rate to 9/30/2030, variable ratethereafter), 5.700%(j) 968,800
3,870,000 Goodyear Tire & Rubber Co. (The),7.000%, 3/15/2028 4,438,387
53,485,000 Toyota Motor Credit Corp., MTN,0.500%, 6/18/2024 53,249,595
123,590,846
Banking — 6.4%6,000,000 Ally Financial, Inc., 8.000%, 11/01/2031 8,622,290
13,515,000 Ally Financial, Inc., Series B, (fixed rate to5/15/2026, variable rate thereafter), 4.700%(j) 13,997,485
10,840,000 Ally Financial, Inc., Series C, (fixed rate to5/15/2028, variable rate thereafter), 4.700%(j) 10,978,752
13,200,000 Banco Santander Mexico S.A. Institucion deBanca Multiple Grupo Financiero Santander,5.375%, 4/17/2025, 144A(d) 14,977,248
22,800,000 Banco Santander S.A., (fixed rate to6/30/2023, variable rate thereafter),0.701%, 6/30/2024 22,845,528
9,275,000 Bank of America Corp., (fixed rate to10/24/2030, variable rate thereafter), MTN,1.922%, 10/24/2031(d) 9,039,001
983,000 Bank of America Corp., (fixed rate to12/20/2027, variable rate thereafter),3.419%, 12/20/2028(d) 1,070,595
8,355,000 Bank of America Corp., (fixed rate to4/29/2030, variable rate thereafter),2.592%, 4/29/2031(d) 8,613,480
5,895,000 Bank of America Corp., (fixed rate to7/23/2030, variable rate thereafter), MTN,1.898%, 7/23/2031(d) 5,731,401
31,380,000 Barclays PLC, (fixed rate to 9/23/2030, variablerate thereafter), 3.564%, 9/23/2035(d) 32,692,939
19,940,000 BNP Paribas S.A., 2.824%, 1/26/2041, 144A(d) 18,833,52918,860,000 BNP Paribas S.A., (fixed rate to 6/30/2026,
variable rate thereafter), 1.675%, 6/30/2027,144A 18,842,531
9,462,000 BNP Paribas S.A., (fixed rate to 8/12/2030,variable rate thereafter), 2.588%, 8/12/2035,144A(d) 9,229,235
26,680,000 Citigroup, Inc., (fixed rate to 3/31/2030,variable rate thereafter), 4.412%, 3/31/2031(d) 31,153,366
5,670,000 Credit Agricole S.A., 2.811%, 1/11/2041,144A(d) 5,379,723
6,740,000 Credit Agricole S.A., 3.250%, 1/14/2030,144A(d) 7,104,836
5,325,000 Credit Agricole S.A., (fixed rate to 1/10/2028,variable rate thereafter), EMTN,4.000%, 1/10/2033(d) 5,781,624
1,709,000 Deutsche Bank AG, (fixed rate to 12/01/2027,variable rate thereafter), 4.875%, 12/01/2032 1,843,020
6,610,000 Deutsche Bank AG, (fixed rate to 5/28/2031,variable rate thereafter), 3.035%, 5/28/2032 6,721,365
19,245,000 Intesa Sanpaolo SpA, 5.017%, 6/26/2024, 144A 20,941,694
PrincipalAmount (‡) Description Value (†)
Banking — continued$ 18,750,000 JPMorgan Chase & Co., (fixed rate to
11/19/2030, variable rate thereafter),1.764%, 11/19/2031(d) $ 17,981,465
26,645,000 JPMorgan Chase & Co., (fixed rate to2/04/2031, variable rate thereafter),1.953%, 2/04/2032(d) 25,877,589
13,265,000 Natwest Group PLC, (fixed rate to 6/14/2026,variable rate thereafter), 1.642%, 6/14/2027 13,263,340
14,965,000 NatWest Group PLC, (fixed rate to 8/28/2030,variable rate thereafter), 3.032%, 11/28/2035(d) 14,971,734
13,520,000 UniCredit SpA, (fixed rate to 6/30/2030,variable rate thereafter), 5.459%, 6/30/2035,144A 14,741,419
341,235,189
Brokerage — 0.5%14,755,000 Jefferies Group LLC, 6.250%, 1/15/2036 19,719,3927,155,000 Owl Rock Technology Finance Corp.,
4.750%, 12/15/2025, 144A 7,866,282
27,585,674
Building Materials — 1.3%37,210,000 Cemex SAB de CV, 3.875%, 7/11/2031, 144A 37,823,9652,395,000 Cemex SAB de CV, 5.200%, 9/17/2030, 144A 2,633,5426,090,000 Cemex SAB de CV, (fixed rate to 6/8/2026,
variable rate thereafter), 5.125%, 144A(j) 6,286,0983,255,000 JELD-WEN, Inc., 4.875%, 12/15/2027, 144A 3,382,6611,859,000 Masco Corp., 6.500%, 8/15/2032 2,472,8531,226,000 Masco Corp., 7.750%, 8/01/2029 1,681,591
10,800,000 Owens Corning, 7.000%, 12/01/2036 15,673,632
69,954,342
Cable Satellite — 2.9%3,905,000 Charter Communications Operating LLC/
Charter Communications Operating CapitalCorp., 2.800%, 4/01/2031 3,992,126
71,120,000 Charter Communications Operating LLC/Charter Communications Operating CapitalCorp., 3.700%, 4/01/2051 70,342,415
9,570,000 Charter Communications Operating LLC/Charter Communications Operating CapitalCorp., 3.850%, 4/01/2061 9,392,923
4,940,000 Charter Communications Operating LLC/Charter Communications Operating CapitalCorp., 3.900%, 6/01/2052 5,029,940
3,900,000 Charter Communications Operating LLC/Charter Communications Operating CapitalCorp., 5.125%, 7/01/2049 4,644,512
17,880,000 CSC Holdings LLC, 5.375%, 2/01/2028, 144A 18,916,1466,470,000 DISH DBS Corp., 5.125%, 6/01/2029, 144A 6,388,6726,568,000 DISH DBS Corp., 5.875%, 11/15/2024 7,052,390
15,865,000 DISH DBS Corp., 7.750%, 7/01/2026 17,967,1134,835,000 Time Warner Cable LLC, 4.500%, 9/15/2042 5,374,328
135,000 Time Warner Cable LLC, 5.875%, 11/15/2040 174,6294,915,000 Ziggo BV, 5.500%, 1/15/2027, 144A 5,106,685
154,381,879
Chemicals — 0.6%4,205,000 Alpek SAB de CV, 3.250%, 2/25/2031, 144A 4,255,5021,320,000 Braskem Netherlands Finance BV,
4.500%, 1/31/2030, 144A 1,375,3346,735,000 Braskem Netherlands Finance BV,
5.875%, 1/31/2050, 144A 7,374,892905,000 INEOS Quattro Finance 2 PLC,
3.375%, 1/15/2026, 144A 916,973
See accompanying notes to financial statements.55 |
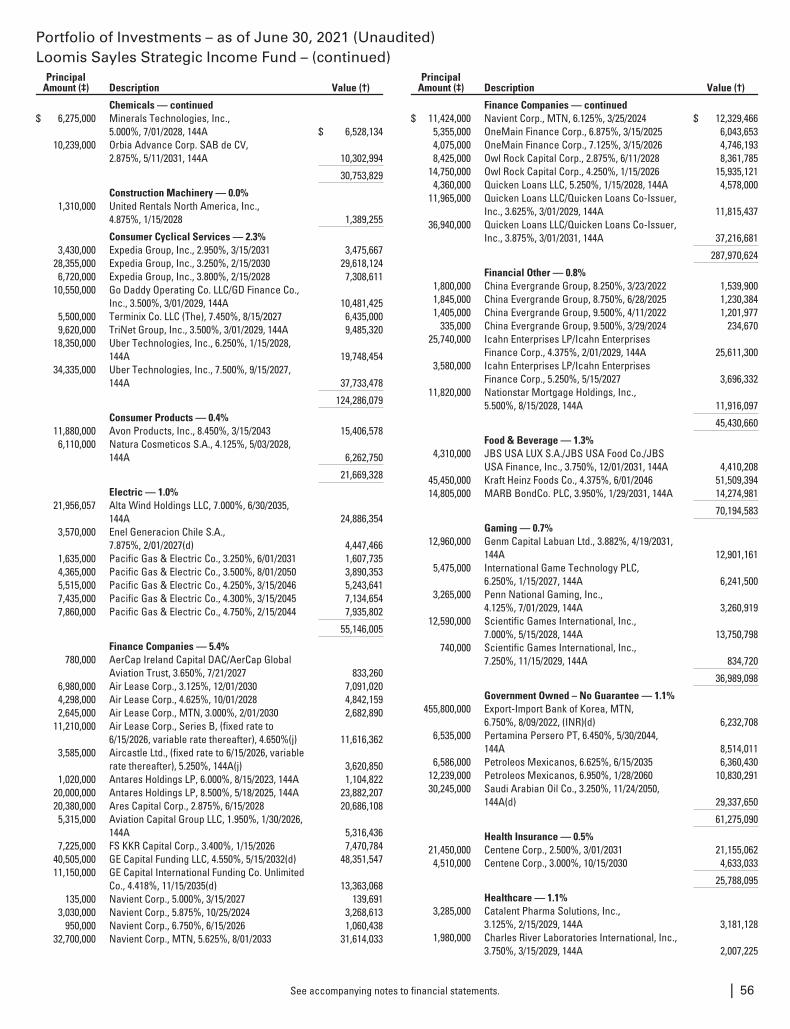
Portfolio of Investments – as of June 30, 2021 (Unaudited)Loomis Sayles Strategic Income Fund – (continued)
PrincipalAmount (‡) Description Value (†)
Chemicals — continued$ 6,275,000 Minerals Technologies, Inc.,
5.000%, 7/01/2028, 144A $ 6,528,13410,239,000 Orbia Advance Corp. SAB de CV,
2.875%, 5/11/2031, 144A 10,302,994
30,753,829
Construction Machinery — 0.0%1,310,000 United Rentals North America, Inc.,
4.875%, 1/15/2028 1,389,255
Consumer Cyclical Services — 2.3%3,430,000 Expedia Group, Inc., 2.950%, 3/15/2031 3,475,667
28,355,000 Expedia Group, Inc., 3.250%, 2/15/2030 29,618,1246,720,000 Expedia Group, Inc., 3.800%, 2/15/2028 7,308,611
10,550,000 Go Daddy Operating Co. LLC/GD Finance Co.,Inc., 3.500%, 3/01/2029, 144A 10,481,425
5,500,000 Terminix Co. LLC (The), 7.450%, 8/15/2027 6,435,0009,620,000 TriNet Group, Inc., 3.500%, 3/01/2029, 144A 9,485,320
18,350,000 Uber Technologies, Inc., 6.250%, 1/15/2028,144A 19,748,454
34,335,000 Uber Technologies, Inc., 7.500%, 9/15/2027,144A 37,733,478
124,286,079
Consumer Products — 0.4%11,880,000 Avon Products, Inc., 8.450%, 3/15/2043 15,406,5786,110,000 Natura Cosmeticos S.A., 4.125%, 5/03/2028,
144A 6,262,750
21,669,328
Electric — 1.0%21,956,057 Alta Wind Holdings LLC, 7.000%, 6/30/2035,
144A 24,886,3543,570,000 Enel Generacion Chile S.A.,
7.875%, 2/01/2027(d) 4,447,4661,635,000 Pacific Gas & Electric Co., 3.250%, 6/01/2031 1,607,7354,365,000 Pacific Gas & Electric Co., 3.500%, 8/01/2050 3,890,3535,515,000 Pacific Gas & Electric Co., 4.250%, 3/15/2046 5,243,6417,435,000 Pacific Gas & Electric Co., 4.300%, 3/15/2045 7,134,6547,860,000 Pacific Gas & Electric Co., 4.750%, 2/15/2044 7,935,802
55,146,005
Finance Companies — 5.4%780,000 AerCap Ireland Capital DAC/AerCap Global
Aviation Trust, 3.650%, 7/21/2027 833,2606,980,000 Air Lease Corp., 3.125%, 12/01/2030 7,091,0204,298,000 Air Lease Corp., 4.625%, 10/01/2028 4,842,1592,645,000 Air Lease Corp., MTN, 3.000%, 2/01/2030 2,682,890
11,210,000 Air Lease Corp., Series B, (fixed rate to6/15/2026, variable rate thereafter), 4.650%(j) 11,616,362
3,585,000 Aircastle Ltd., (fixed rate to 6/15/2026, variablerate thereafter), 5.250%, 144A(j) 3,620,850
1,020,000 Antares Holdings LP, 6.000%, 8/15/2023, 144A 1,104,82220,000,000 Antares Holdings LP, 8.500%, 5/18/2025, 144A 23,882,20720,380,000 Ares Capital Corp., 2.875%, 6/15/2028 20,686,1085,315,000 Aviation Capital Group LLC, 1.950%, 1/30/2026,
144A 5,316,4367,225,000 FS KKR Capital Corp., 3.400%, 1/15/2026 7,470,784
40,505,000 GE Capital Funding LLC, 4.550%, 5/15/2032(d) 48,351,54711,150,000 GE Capital International Funding Co. Unlimited
Co., 4.418%, 11/15/2035(d) 13,363,068135,000 Navient Corp., 5.000%, 3/15/2027 139,691
3,030,000 Navient Corp., 5.875%, 10/25/2024 3,268,613950,000 Navient Corp., 6.750%, 6/15/2026 1,060,438
32,700,000 Navient Corp., MTN, 5.625%, 8/01/2033 31,614,033
PrincipalAmount (‡) Description Value (†)
Finance Companies — continued$ 11,424,000 Navient Corp., MTN, 6.125%, 3/25/2024 $ 12,329,466
5,355,000 OneMain Finance Corp., 6.875%, 3/15/2025 6,043,6534,075,000 OneMain Finance Corp., 7.125%, 3/15/2026 4,746,1938,425,000 Owl Rock Capital Corp., 2.875%, 6/11/2028 8,361,785
14,750,000 Owl Rock Capital Corp., 4.250%, 1/15/2026 15,935,1214,360,000 Quicken Loans LLC, 5.250%, 1/15/2028, 144A 4,578,000
11,965,000 Quicken Loans LLC/Quicken Loans Co-Issuer,Inc., 3.625%, 3/01/2029, 144A 11,815,437
36,940,000 Quicken Loans LLC/Quicken Loans Co-Issuer,Inc., 3.875%, 3/01/2031, 144A 37,216,681
287,970,624
Financial Other — 0.8%1,800,000 China Evergrande Group, 8.250%, 3/23/2022 1,539,9001,845,000 China Evergrande Group, 8.750%, 6/28/2025 1,230,3841,405,000 China Evergrande Group, 9.500%, 4/11/2022 1,201,977
335,000 China Evergrande Group, 9.500%, 3/29/2024 234,67025,740,000 Icahn Enterprises LP/Icahn Enterprises
Finance Corp., 4.375%, 2/01/2029, 144A 25,611,3003,580,000 Icahn Enterprises LP/Icahn Enterprises
Finance Corp., 5.250%, 5/15/2027 3,696,33211,820,000 Nationstar Mortgage Holdings, Inc.,
5.500%, 8/15/2028, 144A 11,916,097
45,430,660
Food & Beverage — 1.3%4,310,000 JBS USA LUX S.A./JBS USA Food Co./JBS
USA Finance, Inc., 3.750%, 12/01/2031, 144A 4,410,20845,450,000 Kraft Heinz Foods Co., 4.375%, 6/01/2046 51,509,39414,805,000 MARB BondCo. PLC, 3.950%, 1/29/2031, 144A 14,274,981
70,194,583
Gaming — 0.7%12,960,000 Genm Capital Labuan Ltd., 3.882%, 4/19/2031,
144A 12,901,1615,475,000 International Game Technology PLC,
6.250%, 1/15/2027, 144A 6,241,5003,265,000 Penn National Gaming, Inc.,
4.125%, 7/01/2029, 144A 3,260,91912,590,000 Scientific Games International, Inc.,
7.000%, 5/15/2028, 144A 13,750,798740,000 Scientific Games International, Inc.,
7.250%, 11/15/2029, 144A 834,720
36,989,098
Government Owned – No Guarantee — 1.1%455,800,000 Export-Import Bank of Korea, MTN,
6.750%, 8/09/2022, (INR)(d) 6,232,7086,535,000 Pertamina Persero PT, 6.450%, 5/30/2044,
144A 8,514,0116,586,000 Petroleos Mexicanos, 6.625%, 6/15/2035 6,360,430
12,239,000 Petroleos Mexicanos, 6.950%, 1/28/2060 10,830,29130,245,000 Saudi Arabian Oil Co., 3.250%, 11/24/2050,
144A(d) 29,337,650
61,275,090
Health Insurance — 0.5%21,450,000 Centene Corp., 2.500%, 3/01/2031 21,155,0624,510,000 Centene Corp., 3.000%, 10/15/2030 4,633,033
25,788,095
Healthcare — 1.1%3,285,000 Catalent Pharma Solutions, Inc.,
3.125%, 2/15/2029, 144A 3,181,1281,980,000 Charles River Laboratories International, Inc.,
3.750%, 3/15/2029, 144A 2,007,225
See accompanying notes to financial statements. | 56
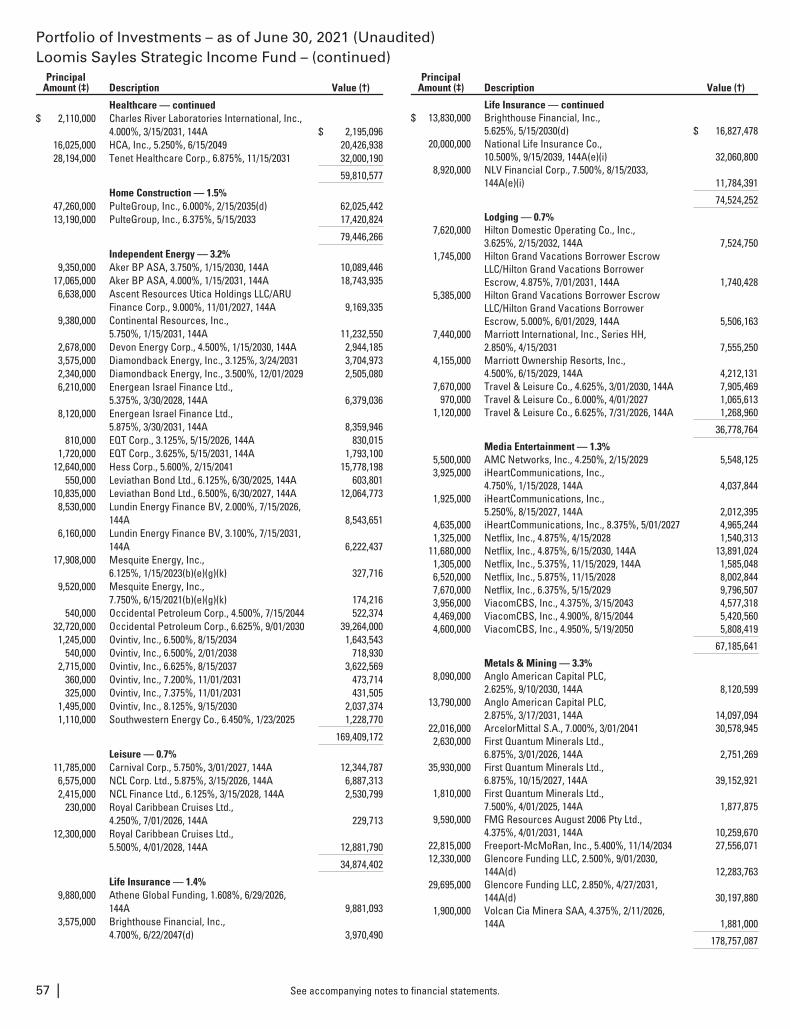
Portfolio of Investments – as of June 30, 2021 (Unaudited)Loomis Sayles Strategic Income Fund – (continued)
PrincipalAmount (‡) Description Value (†)
Healthcare — continued$ 2,110,000 Charles River Laboratories International, Inc.,
4.000%, 3/15/2031, 144A $ 2,195,09616,025,000 HCA, Inc., 5.250%, 6/15/2049 20,426,93828,194,000 Tenet Healthcare Corp., 6.875%, 11/15/2031 32,000,190
59,810,577
Home Construction — 1.5%47,260,000 PulteGroup, Inc., 6.000%, 2/15/2035(d) 62,025,44213,190,000 PulteGroup, Inc., 6.375%, 5/15/2033 17,420,824
79,446,266
Independent Energy — 3.2%9,350,000 Aker BP ASA, 3.750%, 1/15/2030, 144A 10,089,446
17,065,000 Aker BP ASA, 4.000%, 1/15/2031, 144A 18,743,9356,638,000 Ascent Resources Utica Holdings LLC/ARU
Finance Corp., 9.000%, 11/01/2027, 144A 9,169,3359,380,000 Continental Resources, Inc.,
5.750%, 1/15/2031, 144A 11,232,5502,678,000 Devon Energy Corp., 4.500%, 1/15/2030, 144A 2,944,1853,575,000 Diamondback Energy, Inc., 3.125%, 3/24/2031 3,704,9732,340,000 Diamondback Energy, Inc., 3.500%, 12/01/2029 2,505,0806,210,000 Energean Israel Finance Ltd.,
5.375%, 3/30/2028, 144A 6,379,0368,120,000 Energean Israel Finance Ltd.,
5.875%, 3/30/2031, 144A 8,359,946810,000 EQT Corp., 3.125%, 5/15/2026, 144A 830,015
1,720,000 EQT Corp., 3.625%, 5/15/2031, 144A 1,793,10012,640,000 Hess Corp., 5.600%, 2/15/2041 15,778,198
550,000 Leviathan Bond Ltd., 6.125%, 6/30/2025, 144A 603,80110,835,000 Leviathan Bond Ltd., 6.500%, 6/30/2027, 144A 12,064,7738,530,000 Lundin Energy Finance BV, 2.000%, 7/15/2026,
144A 8,543,6516,160,000 Lundin Energy Finance BV, 3.100%, 7/15/2031,
144A 6,222,43717,908,000 Mesquite Energy, Inc.,
6.125%, 1/15/2023(b)(e)(g)(k) 327,7169,520,000 Mesquite Energy, Inc.,
7.750%, 6/15/2021(b)(e)(g)(k) 174,216540,000 Occidental Petroleum Corp., 4.500%, 7/15/2044 522,374
32,720,000 Occidental Petroleum Corp., 6.625%, 9/01/2030 39,264,0001,245,000 Ovintiv, Inc., 6.500%, 8/15/2034 1,643,543
540,000 Ovintiv, Inc., 6.500%, 2/01/2038 718,9302,715,000 Ovintiv, Inc., 6.625%, 8/15/2037 3,622,569
360,000 Ovintiv, Inc., 7.200%, 11/01/2031 473,714325,000 Ovintiv, Inc., 7.375%, 11/01/2031 431,505
1,495,000 Ovintiv, Inc., 8.125%, 9/15/2030 2,037,3741,110,000 Southwestern Energy Co., 6.450%, 1/23/2025 1,228,770
169,409,172
Leisure — 0.7%11,785,000 Carnival Corp., 5.750%, 3/01/2027, 144A 12,344,7876,575,000 NCL Corp. Ltd., 5.875%, 3/15/2026, 144A 6,887,3132,415,000 NCL Finance Ltd., 6.125%, 3/15/2028, 144A 2,530,799
230,000 Royal Caribbean Cruises Ltd.,4.250%, 7/01/2026, 144A 229,713
12,300,000 Royal Caribbean Cruises Ltd.,5.500%, 4/01/2028, 144A 12,881,790
34,874,402
Life Insurance — 1.4%9,880,000 Athene Global Funding, 1.608%, 6/29/2026,
144A 9,881,0933,575,000 Brighthouse Financial, Inc.,
4.700%, 6/22/2047(d) 3,970,490
PrincipalAmount (‡) Description Value (†)
Life Insurance — continued$ 13,830,000 Brighthouse Financial, Inc.,
5.625%, 5/15/2030(d) $ 16,827,47820,000,000 National Life Insurance Co.,
10.500%, 9/15/2039, 144A(e)(i) 32,060,8008,920,000 NLV Financial Corp., 7.500%, 8/15/2033,
144A(e)(i) 11,784,391
74,524,252
Lodging — 0.7%7,620,000 Hilton Domestic Operating Co., Inc.,
3.625%, 2/15/2032, 144A 7,524,7501,745,000 Hilton Grand Vacations Borrower Escrow
LLC/Hilton Grand Vacations BorrowerEscrow, 4.875%, 7/01/2031, 144A 1,740,428
5,385,000 Hilton Grand Vacations Borrower EscrowLLC/Hilton Grand Vacations BorrowerEscrow, 5.000%, 6/01/2029, 144A 5,506,163
7,440,000 Marriott International, Inc., Series HH,2.850%, 4/15/2031 7,555,250
4,155,000 Marriott Ownership Resorts, Inc.,4.500%, 6/15/2029, 144A 4,212,131
7,670,000 Travel & Leisure Co., 4.625%, 3/01/2030, 144A 7,905,469970,000 Travel & Leisure Co., 6.000%, 4/01/2027 1,065,613
1,120,000 Travel & Leisure Co., 6.625%, 7/31/2026, 144A 1,268,960
36,778,764
Media Entertainment — 1.3%5,500,000 AMC Networks, Inc., 4.250%, 2/15/2029 5,548,1253,925,000 iHeartCommunications, Inc.,
4.750%, 1/15/2028, 144A 4,037,8441,925,000 iHeartCommunications, Inc.,
5.250%, 8/15/2027, 144A 2,012,3954,635,000 iHeartCommunications, Inc., 8.375%, 5/01/2027 4,965,2441,325,000 Netflix, Inc., 4.875%, 4/15/2028 1,540,313
11,680,000 Netflix, Inc., 4.875%, 6/15/2030, 144A 13,891,0241,305,000 Netflix, Inc., 5.375%, 11/15/2029, 144A 1,585,0486,520,000 Netflix, Inc., 5.875%, 11/15/2028 8,002,8447,670,000 Netflix, Inc., 6.375%, 5/15/2029 9,796,5073,956,000 ViacomCBS, Inc., 4.375%, 3/15/2043 4,577,3184,469,000 ViacomCBS, Inc., 4.900%, 8/15/2044 5,420,5604,600,000 ViacomCBS, Inc., 4.950%, 5/19/2050 5,808,419
67,185,641
Metals & Mining — 3.3%8,090,000 Anglo American Capital PLC,
2.625%, 9/10/2030, 144A 8,120,59913,790,000 Anglo American Capital PLC,
2.875%, 3/17/2031, 144A 14,097,09422,016,000 ArcelorMittal S.A., 7.000%, 3/01/2041 30,578,9452,630,000 First Quantum Minerals Ltd.,
6.875%, 3/01/2026, 144A 2,751,26935,930,000 First Quantum Minerals Ltd.,
6.875%, 10/15/2027, 144A 39,152,9211,810,000 First Quantum Minerals Ltd.,
7.500%, 4/01/2025, 144A 1,877,8759,590,000 FMG Resources August 2006 Pty Ltd.,
4.375%, 4/01/2031, 144A 10,259,67022,815,000 Freeport-McMoRan, Inc., 5.400%, 11/14/2034 27,556,07112,330,000 Glencore Funding LLC, 2.500%, 9/01/2030,
144A(d) 12,283,76329,695,000 Glencore Funding LLC, 2.850%, 4/27/2031,
144A(d) 30,197,8801,900,000 Volcan Cia Minera SAA, 4.375%, 2/11/2026,
144A 1,881,000
178,757,087
See accompanying notes to financial statements.57 |
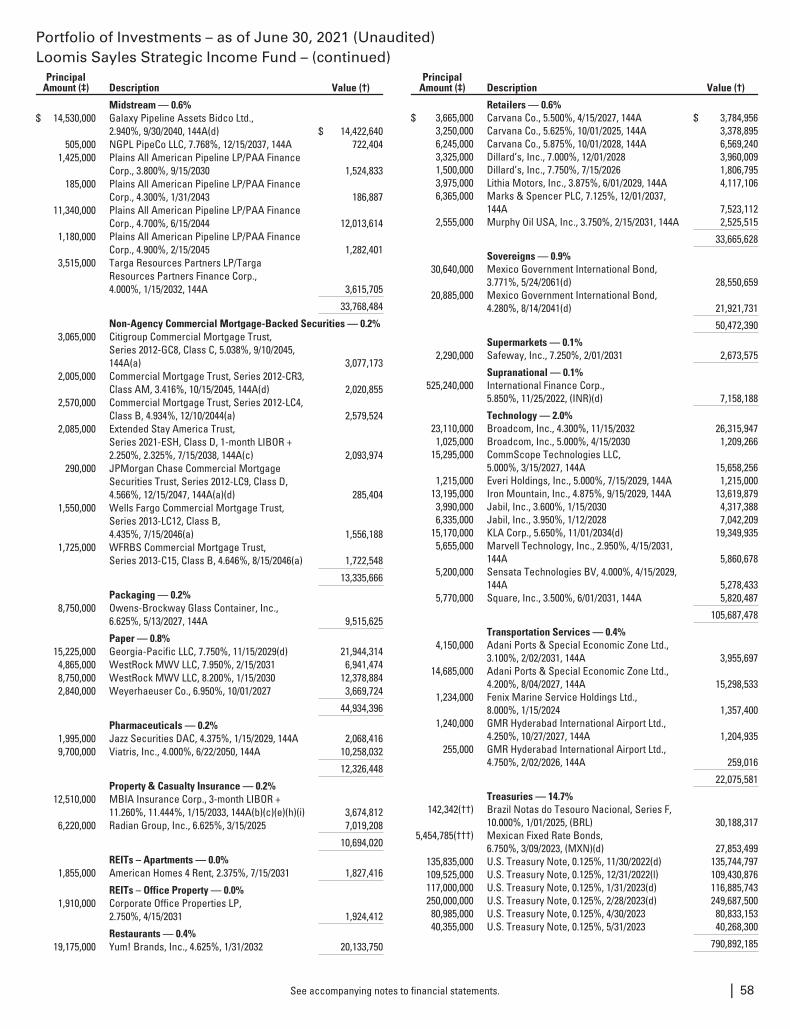
Portfolio of Investments – as of June 30, 2021 (Unaudited)Loomis Sayles Strategic Income Fund – (continued)
PrincipalAmount (‡) Description Value (†)
Midstream — 0.6%$ 14,530,000 Galaxy Pipeline Assets Bidco Ltd.,
2.940%, 9/30/2040, 144A(d) $ 14,422,640505,000 NGPL PipeCo LLC, 7.768%, 12/15/2037, 144A 722,404
1,425,000 Plains All American Pipeline LP/PAA FinanceCorp., 3.800%, 9/15/2030 1,524,833
185,000 Plains All American Pipeline LP/PAA FinanceCorp., 4.300%, 1/31/2043 186,887
11,340,000 Plains All American Pipeline LP/PAA FinanceCorp., 4.700%, 6/15/2044 12,013,614
1,180,000 Plains All American Pipeline LP/PAA FinanceCorp., 4.900%, 2/15/2045 1,282,401
3,515,000 Targa Resources Partners LP/TargaResources Partners Finance Corp.,4.000%, 1/15/2032, 144A 3,615,705
33,768,484
Non-Agency Commercial Mortgage-Backed Securities — 0.2%3,065,000 Citigroup Commercial Mortgage Trust,
Series 2012-GC8, Class C, 5.038%, 9/10/2045,144A(a) 3,077,173
2,005,000 Commercial Mortgage Trust, Series 2012-CR3,Class AM, 3.416%, 10/15/2045, 144A(d) 2,020,855
2,570,000 Commercial Mortgage Trust, Series 2012-LC4,Class B, 4.934%, 12/10/2044(a) 2,579,524
2,085,000 Extended Stay America Trust,Series 2021-ESH, Class D, 1-month LIBOR +2.250%, 2.325%, 7/15/2038, 144A(c) 2,093,974
290,000 JPMorgan Chase Commercial MortgageSecurities Trust, Series 2012-LC9, Class D,4.566%, 12/15/2047, 144A(a)(d) 285,404
1,550,000 Wells Fargo Commercial Mortgage Trust,Series 2013-LC12, Class B,4.435%, 7/15/2046(a) 1,556,188
1,725,000 WFRBS Commercial Mortgage Trust,Series 2013-C15, Class B, 4.646%, 8/15/2046(a) 1,722,548
13,335,666
Packaging — 0.2%8,750,000 Owens-Brockway Glass Container, Inc.,
6.625%, 5/13/2027, 144A 9,515,625
Paper — 0.8%15,225,000 Georgia-Pacific LLC, 7.750%, 11/15/2029(d) 21,944,3144,865,000 WestRock MWV LLC, 7.950%, 2/15/2031 6,941,4748,750,000 WestRock MWV LLC, 8.200%, 1/15/2030 12,378,8842,840,000 Weyerhaeuser Co., 6.950%, 10/01/2027 3,669,724
44,934,396
Pharmaceuticals — 0.2%1,995,000 Jazz Securities DAC, 4.375%, 1/15/2029, 144A 2,068,4169,700,000 Viatris, Inc., 4.000%, 6/22/2050, 144A 10,258,032
12,326,448
Property & Casualty Insurance — 0.2%12,510,000 MBIA Insurance Corp., 3-month LIBOR +
11.260%, 11.444%, 1/15/2033, 144A(b)(c)(e)(h)(i) 3,674,8126,220,000 Radian Group, Inc., 6.625%, 3/15/2025 7,019,208
10,694,020
REITs – Apartments — 0.0%1,855,000 American Homes 4 Rent, 2.375%, 7/15/2031 1,827,416
REITs – Office Property — 0.0%1,910,000 Corporate Office Properties LP,
2.750%, 4/15/2031 1,924,412
Restaurants — 0.4%19,175,000 Yum! Brands, Inc., 4.625%, 1/31/2032 20,133,750
PrincipalAmount (‡) Description Value (†)
Retailers — 0.6%$ 3,665,000 Carvana Co., 5.500%, 4/15/2027, 144A $ 3,784,956
3,250,000 Carvana Co., 5.625%, 10/01/2025, 144A 3,378,8956,245,000 Carvana Co., 5.875%, 10/01/2028, 144A 6,569,2403,325,000 Dillard’s, Inc., 7.000%, 12/01/2028 3,960,0091,500,000 Dillard’s, Inc., 7.750%, 7/15/2026 1,806,7953,975,000 Lithia Motors, Inc., 3.875%, 6/01/2029, 144A 4,117,1066,365,000 Marks & Spencer PLC, 7.125%, 12/01/2037,
144A 7,523,1122,555,000 Murphy Oil USA, Inc., 3.750%, 2/15/2031, 144A 2,525,515
33,665,628
Sovereigns — 0.9%30,640,000 Mexico Government International Bond,
3.771%, 5/24/2061(d) 28,550,65920,885,000 Mexico Government International Bond,
4.280%, 8/14/2041(d) 21,921,731
50,472,390
Supermarkets — 0.1%2,290,000 Safeway, Inc., 7.250%, 2/01/2031 2,673,575
Supranational — 0.1%525,240,000 International Finance Corp.,
5.850%, 11/25/2022, (INR)(d) 7,158,188
Technology — 2.0%23,110,000 Broadcom, Inc., 4.300%, 11/15/2032 26,315,9471,025,000 Broadcom, Inc., 5.000%, 4/15/2030 1,209,266
15,295,000 CommScope Technologies LLC,5.000%, 3/15/2027, 144A 15,658,256
1,215,000 Everi Holdings, Inc., 5.000%, 7/15/2029, 144A 1,215,00013,195,000 Iron Mountain, Inc., 4.875%, 9/15/2029, 144A 13,619,8793,990,000 Jabil, Inc., 3.600%, 1/15/2030 4,317,3886,335,000 Jabil, Inc., 3.950%, 1/12/2028 7,042,209
15,170,000 KLA Corp., 5.650%, 11/01/2034(d) 19,349,9355,655,000 Marvell Technology, Inc., 2.950%, 4/15/2031,
144A 5,860,6785,200,000 Sensata Technologies BV, 4.000%, 4/15/2029,
144A 5,278,4335,770,000 Square, Inc., 3.500%, 6/01/2031, 144A 5,820,487
105,687,478
Transportation Services — 0.4%4,150,000 Adani Ports & Special Economic Zone Ltd.,
3.100%, 2/02/2031, 144A 3,955,69714,685,000 Adani Ports & Special Economic Zone Ltd.,
4.200%, 8/04/2027, 144A 15,298,5331,234,000 Fenix Marine Service Holdings Ltd.,
8.000%, 1/15/2024 1,357,4001,240,000 GMR Hyderabad International Airport Ltd.,
4.250%, 10/27/2027, 144A 1,204,935255,000 GMR Hyderabad International Airport Ltd.,
4.750%, 2/02/2026, 144A 259,016
22,075,581
Treasuries — 14.7%142,342(††) Brazil Notas do Tesouro Nacional, Series F,
10.000%, 1/01/2025, (BRL) 30,188,3175,454,785(†††) Mexican Fixed Rate Bonds,
6.750%, 3/09/2023, (MXN)(d) 27,853,499135,835,000 U.S. Treasury Note, 0.125%, 11/30/2022(d) 135,744,797109,525,000 U.S. Treasury Note, 0.125%, 12/31/2022(l) 109,430,876117,000,000 U.S. Treasury Note, 0.125%, 1/31/2023(d) 116,885,743250,000,000 U.S. Treasury Note, 0.125%, 2/28/2023(d) 249,687,50080,985,000 U.S. Treasury Note, 0.125%, 4/30/2023 80,833,15340,355,000 U.S. Treasury Note, 0.125%, 5/31/2023 40,268,300
790,892,185
See accompanying notes to financial statements. | 58
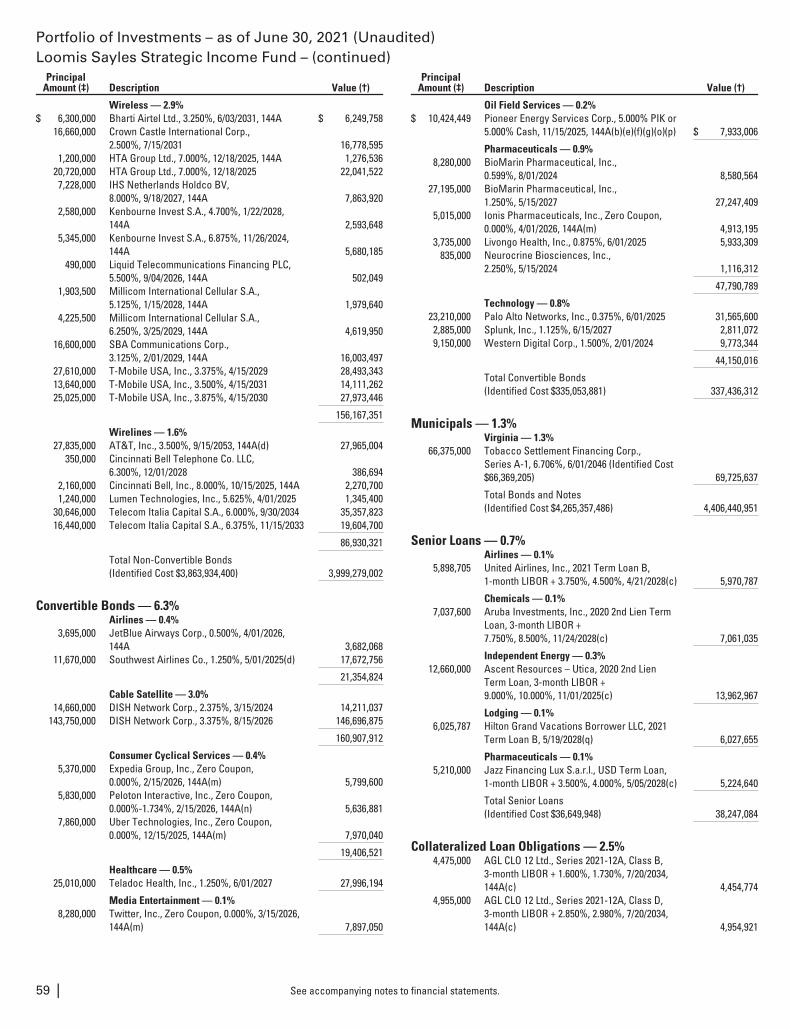
Portfolio of Investments – as of June 30, 2021 (Unaudited)Loomis Sayles Strategic Income Fund – (continued)
PrincipalAmount (‡) Description Value (†)
Wireless — 2.9%$ 6,300,000 Bharti Airtel Ltd., 3.250%, 6/03/2031, 144A $ 6,249,758
16,660,000 Crown Castle International Corp.,2.500%, 7/15/2031 16,778,595
1,200,000 HTA Group Ltd., 7.000%, 12/18/2025, 144A 1,276,53620,720,000 HTA Group Ltd., 7.000%, 12/18/2025 22,041,5227,228,000 IHS Netherlands Holdco BV,
8.000%, 9/18/2027, 144A 7,863,9202,580,000 Kenbourne Invest S.A., 4.700%, 1/22/2028,
144A 2,593,6485,345,000 Kenbourne Invest S.A., 6.875%, 11/26/2024,
144A 5,680,185490,000 Liquid Telecommunications Financing PLC,
5.500%, 9/04/2026, 144A 502,0491,903,500 Millicom International Cellular S.A.,
5.125%, 1/15/2028, 144A 1,979,6404,225,500 Millicom International Cellular S.A.,
6.250%, 3/25/2029, 144A 4,619,95016,600,000 SBA Communications Corp.,
3.125%, 2/01/2029, 144A 16,003,49727,610,000 T-Mobile USA, Inc., 3.375%, 4/15/2029 28,493,34313,640,000 T-Mobile USA, Inc., 3.500%, 4/15/2031 14,111,26225,025,000 T-Mobile USA, Inc., 3.875%, 4/15/2030 27,973,446
156,167,351
Wirelines — 1.6%27,835,000 AT&T, Inc., 3.500%, 9/15/2053, 144A(d) 27,965,004
350,000 Cincinnati Bell Telephone Co. LLC,6.300%, 12/01/2028 386,694
2,160,000 Cincinnati Bell, Inc., 8.000%, 10/15/2025, 144A 2,270,7001,240,000 Lumen Technologies, Inc., 5.625%, 4/01/2025 1,345,400
30,646,000 Telecom Italia Capital S.A., 6.000%, 9/30/2034 35,357,82316,440,000 Telecom Italia Capital S.A., 6.375%, 11/15/2033 19,604,700
86,930,321
Total Non-Convertible Bonds(Identified Cost $3,863,934,400) 3,999,279,002
Convertible Bonds — 6.3%Airlines — 0.4%
3,695,000 JetBlue Airways Corp., 0.500%, 4/01/2026,144A 3,682,068
11,670,000 Southwest Airlines Co., 1.250%, 5/01/2025(d) 17,672,756
21,354,824
Cable Satellite — 3.0%14,660,000 DISH Network Corp., 2.375%, 3/15/2024 14,211,037
143,750,000 DISH Network Corp., 3.375%, 8/15/2026 146,696,875
160,907,912
Consumer Cyclical Services — 0.4%5,370,000 Expedia Group, Inc., Zero Coupon,
0.000%, 2/15/2026, 144A(m) 5,799,6005,830,000 Peloton Interactive, Inc., Zero Coupon,
0.000%-1.734%, 2/15/2026, 144A(n) 5,636,8817,860,000 Uber Technologies, Inc., Zero Coupon,
0.000%, 12/15/2025, 144A(m) 7,970,040
19,406,521
Healthcare — 0.5%25,010,000 Teladoc Health, Inc., 1.250%, 6/01/2027 27,996,194
Media Entertainment — 0.1%8,280,000 Twitter, Inc., Zero Coupon, 0.000%, 3/15/2026,
144A(m) 7,897,050
PrincipalAmount (‡) Description Value (†)
Oil Field Services — 0.2%$ 10,424,449 Pioneer Energy Services Corp., 5.000% PIK or
5.000% Cash, 11/15/2025, 144A(b)(e)(f)(g)(o)(p) $ 7,933,006
Pharmaceuticals — 0.9%8,280,000 BioMarin Pharmaceutical, Inc.,
0.599%, 8/01/2024 8,580,56427,195,000 BioMarin Pharmaceutical, Inc.,
1.250%, 5/15/2027 27,247,4095,015,000 Ionis Pharmaceuticals, Inc., Zero Coupon,
0.000%, 4/01/2026, 144A(m) 4,913,1953,735,000 Livongo Health, Inc., 0.875%, 6/01/2025 5,933,309
835,000 Neurocrine Biosciences, Inc.,2.250%, 5/15/2024 1,116,312
47,790,789
Technology — 0.8%23,210,000 Palo Alto Networks, Inc., 0.375%, 6/01/2025 31,565,6002,885,000 Splunk, Inc., 1.125%, 6/15/2027 2,811,0729,150,000 Western Digital Corp., 1.500%, 2/01/2024 9,773,344
44,150,016
Total Convertible Bonds(Identified Cost $335,053,881) 337,436,312
Municipals — 1.3%Virginia — 1.3%
66,375,000 Tobacco Settlement Financing Corp.,Series A-1, 6.706%, 6/01/2046 (Identified Cost$66,369,205) 69,725,637
Total Bonds and Notes(Identified Cost $4,265,357,486) 4,406,440,951
Senior Loans — 0.7%Airlines — 0.1%
5,898,705 United Airlines, Inc., 2021 Term Loan B,1-month LIBOR + 3.750%, 4.500%, 4/21/2028(c) 5,970,787
Chemicals — 0.1%7,037,600 Aruba Investments, Inc., 2020 2nd Lien Term
Loan, 3-month LIBOR +7.750%, 8.500%, 11/24/2028(c) 7,061,035
Independent Energy — 0.3%12,660,000 Ascent Resources – Utica, 2020 2nd Lien
Term Loan, 3-month LIBOR +9.000%, 10.000%, 11/01/2025(c) 13,962,967
Lodging — 0.1%6,025,787 Hilton Grand Vacations Borrower LLC, 2021
Term Loan B, 5/19/2028(q) 6,027,655
Pharmaceuticals — 0.1%5,210,000 Jazz Financing Lux S.a.r.l., USD Term Loan,
1-month LIBOR + 3.500%, 4.000%, 5/05/2028(c) 5,224,640
Total Senior Loans(Identified Cost $36,649,948) 38,247,084
Collateralized Loan Obligations — 2.5%4,475,000 AGL CLO 12 Ltd., Series 2021-12A, Class B,
3-month LIBOR + 1.600%, 1.730%, 7/20/2034,144A(c) 4,454,774
4,955,000 AGL CLO 12 Ltd., Series 2021-12A, Class D,3-month LIBOR + 2.850%, 2.980%, 7/20/2034,144A(c) 4,954,921
See accompanying notes to financial statements.59 |
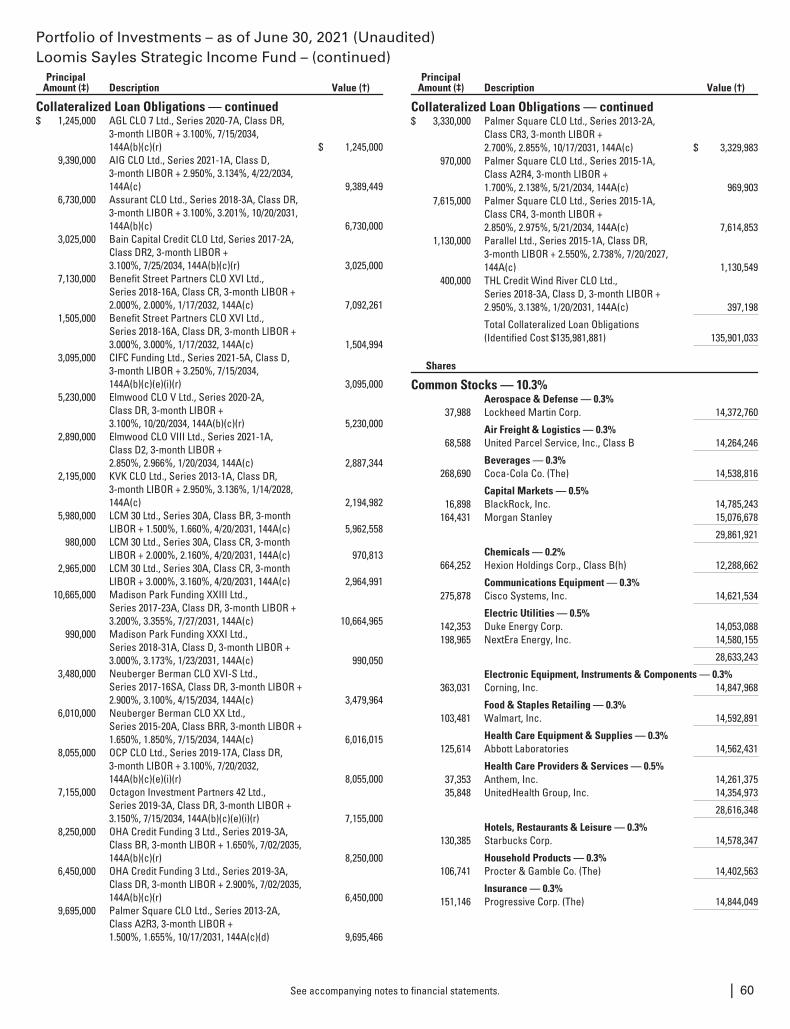
Portfolio of Investments – as of June 30, 2021 (Unaudited)Loomis Sayles Strategic Income Fund – (continued)
PrincipalAmount (‡) Description Value (†)
Collateralized Loan Obligations — continued$ 1,245,000 AGL CLO 7 Ltd., Series 2020-7A, Class DR,
3-month LIBOR + 3.100%, 7/15/2034,144A(b)(c)(r) $ 1,245,000
9,390,000 AIG CLO Ltd., Series 2021-1A, Class D,3-month LIBOR + 2.950%, 3.134%, 4/22/2034,144A(c) 9,389,449
6,730,000 Assurant CLO Ltd., Series 2018-3A, Class DR,3-month LIBOR + 3.100%, 3.201%, 10/20/2031,144A(b)(c) 6,730,000
3,025,000 Bain Capital Credit CLO Ltd, Series 2017-2A,Class DR2, 3-month LIBOR +3.100%, 7/25/2034, 144A(b)(c)(r) 3,025,000
7,130,000 Benefit Street Partners CLO XVI Ltd.,Series 2018-16A, Class CR, 3-month LIBOR +2.000%, 2.000%, 1/17/2032, 144A(c) 7,092,261
1,505,000 Benefit Street Partners CLO XVI Ltd.,Series 2018-16A, Class DR, 3-month LIBOR +3.000%, 3.000%, 1/17/2032, 144A(c) 1,504,994
3,095,000 CIFC Funding Ltd., Series 2021-5A, Class D,3-month LIBOR + 3.250%, 7/15/2034,144A(b)(c)(e)(i)(r) 3,095,000
5,230,000 Elmwood CLO V Ltd., Series 2020-2A,Class DR, 3-month LIBOR +3.100%, 10/20/2034, 144A(b)(c)(r) 5,230,000
2,890,000 Elmwood CLO VIII Ltd., Series 2021-1A,Class D2, 3-month LIBOR +2.850%, 2.966%, 1/20/2034, 144A(c) 2,887,344
2,195,000 KVK CLO Ltd., Series 2013-1A, Class DR,3-month LIBOR + 2.950%, 3.136%, 1/14/2028,144A(c) 2,194,982
5,980,000 LCM 30 Ltd., Series 30A, Class BR, 3-monthLIBOR + 1.500%, 1.660%, 4/20/2031, 144A(c) 5,962,558
980,000 LCM 30 Ltd., Series 30A, Class CR, 3-monthLIBOR + 2.000%, 2.160%, 4/20/2031, 144A(c) 970,813
2,965,000 LCM 30 Ltd., Series 30A, Class CR, 3-monthLIBOR + 3.000%, 3.160%, 4/20/2031, 144A(c) 2,964,991
10,665,000 Madison Park Funding XXIII Ltd.,Series 2017-23A, Class DR, 3-month LIBOR +3.200%, 3.355%, 7/27/2031, 144A(c) 10,664,965
990,000 Madison Park Funding XXXI Ltd.,Series 2018-31A, Class D, 3-month LIBOR +3.000%, 3.173%, 1/23/2031, 144A(c) 990,050
3,480,000 Neuberger Berman CLO XVI-S Ltd.,Series 2017-16SA, Class DR, 3-month LIBOR +2.900%, 3.100%, 4/15/2034, 144A(c) 3,479,964
6,010,000 Neuberger Berman CLO XX Ltd.,Series 2015-20A, Class BRR, 3-month LIBOR +1.650%, 1.850%, 7/15/2034, 144A(c) 6,016,015
8,055,000 OCP CLO Ltd., Series 2019-17A, Class DR,3-month LIBOR + 3.100%, 7/20/2032,144A(b)(c)(e)(i)(r) 8,055,000
7,155,000 Octagon Investment Partners 42 Ltd.,Series 2019-3A, Class DR, 3-month LIBOR +3.150%, 7/15/2034, 144A(b)(c)(e)(i)(r) 7,155,000
8,250,000 OHA Credit Funding 3 Ltd., Series 2019-3A,Class BR, 3-month LIBOR + 1.650%, 7/02/2035,144A(b)(c)(r) 8,250,000
6,450,000 OHA Credit Funding 3 Ltd., Series 2019-3A,Class DR, 3-month LIBOR + 2.900%, 7/02/2035,144A(b)(c)(r) 6,450,000
9,695,000 Palmer Square CLO Ltd., Series 2013-2A,Class A2R3, 3-month LIBOR +1.500%, 1.655%, 10/17/2031, 144A(c)(d) 9,695,466
PrincipalAmount (‡) Description Value (†)
Collateralized Loan Obligations — continued$ 3,330,000 Palmer Square CLO Ltd., Series 2013-2A,
Class CR3, 3-month LIBOR +2.700%, 2.855%, 10/17/2031, 144A(c) $ 3,329,983
970,000 Palmer Square CLO Ltd., Series 2015-1A,Class A2R4, 3-month LIBOR +1.700%, 2.138%, 5/21/2034, 144A(c) 969,903
7,615,000 Palmer Square CLO Ltd., Series 2015-1A,Class CR4, 3-month LIBOR +2.850%, 2.975%, 5/21/2034, 144A(c) 7,614,853
1,130,000 Parallel Ltd., Series 2015-1A, Class DR,3-month LIBOR + 2.550%, 2.738%, 7/20/2027,144A(c) 1,130,549
400,000 THL Credit Wind River CLO Ltd.,Series 2018-3A, Class D, 3-month LIBOR +2.950%, 3.138%, 1/20/2031, 144A(c) 397,198
Total Collateralized Loan Obligations(Identified Cost $135,981,881) 135,901,033
Shares
Common Stocks — 10.3%Aerospace & Defense — 0.3%
37,988 Lockheed Martin Corp. 14,372,760
Air Freight & Logistics — 0.3%68,588 United Parcel Service, Inc., Class B 14,264,246
Beverages — 0.3%268,690 Coca-Cola Co. (The) 14,538,816
Capital Markets — 0.5%16,898 BlackRock, Inc. 14,785,243
164,431 Morgan Stanley 15,076,678
29,861,921
Chemicals — 0.2%664,252 Hexion Holdings Corp., Class B(h) 12,288,662
Communications Equipment — 0.3%275,878 Cisco Systems, Inc. 14,621,534
Electric Utilities — 0.5%142,353 Duke Energy Corp. 14,053,088198,965 NextEra Energy, Inc. 14,580,155
28,633,243
Electronic Equipment, Instruments & Components — 0.3%363,031 Corning, Inc. 14,847,968
Food & Staples Retailing — 0.3%103,481 Walmart, Inc. 14,592,891
Health Care Equipment & Supplies — 0.3%125,614 Abbott Laboratories 14,562,431
Health Care Providers & Services — 0.5%37,353 Anthem, Inc. 14,261,37535,848 UnitedHealth Group, Inc. 14,354,973
28,616,348
Hotels, Restaurants & Leisure — 0.3%130,385 Starbucks Corp. 14,578,347
Household Products — 0.3%106,741 Procter & Gamble Co. (The) 14,402,563
Insurance — 0.3%151,146 Progressive Corp. (The) 14,844,049
See accompanying notes to financial statements. | 60
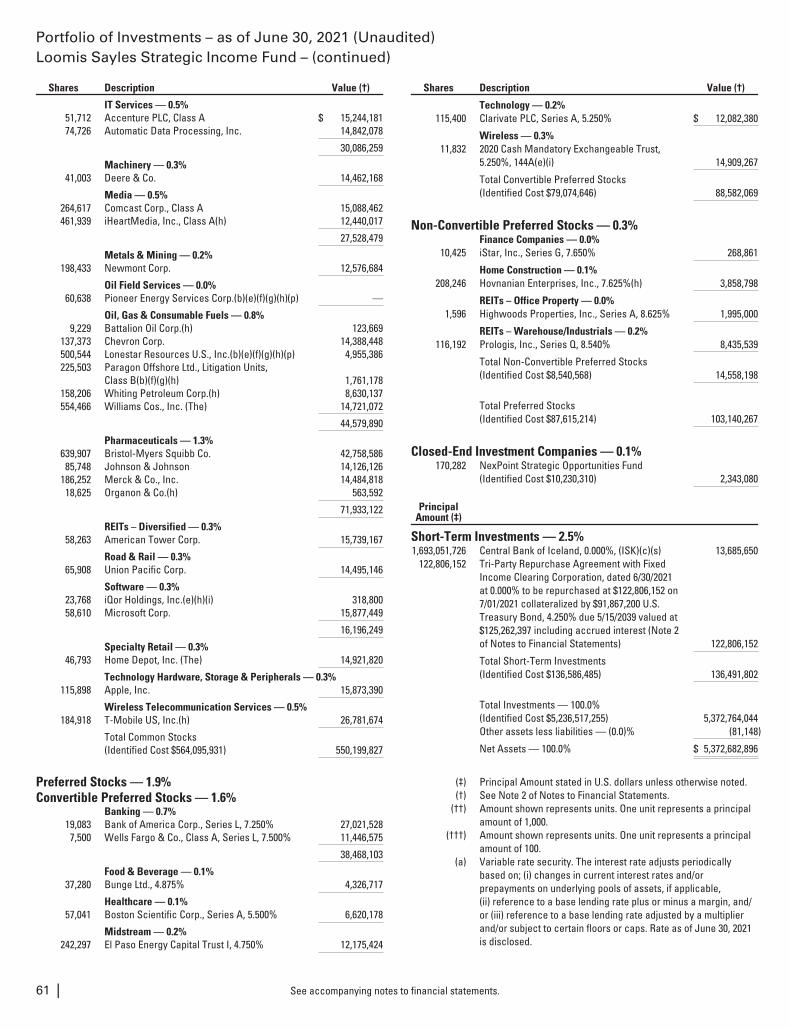
Portfolio of Investments – as of June 30, 2021 (Unaudited)Loomis Sayles Strategic Income Fund – (continued)
Shares Description Value (†)
IT Services — 0.5%51,712 Accenture PLC, Class A $ 15,244,18174,726 Automatic Data Processing, Inc. 14,842,078
30,086,259
Machinery — 0.3%41,003 Deere & Co. 14,462,168
Media — 0.5%264,617 Comcast Corp., Class A 15,088,462461,939 iHeartMedia, Inc., Class A(h) 12,440,017
27,528,479
Metals & Mining — 0.2%198,433 Newmont Corp. 12,576,684
Oil Field Services — 0.0%60,638 Pioneer Energy Services Corp.(b)(e)(f)(g)(h)(p) —
Oil, Gas & Consumable Fuels — 0.8%9,229 Battalion Oil Corp.(h) 123,669
137,373 Chevron Corp. 14,388,448500,544 Lonestar Resources U.S., Inc.(b)(e)(f)(g)(h)(p) 4,955,386225,503 Paragon Offshore Ltd., Litigation Units,
Class B(b)(f)(g)(h) 1,761,178158,206 Whiting Petroleum Corp.(h) 8,630,137554,466 Williams Cos., Inc. (The) 14,721,072
44,579,890
Pharmaceuticals — 1.3%639,907 Bristol-Myers Squibb Co. 42,758,58685,748 Johnson & Johnson 14,126,126
186,252 Merck & Co., Inc. 14,484,81818,625 Organon & Co.(h) 563,592
71,933,122
REITs – Diversified — 0.3%58,263 American Tower Corp. 15,739,167
Road & Rail — 0.3%65,908 Union Pacific Corp. 14,495,146
Software — 0.3%23,768 iQor Holdings, Inc.(e)(h)(i) 318,80058,610 Microsoft Corp. 15,877,449
16,196,249
Specialty Retail — 0.3%46,793 Home Depot, Inc. (The) 14,921,820
Technology Hardware, Storage & Peripherals — 0.3%115,898 Apple, Inc. 15,873,390
Wireless Telecommunication Services — 0.5%184,918 T-Mobile US, Inc.(h) 26,781,674
Total Common Stocks(Identified Cost $564,095,931) 550,199,827
Preferred Stocks — 1.9%Convertible Preferred Stocks — 1.6%
Banking — 0.7%19,083 Bank of America Corp., Series L, 7.250% 27,021,5287,500 Wells Fargo & Co., Class A, Series L, 7.500% 11,446,575
38,468,103
Food & Beverage — 0.1%37,280 Bunge Ltd., 4.875% 4,326,717
Healthcare — 0.1%57,041 Boston Scientific Corp., Series A, 5.500% 6,620,178
Midstream — 0.2%242,297 El Paso Energy Capital Trust I, 4.750% 12,175,424
Shares Description Value (†)
Technology — 0.2%115,400 Clarivate PLC, Series A, 5.250% $ 12,082,380
Wireless — 0.3%11,832 2020 Cash Mandatory Exchangeable Trust,
5.250%, 144A(e)(i) 14,909,267
Total Convertible Preferred Stocks(Identified Cost $79,074,646) 88,582,069
Non-Convertible Preferred Stocks — 0.3%Finance Companies — 0.0%
10,425 iStar, Inc., Series G, 7.650% 268,861
Home Construction — 0.1%208,246 Hovnanian Enterprises, Inc., 7.625%(h) 3,858,798
REITs – Office Property — 0.0%1,596 Highwoods Properties, Inc., Series A, 8.625% 1,995,000
REITs – Warehouse/Industrials — 0.2%116,192 Prologis, Inc., Series Q, 8.540% 8,435,539
Total Non-Convertible Preferred Stocks(Identified Cost $8,540,568) 14,558,198
Total Preferred Stocks(Identified Cost $87,615,214) 103,140,267
Closed-End Investment Companies — 0.1%170,282 NexPoint Strategic Opportunities Fund
(Identified Cost $10,230,310) 2,343,080
PrincipalAmount (‡)
Short-Term Investments — 2.5%1,693,051,726 Central Bank of Iceland, 0.000%, (ISK)(c)(s) 13,685,650
122,806,152 Tri-Party Repurchase Agreement with FixedIncome Clearing Corporation, dated 6/30/2021at 0.000% to be repurchased at $122,806,152 on7/01/2021 collateralized by $91,867,200 U.S.Treasury Bond, 4.250% due 5/15/2039 valued at$125,262,397 including accrued interest (Note 2of Notes to Financial Statements) 122,806,152
Total Short-Term Investments(Identified Cost $136,586,485) 136,491,802
Total Investments — 100.0%(Identified Cost $5,236,517,255) 5,372,764,044Other assets less liabilities — (0.0)% (81,148)
Net Assets — 100.0% $ 5,372,682,896
(‡) Principal Amount stated in U.S. dollars unless otherwise noted.(†) See Note 2 of Notes to Financial Statements.
(††) Amount shown represents units. One unit represents a principalamount of 1,000.
(†††) Amount shown represents units. One unit represents a principalamount of 100.
(a) Variable rate security. The interest rate adjusts periodicallybased on; (i) changes in current interest rates and/orprepayments on underlying pools of assets, if applicable,(ii) reference to a base lending rate plus or minus a margin, and/or (iii) reference to a base lending rate adjusted by a multiplierand/or subject to certain floors or caps. Rate as of June 30, 2021is disclosed.
See accompanying notes to financial statements.61 |
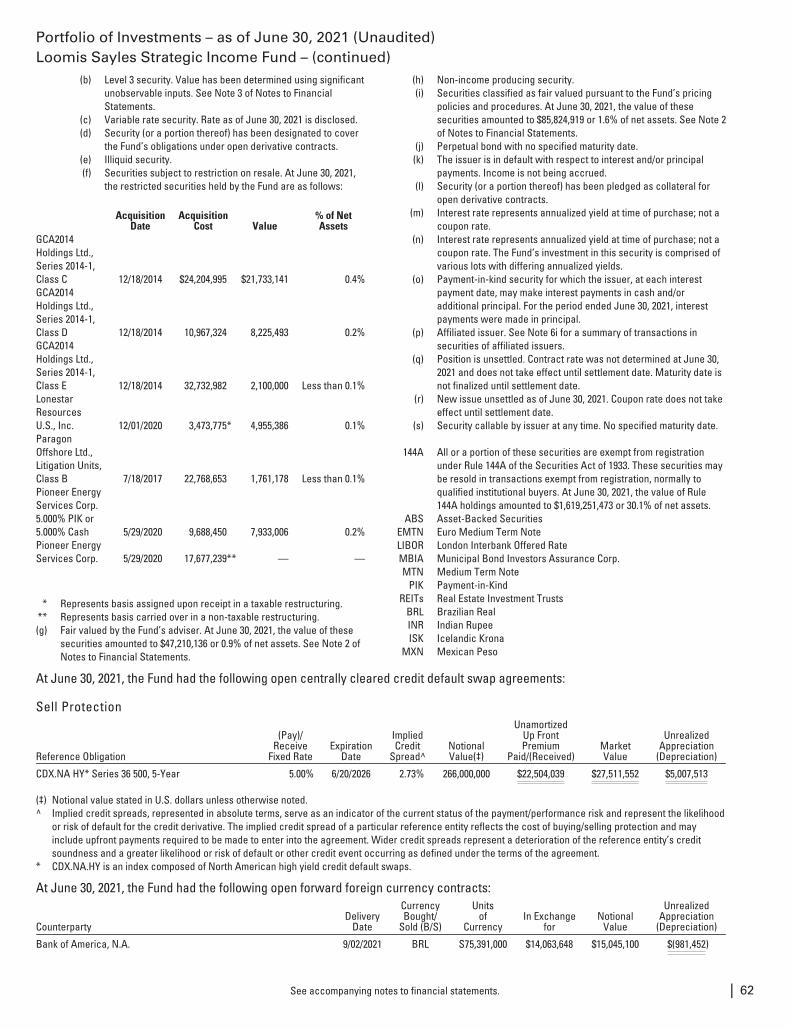
Portfolio of Investments – as of June 30, 2021 (Unaudited)Loomis Sayles Strategic Income Fund – (continued)
(b) Level 3 security. Value has been determined using significantunobservable inputs. See Note 3 of Notes to FinancialStatements.
(c) Variable rate security. Rate as of June 30, 2021 is disclosed.(d) Security (or a portion thereof) has been designated to cover
the Fund’s obligations under open derivative contracts.(e) Illiquid security.(f) Securities subject to restriction on resale. At June 30, 2021,
the restricted securities held by the Fund are as follows:
AcquisitionDate
AcquisitionCost Value
% of NetAssets
GCA2014Holdings Ltd.,Series 2014-1,Class C 12/18/2014 $24,204,995 $21,733,141 0.4%GCA2014Holdings Ltd.,Series 2014-1,Class D 12/18/2014 10,967,324 8,225,493 0.2%GCA2014Holdings Ltd.,Series 2014-1,Class E 12/18/2014 32,732,982 2,100,000 Less than 0.1%LonestarResourcesU.S., Inc. 12/01/2020 3,473,775* 4,955,386 0.1%ParagonOffshore Ltd.,Litigation Units,Class B 7/18/2017 22,768,653 1,761,178 Less than 0.1%Pioneer EnergyServices Corp.5.000% PIK or5.000% Cash 5/29/2020 9,688,450 7,933,006 0.2%Pioneer EnergyServices Corp. 5/29/2020 17,677,239** — —
* Represents basis assigned upon receipt in a taxable restructuring.** Represents basis carried over in a non-taxable restructuring.(g) Fair valued by the Fund’s adviser. At June 30, 2021, the value of these
securities amounted to $47,210,136 or 0.9% of net assets. See Note 2 ofNotes to Financial Statements.
(h) Non-income producing security.(i) Securities classified as fair valued pursuant to the Fund’s pricing
policies and procedures. At June 30, 2021, the value of thesesecurities amounted to $85,824,919 or 1.6% of net assets. See Note 2of Notes to Financial Statements.
(j) Perpetual bond with no specified maturity date.(k) The issuer is in default with respect to interest and/or principal
payments. Income is not being accrued.(l) Security (or a portion thereof) has been pledged as collateral for
open derivative contracts.(m) Interest rate represents annualized yield at time of purchase; not a
coupon rate.(n) Interest rate represents annualized yield at time of purchase; not a
coupon rate. The Fund’s investment in this security is comprised ofvarious lots with differing annualized yields.
(o) Payment-in-kind security for which the issuer, at each interestpayment date, may make interest payments in cash and/oradditional principal. For the period ended June 30, 2021, interestpayments were made in principal.
(p) Affiliated issuer. See Note 6i for a summary of transactions insecurities of affiliated issuers.
(q) Position is unsettled. Contract rate was not determined at June 30,2021 and does not take effect until settlement date. Maturity date isnot finalized until settlement date.
(r) New issue unsettled as of June 30, 2021. Coupon rate does not takeeffect until settlement date.
(s) Security callable by issuer at any time. No specified maturity date.
144A All or a portion of these securities are exempt from registrationunder Rule 144A of the Securities Act of 1933. These securities maybe resold in transactions exempt from registration, normally toqualified institutional buyers. At June 30, 2021, the value of Rule144A holdings amounted to $1,619,251,473 or 30.1% of net assets.
ABS Asset-Backed SecuritiesEMTN Euro Medium Term NoteLIBOR London Interbank Offered RateMBIA Municipal Bond Investors Assurance Corp.MTN Medium Term Note
PIK Payment-in-KindREITs Real Estate Investment Trusts
BRL Brazilian RealINR Indian RupeeISK Icelandic Krona
MXN Mexican Peso
At June 30, 2021, the Fund had the following open centrally cleared credit default swap agreements:
Sell Protection
Reference Obligation
(Pay)/Receive
Fixed RateExpiration
Date
ImpliedCredit
Spread^NotionalValue(‡)
UnamortizedUp FrontPremium
Paid/(Received)MarketValue
UnrealizedAppreciation
(Depreciation)
CDX.NA HY* Series 36 500, 5-Year 5.00% 6/20/2026 2.73% 266,000,000 $22,504,039 $27,511,552 $5,007,513
(‡) Notional value stated in U.S. dollars unless otherwise noted.^ Implied credit spreads, represented in absolute terms, serve as an indicator of the current status of the payment/performance risk and represent the likelihood
or risk of default for the credit derivative. The implied credit spread of a particular reference entity reflects the cost of buying/selling protection and mayinclude upfront payments required to be made to enter into the agreement. Wider credit spreads represent a deterioration of the reference entity’s creditsoundness and a greater likelihood or risk of default or other credit event occurring as defined under the terms of the agreement.
* CDX.NA.HY is an index composed of North American high yield credit default swaps.
At June 30, 2021, the Fund had the following open forward foreign currency contracts:
CounterpartyDelivery
Date
CurrencyBought/
Sold (B/S)
Unitsof
CurrencyIn Exchange
forNotional
Value
UnrealizedAppreciation
(Depreciation)
Bank of America, N.A. 9/02/2021 BRL S75,391,000 $14,063,648 $15,045,100 $(981,452)
See accompanying notes to financial statements. | 62
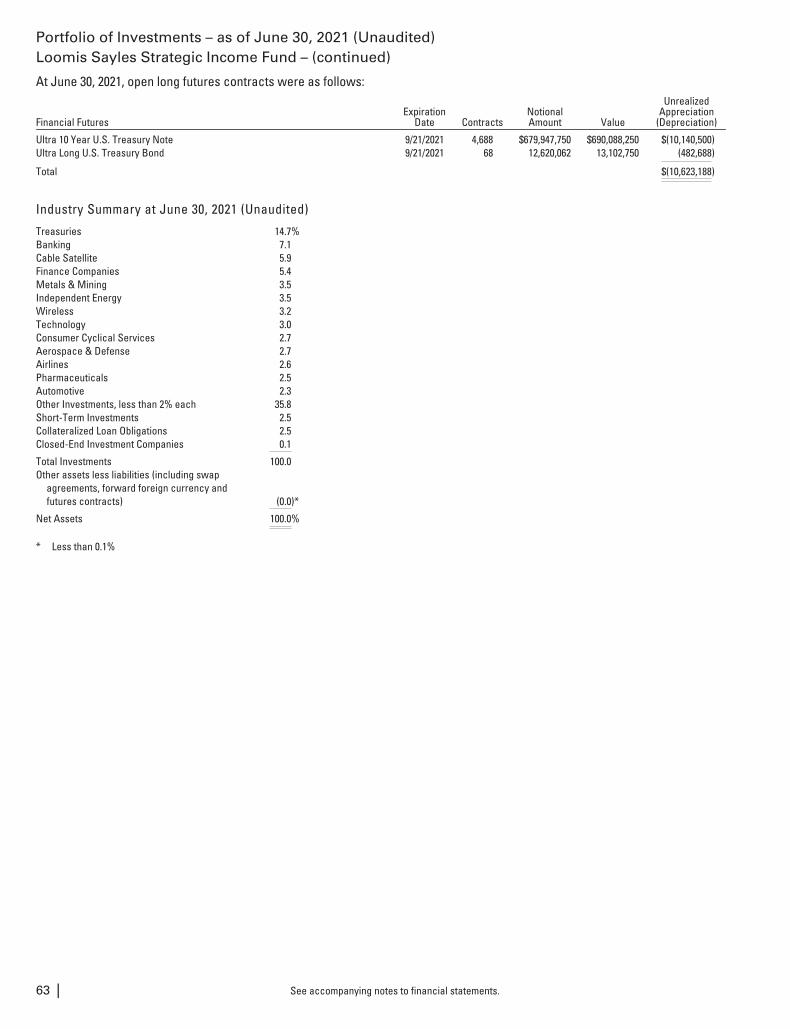
Portfolio of Investments – as of June 30, 2021 (Unaudited)Loomis Sayles Strategic Income Fund – (continued)
At June 30, 2021, open long futures contracts were as follows:
Financial FuturesExpiration
Date ContractsNotionalAmount Value
UnrealizedAppreciation
(Depreciation)
Ultra 10 Year U.S. Treasury Note 9/21/2021 4,688 $679,947,750 $690,088,250 $(10,140,500)Ultra Long U.S. Treasury Bond 9/21/2021 68 12,620,062 13,102,750 (482,688)
Total $(10,623,188)
Industry Summary at June 30, 2021 (Unaudited)
Treasuries 14.7%Banking 7.1Cable Satellite 5.9Finance Companies 5.4Metals & Mining 3.5Independent Energy 3.5Wireless 3.2Technology 3.0Consumer Cyclical Services 2.7Aerospace & Defense 2.7Airlines 2.6Pharmaceuticals 2.5Automotive 2.3Other Investments, less than 2% each 35.8Short-Term Investments 2.5Collateralized Loan Obligations 2.5Closed-End Investment Companies 0.1
Total Investments 100.0Other assets less liabilities (including swap
agreements, forward foreign currency andfutures contracts) (0.0)*
Net Assets 100.0%
* Less than 0.1%
See accompanying notes to financial statements.63 |
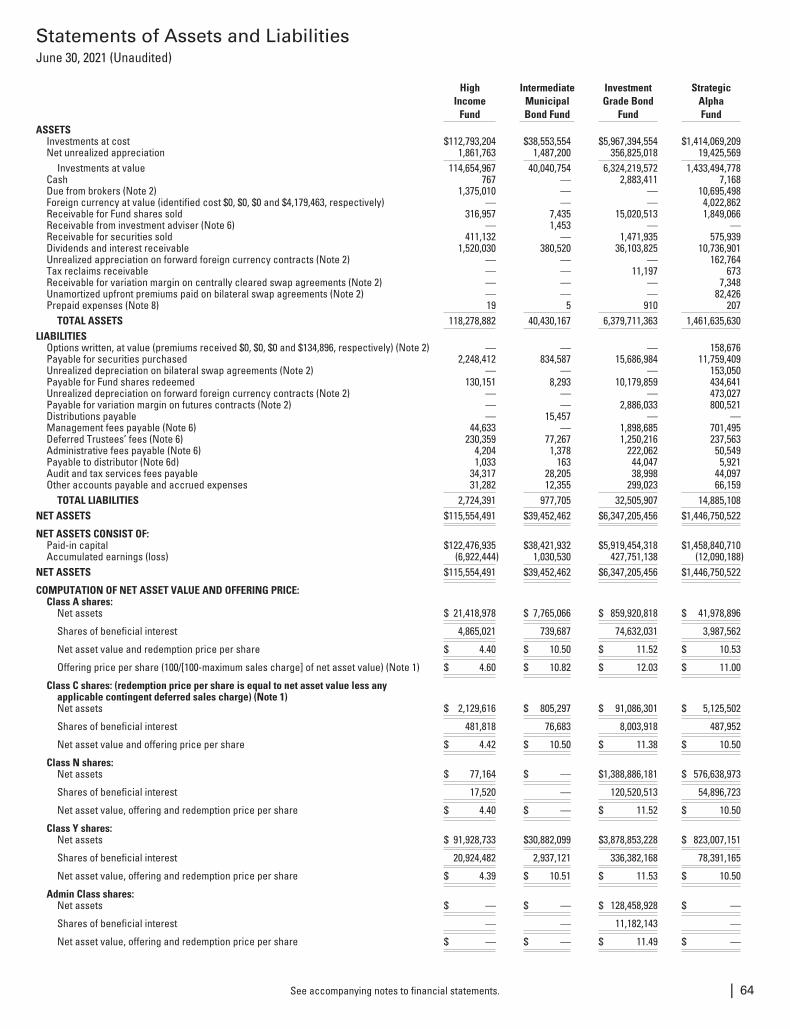
Statements of Assets and LiabilitiesJune 30, 2021 (Unaudited)
HighIncome
Fund
IntermediateMunicipalBond Fund
InvestmentGrade Bond
Fund
StrategicAlphaFund
ASSETSInvestments at cost $112,793,204 $38,553,554 $5,967,394,554 $1,414,069,209Net unrealized appreciation 1,861,763 1,487,200 356,825,018 19,425,569
Investments at value 114,654,967 40,040,754 6,324,219,572 1,433,494,778Cash 767 — 2,883,411 7,168Due from brokers (Note 2) 1,375,010 — — 10,695,498Foreign currency at value (identified cost $0, $0, $0 and $4,179,463, respectively) — — — 4,022,862Receivable for Fund shares sold 316,957 7,435 15,020,513 1,849,066Receivable from investment adviser (Note 6) — 1,453 — —Receivable for securities sold 411,132 — 1,471,935 575,939Dividends and interest receivable 1,520,030 380,520 36,103,825 10,736,901Unrealized appreciation on forward foreign currency contracts (Note 2) — — — 162,764Tax reclaims receivable — — 11,197 673Receivable for variation margin on centrally cleared swap agreements (Note 2) — — — 7,348Unamortized upfront premiums paid on bilateral swap agreements (Note 2) — — — 82,426Prepaid expenses (Note 8) 19 5 910 207
TOTAL ASSETS 118,278,882 40,430,167 6,379,711,363 1,461,635,630LIABILITIES
Options written, at value (premiums received $0, $0, $0 and $134,896, respectively) (Note 2) — — — 158,676Payable for securities purchased 2,248,412 834,587 15,686,984 11,759,409Unrealized depreciation on bilateral swap agreements (Note 2) — — — 153,050Payable for Fund shares redeemed 130,151 8,293 10,179,859 434,641Unrealized depreciation on forward foreign currency contracts (Note 2) — — — 473,027Payable for variation margin on futures contracts (Note 2) — — 2,886,033 800,521Distributions payable — 15,457 — —Management fees payable (Note 6) 44,633 — 1,898,685 701,495Deferred Trustees’ fees (Note 6) 230,359 77,267 1,250,216 237,563Administrative fees payable (Note 6) 4,204 1,378 222,062 50,549Payable to distributor (Note 6d) 1,033 163 44,047 5,921Audit and tax services fees payable 34,317 28,205 38,998 44,097Other accounts payable and accrued expenses 31,282 12,355 299,023 66,159
TOTAL LIABILITIES 2,724,391 977,705 32,505,907 14,885,108NET ASSETS $115,554,491 $39,452,462 $6,347,205,456 $1,446,750,522
NET ASSETS CONSIST OF:Paid-in capital $122,476,935 $38,421,932 $5,919,454,318 $1,458,840,710Accumulated earnings (loss) (6,922,444) 1,030,530 427,751,138 (12,090,188)
NET ASSETS $115,554,491 $39,452,462 $6,347,205,456 $1,446,750,522
COMPUTATION OF NET ASSET VALUE AND OFFERING PRICE:Class A shares:
Net assets $ 21,418,978 $ 7,765,066 $ 859,920,818 $ 41,978,896
Shares of beneficial interest 4,865,021 739,687 74,632,031 3,987,562
Net asset value and redemption price per share $ 4.40 $ 10.50 $ 11.52 $ 10.53
Offering price per share (100/[100-maximum sales charge] of net asset value) (Note 1) $ 4.60 $ 10.82 $ 12.03 $ 11.00
Class C shares: (redemption price per share is equal to net asset value less anyapplicable contingent deferred sales charge) (Note 1)Net assets $ 2,129,616 $ 805,297 $ 91,086,301 $ 5,125,502
Shares of beneficial interest 481,818 76,683 8,003,918 487,952
Net asset value and offering price per share $ 4.42 $ 10.50 $ 11.38 $ 10.50
Class N shares:Net assets $ 77,164 $ — $1,388,886,181 $ 576,638,973
Shares of beneficial interest 17,520 — 120,520,513 54,896,723
Net asset value, offering and redemption price per share $ 4.40 $ — $ 11.52 $ 10.50
Class Y shares:Net assets $ 91,928,733 $30,882,099 $3,878,853,228 $ 823,007,151
Shares of beneficial interest 20,924,482 2,937,121 336,382,168 78,391,165
Net asset value, offering and redemption price per share $ 4.39 $ 10.51 $ 11.53 $ 10.50
Admin Class shares:Net assets $ — $ — $ 128,458,928 $ —
Shares of beneficial interest — — 11,182,143 —
Net asset value, offering and redemption price per share $ — $ — $ 11.49 $ —
See accompanying notes to financial statements. | 64
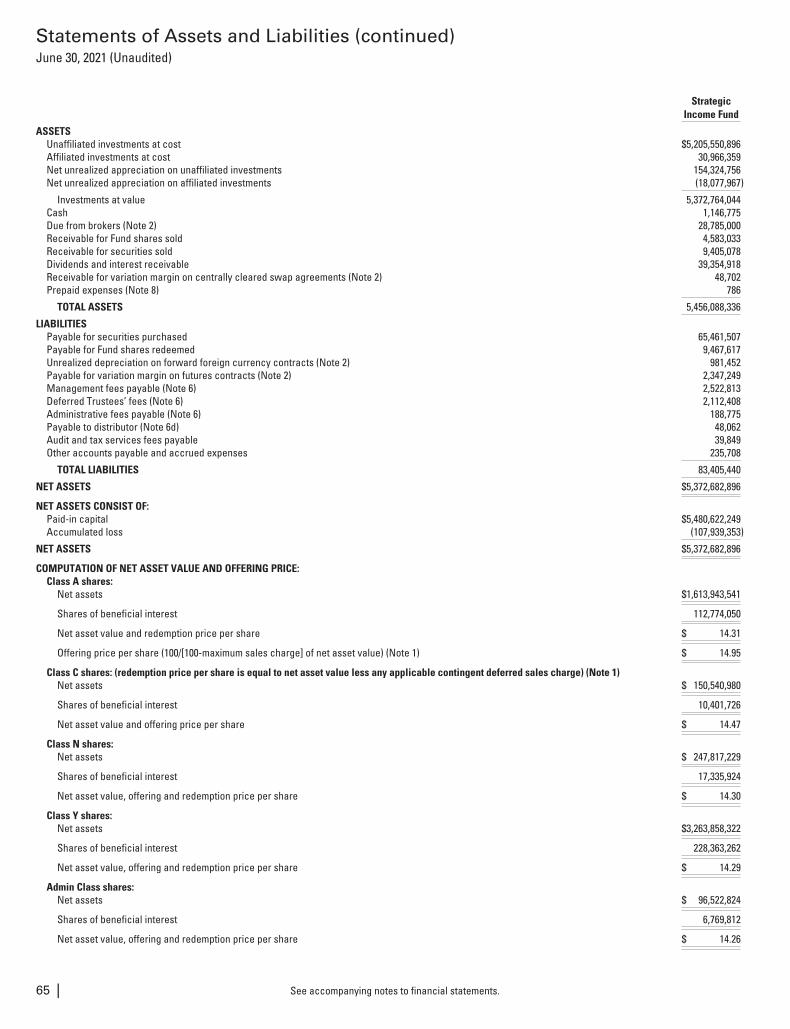
Statements of Assets and Liabilities (continued)June 30, 2021 (Unaudited)
StrategicIncome Fund
ASSETSUnaffiliated investments at cost $5,205,550,896Affiliated investments at cost 30,966,359Net unrealized appreciation on unaffiliated investments 154,324,756Net unrealized appreciation on affiliated investments (18,077,967)
Investments at value 5,372,764,044Cash 1,146,775Due from brokers (Note 2) 28,785,000Receivable for Fund shares sold 4,583,033Receivable for securities sold 9,405,078Dividends and interest receivable 39,354,918Receivable for variation margin on centrally cleared swap agreements (Note 2) 48,702Prepaid expenses (Note 8) 786
TOTAL ASSETS 5,456,088,336
LIABILITIESPayable for securities purchased 65,461,507Payable for Fund shares redeemed 9,467,617Unrealized depreciation on forward foreign currency contracts (Note 2) 981,452Payable for variation margin on futures contracts (Note 2) 2,347,249Management fees payable (Note 6) 2,522,813Deferred Trustees’ fees (Note 6) 2,112,408Administrative fees payable (Note 6) 188,775Payable to distributor (Note 6d) 48,062Audit and tax services fees payable 39,849Other accounts payable and accrued expenses 235,708
TOTAL LIABILITIES 83,405,440
NET ASSETS $5,372,682,896
NET ASSETS CONSIST OF:Paid-in capital $5,480,622,249Accumulated loss (107,939,353)
NET ASSETS $5,372,682,896
COMPUTATION OF NET ASSET VALUE AND OFFERING PRICE:Class A shares:
Net assets $1,613,943,541
Shares of beneficial interest 112,774,050
Net asset value and redemption price per share $ 14.31
Offering price per share (100/[100-maximum sales charge] of net asset value) (Note 1) $ 14.95
Class C shares: (redemption price per share is equal to net asset value less any applicable contingent deferred sales charge) (Note 1)Net assets $ 150,540,980
Shares of beneficial interest 10,401,726
Net asset value and offering price per share $ 14.47
Class N shares:Net assets $ 247,817,229
Shares of beneficial interest 17,335,924
Net asset value, offering and redemption price per share $ 14.30
Class Y shares:Net assets $3,263,858,322
Shares of beneficial interest 228,363,262
Net asset value, offering and redemption price per share $ 14.29
Admin Class shares:Net assets $ 96,522,824
Shares of beneficial interest 6,769,812
Net asset value, offering and redemption price per share $ 14.26
See accompanying notes to financial statements.65 |
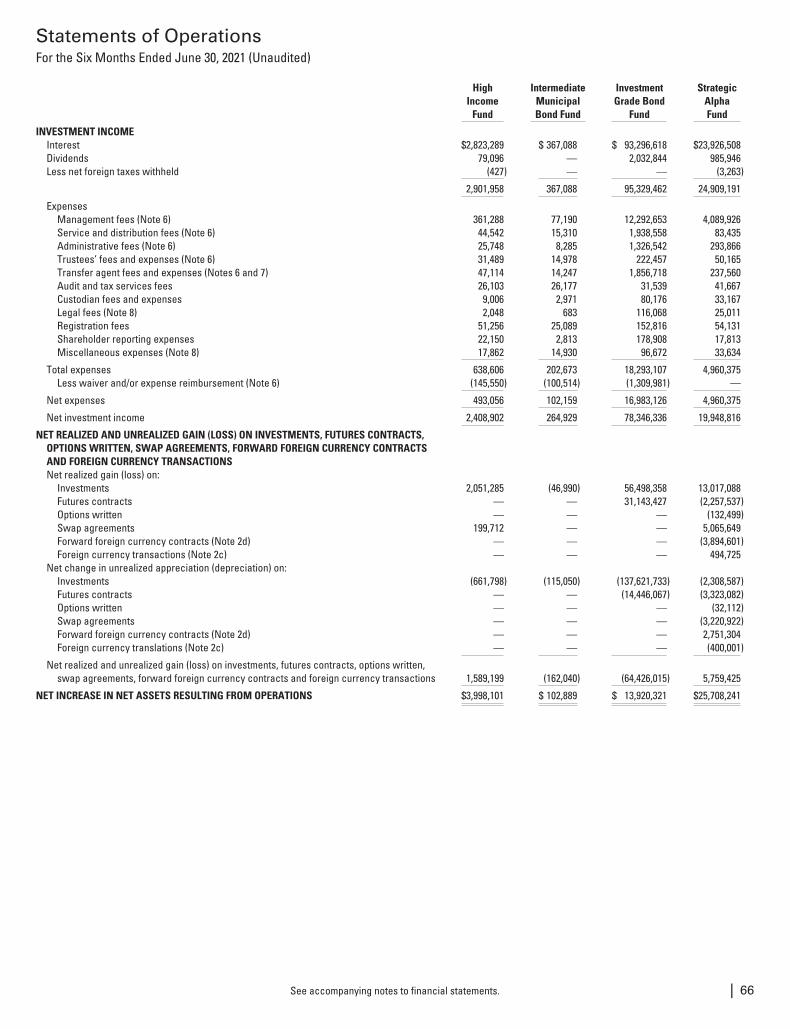
Statements of OperationsFor the Six Months Ended June 30, 2021 (Unaudited)
HighIncome
Fund
IntermediateMunicipalBond Fund
InvestmentGrade Bond
Fund
StrategicAlphaFund
INVESTMENT INCOMEInterest $2,823,289 $ 367,088 $ 93,296,618 $23,926,508Dividends 79,096 — 2,032,844 985,946Less net foreign taxes withheld (427) — — (3,263)
2,901,958 367,088 95,329,462 24,909,191
ExpensesManagement fees (Note 6) 361,288 77,190 12,292,653 4,089,926Service and distribution fees (Note 6) 44,542 15,310 1,938,558 83,435Administrative fees (Note 6) 25,748 8,285 1,326,542 293,866Trustees’ fees and expenses (Note 6) 31,489 14,978 222,457 50,165Transfer agent fees and expenses (Notes 6 and 7) 47,114 14,247 1,856,718 237,560Audit and tax services fees 26,103 26,177 31,539 41,667Custodian fees and expenses 9,006 2,971 80,176 33,167Legal fees (Note 8) 2,048 683 116,068 25,011Registration fees 51,256 25,089 152,816 54,131Shareholder reporting expenses 22,150 2,813 178,908 17,813Miscellaneous expenses (Note 8) 17,862 14,930 96,672 33,634
Total expenses 638,606 202,673 18,293,107 4,960,375Less waiver and/or expense reimbursement (Note 6) (145,550) (100,514) (1,309,981) —
Net expenses 493,056 102,159 16,983,126 4,960,375
Net investment income 2,408,902 264,929 78,346,336 19,948,816
NET REALIZED AND UNREALIZED GAIN (LOSS) ON INVESTMENTS, FUTURES CONTRACTS,OPTIONS WRITTEN, SWAP AGREEMENTS, FORWARD FOREIGN CURRENCY CONTRACTSAND FOREIGN CURRENCY TRANSACTIONSNet realized gain (loss) on:
Investments 2,051,285 (46,990) 56,498,358 13,017,088Futures contracts — — 31,143,427 (2,257,537)Options written — — — (132,499)Swap agreements 199,712 — — 5,065,649Forward foreign currency contracts (Note 2d) — — — (3,894,601)Foreign currency transactions (Note 2c) — — — 494,725
Net change in unrealized appreciation (depreciation) on:Investments (661,798) (115,050) (137,621,733) (2,308,587)Futures contracts — — (14,446,067) (3,323,082)Options written — — — (32,112)Swap agreements — — — (3,220,922)Forward foreign currency contracts (Note 2d) — — — 2,751,304Foreign currency translations (Note 2c) — — — (400,001)
Net realized and unrealized gain (loss) on investments, futures contracts, options written,swap agreements, forward foreign currency contracts and foreign currency transactions 1,589,199 (162,040) (64,426,015) 5,759,425
NET INCREASE IN NET ASSETS RESULTING FROM OPERATIONS $3,998,101 $ 102,889 $ 13,920,321 $25,708,241
See accompanying notes to financial statements. | 66
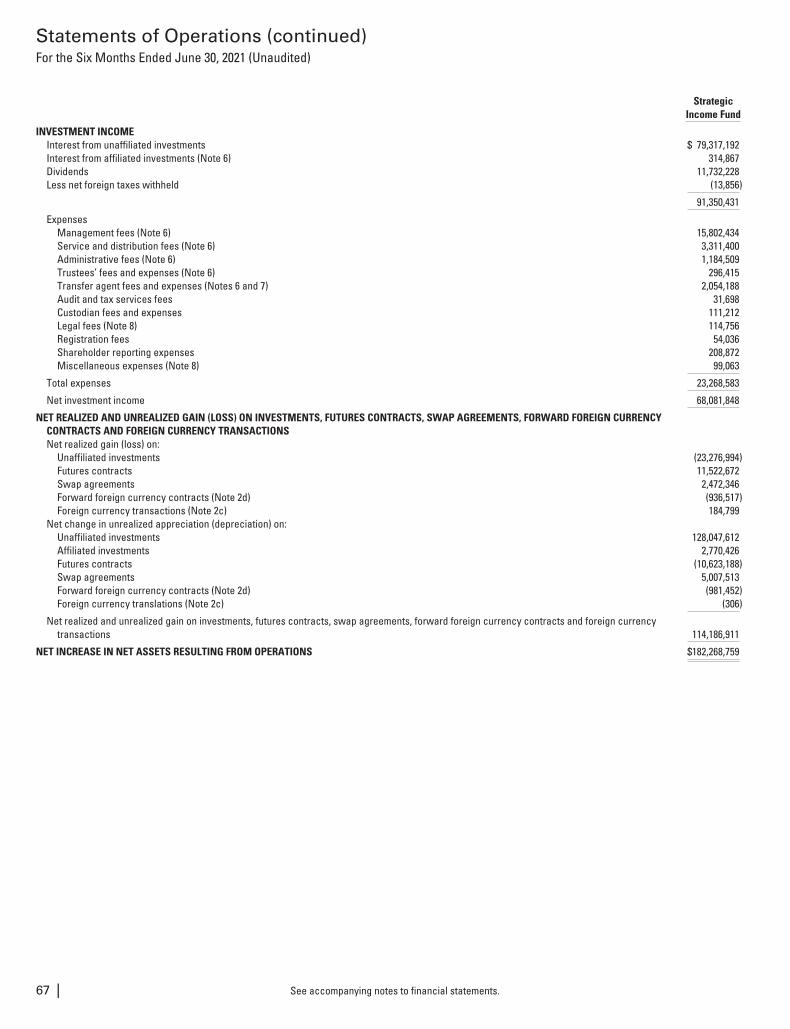
Statements of Operations (continued)For the Six Months Ended June 30, 2021 (Unaudited)
StrategicIncome Fund
INVESTMENT INCOMEInterest from unaffiliated investments $ 79,317,192Interest from affiliated investments (Note 6) 314,867Dividends 11,732,228Less net foreign taxes withheld (13,856)
91,350,431
ExpensesManagement fees (Note 6) 15,802,434Service and distribution fees (Note 6) 3,311,400Administrative fees (Note 6) 1,184,509Trustees’ fees and expenses (Note 6) 296,415Transfer agent fees and expenses (Notes 6 and 7) 2,054,188Audit and tax services fees 31,698Custodian fees and expenses 111,212Legal fees (Note 8) 114,756Registration fees 54,036Shareholder reporting expenses 208,872Miscellaneous expenses (Note 8) 99,063
Total expenses 23,268,583
Net investment income 68,081,848
NET REALIZED AND UNREALIZED GAIN (LOSS) ON INVESTMENTS, FUTURES CONTRACTS, SWAP AGREEMENTS, FORWARD FOREIGN CURRENCYCONTRACTS AND FOREIGN CURRENCY TRANSACTIONSNet realized gain (loss) on:
Unaffiliated investments (23,276,994)Futures contracts 11,522,672Swap agreements 2,472,346Forward foreign currency contracts (Note 2d) (936,517)Foreign currency transactions (Note 2c) 184,799
Net change in unrealized appreciation (depreciation) on:Unaffiliated investments 128,047,612Affiliated investments 2,770,426Futures contracts (10,623,188)Swap agreements 5,007,513Forward foreign currency contracts (Note 2d) (981,452)Foreign currency translations (Note 2c) (306)
Net realized and unrealized gain on investments, futures contracts, swap agreements, forward foreign currency contracts and foreign currencytransactions 114,186,911
NET INCREASE IN NET ASSETS RESULTING FROM OPERATIONS $182,268,759
See accompanying notes to financial statements.67 |
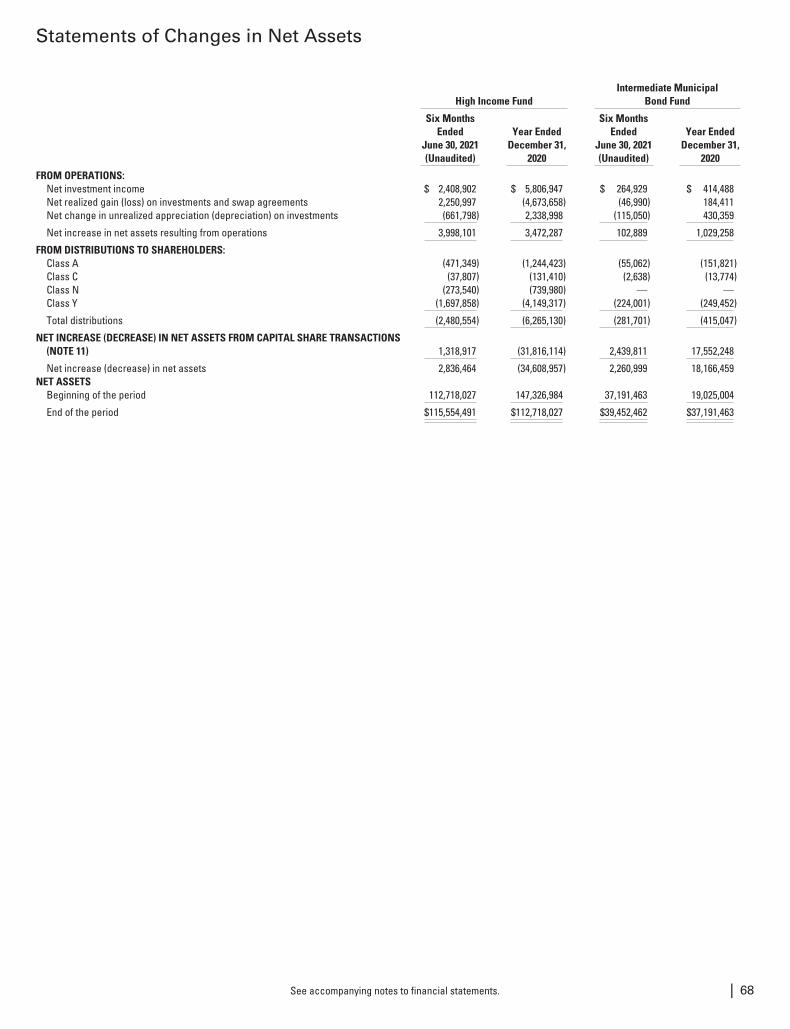
Statements of Changes in Net Assets
High Income FundIntermediate Municipal
Bond Fund
Six MonthsEnded
June 30, 2021(Unaudited)
Year EndedDecember 31,
2020
Six MonthsEnded
June 30, 2021(Unaudited)
Year EndedDecember 31,
2020
FROM OPERATIONS:Net investment income $ 2,408,902 $ 5,806,947 $ 264,929 $ 414,488Net realized gain (loss) on investments and swap agreements 2,250,997 (4,673,658) (46,990) 184,411Net change in unrealized appreciation (depreciation) on investments (661,798) 2,338,998 (115,050) 430,359
Net increase in net assets resulting from operations 3,998,101 3,472,287 102,889 1,029,258
FROM DISTRIBUTIONS TO SHAREHOLDERS:Class A (471,349) (1,244,423) (55,062) (151,821)Class C (37,807) (131,410) (2,638) (13,774)Class N (273,540) (739,980) — —Class Y (1,697,858) (4,149,317) (224,001) (249,452)
Total distributions (2,480,554) (6,265,130) (281,701) (415,047)
NET INCREASE (DECREASE) IN NET ASSETS FROM CAPITAL SHARE TRANSACTIONS(NOTE 11) 1,318,917 (31,816,114) 2,439,811 17,552,248
Net increase (decrease) in net assets 2,836,464 (34,608,957) 2,260,999 18,166,459NET ASSETS
Beginning of the period 112,718,027 147,326,984 37,191,463 19,025,004
End of the period $115,554,491 $112,718,027 $39,452,462 $37,191,463
See accompanying notes to financial statements. | 68
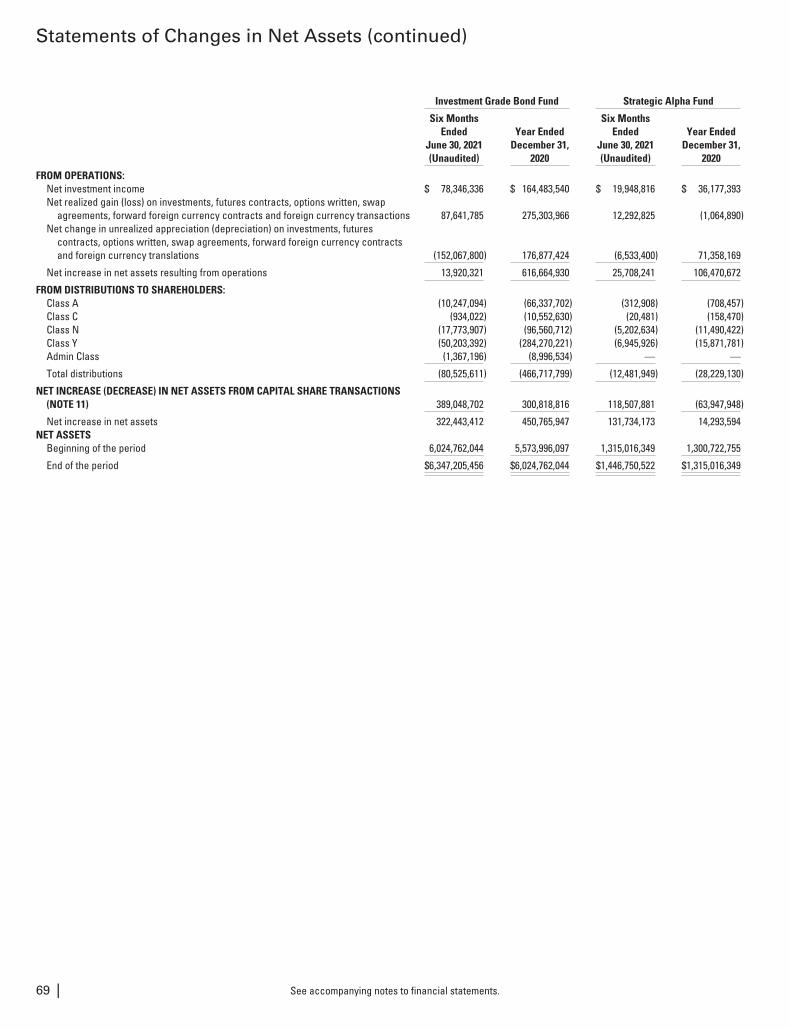
Statements of Changes in Net Assets (continued)
Investment Grade Bond Fund Strategic Alpha Fund
Six MonthsEnded
June 30, 2021(Unaudited)
Year EndedDecember 31,
2020
Six MonthsEnded
June 30, 2021(Unaudited)
Year EndedDecember 31,
2020
FROM OPERATIONS:Net investment income $ 78,346,336 $ 164,483,540 $ 19,948,816 $ 36,177,393Net realized gain (loss) on investments, futures contracts, options written, swap
agreements, forward foreign currency contracts and foreign currency transactions 87,641,785 275,303,966 12,292,825 (1,064,890)Net change in unrealized appreciation (depreciation) on investments, futures
contracts, options written, swap agreements, forward foreign currency contractsand foreign currency translations (152,067,800) 176,877,424 (6,533,400) 71,358,169
Net increase in net assets resulting from operations 13,920,321 616,664,930 25,708,241 106,470,672
FROM DISTRIBUTIONS TO SHAREHOLDERS:Class A (10,247,094) (66,337,702) (312,908) (708,457)Class C (934,022) (10,552,630) (20,481) (158,470)Class N (17,773,907) (96,560,712) (5,202,634) (11,490,422)Class Y (50,203,392) (284,270,221) (6,945,926) (15,871,781)Admin Class (1,367,196) (8,996,534) — —
Total distributions (80,525,611) (466,717,799) (12,481,949) (28,229,130)
NET INCREASE (DECREASE) IN NET ASSETS FROM CAPITAL SHARE TRANSACTIONS(NOTE 11) 389,048,702 300,818,816 118,507,881 (63,947,948)
Net increase in net assets 322,443,412 450,765,947 131,734,173 14,293,594NET ASSETS
Beginning of the period 6,024,762,044 5,573,996,097 1,315,016,349 1,300,722,755
End of the period $6,347,205,456 $6,024,762,044 $1,446,750,522 $1,315,016,349
See accompanying notes to financial statements.69 |
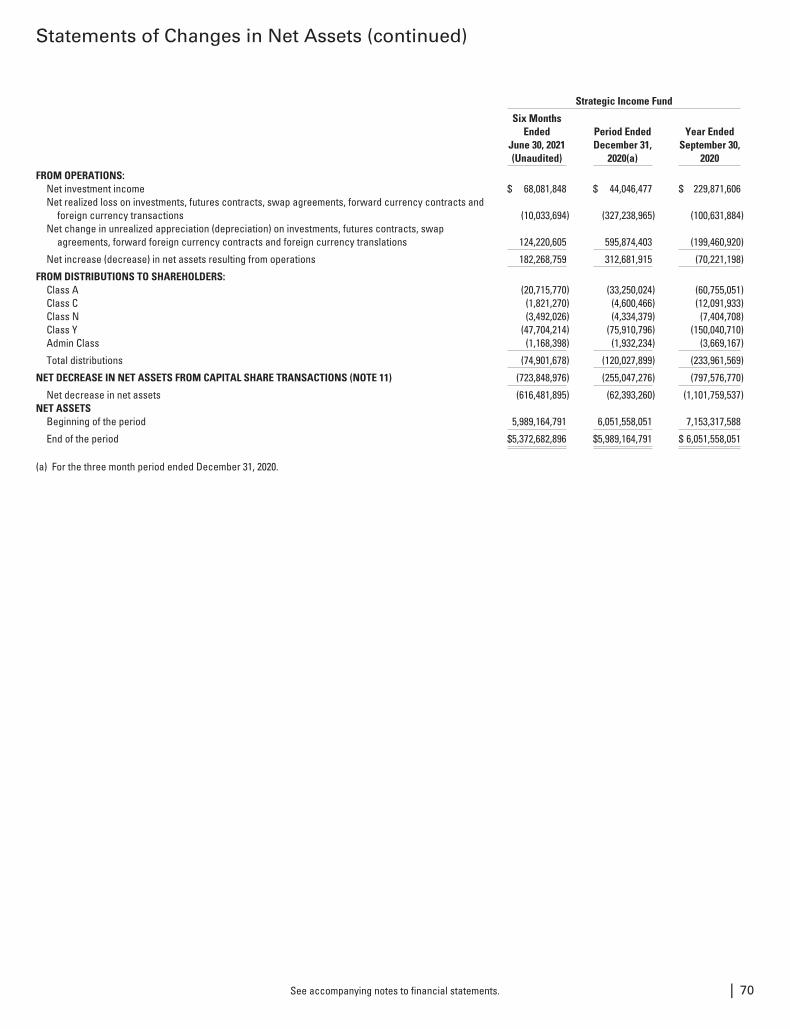
Statements of Changes in Net Assets (continued)
Strategic Income Fund
Six MonthsEnded
June 30, 2021(Unaudited)
Period EndedDecember 31,
2020(a)
Year EndedSeptember 30,
2020
FROM OPERATIONS:Net investment income $ 68,081,848 $ 44,046,477 $ 229,871,606Net realized loss on investments, futures contracts, swap agreements, forward currency contracts and
foreign currency transactions (10,033,694) (327,238,965) (100,631,884)Net change in unrealized appreciation (depreciation) on investments, futures contracts, swap
agreements, forward foreign currency contracts and foreign currency translations 124,220,605 595,874,403 (199,460,920)
Net increase (decrease) in net assets resulting from operations 182,268,759 312,681,915 (70,221,198)
FROM DISTRIBUTIONS TO SHAREHOLDERS:Class A (20,715,770) (33,250,024) (60,755,051)Class C (1,821,270) (4,600,466) (12,091,933)Class N (3,492,026) (4,334,379) (7,404,708)Class Y (47,704,214) (75,910,796) (150,040,710)Admin Class (1,168,398) (1,932,234) (3,669,167)
Total distributions (74,901,678) (120,027,899) (233,961,569)
NET DECREASE IN NET ASSETS FROM CAPITAL SHARE TRANSACTIONS (NOTE 11) (723,848,976) (255,047,276) (797,576,770)
Net decrease in net assets (616,481,895) (62,393,260) (1,101,759,537)NET ASSETS
Beginning of the period 5,989,164,791 6,051,558,051 7,153,317,588
End of the period $5,372,682,896 $5,989,164,791 $ 6,051,558,051
(a) For the three month period ended December 31, 2020.
See accompanying notes to financial statements. | 70
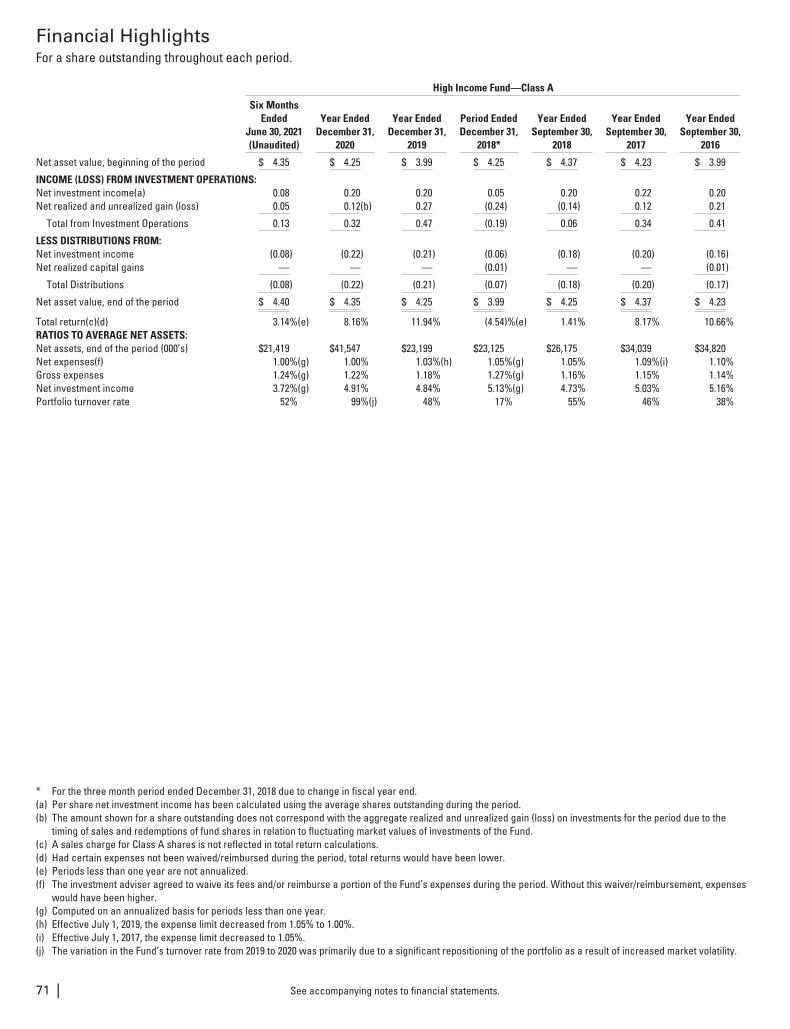
Financial HighlightsFor a share outstanding throughout each period.
High Income Fund—Class A
Six MonthsEnded
June 30, 2021(Unaudited)
Year EndedDecember 31,
2020
Year EndedDecember 31,
2019
Period EndedDecember 31,
2018*
Year EndedSeptember 30,
2018
Year EndedSeptember 30,
2017
Year EndedSeptember 30,
2016
Net asset value, beginning of the period $ 4.35 $ 4.25 $ 3.99 $ 4.25 $ 4.37 $ 4.23 $ 3.99
INCOME (LOSS) FROM INVESTMENT OPERATIONS:Net investment income(a) 0.08 0.20 0.20 0.05 0.20 0.22 0.20Net realized and unrealized gain (loss) 0.05 0.12(b) 0.27 (0.24) (0.14) 0.12 0.21
Total from Investment Operations 0.13 0.32 0.47 (0.19) 0.06 0.34 0.41
LESS DISTRIBUTIONS FROM:Net investment income (0.08) (0.22) (0.21) (0.06) (0.18) (0.20) (0.16)Net realized capital gains — — — (0.01) — — (0.01)
Total Distributions (0.08) (0.22) (0.21) (0.07) (0.18) (0.20) (0.17)
Net asset value, end of the period $ 4.40 $ 4.35 $ 4.25 $ 3.99 $ 4.25 $ 4.37 $ 4.23
Total return(c)(d) 3.14%(e) 8.16% 11.94% (4.54)%(e) 1.41% 8.17% 10.66%RATIOS TO AVERAGE NET ASSETS:Net assets, end of the period (000’s) $21,419 $41,547 $23,199 $23,125 $26,175 $34,039 $34,820Net expenses(f) 1.00%(g) 1.00% 1.03%(h) 1.05%(g) 1.05% 1.09%(i) 1.10%Gross expenses 1.24%(g) 1.22% 1.18% 1.27%(g) 1.16% 1.15% 1.14%Net investment income 3.72%(g) 4.91% 4.84% 5.13%(g) 4.73% 5.03% 5.16%Portfolio turnover rate 52% 99%(j) 48% 17% 55% 46% 38%
* For the three month period ended December 31, 2018 due to change in fiscal year end.(a) Per share net investment income has been calculated using the average shares outstanding during the period.(b) The amount shown for a share outstanding does not correspond with the aggregate realized and unrealized gain (loss) on investments for the period due to the
timing of sales and redemptions of fund shares in relation to fluctuating market values of investments of the Fund.(c) A sales charge for Class A shares is not reflected in total return calculations.(d) Had certain expenses not been waived/reimbursed during the period, total returns would have been lower.(e) Periods less than one year are not annualized.(f) The investment adviser agreed to waive its fees and/or reimburse a portion of the Fund’s expenses during the period. Without this waiver/reimbursement, expenses
would have been higher.(g) Computed on an annualized basis for periods less than one year.(h) Effective July 1, 2019, the expense limit decreased from 1.05% to 1.00%.(i) Effective July 1, 2017, the expense limit decreased to 1.05%.(j) The variation in the Fund’s turnover rate from 2019 to 2020 was primarily due to a significant repositioning of the portfolio as a result of increased market volatility.
See accompanying notes to financial statements.71 |
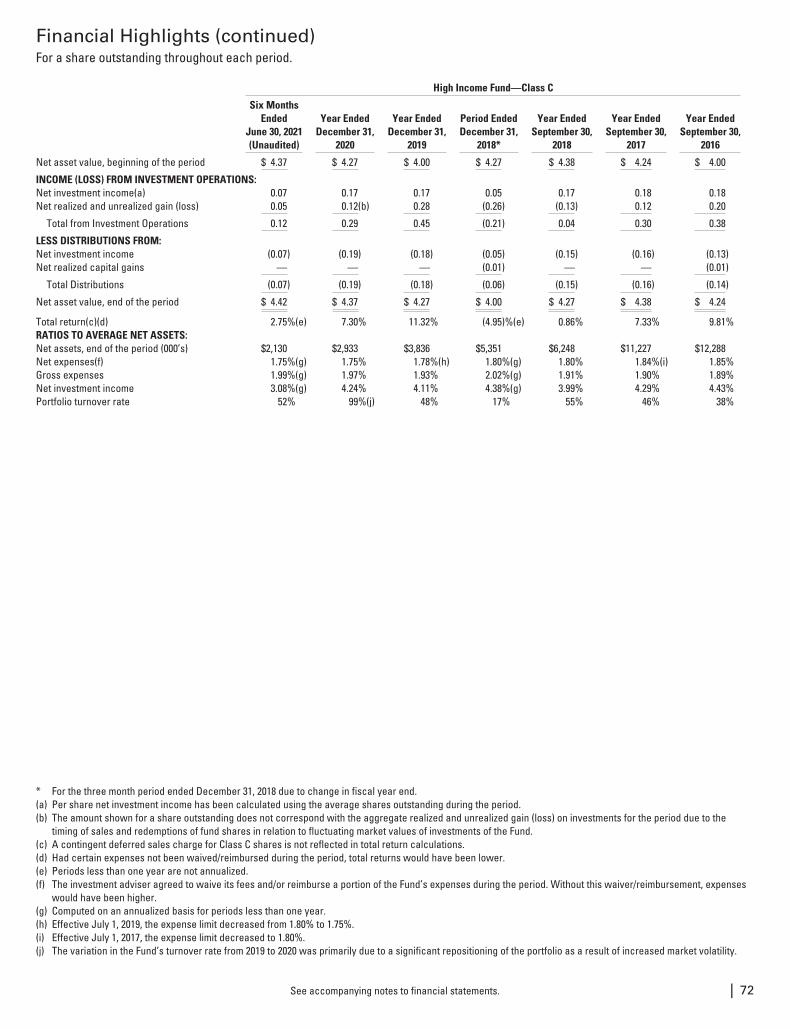
Financial Highlights (continued)For a share outstanding throughout each period.
High Income Fund—Class C
Six MonthsEnded
June 30, 2021(Unaudited)
Year EndedDecember 31,
2020
Year EndedDecember 31,
2019
Period EndedDecember 31,
2018*
Year EndedSeptember 30,
2018
Year EndedSeptember 30,
2017
Year EndedSeptember 30,
2016
Net asset value, beginning of the period $ 4.37 $ 4.27 $ 4.00 $ 4.27 $ 4.38 $ 4.24 $ 4.00
INCOME (LOSS) FROM INVESTMENT OPERATIONS:Net investment income(a) 0.07 0.17 0.17 0.05 0.17 0.18 0.18Net realized and unrealized gain (loss) 0.05 0.12(b) 0.28 (0.26) (0.13) 0.12 0.20
Total from Investment Operations 0.12 0.29 0.45 (0.21) 0.04 0.30 0.38
LESS DISTRIBUTIONS FROM:Net investment income (0.07) (0.19) (0.18) (0.05) (0.15) (0.16) (0.13)Net realized capital gains — — — (0.01) — — (0.01)
Total Distributions (0.07) (0.19) (0.18) (0.06) (0.15) (0.16) (0.14)
Net asset value, end of the period $ 4.42 $ 4.37 $ 4.27 $ 4.00 $ 4.27 $ 4.38 $ 4.24
Total return(c)(d) 2.75%(e) 7.30% 11.32% (4.95)%(e) 0.86% 7.33% 9.81%RATIOS TO AVERAGE NET ASSETS:Net assets, end of the period (000’s) $2,130 $2,933 $3,836 $5,351 $6,248 $11,227 $12,288Net expenses(f) 1.75%(g) 1.75% 1.78%(h) 1.80%(g) 1.80% 1.84%(i) 1.85%Gross expenses 1.99%(g) 1.97% 1.93% 2.02%(g) 1.91% 1.90% 1.89%Net investment income 3.08%(g) 4.24% 4.11% 4.38%(g) 3.99% 4.29% 4.43%Portfolio turnover rate 52% 99%(j) 48% 17% 55% 46% 38%
* For the three month period ended December 31, 2018 due to change in fiscal year end.(a) Per share net investment income has been calculated using the average shares outstanding during the period.(b) The amount shown for a share outstanding does not correspond with the aggregate realized and unrealized gain (loss) on investments for the period due to the
timing of sales and redemptions of fund shares in relation to fluctuating market values of investments of the Fund.(c) A contingent deferred sales charge for Class C shares is not reflected in total return calculations.(d) Had certain expenses not been waived/reimbursed during the period, total returns would have been lower.(e) Periods less than one year are not annualized.(f) The investment adviser agreed to waive its fees and/or reimburse a portion of the Fund’s expenses during the period. Without this waiver/reimbursement, expenses
would have been higher.(g) Computed on an annualized basis for periods less than one year.(h) Effective July 1, 2019, the expense limit decreased from 1.80% to 1.75%.(i) Effective July 1, 2017, the expense limit decreased to 1.80%.(j) The variation in the Fund’s turnover rate from 2019 to 2020 was primarily due to a significant repositioning of the portfolio as a result of increased market volatility.
See accompanying notes to financial statements. | 72
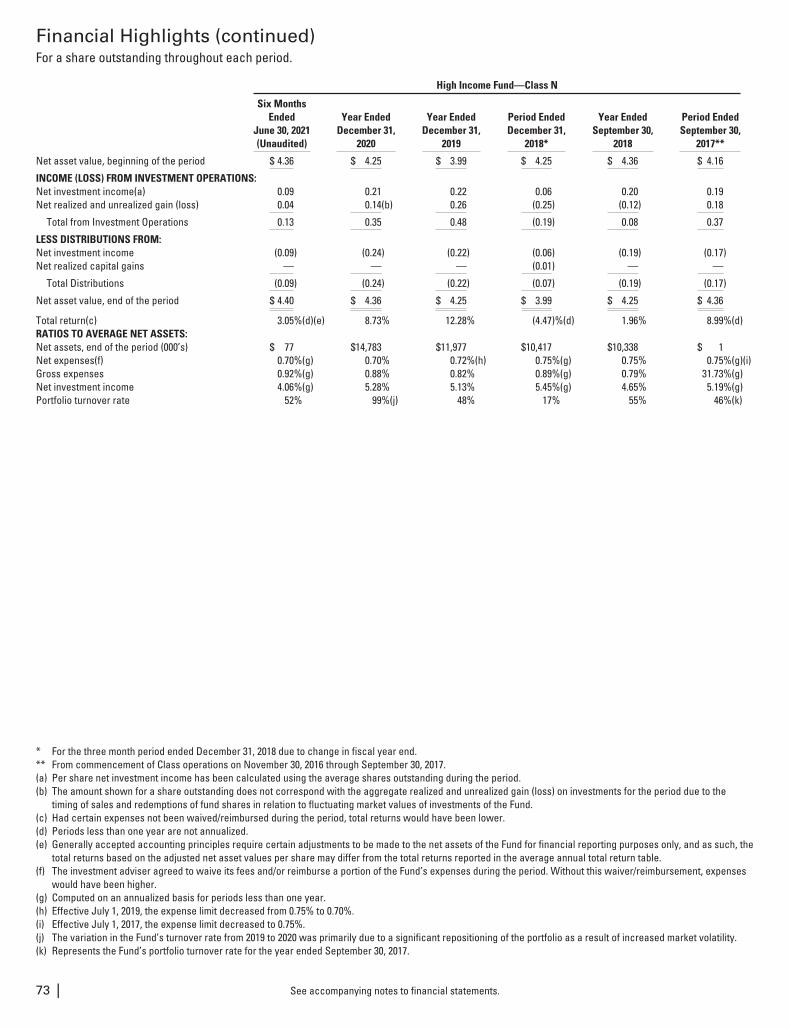
Financial Highlights (continued)For a share outstanding throughout each period.
High Income Fund—Class N
Six MonthsEnded
June 30, 2021(Unaudited)
Year EndedDecember 31,
2020
Year EndedDecember 31,
2019
Period EndedDecember 31,
2018*
Year EndedSeptember 30,
2018
Period EndedSeptember 30,
2017**
Net asset value, beginning of the period $ 4.36 $ 4.25 $ 3.99 $ 4.25 $ 4.36 $ 4.16
INCOME (LOSS) FROM INVESTMENT OPERATIONS:Net investment income(a) 0.09 0.21 0.22 0.06 0.20 0.19Net realized and unrealized gain (loss) 0.04 0.14(b) 0.26 (0.25) (0.12) 0.18
Total from Investment Operations 0.13 0.35 0.48 (0.19) 0.08 0.37
LESS DISTRIBUTIONS FROM:Net investment income (0.09) (0.24) (0.22) (0.06) (0.19) (0.17)Net realized capital gains — — — (0.01) — —
Total Distributions (0.09) (0.24) (0.22) (0.07) (0.19) (0.17)
Net asset value, end of the period $ 4.40 $ 4.36 $ 4.25 $ 3.99 $ 4.25 $ 4.36
Total return(c) 3.05%(d)(e) 8.73% 12.28% (4.47)%(d) 1.96% 8.99%(d)RATIOS TO AVERAGE NET ASSETS:Net assets, end of the period (000’s) $ 77 $14,783 $11,977 $10,417 $10,338 $ 1Net expenses(f) 0.70%(g) 0.70% 0.72%(h) 0.75%(g) 0.75% 0.75%(g)(i)Gross expenses 0.92%(g) 0.88% 0.82% 0.89%(g) 0.79% 31.73%(g)Net investment income 4.06%(g) 5.28% 5.13% 5.45%(g) 4.65% 5.19%(g)Portfolio turnover rate 52% 99%(j) 48% 17% 55% 46%(k)
* For the three month period ended December 31, 2018 due to change in fiscal year end.** From commencement of Class operations on November 30, 2016 through September 30, 2017.(a) Per share net investment income has been calculated using the average shares outstanding during the period.(b) The amount shown for a share outstanding does not correspond with the aggregate realized and unrealized gain (loss) on investments for the period due to the
timing of sales and redemptions of fund shares in relation to fluctuating market values of investments of the Fund.(c) Had certain expenses not been waived/reimbursed during the period, total returns would have been lower.(d) Periods less than one year are not annualized.(e) Generally accepted accounting principles require certain adjustments to be made to the net assets of the Fund for financial reporting purposes only, and as such, the
total returns based on the adjusted net asset values per share may differ from the total returns reported in the average annual total return table.(f) The investment adviser agreed to waive its fees and/or reimburse a portion of the Fund’s expenses during the period. Without this waiver/reimbursement, expenses
would have been higher.(g) Computed on an annualized basis for periods less than one year.(h) Effective July 1, 2019, the expense limit decreased from 0.75% to 0.70%.(i) Effective July 1, 2017, the expense limit decreased to 0.75%.(j) The variation in the Fund’s turnover rate from 2019 to 2020 was primarily due to a significant repositioning of the portfolio as a result of increased market volatility.(k) Represents the Fund’s portfolio turnover rate for the year ended September 30, 2017.
See accompanying notes to financial statements.73 |
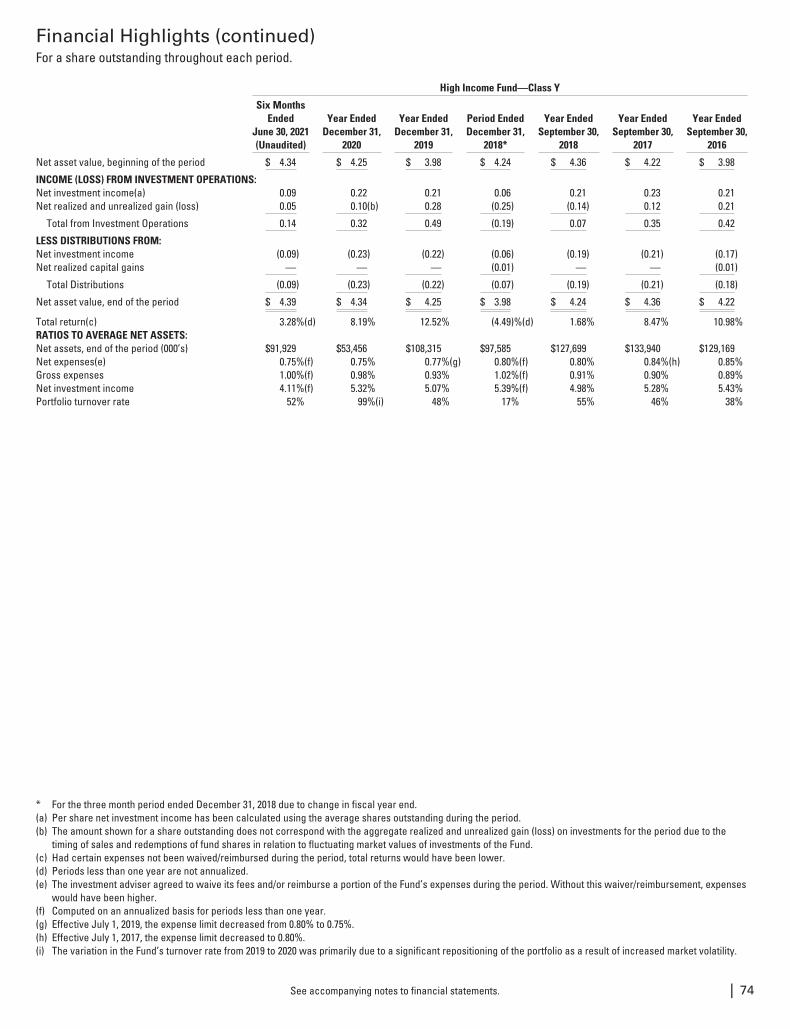
Financial Highlights (continued)For a share outstanding throughout each period.
High Income Fund—Class Y
Six MonthsEnded
June 30, 2021(Unaudited)
Year EndedDecember 31,
2020
Year EndedDecember 31,
2019
Period EndedDecember 31,
2018*
Year EndedSeptember 30,
2018
Year EndedSeptember 30,
2017
Year EndedSeptember 30,
2016
Net asset value, beginning of the period $ 4.34 $ 4.25 $ 3.98 $ 4.24 $ 4.36 $ 4.22 $ 3.98
INCOME (LOSS) FROM INVESTMENT OPERATIONS:Net investment income(a) 0.09 0.22 0.21 0.06 0.21 0.23 0.21Net realized and unrealized gain (loss) 0.05 0.10(b) 0.28 (0.25) (0.14) 0.12 0.21
Total from Investment Operations 0.14 0.32 0.49 (0.19) 0.07 0.35 0.42
LESS DISTRIBUTIONS FROM:Net investment income (0.09) (0.23) (0.22) (0.06) (0.19) (0.21) (0.17)Net realized capital gains — — — (0.01) — — (0.01)
Total Distributions (0.09) (0.23) (0.22) (0.07) (0.19) (0.21) (0.18)
Net asset value, end of the period $ 4.39 $ 4.34 $ 4.25 $ 3.98 $ 4.24 $ 4.36 $ 4.22
Total return(c) 3.28%(d) 8.19% 12.52% (4.49)%(d) 1.68% 8.47% 10.98%RATIOS TO AVERAGE NET ASSETS:Net assets, end of the period (000’s) $91,929 $53,456 $108,315 $97,585 $127,699 $133,940 $129,169Net expenses(e) 0.75%(f) 0.75% 0.77%(g) 0.80%(f) 0.80% 0.84%(h) 0.85%Gross expenses 1.00%(f) 0.98% 0.93% 1.02%(f) 0.91% 0.90% 0.89%Net investment income 4.11%(f) 5.32% 5.07% 5.39%(f) 4.98% 5.28% 5.43%Portfolio turnover rate 52% 99%(i) 48% 17% 55% 46% 38%
* For the three month period ended December 31, 2018 due to change in fiscal year end.(a) Per share net investment income has been calculated using the average shares outstanding during the period.(b) The amount shown for a share outstanding does not correspond with the aggregate realized and unrealized gain (loss) on investments for the period due to the
timing of sales and redemptions of fund shares in relation to fluctuating market values of investments of the Fund.(c) Had certain expenses not been waived/reimbursed during the period, total returns would have been lower.(d) Periods less than one year are not annualized.(e) The investment adviser agreed to waive its fees and/or reimburse a portion of the Fund’s expenses during the period. Without this waiver/reimbursement, expenses
would have been higher.(f) Computed on an annualized basis for periods less than one year.(g) Effective July 1, 2019, the expense limit decreased from 0.80% to 0.75%.(h) Effective July 1, 2017, the expense limit decreased to 0.80%.(i) The variation in the Fund’s turnover rate from 2019 to 2020 was primarily due to a significant repositioning of the portfolio as a result of increased market volatility.
See accompanying notes to financial statements. | 74
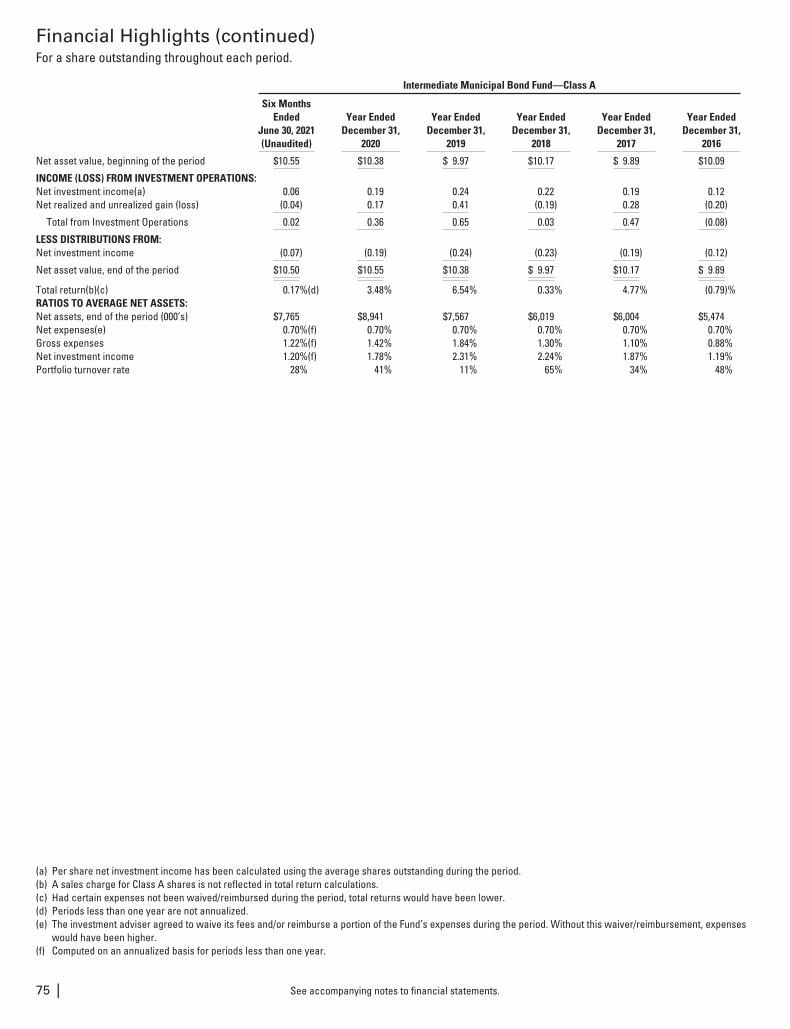
Financial Highlights (continued)For a share outstanding throughout each period.
Intermediate Municipal Bond Fund—Class A
Six MonthsEnded
June 30, 2021(Unaudited)
Year EndedDecember 31,
2020
Year EndedDecember 31,
2019
Year EndedDecember 31,
2018
Year EndedDecember 31,
2017
Year EndedDecember 31,
2016
Net asset value, beginning of the period $10.55 $10.38 $ 9.97 $10.17 $ 9.89 $10.09
INCOME (LOSS) FROM INVESTMENT OPERATIONS:Net investment income(a) 0.06 0.19 0.24 0.22 0.19 0.12Net realized and unrealized gain (loss) (0.04) 0.17 0.41 (0.19) 0.28 (0.20)
Total from Investment Operations 0.02 0.36 0.65 0.03 0.47 (0.08)
LESS DISTRIBUTIONS FROM:Net investment income (0.07) (0.19) (0.24) (0.23) (0.19) (0.12)
Net asset value, end of the period $10.50 $10.55 $10.38 $ 9.97 $10.17 $ 9.89
Total return(b)(c) 0.17%(d) 3.48% 6.54% 0.33% 4.77% (0.79)%RATIOS TO AVERAGE NET ASSETS:Net assets, end of the period (000’s) $7,765 $8,941 $7,567 $6,019 $6,004 $5,474Net expenses(e) 0.70%(f) 0.70% 0.70% 0.70% 0.70% 0.70%Gross expenses 1.22%(f) 1.42% 1.84% 1.30% 1.10% 0.88%Net investment income 1.20%(f) 1.78% 2.31% 2.24% 1.87% 1.19%Portfolio turnover rate 28% 41% 11% 65% 34% 48%
(a) Per share net investment income has been calculated using the average shares outstanding during the period.(b) A sales charge for Class A shares is not reflected in total return calculations.(c) Had certain expenses not been waived/reimbursed during the period, total returns would have been lower.(d) Periods less than one year are not annualized.(e) The investment adviser agreed to waive its fees and/or reimburse a portion of the Fund’s expenses during the period. Without this waiver/reimbursement, expenses
would have been higher.(f) Computed on an annualized basis for periods less than one year.
See accompanying notes to financial statements.75 |

Financial Highlights (continued)For a share outstanding throughout each period.
Intermediate Municipal Bond Fund—Class C
Six MonthsEnded
June 30, 2021(Unaudited)
Year EndedDecember 31,
2020
Year EndedDecember 31,
2019
Year EndedDecember 31,
2018
Year EndedDecember 31,
2017
Year EndedDecember 31,
2016
Net asset value, beginning of the period $10.55 $10.38 $ 9.98 $10.18 $ 9.90 $10.09
INCOME (LOSS) FROM INVESTMENT OPERATIONS:Net investment income(a) 0.02 0.11 0.16 0.15 0.11 0.04Net realized and unrealized gain (loss) (0.04) 0.17 0.40 (0.19) 0.28 (0.18)
Total from Investment Operations (0.02) 0.28 0.56 (0.04) 0.39 (0.14)
LESS DISTRIBUTIONS FROM:Net investment income (0.03) (0.11) (0.16) (0.16) (0.11) (0.05)
Net asset value, end of the period $10.50 $10.55 $10.38 $ 9.98 $10.18 $ 9.90
Total return(b)(c) (0.20)%(d) 2.71% 5.64% (0.42)% 3.98% (1.44)%RATIOS TO AVERAGE NET ASSETS:Net assets, end of the period (000’s) $ 805 $1,050 $1,420 $1,675 $2,395 $4,015Net expenses(e) 1.45%(f) 1.45% 1.45% 1.45% 1.45% 1.45%Gross expenses 1.97%(f) 2.18% 2.60% 2.05% 1.83% 1.63%Net investment income 0.45%(f) 1.08% 1.57% 1.49% 1.10% 0.44%Portfolio turnover rate 28% 41% 11% 65% 34% 48%
(a) Per share net investment income has been calculated using the average shares outstanding during the period.(b) A contingent deferred sales charge for Class C shares is not reflected in total return calculations.(c) Had certain expenses not been waived/reimbursed during the period, total returns would have been lower.(d) Periods less than one year are not annualized.(e) The investment adviser agreed to waive its fees and/or reimburse a portion of the Fund’s expenses during the period. Without this waiver/reimbursement, expenses
would have been higher.(f) Computed on an annualized basis for periods less than one year.
See accompanying notes to financial statements. | 76
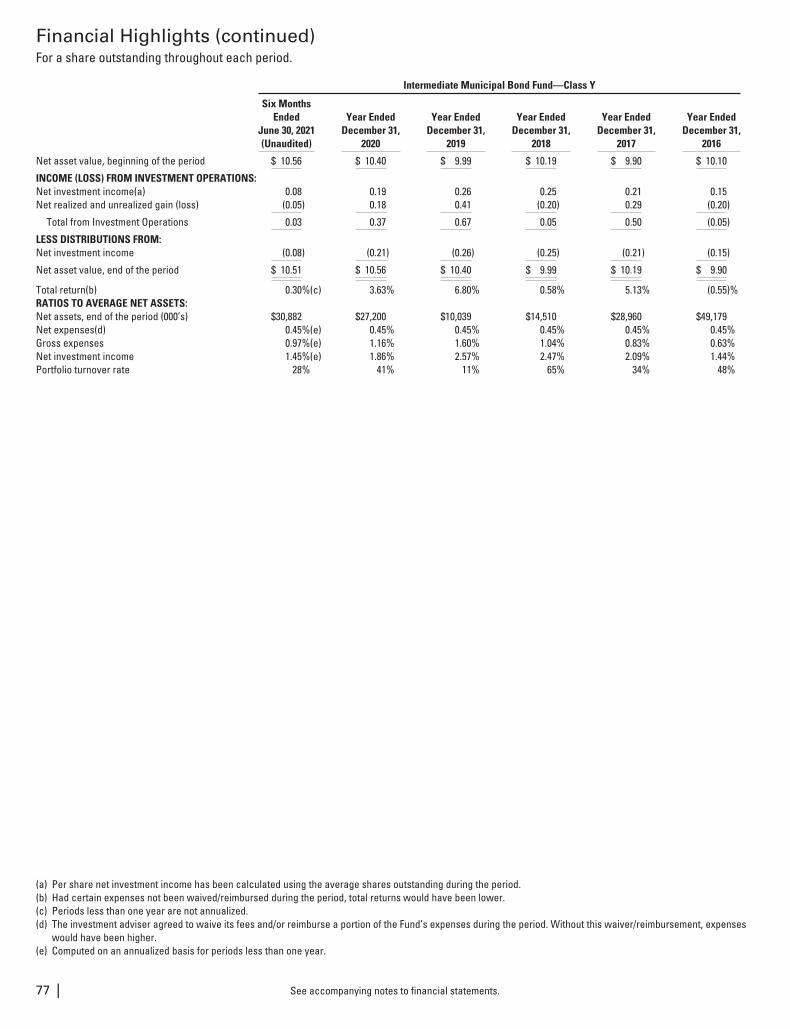
Financial Highlights (continued)For a share outstanding throughout each period.
Intermediate Municipal Bond Fund—Class Y
Six MonthsEnded
June 30, 2021(Unaudited)
Year EndedDecember 31,
2020
Year EndedDecember 31,
2019
Year EndedDecember 31,
2018
Year EndedDecember 31,
2017
Year EndedDecember 31,
2016
Net asset value, beginning of the period $ 10.56 $ 10.40 $ 9.99 $ 10.19 $ 9.90 $ 10.10
INCOME (LOSS) FROM INVESTMENT OPERATIONS:Net investment income(a) 0.08 0.19 0.26 0.25 0.21 0.15Net realized and unrealized gain (loss) (0.05) 0.18 0.41 (0.20) 0.29 (0.20)
Total from Investment Operations 0.03 0.37 0.67 0.05 0.50 (0.05)
LESS DISTRIBUTIONS FROM:Net investment income (0.08) (0.21) (0.26) (0.25) (0.21) (0.15)
Net asset value, end of the period $ 10.51 $ 10.56 $ 10.40 $ 9.99 $ 10.19 $ 9.90
Total return(b) 0.30%(c) 3.63% 6.80% 0.58% 5.13% (0.55)%RATIOS TO AVERAGE NET ASSETS:Net assets, end of the period (000’s) $30,882 $27,200 $10,039 $14,510 $28,960 $49,179Net expenses(d) 0.45%(e) 0.45% 0.45% 0.45% 0.45% 0.45%Gross expenses 0.97%(e) 1.16% 1.60% 1.04% 0.83% 0.63%Net investment income 1.45%(e) 1.86% 2.57% 2.47% 2.09% 1.44%Portfolio turnover rate 28% 41% 11% 65% 34% 48%
(a) Per share net investment income has been calculated using the average shares outstanding during the period.(b) Had certain expenses not been waived/reimbursed during the period, total returns would have been lower.(c) Periods less than one year are not annualized.(d) The investment adviser agreed to waive its fees and/or reimburse a portion of the Fund’s expenses during the period. Without this waiver/reimbursement, expenses
would have been higher.(e) Computed on an annualized basis for periods less than one year.
See accompanying notes to financial statements.77 |
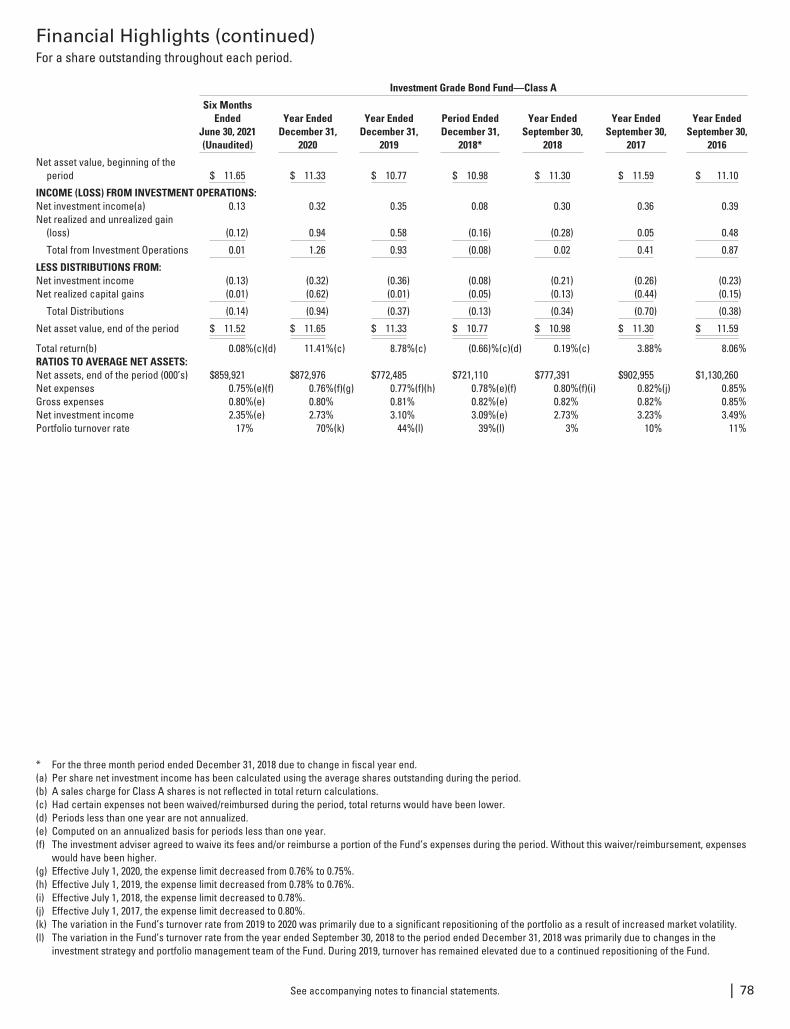
Financial Highlights (continued)For a share outstanding throughout each period.
Investment Grade Bond Fund—Class A
Six MonthsEnded
June 30, 2021(Unaudited)
Year EndedDecember 31,
2020
Year EndedDecember 31,
2019
Period EndedDecember 31,
2018*
Year EndedSeptember 30,
2018
Year EndedSeptember 30,
2017
Year EndedSeptember 30,
2016
Net asset value, beginning of theperiod $ 11.65 $ 11.33 $ 10.77 $ 10.98 $ 11.30 $ 11.59 $ 11.10
INCOME (LOSS) FROM INVESTMENT OPERATIONS:Net investment income(a) 0.13 0.32 0.35 0.08 0.30 0.36 0.39Net realized and unrealized gain
(loss) (0.12) 0.94 0.58 (0.16) (0.28) 0.05 0.48
Total from Investment Operations 0.01 1.26 0.93 (0.08) 0.02 0.41 0.87
LESS DISTRIBUTIONS FROM:Net investment income (0.13) (0.32) (0.36) (0.08) (0.21) (0.26) (0.23)Net realized capital gains (0.01) (0.62) (0.01) (0.05) (0.13) (0.44) (0.15)
Total Distributions (0.14) (0.94) (0.37) (0.13) (0.34) (0.70) (0.38)
Net asset value, end of the period $ 11.52 $ 11.65 $ 11.33 $ 10.77 $ 10.98 $ 11.30 $ 11.59
Total return(b) 0.08%(c)(d) 11.41%(c) 8.78%(c) (0.66)%(c)(d) 0.19%(c) 3.88% 8.06%RATIOS TO AVERAGE NET ASSETS:Net assets, end of the period (000’s) $859,921 $872,976 $772,485 $721,110 $777,391 $902,955 $1,130,260Net expenses 0.75%(e)(f) 0.76%(f)(g) 0.77%(f)(h) 0.78%(e)(f) 0.80%(f)(i) 0.82%(j) 0.85%Gross expenses 0.80%(e) 0.80% 0.81% 0.82%(e) 0.82% 0.82% 0.85%Net investment income 2.35%(e) 2.73% 3.10% 3.09%(e) 2.73% 3.23% 3.49%Portfolio turnover rate 17% 70%(k) 44%(l) 39%(l) 3% 10% 11%
* For the three month period ended December 31, 2018 due to change in fiscal year end.(a) Per share net investment income has been calculated using the average shares outstanding during the period.(b) A sales charge for Class A shares is not reflected in total return calculations.(c) Had certain expenses not been waived/reimbursed during the period, total returns would have been lower.(d) Periods less than one year are not annualized.(e) Computed on an annualized basis for periods less than one year.(f) The investment adviser agreed to waive its fees and/or reimburse a portion of the Fund’s expenses during the period. Without this waiver/reimbursement, expenses
would have been higher.(g) Effective July 1, 2020, the expense limit decreased from 0.76% to 0.75%.(h) Effective July 1, 2019, the expense limit decreased from 0.78% to 0.76%.(i) Effective July 1, 2018, the expense limit decreased to 0.78%.(j) Effective July 1, 2017, the expense limit decreased to 0.80%.(k) The variation in the Fund’s turnover rate from 2019 to 2020 was primarily due to a significant repositioning of the portfolio as a result of increased market volatility.(l) The variation in the Fund’s turnover rate from the year ended September 30, 2018 to the period ended December 31, 2018 was primarily due to changes in the
investment strategy and portfolio management team of the Fund. During 2019, turnover has remained elevated due to a continued repositioning of the Fund.
See accompanying notes to financial statements. | 78
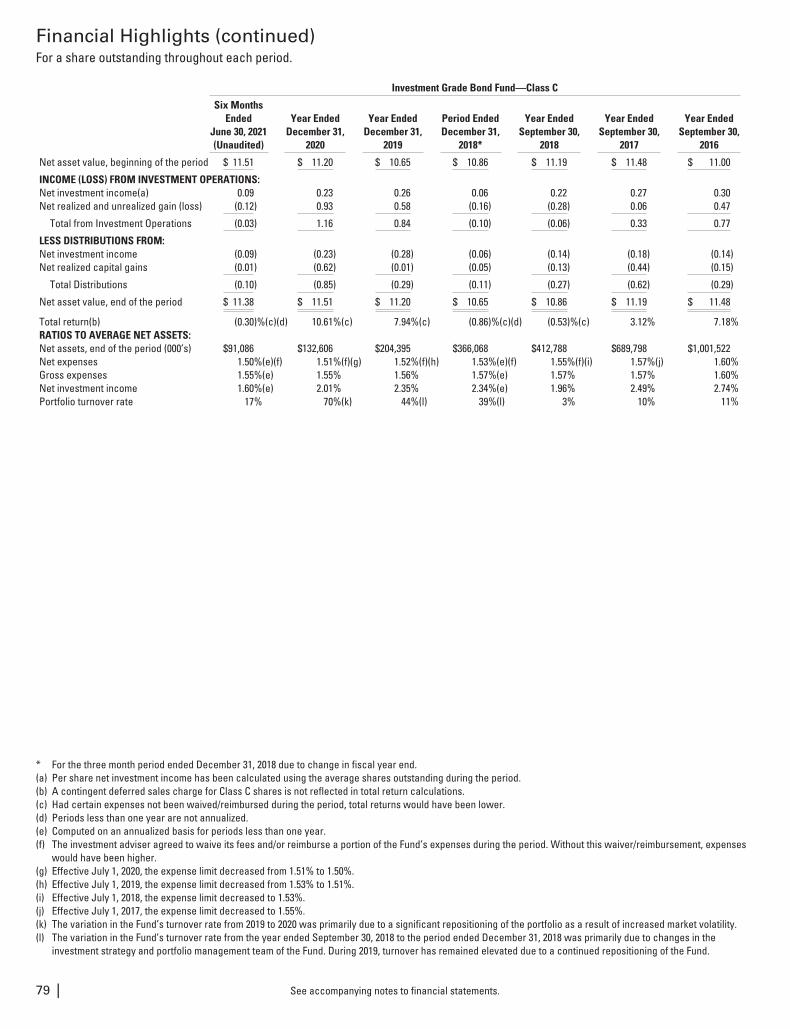
Financial Highlights (continued)For a share outstanding throughout each period.
Investment Grade Bond Fund—Class C
Six MonthsEnded
June 30, 2021(Unaudited)
Year EndedDecember 31,
2020
Year EndedDecember 31,
2019
Period EndedDecember 31,
2018*
Year EndedSeptember 30,
2018
Year EndedSeptember 30,
2017
Year EndedSeptember 30,
2016
Net asset value, beginning of the period $ 11.51 $ 11.20 $ 10.65 $ 10.86 $ 11.19 $ 11.48 $ 11.00
INCOME (LOSS) FROM INVESTMENT OPERATIONS:Net investment income(a) 0.09 0.23 0.26 0.06 0.22 0.27 0.30Net realized and unrealized gain (loss) (0.12) 0.93 0.58 (0.16) (0.28) 0.06 0.47
Total from Investment Operations (0.03) 1.16 0.84 (0.10) (0.06) 0.33 0.77
LESS DISTRIBUTIONS FROM:Net investment income (0.09) (0.23) (0.28) (0.06) (0.14) (0.18) (0.14)Net realized capital gains (0.01) (0.62) (0.01) (0.05) (0.13) (0.44) (0.15)
Total Distributions (0.10) (0.85) (0.29) (0.11) (0.27) (0.62) (0.29)
Net asset value, end of the period $ 11.38 $ 11.51 $ 11.20 $ 10.65 $ 10.86 $ 11.19 $ 11.48
Total return(b) (0.30)%(c)(d) 10.61%(c) 7.94%(c) (0.86)%(c)(d) (0.53)%(c) 3.12% 7.18%RATIOS TO AVERAGE NET ASSETS:Net assets, end of the period (000’s) $91,086 $132,606 $204,395 $366,068 $412,788 $689,798 $1,001,522Net expenses 1.50%(e)(f) 1.51%(f)(g) 1.52%(f)(h) 1.53%(e)(f) 1.55%(f)(i) 1.57%(j) 1.60%Gross expenses 1.55%(e) 1.55% 1.56% 1.57%(e) 1.57% 1.57% 1.60%Net investment income 1.60%(e) 2.01% 2.35% 2.34%(e) 1.96% 2.49% 2.74%Portfolio turnover rate 17% 70%(k) 44%(l) 39%(l) 3% 10% 11%
* For the three month period ended December 31, 2018 due to change in fiscal year end.(a) Per share net investment income has been calculated using the average shares outstanding during the period.(b) A contingent deferred sales charge for Class C shares is not reflected in total return calculations.(c) Had certain expenses not been waived/reimbursed during the period, total returns would have been lower.(d) Periods less than one year are not annualized.(e) Computed on an annualized basis for periods less than one year.(f) The investment adviser agreed to waive its fees and/or reimburse a portion of the Fund’s expenses during the period. Without this waiver/reimbursement, expenses
would have been higher.(g) Effective July 1, 2020, the expense limit decreased from 1.51% to 1.50%.(h) Effective July 1, 2019, the expense limit decreased from 1.53% to 1.51%.(i) Effective July 1, 2018, the expense limit decreased to 1.53%.(j) Effective July 1, 2017, the expense limit decreased to 1.55%.(k) The variation in the Fund’s turnover rate from 2019 to 2020 was primarily due to a significant repositioning of the portfolio as a result of increased market volatility.(l) The variation in the Fund’s turnover rate from the year ended September 30, 2018 to the period ended December 31, 2018 was primarily due to changes in the
investment strategy and portfolio management team of the Fund. During 2019, turnover has remained elevated due to a continued repositioning of the Fund.
See accompanying notes to financial statements.79 |
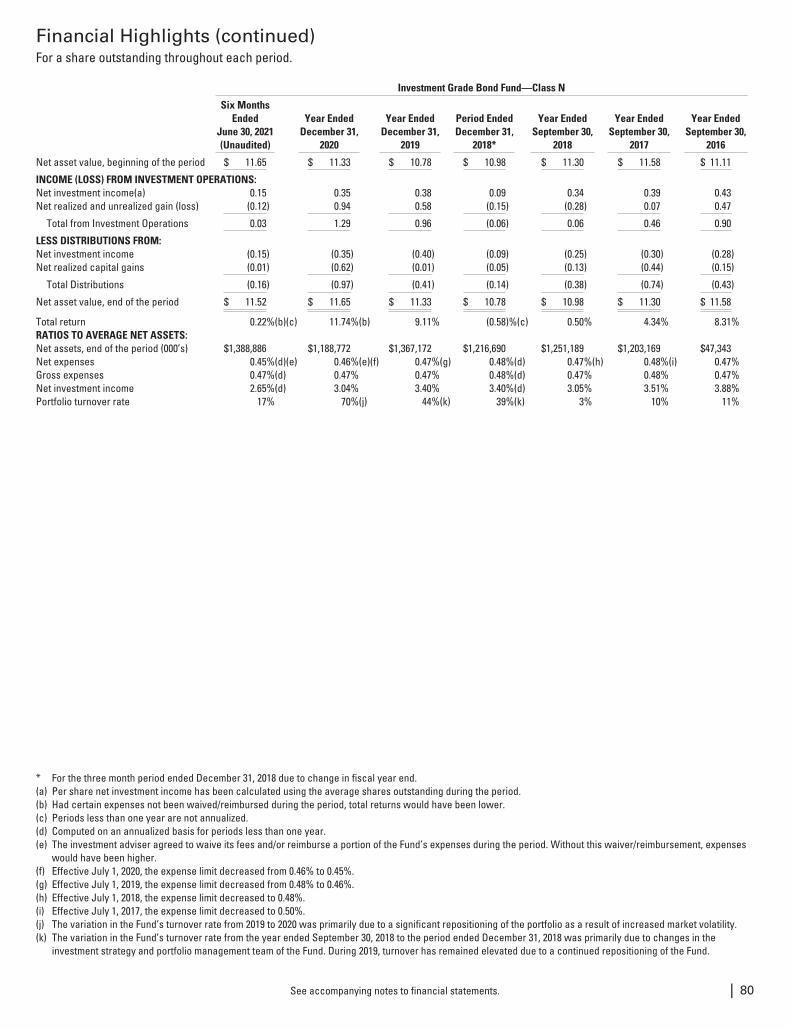
Financial Highlights (continued)For a share outstanding throughout each period.
Investment Grade Bond Fund—Class N
Six MonthsEnded
June 30, 2021(Unaudited)
Year EndedDecember 31,
2020
Year EndedDecember 31,
2019
Period EndedDecember 31,
2018*
Year EndedSeptember 30,
2018
Year EndedSeptember 30,
2017
Year EndedSeptember 30,
2016
Net asset value, beginning of the period $ 11.65 $ 11.33 $ 10.78 $ 10.98 $ 11.30 $ 11.58 $ 11.11
INCOME (LOSS) FROM INVESTMENT OPERATIONS:Net investment income(a) 0.15 0.35 0.38 0.09 0.34 0.39 0.43Net realized and unrealized gain (loss) (0.12) 0.94 0.58 (0.15) (0.28) 0.07 0.47
Total from Investment Operations 0.03 1.29 0.96 (0.06) 0.06 0.46 0.90
LESS DISTRIBUTIONS FROM:Net investment income (0.15) (0.35) (0.40) (0.09) (0.25) (0.30) (0.28)Net realized capital gains (0.01) (0.62) (0.01) (0.05) (0.13) (0.44) (0.15)
Total Distributions (0.16) (0.97) (0.41) (0.14) (0.38) (0.74) (0.43)
Net asset value, end of the period $ 11.52 $ 11.65 $ 11.33 $ 10.78 $ 10.98 $ 11.30 $ 11.58
Total return 0.22%(b)(c) 11.74%(b) 9.11% (0.58)%(c) 0.50% 4.34% 8.31%RATIOS TO AVERAGE NET ASSETS:Net assets, end of the period (000’s) $1,388,886 $1,188,772 $1,367,172 $1,216,690 $1,251,189 $1,203,169 $47,343Net expenses 0.45%(d)(e) 0.46%(e)(f) 0.47%(g) 0.48%(d) 0.47%(h) 0.48%(i) 0.47%Gross expenses 0.47%(d) 0.47% 0.47% 0.48%(d) 0.47% 0.48% 0.47%Net investment income 2.65%(d) 3.04% 3.40% 3.40%(d) 3.05% 3.51% 3.88%Portfolio turnover rate 17% 70%(j) 44%(k) 39%(k) 3% 10% 11%
* For the three month period ended December 31, 2018 due to change in fiscal year end.(a) Per share net investment income has been calculated using the average shares outstanding during the period.(b) Had certain expenses not been waived/reimbursed during the period, total returns would have been lower.(c) Periods less than one year are not annualized.(d) Computed on an annualized basis for periods less than one year.(e) The investment adviser agreed to waive its fees and/or reimburse a portion of the Fund’s expenses during the period. Without this waiver/reimbursement, expenses
would have been higher.(f) Effective July 1, 2020, the expense limit decreased from 0.46% to 0.45%.(g) Effective July 1, 2019, the expense limit decreased from 0.48% to 0.46%.(h) Effective July 1, 2018, the expense limit decreased to 0.48%.(i) Effective July 1, 2017, the expense limit decreased to 0.50%.(j) The variation in the Fund’s turnover rate from 2019 to 2020 was primarily due to a significant repositioning of the portfolio as a result of increased market volatility.(k) The variation in the Fund’s turnover rate from the year ended September 30, 2018 to the period ended December 31, 2018 was primarily due to changes in the
investment strategy and portfolio management team of the Fund. During 2019, turnover has remained elevated due to a continued repositioning of the Fund.
See accompanying notes to financial statements. | 80
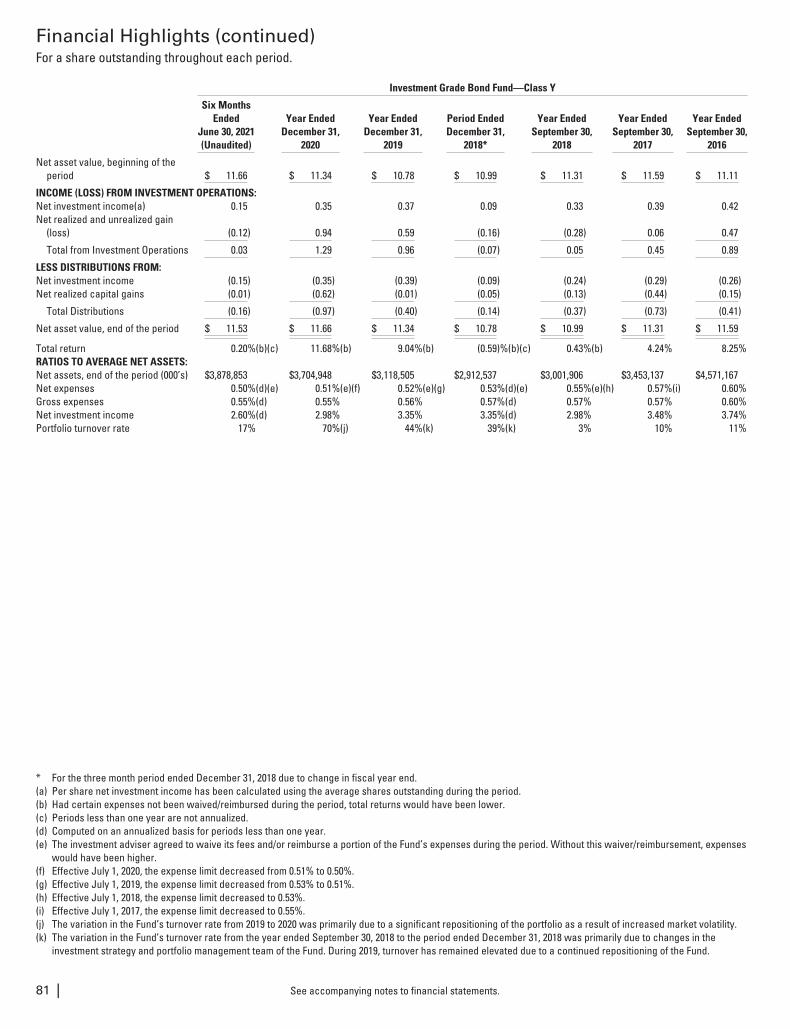
Financial Highlights (continued)For a share outstanding throughout each period.
Investment Grade Bond Fund—Class Y
Six MonthsEnded
June 30, 2021(Unaudited)
Year EndedDecember 31,
2020
Year EndedDecember 31,
2019
Period EndedDecember 31,
2018*
Year EndedSeptember 30,
2018
Year EndedSeptember 30,
2017
Year EndedSeptember 30,
2016
Net asset value, beginning of theperiod $ 11.66 $ 11.34 $ 10.78 $ 10.99 $ 11.31 $ 11.59 $ 11.11
INCOME (LOSS) FROM INVESTMENT OPERATIONS:Net investment income(a) 0.15 0.35 0.37 0.09 0.33 0.39 0.42Net realized and unrealized gain
(loss) (0.12) 0.94 0.59 (0.16) (0.28) 0.06 0.47
Total from Investment Operations 0.03 1.29 0.96 (0.07) 0.05 0.45 0.89
LESS DISTRIBUTIONS FROM:Net investment income (0.15) (0.35) (0.39) (0.09) (0.24) (0.29) (0.26)Net realized capital gains (0.01) (0.62) (0.01) (0.05) (0.13) (0.44) (0.15)
Total Distributions (0.16) (0.97) (0.40) (0.14) (0.37) (0.73) (0.41)
Net asset value, end of the period $ 11.53 $ 11.66 $ 11.34 $ 10.78 $ 10.99 $ 11.31 $ 11.59
Total return 0.20%(b)(c) 11.68%(b) 9.04%(b) (0.59)%(b)(c) 0.43%(b) 4.24% 8.25%RATIOS TO AVERAGE NET ASSETS:Net assets, end of the period (000’s) $3,878,853 $3,704,948 $3,118,505 $2,912,537 $3,001,906 $3,453,137 $4,571,167Net expenses 0.50%(d)(e) 0.51%(e)(f) 0.52%(e)(g) 0.53%(d)(e) 0.55%(e)(h) 0.57%(i) 0.60%Gross expenses 0.55%(d) 0.55% 0.56% 0.57%(d) 0.57% 0.57% 0.60%Net investment income 2.60%(d) 2.98% 3.35% 3.35%(d) 2.98% 3.48% 3.74%Portfolio turnover rate 17% 70%(j) 44%(k) 39%(k) 3% 10% 11%
* For the three month period ended December 31, 2018 due to change in fiscal year end.(a) Per share net investment income has been calculated using the average shares outstanding during the period.(b) Had certain expenses not been waived/reimbursed during the period, total returns would have been lower.(c) Periods less than one year are not annualized.(d) Computed on an annualized basis for periods less than one year.(e) The investment adviser agreed to waive its fees and/or reimburse a portion of the Fund’s expenses during the period. Without this waiver/reimbursement, expenses
would have been higher.(f) Effective July 1, 2020, the expense limit decreased from 0.51% to 0.50%.(g) Effective July 1, 2019, the expense limit decreased from 0.53% to 0.51%.(h) Effective July 1, 2018, the expense limit decreased to 0.53%.(i) Effective July 1, 2017, the expense limit decreased to 0.55%.(j) The variation in the Fund’s turnover rate from 2019 to 2020 was primarily due to a significant repositioning of the portfolio as a result of increased market volatility.(k) The variation in the Fund’s turnover rate from the year ended September 30, 2018 to the period ended December 31, 2018 was primarily due to changes in the
investment strategy and portfolio management team of the Fund. During 2019, turnover has remained elevated due to a continued repositioning of the Fund.
See accompanying notes to financial statements.81 |
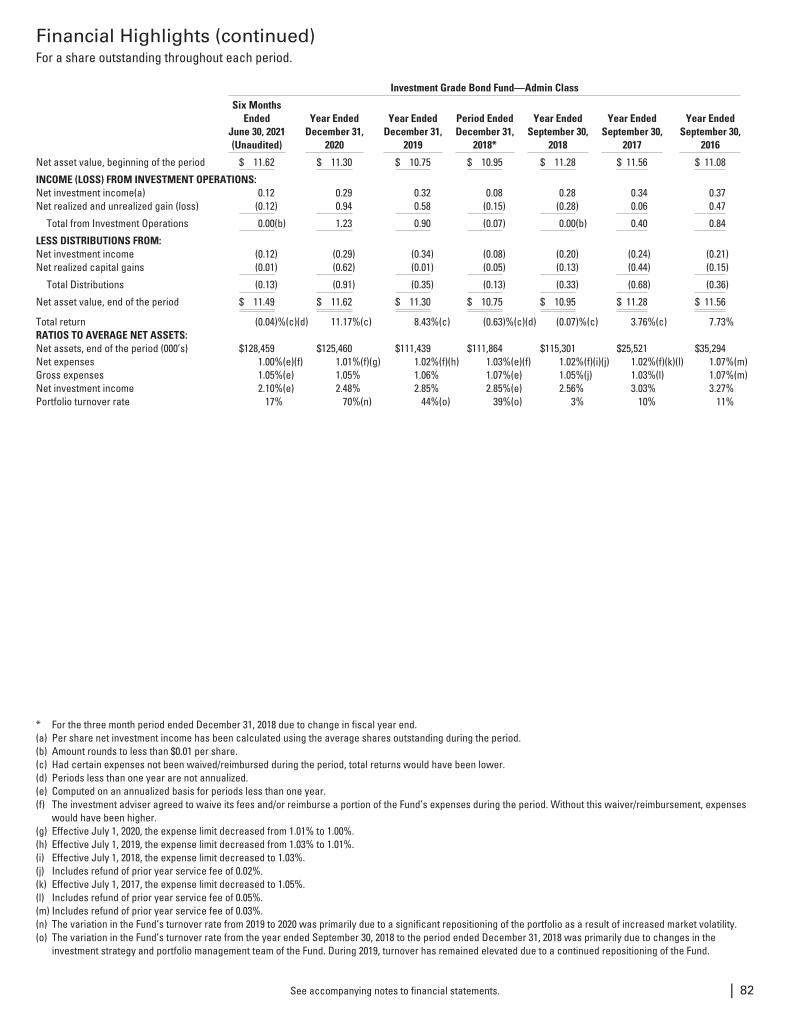
Financial Highlights (continued)For a share outstanding throughout each period.
Investment Grade Bond Fund—Admin Class
Six MonthsEnded
June 30, 2021(Unaudited)
Year EndedDecember 31,
2020
Year EndedDecember 31,
2019
Period EndedDecember 31,
2018*
Year EndedSeptember 30,
2018
Year EndedSeptember 30,
2017
Year EndedSeptember 30,
2016
Net asset value, beginning of the period $ 11.62 $ 11.30 $ 10.75 $ 10.95 $ 11.28 $ 11.56 $ 11.08
INCOME (LOSS) FROM INVESTMENT OPERATIONS:Net investment income(a) 0.12 0.29 0.32 0.08 0.28 0.34 0.37Net realized and unrealized gain (loss) (0.12) 0.94 0.58 (0.15) (0.28) 0.06 0.47
Total from Investment Operations 0.00(b) 1.23 0.90 (0.07) 0.00(b) 0.40 0.84
LESS DISTRIBUTIONS FROM:Net investment income (0.12) (0.29) (0.34) (0.08) (0.20) (0.24) (0.21)Net realized capital gains (0.01) (0.62) (0.01) (0.05) (0.13) (0.44) (0.15)
Total Distributions (0.13) (0.91) (0.35) (0.13) (0.33) (0.68) (0.36)
Net asset value, end of the period $ 11.49 $ 11.62 $ 11.30 $ 10.75 $ 10.95 $ 11.28 $ 11.56
Total return (0.04)%(c)(d) 11.17%(c) 8.43%(c) (0.63)%(c)(d) (0.07)%(c) 3.76%(c) 7.73%RATIOS TO AVERAGE NET ASSETS:Net assets, end of the period (000’s) $128,459 $125,460 $111,439 $111,864 $115,301 $25,521 $35,294Net expenses 1.00%(e)(f) 1.01%(f)(g) 1.02%(f)(h) 1.03%(e)(f) 1.02%(f)(i)(j) 1.02%(f)(k)(l) 1.07%(m)Gross expenses 1.05%(e) 1.05% 1.06% 1.07%(e) 1.05%(j) 1.03%(l) 1.07%(m)Net investment income 2.10%(e) 2.48% 2.85% 2.85%(e) 2.56% 3.03% 3.27%Portfolio turnover rate 17% 70%(n) 44%(o) 39%(o) 3% 10% 11%
* For the three month period ended December 31, 2018 due to change in fiscal year end.(a) Per share net investment income has been calculated using the average shares outstanding during the period.(b) Amount rounds to less than $0.01 per share.(c) Had certain expenses not been waived/reimbursed during the period, total returns would have been lower.(d) Periods less than one year are not annualized.(e) Computed on an annualized basis for periods less than one year.(f) The investment adviser agreed to waive its fees and/or reimburse a portion of the Fund’s expenses during the period. Without this waiver/reimbursement, expenses
would have been higher.(g) Effective July 1, 2020, the expense limit decreased from 1.01% to 1.00%.(h) Effective July 1, 2019, the expense limit decreased from 1.03% to 1.01%.(i) Effective July 1, 2018, the expense limit decreased to 1.03%.(j) Includes refund of prior year service fee of 0.02%.(k) Effective July 1, 2017, the expense limit decreased to 1.05%.(l) Includes refund of prior year service fee of 0.05%.(m) Includes refund of prior year service fee of 0.03%.(n) The variation in the Fund’s turnover rate from 2019 to 2020 was primarily due to a significant repositioning of the portfolio as a result of increased market volatility.(o) The variation in the Fund’s turnover rate from the year ended September 30, 2018 to the period ended December 31, 2018 was primarily due to changes in the
investment strategy and portfolio management team of the Fund. During 2019, turnover has remained elevated due to a continued repositioning of the Fund.
See accompanying notes to financial statements. | 82
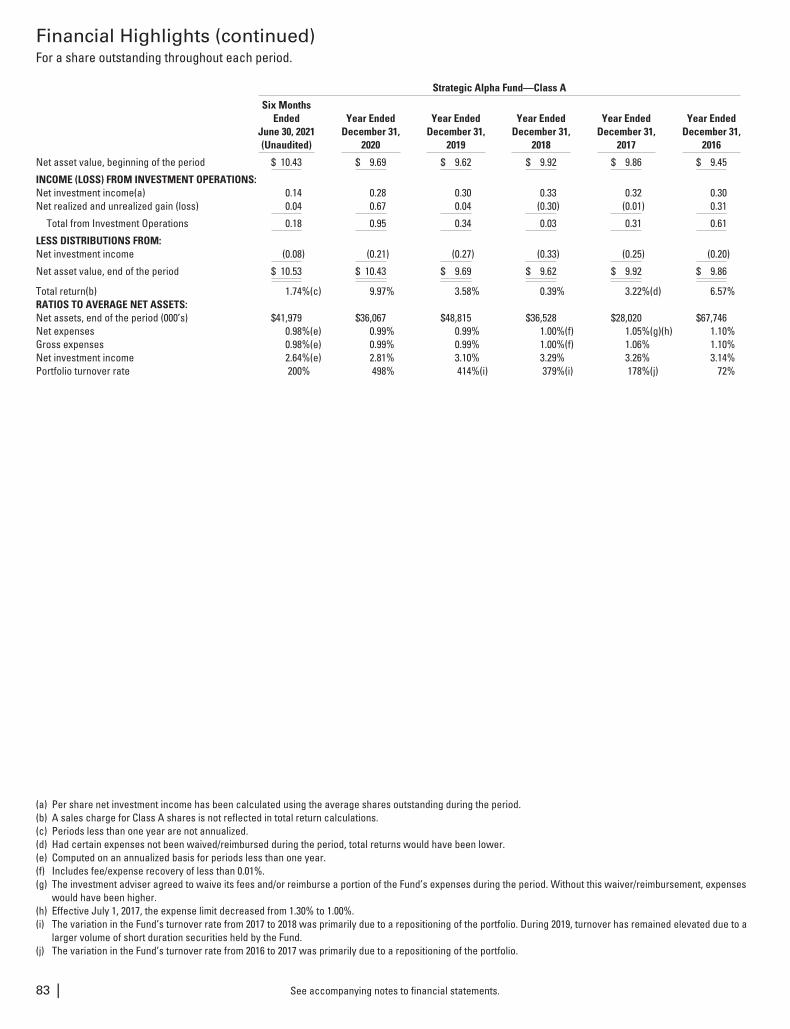
Financial Highlights (continued)For a share outstanding throughout each period.
Strategic Alpha Fund—Class A
Six MonthsEnded
June 30, 2021(Unaudited)
Year EndedDecember 31,
2020
Year EndedDecember 31,
2019
Year EndedDecember 31,
2018
Year EndedDecember 31,
2017
Year EndedDecember 31,
2016
Net asset value, beginning of the period $ 10.43 $ 9.69 $ 9.62 $ 9.92 $ 9.86 $ 9.45
INCOME (LOSS) FROM INVESTMENT OPERATIONS:Net investment income(a) 0.14 0.28 0.30 0.33 0.32 0.30Net realized and unrealized gain (loss) 0.04 0.67 0.04 (0.30) (0.01) 0.31
Total from Investment Operations 0.18 0.95 0.34 0.03 0.31 0.61
LESS DISTRIBUTIONS FROM:Net investment income (0.08) (0.21) (0.27) (0.33) (0.25) (0.20)
Net asset value, end of the period $ 10.53 $ 10.43 $ 9.69 $ 9.62 $ 9.92 $ 9.86
Total return(b) 1.74%(c) 9.97% 3.58% 0.39% 3.22%(d) 6.57%RATIOS TO AVERAGE NET ASSETS:Net assets, end of the period (000’s) $41,979 $36,067 $48,815 $36,528 $28,020 $67,746Net expenses 0.98%(e) 0.99% 0.99% 1.00%(f) 1.05%(g)(h) 1.10%Gross expenses 0.98%(e) 0.99% 0.99% 1.00%(f) 1.06% 1.10%Net investment income 2.64%(e) 2.81% 3.10% 3.29% 3.26% 3.14%Portfolio turnover rate 200% 498% 414%(i) 379%(i) 178%(j) 72%
(a) Per share net investment income has been calculated using the average shares outstanding during the period.(b) A sales charge for Class A shares is not reflected in total return calculations.(c) Periods less than one year are not annualized.(d) Had certain expenses not been waived/reimbursed during the period, total returns would have been lower.(e) Computed on an annualized basis for periods less than one year.(f) Includes fee/expense recovery of less than 0.01%.(g) The investment adviser agreed to waive its fees and/or reimburse a portion of the Fund’s expenses during the period. Without this waiver/reimbursement, expenses
would have been higher.(h) Effective July 1, 2017, the expense limit decreased from 1.30% to 1.00%.(i) The variation in the Fund’s turnover rate from 2017 to 2018 was primarily due to a repositioning of the portfolio. During 2019, turnover has remained elevated due to a
larger volume of short duration securities held by the Fund.(j) The variation in the Fund’s turnover rate from 2016 to 2017 was primarily due to a repositioning of the portfolio.
See accompanying notes to financial statements.83 |
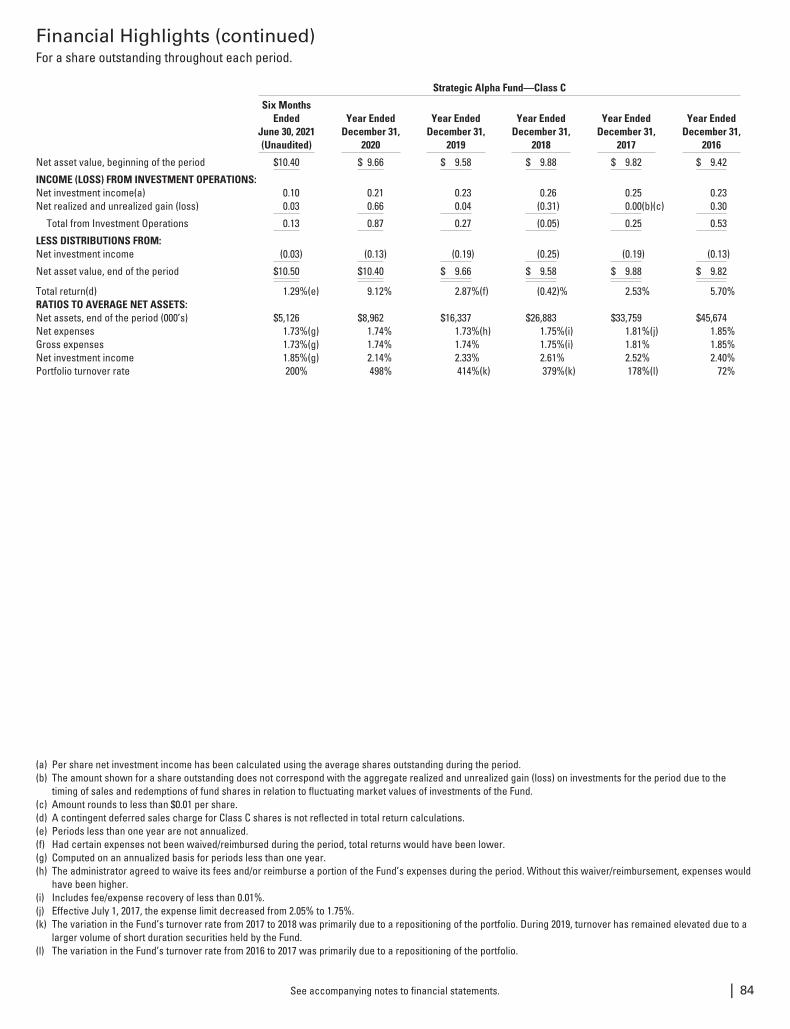
Financial Highlights (continued)For a share outstanding throughout each period.
Strategic Alpha Fund—Class C
Six MonthsEnded
June 30, 2021(Unaudited)
Year EndedDecember 31,
2020
Year EndedDecember 31,
2019
Year EndedDecember 31,
2018
Year EndedDecember 31,
2017
Year EndedDecember 31,
2016
Net asset value, beginning of the period $10.40 $ 9.66 $ 9.58 $ 9.88 $ 9.82 $ 9.42
INCOME (LOSS) FROM INVESTMENT OPERATIONS:Net investment income(a) 0.10 0.21 0.23 0.26 0.25 0.23Net realized and unrealized gain (loss) 0.03 0.66 0.04 (0.31) 0.00(b)(c) 0.30
Total from Investment Operations 0.13 0.87 0.27 (0.05) 0.25 0.53
LESS DISTRIBUTIONS FROM:Net investment income (0.03) (0.13) (0.19) (0.25) (0.19) (0.13)
Net asset value, end of the period $10.50 $10.40 $ 9.66 $ 9.58 $ 9.88 $ 9.82
Total return(d) 1.29%(e) 9.12% 2.87%(f) (0.42)% 2.53% 5.70%RATIOS TO AVERAGE NET ASSETS:Net assets, end of the period (000’s) $5,126 $8,962 $16,337 $26,883 $33,759 $45,674Net expenses 1.73%(g) 1.74% 1.73%(h) 1.75%(i) 1.81%(j) 1.85%Gross expenses 1.73%(g) 1.74% 1.74% 1.75%(i) 1.81% 1.85%Net investment income 1.85%(g) 2.14% 2.33% 2.61% 2.52% 2.40%Portfolio turnover rate 200% 498% 414%(k) 379%(k) 178%(l) 72%
(a) Per share net investment income has been calculated using the average shares outstanding during the period.(b) The amount shown for a share outstanding does not correspond with the aggregate realized and unrealized gain (loss) on investments for the period due to the
timing of sales and redemptions of fund shares in relation to fluctuating market values of investments of the Fund.(c) Amount rounds to less than $0.01 per share.(d) A contingent deferred sales charge for Class C shares is not reflected in total return calculations.(e) Periods less than one year are not annualized.(f) Had certain expenses not been waived/reimbursed during the period, total returns would have been lower.(g) Computed on an annualized basis for periods less than one year.(h) The administrator agreed to waive its fees and/or reimburse a portion of the Fund’s expenses during the period. Without this waiver/reimbursement, expenses would
have been higher.(i) Includes fee/expense recovery of less than 0.01%.(j) Effective July 1, 2017, the expense limit decreased from 2.05% to 1.75%.(k) The variation in the Fund’s turnover rate from 2017 to 2018 was primarily due to a repositioning of the portfolio. During 2019, turnover has remained elevated due to a
larger volume of short duration securities held by the Fund.(l) The variation in the Fund’s turnover rate from 2016 to 2017 was primarily due to a repositioning of the portfolio.
See accompanying notes to financial statements. | 84
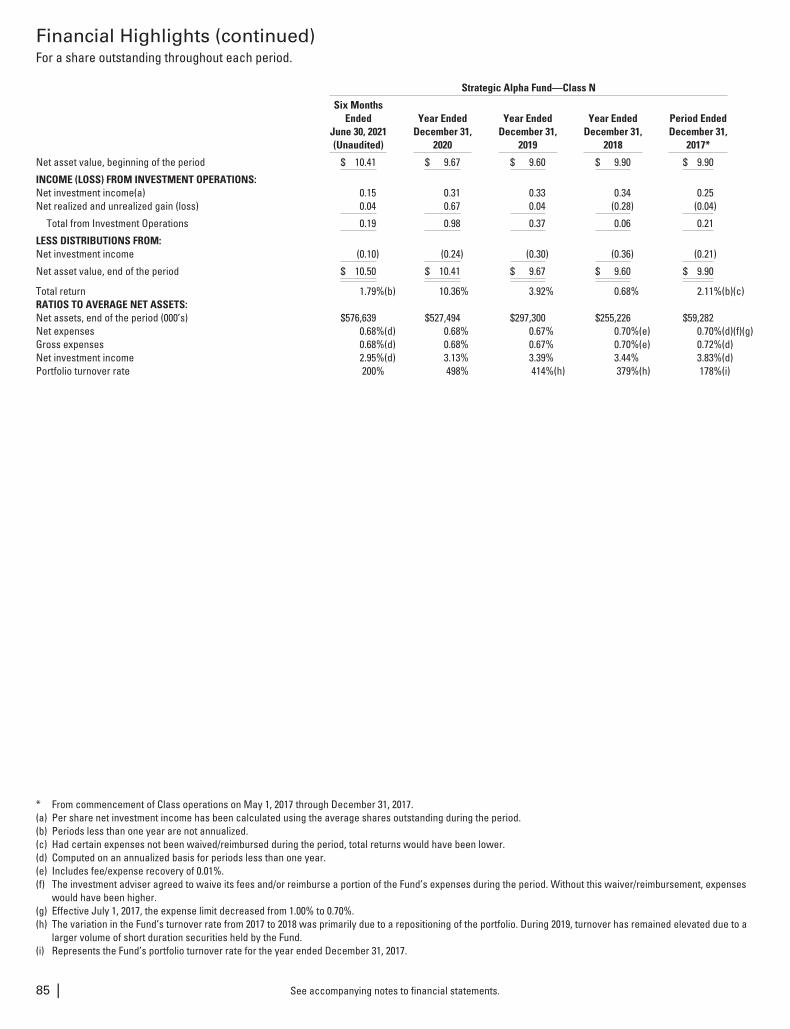
Financial Highlights (continued)For a share outstanding throughout each period.
Strategic Alpha Fund—Class N
Six MonthsEnded
June 30, 2021(Unaudited)
Year EndedDecember 31,
2020
Year EndedDecember 31,
2019
Year EndedDecember 31,
2018
Period EndedDecember 31,
2017*
Net asset value, beginning of the period $ 10.41 $ 9.67 $ 9.60 $ 9.90 $ 9.90
INCOME (LOSS) FROM INVESTMENT OPERATIONS:Net investment income(a) 0.15 0.31 0.33 0.34 0.25Net realized and unrealized gain (loss) 0.04 0.67 0.04 (0.28) (0.04)
Total from Investment Operations 0.19 0.98 0.37 0.06 0.21
LESS DISTRIBUTIONS FROM:Net investment income (0.10) (0.24) (0.30) (0.36) (0.21)
Net asset value, end of the period $ 10.50 $ 10.41 $ 9.67 $ 9.60 $ 9.90
Total return 1.79%(b) 10.36% 3.92% 0.68% 2.11%(b)(c)RATIOS TO AVERAGE NET ASSETS:Net assets, end of the period (000’s) $576,639 $527,494 $297,300 $255,226 $59,282Net expenses 0.68%(d) 0.68% 0.67% 0.70%(e) 0.70%(d)(f)(g)Gross expenses 0.68%(d) 0.68% 0.67% 0.70%(e) 0.72%(d)Net investment income 2.95%(d) 3.13% 3.39% 3.44% 3.83%(d)Portfolio turnover rate 200% 498% 414%(h) 379%(h) 178%(i)
* From commencement of Class operations on May 1, 2017 through December 31, 2017.(a) Per share net investment income has been calculated using the average shares outstanding during the period.(b) Periods less than one year are not annualized.(c) Had certain expenses not been waived/reimbursed during the period, total returns would have been lower.(d) Computed on an annualized basis for periods less than one year.(e) Includes fee/expense recovery of 0.01%.(f) The investment adviser agreed to waive its fees and/or reimburse a portion of the Fund’s expenses during the period. Without this waiver/reimbursement, expenses
would have been higher.(g) Effective July 1, 2017, the expense limit decreased from 1.00% to 0.70%.(h) The variation in the Fund’s turnover rate from 2017 to 2018 was primarily due to a repositioning of the portfolio. During 2019, turnover has remained elevated due to a
larger volume of short duration securities held by the Fund.(i) Represents the Fund’s portfolio turnover rate for the year ended December 31, 2017.
See accompanying notes to financial statements.85 |
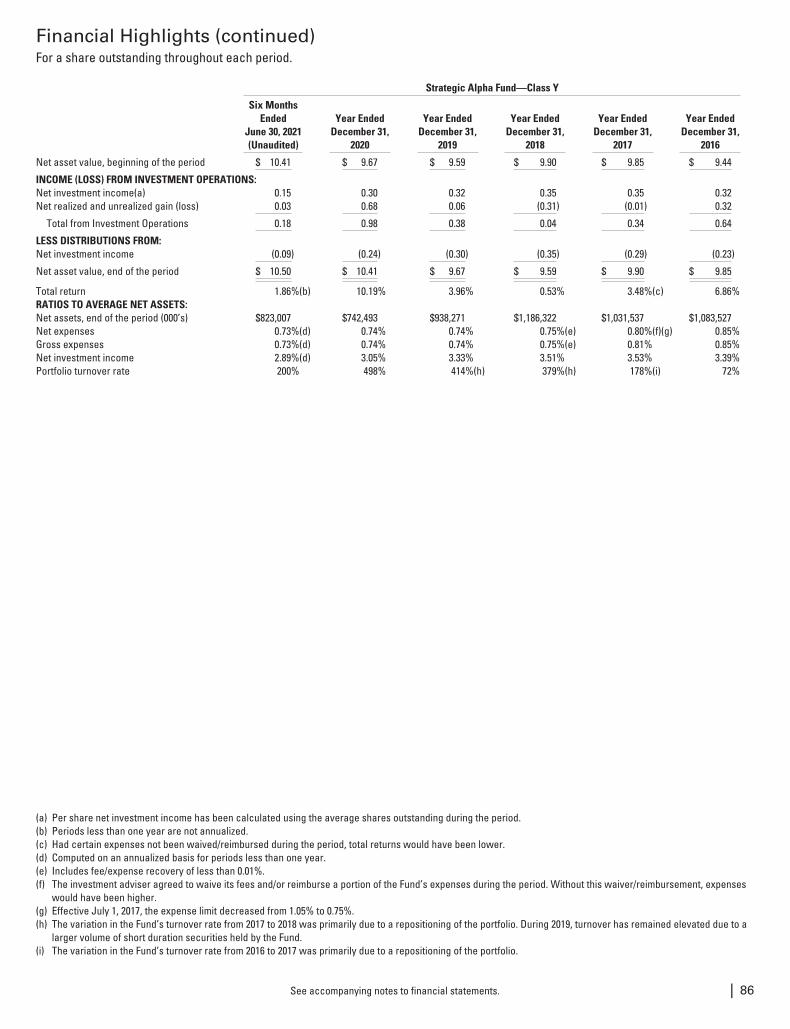
Financial Highlights (continued)For a share outstanding throughout each period.
Strategic Alpha Fund—Class Y
Six MonthsEnded
June 30, 2021(Unaudited)
Year EndedDecember 31,
2020
Year EndedDecember 31,
2019
Year EndedDecember 31,
2018
Year EndedDecember 31,
2017
Year EndedDecember 31,
2016
Net asset value, beginning of the period $ 10.41 $ 9.67 $ 9.59 $ 9.90 $ 9.85 $ 9.44
INCOME (LOSS) FROM INVESTMENT OPERATIONS:Net investment income(a) 0.15 0.30 0.32 0.35 0.35 0.32Net realized and unrealized gain (loss) 0.03 0.68 0.06 (0.31) (0.01) 0.32
Total from Investment Operations 0.18 0.98 0.38 0.04 0.34 0.64
LESS DISTRIBUTIONS FROM:Net investment income (0.09) (0.24) (0.30) (0.35) (0.29) (0.23)
Net asset value, end of the period $ 10.50 $ 10.41 $ 9.67 $ 9.59 $ 9.90 $ 9.85
Total return 1.86%(b) 10.19% 3.96% 0.53% 3.48%(c) 6.86%RATIOS TO AVERAGE NET ASSETS:Net assets, end of the period (000’s) $823,007 $742,493 $938,271 $1,186,322 $1,031,537 $1,083,527Net expenses 0.73%(d) 0.74% 0.74% 0.75%(e) 0.80%(f)(g) 0.85%Gross expenses 0.73%(d) 0.74% 0.74% 0.75%(e) 0.81% 0.85%Net investment income 2.89%(d) 3.05% 3.33% 3.51% 3.53% 3.39%Portfolio turnover rate 200% 498% 414%(h) 379%(h) 178%(i) 72%
(a) Per share net investment income has been calculated using the average shares outstanding during the period.(b) Periods less than one year are not annualized.(c) Had certain expenses not been waived/reimbursed during the period, total returns would have been lower.(d) Computed on an annualized basis for periods less than one year.(e) Includes fee/expense recovery of less than 0.01%.(f) The investment adviser agreed to waive its fees and/or reimburse a portion of the Fund’s expenses during the period. Without this waiver/reimbursement, expenses
would have been higher.(g) Effective July 1, 2017, the expense limit decreased from 1.05% to 0.75%.(h) The variation in the Fund’s turnover rate from 2017 to 2018 was primarily due to a repositioning of the portfolio. During 2019, turnover has remained elevated due to a
larger volume of short duration securities held by the Fund.(i) The variation in the Fund’s turnover rate from 2016 to 2017 was primarily due to a repositioning of the portfolio.
See accompanying notes to financial statements. | 86
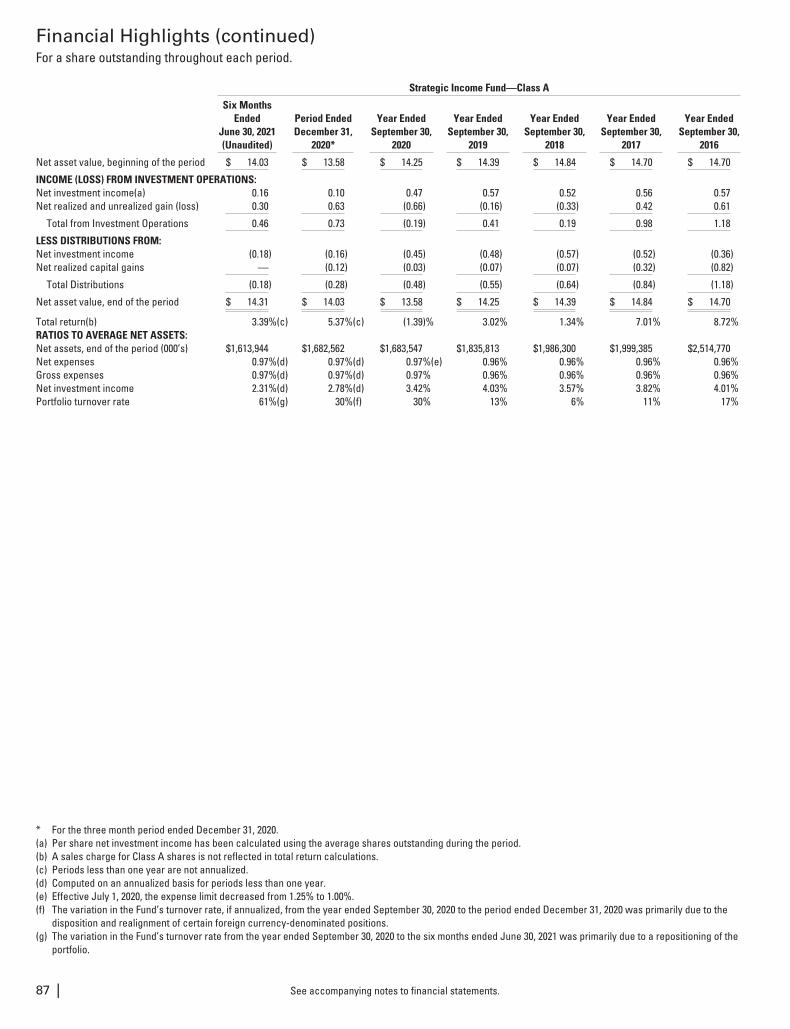
Financial Highlights (continued)For a share outstanding throughout each period.
Strategic Income Fund—Class A
Six MonthsEnded
June 30, 2021(Unaudited)
Period EndedDecember 31,
2020*
Year EndedSeptember 30,
2020
Year EndedSeptember 30,
2019
Year EndedSeptember 30,
2018
Year EndedSeptember 30,
2017
Year EndedSeptember 30,
2016
Net asset value, beginning of the period $ 14.03 $ 13.58 $ 14.25 $ 14.39 $ 14.84 $ 14.70 $ 14.70
INCOME (LOSS) FROM INVESTMENT OPERATIONS:Net investment income(a) 0.16 0.10 0.47 0.57 0.52 0.56 0.57Net realized and unrealized gain (loss) 0.30 0.63 (0.66) (0.16) (0.33) 0.42 0.61
Total from Investment Operations 0.46 0.73 (0.19) 0.41 0.19 0.98 1.18
LESS DISTRIBUTIONS FROM:Net investment income (0.18) (0.16) (0.45) (0.48) (0.57) (0.52) (0.36)Net realized capital gains — (0.12) (0.03) (0.07) (0.07) (0.32) (0.82)
Total Distributions (0.18) (0.28) (0.48) (0.55) (0.64) (0.84) (1.18)
Net asset value, end of the period $ 14.31 $ 14.03 $ 13.58 $ 14.25 $ 14.39 $ 14.84 $ 14.70
Total return(b) 3.39%(c) 5.37%(c) (1.39)% 3.02% 1.34% 7.01% 8.72%RATIOS TO AVERAGE NET ASSETS:Net assets, end of the period (000’s) $1,613,944 $1,682,562 $1,683,547 $1,835,813 $1,986,300 $1,999,385 $2,514,770Net expenses 0.97%(d) 0.97%(d) 0.97%(e) 0.96% 0.96% 0.96% 0.96%Gross expenses 0.97%(d) 0.97%(d) 0.97% 0.96% 0.96% 0.96% 0.96%Net investment income 2.31%(d) 2.78%(d) 3.42% 4.03% 3.57% 3.82% 4.01%Portfolio turnover rate 61%(g) 30%(f) 30% 13% 6% 11% 17%
* For the three month period ended December 31, 2020.(a) Per share net investment income has been calculated using the average shares outstanding during the period.(b) A sales charge for Class A shares is not reflected in total return calculations.(c) Periods less than one year are not annualized.(d) Computed on an annualized basis for periods less than one year.(e) Effective July 1, 2020, the expense limit decreased from 1.25% to 1.00%.(f) The variation in the Fund’s turnover rate, if annualized, from the year ended September 30, 2020 to the period ended December 31, 2020 was primarily due to the
disposition and realignment of certain foreign currency-denominated positions.(g) The variation in the Fund’s turnover rate from the year ended September 30, 2020 to the six months ended June 30, 2021 was primarily due to a repositioning of the
portfolio.
See accompanying notes to financial statements.87 |
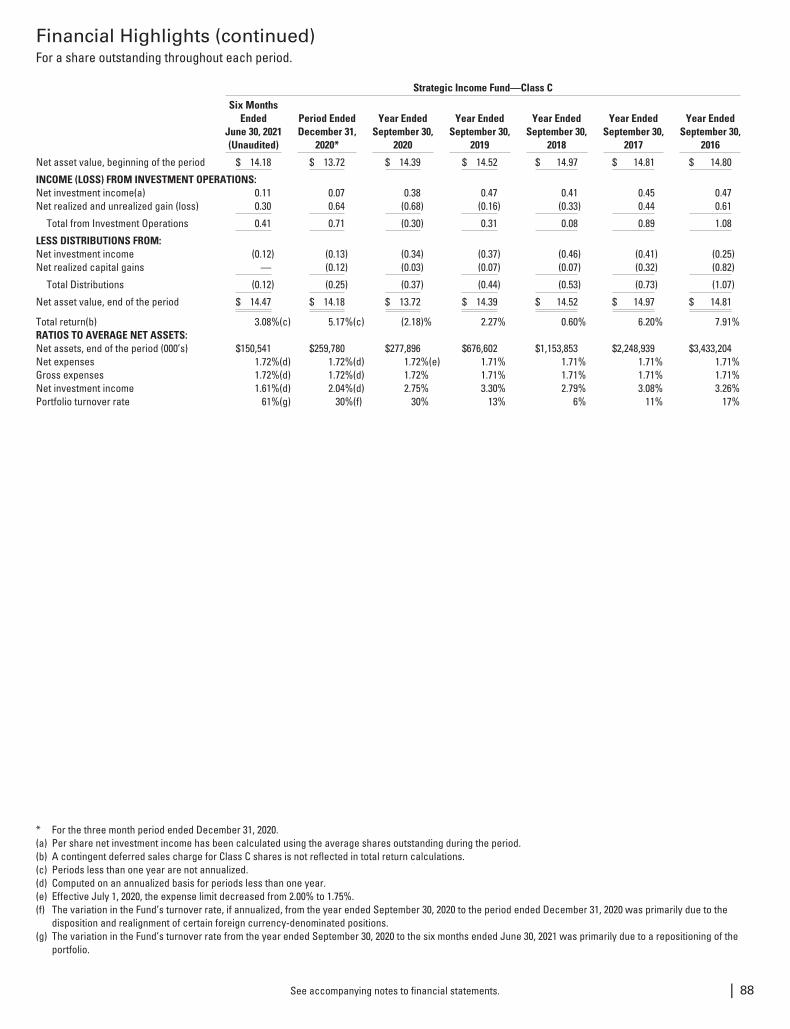
Financial Highlights (continued)For a share outstanding throughout each period.
Strategic Income Fund—Class C
Six MonthsEnded
June 30, 2021(Unaudited)
Period EndedDecember 31,
2020*
Year EndedSeptember 30,
2020
Year EndedSeptember 30,
2019
Year EndedSeptember 30,
2018
Year EndedSeptember 30,
2017
Year EndedSeptember 30,
2016
Net asset value, beginning of the period $ 14.18 $ 13.72 $ 14.39 $ 14.52 $ 14.97 $ 14.81 $ 14.80
INCOME (LOSS) FROM INVESTMENT OPERATIONS:Net investment income(a) 0.11 0.07 0.38 0.47 0.41 0.45 0.47Net realized and unrealized gain (loss) 0.30 0.64 (0.68) (0.16) (0.33) 0.44 0.61
Total from Investment Operations 0.41 0.71 (0.30) 0.31 0.08 0.89 1.08
LESS DISTRIBUTIONS FROM:Net investment income (0.12) (0.13) (0.34) (0.37) (0.46) (0.41) (0.25)Net realized capital gains — (0.12) (0.03) (0.07) (0.07) (0.32) (0.82)
Total Distributions (0.12) (0.25) (0.37) (0.44) (0.53) (0.73) (1.07)
Net asset value, end of the period $ 14.47 $ 14.18 $ 13.72 $ 14.39 $ 14.52 $ 14.97 $ 14.81
Total return(b) 3.08%(c) 5.17%(c) (2.18)% 2.27% 0.60% 6.20% 7.91%RATIOS TO AVERAGE NET ASSETS:Net assets, end of the period (000’s) $150,541 $259,780 $277,896 $676,602 $1,153,853 $2,248,939 $3,433,204Net expenses 1.72%(d) 1.72%(d) 1.72%(e) 1.71% 1.71% 1.71% 1.71%Gross expenses 1.72%(d) 1.72%(d) 1.72% 1.71% 1.71% 1.71% 1.71%Net investment income 1.61%(d) 2.04%(d) 2.75% 3.30% 2.79% 3.08% 3.26%Portfolio turnover rate 61%(g) 30%(f) 30% 13% 6% 11% 17%
* For the three month period ended December 31, 2020.(a) Per share net investment income has been calculated using the average shares outstanding during the period.(b) A contingent deferred sales charge for Class C shares is not reflected in total return calculations.(c) Periods less than one year are not annualized.(d) Computed on an annualized basis for periods less than one year.(e) Effective July 1, 2020, the expense limit decreased from 2.00% to 1.75%.(f) The variation in the Fund’s turnover rate, if annualized, from the year ended September 30, 2020 to the period ended December 31, 2020 was primarily due to the
disposition and realignment of certain foreign currency-denominated positions.(g) The variation in the Fund’s turnover rate from the year ended September 30, 2020 to the six months ended June 30, 2021 was primarily due to a repositioning of the
portfolio.
See accompanying notes to financial statements. | 88
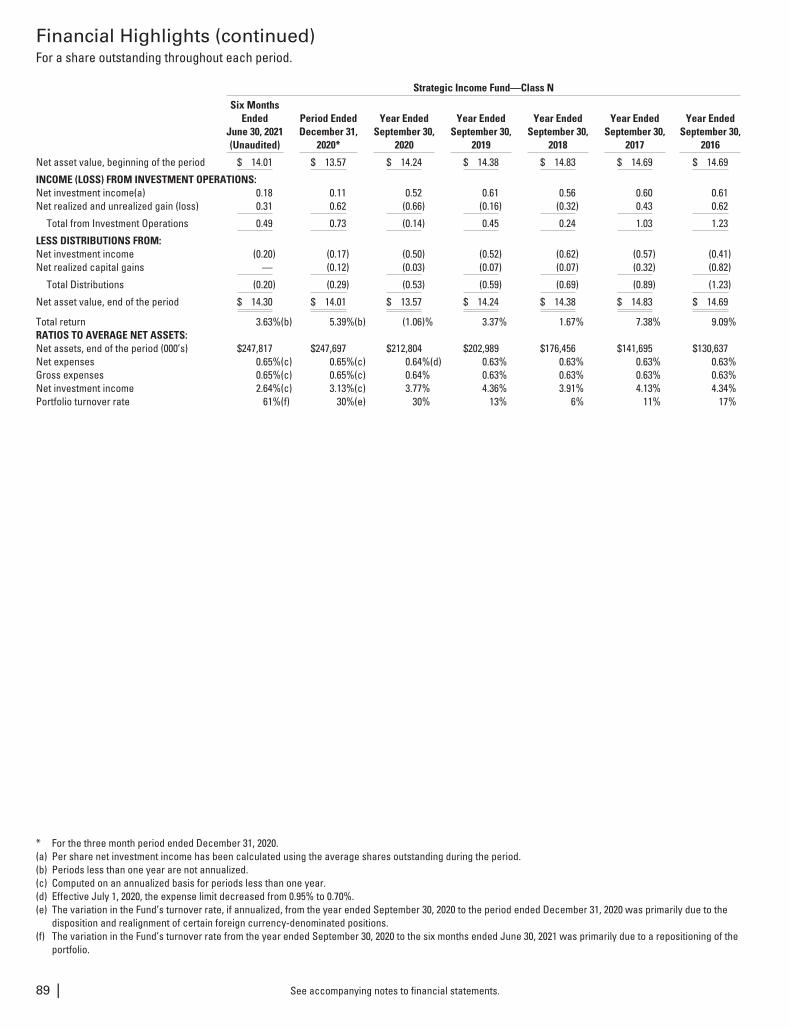
Financial Highlights (continued)For a share outstanding throughout each period.
Strategic Income Fund—Class N
Six MonthsEnded
June 30, 2021(Unaudited)
Period EndedDecember 31,
2020*
Year EndedSeptember 30,
2020
Year EndedSeptember 30,
2019
Year EndedSeptember 30,
2018
Year EndedSeptember 30,
2017
Year EndedSeptember 30,
2016
Net asset value, beginning of the period $ 14.01 $ 13.57 $ 14.24 $ 14.38 $ 14.83 $ 14.69 $ 14.69
INCOME (LOSS) FROM INVESTMENT OPERATIONS:Net investment income(a) 0.18 0.11 0.52 0.61 0.56 0.60 0.61Net realized and unrealized gain (loss) 0.31 0.62 (0.66) (0.16) (0.32) 0.43 0.62
Total from Investment Operations 0.49 0.73 (0.14) 0.45 0.24 1.03 1.23
LESS DISTRIBUTIONS FROM:Net investment income (0.20) (0.17) (0.50) (0.52) (0.62) (0.57) (0.41)Net realized capital gains — (0.12) (0.03) (0.07) (0.07) (0.32) (0.82)
Total Distributions (0.20) (0.29) (0.53) (0.59) (0.69) (0.89) (1.23)
Net asset value, end of the period $ 14.30 $ 14.01 $ 13.57 $ 14.24 $ 14.38 $ 14.83 $ 14.69
Total return 3.63%(b) 5.39%(b) (1.06)% 3.37% 1.67% 7.38% 9.09%RATIOS TO AVERAGE NET ASSETS:Net assets, end of the period (000’s) $247,817 $247,697 $212,804 $202,989 $176,456 $141,695 $130,637Net expenses 0.65%(c) 0.65%(c) 0.64%(d) 0.63% 0.63% 0.63% 0.63%Gross expenses 0.65%(c) 0.65%(c) 0.64% 0.63% 0.63% 0.63% 0.63%Net investment income 2.64%(c) 3.13%(c) 3.77% 4.36% 3.91% 4.13% 4.34%Portfolio turnover rate 61%(f) 30%(e) 30% 13% 6% 11% 17%
* For the three month period ended December 31, 2020.(a) Per share net investment income has been calculated using the average shares outstanding during the period.(b) Periods less than one year are not annualized.(c) Computed on an annualized basis for periods less than one year.(d) Effective July 1, 2020, the expense limit decreased from 0.95% to 0.70%.(e) The variation in the Fund’s turnover rate, if annualized, from the year ended September 30, 2020 to the period ended December 31, 2020 was primarily due to the
disposition and realignment of certain foreign currency-denominated positions.(f) The variation in the Fund’s turnover rate from the year ended September 30, 2020 to the six months ended June 30, 2021 was primarily due to a repositioning of the
portfolio.
See accompanying notes to financial statements.89 |
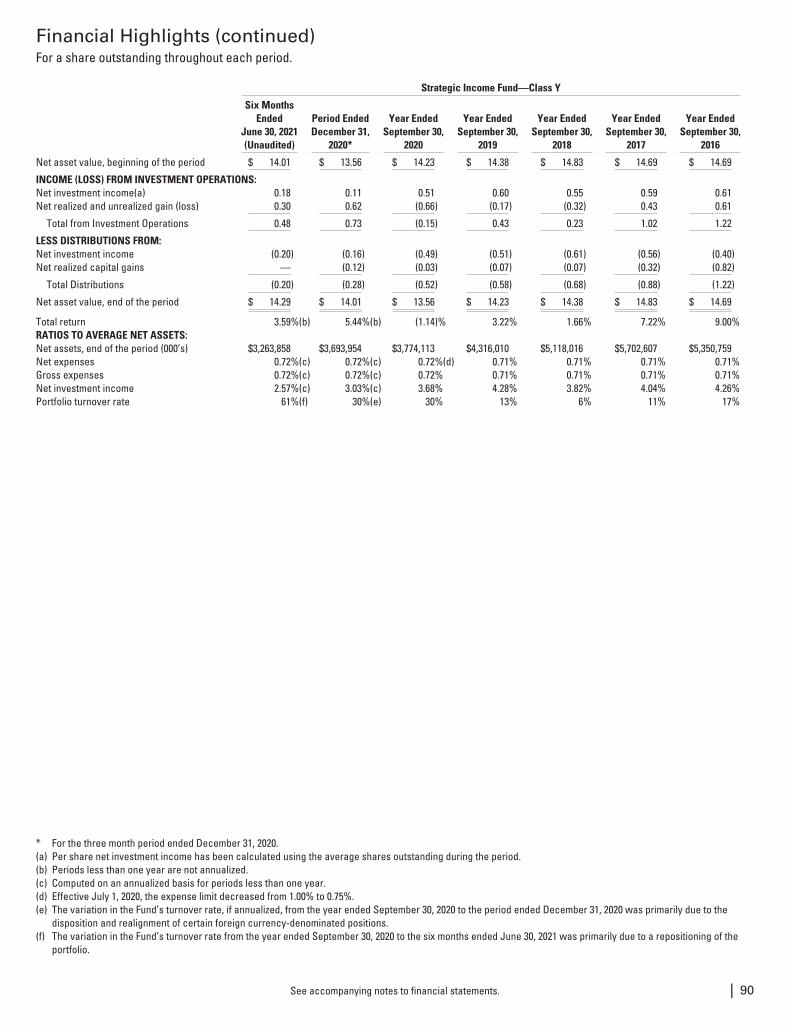
Financial Highlights (continued)For a share outstanding throughout each period.
Strategic Income Fund—Class Y
Six MonthsEnded
June 30, 2021(Unaudited)
Period EndedDecember 31,
2020*
Year EndedSeptember 30,
2020
Year EndedSeptember 30,
2019
Year EndedSeptember 30,
2018
Year EndedSeptember 30,
2017
Year EndedSeptember 30,
2016
Net asset value, beginning of the period $ 14.01 $ 13.56 $ 14.23 $ 14.38 $ 14.83 $ 14.69 $ 14.69
INCOME (LOSS) FROM INVESTMENT OPERATIONS:Net investment income(a) 0.18 0.11 0.51 0.60 0.55 0.59 0.61Net realized and unrealized gain (loss) 0.30 0.62 (0.66) (0.17) (0.32) 0.43 0.61
Total from Investment Operations 0.48 0.73 (0.15) 0.43 0.23 1.02 1.22
LESS DISTRIBUTIONS FROM:Net investment income (0.20) (0.16) (0.49) (0.51) (0.61) (0.56) (0.40)Net realized capital gains — (0.12) (0.03) (0.07) (0.07) (0.32) (0.82)
Total Distributions (0.20) (0.28) (0.52) (0.58) (0.68) (0.88) (1.22)
Net asset value, end of the period $ 14.29 $ 14.01 $ 13.56 $ 14.23 $ 14.38 $ 14.83 $ 14.69
Total return 3.59%(b) 5.44%(b) (1.14)% 3.22% 1.66% 7.22% 9.00%RATIOS TO AVERAGE NET ASSETS:Net assets, end of the period (000’s) $3,263,858 $3,693,954 $3,774,113 $4,316,010 $5,118,016 $5,702,607 $5,350,759Net expenses 0.72%(c) 0.72%(c) 0.72%(d) 0.71% 0.71% 0.71% 0.71%Gross expenses 0.72%(c) 0.72%(c) 0.72% 0.71% 0.71% 0.71% 0.71%Net investment income 2.57%(c) 3.03%(c) 3.68% 4.28% 3.82% 4.04% 4.26%Portfolio turnover rate 61%(f) 30%(e) 30% 13% 6% 11% 17%
* For the three month period ended December 31, 2020.(a) Per share net investment income has been calculated using the average shares outstanding during the period.(b) Periods less than one year are not annualized.(c) Computed on an annualized basis for periods less than one year.(d) Effective July 1, 2020, the expense limit decreased from 1.00% to 0.75%.(e) The variation in the Fund’s turnover rate, if annualized, from the year ended September 30, 2020 to the period ended December 31, 2020 was primarily due to the
disposition and realignment of certain foreign currency-denominated positions.(f) The variation in the Fund’s turnover rate from the year ended September 30, 2020 to the six months ended June 30, 2021 was primarily due to a repositioning of the
portfolio.
See accompanying notes to financial statements. | 90
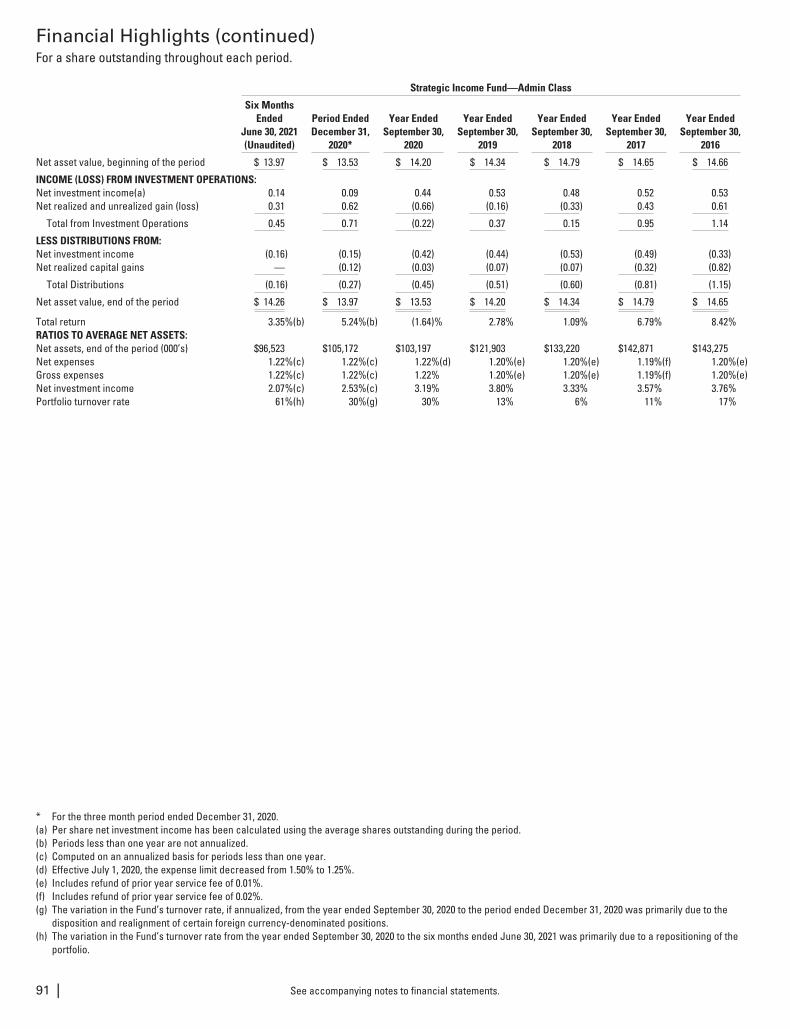
Financial Highlights (continued)For a share outstanding throughout each period.
Strategic Income Fund—Admin Class
Six MonthsEnded
June 30, 2021(Unaudited)
Period EndedDecember 31,
2020*
Year EndedSeptember 30,
2020
Year EndedSeptember 30,
2019
Year EndedSeptember 30,
2018
Year EndedSeptember 30,
2017
Year EndedSeptember 30,
2016
Net asset value, beginning of the period $ 13.97 $ 13.53 $ 14.20 $ 14.34 $ 14.79 $ 14.65 $ 14.66
INCOME (LOSS) FROM INVESTMENT OPERATIONS:Net investment income(a) 0.14 0.09 0.44 0.53 0.48 0.52 0.53Net realized and unrealized gain (loss) 0.31 0.62 (0.66) (0.16) (0.33) 0.43 0.61
Total from Investment Operations 0.45 0.71 (0.22) 0.37 0.15 0.95 1.14
LESS DISTRIBUTIONS FROM:Net investment income (0.16) (0.15) (0.42) (0.44) (0.53) (0.49) (0.33)Net realized capital gains — (0.12) (0.03) (0.07) (0.07) (0.32) (0.82)
Total Distributions (0.16) (0.27) (0.45) (0.51) (0.60) (0.81) (1.15)
Net asset value, end of the period $ 14.26 $ 13.97 $ 13.53 $ 14.20 $ 14.34 $ 14.79 $ 14.65
Total return 3.35%(b) 5.24%(b) (1.64)% 2.78% 1.09% 6.79% 8.42%RATIOS TO AVERAGE NET ASSETS:Net assets, end of the period (000’s) $96,523 $105,172 $103,197 $121,903 $133,220 $142,871 $143,275Net expenses 1.22%(c) 1.22%(c) 1.22%(d) 1.20%(e) 1.20%(e) 1.19%(f) 1.20%(e)Gross expenses 1.22%(c) 1.22%(c) 1.22% 1.20%(e) 1.20%(e) 1.19%(f) 1.20%(e)Net investment income 2.07%(c) 2.53%(c) 3.19% 3.80% 3.33% 3.57% 3.76%Portfolio turnover rate 61%(h) 30%(g) 30% 13% 6% 11% 17%
* For the three month period ended December 31, 2020.(a) Per share net investment income has been calculated using the average shares outstanding during the period.(b) Periods less than one year are not annualized.(c) Computed on an annualized basis for periods less than one year.(d) Effective July 1, 2020, the expense limit decreased from 1.50% to 1.25%.(e) Includes refund of prior year service fee of 0.01%.(f) Includes refund of prior year service fee of 0.02%.(g) The variation in the Fund’s turnover rate, if annualized, from the year ended September 30, 2020 to the period ended December 31, 2020 was primarily due to the
disposition and realignment of certain foreign currency-denominated positions.(h) The variation in the Fund’s turnover rate from the year ended September 30, 2020 to the six months ended June 30, 2021 was primarily due to a repositioning of the
portfolio.
See accompanying notes to financial statements.91 |
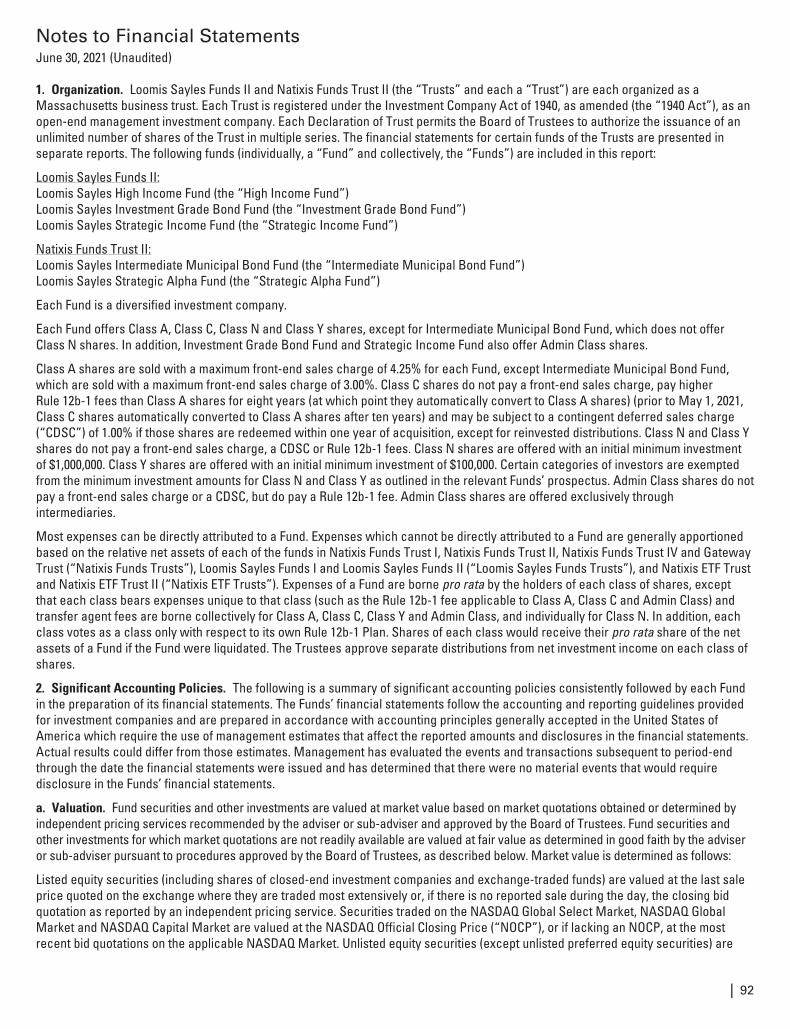
Notes to Financial StatementsJune 30, 2021 (Unaudited)
1. Organization. Loomis Sayles Funds II and Natixis Funds Trust II (the “Trusts” and each a “Trust”) are each organized as aMassachusetts business trust. Each Trust is registered under the Investment Company Act of 1940, as amended (the “1940 Act”), as anopen-end management investment company. Each Declaration of Trust permits the Board of Trustees to authorize the issuance of anunlimited number of shares of the Trust in multiple series. The financial statements for certain funds of the Trusts are presented inseparate reports. The following funds (individually, a “Fund” and collectively, the “Funds”) are included in this report:
Loomis Sayles Funds II:Loomis Sayles High Income Fund (the “High Income Fund”)Loomis Sayles Investment Grade Bond Fund (the “Investment Grade Bond Fund”)Loomis Sayles Strategic Income Fund (the “Strategic Income Fund”)
Natixis Funds Trust II:Loomis Sayles Intermediate Municipal Bond Fund (the “Intermediate Municipal Bond Fund”)Loomis Sayles Strategic Alpha Fund (the “Strategic Alpha Fund”)
Each Fund is a diversified investment company.
Each Fund offers Class A, Class C, Class N and Class Y shares, except for Intermediate Municipal Bond Fund, which does not offerClass N shares. In addition, Investment Grade Bond Fund and Strategic Income Fund also offer Admin Class shares.
Class A shares are sold with a maximum front-end sales charge of 4.25% for each Fund, except Intermediate Municipal Bond Fund,which are sold with a maximum front-end sales charge of 3.00%. Class C shares do not pay a front-end sales charge, pay higherRule 12b-1 fees than Class A shares for eight years (at which point they automatically convert to Class A shares) (prior to May 1, 2021,Class C shares automatically converted to Class A shares after ten years) and may be subject to a contingent deferred sales charge(“CDSC”) of 1.00% if those shares are redeemed within one year of acquisition, except for reinvested distributions. Class N and Class Yshares do not pay a front-end sales charge, a CDSC or Rule 12b-1 fees. Class N shares are offered with an initial minimum investmentof $1,000,000. Class Y shares are offered with an initial minimum investment of $100,000. Certain categories of investors are exemptedfrom the minimum investment amounts for Class N and Class Y as outlined in the relevant Funds’ prospectus. Admin Class shares do notpay a front-end sales charge or a CDSC, but do pay a Rule 12b-1 fee. Admin Class shares are offered exclusively throughintermediaries.
Most expenses can be directly attributed to a Fund. Expenses which cannot be directly attributed to a Fund are generally apportionedbased on the relative net assets of each of the funds in Natixis Funds Trust I, Natixis Funds Trust II, Natixis Funds Trust IV and GatewayTrust (“Natixis Funds Trusts”), Loomis Sayles Funds I and Loomis Sayles Funds II (“Loomis Sayles Funds Trusts”), and Natixis ETF Trustand Natixis ETF Trust II (“Natixis ETF Trusts”). Expenses of a Fund are borne pro rata by the holders of each class of shares, exceptthat each class bears expenses unique to that class (such as the Rule 12b-1 fee applicable to Class A, Class C and Admin Class) andtransfer agent fees are borne collectively for Class A, Class C, Class Y and Admin Class, and individually for Class N. In addition, eachclass votes as a class only with respect to its own Rule 12b-1 Plan. Shares of each class would receive their pro rata share of the netassets of a Fund if the Fund were liquidated. The Trustees approve separate distributions from net investment income on each class ofshares.
2. Significant Accounting Policies. The following is a summary of significant accounting policies consistently followed by each Fundin the preparation of its financial statements. The Funds’ financial statements follow the accounting and reporting guidelines providedfor investment companies and are prepared in accordance with accounting principles generally accepted in the United States ofAmerica which require the use of management estimates that affect the reported amounts and disclosures in the financial statements.Actual results could differ from those estimates. Management has evaluated the events and transactions subsequent to period-endthrough the date the financial statements were issued and has determined that there were no material events that would requiredisclosure in the Funds’ financial statements.
a. Valuation. Fund securities and other investments are valued at market value based on market quotations obtained or determined byindependent pricing services recommended by the adviser or sub-adviser and approved by the Board of Trustees. Fund securities andother investments for which market quotations are not readily available are valued at fair value as determined in good faith by the adviseror sub-adviser pursuant to procedures approved by the Board of Trustees, as described below. Market value is determined as follows:
Listed equity securities (including shares of closed-end investment companies and exchange-traded funds) are valued at the last saleprice quoted on the exchange where they are traded most extensively or, if there is no reported sale during the day, the closing bidquotation as reported by an independent pricing service. Securities traded on the NASDAQ Global Select Market, NASDAQ GlobalMarket and NASDAQ Capital Market are valued at the NASDAQ Official Closing Price (“NOCP”), or if lacking an NOCP, at the mostrecent bid quotations on the applicable NASDAQ Market. Unlisted equity securities (except unlisted preferred equity securities) are
| 92
Notes to Financial Statements (continued)June 30, 2021 (Unaudited)
valued at the last sale price quoted in the market where they are traded most extensively or, if there is no reported sale during the day,the closing bid quotation as reported by an independent pricing service. If there is no last sale price or closing bid quotation available,unlisted equity securities will be valued using evaluated bids furnished by an independent pricing service, if available. In some foreignmarkets, an official close price and a last sale price may be available from the foreign exchange or market. In those cases, the officialclose price is used. Debt securities and unlisted preferred equity securities are valued based on evaluated bids furnished to the Fundsby an independent pricing service or bid prices obtained from broker-dealers. Senior loans and collateralized loan obligations arevalued at bid prices supplied by an independent pricing service, if available. Equity linked notes are valued using broker-dealer bidprices. Broker-dealer bid prices may be used to value debt, unlisted equity securities, senior loans and collateralized loan obligationswhere an independent pricing service is unable to price a security or where an independent pricing service does not provide a reliableprice for the security. Forward foreign currency contracts are valued utilizing interpolated rates determined based on informationprovided by an independent pricing service. Futures contracts are valued at the most recent settlement price on the exchange onwhich the adviser believes that, over time, they are traded most extensively. Centrally cleared swap agreements are valued atsettlement prices of the clearing house on which the contracts were traded or prices obtained from broker-dealers. Bilateral creditdefault swaps are valued based on mid prices (between the bid price and the ask price) supplied by an independent pricing service.Bilateral interest rate swaps are valued based on prices supplied by an independent pricing source. Domestic exchange-traded indexand single name equity option contracts (including options on exchange-traded funds) are valued at the mean of the National Best Bidand Offer quotations as determined by the Options Price Reporting Authority. Options on futures contracts are valued using the currentsettlement price on the exchange on which, over time, they are traded most extensively. Option contracts on foreign indices are pricedat the most recent settlement price. Other exchange-traded options are valued at the average of the closing bid and ask quotations onthe exchange on which, over time, they are traded most extensively. Over-the-counter (“OTC”) currency options and swaptions arevalued at mid prices (between the bid and the ask price) supplied by an independent pricing service, if available. Other OTC optioncontracts (including currency options and swaptions not priced through an independent pricing service) are valued based onquotations obtained from broker-dealers. Shares of open-end investment companies are valued at net asset value per share.
Fund securities and other investments for which market quotations are not readily available are valued at fair value as determined ingood faith by the adviser pursuant to procedures approved by the Board of Trustees. The Funds may also value securities and otherinvestments at fair value in other circumstances such as when extraordinary events occur after the close of a foreign market but priorto the close of the New York Stock Exchange. This may include situations relating to a single issuer (such as a declaration ofbankruptcy or a delisting of the issuer’s security from the primary market on which it has traded) as well as events affecting thesecurities markets in general (such as market disruptions or closings and significant fluctuations in U.S. and/or foreign markets). Whenfair valuing its securities or other investments, the Funds may, among other things, use modeling tools or other processes that may takeinto account factors such as securities or other market activity and/or significant events that occur after the close of the foreignmarket and before the time the Fund’s net asset value (“NAV”) is calculated. Fair value pricing may require subjective determinationsabout the value of a security, and fair values used to determine a Fund’s NAV may differ from quoted or published prices, or from pricesthat are used by others, for the same securities. In addition, the use of fair value pricing may not always result in adjustments to theprices of securities held by a Fund.
Illiquid securities for which market quotations are readily available and have been evaluated by the adviser are considered andclassified as fair valued securities pursuant to the Funds’ pricing policies and procedures.
As of June 30, 2021, securities and other investments of the funds included in net assets were fair valued as follows:
FundEquity
Securities1Percentage of
Net Assets
Securitiesclassified asfair valued
Percentage ofNet Assets
Securities fairvalued by theFund’s adviser
Percentage ofNet Assets
High Income Fund $ — — $ 1,506,842 1.3% $ 250,752 0.2%Investment Grade Bond Fund — — 98,676,926 1.6% — —Strategic Alpha Fund 970,734 0.1% 7,163,951 0.5% 5,989,942 0.4%Strategic Income Fund — — 85,824,919 1.6% 47,210,136 0.9%1 Certain foreign equity securities were fair valued pursuant to procedures approved by the Board of Trustees as events occurring after the close of the foreign market
were believed to materially affect the value of those securities.
b. Investment Transactions and Related Investment Income. Investment transactions are accounted for on a trade date plus one daybasis for daily NAV calculation. However, for financial reporting purposes, investment transactions are reported on trade date.Dividend income (including income reinvested) and foreign withholding tax, if applicable, is recorded on the ex-dividend date, or in thecase of certain foreign securities, as soon as a Fund is notified, and interest income is recorded on an accrual basis. Loan consentfees, upfront origination fees and/or amendment fees are recorded when received and included in interest income on the Statement of
93 |
Notes to Financial Statements (continued)June 30, 2021 (Unaudited)
Operations. Interest income is increased by the accretion of discount and decreased by the amortization of premium, if applicable. Forpayment-in-kind securities, income received in-kind is reflected as an increase to the principal and cost basis of the securities.Periodic principal adjustments for inflation-protected securities are recorded to interest income. Negative principal adjustments (in theevent of deflation) are recorded as reductions of interest income to the extent of interest income earned, not to exceed the amount ofpositive principal adjustments on a cumulative basis. For securities with paydown provisions, principal payments received are treatedas a proportionate reduction to the cost basis of the securities, and excess or shortfall amounts are recorded as income. Distributionsreceived from investments in securities that represent a return of capital or capital gain are recorded as a reduction of cost of theinvestments or as a realized gain, respectively. The calendar year-end amounts of ordinary income, capital gains, and return of capitalincluded in distributions received from the Funds’ investments in real estate investment trusts (“REITs”) are reported to the Funds afterthe end of the fiscal year; accordingly, the Funds estimate these amounts for accounting purposes until the characterization of REITdistributions is reported to the Funds after the end of the fiscal year. Estimates are based on the most recent REIT distributioninformation available. In determining net gain or loss on securities sold, the cost of securities has been determined on an identifiedcost basis. Investment income, non-class specific expenses and realized and unrealized gains and losses are allocated on a pro ratabasis to each class based on the relative net assets of each class to the total net assets of the Fund.
c. Foreign Currency Translation. The books and records of the Funds are maintained in U.S. dollars. The values of securities,currencies and other assets and liabilities denominated in currencies other than U.S. dollars, if any, are translated into U.S. dollarsbased upon foreign exchange rates prevailing at the end of the period. Purchases and sales of investment securities, income andexpenses are translated into U.S. dollars on the respective dates of such transactions.
Net realized foreign exchange gains or losses arise from sales of foreign currency, changes in exchange rates between the trade andsettlement dates on securities transactions and the difference between the amounts of dividends, interest and foreign withholdingtaxes recorded on the Funds’ books and the U.S. dollar equivalent of the amounts actually received or paid. Net unrealized foreignexchange gains or losses arise from changes in the value of assets and liabilities, other than investment securities, as of the end of thefiscal period, resulting from changes in exchange rates. Net realized foreign exchange gains or losses and the net change in unrealizedforeign exchange gains or losses are disclosed in the Statements of Operations. For federal income tax purposes, net realized foreignexchange gains or losses are characterized as ordinary income, and may, if the Funds have net losses, reduce the amount of incomeavailable to be distributed by the Funds.
The values of investment securities are presented at the foreign exchange rates prevailing at the end of the period for financialreporting purposes. Net realized and unrealized gains or losses on investments reported in the Statements of Operations reflect gainsor losses resulting from changes in exchange rates and fluctuations which arise due to changes in market prices of investmentsecurities. For federal income tax purposes, a portion of the net realized gain or loss on investments arising from changes in exchangerates, which is reflected in the Statements of Operations, may be characterized as ordinary income and may, if the Funds have netlosses, reduce the amount of income available to be distributed by the Funds.
For the six months ended June 30, 2021, the amount of income available to be distributed has been reduced by the following amountsas a result of losses arising from changes in exchange rates:
Strategic Alpha Fund $6,485,730Strategic Income Fund 1,484,377
The Funds may use foreign currency exchange contracts to facilitate transactions in foreign-denominated investments. Losses mayarise from changes in the value of the foreign currency or if the counterparties do not perform under the contracts’ terms.
d. Forward Foreign Currency Contracts. The Funds may enter into forward foreign currency contracts, including forward foreign crosscurrency contracts, to acquire exposure to foreign currencies or to hedge the Fund’s investments against currency fluctuation. Acontract can also be used to offset a previous contract. These contracts involve market risk in excess of the unrealized appreciation(depreciation) reflected in the Funds’ Statements of Assets and Liabilities. The U.S. dollar value of the currencies a Fund has committedto buy or sell represents the aggregate exposure to each currency a Fund has acquired or hedged through currency contractsoutstanding at period end. Gains or losses are recorded for financial statement purposes as unrealized until settlement date. Contractsare traded over-the-counter directly with a counterparty. Risks may arise upon entering into these contracts from the potential inabilityof counterparties to meet the terms of their contracts and from unanticipated movements in the value of a foreign currency relative tothe U.S. dollar. Certain contracts may require the movement of cash and/or securities as collateral for the Fund’s or counterparty’s netobligations under the contracts.
e. Futures Contracts. The Funds may enter into futures contracts. Futures contracts are agreements between two parties to buy andsell a particular instrument or index for a specified price on a specified future date.
| 94
Notes to Financial Statements (continued)June 30, 2021 (Unaudited)
When a Fund enters into a futures contract, it is required to deposit with (or for the benefit of) its broker an amount of cash or short-term high-quality securities as “initial margin.” As the value of the contract changes, the value of the futures contract positionincreases or declines. Subsequent payments, known as “variation margin,” are made or received by a Fund, depending on the pricefluctuations in the fair value of the contract and the value of cash or securities on deposit with the broker. The aggregate principalamounts of the contracts are not recorded in the financial statements. Daily fluctuations in the value of the contracts are recorded inthe Statements of Assets and Liabilities as a receivable (payable) and in the Statements of Operations as unrealized appreciation(depreciation) until the contracts are closed, when they are recorded as realized gains (losses). Realized gain or loss on a futuresposition is equal to the difference between the value of the contract at the time it was opened and the value at the time it was closed,minus brokerage commissions. When a Fund enters into a futures contract certain risks may arise, such as illiquidity in the futuresmarket, which may limit a Fund’s ability to close out a futures contract prior to settlement date, and unanticipated movements in thevalue of securities or interest rates.
Futures contracts are exchange-traded. Exchange-traded futures contracts are standardized and are settled through a clearing housewith fulfillment supported by the credit of the exchange. Therefore, counterparty credit risks to the Funds are reduced; however, in theevent that a counterparty enters into bankruptcy, a Fund’s claim against initial/variation margin on deposit with the counterparty maybe subject to terms of a final settlement in bankruptcy court.
f. Option Contracts. Intermediate Municipal Bond Fund and Strategic Alpha Fund may enter into option contracts. When a Fundpurchases an option, it pays a premium and the option is subsequently marked-to-market to reflect current value. Premiums paid forpurchasing options which expire are treated as realized losses. Premiums paid for purchasing options which are exercised are addedto the cost or deducted from the proceeds on the underlying instrument to determine the realized gain or loss. If the Fund enters into aclosing sale transaction, the difference between the premium paid and the proceeds of the closing sale transaction is treated as arealized gain or loss. The risk associated with purchasing options is limited to the premium paid.
When a Fund writes an option, an amount equal to the net premium received (the premium less commission) is recorded as a liabilityand is subsequently adjusted to the current value. Net premiums received for written options which expire are treated as realizedgains. Net premiums received for written options which are exercised are deducted from the cost or added to the proceeds on theunderlying instrument to determine the realized gain or loss. If the Fund enters into a closing purchase transaction, the differencebetween the net premium received and any amount paid on effecting a closing purchase transaction, including commissions, is treatedas a realized gain or, if the net premium received is less than the amount paid, as a realized loss. The Fund, as writer of a written option,bears the risk of an unfavorable change in the market value of the instrument or index underlying the written option.
Exchange-traded options contracts are standardized and are settled through a clearing house with fulfillment supported by the creditof the exchange. Therefore, counterparty credit risks to the Funds are reduced. OTC options are subject to the risk that thecounterparty is unable or unwilling to meet its obligations under the option.
g. Swap Agreements. The Funds may enter into credit default and interest rate swaps. A credit default swap is an agreementbetween two parties (the “protection buyer” and “protection seller”) to exchange the credit risk of an issuer (“reference obligation”)for a specified time period. The reference obligation may be one or more debt securities or an index of such securities. The Funds maybe either the protection buyer or the protection seller. As a protection buyer, the Funds have the ability to hedge the downside risk ofan issuer or group of issuers. As a protection seller, the Funds have the ability to gain exposure to an issuer or group of issuers whosebonds are unavailable or in short supply in the cash bond market, as well as realize additional income in the form of fees paid by theprotection buyer. The protection buyer is obligated to pay the protection seller a stream of payments (“fees”) over the term of thecontract, provided that no credit event, such as a default or a downgrade in credit rating, occurs on the reference obligation. TheFunds may also pay or receive upfront premiums. If a credit event occurs, the protection seller must pay the protection buyer thedifference between the agreed upon notional value and market value of the reference obligation. Market value in this case isdetermined by a facilitated auction whereby a minimum number of allowable broker bids, together with a specified valuation method,are used to calculate the value. The maximum potential amount of undiscounted future payments that a Fund as the protection sellercould be required to make under a credit default swap agreement would be an amount equal to the notional amount of the agreement.
Implied credit spreads, represented in absolute terms, are disclosed in the Portfolio of Investments for those agreements for which theFund is the protection seller. Implied credit spreads serve as an indicator of the current status of the payment/performance risk andrepresent the likelihood or risk of default for the credit derivative. The implied credit spread of a particular reference entity reflects thecost of buying/selling protection and may include upfront payments required to be made to enter into the agreement. Wider creditspreads represent a deterioration of the reference entity’s credit soundness and a greater likelihood or risk of default or other creditevent occurring as defined under the terms of the agreement.
95 |
Notes to Financial Statements (continued)June 30, 2021 (Unaudited)
An interest rate swap is an agreement with another party to receive or pay interest (e.g., an exchange of fixed rate payments forfloating rate payments) to protect themselves from interest rate fluctuations. This type of swap is an agreement that obligates twoparties to exchange a series of cash flows at specified intervals based upon or calculated by reference to a specified interest rate(s)for a specified notional amount. The payment flows are usually netted against each other, with the difference being paid by one partyto the other.
The notional amounts of swap agreements are not recorded in the financial statements. Swap agreements are valued daily, andfluctuations in value are recorded in the Statements of Operations as change in unrealized appreciation (depreciation) on swapagreements. Fees are accrued in accordance with the terms of the agreement and are recorded in the Statements of Assets andLiabilities as part of unrealized appreciation (depreciation) on swap agreements. When received or paid, fees are recorded in theStatements of Operations as realized gain or loss. Upfront premiums paid or received by the Funds are recorded on the Statements ofAssets and Liabilities as an asset or liability, respectively, and are amortized or accreted over the term of the agreement and recordedas realized gain or loss. Payments made or received by the Funds as a result of a credit event or termination of the agreement arerecorded as realized gain or loss.
Swap agreements are privately negotiated in the OTC market and may be entered into as a bilateral contract or centrally cleared(“centrally cleared swaps”). Bilateral swap agreements are traded between counterparties and, as such, are subject to the risk that aparty to the agreement will not be able to meet its obligations. In a centrally cleared swap, immediately following execution of the swapagreement, the swap agreement is novated to a central counterparty (the “CCP”) and the Funds face the CCP through a broker. Uponentering into a centrally cleared swap, the Funds are required to deposit initial margin with the broker in the form of cash or securitiesin an amount that varies depending on the size and risk profile of the particular swap. Subsequent payments, known as “variationmargin,” are made or received by the Funds based on the daily change in the value of the centrally cleared swap agreement. Forcentrally cleared swaps, the Funds’ counterparty credit risk is reduced as the CCP stands between the Funds and the counterparty.The Funds cover their net obligations under outstanding swap agreements by segregating or earmarking cash or securities.
h. Swaptions. The Funds may enter into interest rate swaptions. An interest rate swaption gives the holder the right, but not theobligation, to enter into or cancel an interest rate swap agreement at a future date. Interest rate swaptions may be either purchased orwritten. The buyer of an interest rate swaption may purchase either the right to receive a fixed rate in the underlying swap (known as a“receiver swaption”) or to pay a fixed rate (known as a “payer swaption”), based on the notional amount of the swap agreement, inexchange for a floating rate. The notional amounts of swaptions are not recorded in the financial statements.
When a Fund purchases an interest rate swaption, it pays a premium and the swaption is subsequently marked-to-market to reflectcurrent value. Premiums paid for purchasing interest rate swaptions which expire are treated as realized losses. Premiums paid forpurchasing interest rate swaptions which are exercised are added to the cost or deducted from the proceeds on the underlying swapto determine the realized gain or loss. If a Fund enters into a closing sale transaction, the difference between the premium paid and theproceeds of the closing sale transaction is treated as a realized gain or loss. The risk associated with purchasing interest rateswaptions is limited to the premium paid.
When a Fund writes an interest rate swaption, an amount equal to the premium received is recorded as a liability and is subsequentlyadjusted to the current value. Premiums received for written interest rate swaptions which expire are treated as realized gains.Premiums received for written interest rate swaptions which are exercised are deducted from the cost or added to the proceeds on theunderlying swap to determine the realized gain or loss. If a Fund enters into a closing purchase transaction, the difference between thepremium received and any amount paid on effecting a closing purchase transaction, including commission, is treated as a realized gainor, if the premium received is less than the amount paid, as a realized loss. A Fund, as writer of a written interest rate swaption, bearsthe risk of an unfavorable change in the market value of the swap underlying the written interest rate swaption.
OTC interest rate swaptions are subject to the risk that the counterparty is unable or unwilling to meet its obligations under theswaption.
There were no swaptions held by the Funds as of June 30, 2021.
i. Due from Brokers. Transactions and positions in certain options, futures, forward foreign currency contracts and swap agreementsare maintained and cleared by registered U.S. broker/dealers pursuant to customer agreements between the Funds and the variousbroker/dealers. The due from brokers balance in the Statements of Assets and Liabilities for High Income Fund represents cashpledged as initial margin for closed centrally cleared swap agreements. The due from brokers balance in the Statements of Assets andLiabilities for Strategic Alpha Fund represents cash pledged as collateral for forward foreign currency contracts and options, and asinitial margin for futures contracts and centrally cleared swap agreements. The due from brokers balance in the Statements of Assetsand Liabilities for Strategic Income Fund represents cash pledged as collateral for forward foreign currency contracts, and as initial
| 96
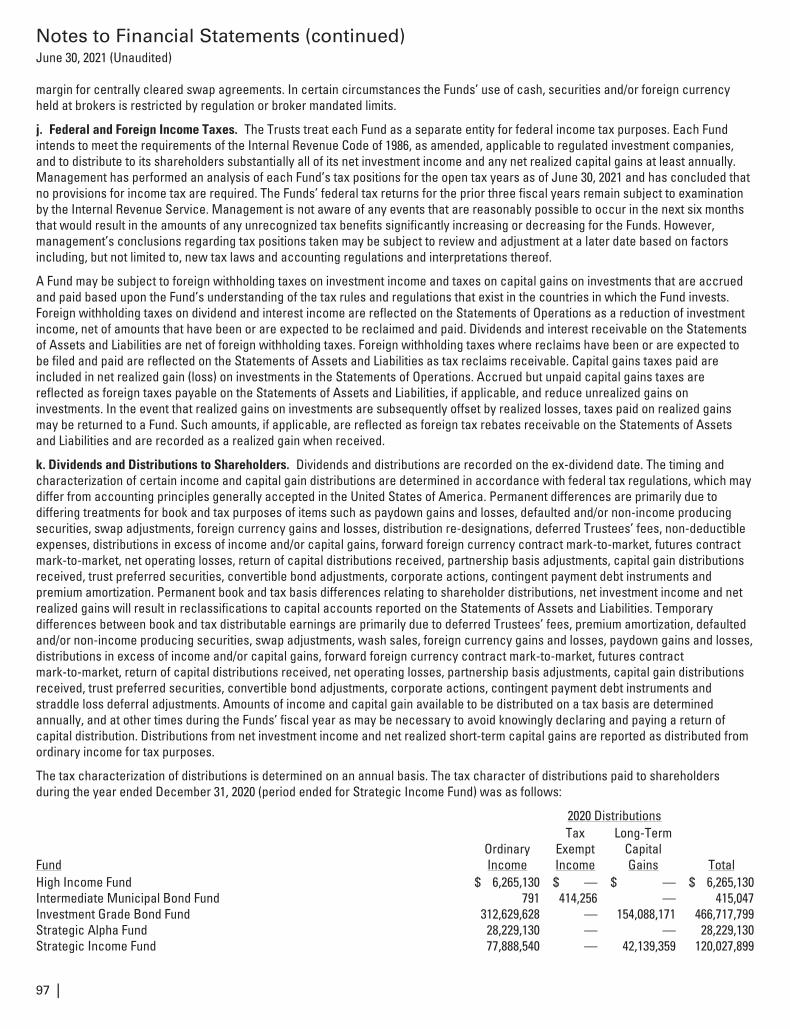
Notes to Financial Statements (continued)June 30, 2021 (Unaudited)
margin for centrally cleared swap agreements. In certain circumstances the Funds’ use of cash, securities and/or foreign currencyheld at brokers is restricted by regulation or broker mandated limits.
j. Federal and Foreign Income Taxes. The Trusts treat each Fund as a separate entity for federal income tax purposes. Each Fundintends to meet the requirements of the Internal Revenue Code of 1986, as amended, applicable to regulated investment companies,and to distribute to its shareholders substantially all of its net investment income and any net realized capital gains at least annually.Management has performed an analysis of each Fund’s tax positions for the open tax years as of June 30, 2021 and has concluded thatno provisions for income tax are required. The Funds’ federal tax returns for the prior three fiscal years remain subject to examinationby the Internal Revenue Service. Management is not aware of any events that are reasonably possible to occur in the next six monthsthat would result in the amounts of any unrecognized tax benefits significantly increasing or decreasing for the Funds. However,management’s conclusions regarding tax positions taken may be subject to review and adjustment at a later date based on factorsincluding, but not limited to, new tax laws and accounting regulations and interpretations thereof.
A Fund may be subject to foreign withholding taxes on investment income and taxes on capital gains on investments that are accruedand paid based upon the Fund’s understanding of the tax rules and regulations that exist in the countries in which the Fund invests.Foreign withholding taxes on dividend and interest income are reflected on the Statements of Operations as a reduction of investmentincome, net of amounts that have been or are expected to be reclaimed and paid. Dividends and interest receivable on the Statementsof Assets and Liabilities are net of foreign withholding taxes. Foreign withholding taxes where reclaims have been or are expected tobe filed and paid are reflected on the Statements of Assets and Liabilities as tax reclaims receivable. Capital gains taxes paid areincluded in net realized gain (loss) on investments in the Statements of Operations. Accrued but unpaid capital gains taxes arereflected as foreign taxes payable on the Statements of Assets and Liabilities, if applicable, and reduce unrealized gains oninvestments. In the event that realized gains on investments are subsequently offset by realized losses, taxes paid on realized gainsmay be returned to a Fund. Such amounts, if applicable, are reflected as foreign tax rebates receivable on the Statements of Assetsand Liabilities and are recorded as a realized gain when received.
k. Dividends and Distributions to Shareholders. Dividends and distributions are recorded on the ex-dividend date. The timing andcharacterization of certain income and capital gain distributions are determined in accordance with federal tax regulations, which maydiffer from accounting principles generally accepted in the United States of America. Permanent differences are primarily due todiffering treatments for book and tax purposes of items such as paydown gains and losses, defaulted and/or non-income producingsecurities, swap adjustments, foreign currency gains and losses, distribution re-designations, deferred Trustees’ fees, non-deductibleexpenses, distributions in excess of income and/or capital gains, forward foreign currency contract mark-to-market, futures contractmark-to-market, net operating losses, return of capital distributions received, partnership basis adjustments, capital gain distributionsreceived, trust preferred securities, convertible bond adjustments, corporate actions, contingent payment debt instruments andpremium amortization. Permanent book and tax basis differences relating to shareholder distributions, net investment income and netrealized gains will result in reclassifications to capital accounts reported on the Statements of Assets and Liabilities. Temporarydifferences between book and tax distributable earnings are primarily due to deferred Trustees’ fees, premium amortization, defaultedand/or non-income producing securities, swap adjustments, wash sales, foreign currency gains and losses, paydown gains and losses,distributions in excess of income and/or capital gains, forward foreign currency contract mark-to-market, futures contractmark-to-market, return of capital distributions received, net operating losses, partnership basis adjustments, capital gain distributionsreceived, trust preferred securities, convertible bond adjustments, corporate actions, contingent payment debt instruments andstraddle loss deferral adjustments. Amounts of income and capital gain available to be distributed on a tax basis are determinedannually, and at other times during the Funds’ fiscal year as may be necessary to avoid knowingly declaring and paying a return ofcapital distribution. Distributions from net investment income and net realized short-term capital gains are reported as distributed fromordinary income for tax purposes.
The tax characterization of distributions is determined on an annual basis. The tax character of distributions paid to shareholdersduring the year ended December 31, 2020 (period ended for Strategic Income Fund) was as follows:
2020 Distributions
FundOrdinaryIncome
TaxExemptIncome
Long-TermCapitalGains Total
High Income Fund $ 6,265,130 $ — $ — $ 6,265,130Intermediate Municipal Bond Fund 791 414,256 — 415,047Investment Grade Bond Fund 312,629,628 — 154,088,171 466,717,799Strategic Alpha Fund 28,229,130 — — 28,229,130Strategic Income Fund 77,888,540 — 42,139,359 120,027,899
97 |
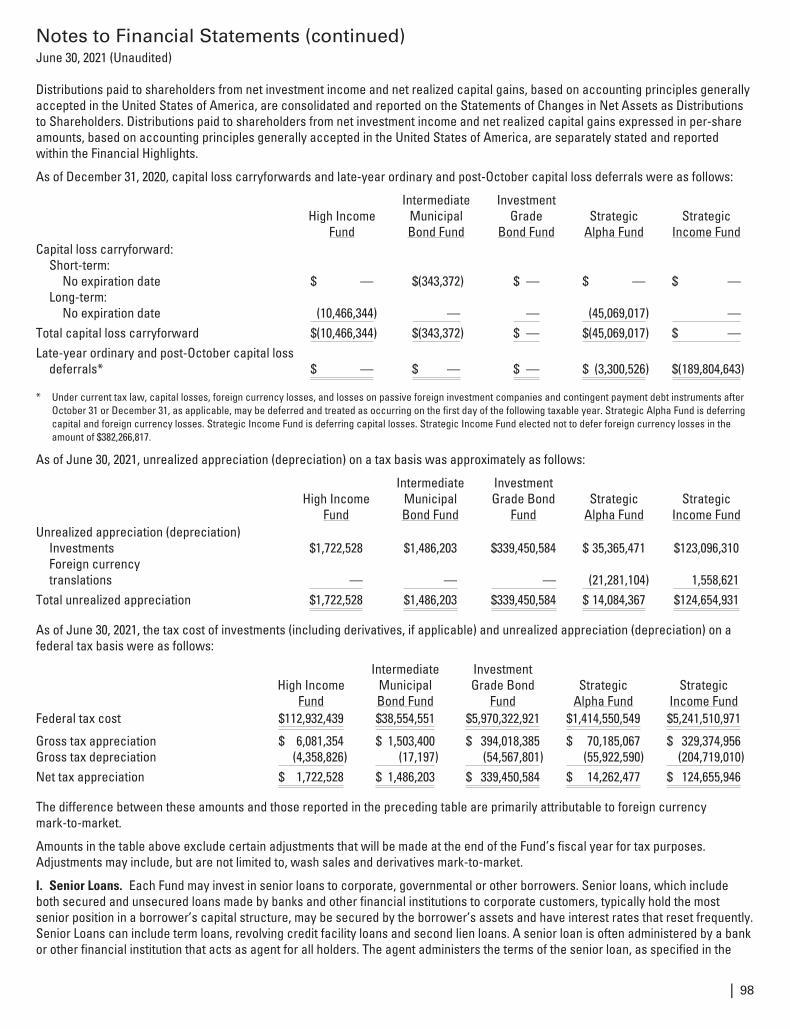
Notes to Financial Statements (continued)June 30, 2021 (Unaudited)
Distributions paid to shareholders from net investment income and net realized capital gains, based on accounting principles generallyaccepted in the United States of America, are consolidated and reported on the Statements of Changes in Net Assets as Distributionsto Shareholders. Distributions paid to shareholders from net investment income and net realized capital gains expressed in per-shareamounts, based on accounting principles generally accepted in the United States of America, are separately stated and reportedwithin the Financial Highlights.
As of December 31, 2020, capital loss carryforwards and late-year ordinary and post-October capital loss deferrals were as follows:
High IncomeFund
IntermediateMunicipalBond Fund
InvestmentGrade
Bond FundStrategic
Alpha FundStrategic
Income FundCapital loss carryforward:
Short-term:No expiration date $ — $(343,372) $ — $ — $ —
Long-term:No expiration date (10,466,344) — — (45,069,017) —
Total capital loss carryforward $(10,466,344) $(343,372) $ — $(45,069,017) $ —Late-year ordinary and post-October capital loss
deferrals* $ — $ — $ — $ (3,300,526) $(189,804,643)
* Under current tax law, capital losses, foreign currency losses, and losses on passive foreign investment companies and contingent payment debt instruments afterOctober 31 or December 31, as applicable, may be deferred and treated as occurring on the first day of the following taxable year. Strategic Alpha Fund is deferringcapital and foreign currency losses. Strategic Income Fund is deferring capital losses. Strategic Income Fund elected not to defer foreign currency losses in theamount of $382,266,817.
As of June 30, 2021, unrealized appreciation (depreciation) on a tax basis was approximately as follows:
High IncomeFund
IntermediateMunicipalBond Fund
InvestmentGrade Bond
FundStrategic
Alpha FundStrategic
Income FundUnrealized appreciation (depreciation)
Investments $1,722,528 $1,486,203 $339,450,584 $ 35,365,471 $123,096,310Foreign currencytranslations — — — (21,281,104) 1,558,621
Total unrealized appreciation $1,722,528 $1,486,203 $339,450,584 $ 14,084,367 $124,654,931
As of June 30, 2021, the tax cost of investments (including derivatives, if applicable) and unrealized appreciation (depreciation) on afederal tax basis were as follows:
High IncomeFund
IntermediateMunicipalBond Fund
InvestmentGrade Bond
FundStrategic
Alpha FundStrategic
Income FundFederal tax cost $112,932,439 $38,554,551 $5,970,322,921 $1,414,550,549 $5,241,510,971
Gross tax appreciation $ 6,081,354 $ 1,503,400 $ 394,018,385 $ 70,185,067 $ 329,374,956Gross tax depreciation (4,358,826) (17,197) (54,567,801) (55,922,590) (204,719,010)Net tax appreciation $ 1,722,528 $ 1,486,203 $ 339,450,584 $ 14,262,477 $ 124,655,946
The difference between these amounts and those reported in the preceding table are primarily attributable to foreign currencymark-to-market.
Amounts in the table above exclude certain adjustments that will be made at the end of the Fund’s fiscal year for tax purposes.Adjustments may include, but are not limited to, wash sales and derivatives mark-to-market.
l. Senior Loans. Each Fund may invest in senior loans to corporate, governmental or other borrowers. Senior loans, which includeboth secured and unsecured loans made by banks and other financial institutions to corporate customers, typically hold the mostsenior position in a borrower’s capital structure, may be secured by the borrower’s assets and have interest rates that reset frequently.Senior Loans can include term loans, revolving credit facility loans and second lien loans. A senior loan is often administered by a bankor other financial institution that acts as agent for all holders. The agent administers the terms of the senior loan, as specified in the
| 98
Notes to Financial Statements (continued)June 30, 2021 (Unaudited)
loan agreement. Large loans may be shared or syndicated among several lenders. The Fund may enter into the primary syndicate for aloan or it may also purchase all or a portion of loans from other lenders (sometimes referred to as loan assignments), in either casebecoming a direct lender. The settlement period for senior loans is uncertain as there is no standardized settlement schedule applicable tosuch investments. Senior loans outstanding at the end of the period, if any, are listed in each applicable Fund’s Portfolio of Investments.
m. Loan Participations. A Fund’s investments in senior loans may be in the form of participations in loans. When investing in a loanparticipation, the Fund has the right to receive payments of principal, interest and any fees to which it is entitled only from the partyfrom whom the Fund has purchased the participation and only upon receipt by that party of payments from the borrower. The Fundgenerally has no right to enforce compliance by the borrower with the terms of the loan agreement or to vote on matters arising underthe loan agreement. Thus, the Fund may be subject to credit risk from both the party from whom it purchased the loan participation andthe borrower. Additionally, the Fund may have minimal control over the terms of any loan modification. Loan participations outstandingat the end of the period, if any, are listed in each applicable Fund’s Portfolio of Investments.
The Funds did not hold any loan participations as of June 30, 2021.
n. Collateralized Loan Obligations. Each Fund may invest in collateralized loan obligations (“CLOs”). A CLO is a type of asset-backedsecurity designed to redirect the cash flows from a pool of leveraged loans to investors based on their risk preferences. Cash flowsfrom a CLO are split into two or more portions, called tranches, varying in risk and yield. The risk of an investment in a CLO dependslargely on the type of the collateralized securities and the class of the instrument in which the Fund invests. The intent of the Fundswhen investing in CLOs is to purchase only higher level, investment grade level select tranches. CLOs outstanding at the end of theperiod, if any, are listed in each applicable Fund’s Portfolio of Investments.
o. Equity Linked Notes. Strategic Alpha Fund may invest in equity linked notes. An equity linked note is a structured product thatdiffers from a standard debt instrument where the cash payouts will be based on the return of an underlying equity. An equity linkednote is typically purchased at a full nominal amount and includes a coupon with an enhanced yield relative to the dividend yield of theunderlying security. At maturity the Fund will receive a redemption amount based on the final price of the underlying equity. The risk ofinvestment in an equity linked note depends on the principal protection offered. Some equity linked notes may guarantee total principalor partial principal amounts while others may not provide any guarantee of principal. The maturity value may also be impacted to theextent of any limit on the return value as part of the note structure. Equity linked notes outstanding at the end of the period, if any, arelisted in the Fund’s Portfolio of Investments.
The Fund did not hold any equity linked notes as of June 30, 2021.
p. Repurchase Agreements. Each Fund, except International Growth Fund, may enter into repurchase agreements, under the terms ofa Master Repurchase Agreement, under which each Fund acquires securities as collateral and agrees to resell the securities at anagreed upon time and at an agreed upon price. It is each Fund’s policy that the market value of the collateral for repurchaseagreements be at least equal to 102% of the repurchase price, including interest. Certain repurchase agreements are tri-partyarrangements whereby the collateral is held in a segregated account for the benefit of the Fund and on behalf of the counterparty.Repurchase agreements could involve certain risks in the event of default or insolvency of the counterparty, including possible delaysor restrictions upon a Fund’s ability to dispose of the underlying securities. As of June 30, 2021, each Fund, as applicable, hadinvestments in repurchase agreements for which the value of the related collateral exceeded the value of the repurchase agreement.The gross value of repurchase agreements is included in the Statements of Assets and Liabilities for financial reporting purposes.
q. When-Issued and Delayed Delivery Transactions. The Funds may enter into when-issued or delayed delivery transactions. When-issued refers to transactions made conditionally because a security, although authorized, has not been issued. Delayed delivery refersto transactions for which delivery or payment will occur at a later date, beyond the normal settlement period. The price of when-issuedand delayed delivery securities and the date when the securities will be delivered and paid for are fixed at the time the transaction isnegotiated. The security and the obligation to pay for it are recorded by the Funds at the time the commitment is entered into. The valueof the security may vary with market fluctuations during the time before the Funds take delivery of the security. No interest accrues tothe Funds until the transaction settles.
Delayed delivery transactions include those designated as To Be Announced (“TBAs”) in the Portfolios of Investments. For TBAs, theactual security that will be delivered to fulfill the transaction is not designated at the time of the trade. The security is “to beannounced” 48 hours prior to the established trade settlement date. Certain transactions require the Funds or counterparty to postcash and/or securities as collateral for the net mark-to-market exposure to the other party. The Funds cover their net obligations underoutstanding delayed delivery commitments by segregating or earmarking cash or securities.
Purchases of when-issued or delayed delivery securities may have a similar effect on the Funds’ NAV as if the Funds’ had created adegree of leverage in the portfolio. Risks may arise upon entering into such transactions from the potential inability of counterparties tomeet their obligations under the transactions. Additionally, losses may arise due to changes in the value of the underlying securities.
99 |
Notes to Financial Statements (continued)June 30, 2021 (Unaudited)
There were no when-issued or delayed delivery securities held by the Funds as of June 30, 2021.
r. Stripped Securities. Each Fund may invest in stripped securities, which are usually structured with two or more classes thatreceive different proportions of the interest and principal distribution on a pool of U.S. or foreign government securities or mortgageassets. In some cases, one class will receive all of the interest (the interest-only or “IO” class), while the other class will receive all ofthe principal (the principal-only or “PO” class). Stripped securities commonly have greater market volatility than other types of fixed-income securities. In the case of stripped mortgage securities, if the underlying mortgage assets experience greater than anticipatedprepayments of principal, a Fund may fail to recoup fully its investments in IOs.
The Funds did not hold any stripped securities as of June 30, 2021.
s. Securities Lending. High Income Fund, Investment Grade Bond Fund and Strategic Income Fund have entered into an agreementwith State Street Bank and Trust Company (“State Street Bank”), as agent of the Funds, to lend securities to certain designatedborrowers. The loans are collateralized with cash or securities in an amount equal to at least 105% or 102% of the market value(including accrued interest) of the loaned international or domestic securities, respectively, when the loan is initiated. Thereafter, thevalue of the collateral must remain at least 102% of the market value (including accrued interest) of loaned securities for U.S. equitiesand U.S. corporate debt; at least 105% of the market value (including accrued interest) of loaned securities for non-U.S. equities; and atleast 100% of the market value (including accrued interest) of loaned securities for U.S. Government securities, sovereign debt issuedby non-U.S. Governments and non-U.S. corporate debt. In the event that the market value of the collateral falls below the requiredpercentages described above, the borrower will deliver additional collateral on the next business day. As with other extensions ofcredit, the Funds may bear the risk of loss with respect to the investment of the collateral. The Funds invest cash collateral in short-term investments, a portion of the income from which is remitted to the borrowers and the remainder allocated between the Funds andState Street Bank as lending agent.
For the six months ended June 30, 2021, the Funds did not loan securities under this agreement.
t. Unfunded Loan Commitments. The Funds may enter into unfunded loan commitments, which are contractual obligations for futurefunding at the option of the borrower. Unfunded loan commitments represent a future obligation, in full, even though a percentage ofthe committed amount may not be utilized by the borrower. Unfunded loan commitments, and the obligation for future funding, arerecorded as a liability on the Statements of Assets and Liabilities at par value at the time the commitment is entered into. Purchases ofunfunded loan commitments may have a similar effect on the Fund’s NAV as if the Fund had created a degree of leverage in theportfolio. Market risk exists with these commitments to the same extent as if the securities were owned on a settled basis. Losses mayarise due to changes in the value of the unfunded loan commitments.
As of June 30, 2021, the Funds did not have any unfunded loan commitments.
u. Indemnifications. Under the Trusts’ organizational documents, their officers and Trustees are indemnified against certain liabilitiesarising out of the performance of their duties to the Funds. Additionally, in the normal course of business, the Funds enter into contractswith service providers that contain general indemnification clauses. The Funds’ maximum exposure under these arrangements isunknown as this would involve future claims that may be made against the Funds that have not yet occurred. However, based onexperience, the Funds expect the risk of loss to be remote.
v. New Accounting Pronouncement. In March 2020, the Financial Accounting Standards Board issued Accounting Standard Update2020-04, Reference Rate Reform (Topic 848) (“ASU 2020-04”). In response to concerns about structural risks of interbank offered rates,and particularly the risk of cessation of the London Interbank Offered Rate (“LIBOR”), which is expected to occur no later than June 30,2023, regulators have undertaken reference rate reform initiatives to identify alternative reference rates that are more observable ortransaction based and less susceptible to manipulation. ASU 2020-04 provides temporary guidance to ease the potential burden inaccounting for (or recognizing the effects of) reference rate reform on financial reporting. ASU 2020-04 is elective and applies to allentities, subject to meeting certain criteria, that have contracts that reference LIBOR or another reference rate expected to bediscontinued because of reference rate reform. ASU 2020-04 amendments offer optional expedients for contract modifications thatwould allow an entity to account for such modifications by prospectively adjusting the effective interest rate, instead of evaluatingeach contract, in accordance with existing accounting standards, as to whether reference rate modifications constitute theestablishment of new contracts or the continuation of existing contracts. ASU 2020-04 amendments are currently effective and anentity may elect to apply its provisions as of any date from the beginning of an interim period that includes or is subsequent toMarch 12, 2020. No Fund contracts have yet been impacted by reference rate reform. Management expects to apply the optionalexpedients when appropriate.
| 100
Notes to Financial Statements (continued)June 30, 2021 (Unaudited)
3. Fair Value Measurements. In accordance with accounting standards related to fair value measurements and disclosures, theFunds have categorized the inputs utilized in determining the value of each Fund’s assets or liabilities. These inputs are summarized inthe three broad levels listed below:
• Level 1 – quoted prices in active markets for identical assets or liabilities;
• Level 2 – prices determined using other significant inputs that are observable either directly, or indirectly through corroboration withobservable market data (which could include quoted prices for similar assets or liabilities, interest rates, credit risk, etc.); and
• Level 3 – prices determined using significant unobservable inputs when quoted prices or observable inputs are unavailable suchas when there is little or no market activity for an asset or liability (unobservable inputs reflect each Fund’s own assumptions indetermining the fair value of assets or liabilities and would be based on the best information available).
The inputs or methodology used for valuing securities are not necessarily an indication of the risk associated with investing in thosesecurities.
The Funds’ pricing policies and procedures are recommended by the adviser and approved by the Board of Trustees. Debt securitiesare valued based on evaluated bids furnished to the Funds by an independent pricing service. Broker-dealer bid prices may be used ifan independent pricing service either is unable to price a security or does not provide a reliable price for a security. The Funds’ advisermay use internally developed models to validate broker-dealer bid prices that are only available from a single broker or market maker.Such securities are considered and classified as fair valued. Broker-dealer bid prices for which the Funds do not have knowledge ofthe inputs used by the broker-dealer are categorized in Level 3. Securities for which market quotations are not readily available arevalued at fair value as determined in good faith by the Funds’ adviser pursuant to procedures approved by the Board of Trustees. Fairvalued securities may be categorized in Level 3.
101 |
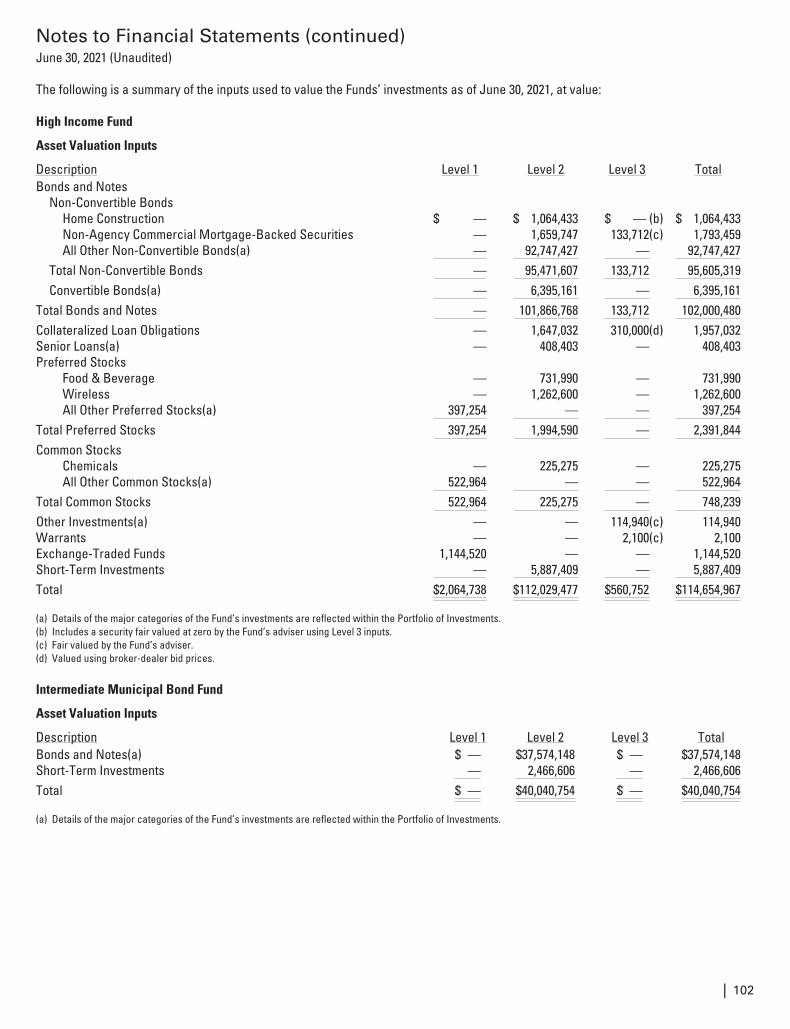
Notes to Financial Statements (continued)June 30, 2021 (Unaudited)
The following is a summary of the inputs used to value the Funds’ investments as of June 30, 2021, at value:
High Income Fund
Asset Valuation Inputs
Description Level 1 Level 2 Level 3 TotalBonds and Notes
Non-Convertible BondsHome Construction $ — $ 1,064,433 $ — (b) $ 1,064,433Non-Agency Commercial Mortgage-Backed Securities — 1,659,747 133,712(c) 1,793,459All Other Non-Convertible Bonds(a) — 92,747,427 — 92,747,427
Total Non-Convertible Bonds — 95,471,607 133,712 95,605,319Convertible Bonds(a) — 6,395,161 — 6,395,161
Total Bonds and Notes — 101,866,768 133,712 102,000,480Collateralized Loan Obligations — 1,647,032 310,000(d) 1,957,032Senior Loans(a) — 408,403 — 408,403Preferred Stocks
Food & Beverage — 731,990 — 731,990Wireless — 1,262,600 — 1,262,600All Other Preferred Stocks(a) 397,254 — — 397,254
Total Preferred Stocks 397,254 1,994,590 — 2,391,844Common Stocks
Chemicals — 225,275 — 225,275All Other Common Stocks(a) 522,964 — — 522,964
Total Common Stocks 522,964 225,275 — 748,239Other Investments(a) — — 114,940(c) 114,940Warrants — — 2,100(c) 2,100Exchange-Traded Funds 1,144,520 — — 1,144,520Short-Term Investments — 5,887,409 — 5,887,409Total $2,064,738 $112,029,477 $560,752 $114,654,967
(a) Details of the major categories of the Fund’s investments are reflected within the Portfolio of Investments.(b) Includes a security fair valued at zero by the Fund’s adviser using Level 3 inputs.(c) Fair valued by the Fund’s adviser.(d) Valued using broker-dealer bid prices.
Intermediate Municipal Bond Fund
Asset Valuation Inputs
Description Level 1 Level 2 Level 3 TotalBonds and Notes(a) $ — $37,574,148 $ — $37,574,148Short-Term Investments — 2,466,606 — 2,466,606Total $ — $40,040,754 $ — $40,040,754
(a) Details of the major categories of the Fund’s investments are reflected within the Portfolio of Investments.
| 102
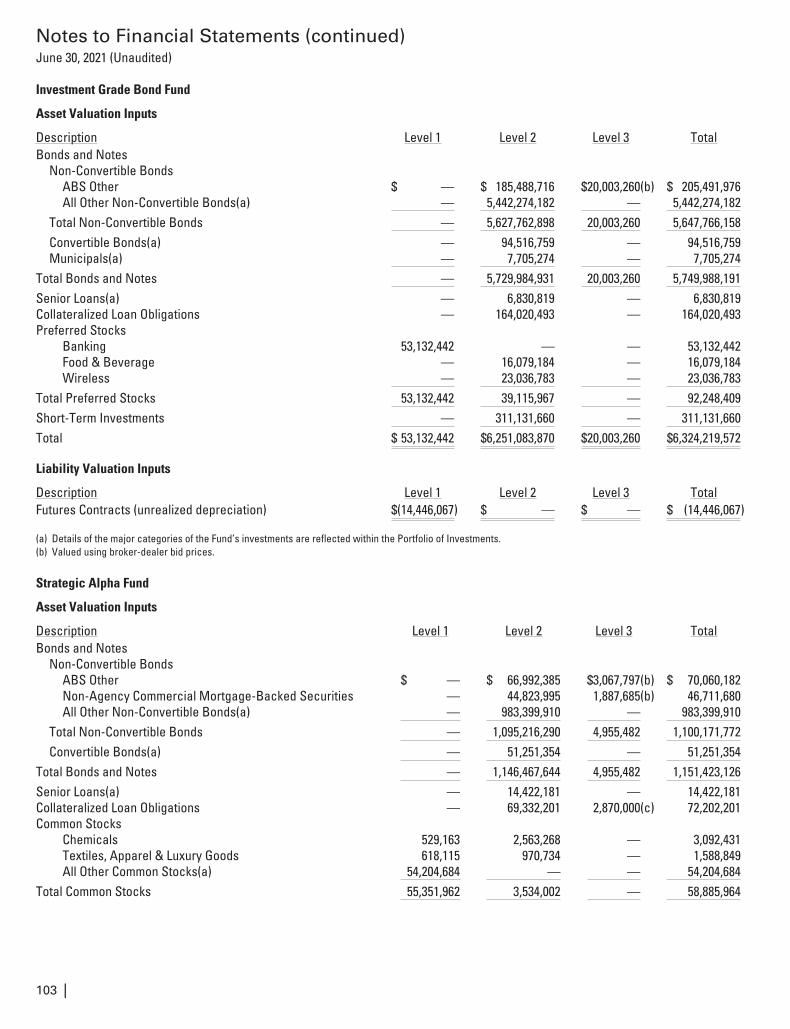
Notes to Financial Statements (continued)June 30, 2021 (Unaudited)
Investment Grade Bond Fund
Asset Valuation Inputs
Description Level 1 Level 2 Level 3 TotalBonds and Notes
Non-Convertible BondsABS Other $ — $ 185,488,716 $20,003,260(b) $ 205,491,976All Other Non-Convertible Bonds(a) — 5,442,274,182 — 5,442,274,182
Total Non-Convertible Bonds — 5,627,762,898 20,003,260 5,647,766,158Convertible Bonds(a) — 94,516,759 — 94,516,759Municipals(a) — 7,705,274 — 7,705,274
Total Bonds and Notes — 5,729,984,931 20,003,260 5,749,988,191Senior Loans(a) — 6,830,819 — 6,830,819Collateralized Loan Obligations — 164,020,493 — 164,020,493Preferred Stocks
Banking 53,132,442 — — 53,132,442Food & Beverage — 16,079,184 — 16,079,184Wireless — 23,036,783 — 23,036,783
Total Preferred Stocks 53,132,442 39,115,967 — 92,248,409Short-Term Investments — 311,131,660 — 311,131,660Total $ 53,132,442 $6,251,083,870 $20,003,260 $6,324,219,572
Liability Valuation Inputs
Description Level 1 Level 2 Level 3 TotalFutures Contracts (unrealized depreciation) $(14,446,067) $ — $ — $ (14,446,067)
(a) Details of the major categories of the Fund’s investments are reflected within the Portfolio of Investments.(b) Valued using broker-dealer bid prices.
Strategic Alpha Fund
Asset Valuation Inputs
Description Level 1 Level 2 Level 3 TotalBonds and Notes
Non-Convertible BondsABS Other $ — $ 66,992,385 $3,067,797(b) $ 70,060,182Non-Agency Commercial Mortgage-Backed Securities — 44,823,995 1,887,685(b) 46,711,680All Other Non-Convertible Bonds(a) — 983,399,910 — 983,399,910
Total Non-Convertible Bonds — 1,095,216,290 4,955,482 1,100,171,772Convertible Bonds(a) — 51,251,354 — 51,251,354
Total Bonds and Notes — 1,146,467,644 4,955,482 1,151,423,126Senior Loans(a) — 14,422,181 — 14,422,181Collateralized Loan Obligations — 69,332,201 2,870,000(c) 72,202,201Common Stocks
Chemicals 529,163 2,563,268 — 3,092,431Textiles, Apparel & Luxury Goods 618,115 970,734 — 1,588,849All Other Common Stocks(a) 54,204,684 — — 54,204,684
Total Common Stocks 55,351,962 3,534,002 — 58,885,964
103 |
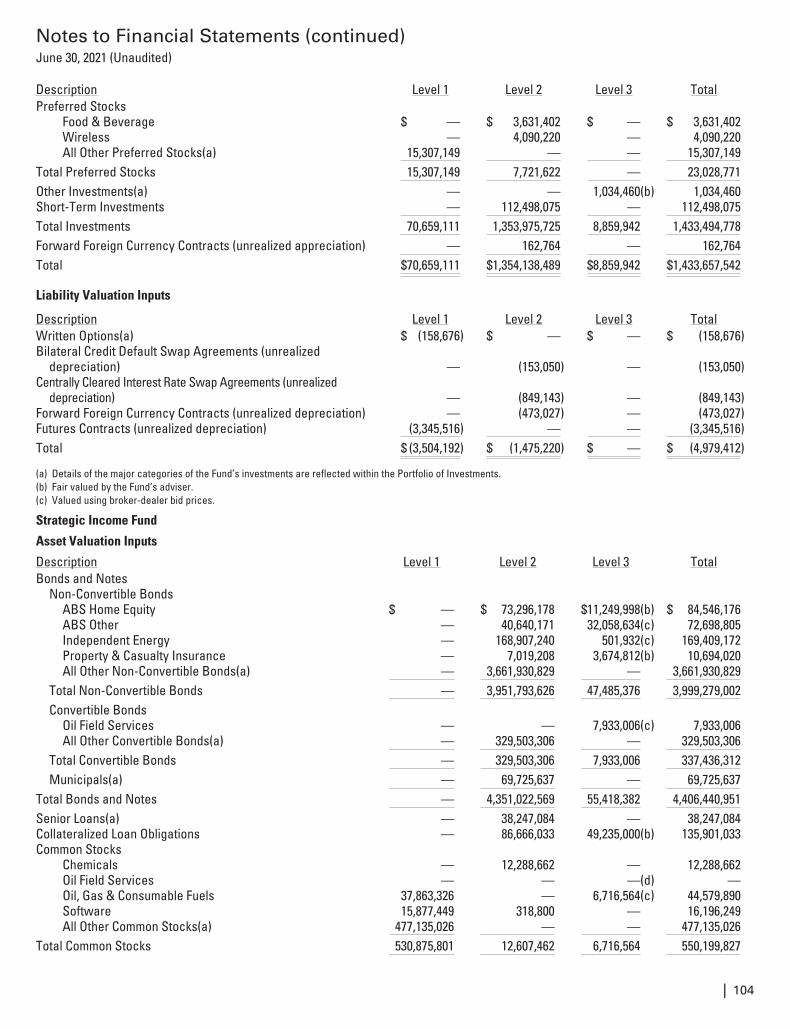
Notes to Financial Statements (continued)June 30, 2021 (Unaudited)
Description Level 1 Level 2 Level 3 TotalPreferred Stocks
Food & Beverage $ — $ 3,631,402 $ — $ 3,631,402Wireless — 4,090,220 — 4,090,220All Other Preferred Stocks(a) 15,307,149 — — 15,307,149
Total Preferred Stocks 15,307,149 7,721,622 — 23,028,771Other Investments(a) — — 1,034,460(b) 1,034,460Short-Term Investments — 112,498,075 — 112,498,075Total Investments 70,659,111 1,353,975,725 8,859,942 1,433,494,778Forward Foreign Currency Contracts (unrealized appreciation) — 162,764 — 162,764Total $70,659,111 $1,354,138,489 $8,859,942 $1,433,657,542
Liability Valuation Inputs
Description Level 1 Level 2 Level 3 TotalWritten Options(a) $ (158,676) $ — $ — $ (158,676)Bilateral Credit Default Swap Agreements (unrealized
depreciation) — (153,050) — (153,050)Centrally Cleared Interest Rate Swap Agreements (unrealized
depreciation) — (849,143) — (849,143)Forward Foreign Currency Contracts (unrealized depreciation) — (473,027) — (473,027)Futures Contracts (unrealized depreciation) (3,345,516) — — (3,345,516)Total $ (3,504,192) $ (1,475,220) $ — $ (4,979,412)
(a) Details of the major categories of the Fund’s investments are reflected within the Portfolio of Investments.(b) Fair valued by the Fund’s adviser.(c) Valued using broker-dealer bid prices.
Strategic Income Fund
Asset Valuation Inputs
Description Level 1 Level 2 Level 3 TotalBonds and Notes
Non-Convertible BondsABS Home Equity $ — $ 73,296,178 $11,249,998(b) $ 84,546,176ABS Other — 40,640,171 32,058,634(c) 72,698,805Independent Energy — 168,907,240 501,932(c) 169,409,172Property & Casualty Insurance — 7,019,208 3,674,812(b) 10,694,020All Other Non-Convertible Bonds(a) — 3,661,930,829 — 3,661,930,829
Total Non-Convertible Bonds — 3,951,793,626 47,485,376 3,999,279,002Convertible Bonds
Oil Field Services — — 7,933,006(c) 7,933,006All Other Convertible Bonds(a) — 329,503,306 — 329,503,306
Total Convertible Bonds — 329,503,306 7,933,006 337,436,312Municipals(a) — 69,725,637 — 69,725,637
Total Bonds and Notes — 4,351,022,569 55,418,382 4,406,440,951Senior Loans(a) — 38,247,084 — 38,247,084Collateralized Loan Obligations — 86,666,033 49,235,000(b) 135,901,033Common Stocks
Chemicals — 12,288,662 — 12,288,662Oil Field Services — — —(d) —Oil, Gas & Consumable Fuels 37,863,326 — 6,716,564(c) 44,579,890Software 15,877,449 318,800 — 16,196,249All Other Common Stocks(a) 477,135,026 — — 477,135,026
Total Common Stocks 530,875,801 12,607,462 6,716,564 550,199,827
| 104
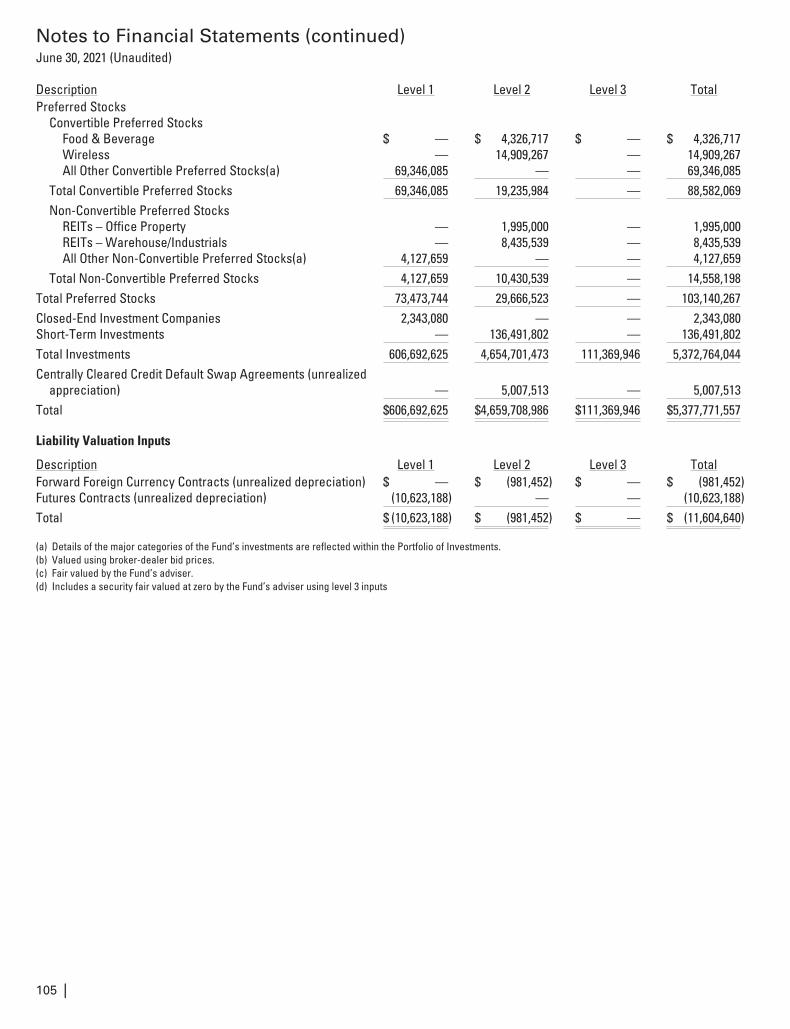
Notes to Financial Statements (continued)June 30, 2021 (Unaudited)
Description Level 1 Level 2 Level 3 TotalPreferred Stocks
Convertible Preferred StocksFood & Beverage $ — $ 4,326,717 $ — $ 4,326,717Wireless — 14,909,267 — 14,909,267All Other Convertible Preferred Stocks(a) 69,346,085 — — 69,346,085
Total Convertible Preferred Stocks 69,346,085 19,235,984 — 88,582,069Non-Convertible Preferred Stocks
REITs – Office Property — 1,995,000 — 1,995,000REITs – Warehouse/Industrials — 8,435,539 — 8,435,539All Other Non-Convertible Preferred Stocks(a) 4,127,659 — — 4,127,659
Total Non-Convertible Preferred Stocks 4,127,659 10,430,539 — 14,558,198Total Preferred Stocks 73,473,744 29,666,523 — 103,140,267Closed-End Investment Companies 2,343,080 — — 2,343,080Short-Term Investments — 136,491,802 — 136,491,802Total Investments 606,692,625 4,654,701,473 111,369,946 5,372,764,044Centrally Cleared Credit Default Swap Agreements (unrealized
appreciation) — 5,007,513 — 5,007,513Total $606,692,625 $4,659,708,986 $111,369,946 $5,377,771,557
Liability Valuation Inputs
Description Level 1 Level 2 Level 3 TotalForward Foreign Currency Contracts (unrealized depreciation) $ — $ (981,452) $ — $ (981,452)Futures Contracts (unrealized depreciation) (10,623,188) — — (10,623,188)Total $ (10,623,188) $ (981,452) $ — $ (11,604,640)
(a) Details of the major categories of the Fund’s investments are reflected within the Portfolio of Investments.(b) Valued using broker-dealer bid prices.(c) Fair valued by the Fund’s adviser.(d) Includes a security fair valued at zero by the Fund’s adviser using level 3 inputs
105 |
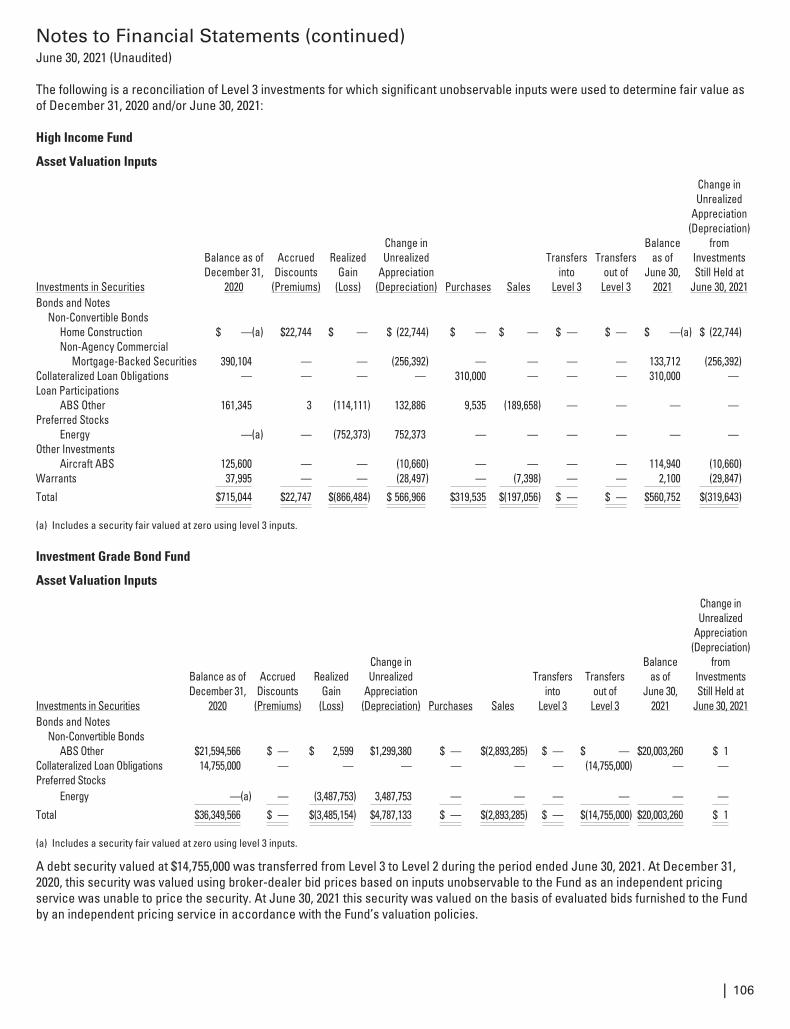
Notes to Financial Statements (continued)June 30, 2021 (Unaudited)
The following is a reconciliation of Level 3 investments for which significant unobservable inputs were used to determine fair value asof December 31, 2020 and/or June 30, 2021:
High Income Fund
Asset Valuation Inputs
Investments in Securities
Balance as ofDecember 31,
2020
AccruedDiscounts
(Premiums)
RealizedGain
(Loss)
Change inUnrealized
Appreciation(Depreciation) Purchases Sales
Transfersinto
Level 3
Transfersout of
Level 3
Balanceas of
June 30,2021
Change inUnrealized
Appreciation(Depreciation)
fromInvestmentsStill Held at
June 30, 2021Bonds and Notes
Non-Convertible BondsHome Construction $ —(a) $22,744 $ — $ (22,744) $ — $ — $ — $ — $ —(a) $ (22,744)Non-Agency Commercial
Mortgage-Backed Securities 390,104 — — (256,392) — — — — 133,712 (256,392)Collateralized Loan Obligations — — — — 310,000 — — — 310,000 —Loan Participations
ABS Other 161,345 3 (114,111) 132,886 9,535 (189,658) — — — —Preferred Stocks
Energy —(a) — (752,373) 752,373 — — — — — —Other Investments
Aircraft ABS 125,600 — — (10,660) — — — — 114,940 (10,660)Warrants 37,995 — — (28,497) — (7,398) — — 2,100 (29,847)
Total $715,044 $22,747 $(866,484) $ 566,966 $319,535 $(197,056) $ — $ — $560,752 $(319,643)
(a) Includes a security fair valued at zero using level 3 inputs.
Investment Grade Bond Fund
Asset Valuation Inputs
Investments in Securities
Balance as ofDecember 31,
2020
AccruedDiscounts
(Premiums)
RealizedGain
(Loss)
Change inUnrealized
Appreciation(Depreciation) Purchases Sales
Transfersinto
Level 3
Transfersout of
Level 3
Balanceas of
June 30,2021
Change inUnrealized
Appreciation(Depreciation)
fromInvestmentsStill Held at
June 30, 2021Bonds and Notes
Non-Convertible BondsABS Other $21,594,566 $ — $ 2,599 $1,299,380 $ — $(2,893,285) $ — $ — $20,003,260 $ 1
Collateralized Loan Obligations 14,755,000 — — — — — — (14,755,000) — —Preferred Stocks
Energy —(a) — (3,487,753) 3,487,753 — — — — — —
Total $36,349,566 $ — $(3,485,154) $4,787,133 $ — $(2,893,285) $ — $(14,755,000) $20,003,260 $ 1
(a) Includes a security fair valued at zero using level 3 inputs.
A debt security valued at $14,755,000 was transferred from Level 3 to Level 2 during the period ended June 30, 2021. At December 31,2020, this security was valued using broker-dealer bid prices based on inputs unobservable to the Fund as an independent pricingservice was unable to price the security. At June 30, 2021 this security was valued on the basis of evaluated bids furnished to the Fundby an independent pricing service in accordance with the Fund’s valuation policies.
| 106
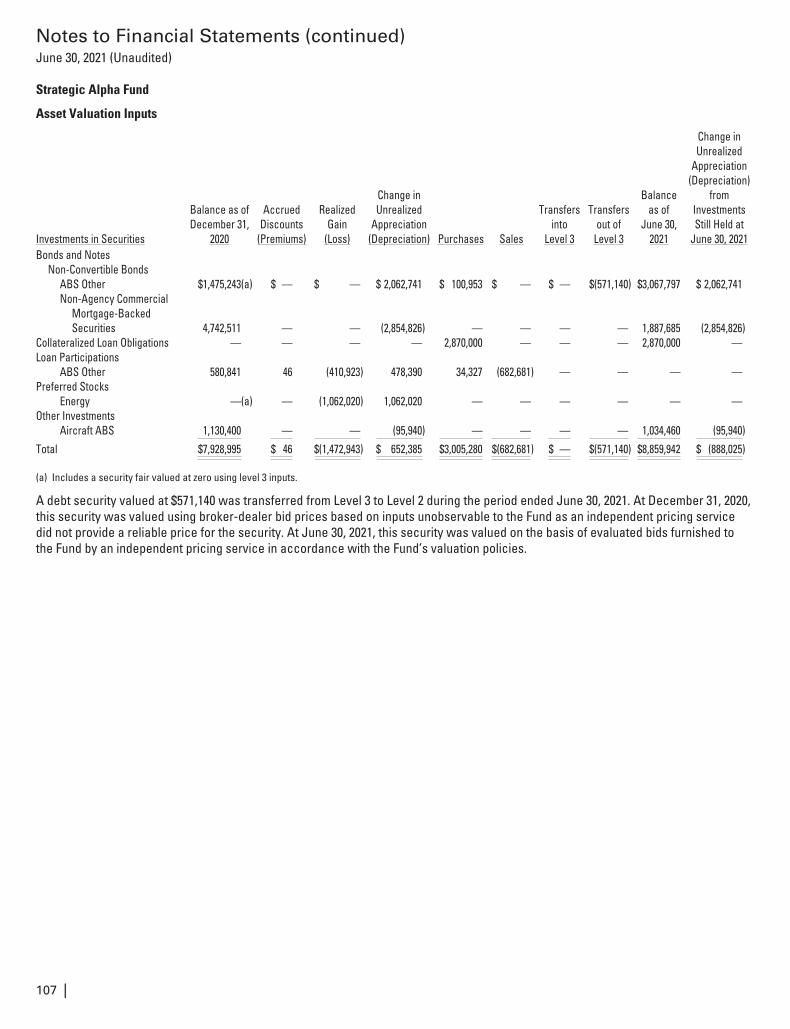
Notes to Financial Statements (continued)June 30, 2021 (Unaudited)
Strategic Alpha Fund
Asset Valuation Inputs
Investments in Securities
Balance as ofDecember 31,
2020
AccruedDiscounts
(Premiums)
RealizedGain
(Loss)
Change inUnrealized
Appreciation(Depreciation) Purchases Sales
Transfersinto
Level 3
Transfersout of
Level 3
Balanceas of
June 30,2021
Change inUnrealized
Appreciation(Depreciation)
fromInvestmentsStill Held at
June 30, 2021Bonds and Notes
Non-Convertible BondsABS Other $1,475,243(a) $ — $ — $ 2,062,741 $ 100,953 $ — $ — $(571,140) $3,067,797 $ 2,062,741Non-Agency Commercial
Mortgage-BackedSecurities 4,742,511 — — (2,854,826) — — — — 1,887,685 (2,854,826)
Collateralized Loan Obligations — — — — 2,870,000 — — — 2,870,000 —Loan Participations
ABS Other 580,841 46 (410,923) 478,390 34,327 (682,681) — — — —Preferred Stocks
Energy —(a) — (1,062,020) 1,062,020 — — — — — —Other Investments
Aircraft ABS 1,130,400 — — (95,940) — — — — 1,034,460 (95,940)
Total $7,928,995 $ 46 $(1,472,943) $ 652,385 $3,005,280 $(682,681) $ — $(571,140) $8,859,942 $ (888,025)
(a) Includes a security fair valued at zero using level 3 inputs.
A debt security valued at $571,140 was transferred from Level 3 to Level 2 during the period ended June 30, 2021. At December 31, 2020,this security was valued using broker-dealer bid prices based on inputs unobservable to the Fund as an independent pricing servicedid not provide a reliable price for the security. At June 30, 2021, this security was valued on the basis of evaluated bids furnished tothe Fund by an independent pricing service in accordance with the Fund’s valuation policies.
107 |
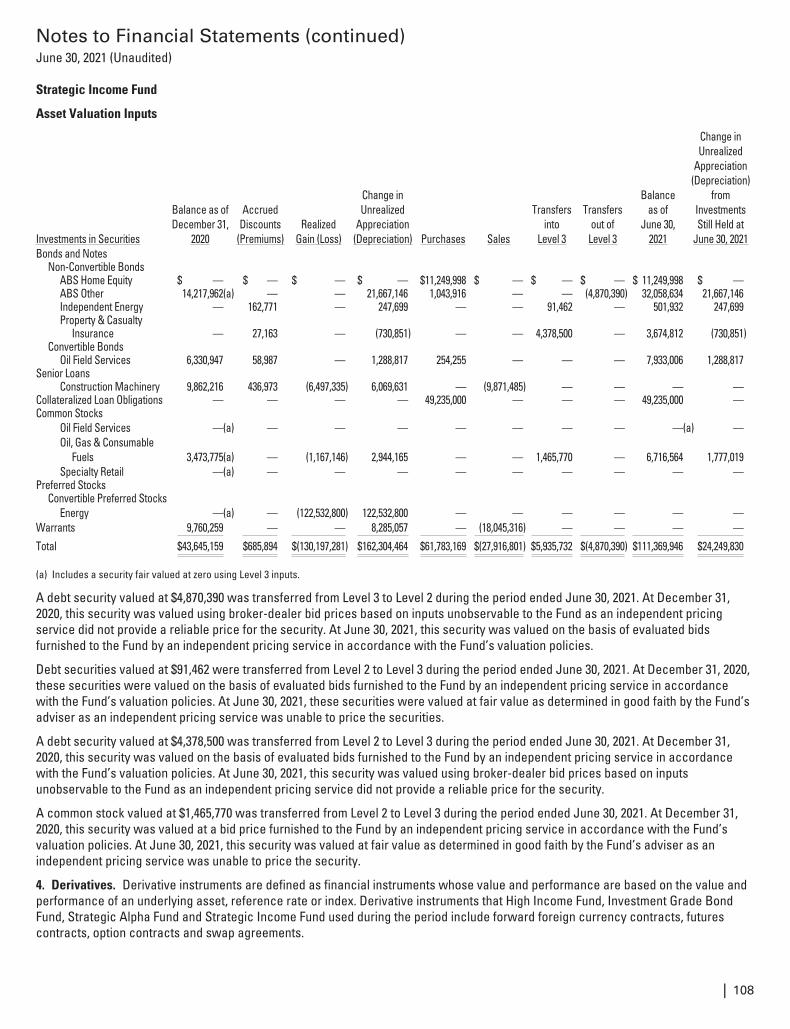
Notes to Financial Statements (continued)June 30, 2021 (Unaudited)
Strategic Income Fund
Asset Valuation Inputs
Investments in Securities
Balance as ofDecember 31,
2020
AccruedDiscounts
(Premiums)Realized
Gain (Loss)
Change inUnrealized
Appreciation(Depreciation) Purchases Sales
Transfersinto
Level 3
Transfersout of
Level 3
Balanceas of
June 30,2021
Change inUnrealized
Appreciation(Depreciation)
fromInvestmentsStill Held at
June 30, 2021Bonds and Notes
Non-Convertible BondsABS Home Equity $ — $ — $ — $ — $11,249,998 $ — $ — $ — $ 11,249,998 $ —ABS Other 14,217,962(a) — — 21,667,146 1,043,916 — — (4,870,390) 32,058,634 21,667,146Independent Energy — 162,771 — 247,699 — — 91,462 — 501,932 247,699Property & Casualty
Insurance — 27,163 — (730,851) — — 4,378,500 — 3,674,812 (730,851)Convertible Bonds
Oil Field Services 6,330,947 58,987 — 1,288,817 254,255 — — — 7,933,006 1,288,817Senior Loans
Construction Machinery 9,862,216 436,973 (6,497,335) 6,069,631 — (9,871,485) — — — —Collateralized Loan Obligations — — — — 49,235,000 — — — 49,235,000 —Common Stocks
Oil Field Services —(a) — — — — — — — —(a) —Oil, Gas & Consumable
Fuels 3,473,775(a) — (1,167,146) 2,944,165 — — 1,465,770 — 6,716,564 1,777,019Specialty Retail —(a) — — — — — — — — —
Preferred StocksConvertible Preferred Stocks
Energy —(a) — (122,532,800) 122,532,800 — — — — — —Warrants 9,760,259 — — 8,285,057 — (18,045,316) — — — —
Total $43,645,159 $685,894 $(130,197,281) $162,304,464 $61,783,169 $(27,916,801) $5,935,732 $(4,870,390) $111,369,946 $24,249,830
(a) Includes a security fair valued at zero using Level 3 inputs.
A debt security valued at $4,870,390 was transferred from Level 3 to Level 2 during the period ended June 30, 2021. At December 31,2020, this security was valued using broker-dealer bid prices based on inputs unobservable to the Fund as an independent pricingservice did not provide a reliable price for the security. At June 30, 2021, this security was valued on the basis of evaluated bidsfurnished to the Fund by an independent pricing service in accordance with the Fund’s valuation policies.
Debt securities valued at $91,462 were transferred from Level 2 to Level 3 during the period ended June 30, 2021. At December 31, 2020,these securities were valued on the basis of evaluated bids furnished to the Fund by an independent pricing service in accordancewith the Fund’s valuation policies. At June 30, 2021, these securities were valued at fair value as determined in good faith by the Fund’sadviser as an independent pricing service was unable to price the securities.
A debt security valued at $4,378,500 was transferred from Level 2 to Level 3 during the period ended June 30, 2021. At December 31,2020, this security was valued on the basis of evaluated bids furnished to the Fund by an independent pricing service in accordancewith the Fund’s valuation policies. At June 30, 2021, this security was valued using broker-dealer bid prices based on inputsunobservable to the Fund as an independent pricing service did not provide a reliable price for the security.
A common stock valued at $1,465,770 was transferred from Level 2 to Level 3 during the period ended June 30, 2021. At December 31,2020, this security was valued at a bid price furnished to the Fund by an independent pricing service in accordance with the Fund’svaluation policies. At June 30, 2021, this security was valued at fair value as determined in good faith by the Fund’s adviser as anindependent pricing service was unable to price the security.
4. Derivatives. Derivative instruments are defined as financial instruments whose value and performance are based on the value andperformance of an underlying asset, reference rate or index. Derivative instruments that High Income Fund, Investment Grade BondFund, Strategic Alpha Fund and Strategic Income Fund used during the period include forward foreign currency contracts, futurescontracts, option contracts and swap agreements.
| 108
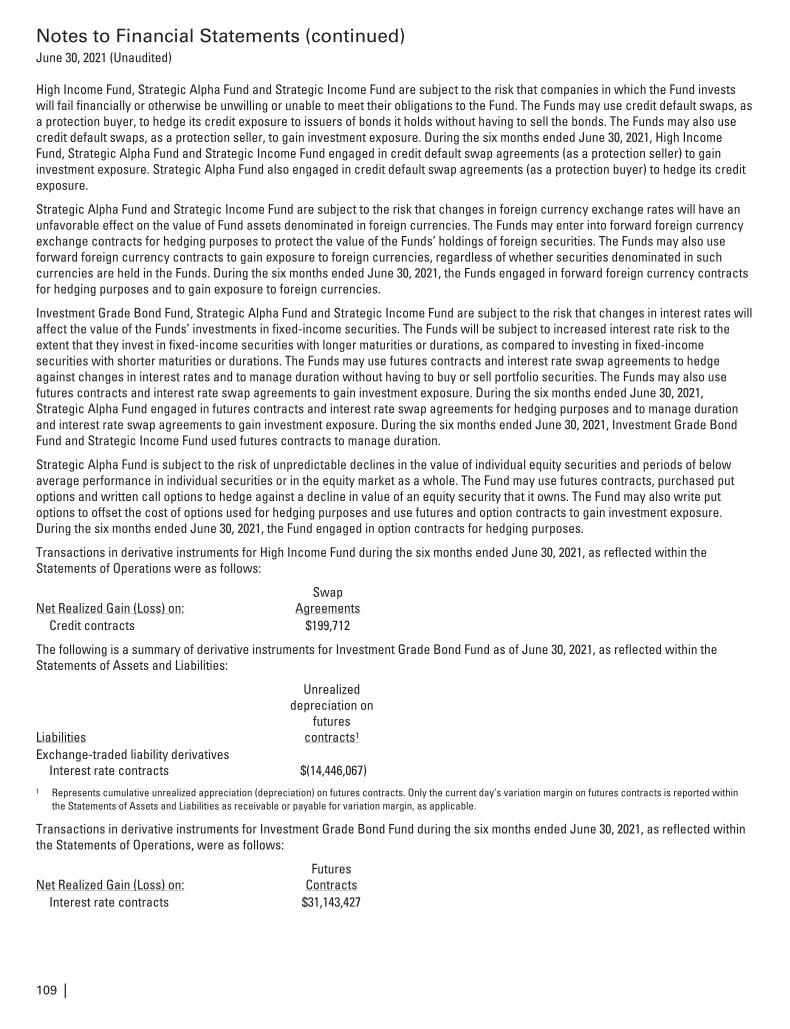
Notes to Financial Statements (continued)June 30, 2021 (Unaudited)
High Income Fund, Strategic Alpha Fund and Strategic Income Fund are subject to the risk that companies in which the Fund investswill fail financially or otherwise be unwilling or unable to meet their obligations to the Fund. The Funds may use credit default swaps, asa protection buyer, to hedge its credit exposure to issuers of bonds it holds without having to sell the bonds. The Funds may also usecredit default swaps, as a protection seller, to gain investment exposure. During the six months ended June 30, 2021, High IncomeFund, Strategic Alpha Fund and Strategic Income Fund engaged in credit default swap agreements (as a protection seller) to gaininvestment exposure. Strategic Alpha Fund also engaged in credit default swap agreements (as a protection buyer) to hedge its creditexposure.
Strategic Alpha Fund and Strategic Income Fund are subject to the risk that changes in foreign currency exchange rates will have anunfavorable effect on the value of Fund assets denominated in foreign currencies. The Funds may enter into forward foreign currencyexchange contracts for hedging purposes to protect the value of the Funds’ holdings of foreign securities. The Funds may also useforward foreign currency contracts to gain exposure to foreign currencies, regardless of whether securities denominated in suchcurrencies are held in the Funds. During the six months ended June 30, 2021, the Funds engaged in forward foreign currency contractsfor hedging purposes and to gain exposure to foreign currencies.
Investment Grade Bond Fund, Strategic Alpha Fund and Strategic Income Fund are subject to the risk that changes in interest rates willaffect the value of the Funds’ investments in fixed-income securities. The Funds will be subject to increased interest rate risk to theextent that they invest in fixed-income securities with longer maturities or durations, as compared to investing in fixed-incomesecurities with shorter maturities or durations. The Funds may use futures contracts and interest rate swap agreements to hedgeagainst changes in interest rates and to manage duration without having to buy or sell portfolio securities. The Funds may also usefutures contracts and interest rate swap agreements to gain investment exposure. During the six months ended June 30, 2021,Strategic Alpha Fund engaged in futures contracts and interest rate swap agreements for hedging purposes and to manage durationand interest rate swap agreements to gain investment exposure. During the six months ended June 30, 2021, Investment Grade BondFund and Strategic Income Fund used futures contracts to manage duration.
Strategic Alpha Fund is subject to the risk of unpredictable declines in the value of individual equity securities and periods of belowaverage performance in individual securities or in the equity market as a whole. The Fund may use futures contracts, purchased putoptions and written call options to hedge against a decline in value of an equity security that it owns. The Fund may also write putoptions to offset the cost of options used for hedging purposes and use futures and option contracts to gain investment exposure.During the six months ended June 30, 2021, the Fund engaged in option contracts for hedging purposes.
Transactions in derivative instruments for High Income Fund during the six months ended June 30, 2021, as reflected within theStatements of Operations were as follows:
Net Realized Gain (Loss) on:Swap
AgreementsCredit contracts $199,712
The following is a summary of derivative instruments for Investment Grade Bond Fund as of June 30, 2021, as reflected within theStatements of Assets and Liabilities:
Liabilities
Unrealizeddepreciation on
futurescontracts1
Exchange-traded liability derivativesInterest rate contracts $(14,446,067)
1 Represents cumulative unrealized appreciation (depreciation) on futures contracts. Only the current day’s variation margin on futures contracts is reported withinthe Statements of Assets and Liabilities as receivable or payable for variation margin, as applicable.
Transactions in derivative instruments for Investment Grade Bond Fund during the six months ended June 30, 2021, as reflected withinthe Statements of Operations, were as follows:
Net Realized Gain (Loss) on:Futures
ContractsInterest rate contracts $31,143,427
109 |
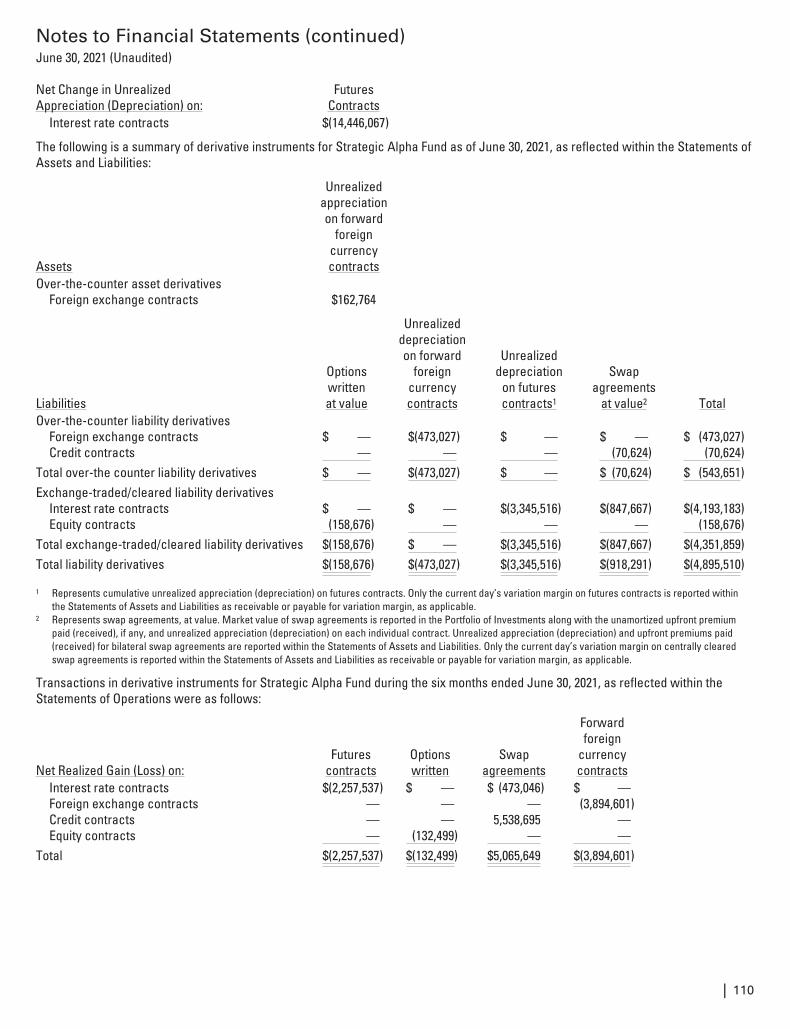
Notes to Financial Statements (continued)June 30, 2021 (Unaudited)
Net Change in UnrealizedAppreciation (Depreciation) on:
FuturesContracts
Interest rate contracts $(14,446,067)
The following is a summary of derivative instruments for Strategic Alpha Fund as of June 30, 2021, as reflected within the Statements ofAssets and Liabilities:
Assets
Unrealizedappreciationon forward
foreigncurrencycontracts
Over-the-counter asset derivativesForeign exchange contracts $162,764
Liabilities
Optionswrittenat value
Unrealizeddepreciationon forward
foreigncurrencycontracts
Unrealizeddepreciation
on futurescontracts1
Swapagreements
at value2 TotalOver-the-counter liability derivatives
Foreign exchange contracts $ — $(473,027) $ — $ — $ (473,027)Credit contracts — — — (70,624) (70,624)
Total over-the counter liability derivatives $ — $(473,027) $ — $ (70,624) $ (543,651)Exchange-traded/cleared liability derivatives
Interest rate contracts $ — $ — $(3,345,516) $(847,667) $(4,193,183)Equity contracts (158,676) — — — (158,676)
Total exchange-traded/cleared liability derivatives $(158,676) $ — $(3,345,516) $(847,667) $(4,351,859)Total liability derivatives $(158,676) $(473,027) $(3,345,516) $(918,291) $(4,895,510)
1 Represents cumulative unrealized appreciation (depreciation) on futures contracts. Only the current day’s variation margin on futures contracts is reported withinthe Statements of Assets and Liabilities as receivable or payable for variation margin, as applicable.
2 Represents swap agreements, at value. Market value of swap agreements is reported in the Portfolio of Investments along with the unamortized upfront premiumpaid (received), if any, and unrealized appreciation (depreciation) on each individual contract. Unrealized appreciation (depreciation) and upfront premiums paid(received) for bilateral swap agreements are reported within the Statements of Assets and Liabilities. Only the current day’s variation margin on centrally clearedswap agreements is reported within the Statements of Assets and Liabilities as receivable or payable for variation margin, as applicable.
Transactions in derivative instruments for Strategic Alpha Fund during the six months ended June 30, 2021, as reflected within theStatements of Operations were as follows:
Net Realized Gain (Loss) on:Futures
contractsOptionswritten
Swapagreements
Forwardforeign
currencycontracts
Interest rate contracts $(2,257,537) $ — $ (473,046) $ —Foreign exchange contracts — — — (3,894,601)Credit contracts — — 5,538,695 —Equity contracts — (132,499) — —
Total $(2,257,537) $(132,499) $5,065,649 $(3,894,601)
| 110
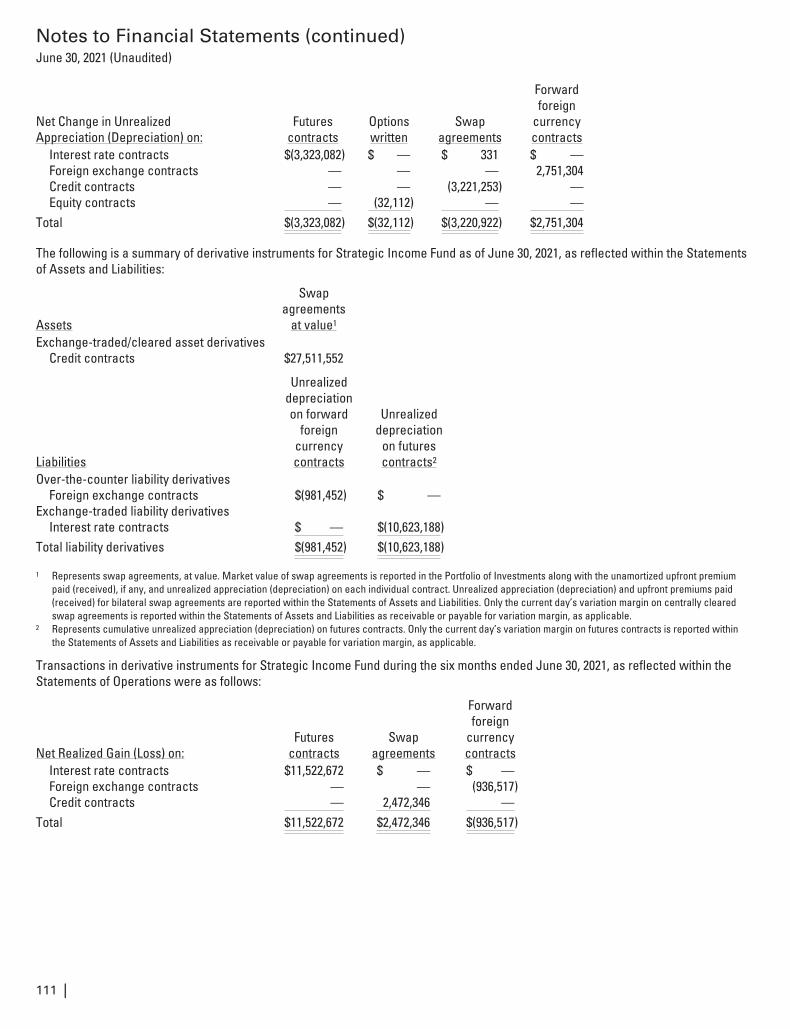
Notes to Financial Statements (continued)June 30, 2021 (Unaudited)
Net Change in UnrealizedAppreciation (Depreciation) on:
Futurescontracts
Optionswritten
Swapagreements
Forwardforeign
currencycontracts
Interest rate contracts $(3,323,082) $ — $ 331 $ —Foreign exchange contracts — — — 2,751,304Credit contracts — — (3,221,253) —Equity contracts — (32,112) — —
Total $(3,323,082) $(32,112) $(3,220,922) $2,751,304
The following is a summary of derivative instruments for Strategic Income Fund as of June 30, 2021, as reflected within the Statementsof Assets and Liabilities:
Assets
Swapagreements
at value1
Exchange-traded/cleared asset derivativesCredit contracts $27,511,552
Liabilities
Unrealizeddepreciationon forward
foreigncurrencycontracts
Unrealizeddepreciation
on futurescontracts2
Over-the-counter liability derivativesForeign exchange contracts $(981,452) $ —
Exchange-traded liability derivativesInterest rate contracts $ — $(10,623,188)
Total liability derivatives $(981,452) $(10,623,188)
1 Represents swap agreements, at value. Market value of swap agreements is reported in the Portfolio of Investments along with the unamortized upfront premiumpaid (received), if any, and unrealized appreciation (depreciation) on each individual contract. Unrealized appreciation (depreciation) and upfront premiums paid(received) for bilateral swap agreements are reported within the Statements of Assets and Liabilities. Only the current day’s variation margin on centrally clearedswap agreements is reported within the Statements of Assets and Liabilities as receivable or payable for variation margin, as applicable.
2 Represents cumulative unrealized appreciation (depreciation) on futures contracts. Only the current day’s variation margin on futures contracts is reported withinthe Statements of Assets and Liabilities as receivable or payable for variation margin, as applicable.
Transactions in derivative instruments for Strategic Income Fund during the six months ended June 30, 2021, as reflected within theStatements of Operations were as follows:
Net Realized Gain (Loss) on:Futures
contractsSwap
agreements
Forwardforeign
currencycontracts
Interest rate contracts $11,522,672 $ — $ —Foreign exchange contracts — — (936,517)Credit contracts — 2,472,346 —
Total $11,522,672 $2,472,346 $(936,517)
111 |
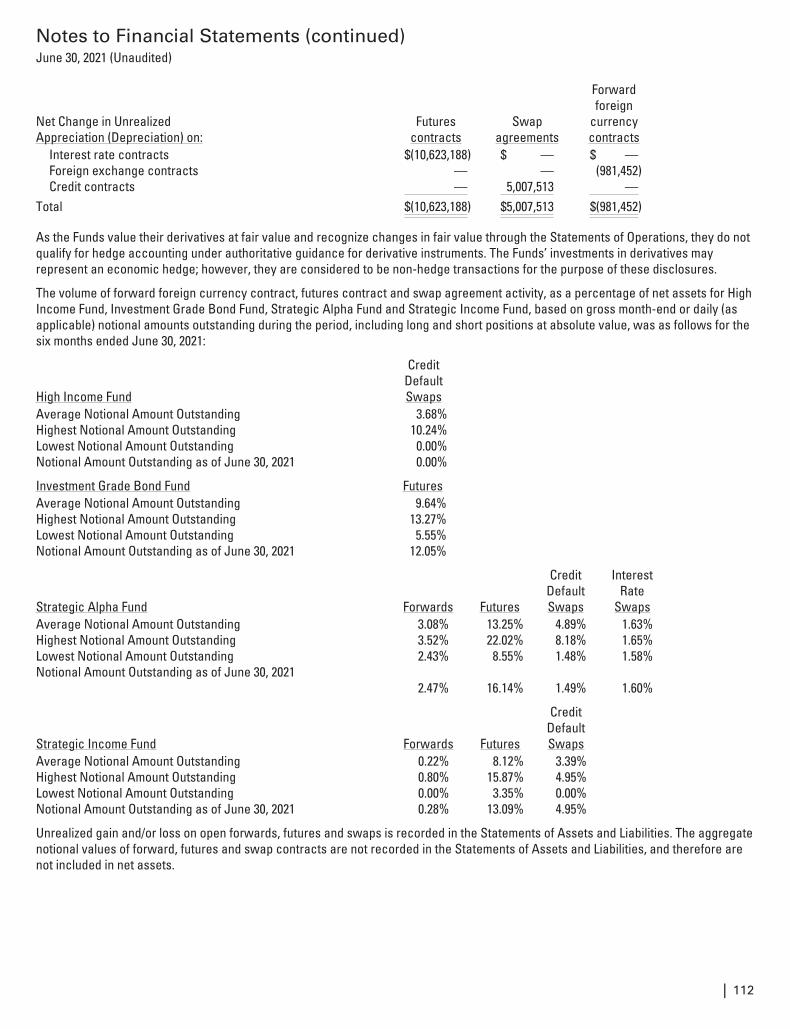
Notes to Financial Statements (continued)June 30, 2021 (Unaudited)
Net Change in UnrealizedAppreciation (Depreciation) on:
Futurescontracts
Swapagreements
Forwardforeign
currencycontracts
Interest rate contracts $(10,623,188) $ — $ —Foreign exchange contracts — — (981,452)Credit contracts — 5,007,513 —
Total $(10,623,188) $5,007,513 $(981,452)
As the Funds value their derivatives at fair value and recognize changes in fair value through the Statements of Operations, they do notqualify for hedge accounting under authoritative guidance for derivative instruments. The Funds’ investments in derivatives mayrepresent an economic hedge; however, they are considered to be non-hedge transactions for the purpose of these disclosures.
The volume of forward foreign currency contract, futures contract and swap agreement activity, as a percentage of net assets for HighIncome Fund, Investment Grade Bond Fund, Strategic Alpha Fund and Strategic Income Fund, based on gross month-end or daily (asapplicable) notional amounts outstanding during the period, including long and short positions at absolute value, was as follows for thesix months ended June 30, 2021:
High Income Fund
CreditDefaultSwaps
Average Notional Amount Outstanding 3.68%Highest Notional Amount Outstanding 10.24%Lowest Notional Amount Outstanding 0.00%Notional Amount Outstanding as of June 30, 2021 0.00%
Investment Grade Bond Fund FuturesAverage Notional Amount Outstanding 9.64%Highest Notional Amount Outstanding 13.27%Lowest Notional Amount Outstanding 5.55%Notional Amount Outstanding as of June 30, 2021 12.05%
Strategic Alpha Fund Forwards Futures
CreditDefaultSwaps
InterestRate
SwapsAverage Notional Amount Outstanding 3.08% 13.25% 4.89% 1.63%Highest Notional Amount Outstanding 3.52% 22.02% 8.18% 1.65%Lowest Notional Amount Outstanding 2.43% 8.55% 1.48% 1.58%Notional Amount Outstanding as of June 30, 2021
2.47% 16.14% 1.49% 1.60%
Strategic Income Fund Forwards Futures
CreditDefaultSwaps
Average Notional Amount Outstanding 0.22% 8.12% 3.39%Highest Notional Amount Outstanding 0.80% 15.87% 4.95%Lowest Notional Amount Outstanding 0.00% 3.35% 0.00%Notional Amount Outstanding as of June 30, 2021 0.28% 13.09% 4.95%
Unrealized gain and/or loss on open forwards, futures and swaps is recorded in the Statements of Assets and Liabilities. The aggregatenotional values of forward, futures and swap contracts are not recorded in the Statements of Assets and Liabilities, and therefore arenot included in net assets.
| 112
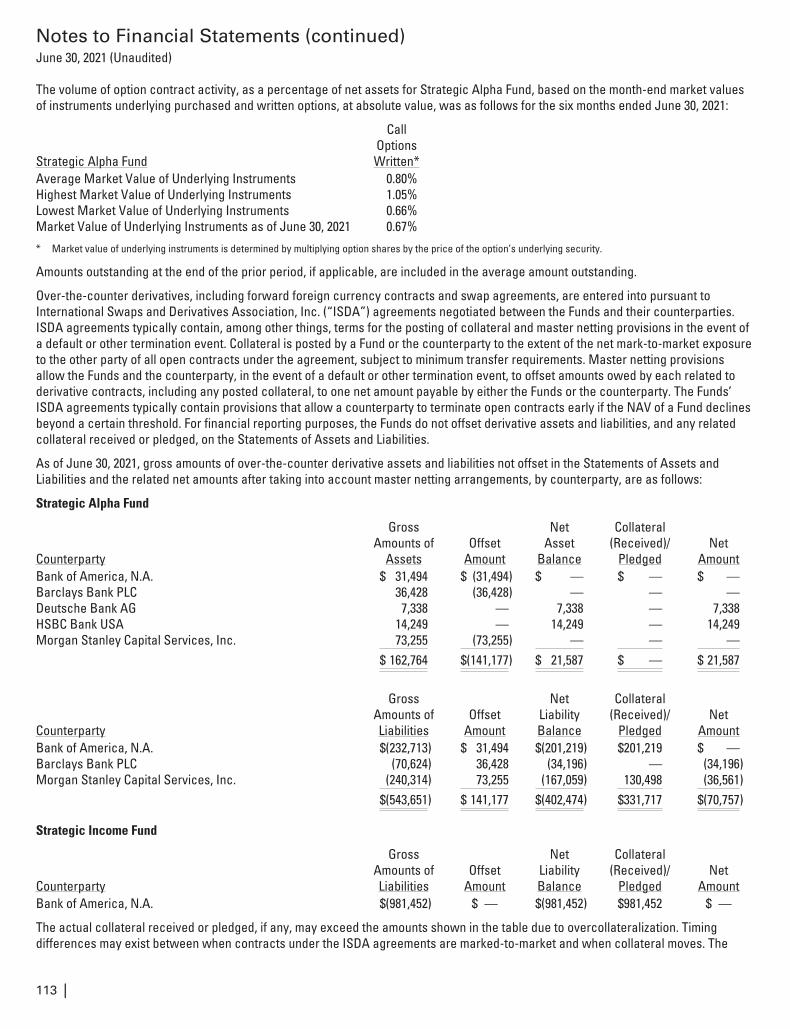
Notes to Financial Statements (continued)June 30, 2021 (Unaudited)
The volume of option contract activity, as a percentage of net assets for Strategic Alpha Fund, based on the month-end market valuesof instruments underlying purchased and written options, at absolute value, was as follows for the six months ended June 30, 2021:
Strategic Alpha Fund
CallOptionsWritten*
Average Market Value of Underlying Instruments 0.80%Highest Market Value of Underlying Instruments 1.05%Lowest Market Value of Underlying Instruments 0.66%Market Value of Underlying Instruments as of June 30, 2021 0.67%
* Market value of underlying instruments is determined by multiplying option shares by the price of the option’s underlying security.
Amounts outstanding at the end of the prior period, if applicable, are included in the average amount outstanding.
Over-the-counter derivatives, including forward foreign currency contracts and swap agreements, are entered into pursuant toInternational Swaps and Derivatives Association, Inc. (“ISDA”) agreements negotiated between the Funds and their counterparties.ISDA agreements typically contain, among other things, terms for the posting of collateral and master netting provisions in the event ofa default or other termination event. Collateral is posted by a Fund or the counterparty to the extent of the net mark-to-market exposureto the other party of all open contracts under the agreement, subject to minimum transfer requirements. Master netting provisionsallow the Funds and the counterparty, in the event of a default or other termination event, to offset amounts owed by each related toderivative contracts, including any posted collateral, to one net amount payable by either the Funds or the counterparty. The Funds’ISDA agreements typically contain provisions that allow a counterparty to terminate open contracts early if the NAV of a Fund declinesbeyond a certain threshold. For financial reporting purposes, the Funds do not offset derivative assets and liabilities, and any relatedcollateral received or pledged, on the Statements of Assets and Liabilities.
As of June 30, 2021, gross amounts of over-the-counter derivative assets and liabilities not offset in the Statements of Assets andLiabilities and the related net amounts after taking into account master netting arrangements, by counterparty, are as follows:
Strategic Alpha Fund
Counterparty
GrossAmounts of
AssetsOffset
Amount
NetAsset
Balance
Collateral(Received)/
PledgedNet
AmountBank of America, N.A. $ 31,494 $ (31,494) $ — $ — $ —Barclays Bank PLC 36,428 (36,428) — — —Deutsche Bank AG 7,338 — 7,338 — 7,338HSBC Bank USA 14,249 — 14,249 — 14,249Morgan Stanley Capital Services, Inc. 73,255 (73,255) — — —
$ 162,764 $(141,177) $ 21,587 $ — $ 21,587
Counterparty
GrossAmounts ofLiabilities
OffsetAmount
NetLiabilityBalance
Collateral(Received)/
PledgedNet
AmountBank of America, N.A. $(232,713) $ 31,494 $(201,219) $201,219 $ —Barclays Bank PLC (70,624) 36,428 (34,196) — (34,196)Morgan Stanley Capital Services, Inc. (240,314) 73,255 (167,059) 130,498 (36,561)
$(543,651) $ 141,177 $(402,474) $331,717 $(70,757)
Strategic Income Fund
Counterparty
GrossAmounts ofLiabilities
OffsetAmount
NetLiabilityBalance
Collateral(Received)/
PledgedNet
AmountBank of America, N.A. $(981,452) $ — $(981,452) $981,452 $ —
The actual collateral received or pledged, if any, may exceed the amounts shown in the table due to overcollateralization. Timingdifferences may exist between when contracts under the ISDA agreements are marked-to-market and when collateral moves. The
113 |
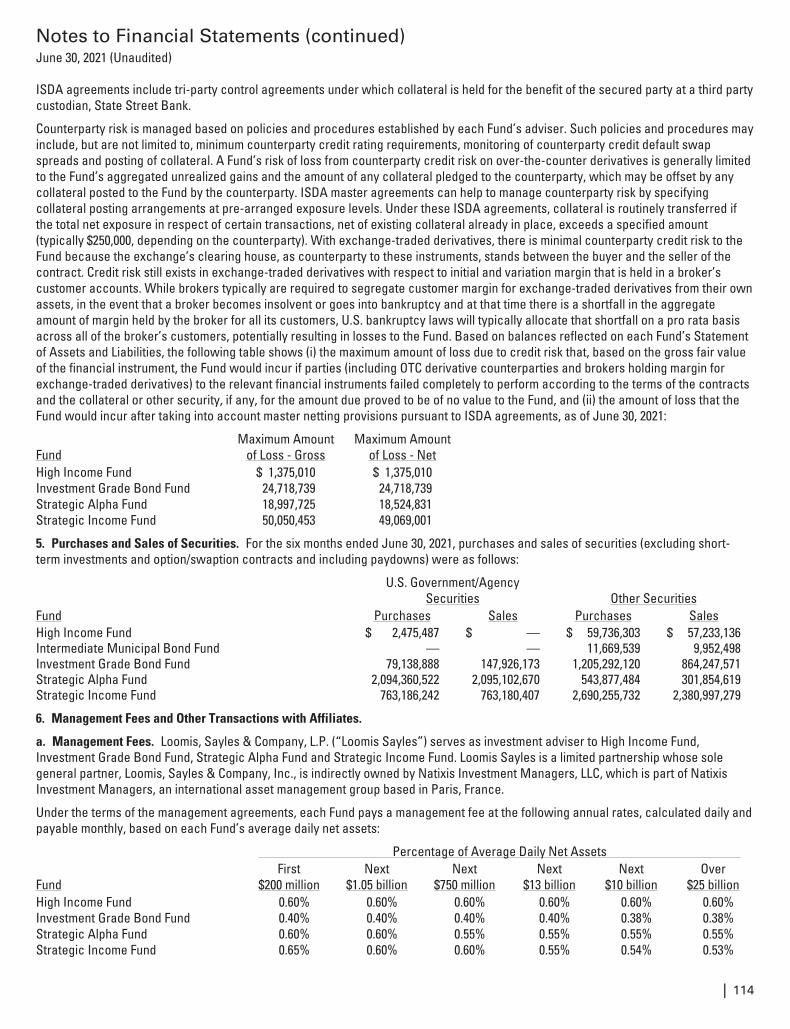
Notes to Financial Statements (continued)June 30, 2021 (Unaudited)
ISDA agreements include tri-party control agreements under which collateral is held for the benefit of the secured party at a third partycustodian, State Street Bank.
Counterparty risk is managed based on policies and procedures established by each Fund’s adviser. Such policies and procedures mayinclude, but are not limited to, minimum counterparty credit rating requirements, monitoring of counterparty credit default swapspreads and posting of collateral. A Fund’s risk of loss from counterparty credit risk on over-the-counter derivatives is generally limitedto the Fund’s aggregated unrealized gains and the amount of any collateral pledged to the counterparty, which may be offset by anycollateral posted to the Fund by the counterparty. ISDA master agreements can help to manage counterparty risk by specifyingcollateral posting arrangements at pre-arranged exposure levels. Under these ISDA agreements, collateral is routinely transferred ifthe total net exposure in respect of certain transactions, net of existing collateral already in place, exceeds a specified amount(typically $250,000, depending on the counterparty). With exchange-traded derivatives, there is minimal counterparty credit risk to theFund because the exchange’s clearing house, as counterparty to these instruments, stands between the buyer and the seller of thecontract. Credit risk still exists in exchange-traded derivatives with respect to initial and variation margin that is held in a broker’scustomer accounts. While brokers typically are required to segregate customer margin for exchange-traded derivatives from their ownassets, in the event that a broker becomes insolvent or goes into bankruptcy and at that time there is a shortfall in the aggregateamount of margin held by the broker for all its customers, U.S. bankruptcy laws will typically allocate that shortfall on a pro rata basisacross all of the broker’s customers, potentially resulting in losses to the Fund. Based on balances reflected on each Fund’s Statementof Assets and Liabilities, the following table shows (i) the maximum amount of loss due to credit risk that, based on the gross fair valueof the financial instrument, the Fund would incur if parties (including OTC derivative counterparties and brokers holding margin forexchange-traded derivatives) to the relevant financial instruments failed completely to perform according to the terms of the contractsand the collateral or other security, if any, for the amount due proved to be of no value to the Fund, and (ii) the amount of loss that theFund would incur after taking into account master netting provisions pursuant to ISDA agreements, as of June 30, 2021:
FundMaximum Amount
of Loss - GrossMaximum Amount
of Loss - NetHigh Income Fund $ 1,375,010 $ 1,375,010Investment Grade Bond Fund 24,718,739 24,718,739Strategic Alpha Fund 18,997,725 18,524,831Strategic Income Fund 50,050,453 49,069,001
5. Purchases and Sales of Securities. For the six months ended June 30, 2021, purchases and sales of securities (excluding short-term investments and option/swaption contracts and including paydowns) were as follows:
U.S. Government/AgencySecurities Other Securities
Fund Purchases Sales Purchases SalesHigh Income Fund $ 2,475,487 $ — $ 59,736,303 $ 57,233,136Intermediate Municipal Bond Fund — — 11,669,539 9,952,498Investment Grade Bond Fund 79,138,888 147,926,173 1,205,292,120 864,247,571Strategic Alpha Fund 2,094,360,522 2,095,102,670 543,877,484 301,854,619Strategic Income Fund 763,186,242 763,180,407 2,690,255,732 2,380,997,279
6. Management Fees and Other Transactions with Affiliates.
a. Management Fees. Loomis, Sayles & Company, L.P. (“Loomis Sayles”) serves as investment adviser to High Income Fund,Investment Grade Bond Fund, Strategic Alpha Fund and Strategic Income Fund. Loomis Sayles is a limited partnership whose solegeneral partner, Loomis, Sayles & Company, Inc., is indirectly owned by Natixis Investment Managers, LLC, which is part of NatixisInvestment Managers, an international asset management group based in Paris, France.
Under the terms of the management agreements, each Fund pays a management fee at the following annual rates, calculated daily andpayable monthly, based on each Fund’s average daily net assets:
Percentage of Average Daily Net Assets
FundFirst
$200 millionNext
$1.05 billionNext
$750 millionNext
$13 billionNext
$10 billionOver
$25 billionHigh Income Fund 0.60% 0.60% 0.60% 0.60% 0.60% 0.60%Investment Grade Bond Fund 0.40% 0.40% 0.40% 0.40% 0.38% 0.38%Strategic Alpha Fund 0.60% 0.60% 0.55% 0.55% 0.55% 0.55%Strategic Income Fund 0.65% 0.60% 0.60% 0.55% 0.54% 0.53%
| 114
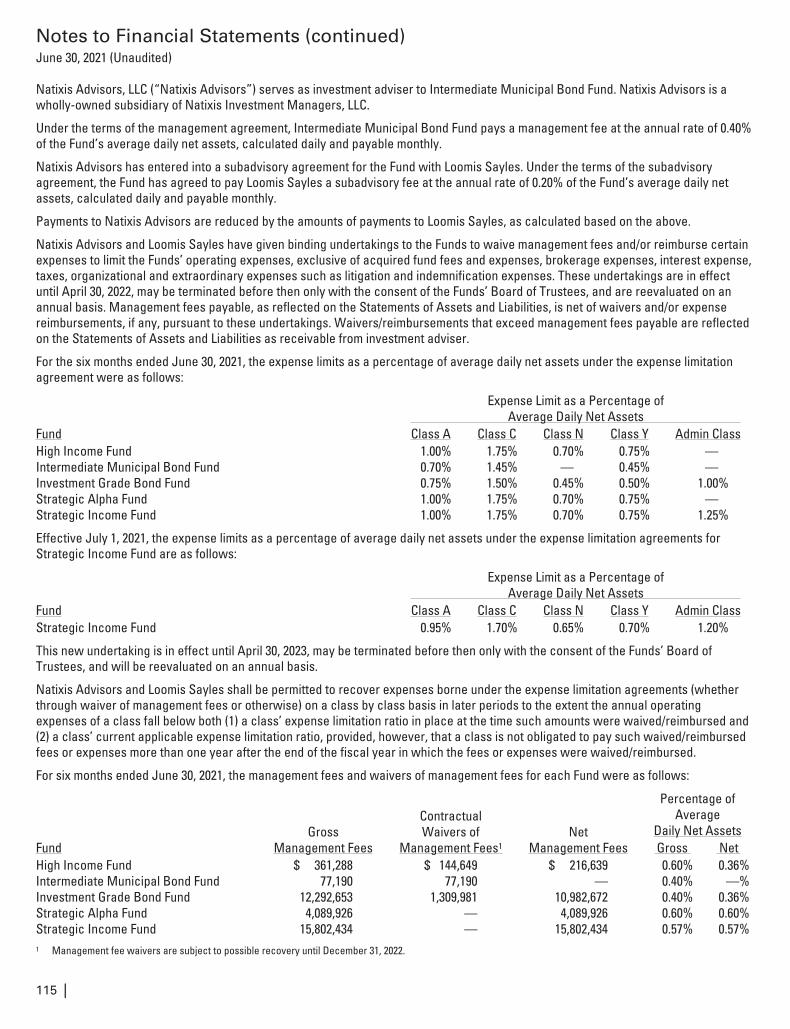
Notes to Financial Statements (continued)June 30, 2021 (Unaudited)
Natixis Advisors, LLC (“Natixis Advisors”) serves as investment adviser to Intermediate Municipal Bond Fund. Natixis Advisors is awholly-owned subsidiary of Natixis Investment Managers, LLC.
Under the terms of the management agreement, Intermediate Municipal Bond Fund pays a management fee at the annual rate of 0.40%of the Fund’s average daily net assets, calculated daily and payable monthly.
Natixis Advisors has entered into a subadvisory agreement for the Fund with Loomis Sayles. Under the terms of the subadvisoryagreement, the Fund has agreed to pay Loomis Sayles a subadvisory fee at the annual rate of 0.20% of the Fund’s average daily netassets, calculated daily and payable monthly.
Payments to Natixis Advisors are reduced by the amounts of payments to Loomis Sayles, as calculated based on the above.
Natixis Advisors and Loomis Sayles have given binding undertakings to the Funds to waive management fees and/or reimburse certainexpenses to limit the Funds’ operating expenses, exclusive of acquired fund fees and expenses, brokerage expenses, interest expense,taxes, organizational and extraordinary expenses such as litigation and indemnification expenses. These undertakings are in effectuntil April 30, 2022, may be terminated before then only with the consent of the Funds’ Board of Trustees, and are reevaluated on anannual basis. Management fees payable, as reflected on the Statements of Assets and Liabilities, is net of waivers and/or expensereimbursements, if any, pursuant to these undertakings. Waivers/reimbursements that exceed management fees payable are reflectedon the Statements of Assets and Liabilities as receivable from investment adviser.
For the six months ended June 30, 2021, the expense limits as a percentage of average daily net assets under the expense limitationagreement were as follows:
Expense Limit as a Percentage ofAverage Daily Net Assets
Fund Class A Class C Class N Class Y Admin ClassHigh Income Fund 1.00% 1.75% 0.70% 0.75% —Intermediate Municipal Bond Fund 0.70% 1.45% — 0.45% —Investment Grade Bond Fund 0.75% 1.50% 0.45% 0.50% 1.00%Strategic Alpha Fund 1.00% 1.75% 0.70% 0.75% —Strategic Income Fund 1.00% 1.75% 0.70% 0.75% 1.25%
Effective July 1, 2021, the expense limits as a percentage of average daily net assets under the expense limitation agreements forStrategic Income Fund are as follows:
Expense Limit as a Percentage ofAverage Daily Net Assets
Fund Class A Class C Class N Class Y Admin ClassStrategic Income Fund 0.95% 1.70% 0.65% 0.70% 1.20%
This new undertaking is in effect until April 30, 2023, may be terminated before then only with the consent of the Funds’ Board ofTrustees, and will be reevaluated on an annual basis.
Natixis Advisors and Loomis Sayles shall be permitted to recover expenses borne under the expense limitation agreements (whetherthrough waiver of management fees or otherwise) on a class by class basis in later periods to the extent the annual operatingexpenses of a class fall below both (1) a class’ expense limitation ratio in place at the time such amounts were waived/reimbursed and(2) a class’ current applicable expense limitation ratio, provided, however, that a class is not obligated to pay such waived/reimbursedfees or expenses more than one year after the end of the fiscal year in which the fees or expenses were waived/reimbursed.
For six months ended June 30, 2021, the management fees and waivers of management fees for each Fund were as follows:
GrossManagement Fees
ContractualWaivers of
Management Fees1Net
Management Fees
Percentage ofAverage
Daily Net AssetsFund Gross NetHigh Income Fund $ 361,288 $ 144,649 $ 216,639 0.60% 0.36%Intermediate Municipal Bond Fund 77,190 77,190 — 0.40% —%Investment Grade Bond Fund 12,292,653 1,309,981 10,982,672 0.40% 0.36%Strategic Alpha Fund 4,089,926 — 4,089,926 0.60% 0.60%Strategic Income Fund 15,802,434 — 15,802,434 0.57% 0.57%1 Management fee waivers are subject to possible recovery until December 31, 2022.
115 |
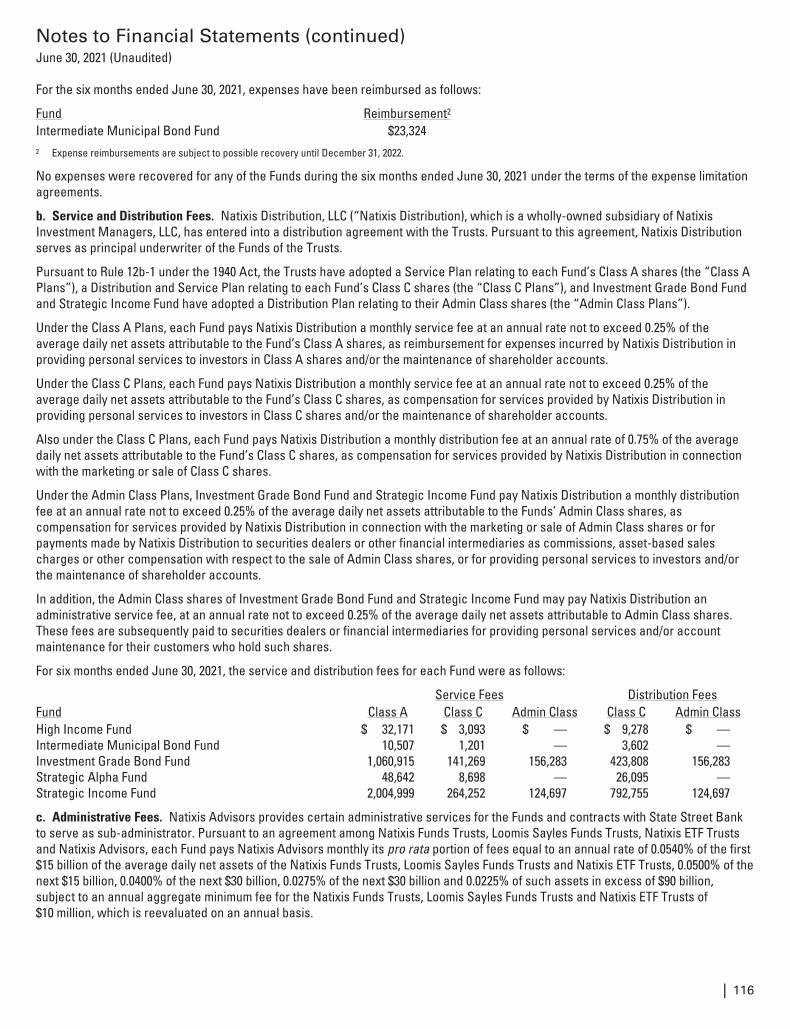
Notes to Financial Statements (continued)June 30, 2021 (Unaudited)
For the six months ended June 30, 2021, expenses have been reimbursed as follows:
Fund Reimbursement2
Intermediate Municipal Bond Fund $23,3242 Expense reimbursements are subject to possible recovery until December 31, 2022.
No expenses were recovered for any of the Funds during the six months ended June 30, 2021 under the terms of the expense limitationagreements.
b. Service and Distribution Fees. Natixis Distribution, LLC (“Natixis Distribution), which is a wholly-owned subsidiary of NatixisInvestment Managers, LLC, has entered into a distribution agreement with the Trusts. Pursuant to this agreement, Natixis Distributionserves as principal underwriter of the Funds of the Trusts.
Pursuant to Rule 12b-1 under the 1940 Act, the Trusts have adopted a Service Plan relating to each Fund’s Class A shares (the “Class APlans”), a Distribution and Service Plan relating to each Fund’s Class C shares (the “Class C Plans”), and Investment Grade Bond Fundand Strategic Income Fund have adopted a Distribution Plan relating to their Admin Class shares (the “Admin Class Plans”).
Under the Class A Plans, each Fund pays Natixis Distribution a monthly service fee at an annual rate not to exceed 0.25% of theaverage daily net assets attributable to the Fund’s Class A shares, as reimbursement for expenses incurred by Natixis Distribution inproviding personal services to investors in Class A shares and/or the maintenance of shareholder accounts.
Under the Class C Plans, each Fund pays Natixis Distribution a monthly service fee at an annual rate not to exceed 0.25% of theaverage daily net assets attributable to the Fund’s Class C shares, as compensation for services provided by Natixis Distribution inproviding personal services to investors in Class C shares and/or the maintenance of shareholder accounts.
Also under the Class C Plans, each Fund pays Natixis Distribution a monthly distribution fee at an annual rate of 0.75% of the averagedaily net assets attributable to the Fund’s Class C shares, as compensation for services provided by Natixis Distribution in connectionwith the marketing or sale of Class C shares.
Under the Admin Class Plans, Investment Grade Bond Fund and Strategic Income Fund pay Natixis Distribution a monthly distributionfee at an annual rate not to exceed 0.25% of the average daily net assets attributable to the Funds’ Admin Class shares, ascompensation for services provided by Natixis Distribution in connection with the marketing or sale of Admin Class shares or forpayments made by Natixis Distribution to securities dealers or other financial intermediaries as commissions, asset-based salescharges or other compensation with respect to the sale of Admin Class shares, or for providing personal services to investors and/orthe maintenance of shareholder accounts.
In addition, the Admin Class shares of Investment Grade Bond Fund and Strategic Income Fund may pay Natixis Distribution anadministrative service fee, at an annual rate not to exceed 0.25% of the average daily net assets attributable to Admin Class shares.These fees are subsequently paid to securities dealers or financial intermediaries for providing personal services and/or accountmaintenance for their customers who hold such shares.
For six months ended June 30, 2021, the service and distribution fees for each Fund were as follows:
Service Fees Distribution FeesFund Class A Class C Admin Class Class C Admin ClassHigh Income Fund $ 32,171 $ 3,093 $ — $ 9,278 $ —Intermediate Municipal Bond Fund 10,507 1,201 — 3,602 —Investment Grade Bond Fund 1,060,915 141,269 156,283 423,808 156,283Strategic Alpha Fund 48,642 8,698 — 26,095 —Strategic Income Fund 2,004,999 264,252 124,697 792,755 124,697
c. Administrative Fees. Natixis Advisors provides certain administrative services for the Funds and contracts with State Street Bankto serve as sub-administrator. Pursuant to an agreement among Natixis Funds Trusts, Loomis Sayles Funds Trusts, Natixis ETF Trustsand Natixis Advisors, each Fund pays Natixis Advisors monthly its pro rata portion of fees equal to an annual rate of 0.0540% of the first$15 billion of the average daily net assets of the Natixis Funds Trusts, Loomis Sayles Funds Trusts and Natixis ETF Trusts, 0.0500% of thenext $15 billion, 0.0400% of the next $30 billion, 0.0275% of the next $30 billion and 0.0225% of such assets in excess of $90 billion,subject to an annual aggregate minimum fee for the Natixis Funds Trusts, Loomis Sayles Funds Trusts and Natixis ETF Trusts of$10 million, which is reevaluated on an annual basis.
| 116
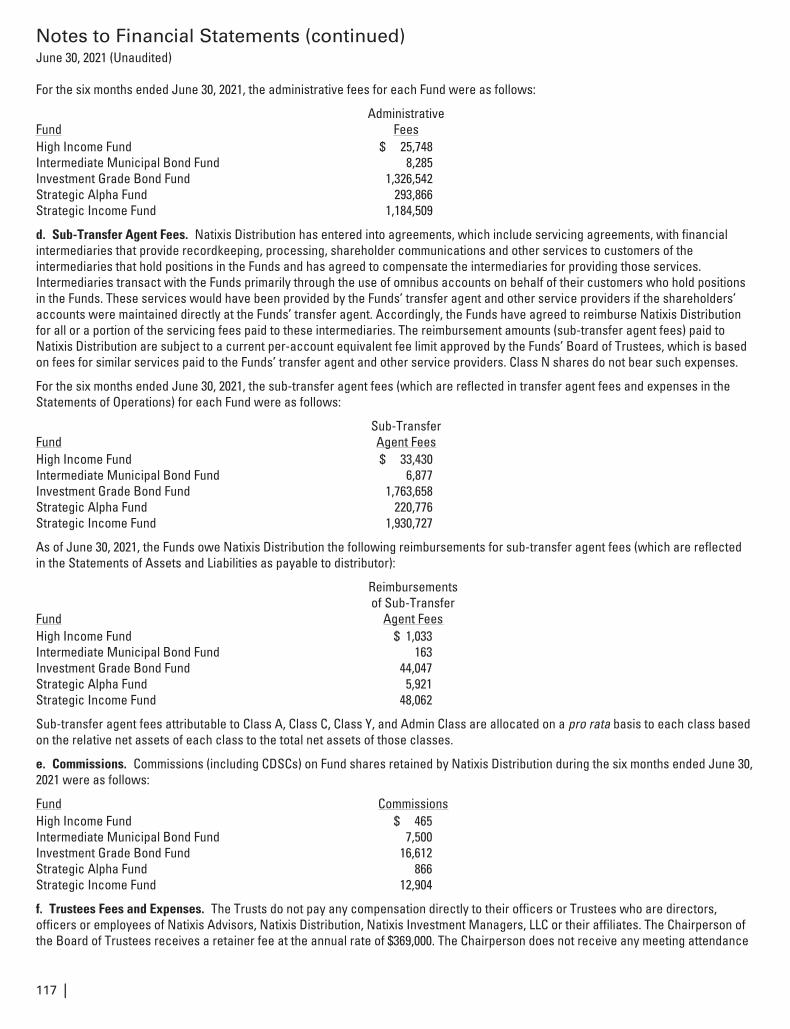
Notes to Financial Statements (continued)June 30, 2021 (Unaudited)
For the six months ended June 30, 2021, the administrative fees for each Fund were as follows:
FundAdministrative
FeesHigh Income Fund $ 25,748Intermediate Municipal Bond Fund 8,285Investment Grade Bond Fund 1,326,542Strategic Alpha Fund 293,866Strategic Income Fund 1,184,509
d. Sub-Transfer Agent Fees. Natixis Distribution has entered into agreements, which include servicing agreements, with financialintermediaries that provide recordkeeping, processing, shareholder communications and other services to customers of theintermediaries that hold positions in the Funds and has agreed to compensate the intermediaries for providing those services.Intermediaries transact with the Funds primarily through the use of omnibus accounts on behalf of their customers who hold positionsin the Funds. These services would have been provided by the Funds’ transfer agent and other service providers if the shareholders’accounts were maintained directly at the Funds’ transfer agent. Accordingly, the Funds have agreed to reimburse Natixis Distributionfor all or a portion of the servicing fees paid to these intermediaries. The reimbursement amounts (sub-transfer agent fees) paid toNatixis Distribution are subject to a current per-account equivalent fee limit approved by the Funds’ Board of Trustees, which is basedon fees for similar services paid to the Funds’ transfer agent and other service providers. Class N shares do not bear such expenses.
For the six months ended June 30, 2021, the sub-transfer agent fees (which are reflected in transfer agent fees and expenses in theStatements of Operations) for each Fund were as follows:
FundSub-TransferAgent Fees
High Income Fund $ 33,430Intermediate Municipal Bond Fund 6,877Investment Grade Bond Fund 1,763,658Strategic Alpha Fund 220,776Strategic Income Fund 1,930,727
As of June 30, 2021, the Funds owe Natixis Distribution the following reimbursements for sub-transfer agent fees (which are reflectedin the Statements of Assets and Liabilities as payable to distributor):
Fund
Reimbursementsof Sub-Transfer
Agent FeesHigh Income Fund $ 1,033Intermediate Municipal Bond Fund 163Investment Grade Bond Fund 44,047Strategic Alpha Fund 5,921Strategic Income Fund 48,062
Sub-transfer agent fees attributable to Class A, Class C, Class Y, and Admin Class are allocated on a pro rata basis to each class basedon the relative net assets of each class to the total net assets of those classes.
e. Commissions. Commissions (including CDSCs) on Fund shares retained by Natixis Distribution during the six months ended June 30,2021 were as follows:
Fund CommissionsHigh Income Fund $ 465Intermediate Municipal Bond Fund 7,500Investment Grade Bond Fund 16,612Strategic Alpha Fund 866Strategic Income Fund 12,904
f. Trustees Fees and Expenses. The Trusts do not pay any compensation directly to their officers or Trustees who are directors,officers or employees of Natixis Advisors, Natixis Distribution, Natixis Investment Managers, LLC or their affiliates. The Chairperson ofthe Board of Trustees receives a retainer fee at the annual rate of $369,000. The Chairperson does not receive any meeting attendance
117 |
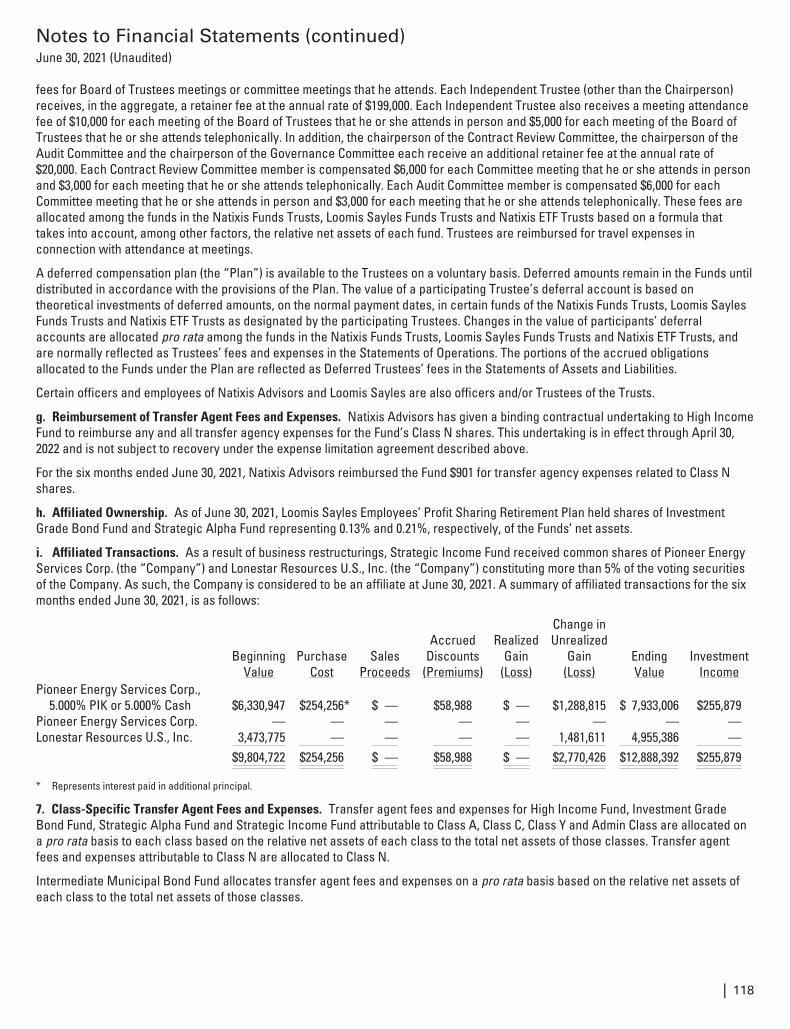
Notes to Financial Statements (continued)June 30, 2021 (Unaudited)
fees for Board of Trustees meetings or committee meetings that he attends. Each Independent Trustee (other than the Chairperson)receives, in the aggregate, a retainer fee at the annual rate of $199,000. Each Independent Trustee also receives a meeting attendancefee of $10,000 for each meeting of the Board of Trustees that he or she attends in person and $5,000 for each meeting of the Board ofTrustees that he or she attends telephonically. In addition, the chairperson of the Contract Review Committee, the chairperson of theAudit Committee and the chairperson of the Governance Committee each receive an additional retainer fee at the annual rate of$20,000. Each Contract Review Committee member is compensated $6,000 for each Committee meeting that he or she attends in personand $3,000 for each meeting that he or she attends telephonically. Each Audit Committee member is compensated $6,000 for eachCommittee meeting that he or she attends in person and $3,000 for each meeting that he or she attends telephonically. These fees areallocated among the funds in the Natixis Funds Trusts, Loomis Sayles Funds Trusts and Natixis ETF Trusts based on a formula thattakes into account, among other factors, the relative net assets of each fund. Trustees are reimbursed for travel expenses inconnection with attendance at meetings.
A deferred compensation plan (the “Plan”) is available to the Trustees on a voluntary basis. Deferred amounts remain in the Funds untildistributed in accordance with the provisions of the Plan. The value of a participating Trustee’s deferral account is based ontheoretical investments of deferred amounts, on the normal payment dates, in certain funds of the Natixis Funds Trusts, Loomis SaylesFunds Trusts and Natixis ETF Trusts as designated by the participating Trustees. Changes in the value of participants’ deferralaccounts are allocated pro rata among the funds in the Natixis Funds Trusts, Loomis Sayles Funds Trusts and Natixis ETF Trusts, andare normally reflected as Trustees’ fees and expenses in the Statements of Operations. The portions of the accrued obligationsallocated to the Funds under the Plan are reflected as Deferred Trustees’ fees in the Statements of Assets and Liabilities.
Certain officers and employees of Natixis Advisors and Loomis Sayles are also officers and/or Trustees of the Trusts.
g. Reimbursement of Transfer Agent Fees and Expenses. Natixis Advisors has given a binding contractual undertaking to High IncomeFund to reimburse any and all transfer agency expenses for the Fund’s Class N shares. This undertaking is in effect through April 30,2022 and is not subject to recovery under the expense limitation agreement described above.
For the six months ended June 30, 2021, Natixis Advisors reimbursed the Fund $901 for transfer agency expenses related to Class Nshares.
h. Affiliated Ownership. As of June 30, 2021, Loomis Sayles Employees’ Profit Sharing Retirement Plan held shares of InvestmentGrade Bond Fund and Strategic Alpha Fund representing 0.13% and 0.21%, respectively, of the Funds’ net assets.
i. Affiliated Transactions. As a result of business restructurings, Strategic Income Fund received common shares of Pioneer EnergyServices Corp. (the “Company”) and Lonestar Resources U.S., Inc. (the “Company”) constituting more than 5% of the voting securitiesof the Company. As such, the Company is considered to be an affiliate at June 30, 2021. A summary of affiliated transactions for the sixmonths ended June 30, 2021, is as follows:
BeginningValue
PurchaseCost
SalesProceeds
AccruedDiscounts
(Premiums)
RealizedGain
(Loss)
Change inUnrealized
Gain(Loss)
EndingValue
InvestmentIncome
Pioneer Energy Services Corp.,5.000% PIK or 5.000% Cash $6,330,947 $254,256* $ — $58,988 $ — $1,288,815 $ 7,933,006 $255,879
Pioneer Energy Services Corp. — — — — — — — —Lonestar Resources U.S., Inc. 3,473,775 — — — — 1,481,611 4,955,386 —
$9,804,722 $254,256 $ — $58,988 $ — $2,770,426 $12,888,392 $255,879
* Represents interest paid in additional principal.
7. Class-Specific Transfer Agent Fees and Expenses. Transfer agent fees and expenses for High Income Fund, Investment GradeBond Fund, Strategic Alpha Fund and Strategic Income Fund attributable to Class A, Class C, Class Y and Admin Class are allocated ona pro rata basis to each class based on the relative net assets of each class to the total net assets of those classes. Transfer agentfees and expenses attributable to Class N are allocated to Class N.
Intermediate Municipal Bond Fund allocates transfer agent fees and expenses on a pro rata basis based on the relative net assets ofeach class to the total net assets of those classes.
| 118
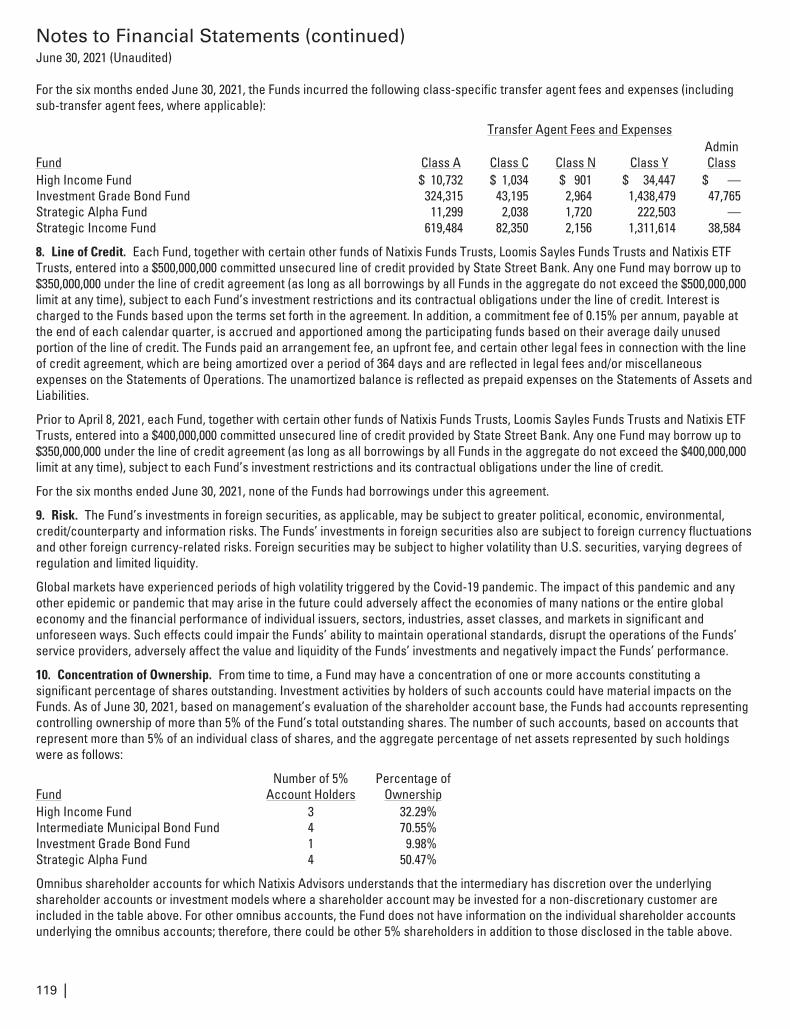
Notes to Financial Statements (continued)June 30, 2021 (Unaudited)
For the six months ended June 30, 2021, the Funds incurred the following class-specific transfer agent fees and expenses (includingsub-transfer agent fees, where applicable):
Transfer Agent Fees and Expenses
Fund Class A Class C Class N Class YAdminClass
High Income Fund $ 10,732 $ 1,034 $ 901 $ 34,447 $ —Investment Grade Bond Fund 324,315 43,195 2,964 1,438,479 47,765Strategic Alpha Fund 11,299 2,038 1,720 222,503 —Strategic Income Fund 619,484 82,350 2,156 1,311,614 38,584
8. Line of Credit. Each Fund, together with certain other funds of Natixis Funds Trusts, Loomis Sayles Funds Trusts and Natixis ETFTrusts, entered into a $500,000,000 committed unsecured line of credit provided by State Street Bank. Any one Fund may borrow up to$350,000,000 under the line of credit agreement (as long as all borrowings by all Funds in the aggregate do not exceed the $500,000,000limit at any time), subject to each Fund’s investment restrictions and its contractual obligations under the line of credit. Interest ischarged to the Funds based upon the terms set forth in the agreement. In addition, a commitment fee of 0.15% per annum, payable atthe end of each calendar quarter, is accrued and apportioned among the participating funds based on their average daily unusedportion of the line of credit. The Funds paid an arrangement fee, an upfront fee, and certain other legal fees in connection with the lineof credit agreement, which are being amortized over a period of 364 days and are reflected in legal fees and/or miscellaneousexpenses on the Statements of Operations. The unamortized balance is reflected as prepaid expenses on the Statements of Assets andLiabilities.
Prior to April 8, 2021, each Fund, together with certain other funds of Natixis Funds Trusts, Loomis Sayles Funds Trusts and Natixis ETFTrusts, entered into a $400,000,000 committed unsecured line of credit provided by State Street Bank. Any one Fund may borrow up to$350,000,000 under the line of credit agreement (as long as all borrowings by all Funds in the aggregate do not exceed the $400,000,000limit at any time), subject to each Fund’s investment restrictions and its contractual obligations under the line of credit.
For the six months ended June 30, 2021, none of the Funds had borrowings under this agreement.
9. Risk. The Fund’s investments in foreign securities, as applicable, may be subject to greater political, economic, environmental,credit/counterparty and information risks. The Funds’ investments in foreign securities also are subject to foreign currency fluctuationsand other foreign currency-related risks. Foreign securities may be subject to higher volatility than U.S. securities, varying degrees ofregulation and limited liquidity.
Global markets have experienced periods of high volatility triggered by the Covid-19 pandemic. The impact of this pandemic and anyother epidemic or pandemic that may arise in the future could adversely affect the economies of many nations or the entire globaleconomy and the financial performance of individual issuers, sectors, industries, asset classes, and markets in significant andunforeseen ways. Such effects could impair the Funds’ ability to maintain operational standards, disrupt the operations of the Funds’service providers, adversely affect the value and liquidity of the Funds’ investments and negatively impact the Funds’ performance.
10. Concentration of Ownership. From time to time, a Fund may have a concentration of one or more accounts constituting asignificant percentage of shares outstanding. Investment activities by holders of such accounts could have material impacts on theFunds. As of June 30, 2021, based on management’s evaluation of the shareholder account base, the Funds had accounts representingcontrolling ownership of more than 5% of the Fund’s total outstanding shares. The number of such accounts, based on accounts thatrepresent more than 5% of an individual class of shares, and the aggregate percentage of net assets represented by such holdingswere as follows:
FundNumber of 5%
Account HoldersPercentage of
OwnershipHigh Income Fund 3 32.29%Intermediate Municipal Bond Fund 4 70.55%Investment Grade Bond Fund 1 9.98%Strategic Alpha Fund 4 50.47%
Omnibus shareholder accounts for which Natixis Advisors understands that the intermediary has discretion over the underlyingshareholder accounts or investment models where a shareholder account may be invested for a non-discretionary customer areincluded in the table above. For other omnibus accounts, the Fund does not have information on the individual shareholder accountsunderlying the omnibus accounts; therefore, there could be other 5% shareholders in addition to those disclosed in the table above.
119 |
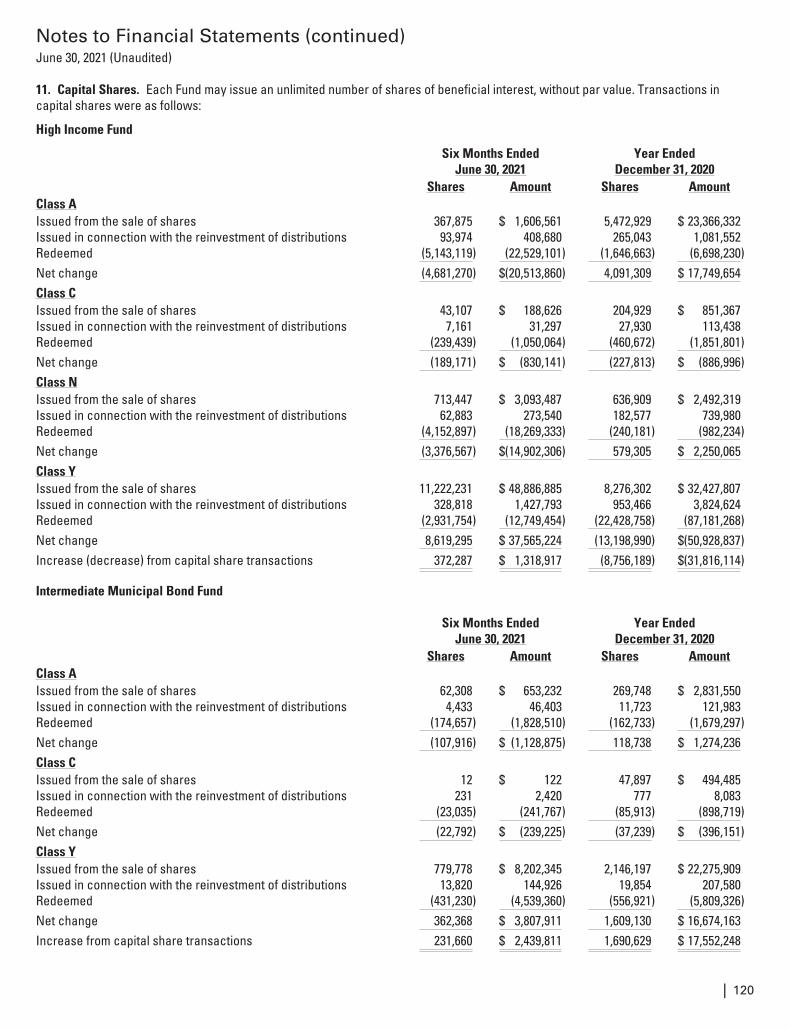
Notes to Financial Statements (continued)June 30, 2021 (Unaudited)
11. Capital Shares. Each Fund may issue an unlimited number of shares of beneficial interest, without par value. Transactions incapital shares were as follows:
High Income Fund
Six Months EndedJune 30, 2021
Year EndedDecember 31, 2020
Shares Amount Shares AmountClass AIssued from the sale of shares 367,875 $ 1,606,561 5,472,929 $ 23,366,332Issued in connection with the reinvestment of distributions 93,974 408,680 265,043 1,081,552Redeemed (5,143,119) (22,529,101) (1,646,663) (6,698,230)Net change (4,681,270) $(20,513,860) 4,091,309 $ 17,749,654Class CIssued from the sale of shares 43,107 $ 188,626 204,929 $ 851,367Issued in connection with the reinvestment of distributions 7,161 31,297 27,930 113,438Redeemed (239,439) (1,050,064) (460,672) (1,851,801)Net change (189,171) $ (830,141) (227,813) $ (886,996)Class NIssued from the sale of shares 713,447 $ 3,093,487 636,909 $ 2,492,319Issued in connection with the reinvestment of distributions 62,883 273,540 182,577 739,980Redeemed (4,152,897) (18,269,333) (240,181) (982,234)Net change (3,376,567) $(14,902,306) 579,305 $ 2,250,065Class YIssued from the sale of shares 11,222,231 $ 48,886,885 8,276,302 $ 32,427,807Issued in connection with the reinvestment of distributions 328,818 1,427,793 953,466 3,824,624Redeemed (2,931,754) (12,749,454) (22,428,758) (87,181,268)Net change 8,619,295 $ 37,565,224 (13,198,990) $(50,928,837)Increase (decrease) from capital share transactions 372,287 $ 1,318,917 (8,756,189) $(31,816,114)
Intermediate Municipal Bond Fund
Six Months EndedJune 30, 2021
Year EndedDecember 31, 2020
Shares Amount Shares AmountClass AIssued from the sale of shares 62,308 $ 653,232 269,748 $ 2,831,550Issued in connection with the reinvestment of distributions 4,433 46,403 11,723 121,983Redeemed (174,657) (1,828,510) (162,733) (1,679,297)Net change (107,916) $ (1,128,875) 118,738 $ 1,274,236Class CIssued from the sale of shares 12 $ 122 47,897 $ 494,485Issued in connection with the reinvestment of distributions 231 2,420 777 8,083Redeemed (23,035) (241,767) (85,913) (898,719)Net change (22,792) $ (239,225) (37,239) $ (396,151)Class YIssued from the sale of shares 779,778 $ 8,202,345 2,146,197 $ 22,275,909Issued in connection with the reinvestment of distributions 13,820 144,926 19,854 207,580Redeemed (431,230) (4,539,360) (556,921) (5,809,326)Net change 362,368 $ 3,807,911 1,609,130 $ 16,674,163Increase from capital share transactions 231,660 $ 2,439,811 1,690,629 $ 17,552,248
| 120
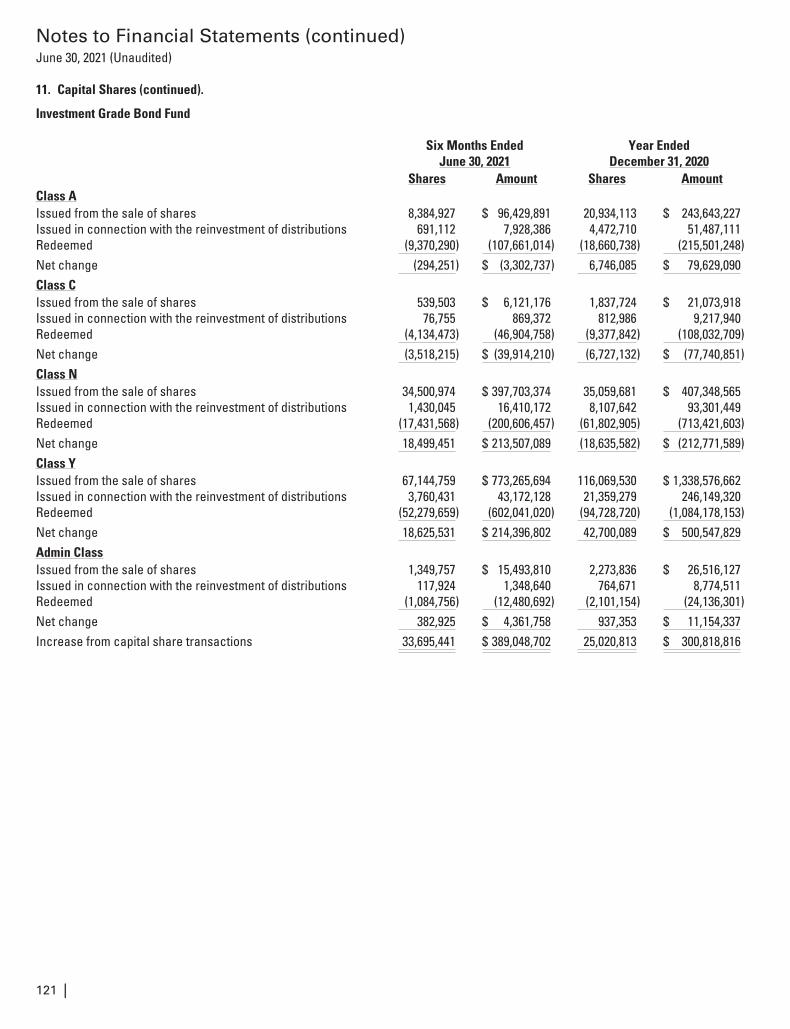
Notes to Financial Statements (continued)June 30, 2021 (Unaudited)
11. Capital Shares (continued).
Investment Grade Bond Fund
Six Months EndedJune 30, 2021
Year EndedDecember 31, 2020
Shares Amount Shares AmountClass AIssued from the sale of shares 8,384,927 $ 96,429,891 20,934,113 $ 243,643,227Issued in connection with the reinvestment of distributions 691,112 7,928,386 4,472,710 51,487,111Redeemed (9,370,290) (107,661,014) (18,660,738) (215,501,248)Net change (294,251) $ (3,302,737) 6,746,085 $ 79,629,090Class CIssued from the sale of shares 539,503 $ 6,121,176 1,837,724 $ 21,073,918Issued in connection with the reinvestment of distributions 76,755 869,372 812,986 9,217,940Redeemed (4,134,473) (46,904,758) (9,377,842) (108,032,709)Net change (3,518,215) $ (39,914,210) (6,727,132) $ (77,740,851)Class NIssued from the sale of shares 34,500,974 $ 397,703,374 35,059,681 $ 407,348,565Issued in connection with the reinvestment of distributions 1,430,045 16,410,172 8,107,642 93,301,449Redeemed (17,431,568) (200,606,457) (61,802,905) (713,421,603)Net change 18,499,451 $ 213,507,089 (18,635,582) $ (212,771,589)Class YIssued from the sale of shares 67,144,759 $ 773,265,694 116,069,530 $ 1,338,576,662Issued in connection with the reinvestment of distributions 3,760,431 43,172,128 21,359,279 246,149,320Redeemed (52,279,659) (602,041,020) (94,728,720) (1,084,178,153)Net change 18,625,531 $ 214,396,802 42,700,089 $ 500,547,829Admin ClassIssued from the sale of shares 1,349,757 $ 15,493,810 2,273,836 $ 26,516,127Issued in connection with the reinvestment of distributions 117,924 1,348,640 764,671 8,774,511Redeemed (1,084,756) (12,480,692) (2,101,154) (24,136,301)Net change 382,925 $ 4,361,758 937,353 $ 11,154,337Increase from capital share transactions 33,695,441 $ 389,048,702 25,020,813 $ 300,818,816
121 |
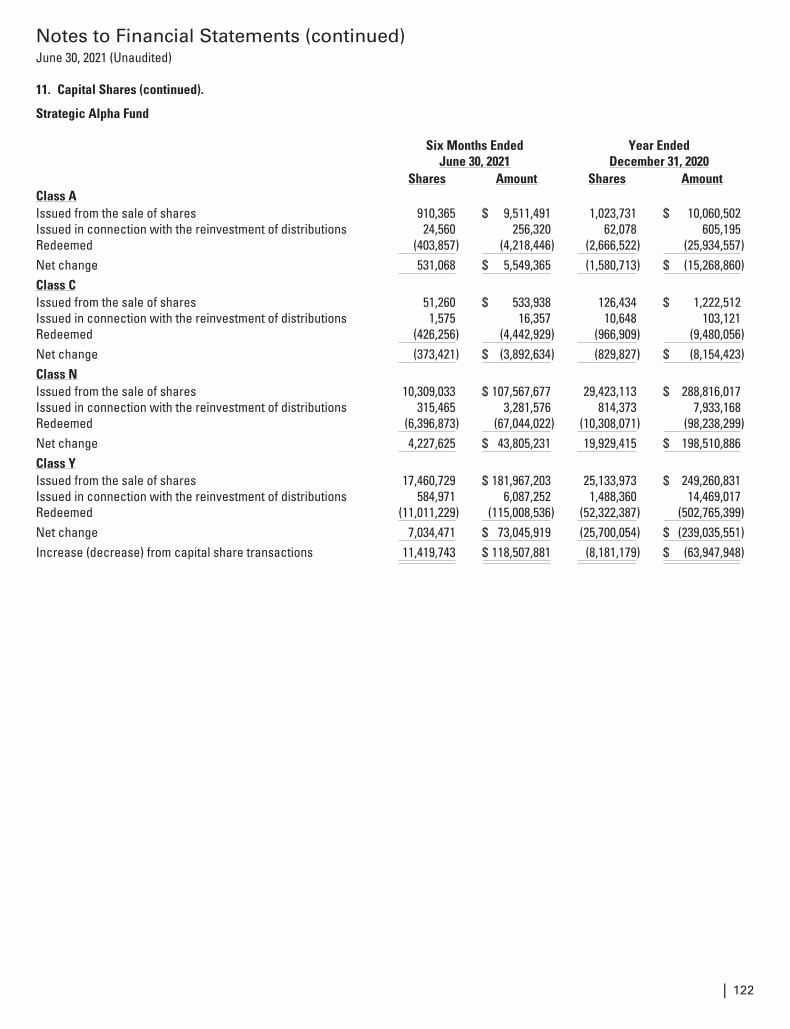
Notes to Financial Statements (continued)June 30, 2021 (Unaudited)
11. Capital Shares (continued).
Strategic Alpha Fund
Six Months EndedJune 30, 2021
Year EndedDecember 31, 2020
Shares Amount Shares AmountClass AIssued from the sale of shares 910,365 $ 9,511,491 1,023,731 $ 10,060,502Issued in connection with the reinvestment of distributions 24,560 256,320 62,078 605,195Redeemed (403,857) (4,218,446) (2,666,522) (25,934,557)Net change 531,068 $ 5,549,365 (1,580,713) $ (15,268,860)Class CIssued from the sale of shares 51,260 $ 533,938 126,434 $ 1,222,512Issued in connection with the reinvestment of distributions 1,575 16,357 10,648 103,121Redeemed (426,256) (4,442,929) (966,909) (9,480,056)Net change (373,421) $ (3,892,634) (829,827) $ (8,154,423)Class NIssued from the sale of shares 10,309,033 $ 107,567,677 29,423,113 $ 288,816,017Issued in connection with the reinvestment of distributions 315,465 3,281,576 814,373 7,933,168Redeemed (6,396,873) (67,044,022) (10,308,071) (98,238,299)Net change 4,227,625 $ 43,805,231 19,929,415 $ 198,510,886Class YIssued from the sale of shares 17,460,729 $ 181,967,203 25,133,973 $ 249,260,831Issued in connection with the reinvestment of distributions 584,971 6,087,252 1,488,360 14,469,017Redeemed (11,011,229) (115,008,536) (52,322,387) (502,765,399)Net change 7,034,471 $ 73,045,919 (25,700,054) $ (239,035,551)Increase (decrease) from capital share transactions 11,419,743 $ 118,507,881 (8,181,179) $ (63,947,948)
| 122
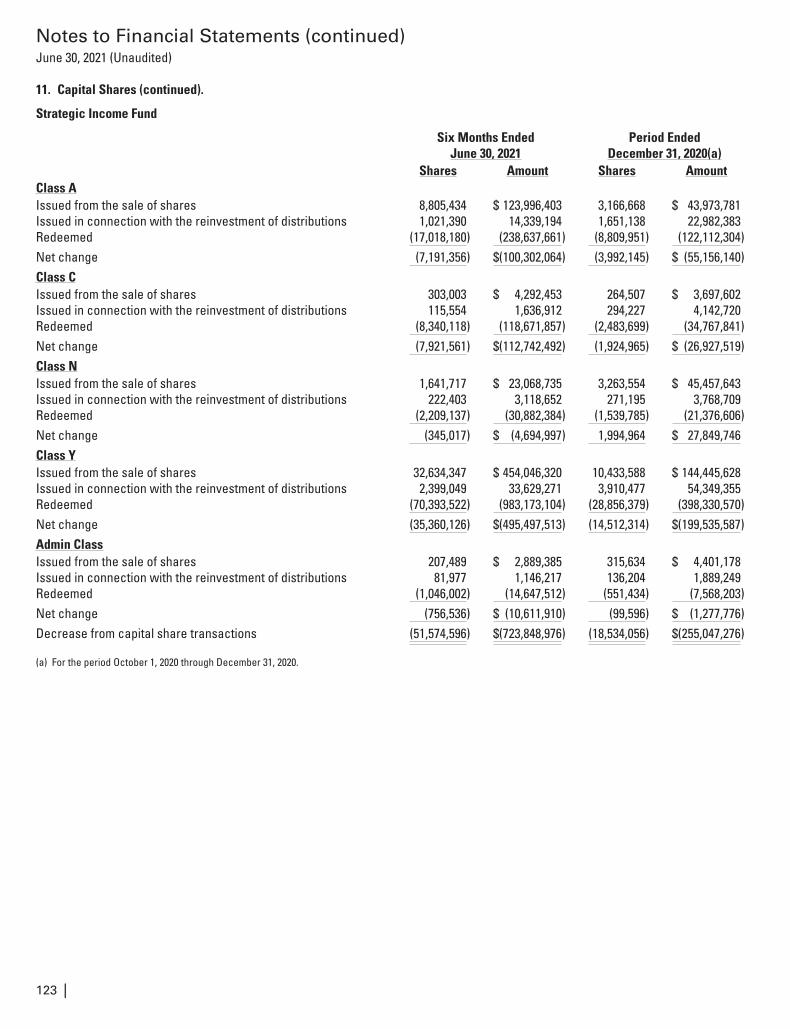
Notes to Financial Statements (continued)June 30, 2021 (Unaudited)
11. Capital Shares (continued).
Strategic Income Fund
Six Months EndedJune 30, 2021
Period EndedDecember 31, 2020(a)
Shares Amount Shares AmountClass AIssued from the sale of shares 8,805,434 $ 123,996,403 3,166,668 $ 43,973,781Issued in connection with the reinvestment of distributions 1,021,390 14,339,194 1,651,138 22,982,383Redeemed (17,018,180) (238,637,661) (8,809,951) (122,112,304)Net change (7,191,356) $(100,302,064) (3,992,145) $ (55,156,140)Class CIssued from the sale of shares 303,003 $ 4,292,453 264,507 $ 3,697,602Issued in connection with the reinvestment of distributions 115,554 1,636,912 294,227 4,142,720Redeemed (8,340,118) (118,671,857) (2,483,699) (34,767,841)Net change (7,921,561) $(112,742,492) (1,924,965) $ (26,927,519)Class NIssued from the sale of shares 1,641,717 $ 23,068,735 3,263,554 $ 45,457,643Issued in connection with the reinvestment of distributions 222,403 3,118,652 271,195 3,768,709Redeemed (2,209,137) (30,882,384) (1,539,785) (21,376,606)Net change (345,017) $ (4,694,997) 1,994,964 $ 27,849,746Class YIssued from the sale of shares 32,634,347 $ 454,046,320 10,433,588 $ 144,445,628Issued in connection with the reinvestment of distributions 2,399,049 33,629,271 3,910,477 54,349,355Redeemed (70,393,522) (983,173,104) (28,856,379) (398,330,570)Net change (35,360,126) $(495,497,513) (14,512,314) $(199,535,587)Admin ClassIssued from the sale of shares 207,489 $ 2,889,385 315,634 $ 4,401,178Issued in connection with the reinvestment of distributions 81,977 1,146,217 136,204 1,889,249Redeemed (1,046,002) (14,647,512) (551,434) (7,568,203)Net change (756,536) $ (10,611,910) (99,596) $ (1,277,776)Decrease from capital share transactions (51,574,596) $(723,848,976) (18,534,056) $(255,047,276)
(a) For the period October 1, 2020 through December 31, 2020.
123 |
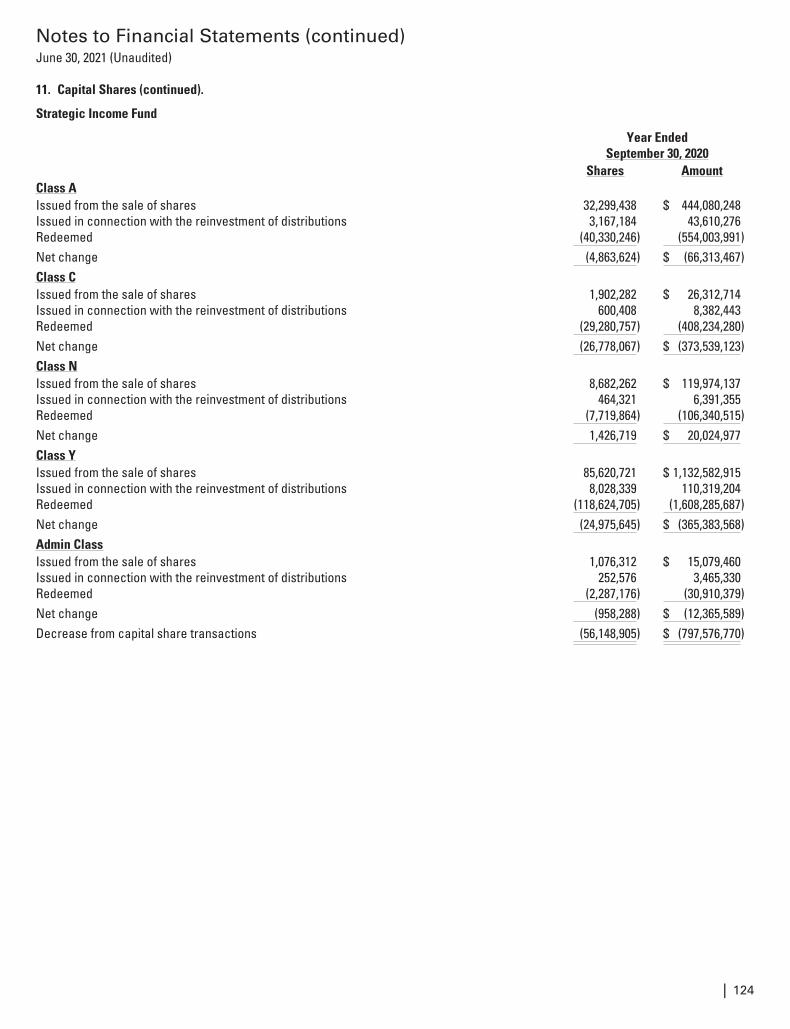
Notes to Financial Statements (continued)June 30, 2021 (Unaudited)
11. Capital Shares (continued).
Strategic Income Fund
Year EndedSeptember 30, 2020
Shares AmountClass AIssued from the sale of shares 32,299,438 $ 444,080,248Issued in connection with the reinvestment of distributions 3,167,184 43,610,276Redeemed (40,330,246) (554,003,991)Net change (4,863,624) $ (66,313,467)Class CIssued from the sale of shares 1,902,282 $ 26,312,714Issued in connection with the reinvestment of distributions 600,408 8,382,443Redeemed (29,280,757) (408,234,280)Net change (26,778,067) $ (373,539,123)Class NIssued from the sale of shares 8,682,262 $ 119,974,137Issued in connection with the reinvestment of distributions 464,321 6,391,355Redeemed (7,719,864) (106,340,515)Net change 1,426,719 $ 20,024,977Class YIssued from the sale of shares 85,620,721 $ 1,132,582,915Issued in connection with the reinvestment of distributions 8,028,339 110,319,204Redeemed (118,624,705) (1,608,285,687)Net change (24,975,645) $ (365,383,568)Admin ClassIssued from the sale of shares 1,076,312 $ 15,079,460Issued in connection with the reinvestment of distributions 252,576 3,465,330Redeemed (2,287,176) (30,910,379)Net change (958,288) $ (12,365,589)Decrease from capital share transactions (56,148,905) $ (797,576,770)
| 124

This Page Intentionally Left Blank

This Page Intentionally Left Blank
> To learn more about Natixis Funds products and services:
Visit: im.natixis.com Call: 800-225-5478
Before investing, consider the fund’s investment objectives, risks, charges, and expenses. Visit
im.natixis.com or call 800-225-5478 for a prospectus or summary prospectus containing this and
other information. Read it carefully.
Contact us by mail:If you wish to communicate with the funds’ Board of Trustees, you maydo so by writing to:
Secretary of the Funds,Natixis Advisors, LLC888 Boylston Street, Suite 800,Boston, MA 02199-8197
The correspondence must (a) be signed by the shareholder; (b) includethe shareholder’s name and address; and (c) identify the fund(s),account number, share class, and number of shares held in that fund, asof a recent date.
Or by e-mail:[email protected](Communications regarding recommendations for Trustee candidatesmay not be submitted by e-mail.)
Please note: Unlike written correspondence, e-mail is not secure. Please doNOT include your account number, Social Security number, PIN, or any othernon-public personal information in an e-mail communication becausethis information may be viewed by others.
This page not part of shareholder reportExp. 8/29/2022
3717126.1.1IF58SA-0621