clinical pharmacokinetics and pharmacodynamics of aliskiren
TRANSCRIPT
Clin Pharmacokinet 2007; 46 (8): 623-644REVIEW ARTICLE 0312-5963/07/0008-0623/$44.95/0
© 2007 Adis Data Information BV. All rights reserved.
Clinical Pharmacokinetics andPharmacodynamics of Allopurinoland OxypurinolRichard O. Day,1 Garry G. Graham,1 Mark Hicks,1 Andrew J. McLachlan,2Sophie L. Stocker2 and Kenneth M. Williams1
1 School of Medical Sciences, Faculty of Medicine, University of New South Wales andDepartment of Clinical Pharmacology and Toxicology, St Vincent’s Hospital, Sydney, NewSouth Wales, Australia
2 Faculty of Pharmacy, University of Sydney and Centre for Education and Research on Aging,Concord Hospital, Sydney, New South Wales, Australia
ContentsAbstract . . . . . . . . . . . . . . . . . . . . . . . . . . . . . . . . . . . . . . . . . . . . . . . . . . . . . . . . . . . . . . . . . . . . . . . . . . . . . . . . . . . . 624
1. Enzyme Nomenclature . . . . . . . . . . . . . . . . . . . . . . . . . . . . . . . . . . . . . . . . . . . . . . . . . . . . . . . . . . . . . . . . . . 6252. Hyperuricaemia and Gout . . . . . . . . . . . . . . . . . . . . . . . . . . . . . . . . . . . . . . . . . . . . . . . . . . . . . . . . . . . . . . . 6263. Chemistry of Allopurinol and Oxypurinol . . . . . . . . . . . . . . . . . . . . . . . . . . . . . . . . . . . . . . . . . . . . . . . . . . . 6264. Pathways of Metabolism and Elimination . . . . . . . . . . . . . . . . . . . . . . . . . . . . . . . . . . . . . . . . . . . . . . . . . . 6265. Mechanism of Hypouricaemic Action . . . . . . . . . . . . . . . . . . . . . . . . . . . . . . . . . . . . . . . . . . . . . . . . . . . . . 6276. Pharmacokinetic Parameters . . . . . . . . . . . . . . . . . . . . . . . . . . . . . . . . . . . . . . . . . . . . . . . . . . . . . . . . . . . . 627
6.1 Estimation of Pharmacokinetic Parameters . . . . . . . . . . . . . . . . . . . . . . . . . . . . . . . . . . . . . . . . . . . . . 6276.2 Patterns of Plasma Concentrations . . . . . . . . . . . . . . . . . . . . . . . . . . . . . . . . . . . . . . . . . . . . . . . . . . . . 6296.3 Oral Bioavailability . . . . . . . . . . . . . . . . . . . . . . . . . . . . . . . . . . . . . . . . . . . . . . . . . . . . . . . . . . . . . . . . . . . 629
6.3.1 Comparative Oral Bioavailability of Different Oral Preparations of Allopurinol . . . . . . . . 6306.4 Elimination Half-Life . . . . . . . . . . . . . . . . . . . . . . . . . . . . . . . . . . . . . . . . . . . . . . . . . . . . . . . . . . . . . . . . . . 6316.5 Distribution . . . . . . . . . . . . . . . . . . . . . . . . . . . . . . . . . . . . . . . . . . . . . . . . . . . . . . . . . . . . . . . . . . . . . . . . . . 6326.6 Clearance . . . . . . . . . . . . . . . . . . . . . . . . . . . . . . . . . . . . . . . . . . . . . . . . . . . . . . . . . . . . . . . . . . . . . . . . . . 6326.7 Effects of Other Drugs on the Clearance and Efficacy of Oxypurinol . . . . . . . . . . . . . . . . . . . . . . 633
6.7.1 Uricosuric Drugs . . . . . . . . . . . . . . . . . . . . . . . . . . . . . . . . . . . . . . . . . . . . . . . . . . . . . . . . . . . . . . . . 6336.7.2 Furosemide . . . . . . . . . . . . . . . . . . . . . . . . . . . . . . . . . . . . . . . . . . . . . . . . . . . . . . . . . . . . . . . . . . . . 6356.7.3 Alcohol . . . . . . . . . . . . . . . . . . . . . . . . . . . . . . . . . . . . . . . . . . . . . . . . . . . . . . . . . . . . . . . . . . . . . . . 635
7. Inhibition of Xanthine Oxidoreductase in Vivo . . . . . . . . . . . . . . . . . . . . . . . . . . . . . . . . . . . . . . . . . . . . . . 6357.1 Urate Pharmacokinetics After Single and Multiple Doses of Allopurinol . . . . . . . . . . . . . . . . . . . . . 6357.2 Dose-Response Studies in Vivo . . . . . . . . . . . . . . . . . . . . . . . . . . . . . . . . . . . . . . . . . . . . . . . . . . . . . . . . 6367.3 Concentration-Effect Relationships in Vivo . . . . . . . . . . . . . . . . . . . . . . . . . . . . . . . . . . . . . . . . . . . . . . 6367.4 Inhibition of the Metabolism of the Synthetic Substrate, 1-Methyl Xanthine . . . . . . . . . . . . . . . . . 638
8. Therapeutic Plasma Concentrations of Oxypurinol and Doses of Allopurinol . . . . . . . . . . . . . . . . . . . 6398.1 Dosage Related to Toxicity . . . . . . . . . . . . . . . . . . . . . . . . . . . . . . . . . . . . . . . . . . . . . . . . . . . . . . . . . . . 6398.2 Dosage Related to Hypouricaemic Effect . . . . . . . . . . . . . . . . . . . . . . . . . . . . . . . . . . . . . . . . . . . . . . 640
9. Optimisation of Dosage with Allopurinol . . . . . . . . . . . . . . . . . . . . . . . . . . . . . . . . . . . . . . . . . . . . . . . . . . . 6409.1 Determine a Reasonable Target Dosage of Allopurinol Based on the Patient’s Creatinine
Clearance . . . . . . . . . . . . . . . . . . . . . . . . . . . . . . . . . . . . . . . . . . . . . . . . . . . . . . . . . . . . . . . . . . . . . . . . . . 6419.2 Start the Dosage at a Low Level and Increase Slowly . . . . . . . . . . . . . . . . . . . . . . . . . . . . . . . . . . . . 6419.3 Measure the Plasma Concentrations of Urate on Several Occasions, Particularly in the Early
Stages of Dosage of Allopurinol . . . . . . . . . . . . . . . . . . . . . . . . . . . . . . . . . . . . . . . . . . . . . . . . . . . . . . . 6419.4 Check Adherence . . . . . . . . . . . . . . . . . . . . . . . . . . . . . . . . . . . . . . . . . . . . . . . . . . . . . . . . . . . . . . . . . . . 6419.5 Monitor the Plasma Concentrations of Oxypurinol . . . . . . . . . . . . . . . . . . . . . . . . . . . . . . . . . . . . . . . 641
10. Conclusions . . . . . . . . . . . . . . . . . . . . . . . . . . . . . . . . . . . . . . . . . . . . . . . . . . . . . . . . . . . . . . . . . . . . . . . . . . . . 642
624 Day et al.
Allopurinol is the drug most widely used to lower the blood concentrations ofAbstracturate and, therefore, to decrease the number of repeated attacks of gout. Allopuri-nol is rapidly and extensively metabolised to oxypurinol (oxipurinol), and thehypouricaemic efficacy of allopurinol is due very largely to this metabolite.
The pharmacokinetic parameters of allopurinol after oral dosage include oralbioavailability of 79 ± 20% (mean ± SD), an elimination half-life (t1/2) of 1.2 ± 0.3hours, apparent oral clearance (CL/F) of 15.8 ± 5.2 mL/min/kg and an apparentvolume of distribution after oral administration (Vd/F) of 1.31 ± 0.41 L/kg.Assuming that 90mg of oxypurinol is formed from every 100mg of allopurinol,the pharmacokinetic parameters of oxypurinol in subjects with normal renalfunction are a t1/2 of 23.3 ± 6.0 hours, CL/F of 0.31 ± 0.07 mL/min/kg, Vd/F of 0.59± 0.16 L/kg, and renal clearance (CLR) relative to creatinine clearance of 0.19 ±0.06. Oxypurinol is cleared almost entirely by urinary excretion and, for manyyears, it has been recommended that the dosage of allopurinol should be reducedin renal impairment. A reduced initial target dosage in renal impairment is stillreasonable, but recent data on the toxicity of allopurinol indicate that the dosagemay be increased above the present guidelines if the reduction in plasma urateconcentrations is inadequate. Measurement of plasma concentrations of oxypuri-nol in selected patients, particularly those with renal impairment, may help todecrease the risk of toxicity and improve the hypouricaemic response. Monitoringof plasma concentrations of oxypurinol should also help to identify patients withpoor adherence. Uricosuric drugs, such as probenecid, have potentially opposingeffects on the hypouricaemic efficacy of allopurinol. Their uricosuric effectlowers the plasma concentrations of urate; however, they increase the CLR ofoxypurinol, thus potentially decreasing the influence of allopurinol. The net effectis an increased degree of hypouricaemia, but the interaction is probably limited topatients with normal renal function or only moderate impairment.
Allopurinol was developed as an inhibitor of the the pharmacokinetic and pharmacodynamic proper-enzyme commonly known as xanthine oxidase. ties of its therapeutically active metabolite, oxypuri-However, it was not tested initially for its hypouri- nol (oxipurinol). The clinical pharmacokinetics ofcaemic activity.[1] Rather, the first use of allopurinol allopurinol and oxypurinol have been summarisedwas to inhibit the xanthine oxidase-catalysed metab- in several reviews of their clinical pharmacology,olism of mercaptopurine and thereby to potentiate but the most recent detailed review of theirthe actions of this cytotoxic drug.[1] Subsequently, pharmacokinetics was published in 1986,[4] andallopurinol was found to decrease plasma concentra- there has been no review of the in vivo pharmacody-tions of urate and the occurrence of acute gout. namics of allopurinol or oxypurinol. Many papersAllopurinol is now the drug most widely used for on the pharmacokinetics and oral bioavailability ofprophylactic treatment of gout. Allopurinol is less allopurinol have been presented, but detailedwell established for several other indications includ- pharmacokinetic analysis has been presented onlying ischaemia-reperfusion injury, protozoal diseas- rarely. Several papers reported the areas under thees, prevention of stones in the urinary tract[2] and as plasma concentration-time curves (AUCs) and thea measure of liver impairment,[3] but the emphasis in elimination half-lives (t1/2) of allopurinol and ox-this review concerns its use in the prophylaxis of ypurinol. From these data, we estimated the appar-gout. ent oral clearances (CL/F) and apparent volumes of
The aim of this review is primarily to present a distribution after oral administration (Vd/F) of bothcritical appraisal of the pharmacokinetics and phar- compounds. The overall mean values of themacodynamics of allopurinol, with an emphasis on pharmacokinetic parameters were then calculated
© 2007 Adis Data Information BV. All rights reserved. Clin Pharmacokinet 2007; 46 (8)
PK/PD of Allopurinol and Oxypurinol 625
together with their standard deviations (SDs). Al- cysteine (sulfhydryl or thiol) residues to cystinesthough no Bayesian pharmacokinetic analysis was (disulfides) leads to the production of an enzymeconducted in the present work, the mean parameters that still oxidises the xanthines but directly reducesand their SDs should serve as suitable prior values
oxygen to superoxide (O2•¯). This enzyme is xan-for Bayesian analysis and computerised dosage pre-
thine oxidase (EC 1.1.3.22). In this review, the termdictions, particularly for oxypurinol.‘xanthine oxidoreductase’ is used to describe bothforms of the enzyme. The oxidase is inhibited in
1. Enzyme Nomenclature vitro by both allopurinol and oxypurinol.[5,6] Al-lopurinol also inhibits the dehydrogenase form.[5] It
Xanthine oxidoreductase is the enzyme that is is presumed, although not proven, that oxypurinolinhibited during allopurinol therapy. The enzyme also inhibits xanthine dehydrogenase in vitro. Theis synthesised as xanthine dehydrogenase (EC
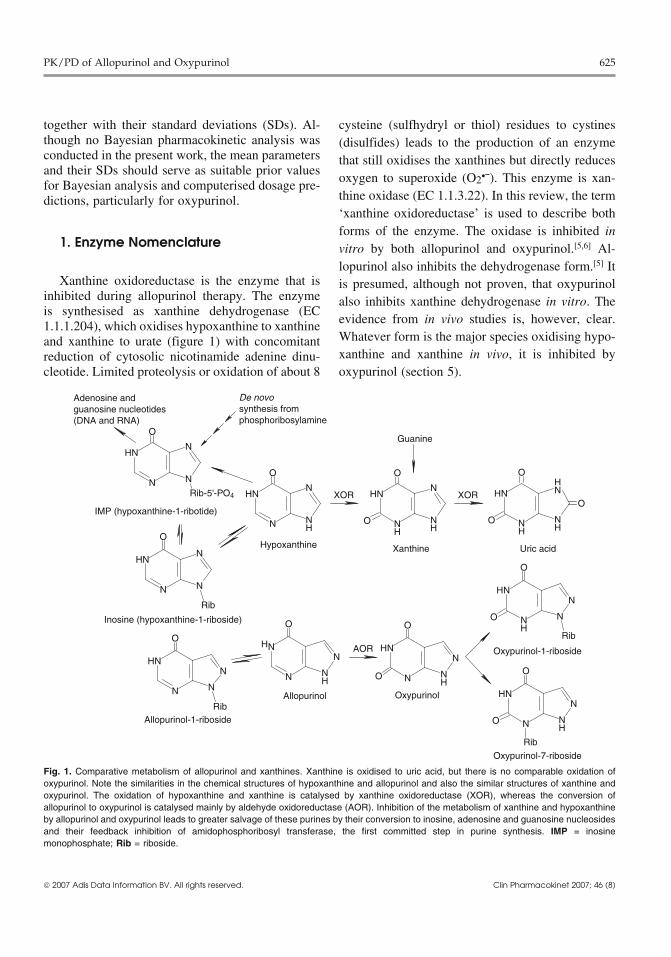
evidence from in vivo studies is, however, clear.1.1.1.204), which oxidises hypoxanthine to xanthineWhatever form is the major species oxidising hypo-and xanthine to urate (figure 1) with concomitantxanthine and xanthine in vivo, it is inhibited byreduction of cytosolic nicotinamide adenine dinu-
cleotide. Limited proteolysis or oxidation of about 8 oxypurinol (section 5).
HN
N
O
N
N
Rib-5'-PO4 HN
N
O
N
NH
HN
NH
O
N
NH
O
HN
NH
OHN
NH
O
O
Rib
HN
NH
N
NO
Rib
O
HN
N
N
NH
O
O
HN
N
N
N
Rib
O
HN
N
N
NH
O
HN
N
N
NH
O
O
Adenosine andguanosine nucleotides(DNA and RNA)
IMP (hypoxanthine-1-ribotide)
Inosine (hypoxanthine-1-riboside)
XOR XOR
Hypoxanthine Xanthine Uric acid
Oxypurinol-1-riboside
Oxypurinol-7-riboside
Allopurinol
HN
N
N
N
Rib
O
Allopurinol-1-riboside
De novosynthesis from phosphoribosylamine
Guanine
Oxypurinol
AOR
Fig. 1. Comparative metabolism of allopurinol and xanthines. Xanthine is oxidised to uric acid, but there is no comparable oxidation ofoxypurinol. Note the similarities in the chemical structures of hypoxanthine and allopurinol and also the similar structures of xanthine andoxypurinol. The oxidation of hypoxanthine and xanthine is catalysed by xanthine oxidoreductase (XOR), whereas the conversion ofallopurinol to oxypurinol is catalysed mainly by aldehyde oxidoreductase (AOR). Inhibition of the metabolism of xanthine and hypoxanthineby allopurinol and oxypurinol leads to greater salvage of these purines by their conversion to inosine, adenosine and guanosine nucleosidesand their feedback inhibition of amidophosphoribosyl transferase, the first committed step in purine synthesis. IMP = inosinemonophosphate; Rib = riboside.
© 2007 Adis Data Information BV. All rights reserved. Clin Pharmacokinet 2007; 46 (8)
626 Day et al.
2. Hyperuricaemia and Gout 4. Pathways of Metabolismand Elimination
The solubility of sodium urate in plasma in vitrois approximately 0.42 mmol/L.[7] Acute gout below After intravenous dosage, 12 ± 6% (mean ± SD)this concentration is uncommon, and the risk in- of the dose of allopurinol is excreted unchanged increases with increasing plasma concentrations of urine, with 76 ± 8% excreted as oxypurinol.[10] Theurate. For example, the annual incidence of the first urinary recovery of unchanged allopurinol is veryattack of gout in men increases from 0.1% at plasma similar after oral administration. The overall meanurate concentrations below 0.42 mmol/L to 0.5% at excretion of allopurinol is 9.5 ± 1.5%.[10-14] (Theplasma urate concentrations of 0.42–0.53 mmol/L method of determining the overall mean and SD isand to 4.9% at plasma concentrations of 0.53 mmol/ the same as that used for the analysis of the t1/2 and isL or greater.[8]
shown in section 6.1). Like hypoxanthine, allopuri-Hyperuricaemia is a marker of accelerated car- nol is metabolised to its riboside metabolite (figure
diovascular disease and is often accompanied by 1), and approximately 10% is converted to allopuri-obesity, type 2 diabetes mellitus, hypertension and nol 1-riboside.[15,16] It is assumed that the remainderhyperlipidaemia. The first-line treatment of these (about 80%) is converted to oxypurinol (figure 1).patients should be measures to reduce their blood Based on the difference in the molecular weights ofpressure and blood glucose, including diet and lifes- allopurinol and oxypurinol, approximately 90mg oftyle changes. Patients should not be treated with oxypurinol is therefore formed from every 100mgallopurinol unless gout has developed. In general, oral dose of allopurinol. This figure has been used inasymptomatic hyperuricaemia should not be treated the pharmacokinetic calculations of oxypurinol inwith allopurinol unless plasma urate concentrations this review.are well above the upper limit of normal and this The major mode of elimination of allopurinol iselevation occurred suddenly or is very likely to its oxidation to oxypurinol (figure 1). Xanthine ox-occur over a short period of time following, for idoreductase metabolises hypoxanthine to xanthineexample, cytotoxic therapy. (as well as the subsequent conversion of xanthine to
urate). It is therefore widely assumed that xanthine3. Chemistry of Allopurinol oxidoreductase converts allopurinol to oxypurinol.and Oxypurinol However, given that both allopurinol and oxypuri-
nol are inhibitors of xanthine oxidoreductase (sec-tion 5), the metabolism of allopurinol should beAllopurinol is an analogue of hypoxanthine (fig-slow and possibly saturable if xanthine ox-ure 1). Allopurinol is a very weak acid with an acididoreductase is the major enzyme responsible for thedissociation constant (pKa) of 9.4 and is thereforeconversion of allopurinol to oxypurinol (i.e. theessentially unionised at all physiological pH values.oxidation should be self-inhibitory).[17,18]Its lipid solubility is quite low as is indicated by its
octanol : water partition coefficient of 0.28.[9] The Oxypurinol is produced rapidly from normalactive metabolite of allopurinol, oxypurinol (also therapeutic doses of allopurinol in vivo (section 6.2)termed oxypurinol or alloxanthine) is an analogue of and, furthermore, the steady-state plasma concentra-xanthine. Oxypurinol is a somewhat stronger acid tions of oxypurinol are proportional to the dose ofwith a pKa of 7.7 and is therefore about 30% ionised allopurinol.[19] These findings indicate that the con-in plasma (pH 7.4). The sodium salt of oxypurinol version of allopurinol to oxypurinol is not self-has been used in some capsules but is not commer- inhibitory in humans. The reason may be that xan-cially available. Its solutions are quite alkaline. De- thine oxidoreductase does not oxidise allopurinol tospite its similarity to allopurinol, oxypurinol is much oxypurinol. Rather, the closely related enzyme, al-more lipid soluble than allopurinol, with an octa- dehyde oxidoreductase (EC 1.2.3.1) appears to benol : water partition coefficient of 14.[9] Oxypurinol the more significant enzyme. An involvement ofshould therefore pass more easily through cell walls aldehyde oxidoreductase is indicated by the metabo-by passive diffusion. lism of allopurinol in those rare patients who
© 2007 Adis Data Information BV. All rights reserved. Clin Pharmacokinet 2007; 46 (8)
PK/PD of Allopurinol and Oxypurinol 627
lack xanthine oxidoreductase but who do have alde- 1). The complex breaks down very slowly, althoughhyde oxidoreductase.[20-23] Detailed pharmacokinet- somewhat faster in the presence of xanthine, to yieldic studies have not been conducted in these patients, oxypurinol.[23] The reaction between allopurinol andbut the urinary excretion of allopurinol and oxypuri- xanthine oxidoreductase has been described asnol is very similar to that seen in the broader popula- ‘pseudo irreversible.’ A second mode of inhibitiontion. Some xanthinuric patients lack both xanthine of xanthine oxidoreductase is by oxypurinol itself inand aldehyde oxidoreductases and do not convert the absence of allopurinol. Oxypurinol, possiblyallopurinol to oxypurinol.[21,22] It is of note that produced by aldehyde oxidoreductase, can bindallopurinol is stated to be a poor inhibitor of alde- strongly to the reduced form of xanthine ox-hyde oxidoreductase in vitro.[24] This is consistent idoreductase and inhibit the enzyme (figure 1).[23]
with aldehyde oxidoreductase being the major en- This provides the second and probably the majorzyme converting allopurinol to oxypurinol. mechanism of inhibition.
Oxypurinol has a much longer t1/2 than allopurinol Oxypurinol has a much longer t1/2 and attainsand is largely responsible for the hypouricaemic higher plasma concentrations than allopurinol and,effect of allopurinol (section 5). Oxypurinol is elim- consequently, oxypurinol should be the more signif-inated almost entirely unchanged in urine (sections icant inhibitor of xanthine oxidoreductase in vivo.6.4 and 6.6), with 1–3% conversion to two riboside This expectation is confirmed by the finding thatmetabolites (figure 1).[15,16] The renal clearance capsules of sodium oxypurinol produce only a(CLR) of oxypurinol is therefore the most important slightly lesser hypouricaemic effect than allopurinolaspect of the clinical pharmacokinetics of allopuri- when the two drugs are administered at equimolarnol (section 6.6). doses.[26] Given that the bioavailability of oxypuri-
nol from these capsules was approximately 75% of5. Mechanism of Hypouricaemic Action that from allopurinol, it is evident that oxypurinol is
the major contributor to the hypouricaemic effect ofThe basic mechanism of action of allopurinol andallopurinol.oxypurinol is inhibition of xanthine oxidoreductase
(or aldehyde oxidoreductase). This leads to de- 6. Pharmacokinetic Parameterscreased plasma concentrations of urate and elevatedconcentrations of the precursors, hypoxanthine and
6.1 Estimation ofxanthine.[1] In addition, hypoxanthine is convert-Pharmacokinetic Parametersed to inosine (hypoxanthine riboside), inosine
monophosphate and closely related purine ribotides, As outlined earlier, many of the pharmacokineticadenosine and guanosine monophosphates (figure parameters of allopurinol and oxypurinol were cal-1). Increased concentrations of hypoxanthine lead to culated from the limited data in papers on theelevated amounts of these ribotides, causing feed- pharmacokinetics and oral bioavailability of al-back inhibition of amidophosphoribosyl transferase, lopurinol. A number of these papers contained thethe first and rate-limiting enzyme in the biosynthesis AUC values of allopurinol and oxypurinol deter-of purines (figure 1).[25] Thus, the primary effect of mined from time zero to infinity (AUC∞) and the t1/2both allopurinol and oxypurinol is inhibition of urate after single oral doses of allopurinol. Consequently,production, but the consequence of this effect is the CL/F values of allopurinol and oxypurinol weredecreased de novo synthesis of purines. The overall calculated from the standard equation 1:result is that the accumulation of hypoxanthine andxanthine in plasma is less marked than the decreasein the concentrations of plasma urate.
CL/F =Dose
AUC�
(Eq. 1)Allopurinol inhibits xanthine oxidoreductase bytwo mechanisms.[23] First, the parent drug, allopuri- where F is the fraction absorbed. The SD of the CL/nol, is a substrate for xanthine oxidoreductase, but F was then determined, assuming that the coefficientthe complex between the reduced enzyme and the of variation (CV) of the AUC values and clearancesoxidised product, oxypurinol, is very stable (figure were the same. From the AUC values and the
© 2007 Adis Data Information BV. All rights reserved. Clin Pharmacokinet 2007; 46 (8)
628 Day et al.
bodyweights (BWs), the CV of the CL/F (relative to time between administration and the appearance ofBW) was then determined by the propagation of oxypurinol in plasma, and ka is the rate constant oferrors. This allowed an estimate of the CV and input into the body which, for oxypurinol, is relatedhence the SD of the CL/F relative to BW (equation to the rate of absorption of allopurinol and the rate of2). conversion of allopurinol to oxypurinol (section
6.3). The dose of oxypurinol was estimated to beCVCL/F = √(CVAUC
2 + CVBW2) 90mg for every 100mg of allopurinol (section 4).
(Eq. 2) This dose of oxypurinol allows a reasonable esti-mate of the actual pharmacokinetic parameters ofFrom the CL/F and the mean t1/2, the mean Vd/Foxypurinol. Similar analysis was conducted bywas estimated from equation 3:Turnheim et al.[32] A more complex model of ox-ypurinol pharmacokinetics is required after intrave-nous administration of allopurinol,[3] but equation 5
Vd/F =t½ • CL/F
0.693
provided an adequate fit to the time course of plasma(Eq. 3)
concentrations of oxypurinol following oral admin-Several papers contained more details of the istration of allopurinol. Attempts to fit the plasma
pharmacokinetics of allopurinol and oxypurinol. concentrations of oxypurinol by the more complexThree reports[14,27,28] included the AUC and t1/2 val- two-compartment open model failed because con-ues in individual subjects, allowing direct determi- vergence to a satisfactory fit was not obtained.nation of the mean ± SD of the CL/F and Vd/F
Following determination of the pharmacokineticwithout the estimation method described above.parameters of allopurinol and oxypurinol in each ofFurthermore, two reports[29,30] included full data onthe cited studies, the overall means and SDs werethe time course of the plasma concentrations ofdetermined according to the recommendations ofallopurinol and oxypurinol. This allowed computa-Sheiner et al.[33] Thus, the overall means were com-tion of the CL/F, Vd/F and t1/2 for each subject. Forputed from equation 6:allopurinol, the AUC was obtained using the trape-
zoidal rule, and the elimination rate constant (ke) Overall mean parameter = ∑w • N • P/∑w • Nwas the slope of the log linear elimination phase of
(Eq. 6)the time course of plasma concentrations. The t1/2
where P is the mean pharmacokinetic parameter inwas then given by equation 4:each study, w is an empirical weighting factor, and
t½ = 0.693/ke N is the number of subjects in each study. The(Eq. 4) overall SD values of each parameter were estimated
The pharmacokinetic parameters CL/F and Vd/F similarly. The values of w were estimates of thewere then calculated as described above. relative reliabilities of the parameters, such as the
t1/2, CL/F and Vd/F, in the cited studies. For example,For oxypurinol, the time (t) course of the plasmapharmacokinetic parameters were given a higherconcentrations of oxypurinol listed by Metzner etweighting if they were determined from a crossoveral.[29] and Fenner et al. [30] were fitted by the standardstudy in which the pharmacokinetic parametersequation for a one-compartment model using thewere determined twice in every subject. For estima-MINIM program (Purves RD, University of Otago,tion of the overall mean and SD of t1/2, w was set at 2Dunedin, New Zealand) [equation 5]:[31]
when the t1/2 values were determined from a singlepharmacokinetic study in each subject, and w wasset at 3 when the recorded t1/2 was determined from a
D • ka • (exp[–ke • (t – tlag)] – exp[–ka • (t – tlag)]
Vd/F/(ka – ke)C =
crossover study and two mean values of t1/2 were(Eq. 5) recorded or could be calculated from the time
where C is the plasma concentration, D is the esti- courses of plasma concentrations. For estimation ofmated amount of oxypurinol formed from allopuri- the mean and SD of both the CL/F and Vd/F ofnol, ke is the ratio of the CL/F and Vd/F, tlag is the allopurinol and oxypurinol, w was set at 1 when
© 2007 Adis Data Information BV. All rights reserved. Clin Pharmacokinet 2007; 46 (8)
PK/PD of Allopurinol and Oxypurinol 629
only mean values of the AUC, BW and t1/2 were 6.3 Oral Bioavailabilityrecorded from non-crossover studies, and w was
The oral bioavailability of unchanged allopurinolfixed at 1.5 in corresponding crossover studies. Inis quite high. The results of the three oral bioavai-cited studies in which the CL/F and Vd/F werelability studies are quite variable, but the estimatedavailable for each subject, w was set at 3 and 4 fororal bioavailability (F) is 79 ± 20% (table III). Thenon-crossover and crossover studies, respectively.clearance of allopurinol is about 10 mL/min/kg afterAll results in this review are presented as mean ±intravenous dosage (table I). This intermediateSD. Details of all calculations are available on re-clearance indicates that about 50% of an oral dosequest.should be absorbed intact if the entire metabolism ofallopurinol occurs in the liver. The higher oral
6.2 Patterns of Plasma Concentrations bioavailability indicates that that some of the meta-bolic clearance is extrahepatic.
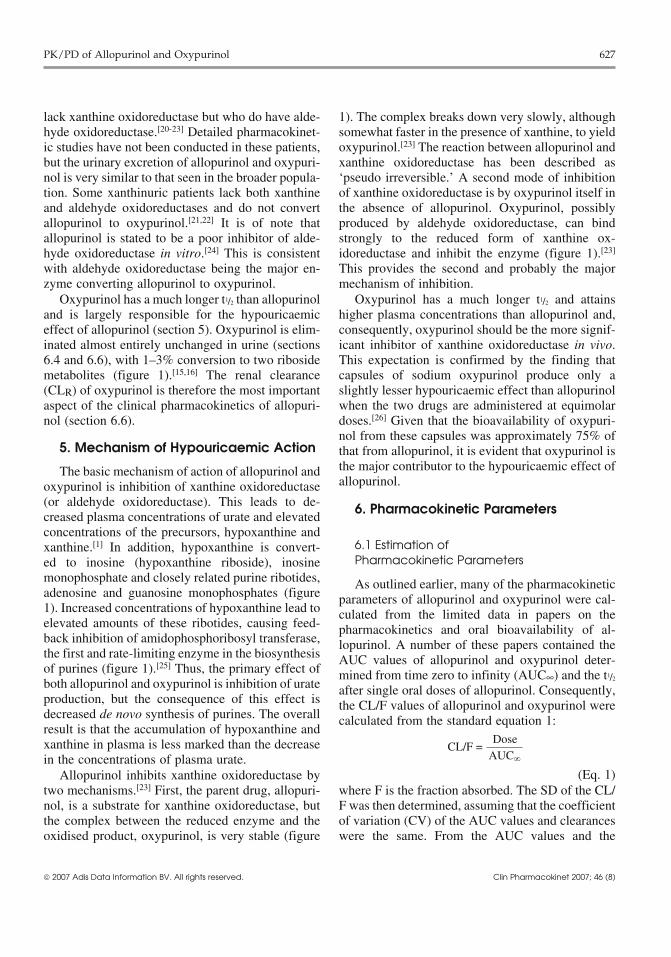
The somewhat incomplete absorption of un-Unchanged allopurinol is rapidly absorbed, withchanged allopurinol is not, however, of great clinicalpeak concentrations of approximately 2 mg/L atsignificance. As discussed above, allopurinol is veryabout 1.5 hours after a standard oral dose of al-largely a pro-drug, with most of its activity beinglopurinol 300mg (figure 2). The plasma concentra-due to the metabolite, oxypurinol. Consequently, thetions then decline rapidly, with a mean t1/2 of 1.2total amount of oxypurinol formed is more signifi-hours (table I). The peak concentrations of oxypuri-cant than the extent of absorption of unchangednol are much higher at about 7 mg/L after the sameallopurinol.single dose of allopurinol, but the peak concentra-
tions occur at approximately 4 hours after dosing, Although oxypurinol is very largely responsiblewhich is longer than observed with allopurinol. The for the pharmacological effects of allopurinol (sec-t1/2 of oxypurinol is much longer than that of al- tion 5), the parent drug is still used. The reason islopurinol (table II), and it is this metabolite that that older preparations of oxypurinol were absorbedaccumulates in plasma during long-term dosing with poorly.[41] More recently, it has been shown thatallopurinol. During long-term treatment, the steady- capsules containing the sodium salt of oxypurinolstate plasma concentrations of oxypurinol increase are well absorbed and efficacious (section 5). At thisapproximately linearly with the dose of allopuri- stage, however, there appears to be no great advan-nol.[19,34] tage to switching treatment from allopurinol to ox-
0.1
1
10
0 1 2 3 4 5 6
Time (h)
Allo
purin
ol p
lasm
a co
ncen
trat
ion
(mg/
L)
a
0.1
1
10
0 20 40 60 80
Oxy
purin
ol p
lasm
a co
ncen
trat
ion
(mg/
L)
b
Fig. 2. Time courses of the mean ± SD plasma concentrations of (a) allopurinol and (b) oxypurinol following oral dosage of 300mg of areference formulation of allopurinol to healthy subjects (n = 18). The time course of the plasma concentrations of allopurinol is presented upto 6 hours, although occasional subjects had measurable plasma concentrations at later times; up to 36 hours in one subject.[29]
© 2007 Adis Data Information BV. All rights reserved. Clin Pharmacokinet 2007; 46 (8)
630 Day et al.
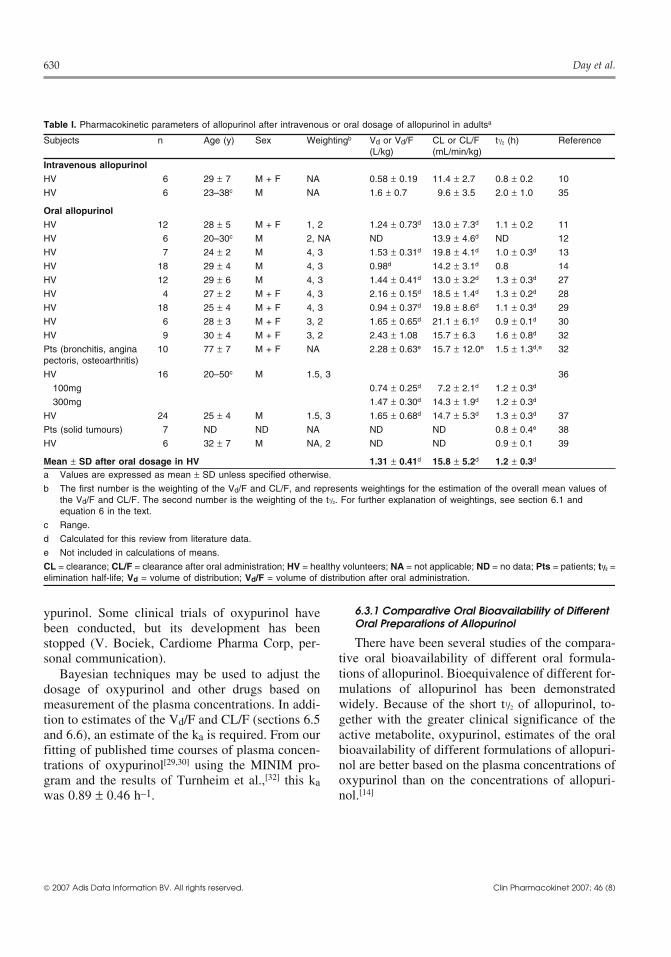
Table I. Pharmacokinetic parameters of allopurinol after intravenous or oral dosage of allopurinol in adultsa
Subjects n Age (y) Sex Weightingb Vd or Vd/F CL or CL/F t1/2 (h) Reference(L/kg) (mL/min/kg)
Intravenous allopurinolHV 6 29 ± 7 M + F NA 0.58 ± 0.19 11.4 ± 2.7 0.8 ± 0.2 10
HV 6 23–38c M NA 1.6 ± 0.7 9.6 ± 3.5 2.0 ± 1.0 35
Oral allopurinolHV 12 28 ± 5 M + F 1, 2 1.24 ± 0.73d 13.0 ± 7.3d 1.1 ± 0.2 11
HV 6 20–30c M 2, NA ND 13.9 ± 4.6d ND 12
HV 7 24 ± 2 M 4, 3 1.53 ± 0.31d 19.8 ± 4.1d 1.0 ± 0.3d 13
HV 18 29 ± 4 M 4, 3 0.98d 14.2 ± 3.1d 0.8 14
HV 12 29 ± 6 M 4, 3 1.44 ± 0.41d 13.0 ± 3.2d 1.3 ± 0.3d 27
HV 4 27 ± 2 M + F 4, 3 2.16 ± 0.15d 18.5 ± 1.4d 1.3 ± 0.2d 28
HV 18 25 ± 4 M + F 4, 3 0.94 ± 0.37d 19.8 ± 8.6d 1.1 ± 0.3d 29
HV 6 28 ± 3 M + F 3, 2 1.65 ± 0.65d 21.1 ± 6.1d 0.9 ± 0.1d 30
HV 9 30 ± 4 M + F 3, 2 2.43 ± 1.08 15.7 ± 6.3 1.6 ± 0.8d 32
Pts (bronchitis, angina 10 77 ± 7 M + F NA 2.28 ± 0.63e 15.7 ± 12.0e 1.5 ± 1.3d,e 32pectoris, osteoarthritis)
HV 16 20–50c M 1.5, 3 36
100mg 0.74 ± 0.25d 7.2 ± 2.1d 1.2 ± 0.3d
300mg 1.47 ± 0.30d 14.3 ± 1.9d 1.2 ± 0.3d
HV 24 25 ± 4 M 1.5, 3 1.65 ± 0.68d 14.7 ± 5.3d 1.3 ± 0.3d 37
Pts (solid tumours) 7 ND ND NA ND ND 0.8 ± 0.4e 38
HV 6 32 ± 7 M NA, 2 ND ND 0.9 ± 0.1 39
Mean ± SD after oral dosage in HV 1.31 ± 0.41d 15.8 ± 5.2d 1.2 ± 0.3d
a Values are expressed as mean ± SD unless specified otherwise.
b The first number is the weighting of the Vd/F and CL/F, and represents weightings for the estimation of the overall mean values ofthe Vd/F and CL/F. The second number is the weighting of the t1/2. For further explanation of weightings, see section 6.1 andequation 6 in the text.
c Range.
d Calculated for this review from literature data.
e Not included in calculations of means.
CL = clearance; CL/F = clearance after oral administration; HV = healthy volunteers; NA = not applicable; ND = no data; Pts = patients; t1/2 =elimination half-life; Vd = volume of distribution; Vd/F = volume of distribution after oral administration.
6.3.1 Comparative Oral Bioavailability of Differentypurinol. Some clinical trials of oxypurinol haveOral Preparations of Allopurinolbeen conducted, but its development has beenThere have been several studies of the compara-stopped (V. Bociek, Cardiome Pharma Corp, per-
tive oral bioavailability of different oral formula-sonal communication).tions of allopurinol. Bioequivalence of different for-Bayesian techniques may be used to adjust themulations of allopurinol has been demonstrateddosage of oxypurinol and other drugs based onwidely. Because of the short t1/2 of allopurinol, to-measurement of the plasma concentrations. In addi-gether with the greater clinical significance of thetion to estimates of the Vd/F and CL/F (sections 6.5active metabolite, oxypurinol, estimates of the oraland 6.6), an estimate of the ka is required. From ourbioavailability of different formulations of allopuri-fitting of published time courses of plasma concen-nol are better based on the plasma concentrations oftrations of oxypurinol[29,30] using the MINIM pro-oxypurinol than on the concentrations of allopuri-gram and the results of Turnheim et al.,[32] this kanol.[14]was 0.89 ± 0.46 h–1.
© 2007 Adis Data Information BV. All rights reserved. Clin Pharmacokinet 2007; 46 (8)
PK/PD of Allopurinol and Oxypurinol 631
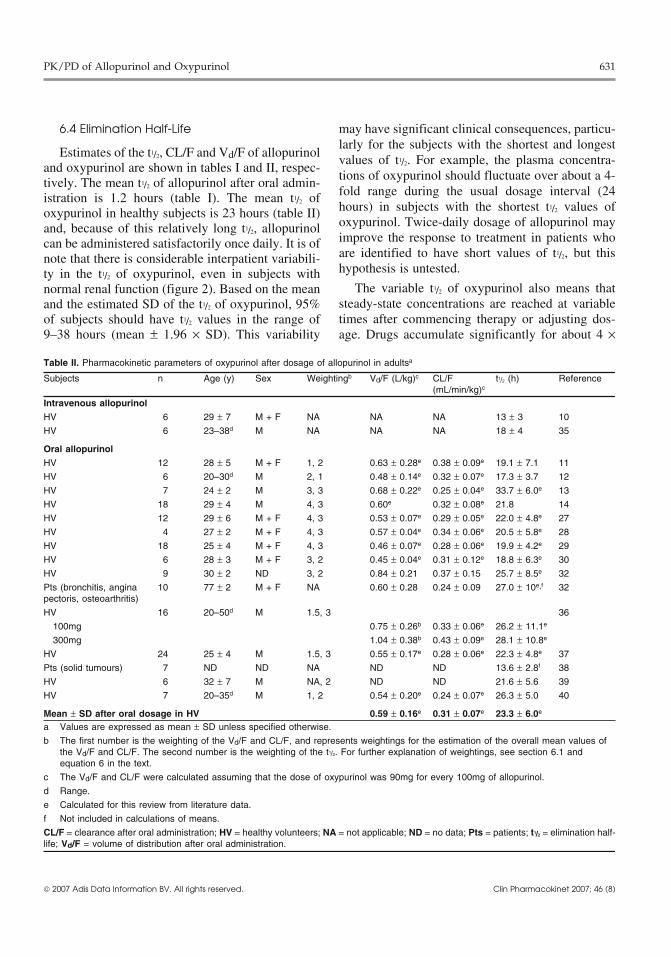
6.4 Elimination Half-Life may have significant clinical consequences, particu-larly for the subjects with the shortest and longest
Estimates of the t1/2, CL/F and Vd/F of allopurinolvalues of t1/2. For example, the plasma concentra-
and oxypurinol are shown in tables I and II, respec-tions of oxypurinol should fluctuate over about a 4-tively. The mean t1/2 of allopurinol after oral admin-fold range during the usual dosage interval (24istration is 1.2 hours (table I). The mean t1/2 ofhours) in subjects with the shortest t1/2 values ofoxypurinol in healthy subjects is 23 hours (table II)oxypurinol. Twice-daily dosage of allopurinol mayand, because of this relatively long t1/2, allopurinolimprove the response to treatment in patients whocan be administered satisfactorily once daily. It is ofare identified to have short values of t1/2, but thisnote that there is considerable interpatient variabili-hypothesis is untested.ty in the t1/2 of oxypurinol, even in subjects with
The variable t1/2 of oxypurinol also means thatnormal renal function (figure 2). Based on the meansteady-state concentrations are reached at variableand the estimated SD of the t1/2 of oxypurinol, 95%times after commencing therapy or adjusting dos-of subjects should have t1/2 values in the range of
9–38 hours (mean ± 1.96 × SD). This variability age. Drugs accumulate significantly for about 4 ×
Table II. Pharmacokinetic parameters of oxypurinol after dosage of allopurinol in adultsa
Subjects n Age (y) Sex Weightingb Vd/F (L/kg)c CL/F t1/2 (h) Reference(mL/min/kg)c
Intravenous allopurinolHV 6 29 ± 7 M + F NA NA NA 13 ± 3 10
HV 6 23–38d M NA NA NA 18 ± 4 35
Oral allopurinolHV 12 28 ± 5 M + F 1, 2 0.63 ± 0.28e 0.38 ± 0.09e 19.1 ± 7.1 11
HV 6 20–30d M 2, 1 0.48 ± 0.14e 0.32 ± 0.07e 17.3 ± 3.7 12
HV 7 24 ± 2 M 3, 3 0.68 ± 0.22e 0.25 ± 0.04e 33.7 ± 6.0e 13
HV 18 29 ± 4 M 4, 3 0.60e 0.32 ± 0.08e 21.8 14
HV 12 29 ± 6 M + F 4, 3 0.53 ± 0.07e 0.29 ± 0.05e 22.0 ± 4.8e 27
HV 4 27 ± 2 M + F 4, 3 0.57 ± 0.04e 0.34 ± 0.06e 20.5 ± 5.8e 28
HV 18 25 ± 4 M + F 4, 3 0.46 ± 0.07e 0.28 ± 0.06e 19.9 ± 4.2e 29
HV 6 28 ± 3 M + F 3, 2 0.45 ± 0.04e 0.31 ± 0.12e 18.8 ± 6.3e 30
HV 9 30 ± 2 ND 3, 2 0.84 ± 0.21 0.37 ± 0.15 25.7 ± 8.5e 32
Pts (bronchitis, angina 10 77 ± 2 M + F NA 0.60 ± 0.28 0.24 ± 0.09 27.0 ± 10e,f 32pectoris, osteoarthritis)
HV 16 20–50d M 1.5, 3 36
100mg 0.75 ± 0.26b 0.33 ± 0.06e 26.2 ± 11.1e
300mg 1.04 ± 0.38b 0.43 ± 0.09e 28.1 ± 10.8e
HV 24 25 ± 4 M 1.5, 3 0.55 ± 0.17e 0.28 ± 0.06e 22.3 ± 4.8e 37
Pts (solid tumours) 7 ND ND NA ND ND 13.6 ± 2.8f 38
HV 6 32 ± 7 M NA, 2 ND ND 21.6 ± 5.6 39
HV 7 20–35d M 1, 2 0.54 ± 0.20e 0.24 ± 0.07e 26.3 ± 5.0 40
Mean ± SD after oral dosage in HV 0.59 ± 0.16e 0.31 ± 0.07e 23.3 ± 6.0e
a Values are expressed as mean ± SD unless specified otherwise.
b The first number is the weighting of the Vd/F and CL/F, and represents weightings for the estimation of the overall mean values ofthe Vd/F and CL/F. The second number is the weighting of the t1/2. For further explanation of weightings, see section 6.1 andequation 6 in the text.
c The Vd/F and CL/F were calculated assuming that the dose of oxypurinol was 90mg for every 100mg of allopurinol.
d Range.
e Calculated for this review from literature data.
f Not included in calculations of means.
CL/F = clearance after oral administration; HV = healthy volunteers; NA = not applicable; ND = no data; Pts = patients; t1/2 = elimination half-life; Vd/F = volume of distribution after oral administration.
© 2007 Adis Data Information BV. All rights reserved. Clin Pharmacokinet 2007; 46 (8)
632 Day et al.
but without significant binding to tissue constitu-ents. From our analysis of the data of Metzner etal.,[29] the Vd/F of oxypurinol correlates with theBW of healthy subjects (r = 0.63, p < 0.005).
6.6 Clearance
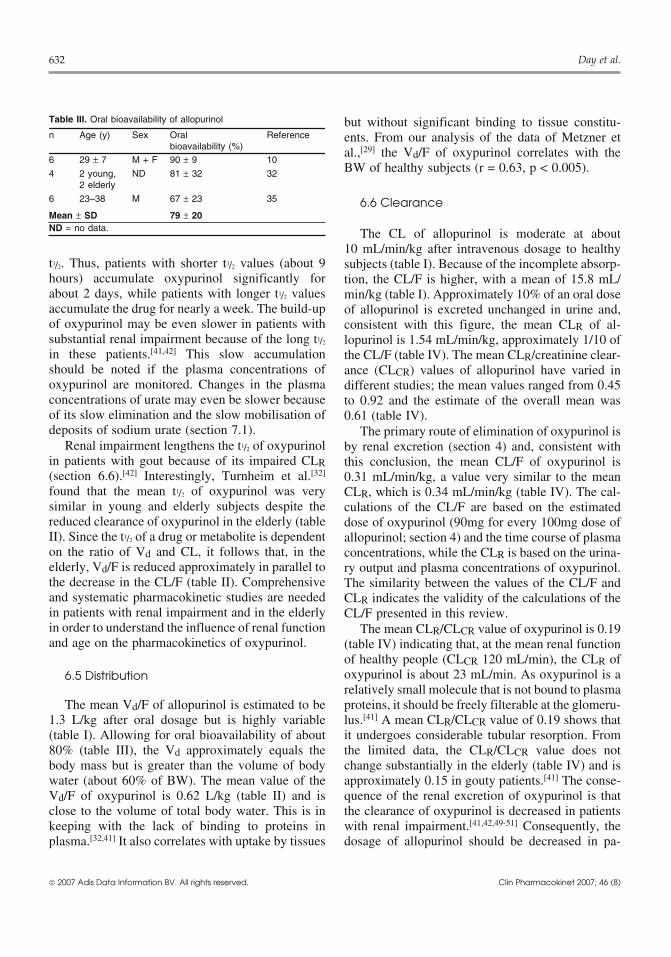
Table III. Oral bioavailability of allopurinol
n Age (y) Sex Oral Referencebioavailability (%)
6 29 ± 7 M + F 90 ± 9 10
4 2 young, ND 81 ± 32 322 elderly
6 23–38 M 67 ± 23 35
Mean ± SD 79 ± 20ND = no data. The CL of allopurinol is moderate at about
10 mL/min/kg after intravenous dosage to healthyt1/2. Thus, patients with shorter t1/2 values (about 9 subjects (table I). Because of the incomplete absorp-hours) accumulate oxypurinol significantly for tion, the CL/F is higher, with a mean of 15.8 mL/about 2 days, while patients with longer t1/2 values min/kg (table I). Approximately 10% of an oral doseaccumulate the drug for nearly a week. The build-up of allopurinol is excreted unchanged in urine and,of oxypurinol may be even slower in patients with consistent with this figure, the mean CLR of al-substantial renal impairment because of the long t1/2 lopurinol is 1.54 mL/min/kg, approximately 1/10 ofin these patients.[41,42] This slow accumulation the CL/F (table IV). The mean CLR/creatinine clear-should be noted if the plasma concentrations of ance (CLCR) values of allopurinol have varied inoxypurinol are monitored. Changes in the plasma different studies; the mean values ranged from 0.45concentrations of urate may even be slower because to 0.92 and the estimate of the overall mean wasof its slow elimination and the slow mobilisation of 0.61 (table IV).deposits of sodium urate (section 7.1). The primary route of elimination of oxypurinol is
Renal impairment lengthens the t1/2 of oxypurinol by renal excretion (section 4) and, consistent within patients with gout because of its impaired CLR this conclusion, the mean CL/F of oxypurinol is(section 6.6).[42] Interestingly, Turnheim et al.[32] 0.31 mL/min/kg, a value very similar to the meanfound that the mean t1/2 of oxypurinol was very CLR, which is 0.34 mL/min/kg (table IV). The cal-similar in young and elderly subjects despite the culations of the CL/F are based on the estimatedreduced clearance of oxypurinol in the elderly (table dose of oxypurinol (90mg for every 100mg dose ofII). Since the t1/2 of a drug or metabolite is dependent allopurinol; section 4) and the time course of plasmaon the ratio of Vd and CL, it follows that, in the concentrations, while the CLR is based on the urina-elderly, Vd/F is reduced approximately in parallel to ry output and plasma concentrations of oxypurinol.the decrease in the CL/F (table II). Comprehensive The similarity between the values of the CL/F andand systematic pharmacokinetic studies are needed CLR indicates the validity of the calculations of thein patients with renal impairment and in the elderly CL/F presented in this review.in order to understand the influence of renal function The mean CLR/CLCR value of oxypurinol is 0.19and age on the pharmacokinetics of oxypurinol. (table IV) indicating that, at the mean renal function
of healthy people (CLCR 120 mL/min), the CLR ofoxypurinol is about 23 mL/min. As oxypurinol is a6.5 Distributionrelatively small molecule that is not bound to plasma
The mean Vd/F of allopurinol is estimated to be proteins, it should be freely filterable at the glomeru-1.3 L/kg after oral dosage but is highly variable lus.[41] A mean CLR/CLCR value of 0.19 shows that(table I). Allowing for oral bioavailability of about it undergoes considerable tubular resorption. From80% (table III), the Vd approximately equals the the limited data, the CLR/CLCR value does notbody mass but is greater than the volume of body change substantially in the elderly (table IV) and iswater (about 60% of BW). The mean value of the approximately 0.15 in gouty patients.[41] The conse-Vd/F of oxypurinol is 0.62 L/kg (table II) and is quence of the renal excretion of oxypurinol is thatclose to the volume of total body water. This is in the clearance of oxypurinol is decreased in patientskeeping with the lack of binding to proteins in with renal impairment.[41,42,49-51] Consequently, theplasma.[32,41] It also correlates with uptake by tissues dosage of allopurinol should be decreased in pa-
© 2007 Adis Data Information BV. All rights reserved. Clin Pharmacokinet 2007; 46 (8)
PK/PD of Allopurinol and Oxypurinol 633
tients with renal impairment, as is discussed in fur- Metzner et al.[29] The mean CL/F values are veryther detail in sections 8 and 9. similar after dosage of the two preparations of al-
lopurinol, but substantial variation in the CL/F (upThe CLR of oxypurinol is about 50% lower thanto 65%) occurs in a few subjects. Diets low inthat of allopurinol (table IV). The difference mayprotein and total calories markedly decrease the CL/be due to greater carrier-mediated resorption of oxy-F of oxypurinol.[12,40] Smaller differences in foodpurinol, but higher passive diffusion of the metabo-intake may lead to intrapatient differences in CL/Flite may also be a contributing factor as the lipidvalues, but further work is required to examine thissolubility of oxypurinol is considerably greater thansuggestion.that of allopurinol (section 3).
The ribosides of allopurinol and oxypurinol, areThe CLR of oxypurinol is about 2–3 times that ofexcreted in urine and, like oxypurinol, they shouldurate, indicating lesser tubular resorption of ox-accumulate in patients with renal failure. There are,ypurinol.[41,42] Recently, the URAT1 transporter hashowever, no data on the CLR values of the ribosides.been identified as being responsible for the proximal
resorption of urate[52] and oxypurinol.[53] Inhibition6.7 Effects of Other Drugs on the Clearanceof this transporter now appears to be the majorand Efficacy of Oxypurinolmechanism by which the uricosuric drugs increase
the CLR of both urate and oxypurinol (section6.7.1). 6.7.1 Uricosuric Drugs
Considerable interpatient variability in the CL/F The interactions of uricosuric drugs with al-of oxypurinol is seen in all studies in healthy sub- lopurinol and oxypurinol are clinically significant.jects. However, there may also be considerable in- These drugs have two opposing effects on the effica-trapatient differences in the CL/F. This is shown cy of allopurinol. First, uricosuric drugs lower themost clearly in the data of Walter-Sack et al.[14] and plasma concentrations of urate by decreasing its
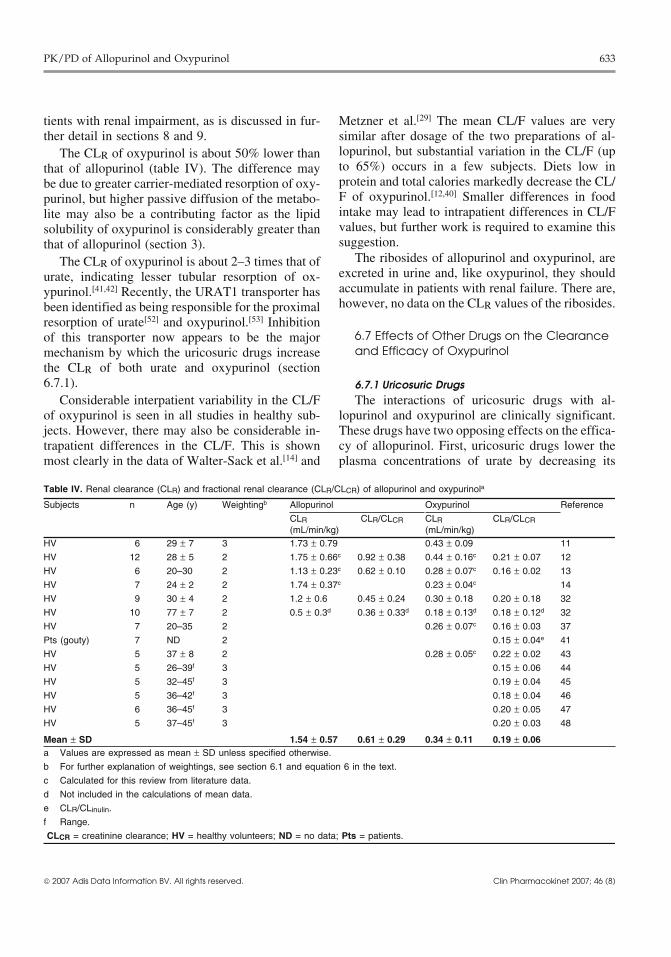
Table IV. Renal clearance (CLR) and fractional renal clearance (CLR/CLCR) of allopurinol and oxypurinola
Subjects n Age (y) Weightingb Allopurinol Oxypurinol Reference
CLR CLR/CLCR CLR CLR/CLCR(mL/min/kg) (mL/min/kg)
HV 6 29 ± 7 3 1.73 ± 0.79 0.43 ± 0.09 11
HV 12 28 ± 5 2 1.75 ± 0.66c 0.92 ± 0.38 0.44 ± 0.16c 0.21 ± 0.07 12
HV 6 20–30 2 1.13 ± 0.23c 0.62 ± 0.10 0.28 ± 0.07c 0.16 ± 0.02 13
HV 7 24 ± 2 2 1.74 ± 0.37c 0.23 ± 0.04c 14
HV 9 30 ± 4 2 1.2 ± 0.6 0.45 ± 0.24 0.30 ± 0.18 0.20 ± 0.18 32
HV 10 77 ± 7 2 0.5 ± 0.3d 0.36 ± 0.33d 0.18 ± 0.13d 0.18 ± 0.12d 32
HV 7 20–35 2 0.26 ± 0.07c 0.16 ± 0.03 37
Pts (gouty) 7 ND 2 0.15 ± 0.04e 41
HV 5 37 ± 8 2 0.28 ± 0.05c 0.22 ± 0.02 43
HV 5 26–39f 3 0.15 ± 0.06 44
HV 5 32–45f 3 0.19 ± 0.04 45
HV 5 36–42f 3 0.18 ± 0.04 46
HV 6 36–45f 3 0.20 ± 0.05 47
HV 5 37–45f 3 0.20 ± 0.03 48
Mean ± SD 1.54 ± 0.57 0.61 ± 0.29 0.34 ± 0.11 0.19 ± 0.06a Values are expressed as mean ± SD unless specified otherwise.
b For further explanation of weightings, see section 6.1 and equation 6 in the text.
c Calculated for this review from literature data.
d Not included in the calculations of mean data.
e CLR/CLinulin.
f Range.
CLCR = creatinine clearance; HV = healthy volunteers; ND = no data; Pts = patients.
© 2007 Adis Data Information BV. All rights reserved. Clin Pharmacokinet 2007; 46 (8)
634 Day et al.
renal resorption and, consequently, should add to the countries. Benzbromarone increases the CLR of ox-hypouricaemic activity of allopurinol. On the other ypurinol,[44,58] but there are conflicting reports on thehand, uricosuric drugs also increase the CLR of interaction between benzbromarone and oxypurinoloxypurinol,[41,44] thus potentially decreasing the hy- during multiple-dose treatment. In two studies inpouricaemic effect of allopurinol. The net effect is subjects with good renal function, the addition ofdifficult to predict but, as outlined in the following benzbromarone to allopurinol treatment decreasedsections, the hypouricaemic effect of uricosuric plasma concentrations of oxypurinol,[11,59] althoughagents generally overcomes the decreased effect of in one study, benzbromarone reportedly had no ef-the lowered plasma concentrations of oxypurinol. fect on plasma oxypurinol in gouty patients.[60]
The t1/2 of the uricosuric agent is also an important However, the combination of allopurinol and benz-variable in understanding the extent of the interac- bromarone consistently produced lower concentra-tion with oxypurinol. tions of plasma urate than were seen with allopuri-
nol treatment alone.[11,59,60] The t1/2 of benz-Probenecid bromarone is only about 3 hours. An activeTwo recent studies have shown that probenecid metabolite with a longer CLR is probably responsi-
potentiates the hypouricaemic effect of allopurinol. ble for the hypouricaemic effect of benz-One study was conducted in healthy subjects[54]
bromarone[61] and the addition to the hypouricaemicwhile the second included gouty patients with mod- action of allopurinol.erate renal impairment (i.e. CLCR values above
Losartan50 mL/min).[55]
In the former study of healthy subjects, the added A single dose of losartan (100mg) increased thehypouricaemic effect of probenecid occurred de- CLR of urate by nearly 4-fold and doubled the CLRspite a decrease in the mean plasma concentrations of oxypurinol,[45] By contrast, long-term dosing ofof oxypurinol (from 9.4 to 5.0 mg/L).[54] In the losartan (50 mg/day) decreased the plasma concen-second study, the addition of probenecid allowed a trations of urate by only an additional 10% whensubstantial reduction in plasma urate concentrations added to the long-term therapy in patients with goutin patients who did not have a clinically adequate with allopurinol.[62] Apart from the smaller dose ofresponse to a maximal dose of allopurinol losartan, two reasons may be suggested for the small200–300 mg/day.[55] long-term effect of losartan. First, as discussed earli-
er, the uricosuric effect of losartan may be counteredIn contrast to the results of these two studies, theby the increased CLR of oxypurinol and the conse-addition of probenecid to treatment with allopurinolquent decreased effect of the active metabolite ofgenerally had little additional effect on the plasmaallopurinol. A second contributing reason for theconcentrations of urate in five gouty patients withsmall additional hypouricaemic effect of losartan isrenal impairment.[56] The mean plasma urate con-that its t1/2 is only about 2 hours.[63] The consequentcentration decreased by 0.41 ± 0.09 to 0.37 (a non-short-lived action of losartan on the CLR of bothsignificant difference). When administered alone,urate and oxypurinol should limit any additionalthe uricosuric effect of probenecid decreases withhypouricaemic activity. Interestingly, losartan itselfincreasing renal impairment.[57] The failure ofis the active uricosuric agent, but a more long-livedprobenecid to add substantially to the hypouri-oxidised metabolite is responsible for its antihyper-caemic effect of allopurinol in patients with substan-tensive activity.[45]tial renal impairment is therefore not unexpected.
Overall, the combination of allopurinol andFenofibrateprobenecid appears to be clinically useful but onlyThis is a hypolipidaemic and uricosuric drug thatin patients with moderate to good renal function.
also increases the CLR of oxypurinol and urate.[46]
Benzbromarone Fenofibrate decreases the plasma concentrations ofThis drug has marked uricosuric activity. How- urate by about 15–20% when administered long-
ever, because there have been reports of fatal hepati- term with allopurinol.[62,64] Fenofibric acid, the ac-tis, it is only available by special order in a few tive hypolipidaemic metabolite of fenofibrate, has a
© 2007 Adis Data Information BV. All rights reserved. Clin Pharmacokinet 2007; 46 (8)
PK/PD of Allopurinol and Oxypurinol 635
t1/2 of about 20 hours.[65] Fenofibric acid is, presuma- zyme. Changes in the ratio of reduced to oxidisedbly, also the active uricosuric agent. A prolonged NAD may also decrease the activity of aldehydeinteraction between fenofibrate and allopurinol is oxidoreductase.therefore expected. Overall, alcohol-induced changes in the metabo-
lism of purines and allopurinol, as well as poor6.7.2 Furosemide adherence to allopurinol treatment, all contribute toLike the uricosuric drugs, furosemide the considerable difficulty of treating alcoholic pa-
(frusemide) may have two opposing effects on the tients with allopurinol.[72]
actions of oxypurinol, but in the reverse direction. Asingle intravenous dose of furosemide (20mg) de- 7. Inhibition of Xanthine Oxidoreductasecreases the CLR of both oxypurinol and urate by in Vivoabout 40%.[47] The t1/2 of furosemide is about 1.5hours but, despite this short t1/2, its hyperuricaemic
7.1 Urate Pharmacokinetics After Single andeffect lasts for up to 9 hours.[66] As oxypurinol andMultiple Doses of Allopurinolurate are both resorbed from the renal tubule by the
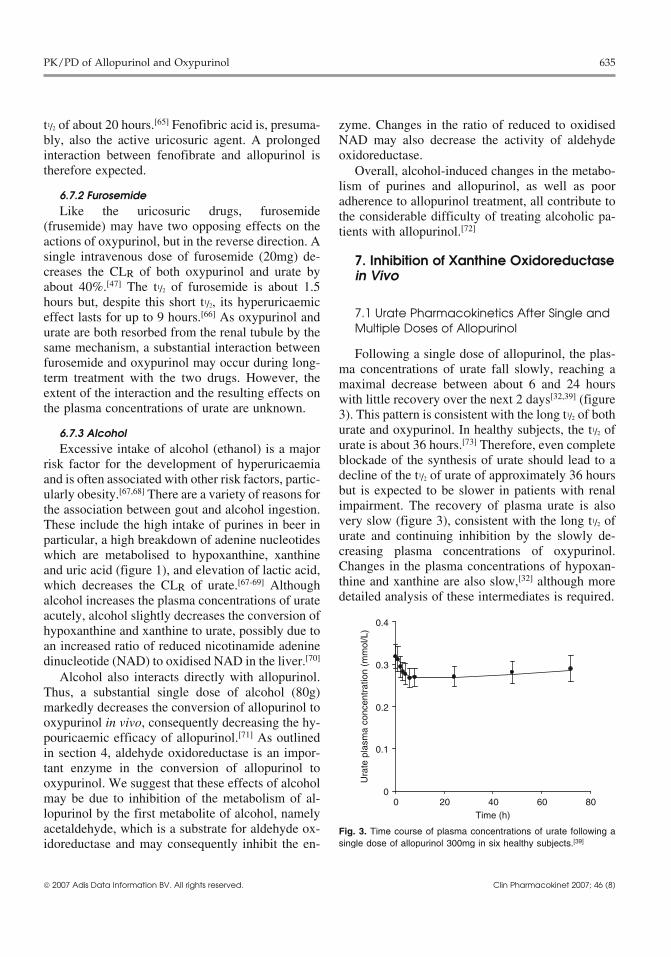
same mechanism, a substantial interaction between Following a single dose of allopurinol, the plas-furosemide and oxypurinol may occur during long- ma concentrations of urate fall slowly, reaching aterm treatment with the two drugs. However, the maximal decrease between about 6 and 24 hoursextent of the interaction and the resulting effects on with little recovery over the next 2 days[32,39] (figurethe plasma concentrations of urate are unknown. 3). This pattern is consistent with the long t1/2 of both
urate and oxypurinol. In healthy subjects, the t1/2 of6.7.3 Alcoholurate is about 36 hours.[73] Therefore, even completeExcessive intake of alcohol (ethanol) is a majorblockade of the synthesis of urate should lead to arisk factor for the development of hyperuricaemiadecline of the t1/2 of urate of approximately 36 hoursand is often associated with other risk factors, partic-but is expected to be slower in patients with renalularly obesity.[67,68] There are a variety of reasons forimpairment. The recovery of plasma urate is alsothe association between gout and alcohol ingestion.very slow (figure 3), consistent with the long t1/2 ofThese include the high intake of purines in beer inurate and continuing inhibition by the slowly de-particular, a high breakdown of adenine nucleotidescreasing plasma concentrations of oxypurinol.which are metabolised to hypoxanthine, xanthineChanges in the plasma concentrations of hypoxan-and uric acid (figure 1), and elevation of lactic acid,thine and xanthine are also slow,[32] although morewhich decreases the CLR of urate.[67-69] Althoughdetailed analysis of these intermediates is required.alcohol increases the plasma concentrations of urate
acutely, alcohol slightly decreases the conversion ofhypoxanthine and xanthine to urate, possibly due toan increased ratio of reduced nicotinamide adeninedinucleotide (NAD) to oxidised NAD in the liver.[70]
Alcohol also interacts directly with allopurinol.Thus, a substantial single dose of alcohol (80g)markedly decreases the conversion of allopurinol tooxypurinol in vivo, consequently decreasing the hy-pouricaemic efficacy of allopurinol.[71] As outlinedin section 4, aldehyde oxidoreductase is an impor-tant enzyme in the conversion of allopurinol tooxypurinol. We suggest that these effects of alcoholmay be due to inhibition of the metabolism of al-lopurinol by the first metabolite of alcohol, namelyacetaldehyde, which is a substrate for aldehyde ox-idoreductase and may consequently inhibit the en-
0
0.1
0.2
0.3
0.4
0 20 40 60 80Time (h)
Ura
te p
lasm
a co
ncen
trat
ion
(mm
ol/L
)
Fig. 3. Time course of plasma concentrations of urate following asingle dose of allopurinol 300mg in six healthy subjects.[39]
© 2007 Adis Data Information BV. All rights reserved. Clin Pharmacokinet 2007; 46 (8)
636 Day et al.
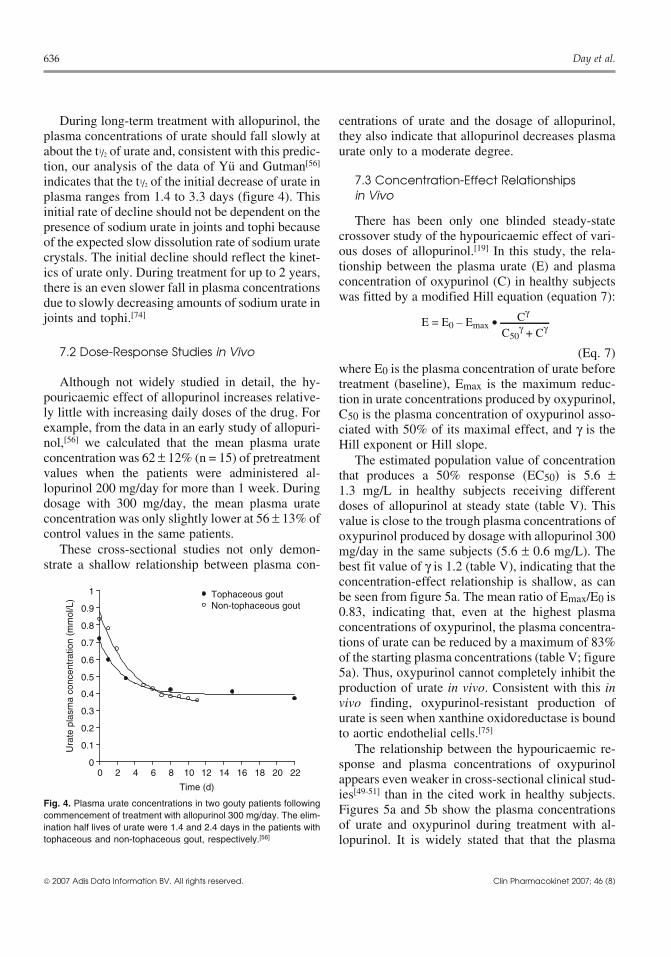
During long-term treatment with allopurinol, the centrations of urate and the dosage of allopurinol,plasma concentrations of urate should fall slowly at they also indicate that allopurinol decreases plasmaabout the t1/2 of urate and, consistent with this predic- urate only to a moderate degree.tion, our analysis of the data of Yu and Gutman[56]
7.3 Concentration-Effect Relationshipsindicates that the t1/2 of the initial decrease of urate inin Vivoplasma ranges from 1.4 to 3.3 days (figure 4). This
initial rate of decline should not be dependent on theThere has been only one blinded steady-statepresence of sodium urate in joints and tophi because
crossover study of the hypouricaemic effect of vari-of the expected slow dissolution rate of sodium urateous doses of allopurinol.[19] In this study, the rela-crystals. The initial decline should reflect the kinet-tionship between the plasma urate (E) and plasmaics of urate only. During treatment for up to 2 years,concentration of oxypurinol (C) in healthy subjectsthere is an even slower fall in plasma concentrationswas fitted by a modified Hill equation (equation 7):due to slowly decreasing amounts of sodium urate in
joints and tophi.[74]E = E0 – Emax • Cγ
C50γ + Cγ
7.2 Dose-Response Studies in Vivo (Eq. 7)where E0 is the plasma concentration of urate before
Although not widely studied in detail, the hy- treatment (baseline), Emax is the maximum reduc-pouricaemic effect of allopurinol increases relative- tion in urate concentrations produced by oxypurinol,ly little with increasing daily doses of the drug. For C50 is the plasma concentration of oxypurinol asso-example, from the data in an early study of allopuri- ciated with 50% of its maximal effect, and γ is thenol,[56] we calculated that the mean plasma urate Hill exponent or Hill slope.concentration was 62 ± 12% (n = 15) of pretreatment The estimated population value of concentrationvalues when the patients were administered al- that produces a 50% response (EC50) is 5.6 ±lopurinol 200 mg/day for more than 1 week. During 1.3 mg/L in healthy subjects receiving differentdosage with 300 mg/day, the mean plasma urate doses of allopurinol at steady state (table V). Thisconcentration was only slightly lower at 56 ± 13% of value is close to the trough plasma concentrations ofcontrol values in the same patients. oxypurinol produced by dosage with allopurinol 300
These cross-sectional studies not only demon- mg/day in the same subjects (5.6 ± 0.6 mg/L). Thestrate a shallow relationship between plasma con- best fit value of γ is 1.2 (table V), indicating that the
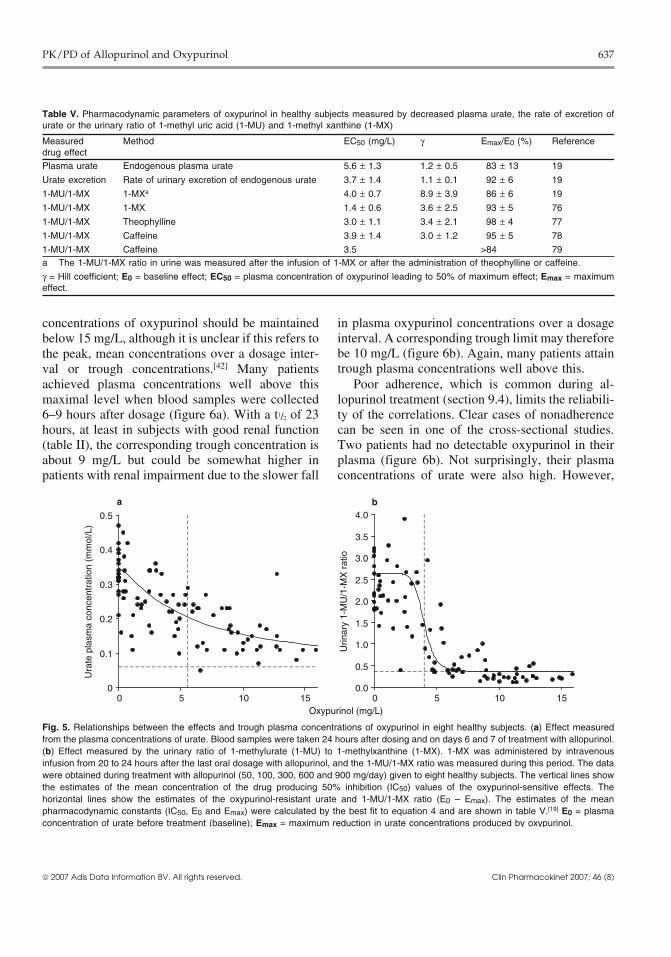
concentration-effect relationship is shallow, as canbe seen from figure 5a. The mean ratio of Emax/E0 is0.83, indicating that, even at the highest plasmaconcentrations of oxypurinol, the plasma concentra-tions of urate can be reduced by a maximum of 83%of the starting plasma concentrations (table V; figure5a). Thus, oxypurinol cannot completely inhibit theproduction of urate in vivo. Consistent with this invivo finding, oxypurinol-resistant production ofurate is seen when xanthine oxidoreductase is boundto aortic endothelial cells.[75]
The relationship between the hypouricaemic re-sponse and plasma concentrations of oxypurinolappears even weaker in cross-sectional clinical stud-ies[49-51] than in the cited work in healthy subjects.Figures 5a and 5b show the plasma concentrationsof urate and oxypurinol during treatment with al-lopurinol. It is widely stated that that the plasma
Ura
te p
lasm
a co
ncen
trat
ion
(mm
ol/L
)
0
0.1
0.2
0.3
0.4
0.5
0.6
0.7
0.8
0.9
1
0 2 4 6 8 10 12 14 16 18 20 22
Time (d)
Tophaceous goutNon-tophaceous gout
Fig. 4. Plasma urate concentrations in two gouty patients followingcommencement of treatment with allopurinol 300 mg/day. The elim-ination half lives of urate were 1.4 and 2.4 days in the patients withtophaceous and non-tophaceous gout, respectively.[56]
© 2007 Adis Data Information BV. All rights reserved. Clin Pharmacokinet 2007; 46 (8)
PK/PD of Allopurinol and Oxypurinol 637
Table V. Pharmacodynamic parameters of oxypurinol in healthy subjects measured by decreased plasma urate, the rate of excretion ofurate or the urinary ratio of 1-methyl uric acid (1-MU) and 1-methyl xanthine (1-MX)
Measured Method EC50 (mg/L) γ Emax/E0 (%) Referencedrug effectPlasma urate Endogenous plasma urate 5.6 ± 1.3 1.2 ± 0.5 83 ± 13 19
Urate excretion Rate of urinary excretion of endogenous urate 3.7 ± 1.4 1.1 ± 0.1 92 ± 6 19
1-MU/1-MX 1-MXa 4.0 ± 0.7 8.9 ± 3.9 86 ± 6 19
1-MU/1-MX 1-MX 1.4 ± 0.6 3.6 ± 2.5 93 ± 5 76
1-MU/1-MX Theophylline 3.0 ± 1.1 3.4 ± 2.1 98 ± 4 77
1-MU/1-MX Caffeine 3.9 ± 1.4 3.0 ± 1.2 95 ± 5 78
1-MU/1-MX Caffeine 3.5 >84 79a The 1-MU/1-MX ratio in urine was measured after the infusion of 1-MX or after the administration of theophylline or caffeine.
γ = Hill coefficient; E0 = baseline effect; EC50 = plasma concentration of oxypurinol leading to 50% of maximum effect; Emax = maximumeffect.
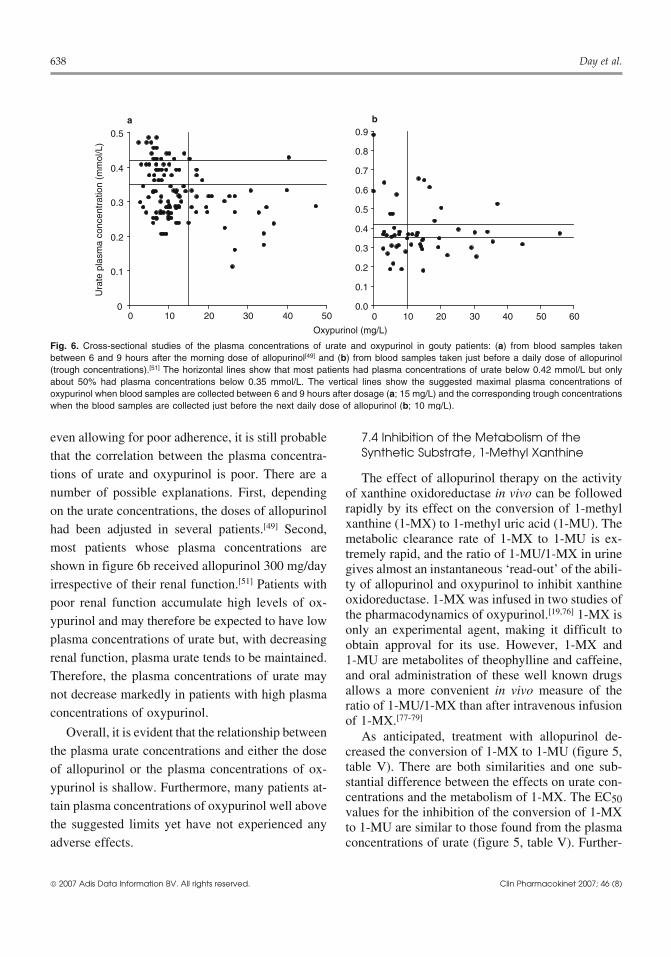
concentrations of oxypurinol should be maintained in plasma oxypurinol concentrations over a dosageinterval. A corresponding trough limit may thereforebelow 15 mg/L, although it is unclear if this refers tobe 10 mg/L (figure 6b). Again, many patients attainthe peak, mean concentrations over a dosage inter-trough plasma concentrations well above this.val or trough concentrations.[42] Many patients
achieved plasma concentrations well above this Poor adherence, which is common during al-maximal level when blood samples were collected lopurinol treatment (section 9.4), limits the reliabili-6–9 hours after dosage (figure 6a). With a t1/2 of 23 ty of the correlations. Clear cases of nonadherencehours, at least in subjects with good renal function can be seen in one of the cross-sectional studies.(table II), the corresponding trough concentration is Two patients had no detectable oxypurinol in theirabout 9 mg/L but could be somewhat higher in plasma (figure 6b). Not surprisingly, their plasmapatients with renal impairment due to the slower fall concentrations of urate were also high. However,
Ura
te p
lasm
a co
ncen
trat
ion
(mm
ol/L
)
0
0.1
0.2
0.3
0.4
0.5
0 5 10 15
a
Urin
ary
1-M
U/1
-MX
rat
io
Oxypurinol (mg/L)
0.0
0.5
1.0
1.5
2.0
2.5
3.0
3.5
4.0
0 5 10 15
b
Fig. 5. Relationships between the effects and trough plasma concentrations of oxypurinol in eight healthy subjects. (a) Effect measuredfrom the plasma concentrations of urate. Blood samples were taken 24 hours after dosing and on days 6 and 7 of treatment with allopurinol.(b) Effect measured by the urinary ratio of 1-methylurate (1-MU) to 1-methylxanthine (1-MX). 1-MX was administered by intravenousinfusion from 20 to 24 hours after the last oral dosage with allopurinol, and the 1-MU/1-MX ratio was measured during this period. The datawere obtained during treatment with allopurinol (50, 100, 300, 600 and 900 mg/day) given to eight healthy subjects. The vertical lines showthe estimates of the mean concentration of the drug producing 50% inhibition (IC50) values of the oxypurinol-sensitive effects. Thehorizontal lines show the estimates of the oxypurinol-resistant urate and 1-MU/1-MX ratio (E0 – Emax). The estimates of the meanpharmacodynamic constants (IC50, E0 and Emax) were calculated by the best fit to equation 4 and are shown in table V.[19] E0 = plasmaconcentration of urate before treatment (baseline); Emax = maximum reduction in urate concentrations produced by oxypurinol.
© 2007 Adis Data Information BV. All rights reserved. Clin Pharmacokinet 2007; 46 (8)
638 Day et al.
Ura
te p
lasm
a co
ncen
trat
ion
(mm
ol/L
)
0
0.1
0.2
0.3
0.4
0.5
0 10 20 30 40 500.0
0.1
0.2
0.3
0.4
0.5
0.6
0.7
0.8
0.9
0 10 20 30 40 50 60
Oxypurinol (mg/L)
a b
Fig. 6. Cross-sectional studies of the plasma concentrations of urate and oxypurinol in gouty patients: (a) from blood samples takenbetween 6 and 9 hours after the morning dose of allopurinol[49] and (b) from blood samples taken just before a daily dose of allopurinol(trough concentrations).[51] The horizontal lines show that most patients had plasma concentrations of urate below 0.42 mmol/L but onlyabout 50% had plasma concentrations below 0.35 mmol/L. The vertical lines show the suggested maximal plasma concentrations ofoxypurinol when blood samples are collected between 6 and 9 hours after dosage (a; 15 mg/L) and the corresponding trough concentrationswhen the blood samples are collected just before the next daily dose of allopurinol (b; 10 mg/L).
even allowing for poor adherence, it is still probable 7.4 Inhibition of the Metabolism of theSynthetic Substrate, 1-Methyl Xanthinethat the correlation between the plasma concentra-
tions of urate and oxypurinol is poor. There are a The effect of allopurinol therapy on the activitynumber of possible explanations. First, depending of xanthine oxidoreductase in vivo can be followed
rapidly by its effect on the conversion of 1-methylon the urate concentrations, the doses of allopurinolxanthine (1-MX) to 1-methyl uric acid (1-MU). Thehad been adjusted in several patients.[49] Second,metabolic clearance rate of 1-MX to 1-MU is ex-
most patients whose plasma concentrations are tremely rapid, and the ratio of 1-MU/1-MX in urineshown in figure 6b received allopurinol 300 mg/day gives almost an instantaneous ‘read-out’ of the abili-irrespective of their renal function.[51] Patients with ty of allopurinol and oxypurinol to inhibit xanthine
oxidoreductase. 1-MX was infused in two studies ofpoor renal function accumulate high levels of ox-the pharmacodynamics of oxypurinol.[19,76] 1-MX isypurinol and may therefore be expected to have lowonly an experimental agent, making it difficult to
plasma concentrations of urate but, with decreasing obtain approval for its use. However, 1-MX andrenal function, plasma urate tends to be maintained. 1-MU are metabolites of theophylline and caffeine,
and oral administration of these well known drugsTherefore, the plasma concentrations of urate mayallows a more convenient in vivo measure of thenot decrease markedly in patients with high plasmaratio of 1-MU/1-MX than after intravenous infusionconcentrations of oxypurinol.of 1-MX.[77-79]
Overall, it is evident that the relationship between As anticipated, treatment with allopurinol de-the plasma urate concentrations and either the dose creased the conversion of 1-MX to 1-MU (figure 5,
table V). There are both similarities and one sub-of allopurinol or the plasma concentrations of ox-stantial difference between the effects on urate con-ypurinol is shallow. Furthermore, many patients at-centrations and the metabolism of 1-MX. The EC50
tain plasma concentrations of oxypurinol well above values for the inhibition of the conversion of 1-MXthe suggested limits yet have not experienced any to 1-MU are similar to those found from the plasmaadverse effects. concentrations of urate (figure 5, table V). Further-
© 2007 Adis Data Information BV. All rights reserved. Clin Pharmacokinet 2007; 46 (8)
PK/PD of Allopurinol and Oxypurinol 639
more, oxypurinol-resistant activity is seen in both tients. The lymphocyte stimulation test is, in gener-experimental procedures, although it is clearer in the al, controversial and does not provide highly specif-metabolism of 1-MX than in the decreased plasma ic identification of allopurinol or oxypurinol as theconcentrations of urate. However, the relationship causative species.[83] Although oxypurinol has oftenbetween the effect and the plasma concentration of shown activity in the lymphocyte stimulation test, itoxypurinol is very much steeper when the effect is has been claimed that oxypurinol may be adminis-the decreased ratio of 1-MU/1-MX rather than its tered safely to some patients who have adversehypouricaemic activity (figure 5). Thus, the ratio of reactions to allopurinol. A preparation of oxypurinol1-MU/1-MX decreases over a very small range of could formerly be obtained by special order in theplasma concentrations of oxypurinol over the mid- US but is no longer available (section 6.3).point of the effect values. The high value of the Hill Despite the apparent immunological nature of thecoefficient, γ, indicates such a steep relationship DRESS syndrome, Hande et al.[42] concluded that(table V). the risk of this adverse effect correlated with plasma
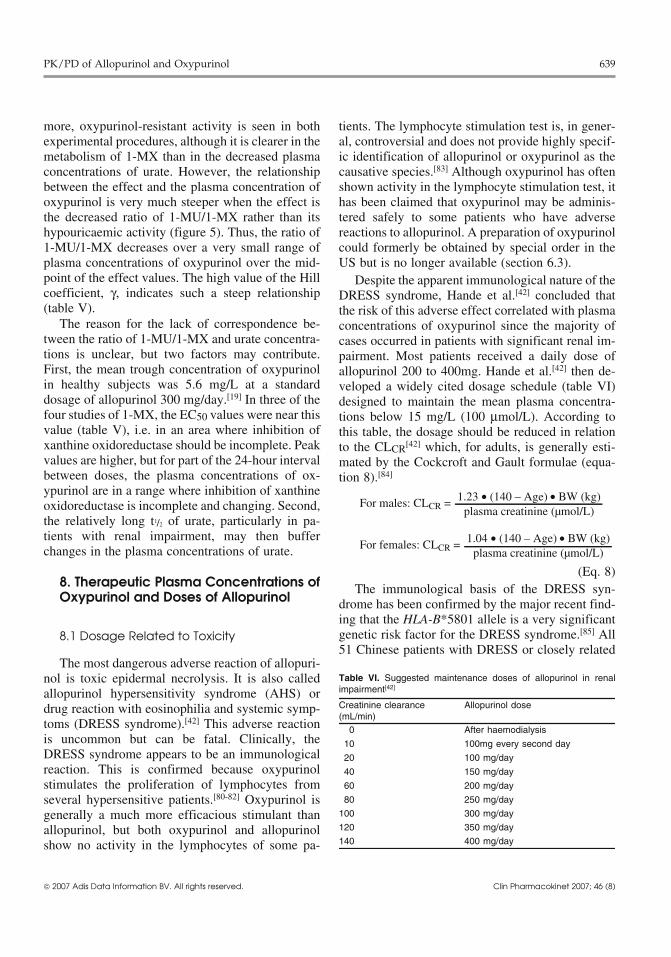
The reason for the lack of correspondence be- concentrations of oxypurinol since the majority oftween the ratio of 1-MU/1-MX and urate concentra- cases occurred in patients with significant renal im-tions is unclear, but two factors may contribute. pairment. Most patients received a daily dose ofFirst, the mean trough concentration of oxypurinol allopurinol 200 to 400mg. Hande et al.[42] then de-in healthy subjects was 5.6 mg/L at a standard veloped a widely cited dosage schedule (table VI)dosage of allopurinol 300 mg/day.[19] In three of the designed to maintain the mean plasma concentra-four studies of 1-MX, the EC50 values were near this tions below 15 mg/L (100 μmol/L). According tovalue (table V), i.e. in an area where inhibition of this table, the dosage should be reduced in relationxanthine oxidoreductase should be incomplete. Peak to the CLCR[42] which, for adults, is generally esti-values are higher, but for part of the 24-hour interval mated by the Cockcroft and Gault formulae (equa-between doses, the plasma concentrations of ox- tion 8).[84]
ypurinol are in a range where inhibition of xanthineoxidoreductase is incomplete and changing. Second,the relatively long t1/2 of urate, particularly in pa-tients with renal impairment, may then bufferchanges in the plasma concentrations of urate.
For males: CLCR = 1.23 • (140 – Age) • BW (kg)plasma creatinine (μmol/L)
For females: CLCR = 1.04 • (140 – Age) • BW (kg)plasma creatinine (μmol/L)
(Eq. 8)8. Therapeutic Plasma Concentrations of The immunological basis of the DRESS syn-Oxypurinol and Doses of Allopurinol drome has been confirmed by the major recent find-
ing that the HLA-B*5801 allele is a very significantgenetic risk factor for the DRESS syndrome.[85] All8.1 Dosage Related to Toxicity51 Chinese patients with DRESS or closely related
The most dangerous adverse reaction of allopuri-nol is toxic epidermal necrolysis. It is also calledallopurinol hypersensitivity syndrome (AHS) ordrug reaction with eosinophilia and systemic symp-toms (DRESS syndrome).[42] This adverse reactionis uncommon but can be fatal. Clinically, theDRESS syndrome appears to be an immunologicalreaction. This is confirmed because oxypurinolstimulates the proliferation of lymphocytes fromseveral hypersensitive patients.[80-82] Oxypurinol isgenerally a much more efficacious stimulant thanallopurinol, but both oxypurinol and allopurinolshow no activity in the lymphocytes of some pa-
Table VI. Suggested maintenance doses of allopurinol in renalimpairment[42]
Creatinine clearance Allopurinol dose(mL/min)
0 After haemodialysis
10 100mg every second day
20 100 mg/day
40 150 mg/day
60 200 mg/day
80 250 mg/day
100 300 mg/day
120 350 mg/day
140 400 mg/day
© 2007 Adis Data Information BV. All rights reserved. Clin Pharmacokinet 2007; 46 (8)
640 Day et al.
syndromes had this allele. The HLA-B*5801 allele 8.2 Dosage Related to Hypouricaemic Effectis, however, quite a common allele in the Chinese
The recommended dosage schedule in table VIpopulation, being present in 15% of patients whomay not be reasonable in terms of therapeutic activi-
tolerated allopurinol and 20% of healthy subjects.[85]ty, as well as toxicity. At the usual doses of allopuri-
It will be of interest to see examination of these nol 300mg daily, most patients attain plasma con-findings in patients from other racial groups. centrations of urate below the approximate solubili-
ty limit of urate (0.42 mmol/L; section 2). TheAs outlined in section 8.2, the dosage of allopuri-relationships between the hypouricaemic effect andnol (table VI) may not provide a sufficient therapeu-both the dosage of allopurinol (section 7.1) and thetic response in a sizable proportion of patients. Fur-plasma concentrations of oxypurinol (section 7.2)thermore, in a retrospective study, allopurinol dosesare shallow. However, the dosage of allopurinolat higher than the tabulated doses did not producemay be reasonably increased in order to produce anany greater incidence of toxicity.[86] The number ofadequate reduction of plasma concentrations of
patients with adverse reactions was, however, only urate, particularly if the target of dosage is to reducesmall (five patients). plasma urate concentrations to below 0.35 mmol/
The recommended dosage regimen of allopurinol L.[86-88] For example, increasing the dose of allopuri-nol in many patients from 300 mg/day to 450 mg/(table VI) was developed on the not unreasonableday, and in a few cases to 600 mg/day, caused thehypothesis that the cause of the association betweenplasma concentrations of urate to fall from above tothe toxicity of allopurinol and renal impairment wasbelow 0.35 mmol/L. In two patients, the dose ofthe increased retention of oxypurinol in renal im-allopurinol could be reduced to 200 mg/day.[86] It ispairment. However, this may not be correct. Hung etof note that this finding was made in patients with, atal.[85] also reported that a high proportion of patientsworst, moderately impaired renal function (CLCRwith allopurinol-induced toxicity had significant re- >60 mL/min), and the influence of increased dosage
nal impairment. However, the most common dosage in patients with more substantial renal impairment isof allopurinol was only 100 mg/day; lower than the not known.dosage (200 to 400 mg/day) in the many adverse Overall, recent clinical studies indicate that in-reactions reviewed by Hande et al.[42] Thus, renal dividualisation of dosage of allopurinol is an impor-impairment may still be a risk factor for allopurinol- tant aspect of its use. In this regard, it is of note that
practically all cases of the DRESS syndrome haveinduced toxicity but not because of excessive reten-occurred within 2 months of the commencement oftion of oxypurinol.dosage with allopurinol.[42,85] Thus, if the dosage ofA very different dosage table is included in theallopurinol for 2 months has produced an inadequate
approved product information on allopurinol. This decrease in plasma urate, it appears likely that thestates that the dosage in patients with normal renal dosage could be increased with little risk of develop-function should be 100–200 mg/day in patients with ment of the DRESS syndrome. However, this hy-mild conditions, 300–600 mg/day in patients with pothesis should be checked by prospective clinicalmoderate conditions and 700–800mg (US) or trials and continuing surveillance of the use of this700–900mg (UK) in patients with severe conditions. valuable drug.Further, it is reasonably stated that the dosage
9. Optimisation of Dosageshould be reduced in renal failure, although no clearwith Allopurinolrecommendations are made. It is further stated that,
for patients with severe renal impairment, “Alterna- The present guidelines on the dosage of allopuri-tive schedules based on CLCR values are unsatisfac- nol are based on inadequate knowledge of thetory because of the imprecision of low clearance clinical pharmacology and pharmacokinetics of al-values.” We have not found a referenced source for lopurinol and oxypurinol, especially in patients withthis dosage table. gout. However, some recommendations about dos-
© 2007 Adis Data Information BV. All rights reserved. Clin Pharmacokinet 2007; 46 (8)
PK/PD of Allopurinol and Oxypurinol 641
age regimens can be suggested at this stage, both ing doses at even longer intervals may be required iffrom recent literature[89,90] and from data analysed in renal function is substantially impaired. The aim ofthis review. this graded introduction of treatment with allopuri-
nol is to avoid excessive dosage, reducing not only9.1 Determine a Reasonable Target Dosage the risk of precipitating acute gout but also theof Allopurinol Based on the Patient’s possible induction of adverse events. Although thisCreatinine Clearance general dosage regimen has not been tested system-
atically under double-blind conditions, it is beingThe aim is to keep the dosage of allopurinol as used in clinical practice.
low as possible while maintaining the therapeuticgoal of preventing attacks of gout. It is reasonable 9.3 Measure the Plasma Concentrations ofthat the dosage should be increased above the target Urate on Several Occasions, Particularly inconcentrations if attacks of gout continue and urate the Early Stages of Dosage of Allopurinolconcentrations remain unacceptably high, particu-
There are many determinants of plasma uratelarly if adherence is assured and the oxypurinolconcentrations. These include not only endogenousconcentrations are below the upper limits of thesynthesis and the dietary intake of precursors ofsuggested therapeutic ranges (section 9.5). We con-urate but also renal function, which is the majorsider that the doses of allopurinol in table VI are stilldeterminant of the clearance of both oxypurinol andreasonable initial targets, but careful increases up tourate. A difficult issue when monitoring plasma50% above the tabulated doses may be reasonable.urate concentrations in patients with tophaceousThe target doses for the elderly require specialgout is the rate of leaching from the deposits intoattention because of their reduced renal function.plasma. Plasma concentrations of urate should de-Doses of allopurinol should generally be lower thancrease over the first few days of treatment, butin young adults. Their creatinine concentrations areplasma concentrations should subsequently declinenot necessarily increased, and it is important toslowly (section 7.1).estimate the CLCR by the Cockcroft and Gault for-
mulae (section 8.1).9.4 Check AdherenceIn dialysed patients, there is negligible clearance
of oxypurinol between dialyses.[42] Plasma concen- A common scenario is one of recurrent attacks oftrations decrease by about 40% during dialysis for 4 acute gout despite escalating doses of allopurinol,hours, and allopurinol should only be administered often on a background of tophaceous gout that givesafter dialysis.[42,91] Thus, the t1/2 is shorter during little sign of responding to allopurinol therapy. Andialysis than in subjects with normal renal function inadequate response is frequently due to poor adher-(table II). Urate is also removed readily by haemodi- ence, which is common during allopurinol treat-alysis, and the plasma concentrations of urate should ment[92] as it is during treatment with probenecid.[93]
be measured before and after dialysis. Poor adherence is often accompanied by excessiveintake of alcohol, seafood and high-protein diets, all
9.2 Start the Dosage at a Low Level and of which contribute to hyperuricaemia and decreaseIncrease Slowly the hypouricaemic effect of allopurinol.[72,94]
A low dosage, 100 mg/day, is strongly recom- 9.5 Monitor the Plasma Concentrationsmended for patients with normal renal function.[89,90]
of OxypurinolStarting doses should be even lower in patients withrenal impairment, and lower than those shown in Measurement of the plasma concentrations oftable VI. In the light of plasma urate concentrations, oxypurinol is not standard clinical practice but maythe daily dose can be adjusted every 2–4 weeks in be of clinical benefit for a small number of patientspatients with normal renal function, this process where the response to allopurinol is inadequate de-being repeated until the dose needed to attain target spite increases in dosage. Therapeutic monitoringplasma urate concentrations is reached.[90] Increas- should also be useful in patients with substantial
© 2007 Adis Data Information BV. All rights reserved. Clin Pharmacokinet 2007; 46 (8)
642 Day et al.
renal impairment and to check the adherence of relationship between the DRESS syndrome and re-some patients. The time of the blood collection and nal failure at relatively low doses of allopurinol.the last dose of allopurinol should be recorded be-
Acknowledgementscause of fluctuations in the plasma concentrations ofoxypurinol. In patients with normal renal function,
The authors gratefully acknowledge the help of Dr Palthe mean t1/2 of oxypurinol is about 23 hours, and its Pacher and Associate Prof. J.B. Ziegler for help with refer-plasma concentrations fluctuate over about a 2-fold ences on allopurinol and Prof. K. Turnheim for the supply ofrange over a dosage interval. In contrast, the time of his experimental data. No sources of funding were used to
assist in the preparation of this review. The authors have nocollection is less important in patients with substan-conflicts of interest that are directly relevant to the content oftially impaired renal function because the t1/2 ofthis review.
oxypurinol is longer and, therefore, the plasma con-centrations fluctuate to a much lesser extent.
ReferencesFor many years, the upper limit of plasma con-1. Rundles RW. The development of allopurinol. Arch Intern Med
centrations of oxypurinol has been suggested to be 1982; 145: 89-942. Day R, Birkett DJ, Hicks M, et al. Allopurinol: new uses. Drugs15 mg/L (section 7.3; figure 6). This may be an
1994; 48: 339-44initial maximal level, but higher plasma concentra- 3. van Waeg G, Loof L, Groth T, et al. Allopurinol kinetics inhumans as a means to assess liver function: evaluation of antions may be considered, again if the hypouricaemicallopurinol loading test. Scand J Clin Lab Med 1988; 48: 45-57response is inadequate or acute attacks of gout con-
4. Murrell GAC, Rapeport WG. Clinical pharmacokinetics of al-tinue and if patients have not developed any adverse lopurinol. Clin Pharmacokinet 1986; 11: 343-53
5. Fujimoto Y, Sakuma S, Tagami T, et al. N-ethylmaleimidereactions to allopurinol. At this stage, the upperinhibits xanthine oxidase activity with no detectable change inlimits are most uncertain, but we suggest that the xanthine dehydrogenase activity in rabbit liver. Life Sci 2000;68: 517-24upper limit of trough therapeutic plasma concentra-
6. Massey V, Komai H, Palmer G, et al. On the mechanism oftions could possibly be increased to 15 mg/L, theinactivation of xanthine oxidase by allopurinol and other
mean plasma concentrations over a dosage interval pyrazolo[3,4-d]pyrimidines. J Biol Chem 1970; 245: 2837-447. Seegmiller JE. The acute attack of gouty arthritis. Arthritisincreased to 20 mg/L and the maximal peak plasma
Rheum 1965; 8: 714-25concentrations elevated to 25 mg/L. 8. Campion EW, Glynn RJ, DeLabry LO. Asymptomatichyperuricemia: risks and consequences in the normative agingstudy. Am J Med 1987; 82: 421-6
10. Conclusions 9. Drayton CJ. Comprehensive medicinal chemistry. Vol. 6. Ox-ford: Pergamon Press, 1990
10. Breithaupt H, Tittel M. Kinetics of allopurinol after singleAllopurinol is the major drug used for prophylac- intravenous and oral doses. Eur J Clin Pharmacol 1982; 22:
77-84tic treatment of gout but, despite its long use, there is11. Colin JN, Farinotti R, Fredj G, et al. Kinetics of allopurinol andstill uncertainty about its optimal dosage. Most of oxipurinol after chronic oral administration: interaction with
the hypouricaemic activity of allopurinol is due to benzbromarone. Eur J Clin Pharmacol 1986; 31: 53-812. Berlinger WG, Park GD, Spector R. The effect of dietary proteinits metabolite, oxypurinol. Once-daily dosage is rea-
on the clearance of allopurinol and oxypurinol. New Engl Jsonable because of the long t1/2 of oxypurinol. How- Med 1985; 313: 771-6
13. de Vries JX, Voss A, Ittensohn A, et al. Interaction of allopuri-ever, the t1/2 of oxypurinol is very variable, andnol and hydrochlorothiazide during prolonged oral administra-twice-daily dosage may improve the treatment of tion of both drugs in normal subjects: II. Kinetics of allopuri-
occasional patients with a short t1/2. Although treat- nol, oxipurinol, and hydrochlorothiazide. Clin Invest 1994; 72:1076-81ment with allopurinol consistently lowers plasma
14. Walter-Sack I, de Vries JX, Kreiner C, et al. Bioequivalence ofconcentrations of urate, more detailed studies are allopurinol preparations: to be assessed by the parent drug or
the active metabolite? Clin Invest 1993; 71: 240-6required on the relationships between plasma con-15. Simmonds HA. Urinary excretion of purines, pyrimidines andcentrations of oxypurinol and the hypouricaemic pyrazolopyrimidines in patients treated with allopurinol or
oxipurinol. Clin Chim Acta 1969; 23: 353-64response in patients with gout. Monitoring of plas-16. Reiter S, Loffler W, Grobner W, et al. Urinary oxypuri-ma concentrations of oxypurinol may help to op-
nol-1-riboside and allopurinol-induced oroticaciduria. Advtimise the dosage of allopurinol in selected patients Exp Med Biol 1986; 195 Pt A: 453-60
17. Robson RA, Begg EJ, Saunders DA. Allopurinol autoinhibition.although, at present, the assay of oxypurinol is onlyClin Exp Pharmacol Physiol 1993; Suppl. 1: 62available in a few laboratories. The dosage of al- 18. Nelson DJ, Elion GB. Metabolic studies of high doses of al-
lopurinol requires re-examination in view of the lopurinol in humans. Adv Exp Med Biol 1984; 165A: 167-70
© 2007 Adis Data Information BV. All rights reserved. Clin Pharmacokinet 2007; 46 (8)
PK/PD of Allopurinol and Oxypurinol 643
19. Graham S, Day RO, Wong H, et al. Pharmacodynamics of 40. Kitt TM, Park GD, Spector R, et al. Reduced renal clearance ofoxypurinol after administration of allopurinol to healthy sub- oxypurinol during a 400 calorie protein-free diet. J Clinjects. Br J Clin Pharmacol 1996; 41: 299-304 Pharmacol 1989; 29: 65-71
41. Elion GB, Yu T, Gutman AB, et al. Renal clearance of oxipuri-20. Shibutani Y, Ueo T, Yamamoto T, et al. A case of classicalnol, the chief metabolite of allopurinol. Am J Med 1968; 45:xanthinuria (type 1) with diabetes mellitus and Hashimoto’s69-77thyroiditis. Clin Chim Acta 1999; 285: 183-9
42. Hande KR, Noone RM, Stone WJ. Severe allopurinol toxicity:21. Reiter S, Simmonds HA, Zollner N, et al. Demonstration of adescription and guidelines for prevention in patients with renalcombined deficiency of xanthine oxidase and aldehyde oxi-insufficiency. Am J Med 1984; 76: 47-56dase in xanthinuric patients not forming oxipurinol. Clin Chim
43. Moriwaki Y, Yamamoto T, Tsutsumi Z, et al. Effects of angi-Acta 1990; 187: 221-34otensin II infusion on renal excretion of purine bases and22. Auscher C, Pasquier C, Mercier N, et al. Urinary excretion of a 6oxypurinol. Metabolism 2002; 51: 893-5hydroxylated metabolite and oxypurines in a xanthinuric man
44. Yamamoto T, Moriwaki Y, Takahashi S, et al. Effects ofgiven allopurinol or thiopurinol. Adv Exp Med Biol 1973; 41:pyrazinamide, probenecid, and benzbromarone on renal excre-663-7tion of oxypurinol. Ann Rheum Dis 1991; 50: 631-323. Spector T. Inhibition of urate production by allopurinol. Bi-
45. Yamamoto T, Moriwaki Y, Takahashi S, et al. Effect of losartanochem Pharmacol 1977; 26: 355-8potassium, an angiotensin antagonist, on renal excretion of24. Johns DG. Human liver aldehyde oxidase: differential inhibitionoxypurinol and purine bases. J Rheumatol 2000; 27: 2232-6of oxidation of charged and uncharged substrates. J Clin Invest
46. Yamamoto T, Moriwaki Y, Takahashi S, et al. Effect of fe-1967; 46: 1492-505nofibrate on plasma concentration and urinary excretion of25. Choi HK, Mount DB, Reginato AM. Pathogenesis of gout. Annpurine bases and oxypurinol. J Rheumatol 2001; 28: 2294-7Int Med 2005; 143: 499-516
47. Yamamoto T, Moriwaki Y, Takahashi S, et al. Effect of26. Walter-Sack I, de Vries JX, Ernst B, et al. Uric acid loweringfrusemide on renal excretion of oxypurinol and purine bases.effect of oxipurinol sodium in hyperuricemic patients – thera-Metabolism 2001; 50: 241-5peutic equivalence to allopurinol. J Rheumatol 1996; 23: 498-
48. Yamamoto T, Moriwaki Y, Takahashi S, et al. Effect of501norepinephrine on the urinary excretion of purine bases and27. Buhrens K, Berndt P, Hilgenstock CM, et al. Bioequivalence ofoxypurinol. Metabolism 2001; 50: 1230-3two allopurinol preparations. Arzneim-Forsch 1991; 41: 250-3
49. Emmerson BT, Gordon RB, Cross M, et al. Plasma oxipurinol28. Schuster O, Haertel M, Hugemann B, et al. Studies onconcentrations during allopurinol therapy. Br J Rheumatolthe clinical pharmacokinetics of allopurinol. Arzneim-Forsch1987; 26: 445-91985; 35: 760-5
50. Peterson GM, Boyle RR, Francis, et al. Dosage prescribing and29. Metzner JE, Buchberger D, Lauter J, et al. Investigation into the plasma oxipurinol levels in patients receiving allopurinol ther-bioequivalence of a new allopurinol tablet formulation com- apy. Eur J Clin Pharmacol 1990; 26: 419-21pared with a standard preparation. Arzneim-Forsch 1997; 47:51. Day RO, Miners JO, Birkett DJ, et al. Allopurinol dosage1236-41
selection: relationships between dose and plasma oxypurinol30. Fenner H, Schiemann O, Gikalov I. The clinical pharmacokinet- and urate concentrations and urinary urate excretion. Br J Clin
ics of allopurinol. 2. Allopurinol/oxypurinol pharmacokinetics Pharmacol 1988; 26: 423-8following allopurinol in single doses and multiple application. 52. Ichida K, Hosoyamada M, Hisatome I, et al. Clinical andArzneim-Forsch 1985; 35: 1093-6 molecular analysis of patients with renal hypouricemia in
31. Purves RD. Anomalous parameter estimates in the one-compart- Japan: influence of URAT1 gene on urinary urate excretion. Jment model with first-order absorption. J Pharm Pharmacol Am Soc Nephrol 2004; 15: 164-731993; 45: 934-6 53. Iwanaga T, Kobayashi D, Hirayama M, et al. Involvement of
32. Turnheim K, Krivanek P, Oberbauer R. Pharmacokinetics and uric acid transporter in increased renal clearance of the xan-pharmacodynamics of allopurinol in elderly and young sub- thine oxidase inhibitor oxypurinol induced by a uricosuricjects. Br J Clin Pharmacol 1999; 48: 501-9 agent, benzbromarone. Drug Metab Disp 2005; 33: 1791-5
33. Sheiner LB, Benet LZ, Pagliaro LA. A standard approach to 54. Williams KM, Stocker SL, McLachlan AJ, et al. Investigatingcompiling clinical pharmacokinetic data. J Pharmacokinet Bi- pharmacokinetic and pharmacodynamic interaction betweenopharm 1981; 9: 59-127 allopurinol and probenecid in healthy subjects [abstract]. In-
34. Saji M. A study of the serum oxypurinol concentration and renal tern Med J 2006; 36: A39function in patients administered allopurinol. Jap J Nephrol 55. Reinders MK, van Roon EN, Houtman PM, et al. Biochemical1996; 38: 640-50 effectiveness of allopurinol and allopurinol-probenecid in pre-
35. Appelbaum SJ, Mayersohn M, Dorr RT, et al. Allopurinol viously benzbromarone-treated gout patients. Clin Rheumatol.kinetics and bioavailability: intravenous, oral and rectal ad- Epub 2007 Feb 17ministration. Cancer Chemother Pharmacol 1982; 8: 93-8 56. Yu T, Gutman AB. Effect of allopurinol (4-hydroxypyrazolo-
36. Marcus M, Tse FL, Kleinberg SI. The bioavailability of two (3,4-d)pyrimidine) on serum and urinary uric acid in primarycommercial preparations of allopurinol tablets. Int J Clin and secondary gout. Am J Med 1964; 37: 885-98Pharmacol Ther Toxicol 1982; 20: 302-5 57. Garyfallos A, Magoula I, Tsapas G. Evaluation of the renal
37. Guerra P, Frias J, Ruiz B, et al. Bioequivalence of allopurinol mechanisms for urate homeostasis in uremic patients byand its metabolite in two tablet formulations. J Clin Pharm probenecid and pyrazinamide test. Nephron 1987; 46: 273-80Ther 2001; 26: 113-9 58. Ruffer C, Zorn G, Henkel E, et al. Influence of benzbromarone
38. Hande K, Reed E, Chabner B. Allopurinol kinetics. Clin on the pharmacokinetics and pharmacodynamics of oxipuri-Pharmacol Ther 1978; 23: 598-605 nol. Arzneim Forsch 1982; 32: 1149-52
59. Muller FO, Schall R, Groenewoud G, et al. The effect of39. Lartigue-Mattei C, Chabard JL, Ristori JM. Kinetics of allopuri-benzbromarone on allopurinol/oxypurinol kinetics in patientsnol and its metabolite oxypurinol after oral administration ofwith gout. Eur J Clin Pharmacol 1993; 44: 69-72allopurinol alone or associated with benzbromarone in man:
simultaneous assay of hypoxanthine and xanthine by gas chro- 60. Mertz DP, Eichhorn R. Does benzbromarone in therapeuticmatography-mass spectrometry. Fundam Clin Pharmacol doses raise renal excretion of oxipurinol? Klin Wochenschr1991; 5: 621-33 1984; 62: 1170-2
© 2007 Adis Data Information BV. All rights reserved. Clin Pharmacokinet 2007; 46 (8)
644 Day et al.
61. Walter-Sack I, de Vries JX, von Bubnoff A, et al. Biotrans- 79. Fuchs P, Haefeli WE, Ledermann HR, et al. Xanthine oxidaseformation and uric acid lowering effect of benzbromarone in inhibition by allopurinol affects the reliability of urinary caf-patients with liver cirrhosis – evidence for active benz- feine metabolic ratios as markers for N-acetyltransferase 2 andbromarone metabolites? Eur J Med Res 1995; 1: 16-20 CYP1A2 activities. Eur J Clin Pharmacol 1999; 54: 869-76
62. Takahashi S, Moriwaki Y, Yamamoto T, et al. Effects of combi- 80. Hamanaka H, Mizutani H, Nouchi N, et al. Allopurinol hyper-nation treatment using anti-hyperuricaemic agents with fe- sensitivity syndrome: hypersensitivity to oxypurinol but notnofibrate and/or losartan on uric acid metabolism. Ann Rheum allopurinol. Clin Exp Dermatol 1998; 23: 32-4Dis 2003; 62: 572-5
81. Braden GL, Warzynski MJ, Golightly M, et al. Cell-mediated63. Sica DA, Gehr TWB, Ghosh S. Clinical pharmacokinetics of immunity in allopurinol-induced hypersensitivity. Clin Immu-
losartan. Clin Pharmacokinet 2005; 44: 797-814 nol Immunopathol 1994; 70: 145-51
64. Feher MD, Hepburn AL, Hogarth MB, Ball SG, Kaye SA. 82. Emmerson BT, Hazelton RA, Frazer IH. Some adverse reac-Fenofibrate enhances urate reduction in men treated with al- tions to allopurinol may be mediated by lymphocyte reactivitylopurinol for hyperuricaemia and gout. Rheumatology 2003, to oxypurinol. Arthritis Rheum 1988; 31: 436-4042, 321-5
83. Pichler WJ, Tilch J. The lymphocyte transformation test in the65. Jones MR, Baker BA, Matthew P. The effect of colesevelam diagnosis of drug hypersensitivity. Allergy 2004; 59: 809-20
HCl on single dose fenofibrate kinetics. Clin Pharmacokinet84. Cockcroft DW, Gault MH. Prediction of creatinine clearance2004; 43: 943-50
from serum creatinine. Nephron 1976; 16: 31-4166. Leary WP, Reyes AJ, Wynne RD, et al. Renal excretory actions
85. Hung S, Chung WH, Liou LB, et al. HLA-B*5801 allele as aof frusemide, of hydrochlorothiazide and of the vasodilatorgenetic marker for severe cutaneous adverse reactions causedflosequinan in healthy subjects. J Int Med Res 1990; 18: 120-by allopurinol. Proc Nat Acad Sci 2005; 102: 4134-941
86. Vazquez-Mellado J, Morales EM, Pacheco-Tena C, et al. Rela-67. Yamamoto T, Moriwaki Y, Takahashi S. Effect of ethanol ontion between adverse events associated with allopurinol andmetabolism of purine bases (hypoxanthine, xanthine, and uric
acid). Clin Chim Acta 205; 356: 35-57 renal function in patients with gout. Ann Rheum Dis 2001; 60:981-3
68. Choi HK, Atkinson K, Karlson EW, et al. Alcohol intake andrisk of incident gout in men: a prospective study. Lancet 2004; 87. Becker MA, Schumacher HR, Wortmann RL, et al. Febuxostat363: 1277-81 compared with allopurinol in patients with hyperuricemia and
gout. New Engl J Med 2005; 353: 2450-6169. Gibson T, Rodgers AV, Simmonds HA, et al. Beer drinking andits effect on uric acid. Br J Rheumatol 1984; 23: 203-9 88. Dalbeth N, Kumar S, Stamp L, et al. Dose adjustment of
allopurinol according to creatinine clearance does not provide70. Yamamoto T, Moriwaki Y, Takahashi S, et al. Ethanol as aadequate control of hyperuricaemia in patients with gout. Jxanthine dehydrogenase inhibitor. Metabolism 1995; 44: 779-Rheumatol 2006; 33: 1646-5085
89. Dalbeth N, Stamp L. Allopurinol dosing in renal impairment:71. Kaneko K, Fujimori S, Ishizuka I, et al. Effect of ethanol on thewalking the tightrope between adequate urate lowering andmetabolism of the hyperuricemic agents allopurinol and benz-adverse events. Semin Dial. Epub 2007 Apr 17bromarone. Clin Chim Acta 1990; 193: 181-6
90. Zhang W, Doherty M, Bardin T, et al. EULAR evidence based72. Ralston SH, Capell HA, Sturrock RD. Alcohol and response torecommendations for gout. Part II: management. Report of atreatment of gout. BMJ 1988; 296: 1641-2task force of the EULAR Standing Committee For Internation-
73. Bianchi R, Vitali C, Clerico A, et al. Uric acid metabolism in al Clinical Studies Including Therapeutics (ESCISIT). Annnormal subjects and in gouty patients by chromatographic Rheum Dis 2006; 65: 1312-24measurement of 14C-uric acid in plasma and urine. Metabolism
91. Elion GB, Benezra FM, Beardmore TD, et al. Studies with1979; 28: 1105-13allopurinol in patients with impaired renal function. Adv Exp
74. Berg H. Examination of the effectiveness and tolerance of long Med Biol 1980; 122A: 263-7term urate lowering treatment. Z Gesamte Inn Med 1990; 45:
92. Sarawate CA, Brewer KK, Yang W, et al. Gout medication719-20treatment patterns and adherence to standards of care from a
75. Kelley EE, Trostchansky A, Rubbo H, et al. Binding of xanthine managed care perspective. Mayo Clin Proc 2006; 81: 925-34oxidase to glycoaminoglycans limits inhibition by oxypurinol.
93. Thompson GR, Duff IF, Robinson WD, et al. Long termJ Biol Chem 2004; 279: 37231-4uricosuric therapy in gout. Arthritis Rheum 1962; 5: 384-96
76. Day RO, Miners J, Birkett DJ, et al. Relationship between94. Emmerson BT. The use of the xanthine oxidase inhibitor, al-plasma oxipurinol concentrations and xanthine oxidase activi-
ty in volunteers dosed with allopurinol. Br J Clin Pharmacol lopurinol, in the control of hyperuricaemia, gout and uric acid1988; 26: 429-34 calculi. Aust Ann Med 1967; 16: 205-14
77. Birkett DJ, Miners J, Day RO. 1-Methylxanthine derived fromtheophylline as an in vivo biochemical probe of allopurinol
Correspondence: Prof. Richard O. Day, Department ofeffect. Br J Clin Pharmacol 1991; 32: 238-41Clinical Pharmacology & Toxicology, St Vincent’s Hospital,
78. Birkett DJ, Miners JO, Valente L, et al. 1-methylxanthine de-Darlinghurst, NSW 2010, Australia.rived from caffeine as a pharmacodynamic probe of oxypuri-E-mail: [email protected] effect. Br J Clin Pharmacol 1997; 43: 197-200
© 2007 Adis Data Information BV. All rights reserved. Clin Pharmacokinet 2007; 46 (8)