clinical chemistry of congenic mice with quantitative trait loci for predicted responses to...
TRANSCRIPT

INFECTION AND IMMUNITY, Sept. 2009, p. 3948–3957 Vol. 77, No. 90019-9567/09/$08.00�0 doi:10.1128/IAI.00658-09Copyright © 2009, American Society for Microbiology. All Rights Reserved.
Clinical Chemistry of Congenic Mice with Quantitative Trait Loci forPredicted Responses to Trypanosoma congolense Infection�†
Birgit Rathkolb,2,3‡ Harry A. Noyes,7‡ Andy Brass,4,5 Paul Dark,6 Helmut Fuchs,2Valerie Gailus-Durner,2 John Gibson,1§ Martin Hrabe de Angelis,2,8
Moses Ogugo,1 Fuad Iraqi,1¶ Steve J. Kemp,1,7 Jan Naessens,1Mathew E. Pope,1� Eckhard Wolf,3 and Morris Agaba1*
International Livestock Research Institute, P.O. Box 30709, Nairobi 00100, Kenya1; Institute of Experimental Genetics,Helmholtz Zentrum Munchen, Ingolstadter Landstraße 1, D-85764 Neuherberg, Germany2; Molecular Animal Breeding and
Biotechnology, and Laboratory for Functional Genome Analysis (LAFUGA), Gene Center, Ludwig Maximilians UniversitatMunchen, Feodor-Lynen-Str. 25, D-81377 Munich, Germany3; Faculty of Life Sciences, University of Manchester,
Michael Smith Building, Oxford Road, Manchester M13 9PT, United Kingdom4; School of Computer Science,Kilburn Building, University of Manchester, Oxford Road, Manchester M13 9PL, United Kingdom5;
Intensive Care Medicine, Salford Royal NHS Foundation Trust, The University of Manchester,Manchester M6 8HD, United Kingdom6; School of Biological Sciences, University ofLiverpool, Crown Street, Liverpool L69 7ZB, United Kingdom7; and Experimental Genetics,
Center of Life and Food Sciences Weihenstephan, Technische Universitat Munchen,Alte Akademie 8, D 85354 Freising, Germany8
Received 10 June 2009/Returned for modification 18 June 2009/Accepted 2 July 2009
Trypanosoma congolense is a protozoan parasite that causes severe diseases in livestock. Three major quantativetrait loci (QTL), Tir1, Tir2, and Tir3, control the survival time of mice after infection with T. congolense. Congenicmice carrying the C57BL/6 resistance alleles on the A/J background were developed for each of these loci. Thecongenic mice were used to physically map the regions containing the QTL gene(s) and to investigate the physio-logical effect of each locus. Clinical chemistry data for infected A/J, C57BL/6, and BALB/c mice were obtained for15 analytes at five time points. Congenic mice were assessed for survival, parasitemia, and anemia as well as sevenclinical-chemical analytes. The survival times were significantly increased in the Tir1 and Tir2 mice but not Tir3congenic mice. The survival time of the parental inbred mice correlated negatively with parasitemia but positivelywith alanine aminotransferase activities in serum, suggesting that inflammatory reactions in the liver had abeneficial effect possibly associated with reduced parasitemia. However, there was no difference in parasitemia orliver enzyme activities of Tir1 and Tir2 congenic mice relative to their controls, showing that survival, parasitemia,and degree of liver damage are not associated with each other, despite the correlation in the parental lines. Thesedata suggest that the congenic loci affect survival but do not affect control of parasite number. They may thereforeact by limiting the pathological consequences of T. congolense infection.
African trypanosomes are extracellular protozoan parasitesthat multiply in the bloodstream and cause severe diseases inhumans and livestock with fatal consequences unless treated.While trypanosomiasis due to Trypanosoma brucei causes sig-nificant morbidity and mortality in humans, trypanosomiasiscaused by Trypanosoma congolense and Trypanosoma vivax isone of the most significant constraints on cattle production inAfrica and the cause of major economic losses with seriouseffects on human health and welfare (13). Anemia is the keyfeature of disease in cattle and persists after the first wave of
parasitemia when parasite numbers have declined to low orundetectable levels. Anemia rather than parasitemia is bestcorrelated with productivity and is used as the primary indica-tor of when to treat the infection; treatment to clear the par-asites usually resolves the anemia.
African trypanosomes also infect laboratory mice, and thesurvival time after infection varies significantly between inbredstrains of mice. A/J, BALB/c, and C57BL/6 mice have survivaltimes of �16, 50, and 110 days after infection with T. congo-lense strain 5E-12 (17a), and similar survival times have beenobserved with T. congolense IL1180 used in this study (8–10).However differences in survival times between C57BL/6, A/J,and BALB/c mice are not dependent on the degree of anemiadeveloped (17, 24), suggesting that effects other than anemiaare the major cause of death in mice. Nevertheless any insightinto the mechanisms regulating anemia in mice may be ofrelevance to the anemia of cattle.
Three quantitative trait loci (QTL) affecting survival timeafter infection have been mapped in independent crosses be-tween C57BL/6 and A/J mice and between C57BL/6 andBALB/c mice (10). The three loci located on proximal chro-mosome 17, near the center of chromosome 5, and distal chro-
* Corresponding author. Mailing address: International Livestock Re-search Institute, P.O. Box 30709, Nairobi, GPO 00100, Kenya. Phone: 25420 422 3327. Fax: 254 20 422 3001. E-mail: [email protected].
† Supplemental material for this article may be found at http://iai.asm.org/.
‡ B.R. and H.A.N. contributed equally to this work.§ Present address: Institute for Bioinformatics and Genetics, Uni-
versity of New England, Armidale, New South Wales, Australia.¶ Present address: Department of Human Microbiology, Sackler Fac-
ulty of Medicine, Tel Aviv University, Ramat Aviv, Tel Aviv 69978, Israel.� Present address: Pearson Laboratory, Petch Building, Ring Road,
University of Victoria, Victoria, British Columbia V8W 3P6, Canada.� Published ahead of print on 13 July 2009.
3948

mosome 1, respectively, were designated Tir1, Tir2, and Tir3for “Trypanosoma infection response.” The genomic positionsof these large loci were refined to five smaller regions in a studyof the same crosses that were extended to the F6 generation(8). The QTL contributed 36, 22, and 32 days, respectively, tothe difference in survival in the C57BL/6 � BALB/c F2 crossand 31 and 22 days for Tir1 and Tir2 in the A/J � C57BL/6 F2cross. The Tir3 locus was nonsignificant in the F2 A/J �C57BL/6 cross but highly significant in a subsequent F6 cross.These regions contain hundreds of genes; a combination ofstrategies is therefore required to identify plausible candidategenes for detailed evaluation. We have therefore collectedextensive clinical chemistry data on these animals in order tohelp identify candidate genes that might plausibly control as-pects of phenotype that correlate with survival.
Our previous mapping studies have shown that A/J andBALB/c mice appear to carry the same susceptibility alleles atthe Tir1, Tir2, and Tir3 loci (8, 10), although BALB/c mice havea significantly longer survival time than A/J mice (50 versus 16days). Therefore, phenotypes regulated by strain-specific ge-notypes of QTL affecting survival time are likely to exhibitsimilar profiles in A/J and BALB/c mice, with BALB/c micepossibly showing intermediate values for parameters that arecorrelated with survival. We do not expect to see intermediatevalues of any phenotype in C57BL/6 mice, and consequently,where we do, that trait is unlikely to be associated with survival.Hence, by including BALB/c mice in any experiment, we canincrease our power to detect correlations between any givenparameter and survival.
Congenic mice are a powerful tool for identifying the spe-cific effect of a single locus on a phenotype. A panel of threecongenic mouse lines for the Tir loci has been created previ-ously and phenotyped at the N4 generation (12). We have nowbackcrossed the congenic lines to A/J for a further 4 genera-tions to N8 to reduce the expected amount of residual non-target-donor DNA from 6% to �1%. And we have produceda specific control line for each congenic line, since it has beenshown that even the small proportion of residual non-target-donor DNA that remains in the N8 genome after 7 generationsof backcrossing can double the survival time of the mice. Thesecontrols carry the same nontarget regions derived fromC57BL/6 mice as the congenic lines, and since these arepresent in test and control animals, they are not expected togive rise to observable differences in response to infection.Using these mice, it is possible to evaluate the effect of eachQTL on the phenotype.
While the immune response to infection with T. congolensehas been studied intensively (19, 31), we are not aware of anysystematic studies of the clinical chemistry of mice followinginfection with African trypanosomes, with the exception ofstudies of the interaction between host and parasite glycolysis(3, 33). Clinical chemistry is routinely used in human medicineto identify pathological alterations of tissues, organ functions,or metabolic pathways that develop during the course of adisease, to estimate the severity of these alterations, and todecide on interventions that might be required.
In this article, we test the hypothesis that pathological con-sequences of trypanosomiasis, other than anemia, are respon-sible for differences in survival times of inbred mouse strains byreporting on 15 clinical chemical parameters for three inbred
mouse strains and 8 parameters for six congenic mouse lines atfive time points over the course of T. congolense infection.
MATERIALS AND METHODS
The founders of the inbred mouse lines C57BL/6J OlaHsd (C57BL/6), A/JOlaHsdnd (A/J), and BALB/cJ OlaHsdce (BALB/c) were purchased from Har-lan UK, Ltd. (Bicester, Oxon, United Kingdom), and bred in the small animalunit at the International Livestock Research Unit, together with the congenicmice. All animals were treated in accordance with the Institute’s Animal Careand Use Committee policies.
Congenic mouse lines are created by crossing two different lines, one of whichis designated the donor line (C57BL/6 in this case) and the other the recipientstrain (A/J). At each generation after F1, the offspring are genotyped to identifythose animals that carry alleles from the donor strain (C57BL/6) in the region ofinterest. These are then backcrossed to the recipient line (A/J). The amount ofdonor genome present in the recipient line of the offspring halves at eachgeneration, and by the N7 generation, it is reduced to �1% in addition to thetarget region.
Three congenic lines were created corresponding to each of the predictedTrypanosoma infection response (Tir) loci: Tir1, Tir2, and Tir3 on chromosomes17, 5, and 1, respectively. The progeny at each backcross generation were geno-typed with microsatellite markers defining the genetic intervals containing theQTL using the following markers: D17Mit29, D17Mit16, and D17Mit11 for Tir1;D5Mit200, D5Mit157, and D5Mit58 for Tir2; and D1Mit60, D1Mit217, andD1Mit87 for Tir3. At the seventh generation of backcrossing, each line was typedwith a series of markers at �2-cM intervals flanking the Tir loci. The individualswith the shortest donor haplotype extending beyond the QTL interval were usedfor breeding the next generation by intercrossing full- or half-sib male and femalecarriers of the C57BL/6 donor region. The progeny of these were genotyped, andthose individuals homozygous for the alternative haplotypes were used asfounders to propagate each line, which were denoted either “Tir1AA,”“Tir2AA,” or “Tir3AA” for homozygotes at the QTL for the recipient A/Jhaplotype or “Tir1CC,” “Tir2CC,” or “Tir3CC” for homozygotes at the QTL forthe donor C57BL/6 haplotype. Thus, a total of six lines were produced: these areTir1AA and Tir1CC, Tir2AA and Tir2CC, and Tir3AA and Tir3CC. The Tir1CCline is homozygous for a C57BL/6 haplotype spanning the 10-cM interval be-tween markers D17Mit84 and D17Mit177 on Mmu17. The Tir2CC line is ho-mozygous for a C57BL/6 haplotype spanning �30 cM between markersD5Mit184 and D5Mit136 on Mmu5. Tir3CC individuals have a C57BL/6 haplo-type spanning �10 cM between markers D1Mit49 and D1Mit139 on Mmu1.
The recommended names for the test lines according to the Mouse GenomeInformatics would be “A.B6-Tir1,” “A.B6-Tir2,” and “A.B6-Tir3.” However,there is no recommended nomenclature for the control lines, so for clarity, thestyle Tir1AA to -3AA and Tir1CC to -3CC will be used in the following descrip-tion. Survival of congenic mouse lines was compared using the Kaplan-Meier logrank test implemented in SPSS.
The homozygous congenic mouse lines were genotyped at the Wellcome TrustClinical Research Facility, Edinburgh, United Kingdom, using the Illuminamouse medium-density linkage panel on an Illumina BeadStation 500 instru-ment. This panel contains 1,449 single nucleotide polymorphism (SNP) markers,of which 959 were informative between A/J and C57BL/6, with a mean spacingof 2.61 Mb. Using these data, it was possible to identify the approximate bound-aries of the introgressed regions and also to identify nontarget regions ofC57BL/6 origin that had been carried through into the congenic lines.
Clinical chemistry data were collected from a total of nine lines: the threeinbred strains A/J, BALB/c, and C57BL/6; each of the three congenic linesTir1CC, Tir2CC, and Tir3CC; and each of their respective control lines,Tir1AA, Tir2AA, and Tir3AA. Mice were co-housed, and each cage wasrandomly allocated a place on the rack to minimize batch effects of theenvironment. Forty mice of each line were infected intraperitoneally (i.p.)with 104 T. congolense IL1180 parasites, and 10 mice of each line wereinoculated i.p. with 0.01 M phosphate-NaCl (pH 8.0)–1% glucose buffer(PSG) as controls. All mice that were not being monitored for parasitemiawere checked by microscopy for patent parasitemia at day 7 when a 3-�lblood sample was taken from the tail. Mice in which no parasites were seenwere resampled after 48 h. Six of the 320 infected mice remained apara-sitemic and were excluded from the study.
Mice were weighed and killed by CO2 anesthesia at different time points tocollect serum samples. Groups of 10 mice of each line were sampled immediatelybefore infection and on each of days 3, 9, 17, and 35 following infection. On eachoccasion, processing started at 1:30 p.m. and was completed by 5:00 p.m. Foodand water were not withdrawn before killing. In order to minimize hemolysis
VOL. 77, 2009 CLINICAL CHEMISTRY OF T. CONGOLENSE INFECTION IN MICE 3949

during postmortem sample collection, blood was collected by opening the tho-racic cavity, removing the sternum, cutting the vena cava caudalis and the aortacranial to the diaphragm, and collecting all the blood from the thoracic cavityusing a pipette; the volume collected was 0.5 to 1 ml. Blood was left for 2 h atroom temperature to clot and then stirred and centrifuged at 4,600 � g for 10min, and the serum was collected.
Serum samples were stored at �80°C until all samples were collected. Thenthey were shipped to the German Mouse Clinic on dry ice and stored again at�80°C until they were analyzed. For the clinical chemistry analysis, samples werethawed, centrifuged, transferred to 1.5-ml Eppendorf tubes, and stored overnightat 4°C before analysis using an AU400 autoanalyzer (Olympus) and adapted testkits (Olympus). Samples were briefly vortexed and centrifuged again to removeclots. Uric acid concentrations were measured from undiluted samples, exceptfor the samples from the three parental inbred strains, which were diluted for allparameters. For the analysis of all other parameters, samples were diluted 1:2with deionized water, mixed, and centrifuged again, before being tested (seeTable 2). Samples that contained �90 �l of serum were pooled with one othersample collected from another animal of the same strain or congenic line at thesame time point, in order to get enough material to test all parameters chosen.
Hemoglobin levels. Before the mice were killed, three samples of 2 �l of wholeblood were collected from the tail (after discarding the first drop). The relativehemoglobin concentrations were measured spectrophotometrically at 540 nmusing Drabkin’s method (2a). Each of the triplicate samples of 2 �l of tail bloodwas diluted in 200 �l of Drabkin’s solution mixed with Brij detergent (Sigma) ina 96-well round-bottom plate (Costar 3799; Corning, Inc., Corning, NY). After30 min at room temperature, the optical density was measured at 540 nm in anenzyme-linked immunosorbent assay plate reader (Multiscan MCC/340; TitertekInstruments, Huntsville, AL).
Parasitemia. At days 4, 6, 8, 10, and 13, 3 �l of blood was collected from thetails of five mice per strain or congenic line. The blood was diluted 100:1 in twostages, and parasitemia was determined with a hemocytometer.
Statistics. Data were explored by analysis of variance using the general linearmodel univariate procedure in SPSS. The inbred mice and each of the pairs ofcongenic lines and their controls were analyzed independently, and no compar-ison was made between different congenic lines or between congenic lines andinbred mice. Consequently there were a maximum of three strains and five timepoints for each analysis. Time points were considered as an explanatory variable(i.e., independent) as mice were sacrificed at each time point. Duncan’s multiplecomparison test was used to identify strains or time points that differed signifi-cantly from each other. No multiple-testing protection was applied to the resultssince the primary objective was to generate hypotheses by screening a large panelof analytes for any that might show an association with breed. Histograms ofstandardized residuals and plots of fitted values versus residuals were used tocheck the assumptions of the model, and natural log transformations were usedwhere necessary.
RESULTS
Positions of donor haplotypes within recipient genome. SNPgenotypes of the mice obtained with the Illumina 1,536-SNPpanel are shown in supplemental material for genotypes withpositions relative to mouse genome assembly NCBI36. Thesedata showed that the Tir1CC congenic mice carried the ex-pected region of C57BL/6 origin between 26.0 and 43.9 Mb onMmu17 in the A/J background. The Tir2CC mice carry four
regions of C57BL/6 origin on chromosome 5: 27.4 to 32.9 Mb,35.8 to 37.4 Mb, around 78.5 Mb, and 99.5 to 118.2 Mb. TheTir3CC mice harbor a region of C57BL/6 origin between 93.3and 123.6 Mb on Mmu1. In addition, all congenic lines carriednontarget C57BL/6 sequences on some other chromosomes:70.7 to 82.6 Mb on Mmu15 in 4/5 Tir1CC mice; 52.8 to 63.7 Mbon Mmu14 in 5/5 Tir1CC mice; around 98.8, 102.2, and 121.5Mb on Mmu8 in 1/3 Tir2CC mice; 108.5 to 117.8 Mb on Mmu9in 1/3 Tir2CC mice; 51.6 to 86.4 Mb on Mmu8 in 3/4 Tir3CCmice; and 0 to 21.7 Mb on Mmu6 in 3/4 Tir3CC mice. In mostcases, these C57BL/6 regions were also present in the litter-mate control mice and were therefore unlikely to account forgenotype-specific differences found between carriers of thecongenic region and control mice from the same line. Com-plete data are shown in the supplemental material table forgenotypes.
Effect of congenic loci on survival. Survival times postinfec-tion are shown in Table 1 and Fig. 1. The Tir1CC mice carryingthe C57BL/6 allele at the Tir1 locus survived 21 days longerthan their littermate controls carrying the A/J allele at thislocus. Similarly, the Tir2CC animals carrying the C57BL/6 al-lele at the Tir2 locus survived 10 days longer than their litter-mate controls carrying the A/J allele. There was no significantdifference in survival between the Tir3CC and Tir3AA mice.
Clinical chemistry of inbred mice. Clinical chemistry datawere obtained in two steps. In step 1, parental A/J, BALB/c,and C57BL/6 inbred mice were screened for 15 parametersprior to infection and at four time points (3, 9, 17, and 35 dayspostinfection). In step 2, the congenic mice were screened forseven parameters that showed differences between the inbredstrains or that varied over the period of infection. The com-plete results are available in the supplemental material, under“Clinical chemistry.” P values indicating the probability of asignificant influence of strain, day postinfection, and the inter-action strain � day postinfection on each parameter measuredare shown in Table 2.
FIG. 1. Survival of Tir1CC and Tir2CC congenic mice and theircontrol lines (Tir1AA and Tir2AA) after infection with T. congolenseshowing the difference in survival between lines. In each case, theTir1CC or Tir2CC line survived longer than the Tir1AA or Tir2AAline.
TABLE 1. Mean number of days that carriers of each congenicregion and littermate controls survived after infection
Strain No. ofmice
Mean survival(days) SE �2 P valuea
Tir1AA 18 60.33 3.75 �0.001Tir1CC 21 81.24 3.56Tir2AA 52 63.67 1.55 �0.001Tir2CC 94 73.99 1.47Tir3AA 19 57.84 1.95 0.905Tir3CC 66 57.35 1.14
a The �2 P values are for the significance of the Kaplan-Meier function fordifference in survival.
3950 RATHKOLB ET AL. INFECT. IMMUN.

Electrolytes. Levels of potassium and chloride in preinfec-tion samples from BALB/c mice were relatively high for un-known reasons, but by day 3 postinfection, these had droppedto within the range for A/J and C57BL/6 mice. Thereafter,there were only small differences in potassium and chloridelevels between the inbred parental mouse strains (Fig. 2).C57BL/6 mice had a mean K� of 7% less than A/J and BALB/cmice; chloride in A/J mice was significantly lower than inBALB/c or C57BL/6 mice, but only by 1 to 3%. There were nosignificant differences between strains in sodium and inorganicphosphorus (not shown). The very small absolute variations inpotassium and chloride levels between strains were statisticallysignificant (P � 0.001), but this may be a reflection of thehighly reproducible measurements of these analytes ratherthan any clinical significance.
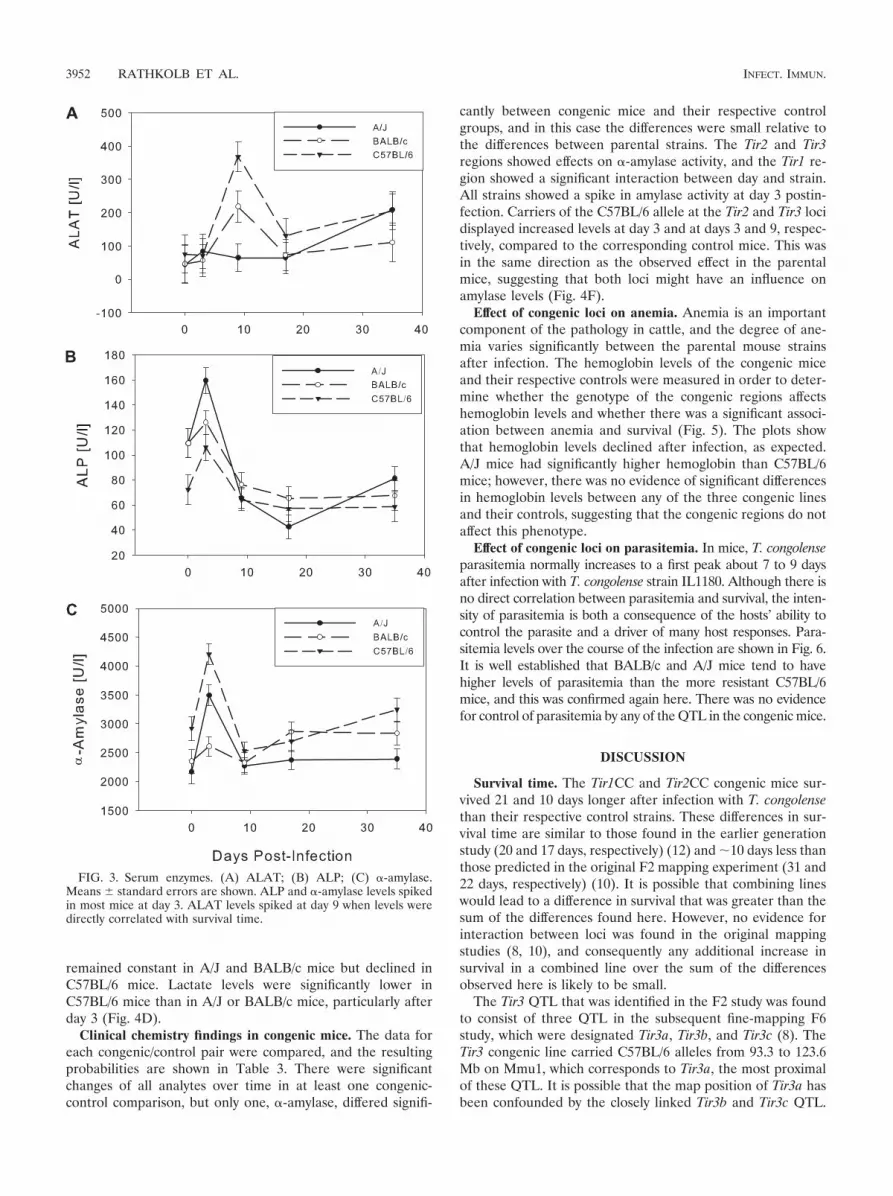
Serum enzyme activities. Alanine aminotransferase (ALAT)activity (Fig. 3) reached a maximum around the first peak ofparasitemia at day 9 in BALB/c and C57BL/6 mice, but did notrespond until day 35 in A/J mice. A/J is the most susceptiblestrain, and by day 35 postinfection, many of the A/J mice beganto show visible symptoms, such as swollen spleen, spiky coat,hunched posture, and reduced mobility.
Alkaline phosphatase (ALP) activity (Fig. 3B) showed amarked increase at day 3 postinfection in all strains and thenreturned to baseline levels.
�-Amylase activity peaked at day 3 in all three mouse strainsand then returned to baseline levels (Fig. 3C). The strongestreaction was seen in C57BL/6 mice.
Markers of kidney function. Kidney diseases lead to thefailure of the urinary excretion of metabolites, thereby result-ing in increased serum levels of creatinine and urea. Creatininelevels did not differ during the observation period betweenstrains and changed only slightly over time, similar to urealevels, which remained constant in all strains until they in-creased by 21 to 47% at day 35 (Fig. 4A and B).
Uric acid. Uric acid is an intermediate in purine catabolism,and levels can be increased as a consequence of infections andmassive cell death. Uric acid metabolism has been implicatedin the control of malaria and also T. congolense infection incape buffalo (6, 34). However, in the present study uric acidlevels remained reasonably constant during the course of in-fection in A/J and BALB/c mice, while they fluctuated between2 and 4 mg/dl in C57BL/6 mice (not shown). However, thesevalues are within the ranges seen in wild-type mice of differentstrains.
Albumin concentration. Albumin is known as a negativeacute-phase protein since levels decline during the acute-phaseresponse. Albumin declined throughout the infection in allmouse strains (Fig. 4F), probably indicating a decline in liverfunction, while total plasma protein remained constant (datanot shown).
Glucose and lactate concentrations. Glucose levels were 19to 75% higher in C57BL/6 mice than in A/J and BALB/c miceat all time points, and glucose concentrations declined in allstrains over the course of infection (Fig. 4C). Lactate levels
FIG. 2. Levels of electrolytes over the course of infection. (A) Potassium; (B) chloride. Means standard errors are shown. BALB/c mice hadhigh initial levels of both potassium and chloride, but these dropped by day 3 to within the range of the other strains. From day 3 onwards, all valuesfor all strains remained within a tight band.
TABLE 2. Clinical chemistry of inbred micea
AnalyteP value for:
Adjusted r2
Strain Day Day � strain
ALAT 0.04 �0.001 0.028 0.335�-Amylase 0.001 �0.001 �0.001 0.584Albumin �0.001 �0.001 0.035 0.711ALP 0.007 �0.001 0.041 0.597Chloride �0.001 �0.001 0.024 0.423Creatinine NSb 0.025 0.043 0.211Glucose 0.001 0.003 0.052 0.498Phosphorus NS NS NS 0.011Lactate 0.003 NS NS 0.16Lipase NS NS NS 0.067Potassium 0.001 0.009 �0.001 0.388Sodium 0.069 0.001 0.033 0.277Transferrin �0.001 �0.001 �0.001 0.726Urea 0.002 �0.001 0.394 0.407Uric acid 0.008 �0.001 0.053 0.364
a Values represent the probabilities of strain- and/or time-dependent differ-ences in response to infection for the analytes tested. ALAT data were logntransformed before analysis; all other data were approximately normally distrib-uted. There were highly significant effects detected for the levels of most analytesboth over time (day) and between strains. No multiple-testing correction hasbeen applied, but if Bonferroni’s correction was used, then 0.0033 would beequivalent to the 0.05 significance threshold used here. Plots of transferrin levelshave been published previously but are included here for completeness (25).
b NS, not significant.
VOL. 77, 2009 CLINICAL CHEMISTRY OF T. CONGOLENSE INFECTION IN MICE 3951
remained constant in A/J and BALB/c mice but declined inC57BL/6 mice. Lactate levels were significantly lower inC57BL/6 mice than in A/J or BALB/c mice, particularly afterday 3 (Fig. 4D).
Clinical chemistry findings in congenic mice. The data foreach congenic/control pair were compared, and the resultingprobabilities are shown in Table 3. There were significantchanges of all analytes over time in at least one congenic-control comparison, but only one, �-amylase, differed signifi-
cantly between congenic mice and their respective controlgroups, and in this case the differences were small relative tothe differences between parental strains. The Tir2 and Tir3regions showed effects on �-amylase activity, and the Tir1 re-gion showed a significant interaction between day and strain.All strains showed a spike in amylase activity at day 3 postin-fection. Carriers of the C57BL/6 allele at the Tir2 and Tir3 locidisplayed increased levels at day 3 and at days 3 and 9, respec-tively, compared to the corresponding control mice. This wasin the same direction as the observed effect in the parentalmice, suggesting that both loci might have an influence onamylase levels (Fig. 4F).
Effect of congenic loci on anemia. Anemia is an importantcomponent of the pathology in cattle, and the degree of ane-mia varies significantly between the parental mouse strainsafter infection. The hemoglobin levels of the congenic miceand their respective controls were measured in order to deter-mine whether the genotype of the congenic regions affectshemoglobin levels and whether there was a significant associ-ation between anemia and survival (Fig. 5). The plots showthat hemoglobin levels declined after infection, as expected.A/J mice had significantly higher hemoglobin than C57BL/6mice; however, there was no evidence of significant differencesin hemoglobin levels between any of the three congenic linesand their controls, suggesting that the congenic regions do notaffect this phenotype.
Effect of congenic loci on parasitemia. In mice, T. congolenseparasitemia normally increases to a first peak about 7 to 9 daysafter infection with T. congolense strain IL1180. Although there isno direct correlation between parasitemia and survival, the inten-sity of parasitemia is both a consequence of the hosts’ ability tocontrol the parasite and a driver of many host responses. Para-sitemia levels over the course of the infection are shown in Fig. 6.It is well established that BALB/c and A/J mice tend to havehigher levels of parasitemia than the more resistant C57BL/6mice, and this was confirmed again here. There was no evidencefor control of parasitemia by any of the QTL in the congenic mice.
DISCUSSION
Survival time. The Tir1CC and Tir2CC congenic mice sur-vived 21 and 10 days longer after infection with T. congolensethan their respective control strains. These differences in sur-vival time are similar to those found in the earlier generationstudy (20 and 17 days, respectively) (12) and �10 days less thanthose predicted in the original F2 mapping experiment (31 and22 days, respectively) (10). It is possible that combining lineswould lead to a difference in survival that was greater than thesum of the differences found here. However, no evidence forinteraction between loci was found in the original mappingstudies (8, 10), and consequently any additional increase insurvival in a combined line over the sum of the differencesobserved here is likely to be small.
The Tir3 QTL that was identified in the F2 study was foundto consist of three QTL in the subsequent fine-mapping F6study, which were designated Tir3a, Tir3b, and Tir3c (8). TheTir3 congenic line carried C57BL/6 alleles from 93.3 to 123.6Mb on Mmu1, which corresponds to Tir3a, the most proximalof these QTL. It is possible that the map position of Tir3a hasbeen confounded by the closely linked Tir3b and Tir3c QTL.
FIG. 3. Serum enzymes. (A) ALAT; (B) ALP; (C) �-amylase.Means standard errors are shown. ALP and �-amylase levels spikedin most mice at day 3. ALAT levels spiked at day 9 when levels weredirectly correlated with survival time.
3952 RATHKOLB ET AL. INFECT. IMMUN.

The failure to detect a difference in this study, whereas a28-day difference was found in the earlier congenic study (12),may be a consequence of additional recombination events inthe introgressed region or the use of matched controls in this
study rather than the common controls that were used in theearlier one. New congenic lines are being developed to test theeffects of Tir3a, Tir3b, and Tir3c and might identify the numberand location of these QTL.
FIG. 4. Levels of urea (A), creatinine (B), glucose (C), lactate (D), and serum albumin (E) in inbred mice and �-amylase (F) in congenic mice.Means standard errors are shown. Urea declined in BALB/c mice from day 0 to day 3; thereafter, all strains remained stable until day 17, afterwhich they increased to day 35. A/J mice had lower levels at all time points. Creatinine remained within normal ranges at all time points. Bothglucose and lactate declined in C57BL/6 mice over the course of the infection, but levels remained constant in the other two strains. The inverserelationship between glucose and lactate in C57BL/6 mice, compared to the other two strains, might indicate reduced glucose flux through theerythrocyte glycolysis pathway or increased gluconeogenesis in this strain. Albumin declined consistent with an acute-phase response; transferrinincreased, presumably in response to the developing anemia. The differences in �-amylase between Tir2CC and Tir2AA mice and between Tir3CCand Tir3AA mice were significant. The general trend was very similar to that of the A/J parental strain (Fig. 3C).
VOL. 77, 2009 CLINICAL CHEMISTRY OF T. CONGOLENSE INFECTION IN MICE 3953

Clinical chemistry. The dominant features of the clinicalchemistry data are the successful maintenance of homeostasisof the major organ systems during the first 35 days of infection.Although there are responses to infection at specific timepoints, it is clear that the mice are not suffering serious loss ofany organ functions despite the intensity of the infection. Thestability of electrolyte levels indicates that the animals aremaintaining homeostasis during the infection and that there-fore the animal has some degree of control over its response.However, a common feature in all groups investigated weredecreasing levels of glucose and albumin during the course ofthe disease, most likely reflecting developing cachexia.
Differences in glucose and lactate levels between the inbredstrains might be caused by genetically fixed background effects,since C57BL/6J mice are known to show glucose intolerancedue to impaired insulin production (31a). In the absence ofdifferences in insulin resistance, the increased glucose and re-duced lactate levels in the C57BL/6 mice relative to A/J andBALB/c mice could also be a consequence of one or more ofthe following three factors: reduced flux through the erythro-cyte glycolysis pathway in the presence of more severe anemia,reduced flux through the parasite glycolysis pathway in thepresence of lower parasitemia, and increased gluconeogenesis.
African trypanosomes have been estimated to consumetwice their own weight in glucose per day, and hence highparasitemia could have a significant impact on glucose levels;however, trypanosomes actively excrete pyruvate rather thanlactate, so the apparent inverse correlation between glucoseand lactate levels is not readily explained by parasite glycolysis.
It is not possible to choose between the other two hypotheseswith the data presented here.
A recent nuclear magnetic resonance-based study found thatlactate tended to increase and glucose tended to decrease inthe NMRI strain of mice infected with T. brucei (GVR35) (35).This is not consistent with the data presented here. It is evidentfrom this study that the levels of these analytes are dependenton mouse strain, and they may also be dependent on parasitestrain as well. The differences in mouse and parasite strainscould therefore account for the differences between the twostudies.
Transferrin is also a negative acute-phase protein that nor-mally declines during the acute-phase response (28), but it isupregulated in response to anemia and iron deficiency. Thesamples collected for this study were assayed for transferrin,and the data have been published separately (25): the level oftransferrin increased significantly over the course of the infec-tion, particularly in the A/J mice. The fact that transferrinlevels rose rather than fell, as would be expected during aclassical acute-phase response, is further evidence of the weak-ness of the inflammatory reaction. The relatively weak acute-phase response and the general maintenance of homeostasisare consistent with the behavior of mice during infection,which generally appeared normal upon visual inspection, evenduring peaks of parasitemia.
ALAT is a leakage enzyme (reflecting alterations in cellmembrane function) and is found in the highest concentrationsin the liver of mice. It is a useful analyte to measure as an indexof hepatocellular damage (14). Increased activities of ALAT inserum of BALB/c and C57BL/6 mice most likely indicate livercell damage due to inflammation around the peak of para-sitemia at day 9. It has been shown that opsonized parasites arecleared from the blood via phagocytosis by Kupffer cells in theliver, which become greatly enlarged (29). Kupffer cells mayalso secrete inflammatory mediators, which could induce in-flammatory reactions resulting in an increased ALAT level. Itis interesting that the ALAT level did not rise in A/J mice orany of the congenic mice during the first peak of parasitemia,suggesting that these mice do not mount a significant inflam-matory response to the first peak of parasitemia. Parasitemiacould be a confounder of any measure of inflammation since itis not certain to what extent high parasitemia might inducemore severe inflammation or conversely to what extent theinflammatory response might help to control parasitemia. Inthis case, ALAT levels were not ranked in the same order asparasitemia, suggesting that there was no direct correlationbetween the two. However, C57BL/6 mice had the highestALAT levels and the lowest parasitemia, suggesting that astronger inflammatory response might contribute to the reduc-tion in parasitemia, although with only three mouse strains it isnot possible to attach any statistical significance to this obser-vation. A/J mice tend to have higher parasitemia than C57BL/6mice (Fig. 6), and the lack of inflammation in the liver might beassociated with reduced parasite clearance by Kupffer cells.The absence of an obvious acute phase or inflammatory re-sponse from the most susceptible mouse strain could suggestthat this contributed to their early death after infection. How-ever, all of the congenic mice also failed to exhibit an ALATincrease around the first peak of parasitemia, indicating thatthe individual congenic regions did not control the response
TABLE 3. Clinical chemistry of congenic micea
QTL andanalyte
P value for:Adjusted r2 Model
Strain Day Day � strain
Tir1ALAT 0.675 �0.001 0.262 0.425 LognAlbumin 0.359 �0.001 0.201 0.649 NormalALP 0.372 �0.001 0.027 0.334 NormalGlucose 0.073 �0.001 0.275 0.379 NormalLactate 0.258 0.020 0.322 0.093 NormalTransferrin 0.865 0.009 0.588 0.107 Normal�-Amylase 0.501 �0.001 0.005 0.597 Normal
Tir2ALAT 0.670 �0.001 0.691 0.407 LognAlbumin 0.16 �0.001 0.52 0.45 NormalALP 0.798 �0.001 0.703 0.231 NormalGlucose 0.734 �0.001 0.279 0.347 NormalLactate 0.166 0.007 0.021 0.208 NormalTransferrin 0.200 0.006 0.144 0.147 Normal�-Amylase 0.015 �0.001 0.762 0.441 Normal
Tir3ALAT 0.17 �0.001 0.33 0.29 LognAlbumin 0.765 �0.001 0.179 0.586 NormalALP 0.67 �0.001 0.23 0.27 NormalGlucose 0.291 �0.001 0.773 0.334 NormalLactate 0.21 0.07 0.72 0.04 NormalTransferrin 0.148 �0.001 0.955 0.234 Normal�-Amylase 0.02 �0.001 0.28 0.33 Logn
a Values represent the analysis of variance probabilities of strain- and/or time-dependent responses to infection. There was a highly significant response toinfection over time (day) in the levels of most analytes, since the day postinfec-tion had a significant effect on almost all analytes in all strains. However, signif-icant strain effects (P � 0.05) were seen for amylase activity only.
3954 RATHKOLB ET AL. INFECT. IMMUN.

resulting in increased ALAT activity on day 9. This is partic-ularly surprising in the case of Tir1 since it includes the majorhistocompatibility complex region. Since there were significantdifferences in survival between congenic and control lines, itappears that the presence of an early response, as indicated bythe clinical chemistry analytes measured here, does not con-tribute to prolonged survival after infection. However, plasmaALAT activities did rise in the late stage of infection in thecongenic mice, although the levels were not significantly dif-ferent between congenic and control mice, and urea levelswere also increased on day 35 in the parental strains, suggest-ing that the latest time point chosen might have been too earlyto diagnose pathological consequences of the infection finallyleading to the death of the animal.
Serum activity of ALP, an enzyme produced by hepatocyteslining the bile canicula and by osteoblasts, is typically increasedin all liver diseases associated with cholestasis and in disordersof bone metabolism. Since ALP is also found in many othertissues (intestinal mucosa, kidneys, and blood vessels), in-creased activities sometimes can also be found under otherpathological conditions such as peritonitis (1).
Increased activities of �-amylase are found in pancreatitis,peritonitis, diseases of the parotid glands, and kidney failure,while decreased activities are found in severe liver damage.
�-Amylase was the only clinical chemistry analyte that differedbetween congenic lines and controls. The transient spikes inserum amylase and ALP in both inbred and congenic mice atday 3 could both be associated with a transient peritonitiscaused by the i.p. injection of parasites. However, amylase alsoincreases after feeding (26), so it is possible that the earlystages of the infection are associated with increased appetance.Since food was not withdrawn before sampling, the differencesin serum amylase between congenic mice and controls mightbe a consequence of greater increases in feeding in the Tir2and Tir3 congenic mice than their controls or an interactionbetween the congenic regions and either appetite or digestion.Since Tir3 congenic mice did not survive longer than controls,it is unlikely that there is a direct correlation between serumamylase and survival.
The difference in survival between congenic and control mice isassumed to be a consequence of differences in the immune re-sponse and how it is initiated and subsequently controlled (2).The stronger inflammatory response of C57BL/6 mice as mea-sured by ALAT levels may help control parasitemia and extendsurvival in this strain, consistent with the evidence that type 1inflammatory immune responses are associated with lower par-asitemia (11, 21). However, the absence of a difference inALAT between congenic and control mice indicates that stron-
FIG. 5. Hemoglobin levels in congenic mice compared to their controls and the inbred mice. Means standard errors are shown. (A) Inbred strains;(B) Tir1 strains; (C) Tir2 strains; (D) Tir3 strains. Hemoglobin declined in all strains after infection, except in C57BL/6 mice, in which it started low andstayed low. Both the Tir2 strains appeared to make a recovery in hemoglobin levels, but since there was no difference between them, this is not likely to be dueto the congenic region. The hemoglobins of A/J and C57BL/6 mice are shown on each of the congenic plots with the same symbols as in panel A.
VOL. 77, 2009 CLINICAL CHEMISTRY OF T. CONGOLENSE INFECTION IN MICE 3955

ger inflammatory responses are not necessary for extendedsurvival. Splenectomy and deletion of the proinflammatorycytokines tumor necrosis factor alpha and lymphotoxin-� in-creases survival after infection with T. brucei (16) but not T.congolense (11, 21). Deletion of proinflammatory T cells inmice and cattle also has no effect on survival (23, 30), butdeletion of the antioxidant Sepp1 gene reduces survival (5).Deletion of both anti-inflammatory interleukin-10 and regula-tory T cells reduces survival of T. congolense-infected mice (7),while overexpression of the antioxidant paraoxonase extendssurvival (4), suggesting that an effective anti-inflammatory re-sponse that controls the damage caused by infection is at leastas important as effective parasite control.
Anemia and parasitemia. Anemia, the most prominent fea-ture of trypanosomiasis in cattle, is also seen in murinetrypanosomiasis models (15, 17, 22, 24). A comparison of ane-mia and parasitemia between A/J mice and more resistantC57BL/6 mice revealed that anemia development was moresevere in the C57BL/6 strain, despite the fact that this strainacquires lower parasitemia and survives longer after infectionthan strain A/J (24). The finding that none of the QTL regu-lated anemia is consistent with previous observations in infec-tions with T. congolense and the closely related parasite T.brucei (17, 24). No correlation between either anemia or par-asitemia and survival of C3H/HeN, BALB/c, C57BL/6, orCBA/Ca mice was found after infection with T. brucei (17).This is in contrast to the situation in cattle, where chronic
anemia is associated with death, and anemia rather than par-asitemia is used as the criterion to decide whether to treat theanimal (32). In the mouse strains used in the present study,anemia is unrelated to survival, with the most resistantC57BL/6 mice developing the most severe anemia (24). Themore severe anemia of C57BL/6 mice is likely to be associatedwith the stronger inflammatory response to infection of thesemice as measured by Tnfa and Ifng expression. Nitric oxidelevels have been correlated with anemia after T. brucei infec-tion; however, deletion of T cells in cattle has no effect onanemia, nor does deletion of the Tnfa gene of mice or irradi-ation of rats (15, 18, 20, 21). Consequently, the more severeanemia of C57BL/6 mice may be due to differences in inflam-mation driven by the innate immune response.
Conclusion. The congenic mice confirmed the physical loca-tion of two out of the three QTL tested and showed that thesetwo loci did not regulate either parasitemia or anemia. Clinicalchemical investigations identified differences in the early re-sponse to the parasite seen in the parental inbred strains, butwith the possible exception of �-amylase, these were not seenin congenic lines and therefore are unlikely to represent amajor contribution to differences in survival time. It has beenproposed that the genetic response to parasites is comprised of“two conceptually different components: resistance (the abilityto limit parasite burden) and tolerance (the ability to limit thedisease severity induced by a given parasite burden)” (27). Inthis context, “tolerance” is used in the genetic sense and is
FIG. 6. Parasitemia units in the three congenic strains compared to their controls and the inbred mice. Means standard errors are shown.OD, optical density. (A) Inbred strains; (B) Tir1 strains; (C) Tir2 strains; (D) Tir3 strains. The parasitemia of A/J and C57BL/6 mice is shown oneach of the congenic plots with the same symbols as in panel A.
3956 RATHKOLB ET AL. INFECT. IMMUN.

similar to the term “resilience” used in veterinary helminthol-ogy and not “tolerance” as used by immunologists. The ab-sence of an association between the QTL and parasitemia orproinflammatory response suggests that the Tir1 and Tir2 QTLregulate tolerance rather than resistance. Further experimen-tal work will be required to test this hypothesis.
The congenic mice described here provide a powerful resourcefor discriminating between those factors that simply respond toinfection and those that regulate survival after infection.
ACKNOWLEDGMENTS
We thank the staff of the International Livestock Research Institute(ILRI) small animal unit and Elfi Holupirek of the German MouseClinic for expert technical assistance, Jane Poole of the ILRI forassistance with statistical analysis, and Kate Goodheart for preparationof the figures.
Funding to H.A.N., M.A., S.K., J.G., and A.B. was provided by theWellcome Trust (GR066764MA to S.J.K.). The German Mouse ClinicCore (V.G.-D., H.F., and M.H.D.A.) and clinical chemistry laboratory(B.R. and E.W.) received funding from the EU (EUMODIC grant no.LSHG-2006-037188) and the Federal Ministry of Education and Re-search (National Genome Research Net NGFNplus grants 01GS0850and 01GS0851).
REFERENCES
1. Andersson, R., H. E. Poulsen, and B. Ahren. 1991. Effect of bile on liverfunction tests in experimental E. coli peritonitis in the rat. Hepatogastroen-terology 38:388–390.
2. Antoine-Moussiaux, N., S. Magez, and D. Desmecht. 2008. Contributions ofexperimental mouse models to the understanding of African trypanosomia-sis. Trends Parasitol. 24:411–418.
2a.Balasubramaniam, P., and A. Malathi. 1992. Comparative study of hemo-globin estimated by Drabkin’s and Sahli’s methods. J. Postgrad. Med. 38:8–9.
3. Barnard, J. P., B. Reynafarje, and P. L. Pedersen. 1993. Glucose catabolismin African trypanosomes. Evidence that the terminal step is catalyzed by apyruvate transporter capable of facilitating uptake of toxic analogs. J. Biol.Chem. 268:3654–3661.
4. Bhasin, K. K., J. M. Yu, A. Tward, D. Shih, D. A. Campbell, and A. J. Lusis.2006. Trypanosoma congolense: paraoxonase 1 prolongs survival of infectedmice. Exp. Parasitol. 114:240–245.
5. Bosschaerts, T., M. Guilliams, W. Noel, M. Herin, R. F. Burk, K. E. Hill, L.Brys, G. Raes, G. H. Ghassabeh, P. De Baetselier, and A. Beschin. 2008.Alternatively activated myeloid cells limit pathogenicity associated with Af-rican trypanosomiasis through the IL-10 inducible gene selenoprotein P. J.Immunol. 180:6168–6175.
6. Erdman, L. K., C. A. Finney, W. C. Liles, and K. C. Kain. 2008. Inflammatorypathways in malaria infection: TLRs share the stage with other componentsof innate immunity. Mol. Biochem. Parasitol. 162:105–111.
7. Guilliams, M., G. Oldenhove, W. Noel, M. Herin, L. Brys, P. Loi, V. Fla-mand, M. Moser, P. De Baetselier, and A. Beschin. 2007. African trypano-somiasis: naturally occurring regulatory T cells favor trypanotolerance bylimiting pathology associated with sustained type 1 inflammation. J. Immu-nol. 179:2748–2757.
8. Iraqi, F., S. Clapcott, P. Kumari, C. Haley, S. Kemp, and A. Teale. 2000. Finemapping of trypanosomiasis resistance loci in murine advanced intercrosslines. Mamm. Genome 11:645–648.
9. Kemp, S. J., A. Darvasi, M. Soller, and A. J. Teale. 1996. Genetic control ofresistance to trypanosomiasis. Vet. Immunol. Immunopathol. 54:239–243.
10. Kemp, S. J., F. Iraqi, A. Darvasi, M. Soller, and A. J. Teale. 1997. Local-ization of genes controlling resistance to trypanosomiasis in mice. Nat.Genet. 16:194–196.
11. Kitani, H., Y. Yagi, J. Naessens, K. Sekikawa, and F. Iraqi. 2004. Thesecretion of acute phase proteins and inflammatory cytokines duringTrypanosoma congolense infection is not affected by the absence of theTNF-alpha gene. Acta Trop. 92:35–42.
12. Koudande, O., J. Arendonk, and F. Iraqi. 2005. Marker-assisted introgres-sion of trypanotolerance QTL in mice. Mamm. Genome 16:112–119.
13. Kristjanson, P. M., B. M. Swallow, G. J. Rowlands, R. L. Kruska, and P. N.de Leeuw. 1999. Measuring the costs of African animal trypanosomosis, thepotential benefits of control and returns to research. Agric. Syst. 59:79–98.
14. Loeb, W., and F. Quimby. 1999. The clinical chemistry of laboratory animals,2nd ed. CRC Press, Boca Raton, FL.
15. Mabbott, N., and J. Sternberg. 1995. Bone marrow nitric oxide productionand development of anemia in Trypanosoma brucei-infected mice. Infect.Immun. 63:1563–1566.
16. Magez, S., B. Stijlemans, G. Caljon, H.-P. Eugster, and P. De Baetselier.2002. Control of experimental Trypanosoma brucei infections occurs inde-pendently of lymphotoxin-� induction. Infect. Immun. 70:1342–1351.
17. Magez, S., C. Truyens, M. Merimi, M. Radwanska, B. Stijlemans, P. Brouc-kaert, F. Brombacher, E. Pays, and P. De Baetselier. 2004. P75 tumornecrosis factor-receptor shedding occurs as a protective host response duringAfrican trypanosomiasis. J. Infect. Dis. 189:527–539.
17a.Morrison, W., G. Roelants, K. Mayor-Withey, and M. Murray. 1978.Susceptibility of inbred strains of mice of Trypanosoma congolense: cor-relation with changes in spleen lymphocyte populations. Clin. Exp. Im-munol. 32:25–40.
18. Murray, M., and T. M. Dexter. 1988. Anemia in bovine African trypanoso-miasis. Acta Trop. 45:389–432.
19. Naessens, J. 2006. Bovine trypanotolerance: a natural ability to preventsevere anaemia and haemophagocytic syndrome? Int. J. Parasitol. 36:521–528.
20. Naessens, J., H. Kitani, E. Momotani, K. Sekikawa, J. M. Nthale, and F.Iraqi. 2004. Susceptibility of TNF-alpha-deficient mice to Trypanosoma con-golense is not due to a defective antibody response. Acta Trop. 92:193–203.
21. Naessens, J., H. Kitani, Y. Nakamura, Y. Yagi, K. Sekikawa, and F. Iraqi.2005. TNF-alpha mediates the development of anaemia in a murineTrypanosoma brucei rhodesiense infection, but not the anaemia associatedwith a murine Trypanosoma congolense infection. Clin. Exp. Immunol. 139:405–410.
22. Naessens, J., S. G. Leak, D. J. Kennedy, S. J. Kemp, and A. J. Teale. 2003.Responses of bovine chimaeras combining trypanosomosis resistant andsusceptible genotypes to experimental infection with Trypanosoma congo-lense. Vet. Parasitol. 111:125–142.
23. Naessens, J., A. J. Teale, and M. Sileghem. 2002. Identification of mecha-nisms of natural resistance to African trypanosomiasis in cattle. Vet. Immu-nol. Immunopathol. 87:187–194.
24. Nakamura, Y., J. Naessens, M. Takata, T. Taniguchi, K. Sekikawa, J. Gib-son, and F. Iraqi. 2003. Susceptibility of heat shock protein 70.1-deficientC57BL/6 J, wild-type C57BL/6 J, and A/J mice to Trypanosoma congolenseinfection. Parasitol. Res. 90:171–174.
25. Noyes, H. A., M. H. Alimohammadian, M. Agaba, A. Brass, H. Fuchs, V.Gailus-Durner, H. Hulme, F. Iraqi, S. Kemp, B. Rathkolb, E. Wolf, M. H. deAngelis, D. Roshandel, and J. Naessens. 2009. Mechanisms controlling anae-mia in Trypanosoma congolense infected mice. PLoS ONE 4:e5170.
26. Proctor, G. B., B. Asking, and J. R. Garrett. 1991. Serum amylase of non-parotid and non-pancreatic origin increases on feeding in rats and mayoriginate from the liver. Comp. Biochem. Physiol. B 98:631–635.
27. Raberg, L., D. Sim, and A. Read. 2007. Disentangling genetic variation forresistance and tolerance to infectious diseases in animals. Science 318:812–814.
28. Ritchie, R., G. Palomaki, L. Neveux, O. Navolotskaia, T. Ledue, and W.Craig. 1999. Reference distributions for the negative acute-phase serumproteins, albumin, transferrin and transthyretin: a practical, simple and clin-ically relevant approach in a large cohort. J. Clin. Lab. Anal. 13:273–279.
29. Shi, M., G. Wei, W. Pan, and H. Tabel. 2004. Trypanosoma congolenseinfections: antibody-mediated phagocytosis by Kupffer cells. J. Leukoc. Biol.76:399–405.
30. Sileghem, M., and J. Naessens. 1995. Are Cd8 T-cells involved in control ofAfrican trypanosomiasis in a natural host environment. Eur. J. Immunol.25:1965–1971.
31. Tabel, H., R. S. Kaushik, and J. E. Uzonna. 2000. Susceptibility and resis-tance to Trypanosoma congolense infections. Microbes Infect. 2:1619–1629.
31a.Toye, A., J. Lippiat, P. Proks, K. Shimomura, L. Bentley, A. Hugill, V. Mijat,M. Goldsworthy, L. Moir, A. Haynes, J. Quarterman, H. Freeman, F. Ash-croft, and R. Cox. 2005. A genetic and physiological study of impairedglucose homeostasis control in C57BL/6J mice. Diabetologia 48:675–686.
32. Trail, J. C., G. D. d’Ieteren, A. Feron, O. Kakiese, M. Mulungo, and M. Pelo.1990. Effect of trypanosome infection, control of parasitaemia and controlof anaemia development on productivity of NDama cattle. Acta Trop. 48:37–45.
33. von Theodor, B. 1938. The metabolism of pathogenic trypanosomes and thecarbohydrate metabolism of their hosts. Q. Rev. Biol. 13:41–50.
34. Wang, J., A. Van Praagh, E. Hamilton, Q. Wang, B. Zou, M. Muranjan, N. B.Murphy, and S. J. Black. 2002. Serum xanthine oxidase: origin, regulation,and contribution to control of trypanosome parasitemia. Antioxid. RedoxSignal. 4:161–178.
35. Wang, Y., J. Utzinger, J. Saric, J. V. Li, J. Burckhardt, S. Dirnhofer, J.Nicholson, B. H. Singer, R. Burn, and E. Holmes. 2008. Global metabolicresponses of mice to Trypanosoma brucei burcei infection. Proc. Natl. Acad.Sci. USA 105:6127–6132.
Editor: W. A. Petri, Jr.
VOL. 77, 2009 CLINICAL CHEMISTRY OF T. CONGOLENSE INFECTION IN MICE 3957