climate change - umweltbundesamt
TRANSCRIPT
Options for the second commitment period of the Kyoto Protocol
Climate Change
ClimateChange
0205
ISSN1611-8855
Climate Change
ENVIRONMENTAL RESEARCH OF THE FEDERAL MINISTRY OF THE ENVIRONMENT, NATURE CONSERVATION AND NUCLEAR SAFETY Research Report 203 41 148/01
UBA-FB 000771
by
Niklas Höhne Dian Phylipsen Simone Ullrich Kornelis Blok with contributions from:
Carolina Galleguillos Ruut Brandsma Robert Janzic Jochen Harnisch (Ecofys) Michel den Elzen (RIVM) Martin Weiß (German Federal Environmental Agency) ECOFYS GmbH, Cologne
UMWELTBUNDESAMT
Climate Change
0205
ISSN
1611-8855
Options for the second commitment period of the Kyoto Protocol
This Publication is only available as Download at http://www.umweltbundesamt.de The publisher does not accept responsibility for the correctness, accuracy or completeness of the information, or for the observance of the private rights of third parties. The contents of this publication do not necessarily reflect the official opinions. Publisher: Federal Environmental Agency (Umweltbundesamt) Postfach 33 00 22 14191 Berlin Tel.: +49/30/8903-0 Telex: 183 756 Telefax: +49/30/8903 2285 Internet: http://www.umweltbundesamt.de Edited by: Section I 4.1 Martin Weiß Berlin, February 2005
ECOFYS Options for the second commitment period
1. Berichtsnummer UBA-FB
2. 3.
4. Titel des Berichts „Kyoto-Protokoll: Untersuchung von Optionen für die Weiterentwicklung der
Verpflichtungen für die 2. Verpflichtungsperiode“.
5. Autor(en), Name(n), Vorname(n) 8. Abschlussdatum 12. November 2004
Höhne, Niklas Dr. Phylipsen, Dian Ullrich, Simone Prof. Dr. Blok, Kornelis Mit Beiträgen von
Galleguillos, Carolina (ECOFYS) Brandsma, Ruut (ECOFYS) Janzic, Robert (ECOFYS) Harnisch, Jochen (ECOFYS) den Elzen, Michel (RIVM) Weiß, Martin (Umweltbundesamt)
9. Veröffentlichungsdatum
6. Durchführende Institution (Name, Anschrift) 10. UFOPLAN-Nr. 203 41 148/01 11. Seitenzahl
ECOFYS GmbH Eupener Straße 59 50933 Köln Deutschland Tel. +49 221 510 907 0
192 7. Fördernde Institution (Name, Anschrift)
12. Literaturangaben 13. Tabellen und Diagramme 36 14. Abbildungen 37
Umweltbundesamt Postfach 33 00 22 D-14191 Berlin
15. Zusätzliche Angaben -/- 16. Kurzfassung Diese Studie untersucht Optionen für die Weiterentwicklung der Verpflichtungen des
Kyoto-Protokolls für die 2. Verpflichtungsperiode. Die Studie umfasst die folgenden inhaltlichen Kapitel: eine Einführung, einen Überblick über Regimevorschläge und den Aufbau eines Netzwerkes, Analyse von Länderinteressen, beispielhafte Länderstudien, einen Überblick über die zu beachtenden Themen, Optionen zur Anpassung an den Klimawandel, ein neuer Vorschlag „Common but Differentiated Convergence“, eine Überarbeitung des Triptych Ansatzes, ein umfassender Kompromissvorschlag, der Vergleich von Emissionsberechtigungen unter verschiedenen Ansätzen und eine Verhandlungsstrategie für die EU und Deutschland in den internationalen Verhandlungen.
17. Schlagwörter Klimarahmenkonvention, UNFCCC, Kyoto-Protokoll, zukünftige Verpflichtungen,
internationale Klimapolitik, Gerechtigkeitsprinzipien, Mehrstufenansatz 18. Preis 19. 20.
2
ECOFYS Options for the second commitment period
1. Report No. UBA-FB
2. 3.
4. Report Title Options for the second commitment period of the Kyoto Protocol
5. Autor(s), Family Name(s), First Name(s) 8. Report Date 12. November 2004 9. Publication Date
Höhne, Niklas Dr. Phylipsen, Dian Ullrich, Simone Prof. Dr. Blok, Kornelis With contributions from:
Galleguillos, Carolina (ECOFYS) Brandsma, Ruut (ECOFYS) Janzic, Robert (ECOFYS) Harnisch, Jochen (ECOFYS) den Elzen, Michel (RIVM) Weiß, Martin (German Federal Environmental Agency)
10. UFOPLAN-Ref. No. 203 41 148/01 11. No. of Pages
6. Performing Organisation (Name, Address) ECOFYS GmbH Eupener Straße 59 50933 Cologne Germany Tel. +49 221 510 907 0 192 7. Sponsoring Agency (Name, Address)
12. No. of Reference 13. No. of Tables, Diagrams 36 14. No. of Figures 37
Umweltbundesamt (Federal Environmental
Agency) Postfach 33 00 22 D-14191 Berlin Germany
15. Supplementary Notes -/- 16. Abstract
This study assesses available options for the second commitment period of the Kyoto Protocol. The study includes the following sections: An introduction, an overview of proposals and establishing a network, analysis of interests of countries, selected country case studies, an overview of the issues to be considered, options for adaptation to climate change, a new approach “Common but Differentiated Convergence”, an update of the Triptych approach, a comprehensive compromise proposal, the comparison of emission allowances under various approaches and a negotiation strategy for the EU and Germany.
17. Keywords Climate Change Convention, UNFCCC, Kyoto Protocol, future commitments, international climate policy, equity principles, multistage
18. Price 19. 20.
3
ECOFYS Options for the second commitment period
SUMMARY 1. Introduction With the long awaited entry into force of the Kyoto Protocol on 16 February 2005 there is hope that the deadlock in international climate negotiations can be overcome. Still, the USA, as the largest emitter, has rejected emission reductions and developing countries will not act before industrialized countries (including the USA) have demonstrated substantial action. It is the general understanding that the first commitment period of the Kyoto Protocol is only a first step. Reaching the ultimate objective of the climate convention (UNFCCC), “to achieve … stabilization of greenhouse gas concentrations in the atmosphere at a level that would prevent dangerous anthropogenic interference with the climate system” is only possible, if emission reductions are intensified and participation in those reductions is broadened.
This project “Options for the second commitment period of the Kyoto Protocol” was commissioned to ECOFYS GmbH by the German Federal Environmental Agency (UBA) in June 2003. Building upon the previous ECOFYS study on “Evolution of commitments under the UNFCCC: Involving newly industrialized economies and development countries”, the project aims at identifying possible options of a post 2012 commitment period of the Kyoto Protocol.
The objective of this final report thus is to provide an overview of the issues, to further develop approaches and to discuss a possible negotiation strategy related to the design of the second commitment period after 2012. The findings of this report intend to facilitate any discussion on the future of the international climate change regime.
The scope of work of the project included the following modules:
To establish an international network of experts active in future climate change activities and post-2012 discussions and dialogues;
To review possible options how to design a second commitment period;
To further develop selected available approaches for a second commitment period;
To quantify and to assess effects of approaches for selected countries and regions; and
To provide some recommendations of how to develop a negotiating strategy for Germany and the EU.
The key findings are presented in Chapter 2 to 11 of the final report. The results of each chapter are outlined below.
2. Network and overview of proposals The project team set up the website on “Future international action on climate change (www.fiacc.net) that serves since December 2003 as an information platform pooling information on active players discussing future international action on climate change, approaches, tools supporting quantification of future commitments, contributions and actions. An online discussion forum has been used as a platform to discuss various topics related to future action on climate change together with experts and an interested audience. The website has achieved a substantial level of interest among the climate change community and is consulted frequently by individuals to retrieve information and read about recent developments.
4
ECOFYS Options for the second commitment period
The online discussions included the following topics: “converging per capita emissions”, “the role of the USA and its re-engagement in climate policy debates”, “interpreting Article 2 of the Convention, dangerous anthropogenic interference with the climate system” and “costs of mitigation and its calculation by utilising Integrated Assessment Models”. 230 individuals registered and followed discussions.
The website will remain active and discussions will continue on further topics also after this project terminates, then funded by the European Commission.
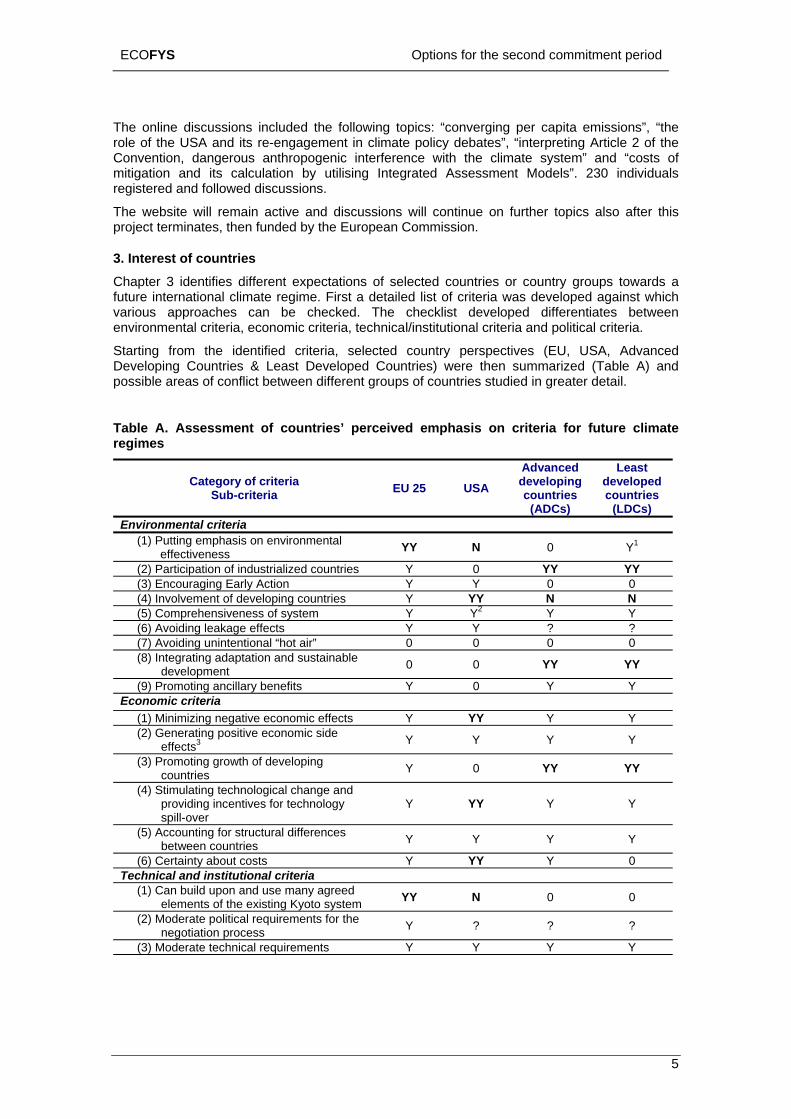
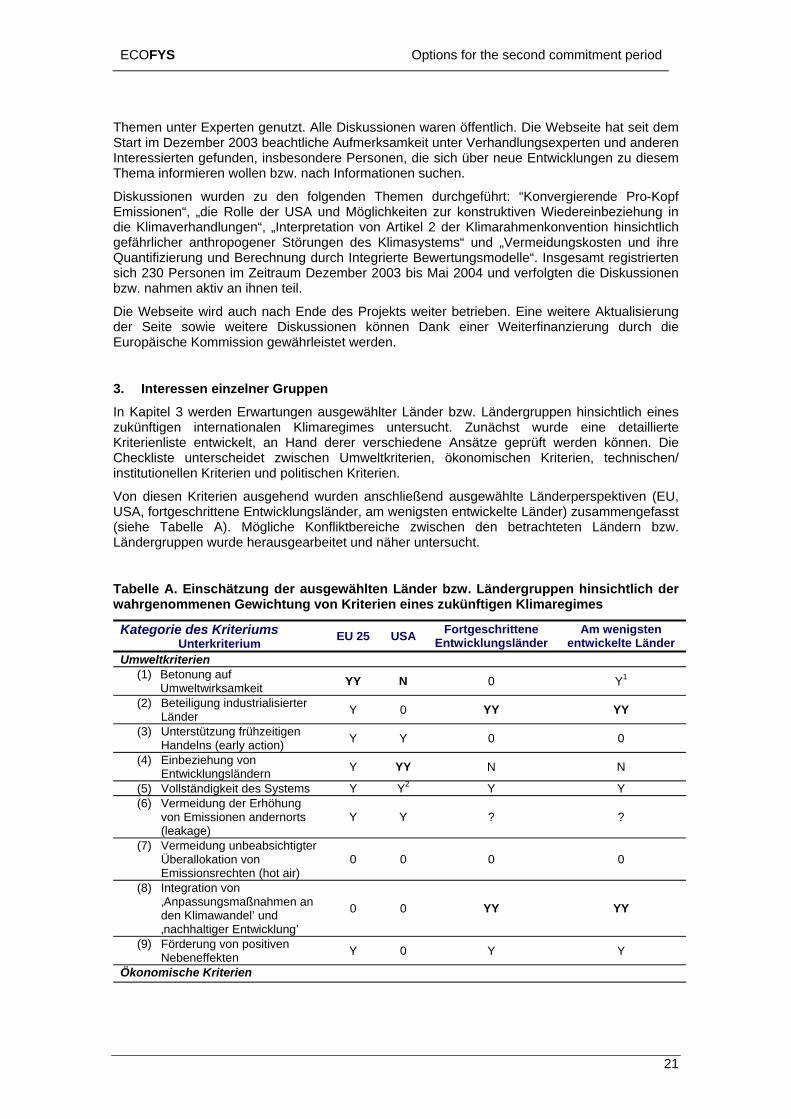
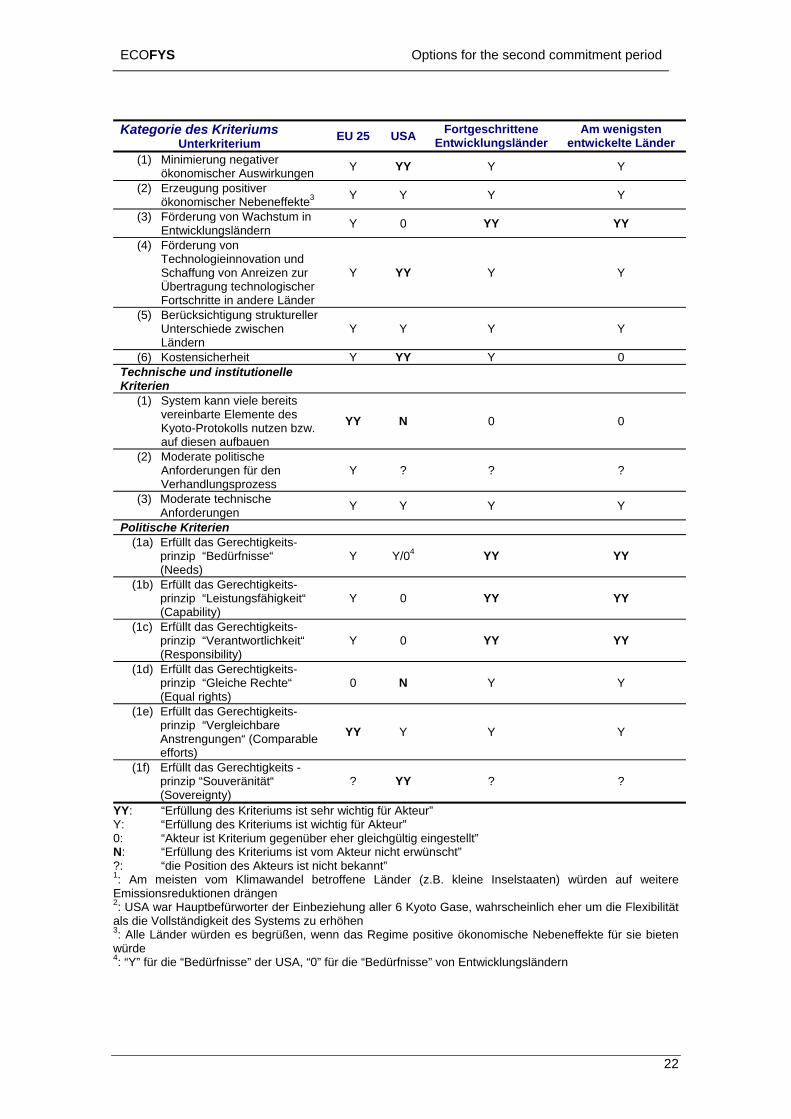
3. Interest of countries Chapter 3 identifies different expectations of selected countries or country groups towards a future international climate regime. First a detailed list of criteria was developed against which various approaches can be checked. The checklist developed differentiates between environmental criteria, economic criteria, technical/institutional criteria and political criteria.
Starting from the identified criteria, selected country perspectives (EU, USA, Advanced Developing Countries & Least Developed Countries) were then summarized (Table A) and possible areas of conflict between different groups of countries studied in greater detail.
Table A. Assessment of countries’ perceived emphasis on criteria for future climate regimes
Category of criteria Sub-criteria EU 25 USA
Advanced developing countries
(ADCs)
Least developed countries
(LDCs) Environmental criteria
(1) Putting emphasis on environmental effectiveness YY N 0 Y1
(2) Participation of industrialized countries Y 0 YY YY (3) Encouraging Early Action Y Y 0 0 (4) Involvement of developing countries Y YY N N (5) Comprehensiveness of system Y Y2 Y Y (6) Avoiding leakage effects Y Y ? ? (7) Avoiding unintentional “hot air” 0 0 0 0 (8) Integrating adaptation and sustainable
development 0 0 YY YY
(9) Promoting ancillary benefits Y 0 Y Y Economic criteria
(1) Minimizing negative economic effects Y YY Y Y (2) Generating positive economic side
effects3 Y Y Y Y
(3) Promoting growth of developing countries Y 0 YY YY
(4) Stimulating technological change and providing incentives for technology spill-over
Y YY Y Y
(5) Accounting for structural differences between countries Y Y Y Y
(6) Certainty about costs Y YY Y 0 Technical and institutional criteria
(1) Can build upon and use many agreed elements of the existing Kyoto system YY N 0 0
(2) Moderate political requirements for the negotiation process Y ? ? ?
(3) Moderate technical requirements Y Y Y Y
5
ECOFYS Options for the second commitment period
Political criteria (1a) Meeting equity principle “Needs” Y Y/04 YY YY (1b) Meeting equity principle “Capability” Y 0 YY YY (1c) Meeting equity principle
“Responsibility” Y 0 YY YY
(1d) Meeting equity principle “Equal rights” 0 N Y Y (1e) Meeting equity principle “Comparable
efforts” YY Y Y Y
(1f) Meeting equity principle “Sovereignty” ? YY ? ? YY: “Fulfilment of the criterion is very important for the player” Y: “Fulfilment of the criterion is important for the player” 0: “Player is indifferent towards this criterion” N: “Fulfilment of the criterion is not desired by the player” ?: “Position of the player is not known” 1: most vulnerable countries (e.g. small island states) would urge emission reductions 2: USA was a main proponent of 6-gas basket, probably rather to increase flexibility than to be inclusive 3: all countries would welcome if the regime had positive economic side effects for them. 4: “Y” for needs of the USA, “0” for developing countries’ needs
General points of agreement can be observed. Several criteria seem to be important for all major players considered here. Such criteria should be fulfilled by any future regime; they are uncontroversial. The uncontroversial environmental criteria include the comprehensiveness of the systems, and the less important avoiding leakage effects and unintentional “hot air”. Many countries would also subscribe to most of the economic criteria such as minimizing negative economic effects, generating positive economic side effects, stimulating technological change and providing incentives for technology spillover, accounting for structural differences of countries and certainty about costs. The equity principles “capability” and “comparable efforts” are also generally accepted. As long as these criteria are formulated in such general way, they are generally acceptable. But it depends on the details of the future regime, whether countries will view these criteria as fulfilled or not.
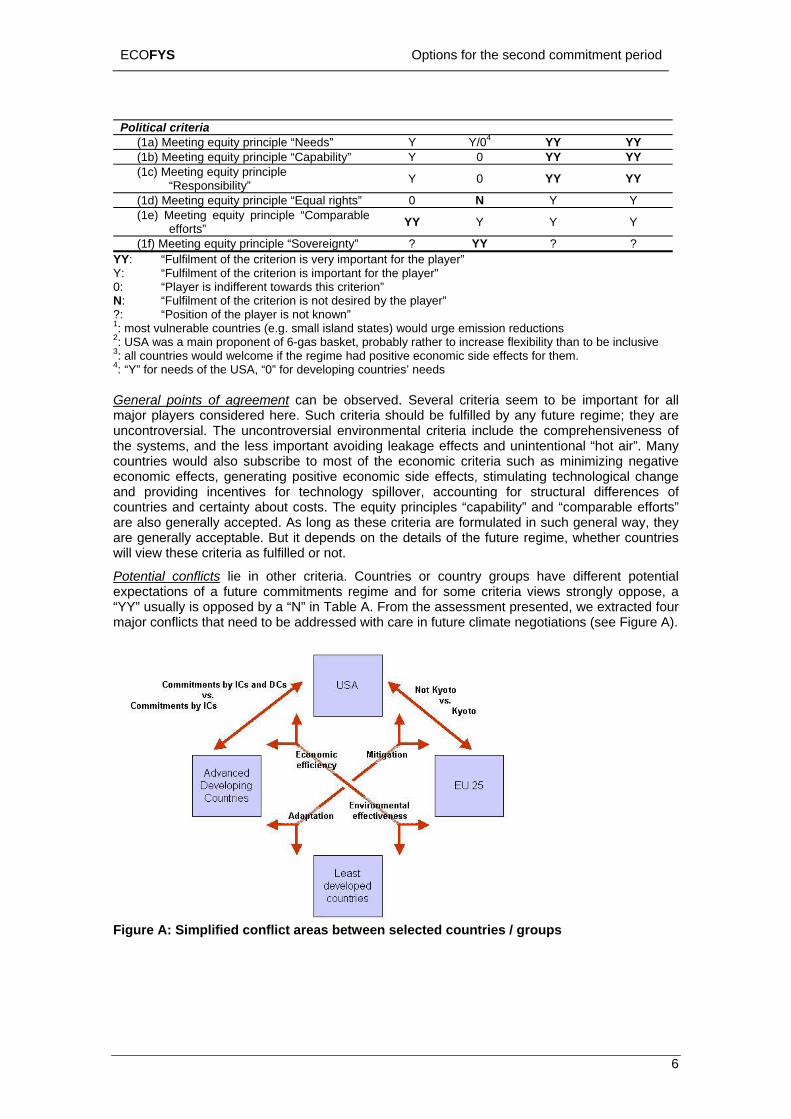
Potential conflicts lie in other criteria. Countries or country groups have different potential expectations of a future commitments regime and for some criteria views strongly oppose, a “YY” usually is opposed by a “N” in Table A. From the assessment presented, we extracted four major conflicts that need to be addressed with care in future climate negotiations (see Figure A).
Figure A: Simplified conflict areas between selected countries / groups
6
ECOFYS Options for the second commitment period
Future consultations and negotiations should focus on the major conflict areas identified here.
osition themselves towards these criteria, a closer look was taken at some countries
We observe that several fundamental conflicts involve only a limited group of countries. E.g. the question of using the structure of the Kyoto Protocol and to a large extent the divergence on the issue of economic efficiency versus environmental effectiveness are essentially disputes between the EU and the USA. Involvement of developing countries in a future climate regime needs agreement between the USA and advanced developing countries. This may point towards a strategy that these major conflicts are addressed first between the players most concerned.
Another observation is that individual countries within the group of developing countries have very diverse and often conflicting positions. For example, the group of developing countries is split on the issue of economic efficiency and environmental effectiveness. Least developed countries would opt for stringent global emission reduction efforts, while advanced developing countries would (and currently do) resist this. The way the group of developing countries operates would be an important element to consider for the negotiation strategy.
4. Country Case Studies Following the criteria analysis and assessment of how selected countries and country groups would pnamely Mexico, India, China and the USA to study their implemented climate policies, their emission profiles and projections, vulnerability and key incentives to participate in a climate regime. In terms of incentives for participation in future climate change regimes the following observations can be made:
Mexico has demonstrated a positive position towards combating climate change. Two
bal commitment as an OECD
conditions were informally mentioned by Mexico’s government under which it would be willing to support further actions on climate change. First, future actions on climate change would need to be explicitly linked to visible progress by industrialized countries to reduce emissions. This could be achieved by making a “condition for action by developing countries” that the global average per capita emissions or global average emission intensity decreases. Second, further action is taken through a broadened CDM, which could be applied to sectors and policies.
There are two major forces outside the climate regime that could influence Mexico’s participation on future action on climate change. One is its glocountry and the other one is the future negotiation to continue with NAFTA and the EU-Mexico treaty.
India had a very clear and strong position and has played a very active role right at the
for developing country
els from different
beginning of the negotiation process by e.g. being a spokesperson for the G77/China. India has stated that emissions will grow as the country seeks to expand its economic growth. India thus has a position that no further commitments are accepted until developed countries have demonstrated to take the lead in combating climate change.
At COP8 in New Delhi 2002, Prime Minister Vajpayee described the callcommitments “misplaced” and said that the only equitable form for the future would be one based on equal per capita rights. A per-capita approach, where emission levcountries converge at a common per capita level, is the preferred approach, since India’s per-capita emissions are only one third of the world’s average. Due to India’s current firm position on future commitments, it is difficult to believe that it will accept any absolute emission target in the near term. Choosing an approach that clearly incorporates the element of per-capita emissions could open the door for possible acceptance by India.
Nevertheless, based on how AIJ issues developed in India and its priority for economic growth, the position may change. If India perceives that taking a commitment could contribute to economic growth, it would be open to change its position.
China is experiencing a remarkable growth in GDP (9% in 2003). The short and medium-term, China takes economic development as its top priority. The severe environmental problems and
7
ECOFYS Options for the second commitment period
unfavourable energy resource endowment are forcing China to take some measures to maintain its economic growth, including encouraging energy saving, the use of clean energy and
cing the number of people living in poverty and
1), China’s position remains one where developed countries should
empt to impose emission reduction
supporting the development of energy efficiency and renewable energy.
Even without external pressure and support, China has some initiative to improve its energy utilization efficiency, a side effect of its various related measures and policies.
China has played an important role in G77/China and takes a proactive attitude towards the global efforts for climate change control. However, it reiterates that as a developing country, its should focus on economic development and redunot be subject to binding emission reduction obligations under world climate change framework.
As expressed in the National Coordination Committee for Climate Change’s paper on global climate change (June 200take the lead in combating climate change. These countries have been responsible for the bulk of emissions to date and a large disparity in per capita emissions continues to this day. Developing countries, like China, must be able to increase their emissions to meet their social and developmental needs. As the paper concludes, “the attor limitation obligations on developing countries is neither fair nor realistic and is in breach of the basic principles of the Convention.”
China may only be convinced to take further action, if the obligation is perceived as not capping economic growth or being economically beneficial for China. Increased participation in the CDM could generate revenues. “Positively binding” or “no lose targets” could be applied that allow the sale of excess emission credits, if the target is overachieved but that imply no penalty if not achieved. Or rate based targets (e.g. as a function of kWh or tonne of steel produced) could take away the fear of capping economic growth.
The USA takes a unique position with respect to engagement on future climate change actions. American policy on climate change is less consistent and is greatly influenced by the flavour of the ruling administration.
Presidential candidate John Kerry recently commented that “because of the Bush binding targets set in the Kyoto Protocol are no longer achievable;"
e remains an interesting option in engaging the US in a more multilateral approach to greenhouse gas mitigation through the involvement of individual states. There is a history of states taking the lead in environmental policies (such as the Regional Clean Air Incentives Market operating in Southern California and the US Clean Air Act), which in turn become matters of federal concern. Individual states have also been pressing the Bush Administration to regulate emissions of greenhouse gases. State action has a tendency to replicate itself across other states and could form the catalyst to building sufficient political will in establishing a mandatory national greenhouse gas policy. Given the recent defeat of the Lieberman-McCain bill to cap greenhouse gas emissions within the USA by a narrow margin of 55 to 43, a “bottom-up” approach could well serve as the catalyst to ensure federal acceptance of a more active international role in greenhouse gas mitigation efforts.
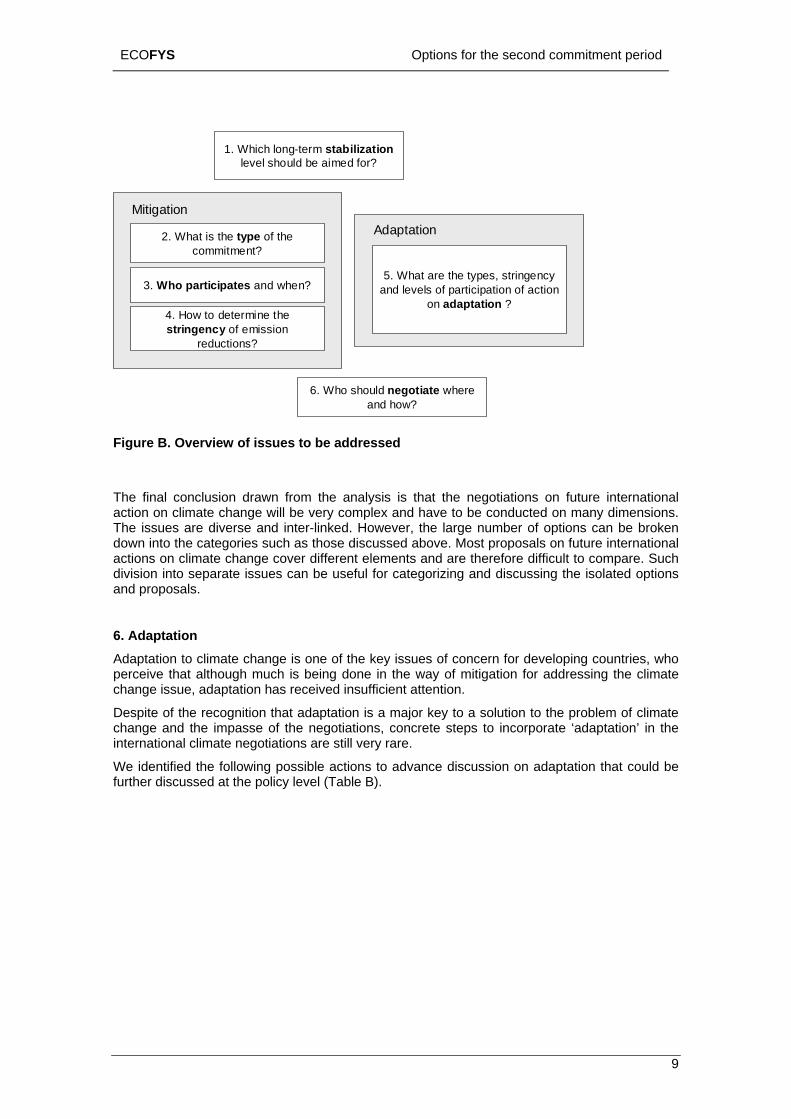
5. Issues to be considered Issues to be considered to design a full international regime on climate change are discussed in Chapter 5, summarized here in Figure B. In the chapter, for each issue the proposed options are presented and discussed.
Administration's inaction, the he would therefore "immediately reengage the international process [that would lead to] a strong, effective, and meaningful international agreement.”
Notwithstanding this issue, ther
8
ECOFYS Options for the second commitment period
3. Who participates and when?
2. What is the type of the commitment?
1. Which long-term stabilizationlevel should be aimed for?
6. Who should negotiate where and how?
5. What are the types, stringency and levels of participation of action
on adaptation ?4. How to determine the stringency of emission
reductions?
MitigationAdaptation
Figure B. Overview of issues to be addressed
The final conclusion drawn from the analysis is that the negotiations on future international action on climate change will be very complex and have to be conducted on many dimensions. The issues are diverse and inter-linked. However, the large number of options can be broken down into the categories such as those discussed above. Most proposals on future international actions on climate change cover different elements and are therefore difficult to compare. Such division into separate issues can be useful for categorizing and discussing the isolated options and proposals.
6. Adaptation Adaptation to climate change is one of the key issues of concern for developing countries, who perceive that although much is being done in the way of mitigation for addressing the climate change issue, adaptation has received insufficient attention.
Despite of the recognition that adaptation is a major key to a solution to the problem of climate change and the impasse of the negotiations, concrete steps to incorporate ‘adaptation’ in the international climate negotiations are still very rare.
We identified the following possible actions to advance discussion on adaptation that could be further discussed at the policy level (Table B).
9
ECOFYS Options for the second commitment period
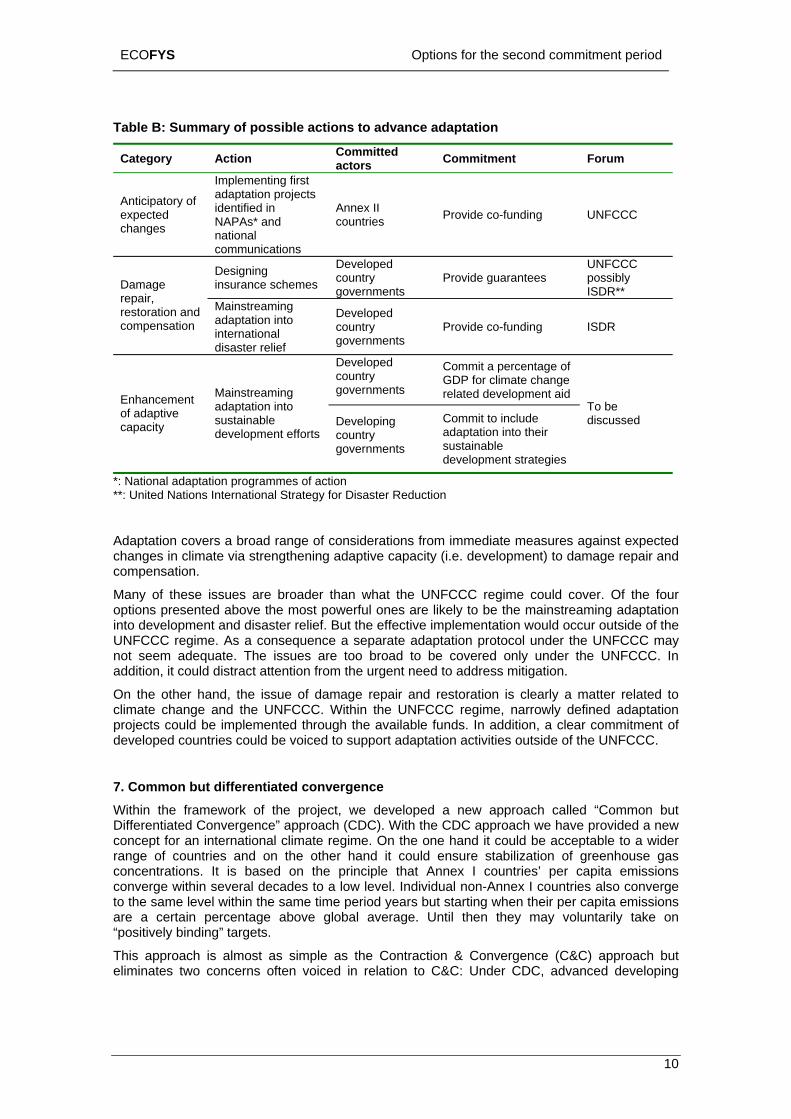
Table B: Summary of possible actions to advance adaptation
Category Action Committed actors Commitment Forum
Anticipatory of expected changes
Implementing first adaptation projects identified in NAPAs* and national communications
Annex II countries Provide co-funding UNFCCC
Designing insurance schemes
Developed country governments
Provide guarantees UNFCCC possibly ISDR** Damage
repair, restoration and compensation
Mainstreaming adaptation into international disaster relief
Developed country governments
Provide co-funding ISDR
Developed country governments
Commit a percentage of GDP for climate change related development aid Enhancement
of adaptive capacity
Mainstreaming adaptation into sustainable development efforts
Developing country governments
Commit to include adaptation into their sustainable development strategies
To be discussed
*: National adaptation programmes of action **: United Nations International Strategy for Disaster Reduction
Adaptation covers a broad range of considerations from immediate measures against expected changes in climate via strengthening adaptive capacity (i.e. development) to damage repair and compensation.
Many of these issues are broader than what the UNFCCC regime could cover. Of the four options presented above the most powerful ones are likely to be the mainstreaming adaptation into development and disaster relief. But the effective implementation would occur outside of the UNFCCC regime. As a consequence a separate adaptation protocol under the UNFCCC may not seem adequate. The issues are too broad to be covered only under the UNFCCC. In addition, it could distract attention from the urgent need to address mitigation.
On the other hand, the issue of damage repair and restoration is clearly a matter related to climate change and the UNFCCC. Within the UNFCCC regime, narrowly defined adaptation projects could be implemented through the available funds. In addition, a clear commitment of developed countries could be voiced to support adaptation activities outside of the UNFCCC.
7. Common but differentiated convergence Within the framework of the project, we developed a new approach called “Common but Differentiated Convergence” approach (CDC). With the CDC approach we have provided a new concept for an international climate regime. On the one hand it could be acceptable to a wider range of countries and on the other hand it could ensure stabilization of greenhouse gas concentrations. It is based on the principle that Annex I countries’ per capita emissions converge within several decades to a low level. Individual non-Annex I countries also converge to the same level within the same time period years but starting when their per capita emissions are a certain percentage above global average. Until then they may voluntarily take on “positively binding” targets.
This approach is almost as simple as the Contraction & Convergence (C&C) approach but eliminates two concerns often voiced in relation to C&C: Under CDC, advanced developing
10
ECOFYS Options for the second commitment period
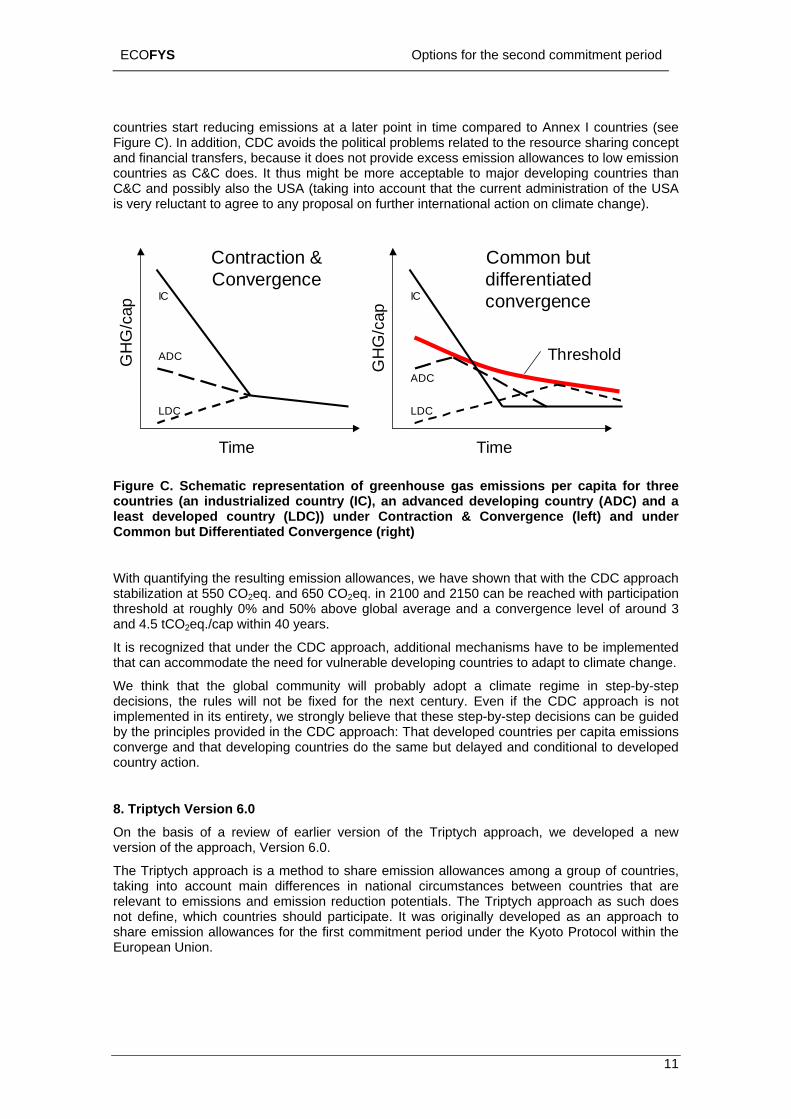
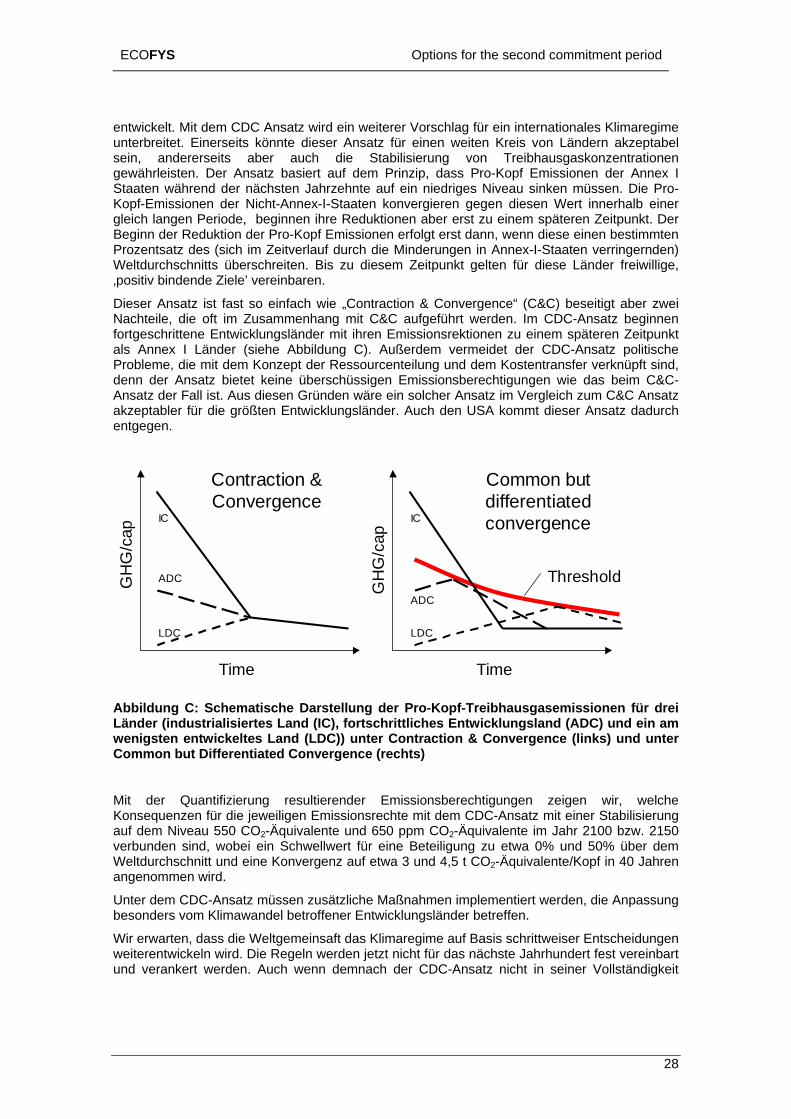
countries start reducing emissions at a later point in time compared to Annex I countries (see Figure C). In addition, CDC avoids the political problems related to the resource sharing concept and financial transfers, because it does not provide excess emission allowances to low emission countries as C&C does. It thus might be more acceptable to major developing countries than C&C and possibly also the USA (taking into account that the current administration of the USA is very reluctant to agree to any proposal on further international action on climate change).
Contraction & Convergence differentiated
convergence
G/c
ap
G/c
ap
Common but
GH
IC IC
GH
Time Time
ThresholdADC
ith quantifying the resulting emission allowances, we have shown that with the CDC approach CO2eq. in 2100 and 2150 can be reached with participation
and 50% above global average and a convergence level of around 3
proach, additional mechanisms have to be implemented
developing countries do the same but delayed and conditional to developed
ntries that are
sha Eur a
LDC
ADC
LDC
Figure C. Schematic representation of greenhouse gas emissions per capita for three countries (an industrialized country (IC), an advanced developing country (ADC) and a least developed country (LDC)) under Contraction & Convergence (left) and under Common but Differentiated Convergence (right)
Wstabilization at 550 CO2eq. and 650threshold at roughly 0% and 4.5 tCO2eq./cap within 40 years.
It is recognized that under the CDC apthat can accommodate the need for vulnerable developing countries to adapt to climate change.
We think that the global community will probably adopt a climate regime in step-by-step decisions, the rules will not be fixed for the next century. Even if the CDC approach is not implemented in its entirety, we strongly believe that these step-by-step decisions can be guided by the principles provided in the CDC approach: That developed countries per capita emissions converge and that country action.
8. Triptych Version 6.0 On the basis of a review of earlier version of the Triptych approach, we developed a new version of the approach, Version 6.0.
The Triptych approach is a method to share emission allowances among a group of countries, taking into account main differences in national circumstances between courelevant to emissions and emission reduction potentials. The Triptych approach as such does not define, which countries should participate. It was originally developed as an approach to
re emission allowances for the first commitment period under the Kyoto Protocol within theope n Union.
11
ECOFYS Options for the second commitment period
In t o oad categories of emissions were distinguished: The power s s and the ‘domestic’ sectors. The selection of th ethe neg for the generation of electricity, in
added up to a national target for each country. Only one national target per country is proposed, no sectoral targets, to allow countries the flexibility to pursue any cost-effective emission reduction strategy.
The main differences between the Triptych version 6.0 and the previous Triptych versions are:
• The harmonised data set and clear data hierarchy based on the IPCC SRES scenarios • Calculation on the basis of 192 individual countries • The (possibility of) inclusion of the 6 Kyoto gases and sinks • Expansion to 2050 (and beyond) • Variable base year between 1990 and 2010 • The use of normative but scenario-derived growth rates for electricity demand and
industrial production based on GDP per capita levels
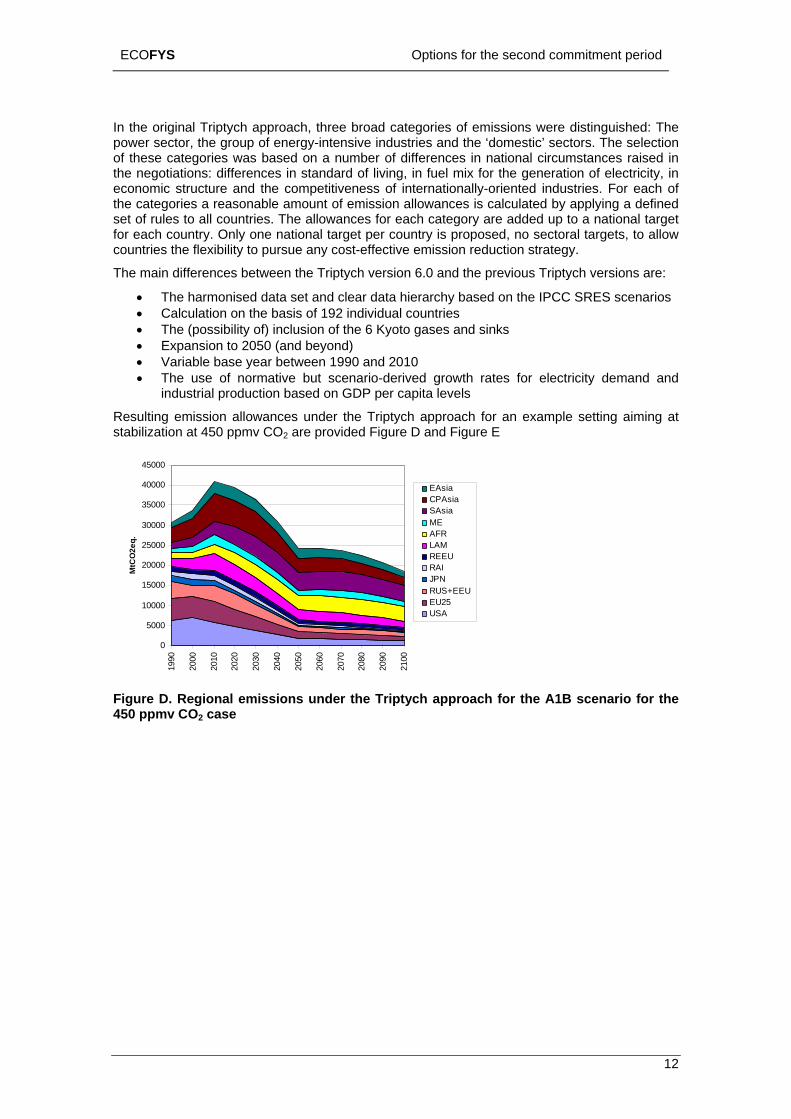
Resulting emission allowances under the Triptych approach for an example setting aiming at stabilization at 450 ppmv CO2 are provided Figure D and Figure E
he riginal Triptych approach, three brector, the group of energy-intensive industrie
es categories was based on a number of differences in national circumstances raised in otiations: differences in standard of living, in fuel mix
economic structure and the competitiveness of internationally-oriented industries. For each of the categories a reasonable amount of emission allowances is calculated by applying a defined set of rules to all countries. The allowances for each category are
25000
30000
45000
O
35000
40000 EAsiaCPAsiaSAsiaMEAFRLAMREEU
2eq.
15000
20000
MtC RAI
JPNRUS+EEUEU25USA
0
5000
10000
1990
2000
2010
2020
2030
2040
2050
2060
2070
2080
2090
2100
Figure D. Regional emissions under the Triptych approach for the A1B scenario for the 450 ppmv CO2 case
12
ECOFYS Options for the second commitment period
0
2000
4000
6000
8000
MtC
O2e
q.
10000
12000
14000
1990 2000 2010 2020 2030 2040 2050 2060 2070 2080 2090 2100
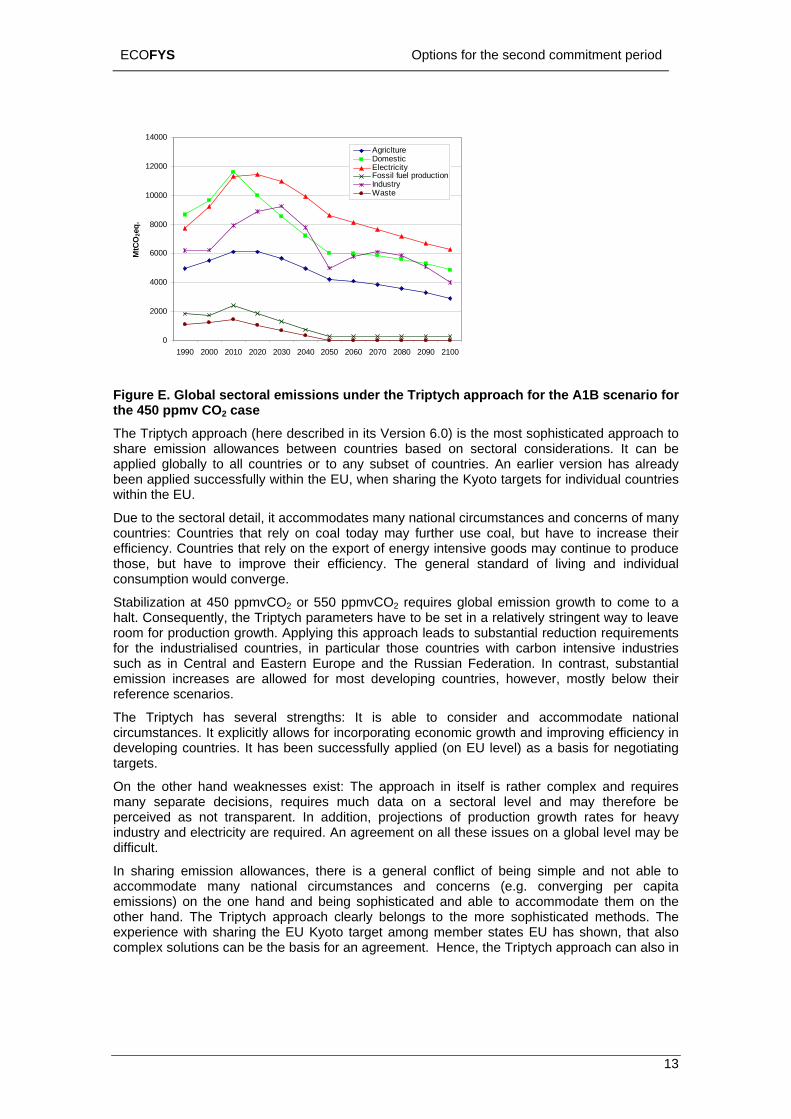
AgricltureDomesticElectricityFossil fuel productionIndustryWaste
roach to
Due t nal circumstances and concerns of many cou coal, but have to increase their efficiency. Co energy intensive goods may continue to produce thos efficiency. The general standard of living and individual con
2 requires global emission growth to come to a
e industries
approach clearly belongs to the more sophisticated methods. The
Figure E. Global sectoral emissions under the Triptych approach for the A1B scenario for the 450 ppmv CO2 case The Triptych approach (here described in its Version 6.0) is the most sophisticated appshare emission allowances between countries based on sectoral considerations. It can be applied globally to all countries or to any subset of countries. An earlier version has already been applied successfully within the EU, when sharing the Kyoto targets for individual countries within the EU.
to he sectoral detail, it accommodates many nationtries: Countries that rely on coal today may further use
untries that rely on the export ofe, but have to improve their
sumption would converge.
Stabilization at 450 ppmvCO2 or 550 ppmvCOhalt. Consequently, the Triptych parameters have to be set in a relatively stringent way to leave room for production growth. Applying this approach leads to substantial reduction requirements for the industrialised countries, in particular those countries with carbon intensivsuch as in Central and Eastern Europe and the Russian Federation. In contrast, substantial emission increases are allowed for most developing countries, however, mostly below their reference scenarios.
The Triptych has several strengths: It is able to consider and accommodate national circumstances. It explicitly allows for incorporating economic growth and improving efficiency in developing countries. It has been successfully applied (on EU level) as a basis for negotiating targets.
On the other hand weaknesses exist: The approach in itself is rather complex and requires many separate decisions, requires much data on a sectoral level and may therefore be perceived as not transparent. In addition, projections of production growth rates for heavy industry and electricity are required. An agreement on all these issues on a global level may be difficult.
In sharing emission allowances, there is a general conflict of being simple and not able to accommodate many national circumstances and concerns (e.g. converging per capita emissions) on the one hand and being sophisticated and able to accommodate them on the other hand. The Triptychexperience with sharing the EU Kyoto target among member states EU has shown, that also complex solutions can be the basis for an agreement. Hence, the Triptych approach can also in
13
ECOFYS Options for the second commitment period
the future provide the basis for the sharing of emission allowances between countries within a group.
9. A compromise proposal Within this project, we developed a compromise proposal that combines many elements of the approaches previously discussed. This proposal aims to satisfy most demands and concerns, while still being able to meet the anticipated environmental goal. We believe that this overall
1. Multistage agreement on emission reductions
2. New technology development and implementation
3. Agreement on adaptation
4. Additional emission reduction efforts
The multistage setting would include 4 stages:
Stage 1- No commitments: Countries with low level of development do not have climate commitments. At least all least developed countries (LDCs) would be in this stage.
Stage 2 - Enhanced sustainable development: At the next stage, countries commit in a clear way to sustainable development. The environmental objectives are built into the development policies. Requirements for such a sustainable pathway could be defined, e.g., that inefficient equipment is phased out and requirements and certain standards are met for any new equipment or a clear deviation from the current policies depending on the countries. The implementation of such sustainable development pathway has to be monitored and verified. The additional costs could be borne by the country itself or by other countries, e.g. official development aid supplemented by additional climate related funds.
Stage 3 - Moderate absolute target: Countries commit to a moderate target for absolute emissions. The emission level may be increasing, but should be below a business as usual scenario. The target could also be positively binding, meaning that allowances can be sold, if the target is exceeded, but no allowances have to be bought, if the target is not achieved. An incentive to accept such target would be the possibility to participate in emissions trading.
Stage 4 - Absolute reduction: Countries in stage 4 have to reduce absolute emissions substantially until a low per-capita level is reached. As time progresses, more and more countries enter stage 4.
Countries move through these stages based on defined thresholds, e.g. their level of emissions per capita. Since “followers do better” (they benefit from technological developments of others), the threshold for entering the last group decreases with time.
In addition to immediate emission reductions, countries need to commit to develop and to implement new greenhouse gas mitigation technologies in a clearer sense as already with the Convention and the Kyoto Protocol (Part 2 of the compromise proposal). When negotiating the absolute emission reduction commitments, countries will be given the opportunity to make a commitment to technology development and its implementation and diffusion. They can expect a relaxation of their absolute emission reduction commitments in return. Of course, the verifiability of the technology commitment is crucial as not to create a loophole for being exempt from emission reactions.
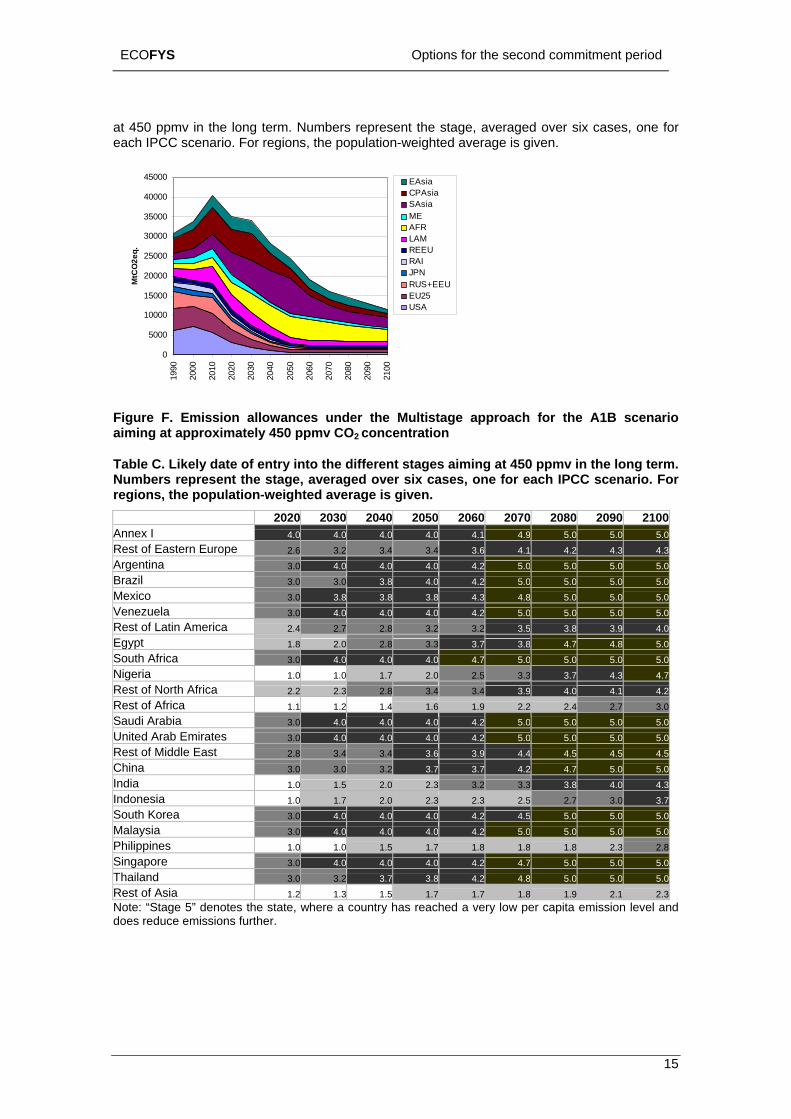
We quantified the emission allowances for exemplary cases. Figure F shows the emission allowances under the Multistage agreement for the A1B scenario aiming at approximately 450 ppmv CO2 concentration. Table C shows the likely date of entry into the different stages aiming
concept could be a possible way forward in the multilateral international climate policy.
Reaching stabilisation targets such as 2°C will only be possible, if all considerable efforts are made on many levels to reduce emissions in industrialized countries and to keep emissions low in developing countries. Hence, the compromise proposal consist of four parts:
14
ECOFYS Options for the second commitment period
at 450 ppmv in the long term. Numbers represent the stage, averaged over six cases, one for each IPCC scenario. For regions, the population-weighted average is given.
0
5000
10000
15000
20000
25000
30000
35000
40000
4500019
90
2000
2010
2020
2030
2040
2050
2060
2070
2080
2090
2100
MtC
O2e
q.
EAsiaCPAsiaSAsiaMEAFRLAMREEURAIJPNRUS+EEUEU25USA
aiming at 450 ppmv in the long term. umbers represent the s a ed s se e ch C ri r
, the population-wei ted a age ive20 20 20 20 20 20 20 20 21
Figure F. Emission allowances under the Multistage approach for the A1B scenario aiming at approximately 450 ppmv CO2 concentration
Table C. Likely date of entry into the different stagesN tage, verag over ix ca s, on for ea IPC scena o. Foregions gh ver is g n. 20 30 40 50 60 70 80 90 00Annex I 4.0 4.0 4.0 4.0 4.1 4.9 5.0 5.0 5.0Rest of Eastern Europe 2.6 3.2 3.4 3.4 3.6 4.1 4.2 4.3 4.3Argentina 3.0 4.0 4.0 4.0 4.2 5.0 5.0 5.0 5.0Brazil 3.0 3.0 3.8 4.0 4.2 5.0 5.0 5.0 5.0Mexico 3.0 3.8 3.8 3.8 4.3 4.8 5.0 5.0 5.0Venezuela 3.0 4.0 4.0 4.0 4.2 5.0 5.0 5.0 5.0Rest of Latin America 2.4 2.7 2.8 3.2 3.2 3.5 3.8 3.9 4.0Egypt 1.8 2.0 2.8 3.3 3.7 3.8 4.7 4.8 5.0South Africa 3.0 4.0 4.0 4.0 4.7 5.0 5.0 5.0 5.0Nigeria 1.0 1.0 1.7 2.0 2.5 3.3 3.7 4.3 4.7Rest of North Africa 2.2 2.3 2.8 3.4 3.4 3.9 4.0 4.1 4.2Rest of Africa 1.1 1.2 1.4 1.6 1.9 2.2 2.4 2.7 3.0Saudi Arabia 3.0 4.0 4.0 4.0 4.2 5.0 5.0 5.0 5.0United Arab Emirates 3.0 4.0 4.0 4.0 4.2 5.0 5.0 5.0 5.0Rest of Middle East 2.8 3.4 3.4 3.6 3.9 4.4 4.5 4.5 4.5China 3.0 3.0 3.2 3.7 3.7 4.2 4.7 5.0 5.0India 1.0 1.5 2.0 2.3 3.2 3.3 3.8 4.0 4.3Indonesia 1.0 1.7 2.0 2.3 2.3 2.5 2.7 3.0 3.7South Korea 3.0 4.0 4.0 4.0 4.2 4.5 5.0 5.0 5.0Malaysia 3.0 4.0 4.0 4.0 4.2 5.0 5.0 5.0 5.0Philippines 1.0 1.0 1.5 1.7 1.8 1.8 1.8 2.3 2.8Singapore 3.0 4.0 4.0 4.0 4.2 4.7 5.0 5.0 5.0Thailand 3.0 3.2 3.7 3.8 4.2 4.8 5.0 5.0 5.0Rest of Asia 1.2 1.3 1.5 1.7 1.7 1.8 1.9 2.1 2.3Note: “Stage 5” denotes the state, where a country has reached a very low per capita emission level and does reduce emissions further.
15
ECOFYS Options for the second commitment period
The compromise proposal has several strengths:
• The proposal is designed as a compromise to accommodate many different viewpoints on specific issues and to satisfy multiple demands. Many countries or country groups can find elements of their concern in this proposal.
• The proposal allows for a gradual phase-in of countries in the mandatory emission reduction effort, which is in line with the UNFCCC spirit, and takes into account national circumstances (esp. if Triptych is chosen as the burden sharing concept for stage 4).
• The proposal allows flexibility to implement immediate emission reduction measures or to develop technologies that are able to reduce emissions in the future.
• The proposal allows for gradual decision making, which seems the most likely way of reaching an international agreement.
• The proposal builds trust, as industrialised countries take the lead in emission reduction efforts.
The proposal however has some weaknesses:
• The overall proposal describes a relative complex system that requires many decisions.
• The risk that countries enter too late in the emission reduction effort is high, so that some long-term stabilization options may be lost. Hence, incentives are needed for countries to participate in a certain stage, not just thresholds. The flexibility provided for countries in stage 3 and/or 4 to take a commitment in technology development while receiving a reduction of their commitment of absolute emissions in return adds additional uncertainty on the global emission levels.
Critical in this setting would be the participation of the USA. Their current point of view can be incorporated through the commitment for technology development. Here the USA would have to demonstrate serious actions for the development of new technologies. In return, the USA could receive a relatively moderate emission reduction target.
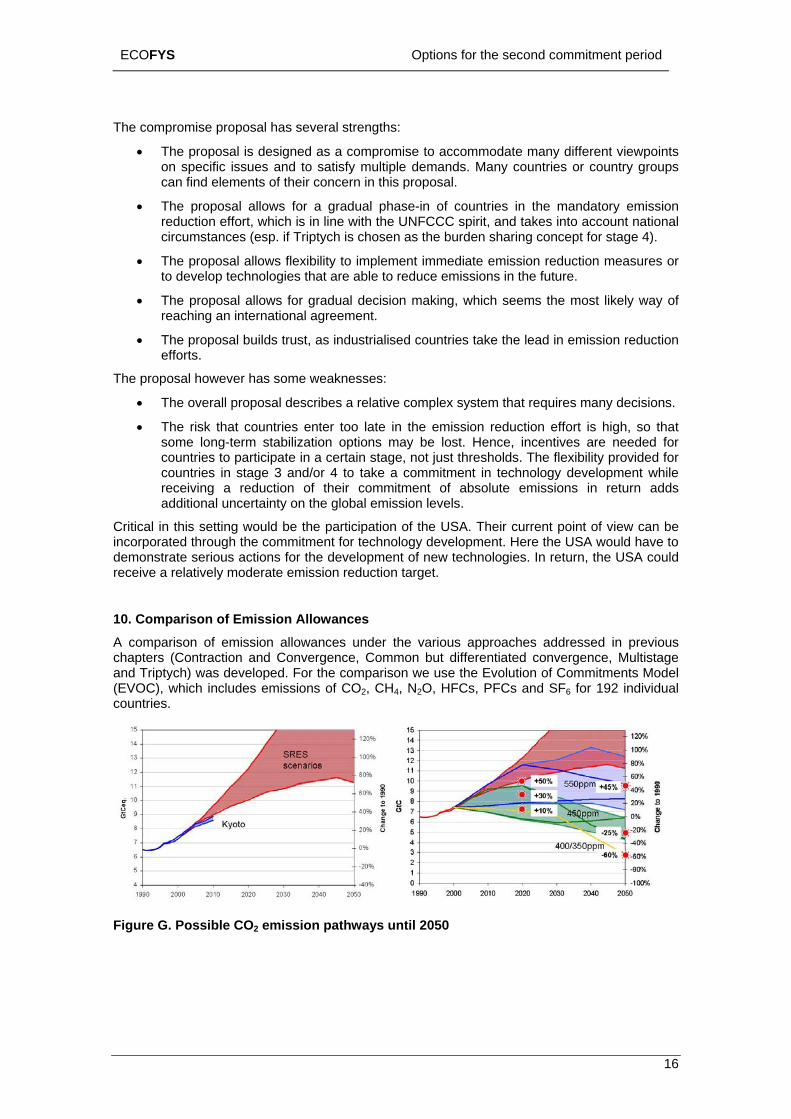
10. Comparison of Emission Allowances A comparison of emission allowances under the various approaches addressed in previous chapters (Contraction and Convergence, Common but differentiated convergence, Multistage and Triptych) was developed. For the comparison we use the Evolution of Commitments Model (EVOC), which includes emissions of CO2, CH4, N2O, HFCs, PFCs and SF6 for 192 individual countries.
Figure G. Possible CO2 emission pathways until 2050
16
ECOFYS Options for the second commitment period
We selected global emission levels in 2020 and 2050, which have to be met by all approaches for the following quantification of emission allowances for the various proposals. These are taken from Figure G to be in line with 550 ppmv CO2 (roughly 650 ppmv CO2eq.), 450 ppmv CO2 (roughly ppmv 550 CO2eq.) and towards 400 ppmv (roughly 450 ppmv CO2eq).
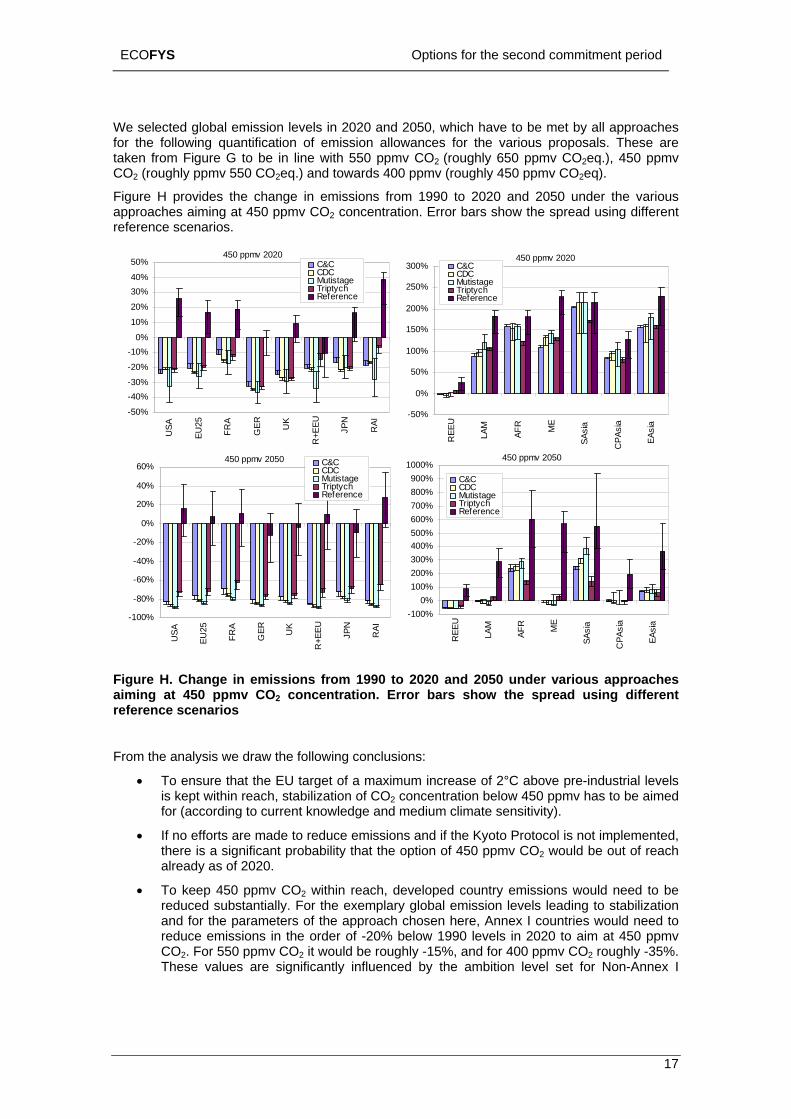
Figure H provides the change in emissions from 1990 to 2020 and 2050 under the various approaches aiming at 450 ppmv CO2 concentration. Error bars show the spread using different reference scenarios.
450 ppmv 2020
-50%
-40%-30
450 ppmv 2020
150%
300%
a a a
0%
50% C&C C&CCDCMutistageTriptychReference
CDCMutistageTriptychReference
10%
20%
30%40%
200%
250%
100%
-20%
-10%
-50%
0%
50%
U R
%
A 25 A R
UK U N I
REE LA
M
AF ME
SAsi
CPA
si
EAsiUS
EU FR GE
R+E
E JP RA
450 ppmv 20501000%450 ppmv 2050 C&C
-1
-80%
-60%
-40%
-20%
0%
20%
60% CDCMutistage
0%
900% C&C40% Triptych
ReferenceCDCMutistageTriptychReference
100%200%300%400%500%600%700%800%
-100%
REE
U
LAM
AFR ME
SAsi
a
CPA
sia
EAsi
a00%
USA
EU25
FRA
GER UK
R+E
EU JPN
RAI
H. Change in emissions from 1990 to 2020 and 2050 under various approaches at 450 ppmv CO
Figure aiming referenc
From th
• 2
owledge and medium climate sensitivity).
, Annex I countries would need to 20 to aim at 450 ppmv
CO2. For 550 ppmv CO2 it would be roughly -15%, and for 400 ppmv CO2 roughly -35%. These values are significantly influenced by the ambition level set for Non-Annex I
2 concentration. Error bars show the spread using different e scenarios
e analysis we draw the following conclusions:
To ensure that the EU target of a maximum increase of 2°C above pre-industrial levels is kept within reach, stabilization of CO concentration below 450 ppmv has to be aimed for (according to current kn
• If no efforts are made to reduce emissions and if the Kyoto Protocol is not implemented, there is a significant probability that the option of 450 ppmv CO2 would be out of reach already as of 2020.
• To keep 450 ppmv CO2 within reach, developed country emissions would need to be reduced substantially. For the exemplary global emission levels leading to stabilization and for the parameters of the approach chosen herereduce emissions in the order of -20% below 1990 levels in 20
17
ECOFYS Options for the second commitment period
countries. Almost all approaches leave room to alter this balance by varying some of the parameters.
• To keep 450 ppmv CO2 within re he USA needs to be involv e system most lik r action than t nal target of 18% intensity improvement. As this target can lead to US em bove 1990 level ambitious re giv Ann For 550 pp nat nt, s would undertake more am
To kee ppmv eloping country emission d to deviate fro ference as soon countrie 020 (Latin Am Ea v C 0 ppmv C rie ntr nsfer or financial contributio e I countries below their referenc
Fo untries, the differen ductions between stabiliza gets (400, 450 an mv) is larger tha e between the var aiming at on tar ter n th ap
• National long-term e f individual co ious, but
able D. Difference between emissions in 1990 and emission allowances in 2020/2050 for n levels.
ach, t ed in thely with stronge he natio
issions 20% a s in 2010, theduction levels mv, the US
en above for the group of ional target may be sufficiebitious reductions.
CO
ex I may be out of reach. if other Annex I countrie
• p 450m the re
2 within reach, dev s neeen as of 2 as e, for some
Asia). For 550 possibl s ev
erica, MiddleO
st, East ppms. Actions from Annex I couns would be needed to keepe.
O2 it would be less, for 40ies, such as technology tramissions in Non-Annex
2 more count
• r most co ce in re tion tard 550 pp n the differenc ious approachese stabilizatione choice of the
get. The choice of the long-proach.
mission targets o
m ambition is more significant tha
untries of the EU are ambitdiffer in which stabilization levels could be reached.
The reductions that are necessary to reach are summarized in Table D.
Tvarious CO2 concentratio
2020 2050 Global* +10% -60% Annex I -25% to -50% -80% to -90%
400 ppmv CO2 Non-Annex I Substantial deviation from
reference in Latin America, Middle East, East Asia and Centrally planned Asia
Substantial deviation from reference in all regions
Global* +30% -25% 450 Annex I -10% to -30% -70% to –90% ppmv
CO2 Non-Annex I Deviation from reference in Latin America, Middle East, East Asia and Centrally
Substantial deviation from reference in all regions
Planned Asia Global* +50% +45% Annex I -5% to -25% -40% to –80%
550 ppmv CO2 Non-Annex I Deviation from reference in
Latin America and Middle East, East Asia
Deviation from reference in most regions, specially in Latin America and Middle East
*: Global reduction values are chose to represent one possible path towards the given stabilization level.
ime post 2012 were analysed from the viewpoint of the
Other global emission levels in 2020 and 2050 would be possible to reach the same stabilization levels and their choice would influence the necessary reductions for the country groups.
11. Negotiation Strategy Based on the results of the preceding analysis, elements and various aspects of a strategy to negotiating a future climate regEuropean Union.
18
ECOFYS Options for the second commitment period
To meedegrees levels. Negene ,develop
In this targets, pred and structural
system may include US
s should be intensified. The EU should
ucial for the stringency of short-term reductions and the timing of participation of further countries
• Agreement on types of commitments (e.g. binding emission targets or policies and measures), including an indication when they should be assumed and by whom
• Definition of the accounting or monitoring rules for these types of commitment
• Agreement on target values (reduction percentages or specific p
key to break the deadlock could be to agree already in a mandate for the negotiations on ture commitments at COP 11 in November 2005, which types of commitments will be taken by
ountries and when, e.g. binding emission limitation and reduction targets for
duce the reluctance against climate policies in the international
t the EU’s long-term goal that “global average temperatures should not exceed 2 Celsius above pre-industrial levels”, serious efforts are required on multiple
otiations within the UNFCCC have to be supplemented by agreements on renewable rgy technology in general and development cooperation. In addition, capacity building for
ing countries and support for the scientific community is needed.
effort, EU leadership is crucial. Directional leadership (meeting the Kyotoominantly domestically), instrumental leadership (actively building coalitions)
leadership (making use of the general and economic weight of the EU) are needed.
The EU could be more aware of the weight it can have as a major trading or political block, and not hesitate to link the climate change issue to other issues, such as trade relations and foreign relations.
The USA needs to be in the focus of EU efforts. An expanding EU emission trading system can be complementary to the UNFCCC / Kyoto Protocol. This expanding States, providing a lever to future involvement of the US at a federal level after harmonisation.
Further, the dialogue with developing countrieconcentrate on those countries within the G77 and China that have shown first actions and would be eager to further extend actions provided the framework is acceptable. The goal must be to find ways to formulate targets that are acceptable for active developing countries to date. The EU could promote approaches that facilitate the participation of developing countries, such as a multistage setting with first targets for developing countries that avoid capping economic growth or the Triptych approach.
Within the UNFCCC process, the following sequence of decisions could be aimed at:
• Further definition of the long-term ambition level, as it is cr
olicies)
Afuvarious groups of call developed countries together with sustainable development oriented or non-binding targets for most developed countries for 2020 but binding targets in 2030. Giving it a long-term but defined perspective may increase the acceptability for all countries.
In addition, the efforts complementary to the UNFCCC, such as the coalition and the targets on renewable energy, should be further enhanced.
Finally, the EU should be instrumental in bringing scientists together on the future climate policy. An international scientific conference on the future climate policy would be an opportunity for the exchange of the divergent views on the most effective and efficient long-term climate policy. In addition, the elaboration and quantification of side benefits of emission reduction measures could be an important tool to renegotiations.
Meeting the 2°C target is a major challenge. We would hope that the array of activities presented in this strategy will help the EU in meeting this challenge.
19
ECOFYS Options for the second commitment period
ZUSAMMENFASSUNG 1. Einleitung
, dass die Blockade der internationalen Klimaverhandlungen aufgehoben werden n
Emis(inkl SA) nicht erhebliche Emissionsreduktionen nachgewiesen haben. Die
gefä törung des Klimasystems vermeidet, ist nur möglich, wenn die ahmen in
Die rotokoll: Untersuchung von Optionen für die it rde vom deutschen
n. Die vorliegende
öglichkeiten der Ausgestaltung einer weiteren Verpflichtungsperiode Kyoto-Protokolls ab dem
ahr 2012 aufzuzeigen.
ber die Themen, die im Zusammenhang mit
zur Ausgestaltung einer zweiten
. Netzwerk und Überblick über Vorschläge te „Future international action on climate change“
Mit dem lange erwarteten In-Kraft-Treten des Kyoto-Protokolls am 16. Februar 2005 besteht Hoffnungkön te. Die USA als weltweit größter Emittent lehnen jedoch weiterhin verbindliche
sionsreduktionen ab. Entwicklungsländer werden nicht agieren, bevor Industriestaaten usive der U
Erreichung der Zielsetzung der Klimarahmenkonvention (UNFCCC), die Stabilisierung der Treibhausgaskonzentration in der Atmosphäre auf einem Niveau zu erreichen, welches eine
hrliche anthropogene SEmissionsreduktionen weiter intensiviert und eine Beteiligung an Reduktionsmaßngrößerer Breite erreicht wird.
Bearbeitung des Projekts: „Kyoto-PWe erentwicklung der Verpflichtungen für die 2. Verpflichtungsperiode“ wuUmweltbundesamt (UBA) an die ECOFYS GmbH im Juni 2003 vergebeStudie baut auf der ECOFYS Studie: „Weiterentwicklung der Verpflichtungen des UNFCCC: Einbeziehung von Schwellenländern und Entwicklungsländern“ auf und hat zum Ziel,MJ
Der vorliegende Endbericht gibt einen Überblick üder Weiterentwicklung von bestehenden Ansätzen stehen. Außerdem zeigt der Bericht eine mögliche Strategie für die Verhandlung einer zweiten Verpflichtungsperiode nach 2012 auf. Die Ergebnisse dieses Berichtes sollen die laufenden Diskussionen um ein zukünftiges Klimaregime unterstützen.
Die im Rahmen dieses Projekts vorgenommenen Untersuchungen beinhalteten die folgenden Module:
Aufbau eines internationalen Netzwerks von Experten, die aktiv zum Thema eines zukünftigen Klimaregimes arbeiten und an Post-2012 Diskussionen und Dialogprozessen teilnehmen,
Durchsicht möglicher und derzeit diskutierter OptionenVerpflichtungsperiode,
Weiterentwicklung ausgewählter Ansätze für eine zweite Verpflichtungsperiode, Quantifizierung und Einschätzung der Auswirkungen verschiedener Ansätze für
ausgewählte Länder und Regionen und Entwicklung einer Verhandlungsstrategie für Deutschland und die EU.
Die Ergebnisse sind in diesem Endbericht in Kapitel 2 bis 11 detailliert dargestellt. Die wesentlichen Ergebnisse der einzelnen Kapitel sind im nachfolgenden kurz zusammen gefasst.
2Das Projektteam hat eine Websei(www.fiacc.net) entwickelt, die seit Dezember 2003 als Informationsplattform genutzt werden kann. Über die Webseite sind Informationen zu aktiv beteiligten Experten und Organisationen, die sich mit der Diskussion zur zukünftigen internationalen Weiterentwicklung des Klimaschutzes beschäftigen, bereitgestellt. Außerdem werden einzelne Ansätze erläutert und Unterstützungshilfen zur Quantifizierung weiterer Verpflichtungen und Handlungen angeboten. Eine Online-Diskussionsplattform wurde bereitgestellt und für die Diskussion verschiedener
20
ECOFYS Options for the second commitment period
Themen unter Experten genutzt. Alle Diskussionen waren öffentlich. Die Webseite hat seit dem Start im Dezember 2003 beachtliche Aufmerksamkeit unter Verhandlungsexperten und anderen Interessierten gefunden, insbesondere Personen, die sich über neue Entwicklungen zu diesem Thema informieren wollen bzw. nach Informationen suchen.
Diskussionen wurden zu den folgenden Themen durchgeführt: “Konvergierende Pro-Kopf
n und ihre Q ung durch we nsges n sich 2 Deze 0 M eb v an ihnen teil.
Die ach Ende de ojek eiter betrie . Eine weitere Ak sierung der sionen können Dank einer Weiterfinanzierung durch die Eur eistet en.
3. r Gruppen In K ausg ählter nder bzw. L dergruppen hinsichtlich eines zuk areg s u rsucht. Zunächst wurde eine detaillierte Krit dere versch ne Ansätze geprüft werden köChecklis en Umweltkrit en, ökonomi Kriterien, technischen/ inst en Kriterien.
Von die wurden ansch ßend ausge hlte Länderperspektiven (EU, USA gsländer, am wenigsten entwickelte Länder) zusammengefasst (sie nfliktbereiche zwischen den betrachteten Ländern bzw. Länderg d näh untersucht.
Tabelle ng der ausgew lten L er bzw. L ergruppen hinsichtlich der w ichtung von Kriterien eines zukünfti en Klimaregimes
Ka EU 25 U Fortgeschrittene Entwicklungsländer
Am w ten entwickelte Länder
Emissionen“, „die Rolle der USA und Möglichkeiten zur konstruktiven Wiedereinbeziehung in die Klimaverhandlungen“, „Interpretation von Artikel 2 der Klimarahmenkonvention hinsichtlich gefährlicher anthropogener Störungen des Klimasystems“ und „Vermeidungskoste
uantifizierung und Berechn30 P traum
Integriember 2
rte Be03 bis
rtungsmodelle“. I amt registrierten die Diskussionen ersonen im Zei ai 2004 und verfolgt
zw. nahmen akti
Webseite wird auch n s Pr ts w ben tualiSeite sowie weitere Diskus
opäische Kommission gewährl werd
Interessen einzelneapitel 3 werden Erwartungen
imewime
Länte
änünftigen internationalen Klerienliste entwickelt, an Hand
te unterscheidet zwischr iede
erinnen. Die
schenitutionellen Kriterien und politisch
sen Kriterien ausgehendEntwicklun
lie wä, fortgeschrittene
he Tabelle A). Mögliche Koruppen wurde herausgearbeitet un er
A. Einschätzu äh änd ändahrgenommenen Gew g
tegorie des Kriteriums Unterkriterium SA enigs
Um weltkriterien (1) Betonung auf
Umweltwirksamkeit YY N 0 Y1
(2) Beteiligung induLänder
strialisierter Y 0 YY YY
(3) Unterstützung frühzeitigen Handelns (early action) Y Y 0 0
(4) Y YY N N Einbeziehung von Entwicklungsländern
(5) ms Vollständigkeit des Syste Y Y2 Y Y (6) g der Erhöhung
ndernorts Vermeidunvon Emissionen a(leakage)
Y Y ? ?
(7) Vermeidung unbeabsichtigter 0 0 0 0 Überallokation von
Emissionsrechten (hot air) (8)
en an
g’
0 0 YY YY Integration von ‚Anpassungsmaßnahmden Klimawandel’ und‚nachhaltiger Entwicklun
(9) Y 0 Y Y Förderung von positivenNebeneffekten
Ökono mische Kriterien
21
ECOFYS Options for the second commitment period
Kategorie des Kriteriums Unterkriterium EU 25 USA Fortgeschrittene
Entwicklungsländer Am wenigsten
entwickelte Länder (1) Minimierung negativer
en Y YY Y Y ökonomischer Auswirkung(2)
cher Nebeneffekte3Erzeugung positiver ökonomis Y Y Y Y
(3) Förderung von Wachstum iEntwicklungsländern
n Y 0 YY YY
(4) n
nologischer er
Förderung voTechnologieinnovation undSchaffung von Anreizen zur Übertragung techFortschritte in andere Länd
Y YY Y Y
(5) ller wischen Y Y Y Y
Berücksichtigung struktureUnterschiede zLändern
(6) Kostensicherheit Y YY Y 0 TechniKriterie sche und institutionelle
n (1) System kann viele bereits
vereinbarte Elemente dKyoto-Protokol
es ls nutzen bzw. YY N 0 0
auf diesen aufbauen (2)
? ? Moderate politische Anforderungen für den Y ? Verhandlungsprozess
(3) Moderate technische Anforderungen Y Y Y Y
Politische Kriterien (1a) Erfüllt das Gerechtigkeits-
prinzip “Bedürfnisse“ Y (Needs)
Y/0 YY YY 4
(1b) Erfüllt das Gerechtigkeits- prinzip “Leistungsfähigkeit“ Y 0 YY (Capability)
YY
(1c) Erfüllt das Gerechtigkeits- prinzip “Verantwortlichkeit“ (Responsibility)
Y 0 YY YY
(1d) Erfüllt das Gerechtigkeits- prinzip “Gleiche Rechte“ (Equal rights)
0 N Y Y
(1e) Erfüllt das Gerechtigkeits- prinzip “Vergleichbare Anstrengungen“ (Comparable efforts)
YY Y Y Y
(1f) Erfüllt das Gerechtigkeits -prinzip “Souveränität“ (Sovereignty)
? YY ? ?
YY: “Erfüllung des Kriteriums ist sehr wichtig für Akteur” Y: “Erfüllung des Kriteriums ist wichtig für Akteur” 0: “Akteur ist Kriterium gegenüber eher gleichgültig eingestellt”
für die “Bedürfnisse” der USA, “0” für die “Bedürfnisse” von Entwicklungsländern
N: “Erfüllung des Kriteriums ist vom Akteur nicht erwünscht” ?: “die Position des Akteurs ist nicht bekannt” 1: Am meisten vom Klimawandel betroffene Länder (z.B. kleine Inselstaaten) würden auf weitere Emissionsreduktionen drängen 2: USA war Hauptbefürworter der Einbeziehung aller 6 Kyoto Gase, wahrscheinlich eher um die Flexibilität als die Vollständigkeit des Systems zu erhöhen 3: Alle Länder würden es begrüßen, wenn das Regime positive ökonomische Nebeneffekte für sie bieten würde 4: “Y”
22
ECOFYS Options for the second commitment period
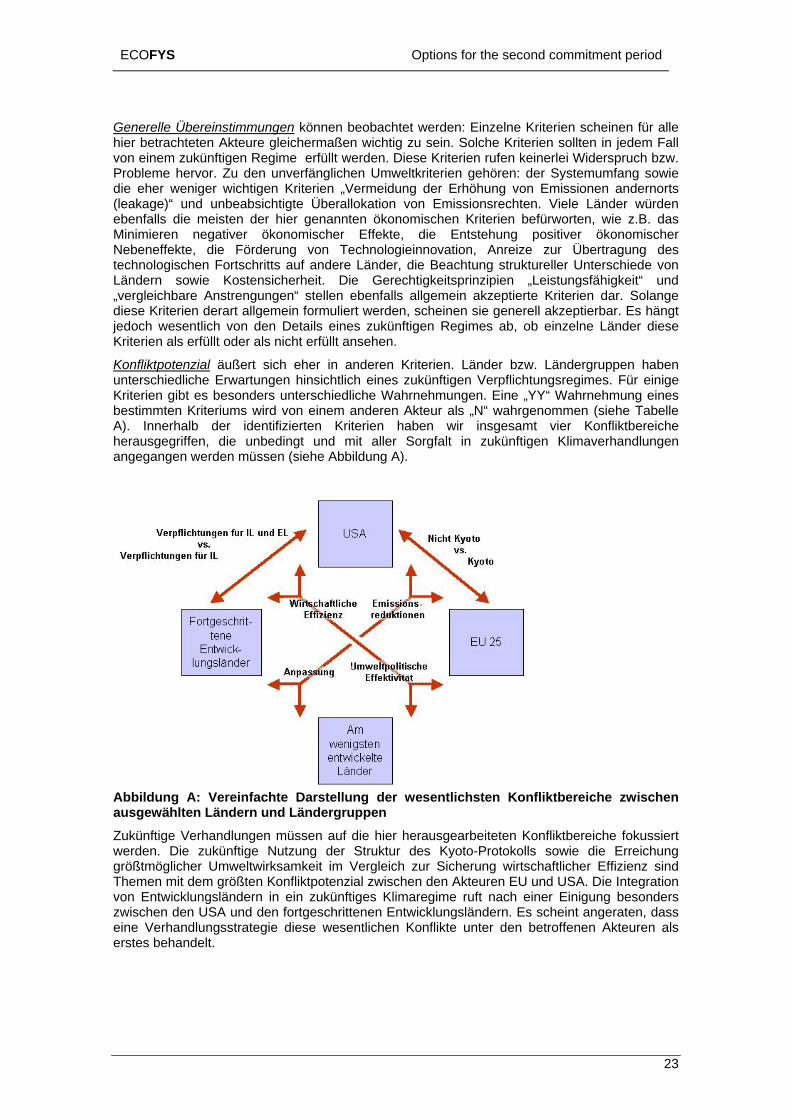
Generelle Übereinstimmungen können beobachtet werden: Einzelne Kriterien scheinen für alle hier betrachteten Akteure gleichermaßen wichtig zu sein. Solche Kriterien sollten in jedem Fall von einem zukünftigen Regime erfüllt werden. Diese Kriterien rufen keinerlei Widerspruch bzw. Probleme hervor. Zu den unverfänglichen Umweltkriterien gehören: der Systemumfang sowie die eher weniger wichtigen Kriterien „Vermeidung der Erhöhung von Emissionen andernorts (leakage)“ und unbeabsichtigte Überallokation von Emissionsrechten. Viele Länder würden ebenfalls die meisten der hier genannten ökonomischen Kriterien befürworten, wie z.B. das Minimieren negativer ökonomischer Effekte, die Entstehung positiver ökonomischer Nebeneffekte, die Förderung von Technologieinnovation, Anreize zur Übertragung des technologischen Fortschritts auf andere Länder, die Beachtung struktureller Unterschiede von Ländern sowie Kostensicherheit. Die Gerechtigkeitsprinzipien „Leistungsfähigkeit“ und „vergleichbare Anstrengungen“ stellen ebenfalls allgemein akzeptierte Kriterien dar. Solange diese Kriterien derart allgemein formuliert werden, scheinen sie generell akzeptierbar. Es hängt jedoch wesentlich von den Details eines zukünftigen Regimes ab, ob einzelne Länder diese Kriterien als erfüllt oder als nicht erfüllt ansehen.
Konfliktpotenzial äußert sich eher in anderen Kriterien. Länder bzw. Ländergruppen haben unterschiedliche Erwartungen hinsichtlich eines zukünftigen Verpflichtungsregimes. Für einige Kriterien gibt es besonders unterschiedliche Wahrnehmungen. Eine „YY“ Wahrnehmung eines
Sorgfalt in zukünftigen Klimaverhandlungen
bestimmten Kriteriums wird von einem anderen Akteur als „N“ wahrg men (siehe Tabelle A). Innerhalb der identifizierten Kriterien haben wir insgesamt vier Konfliktbereiche herausgegriffen, die unbedingt und mit aller
enom
angegangen werden müssen (siehe Abbildung A).
Abbildung A: Vereinfachte Darstellung der wesentlichsten Konfliktbereiche zwischen ausgewählten Ländern und Ländergruppen Zukünftige Verhandlungen müssen auf die hier herausgearbeiteten Konfliktbereiche fokussiert werden. Die zukünftige Nutzung der Struktur des Kyoto-Protokolls sowie die Erreichung größtmöglicher Umweltwirksamkeit im Vergleich zur Sicherung wirtschaftlicher Effizienz sind Themen mit dem größten Konfliktpotenzial zwischen den Akteuren EU und USA. Die Integration von Entwicklungsländern in ein zukünftiges Klimaregime ruft nach einer Einigung besonders zwischen den USA und den fortgeschrittenen Entwicklungsländern. Es scheint angeraten, dass eine Verhandlungsstrategie diese wesentlichen Konflikte unter den betroffenen Akteuren als erstes behandelt.
23
ECOFYS Options for the second commitment period
Weiterhin nehmen bestimmte Länder innerhalb der Gruppe der Entwicklungsländer divergierende Positionen ein. Beispielsweise ist die Gruppe der Entwicklungsländer hinsichtlich
r die Entwicklung
rien an. Für die Länder Mexiko, Indien, China und die USA
der Erreichung größtmöglicher Umweltwirksamkeit und ökonomischer Effizienz des Systems stark gespalten. Die am wenigsten entwickelten Länder würden für stringente Anforderungen hinsichtlich globaler Emissionsreduktionen stimmen, während fortschrittliche Entwicklungsländer sich dem (und das tun sie bereits) widersetzten würden. Annahmen, wie die Gruppe der Entwicklungsländer agieren wird, sind ein wichtiges Element füeiner Verhandlungsstrategie.
4. Länderstudien An die Kriterienanalyse schließt sich eine Untersuchung ausgewählter Länder hinsichtlich ihrer Position zu den diskutierten Kritewurden bereits in Kraft getretene nationale Klimaschutzstrategien, ihre Emissionsprofile und zukünftige Emissionsentwicklungen untersucht, ihre Anfälligkeit gegenüber dem Klimawandel eingeschätzt und Anreize herausgearbeitet, unter welchen diese Länder in einem zukünftigen Klimaregime teilnehmen könnten. Hinsichtlich der Anreize zur Teilnahme an einem zukünftigen Klimaregime können folgende Beobachtungen gemacht werden.
Mexiko ist dem Thema ‘Bekämpfung des Klimawandels’ positiv eingestellt. Informellen Angaben zufolge hat die mexikanische Regierung zwei Bedingungen genannt, unter denen sie bereit wäre, weitere Anstrengungen gegen den Klimawandel zu unternehmen. Erstens würden solche weiterführenden Verpflichtungen seitens Mexiko nur dann übernommen, wenn sichtbare Emissionsminderungen von Industriestaaten erkennbar sind. Das könnte beispielsweise erreicht werden, indem man für Entwicklungsländer als Handlungsvoraussetzung vereinbart, dass die
einer zukünftigen Klimaschutzkooperation: Einerseits
globalen, durchschnittlichen Pro-Kopf-Emissionen oder die Emissionsintensität sinken. Zweitens wäre eine Zusammenarbeit im Rahmen eines ausgeweiteten CDM denkbar, der auf bestimmte Sektoren und Politikbereiche angewendet werden könnte.
Außerhalb der Klimaverhandlungen gibt es zwei nicht zu unterschätzende Querbezüge hinsichtlich einer Teilnahme Mexikos anwäre dies Mexikos weltweite Verpflichtung als Mitglied in der OECD und zum anderen weiterführende Verhandlungen mit der NAFTA und dem EU-Mexiko Vertrag.
Indien nimmt eine sehr klare Position ein und hat als Sprecher für die Gruppe G77/China eine sehr aktive Rolle seit Beginn der Verhandlungen gespielt. Indien hat frühzeitig klargestellt, dass die Emissionen im Land weiter steigen werden, da Indien sein wirtschaftliches Wachstum weiter verstärken will. Indien wird keine zukünftigen Verpflichtungen akzeptieren, bevor
der Ruf nach Verpflichtungen für Entwicklungsländer
gen Indiens starker
Industriestaaten nicht klar erkennen lassen, dass sie eine führende Rolle in der Bekämpfung des Klimawandels übernehmen.
Während der 8. Vertragsstaatenkonferenz (COP8) in New Delhi im Jahr 2002, äußerte sich der Premierminister Vajpayee, dass unangebracht sei und erklärte, dass der einzig als gerecht erachtete, zukünftige Ansatz ein solcher sei, der auf Pro-Kopf-Emissionsrechten basiere. Ein Pro-Kopf-Ansatz, nach dem die länderspezifischen Pro-Kopf-Emissionen gegen einen vereinbarten Pro-Kopf-Emissionswert in der Zukunft konvergieren, wäre der bevorzugte Ansatz, da Indiens gegenwärtige Pro-Kopf-Emissionen nur bei rund einem Drittel des Weltdurchschnitts liegen. WePositionierung hinsichtlich weiterer Verpflichtungen kann derzeit kaum davon ausgegangen werden, dass Indien in naher Zukunft absolute Emissionsminderungsziele akzeptieren wird. Ein Vorschlag, der Elemente eines Pro-Kopf-Ansatzes enthält, könnte Türöffner sein, um eine mögliche Zustimmung Indiens zu einem weiterführenden Klimaregime zu gewährleisten.
Aus der Erfahrung im Zusammenhang mit der indischen Position zu AIJ (Activities Implemented Jointly) und einer generellen Priorität für wirtschaftliches Wachstum, könnte sich diese Position jedoch auch ändern, wenn Indiens Verpflichtungen als ein Vehikel für wirtschaftliches Wachstum verstanden werden. Unter solchen Voraussetzungen wäre das Land bereit, seine Position zu überdenken und zu ändern.
24
ECOFYS Options for the second commitment period
China befindet sich derzeit in einem enormen wirtschaftlichen Wachstumsprozess (das Bruttoinlandsprodukt stieg um 9% im Jahr 2003). Ernstzunehmende Umweltprobleme und eine unvorteilhafte Ausstattung an Energieressourcen zwingen China, Maßnahmen zu ergreifen, die weiteren wirtschaftlichen Aufschwung ermöglichen. Dies umfasst z.B. vermehrte Anstrengungen hinsichtlich Energieeinsparungen, die Nutzung sauberer Energieformen sowie die Entwicklung effizienterer und erneuerbarer Energietechnologie.
Auch ohne äußere Einflusse in Form von politischem Druck oder durch äußere Unterstützung gibt es in China verschiedene Initiativen, die Energienutzungseffizienz zu erhöhen. Dies ist ein Nebeneffekt von Maßnahmen und Politiken, die auf Ziele wie Energiesicherheit und
ngen für eine bekämpfung des Klimawandels
legten Berichts
h ziehen. Ziele wie z.B. pro erzeugte Menge Strom O2 pro kWh) oder bezogen auf eine Tonne produzierten Stahls könnten ebenfalls akzeptiert
ken und Wahrnehmungen einer Begrenzung des wirtschaftlichen n.
Gesundheitsschutz gerichtet sind.
China hat in der Gruppe G77/China eine wichtige Rolle während der Verhandlungen gespielt und nimmt hinsichtlich der weltweiten Anstrenguallgemein eine proaktive Rolle ein. Allerdings wiederholte China als Entwicklungsland, dass es die wirtschaftliche Entwicklung und Armutsbekämpfung nicht den verbindlichen Emissionsreduktionen eines weltweiten Klimaregimes unterordnen werde.
Gemäß eines durch das Nationale Koordinationskomitee für Klimawandel vorge(Juni 2001) sollten entwickelte Staaten weiterhin die Führung in der Bekämpfung des Klimawandels übernehmen. Diese Länder seien heute für einen Großteil der Emissionen verantwortlich und die Pro-Kopf-Emissionen weisen weiterhin ein großes Ungleichgewicht zwischen Industrie- und Entwicklungsländern auf. Entwicklungsländer wie China müssen in der Lage sein, ihre Emissionen zu erhöhen, um soziale und entwicklungspolitische Ziele zu erreichen. Der vorgelegte Bericht schließt mit der Bemerkung, „dass der Versuch, Entwicklungsländern Emissionsreduktionen oder Emissionsbegrenzungen aufzuerlegen weder fair noch realistisch ist und im Widerstreit mit den Grundprinzipien der Konvention liegt“.
China könnte von zukünftigen Aktionen nur überzeugt werden, wenn die Auflage so verstanden wird, dass sie wirtschaftliches Wachstum nicht beschränkt oder sogar ökonomisch von Vorteil für China wäre. Vermehrte Teilnahme im CDM könnte Einkünfte generieren. „Positiv bindende Ziele“ könnten angewendet werden, damit der Verkauf überschüssiger Emissionsrechte ermöglicht werden kann, sollten die Ziele übererfüllt werden. Solche Ziele sollten bei Nichterfüllung jedoch keine Strafen nach sic(Cwerden und den BedenWachstums entgegenwirke
Die USA nehmen unter den hier diskutierten Ländern eine besondere Stellung bezüglich weiterer Klimaschutzmaßnahmen ein. Die amerikanische Klimaschutzpolitik ist wenig konsistent und stark vom jeweiligen Präsidenten abhängig.
Pv
räsidentschaftskandidat John Kerry hatte kürzlich bemerkt, „dass auf Grund der Untätigkeit on Bush’s Administration, die im Kyoto-Protokoll festgeschriebenen Ziele nicht mehr erreichbar
seinen.“ Er würde sich dagegen „sofort für den internationalen Prozess einsetzen, der zu strengen, effektiven und bedeutsamen internationalen Vereinbarungen führt“.
ber einzelne Bundesstaaten
den notwendigen politischen Willen zu erzeugen und darauf ufbauend eine verpflichtende nationale Klimagesetzgebung anzustoßen. Da der Liebermann-cCain Gesetzentwurf, der vorsieht, Treibhausgasemissionen in den USA zu beschränken,
on unten nach oben“ Ansatz als Katalysator dienen, sich
Dessen ungeachtet besteht eine attraktive Möglichkeit, die USA üfür einen multilateralen Ansatz zur Treibhausgasreduktion zu gewinnen und einzubinden. Einige Staaten sind seit einiger Zeit aktiv und nehmen eine führende Rolle in der Verabschiedung und Umsetzung umweltpolitischer Vereinbarungen ein, z.B. über den regionalen „Clean Air Initiative Market“ für das südliche Kalifornien und den „US Clean Air Act“. Diese Themen können auf die US-Bundesebene gehoben werden. Einige Staaten haben auf die Bush-Regierung bereits Druck ausgeübt, die Emission von Treibhausgasen zu regulieren. Aktivitäten auf Ebene der Bundesstaaten haben eine Tendenz, sich auf andere Staaten auszudehnen und können somit zum Katalysator werden,aMzunächst gescheitert ist, könnte ein „v
25
ECOFYS Options for the second commitment period
zunächst die Akzeptanz der einzelnen Bundesstaaten hinsichtlich einer zunehmend aktiveren Rolle bei Emissionsreduktionen zu sichern.
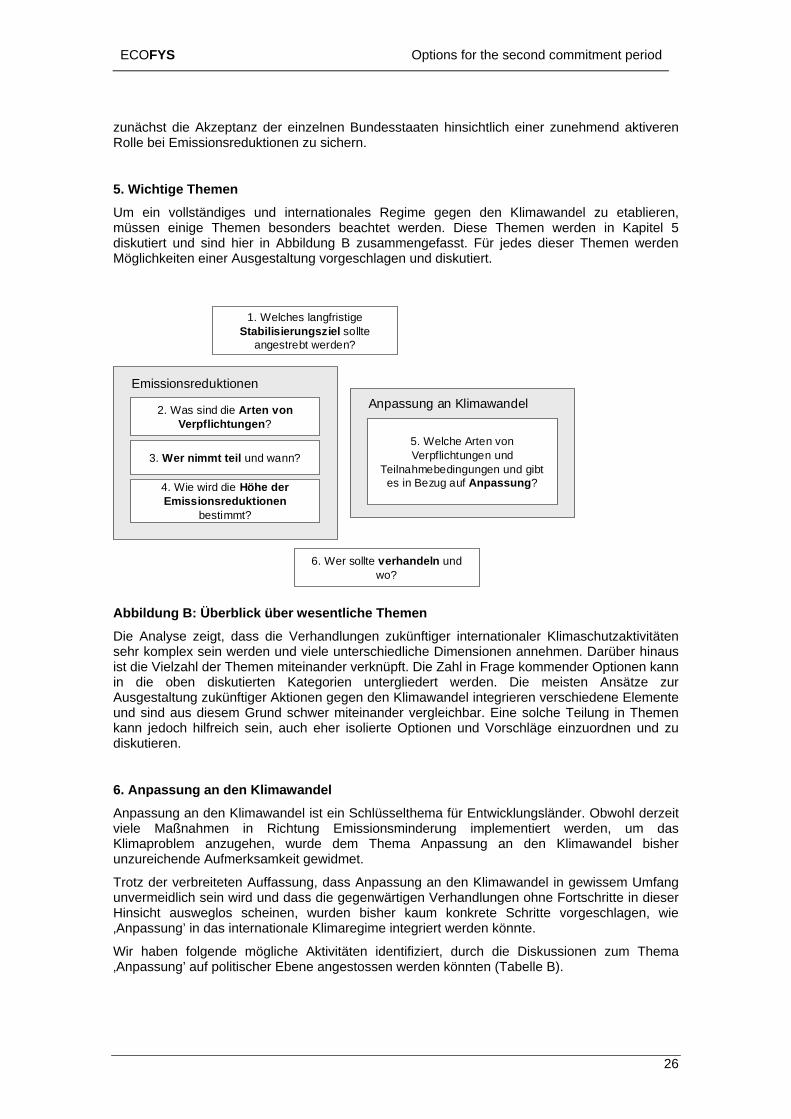
5. Wichtige Themen Um ein vollständiges und internationales Regime gegen den Klimawandel zu etablieren, müssen einige Themen besonders beachtet werden. Diese Themen werden in Kapitel 5 diskutiert und sind hier in Abbildung B zusammengefasst. Für jedes dieser Themen werden Möglichkeiten einer Ausgestaltung vorgeschlagen und diskutiert.
1. Welches langfristige Stabilisierungsziel sollte
angestrebt werden?
3. Wer nimmt teil und wann?
2. Was sindVerpfli
c
die Arten von htungen?
5. Welche Arten von Verpflichtungen und
Teilnahmebedingungen und gibt aues in Bezug f Anpassung?
6. Wer eln und?
sollte verhandwo
4. Wie wird ions
ti
EmissionsredukAnpassung an Klimawandel
Abbildung B: Überblick über wesentliDie Analyse zeigt handlu ftiger in chutzaktivitäten s ein ele un che Dime n. Da inaus ist die Vielzahl der Themen miteinander verknüpft. Die Zahl der O n i dis rien untergliedert werd eisten zur Ausgestaltung zuk nen geg nde erschiede ente und sind aus diesem Grund schwer mi ng in Themen kann jedoch hilfreich sein, auch eher i u rdnen und zu diskutieren.
ndel
gewidmet.
‚Anpassung’ auf politischer Ebene angestossen werden könnten (Tabelle B).
die Höhe der reduktionenmmt?
Emissbes
tionen
che Themen ngen zukünterschiedli
, dass die Ver werden und vi
kutierten Kategoünftiger Aktio
ternationaler Klimasnsionen annehme in Frage kommen
ehr komplex s
n die oben
rüber hptionen kanAnsätze ne Elem
en. Die ml integrieren v
bar. Eine solche Teilund Vorschläge einzuo
en den Klimawateinander vergleichsolierte Optionen
6. Anpassung an den KlimawaAnpassung an den Klimawandel ist ein Schlüsselthema für Entwicklungsländer. Obwohl derzeit viele Maßnahmen in Richtung Emissionsminderung implementiert werden, um das Klimaproblem anzugehen, wurde dem Thema Anpassung an den Klimawandel bisher unzureichende Aufmerksamkeit
Trotz der verbreiteten Auffassung, dass Anpassung an den Klimawandel in gewissem Umfang unvermeidlich sein wird und dass die gegenwärtigen Verhandlungen ohne Fortschritte in dieser Hinsicht ausweglos scheinen, wurden bisher kaum konkrete Schritte vorgeschlagen, wie ‚Anpassung’ in das internationale Klimaregime integriert werden könnte.
Wir haben folgende mögliche Aktivitäten identifiziert, durch die Diskussionen zum Thema
26
ECOFYS Options for the second commitment period
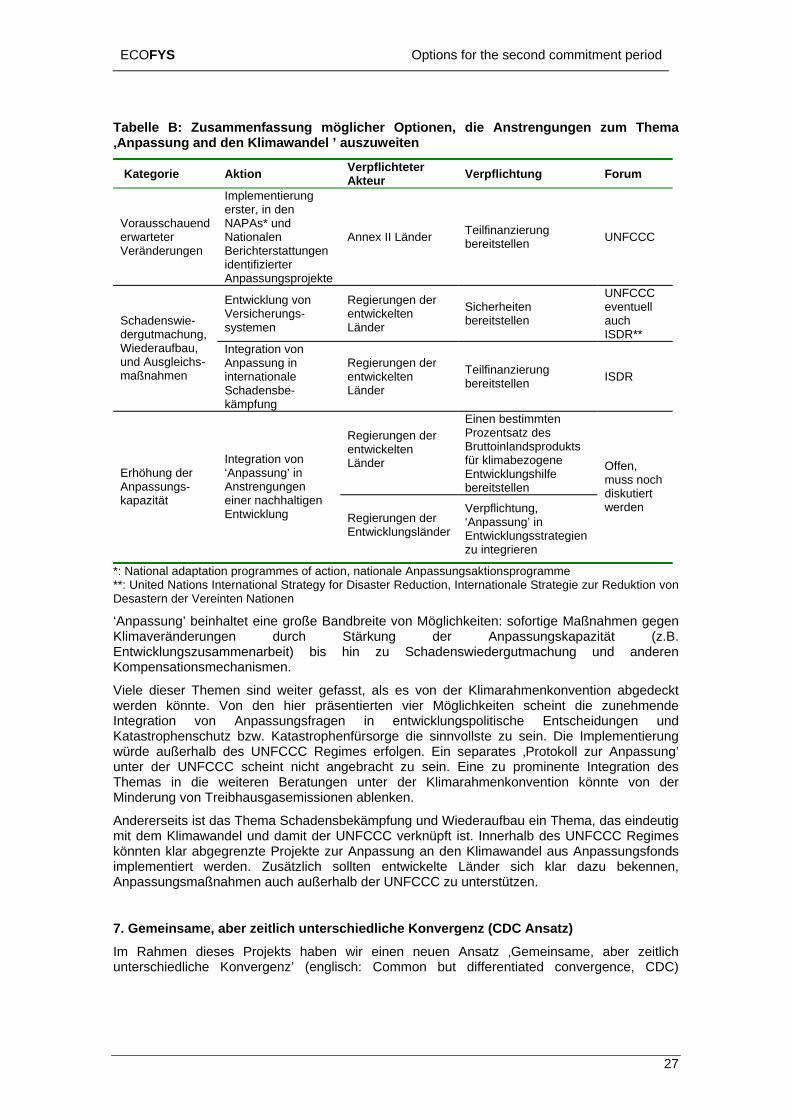
Tabelle B: Zusammenfassung möglicher Optionen, die Anstrengungen zum Thema ‚Anpassung and den Klimawandel ’ auszuweiten
Kategorie Aktion Verpflichteter Akteur Verpflichtung Forum
Vorausschauend erwarteter
Implementierung erster, in den NAPAs* und Nationalen Annex II Länder Teilfinanzierung
Veränderungen Berichterstattungen
bereitstellen UNFCCC
identifizierter Anpassungsprojekte
Entwicklung von Versicherungs-systemen
Regierungen der entwickelten Länder
Sicherheiten bereitstellen
UNFCCC eventuell auch ISDR**
Schadenswie-dergutmachung, Wiederaufbau, und Ausgleichs-maßnahmen
Integration von Anpassung in internationale Schadensbe-kämpfung
Regierungen der entwickelten Länder
Teilfinanzierung bereitstellen ISDR
Regierungen der entwickelten Länder
Einen bestimmten Prozentsatz des Bruttoinlandsprodukts für klimabezogene Entwicklungshilfe bereitstellen
Erhöhung der Anpassungs-
Integration von ‘Anpassung’ in Anstrengungen
Offen,
kapazität einer nachhaltigen Entwicklung Regierungen der
Entwicklungsländer
Verpflichtung, ‘Anpassung’ in Entwicklungsstrategien zu integrieren
diskutiert werden
muss noch
*: National adaptation programmes of action, nationale Anpassungsaktionsprogramme **: United Nations International Strategy for Disaster Reduction, Internationale Strategie zur Reduktion von Desastern der Vereinten Nationen
‘Anpassung’ beinhaltet eine große Bandbreite von Möglichkeiten: sofortige Maßnahmen gegen Klimaveränderungen durch Stärkung der Anpassungskapazität (z.B.
ntwicklungszusammenarbeit) bis hin zu Schadenswiedergutmachung und anderen Kompensationsmechanismen.
Viele dieser Themen sind weiter gefasst, als es von der Klimarahmenkonvention abgedeckt werden könnte. Von den hier präsentierten vier Möglichkeiten scheint die zunehmende Integration von Anpassungsfragen in entwicklungspolitische Entscheidungen und Katastrophenschutz bzw. Katastrophenfürsorge die sinnvollste zu sein. Die Implementierung würde außerhalb des UNFCCC Regimes erfolgen. Ein separates ‚Protokoll zur Anpassung’ unter der UNFCCC scheint nicht angebracht zu sein. Eine zu prominente Integration des Themas in die weiteren Beratungen unter der Klimarahmenkonvention könnte von der Minderung von Treibhausgasemissionen ablenken.
Andererseits ist das Thema Schadensbekämpfung und Wiederaufbau ein Thema, das eindeutig mit dem Klimawandel und damit der UNFCCC verknüpft ist. Innerhalb des UNFCCC Regimes könnten klar abgegrenzte Projekte zur Anpassung an den Klimawandel aus Anpassungsfonds implementiert werden. Zusätzlich sollten entwickelte Länder sich klar dazu bekennen, Anpassungsmaßnahmen auch außerhalb der UNFCCC zu unterstützen.
7. Gemeinsame, aber zeitlich unterschiedliche Konvergenz (CDC Ansatz) Im Rahmen dieses Projekts haben wir einen neuen Ansatz ‚Gemeinsame, aber zeitlich unterschiedliche Konvergenz’ (englisch: Common but differentiated convergence, CDC)
E
27
ECOFYS Options for the second commitment period
entwickelt. Mit dem CDC Ansatz wird ein weiterer Vorschlag für ein internationales Klimaregime unterbreitet. Einerseits könnte dieser Ansatz für einen weiten Kreis von Ländern akzeptabel sein, andererseits aber auch die Stabilisierung von Treibhausgaskonzentrationen gewährleisten. Der Ansatz basiert auf dem Prinzip, dass Pro-Kopf Emissionen der Annex I
taaten während der nächsten Jahrzehnte auf ein niedriges Niveau sinken müssen. Die Pro-opf-Emissionen der Nicht-Annex-I-Staaten konvergieren gegen diesen Wert innerhalb einer
t so einfach wie „Contraction & Convergence“ (C&C) beseitigt aber zwei
nem späteren Zeitpunkt
SKgleich langen Periode, beginnen ihre Reduktionen aber erst zu einem späteren Zeitpunkt. Der Beginn der Reduktion der Pro-Kopf Emissionen erfolgt erst dann, wenn diese einen bestimmten Prozentsatz des (sich im Zeitverlauf durch die Minderungen in Annex-I-Staaten verringernden) Weltdurchschnitts überschreiten. Bis zu diesem Zeitpunkt gelten für diese Länder freiwillige, ‚positiv bindende Ziele’ vereinbaren.
Dieser Ansatz ist fasNachteile, die oft im Zusammenhang mit C&C aufgeführt werden. Im CDC-Ansatz beginnen fortgeschrittene Entwicklungsländer mit ihren Emissionsrektionen zu eials Annex I Länder (siehe Abbildung C). Außerdem vermeidet der CDC-Ansatz politische Probleme, die mit dem Konzept der Ressourcenteilung und dem Kostentransfer verknüpft sind, denn der Ansatz bietet keine überschüssigen Emissionsberechtigungen wie das beim C&C- Ansatz der Fall ist. Aus diesen Gründen wäre ein solcher Ansatz im Vergleich zum C&C Ansatz akzeptabler für die größten Entwicklungsländer. Auch den USA kommt dieser Ansatz dadurch entgegen.
Contraction & Common but differentiated Convergenceconvergenceap ap
IC IC
GH
G/c
GH
G/c
ThresholdADC
LDC
ADC
LDC
Time Time
Abbildung C: Schematische Darstellung der Pro-Kopf-Treibhausgasemissionen für drei Länder (industrialisiertes Land (IC), fortschrittliches Entwicklungsland (ADC) und ein am wenigsten entwickeltes Land (LDC)) unter Contraction & Convergence (links) und unter Common but Differentiated Convergence (rechts)
Mit der Quantifizierung resultierender Emissionsberechtigungen zeigen wir, welche Konsequenzen für die jeweiligen Emissionsrechte mit dem CDC-Ansatz mit einer Stabilisierung
Weltdurchschang
Unter de nahmen implementiert werden, die Anpassung besonde
Wir eidungen wei n Jahrhundert fest vereinbart und verankert werden. Auch wenn demnach der CDC-Ansatz nicht in seiner Vollständigkeit
auf dem Niveau 550 CO2-Äquivalente und 650 ppm CO2-Äquivalente im Jahr 2100 bzw. 2150 verbunden sind, wobei ein Schwellwert für eine Beteiligung zu etwa 0% und 50% über dem
nitt und eine Konvergenz auf etwa 3 und 4,5 t CO2-Äquivalente/Kopf in 40 Jahren enommen wird.
m CDC-Ansatz müssen zusätzliche Maßrs vom Klimawandel betroffener Entwicklungsländer betreffen.
erwarten, dass die Weltgemeinsaft das Klimaregime auf Basis schrittweiser Entschtere twickeln wird. Die Regeln werden jetzt nicht für das nächste
28
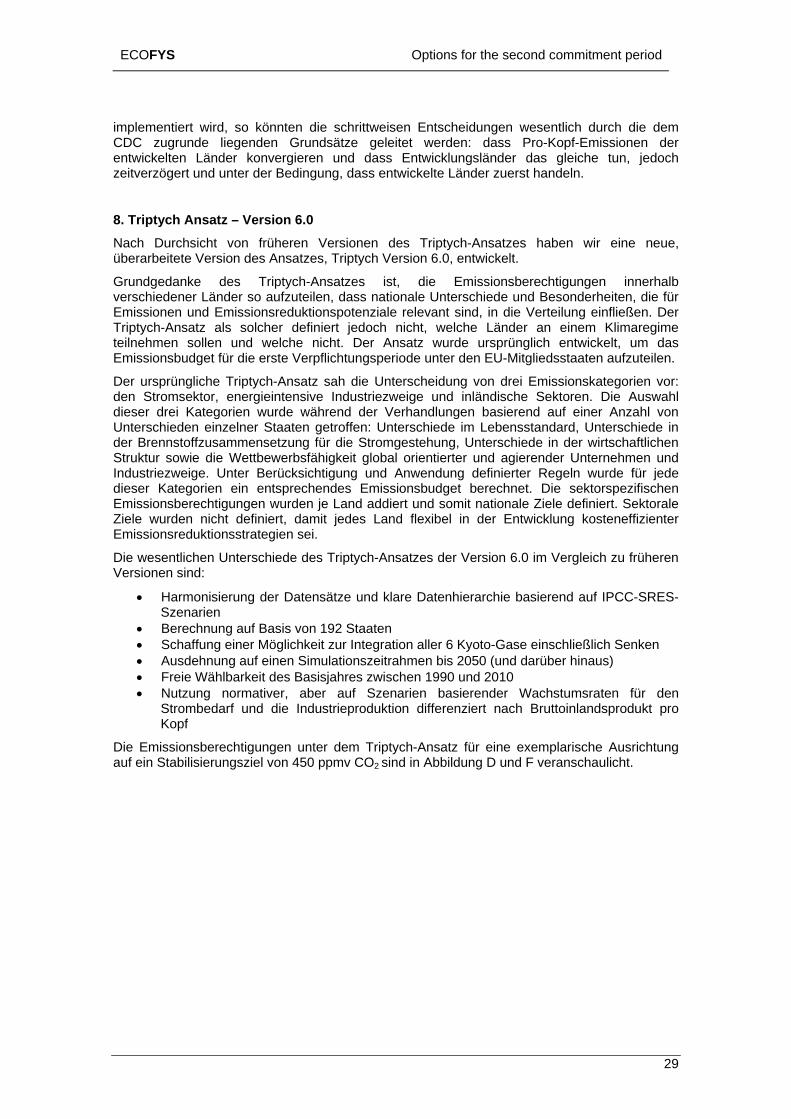
ECOFYS Options for the second commitment period
implemeCDC zentwick Länder konvergieren und dass Entwicklungsländer das gleiche tun, jedoch
8. Triptych Ansatz – Version 6.0
ckelt.
rundgedanke des Triptych-Ansatzes ist, die Emissionsberechtigungen innerhalb erschiedener Länder so aufzuteilen, dass nationale Unterschiede und Besonderheiten, die für
Emissionen und Emissionsreduktionspotenziale relevant sind, in die Verteilung einfließen. Der Triptych-Ansatz als solcher definiert jedoch nicht, welche Länder an einem Klimaregime teilnehmen sollen und welche nicht. Der Ansatz wurde ursprünglich entwickelt, um das Emissionsbudget für die erste Verpflichtungsperiode unter den EU-Mitgliedsstaaten aufzuteilen.
Der ursprüngliche Triptych-Ansatz sah die Unterscheidung von drei Emissionskategorien vor: den Stromsektor, energieintensive Industriezweige und inländische Sektoren. Die Auswahl dieser drei Kategorien wurde während der Verhandlungen basierend auf einer Anzahl von Unterschieden einzelner Staaten getroffen: Unterschiede im Lebensstandard, Unterschiede in der Brennstoffzusammensetzung für die Stromgestehung, Unterschiede in der wirtschaftlichen Struktur sowie die Wettbewerbsfähigkeit global orientierter und agierender Unternehmen und Industriezweige. Unter Berücksichtigung und Anwendung definierter Regeln wurde für jede dieser Kategorien ein entsprechendes Emissionsbudget berechnet. Die sektorspezifischen Emissionsberechtigungen wurden je Land addiert und somit nationale Ziele definiert. Sektorale Ziele wurden nicht definiert, damit jedes Land flexibel in der Entwicklung kosteneffizienter Emissionsreduktionsstrategien sei.
Die wesentlichen Unterschiede des Triptych-Ansatzes der Version 6.0 im Vergleich zu früheren
end auf IPCC-SRES-
aber auf Szenarien basierender Wachstumsraten für den
ntiert wird, so könnten die schrittweisen Entscheidungen wesentlich durch die dem ugrunde liegenden Grundsätze geleitet werden: dass Pro-Kopf-Emissionen der elten
zeitverzögert und unter der Bedingung, dass entwickelte Länder zuerst handeln.
Nach Durchsicht von früheren Versionen des Triptych-Ansatzes haben wir eine neue, überarbeitete Version des Ansatzes, Triptych Version 6.0, entwi
Gv
Versionen sind:
• Harmonisierung der Datensätze und klare Datenhierarchie basierSzenarien
• Berechnung auf Basis von 192 Staaten • Schaffung einer Möglichkeit zur Integration aller 6 Kyoto-Gase einschließlich Senken • Ausdehnung auf einen Simulationszeitrahmen bis 2050 (und darüber hinaus) • Freie Wählbarkeit des Basisjahres zwischen 1990 und 2010 • Nutzung normativer,
Strombedarf und die Industrieproduktion differenziert nach Bruttoinlandsprodukt pro Kopf
Die Emissionsberechtigungen unter dem Triptych-Ansatz für eine exemplarische Ausrichtung auf ein Stabilisierungsziel von 450 ppmv CO2 sind in Abbildung D und F veranschaulicht.
29
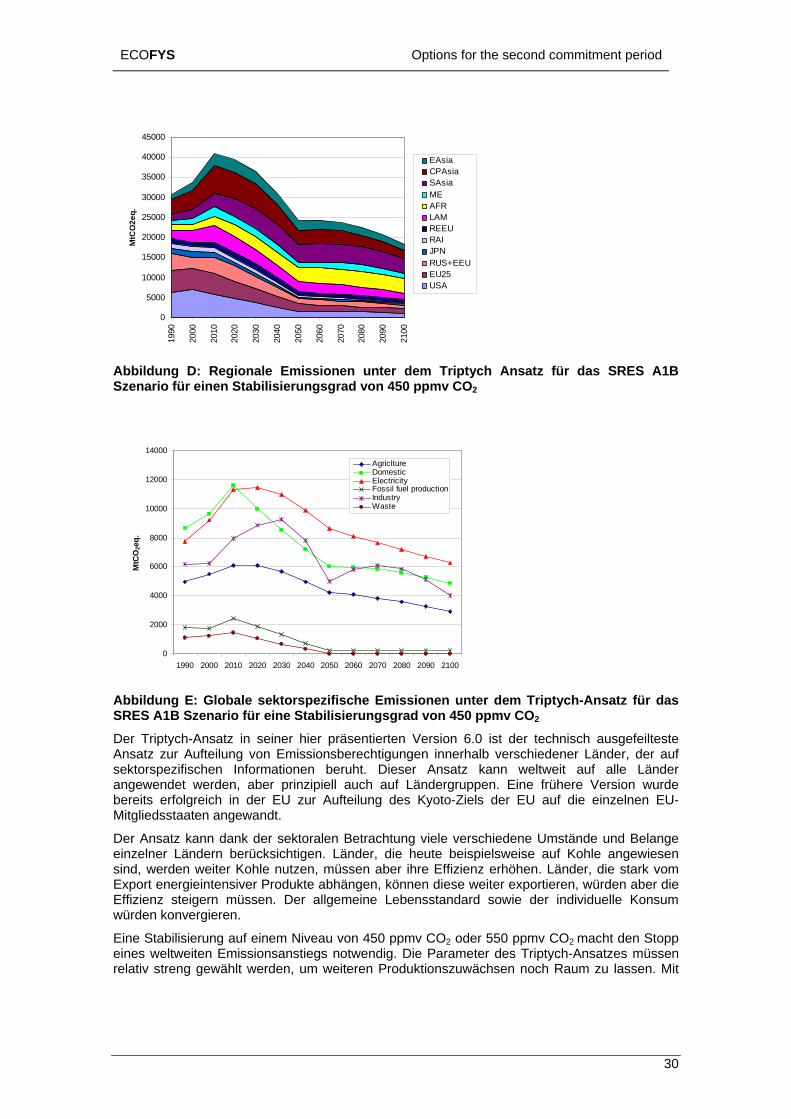
ECOFYS Options for the second commitment period
45000
20000
25000
30000
35000
40000
MtC
O2e
q.
EAsiaCPAsiaSAsiaMEAFRLAMREEURAIJPN
0
5000
10000
15000
1990
2000
2010
2020
2030
2040
2050
2060
2070
2080
2090
2100
RUS+EEUEU25USA
AS
bbildung D: Regionale Emissionen unter dem Triptych Ansatz für das SRES A1B zenario für einen Stabilisierungsgrad von 450 ppmv CO2
10000
12000
14000AgricltureDomesticElectricityFossil fuel productionIndustryWaste
4000
6000
8000
MtC
O2e
q.
2000
01990 2000 2010 2020 2030 2040 2050 2060 2070 2080 2090 2100
Abbildung E: Globale sektorspezifische Emissionen unter dem Triptych-Ansatz für das
ht. Dieser Ansatz kann weltweit auf alle Länder
SRES A1B Szenario für eine Stabilisierungsgrad von 450 ppmv CO2 Der Triptych-Ansatz in seiner hier präsentierten Version 6.0 ist der technisch ausgefeilteste Ansatz zur Aufteilung von Emissionsberechtigungen innerhalb verschiedener Länder, der auf sektorspezifischen Informationen beruangewendet werden, aber prinzipiell auch auf Ländergruppen. Eine frühere Version wurde bereits erfolgreich in der EU zur Aufteilung des Kyoto-Ziels der EU auf die einzelnen EU- Mitgliedsstaaten angewandt.
Der Ansatz kann dank der sektoralen Betrachtung viele verschiedene Umstände und Belange einzelner Ländern berücksichtigen. Länder, die heute beispielsweise auf Kohle angewiesen sind, werden weiter Kohle nutzen, müssen aber ihre Effizienz erhöhen. Länder, die stark vom Export energieintensiver Produkte abhängen, können diese weiter exportieren, würden aber die Effizienz steigern müssen. Der allgemeine Lebensstandard sowie der individuelle Konsum würden konvergieren.
Eine Stabilisierung auf einem Niveau von 450 ppmv CO2 oder 550 ppmv CO2 macht den Stopp eines weltweiten Emissionsanstiegs notwendig. Die Parameter des Triptych-Ansatzes müssen relativ streng gewählt werden, um weiteren Produktionszuwächsen noch Raum zu lassen. Mit
30
ECOFYS Options for the second commitment period
Hilfe dieses Ansatzes sind beträchtliche Reduktionen durch Industriestaaten erforderlich und erkennbar, besonders in Ländern mit kohlenstoffintensiver Industrie, wie dies in Mittel- und Osteuropa und in der russischen Föderation der Fall ist. Im Gegensatz dazu sind beträchtliche Emissionssteigerungen für die meisten Entwicklungsländer erlaubt, jedoch liegen diese in den meisten Fällen unterhalb des Referenzszenarios.
ls Basis der Verhandlung einzelner Ziele der EU-Mitgliedsstaaten.
inigung auf all die benötigten Daten und Parameter auf einem
oll. Wir glauben, dass dieses Konzept inen möglichen Weg aufzeigt, auf den sich weiterführende, multilaterale und internationale limapolitik gründen lässt.
Die Erreichung eines Stabilisierungsziels wie z.B. 2°C, ist nur möglich, wenn alle erdenklichen
1. Mehrstufenvereinbarung hinsichtlich Emissionsreduktionen
2. Neue Technologieentwicklung und Implementierung
3. Eine Vereinbarung zur Anpassung an den Klimawandel
4. Zusätzliche Anstrengungen hinsichtlich Emissionsreduktionen
Der Mehrstufenansatz würde insgesamt vier Stufen integrieren:
Stufe 1 – Keine Verpflichtungen: Länder mit besonders geringem Entwicklungsniveau haben keine Klimaverpflichtungen. Alle am wenigsten entwickelten Länder (englisch: least developed countries – LDCs) würden dazu zählen.
Stufe 2 – Vermehrte zukunftsfähige Entwicklung: In der nächsten Stufe verpflichten sich Länder, klare Schritte in Richtung einer zukunftsfähigen Entwicklung zu unternehmen. Umweltziele sind in Entwicklungsstrategien und –politiken eingebaut. Anforderungen für solch einen nachhaltigen Weg können definiert werden, z.B. das Auslaufen ineffizienter Technologie über einen bestimmten Zeitpunkt hinaus, ab dem definierte Standards eingehalten werden müssen, die neue Technologien zu erfüllen haben. Die Implementierung eines solchen
Der Triptych-Ansatz hat verschiedene Vorteile: Er kann unterschiedliche nationale Gegebenheiten berücksichtigen. Er erlaubt ausdrücklich die Integration von wirtschaftlichem Wachstum sowie die Verbesserung der Effizienz in Entwicklungsländern. Er wurde erfolgreich angewendet a
Auf der anderen Seite ist der Ansatz an sich eher komplex und erfordert viele verschiedene Entscheidungen und eine Vielzahl von sektorspezifischen Daten, weswegen er als wenig transparent wahrgenommen werden kann. Vorhersagen von Produktionswachstumsraten für die Schwerindustrie und den Stromsektor sind zudem notwendig, die oftmals nur grobe Schätzungen darstellen. Eine Eglobalen Niveau könnte sehr schwierig sein.
Bei der Verteilung von Emissionsrechten ist ein grundlegender Zwiespalt sichtbar: Ansätze, die einfach sind, können keine nationalen Umstände und Besonderheiten berücksichtigen. Auf der anderen Seite können sehr ausgeklügelte Ansätze eben diese Unterschiede berücksichtigen. Der Triptych-Ansatz zählt zu den eher ausgefeilten Methoden. Die Anwendung in der EU hat aber gezeigt, das auch komplexe Vorschläge als Basis für politische Entscheidungen genutzt werden können. Trotz seiner Komplexität kann der Triptych-Ansatz weiterhin als Grundlage für die Aufteilung von Emissionsberechtigungen von Staaten oder Ländergruppen genutzt werden.
9. Ein Kompromiss Vorschlag Im Rahmen dieses Projekts haben wir auch einen sogenannten „Kompromissvorschlag“ (Englisch: a compromise proposal) entwickelt. Dieser enthält und verbindet viele der vorangegangenen und diskutierten Vorschläge. Der Kompromissvorschlag zielt darauf ab, die meisten Bedürfnisse und Bedenken zu berücksichtigen, wobei jedoch das Umweltziel einer Treibhausgasstabilisierung weiterhin erreichbar sein seK
Anstrengungen unternommen werden, auf möglichst vielen Ebenen Emissionsreduktionen in Industriestaaten zu erreichen und Emissionen in Entwicklungsländern möglich niedrig zu halten. Der Kompromissvorschlag besteht aus vier Teilen:
31
ECOFYS Options for the second commitment period
nachhaltigen Entwicklungspfads muss beobachtet und Ergebnisse verifiziert werden. Die dafür notwendigen Kosten können einerseits vom entsprechenden Land selber getragen werden oder aber durch Entwicklungshilfebudgets gedeckt werden, die durch zusätzliche klimabezogene Fonds ergänzt werden können.
Stufe 3 – Moderate, absolu el n e te h, olu ie r nsreduktionen anzunehmen. Das Emission u nnte steigen, sollte aber u r
liegen olch ne Z erei rung nnte alterna auchZiele’ gestaltet werden, w it ge int rechtigung verk we
n, sollte das Ziel übe füllt . Sollte das Ziel nicht err ht werden, sen räge an Emissionsbe htigu gs cht z kauft werden. Ein wesentlicher
solches Ziel z akze ren steht de ögli eit Tei me am Übererfüllung d iele.
te Red ione Län in Stufe 4 müssen bet htlich absolute duktionen erzielen bis ei Pro pf-E onsniveau eich . Mit r
ehr Län in S 4 ei ten sich solc absoluten Reduktionen
egen sich durch die Stu ge de ierte chw nen z.B Pro- ne sein. a M erun fü äte
intretende Länd ten ziell infac w en (sie k en von cklungen profitieren) wird sich r Sc llen t von ufe Stu
ie Zeit weiter verminde
zu sofortigen Emis nsm rungen kön sich Lände iwillig dazu flich , ologien zu entwickeln zu implem b sgas uktio
(ähnlich wie das bereits im hme K venti und Kyo Protokolls er t Teil 2 des Kompromissvorschla B der erh ng absoluter
minderungsziele w de ändern Ge enheit gege , s T nologie-ungen einzugehen. ollten iese nde avon ebra h m en, rden
hre absoluten Emission le etwas en annt, d.h. ihnen we n m Re
raben.
Beispielfall berechnet. Abbildung F zeigt die Emis nStabilisiewann diezu 450 pDurchschnittswerte nario. Für Regionen sind bevölkeru
te Zi e: Lä der v rpflich n sic abs te Z le füEmissio snivea kö ntedem Referenzszenario . S ei ielv nba kö tiv als ‚positiv bindende om me ist, dass Be en auft rdenkönne rer sein eic müs dieFehlbet rec ngen allerdin ni ugeAnreiz, ein u ptie be in r M chk zur lnahEmissionshandel bei er Z
Stufe 4 – AbsoluEmissionsre
ukt n: der räc e n niedriges -Ko missi err t ist de
Zeit würden immer mverpflichten.
der tufe ntre und zu hen
Länder bew se fen mäß fin r S ellenwerte. SolcheSchwellenwerte kön . Kopf-Emissio n D ind gen r sp r inVerpflichtungen e
logischen Entwier den e her erd önn
techno de hwe wer St 3 zu fe 4über d rt.
Zusätzlich sio inde nen r fre verp tenneue Techn und entieren, die zu Trei hau red nenbeitragen Ra n der on on des to- folgist, siehe gs). ei V andluEmissions ird n L leg ben olche echverpflicht S d Lä r d G uc ach we imGegenzug i szie tsp rde ehr chtezugeteilt. Die Verifizierung von Technologieverpflichtungen ist problematisch und müsste weiter konkretisiert werden, denn hier besteht Potential, das System zu unterg
Wir haben die Emissionsberechtigungen für einensio sberechtigungen unter einem Mehrstufenansatz für das Szenario A1B mit einem
rungsniveau 450 ppmv CO2 Konzentration. Tabelle C zeigt den möglichen Zeitpunkt, ses Land in die verschiedene Stufen wechselt, wobei ein Langfriststabilisierungsniveau pmv angestrebt wird. Die Zahlenwerte in der Tabelle verdeutlichen die Stufe als
über 6 Fälle, ein Fall je IPCC Szengsgewichtete Durchschnitte angegeben.
32

ECOFYS Options for the second commitment period
0
5000
10000
15000
20000
MtC
2500
3000
3500
4000
00
1990
2000
2010
2020
2030
2040
2050
2060
2070
2080
2090
2100
O2e
q. 0
0
0
0
45 0 EAsiaCPAsiaSAsiaMEAFRLAMREEURAIJPNRUS+EEUEU25USA
Tabelle C. Wahrscheinlicher Termin für den Übergang von Ländern in verschiedene Stufen unter Zielsetzung eines 450 ppmv Langzeitstabilisierungsniveaus. Die Zahlenwerte verdeutlichen die Stufe als Durchschnittswerte über 6 Fälle, ein Fall je IPCC Szenario. Für Regionen sind bevölkerungsgewichtete Durchschnitte angegeben. 2020 2030 2040 2050 2060 2070 2080 2090 2100
Abbildung F: Emissionsberechtigungen unter einem Mehrstufen Ansatz für das A1B Szenario mit dem Ziel einer Stabilisierung zum Niveau 450 ppmv CO2 Konzentration
Annex I 4.0 4.0 4.0 4.0 4.1 4.9 5.0 5.0 5.0Rest of Eastern Europe 2.6 3.2 3.4 3.4 3.6 4.1 4.2 4.3 4.3Argentina 3.0 4.0 4.0 4.0 4.2 5.0 5.0 5.0 5.0Brazil 3.0 3.0 3.8 4.0 4.2 5.0 5.0 5.0 5.0Mexico 3.0 3.8 3.8 3.8 4.3 4.8 5.0 5.0 5.0Venezuela 3.0 4.0 4.0 4.0 4.2 5.0 5.0 5.0 5.0Rest of Latin America 2.4 2.7 2.8 3.2 3.2 3.5 3.8 3.9 4.0Egypt 1.8 2.0 2.8 3.3 3.7 3.8 4.7 4.8 5.0South Africa 3.0 4.0 4.0 4.0 4.7 5.0 5.0 5.0 5.0Nigeria 1.0 1.0 1.7 2.0 2.5 3.3 3.7 4.3 4.7Rest of North Africa 2.2 2.3 2.8 3.4 3.4 3.9 4.0 4.1 4.2Rest of Africa 1.1 1.2 1.4 1.6 1.9 2.2 2.4 2.7 3.0Saudi Arabia 3.0 4.0 4.0 4.0 4.2 5.0 5.0 5.0 5.0United Arab Emirates 3.0 4.0 4.0 4.0 4.2 5.0 5.0 5.0 5.0Rest of Middle East 2.8 3.4 3.4 3.6 3.9 4.4 4.5 4.5 4.5China 3.0 3.0 3.2 3.7 3.7 4.2 4.7 5.0 5.0India 1.0 1.5 2.0 2.3 3.2 3.3 3.8 4.0 4.3Indonesia 1.0 1.7 2.0 2.3 2.3 2.5 2.7 3.0 3.7South Korea 3.0 4.0 4.0 4.0 4.2 4.5 5.0 5.0 5.0Malaysia 3.0 4.0 4.0 4.0 4.2 5.0 5.0 5.0 5.0Philippines 1.0 1.0 1.5 1.7 1.8 1.8 1.8 2.3 2.8Singapore 3.0 4.0 4.0 4.0 4.2 4.7 5.0 5.0 5.0Thailand 3.0 3.2 3.7 3.8 4.2 4.8 5.0 5.0 5.0Rest of Asia 1.2 1.3 1.5 1.7 1.7 1.8 1.9 2.1 2.3“Stufe 5” ist der Zustand, in dem ein Land in Stufe 4 pro Kopf Emissionen auf ein sehr niedriges Niveau gesenkt hat und nun keine weiteren Emissionsreduktionen durchführen muss.
33
ECOFYS Options for the second commitment period
Der Kompromiss Vorschlag hat mehrere Vorteile:
• Der Vorschlag ist als Kompromiss gestaltet, um viele verschiedene Ansichten zu unterschiedlichen Themen zu integrieren. Er kann somit verschiedene Anforderungen erfüllen. Viele Länder oder Ländergruppen können in diesem Ansatz ihre eigen Bedenken wieder- und letztlich berücksichtigt finden.
• Der Vorschlag ermöglicht eine Integration von Ländern in obligatorische Emissionsminderungsverpflichtungen. Dies ist im Sinne der UNFCCC. Der Vorschlag berücksichtigt damit nationale Umstände (insbesondere wenn Tryptich zur Lastenverteilung in Stufe 4 herangezogen wird).
• Der Vorschlag erlaubt Flexibilität hinsichtlich sofortiger Emissionsreduktionen und Technologieentwicklung, die zukünftige Emissionen reduzieren helfen.
• Der Vorschlag erlaubt eine schrittweise Entscheidungsfindung. Dies wird wohl der gangbare Weg sein, langfristige internationale Vereinbarungen zu erzielen.
• Der Vorschlag baut Vertrauen auf, denn industrialisierte Länder übernehmen zunächst massive Emissionsreduktionen.
Der Ansatz besitzt allerdings auch einige Schwächen:
• Der Gesamtansatz beschreibt ein relativ komplexes System, das viele Entscheidungen erfordert.
• Es besteht ein beträchtliches Risiko, dass Länder zu spät in die nächst höhere Stufe aufsteigen. Damit besteht die Möglichkeit, dass ambitionierte längerfristige Stabilisierungsniveaus außer Rechnweite gelangen könnten. Deshalb sind Anreize für Länder notwendig, in den einzelnen Stufen teilzunehmen. Schwellenwerte allein sin nicht ausreichend. Die für Stufe 3 und 4 vorgesehene Flexibilität hinsichtlich reduzierter
punkt kann jedoch in ein solches System durch die en. Die USA müsste dann allerdings umfassende
Anstreneher mo
10. VerEin eAns eMehrstuof Com Cs, PFCs und SF6 für insg
d
Emissionsziele bei freiwilligen Technologievereinbarungen steigert zudem die Unsicherheiten der Erreichung globaler Emissionsziele.
Als besonders kritisch für die Praxistauglichkeit dieses Systems ist die Teilnahme der USA zu bewerten. Ihr gegenwärtiger StandTechnologieoption aufgenommen werd
gungen zeigen, neue Technologie zu entwickeln. Im Gegenzug würden die USA ein derates Emissionsminderungsziel erhalten.
gleich der Emissionsberechtigungen V rgleich von Emissionsberechtigungen unter den verschiedenen hier diskutierten ätz n wurde abschließend vorgenommen (Contraction & Convergence, CDC,
fenansatz und Triptych 6.0). Für den Vergleich nutzen wir das EVOC Modell (Evolution mitments Model), welches Emissionen der Gase CO2, CH4, N2O, HFesamt 192 Länder enthält.
34
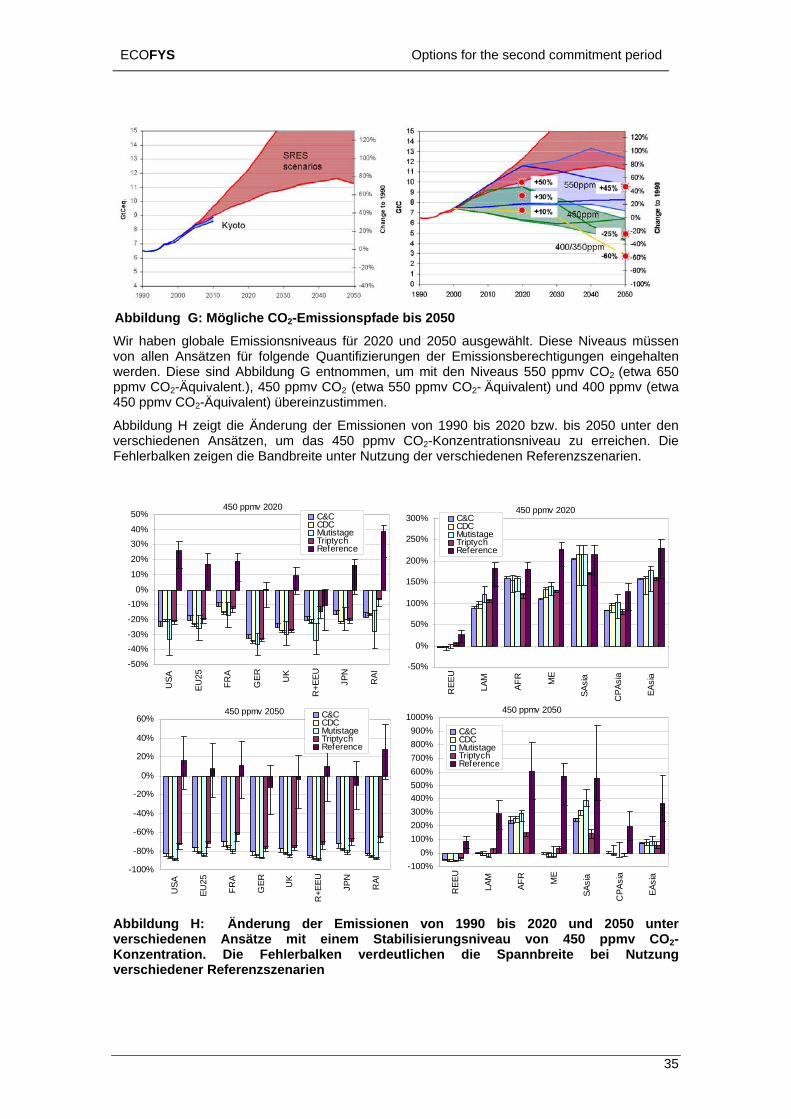
ECOFYS Options for the second commitment period
ng G: Mögliche COAbbildu
Wir habvon allewerden.ppmv C450 ppm
Abb uverschie
renzszenarien.
2-Emissionspfade bis 2050 en globale Emissionsniveaus für 2020 und 2050 ausgewählt. Diese Niveaus müssen n Ansätzen für folgende Quantifizierungen der Emissionsberechtigungen eingehalten Diese sind Abbildung G entnommen, um mit den Niveaus 550 ppmv CO2 (etwa 650 O2-Äquivalent.), 450 ppmv CO2 (etwa 550 ppmv CO2- Äquivalent) und 400 ppmv (etwa v CO2-Äquivalent) übereinzustimmen.
ild ng H zeigt die Änderung der Emissionen von 1990 bis 2020 bzw. bis 2050 unter den denen Ansätzen, um das 450 ppmv CO2-Konzentrationsniveau zu erreichen. Die
Fehlerbalken zeigen die Bandbreite unter Nutzung der verschiedenen Refe
450 ppmv 202050% 450 ppmv 2020
-50%
-40%-30%
-20%
-10%%
%40%
USA
0
10%
20%
30
EU25
FRA
GER UK
R+E
EU JP RAN I
C&CCDC
-50%
%
250%
300%
REE
U
0%
50%
100%
150%
200
LAM
AFR ME
SAsi
a
CPA
sia
EAsi
a
MutistageTriptychReference
C&CCDCMutistageTriptychReference
450 ppmv 205
-60%
-40%
-20%
0%
0%
60%0
-100%
-80%
USA
EU25
FRA
GER UK
R+E
EU JPN
RAI
20%
4
C&CCDCMutistageTriptychReference
450 ppmv 2050
100%20
500%600%700%800%
CP
0%300%400%
900%1000%
-100%0%
REE
U
LAM
AFR ME
SAsi
a
Asia
EAsi
a
C&CCDCMutistageTriptychRe
bbildung H: Änderung der Emissionen von 1990 bis 2020 und 2050 unter
it einem Stabilisierungsniveau von 450 ppmv CO2-Konzentration. Die Fehlerbalken verdeutlichen die Spannbreite bei Nutzung verschiedener Referenzszenarien
ference
Averschiedenen Ansätze m
35
ECOFYS Options for the second commitment period
Die Analyse zeigt folgende Ergebnisse:
• Um die Einhaltung des EU-Ziels, den Temperaturanstieg im Vergleich zum vorindustriellen Niveau auf höchstens 2°C zu begrenzen, müsste nach gegenwärtigem
2
d wesentlich von den Annahmen für Nicht-
tionale Ziel einer Verbesserung der Energieintensität um 18% der Fall wäre. Das von
m Referenzszenario abweichen. Einige Länder müssen
n Vorgaben, wie 400 ppmv CO Konzentration, wären es
• ßer als die Differenz zwischen den
• er EU-Mitgliedsstaaten sind sehr anspruchsvoll,
Stand des Wissens und unter Annahme einer mittleren Klimasensitivität eine Stabilisierung der CO2-Konzentration deutlich unterhalb von 450 ppmv angestrebt werden.
• Im Falle, dass keine Anstrengungen unternommen werden, Emissionen weiter zu reduzieren, besteht eine hohe Wahrscheinlichkeit, dass die Option 450 ppmv CO bereits zu Beginn des Jahres 2020 nicht mehr erreichbar sein wird.
• Um das 450 ppmv CO2-Niveau zu erreichen, müssen die Emissionen der entwickelten Länder beträchtlich reduziert werden. Für das hier gewählte Beispiel hinsichtlich Stabilisierungsniveau und die für die betrachteten Ansätze gewählten Parameter müssten Annex-I-Länder ihre Emissionen in der Größenordung -20% unterhalb der Emissionen von 1990 bereits im Jahr 2020 senken. Für das 550 ppmv CO2 Niveau würden die Reduktionen der Größenordung -15% und für das 400 ppmv CO2 Niveau ungefähr –35% betragen. Diese Werte sinAnnex-I-Länder beeinflusst. Fast alle Ansätze lassen Spielraum, durch Variation der gewählten Parameter diese Balance zu ändern.
• Um das 450 ppmv CO2-Konzentrationsziel zu erreichen, müsste die USA in das System involviert werden und weitaus größere Anstrengungen unternehmen, als dies durch das naden USA vereinbarte nationale Ziel würde einen Anstieg der absoluten Emissionen um 20% zum Jahr 2010 im Vergleich zu 1990 erlauben. Mit diesem Ziel könnten die notwendigen Reduktionsziele für die Annex-I-Gruppe nicht erreicht werden. Für das 550 ppmv CO2-Konzentrationsniveau könnte dieses nationale Ziel der USA ausreichend sein, wenn andere Annex-I-Staaten entsprechend ambitioniertere Reduktionen vornehmen.
• Um das 450 ppmv CO2-Konzentrationsziel zu erreichen, müssen Entwicklungsländer so schnell wie möglich von ihredamit bereits ab 2020 beginnen, z.B. Lateinamerika, der Mittlere Osten, Ostasien. Für das 550 ppmv CO2 Niveau wären von einer frühzeitigen Abweichung weniger Länder betroffen, bei strengere 2dagegen entsprechend mehr Länder. Aktionen von Annex-I-Ländern in Form von Technologietransfer oder finanzieller Unterstützung wären notwendig, um die Emissionen der Nicht-Annex-I-Länder unterhalb ihres Referenzszenarios zu halten.
Für die meisten Länder ist die Differenz der Reduktionen zwischen den Stabilisierungsniveaus (400, 450, 550 ppmv) gröverschiedenen Ansätzen, die alle auf ein bestimmtes Stabilisierungsniveau hinzielen. Die Wahl eines bestimmten Langfriststabilisierungsziels ist somit signifikanter als die Wahl eines bestimmten Lastenteilungsansatzes.
Nationale Langfristziele einzelnentsprechen aber unterschiedlichen Stabilisierungszielen.
Die notwendigen Reduktionen sind in Tabelle D zusammen gefasst.
36
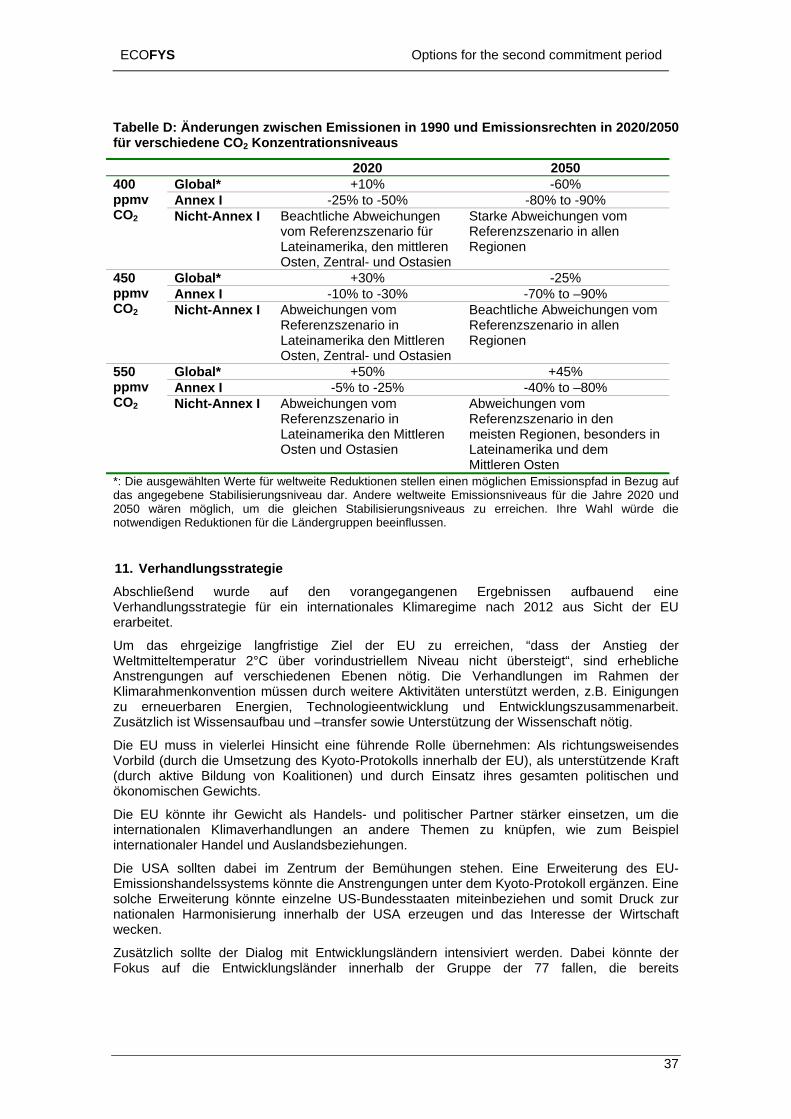
ECOFYS Options for the second commitment period
Tabelle D: Änderungen zwischen Emissionen in 1990 und Emissionsrechten in 2020/2050 für verschiedene CO2 Konzentrationsniveaus
2020 2050 Global* +10% -60% Annex I -25% to -50% -80% to -90%
400 ppmv CO2 Nicht-Annex I Beachtliche Abweichungen
vom Referenzszenario für Lateinamerika, den mittleren Osten, Zentral- und Os
Starke Abweichungen vom Referenzszenario in allen Regionen
tasien Global* +30% -25% Annex I -10% to -30% -70% to –90%
450 ppmv CO2 Nicht-Annex I Abweichungen vom
Referenzszenario in Lateinamerika den Mittleren Osten, Zentral- und Ostasien
Beachtliche Abweichungen vom Referenzszenario in allen Regionen
Global* +50% +45% Annex I -5% to -25% -40% to –80%
550 ppmv CO2 Nicht-Annex I Abweichungen vom
Referenzszenario in Lateinamerika den Mittleren Osten und Ostasien
Abweichungen vom Referenzszenario in den meisten Regionen, besonders in Lateinamerika und dem Mittleren Osten
*: Die ausgewählten Werte für weltweite Reduktionen stellen einen möglichen Emissionspfad in Bezug auf das angegebene Stabilisierungsniveau dar. Andere weltweite Emissionsniveaus für die Jahre 2020 und 2050 wären möglich, um die gleichen Stabilisierungsniveaus zu erreichen. Ihre Wahl würde die notwendigen Reduktionen für die Ländergruppen beeinflussen.
11. Verhandlungsstrategie Abschließend wurde auf den vorangegangenen Ergebnissen aufbauend eine Verhandlungsstrategie für ein internationales Klimaregime nach 2012 aus Sicht der EU erarbeitet.
Um das ehrgeizige langfristige Ziel der EU zu erreichen, “dass der Anstieg der Weltmitteltemperatur 2°C über vorindustriellem Niveau nicht übersteigt“, sind erhebliche Anstrengungen auf verschiedenen Ebenen nötig. Die Verhandlungen im Rahmen der Klimarahmenkonvention müssen durch weitere Aktivitäten unterstützt werden, z.B. Einigungen zu erneuerbaren Energien, Technologieentwicklung und Entwicklungszusammenarbeit. Zusätzlich ist Wissensaufbau und –transfer sowie Unterstützung der Wissenschaft nötig.
Die EU muss in vielerlei Hinsicht eine führende Rolle übernehmen: Als richtungsweisendes Vorbild (durch die Umsetzung des Kyoto-Protokolls innerhalb der EU), als unterstützende Kraft (durch aktive Bildung von Koalitionen) und durch Einsatz ihres gesamten politischen und ökonomischen Gewichts.
Die EU könnte ihr Gewicht als Handels- und politischer Partner stärker einsetzen, um die internationalen Klimaverhandlungen an andere Themen zu knüpfen, wie zum Beispiel internationaler Handel und Auslandsbeziehungen.
Die USA sollten dabei im Zentrum der Bemühungen stehen. Eine Erweiterung des EU- Emissionshandelssystems könnte die Anstrengungen unter dem Kyoto-Protokoll ergänzen. Eine solche Erweiterung könnte einzelne US-Bundesstaaten miteinbeziehen und somit Druck zur nationalen Harmonisierung innerhalb der USA erzeugen und das Interesse der Wirtschaft wecken.
Zusätzlich sollte der Dialog mit Entwicklungsländern intensiviert werden. Dabei könnte der Fokus auf die Entwicklungsländer innerhalb der Gruppe der 77 fallen, die bereits
37
ECOFYS Options for the second commitment period
Anstrengungen zur Emissionsreduktion gezeigt haben und die zu weiteren Schritten innerhalb rt e in ht
gefä ,
Inne uf von Entsch
t
e d
er ion n
•
Der ta n Verpflic per m festges n n übernom r, auf na n Entwick nd er defin P
Auch A n n verstärk en,
Ebenso e d unterstü ik würd e d effizient te und Ne fek g gegenü a in Entwick nd
Das er
eines insgesamt akzeptablen Systems bereit wären. Die einzelnen Ziele müssen so formuliewerden, dass sie für diese Entwicklungsländer akzeptabel sind. Die EU könnte solche Ansätzunterstützen, die die Teilnahme von Entwicklungsländern begünstigt, wie z.B. eMehrstufenansatz mit einer ersten Stufe, die die wirtschaftliche Entwicklung der Länder nic
hrdet oder dem Triptych-Ansatz.
rhalb des Verhandlungsprozesses der Klimarahmenkonvention wäre der folgende Ablaeidungen denkbar:
• Spezifikation der langfristigen Bestrebungen, da eine solche Entscheidung weitreichende Auswirkung auf kurzfristige Reduktionen und den Reduktionszeitplan ha
• Einigung über die Arten der Verpflichtungen (wie z.B. bindendEmissionsreduktionsziele oder Politiken und Maßnahmen), sowie Angabe, wann unvon wem diese Ziele übernommen werden sollten
• Definition der Berechnungsgrundlage der Arten von Verpflichtungen (für ionEmiss sreduktionsverpflichtungen z.B. die Frage nach der Einbeziehung d
Emiss en aus Landnutzungsänderungen, vom Flug- und Schiffsverkehr und voanderen klimawirksamen Gasen)
Einigung über die exakten Ziele (Reduktionswerte oder bestimmte Maßnahmen)
Stills nd der Verhandlungen könnte mit einem Mandat zur Verhandlung der zweitehtungs iode bei COP 11 im November 2005 aufgehoben werden, in dechriebe ist, welche Arten von Verpflichtungen von welchen Ländergruppe
men werden sollten, z.B. bindende Emissionsverpflichtungen für alle Industrieländechhaltige Entwicklung ausgerichtete oder positiv bindende Ziele für die meistelungslä er in 2020, aber bindende Ziele in 2030. Eine solche langfristige ab
ierte erspektive könnte die Akzeptanz eines solchen Mandats für alle Länder erhöhen.
ktivitäte außerhalb der Klimaverhandlungen unter der Klimarahmenkonvention solltet wer wie z.B. die Koalition und Zielvereinbarungen zu erneuerbaren Energien. d
könnt ie EU die Wissenschaft zum Thema langfristiger internationaler Klimapolitiktzen. Eine internationale wissenschaftliche Konferenz zur internationalen Klimapolit
e di Möglichkeit schaffen, die unterschiedlichen Auffassungen zu einer effektiven unen langfristigen Strategie zu diskutieren. Weitere Untersuchung der positiven Effekbenef te von Emissionsreduktionen könnte dazu beitragen, die Zurückhaltun
ber klim politische Maßnahmen zu senken und bereits unternommene Reduktionen lungslä ern mit in den Blick zu nehmen.
2°C iel einzuhalten ist eine große Herausforderung. Wir hoffen, dass die in dies ZStrategie beschrieben Aktivitäten der EU helfen, diese Herausforderung zu meistern.
38
ECOFYS Options for the second commitment period
12. eACK
2.3 erv
3.
4.
4.55. ISS
5.35.45.5
ni
6.5 Possible actions to further advance adaptation ............................................. 94
Cont nts NOWLEDGEMENTS...................................................................................................... 41
1. INTRODUCTION ............................................................................................................ 42 2. NETWORK AND OVERVIEW OF PROPOSALS .......................................................... 44
2.1 Development of the network ............................................................................. 44 2.2 erv Ov iew of processes on future action.......................................................... 45
Ov iew of approaches, targets and cross-cutting issues .......................... 46 2.4 Overview of institutions..................................................................................... 49 2.5 Interactive forum ................................................................................................ 50 2.6 Lessons learnt and outlook............................................................................... 51 INTERESTS OF COUNTRIES ....................................................................................... 53 3.1 Catalogue of criteria........................................................................................... 53 3.2 Country perspectives and possible conflicts.................................................. 55 3.3 Summary ............................................................................................................. 59 COUNTRY CASE STUDIES .......................................................................................... 60 4.1 Case study: Mexico............................................................................................ 60
4.1.1 National climate policy ............................................................................... 60 4.1.2 Emission profile: current and future emissions .......................................... 61 4.1.3 Vulnerability................................................................................................ 62 4.1.4 Domestic interest groups supporting climate change activities ................. 62 4.1.5 Incentive for Mexico to engage in further action on climate change.......... 62
4.2 Case study: India................................................................................................ 63 4.2.1 National climate policy ............................................................................... 63 4.2.2 Emission profile: current and future ........................................................... 64 4.2.3 Vulnerability................................................................................................ 66 4.2.4 Domestic interest groups supporting climate change activities ................. 66 4.2.5 Incentive for India to engage in future actions on climate change............. 66
4.3 Case study: China .............................................................................................. 67 4.3.1 National climate policy ............................................................................... 67 4.3.2 Emission profile: current and future ........................................................... 69 4.3.3 Vulnerability................................................................................................ 71 4.3.4 Domestic interest groups supporting climate change activities ................. 72 4.3.5 Incentive for China to engage in future actions on climate change ........... 73
4.4 Case study: USA................................................................................................. 74 4.4.1 National climate policy ............................................................................... 74 4.4.2 Emission profile: current and future ........................................................... 76 4.4.3 Vulnerability................................................................................................ 77 4.4.4 Domestic interest groups supporting climate change activities ................. 77 4.4.5 Incentive for the USA to engage in future actions on climate change ....... 78 References .......................................................................................................... 78 UES TO BE CONSIDERED ..................................................................................... 79
5.1 Stabilization of greenhouse gas concentrations ............................................ 79 5.2 Types of future commitments ........................................................................... 81
Participation........................................................................................................ 83 Stringency of emission reductions .................................................................. 86 Adaptation........................................................................................................... 87
5.6 Negotiations........................................................................................................ 88 5.7 Conclusions........................................................................................................ 88 5.8 References .......................................................................................................... 89
6. ADAPTATION ................................................................................................................ 91 6.1 Introduction......................................................................................................... 91 6.2 Defi tion of adaptation ..................................................................................... 91 6.3 Adaptation in the UNFCCC framework ............................................................ 92 6.4 Funding for adaptation under the UNFCCC .................................................... 93
39
ECOFYS Options for the second commitment period
6.6 Further issues....................6.7 Conclusions.......................
................................................................................. 97
................................................................................. 98
7
and cons of CDC and C&C ..................................................................... 113 ............... 115
116 8
........................................................................... 118 8.3 Results............................................................................................................... 124
8.3.1 450 ppmv case......................................................................................... 124 8.3.2 550 ppmv case......................................................................................... 127
8.4 Conclusions...................................................................................................... 129 8.5 References ........................................................................................................ 130
9. A COMPROMISE PROPOSAL.................................................................................... 132 9.1 Description........................................................................................................ 132 9.2 Quantification of emission allowances.......................................................... 135 9.3 Discussion of the criteria ................................................................................ 141 9.4 Conclusions on compromise proposal.......................................................... 142 9.5 References ........................................................................................................ 143
10. COMPARISON OF EMISSION ALLOWANCES ......................................................... 144 10.1 Stabilization of greenhouse gas concentrations .......................................... 144 10.2 Results............................................................................................................... 147
10.2.1 550 ppmv CO2.......................................................................................... 148 10.2.2 450 ppmv CO2.......................................................................................... 150 10.2.3 400 ppmv CO2.......................................................................................... 151 10.2.4 Individual country long-term targets......................................................... 152
10.3 Mitigation costs ................................................................................................ 153 10.4 Conclusions...................................................................................................... 154 10.5 References ........................................................................................................ 155
11. NEGOTIATION STRATEGY ........................................................................................ 157 11.1 Introduction....................................................................................................... 157 11.2 Framework architecture................................................................................... 158
11.2.1 Action until 2012....................................................................................... 158 11.2.2 Negotiations on post-2012 action ............................................................ 158 11.2.3 Links to international activities in other fora ............................................. 161
11.3 Elements of a strategy ..................................................................................... 164 11.3.1 EU leadership........................................................................................... 164 11.3.2 Contents ................................................................................................... 165 11.3.3 Partners.................................................................................................... 167 11.3.4 Supporting activities ................................................................................. 168
11.4 Conclusions...................................................................................................... 169 11.5 References ........................................................................................................ 170
APPENDIX A KICK OFF PAPER NO.1 ......................................................................... 172 APPENDIX B KICK OFF PAPER NO.2 ......................................................................... 174 APPENDIX C KICK OFF PAPER NO.3 ......................................................................... 176 APPENDIX D KICK OFF PAPER NO.4 ......................................................................... 180 APPENDIX E DESCRIPTION OF THE EVOC MODEL................................................. 186
6.8 References .......................................................................................................... 99 . COMMON BUT DIFFERENTIATED CONVERGENCE ............................................... 101
7.1 Introduction....................................................................................................... 101 7.2 A new approach: “Common but differentiated convergence” .................... 104
7.2.1 Description ............................................................................................... 1047.2.2 Methodology of quantification .................................................................. 108
7.3 Comparison of emission allocations ............................................................. 109 7.4 Pros7.5 Conclusions.......................................................................................7.6 References ........................................................................................................
. TRIPTYCH VERSION 6.0............................................................................................. 118 8.1 Introduction....................................................................................................... 118 8.2 Description.............................
40
ECOFYS Options for the second commitment period
ACKNOWLEDGEMENTS This work was funded by the German Federal Environmental Agency as „Kyoto-Protokoll: Untersuchung von Optionen für die Weiterentwicklung der Verpflichtungen für die 2. Verpflichtungsperiode“/“Options for the second commitment period of the Kyoto Protocol”, FKZ 203 41 148/01.
The development of the “Future international action on climate change network” www.fiacc.net was co-financed by the European Commission, Directorate General Environment.
The development of the Triptych 6.0 approach was co-financed by the RIVM.
The authors thank Martin Weiß and Rolf Sartorius of the German Federal Environmental Agency, Michel den Elzen of RIVM and Xianli Zhu from the Chinese Academy of Social Science for their valuable contributions.
41
ECOFYS Options for the second commitment period
42
1. The bapproaccommit the Kyoto Protocol. It intends to facilitate any discussion on the future of the internat ate change regime.
Under the Kyoto Protocol, OECD countries and economies in transition, the so-called Annex I countries, have accepted binding greenhouse gases (GHG) emission targets for period 2008-2012, the first commitment period. Developing countries (non-Annex I countries) have no such commitment, but may host emission reduction projects through the Clean Development Mechanism (CDM). But, reaching the ultimate objective of the UNFCCC, “to achieve … stabilization of greenhouse gas concentrations in the atmosphere at a level that would prevent dangerous anthropogenic interference with the climate system” (UNFCCC, 1992) is only possible, if emission reductions are intensified and participation in those reductions is broadened.
With the US’ repudiation of its Kyoto commitments, the Protocol depended for a long time on ratification by the Russian Federation to enter into force. The EU intended to initiate a dialogue with developing countries on new mitigation commitments to prepare for formal discussions on future action in 2005, as called for under the Protocol. At COP8 in Delhi, India, 2002, and COP9 in Milan, Italy, 2003, it has become very clear that developing countries will not return to the table as long as the fate of the Kyoto Protocol is still uncertain and the USA is not seriously engaged. With the expected entry into force of the Kyoto Protocol on 16 February 205 it seems clear that any post-2012 regime architecture will have to bring both the USA and the major developing countries on board to be politically viable. The key question is how that could be reached in an acceptable way.
While the official negotiations are on hold, multiple activities and initiatives aim at identifying approaches for an international climate policy regime to follow the first commitment period after 2012. Much time and conceptual work was and continues to be dedicated to address the existing obstacles and examining alternative scenarios how such an approach would preferably result in full participation of Parties to the Convention.
This report is the final report of the research project „Kyoto-Protokoll: Untersuchung von Optionen für die Weiterentwicklung der Verpflichtungen für die 2. Verpflichtungsperiode“/“Options for the second commitment period of the Kyoto Protocol”, FKZ 203 41 148/01, which was carried out by Ecofys on behalf of the German Federal Environmental Agency. The project was initiated in June 2003 and terminated in November 2004. The research project builds upon the preceding work of ECOFYS under the project “Evolution of commitments under the UNFCCC: Involving newly industrialized countries and developing countries“ for the Germany Federal Environmental Agency (Höhne et al. 2003)
Within the project we focused our work around the following research questions:
• Which proposals for future commitments or future actions are available and where are they discussed? Chapter 2 includes a description of the activities and currently discussed proposals. A website was developed (www.fiacc.net), that provides detailed up to date information.
• Which elements are important for individual countries or country groups? Chapter 3 summarizes criteria for the evaluation of proposals. Chapter 4 considers in more detail individual interests of some countries.
• Which overall concept can satisfy all demands? As a first step, Chapter 5 lays out the key issues that need to be agreed upon when negotiating a future commitment scheme. Chapter 6 discusses in more detail the issue of adaptation to climate change. Chapters 7, 8 and 9 modify and further develop some of the existing approaches to better increase possible acceptance. Chapters 7 and 8 provide a new approach, the “Common but Differentiated Convergence Approach” and an update of
INTRODUCTION o jective of this report is to provide an overview of the issues, to further develop
hes and to discuss a possible negotiation strategy related to the design the second ment period of
ional clim
ECOFYS Options for the second commitment period
43
the Triptych approach. Based on these considerations, a compromise proposal is pr of emission all
esented in Chapter 9. Chapter 10 provides a quantitative comparisonowances of various approaches.
• How should Germany and the EU act in the international negotiations? Chapter 11 provides a strategy for Germany and the EU on how to act in the international negotiations.
ECOFYS Options for the second commitment period
44
2. ND OVERVIEW OF PROPOSALS NETWORK AThis chapter describes the steps carried out to establish and maintain an information platform “Future international action on climate change network” (www.fiacc.net). It further provides an extract of the content of the website with an overview of discussion processes, active
2.1
NetReferrincommuni of sim
Future this topilevewill star search consortia and working groups at wposframew
Somraised events to a wide holders. In addition, many workshops were initiated and hos iscussing specific issues on future commitments
The more concepts are being presented and discussed by the international climate change and the less manageable it is to
ternational action on climate change
piled in the initial phase of the project.
strengthened in particular and awareness raising addressed throughout the entire project lifetime.
al Action on Climate ormation on current
rganised, transparent and
ts, reminders and
institutions and recently discussed proposals.
DEVELOPMENT OF THE NETWORK
works have different connotations and the term is used widespread in every day’s life. g to people and their communication processes, a network represents a cation system consisting of a group of individuals sharing ideas and information
ilar nature.
climate commitments after 2012 are widely discussed today. To date, discussion on c is not coordinated or streamlined nor is the issue officially negotiated at political
l. Official negotiations on a second commitment period and a review of the Kyoto Protocol t in 2005 at the earliest. Currently, individuals, re
ell established climate policy research organizations develop alternative concepts of a t-2012 regime and invite interested stakeholders to discussing these concepts within the
ork of different dialog processes.
e level of awareness on the various existing approaches, concepts and ideas has been by presenting those concepts at e.g. the Conferences of Parties and at SBSTA side
r range of staketed by researchers, project teams and other organizations in the past d
audience the more difficult it becomes to follow all activitieskeep on track with the latest developments.
In mid 2003, there was clearly a need to address the ineffective information dissemination. Within this project, Ecofys developed the “future innetwork (FIACC)”. This web-based information network provides a single information pool on the “who is active”, “what are the approaches” and “how do discussion and dialog processes work” for any stakeholder that is interested in the negotiations on a second commitment period after 2012.
The main activities undertaken to develop such a network include:
• Collecting and updating information by establishing contact to research institutions, delegates and individuals either hosting discussion processes on future commitments or developing approaches for a post-2012 commitments. A list of active players and processes was com
• Increasing stakeholder participation by awareness raising and information dissemination activities on the network during side events at COP9 and SBSTA 20. Contacts to developing country representatives active in research or negotiations on future action were
Setting up a website in English language on “Future InternationChange” and public announcement. The website provides inf
•
processes, approaches and cross-cutting issues in an oopen way and was launched in December 2003.
• Supporting monthly discussions that took place between December 2003 and May 2004 by inviting for opinion exchange on selected topics, providing input on various discussion papers to initiate discussions, circulating announcemen
ECOFYS Options for the second commitment period
45
providing the required web based logistics for posting information according different ams.
A w egovernm tively working in the area of future international climate change acti became an internationally well-rec
To e
such as announcements of
esentations of
re commitments and future actions distinguishing between dialog process for
g processes for generating new ideas and completed processes;
rnative approaches to the first
on
hen considering future international actions on climate change, and
mostly
by external funding agencies. These new
The followicoowithin t ogue - Equity in the Greenhouse", one of the proc
Dialog processes for negotiators
•
• International Network To Advise Climate Talks (INTACT), by SWP
discussion stre
id range of stakeholders such as research institutes, private businesses, NGOs, ents and delegates ac
ons were reached with this networking initiative. The websiteognised information platform on future action on climate change.
dat , the FIACC website covers the following items:
A home page welcoming the user and providing newsrecent meetings, upcoming meetings and recent literature;
A meeting page where detailed information including results and prrecently held meetings can be accessed and upcoming meetings are announced;
A compilation of ongoing and completed discussion processes and dialogs on futu
negotiators, dialo
A compilation of institutions involved in designcommitment period and ordered by continents;
ing alte
A list and description of approaches under consideration and discussion international action on climate change after 2012, special types of targets and additional and rather cross-cutting issues;
A compilation of tools instructive w
A forum interface for online discussions and information exchange.
2.2 OVERVIEW OF PROCESSES ON FUTURE ACTION
Informal discussion and dialog on future international actions on climate change currently take place at negotiator level and at policy research level.
At negotiator level, discussions are not yet formal but designed as informal and rather informative non-regular meetings and exchange of viewpoints. These discussions are by invitation only and sometime include only certain countries or country groups.
At policy research level, the core activities include generating new ideas on future action and commitment schemes and discussing them with the international scientific and policy research community. These discussions are structured, linked to fixed term dialog processes and concrete outputs and are often supported insights and scientific outputs are meant to inform negotiators and assist them with preparing their negotiation strategy.
ng processes on future international action on climate change were identified in peration with Wuppertal Institute that kindly made information available that was compiled
he framework of the "South-North-Dialess listed below.
• Negotiations under the Climate Change Convention (UNFCCC) OECD Annex I Expert Group
• European Union Expert Group on Future Action (EGFA) • Japanese Initiative • CCAP dialogue on CDM and future international actions to address global Climate
change
ECOFYS Options for the second commitment period
46
• Beyond Kyoto: Advancing the International Effort against Climate Change, by the
ate, by UNEP Risoe, RIVM, IIED
Com• ng Term (COOL), by RIVM
Fur ct details
Ongoing processes
PEW Center • CAN Equity Process • Climate of Trust: the Kyoto Protocol and Beyond, by WRI • Climate Policy for the 21st Century, by Centre for Transatlantic Relations • Developing a post-2012 policy architecture, by Fridtjof Nansen Institute et al. • Development and Clim• Equity and Justice Implications of Adaptation to Climate Change • Helping to operationalise Article 2 (HOT), by RIVM, IVM • Options for future international action on climate change, by ECOFYS • Research project on the Next Step of Climate Change Regime, by NIES and IGES • South-North-Dialogue: Equity in the greenhouse, by Wuppertal Institut and EDRC
pleted processes
Climate Options for the Lo• Dangerous Climate Change, by Tyndall Centre • Strategic Assessment of the Kyoto-Marrakech System, by RIIA et al. • The transatlantic Dialogue on climate change: new ideas for a new era, by CEPS
ther information on those listed processes including their objectives and contacan be found at the website www.fiacc.net.
2.3 OVERVIEW OF APPROACHES, TARGETS AND CROSS-CUTTING ISSUES
fiacc.net
The website provides also an overview of approaches on how to design a post 2012 commitment scheme. Furthermore, different types of proposed targets are discussed and some additional issues addressed, representing rather crosscutting issues for a future political debate to consider.
The term “Approach” encompasses in principle the conceptual idea of how a post 2012 system can be designed. Currently, a number of such approaches are developed by different organisations. These approaches are briefly summarised in the following section and active researchers are identified. For more information readers should refer to www. .
g Kyoto” or “increasing participation”, often the key features of
ept and only minor
Continuing Kyoto: (Research is done, e.g., by WRI and Ecofys). The Kyoto Protocol provides a very flexible structure, which could incorporate many of the approaches described below. For example, the converging per capita emissions or intensity targets could be included in a second commitment period of the Kyoto Protocol. Essentially, most other approaches could be called “Continuing Kyoto”.
When referring to “Continuinthe Kyoto Protocol are meant, which include:
• Maintaining two groups of countries, Annex I and Non-Annex I, assuming that gradually countries move into Annex I
• Binding absolute emissions reduction targets for Annex I countries for a basket of greenhouse gases
• Flexibility through Kyoto Mechanisms, such as emissions trading (ET), Joint Implementation (JI) and the Clean Development mechanism (CDM)
Some also refer to a "Kyoto Plus" approach, where the main features are kadditional changes are made. Intensity targets instead of absolute targets or other minor adjustments such as "price caps" or only "positively binding targets" can be introduced as an interim measure for some or all developing countries. The critical issue of this approach is to
ECOFYS Options for the second commitment period
47
: (Research is done, e.g., by RIVM, HWWA, Ecofys). The “multistage
of yearly global emissions that lead to that
As all countries participate, those countries
nvergence to a per capita
nical potential. They are also open to political
ent emissions structures of the countries. It can take into account that emissions from some sectors, e.g. transport, are difficult to reduce (resulting in a high sector per-capita convergence level), while
ensure that Annex I countries commit to sufficiently stringent targets and that some further countries move into Annex I.
Multistage Approachapproach” assumes that countries gradually move through several stages in between Annex I and Non-Annex I countries with respect to increasing stringency, as opposed to the current system of two stages (Annex I and Non-Annex I). This approach would reflect that countries today have different levels of economic development and therefore have different obligations under a future climate treaty. The starting point for grouping countries is to assess their characteristics and to define, to what stage they best correspond. Usually a country “graduates” into the next stage, when it exceeds a certain threshold expressed in, e.g., emissions per capita or GDP per capita.
Such multistage approaches are developed by a number of organizations. One option would be to define four such stages e.g.:
1. No Commitments Stage, where countries have no binding emission obligations (as the current Non-Annex I)
2. Decarbonisation Stage, where countries will have GHG intensity targets expressed as emissions per GDP
3. Stabilization Stage, where countries stabilize their absolute emissions
4. Reduction Stage, where countries need to reduce their absolute emissions
The critical issue about this approach is to ensure that a sufficient number of countries move to higher stages. Regular review of each country's situation and assessment whether it graduates into the next stage would be necessary.
Contraction and Convergence: (Research is done, e.g., by GCI (The Global Commons Institute), RIVM, ECOFYS). With the “Contraction and Convergence” approach, all countries would agree on a global target of, e.g., 450 ppmv stable concentration of carbon dioxide in the atmosphere. They would also agree on a path concentration level (contraction). In a second step, the global emission limit for each year would be shared among all countries, including developing countries, so that per-capita emissions converge by a specific date, e.g. 2050 (convergence). The defined targets for each country can be reviewed and revised when new scientific findings require it. This approach allows for full emissions trading.with less allowances than needed (e.g. industrialized countries) can buy allowances from other countries that receive excess allowances (e.g. least developed countries). If stringent stabilization levels such as 450 ppmv CO2 are to be reached, coemission level below current Non-Annex I average is needed. Consequently, benefits from transfer of resources will be limited to the least developed countries and to the first decades of operation of the system.
This approach has very simple rules. Two major issues need to be negotiated and agreed upon: the target atmospheric concentration of CO2 and the date, at which the entitlements would converge at equal per capita allocations.
Multi-Sector Convergence: (Research is done, e.g., by ECN, CICERO). The “multi-sector convergence” approach applies the principle of converging per-capita emissions to emissions of individual sectors and not on the national level (as the contraction and convergence approach). The convergence level for each sector and the date when convergence should be achieved are defined beforehand based on technegotiations. This approach can in principle be applied on a global scale. It can include all greenhouse emissions gases currently covered under the Kyoto Protocol.
The multi-sector convergence approach takes into consideration the differ
ECOFYS Options for the second commitment period
48
emissions more than a country with high
Bra ia and RIVM). In the negotiations of the Kyo Pamongsimp t rature change and to share emission red
The ap c emissions and attribute cou change, which is subject to further research (see
n started later.
The pro nex I countries. However, it could theoreti ries as well.
Triptyc s done, e.g., by Utrecht University, ECOFYS, RIVM). The Trip h share emission allowances among a group of countries, based on sectoral considerations. The approach can theoretically be applied to any group of
fferences in standard of living, in fuel mix for the ion of electricity, in economic structure and the competitiveness of internationally-
orie clude deforestation and emi
ssions of the sectors are treated differently: For electricity production and industrial ction, a growth in the physical production is assumed together with an improvement in
pro r economic development. For the ‘dom s s into account the n
The allo llowance for each country. Only on ets, to allow countries the flex it ective emission reduction strategy.
The ri ty of Utrecht to share the emi o Kyoto Protocol within the Eur
Com i ions: (Research done by Research Cen of Social Sciences (CASS), China).
mitment to human development with low emissions” approach draws a line between luxury goods of human beings and associated emissions. Having a decent living
stan r tments to red se gas emissions lies with t asic needs and thus generate GHG em
Unr oand xthat wo which would not.
emissions in other sectors, e.g. from landfills, are relatively easy to reduce (resulting in low sector per-capita convergence levels). Under the multi-sector convergence approach, a country with high landfill emissions has to reducetransport emissions.
zil n Proposal: (Research is done, e.g., by IVIGto rotocol, the Brazilian government suggested a method to share emission reductions
t countries. It was proposed to attribute responsibilities to countries according to the of their historical emissions on the surface tempeac
uction efforts proportional to their historical contribution.
a complex analysis to identify historiproach requiresntry's contributions to temperature
, www.match-info.net). In general, coMATCH untries with a longer process of industrialization and thus a longer record of greenhouse gas emissions will have a greater share of responsibility for emission reductions than countries where industrializatio
posal was originally designed for covering Ancally be applied to other count
h Approach: (Research ityc approach is a method to
countries.
The Triptych approach originally distinguished three broad emission sectors: the power sector, the sector of energy-intensive industries and the 'domestic' sectors (e.g. residential and transport emissions). The selection of these sectors was based on a number of differences in national circumstances raised in the negotiations that are relevant to emissions
ission reduction potentials: diand emgenerat
nted industries. The approach was later extended to include also inssions of methane and nitrous oxide.
The emiprodu
duction efficiency. This takes into account the need foe tic’ sectors, convergence of per-capita emissions is assumed. This take
co verging living standard of the countries.
wances of the sectors are added up to a fixed national ae national target per country is proposed, no sectoral targ
ibil y to pursue any cost-eff
T ptych approach was originally developed at the Universissi n allowances of the first commitment period under theopean Union.
m tment to Human Development with Low Emisse for Sustainable Development, Chinese Academy tr
The “combasic and
da d and meeting human being basic needs would not result in taking on commiuce greenhouse gases. The problem with anthropogenic greenhouin he consumption of luxury goods that go beyond the b
issions that are not necessary.
lved in thies s approach is the line between basic and luxury consumption and thus basic lu ury GHG emissions. In addition, those products and services need to be identified,
uld be acceptable under a decent living standard and
ECOFYS Options for the second commitment period
49
Som oof discu ns, treaties, the u tation.
In th fo ction 5.2).
ding targets, positively binding
In a it , information is provided on the web hapter 5):
OF INSTITUTIONS
The pro olders to contact active inst io cessible on the
eb odically when comes available:
re (EDRC), South Africa onde (ENDA), Senegal
Asi
a s (IGES), Japan
• Government of Japan Environment Institute, Korea
he Institute for Development (MIND), Sri Lanka ntal Studies (NIES), Japan
Europe
tal System Research, University of Kassel, Germany
ntre for European Policy Studies (CEPS), Brussels
•
• Centre of the Netherlands (ECN) • ECOFYS • Fondazione Eni Enrico Mattei (FEEM), Italy
e ther issues are listed on the website under “Approaches” that refer to broader topics ssion such as different types of targets, the structure of future negotiatio
eq ity issue and vulnerability and adap
e llowing, different proposed types of targets are discussed (for details see se
• Absolute binding emission reduction targets • Flexible emission targets (dynamic targets, non-bin
targets, dual targets, price caps, sector targets) • Coordinated policies and measures • Enhanced coordinated technology RD&D efforts • Extended CDM • Sustainable Development First dd ion to different concept designs and types of targets site on the following crosscutting issues (for details see C
• Stabilization of greenhouse gas concentrations • Vulnerability and adaptation • Equity • Structure of negotiations
2.4 OVERVIEW
ject team compiled a list of institutions to allow stakehitut ns in either guiding processes or developing approaches. The list is acsite as a means to facilitate network operation. The page is updated periw
new information be
Africa Energy and Development Research Cent
Dévelopment du Tiers-M Environement et a
• Bangladesh Centre for Advanced Studies (BCAS) • Central Research Institute of Electric Power Industry (CRIEPI), Japan • Centre for Science and Environment (CSE), India • Chinese Academy of Social Sciences (CASS), PR Chin• Institute for Global Environmental Studie
• Korea • Munasing• National Institute for Environme• Pelangi, Indonesia • The Energy and Resource Institute (TERI), India
• Centre for Environmen• Centre for European Economic Research (ZEW), Germany • Ce• Centre for International Climate and Environmental Research Oslo, (CICERO),
Norway Chalmers University of Technology, Department of Physical Resource Theory, Sweden Energy Research
ECOFYS Options for the second commitment period
50
•
• • • • • •
• • • • •
Lat
• •
North A
• • • • ory, USA • McDonough School of Business, Georgetown University Washington, D.C. • d Policy of Global Change, USA
nge (PEW), USA
Interna
• • •
2.5 INT
The wepurpose
• Foundation for Environmental Law & Development (FIELD), United Kingdom Free University of Amsterdam, Institute for Environmental Studies (IVM) Fridtjof Nansen Institute, Norway
• German Advisory Council on Global Change (WBGU) • German Federal Environmental Agency (Umweltbundesamt), Germany • German Institute for International and Security Affairs (SWP) • Global Commons Institute (GCI), United Kingdom
Hamburg Institute if International Economics (HWWA), Germany International Energy Agency (IEA), France International Institute for Environment and Development (IIED), United Kingdom National Environmental Research Institute (NERI), Denmark National Institute for Public Health and the Environment (RIVM), The Netherlands New Economies Foundation (NEF), United Kingdom
• Oxford Institute for Energy Studies, United Kingdom Royal Institute of International Affairs (RIIA), United Kingdom Swedish Environmental Protection Agency, Sweden UNEP Risoe Centre (URC), Denmark University of Utrecht, The Netherlands Wuppertal Institute, Germany
in America
IVIG (COPPE / Federal University of Rio de Janeiro), Brazil El Colegio de Mexico (Programa Agua, Medio Ambiente y Sociedad)
merica
• Centre for Clean Air Policy, USA Center for Transatlantic Relations, USA EcoEquity, USA International Institute for Sustainable Development (IISD), Canada Lawrence Berkeley National Laborat
MIT Joint Program on the Science an• PEW Center for Global Climate Cha• Tellus Institute/ Stockholm Environment Institute, USA • World Resources Institute (WRI), USA
tional
Climate Action Network (CAN) International Energy Agency Organization for Economic Co-operation and Development (OECD)
ERACTIVE FORUM
b site includes an interactive internet-based discussion forum with the following s:
a) Allow stakeholders to share their viewpoints and opinions on specific discussion topics that were initiated on a regular basis. The preparation of discussion papers was initiated by the German Federal Environmental Agency, supported by Ecofys or other co-authors.
ECOFYS Options for the second commitment period
51
ge such as to
Online f scussions were organised at www.fiacc.net
b) To provide individuals not directly involved in future actions on climate change an opportunity to post questions on future actions on climate chanapproaches or discussion processes.
orum di and discussed the following them
D ry 2004: “Converging per capita emissions”. Discussions focused on two areas: First, the trade off between simplicity and adequacy was addressed. It was noted that some differentiation in addition to per capita emissions would be necessary in particular related to historical responsibility. Second, the issue of inclusiveness versus practicability was addressed. Converging per capita emissions is often seen as including all countries, but also an approach including only the largest emitters could still aim for convergence in per capita emissions.
Discussion February 2004: “The role of the USA and its re-engagement in climate policy debates”. Discussion concluded that engaging private businesses constructively with proactive players will be key for a re-engagement of the USA. It was mentioned that many US states have implemented or are planning to implement binding absolute targets. The question whether federal actions could be triggered by such state action was controversially discussed, although general consensus was there, that state-level action is key to US-reengagement.
Discussion March 2004: “Interpreting Article 2 of the Convention, dangerous anthropogenic interference with the climate system”. Discussion concluded that any target is strategic, since it implies damages/risks to some which cannot be justified on ethical grounds. The perception of risks seems to be the key to a decision on Article 2. Accordingly, it is not science only that matters, but public and administrative awareness as well.
Discussion May 2004: “Costs of mitigation and its calculation by utilising Integrated Assessment Models”. Online discussion was intended to provide some preliminary thoughts that could be used to further discuss at a workshop organised on this topic and hosted by the Federal Environmental Agency at Berlin on 9 to 11 June 2004. Possibly because of the proximity to the workshop, unfortunately no contributions to this discussion topic were received.
2.6 LESSONS LEARNT AND OUTLOOK
At project end, the functioning of the interactive forum discussion platform was assessed. The results can be summarised as follows.
Users reported personal registration to participate in forum discussions to be not user friendly and would prefer an alternative means for participation. However, apart from minor problems with registration handling, 230 individuals registered and followed discussion but only a few contributed to discussion. The team concludes that some adjustments should be provided to facilitate discussion participation thus attracting more people to participate.
High-quality kick-off papers were prepared to initiate monthly discussions. Although very useful to use as a document to start a debate on, some of the papers may have been too long to attract readers to share their viewpoints with others. A rather long discussion paper might be a major reason for no participation in the May discussion on mitigation costs and Integrated Assessment Models.
Participation takes place on a voluntary basis and required participants to free up some of their time. Since time is the most critical issue for many professionals in climate change, moderate participation in discussion is likely due to individual time constraints.
The website will remain active and discussions will continue on further topics also after project termination in November 2004, then funded by the European Commission. Ecofys will
es (Kick-off papers can be found in Appendix A to Appendix D):
iscussion Janua
ECOFYS Options for the second commitment period
52
improve user-friendliness of global opinion exchange and discussion. Future discussion ld for instance include:
The future role of adaptation and its inter-linkages with mitigation in a future climate
themes tentatively scheduled until the end of 2004 cou
regime
Differentiations between developing countries with regard to their position of a future climate regime.
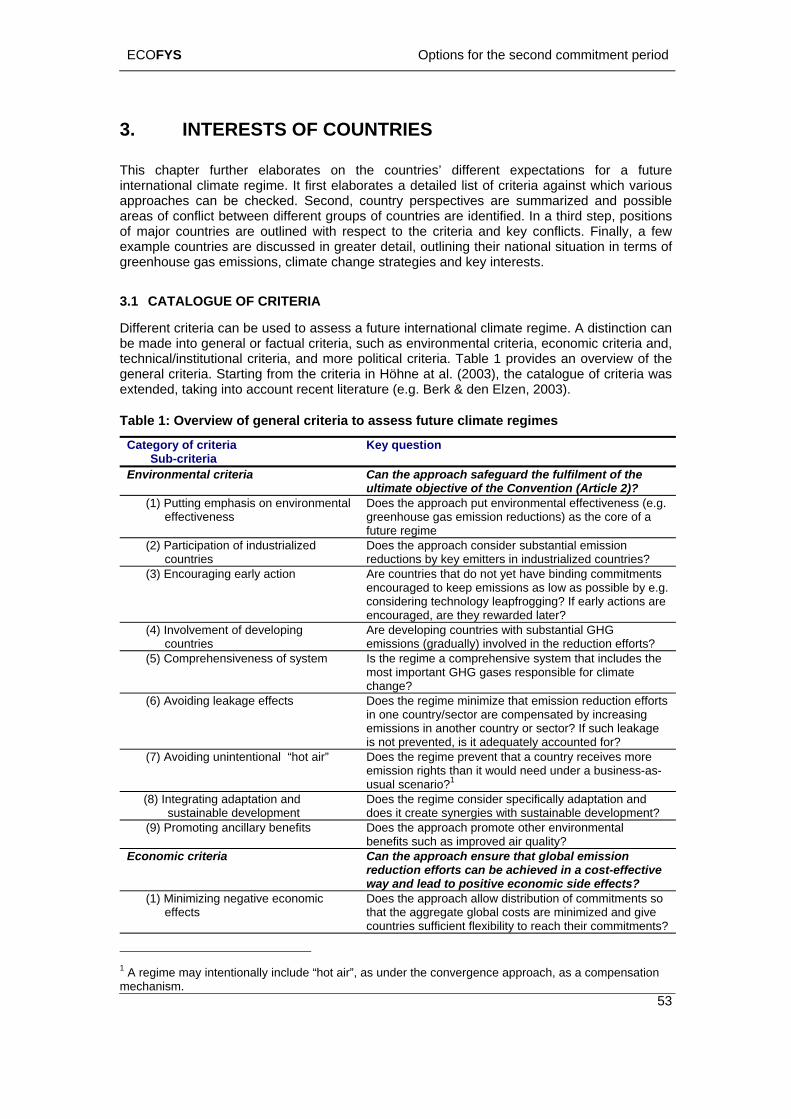
ECOFYS Options for the second commitment period
53
3 RESTS OF COUNTRIES
This n th interna ate regime. It first elabo us approa c e area ups ns of majo ith resp few examp ussed in great s of greenhouse gas emissions, climate chang
3.1
Different criteria can be used to assess a n be made into general or factual criteria, s d, t ore p of the g iteria exte litera
Table 1: Overview of general criteria to te regimes
Ca Su
. INTE
chapter further elaborates otional clim
e countries’ different expectations for a futurerates a detailed list of criteria against which varioountry perspectivches can be checked. Second,
s of conflict between different gror countries are outlined w
le countries are disc
es are summarized and possibl of countries are identified. In a third step, positioect to the criteria and key conflicts. Finally, a er detail, outlining their national situation in terme strategies and key interests.
CATALOGUE OF CRITERIA
future international climate regime. A distinction cauch as environmental criteria, economic criteria an
echnical/institutional criteria, and mene
olitical criteria. Table 1 provides an overview ral criteria. Starting from the cr
nded, taking into account recent in Höhne at al. (2003), the catalogue of criteria wasture (e.g. Berk & den Elzen, 2003).
assess future clima
tegory of criteria b-criteria
Key question
Environmental criteria the Can the approach safeguard the fulfilment ofultimate objective of the Convention (Article 2)?
(1) Putting emphasis on environmental effectiveness
Does the approach put environmental effectiveness (e.g. greenhouse gas emission reductions) as the core of a future regime
(2) Participation of industrialized countries
Does the approach consider substantial emission reductions by key emitters in industrialized countries?
(3) Encouraging early action keep emissions as low as possible by e.g.
considering technology leapfrogging? If early actions are encouraged, are they rewarded later?
Are countries that do not yet have binding commitments encouraged to
(4) Involvement of developing countries
Are developing countries with substantial GHG emissions (gradually) involved in the reduction efforts?
(5) Comprehensiveness of system Is the regime a comprehensive system that includes the most important GHG gases responsible for climate change?
(6) Avoiding leakage effects Does the regime minimize that emission reduction efforts in one country/sector are compensated by increasing emissions in another country or sector? If such leakage is not prevented, is it adequately accounted for?
(7) Avoiding unintentional “hot air” Does the regime prevent that a country receives more emission rights than it would need under a business-as-usual scenario?1
(8) Integrating adaptation and sustainable development
Does the regime consider specifically adaptation and does it create synergies with sustainable development?
(9) Promoting ancillary benefits Does the approach promote other environmental benefits such as improved air quality?
Economic criteria Can the approach ensure that global emission reduction efforts can be achieved in a cost-effective way and lead to positive economic side effects?
(1) Minimizing negative economic effects
Does the approach allow distribution of commitments so that the aggregate global costs are minimized and give countries sufficient flexibility to reach their commitments?
1 A regime may intentionally include “hot air”, as under the convergence approach, as a compensation mechanism.
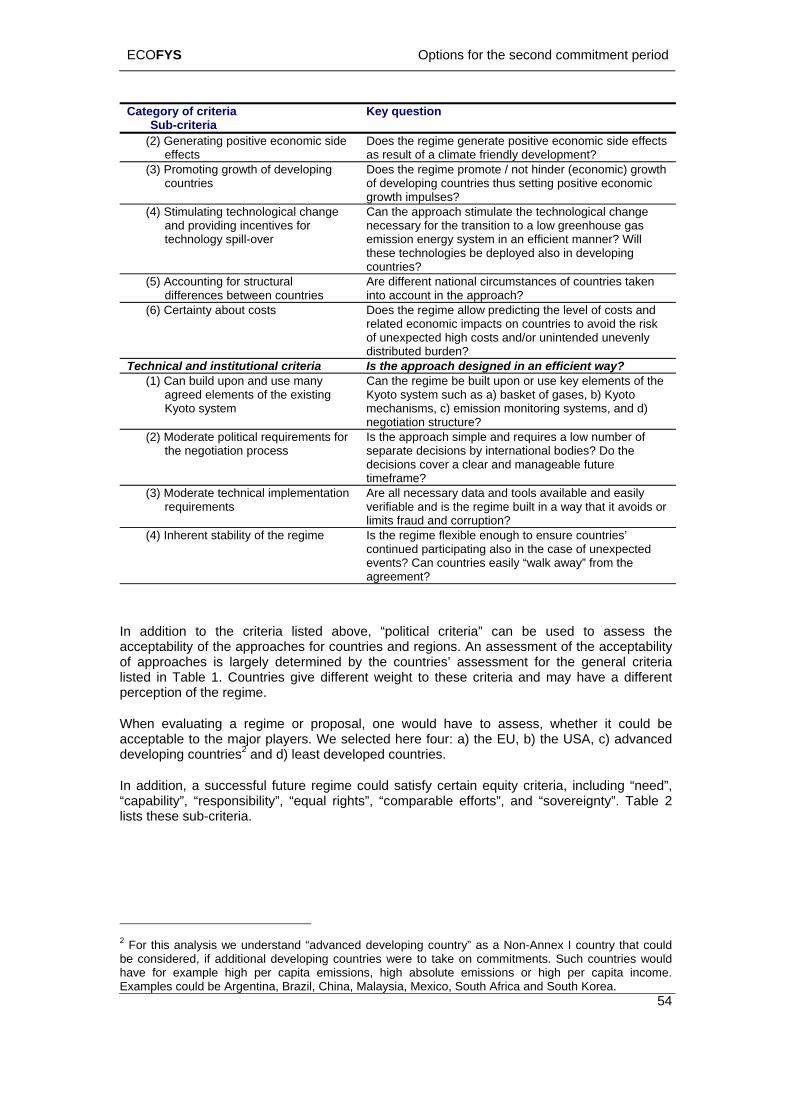
ECOFYS Options for the second commitment period
Category of criteria Sub-criteria
Key question
(2) Generating poseffects
itive economic e regime generate positive economic side effects t of a climate friendly development?
side Does thas resul
(3) Promoting growth of developing Does the regime promote / not hinder (economic) growth countries of developing countries thus setting positive economic
growth impulses? (4) S technological chan
and providing incentives fochnology spil
timulating ge Can the approar
te l-over n energy system in an efficient manner? Will
es?
ch stimulate the technological change necessary for the transition to a low greenhouse gas emissiothese technologies be deployed also in developing countri
(5) Accounting for structural ifferences betwd een countries
ken pproach?
Are different national circumstances of countries tainto account in the a
(6) Certainty about costs Does the regime allow predicting the level of costs anrelated economic impacts on co
d untries to avoid the risk
of unexpected high costs and/or unintended unevenly distributed burden?
Technical and institutional criteria designed in an efficient way? Is the approach(1) Can build upon and u
greed elements of the exisyoto sys
se manya tinK tem
oto system such as a) basket of gases, b) Kyoto mechanisms, c) emission monitoring systems, and d)
g
Can the regime be built upon or use key elements of the Ky
negotiation structure? (2) M nt
th tion process oach simple and requires a low number of
separate decisions by international bodies? Do the oderate political requiremee negotia
s for Is the appr
decisions cover a clear and manageable future timeframe?
(3) M mentation re
Are all necessary data and tools available and easily verifiable and is the regime built in a way that it avoids or
oderate technical implequirements
limits fraud and corruption? (4) In nsure countries’
continued participating also in the case of unexpected herent stability of the regime Is the regime flexible enough to e
events? Can countries easily “walk away” from the agreement?
In addition to the criteria listed above, “political criteria” can be uacceptability of the approaches for countries and regions. An asse
sed to assess the ssment of the acceptability
of approaches is largely determined by the countries’ assessment for the general criteria
developing countries and d) least developed countries.
listed in Table 1. Countries give different weight to these criteria and may have a different perception of the regime.
When evaluating a regime or proposal, one would have to assess, whether it could be acceptable to the major players. We selected here four: a) the EU, b) the USA, c) advanced
2
In addition, a successful future regime could satisfy certain equity criteria, including “need”, “capability”, “responsibility”, “equal rights”, “comparable efforts”, and “sovereignty”. Table 2 lists these sub-criteria.
54
2 For this analysis we understand “advanced developing country” as a Non-Annex I country that could be considered, if additional developing countries were to take on commitments. Such countries would have for example high per capita emissions, high absolute emissions or high per capita income. Examples could be Argentina, Brazil, China, Malaysia, Mexico, South Africa and South Korea.
ECOFYS Options for the second commitment period
55
es and country perspectives
Category of criteria Sub-crit
Key question
Table 2: Overview of political criteria to be used to assess equity elements of approach
eria Political criteria
(1a) Meeting equity principle Is the opportunity given to all countries ir bdevelopment needs? “Needs”
to satisfy the asic
(1b) Meeting equity principle “Capability”
Are the countries required to t those that have the capa y to do so?
ac bilit
(1c) Meeting equity principle Are the c“Responsibility”
ountries required to t those that are responsib the problem?
ac le for
(1d) Meeting equity principle Does th“Equal rights” at
e regim ke equal s of all pemosphere into count?
e ta right ople to use the ac
(1e) Meeting equity principle “Comparable efforts” countri
Does the regim ticipate c parable eff s from similaes to mitigate climate nge?
e an om ort r cha
(1f) Meeting equity principle “Sovereignty”
Does theDoes the a
approach take into unt that states are sover n? pproach use natio current e on as the b for
a future climate policy?
accons’
eigasismissi
(2a) In agreement with fundamental positions of positionthe EU
Could the approach be acceptable for the EU given their c ent ?
u rr
(2b) In agreement with Coulfundamental positions of the USA
cud the approach be acce ble for the ir
rrent position? pta USA given the
(2c) In agreement with fundamental positions of advanced developing countries
Could thgiven th
e approach be acceptable for large developing countries eir current position?
(2d) In agreement with fundamental positi
Could o
LDCs ns of
the approach be acce ble for LDC Least Develo d Countries) given their current position?
pta s ( pe
The hensi nd may ove too long to serve an assessm climate policy regimes. H er, it may be inst furthe evelopin cted ap oaches.
.2 COUNTRY PERSPECTIVES AND POSSIBLE CONFLICTS
This outlined in Tab and Table 2 are parti rly imp U 25, the USA, advanced developing countr nd leas ilter out the most important criteria and major conflic e reco of th NFCCC e more diverse than the four sho are the crucial o for the future negotiat s.
As given the diffe criteria by the major players own public ssment
bje ifferent players think the fulfilment the c nt (YY), whether they are indifferent towards
is undesirable (N) or whether the ition ned (?).
catalogue of criteria is quite compreent framework for different future
ve a pr asowev
ructive to keep this full list in mind when r d g sele pr
3
chapter discusses, which of the criteria le 1 culaortant for major players, such as the E ies at developed countries to f ts. Wgnize that the views of the 189 parties e U ar
neswn here, but we also view that these four ion
a first step, we assessed the emphasis to rent knaccording to our own assessment. As most positions are not
u e dly, the asse
is s ctive. Table 3 shows our perception of whether thof riterion is important (Y) or very importathe criterion (0), whether the fulfilment of the criterion pos of the player could not be determi
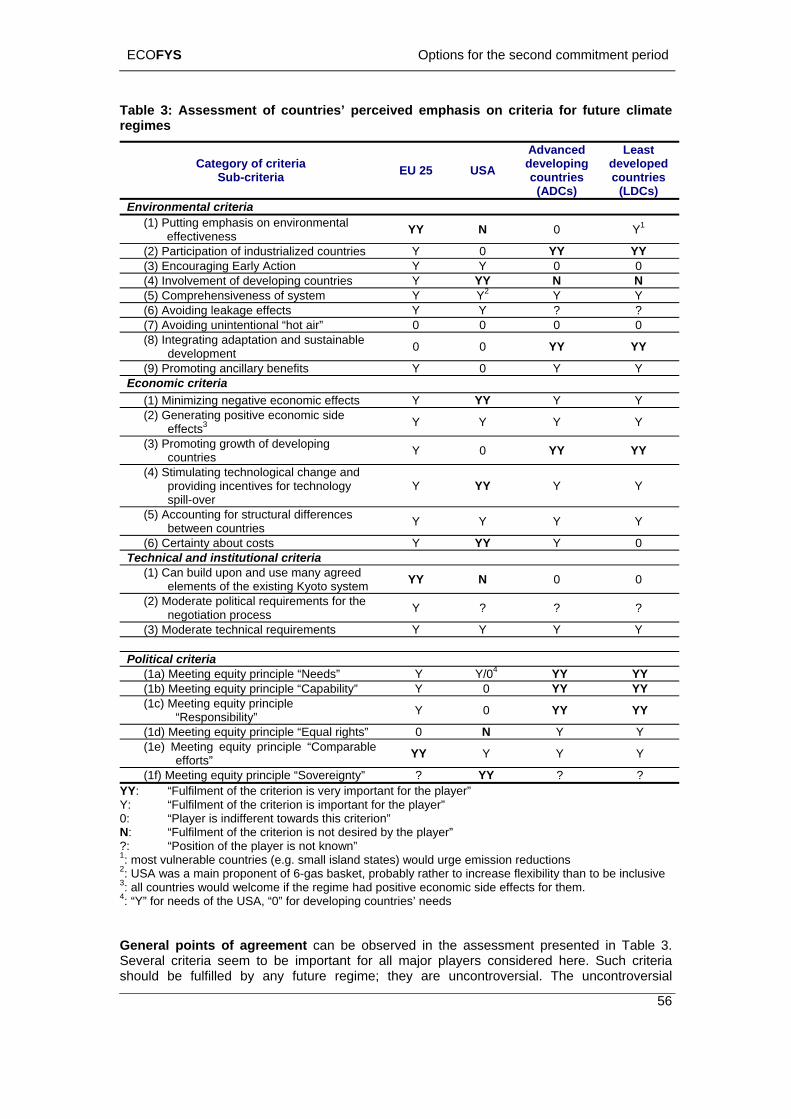
ECOFYS Options for the second commitment period
Table 3: Assessment of countries’ perceived emphasis on criteria for future climate regimes
Category of criteria Sub-criteria EU 25 USA
Advanced developing countries
(ADCs)
Least developed countries
(LDCs) Environmental criteria
(1) Putting emphasis on environmental effective
1ness YY N 0 Y
(2) Participation of industrialized countries Y 0 YY YY (3) Encouraging Early Action Y Y 0 0 (4) Involvement of developing countries Y YY N N (5) Comprehensiveness of system Y Y2 Y Y (6) Avoiding leakage effects Y Y ? ? (7) Avoiding unintentional “hot air” 0 0 0 0 (8) Integrating adaptation and sustainable
development 0 0 YY YY
(9) Promoting ancillary benefits Y 0 Y Y Economic criteria
(1) Minimizing negative economic effects Y Y Y YY (2) Generating positive economic side Y
effects3 Y Y Y
(3) Promoting growth of developing countries Y 0 YY YY
(4) Stimulating technological changeproviding incentives for spill-over
and technology Y Y Y
YY
(5) Accounting for structural differences Y between countries Y Y Y
(6) Certainty about costs Y Y 0 YY Technical and institutional criteria
(1) Can build upon and use many agreed YY N 0 0 elements of the existing Kyoto system (2) Moderate political requirements for the Y ? ? negotiation process ?
(3) Moderate technical requirements Y Y Y Y
Political criteria (1a) Meeting equity principle “Needs” Y Y/04 YY YY (1b) Meeting equity principle “Capability” Y 0 YY YY (1c) Meeting equity principle
“Responsibility” Y 0 YY YY
(1d) Meeting equity principle “Equal rights” 0 N Y Y (1e) Meeting equity principle “Comparable
efforts” YY Y Y Y
(1f) Meeting equity principle “Sovereignty” ? YY ? ? YY: “Fulfilment of the criterion is very important for the player” Y: “Fulfilment of the criterion is important for the player” 0: “Player is indifferent towards this criterion” N: “Fulfilment of the criterion is not desired by the player” ?: “Position of the player is not known” 1: most vulnerable countries (e.g. small island states) would urge emission reductions 2: USA was a main proponent of 6-gas basket, probably rather to increase flexibility than to be inclusive
for them. 3: all countries would welcome if the regime had positive economic side effects4: “Y” for needs of the USA, “0” for developing countries’ needs
General points of agreement can be observed in the assessment presented in Table 3. Several criteria seem to be important for all major players considered here. Such criteria should be fulfilled by any future regime; they are uncontroversial. The uncontroversial
56
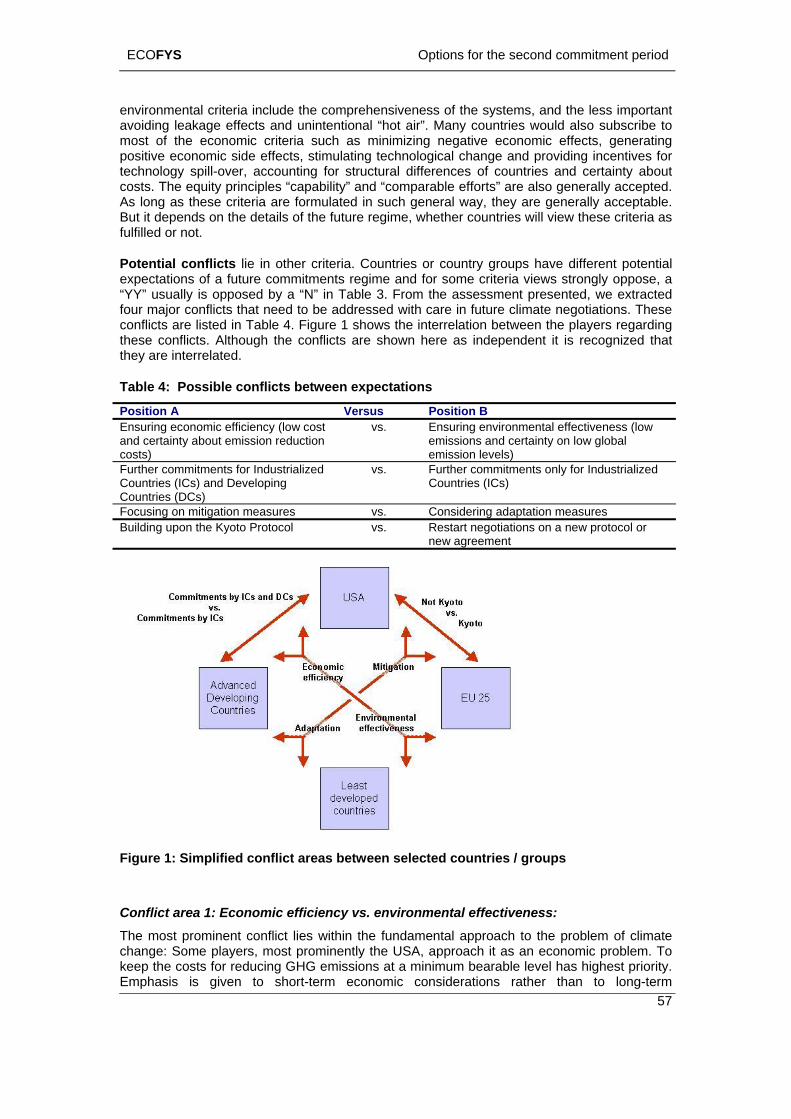
ECOFYS Options for the second commitment period
57
he assessment presented, we extracted with care in future climate negotiations. These the interrelation between the players regarding
environmental criteria include the comprehensiveness of the systems, and the less important avoiding leakage effects and unintentional “hot air”. Many countries would also subscribe to most of the economic criteria such as minimizing negative economic effects, generating positive economic side effects, stimulating technological change and providing incentives for technology spill-over, accounting for structural differences of countries and certainty about costs. The equity principles “capability” and “comparable efforts” are also generally accepted. As long as these criteria are formulated in such general way, they are generally acceptable. But it depends on the details of the future regime, whether countries will view these criteria as fulfilled or not.
Potential conflicts lie in other criteria. Countries or country groups have different potential expectations of a future commitments regime and for some criteria views strongly oppose, a “YY” usually is opposed by a “N” in Table 3. From tfour major conflicts that need to be addressedconflicts are listed in Table 4. Figure 1 showsthese conflicts. Although the conflicts are shown here as independent it is recognized that they are interrelated.
Table 4: Possible conflicts between expectations
Position A Versus Position B Ensuring economic efficiency (low cost and certainty about emission reduction costs)
vs. Ensuring environmental effectiveness (low emissions and certainty on low global emission levels)
Further commitments for Industrialized Countries (ICs) and Developing Countries (DCs)
vs. Further commitments only for Industrialized Countries (ICs)
Focusing on mitigation measures vs. Considering adaptation measures Building upon the Kyoto Protocol vs. Restart negotiations on a new protocol or
new agreement
Figure 1: Simplified conflict areas between selected countries / groups
est priority. Emphasis is given to short-term economic considerations rather than to long-term
Conflict area 1: Economic efficiency vs. environmental effectiveness: The most prominent conflict lies within the fundamental approach to the problem of climate change: Some players, most prominently the USA, approach it as an economic problem. To keep the costs for reducing GHG emissions at a minimum bearable level has high
ECOFYS Options for the second commitment period
58
strated in Figure 1 between the USA and advanced developing countries on the one side and the EU and least developed countries on the other side.
the Kyoto Protocol still has not entered into force, two fundamentally different positions still exist: On the one hand, the group of developing countries is of the view that industrialized countries have not yet “taken the lead” and should commit to further reductions due to the fact that they started emitting greenhouse gases many decades ago and therefore carry most historic responsibility. Developing countries will only commit to act, once proven progress has been made by Annex I countries to reduce emissions. On the other hand some countries point to the fact that some developing countries considerably contribute to global GHG emissions today and that even dramatic emission reductions in industrialized countries alone cannot ensure that stabilization of greenhouse gas concentrations. In addition, limits on greenhouse gas emissions only on some countries would distort the market and provide a competitive advantage. Some developing countries should also commit to reductions depending on their current stage of development. On this conflicting issue, which is essentially between the USA (and to a lesser extent the EU) and advanced developing countries (Figure 1), a compromise has to be found.
Conflict area 3: Mitigation vs. adaptation: Another conflict area is the relation between mitigation and adaptation. Some countries are more vulnerable than others to climate change, e.g. countries with low lying coastal areas. In most cases, these countries do not have the financial resources to cope with the effects of climate change themselves such as sea level rise, accelerated soil erosion and increased risks of storm flooding. They therefore need considerable financial assistance today or in the very near future. These most vulnerable and affected countries therefore call for early and effective adaptation measures as part of their sustainable development and argue a future climate change regime should support their sustainable development in general. For another group of countries, mitigation, the reduction of greenhouse gas emissions, is of priority rather than adaptation. They argue that mitigation measures are the best means to adapt to climate change, thus a future regime should focus on further reducing emissions. Those countries are not completely against adaptation measures but the immediate need for adaptation with its immediate effects needs to be balanced with mitigation efforts, which show an effect only with some time delay. Attention on adaptation should not distract from the need to reduce emissions. This fundamental conflict is illustrated in Figure 1 between the USA and the EU on the one side and the developing countries on the other.
Conflict area 4: Building upon Kyoto Protocol or negotiating a new Protocol: Some countries, lead by the EU, clearly stated that a second commitment period of the Kyoto Protocol is the only way forward in international climate policy. Building upon the existing elements and the institutional structure would avoid time-consuming and costly future negotiations on a completely new institutional setup. One should make use of as many elements (technical and institutional structures) of the Kyoto Protocol as possible when strengthening the overall mitigation efforts. Some other countries, lead by the USA, have taken a very different position, arguing that the Kyoto Protocol includes too many flaws and does not provide a good basis for a continued discussion on future actions to mitigate climate
environmental objectives. Hence, emission reductions are not treated with urgency, one is preparing to act later through, e.g. technology development. Some other players, in particular the EU and LDCs, put instead high priority to the environmental aspect of the problem and stress the urgency to act. For these groups of countries, keeping global emissions low has the highest priority. Those countries could probably not agree to a regime where the costs are minimized, but where it is unclear whether the long-term objective of the Convention can be met. Those countries would prefer to work towards defining a joint long-term goal. This fundamental conflict is illu
Conflict area 2: Further commitments for ICs & DCs or only ICs: The UNFCCC states that Parties should protect the climate system “in accordance with their common but differentiated responsibilities and respective capabilities. Accordingly, the developed country Parties should take the lead in combating climate change and the adverse effects thereof.” With the Kyoto Protocol, such a first step for Annex I countries was negotiated. Since
ECOFYS Options for the second commitment period
59
change. Abandoning the Kyoto Protocol, setting up some other mechanism is therefore nts are brought forward in
xactly which elements are to be
3.3 SUMMARY
t by all major countries or country groups. These uncontroversial criteria should always be satisfied when designing a future international
rehensive, should minimise negative economic
ries. E.g.
rst between the
p concerned.
A at ave v ften con ies is split on the issue of economic efficie oped countries would opt for strin loping c r o m cha
favoured by those countries. Strong, almost emotional sentimefavour or against the Kyoto Protocol. Yet it is unclear, erejected and which could possibly be kept. Again, a compromise must incorporate the divergent views of mainly the USA and EU (Figure 1).
Several criteria are perceived importan
climate regime. The system should be compeffects and should be shaped according to the principle of capability and comparable effort. All countries could agree to these general requirements. These areas would need careful consideration when designing the future regime, but it will depend on the detailed elaboration of these concepts, whether countries will view the requirements as fulfilled or not.
Future consultations and negotiations must focus on the major conflict areas identified here. We observe that several fundamental conflicts involve only a limited group of countthe question of using the structure of the Kyoto Protocol and to a large extent the divergence on the issue of economic efficiency versus environmental effectiveness are essentially disputes between the EU and the USA. Involvement of developing countries in a future
g countries. Thisclimate regime needs agreement between the USA and advanced developinmay point towards a strategy that these major conflicts are addressed filayers most
nother observation is thery diverse and o
individual countries within the group of developing countries hflicting positions. For example, the group of developing countr
ncy and environmental effectiveness. Least develgent global emission reduction efforts, while advanced deve
ountries would (and curperates would be an i
pter 11).
ently do) resist this. The way the group of developing countriesportant element to consider for the negotiation strategy (see
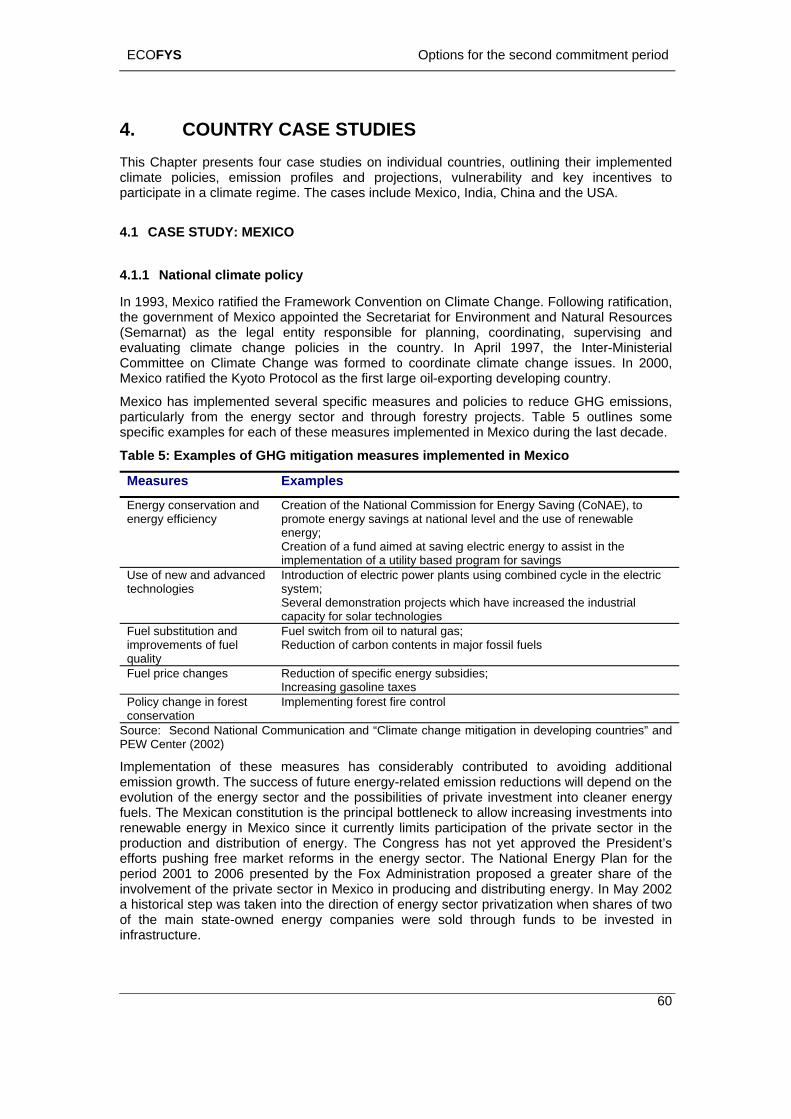
ECOFYS Options for the second commitment period
4. COUNTRY CASE STUDIES This Chapter presents four case studies on individual countries, outlining their implemented climate policies, emission profiles and projections, vulnerability and key incentives to participate in a climate regime. The cases include Mexico, India, China and the USA.
60
4.1 CASE STUDY: MEXICO
4.1.1 National climate policy
In 1993, Mexico ratified the Framework Convention on Climate Change. Following ratification, the government of Mexico appointed the Secretariat for Environment and Natural Resources (Semarnat) as the legal entity responsible for planning, coordinating, supervising and evaluating climate change policies in the country. In April 1997, the Inter-Ministerial Committee on Climate Change was formed to coordinate climate change issues. In 2000, Mexico ratified the Kyoto Protocol as the first large oil-exporting developing country.
Mexico has implemented several specific measures and policies to reduce GHG emissions, particularly from the energy sector and through forestry projects. Table 5 outlines some specific examples for each of these measures implemented in Mexico during the last deca .
s implemented in Mexico de
Table 5: Examples of GHG mitigation measure
Measures Examples
Energy conservation and Creation of the National Commission for Energy Saving (CoNAE), to
utility based program for savings
energy efficiency promote energy savings at national level and the use of renewable energy; Creation of a fund aimed at saving electric energy to assist in the implementation of a
Use of new and advanced technologies
Introduction of electric power plants using combined cycle in the electric system; Several demonstration projects which have increased the industrial capacity for solar technologies
Fuel substitution and Fuel switch from oil to natural gas; improvements o uc carb ten ajo fuef fuel quality
Red tion of on con ts in m r fossil ls
Fuel price chan uc pe rg dieea ol s
ges Red tion of s cific ene y subsi s; Incr sing gas ine taxe
Policy change inn
em fore con forest conservatio
Impl enting st fire trol
Source: Second al ni nd e in nP nter (2002)
Implementation of these measures has considerably contributed to avoiding additional
nergy sector and the possibilities of private investment into cleaner energy els. The Mexican constitution is the principal bottleneck to allow increasing investments into
of the main state-owned energy companies were sold through funds to be invested in infrastructure.
Nation Commu cation a “Climat change mitigation developi g countries” and EW Ce
emission growth. The success of future energy-related emission reductions will depend on the evolution of the efurenewable energy in Mexico since it currently limits participation of the private sector in the production and distribution of energy. The Congress has not yet approved the President’s efforts pushing free market reforms in the energy sector. The National Energy Plan for the period 2001 to 2006 presented by the Fox Administration proposed a greater share of the involvement of the private sector in Mexico in producing and distributing energy. In May 2002 a historical step was taken into the direction of energy sector privatization when shares of two
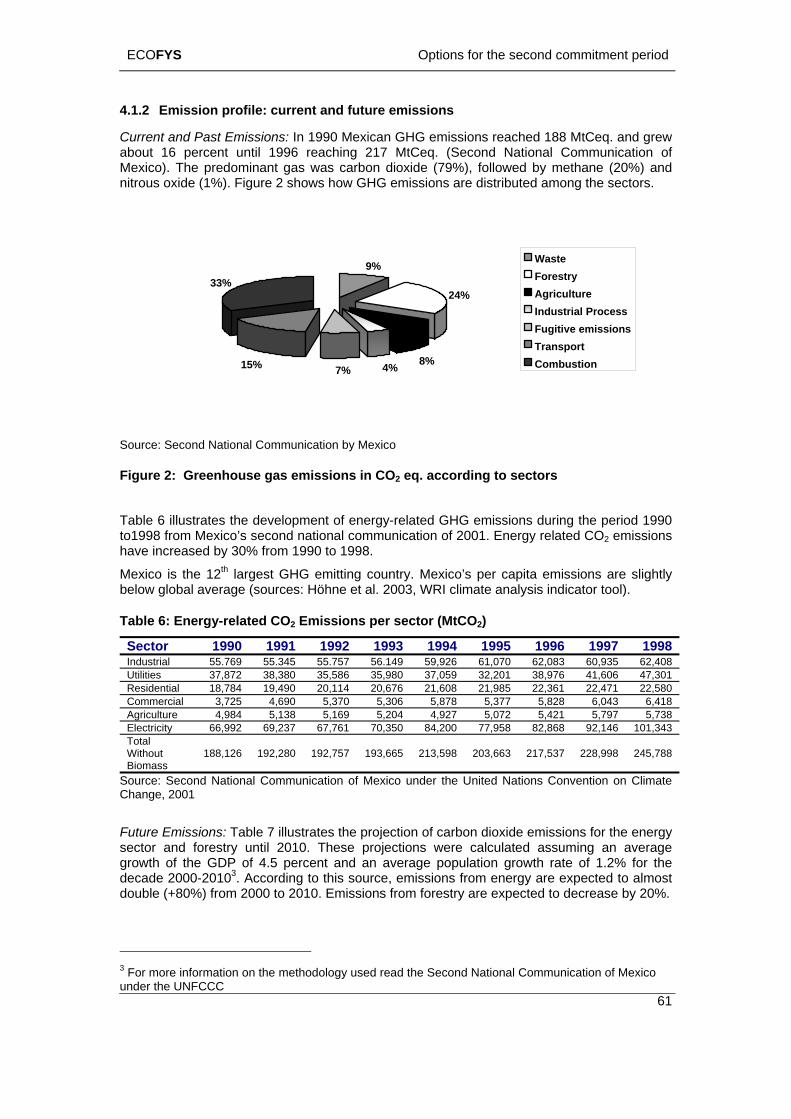
ECOFYS Options for the second commitment period
61
missions
and Past Emiss In 1990 M GHG emi s reached 188 MtCeq. and rcent until 1996 reachin MtCeq. d Nation municati
The predomin s was ca ioxide (79%), followed by methane (20%1%). Fig hows how GHG emissions are distributed a the secto
4.1.2 Emission profile: current and future e
Current ions: exican ssion grew about 16 pe g 217 (Secon al Com on of Mexico). ant ga rbon d ) and nitrous oxide ( ure 2 s mong rs.
9% WasteForestryAgricultureIndustrial ProcessFugitive emissions
24%33%
Transport8%4%7%15% Combustion
Source: Second National Communication by Mexico
Figure 2: Greenhouse gas emissions in CO2 eq. according to sectors
Table 6 illustrates the development of energy-related GHG emissions during the period 1990 to1998 from Mexico’s second national communication of 2001. Energy related CO2 emissions have increased by 30% from 1990 to 1998.
Mexico is the 12th largest GHG emitting country. Mexico’s per capita emissions are slightly below global average (sources: Höhne et al. 2003, WRI climate analysis indicator tool).
Table 6: Energy-related CO2 Emissions per sector (MtCO2)
Sector 1990 1991 1992 1993 1994 1995 1996 1997 1998Industrial 55.769 55.345 55.757 56.149 59,926 61,070 62,083 60,935 62,408 Utilities 37,872 38,380 35,586 35,980 37,059 32,201 38,976 41,606 47,301 Residential 18,784 19,490 20,114 20,676 21,608 21,985 22,361 22,471 22,580 Commercial 3,725 4,690 5,370 5,306 5,878 5,377 5,828 6,043 6,418 Agriculture 4,984 5,138 5,169 5,204 4,927 5,072 5,421 5,797 5,738 Electricity 66,992 69,237 67,761 70,350 84,200 77,958 82,868 92,146 101,343 Total Without Biomass
188,126 192,280 192,757 193,665 213,598 203,663 217,537 228,998 245,788
Source: Second National Communication of Mexico under the United Nations Convention on Climate Change, 2001
Future Emissions: Table 7 illustrates the projection of carbon dioxide emissionssector and forestry until 2010. These projections were calculated assumin
for the energy g an average
se by 20%.
growth of the GDP of 4.5 percent and an average population growth rate of 1.2% for the decade 2000-20103. According to this source, emissions from energy are expected to almost double (+80%) from 2000 to 2010. Emissions from forestry are expected to decrea
3 For more information on the methodology used read the Second National Communication of Mexico under the UNFCCC
ECOFYS Options for the second commitment period
Table 7: Projected CO2 emissions (MtCO2)
Sector 1990 1995 2000 2005 2010Energy4 292,1 333,4 397,9 546,3 726,0Forestry 228,9 206,7 186,6 168,9 152,9Total 521,0 540,1 584,5 715,2 878,9
Source: see 2nd NC Mexico: Sheinbaum C. y O. Masera 2000. Mitigating carbon emissions while advancing national development priorities; the case of Mexico climatic change
4.1.3 Vulnerability
Changes in climate can already be observed in Mexico. In northwestern Mexico, there is a tendency for more winter precipitation, which has resulted in positive trends in river water levels. However, inter-annual climate variability has also increased. On the other hand some parts of southern Mexico and Central America exhibit positive or negative rainfall trends, depending on the orientation of the catchment.
Future climate scenarios of Global Climate Models predict an increase in mean temperature changes for the next century between 0,2-2% for large parts of Latin America. Downscaled
g the central American coastline that includes parts of Mexico, sea level rise will affect infrastructure, agriculture and natural resources, as well a potentially
and salinization of aquifers and increased flood risks and the CC, Impacts, Adaptation, and Vulnerability, 2001).
s carried out, in order to analyze a scenario of s city in the case of doubling of CO2 concentrations in the
in Mexico are the Petroleos Mexicanos (PEMEX) a state-
n
4 ive for Mexic in further action on climate change
M d 6, Mexico confirmed suppor to continue with implementing
T rm ntry w ort
global climate model experiments for Mexico suggest that the climate in Mexico in general will be drier and warmer. Several hydrological regions in Mexico are highly vulnerable to decreased precipitation and higher temperature having a substantial impact on agriculture and land use. Alon
exacerbate coastal erosionimpacts of severe storms (IP
In 1998 a Vulnerability Study of Mexico City wathe bioclimatic conditions of thiatmosphere. With one of the models a possible increase of 2.1°C in the annual temperature was obtained for a specific part of this urban area.
The 1982-1983 droughts and forest fires registered in Mexico and Central America caused damages estimated at more than US$600 million. The extended drought over the past decade in Mexico seems to be the result of general climate changes. The “El Nino” events have been occurring more frequently and more intensively since the eighties, as compared with previous periods (Magana 1999)
4.1.4 Domestic interest groups supporting climate change activities
Amongst the major interest groupsowned oil and gas company and the Comision Federal de Electricidad (CFE), the national electricity utility. PEMEX (in contrary to CFE) has a rather proactive position towards climate protection. It has implemented internal energy saving programs, and is at the moment developing plans to deal with climate change issues. In addition, the firm has developed a voluntary company-based emission trading system to early gain knowledge and hands oexperience with such a new mechanism.
62
.1.5 Incent o to engage
exico has demonstrate a positive position towards combating climate change. At COPting the Kyoto Protocol and announced political willingness additional GHG regulations in the country.
wo conditions were infoould be willing to supp
ally mentioned by Mexico’s government under which the cou further actions on climate change. First, future actions on climate
4
transport sector. The energy sector includes; industrial, self-consumption, residential, commercial, electricity and
ECOFYS Options for the second commitment period
63
c d need to be gress by industrialized countries to reduce emissions. This co countries” that the global a capita emissions or global average emission intensity d further pplied t olicies.
In spite of its active nationa licy, Mexico is one of the two OECD countries that are n x Ithis was that the Framewbecame a member of the O
Becoming member of the O olicy implemented in the
e Organisation) and signed everal bilateral and multilateral international trade agreements. Within the most relevant
s are the EU-Mexico and the North American Free Trade Agreement (NAFTA) with
ange and appointed responsibility for national climate change issues to the MoEF. In August 2002, India ratified the Kyoto Protocol.
One of the key challenges for GHG emissions reductions is the substantial development need that India faces today. In order to increase economic growth India has developed an open and market based economy and developed a highly sophisticated science and technology sector. This market reform has, among others measures, improved India’s fuel quality, technological standards, infrastructure and operating practices in the power and coal sector. Another important change was implemented with price reforms, which brought the coal price in India to world coal price levels.
Despite technology improvements local environmental protection initiatives are a second important factor that have contributed to GHG emissions reductions. Pressure from citizens to reduce air pollution has pushed the court to enforce existing laws to improve air quality. Table 8 below provides some examples of the GHG mitigation measures implemented in India.
able 8: Examples of GHG mitigation measures implemented in India
Measures Examples
hange woul explicitly linked to visible prould be achieved by making a “condition for action by developingverage per
ecreases. Second, o sectors and p
action is taken through a broadened CDM, which could be a
l climate poot included in the Anne to the UNFCCC (together with South Korea). The main reason for
ork Convention on Climate Change was adopted before Mexico ECD, of which it is now a member for almost 10 years.
ECD was part of the international trade pbeginning of the 80’s. As part of this process Mexico also joined the GATT (General Agreement on Tariffs and Trade) and the WTO (World TradsoneCanada and the United States. As only Canada and the EU are committed to emission targets, Mexico may be left with a competitive advantage. Canada has already expressed its concern about this matter.
Consequently, there are two mayor forces outside the climate regime that could influence Mexico’s participation on future action on climate change. One is its global commitment as an OECD country. And the other one is the future negotiation to continue with NAFTA and the EU-Mexico treaty.
4.2 CASE STUDY: INDIA
4.2.1 National climate policy
In 1985, India founded the Ministry of Environment and Forests, MoEF that has since then initiated many activities in the area of environmental protection. In 1993, India ratified the United Nation Framework Convention on Climate Ch
T
Clean Power from Fossil Fuel
More efficient use of coal is being encouraged through legislative, financial, managerial and technical interventions; In 1994, the Centre for Power Efficiency and Environmental Protection was established to assist utilities in reducing CO2 emissions.
Energy Conservation and Efficiency Improvements
Under the Energy Act 2001, the Bureau of Energy Efficiency was established to facilitate and enforce efficient use of energy; Energy conservation measures such as increasing recovery of heat and use of natural gas were implemented the Indian refining industry.
Harnessing Renewable The foundation of the Ministry of Non-Conventional Energy Sources in
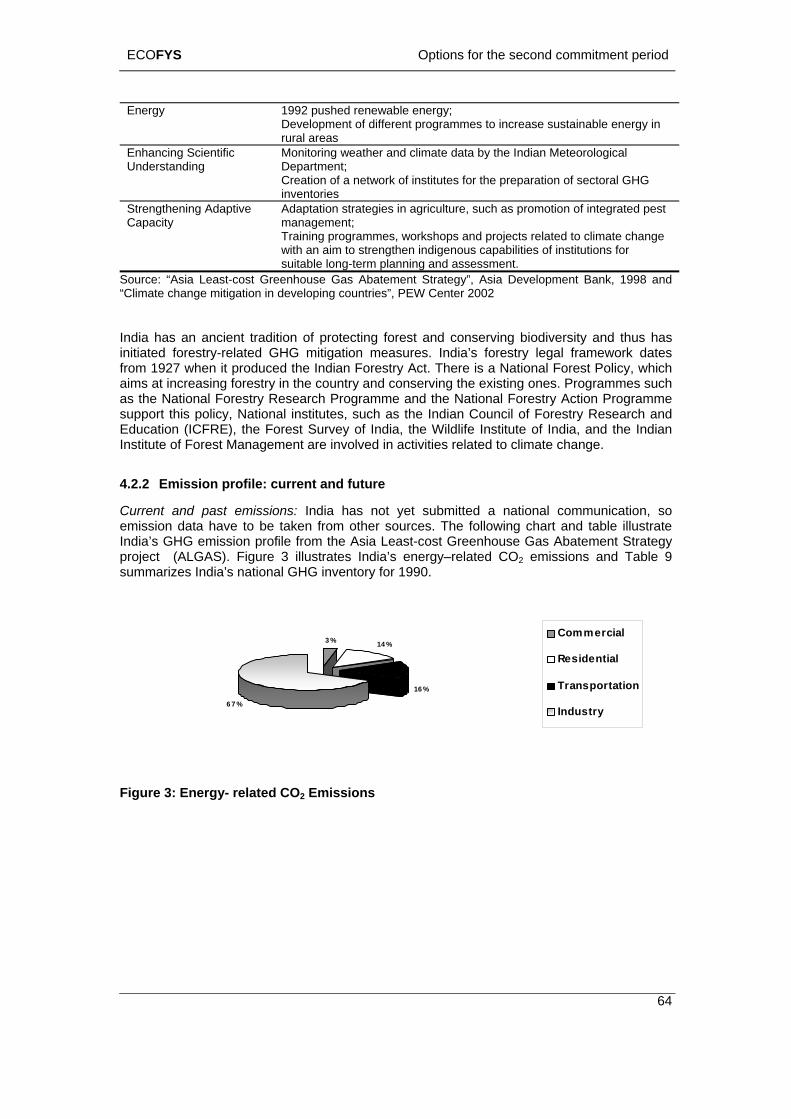
ECOFYS Options for the second commitment period
64
rgy; Development of different programmes to increase sustainable enrural areas
Energy 1992 pushed renewable eneergy in
EnU
w cli dat e Me log
Creation of a ne rk of institutes for the preparation of sectorinve
hancing Scientific nderstanding
MonitoringDepartment;
eather and mate a by th Indian teoro ical
two al GHG ntories
Strengthening AdapCapacity
tive
A strategies i ag , s a ti gramanagement; T ogrammes, orkshops and projects related to cli ate cwith an a to strength n us bili f in s fosu ing and assessment.
daptation n riculture uch s promo on of inte ted pest
raining pr w m hange im e indigeno capa ties o stitution r
itable long-term plannSource: “Asia Least-cost Greenh Abatement Strategy”, Asi Development Bank, 199 “Climate change mitigation in developin countries”, PEW Center 2002
I an ancient tradition of protecting forest and conserving biodiversity and thus has
ct. There is a National Forest Policy, which ims at increasing forestry in the country and conserving the existing ones. Programmes such
(ICFRE), the Forest Survey of India, the Wildlife Institute of India, and the Indian ge.
.2.2 Emission profile: curren
ons: In o t m a l cother ng chart and table illustrat
file from A Le t-c G nh s A te t tere 3 illustr s ia’ ne –r ed O2 is s d le
l GHG inven
ouse Gas a 8 andg
ndia has initiated forestry-related GHG mitigation measures. India’s forestry legal framework dates from 1927 when it produced the Indian Forestry Aaas the National Forestry Research Programme and the National Forestry Action Programme support this policy, National institutes, such as the Indian Council of Forestry Research and Education Institute of Forest Management are involved in activities related to climate chan
4 t and future
Current and past emissi dia hr
as n t yesource
sub itted a nowi
tiona communi ation, so emission data have to be taken fIndia’s GHG emission pro
om the
s. The follost
egy sia as ree ouse Ga ba men Stra
project (ALGAS). Figu ate Ind s e rgy elat C em sion an Tab 9 summarizes India’s nationa tory for 1990.
Commercial3 % 14 %
Residential
Transportation
Industry
16 %
6 7 %
Figure 3: Energy- related CO2 Emissions
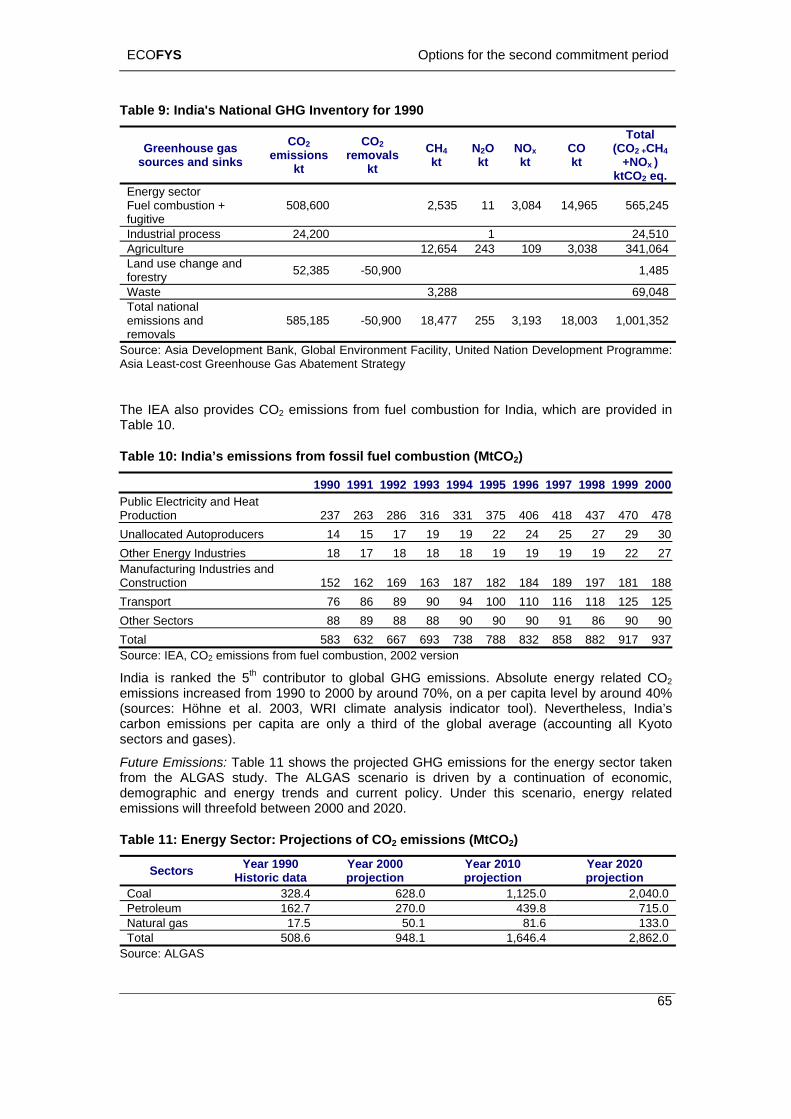
ECOFYS Options for the second commitment period
65
nal GHG Inventory for 1990 Table 9: India's Natio
Greenhouse gas sources and sinks
CO2 emissions
kt
CO2 removals
kt CH4 kt
N2O kt
NOx kt
CO kt
Total (CO2 +CH4
+NOx ) ktCO2 eq.
Energy sector Fuel combustion + fugitive
508,600 2,535 11 3,084 14,965 565,245
Industrial process 24,200 1 24,510 Agriculture 12,654 243 109 3,038 341,064 Land use change and forestry 52,385 -50,900 1,485
Waste 3,288 69,048 Total national emissions and 585,185 -50,900 18,477 255 3,193 removals
18,003 1,001,352
Source: Asia Development Bank, Global Environment Facility, United Nation Development Programme: Asia Least-cost Greenhouse Gas Abatement Strategy
The IEA also provides CO2 emissions from fuel combustion for India, which are provided in Table 10.
Table 10: India’s emissions from fossil fuel combustion (MtCO ) 2
1990 1991 1992 1993 1994 1995 1996 1997 1998 1999 2000Public Electricity and Heat Production 237 263 286 316 331 375 406 418 437 470 478Unallocated Autoproducers 14 15 17 19 19 22 24 25 27 29 30Other Energy Industries 18 17 18 18 18 19 19 19 19 22 27Manufacturing Industries and Construction 152 162 169 163 187 182 184 189 197 181 188Transport 76 86 89 90 94 100 110 116 118 125 125Other Sectors 88 89 88 88 90 90 90 91 86 90 90Total 583 632 667 693 738 788 832 858 882 917 937Source: IEA, CO2 emissions from fuel combustion, 2002 version
India is ranked the 5th contributor to global GHG emissions. Absolute energy related CO2 emissions increased from 1990 to 2000 by around 70%, on a per capita level by around 40% (sources: Höhne et al. 2003, WRI climate analysis indicator tool). Nevertheless, India’s carbon emissions per capita are only a third of the global average (accounting all Kyoto sectors and gases). Future Emissions: Table 11 shows the projected GHG emissions for the energy sector taken from the ALGAS study. The ALGAS scenario is driven by a continuation of economic, demographic and energy trends and current policy. Under this scenario, energy related emissions will threefold between 2000 and 2020.
Table 11: Energy Sector: Projections of CO emissions (MtCO ) 2 2
Sectors Year 1990 Historic data
Year 2000 projection
Year 2010 projection
Year 2020 projection
Coal 328.4 628.0 1,125.0 2,040.0 Petroleum 162.7 270.0 439.8 715.0 Natural gas 17.5 50.1 81.6 133.0 Total 508.6 948.1 1,646.4 2,862.0
Source: ALGAS
ECOFYS Options for the second commitment period
4.2.3 Vulnerability
66
nsively used low-lying coastal plains, islands and deltas,
participated or were involved in the policy making process with regard to climate change. However, the private sector is active
positions on climate change and climate policies. For example, the Indian coal-fired power sector generally objects to international agreements on climate change policies and measures. The main concern lies within the argument that an emission
ducing sector would restrict the growth of the sector thus
s facing little market
e Centre for Science and
the position that no further commitments are accepted by India
e with
ze national GHG-emissions at the 1990 level by the
In India, chronically drought-affected areas cover the western parts of Rajastahan and Kutch region of Gujarat. Drought conditions have also been reported in Bihar and Orissa States in India. Drought disasters are expected to increase and happen more frequently in the areas mentioned during the following decades thus intensifying stress on ecosystems and population. Densely settled and inteincluding the Indian coastline, are extremely vulnerable to coastal erosion and land-loss, inundation, sea flooding and upstream water fronts as a result of seal-level rise. Due to the high population and still increasing number of population India, is likely to suffer from adverse impacts on agriculture, significant differences in seasonal runoff and increased risks of severe tropical weather disturbances, including storms and other stresses (IPCC, 2001).
4.2.4 Domestic interest groups supporting climate change activities
Climate change issues in the past have been only dealt with within the Indian government. Neither industry nor the Confederation of Indian Industry has
to announce their individual
target allocated to the coal-proaffecting Indian economic growth.
The power sector is also an important group that can influence climate change issues to some extent. Nevertheless, its position is only slightly different than the position of the coal sector, since the increasing energy demand could be met from alternative energy sources.
The Indian industry sector such as the steel, cement, aluminium, fertilizer and chemical industry is another group influencing climate change issues. These industries are to large extent publicly owned and benefit from an administered price system thucompetition. They are therefore in a position to hampering efforts to improve their energy efficiency. Investment expanding the growing demand for industrial products is more attractive than investment to reduce costs by improving energy efficiency (Akiyama, 1995).
Two other significant players in the Indian climate change policymaking process should be mentioned: TATA Energy Research Institute (TERI) and thEnvironment (CSE). These research organizations gain a more important standing to advise government in climate policy issues. Research, lobbying and other efforts by TERI resulted in governmental approval to accept an AIJ pilot phase. Since then, TERI has established itself as one of the major advisers to the federal administration on energy matters.
4.2.5 Incentive for India to engage in future actions on climate change
Right at the beginning of the negotiation process India had a very clear and strong position and has played a very active role by being as spokesperson for the G77/China. Although India’s economy is highly vulnerable to climate change, economic growth and meeting the needs of large parts of the Indian population are priority issues. As a matter of fact, India has stated that emissions will grow as the country seeks to expand its economic growth.
India, as part of the G77, hasuntil developed countries have demonstrated to take the lead in combating climate change. At COP8 in New Delhi 2002, Prime Minister Vajpayee described the call for developing country commitments “misplaced” and said that the only equitable form for the future would be one based on equal per capita rights.
One of India’s major concern after adoption of the Convention has been securing thimplementation of convention-specific commitments by industrialized countries, both respect to their commitments to stabili
ECOFYS Options for the second commitment period
year 2000 and with respect to promised technological and financial transfer to developing counties.
67
n by developing s an attempt to Annex I country obligations. India has changed its
tha
For India, a per-capita ap o t a common per capita leve isonly one third of the wor m position on future commitments, it is difficu to bsolute emission target in the near term. Choosing a aemissions could open the o
Nevertheless, based on ho d its priority for economic growth, the position may a mitment could contribute to economic growth, it wo d
4.3 CASE STUDY: CHINA
4.3.1 National climate poli
China was regarded as oneThe transition toward markecountry on the track of rapid of over
The set the ambitious GDP on the 2000 level by 2020,
l P is 9% and the Chinese
In recent years, the restrictions of energy resources on development are increasingly felt in China. In 2003, the ele icincrease in supply, in summe 9 out of the 32 Chinese provinces, autonomous regions
f eo enterprises was pro
According to the State Elgenerating capacity has enationwide electricity shortaperiod of fast development a ly country in the world that sees some new generating units of 2 min the next 15 years, the lesatisfy its targets of comp h
In a country with a large poped syno
elopment. Ch newable energy and en
omic Development6-200 ).
men to only one year e United Nations issued the Agenda 21. China ratified the UNFCCC in January of
o Proto l
China is drafting a Renewable ion Promoting Law, which is expected to be approved by the National People's Congress (NPC) Standing Committee, China's legislature, in 2005.
With regard to AIJ, India has been quite sceptical. The AIJ phase was seecountries aposition af
distract fromat AIJ and ter realizing
achieving the overall gosubsequently the CDM is an instrument that assists in
l.
pr ach, where emission levels from different countries converge al, the preferred approach, since India’s per-capita emissions are
ld’s average. Due to India’s current firlt believe that it will accept any an pproach that clearly incorporates the element of per-capita
or for possible acceptance by India. d
w AIJ issues developed in India an ch nge. If India perceives that taking a comul be open to change its position.
cy
of the world’s poorest countries over much of the 20th century. t economy and opening to outside world since 1978 has put the development. With an average annual GDP growth rate
9%, China had more thacountry has
n quadrupled its GDP during the years between 1978 and 2000. target of further quadrupling its
which means an annua2003
GD growth of 7.18%. The annual GDP growth rate of the country in economy continues showing strong vitality.
ctr ity demand grew 15% from the year before. Despite an 8% r 2004, 1
and municipalities weresupply t
orc d to implement electricity consumption restrictions and electricity vided in shifts.
ectricity Regulatory Commission of China, China’s installed xceeded 400 GW by May 2004. Under the background of ge, the Chinese electricity-generating sector has entered in a nd China becomes the on
0 illion or above kW put into operation each year. It is expected by ctr ity generating capacity of China has to increase 500 e ic GW to
re ensively building a well-off society.
ulation and limited energy resources, reducing growth in energy demand was deemeconomic dev
nymous with raising the sustainability of its ongoing rapid ina has a history of implementing re
sustainable developmand Econ
t programs stretching back to the 1980s under its Five-Year Social plans. Environmental goals were officially included in the Ninth
Five-Year Plan (199
The Chinese governafter th
0
t ok the lead in publishing its Agenda 21 in 1994,
1993 and the Kyot co in August of 2002.
Energy Development and Utilisat
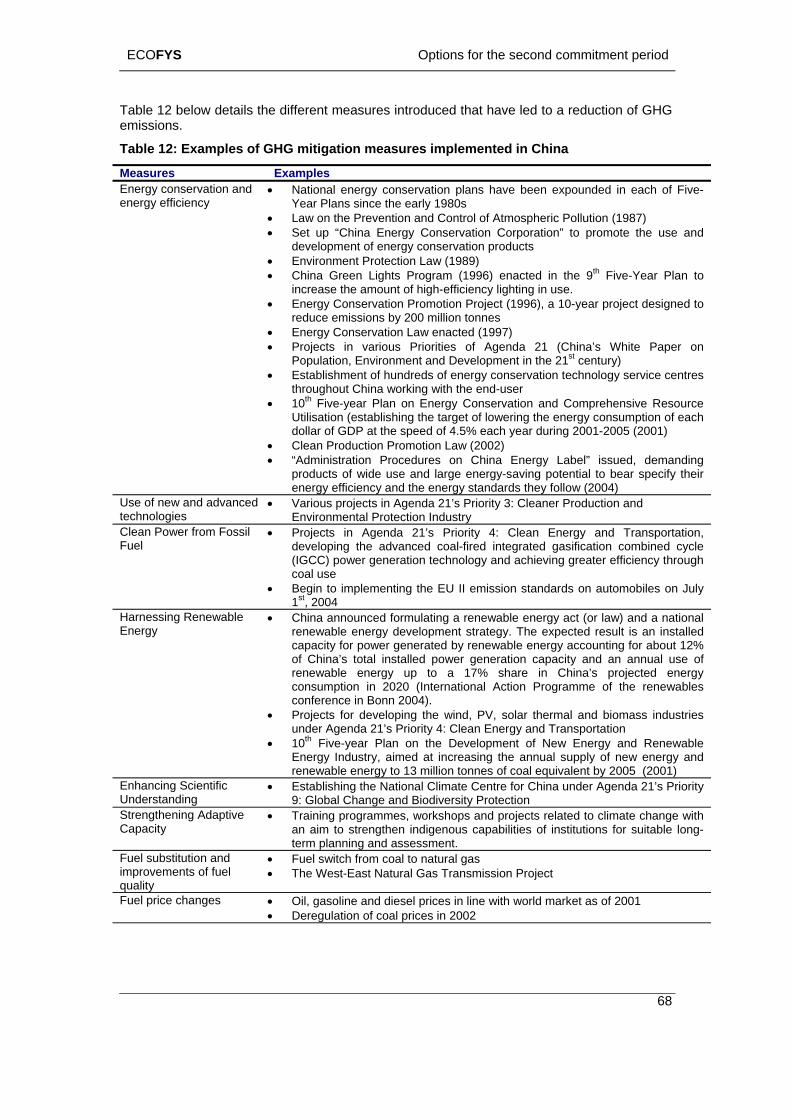
ECOFYS Options for the second commitment period
68
s th di ced that have led to a reduction of GHG
Table 12: Examples of G G
Measures Ex
Table 12 below detailemissions.
e fferent measures introdu
H mitigation measures implemented in China
amples Energy conservation and •
and
rotection Law (1989) n to
d to
Energy Conservation Law enacted (1997) • s Priorities of Agenda 21 (China’s White Paper on
ment and Development in the 21st century)
urce ach
Clean Production Promotion Law (2002) ding their
energy efficiency Year Plans since the early 1980s • Law on the Prevention and Control of Atmospheric Pollution (1987)
National energy conservation plans have been expounded in each of Five-
• Set up “China Energy Conservation Corporation” to promote the use development of energy conservation products
• Environment P• China Green Lights Program (1996) enacted in the 9th Five-Year Pla
increase the amount of high-efficiency lighting in use. • Energy Conservation Promotion Project (1996), a 10-year project designe
reduce emissions by 200 million tonnes •
Projects in variouPopulation, Environ
• Establishment of hundreds of energy conservation technology service centresthroughout China working with the end-user
• 10th Five-year Plan on Energy Conservation and Comprehensive ResoUtilisation (establishing the target of lowering the energy consumption of edollar of GDP at the speed of 4.5% each year during 2001-2005 (2001)
• • “Administration Procedures on China Energy Label” issued, deman
products of wide use and large energy-saving potential to bear specify energy efficiency and the energy standards they follow (2004)
Use of new and advanced technologies
• Various projects in Agenda 21’s Priority 3: Cleaner Production and Environmental Protection Industry
Clean Power from Fossil Fuel
• Projects in Agenda 21’s Priority 4: Clean Energy and Transportadeveloping the advanced coal-fired integrated gasification combined c(IGCC) power generation technology and achieving greater efficiency throcoal use
tion, ycle ugh
• Begin to implementing the EU II emission standards on automobiles on July 1st, 2004
Harnessing Renewable • China announced formulating a reneEnergy renewable energ
wable energy act (or law) and a national y development strategy. The expected result is an installed
capacity for power generated by renewable energy accounting for about 12% neration capacity and an annual use of
are in China’s projected energy ption 20 (Intern tional Action Programme of the renewables
ence in 2004• Projects for de g the solar thermal and biomass industries
u nda o an Energy and Transportation • 10 -year n t velopment of New Energy and Renewable
En d asing the annual supply of new energy and re ne 3 m nnes of coal equivalent by 2005 (2001)
of China’s total installed power gerenewable energy up to a 17% shconsumconfer
in 20 Bonn
a).
velopin 21’s Pri
wind, PV,rity 4: Clender Age
th Five Plan o he Deergy Industry, aime at incre
newable e rgy to 1 illion toE ng Scientific U nding
• Esta ng the N nal C Centre for China under Agenda 21’s Priority 9: Global Change Biodi ty Protection
nhancindersta
blishi atio limate and versi
Strengthening Adaptive C
• T gra w s and projects related to climate change with a str in capabilities of institutions for suitable long-
ent. apacity
raining pron aim to
mmes, engthen
orkdigenous
shop
term planning and assessmFuel substitution and • Fuel switch from coal to natural gas improvements of fuel quality
• The West-East Natural Gas Transmission Project
Fuel price changes • Oil, gasoline and diesel prices in line with world market as of 2001 • Deregulation of coal prices in 2002
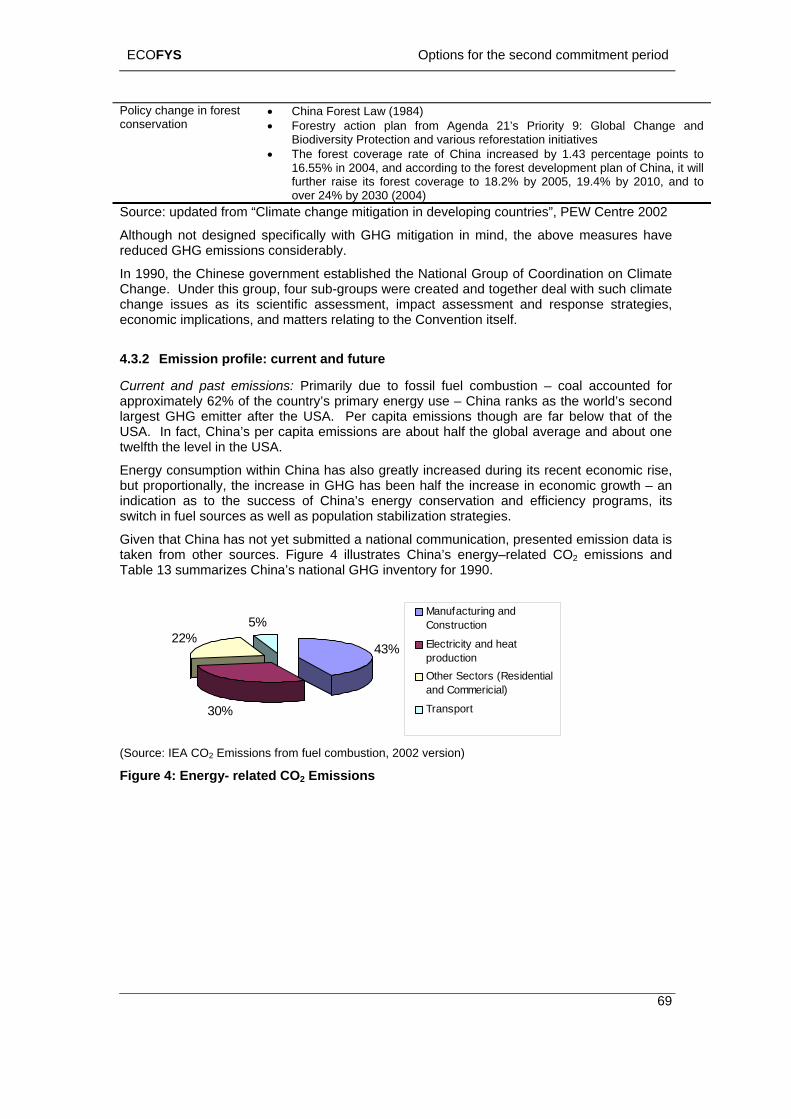
ECOFYS Options for the second commitment period
69
Policy change in forest conservation
• China Forest Law (1984) • Forestry action plan from Agenda 21’s Priority 9: Global Change and
Biodiversity Protection and various reforestation initiatives • The forest coverage rate of China increased by 1.43 percentage points to
16.55% in 2004, and according to the forest development plan of China, it will further raise its forest coverage to 18.2% by 2005, 19.4% by 2010, and to over 24% by 2030 (2004)
Source: updated from “Climate change mitigation in developing countries”, PEW Centre 2002
Although not designed specifically with GHG mitigation in mind, the above measures have reduced GHG emissions considerably.
In 1990, the Chinese government established the National Group of Coordination on Climate Change. Under this group, four sub-groups were created and together deal with such climate change issues as its scientific assessment, impact assessment and response strategies, economic implications, and matters relating to the Convention itself.
rofile: current and future
nted for
ase in economic growth – an to the success of China’s energy conservation and efficiency programs, its
4.3.2 Emission p
Current and past emissions: Primarily due to fossil fuel combustion – coal accouapproximately 62% of the country’s primary energy use – China ranks as the world’s second largest GHG emitter after the USA. Per capita emissions though are far below that of the USA. In fact, China’s per capita emissions are about half the global average and about one twelfth the level in the USA.
Energy consumption within China has also greatly increased during its recent economic rise, but proportionally, the increase in GHG has been half the increindication as switch in fuel sources as well as population stabilization strategies.
Given that China has not yet submitted a national communication, presented emission data is taken from other sources. Figure 4 illustrates China’s energy–related CO2 emissions and Table 13 summarizes China’s national GHG inventory for 1990.
43%
30%
22%5%
Manufacturing andConstruction
Electricity and heatproductionOther Sectors (Residentialand Commericial)
Transport
(Source: IEA CO2 Emissions from fuel combustion, 2002 version)
Figure 4: Energy- related CO2 Emissions
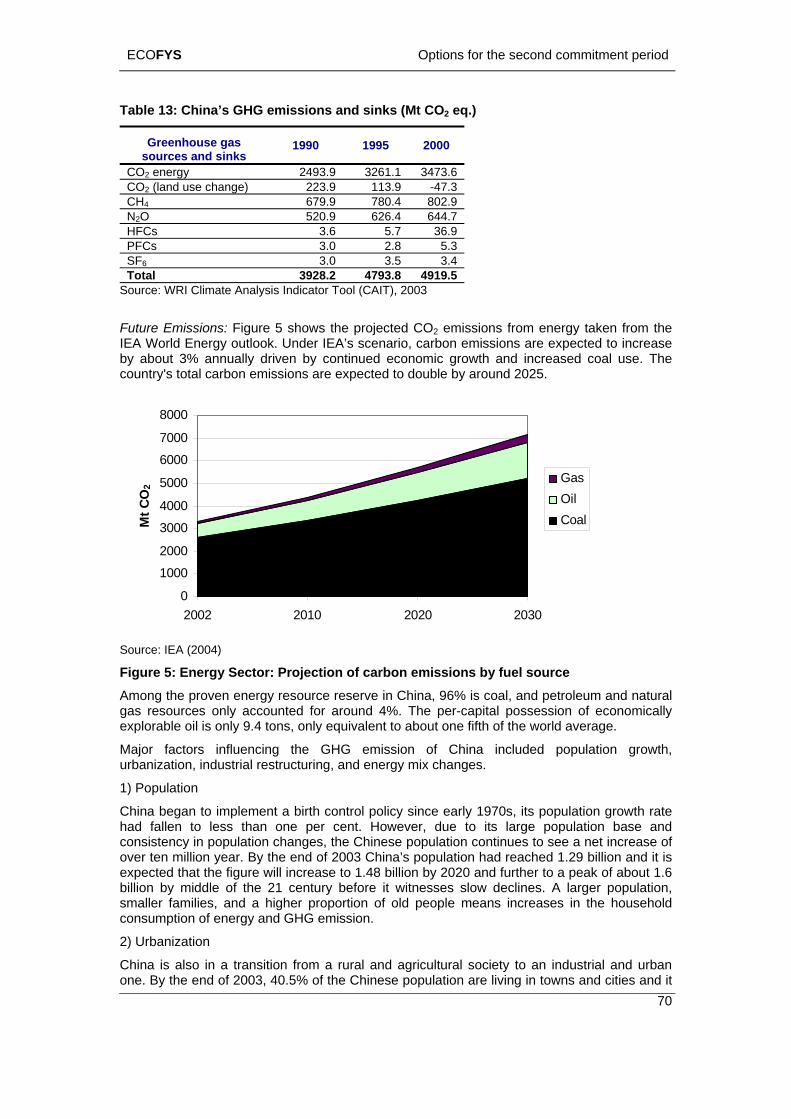
ECOFYS Options for the second commitment period
Table 13: China’s GHG emissions and sinks (Mt CO2 eq.)
Greenhouse gas sources and sinks
1990 1995 2000
CO2 energy 2493.9 3261.1 3473.6 CO (land use chan2 ge) 223.9 113.9 -47.3 CH4 679.9 780.4 802.9 N2O 520.9 626.4 644.7 HFCs 3.6 5.7 36.9 PFCs 3.0 2.8 5.3 SF6 3.0 3.5 3.4 Total 3928.2 4793.8 4919.5
Source: WRI Climate Analysis Indicator Tool (CAIT), 2003 Future Emissions: Figure 5 shows the projected CO2 emissions from energy taken from the IEA World Energy outlook. Under IEA’s scenario, carbon emissions are expected to increase by about 3% annually driven by continued economic growth and increased coal use. The country's total carbon emissions are expected to double by around 2025.
7000
8000
0
1000
2002 2010 2020 2030
2000
30004000
5000
6000
Mt C
O2
GasOilCoal
Source: IEA (2004)
Figure 5: Energy Sector: Projection of carbon emissions by fuel source Among the proven energy resource reserve in China, 96% is coal, and petroleum and natural gas resources only accounted for around 4%. The per-capital possession of economically explorable oil is only 9.4 tons, only equivalent to about one fifth of the world average.
Major factors influencing the GHG emission of China included population growth,
opulation had reached 1.29 billion and it is expectebilli bsmaller r proportion of old people means increases in the household con GHG emission.
2) Urba
Chi ltural society to an industrial and urban one. By the e ation are living in towns and cities and it
urbanization, industrial restructuring, and energy mix changes.
1) Population
China began to implement a birth control policy since early 1970s, its population growth rate had fallen to less than one per cent. However, due to its large population base and consistency in population changes, the Chinese population continues to see a net increase of over ten million year. By the end of 2003 China’s p
d that the figure will increase to 1.48 billion by 2020 and further to a peak of about 1.6 on y middle of the 21 century before it witnesses slow declines. A larger population,
families, and a highesumption of energy and
nization
na is also in a transition from a rural and agricund of 2003, 40.5% of the Chinese popul
70
ECOFYS Options for the second commitment period
71
is e c further increase to 44% by 2010 and further to 55% by 2020 (Zhou et
3) Industrial Restructuring
1980 to 2003, the shares of primary sector, secondary sector and tertiary sector in China’s annual GDP had
-direct
heir higher costs and the small
minated by fossil fuel and higher energy consumption and supply will lead to more emission.
rcent of its GDP, far
omplicated physiographic conditions, the extreme uneven
The country’s share of GDP assumed by agriculture is about 14.86% (2003). Although the past few decades this figure has been steadily decreasing, China’s share remains considerably higher than in other developed countries – about 8 times greater than the shares
xpe ted the rate will al. 2003). Although population aggregation means higher efficiency of economic resources, it also means the massive construction of infrastructure facilities and houses. Higher urbanization rate means further expansion of existing cities and towns and the building of new cities and towns. This will cause rises in energy consumption and GHG emission.
Besides, at higher living standards, people also use more household electric appliances, automobiles, and public infrastructure facilities. The per capita energy consumption of a Chinese resident is over 3 times that of a rural resident. Moreover, people’s energy consumption will also shift from non-commercial biomass to commercial energy.
China is still in the process of industrialization. During the 20 years from
changed from 30:49:21 to 15:53:32 (China Statistics Bureau), indicating that the industrial sector is the pillar to China’s rapid economic growth. Among the total energy consumption in China, around 70% goes to the industrial sector. Industrial sector not only contributes to more than half of China’s GDP, it is also the sector sees the fast growth. Because of its low labour costs and huge markets in China, China is one of the biggest uses of foreigninvestment and many multinational enterprises are moving their production centre into China. The technology, managerial, and human resource capability gap between China and western countries is there. So it is unlikely that China’s role in the worldwide labour division as a manufacturing centre could be changed in the next 15 years.
4) Energy Mix
The potential of developing large-scale hydropower in China is limited. Besides, most of China’s energy resources, including coal, natural gas, petroleum and rivers on which hydropower plants can be built are located in west China while its economic activities and growth are concentrated in the coastal East China. This means long distance of energy resource transport or power transmission. Although the Chinese government gives strong support to the development of renewable energy, because of tscale developments, renewable energy’s share in China’s energy mix is unlikely see major increase. In China’s Sustainable Energy Scenarios in 2020, it is estimated even if 70% of the explorable hydropower development potential is put into use and nuclear, wind, solar energy as well as other energy sees rapid development, 90% of China’s energy consumption still relies on such fossil fuel as coal, natural gas, and petroleum. So in the foreseeable future, the Chinese energy mix will still be do
4.3.3 Vulnerability
China is suffering severely of weather-related disasters. Higher temperatures have bring about numerous problems in ecology, resources and environment, which include frequent dry spells, tropical cyclones, a rapid rise in the number of rainstorms and severe droughts, landslide, hailstones, frost, and hurricanes at increasing severity. Each year, weather-related disasters inflict direct economic losses accounting for 3 percent to 6 peexceeding the average of less than 2 per of developed countries (Dahe 2003). In ordinary years, the area of crops hit by natural disasters is between 40 and 47 million hectares and around 200 million Chinese people are struck by natural disasters.
China is vulnerable to climate change due to a number of circumstances. To begin with, because of its vast territory and cspatial and temporal distribution of rainfalls, climate-related disasters are frequent in China. Over 10% of the Chinese territory is under the threat of floods. Mountainous region, tableland, and hills cover two thirds of China’s total land area.
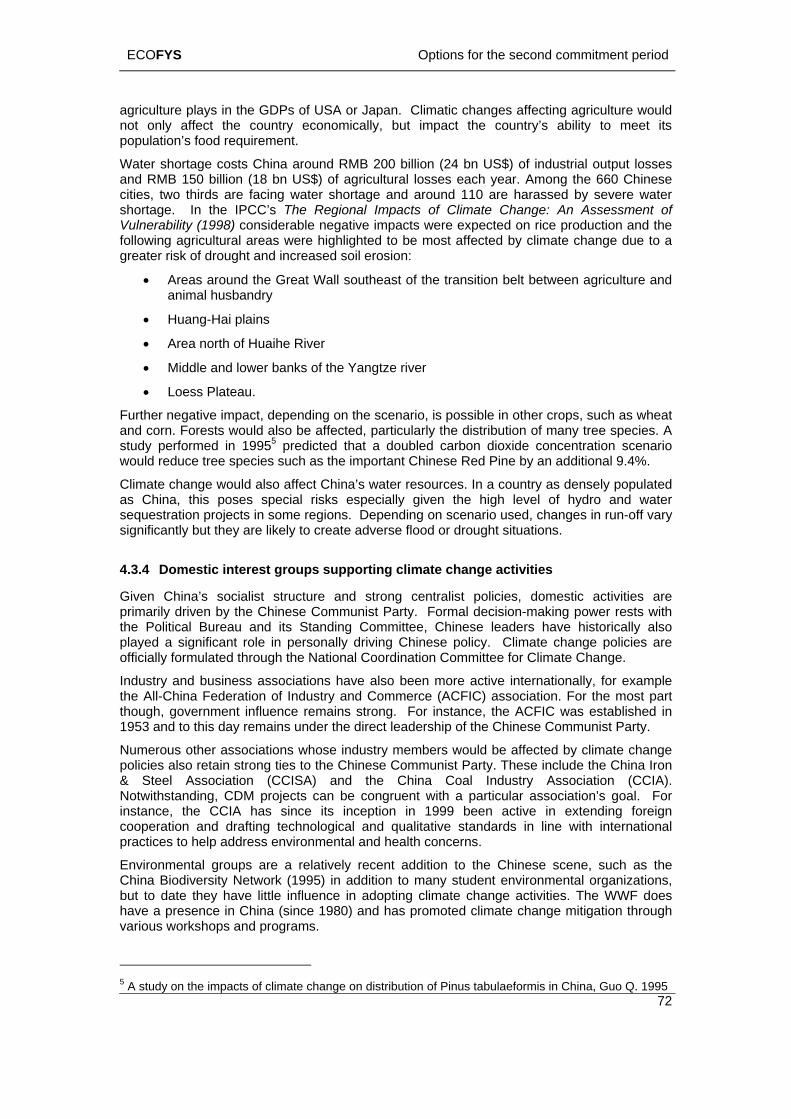
ECOFYS Options for the second commitment period
72
country economically, but impact the country’s ability to meet its
drought and increased soil erosion:
g on scenario used, changes in run-off vary
nding Committee, Chinese leaders have historically also
inese Communist Party.
Numerous other associations whose industry members would be affected by climate change ies to the Chinese Communist Party. These include the China Iron
& Steel Association (CCISA) and the China Coal Industry Association (CCIA). can be congruent with a particular association’s goal. For its inception in 1999 been active in extending foreign
agriculture plays in the GDPs of USA or Japan. Climatic changes affecting agriculture would not only affect thepopulation’s food requirement.
Water shortage costs China around RMB 200 billion (24 bn US$) of industrial output losses and RMB 150 billion (18 bn US$) of agricultural losses each year. Among the 660 Chinese cities, two thirds are facing water shortage and around 110 are harassed by severe water shortage. In the IPCC’s The Regional Impacts of Climate Change: An Assessment of Vulnerability (1998) considerable negative impacts were expected on rice production and the following agricultural areas were highlighted to be most affected by climate change due to a greater risk of
• Areas around the Great Wall southeast of the transition belt between agriculture and animal husbandry
• Huang-Hai plains
• Area north of Huaihe River
• Middle and lower banks of the Yangtze river
• Loess Plateau.
Further negative impact, depending on the scenario, is possible in other crops, such as wheat and corn. Forests would also be affected, particularly the distribution of many tree species. A study performed in 19955 predicted that a doubled carbon dioxide concentration scenario would reduce tree species such as the important Chinese Red Pine by an additional 9.4%.
Climate change would also affect China’s water resources. In a country as densely populated as China, this poses special risks especially given the high level of hydro and water sequestration projects in some regions. Dependinsignificantly but they are likely to create adverse flood or drought situations.
4.3.4 Domestic interest groups supporting climate change activities
Given China’s socialist structure and strong centralist policies, domestic activities are primarily driven by the Chinese Communist Party. Formal decision-making power rests with the Political Bureau and its Staplayed a significant role in personally driving Chinese policy. Climate change policies are officially formulated through the National Coordination Committee for Climate Change.
Industry and business associations have also been more active internationally, for example the All-China Federation of Industry and Commerce (ACFIC) association. For the most part though, government influence remains strong. For instance, the ACFIC was established in 1953 and to this day remains under the direct leadership of the Ch
policies also retain strong t
Notwithstanding, CDM projects instance, the CCIA has sincecooperation and drafting technological and qualitative standards in line with international practices to help address environmental and health concerns.
Environmental groups are a relatively recent addition to the Chinese scene, such as the China Biodiversity Network (1995) in addition to many student environmental organizations, but to date they have little influence in adopting climate change activities. The WWF does have a presence in China (since 1980) and has promoted climate change mitigation through various workshops and programs.
5 A study on the impacts of climate change on distribution of Pinus tabulaeformis in China, Guo Q. 1995
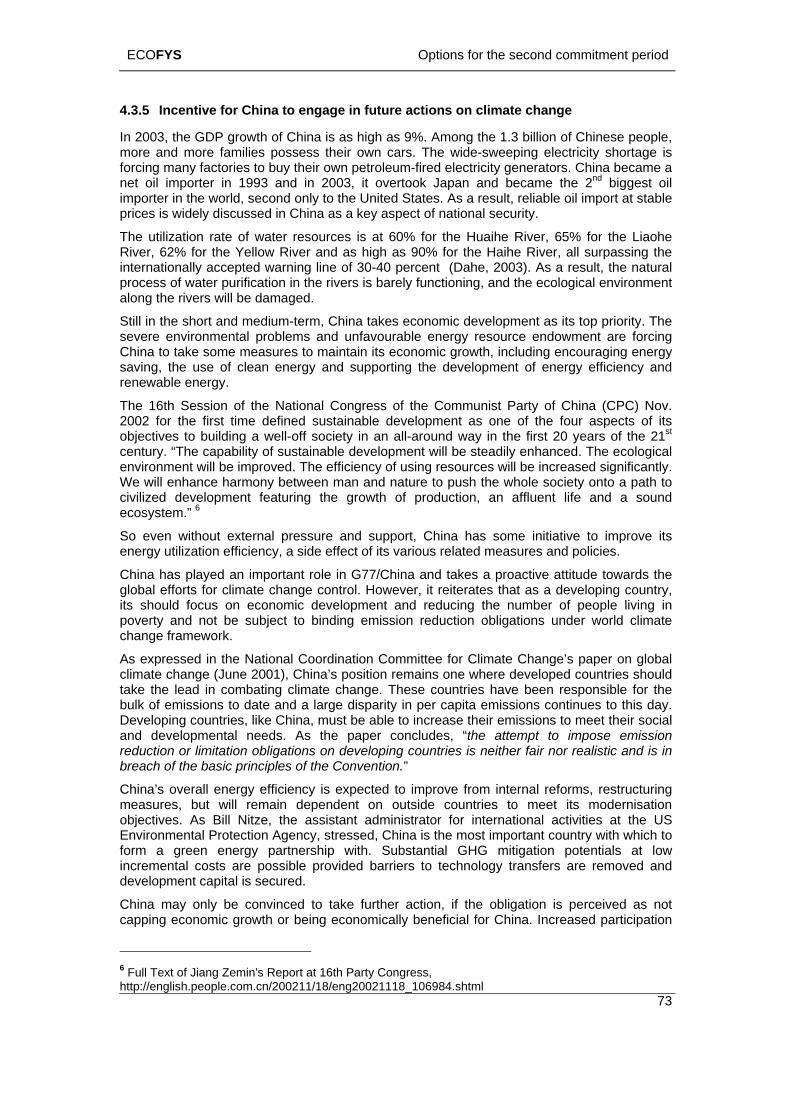
ECOFYS Options for the second commitment period
73
of its
cial ludes, “the attempt to impose emission untries is neither fair nor realistic and is in
b of the basic the Convention.”
China’s overall ene measures, but wi n obje As Bill E ntal Pro ich to form a green enincremental costs d and development capita
China may only b t c g economic
4.3.5 Incentive for China to engage in future actions on climate change
In 2003, the GDP growth of China is as high as 9%. Among the 1.3 billion of Chinese people, more and more families possess their own cars. The wide-sweeping electricity shortage is forcing many factories to buy their own petroleum-fired electricity generators. China became a net oil importer in 1993 and in 2003, it overtook Japan and became the 2nd biggest oil importer in the world, second only to the United States. As a result, reliable oil import at stable prices is widely discussed in China as a key aspect of national security.
The utilization rate of water resources is at 60% for the Huaihe River, 65% for the Liaohe River, 62% for the Yellow River and as high as 90% for the Haihe River, all surpassing the internationally accepted warning line of 30-40 percent (Dahe, 2003). As a result, the natural process of water purification in the rivers is barely functioning, and the ecological environment along the rivers will be damaged.
Still in the short and medium-term, China takes economic development as its top priority. The severe environmental problems and unfavourable energy resource endowment are forcing China to take some measures to maintain its economic growth, including encouraging energy saving, the use of clean energy and supporting the development of energy efficiency and renewable energy.
The 16th Session of the National Congress of the Communist Party of China (CPC) Nov. 2002 for the first time defined sustainable development as one of the four aspects objectives to building a well-off society in an all-around way in the first 20 years of the 21st century. “The capability of sustainable development will be steadily enhanced. The ecological environment will be improved. The efficiency of using resources will be increased significantly. We will enhance harmony between man and nature to push the whole society onto a path to civilized development featuring the growth of production, an affluent life and a sound ecosystem.” 6
So even without external pressure and support, China has some initiative to improve its energy utilization efficiency, a side effect of its various related measures and policies.
China has played an important role in G77/China and takes a proactive attitude towards the global efforts for climate change control. However, it reiterates that as a developing country, its should focus on economic development and reducing the number of people living in poverty and not be subject to binding emission reduction obligations under world climate change framework.
As expressed in the National Coordination Committee for Climate Change’s paper on global climate change (June 2001), China’s position remains one where developed countries should take the lead in combating climate change. These countries have been responsible for the bulk of emissions to date and a large disparity in per capita emissions continues to this day. Developing countries, like China, must be able to increase their emissions to meet their soand developmental needs. As the paper concreduction or limitation obligations on developing co
reach principles of
rgy efficiency is expected to improve from internal reforms, restructuringll remain dependent on outside countries to meet its modernisatio Nitze, the assistant administrator for international activities at the UStection Agency, stressed, China is the most important country with whergy partnership with. Substantial GHG mitigation potentials at low are possible provided barriers to technology transfers are removel is secured.
ctives.nvironme
e convinced to take further action, if the obligation is perceived as nogrowth or being economically beneficial for China. Increased participationappin
6
http://english.people.com.cn/200211/18/eng20021118_106984.shtml Full Text of Jiang Zemin's Report at 16th Party Congress,
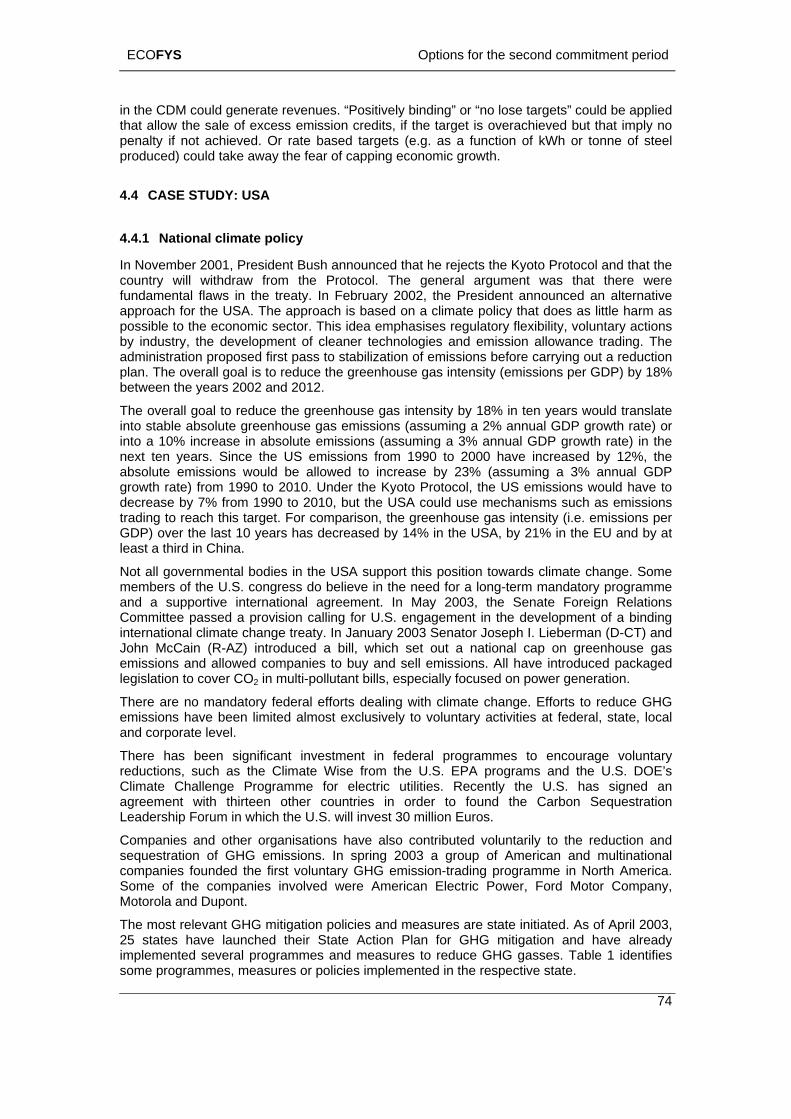
ECOFYS Options for the second commitment period
74
in the CDM could generate revenues. “Positively binding” or “no lose targets” could be applied that allow the sale ply no penalty if not achi steel produced) could ta
4.4 CASE STUDY
4.4.1 National cli
In November 2001c thd fundame ws ative approach for the Upossible to the ecob de administration prop n plan. The overall gbetwe ears
The overall goal to into stable absolute te) or into a 10% increas the next ten years. Si the absolute emissiong te) from 1 decrease by 7% fr trading to reach thi s per GDP) over the last 21% in the EU and by at least a third in Chin
Not all governmenmembers of the U. gramme and a supportive Committee passed g international climatJohn McCain (R-Ae allol over
limate change. Efforts to reduce GHG emissions have been limited almost exclusively to voluntary activities at federal, state, local
llion Euros.
Companies and other organisations have also contributed voluntarily to the reduction and gro
companies involved were American Electric Power, Ford Motor Company, a and Dupont.
st relevant GHG mitigation policies and measures are state initiated. As of April 2003, igation and have already
s. Table 1 identifies ome programmes, measures or polici s v
of excess emission credits, if the target is overachieved but that imeved. Or rate based targets (e.g. as a function of kWh or tonne ofke away the fear of capping economic growth.
: USA
mate policy
, President Bush announced that he rejects the Kyoto Protocol and that the raw from the Protocol. The general argument was that there were in the treaty. In February 2002, the President announced an alternSA. The approach
ountry will wintal fla
is based on a climate policy that does as little harm as nomic sector. This idea emphasises regulatory flexibility, voluntary actions velopment of cleaner technologies and emission allowance trading. Theosed first pass to stabilization of emissions before carrying out a reductio
y industry, the
oal is to reduce the greenhouse gas intensity (emissions per GDP) by 18% 2002 and 2012.
reduce the greenhouse gas intensity by 18% in ten years would translate
en the y
greenhouse gas emissions (assuming a 2% annual GDP growth rae in absolute emissions (assuming a 3% annual GDP growth rate) innce the US emissions from 1990 to 2000 have increased by 12%,s would be allowed to increase by 23% (assuming a 3% annual GDP 990 to 2010. Under the Kyoto Protocol, the US emissions would have to
om 1990 to 2010, but the USA could use mechanisms such as emissionss target. For comparison, the greenhouse gas intensity (i.e. emission 10 years has decreased by 14% in the USA, by
rowth ra
a.
tal bodies in the USA support this position towards climate change. Some S. congress do believe in the need for a long-term mandatory prointernational agreement. In May 2003, the Senate Foreign Relations a provision calling for U.S. engagement in the development of a bindine change treaty. In January 2003 Senator Joseph I. Lieberman (D-CT) and Z) introduced a bill, which set out a national cap on greenhouse gas
missions andegislation to c
wed companies to buy and sell emissions. All have introduced packaged CO2 in multi-pollutant bills, especially focused on power generation.
There are no mandatory federal efforts dealing with c
and corporate level.
There has been significant investment in federal programmes to encourage voluntary reductions, such as the Climate Wise from the U.S. EPA programs and the U.S. DOE’s Climate Challenge Programme for electric utilities. Recently the U.S. has signed an agreement with thirteen other countries in order to found the Carbon Sequestration Leadership Forum in which the U.S. will invest 30 mi
sequestration of GHG emissions. In spring 2003 a up of American and multinational companies founded the first voluntary GHG emission-trading programme in North America. Some of the Motorol
The mo25 states have launched their State Action Plan for GHG mitimplemented several programmes and measures to reduce GHG gasses es implemented in the re pecti e state.
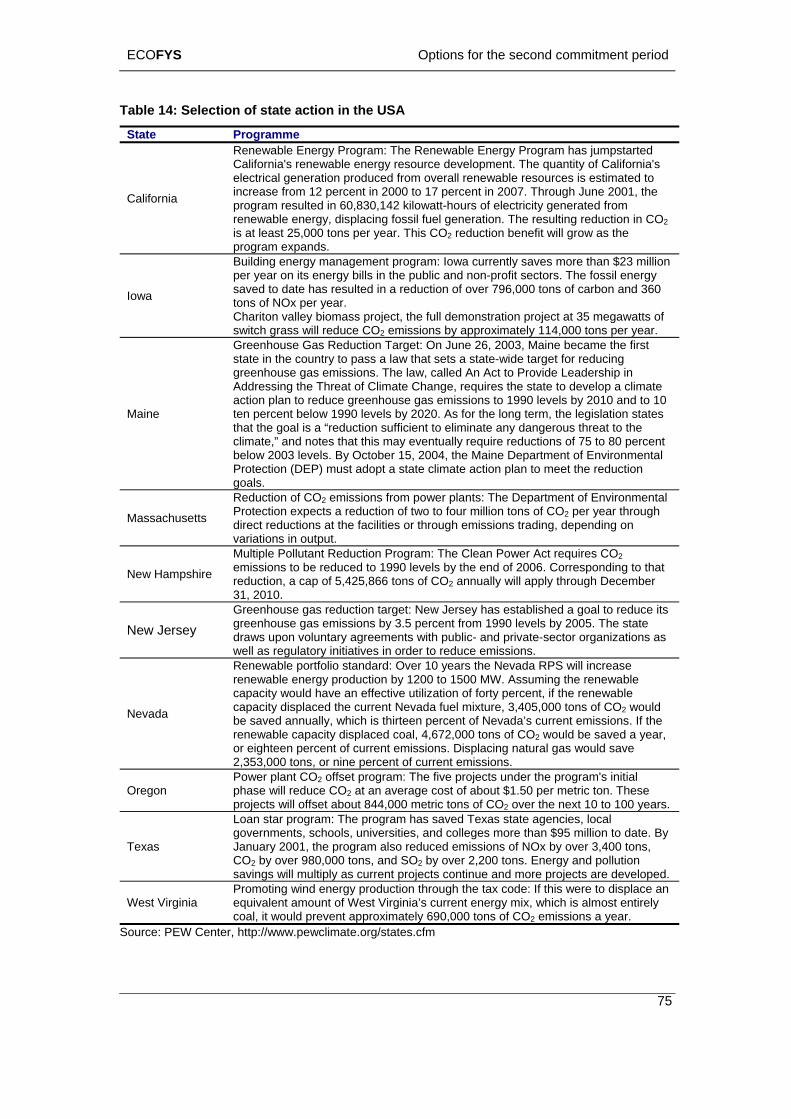
ECOFYS Options for the second commitment period
75
e action in
e
Table 14: Selection of stat the USA
State Programm
California
Renewable Energy Pro : e bl er ro h eCalifornia's renewable gy ur v e he ti C ielectrical generation pro ed o ll r a s s tim tincrease from 12 percent in 2000 to 17 rcent in 20 Th h 2 thprogram resulted in 60,8 42 wa our ele ity era fromrenewable energy, displ g fo fue ne n. re g reducti C
is CO reductio
gram The R newa e En gy P gram as jumpstart d ener reso
ce dev
elopme
nt. Tbl
quano
ty of aliforn a's duc from era
penew e re
07.urceroug
is es June
ated001,
o e
30,1 kilo tt-h s of ctric gen ted acin ssil l ge ratio The sultin on in O2
is at least 25,000 tons pprogram expands.
er year. Th 2 n benefit will grow as the
Iowa
ergy man nctors. The fossil energy
0 tons of carbon and 360
Building en ageme t program: Iowa currently saves more than $23 million per year on its energy bills in the public and non-profit sesaved to date has resulted in a reduction of over 796,00tons of NOx per year. Chariton valley biomass project, the full demonstration project at 35 megawatts of switch grass will reduce CO2 emissions by approximately 114,000 tons per year.
Maine action plan to reduce greenhouse gas emissions to 1990 levels by 2010 and to 10 ten percent below 1990 levels by 2020. As for the long term, the legislation states that the goal is a “reduction sufficient to eliminate any dangerous threat to the climate,” and notes that this may eventually require reductions of 75 to 80 percent below 2003 levels. By October 15, 2004, the Maine Departm
Greenhouse Gas Reduction Target: On June 26, 2003, Maine became the first state in the country to pass a law that sets a state-wide target for reducing greenhouse gas emissions. The law, called An Act to Provide Leadership in Addressing the Threat of Climate Change, requires the state to develop a climate
ent of Environmental Protection (DEP) must adopt a state climate action plan to meet the reduction goals.
Mas2
Protection expects a reduction of two to four million tons of CO per year through ect reductions at the facilities ough em ding, ding on
variations in ou
Reduction of CO emissions from power plants: The Department of Environmental
sachusetts dir2
depen or thr issions tratput.
N w e Hampshire
Multiple Pollutan uction Program: The Clea er Act re CO2 emissions to be ed to 1990 ls by the e 2006. Corresponding to reduction, a cap 25,866 tons of CO2 annu ill apply th Decemb
, 2010.
t Red n Pow quiresreduc leve nd of that of 5,4 ally w rough er
31
New Jersey Greegree
nhouse g ction ta w Jerse tablish l to rednhouse ga ns by fro evels b The state
draws upon vo agreem blic ate-sector organizatio
as redus emissio
rget: Ne 3.5 percent
y has esm 1990 l
ed a goay 2
uce its 005.
luntary ents with pu - and priv ns as well as regulatory initiatives in order to reduce emissions. Renewable portfolio standard: Over 10 years the Nevada RPS will increase renewable energy prod
Nevada capabe save
uction by 1200 to 1500 MW. Assuming the renewable capacity would have an effective utilization of forty percent, if the renewable
city displaced the current Nevada fuel mixture, 3,405,000 tons of CO2 would d annually, which is thirteen percent of Nevada’s current emissions. If the
renewable capacity displaced coal, 4,672,000 tons of CO2 would be saved a year, or eighteen percent of current emissions. Displacing natural gas would save 2,353,000 tons, or nine percent of current emissions.
Oregon Power plant CO2 offset program: The five projects under the program's initial phase will reduce CO2 at an average cost of about $1.50 per metric ton. These projects will offset about 844,000 metric tons of CO2 over the next 10 to 100 years.
Texas
Loan star program: The program has saved Texas state agencies, local governments, schools, universities, and colleges more than $95 million to date. By January 2001, the program also reduced emissions of NOx by over 3,400 tons, CO2 by over 980,000 tons, and SO2 by over 2,200 tons. Energy and pollution savings will multiply as current projects continue and more projects are developed.
West Virginia Promoting wind energy production through the tax code: If this were to displace an equivalent amount of West Virginia’s current energy mix, which is almost entirely coal, it would prevent approximately 690,000 tons of CO2 emissions a year.
Source: PEW Center, http://www.pewclimate.org/states.cfm
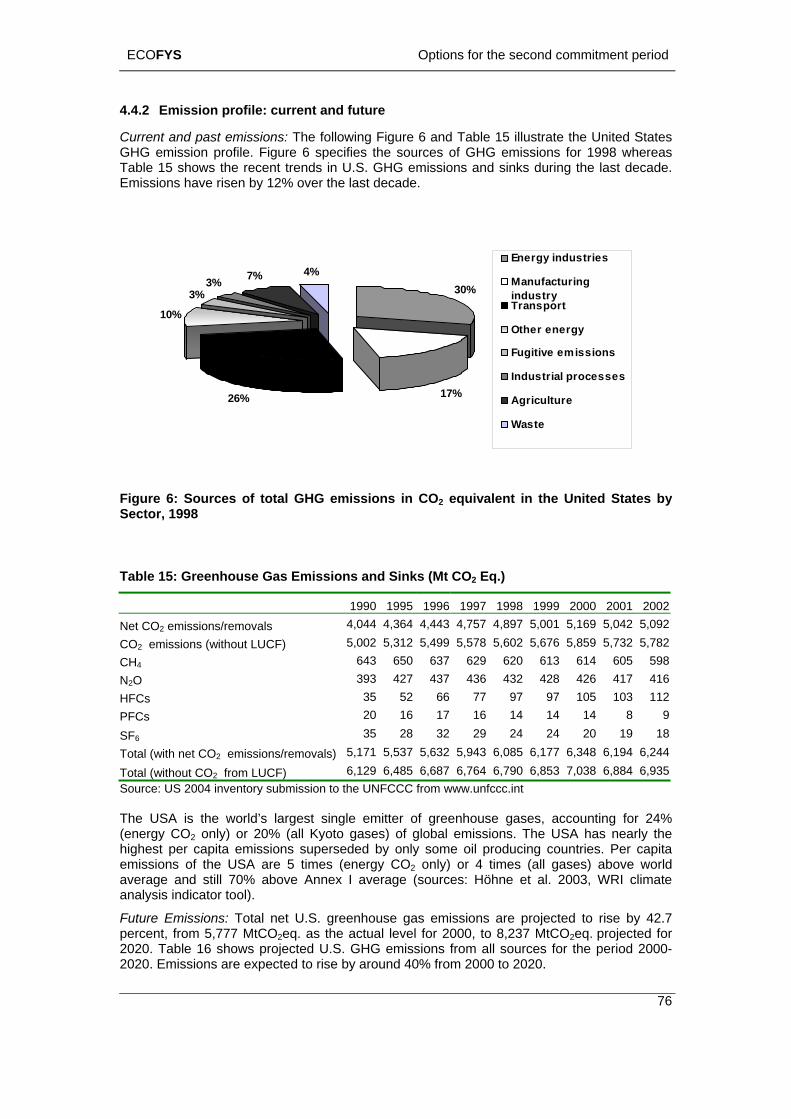
ECOFYS Options for the second commitment period
4.4.2 Emission profile: current and future
Current and past emissions: The following Figure 6 and Table 15 illustrate the United States GHG emission profile. Figure 6 specifies the sources of GHG emissions for 1998 whereas Table 15 shows the recent trends in U.S. GHG emissions and sinks during the last decade. Emissions have risen by 12% over the last decade.
30%
17%26%
10%
3%3% 7% 4%
Energy industries
ManufacturingindustryTransport
Other energy
Fugitive emissions
Industrial processes
Agriculture
Waste
Figure 6: Sources of total GHG emissions in CO2 equivalent in the United States by Sector, 1998
Table 15: Greenhouse Gas Emissions and Sinks (Mt CO2 Eq.)
1 2002 1990 1995 1996 1997 1998 1999 2000 200Net CO emissions/removals 4,044 4,364 4,443 4,757 4,897 5,001 5,1692 5,042 5,092CO2 emissions (without LUCF) 5,002 5,312 5,499 5,578 5,602 5,676 5,859 5,732 5,782CH4 643 650 637 629 620 613 614 605 598N2O 393 427 437 436 432 428 426 417 416HFCs 35 52 66 77 97 97 105 103 112PFCs 20 16 17 16 14 14 14 8 9
SF6 35 28 32 29 24 24 20 19 18Total (with net CO2 emissions/removals) 5,171 5,537 5,632 5,943 6,085 6,177 6,348 6,194 6,244
Total (without CO2 from LUCF) 6,129 6,485 6,687 6,764 6,790 6,853 7,038 6,884 6,935Source: US 2004 inventory submission to the UNFCCC from www.unfccc.int The USA is the world’s largest single emitter of greenhouse gases, accounting for 24%
o rise by 42.7
(energy CO2 only) or 20% (all Kyoto gases) of global emissions. The USA has nearly the highest per capita emissions superseded by only some oil producing countries. Per capita emissions of the USA are 5 times (energy CO2 only) or 4 times (all gases) above world average and still 70% above Annex I average (sources: Höhne et al. 2003, WRI climate analysis indicator tool).
Future Emissions: Total net U.S. greenhouse gas emissions are projected tpercent, from 5,777 MtCO2eq. as the actual level for 2000, to 8,237 MtCO2eq. projected for 2020. Table 16 shows projected U.S. GHG emissions from all sources for the period 2000-2020. Emissions are expected to rise by around 40% from 2000 to 2020.
76
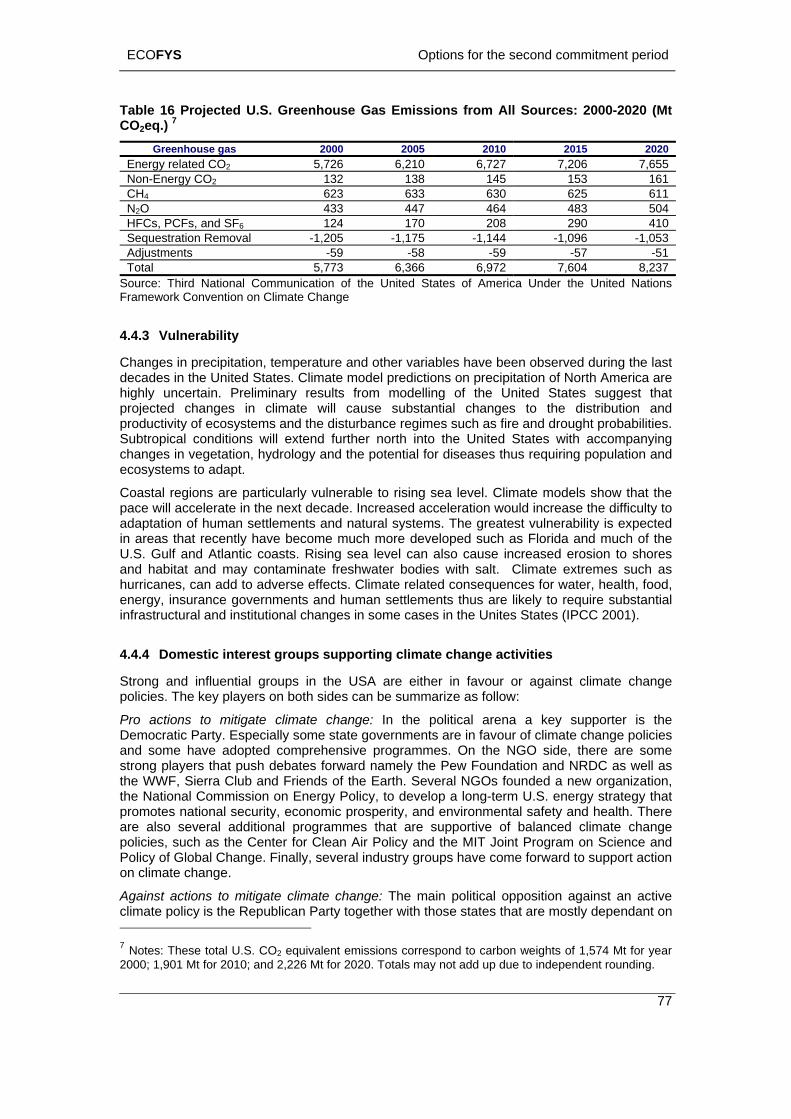
ECOFYS Options for the second commitment period
77
s 2000 2005 2010 2015 2020
Table 16 Projected U.S. Greenhouse Gas Emissions from All Sources: 2000-2020 (Mt CO2eq.) 7
Greenhouse gaEnergy related CO2 5,726 6,210 6,727 7,206 7,655 Non-Energy CO2 132 138 145 153 161 CH4 623 633 630 625 611 N2O 433 447 464 483 504 HFCs, PCFs, and SF6 124 170 208 290 410 Sequestration Removal -1,205 -1,175 -1,144 -1,096 -1,053 Adjustments -59 -58 -59 -57 -51 Total 5,773 6,366 6,972 7,604 8,237
Source: Third National Communication of the United States of America Under the United Nations
Chang emperature and other variables have been observed during the last
highly States suggest that
Subtropi States with accompanying changes in vegetation, hydrology and the potential for diseases thus requiring population and ecosystems to adapt.
Coastal regions are particularly vulnerable to rising sea level. Climate models show that the pace will accelerate in the next decade. Increased acceleration would increase the difficulty to adaptation of human settlements and natural systems. The greatest vulnerability is expected in areas that recently have become much more developed such as Florida and much of the U.S. Gulf and Atlantic coasts. Rising sea level can also cause increased erosion to shores and habitat and may contaminate freshwater bodies with salt. Climate extremes such as hurricanes, can add to adverse effects. Climate related consequences for water, health, food, energy, insurance governments and human settlements thus are likely to require substantial infrastructural and institutional changes in some cases in the Unites States (IPCC 2001).
4.4.4 Domestic interest groups supporting climate change activities
Strong and influential groups in the USA are either in favour or against climate change policies. The key players on both sides can be summarize as follow:
Pro actions to mitigate climate change: In the political arena a key supporter is the Democratic Party. Especially some state governments are in favour of climate change policies and some have adopted comprehensive programmes. On the NGO side, there are some strong players that push debates forward namely the Pew Foundation and NRDC as well as the WWF, Sierra Club and Friends of the Earth. Several NGOs founded a new organization, the National Commission on Energy Policy, to develop a long-term U.S. energy strategy that promotes national security, economic prosperity, and environmental safety and health. There are also several additional programmes that are supportive of balanced climate change policies, such as the Center for Clean Air Policy and the MIT Joint Program on Science and Policy of Global Change. Finally, several industry groups have come forward to support action on climate change.
Against actions to mitigate climate change: The main political opposition against an active climate policy is the Republican Party together with those states that are mostly dependant on
Framework Convention on Climate Change
4.4.3 Vulnerability
es in precipitation, tdecades in the United States. Climate model predictions on precipitation of North America are
uncertain. Preliminary results from modelling of the United projected changes in climate will cause substantial changes to the distribution and productivity of ecosystems and the disturbance regimes such as fire and drought probabilities.
cal conditions will extend further north into the United
7 Notes: These total U.S. CO2 equivalent emissions correspond to carbon weights of 1,574 Mt for year 2000; 1,901 Mt for 2010; and 2,226 Mt for 2020. Totals may not add up due to independent rounding.
ECOFYS Options for the second commitment period
78
fossil fuels. On the governmental side a non-supporter is the White House Council on inst climate change actions such as te. Some oil companies, such as
rialised countries as their
John Kerry recently commented that “because of the Bush Adm st set in the Kyoto Protocol are no longer achievable;" e international process [that would lead ] a greement.”
Notwiths ng option in engaging the US in a more ent of individual ies (such as the
egional Clean Air Incentives Market operating in Southern California and the US Clean Air Act), which in turn become matters of federal concern. Individual states have also been pressing the Bush Administration to regulate emissions of greenhouse gases.
State action has a tendency to replicate itself across other states and could form the catalyst to building sufficient political will in establishing a mandatory national greenhouse gas policy. Given the recent defeat of the Lieberman-McCain bill to cap greenhouse gas emissions within the USA by a narrow margin of 55 to 43, a “bottom-up” approach could well serve as the catalyst to ensure federal acceptance of a more active international role in greenhouse gas mitigation efforts.
4.5 REFERENCES
ALGAS, 1998, “Asia Least-cost Greenhouse Gas Abatement Strategy for India” Asia Development Bank, Global Environment Facility, United Nation Development Programme, ISBN: 971-561-186-9
International Energy Agency 2004, “World Energy Outlook 2004”, IEA/OECD, Paris
Mexico, 2001, “Second national communication to the UNFCCC”, available at www.unfcc
PEW Center 2002, “Climate change mitigation in developing countries” available at www.pewclimate.org
rological Administration, Xinhua News Agency December 24, 2003
WRI, 2003, “Climate analysis indicator tool”, computer tool to compare emissions and other indicators
gy Scenarios in
Environmental Quality. Several organizations lobby agaCompetitive Enterprise Institute and the Cato InstituExxonMobil, coal companies and power companies, such as Southern Co. lobby against action on climate change. Also the railroads are not in favour, since bringing coal from Wyoming to the Midwest and East is a major revenue source.
4.4.5 Incentive for the USA to engage in future actions on climate change
Unlike some of the other countries discussed above, the USA take a unique position with respect to engagement on future climate change actions. In the case of China and India, for example, there remains a “consistent” view towards adopting a binding greenhouse gas emissions target – i.e. responsibility must start with the most industper capita emissions are much less than the majority of Annex I countries and these countries’ comparatively low GDPs bring their own set of deflections from climate change. American policy on climate change is less consistent and is greatly influenced by the flavour of the ruling administration.
Presidential candidateini ration's inaction, the binding targets
he would therefore "immediately reengage th to strong, effective, and meaningful international a
tanding this issue, there remains an interestimultilateral approach to greenhouse gas mitigation through the involvemstates. There is a history of states taking the lead in environmental policR
c.int
D. Qin, 2003, Director-General of the China Meteo
for all countries, available from cait.wri.org as of December 2003
D. Zhou, Y. Dai, C. Cong, Y. Guo, and Y. Zhu et al. 2003, China’s Sustainable Ener2020, China Environmental Science Press, Aug. 2003
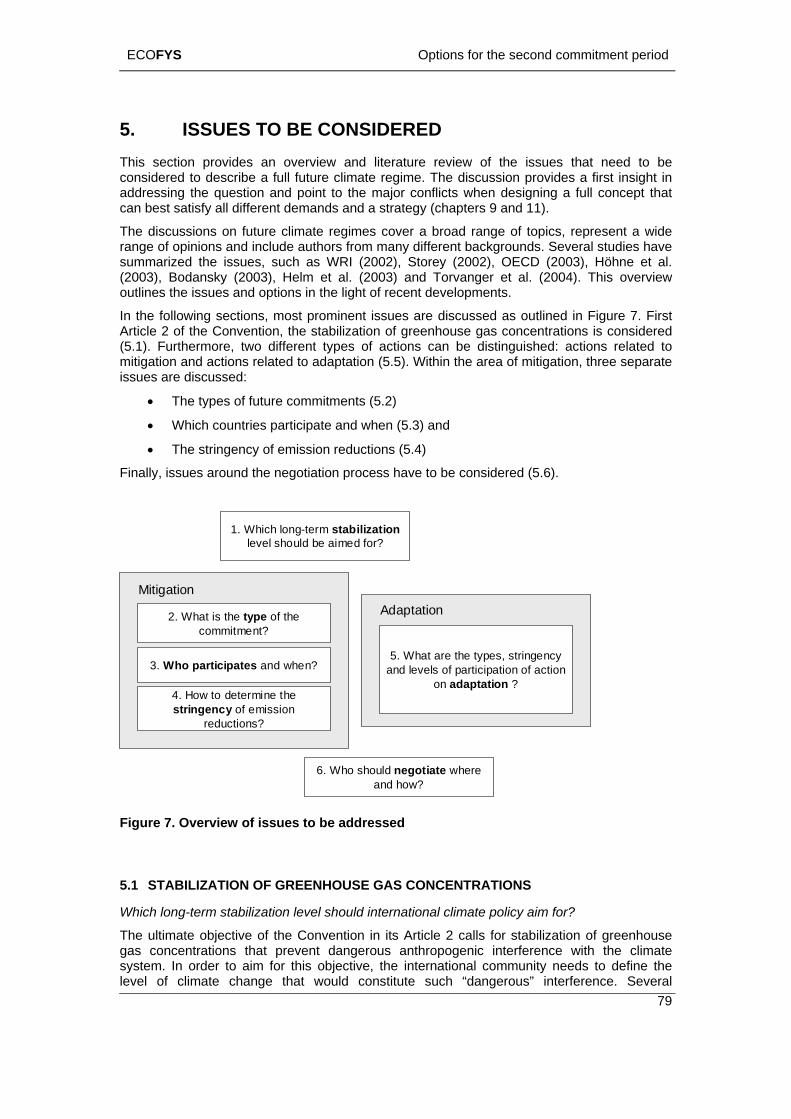
ECOFYS Options for the second commitment period
5. ISSUES TO BE CONSIDERED
79
This seconsideaddress ning a full concept that can best satisfy all different demand
The disrange osumma(2003), outlines
In the f ined in Figure 7. First Arti 2(5.1). Fmitigatioissues are di
•
•
ction provides an overview and literature review of the issues that need to be red to describe a full future climate regime. The discussion provides a first insight in ing the question and point to the major conflicts when desig
s and a strategy (chapters 9 and 11).
cussions on future climate regimes cover a broad range of topics, represent a wide f opinions and include authors from many different backgrounds. Several studies have rized the issues, such as WRI (2002), Storey (2002), OECD (2003), Höhne et al. Bodansky (2003), Helm et al. (2003) and Torvanger et al. (2004). This overview the issues and options in the light of recent developments.
ollowing sections, most prominent issues are discussed as outlcle of the Convention, the stabilization of greenhouse gas concentrations is considered
urthermore, two different types of actions can be distinguished: actions related to n and actions related to adaptation (5.5). Within the area of mitigation, three separate
scussed:
• The types of future commitments (5.2)
Which countries participate and when (5.3) and
The stringency of emission reductions (5.4)
Finally, issues around the negotiation process have to be considered (5.6).
3. Who participates and when?
2. What is the type of the commitment?
1. Which long-term stabilizationlevel should be aimed for?
MitigationAdaptation
5. What are the types, stringency and levels of participation of action
on adaptation ?4. How to determine the stringency of emission
reductions?
6. Who should negotiate where and how?
F
5.1
Whic rm stabilization level should international climate policy aim for?
T gas systeleve
igure 7. Overview of issues to be addressed
STABILIZATION OF GREENHOUSE GAS CONCENTRATIONS
h long-te
he ultimate objective of the Convention in its Article 2 calls for stabilization of greenhouse concentrations that prevent dangerous anthropogenic interference with the climate m. In order to aim for this objective, the international community needs to define the
l of climate change that would constitute such “dangerous” interference. Several
ECOFYS Options for the second commitment period
80
obstoffic e-Morlot & Höhne, 2003):
• Long time scale: A stable level of concentration will be reached only in one to several continue to rise for a century even when
o equilibrium (IPCC 2001a).
ined objectively. It always involves a value judgeme ed to be
ich may be
tability of any level: ostabilisation other than tha ates
c ritory re level
t prior
G uncil of uropean Union made a political j ng u rage t ot exceed 2 de us above pre-industrial levels and that t wer th nd r orts” (EC 1996). Clim e gases ther than CO2 and use average climate sensitivity, usually predict a temperature increase
temstremforcon
Thne
f greenhouse gas concentrations that are “dangerous” and that are not
rise level. But due to the reasons mentioned
2. A de ble to reach a range of desirable
maop
3. A third option
Kylate has the risk that the individual reductions
acles prevented the international community from taking such a decision or even from ially discussing such levels in the past (see also Corfe
centuries and temperature will concentrations have stabilized. Sea level rise will even continue to rise for millennia. Itis difficult to take decisions on such enormous time scales.
• Inherent uncertainty: Due to the current scientific uncertainties of the carbon cycle and the effect of elevated CO2 concentrations on temperature, the range of possible changes in the global-mean surface temperature associated with certain greenhouse gas concentration stabilization levels is large. E.g. stabilization of CO2 concentrations at 450 ppmv and similar levels for other greenhouse gases can lead to a global-mean surface temperature change of between 1.2°C to 2.3°C from 1990 to 2100 and between 1.5°C to 4°C from 1990 t
• Value judgement of “dangerous”: A “dangerous” level cannot be defnt on priorities, e.g. which ecosystems ne
lost without constituting a danger. secured and wh
• Unaccep S me countries may not be able to agree to any level of t prior to industrialization. E.g. some small island st
fear already at the current will be flooded in the futu
oncentration level that large parts of their national ter. Those countries may not be able to agree to any
that is higher than tha
iven these difficulties, the Coudgment on what constitutes “daemperatures should n
to the industrial revolution.
Ministers of the Eero s” interference in 1996: It agreed that “global ave
grees Celsiherefore concentration levels loeduction eff
an 550 ppmv CO2 should guide global limitation aate models, which take into account greenhous
ohigher than 2°C for a stabilization of CO2 concentrations at 550 ppmv in 2100 (1.5° to 3° in 2100 and 2° to 5 ° at equilibrium, see also Figure 28 in Chapter 10). Keeping global mean
perature below 2°C above pre-industrial level is therefore likely to require even more ingent reductions aiming at stabilization of CO2-concentration below 450ppmv. Substantial ission reductions (in the order of globally 25% below 1990 levels in 2050 and 80% below industrialized countries) are necessary to reach the stabilization level of 450ppmv CO2 centrations (see also Chapter 10).
ree options for considering long-term stabilization levels in the international climate gotiations are outlined below:
1. A first option would be to agree on a long-term stabilization level. A discussion on the level o“dangerous” helps to understand the magnitude and scope of the problems ahead and is urgently needed. The EU has already agreed that global average temperature should not
with more than 2°C above the pre-industrial above, a broader international agreement on this seems unlikely.
second option would be to adopt a “hedging strategy” (IPCC 2001b, chapter 10), fined as a shorter-term goal, from which it is still possi
long-term goals. Once the short-term goal is reached, decisions on next steps can be de in light of new knowledge and decreased levels of uncertainty. To implement this
tion, the international community could agree on a maximum amount of greenhouse gases that the global community should emit in, e.g., 2020 (see Corfee-Morlot & Höhne, 2003).
would be to formulate reductions step by step, based on the willingness of countries to act, without explicitly considering a long-term perspective. As under the
oto Protocol negotiations, countries would propose reduction percentages, which are r modified by negotiations. This approach
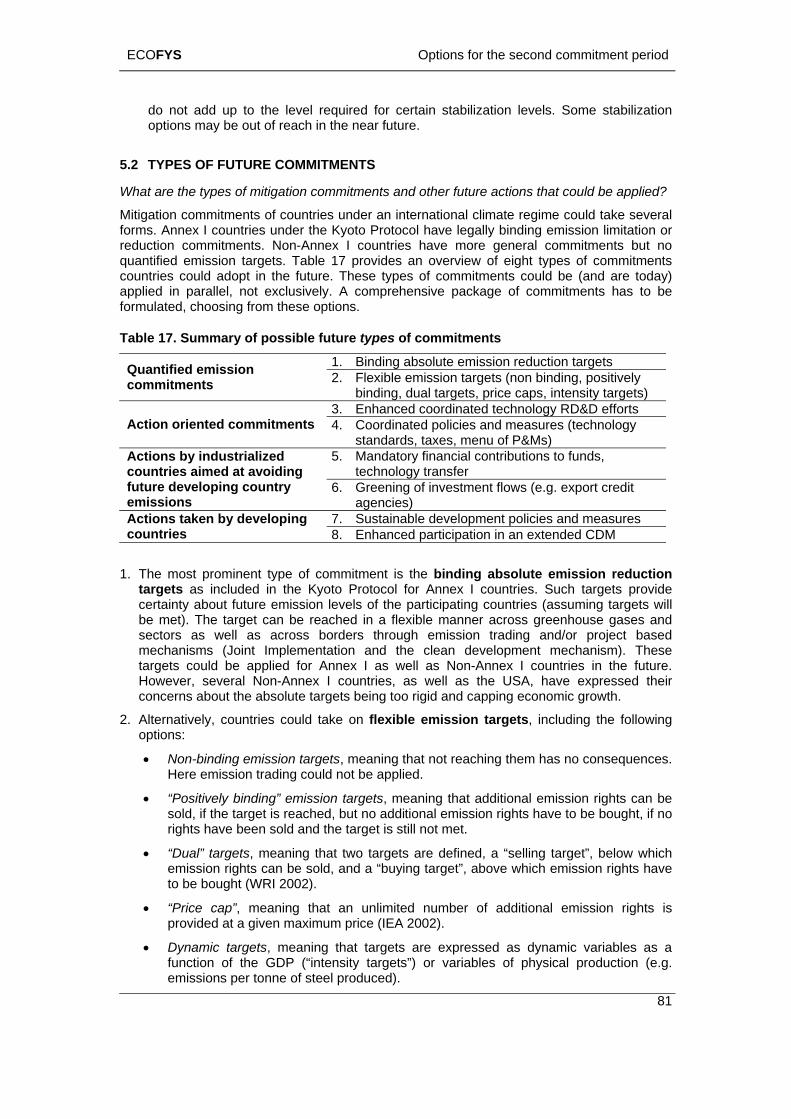
ECOFYS Options for the second commitment period
81
5.2
What are the types of mitigation commitments and other future actions that could be applied?
redqucouapfor
do not add up to the level required for certain stabilization levels. Some stabilization options may be out of reach in the near future.
TYPES OF FUTURE COMMITMENTS
Mitigation commitments of countries under an international climate regime could take several forms. Annex I countries under the Kyoto Protocol have legally binding emission limitation or
uction commitments. Non-Annex I countries have more general commitments but no antified emission targets. Table 17 provides an overview of eight types of commitments ntries could adopt in the future. These types of commitments could be (and are today)
plied in parallel, not exclusively. A comprehensive package of commitments has to be mulated, choosing from these options.
Table 17. Summary of possible future types of commitments
1. Binding absolute emission reduction targets Qco
uantified emission mmitments 2. Flexible emission targets (non binding, positively
binding, dual targets, price caps, intensity targets) 3. Enhanced coordinated technology RD&D efforts
Action oriented commitments 4. Coordinated policies and measures (technology standards, taxes, menu of P&Ms)
5. Mandatory financial contributions to funds, technology transfer
Aco voiding
ctions by industrialized untries aimed at a
future developing country emissions
6. Greening of investment flows (e.g. export credit agencies)
7. Sustainable development policies and measures Aco
ctions taken by developing untries 8. Enhanced participation in an extended CDM
1. s included in the Kyoto Protocol for Annex I countries. Such targets provide
2. could take on flexible emission targets, including the following
be sold, and a “buying target”, above which emission rights have
ssed as dynamic variables as a
The most prominent type of commitment is the binding absolute emission reduction targets acertainty about future emission levels of the participating countries (assuming targets will be met). The target can be reached in a flexible manner across greenhouse gases and sectors as well as across borders through emission trading and/or project based mechanisms (Joint Implementation and the clean development mechanism). These targets could be applied for Annex I as well as Non-Annex I countries in the future. However, several Non-Annex I countries, as well as the USA, have expressed their concerns about the absolute targets being too rigid and capping economic growth.
Alternatively, countries options:
• Non-binding emission targets, meaning that not reaching them has no consequences. Here emission trading could not be applied.
• “Positively binding” emission targets, meaning that additional emission rights can be sold, if the target is reached, but no additional emission rights have to be bought, if no rights have been sold and the target is still not met.
• “Dual” targets, meaning that two targets are defined, a “selling target”, below which emission rights canto be bought (WRI 2002).
• “Price cap”, meaning that an unlimited number of additional emission rights is provided at a given maximum price (IEA 2002).
• Dynamic targets, meaning that targets are exprefunction of the GDP (“intensity targets”) or variables of physical production (e.g. emissions per tonne of steel produced).
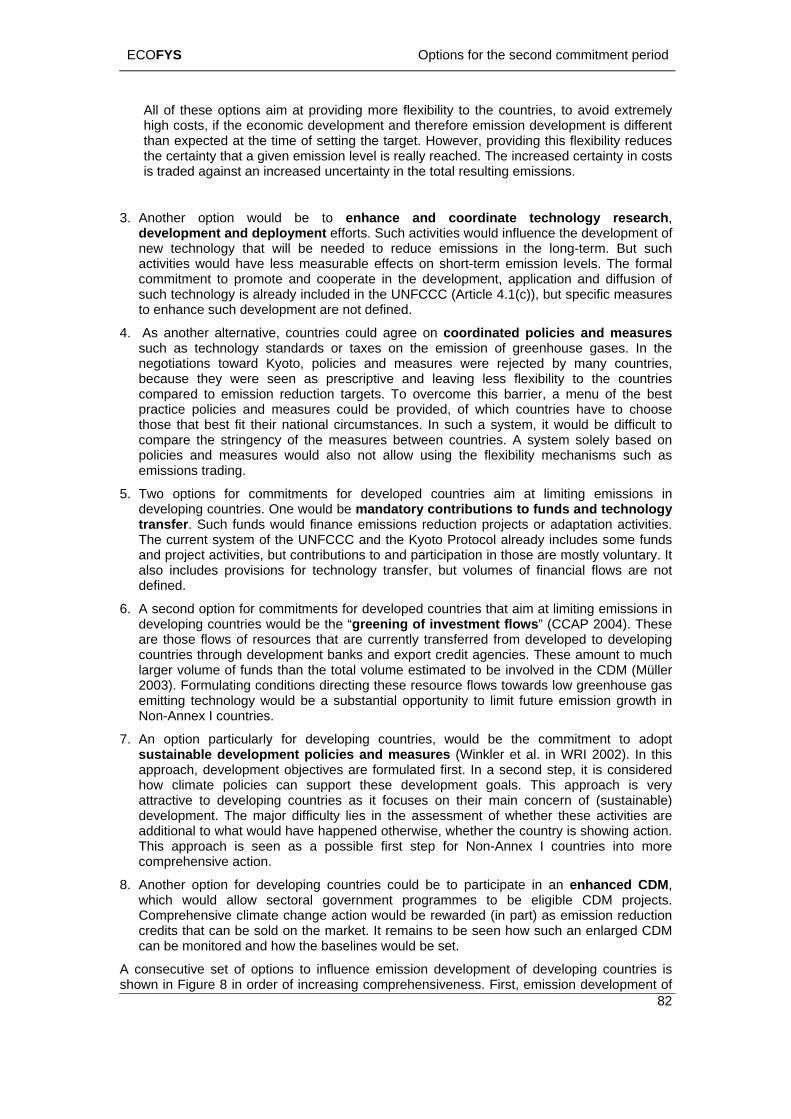
ECOFYS Options for the second commitment period
82
3. Another option would be to enhance and coordinate technology research, development and deployment efforts. Such activities would influence the development of
long-term. But such on levels. The formal
commitment to promote and cooperate in the development, application and diffusion of
to the countries
ce emissions reduction projects or adaptation activities.
AP 2004). These
nt to much larger volume of funds than the total volume estimated to be involved in the CDM (Müller
ditions directing these resource flows towards low greenhouse gas d be a substantial opportunity to limit future emission growth in
velopment objectives are formulated first. In a second step, it is considered
8.
A shown in Figure 8 in order of increasing comprehensiveness. First, emission development of
All of these options aim at providing more flexibility to the countries, to avoid extremely high costs, if the economic development and therefore emission development is different than expected at the time of setting the target. However, providing this flexibility reduces the certainty that a given emission level is really reached. The increased certainty in costs is traded against an increased uncertainty in the total resulting emissions.
new technology that will be needed to reduce emissions in theactivities would have less measurable effects on short-term emissi
such technology is already included in the UNFCCC (Article 4.1(c)), but specific measures to enhance such development are not defined.
4. As another alternative, countries could agree on coordinated policies and measures such as technology standards or taxes on the emission of greenhouse gases. In the negotiations toward Kyoto, policies and measures were rejected by many countries, because they were seen as prescriptive and leaving less flexibility compared to emission reduction targets. To overcome this barrier, a menu of the best practice policies and measures could be provided, of which countries have to choose those that best fit their national circumstances. In such a system, it would be difficult to compare the stringency of the measures between countries. A system solely based on policies and measures would also not allow using the flexibility mechanisms such as emissions trading.
5. Two options for commitments for developed countries aim at limiting emissions in developing countries. One would be mandatory contributions to funds and technology transfer. Such funds would finanThe current system of the UNFCCC and the Kyoto Protocol already includes some funds and project activities, but contributions to and participation in those are mostly voluntary. It also includes provisions for technology transfer, but volumes of financial flows are not defined.
6. A second option for commitments for developed countries that aim at limiting emissions in developing countries would be the “greening of investment flows” (CCare those flows of resources that are currently transferred from developed to developing countries through development banks and export credit agencies. These amou
2003). Formulating conemitting technology woulNon-Annex I countries.
7. An option particularly for developing countries, would be the commitment to adopt sustainable development policies and measures (Winkler et al. in WRI 2002). In this approach, dehow climate policies can support these development goals. This approach is very attractive to developing countries as it focuses on their main concern of (sustainable) development. The major difficulty lies in the assessment of whether these activities are additional to what would have happened otherwise, whether the country is showing action. This approach is seen as a possible first step for Non-Annex I countries into more comprehensive action.
Another option for developing countries could be to participate in an enhanced CDM, which would allow sectoral government programmes to be eligible CDM projects. Comprehensive climate change action would be rewarded (in part) as emission reduction credits that can be sold on the market. It remains to be seen how such an enlarged CDM can be monitored and how the baselines would be set.
consecutive set of options to influence emission development of developing countries is
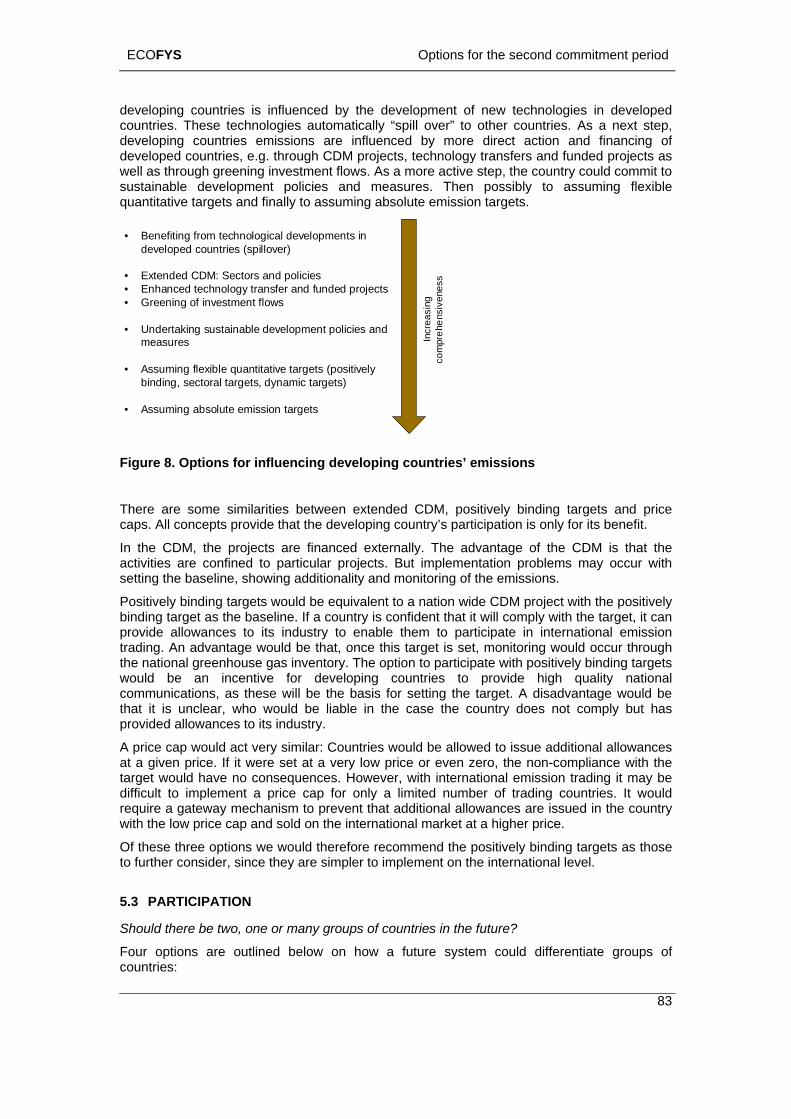
ECOFYS Options for the second commitment period
83
decou atically “spill over” to other countries. As a next step,
wesusqu
•• transfer and funded projects
•
•
•
veloping countries is influenced by the development of new technologies in developed ntries. These technologies autom
developing countries emissions are influenced by more direct action and financing of developed countries, e.g. through CDM projects, technology transfers and funded projects as
ll as through greening investment flows. As a more active step, the country could commit to tainable development policies and measures. Then possibly to assuming flexible
antitative targets and finally to assuming absolute emission targets.
Benefiting from technological developments in developed countries (spillover)
Extended CDM: Sectors and policiesEnhanced technology
•
• Greening of investment flows
Undertaking sustainable development policies and measures
Assuming flexible quantitative targets (positively binding, sectoral targets, dynamic targets)
Assuming absolute emission targetsIn
crea
sing
com
preh
ensi
ve
s ne
s
Thcap
In the CDM, the projects are financed externally. The advantage of the CDM is that the activities are confined to particular projects. But implementation problems may occur with setting the baseline, showing additionality and monitoring of the emissions.
Positively binding targets would be equivalent to a nation wide CDM project with the positively binding target as the baseline. If a country is confident that it will comply with the target, it can provide allowances to its industry to enable them to participate in international emission trading. An advantage would be that, once this target is set, monitoring would occur through the national greenhouse gas inventory. The option to participate with positively binding targets would be an incentive for developing countries to provide high quality national communications, as these will be the basis for setting the target. A disadvantage would be that it is unclear, who would be liable in the case the country does not comply but has provided allowances to its industry.
A price cap would act very similar: Countries would be allowed to issue additional allowances at a given price. If it were set at a very low price or even zero, the non-compliance with the target would have no consequences. However, with international emission trading it may be difficult to implement a price cap for only a limited number of trading countries. It would require a gateway mechanism to prevent that additional allowances are issued in the country with the low price cap and sold on the international market at a higher price.
Of these three options we would therefore recommend the positively binding targets as those to further consider, since they are simpler to implement on the international level.
.3 PARTICIPATION
how a future system could differentiate groups of countries:
Figure 8. Options for influencing developing countries’ emissions
ere are some similarities between extended CDM, positively binding targets and price s. All concepts provide that the developing country’s participation is only for its benefit.
5
Should there be two, one or many groups of countries in the future?
Four options are outlined below on
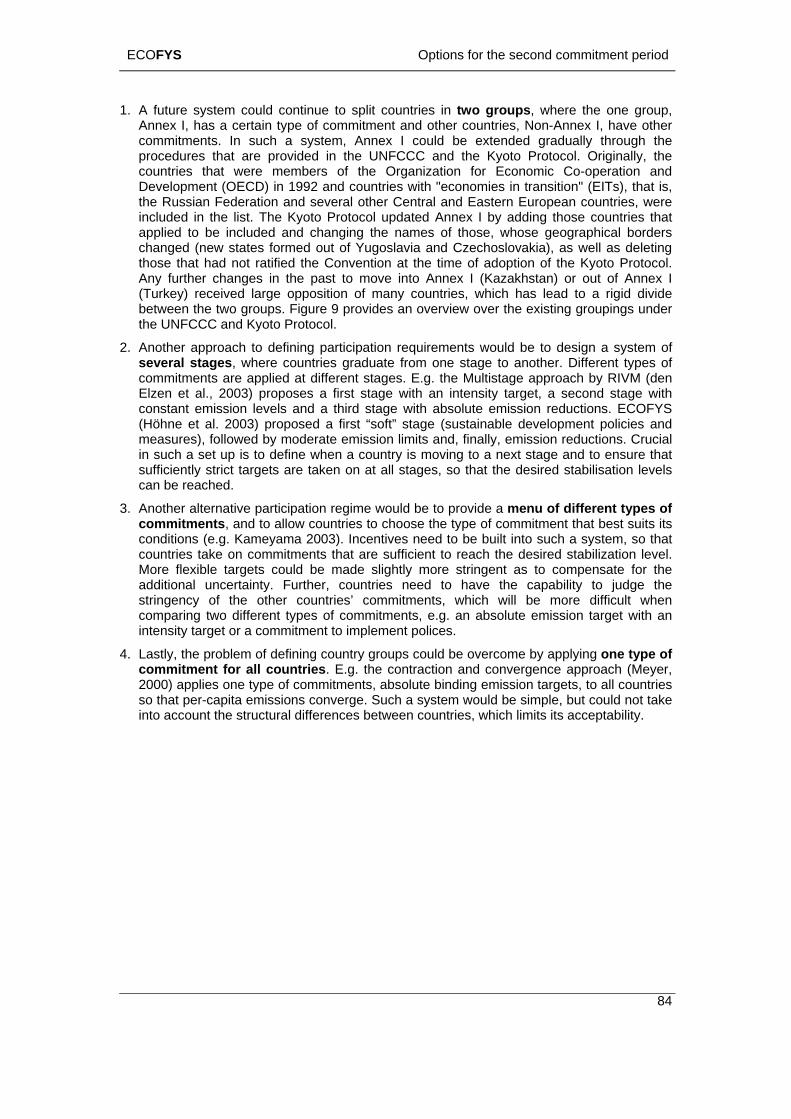
ECOFYS Options for the second commitment period
84
members of the Organization for Economic Co-operation and
be to design a system of
ith absolute emission reductions. ECOFYS (Höh osed a first “soft” stage (sustainable development policies and m a e emission limits and, finally, emission reductions. Crucial
e when a country is moving to a next stage and to ensure that fic re taken on at all stages, so that the desired stabilisation levels
3. t ld be to provide a menu of different types of c est suits its cond tem, so that
4.
itments, absolute binding emission targets, to all countries
1. A future system could continue to split countries in two groups, where the one group, Annex I, has a certain type of commitment and other countries, Non-Annex I, have other commitments. In such a system, Annex I could be extended gradually through the procedures that are provided in the UNFCCC and the Kyoto Protocol. Originally, the countries that were Development (OECD) in 1992 and countries with "economies in transition" (EITs), that is, the Russian Federation and several other Central and Eastern European countries, were included in the list. The Kyoto Protocol updated Annex I by adding those countries that applied to be included and changing the names of those, whose geographical borders changed (new states formed out of Yugoslavia and Czechoslovakia), as well as deleting those that had not ratified the Convention at the time of adoption of the Kyoto Protocol. Any further changes in the past to move into Annex I (Kazakhstan) or out of Annex I (Turkey) received large opposition of many countries, which has lead to a rigid divide between the two groups. Figure 9 provides an overview over the existing groupings under the UNFCCC and Kyoto Protocol.
2. Another approach to defining participation requirements would several stages, where countries graduate from one stage to another. Different types of commitments are applied at different stages. E.g. the Multistage approach by RIVM (den Elzen et al., 2003) proposes a first stage with an intensity target, a second stage with constant emission levels and a third stage w
ne et al. 2003) prope sures), followed by moderat
in such a set up is to definsuf iently strict targets acan be reached.
Ano her alternative participation regime wouommitments, and to allow countries to choose the type of commitment that b
itions (e.g. Kameyama 2003). Incentives need to be built into such a syscountries take on commitments that are sufficient to reach the desired stabilization level. More flexible targets could be made slightly more stringent as to compensate for the additional uncertainty. Further, countries need to have the capability to judge thestringency of the other countries’ commitments, which will be more difficult when comparing two different types of commitments, e.g. an absolute emission target with an intensity target or a commitment to implement polices.
Lastly, the problem of defining country groups could be overcome by applying one type of commitment for all countries. E.g. the contraction and convergence approach (Meyer, 2000) applies one type of commso that per-capita emissions converge. Such a system would be simple, but could not take into account the structural differences between countries, which limits its acceptability.
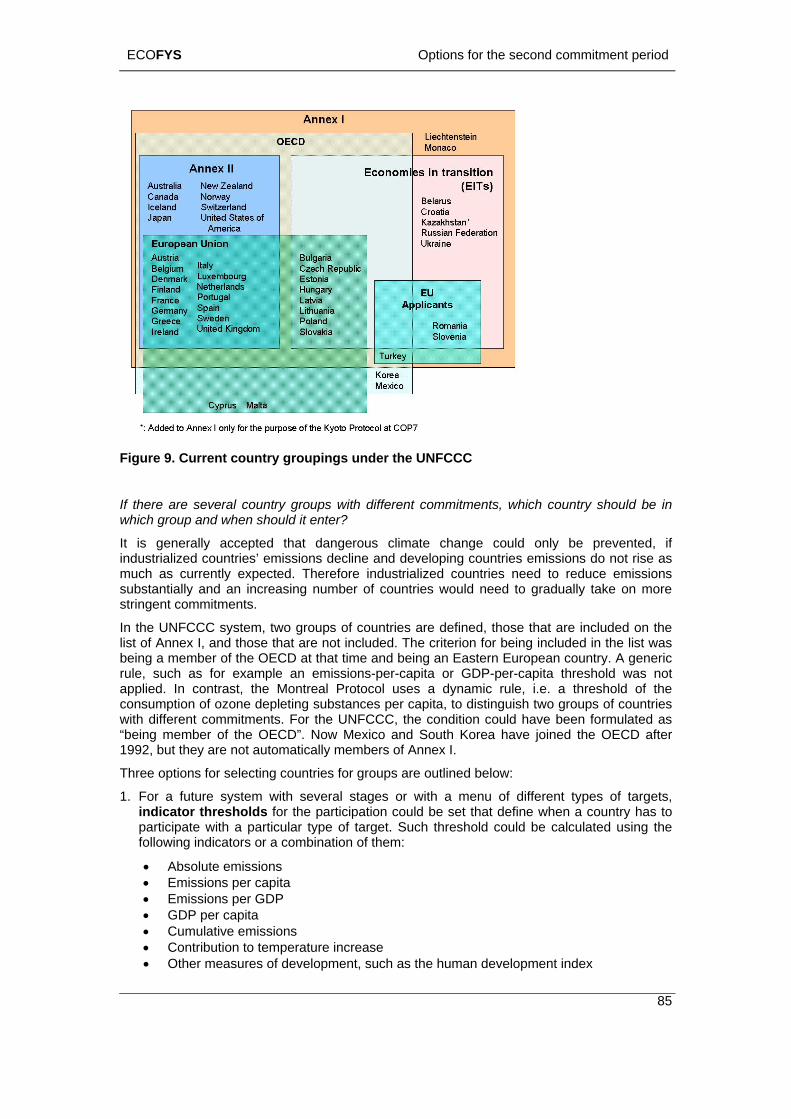
ECOFYS Options for the second commitment period
Figure 9. Current country groupings under the UNFCCC
If there are several country groups with different commitments, which country should be in
It indmu rrently expected. Therefore industrialized countries need to reduce emissions
In e that are included on the
rulapcon ng substances per capita, to distinguish two groups of countries
ith different commitments. For the UNFCCC, the condition could have been formulated as
increase human development index
which group and when should it enter?
is generally accepted that dangerous climate change could only be prevented, if ustrialized countries’ emissions decline and developing countries emissions do not rise as ch as cu
substantially and an increasing number of countries would need to gradually take on more stringent commitments.
the UNFCCC system, two groups of countries are defined, thoslist of Annex I, and those that are not included. The criterion for being included in the list was being a member of the OECD at that time and being an Eastern European country. A generic
e, such as for example an emissions-per-capita or GDP-per-capita threshold was not plied. In contrast, the Montreal Protocol uses a dynamic rule, i.e. a threshold of the sumption of ozone depleti
w“being member of the OECD”. Now Mexico and South Korea have joined the OECD after 1992, but they are not automatically members of Annex I.
Three options for selecting countries for groups are outlined below:
1. For a future system with several stages or with a menu of different types of targets, indicator thresholds for the participation could be set that define when a country has to participate with a particular type of target. Such threshold could be calculated using the following indicators or a combination of them:
• Absolute emissions • Emissions per capita • Emissions per GDP • GDP per capita • Cumulative emissions • Contribution to temperature• Other measures of development, such as the
85
ECOFYS Options for the second commitment period
86
ch indicator would be very controversial, as countries will have e opriate indicator. It seems unlikely that any single ic of indicators would be generally acceptable to all countries.
s s with
”) help countries to participate, if they see a benefit in it. Russia would have an economic benefit when participating in the Kyoto
e amount of excess emissions that could be sold. CDM or positively uld be incentives for developing countries to participate, because they
cess to the
the absence of a supra-national authority, only countries exercise incentives against other
is to link the climate to other issues such as trade. Trade sanctions er, the application of border tax adjustments as well as engaging into
rt to take on further commitments once the global or
a
5.4
TheMarthemredutargbelo
1. It
However, the choice of sudiff rent views on which is the most apprind ator or any combination
A threshold defined as per-capita emissions would provide an incentive to keep emissionlow as to not move to the more stringent next step. It would however include countriehigh emissions but relatively low development, such as South Africa and oil exporting countries, and exclude countries with high development and income, but low emissions. Therefore Criqui et al. (2003) proposed a composite index using the sum of per-capita emissions and per-capita GDP.
2. A second option would be that countries themselves decide which group to join (self-identification). In such a system, incentives have to be provided to motivate countries to move into certain groups, e.g. publicly available and comparable data on the indicators and political pressure. The withdrawal of the USA from the Kyoto Protocol and hesitance of the Russian Federation to ratify shows that the placement of countries in groups and incentives for participation is not only an issue for Non-Annex I countries but also for Annex I countries.
One the one hand, pull incentives (“carrots
Protocol due to thbinding targets wocan only benefit from participating. For companies in the USA it would be the acEU emission trading market that could be an incentive to participate. The choice of the topic of the discussion may also be an incentive to participate, e.g. the USA may be more willing to participate, if the focus of the action is on technology development and innovation. Developing countries would be interested, if the focus of the activities is on their economic development.
On the other hand, push incentives (“sticks”) may have to be applied as well. In
countries. One optionmay too strict, howevpreferred trade relations in the case of climate change action to could be viable options (see also chapter 11.2.3).
In addition, disincentives should be eliminated. For example, it would be a clear disincentive for developing countries to participate, if they have to fear that their economic development is capped.
3. Yet another option would be to explicitly link the participation of some developing countries to the success of reductions taken by developed countries. One proposal would be that developing countries only staAnnex I average per capita emissions are reduced. An appropriate indicator would have to be found in such a system. (See also the common but differentiated convergence
pproach, Chapter 7.)
STRINGENCY OF EMISSION REDUCTIONS
What would be the process to agree on differentiated targets?
resulting emission reduction percentages of countries in the Kyoto Protocol and the rakech Accords were essentially based on the political willingness of the countries selves. A general formula for setting the emission reductions was not applied. If emission ction commitments are applied in the future, a process on differentiating the emission ets between countries has to be agreed. Three options for such a process are outlined w.
n a next round of negotiations, the participating countries could again make proposals for heir individual reductions on a bottom-up basis. This approach has the risk that these
ECOFYS Options for the second commitment period
87
r
2.
3.
countries, the total of the G77 or any
Wh
Forbetw
Theto adiffeunlikely that it will be applied.
have been proposed that use further indicators to determine ns. Possible differentiation criteria include:
sic needs and luxury emissions al targets added to a national target (e.g. the Triptych approach)
they cemissconve
generemissTripty orate many structural differences. It
other emi
5.5 A
What
adaptatio s well as sustainable development. Such a link has been stressed many times, most prominently at the Conference of the Parties in New Delhi in 2002. However, only a few concrete proposals have been made on an explicit link. Müller (2003), for example, proposed a separate adaptation protocol. The issue of adaptation is further considered in section 6.
eductions do not lead to the low emission level needed to reach the desired stabilization levels.
Alternatively a common formula could be agreed (see also below) according to which the emission targets are determined. This rule could lead to reduction percentages for each individual country, which can then be modified by negotiations.
Another approach would be to give an overall target to a group of countries and to let the group decide on how to share the target amongst the participants. This could, for example, be applied to the EU, the current group of Annex Iother group of countries.
at are the options to determine emission targets for individual countries within a group?
options 2 and 3 above, a rule would have to be found to share emission allowances een countries within a certain group. Some options are outlined below:
simplest option is to choose a reference year and to apply equal percentage reductions ll countries (“flat rate”). This method is simple but does not take into account structural rences between countries, historic trends and reduction potentials. It is therefore very
Several other rules “differentiated” reductio
• Historic, current or assumed future emissions • Contributions to temperature increase (Brazilian Proposal) • Population (Convergence) • GDP or other measure of welfare or income • Geographic area • Reduction potentials • Costs and/or benefits of reductions • Sectoral benchmarks • Emissions to satisfy ba• Several sector
The individual reductions could be fine-tuned to reach a global emissions target. In addition, ould be designed in a way that leads (converges) to a common absolute level of
ions, e.g. a certain amount of emissions per capita, as for the ‘contraction and rgence’ approach, or per GDP.
Again it will be difficult to satisfy all possible country conditions with one formula. There is a al conflict between a simple transparent formula (such as converging per capita ions) and incorporating many national circumstances (e.g. the Triptych approach). The ch approach provides a formula that can incorp
derives national targets from sectoral considerations, assuming growth in industrial production and electricity production with improvements in efficiency and assuming convergence of all
ssions to equal per capita levels. However, this approach is relatively complicatedand therefore difficult to negotiate (see also 7).
DAPTATION
are the types, stringency and levels of participation of action on adaptation?
The next step on future international action will most likely only be acceptable to some countries if mitigation actions are combined with elements related to vulnerability and
n a
ECOFYS Options for the second commitment period
88
How streaty
in the rejecte ary 2005. 128 countries have ratified
it and climat
veU difficult. If the
ef
toon b climate change is widely
tabr reement, other countries may feel under pressure to
in participating countries in the beginning, as they may be faced with
3. Inth h include many Non-Annex I
of country (e.g. ting countries to clearly weaken
an itters
4. Fu proposed that negotiations are split into several treaties, e.g. a
lase countries that want
sypa cess down rather than
from methane.
5.7 CONCLUSIONS
The negotiations on future international action on climate change will be very complex and have to be conducted on many dimensions. The issues are diverse and inter-linked. However, the large number of options can be broken down into the categories such as those discussed above. Most proposals on future international actions on climate change cover different elements and are therefore difficult to compare. Such division into separate issues can be
5.6 NEGOTIATIONS
hould future international action on climate change be negotiated? What is the resulting architecture?
Currently, the Framework Convention on Climate Change is supported by almost all countries world. The Kyoto Protocol, as the next international step to mitigate climate change, is d by the USA but will enter into force on 16 Febru
the Kyoto Protocol to date. Especially the European Union and Japan are eager to implement do not want to start a parallel discussion forum. Four options for the future forum of the e negotiations are outlined below:
1. Discussions could continue under the Kyoto Protocol umbrella and efforts to bring the USA back into the process could be intensified. However, some observers note that it is
ry unlikely that the USA will be able to agree to anything that carries the name “Kyoto”. nder such circumstances, official discussions on next steps are very
Kyoto Protocol should be abandoned, six years or even more of negotiating time and fort to design the Protocol and the associated Marrakech Accords may be lost.
2. Alternatively, the “Kyoto countries” that are committed to reducing emissions could implement the Kyoto Protocol and negotiate amongst themselves on their further efforts
reduce emissions. Emphasis would be placed on actions to reduce emission and not ringing other countries into the regime. As the problem of
recognized, it is certain that measures to curb greenhouse gas emissions will have to be ken. There is only a serious debate about the costs and timing. If a critical mass is ought together under such an ag
join. However, such system would raise serious concerns of the internationally competing dustries in the
competitive disadvantages.
stead, it was also proposed that the major emitters negotiate a deal only amongst emselves. The 28 largest emitting countries, whic
countries, cause 80% of global emissions (see Höhne et al. 2003). With a smaller number negotiators, it may be easier to strike a deal. One intermediary
Switzerland) could take the initiative to bring together the major emitdiscuss and agree future steps. However, such a separate process wouldthe all-encompassing process under the UNFCCC, which is based on global participation
d decisions by consensus of all Parties. Still, an agreement between the major emcould be carried back into the UNFCCC process.
rthermore, it wastreaty on reporting, one on mandatory emissions reductions, one on adaptation, one on
nd-use change and forestry etc. The advantage would be to officially decouple the parate issues and to negotiate each issue separately only with the
to participate. However, the risk still persists that the shortcomings of the one-treaty stem remain: Some countries could link the topics unofficially and some countries could rticipate in the separate treaty negotiations to slow the pro
moving it forward, as it happens today under the UNFCCC. One emerging example is the US initiative „Methane to markets”, that gathers interested countries to reduce emissions
8
8 See http://www.methanetomarkets.org/ or http://www.epa.gov/methane/international.html
ECOFYS Options for the second commitment period
89
useful for categorizing and discussing the isolated options and proposals. Structuring the tiation issues, which can be discussed one by one, may accelerate
hing a
ng-term targets and short-term commitments",
ren, N. Kouvaritakis and
EC 1996. Communication on Community strategy on climate change. Council conclusions, 25-26 June
Eickhout, B. and Van Vuuren, D.P., 2003. Exploring climate
n climate change organized by the Center for Clean Air Policy in
412
Inte ion, and
Inter
Inter imate Change 2001; Synthesis report.
Inter
Kam
ub/dp2003-3ver2.pdf
nego s around the distinct reac n agreement.
5.8 REFERENCES
M. Berk & M. den Elzen, 2003, “How can the Parties fairly and effectively establish future obligations under long-term objectives?” in David Michel (ed.),(2003): "Climate Policy for the 21st Century, Meeting the Long-Term Challenge of Global Warming". Washington D.C., Center for Transatlantic Relations http://transatlantic.sais-jhu.edu
Bodansky, D., 2003, “Climate commitments: assessing the options”, in J. E. Aldy, J. Ashton, R. Baron, D. Bodansky, S. Charnovitz, E. Diringer, T. C. Heller, J. Pershing, P. R. Shukla, L. Tubiana, F. Tudela, X. Wang, “Beyond Kyoto, advancing the international effort against climate change”, Pew Center on Global Climate Change, Arlington, USA, available at http://www.pewclimate.org/global-warming-in-depth/all_reports/beyond_kyoto/index.cfm
J. Corfee-Morlot, N. Höhne, 2003: "Climate change: loGlobal Environmental Change, Volume 13, Issue 4 , December 2003, Pages 277-293
Center for Clean Air Poloicy 2004. “Greening investment flows”, Discussion paper
P. Criqui, A. Kitous, M. Berk, M. den Elzen, B. Eickhout, P. Lucas, D. van VuuD. Vanregemorter, 2003, “Greenhouse Gas Reduction Pathways In The UNFCCC Process Up To 2025 − Technical Report”, Study Contract: B4-3040/2001/325703/MAR/E.1 for the European Commission, DG Environment http://europa.eu.int/comm/environment/climat/pdf/pm_techreport2025.pdf
1996
Den Elzen, M.G.J., Berk, M.M., Lucas, P., regimes for differentiation of commitments to achieve the EU climate target. RIVM Report no. 728001023, National Institute of Public Health and the Environment, Bilthoven, the Netherlands http://arch.rivm.nl/ieweb/ieweb/Reports/728%20001%20023_final_V1.pdf
Helm, N., E. Williams, H. Winkler, N. Höhne, 2003, “Matrix of issues”, Presentation at the dialogue on future international action oSouth Korea October 2003, available at www.ccap.org
Höhne, N., J. Harnisch, D. Phylipsen, K. Blok, C. Galleguillos, 2003, “Evolution of commitments under the UNFCCC: involving newly industrialized economies and developing countries”, Environmental research of the Federal Ministry of the Environment, Nature Conservation and Nuclear Safety, Research Report 201 41 255, UBA-FB 000
Intergovernmental Panel on Climate Change, 2001a, Climate Change 2001: The scientific basis. Contribution of Working Group I to the Third Assessment Report. Cambridge University Press: Cambridge, United Kingdom, available at http://www.ipcc.ch/pub/tar/index.htm
rgovernmental Panel on Climate Change, 2001b, Climate Change 2001: Impacts, adaptatVulnerability. Contribution of Working Group II to the Third Assessment Report. Cambridge University Press: Cambridge, United Kingdom, available at http://www.ipcc.ch/pub/tar/index.htm
governmental Panel on Climate Change, 2001c, Climate Change 2001: Mitigation. Contribution of Working Group III to the Third Assessment Report. Cambridge University Press: Cambridge, United Kingdom, available at http://www.ipcc.ch/pub/tar/index.htm
governmental Panel on Climate Change 2001d, ClCambridge University Press: Cambridge, United Kingdom, available at http://www.ipcc.ch/pub/tar/index.htm
national Energy Agency 2002, “Beyond Kyoto -- Energy Dynamics and Climate Stabilisation”, ISBN 92-64-19838-5
eyama, Yasuko, 2003. Dual track approach: an optional climate architecture for beyond 2012, National Institute for Environmental Studies, Japan, Discussion paper 2003-3, available at http://www.nies.go.jp/social/post2012/p
ECOFYS Options for the second commitment period
90
on paper, COM/NENV/EPOC/IEA/SLT(2003)3
ena and Jonas Vevatne, 2004. Climate policy beyond 2012: A survey of long-term targets and future frameworks. Report 2004:02. CICERO, Oslo, Norway, available at
ation_id=2776
Meyer, A., 2000, “Contraction and Convergence - The Global Solution to Climate Change”, Global Commons Institute, Schumacher Briefing No.5, see also http://www.gci.org.uk/
Müller, B. 2003, “Framing Future Commitments”, Oxford Institute for Energy Studies
Organization for Economic Cooperation and Development, 2003, “Evolution of mitigation commitments: some key issues”, OECF and IEA informati
Philibert, C., & J.Pershing, 2001, “Considering the Options: Climate Targets for All Countries”, Climate Policy, 1, 211-227.
Storey, M., 2002, “Kyoto and Beyond, Issues and options in the global response to climate change”, for the Swedish Environmental Protection Agency available at http://www.internat.environ.se/documents/issues/ climate/report/Kyoto.pdf
Torvanger, Asbjørn, Michelle Tw
http://www.cicero.uio.no/publications/detail.asp?public
World Resources Institute 2002: “Building on the Kyoto Protocol, options for protecting the climate”, Washington, USA, ISBN 1-56973-524-7, also available at www.wri.org
ECOFYS Options for the second commitment period
91
N
area was re-emphasized in the Delhi Ministerial Declaration resulting from COP8. Discussions to address
re fruitful, if developed countries a
th some final
pensation.
3.
It wadaptatio
6. ADAPTATIO
6.1 INTRODUCTION
Adaptation to climate change is one of the key issues of concern for developing countries, who perceive that although much is being done in the way of mitigation for addressing the climate change issue, adaptation has taken a back seat (Najam et al. 2003, Ott et al. 2004). Indeed, mitigation efforts are already underway in both Annex I and non-Annex I countries and mitigation still dominates the climate change negotiation process. Adaptation issues have advanced much less rapidly and the urgency to achieve progress in this
mitigation efforts of developing countries are likely to be mocan lready clearly demonstrate a commitment to addressing adaptation. Adaptation must therefore form part of a final negotiation package.
Despite of the recognition that adaptation is a major key to a solution to the problem of climate change and the impasse of the negotiations, concrete steps to incorporate ‘adaptation’ in the international climate negotiations are still very rare.
The following chapters discuss the definition of adaptation (6.2), adaptation in the UNFCCC framework (6.3), funding schemes for adaptation (6.4), actions to further advance adaptation (6.5) and further issues (6.6). The discussion on adaptation concludes wiremarks in chapter 6.7.
6.2 DEFINITION OF ADAPTATION
The problem of global climate change can be addressed with three types of action: reducing greenhouse gas emissions (mitigation), adapting to the changing climate and restoring the remaining impacts of climate change. Adaptation is generally seen as proactive measure while restoration would be rather reactive, but the distinction between adaptation and restoration is not always clear.
The Third Assessment Report of the IPCC defines adaptation as “adjustments in ecological, social or economic systems in response to actual or expected climatic stimuli and their effects or impacts” (Burton et al. 2001). This definition still leaves room for interpretation. In principle, three types of adaptation activities could be envisaged:
1. Measures could be anticipatory of explicit changes in the climatic conditions to avoid expected damage or to prevent damages that have occurred for the first time in the past. Building dikes against sea level rise or changing agricultural practice to keep production on a sufficient level under drier circumstance would be such proactive measures.
2. Measures damage repair, restoration or comcould also be taken to ensure Insurance could compensate for the damage that will occur, if no adaptation measures are taken or if adaptation measures are insufficient to avoid damage. Such insurance could be seen as a form of adaptation. If the risks increase, the coverage of the insurance is extended. Any restoration could also include adaptive measures that would soften the impacts of subsequent (extreme whether) events.
In addition, measures could be taken to strengthening the general capacity of communities to adapt to unexpected or future changes in climate. A country with higher economic development can better adapt to changes in climatic conditions than countries with a lower economic development. Such measures can be interpreted as covering a very broad set of issues, basically covering poverty alleviation and economic development. In such case, only the climate change specific adaptation activities should be considered under the UNFCCC.
as suggested as one option to first focus on projects that have a mitigation and an n component at the same time. Examples could be buildings that are more energy
ECOFYS Options for the second commitment period
92
efficstor ake the soil more resilient. The number of such projects, however, is very limiSomada
Vul and adaptation to climate change is a topic of intensive research. The regiCon
Thediscmay
6.3
TheUNFPro
ge.
ntions insurance. In this article, the adverse effects of climate change are linked to
te change impacts and
c aspects of n on
It agreed to further discuss adaptation on a very general sense; concrete ‘adaptation commitments’ are not on the agenda. The SBSTA agreed to continue focusing its work on exchanging information and sharing experiences and views among Parties on practical opportunities and solutions to facilitate the UNFCCC’s implementation and to organize a further workshop for sharing experiences and on the application of methods and tools for
ient and at the same time less susceptible to extreme whether events or plantations that e carbon and mted and by far not all adaptation or mitigation needs will be covered by such projects.
e argue that resources would be more effective, if spent half on mitigation and half on ptation (Klein et al. 2003).
nerability, impactsonal impacts of climate change and possible adaptation measures are poorly understood. sequently, the costs of the necessary adaptation measures are not available.
re may also be limits to adaptation to climate change. Certain events, such as the ontinuation of the thermohaline circulation may lead to substantial changes in climate that be difficult to adapt to.
ADAPTATION IN THE UNFCCC FRAMEWORK
issue of adaptation to climate change is treated in a very fragmented manner in the CCC negotiations. It is included in several articles of the UNFCCC and the Kyoto
tocol and is considered in several negotiation items. Funds are established and the issue of insurance against climate related events is discussed.
Several articles of the Climate Change Convention consider adaptation:
• Articles 4.1b, 4.1e and 4.1f of the Convention refer to all Parties committing to ‘cooperate in preparing for adaptation to the impacts change’ and to ‘formulate, implement, publish and update’ national ‘programmes containing measures to facilitate adequate adaptation to climate chan
• Article 4.4 of the Convention requires Annex II Parties to fund developing country adaptation on climate change (see also Arts. 4.3, 4.7 and 4.9 with respect to funding in general).
• Article 4.5 refers to promoting, facilitating and financing transfer of ‘environmentally sound technologies and know-how’ to enable developing countries to implement provisions of the Convention. These technologies include adaptation technologies as well as technologies reducing greenhouse gases. A general framework on technology transfer has been adopted, including the formation of an expert group on technology transfer (EGTT), which also considers adaptation technologies.
• Article 4.8 states that all Parties shall give full consideration of needs of developing countries from adverse effects of climate change. It is also the only article that meeffects of “response measures” (actions by Annex I Parties to reduce emissions and therefore, e.g., lowering the revenues from oil exports) on developing countries. This explicit link prevented fast progress on these issues, as developed countries are more prepared to fund adaptation activities than to compensate for losses in oil revenues.
• The SBSTA worked also on methods and tools to assess climaadaptation options
In June 2004, the SBSTA for the first time considered adaptation as a separate agenda item and organized a in-session workshop on “Scientific, technical and socio-economiimpacts of, and vulnerability and adaptation to, climate change” to focus the discussioadaptation in one place.
ECOFYS Options for the second commitment period
93
as
effects of climate change and of
rovided most of
ACC)” project in Caribbean ted in 2002 with the aim to integrate climate change and
ncremental global benefit can be identified
COgenund
1.
2.
cially adaptation technology).
assessing impacts and vulnerability and adaptation and the linkages between adaptation and sustainable development.
As part of the package agreed at COP7, a UNFCCC workshop on insurance was mandated under the discussion related to Articles 4.8 and 4.9 (adverse effects of climate change). It wheld in Bonn, May 2003. Due to the linkage of adverse effect of climate change and of response measures in Article 4.8 of the UNFCCC, insurance for both issues were discussed. Subsequently the Subsidiary Body for Implementation (SBI) considered the issues related to adverse effects (Article 4.8 and 4.9, Decision 5/CP.7) including the workshop on insurance, but did not reach a conclusion in June 2003, December 2003 and June 2004. This disagreement is partly due to the link between adverseresponse measures as well as the retarding role of Saudi Arabia (ENB 2003).
6.4 FUNDING FOR ADAPTATION UNDER THE UNFCCC
The Global Environment Facility (GEF) of the World Bank provides resources for developing countries as the financial mechanism of the UNFCCC. The GEF pits budget within its focal area “climate change” from 1991 to 2003 for emissions reduction projects and around 7% of this budget for preparation of national communications, which includes assessments of vulnerability and adaptation (GEF 2004a). The GEF also co-funds projects like the “Mainstreaming Adaptation to Climate Change (Mregion. This five-year project starvariability into sectors such as tourism, agriculture, fisheries and infrastructure.
The Conference of the Parties of the UNFCCC (COP) oversees the activities of the GEF related to climate change. COP 1 (Berlin 1995) requested the GEF to first fund studies on climate change impacts in developing countries through their support for national communications (stage I). COP 4 (Buenos Aires 1998) requested the GEF to fund projects to identify measures to prepare for adaptation (stage II). COP 9 (Milan 2003) requested the GEF to operationalize a new strategic priority “piloting an operational approach to adaptation” (SPA). It will support projects that integrate adaptation into national policy and sustainable development planning. This priority will be funded with US$ 50 million over three years and is to be operational as of 1 July 2004 (GEF, 2004b).
One obstacle for this general GEF funding is that it includes only incremental costs of measures to achieve a global environmental benefit. The new strategic priority “piloting an operational approach to adaptation also supports only incremental costs and global environmental benefits. Adaptation activities, however, have primarily a local benefit. The implementation of the pilot projects will show, how ifor adaptation.
P 7 (Marrakech 2001) requested the creation of three funds that are additional to the eral GEF funding and that are to be administered by the GEF. These funds do not erlie the principle of incremental costs of global environmental benefits:
The special climate change fund (SCCF) was established (Decision 7/CP.7) to support climate change activities in the areas of: “adaptation (5/CP.7 para. 8); technology transfer (4/CP.7); energy, transport, industry, agriculture, forestry and waste management; and activities to assist developing countries…in diversifying their economies”. COP 9 (Milan 2003) requested the GEF to make this Convention fund operational without delay. Adaptation as “top priority” shall include implementation of adaptation activities, improving the monitoring of diseases and vectors affected by climate change, supporting capacity-building, and supporting national and regional centers for rapid response to extreme weather events (Decision 5/CP.9).
The least developed country (LDC) fund, a fund of the Convention, (established under 7/CP.7) is to support a work programme for LDCs, which includes, amongst others, support in development, preparation and implementation of national adaptation programmes of action (NAPAs) to communicate vulnerabilities and adaptation needs, and the development & transfer of technology (espe
ECOFYS Options for the second commitment period
94
jects totaling US$ 8 million for the preparation of NAPAs in 37 countries
lnerability and
aration of NAPAs (Decision 28/CP.7).
tivities identified in the
ing country Parties that are particularly vulnerable to the adverse effects of
s to all climate change related activities; bilateral
funding for the special climate change
OP has not greed on volumes of contributions. It was also suggested that the provision of funding is
linked to responsibility for the impacts of climate change (Ott et al. 2004).
6.5 POSSIBLE ACTIONS TO FURTHER ADVANCE ADAPTATION
Several options are available to further advance international action on adaptation. This section provides an inventory of the diverse proposals, summarized in Table 18.
Implementing first adaptation projects identified in, e.g., NAPAs or National Communications
Contributions to that fund are voluntary. It is currently the only of these three funds, which is operational.
As of 15 April 2004, total contributions received amounted to US$ 16 million, with outstanding pledges in the further amount of US$ 18 million (GEF, 2004c). As of the same date, prowere approved.9
The national action plans for adaptation (NAPAs) were established to serve as a ‘simplified and direct channel of communication of information relating to vuadaptation needs of least developed countries’, and may act as a first step in the preparation of National Communications to the UNFCCC (5/CP.7, II.15). The NAPA identifies urgent and immediate adaptation needs of LDCs for adapting to the adverse impacts of climate change, and sets out a list of priority activities, as identified by the LDCs themselves (according to justification criteria). Guidelines have been established for the prep
COP 9 decided that now also the implementation of priority acNAPAs can be funded by the LDC fund (decision 6/CP.9). The “agreed full costs” of such adaptation projects will be funded, not only the incremental costs.
3. The adaptation fund is a Kyoto Protocol fund (Art. 12.8 of KP, (established under 10/CP.7), which is to support “concrete adaptation projects and programmes” in developing countries. It will be financed from the "share of the proceeds" on the clean development mechanism and other sources of funding. It is to be used to “assist developclimate change to meet the costs of adaptation”.
The total envelope of the fund depends on the level of CDM activity (which depends on the level of domestic action of each developed country to reach its Kyoto target). The fund is not yet operational. A rough estimate of the share of proceeds from CDM could be 60 million US$10 over the first commitment period.
A volume of these funds has not been agreed, but at COP7, a joint political declaration was made by the European Community and its Member States, together with Canada, Iceland, New Zealand, Norway and Switzerland, on their preparedness to collectively contribute €450 Million annually by 2005 with this level to be reviewed in 2008. It includes contributionof the activities above, i.e. “contributions to GEFand multilateral funding additional to current levels;funds, the Kyoto Protocol Adaptation Fund and the LDC fund; and funding deriving from the share of proceeds of the clean development mechanism following entry into force of the Kyoto Protocol.”
Developing countries have expressed the wish to have greater consistency and commitment to climate change funding. The new funds only slowly become operational. The Ca
9 Bangladesh, Benin, Bhutan, Burkina Faso, Cambodia, Cape Verde, Central African Republic, Chad, Comoros, Congo DR, Djibouti, Eritrea, Ethiopia, Gambia, Guinea, Haiti, Kiribati, Lao PDR, Lesotho, Liberia, Malawi, Maldives, Mali, Mauritania, Mozambique, Niger, Samoa, Sao Tome and Principe, Senegal, Sudan, Tanzania, Togo, Tuvalu, Uganda, Vanuatu, Yemen, Zambia 10 Calculated as 2% of the CDM market from den Elzen and Moor (2001)
ECOFYS Options for the second commitment period
95
ity activities identified in the NAPAs or in national communications. countries are preparing NAPAs. It may be
that ed NAPAs dy be or 2004 eking implementation. icat available from 120 Non-Annex I countries.
un co f adequa times and the inancing at ifferent LDC on s for N ations clearly state concern of adequacy of funding for
adaptation partic fina itments of Annex I countries to date. LDCs and other develo tries are lo clear leve ces
t / C.4)
deve ntries demonstrate the clear willingness to atio conc ding. The place n enter
into place soon, to be e necessary resources. As a first step this could be achieve ommitm port NAPA implementation via the LDC fund and the new strategic GEF priority “pil eration on”. This could help to initiate the ss for ion o
e t GEF fund of glob be se en he f be
placed on the ne h es n
Designing insurance schemes surance schemes would be a means to help developing countries to deal with the negative
sures on developing countries. If a way
demonstrate to developing countries a commitment to addressing their rns.
an international insurance are described below (A. ce 2003, UNEP 1993):
ouse gas emitters are liable for climate-related disasters in
would be
The continuation of the process would be to implement priorSo far 37
may alreaions are
expected complet available f and seNational commun
tries have raised NAPA implement
APA implementularly in view of
Developing coissue of fstrategie
ncerns oion is no d
cy of funding several . Submissions from s on views
ncial commoking for aSBI/2003/MIS
ping couno adaptation (FCCC
commitment on the.
l of resourto be dedicated
A way forward support adapt
would be thatn projects withbut they haved through a c
loped courete fun
filled with th instruments are in or ca
ent to supoting an op implementat
al approach to adaptatif adaptation projects. funding proce
aken about theen how this principlew funds, for which t
Care has to bremains to
principle to can be implemis principle do
incremental costs ted for adaptation. Tot apply.
al benefits. It ocus could
Ineffects and impacts of climate change. Since the attribution of liability for current extreme climate change effects is placed with the historically largest greenhouse gas emitters (the main target amongst these being the developed countries, seen to benefit the most from their emissions), developing countries expect large emitters to compensate.
Article 4.8 of the Convention refers to insurance as a means to minimize adverse effects of climate change and/or the impacts of response meacould be found to establish a system of insurance at international/global level to compensate for the adverse effects of climate change (for e.g. insurance against extreme weather events), then it would provide a vehicle for structured funding of adaptation measures by developed countries, and adaptation conce
Two approaches to establishing Michaelowa 2003, M.J. Ma
1. Insurance based on contributions from emitters (non-risk community): Taking as an example the increase in number and severity of natural disasters in DCs – on the principle that greenhdeveloping countries - a system of insurance could be envisaged where the emitters pay the premium of developing country losses from climate change (see also Müller 2003). This could be accompanied by a small share of loss-bearing on the part of the insured developing countries so as to avoid moral hazard.
This concept was taken further in a proposal put forward by AOSIS (Alliance of Small Island States) in 1991. AOSIS proposed the idea of an “international insurance pool” to cover loss risks experienced by DCs as a result of climate change impacts (in case of small island states, losses will relate to sea-level rise), and to distribute the financial burden amongst developed countries. Under the proposal, the insurance poolfunded via mandatory contributions from developed countries, based on their level of CO2 emissions and their GNP (50/50 weighting). The loss-sharing approach in the AOSIS proposal is similar to that used in the OECD Nuclear Damage Convention (1963) and Oil Pollution Damage Convention (1971). Even though the AOSIS proposal addresses the concerns of its members about sea-level rise, the same concept could be applied to other groups of countries and other climate change damages.
ECOFYS Options for the second commitment period
96
contributions from the at-risk community (persons,
n of damages to be included in the
uch as the regime on e.g.
s seen as making more efficient
change. Furthermore, it
integration (VARG 2003). A further stage could be a target for
ISDR). Integrating adaptation into the risk management strategies that
2. Insurance based on contributions from affected countries (at-risk community): This type of insurance comprises, as a first basis, enterprises, governments at risk) e.g. via commercial, public insurance. International bodies, or governments can subsidize this type of system for e.g. by providing forms of reinsurance.
Regardless of the architecture of an international insurance system, more work still needs to be done with respect to determining the actual valuatioscheme, and ultimately the level of funding required from developed countries.
Given the past discussion, it seems unlikely that a discussion on insurance of climate change damages can be held in isolation from insurance for adverse effects of “response measures”. Either both issues have to be de-coupled or progress has to be made on both areas. In addition, it seems likely that any system of insurance can be initiated by the UNFCCC but would then be transferred to a different international regime, sdisaster relief.
Mainstreaming adaptation into sustainable development efforts One option would be to integrate adaptation measures into the funding efforts for sustainable development (Klein at al. 2003, VARG 2003). Mainstreaming iand effective use of financial and human resources than designing and implementing adaptation policy separately from ongoing development activities. Development agencies and donors could as a priority select those projects that also have a benefit for adaptation. Developing country governments could integrate adaptation into their poverty reduction strategies.
If climate change, including adaptation, and development are integrated, it will be difficult to assess the incremental actions by countries as a reaction to climatehas been argued that development aid and funding for adaptation are principally different, because the development aid is charity based while funding adaptation to climate change can be related to commitments under the UNFCCC (Ott et al. 2004).
Donor agencies have already formed the “Vulnerability and Adaptation Resources Group (VARG)” that analyses such donor countries to commit to provide funds for climate change, and in particular adaptation, related development assistance equal to a percentage of their GDP (Drexhage 2004).
Mainstreaming adaptation into disaster relief A new notion would be to integrate adaptation to climate change into international disaster relief. Reacting to natural disasters is the field of the United Nations International Strategy for Disaster Reduction (are developed under the ISDR could be a major step forward. ISDR and the Vulnerability and Adaptation Resource Group will present a paper on such integration end of 2004.
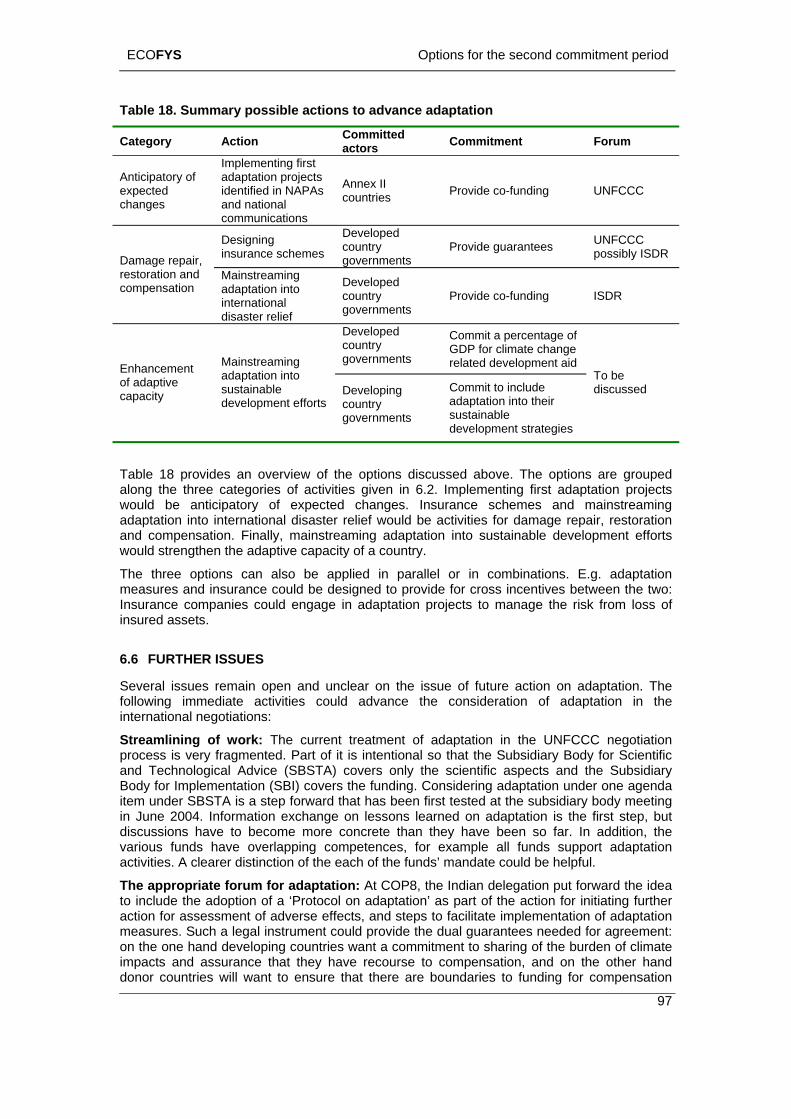
ECOFYS Options for the second commitment period
Table 18. Summary possible actions to advance adaptation
Category Action Committed actors Commitment Forum
Anticipatory of expected changes
Implementing first adaptation projects identified in NAPAs and national communications
Annex II countries Provide co-funding UNFCCC
Desiginsurance sch
ning emes
Developed country governments
Provide guarantees UNFCCC possibly ISDR Damage repair,
restoration and nsation
Mainstreaming adaptation into international
Developed country gover
Provide co-funding ISDR compe
nments disaster relief Developed country governments
Commit a percentage of GDP for climate change related development aid Enhan
of adap discussed
cement tive
Mainstreaming adaptation into sustainable Developing Commit to include
To be
capacity development efforts country governments
adaptation into their sustainable development strategies
Table 18 p The options are grouped
wouldadapt air, restoration
would untry.
measu e for cross incentives between the two:
insure
6.6 F
Streamproces and T TA) covers only the scientific aspects and the Subsidiary
in Jundiscus become more concrete than they have been so far. In addition, the
The a forum for adaptation: At COP8, the Indian delegation put forward the idea
actionmeasuon theimpact d donor countries will want to ensure that there are boundaries to funding for compensation
rovides an overview of the options discussed above. along the three categories of activities given in 6.2. Implementing first adaptation projects
be anticipatory of expected changes. Insurance schemes and mainstreaming ation into international disaster relief would be activities for damage rep
and compensation. Finally, mainstreaming adaptation into sustainable development efforts strengthen the adaptive capacity of a co
The three options can also be applied in parallel or in combinations. E.g. adaptation res and insurance could be designed to provid
Insurance companies could engage in adaptation projects to manage the risk from loss of d assets.
URTHER ISSUES
Several issues remain open and unclear on the issue of future action on adaptation. The following immediate activities could advance the consideration of adaptation in the international negotiations:
lining of work: The current treatment of adaptation in the UNFCCC negotiation s is very fragmented. Part of it is intentional so that the Subsidiary Body for Scientificechnological Advice (SBS
Body for Implementation (SBI) covers the funding. Considering adaptation under one agenda item under SBSTA is a step forward that has been first tested at the subsidiary body meeting
e 2004. Information exchange on lessons learned on adaptation is the first step, but sions have to
various funds have overlapping competences, for example all funds support adaptation activities. A clearer distinction of the each of the funds’ mandate could be helpful.
ppropriateto include the adoption of a ‘Protocol on adaptation’ as part of the action for initiating further
for assessment of adverse effects, and steps to facilitate implementation of adaptation res. Such a legal instrument could provide the dual guarantees needed for agreement: one hand developing countries want a commitment to sharing of the burden of climate s and assurance that they have recourse to compensation, and on the other han
97
ECOFYS Options for the second commitment period
98
curren
But th at several options for action would be placed
placedcovere
SeparThis eDevel
showe
a clea . Or at least constituencies should always
Althouperce tions such as - What is the nature
some that h rnance indicators can provide reasonable
In addsociet ly in the face of threats posed by
transla e adaptive capacity of a
Adapof the phic distribution, ability to cope
terms ue to the
what f
certain
consid
On a will need to be done into estimation of costs associated with damage repair and compensation as well as the magnitudes of funding required to effectively address these, e.g., within an international insurance system.
6.7 CONCLUSIONS
Adaptation covers a broad range of considerations from immediate measures against expected changes in climate via strengthening adaptive capacity (i.e. development) to damage repair and compensation.
Many of these issues are broader than what the UNFCCC regime could cover. Of the four options presented in Table 18, the most powerful ones are likely to be the mainstreaming adaptation into development and disaster relief. But the effective implementation would occur
(Müller 2003). Such an adaptation protocol could focus all activities on adaptation that are tly undertaken under the UNFCCC.
e discussion above (Table 18) reveals thoutside of the UNFCCC. Mainstreaming adaptation into sustainable development would be an issue much broader than the UNFCCC. Consideration of adaptation in disaster relief would be
with the International Strategy for Disaster Reduction. Such options would not be d in an adaptation protocol under the UNFCCC.
ation of adverse effects of climate change and effects of response measures: xplicit link in Article 4.8 of the Convention prevented fast progress on adaptation.
oped countries are more prepared to fund adaptation activities but are not prepared to compensate for losses in oil revenues. First attempts from within the G77 at the UNFCCC subsidiary body meetings in June 2004 to separate the issues were not successful, but
d that there could be a resolution in the future (ENB 2004).
Clarifying the definitions: The term “adaptation” is still used for damage repair (as is the case with insurance) and for damage prevention (increasing adaptive capacity). As a first step
r definition of adaptation should be agreedmake clear, which kind of adaptation they refer to.
gh some work has been done in the past to define vulnerability there is still no clear ption of what this means to individual countries. Ques
of vulnerability? How is it to be measured and addressed? Is it possible to create a common yardstick for vulnerability? How can vulnerability best be reduced? - were put on the agenda
time ago, but a clear and commonly shared interpretation is still missing. Some suggest ealth, education and particularly gove
assessment of vulnerability to climate hazard (Tyndall Center 2004).
ition, the term adaptive capacity needs further evaluation. The adaptive capacity of ies depends largely on the ability to act collective
climate variability (Tyndall Center, 2004). These concepts and definitions have not yet been ted into more concrete examples or indicators (e.g. when is th
farmer low, medium, high?).
tation needs and cost: Despite the body of work that has already been done in respect adaptation issue – risk identification, geogra
(vulnerability) – it is clear that not enough is known about the level of adaptation needs, in of quantified costs of adaptation for developing countries. This is partly d
uncertainty of which activities adaptation includes. Further studies are still required to determine what adaptation activities are required, where, with what urgency, and ultimately at
inancial cost.
The costs of implementation of the NAPAs can provide a useful reference for the costs of adaptation activities – in particular those aimed at preventing or reducing potential
future damages and associated future costs. But NAPAs are currently only developed for the least developed countries. Introducing NAPAs for all Non-Annex I countries may warrant
eration.
more long-term basis further work
ECOFYS Options for the second commitment period
99
outside of the UNFCCC regime. As a consequence a separate adaptation protocol under the CCC er the CCC. n.
CCC regime, narrowly defined adaptation projects could be implemented through the available funds. In addition, a clear commitment of
ld be voiced to support adaptation activities outside of the UNFCCC.
n, G. Yohe 2001: “Adaptation to Climate Change in the
ridge University Press:
2002: ‘Linking Sustainable Livelihoods and Global Climate Change in Vulnerable Food at
T. E. Downing ‘Use agriculture’. Presentation at AWorkshop Ada for Agricultural Productivity, 2Delhi, India http orkshop/documents/TS3_2_
elopment Assistance and Climate , Presentation given at a event atnn, 22 June 200
egotiations Bulle 2003 Vol. av e at tp://www.iisd.ca/downlo f/enb122
egotiations Bull 2004 av e at //www.iisd.ca/downlo f/enb122
en Elzen and A.P.G. d r, 2001, Bo ents and the Marrakech accords, ananal report 72 17/2001,
.nl/ieweb/ie Reports/r 800 rrakech.pdf
Environment Facilit 2004a, F Report 2003”, e atp://www.gefweb.org/20 nnual_Re pdf
ironment Facility 2004 EF assistance to a daptation’, GEF/C.23/Inf.8/Rev.1, May 04 available at:p://www.gefweb.org/Doc n ocu EF_C23/C.23.Inf.8.Rev.1 n_
ouncil_paper_FINAL.doc
Global Environment Facility 2004c, ‘Status Report on the Least Developed Countries trust Fund for Climate Change’, GEF/C.23/10/Rev.1, April 20, 2004 available at: http://www.gefweb.org/Documents/Council_Documents/GEF_C23/C.23.10.Rev.1_LDC_Trust_Fund_FINAL.doc
R. Klein, L. Shipper, S. Dessai, 2003, “Integrating mitigation and adaptation into climate and development policy: three research questions”, Tyndall Centre for Climate Research, Working Paper 40.
J. Linnerooth-Bayer, 2003, ‘Overview of insurance-related actions in the context of the adverse effects of climate change’. Presentation for UNFCCC Workshop on insurance-related actions to address the specific needs and concerns of developing country Parties arising from the adverse effects of climate change and from the impact of the implementation of response measures, 14 - 15 May 2003, Bonn, Germany. http://unfccc.int/sessions/workshop/140503/documents/bayer.pps
UNF may not seem adequate. The issues are too broad to be covered only undUNF In addition, it could distract attention from the urgent need to address mitigatio
On the other hand the issue of damage repair and restoration is clearly a matter related to climate change and the UNFCCC. Within the UNF
developed countries cou
6.8 REFERENCES
Adger W. N., N. Brooks, M. Kelly, S. Bentham, S. Eriksen (2004) 'New indicators of Vulnerability and Adaptive Capacity', Tyndall Centre for Climate Change Research, Technical Report No. 7, University of East Anglia: Norwich.
Burton, I., B. Challenger, S. Huq, R.J.T. KleiContext of Sustainable Development and Equity”, Chapter 18 of Intergovernmental Panel on Climate Change, 2001b, Climate Change 2001: Impacts, adaptation, and Vulnerability. Contribution of Working Group II to the Third Assessment Report. CambCambridge, United Kingdom, available at http://www.ipcc.ch/pub/tar/index.htm
Burton, I., S. Huq, B. Lim, O. Pilifosova, E.L. Schipper, 2002: 'From Impacts Assessment to Adaptation Priorities: The Shaping of Adaptation Policy' Climate Policy 2 (2-3) 145-159.
T. E. Downing,Systems’, Die Erde 4. Presentation containing elements available http://unfccc.int/sessions/workshop/040402/downing.pdf
of vulnerabilit the South y indices in sia Expert ptation to Clim 1 – 3 May ate Change 002, New
org/dpdl/indiaw://www.unep. 1b.ppt
J. Drexhage 2004 “Devthe SB 20 meetings in Bo
Change” side 4
Earth N tin 12 No. 231, ailablht ad/pd 31e.pdf
Earth Nhttp:
etin ad/pd
Vol.42e.pdf
12 No. 242, ailabl
M.G.J. d e Mooys
“The nn agreem updated
http://arch.rivmis”, RIVMeb/
80010w ep72 1017_ma
Global y, 03_
“GEp
Annual availabl t ht A ort.
Global Env,
b ‘G ddress a11htt
20uments/Cou
cil_D ments/G _Adaptatio
C
ECOFYS Options for the second commitment period
100
M. Mace (FIELD), 2003, ‘Legal Framework on Adaptation’. Presentation for CCAP Dialogue on Future International Actions to Address Global Climate Change, 22 Oct. 2003, Jeju Island, South Korea. http://www.ccap.org/Presentations/CDM-FAD/2003-Oct-22--Korea--Mace--
gal_Framework_on_Ada ion.pdf
elowa, 2003, ‘Insuranc lated actions to the specific needs and concerns ofveloping country Parti ising from erse effects of climate change and from the
ures’. Background paper for UNFCCC Workshop to address the specific needs and concerns of developing country
h Dialogue
Le ptat
A. Micha e-re address de es ar the adv
e measimpact of the implementation of responson insurance-related actions Parties arising from the adverse effects of climate change and from the impact of the implementation of response measures, 14 - 15 May 2003, Bonn, Germany. Commissioned by the UNFCCC Secretariat, May 2003. http://unfccc.int/sessions/workshop/140503/documents/background.pdf
B. Müller, 2003, ‘Framing Future Commitments: A Pilot Study on the Evolution of the UNFCCC Greenhouse Gas Mitigation Regime’, with contributions from J. Drexhage, M. Grubb, A. Michaelowa, A. Sharma. Oxford Institute for Energy Studies, June 2003
A. Najam, S. Huq, Y. Sokona, 2003, “Climate negotiations beyond Kyoto: developing countries concerns and interests”, Climate Policy, 3 (2003) 221-231
H. Ott, B. Brouns, H. Winkler, S. Kartha, M.J. Mace, S. Huq, Y. Kameyama, A.P. Sari, J. Pan, Y. Sokona, P.M. Bhandari, A. Kassenberg, E. La Rovere, A. Rahman, 2004, "South-Nort- Equity in the Greenhouse", GTZ, PN 2001.2184.8 available at http://www.wupperinst.org/download/1085_proposal.pdf
J. Schmidt, 2004, “Adaptation structural options”, presentation a the dialogue on future international actions to address global climate change, Stockholm, Sweden, 16-19 May 2004, available at http://www.ccap.org/Presentations/CDM-FAD/2004-May--cdm-fad-Schmidt--Adapatation_Structural_Options.pdf
UNEP, 1993, ‘Insurance against climate change? The AOSIS proposal’, last revised May 1993 by the Information Unit on Climate Change (IUCC), UNEP. Available at http://unfccc.int/resource/ccsites/senegal/fact/fs238.htm
UNFCCC, 1997, 'Implementation of the Berlin Mandate, Additional proposal by Parties'. Document FCCC/AGBM/1997/MISC.1/Add.3, available at http://www.unfccc.int
UNFCCC, SBSTA 20, Draft conclusions proposed by the co-chairs of the contact group on agenda item on Scientific, technical and socio-economic aspects of impacts of, and vulnerability and adaptation to, climate change (FCCC/SBSTA/2004/L.13)
J. Linnerooth-Bayer; M.J. Mace; R. Verheyen, 2003: Insurance-Related Actions and Risk Assessment in the Context of the UNFCCCC, background paper for UNFCCC workshop, May 2003
Presentations of UNFCCC workshop held on insurance, May 2003 available under http://unfccc.int/sessions/workshop/120503/present.html
O. Pilifosova, 2000: “Where is adaptation going in the UNFCCC? In: Proceedings of SURVAS Expert Workshop on European Vulnerability and Adaptation to impacts of Accelerated Sea-Level Rise (ASLR), Hamburg, 19-21 June 2000
Vulnerability and Adaptation Resources Group, 2003, “Poverty and climate change, reducing the vulnerability of the poor through adaptation”, available at http://lnweb18.worldbank.org/ESSD/envext.nsf/46ByDocName/KeyThemesVulnerabilityandAdaptationPovertyandClimateChange
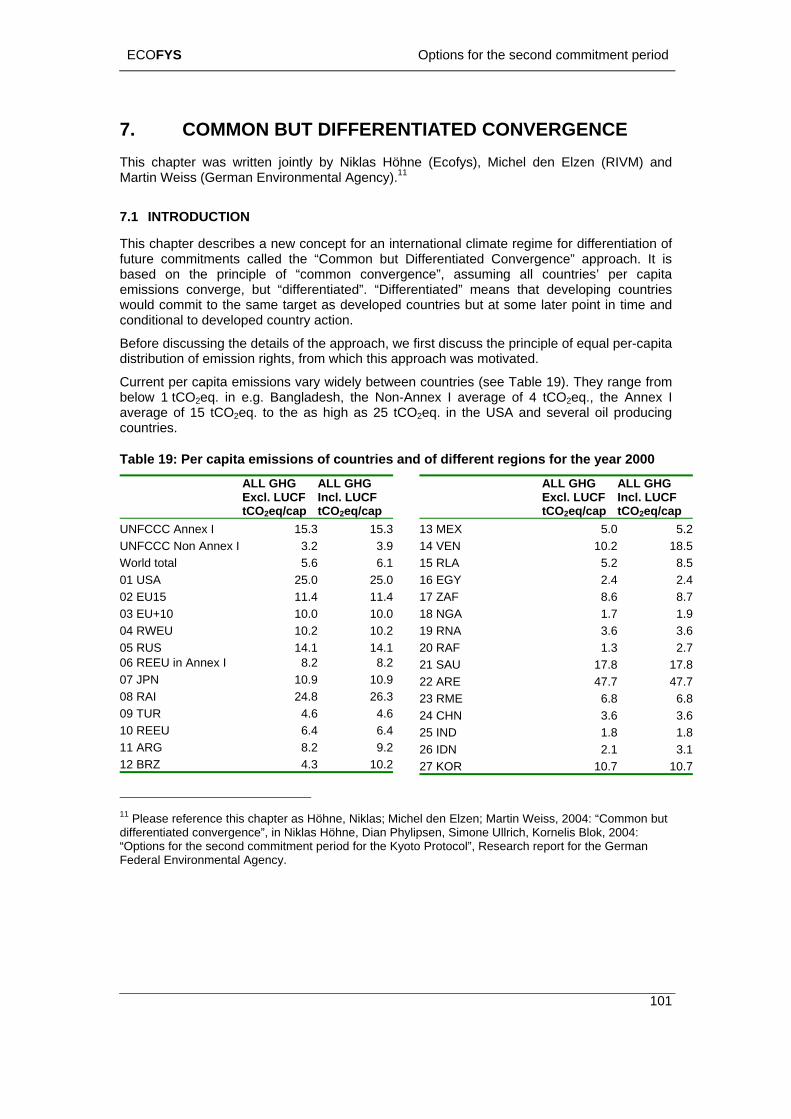
ECOFYS Options for the second commitment period
101
ency).11
7. COMMON BUT DIFFERENTIATED CONVERGENCE This chapter was written jointly by Niklas Höhne (Ecofys), Michel den Elzen (RIVM) and Martin Weiss (German Environmental Ag
7.1 INTRODUCTION
This chapter describes a new concept for an international climate regime for differentiation of future commitments called the “Common but Differentiated Convergence” approach. It is based on the principle of “common convergence”, assuming all countries’ per capita emissions converge, but “differentiated”. “Differentiated” means that developing countries would commit to the same target as developed countries but at some later point in time and conditional to developed country action.
Before discussing the details of the approach, we first discuss the principle of equal per-capita distribution of emission rights, from which this approach was motivated.
Current per capita emissions vary widely between countries (see Table 19). They range from below 1 tCO2eq. in e.g. Bangladesh, the Non-Annex I average of 4 tCO2eq., the Annex I average of 15 tCO2eq. to the as high as 25 tCO2eq. in the USA and several oil producing countries.
Table 19: Per capita emissions of countries and of different regions for the year 2000
11 Please reference this chapter as Höhne, Niklas; Michel den Elzen; Martin Weiss, 2004: “Common but differentiated convergence”, in Niklas Höhne, Dian Phylipsen, Simone Ullrich, Kornelis Blok, 2004: “Options for the second commitment period for the Kyoto Protocol”, Research report for the German Federal Environmental Agency.
ALL GHG Excl. LUCF tCO2eq/cap
ALL GHG Incl. LUCF
tCO2eq/cap UNFCCC Annex I 15.3 15.3UNFCCC Non Annex I 3.2 3.9World total 5.6 6.101 USA 25.0 25.002 EU15 11.4 11.403 EU+10 10.0 10.004 RWEU 10.2 10.205 RUS 14.1 14.106 REEU in Annex I 8.2 8.207 JPN 10.9 10.908 RAI 24.8 26.309 TUR 4.6 4.610 REEU 6.4 6.411 ARG 8.2 9.212 BRZ 4.3 10.2
tCO2eq/cap tCO2eq/cap
ALL GHG Excl. LUCF
ALL GHG Incl. LUCF
13 MEX 5.0 5.214 VEN 10.2 1815 RLA 5.2 816 EGY 2.4 217 ZAF 8.6 818 NGA 1.7 119 RNA 3.6 320 RAF 1.3 2.721 SAU 17.8 1722 ARE 47.7 4723 RME 6.8 624 CHN 3.6 325 IND 1.8 126 IDN 2.1
.5
.5
.4
.7
.9
.6
.8
.7
.8
.6
.83.1.727 KOR 10.7 10
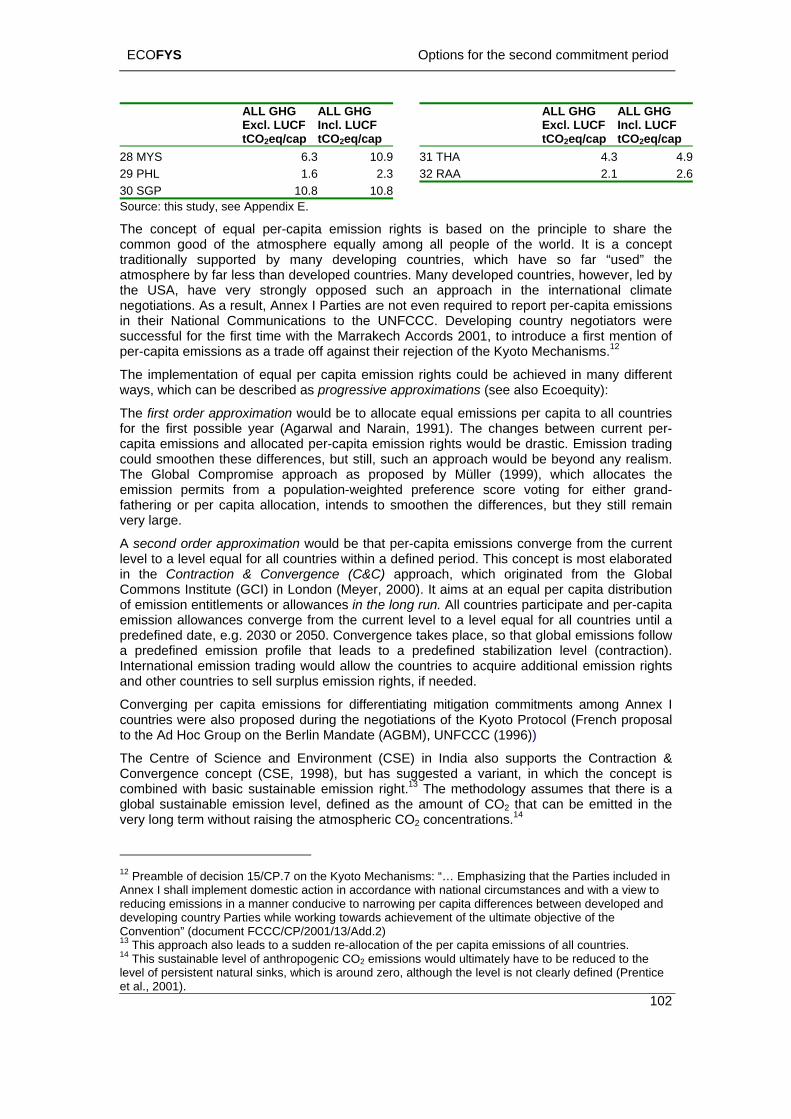
ECOFYS Options for the second commitment period
ALL GHG Excl. LUCF tCO2eq/cap
ALL GHG Incl. LUCF tCO2eq/cap
28 MYS 6.3 10.929 PHL 1.6 2.330 SGP 10.8 10.8
ALL GHG Excl. LUCF tCO2eq/cap
ALL GHG Incl. LUCF tCO2eq/cap
31 THA 4.3 4.932 RAA 2.1 2.6
Source: this study, see Appendix E.
The concept of equal per-capita emission rights is based on the principle to share the
cquire additional emission rights and other countries to sell surplus emission rights, if needed.
Annex I countries were also proposed during the negotiations of the Kyoto Protocol (French proposal
Berlin Mandate (AGBM), UNFCCC (1996))
The Centre of Science and Environment (CSE) in India also supports the Contraction &
asic sustainable emission right.13 The methodology assumes that there is a global svery n
common good of the atmosphere equally among all people of the world. It is a concept traditionally supported by many developing countries, which have so far “used” the atmosphere by far less than developed countries. Many developed countries, however, led by the USA, have very strongly opposed such an approach in the international climate negotiations. As a result, Annex I Parties are not even required to report per-capita emissions in their National Communications to the UNFCCC. Developing country negotiators were successful for the first time with the Marrakech Accords 2001, to introduce a first mention of per-capita emissions as a trade off against their rejection of the Kyoto Mechanisms.12
The implementation of equal per capita emission rights could be achieved in many different ways, which can be described as progressive approximations (see also Ecoequity):
The first order approximation would be to allocate equal emissions per capita to all countries for the first possible year (Agarwal and Narain, 1991). The changes between current per-capita emissions and allocated per-capita emission rights would be drastic. Emission trading could smoothen these differences, but still, such an approach would be beyond any realism. The Global Compromise approach as proposed by Müller (1999), which allocates the emission permits from a population-weighted preference score voting for either grand-fathering or per capita allocation, intends to smoothen the differences, but they still remain very large.
A second order approximation would be that per-capita emissions converge from the current level to a level equal for all countries within a defined period. This concept is most elaborated in the Contraction & Convergence (C&C) approach, which originated from the Global Commons Institute (GCI) in London (Meyer, 2000). It aims at an equal per capita distribution of emission entitlements or allowances in the long run. All countries participate and per-capita emission allowances converge from the current level to a level equal for all countries until a predefined date, e.g. 2030 or 2050. Convergence takes place, so that global emissions follow a predefined emission profile that leads to a predefined stabilization level (contraction). International emission trading would allow the countries to a
Converging per capita emissions for differentiating mitigation commitments among
to the Ad Hoc Group on the
Convergence concept (CSE, 1998), but has suggested a variant, in which the concept is combined with b
ustainable emission level, defined as the amount of CO2 that can be emitted in the lo g term without raising the atmospheric CO2 concentrations.14
ble of decision 15/CP.7 on the Kyoto Mechanisms: “… Emphasizing that the Parties included in
shall implement domestic action in accordance with national circumstances and with a view to emissions in
102
12 PreamAnnex I reducing a manner conducive to narrowing per capita differences between developed and deve iConventi13 This a14 This slevel of pet al., 2001).
lop ng country Parties while working towards achievement of the ultimate objective of the on” (document FCCC/CP/2001/13/Add.2) pproach also leads to a sudden re-allocation of the per capita emissions of all countries. ustainable level of anthropogenic CO2 emissions would ultimately have to be reduced to the ersistent natural sinks, which is around zero, although the level is not clearly defined (Prentice
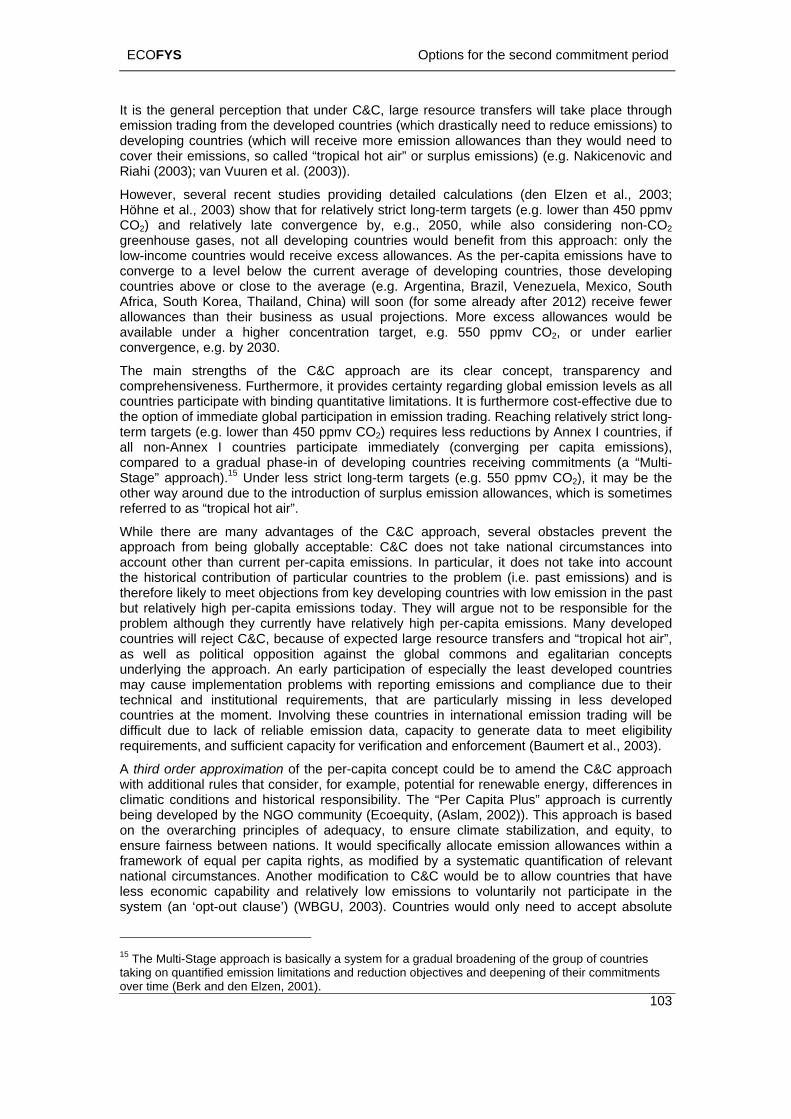
ECOFYS Options for the second commitment period
103
It is theemissio om the developed countries (which drastically need to reduce emissions) to
eed to vic and
Ria 2
HoweveHöhne 003) show that for relatively strict long-term targets (e.g. lower than 450 ppmv COgreenho only the low-i come countriecon gcountrieAfrica, allowan iness as usual projections. More excess allowances would be ava lconverg
The mcompre ll cou iethe titerm tarall noncompared to ents (a “Multi-Sta other wreferred
While tapproac bally acceptable: C&C does not take national circumstances into accthe histtherefor with low emission in the past
the global commons and egalitarian concepts
veloped by the NGO community (Ecoequity, (Aslam, 2002)). This approach is based
general perception that under C&C, large resource transfers will take place through n trading fr
developing countries (which will receive more emission allowances than they would ncover their emissions, so called “tropical hot air” or surplus emissions) (e.g. Nakiceno
hi ( 003); van Vuuren et al. (2003)).
r, several recent studies providing detailed calculations (den Elzen et al., 2003; et al., 2
2) and relatively late convergence by, e.g., 2050, while also considering non-CO2 use gases, not all developing countries would benefit from this approach:
n s would receive excess allowances. As the per-capita emissions have to ver e to a level below the current average of developing countries, those developing
s above or close to the average (e.g. Argentina, Brazil, Venezuela, Mexico, South South Korea, Thailand, China) will soon (for some already after 2012) receive fewer ces than their bus
ilab e under a higher concentration target, e.g. 550 ppmv CO2, or under earlier ence, e.g. by 2030.
ain strengths of the C&C approach are its clear concept, transparency and hensiveness. Furthermore, it provides certainty regarding global emission levels as a
ntr s participate with binding quantitative limitations. It is furthermore cost-effective due to op on of immediate global participation in emission trading. Reaching relatively strict long-
gets (e.g. lower than 450 ppmv CO2) requires less reductions by Annex I countries, if -Annex I countries participate immediately (converging per capita emissions),
a gradual phase-in of developing countries receiving commitmge” approach).15 Under less strict long-term targets (e.g. 550 ppmv CO2), it may be the
ay around due to the introduction of surplus emission allowances, which is sometimes to as “tropical hot air”.
here are many advantages of the C&C approach, several obstacles prevent the h from being glo
ount other than current per-capita emissions. In particular, it does not take into account orical contribution of particular countries to the problem (i.e. past emissions) and is e likely to meet objections from key developing countries
but relatively high per-capita emissions today. They will argue not to be responsible for the problem although they currently have relatively high per-capita emissions. Many developed countries will reject C&C, because of expected large resource transfers and “tropical hot air”, as well as political opposition against underlying the approach. An early participation of especially the least developed countries may cause implementation problems with reporting emissions and compliance due to their technical and institutional requirements, that are particularly missing in less developed countries at the moment. Involving these countries in international emission trading will be difficult due to lack of reliable emission data, capacity to generate data to meet eligibility requirements, and sufficient capacity for verification and enforcement (Baumert et al., 2003). A third order approximation of the per-capita concept could be to amend the C&C approach with additional rules that consider, for example, potential for renewable energy, differences in climatic conditions and historical responsibility. The “Per Capita Plus” approach is currently being deon the overarching principles of adequacy, to ensure climate stabilization, and equity, to ensure fairness between nations. It would specifically allocate emission allowances within a framework of equal per capita rights, as modified by a systematic quantification of relevant national circumstances. Another modification to C&C would be to allow countries that have less economic capability and relatively low emissions to voluntarily not participate in the system (an ‘opt-out clause’) (WBGU, 2003). Countries would only need to accept absolute
15 The Multi-Stage approach is basically a system for a gradual broadening of the group of countries taking on quantified emission limitations and reduction objectives and deepening of their commitments over time (Berk and den Elzen, 2001).
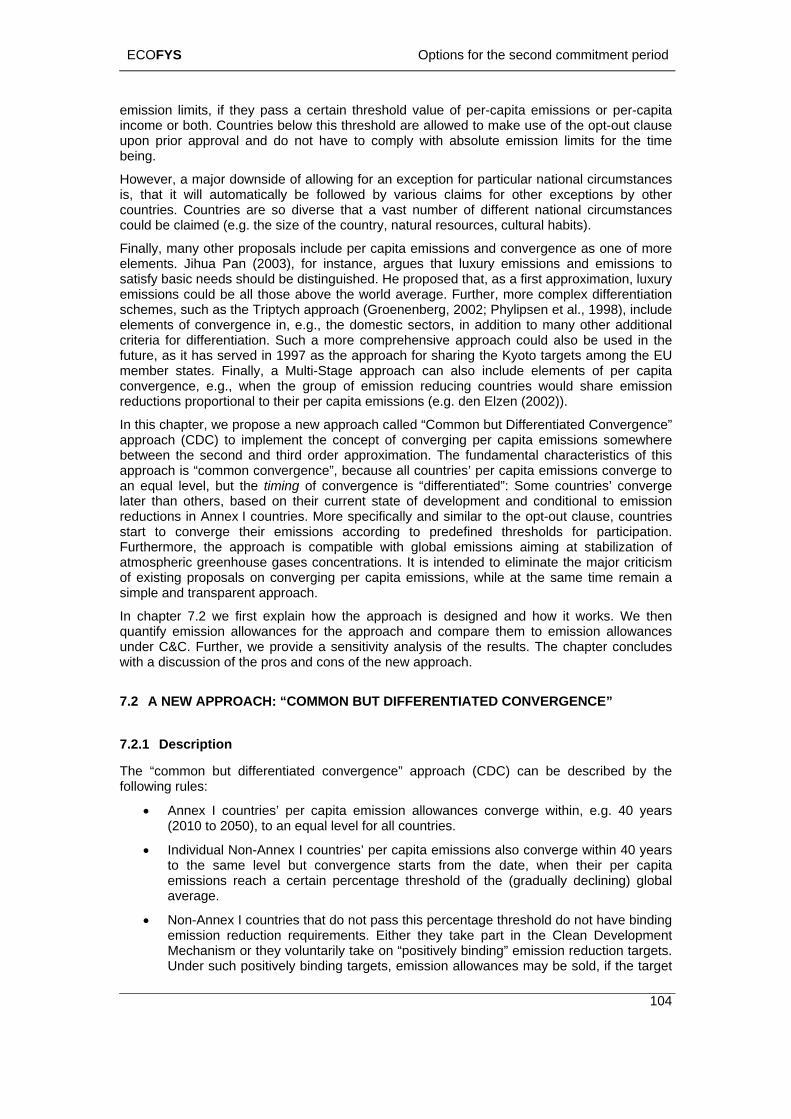
ECOFYS Options for the second commitment period
104
emission limits, if they pass a certain threshold value of per-capita emissions or per-capita income or both. Countries below this threshold are allowed to make use of the opt-out clause
claims for other exceptions by other
d that, as a first approximation, luxury
n 1997 as the approach for sharing the Kyoto targets among the EU
onvergence is “differentiated”: Some countries’ converge
ch is designed and how it works. We then quantify emission allowances for the approach and compare them to emission allowances under C&C. Further, we provide a sensitivity analysis of the results. The chapter concludes with a discussion of the pros and cons of the new approach.
7.2 A NEW APPROACH: “COMMON BUT DIFFERENTIATED CONVERGENCE”
7.2.1 Description
The “common but differentiated convergence” approach (CDC) can be described by the following rules:
• Annex I countries’ per capita emission allowances converge within, e.g. 40 years (2010 to 2050), to an equal level for all countries.
• Individual Non-Annex I countries’ per capita emissions also converge within 40 years to the same level but convergence starts from the date, when their per capita emissions reach a certain percentage threshold of the (gradually declining) global average.
• Non-Annex I countries that do not pass this percentage threshold do not have binding emission reduction requirements. Either they take part in the Clean Development Mechanism or they voluntarily take on “positively binding” emission reduction targets. Under such positively binding targets, emission allowances may be sold, if the target
upon prior approval and do not have to comply with absolute emission limits for the time being.
However, a major downside of allowing for an exception for particular national circumstances is, that it will automatically be followed by variouscountries. Countries are so diverse that a vast number of different national circumstances could be claimed (e.g. the size of the country, natural resources, cultural habits).
Finally, many other proposals include per capita emissions and convergence as one of more elements. Jihua Pan (2003), for instance, argues that luxury emissions and emissions to satisfy basic needs should be distinguished. He proposeemissions could be all those above the world average. Further, more complex differentiation schemes, such as the Triptych approach (Groenenberg, 2002; Phylipsen et al., 1998), include elements of convergence in, e.g., the domestic sectors, in addition to many other additional criteria for differentiation. Such a more comprehensive approach could also be used in the future, as it has served imember states. Finally, a Multi-Stage approach can also include elements of per capita convergence, e.g., when the group of emission reducing countries would share emission reductions proportional to their per capita emissions (e.g. den Elzen (2002)).
In this chapter, we propose a new approach called “Common but Differentiated Convergence” approach (CDC) to implement the concept of converging per capita emissions somewhere between the second and third order approximation. The fundamental characteristics of this approach is “common convergence”, because all countries’ per capita emissions converge to an equal level, but the timing of clater than others, based on their current state of development and conditional to emission reductions in Annex I countries. More specifically and similar to the opt-out clause, countries start to converge their emissions according to predefined thresholds for participation. Furthermore, the approach is compatible with global emissions aiming at stabilization of atmospheric greenhouse gases concentrations. It is intended to eliminate the major criticism of existing proposals on converging per capita emissions, while at the same time remain a simple and transparent approach.
In chapter 7.2 we first explain how the approa
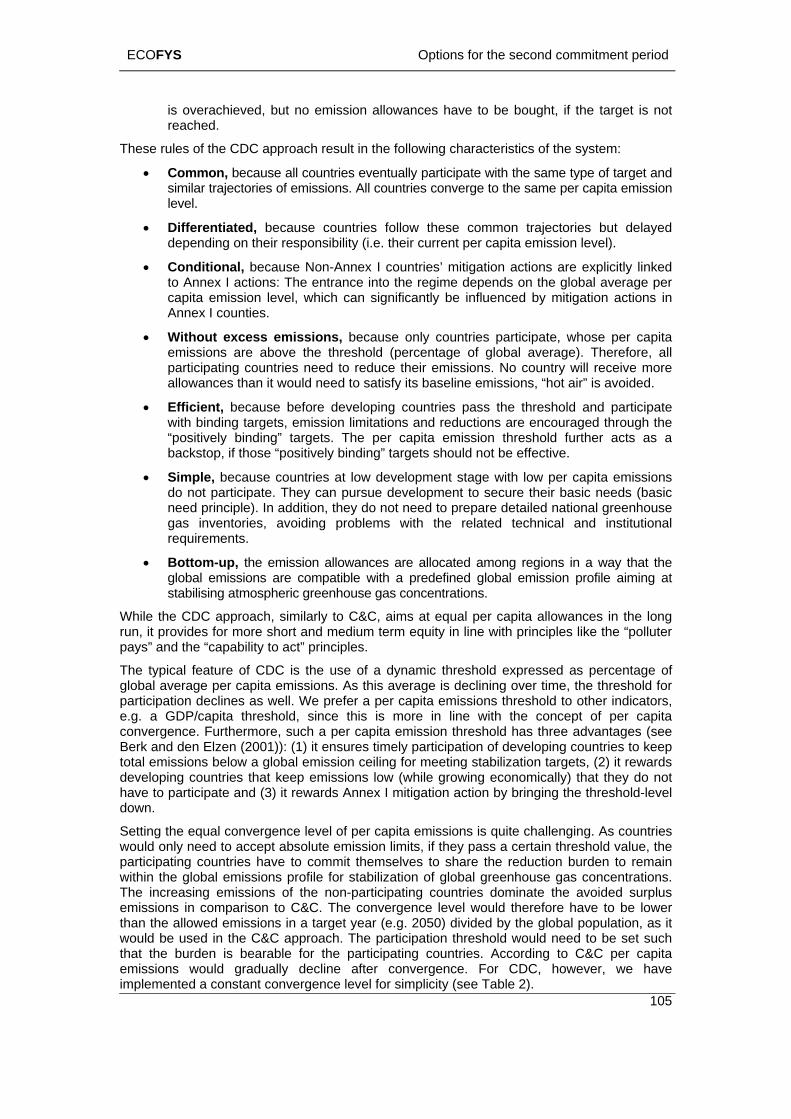
ECOFYS Options for the second commitment period
105
is overachieved, but no emission allowances have to be bought, if the target is not reached.
These rules of the CDC approach result in the following characteristics of the system:
• Common, because all countries eventually participate with the same type of target and similar trajectories of emissions. All countries converge to the same per capita emission level.
• Differentiated, because countries follow these common trajectories but delayed depending on their responsibility (i.e. their current per capita emission level).
• Conditional, because Non-Annex I countries’ mitigation actions are explicitly linked to Annex I actions: The entrance into the regime depends on the global average per capita emission level, which can significantly be influenced by mitigation actions in Annex I counties.
• Without excess emissions, because only countries participate, whose per capita emissions are above the threshold (percentage of global average). Therefore, all participating countries need to reduce their emissions. No country will receive more allowances than it would need to satisfy its baseline emissions, “hot air” is avoided.
• Efficient, because before developing countries pass the thresh nd participate with binding targets, emission limitations and reductions are enco aged through the
sue development to secure their basic needs (basic need principle). In addition, they do not need to prepare detailed national greenhouse gas inventories, avoiding problems with the related technical and institutional
e gas concentrations.
hile the CDC approach, similarly to C&C, aims at equal per capita allowances in the long
al emission ceiling for meeting stabilization targets, (2) it rewards
Setting the equal convergence level of per capita emissions is quite challenging. As countries sion limits, if they pass a certain threshold value, the
share the reduction burden to remain
sing emissions of the non-participating countries dominate the avoided surplus
eed to be set such
CDC, however, we have implemented a constant convergence level for simplicity (see Table 2).
old aur
“positively binding” targets. The per capita emission threshold further acts as a backstop, if those “positively binding” targets should not be effective.
• Simple, because countries at low development stage with low per capita emissions do not participate. They can pur
requirements.
• Bottom-up, the emission allowances are allocated among regions in a way that the global emissions are compatible with a predefined global emission profile aiming at stabilising atmospheric greenhous
Wrun, it provides for more short and medium term equity in line with principles like the “polluter pays” and the “capability to act” principles.
The typical feature of CDC is the use of a dynamic threshold expressed as percentage of global average per capita emissions. As this average is declining over time, the threshold for participation declines as well. We prefer a per capita emissions threshold to other indicators, e.g. a GDP/capita threshold, since this is more in line with the concept of per capita convergence. Furthermore, such a per capita emission threshold has three advantages (see Berk and den Elzen (2001)): (1) it ensures timely participation of developing countries to keep total emissions below a globdeveloping countries that keep emissions low (while growing economically) that they do not have to participate and (3) it rewards Annex I mitigation action by bringing the threshold-level down.
would only need to accept absolute emisparticipating countries have to commit themselves towithin the global emissions profile for stabilization of global greenhouse gas concentrations. The increaemissions in comparison to C&C. The convergence level would therefore have to be lower than the allowed emissions in a target year (e.g. 2050) divided by the global population, as it would be used in the C&C approach. The participation threshold would nthat the burden is bearable for the participating countries. According to C&C per capita emissions would gradually decline after convergence. For
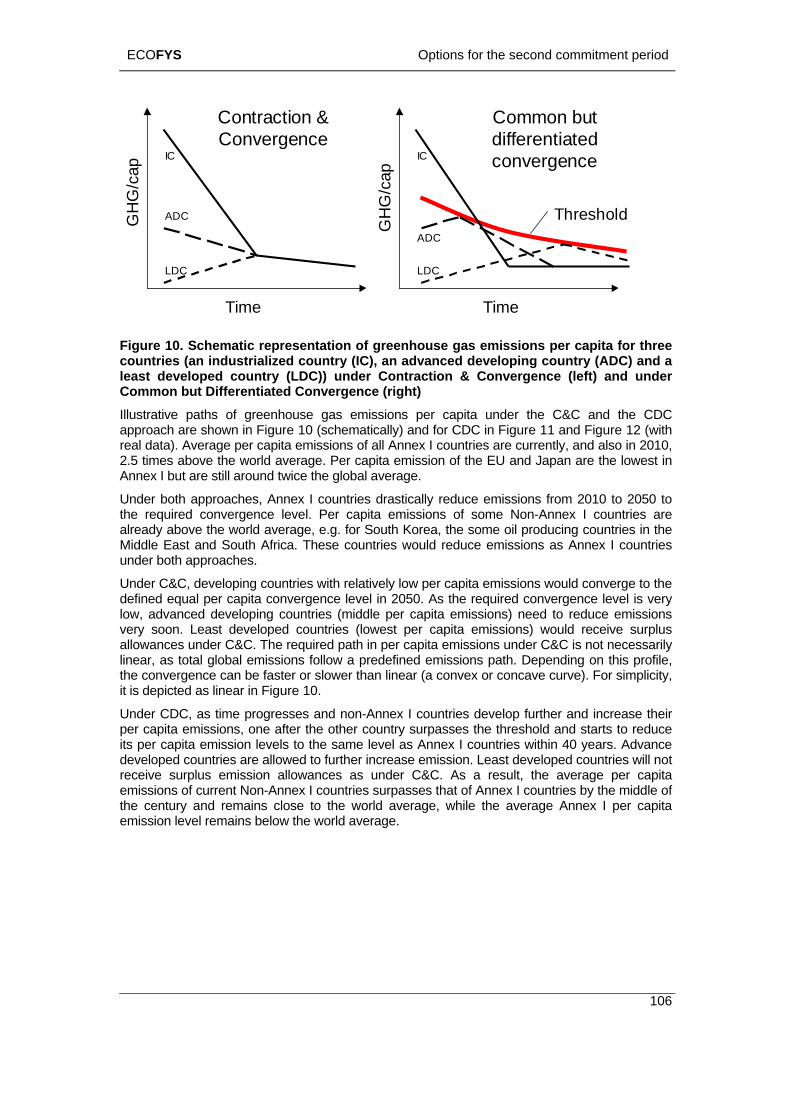
ECOFYS Options for the second commitment period
Contraction & Convergence
Common but differentiated convergence
GH
G/c
ap
GH
G/c
ap
Time Time
Threshold
IC
ADC
IC
ADC
), an advanced developing country (ADC) and a
e 11 and Figure 12 (with real data). Average per capita emissions of all Annex I countries are currently, and also in 2010, 2.5 times above the world average. Per capita emission of the EU and Japan are the lowest in Annex I but are still around twice the global average.
Under both approaches, Annex I countries drastically reduce emissions from 2010 to 2050 to the required convergence level. Per capita emissions of some Non-Annex I countries are already above the world average, e.g. for South Korea, the some oil producing countries in the Middle East and South Africa. These countries would reduce emissions as Annex I countries under both approaches.
pita emissions would converge to the e required convergence level is very missions) need to reduce emissions
west per capita emissions) would receive surplus in per capita emissions under C&C is not necessarily
0 years. Advance developed countries are allowed to further increase emission. Least developed countries will not receive surplus emission allowances as under C&C. As a result, the average per capita
LDC LDC
Figure 10. Schematic representation of greenhouse gas emissions per capita for three countries (an industrialized country (ICleast developed country (LDC)) under Contraction & Convergence (left) and under Common but Differentiated Convergence (right) Illustrative paths of greenhouse gas emissions per capita under the C&C and the CDC approach are shown in Figure 10 (schematically) and for CDC in Figur
Under C&C, developing countries with relatively low per cathdefined equal per capita convergence level in 2050. As
le per capita elow, advanced developing countries (midd(lovery soon. Least developed countries
allowances under C&C. The required pathlinear, as total global emissions follow a predefined emissions path. Depending on this profile, the convergence can be faster or slower than linear (a convex or concave curve). For simplicity, it is depicted as linear in Figure 10.
Under CDC, as time progresses and non-Annex I countries develop further and increase their per capita emissions, one after the other country surpasses the threshold and starts to reduce its per capita emission levels to the same level as Annex I countries within 4
emissions of current Non-Annex I countries surpasses that of Annex I countries by the middle of the century and remains close to the world average, while the average Annex I per capita emission level remains below the world average.
106
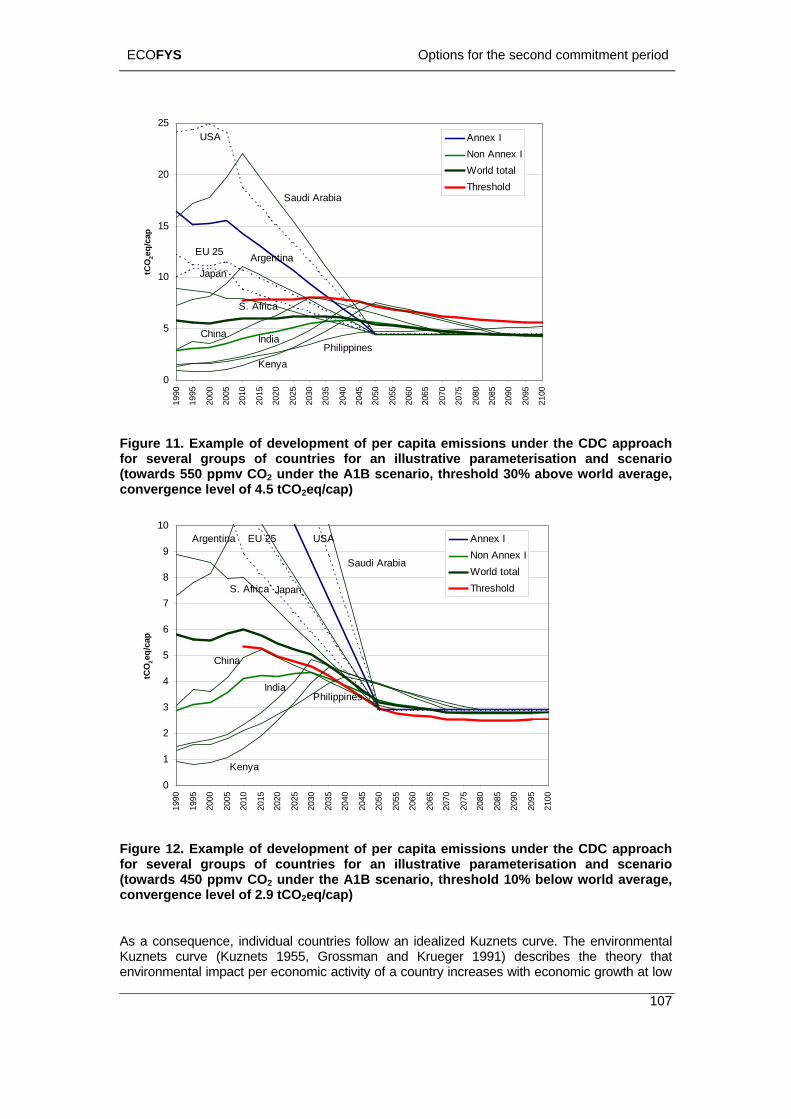
ECOFYS Options for the second commitment period
10
15
tCO
2eq/
cap
20
25Annex INon Annex IWorld totalThreshold
Saudi Arabia
EU 25
Japan
USA
Argentina
107
0
1990
1995
2000
2005
2010
2015
2020
2025
2030
2035
2040
2045
2050
2055
2060
2065
2070
2075
2080
2085
2090
2095
2100
5
PhilippinesKenya
India
S. Africa
China
Figure 11. Example of development of per capita emissions under the CDC approach for several groups of countries for an illustrative parameterisation and scenario (towards 550 ppmv CO2 under the A1B scenario, threshold 30% above world average, convergence level of 4.5 tCO2eq/cap)
2
3
4
5
6
7
8
tCO
2eq/
cap
9
10Annex INon Annex IWorld totalThreshold
China
S. Africa Japan
Philippines
Saudi Arabia
USAEU 25Argentina
India
0
1Kenya
1990
1995
2000
2005
2010
2015
2020
2025
2030
2035
2040
2045
2050
2055
2060
2065
2070
2075
2080
2090
2100
2085
2095
Figure 12. Example of development of per capita emissions under the CDC approach r several groups of countries for an illustrative parameterisation and scenario
s 450 ppmv CO2 under the A1B sce 0 elo orld average,
an alized Kuznets curve. The environmental Kuzne nd ueger 1991) describes the theory that nviro a c y growth at low
fo(towaconve
rdr
nario, threshold 1 % b w wgence level of 2.9 tCO2eq/cap)
As a consequence, individual countries follow idets curve (Kuznets 1955, Grossman anmental impact per economic activity of
Krountre increases with economic
ECOFYS Options for the second commitment period
108
n countries that developed before.
7.2.2 Methodology of quantification
The following methodology was used to quantify the emission allowances under the CDC approach:
The group of participating countries comprises those that are in Annex I plus countries with per capita emissions at a certain percentage above the global average.
The participating countries start to linearly converge their per capita emissions towards the convergence level within e.g. 40 years. The formula is as follows:
income per capita, reaches a maximum and then decreases at higher levels of income (inverted U-shape). If several economies take the same development paths one after the other, the maximum of environmental impact per economic output is reached at a lower level for those countries that are developing at a later point in time (Bernardini & Galli, 1993), because countries that are developing at a later stage benefit from the technological developments that occurred in other countries.
Figure 11 shows this effect, not in terms of economic output, but in terms of per capita emissions over time. Under the CDC approach the “followers” have to start reducing emissions earlier (at lower per capita emission levels) tha
( )
40for 1
40for 40
)( ,, +<
−=
)()()()(
,
,,
+>=
⋅−−=
cstart
cconvcstartccstartcc
tt
tpcetpcetpcetpce
cstartcstart
c tttt
tτ
τ
with pcec(t): Per capita emissions at time t of country c pceconv: Convergence level of per capita emission tstart,c: Year in which the country c starts to participate, that is when the per capita emissions
are above a threshold.
Before Non-Annex I countries meet this participation threshold they may commit to “positively binding” emission targets. These are not particularly quantified: All countries below the threshold follow their reference scenario.
The parameters for the CDC approach (threshold and convergence level) can be chosen such as to best fit a given stabilization scenarios (see below).
For comparison, we also model the original “Contraction & Convergence”, where per capita emissions converge from 2010 to 2050. The formulas are as follows:
( )
)()()(2050for 1
2050for 402010)(
)()()2010()2010()(
tsetetet
ttt
ttspsesetse
ctotalc
c
ccccc
⋅=>=
<−
=
⋅−−=
τ
τ
with sec(t): Share of global emissions of country c at time t spc(t): Share of global population of country c at time t etotal(t): Total emissions allowed at time t e (t): Emissions of country c at time c t
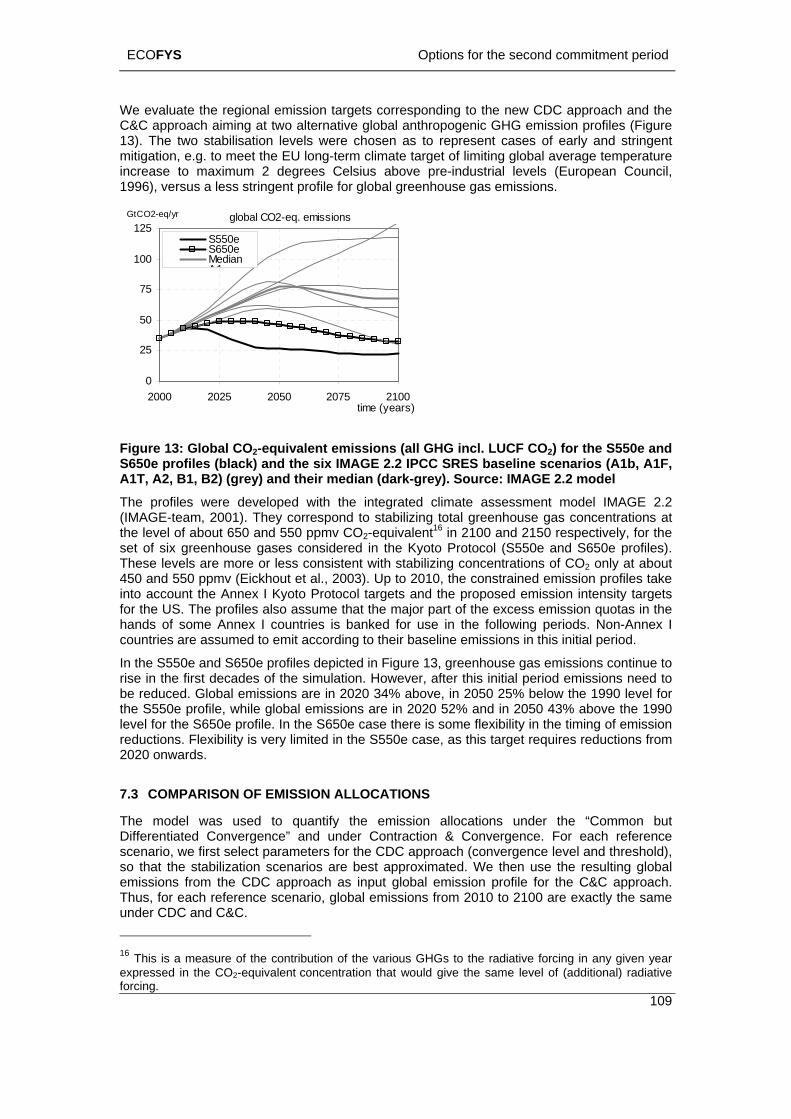
ECOFYS Options for the second commitment period
109
s Celsius above pre-industrial levels (European Council, 1996), versus a less stringent profile for global greenhouse gas emissions.
We evaluate the regional emission targets corresponding to the new CDC approach and the C&C approach aiming at two alternative global anthropogenic GHG emission profiles (Figure 13). The two stabilisation levels were chosen as to represent cases of early and stringent mitigation, e.g. to meet the EU long-term climate target of limiting global average temperature increase to maximum 2 degree
global CO2-eq. emissions125
GtCO2-eq/yr
0
25
50
75
100
2000 2025 2050 21ti ear
2075 00me (y s)
S550eS650eMedianA1
Figure 13: Global CO2-equivalent emissions (all GHG cl. F ) fo S aes (black) and the s A .2 C line scen A
ey) and their median (dar y ur A 2. eped with the integrate ssment mo IMAGE 2.2
E-team, 2001). They correspo use gas entrations atf about 650 and 550 ppmv CO2-equivalent16 in 2100 and 2150 respe tively, for th
eenhouse gases con d the c 550e and are more or less co nt with stabilizi nc ti f n abppmv (Eickhout et al., 2003). Up to 2010, the co ined emis profiles ta
t the Annex I Kyoto P ol s th op emission nsity targ. The profiles also assu hat the m a th es is u
me Annex I countries is ba f e e in ri n assumed to emit acco g to their baseline emissions in this initial period.
In the S550e and S650e profiles depicted in Figure 13, greenhouse gas emissions continue to
hile global emissions are in 2020 52% and in 2050 43% above the 1990 level for the S650e profile. In the S650e case there is some flexibility in the timing of emission
ns. Flexibility is very limited in the S550e case, as thi e ir u wards.
ARISON OF EMISSION ALLO TI
el was used to quantify the emis allocatio un th om n rgence” and de nt n on en Fo ch re
lect parameter r th DC roa co ge lev d t ho stabilization scenarios be ppr ma W en th ult glorom the CDC approa s i gl emission file the C oa
rence scenario, al issi from 2010 to 2100 are tly saC.
in LUC CO2 r the 550e nd S650e profil ix IM GE 2 IPC SRES base arios (A1b, 1F, A1T, A2, B1, B2) (gr k-gre ). So ce: IM GE 2 mod l The profiles were develo d climate asse del(IMAG nd to stabilizing total greenho conc the level o c e set of six gr
velssiderensiste
in Kyoto Proto ol (Sentra
S650e pCO o
rofilely at
s). out These le ng co ons o 2
450 and 550 n
nstraosed
sion inte
ke ets into accou
Srome t
toc target ajor p
and e prfor the U rt of e exc s em sion q otas in the hands of soountries are
nked or us in th follow g pe ods. Non-An ex I c rdin
rise in the first decades of the simulation. However, after this initial period emissions need to be reduced. Global emissions are in 2020 34% above, in 2050 25% below the 1990 level for the S550e profile, w
reductio s targ t requ es red ctions from 2020 on
7.3 COMP CA ONS
The modDifferentia
sion ns der e “C mo but ted Conve
scenario, we first se un r Co ractio & C verg ce. r ea refe nce s fo e C app ch ( nver nce el an hres ld),
so that the are st a oxi ted. e th use e res ing bal emissions f ch a nput obal pro for C& appr ch. Thus, for each refeunder CDC and C&
glob em ons exac the me
of the contribu f t rio G he radiativ cin n n 2-equivalent con on that give the le f (a ona dia
forcing.
16 This is a measure tion o he va us GH s to t e for g in a y give year expressed in the CO centrati would same vel o dditi l) ra tive
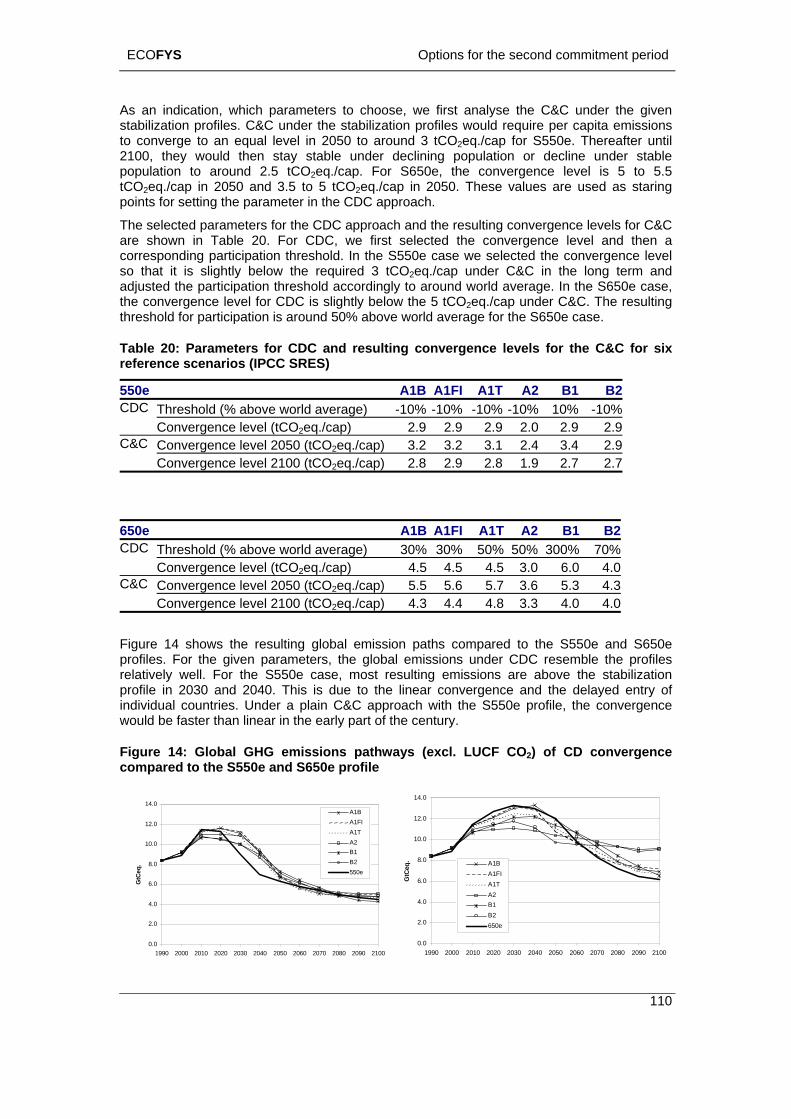
ECOFYS Options for the second commitment period
110
indication, which parameters to c se, we first ana the C&C er givlization profiles. C&C under th tab tion ofile ou qu er ita o
ge to an equal level in 2050 to aroun tCO q./c for 0e ereafter uwould then stay sta un de ing ul cli und sta
n to around 2.5 tCO2eq./cap , c rge le is o p in 2050 and 3.5 to 5 O2e ap 2050. Thes alu are d r
setting the parameter in CD pr .
meters for the CDC app ch the ult en ve r Cin Table 20. For CDC, we t s co erg l an en
orresponding participation threshold. In the S550e case we selected the convergence level it is slightly below the required 3 tCO2eq./cap under C&C in the long term and
adjuste ation threshold accordingly to around world average. In the S650e case, t con lightly below the 5 tCO2eq./cap under C&C. The resulting t esho 50% above world average for the S650e case.
T ble d resulting convergence levels for the C&C for six referen
0e A1B A1FI A1T A2 B1 B2
As an hoo lyse und the en stabi e s iliza pr s w ld re ire p cap emissi ns to conver d 3 2e ap S55 . Th ntil 2100, they ble der clin pop ation or de ne er ble populatio . For S650e the onve nce vel 5 t 5.5 tCO2eq./ca tC q./c in e v es use as sta ing points for the C ap oach
The selected paraare shown
roa and res ing converg ce le ls fo &C firs elected the nv ence evel d th a
cso that
d the participhe vergence level for CDC is shr ld for participation is around
a 20: Parameters for CDC ance scenarios (IPCC SRES)
55Threshold (% above world average) -10% -10% -10% -10% 10% -10%CDC
9 2.0 2.9 2.9Convergence level (tCO2eq./cap) 2.9 2.9 2.Convergence level 2050 (tCO2eq./cap) 3.2 3.2 3.1 2.4 3.4 2.9C&C Convergence level 2100 (tCO2eq./cap) 2.8 2.9 2.8 1.9 2.7 2.7
650e A1B A1FI A1T A2 B1 B2Threshold (% above world average) 30% 30% 50% 50% 300% 70%CDConvergence level (tCO
C 2eq./cap) 4.5 4.5 4.5 3.0 6.0 4.0
Convergence level 2050 (tCO2eq./cap) 5.5 5.6 5.7 3.6 5.3 4.3C&C Convergence level 2100 (tCO2eq./cap) 4.3 4.4 4.8 3.3 4.0 4.0
prorelaproindi in C&C approach with the S550e profile, the convergence
ou
Figcom
Figure 14 shows the resulting global emission paths compared to the S550e and S650e files. For the given parameters, the global emissions under CDC resemble the profiles tively well. For the S550e case, most resulting emissions are above the stabilization file in 2030 and 2040. This is due to the linear convergence and the delayed entry of vidual countries. Under a pla
w ld be faster than linear in the early part of the century.
ure 14: Global GHG emissions pathways (excl. LUCF CO2) of CD convergence pared to the S550e and S650e profile
10.0
12.0
14.0
0.0
2.0
4.0
1990 2000 2010 2020 2030 2040 2050 2060 2070 2080 2090 2100
6.0
8.0
GtC
eq.
10.0
12.0
14.0A1BA1FIA1TA2B1B2550e
0.0
2.0
4.0
1990 2000 2010 2020 2030 2040 2050 2060 2070 2080 2090 2100
6.0Gt
8.0
Ceq. A1B
A1FIA1TA2B1B2650e
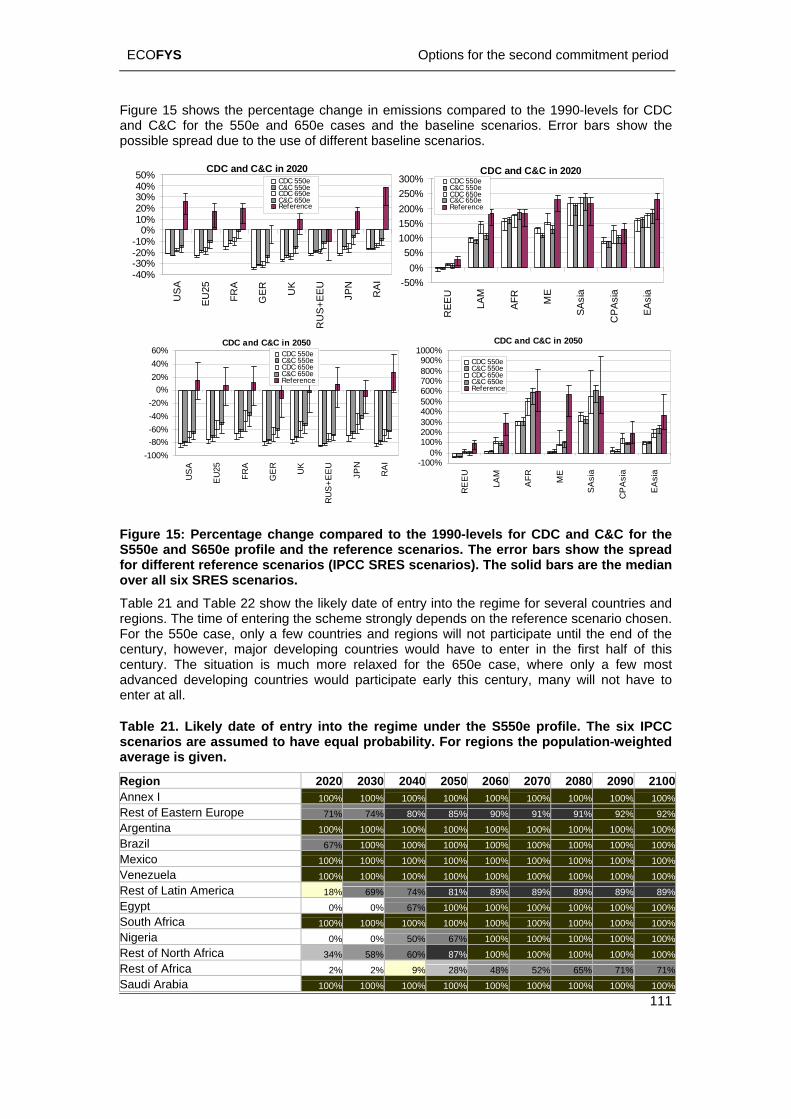
ECOFYS Options for the second commitment period
111
and 550e and 650e cases and the baseline scenarios. Error bars show the ossible spread due to the use of different baseline scenarios.
Figure 15 shows the percentage change in emissions compared to the 1990-levels for CDC C&C for the
p
CDC and C&C in 2020
20%30%40%50%
-40%-30%
USA
EU25
FRA
GER U
K
EEU
JPN
RAI
-20%-10%
0%10%
US+
R
CDC 550eC&C 550eCDC 650eC&C 650eReference
CDC and C&C in 2020
250%300%
-50%0%
M R
ME ia ia ia
50%100%150%200%
REE
U
LA AF SAs
CPA
s
EAs
CDC 550eC&C 550eCDC 650eC&C 650eReference
CDC and C&C in 20501000%
CDC and C&C in 205060%
-
SA
s
PA
sia
EA
sia
100%0%
EE
U
LAM
AFR M
E ia
100%200%300%400%500%600%700%800%900%
R C
CDC 550eC&C 550eCDC 650eC&C 650eReference
-100%-80%
US
A
EU
25
FRA N
-60%-40%-20%
0%20%40%
GE
R
UK
+EE
U
JP RA
I
RU
S
CDC 550eC&C 550eCDC 650eC&C 650eReference
Fig pared to th he e d
SRE c n over all six SRES scenarios.
kely date of e tr regions. The time of entering the scheme strongly d .
d r io of the n ies o this
cen axed for ost ticipate to
te
ab regime under the S550e profile. The six IPCC cenarios are assumed to have equal probability. For regions the population-weighted
ure 15: Percentage change com e 1990-levels for CDC and C&C for tnarios. The error bars show theS550e and S650e profile and the reference s
for different reference scenarios (IPCCc sprea
S s enarios). The solid bars are the media
Table 21 and Table 22 show the li n y into the regime for several countries andepends on the reference scenario chosen
For the 550e case, only a few countries ance tury, however, major developing countr
tury. The situation is much more rel
eg ns will not participate until the end w uld have to enter in the first half of
the 650e case, where only a few madvanced developing countries would paren r at all.
le 21. Likely date of entry into the
early this century, many will not have
Tsaverage is given.
Region 2020 2030 2040 2050 2060 2070 2080 2090 2100Annex I 100% 100% 100% 100% 100% 100% 100% 100% 100%Rest of Eastern Europe 71% 74% 80% 85% 90% 91% 91% 92% 92%Argentina 100% 100% 100% 100% 100% 100% 100% 100% 100%Brazil 67% 100% 100% 100% 100% 100% 100% 100% 100%Mexico 100% 100% 100% 100% 100% 100% 100% 100% 100%Venezuela 100% 100% 100% 100% 100% 100% 100% 100% 100%Rest of Latin America 18% 69% 74% 81% 89% 89% 89% 89% 89%Egypt 0% 0% 67% 100% 100% 100% 100% 100% 100%South Africa 100% 100% 100% 100% 100% 100% 100% 100% 100%Nigeria 0% 0% 50% 67% 100% 100% 100% 100% 100%Rest of North Africa 34% 58% 60% 87% 100% 100% 100% 100% 100%Rest of Africa 2% 2% 9% 28% 48% 52% 65% 71% 71%Saudi Arabia 100% 100% 100% 100% 100% 100% 100% 100% 100%
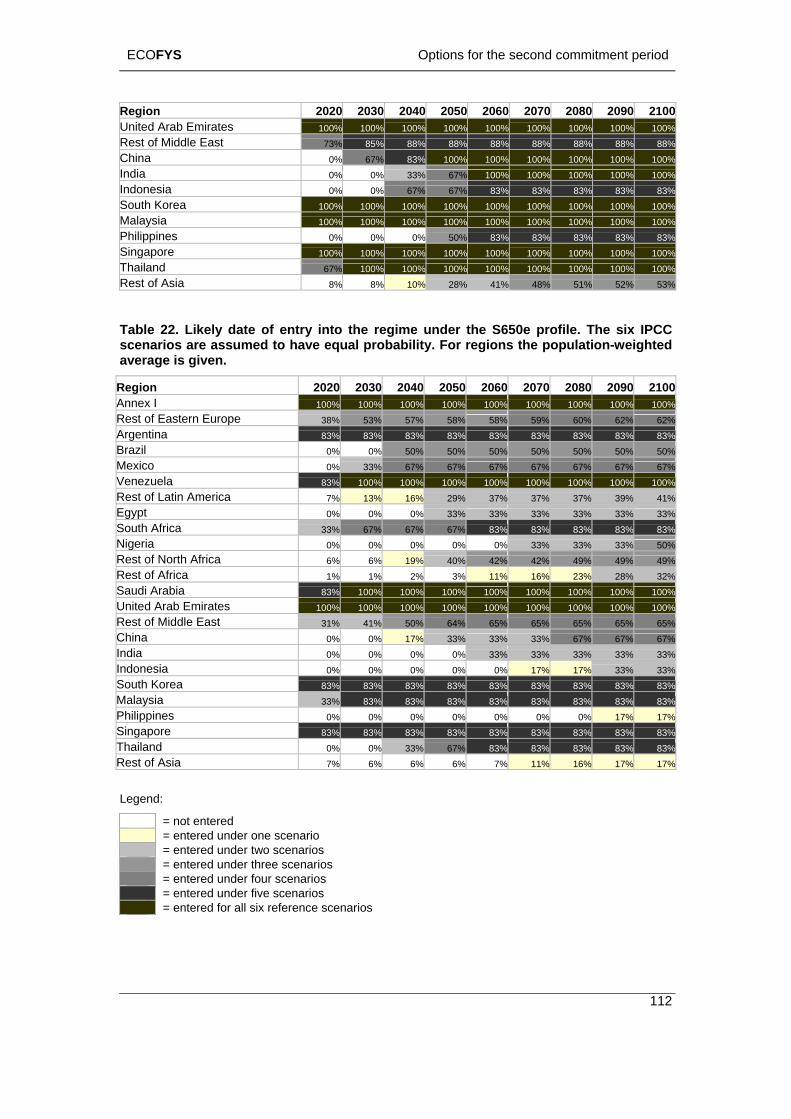
ECOFYS Options for the second commitment period
Region 2020 2030 2040 2050 2060 2070 2080 2090 2100United Arab Emirates 100% 100% 100% 100% 100% 100% 100% 100% 100%Rest of Middle East 73% 85% 88% 88% 88% 88% 88% 88% 88%China 0% 67% 83% 100% 100% 100% 100% 100% 100%India 0% 0% 33% 67% 100% 100% 100% 100% 100%Indonesia 0% 0% 67% 67% 83% 83% 83% 83% 83%South Korea 100% 100% 100% 100% 100% 100% 100% 100% 100%Malaysia 100% 100% 100% 100% 100% 100% 100% 100% 100%Philippines 0% 0% 0% 50% 83% 83% 83% 83% 83%Singapore 100% 100% 100% 100% 100% 100% 100% 100% 100%Thailand 67% 100% 100% 100% 100% 100% 100% 100% 100%Rest of Asia 8% 8% 10% 28% 41% 48% 51% 52% 53%
Table 22. Likely date of entry into the regime under the S650e profile. The six IPCC scenarios are assumed to have equal probability. For regions the population-weighted average is given.
Region 2020 2030 2040 2050 2060 2070 2080 2090 2100Annex I 100% 100% 100% 100% 100% 100% 100% 100% 100%Rest of Eastern Europe 38% 53% 57% 58% 58% 59% 60% 62% 62%Argentina 83% 83% 83% 83% 83% 83% 83% 83% 83%Brazil 0% 0% 50% 50% 50% 50% 50% 50% 50%Mexico 0% 33% 67% 67% 67% 67% 67% 67% 67%Venezuela 83% 100% 100% 100% 100% 100% 100% 100% 100%Rest of Latin America 7% 13% 16% 29% 37% 37% 37% 39% 41%Egypt 0% 0% 0% 33% 33% 33% 33% 33% 33%South Africa 33% 67% 67% 67% 83% 83% 83% 83% 83%Nigeria 0% 0% 0% 0% 0% 33% 33% 33% 50%Rest of North Africa 6% 6% 19% 40% 42% 42% 49% 49% 49%Rest of Africa 1% 1% 2% 3% 11% 16% 23% 28% 32%Saudi Arabia 83% 100% 100% 100% 100% 100% 100% 100% 100%United Arab Emirates 100% 100% 100% 100% 100% 100% 100% 100% 100%Rest of Middle East 31% 41% 50% 64% 65% 65% 65% 65% 65%China 0% 0% 17% 33% 33% 33% 67% 67% 67%India 0% 0% 0% 0% 33% 33% 33% 33% 33%Indonesia 0% 0% 0% 0% 0% 17% 17% 33% 33%South Korea 83% 83% 83% 83% 83% 83% 83% 83% 83%Malaysia 33% 83% 83% 83% 83% 83% 83% 83% 83%Philippines 0% 0% 0% 0% 0% 0% 0% 17% 17%Singapore 83% 83% 83% 83% 83% 83% 83% 83% 83%Thailand 0% 0% 33% 67% 83% 83% 83% 83% 83%Rest of Asia 7% 6% 6% 6% 7% 11% 16% 17% 17%
Legend:
= not entered = entered under one scenario = entered under two scenarios = entered under three scenarios = entered under four scenarios = entered under five scenarios = entered for all six reference scenarios
112
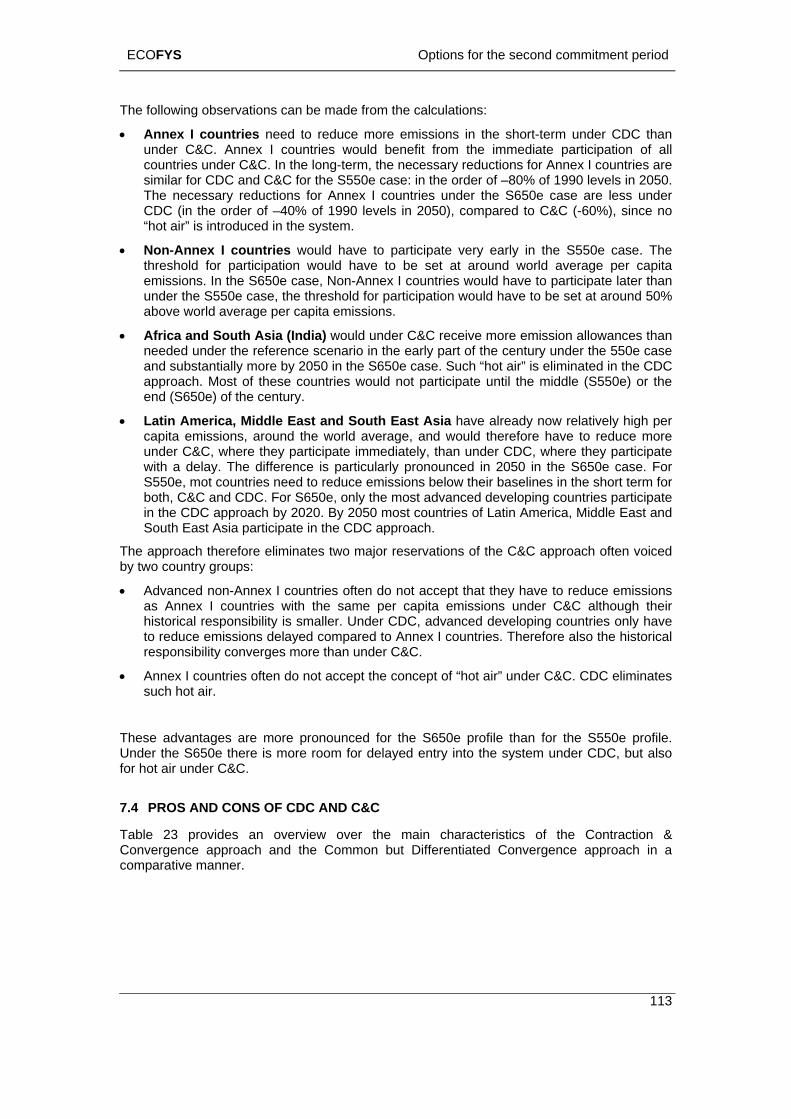
ECOFYS Options for the second commitment period
113
n
dia) would under C&C receive more emission allowances than
East and South East Asia the world average, and would therefore have to reduce more
under C&C, where they participate immediately, than under CDC, where they participate difference is particularly pronounced in 2050 in the S650e case. For
in merica, Middle East and
The aby two ntry groups:
ashi r. Under CDC, advanced developing countries only have
re
• An
Underfor ho C&C.
7.4 P D C&C
Table ver the main characteristics of the Contraction &
The following observations can be made from the calculations:
• Annex I countries need to reduce more emissions in the short-term under CDC than under C&C. Annex I countries would benefit from the immediate participation of all countries under C&C. In the long-term, the necessary reductions for Annex I countries are similar for CDC and C&C for the S550e case: in the order of –80% of 1990 levels in 2050. The necessary reductions for Annex I countries under the S650e case are less under CDC (in the order of –40% of 1990 levels in 2050), compared to C&C (-60%), since no “hot air” is introduced in the system.
• Non-Annex I countries would have to participate very early in the S550e case. The threshold for participation would have to be set at around world average per capita emissions. In the S650e case, Non-Annex I countries would have to participate later thaunder the S550e case, the threshold for participation would have to be set at around 50% above world average per capita emissions.
• Africa and South Asia (Inneeded under the reference scenario in the early part of the century under the 550e case and substantially more by 2050 in the S650e case. Such “hot air” is eliminated in the CDC approach. Most of these countries would not participate until the middle (S550e) or the end (S650e) of the century.
• Latin America, Middle have already now relatively high per capita emissions, around
with a delay. The S550e, mot countries need to reduce emissions below their baselines in the short term for both, C&C and CDC. For S650e, only the most advanced developing countries participate
the CDC approach by 2020. By 2050 most countries of Latin ASouth East Asia participate in the CDC approach.
pproach therefore eliminates two major reservations of the C&C approach often voiced cou
• Advanced non-Annex I countries often do not accept that they have to reduce emissions Annex I countries with the same per capita emissions under C&C although their
storical responsibility is smalleto reduce emissions delayed compared to Annex I countries. Therefore also the historical
sponsibility converges more than under C&C.
nex I countries often do not accept the concept of “hot air” under C&C. CDC eliminates such hot air.
These advantages are more pronounced for the S650e profile than for the S550e profile. the S650e there is more room for delayed entry into the system under CDC, but also t air under
ROS AND CONS OF CDC AN
23 provides an overview oConvergence approach and the Common but Differentiated Convergence approach in a comparative manner.
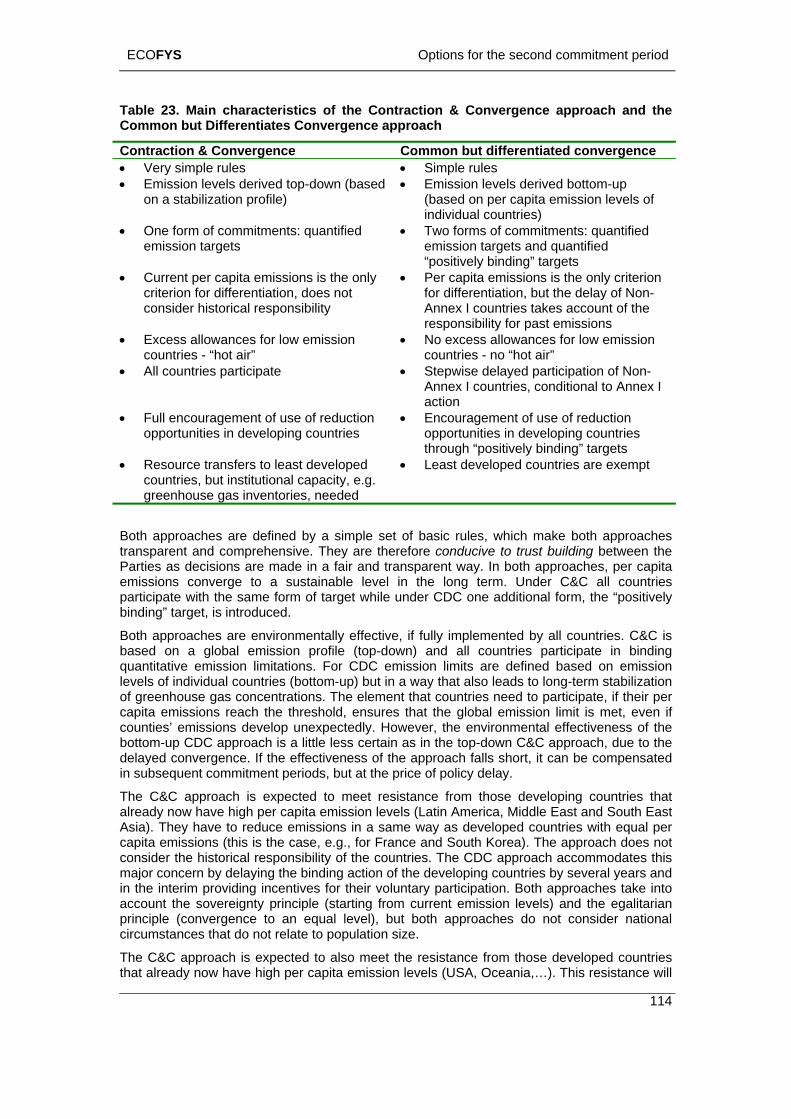
ECOFYS Options for the second commitment period
114
CommTable 23. Main characteristics of the Contraction & Convergence approach and the
on but Differentiates Convergence approach
Contraction & Convergence Common but differentiated convergence • Very simple rules • Simple rules • Emission levels derived top-down (based
on a stabilization profile) • Emission levels derived bottom-up
(based on per capita emission levels of individual countries)
ne form of commitments: quantified • O • Two forms of commitments: quantified
“positively binding” targets
cr for differentiation, but the delay of Non-
• Ex
op
• Rcou city, e.g.
emission targets emission targets and quantified
• Current per capita emissions is the only iterion for differentiation, does not
• Per capita emissions is the only criterion
consider historical responsibility Annex I countries takes account of the responsibility for past emissions
cess allowances for low emission • No excess allowances for low emission countries - “hot air” countries - no “hot air”
• All countries participate • Stepwise delayed participation of Non-Annex I countries, conditional to Annex I action
• Full encouragement of use of reduction portunities in developing countries
• Encouragement of use of reduction opportunities in developing countries through “positively binding” targets
esource transfers to least developed ntries, but institutional capa
• Least developed countries are exempt
greenhouse gas inventories, needed
Partie
bindin
of gre ntries need to participate, if their per
countibottom is a little less certain as in the top-down C&C approach, due to the
mpensated
The Calread and South East
in theaccou
Both approaches are defined by a simple set of basic rules, which make both approaches transparent and comprehensive. They are therefore conducive to trust building between the
s as decisions are made in a fair and transparent way. In both approaches, per capita emissions converge to a sustainable level in the long term. Under C&C all countries participate with the same form of target while under CDC one additional form, the “positively
g” target, is introduced.
Both approaches are environmentally effective, if fully implemented by all countries. C&C is based on a global emission profile (top-down) and all countries participate in binding quantitative emission limitations. For CDC emission limits are defined based on emission levels of individual countries (bottom-up) but in a way that also leads to long-term stabilization
enhouse gas concentrations. The element that coucapita emissions reach the threshold, ensures that the global emission limit is met, even if
es’ emissions develop unexpectedly. However, the environmental effectiveness of the -up CDC approach
delayed convergence. If the effectiveness of the approach falls short, it can be coin subsequent commitment periods, but at the price of policy delay.
&C approach is expected to meet resistance from those developing countries that y now have high per capita emission levels (Latin America, Middle East
Asia). They have to reduce emissions in a same way as developed countries with equal per capita emissions (this is the case, e.g., for France and South Korea). The approach does not consider the historical responsibility of the countries. The CDC approach accommodates this major concern by delaying the binding action of the developing countries by several years and
interim providing incentives for their voluntary participation. Both approaches take into nt the sovereignty principle (starting from current emission levels) and the egalitarian
principle (convergence to an equal level), but both approaches do not consider national circumstances that do not relate to population size.
The C&C approach is expected to also meet the resistance from those developed countries that already now have high per capita emission levels (USA, Oceania,…). This resistance will
ECOFYS Options for the second commitment period
115
countrunder CDC approach accommodates part of this concern as it
(comp y do not have to provide
USA, whi general concern about the concept of per capita
appro
market. In the case of l s of excess emission allowances under C&C, this incentive may be weak. For CDC, the magnitude of the first incentive (the “carrot”) lies in the way the “positively binding” targets are set for the developing countries. In addition, the second incentive (the “stick”) is provided by the element that countries receive binding reduction targets, if their per capita emissions reach a threshold.
Up to now there has been a clear policy divide between the developed and developing countries in the climate change negotiations, with developing countries having a joint position through the “Group of 77 and China” notwithstanding clear differences in their interests (e.g. between the Alliance of Small Island States (AOSIS) and OPEC member states). This historic North-South policy divide will have to be overcome in the CDC approach in order to differentiate developing country commitments in the climate change regime.
Under the C&C approach, least developed countries strongly benefit from participating in the regime. They would receive large resource transfers, which could be used for economic development or adaptation measures. But they also would have to have the institutional capacity to participate in the regime, e.g. prepare robust national greenhouse gas inventories and to be capable to participate in emissions trading. In the CDC approach, this element of support for least developed countries is not included. The need for development and adaptation to climate change would have to be ensured through additional mechanisms.
7.5 CONCLUSIONS
With the “Common but Differentiated Convergence” approach we have provided a new concept for an international climate regime. On the one hand it could be acceptable to a wider range of countries and on the other hand it could ensure stabilization of greenhouse gas concentrations. It is based on the principle that Annex I countries’ per capita emissions converge within several decades to a low level. Individual non-Annex I countries also converge to the same level within the same time period years but starting when their per capita emissions are a certain percentage above global average. Until then they may voluntarily take on “positively binding” targets.
This approach is almost as simple as the Contraction & Convergence approach but eliminates two concerns often voiced in relation to C&C: Under CDC, advanced developing countries start reducing emissions at a later point in time compared to Annex I countries. In addition, CDC avoids the political problems related to the resource sharing concept and financial transfers, because it does not provide excess emission allowances to low emission countries as C&C does. It thus might be more acceptable to major developing countries than C&C and possibly also the USA (taking into account that the current administration of the USA is very reluctant to agree to any proposal on further international action on climate change).
We have shown that with the CDC approach stabilization at 550 CO2eq. and 650 CO2eq. in 2100 and 2150 can be reached with participation threshold at roughly 0% and 50% above global average and a convergence level of around 3 and 4.5 tCO2eq./cap within 40 years.
be based on both economic concerns related to the large resource transfers to developing ies as well as political opposition against the global commons and egalitarian concepts lying the approach. The
eliminates the component of “hot air”. Annex I countries need to reduce slightly more ared to C&C) in the short term, but less in the long term, as the
for the “hot air”. But CDC will lead to the situation that per capita emissions of developing countries, like China, will be at some point higher than those of developed countries, like the
ch will meet their resistance. The emissions, which is often voiced by several developed countries, is still valid for both
aches.
Both approaches provide incentives for developing countries to take action to limit their greenhouse gas emissions because they create emission allowances that can be sold on the
arge amount
ECOFYS Options for the second commitment period
116
It is recognized that under the CDC approach, additional mechanisms have to be ement r vulnerable developing countries to adapt to
We think that the global community will probably adopt a climate regime in step-by-step ot be fixed for the next century. Even if the CDC approach is not
S
tions for
47
Criqui, P. and Kouvaritakis, N., 2000. World energy projections to 2030. International Journal of Global (1-4): 116-136.
oring climate regimes for differentiation of future commitments to stabilise essment, 3(4): 343-359.
and Vuuren, D.P. van, 2003. Exploring climate or differentiation of commitments to achieve the EU climate target. RIVM-report
impl ed that can accommodate the need foclimate change.
decisions, the rules will nimplemented in its entirety, we strongly believe that these step-by-step decisions can be guided by the principles provided in the CDC approach: That developed countries per capita emissions converge and that developing countries do the same but delayed and conditional to developed country action.
7.6 REFERENCE
Agarwal , A and Narain, S., 1991. Global Warming in an Unequal World, a case of environmental colonialism, Centre for Science and Environment (CSE), Delhi, India.
Aldy, J.E, Ashton, J., Baron, R., Bodansky, D., Charnovitz, S., Diringer, E., Heller, T.C., Pershing, J., Shukla, P.R., Tubiana, L., Tudela, F. and Wang, X., 2003. Beyond Kyoto, Advancing the international effort against climate change. Pew Center on Global Climate Change, Arlington, US.
Aslam, M.A., 2002. Equal per capita entitlements: a key to global participation on climate change? In: K.A. Baumert, O. Blanchard, Llose and J.F. Perkaus (Editors), Options for protecting the climate. WRI, Washington, pp. 175-201.
Baumert, K. A., Figueres, C. and Willems, S., 2003. Capacity Challenges and Future Commitments under the UNFCCC. In: D. Michel (Editor), Beyond Kyoto: Meeting the Long-Term Challenge of Global Climate Change, the Johns Hopkins University Center for Transatlantic relations, Transatlantic Dialogue on Climate Change., Washington DC.
Baumert, K., Blanchard, O. , Llose, S. and Perkaus, J., 2002. Building on the Kyoto Protocol: OpProtecting the Climate, World Resource Institute, Washington DC.
Berk, M.M. and den Elzen, M.G.J., 2001. Options for differentiation of future commitments in climate policy: how to realise timely participation to meet stringent climate goals? Climate Policy, 1(4): 465-480.
Bernardini O. and R. Galli, 1993. ‘Dematerialization: long-term trends in the intensity of use of materials and energy’, Future 25, 431-4
Energy Issues, 14
CSE, 1998. Definitions of equal entitlements. CSE-dossier, fact sheet 5, Centre for Science and Environment (CSE), Delhi, India.
den Elzen, M.G.J., 2002. Explgreenhouse gas concentrations. Integrated Ass
Eickhout, B.den Elzen, M.G.J., Berk, M.M., Lucas, P., regimes f728001023, RIVM, Bilthoven, the Netherlands (www.rivm.nl/ieweb).
den Elzen, M.G.J. and Lucas, P., 2003. FAIR 2.0: a decision-support model to assess the environmental and economic consequences of future climate regimes, www.rivm.nl/fair. RIVM-report 550015001, Bilthoven, the Netherlands.
den Elzen, M.G.J., Lucas, P. and van Vuuren, D., 2004. Abatement costs of post-Kyoto climate regimes. Energy Policy (in press).
den Elzen, M.G.J., Berk, M.M., Lucas, P., Criqui, P. and Kitous, A., 2004. Multi-Stage: a rule-based evolution of future commitments under the Climate Change Convention. International Environmental Agreements (in press).
European-Council, 1996. Communication on Community Strategy on Climate Change, Council Conclusions, European Commission, Brussels.
Depledge, J., 2000. Tracing the origins of the Kyoto Protocol: an article by article textual history, UNFCCC/TP/2000/2, UNFCCC, Bonn.
ECOFYS Options for the second commitment period
Eickhout, B., den Elzen, M.G.J. and van Vuuren, D.P., 2003. Multi-gas emission profiles for stabilising greenhouse gas concentrations. RIVM-report 728001026, Bilthoven, the Netherlands (www.rivm.nl/ieweb).
Groenenberg, H, 2002. Development and Convergence: a bottom-up analysis for the differentiation of future commitments under the Climate Convention. PhD Thesis, Utrecht University, Utrecht, the Netherlands.
Hare, William, 2003. Assessment of Knowledge on Impacts of Climate Change – Contribution to the Specification of Art. 2 of the UNFCCC, External Expertise for WBGU- Special Report "Climate Protection Strategies for the 21st Century: Kyoto and beyond", WBGU - German Advisory Council on Global Change, http://www.wbgu.de/wbgu_sn2003_ex01.pdf, Berlin: WBGU 2003, 104 S.
Höhne, N., Galleguillos, C., Blok, K., Harnisch, J. and Phylipsen, D., 2003. Evolution of commitments under the UNFCCC: Involving newly industrialized countries and developing countries. Research-report 20141255, UBA-FB 000412, ECOFYS Gmbh, Berlin.
Höhne, Niklas, Simone Ullrich, Dian Phylipsen, Kornelis Blok, 2004. " Options for the second
IMA -toB Netherlands.
Mey change. Schumacher B
Müller, c
NakicenD n Global Change, Berlin, Germany.
gy dynamics and climate stabilisation. OECD, Paris.
.G M ions sources and sinks. In: J. Berdowski, R. uic d System. A.A. Balkema Publishers/Swets &
nger Pu se, The Nethe 255 0, pp. 33-78.
sen, G.J.M ok, K., Merk nd Metz, B., 1998. A Triptych sectoral approach to den di emissions i an bubble. Energy Policy, 26(12): 929-943.
e, I. C., Farquhar, G., Fasham, M.J.R., Goulden, M.L., Heimann, M., Jaramillo, V.J., Kheshgi, H. S., Le Quere, C., Scholes, R. J. and Wallace, D.W.R., 2001. The Carbon Cycle and Atmospheric
n Dioxide. In: J.T. Houghton et al. (Editors), Climate Change 2001: The Scientific Basis. bridge University Press, Cambridge, UK, pp. 892.
ironmental & Resource Economics, 12(1): 25-51.
1992. United Nations General Assemby, United Nations Framework Convention on Climate C
UNFCCC mments by Parties. Notes by the Secretariat, d
van Vuuren, D.27 .
WBGU, 2003. Climate Protection Strategies for the 21st Century. Kyoto and Beyond. German Advisory Council on Global Change, Berlin.
commitment period of the Kyoto Protocol" Report for the German Environmental Protection Agency (forthcoming)
GE eam, 2001. The IMAGE 2.2 implementation of the SRES scenarios. A comprehensive analysis f emissions, climate change and impacts in the 21st century. CD-ROM publication 481508018, ilthoven, the
er, A., 2000. Contraction & Convergence. The global solution to climateriefings, 5. Green Books, Bristol, UK.
B., 1999. Justice in Global Warming Negotiations - How to achieve a procedurally fair ompromis, Osford Institute for Energy Studies, Oxford.
ovic, N. and Riahi, K., 2003. Model runs with MESSAGE in the Context of the Further evelopment of the Kyoto-Protocol, WBGU - German Advisory Council o
OECD/IEA, 2002. Beyond Kyoto, Ener
Olivier, JG
.J. and Berdowski, J.J. ., 2001. Global emissitors), The Climate herit and B.J. Heij (E
Zeitli blishers, Lis rlands. ISBN 90 5809
Phylip ., Bode, J.W., Bl us, H. abur fferentiation; GHG n the Europe
Prentic
CarboCam
Ringius, L., Torvanger, A. and Holtsmark, B., 1998. Can multi-criteria rules fairly distribute climate burdens? - OECD results from three burden sharing rules. Energy Policy, 26(10): 777-793.
Rose, A., Stevens, B., Edmonds, J. and Wise, M., 1998. International Equity and differentiation in Global Warming policy. Env
Torvanger, A. and Godal, O., 1999. A survey of differentiation methods for national greenhouse gasa reduction targets. CICERO Report 1999: 5, Center for International Climate and Environmental Research (CICERO), Oslo.
UNFCCC, hange, http://www.unfccc.int/resources, United Nations, New York.
, 1996. Implementation of the Berlin Mandate. Coocument AGBM/1996/Misc.1/.
P., den Elzen, M.G.J., Berk, M.M., Lucas, P., Eickhout, B., Eerens, H. and Oostenrijk, R, 003. Regional costs and benefits of alternative post-Kyoto climate regimes. RIVM-report 28001025, Bilthoven, the Netherlands
117
ECOFYS Options for the second commitment period
118
emission reduction potentials. The Triptych approach as such does
ns were distinguished: The p of energy-intensive industries and the ‘domestic’ sectors. The
iptych approach was developed, a number of different versions have enenberg et al. 2001; Groenenberg et al. 2002; RIVM, 2003 (FAIR 2.0);
tor
gas. It is further assumed that the power generation efficiencies (CO2 per kWh for each fuel) converge by a certain year. These requirements are the same for all countries. In addition, assumptions are made about the growth in electricity consumption for
8. TRIPTYCH VERSION 6.0
8.1 INTRODUCTION
The Triptych approach is a method to share emission allowances among a group of countries, taking into account main differences in national circumstances between countries that are relevant to emissions andnot define, which countries should participate. It was originally developed as an approach to share emission allowances for the first commitment period under the Kyoto Protocol within the European Union.
In the original Triptych approach, three broad categories of emissiopower sector, the grouselection of these categories was based on a number of differences in national circumstances raised in the negotiations: differences in standard of living, in fuel mix for the generation of electricity, in economic structure and the competitiveness of internationally-oriented industries. For each of the categories a reasonable amount of emission allowances is calculated by applying a defined set of rules to all countries. The allowances for each category are added up to a national target for each country. Only one national target per country is proposed, no sectoral targets, to allow countries the flexibility to pursue any cost-effective emission reduction strategy.
Since the original Trbeen developed (GroHöhne et al. 2003), that started to include more gases, more countries and more sectors. However, there are some methodological differences between the different versions.
On the basis of a review of existing Triptych methodologies, we developed a new version of the approach, version 6.0, which is described in Section 8.2. Parameter settings for two example stabilization scenarios are elaborated in Section 8.3, followed by conclusions in Section 8.4. A full description of the methodology and model can be found in the separate report called “Implementing Triptych 6.0 – technical report” (Phylipsen et al. 2004), that was prepared on behalf of RIVM.
8.2 DESCRIPTION
On the basis of a review of previously developed versions of the Triptych approach, we developed an updated version (version 6.0). All used input data has been generated as described in Appendix E.
The methodology can be described as follows.
Power secIn the power sector, CO2 emissions differ greatly from country to country due to large differences in the shares of nuclear power and renewables and in the fuel mix in fossil-fuel-fired power plants. The potential for renewable energy is different for each country, as is the case for the public acceptance of nuclear energy.
To calculate the emission allowance for the power sector of a country, we make assumptions about the future electricity generation. Similar to previous versions, requirements are set for the share of renewables and combined heat and power in total electricity production in a certain year, e.g. 30% in 2050. The shares of solid and liquid fossil fuels have to be reduced by a user-defined percentage from the current level. Electricity production from nuclear power is assumed to stay at the same level. The remaining electricity generation is assumed to be filled with natural
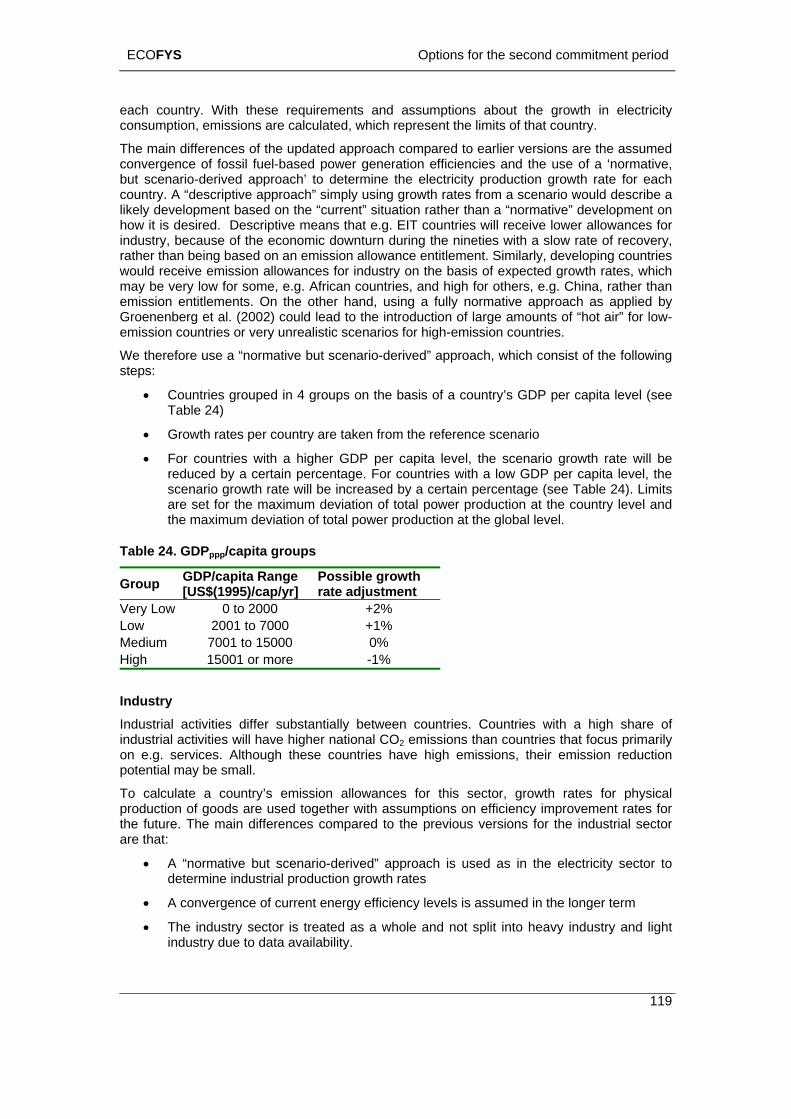
ECOFYS Options for the second commitment period
119
untry. With these requirements and assumptions about the growth in electricity
ach’ to determine the electricity production growth rate for each ountry. A “descriptive approach” simply using growth rates from a scenario would describe a kely development based on the “current” situation rather than a “normative” development on
for
ed growth rates, which ers, e.g. China, rather than
emi ioGroemi io n countries.
We r h consist of the following step
of a country’s GDP per capita level (see
• rio
el, the scenario growth rate will be reduced tage. For co a low GDP pe the
increased by a certai age (see Table 24). set fo d
p
Group GDP/c[US$(1 rate adjustment
each coconsumption, emissions are calculated, which represent the limits of that country.
The main differences of the updated approach compared to earlier versions are the assumed convergence of fossil fuel-based power generation efficiencies and the use of a ‘normative, but scenario-derived approclihow it is desired. Descriptive means that e.g. EIT countries will receive lower allowancesindustry, because of the economic downturn during the nineties with a slow rate of recovery, rather than being based on an emission allowance entitlement. Similarly, developing countries would receive emission allowances for industry on the basis of expectmay be very low for some, e.g. African countries, and high for oth
ss n entitlements. On the other hand, using a fully normative approach as applied by enenberg et al. (2002) could lead to the introduction of large amounts of “hot air” for low-
n countries ss or very unrealistic scenarios for high-emissio
the efore use a “normative but scenario-derived” approach, whics:
• Countries grouped in 4 groups on the basis Table 24)
Growth rates per country are taken from the reference scena
• For countries with a higher GDP per capita levby a certain percen
rate will be untries with
n percentr capita level,
Limits scenario growth arethe maximum
r the maximum deviation of total power production at the country level an deviation of total power production at the global level.
Table 24. GDPp p/capita groups
apita Range Possible growth 995)/cap/yr]
Very Low 0 to 2000 +2% Low 20
70High 15001 or more -1%
01 to 7000 +1% Medium 01 to 15000 0%
Industry Industrial activities differ substantially between countries. Countries with e of industrial activities will have higher national CO2 emissions than countries th
ervices. emissions, their emission reduction ay be
te a c for physical of goo ro
. The m dustrial sector are that:
• A “normative but scenario-derived” approach is used as in the electricity sector to
• A convergence of current energy efficiency levels is assumed in the longer term
• The industry sector is treated as a whole and not split into heavy industry and light industry due to data availability.
a high sharat focus primarily
on e.g. s Although these countries have high potential m
To calcula
small.
ountry’s emission allowances for this sector, growth rates productionthe future
ds are used together with assumptions on efficiency impain differences compared to the previous versions for the in
vement rates for
determine industrial production growth rates
ECOFYS Options for the second commitment period
120
orstic’ se ntial s to
d C re a HFC as a joint categ assum be more homogeneous in ission reductions can be achienational policies in this category are likelywith the number ellings, have a workplace, requtransportation services.
domthat emissions in ll co convergence of . num r of areduction in exist ficiency of devices.
uSome fossil fuel fugitive emissions from that . However, emission reductio as tighter gas pipelines, a reduction in venting or flaring of gas ethane. Due to this different expected future behaviour, emissi re treated as a separate sector. Emissions from the fossil fuel prod ossil fuel combustion emissions) are
cr l to a small percentage in a certain year (after 2020), afte at the same level (relative to the reference scenario).
gricultural secte non-energy-related emissions from the agricultural sector, which are
row cted or d missio
regions w will be reached in the s ond half of the century. Substan ction options are available at relatively moderate costs to decrease emissio ence scenario (Graus et al. 2004). Hence, emissions are assumed to be re ercentage below the reference scenario. Two groups of countries are di ies with higher GDP/cap have to reduce more than countries with a lo
Land use chang restry cording to the reference scenarios, the net effect of the land use change and forestry
of the century mostly an emission (deforestation), while in the second estratio t h
ric n tthe century, it i l a and the former rther deforestation and erica t Asia.
In the Triptych V anddecrease to zero by a user-specified year (e.g. 2050). This means that lardeforestation by that time. Large removals in the reference scenario after th d are also
unted for tified by the complication of sinduced emission estration, especially in the scentury, when pla d CO2 concentrations and
We have also im tion to exclude the land-use change and completely from the Triptych analysis. Emissions from this source are high certain and
ission estimates from various sources are often not consistent. It therefore has also been ggested to treat emissions from deforestation with a different instrument separate from
ns.
Domestic sectThe ‘domeenergy-relate
s ctors comprise the reside
Oector, the commercial sec r, transportation,
s, PFCs and SF2 emissions from agricultuory for a number of reasons.these sectors. Second, emand measures. Third, emissionsof people that live in dw
nd all emissions fromFirst, countries are
6ed to
ved by means of to be correlated ire and consume
To calculate the emission allowances for the the domestic sectors wi
estic sector in each countnverge to a globally equaber of cars, numbe
ry, it is assumed l level due to appliances) and a the standard of living (e.g
ing differences in energy ef
Fossil fuel prod ction producing countries have high n options are available, such or reduction of coal bed mons from fossil fuel production a
uction sector (excluding f
sector
assumed to de ease linearly from the current ler which emissions remain stable
or
ve
AThis sector includes thexpected to gthis century f
substantially. Substantial emiseveloping country regions and
sion increase is expea stabilization of e
in the first half of ns for developed
country hile for all countries stabilizatiotial emission redu
n ec
ns below the referduced by a certain p
stinguished: Countrwer GDP/cap.
e and foAcsector is in the first halfhalf of the centurthis sector is dom
y mostly a removal (sequinated by the emissions in Af
s dominated by the remova thus net emission is assumed
ersion 6.0, per capita emissions
n of carbon). In the firsa and South America. Iin Afric
alf of the century, he second half of USSR. Fu and South Easto occur in South Am
from land use change forestry have to ge emitters stop
at perionot acco in the model. This can be jus
s and natural emissions/sequeparating human econd half of the
nt growth is influenced by elevate
plemented the op
warmer climate.
forestry emission ly un
emsuother emissio
ECOFYS Options for the second commitment period
121
Emissions from w duction options exist (e.g. capture of methane from sions are treated as a Emissions from t ssumed to converge to a certain percertain convergen
The emission allo ories are added to obtain a national target.
mm ed iptych 6.0” apprequirements and that have to be chosen.
in differen
• The harmonised data set and clear data hierarchy based on the IPCC SRES scenarios
Table 25. Summary of the Triptych 6.0 methodology
Waste aste are substantial but many em landfills). Hence, these emis
he waste sector are ace year.
wances of the various categ
ission reseparate sector. capita level in a
Table 24 su arises the methodology us the exogenous parameters
for the “Tr roach, the data
The ma ces with the previous Triptych versions are:
• Calculation on the basis of 192 individual countries • The (possibility of) inclusion of the 6 Kyoto gases and sinks • Expansion to 2050 (and beyond) • Variable base year between 1990 and 2010 • The use of normative but scenario-derived growth rates for electricity demand and
industrial production based on GDP per capita levels
Sector Approach selected Data needs User choices General Target year 2000 to 2050 (2051 to 2100 are also calculated, but only for illustrative purposes)
Base year Any between 1990 and 2010 Base year Emission level in 2010
- Kyoto countries: same share of sectors in 2010 as in reference scenario, with an exception for transport - USA reaches its Kyoto target or its national target - Two options: 1) Countries reach the lower of the Kyoto target and the reference scenario 2) Countries reach the Kyoto targets
Gases CO2, CH4, N2O, HFCs (sum), PFCs (sum) and SF6 Choice for - CO2 only, 3 gases or 6 gases - including LUCF or not - including international transport or not
Countries Up to 192 (dependent on data availability) Base year emissions
Emissions in the base year are collected from various sources. The data available from the source highest in a hierarchy is be chosen (see Appendix E)
Reference scenario
6 IPCC scenarios (A1B, A1FI, A1T, A2, B1, B2). The choice of reference scenario is used consistently throughout the calculations, i.e all required scenario elements are taken from the same scenario.
Choice of scenario
Internationally Operating Energy-Intensive Industries
ECOFYS Options for the second commitment period
122
he growth rates used are
rates than provided in the
- Industrial production growth
derived from IMAGE
Choice of using the
rates. Maximum deviation of normative growth rate from scenario value
Growth rates of Tindustrial production
normative but are scenario derived. Countries with low GDP/cap are allowed higher growth
rates (used industrial value added, IVA) - per capita GDP, both
normative growth rates or the reference growth
scenario, countries with high GDP/cap are allowed lower growth rates than in the scenario.
Ene e
further improves over time. onvergence includes onisation of fuels
x
Groenenberg (2002)
- Convergence year and level - EEI levels after convergence year
rgy fficiency Energy efficiency index (EEI) Initial energy efficconverges and subsequently
iency indefor regions, taken from from
Such cdecarb
Sectoral change Industrial value added, IVA, grows faster than industrial production, caused by shift in economic structure to higher value added sectors over time. A structural change factor is applied to account for this
Structural change factor
Sectors/Gases “Energy: Manufacturing Industries
CH4 and N2O)
and Construction” plus “Industrial processes” as one sector (CO2,
Domestic Sectors Convergence Convergenc r
and level Linear convergence of per capita Population (UN 2002) emissions
e yea
Sectors emissions from in:
ure
CO2, CH4 and N2Oenergy use Transport Commercial Residential Agricult
All emissions from HFCs, PFCs and SF6
Power Sector Production grorates
he growth rates used are
ountries with low GDP/cap are tes than in
high
- Electricity demand, per
IMAGE - Current efficiencies / emission factors per fossil
m IEA 2002
- Choice of using the normative grates or the
nce g
tion wth
rate from scenario value
wth Tnormative but scenario derived. C
capita GDP, derived from
allowed higher growth rascenario, countries withGDP/cap are allowed lower growth fuel type, frorates than in scenario. See Section 3.3.
rowth
refere rowth rates.- Maximum deviaof normative gro
Method Shares or changes in shares of
electricity sources are defined. er generation Fossil fuel-based pow
efficiencies converge and further
t city s
after convergence year
improve over time
Shares of differenelectri ourcesConvergence levelEfficiency levels
Fossil Fuel Production
Reduce emissions by x% in target year
Target year, reduction percentage
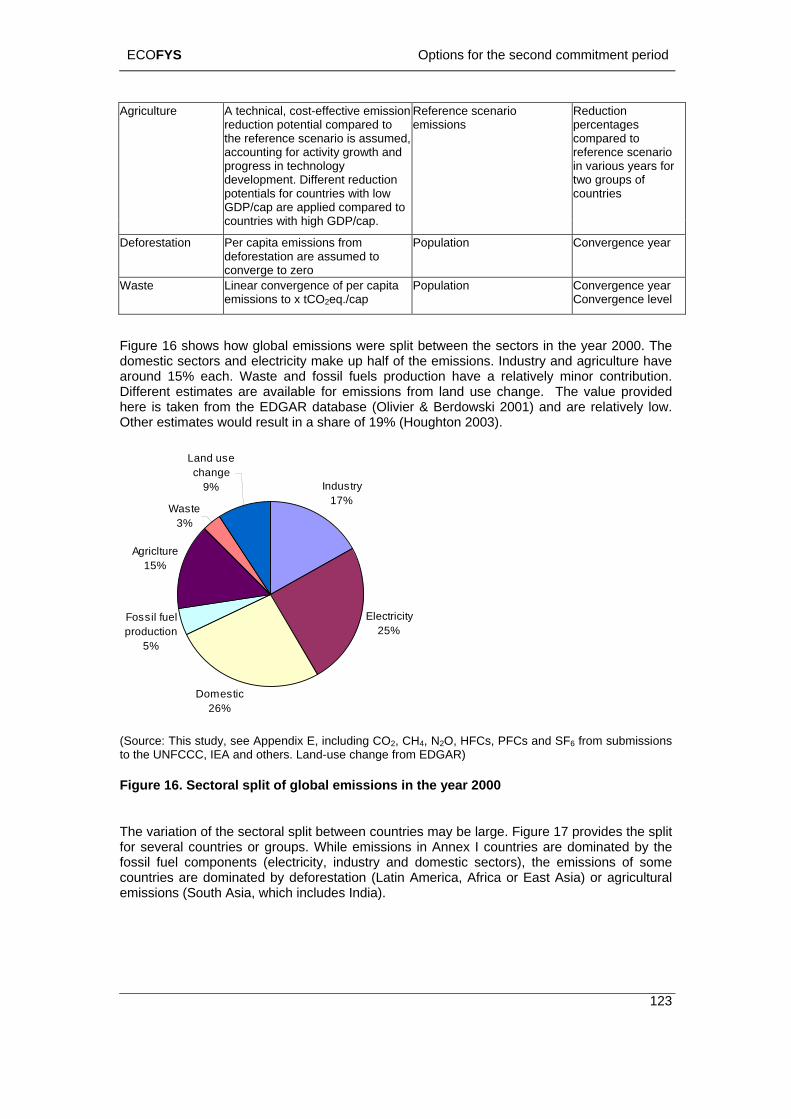
ECOFYS Options for the second commitment period
Agriculture A technical, cost-effective emission reduction potentithe reference sc
Reference scenario Reduction al compared to enario is assumed,
accounting for activity grprogress in technodevelopment. Diffe tipotentials for countries GDP/cap are applied c d to countries with high GD
emissions percentages compared to refere enari
of count
owth and logy rent reduc on
with lowompareP/cap.
nce sc o in various ytwo groups
ears for
ries
Deforestation Per capita emissions frodeforestation are assum
ge to zero
tion Conve e year m ed to
conver
Popula rgenc
Waste Linear convergence of peemissions to x tCO2eq./c
P tion Converg e year Conver e lev
r capita ap
opula encgenc el
Figure 16 shows how global emissions split een th ctors year . Thsectors and electricity make up f of th ission dust agriculture have
and fossil f produc have lative nor co utionstimates are available for em s fro nd us ange. The value provided
taken from the EDGAR databas livier w 01) re rela lowtimates would result in a share of 19% (Ho
were betw e se in the 2000 e domestic hal e em s. In ry and around 15% each. Waste uels tion a re ly mi ntrib . Different e ission m la e ch here is e (O & Berdo ski 20 and a tively . Other es ughton 2003).
Industry17%
123
Electricity5%
Domestic26%
hange9%
(Source: This study, see Appendix E, including CO2, CH4, N2O, HFCs, PFCs and SF6 from submissions to the UNFCCC, IEA and others. Land-use change from EDGAR)
The variation of the sectoral split between countries may be large. Figure 17 provides the split for several countries or groups. While emissions in Annex I countries are dominated by the fossil fuel components (electricity, industry and domestic sectors), the emissions of some countries are dominated by deforestation (Latin America, Africa or East Asia) or agricultural emissions (South Asia, which includes India).
Land use c
Waste3%
2Fossil fuel production
5%
Agriclture15%
Figure 16. Sectoral split of global emissions in the year 2000
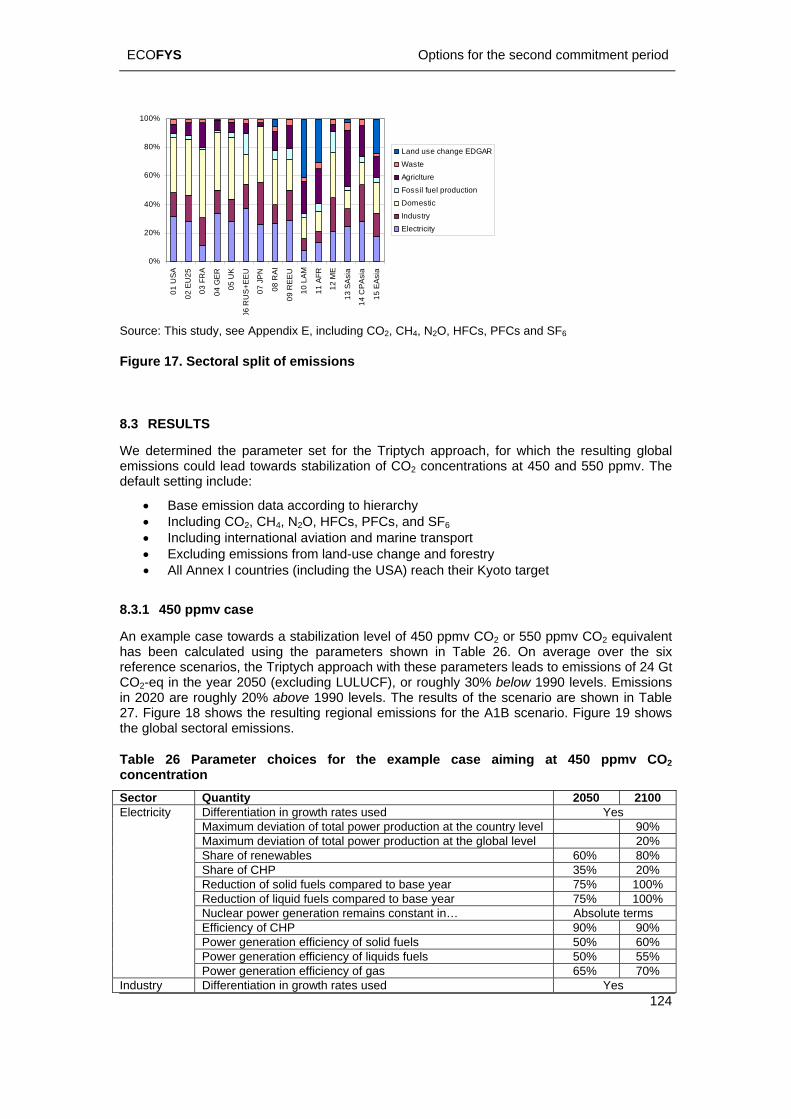
ECOFYS Options for the second commitment period
0%
20%
40%
60%
80%
100%
01 U
SA
02 E
U25
03 F
RA
04 G
ER
05 U
K
06 R
US+
EEU
07 J
PN
08 R
AI
09 R
EEU
10 L
AM
11 A
FR
12 M
E
13 S
Asia
14 C
PAsi
a
15 E
Asia
Land use change EDGARWasteAgricltureFossil fuel productionDomesticIndustryElectricity
Source: This study, see Appendix E, including CO2, CH4, N2O, HFCs, PFCs and SF6
Figure 17. Sectoral split of emissions
.3 RESULTS
ch, for which the resulting global d lead towards stabilization of CO2 concentrations at 450 and 550 ppmv. The
defa t
• •
e transport
8.3.1 4
An mhas bereferenc s to emissions of 24 Gt COin 202027. Figuthe glob
TabconcenSector 2050 2100
8
We determined the paemissions coul
rameter set for the Triptych approa
ul setting include:
Base emission data according to hierarchy Including CO2, CH4, N2O, HFCs, PFCs, and SF6
• Including international aviation and marin• Excluding emissions from land-use change and forestry • All Annex I countries (including the USA) reach their Kyoto target
50 ppmv case
exa ple case towards a stabilization level of 450 ppmv CO2 or 550 ppmv CO2 equivalent en calculated using the parameters shown in Table 26. On average over the six e scenarios, the Triptych approach with these parameters lead
2-eq in the year 2050 (excluding LULUCF), or roughly 30% below 1990 levels. Emissions are roughly 20% above 1990 levels. The results of the scenario are shown in Table re 18 shows the resulting regional emissions for the A1B scenario. Figure 19 shows al sectoral emissions.
le 26 Parameter choices for the example case aiming at 450 ppmv CO2 tration
Quantity
124
Differentiation in growth rates used Yes Maximum deviation of total power production at the country level 90% Maximum deviation of total power production at the global level 20% Share of renewables 60% 80% Share of CHP 35% 20% Reduction of solid fuels compared to base year 75% 100% Reduction of liquid fuels compared to base year 75% 100%
Electricity
Nuclear power generation remains constant in… Absolute terms Efficiency of CHP 90% 90% Power generation efficiency of solid fuels 50% 60% Power generation efficiency of liquids fuels 50% 55% Power generation efficiency of gas 65% 70%
Industry Differentiation in growth rates used Yes
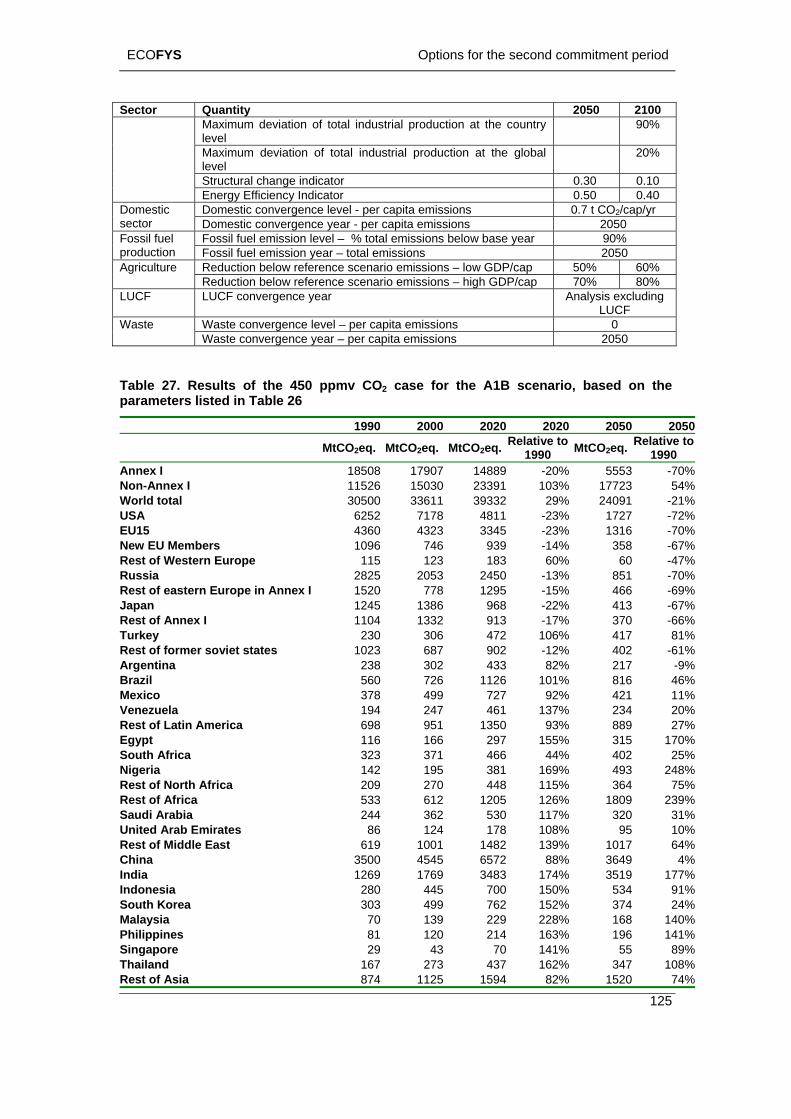
ECOFYS Options for the second commitment period
125
Sec tor Quantity 2050 2100 Maximum deviation of total industrial production at the country 90% level Maximum deviation of total industrial production at the global level
20%
Structural change indicator 0.30 0.10
Energy Efficiency Indicator 0.50 0.40 Domestic convergence level - per capita emissions 0.7 t CO2/cap/yr Domesti
sector ita emissions 2050 c
Domestic convergence year - per capFossil fuel emission level – % total emissions below base year 90% F
possil fuel roduction Fossil fuel emission year – total emissions 2050
Reduction below reference scenario emissions – low GDP/cap 50% 60% Agriculture ow reference scenario emissions – high GDP/cap 70% 80% Reduction bel
LUCF LUCF convergence year Analysis excluding LUCF
Waste convergence level – per capita emissions 0 Waste Waste convergence year – per capita emissions 2050
Table 27. Results of the 450 ppmv CO2 case for the A1B scenario, based on the parameters listed in Table 26
0 2020 2050 2050 1990 2000 202
MtCO2eq. MtCO2eq. MtCO2eq. Relative t1990
tive to 1990
o MtCO2eq. Rela
Annex I 555 -70%18508 17907 14889 -20% 3 Non-Annex I 11526 15030 23391 103% 17723 54%World total 29% 24091 -21%USA 6252 7178 4811 -23 172 -72%EU15 3345 -23 131 -70%New EU Memb 939 -14 358 -67%Rest of Weste 183 60Russia 2450 -13 -70%Rest of easter 1295 -15 466 -69%Japan 6 968 -22 413 -67%Rest of Annex 2 913 -17 370 -66%
306 472 106 81%orme -61%
rgentina 82% 217 -9%01% 816 46%
Mexico 92% 421 11%Venezuela 194 247 461 137 234 20%Rest of Latin A 698 951 1350 93 889 27%
297 155 170%Africa 466 44% 2 25%
% 3 248% 0 448 115% 4 75%
ca 126 180 239%Saudi Arabia 7 320 31%United Arab E 86 124 178 108% 95 10%
iddle 619 1001 1482 139 64%6572 88% 4%3483 174% 9 177%
Indonesia 700 150% 4 91%South Korea 303 499 762 152% 374 24%
ia %%
29 43 70 141% 55 89%Thailand 67 273 437 62% 347 108%Rest of Asia 74 1125 594 82% 0 74%
30500 33611 39332% 7
4360 4323ers 1096 746
% 6 %
rn Europe 2825 2053
115 123 % 60 -47%% 851
n Europe in Annex I 1520 778 %1245 138
133%
I 1104 %%Turkey
est of f230 41
407
R r soviet states 1023 687 902 -12%238 302 433
2 ABrazil 560 726 1126 1
378 499 727%
merica %Egypt South
116 166 % 315 323 371 40
Nigeria Rest of North
142 195 381 169 49Africa 209 27 36
Rest of Afri 533 612 1205 % 9 244 362 530 11
mirates %
Rest of M East % 1017 3649 China
India 3500 45451269 1769 351
53280 445
Malays 70 139 229 228% 168 140Philippines 81 120 214 163% 196 141Singapore
18
11 152
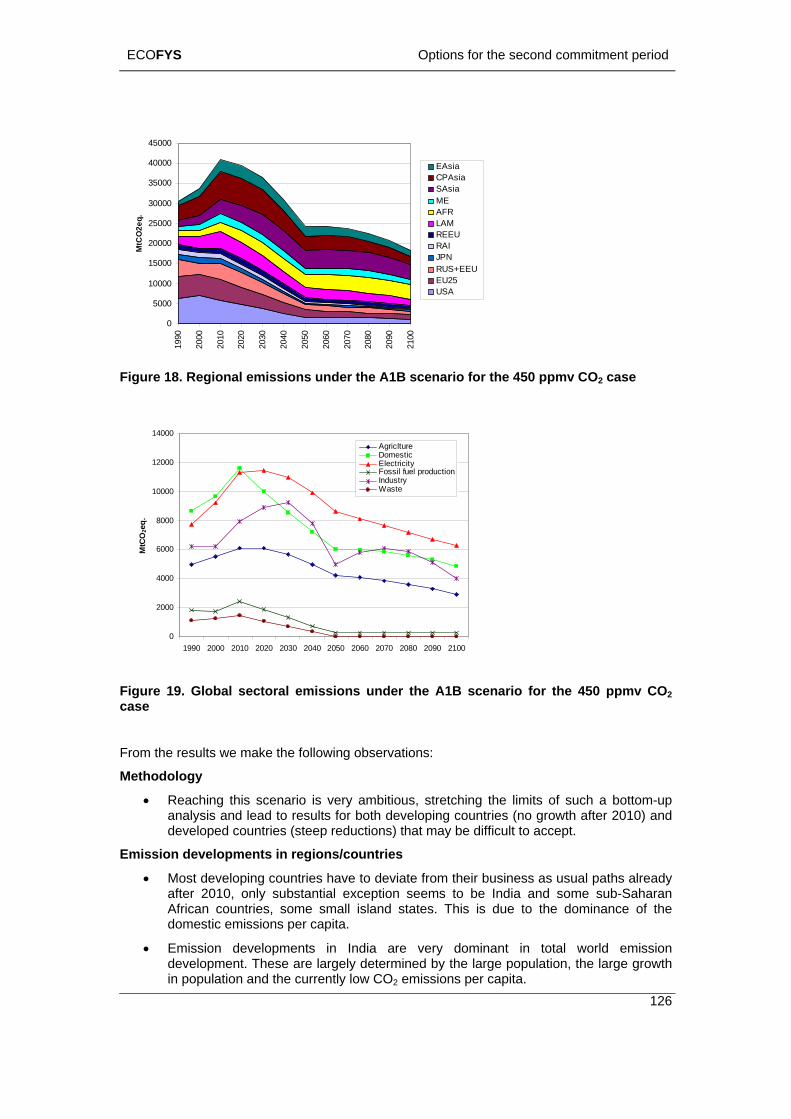
ECOFYS Options for the second commitment period
126
0
5000
0
0001 20
00
2010
2020
2030
2040
2050
2060
2070
2090
2100
10000
15000
2000
MtC
25000
O2e
30000
q.
35
40000
45000
990
2080
EAsiaCPAsiaSAsiaMEAFRLAMREEURAIJPNRUS+EEUEU25USA
Regional emissions under A1B s ario for the 450 ppmv CO2 case
Figure 18. the cen
0
2000
4000
6000Mt
8000
10000
12000
14000
0 2000 2010 2020 2030 2040 2050 2 70 20 2100199 060 20 80 2090
CO2e
q.
AgricltureDomesticElectricityFossil fuel tion producIndustryWaste
19 CO2
From the results we make the following observations:
Methodology
• Reaching this scenario is very ambitious, stretching the limits of such a bottom-up analysis and lead to results for both developing countries (no growth after 2010) and developed countries (steep reductions) that may be difficult to accept.
Emission developments in regions/countries
• Most developing countries have to deviate from their business as usual paths already after 2010, only substantial exception seems to be India and some sub-Saharan African countries, some small island states. This is due to the dominance of the domestic emissions per capita.
• Emission developments in India are very dominant in total world emission development. These are largely determined by the large population, the large growth in population and the currently low CO2 emissions per capita.
Figure . Global sectoral emissions under the A1B scenario for the 450 ppmvcase
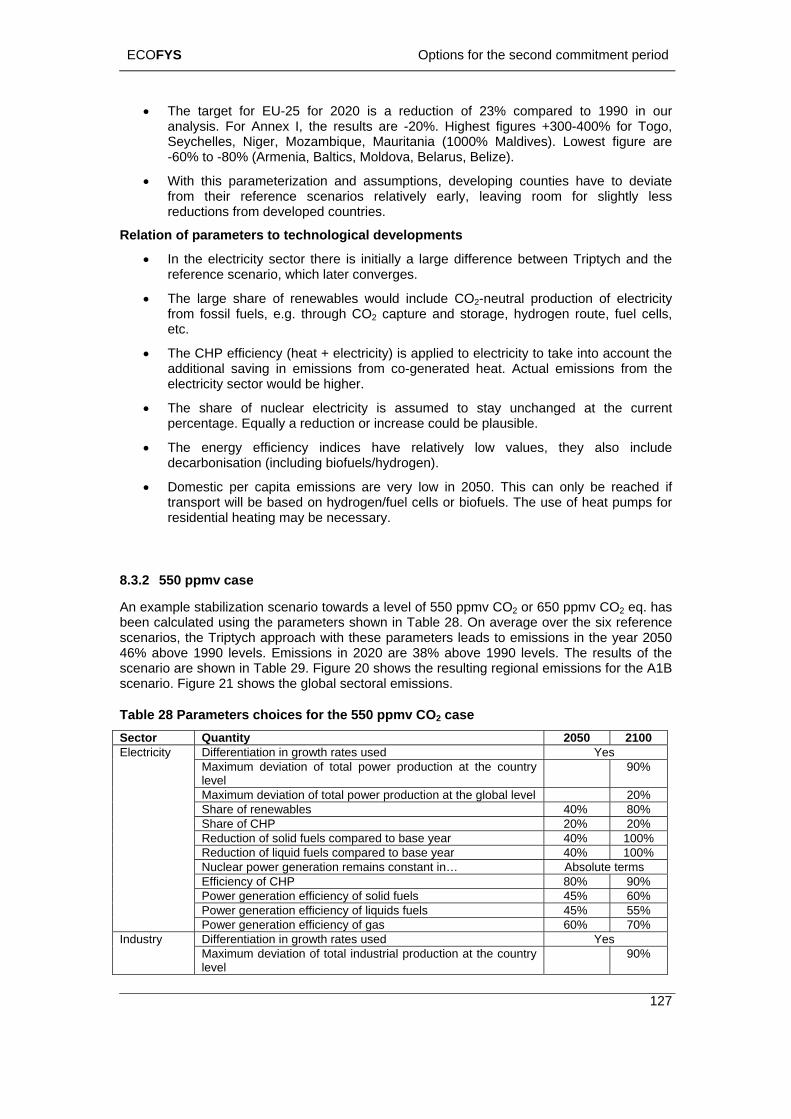
ECOFYS Options for the second commitment period
127
analysis. For Annex I, the results are -20%. Highest figures +300-400% for Togo, Seychelles, Niger, Mozambique, Mauritania (1000% Maldives). Lowest figure are -60% to -80% (Armenia, Baltics, Moldova, Belarus, Belize).
• With this parameterization and assumptions, developing counties have to deviate from their reference scenarios relatively early, leaving room for slightly less reductions from developed countries.
Relation of parameters to technological developments
• In the electricity sector there is initially a large difference between Triptych and the reference scenario, which later converges.
• The large share of renewables would include CO2-neutral production of electricity from fossil fuels, e.g. through CO2 capture and storage, hydrogen route, fuel cells, etc.
• The CHP efficiency (heat + electricity) is applied to electricity to take into account the additional saving in emissions from co-generated heat. Actual emissions from the electricity sector would be higher.
• The share of nuclear electricity is assumed to stay unchanged at the current percentage. Equally a reduction or increase could be plausible.
• The energy efficiency indices have relatively low values, they also include decarbonisation (including biofuels/hydrogen).
apita emissions are very low in 2050. This can only be reached if transport will be based on hydrogen/fuel cells or biofuels. The use of heat pumps for
0 shows the resulting regional emissions for the A1B
• The target for EU-25 for 2020 is a reduction of 23% compared to 1990 in our
• Domestic per c
residential heating may be necessary.
8.3.2 550 ppmv case
An example stabilization scenario towards a level of 550 ppmv CO2 or 650 ppmv CO2 eq. has been calculated using the parameters shown in Table 28. On average over the six reference scenarios, the Triptych approach with these parameters leads to emissions in the year 2050 46% above 1990 levels. Emissions in 2020 are 38% above 1990 levels. The results of the scenario are shown in Table 29. Figure 2scenario. Figure 21 shows the global sectoral emissions.
Table 28 Parameters choices for the 550 ppmv CO2 case Sector Quantity 2050 2100
Differentiation in growth rates used Yes Maximum deviation of total power production at the country level
90% Electricity
Maximum deviation of total power production at the global level 20% Share of renewables 40% 80% Share of CHP 20% 20% Reduction of solid fuels compared to base year 40% 100% Reduction of liquid fuels compared to base year 40% 100% Nuclear power generation remains constant in… Absolute terms Efficiency of CHP 80% 90% Power generation efficiency of solid fuels 45% 60% Power generation efficiency of liquids fuels 45% 55% Power generation efficiency of gas 60% 70% Differentiation in growth rates used Yes Industry
Maximum deviation of total industrial production at the country level
90%
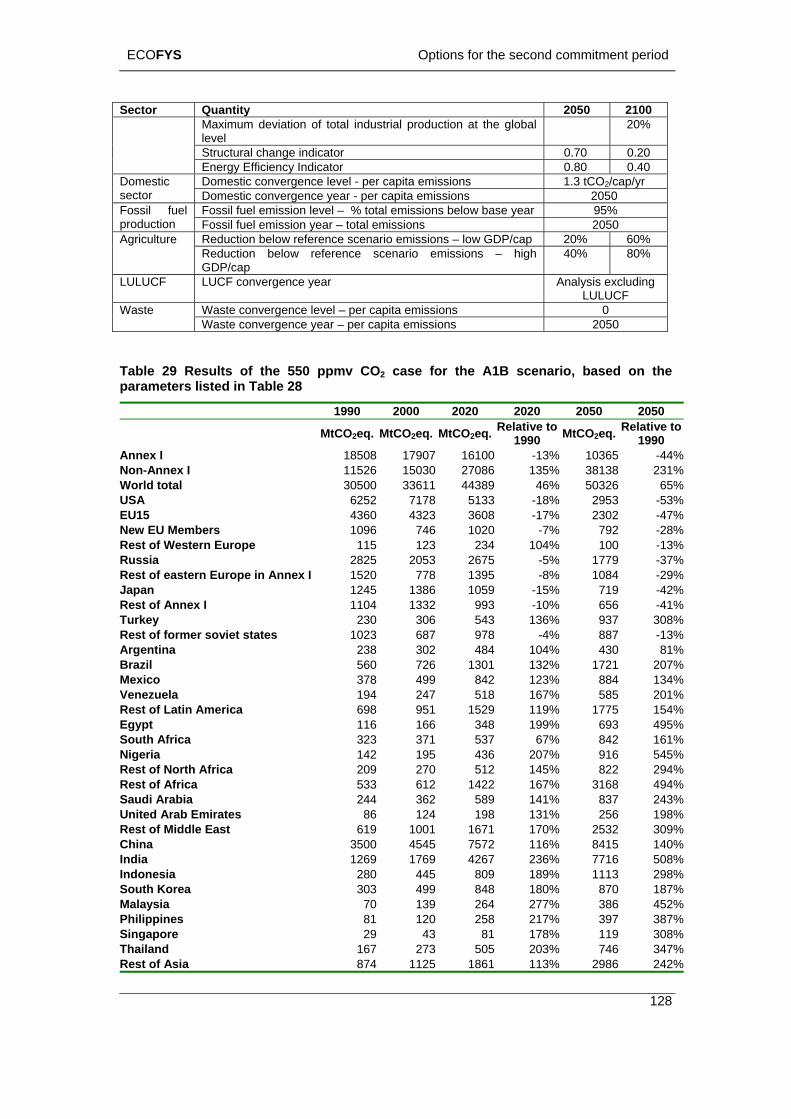
ECOFYS Options for the second commitment period
Sector Quantity 2050 2100 Maximum deviation of total industrial production at the global level
20%
Structural change indicator 0.70 0.20
Energy Efficiency Indicator 0.80 0.40 Domestic convergence level - per capita emissions 1.3 tCO2/cap/yr Domestic
sector Domestic convergence year - per capita emissions 2050 Fossil fuel emission level – % total emissions below base year 95% Fossil fuel
production Fossil fuel emission year – total emissions 2050 Reduction below reference scenario emissions – low GDP/cap 20% 60% Agriculture Reduction below reference scenario emissions – high GDP/cap
40% 80%
LULUC onvergence year Analysis excluding LULUCF
F LUCF c
Waste convergence level – per capita emissions 0 Waste Waste convergence year – per capita emissions 2050
Tableparam in Table 28
29 Results of the 550 ppmv CO2 case for the A1B scenario, based on the eters listed
1990 2000 2020 2020 2050 2050
MtCO2eq. MtCO2eq. MtCO2eq Relative to Relative to. 1990 MtCO2eq. 1990
Annex I 18508 17907 16100 -13% 10365 -44%nnex I 11526 15030 27086 13Non-A 5% 38138 231%
EU15 New E 746 1020 -7% 792 -28%
Rest oJapanRest of 656 -41%
Rest oArgen 104% 430 81%
Mexico 884 134%Venezuela 194 247 518 167% 585 201%Rest of Latin America 698 951 1529 119% 1775 154%Egypt 116 166 348 199% 693 495%
NigeriRest o
Saudi United es 86 124 198 131% 256 198%
India 1269 1769 4267 236% 7716 508%
SouthMalaysPhilipp 397 387%
ThailaRest o 6 242%
World total 30500 33611 44389 46% 50326 65%USA 6252 7178 5133 -18% 2953 -53%
4360 4323 3608 -17% 2302 -47%U Members 1096
Rest of Western Europe 115 123 234 104% 100 -13%Russia 2825 2053 2675 -5% 1779 -37%
f eastern Europe in Annex I 1520 778 1395 -8% 1084 -29% 1245 1386 1059 -15% 719 -42%
Annex I 1104 1332 993 -10%Turkey 230 306 543 136% 937 308%
f former soviet states 1023 687 978 -4% 887 -13%tina 238 302 484
Brazil 560 726 1301 132% 1721 207% 378 499 842 123%
South Africa 323 371 537 67% 842 161%a 142 195 436 207% 916 545%f North Africa 209 270 512 145% 822 294%
Rest of Africa 533 612 1422 167% 3168 494%Arabia 244 362 589 141% 837 243% Arab Emirat
Rest of Middle East 619 1001 1671 170% 2532 309%China 3500 4545 7572 116% 8415 140%
Indonesia 280 445 809 189% 1113 298% Korea 303 499 848 180% 870 187%ia 70 139 264 277% 386 452%ines 81 120 258 217%
Singapore 29 43 81 178% 119 308%nd 167 273 505 203% 746 347%f Asia 874 1125 1861 113% 298
128
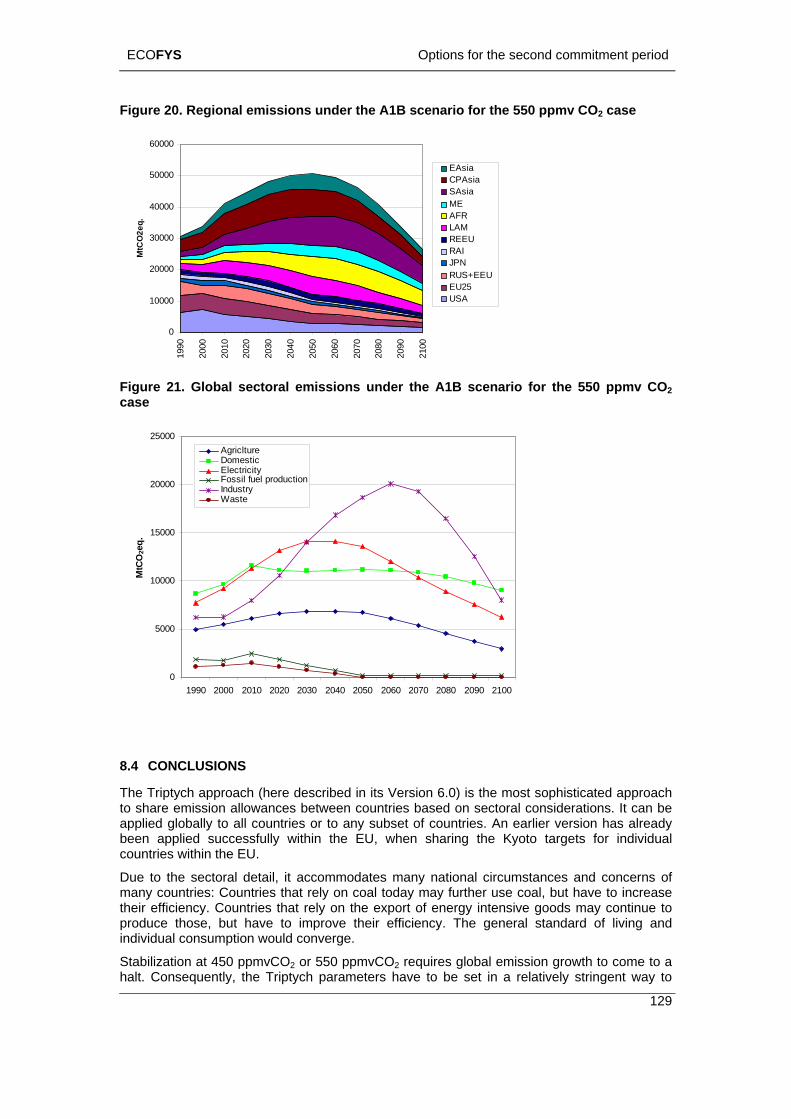
ECOFYS Options for the second commitment period
129
Figure 20. Regional emissions under the A1B scenario for the 550 ppmv CO2 case
60000
EAsiaCPAsiaSAsiaMEAFR
0
10000
20000
30000
MtC
O
40000
50000
2eq. LAM
REEURAIJPNRUS+EEUEU25USA
1990
2000
2010
2020
2030
2040
2050
2060
2070
2080
2090
2100
Figure 21. Global sectoral emissions under the A1B scenario for the 550 ppmv CO2 case
25000AgricltureDomesticElectricityFossil fuel productionInd20000
15000
10000MtC
O2e
q.
0
5000
1990 2000 2010 2020 2030 2040 2050 2060 2070 2080 2090 2100
ustryWaste
8.4
Thto apbecou
Du y national circumstances and concerns of many co ay further use coal, but have to increase their efficiency. Countries that rely on the export of energy intensive goods may continue to produce those, but have to improve their efficiency. The general standard of living and individual consumption would converge.
Stabilization at 450 ppmvCO2 or 550 ppmvCO2 requires global emission growth to come to a halt. Consequently, the Triptych parameters have to be set in a relatively stringent way to
CONCLUSIONS
e Triptych approach (here described in its Version 6.0) is the most sophisticated approach share emission allowances between countries based on sectoral considerations. It can be plied globally to all countries or to any subset of countries. An earlier version has already en applied successfully within the EU, when sharing the Kyoto targets for individual ntries within the EU.
e to the sectoral detail, it accommodates manuntries: Countries that rely on coal today m
ECOFYS Options for the second commitment period
130
lea requirintens s such as in Central and Eastern Europe and the Russian Federation. In contrast, mo y
The Tcircumin devnegot
On thmany perce ections of production growth rates for heavy indbe diff
In shaaccomemissother belongs to the more sophisticated methods. The expcomplin thewithin a grou
8.5
Blo Burden differentiation of CO2 s, Initial discussion paper prepared for
Fai
Gra
Gro m up analysis for the differentiation of
Incl
He er and Heat production: plant
Ho
Höhne N., Harnisch J., Phylipsen D., Blok K., Galleguillos C., (2003). Evolution of commitments under the UNFCCC: involving newly industrialized economies and developing countries, 106 pp. Research Report 201 41 255, UBA-FB 000412, German Federal Environmental Agency, Berlin, Germany, available at http://www.umweltbundesamt.org/fpdf-l/2246.pdf
IMAGE-team (2001). The IMAGE 2.2 implementation of the SRES scenarios. A comprehensive analysis of emissions, climate change and impacts in the 21st cen-tury. Bilthoven, the Netherlands, available at http://arch.rivm.nl/ieweb/ieweb/index.html
International Energy Agency 2002. CO2 Emissions from Fuel Combustion (2002 edition), CD version . OECD/IEA, Paris. Available online at: http://data.iea.org/ieastore/co2_main.asp.
ve room for production growth. Applying this approach leads to substantial reduction ements for the industrialised countries, in particular those countries with carbon ive industrie
substantial emission increases are allowed for most developing countries, however, stl below their reference scenarios.
riptych has several strengths: It is able to consider and accommodate national stances. It explicitly allows for incorporating economic growth and improving efficiency eloping countries. It has been successfully applied (on EU level) as a basis for
iating targets.
e other hand weaknesses exist: The approach in itself is rather complex and requires separate decisions, requires much data on a sectoral level and may therefore be
ived as not transparent. In addition, projustry and electricity are required. An agreement on all these issues on a global level may
icult.
ring emission allowances, there is a general conflict of being simple and not able to modate many national circumstances and concerns (e.g. converging per capita
ions) on the one hand and being sophisticated and able to accommodate them on the hand. The Triptych approach clearly
erience with sharing the EU Kyoto target among member states EU has shown, that also ex solutions can be the basis for an agreement. Hence the Triptych approach can also future provide the basis for the sharing of emission allowances between countries
p (see also Chapter 9).
REFERENCES
k, K., G.J.M. Phylipsen, J.W. Bode, 1997. The triptych approach -emission reduction among European Union member statethe informal workshop for the European Union Ad Hoc Group on Climate, University Utrecht, January 1997.
r 2.0 model 2004, available at http://www.rivm.nl/fair/
us, W., M. Harmelink, C. Hendriks 2004, Marginal GHG-abatement curves for agriculture, for RIVM, by Ecofys, Utrecht, The Netherlands
enenberg. H., 2002, Development and Convergence – A bottofuture commitments under the Climate Convention, PhD thesis, University of Utrecht, ISBN 90-393-3189-8
uding: Groenenberg, H., D. Phylipsen, K. Blok, 2001, ‘Differentiating commitments world wide: global differentiation of GHG emissions reductions based on the Triptych approach-a preliminary assessment’, Energy Policy, vol.29, issue12, pp 1007-1030
ndriks, C., M. Harmelink, K.Burges and K. Ramsel, 2004, Powdevelopments and grid losses, Ecofys, Utrecht, commissioned by RIVM
ughton, R.A. 2003. “Emissions (and Sinks) of Carbon from Land-Use Change.” (Estimates of national sources and sinks of carbon resulting from changes in land use, 1950 to 2000). Report to the World Resources Institute from the Woods Hole Research Center. Available at: http://cait.wri.org.
ECOFYS Options for the second commitment period
131
J. Alcamo, et al. (2000). Special Report on emissions scenarios. Cambridge, UK,
OlivHeij, eds. The Climate System: 33-77. Lisse: Swets & Zeitlinger Publishers.
Ph
Ph
US
ic and Social Affairs of the United Nations Secretariat,
Nakicenovic, N., Cambridge University Press.
ier, J.G.J. and Berdowski, J.J.M., 2001, Global emission sources and sinks. In: J. Berdowski, R. Guicherit and B.J. Available at: http://arch.rivm.nl/env/int/coredata/edgar/.
ylipsen, D., 2000, International Comparisons & National Commitments; analysing energy and technology differences in the climate debate, PhD thesis, Utrecht University, Utrecht, The Netherlands
ylipsen, D., N. Höhne, R. Janzic, 2004. Implementing Triptych 6.0 – technical report, Ecofys, Utrecht, The Netherlands.
Environmental Protection Agency 2002. International Analysis of Methane and Nitrous Oxide Abatement Opportunities: Report to Energy Modeling Forum, Working Group 21. Appendix A; Draft Emissions and Projections of Non-CO2 Greenhouse Gases for Developing Countries: 1990-2020. Available online at: http://www.epa.gov/ghginfo/reports/index.htm
Population Division of the Department of Econom2002. World Population Prospects: The 2000 Revision. Dataset on CD-ROM. New York: United Nations. As downloaded at downloaded from earthtrend.wri.org on 15 January 2004
ECOFYS Options for the second commitment period
132
that this overall concept could be a possible way forward in the multilateral inte t
Basical can be distinguished:
On the derivedDifferenrelevan t of view but are not able to consider, for example, differen
On the multista ce approach (Sijm et aalso incdiversesecond
The comin secticonclus
17
nt th
Absolute reduction targets: Stabilization of greenhouse gas concentration requires substantial emission reductions in developed countries in the short term. Reductions can best be achieved and monitored with quantitative emission reduction targets. Absolute emission reduction targets could be supplemented, if necessary, with additional rules aimed at providing flexibility, such as price caps or indexing to GDP.
The multistage setting would include 4 stages:
9. A COMPROMISE PROPOSAL With the insight from the previous chapters, we develop in this section an overall concept that combines many elements of the approaches discussed. This proposal aims to satisfy most demands and concerns, while still being able to meet the anticipated environmental goal. We believe
rna ional climate policy.
ly two types of approaches
one hand there are the rather simple approaches based on a simple set of rules from one basic principle. Contraction & Convergence and also the Common but tiated Convergence Approach would be examples. These frameworks are very t from the conceptual poinces in national circumstances.
other hand there are complex settings with detailed rules and exceptions such as the ge approach (Den Elzen et al. 2003) or the multi-sector convergen
l. 2001) or the proposal of the South North Dialogue (Ott et al. 2004). These proposals lude the simple elements but are designed to be realistic and to accommodate the
national circumstances. The compromise proposal described in this chapter is of that kind.
promise proposal is first described (9.1). We then quantify the emission allowances on 9.2. After a discussion of the assessment criteria of chapter 3 (9.3), we draw ions (9.4).
9.1 DESCRIPTION
The compromise proposal consists of four parts: 1. Multistage agreement on emission reductions
It seems likely that the international climate regime will continue to be designed in sequential steps. Although the emission reduction scheme “contraction and convergence” is very attractive from a conceptual point of view, it seems unlikely that the international community will make decisions on an overall architecture that will be valid for the next 50 years to come. Therefore, sequential decision-making will ultimately lead to a sequential system. In addition, countries’ capabilities and responsibilities are so differe at a single formula is politically not realistic. Thus differentiation will have to be included in a flexible way, also with regard to timing: a multistage setting is necessary.
Differentiating types of targets: The diverse needs and expectations by all countries can only be satisfied by allowing several forms of targets aimed at reducing greenhouse gas emissions, including those that provide quantitative limits on emissions, as well as those that are formulated in terms of action or policies.
17 Various multistage proposals and proposals for differentiation between countries have been proposed before: e.g. Gupta 1998, 2003, den Elzen et al. 2003, Höhne et al. 2003, Michaelowa et al. 2003, Criqui et al. 2003, Ott et al. 2004
ECOFYS Options for the second commitment period
133
tleast all least developed countries (LDCs) would be in this
stage.
• Stage 2 - Enhanced sustainable deve ne e, c s commit in a cle y to sustai le d me en en ctiv e bu
ment poli Re ents for suc ustainable pa could be t in t equipment is hased and r irem d c n
standards are met fo ew equipment or a clear deviation from th t policies c s. T implementation uch ina lo t m d and verified. The additional costs could b e by the y count .g. ficial de elopm d supplement e ds.
era lute target: Countries commit to a moderate target for ons. missi level may be in asing, but shoul below a
usual scena o. The target could also be positively binding, meaning that sold, if the target is exceeded, but wan es have to be bought, achi d. An ntive t ccept targe uld b poss ity
in emissions trading.
lute reduction Countries in stage 4 have to reduce absolute ntiall ntil a low per- lev eac s t ogr
and more countries enter stage 4. rough se s s de re e. ir le ita. S e “fo s d tter” (they b fro hno l
chnology development and implementation: In addition to immediate emission reductions, the development and implementation of
icreement described above may not
u p ch
commitments, countries will be given
• S age 1- No commitments: Countries with low level of development do not have climate commitments. At
lopment:nt. The
At thevironm
h a s
xt stagtal obje
ountriees arthway
ar wathe develop
nabcies.
evelopquirem
ilt into
defined, e.g., tha efficien p out equ ents ane n
ertair any nountrie
curreble deve
e borndepending on the he of s susta pmenpathway has to becountry itself or b
onitoreother ries, e of v ent ai ed by
additional climate r lated fun
b• Stage 3 - Modabsolute emissi
te a so The e
rion cre d be
business asallowances can beif the target is not to participate
no allosuch
ct woeve ince o a e the ibil
• Stage 4 - Absoemissions substamore
: y u capita el is r hed. A ime pr esses,
Countries move themissions per cap
theinc
tages ballower
ed ono be
fined th sholds,enefit
g. them tec
vel oflogica
developments of others), the threshold for entering the last group decreases with time (as under “Common but differentiated convergence”, Chapter 7).
2. New te
those appropriate technologies has to be stimulated, wh h can reduce emissions substantially in the long term. The emission reduction agbe s fficient to rovide this te nology “push”. Hence, countries need to commit to develop and to implement new greenhouse gas mitigation technologies, in a clearer sense as already with the Convention and the Kyoto Protocol.
Such commitments must be defined clearly as measurable and verifiable goals. An example could be to express them in terms of the amount of a dedicated research budget or financial support provided for the implementation of the new technologies. In addition, countries could promise an amount of innovation that is equivalent to a certain amount of emission reductions in e.g. 2050. A respective roadmap should include quantitative estimates, timetables and mechanisms to monitor progress.18
When negotiating the absolute emission reduction the opportunity to make a commitment to technology development and its implementation and diffusion. They can expect a relaxation of their absolute emission reduction commitments in return. Of course, the verifiability of the technology commitment is crucial as not to create a loophole for being exempt from emission reactions.
18 A new idea could be, for example, to assist with the implementation of a feed-in law: A developed country could assist a developing country to implement a feed-in law for renewable electricity, where a fixed price is paid for each kWh from renewable sources fed into the grid. The additional resources to pay the slightly elevated prices for the feed-in tariff will be added to the developed country general electricity price or might shared between developing and developed country electricity price. For the developed country, this would be a commitment for action that could be at the same time favourable for its exporting renewables industry. In addition, it supports the transfer of technologies to developing countries.
ECOFYS Options for the second commitment period
134
3. Adaptation
Adaptation covers a broad range of considerations from narrowly defined immediate measures against expected changes in climate via strengthening adaptive capacity (i.e.
damage r a to r a la e UN C r me, w e dap p
ough t avai le fu . In ition, a clea mm ent eve ies could be voiced upp da tion vitie utside of the UNFCCC.
tional emission reduction e rts su as m imum mpe ure ease 2°C ill on e
nsidera effo are ade on many levels to reduce emissio in ustrialized countries a o ke emi s low in developing countries. T emi
agreement desc ed a e ne s to be supported b ther ivitie
f like-mi d c ntries on sustai elo ent me In on redu ments, groups of interes cou s a indu s
ged to jointl ke acti s ctors or technolog that are relevant for both, sustaina opment (esp ally in Non-Annex I countrie and the
bal emissi nhouse ga s. One exa e is the Joh sbCoaliti where like-minded coun es sup
ewable energy. Similar d be sta rea s: Improvement of ind strial h modern te nology (e.g. i on
nd steel, cement) n of natural-gas CHP for g ration, fuel switch or efficiency
improvements Introduction of clean and efficient cars Use of energy-efficient ap ce
deforestation: iss he b phe different to tho relat
• The anthropogenic part of forestry emissions (deforestation) and removal (newly planted vegetation) is very small compared to the natural turnover of CO2 in the atmosphere, making it difficult to separate the human induced part from the natural part.
• Quantification of forestry emissions and removal is uncertain. Still, within the bands of uncertainty, the emissions and removals from forestry may be potentially higher compared to fossil fuels emissions (one quarter to one third of emissions of global CO2 emissions today)
• Forestry can also remove CO2 from the atmosphere (negative emission). These removals are however not permanent, but can be reversed, by e.g. harvesting the forest.
The multistage agreement on emission reductions described above may or may not include emissions from land-use change and forestry. In any case, separate action on avoiding and limiting deforestation has to be undertaken. This could be of the form agreeing to keep deforestation at current levels in 2020 or to decrease the deforestation rate (emissions) by e.g. 10%.
In addition, the agreement must include substantial activities on adaptation (see also chapter 6).
development) to damage repair and compensation. Many of these issues are broader than what the UNFCCC regime could cover. Mainstreaming adaptation into development and disaster relief seem to be feasible options, but they best will be implemented outside of the UNFCCC regime.
The issue of and th
epair nd res ration is clea ly a m tter re ted to climat change e UNFCCC. Within
be implemented thrthe FCC egi narro ly defin d a tation rojects could he lab nds add r co itm of d loped
countr to s ort a pta acti s o
4. Addi ffoReaching stabilization targets, ch ax te rat incr of , w ly bpossible, if all co ble rts m ns ind nd t ep ssion he ssionreduction rib bov ed y o act s:
Agreements o emissi
nde ou nable dev pm the s: addition to
uraction commit ted ntrie nd strie
are enco y ta up on on theme , se iesble develon of g
eci s) limitation of glo
newable Energy ree se mpl anne urg
Ren
on (JREC), tri port the theme of re activities coul rted in other a s, such a
• u energy efficiency throug ch raApplicatio• fired power ene
• • plian s
Stopping Em ions from t ios re are se ed to energy and industry for three reasons.
ECOFYS Options for the second commitment period
135
9.2 QUANTIFICATION OF EMISSION ALLOWANCES
In this section we present the quantification of emission allowances according to this proposal. We have only implemented the multistage agreement on emission reductions of the compromise proposal in the model for quantification of emissions allowances (EVOC). The effects of the other parts could not be quantified. We have implemented the four stages as follows:
• All countries in the first stage follow their reference scenario, as no emission reductions are required.
• All countries in stage 2 (Enhanced sustainable development) reduce emissions a percentage below their reference scenario within 10 years (a very simple representation). Countries will move into this stage, if their per capita emissions are higher than a certain level.
• All countries in stage 3 (Moderate absolute target) reduce emissions by a percentage further below their reference scenario within 10 years. Countries will move into this st
to reduce absolute emissions by a given percentage per year. Those countries with higher emissions per capita reduce more compared to those with lower emissions per capita. The sensitivity to other o
urther reduce (stage 5), once they reach a ow of ap is
year step, it is asse d, w her a untry should ove nex age. havn, that vem into ge 4 only ble ter a ntry has bee
de in stage 3. This to a the hat a velo g costage 1 directly to stage 4. Hence, all current Non- ex I untrie will b t ma um
in 2020 and in stage 4 in 203
(threshold and reductio vels) are se wa o th esult glob0, 450 a 550 v C con tratio n the long term (se apt
0 shows the para ters t are ed fo e di ent s rio or e of th scenarios, we have chosen the rame s to m t the quire miss leve
r 400, 450 and 55 2. In of th cas emis ns in 2020 wediately required. We therefore epared addi al c s with slightly
ntil 20, w re th ission levels in 2020 are met.
rees freed wh e g th aram rs. same globn be reached by choo low participation thresho and relaxe
ions for the participating count or e ally hoo high partic ion t oldambitious reductions the rticip s e bala g th
s, but other parameter sets uld a be applied.
age, if their per capita emissions are higher than a certain level.
• All countries in stage 4 (Absolute reduction) need
ptions such as the Triptych approach for the countries in this stage is assessed. Countries with per capita emissions above a threshold will enter this stage. This threshold is decreasing from 2010 to 2100. Countries do not f
very l level per c ita em sions.
Each 10 sse het co m to a t st We e introduced the conditio mo ent sta is possi af cou n one deca is void situation t de pin untry jumps from
Ann co s e a xim in stage 3 0.
The free parametersemissions aim at 40
n le t in a y s at r ing al nd ppm O2
uscen n i e Ch er
10). Table 3six reference
me tha r th ffer cena s. F ach e pa ter ee re d e ion ls
in the long term fobe lower than imm
0 ppmv CO all ose es sio ill pr tion ase
relaxed parameters only u 20 he e em
There are several deg of om en sel ctin e p ete The al emission level ca sing lds d reduct ries qu by c sing ipat hresh s and for pa ating countrie . W aimed at ncin e parameter co lso
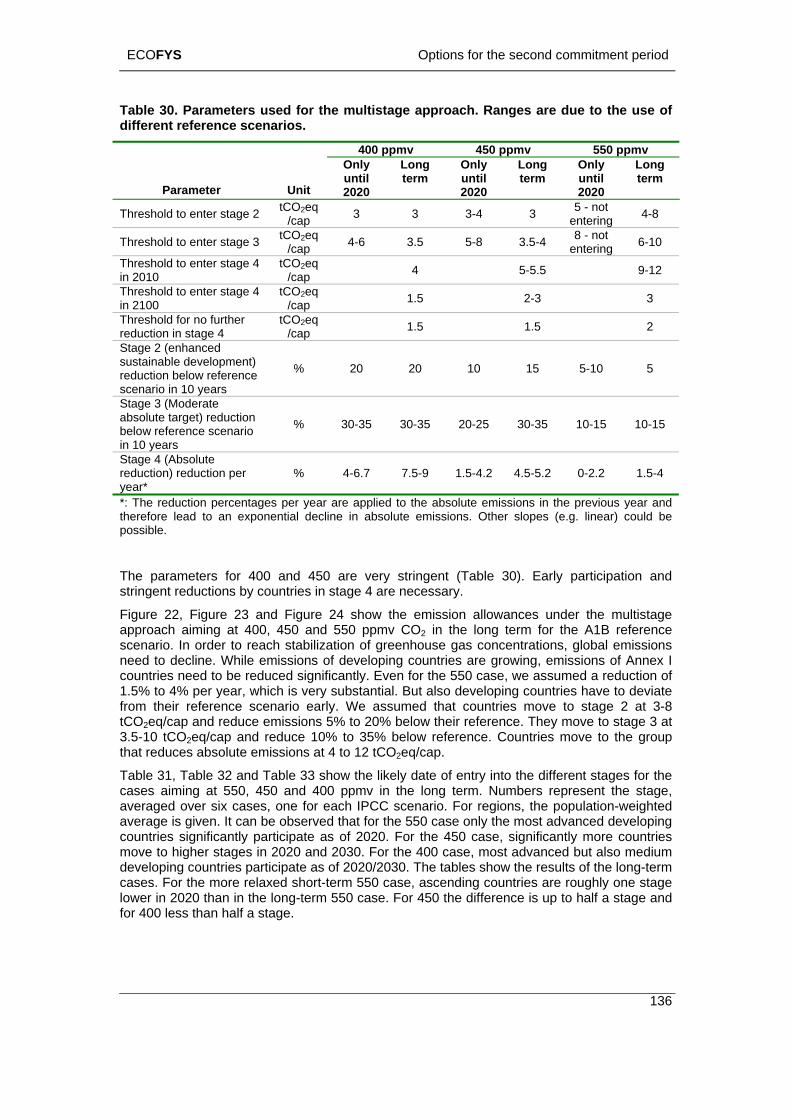
ECOFYS Options for the second commitment period
Table 30. Parameters used for the multistage approach. Ranges are due to the use of different reference scenarios.
136
400 ppmv 450 ppmv 550 ppmv
Parameter Unit until 2020
term until 2020
term until 2020
term Only Long Only Long Only Long
Threshold to enter stage 2 tCO2eq/cap 3 3 3-4 3 5 - not
entering 4-8
Threshold to enter stage 3 t/c 3.5 no
ring 6-CO2eqap 4-6 5-8 3.5-4 8 - t
ente 10
Threshold to enter stage 4 tCO/c 4 5 9-12 in 2010
2eqap -5.5
Threshold to enter stage 4 tCO/c 1.5 3 in 2100
2eqap 2-3
Threshold freduction in
or no further tCO/c 1.5 2 stage 4
2ap
eq 1.5
Stage 2 (enhanced sustainable development)
w reference in 10 years
% 5 reduction beloscenario
20 20 10 15 5-10
Stage 3 (Moderate ) reduabsolute target
cction
e scenario % 5 0-35 20-2 3 -15 10-15below referenin 10 years
30-3 3 5 0-35 10
Stage 4 (Absolute reduction) reduction per % 4-6.7 .5-9 1.5-4 4. 2 2.2 1.5-4 year*
7 .2 5-5. 0-
*: The reduction percentages per ar ar ed to the a olute emissions in the vious ar anad to an exponential cline abso emi ns. r sl s (e. near) uld b
eters for 400 and 450 a (Tab 30). Early participa an reductions by countries in sta 4 ar ecessary.
tabilization of greenhouse gas concentrations, global emissions need to decline. While emissions of developing countries are growing, emissions of Annex I
s
-weighted
ye e appli bs pre ye d therefore le de in lute ssio Othe ope g. li co e possible.
The param re very stringent le tion d stringent ge e n
Figure 22, Figure 23 and Fi 24 ow emi on a nc nde he multistagapproach aiming at 400, 450 and 550 ppmv CO
gure sh the ssi llowa es u r t e 2 in the long term for the A1B reference
scenario. In order to reach s
countrie need to be reduced significantly. Even for the 550 case, we assumed a reduction of 1.5% to 4% per year, which is very substantial. But also developing countries have to deviate from their reference scenario early. We assumed that countries move to stage 2 at 3-8 tCO2eq/cap and reduce emissions 5% to 20% below their reference. They move to stage 3 at 3.5-10 tCO2eq/cap and reduce 10% to 35% below reference. Countries move to the group that reduces absolute emissions at 4 to 12 tCO2eq/cap.
Table 31, Table 32 and Table 33 show the likely date of entry into the different stages for the cases aiming at 550, 450 and 400 ppmv in the long term. Numbers represent the stage, averaged over six cases, one for each IPCC scenario. For regions, the populationaverage is given. It can be observed that for the 550 case only the most advanced developing countries significantly participate as of 2020. For the 450 case, significantly more countries move to higher stages in 2020 and 2030. For the 400 case, most advanced but also medium developing countries participate as of 2020/2030. The tables show the results of the long-term cases. For the more relaxed short-term 550 case, ascending countries are roughly one stage lower in 2020 than in the long-term 550 case. For 450 the difference is up to half a stage and for 400 less than half a stage.
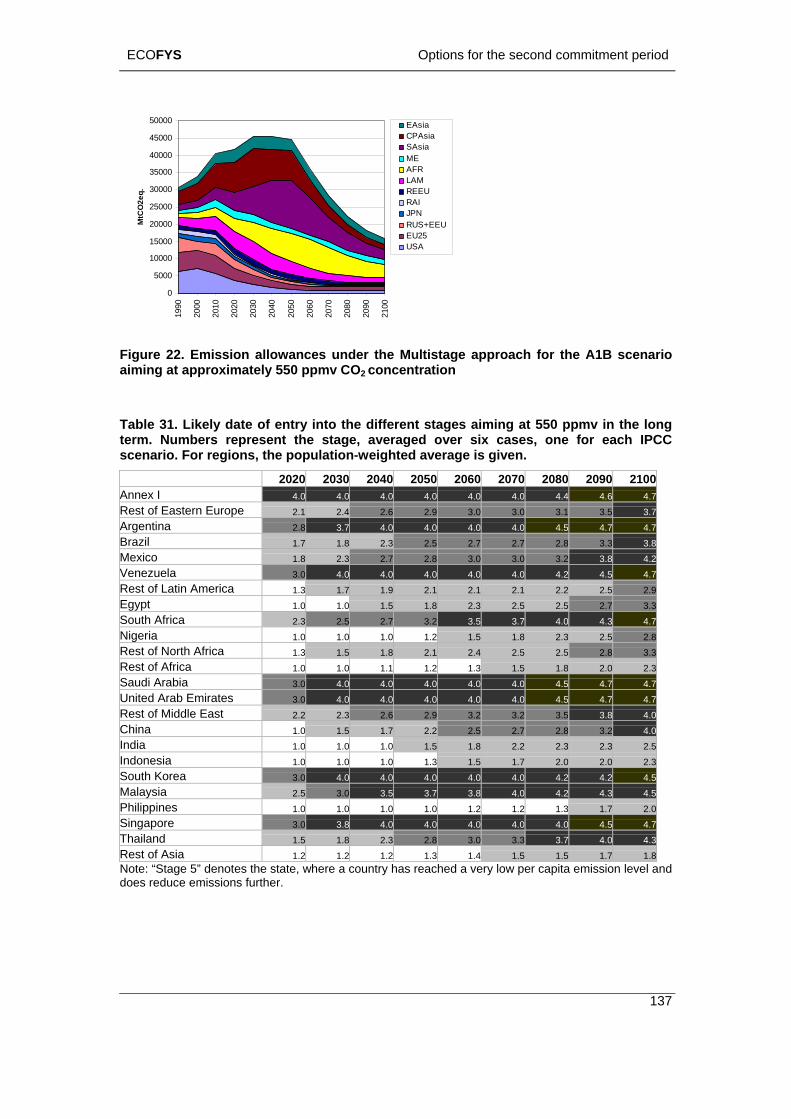
ECOFYS Options for the second commitment period
0
5000
10000
15000
20000
25000
30000
35000
40000
45000
50000
1990
2000
2010
2020
2030
2040
2050
2060
2070
2080
2090
2100
MtC
O2e
q.
EAsiaCPAsiaSAsiaMEAFRLAMREEURAIJPNRUS+EEUEU25USA
Figure 22. Emission allowances under the Multistage approach for the A1B scenario aiming at approximately 550 ppmv CO2 concentration
Table 31. Likely date of entry into the different stages aiming at 550 ppmv in the long term. Numbers represent the stage, averaged over six cases, one for each IPCC scenario. For regions, the population-weighted average is given.
2020 2030 2040 2050 2060 2070 2080 2090 2100Annex I 4.0 4.0 4.0 4.0 4.0 4.0 4.4 4.6 4.7Rest of Eastern Europe 2.1 2.4 2.6 2.9 3.0 3.0 3.1 3.5 3.7Argentina 2.8 3.7 4.0 4.0 4.0 4.0 4.5 4.7 4.7Brazil 1.7 1.8 2.3 2.5 2.7 2.7 2.8 3.3 3.8Mexico 1.8 2.3 2.7 2.8 3.0 3.0 3.2 3.8 4.2Venezuela 3.0 4.0 4.0 4.0 4.0 4.0 4.2 4.5 4.7Rest of Latin America 1.3 1.7 1.9 2.1 2.1 2.1 2.2 2.5 2.9Egypt 1.0 1.0 1.5 1.8 2.3 2.5 2.5 2.7 3.3South Africa 2.3 2.5 2.7 3.2 3.5 3.7 4.0 4.3 4.7Nigeria 1.0 1.0 1.0 1.2 1.5 1.8 2.3 2.5 2.8Rest of North Africa 1.3 1.5 1.8 2.1 2.4 2.5 2.5 2.8 3.3Rest of Africa 1.0 1.0 1.1 1.2 1.3 1.5 1.8 2.0 2.3Saudi Arabia 3.0 4.0 4.0 4.0 4.0 4.0 4.5 4.7 4.7United Arab Emirates 3.0 4.0 4.0 4.0 4.0 4.0 4.5 4.7 4.7Rest of Middle East 2.2 2.3 2.6 2.9 3.2 3.2 3.5 3.8 4.0China 1.0 1.5 1.7 2.2 2.5 2.7 2.8 3.2 4.0India 1.0 1.0 1.0 1.5 1.8 2.2 2.3 2.3 2.5Indonesia 1.0 1.0 1.0 1.3 1.5 1.7 2.0 2.0 2.3South Ko a re 3.0 4.0 4.0 4.0 4.0 4.0 4.2 4.2 4.5Malaysia 2.5 3.0 3.5 3.7 3.8 4.0 4.2 4.3 4.5Philippines 1.0 1.0 1.0 1.0 1.2 1.2 1.3 1.7 2.0Singapore 3.0 3.8 4.0 4.0 4.0 4.0 4.0 4.5 4.7Thailand 1.5 1.8 2.3 2.8 3.0 3.3 3.7 4.0 4.3Rest of Asia 1.2 1.2 1.2 1.3 1.4 1.5 1.5 1.7 1.8Note: “Stage 5” denotes the state, where a country has reached a very low per capita emission level and does reduce emissions further.
137
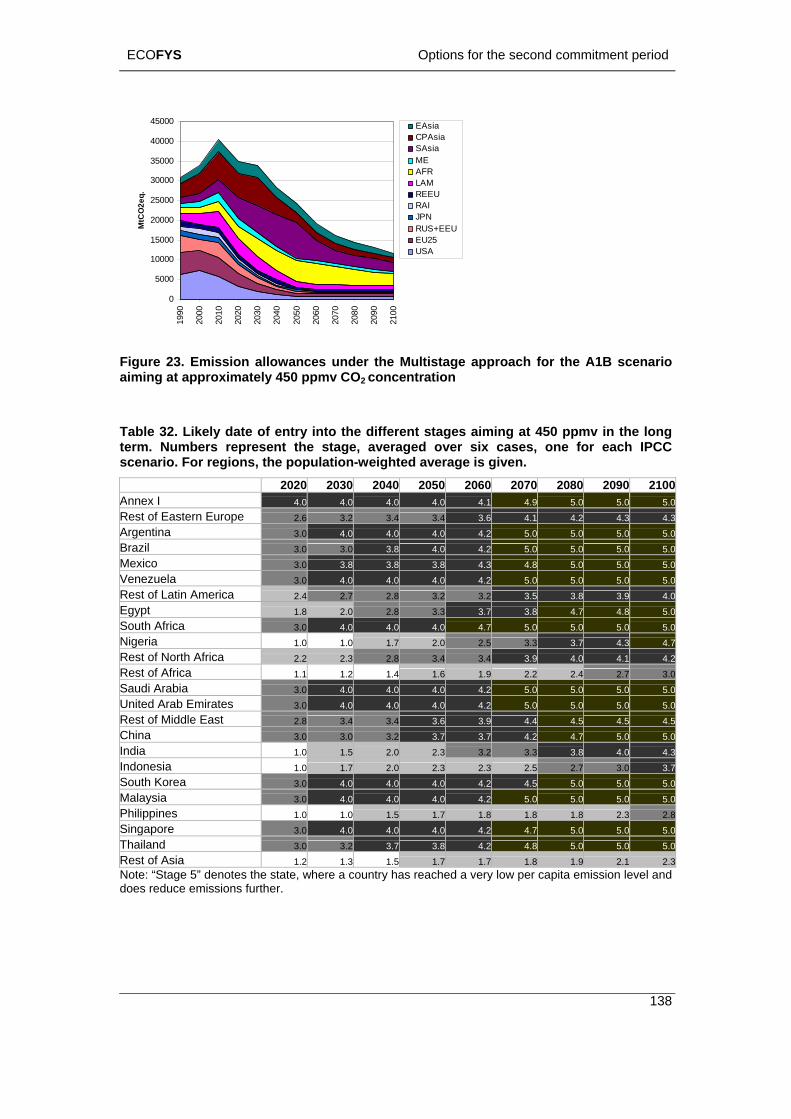
ECOFYS Options for the second commitment period
5000
10000
15000
20000
25000
30000
35000
40000
45000
MtC
O2e
q.
EAsiaCPAsiaSAsiaMEAFRLAMREEURAIJPNRUS+EEUEU25USA
0
1990
2000
2010
2020
2030
2040
2050
2060
2070
2080
2090
2100
Figure 23. Emission allowances under the Multistage approach for the A1B scenario aiming at approximately 450 ppmv CO2 concentration
t stages aiming at 450 ppmv in the long
Table 32. Likely date of entry into the differenterm. Numbers represent the stage, averaged over six cases, one for each IPCC scenario. For regions, the population-weighted average is given. 2020 2030 2040 2050 2060 2070 2080 2090 2100Annex I 4.0 4.0 4.0 4.0 4.1 4.9 5.0 5.0 5.0Rest of Eastern Europe 2.6 3.2 3.4 3.4 3.6 4.1 4.2 4.3 4.3Argentina 3.0 4.0 4.0 4.0 4.2 5.0 5.0 5.0 5.0Brazil 3.0 3.0 3.8 4.0 4.2 5.0 5.0 5.0 5.0Mexico 3.0 3.8 3.8 3.8 4.3 4.8 5.0 5.0 5.0Venezuela 3.0 4.0 4.0 4.0 4.2 5.0 5.0 5.0 5.0Rest of Latin America 2.4 2.7 2.8 3.2 3.2 3.5 3.8 3.9 4.0Egypt 1.8 2.0 2.8 3.3 3.7 3.8 4.7 4.8 5.0South Africa 3.0 4.0 4.0 4.0 4.7 5.0 5.0 5.0 5.0Nigeria 1.0 1.0 1.7 2.0 2.5 3.3 3.7 4.3 4.7Rest of North Africa 2.2 2.3 2.8 3.4 3.4 3.9 4.0 4.1 4.2Rest of Africa 1.1 1.2 1.4 1.6 1.9 2.2 2.4 2.7 3.0Saudi Arabia 3.0 4.0 4.0 4.0 4.2 5.0 5.0 5.0 5.0United Arab Emirates 3.0 4.0 4.0 4.0 4.2 5.0 5.0 5.0 5.0Rest of Middle East 2.8 3.4 3.4 3.6 3.9 4.4 4.5 4.5 4.5China 3.0 3.0 3.2 3.7 3.7 4.2 4.7 5.0 5.0India 1.0 1.5 2.0 2.3 3.2 3.3 3.8 4.0 4.3Indonesia 1.0 1.7 2.0 2.3 2.3 2.5 2.7 3.0 3.7South Korea 3.0 4.0 4.0 4.0 4.2 4.5 5.0 5.0 5.0Malaysia 3.0 4.0 4.0 4.0 4.2 5.0 5.0 5.0 5.0Philippines 1.0 1.0 1.5 1.7 1.8 1.8 1.8 2.3 2.8Singapore 3.0 4.0 4.0 4.0 4.2 4.7 5.0 5.0 5.0Thailand 3.0 3.2 3.7 3.8 4.2 4.8 5.0 5.0 5.0Rest of Asia 1.2 1.3 1.5 1.7 1.7 1.8 1.9 2.1 2.3Note: “Stage 5” denotes the state, where a country has reached a very low per capita emission level and does reduce emissions further.
138
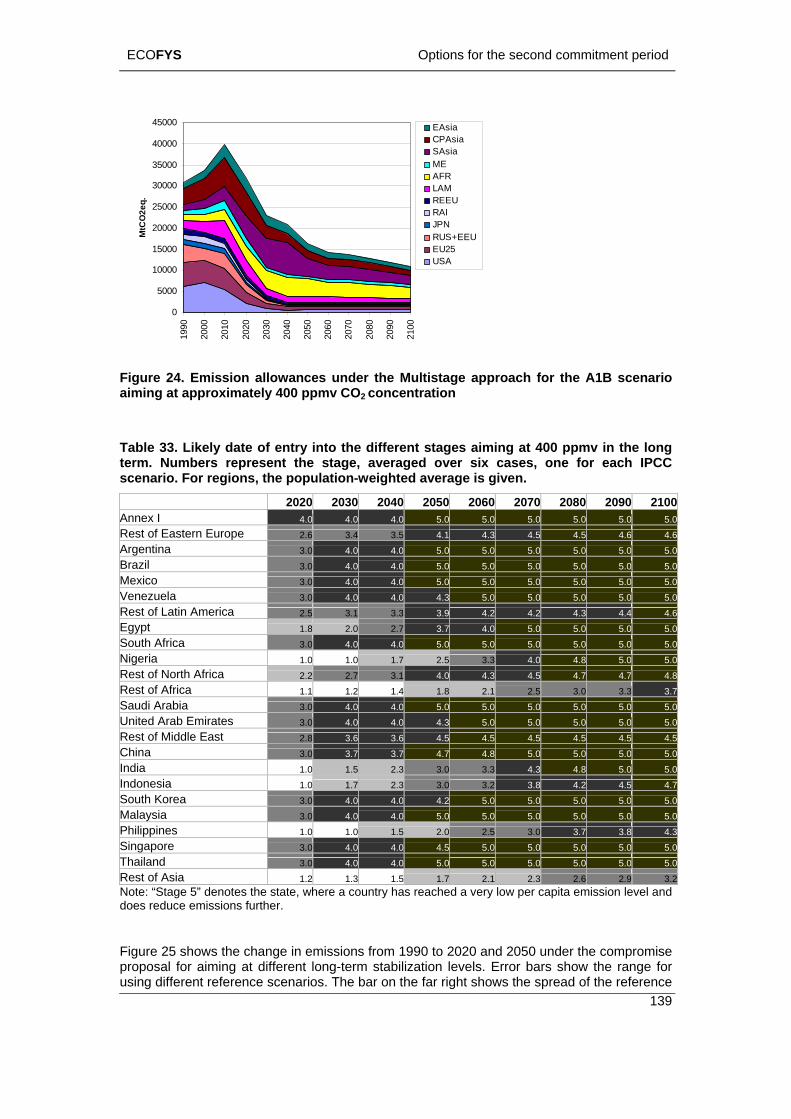
ECOFYS Options for the second commitment period
0
50
45000 EAsiaCPAsia40000SAsiaMEAFRLAMREEU
100
150
200
50
300
50
MtC
O2e
q.
00
3 00
00
00
00
2 00 RAIJPNRUS+EEUEU25
00
1990
2000
2010
2020
2030
2040
2050
2060
2070
2080
2090
2100
USA
Figure 24. Emission allowances under the Multistage approach for the A1B scenario ntration
Table 3 ate of entry into the different stages aiming at 400 ppmv in the long term Nscenar
aiming at approximately 400 ppmv CO2 conce
3. Likely d. umbers represent the stage, averaged over six cases, one for each IPCC
io. For regions, the population-weighted average is given.
2020 2030 2040 2050 2060 2070 2080 2090 2100Annex I 4.0 4.0 4.0 5.0 5.0 5.0 5.0 5.0 5.0Rest of Eastern Europe 2.6 3.4 3.5 4.1 4.3 4.5 4.5 4.6 4.6Argentina 3.0 4.0 4.0 5.0 5.0 5.0 5.0 5.0 5.0Brazil 3.0 4.0 4.0 5.0 5.0 5.0 5.0 5.0 5.0Mexico 3.0 4.0 4.0 5.0 5.0 5.0 5.0 5.0 5.0Venezuela 3.0 4.0 4.0 4.3 5.0 5.0 5.0 5.0 5.0Rest of Latin America 2.5 3.1 3.3 3.9 4.2 4.2 4.3 4.4 4.6Egypt 1.8 2.0 2.7 3.7 4.0 5.0 5.0 5.0 5.0South Africa 3.0 4.0 4.0 5.0 5.0 5.0 5.0 5.0 5.0Nigeria 1.0 1.0 1.7 2.5 3.3 4.0 4.8 5.0 5.0Rest of North Africa 2.2 2.7 3.1 4.0 4.3 4.5 4.7 4.7 4.8Rest of Africa 1.1 1.2 1.4 1.8 2.1 2.5 3.0 3.3 3.7Saudi Arabia 3.0 4.0 4.0 5.0 5.0 5.0 5.0 5.0 5.0United Arab Emirates 3.0 4.0 4.0 4.3 5.0 5.0 5.0 5.0 5.0Rest of Middle East 2.8 3.6 3.6 4.5 4.5 4.5 4.5 4.5 4.5China 3.0 3.7 3.7 4.7 4.8 5.0 5.0 5.0 5.0India 1.0 1.5 2.3 3.0 3.3 4.3 4.8 5.0 5.0Indonesia 1.0 1.7 2.3 3.0 3.2 3.8 4.2 4.5 4.7South Korea 3.0 4.0 4.0 4.2 5.0 5.0 5.0 5.0 5.0Malaysia 3.0 4.0 4.0 5.0 5.0 5.0 5.0 5.0 5.0Philippines 1.0 1.0 1.5 2.0 2.5 3.0 3.7 3.8 4.3Singapore 3.0 4.0 4.0 4.5 5.0 5.0 5.0 5.0 5.0Thailand 3.0 4.0 4.0 5.0 5.0 5.0 5.0 5.0 5.0Rest of Asia 1.2 1.3 1.5 1.7 2.1 2.3 2.6 2.9 3.2Note: “
Figure
using ws the spread of the reference
Stage 5” denotes the state, where a country has reached a very low per capita emission level anddoes reduce emissions further.
25 shows the change in emissions from 1990 to 2020 and 2050 under the compromiseproposal for aiming at different long-term stabilization levels. Error bars show the range for
different reference scenarios. The bar on the far right sho
139
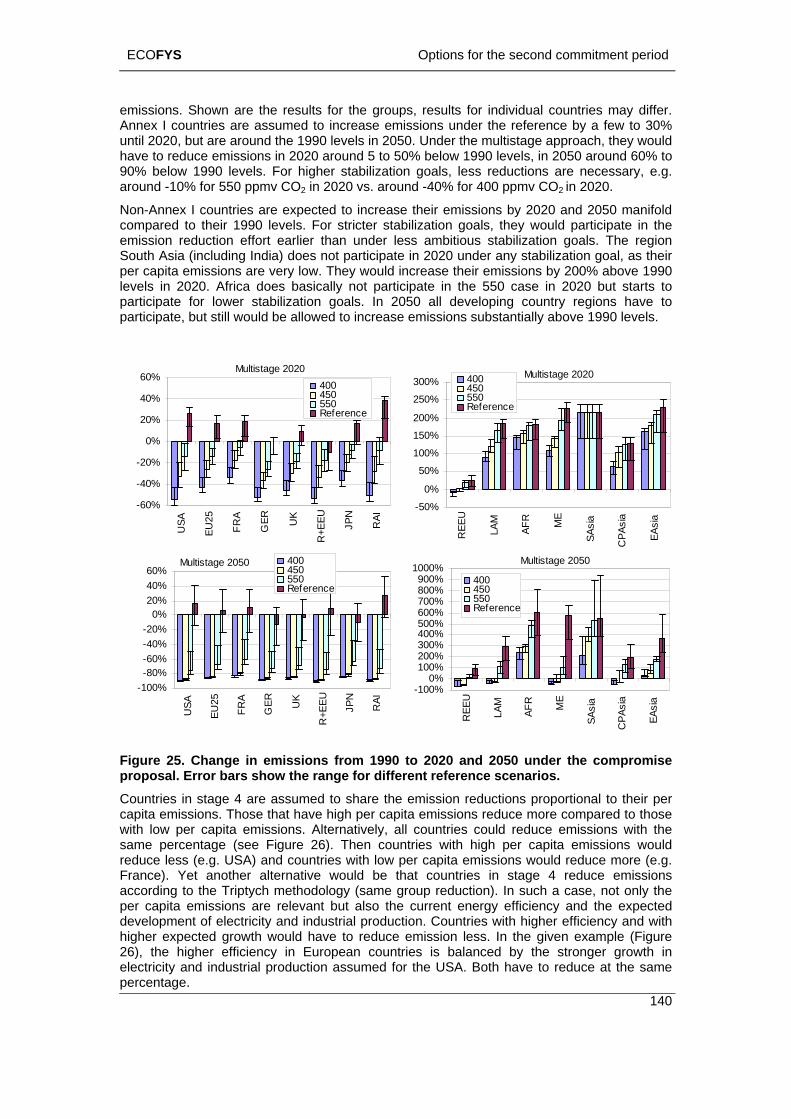
ECOFYS Options for the second commitment period
140
Annexuntil 2have t 20 around 5 to 50% below 1990 levels, in 2050 around 60% to
aroun 2 in 2020.
on-Annex I countries are expected to increase their emissions by 2020 and 2050 manifold compared to their 1990 levels. For stricter stabilization goals, they would participate in the emission reduction effort earlier than under less ambitious stabilization goals. The region South Asia (including India) does not participate in 2020 under any stabilization goal, as their per capita emissions are very low. They would increase their emissions by 200% above 1990 levels in 2020. Africa does basically not participate in the 550 case in 2020 but starts to participate for lower stabilization goals. In 2050 all developing country regions have to participate, but still would be allowed to increase emissions substantially above 1990 levels.
emissions. Shown are the results for the groups, results for individual countries may differ. I countries are assumed to increase emissions under the reference by a few to 30% 020, but are around the 1990 levels in 2050. Under the multistage approach, they would o reduce emissions in 20
90% below 1990 levels. For higher stabilization goals, less reductions are necessary, e.g. d -10% for 550 ppmv CO2 in 2020 vs. around -40% for 400 ppmv CO
N
Multistage 2020
-60%
-40%
-20%
0%
20%
40%
60%
USA
EU25
FRA
GER UK
R+E
EU JPN
RAI
400450550Reference
Multistage 2020
-50%
0%
50%
100%
150%
200%
250%
300%
REE
U
LAM
AFR ME
SAsi
a
CPA
sia
EAsi
a
400450550Reference
Multistage 2050
-100%-80%-60%-40%-20%
0%20%40%60%
USA
EU25
FRA
GER UK
R+E
EU JPN
RAI
400450550Reference
Multistage 2050
-100%0%
100%200%300%400%500%600%700%800%900%
1000%
REE
U
LAM
AFR ME
SAsi
a
CPA
sia
EAsi
a
400450550Reference
Figure 25. Change in emissions from 1990 to 2020 and 2050 under the compromise proposal. Error bars show the range for different reference scenarios. Countries in stage 4 are assumed to share the emission reductions proportional to their per capita emissions. Those that have high per capita emissions reduce more compared to those with low per capita emissions. Alternatively, all countries could reduce emissions with the same percentage (see Figure 26). Then countries with high per capita emissions would reduce less (e.g. USA) and countries with low per capita emissions would reduce more (e.g. France). Yet another alternative would be that countries in stage 4 reduce emissions according to the Triptych methodology (same group reduction). In such a case, not only the per capita emissions are relevant but also the current energy efficiency and the expected development of electricity and industrial production. Countries with higher efficiency and with higher expected growth would have to reduce emission less. In the given example (Figure 26), the higher efficiency in European countries is balanced by the stronger growth in electricity and industrial production assumed for the USA. Both have to reduce at the same percentage.
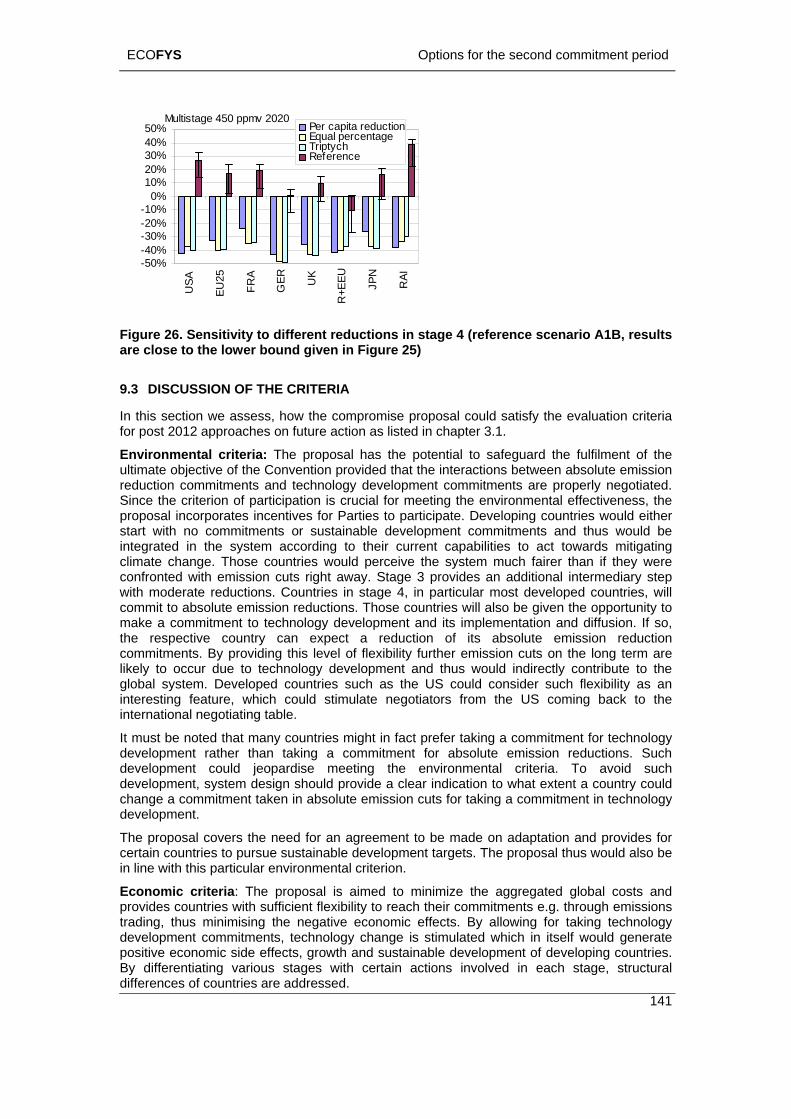
ECOFYS Options for the second commitment period
Multistage 450 ppmv 2020
141
-50%-40%-30%-20%-10%
0%10%20%30%
A 25 A R
UK EU N
RAI
40%50%
US
EU FR GE
R+E JP
Per capita reductionEqual percentageTriptychReference
Figure 26. Sensitivity to different reductions in stage 4 (reference scenario A1B, results are close to the lower bound given in Figure 25)
9.3 DISCUSSION OF THE
start with no commitments or sustainable development commitments and thus would be integrated in the system according to their current capabilities to act towards mitigating climate change. Those countries would perceive the system much fairer than if they were confronted with emission cuts right away. Stage 3 provides an additional intermediary step with moderate reductions. Countries in stage 4, in particular most developed countries, will commit to absolute emission reductions. Those countries will also be given the opportunity to make a commitment to technology development and its implementation and diffusion. If so, the respective country can expect a reduction of its absolute emission reduction commitments. By providing this level of flexibility further emission cuts on the long term are likely to occur due to technology development and thus would indirectly contribute to the global system. Developed countries such as the US could consider such flexibility as an interesting feature, which could stimulate negotiators from the US coming back to the international negotiating table.
It must be noted that many countries might in fact prefer taking a commitment for technology development rather than taking a commitment for absolute emission reductions. Such development could jeopardise meeting the environmental criteria. To avoid such development, system design should provide a clear indication to what extent a country could change a commitment taken in absolute emission cuts for taking a commitment in technology development.
The proposal covers the need for an agreement to be made on adaptation and provides for certain countries to pursue sustainable development targets. The proposal thus would also be
countries with sufficient flexibility to reach their commitments e.g. through emissions chnology generate
pos eBy diffedifferen
CRITERIA
In this section we assess, how the compromise proposal could satisfy the evaluation criteria for post 2012 approaches on future action as listed in chapter 3.1.
Environmental criteria: The proposal has the potential to safeguard the fulfilment of the ultimate objective of the Convention provided that the interactions between absolute emission reduction commitments and technology development commitments are properly negotiated. Since the criterion of participation is crucial for meeting the environmental effectiveness, the proposal incorporates incentives for Parties to participate. Developing countries would either
in line with this particular environmental criterion.
Economic criteria: The proposal is aimed to minimize the aggregated global costs and providestrading, thus minimising the negative economic effects. By allowing for taking tedevelopment commitments, technology change is stimulated which in itself would
itiv economic side effects, growth and sustainable development of developing countries. rentiating various stages with certain actions involved in each stage, structural
ces of countries are addressed.
ECOFYS Options for the second commitment period
142
Techni s and fineexisting g and reporting arrangements. Certainly, monitoriwith edevelop ion measures etc. If negotiated for a more than one outcomeparticipaindustry
Politicacriteria. opportunational
The prodiscuss , advanced developed countries and least
emes developed under the Kyoto Protocol.
9.4 CONCLUSIONS ON COMPROMISE PROPOSAL
T
i
international agreement.
T
ntries to participate in a certain stage, not just thresholds. The flexibility provided fo
Critical in this setting would be the participation of the USA. Their current point of view can be incorporated through the commitment for technology development. Here the USA would have
cal criteria: There i no doubt that this proposal requires considerable negotiations -tuning if pursued. However, it can build upon fundamental agreed elements of the
Kyoto system in particular the monitorinng mitigation measures would need to be extended by monitoring progress achieved
m eting technology development targets or commitments of countries, sustainable ment targets, progress with adaptat
commitment period, say for instance for the next 15 years with 5 year interval targets, the would communicate stability of the system and would ensure a continued tion of countries. In addition, such longer timeframes would provide a clear signal to
that is the driving force to materialise technology development.
l criteria. The proposal meets the ‘capability’, ‘responsibility’, and ‘comparable efforts’ In terms of the criteria ‘needs’, developing countries in stage 1 and 2 are given the nity to satisfy basic development needs. The proposal furthermore takes current emission levels as the basis for a future climate policy into account.
posal is addressing fundamental and controversial positions of the major players ed in this report such as the EU, USA
developed countries. For instance, by the inclusion of LDCs and ADCs in stage 1 and 2 with the longer-term perspective to enter stages with more commitment, a fundamental requirement voiced by the US for developing country participation is met. On the other hand, LDCs would see big emitters taking a leading role in emission reductions and would see the inclusion of fostering sustainable development and adaptation measures. Further, the proposal satisfies the EU ‘s position of meeting environmental effectiveness and utilizing the established monitoring and reporting sch
The compromise proposal has several strengths:
• he proposal is designed as a compromise to accommodate many different viewpoints on specific issues and to satisfy multiple demands. Many countries or country groups can find elements of their concern in this proposal.
• The proposal allows for a gradual phase-in of countries in the mandatory emission reduction effort, which is in line with the UNFCCC spirit, and takes into account national circumstances (esp. if Triptych is chosen as the burden sharing concept for stage 4).
• The proposal allows flex bility to implement immediate emission reduction measures or to develop technologies that are able to reduce emissions in the future.
• The proposal allows for gradual decision making, which seems the most likely way of reaching an
• he proposal builds trust, as industrialised countries take the lead in emission reduction efforts.
The proposal however has some weaknesses:
• The overall proposal describes a relative complex system that requires many decisions.
• The risk that countries enter too late in the emission reduction effort is high, so that some long-term stabilization options may be lost. Hence, incentives are needed for cou
r countries in stage 3 and/or 4 to take a commitment in technology development while receiving a reduction of their commitment of absolute emissions in return adds additional uncertainty on the global emission levels.
ECOFYS Options for the second commitment period
143
ui, A. Kitous, M. Berk, M. den Elzen, B. Eickhout, P. Lucas, D. van Vuuren, N. Kouvaritakis and
Global Warming". Washington D.C., Center for Transatlantic Relations http://transatlantic.sais-
nd Deepening - An ambitious
to demonstrate serious actions for the development of new technologies. In return, the USA could receive a relatively moderate emission reduction target.
9.5 REFERENCES
P. CriqD. Vanregemorter, 2003, “Greenhouse Gas Reduction Pathways In The Unfccc Process Up To 2025 − Technical Report”, Study Contract: B4-3040/2001/325703/MAR/E.1 for the European Commission, DG Environment http://europa.eu.int/comm/environment/climat/pdf/pm_techreport2025.pdf
Den Elzen, M.G.J., Berk, M.M., Lucas, P., Eickhout, B. and Van Vuuren, D.P., 2003. Exploring climate regimes for differentiation of commitments to achieve the EU climate target. RIVM Report no. 728001023, National Institute of Public Health and the Environment, Bilthoven, the Netherlands http://arch.rivm.nl/ieweb/ieweb/Reports/728%20001%20023_final_V1.pdf
J. Gupta, 1998 “Encouraging developing country participation in the climate change regime,” Institute for Environmental Studies (IVM), Vrije Universiteit, Amsterdam, The Netherlands
J. Gupta, 2003, “Engaging developing countries in climate change: (KISS and Make-up!)” in David Michel (ed.),(2003): "Climate Policy for the 21st Century, Meeting the Long-Term Challenge of
jhu.edu
Höhne, N., J. Harnisch, G.J.M Phylipsen, K. Blok, C. Galleguillos (2003): Evolution of commitments under the UNFCCC: Involving newly industrialized economies and developing countries. Research Report 201 41 255. UBA-FB 000412 http://www.umweltbundesamt.org/fpdf-l/2246.pdf
Axel Michaelowa, Sonja Butzengeiger, Martina Jung, 2003. “Graduation apost-2012 climate policy scenario”. HWWA Discussion paper.
Ott, H E; Winkler, H; Brouns, B; Kartha, S; Mace, M; Huq, S; Kameyama, Y; Sari, A P; Pan, J; Sokona, Y; Bhandari, P M; Kassenberg, A; La Rovere, E L & Rahman, A, 2004: South-North dialogue on equity in the greenhouse. A proposal for an adequate and equitable global climate agreement. GTZ, Eschborn, Germany
Sijm, Jos, Jaap Jansen, and Asbjørn Torvanger (2001), Differentiation of mitigation commitments: the multi-sector convergence approach, Climate Policy, Vol. 1, No. 4, 481-497
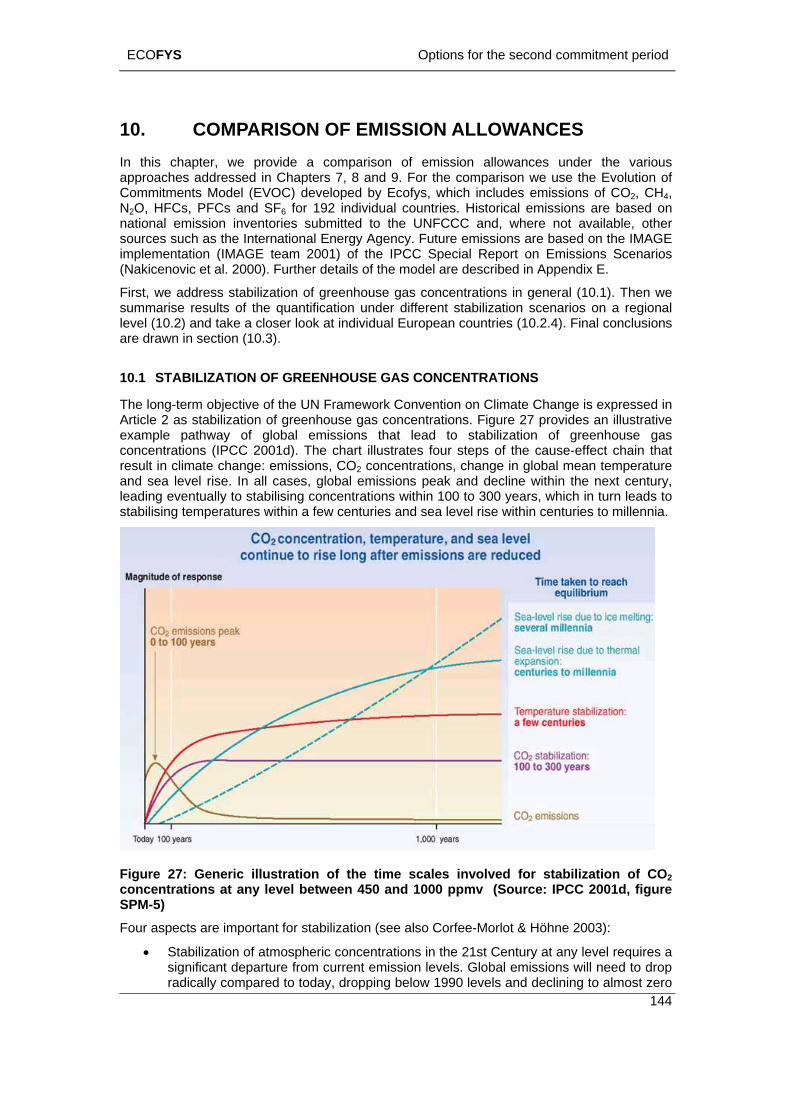
ECOFYS Options for the second commitment period
144
ents Model (EVOC) developed by Ecofys, which includes emissions of CO2, CH4,
nd take a closer look at individual European countries (10.2.4). Final conclusions
eenhouse gas concentrations. Figure 27 provides an illustrative example pathway of global emissions that lead to stabilization of greenhouse gas concentrations (IPCC 2001d). The chart illustrates four steps of the cause-effect chain that
to millennia.
10. COMPARISON OF EMISSION ALLOWANCES In this chapter, we provide a comparison of emission allowances under the various approaches addressed in Chapters 7, 8 and 9. For the comparison we use the Evolution of CommitmN2O, HFCs, PFCs and SF6 for 192 individual countries. Historical emissions are based on national emission inventories submitted to the UNFCCC and, where not available, other sources such as the International Energy Agency. Future emissions are based on the IMAGE implementation (IMAGE team 2001) of the IPCC Special Report on Emissions Scenarios (Nakicenovic et al. 2000). Further details of the model are described in Appendix E.
First, we address stabilization of greenhouse gas concentrations in general (10.1). Then we summarise results of the quantification under different stabilization scenarios on a regional level (10.2) aare drawn in section (10.3).
10.1 STABILIZATION OF GREENHOUSE GAS CONCENTRATIONS
The long-term objective of the UN Framework Convention on Climate Change is expressed in Article 2 as stabilization of gr
result in climate change: emissions, CO2 concentrations, change in global mean temperature and sea level rise. In all cases, global emissions peak and decline within the next century, leading eventually to stabilising concentrations within 100 to 300 years, which in turn leads to stabilising temperatures within a few centuries and sea level rise within centuries
Fig concenSPM-5) Four as nt for stabilization (see also Corfee-Morlot & Höhne 2003):
ure 27: Generic illustration of the time scales involved for stabilization of CO2 trations at any level between 450 and 1000 ppmv (Source: IPCC 2001d, figure
pects are importa
• Stabilization of atmospheric concentrations in the 21st Century at any level requires a significant departure from current emission levels. Global emissions will need to drop radically compared to today, dropping below 1990 levels and declining to almost zero
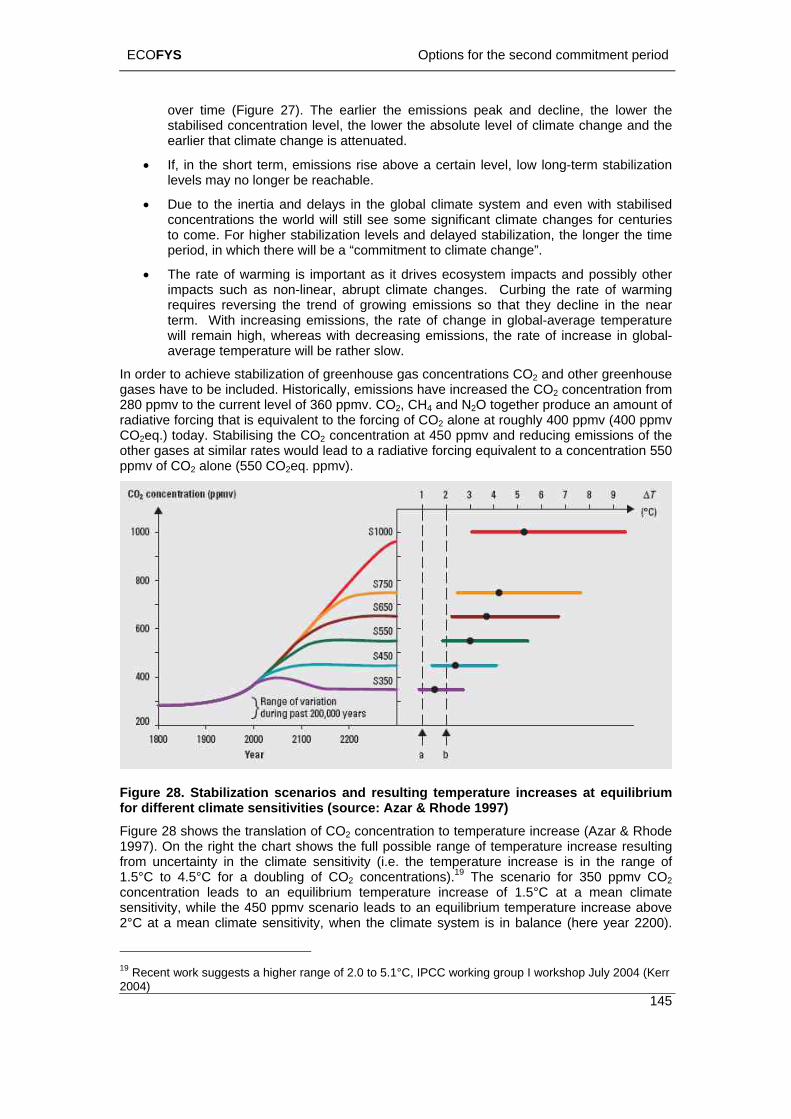
ECOFYS Options for the second commitment period
145
nge is attenuated.
• If, in the short term, emissions rise above a certain level, low long-term stabilization
• The rate of warming is important as it drives ecosystem impacts and possibly other impacts such as non-linear, abrupt climate changes. Curbing the rate of warming requires reversing the trend of growing emissions so that they decline in the near term. With increasing emissions, the rate of change in global-average temperature will remain high, whereas with decreasing emissions, the rate of increase in global-average temperature will be rather slow.
In order to achieve stabilization of greenhouse gas concentrations CO2 and other greenhouse gases have to be included. Historically, emissions have increased the CO2 concentration from 280 ppmv to the current level of 360 ppmv. CO2, CH4 and N2O together produce an amount of radiative forcing that is equivalent to the forcing of CO2 alone at roughly 400 ppmv (400 ppmv CO2eq.) today. Stabilising the CO2 concentration at 450 ppmv and reducing emissions of the other gases at similar rates would lead to a radiative forcing equivalent to a concentration 550 ppmv of CO2 alone (550 CO2eq. ppmv).
over time (Figure 27). The earlier the emissions peak and decline, the lower the stabilised concentration level, the lower the absolute level of climate change and the earlier that climate cha
levels may no longer be reachable.
• Due to the inertia and delays in the global climate system and even with stabilised concentrations the world will still see some significant climate changes for centuries to come. For higher stabilization levels and delayed stabilization, the longer the time period, in which there will be a “commitment to climate change”.
Figure 28. Stabilization scenarios and resulting temperature increases at equilibrium for different climate sensitivities (source: Azar & Rhode 1997)
year 2200).
Figure 28 shows the translation of CO2 concentration to temperature increase (Azar & Rhode 1997). On the right the chart shows the full possible range of temperature increase resulting from uncertainty in the climate sensitivity (i.e. the temperature increase is in the range of 1.5°C to 4.5°C for a doubling of CO2 concentrations).19 The scenario for 350 ppmv CO2 concentration leads to an equilibrium temperature increase of 1.5°C at a mean climate sensitivity, while the 450 ppmv scenario leads to an equilibrium temperature increase above 2°C at a mean climate sensitivity, when the climate system is in balance (here
19 Recent work suggests a higher range of 2.0 to 5.1°C, IPCC working group I workshop July 2004 (Kerr 2004)
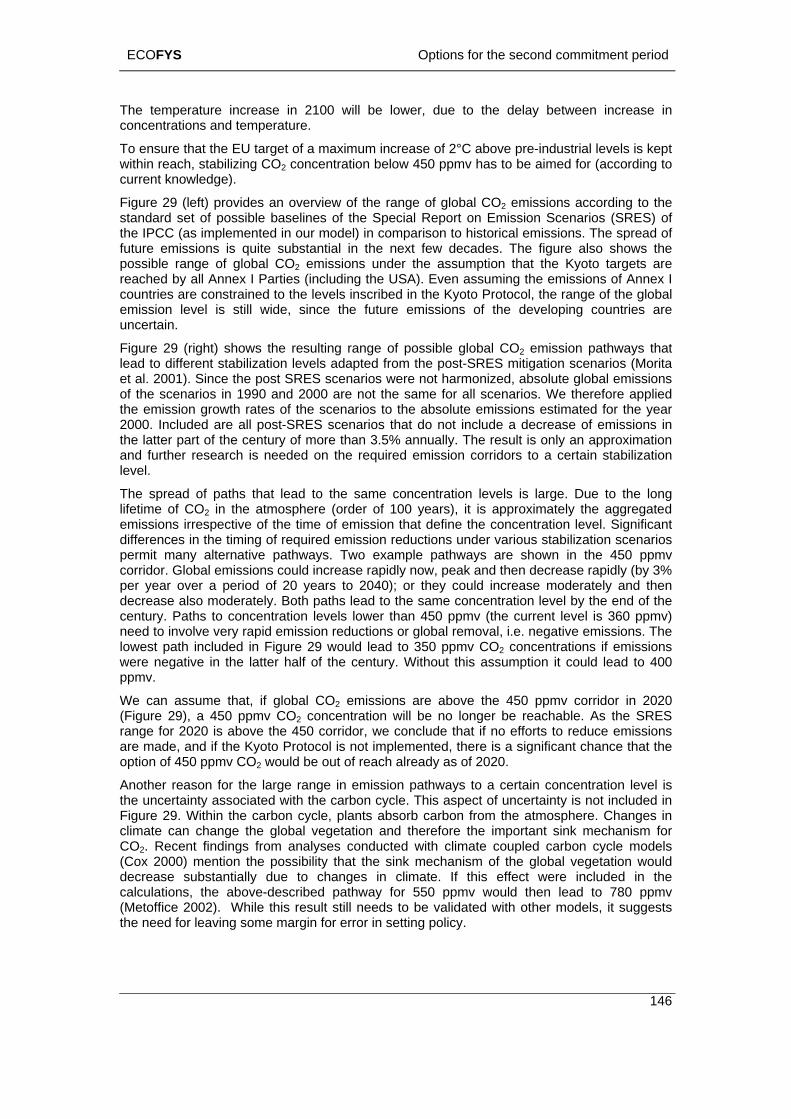
ECOFYS Options for the second commitment period
146
nge of global CO2 emissions according to the
re also shows the possible range of global CO2 emissions under the assumption that the Kyoto targets are reached Parties (including the USA). Even assuming the emissions of Annex I countries are constrained to the levels inscribed in the Kyoto Protocol, the range of the global
aarios were not harmonized, absolute global emissions
of the scenarios in 1990 and 2000 are not the same for all scenarios. We therefore applied the emission growth rates of the scenarios to the absolute emissions estimated for the year 2000. Included are all post-SRES scenarios that do not include a decrease of emissions in the latter part of the century of more than 3.5% annually. The result is only an approximation and further research is needed on the required emission corridors to a certain stabilization level.
The spread of paths that lead to the same concentration levels is large. Due to the long lifetime of CO2 in the atmosphere (order of 100 years), it is approximately the aggregated emissions irrespective of the time of emission that define the concentration level. Significant differences in the timing of required emission reductions under various stabilization scenarios permit many alternative pathways. Two example pathways are shown in the 450 ppmv corridor. Global emissions could increase rapidly now, peak and then decrease rapidly (by 3% per year over a period of 20 years to 2040); or they could increase moderately and then decrease also moderately. Both paths lead to the same concentration level by the end of the century. Paths to concentration levels lower than 450 ppmv (the current level is 360 ppmv) need to involve very rapid emission reductions or global removal, i.e. negative emissions. The lowest path included in Figure 29 would lead to 350 ppmv CO2 concentrations if emissions were negative in the latter half of the century. Without this assumption it could lead to 400 ppmv.
We can assume that, if global CO2 emissions are above the 450 ppmv corridor in 2020 (Figure 29), a 450 ppmv CO2 concentration will be no longer be reachable. As the SRES range for 2020 is above the 450 corridor, we conclude that if no efforts to reduce emissions are made, and if the Kyoto Protocol is not implemented, there is a significant chance that the option of 450 ppmv CO2 would be out of reach already as of 2020.
Another reason for the large range in emission pathways to a certain concentration level is the uncertainty associated with the carbon cycle. This aspect of uncertainty is not included in
the possibility that the sink mechanism of the global vegetation would ecrease substantially due to changes in climate. If this effect were included in the
The temperature increase in 2100 will be lower, due to the delay between increase in concentrations and temperature.
To ensure that the EU target of a maximum increase of 2°C above pre-industrial levels is kept within reach, stabilizing CO2 concentration below 450 ppmv has to be aimed for (according to current knowledge).
Figure 29 (left) provides an overview of the rastandard set of possible baselines of the Special Report on Emission Scenarios (SRES) of the IPCC (as implemented in our model) in comparison to historical emissions. The spread of future emissions is quite substantial in the next few decades. The figu
by all Annex I
emission level is still wide, since the future emissions of the developing countries are uncertain.
Figure 29 (right) shows the resulting range of possible global CO2 emission pathways that lead to different stabilization levels dapted from the post-SRES mitigation scenarios (Morita et al. 2001). Since the post SRES scen
Figure 29. Within the carbon cycle, plants absorb carbon from the atmosphere. Changes in climate can change the global vegetation and therefore the important sink mechanism for CO2. Recent findings from analyses conducted with climate coupled carbon cycle models (Cox 2000) mention dcalculations, the above-described pathway for 550 ppmv would then lead to 780 ppmv (Metoffice 2002). While this result still needs to be validated with other models, it suggests the need for leaving some margin for error in setting policy.
ECOFYS Options for the second commitment period
Figure 29. Possible CO2 emission pathways until 2050 Notes: For the case of Kyoto implementation, it is assumed that all countries reach their Kyoto targets. On the one hand, the current emissions of the USA are far above its national Kyoto target. On the other hand, emissions of the Russian Federation and of several other economies in transition are far below
. We therefore applied the emission growth rates of the scenarios to the absolute emissions estimated for the year 2000. Included are all post-SRES scenarios that do not include a decrease of emissions in the latter part of the century of more than 3.5% annually.
, 2 2
CO2eq).
These global targets are only based on considerations of the most important greenhouse gas (CO2). Stabilization scenarios considering all greenhouse gases are rare in the literature (e.g. Eickhout et al. 2003). In assessing emission pathways to stabilise climate, however, other greenhouse gases are also important. Non-CO2 emissions are a significant part of the Kyoto basket, even more so for Non-Annex I countries. In addition, non-CO2 gases provide some low cost reduction options. For simplicity, we assume that for a given concentration level, emissions of the non-CO2 gases need to be reduced with the same percentage as the CO2 emissions.
Hence, we assumed here as a case towards 550 ppmv that global greenhouse gas emissions, weighted with global warming potentials, can be 50% above 1990 levels in 2020 and 45% above 2050, decreasing steadily thereafter. For a 450 ppmv case, it would be +30% in 2020 and -25% in 2050. In the direction of 400/350 ppmv it would be +10% in 2020 and -60% in 2050.
10.2 RESULTS
In the following sections, we provide the emission allowances under different approaches for the global emission levels given in Figure 29, which aim towards CO2 concentration of 550, 450 and 400 ppmv. We use the following default settings (see also Appendix E):
• Including emissions of CO2, CH4, N2O, HFCs, PFCs, and SF6 • Including international aviation and marine transport • Excluding CO2 emissions from land-use change and forestry • All Annex I countries (including the USA) reach their Kyoto target in 2010 • Future emissions are based on the six marker scenarios of the IPCC special report
on emission scenarios (IPCC 2000)
We have included the following approaches:
their Kyoto target. Since the post SRES scenarios were not harmonized, absolute global emissions of the scenarios in 1990 and 2000 are not the same for all scenarios
We selected global emission levels in 2020 and 2050, which have to be met by all approaches for the following quantification of emission allowances for the various proposals. These are taken from Figure 29 to be in line with 550 ppmv CO2 (roughly 650 ppmv CO2eq.)450 ppmv CO (roughly ppmv 550 CO eq.) and towards 400 ppmv (roughly 450 ppmv
147
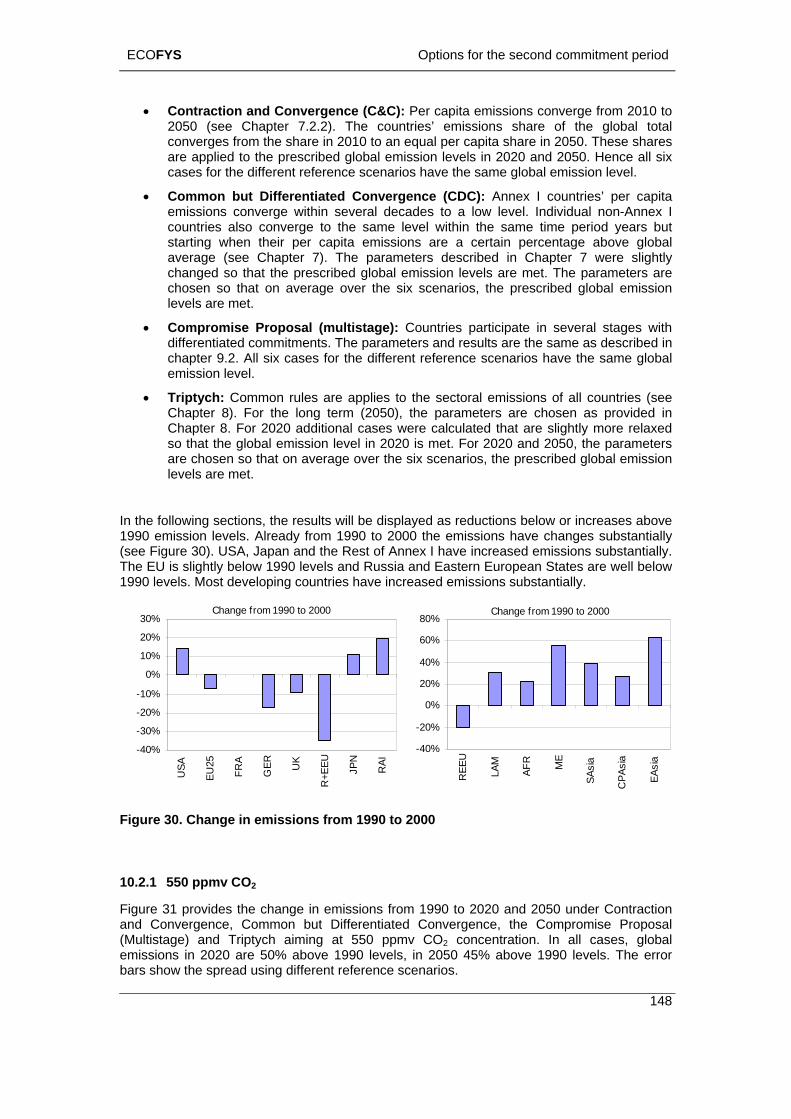
ECOFYS Options for the second commitment period
148
• Contraction and Convergence (C&C): Per capita emissions converge from 2010 to 2050 (see Chapter 7.2.2). The countries’ emissions share of the global total converges from the share in 2010 to an equal per capita share in 2050. These shares are applied to the prescribed global emission levels in 2020 and 2050. Hence all six cases for the different reference scenarios have the same global emission level.
• Common but Differentiated Convergence (CDC): Annex I countries’ per capita emissions converge within several decades to a low level. Individual non-Annex I countries also converge to the same level within the same time period years but starting when their per capita emissions are a certain percentage above global average (see Chapter 7). The parameters described in Chapter 7 were slightly changed so that the prescribed global emission levels are met. The parameters are chosen so that on average over the six scenarios, the prescribed global emission levels are met.
• Compromise Proposal (multistage): Countries participate in several stages with differentiated commitments. The parameters and results are the same as described in chapter 9.2. All six cases for the different reference scenarios have the same global emission level.
• Triptych: Common rules are applies to the sectoral emissions of all countries (see Chapter 8). For the long term (2050), the parameters are chosen as provided in Chapter 8. For 2020 additional cases were calculated that are slightly more relaxed so that the global emission level in 2020 is met. For 2020 and 2050, the parameters are chosen so that on average over the six scenarios, the prescribed global emission levels are met.
w 1990 levels and Russia and Eastern European States are well below
In the following sections, the results will be displayed as reductions below or increases above 1990 emission levels. Already from 1990 to 2000 the emissions have changes substantially (see Figure 30). USA, Japan and the Rest of Annex I have increased emissions substantially. The EU is slightly belo1990 levels. Most developing countries have increased emissions substantially.
Change from 1990 to 200030%
-40%
-30%
-20%
-10%
0%
10%
20%
USA
EU25
FRA
GER UK
+EEU JPN
RAI
R
Change from 1990 to 2000
-40%
-20%
0%
80%C
rovides the change in emissions from 1990 to 2020 and 2050 under Contraction and Convergence, Common but Differentiated Convergence, the Compromise Proposal (Multistage) and Triptych aiming at 550 ppmv CO2 concentration. In all cases, global emissions in 2020 are 50% above 1990 levels, in 2050 45% above 1990 levels. The error bars show the spread using different reference scenarios.
20%
40%
60%
REE
U
LAM
AFR ME
SAsi
a
PAsi
a
EAsi
a
Figure 30. Change in emissions from 1990 to 2000
10.2.1 550 ppmv CO2
Figure 31 p
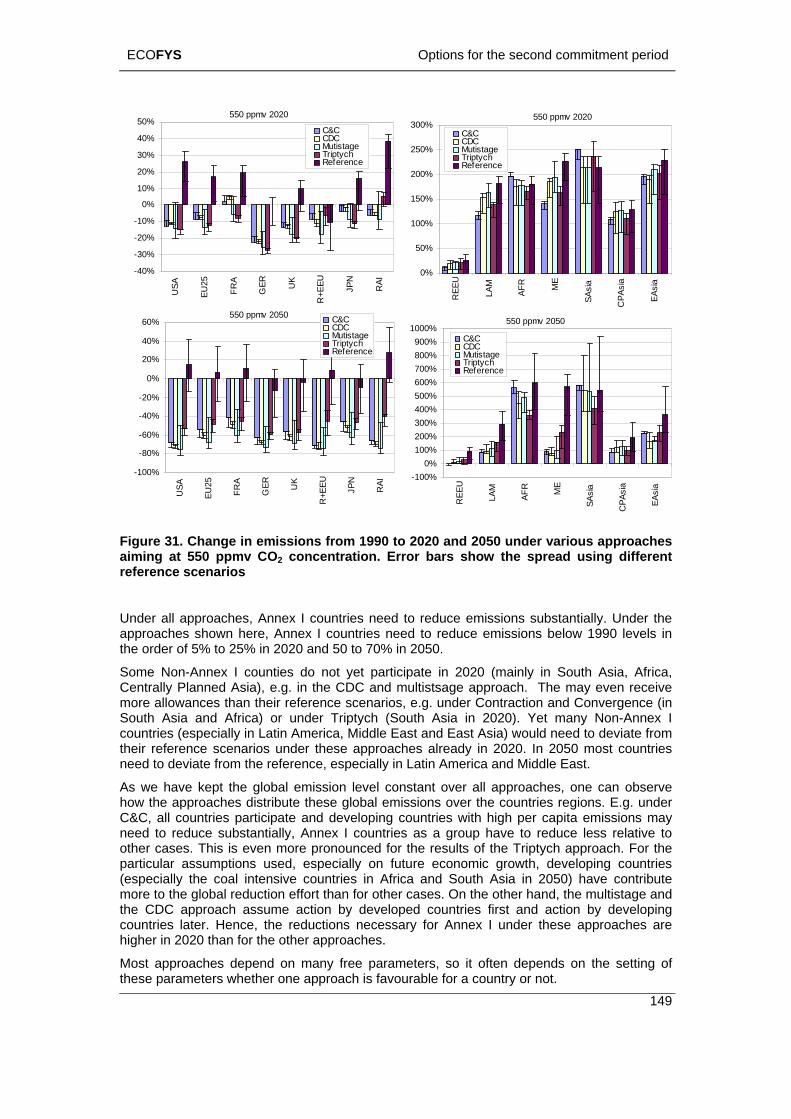
ECOFYS Options for the second commitment period
550 ppmv 202050%
-40%
-30%
-20%
-10%
USA
EU25
FRA
GER UK
R+E
EU JPN
RAI
149
0%
10%
20%
30%
40%C&CCDCMutistageTriptychReference
550 ppmv 2020300%
0%
50%
100%
REE
U
LAM
AFR ME
SAsi
a
CPA
sia
EAsi
a
200%
250%
C&C
150%
CDCMutistageTriptychReference
550 ppmv 2050
0%
20%
40%
60%
-100%
-80%
-60%
-40%
-20%
USA
EU25
FRA
GER UK
R+E
EU JPN
RAI
C&CCDCMutistageTriptychReference
550 ppmv 2050
600%700%800%900%
1000%
-100%0%
100%200%300%400%500%
REE
U
LAM
AFR ME
SAsi
a
CPA
sia
EAsi
a
C&CCDCMutistageTriptychReference
Figure 31. Change in emissions from 1990 to 2020 and 2050 under various approaches aiming at 550 ppmv CO2 concentration. Error bars show the spread using different reference scenarios
20). Yet many Non-Annex I
ssume action by developed countries first and action by developing countries later. Hence, the reductions necessary for Annex I under these approaches are higher in 2020 than for the other approaches.
Most approaches depend on many free parameters, so it often depends on the setting of these parameters whether one approach is favourable for a country or not.
Under all approaches, Annex I countries need to reduce emissions substantially. Under the approaches shown here, Annex I countries need to reduce emissions below 1990 levels in the order of 5% to 25% in 2020 and 50 to 70% in 2050.
Some Non-Annex I counties do not yet participate in 2020 (mainly in South Asia, Africa, Centrally Planned Asia), e.g. in the CDC and multistsage approach. The may even receive more allowances than their reference scenarios, e.g. under Contraction and Convergence (in South Asia and Africa) or under Triptych (South Asia in 20countries (especially in Latin America, Middle East and East Asia) would need to deviate from their reference scenarios under these approaches already in 2020. In 2050 most countries need to deviate from the reference, especially in Latin America and Middle East.
As we have kept the global emission level constant over all approaches, one can observe how the approaches distribute these global emissions over the countries regions. E.g. under C&C, all countries participate and developing countries with high per capita emissions may need to reduce substantially, Annex I countries as a group have to reduce less relative to other cases. This is even more pronounced for the results of the Triptych approach. For the particular assumptions used, especially on future economic growth, developing countries (especially the coal intensive countries in Africa and South Asia in 2050) have contribute more to the global reduction effort than for other cases. On the other hand, the multistage and the CDC approach a
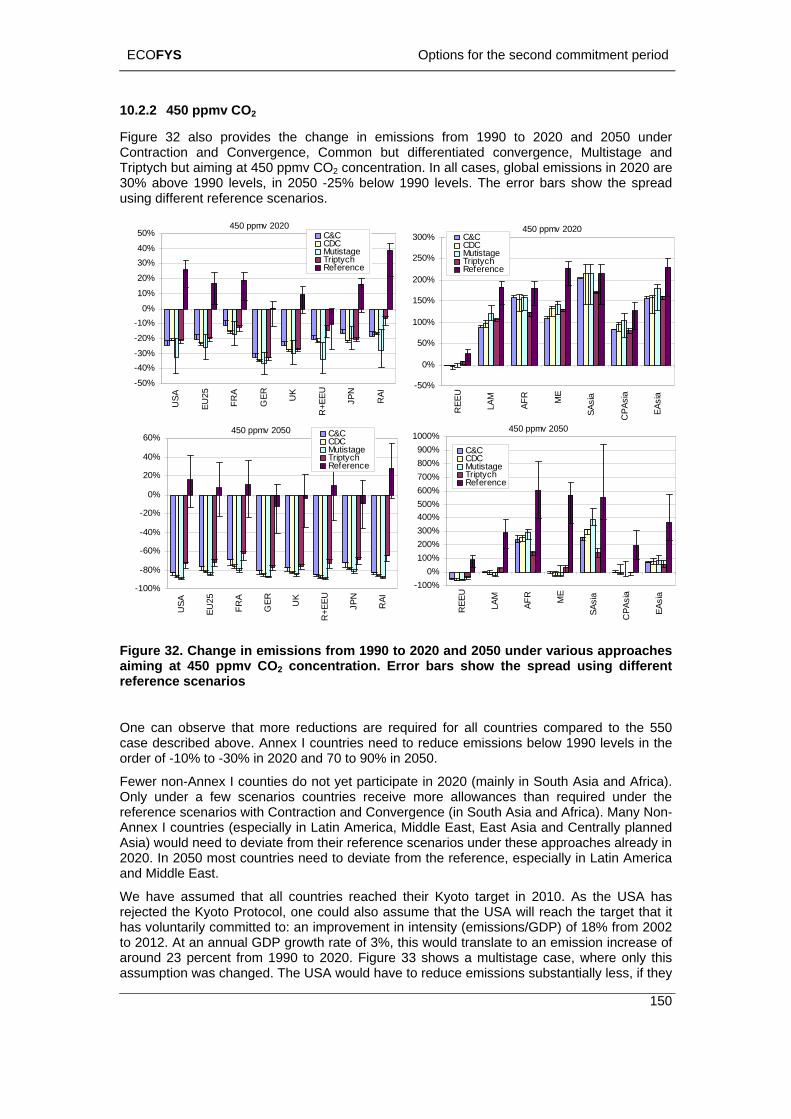
ECOFYS Options for the second commitment period
10.2.2 450 ppmv CO2
150
from 1990 to 2020 and 2050 under ContracTriptych30% abusing d
Figure 32 also provides the change in emissionstion and Convergence, Common but differentiated convergence, Multistage and but aiming at 450 ppmv CO2 concentration. In all cases, global emissions in 2020 are ove 1990 levels, in 2050 -25% below 1990 levels. The error bars show the spread
ifferent reference scenarios.
450 ppmv 2020 450 ppmv 2020300%
-50%
-40%-30%
-20%
-10%0%
10%
20%
30%40%
50% C&CCDCMutistage
C&CCDCMutistage250%
USA
EU25
FRA
GER UK
R+E
EU JPN
RAI
TriptychReference
TriptychReference
-50%
0%
50%
100%
150%
200%
REE
U
LAM
AFR ME
SAsi
a
CPA
sia
EAsi
a
450 ppmv 2050
-100%
-80%
-60%
-40%
-20%
0%
20%
40%
60%
USA
EU25
FRA
GER UK
R+E
EU JPN
RAI
C&CCDCMutistageTriptychReference
450 ppmv 2050
700%800%900%
1000%C&CCDCMutistageTriptych
0%100%200%300%400%500%600%
-100%
REE
U
LAM
AFR ME
SAsi
a
CPA
sia
EAsi
a
Reference
Figure 0 and 2050 under various approaches aimrefe n
One can observe that more reductions are required for all countries compared to the 550 case described above. Annex I countries need to reduce emissions below 1990 levels in the order of -10% to -30% in 2020 and 70 to 90% in 2050.
Fewer non-Annex I counties do not yet participate in 2020 (mainly in South Asia and Africa). Only under a few scenarios countries receive more allowances than required under the reference scenarios with Contraction and Convergence (in South Asia and Africa). Many Non-Annex I countries (especially in Latin America, Middle East, East Asia and Centrally planned Asia) would need to deviate from their reference scenarios under these approaches already in 2020. In 2050 most countries need to deviate from the reference, especially in Latin America and Middle East.
We have assumed that all countries reached their Kyoto target in 2010. As the USA has rejected the Kyoto Protocol, one could also assume that the USA will reach the target that it has voluntarily committed to: an improvement in intensity (emissions/GDP) of 18% from 2002 to 2012. At an annual GDP growth rate of 3%, this would translate to an emission increase of around 23 percent from 1990 to 2020. Figure 33 shows a multistage case, where only this assumption was changed. The USA would have to reduce emissions substantially less, if they
32. Change in emissions from 1990 to 202ing at 450 ppmv CO2 concentration. Error bars show the spread using different re ce scenarios
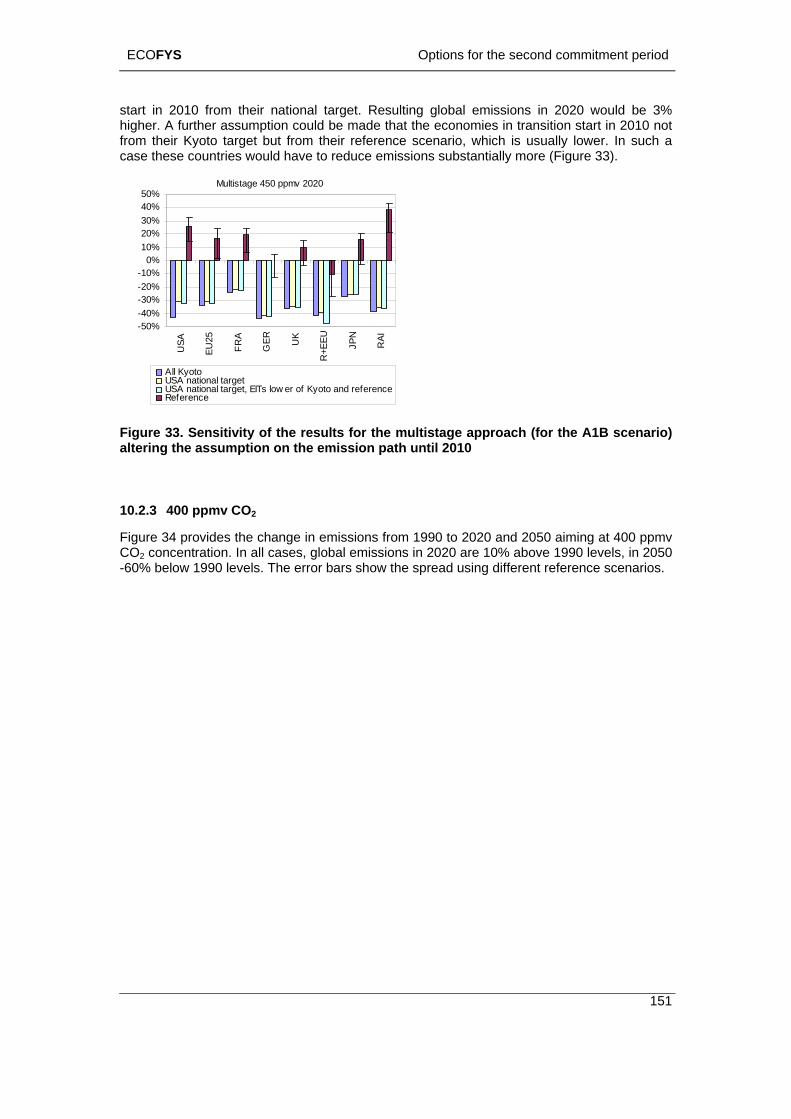
ECOFYS Options for the second commitment period
151
that the economies in transition start in 2010 not om their Kyoto target but from their re e scenario, which is usua r. In such a
se countries would have to redu ssions substantially more ( 33).
start in 2010 from their national target. Resulting global emissions in 2020 would be 3% higher. A further assumption could be madefrc
ferencce emi
lly loweFigure ase the
Multistage 450 ppmv 2020
-50%-40%
%
10%20%30%
%
USA 25 A
GER
R+
A
-30-20%-10%
0%
4050%
EU FR UK
EEU
JPN I
RAll KyotoUSA national targetUS lowA national target, EITs er of Kyoto and referenceRefe
10.2.3
Figure 34 provides the change in emissions from 1990 to 2020 and 2050 aiming at 400 ppmv
rence
Figure 33. Sensitivity of the results for the multistage approach (for the A1B scenario) altering the assumption on the emission path until 2010
400 ppmv CO2
CO2 concentration. In all cases, global emissions in 2020 are 10% above 1990 levels, in 2050 -60% below 1990 levels. The error bars show the spread using different reference scenarios.
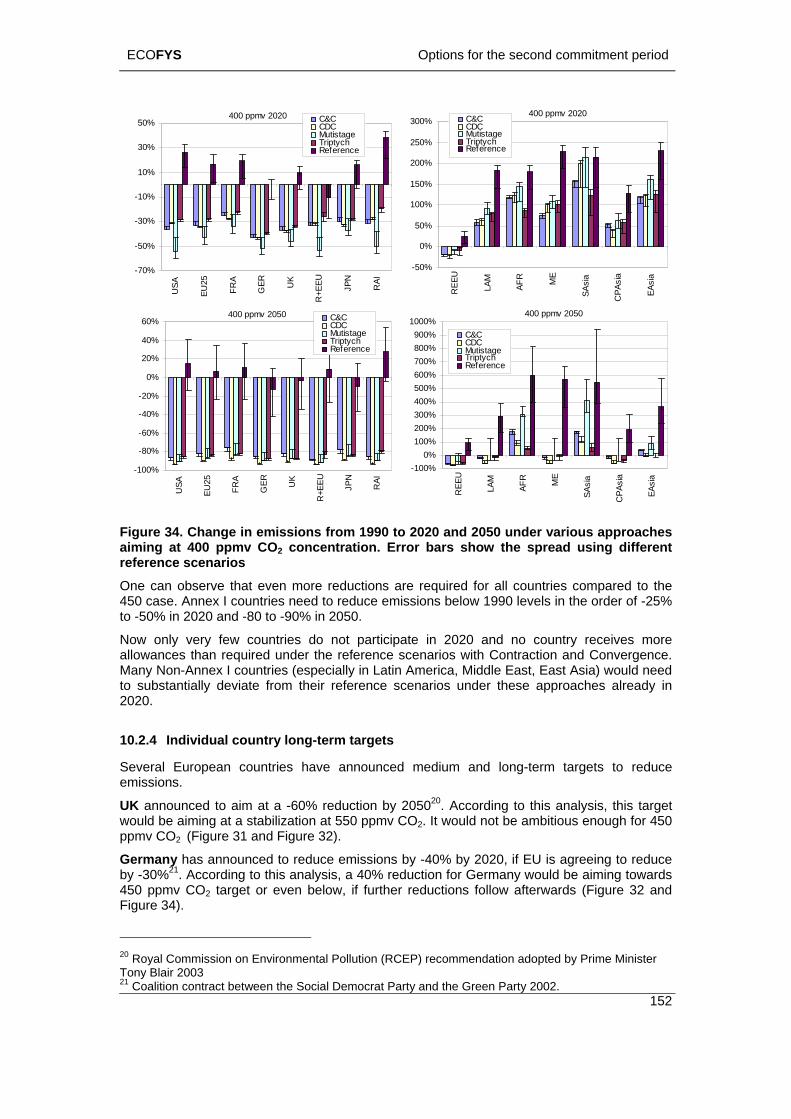
ECOFYS Options for the second commitment period
400 ppmv 2020400 ppmv 2020
152
-70%
-30%
50%
-50%
USA 25
FRA
GER UK
EEU
JPN
RAI
-10%
10%
30%
EU R+
C&CCDCMutistageTriptychReference
-50%
0%
50%
EEU
LAM
AFR ME a
100%
150%
200%
250%
300%
R SAsi
a
CPA
si
EAsi
a
C&CCDCMutistageTriptychReference
400 ppmv 20501000%
400 ppmv 205060% C&C
CDCMutistageTriptych
-100%
400%
900%
C
-100%
-80%
-20%
40%
700%800%Reference
20%
500%600%0%
-40% 300%
0%100%200%-60%
REE
U
LAM
AFR ME
SAsi
a
PAsi
a
EAsi
a
USA
EU25
FRA
GER UK
R+E
EU JPN
RAI
C&CCDCMutistageTriptychReference
Figure 34. Change in emissions from 1990 to 2020 and 2050 under various approaches aiming at 400 ppmv CO2 concentration. Error bars show the spread using different reference scenarios One can observe that even more reductions are required for all countries compared to the 450 case. Annex I countries need to reduce emissions below 1990 levels in the order of -25% to -50% in 2020 and -80 to -90% in 2050.
Now only very few countries do not participate in 2020 and no country receives more allowances than required under the reference scenarios with Contraction and Convergence. Many Non-Annex I countries (especially in Latin America, Middle East, East Asia) would need to substantially deviate from their reference scenarios under these approaches already in 2020.
10.2.4 Individual country long-term targets
Several European countries have announced medium and long-term targets to reduce emissions.
UK announced to aim at a -60% reduction by 205020. According to this analysis, this target would be aiming at a stabilization at 550 ppmv CO2. It would not be ambitious enough for 450 ppmv CO2 (Figure 31 and Figure 32).
Germany has announced to reduce emissions by -40% by 2020, if EU is agreeing to reduce by -30%21. According to this analysis, a 40% reduction for Germany would be aiming towards 450 ppmv CO2 target or even below, if further reductions follow afterwards (Figure 32 and Figure 34).
20 Royal Commission on Environmental Pollution (RCEP) recommendation adopted by Prime Minister Tony Blair 2003 21 Coalition contract between the Social Democrat Party and the Green Party 2002.
ECOFYS Options for the second commitment period
153
France is willing to reduce emission by a factor 4 (-75%) by 205022. According to this ure 32).
10.3 MITIGATION COSTS
This sub-chapter we briefly describe the current understanding of mitigation costs to meet
01).
nt. Hourcade et
ES framework. On the extremes, the A1T scenario
welfare losses as usually included in e noare only enario leading to 950 ppmv. They conclude that looking at the arun.
Azar and Schneidexpectethe peri substantially to 2100, they note that
e that any decision to achieve low
osts of
analysis, this would be aiming at a 450 ppmv CO2 target (Fig
long-term stabilization goals based on a literature analysis.
The IPCC TAR points out that level of stabilization and the timing of emission reductions is expected to significantly influence the marginal and absolute costs of mitigation. Many studies of the cost of mitigation exist (for surveys see Weyant and Hill 1999; Hourcade et al. 20Often these studies focus on nearer-term rather than longer-term mitigation strategies. OECD (1999) found that the method of allocation of emission allowances influenced aggregate costs less than the level and the timing of meeting the concentration target and whether emission trading was available as a means to “reallocate” the costs of required abatemeal. (2001) concluded that costs23 of mitigation jump dramatically for scenarios that stabilise at 450 ppmv CO2 compared to 550 ppmv due in large part to the required early timing of abatement, however, this study also came to the conclusion that costs depend significantly on the assumed baseline and on the level of stabilization.
An alternative view on global costs is provided by Roehrl & Riahi (2000). This study only looks at the total investment costs of the energy system, not at other costs within the economy. For the scenarios of similar demographic and economic development, they consider a wide range of possible emissions within the IPCC SRwould lead to 550 ppmv CO2 in 2100 and the A1C scenario to 950 ppmv. Roehrl & Riahi calculate the cumulative discounted investment costs for the energy system, including the investment costs, fixed and variable maintenance cost, excluding investments in research and development. The analysis does not include costs through
co mic models. For the A1T scenario leading to 550 ppmv, cumulative investment costs half of those of the A1C sc
tot l energy system, efficient use of energy pays off in low energy fuel costs in the long
er (2002) also suggest that mitigation costs need to be compared to d growth rather than being presented simply as discounted, present value sums for od to 2100. As the economy is expected to grow
estimated mitigation costs are relatively small when compared to the increase in welfare in this period. For example, the IPCC (2001c) reports on studies showing mitigation costs of up to 4% in GDP (upper bound) in 2050 for stabilization at 450 ppm, while these studies also assume GDP growth rate of 2-3% per year. According to Azar and Schneider (2002), even the “worst case” loss of 4% would be overtaken in less than two year, slightly delaying (rather than suppressing) impressive economic growth in this century.
The numerical estimates from modelling studies remain uncertain. They are therefore not of as much interest as the underlying relationships between various drivers and assumptions and future emissions. A robust result appears to bstabilization levels will require significant emission reductions in the near-term and this carries potentially high economic stakes in absolute and marginal terms (OECD 2001a, 2001b, OECD, 1999 and IPCC 2001c). However, the estimates of the cost appear to have decreased over the recent years (e.g. Criqui et al. 2003). The trade-offs between avoided cmitigation and avoided impacts or damages are not well understood (Wigley et al. 1996; Pearce 2003). A delay in global mitigation efforts because of mitigation costs could preclude the achievement of stricter long-term climate targets. Mitigation requirements of stabilizing at 400 or 450 ppmv, however, show, that delaying is not an option when aiming a 2°C temperature target.
22 Government adopted “Plan Climat 2004” 23 Presented as present value discounted at 5% per year for the period 1990–2100.
ECOFYS Options for the second commitment period
154
w the following conclusions:
a maximum increase of 2°C above pre-industrial zation of CO concentration below 450 ppmv has to
to reduce emissions in the order of -20% below 1990 levels in 2020 to
CO2 within reach, the USA needs to be involved in the system ger action than the national target of 18% intensity improvement.
0 ppmv CO it would be less, for 400 ppmv
The reductions that are necessary to reach are summarized in Table 34.
10.4 CONCLUSIONS
From the analysis we dra
• To ensure that the EU target oflevels is kept within reach, stabili 2be aimed for (according to current knowledge and medium climate sensitivity).
• If no efforts are made to reduce emissions and if the Kyoto Protocol is not implemented, there is a significant probability that the option of 450 ppmv CO2 would be out of reach already as of 2020.
• To keep 450 ppmv CO2 within reach, developed country emissions would need to be reduced substantially. For the exemplary global emission levels leading to stabilization and for the parameters of the approach chosen here, Annex I countries would needaim at 450 ppmv CO2. For 550 ppmv CO2 it would be roughly -15%, and for 400 ppmv CO2 roughly -35%. These values are significantly influenced by the ambition level set for Non-Annex I countries. Almost all approaches leave room to alter this balance by varying some of the parameters.
• To keep 450 ppmv most likely with stronAs this target can lead to US emissions 20% above 1990 levels in 2010, the ambitious reduction levels given above for the group of Annex I may be out of reach. For 550 ppmv, the US national target may be sufficient, if other Annex I countries would undertake more ambitious reductions.
• To keep 450 ppmv CO2 within reach, developing country emissions need to deviate from the reference as soon as possible, for some countries even as of 2020 (Latin America, Middle East, East Asia). For 55 2CO2 more countries. Actions from Annex I countries, such as technology transfer or financial contributions would be needed to keep emissions in Non-Annex I countries below their reference.
• For most countries, the difference in reductions between stabilization targets (400, 450 and 550 ppmv) is larger than the difference between the various approaches aiming at one stabilization target. The choice of the long-term ambition is more significant than the choice of the approach.
• National long-term emission targets of individual countries of the EU are ambitious, but differ in which stabilization levels could be reached.
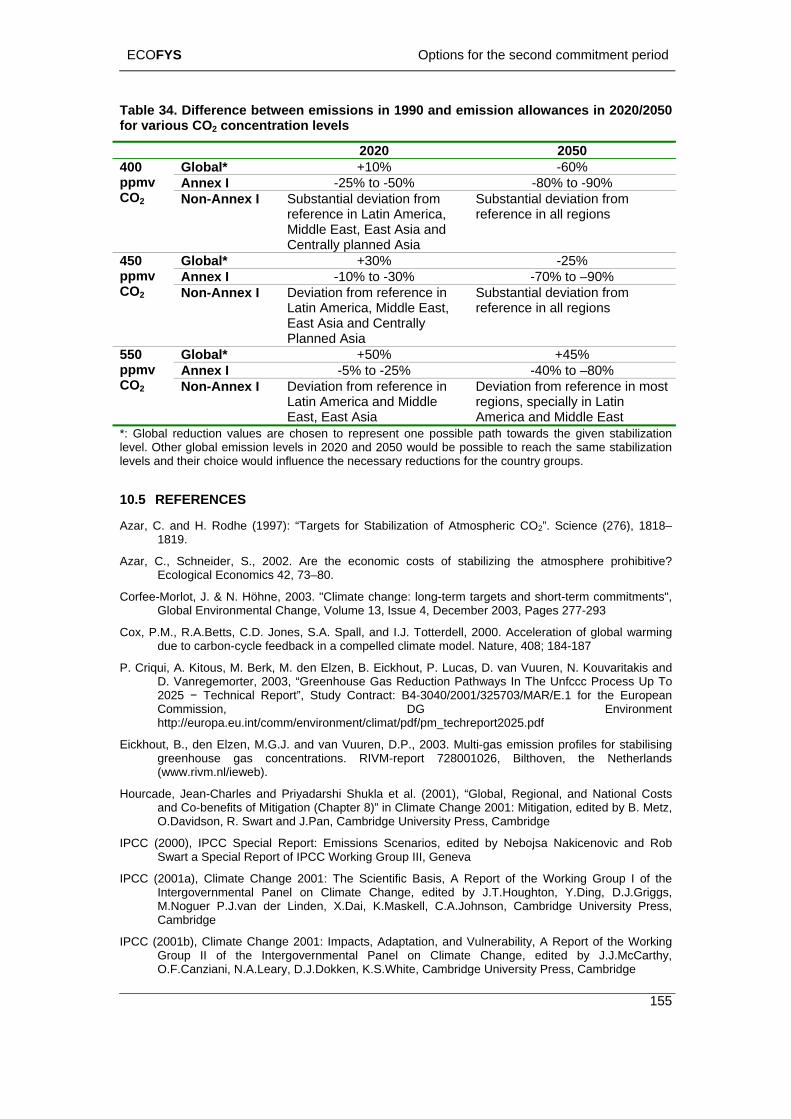
ECOFYS Options for the second commitment period
Table 34. Difference between emissions in 1990 and emission allowances in 2020/2050 for various CO2 concentration levels
2020 2050 Global* +10% -60% 400 Annex I -25% to -50% -80% to -90% ppmv
CO2 Non-Annex I Substantial deviation from reference in Latin America, Middle East, East Asia and Centrally planned Asia
Substantial deviation from reference in all regions
Global* +30% -25% Annex I -10% to -30% -70% to –90%
450 ppmv CO2 Non-Annex I Deviation from reference in
Latin America, Middle East, East Asia and Centrally Planned Asia
Substantial deviation from reference in all regions
Global* +50% +45% Annex I -5% to -25% -40% to –80%
550 ppmv CO2 Non-Annex I Deviation from reference in
Latin America and Middle East, East Asia
Deviation from reference in most regions, specially in Latin America and Middle East
*: Global reduction values are chosen to represent one possible path towards the given stabilization level. Other global emission levels in 2020 and 2050 would be possible to reach the same stabilization levels and their choice would influence the necessary reductions for the country groups.
al Economics 42, 73–80.
l warming due to carbon-cycle feedback in a compelled climate model. Nature, 408; 184-187
P. Criqui, A. Kitous, M. Berk, M. den Elzen, B. Eickhout, P. Lucas, D. van Vuuren, N. Kouvaritakis and
, DG Environment
(www.rivm.nl/ieweb).
00
n, and Vulnerability, A Report of the Working GO
10.5 REFERENCES
Azar, C. and H. Rodhe (1997): “Targets for Stabilization of Atmospheric CO2”. Science (276), 1818–1819.
Azar, C., Schneider, S., 2002. Are the economic costs of stabilizing the atmosphere prohibitive? Ecologic
Corfee-Morlot, J. & N. Höhne, 2003. "Climate change: long-term targets and short-term commitments", Global Environmental Change, Volume 13, Issue 4, December 2003, Pages 277-293
Cox, P.M., R.A.Betts, C.D. Jones, S.A. Spall, and I.J. Totterdell, 2000. Acceleration of globa
D. Vanregemorter, 2003, “Greenhouse Gas Reduction Pathways In The Unfccc Process Up To 2025 − Technical Report”, Study Contract: B4-3040/2001/325703/MAR/E.1 for the European Commissionhttp://europa.eu.int/comm/environment/climat/pdf/pm_techreport2025.pdf
Eickhout, B., den Elzen, M.G.J. and van Vuuren, D.P., 2003. Multi-gas emission profiles for stabilising greenhouse gas concentrations. RIVM-report 728001026, Bilthoven, the Netherlands
Hourcade, Jean-Charles and Priyadarshi Shukla et al. (2001), “Global, Regional, and National Costs and Co-benefits of Mitigation (Chapter 8)” in Climate Change 2001: Mitigation, edited by B. Metz, O.Davidson, R. Swart and J.Pan, Cambridge University Press, Cambridge
IPCC (2000), IPCC Special Report: Emissions Scenarios, edited by Nebojsa Nakicenovic and Rob Swart a Special Report of IPCC Working Group III, Geneva
IPCC (2 1a), Climate Change 2001: The Scientific Basis, A Report of the Working Group I of the Intergovernmental Panel on Climate Change, edited by J.T.Houghton, Y.Ding, D.J.Griggs, M.Noguer P.J.van der Linden, X.Dai, K.Maskell, C.A.Johnson, Cambridge University Press,Cambridge
IPCC (2001b), Climate Change 2001: Impacts, Adaptatioroup II of the Intergovernmental Panel on Climate Change, edited by J.J.McCarthy, .F.Canziani, N.A.Leary, D.J.Dokken, K.S.White, Cambridge University Press, Cambridge
155
ECOFYS Options for the second commitment period
156
IPCC (2C
IPCC, 20
Richard
Met cHw
Morita, TaMP
OECD (1
OECD, 2a
OEC 2
Pearce, 3. The social cost of carbon and its policy implications. Oxford Review of Economic
centrations. Nature 379, 240–243.
001c) Climate Change 2001: Mitigation, edited by B. Metz, O.Davidson, R. Swart and J.Pan, ambridge University Press, Cambridge
01d, Climate Change 2001, Synthesis Report, Cambridge University Press, Cambridge
A. Kerr, 2004: Three Degrees of Consensus. Science 305, 932-4, 13 Aug. 2004
Offi e UK (2002) Stabilization and commitment to future climate change, scientific findings from the adley Center, available at ww.metoffice.com/research/hadleycentre/pubs/brochures/B2002/global.pdf
suneyuki and John Robinson et al. (2001), “Greenhouse Gas Emission Mitigation Scenarios nd Implications”, in B. Metz, O. Davidson, R. Swart and J. Pan, (Eds.), Climate Change 2001: itigation, Contribution of Working III to the Third Assessment Report of the Intergovernmental anel on Climate Change, edited by Cambridge University Press, Cambridge
999), Action Against Climate Change, Paris.
001a. OECD Environmental Strategy for the First Decade of the 21st Century. OECD, Paris, vailable at http://www.oecd.org/env.
D, 001b. OECD Environmental Outlook. OECD, Paris.
D.W., 200Policy 19(3)
Roehrl, R.A. and K. Riahi (2000), Technological Forecasting and Social Change 63, 231-261
Weyant, J. and J.Hill (1999), “Introduction and Overview: The Costs of the Kyoto Protocol; A Multi-Model Evaluation”, in The Energy Journal, Special Issue, International Association of Energy Economics.
Wigley, T., Richels, R., Edmonds, J., 1996. Economic and environmental choices in the stabilization of atmospheric CO2 con
ECOFYS Options for the second commitment period
11. NEGOTIATION STRATEGY
157
U strategy in future negotiations.
ight become more difficult than within EU15 at
P by 18% from 2002 to 2012
the political declaration of that conference. This incident had negative impact on the
(Section 11.2) followed by a discussion of the
11.1 INTRODUCTION
With the long awaited entry into force of the Kyoto Protocol on 16 February 2005 there is hope that the deadlock in international climate negotiations can be overcome. Still, the USA, as the largest emitter, has rejected emission reductions and developing countries will not act before industrialized countries (including the USA) have demonstrated substantial action.
This chapter provides information on various aspects of a strategy to negotiating a future climate regime to come into effect after 2012. This strategy is written from the viewpoint of the European Union. The national government of any Member State, including Germany, can in principle work towards the proposed E
While this section looks at the EU and its possible actions in general, intra-EU Member States discussions are not covered. It must be noted that as of 1 May 2004 the enlarged EU with 25 Member States has different characteristics than the former EU with only 15 Member States. The accession of new Member States will add interests and complexity and thus agreeing on a joint EU position on future climate change mthe time a position was formulated regarding the Kyoto Protocol. A possible tension is that the new members are not included in Annex II of the UNFCCC and therefore have other financial commitments than the original members.
For this strategy, we assume that the 2°C target agreed by the European Council in 1996 should be kept within reach. It roughly corresponds to stabilization of CO2 concentrations below 450 ppmv (see also Chapter 10.1). This means that
• Developed country emission reductions would need to be in the range of roughly 20% below 1990 levels in 2020
• The USA needs to be involved in the system, most likely with stronger action than the national target to improve the emissions per GD
• Developing country emissions need to deviate from the reference as soon as possible, for some countries even before 2020.
The negotiation strategy should avoid situations that may jeopardise negotiation efforts and further enhance the blockage in the negotiations. For instance, the EU needs to avoid that it is seen as pushing developing countries into commitments, as it unintentionally was the case at COP8 in New Delhi. At that meeting, the EU called for a “dialogue to kick off a process for future action” stating explicitly that such dialogue would not be about developing country commitments. Still, some developing countries interpreted this (intentionally or inadvertently) as a call for developing country commitments and rejected inclusion of any reference to future actions inrelationship between the EU and developing countries.
In addition, it should be avoided that the EU is being seen to break promises. The joint political declaration was made in June 2001 by the EU together with Canada, Iceland, New Zealand, Norway and Switzerland, to collectively contribute €450 Million/US$ 410 Million annually by 2005 has to be implemented in a transparent way in order to be credible.
This chapter first discusses the framework architecture of the Kyoto Protocol as well as alternative frameworks and related timeframes various elements a strategy could include (Section 11.3). These elements include the need and potential for EU leadership in future climate change activities (Section 11.3.1), a number of recommendations, how issues discussed in Chapters 3.2 and 5 can be approached by the EU (11.3.2), suggestions how the EU could approach other Parties and intensify dialogue processes on a post-2012 climate regime (Section 11.3.3) and finally outlines important supporting activities to accompany the negotiations are suggested (Section 11.3.4). The
ECOFYS Options for the second commitment period
section closes with final conclusions and recommendations drawn from the discussion above (Section 11.4).
11.2 FRAMEWORK ARCHITECTURE
158
oto Protocol is
November 2005. Although it is now certain that the Kyoto Protocol
n. The EU, as
nters into force, it will become binding untries that ratified it and future negotiations would be held under the same umbrella.
eting of the Parties to the Kyoto Protocol would include only those countries that are
em. Consequently,
The Kyoto Protocol also demands a review of commitments in two Articles. According to Article 3.9 on the quantified commitments for Annex I Parties, the review of commitments for
The framework of the UNFCCC and the Kyoto Protocol is the only fully multilateral effort underway to address climate change. No alternative framework exists to date. Nevertheless, the Kyoto Protocol is rejected by the USA and Australia and has not been ratified for a long time by Russia, prohibiting its entry-into-force. At the time of writing of this report, the ratification process in Russia has advanced and an entry into force is expected for 16 February 2005. As the Kyoto Protocol is rejected by the USA and Australia, it warrants considering how this framework can be strengthened. However, in case the Kystill rejected as a model for future international effort, alternative frameworks may have to be addressed as well.
For both, the pre-2012 period (Section 11.2.1) and the post-2012 period (Section 11.2.2) the UNFCCC/KP framework as well as alternative frameworks are discussed. In Section 11.2.3, links of the UNFCCC / Kyoto Protocol framework with other possible treaties are discussed.
11.2.1 Action until 2012
The future of the Kyoto Protocol has long been uncertain due to the rejection by the USA and the hesitation of Russia to ratify it. At the time of writing of this report (November 2004) Russia had finally completed its ratification process and the Kyoto Protocol will enter into force on 16 February 2005. The first Meeting of the Parties of the Kyoto Protocol (COP/MOP) will be held in conjunction with the first UNFCCC COP after the entry into force of the Kyoto Protocol, which would be will enter into force, it is still rejected by the USA.
While starting to implement the Kyoto Protocol, a gradual expansion of the EU Emission Trading System (ETS) would further strengthen this framework. Currently, discussions with non-EU countries about joining are already ongoing, e.g. with Canada and Japathe party with the strongest negotiating position, could require from applying countries to adhere to their respective Kyoto targets as a condition to joining the EU ETS. This would lead to a slowly expanding carbon market. A well-functioning market would lower the reluctance to climate commitments, especially when carbon prices are relatively low. In addition, it will also lead to pressure from companies outside the EU ETS on their national governments, as they want to be able to profit from the opportunities in this market. In this context it might also be interesting to assess the possibilities of certain progressive US States to join the EU ETS.
11.2.2 Negotiations on post-2012 action
The framework of the UNFCCC and the Kyoto Protocol would be the natural home of future climate negotiations. Once the Kyoto Protocol efor all coThe Mecommitted to the Protocol.
In the past, an official start of the negotiations on next steps after 2012 was prevented by the fact that the Protocol has not yet entered into force. Without a clear signal that developed countries are taking the lead, developing countries are not willing to enter any discussion on future steps, which evidently might result in additional commitments for ththe agenda item on the revision of the Convention (“second review of adequacy” Article 4.2 (d) of the Convention) was initiated in 1998, as required by the Convention, but deferred without decision for six years in a row. Only unofficial discussions and dialogues on future actions are now going on.
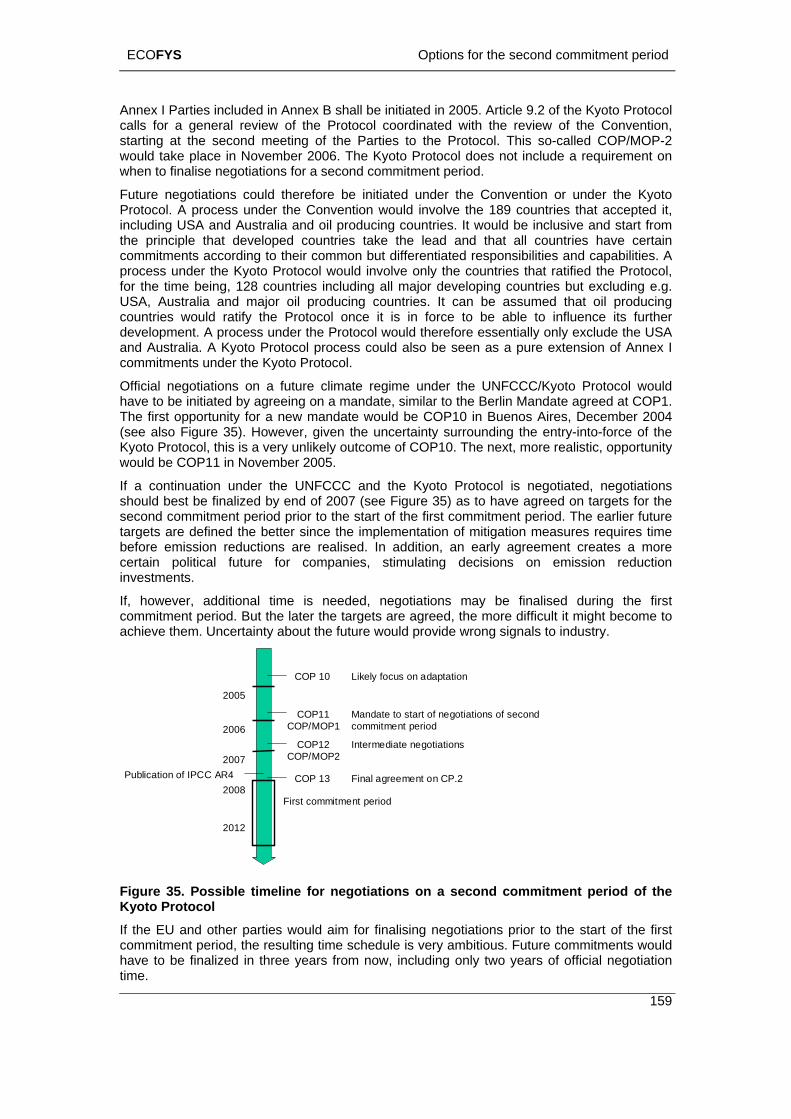
ECOFYS Options for the second commitment period
159
a requirement on whe
Future neg nder the Kyoto Pro o that accepted it, incl n tart from
ld ratify the Protocol once it is in force to be able to influence its further
given the uncertainty surrounding the entry-into-force of the
ent period. The earlier future
Annex I Parties included in Annex B shall be initiated in 2005. Article 9.2 of the Kyoto Protocol calls for a general review of the Protocol coordinated with the review of the Convention, starting at the second meeting of the Parties to the Protocol. This so-called COP/MOP-2 would take place in November 2006. The Kyoto Protocol does not include
n to finalise negotiations for a second commitment period.
otiations could therefore be initiated under the Convention or utoc l. A process under the Convention would involve the 189 countries udi g USA and Australia and oil producing countries. It would be inclusive and s
the principle that developed countries take the lead and that all countries have certain commitments according to their common but differentiated responsibilities and capabilities. A process under the Kyoto Protocol would involve only the countries that ratified the Protocol, for the time being, 128 countries including all major developing countries but excluding e.g. USA, Australia and major oil producing countries. It can be assumed that oil producing countries woudevelopment. A process under the Protocol would therefore essentially only exclude the USA and Australia. A Kyoto Protocol process could also be seen as a pure extension of Annex I commitments under the Kyoto Protocol.
Official negotiations on a future climate regime under the UNFCCC/Kyoto Protocol would have to be initiated by agreeing on a mandate, similar to the Berlin Mandate agreed at COP1. The first opportunity for a new mandate would be COP10 in Buenos Aires, December 2004 (see also Figure 35). However, Kyoto Protocol, this is a very unlikely outcome of COP10. The next, more realistic, opportunity would be COP11 in November 2005.
If a continuation under the UNFCCC and the Kyoto Protocol is negotiated, negotiations should best be finalized by end of 2007 (see Figure 35) as to have agreed on targets for the second commitment period prior to the start of the first commitmtargets are defined the better since the implementation of mitigation measures requires time before emission reductions are realised. In addition, an early agreement creates a more certain political future for companies, stimulating decisions on emission reduction investments.
If, however, additional time is needed, negotiations may be finalised during the first commitment period. But the later the targets are agreed, the more difficult it might become to achieve them. Uncertainty about the future would provide wrong signals to industry.
COP 10 Likely focus on adaptation
2005
First commitment period2008
Publication of IPCC AR4
2012
2006
2007
Mandate to start of negotiations of second commitment period
COP11COP/MOP1
COP1
COP 13 Final agreement on CP.2
Intermediate negotiations2COP/MOP2
s prior to the start of the first
Figure 35. Possible timeline for negotiations on a second commitment period of the Kyoto Protocol If the EU and other parties would aim for finalising negotiationcommitment period, the resulting time schedule is very ambitious. Future commitments would have to be finalized in three years from now, including only two years of official negotiation time.
ECOFYS Options for the second commitment period
160
To cdecision as Annex I countries would receive binding commitments and a substantial par t
The assessm (IPCC) have the pote ia ario depicted in
tion, it needs to be defined
or specific policies) have to be
reach.
ac elerate the process, a mandate at COP 11 could already include some guiding s, such
t of he Non-Annex I would receive concrete but non-quantified targets.
ent reports of the Intergovernmental Panel on Climate Change nt l to serve as a constructive push for the negotiations. In the scen
Figure 35, the fourth assessment report of the IPCC will unfortunately be published relatively late (planned for the end of 2007) to have a substantial impact on the negotiations. If negotiations are extended, the new scientific insights could influence the negotiations.
A sequence of decisions could be envisaged:
• First, the long-term ambition level is defined. The choice of the stabilization level (e.g. 400, 450 or 550 ppmvCO2) significantly influences the required reductions and the entry of countries into the regime (see Chapter 10). Defining a (preliminary) ambition level at an early stage would be very useful for the further design of the system. It may be difficult to reach an agreement on a long-term temperature or concentration level due to uncertainties and the long time horizon. But already the desired global emission level by e.g. 2020 and the direction thereafter would be a useful indication.
• Next, the types of commitments could be agreed (e.g. binding emission targets or policies and measures), including an indication when they should be assumed and by whom.
• Once the types are defined, the accounting or monitoring rules have to be defined unambiguously. For the first commitment period of the Kyoto Protocol, reduction percentages were agreed without a clear agreement how to account for land use change and forestry (LUCF). The then following negotiations on the accounting rules for LUCF were therefore very cumbersome. In addiwhether and if so how emissions from international transportation and other greenhouse gas agents should be included.
• Finally the target values (reduction percentagesagreed.
An alternative framework to that of the UNFCCC and the Kyoto Protocol would be the decomposition into several treaties on a bilateral or sub-global multilateral basis (see also Sugiyama and Sinton, 2003 or Berk & den Elzen, 2004). Such a system may be easier to implement, as like-minded countries would join efforts on clearly defined issues of their concern. It could include a scenario, where the Kyoto Protocol is in force, not supported by the federal government of the USA, but with several US states being linked through the emission trading system.
As an example, the USA is starting a “methane to markets” initiative, gathering several interested countries to jointly make efforts to reduce CH4 emissions from landfills, underground coalmines, and natural gas and oil systems. 24
As climate change is a global problem, such a decomposed system may not be able to ensure the stringency necessary on the global level to keep the 2°C target within
Even if the Kyoto Protocol enters into force, the participation of the USA would be crucial for the overall success of the global emission reduction effort. One alternative could be to organize consultations of the major emitters, e.g. only the USA, China and the EU.
Such an approach would be attractive to the participating countries. China could represent the concerns of the developing nations, USA would be given a prominent role as the leading economic power and the EU could act as an intermediary.
Such an approach would have to have the acceptance of all other countries that are not directly involved. Consequently, any results of such a process should be brought back to the global forum of the UNFCCC. But any proposal that has the backing of China, the USA and 24 See http://www.methanetomarkets.org/ or http://www.epa.gov/methane/international.html
ECOFYS Options for the second commitment period
161
plement to the global process.
The advantage of a limited group would be that finding an agreement between three parties may be n between 189, but with a view to broader agreement to the outcome
e to the very divergent views and interests of these
s
ustainable
on patterns, governments agreed to increase the global
hannesburg
al JREC
meeting
nergy consumption is achievable in the EU by
governments of the participating countries commit to work towards these objectives, individually or jointly, by undertaking actions they have submitted for inclusion in the ‘International Action Programme’ and through other voluntary measures. They agree that
the EU has a high chance of being acceptable on a global level. This process would therefore be a sup
easier thaafterwards they will have to tackle a wide range of issues important to others. Although only three countries participate, they represent a large share of the global variation in national circumstances. On the other hand it is not guaranteed that these three parties would be able to reach a common position at all, ducountries.
11.2.3 Links to international activities in other fora
In addition to the climate negotiations, activities in other international fora are relevant for international action on climate change. This chapter covers other frameworks such arenewable energy, sustainable development and trade.
Activities on renewable energy could be very important for the negotiations on climate change. While renewable energy started to become important on the political agenda during the oil crisis in the mid 70s, it took almost three decades until renewable energy targets were discussed globally for the first time (IISD 2004). In 2002, renewable energy targets were raised at the WSSD (World Summit on Sustainable development) in Johannesburg, where it was considered as an important means to address different goals such as contributing to securing energy access in particular in developing countries, contributing to sdevelopment and poverty alleviation and eventually addressing the climate challenge (see also section 11.3.4 on side benefits).
One of the major outcomes of the WSSD was the adoption of the Johannesburg Plan of Implementation, which addresses renewable energy in several chapters. Regarding sustainable development and productishare of renewable energy sources substantially and emphasised the role and importance of national and voluntary targets and initiatives.
During the final WSSD Plenary, Denmark, on behalf of the EU, announced the formation of a like-minded group of countries on renewable energy, now known as the JoRenewable Energy Coalition (JREC). The EU, with the Alliance of Small Island States, Bulgaria, Cyprus, the Czech Republic, Estonia, Hungary, Iceland, Latvia, Lithuania, Malta, New Zealand, Norway, Poland, Romania, Slovakia, Slovenia, Switzerland and Turkey, issued a statement entitled "The Way Forward on Renewable Energy." The statement indicates participating countries have adopted, or will adopt, targets for the increased implementation of renewable energy, and will encourage others to do likewise. The first internationconference was held in June 2003, and focused on the regional status and potential for renewable energy use. By June 2004, JREC had 87 members and was being serviced by a Secretariat hosted by the European Commission (EC).
To advance on the renewable energy commitments and report on actions taken to foster renewables following the WSSD, the German government invited the international community in June 2004 to the international conference on renewable energy ‘renewables 2004’.
During preparation of the renewables 2004, the European Conference for Renewable Energy - Intelligent Policy Options, was held in January 2004, in Berlin, Germany. Theadopted the "Berlin Conclusions" urging, inter alia, EU institutions to start a political process of setting ambitious, time-bound targets for increasing the share of renewable energy in final energy consumption for the medium (2020) and long term. The Berlin Conclusions note that a 20% renewable energy target for gross inland e2020.
The renewables 2004 conference itself resulted in a political declaration where “Ministers and
ECOFYS Options for the second commitment period
162
d as foreseen in the Johannesburg
mitments to goals, targets and actions
y efforts can be supported.
al and economic
t and
the WSSD - the first session that took a critical and
key element that emerged during the session was the clear link between the Millennium Development Goals (MDGs) and the Johannesburg Plan of Implementation
relationship had its detractors in Johannesburg, two years later the
these measurable steps should be reported to the UN Commission on Sustainable Development (CSD) and that progress should be reviewePlan of Implementation. An appropriate arrangement for follow-up should be identified in a further meeting in preparation for CSD 14/15.”
In addition, an International Action Programme (IAP) was presented. It includes concrete actions and commitments towards developing renewable energies, which were put forward by a large number of governments, international organisations and stakeholders from civil society, the private sector and other stakeholder groups. All conference participants were invited to contribute to the IAP with voluntary comwithin their own spheres of responsibility.
International discussions on renewable energy are an important complementary element, but they are not to be seen as alternative to international efforts to address climate change. The climate agenda is so broad that it has proven useful to consider the specific issue of renewable energy separate and only with the countries really interested in the issue. Possibly other such complementar
Activities on Sustainable development: The Millennium Summit held in September 2000 concluded with the Millennium Declaration incorporating the Millennium Development Goals. These goals commit the international community to an expanded vision of development that vigorously promotes human development as the key to sustaining sociprogress in all countries, and recognizes the importance of creating a global partnership for development. The goals have been commonly accepted as a framework for measuring development progress. In total eight goals and eighteen targets were defined.
Goal seven “Ensuring Environmental Sustainability” addresses among other indicators, energy use and carbon dioxide emissions (per capita) and consumption of ozone depleting substances. These indicators relate to target nine “Integrate the principles of sustainable development into country policies and programmes and reverse the loss of environmental resources”. The Commission on Sustainable Development (CSD) emerged from Agenda 21 in June 1992 as a programme to be adopted by the United Nations Conference on EnvironmenDevelopment (UNCED). The CSD was created to ensure effective follow-up of UNCED, enhance international cooperation, and examine progress in the implementation of Agenda 21 at the local, national, regional and international levels. In 1997, at Rio+5, the implementation of Agenda 21 was reviewed and a five-year CSD work programme defined, which identified sectoral, cross-sectoral and economic sector/Major Group themes for the subsequent four sessions of the CSD.
CSD 12, held in April 2004, was - since comprehensive look on how the world is implementing sustainable development. The idea was put forward at that meeting that the CSD should be challenged to become the “watchdog” of progress aimed at implementing the Johannesburg goals and targets.
Another
(JPOI). While this rationale behind linking the two sets of international targets and goals has found a new home, with many delegates calling on the CSD to become an effective mechanism for monitoring progress. CSD-12 reaffirmed the WSSD’s agreement of placing the issue of poverty eradication at the center of the sustainable development agenda (IISD coverage CSD-12, 2004)
These international efforts on sustainable development are an important supplement to the climate negotiations. Development plays a crucial role in developing countries in mitigation (keeping GHG emissions low) as well as adaptation (strengthening adaptive capacity being able to cope with the occurring or expected changes).
Trade
ECOFYS Options for the second commitment period
163
nce in this area. In the field of trade relations, the US
that the preferred trade partner status does not necessarily apply to all
be worthwhile for the EU to review its ions. An
ven pe nbord dispute
The EU and its Member States generally do not have a strong history of linking different political issues to obtain a better negotiating result. Such linking might, however, provide an incentive for certain countries to take a more progressive stance in the climate negotiations. A recent example of such a linking is the negotiations with Russia on its WTO membership, which played a role in Russia’s ratification process of the Kyoto Protocol.
The US has more substantial experiecan award the most-favoured-nation (MFN) trading status to countries. In many cases25, this status is awarded permanently, but for certain countries such as China this status is reviewed on an annual basis (World Council on International Trade, 2004).
It should be noted goods of a certain country. It can also be valid for certain goods or products, e.g. if there is a shortage of a certain product in the importing country. Advantages that may be awarded to preferred trade partners are e.g. (International Trade Data system, 2004):
• The right to be paid before other creditors of the same debtor
• The use of lower duty rates on goods imported from some countries
• Admissibility of goods in quantities over and above those normally permitted
In the context of certain disputes, e.g. on human rights, the preferred trade partner status can be changed. The threat of removing this status can be an instrument in achieving certain negotiation objectives. An example where this may have played a role is the debate on the removal of China’s MFN status after the spy plane incident in April 2001 (Americans and the world, 2004).
In the context of the climate negotiations it mighttrade/foreign relations and current and/or potential future preferred partner provisanalytical step that might be useful in this perspective is to prepare a matrix in which for major parties in the climate negotiations (in terms of negotiation bottlenecks) the major trade/foreign relation partners in the EU and its Member States are identified. These can than be matched against existing preferred partner provisions to identify areas in which these relations can be used to further the negotiations.
One important bottleneck in this approach may be the strength of the position of the minister responsible for climate issues in relation to the other ministers. It depends whether the responsible minister has sufficient influence to make e.g. trade and foreign relations subject to this link. This will also be influenced by the relative importance the public attaches to the climate issue compared to other issues on the political agenda.
Other possibilities of linking, that may not have this drawback, can be the provision of financial or other support in certain areas as an award, e.g. related to capacity building in certain areas, technology transfer, etc.
Furthermore, tax adjustments at the border for energy intensive goods could be applied. The rationale would be that industries in a country with high energy taxes have a competitive disadvantage when selling their goods on the international market. Biermann and Brohm (2003) analysed whether certain border adjustments for energy taxes would be permissible under world trade law, in particular the General Agreement on Tariffs and Trade and the Agreement on Subsidies and Countervailing Measures. They conclude “that despite remaining ambiguity in both the legal provisions and the pertinent case law, border tax adjustments are under certain circumstances compatible with world trade law. Yet gi
rsisti g degrees of legal uncertainty, it seems likely that such energy tax adjustments at the er would be challenged by affected members of the World Trade Organisation before its
settlement mechanism.”
25 In total the MFN status is awarded to about 170 countries.
ECOFYS Options for the second commitment period
164
11
11
An va singleParty trepresepush in nal efforts (Gupta & Grubb, 1999, Obertür & Ott 1999, Ott et al. 2004). If the
• Structural leadership, referring to making use of general political and economic
itment
t and need to be extended further to close the gaps for a few EU
, the EU could show leadership in climate change specifically at the structural level.
g comparable statements. However, there are some
al initiatives to bring countries together under the issuthe ‘Grethis rega
Advantainternatamong potentiacountrie
.3 ELEMENTS OF A STRATEGY
.3.1 EU leadership
y en ironmental treaty needs a driving force to stimulate its implementation, which can be country or a country group. With regard to climate change, the EU is the Annex I
hat is politically most committed to act against climate change and thus would nt the only entity capable to act as a global leader today to further encourage and ternatio
EU takes the 2°C target seriously, it needs to show leadership.
The report of the South-North Dialog on Equity in the Greenhouse (Ott et al. 2004) mentions three different aspects of leadership:
weight
• Instrumental leadership, referring to building coalitions and alliances
• Directional leadership, referring to demonstrating solutions to others
Concrete implementation actions (directional leadership) provide positive signals to other Parties to follow since Parties will acknowledge that the leader is taking the issue seriously (see also Sections 11.3.2 and 11.3.4).
The EU for instance demonstrates such aspect of leadership already today by implementing measures to combat climate change through the implementation of the EU wide emissions trading system as of 1 January 2005, three years prior to the start of the first commperiod of the Kyoto Protocol. Additional climate change measures are implemented such as the renewable energy directive and the energy efficiency directive. Individual Member States pursue strategies at different levels, such as renewable energy support programmes that stimulate market penetration of low to zero emission technologies. These measures are a first step, but not yet sufficienmembers between current emission trends and the Kyoto targets.
In additionHere, this would mean to continue to commit to the Kyoto Protocol. It is important that the Parties that ratified the Protocol emphasize adherence to the emission reduction targets agreed under the Kyoto Protocol. The EU has officially stated that it would adhere to the Kyoto targets even if the Kyoto Protocol should not come into force and thus has set another signal to other Parties taking the climate change issue seriously. Thus, the EU acts as a driving force for other Parties stimulatinindividual Member States that attempt to weaken this resolve.
In addition, The EU could put in its weight linking climate change to other processes, including the preferred trading status discussed in Section 11.2.3. The support of the EU to the membership of Russia in the WTO would be an example.
Finally, leadership can be demonstrated by playing an active role in bringing countries together through informal discussions and dialog processes prior to negotiations thus representing instrumental leadership (see also chapter 11.3.3, 11.3.4). The EU and its member states are funding the informal process to foster information exchange (such as this project, FIACC), but it has not implemented offici
e of climate change – apart from its initiative to collaborate with the G77 by forming en Group’ in Berlin in 1995. The EU could seek to strengthen its leadership position in rd, as it has done for the coalition on renewable energy (JREC).
ges of the EU taking leadership are manifold: a) the EU would strengthen its ional recognition as a motor to combat climate change, b) the EU would enhance trust Parties to further talk, negotiate and undertake joint efforts no matter what the l obstacles might be and c) the EU would become preferred partner for developing s, partly with strongly growing economies and large domestic markets.
ECOFYS Options for the second commitment period
165
Being tcertain term, thtechnol in the EU could protest against the EU takicom tadvantaworld mcost inc sive industries that are internationally competing. And the besemissiofunding upport to bring existing technologies to markets.
Con qthe EU.
11.3.2
vs. economic efficiency): There is a
ambitious long-term targets
earchers, e.g. on the timing of action: Wigley et al. (1996; WRE profiles) argued that postponing abatement action is always
tegy, mainly because reduction options will become cheaper in the
d in the mitigation efforts. Developing countries are only willing to act after
d developing countries. The EU could promote approaches that facilitate the
he first to act could also provide a ‘‘competitive advantage’’ (Höhne 2003). It seems that measures to curb greenhouse gas emissions will have to be taken in the long ere is only a serious debate about when and which measures should be taken. New ogies will play an important role. Industry with
ng the lead in reducing emissions, arguing it would distort the international pe itiveness. But reducing energy costs and increasing productivity is always an
ge. In addition, early developed and adopted new technology can later be sold on the arket. And finally, policies could be designed in a way that does not lead to substantial reases for those energy-intent performing industries would have new economic opportunities for selling excess n allowances. This advantage could be further enhanced by further technology R&D by the EU, but also implementation s
se uently, a major part of any successful negotiating strategy should be the leadership by
Contents
The strategy would entail to consider in particular the critical issues with Parties that have opposite viewpoints.26 Building on the analysis provided in Chapter 3.2, Figure 1, we identify the following critical issues.
Urgency to act (environmental effectiveness different perception of ‘urgency’ between the USA and EU politicians and scientists. The US has the viewpoint that immediate emission reductions are not necessary and that it is sufficient to foster technology development so that emissions can decrease in the future. The EU rather believes that urgent action is necessary, as otherwise(such as a maximum 2°C temperature increase) may be out of reach within a few decades.
This fundamental difference cannot only be observed in the negotiations but also in the scientific literature comparing US authors and European res
a more cost-effective strafuture. On the other hand, mostly Europeans (e.g. Azar, 1998; Van Vuuren and De Vries, 2001) argued that early abatement can significantly accelerate technology development and therefore reduce costs. The difference is also apparent on the future design of an international climate regime (compare e.g. Aldy et al. 2003 and Criqui et al. 2004).
The EU should seek an active dialogue with the USA on their views on what level of emissions is necessary to prevent dangerous interference with the climate system in the short term. As the economic argument has high value in the USA, economists of both sides could be brought together to openly discuss the economics of acting early versus acting late (see also section 11.3.4 on side benefits).
Developing country involvement: There is a major conflict, mainly between advanced developing countries and the USA, on whether and how advanced developing countries should be includethe USA has acted, the USA will only act together with the developing countries.
On this controversial point, the EU could enable the dialogue between the USA and the advanced developing countries, as this issue can ultimately be solved only between the USA and the advanceparticipation of developing countries, such as a multistage setting with first targets for developing countries that avoid capping economic growth or the Triptych approach.
In addition, one could aim to combine the actions already occurring in developing countries with the concept of “meaningful participation” of developing countries requested by the USA. Advanced developing countries have a clear desire to develop in an efficient way and already
26 On the importance of focal issues see also Hasenclever et al. (2000)
ECOFYS Options for the second commitment period
166
impinternat o have USA incladv cactivitie ve to incl
Adaptathat of athe dev ies has to be intensified.
It h t is the case
t effective
change and the ffects of “response measures” (actions by Annex I Parties to reduce emissions and
therefore, e.g., lowering the revenues from oil exports) on developing countries. This explicit link in e Convention prevented fast progress on adaptation.
shape ocol are really unacceptable
that a ing country “involvement” are the major obstacles
boundemiss ll be, that in the future the USA will
Techn
emiss agree ration of technology under the UNFCCC is
Certai d also provide an incentive for Parties that
2 storage.
lement actions towards low emissions. But by no means they want to be bound by ional obligations. Possibly, least developed countries (with the aim t
uded in the reduction effort to reduce the impacts of climate change) could convince an ed developing countries to adopt some kind of targets for the already occurring
s that could move the USA to also adopt measures. These targets would also haude a little extra effort and would have to be quantified but on a voluntary basis.
tion: A still unresolved and difficult topic in the international climate negotiations is daptation (see also Chapter 6). Here, the dialogue between the Annex I countries and
eloping countr
as o be clarified whether “adaptation” is used to refer to damage repair (aswith insurance) or to damage prevention (increasing adaptive capacity). As a first step a clear definition of adaptation should be agreed upon, or at least constituencies should always make clear, which kind of adaptation they refer to.
Many of the issues considered under adaptation are beyond the coverage of the UNFCCC regime. Promising options for further action on adaptation are the inclusion of adaptation considerations into development and disaster relief (mainstreaming). Buimplementation of these options would occur outside of the UNFCCC regime. As a consequence, a separate adaptation protocol under the UNFCCC may not seem adequate. The issues are too broad to be covered only under the UNFCCC. In addition, it could distract attention from the urgent need to address mitigation.
On the other hand, the issue of damage repair and restoration is clearly a matter related to climate change and the UNFCCC. Within the UNFCCC regime, narrowly defined adaptation projects could be implemented through the available funds (GEF, least developed country fund and later the special climate change fund and the adaptation fund). Here, a clear commitment of developed countries could be voiced to support adaptation activities also outside of the UNFCCC.
e EU should work towards de-linking adverse effects of climate In addition, the
Article 4.8 of th
Kyoto or not Kyoto: Another major conflict between the USA and the EU is the rejection or continuation of the Kyoto Protocol. The USA is rejecting it, although US negotiators have
d it significantly. It is unclear, which elements of the Protand which could be kept. One could assume that the nature of an absolute cap, the level of
bsolute cap and the missing developfor the USA as voiced several times. The flexibility over gases, sectors and national
aries introduced through emission trading is likely to be supported by the USA. As ion trading works best with absolute caps, it could we
also support absolute caps, see speech by Senator Byrd (2003). It would be useful to get a clearer view of which elements are acceptable and which not would be a step forward.
ology: Another topic of particular interest to the USA and Japan is that of “technology”. It seems clear that technology will have an important role to play in reducing greenhouse gas
ions, but it is unclear how “technology” can be incorporated within an internationalment on climate change. The current conside
related to technology transfer and less to technology development. Further dialogue has to be sought with the USA and also Japan on how technology development can be supported and integrated in an international agreement.
n areas of technological cooperation couleither depend heavily on fossil fuels or whose GDP is strongly determined by the export of fossil fuels (e.g. OPEC countries). Relevant technologies could include CO removal and
ECOFYS Options for the second commitment period
11.3.3 Partners
167
iscussed above, the strategy also includes the dialogue with ation of coalitions and strategic considerations to split up existing
possib
compl ary measure to the UNFCCC/Kyoto Protocol (see Section 11.2.1). However, the
becom up state
the la
may le d etween companies from different states. Similar harmonisation efforts have in the past led to
the US-wide adoption of progressive legislation first adopted in e.g. California, at the request of companies active in several states.
The United Kingdom could play an important role in bridging the gap between the EU and the USA. UK Prime Minister Blair has announced that climate change would be a priority for his G8 presidency in 2005. It seems likely that the UK will start an initiative to join also the USA on climate change.
The USA is initiating various activities that are within their interests, such as the initiative on carbon sequestration technologies or the programme “methane to markets”. As multiple efforts are needed to reduce emissions, these activities could well be support by the EU, but they should not distract from a comprehensive international approach.
Dialogue with the individual groups within the G77: Non-Annex I countries with their diverse national circumstances, and therefore sometimes opposite interests, are joined in the ‘Group of 77 and China’ or ‘G77’. This group represents the interests of all developing countries, most of which have the common difficulty of having scarce resources available for the international negotiations. Within the G77, small island states (e.g. Marshall Islands, Tuvalu) fear loss of their territory due to sea level rise and have formed the Alliance of Small Island States, AOSIS. Oil producing countries (e.g. Saudi Arabia, Qatar) fear loss of their income and act accordingly. Rapid developing countries like China fear a constraint to development. The group of the least developed countries can receive special benefits under the Convention and more and more act as a group.
The EU could seek a dialogue with the separate groups of countries within the G77:
Strengthening least developed countries is important, since these countries have similar interest as the EU. They are favouring immediate global mitigation action. Being most threatened by the impacts of climate change, these countries could opt within the G77 for an opening of a discussion on next steps after 2012. But LDCs would have to be actively supported with capacity building measures to be able to effectively negotiate within the G77.
Concentrate on selected advanced developing countries: Engage in a direct dialogue with the major emitting and advanced developing countries to understand their concerns and opportunities. These countries could include Brazil, China, India, Mexico, South Africa and South Korea. Such direct dialogue could benefit from analytical work on the individual countries.
Oil exporting countries: Oil exporting countries are a very influential group within the G77. Their negotiators are often selected to represent the G77 as a whole. Due to their often
In addition to the topics drespective partners, the formcoalitions that hinder progress on future commitments. This section discusses a few
ilities, building upon Chapter 4.
USA: The extension of the EU ETS to include other countries was discussed as a possible ement
EU ETS may also be used as an instrument to involve the USA. Several US states are ing active in the area of (GHG) emissions trading and are planning to set
systems. If the EU ETS would allow individual states to link their systems, this would increase the flexibility of the participating US companies to achieve their targets by having access to
rger EU market. Care must be taken, on the other hand, to not jeopardize the overall effectiveness of the EU ETS by lowering price levels due to generous US State allocations. It may also lead to a turn in the US position on economic risks of climate policies. In addition, it
ad to a call for harmonisation of legislation between US states to level the playing fielb
ECOFYS Options for the second commitment period
168
unconstructive behaviour in the negotiations, they are often excluded from the considerations. lso s.27
Building coalitions with countries having renewable energy targets: The EU could countries that have formulated clear national or
o
(no Party should have the impression of being
t, the EU could engage scientists to discuss the question of urgency of the action, with negotiators as observers. This could even be of the form of organizing a global scientific conference on future climate policy. Such conference does not exist yet and would be a very useful addition to the scientific conference landscape.
Work on quantification of (monetary) benefits of climate policy: The costs of climate change policies have received much attention in the climate debate. The topic of ancillary
Any concept should a include a solution for those countrie
strengthen coalitions with those developingvoluntary targets to increase the share of renewables. Several country governments have voluntarily committed to take on renewable energy targets and a compilation of those national commitments was provided at the Bonn renewables 2004. A list of national targets (not inclusive but indicative) is provided below to indicate the available range of commitments.
Egypt committed to meeting 14% of the Egyptian electricity demand with Renewables in 2020 subject to appropriate financing schemes to render renewable energy projectcompetitive
Argentina wants to promote renewables with the aim of achieving 8% of power consumption from renewable energies in the country (JREC commitment)
Philippines aims at doubling the generation capacity from renewable energy sources by 2013
China announced formulating a renewable energy act (or law) and a national renewable energy development strategy. The expected result is an annual use of renewable energy up to a 17% share in China’s projected energy consumption in 2020.
Those c untries that are willing to move forward on the issue of renewable energy may also be good partners in the general climate change negotiations. The EU could seek partnerships with advanced DCs to promote mitigation measures, such as renewables targets or power sector modernisation.
11.3.4 Supporting activities
In addition to the activities described above, the EU could play an active role in bringing countries together on climate change. The following activities could be envisaged: Capacity building is an important and critical issue needed to a) ensure future negotiations are perceived fair by all negotiating Partiestreated unfair due to lack of information and knowledge on future commitment schemes) and to b) future negotiations can be handled in a time and cost effective manner. It is important to note that today many developing countries do not have the personnel and financial resources to be well represented at the negotiations and often have to miss important sessions.
The EU has recognised the need for supporting developing countries by enhancing their capacity to become well-informed and confident negotiating counterparts. The EU Commission thus has initiated a new 3-year programme that will address building capacity in developing countries on future international action on climate change. The project is expected to start in January 2005.
Individual countries within the EU could supplement these efforts by supporting similar activities.
Encourage scientific dialogue: To bridge the divide in views on the urgency to ac
27 For most oil exporting countries, oil exports are responsible for around half of the national GDP. For coal exporting countries, the revenues are usually only a few percent of GDP.
ECOFYS Options for the second commitment period
169
natural ecosystems and any productive functions of e.g. forests, agricultural fits, which may
and operation of projects, increased
iency on the demand-side will reduce energy cost, increase productivity and
• Policies aiming to reduce transport emissions can positively influence the mobility of poor people e.g. through increased access to public transport, reduce traffic jams and traffic accidents, and as mentioned before improve air quality adependency on imported oil.
• Sustainable forestry activities lead to the recovery of degraded soils and watershed restoration, permanent job creation, the introduction of sustainable production systems and a better quality of life;
• Waste management projects may lead to energy generation from waste (landfill gas, manure management, etc), decreased photochemical smog formation from NMVOC, improved leach ate control (i.e. better protection for ground and surface water), reduced risks of fires and explosions, reduced odour problems and better control of pathogens, all leading to improved health of the local population
Considering these benefits can decrease the reluctance to climate mitigation policies. However, this would require a systematic approach to quantifying (and possibly monetarising) these effects in a way that is transparent and acceptable to many countries. A first step in this direction has been made in e.g. Criqui et al. 2004.
Communication strategy: To help the strategy to become a success and to avoid any misunderstandings, the EU should explicitly address how it will communicate to other industrialised countries, developing countries and to the public.
Especially public communication can be enhanced. Climate change “sceptics” receive large attention in the media, while the mainstream scientific opinion of e.g. the IPCC is less heard. An awareness campaign in the EU could raise local support.
11.4 CONCLUSIONS
To meet the EU’s long-term goal that “global average temperatures should not exceed 2 degrees Celsius above pre-industrial levels”, serious efforts are required on multiple levels. Negotiations within the UNFCCC have to be supplemented by agreements on renewable energy, technology in general and development cooperation. In addition, capacity building for developing countries and support for the scientific community is needed.
In this effort, EU leadership is crucial. Directional leadership (meeting the Kyoto targets, predominantly domestically), instrumental leadership (actively building coalitions) and structural leadership (making use of the general and economic weight of the EU) are needed.
benefits associated with climate change mitigation has received much less attention. It should be noted that we refer here to side benefits of (net) emission reduction policies, not the avoided costs of adaptation to a changing climate. Such benefits may include aspects such as the reduction of other environmental concerns, e.g. acidification, eutrophication, local air pollution of fine particles. This will lead to reduced health damage and reduced damage to buildings andlands and surface and ground water. There are many other side beneespecially be relevant for developing countries.
• Increasing supply efficiency and the implementation of renewable energy will lead to an improved quality of life and increased productivity through an increased access to electricity, direct job creation from realisationsecurity of supply and a decreased dependency on imported fuels, thereby improving political stability as well as the national trade balance. In addition, improving energy efficdecrease or delay the need for new power plants. For rural electrification projects these benefits are more localised and therefore stronger. Because often no viable alternatives for electrification exist, more expansive technologies (e.g. PV) can be used. Additional benefits are improved health because of improved indoor air quality (decreased use of e.g. kerosene lamps), less costly transport of diesel to remote areas and reduced migration to urban areas.
nd decrease
ECOFYS Options for the second commitment period
170
The EU could be more aware of the weight it can have as a major trading or political block, nk s, such as trade relations and
n.
isions could be aimed at:
s it is crucial for the stringency of
uld be an
and not hesitate to li the climate change issue to other issueforeign relations.
The USA needs to be in the focus of EU efforts. An expanding EU emission trading systemcan be complementary to the UNFCCC / Kyoto Protocol. This expanding system may include US States, providing a lever to future involvement of the US at a federal level after harmonisatio
Further, the dialogue with developing countries should be intensified. The EU should concentrate on those countries within the G77 and China that have shown first actions and would be eager to further extend actions provided the framework is acceptable. The goal must be to find ways to formulate targets that are acceptable for active developing countries to date. The EU could promote approaches that facilitate the participation of developing countries, such as a multistage setting with first targets for developing countries that avoid capping economic growth or the Triptych approach.
Within the UNFCCC process, the following sequence of dec
• Further definition of the long-term ambition level, ashort-term reductions and the timing of participation of further countries
• Agreement on types of commitments (e.g. binding emission targets or policies and measures), including an indication when they should be assumed and by whom
• Definition of the accounting or monitoring rules for these types of commitment (for emission reductions e.g. the question on the inclusion of emissions from land use change and forestry, international aviation and shipping as well as other greenhouse gas agents.)
• Agreement on target values (reduction percentages or specific policies)
A key to break the deadlock could be to agree already in a mandate for the negotiations on future commitments at COP 11 in November 2005, which types of commitments will be taken by various groups of countries and when, e.g. binding emission limitation and reduction targets for all developed countries together with sustainable development oriented or non-binding targets for most developed countries for 2020 but binding targets in 2030. Giving it a long-term but defined perspective may increase the acceptability for all countries.
In addition, the efforts complementary to the UNFCCC, such as the coalition and the targets on renewable energy, should be further enhanced.
Finally, the EU should be instrumental in bringing scientists together on the future climate policy. An international scientific conference on the future climate policy woopportunity for the exchange of the divergent views on the most effective and efficient long-term climate policy. In addition, the elaboration and quantification of side benefits of emission reduction measures could be an important tool to reduce the reluctance against climate policies in the international negotiations.
Meeting the 2°C target is a major challenge. We would hope that the array of activities presented in this strategy will help the EU in meeting this challenge.
11.5 REFERENCES
Americans and the world 2004, US relations with China, available at http://www.americans-world.org/digest/regional_issues/china/china9.cfm, 29 July 2004.
eduction - the Debate Revisited, International Journal of Azar, C., 1998. The timing of CO2-emissions REnvironment and Pollution 10, 508-521.
Berk, M.M., den Elzen, M.G.J., 2004. What if the Russians don't ratify? RIVM report no. 728001028, National Institute for Public Health and the Environment, Bilthoven, the Netherlands. Available at http://www.rivm.nl/bibliotheek/rapporten/728001028.html
ECOFYS Options for the second commitment period
171
. “The Administration's Failed Climate Change Policy”, speech available at
opted by the General Assembly, 18 September
Biermann, Frank, and Rainer Brohm. 2003. Implementing the Kyoto Protocol Without the United States: The Strategic Role of Energy Tax Adjustments at the Border. Global Governance Working Paper No 5. Potsdam, Berlin, Oldenburg: The Global Governance Project. Available at www.glogov.org.
Robert C. Byrd 2003http://byrd.senate.gov/byrd_speeches/byrd_speeches_2003october/byrd_speeches_2003october_list/byrd_speeches_2003october_list_4.html
Gupta, J. and M. Grubb (1999), Climatic change and the leadership paradigm. Options for the European Union, Kluwer, Dordrecht.
Hasenclever, A., P. Mayer and V. Rittberger (2000), Integrating theories of international regimes, Review of International Studies, Vol. 26, 3-33.
Höhne, N 2003, “The EU should go ahead with the implementation the Kyoto Protocol without Russian ratification”, Climate Policy 3 (2003) 479–480
IISD, 2004 “Renewables 2004 bulletin” available at…
International Trade data system 2004, International trade terms, available at http://www.itds.treas.gov/glossary6.html, 29 July 2004.
Oberthür, S. and H. E. Ott (1999), The Kyoto Protocol. International climate policy for the 21 century, Springer Verlag, Berlin.
Ott et al. South North dialogue
Sugiyama, T and Sinton, J. 2003 “Orchestra of treaties”. Draft, available at http://www.fni.no/post2012/sugiyama_sinton_paper_draft.pdf
United Nations Millennium Declaration: Resolution ad2000
Van Vuuren, D.P. and De Vries, H.J.M., 2001. Mitigation scenarios in a world oriented at sustainable development: the role of technology efficiency and timing. Climate Policy, 1: 189-210.
Wigley, T.M.L., Richels, R. and Edmonds, J.A., 1996. Economic and environmental choices in the stabilisation of CO2 concentrations: choosing the "right" emissions pathway. Nature, 379: 240-243.
World Council on International Trade, 2004, Issue brief: China's MFN Status, available at http://www.wcit.org/resources/publications/issue_briefs/ib_china_mfn_status.htm, 29 July 2004
ECOFYS Options for the second commitment period
172
APPENDIX A KICK OFF PAPER NO.1 Converging per-capita emissions Kick off contribution for the on-line discussion on www.fiacc.net from 27 January to 3 February 2004
A future international climate regime based on converging per-capita emissions in conjunction crease in global emissions towards stabilization of greenhouse gas
has been proposed by many institutions, most prominent by the Global
ents for the principle idea
concept in general think of possible ways to s of countries, e.g., by
ch d
th Africa, North Korea, Namibia, Thailand, China) will soon (e.g. 2020) be constrained and will not receive excess allowances. More excess allowances would be available under a higher concentration target, e.g. 550 ppmvCO2, or under earlier convergence, e.g. by 2030.
with a gradual deconcentrationsCommons Institute as the main component of the “Contraction and Convergence” approach28.
Converging per-capita emission is traditionally considered an approach supported by many developing countries. It is based on the principle to share the common good of the atmosphere equally between citizens. Many developed countries, led by the US, have very strongly opposed such an approach - even to the concept of using per-capita emissions as an indicator. As a result, Annex I Parties are not required to report per-capita emissions in their National Communications.
Recently, the German Advisory Council on Global Environmental Change has slightly changed this “black and white picture” by recommending the contraction and convergence approach as the most suitable one for a comprehensive solution of the problem.29 This most elaborate advocacy was preceded by some more general endorsemof C&C.
Per-capita convergence is a simple approach and easy to understand: All countries participate and per capita emission allowances converge to the same level until a predefined date, e.g. 2030 or 2050, so that global emissions lead to a predefined stabilization level. But maybe per-capita convergence is too simple to adequately take into account the great variety of national circumstances, to which individual country parties often refer. Therefore, quite a few proponents of an equal per capitaaccommodate these circumstances by differentiating between groupallowing for delayed entry into the scheme, differing types of targets in the beginning, or tolerance clauses, which could allow opting out for least developed countries triggered by predefined thresholds for participation.
It is the general perception that under per-capita convergence large resource transfers will take place through emission trading from the developed countries (whi rastically need to reduce emissions) to developing countries (which will receive more emission allowances than they would need to cover their emissions).
However, several recent studies (RIVM30/ECOFYS31) providing detailed calculations show that for relatively strict long-term targets (e.g. 450 ppmvCO2) and convergence by, e.g., 2050, not all developing countries would benefit from this approach. As the per-capita emissions have to converge to a level below current average of developing countries, those developing countries above or close to the average (e.g. Argentina, Brazil, Venezuela, Mexico, Sou
28 See http://www.gci.org.uk/images/CC_Demo(pc).exe 29 WBGU, 2003 “Climate Protection Strategies for the 21st Century. Kyoto and Beyond”, http://www.wbgu.de/wbgu_sn2003_engl.html 30 Den Elzen, M.G.J., Berk, M.M., Lucas, P., Eickhout, B. and Van Vuuren, D.P., 2003. Exploring climate regimes for differentiation of commitments to achieve the EU climate target. RIVM Report no. 728001023, National Institute of Public Health and the Environment, Bilthoven, the Netherlands, page 53, http://arch.rivm.nl/ieweb/ieweb/Reports/728%20001%20023_final_V1.pdf 31 Höhne, N.; C. Galleguillos, K. Blok, J. Harnisch, G.J.M Phylipsen (2003): Evolution of commitments under the UNFCCC: Involving newly industrialized economies and developing countries. Research Report 201 41 255. UBA-FB 000412, page 41, http://www.umweltbundesamt.org/fpdf-l/2246.pdf
ECOFYS Options for the second commitment period
173
accredited and traded within
ted in a per-capita convergence approach? How to operationalise, e.g. a “per ncept (EcoEquity), a “tolerance clause” (German WBGU) or “regional bubbles”
(GC e
Niklas Höhne
On the other hand, it becomes apparent in many studies, that reaching a fixed global emission level is easier for Annex I countries, if all Non-Annex I countries participate immediately (converging per capita emissions), compared to a gradual phase-in of developing countries receiving commitments (a “multistage” approach), because only then relatively cost effective mitigation options in some developing countries can bethe system.
Following questions would also be interesting to discuss in the on-line forum:
- Have developing countries (especially those with relatively high per-capita emissions) recently voiced their positions on converging per capita emissions or in particular “contraction and convergence”? What about developed countries?
- Is the advantage of per-capita convergence, that all countries participate in the reduction effort immediately, sufficient to convince opposing developed countries of the merits of this approach?
- Which modifications to per-capita convergence might be appropriate to accommodate different national circumstances in developing and developed countries to facilitate acceptance? E.g. how can developing countries with relatively high per capita emissions be accommodacapita plus” co
I) tc.?
ECOFYS energy & environment
ECOFYS Options for the second commitment period
174
Prospects for the role of the US in the international climate protection process Kick off contribution for the o iac
APPENDIX B KICK OFF PAPER NO.2
n-line discussion on www.f c.net from 26 February to 5 March 2004
c o ch tou ram ate
its Kyoto Protocol processes ucially influenced the philosophy and design of this treaty system. As the worlds largest emitter of greenhouse
ases (about one quarter of the global CO2 emissions in 2000, one fifth of all six “Kyoto sion of the USA is indispensable for any effective climate protection regime. is even more so necessary politically, since developing countries will only
follo A“dem
How oAlreadypromine 1997 (Byrd-Hagel Resolution, S.Res.98),
at they would only commit to reduce their greenhouse gas emissions, if also important eveloping countries engage in considerable efforts of climate protection (“meaningful
GBM mandate to negotiate a protocol that recognizes the industrialized nations historical responsibility for climate change and should as first step reverse the trend of industrialized countries greenhouse gas emissions.
Hope for ratification of the Kyoto Protocol by the USA expired finally, when the president of the USA, George W. Bush in March 2001 publicly denounced the treaty as economically ruinous for the USA and unfair, since major developing countries, esp. China and India, are not included. In the follow-up the US government presented a national climate protection goal, which plans a reduction of greenhouse gas emissions relative to its GDP. Between 2002 and 2012 this measure should be lowered by around 18%, which according to many experts’ view
bles business as usual. Any consideration of further action was thereby 2, when reviewing the effect and adequacy of this (voluntary) goal.
In t robservesupportobligatiomaintai
COP 9 in Milan 2003, however, has seen the USA heavily promoting its hydrogen and climate science research programmes as the way forward in climate protection, many would say as an actionist disguise for postponing real action. At home, the US administration has recently bee l resolution to justify a “know
othing” policy vis-à-vis climate change. He made clear, that quantified emission duction targets (also for the USA) are at the heart of emissions trading, a mechanism, which key to any cost-effective international treaty.
Is the US
Signs of hope from the federal states? Looking beyond the federal administration, however, reveals a proactive role of more and more federal states in climate protection in recent years. The northeast states, e.g., together with five east Canadian provinces are aiming at cutting their greenhouse gas emissions until
The International climate protethe result of many years ofChange and
tion architecture is coined by tw agreements, which are eaework Convention on Climthe USA, cr
gh negotiations: The UN F. In both negotiation
gGases”) the incluUSA participation
w nnex I countries in curbing their emission trends, if real efforts of the latter and onstrable progress”, esp. by the USA, can be shown.
t re-engage the USA in the multilateral process? in the run-up to the negotiations of the Kyoto Protocol the USA made clear, ntly in form of a senate resolution from July
thdparticipation”). This claim, however, ran counter to the A
essentially resempostponed to 201
he ecent past, esp. during COP 8 in Delhi 2002 a strategy change of the USA could be d. Instead of demanding meaningful participation of developing countries, it expressly ed developing countries in their strict rejection of any discussion of climate protection ns for them. This was seen by many observers as an efficient method to help to
n the present impasse of the international climate protection negotiations.
n b amed by Senator Byrd for hiding behind the Byrd/Hagel nothing, do nreis
What can be done at the multilateral stage to meaningfully re-engage the USA? technology approach just a dead end street to a fossil fuelled “hydrogen” economy or does it provide for effective links to new international cooperation and action? Can we expect the US to take on binding emission reduction targets in the future or shall we rather search for other types of commitments to engage the USA?
ECOFYS Options for the second commitment period
175
wable energy targets (shares in energy portfolio) exist in 14 tates (incl. Texas).
more facets could be mentioned, but this mes down to the conclusion, that state ral go w, chang . In
stateme e tion”. C by
enators missions
late 2003. Although, i.e. its 95 to 0
A move the federal government to reengage in action contributes to a more constructive
USA in international climateral states in thei eme in the Northeast of the USA be a feasible option? What
d be the preconditions regarding the design of federal state emission trading systems?
ather extremes, the risk of law
or these attempts to be successful, it is, however, essential to maintain momentum in the ternational or regional (EU, Japan, Canada ...) climate process , e.g. by setting clear near
signals to the markets. A successful “Renewables” conference in June in Bon G
What w2012)? sures on the USA to be more proactive on climate hange? Is it after the start of an EU emission trading system in the direct business interest of uropean and transnational businesses, that the US will rejoin an international climate gime? Is business already doing what governments seem to be unable to: think beyond the
next decade? If so, which part of bto do so? How can one conceivemultilater
anagement of business regarding the mounting climate risks? Would it make sense, to itiate negotiations restricted to the car and airplane producer countries, to initiate joint chnological action?
[Questions in italics are meant to constitute the initial threads of the online debate, any other threads can, however, be introduced as well.]
Martin Weiß, Federal Environment Agency, Berlin, Germany, [email protected]
2010 to the level of 1990 and again 10% lower by 2017. The state New York was first to establish a regional certificate market for power plants and won the interest of nine neighbouring states to join. Renes
Many all colevel could be a lever to pressure the fedethat 75% of the population regard climate November 2003, 60%
vernment towards action. Opinion polls shoe as a real problem demanding real actionnt, that “we know, assented to the
change” and that “it is time to start acRepublicans, a bill introduce
what to do against climatonsequently, even in a Senate dominatedMcCaind by S
essentially covers 80% of US CO (REP) and Liberman (DEM), which
and requires those to fall to 1990 levels by2 e2012, got 43 out of 100 votes inin breaking the Byrd/Hagel myth
defeated in its first attempt, it succeeded vote back in 1997.
Can action of federal states in the USinternational climate negotiations? If state engagement of the e protection, how can Europe or international
r efforts? Would linking the EU emissionsagents in general support fedading system to a similar schtr
woulOr could Border Tax Adjustments be applied for companies who are neither part of the EU-ETS nor a comparable US scheme? Since US ENGOs are crucial for public opinion and domestic political will, how can they be supported?
Are Business and Finance getting the point ? Emerging emissions trading systems, high potential costs of wesuits because of climate related damages, and geopolitical risk (oil dependence) are all increasing stakeholder activism and are pointing business and especially finance markets to incorporating “carbon risks” into their balances. WestLB Panmure, a major finance services company, estimates Market Value at Risk in the order of 210 to 915 billion US$. To attribute those risks to individual companies and make them transparent to investors and shareholders, the so-called “Carbon Disclosure Project” (35 investors worth 4.5 trillion US$) started in 2002 to request emissions data from the 500 largest corporations globally. A few other investors and agents like US state and city treasurers have also begun to request disclosure of financial risks or to assess long term risks to major investments posed by climate change.
Finterm targets as
n, ermany could be an important driver for business to come in.
ill be the likely role of business in the next round of negotiations (on action post Can and will businesses put pres
cEre
usiness? Which type of regulation can increase the ability of a BINGO/ENGO alliance to press for a new effort in
al process? What alliances of this kind already exist? What is an adequate risk minte
ECOFYS Options for the second commitment period
APPENDIX C KICK OFF PAPER NO.3
176
DangeroKick off contri
us Anthropogenic Interference bution for the on-line discussion on www.fiacc.net fromsday 6 April 2004
Tuesday, 30 March until Tue
Introduction The steadily growing debate over short and long term climate policy and the accelerating
ess of the scale of projected climate impacts, including the increasing risk of ab
es, which can be related to h change of climate parameters. These parameters will, in turn, be
d lution of emissions and consequent atmospheric greenhouse gas c ate change outcomes to determine those that may ndertaking, involving substantial u lue judgments.”
he debate as to what is dangerous anthropogenic interference
s climate change in the last year or two. We mention four here, in addition to the ports of the IPCC, that we judge particularly important, and which we suggest as further
background for this discussion. In roughly chronological order, they are:
'Neill and Oppenheimer in Science Magazine,33 in which they recommended a limit of 1ºC beyond 1990 temperatures to protect coral reefs,. 2ºC to protect the Greenland and West Antarctic Ice sheets; and 3º to protect the thermohaline circulation;
2)
Global Change (WBGU) and its supporting ocumentation calling for stabilization not higher than 2ºC above pre-industrial,35
scientific awarenrupt climate change, has focused increasing attention on Article 2 of the UNFCCC. This
calls for the "stabilization of greenhouse gas concentrations in the atmosphere at a level that would prevent dangerous anthropogenic interference with the climate system". Such a level “should be achieved within a time frame sufficient to allow ecosystems to adapt naturally to climate change, to ensure that food production is not threatened and to enable economic development to proceed in a sustainable manner.”
Defining the meaning of Article 2 and operationalizing it entails a broad set of very complex scientific, political and ethical issues. As Anand Patwardhan, Stephen Schneider and Serguei M. Semenov point out in a concept paper for the IPCC in mid 2003: 32
Thus, the term “dangerous anthropogenic interference” may be defined or characterized in erms of the consequences (or impacts) of climate change outcomt
t e levels and rates ofetermined by the evooncentrations. Evaluating the consequences of clim
be considered “dangerous” is a complex uncertainties as well as va
TIt is beyond the scope of this paper to review the current scientific literature regarding potential impacts of climate change. There have been numerous contributions to the debate on dangeroure
1) An editorial in 2002 by O
A position paper issued at COP-8 by the International Climate Action Network34 calling for global temperature increase to be held below two degrees above pre-industrial levels and then to drop, based on a wide range of concerns for equity, human health, and ecosystems;
) A report by the German Advisory Council on3d
32 This paper is available for reference at http://www.fiacc.net/data/cct3_Art_2_key_vulnerabilities.pdf 33 O'Neill, B. C. and M. Oppenheimer (2002). "Climate change - Dangerous climate impacts and the Kyoto protocol." Science 296(5575): 1971-1972. 34 Climate Action Network (2002). Preventing Dangerous Climate Change, available at http://www.climatenetwork.org/docs/CAN-adequacy30102002.pdf 35 Grassl, H., J. Kokott, et al. (2003). Climate Protection for the 21st Century: Kyoto and beyond. Berlin, German Advisory Council on Global Change (WBGU). Available at http://www.wbgu.de/wbgu_sn2003_engl.pdf. Also Hare, W. (2003). Assessment of Knowledge on Impacts of Climate Change – Contribution to the Specification of Art. 2 of the UNFCCC. Berlin, German Advisory Council on Global Change (WBGU),. Available at http://www.wbgu.de/wbgu_sn2003_ex01.pdf
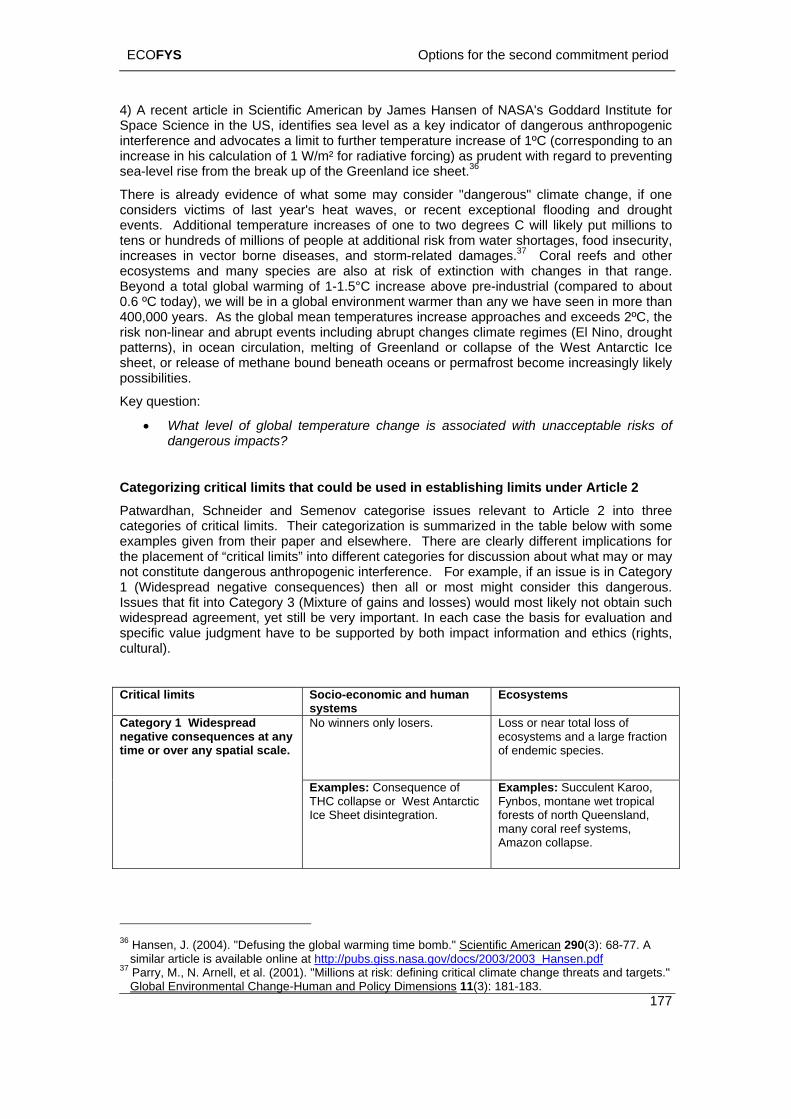
ECOFYS Options for the second commitment period
177
4) A recent article in Scientific American by James Hansen of NASA's Goddard Institute for Space Science in the US, identifies sea level as a key indicator of dangerous anthropogenic interference and advocates a limit to further temperature increase of 1ºC (corresponding to an increase in his calculation of 1 W/m² for radiative forcing) as prudent with regard to preventing sea-level rise from the break up of the Greenland ice sheet.36
There is already evidence of what some may consider "dangerous" climate change, if one considers victims of last year's heat waves, or recent exceptional flooding and drought events. Additional temperature increases of one to two degrees C will likely put millions to tens or hundreds of millions of people at additional risk from water shortages, food insecurity, increases in vector borne diseases, and storm-related damages.37 Coral reefs and other ecosystems and many species are also at risk of extinction with changes in that range. Beyond a total global warming of 1-1.5°C increase above pre-industrial (compared to about 0.6 ºC today), we will be in a global environment warmer than any we have seen in more than 400,000 years. As the global mean temperatures increase approaches and exceeds 2ºC, the risk non-linear and abrupt events including abrupt changes climate regimes (El Nino, drought patterns), in ocean circulation, melting of Greenland or collapse of the West Antarctic Ice sheet, or release of methane bound beneath oceans or permafrost become increasingly likely possibilities.
Key question:
• What level of global temperature change is associated with unacceptable risks of dangerous impacts?
limits under Article 2 Pa
nd human Ecosystems
Categorizing critical limits that could be used in establishingtwardhan, Schneider and Semenov categorise issues relevant to Article 2 into three
categories of critical limits. Their categorization is summarized in the table below with some examples given from their paper and elsewhere. There are clearly different implications for the placement of “critical limits” into different categories for discussion about what may or may not constitute dangerous anthropogenic interference. For example, if an issue is in Category 1 (Widespread negative consequences) then all or most might consider this dangerous. Issues that fit into Category 3 (Mixture of gains and losses) would most likely not obtain such widespread agreement, yet still be very important. In each case the basis for evaluation and specific value judgment have to be supported by both impact information and ethics (rights, cultural).
Critical limits Socio-economic asystems No winners only losers.
Loss or near total loss of ecosystems and a large fraction of endemic species.
Category 1 Widespread negative consequences at any time or over any spatial scale.
Examples: Consequence of THC collapse or West Antarctic Ice Sheet disintegration.
Examples: Succulent Karoo, Fynbos, montane wet tropical forests of north Queensland, many coral reef systems, Amazon collapse.
36 Hansen, J. (2004). "Defusing the global warming time bomb." Scientific American 290(3): 68-77. A
similar article is available online at http://pubs.giss.nasa.gov/docs/2003/2003_Hansen.pdf 37 Parry, M., N. Arnell, et al. (2001). "Millions at risk: defining critical climate change threats and targets."
Global Environmental Change-Human and Policy Dimensions 11(3): 181-183.
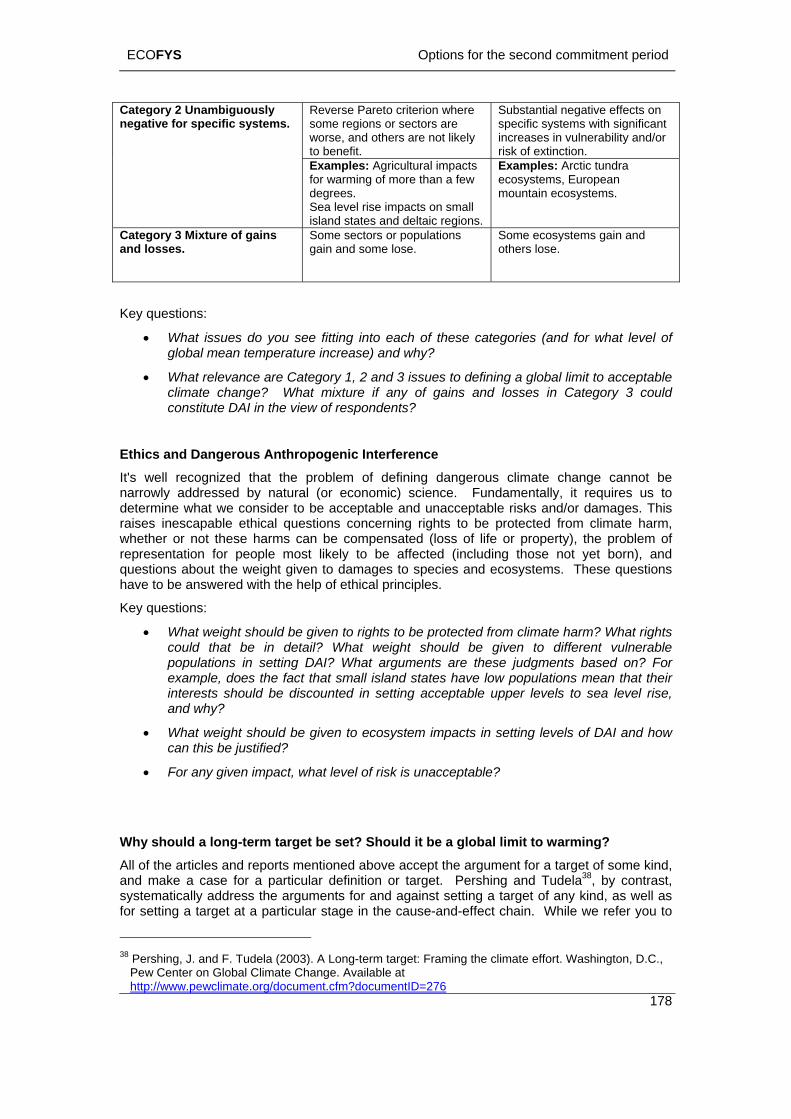
ECOFYS Options for the second commitment period
178
Reverse Pareto criterion where some regions or sectors are worse, and others are not likely
Substantial negative effects on specific systems with significant increases in vulnerability and/or
to benefit. risk of extinction.
Category 2 Unambiguously negative for specific systems.
Examples: Agricultural impacts for warming of more than a few degrees. Sea level rise impacts on small island states and deltaic re
Examples: Arctic tundra ecosystems, European mountain ecosystems.
gions. C gory 3 Mixture of gains Some sectors or populations
some lose. Some ecosystems gain and others lose.
ateand losses. gain and
Key questions:
• What issues do you see fitting into each of these categories (and for what level of global mean temperature increase) and why?
• What relevance are Category 1, 2 and 3 issues to defining a global limit to acceptable climate change? What mixture if any of gains and losses in Category 3 could constitute DAI in the view of respondents?
Ethics and Dangerous Anthropogenic Interference It's well recognized that the problem of defining dangerous climate change cannot be narrowly addressed by natural (or economic) science. Fundamentally, it requires us to determine what we consider to be acceptable and unacceptable risks and/orrai
damages. This
how
ble?
Whd reports mentioned above accept the argument for a target of some kind,
a38, by contrast, kind, as well as
for
ses inescapable ethical questions concerning rights to be protected from climate harm, whether or not these harms can be compensated (loss of life or property), the problem of representation for people most likely to be affected (including those not yet born), and questions about the weight given to damages to species and ecosystems. These questions have to be answered with the help of ethical principles.
Key questions:
• What weight should be given to rights to be protected from climate harm? What rights could that be in detail? What weight should be given to different vulnerable populations in setting DAI? What arguments are these judgments based on? For example, does the fact that small island states have low populations mean that their interests should be discounted in setting acceptable upper levels to sea level rise, and why?
• What weight should be given to ecosystem impacts in setting levels of DAI andcan this be justified?
• For any given impact, what level of risk is unaccepta
y should a long-term target be set? Should it be a global limit to warming? All of the articles anand make a case for a particular definition or target. Pershing and Tudelsystematically address the arguments for and against setting a target of any
setting a target at a particular stage in the cause-and-effect chain. While we refer you to
38 Pershing, J. and F. Tudela (2003). A Long-term target: Framing the climate effort. Washington, D.C.,
Pew Center on Global Climate Change. Available at http://www.pewclimate.org/document.cfm?documentID=276
ECOFYS Options for the second commitment period
179
their article for the arguments concerning the different stages, their overall reasons for having or not having an internationally negotiated target are worth repeating (note that the items on the right and left are not paired).
PRO CON Providing a concrete goal for current and future climate efforts
It will be difficult to agree on a measure of "acceptable risk"
Increasing awareness of the long-term consequences of our actions
Target setting requires that we apportion effort
Calibrating short-term measures and measuring progress
Too stringent a target may produce backlash
Inducing technological change Too weak a target may be worse than none
Limiting future risks derived from climate change
Difficult negotiations may delay short-term action
Mobilizing society Negotiation failure may impede overall efforts Promoting global participation
These considerations remind us that this discussion is taking place in the real world of conflicting national interests and economic and political inequality. They further highlight the point that these issues are not separable from questions of timing, and from issues of political strategy. Put bluntly, we care about the results (preventing climate change), not the target, and as Pershing and Tudela note, it is not necessarily the case that establishin a more stringent target, or any target at all, will produce better results.
e US has rejected even the modest reductions associated with the Kyoto Protocol, and is unlikely to move rap
of this, however, several important actors, including the Climate Action Network and the WBGU, as well as the EU Environmental
tablishment of a formal target is an important
g
Two critical political facts need to inform this discussion. The first is that th
idly from this opposition all the way to a global accord embracing a stringent target. Similarly, most developing countries remain adamantly opposed to any limits on their emissions, and many have opposed discussions of "adequacy of commitments" (an implicit confrontation with the demands of Article 2) because developing country commitments are unavoidable with stringent climate targets. In spite
Council decision in 199639, have argued that esstep.
Key questions:
• Will attempting to negotiate a globally agreed limit to climate change produce better results than countries or regions using their own view of this to pressure international negotiations on climate change?
Paul Baer, EcoEquity, USA, [email protected]
William Hare, Potsdam Institute for Climate Impact Research, [email protected]
39 European Community (1996). Climate Change - Council conclusions 8518/96. Available at
http://ue.eu.int/newsroom/LoadDoc.asp?BID=89&DID=43617&from=&LANG=6
ECOFYS Options for the second commitment period
APPENDIX D KICK OFF PAPER NO.4
180
ated Assessment Models
tmar Edenhofer, Marian Leimbach40
1. In
ppEffec(IAM) su
Over the last decade, technological change has been an important issue in Integrated s
ological change and investments
First w ted by technological change
marke
2. Tec
Learn
Learning-by-doing denotes the decrease of investment costs when cumulated capacity
decrecapac duction) is doubled.
Why Do many IntegrOverestimate the Costs of Mitigation ?
Ot
troduction How much economic growth does it cost in order to stabilise CO2 concentration below 450
m? In general, this question is answered by Cost-Benefit-Models (CBM) or Cost-tiveness-Models (CEM) which are the dominant type of Integrated Assessment Models
pplied by many scientists and demanded by most decision makers.
A sessment modeling. On the one hand, technological change may have a great opportunity to reduce the costs. On the other hand, most economists would agree that the potential of cost reduction cannot be realised by decentralised markets alone. Because of, technically speaking, overall non-convexities, technological change is the main source of market failure. Techno-logical change can only be the solution if it is embedded in an appropriate institutional framework. We describe three aspects of technological change :
1. Learning-by-doing
2. Biased techn
3. Path dependencies.
e will show to what extent the mitigation costs are affec
and second why this potential of cost reduction can probably not be realized by real-world ts.
hnological Change
ing-by-doing
and operational technological knowledge increase. For example, a learning rate of 10% ases the investment costs per kW (or production cost per kWh) by 10% if the cumulative ity (or cumulative pro
Impact Research, P.O.Box 60 12 03, D-14412 Potsdam, Germany40
mail: ed Potsdam Institute for Climate , e-
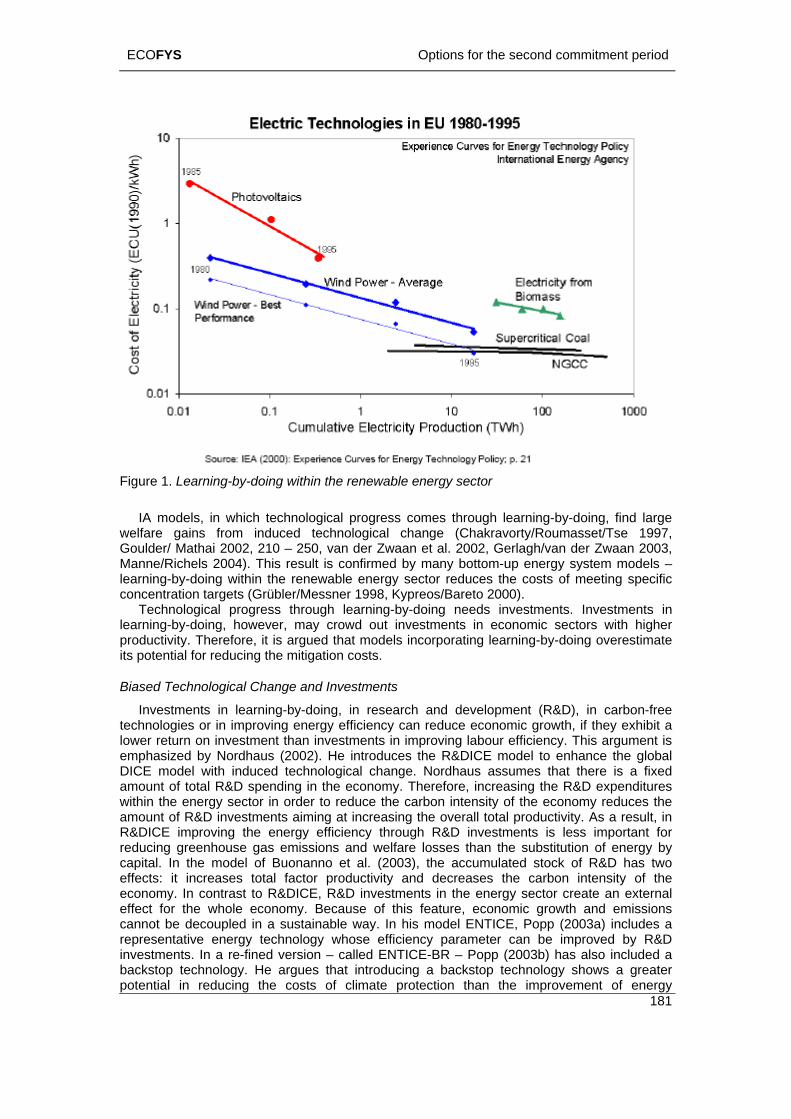
ECOFYS Options for the second commitment period
arning-by-doing within the renewable energy sector
181
Figure 1. Le
IA modewelfare gai change (Chakravorty/Roumasset/Tse 1997,
in the renewable energy sector reduces the costs of meeting specific
lea
l for reducing the mitigation costs.
Investments in learning-by-doing, in research and development (R&D), in carbon-free technologies or in improving energy efficiency can reduce economic growth, if they exhibit a low turnemphasizedDICE mode d technological change. Nordhaus assumes that there is a fixed amo of twithin the eamount of R l productivity. As a result, in
ock of R&D has two effects: it increases total factor productivity and decreases the carbon intensity of the
in the energy sector create an external effect for the whole economy. Because of this feature, economic growth and emissions cannot be decoupled in a sustainable way. In his model ENTICE, Popp (2003a) includes a representative energy technology whose efficiency parameter can be improved by R&D investments. In a re-fined version – called ENTICE-BR – Popp (2003b) has also included a backstop technology. He argues that introducing a backstop technology shows a greater potential in reducing the costs of climate protection than the improvement of energy
ls, in which technological progress comes through learning-by-doing, find large ns from induced technological
Goulder/ Mathai 2002, 210 – 250, van der Zwaan et al. 2002, Gerlagh/van der Zwaan 2003, Manne/Richels 2004). This result is confirmed by many bottom-up energy system models – learning-by-doing withconcentration targets (Grübler/Messner 1998, Kypreos/Bareto 2000).
Technological progress through learning-by-doing needs investments. Investments in rning-by-doing, however, may crowd out investments in economic sectors with higher
productivity. Therefore, it is argued that models incorporating learning-by-doing overestimate its potentia
Biased Technological Change and Investments
er re on investment than investments in improving labour efficiency. This argument is by Nordhaus (2002). He introduces the R&DICE model to enhance the global l with induce
unt otal R&D spending in the economy. Therefore, increasing the R&D expenditures nergy sector in order to reduce the carbon intensity of the economy reduces the &D investments aiming at increasing the overall tota
R&DICE improving the energy efficiency through R&D investments is less important for reducing greenhouse gas emissions and welfare losses than the substitution of energy by capital. In the model of Buonanno et al. (2003), the accumulated st
economy. In contrast to R&DICE, R&D investments
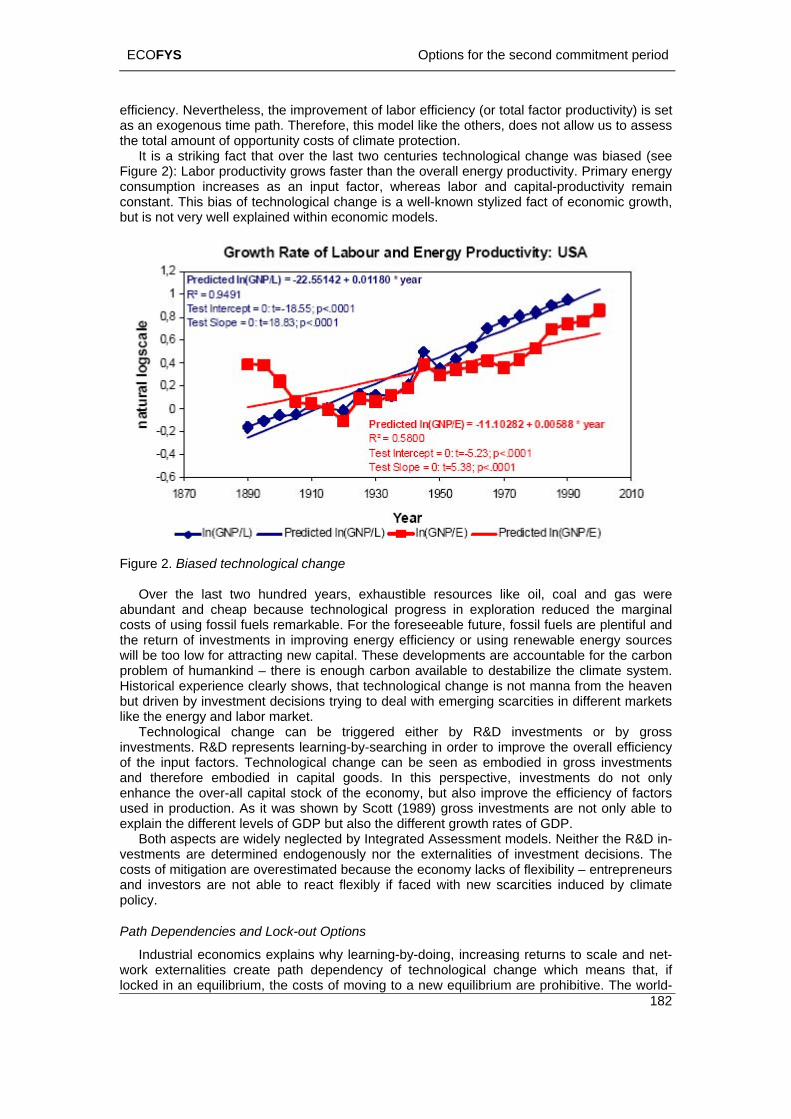
ECOFYS Options for the second commitment period
182
vement of labor efficiency (or total factor productivity) is set as an ethe tota
It is centuries technological change was biased (see Figure 2consum ut factor, whereas labor and capital-productivity remai cons nge is a well-known stylized fact of economic growth, but
efficiency. Nevertheless, the improxogenous time path. Therefore, this model like the others, does not allow us to assess l amount of opportunity costs of climate protection. a striking fact that over the last two ): Labor productivity grows faster than the overall energy productivity. Primary energy ption increases as an inp n
tant. This bias of technological chais not very well explained within economic models.
technological chanFigure 2. Bia d
O er rces like oil, coal and gas were
abun a ration reduced the marginal costs of usin are plentiful and the return o energy sources will be too l ese developments are accountable for the carbon roblem of humankind – there is enough carbon available to destabilize the climate system.
technological change is not manna from the heaven sions trying to deal with emerging scarcities in different markets
fore embodied in capital goods. In this perspective, investments do not only enhance the over-all capital stock of the economy, but also improve the efficiency of factors used in production. As it was shown by Scott (1989) gross investments are not only able to
d endogenously nor the externalities of investment decisions. The because the economy lacks of flexibility – entrepreneurs
Lock-out Options
g returns to scale and net-e path dependency of technological change which means that, if , the costs of moving to a new equilibrium are prohibitive. The world-
se ge
v the last two hundred years, exhaustible resoud nt an nological progress in explod cheap because tech
g fossil fuels remarkable. For the foreseeable future, fossil fuelsrgy efficiency or using renewablef investments in improving ene
ow for attracting new capital. ThpHistorical experience clearly shows, thatbut driven by investment decilike the energy and labor market.
Technological change can be triggered either by R&D investments or by gross investments. R&D represents learning-by-searching in order to improve the overall efficiency of the input factors. Technological change can be seen as embodied in gross investments and there
explain the different levels of GDP but also the different growth rates of GDP. Both aspects are widely neglected by Integrated Assessment models. Neither the R&D in-
vestments are determinecosts of mitigation are overestimatedand investors are not able to react flexibly if faced with new scarcities induced by climate policy.
Path Dependencies and
Industrial economics explains why learning-by-doing, increasinwork externalities creatlocked in an equilibrium
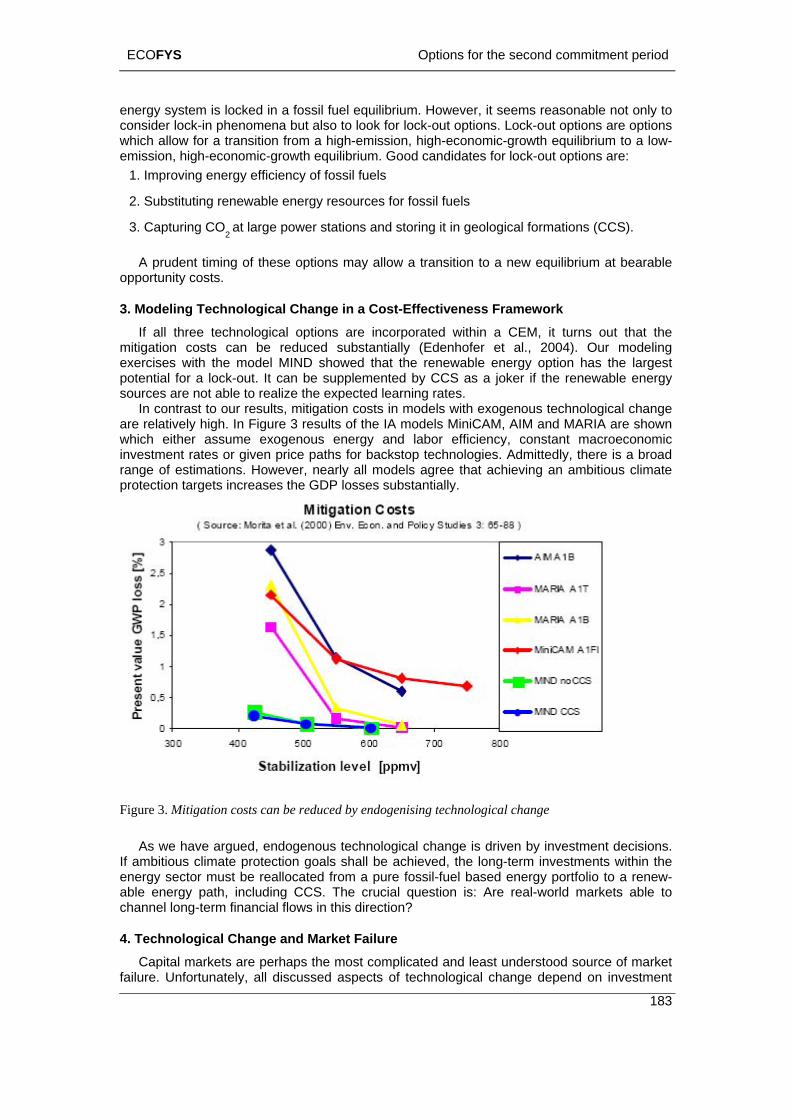
ECOFYS Options for the second commitment period
183
h-economic-growth equilibrium to a low-owth equilibrium. Good candidates for lock-out options are: ncy of fossil fuels
energy resources for fossil fuels
ower stations and storing it in geological formations (CCS).
gical options are incorporated within a CEM, it turns out that the be reduced substantially (Edenhofer et al., 2004). Our modeling
ND showed that the renewable energy option has the largest potential for a lock-out. It can be supplemented by CCS as a joker if the renewable energy sources are not able to realize the expected learning rates.
technological change
energy system is locked in a fossil fuel equilibrium. However, it seems reasonable not only to consider lock-in phenomena but also to look for lock-out options. Lock-out options are options which allow for a transition from a high-emission, higemission, high-economic-gr
1. Improving energy efficie
2. Substituting renewable
3. Capturing CO2 at large p
A prudent timing of these options may allow a transition to a new equilibrium at bearable opportunity costs.
3. Modeling Technological Change in a Cost-Effectiveness Framework If all three technolo
mitigation costs can exercises with the model MI
In contrast to our results, mitigation costs in models with exogenous are relatively high. In Figure 3 results of the IA models MiniCAM, AIM and MARIA are shown which either assume exogenous energy and labor efficiency, constant macroeconomic investment rates or given price paths for backstop technologies. Admittedly, there is a broad range of estimations. However, nearly all models agree that achieving an ambitious climate protection targets increases the GDP losses substantially.
Figure 3. Mitigation costs can be reduced by endogenising technological change
As we have argued, endogenous technological change is driven by investment decisions. If ambitious climate protection goals shall be achieved, the long-term investments within the energy sector must be reallocated from a pure fossil-fuel based energy portfolio to a renew-
ucial question is: Are real-world markets able to
erhaps the most complicated and least understood source of market ssed aspects of technological change depend on investment
able energy path, including CCS. The crchannel long-term financial flows in this direction?
4. Technological Change and Market Failure Capital markets are p
failure. Unfortunately, all discu
ECOFYS Options for the second commitment period
184
unctioning of capital markets: Changing the bias of technological ing and spillover effects, and implementing lock-out options t failure. The conventional economic wisdom to cure market
g a however, do not address the most fundamental reason for market capital markets to ensure intertemporal efficiency and justice. Agents
estment portfolio will be re-allocated according to
r. The outcome of the
ere is little research about long-term investment decisions of
2. Understanding long-term investment decisions, especially the role of investors and firms endowed with bounded rationality in trading expectations and risks on imperfect or
ty).
unrealistic to expect that this research program can improve IAM in such a ptimum can be achieved by implementing optimal policy ore realistic representation of markets, especially with a
more realistic representation of the role of capital markets, scie e local optima which can be achieved even by less rational agSuch IAM are no longer unreali s for Lev o and to participate in a ansition todangerous landscape.
REFERENCES
B rr M. (20 n o I ang C. Re e y 2 1
C , U., Roumas , 997), E g erg ou s aobal Warm li E m 5, 1 1 4
Edenhofer, O., Bauer, N., Kriegler, E. (2004), Climate Prot tio l In ts D, Ecolog E m
G .H., Math . 2 ti C t P cer N e or .D. d e lo l C g d
nvironment. Resource for the Fu e, -250.
decisions and on the well-fchange, realising learning-by-doare hindered by long-term markefailures recommends imposing taxes (e.g. on CO2) or R&D subsidies. While havincorrecting impact, they,failure – the inability of endowed with imperfect information take decisions within incomplete future markets: There are no good reasons to believe that the invour CEM analysis if capital markets are incomplete, investors and firms do not have perfect fore-sight about the future or act myopic.
In one of our model experiments we have compared a social optimum solution with a market solution if learning-by-doing is a by-product of technology transfemarket solution differs substantially from the social desired solution in terms of efficiency and justice because decentralised agents do not take into account the welfare effects of spillovers for other agents.
Admittedly, there is an impressive body of literature to describe herd behaviour on short-term financial markets, but thfirms and investors. The existing literature confirms our simulation results that the outcomes of capital markets are not socially optimal. Beyond this general statement there is little knowledge how governments, investors and firms deal with incomplete and imperfect capital markets. This question, however, is not only of interest within the scientific community, since, if there is a market failure especially on the long-term capital market, the potential of cost reduction will never be realised without a reasonable policy intervention.
5. Implications for a Research Agenda Therefore, three main research questions can be formulated which are highly relevant for
Integrated Assessment: 1. Assessing the potential of technological change within a CBM and CEM framework.
incomplete capital markets.
3. Exploring the potential of policy instruments to overcome the distortions of capital markets in order to support the transition of crucial sectors (like the energy sector) towards socially desirable outcomes (like climate protection and sustainabili
It seems highly
way that in general a unique global oinstruments. However, IAM with a m
may eents n but socia
nablewithinan inlly de
ntistsmpletent t
le out
to ide mar stru
comes
ntifykets. cture in a
incostrumsirab
stic mind mapabout
iathawards discourse the tr
uonanno, P., Ca aro, C., Galeotti, 03), E dogen us nduced Technical Ch e and the osts of Kyoto sourc and Energ Economics 5, 1 -34.
hakravorty set, J., Tse K. (1 ndogenous Substitution amon En y S rce nd Gl ing. Journal of Po tical cono y 10 20 -123 .
ec n and We fare: sigh from the Model MIN ical cono ics, in press.
oulder, L ai, K (200 ), Op mal O2 Abatement in he
resence of Induced Te hnological Change. In: Grübl , A., akic novic, N., N dhaus, W (E s.), T chno gica han e an the
E tur 210
ECOFYS Options for the second commitment period
185
G R., van d B ofk ., se G. Im ts C nnomy with he k nd n -b oing. Wo g r
G , Messne (1 , no ic ange an e in Mitigation Mea s -eonomics 20, .5 9 2.
K S., Barreto 20 A pl lob lectricity MARKAL Model E ge s rniul Scherrer titu G al er esearch p ent-ENE, Ener i r
lligen, Switze dM A, Richels, R. (20 T Imp t of Lea oi o e in nd st C
atement, Eco gic co ics, in press. N , W.D. (2002), M ll In ed ov te nge Po
kicenovic, N or us, W.D d echnolo l g d the E n . o the Future, 182-209.
Popp, D. (2003a), E E o ou ch gi ha ge i h E de Gl W -iurnal of E l Econo a em
P . (2003b), E E : Ef s ac p D Cl y drking pape
Scott, M. F. (1989), A New View of Economic Growth. Clarendo s f Kvan der Zwaan, B.C. G h , Kl ss G., ch enh er, (2 ), o u ch
ical change lim ch ge modeli Energy Econo 1-
erlagh, er Zwaan, ., H es, M.W Klaa n, (2003), pac of O2-Taxes i an Eco
A.
r, Nic Mar e
Tts a Lear ing y-D rkin pape .
rübler, S. 998) ech log al Ch d th Tim g of sure . En rgy Ec No -6, 4 5-51
ypreos, , L. ( 00), Sim e G al E with ndo nou Lea ng. Pa Ins te, ener En gy R De artm gy Model-l ng G oup, Vi rlan .
anne, 04), he ac rning-By-D ng n th Tim g a Co s of O2 Ab lo al E nom
ordhaus ode licy. In: Grübler, A., ing duc s.),
Inn ation in Clima -ChaNa ., N dha . (E T gica Chan e an nviro ment Res urce for
NTIC : end gen s Te nolo cal C n n t e DIC mo of obal arm ng. Jo nvironmenta mics and M nag ent. Forthcoming.
opp, D NTIC -BR The fect of B ksto Technology R& on imate Polic Mo -els. Wo r.
n Pre s Ox ord, U . C., erlag , R. aa en, S ratt olz L.
, 002 End geno s te no-
log in c an ng. mics 24ate 19.
ECOFYS Options for the second commitment period
186
APP IPTION OF THE EVOC MODEL Mode
CO2, based
The g orithm that combi es emission estimates from various sources.
We first collected historical emission estimates by country, by gas and by sector from the following sources and ordered them in the following hierarchy:
1. National submissions to the UNFCCC as collected by the UNFCCC secretariat and published in the GHG emission database available at their web site
2. CO2 emissions from fuel combustion as published by the International Energy Agency (IEA 2002)
3. Emissions from Land-use change as published by Houghton in the WRI climate indicator analysis tool (Houghton 2003)
4. Emissions from CH4 and N2O as estimated by the US Environmental Protection Agency (USEPA 2002)
5. CO2, CH4, N2O, HFC, PFC and SF6 emissions from the EDGAR database version 3.2 (Olivier and Berdowski, 2001)41
Future emissions are derived from the RIVM IMAGE implementation of the SRES scenarios (IMAGE-Team 2001).
The datasets vary in their completeness and sectoral split. We first defined, which of the sectors provided in the datasets correspond to 7 sectors. This definition is provided in Table 35. Note that CO2 emissions from the IEA do not include process emissions from cement production. Hence, if IEA data is chosen, process emissions from cement production are not included.
For each country, gas and sector, the algorithm completes the following steps
1. For all data sets, missing years in-between available years within a data set are linearly interpolated and the growth rate is calculated for each year step.
2. The data source is selected, which is highest in hierarchy and for which emission data are available. All available data points are chosen as the basis for absolute emissions.
3. Still missing years are filled by applying the growth rates from the highest data set in the hierarchy for which a growth rate is available.
As future emissions are only available on a regional basis and not country-by-country, the resulting set of emissions in then extended into the future by applying the growth rates of the respective sectors and gas of the region, to which the country belongs.
ENDIX E DESCRl description
This section describes the Evolution of commitments model (EVOC) that is used to quantify emission allowances under the various approaches in this report. It includes emissions of
CH4, N2O, HFCs, PFCs and SF6 for 192 individual countries. Historical emissions are on national emission inventories submitted to the UNFCCC and, where not available,
other sources such as the International Energy Agency. Future emissions are based on the IPCC Special Report on Emissions Scenarios (Nakicenovic et al. 2000).
reenhouse gas emission data for 1990 to 2000 (or 2001) is derived by an algn
41 For CH4 and N2O, the values of EPA are largely based from the EDGAR database (1990 and 1995), but extended to the year 2000.
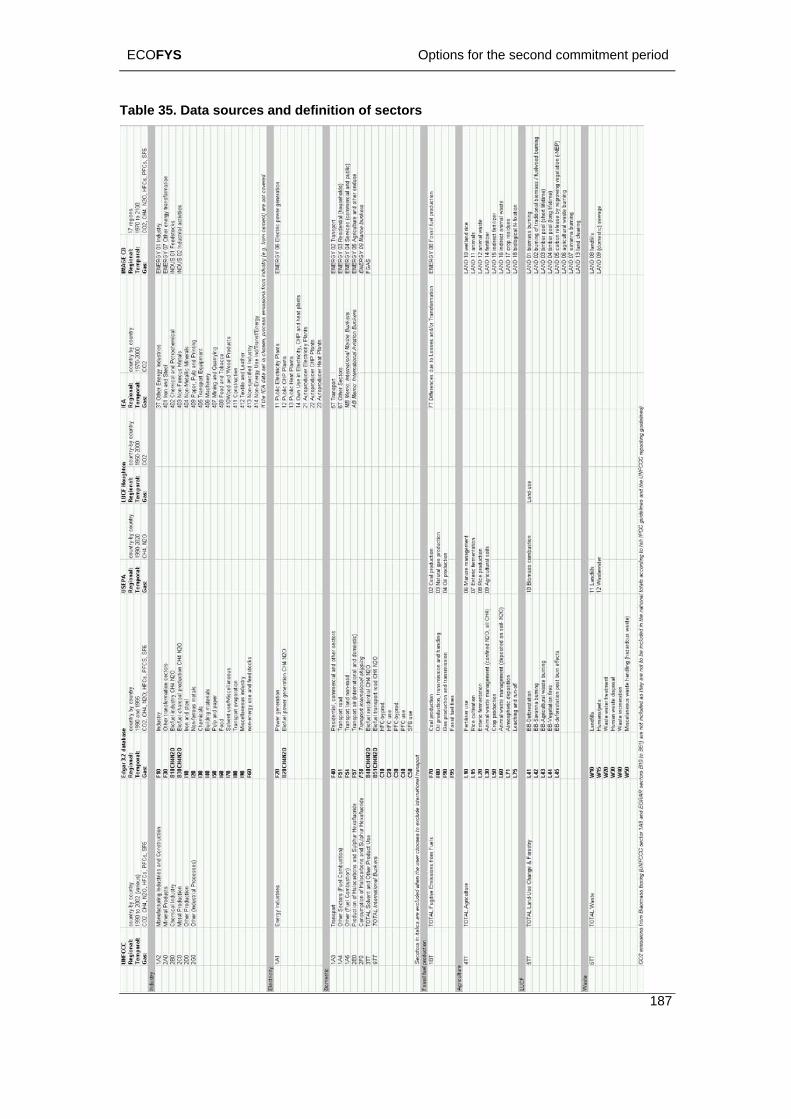
ECOFYS Options for the second commitment period
187
Table 35. Data sources and definition of sectors
ECOFYS Options for the second commitment period
188
The user can specify to following:
• Whether the emissions are determined on the basis of the hierarchy or are based exclusively on the EDGAR database
• Whether to consider only COB2B, the group of CHB4B and NB2BO or the group of COB2B, CHB4 B, NB2BO, HFC, PFCs and SFB6B
• Whether the analysis should o exclude emissions from land use change and forestry o include emissions from land use change and forestry from the hierarchy o include emissions from land use change and forestry from Houghton o include emissions from land use change and forestry from EDGAR
• Whether international aviation and marine transport is included or excluded
For population, GDP in purchase power parities and electricity demand, the country base year data was taken from UN 2002 and IEA 2002 and extended into the future applying the growth rates from the IMAGE model for the region, to which the country belongs.
Emissions until 2010 are estimated as follows: It is assumed that Annex I countries implement their Kyoto targets by 2010. It is assumed that the reductions necessary to meet the Kyoto target are achieved in the all sectors equally, except the domestic sector (which includes transport). In 2010, the level of the domestic sector is taken from the relevant reference scenario. The level of the other sectors are taken from the reference scenario and reduced, so that the Kyoto target is met. The years from the last available year to 2010 are linearly interpolated. All Non-Annex I countries follow their reference scenario until 2010.
Additionally, the user can select the following:
• Whether the USA reaches in 2010 o Its Kyoto target o It national target, which we interpreted as a 23% increase of total emissions
from 1990 to 2010 o Its reference emissions
• Whether all other Annex I countries reach in 2010 o Their Kyoto targets o The lower of their Kyoto target and their reference scenario o Their reference emissions
Explanation of the regions EVOC 01 USA: United States of America
EVOC 02 EU15, Old EU Member states: Austria, Belgium, Denmark, Finland, France, Germany, Greece, Ireland, Italy, Luxembourg, Netherlands, Portugal, Spain, Sweden, United Kingdom
EVOC 03 EU+10, New EU Member states: Cyprus, Czech Republic, Estonia, Hungary, Latvia, Lithuania, Malta, Poland, Slovakia, Slovenia
EVOC 04 RWEU, Rest of Western Europe: Iceland, Liechtenstein, Monaco, Norway, San Marino, Switzerland
EVOC 05 RUS: Russian Federation
EVOC 06 REEU in Annex I, Rest of Eastern Europe in Annex I: Belarus, Bulgaria, Croatia, Romania, Ukraine
EVOC 07 JPN: Japan
EVOC 08 RAI, Rest of Annex I: Australia, Canada, New Zealand
EVOC 09 TUR: Turkey
ECOFYS Options for the second commitment period
189
EVOC 10 REEU, Rest of former soviet states: Albania, Armenia, Azerbaijan, Belarus, Bosnia & Herzegovina, Georgia, Kazakhstan, Kyrgyzstan, FYR Macedonia, Moldova, Serbia & Montenegro, Tajikistan, Turkmenistan, Uzbekistan
EVOC 11 ARG: Argentina
EVOC 12 BRZ: Brazil
EVOC 13 MEX: Mexico
EVOC 14 VEN: Venezuela
EVOC 15 RLA: Rest of Latin America: Bahamas, Barbados, Belize, Bolivia, Chile, Colombia, Costa Rica, Cuba, Dominica, Dominican Republic, Ecuador, El Salvador, Grenada, Guatemala, Guyana, Haiti, Honduras, Jamaica, Nicaragua, Panama, Paraguay, Peru, Saint Kitts & Nevis, Saint Lucia, Saint Vincent & Grenadines, Suriname, Trinidad & Tobago, Uruguay
EVOC 16 EGY: Egypt
EVOC 17 ZAF: South Africa
EVOC 18 NGA: Nigeria
EVOC 19 RNA, Rest of North Africa: Algeria, Libya, Morocco, Tunisia
EVOC 20 RAF, Rest of Africa: Angola, Benin, Botswana, Burkina Faso, Burundi, Cameroon, Cape Verde, Central African Republic, Chad, Comoros, Congo, Dem. Republic Congo, Côte d'Ivoire, Djibouti, Equatorial Guinea, Eritrea, Ethiopia, Gabon, Gambia, Ghana, Guinea, Guinea-Bissau, Kenya, Lesotho, Liberia, Madagascar, Malawi, Mali, Mauritania, Mauritius, Mozambique, Namibia, Niger, Rwanda, Sao Tome & Principe, Senegal, Seychelles, Sierra Leone, Sudan, Swaziland, Tanzania, Togo, Uganda, Zambia, Zimbabwe
EVOC 21 SAU: Saudi Arabia
EVOC 22 ARE: United Arab Emirates
EVOC 23 RME, Rest of Middle East: Bahrain, Iran, Iraq, Israel, Jordan, Kuwait, Lebanon, Oman, Qatar, Syria, Yemen
EVOC 24 CHN: China
EVOC 25 IND: India
EVOC 26 IDN: Indonesia
EVOC 27 KOR: Korea (South)
EVOC 28 MYS: Malaysia
EVOC 29 PHL: Philippines
EVOC 30 SGP: Singapore
EVOC 31 THA: Thailand
EVOC 32 RAA, Rest of Asia: Afghanistan, Bangladesh, Bhutan, Brunei, Cambodia, Cook Islands, Fiji, Kiribati, Korea (North), Laos, Maldives, Marshall Islands, Federated States of Micronesia, Mongolia, Myanmar, Nauru, Nepal, Niue, Pakistan, Palau, Papua New Guinea, Samoa, Solomon Islands, Sri Lanka, Taiwan, Timor-Leste (East Timor), Tonga, Tuvalu, Vanuatu, Vietnam
Figure 01 USA: United States of America
Figure 02 EU25: Austria, Belgium, Cyprus, Czech Republic, Denmark, Estonia, Finland, France, Germany, Greece, Hungary, Ireland, Italy, Latvia, Lithuania, Luxembourg, Malta, Netherlands, Poland, Portugal, Slovakia, Slovenia, Spain, Sweden, United Kingdom
Figure 03 FRA: France
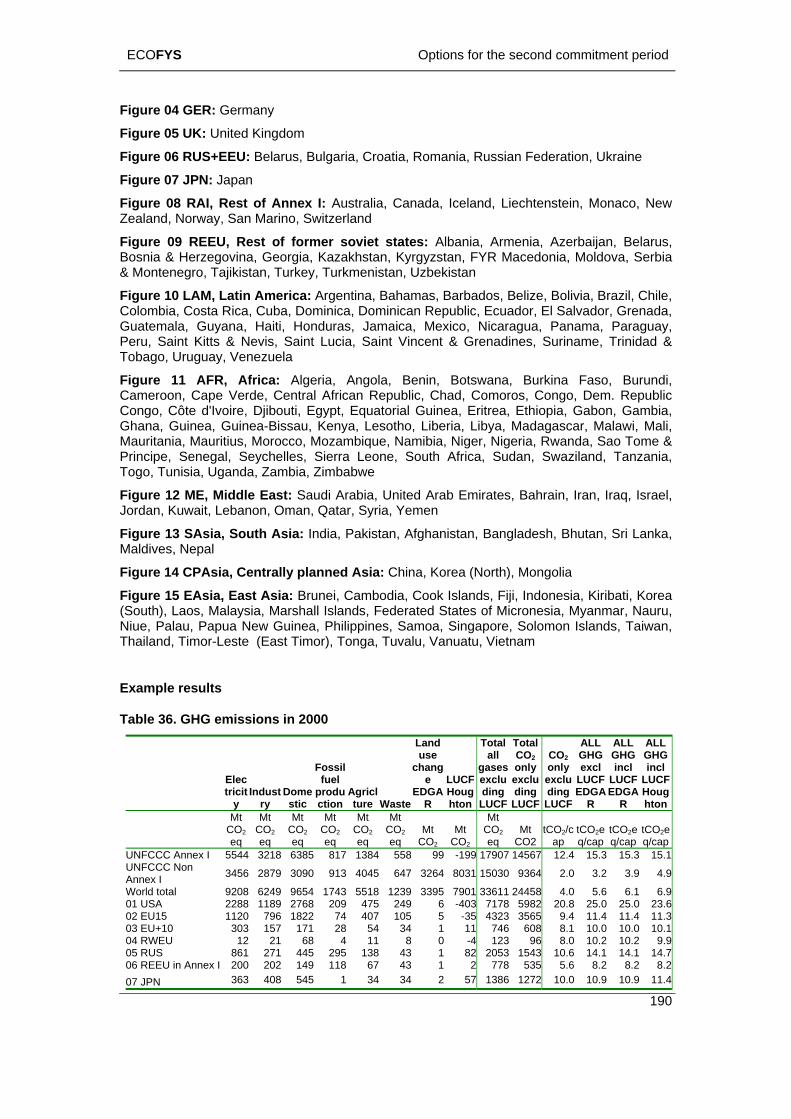
ECOFYS Options for the second commitment period
190
Figure 04 GER: Germany
Figure 05 UK: United Kingdom
Figure 06 RUS+EEU: Belarus, Bulgaria, Croatia, Romania, Russian Federation, Ukraine
Figure 07 JPN: Japan
Figure 08 RAI, Rest of Annex I: Australia, Canada, Iceland, Liechtenstein, Monaco, New Zealand, Norway, San Marino, Switzerland
Figure 09 REEU, Rest of former soviet states: Albania, Armenia, Azerbaijan, Belarus, Bosnia & Herzegovina, Georgia, Kazakhstan, Kyrgyzstan, FYR Macedonia, Moldova, Serbia & Montenegro, Tajikistan, Turkey, Turkmenistan, Uzbekistan
Figure 10 LAM, Latin America: Argentina, Bahamas, Barbados, Belize, Bolivia, Brazil, Chile, Colombia, Costa Rica, Cuba, Dominica, Dominican Republic, Ecuador, El Salvador, Grenada, Guatemala, Guyana, Haiti, Honduras, Jamaica, Mexico, Nicaragua, Panama, Paraguay, Peru, Saint Kitts & Nevis, Saint Lucia, Saint Vincent & Grenadines, Suriname, Trinidad & Tobago, Uruguay, Venezuela
Figure 11 AFR, Africa: Algeria, Angola, Benin, Botswana, Burkina Faso, Burundi, Cameroon, Cape Verde, Central African Republic, Chad, Comoros, Congo, Dem. Republic Congo, Côte d'Ivoire, Djibouti, Egypt, Equatorial Guinea, Eritrea, Ethiopia, Gabon, Gambia, Ghana, Guinea, Guinea-Bissau, Kenya, Lesotho, Liberia, Libya, Madagascar, Malawi, Mali, Mauritania, Mauritius, Morocco, Mozambique, Namibia, Niger, Nigeria, Rwanda, Sao Tome & Principe, Senegal, Seychelles, Sierra Leone, South Africa, Sudan, Swaziland, Tanzania, Togo, Tunisia, Uganda, Zambia, Zimbabwe
Figure 12 ME, Middle East: Saudi Arabia, United Arab Emirates, Bahrain, Iran, Iraq, Israel, Jordan, Kuwait, Lebanon, Oman, Qatar, Syria, Yemen
Figure 13 SAsia, South Asia: India, Pakistan, Afghanistan, Bangladesh, Bhutan, Sri Lanka, Maldives, Nepal
Figure 14 CPAsia, Centrally planned Asia: China, Korea (North), Mongolia
Figure 15 EAsia, East Asia: Brunei, Cambodia, Cook Islands, Fiji, Indonesia, Kiribati, Korea (South), Laos, Malaysia, Marshall Islands, Federated States of Micronesia, Myanmar, Nauru, Niue, Palau, Papua New Guinea, Philippines, Samoa, Singapore, Solomon Islands, Taiwan, Thailand, Timor-Leste (East Timor), Tonga, Tuvalu, Vanuatu, Vietnam
Example results
Table 36. GHG emissions in 2000
Electricit
y Indust
ry Domestic
Fossil fuel
production
Agriclture Waste
Land use
change
EDGAR
LUCF Houghton
Total all
gases excluding
LUCF
Total COB2B only excluding
LUCF
COB2B only excluding
LUCF
ALL GHG excl
LUCF EDGA
R
ALL GHG incl
LUCF EDGA
R
ALL GHG incl
LUCF Houghton
Mt COB2B eq
Mt COB2B eq
Mt COB2B eq
Mt COB2B eq
Mt COB2B eq
Mt COB2B eq
Mt COB2B
Mt COB2B
Mt COB2B eq
Mt CO2
tCOB2B/cap
tCOB2Beq/cap
tCOB2Beq/cap
tCOB2Beq/cap
UNFCCC Annex I 5544 3218 6385 817 1384 558 99 -199 17907 14567 12.4 15.3 15.3 15.1UNFCCC Non Annex I 3456 2879 3090 913 4045 647 3264 8031 15030 9364 2.0 3.2 3.9 4.9
World total 9208 6249 9654 1743 5518 1239 3395 7901 33611 24458 4.0 5.6 6.1 6.901 USA 2288 1189 2768 209 475 249 6 -403 7178 5982 20.8 25.0 25.0 23.602 EU15 1120 796 1822 74 407 105 5 -35 4323 3565 9.4 11.4 11.4 11.303 EU+10 303 157 171 28 54 34 1 11 746 608 8.1 10.0 10.0 10.104 RWEU 12 21 68 4 11 8 0 -4 123 96 8.0 10.2 10.2 9.905 RUS 861 271 445 295 138 43 1 82 2053 1543 10.6 14.1 14.1 14.706 REEU in Annex I 200 202 149 118 67 43 1 2 778 535 5.6 8.2 8.2 8.207 JPN 363 408 545 1 34 34 2 57 1386 1272 10.0 10.9 10.9 11.4
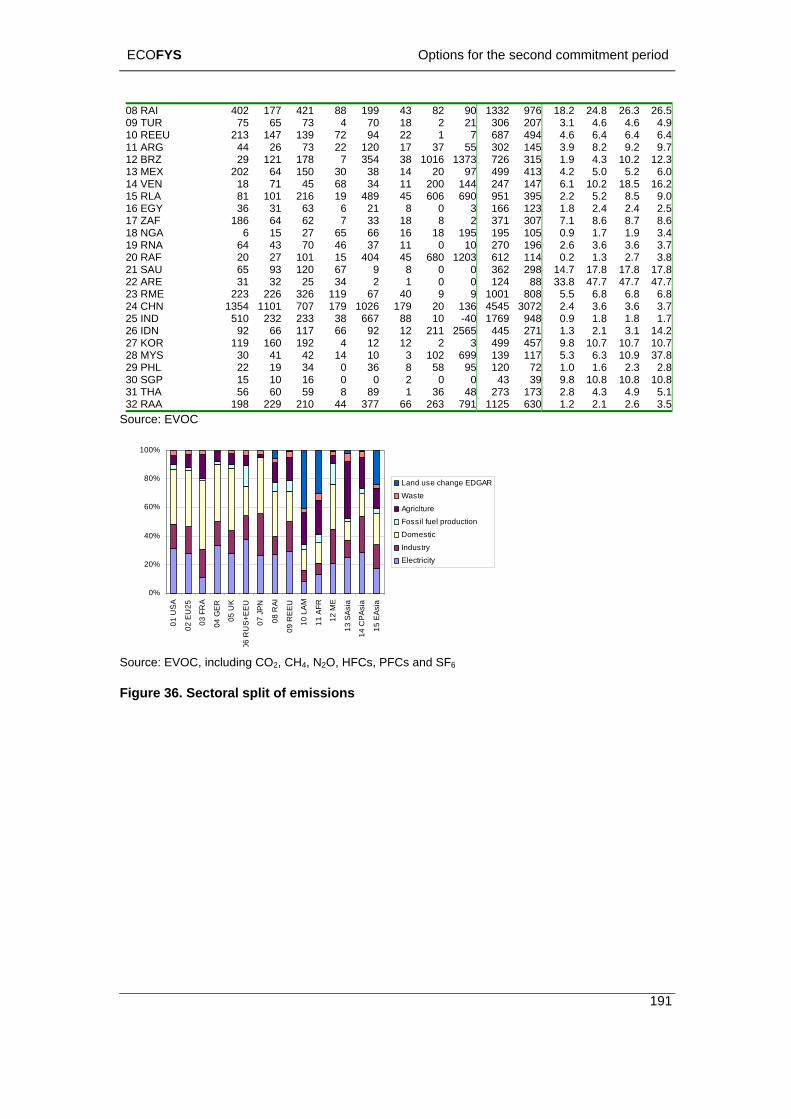
ECOFYS Options for the second commitment period
191
08 RAI 402 177 421 88 199 43 82 90 1332 976 18.2 24.8 26.3 26.509 TUR 75 65 73 4 70 18 2 21 306 207 3.1 4.6 4.6 4.910 REEU 213 147 139 72 94 22 1 7 687 494 4.6 6.4 6.4 6.411 ARG 44 26 73 22 120 17 37 55 302 145 3.9 8.2 9.2 9.712 BRZ 29 121 178 7 354 38 1016 1373 726 315 1.9 4.3 10.2 12.313 MEX 202 64 150 30 38 14 20 97 499 413 4.2 5.0 5.2 6.014 VEN 18 71 45 68 34 11 200 144 247 147 6.1 10.2 18.5 16.215 RLA 81 101 216 19 489 45 606 690 951 395 2.2 5.2 8.5 9.016 EGY 36 31 63 6 21 8 0 3 166 123 1.8 2.4 2.4 2.517 ZAF 186 64 62 7 33 18 8 2 371 307 7.1 8.6 8.7 8.618 NGA 6 15 27 65 66 16 18 195 195 105 0.9 1.7 1.9 3.419 RNA 64 43 70 46 37 11 0 10 270 196 2.6 3.6 3.6 3.720 RAF 20 27 101 15 404 45 680 1203 612 114 0.2 1.3 2.7 3.821 SAU 65 93 120 67 9 8 0 0 362 298 14.7 17.8 17.8 17.822 ARE 31 32 25 34 2 1 0 0 124 88 33.8 47.7 47.7 47.723 RME 223 226 326 119 67 40 9 9 1001 808 5.5 6.8 6.8 6.824 CHN 1354 1101 707 179 1026 179 20 136 4545 3072 2.4 3.6 3.6 3.725 IND 510 232 233 38 667 88 10 -40 1769 948 0.9 1.8 1.8 1.726 IDN 92 66 117 66 92 12 211 2565 445 271 1.3 2.1 3.1 14.227 KOR 119 160 192 4 12 12 2 3 499 457 9.8 10.7 10.7 10.728 MYS 30 41 42 14 10 3 102 699 139 117 5.3 6.3 10.9 37.829 PHL 22 19 34 0 36 8 58 95 120 72 1.0 1.6 2.3 2.830 SGP 15 10 16 0 0 2 0 0 43 39 9.8 10.8 10.8 10.831 THA 56 60 59 8 89 1 36 48 273 173 2.8 4.3 4.9 5.132 RAA 198 229 210 44 377 66 263 791 1125 630 1.2 2.1 2.6 3.5
Source: EVOC
0%
20%
40%
60%
80%
100%
01 U
SA
02 E
U25
03 F
RA
04 G
ER
05 U
K
06 R
US+
EEU
07 J
PN
08 R
AI
09 R
EEU
10 L
AM
11 A
FR
12 M
E
13 S
Asia
14 C
PAsi
a
15 E
Asia
Land use change EDGARWasteAgricltureFossil fuel productionDomesticIndustryElectricity
Source: EVOC, including CO B2 B, CHB4 B, NB2 BO, HFCs, PFCs and SFB6B
Figure 36. Sectoral split of emissions
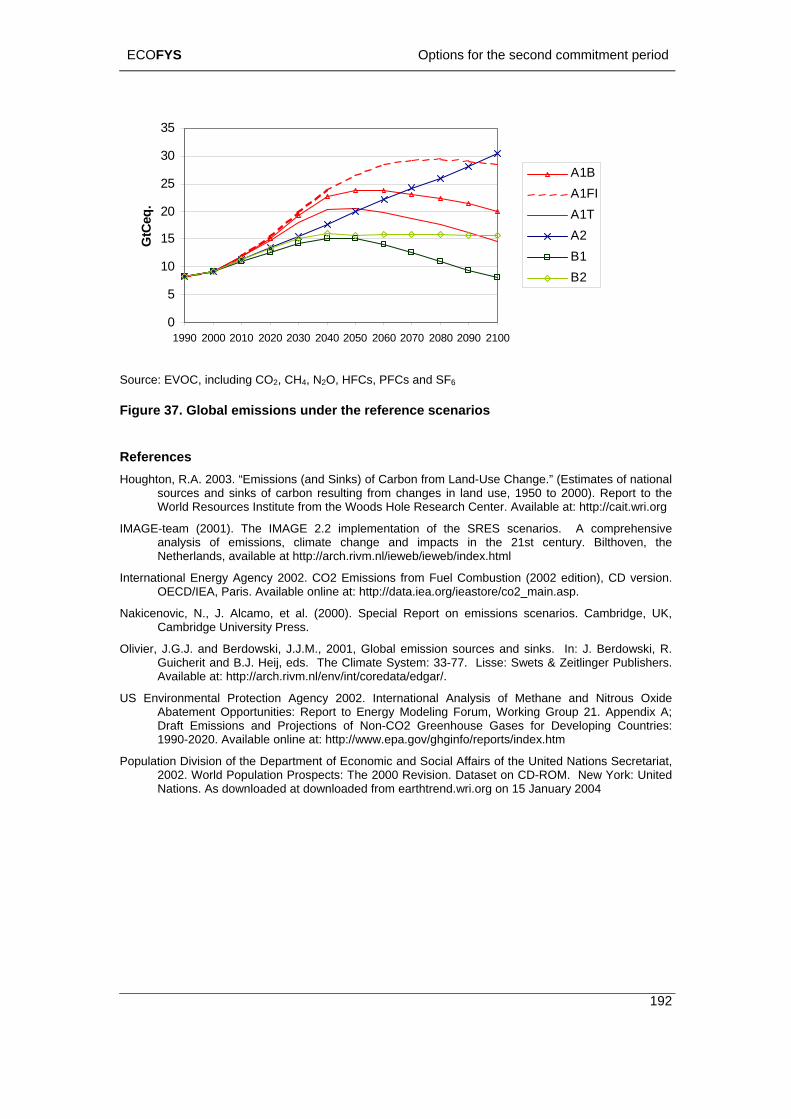
ECOFYS Options for the second commitment period
192
0
5
10
15
20
25
30
35
1990 2000 2010 2020 2030 2040 2050 2060 2070 2080 2090 2100
GtC
eq.
A1BA1FIA1TA2B1B2
Source: EVOC, including CO B2 B, CHB4 B, NB2 BO, HFCs, PFCs and SFB6B
Figure 37. Global emissions under the reference scenarios
References Houghton, R.A. 2003. “Emissions (and Sinks) of Carbon from Land-Use Change.” (Estimates of national
sources and sinks of carbon resulting from changes in land use, 1950 to 2000). Report to the World Resources Institute from the Woods Hole Research Center. Available at: http://cait.wri.org
IMAGE-team (2001). The IMAGE 2.2 implementation of the SRES scenarios. A comprehensive analysis of emissions, climate change and impacts in the 21st century. Bilthoven, the Netherlands, available at http://arch.rivm.nl/ieweb/ieweb/index.html
International Energy Agency 2002. CO2 Emissions from Fuel Combustion (2002 edition), CD version. OECD/IEA, Paris. Available online at: http://data.iea.org/ieastore/co2_main.asp.
Nakicenovic, N., J. Alcamo, et al. (2000). Special Report on emissions scenarios. Cambridge, UK, Cambridge University Press.
Olivier, J.G.J. and Berdowski, J.J.M., 2001, Global emission sources and sinks. In: J. Berdowski, R. Guicherit and B.J. Heij, eds. The Climate System: 33-77. Lisse: Swets & Zeitlinger Publishers. Available at: http://arch.rivm.nl/env/int/coredata/edgar/.
US Environmental Protection Agency 2002. International Analysis of Methane and Nitrous Oxide Abatement Opportunities: Report to Energy Modeling Forum, Working Group 21. Appendix A; Draft Emissions and Projections of Non-CO2 Greenhouse Gases for Developing Countries: 1990-2020. Available online at: http://www.epa.gov/ghginfo/reports/index.htm
Population Division of the Department of Economic and Social Affairs of the United Nations Secretariat, 2002. World Population Prospects: The 2000 Revision. Dataset on CD-ROM. New York: United Nations. As downloaded at downloaded from earthtrend.wri.org on 15 January 2004