clhynabee lu aba - vtechworks
TRANSCRIPT
,AN X-RAY STUDY OF THE BEHAVIOR OF
TITANIUM FILMS ON SILICON SUBSTRATES ,
by
Frank E.,Dietrichy;,
Thesis submitted to the Graduate Faculty of the
Virginia Polytechnic Institute and State University
in partial fulfillment of the requirements for the degree of
MASTER OF SCIENCE
in
Metallurgical Engineering
APPROVED:
x A: CLhynabee Lu Aba C. R. Houska, Chairman W. R. Hibbard
. _-4
J. T. P. Floridis L. Lytton”
June, 1977
Blacksburg, Virginia

TY) SSS
VASS \At7I
DS¢+
pea
h ib
FP
ACKNOWLEDGMENTS
The author expresses his thanks to Dr. C. R. Houska who provided
the challenge and assistance required to complete this work. Thanks
also go to Drs. T. P. Floridis and J. L. Lytton for their interesting
and useful discussions.
Thanks are also due to Mr. Harry C. Dudley and Mr. Lawrence
McDonald, both technicians for the Department of Materials
Engineering. Appreciation is extended to Mrs. Teresa K. Belcher ©
for the typing of the manuscript and Mrs. Jeanne Warner for her
assistance. Thanks also go to Lawrence P. Johnson for his help in
computer graphics.
The author wishes to express his thanks to his family and
especially to Mr. James E. Kramer for his untiring encouragement
and financial assistance to both his daughter and son-in-law. Long
overdue thanks is offered to his wife, Robin, for her loving care
and encouragement.
The author is grateful to the National Science Foundation for
providing the funds that made this research possible.
Li
TABLE OF CONTENTS
ACKNOWLEDGMENTS . 6 6 we ee ee ee ee ee ee ee
LIST OF FIGURES. 2... ee ee ee ee ee iv
LIST OF TABLES... 1... ee ee ee eee ee ee VEE
I. INTRODUCTION. . 2. 2. 6 6 ew ew ew ew ew ww we we we ew ee eh el UL
II. REVIEW OF LITERATURE. . 2... 1 1 eee ee ee ee ee ee
III. THEORY. 2. ee ee ee ee 9
IV. EXPERIMENTAL PROCEDURES...) 1. ee eee eee ee ee 24
V. ANALYTICAL PROCEDURES . ~~... . ee ee ee ee ee ee 38
VI. RESULTS AND DISCUSSION... .....-----4-024. 43
REFERENCES. . ee ee eee ee ee eee ee 1168
APPENDIX Le ww ee eee ee ee eww LL
APPENDIX ID. we ee ee ee ee A LB
VITAL fc ee ee eee 193
ABSTRACT
iii
LIST OF FIGUR:S
Figure Page
1. Equilibrium phase diagram of the titaniun-silicon syst em e ° *. * ° e s * a . ct . a ° *. e e e e ° a . s * e e 6
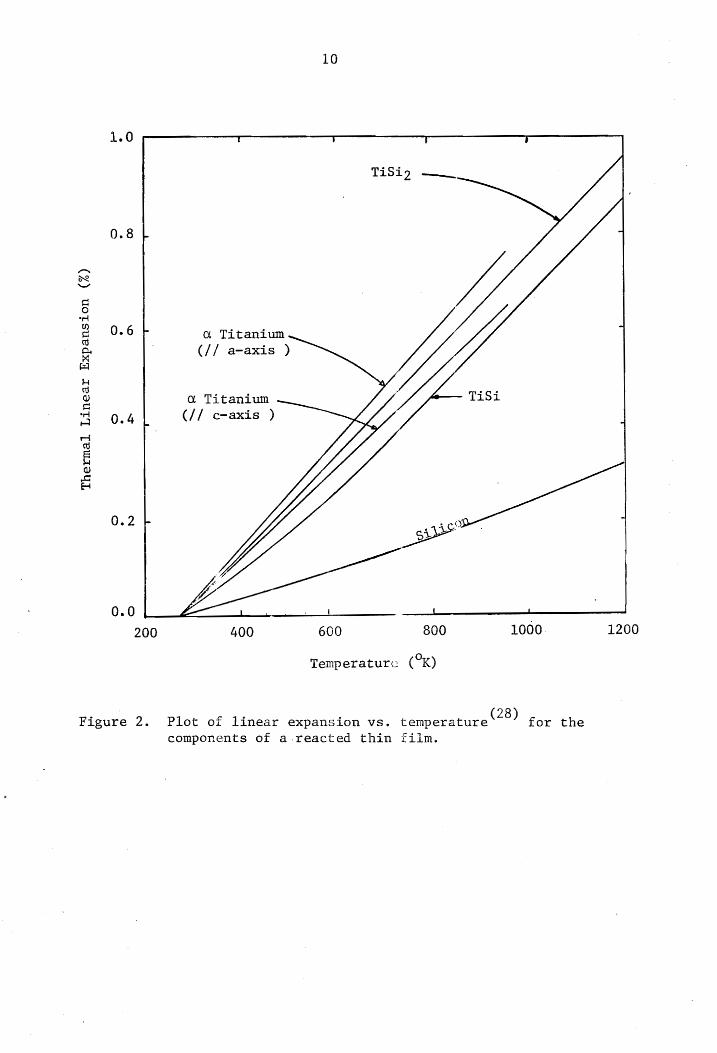
2. Plot of linear expansion vs. temperature for the
components of a reacted thin film. ............ 10
3. Illustration of axis designation for a texture diffractometer . . . 1... 1 ee ew ew ew ww ew ew we ew we et 1
4, X-ray diffraction geometry ......... 4.4.44 .64. 14
5. High resolution Koy diffractomete« with line source. . .. 33
6. Schematic drawing of elimination 95f Ky, component. ... . 34 2
L. 7. Plot of heat treatment temperatu) 2 (°c) vs. (time)? to
fracture of cyclic anneals on thii films ......... 48
8. Scanning electron micrograph of titanium thick film
surface (2.2 um) after cyclic anr2al at 650 C, total
time of 2 hours. . . 1. 6 6 ee ee we et we tw ww ew ew 49
9. Scanning electron micrograph of titanium thick film
surface (2.2 um) after cyclic anreal at 650° C, total
time of 5 hours. . . 6. 1. 1. 1 6 we ew ee ww wee ew ee OD
10. Scanning electron micrograph of titanium thick film
surface (2.3 um) after total annealing time of 1 hour
at 625° CGC. ww ew we ww tet wt tt lt le le tle te lt lw ew OL
ll. Scanning electron micrograph of -:itanium thick film
surface (2.5 um) after cyclic anieal at 600 C, total time of 745 hours . . . 1 1 ee ew ee ee we ee ee ee ee «C2
12. Experimental intensity simulation for as-received
2. 2 pm titanium-silicon thin fila, 26 region from 35° to AS ee ee ee ee 60
13. Experimental intensity simulation for as-received 6
2.2 micron titanium thin film, 2¢ region from 70 to 80 . 61
14. Experimental intensity simulation for step. anneal for
2 hours at 350° C, 28 region from 35° to 45°... 2 wee 62
iv
Figure
15.
16.
17.
18.
19.
20.
21.
22.
23.
24.
25.
26.
27.
28.
29.
30.
Experimental intensity simulation for step two hours at 350° C, 26 region 72 to 73°
anneal for
Experimental intensity simulation from oreo anneal for
2 hours at 450°C, 20 region from 35° to 45
Experimental intensity simulation for 9 Step
2 hours at 450° C, 26 region 72° to 79°
Experimental intensity simulation for step)
2 hours at 500° C, 26 region from 35° to 45°
Experimental intensity simulation for step
2 hours at 500° C, 28 region from 72° to 79°
Experimental intensity simulation for step.
2 hours at 550° C, 20 region from 35° to 46°
Experimental intensity simulation For step
2 hours at 550 C, 29 region from 72° to 79°
Experimental intensity simulation for step
2 hours at 575° C, 26 region from 35° to 45°
Experimental intensity simulation for step |
2 hours at 575° C, 28 region from 72° to 79°
Experimental intensity simulation for step.
2 hours at 600° C, 28 region from 35° to 46°
Experimental intensity simulation for step.
2 hours at 600° C, 26 region from 58° to 65°
Experimental intensity simulation for step 2 hours at 600°C, 20 region from 71° to 79°.
Experimental intensity simulation for step. 2 hours at 625° C, 28 region from 35° to 46°
Experimental intensity simulation for SreP o®
2 hours at 625° C, 28 region from 59 to 63
Experimental intensity simulation for step.
2 hours at 625° C, 26 region from 70° to 83°,
Experimental intensity simulation for. sted
2 hours at 650° C, 26 region from 32° to 40°
anneal for
anneal for
anneal for
anneal for
anneal for
anneal for
° . . e °
anneal for
anneal for
anneal for
anneal for
anneal for
anneal for
anneal for
* . . * e °
oanneal for
» a
Page
63
64
65
66
67
68
69
70
71
72
73
74
75
76
77
78
Figure
31.
32.
33.
34A.
34B.
35.
36.
37.
38.
39.
4Q.
41.
42.
43.
44.
Experimental intensity simulat:on for step, anneal for
2 hours at 650° C, 260 region from 60° to 63°... .
Experimental intensity simulation for step. anneal for 2 hours at 650° C, 28 region from 72° to 79°
Experimental intensity simulation for step anneal for
2 hours at 650° C, 26 region from 82° to 87°
Optical interference techniques measured the elastic
bending of the silicon substrate taken at right angles
Optical interference technique; measured the elastic
bending of the silicon substrate taken at right angles
Optical interference techniques measured the elastic
bending of the silicon substrate cu’ to within 3. 5° of
the 111 planes ........4.+4.-.64+24484
Experimental intensity simulation for as-received,
2.3 pm titanium thin film, 26 regiou from 34° to 42°
Experimental intensity simulation for as-received,
2.3 um titanium thin film, 2@ region from 52° to 54
Experimental intensity simulation for as- -received,
2.3 pm titanium thin film, 20 regior from 62° to 64°
Experimental intensity simulation for as-received,
2.3 um titanium thin film, 29 region from 70° to 84°
Experimental intensity simulation for 15 minute anneal
at 625° C, 28 region 34° to 42° 7. ke ee ee
Experimental intensity simulation for 15 minute anneal
at 625° C, 20 region 75° to 79°
Experimental intensity simulation for 15 minute anneal
at 625° C, 20 region from 80° to 84°... 2.
Experimental intensity simulation for 30 minute anneal
at 625°C, 28 region from 34° to 42°
Experimental intensity simulation for 30 minute anneal
at 625° C, 28 region from 59° to 62°. .....2..
vi
Page
79
80
. 81
82
83
84
85
. 86
87
88
. 89
90
91
92
93
Figure
45.
46.
47.
48.
49,
50.
Sl.
52.
53.
54.
35.
56.
57.
58.
Experimental intensity simulation for 30 minute anneal
Page
at 625°C, 26 region from 70° to 83°. oe - 94
Illustration of cross-section of thin film structure
for as-received and 350 C step anneals for 2 hours . 95
illustration of cross-section of thin film structure
for 450 C step anneal for 2 hours. . . woe - 96
Illustration of cross=section of thin film structure
for 500 C anneal for 2 hours .... oe 97
Tilustration of cross-section of thin film structure for 550 C step anneal for 2 hours... - 98
Illustration of cross-section of thin film structure
for 575 C step anneal for 2 hours. . . 99
Illustration of cross-section of thin film structure
for 600 C step anneal for 2 hours. . . L00
Illustration of cross~section of thin film structure
for 625 C step anneal for 2 hours. . . -LO1
Illustration of cross-section of thin film structure
for 650 C step anneal for 2 hours. - 102
Plot of "G' factor vs. disilicide thickness; in final step anneal treatment at 650 C for 2 hours ..... .103
Plot of strain vs. temperature increment above
deposition temperature perpendicular to the crystal-
lographic planes in step annealed thin films... - 104
Experimental intensity simulation for step anneal at
350 C for 2 hours, to illustrate the location of mono-
Silicide in this film. .......... 2... .42.. . .105
Terminal selection panel on the PDP 8/e rack .... .173
PDP 8/e computer... 1 4. 1 ee ew ee ee ee ew ew ww We LT4
vil
Table
II.
Ill.
IV.
VI.
VII.
VIII.
IX.
XI.
XII.
XIII.
XIV.
XV.
LIST OF TABLES
Completed Reflections of TiSi, (C54).
Atomic Scattering Factors .
Reflections for TiSi. .... . . . s . °
Intensities for 20 Region, As Received 2.2 jm
Titanium Thin Film. .....
Intensities for 29 Region, Step
at 350°C.
Intensities
at 450°C.
Intensities
at 500 C. .
Intensities
at 550 Cc. .
Intensities
at 575 C.
Intensi' ies
at 600 (. .
Intensities
at 625 °C.
Intensities
at 650 C.
Intensities
Thin Film.
for
for
for
for
for
for
for
for
20 Region, Step
° *. ° . °
26 Region, Stef
. * ° e °
26 Region, Stef
* ° » e e °
26 Region, Step
26 Region, Ste;
26 Region, Step
26 Region, Stef
. * e
° e .
Anneal for 2
Anneal for 2
Anneal for 2
Anneal for 2
Anneal for 2
Anneal for 2
Anneal for 2
* e * . e
Anneal for 2
Hours
Hours
Hours
Hours
Hours
Hours
Hours
Hours
28 Region, as Feceived 2.3 pm Ti
°
Intensi:y for 26 Region, 15 Mirute Anneal at 625°C.
Intensities for 26 Region, 30 Minute Anneal at 625°C.
28 Positions for Experimental Intensity Simulations .
viii
- 112
120
. 122
. 124
127
130
133
. 136
. 140
144
149
152
154
157
Table
XVII.
XVIII.
Page
28 Positions for Experimental Intensity Simulations . . . 163
Thin Film Specimen 2.5 Micron of Titanium Cut Within 3.5° of the 111 Planes Annealed at Various Temperatures
for 2 Hours, Measured at Room Temperature ....... . 166
I. INTRODUCTIO.J
Preliminary investigations of titanium-silicon thick films are
incapable of presenting quantitative models describing their behavior
at intermediate temperatures. The silicides associated with diffused
-thin film structures have received limited attention thus necessitating
conclusive determinations of structure and lattice parameters. The
confusion in the literature on the reaction between titanium films
and silicon possibly stems from the acceptance of previous incomplete
and inaccurate studies of the bulk silicides. The characterization
of this transition metal system is the purpose of this study.
The nature of X-ray diffraction makes it a particularly attractive
tool for analyzing diffusion on the order of several microns in
specimens. Refinements in the analysis of diffraction data have made
it possible to investigate uniform and non-uniform strains, grain
size, stacking faults and other defects as well as texture and crystal
structure. Grain boundary diffusion and volume diffusion in films
can be studied quantitatively in detail with an X-ray technique.
The titanium-silicon thin film system has been mainly examined with
MeV He backscattering along with some supporting K-ray diffraction.
A detailed study on thick film specimens which are free of oxides
at the interface was carried out. Titanium films of approximately
two microns thick, a factor of ten thicker than in previous studies,
were deposited on 111 oriented silicon single crystals. An additional
complication evolved from the highly deformed nature of the deposited
metal films. The diffraction line broadening found with these films
is probably considerably greater than that of cold worked titanium
filings at room temperature. A computer simulation data analysis
technique was developed to evaluate the diffused structure of the
films..
The build-up of strain about the various interfaces and its affect
on the long term mechanical stability of the reacted film is a major
concern. Examination of both uniform and ncn-uniform strains resulting
from various heat treatments and substrate orientations supplied some
insight as to the origin and subsequent reduction of the mechanical
instability.
Lattice parameters and structure factor determinations of both
titanium monosilicide and disilicide eliminated a major problem for
identification of these phases with X-ray diffraction. A range of
compositions along with the identification of TisSi, as a high
temperature phase will modify the most recent phase diagram‘ (see
Figure 1). Results of the bulk titanium si icides represent
significant differences from those integrat:d intensities and lattice
parameters previously reported.
Finally, it should be noted that the d:terminations presented
in the following sections have not completely charécterized the
titanium-silicon system. A continuing effort in tle examination
of diffused films and bulk standards will eventually complete the
study.
IIT. REVIEW OF LITERATURE
‘In the past ten years, a renewed inter:st in the silicides of
titanium evolved from their importance in iutegrated circuits and
energy conversion devices. These applications impose an acceptatle
period of operation at a given temperature ind consequently encourage
the development of new techniques to measur: composition and structural
changes on a fine scale. The thin film rea: tion between silicon and
titanium may differ from the ordinary diffu.:ion process in bulk
samples at elevated temperatures. Baluffi ::nd Blakely‘) have
attempted to identify and describe a number of special characteristics -
for diffusion in thin films. Although prel minary work has been done
on this system, it is not as clearly unders ood as many conventional
engineering materials.
A technique using the energy spectrum of MeV backscattered He
ions provides sensitive measurements of relative atomic composition
as a function of depth. This method along with glancing X-ray
diffraction furnish specific pictures of the transformations in thin
films after thermal treatment. Although there is some disagreement
as to whether ion backscattering is nondestructive ‘7??? (since it may
create some defects which could influence the diffusion data) it is
at worst categorized as "nearly nondestructive" , The subsequent
information, which has been collected for the thick film reaction
between silicon and titanium (less than one nicron) has made use of
this technique.
Silicide formation is most commonly obtained through direct
reaction of a vapor deposited film on an oriented silicon substrate.
Typically one, and in a few cases two, silicide phase(s) are formed
3) in thin film structures after thermal treatment ‘ . The minimum
reaction temperature and the silicide phase(s) present in reacted thin
film structures are dependent upon the extent to which the native
(253). "The thickness of native oxide
(3)
silicon oxide film is present
layer is markedly different for different substrate orientations.
Film cracking and peeling aftcr thermal treatment, which is often
enhanced for thicknesses greater than a few thousand Angstroms, has
(3) also been correlated with these silicon oxide layers
(2) Mayer and Bower have reported that titaaium disilicide forms
at approximately one-half its absolute melting point (600°C) in thin
film structures where the substrates are oxide free. Prior to the
formation of TiSi Tu 6) »? has suggested that the lower free energy
monosilicide of titanium will form. In both the zirconium and
hafnium-silicon systems, these transition monosilicides have formed
(3) during thermal treatment » but no direct evidence was found for
1 a
the analogous titanium-silicon system. A relationship of (time)?
(3 os was found for the growth of titanium disilicide ), which is character~
istic of a diffusion dominated process. Silicon was identified as
(6) the diffusing species in the titanium-silicon system by the use
of implanted nobel gas markers.
(6) It has been postulated that since silicon is the diffusing
species, it will leave vacancies near the silicon-silicide interface.
If these vacancies coalesce to form voids, the silicide could fracture
(1) easily under an applied stress. Balluffi and Blakely~~ have reviewed
several explanations as to the origin of re!atively large biaxial
(7,8) stresses often present in thin films - Commonly found stresses
, 9 10 ~2(7,8,9) , of the magnitude 10° -10 dynes cm are likely to affect the
thin film diffusion process and the stabilicy of the conesive inter-
(10) face forces. Dearnaley and Hartley emphasized that several
intermediate phases formed in the diffusion zone are brittle and
easily susceptible to fracture. These effects are recognized in oxide
films but little attention has been given to thin metal film processes.
Direct information on crystal structure, grain size, internal
strains, and the texture in thin film structures has not been obtained
with ion backscattering. It should be pointed out that there is
disagreement among authors (11> 12) as to the structure of TiSi,.
(2) Titanium disilicide, identified by Mayer and Bower » was reported
to be of the orthorhombic C49 type. Preliminary work by Kato and
(13) Nakamura using X-ray diffraction has reported both the C49 and C54
orthorhombic structures in the same thin film of titanium and silicon.
(11), Cotter, Kohn and Potter have claimed that TiSi
(14)
9 is dimorphous
Another author has inferred that the C49 orthorhombic
disilicide is a ternary phase containing aiuminum.
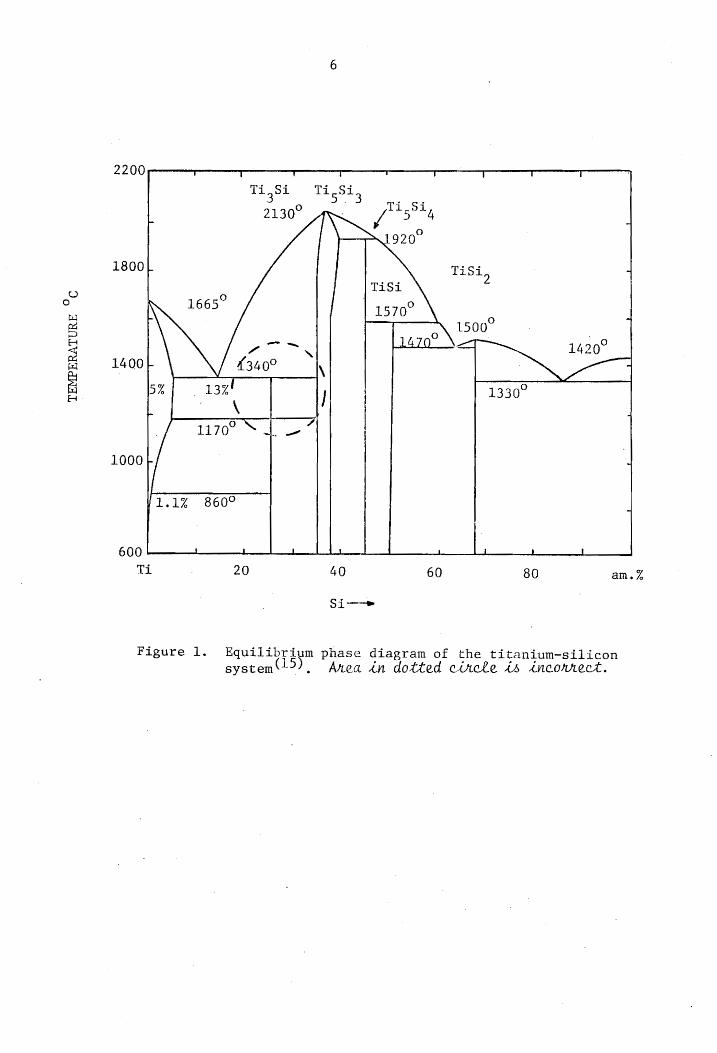
(15) An examination of the phase diagram for the titanium-silicon
system (Figure 1) indicates that a number of intecmediate compounds
are observed under equilibrium. At the resorted reaction temperature
for thin films, approximately one-half the absolve melting point,
TEMP
ERAT
URE
°C
2200
T J t 1 ' qT | tT 1
B3h8 Ti,Si., i Si
; 2130 f3-4 | 920°
1800; TiSi, 4
TiSi oO ,
1665 1570° ,
' 3X 1500 ,
softy P1420 1420° 1400} £340° \ :
5% 13%! 1330° . \ |
1170° “| U7”
1000+ /
1.1% 860°
600 —l 4 L 1 1 _4 t
Ti 20 40 60 80 am.%
si—
Figure 1. Equilip riu
system 15),
lum phase diagram of the titanium-silicon Anea in dotted circle is incorrect.
the solubility of silicon in titanium is less than one percent. The
solubility of titanium in silicon is negligible. The crystal
structures for the Ti-Si system are: orthorhombic Tisi, with a C54
structure 12) | a = 8.236, b = 4.773 andc 8.523A; a C49
structure‘)? also orthorhombic, a = 3.62 + 0.01, b = 13.76 + 0.01
and c = 3.60 + 0.01; TiSi is also orthorhombic ‘1° a = 6.544,
b = 3.638, and c = 4.997; Ti,Si, is hexagonal of the D8, type with
a = 7.429 andc = 5.13924. 2”)
Reacted transition metal films yield silicides which range from
(18) nearly random to textured or epitaxial , and consequently some
preferred orientation or texture may be anticipated in any sample.
The subsequent study is an effort to exemplify the use of X-ray
diffraction as a technique which can better characterize both texture
and strain effects in thick films. Emphasis is placed upon the strains
which are present in the plane of the film and their effect upon the
stability of the reacted structure.
Summary
1. Existing studies have been of a preliminary nature using
nearly nondestructive techniques, mainly MeV backscattering
with some supporting X-ray diffraction.
2. There have been no studies which kave measured the effects
of either stress or texture on the diffusion process in thin
films.
3. Grain boundary diffusion and grain size have aot been
properly addressed in silicide formation.
The effects of epitaxial growth on the stability of the
diffused film have not been addressed but have been shown
. . . . (19) to be important in the Pd-Si system by Hutchins and Shepla
A detailed kinetics study on thin film specimens which are
free of oxides at the interface is still to be carried out.
Conclusive determinations of structure and lattice parameter
of both TiSi and TiSi, in bulk samples are absent. 2
III. THEORY
An X-Ray Diffraction Approach to a Kinetic Model
Introduction
X-ray diffraction provides non-destructive measurements of both
(20, 21,22) in films. volume diffusion and grain boundary diffusion
High diffusivity paths, such as grain boundaries and dislocations,
are known to be important at lower and intermediate temperatures
and are of significance in determining the behavior of material
systems.
(18) Random to textured or epitaxial silicides form in reacted
transition metal films. The problem of texture must be considered
if accurate measurements of the thickness of growing phases are to
be made. The diffraction equations should be sufficiently general
to treat phases with various degrees of preferred orientation.
Thick metal films are capable of withstanding a surprising amount
of mechanical deformation during cooling from elevated temperatures.
The deformation results from large differences in thermal expansions
of the individual materials (see Figure: 2). Strain data can be
measured in three ways: (a) X-ray linc shifts (uniform strain),
(b) line broadening (non-uniform straii), and ‘c) the elastic bending
of the substrate.
An X-ray diffraction approach is « escribed along with experi-
mental results to illustrate methods wi ich enatle the determination
of a kinetic model. Only after understanding the texture and strain
10
1.0 T ¥ } ’
TiSig —
0.8 |
&
et oO
” < O.6F oa Titanium a . Gs (// a-axis ) a 44 © . Y a Titanium
37 .0C(C«OOW4 LL (// c-axis )
rt ow E o & E
0.2 -
0.0 , 200 800 1000. 1200
Temperature (°K)
. . . 28 Figure 2. Plot of linear expansion vs. temperature ) for the
components of a-.reacted thin film.
il
developed in thick films, along with the identity of reactant products
either deposited at the grain boundaries or at the interface, will
this system be characterized.
X-Ray Diffraction Theory
The diffraction equations below are for a polycrystalline film
deposited on a silicon single crystal substrate. Polycrystailine
materials require texture information to obtain quantitative results.
The use of parafocusing geometry results in simultaneous measurements
of an orientation function and the reactant phase thickness. At later
stages of this development the diffraction equations will reflect the
experimental limitations observed in this study.
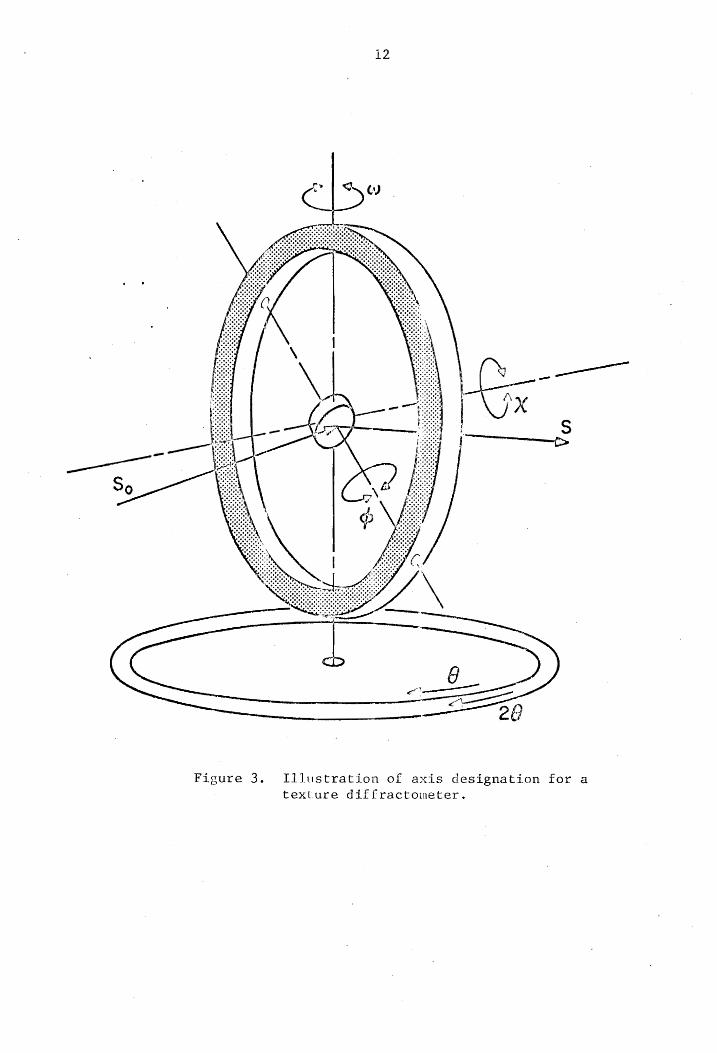
Two mutually perpendicular angles, x and © (Figure 3), allow
various sample orientations. Phi is perpendicular to the specimen
surface. The plane containing the incident and diffracted beam also
parallel to the specimen surface contains the x axis. Specimen size
limitations restrict examination to 60° in x and a full rotation in
d. Chi should be taken as 0° when the specimen surface is perpen-
dicular to the plane defined by the incident and diffracted beams.
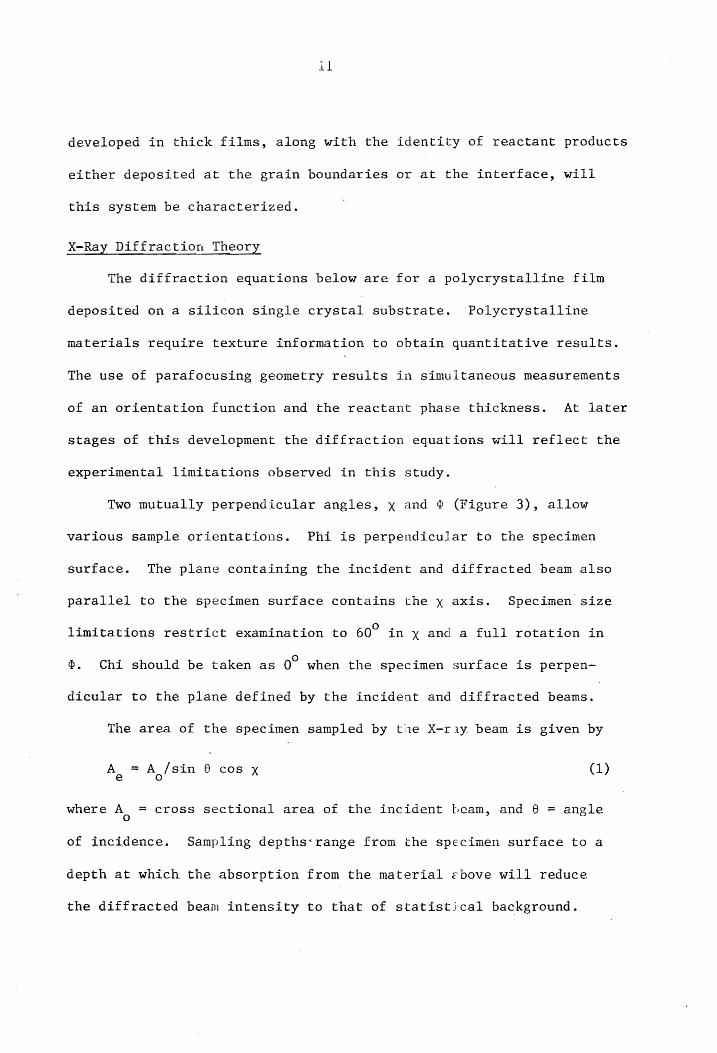
The area of the specimen sampled by tie X-riy beam is given by
A, = A,/sin 8 cos x (1)
where A, = cross sectional area of the incident beam, and @ = angle
of incidence. Sampling depths«range from the specimen surface to a
depth at which the absorption from the material <ebove will reduce
the diffracted beam intensity to that of statistical background.
L2
Figure 3. Illustration of axis designation for a
texture diffractometer.
13
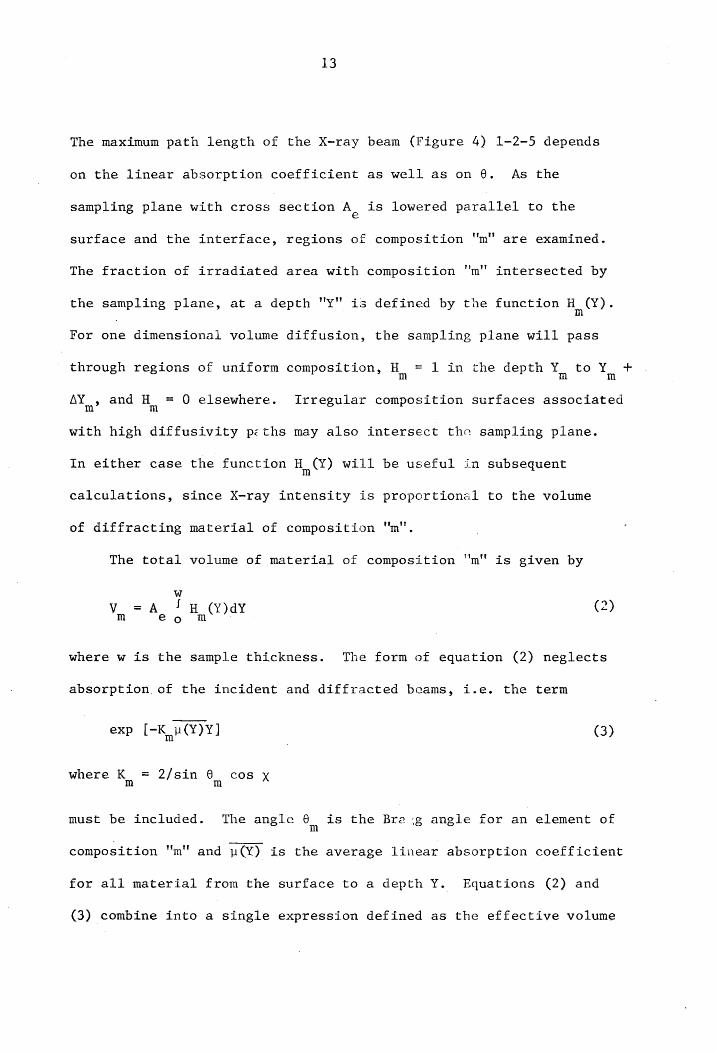
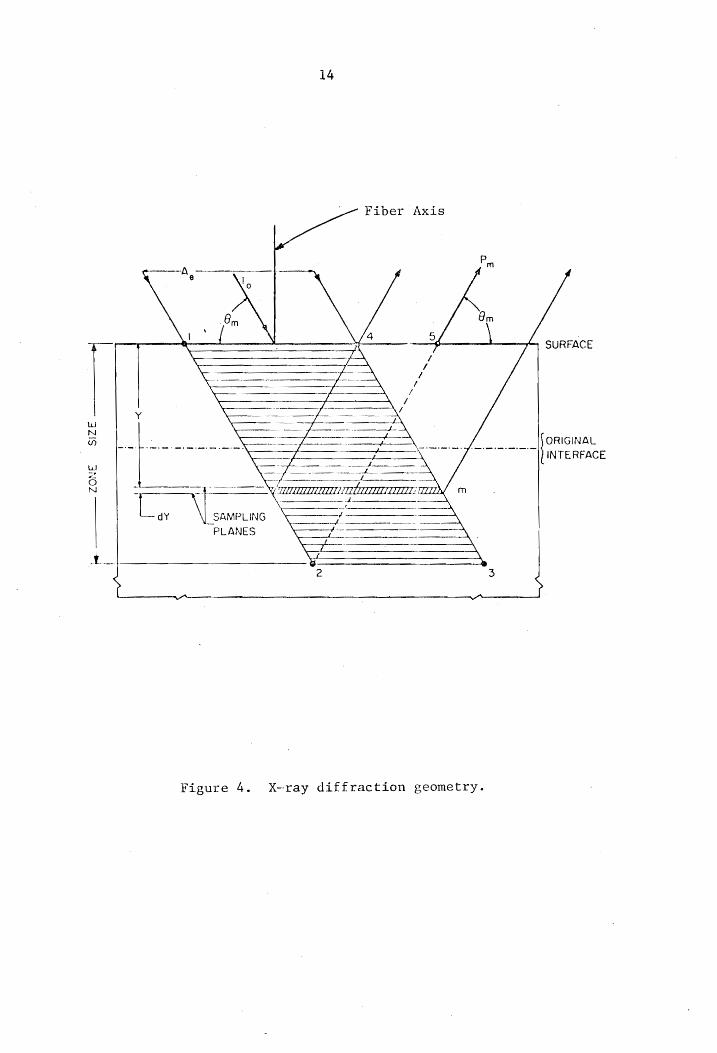
The maximum path length of the X-ray beam (Figure 4) 1-2-5 depends
on the linear absorption coefficient as well as on 6. As the
sampling plane with cross section A. is lowered parallel to the
surface and the interface, regions of composition "m" are examined.
The fraction of irradiated area with composition "m"’ intersected by
the sampling plane, at a depth "Y" is defined by the function HY).
For one dimensional volume diffusion, the sampling plane will pass
through regions of uniform composition, Hs = ] in the depth Ya to ae +
AY and He = 0 elsewhere. Irregular composition surfaces associated
with high diffusivity pzths may also intersect the sampling plane.
In either case the function H@) will be useful in subsequent
calculations, since X-ray intensity is proportional to the volume
of diffracting material of composition "m".
The total volume of material of composition "m'' is given by
W
Vy =A ‘/ 4 (y)dY (2) m @o mM
where w is the sample thickness. The form of equation (2) neglects
absorption of the incident and diffracted beams, i.e. the term
exp [-K u(¥)Y¥] (3)
where K_ = 2/sin @ cos x m m
must be included. The angle oF is the Bra :g angle for an element of
composition 'm" and p(Y) is the average linear absorption coefficient
for all material from the surface to a depth Y. Equations (2) and
(3) combine into a single expression defined as the effective volume
SIZE —_—____—__-»
SURFACE
INTERFACE
hNTene
Fiber Axis
——-A 6 ly
8m
1° { % —TH
aa v ae 7 x Z — 7
C f= — f- / " pa X 7
X 7 X Z
Je mee mes ee eee ee a ee 7 x ZL
w x 7
é , N TELE EEE
a
La \| samen \ / _f
PLANES 7
1. =
t | s a Catlin
Figure 4. X-ray diffraction geometry.
15
<Ve ms sO OOA, i H_(¥)exp[-K yu (¥)¥]d¥> (4)
The integral has been extended to = Since the integrand vanishes for
thick substrates. The orientation factor, 00> represents the ratio
of the actual pole density for a specific composition "m" to that of
the ideally random case. Rotational symmetry may be assumed for the
present application of diffused planar films deposited onto oriented
single crystals.
The diffracted intensity is proportional to the effective volume,
Vie? and is given by the following equatior
Pa ~ ten me” . (>)
where Ow the reflectivity per unit length, 72°2” .
rn 1+ cos26 cos”2a 2
Ge a7 OF, exp[-20, ] (6) vn sin 26 (1 + cos’ 2a)
The constant terms are:
I_ = intensity of incident beam, o .
re classic radius of the electron (= e”/me*)
A = X-ray waveleng <h.
Terms dependent upon the composition, 11, of the diffracting element:
Via = volume of unit cell,
N |
F = structure factor = £ f_ exp[?a(hu_ + kv + dw_] (6a) m 1 2 n n n
16
fo = atomic scattering factor, /
us Yn? = coordinates of the atoms in the unit cell
N = number of atoms per unit cell
exp[-2M_] = Debye-Waller factor,
oF = Bragg angle for diffracting composition
angle for the monochromator. a
Equation (4) may be written in terms of an average over a hemisphere
for a specific oF
A n/2 “9
= —?. f -K u(Y) <V nee sin a 5 0&0 tan x S H(t exp l K CY ]d¥dx (7)
a/2
with the J 00 sin x dx = 1 (7') oO
The integral can be carried out if the transformation products are
planar and of uniform ecmposition to a depth Y. The general case has
several planar phases b:tween the suxface and the diffracting phase.
The intensity for an intermediate phase of composition "m" is
A, w/2
Pr. Tal au : 0x) sin x [1 - exp(-K u Y)] x
exp (-K_u(Z)¥) Idx (8)
where Y = distance to the surface,
Y thickness of planar composition"m", and the average linear m
Nt
absorption coefficient is given by:
17
Y I ucyv)dy (9) Q
KL
u(y) =
The integrated intensity of a single uniform phase with a texture
represents the limiting case of equation (8):
A, n/2 = —_—— f ; Pa TQ, 2h ; 0% sin x)dy (10)
letting Y > O and va +o, The last integral is unity by (7') and the
effective volume expression reduces to
<V >= co (11)
which is the effective volume for a uniform phase.
Existing literature on silicide formation in thin films indicates
that the planar model is adequate. Equations (4), (7'), and (8) (or
simplifications) can be used to determine phase thickness, we and
the distribution function, 0 6X) - In the case of epitaxial phases,
(20,2122). In this methods are available to give similar information
case, X-ray rocking curves and integrated intensities supply the
distribution of subgrains and phase thickness respectively.
Experimental Limitations
The long term mechanical stability of the reacted thick film is
limited by the build-up of strain about the various interfaces.
X-ray data obtained by systematic isothermal anneals provide
diffraction lines which overlap and are considerably broader than
those obtained from cold worked metal filings. Chi rotation, carried
out with an Eulerian cradle, would result in a complex analysis of the
X-ray data. A simplification of the development presented above is
given in the following section.
The effective volume, equation (4), reduces to the following when
conventional reflection geometry is assumed
Ve. = A.8 i HY) exp[-K_u(Y)¥]d¥ (12)
where g = 00x) and chi is restricted to + 3.4°, The intensity for
an intermediate phase of composition '"m" is given by
rd I TQ A.8ft - exp (-Ku_Y_) :exp[-K u(Y)Y] (13)
where Y = distance to the surface
Y thickness of planar composition "m'" and the average linear Pp Pp g m
absorption coefficient is given by equation (9). The orientation
factor, g (eqn (12)), designates the volume fraction of grains that
have {hk&} plane normals lying parallel to the fiber axis (see
Figure 4).
Bulk standards allow the X-ray data to be reduced to the
effective volume term of the various silicides (and pure materials)
given by equation (11). From an ideal powder standard of a, the
intensity is
A e)
P, = 1,9, a (14)
19
where "g"' = 1, a randomly oriented material. For a given hk&
reflection the ratio of a standard powder to that of the general case
of a thick film structure yields the following intensity relationship:
<P ,> QQ, #
a O a _—
P =o => X,8ll - exp(-K <u, >¥, Jexp[-K u@)¥] (15) a a a
. (25) Harris has shown that the values of Syke? averaged over all
orientations, is equal to unity:
zg hke _ TO ee)
where N is the total number of reflections. If only a few reflections
are available, equation (16) may no longer be valid.
Equation (15) or a modification of it can be used to consider
a homogeneous dispersion of "o" in a thick film or a columnar reaction
product at the grain boundaries. In this case the grain size is
assumed to be much smaller than 1/ny- Through the use of the
preceding equations, a kin2tic model for silicide formation in the
titanium-silicon system will be developed.
Simulation of X-ray Patterns
The complexity of X-ray diffraction patterns obtained from highly
deformed materials necessitate the use of computer simulation in
their analysis. Symmetrical diffraction peaks are often represented
by simple mathematical functions. Gaussian or Cauchy distributions
20
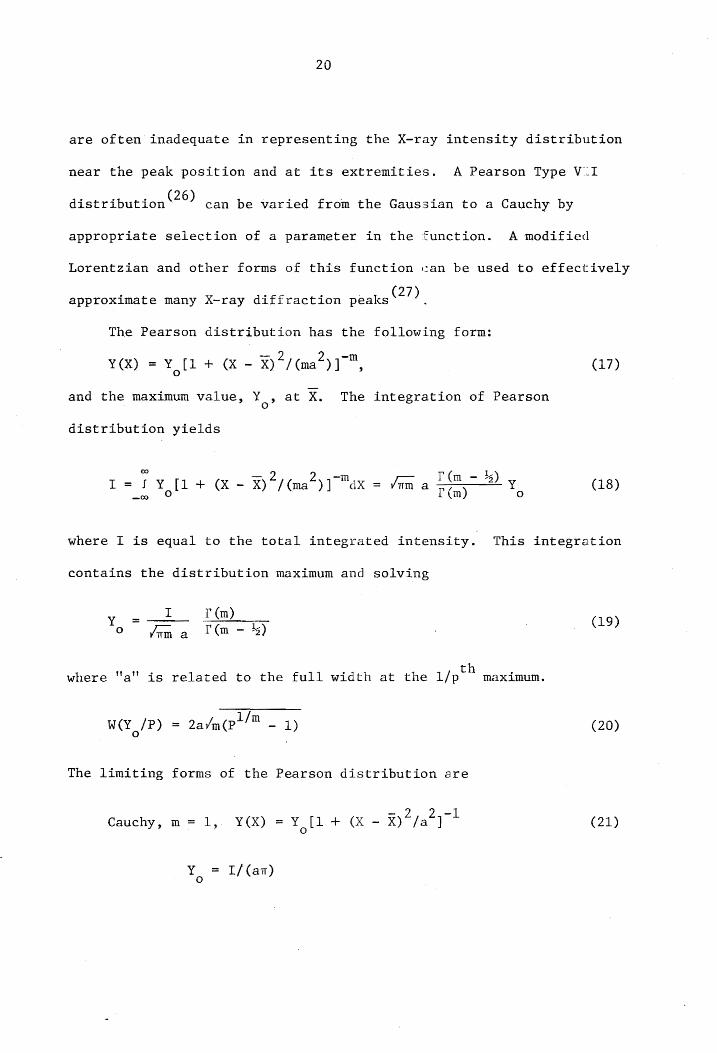
are often inadequate in representing the X-ray intensity distribution
near the peak position and at its extremities. A Pearson Type VI
(26) distribution can be varied from the Gaussian to a Cauchy by
appropriate selection of a parameter in the function. A modified
Lorentzian and other forms of this function can be used to effectively
approximate many X-ray diffraction peaks (27) |
The Pearson distribution has the following form:
y(X) = Yo[L + (K - %)°/ (ma), (17)
and the maximum value, Yo? at X. The integration of Pearson
distribution yields
Pm = 3) y (18) l= i Yf1+ &@ ~ X)7/ (ma) J Max = vim a T (m) oO
where I is equal to the total integrated intensity. This integration
contains the distribution maximum and solving
_ I tT (m)
Yo vim a F(m - 4) (19)
where "a'’ is related to the full width at the 1/pt® maximum.
W(Y/P) = 2avm(pl/™ - 1) (20)
The limiting forms of the Pearson distribution are
-1 Cauchy, m= 1, Y(X) =Y [1+ & - %)*/a-] (21)
YG = I/(at)
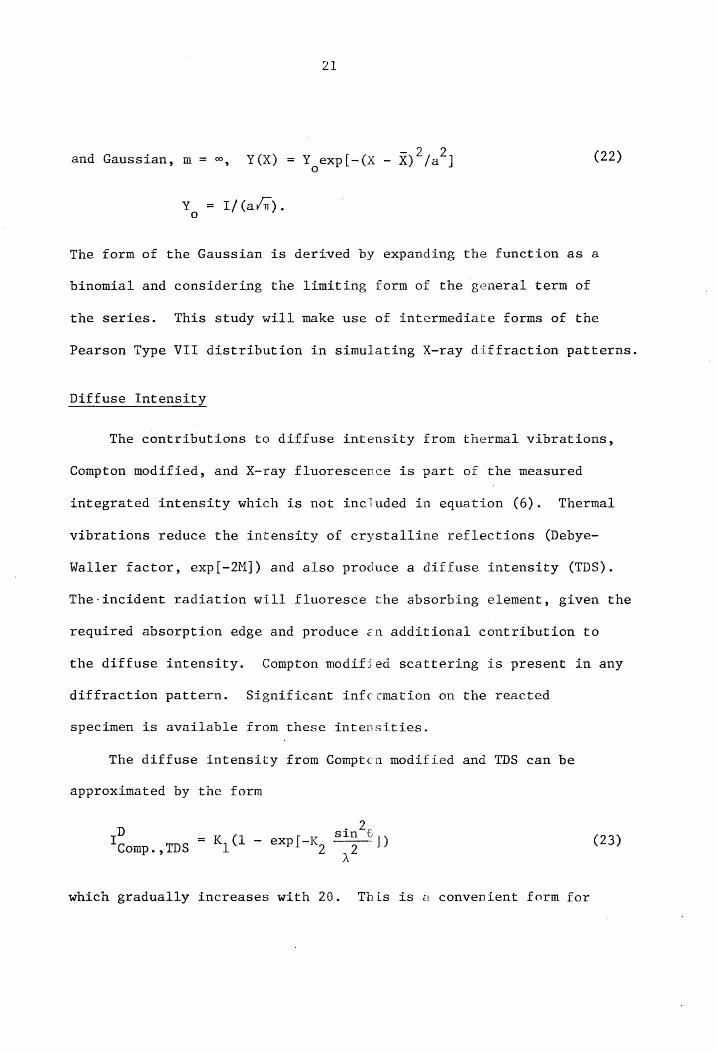
and Gaussian, m= ~, Y(X) = Y exp l[-(x ~ X)*/a7] (22)
Y, = I/(ayn).
The form of the Gaussian is derived by expanding the function as a
binomial and considering the limiting form of the general term of
the series. This study will make use of intermediate forms of the
Pearson Type VII distribution in simulating X-ray diffraction patterns.
Diffuse Intensity
The contributions to diffuse intensity from thermal vibrations,
Compton modified, and X-ray fluorescence is part of the measured
integrated intensity which is not included in equation (6). Thermal
vibrations reduce the intensity of crystalline reflections (Debye-
Waller factor, exp[-2M]) and also produce a diffuse intensity (TDS).
The-incident radiation will fluoresce the absorbing element, given the
required absorption edge and produce ¢n additional contribution to
the diffuse intensity. Compton modified scattering is present in any
diffraction pattern. Significant infccmation on the reacted
Specimen is available from these intensities.
The diffuse intensity from Comptcn modified and TDS can be
approximated by the form
2 D _ _ sin 6
Tcomp.,tos ~ *, 1 ~ exPI-K, 2 )) (23)
which gradually increases with 28. This is a convenient form for
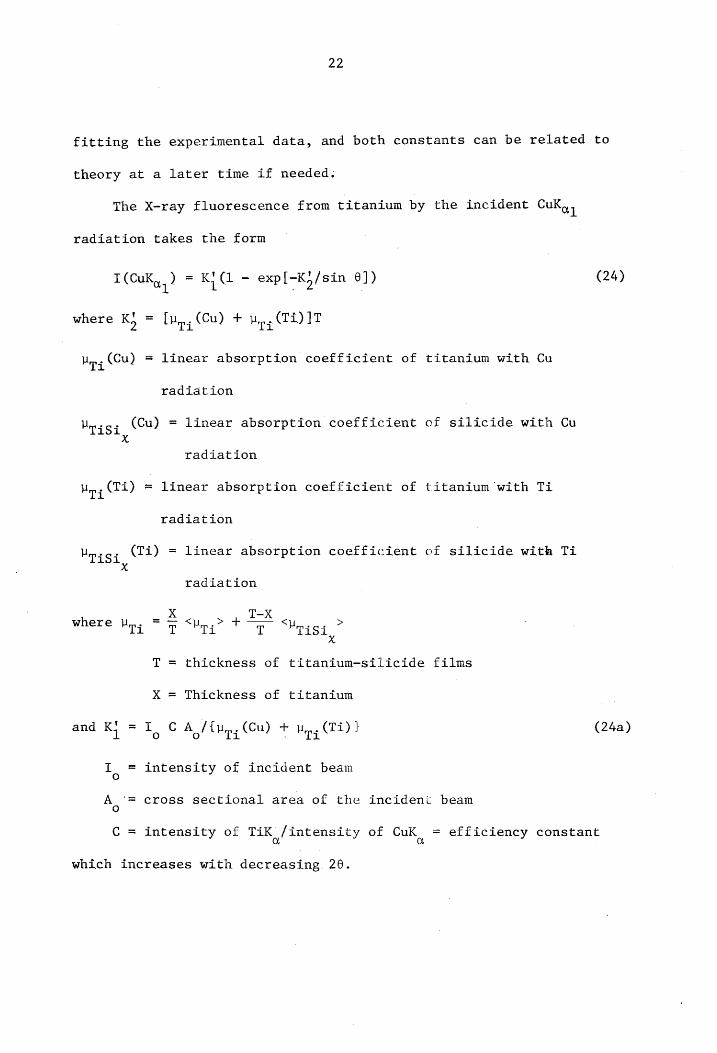
22
fitting the experimental data, and both constants can be related to
theory at a later time if needed.
The X-ray fluorescence from titanium by the incident Cuky,
radiation takes the form
T (CuK, ) = KG - exp[-K,/sin 6]) (24)
Wi where K! > = Ing, (Ca) + Mpg HIT
Hp; (Cu) linear absorption coefficient of titanium with Cu
radiation
Ups gy (Cu) = linear absorption coefficient of silicide with Cu
x
radiation
Hp, (TL) = linear absorption coefficient of titanium with Ti
radiation
Uns ge (Ti) = linear absorption coefficient of silicide with Ti
° radiation
where Ung = FS? + “risa”
T = thickness of titanium-silicide films
X = Thickness of titanium
and Ki = I, C Afi (Cu) + Mpg (TL) I (24a)
I= intensity of incident beam
A, = cross sectional area of the incident beam
C = intensity of TiK /intensity of CuK = efficiency constant
which increases with decreasing. 26.
23
The effective volume of titanium after each diffusion treatment can
be cross-checked by the use of this flvorescence, which is independent
of orientation. The application of these two forms of diffuse
intensity will be described in detail in the Analytical Procedures
(Section IV).
IV. EXPERIMENTAL PROCEDURES
An examination of both thick films and bulk powder standards were
necessary to complete this study. The existing ASTM powder dif-
fraction card files for TiSi and TiSi, were discovered to be incom-
plete or inaccurate, and standards had to be prepared. These silicide
standards along with a Ti powder sample supplied the fundamental
information essential to pursue tre development of a kinetic model
of silicide formation in titanium-silicon thick films.
This chapter describes the procedures employed in the preparation
and reaction of both thick films and bulk powder standards. Certain
preliminary results from the preparatory stage of the powder standards
are also presented. A detailed description of the experimental
equipment is given for completeness.
A. Thick Film Preparation
This is an important stage of the research because one of the
purposes of this study is to obtain a thin film structure free of the
native silicon oxide layer. In order to clean this interface, the
silicon substrates were first placed in acetone in an ultrasonic
cleaner for twenty minutes. The samples were then sputter etched in
the same chamber where the metal films were later deposited. This
procedure did not allow th: Si to be exposed to oxygen prior to Ti
deposition. The etching ws done at 0.8 kV, 60 watts for 30 minutes.
The samples were subsequently heated to 340 and 360°C*, and the
Oo, . . . *Samples (b) were heated tc 275 C in order to examine the effects this
different substrate temperature would have on the fracture process.
24
25
titanium was then deposited at 2.1 kV and 300 watts. The sputtering
pressure of argon was 5 microns. The purity of the Ti target was
99.9%. Auger spectroscopy was used to determine the amount of sputter
etching required to remove the native oxide film on the silicon
substrate. Specimens were prepared at the Oak Ridge National
Laboratory by the Isotope Research Materials Laboratory.
Three different sets of thin film samples were received from the
Oak Ridge National Laboratory at different stages of the study:
1. Ti-Si specimens with a uniform deposit of 2.3 microns of
Ti within 0.95 to 1.00 of the theoretical density. The
substrates were cut to within 2.5° of the lll planes and
measured 0.5 x 0.5 x 0.01". |
2. Ti-Si specimens with a uniform deposit of 2.5 microns of Ti
within 0.95 to 1.00 of the theoretical density. The sub-
strates were cut to within 3.5° of the 111 planes and
measured 0.7 x 0.7 x 0.02".
3. Ti-Si specimens with a uniform deposit of 2.2 microns of Ti
within 0.95 to 1.00 of the theoretical density. The sub-
strates were cut to within 0.5° of the 111 planes and measured
to 0.875" in diameter, thickness of 0.013". These substrates
were purchased from Pensilco in Bradford, Pennsylvania with
a dislocation density of less than 500 em? resistivity, 1 ohm-
cm, and polished on both sides.
Samples for cyclic annealing studies measuring 0.1 x 0.1" were
cut from the as-received sampled using an ultrasonic milling machine.
26
The specimens were sandwiched between two glass slides using pyseal
cement. A 345 mesh boron carbide abrasive was used for cutting. All
samples were cleaned in hot (50°C) chloroform which was found to be
the solvent inert to both titanium and silicon, yet it readily removes
pyseal cement.
B. Bulk Standards Preparation
High purity silicon and titanium hydride powders, supplied by
(30) Ventron Corporation's Alpha Products » were used in preparing
the samples. Emission spectroscopy suppl:.ed by the manufacturer found
the silicon powder to be highly pure (iron the gieatest at 500 ppm).
Wet chemical analysis of the hydride found 94.5 4 O.1 weight percent
titanium, and from hydrogen evolution, 4 + (0.1-(.3) weight percent
hydrogen. All powders were mixed in methanol anc evacuated in a vacuum
desicator (1077 torr) and allowed to dry.
Titanium and silicon were mixed in the exact stoichiometric
ratio of:
18.8206 grams Til,
21.1794 grams Silicon
to prepare a 40 gram sample. The mixed powder was placed in a 3-inch
long, high alumina boat, and subsequently evacuated to i0°° torr in
an ion sorption vacuum system (see annealing furnaces, Section IV).
A total reaction time of 279 hours of annezling ensured complete
reaction of the sample in five steps at 1000°C. The first anneal
was 111 hours, of which 5 hours at 107" torr was due to hydrogen
. 3 ~6 . evolution. All subsequent anneals were at 10 torr during the
27
reaction. The weight loss could be attributed entirely to hydrogen
evolution in the initial anneal.
After each anneal (111, 24, 48, 48, 48 hours) the samples were
removed from the furnace and reduced to less than 37 um (-400 mesh)
particle size with a steel impact mortar. X-ray patterns were taken
without the use of a binder, and throughout the anneals the diffraction
lines remained sharp and no shifts were observed. Full reaction was
found after the fourth anneal with no evidence of residual titanium
or silicon. A fifth anneal was carried out to assure completeness
of the reaction. All X-ray patterns were made using a graphite
diffracted beam monochromator. This allowed very weak peaks to be
observable.
Titanium and silicon were mixed in the stoichiometric ratio of:
25.5973 grams of Til,
14.4027 grams of Silicon
for preparation of a 40 gram sample. All preliminary preparation
methods were identical to those employed wit the disilicide.
A total reaction time of 528 hours at 100°C in 11 steps assured
complete reaction of the standard. A111 anneals were 48 hours in
length of which 7 hours of the initial anneal was at 107 torr.
Weight loss again could be attributed entirely to hydrogen evolution
during the initial anneal. All sequential anneals were at 10°° torr
as in the disilicide treatment.
The X-ray diffraction patterns obtained with the same conditions
as before contained peak position shifts. Examination of the final.
sample found Ti,Si., and TiSi in the completely reacted state. A
10 atomic percent deficiency in silicon was determined and a corres-
ponding sample prepared.
All conditions remained the same as those of the previous samples
except the reaction temperature was increased to 1050°C. Seven treat-
ments of 48 hours in length produced a sample of only monosilicide.
The X-ray diffraction lines remained sharp and shifted to lower 26
positions during the treatment.
Each silicice powder of less than 400 mesh was filled into the
cavity of an aluminum sample holder after the final anneal. Acetone
and Duco cement (10 parts to 1) was used as a binder after the powder
was settled with acetone. This produced a sample with limited
surface roughness.
C. Annealing Procedure
Thin film anc. bulk sample heat treatments were carried out in
oil free, high vacuum furnaces which incorporate sorp*ion and ion
(20 liter/sec) pumping. Using both control and specinen thermocouples,
temperature measurements were within + 2°C. {interlocks in both
furnaces did not permit operation unless a vacuum of 107" torr or
better was maintained. Both furnaces and a general procedure is
described in the following section.
1. Bulk Standard Treatments
Powder samples were reacted at 1000 or 1050°C in a horizontal
tube furnace positioned around a quartz furnace tube which contained
29
the powders under constant vacuum. A West furnace controller provided
many different constant rise and fall rates, ranging from 20°F/hr to
300°F/min (0.001 to 1.0). Temperature was measured on a Brown Elec-—
tronic recorder with a chromel-alumel thermocouple which was in
contact with an alumina boat containing the powders. The furnace
control thermocouple was platinum-10% rhodium. A three-inch constant
temperature zone was measured at 1000° or 1050°C which was the reaction
temperature for all powder samples. Prior to heat treatments of all
powders, each alumina boat was air-baked at 1000°C for 8 hours in an
alundum tube inserted in the furnace.
A fused quartz, 3/4 inch I.D., tube was thoroughly cleaned in
acetone and methyl alcohol prior to any heat treatments. The alumina
boat located in the end of the tube was sealed to the vacuum system
by tightening two flanges against a copper gasket. The furnace was
positioned around the glass tube so that the constant temperature
zone enclosed the entire specimen.
If the following recommended start-up procedures are employed,
the inefficient pumping of samples to reaction vacuums will be
eliminated.
The ion pump is isolated from the remainder of the system during
an exposure to atmosphere. Dry nitrogen is bled to eliminate the
vacuum and a constant purge is continued during exposure to increase
pumping efficiency. A roughing vacuum is produced by filling the
sorption pump with liquid nitrogen. After a»proximately 15 minutes
the valve between the ion pump and the remai ider of the system may
be opened after valving off the sorption pum>. The vacuum should
stabilize at 5 x 10° torr and be allowed sufficient time to pump
well below this level.
The initial anneal produces a large amount of hydrogen at the
reaction temperature and is easily handled by the sorption pump.
During this anneal it is necessary to supply liquid nitrogen to the
sorption pump so that the roughing vacuum is not lost. This is
necessary for 5 to 7 hours at which time the ion pump may be bled
into the system. All subsequent anneals were done at 10° torr at
the ion pump. The rise rate of the furnace was set at 200°F per hour.
At the end of each anneal the samples were allowed to air cool by
retracting the furnace.
2. Thick Film Treatments
Thick film specimens were enclosed in a one-inch I.D. fused
quartz tube and evacuated to 5 x 10> torr. The vacuum was produced
with the same procedure described in the previous section. The
specimens were suspended in the tube on a horizontal high alumina
platform which eliminated contact of the specimen with the quartz.
A water cooled, open coil furnace was positioned around the sample
tube to produce a 3/4 inch constant temperature zone at 650°C (the
maximum heat treatment temperature).
Heat treatments of all thin films were carried out with the
"Thermac'' controller in the remote option. This option follows a
predetermined time-temperature profile ruled on a totating drum.
The limiter and gain controls were adjusted such that there was a
maximum of 2°¢ deviation between the chromel-alumel specimen and
command thermocouples. Limiter control enables the maximum voltage
applied to the heating coil to be any desired fraction of the full
line voltage. The width of the proportional band is dependent on the
gain setting; increasing the gain will narrow the proportional band.
For optimum control, the gain was 8 with the Limiter set on 4.
Cycled specimens (see Section VI and Figures 9-12) were heat-
treated with 50°C per minute heating and cooling rates at temperature
times of 5, 10, and 15 minutes. All stepped and isothermal anneals
had heating and cooling rates of 100°¢ per mi.iute.
D. X-Ray Measurements
The two X-ray diffractometers used to collect all data on bulk
and thin film specimens will be briefly described in this section.
Distinct advantages obtained through the use of this equipment are
emphasized.
1. Powder Diffractometer
(32) A Siemens diffractometer, allowing the specimen to be
rotated about the % axis (see Figure 3} independently of the detector
carriage, collected all data on the powder standards. The diffracto-
meter was used with a one-half degree cntrance, 0.2 mm receiver slit,
and a Soller slit in the incident beam. The data was collected with
a scintillation counter, a pulse height analyzer, and an E&S Industries
diffracted beam graphite monochromator. All final runs were made at
32
1/8° per minute. A silicon powder* standard was used to provide a
small correction to the bulk sample line positions. Integrated inten-
sities were measured using a planimeter after subtracting background.
The peak to background ratio was considerably improved with the
use of a diffracted beam sraphite monochromator. This diffractometer
set-up allowed relatively low intensity line measurements.
2. Single Crystal Diffractometer
The X-ray unit used to collect all data on the diffused thin
(32) films was basically a modified Siemens diffractometer, equipped
so that the Kyo component is eliminated. The instrument halfwidths
for a line source are 0.037° and 0.081° at 29 =~ 40° and 95°
respectively, which is only a factor of two _arger chan the natural
half-width due to the spectral distribution of the Ka, line using
Cu radiation.
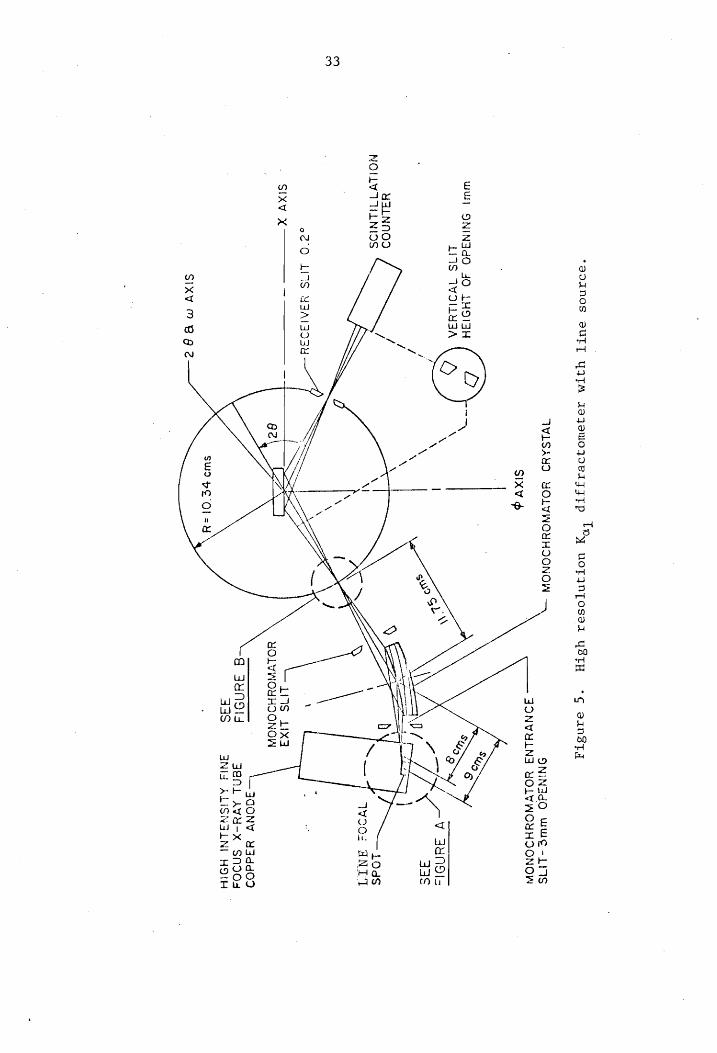
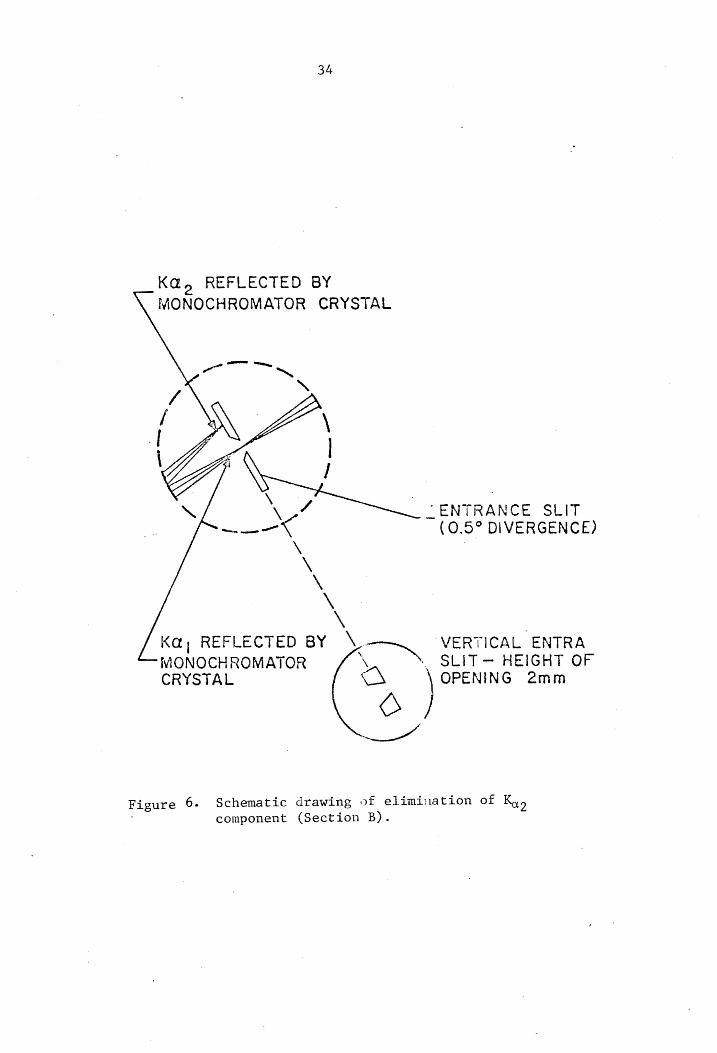
The Kao component of the radiation from the hi:,h voltage fine
focus Cu tube was removed with an incident beam Jagodzinski singly
bent quartz crystal monochromator (see Figures 5 and 6). The total
elimination of the Kao component would result in an asymmetry of the
instrumental function. A ratio of 1:200 between Kay and Kay intensities
provided an insignificant contribution of K,, without causing excessive 2
high angle asymmetries. The monochromator was adjusted at this position
and remained there during the completion of the expcriments.
The data was collected with a one-half degree entrance slit,
0.05 degree receiver slit, a scintillation counter and pulse height
*Supplied by National Bureau of Standards.
BANOS
BUTT UFIM
ABJOWOROeATFIP
Toy uoTINTOSeI
YBTH ~°¢
aean3Tyq
WLSAYD
YOLYWOYHIONOW
>
QNINSdO
wwe
-11TS
JONVYLNE YOLYWOYHIONOW
SIX
Ss »
“WS wu}
ONINSdO JO
LHOISH --\
SNe
LINS VVOILYBA
\ %9
—_
\ —
VY 3ygnodls
i /
”
WLI
/ <
33S /
\
s
YaLNNOD /
\ :
! h
NOLLYTULNIOS \
\ \
LOds \I
~ —7F
yoo. ANIT
. SO
» oe
os
, /
of O
LTS eno“
F SS
.
: SIX
X _
_
YOLVWOYHDONOW
_—_ 3JGONY
H3dd09
@ 3eNnols
Beni AVH-X
SNd04 33S
3Nis ALISNSLNI
HOH
SIXVM™SBEG@e
34
Ka, REFLECTED BY
MONOCHROMATOR CRYSTAL
_ ENTRANCE SLIT (0.5° DIVERGENCE)
Ka, REFLECTED BY Se VERTICAL ENTRA MONOCHROMATOR \ . SLIT— HEIGHT OF CRYSTAL aN OPENING 2mm
_
Figure 6. Schematic drawing of elimination of Koo
component (Section B).
analyzer. The arrangement provided high resolution and refined line
shape making it well suited for defect studies.
Use of the Diffractometer: The high voltage generator was warmed
up at the operating voltage for several hours prior to data collection.
The pure silicon 26 positions were found to be in constant error over
the 26 region (30° to 150°) and corresponding corrections were made
to the experimental line positions. The detector panel settings were:
Detector Voltage: 1200
Pulse Height Analyzer: 2.0 (base and window)
Linear Amplifier: 4 x 64
on both diffractometers
3. Thin Film Thickness Measurements
The weight gain measurement supplied by Oak Ridge Laboratory
was varified using an X-ray diffraction method. Using the integrated
intensity of one or more orders of the substrate reflections, the
thickness can be calculated as follows:
gn (I/To)
. Ung (25)
t = film thickness
I = intensity measured in the plated condition
1, = intensity in the unplated condit’ on
Weg = absorption coefficient of film material
Ko= 2
sin Oo.
Gay on
The silicon single crystal substrate first order reflection will be
decreased by extinction. The use of the third order reflection will
minimize this effect and yield reliable thickness measurements.
4. Locating the Specimen
The mounting of thick film specimens in vaseline eliminated
additional contributions to the large amount of strain present in the
titanium. Destruction of the sample was inevitable if conventional
backings were used (i.e. mounting clay), resulting in a local fracture
of the titanium from the substrate. The sample was positioned by the
weight of a glass slide placed on the sanple which caused the vaseline
to creep. This located the sample surface parallel to the face of the
X-ray specimen holder.
The thick films were cleaned of vaseline in ios-octane after each
X-ray examination. Prior to heat treatment, all specimens were cleaned
in acetone to remove all traces of the iso-octane and then rinsed in
methanol.
E. Optical Interference Techniques
The elastic bending of thick film specimens has bcen measured using
an optical interference (Newton rings) technique. St-ains in the
plane of the metallic film distort the substrate into a saucer-like
shape, thus presenting difficulties in mounting the specimens (see
previous section). Information on the deflection of the specimen
resulting from stepped annealing upwards from the depcsition tempera-
ture will compliment the strain measurements obtained with X-rays.
A monochromatic mercury (5461 R) light along with an optical
flat were used to produce a pattern of contours for the film surface.
The factors that determine the nature of the interference are
differences in optical path length and phase changes on reflection.
Assuming normal incidence, the respective minimum and maximum inten-
sities are
2d = md (26a)
2d = (m¥s)A (26b)
where A = wavelength
m= 0,1,2,...
d = deflection from one rin‘, to the next.
Perfect flatness will form a pattern of uniform brightness. Each
fringe represents a charge in height of 18 millionths of an inch.
' The surface of the specimens were wiped clean and the optical
flat placed in contact with the metallic side of the thin film. It
is essential at all times to have the flat level with the surface.
The monochromatic light, at normal incidence, illuminated the surface
so that a reflection of it could be scen in the sample. The pattern
was viewed from an angle of 30° to the specinen normal through a
macroscope (5X). The photographs takcn of each fringe pattern were
enlarged to 8" x 10", and the distance between fringes was measured.
V. ANALYTICAL PROCEDURE
Calculations of the structure factors and relative intensities
for various crystalline reflections of a material are dependent upon
the atomic positions of the atoms in the unit cell. Substances of
the orthorhombic crystal structure yield X-ray patterns containing a
larger number of reflections than those of a cubic material and
accordingly less non-zero structure factors. The diffracted intensity
pattern for a structure composed of several phases will consist of
the individual intensities from each sei of crystalline planes parallel
to the surface. The difficulty in dete mining the individual contri-
butions from each phase to the total di fracted intensity is magnified
if uniform and non-uniform strain along with composition variations
are present in the material.
The computer analysis of both comp ex diffraction patterns and
the general forms for the structure fac: 2rs will be discussed in the
following section. The simulation of t .e entire diffraction pattern
determines the effective volume of each phase present in the reacted
structure. This is possible only after having determined the
experimental structure factors for the constituents.
Silicide Standards
The calculated relative integrated intensity for a powder can be
expressed by a combination of equations 5, 6, and 11. The diffracted
relative intensity, neglecting a thermal correction:
38
39
1+ cos-20 cos 2a 2
Tel ~ 2 PF, [Tax sin 26(1 + cos’ 2a)
a = 13.3°
can be calculated by the computer program listed in Appendix II.
Atomic scattering factors for titanium and silicon are presented
in Table II.
In general, F. is a complex number, and it expresses both the
amplitude and phase of the resultant scattered wave. The structure
can be expressed as:
Py = f [cos 20 (hu, + kv + gw) + i sin 2 (hu. + kv, + ww)
(28)
where fA = the atomic scattering factor.
The diffracted intensity is proportional to FI? which is obtained
by multiplying the expression above by its complex conjugate.
| If the space group and structure are known for a material, the u_>
va W, can be introduced into equation 28) and the structure factor
can be calculated for each crystalline reflection. Experimental
structure factors and those determined from equation 28 can confirm
the positions of each atom in the lattice (us v5 and wi) by the
following relationship:
rl|F | - |FI| R = ——?—__+_ (29)
z|F | oO
40
observed structure factors ll where F Oo
F e
calculated structure factors (see Eq. 6a)
when R is called the residual for a set of structure-factor magnitudes.
In principle, R < .50 suggests a correct structure, although a con-
siderably smaller R is necessary to lend credibility to the proposed
structure.
Lattice parameters are determined from agreement of the high
angle lines and a deviation of no more than 0.02° of those at low
angles. The initial approximation of each parameter is obtained from
hk& planes of the form; two indices zero and the other having a large
value, along with substantial line intensity. An iterative computer
program has been written which gives four decimal place accuracy in
each lattice parameter.
Thin Film Diffraction Pattern Simulation
An X-ray intensity simulation prog:-am was used to calculate the
total diffracted intensity from a diffused thick film structure.
Contributions from each reflection of a phase located as a dispersion
or a film were summed to represent the iotal measured X-ray intensity.
The diffuse intensity was considered as a combination of temperature
diffuse, Compton modified and X-ray flucrescence scattering. A
Pearson type VII distribution approximated the symmetrical diffraction
peaks, since the asymmetry of instrumental function can be neglected
due to the large line broadening found in all crystalline reflections.
41
Detail about a simulated diffraction peak is obtained by solving
equation (17), which determines a 26 position given an intensity:
2 Y¥(x) vima P (ins) ji/m ~ 1) 20 + ([ma I, Gn) 28 lt C17")
20 uN the peak position
where Y(x) is the measured intensity at any 29 position. The intensity,
Ty is related to that of the powder standards by the following:
ri ] I -_ a , _ 1 a ~ Ig¢q & ¥ 14 - exp(-K <u?) lexpl-K <u (Y)°¥] (15')
q K 2/sin 8 ™
for the general case.
The full halfwidth, By and full quarter width, By can determine
the "m'' of the Pearson function for a peak having a shape intermediate
between a Cauchy and Gaussian distribution by:
m= kn 2 , (30)
B - 1)
L
4 ng
and "a" is related by equation (20). Uniform strain is treated simply
by the increasing or decreasing X in equation (17').
The form for Compton modified and TDS scattering (equation 23)
is evaluated by fixed point iteration at two high angle points. Using
equation (24), the fluorescence from titanium is fit to two low angle
. . . . . - os (38) . points and substituting the mass absorption coefficients is
expressed by:
42
I= K,Q - exp[.1391T/sin 6]) (31)
I CA K =—-0 _
1 1391.06
where T is the thickness of the titanium film in microns. The two
diffuse intensity expressions are summed to represent the background
present in the recorded diffraction pattern.
The criterion imposed upon the simulations are those of con-
servation of material and that "g'' will sum to unity. Each
diffraction region of interest is fit with the diffuse intensity
from the predetermined functions to which is added the contributions
of each diffracting phase. Reflections of the diffracting phase are
considered initially random in orientation (g=1). Uniform and non-
uniform strain along with a preferred orientation are introduced as
the simulation progresses. As a planar reactant product grows, a
linear variation of "g"' from the substrate interface to the metallic
film is introduced. The simulation of the entire diffraction pattern
provides a model for the amount, distribution, and structural
perfection of the reacted sample.
A comparison of the experimental data, introduced as points, and
the simulated X-ray regions are viewed on a Tektronix graphics terminal
during the refinement procedure. An area difference routine of the
simulated and experimental intensities increase the ease at which an
operator can converge upon a solution. The computer program along with
details of operation will be presented in a College of Engineering
technical report.
VI. RESULTS AND DISCUSSION
Results of isothermal, cyclic, and step annealed titanium-silicon
thick films will be presented in this chapter. Silicide powder results
represent the fundamental link in the analysis of the reacted thick
film structure. Thick film results are related to the bulk standard
kinetics observed and the appropriate analogies will be made. All
computer simulated experimental data is included to emphasize its
central role in the present analysis.
Silicide Powder Results
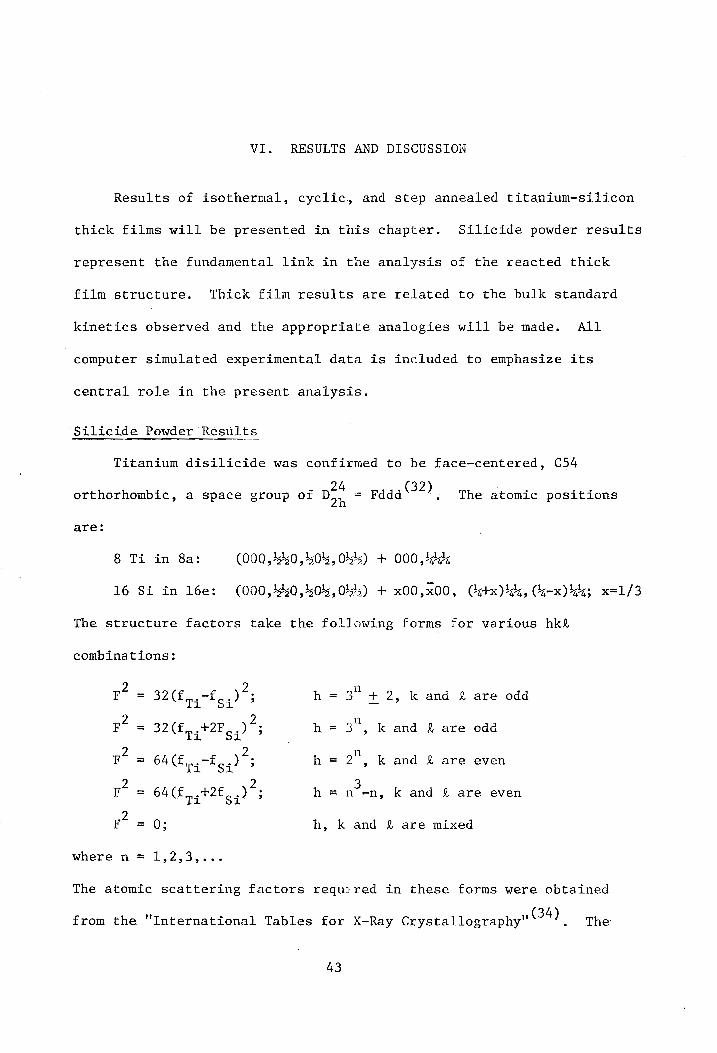
Titanium disilicide was confirmed to be face-centered, C54
orthorhombic, a space group of Ds = rada 632) | The atomic positions
are:
8 Ti in 8a: (000, *50, 30's, 0's's) + 000, eax
16 Si in l6e: (000,!:0,%0%,0%!s) + x00,x00, (etx), Ce-x) des x=1/3
The structure factors take the following forms for various hk&
combinations:
2 _ _ . _ 0 F 32(fa4 fo4) ; h 3° + 2, k and & are odd
Fo = 32(£..42F..)°: h = 3", k and & are odd Ti “Si? | °
2 2 n FO = 64(£,,-f55) ; h = 2°, k and & are even
2 2. _ 3 FU = 64(£,,,+2f, 5) ; h =n --n, k and 2 are even
RF = 0; h, k and & are mixed
where n = 1,2,3,...
The atomic scattering factors required in these forms were obtained
from the "International Tables for X-Ray Crystallography" °” , The
43
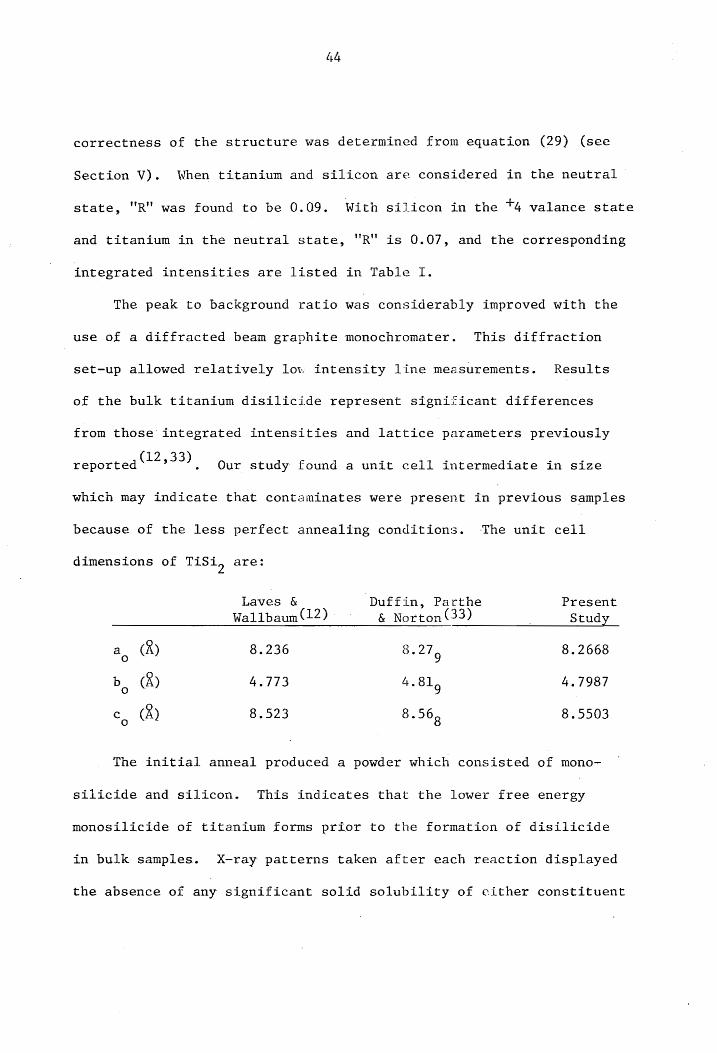
44
correctness of the structure was determined from equation (29) (see
Section V). When titanium and silicon are considered in the neutral
state, "R'' was found to be 0.09. With silicon in the *4 valance state
and titanium in the neutral state, "R'" is 0.07, and the corresponding
integrated intensities are listed in Table I.
The peak to background ratio was considerably improved with the
use of a diffracted beam graphite monochromater. This diffraction
set-up allowed relatively lov. intensity line measurements. Results
of the bulk titanium disilicide represent significant differences
from those integrated intensities and lattice parameters previously
reported (12233) | Our study found a unit cell intermediate in size
which may indicate that contaminates were present in previous samples
because of the less perfect annealing conditions. The unit cell
dimensions of TiSi. are:
2
Laves & Duffin, Parthe Present
Wallbaum (12) & Norton (33) Study _
a (2) 8.236 8.27, 8.2668
b, @) 4.773 4.81, 4.7987
c (8) 8.523 8.56, 8.5503
The initial anneal produced a powder which consisted of mono-
silicide and silicon. This indicates that the lower free energy
monosilicide of titanium forms prior to the formation of disilicide
in bulk samples. X-ray patterns taken after each reaction displayed
the absence of any significant solid solubility of either constituent
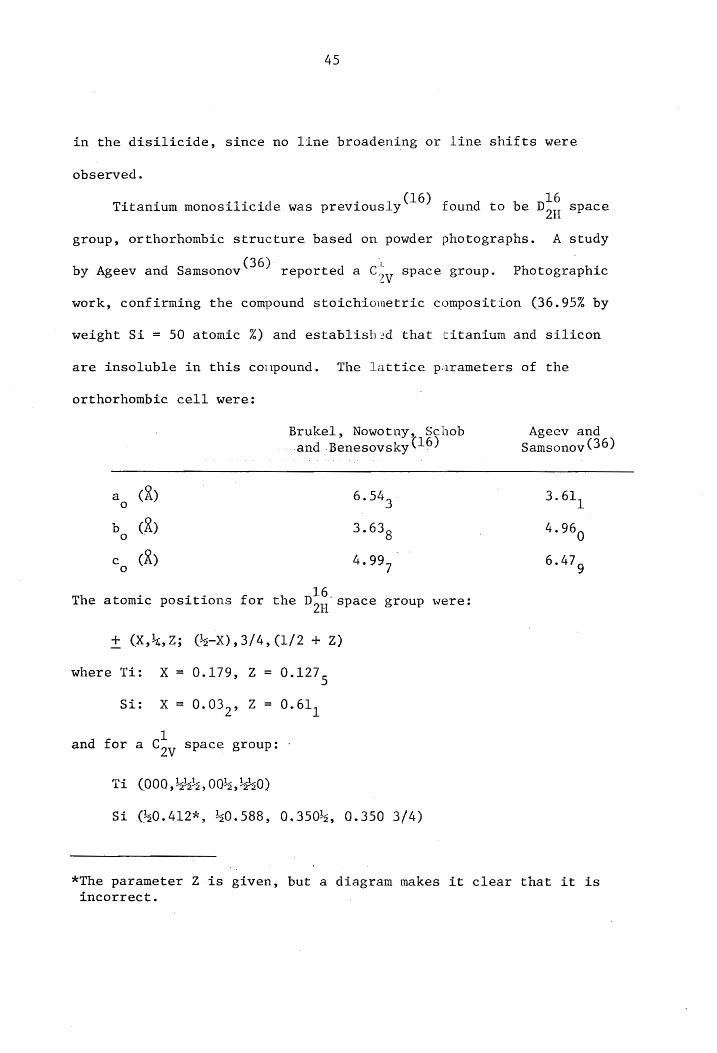
45
in the disilicide, since no line broadening or line shifts were
observed.
(16) found to be pt® space Titanium monosilicide was previously oH
group, orthorhombic structure based on powder photographs. A study
(36) L by Ageev and Samsonov reported a Coy space group. Photographic
work, confirming the compound stoichiometric composition (36.95% by
weight Si = 50 atomic 4) and established that titanium and silicon
are insoluble in this coipound. The lattice pirameters of the
orthorhombic cell were:
Brukel, Nowotny, Schob Ageev and
and Benesovsky ) Samsonov (36
a, (R) 6.54. 3.61,
b (A) 3.63, 4.96,
ec. (A) 4.99, 6.47,
6. space group were: The atomic positions for the Dow
+ (X,%, Z5 (4-X), 3/4, (1/2 + Z)
UW Hl 0.127 where Ti: X 5 0.179, 2
Si: X= 0.0355 Z= 0.61,
and for a Co Space group:
Ti (000, %s*s, 00's, 1550)
Si (0.412%, 40.588, 0.350’, 0.350 3/4)
*The parameter Z is given, but a diagram makes it clear that it is
incorrect.
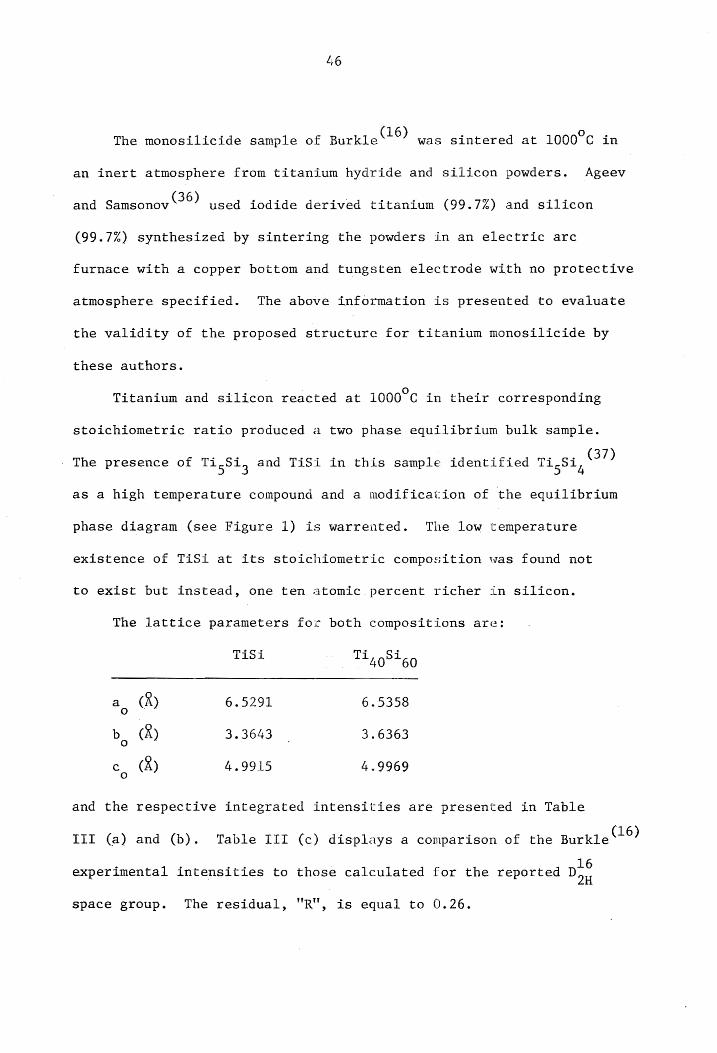
£6
(16) The monosilicide sample of Burkle was sintered at 1000°C in
an inert atmosphere from titanium hydride and silicon powders. Ageev
(36) and Samsonov used iodide derived titanium (99.7%) and silicon
(99.7%) synthesized by sintering the powders in an electric arc
furnace with a copper bottom and tungsten electrode with no protective
atmosphere specified. The above information is presented to evaluate
the validity of the proposed structure for titanium monosilicide by
these authors.
Titanium and silicon reacted at 1000°C in their corresponding
stoichiometric ratio produced a two phase equilibrium bulk sample.
(37) - The presence of Ti and TiSi in this sample identified Ti Si Si 5 3 5 4
as a high temperature compound and a modification of the equilibrium
phase diagram (see Figure 1) is warrented. The low temperature
existence of TiSi at its stoichiometric composition was found not
to exist but instead, one ten atomic percent richer in silicon.
The lattice parameters for both compositions are:
TiSi Ti, Sigg
a. (R) 6.5291 6.5358
bd, (A) 3.3643 3.6363
ec (R) 4.9915 4.9969 0
and the respective integrated intensities are presented in Table
III (a) and (b). Table III (c) displays a comparison of the Burkle (1°)
16 experimental intensities to those calculated for the reported Day
space group. The residual, "R", is equal to 0.26.
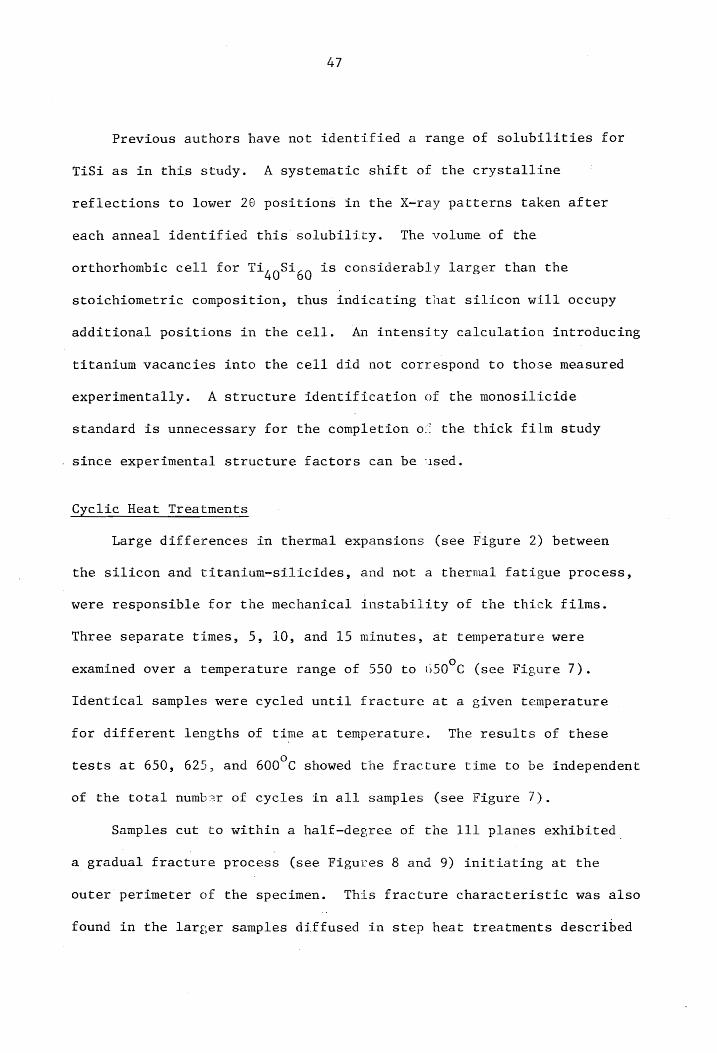
47
Previous authors have not identified a range of solubilities for
TiSi as in this study. A systematic shift of the crystalline
reflections to lower 26 positions in the X-ray patterns taken after
each anneal identified this solubility. The volume of the
orthorhombic cell for Ti is considerably larger than the 40°*60 stoichiometric composition, thus indicating that silicon will occupy
additional positions in the cell. An intensity calculation introducing
titanium vacancies into the cell did not correspond to those measured
experimentally. A structure identification of the monosilicide
standard is unnecessary for the completion o” the thick film study
. Since experimental structure factors can be ‘ised.
Cyclic Heat Treatments
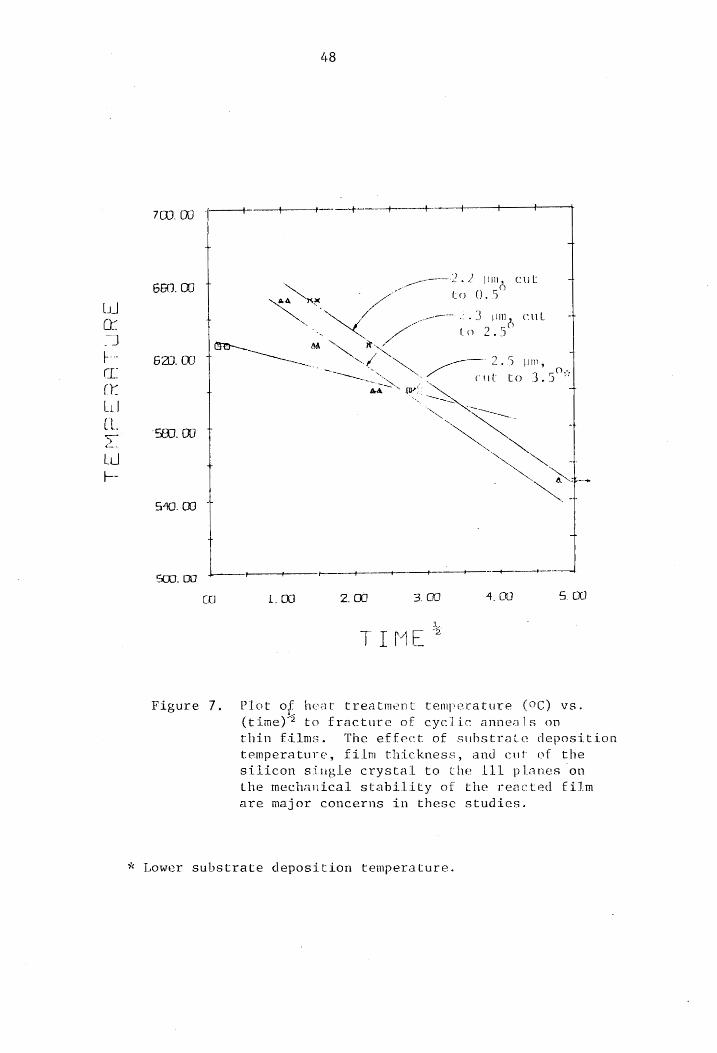
Large differences in thermal expansions (see Figure 2) between
the silicon and titanium-silicides, and not a thermal fatigue process,
were responsible for the mechanical instability of the thick films.
Three separate times, 5, 10, and 15 minutes, at temperature were
examined over a temperature range of 550 to 650°C (see Figure 7).
Identical samples were cycled until fracture at a given temperature
for different lengths of time at temperature. The results of these
tests at 650, 625, and 600°C showed the fracture time to be independent
of the total number of cycles in all samples (see Figure 7).
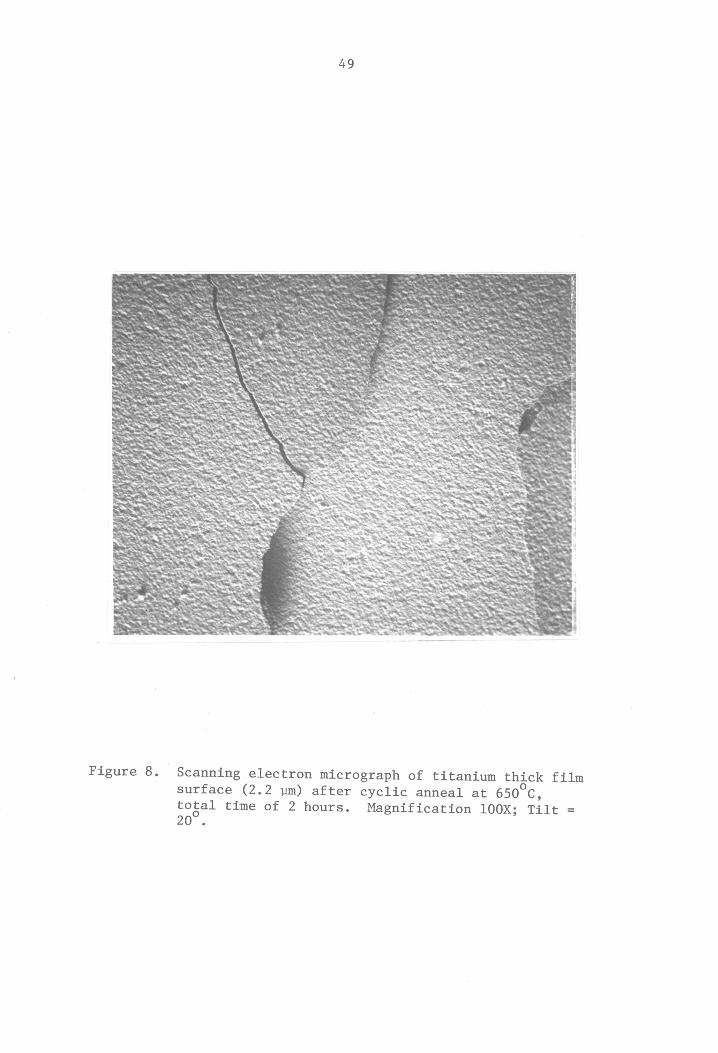
Samples cut to within a half-degree of the 111 planes exhibited
a gradual fracture process (see Figures 8 and 9) initiating at the
outer perimeter of the specimen. This fracture characteristic was also
found in the larger samples diffused in step heat treatments described
48
703. 00 | FF ' ,
yoy ae eee eM cul 4 660. 00 oe va to 0.5
™~ ceo Sumy cul + ONG LO Lo 2.5°
AA NN +
- a a“ Ty 620). 00 me NA 5 um,
TS NOt Lo 3.508 aa we or SN +
.. ——_
NN SS
‘S90. 00 NS NS
NO
540.00 + T
T tT
500, 00 -——+ he —+
co L. 00 2. OO 3.00 4.00 5 00
6 TIME
Figure 7. Plot of heat treatment temperature (°C) vs.
(time)? to fracture of cyclic anneals on thin films. The effect of substrate deposition
temperature, film thickness, and cut of the
silicon single crystal to the 111 planes on
the mechanical stability of the reacted film are major concerns in these studies.
* Lower substrate deposition temperature
49
Figure 8, Scanning electron micrograph of titanium thick film
surface (2.2 um) after cyclic anneal at 650 Cy total time of 2 hours. Magnification 100X; Tilt = 20°.
50
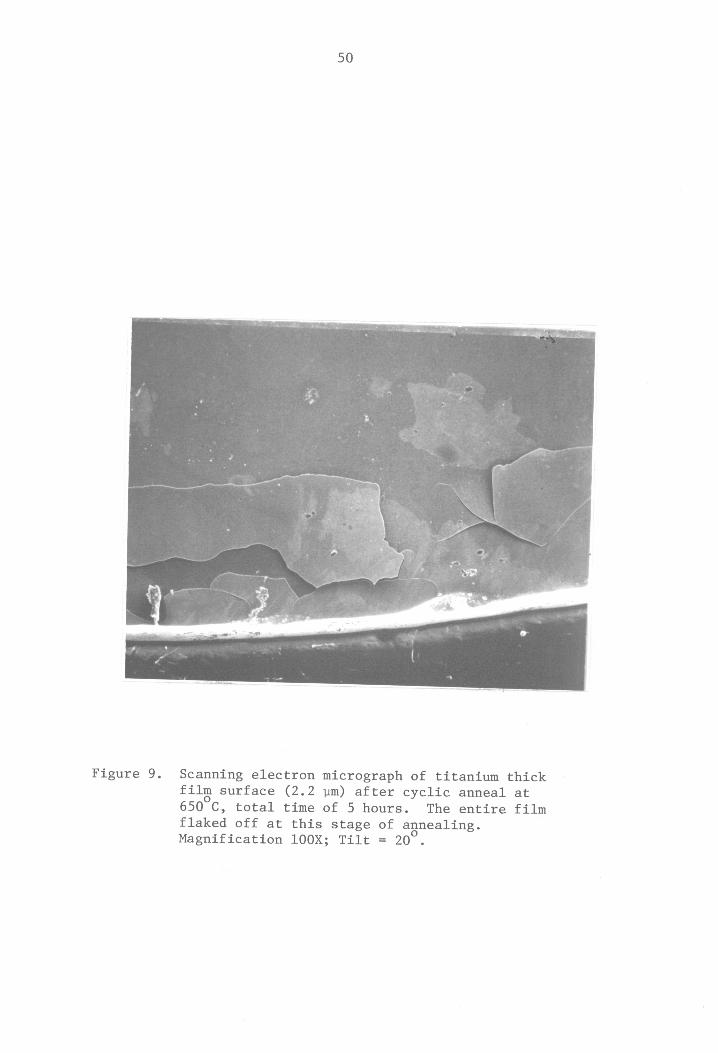
Figure 9. Scanning electron micrograph of titanium thick
film surface (2.2 wm) after cyclic anneal at 650 C, total time of 5 hours. The entire film flaked off at this stage of annealing. Magnification 100X; Tilt = 20.
51
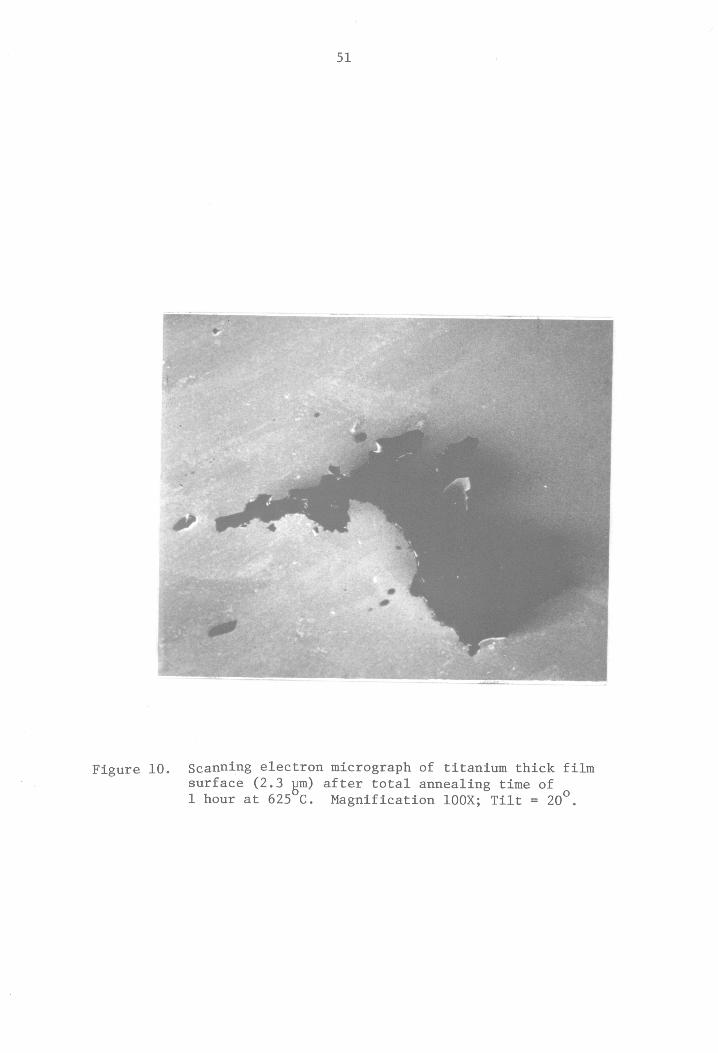
Figure 10. Scanning electron micrograph of titanium thick film
surface (2.3 pm) after total annealing time of 5
1 hour at 625 C. Magnification 100X; Tilt = 20°.
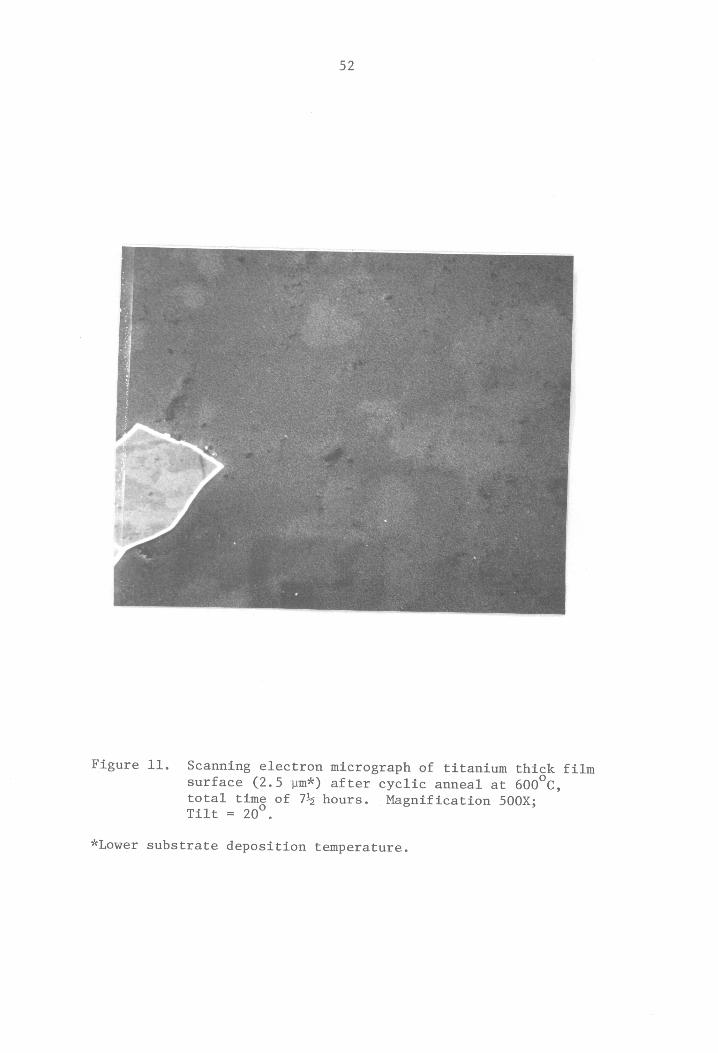
52
Figure 11. Scanning electron micrograph of titanium thick film
surface (2.5 pm*) after cyclic anneal at 600 C, total time of 7% hours. Magnification 500X; Tilt = 20°.
*Lower substrate deposition temperature.
53
in the latter part of this chapter. A‘l1 other samples (described in
Section IV) had a spontaneous fracture point (see Figures 10 and 11).
The data collected on Figure 7 served in planning anneals for the
larger X-ray samples.
Optimum deposition temperature appears to be at 350°C since
greater interface instability exists in films deposited at 275°C. It
appears, as in mechanical fatigue, that an endurance limit may exist
allowing samples to be cycled indefinitely below this temperature.
Complete information on the effect of substrate cut, film thickness,
and surface roughness of the silicon substrate on the endurance limit
is not available. An attempt to retain the reacted structures after
one hour at temperature with a cooling rate of 3°C per minute resulted
in the same characteristic fracture at approximately 300°C. In every
case, fracture occurs on cooling after annealing within a well defined
temperature range. Most often the fracture correlates with measurable
Silicide formation.
Step and Isothermal Anneals
A total of eight two-hour diffusicn treatments at temperatures
from 350 to 650°C were carried out on a 2.2 micron titanium thick
film, cut to within one-half degree of the 111 planes. The first step
anneal was chosen at 350°C to facilitate comparison with the as-
received sample deposited under similar conditions. Subsequent
temperature increments were determined from cyclic arneals and general
observations of conditions allowing the metallic films to remain
adherent. Since the mechanical instability results from differences
in thermal expansions of the individual materials, the temperature
increment was systematically decreased as higher reaction temperatures
were approached. Systematic step anneal upwards from the deposition
| temperature indicated that X-ray line shift, line broadening and
elastic bending of substrate are influenced by silicide formation.
Tables IV through XII are a list of integrated intensities at
different two-theta positions of all diffracted intensity above
statistical background for each of the eight anneals. It should be
emphasized that very little high angle diffracted intensity is present
in these thick film samples. The computer simulations of these high
angle regions are only semi-quantitative and all foundations for a
diffuse model are based on the low angle regions. The half-widths
of lines lying at 26 positions greater than 50° are the only simulated
parameters in which confidence can be placed. Figures 12 through 33
are the corresponding computer simulations where the points represent
the experimental intensity. The individual simulated reflections
along with the summed intensity is displayed in each figure for
comparison of the fit. Table XVI lists the Pearson function parameters
for each step anneal. A modified Lorentzian (m=2) best approximated
the shape of the X-ray diffraction peaks throughout the anneals with
the one exception being the titanium (011) at reaction temperatures
of 600 through 650°C, where "m' equals five.
In order to measure the response of the elastically bent substrate
to silicide formation, optical interference measurements of the
deflection in the sample were made and the contours plotted on Figures
55
35a and b. The maximum deflection of the substrate decrease with
increasing diffusion temperature or time corresponding to increased
silicide formation. In contrast, Figure 36 displays the profile of
a 2.5 micron thick film cut to within three and a half degrees of the
111 planes. The convex profile suggests that orientation of the
silicon cut affects the amount of strain present in the film and thus
the mechanical stability.
An isothermal anneal for times of 15 and 30 minutes at 625°C
reflect the effect of substrate orientation on silicide formation.
Samples cut to within two and a half degrees of the 111 planes
exhibited a lack of appreciable strain in the plane of the metallic
film. Tables XIII through XV are lists of integrated intensities at
different two-theta positions for each anneal. The X-ray simulations
needed to determine the preferred orientation and resolution of the
silicides formed are presented in Figures 36 to 45. Once again, a
modified Lorentzian distribution sufficiently approximated all
diffraction peaks. Table XVII contains the parameters of the Pearson
distribution for each individual reflection observed as a contribution
to the total experimental intensity.
It is evident from each set of simulations for the step and
isothermal annealed samples that two distinct orientations of the
titanium are present although a strong basal plane orientation is
common to both. The isothermal annealed specimen contained a tensile
strain on the (010) prism planes and a compressive one along the basal
plane (002) which decreased with increasing diffusion time. Titanium
56
monosilicide (0.1 um) present at the interface was strongly preferred
in the as-received sample. The silicide thickness increased to half
a micron after treatment for 30 minutes and fractured on cooling from
a subsequent anneal for an additional 30 minutes (see Figure 9).
The fracture corresponded to the cyclic heat treatment analysis of
these specimens (see Figure /) and substantiated a previous conclusion
for the fracture mechanism.
The titanium film remained adherent throughout all eight stepped
anneals; however, cracks initiating at the perimeter of the sample
were present after the final treatment. The existence of titanium
monosilicide as a dispersed phase (see Figure 46) in the initial thin
film structure exemplified the dominance of grain boundary diffusion
and nucleation at 350°C. A step anneal at 350°C produced an
approximate doubling of the volume fraction of monosilicide contained
in the titanium, from two to five percent (see Figures 12-15). The
monosilicide was random in orientation during all anneals. and was a
constant volume fraction of the remaining titanium film. If the
monosilicide were a planar deposit at the interface, a 0.2 ym decrease
of the plating would be required. The simulation was forced to fit
at low angles, relaxing on the condition of "g" factors summing to
one and conservation of material, yet the nigher angle intensity
region failed to yield a reasonable solution (see Figure 56).
Annealing upwards from the deposition temperature resulted in the
formation of a planar titanium disilicide deposit (see Figures 47-49)
at the original titanium-silicon interface. A linear decrease of "g"
57
from the silicon substrate with increasing silicide formation was
observed (see Figure 54) in each subsequent anneal (see Figures 50-52).
The final treatment at 650°C resulted in a maximum thickness of the
disilicide (3.9 um) and the formation of a planar deposit of mono-
silicide at the titanium-disilicide interface (see Figure 53).
Uniform tensile strains in the plene of the titanium film varied
insignificantly for the crystallographic planes displayed in Figure
56 in this series of heat treatments. The prism planes (010), whose
(39) when compared to the (002) modulus of elasticity is ten smaller
and (011),.showed the largest Poisson's contraction in the planes
parallel to the surface. Correspondingly, the smallest non-uniform
strain (line broadening) was associated with the (010) planes which are
(40) the slip planes in titanium The X-ray strain data does concur with
the mechanical constants presented in tiat a low modulus of elasticity
for a given plane will display a large ’oisson contraction and less
non-uniform strain. Line brodening inc -eased with silicide formation
for all reflections of titanium.
The disilicide reflection remained sharp after all stepped anneals,
thus agreeing with the bulk sample whici found titanium and silicon
insoluble in TiSi,- In the completely diffused sample, the monosilicide
present as a film displayed additional line broadening, probably due
to the range of compositions found for chis silicide in the powder
study. A weak preferred orientation of the TiSi in contrast to the
9 layer, reflected the influence of orientation of the initial TiSi
distance from the single crystal silicon substate.
58
Table XVIII is a list of X-ray data obtained for a step annealed
sample, 2.5 microns thick and cut to within three and a half degrees
of the 111 planes. The absence of any appreciable silicide formation
indicated the lack of adhesion of the titanium film due to the lower
a O substrate deposition temperature of 275 C.
Conclusions:
ol. TiSi, was confirmed a C54 orthorhombic structure having correspond-
ing structure factor forms and lattice parameters determined by
this study. The compound is stoichiometric in composition exhibit-
ing no solubility of titanium or silicon in it.
TiSi is not stoichiometric at low temperatures; rather a range of
compositions and lattice parameters exist. Ti,Si, is a high
. te Oo temperature compound, absent in equilibrium below 1050 C.
The thick film reaction between titaiium and silicon differed from
that of bulk samples, forming a large planar film of disilicide
at the original interface. The disi:icide film decreased the
transport of silicon and a second re: ction product of monosilicide
formed at the titanium/disilicide inierface.
The dominance of grain boundary diffision and nucleation in a film
diffused at a temperature of 350°C was observed, forming a dis-
persion of the lower free energy moncsilicide. Temperatures of
(2) silicide formation were higher in previous studies because of
the presence of silicon oxide at the interface. The absence of
degassing in the thick films verified that the method of
preparation did eliminate the oxide layer on the substrate.
Mechanical instability of the film results from large thermal
expansion differences of the components and silicide formation.
The highly deformed nature, dependent on cut of the silicon crystal,
warrented the use of computer simulation analysis of the X-ray
diffraction patterns from the diffused structure.
Suggestions for Future Work
1. More detailed studies of the low temperature phase diagram for
the titanium-silicon system is essential in characterizing the
kinetics of silicide formation in thick film structures.
The effect of substrate orientations on silicide formation
temperatures and phases characteristic to each should be explored
holding the substrate deposition temperattre at 350°C.
X-ray data obtained at temperature should provide sharper
diffraction lines because of the absence of that mechanical
deformation which is prodtced about each interface on cooling to
room temperature. The intercomparison between at temperature data
and room temperature data should provide considerable information
on the deformation mechanisms which are active on cooling.
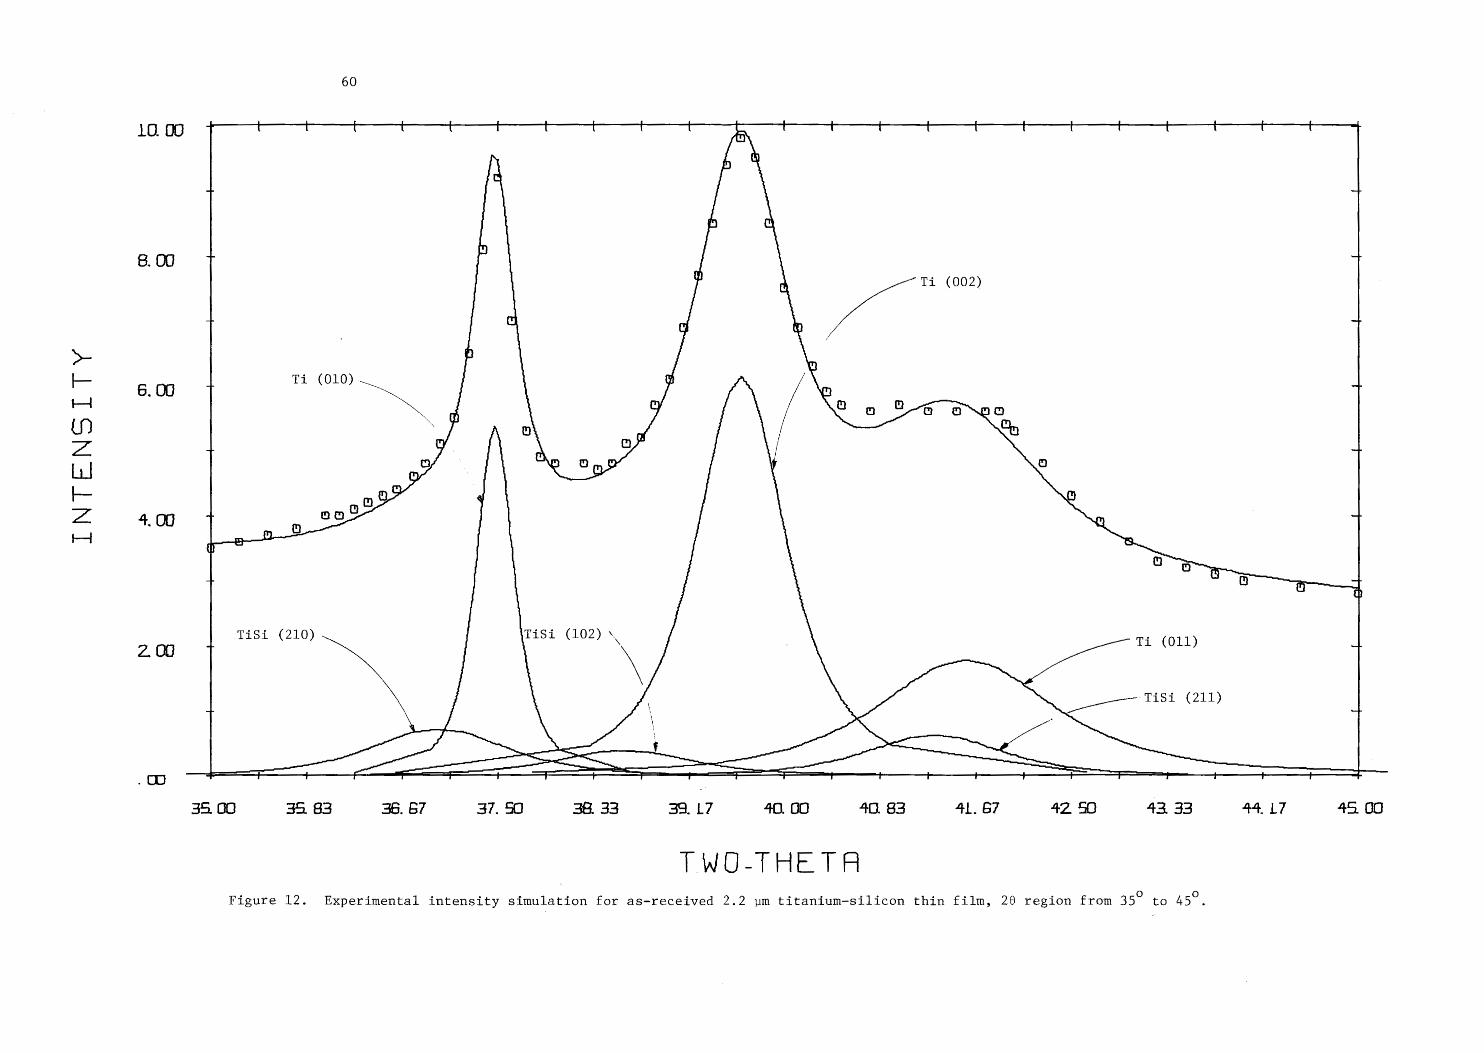
INTENSITY
10. OO
8. OO
6. OO
4.00
Z. OD
60
7 t i: + + —t {- t —— t — t -t- + — t +t t —+ t +
, &@
1 1 m u
+ } T
mn . A Ti (002)
| _ Ci a T
F}
| Ti (010) y / . 4
Sg 7 Gf o 2 coo . m
T ul 0 ~~
0 Nn 0,0 Q 7 m
QF ) 0
1 oo 0 +
: Q ¢—
0 0 | Q wh
W a
TiSi (210) TiSi (102) x . 4 \ Ti (011) +
| St 21) ;
<— : . > Sn — —
35 00 35 83 36. 67 37. 50 38. 33 39. 17 40. oO 40. 83 4\. G7 42. 50 43. 33 44.17 45. 00
TWO-THETA Figure 12. Experimental intensity simulation for as-received 2.2 um titanium-silicon thin film, 28 region from 35° to 45°.
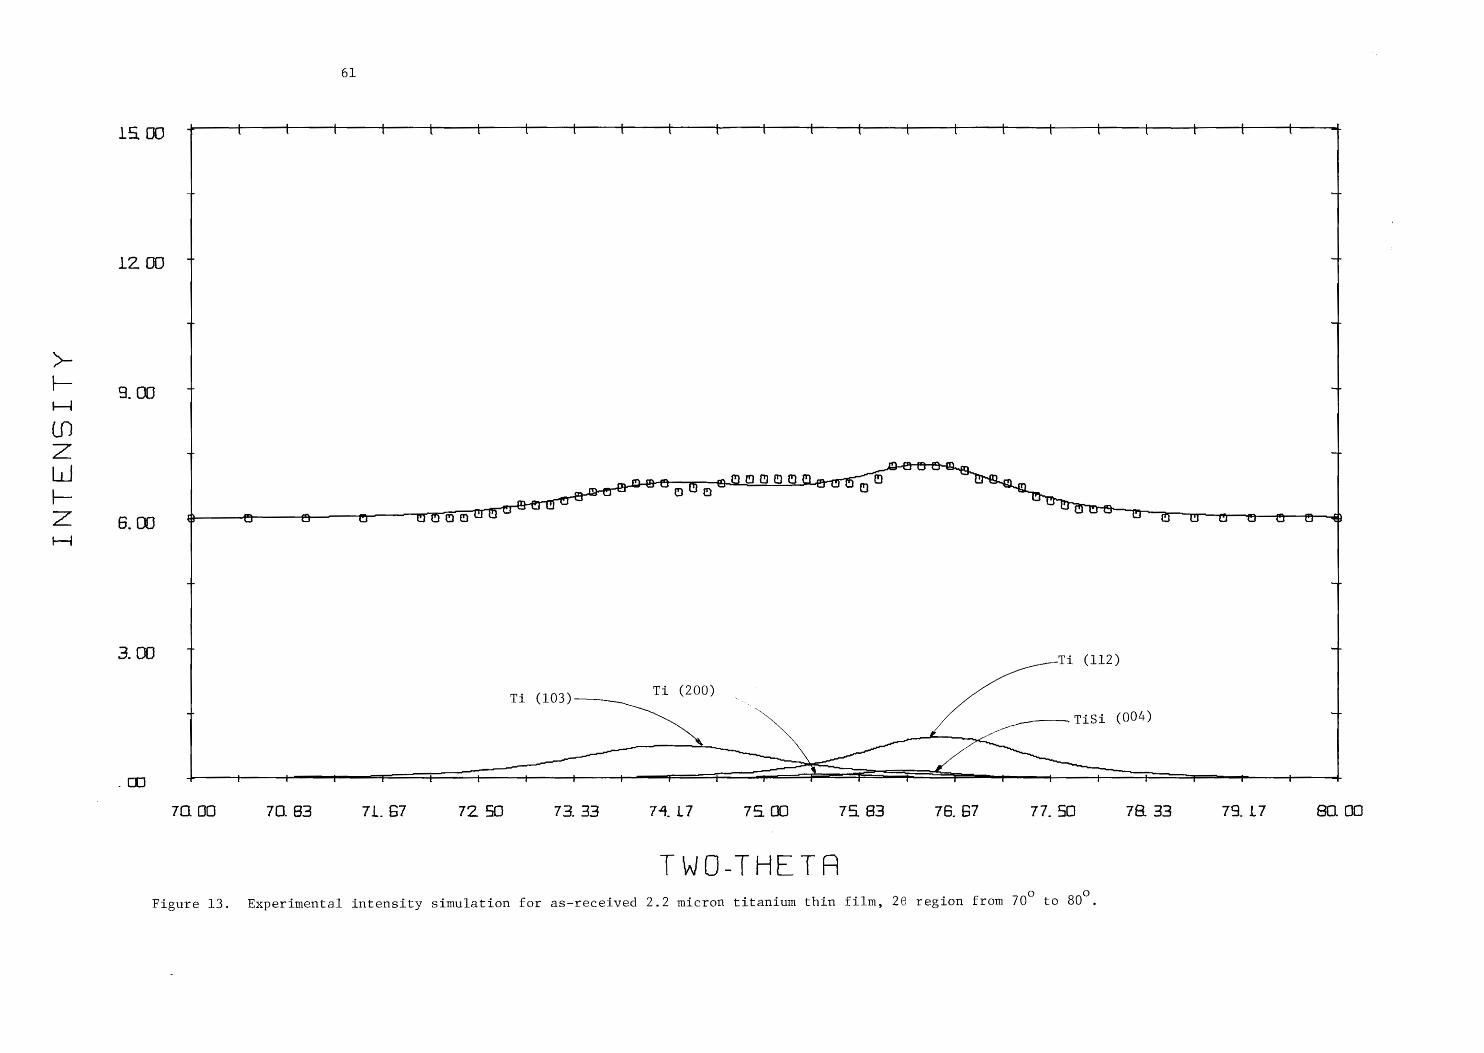
INTENSITY
61
=—_
15 00 t—— tt ot tt Ht Ht tt tt} 1— t—— —
+ al
1200 7 4
+ {
9.00 7 1
| +
6.00 Ff a ° o Te 8
| 1
3.00 | Ti (112) ai
Ti (103)
| TiSsi (004) +
.0O a t = . _- .
70. OO 70. 83 7L. 67 72 5O 73. 33 74. L7 75 00 79 83 76. 67 77. 50 78. 33 79. L7 80. 00
TWO-THETA . . . . O oO
Figure 13. Experimental intensity simulation for as-received 2.2 micron titanium thin film, 26 region from 70° to 80°.
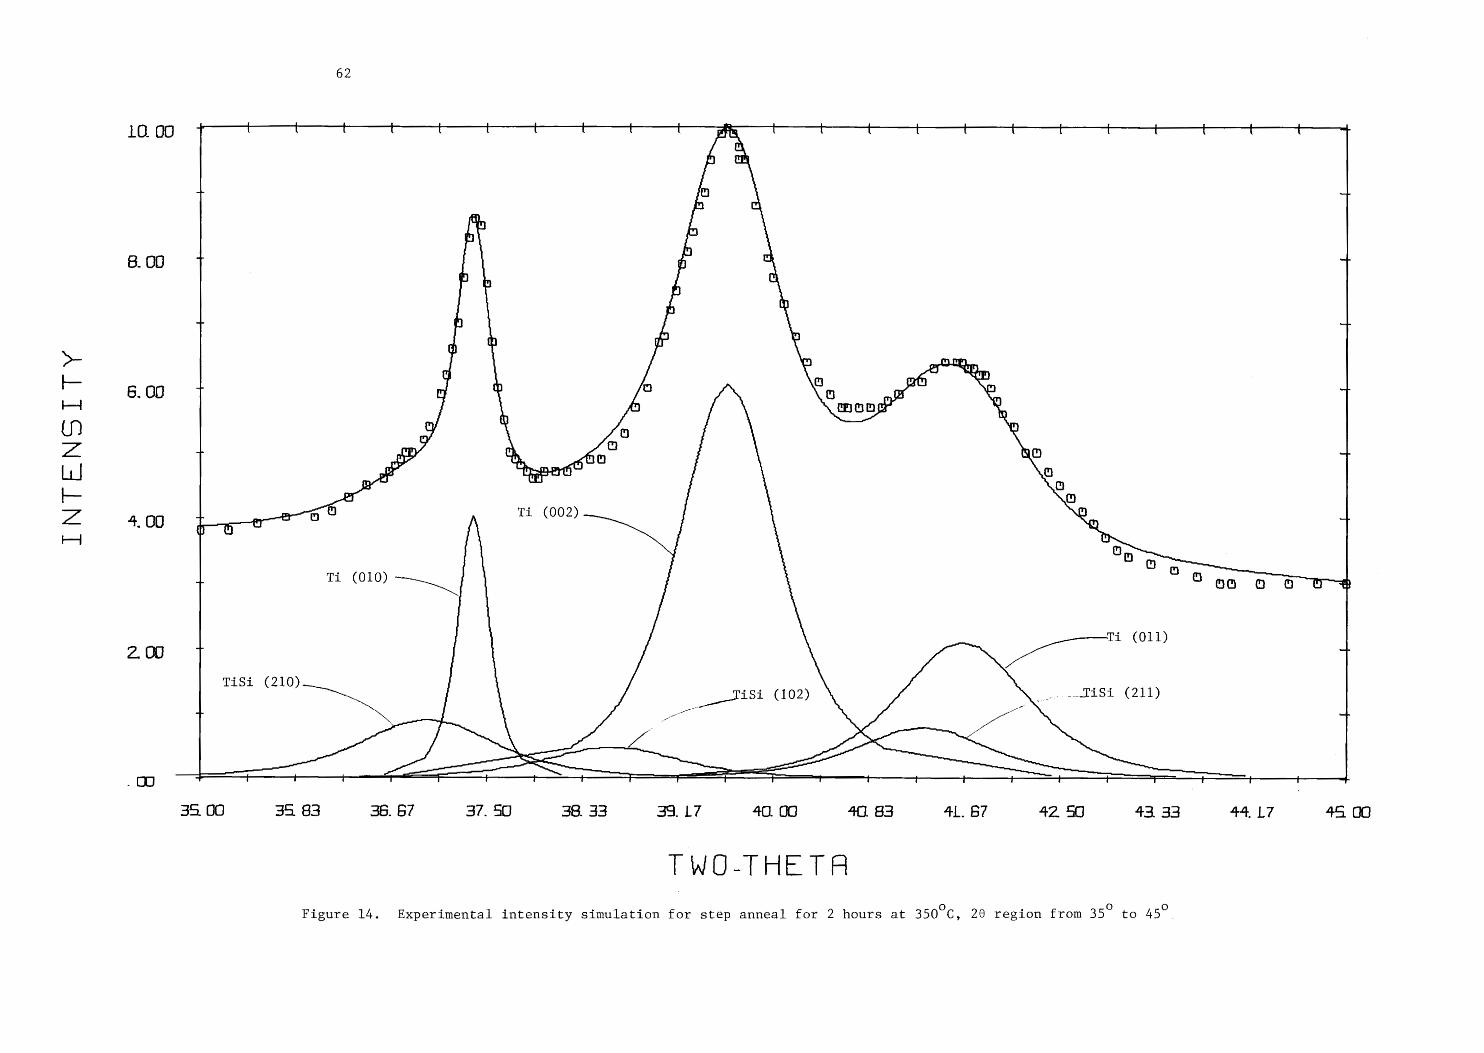
INTENSITY
10. GO
8. OD
6. 00
4. 00
2. OO
62
Figure 14.
TWO-THETA
Experimental intensity simulation for step anneal for 2 hours at 350°C, 280 region from 35° to 45°
{——++ +——+ {+ t +- ae + + +——++
4 fu) +
o, f
vy
4 ih iP r
f \ 1 F |
i, iT}
T + rf iF) rr
1 oy 4 .
y ]
C ‘ w
1 wd AO 4
er O . @ 7 m 4 a QP UO iu _
(¢]
0 ba) t Ti (010) Soa © 6
Ti (011) - —_J
a TiSi (210)
oo fist (211) L
_ | \ a "|
35 00 34 83 36. 67 37. 50 38. 33 39. L7 40. GO 40, 83 41. 67 42 50 43.33 44.17 45 00
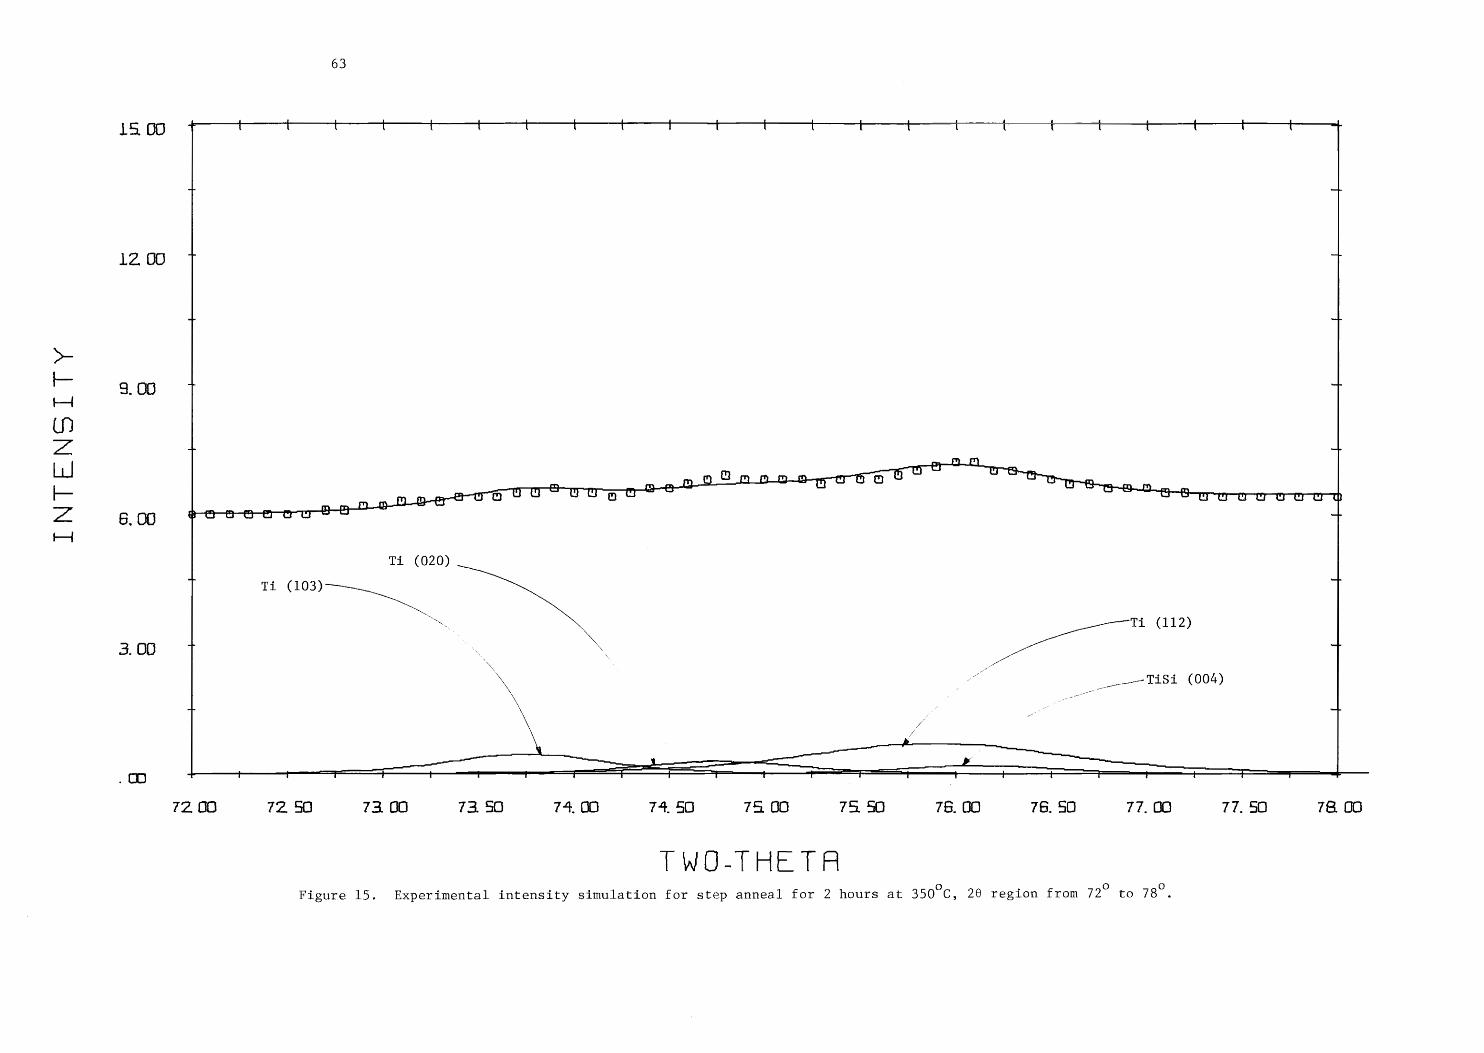
INTENSITY
1& 60
12 00
3. 06
6, 06
3. 06
63
{ +- t t t t t t t —t t t t— t— t i —t —t t t
I _
Ti (020)
: Ti (103) "|
. oo ao (112)
| \ a __--TiSi (004)
7Z GO 72 SO 73 00 73. 50 74. GO 74 50 75 0O 7& 50 78. GO 76. SO 77. CO 77. 50
Figure 15.
TWO-THETA Experimental intensity simulation for step anneal for 2 hours at 350°C, 28 region from 72° to 78°.
78 00
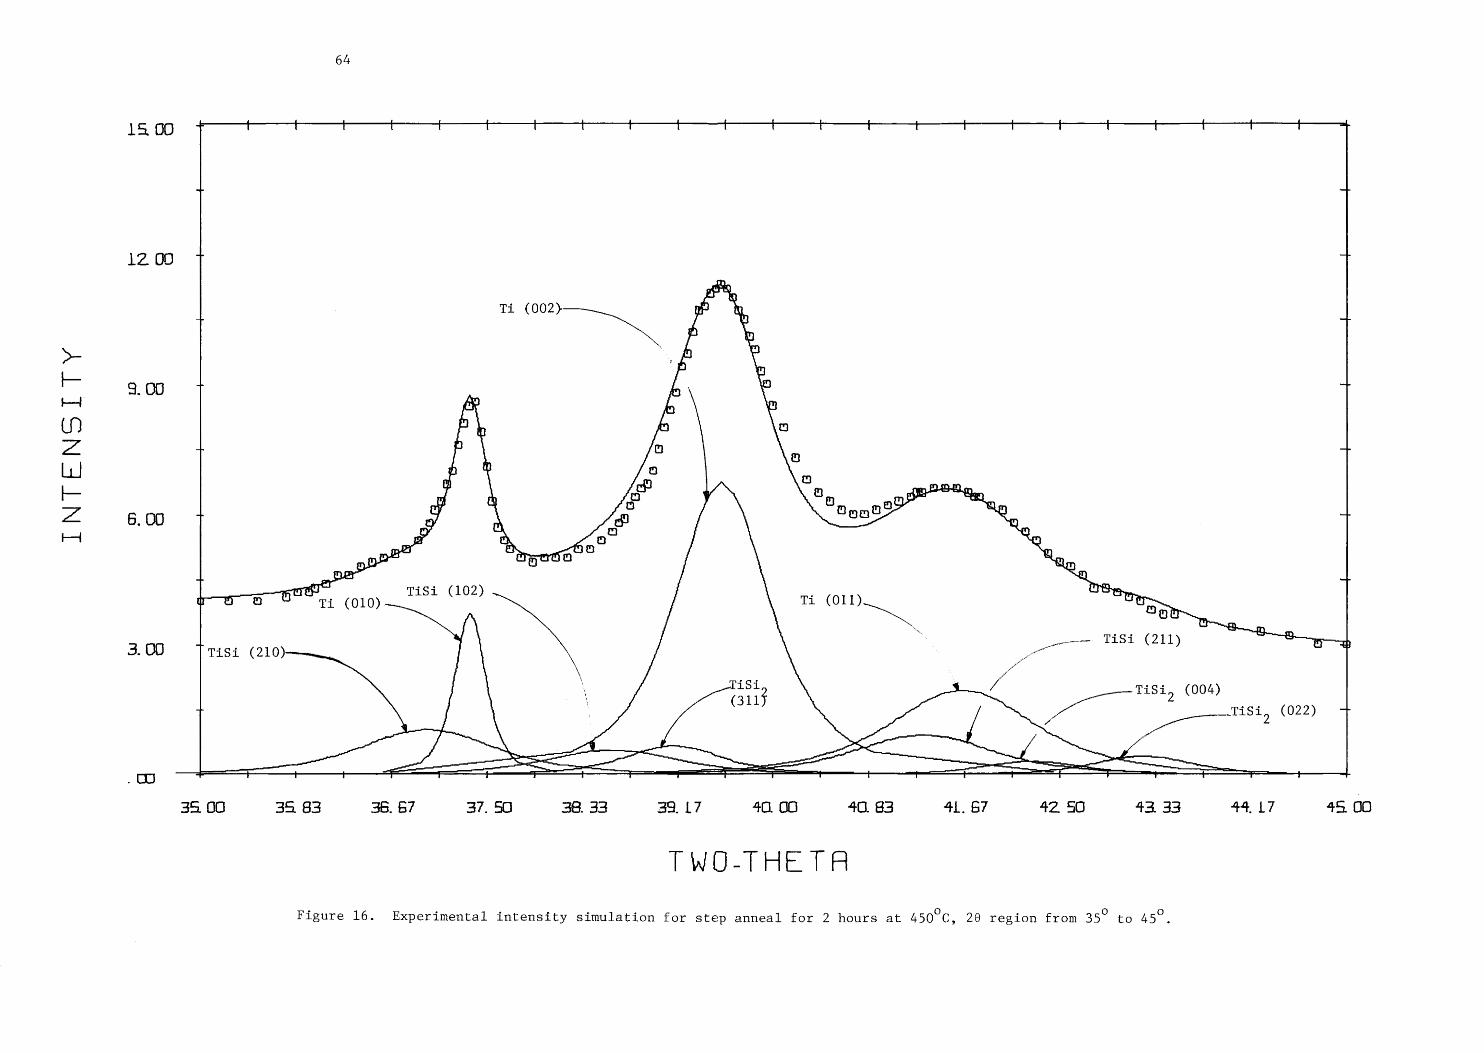
INTENSITY
145 00
12 00
3. OO
6. 00
3. OO
64
+ ~~
~~
—_
=e
a
-~
—
45 00
Are
Ti (002) ae y of
fy) :
- -
} i m
= Pf eo
C)
(yp i m
ae Ms o 4 LS —
a 0 a iT} ad
. ha]
f oF ) u slog y A o 8 ao e
4 ul Dnm8 ul a < \ fi Z ) oO u
> 2 ex é, Oo a
1 _ OF 2 +
i TiSi (102) . Tos ta Ti (010) Ti (O11) Wl TT
we On
+ , —— TiSi (211 ie TiSi (210) a )
\ fo TiSi, (004)
1 . a Tisi, (022) 4 . 7 2
35 00 35 83 36. 67 37. 50 38. 33 39. 17 40. OO 40. 83 41. 67 42. 50 43. 33 44.17
Figure 16. Experimental intensity simulation for step anneal for 2 hours at 450°C, 280 region from 35° to 45°,
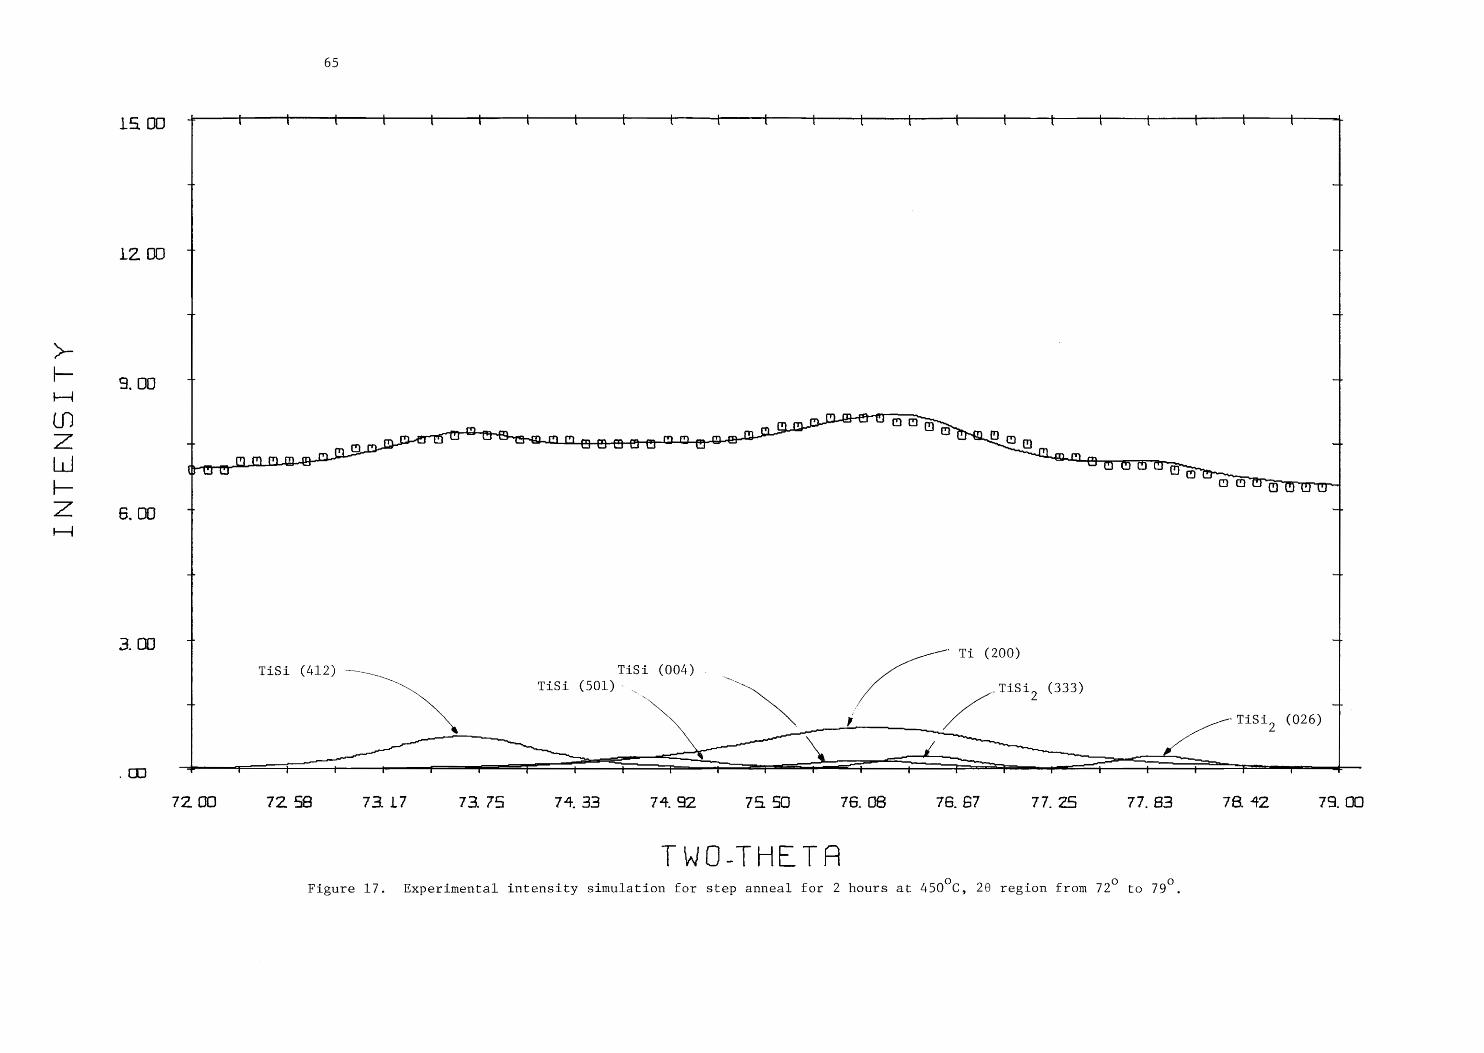
INTENSITY
1§ DO
iz 00
3. OO
6. 00
3. OO
65
t —t t t t t t t t —t t t t t t t —t t 7
a ai
| - Ti (200) | Tisi (412) — TiSi (004) _
TiSi (501) - a ~ . TiSi, (333)
A _N y Lo “TiSi, (026)
72 OO 7Z 58 73.17 73.79 74. 33 74. 92 74 50 76. 08 76. 67 77. 295 77. 83 78. 42 72.
Figure l/.
TWO-THETA Experimental intensity simulation for step anneal for 2 hours at 450°C, 26 region from 72° to 79°,
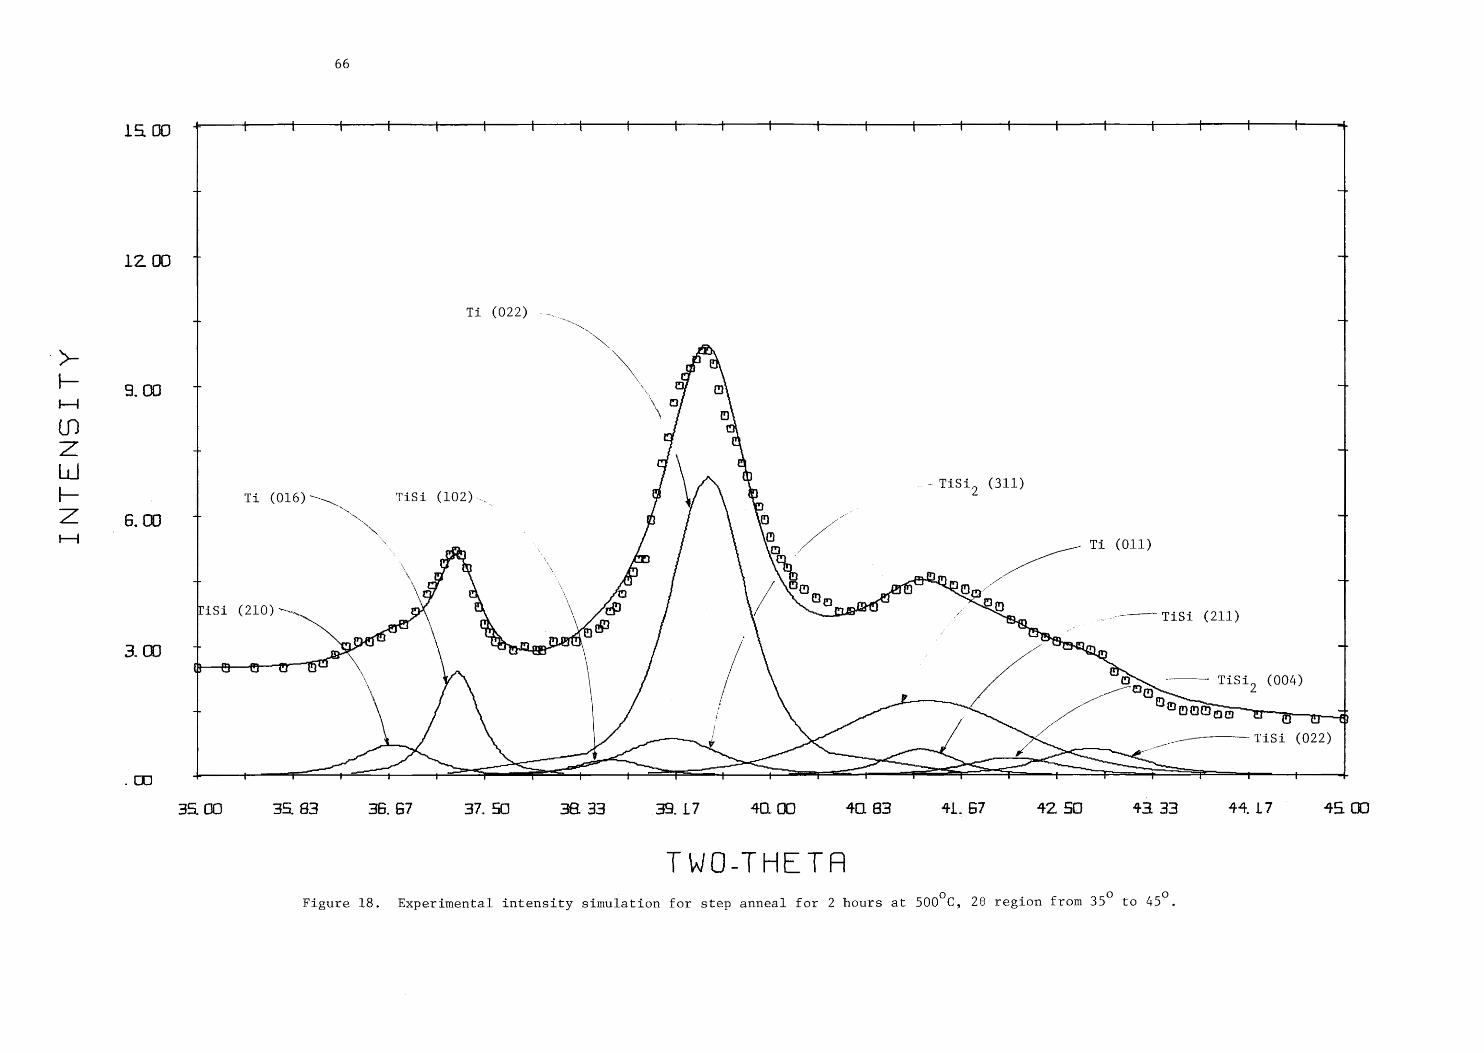
INTENSITY
15 00
12 00
9. OO
6,00
3. OO
66
+ t t t t t t t t f —t t t t t t f f { t t
; Ti (022) Ha + oN .
\ a a
4 \. oy m 4.
\ 2 \ 0
n A “
- Tisi, (311)
Ti (016) —~_ TiSi (102). J oN -—T
‘\ .
oR Ti (011)
f v | 7
| | 7 fr} \
Q 2 RD na —~L
TiSi (210) 5 ) Ca ae “8p } am, nh a 2 TiSi (211)
otf us ' 7 ne
7 ye Le ~ Oe = p- Q) m
{ Cj CF wt u eS
\ fo oN TiSi, (004) \ a OOO aa |
a 0a rn" a © )
SE (022)
_ —_ ™ eee EE |
35. 00 35 83 36. &7 37. 50 38. 33 39. 17 40. 00 40. 83 41. 67 42. SO 43 43 44.17 45 00
TWO-THETA Figure 18. Experimental intensity simulation for step anneal for 2 hours at 500°C, 28 region from 35° to 45°.
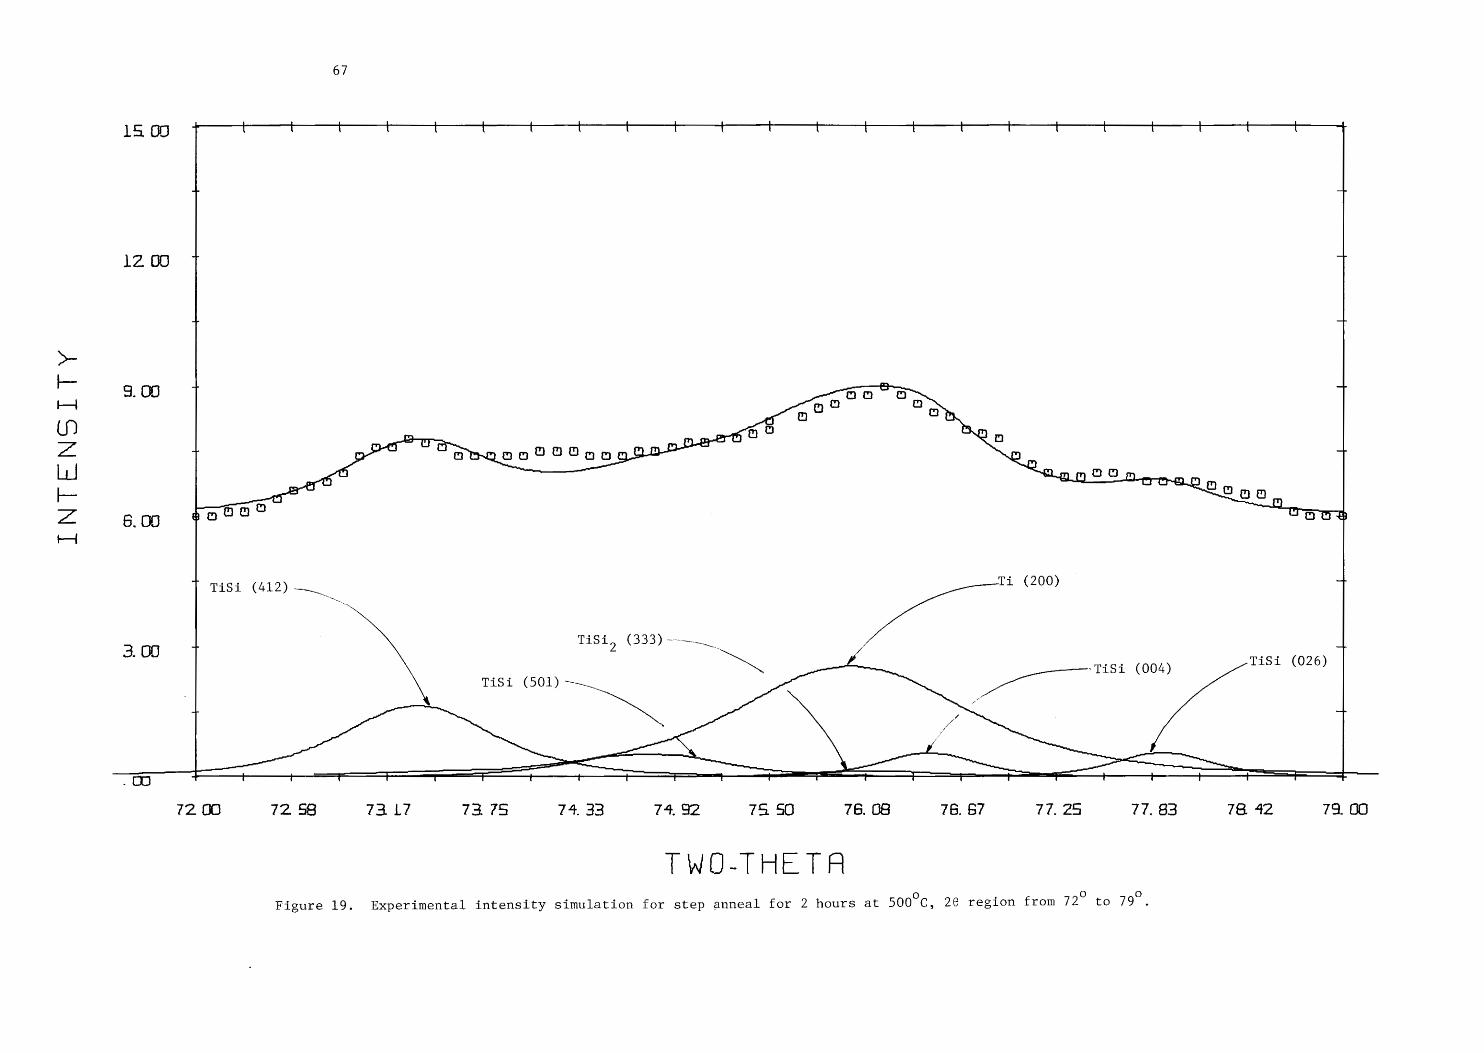
INTENSITY
67
“ +
| ao
4 4
LS 00 t t t t — +— {———_t t t -t t t— t
4 +
1200 7 T
| al
goo - |
500 92 age ;
[ Tisi (412) —_ Ti (200) T
TiSi, (333) --~_ 7 3. 00 1 2 ” / os r ~~ ZL “nisi (004) TiSi (026)
Tisi (501) aa
| ao ~ | . a“
. oO { t T t ——f t t + t tT T { t —t T ——— t —t t— / —t t
72 CO 72 58 7317 73.75 74 33 74. 92 7a 50 76. 08 76. 67 77. 25 77. 83 78. 42 79. GO
TWO-THETA Oo . Oo O
Figure 19. Experimental intensity simulation for step anneal for 2 hours at 500 C, 26 region from 72° to 79 .
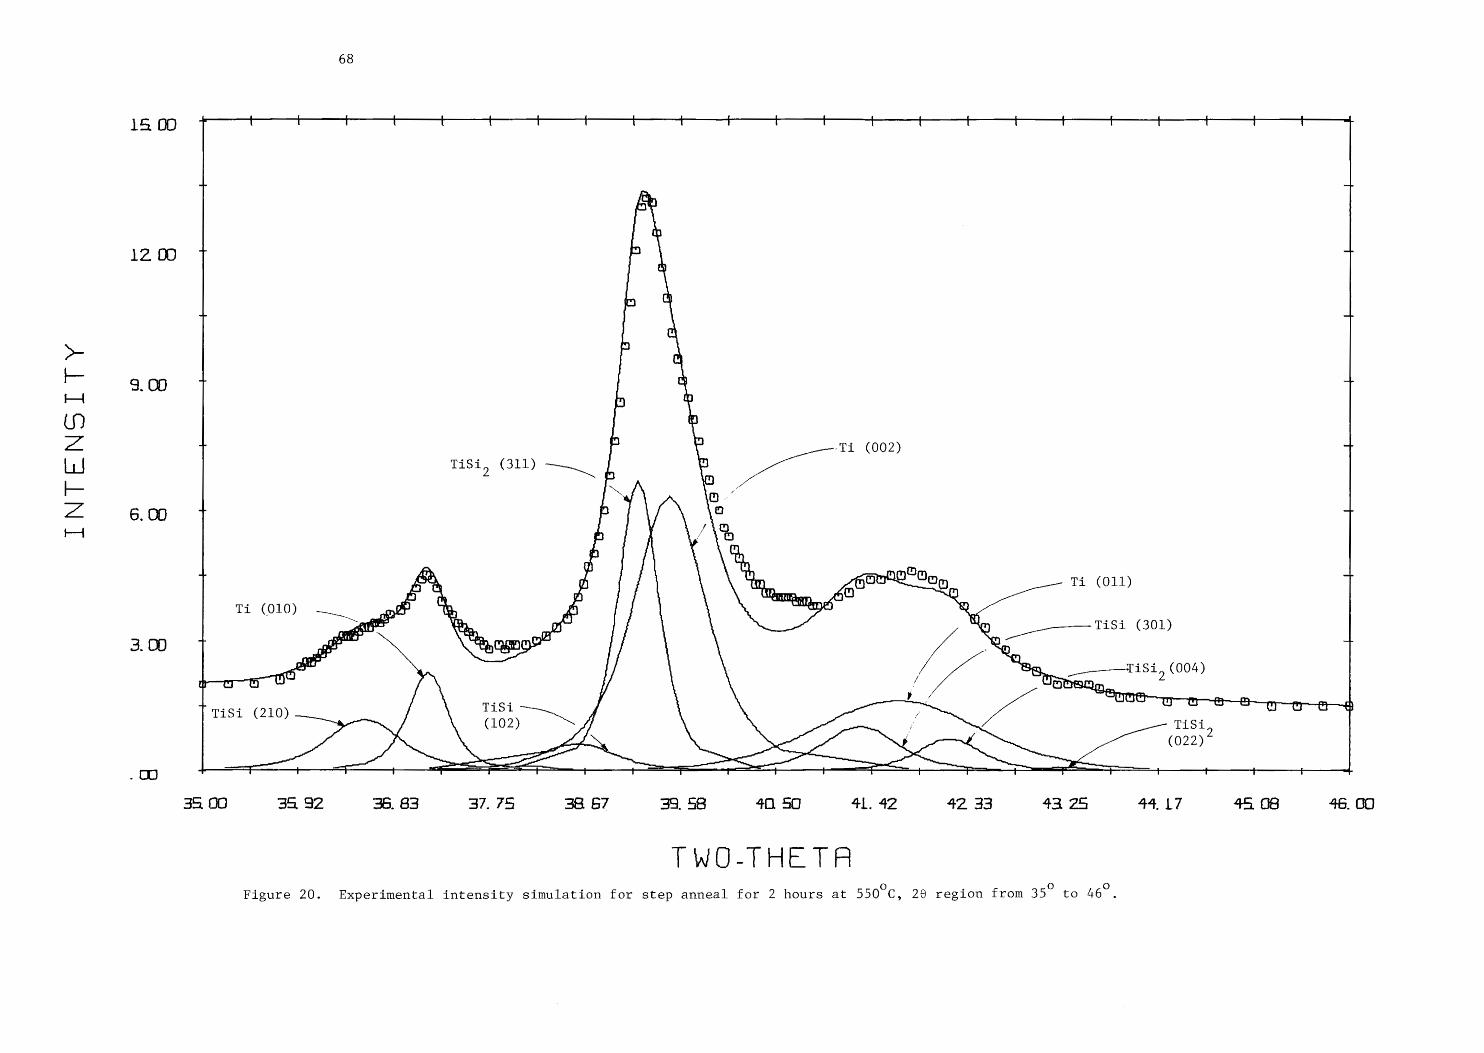
INTENSITY
14 OO
12 00
3. OD
6. OO
3. OD
68
- t r—t —t +——t t t + — t t — t t + —t t
+
frye
i)
4 a
\
| be ch
C" J
ui
+4 cy
rr ie
r
4 r , ‘Ti (002) Tisi, (311) —_ f v a
7m
5 Q
S oO "
| q L fr ©
an ty OTIQ Com Ti (O11) ate! © a T4 (010) A A CT of J om
- yo o Ne at a en aS (301)
t 2 AAC hh, ROS /. ; Qn
eal Ml tas Al San _———TiSi, (004) . Pr (yu / oO SAMEN. 2
TiSi > a ae a | TiSi (210 St , iSi (210) (102) :
36 00 38 92 36. 83 37. 75 38. 67 39. 58 40 50 41. 42 42 33 43 25 44. 17
Figure 20. Experimental intensity simulation for step anneal for 2 hours at 550°C, 26 region from 35° to 46°.
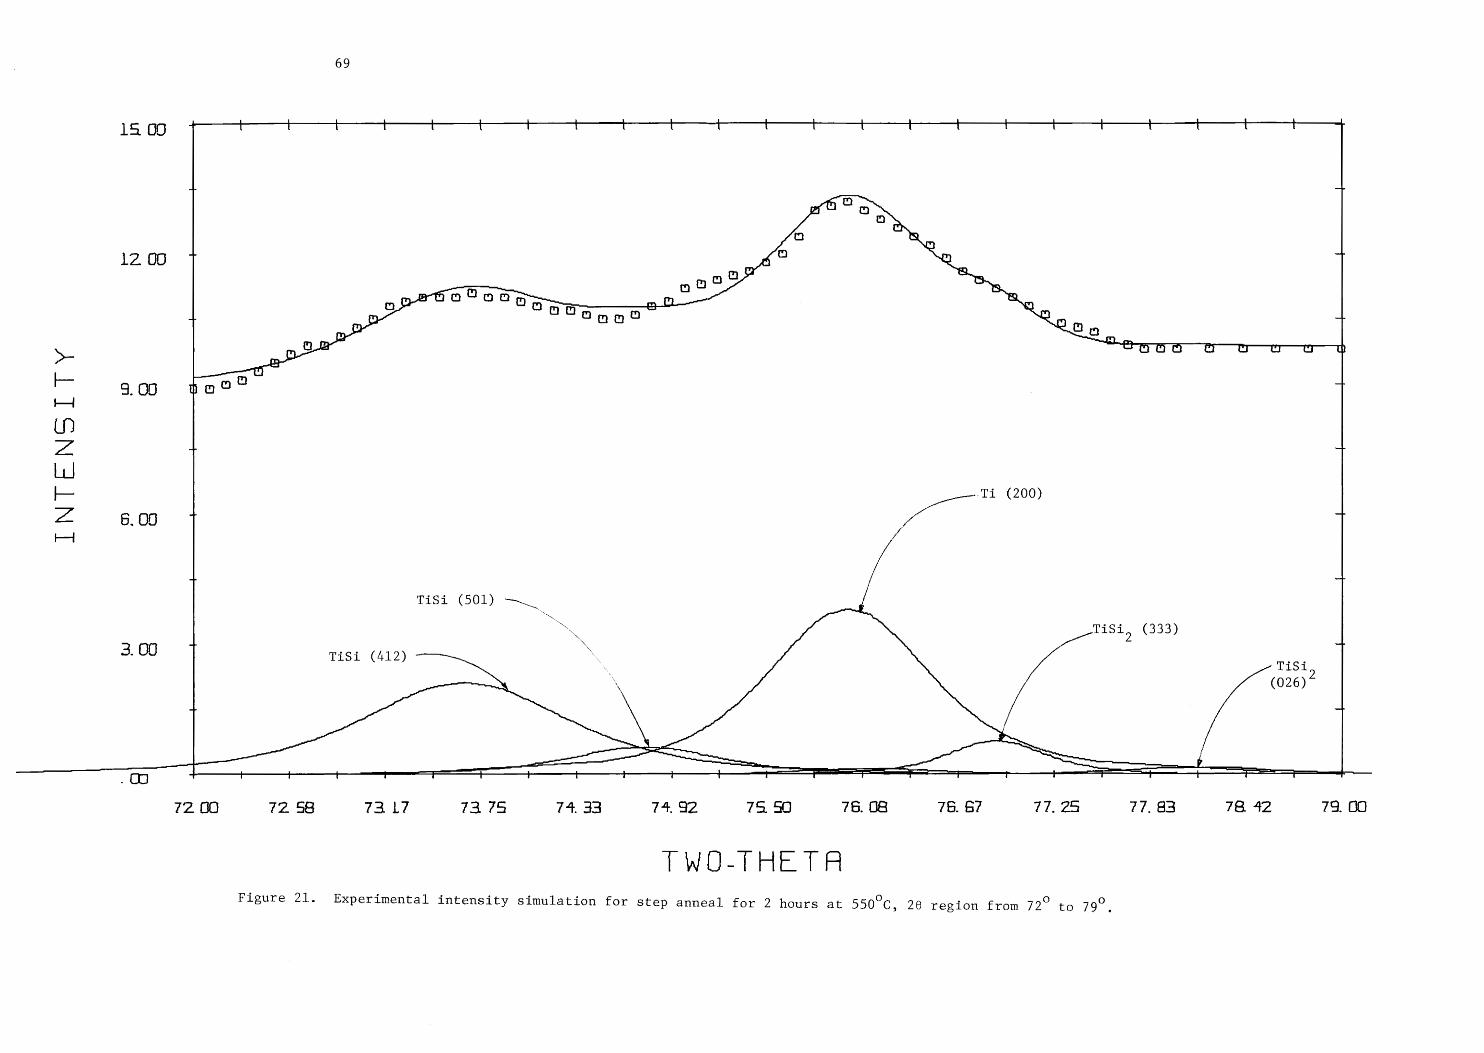
INTENSITY
69
— A + 7
1S oO t t t t t t i t t t —
12 00
3. OO
‘Ti (200)
6. 09 | oo T ?
TiSi (501) ~_
TiSi., (333)
| \ 4 3. OO TiSi (412) ‘. iSi , Tisi,
(026)
Wen t t t t t — ' —— ! i ———t —
72 GO 72 58 73 17 73 79 74. 43 74. 92 72 50 76. 08 78. 67 77.25 77,83 78 42 79. OO
TWO-THETA Figure 21. Experimental intensity simulation for step anneal for 2 hours at 550°C, 28 region from 72° to 79°
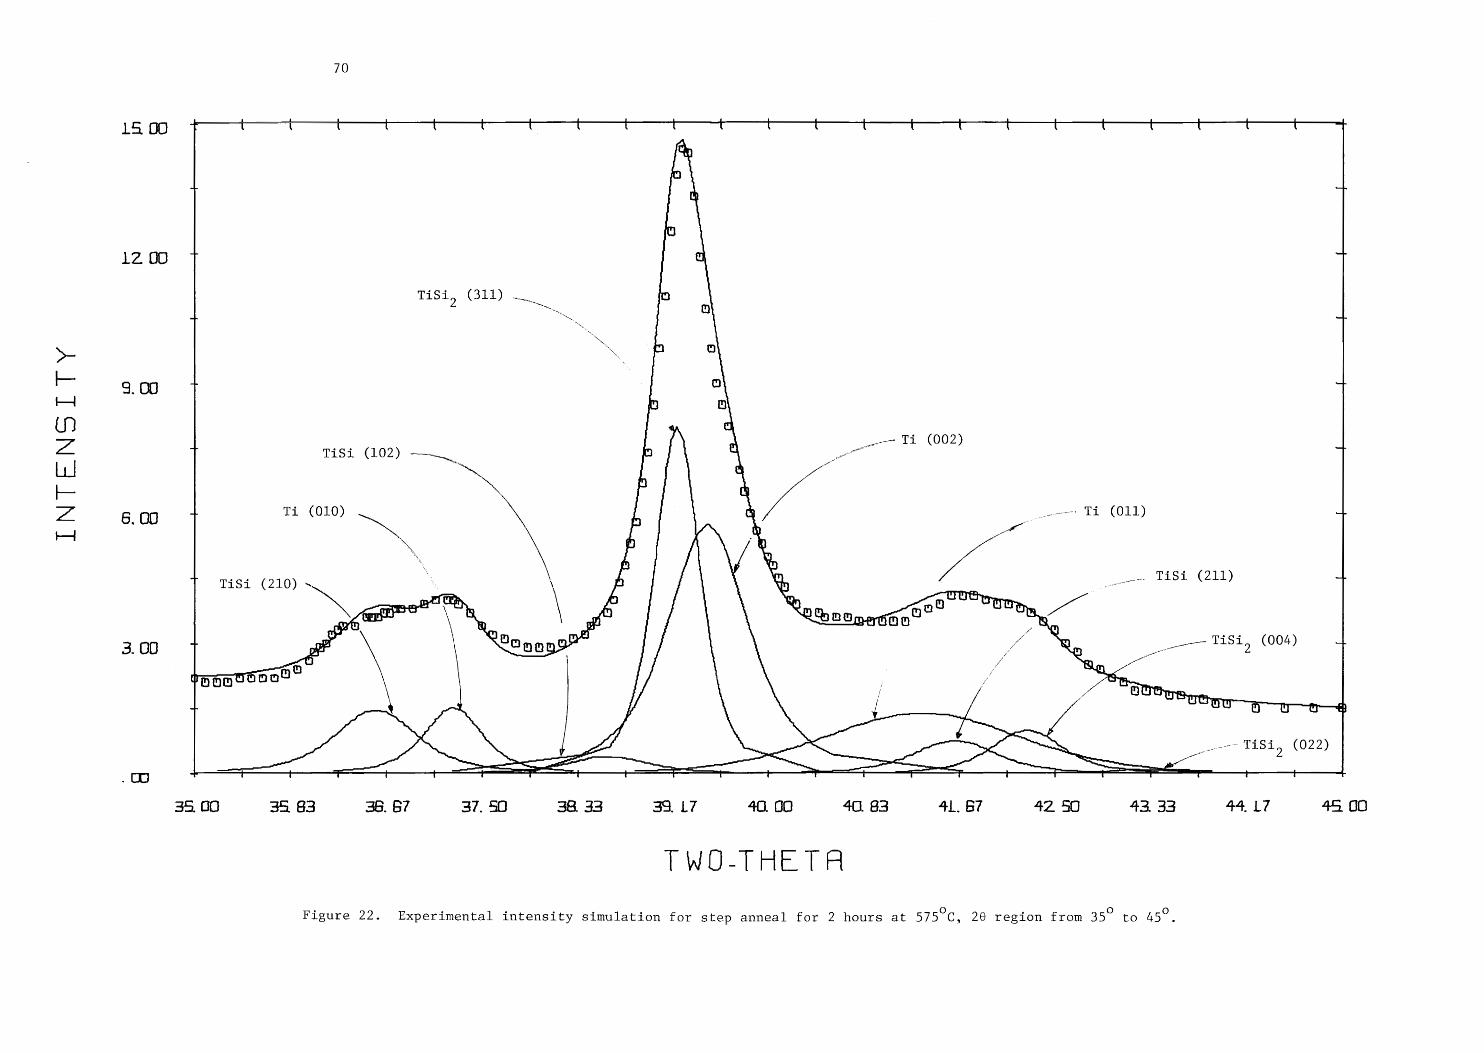
INTENSITY
14, 00
12 00
3. 0G
6. OG
3. OD
70
t { t t — —+ + + t t— { t t t t t -t t t t t t t
wae
: bi T
m7
A 7 me
Tisi, (311) 9 | ae . rua) |
NS
a u 0
| 0 | m pH
4102) ___-- Ti (002) 1 TiSi (102 | a al
ee a
™
1 Ti (010) TH (011) a
\ Lo ‘
J Tisi (210) NN , C TAS (211) +
me cry fy UN Gi OO .
(ane “ \ is 08> DO me Kone Md a
Re it Y u
4 oe x DOM m OQ” Lo Qo eo TiSi, (004) at
J / yD a
tpAnTbaae” | a ee / / “ Ou C iy TTR
TAT d 4 ’ uy () A (" A
<a. = pw TEST) (022)
354. G0 35. 83 38. 67 37. 50 38. 33 39. L7 40. 00 40. 83 41. 67 42. 50 43. 33 4417 45 00
TWO-THETA
Figure 22. Experimental intensity simulation for step anneal for 2 hours at 575°C, 29 region from 35° to 45°,
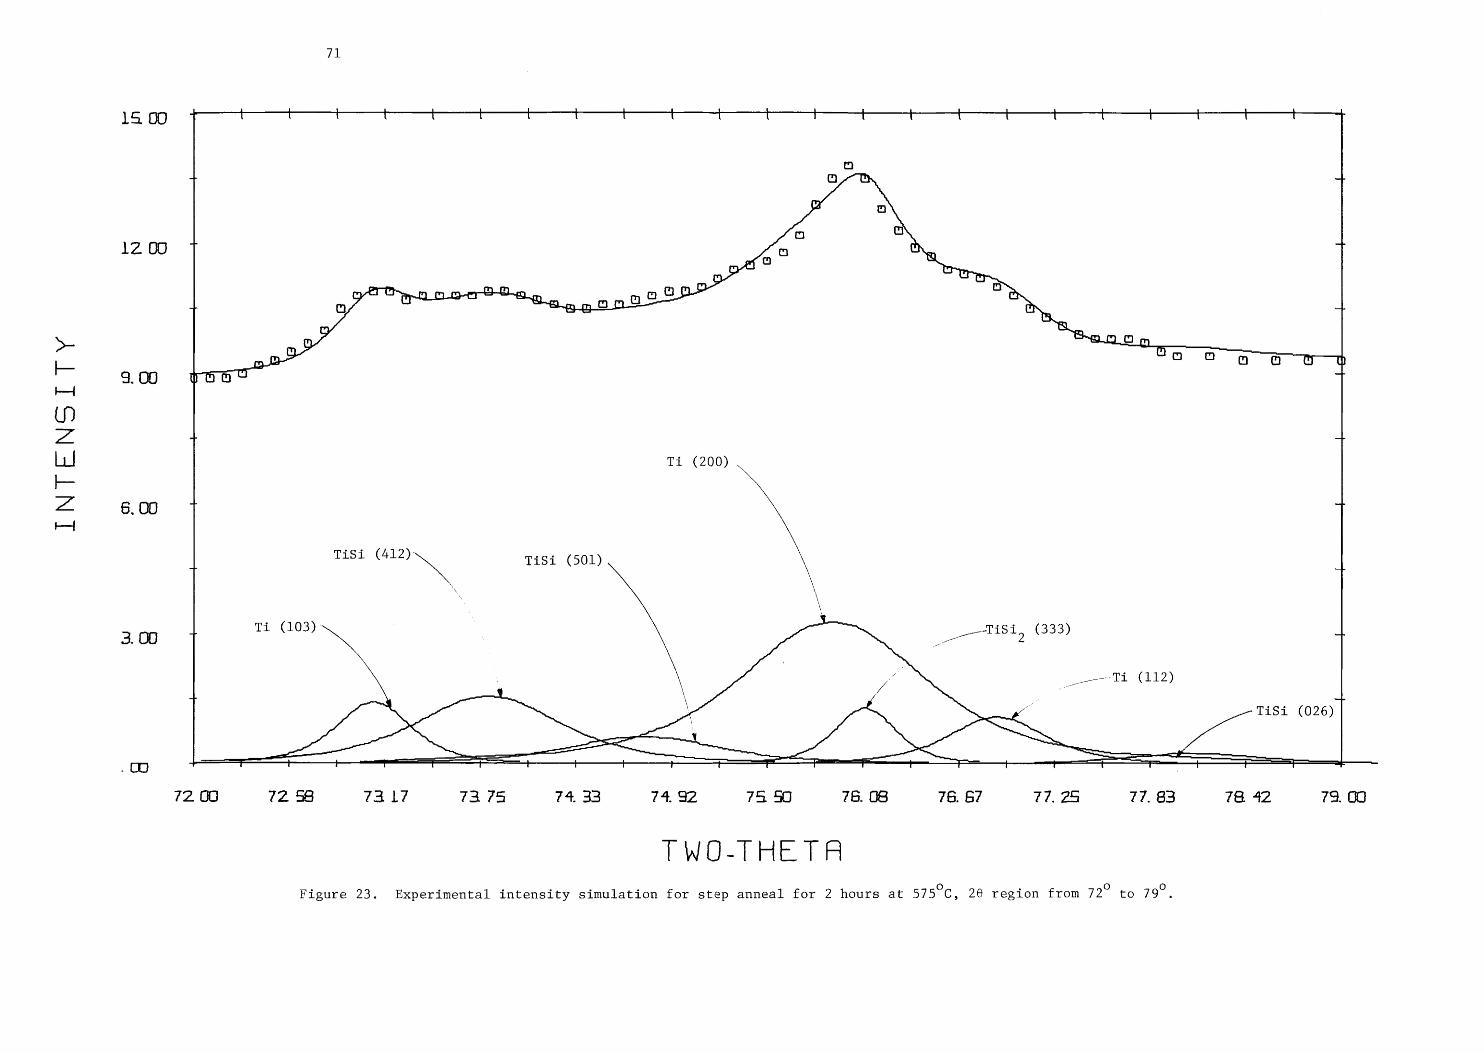
INTENSITY
1& 00
12 00
9. 05
6, OO
3. OD
71
t t t t t t t t t — t t t + t t t t t t t
©
art +
ys m
fo a
Oo D 7 c us a a aus >
* w
| a a oer SS a mang2e om :
4 cy rm WN
a “2. 0 m
a "oO ao oO oD woo
+
[i (200)
+ —
| TiSt (412)\ Tisi (501) | \
Ti (103) TSI, (333) -
oo _-— Ti (112) — f |
\ 7 TiSi (026)
\ aw —_
— t -—— t + -— i = t t t t t —<——} —— { >=
72 OO 72 8 7317 7375 74. 33 74. 92 75 50 76. 08 76. &7 7%. 25 77. 83 78 42 72. GO
Figure 23. Experimental intensity simulation for step anneal for 2 hours at 575°C, 28 region from 72° to 79°.
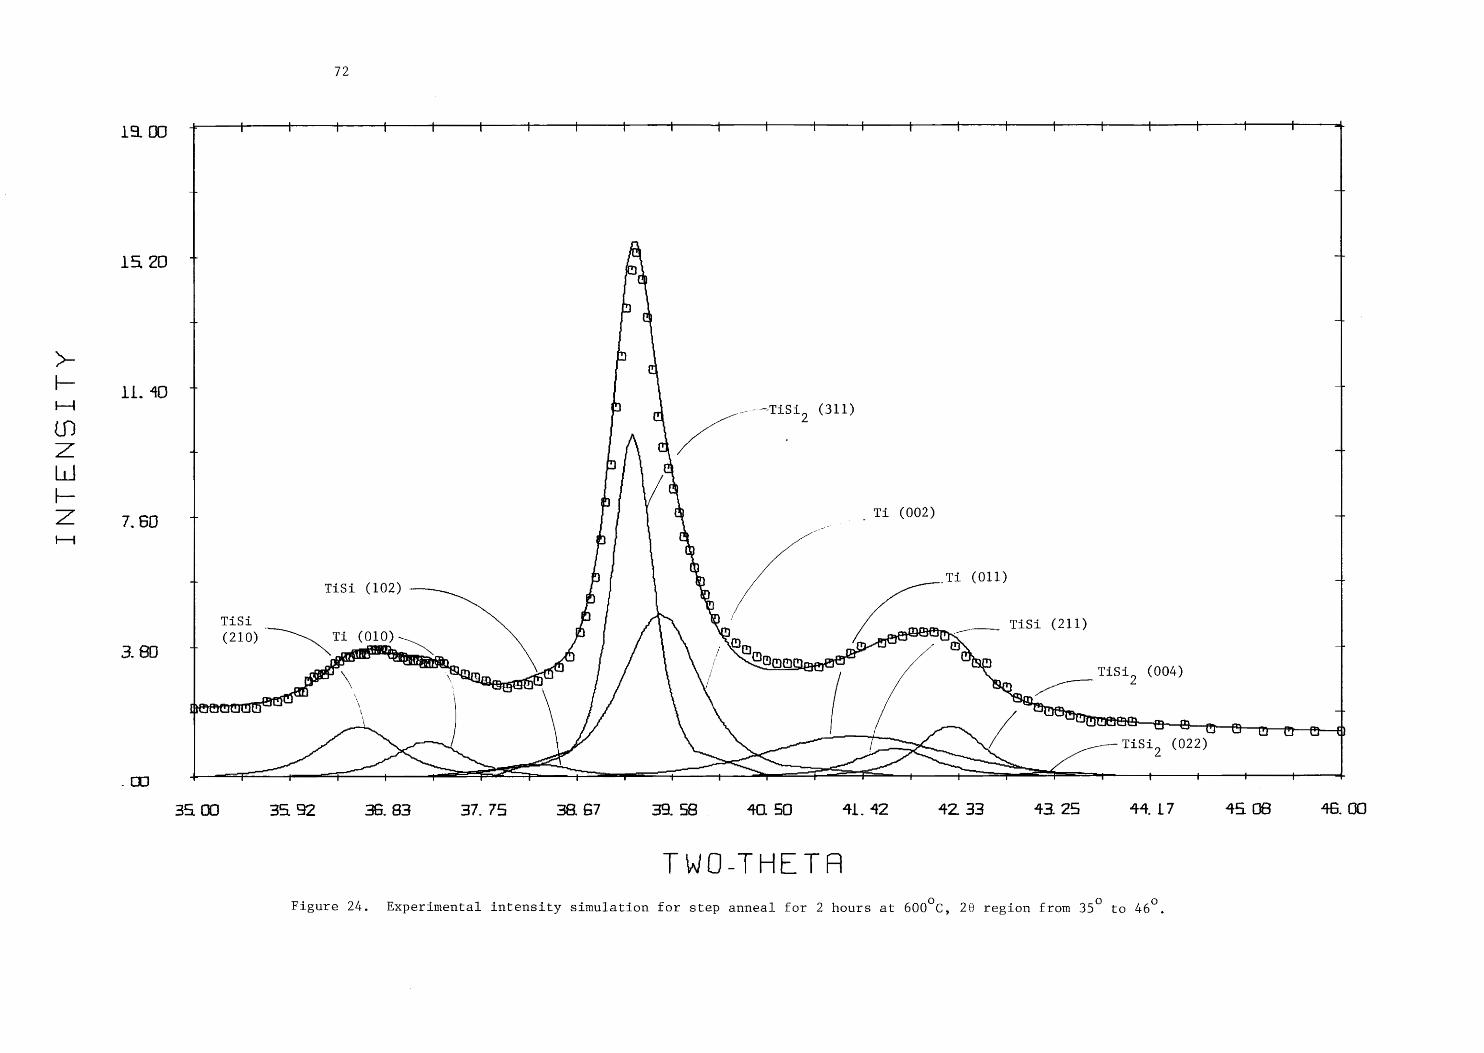
INTENSITY
19. 00
15,20
ll. 40
7.60
3. 8B
72
t + { t t t t t —t — t f t t t t t t t
si _ C 4
" a
") + ui a
m C]
~oTiSi, (311)
4 Ti (002) 4
A _Ti (011) 4
ee TiSi (211)
4 Lf oy _
t TiSi, (004) “2 2
fhe / BEM OMB—p—m |
ST @—_H <M TASi, (022)
35 00 35 92 36. 83 37.75 38. 67 32. $8 40. 50 41. 42 42 33 43.25 44. 17 45 06 46. G0
Figure 24. Experimental intensity simulation for step anneal for 2 hours at 600°C, 286 region from 35° to 46°.
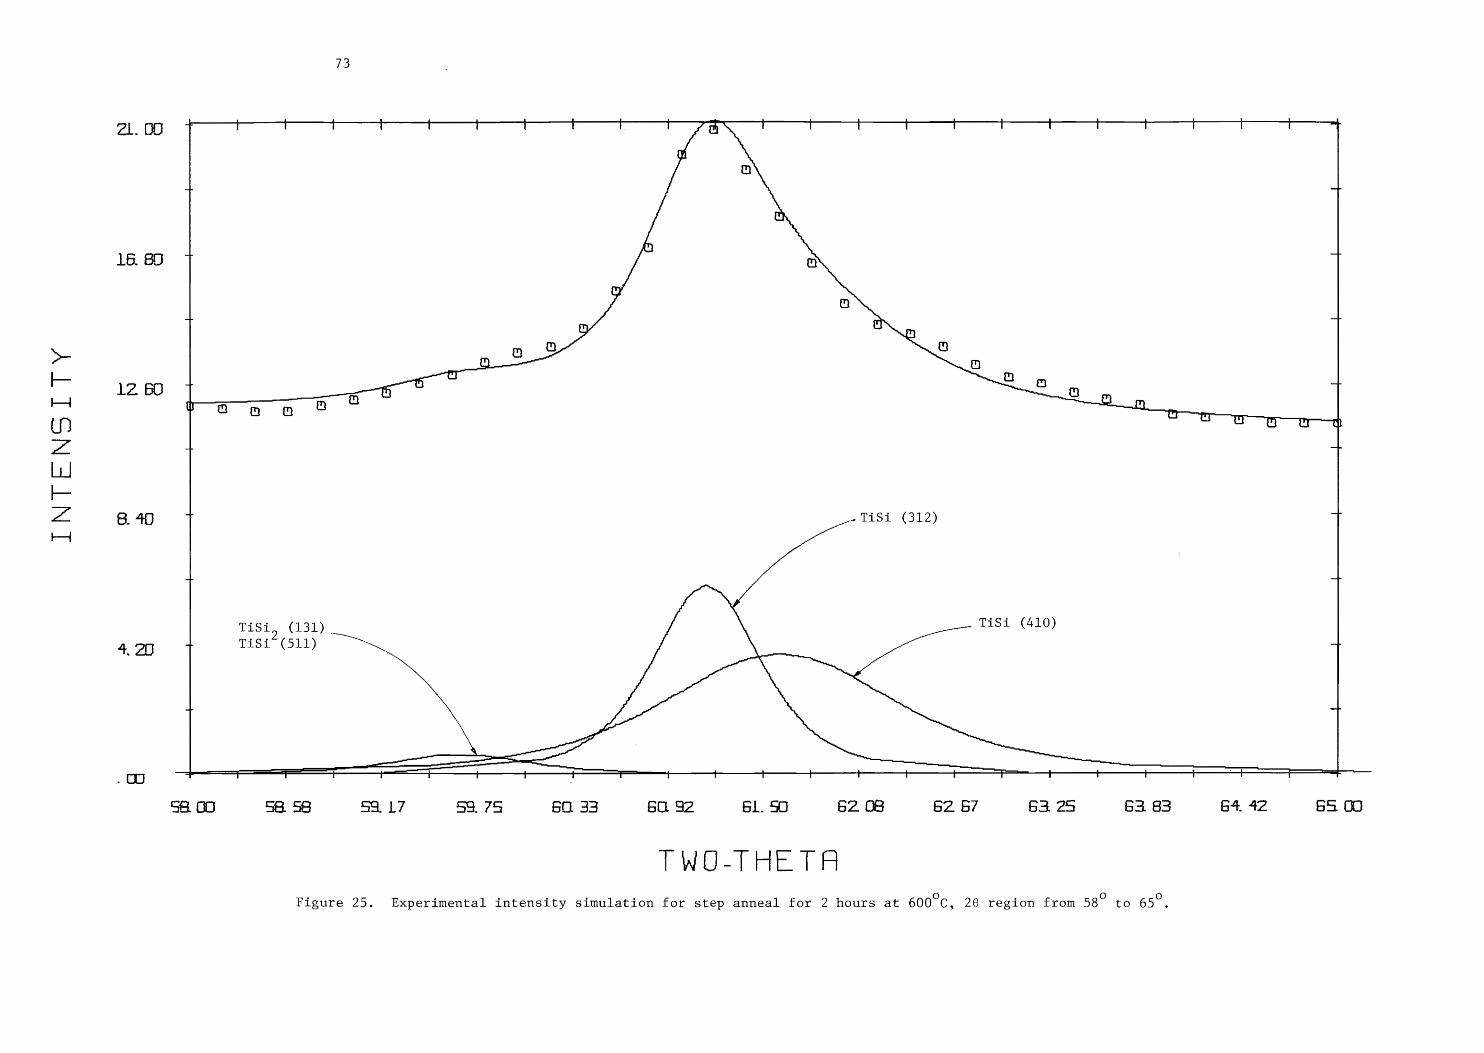
INTENSITY
16. 8D
12 60
8. 40
4. 2B
73
/ ~TiSi (312) |
4 +
TiSi, (131). TiSi (410) - TiSi’ (511) 4
4 -4
—— t i + t t t i t t t —
68. 00 58. 98 So. 17 So. 7S 60. 33 60. 92 6L. SO 62 08 62 67 63 25 63 83 64. 42 6S OO
Figure 25. Experimental intensity simulation for step anneal for 2 hours at 600°C, 28 region from 58° to 65°.
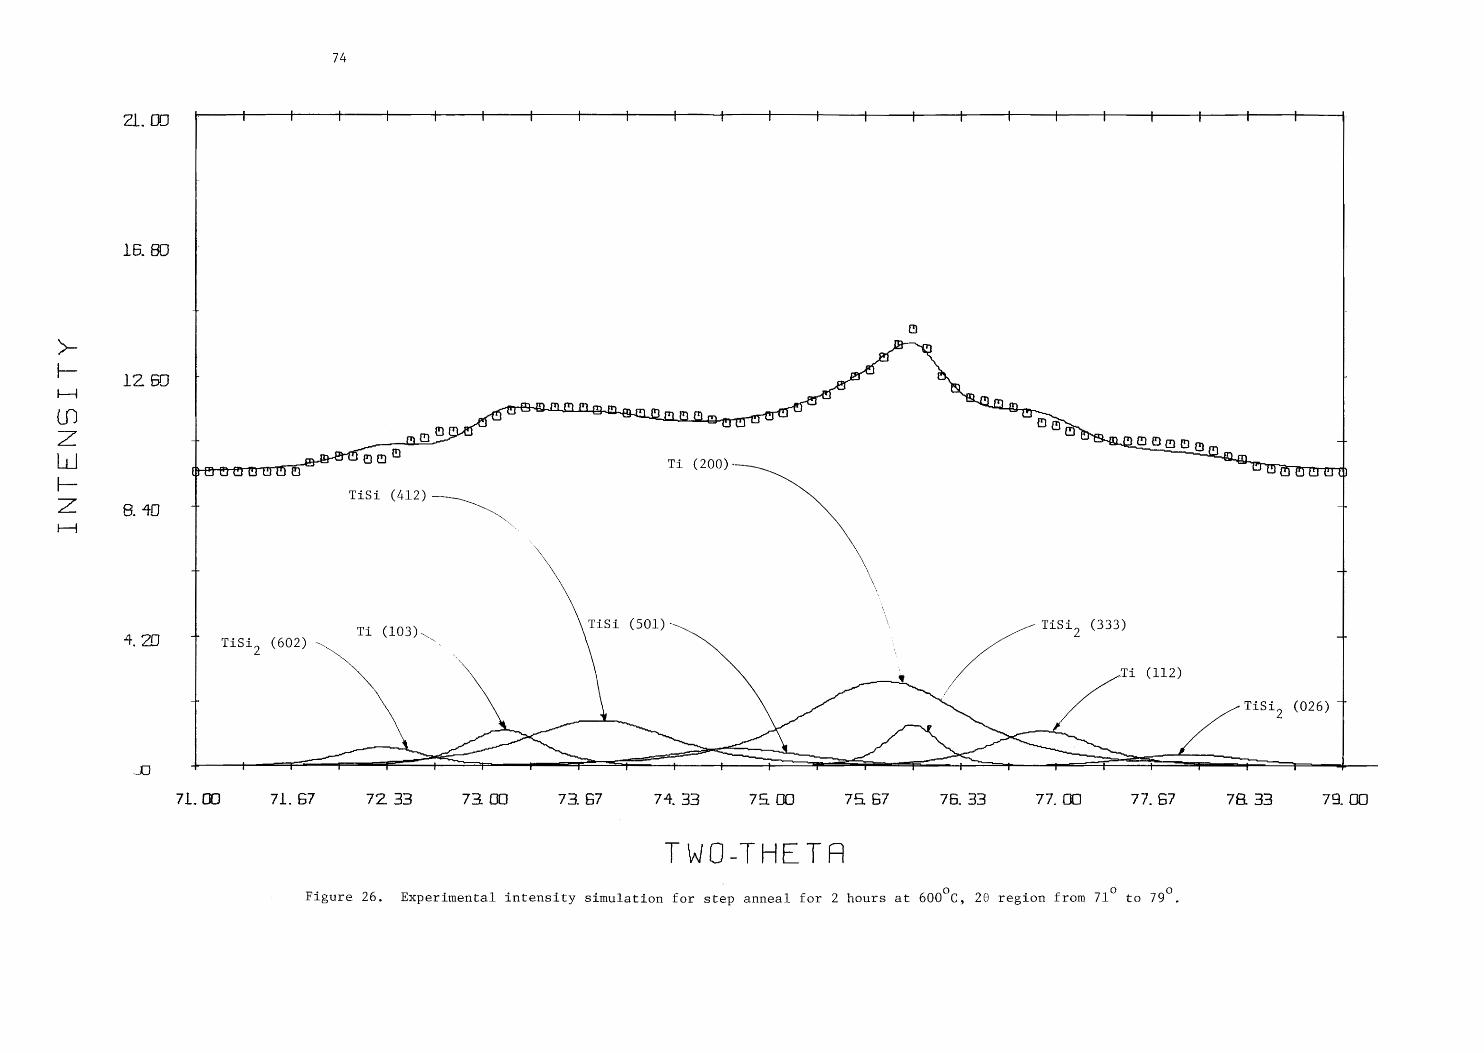
INTENSITY
21. OO
15. 80
12 50
8. 40
4.20
74
t —+ t t + t — t t t — — t { t +- I t t t
a
oye fs
“i A
OE] 1 ° o SOL
ASO BOON A a OTT " Ne 2 Ove a
a BItt nm 2 , ND ligigugugamunu eee TL (200): SOR COT
TASd (412) — 7
TiSi (501) \ TiSi, (333) T 103
TiSi, (602) #03) :
. Ti (112)
7 TiSi, (026) T
71. OO 71. 67 72. 33 73 00 73. 67 74. 33 75 00 79 67 76. 33 77. 00 77.67 78 33 79. BO
TWO-THETA
Figure 26. Experimental intensity simulation for step anneal for 2 hours at 600°C, 20 region from 71° to 79°,
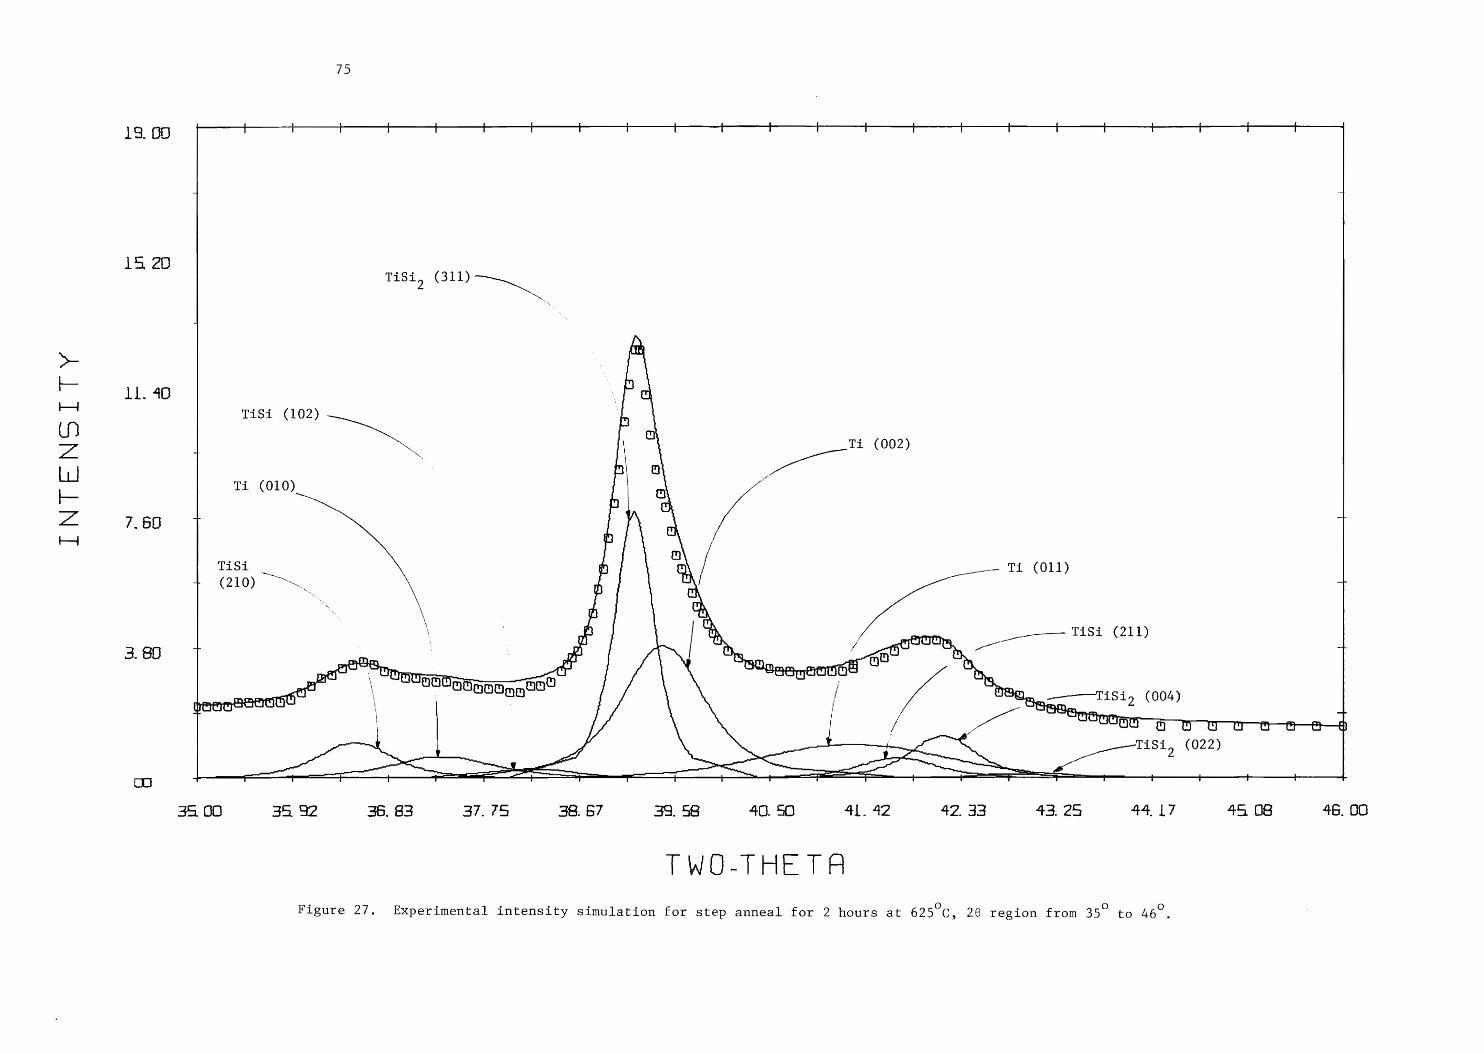
INTENSITY
19 00
14 20
Ll. 40
7,66
3. BD
75
46. 00
Tisi, (311) we
N ey
u
‘ CS
TiSi (102) fs oN
QO aa (002)
Ti (010) o
Tist _ Ti (011)
+ (210) ~~~ 4
TiSi (211) 4 an ~
eT
aes \ ‘SS
mene \ NSO, ———TiSiy (004) PRAgsTre \ BB aa | |
a SOON ae a a Q TiSi, (022)
35 00 35 92 36. 83 37.79 36. 67 39. 98 40. 50 41. 42 47. 33 43.25 44.17 45 08
Figure 27.
TWO-THETA
Experimental intensity simulation for step anneal for 2 hours at 625°C, 28 region from 35° to 46°.
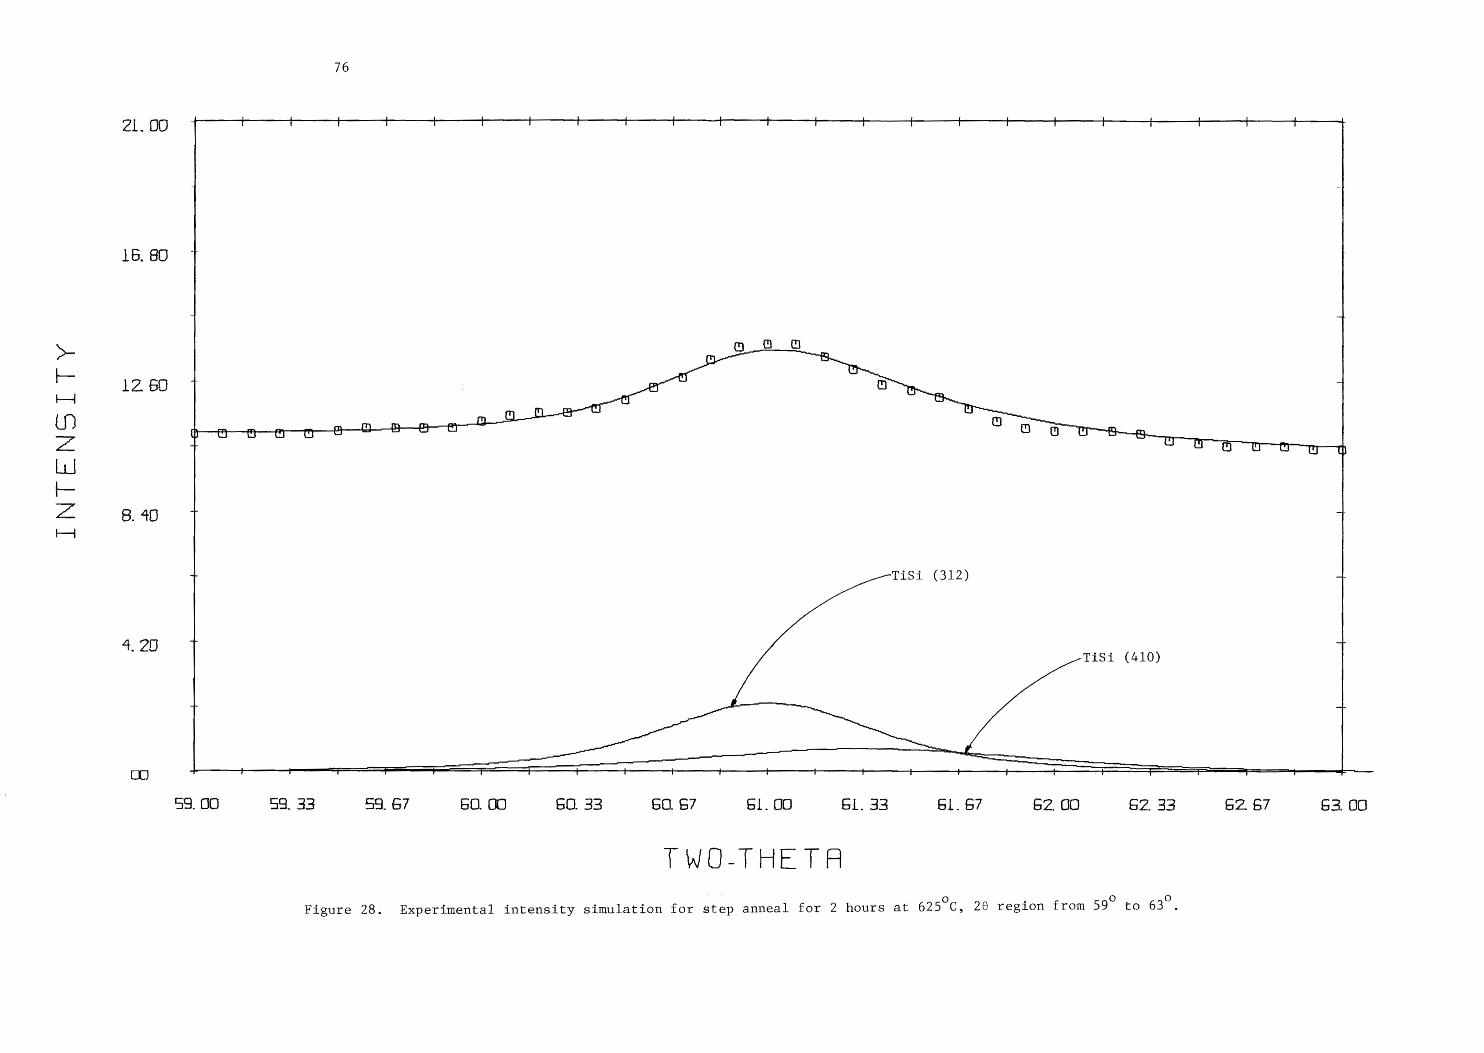
INTENSITY
Zl. OO
16, 60
12 50
8. 40
4. 20
76
T
|
4 TiSi (312) +
| TiSi (410) |
59. 00 59. 33 59 67 6&0. OO 60. 33 60. 67 61. 00 61. 33 61.67 G2. 0O 62. 33 G62 67 63. 00
TWO-THE TA
O Figure 28. Experimental intensity simulation for step anneal for 2 hours at 625°C, 20 region from 59° to 63°.
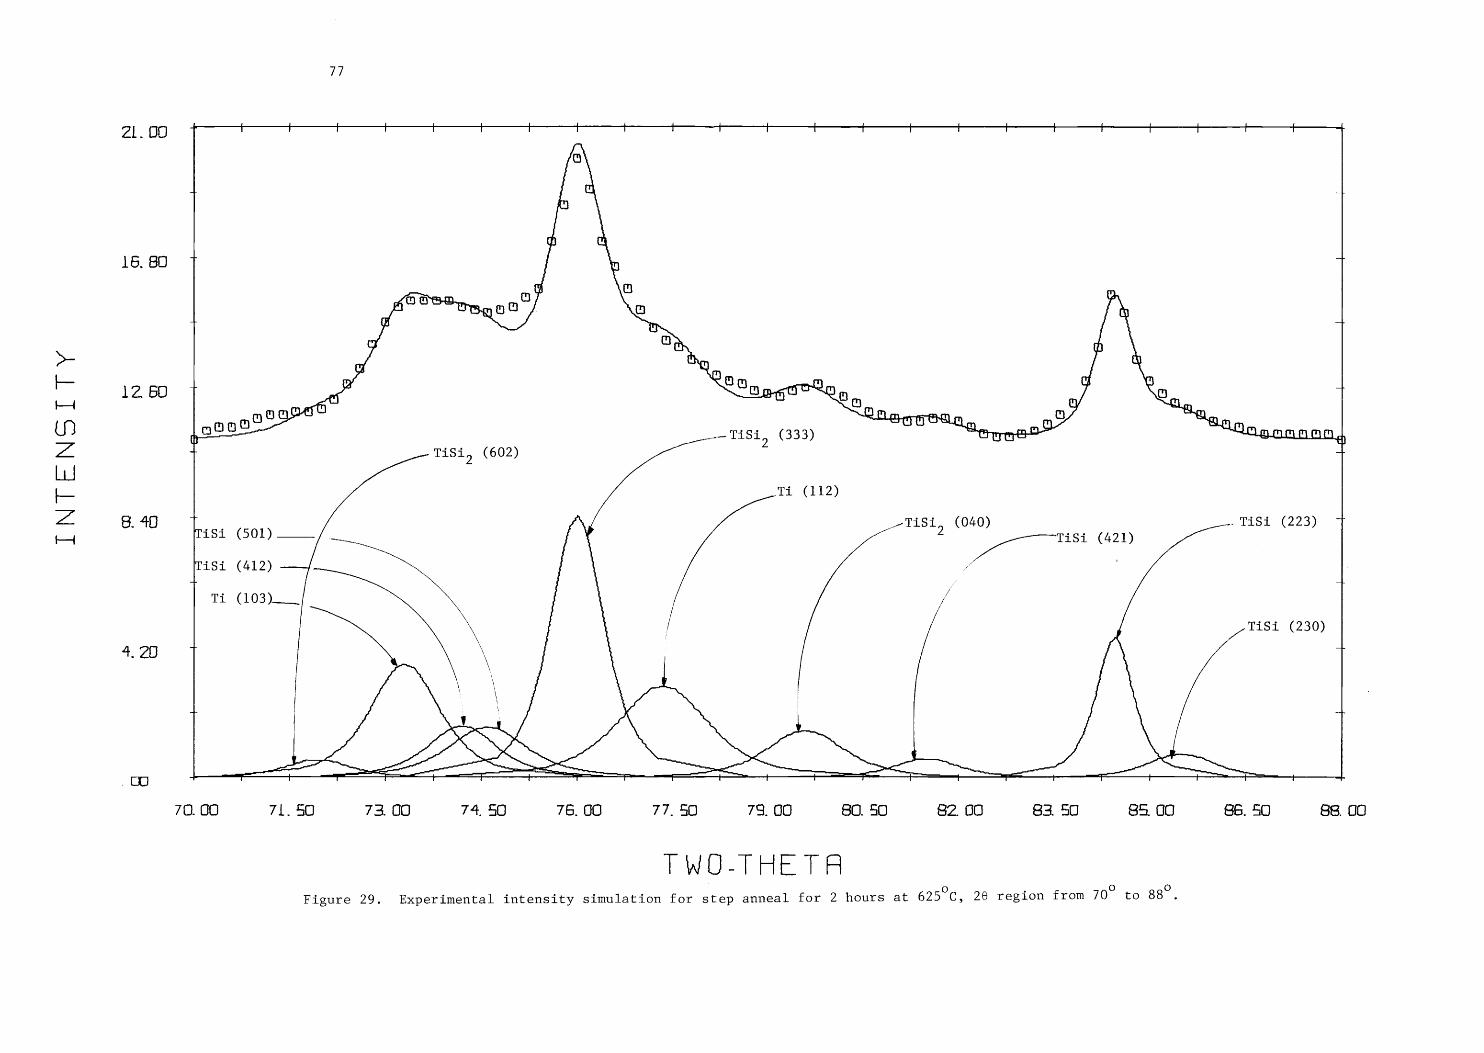
INTENSITY
ZL. OO
16. 80
12 60
8. 40
4. 20
77
a
4 UI _|
A)
CN
a "
Ao UB OO O iF, 7 T
Oh On if . te m7 (4
LF | v Sop goo ln , v. Roy |
nooo Oo no She
oO Shy ty Gag “ag pooo® -—Tisi, (333) erm = “Qoaanammmd 7 TiSi, (602) +
Ti (112)
t So TiSi, (040) -TaSi (223) 4 TiSi (501) ____ a nS (421)
TiSi (412) Y .
Ti (103)___ /
TiSi (230)
\
= ' +
«KN
= SON,
70. GO 71.50 73. 00 74, 50 76. GO 77. 50 793. GO 80. 50 82. 00 83. 50 85 G0 86. 50 88. 00
TWO-THETA Oo . oO oO
Figure 29. Experimental intensity simulation for step anneal for 2 hours at 625°C, 26 region from 70 to 88.
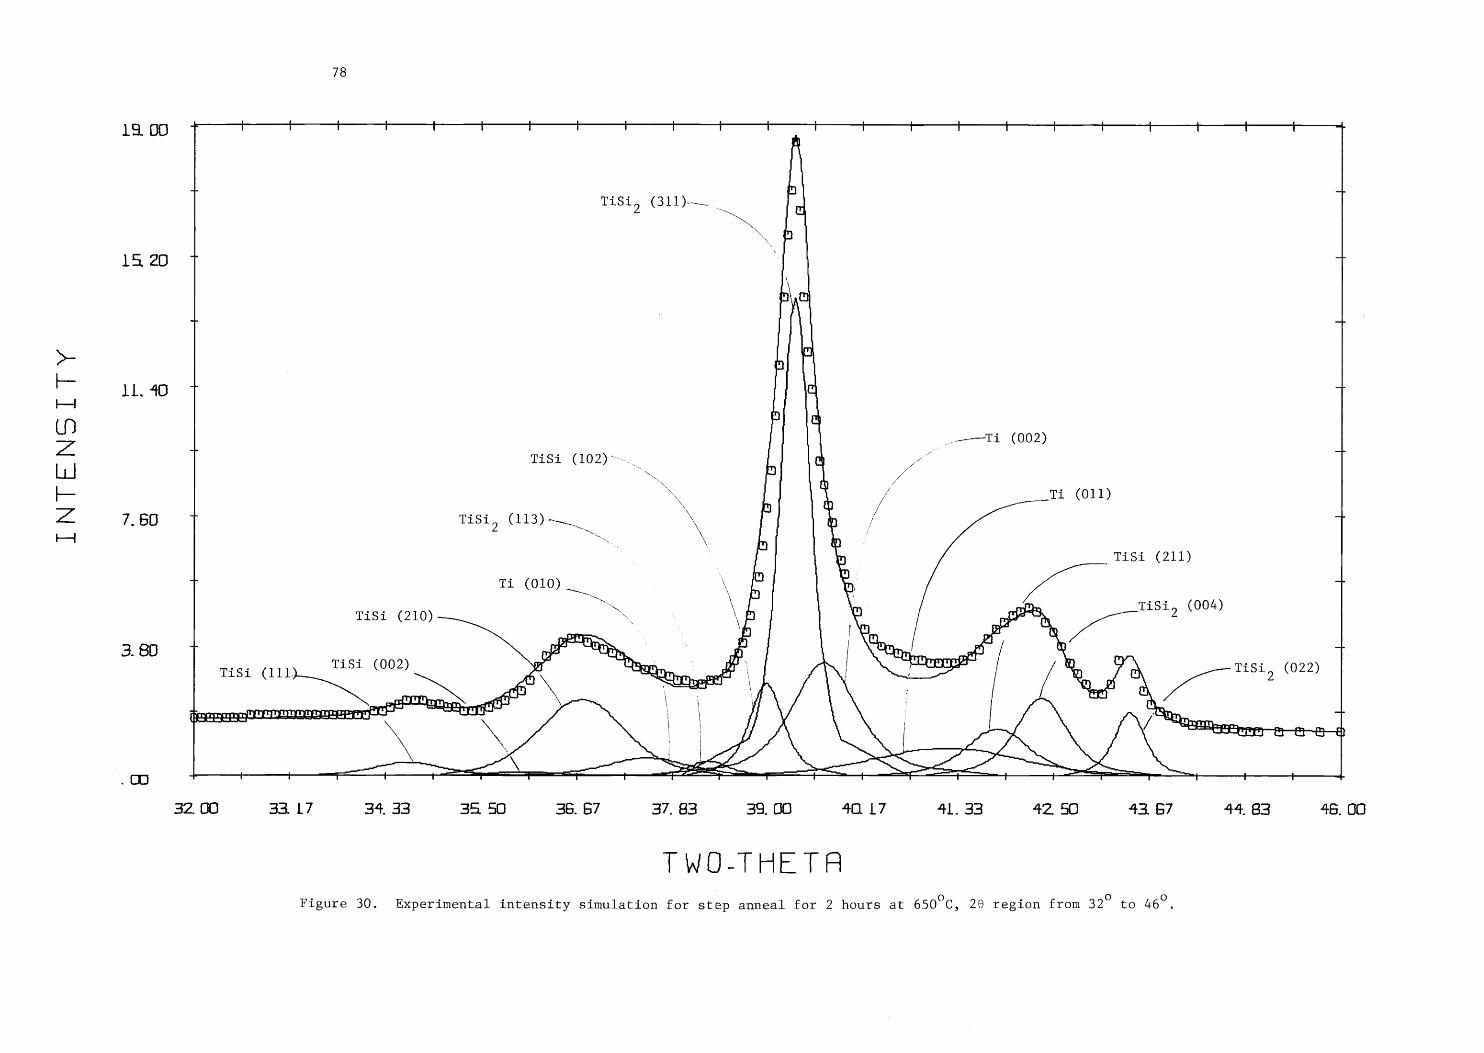
INTENSITY
13. OO
1520
il. 40
7,60
3. 8D
78
t
1 2 . Ma
—_
TiSi, ere a
\ 7)
. +
—-—Ti (002)
| TiS (102) o 7
Ti (011)
T Tisi, (113)—_ J
‘TiSi (211) - Ti (010) a Lo 4
os = iSi 004 TiSi (210) N fre, aa iy (004)
- )
5 Vigan as 4 1) +
tae ry ph, ug ph
TiSi (111. TiSt (002) a +t Mean / Rm, OU TiSi, (022) we — fs \
Qa 7
A ptm 4 (rh ua Poor OOOO eg ‘On "|
oO \ \ ! i? (RSs eee
| ——~ Ss SES |
32 00 33. 17 34. 33 35 50 36. 67 37. 83 39. 00 40. 17 41. 33 42. 50 43 67 44. 83 46. GO
Figure 30. Experimental intensity simulation for step anneal for 2 hours at 650°C, 20 region from 32° to 46°.
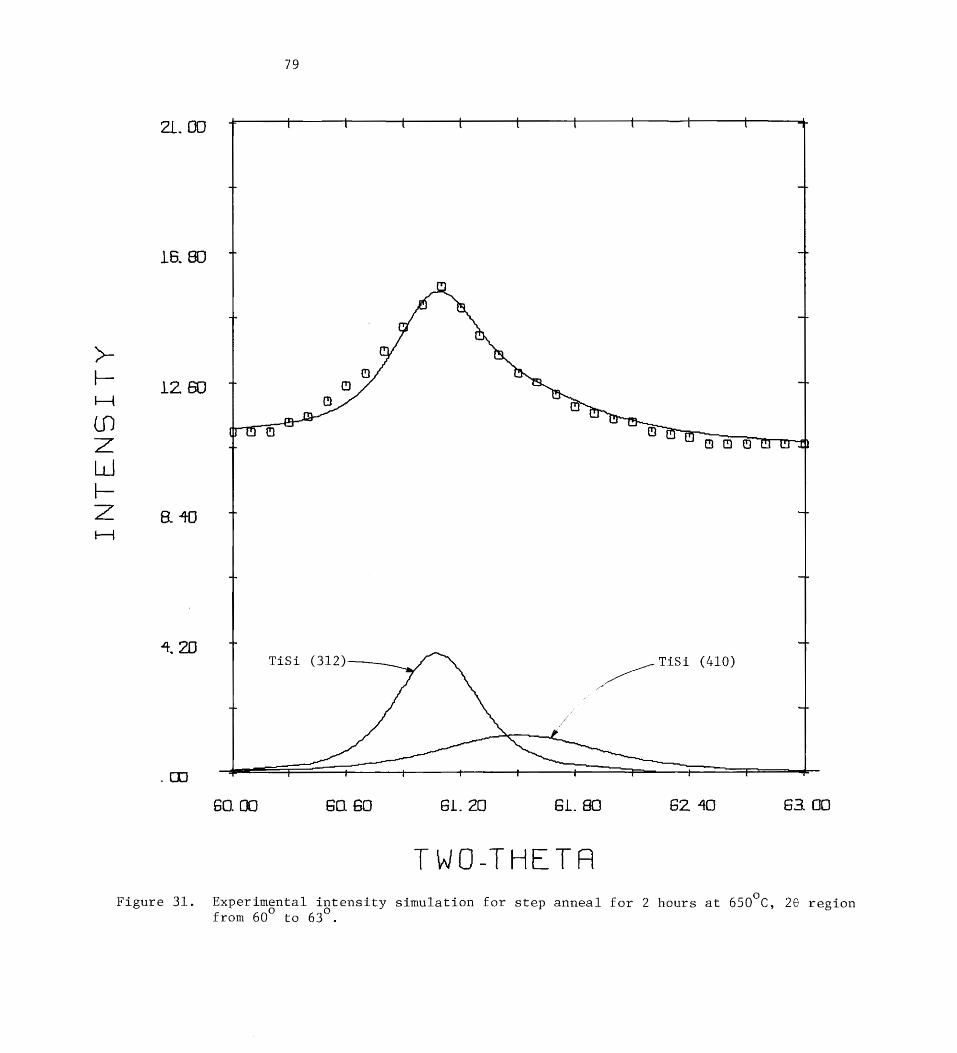
INTENSITY
79
T
16.80 7 T
12 60
B40 7 +
TiSi (312) TiSi (410) 60. 00 60. 60 6L. 20 61. 80 62 40 63 60
TWO-THETA
Figure 31. Experimental intensity simulation for step anneal for 2 hours at 650°C, 28 region from 60° to 63.
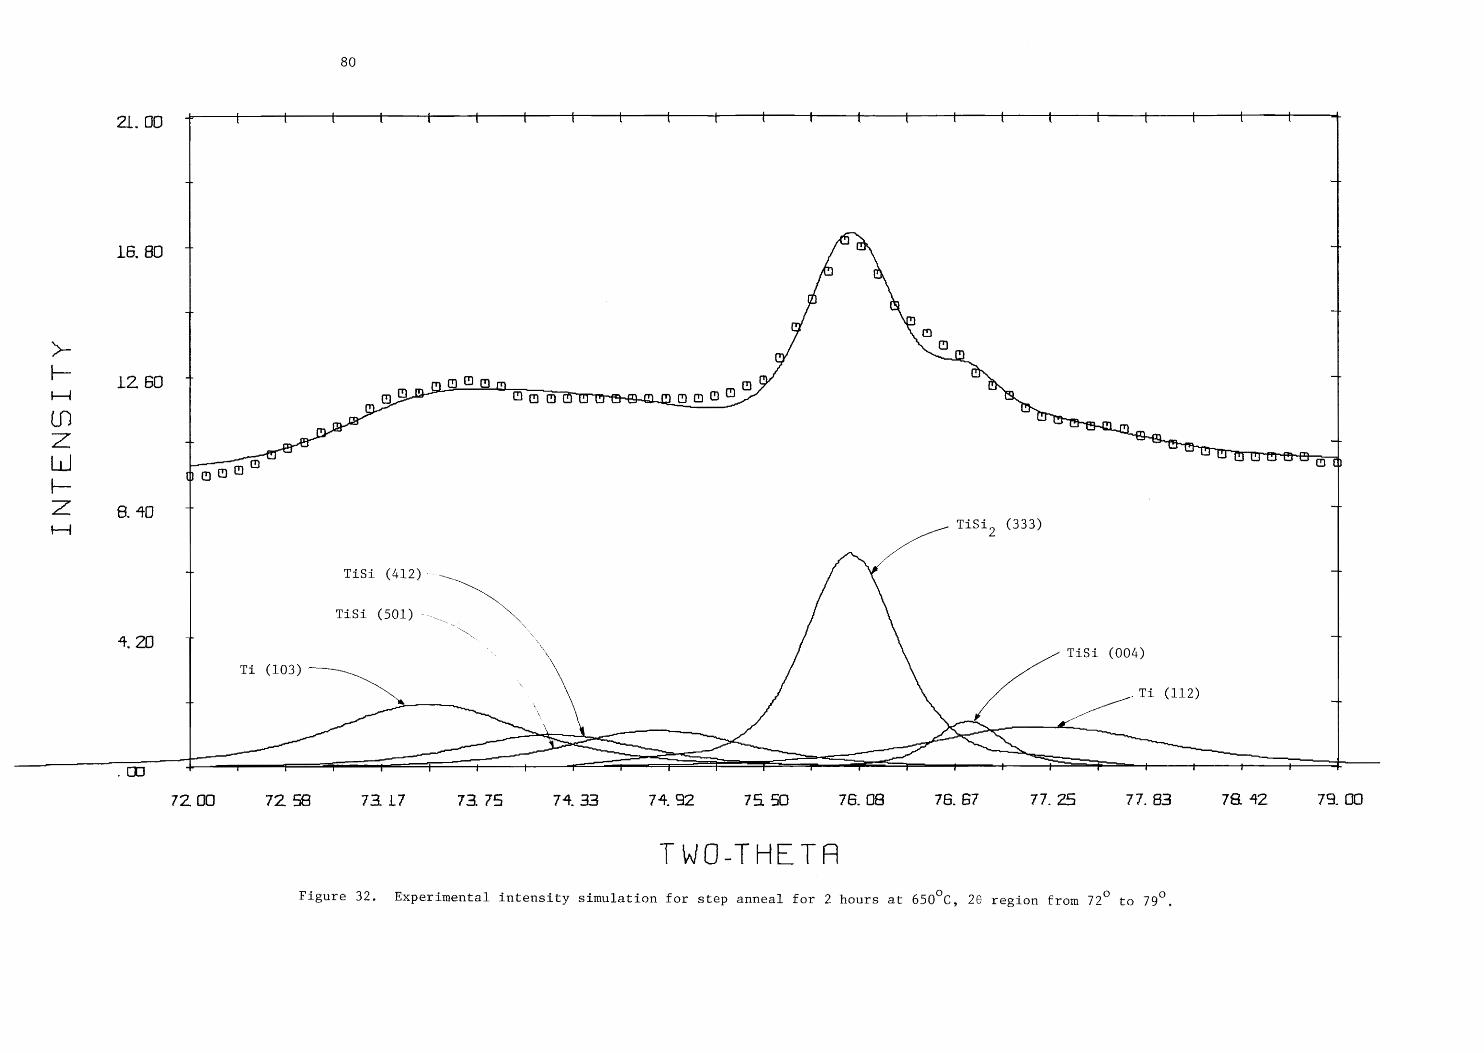
80
TWO-THETA
Figure 32. Experimental intensity simulation for step anneal for 2 hours at 650°C, 260 region from 72° to 79°,
21. oO t t t t t t t t t + t t t t t t t + + t t t
+ -
AS a 16,80 —
u ub
" \ | T . 7
° © > 0 q [- + m © m u u > 4
4 1? 60 7 oD Th Uren nanmoe® a
YY) os ° ~ thee Lon v op |
= , ee SOUT rr tresadt
Lu boaae
- — < 68.40 4 a Tisi, (333)
: TiSi (412) .
TiSi (501) oa‘
4.20 | AN TiSi (004) Ti (103)
oo .Ti (112) |
<> Se _ oN. . co “ Tt t t i t u T t a tr —— — =_— T t + t r t t t t
72, OO 72. 56 73.17 73.75 74 33 74 92 79 50 76. 08 76. 67 77.25 77. 83 78 42 793. GO
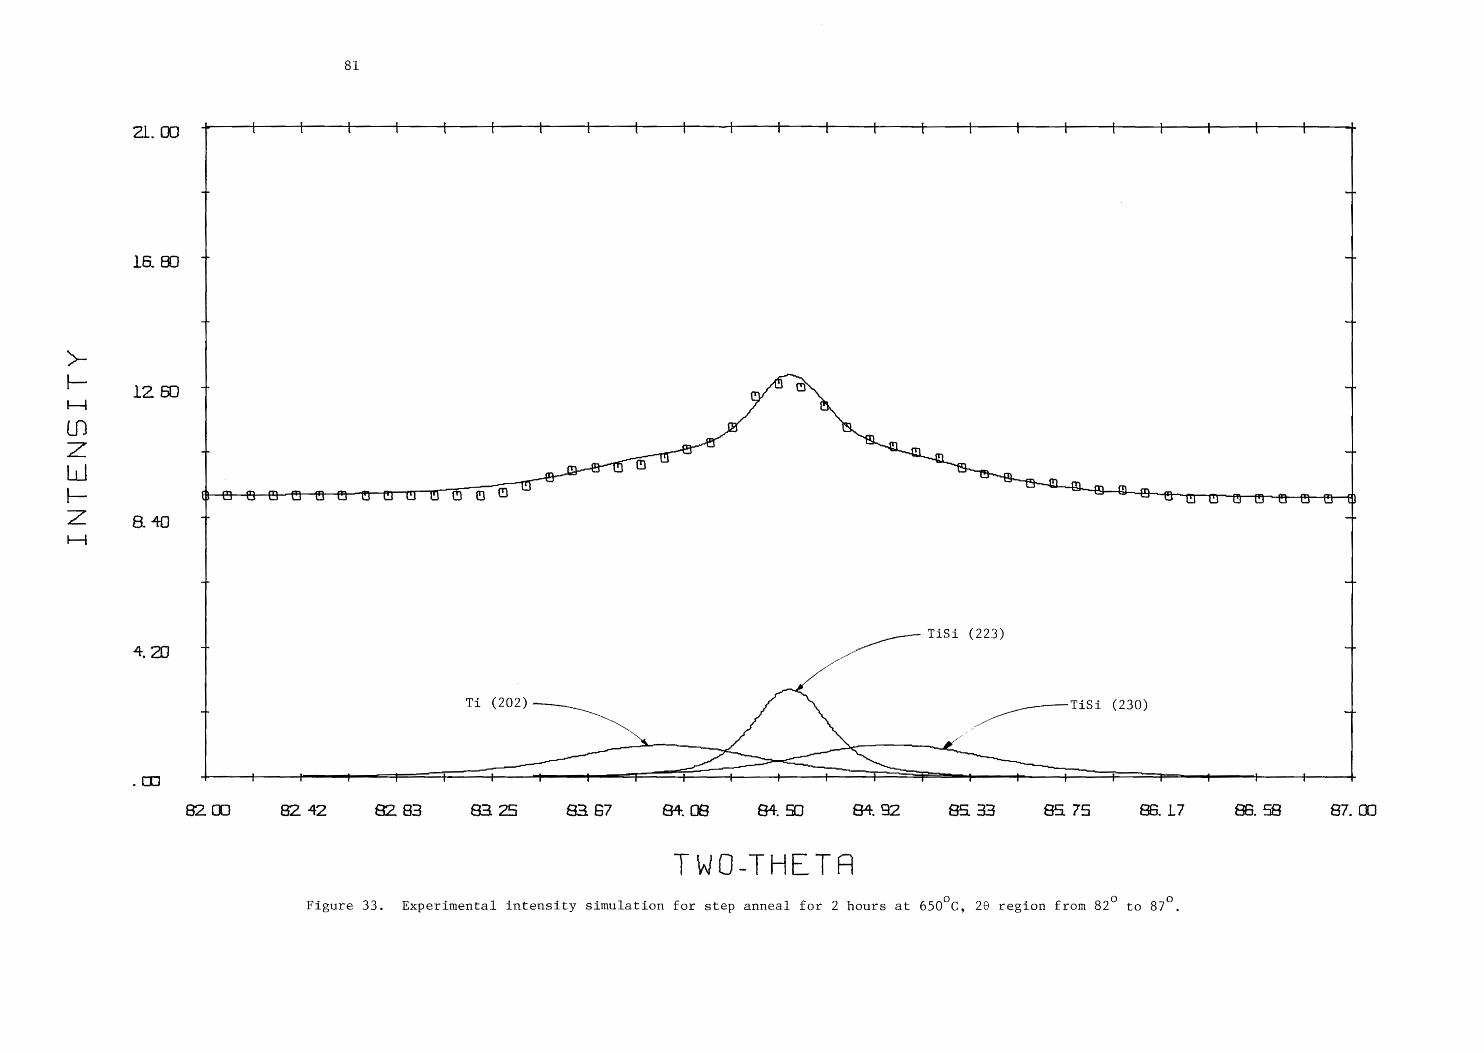
INTENSITY
16. 80
12 60
8. 40
4. 20
81
t t t t 4 + + t + t — + t——_ + —t—— t t t t——t t-
| T
+ +
+ 4
TiSi (223)
| Ti (202) aS (230) |
82 00 82 42 82? 83 G3.25 83, 67 8+. 08 8&4. 50 84. 92 85 33 85 75 86. 17 86. 58 87. 00
TWO-THETA
Figure 33. Experimental intensity simulation for step anneal for 2 hours at 650°C, 28 region from 82° to 87°.
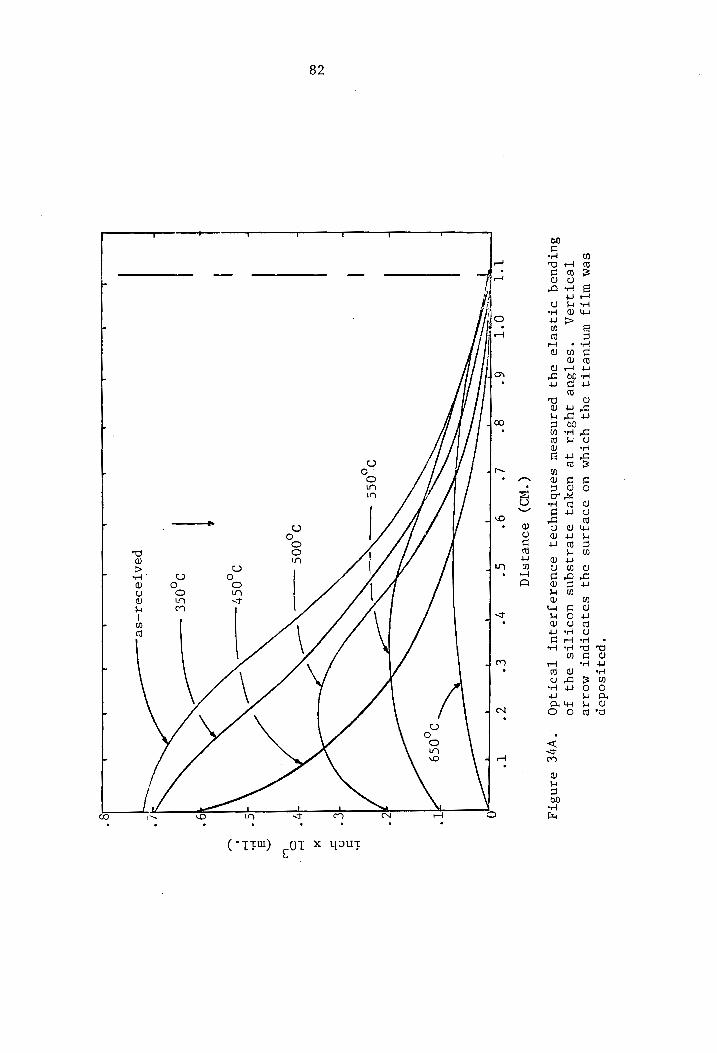
82
*poqtsodop
SCM WIT}
WNTURITI
94. YOEYM
UO sOeFJANS
VY} SBEOTPUT
MOITIe TBOTISA
*SaTsue VYSsTA
Je usyZeJ
azeAASQGNS UODTTTS
ay
FO
SUTpuseqd
IIASeTe
9Yy} paansesauw
sanbruyoeq
souaTaTAaqUT
Teotadg
‘yrE
ain8tTy
(°WO)
9F0ueIsSTG
T°t c°
7° €°
co" T*
0 Te
mn, v
4 4
T T
a -
T
°
9,059
L. z°
9,068 ——\-—-
L qe"
- |
3,00 —
i"
L _
(°TFW) OT X Your
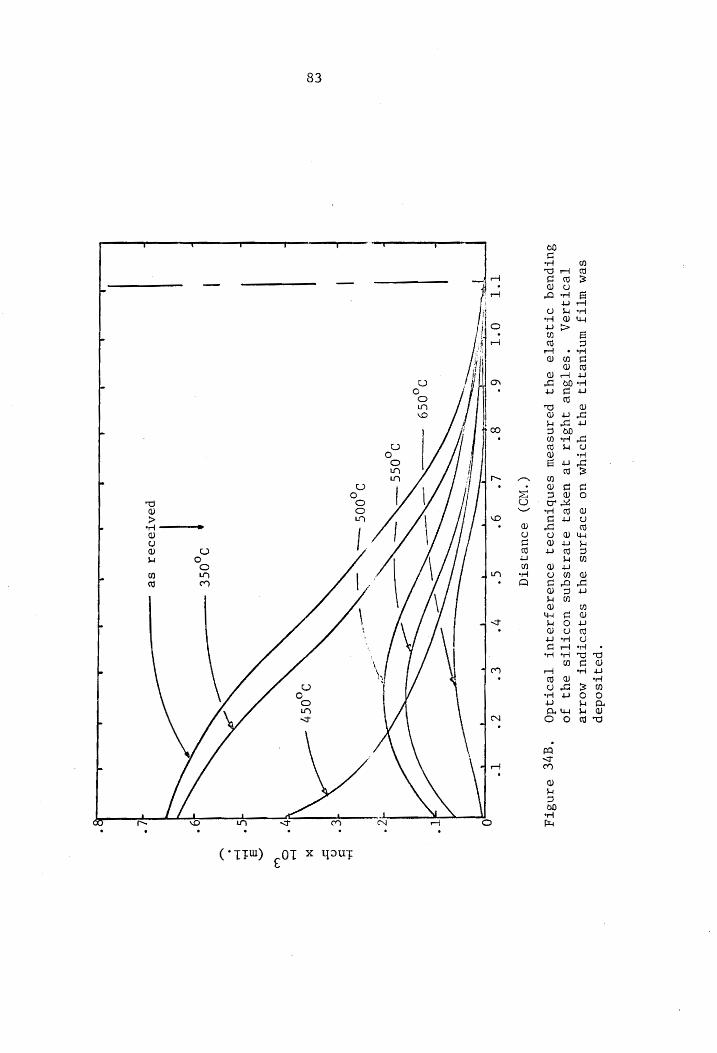
83
*poejqtsodep
SCM WTF
WNTUeAT}
ey
YOTYM
UO BdeJANS
9Yy Sa2ReOTPUT
MOIIe
Te°TIPA
«“*SaTBue WUSTA
Je Useye
|}eAISGNS
UODTTIS
3syW jo
BUTpueg
DTISeTS
sy} peanseow
saenbruyds}
souaTazZAaquT
Teotjdg
(°WO) soueIqSsSTd
‘qve einsTy
TT see
(THM) OT * your
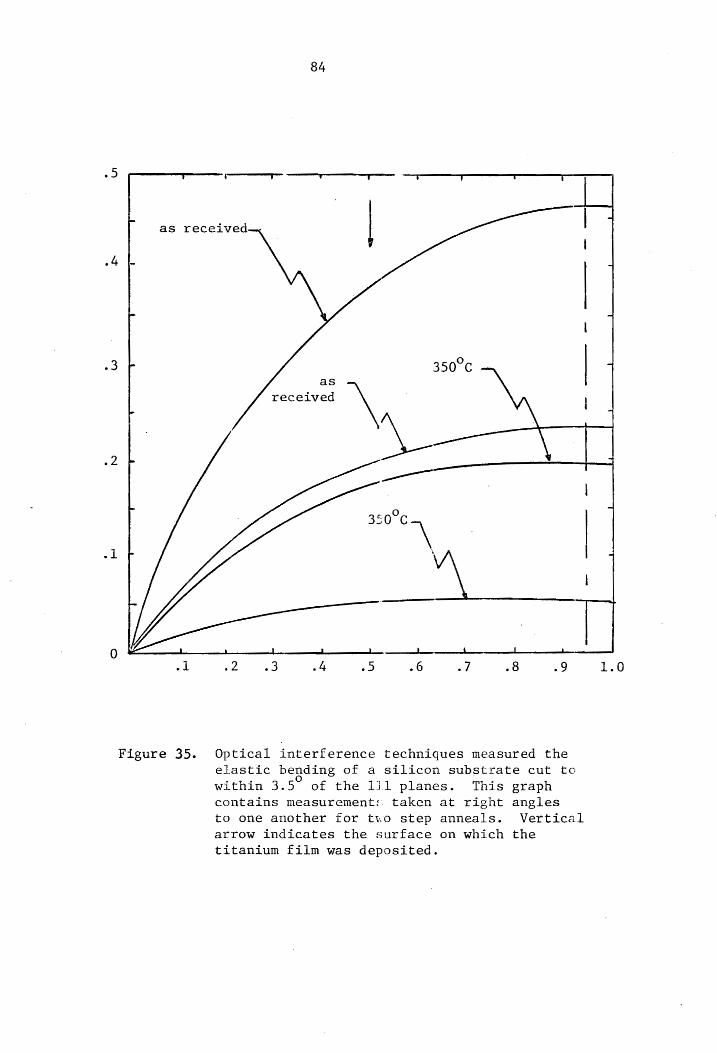
84
as received
as
received
Po,
Figure 35. Optical interference technigues measured the
elastic bending of a silicon substrate cut to
within 3.5° of the lil planes. This graph contains measurement: taken at right angles
to one another for tro step anneals. Vertical
arrow indicates the surface on which the
titanium film was deposited.
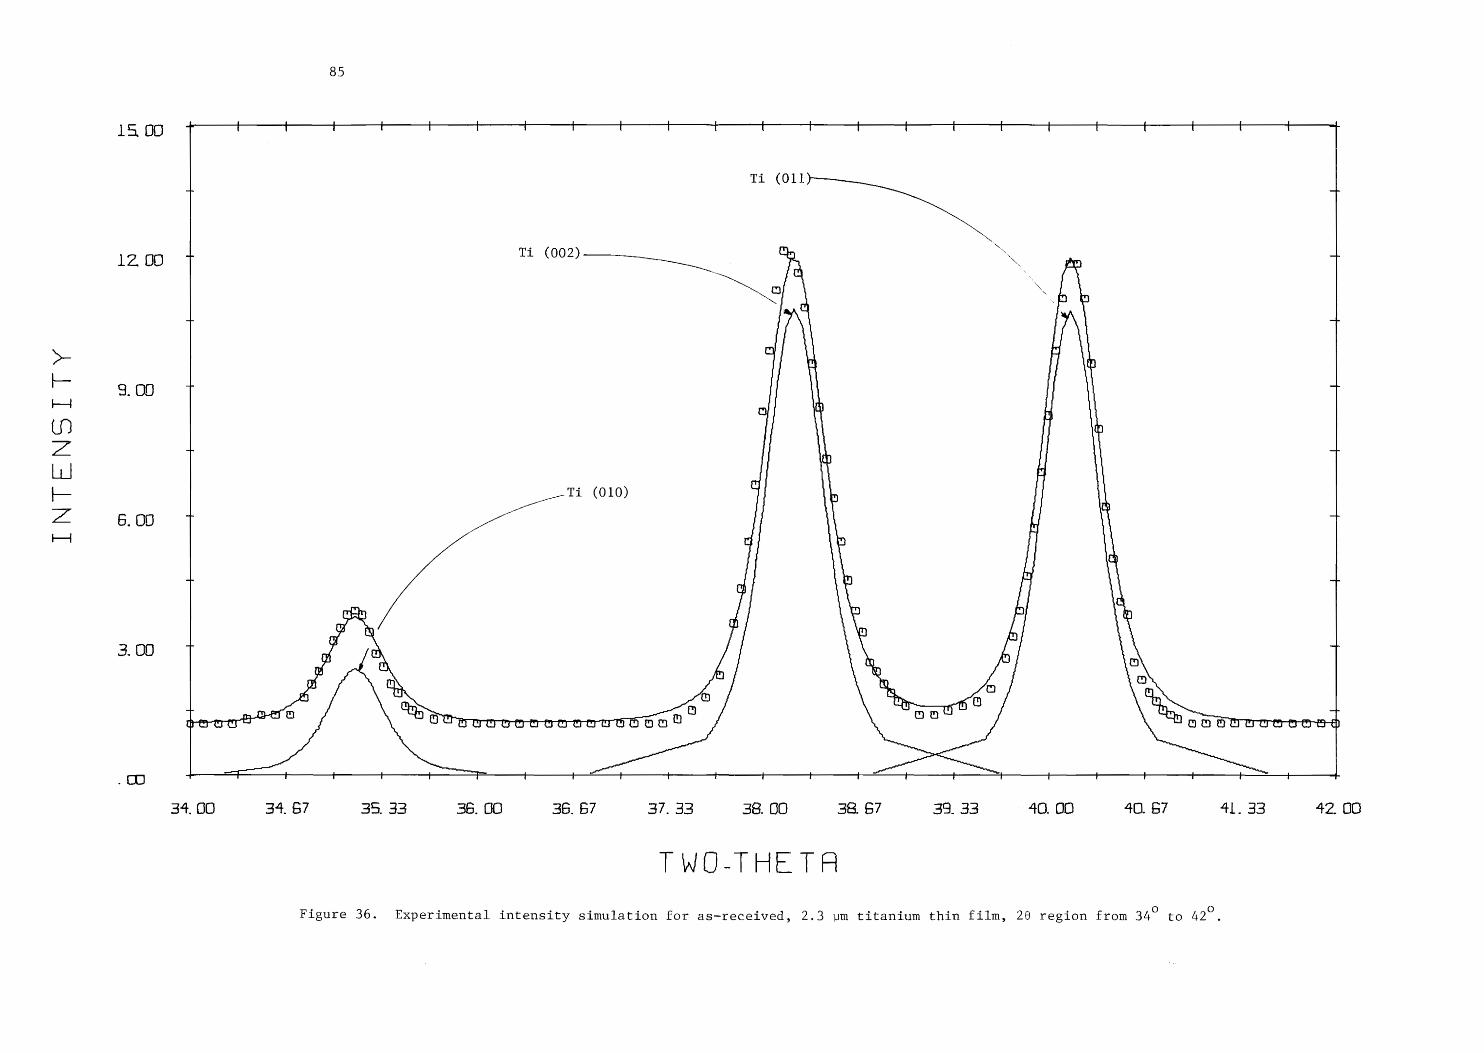
INTENSITY
85
15 oo t t t t t t +t t +t +— t t t t t +- t t t +
Ti (O11
12 00 | TE (002) ae - ° \ A T “ ,
oo \ my
m7 a
FI
9. OO T 7
Qo
}
Ti (010) 1
6. OO T 7
rj
ma
4 - —
th 7
3. OO T 7 ©
a Q © ~~
a Q +
re Oe ee eer erertr ty 6 Hm 2 OO O»yrrrerrenernta
. OO t t t { + t f t —t- t | t { t f —r —t
34. 00 34. 57 35 33 36. 00 36. 67 37. 33 38. 0O 38 67 33. 33 40. 00 40. 67 41.33 42. 00
TWO-THETA
Figure 36. Experimental intensity simulation for as-received, 2.3 um titanium thin film, 26 region from 34° to 42°,
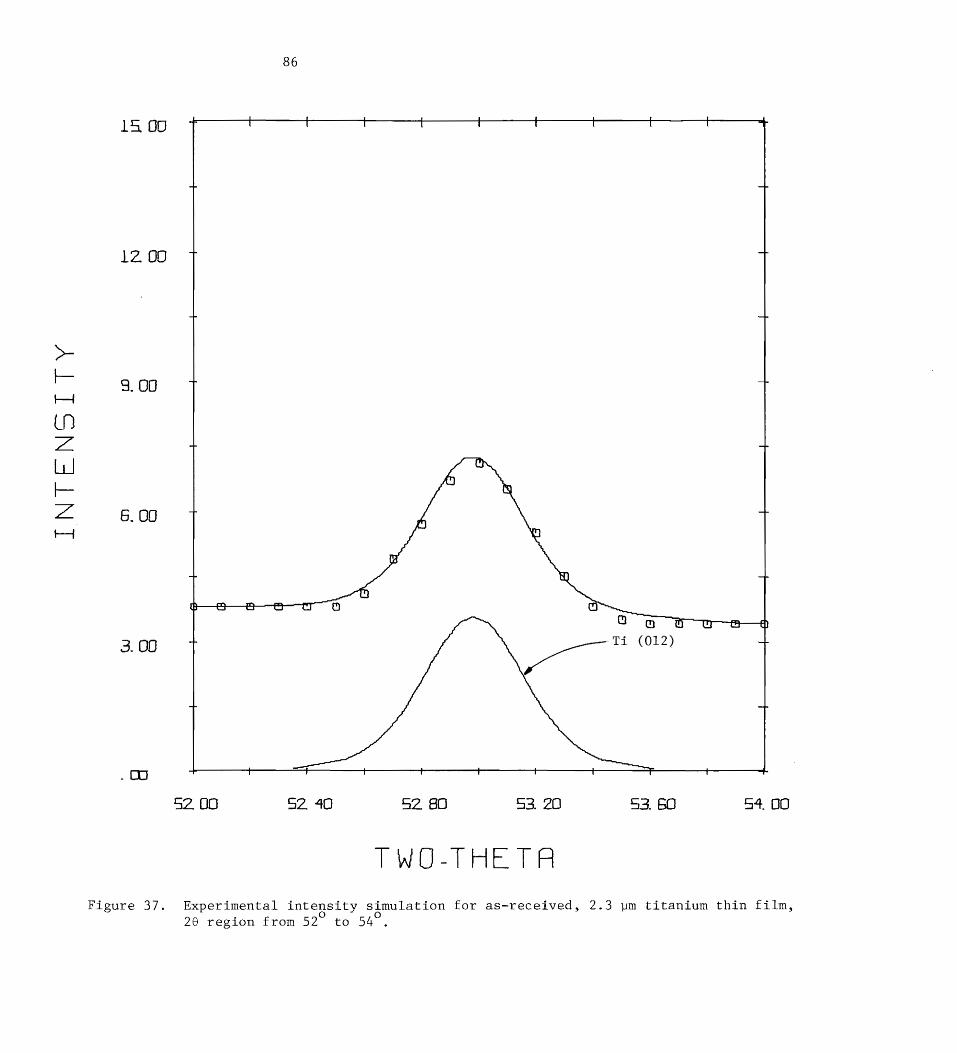
INTENSITY
86
soo 7 — { t t t t
/ +
12 ao 7 T
9. OO T L
6. OO T 7
q
ao o )
3. OO T a Ti (012) +
| |
. OO t “+ ' T t t ' t q
52 00 52. 40 52. 80 53. 20 53. 60 54 00
TWO-THETA
Figure 37. Experimental intensity simulation for as-received, 2.3 um titanium thin filn,
28 region from 52° to 54.
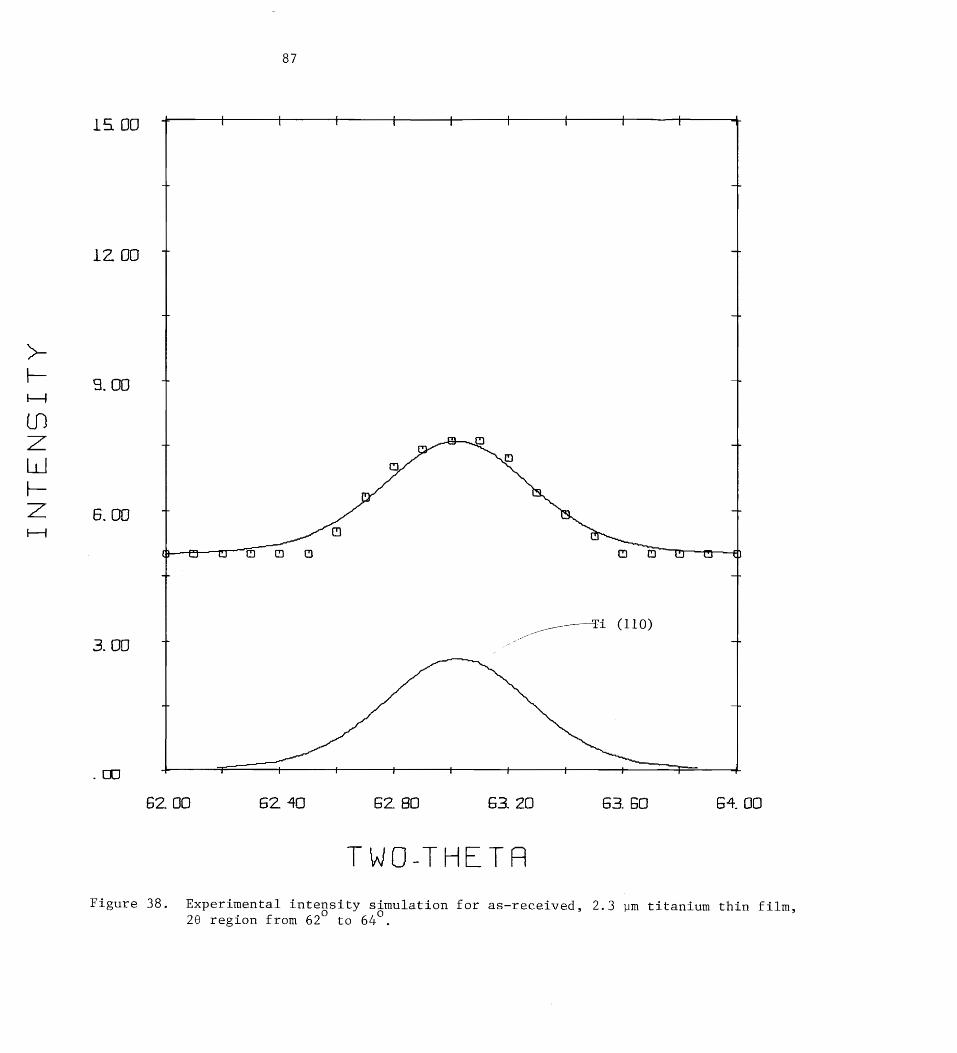
INTENSITY
87
15 oo t t t t t t t t t
iz00 7 T
3. OO | T
6. OO
(110)
3. OO 7 oo a
. OU T t t t t t t t a
62. 0O 62 40 62. 80 63. 20 63. 60 64. OO
TWO-THETA
Figure 38. Experimental intensity simulation for as-received, 2.3 um titanium thin film, 28 region from 62 to 64.
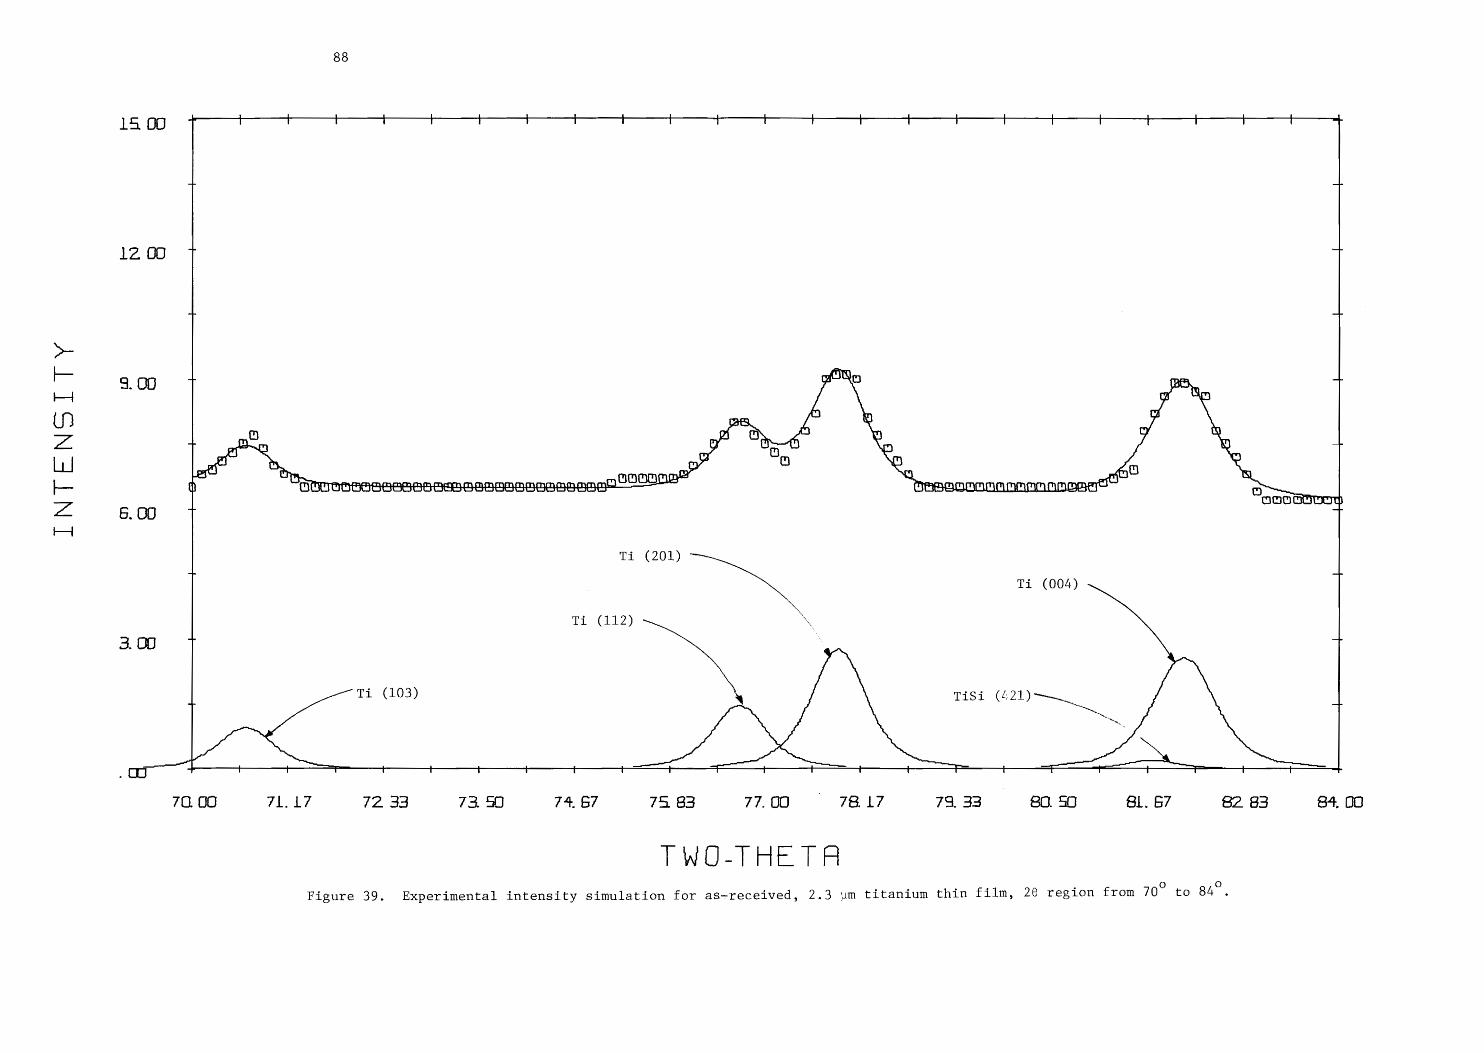
INTENSITY
88
15 00 -——- t t t { t + t t + f — t t t t + t ——
4 4
1200 T +
|
4 ASR _ + 9. OG af Un
TARR ) i) A
m A FF ny 7 c ty 7 m P pF} 7 N -
: oF eg rc a po) CI HoOMoMAwp- Mi Kon yy
0 OOCARSASSSSGR Sea DamoAa aaa ome ~ TABOO ORAMAAmAMAMewBer ©
DOVAAMM
6. OO ; T
| Ci (201) |
: Ti (004) L
. Ti (112)
3. 00 r |
| Ti (103) :
_ en 4 3 2 i 1 1 , 1 4 4 1 4 4 1. 1
. oO q qT 1 v 1 i t t | ' T 4 qt ' Oo t { of 1 T t
70. 00 71.17 72 33 73.50 74. 67 74 83 77.00 7817 79. 33 80. SO 81. 67 82. 83 84, 00
TWO-THETA . . . O O
Figure 39. Experimental intensity simulation for as-received, 2.3 wm titanium thin filn, 28 region from 70° to 84.
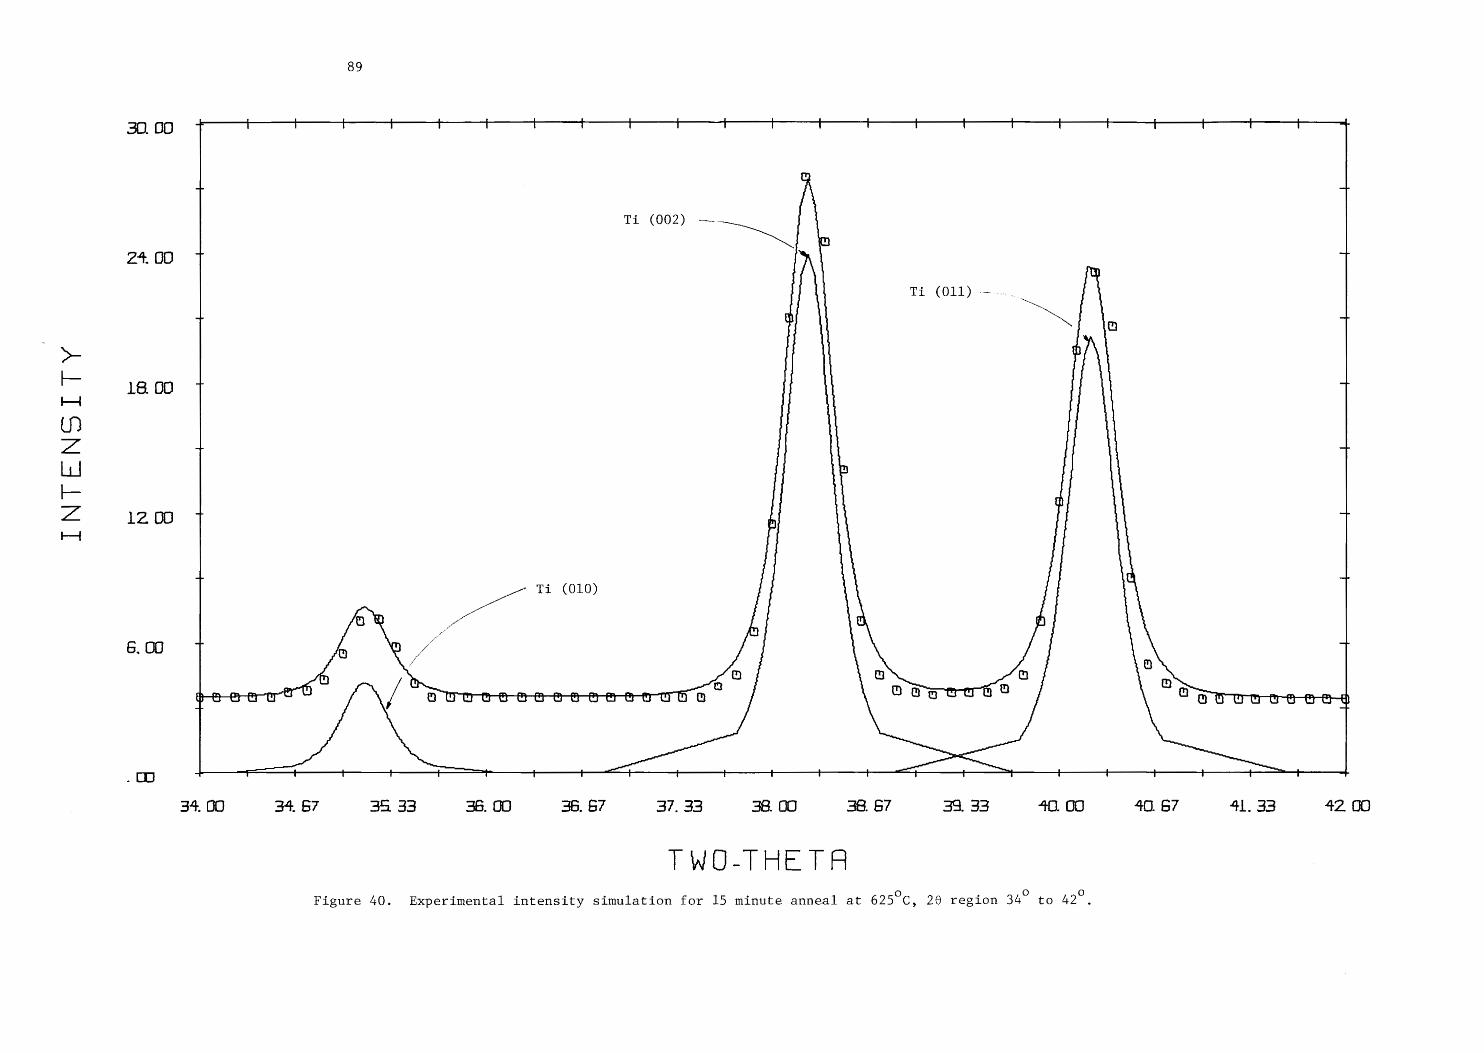
INTENSITY
30. 00
24. OD
18. 00
1z 00
6. OO
89
4 t t t t + t —t t t t t ——- t t t +t t t —t
u
Ti (002) —- ae ;
m
Ti (011) -
| 4 oo
ff
n 4 ; _
1 t - Ti (010)
Oo W a u am
Ua ua
T ua + DR .
/ 0 Fr . ra Q Q m
6-B--2r-F- [ OUTST Fe he hee)]nod © 8 8a pou U 8 Q Q OVW rae Re +
34. 34. 67 35. 33 36. 00 36. &7 37. 33 38. 0D 38. 67 33. 33 40. OO 40. 67 41. 33 42. 00
Figure 40. Experimental intensity simulation for 15 minute anneal at 625°C, 26 region 34° to 42°,
TWO-THETA
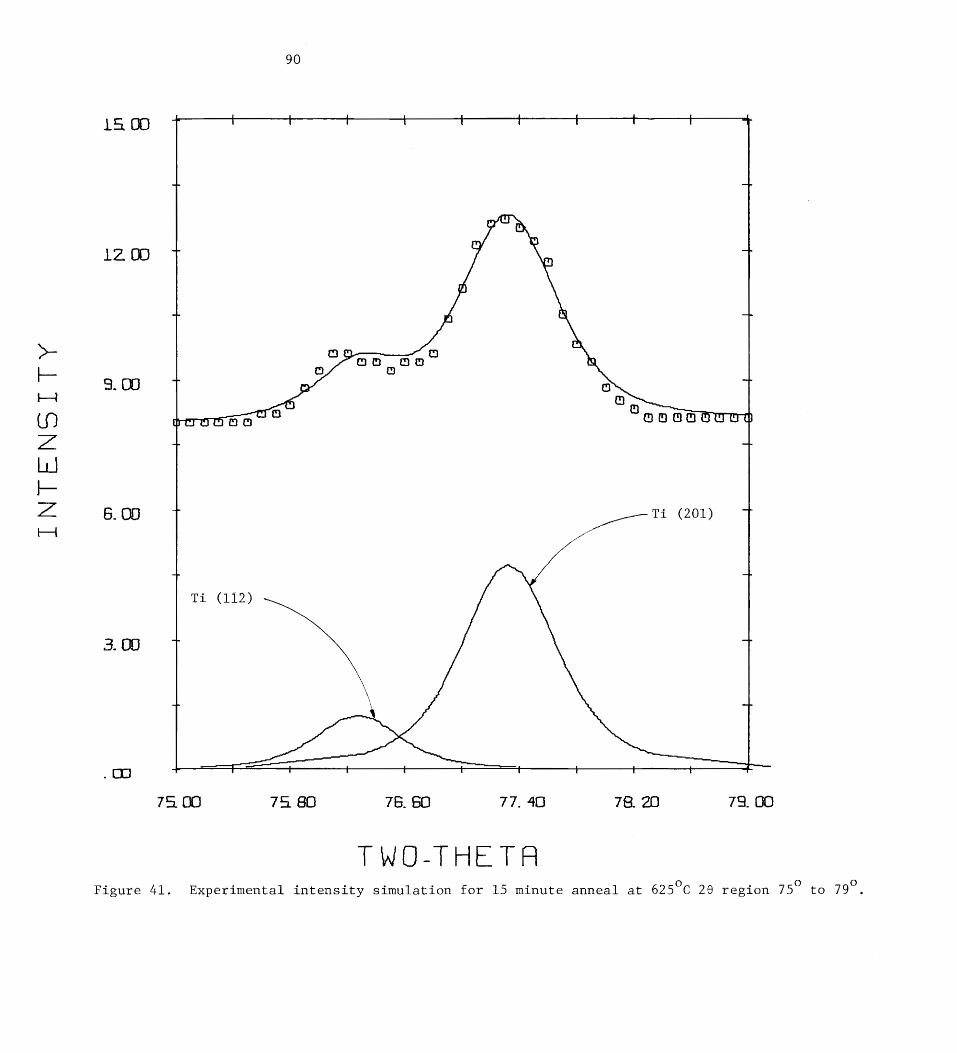
INTENSITY
15 00
12 0
a. OB
6. OO
3. 0D
90
ao (201) a
i. 1 4 4. 4 4.
v 4 q { t t '
75 00 75 GO 76. 60 77. 40
Figure 41.
TWO-THETA Experimental intensity simulation for 15 minute anneal at 625°C 26 region 75° to 79°,
78. 20 79. 06
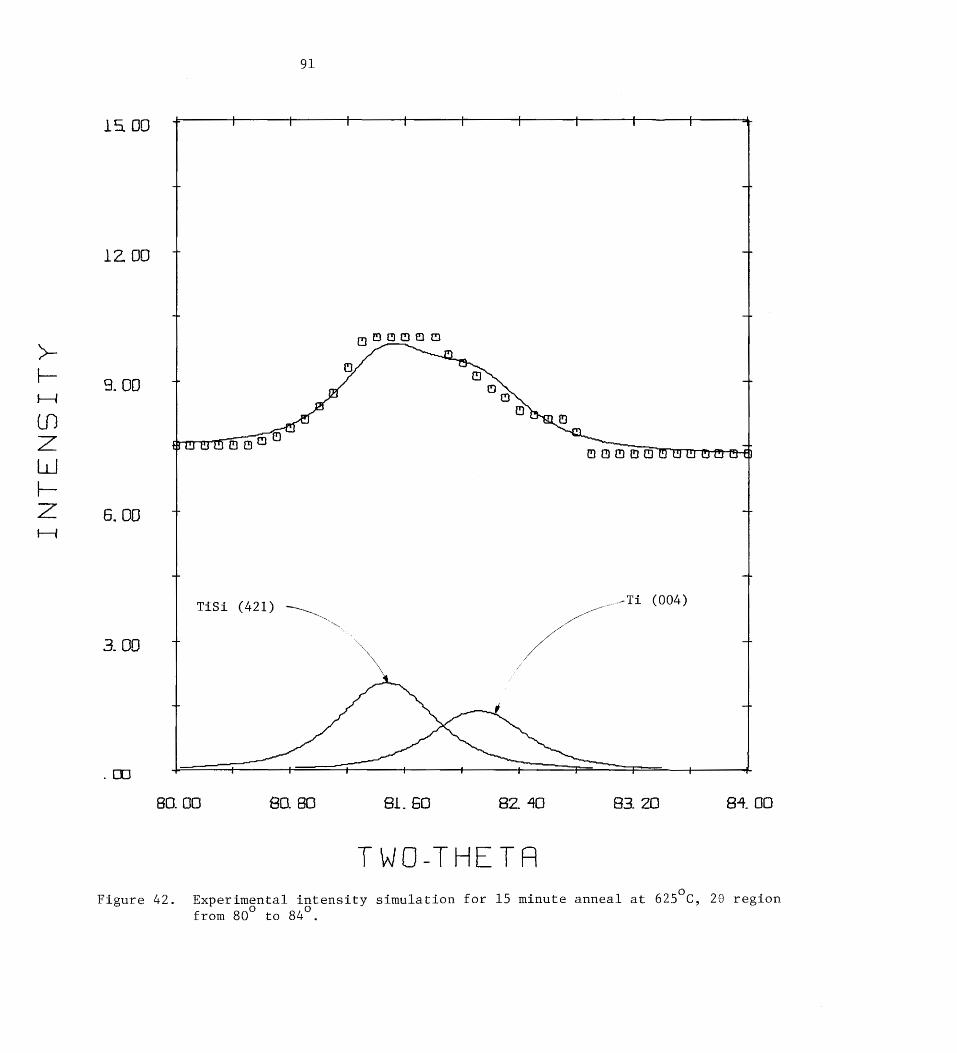
INTENSITY
145, 00
1Z BO
9. OD
6, 06 Ty
3. OD
91
TiSi (421) ee eel (004)
80. 00 80. 80 81. 60 82. 40 83. 20 84. 60
Figure 42.
TWO-THETA
Experimental intensity simulation for 15 minute anneal at 625°C, 28 region
from 80° to 84°.
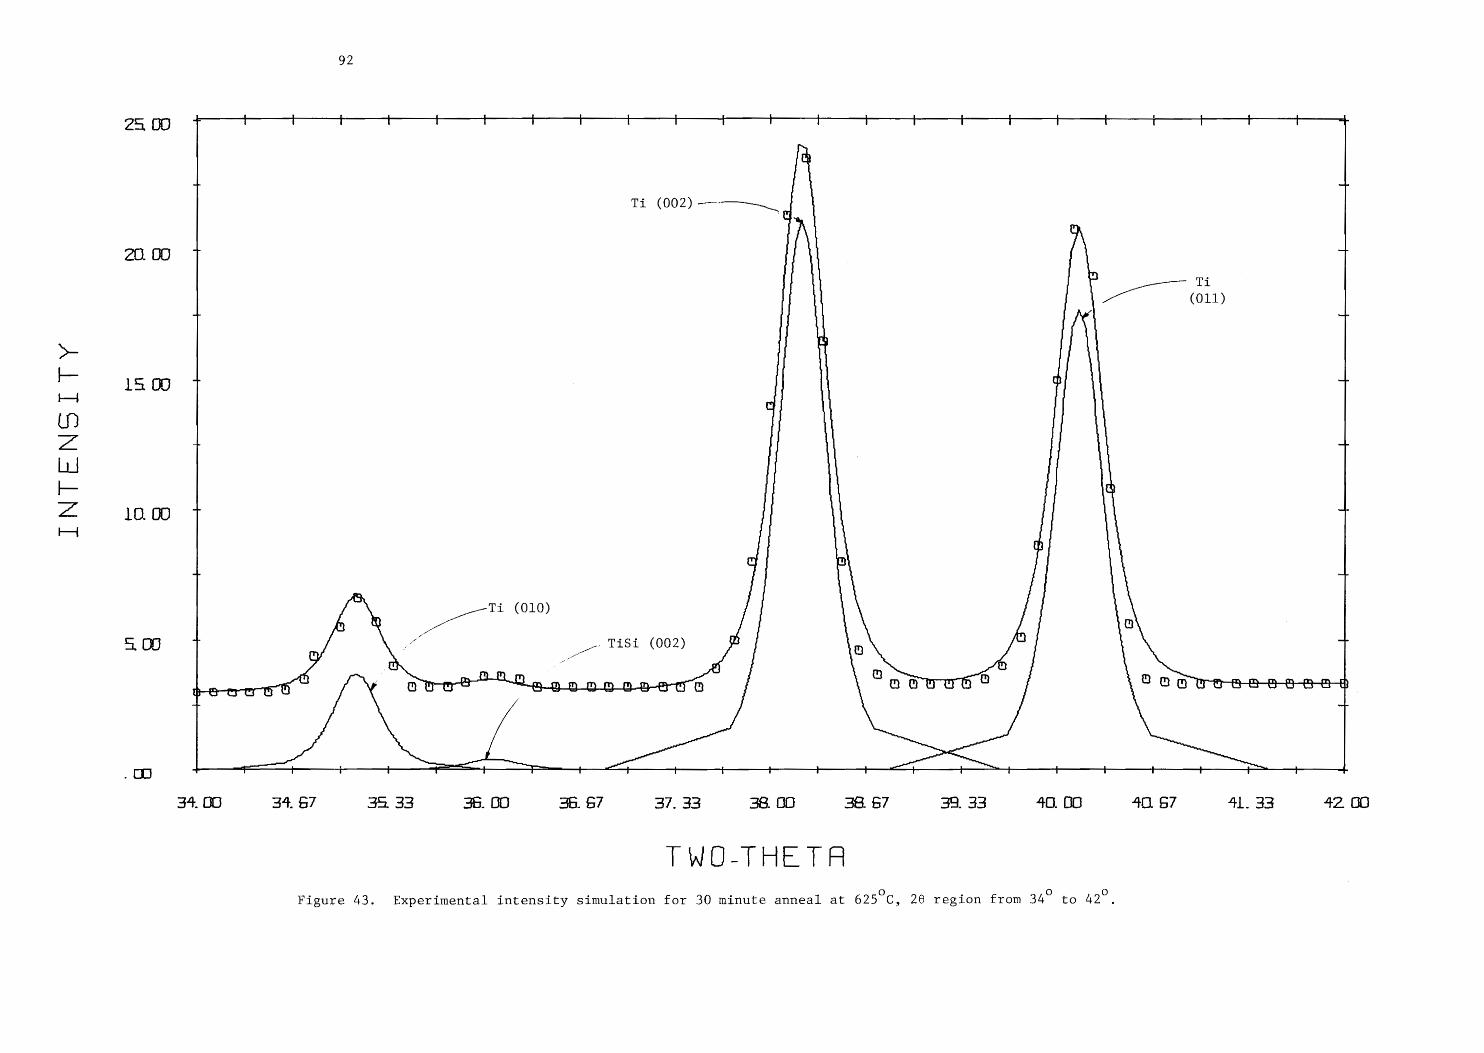
INTENSITY
25, 0D
20. OD
1& 0D
10, OO
3, OO
92
+
_~-
+— + t f t —+- +—- t t — t t +- t f t t am i t—
by)
4 2
Ti (002) ———__ 7
m
r Ti (011)
+
—
iy
{ : +
uw
4
| | af
" u
4 J
. Ti (010)
5 a ° J r a . TiSi (002) eH p O .
a 7 0 f
{ a owes & 82 Owe sess
34. CO 34. 67 35 33 36. OD 3b. &7 37. 33 38. 0D 38. 67 39. 33 40. 00 40, 67 41. 33 42. 00
Figure 43.
TWO-THETA
Experimental intensity simulation for 30 minute anneal at 625°C, 28 region from 34° to 42°,
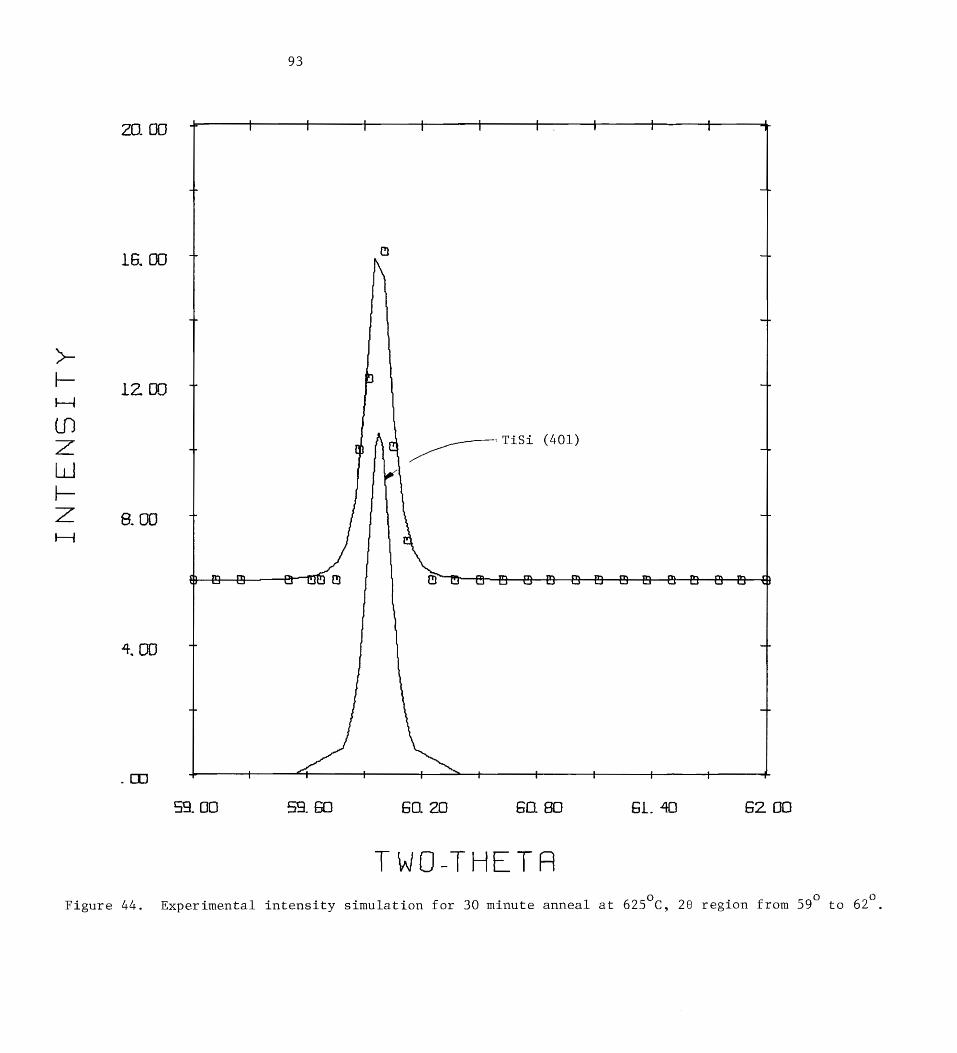
93
: | : 7 20. GO
16. 00
12 00
6. OO
INTENSITY
4. 00 59. 60 59. 60 60. 20 60. 80 BL. 40 62 00
TWO-THETA
Figure 44, Experimental intensity simulation for 30 minute anneal at 625°C, 26 region from 59° to 62°,
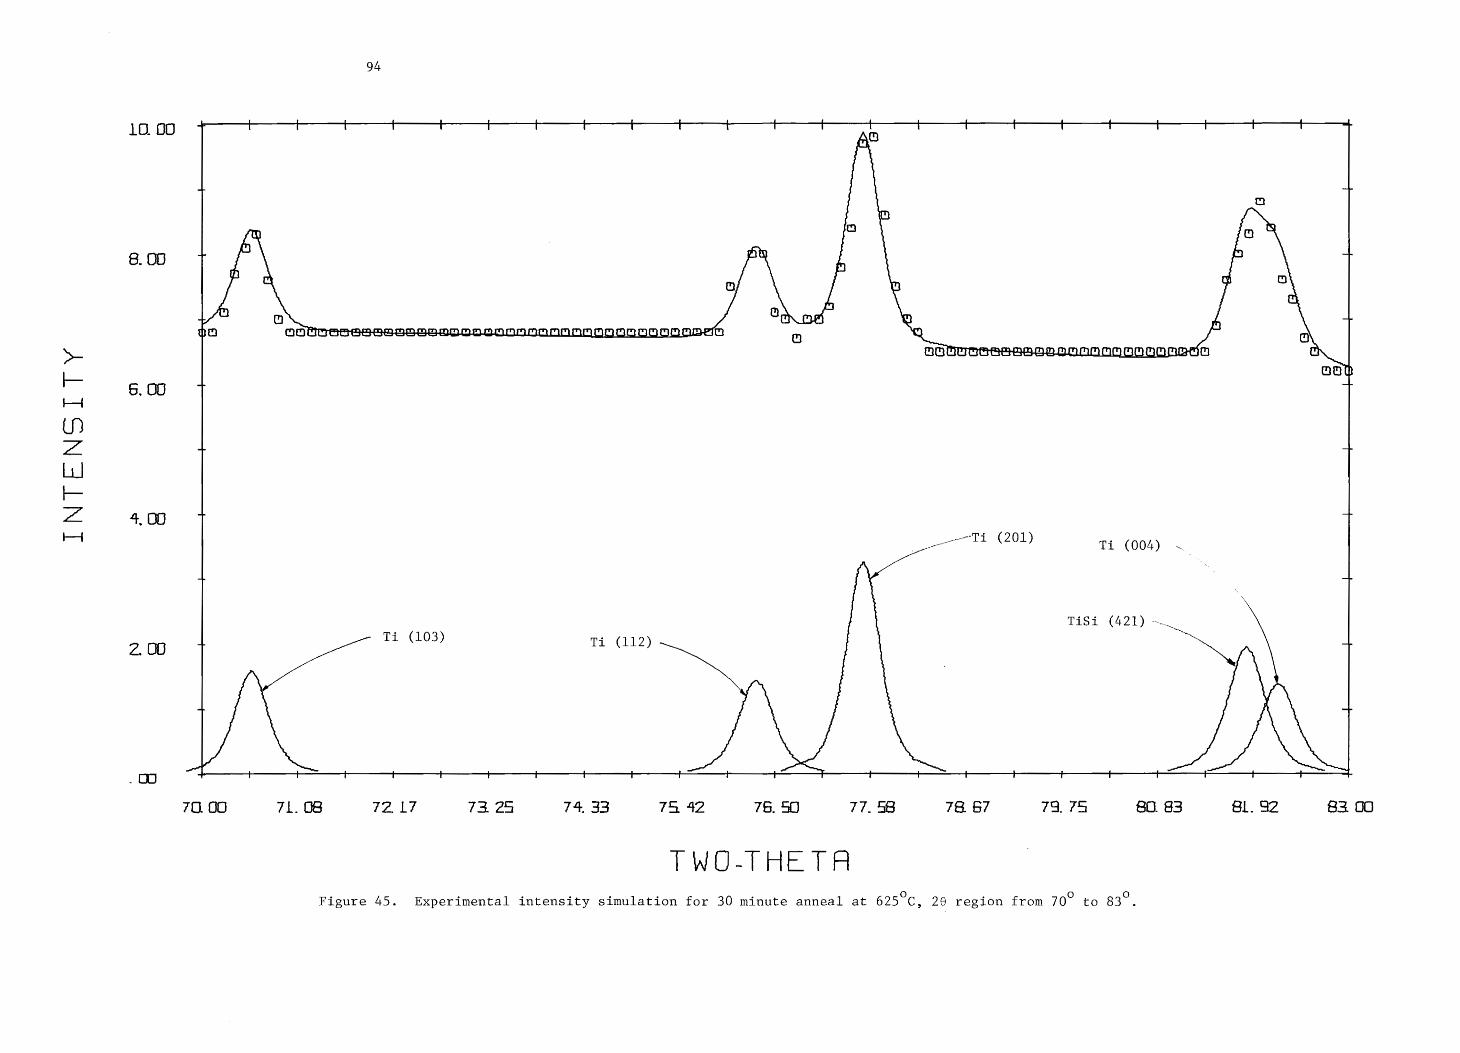
INTENSITY
10. OO
8. OD
6, OO
4, OO
2. OO
94
f t— +— f t t— t —t+ —+- + t +— t —+- t — —+ t ti———_r AO
4 m |
u
yp ©
m Nc)
5 AC rw 3 T
MW HS ry n 7 ai ©
fe @ Gh mat f - DQ OD OCP Se ee eee MMR MnMAMOMOMMOMNMMD?In Q
NO OOM PPSEseBoeonMAADonoOaeBan
Q t oT
+4 -
+ 4
TE (201) Ti (004) ~
TiSi (421) ~.
i a Ti (103) Ti (112) mo, al
4 4+
70. OO 7L. 08 7Z L7 73.25 74 33 74 42 76. 50 77. 58 78. 67 79. 74 80. 83 Bl. 92 83. 00
TWO-THETA
Figure 45. Experimental intensity simulation for 30 minute anneal at 625°C, 26 region from 70° to 83°.
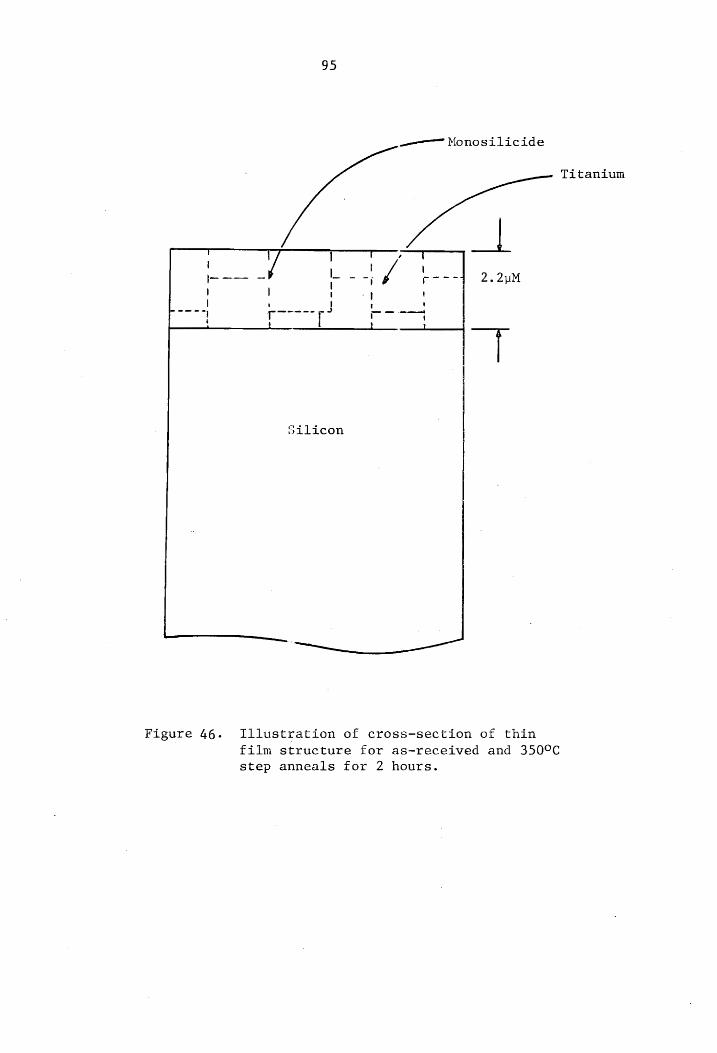
95
——=~Monosilicide
Titanium
! \ — - Ay i poccd) = 2.2—uM
| '
Silicon
bo
Figure 46. Illustration of cross-section of thin
film structure for as-received and 350°C
step anneals for 2 hours.
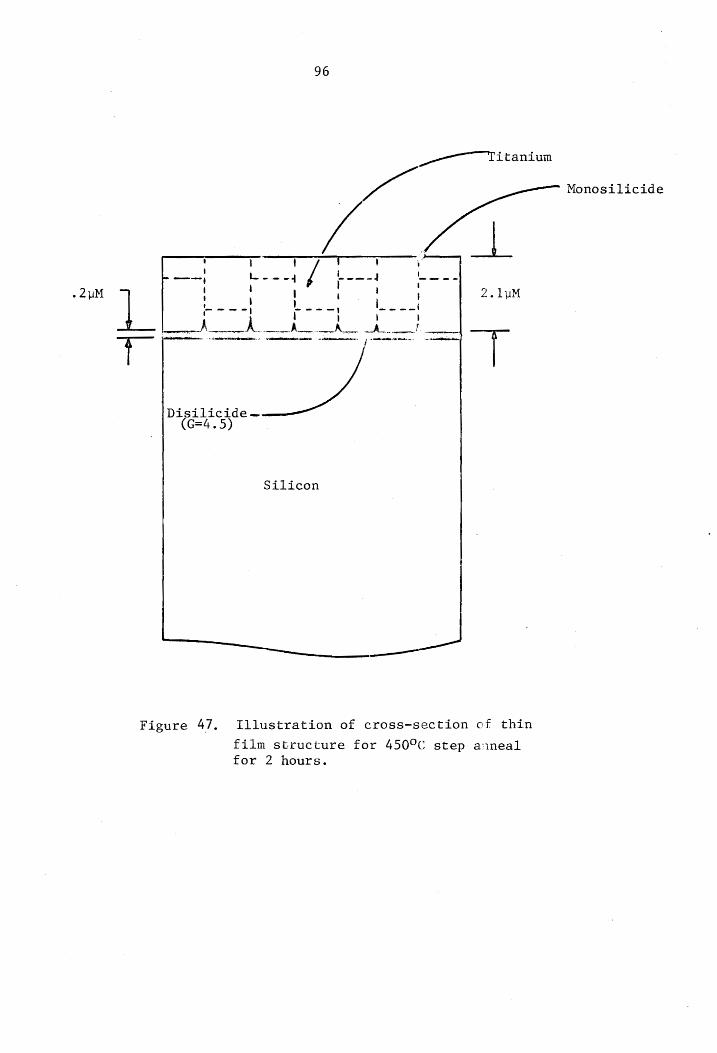
Figure 47,
96
a Titanium
Monosilicide
Silicon
oC
2.1uM
Tilustration of cross-section cf thin
film structure for 450°C step anneal for 2 hours.
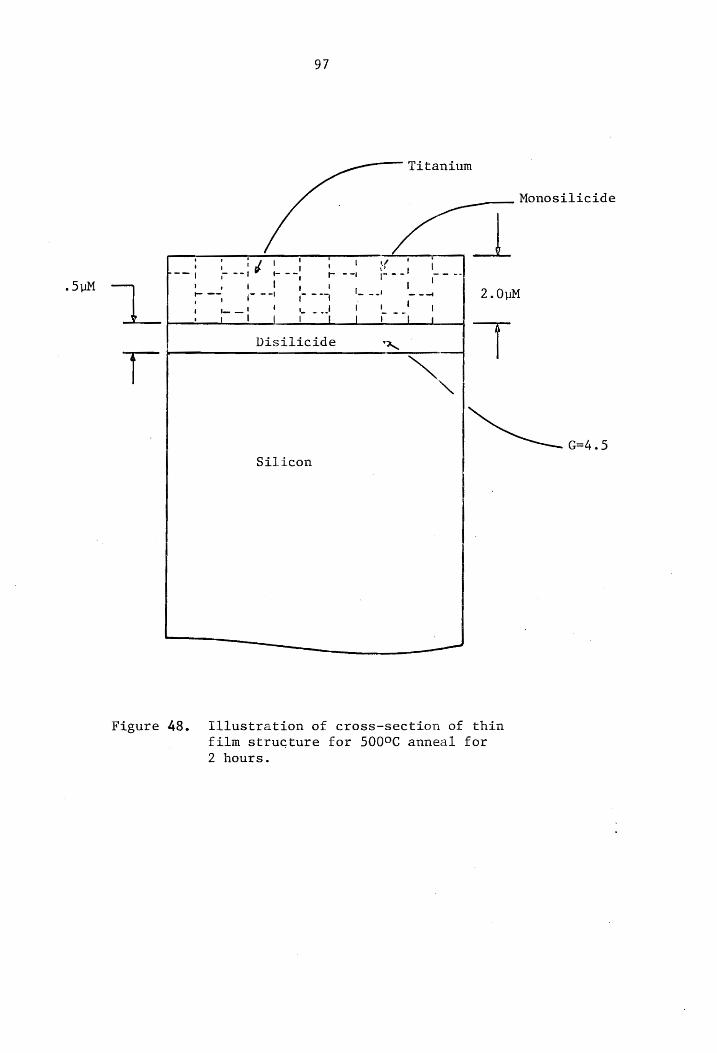
-5uUM |
97
Titanium
Monosilicide
|
NN
4 ' ' | ' ' 1 if U '
Lut LL pet pa Reel = - 1 ' \ { ' \ \ aie ioc roo4 --- <1 2.0uM
i i —. ! ‘ | | r /| i
' | | | | L | 1 i
Disilicide op
\
Silicon
Figure 48.
Mo
Tllustration of cross-section of thin
film structure for 500°C anneal for
2 hours.
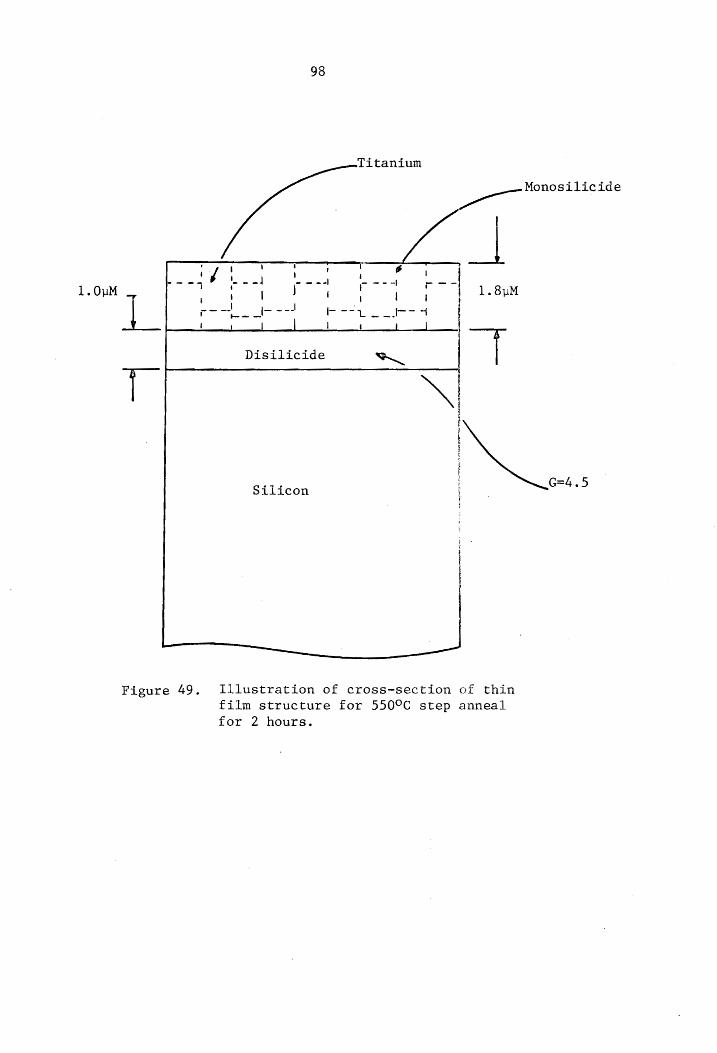
1.0uM
98
Titanium
fo a Momost Hicide
\ fi! i ; d 1 Le ee ---- ee r--
; J ‘ i 1.8uM
| poste te Hep Le i ) | | \ LJ
Disilicide nN
)
|
j = Silicon G=4.5
i
Figure 49. Tllustration of cross- section of thin
film structure for 550°C step anneal
for 2 hours.
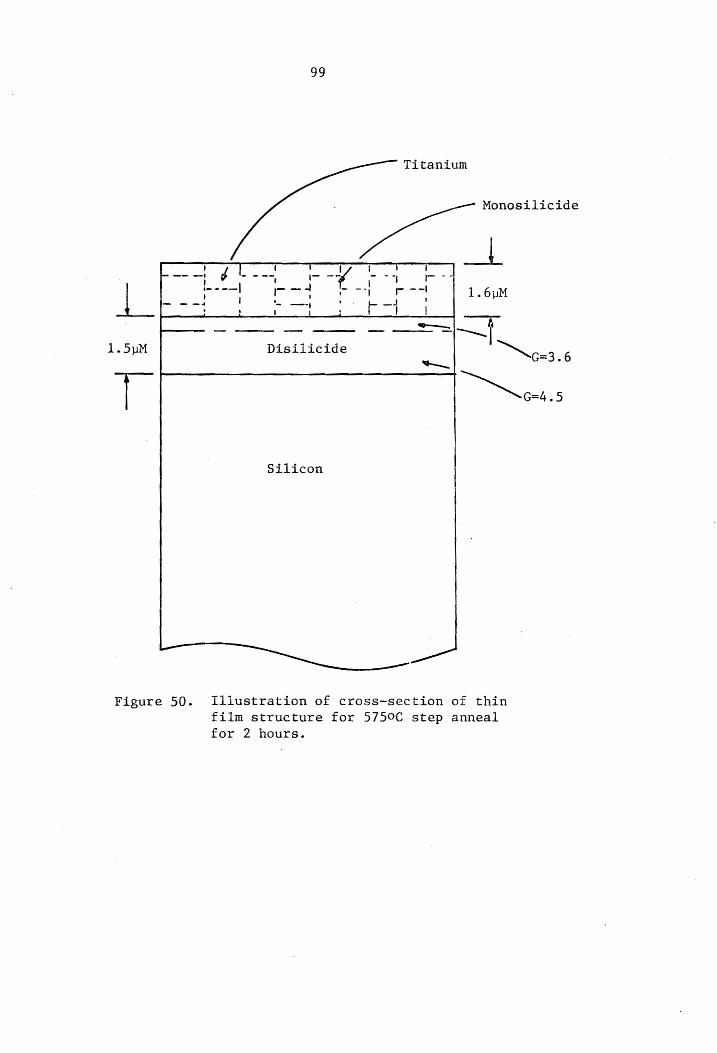
99
Titanium
Monosilicide
i j j i Ha-—) ff L--- i- -¥ - 4 oped
| rool I~ 4 oT} ro 1.6uM
a: L a re Pr |
1. 5uM Disilicide ce 3.6 tH ~
geass
Silicon
Figure 50.
——__
Tllustration of cross-section of thin
film structure for 5750C step anneal for 2 hours.
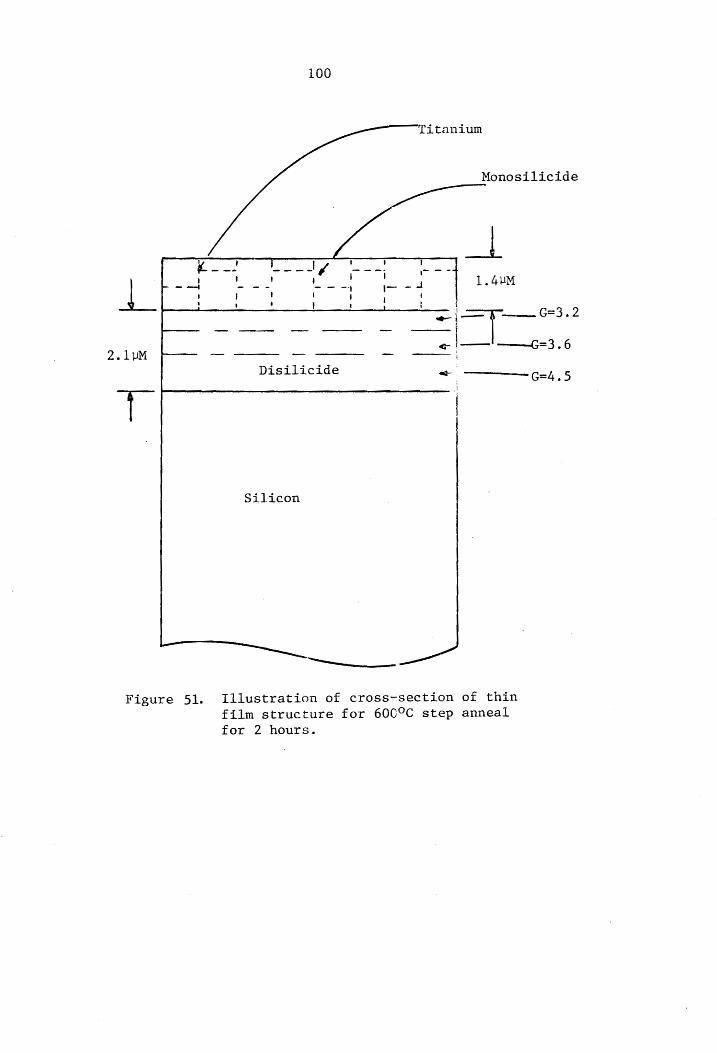
100
Titanium
Monosilicide
=|
dim be — —— — SO «a Disilicide
Silicon
es Figure 51. Illustration of cross-section of thin
film structure for 600°C step anneal
for 2 hours.
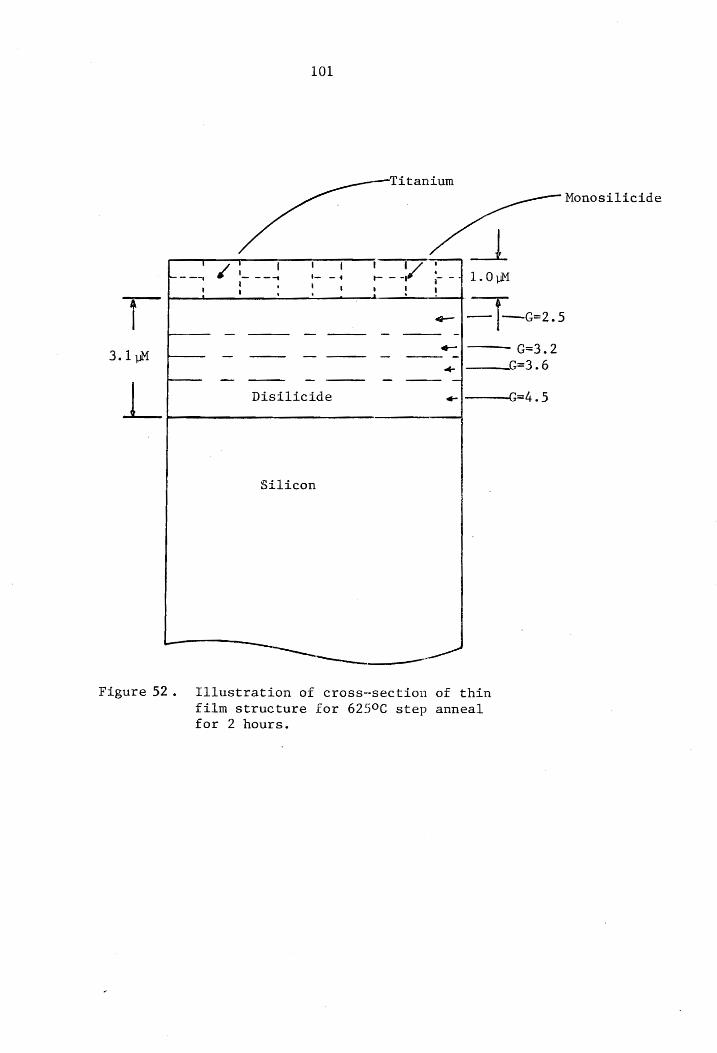
101
Titanium
an
Monosilicide
1.0 iM
T 1 j i i t { ' Lm my —~--4 i- 4 ---1 rnd
’ ‘ \ ' ' \ t a . ‘ . a
| <— —|—ce2.5
G=3.2 Bebe Fp
| Disilicide « |———G=4.5
Silicon
ae _—
Figure 52. Illustration of cross-section of thin film structure for 625°C step anneal
for 2 hours.
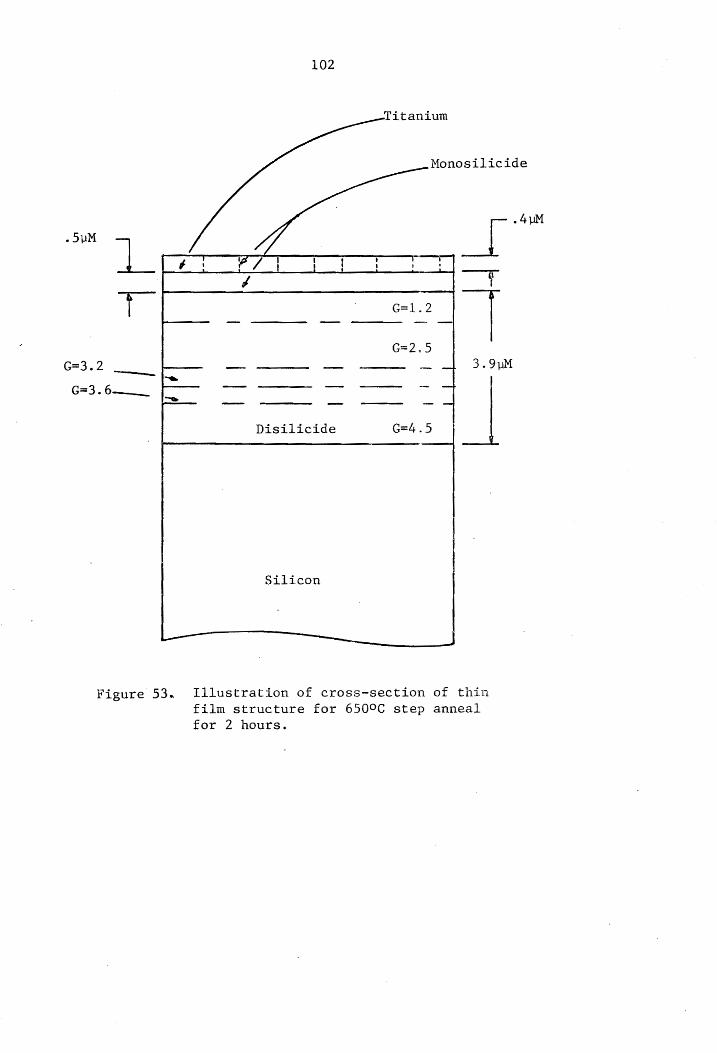
102
Titanium
Monosilicide
-4M so r ] és FF Gf fot
é H
; G=1.2 |
G=2.5
G=3.2 _ ee — —} 3.9uM
G=3.6.— —_ — —. _—— — —e — awed
Disilicide G=4.5
Silicon
Figure 53. Tllustration of cross-section of thin
film structure for 650°C step anneal
for 2 hours.
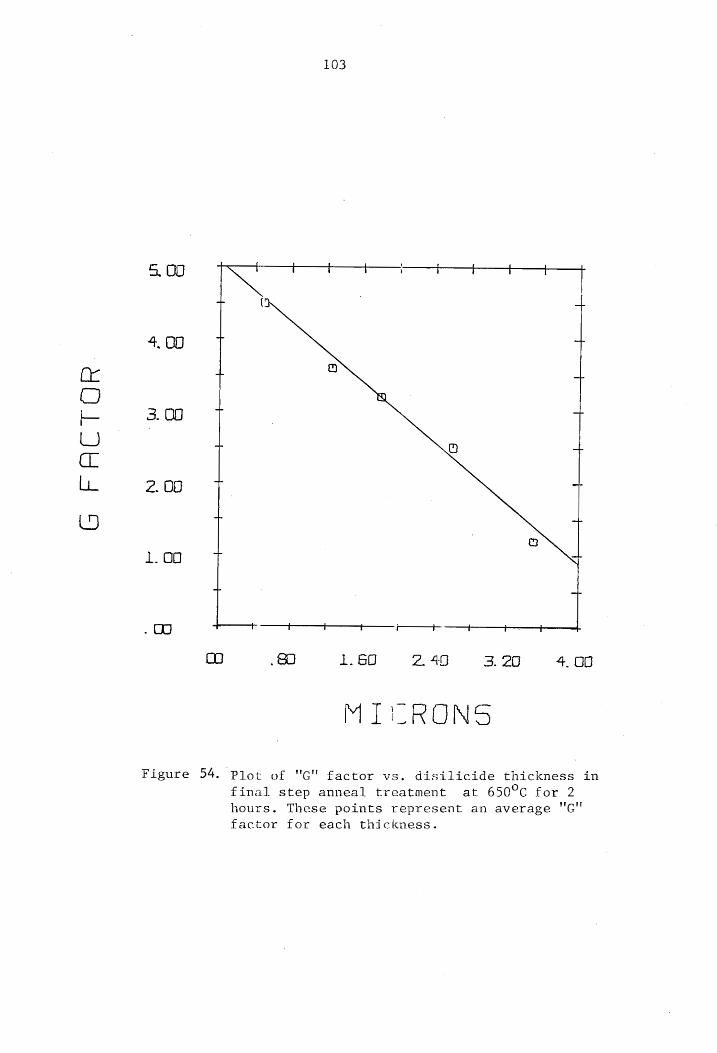
G FACTOR
3, 00
4, 00
3. OO
2. 00
1.00
103
CO 8 1.60 Z2. 43 3. 20 4.00
MIIRONS
Figure 54. Plot of "G" factor vs. disilicide thickness in
final step anneal treatment at 650°C for 2
hours. These points represent an average "G" factor for each thickness.
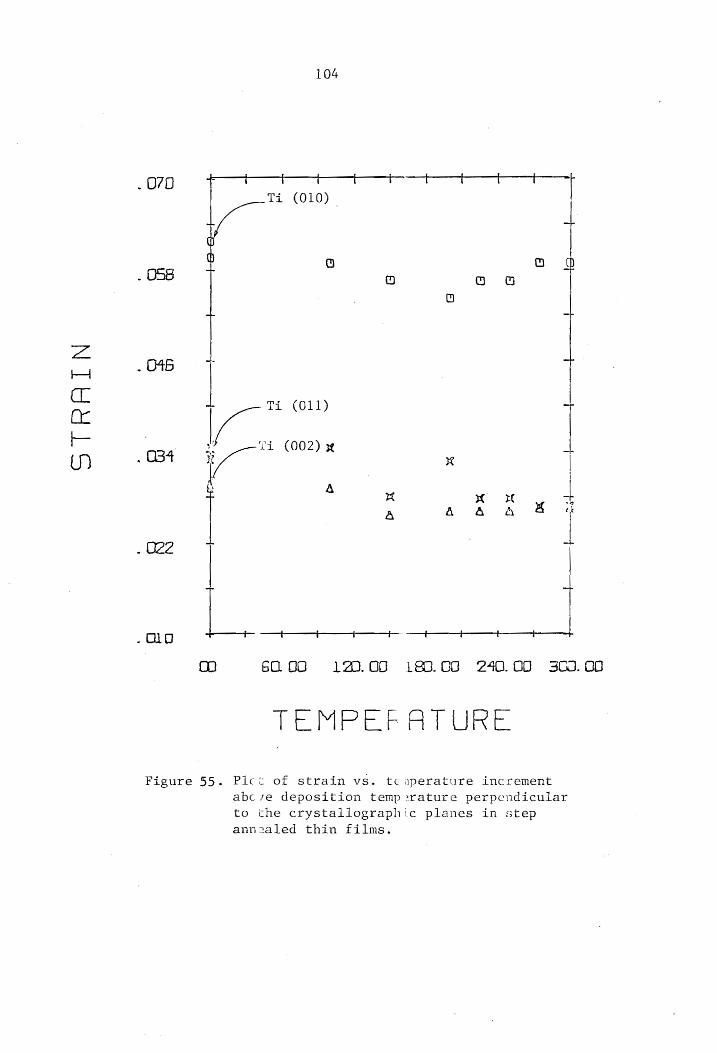
OTRAIN
104
CO 6000 120.00 180.00
_070 { { i t f t t t =f
Ti (O10) fo tL (
: 8 o o . O58 m Go 8
. 045 : T
a Ti (011) +
aoe Ok Ti (002) x t
fs A T rm KO
A A “A 4 x
. 022 7 T
-olo + —t i—— i !
240.00 300.
TEMPEF ATURE
Figure 55. Plct of strain vs. tc aperature increment abc re deposition temp :rature perpendicular
to the crystallographic planes in step
ann2aled thin films.
O06
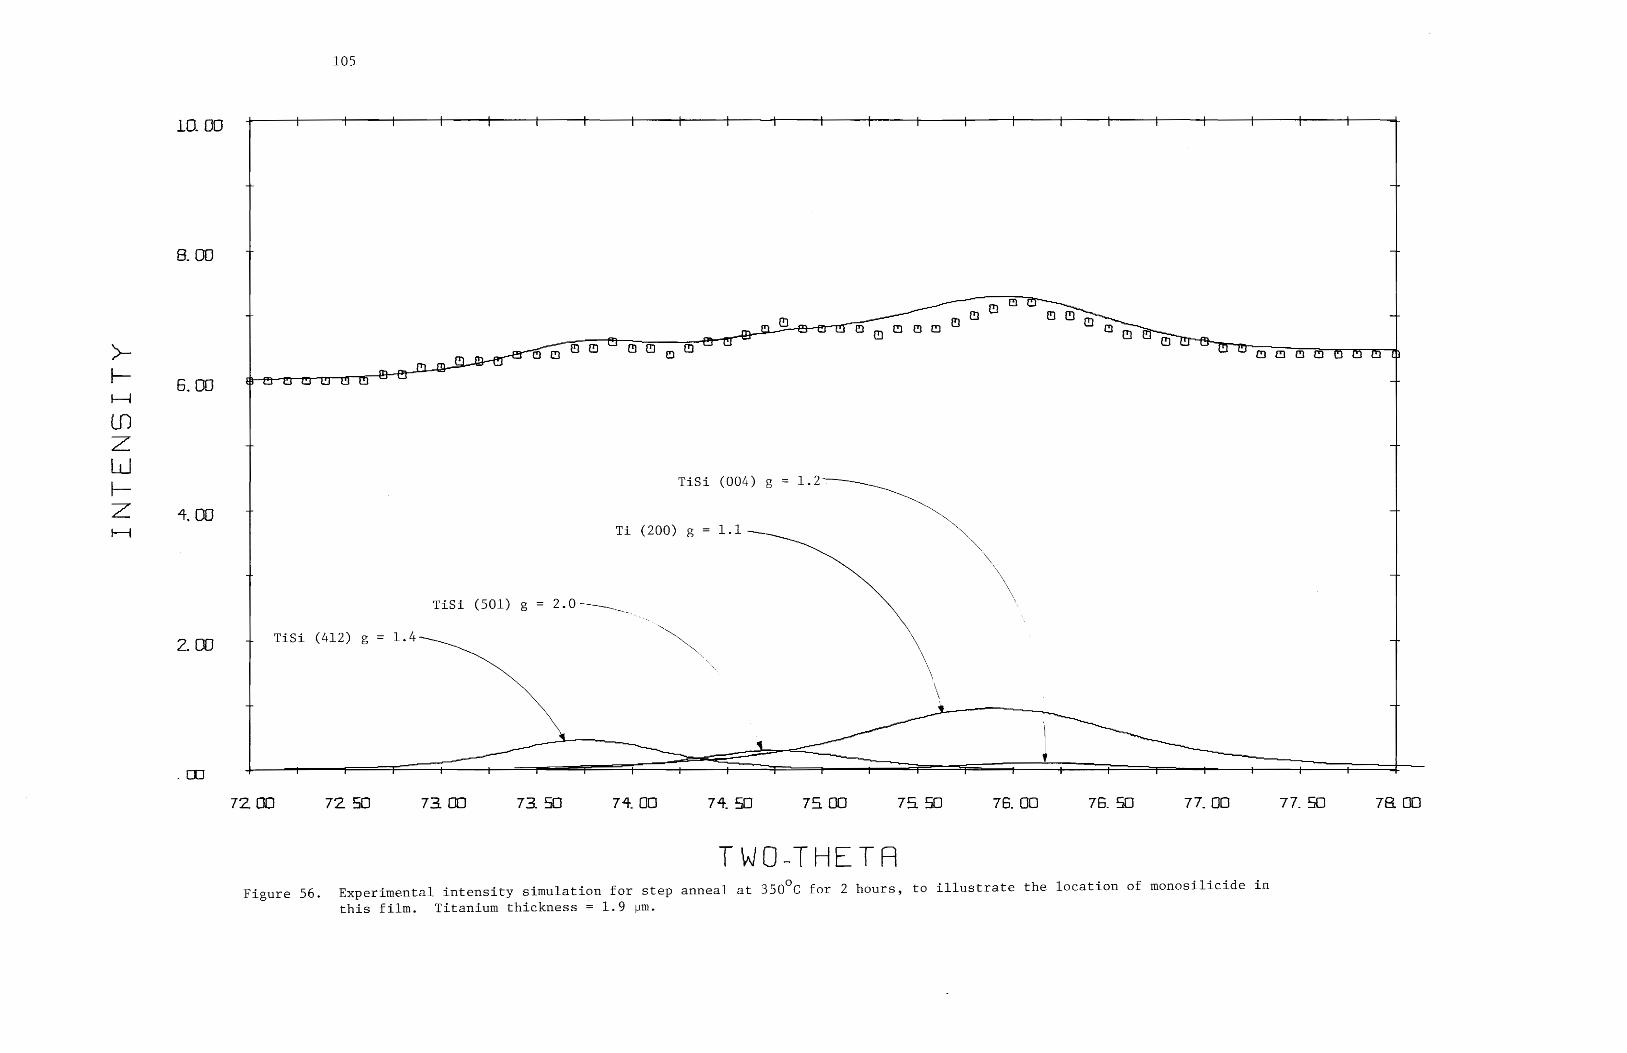
INTENSITY
10. 08
8. OO
6. OO
4. 00
2. OO
105
TiSi (004) g = ae
Ti (200) g=1.1 .
\
\
1 \ T \
TiSi (501) g = 2.0 \
| visi (412) g = 1.4 |
| \
Se v f f f t —t f == t t i t t > —t + t T —— t t
72 OO 72 50 73. 00 73. 50 74 OO 74 50 74 00 7% 50 76. CO 76. SO 77. 00 77. 50
TWO-THETA O, . . arr .
Figure 56. Experimental intensity simulation for step anneal at 350 C for 2 hours, to illustrate the location of monosilicide in
this film. Titanium thickness = 1.9 um.
7& GO
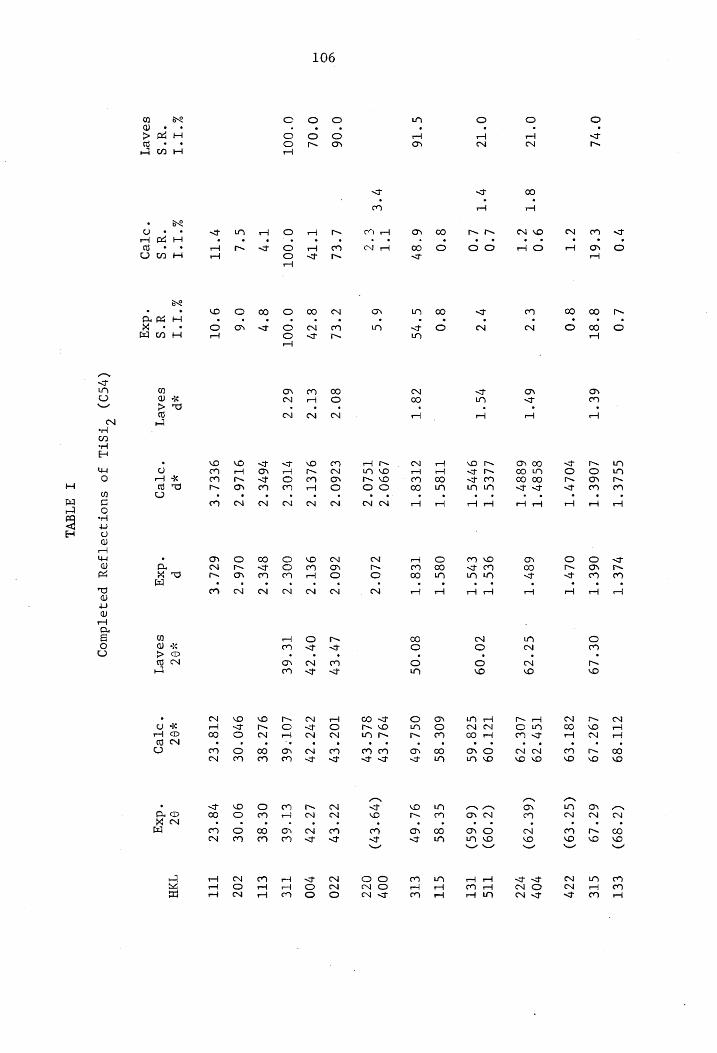
106
O°vL
O°T?
O° T?
G°T6
0°06
O°OL
Q°*OOT
bb LT
“a’s SOAP T
8°T
2°T
7°€ TT
7?
L°el
U'Ty
O°OOT |
T°?
G'2
Y°TT
Z 1° “aes
“9TBD
L*0
8° 8T
3°0
€°?
7°?
8°0
G° 4S
6°S
cel
83°C?
0°O0T
877
Q°6
9°OT
4 1°T
as
*dxq
6t°T
67°T
7O°T
c3°t
80°C
el?
6c°C
%P
SOAR]
GGLE*T
LO6E°T
VOLT T
8S8r7'°T 6887
°T
LLEG*T
9797S °T
TT8S°t
CLES *T
L£990°7 TSLO°?
€260°2
9LET*?
VIO?
767E °C
9TL6°C
9EEL*E
¥P
"oTeD
PLE TT
O6€ *T
OL7°T
687 °T
9€9°T C7G°T
O8S°T
TEs T
CLO"?
60°?
SET"?
OOE*Z
B7E°?
016°C
6cL°E
P *dxy
O€*L9
Gé°C9
c0°09
80°0S
Lye”
07°C
TE*6E
4% OC
SOAP]
(769) CrstL
JO SUOFIDETJeY
peeTduog
I ATavi
cIT "89
L9C°L9I
c8T°e9
TS7°79 LOe* 79
TcT°09 G78 °6S
60€°8S
OSL*6
POL EY
SLS°CH
TO? “€7
CVC CV
LOT" 6€
9LE°8E
970 °0€
cl8°€?
¥OC
*“OTeBD
(7°89)
67°19
(67° €9)
(6£°Z9)
(7°09) (6°6S)
GE°S8s
9L°6¥
(79 °€4)
CC EY
LO°C%
el oe
O° SE
90°0€
78°CTC
O¢ *dxq
cet
GTE
CCV
70%
7CC
TTS
TeT
STT
ETE
007 OC?
Zc0
700
TTe
etl
c0Z
TIT
"TAH
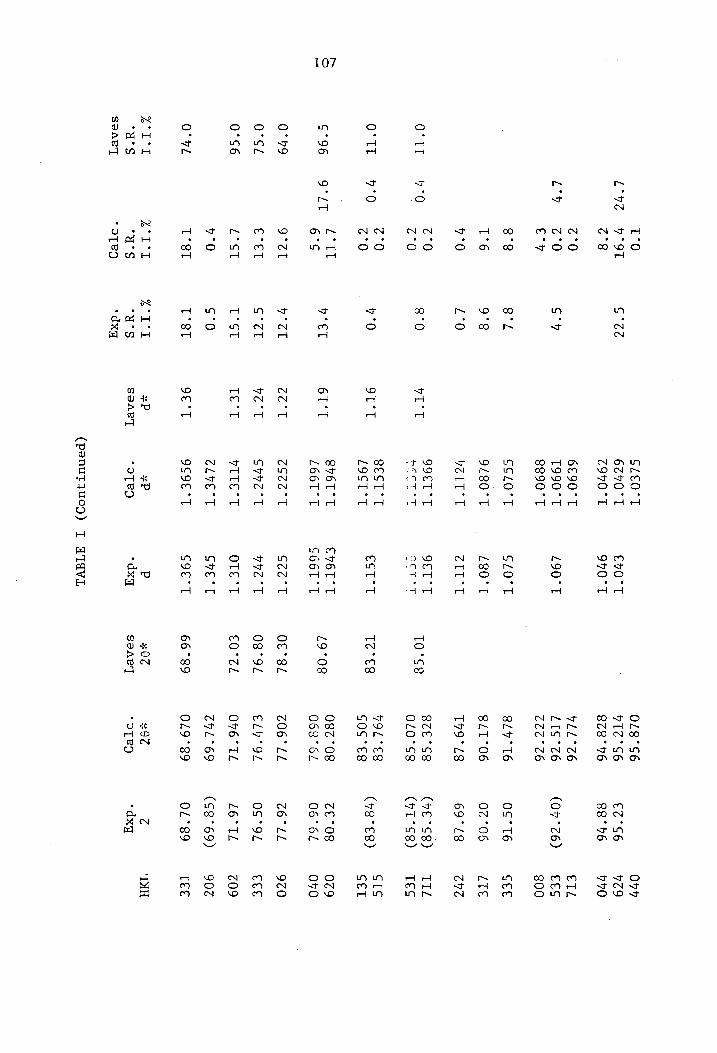
107
O°TT
O°TT
¢°96
0°79
O°SL
0°S6
O° 72
ZIT
“aes SOAR]
L°%7
L°Y
7°0
7°0
9° LT
Oo
9°?T
€°eT
L£°cT
7°O
T°St
ZH L°T
“as
“9TPO
G°¢c?
c°”
8°0
7°0
7° eT
7°?cT
G*?er
T°St
S*0
T°8st
VT'T
9T°T
6t'T
cel
7e°T
Teer
9E°T
as Tv
SOAP]
GLEO'T 6c70°T 6970
°T
6£90°T T990°T 8890'T
SSLO'T
9/80°T
HZIT'T
99ET*T BECT
YT
owe
-
StstT
LOST'T
S76. T
Lo6T T
cSée TL
SVVc°T
VITE°T
cLYeT
9S9E°T
a
T
"OTRO
€70°T 970°T
L90°T
GLO°T
L80°T
elt’
9ET*T OCT
YT
CST’
€V6T°T G66T*T
Gcc 1
270 °T
OTE *T
SverT
G9C°T
P *dxq
(penutjuo))
I ATAVL
TO °S8
Té°€8
L£9°08
O€°S8Z
O8°9L
€0°CL
66°89
x OZ
SOAR]
028°S6
7TC°S6 8c8°
76
71L°C6 LTS
°* 76 CCC
CO
8L7°T6
SLT "06
T79° 28
8ce SB
020°S8
7OL*ES8 GOS
’*€8
O8¢ °08 068°62
C06 *LL
EL7°9OL
076°TL
CVL°69
QL9°89
%O7
*“oTeO
€o°S6 88°76
(07°76)
OS*T6
07°06
69°L8
(7€°S8) (7T°S8)
(78°€8)
cf °08 06°62
COLL
OS‘*9L
L£6°TL
(S8°69)
02°89
C *dxq
O77 709 770
€TZ Ces
800
Gee
LTEe
CVC
TTL TES
GTS Set
0c9 070
9720
Cee
cO9
902
TEE
‘TH
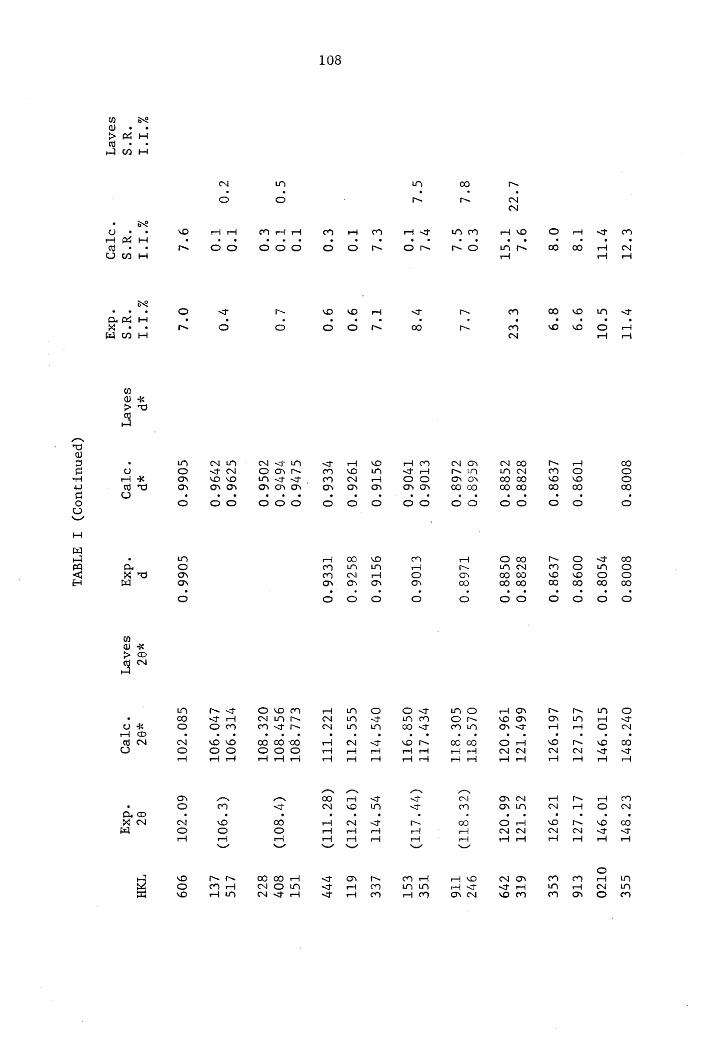
108
L°C?
8° 2
G°L
S*0
c°0
h° I'l
“u's SOAPT
€°¢eT
0° TT
T*8
0°8
On
ooo
mor
oo
~ 1°T
“a's ‘OTe
7° IT
S°OT
9°9
8°9
€°€?
7°8
UL
9°0
9°0
£°0
7°0
O°Z
ZI!
%*P “U's
SOAR]
*dxq
8008 "0
T098°O
LE98°0
8c88°0 S88 °0
6S68°0 €L68°0
€T06°0 T706°0
9ST6'0
1976 °0
4EE6'0
6176°0 7646 °0 Z0S6°0
$296 °0
6796°0
S066 °0
¥P
“OTBO
8008°0
7S08°0
0098°0
£€98°O
8238 °0
0S88°0
TL68°0
€T06°O
9ST6°0
89260
TEE6*O
S066°0
P *dxq
(penut uo)
I WIGVL
¥O7 SOAR]
OV °S4rT
CTO0°94FT
LGT° LCT
L6T*9cT
667° TCT
T96°O?¢T
OLS°STT
SOE*STT
PER LTT
OS8°9TT
OVS FLT
GcSs’*?erl
Tee ttt
ELL*S8OT
9S47°S80T OcE*
80T
VTE *90T
£70°90T
¢80°cOT
¥OZ
“OTPBO
EC °S8vT
TO°9#T
LT° LCT
Te °9CT
cS Tel
66°OcT
(ZE‘ SIT)
(77° LTT)
9G°YTT
(19°ZTT)
(82° TIT)
(7°80T)
(€°90T)
60° OT
OC *dxq
Se
OTZO
€T6
€Se
6TE o79
97¢ TT6
TSE est
LEE
6TT
77Y
TSt 8047 Bcc
LTS LET
909
‘THH
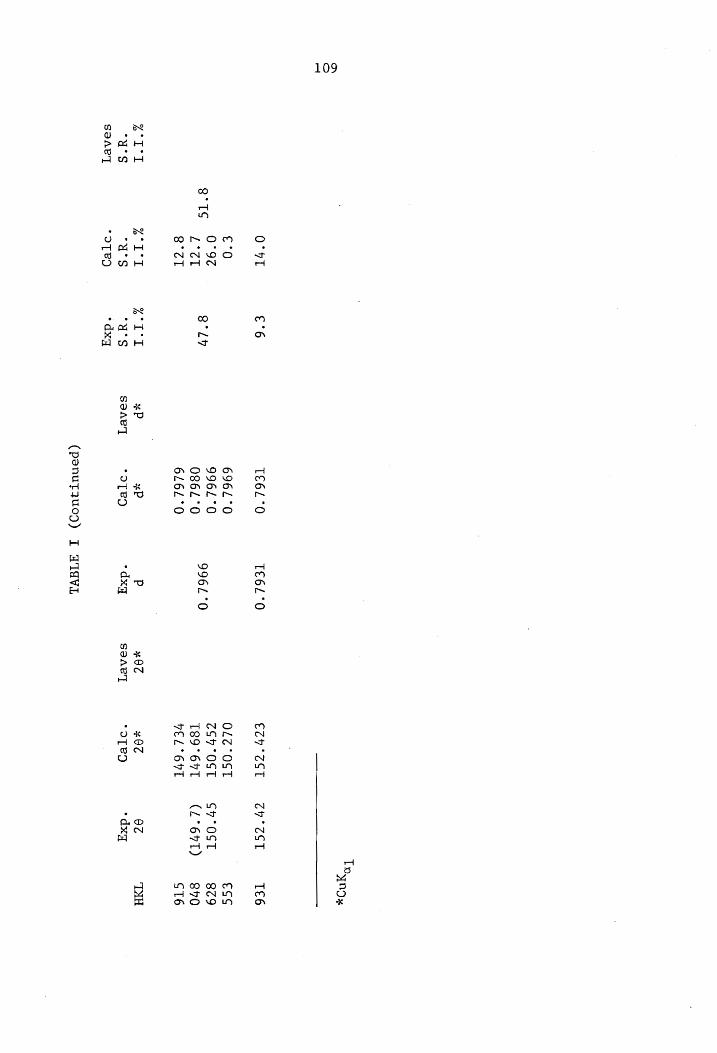
109
4° II
“a’s SOAP]
8° TS
ee €°6
8° LY
Aa Ra HW
me Ww
%P
SOABT
TE6L°0
TE6L°O
696L°0
996L°0
. 0261°0
996L°0
616£°O
*P P
"OTB °dxq
(penutjuo))
I aATaVL
%O7C
SOABT
Pyndy
ecyv est
OL2 OST
cS? OST
T89°67T
VEL
OUT
¥O8Z
“OTeBD
cv CST
S7° OST (2°64)
82 *dxq
TE6
ESS 89
870 GT6
THH
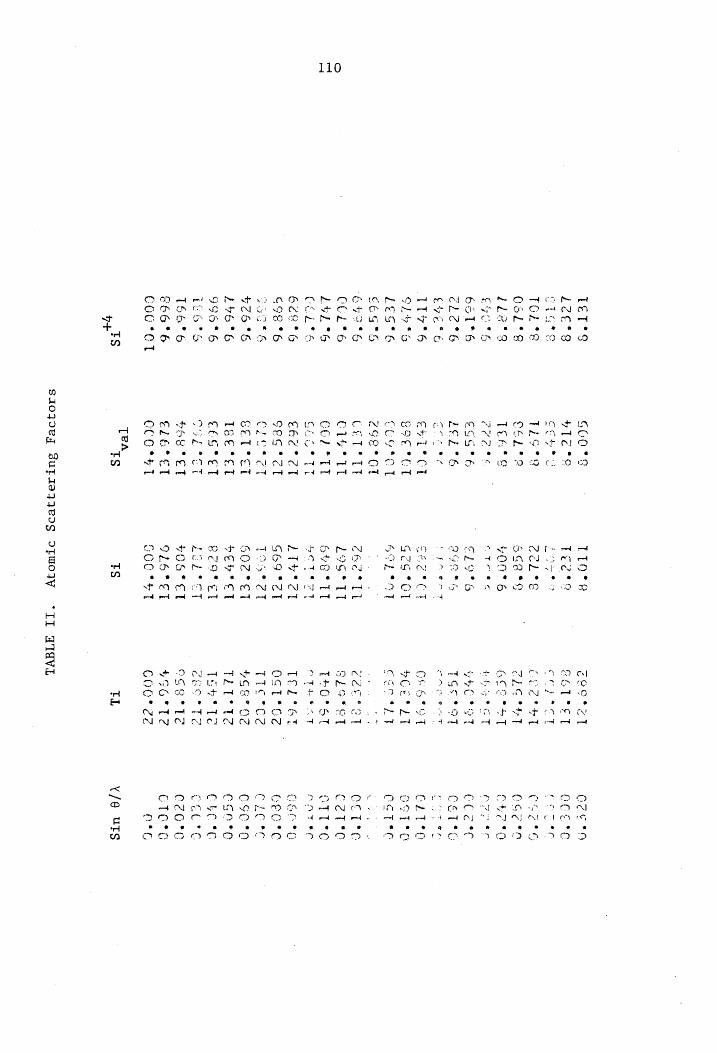
110
TctT
LéE
ets
FOL
Cod
Li
Ee
661
el2
C¥e
Tt?
Les
ve cm
us
GS5
126
T64
c66
COG 7+ "3
GCO"R TIN*R
“3 y1E°2
Tec? "e
cout Logte
"e TLS
"9 Zeb
"8 SEL
52 agets
3 Tears
YOO" 6 -
sya Pyree
"6 ESS °6
FLO%E 6
LEL°G BTS
“6 ones
poens “6
eH TTCT SAETCT
“6 E9E°CT
G25 °C)
"6 COGENT
SOLAN "6
Zoe° ot ——
"6 CETTIt
ZRETU "6
C1e* TT
LoS*tt "5
cOnttt 6YBtTT
"6 CLOT TT
ete zy
*6 coe
LTy*21 "6
Gestalt G69
°2ZT "6
CLeteT T2st2t
"6 ELT
ET 60Z°E1
"6 Ise
tet SER TET
“6 CES*ET
STOTT "5
CULTET LOL‘ ET
"6 bog
ted YOS*ET
“6 ELG*ET
9L6°ET “Ol
CCOtHI COOtHT
TPA TS
TS TS
sio}0ey
Surzez7eoS
DTMOIV
ceo sy
SOLE T
COpeT
CLE
S47]
OCS
PST
bh SOT
SHC t9T
T6587 ceo
ent
OF 6TOT bOc*lt
Cette
™.
OX
y f
ice:
A
ii?
4
rod
‘tf oO
yp
my
» a
OR a OE OL AL OAL AL AD pat are ete -
=) 1 t
*
OL aH om AR md Oot [OL Lt ed sd ee COI eet Be
oad eet end £5
wo *:
CES "1S
4SO°T?
GOC*
22
TL
“IIT WIV
Yee SAY
oCce*e
rover
LETS CGE
FO
CHe
tO
nave
COE
8
CET
TEC cosy
er
CETTO
OET*O Cette
’
i
MA Mm 0°
DANO. dd met ot
e
2
ro en
ar ue
nm cr
G &
fe .
QO
kA NR DY Am Pe
Mm De YQ
MAA CT D-AMDMMO- e
a
aa NN
¥/@ UTS
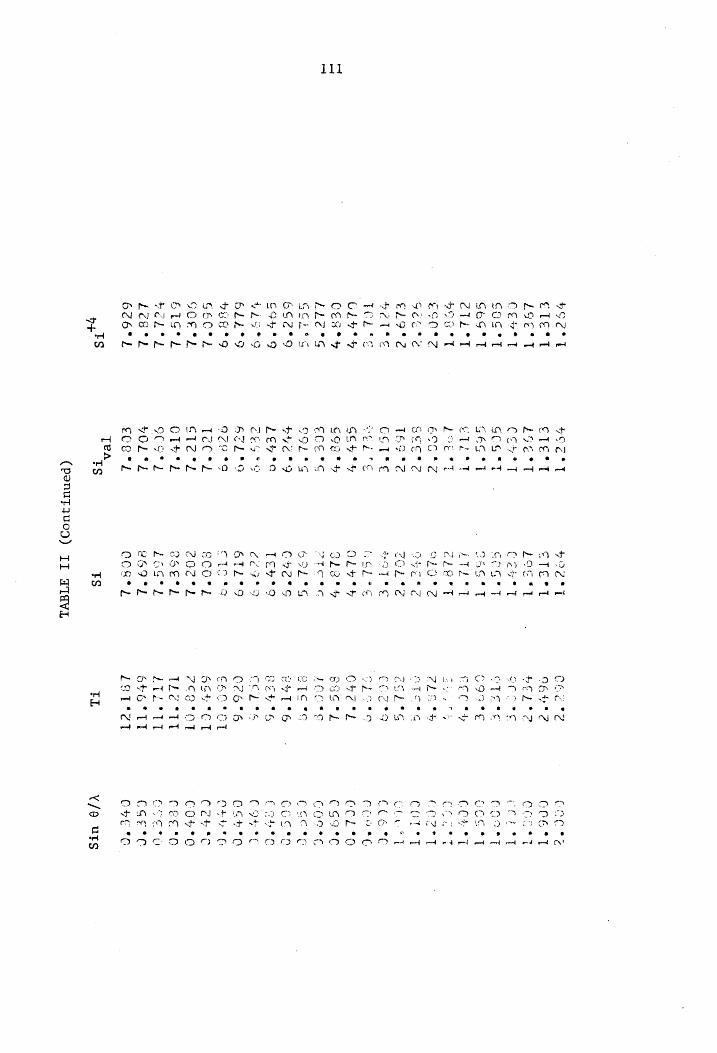
TABLE
II
(Continued)
+4
val
712853
72794
)
Sin
6/ir
12929
ce
™
Ay Cy 2h
SO oe
ag wean
WOOLY
on
wh oH
Lil.717
11.271
10.0592
il.
7.2519
ra 3Q5
1 nh
4
7.21
mp oy om
oy oN
a mr o
” a fod
1.9093
5.884
2ols
Oe 7id
2/79
“I oF
ay
TS.
4 _?
in 2
o.437
&
r) Pts
"pry
ony
ry
we
Sho
o uy
es)
Cy oO ivy
*
ro
“~ 24
ry
0 Sa
yo
2f&%S
4 eo
Le
4.876
5
os
wy NO
oT
lll
~
NJ
LY
ny ™ ny
LEN
0 5
we
orm “ny
Ta ‘
ry
ry
Ls
wh
4
at” ™I
4647
9,
TIL
~+
3
af
mM
wy
rr
it
321c
3.999
673
Ze 326
cn
3 Cc?
AY
m Le
Pm ay a
4#.u
72
ms,
ST
co fete!
2? 1.37,
1.712
~~
ef Pam
ay
a
1.42)
1.5!
i
Ln
3e 63
a
~ ore
1.439
1.257
ir ¢ ny ke.
ed
4 aN
oy
Le
sy,
i
a
of
1.313
367
Ll,
1.313
1.254
wy
a7
le VD
st re
oO)
sf 1.26
7) on
Cx)
_s
os oe
7
oO!
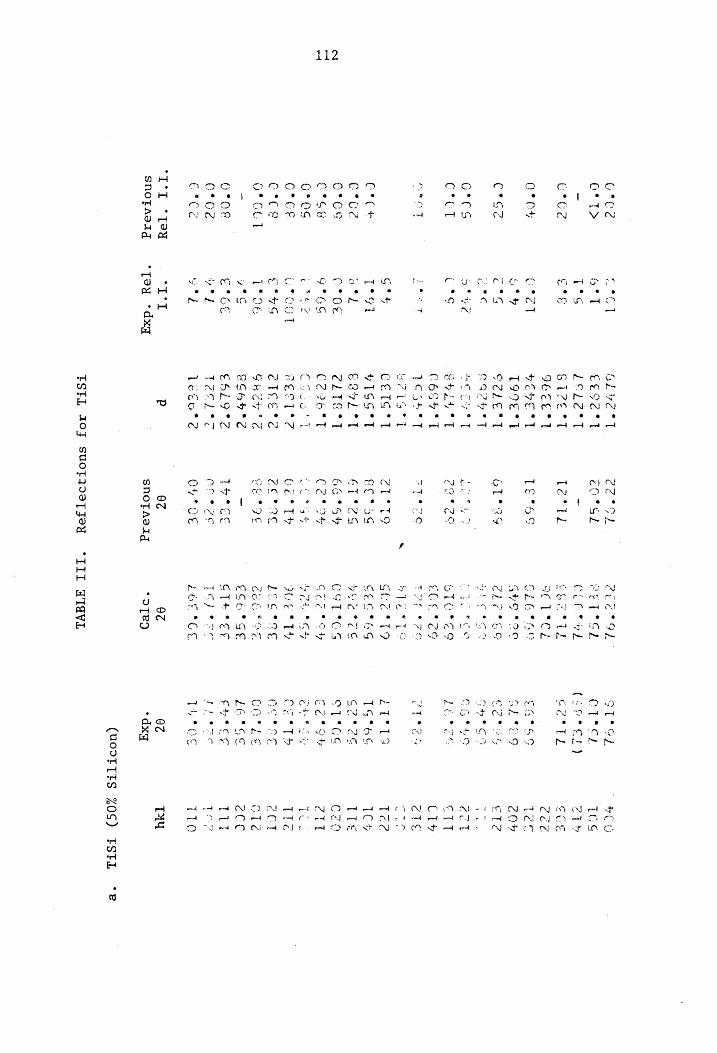
iSi
Reflections
for
T TABLE
III.
TiSi
(50%
Silicon)
Previous
Rel.
Exp.
Rel.
Previous
Calc.
Exp.
I.1.
I.f.
20
20
20
hkl
wt
BO.
tO
OL!
~
29290
A
80.5
hm OY
NS
my
bie
fol
on
3236
41
ill
332
Kw
204953
De IT
7209
3
L390.
cr
st
™ im
on)
59
~o*es
Loe
a
cn
os Mae
S32
2el
414°:
\ 1
. 2
2 4 $
— ol oy
“& 1
a 3
Ye.
5029
om
ce)
sw “~
uy le
)
€
112
1.9629
+ AG
sb
cc my
ave!
m™ |
el
59
3294
9 5172
1.7483
1.5514
l.
pe
lH59
C at
elo
>
7 oN
7.8
ond
*
iN LY
xr ae
tN!
my LN
~r
as -
uy, Dre L.
+ Jed
ue
us
LY
nn
La
~ oy
ts \
ws
2139
i.
LW
NI
ol.
nl.el7
ond
MT NJ
cr wy
wy
Ww
ped
cy ed
wy
Les+Col
Lu
1.4
}
“~Y
r X SOY
1 °
4 74R
41)
1).3
Je
x Oo
A
L113
e OLS
> *
a) ay
soo
“ « woos
™!
bo
oad
or SroNP
» « ret a
ft -
»
’
- | Rg a
ey nay
Goo
wd
tm sr * a
are Ly A
a ef yor
ma
1.3725
1.3661
. 19
xy,
an ve
ey
od
OCe
54
>
)
wy
= c. a e
coal N
an ec e eo
Ol oo a
Ow oy CO ead
SP onyn my eae
a e ®
rel end oot
- rd oo Od
a cd
ie oo
9 h-
Cy ey Ue
Peo a
TN eet Td
a e e
LY ed
Sh hs
ey m
oO OS a s
op ret
“OD h
mat TP PS)
OA OL
SN ON of
en
Ll.27o7
iN
<1.9
|
i
foeld
7501
wt
uN
1.2479
~y
Ot as
© aD
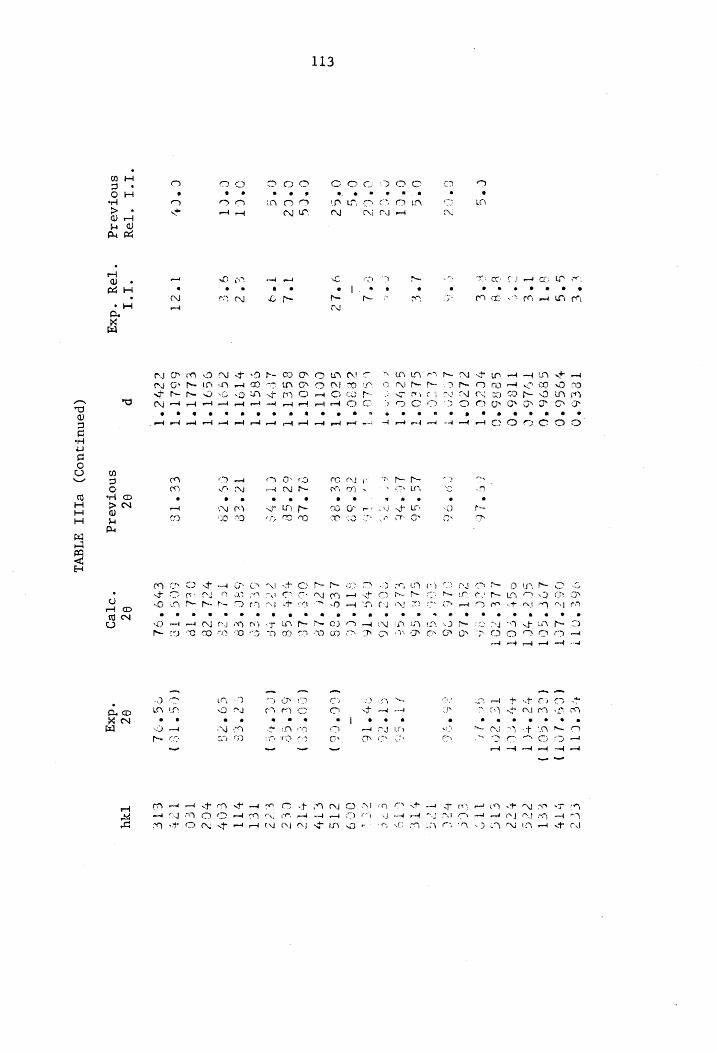
TABLE
IIIa
(Continued)
Previous
Rel,
Exp.
Re
l.
Calc.
Previous
Exp.
I.1.
I.I.
26
20
26
hk1
A
1.24
a43
sO
TG.
5S
313
OO
.
vV-)
ad
oon
«
NS pal
CR rm Gy hm in fe Bh mod et
* @ @
eed pe reed
me
Oo
a
ot
x)
on. Tr OY Sy he Ph
e* ee 8
ret med ON]
92° ©
-~
icy a
rod
co
one
rod date
SY OO
FON,
LJ.d
1)
G
ny
> won
F
9
mo
went
gy
au
}
A“
oy rx)
114
i3t
4 4 »
l ° L457
oy nN)
ce)
a ae)
CN ey
Co ce
4}
52-9
1.21099
1,11
3a7.7a
-
aa
on)
21
113
Dd
i ots
127
413
512
Mm OM >? *, e « ?
TAL om OX O) MN OJ
ay m4 e |. @ @®
h mM FP os
12.1025
38.33
ES
oy SB)
0)
cn!
A m
cst
Jell®
JL
* 44
2
on™
a OT)
ao
on
os ws
1.094275
2
13. 5
OLA
un oo,
or oS
cL GY
Doe
Lb
CN OP eed
SELLY
oT “p>
eviaw
. 5
a
re Le
cot
12
1.9794
oN ~
5 2
f.15
“sy
a
DD
Lo
37.9
)
LOo2.377
il
Ka
51
l t)o
wy
un
0.9811
Je97T451
0 +4
L 4.
24
nm
ONS
1J4.
.
im cy
Om!
“ iN
2
un
~m
ry
Lj7.2°
(107.99)
0.9321
1 1).
34
C8)
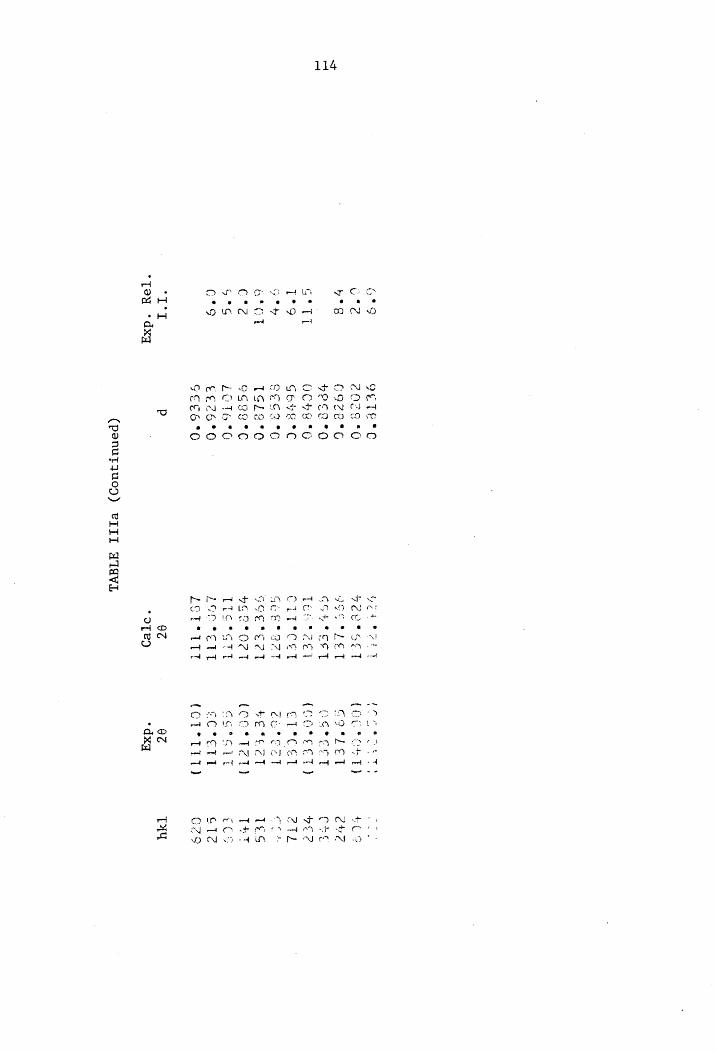
TABLE
IIIa
(Continued)
Exp.
Re
l.
Calc.
Exp.
I.I.
20
26
hkl
sO
cy
cr
{1l11.19)
2)
OD
Li3.93
uN
ILO7
t *
9.8
i
ra
ics
oy
rd ed
on i
eh)
rd
wy
cy
LQ.
é G5
~
120.5594
4 ~*
oe
nn .
uy
tO
aA
4. % ey
=
ae
SRR
ODO
0.
6
uf
1
wo
NI ~d
A)
oy .
oy oa
SO
a w L33.11
tie
490
8 Qo.
114
een
ON co
oD
poe
Lif.
242
-
tm -
oa AM
r ‘ 4
fy
in
mt
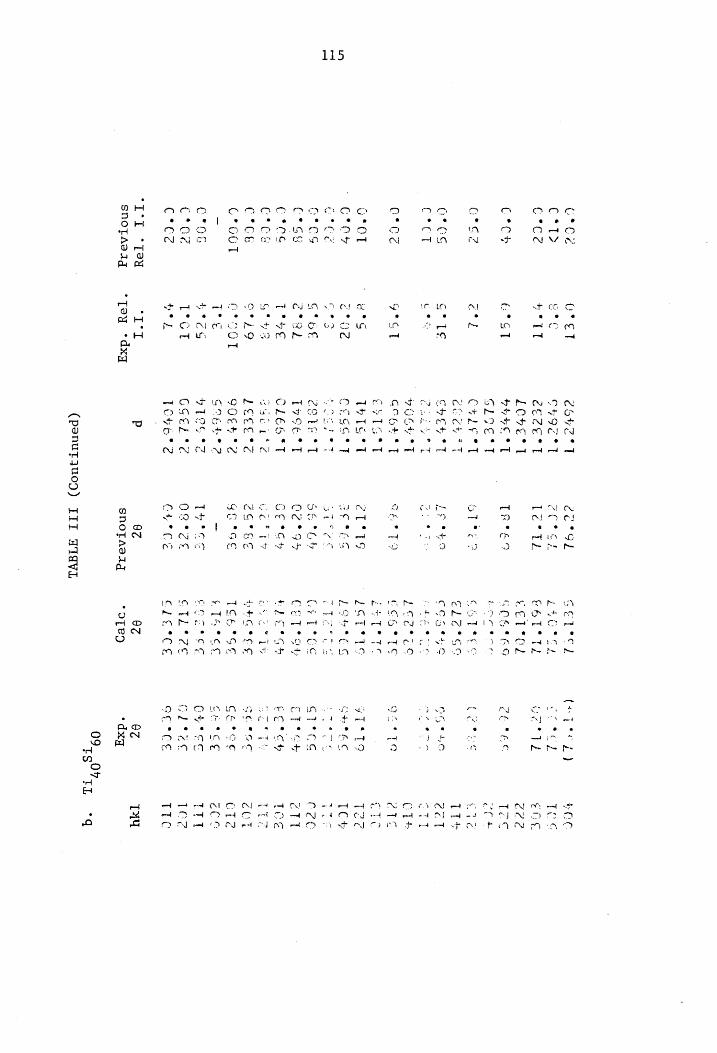
I.I.
$0.9
4
Previous
Rel.
ot
Exp.
Rel.
I.I.
1.1
L4
4 ca
ws
>
2.7359
“”
L
@
J e
4 Q
“+1
20
2,
TABLE
III
(Continued)
Previous
Calc.
26
60
Exp.
20
33230
*40
2 2
hkl
JL
201
7)
115
oS ON ENS ODN SO 2 cy o> oO On a e * * ® > a e e . e « . a e
OM DP QIN MAA oO o™ > um cy Qe Co GOR OS Ap oe ™ wot iy rl “Tr AEM wot
RD LD et OVE STO A Ram re e a a e e a * ® ¢ n a * ® e a eo
wth sb a oh a SO un Ch peed Mh Lo wm oo
SO LO em MS A rod a weed ol rod
Eh a Od mA OD et MN Om OY AM Cry Mm APG ee a wr De Shot Ph SOs at ANON eet SL re ed OL A Be DN RO SCT me Re SIN LO ttm a ar ay
e e & a e . a * a a = * 2 a a& a a * ° ° *
COOKE CNT md me ed ded et md eg md et ed ed ed ed en
Geop cg. CP am Mh Le va ny g Cl fo oc co rts
CTU Mey NE DP Ra * “y — 2 Ap om es * " ” ® * . * a * * * . * e °
DO me ND TN greed od tay Nt ” en ret iN
oy af Srp ao oe O oO a Pp
ped th RN | Dee Be fee EN Be pa eT et om IN + 0 fw ee ot A CLIN wd by meek AO OM Oo om em ch ot
CRO wed Pe ee AD et DCR ed ad ™ e . # s ° ® a ® eo . e » * a » a ® o *® * 2
SV ee EN OT emt at ee RE NOU RD ea ST SOA EIN DA OTD ADD a eS
UN PD OTE 0 -4aoa3 aa an] crt ETON EL OO nt met do nel ie moNUN “Ay om myo)
e a * * e * e ° * * ® e e . * a
Teh EQS pet es tof > ™ met
TA A EY LA 3 » 2 a ny he fh
CTE ON eh A OT mE INT ON met cE A ot et
eed TT met AY ed met ed dD ee TUS ONE TTD CJ SU Wy eet OM SRO TD tp PLN
13.9
22
ke
15.6
{5.135
(7
2» toy)
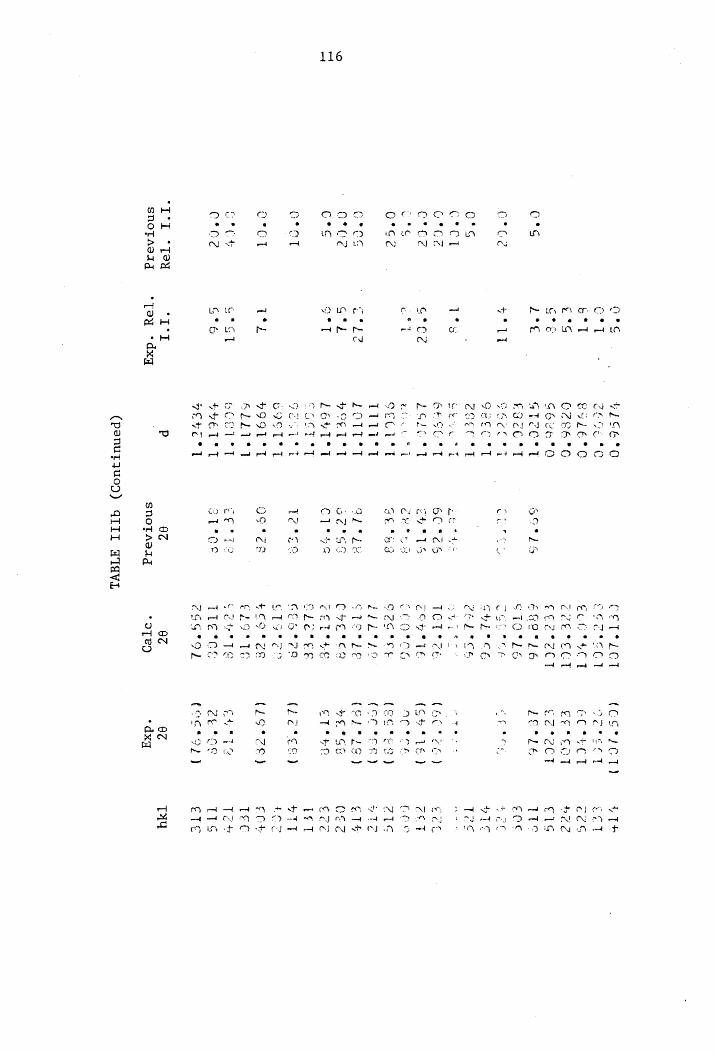
TABL
E II
Ib
(Continued)
Previous
Exp.
Rel.
Calc.
Previous
Exp.
I.1.
Rel.
I.f.
20
20
20
hk1
m™
313
Lim
1 s
1 3 2%
a
fo
SO,LE
e1l.3
rnd
o
oN
2 32
aN
“es a
il
Je
“F
car
D4
- 7
3 {
ott:
uy ot
L.L77s
1.1664
1.673
33
wd
19.09
tel
57)
3 OL e
> (.
A
2
Ouse
LN rot ey
we
Aly
116
l.
o
a rod
1.1497
Te
LO
3
, >
33.273
Stel
oO
> Ni
Gi es]
wa Ww
-™ nt
ny
ny
A
4
a
waa
1.11907
LeLLil
xh
Pe
fe
roy
>
uy
sy oa
ow
OJ
OO ee « «4
UN LO
M™ md
mL a a
ri AS
we rm fr hee
woot rd e e
wed el ed
CY OL 004
mo Ne
e ¢ ®
CO penned
Cow
TIMI NOT Oo
* « @
TD ed
coo
ere, en
ae) > uw
rm m7 wh
eo * a
OO pent
ay om OD nil fae
NS TON ad TY A
uy od
a)
De
LO.)
NE
Gy
™i
Ww
om .
ry
mt
m™
* oa
uy
rm,
1,5332
ob
ra
Doe (45
5314
bo
_
OS
11.4
cy
roan
oe
50
ran)
je
1,928
3 a
7.0
303
oll
uy 4 “sy
m
Ff.37
Loe.
uy
cn
md
ry
iN
ae
UN
ot
193.32
2
134.03
a] C fy
<a
io
ion
oN
ne
ey
nvy =?
74
ID
0 4 4
LI7.13.
f.5))
a) CL
+1%
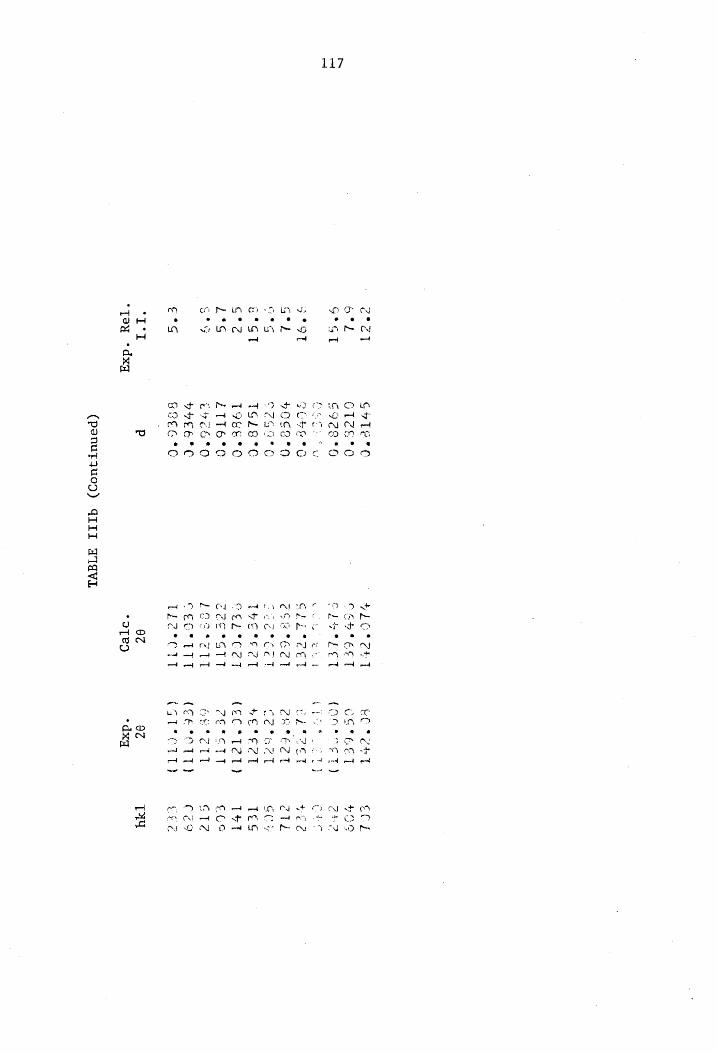
TABLE
IIIb
(Continued)
Exp.
Re
l.
Calc.
Exp.
I.I1.
26
26
hk1
029344
oO
LideeT]
LL1.935
elt}
{LlG.93)
\ 3 2
(11.
3
a
Fy
e 1243
om:
ee
112,388
527
Oe9117
oO SI —O
LLS.
my
coy
~
uN
129.736
ny
(121.
~f
(Thos
uN
123.3%
531
uy
oN a a
al
Nem
tO oo
lan) o
wed
ot
iP
f12
L23.%e2
117
ta re
e e
SO ey road ood
MD LY
Oe apPocias OO oo
¢ 6"
Oc 2
ry OY
me Pam
Bheoooosr * ®
aper Pp.
co nm
reed ie ed
a atti,
Cth eet C9 Me OS
« a e
ost é 3
mor wy
wed ct pod
bateteli eal
wh) ON
mye Mp 3 ON
ry
7.6
190
9.23145
CN |
os
we
Wy
cm
my
a
ua ww
17%
ee.
t 142
cn
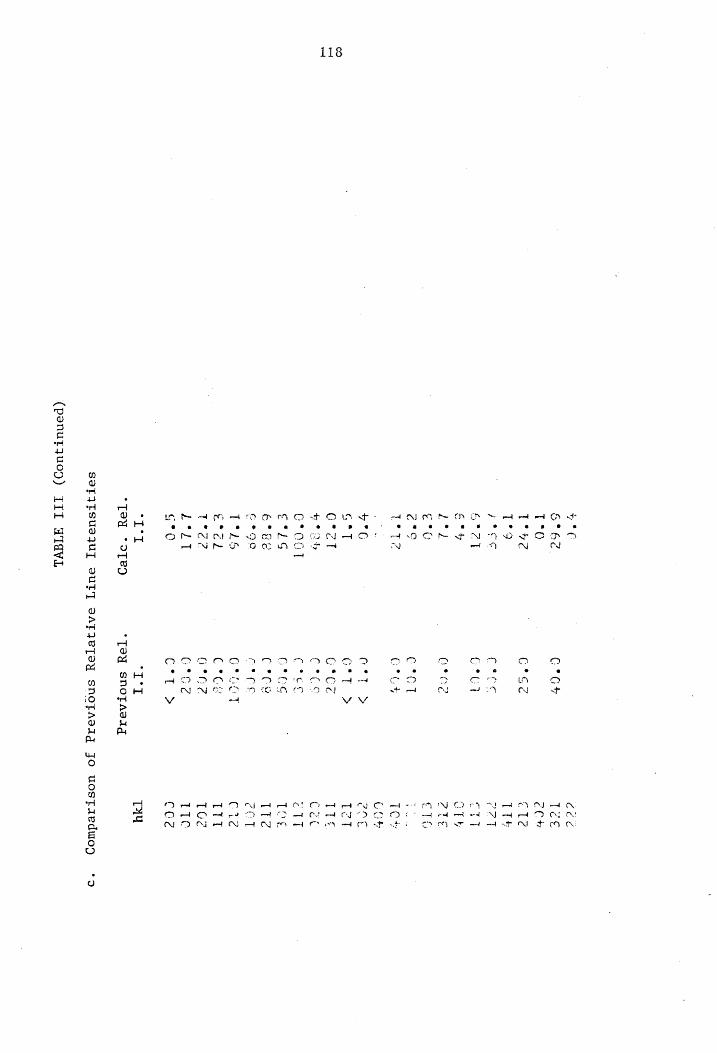
118
* ™
6°62.
C° Ge
T*O
T° 472
C°o2d
T°?
Ae OE
C eee
f° 27
CeO]
E°4
Leh
Cee?
& °C
c“S
C°CT
T° t?
GPoty
¥°G
ort
>
G*T
G*T
>
Get
C*Ce
bene
cece
G*aay
cece
E°LG
C8 OG
E°8E
C°CY
e*go cece
T*15
G°aey
t* cd
C°CE
T°?
O°62
L°Lt
G°*GZd
G*O
C*Tt >
“T°! “I°!I
“Tay °oTe9
"Tey snoptaelig
SOTITSUSJUL
SUTT
DATRIETSY
snotTasig
jo uostieduoy)
(penutzuop)
III ATAVL
Cee Tee cCh amar TTt
~J
—4 ee ed med ow al
NTE NT werd r NS 4
Dis TOE AEN St md ce
™~ Po "oe ret OP wed OY o™ _
mee ee OP et dN Ty ot
) pond DAO tre
AS
we
Tad
a)
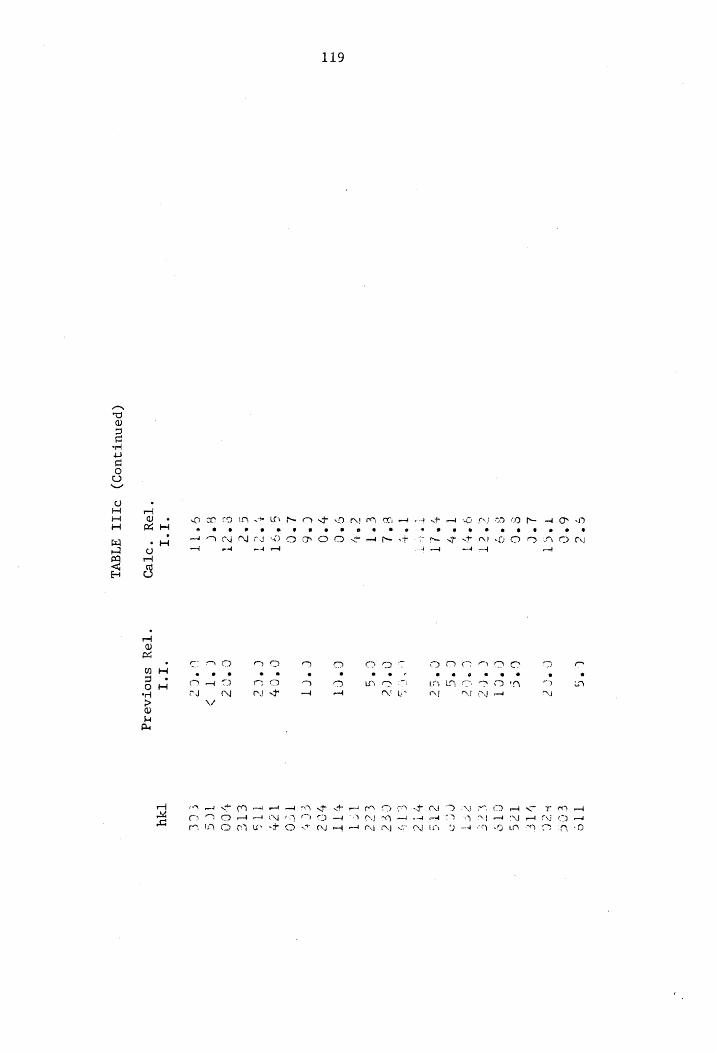
Rel.
TABLE
IIIc
(Continued)
Previous
Rel.
Calc.
hkl
119
SO IN TO LA SR LO Be OS LO OO et a PO I OTT HOO
eo ¢ # 8 @ 8» 08 8 #8 8 8 & 8 9 * #8 8 &@ %8© #@# @ G8 #8 &
AINA OO POD Sat mor rm er OOD ND ~ ed | Ldn ot rt
Cco™ > om ry ™ Om 7 TM OY DVAO oe) o . e e e * e e * © ® e a a a e s ®
CY rt TD m2 my on wm EYL moe SBI a) uy rd Cy Ol nd | Gobet mr} A ONG es “Yd
WV
ON met SE eh et med OR RE ON POO OO OOO CV TE OD mE TD Tmt Oe a TD OA AOS RHO OW
VEY ON OO ER AD SON TD BIN OH TM AO
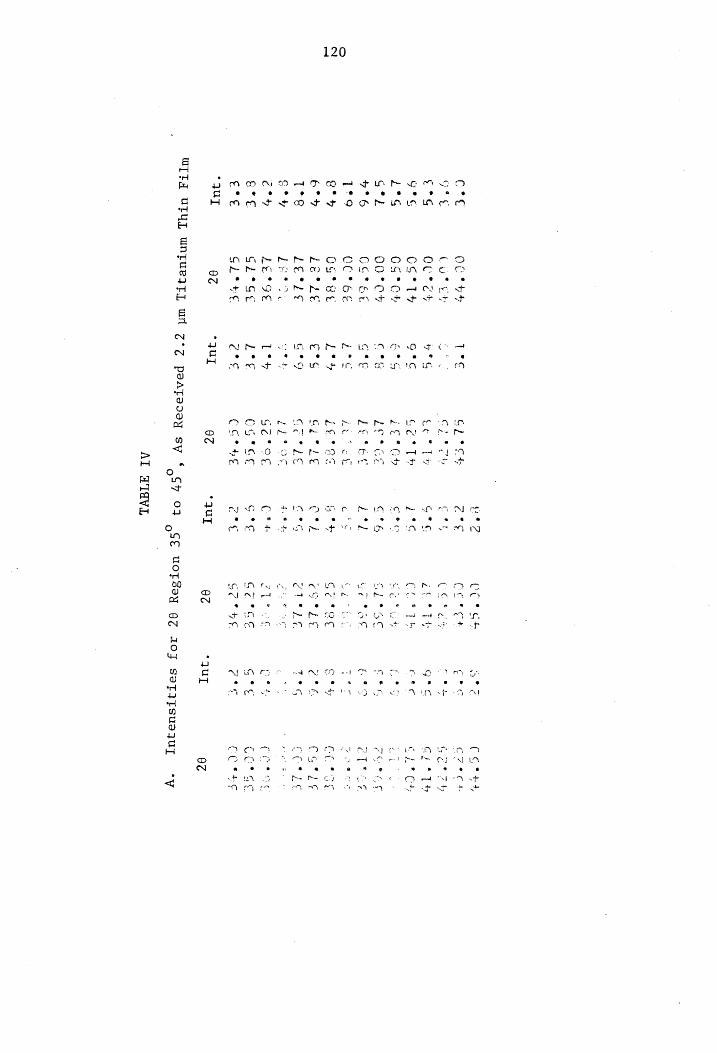
TABLE
IV
Film
in
Th
Lum
A.
Intensities
for
26
Region
35°
to
45°,
As
Received
2.2
um
Titani
Int.
26
Int.
20
Int.
20
Int.
20
ony) fi?
urs
eS
G
OM
mt!
e
ny
ve
oy
Ny:
4.?
ty 36.
“ha
4.5
T 37.37
37
: Ye
“fh
as?
cel?
8.1
23
aad
aN
4.8
osl
in
“!
” MA
mm
120
38,59
fi.
ay
SD
wey
a
a?
de
36
a wt
‘be
39.290
3 ~ +
5.7?
~ al
or
l.7
el
) o
Ino At
en @
PU Ln
OO OD TS LA LIN
* ® e
abo oa
PN fs AD
*. *
QOL IN
Phe Be. 1m
"QU TA MS - mm ©
CN ead
my xb oot
Iya ® a e
Uo UIN
Wey ey a fe mo
. e oo
(Py ed
CV wPoer
“ye e oo» «
Ay: in
ee Le
e *
eS ~y we
oe LF
. °
LA
o- mf
a *
OL oe; aT At
wt C
a
ion i
cay ms he
« a
rd 5
wht
a *
-_ ie)
fhe em
nema
° e
a4 OL
wt
Wa 7) s a
iN SP
ON LS rr os
e *
cot | eo “te
309
44.90
St:
ny
5 42
“+ De
ae
end
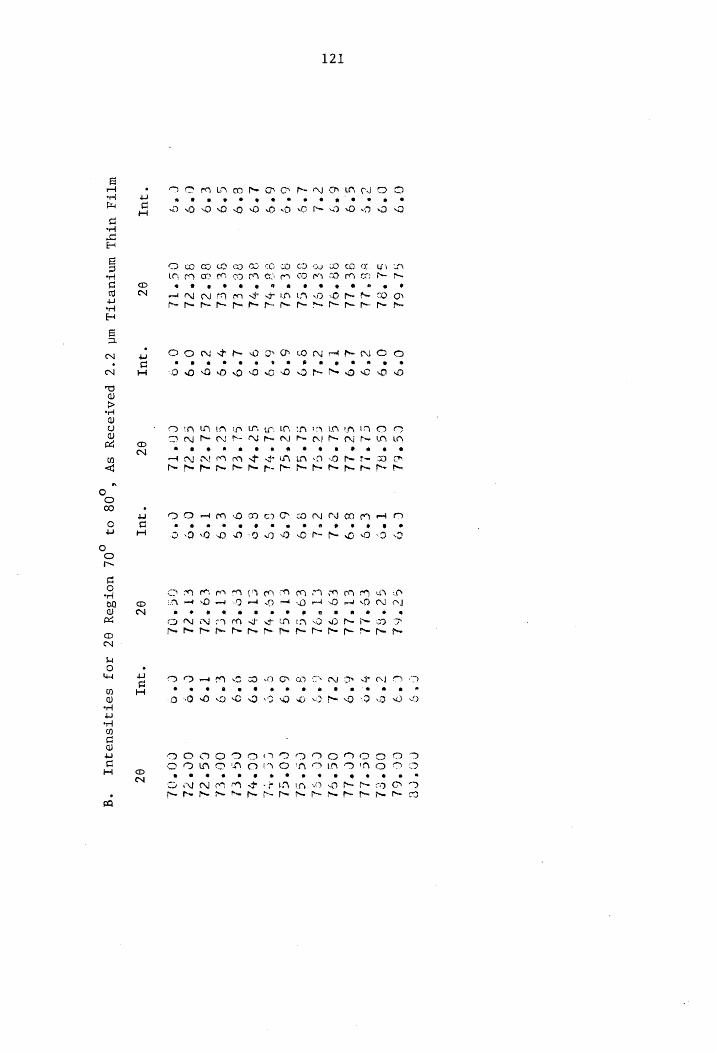
121
“OL "Qh
“2b °il "OL "ol "Sl "Sh aan "Oh "tl "ek "él
"el "tL
* a
0 0 0 0 0 0 0 40 0 Pe 0 0
i DOV Oem CO RS CO ty cr Pe
>
MLN OM POM NN DIN GY OO °
WOON DO wonwnowe nn;
a & n
>
tO ory a
u es H
Oc
ee © = @ © 9 ® a * e « 2
CAN STH ORTON BEN Ca o
9oOOOW ODOM HOV OO
-4uy
CEo*ed
CS*Rh
Cicie
COT LE
cl °*sol
ceecL
Gi°GL
Ce*Sh
GLA
G2° 7h
Gite
ce*
el
GLeek
e?g° dl
COtTE
9¢
e e * 2 ® e »
APDAXHMOOMOP DAN DM AO e
oO.o Op O ON 0 CEM 1.6 0°09 9
« qUI
GCTARL S2°Sk
corse
ertid
£9"*OL
CL Sol
CO*Gh
eT*cL
Cot ye
CTT¢d
georee Etech
c9o°2t ET*2l
OG*O)
OC
ON OR LOD ®
>
WO AM Ce BOA wD a
x
. qu
CETEe
COPEL
corel
OG tle
CC%LL
CE*GL
COSSeL OGc*tc) CO°G?L
ear
eee y
COtH)
CGY?
OOP
Ed
CS°?l
CCe% ed
CoO*oaL
O¢
UTFa UTYL
wnzueITL wl
7° peatesey
sy ‘0g
02 (OL
uoTSey eZ
AO} seTATsueqWT
“g
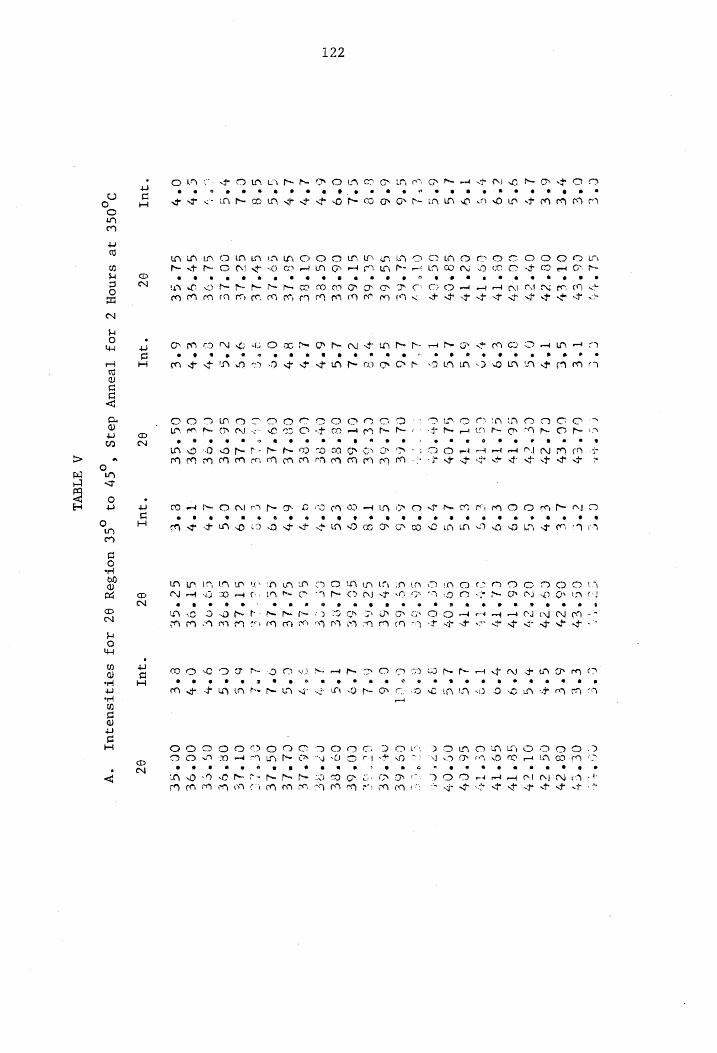
122
CR OS eed SEO a
LAA On OL
wy oe
s * ¥
an Oo t-
"9
AVP he BOW OOD eo 8 @ # 8
wor sh oO fh
FON «¢ * 6
he CO LA
Mine. «
+
‘qu
~ 3
a CG
OL
O€
OF
GC
O& US oe)
OO ON TM ANI SRO ee LN TL Bee OW MINN OO MIN HL TOW Ln
oh
SL
as.
ot. 44
eh
"ty
"cv
"co?
*é%
“17
"TY
"1
“OF
"CH
“Us
"AS
"6E
“6¢
"BE
"SE
"ee
"Ee
"Je
"LE
"le
"Le
"LE
"OE
"GE
"SE
O¢
vy - 8 @
Mo DAA e 2 8 * 9 * ~ o
DIU In DOW IAS AMA 2 ® a e a s « e
Oar wr Ah OO OP
WO OG OR PR ASU et I a
Om PP IN
PO MmcaN a
. qUI
Corer Ore
OL Ev
cto
CGT EY
L2°*e CL
*?Y¥ e°4
CE SCY
O°S
CE° TY
C*°9 Cle
Ty E°G
CG °
Tt aS
OL' Ti?
E°%S GL*O¥
£°S Cb
° Ob
%*9
Ce
C*s Ol
°6E
&*6
GLSG6E G°6
CE TSE
T°9 CT
6E 3°9
CE*EE
*S CY
OE eet
CORE
Qfy Ce
ele Be
OG FFE
L°9 Gee
Ze q°o
CELE
c°S
GE°GE
Crs CL
TSE pet
CL*9€
TT" 06
°GE e°e
QZ "qu
gout}
emer et
wee oo¢
1G*° Ev
05°
24% CSY
2H
Ce CY
C6°
TT?
° TY
ere,
iy
“T+
"OF
"Ch
- ane
Lae €
"BE
ry
~
~
ae OO + DLA MIAN OD
® on
ey
UM OPA pm ® % 4 =
cn
aa
oe
ey.
*
Lm he co
*
hm fh PD SEA oy oN
e
Med ¢ e
or -- yoy
SETS PALA LO LA UN LEY M2
s
5 a
OC
TON M™ Aa e
NIN 13 0
65 mF
9
Gee
G*6
f. 7
fF
L°>
T°s
i‘
34 9
C YG
or)
aa
6*¢
Q°%sG
Ge
O° 4
RFE
“Aur
red
~
a 1
QO o a
WOT SDT A Mey Ot se
OQ ry
n
OM Te RN
D,0S€ #8
SsanoH Z
Joz [vouuy
dais “Oo”
0} SE
uoOTSey 9Z
AOF SoTIIsuequl
‘vy
A WTdvi
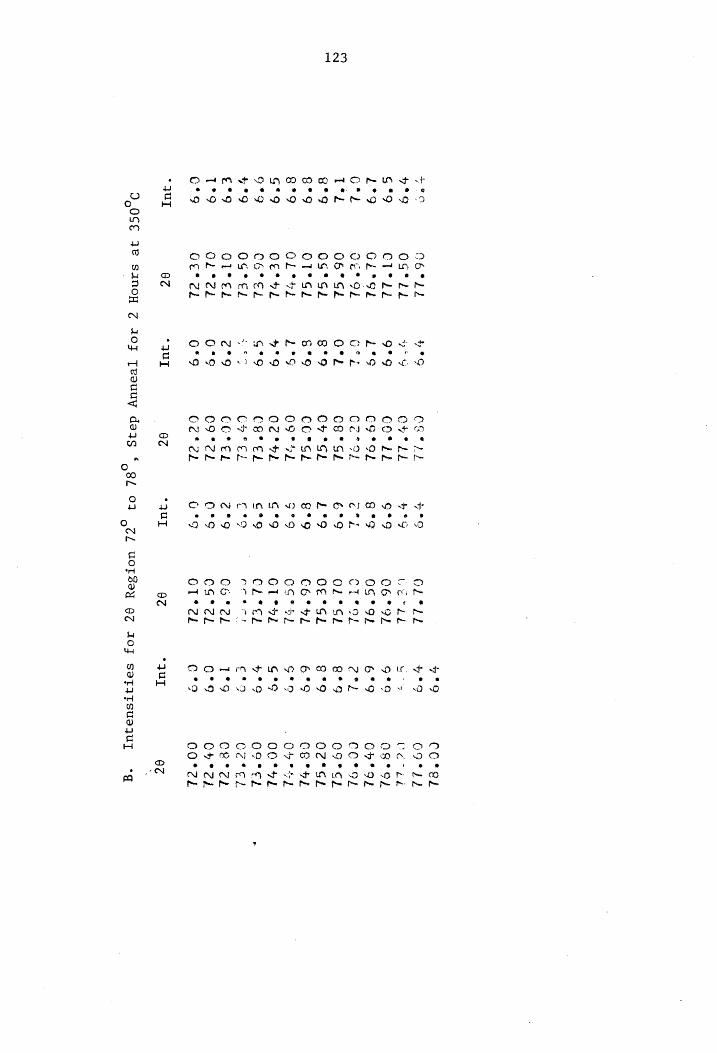
123
ra A6%)2
OSstiL Cr
sed Gi°gl
Un* OL
06°SEL OS*Sl
O1°SL
OL Te
Oct el
C6 %EL
OsSs* el O°
ed OL
ed
Gee dh
* * @ @ a ew #@ @ we wmvowuo COO OOOH & OO
Mo et A SP OLA OD OO OO rs Bh LAS e u
a 4
8
whe
eae #® @
NO
9 s s e
mary OOOH OL * ”
oon -> * 6 ®
MO Os OW WO DMP OO ©
qu
CE SDE
O7els
cCo*cled
cg*ol
Cer
se
O8 *SL
CH °St
COSSL
O09
° 47
Og
* HL
CE EL
CY el
COPEL
C9%CcL
Oct
dl
8d
* a e ° e 2
CMN MIN IA SO com OO! OD or » e« # #8» oe @
Oo .0 00 0 0 OO 0 10M OO OO
“3UT
OL LL
tee
vw dd
06°
OR
OS °9OL
CT"
ol
O2°SL
OF *SL
C6°%HL
OG*
he)
CT°ol
CL*Ed
mce
ot
C6%2L
CS°*?2L
O°
2l
OC
*
“O40 « * @ © @
WoO OO 090 0 OO Dh O00 48 ° e a ® e
DOaAAFINO RT OMN OD Ole st + « ‘
* UL
CO*SL
C9)
Cero kd
ag*
Oo)
Cy? ok
COToE
o9°cL
OC“
GE
CET HE
Ov *
OOS FL
ogreL
Ce
* EL
Ce ch
Oy ed
COc?cl
0% O,0SE
328 sanoH
Z 10}
Teauuy
daqs
* 584 O73
oct uoTB2eyY
QZ AOF
Set ATsuejuy
°g
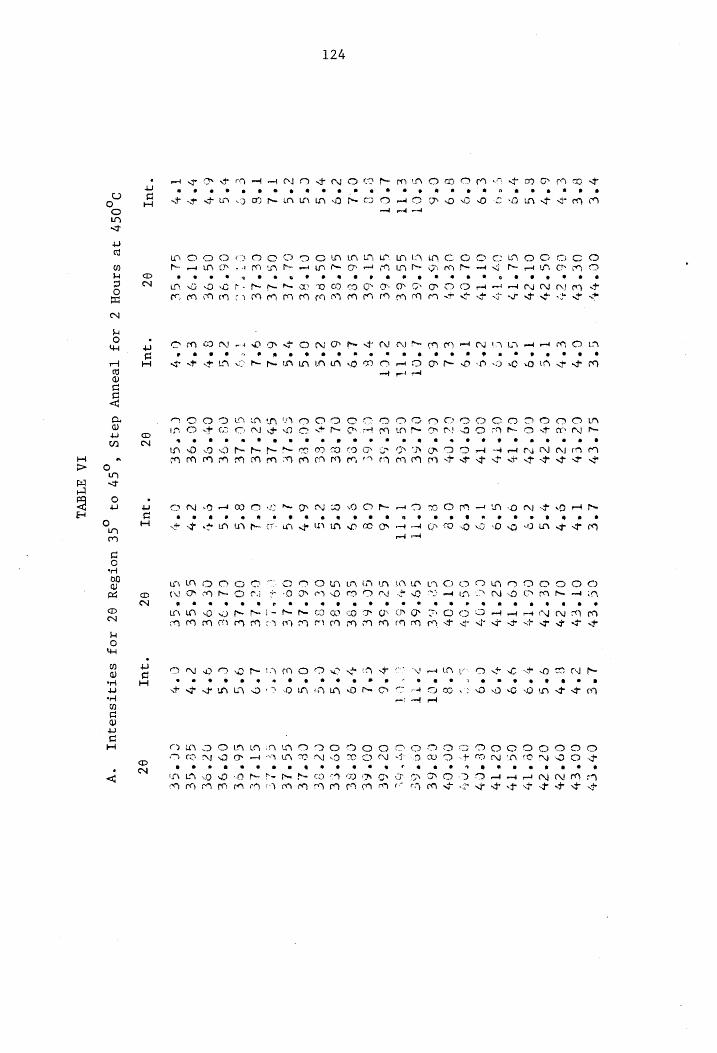
124
mop TF PO om et OL SP GY OO * .
Shook OD ME INNO * * ° e ®
*qur
OC SH
OF ey
Ub°
¢%
OS°?4
OL°
2%
Gl°
1%
U7
°
OT" Ty
OL TOY
UE CY
G5S*6E
GL YGEe
GSG°EE
Gere
Gt
G6
°
Po mo
Da Qw man
ao @ @
me mm OO me eo
=
a
aa Qc un
e
C)
oO a a
a
fh Pe rye ee
C4°9€ OS°9E OT°IE GL°*GE
9Z
% a e * e e a ®
PO am HM FOL ALM OO RAN UNA ed etm OLN 2 e * e a . ti] e e a
weet pet reed
a * *
PR Re LOLA IA UN OO DOOM OF 8 ON xr OO
9°
>
u
c°s
gS °
€°%
G*%
“QUI
chtehy Lt
CZ°Eh Tt
C&etty ory
Ch°Zh #8
COt ey
Z*9 CL° TY
9°9 Getty
G*9 COtTy
19 CIO
Ete cette
te CO"6E
£°6 OL
TEE cl
CS*6E 1°t
CETSE —
LG CT*6c
Gt Getee
8% CL
“RE Q'S
G4 '8E
2°s CoTke
bt CG*LE
bt Sb
LE Gy
GeLe CFL
SUTLE Bw
1g "FE 1°S
CFE
ott CO
"9€E Zh
CErse oy
02 "Ul
red
uw Oo
« Clo)
Oo OQ IN a °*
.
e
~ GS ©
e« 6
UV LY SO Sa om hein ih
Co h
*
> wy
*
AM AM AMaAM mec
°
PSO WO DN SS MS woe
OTA a
Mm FS e *
Nb et UN Le e
cD re
“jul
~GG*LE
J,0S7 38
Ssinoy Z
ioz Teouuy
days “O97
07 {SE
uoTSeyY QZ
AOF soeTATsusqutT
cy
IA ATIVE
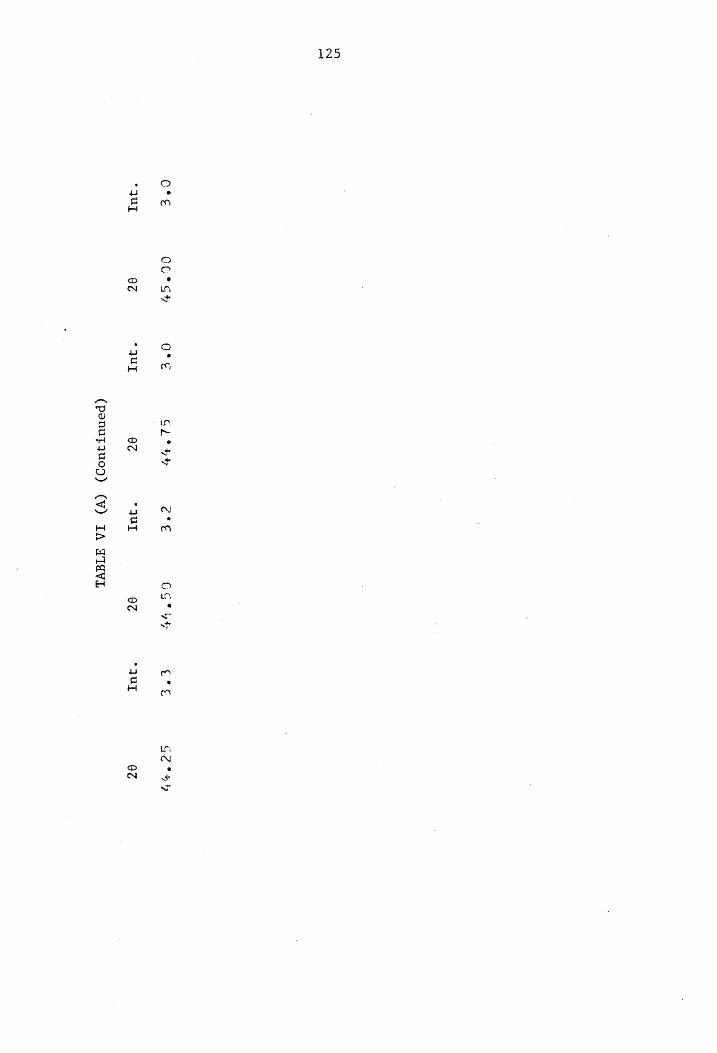
125
‘UI
GL°HY
c°e G
A * UT
(penutjuo))
(V) IA
WIdVL
tre
“UL
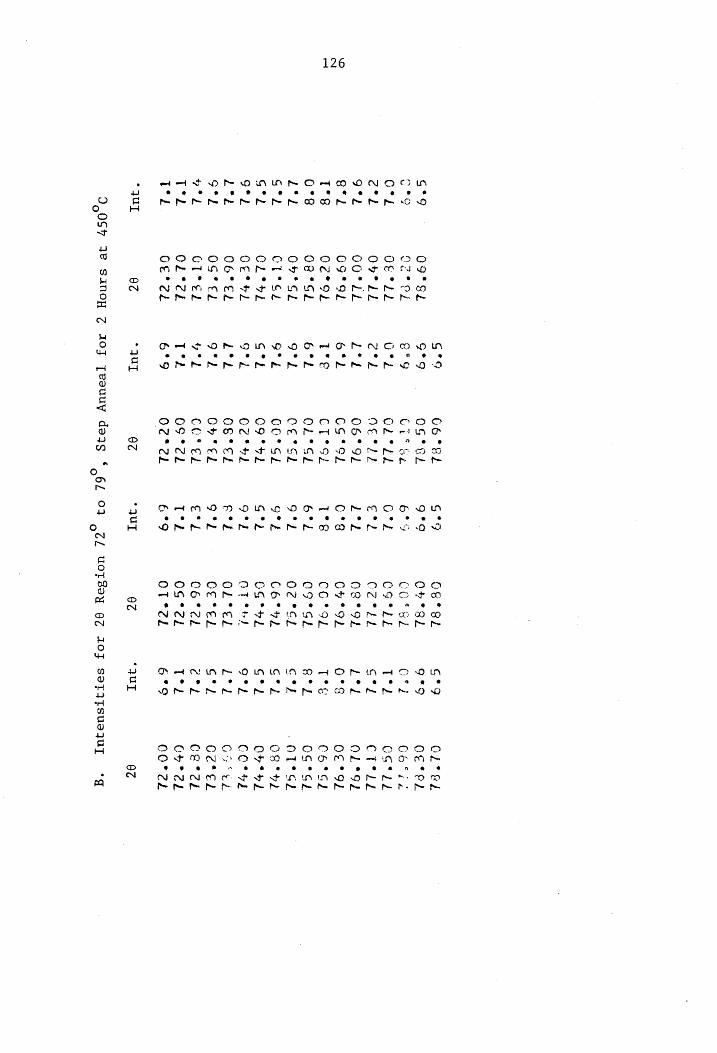
126
G*9 O93"
SEL v9
cee ©
GPL OE
PLL
er O¥P
LL 9°L
OOTLL
BL
CS*9L
1°sS Oc
OL
0°8 Oe
Sl
Z°l Or°sl
S*2 CL°GE
G°l CL
°oL ofl
Cet hl
L*t 06°
EL SPL
OS* EL
ye GTtel
Tek OL
el
ToL Oe*
dL
“Uy
A
e * e t f * ° s e ° e e e e
Oe EEE EE Bee eM OO
mt SOM OIN OO DW OH A OOM OWM °
“quT
C6*El
OG*
ar
Ci Ge
OL LL
NE %s)
06°91
OS's
CT*SL
OL GL
oe tcl
OG SL
O9°oL
O¢* +L
OS cet
Ch el
COS EL
OS*dl
Oe" 2k
82
>. °# ee & @
Q 0
AMO DMDOMWCOWVWO OA Om MOooOoNM ° e
SO Pe fe Be fee Pee fe Be Pe 00 CO fe fe Be OD
en «
e UT
OS"
Sl
Or sh
COS
CST*Le
Cereke
GeeoL
OF
° OL
CO*OL
O9°sSt
Od *eh
C6*?)
GG Soy
OT St)
OL El
Cetel
C& %?2L
0G*dL
O1T*Zl
82
e @ Oo NO
a
7
e e e
Be Pee Be rr
*
wo
a eo
cn e a * ° e
No a
Poet GE LAM SO LALA IN DD Rt OM I ed OO LN *
e qUL
CL
* Sl Oe
fed Boia
CG*2d
CETLE
OL S92
Oc
° ol C6°S)
OS*S2d -OTPSL
O8 °o)
OF* aL
COSH)
Go ek
CZ°eLk Cece
Cy°?al
00O°?7L
82
0,0S7 38
Sanoy Z
Joy [veuuy
deqs * 64
07 2L
uoTsay
QZ TOF
SaetTATsuejzut “*g
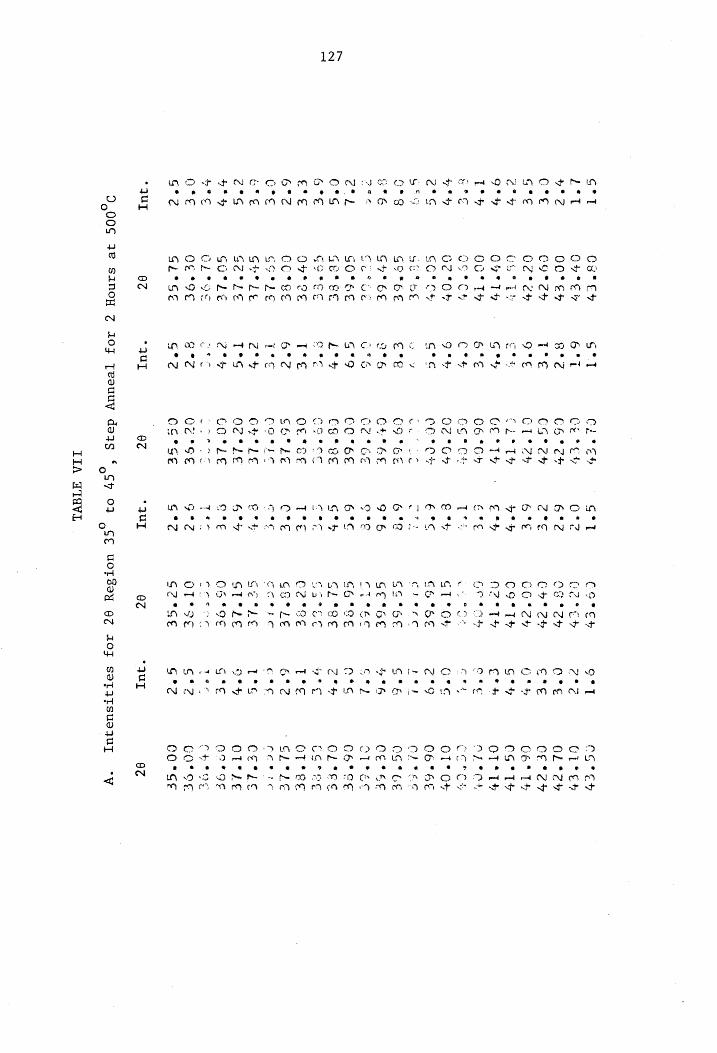
127
G*] Cat
ey S°T
CL EY
S*T Co*ery
o°T CG°CY
i*t Ov
Cy
6°F Ce
* CY 2°
2 Gere
C8? GL’
eh ye?
OO*% Ee”
Be? C5°eF
6° OS
8 e+ O°E
OL cy
C°E COT?
T° €e
CS° Cy
e°e Coe
ey EE
CET CY
GE
Co* eh
2° €
C1l* 2s
6°%e COt?Y
oO" %
GC6* T+
oc’ Ghee
Ly eet
CLS TY
7h
Co* hy
G° 7
CG°TY
9° 4
OU" 1%
G* GOST?
£°% O2°T%
ce #
OT* Te
T° CO*
TY &°E
06°C
E FE OCS
Ne ere
OF oO’
Ble Uo
Cy Cee
CG" Ct
Tt. woe
cee CORY
yey O¢
°OF Gee
Og *G4
€ ° 4%
GT ° OF
Gre OT*
OF e*s
GGS Oe
G°G COP
Oe ES?
66 °EE
c*? C6°HE
BES St
Woe wy
eeooLe ars
crere
pee OP
TEE C8
GO*GE
€°€ COOGEE
6°82 SE°SE
G"&
OG
* GE &°
6 SYP
Oe 2°6
CH EE
9°6 GETEE
76
CEC AE
ye *
Cet Ge
US
Ce PGE
ore oA
ES S&L
TPE?
e°k SO*E&E
G*9 COE
6°C GG“SE
O° COP
Se G*s
GEt ee
L*4 CET
SE G*
> GLYSE
a*y OLTEES
G*E GOTEE
See CF
eee ore
37
GE we
CS TRE
E° Ee OPT
CE rte
Oe TS
Tee C2°RE
T°e OTS
ee
6°? CC*SE
6°?
COo° LE
Cre GSE°LE
GP? SLeLle
oF E GGT*LE
Te
CG SEC
eee Saeko
cee roere
&*€ Gee
le c*%
CvTlE
Ewe Ge
ThE 1°S
CemLle c°s
SC°LE
T*s OF LE
f° GT°LE
Oe D
OT°sLE oe
4 GUT
LE c°
COPLE
T° €
O05 °9E
S°E NOT
GE oe
OL os
ne eee
per cote
aa CH
OT
O°E
0% S9E
a°? Qc
PSE 9°
OT°3e
G°2 COPE?
G*2 GE°GE
S°2 CO*SE
Se
GZ°GE
G°? CO
"GE
*3ut OZ
“UT
QC “UT
QC “WUT
8c
9,006 372
Sinoy Z
103 Teouuy
days “Oo?
03 SE
UOTSIY
OZ AOF
SOTITSUeqULT -“°y
ITA WTEVI
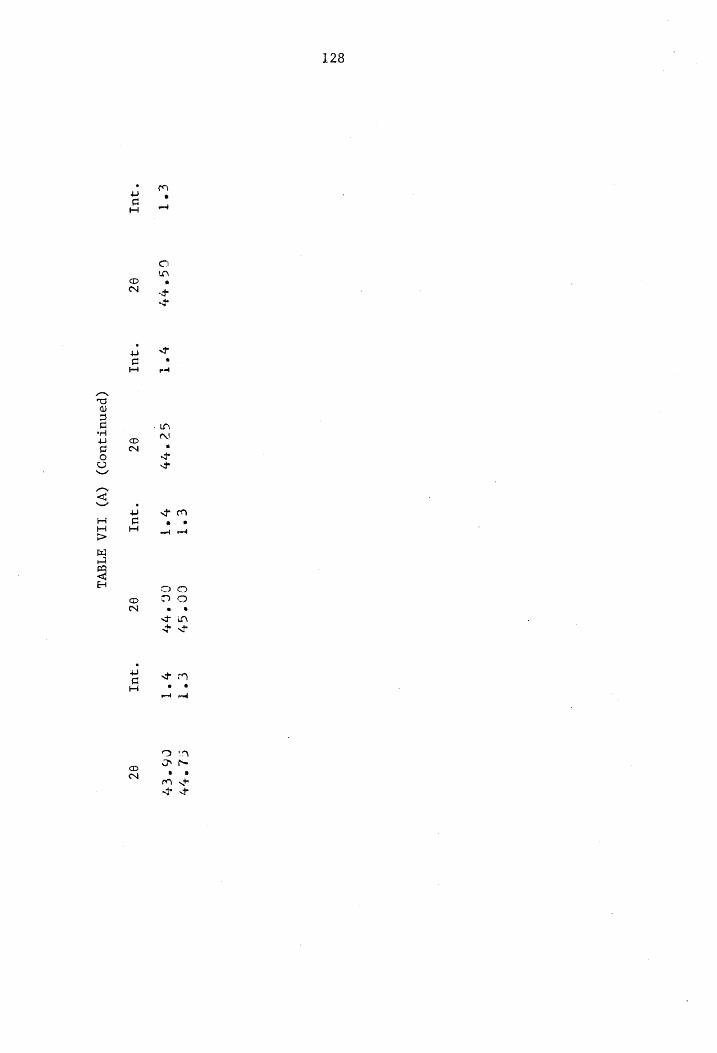
128
e*T o07SY
Gotey oT
OG tee
T4 "qU]
Oz
(penutqzuog) (V¥)
LIA WIAVL
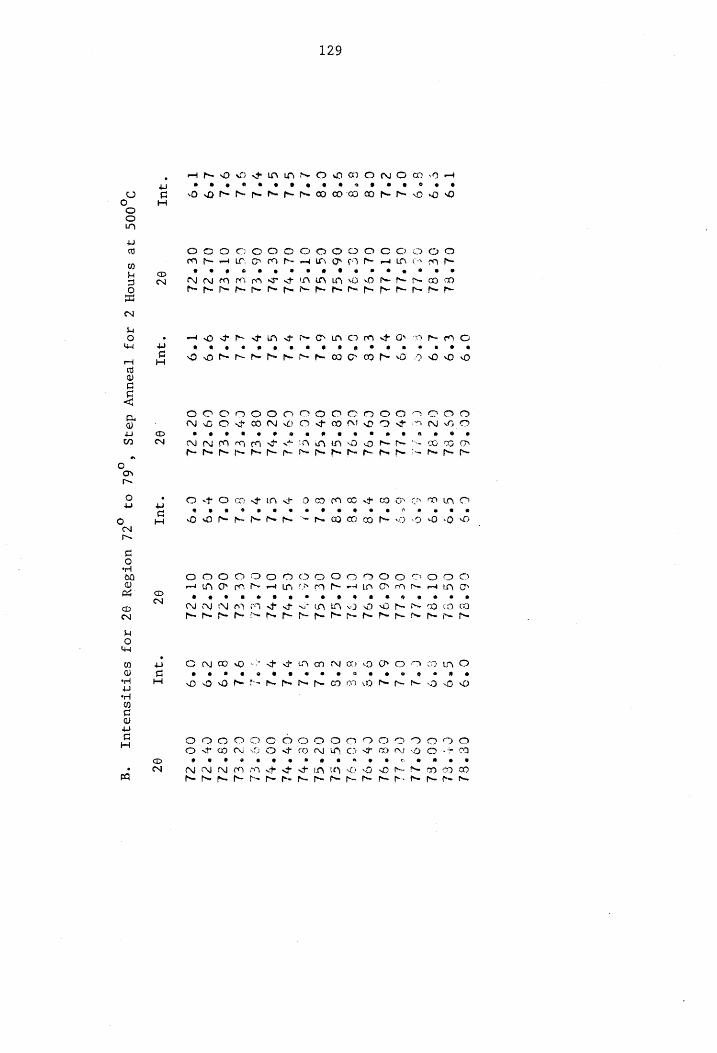
129
T°g OL°SL
e°9 O°
Sd Be"
9 enone
a4 O°L
OG*LL
ek
OlfsL
0°8 OL°OL
3°83 Jo° Ll
o°S 06*Sl
C°s OS*SL
Aee OT°SL
S*L OL°RL
S*2 Ge
eel yok
Ob
% EL SPk
US ek
O°h OT*el
L°9 OL
% ck T*9
Oe*ck
* ULI 8¢
®
CCP
ed
co* el
CE°R?
Cress
CyeLb
COtle
Cg"
oL
Ce °9Lk
Ce*sk
OV" Gk
Co ece
Cott
Od
° HL 08°
Cl C#
eh
GG*El
Co*eL
O°
él
Om eNO - e oe *&® #8 @ a e @ * * ° a
DORE EEE MOO OHO DD DO
AOR FOE EH ONO M +O a
*3UurT . 8¢
"qUI
OS*Soh
OT*el
CL Shh
o€ fil
O6°9L
CSo"SL
ToL
OL°StL
cCE*soL ar
Of 9%
Cot OL Olt
OLtEL cere 06°22 CS*2L O1°zL
82
a @ @ @ «4 ®
uw? hh Mh D0 40
*
Com
J e e
hh
"Lh
o°L 8°9 Z*9 org
eA EIN ON MLD POD DIN ©
*quy
cer°sl Creed
Cot el
Corl
Coole
Oe* ok
ObP OL
Oe od
O0So°sL O¢c*Sh Oe
theL CHL
OO° FL
OP el
O2* Eb
CBr ed
CH°SL
00O*%?¢L
OZ
9,005
378 SAnoH
Z AOF
Teoauuy deas
* 562 0}
ocd uoTsey
9Z OJ
seTyTsuequyT
-g
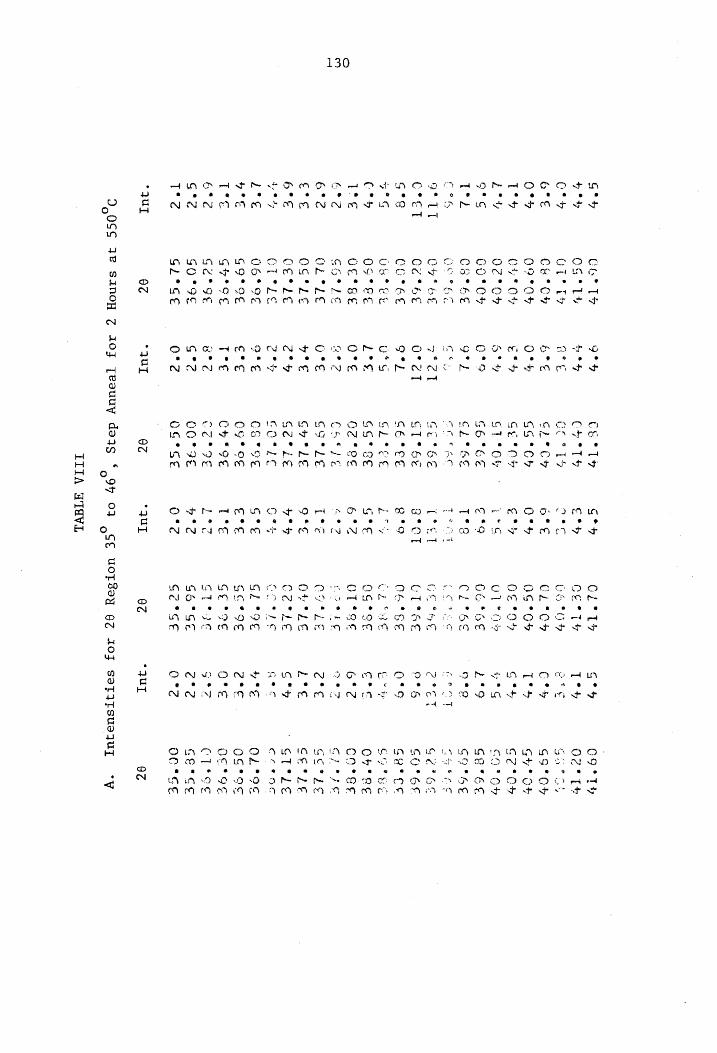
TABLE
VIII
for
28
Region
35°
to
46°,
Step
Anneal
for
2 Hours
at
550°C
Intensities
A.
Int.
20
Int.
20
Int.
28
Int.
26
35.75
2 el
2.20
205
LN
LA
my
2.4
Ol
sa)
2
2
35290
N
209
; 4, 36
e
uN i? ‘
~m
LAN mx
un
209
36.25
35245
7
3e1
NS
3.1
—t
sO
rey
uD
coy
230
36
35,59
323
c ad
36.75
5 366
302
No
ood
cy
ov
ms
oe)
cy
LY
» “+
my
2
sO on
we
oN
Sta
od
2Ge
sb
37.225
4.22
37239
36
3.4
37245
4.4
37215 in
ey 26
cS
37. 4
3.7
37.35
37.70
329
LN ¢ M+
cy
°
my
ALY q
oy
iC, im:
oy.
130
i
co
fen)
oo
mi
a
Biec
oy e
—
33.30
3el
320
3.7
ro
© mt
mW
eee
vO
me
38.55
> In
tO ‘
aa)
49
3
st
LS
549
126
a
39290
33.95
5.3
o.9
Ged
39.279
343 40
9.1)
wr
ra)
oo
Li
ef
uN
ch
ny
uw
5D»
2 12.4
Ya
fel
mM
A
Jaw
49259
40.09
X ye
~
a
eo
aT
a
146
h-
en)
A
39,655
39.285
629
4.9
39.95
ay
Des
39.99
“od
41
40220
fy
OQ »
4 0
iT
49,45
iy
(Ge
LO
40230
Ze
3
fy me
40
& GD
40.225
uy re,
ww
4.20
~
Ny Fa)
4.0
3.20
49.50
Gel
4.9
Ly
©) -
329
49.39
wm ~
on;
) 40.7
49.55
i
42%
> ms
wr
°)
cy
41.
50
41 eh
Let
4.6
41. 4d
4l.
4.3
4
A
at
oO
uy
41.79
4.5
41.60
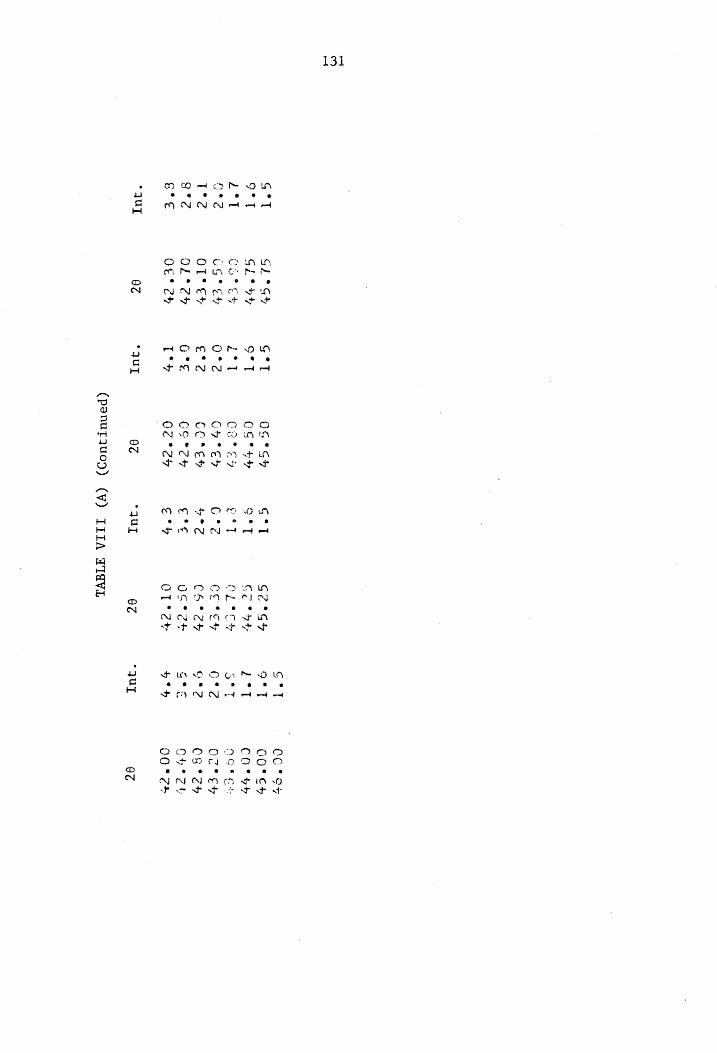
131
G*T GL*SY
S*t o°
T GLY oy
O° 7]
L°T
Cot
ey
i*tT
GY?
UG*
EY O°d
T°2
OT*
cy £°?
g°2¢ OLY
Sy Gk
G°€
Oe*
2% T°
*3UuyT 6Z
*qUrL
OG *G¥Y
CG* Hy
8 ee
CYTE
CC*
ER
COP ey
Od
* S47
8¢
ON * 8 a
te af
e
or on
®
POA NH ated
Oy es ®
*quq 9¢
(penutquog)
(Vv) IIIA
WIGVL
FLO Mo Mh OLN *
SPOT ND ND 4 ed eet
W S eI
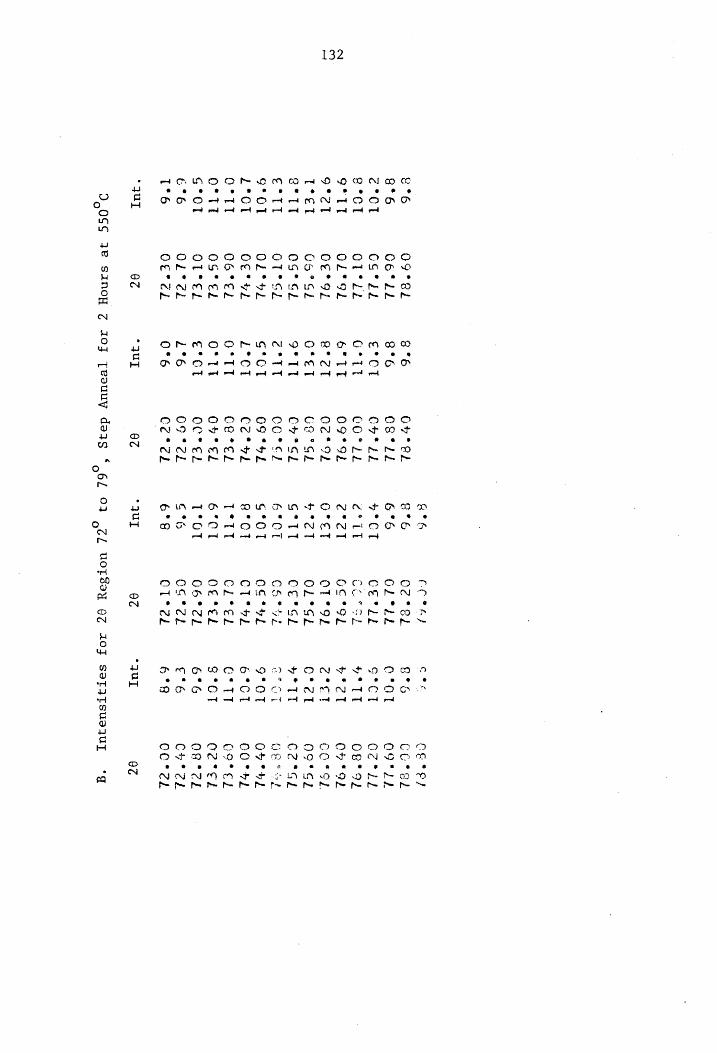
132
e
0 TO AO! co co ®
et OO OD ioe eed
9°*cT T*et
o° tt
€°tt
S* OT
Z°OT
O°TT
O°tt
S*OT
G°6& T°6
° JUL
O9° se
C6*LL
CS*kib O1°LL
OL °9L
Oe° OL
GS°scl OS*sGe OT°SL
OLS oh
Cer el
06°el
OS* ee
OT*EL
OL*é2
Oc*él
8
8 °6 8°6
e°*cl G°tt
6° 1t
e*ctT O*ET
9° TT
c°TtT c*Cl
i°ct
O°TT
Ott
c°ct
L£°6 0*°6
“UI
GP
el O8*id
CHP Ld
COPLEL 09°9t
O2* OL
C8 °Gk
CH*SL
Core?
OG *hs
Corel
cer*el Ov°cd
OC TEL
CF
* ck Céo*cl
QZ
&*6
e°6
G°6
7°CT
c* tt
c° dT
O° eT
“eT
“TT
“OT
"OT
“OT
“tl
"OT
°oT
*6
*8
PN ae Oe DW DINO
*quy
CCT)
Oc
* 8h
O2°LL
Certil
GE *o)
OT*9OL
OL SL
CETGL
CEPbL
OG*HL
Cl
aL
OL cl
Qf *El
C6 cL
OG°*écl CT*
2d
OC
8°G O°OT
G°ct
y* TT yee
c° ey
C*ct
¥° TT
ns
mm
eed
9° OT
6°CT
C*TT
$°OT
mM ey oF a
Dan
-quUI
CEP)
CO*%ek O9°2L
COc°Lle O08
OL
02° OL
COPoL
O9°SGL C2°SL
Ge toyL
OF HL
CO° ey,
Cote?
Og "ck
OR TCL
CH Yeh
CC Zh
QC
D,0SS
38 sainoy
Z Joz
[eeuuy
dais * 62
03 QL
uoTsay
gz AOF
SeTATSsueIU,
“*g
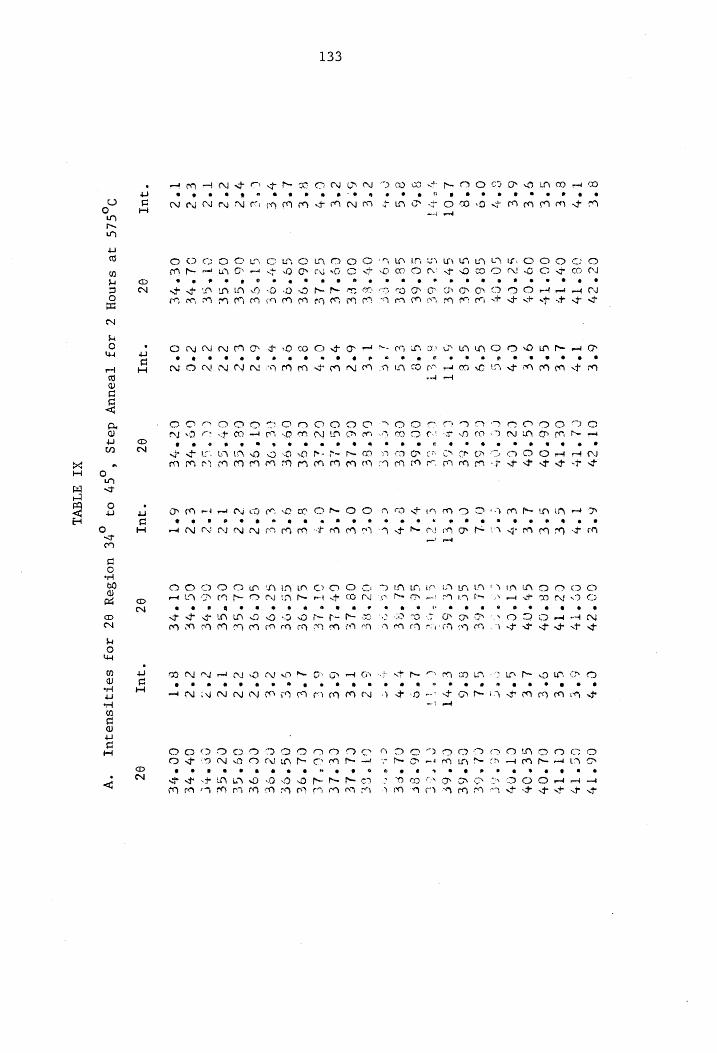
133
Bre Cc
ey T°4
usr TY
eee One
14 G*°e
OOP Te
Gre OF
° OF G°E
SERCY
Be? SO°%CO%
O*°9 S8°6t
Cc*e SO°6E
L°*OT SVYSe
Yee Sc*
OF 3°6
CC°6E
e° GE
PE
O° tr CGP
OE e*t
OF FEE
B°C? OOF
EE c*€
CELE
Crs G2°LE
GP €e
06° SE
Ere GO"9E
ee
Gyro’
Cee GU*
oe or?
OG “SE
c°e OS°SE
T*? CESGE
er? OL
° VE T°?
Cer ve
“UL
OC
e s * . e
TUN Oo CIN MMe Ss | * @© » © © 2 @ «© @ ©
MNO
TOO OASF RH ™ MH We W MO ODO WLM AD «
“yr oY NI
on °
AEN TS ae @
AL MONE AL OA
an e
-quI
rao
O°
dc Ate
ChE
Te T°
Oe * TY
ere
CE°O"
G°€
CGS °C
Z°E€
Cc°
ay €
°F
CO ea
ore
CE TEE
0
*h
Coté
C*H
CL"
G €°Ee
CET
Ed cre
OC *° GE
ye?
CEE
E&Y
peree
cee
GCETEE
O%e
CE°LE
O°E
GG FE
L°€
CES aek
C &
CEYSE
GE
OG *GE
Gre
CE SOE
ePE
CTY
SE ge?
GETCE
c°?é
OF PGE
ara
CO FOS
L*¢
OF *
Ee E°?
GET 7E
6*T
Od *4Uurt
pont peed
GO"?
Oo
* Te
C2°Ts
C&S OH
GH°*O#
cT°Ch
Coe
Oe
GL TGEe
GC*6E
GE*5E
Gite CE*GE
Gi eee
CETOE Od
SRE
Oe tLe
CY?
2de
OL se
CL SGE
GG*9O
SC'9E
GC °SE
CL YGE
oc *GE
OAS OE
GG PSE
CLI°Ve
02
Cr+
Ge
o°¢ Lee G°% Oem
Gtk 8°6 eth tai
Lee oh
TAN el AL A OMe GDN et e
mn
“Ur
CO. TH
CG* ET
CL ty
CL °Ov
GE° OF
CT*O¥
Ppaoer ce
wwe
tre
CLLEGE
CG*HBE
CES 6E
NT
Re
ot
woo
G6
° BE
CL TEE
chene
GT
Ss
CL ELE
CereLe
COLE
CL Y9E
QG*gEe
OZ
° OE
CCSSE
OG° GE
C?°SE
Of PEC
OF TE
COceEe
8¢
DooLS 7
Sainoy Z
1OzZ Teouuy
dais “597
07 ve
UOTSeY
9Z AOF
set AITsuseqUT
‘*y
XI FIAVE
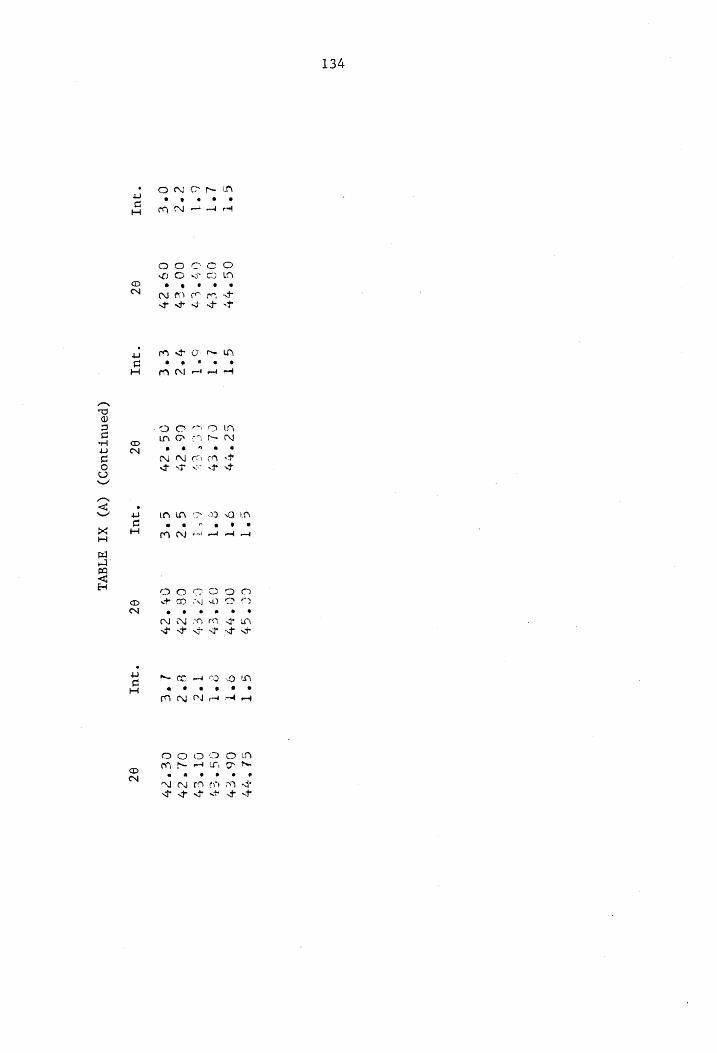
TABL
E IX
(A)
(Continued)
20
Int.
20
Int.
20
Int.
Int.
20
42.50
3.0
202
42.60
42.00
323
3.7
420%
3.5
42,30
42.70
2.5
2.8
42499
on
pod
ct} wN
wT
O°
cn
st
1.5
rn
pod
wy
yy v
tH
uN
a
css
a 2>
44.90
Ls
7~ 4
ew
5
134
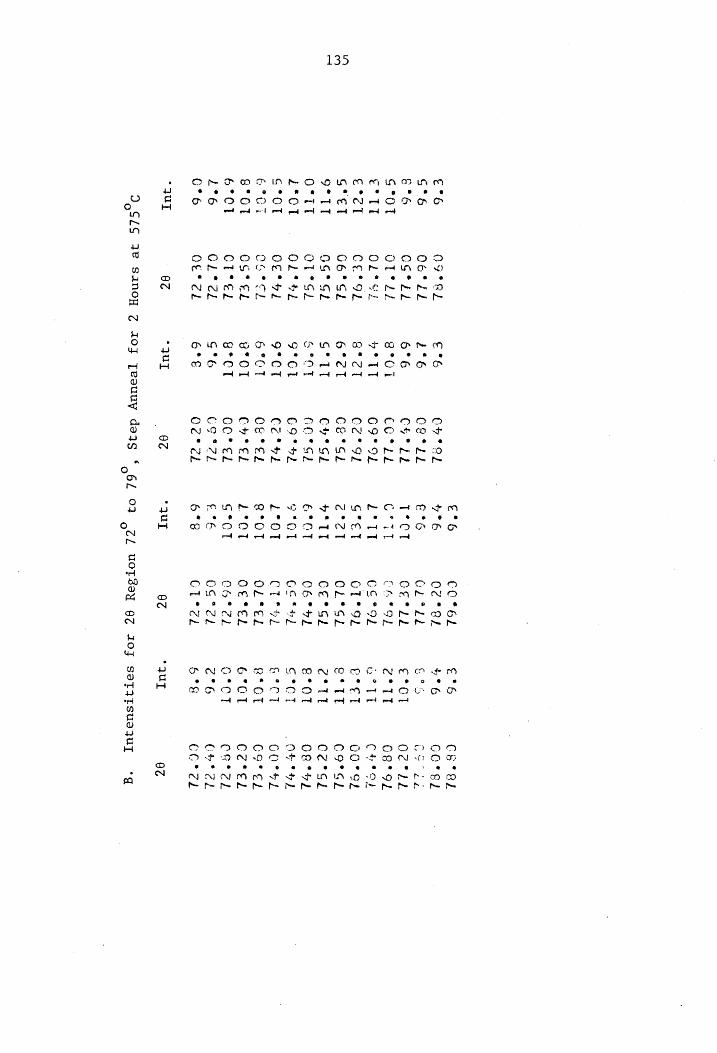
135
E76 o9teL
S°6 O6°LL
6°6 CStEL
S°01 OTTLL
E°1T OLTYL
E°CT CEtOL
S*ET G6°SL
O°1T OS°S2
O°lT O1TSL
L°01 OLt HL
S*OT Ofte
&TCT O6°C2
8° OT OS*EL
6°OT O1°EL
16 GL*2L
O°6 OeteLl
"Quy OZ
e e * e *
OO DAHAN HODaA GD god pet ed med ped eed eed mel
a m=
aed
Cano oF IND Dt anm ®
QO —
e
o> T S°6 6°E
eo qUuy
Cy OL
CecrLle
CETL
cowed
o9*oL
Cé°
ol
Ce °sh
CHS
Sh
Geo)
C9° ee
Coco!
Cec EL
Cy*TEL
CO°
El
Co*7l
Odc° eb
8¢
€°6 U°6 E°6 T° CT J
* iT
Z°tt
G°et
e°etl O°
TT EP
OT S*OT
L°OT
R*OT
L°OT
S*°OT £°E 6° 8
“jul
CC*%6L
Oc
° aL
GCE eLed
GCetld
CHOP
cco °*od
OT*
SL
OL SL
CE*GL
OC6°HL
Ge ft
CTP ee
OL TEL
Oe *el
C6
%* 2h
OG*2L
CT ed
8c ° UT
CS °eL
GO*el
OS oka
Oc
LL
C8°9L
C8
OF
0O°
9)
G9°SGk
C?2°sl
O8 SUL
Ob
eet COOL
Co EL
Cc*el
C8e cl
Cee cd
COP¢l
O¢
I5S2S
38 sanoy
Z 1o¥
Tesuuy
doajs “64
03 QcL
uoTSay
QZ AOF
SaeTATsuequtT
“gq
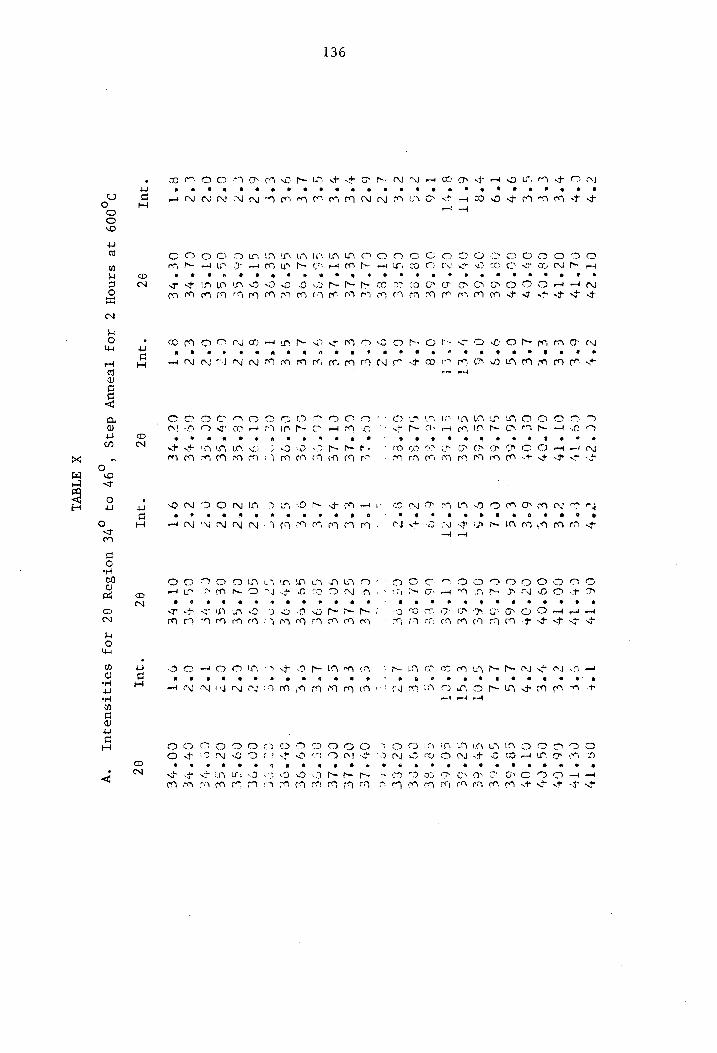
136
c* 7
CT"
¢¥v c°4y
C*+
CL° TY
6°
Hee
OC °T#?
£°E
C°¢
Ov" OF
ere
Swe
OUTCY
Lee
9° 4%
00° OF
O°S
T*9
GQE*6E
9°S
y°8
OS°6OE
O°S
46° TT
Ov *6€
yee
6° T
Cot ot
fe
1*6
OC *EE
O°8
c°S
OR8* FE
it
c°'e CG*he
Cft
£°eé CL°Se
or
6°Z
CL hE
cre
Yee
GerLeE e*€
9° ¢
GEi*dte wre
Gfe
SE°9E
Gre
L°€
Gitoe
2°E
ote
GG*OE
GTe
€°¢
GETSE
T*€
A*2
GI°Se
e°2¢
C°2
Ca*Ge
e°?
Cr?
OG °GE
Cf ¢
ie <¢
OLS SE
Ged
E°?
CL*¥E
cw?
3°17 OT
VE e*t
* Uy
8Z * Uy
reed peed
CO'C
CoS
Ty
O1°
T#
OL"O%
Ce tot
G6°EE
GLT6E
*£f o
"BE
e fe
ke’
GE
"EE
moo uN LAA ES LL
ooh fh oy.
e
a “
~ slg
eS
"LE “LE
CEPGSE
CLE
CGSOE
Co
ene
'
OL* cg: om ec US oct
om Or! wd OO
TA LALA
°
hw PAT MA OD wl
OZ
vty ErE Zee EcE 6°E E°G OTL 9°54 GthT €*
27 669 C *4-
Q°2
i°¢ Ete rE
nte QtF Gt
G°Z Z°2 0°2 at? Z*z 9°T
-4uy
C6 °T+ Ch
ly OGtTY 09°04 OZ
O04 CA%6E CLOSE OG*KE ares CT
COTE OL? G >
© fy i
vy
wo. PD
mm een ey rn
™
LA En ALN LN LN Dye Oo DAN:
e
9 roa
A
®
COL he BM OY A Od a
EW DA Tm UF OO OO
C1 et
e
_e te
*
an A
°
oe LN a °
TP OM IN md a s 4 e ¢ e
mA ON NOY NIM a oT MT ers
2 OO AO OU a
“qUT
ed et
one
OR
* Et
Ce STP
GES
OF
in
a 8
= a
e-
CQ ed
OG
7 wd
e
m~ o oy
a ony
MO Oy Al e
co
wr e
2 OD
DDININ MIAN INO Oo ™
e ay 7
7
3 @
™ “l
a
LO) fe fh Ph
~
OS
oge
olf
co*
cg
Od*
Go *
Cv"
COTE sroury ity <3 em a ”
MASA OV AO AMO ACA A OY OS MD CO OO OM NE
8d
09009 38
sanoy Z
Joj3 Teeuuy
days “697
07 ve
uotsey
QZ AOJ
SaTyTsuequtT ‘ty
X FTaVL
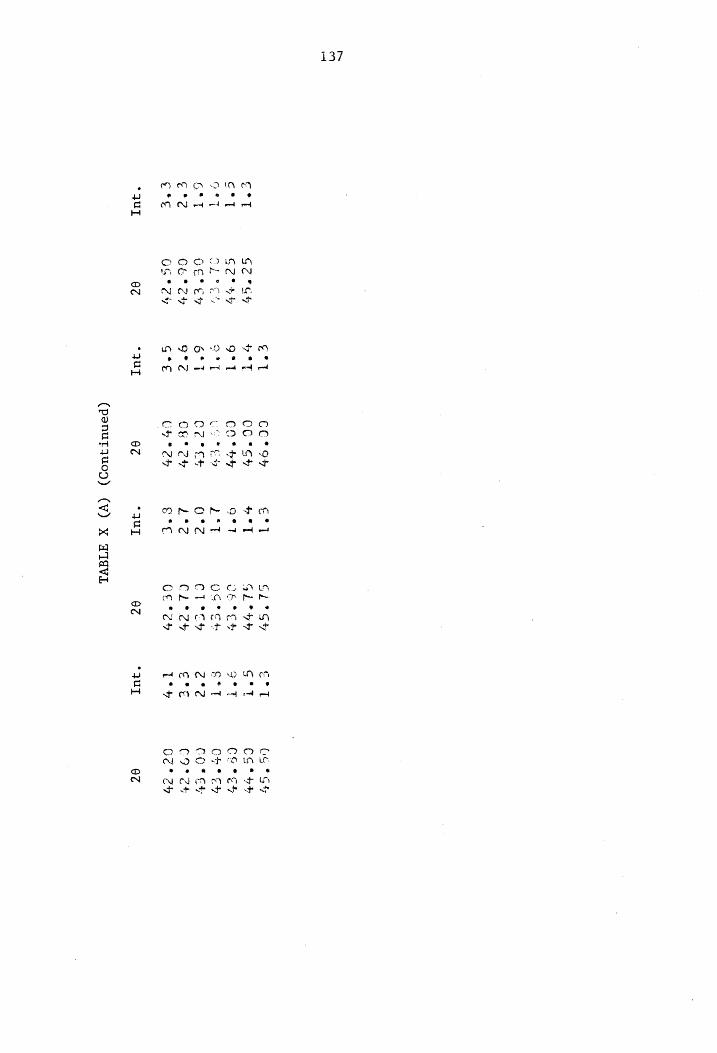
137
°
rm oF wa
a * my Oo
ee ®
MYL OS ed ed ed edt
quy
G2 °S4
G2° UY
Thee
OE*
ey?
CE CF
OS° CY
Og
sO 0 Fm e *
CON ed ee ed ed oe
wy SG OF .
-quT
COY%9Y¥
COSY
1O
* ty
wr
“C49
Cd
° eh
C&T CY”
Ob "24
67
(penut iwo))
(Vv) X
FIVL
- OM OO Fo e a a 2
CN AD ON ed wt ed et
gf
. qUL
° ¢
CA Pe eet OR Pe zoe * 8
NNT ET eT SON Popp sro
OM Ca OU OZ
e Ln
PTOI n a aetie
o
ee CON TN *
. 3UL
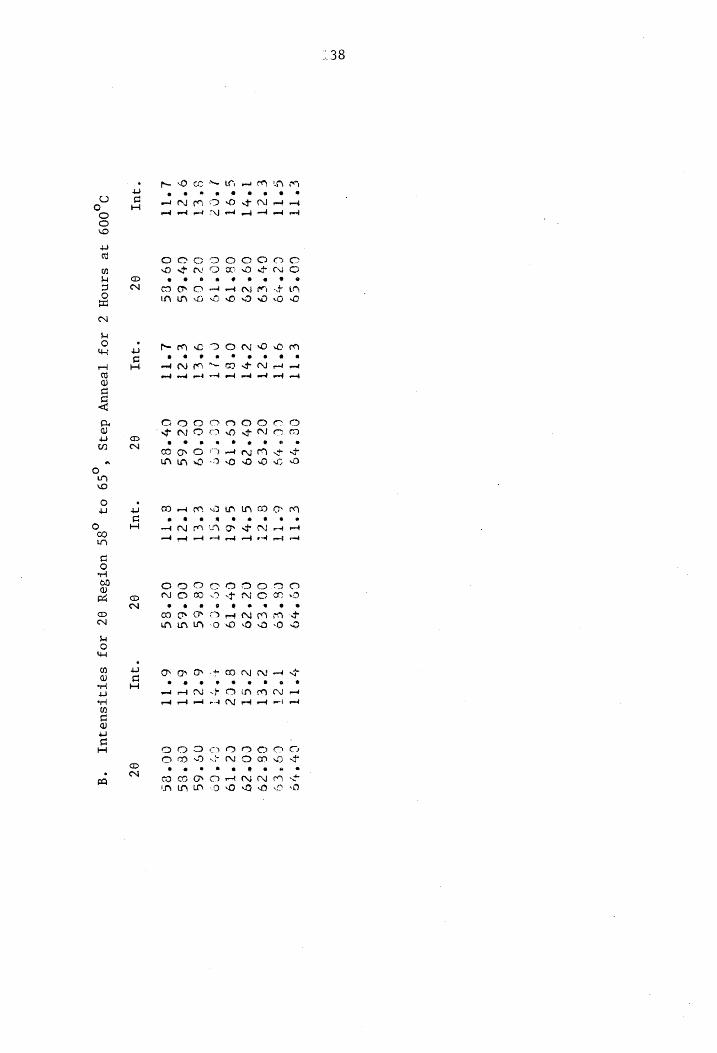
38
e* Tt
G* TT
€°ctl tat
S°oT
2°02
s*et
9°cT
L°utl
“qu
CO* Cs
C2Z%+9
G7 °e9
C9*
29
Ob *T9
COSTS
O¢* GS
O° 6S
O9°SS
82
e*ttT G*tt
9°}
c*T
O° et
O°) T
9*et
c°él
2°TT
‘uy
CE
° 29 COS
HS Cc
°E9 C7"
29 CS*T9
Coetce 00°09 02° 6S C4°8S
OC
e°ttT 6°
UT ere?
S*yT
S°6T
R°oT
e*el
T*¢etl e°tt
“url
Co Pn
C& YEE
QG°E9
O¢*
29
CH? Tg
Of *Ce
CB YES
O00
° 6S
O¢°8S
Q¢
7° TT
Te?ci c° et e*st
e°Ce
Pet
6°cT
6° TT
6° TT
“qu
C7 8ue
C9*ES
CE°
CS ©
COr?Y
C2 °TS
o£
Eo
99° 6S
ceress
OG" es
OC
0,009
38 Ssinoy
Z 103
Teeuuy
dais * 599
03 8S
uoTSay
QZ AOF
SAaTAISsusIUyT “g
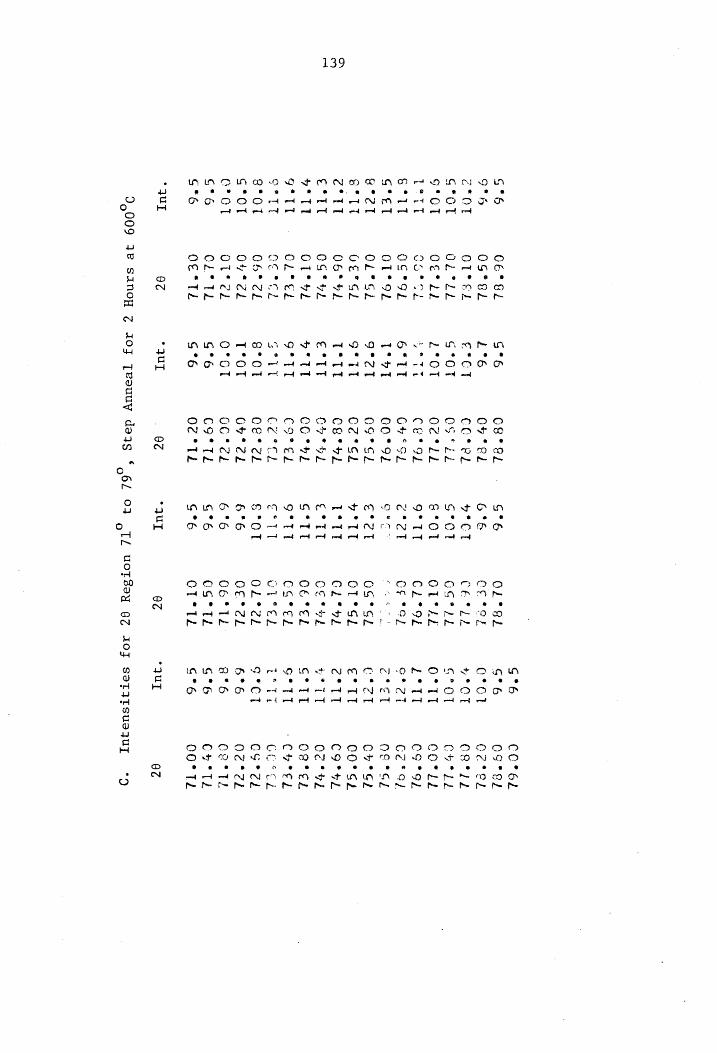
139
s
rN Met et OO DR * @
oud praed
te et ed ee tt od rst eet
9° TT O°
TT 8° ot S*OT
O° OT
S*6 S°6
POA AN oc Tin Des Wma om e
wnt
poent
e UT
C6" BL
OS°&L
OTS EL
OL LL
Oer° ld
Or
Bret
wu
ad
oo*gL
OT*°9L OL
GL
OErsl
06° HL
OS HL
OT* tl
OL Eh
cece
O06
° cL Gt
él
OL* él
CL tL
OE PTL
82
* * &@ 2
SOO et ORE a
No set et OO OND wed wed eed ed eed red med
e
ord
ome
T*ttT €°tt
y°TT
G* IT
S° ET
8° OT
T*OT
O°OT
S°6 S°6
-3UT
Cs° el
OF
° el COGtel OS
Sid OewldL Cee
OL aa
COP9L
GS" oh)
Co°scl Cer
oL C2?
bl
CO PHL
Co El
Cee
Cee dL
OF*cl
OC* cL
Co* Tl
Oc °TL
Q¢
a *
eA ALIN OO mM DH rood
et TOON O MIN FO Ww * e ® e« eo *
wood
rod ‘ed emf ped net md
”
pot rod
° qUI
OL Bl
ce eee
CE%LL
OG*/L
OLTAL
CL°9OL CE
eof
OS*sed OT*
GL CL
EOL Ceo
fee CE%EL
CS*ek
eirel
OL °?L
Cee eh
O6*TL
CS*TtL OT*tL
QC
G*6
S°6
O° OT
v°CT
G* OT
O° tT
i°*tt
Of ?eT
c°€
Cet
e* TT
"TT
“TT
"TT
"TT er7
tt "CT "6 "6 "6
“6
tA IN DH BD kt ODI at
qu
CC°6L
og°eL
Cc tel
OB cil
CHTLE
Corld
Co *SL
Cero)
Of °G?e
Cy*SL
COPSt
COP HL
Od PHL
O8°¢eh
Ch eed
GCotcL
OS°¢L
O20
* 2k
Ce ets
Ce Te
OO°
TL
O¢
9,009
72 sainoy
Z Joy
Teauuy
dajs
* 64
03 old
uotsay
9% AOS
satjtsuequy
“9
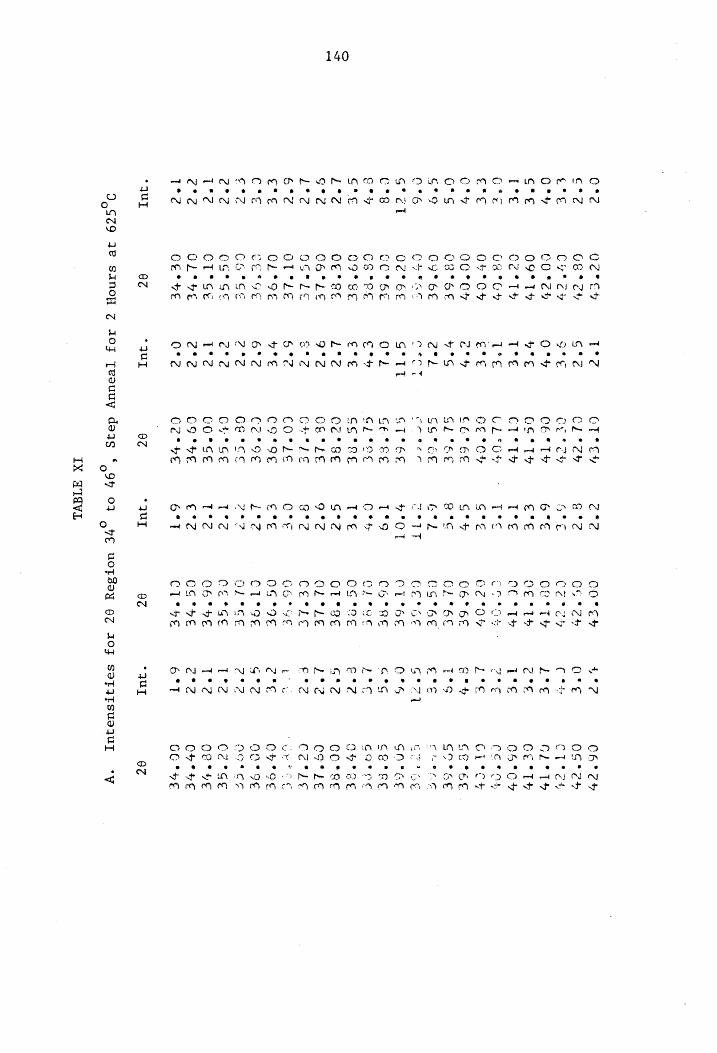
140
e » ° a e ® * 6©@ a 2 4 e e e e * e ® e s ® e * s o
AEAL NEN NCO CINE N NN OS DON DON SOM IAMS SNS
AAPM AL ODO Am DM IND TN DIM ODMMDAIN OD CIN ©
Og° CY
GS*% eV
Cy coy
COSY
O9*
1%
CoP
TY
G8 °O9
OP Ose
00°C
OB *6E
CY*° 6E
CY FSS
O¢* 6E&
uC*&t
CS°RE
OF SE
OE“ EE
CG%LE
OG°2LE OTTLE
OL Se
CEEGE
PO °GE
CS*GE
CT* Se
OLS v7e
CEP ve
8d
ee ¢© # » # @ @ &®& @ @© @ » @ #® &§ ® @ @® #& @ & @® @ #® 8 @
CEA AL AY OE NE OS SEN ALN Rr om ME SE MM Im Se NN rand
MAR OUN Dt OMOMmM MO OMIIN TN Me a tO WY
OT TEy
CL ech
Cot ey
CEST
Ger
Ty
CT*° ts?
UL SO
OE
° OR
CE*° EE
GSl°6E
SG°GEE
T°6E
€ SEES
2°8E
G*RkE
c° Se
&°lEe
Geese
COPLE
COor9Ee
CERGE
CECE
C4
° GE
COPSE
CG PVE
CC
RE
OC
IX aATdvi
* * ® ° ry ® e ry e
eC mM OA RA ON
4
ph
Ih NAO DOW test PUI PDN OH AHO OOM *o» *® «4 e# ®8® 2 @& 8 @o@ & @ @ @
mA ALN ALS NM) NANI ND 6 OS OO
OX CO wt eed
OO%EY
OG
* 2b Cote?
CeTTy
Of
FP Th OC
* T#
OC °O%
CB°6E
G2 Ge
4 i.
CS*HE
GEerae CLT6€
CHPRE
OLS?
CG “OE
CT"8e
OL°LE
Cerere
C6 "GE
05 °9€
C1LYSe GOLYGE CE
RGE CHT
VE CG*9E
CI°ve
9¢
TT IAN OR AR DO MR mR ng et OM 9 oO DAD at ed AG UY ore
ar
*
Cy
OO AG Cé
Oe
CVT HE
GG 8¢
0,629 #8
SainoH 7
toy Teouuy
deas “Oo”
07 Qvé
uoTZ9Y
OZ AOF
SeTATSsusqUy
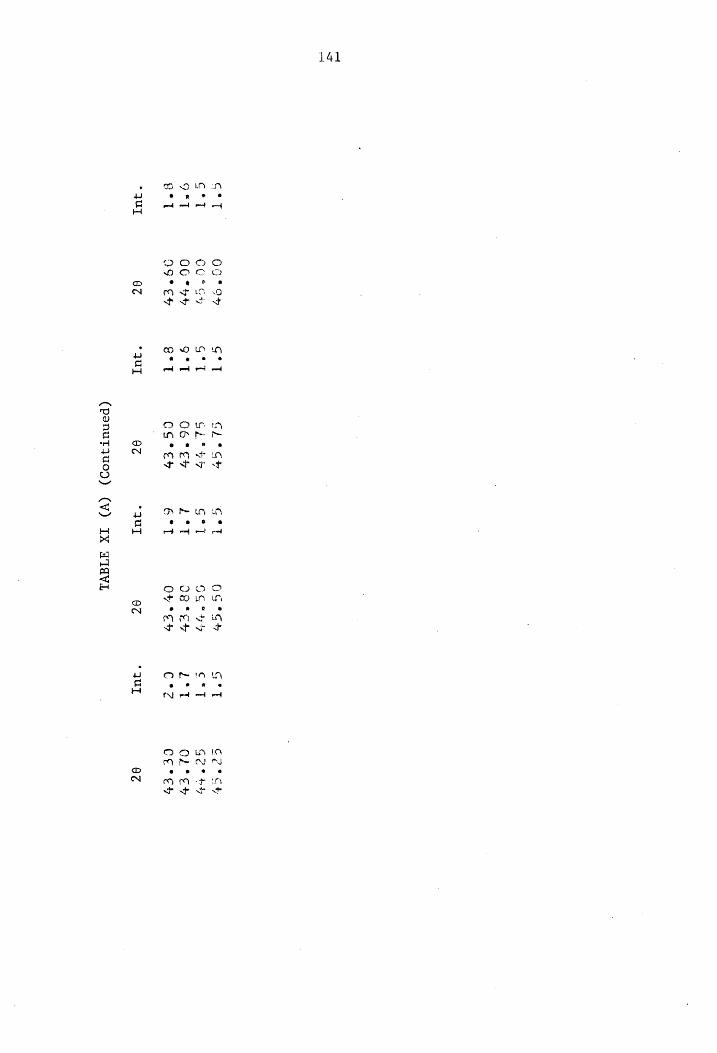
141
Cotoy COS
SY
00 “7b
O5°
EH
OC
co SOO LY *
red red pt med
quy
GL° Se
SLA’?
06° EF
CS*° EY
OC ul
(panutquo)) (VV)
IX wIaVL
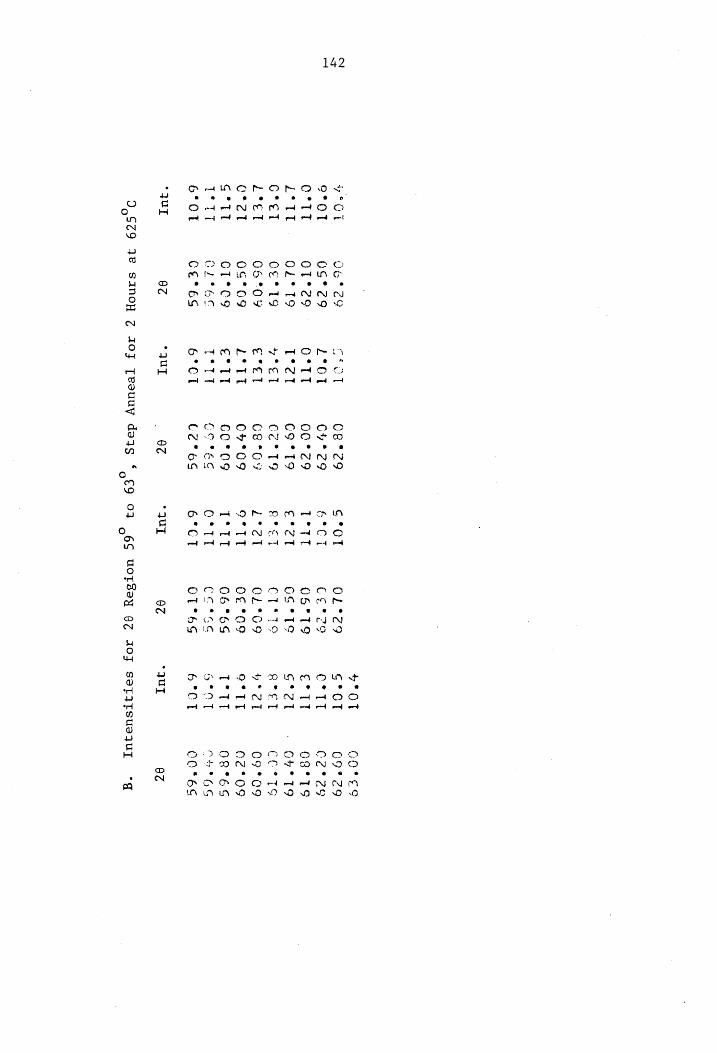
142
yO
e°OT
O°TT
L°*tt C*etl L°et
C*dl
G*tt
T° TT
6° OT
e JUL
U6°S9
0S°¢9
O° ¢?
OL
° 19 CCT
1g
06°OY
OS° O69
CT° Ce?
QL %6¢
CE* 6S
82
TP OT
L°OT
O° TT
T*2éT vt
Eel
€°el
L°Ttt e°
tt T*
tt 6°CT
e UT
C8 wC9
Cy" e9
00° 9
Co
* Ts
Cee tgs
C8 °O?
Cv*SO9 CO*OS
ECE
Ne
is
Cé*°6S
Q¢
GS *OT
&°CT
1°TT
E°dT
Rect
i*dl
O° TT
T° TT
O° TT
6°CT
“quy
OL T?9
Cee?
O6°%T9
GG "TS
CITSTS
OL *O9
O&
° OG
06 °6S
Cetge
OT°AS
OC
S°OT
S°OT
C* TT
e° tt
G*Zl
R°ET
ye ?eTl
o°TtT
TTT
gS*AT
6°CT
"Jul
GO*Ees
09° 29
CE° 29
C8
° Ts
Ov"
T9
COP
TS
09°O9
02° OS
OR TES
PY
GG
CO°6S
0c
049¢9 728
SAnoH Z
10F¥ Teeuuy
dais * £9
03 46S
uoTSay
9Z AOFJ
SatjtTsuequy -g
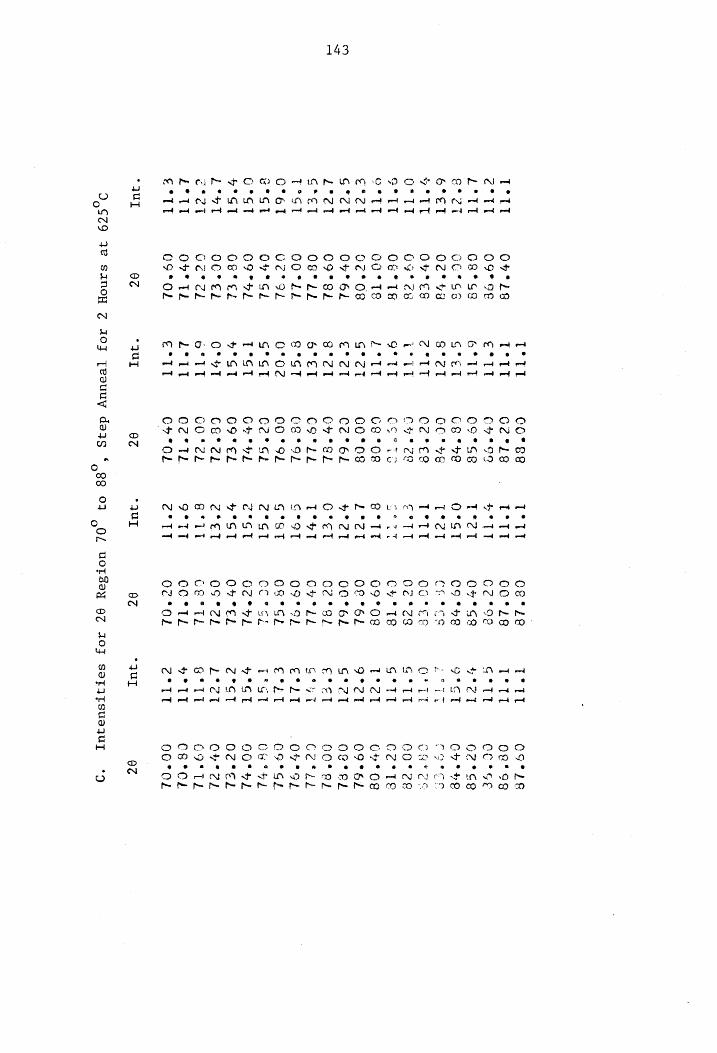
143
T°tt
c* tt
L°TtT E€*
ZT 6°ET
Y°TT
O° TT
o° TT
O° TT
€*cl
G*éT
Z°ét
G*eT
T°ST
C°é6T e°St
G°st
H°GtT L°*7T c*
ct L°
tt £°tt
“QUI
047° 18
Oo9* 9€
08 °S8
0O"SS
02° 78
OF*ES
09°
ds
O&°
TS
OO*TE
O¢*
08
Ov°6L
09°8L
O8*
lL
OO°Ls
Od°
SL
O°
Gl
O9°HL
Gere
Oct
EL
Ge ch
Oo*
TL
CS* OL
82
T° Ut
T°It
€*ttT
6° TT
G*eTl
8°¢T
c* tt
told
9° TT
2° Tt
G*¢cT
€* dl
e*ctT
5° ET
8°ST
0°02
G° sot
T°StT
O° GT
O° 7T
of lt
L*tt
&°TT
“qu
co*se o2°18 C7999 cee
C8 tHE
CC° HE
ez*ee 04°29 Certs og *0R coto8 CZ°6L OF
"SL COTLE Og
ToL 00°92 C2°SL ObtyL 09°
EL Ce
2L 00
*2L O°
TL OF "OL
OZ
T° ttl
T*Tt
bert
T'?eT QO°StT T*et
T° tt
e°TT
“Tt “ct °2l1 ‘ct “oT "oT “St “GT “St “ST “el ‘11 “TT
e* TT
APO MN AEN NU IN Or OLS
-qUr
CE*le
CO*°L8 C2
* 98 0F°S8
CS
* be Cle
CE
OUT EE
O¢ *Z8
Ce" TS
09°08
oe *6L
OC*6L
O2°8L
CY¥* LL
oor ol
OS °St
mere
Ne sd
OC 7b
O87 *%El
OS*2éL ce
ttl COTTL
Oc
° OL
8¢
° 37
* e e a 9
reat ACY IS UN ur, Pe ph
meted et eed met pe ed ed
NF OM ADS RE MLO MIN OQ EIN EN OD *
-qUI
OS*%1&
08°98
CC*GE
G2°S2
Oye be
UGS
ee
CO*
de
GCC°TEe
Gv* Og
O9°6L
Og*eL
GO* ek
Cech
-O7°Sl
COSGL
O8 SFL
60° Ll
O2*el
One eel
cCoOrTtL ceeck
oo°aL
OC
I4Se9
ye sanoy
Z 10ojy
[eouuy
daqs
* 588
07 904
uoTSaey
QZ AOF
SoTALSueqUyT
°*49
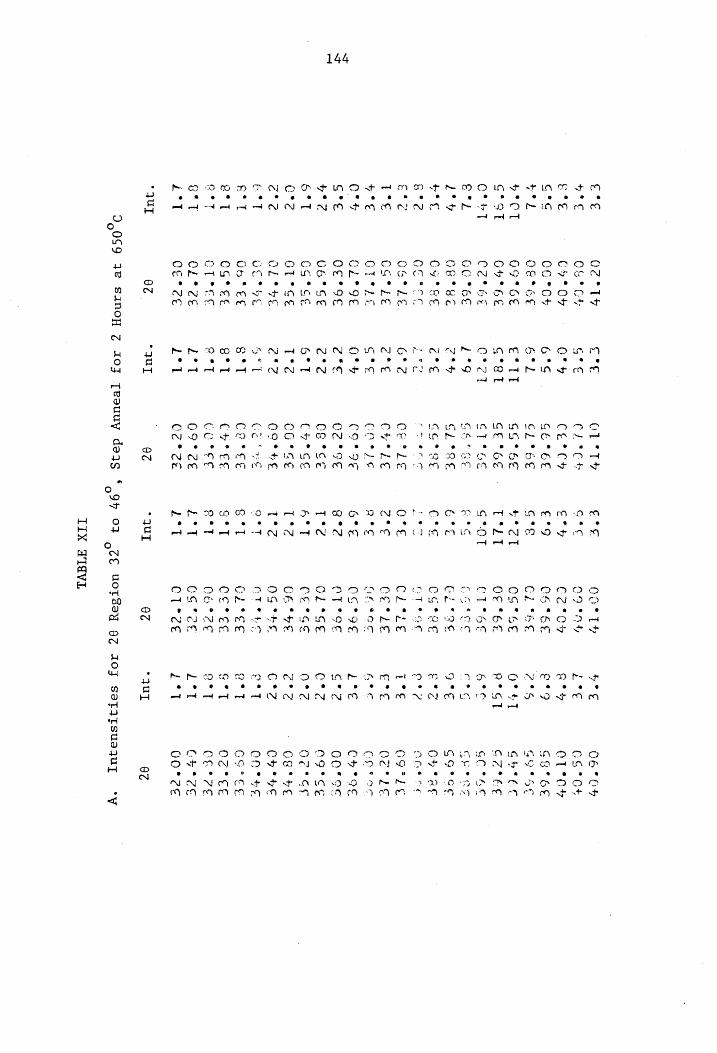
144
E°€ OZ*14
4° €
GOH
et Co°
0% G°G
OC *04 va
Of GE
50
O9°6E G*9T
OF" 6E Of bT
CZ°6E el
GO°6E L°4
OG°BE bE
Cytee g°2
Cette Ete
OGTLE TE
CS*LE HE
CTLE O°%
CLT9E S*€
OC°9E 7°72
G6"SE 5°
OS GE
C2 OLSE
2°z OL
HE BT
Sot ye
ett ObtEE
ect CG* EE
ary CT
CE gtT
OL° ze ict
cE
* ze
"Uy QZ
£rE
GTE
O° ¥
Gs
Beh c*
tt
G*at Cte1 L°s a
Z°€
Gz cre
G*¢
O° F%
Zre c°?¢
5°T T*2¢
c*2
He
8° T
g°1 QT
Z°T
itt
“UT
CO1L° TY
CATCH
CEPCY
GE*6E
cys
GG¢
LA ry
s
oo
in owed
°
Da HYD Vee aA TA FO
e
ns Ad
SOLA LA LA
SOLA Pm CN
® e y
™ 3 OD rm
a
Pe Pe cA rey
—~ at
* aed
0
O°
*4
s CE
Sve CECE anne GOTEE 09°2E CZ°2e
QZ
* a e a . e
mod eed
TDL me er LN CA eH OS a € & b 9 eg Z L C
GE
cre
Ore Zt¢ are 6°€ gz
T*2 A°T L°z Lz Ort S*] g*T ect LT
L°t
qu]
oe mo LO he ca
* ® s
2 wy gS EP gs A eA eA EM
Vane
oO
[~~
e
ft
ce
Oe *
fi
rm
~
th,
°
0? 7
OGS*9E
0%
Nm 1 Pe Ap °*
eM r o
oO e
rt
pry “OM DA yn DB ee #e@ # e# @® go *® eo ©
LA Bh ®
ION DO s * e s ° e q
sont tmnt met med et INO OA NE PO TON OY OE OS pomed
Ph ™ 70 tO 9 ®
qu
06° OF
COS
° Ot OT*O%”
SB8°6E
OgFLe
OP
LE COP
Oe CH
POE COrSE
O9* CE
OCP EE
C&EN HE
CHE PE
COPE
Co* CE
OS "CE
OG 7E
CHEE
OCO°?E
A
D069
78 sanoH
7 Joy
[Peuuy
daqs * 59%
02 ,z€
uoTSay
QZ AOJ
Sat}Tsuaqurl
‘cy
TIX WIAVL
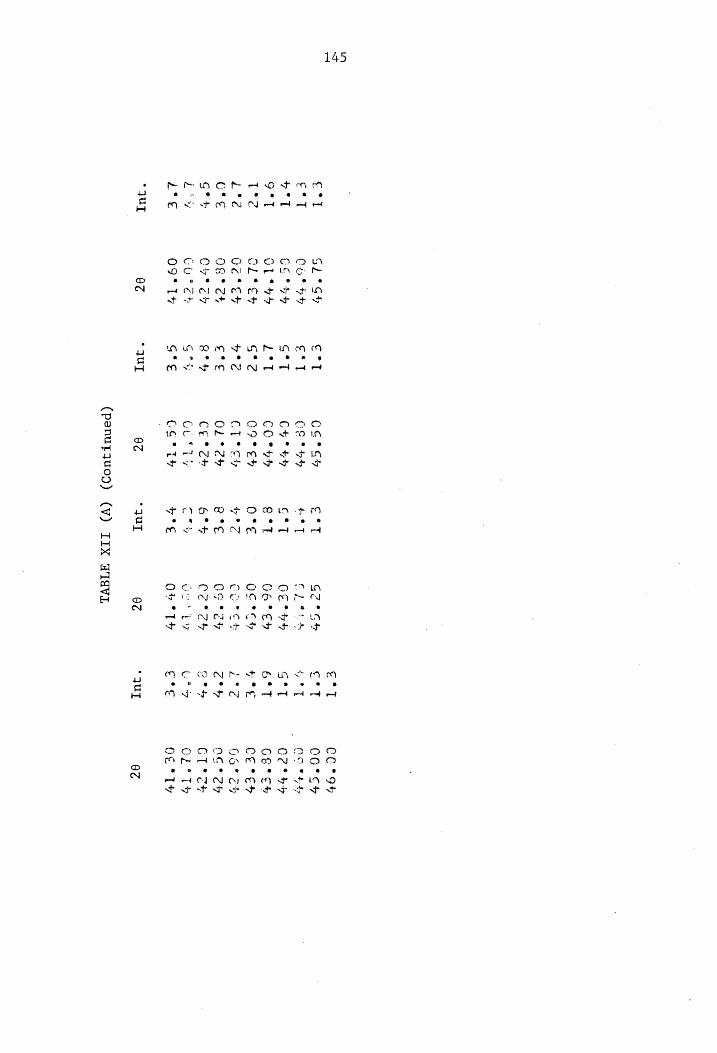
145
“ «@ ®© » & & @
SPOON NI et rt a es e n
we
Phe PR Um tO OS
rae
S1°SY
Cor
oY
Co*s
OL
CL YEH
Oe
* CY
Og
° ey
Cr "cy
GU
Et
O9*
1
9~
e +» ® » © @ »@ @ # @
CA CAN A eet mt et end
LV OD oy SPUN Bh EN ca
OS °S%
CE
% 74%
CY 4H
COSHF
CGT
EH
CL ey
Ol
% dé
Cee
cr
COSTLY
CG*
Ty
82
(penutquoj) (Vv)
IIX WIGVL
a e * * » a ®
Qh OA SS
SPONP OO) PO od et ed ret at
~ Ne
s ra ry
oS
moe
CCP Ou
CO*EY
OG
8 tty OCS
BY GS*
cr CE*EY
03° 2%
OG
° Cy CT
Cyr OL
PTY Oc
rly
9¢
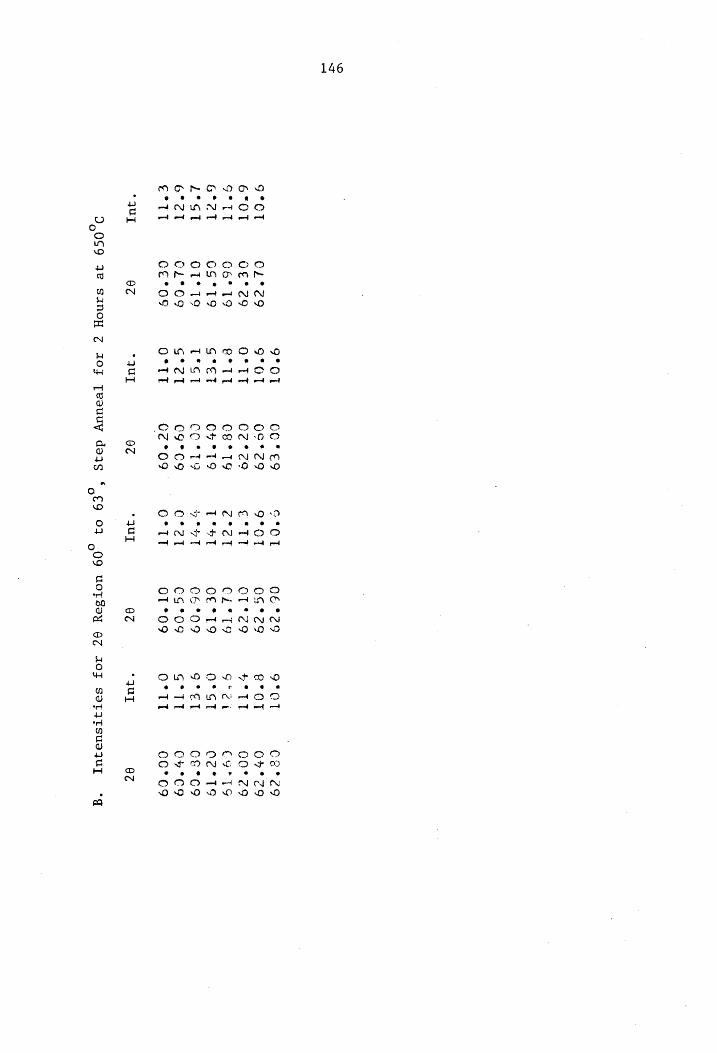
146
9° OT 6*OT
G*tt
G°daT L°sctl 6°?T
c° tT
‘qu
CL °?9
O£° ¢9
Ca* 19
GoS*T9 OT’
19 OL°O9
Cc °OS
OC
9° OT
9° OT O°Ttt e°
tt S°Et
T°St
S*eT
O°TTt
qu]
oot E9 oo*z9 oz*z9 cBeTy CH°TS cette 09°C oz*09
O¢
©
° Oy]
9° OT
e*tTtT
c*ct
T*#t
yyy
C*dtT
O°TTt
“QUI
OE
* 2S 0S
°¢9 CTY
cS CLET9
Oc
* 19 CE°09
CS*O9
OT*O9
82 -qUqT
Cereg
07° 29
GO" <9
C8
1s O2°
TS O&°69
C#P C9 00°
O69
QC
0,069 #8
SsanoH Z
Joy Teouuy
dears £9
03 09
uOTSay
OZ AOF
Sat Tsusqzuy
-g
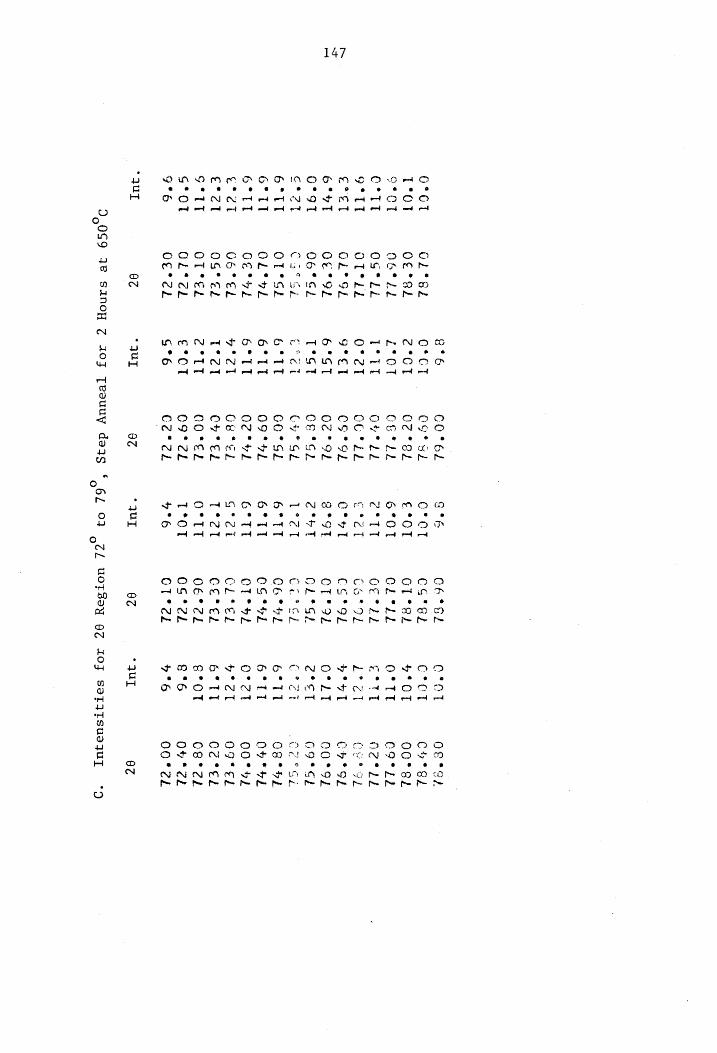
147
O°GT
T°OT
o' Ctl
C°TtT 9°TtT £°
eT 6°UT
O*9T
c*2t
6°TT
6° TT
6°Tl
tet
E*cl
G° tt
S*ot
9°6
“qUT
OL
° Se
Oe *SL
06°21
OS*ki
OTTLEL
OL° SE
OC*OL
C6°SL
C38
Sb
O1LTSE
OLS 4L
Geto
O6 EL
OG* el
OTted
OL Ch
Oe*dh
OC
Let
6°TT
6°tT
6°
7° et
E*¢c!l e*
tt e°cT
G°6
uy
CO°6L
O9*% sk
O¢
° 8h
CGS
LS
Ove
le
OGL
CS* gL
Od
° 9k
CE YG)
CY Gd
CO°sl
09° OL
Oc
° vl
Gets
Cy.
EL
O0O°EL
09%
el
Cé°cl
QC
ALD aA oO 3 e °
ADO OOD rot nd red ed
0 e »
oN mt
o°9t
c°hT
L°ct
6° TT
6° TT
G°TT
G*ét
T*2l
O°TTt
T*OT
7°6
. UT
Cé*Se
CG°SL
OT *°el
OL TLL
Cech
Cot
OL
Coto
OT*9L
OLY
Se
Cue
ck
C6°% RL
CG eoL
OTe o2
CL YE
Cce*el
OE°CL
OS*2L
GI°ded
A
COT
C*cT
%* OT
O° TT e*
TT L° él ye
ot O°lt
c*et
C° eT
6°TT
6°TT
O° ct
vel
é° Tt
6° OT
8°6 7°6
“4UI
oeteh
Cy
* Sh
00° SL
Cgel?d O?*2L
cet os
CH os
O0°SE
COSCe
mF
& Ce
fGL
C8 coh
O”F HL
00% FL
09° EL
Cc °ek
C8°?L
O°
dk 00*¢L
OC
0,089
ye sainoy
Z az0jy
Teouuy
deqs
“04
02 ott
uoTsay
9Z AOJ
SaTATsueqwyf
i:y*4
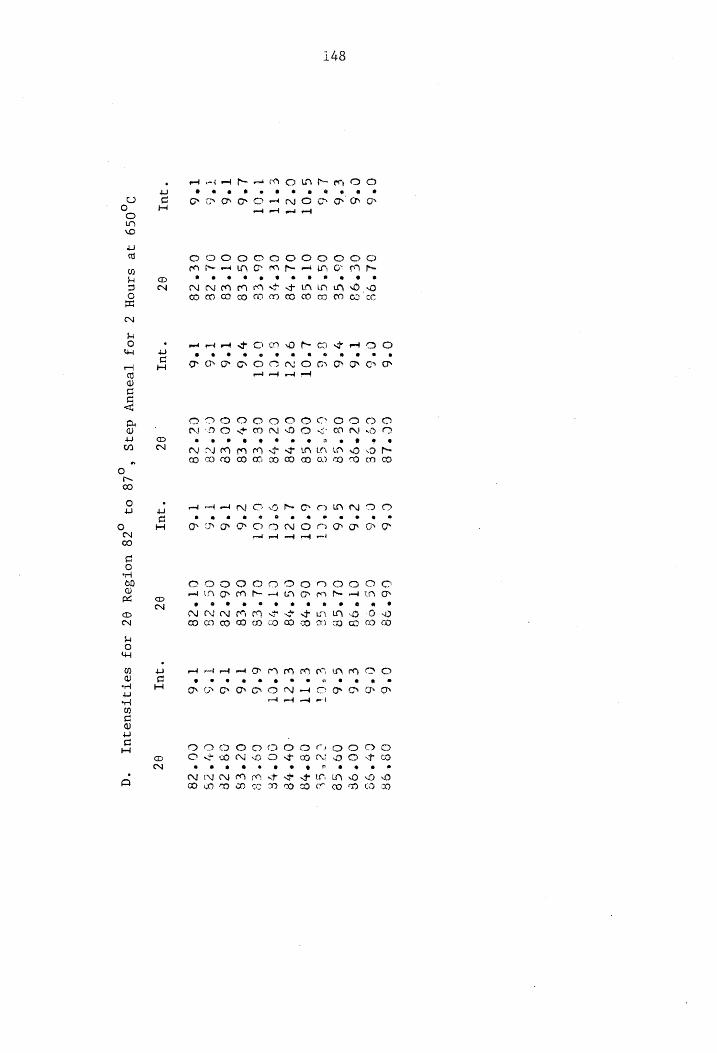
148
0°6 OL
98 0°6
6€°98 E°6
06°SE L°6
0S°S8 G*OT
ose
O°21 OL
48 e°tt
OEtee Lot
Co°Es L*6
os*ee T°6
O1° Es 16
On*ze 1°6
oe*z8
“QUT QZ
weetedt SOM OM cs OO} * @ © @* «
Peer aDdIan am PE ® ee ed pet od
. UI
cc"le
Cg*OE
Oc*9e
0& °S®@
uv?
Ss
00°SE
C9 *7E
02° Ue
CE ES
Cv" C8
Oot Ee
Co °?R
Cé°dcs
OC
ead AP OTM OH OLA A) DO a e 6 e os
RAPNADMINAMAAAN
QUT
od et med ed reed
G6° 98
OS *O8g
OT° 98
OL*S®
CiLYGE 06°
QG
°° CT"
2S OL°€s
GE *E8
06° 8
Co
* eS CT
*ds
Oc
O°6 08°98
C*6 C7*
9S £°6
00°98
G°6 OS°
Se ‘°OT
CE St
e°* Tt
O8° 98
e°ctT “07°
UR e*OT
OO eS
6°6G GOS°
ES 1°6
Oe
° Ch T*6
C9" ce
T°S OU"
2S T°6
OG* 8
* Ul
QC
9,069
78 sinoy
Z iojz
[eauuy
dag
* 548 03
28
uoTsoy
QZ JOJ
SaT}ITsuequy
<‘q
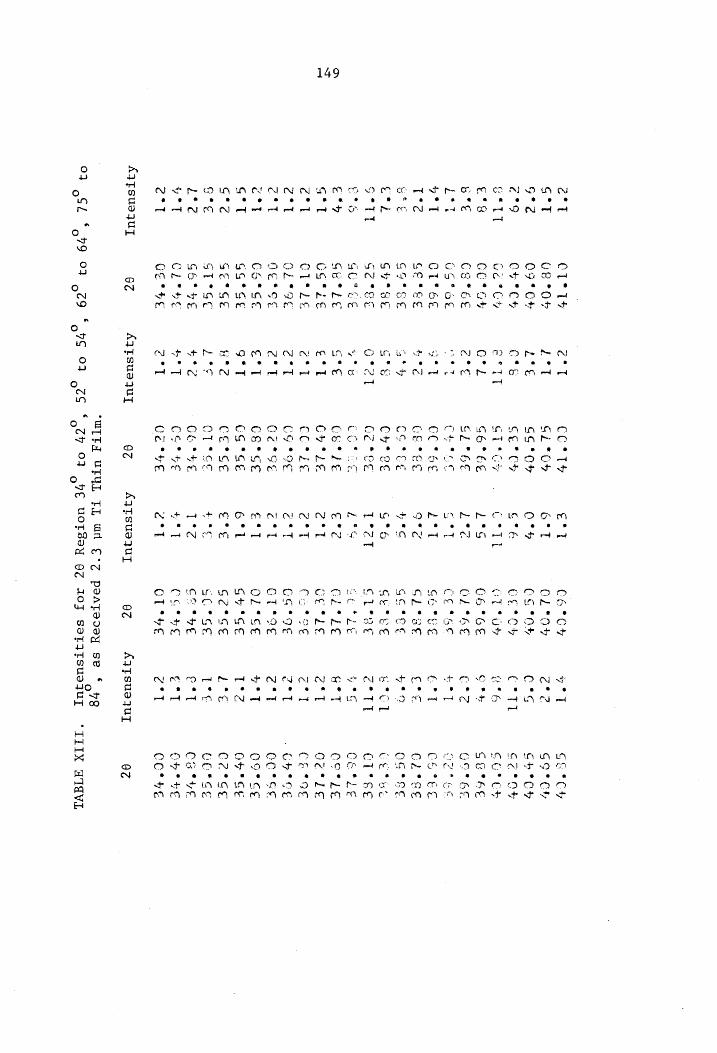
Film.
in
34°
to
42°,
52°
to
54°,
62°
to
64°,
75°
te ion
» as
Received
2.3
um
Ti
Th
* ties
for
26
Reg
Intensi
84
TABLE
XIII.
Intensity
28
Intensity
20
Intensity
26
Intensity
20
34.2
70
1.4
020
34479
—
ad
1.
1.2
1.2
34219
le
34209
oY ma
wt en
mt
342 4D
3%.
209
of
36
A
om
st ry
ON
34.9
9 2el
a)
mn a
L.3
4
fn.
oy
+ 72
@
cC
uw ce
w
on
un
ey
LA cy
1.5
us
uN
35.59
1.6
1.9
wt
un
Gn
uN a
1.3
1.2
1.2
~
wm
af
2/0
36019
Ln
™
om Snel
™
ns
NI
L.2
35.2
0%)
1.2
mr Ww
366976
0 5)
fe)
x rs
£
c of
am cs
1.2
37.219
3 i.2
mi
ond
36.3)
149
Ly oS 2 a
om ot
mo a Le
» 6
he fh cy
ren Ut,
a *
ret Cr}
oy
ar *
fh
my
We °
pal Of
CT Om fh
* 2
Ph my ry
MS! ® *
road
= > ALY
* «@
ef
my ety
37,39
oe
as, wf
my
rh
ey
cS
12.i
38215
33.35
11.2
2) 33.1
4)
: Oe
3;
9.5
co rt
ica
A
oO
oD Ww
em
uy
ny
ca en
~ eS
ES
~
a
Se
mI
a
ny
343
739
x re
ww
®
L.4
ue
ory
on
te
ea
ww
om
4
on
ay
ose
oe: e
wo
ao
ar ah ne
39019
ny
c™
aa «
&
39.95
Psy
39.99
+
11.5
Lli.
e 2215
Ae
40,19
li.
Jae
Ll.)
a Cc
fF
At
«OD
39
wr
IN
™]
t
Ww
#9.60
a
iy
7,
a a
a Y
Fa) Tr
St
1.7
49.75
41.9)
1.9
40,79
4Oe
22
49.255
4).
41.190
1.2
1.2
1.3
a 3
won
8
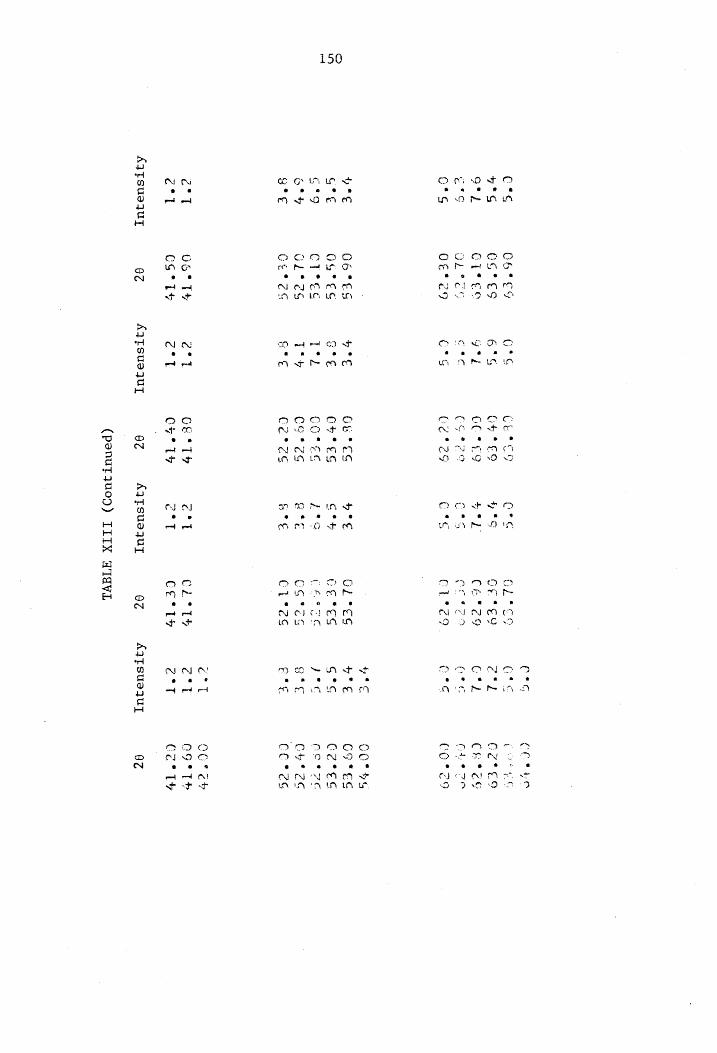
TABL
E XI
II
(Continued)
Intensity
20
Intensity
20
Intensity
28
Intensity
26
MS
1.2
41.259
1.
1.2
41249
41.39
1.2
41.39
1.2
1.2
41
s 29
a
41.279)
a) oO
OA! tf
ce
GS)
on
a
CS
on
Ln
S201)
»
on: un -
c ur
wt
ts 4
Ly
om un
pmo
qt m
~~ 8
{ 525
De
150
53259
5 3.
8 53.49
532259
36
3.4
3.290
53.239
3-4
54.09
529
62.30
a)
Ped
~™E
na
20
Sa
CJ
C> .
aan
0
DP
70
ey
i)
? Pa a.
& e.
a? rs
de
7.29
J Woe
t
12%
62439)
9g ?
» fy
J
ar
aD
7 ont
29
O32
©939
0
ry ~
0
2?
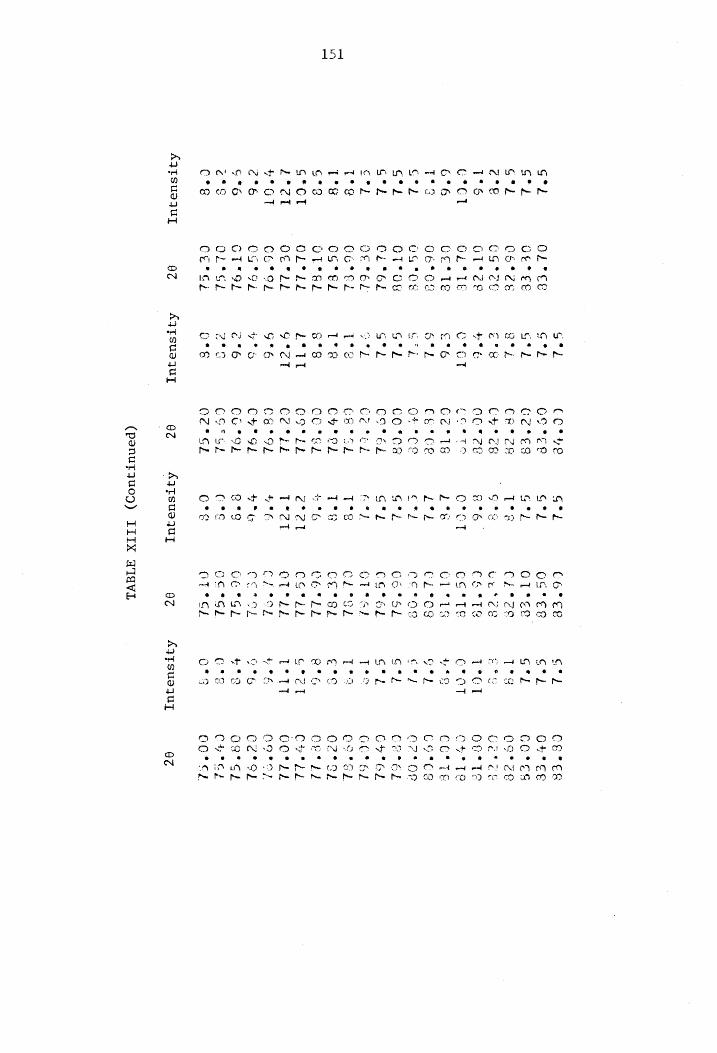
151
* a 9
CR COM *
Ia |
a Ld a *
Pre foe Pee Be,
e &
e e@ “CT ai
e
es
onal
- «8 @
ao mo *
Oo
OF AEM AR eM LTR et RI LO LN IS ea OOOO LOL
ATSUa UL
OL
° Eb
GE EE
CE ?E
UG*ée
GT
ée
CL Te
Oe*
Te
O6°OR
UG "OE
CT* Og
Ci*6L
Oe °6L
Core:
CS*EL
OT*SL
OL id
Oeil
CE*OL
Sa Gk
CTS9L
OLTGes CowGe
OZ
S°b
G*t
GL
Be
ck
°G
CCT
c°sé
6° L
Qk
G*L
S°2
“
e i
we
T"é
3° 8
2° TT
G*CT
G°&
yea
c*6
oe
O°§
AjTsus Uy
cc*ve
G*i
C6*Ce
GO *ce
G*)
GS* ER
Cé* ES
GP)
OT*ee
Cre
2s Te
Cit Ze
CH c&
Gee
ux cs
OO" Ze
BSG CE*TS
cece Te
CPt
Co*Te
Cé*1s
ifs
G1*Ls
€&°Ce
é°b
Ci*es
ote ce
cr) Me
foe
CO%Ca
Gtk
C6 *sk
CO GEL
c*Z
CG°%S
oe TEL
AS)
GES
as
CRYEL
T°S
Cl °sl
Cy oe
° Cee
Sh
CO TEL
°6
Ce*LL
2O°%22h c*?et
C°eb
CZtLL T*2T
CTtLL Ca
® Gh
4° G
Ce toe
CH SL
b*G con
od CO*%OE
ers
CG TGL
Cortes Gee
Oe"G] O€
* GE
Cre
GT eos
02 AjTsue
uy OZ
(penutzu0D)
LTIIX alavi
mL: a
he ft
eet sh
af
OT ed * &
aA
Spo LO OO mE UN I I AD ow *
i)
e
Pe Pe oe Be OT Oe
*
9 ®
a)
s uF
ran
“TT ef
"6 €a uw
Ge
O° 3
A}TSusqU
OM O M D> wr OD * oe 8 @
cn
wy on mM oO DQ mn eD ao
cD An *
PO ON et eed eed OI OAL try
2 a [b=
Cee
Ge°ol
OCT
6E
CSE O2°o)
Ce LD
Cetid
COtlL
OOo.
CE°ok
aa’ esd
CH Ges
Coe cy
9¢
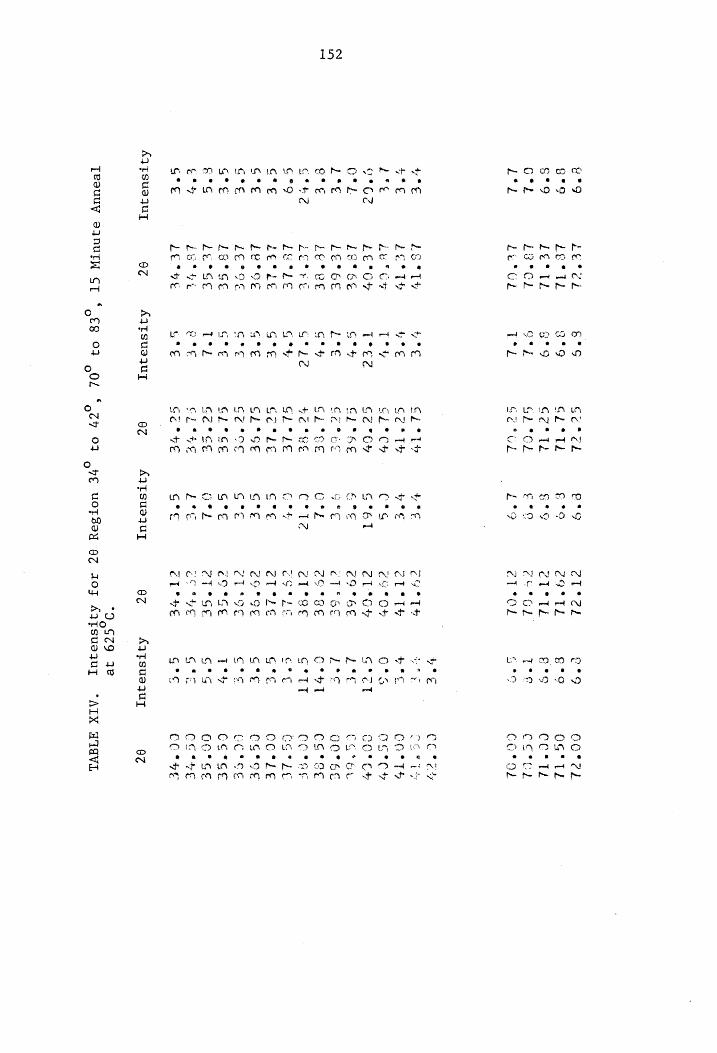
152
u°9
g°9
g°9
GL
L*k
4; *
&
Bee
Lft
O°GZ?
O°L
L°€
E°E
Gt?
G*9
cre
G°e
G*E
Gre
6 °S
£°%
G*¢
A] Tsuajquy
Ae°eéed Lerrh
Ze*tl
LB°CL
2e*Ok
Z£5°T%
ee
Tt
[eauUuy eINUTW
CT
Nn e
Go e
i OT e a
Ph & 39 30 0
ped:
e
Bre
yee
Tey
T*e?
G* +
Let
° 4
"led “4
*€
"¢ ‘fo <
"€ “L maa
"¢
PO ee LOU LN ir
ARTSUa UT
Ger el
GL*TL
Gerd
Geol
GS¢°UL
ELLY
Cec te
SL° Cv
Ge "GY
CLSGE
Ce Gk te *
LS LY ~
* » 6 *
Sb OE ID IN DOM Mm om oD
a °
AeA AM TM eA A ere
La LA LLL CPt AT Be Ot he at
a
82
« <
of8 OF
(OL 6,27
03
e
[3 60 OG 4G ‘
f= ea on oO » eo
So
+ *
sw m > a 9
CM OLN @
mmm es tm em ak Re PR OO DID OAS
s e * *
™
LA Ph TUM MOIA IN DM OM °
AVTsusdjUy
ct°2@e e°g
Oot?¢el CO°
TL GS
OGTTL
cle te
f°S CC*TtL
CCfGh
Tee cere.
ct*OL
*O Catal
yee
CO EY
cd
T# ey
CST te
cl* ty?
Bre CatTs
CF" OF
O°S
OG*CY
Clay
G*cet CC
CF C9
° BE
Lee
CS 6L
e1°6¢C
L°e
OO*° EE
cS "Se
Cte]
CG*Ee
cT° Re
c°TtT COPE
CST Lhe
eee CGTLE
cTTLe
G°S COLE
CO" FE
G*E CS*9OE
CLS ee
C*e CCSSE
co *GE
1°y CE*GE
CT *GE
G°S CO°GE
ao fe
GSE
CEPSPE CL°VE
gre CO
8HE
QZ Aj} sue
quy QZ
"059¢9 38
“ATX
ATAVL
ove uot
say 9Z
aoz AQTSuUaqUT
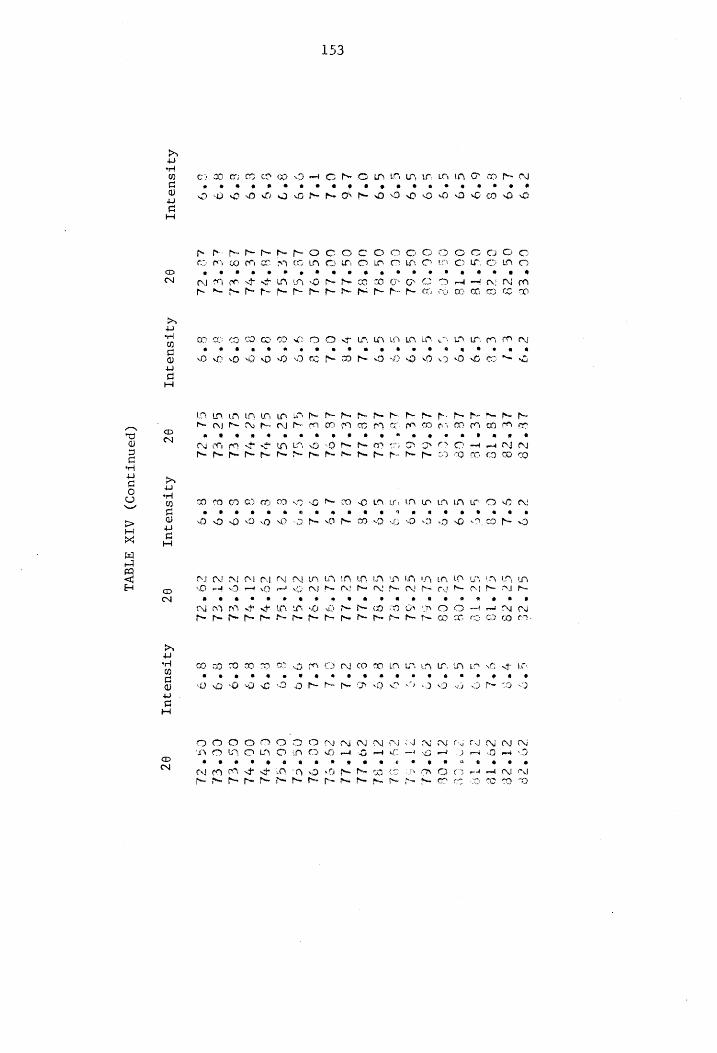
153
« wo
. @
co ® e
0 0
e 9
oe © @ @ @ @ @ ©
sof Bh Be CAM 059 0
*o
™
Y; Cn CO OO De OM CIN IN Em Ir LAIN GS am A *
OO
°g 3
*
cr
Aj Tsusa
uy
c LA CU CLL
—~ oco coo
"te
e ~ > Cl OT ed AL a pe Co ro OO ee: 3 i
* ®
cA ®
he
LA, «
o
em
LEY LLNS °
1 * e
wo C3 SO co a
om e
SOs 60 SO 4D 0 6 GM SO om 69 42 SO 048
oO
A}TSUa UT
LESZE
o°9 SL%2L
2€£°22 Gey
C2°ZS
iste
C8
CL 1S
LETTE
Gee Sette
Le*Ge2 G*9
G1 *OS
£etcs
G°S Ce"cs
LE°6L
G*S cLeey
LE*6L
G*9 Gets
bet id
st9 GLteL
€°s G°¢
GZ°Rh
iethd
9°S Gl
LL
LETLE
Eth CetdL
igtel
Lty GL'SE
2€°9OL Qty
CEtoL
GL°SL
gen CeegL
GE*sl
e*g 21°S2
Githl
e*¢ ES
* a) G2tuL
g°9 CUtes
CL°EL
E°9 COCEL
Sorel
e*9 ZTE
Ce Zh
g°S Eat?)
02 A} TsueqUy
02
(penut 30D)
AIX FIVL
MO CG COAT LAIN LA LT EO te *
2D
oe * ®
Ph p
g°9 *O
= ny Moo Mma ™
a
“GO
AUTsua4uy
oO om x
xt
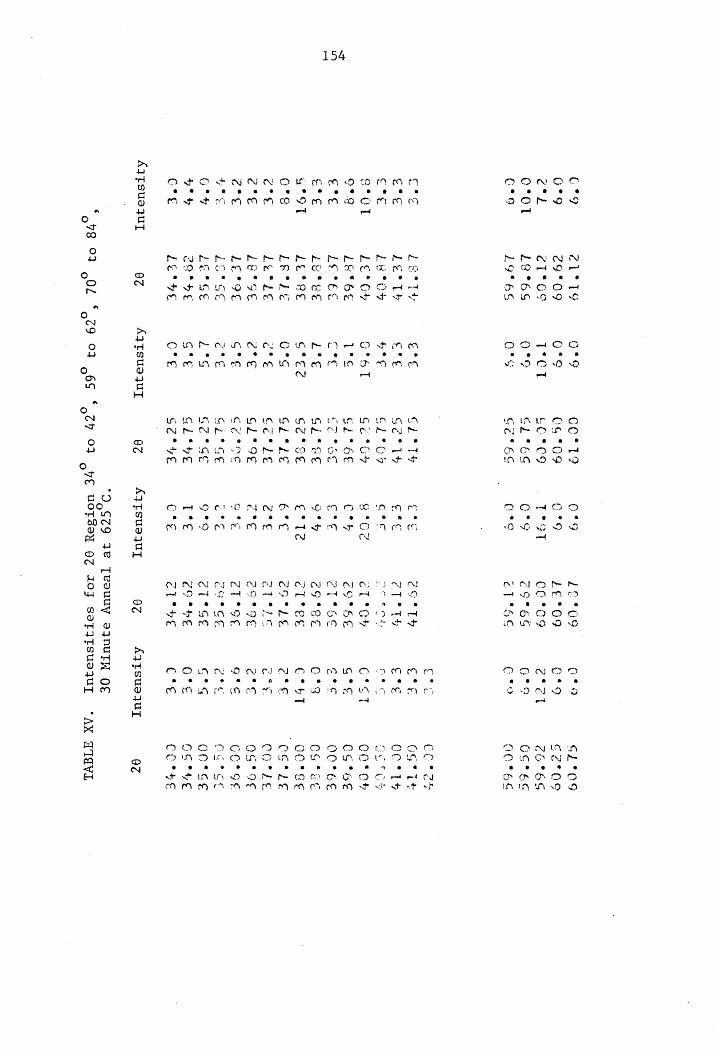
Intensity
300
26
34.37
f
Be.
Intensity
3
26
34°
to 42
°,
59°
to 62
°,
70°
to 84
°,
34.22%
ion C.
Intensity
3.9
Intensities
for
20
Reg
30 Minute
Anneal
at
625
26
34.12
Intensity
TABLE
XV.
20
154
Os AN A OL mma comm 4 = OD * e¢ @ 9 © &# @ & * @ #& © #@ 8 8 » 6
soso eT Oo Sm mm oS 9 OD sored rod wont
Od Pe ph hehe Ph Em he he fr Po A OMY ny men ee ey mm mn cs om. rs OG — CS
* 8 * 9» @ © @©@ *@® ® #© & 8 @ @ *
SPM ry Tm Oo Om PR OD OS et mn Pee CT A OT epee SS 8 Ln un
BP ON OS CI Py et OP Om & * « #¢ *e® @& &#® a 68 # @ & # @ 8 © * ¢@
MUD ETA Oe ED oem Om en wo OAD
Om rot
LOLOL LE LOR Em ETA EEUU LS ‘A As hm SIP am Pm AT Re GE p.m Be Gu me ag qo:
a @ @ ©» *#& @ © @ & @ @ @ © 8 © e
SPM LN 2 mh h coos Go: oe oO OD et me cn
my ee PA Ae Oe Le ND na Sh OSE ta LA
eH OCOD AL APR ee so mt OS Nm m2 O eo oo 4 o.mUmtmlCUHUmUCUCMOmUmCUMM eS eae es
CD OV MY OO met rt PMT CNS 6Q050 Os Cs!
QE AL Ca A OY SY BE OY AL mE AY GE oT Ag oS Atos Sed Dm me NT ret ea son
ex *# 08 &® # #®# @®& @® ® #& @ @® ® @ © «
SPUN iA Go De M00 oO OCR OD et od aA OD TH OTM mr py Se St i LY
DLN ALO AL AL AL mM mW Ooo mmm mo OD ee 8 *#® *® &® an *# & & *# @ #*§ @ am @ & a 6h!
COLA PEO oF oT oN ar Doo HV om % ond o~l
IO AOD Or oanrrwnannr aI IN DME OU DIA DME Mw Din WIA M man
> «© @® 8 @&@ 0 j8& @ ®& © @& *§ %S @& & f » 6f
SOL SD Be OD TT et et ot Mon PTA POR PA ty ho Et TES Uy
640
Ls o)
60.62
Lo.
5.9
529
61.900
O2-295
60.
59
f920
Liel
60.90
60.37
o2
O »
Q)
o
60.225
80.75
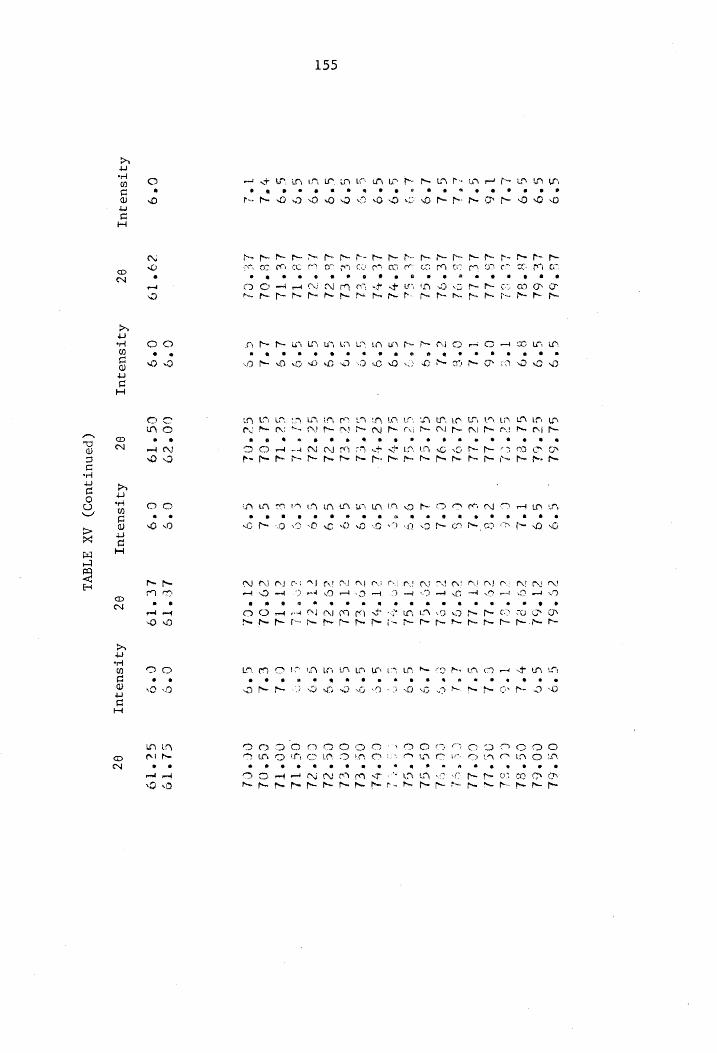
TABLE
XV
(Continued)
Intensity
26
Intensity
26
Intensity
Intensity
26
61
2&2?
6.0
6.0
9 61.37
6.9
ol.
£5
. )
61,25
5.9
62.09
529
79212
T)200
10.59
124
un
a]
©
&.5
Te)
T1212
Oo.
3 71
.2?
71.00
wn
sad
ws
Se)
uN a
read
fh
iA
so
OQ i,
155
Oe
“
Pe bY
? 7
ra)
wo
sp MN]
pod
mI ih
237
73.37
iO
Ol]
Cs) O
OMI
is
tt
72.930
wy
PS
on
73.2
i)
73.1:
13.00
3
we
Va
625
be
ph
Cus
Me
ve)
MI
“2
me
wn
M8
220
7%.37
14.37
5
o 7!
7 t~2 2°
7 2?
1%»
L
6.5
5 é
T/
~
Le ed
bel
ra Ae
uw CK
tm,
—
75.75
7 f Woe
oe
i
a x
Da
OD
tN
iy
UN
oO
<e) h-
h-
or
Me
O1
Vo
i 9
Te 7%
s 7%
Tq
T7.75
Om!
sO
ee
UN
920
wy
>
77
le
»>
q 77
.99
y T7.
a2
‘ 4 ide
52
t~
tim oO!
cn
ON
? 136
Del
29
~ at ¢
i ow4 @®
7
645
Oe
73.75
el
ce
Lo
a
fh
er
Ly
s
An
Se)
6.5
19.90
wy
79.57
nN! 2D
ga
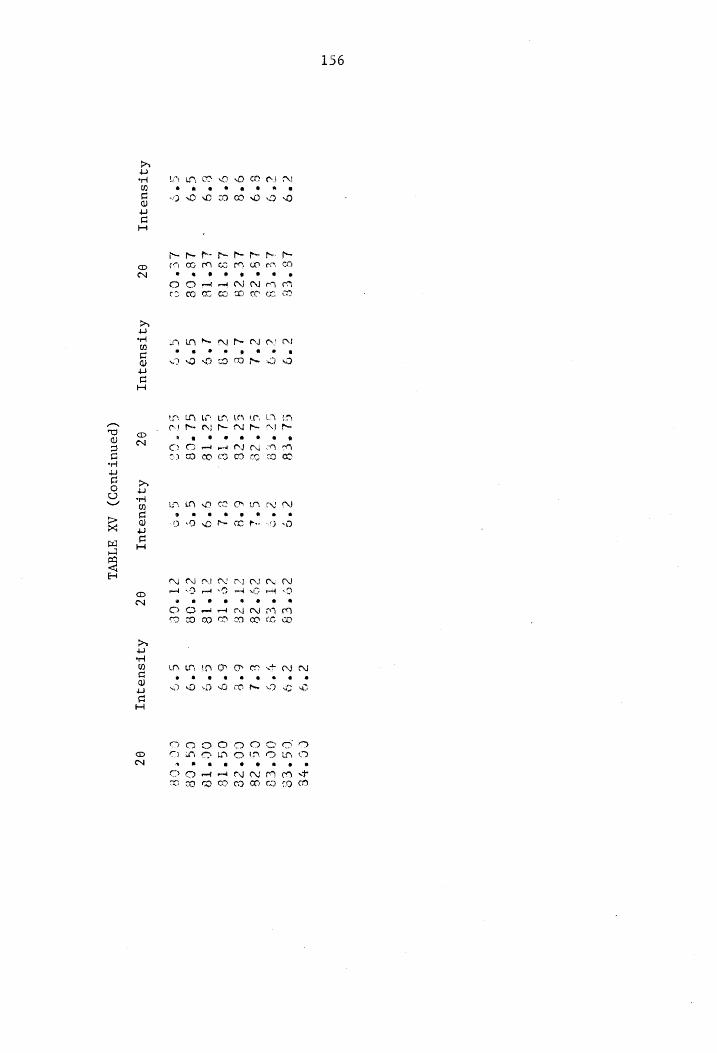
156
a
Oo 0.9 00 a
ct e
wD wO se)
a
LV in OF OO MAIN *
AYTsus uy
LE °ECS
LETC
LS*Ze Le°ea L3*
1g LE*
LE 18°Os Leroe
QC
a xa SD
* we tes
a s
sO 0
e
IN NE NO ,
3 fp
Aj Tsuequy
EL TES
GEtER GLtze fz°78 cLt1e GETS Gi
*C8 GEG
OZ
, 8 e 2) 6D se
IN cl amin a A s 68
hm oc fe
°g
*¢
Gee
A} Tsua zy
20° ER
cL Pee
eg*eg et
ze CO*TE Z1°18 Zo
°OR Z1°Ck
OC
(penutquod)
AX AIAVL
Oy A) «
No
<r *
IN MIA TP aH
AjTsuajuy
COSEE
CS* Ee
OC fC
C&* 2&
ca*7ze OG6°TS
occ
Te
CS* Ce
COTO
972
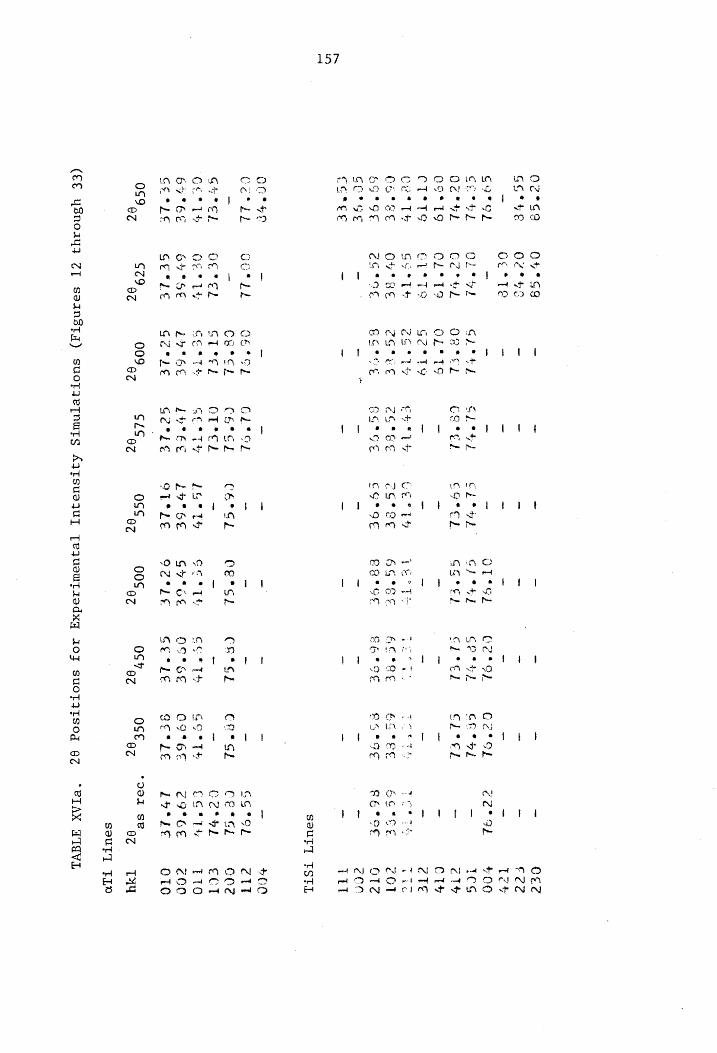
157
i
&
un
LA Cy
e
- a8)
a°oh
rb
cru
Oot 19
CTS
Cet T+
CESEE
29° GE
PSOE 2"
EE
S € 0 ro as ™~ TT
”
(C€ ysnoszyq
ZI sean3tq)
suorqje[nuts
AjLsusqUy
[ejUseUtsedxg
AOF suotAIsog
97
is LA LS *
peo
Mapes uy
*
LA Pu LN OD CD Sj osr ch et am cp
*
fe TA I AD
009
ate Bee pe ™ om of @D N
Cy
oO e
co iis
mm my ot Lf LEN
*
3 CY ere!
cae xr
GLtoL CETEL OT°EL GETTY Leree Gerke
SLSy7
OLS.
Cc) *t]
G5°¢)
pee
ds
69 °EE
Bator
Cers?s
Eee
Tt
GY¥TG
92°LE
005 ,.
Ce
® eh
Getesy
cc] *¢e?}
Te
EE *Ge
cAS
Ie
Cots Of°GE GELE
05757
CztoL cet H! CL°EL
CW ef
mn ®
Px -
a.
ef
*
nad f
re)
Cech
Got
O9°6E QErLe
OSE 4.
Cec
£2?¢ Tey OO
TCS oly Cy
ete Tic
fOT OT? cce THT
SeuryT FSTL
GG *ol
Cera
C2Tel
CG
* Tt c9°6E
Lele
‘201 SB
8Z
bCO cll LO2
ECT Td
€60 O10
Tad
Sour] FLO
“PIAX ATAVL
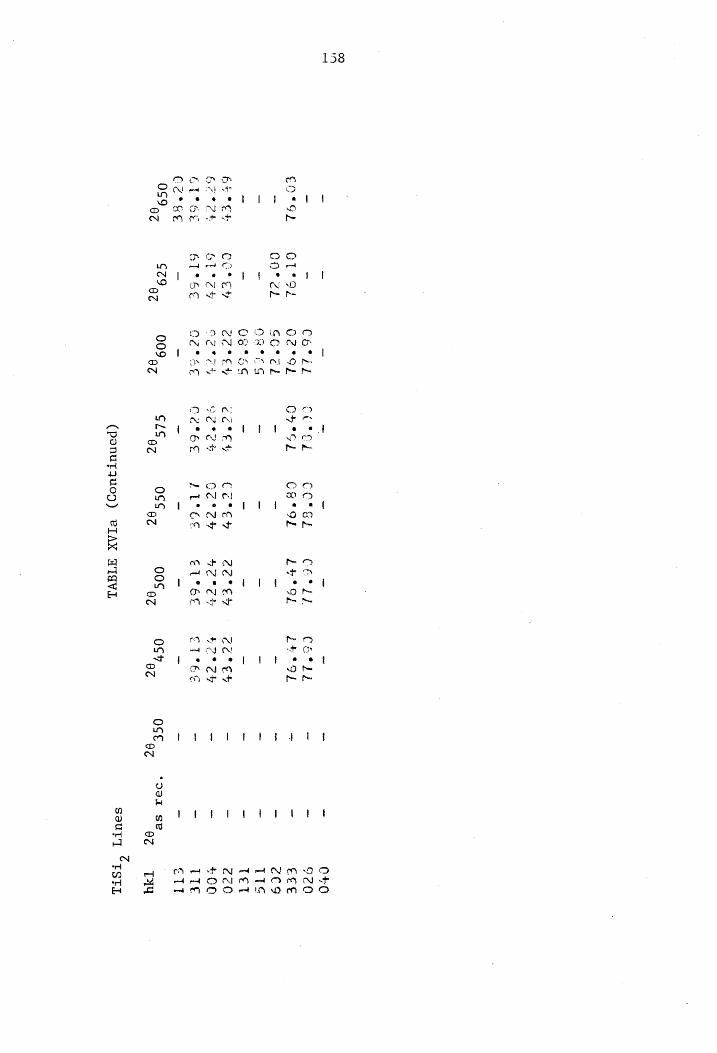
158
ENG)
yt eb
cn
*
oe 4
ry
BN
NS Am ae
CT° ol
corded
co > pet ed OD
a a
ire ety ty ak OS
7 ‘ S294,
CociL O2°SL CG*EL CSCS
USSG
ZZ°E4 ager
CETEE NN
009,
Wm
sO 9 hf
C7 TY
wh ON met ON ON wy
2
alan
cm we NF (penutquoj)
PIAX AIaVL
*“O0902 SP
SOUTT
C#O °20 EEE eC
LTS Tel cc
5CO
TTe clt
TAY
CrSTE
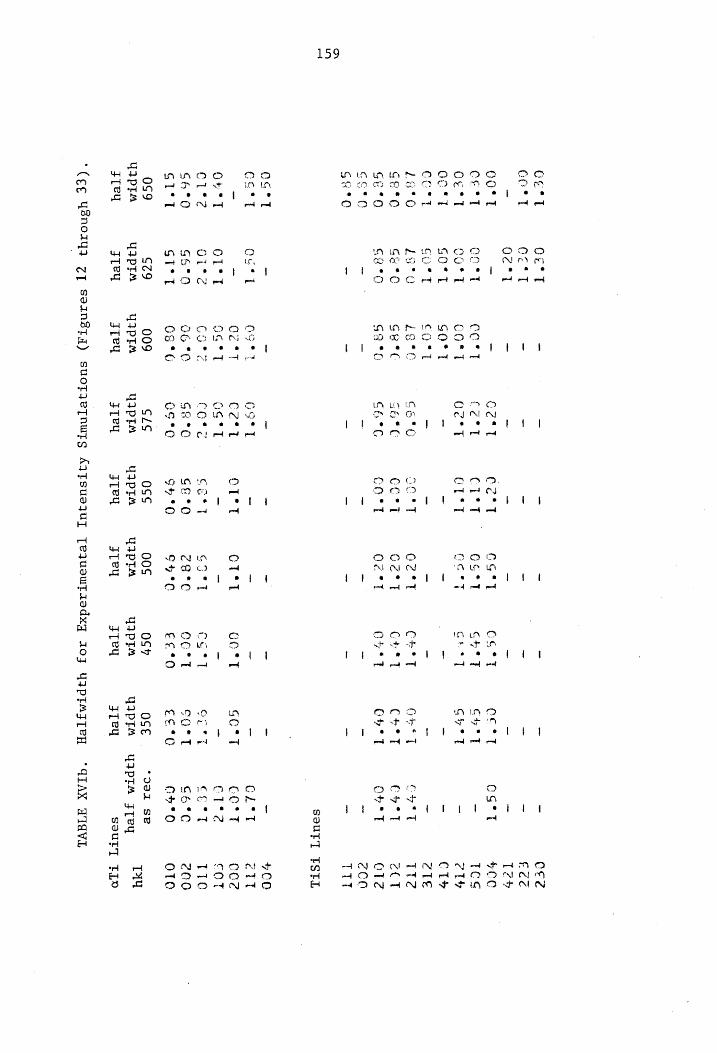
159
Gert
GOST
Oar tT
CE eT
Cet
oct
un
eo 4
id
om, a
3
LA LS LA Ln
ac) m4 4 a 6a
oOnoa nar
“Ne tet SES
*
OT
C1?
GH°O
G1°T
0S9
YApTA
sTey
Oc°T
ee
Oo NS
° |
6 fe * * e
ed pod mend read
at
*
~
re
C
«
oO
QUA Mm IN LA cm
“’
So at
*
m}
t
i
ostt
ott Gite GEO ST*t Cz9
yapT” 3Tey
a
»O 0% * a
CO emt ed ped rend
oo ae
*
on CO e a
om
ad
e om
DLA IMS OR
CSP
Cet
oo wn
e
od e
t
oN
£3
MN
06°C 68°C
009 yapTa yrTey
OS* 1
Cé°T
OG*T
CO%?
GE YO
CE*O
CLS yIpT! FTeY
G2" CL*T
Ott
OO°T cert Cott
OT
Cott GE*O 94 °O
OSs yIPTA FTeY
mm Om
TU o
md met met
OTttT
ctl
c8tec
Cy ec
00S
YIpTa
JT PY
* e
{in oe LG
e
paved omg pan
CHT CHT Ot
cst COT Ef*O
OS¥ yIPFm sTeY
CceT
cy" tT
Ge? T
Get] CHT
CHT
GOTT
eg
cOtT EEO
OSE q3p FA 3Tey
“(ee Usnory.
z_ SeAN3Tq)
suoTje[nwtTs AATsuaequUl
TeJuewTsedxg
AoF YAPTASTeH
*
oO DO sFoxf ost
®
sand pect md
CEed ECC Ter CO
TCs CTY CITY
cle Tt? ect OT? c00 TTT
SsoutyT TSTL
GL°T COtT C12 cor] ce" CHO
‘d91 se
qIPpFA FTeYy
¥CO
ett CO? COT TIC 200 OTO
TAY
SOUTT TL
“qTAX ATAVL
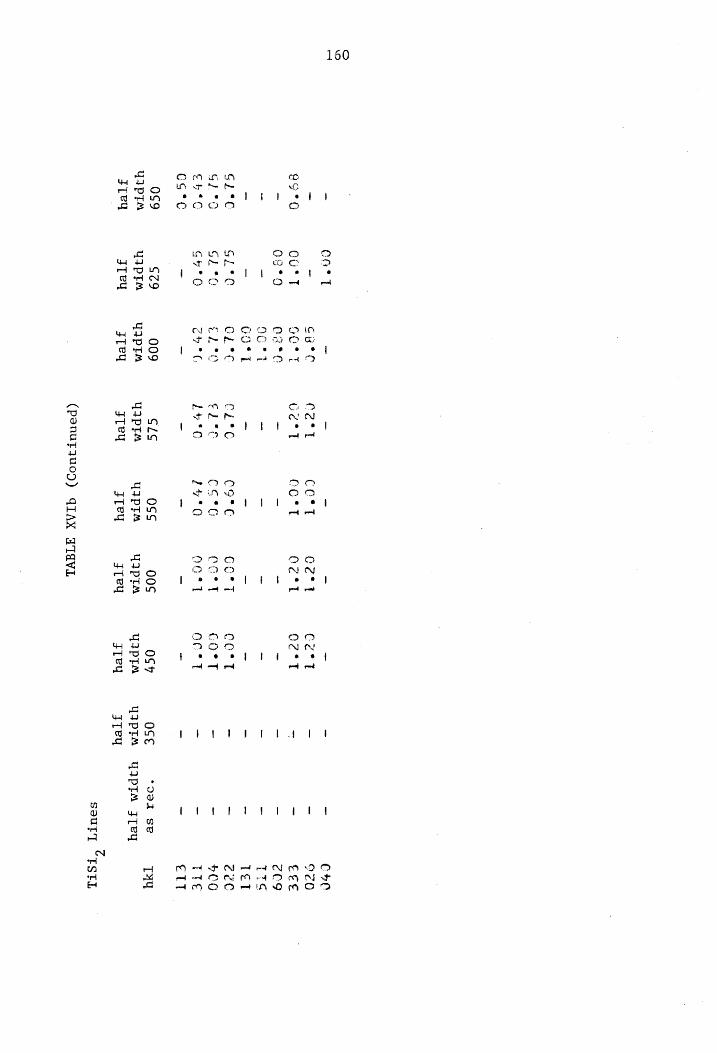
160
Orman UN
Woah * * ® a
OO cd a
YIPpEA 3 Tey
Cac T
CUT
a2*o
SLO GL*G G7*O
679 Y2PTA JTey
009 yapTA FTeY
a ON
°
CL°C elre Ly CLS
qapra Frey
cett octT
coc CErO 240 —
OSS YIpTs FTey
00¢ qapTa FTey
(PenutqwUOD) qIAX
ATAVL
Cztt OztT
Cott Cort ocetT
OSy yap Te Frey
OSE
- CHO
- 920
~ ECE
- Zc9
- TTS
~ TET
- Zec
- »CO
~ LTE
- Ell
‘O01 se
TAY
QIPFaA YIPTA
FTey JTePY
SourTry CISTL
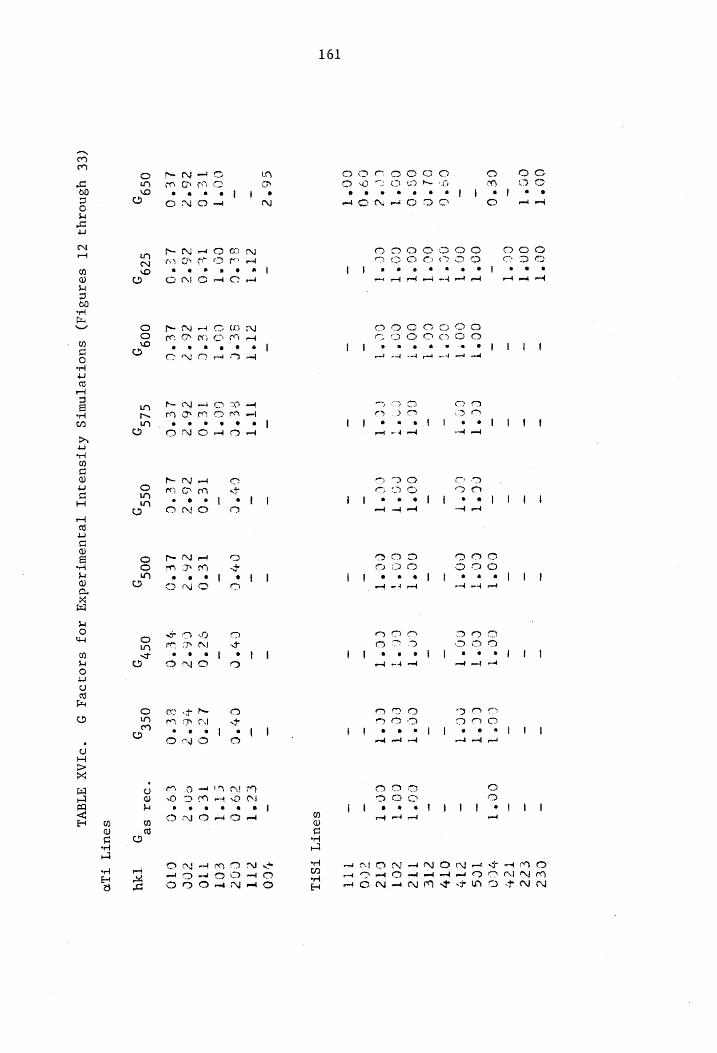
161
0O°T
OCc'T
Cee
GotG
OL*a
OS °O
Cott
Cet?
C9*G
CacT
oc*
aattT
Cet
Cort
On %T
Oo°T
Ge*T
oc *t
COST
co fy]
ZI‘ gic OOtT Te*0 262
oce cot are
Ww
ces 00° cot Get
wad pod end eel vod rud sod
s @# @
ITD eed OM med
*
f= Aled T™ CO A]
CO EPR ET OO md °
co oO
a7
ae)
e
nny
me * *
mm Te
*Q ce?
L£e%O
00S
aa
> *
~ 4 sme
C (
°
cCc*
a
“VT
a 2 8 ord md wd
COtT ect cett
CHC —
Leé°O
HE?
EC*O
OSE,
CE2
C2?
Tc
vA
TCs
cl?
OT
ele
TT?
eT
G12
cOG
Tt
SOUT TSTL
ec*T
cF*O
ett
TE%C
One? c9°C °Oo01
SP 9
LOO
ett (G2 eOT TTC cCC G1O
TAY
SeuTT TL0
(€€ yYsnoiy?
ZI seanstyq)
suotjertnuts Aq
Tsuequy [Tequeutaedxy
azoxy si1070ePT
N *OIAX
ATIAVL
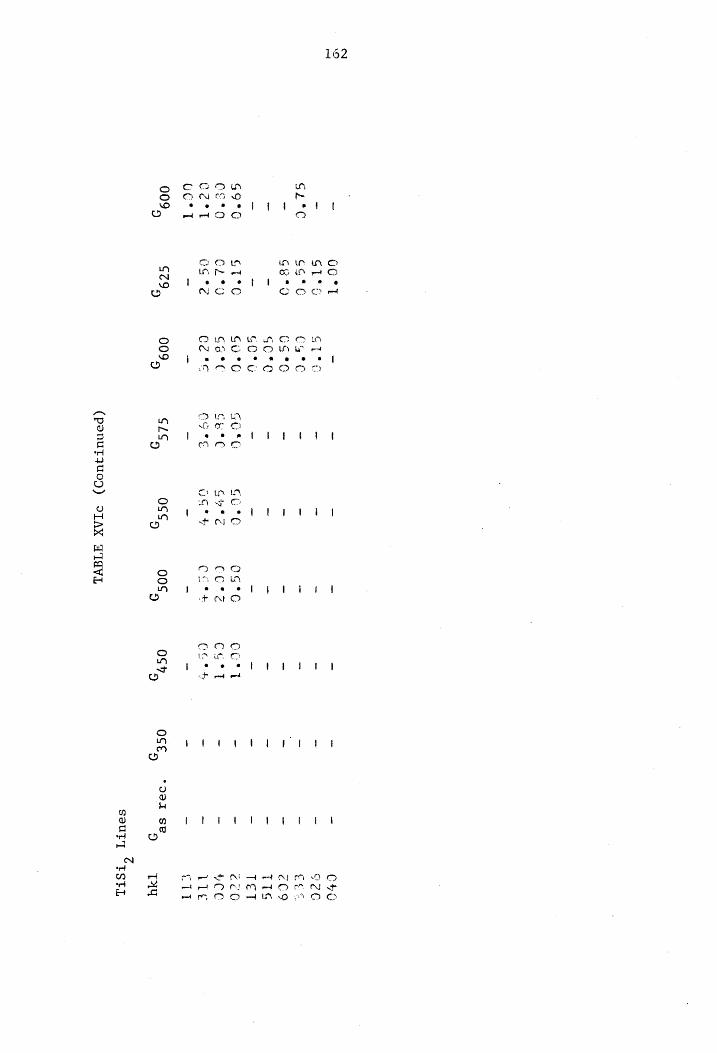
TABLE
XVIc
(Continued)
Tisi,
Lines
CA 50
F500
Co
50
C575
S600
Ce
o5
S600
C359
hkl
as
rec.
1.99
"y
~ 3
LL
311
3220
2 wy
4.59
“} ny
a
ay
ae
O.
O79
9215
i on
Wn
O)
00)
ml
JO"
0.65
005
1 x
i
0.22
f L3l1
SLL
un oO
C 2 3
3 9
2»?
, &
9.75
Ww wm
S15
1.99
m 926
162
949
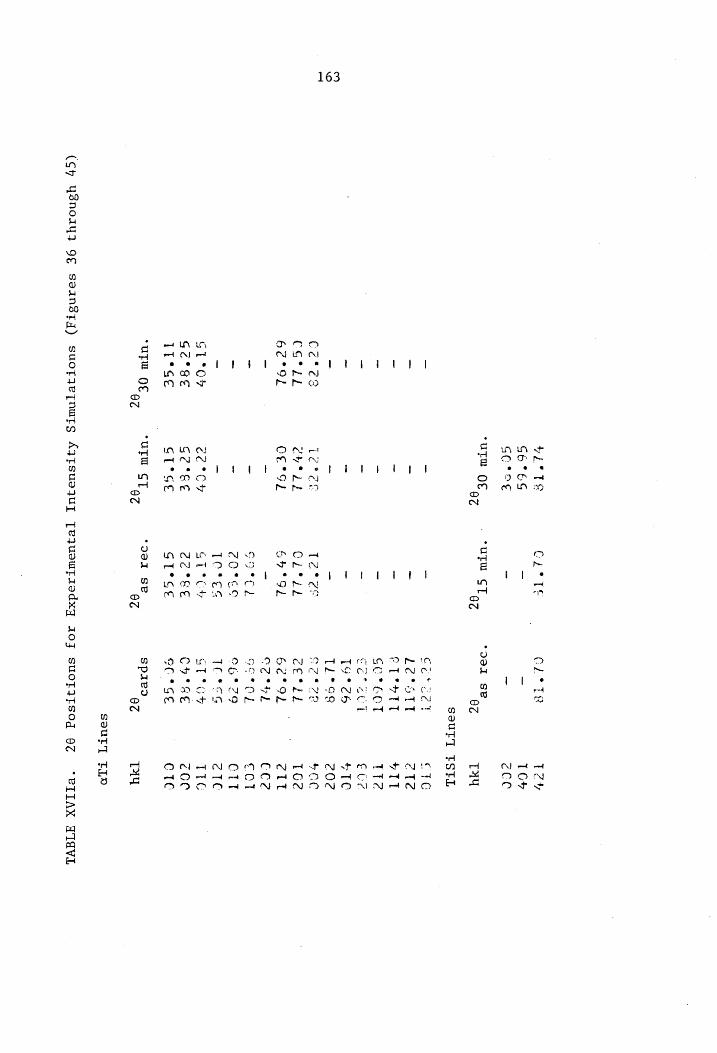
163
YL TE
CL TE
CL TR
Tc"
G6°6S -
~ TG
GO°SE -
- Zee
“uTW
- *UTW
"D901
SP
rm OF gz
rm St oe
QZ TAY
SoUuT] TSTL
- -
- Cot
cet CFG
- -
~- Leesatt
cle a
- -
ST°?
tT IT
- -
- GC*ECT
TTt¢2 -
- -
ee etl
Ev? -
- -
Ta ° 26
ETC
- —
- TL
* 98
CO? Ce*es
tee
T2° és
Set 7e
FEE CG*iL
cyeit
CLtil
c€*ilL Tbe
6c°OL
CEPSL
E5°SL
6c°9L
ett -
_ -
Ce erh
CCe2 -
- CO8
CL Go
ok COT
- -
coree
C&* 29
CT
- -
TO% ES
TO° SG
eT
GL°O?
ec * CY”
SE°C?
STTGY
TEC GE°sSe
SC°EE
ce °ee
CH SE
eG
TT*se
GT°sSe ST°SE
SO °GE
CTC
uTw 0.
UT ST,
val Ste
SPAed |
a
SOUT] TL
(Sy Ysnorzyi
9€ SeAN3Tq)
suoTAe[NuUTS
Aj[suaquy
TeJuewTIedxyY
AOF suoTATsoOg
eZ “eTIAX ATAVL
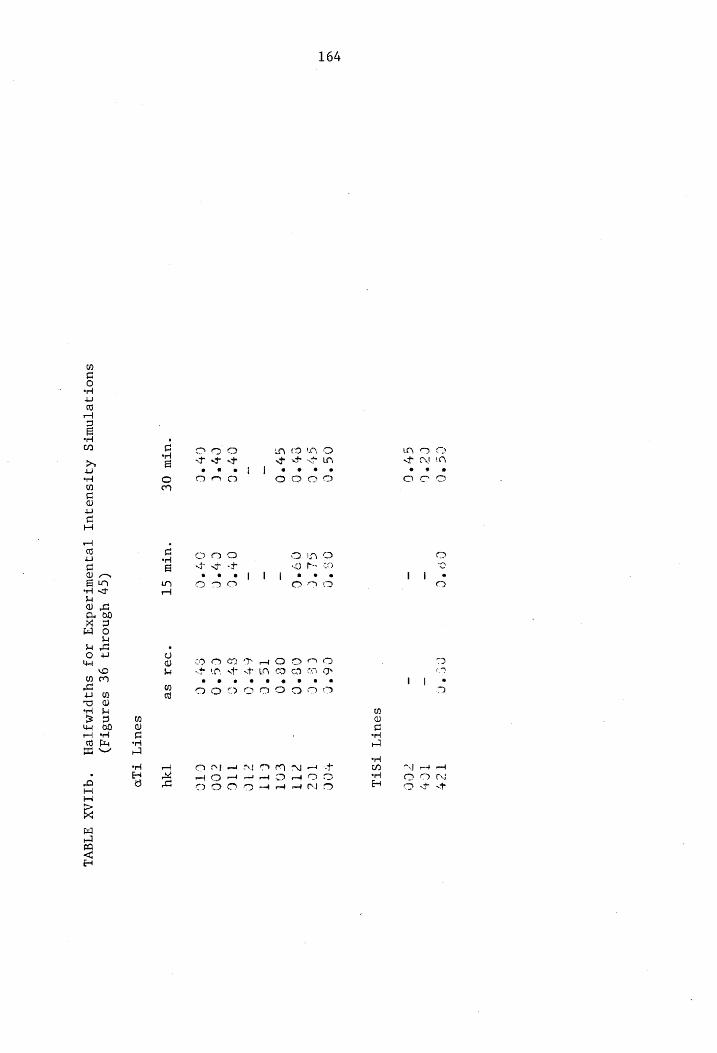
164
CE*G CZ*G GHG
suotzepTnutrs
AjTSsusqUy
[ejUuswuTAsdxy
10F syApraAs[eyn
ENC
ecter Té2F
TC
cCO
SourT
TSTL
aS °C
C6%C
Gite
CefC
age*¢ OG°O
- 08°O
- To
*e
- 64
°O
O+ °C
Ses
CHPee CG*°O
047° O
Ce °C
‘UT
CT "201
se
FOC Ce
clt EGT CTT 21
ETC cO0 CS
TAY
SeuryT TL
(cy yYsnorzyy
9¢€ SeansT4)
“GQTTAX WIdViL
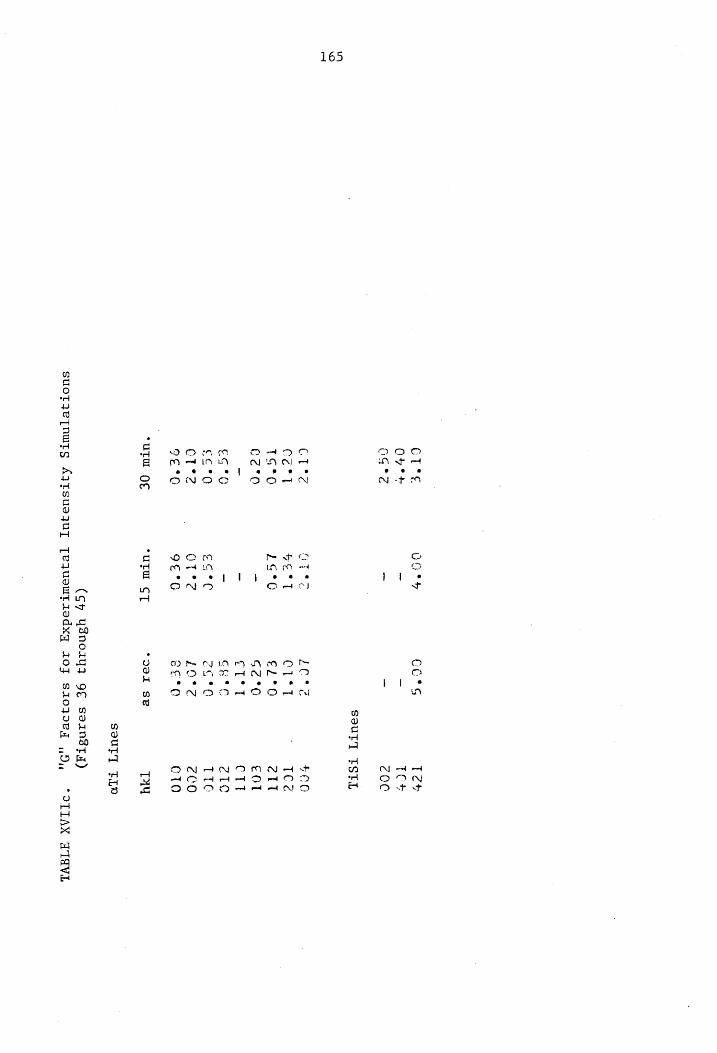
165
CT we’
Ov" +
OG*e
Om AMO AQIS SL et
*
DO Oa A
Oey
e
NO @
OO Mm aw In
e
* ‘
o 2
‘
oo cc's
T2b -
~ TC
~ ~
Z0C
SOUTT
TSTEL
OF te
O°?
FOC
on
C1" T 7
TCS 16°C
eL°O elt
- G2°O
col -
ctet CTT
- GHTC
éTe care
cato TTC
OT°%? LO%?
cCO 9€°O
ecta CTO
‘UTW CT
‘291 se
TAY
SeuTT TL0
(s7 Y8norzyq
9€ Ssean3TJZ)
suoTqe[nuts
AjTsuequy
[Tequewtiedxy
AOZ sz0
ey
9,
*“VLLAX ATAVL
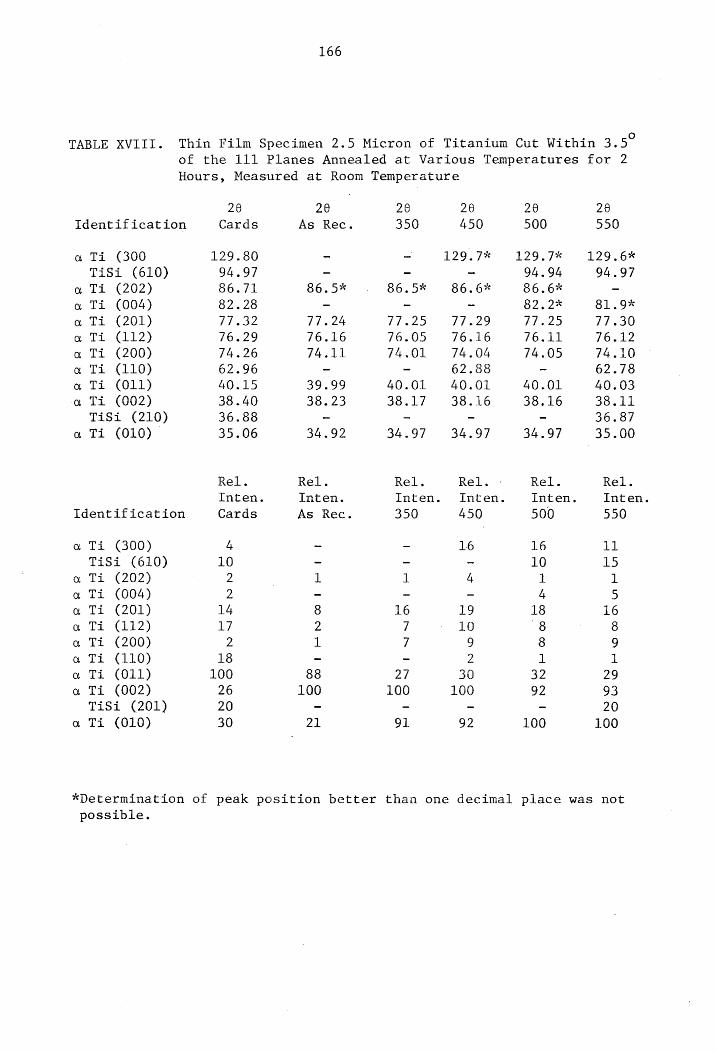
166
TABLE XVIII. Thin Film Specimen 2.5 Micron of Titanium Cut Within 3.5° of the 111 Planes Annealed at Various Temperatures for 2
Hours, Measured at Room Temperature
28 26 26 26 20 28
Identification Cards As Rec. 350 450 500 550
a Ti (300 129.80 - - 129.7% 129.7% 129.6%
TiSi (610) 94.97 - - - 94.94 94.97
a Ti (202) 86.71 86.5* . 86.5% 86.6% 86.6% -
a Ti (004) 82.28 - - - 82.2% 81.9%
a Ti (201) 77.32 77.24 77.25 77.29 77.25 77.30
a Ti (112) 76.29 76.16 76.05 76.16 76.11 76.12
a Ti (200) 74.26 74.11 74,01 74.04 74.05 74.10
a Ti (110) 62.96 - - 62.88 - 62.78
oa Ti (011) 40.15 39.99 40.01 40.01 40.01 40.03
a Ti (002) 38.40 38.23 38.17 38.16 38.16 38.11
TiSi (210) 36.88 - - - - 36.87
ao Ti (010) — 35.06 34.92 34.97 34.97 34.97 35.00
Rel. Rel. Rel. Rel. - Rel. Rel.
Inten. Inten. Inten. Inten. Inten. Inten.
Identification Cards As Rec. 350 450 500 550
a Ti (300) 4 - - 16 16 11
TiSi (610) 10 ~ - - 10 15
a Ti (202) 2 1 1 4 1 1
a Ti (004) 2 ~ - - 4 5 a Ti (201) 14 8 16 19 18 16
o Ti (112) 17 2 7 10 8 8
a Ti €200) 2 1 7 9 8 9
a Ti (110) 18 - - 2 1 1
a Ti (011) 100 88 2/ 30 32 29
a Ti (002) 26 100 100 100 92 93
TiSi (201) 20 - - - - 20
a Ti (010) 30 21 91 92 100 100
*Determination of peak position better than one decimal place was not
possible.
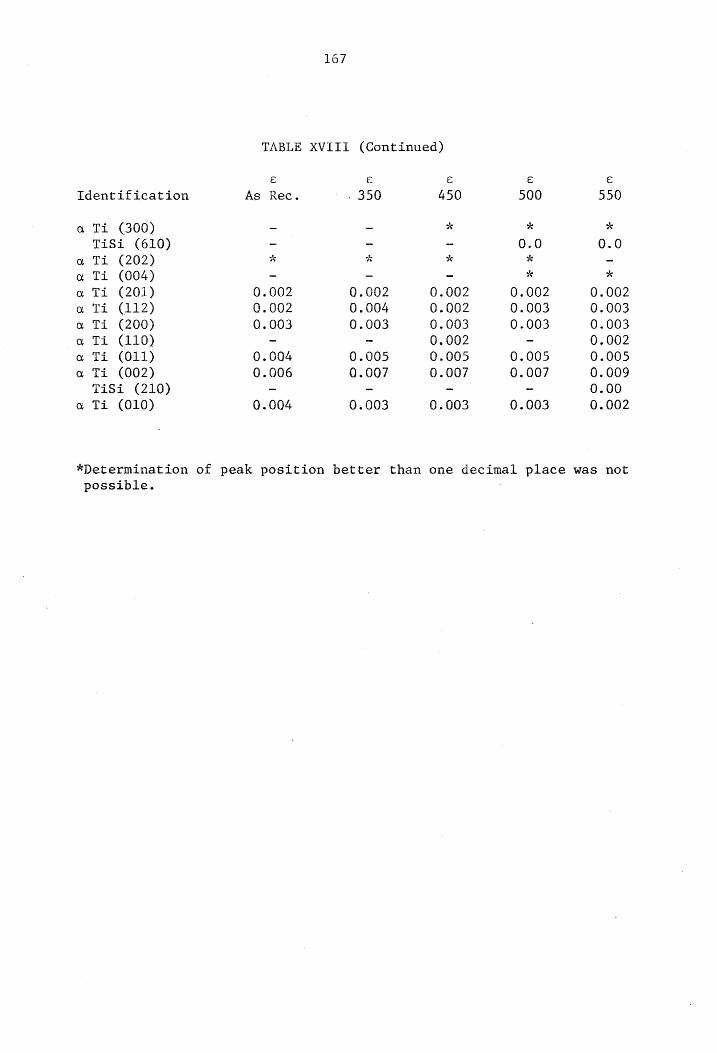
Identification
Ti R
TiSi (610) Ti
Ti
Ti
Ti
Ti
Ti
Ti
Ti eerkreekk eee
TiSi (210) Ti 2
*Determination of peak position better than one decimal
(300)
(202) (004) (201) (112) (200) (110) (011) (002)
(010)
possible.
As
Ooo
€
Rec.
167
Oo
€
- 350
*
002 004 003
005 007
.003
oooooo
TABLE XVIII (Continued)
€ 450
*
*
002 002 -003 . 002 005 .007
-003
-003
005 .007
oooooc0oc0 ©}
003
place was
550
0.0
002 003 .003 002 005 . 009 -00 002
not
REFERENCES
1. Balluffi, R. W. and Blakely, J. M., "Special Aspects of Diffusion in Thin Films", Thin Solid Films, 25, (1975), pp. 363-392.
2. Bower, R. W. and Mayer, J. W., Appl. Phys. Lett., 20, (1972) p. 359.
3. Mayer, J. W. and Tu, K. N., J. Vac. Sci. Technol., 11, (1974), p. 86.
4. Picraux, S. T., 'Mass Transport Between Two Metal Layers as
Studied by Ion Scattering", 6th International Vacuum Congress, Kyoto, Japan (1974).
5. Tu, K. N., Electrochemical Society, Extended Abstracts, 1, Vol.
116, (1975), p. 267.
6. Chu, W. K., Krautle, H., Mayer, J. W., Muller, H., and Nicolet,
M. A., Appl. Phys. Lett., 25, Vol. 8 (1974), p. 454.
7. Chopra, K. L., Thin Film Phenomenon, McGraw-Hill, New York,
(1969), p. 266.
8. Campbell, D. S., in L. I. Maissel and R. Glang (eds.), Handbook
of Thin Film Technology, McGraw-Hill, New York, (1970), p. 12-13.
9. Gangulee, A., Acta. Met., 22, (1974), p. 177.
10. Dearnaley, G. and Hartley, N. E. W., Phys. Lett., 46a, (1974) p- 345.
ll. Cotter, P. G., Kohn, J. A., and Potter, R. A., J. Amer. Ceram.
Soc., 39, (1959), p. 11-12.
12. Laves, V. F. and Wallbaum, H. J., Z. Krist., 101 (1939), p. 78-92.
13. Kato, H. and Nakamura, Y., Thin Solid Films, 34, (1976), p. 135- 138.
14. Schob, 0., Nowotny, H., and Benesovsky, F., Planseeber. Pulvermet.,
10, (1962), p. 65-71.
15. Svechnikov, V. N., A. Kad. Nauk, SSSR, 193, No. 2, (1970) p. 393.
16. Burkl et al. Monatsh. Chem., 92, (1961), pp. 781-88.
17. Nat. Bureau of Std. Circular, 539, 8, 64, (1958).
168
18.
19.
20.
21.
22.
23.
24.
25.
26.
27.
28.
29.
30.
31.
32.
33.
34.
169
S. S. Lau, W. K. Chu and J. W. Mayer, "Evaluation of Glancing Angle X-Ray Diffraction and MeV,He Backscattering Analyses of Silicide Formation", (submitted to Thin Solid Films, March, 1974).
Hutchins, G. A., Shepala, A., Thin Solid Films (to be published).
C. R. Houska, J. Appl. Phys. 41, 69 (1970).
C. R. Houska, High Temperature - High Press, 4, 417 (1972).
Houska, C. R., Thin Solid Films, 25 (1975) pp. 451-464.
James, R. W., The Optical Principles of the Diffraction of X-Rays,
Vol. II, The Crystalline State, Cornell University Press, Ithaca,
New York (1965).
Guinier, A., X-Ray Diffraction in Crystals, Imperfect Crystals
and Amorphous Bodies, W. H. Freeman and Company, San Francisco
(1963).
Harris, G. B., Phil. Mag., Ser 7, Vol. 43, No. 336, Jan. 1952,
pp. 113-123.
Elderton, W. D., and Johnson, N. L., "Systems of Frequency Curves",
Cambridge Press, New York (1969) pp. 77-78.
Hall, M. M., Veeraraghavan, V. G., Herman, Rubin, and Winchell,
P. G., J. Appl. Cryst., 10, (1977) pp. 66-68.
"Thermophysical Properties of Matter", IFI/Plenum Data Company, Division of Plenum Publishing Gorporation, New York, New York
(1975).
Schultz, L. G., J. Appl. Phys., 20, 1030 (1949).
Ventron Corporation, Alfa Products, Danvers, MA.
Dietrich, F., Smith, T., and Houska, C. R., J. Appl. Crystallo-
graphy, to be published.
Siemens America, Incorporated, New York, New York.
Diffin, W. J., Parthe, E. and Norton, J. T., Acta. Cryst. 17 (1964) p. 450-451.
"International Tables for X-Ray Crystallography", Kynoch Press, Birmingham, England, Vol. IV (1959) p. 74,76.
35.
36.
37.
38.
39.
40.
170
"0S/8 Handbook", Digital Equipment Corporation, (1974) Section 1, p. 93-97.
Ageev, N. and Samsonov, V., J. Neorg. Chim. 4, (1950) p. 950.
Hans-Ulrich Pheifer, Schubert, K., Zs. Metallkunde, 57 (1966) p. 884.
"Tnternational Tables for X-Ray Crystallography", Kynoch Press, Birmingham, England, Vol. III (1959).
"Handbook of the Phyicochemical Properties of the Elements", edited by Samsonon, G. V., IFI/Plenum, New York, New York (1968) p. 388.
Anderson, E. A., Jillson, D. C., and Dunbar, S. R., Trans. AIME,
197 (1953) p. 191.
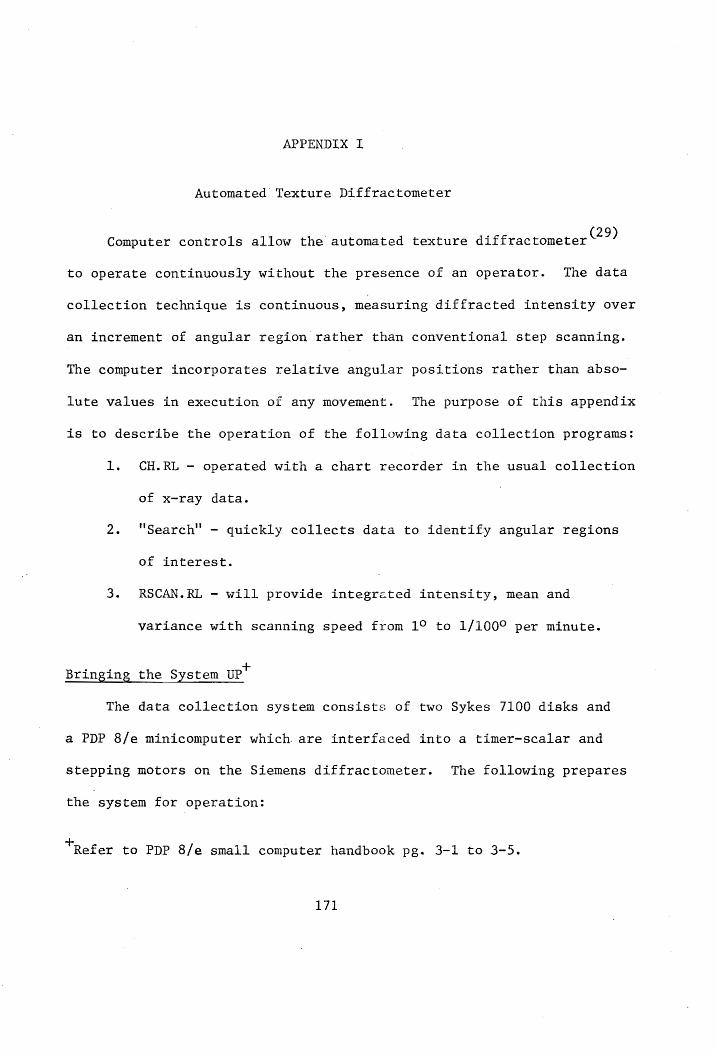
APPENDIX I
Automated Texture Diffractometer
(29) Computer controls allow the automated texture diffractometer
to operate continuously without the presence of an operator. The data
collection technique is continuous, measuring diffracted intensity over
an increment of angular region rather than conventional step scanning.
The computer incorporates relative angular positions rather than abso-
lute values in execution of any movement. The purpose of this appendix
is to describe the operation of the following data collection programs:
1. CH.RL — operated with a chart recorder in the usual collection
of x-ray data.
2. "Search" - quickly collects data to identify angular regions
of interest.
3. RSCAN.RL ~— will provide integrated intensity, mean and
variance with scanning speed from 1° to 1/100° per minute.
Bringing the System UPY
The data collection system consists of two Sykes 7100 disks and
a PDP 8/e minicomputer which are interfaced into a timer-scalar and
stepping motors on the Siemens diffractometer. The following prepares
the system for operation:
"Refer to PDP 8/e small computer handbook pg. 3-1 to 3-5.
171
172
1. Insert the system programs disk which is placed with slot to
the back in the upper Sykes unit, push in, and lower cover
to the vertical position.
2. Insert the data disk which is placed in the lower Sykes unit
as above.
3. Turn the key switch on: the PDP 8/e (left side) to the power
position (center) (see Figure 58).
4. Select the appropriate terminai, either teletype or teleray
by switches directly above the PDP unit (see Figure 57).
5. Activate terminal
a. Teleray - turn switch on left to desired brightness,
position middle two switches down and all others to the
middle on box above terminal.
b. Teletype - turn switch on right to "Line".
In the event of a line power interupt to the computer, a boot strap
load (see next section) will be necessary if the following results in
no response from the computer. Initiating the system (first five keys
up, O through 4, refer Figure 58) is accomplished by:
1. Place HALT button in "UP" position.
2. Pressing ADDRESS LOAD, CLEAR, CONTINUE, on the right of PDP 3/e.
which results in a dot display on the active terminal.
Boot Strap Load
If a 7600 start has failed, the following load will bring the
system up without damaging any system programs. This must be loaded
on the switch register of the PDP 8/e in the following order:
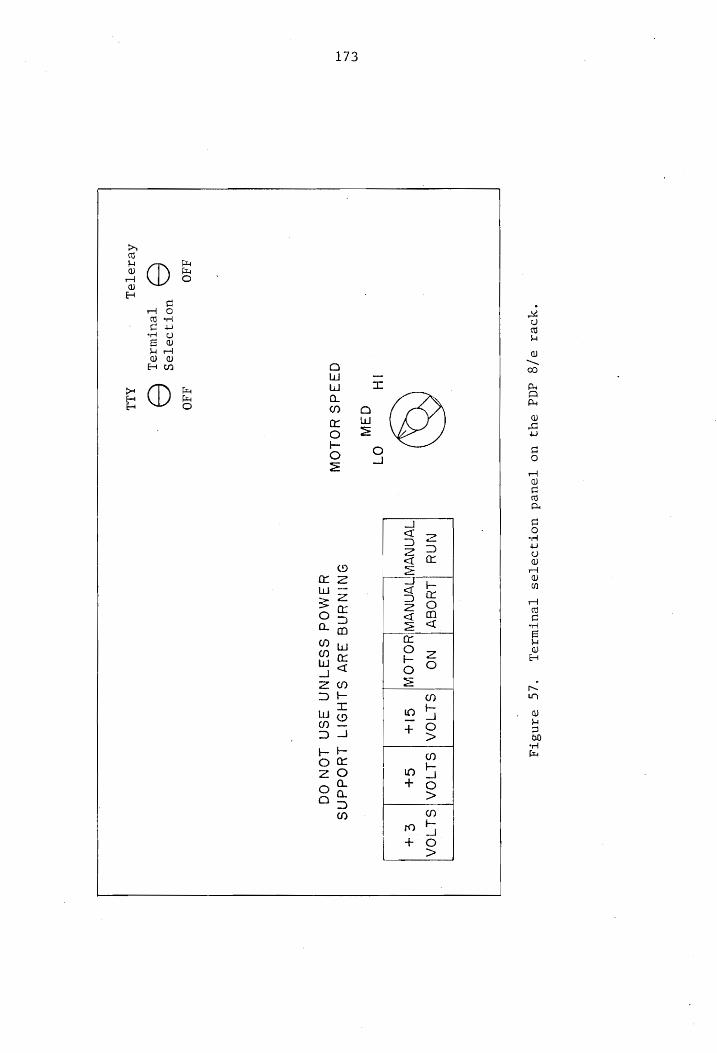
"yoezr 9/8
ddd 9y}
uo Toued
uoTIoOeTes TeuTwAze,
‘fg eAinsTy
173
NAY
;LYOs7; NO
|SLIOA|SLIOA|SLION
TIVANVAAYANVAIYOLOW)
SI+ G+
E+
1H O71
qgAaw
ONINGNSE
3dVv SLHOIT LYOddNs
YAMOd
SSA INN
3SN
LON
OG Q33dS YOLOW
AAO 440
UOT IIeTAS
QO Teuluarsy]
AesoyaL ALL
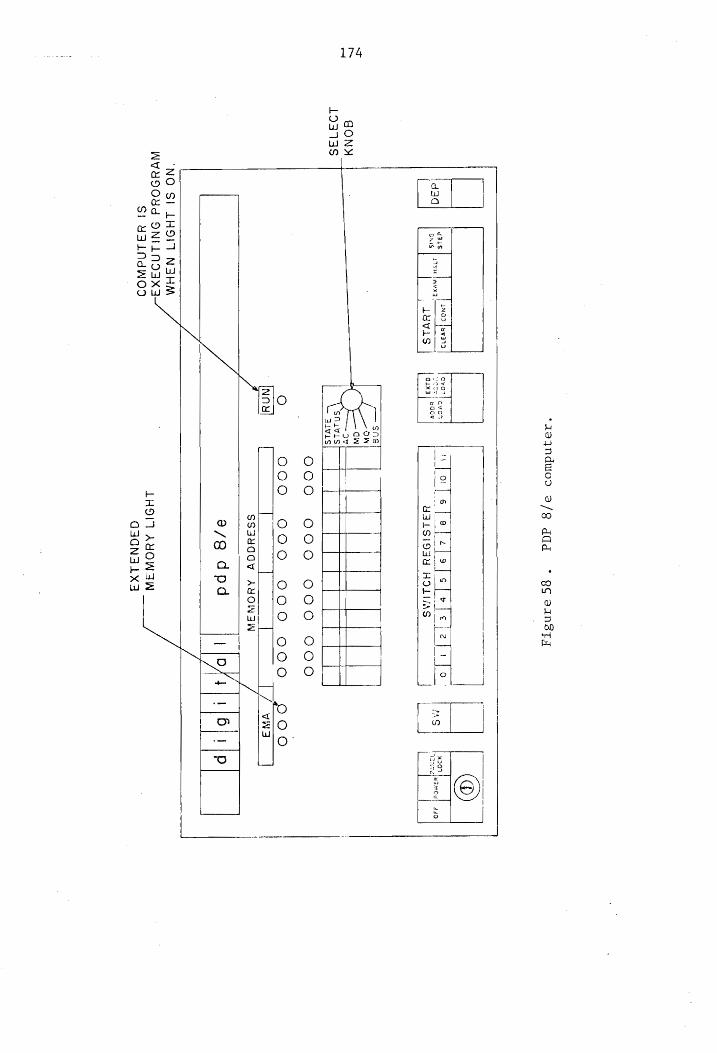
174
GON _|
193738
‘zaynduod
3/8 ddd
* gg oan8Ty
| |
d31S
A300
SKIS omens
4NO0D Vyeana
tj
Luvs
|
| ovo]
ayvay
*! yagy
fotsfelz[s]}s[ele HTS
YSLSIOSY
HOLIAS
fe aul
r—
Sng
OW
aw
oY SNaivis
SLVisS
OOO
COO
000
000
O00
000
000
000
poo
Now |
| |
| L[/
ww |
SS3Y¥adgY AYONSW
/
a/g dpd
0/1 6}
1)}p
"NO Si
LHOIT NSHM
WVYdH9Odd
ONILNDSAXA
S! YSLNdWOD
LZ
LHOIT AYOWSAW
QSQN35LX4
//
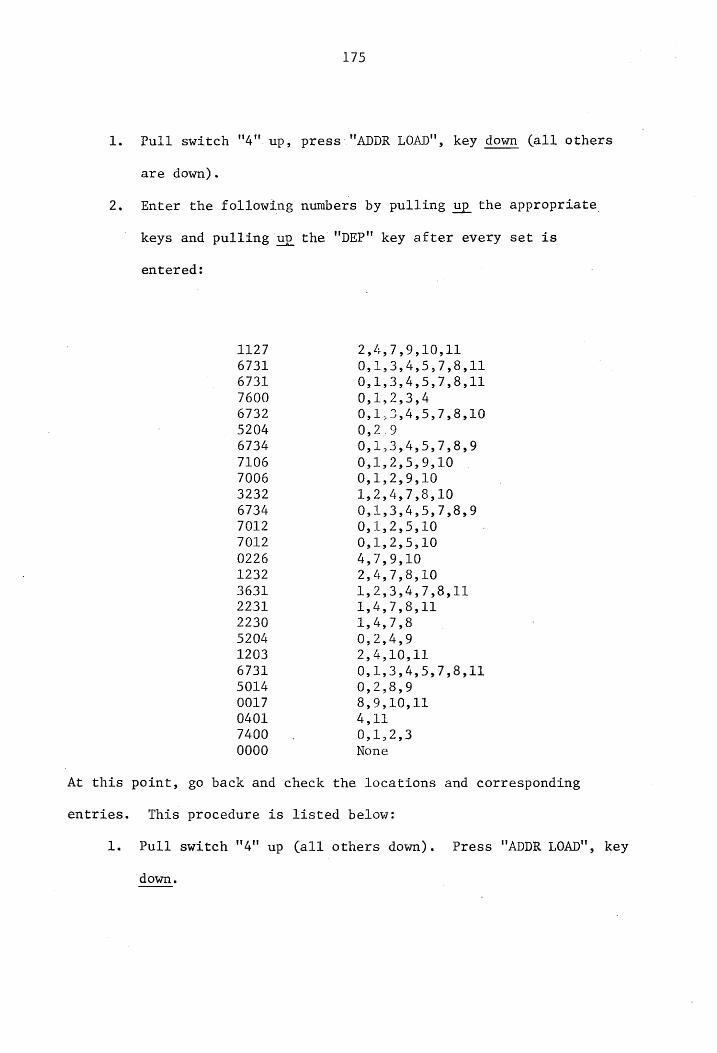
175
1. Pull switch "4" up, press "ADDR LOAD", key down (all others
are down).
2. Enter the following numbers by pulling up the appropriate
keys and pulling up the "DEP" key after every set is
entered:
1127 6731 6731 7600 6732 5204 6734 7106 7006 3232 6734 7012 7012 0226 1232 3631 2231 2230 5204 1203 6731 5014 0017 0401 7400 0000
So
NR
NM
NN
we
©}!
Oo he
|
BW
h
wo CS
we w
“
WwoMmMororUuUUNPsAI
OU
Ov
v wow
‘ w
Av v7
iv)
w w
w w
1 ,5,7,8,11
oO Pe
PPE FAMP
AMOR EPLERRE
PCE PLELD
wow
a
HH
FOwWOONOrFRRrFEREN
FOC
OCrFOOCOCOCOCOCO CO
bh vue
ee
ee
lll
lhl lll
rPmoONnNrFPRNME
HN PNP
RP RP
NMRFPRP ENP PRE >
fea
v w
w we
« w
vt
we
\ iv
vy
w vw
\ wT
wy
At this point, go back and check the locations and corresponding
entries. This procedure is listed below:
1. Pull switch "4" up (all others down). Press "ADDR LOAD", key
down.
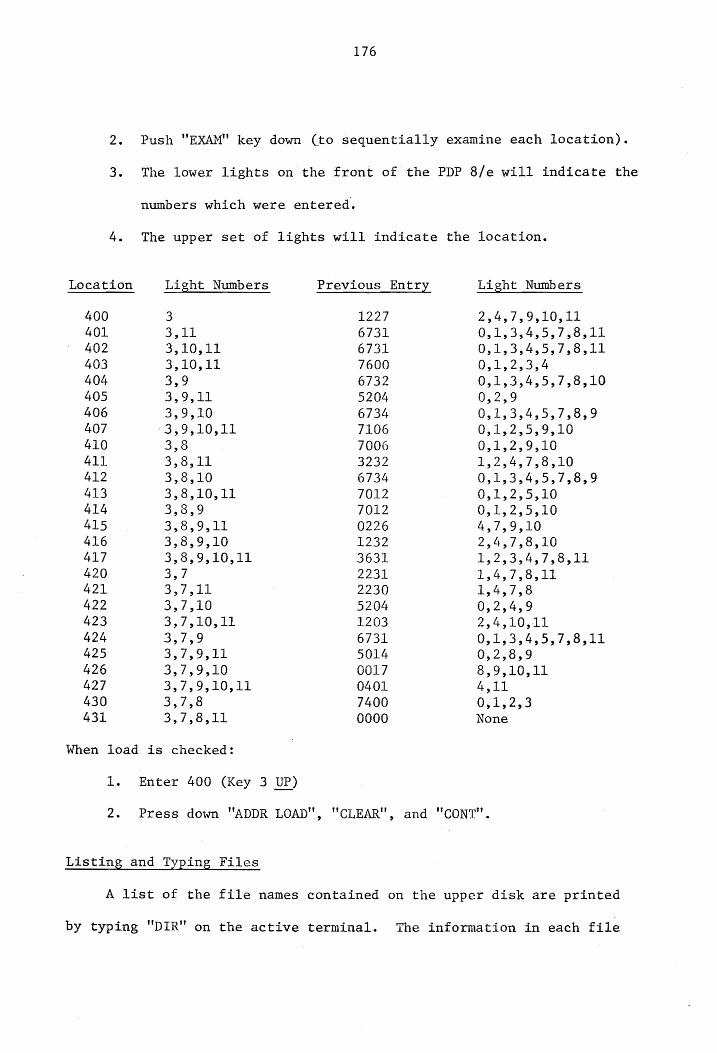
Location
400 401 402 403 404 405 406 407 410 411 412 413 414 415 416 417 420 421 422 423 424 425 426 427 430 431
176
Push "EXAM" key down (to sequentially examine each location).
The lower lights on the front of the PDP 8/e will indicate the
numbers which were entered.
The upper set of lights will indicate the location.
Light Numbers
bY ba
OOH
we
we “
ww
w
w
we
we
w
we
WKWWOREE
OOF
+»
» oOOF
HbHRe
fs PHP
QOrF
OOF
. bs
. bs
= ja
bs
bs
w
ww
w
Wo lo
GH WH
WO
WD WH
W& DW Ww
WH wD HW
&
©
WD WD Ww www
MEN MINN NNN NS
WO OWDWDMWMAMMDAWO
WOO OH RH
w
ww
w
w
w
we
Ne
w
w
ww
we
w
we
w
w
w
w
w
we
w
we
we
w
we
DOW wowowoworh
Fb
4
HA
. w
we
w.
‘
w
w
“se
we
When load is checked:
1.
2.
Enter 400 (Key 3 UP)
Previous Entry
1227 6731 6731 7600 6732 5204 6734 7106 7006 3232 6734 7012 7012 0226 1232 3631 2231 2230 5204 1203 6731 5014 0017 0401 7400 0000
Light Numbers
we “
WMmMeoOorMOrRPUU
Ps OW
Q-v
ww
we
w e
vy
“ iv)
v7
“ tv
) ‘e
»7,8,11
oO Pe
Wb
BPP
REFINE DERRY ERRYWOWN WEN
we
we
w pa fu
ww
ww
w ee
ee
eee
we
we we
ww
we
we el
OmlUlUlUOUlUlUlOlUlUlUOUlUlUlUOUlUlUUlUlUU
PONFENPE
NEAR
P NFP PRP NHR PHP
Bs
Rv
w w
« w
“ .
w vy
7 a
tv Y
‘ w
w “w
Ov vw
w w
FOODOONOFEFEHENFOOCOOFrCOCO
COCO CN
Press down "ADDR LOAD", "CLEAR", and "CONT".
Listing and Typing Files
A list of the file names contained on the upper disk are printed
by typing "DIR" on the active terminal. The information in each file
177
is typed by entering "TYPE File Name File Type”. Substituting "FLP:"
after each command, Dir or Type, will accomplish the same as that
above except the information will be generated form the lower disk.
Changing to Another Terminal
Either one of the two terminals (teletype or teleray’) can be
used with the PDP 8/e, at the discretion of the operator. During
the operation of the system, it may become necessary to change from
one terminal to another (i.e., to receive a hard copy - teletype) which
is the simple procedure listed below:
Type the following on operating terminal after dot appears:
R TLS (press return)
1. When computer halts, (PDP 8/e, "RUN" light goes off) change
terminal switches (see Fig. 57) for desired terminal.
2. Press continue.
3. Computer should print a dot on now active terminal.
PDP 8/e Programs
A. Position Program — POS.RL
This program enables the operator to conveniently position
the diffractometer at any 20, XxX, ®, or W setting.
Type on operating terminal after viewing dot:
R POS (press return)
The response from the computer will be a series of questions
which, when answered correctly, can position the instrument to any
+
Teleray is preferred because of its speed.
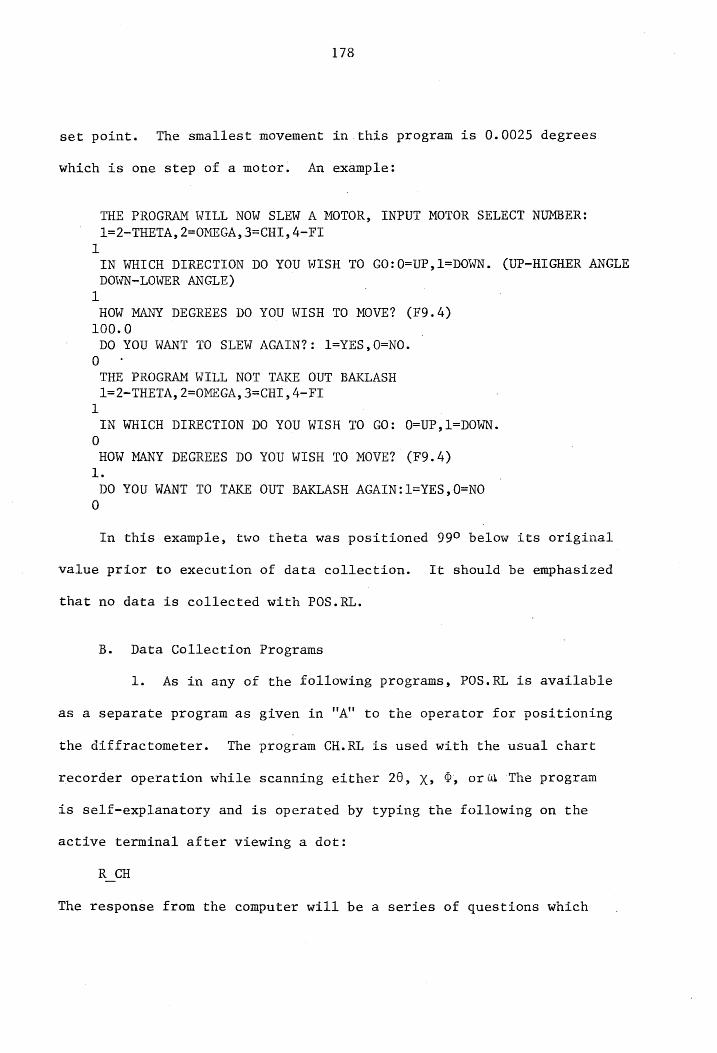
178
set point. The smallest movement in this program is 0.0025 degrees
which is one step of a motor. An example:
THE PROGRAM WILL NOW SLEW A MOTOR, INPUT MOTOR SELECT NUMBER: 1=2-THETA, 2=OMEGA, 3=CHL, 4-FI
1 IN WHICH DIRECTION DO YOU WISH TO GO:0=UP,1=DOWN. (UP-HIGHER ANGLE DOWN-LOWER ANGLE)
1 HOW MANY DEGREES DO YOU WISH TO MOVE? (F9.4)
100.0 DO YOU WANT TO SLEW AGAIN?: 1=YES,0=NO.
0 «
THE PROGRAM WILL NOT TAKE OUT BAKLASH 1=2-THETA, 2=OMEGA, 3=CHL, 4-FI
1 IN WHICH DIRECTION DO YOU WISH TO GO: O=UP,1=DOWN.
0 HOW MANY DEGREES DO YOU WISH TO MOVE? (F9.4)
1. DO YOU WANT TO TAKE OUT BAKLASH AGAIN: 1=YES, 0=NO
0
In this example, two theta was positioned 99° below its original
value prior to execution of data collection. It should be emphasized
that no data is collected with POS.RL.
B. Data Collection Programs
1. As in any of the following programs, POS.RL is available
as a separate program as given in "A" to the operator for positioning
the diffractometer. The program CH.RL is used with the usual chart
recorder operation while scanning either 20, xy, %, orw The program
is self-explanatory and is operated by typing the following on the
active terminal after viewing a dot:
R CH
The response from the computer will be a series of questions which
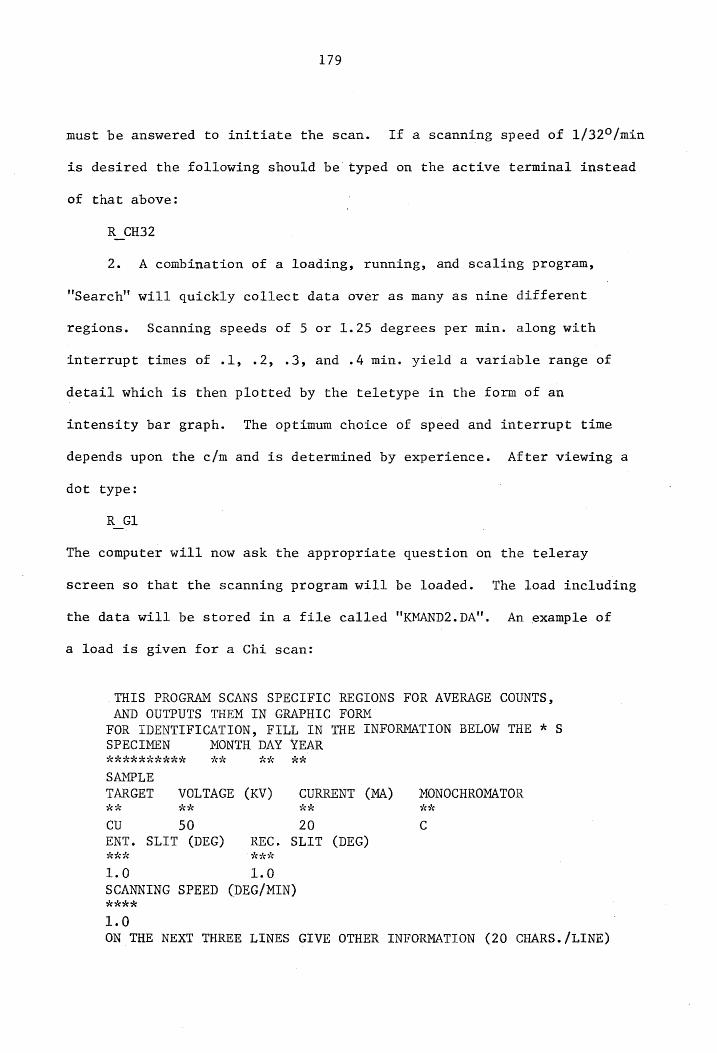
179
must be answered to initiate the scan. If a scanning speed of 1/32°/min
is desired the following should be typed on the active terminal instead
of that above:
R_CH32
2. A combination of a loading, running, and scaling program,
"Search" will quickly collect data over as many as nine different
regions. Scanning speeds of 5 or 1.25 degrees per min. along with
interrupt times of .1, .2, .3, and .4 min. yield a variable range of
detail which is then plotted by the teletype in the form of an
intensity bar graph. The optimum choice of speed and interrupt time
depends upon the c/m and is determined by experience. After viewing a
dot type:
R_Gl
The computer will now ask the appropriate question on the teleray
Screen so that the scanning program will be loaded. The load including
the data will be stored in a file called "KMAND2.DA". An example of
a load is given for a Chi scan:
.THIS PROGRAM SCANS SPECIFIC REGIONS FOR AVERAGE COUNTS, AND OUTPUTS THEM IN GRAPHIC FORM
FOR IDENTIFICATION, FILL IN THE INFORMATION BELOW THE * &
SPECIMEN MONTH DAY YEAR HRAKAKRKEAESH Ks ws RK
SAMPLE
TARGET VOLTAGE (KV) CURRENT (MA) MONOCHROMATOR wk* wk kk k4*
CU 50 20 C ENT. SLIT (DEG) REC. SLIT (DEG) KKK ReK
1.0 1.0
SCANNING SPEED (DEG/MIN) ARK
1.0 ON THE NEXT THREE LINES GIVE OTHER INFORMATION (20 CHARS./LINE)
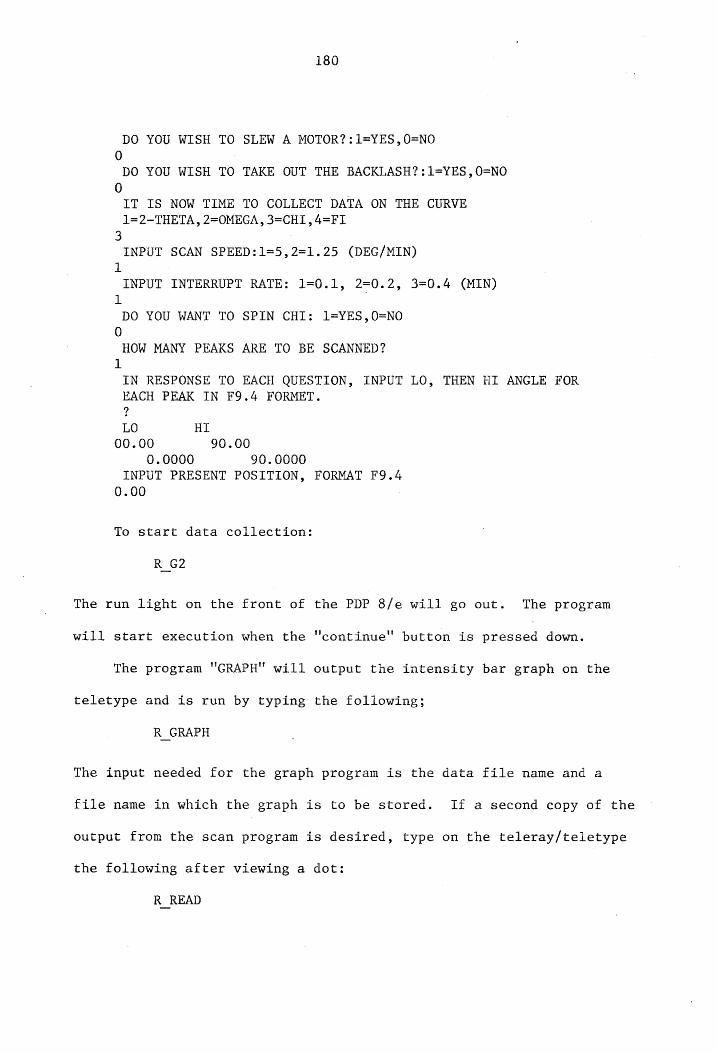
180
DO YOU WISH TO SLEW A MOTOR?:1=YES,0=NO
0 DO YOU WISH TO TAKE OUT THE BACKLASH? :1=YES,0=NO
8)
IT IS NOW TIME TO COLLECT DATA ON THE CURVE 1=2-~THETA, 2=OMEGA, 3=CHI1, 4=FIL
3
INPUT SCAN SPEED:1=5,2=1.25 (DEG/MIN) 1 INPUT INTERRUPT RATE: 1=0.1, 2=0.2, 3=0.4 (MIN)
1 DO YOU WANT TO SPIN CHI: 1=YES,0=NO
0 HOW MANY PEAKS ARE TO BE SCANNED?
1 IN RESPONSE TO EACH QUESTION, INPUT LO, THEN HI ANGLE FOR EACH PEAK IN F9.4 FORMET. ? LO HI
00.00 90.00 0.0000 90.0000
INPUT PRESENT POSITION, FORMAT F9.4 0.00
To start data collection:
R G2
The run light on the front of the PDP 8/e will go out. The program
will start execution when the "continue" button is pressed down.
The program "GRAPH" will output the intensity bar graph on the
teletype and is run by typing the following;
R_GRAPH
The input needed for the graph program is the data file name and a
file name in which the graph is to be stored. If a second copy of the
output from the scan program is desired, type on the teleray/teletype
the following after viewing a dot:
R_READ
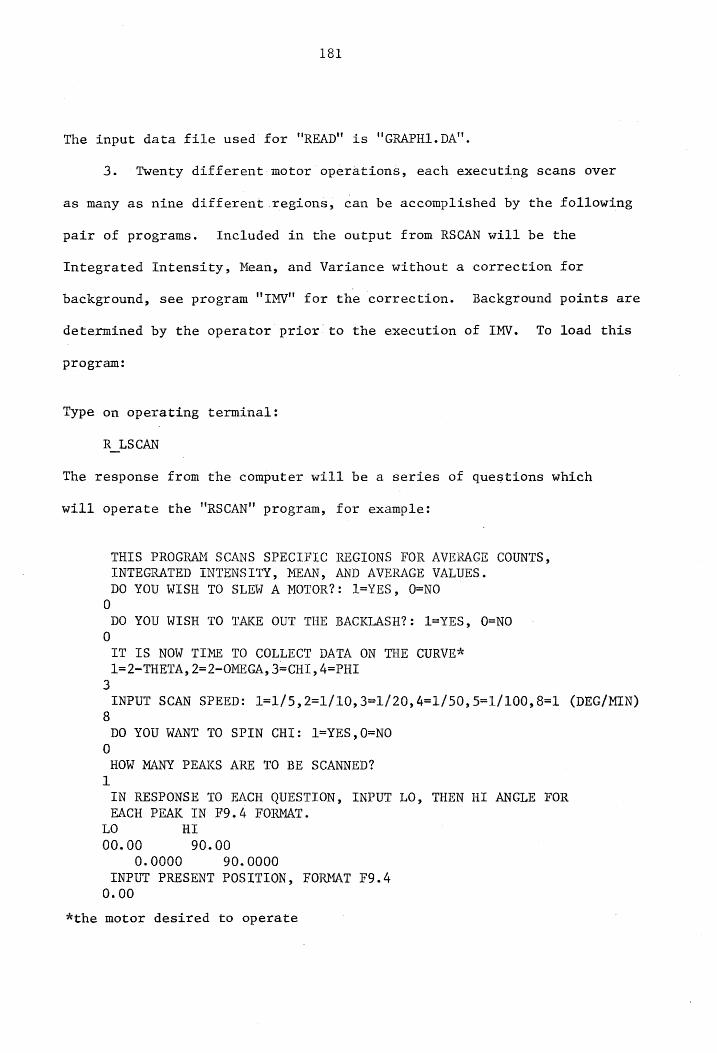
181
The input data file used for "READ" is "GRAPH1.DA".
3. Twenty different motor operations, each executing scans over
as many as nine different regions, can be accomplished by the following
pair of programs. Included in the output from RSCAN will be the
Integrated Intensity, Mean, and Variance without a correction for
background, see program "IMV" for the correction. Background points are
determined by the operator prior to the execution of IMV. To load this
program:
Type on operating terminal:
R_LSCAN
The response from the computer will be a series of questions which
will operate the 'RSCAN" program, for example:
THIS PROGRAM SCANS SPECIFIC REGIONS FOR AVERAGE COUNTS,
INTEGRATED INTENSITY, MEAN, AND AVERAGE VALUES.
DO YOU WISH TO SLEW A MOTOR?: 1=YES, O=NO 0 .
DO YOU WISH TO TAKE OUT THE BACKLASH?: 1=YES, O=NO
0
IT IS NOW TIME TO COLLECT DATA ON THE CURVE*
1=2-THETA, 2=2-OMEGA, 3=CHI, 4=PHI
3
INPUT SCAN SPEED: 1=1/5,2=1/10,3=1/20, 4=1/50,5=1/100,8=1 (DEG/MIN)
8 DO YOU WANT TO SPIN CHI: 1=YES,0=NO
0
HOW MANY PEAKS ARE TO BE SCANNED?
1
IN RESPONSE TO EACH QUESTION, INPUT LO, THEN HI ANGLE FOR
EACH PEAK IN F9.4 FORMAT.
LO HI
00.00 90.00
0.0000 90.0000
INPUT PRESENT POSITION, FORMAT F9.4
0.00
*the motor desired to operate
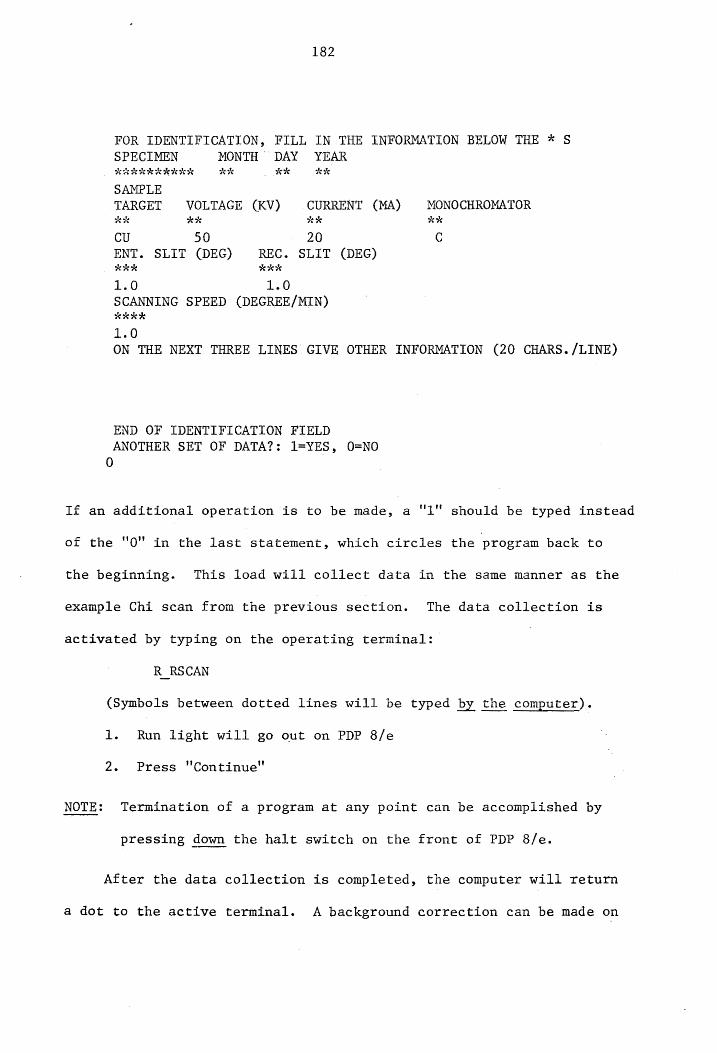
182
FOR IDENTIFICATION, FILL IN THE INFORMATION BELOW THE * 8
SPECIMEN MONTH DAY YEAR
Ke keRARKAS wAK *K* *w*
SAMPLE
TARGET VOLTAGE (KV) CURRENT (MA) MONOCHROMATOR
ws k* wx kx
CU 50 20 C
ENT. SLIT (DEG) REC. SLIT (DEG) KK* hike
1.0 1.0
SCANNING SPEED (DEGREE/MIN)
#AAKK
1.0
ON THE NEXT THREE LINES GIVE OTHER INFORMATION (20 CHARS. /LINE)
END OF IDENTIFICATION FIELD ANOTHER SET OF DATA?: 1=YES, O=NO
0
If an additional operation is to be made, a "1" should be typed instead
of the "0" in the last statement, which circles the program back to
the beginning. This load will collect data in the same manner as the
example Chi scan from the previous section. The data collection is
activated by typing on the operating terminal:
R_RSCAN
(Symbols between dotted lines will be typed by the computer).
1. Run light will go out on PDP 8/e
2. Press "Continue"
NOTE: Termination of a program at any point can be accomplished by
pressing down the halt switch on the front of PDP 8/e.
After the data collection is completed, the computer will return
a dot to the active terminal. A background correction can be made on
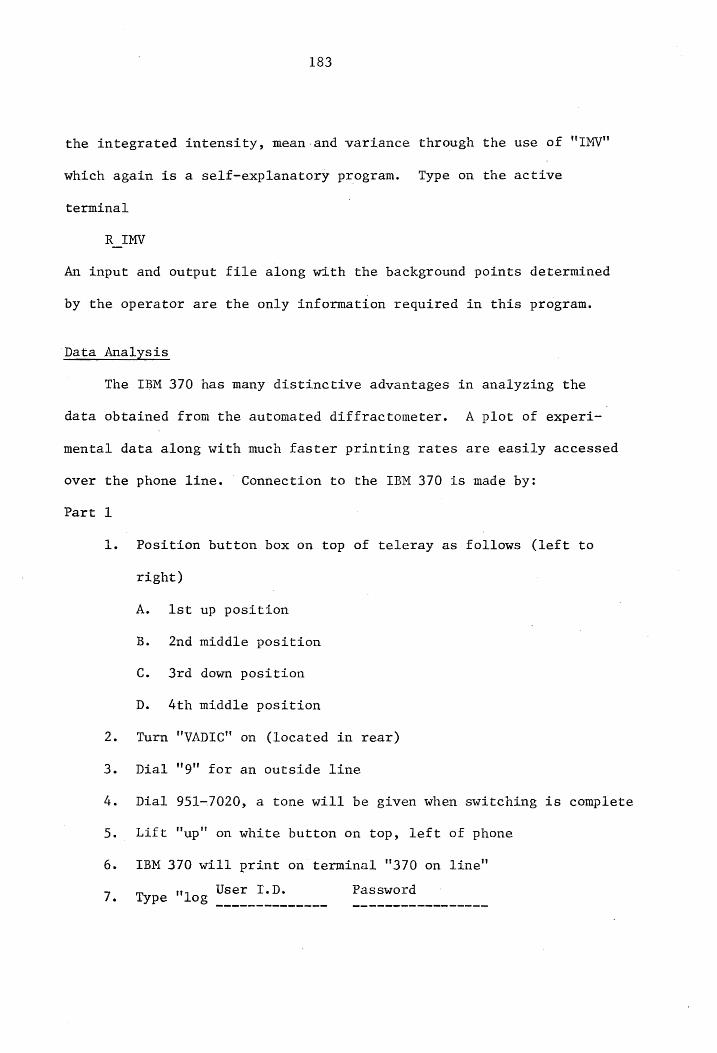
183
the integrated intensity, mean:and variance through the use of "IMV"
which again is a self-explanatory program. Type on the active
terminal
R_IMV
An input and output file along with the background points determined
by the operator are the only information required in this program.
Data Analysis
The IBM 370 has many distinctive advantages in analyzing the
data obtained from the automated diffractometer. A plot of experi-
mental data along with much faster printing rates are easily accessed
over the phone line. Connection to the IBM 370 is made by:
Part 1
1. Position button box on top of teleray as follows (left to
right)
A. I1st up position
B. 2nd middle position
C. 3rd down position
D. 4th middle position
2. Turn "VADIC" on (located in rear)
3. Dial "9" for an outside line
4. Dial 951-7020, a tone will be given when switching is complete
5. Lift "up" on white button on top, left of phone
6. IBM 370 will print on terminal "370 on line"
User I.D. Password
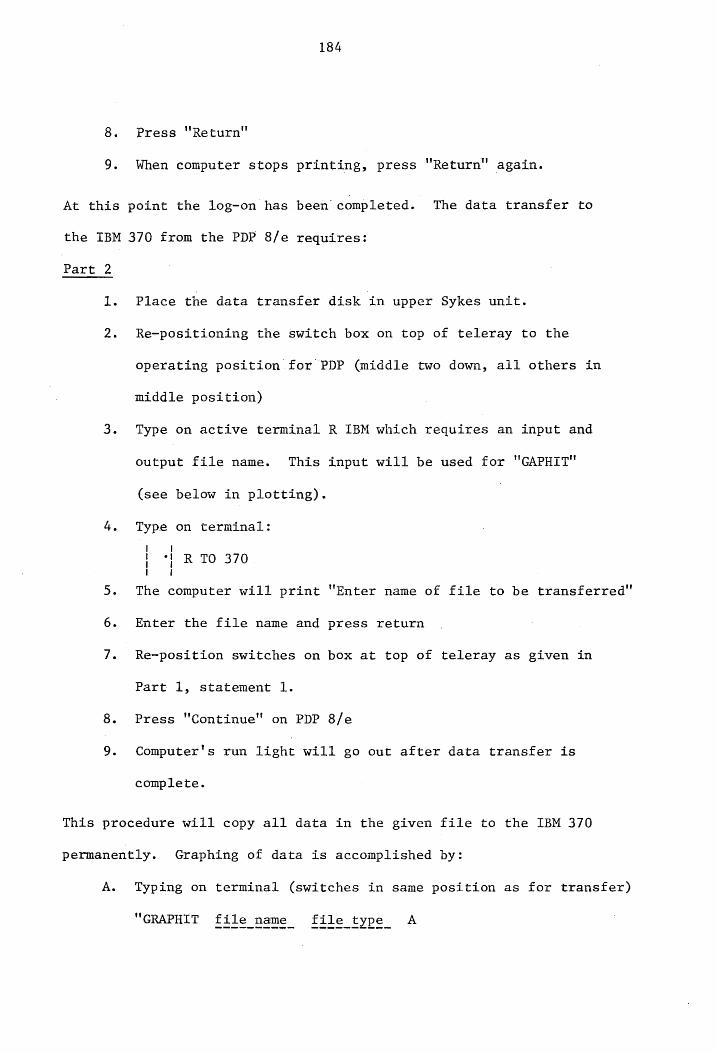
8.
9.
184
Press "Return"
When computer stops printing, press ''Return" again.
At this point the log-on has been completed. The data transfer to
the IBM 370 from the PDP 8/e requires:
Part 2
1.
2.
Place the data transfer disk in upper Sykes unit.
Re-positioning the switch box on top of teleray to the
operating position for PDP (middle two down, all others in
middle position)
Type on active terminal R IBM which requires an input and
output file name. This input will be used for "GAPHIT"
(see below in plotting).
Type on terminal:
| R TO 370
The computer will print "Enter name of file to be transferred"
Enter the file name and press return
Re-position switches on box at top of teleray as given in
Part 1, statement 1.
Press "Continue" on PDP 8/e
Computer's run light will go out after data transfer is
complete.
This procedure will copy all data in the given file to the IBM 370
permanently. Graphing of data is accomplished by:
A. Typing on terminal (switches in same position as for transfer)
"GRAPHIT file name file type A
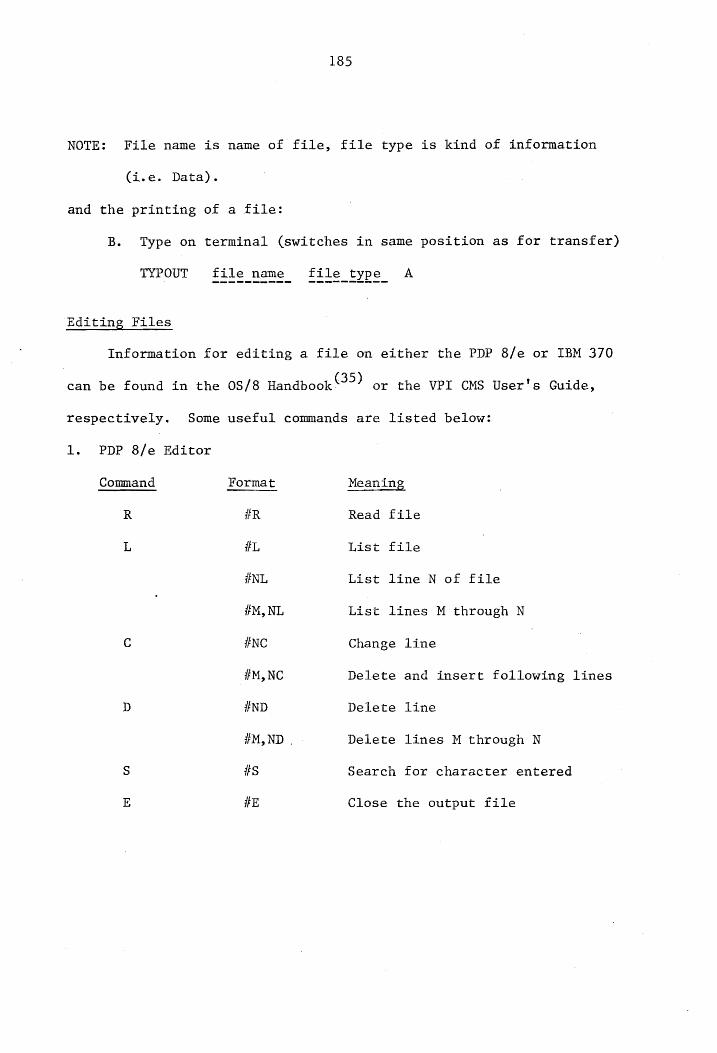
185
NOTE: File name is name of file, file type is kind of information
(i.e. Data).
and the printing of a file:
B. Type on terminal (switches in same position as for transfer)
TYPOUT file name file type A
Editing Files
Information for editing a file on either the PDP 8/e or IBM 370
(35) or the VPI CMS User's Guide, can be found in the 0S/8 Handbook
respectively. Some useful commands are listed below:
1. PDP 8/e Editor
Command Format Meaning
R #R Read file
L #L List file
#NL List line N of file
#M, NL List lines M through N
C #NC Change line |
#M, NC Delete and insert following lines
D #ND Delete line
#M,ND | Delete lines M through N
S #S Search for character entered
E #E Close the output file
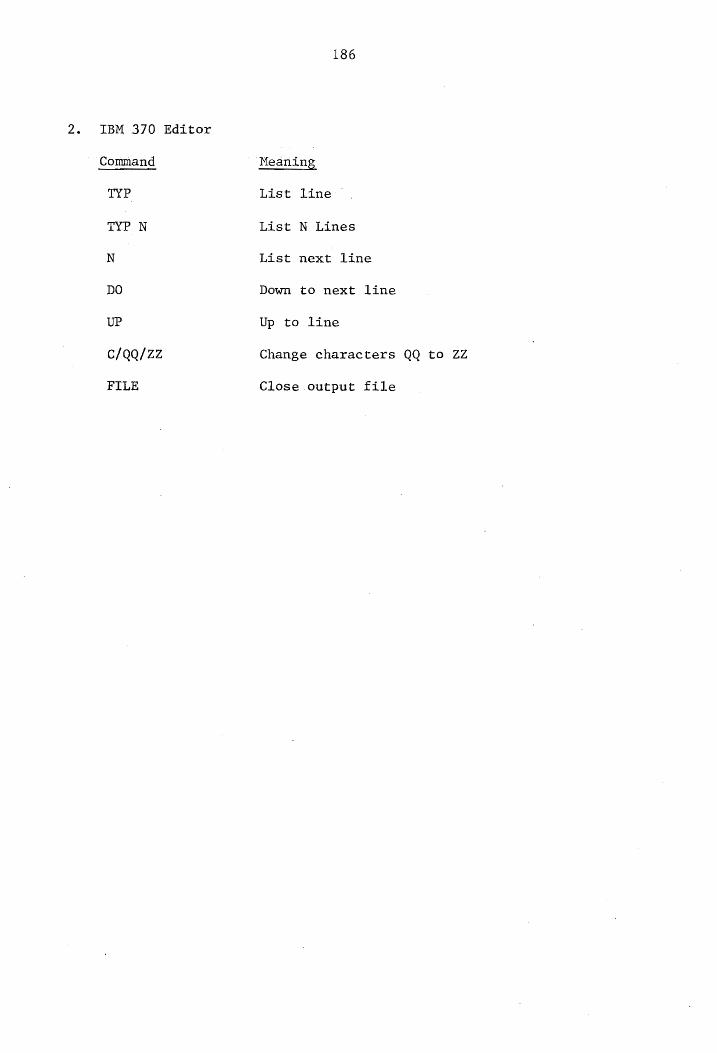
186
2. IBM 370 Editor
Command Meaning
TYP List line
TYP N List N Lines
N List next line
DO Down to next line
UP Up to line
C/QQ/ZZ Change characters QQ to ZZ
FILE Close output file
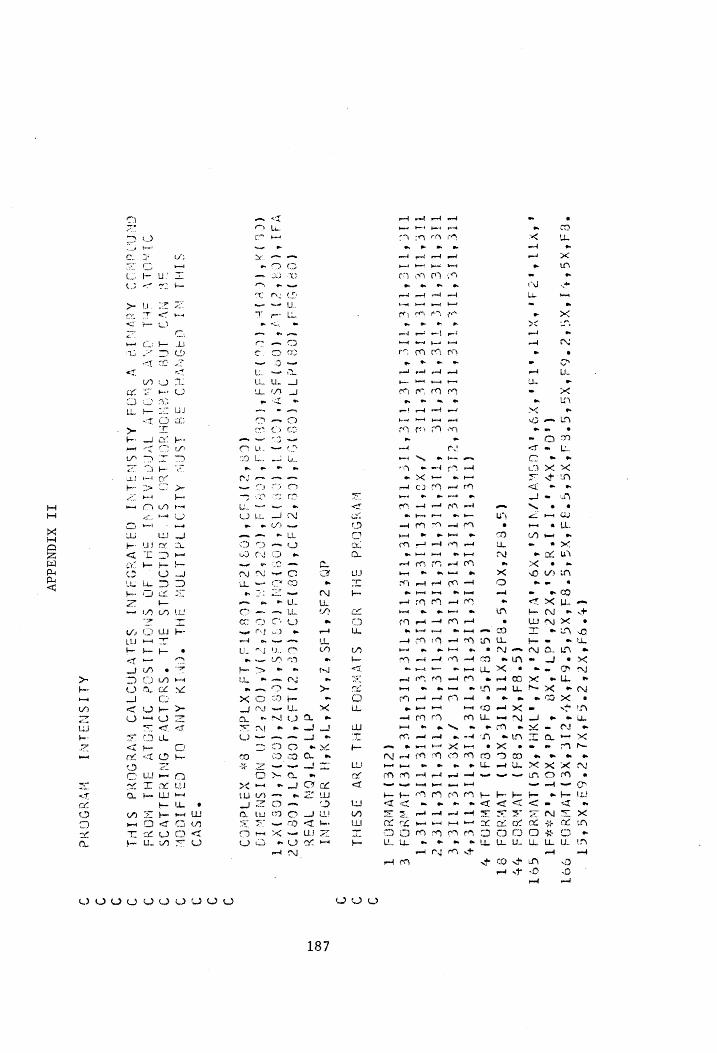
XG*E
TS XGSS
ef¥TT Sade OXI
(S°CASSXOTSS *S4C*XTTSTIEfXOT)
ives
SI (G8
E44 G8
84 4Gt
C4) AvRNOA
¥ (TIESTICSTIEf{TIESTIC*TIctTictties*tictitic!
TEE ATIC
STIC STILE
STILE STE
feet ef Te
fTief§tict# icf
Tic sf
XE TICfITLe
Tic {Tileftic*TicitileftTie
fTIieslicsTicftie*
Tle icf
tie fTie
fie
tice
Prete Tee ers
/PMOPTLE* TIE
Tie
Tie Ties
Ties ie
Tet
Lie sh
TICfTT
eft beftre {Lief
ef Pict
icf Tle STE fics Tle
Tic {Tie
{Tiley ivweod
€ (Zi€)ivwuos
T
RVYOOdd
FHL NOS
SAVevO4d JHL
Sav SSSHI
dS* Za
TAS * ZA
FY ETE
YAODEN
ATT
d TSGN WSt
(Osos
COs ddd (oe sos!
(CE S259!
(Ce lsaaf ice! éyLSI* (ONT 16€Ge}9?
VALE (CAEP
LT ECOPPSS
TE COOP
TEES
PIS ECOG
FENS (OSPSS ECCS
ITE(ORIAT
ECE DX ET (Codaf
(Cede fC
ssa hGb
ys ah
Os
y a
COS Fe
ye ECCT
OAS
(OZF 240
NOTSNSRTD
(Cefesrso*
(68
2st (CU TSS ds !X I
do
Gx XAIVdWOD
*3SV5 STHL
WE GFIDNVHD
38 ish:
LIDTIVLL
ING FHL
SChIM
ANY GL
CSLAICOL:
ar NYO
It
DiaAioH ohio
ST S3uMloONyls
ShL *Sy¥Cidvd
ONTYILLVOS
DiweDL\y Skil
GNY SedLy
WOOT
TCNT SHEL
40 SNGTL1SOe
DJIYOLY SHL
NOUS ChAIGeOoD
Aevile
Wood
ALTS IHL
I G3iVsSO4iNT
SSLVIGDTVO
bY OGUd
SIRE
é
GA
lk Xs ee
ESF XG
sGe
erga
*xe E° ea! xG
‘XH4,
abana XS VCShVIZ/NI
Ss
(+°944*xXe*7*
6G"
GAPXL
PS8 OB EXG SE
S°XU CIE
“Eyes
XS Sh ad tf Xk fade
S XOT Se
*¥OGF AVESHES
sf XL Sa
TV
(S°8a*xe*o*8a)
LVREd
ALISNSiNT
Fi
II XIGNdddVv
KEV LVDS
89]
exxiT
S¥G)IVeYOH
SOT
ly Yt
00 OOOO VOUNOO
187
188
Chase C (PRT) DC
TP STIP
NACHT CECSTICVAFICT
Hac CIC ETI
CUNT INISH+4
4S 39 4S CTs
COPD ED
CEC ETIPY
SCE Ee
CEO ETT
PDAS (PL
He (IC ELIS IND
SOOFEAS=ESS NN‘T=IP
L GG
O°C=¥4S C'C=€45S
dO=HNNCETO3°TIF)
Al FNFENN
GE TT OS*
FIC) al
c*T=1If
& CG
RON
* T=F1
9 OG
CoP ESIEECSEEZIAL
OUP
FA SINGCESTTEG)
ALTUM
CUP PCERSOOE
AS SCIAL (NE OSIM
(4%°G) GVay
dP*t=ur
Co ac
(CETIMECPETIAL
CF ETING OSTT
ESO) ALTUM
(FETIBRACEITIATOCR
ATIC (#Fo)ayv3ay
AVeaw
RY F159
LINA
HL
NI SBPOLV
GHL 30
SNCITLISOd
JHIL/
CNf ATH
SG Oa
CT XNEF-N=d0 (TLATHATS
CLV TSCT ISS ELH)
(ers)
CVS PNEANARONCT
ASG) Gyad
AvdadayY NY
*Ca3i¥
TA 9199
ae OL
SNCIIVNOETSSOQ
ANV Ids
ONIX
iSt1Td SHEL
JO SwOiV
40 YSGhON/
W223
LINN
dad SROLV
JO t3aahAN
TWLOLZ
(22 eh kViy)
G¥Vau 439
OL VYH
40 siGhoN
WioL/
CSLESFELLLLSITLLETL
EELS LTTE
I STILL EXO)
LN WSCS
LOEGRTES?C*S=lId
(s°e@4a'xoforea*
xo’ Gres
* xe dl ywucd
(G*84e) LVwdOd
(///e8SMOT104
SV ST
CISTL
MGA
SIEVE
FHL sf
XG) IVREUOS
wy
MAN
THH
TNF
WW Ob.
REe
66TT
ra A
TLT
Wo O OVQaUOO
189
V3W39 LINA
SHE
dO eslakvVuvd
@ 2HL/
Vso LI
ZHL
sO SALGNVveyd
Vo RHIS
JON
TINGS
(Ii) 2d=(04T)e45
CTS} T4=€4HT)TS
(INJV=OH1)7
(INI Y=OKITIDA
(CINJH=C€4I)X
T4H¥T=H1
SANTINC2?
NOT
OL GOCOSES*G*GNV EC*69°9)
Al
SPR TINGD
Gi Qi
69
Z2 OL
O5(C°GS°SG°ONRV TC*ES"V
Gl
(CIN
ZAIIVWTV=0
(CIN)
22) 1V3=9
CCIN} TAPOVETV=9
(CIN)
Ta) Wadev
WANS T=IN
OCT
OG
C=yHI
SANTINO D
(FIYZSS(FTITSAS
ECE) TECF TINS OF
LTIHOSTSS)SLIUM
SANT LNOD
(CHU
ST ayy
KX TdWO=(F
TTS
PANT LCD
§ OL
09
(CSe*TAN
XX TdwWo=(fT 24
C2 OL
G9 (T°OS°TIC)
Atl V7AS=2454
€iS=1T34
SANT INOS
aaa 9
VVV 9
OCT
6L
LL
O¢
3
190
GTTt O01
O09 YET
GL Po
COLSD
DORSAL CNT
DD TS*GN
VY CINTI On
LO"
(NTID
IS) 3]
T+iNT=1NI
SG*l=INI
GIT Cad
T=1N1
MT4T=N1IT
€1Tt aa
T4+dNIT=dN 1
(RI JASV
SEND ISS
(oh fe)
Gvau
TIT 3
“ESel4d LN3RI
Ia LSSTA
BL
a%d SAOIVA
SHI SCVde
eV uUSONd
Shi °LNabNST4
3 BOVG
SsOa VGEUY I/O
Lab ibis
G@%d OL
OF0 bOsd
SaNnIvA
GSS 40
TV¥LDE YV
2 Alidy
SOG TVIVESAGD
AVU-K
dad SlaVi
GOA YSLOVA
ON TeSLAVoOS
DNCLY/
4SV 9
VOARVTACVELAHLINISZ
ON 9
CVS 4
SAN¥V SBOLODVG ONT UGLivos
STW OLV
SHI 3 3
O¢*T=NI
TTT CG
SANTINCD
¢tt C=daNXT
T-NPENI
SNNELKNOD
€€€ SANTLINGD
OCT TEQeG*
TA(INP J4AS= ENE I
TS
Meee GONE
lig
“Lox CCN)
45 SuV=(NPF)
444 UNE)
a7 0" 271604 e
T)=ONF
194
CONP
IS) LdOS=(NF)
44 in
C8éxe DIDI SOC®
Cue (NG
VZ) DP 4ACCOP
Cee ad)
OT
C8 Prox
(NTA DEES See VVV
ISL CGT See
ENF IX
DD eC
TU SI
C® CexT GOS SLIP HCNP DS
M1‘T=Nf
O1T OG
D900 fead*vvVi?27's)
AVA
2 VW7S9
LINN
SHE JO
walakvevd
D SHL/
393 9
NUE
; CUNT
116
YD)
CSe
cil
y—-hQET?
iT
IN
i {
{ t
‘Gh
F(INT)-ASFCINI))/(>
8 =ASFCINT) +004
ATCINP,LIN)
QCINT)))
LN)-N
CONTINUE
115
113
CONTINUE
GO
TO
lle
NPLEQ.L)
IF
(I
D9
L190
=L,Ik
NIJ
r 1
L.-
EXPRESS
AULTIPLICITY
IS
THE
wae
ate
ote
ala
y yoUS a
a
ase
vr
ule
Tal
223
wie
se
ye
als
Ate ale
Fe
at
‘ sf
xc
S35
5;
< ? os
le
ube
de
Pe
Te
BL
BL
ar
At
ae
4, oe
oute
abe
we
ale
ale
ate
wt ie
ate
a ye
whe
ste
ate
ate
ate
FASS BAR
SS
AS
aS
PS SS kT
AS
oy bp
al ste
yy
TN OF
RA
wie
te
whe
+, at,
as
yemi
xk
Re
TFACINI
JS) =4
IF
(X(NITJ).4
5 \ qi
QV TEAC
{AT
I)
~Z{*
TS)
eet,
NO
03
i #
=O.
2.2024
C
4
191
tod IN|
ar La atined
TJ
1 i QeJVTFAC(S
by wh
e mts
ate
ale
ale
ate
we
ale
ale
RAL
AS
FR
tent nig
ie .
eae ety,
~ > Dent
O 7
“~~ >
«
i 4 Xx }
<L a
« O ~~ @
™ C7 wet LE
— *
wet ate
x 7 weet tot
bide an Pent ener
omed
a wot
i wh
a ade
tle,
MAS
RL
Se
a a 8
he + 3 Je a
Nie
Flos
Togs
we
ete
ate
we
QL
we
ste
SAY
AS IRS
Re
2s
2s
TS
aS
as
FD
BS
é 3, ’ tear
ate
we
Pee
- af,
Fo gh
gle
aie
ae
be
wl
te
ate
07 SR
I ES
OR FES
x -
oats
ote
we
sz
whe
ate
als
ale al
e alo
cole
slo aie
sic
ake
ie ate
fe
ofc o
le 3K
a C
3%
"yy,
UT
OYE
aN
OO
mR
o ty
as
IM A
T!
CHa
+ MO
° 5
(26
S$
ITS
)/a7e24955)
io Nd
x NDJd=
014+
(C
t LLP {
L/(it (Cost Frat
‘2))
wer
- 2,
a) ” ny i,
et
WY “>
—_—
—
~—s
sevontelh
Zz
one a . * “ 3s
t 3 ay ral ae
Ww . x
fl
3
=(1+
LP(NI
J)
L8))* (L
LP
Tl { i
yo
Pas
ale
Wo
vty
ale
ote hone
2 Teo
3
oe
stows
wee
v:
Lr
BS BLS
as
PA
RE
RS Ns
Be
le oe
ta
gh
at
ye et
ate
we
Pe
Pe URS
FAAS
TA tS
a.
F whe
Ale at
e i.
WW
whe
te
ste
fo
ie
* de
ve te
We ek
ale
= a
FS SAF.
78
at
ghee
ate
wy
ae Xs 3)
C t
TINU
a id a
L100
CON
=l1,I1
vy t a
D3
141
JJ
T))
4 rw
KFLQCJGD
V0 t04T 02,500) er
2s
“r }
(AT(1L,JJI
IG(CRICLyJIT))
Ce
FJCL,JJIT)
CFI(1L, JS
UT)
}M CFI(2,I55T)
CFF(JJST1)
FJC2,5ST)
rm Ve
ve we
C
UE
NY J
cy
oO)
L41
192
CPR VTO4
ECP RESP
LAD EER
EN ATP
LAD SOP
RNI OTE
CPR
DOWST
OC PRN)
4404 (PENT
SP yiv
(Pai
h TILE OGRE
TS oO
*, iat Bee
GNa eCi$
NISad
6 OF
ANIZ
SCP RNIAS
OPEN
IX OSSTS9)
SLIUM
WIAT=Feh
£OT OG
(SeTf'S)
SLIUM
(TZT*S)
BLUM
(ses*9o)
JLIYM
"OTe CLNO/ (BER
STE LADD HONE
fo?) 44d
ML‘T=NEF
COT ac
(RAN
ST) LAS=LUO CLUBS
CNN fT 149)
Sl
YES THANKN
29T
OG
C*0=1u49
SANT EROD
(NINVOV4AL&
(NIN) d Te (NIN SS9=ENINAT) 149
MIST=NIN
TOL GG
¥ST
EST
cot
Tot
193
VITA
The author was born on November 27, 1953 in York, Pennsylvania.
He received his elementary and secondary school education in York,
along with two years at York College of Pennsylvania majoring in
engineering.
In December of 1975 he finished the requirements for a Bachelor
of Science in Metallurgical Engineering from Virginia Polytechnic
Institute and State University. He worked on his master's degree
from the Fall of 1975 as a graduate research assistant for
Dr. Charles R. Houska. In July of 1977 he joined Bethlehem Steel
Corporation's Steelton Plant in the Steel Operations Department.
The author is a member of the American Society for Metals,
Alpha Sigma Mu, and Sigma Xi.
He married the former Robin Lou Kramer on June 28, 1975.
Frank Ew Dietrich
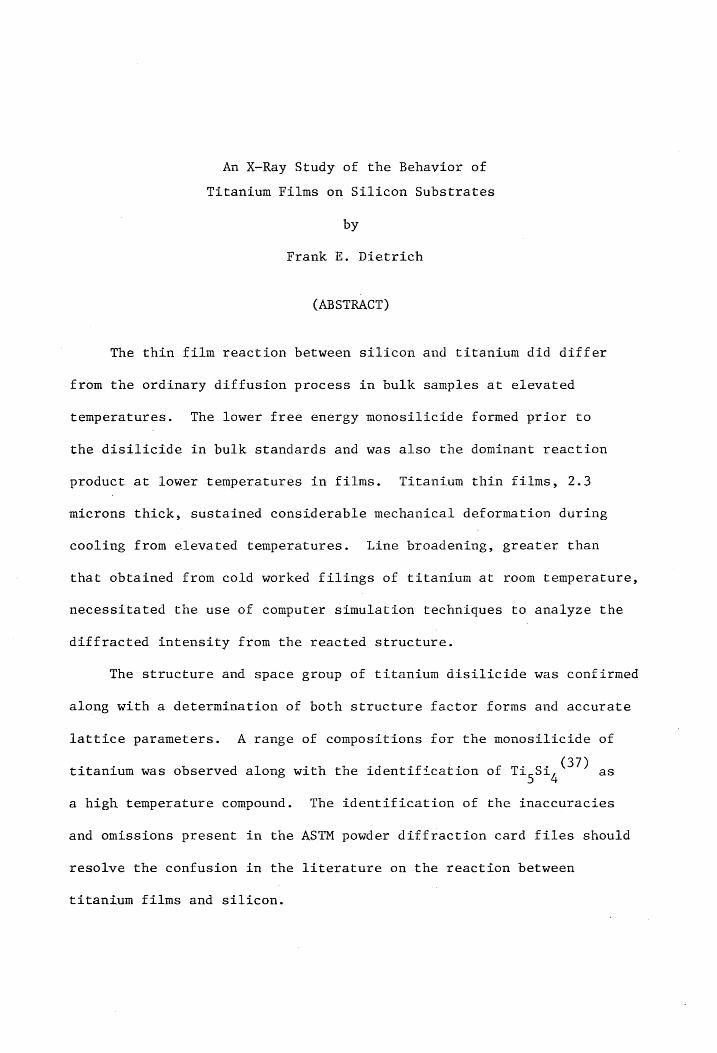
An X-Ray Study of the Behavior of
Titanium Films on Silicon Substrates
by
Frank E. Dietrich
(ABSTRACT)
The thin film reaction between silicon and titanium did differ
from the ordinary diffusion process in bulk samples at elevated
temperatures. The lower free energy monosilicide formed prior to
the disilicide in bulk standards and was also the dominant reaction
product at lower temperatures in films. Titanium thin films, 2.3
microns thick, sustained considerable mechanical deformation during
cooling from elevated temperatures. Line broadening, greater than
that obtained from cold worked filings of titanium at room temperature,
necessitated the use of computer simulation techniques to analyze the
diffracted intensity from the reacted structure.
The structure and space group of titanium disilicide was confirmed
along with a determination of both structure factor forms and accurate
lattice parameters. A range of compositions for the monosilicide of
titanium was observed along with the identification of visi, 0”? as
a high temperature compound. The identification of the inaccuracies
and omissions present in the ASTM powder diffraction card files should
resolve the confusion in the literature on the reaction between
titanium films and silicon.
The temperatures for formation of silicides in thin films was
found to be substantially lower than previously reported? , indicative
of the oxide free interface of the silicon substrates. The identifi-
cation of the reactant silicides, deposited at the grain boundaries
and as planar film at interfaces, establishes this study as the first
attempt to develop a quantitative model for silicide formation in
this transition metal system.