ck-12 middle school math concepts - grade 7
TRANSCRIPT
CK-12 Middle School MathConcepts - Grade 7
Jen Kershaw
Say Thanks to the AuthorsClick http://www.ck12.org/saythanks
(No sign in required)

www.ck12.org
To access a customizable version of this book, as well as otherinteractive content, visit www.ck12.org
CK-12 Foundation is a non-profit organization with a mission toreduce the cost of textbook materials for the K-12 market both inthe U.S. and worldwide. Using an open-source, collaborative, andweb-based compilation model, CK-12 pioneers and promotes thecreation and distribution of high-quality, adaptive online textbooksthat can be mixed, modified and printed (i.e., the FlexBook®textbooks).
Copyright © 2015 CK-12 Foundation, www.ck12.org
The names “CK-12” and “CK12” and associated logos and theterms “FlexBook®” and “FlexBook Platform®” (collectively“CK-12 Marks”) are trademarks and service marks of CK-12Foundation and are protected by federal, state, and internationallaws.
Any form of reproduction of this book in any format or medium,in whole or in sections must include the referral attribution linkhttp://www.ck12.org/saythanks (placed in a visible location) inaddition to the following terms.
Except as otherwise noted, all CK-12 Content (including CK-12Curriculum Material) is made available to Users in accordancewith the Creative Commons Attribution-Non-Commercial 3.0Unported (CC BY-NC 3.0) License (http://creativecommons.org/licenses/by-nc/3.0/), as amended and updated by Creative Com-mons from time to time (the “CC License”), which is incorporatedherein by this reference.
Complete terms can be found at http://www.ck12.org/about/terms-of-use.
Printed: April 1, 2015
AUTHORJen Kershaw
iii
Contents www.ck12.org
Contents
1 Algebraic Thinking 11.1 Equations that Describe Patterns . . . . . . . . . . . . . . . . . . . . . . . . . . . . . . . . . . 21.2 Extend Numerical Patterns . . . . . . . . . . . . . . . . . . . . . . . . . . . . . . . . . . . . . 81.3 Visual Patterns . . . . . . . . . . . . . . . . . . . . . . . . . . . . . . . . . . . . . . . . . . . . 111.4 Single Variable Expressions . . . . . . . . . . . . . . . . . . . . . . . . . . . . . . . . . . . . . 171.5 Expressions with One or More Variables . . . . . . . . . . . . . . . . . . . . . . . . . . . . . . 221.6 Expressions for Real-Life Situations . . . . . . . . . . . . . . . . . . . . . . . . . . . . . . . . 271.7 Whole Number Exponents . . . . . . . . . . . . . . . . . . . . . . . . . . . . . . . . . . . . . 301.8 Algebra Expressions with Exponents . . . . . . . . . . . . . . . . . . . . . . . . . . . . . . . . 341.9 Numerical Expression Evaluation with Basic Operations . . . . . . . . . . . . . . . . . . . . . 401.10 Expression Evaluation with Powers and Grouping Symbols . . . . . . . . . . . . . . . . . . . . 451.11 Mental Math for Addition and Subtraction Equations . . . . . . . . . . . . . . . . . . . . . . . 491.12 Mental Math for Multiplication/Division Equations . . . . . . . . . . . . . . . . . . . . . . . . 551.13 Appropriate Tools for Measurement of Squares and Rectangles . . . . . . . . . . . . . . . . . . 601.14 Area and Perimeter of Rectangles . . . . . . . . . . . . . . . . . . . . . . . . . . . . . . . . . . 651.15 Unknown Dimensions Using Formulas . . . . . . . . . . . . . . . . . . . . . . . . . . . . . . . 711.16 Problem-Solving Models . . . . . . . . . . . . . . . . . . . . . . . . . . . . . . . . . . . . . . 771.17 Comparison of Problem-Solving Models . . . . . . . . . . . . . . . . . . . . . . . . . . . . . . 83
2 Using Decimals 902.1 Decimal Comparisons without Rounding . . . . . . . . . . . . . . . . . . . . . . . . . . . . . . 912.2 Decimal Rounding Given Place Value . . . . . . . . . . . . . . . . . . . . . . . . . . . . . . . 982.3 Decimal Comparisons with Rounding . . . . . . . . . . . . . . . . . . . . . . . . . . . . . . . 1012.4 Decimal Addition . . . . . . . . . . . . . . . . . . . . . . . . . . . . . . . . . . . . . . . . . . 1062.5 Decimal Addition Using Front-End Estimation . . . . . . . . . . . . . . . . . . . . . . . . . . . 1122.6 Commutative Property of Addition with Decimals . . . . . . . . . . . . . . . . . . . . . . . . . 1162.7 Decimal Subtraction . . . . . . . . . . . . . . . . . . . . . . . . . . . . . . . . . . . . . . . . . 1202.8 Decimal Subtraction Using Front-End Estimation . . . . . . . . . . . . . . . . . . . . . . . . . 1252.9 Inverse Property of Addition in Decimal Equations . . . . . . . . . . . . . . . . . . . . . . . . 1302.10 Decimal Multiplication . . . . . . . . . . . . . . . . . . . . . . . . . . . . . . . . . . . . . . . 1342.11 Estimation to Check Decimal Multiplication . . . . . . . . . . . . . . . . . . . . . . . . . . . . 1402.12 Commutative Property of Multiplication with Decimals . . . . . . . . . . . . . . . . . . . . . . 1442.13 Decimal Division . . . . . . . . . . . . . . . . . . . . . . . . . . . . . . . . . . . . . . . . . . 1492.14 Estimation to Check Decimal Division . . . . . . . . . . . . . . . . . . . . . . . . . . . . . . . 1552.15 Division to Solve Decimal Equations . . . . . . . . . . . . . . . . . . . . . . . . . . . . . . . . 1592.16 Scientific Notation . . . . . . . . . . . . . . . . . . . . . . . . . . . . . . . . . . . . . . . . . . 1652.17 Comparison of Numbers in Scientific Notation . . . . . . . . . . . . . . . . . . . . . . . . . . . 1702.18 Operations with Numbers in Scientific Notation . . . . . . . . . . . . . . . . . . . . . . . . . . 1752.19 Metric System . . . . . . . . . . . . . . . . . . . . . . . . . . . . . . . . . . . . . . . . . . . . 1792.20 Appropriate Tools for Metric Measurement . . . . . . . . . . . . . . . . . . . . . . . . . . . . . 1852.21 Conversions of Length, Mass, Capacity in Metric Units . . . . . . . . . . . . . . . . . . . . . . 190
iv
www.ck12.org Contents
2.22 Comparison of Metric Measurements . . . . . . . . . . . . . . . . . . . . . . . . . . . . . . . . 1932.23 Estimation of Conversion to Metric Units . . . . . . . . . . . . . . . . . . . . . . . . . . . . . . 197
3 Using Fractions 2013.1 Equivalent Fractions . . . . . . . . . . . . . . . . . . . . . . . . . . . . . . . . . . . . . . . . . 2023.2 Mixed Number and Fraction Estimation . . . . . . . . . . . . . . . . . . . . . . . . . . . . . . 2083.3 Fraction and Mixed Number Comparison . . . . . . . . . . . . . . . . . . . . . . . . . . . . . . 2113.4 Addition of Fractions . . . . . . . . . . . . . . . . . . . . . . . . . . . . . . . . . . . . . . . . 2163.5 Estimation of Sums of Mixed Numbers and Fractions . . . . . . . . . . . . . . . . . . . . . . . 2213.6 Commutative Property of Addition with Fractions . . . . . . . . . . . . . . . . . . . . . . . . . 2253.7 Subtraction of Fractions . . . . . . . . . . . . . . . . . . . . . . . . . . . . . . . . . . . . . . . 2313.8 Estimation with Mixed Number/Fraction Subtraction . . . . . . . . . . . . . . . . . . . . . . . 2383.9 Inverse Property of Addition in Fraction Equations . . . . . . . . . . . . . . . . . . . . . . . . . 2423.10 Products of Mixed Numbers . . . . . . . . . . . . . . . . . . . . . . . . . . . . . . . . . . . . . 2463.11 Product Estimation with Mixed Numbers/Fractions . . . . . . . . . . . . . . . . . . . . . . . . 2523.12 Commutative Property with Products of Fractions . . . . . . . . . . . . . . . . . . . . . . . . . 2553.13 Division of Fractions . . . . . . . . . . . . . . . . . . . . . . . . . . . . . . . . . . . . . . . . 2603.14 Quotient Estimation with Mixed Numbers/Fractions . . . . . . . . . . . . . . . . . . . . . . . . 2653.15 Fractions as Decimals . . . . . . . . . . . . . . . . . . . . . . . . . . . . . . . . . . . . . . . . 2693.16 Repeating Decimals . . . . . . . . . . . . . . . . . . . . . . . . . . . . . . . . . . . . . . . . . 2743.17 Decimals as Fractions . . . . . . . . . . . . . . . . . . . . . . . . . . . . . . . . . . . . . . . . 2783.18 Positive and Negative Fraction and Decimal Comparison . . . . . . . . . . . . . . . . . . . . . 2813.19 United States Customary Units . . . . . . . . . . . . . . . . . . . . . . . . . . . . . . . . . . . 2863.20 Appropriate Tools for Customary Measurement . . . . . . . . . . . . . . . . . . . . . . . . . . 2913.21 Conversion of Customary Units of Measurement . . . . . . . . . . . . . . . . . . . . . . . . . . 2963.22 Conversion Estimation between Systems of Measure . . . . . . . . . . . . . . . . . . . . . . . . 302
4 Using Integers 3064.1 Integers that Represent Different Situations . . . . . . . . . . . . . . . . . . . . . . . . . . . . . 3074.2 Absolute Value of Integers . . . . . . . . . . . . . . . . . . . . . . . . . . . . . . . . . . . . . 3124.3 Comparison of Integers with Absolute Value . . . . . . . . . . . . . . . . . . . . . . . . . . . . 3164.4 Sums of Integers on a Number Line . . . . . . . . . . . . . . . . . . . . . . . . . . . . . . . . . 3214.5 Sums of Integers Using Absolute Value . . . . . . . . . . . . . . . . . . . . . . . . . . . . . . . 3274.6 Simplify Variable Expressions Involving Integer Addition . . . . . . . . . . . . . . . . . . . . . 3314.7 Differences of Integers Using a Number Line . . . . . . . . . . . . . . . . . . . . . . . . . . . 3354.8 Differences of Integers Using Absolute Value . . . . . . . . . . . . . . . . . . . . . . . . . . . 3414.9 Simplify Variable Expressions Involving Integer Subtraction . . . . . . . . . . . . . . . . . . . 3464.10 Integer Multiplication . . . . . . . . . . . . . . . . . . . . . . . . . . . . . . . . . . . . . . . . 3494.11 Simplify Variable Expressions Involving Integer Multiplication . . . . . . . . . . . . . . . . . . 3564.12 Integer Division . . . . . . . . . . . . . . . . . . . . . . . . . . . . . . . . . . . . . . . . . . . 3604.13 Simplify Variable Expressions Involving Integer Division . . . . . . . . . . . . . . . . . . . . . 3664.14 Properties of Rational Numbers . . . . . . . . . . . . . . . . . . . . . . . . . . . . . . . . . . . 3694.15 Comparison of Rational Numbers . . . . . . . . . . . . . . . . . . . . . . . . . . . . . . . . . . 3724.16 Expressions and the Distributive Property . . . . . . . . . . . . . . . . . . . . . . . . . . . . . 3774.17 Points in the Coordinate Plane . . . . . . . . . . . . . . . . . . . . . . . . . . . . . . . . . . . 3834.18 Scatter Plots . . . . . . . . . . . . . . . . . . . . . . . . . . . . . . . . . . . . . . . . . . . . . 392
5 Using Ratios, Rates and Proportions 3995.1 Equivalent Ratios . . . . . . . . . . . . . . . . . . . . . . . . . . . . . . . . . . . . . . . . . . 4005.2 Ratios in Simplest Form . . . . . . . . . . . . . . . . . . . . . . . . . . . . . . . . . . . . . . . 4065.3 Comparison of Ratios in Decimal Form . . . . . . . . . . . . . . . . . . . . . . . . . . . . . . . 4115.4 Identification and Writing of Equivalent Rates . . . . . . . . . . . . . . . . . . . . . . . . . . . 416
v
Contents www.ck12.org
5.5 Unit Rates . . . . . . . . . . . . . . . . . . . . . . . . . . . . . . . . . . . . . . . . . . . . . . 4205.6 Comparison of Unit Rates . . . . . . . . . . . . . . . . . . . . . . . . . . . . . . . . . . . . . . 4255.7 Slope . . . . . . . . . . . . . . . . . . . . . . . . . . . . . . . . . . . . . . . . . . . . . . . . . 4285.8 Slope of a Line Using Two Points . . . . . . . . . . . . . . . . . . . . . . . . . . . . . . . . . . 4415.9 Proportions . . . . . . . . . . . . . . . . . . . . . . . . . . . . . . . . . . . . . . . . . . . . . 4555.10 Proportions with Variable in the Numerator . . . . . . . . . . . . . . . . . . . . . . . . . . . . 4605.11 Proportions Using Cross Products . . . . . . . . . . . . . . . . . . . . . . . . . . . . . . . . . . 4665.12 Proportions with Variable in the Denominator . . . . . . . . . . . . . . . . . . . . . . . . . . . 4715.13 Scale Distances or Dimensions . . . . . . . . . . . . . . . . . . . . . . . . . . . . . . . . . . . 4755.14 Unit Scale to Find Actual Dimensions . . . . . . . . . . . . . . . . . . . . . . . . . . . . . . . 4835.15 Scale Factor to Find Actual Dimensions . . . . . . . . . . . . . . . . . . . . . . . . . . . . . . 4905.16 Problem Solving Plan, Proportions . . . . . . . . . . . . . . . . . . . . . . . . . . . . . . . . . 5005.17 Conversion Using Unit Analysis . . . . . . . . . . . . . . . . . . . . . . . . . . . . . . . . . . 506
6 Using Percents 5116.1 Percents . . . . . . . . . . . . . . . . . . . . . . . . . . . . . . . . . . . . . . . . . . . . . . . 5126.2 Percents as Fractions . . . . . . . . . . . . . . . . . . . . . . . . . . . . . . . . . . . . . . . . 5166.3 Fractions as Percents . . . . . . . . . . . . . . . . . . . . . . . . . . . . . . . . . . . . . . . . 5206.4 Percent of a Number . . . . . . . . . . . . . . . . . . . . . . . . . . . . . . . . . . . . . . . . . 5246.5 Proportions to Find Percent, P . . . . . . . . . . . . . . . . . . . . . . . . . . . . . . . . . . . . 5286.6 Proportions to Find Part a . . . . . . . . . . . . . . . . . . . . . . . . . . . . . . . . . . . . . . 5336.7 Proportions to Find Base b . . . . . . . . . . . . . . . . . . . . . . . . . . . . . . . . . . . . . 5396.8 Percents as Decimals . . . . . . . . . . . . . . . . . . . . . . . . . . . . . . . . . . . . . . . . 5436.9 Decimals as Percents . . . . . . . . . . . . . . . . . . . . . . . . . . . . . . . . . . . . . . . . 5496.10 Small and Large Percents as Decimals . . . . . . . . . . . . . . . . . . . . . . . . . . . . . . . 5526.11 Percent Equation to Find Part a . . . . . . . . . . . . . . . . . . . . . . . . . . . . . . . . . . . 5556.12 Percent Equation to Find Percent . . . . . . . . . . . . . . . . . . . . . . . . . . . . . . . . . . 5606.13 Percent Equation to Find the Base b . . . . . . . . . . . . . . . . . . . . . . . . . . . . . . . . 5656.14 Percent of Increase . . . . . . . . . . . . . . . . . . . . . . . . . . . . . . . . . . . . . . . . . 5696.15 Percent of Decrease . . . . . . . . . . . . . . . . . . . . . . . . . . . . . . . . . . . . . . . . . 5746.16 Percent of Change . . . . . . . . . . . . . . . . . . . . . . . . . . . . . . . . . . . . . . . . . . 5796.17 Prices Involving Discounts . . . . . . . . . . . . . . . . . . . . . . . . . . . . . . . . . . . . . 5826.18 Prices Involving Sales Tax . . . . . . . . . . . . . . . . . . . . . . . . . . . . . . . . . . . . . 5886.19 Total Bill Including Tip and Tax . . . . . . . . . . . . . . . . . . . . . . . . . . . . . . . . . . 5926.20 Simple Interest Equation to Find Interest Rate . . . . . . . . . . . . . . . . . . . . . . . . . . . 5966.21 Simple Interest . . . . . . . . . . . . . . . . . . . . . . . . . . . . . . . . . . . . . . . . . . . . 6006.22 Interpretation of Circle Graphs . . . . . . . . . . . . . . . . . . . . . . . . . . . . . . . . . . . 6056.23 Circle Graphs to Display Data . . . . . . . . . . . . . . . . . . . . . . . . . . . . . . . . . . . 612
7 Equations, Inequalities and Functions 6187.1 Addition and Subtraction Phrases as Equations . . . . . . . . . . . . . . . . . . . . . . . . . . . 6197.2 Multiplication and Division Phrases as Equations . . . . . . . . . . . . . . . . . . . . . . . . . 6247.3 Single Variable Equations from Verbal Models . . . . . . . . . . . . . . . . . . . . . . . . . . . 6307.4 Simplify Sums or Differences of Single Variable Expressions . . . . . . . . . . . . . . . . . . . 6347.5 Simplify Products or Quotients of Single Variable Expressions . . . . . . . . . . . . . . . . . . 6387.6 Simplify Variable Expressions Involving Multiple Operations . . . . . . . . . . . . . . . . . . . 6427.7 Single Variable Addition Equations . . . . . . . . . . . . . . . . . . . . . . . . . . . . . . . . . 6477.8 Single Variable Subtraction Equations . . . . . . . . . . . . . . . . . . . . . . . . . . . . . . . 6527.9 Single Variable Multiplication Equations . . . . . . . . . . . . . . . . . . . . . . . . . . . . . . 6567.10 Single Variable Division Equations . . . . . . . . . . . . . . . . . . . . . . . . . . . . . . . . . 6627.11 Two-Step Equations from Verbal Models . . . . . . . . . . . . . . . . . . . . . . . . . . . . . . 666
vi
www.ck12.org Contents
7.12 Two-Step Equations and Properties of Equality . . . . . . . . . . . . . . . . . . . . . . . . . . . 6707.13 Inequalities on a Number Line . . . . . . . . . . . . . . . . . . . . . . . . . . . . . . . . . . . 6787.14 One-Step Inequalities . . . . . . . . . . . . . . . . . . . . . . . . . . . . . . . . . . . . . . . . 6847.15 Domain and Range of a Function . . . . . . . . . . . . . . . . . . . . . . . . . . . . . . . . . . 6917.16 Input-Output Tables for Function Rules . . . . . . . . . . . . . . . . . . . . . . . . . . . . . . . 6957.17 Function Rules for Input-Output Tables . . . . . . . . . . . . . . . . . . . . . . . . . . . . . . . 7047.18 Graphs of Linear Equations . . . . . . . . . . . . . . . . . . . . . . . . . . . . . . . . . . . . . 7137.19 Linear and Non-Linear Function Distinction . . . . . . . . . . . . . . . . . . . . . . . . . . . . 7217.20 Linear and Non-Linear Patterns of Change . . . . . . . . . . . . . . . . . . . . . . . . . . . . . 729
8 Geometry 7388.1 Angle Classification . . . . . . . . . . . . . . . . . . . . . . . . . . . . . . . . . . . . . . . . . 7398.2 Angle Pairs . . . . . . . . . . . . . . . . . . . . . . . . . . . . . . . . . . . . . . . . . . . . . 7468.3 Supplementary and Complementary Angle Pairs . . . . . . . . . . . . . . . . . . . . . . . . . . 7518.4 Vertical Angles . . . . . . . . . . . . . . . . . . . . . . . . . . . . . . . . . . . . . . . . . . . 7568.5 Parallel and Perpendicular Lines . . . . . . . . . . . . . . . . . . . . . . . . . . . . . . . . . . 7678.6 Corresponding Angles . . . . . . . . . . . . . . . . . . . . . . . . . . . . . . . . . . . . . . . . 7738.7 Triangle Sum Theorem . . . . . . . . . . . . . . . . . . . . . . . . . . . . . . . . . . . . . . . 7798.8 Triangle Classification . . . . . . . . . . . . . . . . . . . . . . . . . . . . . . . . . . . . . . . . 7868.9 Quadrilateral Classification . . . . . . . . . . . . . . . . . . . . . . . . . . . . . . . . . . . . . 7948.10 Polygon Classification . . . . . . . . . . . . . . . . . . . . . . . . . . . . . . . . . . . . . . . . 8028.11 Regular and Irregular Polygons . . . . . . . . . . . . . . . . . . . . . . . . . . . . . . . . . . . 8098.12 Congruent Figures . . . . . . . . . . . . . . . . . . . . . . . . . . . . . . . . . . . . . . . . . . 8158.13 Similarity . . . . . . . . . . . . . . . . . . . . . . . . . . . . . . . . . . . . . . . . . . . . . . 8238.14 Scale Factor of Similar Polygons . . . . . . . . . . . . . . . . . . . . . . . . . . . . . . . . . . 8308.15 Unknown Measures of Similar Figures . . . . . . . . . . . . . . . . . . . . . . . . . . . . . . . 8368.16 Rigid Transformations . . . . . . . . . . . . . . . . . . . . . . . . . . . . . . . . . . . . . . . . 8448.17 Lines of Symmetry . . . . . . . . . . . . . . . . . . . . . . . . . . . . . . . . . . . . . . . . . 8518.18 Transformation Classification . . . . . . . . . . . . . . . . . . . . . . . . . . . . . . . . . . . . 8568.19 Translations, Rotations, and Reflections . . . . . . . . . . . . . . . . . . . . . . . . . . . . . . 865
9 Distance and Area 8749.1 Evaluation of Square Roots . . . . . . . . . . . . . . . . . . . . . . . . . . . . . . . . . . . . . 8759.2 Evaluation of Perfect Square Roots . . . . . . . . . . . . . . . . . . . . . . . . . . . . . . . . . 8819.3 Simplification of Radical Expressions . . . . . . . . . . . . . . . . . . . . . . . . . . . . . . . 8859.4 Equations with Square Roots . . . . . . . . . . . . . . . . . . . . . . . . . . . . . . . . . . . . 8899.5 Estimation of Square Roots . . . . . . . . . . . . . . . . . . . . . . . . . . . . . . . . . . . . . 8939.6 Properties of Rational Numbers versus Irrational Numbers . . . . . . . . . . . . . . . . . . . . 8989.7 Pythagorean Theorem and its Converse . . . . . . . . . . . . . . . . . . . . . . . . . . . . . . . 9029.8 Solving Equations Using the Pythagorean Theorem . . . . . . . . . . . . . . . . . . . . . . . . 9109.9 Area of a Parallelogram . . . . . . . . . . . . . . . . . . . . . . . . . . . . . . . . . . . . . . . 9149.10 Unknown Dimensions of Parallelograms . . . . . . . . . . . . . . . . . . . . . . . . . . . . . . 9199.11 Estimation of Parallelogram Area in Scale Drawings . . . . . . . . . . . . . . . . . . . . . . . . 9249.12 Triangle Area . . . . . . . . . . . . . . . . . . . . . . . . . . . . . . . . . . . . . . . . . . . . 9289.13 Unknown Dimensions of Triangles . . . . . . . . . . . . . . . . . . . . . . . . . . . . . . . . . 9349.14 Area of Composite Shapes Involving Triangles . . . . . . . . . . . . . . . . . . . . . . . . . . . 9389.15 Circle Circumference . . . . . . . . . . . . . . . . . . . . . . . . . . . . . . . . . . . . . . . . 9449.16 Diameter or Radius of a Circle Given Circumference . . . . . . . . . . . . . . . . . . . . . . . 9529.17 Area of a Circle . . . . . . . . . . . . . . . . . . . . . . . . . . . . . . . . . . . . . . . . . . . 9569.18 Radius or Diameter of a Circle Given Area . . . . . . . . . . . . . . . . . . . . . . . . . . . . . 9629.19 Areas of Combined Figures Involving Circles . . . . . . . . . . . . . . . . . . . . . . . . . . . 966
vii
Contents www.ck12.org
10 Surface Area and Volume 97110.1 Classification of Solid Figures . . . . . . . . . . . . . . . . . . . . . . . . . . . . . . . . . . . 97210.2 Faces, Edges, and Vertices of Solids . . . . . . . . . . . . . . . . . . . . . . . . . . . . . . . . 98110.3 Cross-Sections and Nets . . . . . . . . . . . . . . . . . . . . . . . . . . . . . . . . . . . . . . . 99010.4 Surface Area of Rectangular Prisms . . . . . . . . . . . . . . . . . . . . . . . . . . . . . . . . 100210.5 Surface Area of Triangular Prisms . . . . . . . . . . . . . . . . . . . . . . . . . . . . . . . . . 100910.6 Surface Area of Cylinders . . . . . . . . . . . . . . . . . . . . . . . . . . . . . . . . . . . . . . 101510.7 Heights of Cylinders Given Surface Area . . . . . . . . . . . . . . . . . . . . . . . . . . . . . . 102410.8 Surface Area of Pyramids . . . . . . . . . . . . . . . . . . . . . . . . . . . . . . . . . . . . . . 102810.9 Surface Area of Cones . . . . . . . . . . . . . . . . . . . . . . . . . . . . . . . . . . . . . . . . 103610.10 Volume of Rectangular Prisms . . . . . . . . . . . . . . . . . . . . . . . . . . . . . . . . . . . 104210.11 Volume of Triangular Prisms . . . . . . . . . . . . . . . . . . . . . . . . . . . . . . . . . . . . 104910.12 Volume of Cylinders . . . . . . . . . . . . . . . . . . . . . . . . . . . . . . . . . . . . . . . . . 105510.13 Heights of Cylinders Given Volume . . . . . . . . . . . . . . . . . . . . . . . . . . . . . . . . . 106110.14 Volume of Pyramids . . . . . . . . . . . . . . . . . . . . . . . . . . . . . . . . . . . . . . . . . 106510.15 Volume of Cones . . . . . . . . . . . . . . . . . . . . . . . . . . . . . . . . . . . . . . . . . . 1073
11 Data and Statistics 107911.1 Mean . . . . . . . . . . . . . . . . . . . . . . . . . . . . . . . . . . . . . . . . . . . . . . . . . 108011.2 Median . . . . . . . . . . . . . . . . . . . . . . . . . . . . . . . . . . . . . . . . . . . . . . . . 108611.3 Mode . . . . . . . . . . . . . . . . . . . . . . . . . . . . . . . . . . . . . . . . . . . . . . . . . 109011.4 Range of Spread/Dispersion . . . . . . . . . . . . . . . . . . . . . . . . . . . . . . . . . . . . . 109411.5 Bar Graphs . . . . . . . . . . . . . . . . . . . . . . . . . . . . . . . . . . . . . . . . . . . . . . 109811.6 Multiple Bar Graphs . . . . . . . . . . . . . . . . . . . . . . . . . . . . . . . . . . . . . . . . . 110611.7 Line Graphs . . . . . . . . . . . . . . . . . . . . . . . . . . . . . . . . . . . . . . . . . . . . . 111511.8 Multiple Line Graphs . . . . . . . . . . . . . . . . . . . . . . . . . . . . . . . . . . . . . . . . 112111.9 Stem-and-Leaf Plots . . . . . . . . . . . . . . . . . . . . . . . . . . . . . . . . . . . . . . . . . 112811.10 Box-and-Whisker Plots . . . . . . . . . . . . . . . . . . . . . . . . . . . . . . . . . . . . . . . 113711.11 Frequency Tables to Organize and Display Data . . . . . . . . . . . . . . . . . . . . . . . . . . 114511.12 Histograms . . . . . . . . . . . . . . . . . . . . . . . . . . . . . . . . . . . . . . . . . . . . . 115111.13 Identification of Misleading Statistics . . . . . . . . . . . . . . . . . . . . . . . . . . . . . . . . 116011.14 Data Display Choices . . . . . . . . . . . . . . . . . . . . . . . . . . . . . . . . . . . . . . . . 116811.15 Displaying by Type of Data . . . . . . . . . . . . . . . . . . . . . . . . . . . . . . . . . . . . . 1179
12 Probability 118712.1 Definition of Probability . . . . . . . . . . . . . . . . . . . . . . . . . . . . . . . . . . . . . . . 118812.2 Measurement of Probability . . . . . . . . . . . . . . . . . . . . . . . . . . . . . . . . . . . . . 119612.3 Empirical Probability . . . . . . . . . . . . . . . . . . . . . . . . . . . . . . . . . . . . . . . . 120412.4 Mutually Exclusive Events . . . . . . . . . . . . . . . . . . . . . . . . . . . . . . . . . . . . . 121412.5 Mutually Inclusive Events . . . . . . . . . . . . . . . . . . . . . . . . . . . . . . . . . . . . . . 121812.6 Complement Rule for Probability . . . . . . . . . . . . . . . . . . . . . . . . . . . . . . . . . . 122212.7 Counting Events . . . . . . . . . . . . . . . . . . . . . . . . . . . . . . . . . . . . . . . . . . . 122712.8 Sample Spaces and Events . . . . . . . . . . . . . . . . . . . . . . . . . . . . . . . . . . . . . 123612.9 Additive and Multiplicative Rules for Probability . . . . . . . . . . . . . . . . . . . . . . . . . 124012.10 Basic Counting Rules . . . . . . . . . . . . . . . . . . . . . . . . . . . . . . . . . . . . . . . . 124812.11 Counting Rule to Calculate Probabilities . . . . . . . . . . . . . . . . . . . . . . . . . . . . . . 125512.12 Permutations . . . . . . . . . . . . . . . . . . . . . . . . . . . . . . . . . . . . . . . . . . . . . 125912.13 Permutation Problems . . . . . . . . . . . . . . . . . . . . . . . . . . . . . . . . . . . . . . . . 126312.14 Combinations . . . . . . . . . . . . . . . . . . . . . . . . . . . . . . . . . . . . . . . . . . . . 126812.15 Combination Problems . . . . . . . . . . . . . . . . . . . . . . . . . . . . . . . . . . . . . . . 127212.16 Independent Events . . . . . . . . . . . . . . . . . . . . . . . . . . . . . . . . . . . . . . . . . 1280
viii

www.ck12.org Contents
12.17 Probability of Independent Events . . . . . . . . . . . . . . . . . . . . . . . . . . . . . . . . . 128612.18 Dependent Events . . . . . . . . . . . . . . . . . . . . . . . . . . . . . . . . . . . . . . . . . . 1291
ix
www.ck12.org Chapter 1. Algebraic Thinking
CHAPTER 1 Algebraic ThinkingChapter Outline
1.1 EQUATIONS THAT DESCRIBE PATTERNS
1.2 EXTEND NUMERICAL PATTERNS
1.3 VISUAL PATTERNS
1.4 SINGLE VARIABLE EXPRESSIONS
1.5 EXPRESSIONS WITH ONE OR MORE VARIABLES
1.6 EXPRESSIONS FOR REAL-LIFE SITUATIONS
1.7 WHOLE NUMBER EXPONENTS
1.8 ALGEBRA EXPRESSIONS WITH EXPONENTS
1.9 NUMERICAL EXPRESSION EVALUATION WITH BASIC OPERATIONS
1.10 EXPRESSION EVALUATION WITH POWERS AND GROUPING SYMBOLS
1.11 MENTAL MATH FOR ADDITION AND SUBTRACTION EQUATIONS
1.12 MENTAL MATH FOR MULTIPLICATION/DIVISION EQUATIONS
1.13 APPROPRIATE TOOLS FOR MEASUREMENT OF SQUARES AND RECTANGLES
1.14 AREA AND PERIMETER OF RECTANGLES
1.15 UNKNOWN DIMENSIONS USING FORMULAS
1.16 PROBLEM-SOLVING MODELS
1.17 COMPARISON OF PROBLEM-SOLVING MODELS
Introduction
In Math 7, the learning content is divided into Concepts. Each Concept is complete and whole providing focusedlearning on an indicated objective. Theme-based Concepts provide students with experiences that integrate thecontent of each Concept. Students are given opportunities to practice the skills of each Concept through real-worldsituations, examples, guided practice and independent practice sections. There are also video links provided togive students an audio/visual way of connecting with the content. In this Chapter, students will engage with Con-cepts on describing and extending patterns, evaluating expressions, understanding variables, powers and exponents,equations, measurement, perimeter, area and problem solving.
1
1.1. Equations that Describe Patterns www.ck12.org
1.1 Equations that Describe Patterns
Here you’ll learn to recognize and describe numerical patterns by finding a rule.
Have you ever noticed patterns in nature? Have you ever noticed number patterns?
Kelly is very excited for summer vacation. She has been accepted into a Teen Wilderness program and will bespending four weeks hiking, camping and learning wilderness skills in the White Mountains of New Hampshire.There are a bunch of other students who will be going too. Kelly hasn’t met them yet.
In two weeks there will be a pre-trip meeting. At the pre-trip meeting, Kelly will meet the other kids in the programand learn specifics about the summer. In the meantime, Kelly is so excited that she is counting the days. To help herpass the time, her Mom bought her a couple of books about hiking and nature.
One of the books talks all about nature and unique features about nature. One of the chapters in the books talks allabout patterns in nature. Kelly is fascinated.
“Listen to this,” she tells her friend Sara. “There are patterns on leaves and trees and flowers. In fact, according tothis, the way a tree divides into branches follows a specific pattern.”
“That is cool,” Sara says. “Do you think it is really true?”
“We could go and check it out,” Kelly suggests.
The girls decide to investigate. On a piece of paper Kelly writes the following pattern.
1, 1, 2, 3, 5, 8, 13....
When the girls arrive at the park, they sit down in front of one of the trees. Kelly reads the following information.
“This pattern in nature is called the Fibonacci pattern after an Italian mathematician. He discovered that many thingsin nature follow this pattern of numbers.”
“Very interesting, but how does it apply to trees?” Sara asked.
As the girls investigate some trees, it is your turn to learn about patterns. Kelly and Sara are going to discoverpatterns in nature. Patterns in nature are mathematical and that there are many of them. In this lesson youwill learn all about patterns as you explore thinking algebraically. At the end of the lesson we will see whatKelly and Sara learned about patterns in nature.
2
www.ck12.org Chapter 1. Algebraic Thinking
Guidance
We see patterns all around us each and every day. We see them on soccer balls, in fabric, in the way different gardensare designed, even our day can be organized in a pattern. Recognizing patterns is second nature to us and feels verynatural.
In primary grades, you learned to count by 2s,3s,4s,5s, etc. This type of counting involves counting in patterns. Infact, counting in this way was probably so natural that you didn’t even realize how simple it was when you weredoing it.
This chapter is about algebraic thinking. We could say that algebraic thinking is about learning to thinkmathematically. One of the keys to algebraic thinking comes from recognizing and understanding patterns.As you learn more advanced mathematics, patterns are going to become more and more useful. We can investigateand work to understand two types of patterns: numerical patterns and geometric patterns.
Numerical patterns use numbers and geometric patterns use visual shapes and figures. Both are useful and this lessonwill teach you about both of them.
Let’s begin with numerical patterns.
What is a numerical pattern?
A numerical pattern is a sequence of numbers that uses a formula or rule to generate the sequence.
Numerical patterns can be organized in a couple of different ways.
1. When numbers in a pattern get larger as the sequence continues, they are in an ascending pattern.2. When numbers in a pattern get smaller as the sequence continues, they are in a descending pattern.
Every pattern has a sequence that has been created based on a pattern rule. Examining the relationship betweenthe numbers in a pattern can help us to determine the rule used by the pattern. Pattern rules can use one or moremathematical operations to describe the relationship.
Looking for pattern rules is a lot like being a detective! You have to use your detective skills to decipher therelationship between the numbers. Once you have figured out the relationship between the numbers, you canwork on expressing this relationship in the form of a rule.
Find the pattern rule in the following sequence: 243, 81, 27, 9.
Alright math detectives, get ready. We need to figure out how each of these numbers is related to the others.There is a way that they are related we just have to figure out how.
First we can take an overview of the numbers. All the numbers are odd and all have 9 as a factor. The numbersget smaller in value as the sequence continues, so this is a descending pattern.
3
1.1. Equations that Describe Patterns www.ck12.org
Think about this. The pattern is descending-the numbers get smaller. We need to figure out which operationis involved in the pattern rule.
Which operations help us in making numbers smaller?
Subtraction and division help us to make numbers smaller. This tells us that subtraction or division is involved in thepattern rule.
Next we have to dive a little farther into the figuring out the rule.
Let’s start with the smaller numbers.
What is the relationship between 27 and 9?
Nine is a factor of 27 because 9×3 = 27.
But we are looking for division or subtraction here.
Since 9×3 = 27, it is possible that 27÷3 = 9
A possible pattern rule is ÷ 3.
How can we test it out to be sure that this is the correct pattern rule?
To test it out, we have to be sure that it works for all of the other numbers in the pattern. Let’s look at the patternagain.
243,81,27,9
243÷3 = 81
81÷3 = 27
27÷3 = 9
The pattern works! Our pattern rule is ÷ 3.
That pattern was a descending pattern. Now let’s look at an ascending pattern.
Find the pattern rule in the following sequence: 1, 3, 11, 43.
First we take an overview of the numbers. All the numbers are odd and this is an ascending pattern. Therefore,addition and/or multiplication are operations involved in the pattern rule because that is the way we increasenumbers in mathematics.
Now let’s compare the first and second number.
What is the relationship between 1 and 3?
4
www.ck12.org Chapter 1. Algebraic Thinking
1+ 2 = 3, so +2 is a possible pattern rule, but the jump between the second number (3) and the third number (11)is much larger than +2. Such a large jump indicates that multiplication must be one of the operations in the patternrule.
How can we figure out how multiplication is used in the pattern rule?
To do this, we look at the relationship between the second and third number. The third number (11) is close to 9and 12, both of which have relationships with the second number (3), 3×3 = 9 and 3×4 = 12. This means that thepattern rule could either be (× 3+2) or (× 4−1).
When we try out both rules with the list, we see that × 4−1 is the correct pattern rule.
Now it’s time for you to try a few on your own. Practice finding the rule for each pattern.
Example A
5, 8, 11, 14
Solution: The pattern rule is +3.
Example B
20, 10, 5, 2.5
Solution: The pattern rule is ÷2.
Example C
4, 7, 13, 25, 49
Solution: The pattern rule is ×2−1.
Now let’s go back to the patterns that the girls were seeing in nature.
Now that you have learned all about patterns, it is time to revisit the original problem with Kelly and Saraand their nature patterns. Reread the problem and underline any important information.
Kelly is very excited for summer vacation. She has been accepted into a Teen Wilderness program and will bespending four weeks hiking, camping and learning wilderness skills in the White Mountains of New Hampshire.There are a bunch of other students who will be going too. Kelly hasn’t met them yet.
In two weeks there will be a pre-trip meeting. At the pre-trip meeting, Kelly will meet the other kids in the programand learn specifics about the summer. In the meantime, Kelly is so excited that she is counting the days. To help herpass the time, her Mom bought her a couple of books about hiking and nature.
One of the books talks all about nature and unique features about nature. One of the chapters in the books talks allabout patterns in nature. Kelly is fascinating.
“Listen to this,” she tells her friend Sara. “There are patterns on leaves and trees and flowers. In fact, according tothis, the way a tree divides into branches follows a specific pattern.”
“That is cool,” Sara says. “Do you think it is really true?”
“We could go and check it out,” Kelly suggests.
The girls decide to investigate. On a piece of paper Kelly writes the following pattern.
1, 1, 2, 3, 5, 8, 13....
When the girls arrive at the park, they sit down in front of one of the trees. Kelly reads the following information.
5
1.1. Equations that Describe Patterns www.ck12.org
“This pattern in nature is called the Fibonacci pattern after an Italian mathematician. He discovered that many thingsin nature follow this pattern of numbers.”
“Very interesting, but how does it apply to trees?” Sara asked.
You just finished learning all about patterns. What is the rule for the Fibonacci pattern of numbers that Saraand Kelly are using?
1, 1, 2, 3, 5, 8, 13,
If you look you can see that the two previous numbers add together to equal the next number. This is the rule.
Guided Practice
Here is one for you to try on your own.
3, 9, 27, ....
Answer
First, we have to figure out what is happening to each given number to create the next value. If you look, you cansee that each value is being multiplied by 3.
The pattern rule is ×3.
This is our answer.
Video Review
MEDIAClick image to the left or use the URL below.URL: http://www.ck12.org/flx/render/embeddedobject/54780
Khan Academy Patterns in Sequences 1
MEDIAClick image to the left or use the URL below.URL: http://www.ck12.org/flx/render/embeddedobject/80040
Khan Academy Patterns in Sequences 2
Explore More
Directions: Find the pattern rules for the following numerical patterns.
1. 1, 6, 21, 66
2. 95, 80, 65, 50
6
www.ck12.org Chapter 1. Algebraic Thinking
3. 3, 10, 17, 24
4. 256, 64, 16, 4
5. 3, 11, 43, 171
6. 81, 27, 9, 3
7. 4, 13, 40, 121
8. 1, 6, 31, 156
9. 3, 18, 108, 648
10. 100, 90, 80, 70
11. 2, 3, 5, 9
12. 45, 15, 5
13. 142, 70, 34, 16
14. 5, 35, 245, 1715
15. 900, 300, 100
7
1.2. Extend Numerical Patterns www.ck12.org
1.2 Extend Numerical Patterns
Here you’ll learn to extend numerical patterns.
Remember the trees in the Equations that Describe Patterns Concept? Well, Kelly wrote down a pattern of numbersand we figured out a rule for the pattern. Let’s look at the pattern again and the rule for the pattern.
1, 1, 2, 3, 5, 8, 13....
This pattern has a rule. This rule is that the two previous numbers add together to equal the next number. Given thisinformation, what is the next number in the pattern?
When you extend number patterns, you can use the rule to figure out the next numbers in the sequence. Inthis Concept you will learn how to do this, then you can figure out the next few values in this pattern.
Guidance
Once you have figured out a pattern rule it is easy to use that rule to extend the pattern. Extending a pattern involveswriting the numbers that come next in the pattern according to the rule.
Let’s look at an example.
Example
Find the next term in the following pattern: 3, 6, 9, 12, ____
First, notice that this is an ascending pattern meaning that it will involve addition, multiplication or both.
What is the relationship between these numbers? How were they increased?
If you think about this question, you can see that each number was increased by adding three.
To extend the pattern, we simply add three to the last number in the sequence.
12+3 = 15
Our answer is 15.
Sometimes, you need to extend rule by looking far out into the future. Let’s look at an example of this.
What is the seventh number in the sequence: 1, 3, 9, 27, ____ ?
First, let’s figure out the rule. This is an ascending sequence so it uses addition, multiplication or both. The rule inthis case is × 3.
Next we can write out the sequence until we get to the seventh number.
1, 3, 9, 27, 81, 243, 729, 2187
Our answer is 2187.
Now it’s time for you to try a few on your own.
Example A
9, 17, 33, ___, ___
Solution: 65, 129
8
www.ck12.org Chapter 1. Algebraic Thinking
Example B
3, 10, 31, ___, ___
Solution: 94, 283
Example C
4, 17, 56, ____, ____
Solution: 173, 524
Now let’s go back to the trees.
You just finished learning all about patterns. What is the rule for the Fibonacci pattern of numbers that Saraand Kelly are using?
1, 1, 2, 3, 5, 8, 13,
If you look you can see that the two previous numbers add together to equal the next number. This is the rule.Given this information, what is the next number in the pattern?
8+13 = 21
What is the next one after that?
13+21 = 34
By continuing to use this rule, you can continue to extend the numerical pattern.
Guided Practice
Here is one for you to try on your own.
Extend the following pattern.
24, 14, 9, ____, ____
Answer
To figure out this rule, we have to examine the operations done to each value to get to the next value.
24÷2+2 = 14
14÷2+2 = 9
The pattern rule is ÷2+2.
9÷2+2 = 6.5
6.5÷2+2 = 5.25
The next two values are 6.5 and 5.25.
This is our answer.
Video Review
9
1.2. Extend Numerical Patterns www.ck12.org
MEDIAClick image to the left or use the URL below.URL: http://www.ck12.org/flx/render/embeddedobject/54780
Khan Academy Patterns in Sequences 2
MEDIAClick image to the left or use the URL below.URL: http://www.ck12.org/flx/render/embeddedobject/80040
Khan Academy Patterns in Sequences 2
Explore More
Directions: Use what you have learned to extend each numerical pattern.
1. 2, 3, 4, 5, ____, _____
2. 2, 4, 6, 8, _____, _____
3. 2, 5, 11, 23, _____,_____
4. 3, 6, 9, _____, _____
5. 16, 4, _____
6. 3, 8, 18, _____, _____
7. 100, 50, _____, _____
8. 10, 20, 30, 40, _____,_____
9. 15, 30, 45, _____,_____
10. 100, 112, 124, _____, _____
11. 12, 4, 18, 6, 21, _____
12. 40, 4, 120, 12, 130, _____
13. 2.5, _____, 7, 14, 8, 16
14. 25, 12.5, _____
15. 3, 4.5, 6, 7.5, 9, _____
10
www.ck12.org Chapter 1. Algebraic Thinking
1.3 Visual Patterns
Here you’ll learn to recognize, describe and extend visual or geometric patterns.
Remember the trees from the Extend Numerical Patterns Concept?
Previously we worked on looking at the number patterns in nature. Here is one such pattern.
1, 1, 2, 3, 5, 8, 13
This number pattern follows a rule.
Patterns in nature can be visual as well as numerical.
The pattern above is called a Fibonacci Sequence where two of the previous numbers are added together to equal thethird number.
Here is a website where you can see the Fibonacci Sequence in nature.
http://www.maths.surrey.ac.uk/hosted-sites/R.Knott/Fibonacci/fibnat.html
If you continue to follow the rule for this pattern, what will be the next three numbers in the sequence?
This Concept is about recognizing and describing visual and/or geometric patterns. You will know how toanswer this question by the end of the Concept.
Guidance
Visual or geometric patterns are similar to numerical patterns in the sense that the follow a rule. Some geometricpatterns are repeating patterns. Repeating patterns have a pattern unit which repeats. Other geometric patterns,much like numerical patterns, change position, increase, or decrease following a pattern rule or formula.
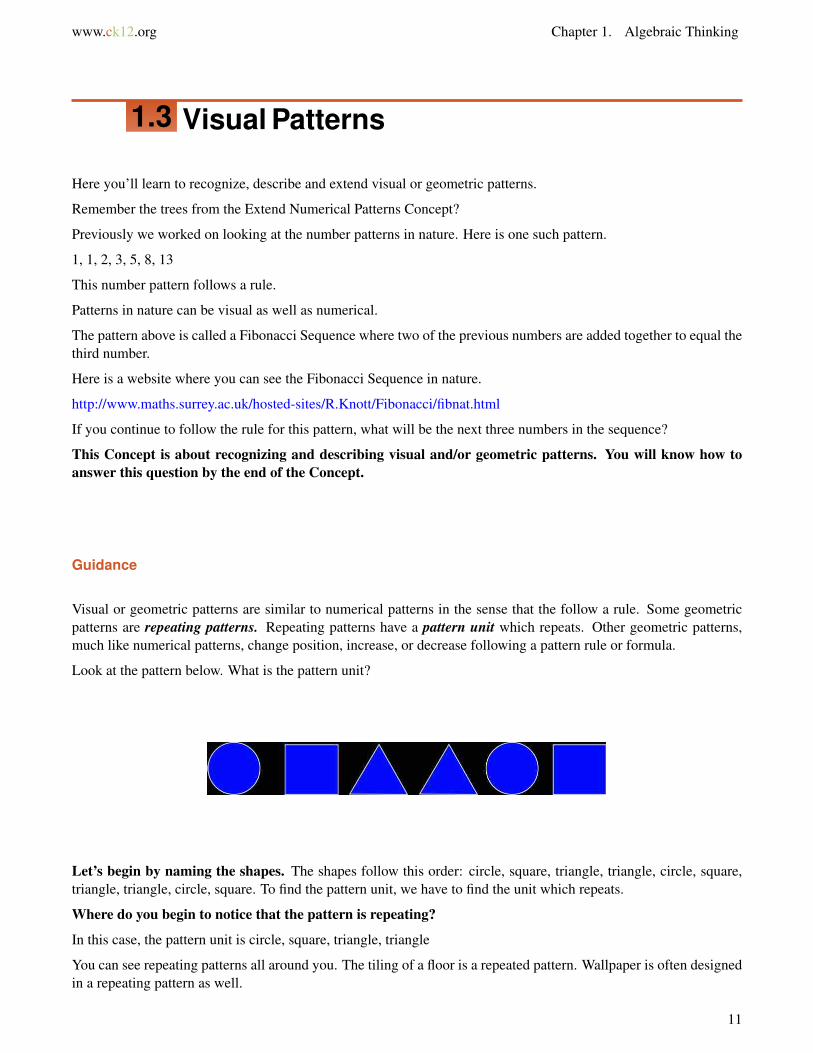
Look at the pattern below. What is the pattern unit?
Let’s begin by naming the shapes. The shapes follow this order: circle, square, triangle, triangle, circle, square,triangle, triangle, circle, square. To find the pattern unit, we have to find the unit which repeats.
Where do you begin to notice that the pattern is repeating?
In this case, the pattern unit is circle, square, triangle, triangle
You can see repeating patterns all around you. The tiling of a floor is a repeated pattern. Wallpaper is often designedin a repeating pattern as well.
11
1.3. Visual Patterns www.ck12.org
What happens when a visual pattern doesn’t repeat? When it is created by some other rule?
When this happens, you have to pull out your detective skills once again. You will have to figure out the rule. Howdid the visual images change? What rule can you write to describe the change?
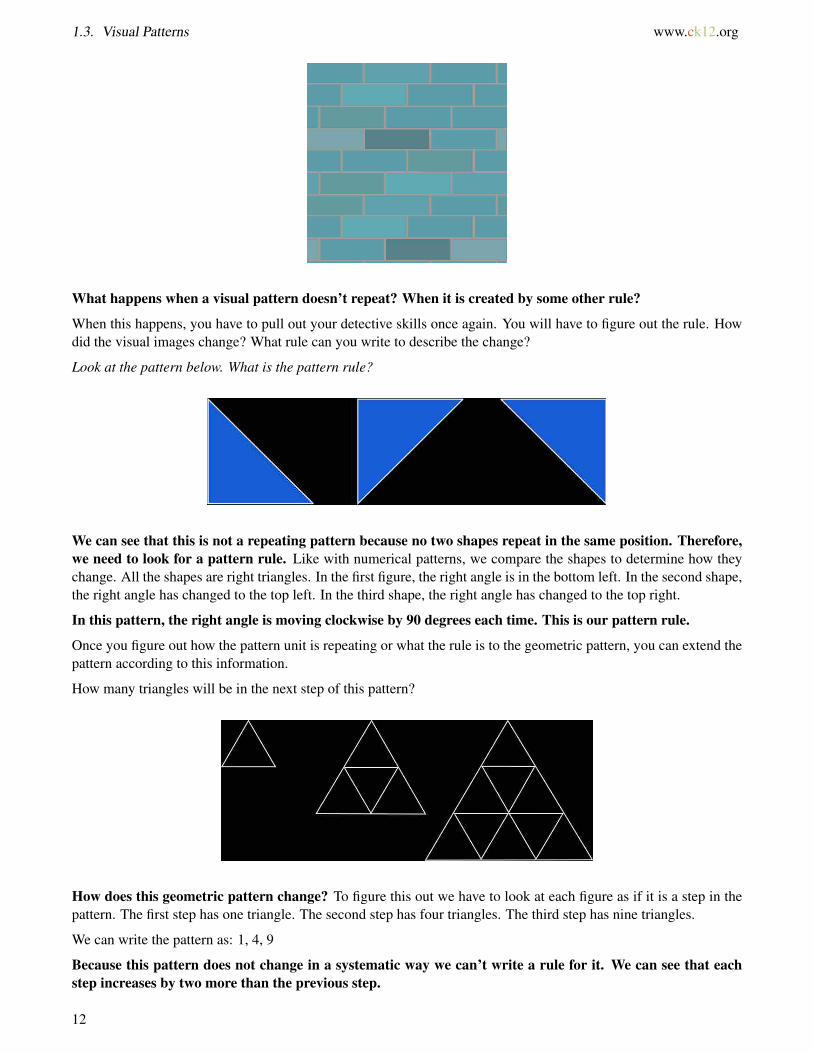
Look at the pattern below. What is the pattern rule?
We can see that this is not a repeating pattern because no two shapes repeat in the same position. Therefore,we need to look for a pattern rule. Like with numerical patterns, we compare the shapes to determine how theychange. All the shapes are right triangles. In the first figure, the right angle is in the bottom left. In the second shape,the right angle has changed to the top left. In the third shape, the right angle has changed to the top right.
In this pattern, the right angle is moving clockwise by 90 degrees each time. This is our pattern rule.
Once you figure out how the pattern unit is repeating or what the rule is to the geometric pattern, you can extend thepattern according to this information.
How many triangles will be in the next step of this pattern?
How does this geometric pattern change? To figure this out we have to look at each figure as if it is a step in thepattern. The first step has one triangle. The second step has four triangles. The third step has nine triangles.
We can write the pattern as: 1, 4, 9
Because this pattern does not change in a systematic way we can’t write a rule for it. We can see that eachstep increases by two more than the previous step.
12

www.ck12.org Chapter 1. Algebraic Thinking
The first step adds 3 to get the second step.
The second step adds 5 to get the third step.
The third step will add two more which is 7.
There are 9 triangles in the third step, 9+7 = 16. There will be 16 triangles in the fourth step.
If we know how to describe and extend numerical, visual or geometric patterns, we can also find missing elementsin these patterns.
What is the missing number in the pattern?
11, 23, 47, ___, 191
First we have to find the pattern rule.
In an increasing number pattern like this one, we start by looking for an addition and/or multiplication relationshipbetween the first two numbers. 11+ 12 = 23, so +12 is a possible pattern rule, but it doesn’t apply to the secondnumber (23) and third number (47), since 23+ 12 = 35, not 47. The third number is 47, which is one more than23×2, so (× 2+1) is a possible pattern rule.
To find the missing number (the fourth number), we need to plug 47 (the third number) into the value for x.
y = 2x+1
y = 2(47)+1
y = 94+1
y = 95
To check that we have the right number, we can plug our answer (the fourth number) into the equation to seeif we get the fifth number in the pattern.
y = 2x+1
y = 2(95)+1
y = 190+1
y = 191
191 is the fifth number, so our solution is correct!
Our answer is 95.
We can do this visually too. Fill in the missing piece of the pattern.
First, we examine the figures in the pattern. The pattern is a pattern of repeating images, so we can look at howthe images repeat and figure out the missing image in the pattern.
13
1.3. Visual Patterns www.ck12.org
This is the missing image. We can check our work by examining the pattern. Design faces to the left, then to theright, then to the left, then to the right, then to the left, then to the right.
This is the correct image to complete the pattern.
Practice examining visual or geometric patterns. Figure out the rule and write down the next image in the pattern.
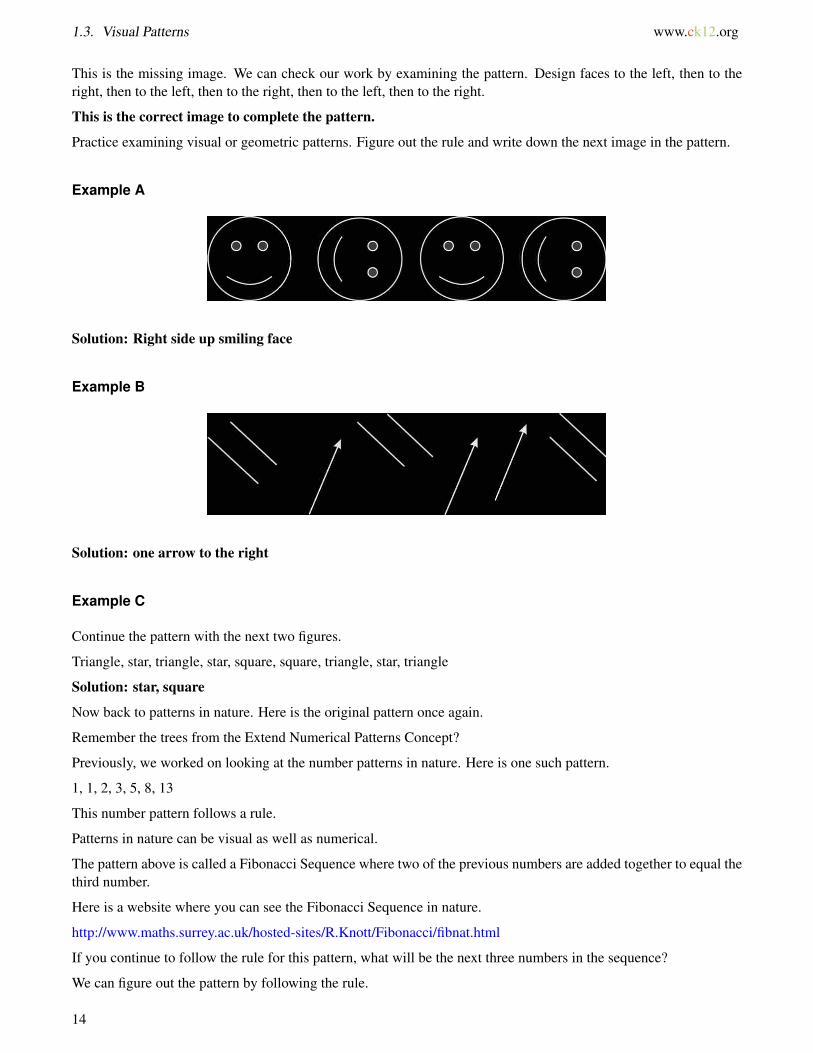
Example A
Solution: Right side up smiling face
Example B
Solution: one arrow to the right
Example C
Continue the pattern with the next two figures.
Triangle, star, triangle, star, square, square, triangle, star, triangle
Solution: star, square
Now back to patterns in nature. Here is the original pattern once again.
Remember the trees from the Extend Numerical Patterns Concept?
Previously, we worked on looking at the number patterns in nature. Here is one such pattern.
1, 1, 2, 3, 5, 8, 13
This number pattern follows a rule.
Patterns in nature can be visual as well as numerical.
The pattern above is called a Fibonacci Sequence where two of the previous numbers are added together to equal thethird number.
Here is a website where you can see the Fibonacci Sequence in nature.
http://www.maths.surrey.ac.uk/hosted-sites/R.Knott/Fibonacci/fibnat.html
If you continue to follow the rule for this pattern, what will be the next three numbers in the sequence?
We can figure out the pattern by following the rule.
14

www.ck12.org Chapter 1. Algebraic Thinking
We add the two preceding numbers to equal the next value in the sequence.
8 + 13 = 21
13 + 21 = 34
21 + 54 = 75
The next three values are 21, 34, 75.
Guided Practice
Here is one for you to try on your own.
What would be the next image in the pattern?
Answer
If you look at what has happened in each step of the pattern, you will see that the pattern decreased by half.
The next step in the pattern would show two boxes or two squares.
Video Review
MEDIAClick image to the left or use the URL below.URL: http://www.ck12.org/flx/render/embeddedobject/113
Khan Academy Geometric Sequences
Explore More
Directions: Write a rule for each number pattern.
1. 4, 7, 13, 25
2. 216, 196, 176, 156
3. 1, 7, 19, 43
4. 10,000, 1,000, 100, 10
Directions: Now write the next number in each pattern.
15

1.3. Visual Patterns www.ck12.org
5. 4, 7, 13, 25, ____
6. 216, 196, 176, 156, ____
7. 1, 7, 19, 43, ____
8. 10,000, 1,000, 100, 10, ____
Directions: Write down the next image in each pattern based on the description.
9. a hexagon, a pentagon, a square, _______
10. five dots, ten dots, fifteen dots, ______
11. fifteen dots, fourteen dots, twelve dots, _____
12. two triangles, four triangles, three triangles, six triangles, five triangles, _______
13. An octagon, a hexagon, an octagon, a pentagon, an octagon, _____
14. One square, 1.5 squares, 2 squares, 2.5 squares, _____
15. eighteen circles, nine circles, four and a half circles _____
16
www.ck12.org Chapter 1. Algebraic Thinking
1.4 Single Variable Expressions
Here you’ll learn to evaluate single variable expressions with a given value for the variable.
After waiting for what seemed like an eternity, the day of Kelly’s pre-trip meeting finally arrived. She had beensent a list of recommended supplies that she needed to bring to the meeting so that the leaders could check her gear.Kelly gathered her things and put everything in the family van. Then her Dad went with her to the pre-trip meeting.
“I am so excited,” she said to her Dad on the way over.
The pre-trip meeting was great. Kelly met several other hikers. They would be organized into hiking groups later,so today they all set together as one big crew. There were six leaders and thirty students with an even mix of boysand girls. While parents had coffee and tea, the leaders talked about trail safety, personal safety and about skills thatthey would learn.
The leaders said that the students would be hiking for about 6 hours per day with breaks.
“Wow,” thought Kelly “This is going to be something.”
Each day the group would have a goal of where they would start and where they would stop.
“The amount of distance traveled depends on the group,” said Scott one of the leaders. “If your group works welltogether, they you can cover about 1 –2 miles per hour on flat terrain. If you are climbing higher ascents, then youmay only cover 1
2 miles to 2 miles per hour.”
On the way home, Kelly started thinking about those variables. It seemed to her like there could be a range ofdistances covered even if they were hiking 6 hours per day. Kelly took out a notebook and made some notes.
6 hours of hiking per day
x number of miles hiked per hour
Kelly wants to figure out the hardest hiking first. She decides to calculate the time it would take if she andher group were only able to cover 1
2 miles per hour. Pay attention and you will be able to help Kelly with thisproblem at the end of the Concept.
Guidance
An algebraic expression is a mathematical phrase involving letters, numbers, and operation symbols.
A variable can be any letter, such as x, m, R, y, P, a, and others, that we use in an expression.
The variable represents possible values of a quantity.
Take a look at the following variable expressions.
3x+10
10r
b3 +2
mx−3
Variable expressions are used to describe real-world situations when we don’t know a value or a quantity. Sometimesa value is dependent on a changing variable.
17
1.4. Single Variable Expressions www.ck12.org
When we work with a variable expression, we can say that we evaluate the expression. To evaluate means to“find the value of”. We find the value of an expression.
Why don’t we “solve” expressions?
To solve something in math means that it has to equal a value. An expression does not have an equal sign. Thereforewe can’t solve it. Also, a variable in an expression can have several different values. Whereas in an equation, thevariable has one value that makes the equation true.
Evaluate the expression 10k−44 if k = 12.
A number next to a letter means that we multiply. This is a good time to blast back in math and think abouthow we show multiplication and division besides using an x or a ÷ sign.
10k−44 if k = 12
First, we substitute the 12 in for the letter k.
10(12) –44
Now we multiply 10 and 12, then we subtract 44.
120−44
76
18
www.ck12.org Chapter 1. Algebraic Thinking
Our answer is 76.
Sometimes, you will also have an expression to evaluate that uses division.
Evaluate the expression x3 +2 if x is 24
First, we substitute the 24 in for x.243 +2
Next, we divide twenty-four by three.
24÷3 = 8
Now we add 2.
8+2 = 10
Our answer is 10.
Now it is your turn. Evaluate the following single-variable expressions.
Example A
4x−9 if x is 20
Solution: 71
Example B
5y+6 if y is 9
Solution: 51
Example C
a4 −8 if a is 36
Solution: 1
Now back to Kelly and her hiking calculations. Here is the original problem once again.
After waiting for what seemed like an eternity, the day of Kelly’s pre-trip meeting finally arrived. She had beensent a list of recommended supplies that she needed to bring to the meeting so that the leaders could check her gear.Kelly gathered her things and put everything in the family van. Then her Dad went with her to the pre-trip meeting.
“I am so excited,” she said to her Dad on the way over.
The pre-trip meeting was great. Kelly met several other hikers. They would be organized into hiking groups later,so today they all set together as one big crew. There were six leaders and thirty students with an even mix of boysand girls. While parents had coffee and tea, the leaders talked about trail safety, personal safety and about skills thatthey would learn.
The leaders said that the students would be hiking for about 6 hours per day with breaks.
“Wow,” thought Kelly “This is going to be something.”
Each day the group would have a goal of where they would start and where they would stop.
“The amount of distance traveled depends on the group,” said Scott one of the leaders. “If your group works welltogether, they you can cover about 1–2 miles per hour on flat terrain. If you are climbing higher ascents, then youmay only cover 1
2 miles to 2 miles per hour.”
19
1.4. Single Variable Expressions www.ck12.org
On the way home, Kelly started thinking about those variables. It seemed to her like there could be a range ofdistances covered even if they were hiking 6 hours per day. Kelly took out a notebook and made some notes.
6 hours of hiking per day
x number of miles hiked per hour
Kelly wants to figure out the number of miles possible between the range of 12 mile per hour and 2 miles per hour.
She is sure that there is a way to do it using a variable and the six hours that the group will hike.
First, let’s write an expression to show the number of hours hiking times the possible number of miles. Sincethe number of miles can vary, we use the variable x for this distance.
6x
First, Kelly substitutes 12 for x to figure out about how many miles they will cover if all six hours is hiking
steep terrain.
6(1
2
)= 6
2 = 3 miles
Wow, on steep terrain the group will probably only cover about 3 miles in the entire day.
Guided Practice
Here is one for you to try on your own.
Evaluate x7 −5 if x is 49.
Answer
To evaluate this expression, we substitute 49 into the expression for x.497 −5
Next, we evaluate the expression.
7−5 = 2
Our answer is 2.
Video Review
MEDIAClick image to the left or use the URL below.URL: http://www.ck12.org/flx/render/embeddedobject/57650
This is a James Sousa video on evaluating algebraic expressions.
Explore More
Directions: Evaluate each expression if the given value of r = 9.
1. r3
2. 63− r
20
www.ck12.org Chapter 1. Algebraic Thinking
3. 11r
4. 2r+7
5. 3r+ r
6. 4r−2r
7. r+5r
8. 12r−1
Directions: Evaluate each expression when h = 12.
9. 70−3h
10. 6h+6
11. 4h−9
12. 11+ h4
13. 3h+h
14. 2h+5h
15. 6h−2h
21
1.5. Expressions with One or More Variables www.ck12.org
1.5 Expressions with One or More Variables
Here you’ll learn to evaluate multi-variable expressions with a given value for the variable.
Remember Kelly and her pre-trip meeting from the Single Variable Expressions Concept? Have you ever beenhiking on difficult terrain?
Kelly figured out how many miles per hour her group would be able to hike on difficult terrain. However, she alsohad other thoughts about flat terrain. Look at this information.
“The amount of distance traveled depends on the group,” said Scott one of the leaders. “If your group works welltogether, they you can cover about 1 –2 miles per hour on flat terrain. If you are climbing higher ascents, then youmay only cover 1
2 miles to 2 miles per hour.”
This is what the group leader told Kelly and the other hikers. Kelly has figured out the difficult hiking and now shehas another idea of a problem to solve. Kelly wants to figure out the number of miles possible between the range of12 mile per hour and 2 miles per hour. She is sure that there is a way to do it using a variable and the six hours thatthe group will hike.
Pay close attention during this Concept and you will know how to use a variable expression to help Kellyfigure things out.
Guidance
Previously we worked on how to evaluate algebraic expressions with a single variable. Well, algebraic expressionscan have more than one variable. Look at the following situations with multi-variable expressions.
xy+4x
mx+b
25r+(x−7)
x+ y+ z
When we know the value of the variables, we can evaluate multi-variable expressions the same way we evaluatedsingle-variable expressions, by substituting the value for the variables in the expression and solving from left toright.
Evaluate xy+ x if x = 2 and y = 4.
In this case we are only given one possible value for x and y. We know that x = 2 and y = 4, we can evaluate theexpression using the given values.
First, we can rewrite the expression by substituting the given values into the equation.
xy+ x
(2)(4)+2
We used the parentheses here to show multiplication. When two variables are next to each other it means multipli-cation. Here we used the parentheses because we needed to show multiplication between 2 and 4.
22
www.ck12.org Chapter 1. Algebraic Thinking
Now we can multiply first.
2×4 = 8
Next, we add two.
8+2 = 10
Our answer is 10.
Let’s look at another one where a given value is a fraction.
Evaluate mx+3m if x = 23 and m = 9.
First, we substitute the given values into the expression.
9(2
3
)+3(9)
Do you remember how to multiply a whole number and a fraction?
To multiply a whole number and a fraction you must first make the whole number a fraction over one.
9 becomes 91
Now you multiply numerator × numerator and denominator × denominator.91 ·
23 +3(9)
Next, we multiply the two fractions and simplify.183 = 6
Now we can substitute the 6 back into the expression.
6+3(9)
Next we multiply.
3(9) = 27
Finally, we add the remaining numbers.
23
1.5. Expressions with One or More Variables www.ck12.org
6+27
33
Our answer is 33.
Evaluate the following expressions using the given values.
Example A
ab+7 when a is 9 and b is 8
Solution: 79
Example B
xy+ zx when x is 2, y is 5 and z is 7
Solution: 24
Example C
xy+ x when x is 14 , and y is 4
5
Solution: 920
Now back to Kelly. Once she has figured out that the group will probably go three miles per hour on difficult terrain,she moved on to other terrains.
Next, Kelly looks at medium terrain. She substitutes 1 mile into the expression for x.
6(1) = 6 miles on medium terrain
Next, Kelly looks at flat terrain. She substitutes 2 miles in for x.
6(2) = 12 miles on flat terrain
Kelly starts to think about this. It would be unlikely for the group to travel on all one type of terrain per day.So she writes this expression to show half the day on flat terrain and half the day on difficult terrain.
x = flat terrain = 2 miles
y = difficult terrain = 12 mile
3x+3y
3(2)+3(
12
)6+1
12
miles = 712
miles
Kelly looks at this figure. While she is estimating travel time and distance per miles, she figures that the groupmay cover a little less than 7 and one-half miles or a little more, but it is probably a good middle estimate fordistance covered per day.
24
www.ck12.org Chapter 1. Algebraic Thinking
Guided Practice
Here is one for you to try on your own.
xy+ xy when x is 12 , and y is 2
3
Answer
To evaluate this expression, we can substitute the given values into the expression for the variables.12(
23)+
12(
23)
26 +
26 = 4
6 = 23
This is our answer.
Video Review
MEDIAClick image to the left or use the URL below.URL: http://www.ck12.org/flx/render/embeddedobject/57650
This is a James Sousa video on evaluating algebraic expressions.
Explore More
Directions: Evaluate each multi-variable expression if x = 3 and y = 4
1. Evaluate xy+2y
2. Evaluate 3y+2y
3. Evaluate 3y+9x
4. Evaluate xy+3xy
5. Evaluate 2xy+9xy
Directions: Evaluate each multi-variable expression if x = 10 and y = 5
6. Evaluate 5x+ xy
7. Evaluate 3x+2y
8. Evaluate 2x+3y
9. Evaluate 4x+3y+ x
10. Evaluate 5x+3y+2x
Directions: Evaluate each multi-variable expression if y = 2 and z = 4
11. Evaluate 2y+3y−2z
12. Evaluate 5y+3y−3z
13. Evaluate 2y+5y−2z
14. Evaluate 4y+3y−2z
25

1.5. Expressions with One or More Variables www.ck12.org
15. Evaluate 6z−2(z+ x) if x is 3 and z is 4
16. Evaluate 8a+3b−2c if a is 5, b is 4 and c is 3
26
www.ck12.org Chapter 1. Algebraic Thinking
1.6 Expressions for Real-Life Situations
Here you’ll learn to use given and variable expressions to solve real-world problems.
Have you ever carried a backpack hiking? Take a look at this dilemma.
Kelly and the other hikers are trying to divide up all of the things that they need for their trip. The group wants thedivision of items to be equitable so that each person carries the same amount. If there are seven hikers, how can theyfigure this out? The group isn’t sure how many items will need to be carried.
Is there a way to write a variable expression to figure this out?
This Concept will show you how to write a variable expression for this dilemma.
Guidance
Previously we learned how to evaluate expressions, both alone and in relation to real-world problems. We can usesome familiar situations to write and evaluate our own variable expressions. The key to writing variable expressionsis analyzing the information you have, identifying the information you need, and recognizing the terms that indicatewhich mathematical operation to use.
Let’s imagine that Ralph is a baker who makes l number of loaves of bread each day.
• If he uses 5 cups of flour for each loaf, the total amount of flour he uses each day would be represented as 5l.• If he only sells half the loaves he makes, then he sells l
2 .• In 2 days, 3 days, 4 days, Ralph would make 2l,3l, and 4l loaves of bread.
Now it’s time for you to try a few on your own. Write variable expressions for each real-world problem.
Example A
Karen bakes cookies every day. How many total cookies would she bake in seven days?
27
1.6. Expressions for Real-Life Situations www.ck12.org
Solution: 7c
Example B
Eden caught fourteen fish and ate some.
Solution: 14− x
Example C
Jessica read a few books each week. How many did she read over four weeks?
Solution: 4x
Here is the original problem once again.
Kelly and the other hikers are trying to divide up all of the things that they need for their trip. The group wants thedivision of items to be equitable so that each person carries the same amount. If there are seven hikers, how can theyfigure this out? The group isn’t sure how many items will need to be carried.
Is there a way to write a variable expression to figure this out?
We can write a variable expression to figure out how many items each person will carry.
First, think about the variable. The unknown quantity is the number of items. Let’s call that x.
There are seven people to carry these items.
We can divide the total number of items by 7.
Here is our answer.x7
Guided Practice
Here is one for you to try on your own.
Write a variable expression to express the following situation.
John runs every day. The number of miles that he runs varies per day. Sometimes he runs four miles and sometimestwo miles. Write a variable expression to show John’s total miles for three days.
Answer
The number of miles that John runs per day is our variable. That is an amount that changes. We can call that m.
We want the total miles for three days.
Our answer is 3m.
Video Review
28
www.ck12.org Chapter 1. Algebraic Thinking
MEDIAClick image to the left or use the URL below.URL: http://www.ck12.org/flx/render/embeddedobject/1
Khan Academy Writing Variable Expressions
Explore More
Directions: Use what you learned about variables and real-life situations for the next problems. Choose a variableto represent the number and write an algebraic expression for the following phrases.
1. 19 decreased by a number
2. 4 less than the product of 4 and a number
3. 30 more than a number
4. 12 more than 3 times a number
5. A number divided by seven
6. A number and seven divided by two
7. 16 times an unknown number
8. A number divided by eight
9. The quantity of a number and seven times two
10. The quantity of a number and five divided by five
11. 22 decreased by a number
12. Seventeen less than three times a number
Directions: Now solve each problem using variable expressions.
13. A librarian has 4 times as many mystery books as romances. She lends out 12 mysteries. How many mysteriesdoes she have now if she started with 15 romances?
14. In Saturday’s basketball game, Roman scored a fourth of his teams points. If the team scored 48 points total,how many points did Roman score? Write an expression and solve.
15. At the garden show daffodil bulbs cost $3 and tulip bulbs cost $4. Latoya buys 7 tulip bulbs and twice as manydaffodil bulbs as tulips bulbs. How much does she spend total? Write an expression and solve.
29
1.7. Whole Number Exponents www.ck12.org
1.7 Whole Number Exponents
Here you’ll learn to identify whole number powers, exponents and bases.
Have you ever been hiking with a group of other teens?
On the first day of Teen Adventure, Kelly thought they would be hiking, but when the group assembled at theLafayette Place Campground she realized that there was a lot to do before they could begin hiking. First, the leadersorganized each group into 10 hikers with 2 leaders each. Then the leaders split off with their groups to do sometraining.
There was a lot to learn. The leaders of Kelly’s group, Scott and Laurel began by having the hikers introducethemselves and share a little about their hiking experience. They learned that the group would be taking it easy thefirst week while everyone got into shape and had a chance to get to know each other. The hiking would get morestrenuous as the time went on.
After introductions, Scott and Laurel gave the campers two tents. Since there were five boys and five girls in eachgroup, the team would need two tents. There would be times when they would be sleeping in cabins, but there alsowould be times where tents would be necessary.
Their first task was to set up the tent and figure out the square footage of the floor. The girls and boys were eachgiven a Kelty Trail Dome 6.
Kelly and the other girls took one tent and began to take it out of its package. They were so excited that they didnot pay attention and almost lost the directions. Luckily, Kara saw this and caught them before the wind did. Kellylooked at the directions. The tent was sized to sleep six so it would be perfect for them and one of the leaders.
Dimensions of the floor = 1202 inches
Kelly and Jessica looked at the dimensions. Who would have thought that they would be solving math problemswhen hiking! Jessica took out a piece of paper and began working on the problem.
1202 inches is a measurement that has an exponent. To figure out the dimensions of the floor of the tent youwill need to know how to work with exponents. In this Concept, you will learn all about exponents. By theend, you will know how to figure out the area of floor of the tent.
30
www.ck12.org Chapter 1. Algebraic Thinking
Guidance
Sometimes, we have to multiply the same number several times. We can say that we are multiplying the number byitself in this case.
4×4×4 is 4 multiplied by itself three times.
When we have a situation like this, it is helpful to use a little number to show how many times to multiply the numberby itself. That little number is called an exponent.
If we were going to write 4×4×4 with an exponent, we would write 43. This lesson is all about exponents. By theend of it, you will how and when to use them and how helpful this shortcut is for multiplication.
Using exponents has an even fancier name too. We can say that we use exponential notation when we expressmultiplication in terms of exponents.
We can use exponential notation to write an expanded multiplication problem into a form with an exponent, wewrite 4×4×4 with an exponent = 43
We can work the other way around too. We can write a number with an exponent as a long multiplication problemand this is called expanded form.
The base is the number being multiplied by itself in this case the base is 4.
The exponent tells how many times to multiply the base by itself in this case, it is a 3.
Using an exponent can also be called “raising to a power.” The exponent represents the power.
Here 43 would be read as “Four to the third power.”
Write the following in exponential notation: 6×6×6×6
Exponential Notation means to write this as a base with an exponent.
Six times itself four times = 64
This is our answer.
Write the following in expanded form: 53
Expanded form means to write this out as a multiplication problem.
5×5×5
This is our answer.
We can also evaluate expressions with variables.
43
Our first step is to write it out into expanded form.
4×4×4
Now multiply.
4×4 = 16×4 = 64
Our answer is 64.
Now it’s time for you to try a few on your own.
Example A
Write the following in exponential form: 3×3×3×3×3
Solution: 35
31
1.7. Whole Number Exponents www.ck12.org
Example B
Write the following in expanded form and evaluate the expression: 63
Solution: 6×6×6
Example C
Evaluate: 43−52
Solution: 39
Now let’s go back to the tent dilemma from the beginning of the Concept.
Kelly and the other girls took one tent and began to take it out of its package. They were so excited that they didnot pay attention and almost lost the directions. Luckily, Kara saw this and caught them before the wind did. Kellylooked at the directions. The tent was sized to sleep six so it would be perfect for them and one of the leaders.
Dimensions of the floor = 1202 inches
Kelly and Jessica looked at the dimensions. Who would have thought that they would be solving math problemswhen hiking! Jessica took out a piece of paper and began working on the problem.
First, notice that the measurement is in inches not feet. Our final answer needs to be in square footage, so afterfiguring out these dimensions, the girls will need to convert the measurement to feet.
The area of a square is one place where we use exponents all the time. The square has side x side, so we can writes2 to find the area of a square. Since the tent floor is square, the dimensions have been written in square inches.
1202 inches
To start, the girls need to multiply this out.
120×120
Next, they can covert each inch dimension to feet.
There are 12 inches in 1 foot, so we divide each measurement by 12. 120 divided by 12 = 10.
Now we multiply to find the area in square feet.
10 f t×10 f t = 100 square feet
Exponents are very useful when working with area!
Guided Practice
Here is one for you to try on your own.
23 +42
Answer
To evaluate this expression write it out in expanded form.
(2)(2)(2)+(4)(4)
Now multiply each part of the expression.
8+16
24
32

www.ck12.org Chapter 1. Algebraic Thinking
Our answer is 24.
Video Review
MEDIAClick image to the left or use the URL below.URL: http://www.ck12.org/flx/render/embeddedobject/5442
This is a James Sousa video about writing numbers in exponential form.
Explore More
Directions: Name the base and exponent in the following examples. Then write each in expanded form.
1. 45
2. 32
3. 58
4. 43
5. 63
6. 25
7. 110
8. 24
9. 34
10. 52
11. 44
12. 810
13. 93
14. 122
15. 133
33
1.8. Algebra Expressions with Exponents www.ck12.org
1.8 Algebra Expressions with Exponents
Here you’ll learn to evaluate powers with variable bases.
Remember the tent dilemma from the Whole Number Exponents?
Well, the hikers were given a specific tent with specific dimensions. They were given a Kelty Trail Dome 6 tent.
What if a different tent was used? What if many different tents were used?
The square footage of the floor would always have an exponent of 2, but a variable would be needed for the basebecause different size tents would be being used.
Here is how we could write this.
a2
In this case, a is the length of one side of a square tent.
What if a tent with 8 feet on one side was being used?
What if a tent with 15 feet on one side was being used?
What would the square footage of each tent be?
This Concept will teach you how to evaluate powers with variable bases. Pay attention and you will know howto work through this at the end of the Concept.
Guidance
When we are dealing with numbers, it is often easier to just simplify. It makes more sense to deal with 16 than with42. Exponential notation really comes in handy when we’re dealing with variables. It is easier to write y12 than it isto write yyyyyyyyyyyy.
34
www.ck12.org Chapter 1. Algebraic Thinking
Yes, and we can simplify by using exponential form and we can also write out the variable expression by usingexpanded form.
Write the following in expanded form: x5
To write this out, we simply write out each x five times.
x5 = xxxxx
We can work the other way to by taking an variable expression in expanded form and write it in exponential form.
aaaa
Our answer is a4.
What about when we multiply two variable terms with exponents?
To do this, we are going to need to follow a few rules.
(m3)(m2)
The first thing to notice is that these terms have the same base. Both bases are m’s. Because of this, we cansimplify the expression quite easily.
Let’s write it out in expanded form.
mmm(mm)
Here we have five m’s being multiplied our answer is m5.
Here is the rule.
Let’s apply this rule to the next one.
(x6)(x3)
The bases are the same, so we add the exponents.
x6+3 = x9
This is the answer.
35
1.8. Algebra Expressions with Exponents www.ck12.org
We can also have an exponential term raised to a power. When this happens, one exponent is outside theparentheses. This means something different.
(x2)3
Let’s think about what this means. It means that we are multiplying x squared by itself three times. We canwrite this out in expanded form.
(x2)(x2)(x2)
Now we are multiplying three bases that are the same so we use Rule 1 and add the exponents.
Our answer is x6.
We could have multiplied the two exponents in the beginning.
(x2)3 = x2(3) = x6
Here is Rule 2.
Simplify x0
Our answer is x0 = 1
Anything to the power of 0 equals 1.
Now it’s time for you to try a few on your own.
Example A
Write the following in exponential form: aaaaaaa
Solution: a7
Example B
Simplify: (a3)(a8)
36
www.ck12.org Chapter 1. Algebraic Thinking
Solution: a11
Example C
Simplify: (x4)2
Solution: x8
Remember the tent dilemma from the beginning of the Concept? Well let’s take a look at it again.
The hikers were given a specific tent with specific dimensions. Remember, they were given a Kelty Trail Dome 6.
What if a different tent was used? What if many different tents were used?
The square footage of the floor would always have an exponent of 2, but a variable would be needed for the basebecause different size tents would be being used.
Here is how we could write this.
a2
In this case, a is the length of one side of a square tent.
What if a tent with 8 feet on one side was being used?
What if a tent with 15 feet on one side was being used?
What would the square footage of each tent be?
Here is our solution.
82 = 64 square feet is the first tent.
152 = 225 square feet is the second tent.
Guided Practice
Here is one for you to try on your own.
Simplify:(x6)(x2)
Answer
When we multiply variables with exponents, we add the exponents.
37
1.8. Algebra Expressions with Exponents www.ck12.org
Our answer is x8.
Video Review
MEDIAClick image to the left or use the URL below.URL: http://www.ck12.org/flx/render/embeddedobject/5444
This is a James Sousa video on evaluating powers with variable bases.
Explore More
Directions: Evaluate each expression.
1. 23
2. 42
3. 52
4. 90
5. 53
6. 26
7. 33
8. 32 +42
9. 53 +22
10. 62 +23
11. 62−52
12. 24−22
13. 72 +33 +22
Directions: Simplify the following variable expressions.
14. (m2)(m5)
15. (x3)(x4)
16. (y5)(y3)
17. (b7)(b2)
18. (a5)(a2)
19. (x9)(x3)
20. (y4)(y5)
Directions: Simplify.
21. (x2)4
38

www.ck12.org Chapter 1. Algebraic Thinking
22. (y5)3
23. (a5)4
24. (x2)8
25. (b3)4
39
1.9. Numerical Expression Evaluation with Basic Operations www.ck12.org
1.9 Numerical Expression Evaluation with Ba-sic Operations
Here you’ll learn to evaluate variable expressions involving the four operations.
Have you ever been to the White Mountains? Take a look at this dilemma.
The first few days of Teen Adventure were spent at the base of the White Mountains in the Lafayette PlaceCampground. There the teens worked on survival skills, map skills and basic first aid. The students were keptall together and Kelly made some terrific new friends. Her favorite part was all of the team building and trustbuilding exercises that they learned. She even surprised herself by being able to complete some tasks that she wasn’tsure that she could do. Kelly and the other students learned to rely on themselves and each other over those first fewdays.
The night before their first hike, the group leaders told them that they would be divided up into hiking groups. Eachweek they would meet altogether once again to talk about their adventures, but during the actual week each groupwould be on a different trail. There would be three groups out of the 30 students. The 6 leaders would be dividedinto the 3 groups. For the first few days, there would be a manager along and two first aid persons. After the first fewdays, the manager and the two first aid persons would head back to the base office to be checked in with weekly orin case of emergency. So they would start with one number of people and after the first few days the number wouldchange.
Kelly is curious about how many people will start and how many will be together after the first few days.
This is where you come in. You can write an expression to figure this out-using grouping symbols and theorder of operations you should be able to calculate two different group numbers. This Concept will teach youall that you need to know. Pay attention because you will see this problem once again.
Guidance
Previously we worked on using the order of operations to evaluate numerical expressions? Remember that anumerical expression is an expression that has numbers and operations in it. Let’s review.
2+3×5
We could evaluate this expression in two different ways.
In the first way, we simply perform the operations in order from left to right.
40
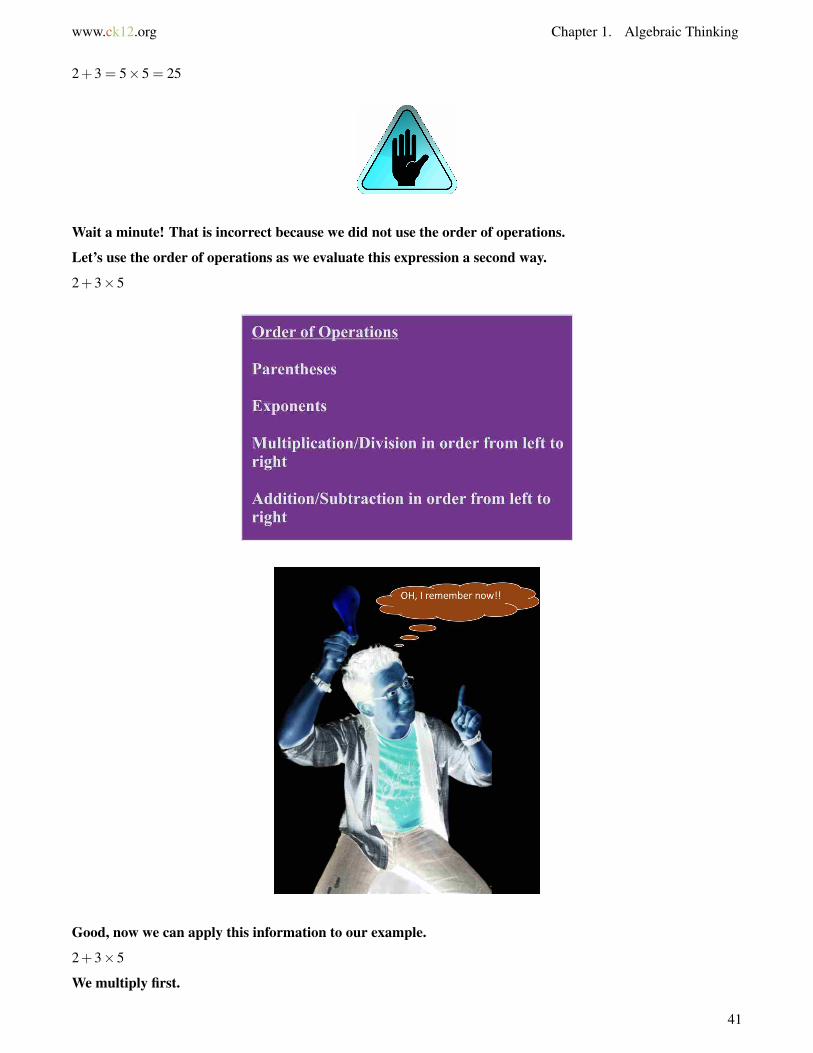
www.ck12.org Chapter 1. Algebraic Thinking
2+3 = 5×5 = 25
Wait a minute! That is incorrect because we did not use the order of operations.
Let’s use the order of operations as we evaluate this expression a second way.
2+3×5
Good, now we can apply this information to our example.
2+3×5
We multiply first.
41
1.9. Numerical Expression Evaluation with Basic Operations www.ck12.org
3×5 = 15
2+15 = 17
Our answer is 17.
We can apply this information to variable expressions. How can we do that?
Remember that a variable expression has variables, numbers, operations and sometimes exponents in it. We canstart by thinking about evaluating variable expressions. When we evaluate a variable expression, we are findingthe value of that expression. If given a value for a variable, we substitute the numerical value of the variable into theexpression. Then we can find the total value of the expression.
Some variable expressions will have more than one variable in it. We can evaluate the expression if we havebeen given values for each of the variables.
Evaluate the expression: 4b+12÷4−8 if b = 6
First, we substitute the given value in for the variable.
4(6)+12÷4−8
Next, we perform multiplication and division in order from left to right.
24+3−8
Now we add and subtract in order from left to right.
27−8 = 19
Our answer is 19.
Sometimes, you will see a problem with two variables in it.
Evaluate the expression: 21x −7+8y if x = 3 and y = 4
First, we substitute the given values for x and y into the expression.213 −7+8(4)
Next, we perform multiplication and division in order from left to right. Notice that this problem has a fractionbar in it which means division.
7−7+32
Now we add and subtract in order from left to right.
0+32 = 32
Our answer is 32.
Evaluate the following variable expressions by following the order of operations.
Example A
5a+6÷2+9 if a is 5
Solution: 37
Example B
7x+14÷7−3 if x is 4
42
www.ck12.org Chapter 1. Algebraic Thinking
Solution: 27
Example C
48x +5y−7 if x is 6 and y is 9
Solution: 46
Now back to the hiking trip and the groupings.
Kelly is curious about how many people will start and how many will be together after the first few days.
First, let’s work with the numbers involved.
30 students
6 group leaders
1 manager
2 first aid persons
Now we can write an expression to show how one group is created out of the whole.
30÷3+6÷3
Next, we solve it for the number of students and leaders per group. Remember to follow the order of operations.
10+2 = 12 persons
For the first few days, there will also be a manager and two first aid persons.
12+1+2
15 people in a group for the first few days.
Then the manager and two first aid persons leave.
15−3 = 12
The core group will consist of 12 people.
Guided Practice
Here is one for you to try on your own.
6x+36÷4−3+8 if x is 4
Answer
First, remember to follow the order of operations. Then substitute 4 into the expression for x.
6(4)+36÷4−3+8
Now we can complete multiplication and division in order from left to right.
24+9−3+8
Next, we can complete addition and subtraction in order from left to right.
Our answer is 38.
Video Review
43
1.9. Numerical Expression Evaluation with Basic Operations www.ck12.org
MEDIAClick image to the left or use the URL below.URL: http://www.ck12.org/flx/render/embeddedobject/5258
This is a James Sousa video on evaluating an expression using the order of operations.
Explore More
Directions: Use the order of operations to evaluate each numerical expression.
1. 5+3×4
2. 6×2+5×3
3. 4+5×2−9
4. 4+6÷2+10−3
5. 8−15÷3+4×5
Directions: Evaluate the following expressions when x is 4.
6. 2x+28÷4−3
7. 6x+30÷2−10
8. 5x+ x−3+8
9. 3x+36÷9−3+1
10. 5x+9−3+8
11. 4x+30÷15−3+8
12. 8x+2x−3+18
13. 2x+ x÷2−3+8
14. 9x+3x÷2+8
15. 12x+4x÷4−6+8
44

www.ck12.org Chapter 1. Algebraic Thinking
1.10 Expression Evaluation with Powers andGrouping Symbols
Here you’ll learn to evaluate variable expressions involving powers and grouping symbols.
Have you ever had a part time job?
Lydia and Bart both work at a bookstore. Lydia makes x amount each hour; Bart has more experience, so he makes1.5 times more than Lydia makes each hour. If Lydia and Bart both work 4 hours a day, how much will they maketogether in seven days if Lydia makes $8 an hour.
Write an expression; then solve it. Do you know how to do this?
This Concept will show you exactly how to do this.
Guidance
Previously we worked on the basic order of operations. Well, now we can expand our rules to include evaluationof more complicated expressions. In intricate expressions parentheses are used as grouping symbols. Parenthesesindicate which operations should be done first. In the order of operations, operations within the parentheses arealways first.
In the Algebra Expressions with Exponents Concept, we learned how to simplify and evaluate exponents.
x3 = xxx.
Exponential notation is another factor we must account for in the order of operations. After completing the operationsin parentheses, we then evaluate the exponents. Then we complete the multiplication and division from left to right;finally, we complete the addition and subtraction from left to right. The chart below shows the complete order ofoperations. If you keep the order of operations in the forefront of your mind and are careful to take each step one at atime and show your work, evaluating complex expressions using the order of operations will become second nature.
Let’s look at the order of operation once again.
45
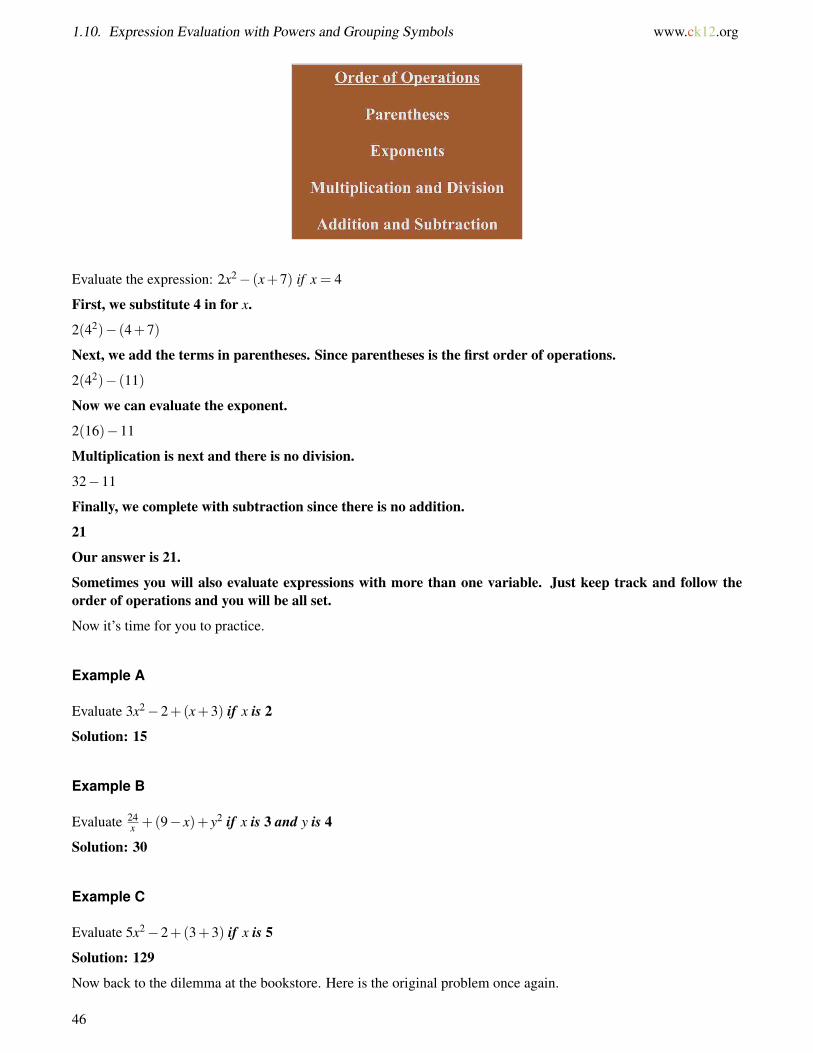
1.10. Expression Evaluation with Powers and Grouping Symbols www.ck12.org
Evaluate the expression: 2x2− (x+7) if x = 4
First, we substitute 4 in for x.
2(42)− (4+7)
Next, we add the terms in parentheses. Since parentheses is the first order of operations.
2(42)− (11)
Now we can evaluate the exponent.
2(16)−11
Multiplication is next and there is no division.
32−11
Finally, we complete with subtraction since there is no addition.
21
Our answer is 21.
Sometimes you will also evaluate expressions with more than one variable. Just keep track and follow theorder of operations and you will be all set.
Now it’s time for you to practice.
Example A
Evaluate 3x2−2+(x+3) if x is 2
Solution: 15
Example B
Evaluate 24x +(9− x)+ y2 if x is 3 and y is 4
Solution: 30
Example C
Evaluate 5x2−2+(3+3) if x is 5
Solution: 129
Now back to the dilemma at the bookstore. Here is the original problem once again.
46
www.ck12.org Chapter 1. Algebraic Thinking
Lydia and Bart both work at a bookstore. Lydia makes x amount each hour; Bart has more experience, so he makes1.5 times more than Lydia makes each hour. If Lydia and Bart both work 4 hours a day, how much will they maketogether in seven days if Lydia makes $8 an hour.
Write an expression; then solve it.
In this problem, x stands for the amount Lydia makes per hour. Because Bart makes 1.5 times the amount that Lydiamakes per hour, then 1.5x describes how much Bart makes per hour. The total Lydia and Bart make in 1 hour istherefore (x+ 1.5x). Now the problem tells us that Lydia and Bart each work 4 hours per day. So, the amountthey both make in 1 day is 4(x+ 1.5x). We want to find out how much they make in 7 days, so our expression is7× 4(x+ 1.5x). The problem gives us the value of x. Lydia makes $8 an hour. We substitute 8 for the variable inour expression and solve using the order of operations. Remember: parenthesis, exponents, multiplication, division,addition, subtraction.
7×4(x+1.5x) = 7×4(8+1.5×8)
7×4(x+1.5x) = 7×4(8+12)
7×4(x+1.5x) = 7×4(20)
7×4(x+1.5x) = 560
The answer is $560.00.
Guided Practice
Here is one for you to try on your own.
Evaluate 6x2−2x+(x+3) if x is 4
Answer
First, substitute 4 into every place that an x appears.
6(4)2−2(4)+(4+3)
Now evaluate according to the order of operations.
The answer is 95.
Video Review
MEDIAClick image to the left or use the URL below.URL: http://www.ck12.org/flx/render/embeddedobject/5260
This is a James Sousa video on evaluating an expressions using the order of operations.
Explore More
Directions: Evaluate the following variable expressions is x = 4,y = 2,z = 3
47
1.10. Expression Evaluation with Powers and Grouping Symbols www.ck12.org
1. x2 + y
2. 2y2 +5−2
3. x2− y2 + z
4. 3x2 +2x2
5. 8+ x2−4y
6. 14÷2+ z2− y
7. 20+ z2− y
8. 5x−2y+3z
9. 5+(x− z)+5(6)
10. 8+ x− y2 + z
11. (x+ y)+5 ·2−3
12. 4x2 +3z3 +2
Directions: Use what you have learned to answer the following questions true or false.
13. Parentheses are a grouping symbol.
14. Exponents can’t be evaluated unless the exponent is equal to 3.
15. If there is multiplication and division in a problem you always do the division first.
48

www.ck12.org Chapter 1. Algebraic Thinking
1.11 Mental Math for Addition and SubtractionEquations
Here you’ll learn to use mental math to solve single variable addition and subtraction equations.
Have you ever made GORP to go hiking with?
GORP stands for "Good ole’ Raisins and Peanuts." However, many people put other things into GORP and still callit GORP.
Jason is mixing the GORP for his whole group. Since there aren’t any allergies, he is having a great time puttingeverything into the GORP.
Jason adds 3 pounds of peanuts, 5 pounds of M&M’s, 3 pounds of cashews, 1 pound of raisins, and a questionableamount of dried fruit. When he weighs the GORP it weighs 22 pounds.
How many pounds of dried fruit was added?
To figure this out, you will need to know how to write an equation using a variable and use mental math tosolve it. You will learn all that you need to know in this Concept.
Guidance
Previously we worked on algebraic expressions. Remember that algebraic expressions combine numbers, variablesand operations together. When given the value of a variable, we can evaluate any expression.
Take the following problem: 10r+11.
If r = 22, we substitute the value of the variable into the expression and evaluate.
Be careful to follow the order of operations.
10r+11 = 10(22)+11
220+11
231
The answer is 231.
An equation is a mathematical statement that two expressions are equal. The key thing to notice in an equation isthat there is an equal sign.
Thinking about this, we can say that
15+7 = 24−2
Since both sides of the equation equal 22, these equations are equivalent.
15+7 = 22 and 24−2 = 22
A variable equation is an equation that includes an algebraic unknown, or a variable. If you think about this it makesperfect sense. We have an unknown in an equation so we use a variable to represent the unknown quantity. We callthis a variable equation.
Take a look at some of these variable equations:
49
1.11. Mental Math for Addition and Subtraction Equations www.ck12.org
15t = 45
12 = x+9
6x = 216
25 = 3(x−7)+1
In variable expressions, we used the value of the variable to evaluate.
Variable equations are different because with equations we already know the value of one side.
When we have a variable equation, we can solve the equation to figure out the value of the variable.
That is just what you are going to learn in this lesson. Let’s begin with solving single variable-equationsaddition and subtraction equations.
Remember, an equation states that two expressions are equal.
When we solve a variable equation, we are finding the value of the variable that makes the equation true. Take thefollowing variable equation.
y+10 = 15
The equal sign tells us that y+10 and 15 have the same value.
Therefore, the value of y must be a number that, when added to 10, equals 15.
What could be the value of y?
We can ask ourselves, “What number plus ten is equal to fifteen?”
You can use mental math to determine that y = 5 because 5+10 = 15.
One advantage of working with equations is that you can always check your work.
Think of it like a balance.
50

www.ck12.org Chapter 1. Algebraic Thinking
This scale is not balanced. When we solve an equation, we want the scale to balance. One side will be equalto the other side.
When you think you know the value of a variable, plug it into the equation.
If your variable for the variable is the correct one, both sides will be equal.
The two expressions will balance!
That situation had addition in it, what about subtraction?
You can work on a subtraction equation in the same way.
x−5 = 10
This is an equation once again. We want to figure out what number minus five is equal to ten. That way both sidesof the equations will be equal and be balanced. We ask ourselves the question, “What number take away fifteen isequal to 10?”
We can use mental math to figure out that x is equal to 15. When working with small numbers, mental math isthe quickest way to figuring out the value of the variable.
Now let’s check our answer. To do this we substitute our answer for x back into the equation and see if both sidesare equal.
15−5 = 10
10 = 10
You can see that if we pick the correct quantity for x that the two halves of the scale will be balanced. If wepick the wrong quantity, one that is too big or too small, then the scales will tip.
51

1.11. Mental Math for Addition and Subtraction Equations www.ck12.org
Solving equations is often called BALANCING EQUATIONS for this very reason!!
Practice using mental math to solve each equation.
Example A
x+5 = 12
Solution: 7
Example B
x−3 = 18
Solution: 21
Example C
6− y = 4
Solution: 2
Now back to the GORP. Here is the original problem once again.
Have you ever made GORP to go hiking with?
GORP stands for "Good ole’ Raisins and Peanuts." However, many people put other things into GORP and still callit GORP.
Jason is mixing the GORP for his whole group. Since there aren’t any allergies, he is having a great time puttingeverything into the GORP.
Jason adds 3 pounds of peanuts, 5 pounds of M&M’s, 3 pounds of cashews, 1 pound of raisins, and a questionableamount of dried fruit. When he weighs the GORP it weighs 22 pounds.
How many pounds of dried fruit was added?
To solve this problem, we have to write an equation with a variable.
3+5+3+1+ x = 22
Here are all the quantities, plus the unknown and it is all equal to 22 pounds.
Now we can add.
12+ x = 22
You can use mental math to solve this.
Jason put 10 pounds of dried fruit into the mix of GORP.
Guided Practice
Here is one for you to try on your own.
There are 63 players in the symphony orchestra. 29 of these players are women. How many players in the orchestraare men? Write a variable equation and solve.
Answer
52
www.ck12.org Chapter 1. Algebraic Thinking
In this problem, we are trying to find the number of men in the orchestra, so let’s give this value the variable x. Theproblem tells us the number of women in the orchestra as well as the total number of players. We know thatthe number of men players plus the number of women players will equal the total number of players, so wecan write the following equation. x+29 = 63
Notice that plus is a key word that means addition. Now we can solve for the value of x.
Using mental math, we know that there are more than 30 men because 30+29 = 59. We need 4 more than 30 menplayers to equal 63. So x = 34.
There are 34 players in the orchestra that are men.
Video Review
MEDIAClick image to the left or use the URL below.URL: http://www.ck12.org/flx/render/embeddedobject/57652
This is a James Sousa video on the basics of solving one-step equations.
MEDIAClick image to the left or use the URL below.URL: http://www.ck12.org/flx/render/embeddedobject/5295
This is a James Sousa video on solving one-step equations with addition and subtraction.
Explore More
Directions: Use mental math to solve each addition or subtraction equation.
1. x+2 = 7
2. y+5 = 10
3. a+7 = 20
4. b+8 = 13
5. z+10 = 32
6. s+14 = 26
7. 4+ y = 8
8. 6+ x = 21
9. 17+a = 23
10. 18+b = 30
53
1.11. Mental Math for Addition and Subtraction Equations www.ck12.org
11. 12+ x = 24
12. 13+ y = 18
13. 15+a = 22
14. x+17 = 24
15. y+3 = 45
16. x−4 = 10
17. y−8 = 20
18. 5− y = 2
19. 22−a = 15
20. 18− y = 2
54
www.ck12.org Chapter 1. Algebraic Thinking
1.12 Mental Math for Multiplication/DivisionEquations
Here you’ll learn to use mental math to solve single variable multiplication and division equations.
Remember the GORP from the Mental Math for Addition and Subtraction Equations Concept?
Jason worked on the GORP and then handed it over for distribution. Some of the best foods to hike with are cheese,peanut butter, candy bars, fruit, beef jerky, dried fruit and energy bars. Jason was very excited about the GORP.
Travis and Henry two of the boys in Kelly’s group took a scoop, a scale, some gallon plastic bags and 24 poundsof GORP. Travis and Henry have to split up the GORP into bags so that each member of the group has the sameamount. They have to gather GORP for the two leaders as well.
How much GORP should go into each bag?
Travis and Henry grab a piece of paper and a pencil and begin working this out.
Wait a minute! An equation would be very helpful here. This Concept is all about writing and solvingequations that have multiplication and division in them. You will learn all about equations and then revisitthis problem at the end of the Concept.
Guidance
Previously we worked on single-variable addition and subtraction equations. To solve variable equations usingmultiplication and division we follow the same procedure. First we examine the problem and use mental math.
55
1.12. Mental Math for Multiplication/Division Equations www.ck12.org
Using mental math requires you to remember your multiplication tables. Remember that division is theopposite of multiplication, so when using small numbers mental math and your times tables will be your beststrategy to balancing equations.
9p = 72
Here is a multiplication problem. Whenever you see a variable next to a number it means multiplication.Here we need to figure out, “What number times 9 is equal to 72?”
Using mental math, you can see that p is equal to 8.
Now let’s check our answer. We do this by substituting the value of the variable, 8, back into the original problem.
9(8) = 72
72 = 72
One side of the equation is equal to the other side, so our equation balances! Our work is complete andaccurate.
We can apply mental math when solving division problems too. Remember that a fraction bar means division,so when you see one you know that you are going to be dividing.x3 = 4
Remember that when the variable is on top of the fraction bar that we are dividing the bottom number intothis number. So we ask ourselves, “What number divided by three is equal to four?”
We use mental math to figure this out. Our missing value is 12.
Next, we can check our work. We substitute 12 back into the equation for the variable x.
123
= 4
4 = 4
One side of the equation is equal to the other side, so our equation balances! Our work is complete andaccurate.
Practice solving these equations by using mental math.
56
www.ck12.org Chapter 1. Algebraic Thinking
Example A
5y = 20
Solution: 4
Example B
6g = 42
Solution: 7
Example C
x7 = 2
Solution: 14
Now back to the GORP calculations.
Jason worked on the GORP and then handed it over for distribution. Some of the best foods to hike with are cheese,peanut butter, candy bars, fruit, beef jerky, dried fruit and energy bars. Jason was very excited about the GORP.
Travis and Henry two of the boys in Kelly’s group took a scoop, a scale, some gallon plastic bags and 24 poundsof GORP. Travis and Henry have to split up the GORP into bags so that each member of the group has the sameamount. They have to gather GORP for the two leaders as well.
How much GORP should go into each bag?
Travis and Henry grab a piece of paper and a pencil and begin working this out.
First, let’s work on writing an equation.
There are 10 kids per group + 2 leaders = 12 total members of the group.
There is 24 lbs of GORP.
12x = 24
x = the number of pounds of GORP per person
57
1.12. Mental Math for Multiplication/Division Equations www.ck12.org
Each person will have 2 pounds of GORP in their bag.
Guided Practice
Here is one for you to try on your own.
Alyssa sold $120 in raffle tickets. If each ticket costs $6, how many tickets did she sell? Write a variable equationand solve.
Answer
This problem will involve multiplication because the number of tickets times the cost of each ticket will equal theamount of money Alyssa made.
Let’s let y represent the number of tickets Alyssa sold. The equation 6y = 120.
Using mental math, you should see the relationship between 6 and 12.
6×2 = 12
6×20 = 120
y = 20
Alyssa sold 20 raffle tickets. This is our answer.
Video Review
MEDIAClick image to the left or use the URL below.URL: http://www.ck12.org/flx/render/embeddedobject/5297
This is a James Sousa video on how to solve one-step equations by multiplication and division.
Explore More
Directions: Use mental math to solve each multiplication or division equation.
1. 5x = 25
2. 6x = 48
3. 2y = 18
4. 3y = 21
5. 4a = 16
6. 13b = 26
7. 15a = 30
8. 15x = 45
58
www.ck12.org Chapter 1. Algebraic Thinking
9. x2 = 3
10. x4 = 5
11. x3 = 11
12. x5 = 12
13. x7 = 8
14. x8 = 9
15. x3 = 12
59
1.13. Appropriate Tools for Measurement of Squares and Rectangles www.ck12.org
1.13 Appropriate Tools for Measurement ofSquares and Rectangles
Here you’ll learn to choose appropriate tools and units for given measurement situations. These situations willinvolve squares and rectangles.
Have you ever wondered which measurement tool you should use to measure something?
Kris went to the hardware store to purchase a new window. She has a large rectangular picture window in her house.It is almost the length of one wall of her living room. Before going to the hardware store, Kris measured the window.
Which measurement tool do you think she used? Which unit would make the most sense to measure with?
This Concept is about measurement tools and units for squares and rectangles. By the end of the Concept,you will understand how to answer these questions.
Guidance
Measurement is the system of comparing an object to a standard.
1 pound, 1 yard, and 1 liter are just a few of the standards we use. Measuring the weight of a bunch of bananasagainst 1 pound, the length of a football field against 1 yard, or the amount of milk needed to make a cake against 1liter helps us understand the quantities we encounter in all aspects of our lives.
We can measure the length, the weight or the capacity of different items.
When we measure, we can use two different measurement systems.
1. Customary System –the Customary System is one that you are very familiar with. We use it all the time hereis the United States. The customary system uses units such as inch, foot, yard, pint, ounce, quart, pound andton.
2. Metric System –the Metric System is a system used outside of the United States. Here in the US, we useoften use metrics in Science. Common units in the Metric System are millimeter, liter, gram and kilogram.
In this Concept, we will look at measuring length.
Customary units of length are inch, foot, yard and mile.
Metric units of length are millimeter, centimeter, meter and kilometer.
Measuring length always involves tools. There are a variety of tools to choose from when measuring length.
The goal in choosing a measurement tool and unit is to find the standard that most closely matches the thing youare measuring. For example, you wouldn’t want to measure the length of a city block in inches because the numberwould be too large and difficult to manage.
This table can give you an idea of how the different units of measurement relate to each other. Clearly an inchis smaller than a foot, just like a centimeter is smaller than a kilometer. Using this table will help you to chooseappropriate units when measuring.
Customary Units of Length
60
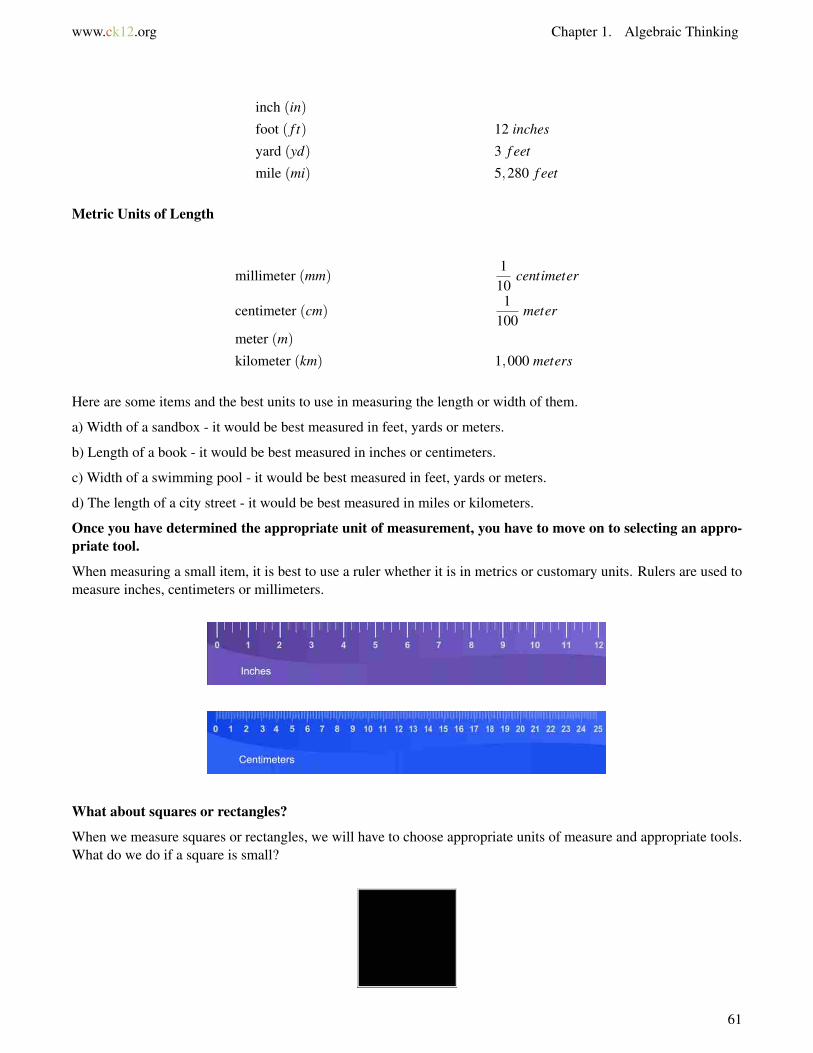
www.ck12.org Chapter 1. Algebraic Thinking
inch (in)
foot ( f t) 12 inches
yard (yd) 3 f eet
mile (mi) 5,280 f eet
Metric Units of Length
millimeter (mm)1
10centimeter
centimeter (cm)1
100meter
meter (m)
kilometer (km) 1,000 meters
Here are some items and the best units to use in measuring the length or width of them.
a) Width of a sandbox - it would be best measured in feet, yards or meters.
b) Length of a book - it would be best measured in inches or centimeters.
c) Width of a swimming pool - it would be best measured in feet, yards or meters.
d) The length of a city street - it would be best measured in miles or kilometers.
Once you have determined the appropriate unit of measurement, you have to move on to selecting an appro-priate tool.
When measuring a small item, it is best to use a ruler whether it is in metrics or customary units. Rulers are used tomeasure inches, centimeters or millimeters.
What about squares or rectangles?
When we measure squares or rectangles, we will have to choose appropriate units of measure and appropriate tools.What do we do if a square is small?
61
1.13. Appropriate Tools for Measurement of Squares and Rectangles www.ck12.org
Using a ruler would make the best sense! Then we could measure it in inches or centimeters.
If we had a large square or rectangle, such as a pool, measuring the length and width would be quite different.
Looking at the entire pool, we can see that it is in the shape of a rectangle.
Name the appropriate unit to use in each measurement situation.
Example A
The distance of a road race
Solution: Miles or Kilometers
Example B
The length of a magazine
Solution: Inches or centimeters
Example C
The width of a football field
Solution: Yards or meters
Here is the original problem once again.
Kris went to the hardware store to purchase a new window. She has a large rectangular picture window in her house.It is almost the length of one wall of her living room. Before going to the hardware store, Kris measured the window.
Which measurement tool do you think she used? Which unit would make the most sense to measure with?
Given that the window is almost the length of one of the living room walls, it would make the most sense for Kris touse a tape measure for measuring it.
Tape measures use feet.
Kris should use a tape measure and write down the measurements of the window in feet.
Guided Practice
Here is one for you to try on your own.
62
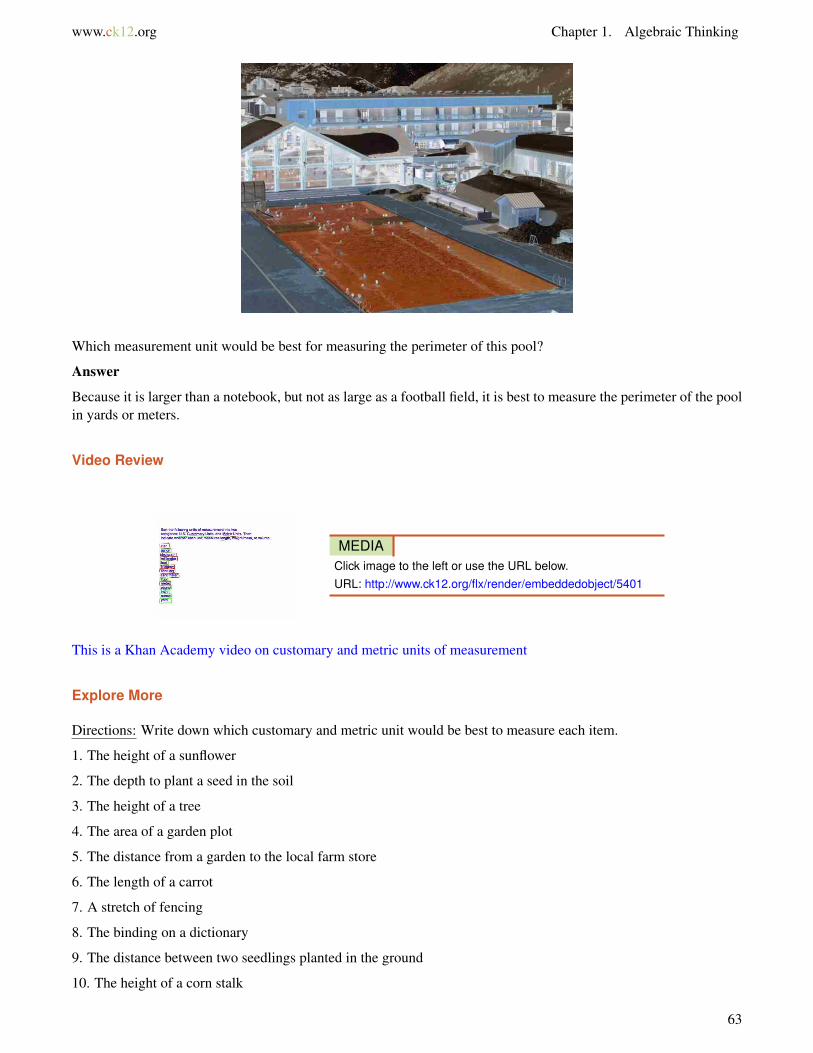
www.ck12.org Chapter 1. Algebraic Thinking
Which measurement unit would be best for measuring the perimeter of this pool?
Answer
Because it is larger than a notebook, but not as large as a football field, it is best to measure the perimeter of the poolin yards or meters.
Video Review
MEDIAClick image to the left or use the URL below.URL: http://www.ck12.org/flx/render/embeddedobject/5401
This is a Khan Academy video on customary and metric units of measurement
Explore More
Directions: Write down which customary and metric unit would be best to measure each item.
1. The height of a sunflower
2. The depth to plant a seed in the soil
3. The height of a tree
4. The area of a garden plot
5. The distance from a garden to the local farm store
6. The length of a carrot
7. A stretch of fencing
8. The binding on a dictionary
9. The distance between two seedlings planted in the ground
10. The height of a corn stalk
63

1.13. Appropriate Tools for Measurement of Squares and Rectangles www.ck12.org
11. Your shoe size
12. A piece of pipe for a water line
13. The depth of a pond or lake
14. The distance across a lake
15. The distance from your home to school
16. A bike trail from one end of a city to another end of the same city.
64
www.ck12.org Chapter 1. Algebraic Thinking
1.14 Area and Perimeter of Rectangles
Here you’ll learn to use formulas to find the perimeter and area of squares and rectangles.
On the morning after the groups were decided and the food was packed up, the groups split up into the backcountry.Kelly’s group began hiking up the Lonesome Lake Trail which starts at the base of the mountains in Lafayette PlaceCampground. They were carrying tons of gear, but were very excited.
Their group leaders Scott and Laurel told them that their first stop would be the Lonesome Lake Hut. The AMC hashuts stationed all through the White Mountains. Some of them are even at the top of mountains. These huts havebeds, some have full kitchens, some have self-service kitchens, but hikers of all different kinds stay at the huts. TheLonesome Lake Hut is located at 2,760 feet and the trail is 1.5 miles. It would be one of the easier hikes they wouldgo on.
Scott told the group that they would be helping to repair the floor of the main house. It seems that there was somewater damage. The roof has been repaired but the floor needs work.
The group hiked the beautiful, relatively easy trail in about an hour and a half. When they got there, they weredelighted to see everything. After unpacking in a bunkhouse and getting some lunch, the hikers got to work.
The crew leader who works at the hut told the students that the floor was damaged during the winter. The area of thefloor is 90,720 square feet and one quarter of the floor would need to be fixed. That is an area of 22,680 square feetand a length of 90 ft wide.
If the length is 90 ft wide and the area is 22,680 square feet, what is the width of the area that needs repair?
To figure this out, you will need to learn about formulas and working backwards. Pay attention and you willknow how to solve this problem at the end of the Concept.
Guidance
Measurement can also be completed with specific figures and formulas.
Once we obtain measurements of the length and width of squares and rectangles, we are able to use formulas to findperimeter and area.
What is perimeter and area? What does each of them measure?
65

1.14. Area and Perimeter of Rectangles www.ck12.org
Perimeter is the distance around a figure.
Area is the square units inside a figure.
Because perimeter is the distance around a figure, we can find the perimeter of a rectangle or square by addingthe lengths of all four sides. A rectangle has two lengths that are equal and two widths that are equal, so theperimeter of a rectangle can be described by the formula P = 2l+2w. Remember that a square has four equal sides.Therefore, it is possible to find the perimeter of a square by multiplying one of the sides times 4. The formula forfinding the perimeter of a square is P = 4s where s is the measurement of one side.
Area is the square units inside a figure; it describes how much space a rectangle or square takes up. To find the areaof rectangle, we multiply the length times the width. A = lw.
A square has four equal sides, so when finding the area of a square, all we need to do is multiply one of the sidesby itself. A = s2.
Sure. Here they are once again.
Rectangle P = 2l +2w
A = lw
Square P = 4s
A = s2
Write these formulas down in a notebook before continuing with the Concept.
Find the perimeter and area of the following rectangle.
66
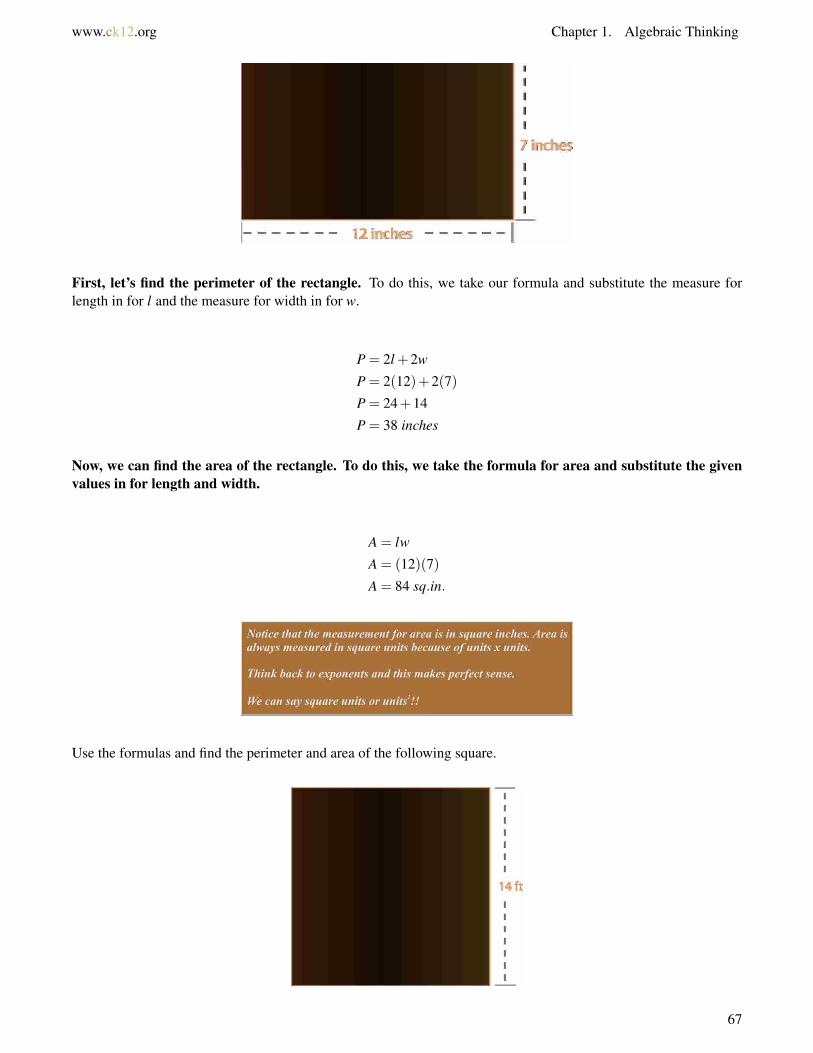
www.ck12.org Chapter 1. Algebraic Thinking
First, let’s find the perimeter of the rectangle. To do this, we take our formula and substitute the measure forlength in for l and the measure for width in for w.
P = 2l +2w
P = 2(12)+2(7)
P = 24+14
P = 38 inches
Now, we can find the area of the rectangle. To do this, we take the formula for area and substitute the givenvalues in for length and width.
A = lw
A = (12)(7)
A = 84 sq.in.
Use the formulas and find the perimeter and area of the following square.
67
1.14. Area and Perimeter of Rectangles www.ck12.org
Here you can see that we have only been given the length on one side. That is okay though because this is asquare. A square has four congruent or equal sides. Therefore, all we need is one side length to work with.
First, let’s find the perimeter of the square.
P = 4s
P = 4(14)
P = 56 f eet
Next, we can use the formula for area to find the area of the square.
P = s2
P = 142 = 14(14)
P = 196 square f eet or f t2
Now try a few on your own.
Example A
Find the perimeter and area of a rectangle with a width of 10 inches and length of 12 inches.
Solution: 44 inches
Example B
The perimeter of a square with a side length of 4.5 inches.
Solution: 18 inches
Example C
The perimeter of a rectangle with a length of 15 feet and a width of 12 feet.
Solution: 54 feet
Now back to the shelter at Lonesome Lake. Here is the original problem once again.
On the morning after the groups were decided and the food was packed up, the groups split up into the backcountry.Kelly’s group began hiking up the Lonesome Lake Trail which starts at the base of the mountains in Lafayette PlaceCampground. They were carrying tons of gear, but were very excited.
Their group leaders Scott and Laurel told them that their first stop would be the Lonesome Lake Hut. The AMC hashuts stationed all through the White Mountains. Some of them are even at the top of mountains. These huts havebeds, some have full kitchens, some have self-service kitchens, but hikers of all different kinds stay at the huts. TheLonesome Lake Hut is located at 2,760 feet and the trail is 1.5 miles. It would be one of the easier hikes they wouldgo on.
Scott told the group that they would be helping to repair the floor of the main house. It seems that there was somewater damage. The roof has been repaired but the floor needs work.
The group hiked the beautiful, relatively easy trail in about an hour and a half. When they got there, they weredelighted to see everything. After unpacking in a bunkhouse and getting some lunch, the hikers got to work.
68
www.ck12.org Chapter 1. Algebraic Thinking
The crew leader who works at the hut told the students that the floor was damaged during the winter. The area of thefloor is 90,720 square feet and one quarter of the floor would need to be fixed. That is an area of 22,680 square feetand a length of 90 ft wide.
If the length is 90 ft wide and the area is 22,680 square feet, what is the width of the area that needs repair?
First, we let’s write an equation to solve this problem. We can assume that the hut is a rectangle in shape becausewe were given a length and asked to find the width.
A = lw
22680 = 90w
We need to find a number that when multiplied by 90 is equal to 22,680. To do this, it makes sense to divide. Divisionis the opposite of multiplication. Since mental math won’t work for this one, division is the next likely option.
22680÷90 = 63 f t
The width of the area of damaged floor is 63 feet wide.
The students worked hard to repair the floor and it was a great two days working at Lonesome Lake Hut! Yet whentheir work was done they were excited to think about hiking to their next destination!
Guided Practice
Here is one for you to try on your own.
Marcy has purchased a new rug for her bedroom. The rug measures 6 ft. x 9 ft. Given these measurements, what isthe perimeter of the rug? What is the area?
Answer
Because you were given the measurements 6’ x 9’, you can deduce that this rug is rectangle. Therefore we can findthe perimeter of the rug by doubling the length and width and then add them together.
P = 2(6)+2(9)
P = 30 feet
The area of the rug can be found by using the following formula.
A = lw
A = (6)(9)
A = 54 sq. feet.
Video Review
MEDIAClick image to the left or use the URL below.URL: http://www.ck12.org/flx/render/embeddedobject/57651
This is a James Sousa video on how to find the perimeter of a given rectangle.
69
1.14. Area and Perimeter of Rectangles www.ck12.org
MEDIAClick image to the left or use the URL below.URL: http://www.ck12.org/flx/render/embeddedobject/5310
This is a James Sousa video on how to determine the area of a given rectangle.
Explore More
Directions: Find the area and perimeter of each rectangle by using the given dimensions.
1. Length = 10 in, width = 5 in
2. Length = 12 ft, width = 8 feet
3. Length = 11 ft, width = 5 feet
4. Length = 17 miles, width = 18 miles
5. Length = 22 ft, width = 20 feet
6. Length = 8 cm, width = 6 cm
7. Length = 20 cm, width = 17 cm
8. Length = 3 feet, width = 2 feet
9. Length = 15 yards, width = 11 yards
10. Length = 10 yards, width = 6 yards
Directions: Find the area and perimeter of each square using the given dimensions.
11. s = 6 f t
12. s = 8 f t
13. s = 9 in
14. s = 4 in
15. s = 12 in
16. s = 7 f t
17. s = 5 cm
18. s = 3 m
19. s = 10 m
20. s = 11 yards
70
www.ck12.org Chapter 1. Algebraic Thinking
1.15 Unknown Dimensions Using Formulas
Here you’ll learn how to use formulas when given a perimeter or area to solve for unknown dimensions.
Have you ever wondered about dimensions of a park or garden plot? Take a look at this dilemma.
Carmen and Jose have a beautiful spot in their yard for a garden. They hope to grow all kinds of vegetables andhopefully plant blueberry bushes along the outside edge of the garden. The square plot is perfect and the area of theplot is 169 square feet.
Given this information, can you figure out the side lengths of the garden?
This Concept will teach you how to take an area or a perimeter and figure out missing dimensions. You willbe using formulas to do this.
Guidance
Previously we worked on how to find the perimeter and area given measurements, now we are going to workbackwards.
An equation states that two expressions are equal and that a variable equation is an equation that includes analgebraic unknown, or a variable. Our formulas for perimeter and area are equations. In the examples above, theperimeter (P) and the area (A) were the variables. In some cases, if we already know the perimeter or the area, wecan make the length or width our variable and solve for that value.
The width of a rectangle is 10 feet and the perimeter is 50 feet. What is the length of the rectangle?
Here we are trying to find the length of the rectangle, so we’ll give that value the variable l. We already know theperimeter and the width. All we have to do is substitute the values for the perimeter and the width into our formulaand solve for l.
Remember to follow the order of operations: Parentheses, Exponents, Multiplication, Division, Addition, Sub-traction.
P = 2l +2w
50 = 2l +2(10)
50 = 2l +20
71

1.15. Unknown Dimensions Using Formulas www.ck12.org
We can use mental math to find a number plus 20 that will give us 50. 30 is a likely choice. Now we have 2l so thatmeans 2 times some number. We want this product to be 30, so l = 15.
Let’s check our work by substituting 15 in for length. If both sides of the equation are equal, then our equationbalances and our work is done.
P = 2l +2w
50 = 2(15)+2(10)
50 = 30+20
50 = 50
Our equation balances and our work is done.
What about finding the side length when you have the area of a square?
If the area of a square is 144 sq. miles, what is the length of one of the sides of the square?
To do this, we work backwards and substitute the given area into the formula.
A = s2
144 = s2
Now we use mental math and figure out what number times itself is equal to 144? The answer is 12.
The side length is 12 miles.
We can check our work by substituting the given values into the formula.
144 = 122
144 = 144
Our equation balances and our work is accurate.
Now you can apply what you have learned to real-world problems.
The perimeter of a square playground is 200 yards. What is the length of one of the sides of the playground?
72
www.ck12.org Chapter 1. Algebraic Thinking
This is one of those working backwards problems. Fill the given information into the formula and solve forthe missing side length.
P = 4s
200 = 4s
What number times four is equal to 200? 50 is the correct answer. 50×4 = 200
The side length of one side of the playground is 50 yards.
Now it’s time for you to try a few on your own.
Example A
If the perimeter of a figure is 30 feet, with a length of 9 feet, what is the width of the figure?
Solution: 6 f t.
Example B
If the area of a square is 225 sq. feet, what is the length of one of its sides?
Solution: 15 f t.
Example C
If the perimeter of a square is 24 meters, what is the length of one of the sides?
Solution: 6 meters
Here is the original problem once again.
Carmen and Jose have a beautiful spot in their yard for a garden. They hope to grow all kinds of vegetables andhopefully plant blueberry bushes along the outside edge of the garden. The square plot is perfect and the area of theplot is 169 square feet.
Given this information, can you figure out the side lengths of the garden?
To start with, let’s look at what we know.
We know the area of the garden plot.
169 sq. f t
We know that the garden plot is square.
Let’s use the formula for area of a square to find the missing side.
A = s2
169 = s2
Next, we can ask ourselves, what value times itself is 169?
The answer is 13.
The length of the side of the garden is 13 feet.
73
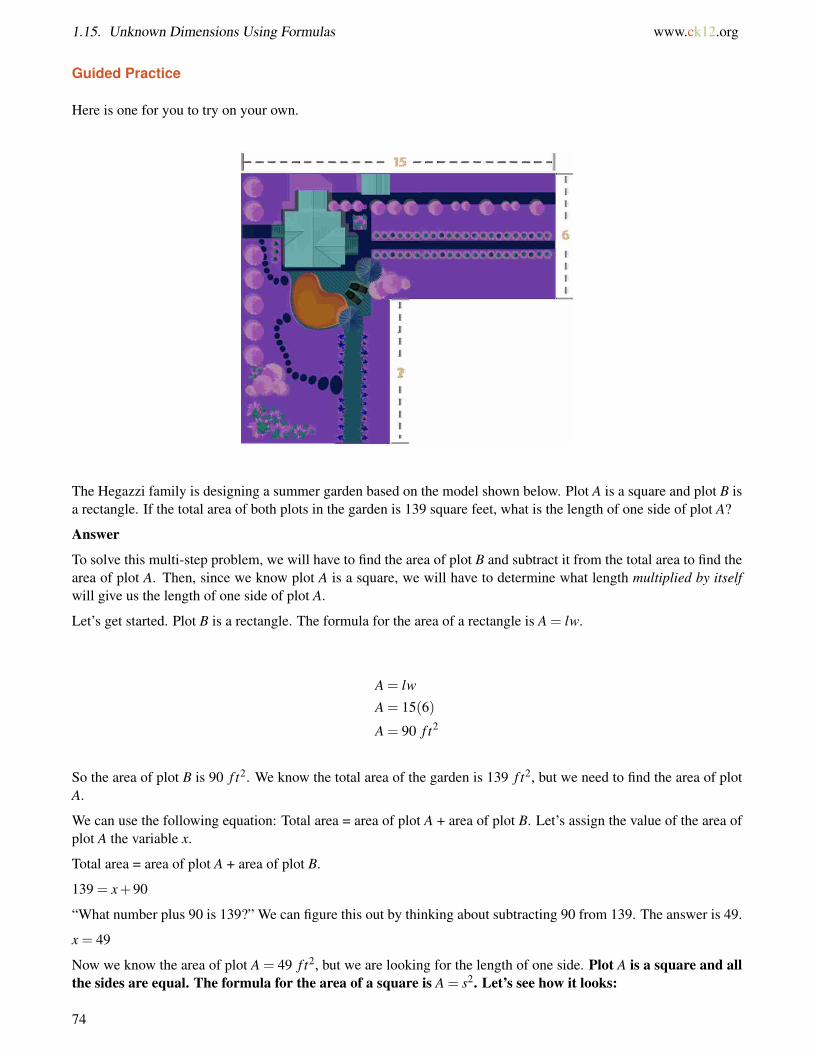
1.15. Unknown Dimensions Using Formulas www.ck12.org
Guided Practice
Here is one for you to try on your own.
The Hegazzi family is designing a summer garden based on the model shown below. Plot A is a square and plot B isa rectangle. If the total area of both plots in the garden is 139 square feet, what is the length of one side of plot A?
Answer
To solve this multi-step problem, we will have to find the area of plot B and subtract it from the total area to find thearea of plot A. Then, since we know plot A is a square, we will have to determine what length multiplied by itselfwill give us the length of one side of plot A.
Let’s get started. Plot B is a rectangle. The formula for the area of a rectangle is A = lw.
A = lw
A = 15(6)
A = 90 f t2
So the area of plot B is 90 f t2. We know the total area of the garden is 139 f t2, but we need to find the area of plotA.
We can use the following equation: Total area = area of plot A + area of plot B. Let’s assign the value of the area ofplot A the variable x.
Total area = area of plot A + area of plot B.
139 = x+90
“What number plus 90 is 139?” We can figure this out by thinking about subtracting 90 from 139. The answer is 49.
x = 49
Now we know the area of plot A = 49 f t2, but we are looking for the length of one side. Plot A is a square and allthe sides are equal. The formula for the area of a square is A = s2. Let’s see how it looks:
74
www.ck12.org Chapter 1. Algebraic Thinking
A = s2
49 = s2
We need to think of what number times itself is equal to 49. 7×7 = 49, so the length of one side of plot A is 7 ft.
Video Review
MEDIAClick image to the left or use the URL below.URL: http://www.ck12.org/flx/render/embeddedobject/57651
This is a James Sousa video on how to find the perimeter of a given rectangle.
MEDIAClick image to the left or use the URL below.URL: http://www.ck12.org/flx/render/embeddedobject/5310
This is a James Sousa video on how to determine the area of a given rectangle.
Explore More
Directions: Given the area, find the side length for each square.
1. A = 16 sq. ft.
2. A = 64 sq. m.
3. A = 100 sq. miles
4. A = 121 sq. inches
5. A = 144 sq. feet
Directions: Given the area and length, find the width of each rectangle.
6. A = 24 sq. feet, length = 8 feet
7. A = 48 sq. feet, length = 12 feet
8. A = 64 sq. feet, length = 10 feet
9. A = 120 sq. meters, length = 40 meters
10. A = 130 sq. feet, length = 13 feet
11. A = 90 sq. inches, length = 45 inches
75

1.15. Unknown Dimensions Using Formulas www.ck12.org
Directions: Given the perimeter, find the side length of each square.
12. P = 48 inches
13. P = 64 inches
14. P = 90 inches
15. P = 35 feet
76
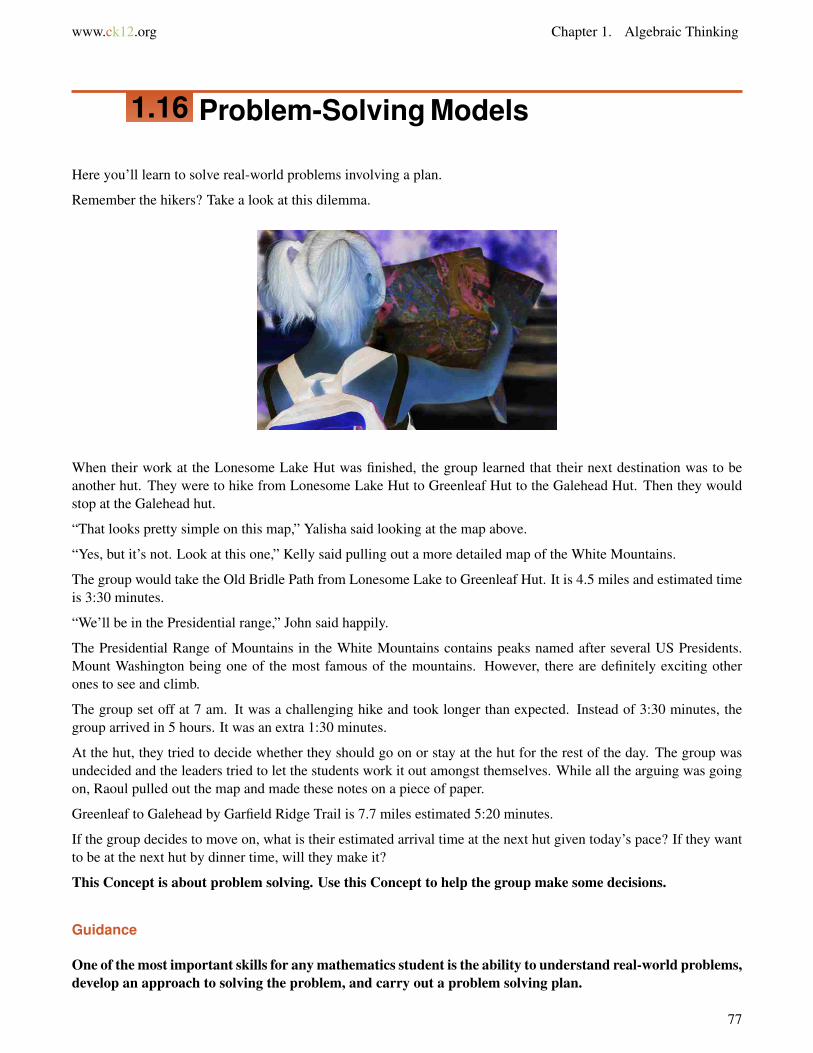
www.ck12.org Chapter 1. Algebraic Thinking
1.16 Problem-Solving Models
Here you’ll learn to solve real-world problems involving a plan.
Remember the hikers? Take a look at this dilemma.
When their work at the Lonesome Lake Hut was finished, the group learned that their next destination was to beanother hut. They were to hike from Lonesome Lake Hut to Greenleaf Hut to the Galehead Hut. Then they wouldstop at the Galehead hut.
“That looks pretty simple on this map,” Yalisha said looking at the map above.
“Yes, but it’s not. Look at this one,” Kelly said pulling out a more detailed map of the White Mountains.
The group would take the Old Bridle Path from Lonesome Lake to Greenleaf Hut. It is 4.5 miles and estimated timeis 3:30 minutes.
“We’ll be in the Presidential range,” John said happily.
The Presidential Range of Mountains in the White Mountains contains peaks named after several US Presidents.Mount Washington being one of the most famous of the mountains. However, there are definitely exciting otherones to see and climb.
The group set off at 7 am. It was a challenging hike and took longer than expected. Instead of 3:30 minutes, thegroup arrived in 5 hours. It was an extra 1:30 minutes.
At the hut, they tried to decide whether they should go on or stay at the hut for the rest of the day. The group wasundecided and the leaders tried to let the students work it out amongst themselves. While all the arguing was goingon, Raoul pulled out the map and made these notes on a piece of paper.
Greenleaf to Galehead by Garfield Ridge Trail is 7.7 miles estimated 5:20 minutes.
If the group decides to move on, what is their estimated arrival time at the next hut given today’s pace? If they wantto be at the next hut by dinner time, will they make it?
This Concept is about problem solving. Use this Concept to help the group make some decisions.
Guidance
One of the most important skills for any mathematics student is the ability to understand real-world problems,develop an approach to solving the problem, and carry out a problem solving plan.
77
1.16. Problem-Solving Models www.ck12.org
There are countless ways to solve problems.
Drawing pictures, making lists, working backwards, guessing and checking, looking for patterns, and writingequations are just a few of the approaches mathematicians take to solving problems.
How do we start when faced with a difficult problem?
The key to developing an appropriate problem solving plan is taking the time to read and understand aproblem situation.
You can’t expect to be able to grasp the important information in a problem if you just skim it for the importantnumbers.
When you come across a complicated problem, don’t panic!
Slow down and carefully read the problem until you understand what it’s really asking.
Look at this situation.
On Monday, Jake spent a total of 180 minutes on her math, history, and science homework.
He spent 45 minutes on his math homework and 1 hour on his science homework.
How many minutes did he spend on his history homework?
Key questions can help you to understand a problem.
Here are a few key questions.
1. What is the question that needs answering?
The amount of time Jake spent on his history homework.
2. What do you need to know to answer this question?
The total amount of time he spent plus the time he spent on his other two subjects.
3. What information have you been given?
He spent 180 minutes total. Of that, he spent 45 minutes on science and 1 hour (60 minutes) on math.
4. How do we solve this problem?
Think about what skills you have already learned. We could write an equation to figure out this problem.
Total time = math time+history time+ science time
180 = 60+ x+45
180 = 105+ x
Now use mental math, “What number plus 105 is equal to 180?”
75 = x
He spent 75 minutes, or 1 hour and 15 minutes, on her history homework.
Many times a problem situation will require more than one step to find a solution. This is where having a planbecomes so important. When confronted with this type of problem remember to carefully read to find out whatthe problem is asking. With multi-step problems, it often helps to solve a simpler problem, then return to the mainproblem and apply what you found in the simpler problem to solve.
William began a fitness schedule. He ran 2 miles the first week, 2.5 miles the second week, and 3 miles the thirdweek. If the pattern continues, how many miles will William have run after five weeks?
First, let’s think about what the problem is asking.
The problem is asking for the number of miles that William has run in the fifth week.
78

www.ck12.org Chapter 1. Algebraic Thinking
What information have we been given?
We have been given his mileage for week’s one, two and three. We have also been told that there is a pattern.
What is our plan?
First, we need to figure out the mileage for week’s four and five. Then, we need to find the sum of all of the weeks.
Think about what you have already learned. We need to use the pattern to figure out the next two week’smileage. What strategies did we use with patterns?
Yes! A table would be perfect! Let’s organize the data in a table. The left column is the number of the week,and the right column is the mileage.
1 2
2 2.5
3 3
4 3.5
5 4
During week’s four and five, here is the mileage. Notice that the pattern increased by one-half mile each week.
79
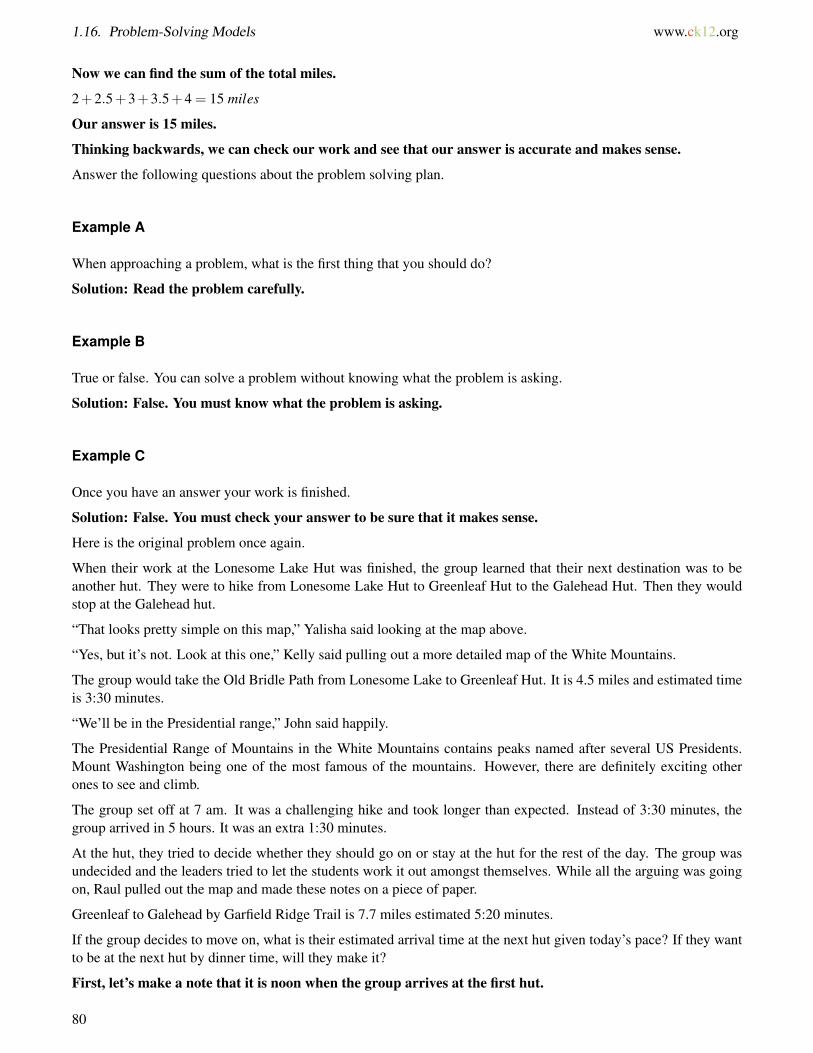
1.16. Problem-Solving Models www.ck12.org
Now we can find the sum of the total miles.
2+2.5+3+3.5+4 = 15 miles
Our answer is 15 miles.
Thinking backwards, we can check our work and see that our answer is accurate and makes sense.
Answer the following questions about the problem solving plan.
Example A
When approaching a problem, what is the first thing that you should do?
Solution: Read the problem carefully.
Example B
True or false. You can solve a problem without knowing what the problem is asking.
Solution: False. You must know what the problem is asking.
Example C
Once you have an answer your work is finished.
Solution: False. You must check your answer to be sure that it makes sense.
Here is the original problem once again.
When their work at the Lonesome Lake Hut was finished, the group learned that their next destination was to beanother hut. They were to hike from Lonesome Lake Hut to Greenleaf Hut to the Galehead Hut. Then they wouldstop at the Galehead hut.
“That looks pretty simple on this map,” Yalisha said looking at the map above.
“Yes, but it’s not. Look at this one,” Kelly said pulling out a more detailed map of the White Mountains.
The group would take the Old Bridle Path from Lonesome Lake to Greenleaf Hut. It is 4.5 miles and estimated timeis 3:30 minutes.
“We’ll be in the Presidential range,” John said happily.
The Presidential Range of Mountains in the White Mountains contains peaks named after several US Presidents.Mount Washington being one of the most famous of the mountains. However, there are definitely exciting otherones to see and climb.
The group set off at 7 am. It was a challenging hike and took longer than expected. Instead of 3:30 minutes, thegroup arrived in 5 hours. It was an extra 1:30 minutes.
At the hut, they tried to decide whether they should go on or stay at the hut for the rest of the day. The group wasundecided and the leaders tried to let the students work it out amongst themselves. While all the arguing was goingon, Raul pulled out the map and made these notes on a piece of paper.
Greenleaf to Galehead by Garfield Ridge Trail is 7.7 miles estimated 5:20 minutes.
If the group decides to move on, what is their estimated arrival time at the next hut given today’s pace? If they wantto be at the next hut by dinner time, will they make it?
First, let’s make a note that it is noon when the group arrives at the first hut.
80

www.ck12.org Chapter 1. Algebraic Thinking
Now let’s figure out the estimated hiking time from one hut to the next one. It is an estimated 5:20 minutes,but the group is taking 1:30 minutes longer.
5:20 + 1:30 = 6:50 or 7 hours
If the group left right away, they wouldn’t arrive before 7 pm. That would definitely make them late fordinner.
Raul showed this math to his friends while they were still arguing. Given the time it would take, the groupdecided to stay at Greenleaf hut for the night.
Guided Practice
A sandwich shop sold 36 tuna fish sandwiches and 45 roast beef sandwiches. The shop sold three times as manyturkey sandwiches as tuna sandwiches. How many turkey sandwiches did the shop sell?
Answer
Use the following questions to help you understand the problem:
1. What is the question?
How many turkey sandwiches did the shop sell?
2. What do you need to know?
How many tuna sandwiches the shop sold
3. What do you know?
The shop sold 36 tuna sandwiches and three times as many turkey sandwiches as tuna sandwiches. You don’tneed to know how many roast beef sandwiches the shop sold.
4. How can you solve the problem?
By multiplying the number of tuna fish sandwiches by three. 36×3 = 108.
The shop sold 108 turkey sandwiches.
Video Review
MEDIAClick image to the left or use the URL below.URL: http://www.ck12.org/flx/render/embeddedobject/9
This is a Khan Academy video on how to solve word problems using a plan.
Explore More
Directions: Use each of the key questions to develop a strategy and solve each problem. Be sure to check youranswer and make sure that it makes sense.
1. Giovanni is working to improve his scores on his weekly science quizzes. The following were his scores for thefirst four weeks of school: 64, 70, 76, 82. If the pattern continues, in which week will Giovanni’s score be 100?
81
1.16. Problem-Solving Models www.ck12.org
2. Lola’s Bakery uses 62 pounds of flour and 19 pounds of sugar each week. The bakery uses half as much butter asflour each week. How much butter will the bakery use in a month’s time?
3. A children’s pool holds 6 cubic meters of water. The length of the pool is three times the height and the width ofthe pool is twice the height. What is the height of the pool?
4. Martin went to the state fair with $30. He rode on 17 rides and came home with $4.50. How much did each ridecost?
5. Lionel arranged 24 photos in an album. The number of photos in each row is two more than the number of rows.How many rows of photos are there?
6. An aquarium has four fish tanks it wants to arrange on a shelf. The shelf has an area of 196 square feet. The areaof second tank is twice the area of the first tank, and the area of the third tank is four times the area of the secondtank. The area of the third tank is 56 square feet. If the aquarium puts all three tanks on the shelf, how much shelfarea will be left over?
7. The Durands are driving 456 miles to the family reunion. If they split the drive equally over three days, how manymiles will they drive each day?
8. At the end of a video game tournament, Raul and Martha had both scored twice as many points as Justice. If theirtotal combined points is 285, how many points did each Justice score?
9. At the lunch counter, Ariana bought a sandwich and lemonade. The sandwich cost five times as much as thelemonade. She paid with $10 and got $2.50 in change. How much did the sandwich cost? How much did thelemonade cost?
10. The area of a playground is 40.5 m2. The width of the playground is 4.5 meters. What is the length of theplayground?
Directions: Write five of your own problems. Be sure that one uses addition, one uses subtraction, one usesmultiplication, one uses division and one uses a pattern that requires a table.
When finished, exchange papers with a friend and solve each other’s problems. Then discuss your solutions.
82
www.ck12.org Chapter 1. Algebraic Thinking
1.17 Comparison of Problem-Solving Models
Here you’ll learn to solve real-world problems using selected strategies as part of a plan.
Do you know all of the peaks of the Presidential Range?
While at Galehead Hut, Kelly found a book on the different mountains in the Presidential Range. She was fascinatedto learn that so many of them were above 4000 feet in elevation. Laurel, one of the leaders saw her reading it andcame over to her.
“Pretty interesting, huh?” she asked Kelly.
“Yes. I had no idea.”
“Well if you continue hiking maybe you’ll become part of the Four Thousand Footers Club,” Laurel said.
“What is that?” Kelly asked.
“That is a group that climbs all of the peaks above 4000 feet. There are 48 of them.”
Wow! Kelly couldn’t believe it. If each peak was at least 4000 feet, that would be quite a collection. Kelly looked inthe book again and found a whole chapter on the Four Thousand Footers Club. She was fascinated. She wrote downthe following mountains in her journal.
Washington 6288 ft.
Adams 5774 ft
Jefferson 5712 ft.
Monroe 5,384 ft.
Madison 5,367 ft.
Lafayette 5,260 ft.
Lincoln 5089 ft.
If she climbed each of these peaks, how many feet would that be in all? If each peak took two days average to climb,how many days would it take her to climb them all?
Use your problem solving to help Kelly figure this out. You will be able to solve this problem by the end of the
83
1.17. Comparison of Problem-Solving Models www.ck12.org
Concept.
Guidance
Taking the time to read and understand a problem is the key to finding a solution. In fact, it is the part that studentsoften rush through and then make mistakes or become confused.
Also, sometimes there will be extra information in a problem to throw you off-pay close attention as you read anddon’t be fooled!
This problem has extra information in it.
Ron arranged his herb garden in the following order:
2 plants, 5 plants, 11 plants, 23 plants
The garden has an area of 25 yd2.
How many plants will be in the fifth row?
Whenever you see a series of numbers, you should be alert to use the find a pattern strategy.
This problem is asking us to identify a pattern rule and use that pattern rule to find how many plants will be in thefifth row.
The pattern rule is 2x+1, so there will be 47 plants in the fifth row.
The question has nothing to do with the area of the garden, so we can ignore that information.
Make a note to in your notebook that when you see a series of numbers that you need to look for a pattern.
Melissa has 72 cookies she wants to put evenly into 7 gift bags.
There are half as many chocolate chip cookies as peanut butter cookies.
How many cookies will be left over after she puts them in the bags?
84
www.ck12.org Chapter 1. Algebraic Thinking
When we see the phrase “how many will be left over, we know the problem is asking about remainders andthat to solve this problem we will need to divide.
We don’t care about the numbers of different types of cookies, so we can ignore that information.
72÷7 = 10
There will be two cookies left over.
There are a variety of strategies that you would select from when working on a problem, such as find a pattern, guessand check, work backward, draw a picture, write an equation, and use a formula. The more you practice solvingproblems, the quicker you will become at identifying the most appropriate strategies to use when solving specifictypes of problems.
Here are some hints to selecting a strategy.
1. Find a Pattern - best used when there is a series of numbers and/or when you are being asked for a laterquantity. For example, find the number in the tenth step.
2. Guess and Check - best used when you are looking for one or two numbers and you think one of them mightwork. You can take a guess, try out a number and then adjust your answer from there.
3. Work Backwards - think about the problems that you had earlier in this chapter when you were given thearea or perimeter and you needed to find a side length. Working backwards is very helpful for problems likethese where an answer of some sort is given right away.
4. Draw a Picture - look for examples that have some kind of visual in them-problems with geometric shapeswork best with drawing a picture.
5. Write an Equation - writing an equation is great when there is a missing quantity that needs to be figuredout. Then you can write an equation and solve for the answer.
6. Use a Formula - Formulas are helpful for area and perimeter problems. You will also encounter other formulasas you work through this book and those can be applied when problem solving as well.
Take a few notes before continuing in this lesson. Be sure that you understand all of the different strategies andwhen to use each one.
Now it’s time to practice. Choose the best strategy based on each description.
Example A
A list of numbers is found in the problem. Which strategy might you use?
Solution: Look for a Pattern
Example B
The answer is given, but part of the problem is missing.
Solution: Working Backwards
85
1.17. Comparison of Problem-Solving Models www.ck12.org
Example C
A problem with a diagram or geometric prism.
Solution: Draw a Picture
Now back to the problem from the beginning of the Concept.
Here is the original problem once again.
While at Galehead Hut, Kelly found a book on the different mountains in the Presidential Range. She was fascinatedto learn that so many of them were above 4000 feet in elevation. Laurel, one of the leaders saw her reading it andcame over to her.
“Pretty interesting, huh?” she asked Kelly.
“Yes. I had no idea.”
“Well if you continue hiking maybe you’ll become part of the Four Thousand Footers Club,” Laurel said.
“What is that?” Kelly asked.
“That is a group that climbs all of the peaks above 4000 feet. There are 48 of them.”
Wow! Kelly couldn’t believe it. If each peak was at least 4000 feet, that would be quite a collection. Kelly looked inthe book again and found a whole chapter on the Four Thousand Footers Club. She was fascinated. She wrote downthe following mountains in her journal.
Washington 6288 ft.
Adams 5774 ft
Jefferson 5712 ft.
Monroe 5,384 ft.
Madison 5,367 ft.
Lafayette 5,260 ft.
Lincoln 5089 ft.
If she climbed each of these peaks, how many feet would that be in all? If each peak took two days average to climb,how many days would it take her to climb them all?
First, let’s find the sum of all of the mountain elevation in Kelly’s list.
6288+5774+5712+5384+5367+5260+5089 = 38874 f eet
86
www.ck12.org Chapter 1. Algebraic Thinking
How many miles is that?
38874 feet ÷ 5280 feet (the distance in one mile) = 7.36 miles
But remember that is uphill all the way!!
Now if it were to take 2 days for each peak, how many days would it take Kelly to climb these mountains onher list?
We can write an equation.
7 mountains
2 days
7×2 = 14 days
At Galehead Hut, Kelly looked out at the views of the mountains and was glad to be a part of the summerteen adventure program. While she was tired, she was also satisfied and proud of what she had accomplishedso far. She was excited to think about what the next adventure of the group would be!
Guided Practice
Here is one for you to try on your own.
Ms. Powell wants to hang a large tapestry lengthwise on her living room wall. The tapestry has a perimeter of 42ft and a width of 9 ft. Ms. Powell’s wall is 10 ft high. Will the length of the tapestry fit against the height of Ms.Powell’s ceiling?
Answer
This is a multi-step problem requiring a variety of different strategies to solve. To start off, it might help to draw apicture to get a feel for what the problem is asking. The problem wants to know if the tapestry will fit. We are goingto have to find the length of the tapestry and compare it to the height of Ms. Powell’s wall.
Because the question involves perimeter, we know we are going to have to use the formula for perimeter. P= 2l+2w.We know the perimeter of the tapestry and we know the width, so we can write an equation to solve for the length.
P = 2l +2w.
42 = 2l +2(9)
42 = 2l +18
24 = 2l
l = 12 f eet
Now we need to return to the problem and compare the length of the tapestry with the height of the ceiling.The tapestry is 12 feet long; the ceiling is only 10 feet high. The tapestry won’t fit!
An alternative approach to solving this problem would have been to only look at a drawing. We could havedrawn each piece of the problem and then compared. Looking at the dimensions, you would have been ableto see that the tapestry would not fit.
87
1.17. Comparison of Problem-Solving Models www.ck12.org
Video Review
MEDIAClick image to the left or use the URL below.URL: http://www.ck12.org/flx/render/embeddedobject/10
This is a Khan Academy video on word problem solving strategies.
Explore More
Directions: Use what you have learned to solve the following problems.
1. Mary went to the music store with her babysitting money. She bought two CDs for $12.50 each and twomagazines for $4.25 each. She left the store with $10.25. How much money did she start with?
2. Since he began his fitness routine, Mr. Trigg has measured his weight every week. His weights for the first sixweeks are as follows: 236, 230, 232, 226, 228, 222. If the pattern continues, how much will he weigh in thetenth week?
3. The area of City Park is 75 km2. The length of the park is 15 feet. What is the perimeter of the park?4. A farmer planted corn, wheat, and cotton in a total of 88 fields. He planted 10 rows of corn. If he planted even
numbers of rows for the other crops, how many rows of wheat did he plant?5. Mrs. Whitaker is mailing a pair of shoes to her daughter. She wants to fit the rectangular shoebox inside a
larger square box. The area of the shoebox is 84 in.2; the length of one side is 12 inches. One side of the largersquare box measures 14 inches. Will the shoebox fit in the larger box? How do you know?
6. After a pin-ball game, the score board showed that the combined points of Peter, Ella, and Ned is 728. Ellascored half the points of Ned and Peter scored one-fourth the points of Ned. How many points did each playerscore?
7. Tami made a total of $47 babysitting on New Year’s Eve. She made her hourly rate plus a $7 tip. If she worked5 hours, what is her hourly rate?
8. A weightlifter lifts weights in the following order: 0.5lb, 1.5lb, 4.5lb, 13.5lb. How many pounds will he liftnext?
9. Figure A is a square, with a side that measures 9 cm. Figure B is a square with a side that measures 6 cm.Which figure has the greater area, Figure A or Figure B?
88
www.ck12.org Chapter 1. Algebraic Thinking
10. Mr. Rowe and Mrs. Rowe are driving 959 miles to a beach vacation. They want to split the distance over 4days, driving the exact same amount on the first three days and the remainder on the fourth day. If they drive119 miles on the fourth day, how many miles will they drive on the first day?
11. Cedric spent $27.75 on pizza for his friends. Each cheese pizza cost $8 and each extra topping cost $0.75. IfCedric bought 3 cheese pizzas, how many extra toppings did he get?
12. What was the total cost without the toppings?13. If 29 people went to the zoo the first day and double went the second, how many went in both days combined?14. If on the third day, double the people from the second day went, how many people went to the zoo?15. If ten less went to the zoo on the fourth day verses the third day, how many people went to the zoo on the
fourth day?
Summary
Having completed this chapter, students are now ready to move on to the next Chapter. Each Concept has providedstudents with an opportunity to engage and practice skills in many Concepts including describing and extending pat-terns, evaluating expressions, understanding variables, powers and exponents, equations, measurement, perimeter,area and problem solving.
89
www.ck12.org
CHAPTER 2 Using DecimalsChapter Outline
2.1 DECIMAL COMPARISONS WITHOUT ROUNDING
2.2 DECIMAL ROUNDING GIVEN PLACE VALUE
2.3 DECIMAL COMPARISONS WITH ROUNDING
2.4 DECIMAL ADDITION
2.5 DECIMAL ADDITION USING FRONT-END ESTIMATION
2.6 COMMUTATIVE PROPERTY OF ADDITION WITH DECIMALS
2.7 DECIMAL SUBTRACTION
2.8 DECIMAL SUBTRACTION USING FRONT-END ESTIMATION
2.9 INVERSE PROPERTY OF ADDITION IN DECIMAL EQUATIONS
2.10 DECIMAL MULTIPLICATION
2.11 ESTIMATION TO CHECK DECIMAL MULTIPLICATION
2.12 COMMUTATIVE PROPERTY OF MULTIPLICATION WITH DECIMALS
2.13 DECIMAL DIVISION
2.14 ESTIMATION TO CHECK DECIMAL DIVISION
2.15 DIVISION TO SOLVE DECIMAL EQUATIONS
2.16 SCIENTIFIC NOTATION
2.17 COMPARISON OF NUMBERS IN SCIENTIFIC NOTATION
2.18 OPERATIONS WITH NUMBERS IN SCIENTIFIC NOTATION
2.19 METRIC SYSTEM
2.20 APPROPRIATE TOOLS FOR METRIC MEASUREMENT
2.21 CONVERSIONS OF LENGTH, MASS, CAPACITY IN METRIC UNITS
2.22 COMPARISON OF METRIC MEASUREMENTS
2.23 ESTIMATION OF CONVERSION TO METRIC UNITS
Introduction
In Math 7, the learning content is divided into Concepts. Each Concept is complete and whole providing focusedlearning on an indicated objective. Theme-based Concepts provide students with experiences that integrate thecontent of each Concept. Students are given opportunities to practice the skills of each Concept through real-worldsituations, examples, guided practice and independent practice sections. There are also video links provided to givestudents an audio/visual way of connecting with the content. In this Chapter, students will engage with Concepts oncomparing and ordering decimals, decimal operations, rounding decimals, commutative and associative propertiesof addition and multiplication, the inverse property, scientific notation, metric system of measurement, convertingand comparing metric units of measurement, and equivalence between customary and metric units of measurement.
90
www.ck12.org Chapter 2. Using Decimals
2.1 Decimal Comparisons without Rounding
Here you’ll learn to compare and order decimals without rounding.
Have you ever run track? Take a look at this dilemma.
Connor loves running track for his middle school. In fact, he is one of the fastest runners and he specializes in shortdistances like the 100. Connor has set a goal this year to run a personal best in the 100. His fastest race time is 13.91and his slowest race time is 15.16. Connor has set a goal of running the 100 in 12.51. While this is ambitious, hebelieves that with the right mind set and perseverance that he will accomplish his goal.
Jeff is a friend of Connor’s who attends the middle school in the next town over. Jeff is also a runner and he alsospecializes in the 100. The boys are good friends but they definitely love to compete against each other. SometimesJeff is faster and sometimes Connor is faster. Jeff’s best race time in the 100 is 13.42. His slowest race time is 15.32.Jeff’s goal this year is to beat his fastest time and finish the 100 in less than 13.00.
One week before the big race, Connor and Jeff decided to try running practice intervals together. They both ran the100 on the track and here were their times. Connor’s time was 13.11 and Jeff’s time was 13.14.
Given these times, who had the faster time? How does Connor’s practice time compare with his best race time? Howdoes Jeff’s practice time compare with his best race time? Given these numbers, who do you think is on track toaccomplish his goal? Give some mathematical reasons why.
Track and field times are calculated in decimals. To answer these questions, you will need to know how tocompare and order decimals. Pay attention and you will see this problem again at the end of the Concept.
Guidance
Before we move to comparing and ordering decimals, let’s first begin by thinking about whole numbers and decimals.
91
2.1. Decimal Comparisons without Rounding www.ck12.org
Yes! You have been working with whole numbers for a long time. Whole numbers were the first numbers that youused to count and figure out quantities.
Whole numbers are numbers like 1, 8, 56, and 278—numbers that don’t contain fractional parts.
Not all numbers are whole.
The decimal system lets us represent numbers or parts of numbers that are less than 1. Money is one of the mostcommon places that we see decimals in everyday life. You are certainly familiar with decimals in your everydaydealings with money.
Take the amount $41.35.
You know that 0.35 represents part of a dollar.
If you had 100 cents, you would have a dollar.
So 35 cents can be represented as 0.35 or 35100 or 35 hundredths of a dollar.
Decimals are used to describe a lot more than money.
In a decimal number like 321.43 the decimal point divides the whole number from its fractional part. As you moveright from the decimal point, each value is divided by 10.
Numbers to the right of the decimal point are whole numbers.
Numbers to the left of the decimal point are the fractional part.
Now that we have reviewed a bit about whole numbers and decimals, we can look at comparing decimals withoutrounding.
First, let’s think about place value. The value of each number in a decimal whether it is a whole number to the left ofthe decimal point and a part of a whole to the right of the decimal point is defined based on the value of the number.The place that each digit is in has a specific name and this helps us to figure out which numbers are larger and whichare smaller.
Here is a place value chart.
92

www.ck12.org Chapter 2. Using Decimals
TABLE 2.1:
Place NumberMillions place 1,000,000.0Hundred-thousands place 100,000.0Ten-thousands place 10,000.0Thousands place 1,000.0Hundreds place 100.0Tens place 10.0Ones place 1.0Decimal point .Tenths place 0.1 or 1
10Hundredths place 0.01 or 1
100Thousandths place 0.001 or 1
1000Ten-thousandths place 0.0001 or 1
10,000Hundred-thousandths place 0.00001 or 1
100,000Millionths place 0.000001 or 1
1,000,000
This chart shows us the value of each digit.
TABLE 2.2:
10 Th ThousandsHundreds Tens Ones Tenths HundredthsThousandthsTen-Thousandths
1 2 4 5 9 . 3 4 7 8
We read this number as: “Twelve thousand four hundred fifty-nine AND three-thousand four hundred and seventy-eight ten-thousandths.”
Alright, you look puzzled. Let’s slow down and look at how we read a decimal so that we can understand its value.
To read a decimal number, we begin with the whole number.
The decimal point is read as “and” or as just “point.”
Then the digits to the right of the decimal point are read by naming the place in the last digit of the number. Forexample, 23.451 is read as twenty-three and four hundred fifty-one thousandths.
How can we use this information to compare decimals?
First, to compare decimals, we can use our symbols for greater than >and less than <. To order decimals, we will bewriting them from least to greatest or from greatest to least. But first, let’s just focus on comparing.
We compare and order decimal numbers just like whole numbers—by working from left to right.
93
2.1. Decimal Comparisons without Rounding www.ck12.org
With decimals, begin by lining up the decimal points. If there are missing places in the decimals, we can figure outwhich one is smaller or larger by filling in zeros for the missing places.
You want each decimal to have the same number of digits so that you can get a clear idea of which is larger andwhich is smaller.
Compare 8.507 and 8.570. Write >, <, or =.
The first thing to notice is that each number has one whole number, 8. Because the whole number is the same, weneed to determine which is greater by looking at the decimal part of the number. These decimals both have threedecimal places, so we don’t need to add any zeros.
The clearest way to see the decimal values is by lining up the decimal points in a place-value chart.
TABLE 2.3:
Ones . Tenths Hundredths Thousandths8 . 5 0 78 . 5 7 0
Use the chart to compare the value of each digit from left to right.
The numbers are identical in the ones place (8) and in the tenths place (5).
In the hundredths place they are different.
0 <7
The number 8.507 has 0100 (0 hundredths), while the number 8.570 has 7
100 (7 hundredths).
0 hundredths is less than 7 hundredths—we don’t even need to look at the thousandths place!
Our answer is that 8.507 <8.570.
Now we can use this information to help us when writing decimals in order from least to greatest or greatestto least.
Order the following numbers from least to greatest: 94.0299, 94.2019, 94.129, 494.019.
We are ordering four numbers from least to greatest.
Use a place-value chart to help us see the difference in values.
This time we’ll have to add extra places to describe our numbers.
Remember to work from left to right when comparing values.
TABLE 2.4:
Hundreds Tens Ones . Tenths Hundredths Thousandths Ten-thousandths
9 4 . 0 2 9 99 4 . 2 0 1 99 4 . 1 2 9
4 9 4 . 0 1 9
With just a glance at the place-value chart, it is easy to see which number is the greatest number.
494.019 is the only number that has a value in the hundreds place.
The question asks us to order the numbers from least to greatest, so put 494.019 at the end of our list.
Now let’s look at the other three numbers.
94
www.ck12.org Chapter 2. Using Decimals
All of them have the same value in the tens and ones places (94), so we need to look to the tenths place. Don’t bethrown off by the 9s in the thousandths and ten-thousandths place!
We don’t need to look further than the tenth place.
0 <1 <2, so 94.0299 <94.129 <94.2019
Now we can put our numbers in order from least to greatest.
Our answer is 94.0299, 94.129, 94.2019, 494.019
Practice these skills by comparing and/or ordering these decimals.
Example A
98.065 ______ 98.08
Solution: <
Example B
5.237 ______ 5.231
Solution: >
Example C
Write in order from least to greatest: .098, 2.45, 2.099, 2.67
Solution: .098, 2.099, 2.45, 2.67
Now back to the 100.
Here is the original problem once again.
Connor loves running track for his middle school. In fact, he is one of the fastest runners and he specializes in shortdistances like the 100. Connor has set a goal this year to run a personal best in the 100. His fastest race time is 13.91and his slowest race time is 15.16. Connor has set a goal of running the 100 in 12.51. While this is ambitious, hebelieves that with the right mind set and perseverance that he will accomplish his goal.
Jeff is a friend of Connor’s who attends the middle school in the next town over. Jeff is also a runner and he alsospecializes in the 100. The boys are good friends but they definitely love to compete against each other. SometimesJeff is faster and sometimes Connor is faster. Jeff’s best race time in the 100 is 13.42. His slowest race time is 15.32.Jeff’s goal this year is to beat his fastest time and finish the 100 in less than 13.00.
One week before the big race, Connor and Jeff decided to try running practice intervals together. They both ran the100 on the track and here were their times. Connor’s time was 13.11 and Jeff’s time was 13.14.
Given these times, who had the faster time? How does Connor’s practice time compare with his best race time? Howdoes Jeff’s practice time compare with his best race time? Given these numbers, who do you think is on track toaccomplish his goal? Give some mathematical reasons why.
To answer the first question, we have to compare the two times that the boys ran during their practice.
13.11 and 13.14
Notice that the thirteen is the same, so we need to look at the decimal. 11 is less than 14, so Connor ran the fastertime.
Next, we compare Connor’s practice time and his best race time.
95

2.1. Decimal Comparisons without Rounding www.ck12.org
His practice time was 13.11
His fastest race time was 13.91
Connor is definitely getting faster, because his practice time was faster than his best race time.
Now we can compare Jeff’s times.
His practice time was 13.14.
His fastest race time was 13.42.
His practice time is faster than his race time. Jeff is also getting faster.
The last question involves your thinking. You need to decide whether or not you think both boys will meet theirtime goals for the race. Discuss this with a partner. Be sure to justify your thinking by using mathematicaldata.
Guided Practice
Here is one for you to try on your own.
Compare .00456 and .00458
Answer
If you look at these two decimals, we can see that the first few four values are all the same. Therefore, we have tolook at the last value to figure out which number is larger and which is smaller.
6 <8
Therefore, .00456 <.00458.
This is our answer.
Video Review
MEDIAClick image to the left or use the URL below.URL: http://www.ck12.org/flx/render/embeddedobject/5319
This is a James Sousa video on ordering decimals from least to greatest.
Explore More
Directions: Compare. Write <, >, or = for each ___.
1. 701.304 _____ 701.33
2. 2,012.201 _____ 2,012.021
3. 6.951 _____ 6.9313
4. 45.081 _____ 45.108
5. 4.5670 _____ 3.452
96
www.ck12.org Chapter 2. Using Decimals
6. .0017 ______.0019
7. 1.0056 ______1.0560
8. 3.4501 ______3.4510
9. 67.001 ______67.1
Directions: Order the following from least to greatest.
10. 373.291, 373.192, 373.129, 373.219
11. 0.4755, 0.4764, 0.4754, 0.4674
12. 7.16, 7.2, 7.06, 7.21
13. 25.417, 25.741, 25.074 25.407
14. 15.001, 15.067, 15.100, 15.0001
15. 6.780, 6.087, 6.870, 6.008
97

2.2. Decimal Rounding Given Place Value www.ck12.org
2.2 Decimal Rounding Given Place Value
Here you’ll learn to round decimals to a given place.
Remember Connor and his track goals in the Decimal Comparisons without Rounding Concept? Take a look at howhe is doing now.
Last month, Connor’s fastest race time was 13.91 and his slowest race time was 15.16. Connor still has a goal ofrunning the 100 in 12.51.
Connor has been running every day, and he practices tirelessly.
If you round Connor’s fastest race time to the nearest minute, how far is he from his goal?
This Concept will teach you how to round decimals to a given place. Then you will be able to tackle thisproblem.
Guidance
Some decimals can extend to the millionth place or even farther and be difficult to handle in operations.
Rounding decimals is useful when estimating sums and difference or comparing measurements.
Previously we worked on how to round whole numbers to a given place value.
Let’s take a minute to review rounding whole numbers.
1,537 rounded to the thousands place is 2,000; rounded to the hundreds place is 1,500; rounded to the tens place is1,540. We can round to any place that we choose to round the number to.
We can use the same steps when rounding decimals. Here are the steps for rounding numbers.
The Steps for Rounding Numbers
1. Identify the place you want to round to, notice that number.2. Look at the digit to the right of that number.3. If the digit to the right is 5 or greater, round up. If the number is less than 5, round down.
Round 406.091 to the nearest whole number
First, underline the number you’re rounding to and bold or circle the number directly to the right.
Rounding to the nearest whole number, underline the ones place.
The bolded number in the tenths place is the one you’ll look at when deciding to round up or down.
Because that number is a zero, we don’t round up. The whole number stays the same.
Our answer is 406.
Here is another one.
Round 206.9595 to the nearest whole number
First, underline the number you’re rounding to and bold or circle the number directly to the right.
Rounding to the nearest whole number, underline the ones place.
The number in the tenths place is the one you look at when deciding to round up or down. This number is anine, so we round up.
98

www.ck12.org Chapter 2. Using Decimals
Our answer is 207.
Now let’s use these same steps when rounding decimal places. Round .07285 to the nearest thousandths place
First, identify that the two is in the thousandths place. We can underline that digit because that is the digitthat we are going to be rounding.
Next, look to the number to the right of the two. That is the number we use to determine whether we roundup or down.
That number is an 8, so we round up.
Our answer is .073.
Notice that we don’t include the digits past the place where we have rounded. This is because we have roundedthat digit.
Now it’s time for you to try a few on your own.
Example A
Round 1.23439 to the nearest ten-thousandth.
Solution: 1.2344
Example B
Round 3035.67 to the nearest whole number.
Solution: 3036
Example C
Round 0.98734 to the nearest thousandth.
Solution: 0.987
Here is the original problem once again.
Last month, Connor’s fastest race time was 13.91 and his slowest race time was 15.16. Connor still has a goal ofrunning the 100 in 12.51.
Connor has been running every day, and he practices tirelessly.
If you round Connor’s fastest race time to the nearest minute, how far is he from his goal?
To found Connor’s fastest time, we have to look at the time itself first.
13.91
We want to round it to the nearest whole. We look at the value in the tenths place. It is a nine, so we round up.
13.91 becomes 14
Now subtract 14−12.51 = 1.09
Connor is about 1 minute and nine seconds away from his goal.
Guided Practice
Here is one for you to try on your own.
99
2.2. Decimal Rounding Given Place Value www.ck12.org
Round to the nearest hundredth.
12.342789
Answer
To do this, we have to identify the value in the hundredths place first.
4 is the value in the hundredths place.
The value to the right of the four is a two. We don’t round up.
The answer is 12.34.
Video Review
MEDIAClick image to the left or use the URL below.URL: http://www.ck12.org/flx/render/embeddedobject/5322
This is a Khan Academy video on rounding decimals.
Explore More
Directions: Round the following to the nearest whole number.
1. 621.891
2. 1,318.0999
3. 17.275
4. 49.64
5. 123.56
6. 349.5
7. 16789.21
8. 12.981
9. 145.7821
Directions: Round the following to the designated place.
10. 32.295 to the nearest hundredth
11. 0.1062461 to the nearest ten-thousandth
12. 2.4004728 to the nearest hundred-thousandth
13. 4,062.03 to the nearest tenth
14. .12378 to the nearest ten - thousandth
15. 3.4567 to the nearest thousandth
100
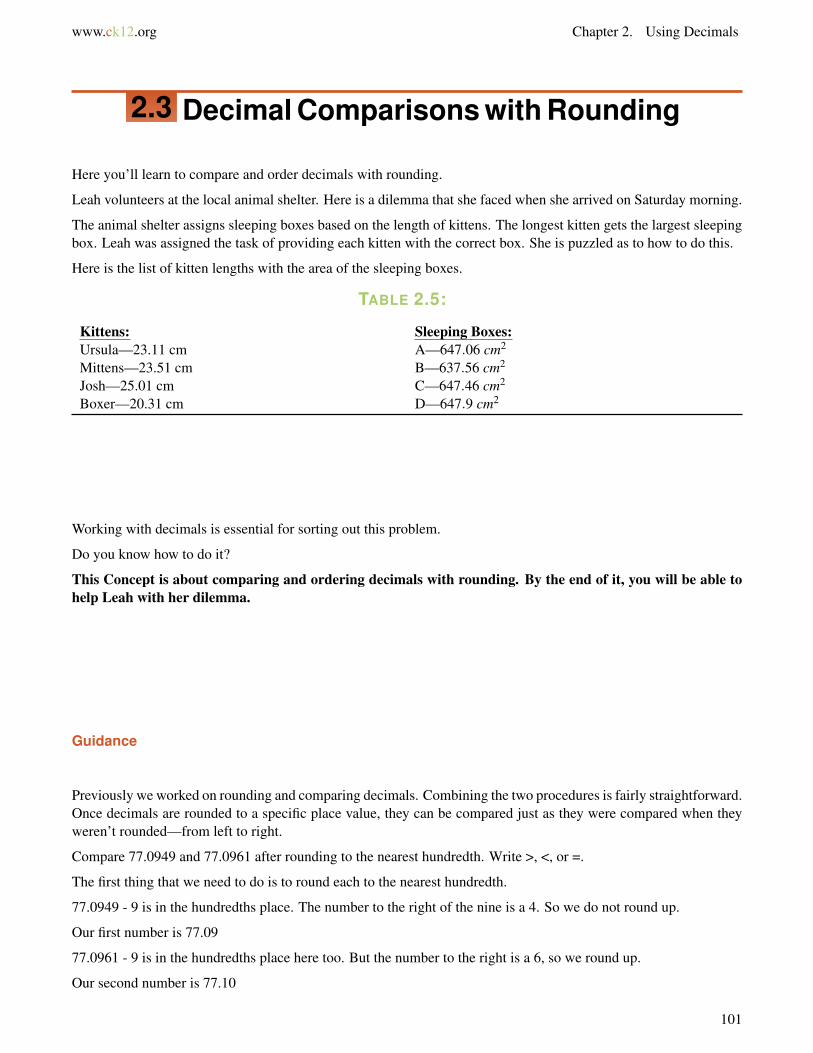
www.ck12.org Chapter 2. Using Decimals
2.3 Decimal Comparisons with Rounding
Here you’ll learn to compare and order decimals with rounding.
Leah volunteers at the local animal shelter. Here is a dilemma that she faced when she arrived on Saturday morning.
The animal shelter assigns sleeping boxes based on the length of kittens. The longest kitten gets the largest sleepingbox. Leah was assigned the task of providing each kitten with the correct box. She is puzzled as to how to do this.
Here is the list of kitten lengths with the area of the sleeping boxes.
TABLE 2.5:
Kittens: Sleeping Boxes:Ursula—23.11 cm A—647.06 cm2
Mittens—23.51 cm B—637.56 cm2
Josh—25.01 cm C—647.46 cm2
Boxer—20.31 cm D—647.9 cm2
Working with decimals is essential for sorting out this problem.
Do you know how to do it?
This Concept is about comparing and ordering decimals with rounding. By the end of it, you will be able tohelp Leah with her dilemma.
Guidance
Previously we worked on rounding and comparing decimals. Combining the two procedures is fairly straightforward.Once decimals are rounded to a specific place value, they can be compared just as they were compared when theyweren’t rounded—from left to right.
Compare 77.0949 and 77.0961 after rounding to the nearest hundredth. Write >, <, or =.
The first thing that we need to do is to round each to the nearest hundredth.
77.0949 - 9 is in the hundredths place. The number to the right of the nine is a 4. So we do not round up.
Our first number is 77.09
77.0961 - 9 is in the hundredths place here too. But the number to the right is a 6, so we round up.
Our second number is 77.10
101

2.3. Decimal Comparisons with Rounding www.ck12.org
What happened is that we needed to round up. We can’t go from 9 to 10 in one digit, so the place of the numbermoved over and we rounded 9 hundredths up to 1 tenth.
Now we can compare these numbers.
Our answer is 77.09 <77.10.
We can use these same steps when ordering numbers from least to greatest or from greatest to least. First, you roundthe numbers to the desired place then you compare and order them.
Round the following numbers to the nearest tenth. Then order from greatest to least. 5.954, 5.599, 5.533, 6.062.
First, we round each number to the nearest tenth. Remember that the tenths place is the first place to the rightof the decimal point. Here the digit being rounded is in bold print and the number that we use to determinewhether we round up or down is in the hundredths place and is underlined.
5. 954 rounds up to 6.0
5. 599 rounds up to 5.6
5. 533 rounds down to 5.5
6. 062 rounds up to 6.1
Next, we write them in order from greatest to least.
Our answer is 6.1, 6.0, 5.6, 5.5
Now it’s time for you to try a few on your own.
Example A
Compare each number after rounding to the nearest hundredth, 4.567 and 4.562
Solution: 4.57 >4.56
Example B
Compare each number after rounding to the nearest tenth, .234 and .245
102
www.ck12.org Chapter 2. Using Decimals
Solution: .2 = .2
Example C
Round each to the nearest tenth and write in order from least to greatest, .0567, .291, .1742
Solution: .0567, .1742, .291
Now back to Leah and the kittens. Here is the original problem once again.
Remember how Connor ran track? Well, his sister Leah volunteers at the local animal shelter. Here is a dilemmathat she faced when she arrived on Saturday morning.
The animal shelter assigns sleeping boxes based on the length of kittens. The longest kitten gets the largest sleepingbox. Leah was assigned the task of providing each kitten with the correct box. She is puzzled as to how to do this.
Here is the list of kitten lengths with the area of the sleeping boxes.
TABLE 2.6:
Kittens: Sleeping Boxes:Ursula—23.11 cm A—647.06 cm2
Mittens—23.51 cm B—637.56 cm2
Josh—25.01 cm C—647.46 cm2
Boxer—20.31 cm D—647.9 cm2
To solve this problem, let’s first write the kittens in order from smallest to largest.
Boxer = 20.31
Ursula = 23.11
Mittens = 23.51
Josh = 25.01
Now the boxes in order from least to greatest.
Box B = 637.56
Box A = 647.06
Box C = 647.46
Box D = 647.9
Next, we put them together.
Boxer = Box B
Ursula = Box A
Mittens = Box C
Josh = Box D
Guided Practice
Here is one for you to try on your own.
Sean weighed his textbooks with these results: Math—3.652 kg; English—3.596 kg; History—3.526 kg; Sci-ence—3.628 kilograms. Order his textbooks from greatest to least weight.
103
2.3. Decimal Comparisons with Rounding www.ck12.org
Answer
To complete this problem, we have to round each to the nearest tenth.
Math = 3.7
English = 3.60
History = 3.5
Science = 3.62
Because both the English book and the Science book round to 3.6, we have to add a hundredths digit. Now we canwrite them from least to greatest.
The answer is History, English, Science, Math.
Video Review
MEDIAClick image to the left or use the URL below.URL: http://www.ck12.org/flx/render/embeddedobject/5322
This is a Khan Academy Video on rounding decimals.
Explore More
Directions: Round each decimal to the nearest hundredth; then compare. Write <, >, or = for each ___.
1. 1.346 ___ 1.349
2. 0.0589 ___ 0.0559
3. 62.216 ___ 62.301
4. 5.011 ___ 5.001
5. 65.47 ____65.047
6. 12.324 ____ 12.325
7. .00897 _____.00967
8. .0009876 _____.0001020
9. .9806_____.9870
Directions: Round each decimal to the nearest thousandth. Then order from greatest to least.
10. 2.03489, 2.03266, 2.0344, 2.03909
11. 16.0995, 16.0875, 16.0885, 16.089
12. 3.8281, 3.8208, 3.8288, 3.8218
13. .05672, .05972, .05612, .0575
Directions: Complete each word problem.
104
www.ck12.org Chapter 2. Using Decimals
14. Tamara’s famous holiday punch follows a precise recipe: 0.872 l orange juice; 0.659 l grapefruit juice; 1.95 lclub soda; 0.981 1 lemonade; and 0.824 l limeade. Round her ingredient list to the nearest tenth; then order fromleast to greatest.
15. Mrs. King is pricing cabins at the state park for a weekend getaway with the family. A 2-person cabin is $53.90for the weekend; a 3-person cabin is $67.53 for the weekend; a 4-person cabin is $89.72 for the weekend. Roundeach price to the nearest whole number; then estimate the cheapest combination of cabins if there are 6 people in theKing family.
105

2.4. Decimal Addition www.ck12.org
2.4 Decimal Addition
Here you’ll learn to add decimals with and without rounding.
Have you ever been on a relay team? Have you ever run a relay race?
Last year, the girl’s middle school relay team ran the 4× 100 meters is 53.87 and won the regional championship.This year, there are four new girls on the team and they have set a goal of running the 4×100 in a faster time thanthe girls did the year before.
Jessica is the lead runner on the team. The second runner is Karin. The third runner is Tasha and the fourth runnerand fastest runner is Uniqua. All four girls worked and trained hard. They didn’t know each prior to making theteam, so it took the girls most of the season to get to know each other’s strengths and weaknesses. Their coach, Ms.Sutter worked hard to help the girls work through their differences while maintaining a good attitude. Ms. Sutterdoesn’t put up with a lot of nonsense and all of the runners show respect to her and their team mates.
Because of their hard work, the relay team made it all the way to the Regional championship.
“Just be sure to run your best race,” Ms. Sutter told them prior to the start.
All four girls shook hands and prepared to run. Here are their individual times:
Jessica = 13.00
Karin = 14.10
Tasha = 14.23
Uniqua = 12.40
Did the girls accomplish their goal of running the relay faster than the previous team?
This Concept is all about adding decimals. To figure out the total time of the relay team, you will need to knowhow to add decimals. Finish this Concept and you will be ready!
Guidance
Decimals appear in all aspects of life—any time there is a part of a whole number—from money to measurement topercentages. Meghan finished 0.75 of her homework; Leo ran 1.34 kilometers; the class ate 5.6 pizzas.
106
www.ck12.org Chapter 2. Using Decimals
Previously we worked on how to compare, order, and round decimals.
In this Concept, we will learn how to add them. Once you know how to add decimals, you can apply your knowledgeto a whole new dimension of real-world situations, some of which involve algebraic reasoning and equations.
How do we get started when we want to add decimals?
Well, first of all, it all comes back down to place value. To add decimals, we line up the digits according to placevalue. To keep the place values straight, we always align the decimal points of the decimals.
Once we have the decimal points lined up, we add exactly like we add whole numbers—from right to left—takingcare to bring the decimal point down into our answer.
1.87
+ 2.30
4.17
There are a few things to notice about this problem.
First, the numbers you are adding have been lined up vertically. When you were in elementary school, most of yourproblems were probably lined up vertically. Now that you are in middle school from now on, you will need to dothis step yourself.
Second, you can see that a zero was added to help even out the columns to line up the decimal points. That zero isin red to help you to see that it was added.
4.5+2.137 =
To add this problem, let’s remember to line up the decimal points and each digit according to place value. Noticethat there is one digit after the decimal point in the first number and three in the second number. You will need toadd some zeros to help with the addition. Now let’s line up the problem.
4.500
+ 2.137
6.637
Sometimes, particularly in real-world situations, decimal numbers are just too long to work with. In these cases, tofind a quick and workable solution we might round the decimals before we add . For instance, rather than gettingbogged down in the ten-millionth place, we can round to the tenth or hundredth place and then add. Look forclues in the problem to tell you whether or not to round before adding. If you are asked to round, make sureyou round to the right place!
Let’s look at a problem where rounding would be helpful.
Round each number to the nearest hundredth then find the sum of 9.199, 11.353, 10.648.
This problem asks us to round before adding and it asks us to round to the hundredth place. To make the roundingsteps clear, it helps to underline the number you’re rounding to and bolding or circling the number directly to
107
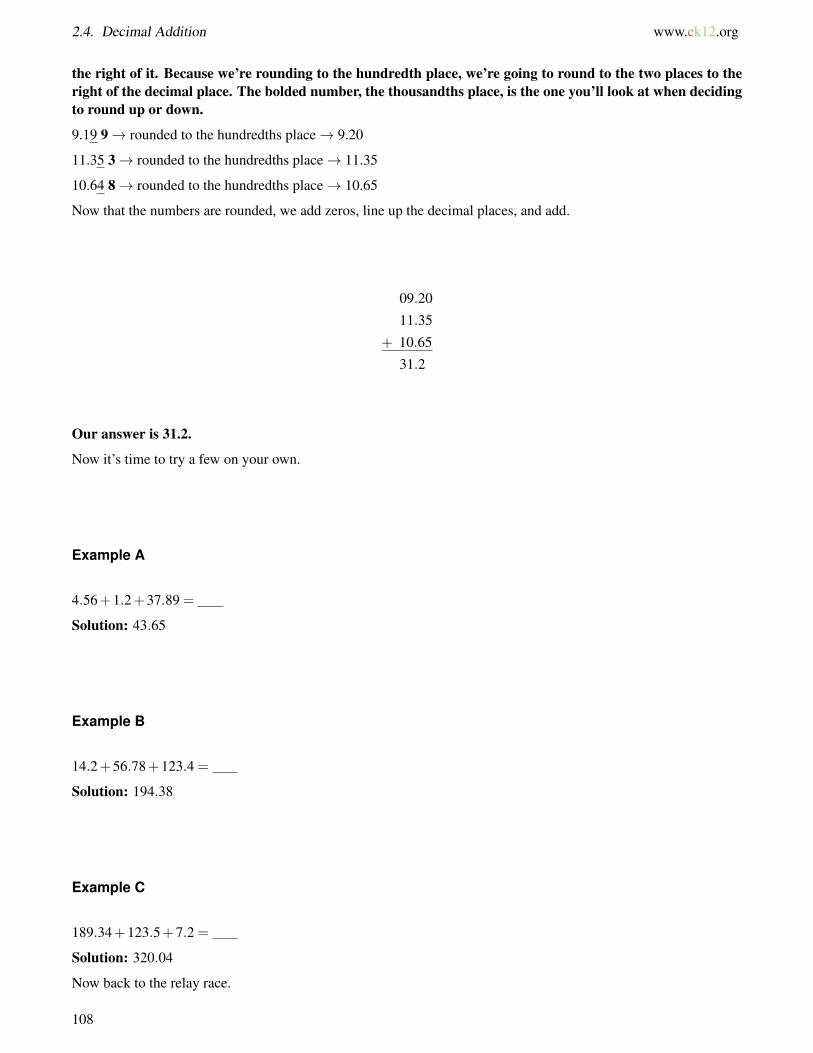
2.4. Decimal Addition www.ck12.org
the right of it. Because we’re rounding to the hundredth place, we’re going to round to the two places to theright of the decimal place. The bolded number, the thousandths place, is the one you’ll look at when decidingto round up or down.
9.19 9→ rounded to the hundredths place→ 9.20
11.35 3→ rounded to the hundredths place→ 11.35
10.64 8→ rounded to the hundredths place→ 10.65
Now that the numbers are rounded, we add zeros, line up the decimal places, and add.
09.20
11.35
+ 10.65
31.2
Our answer is 31.2.
Now it’s time to try a few on your own.
Example A
4.56+1.2+37.89 =
Solution: 43.65
Example B
14.2+56.78+123.4 =
Solution: 194.38
Example C
189.34+123.5+7.2 =
Solution: 320.04
Now back to the relay race.
108

www.ck12.org Chapter 2. Using Decimals
Here is the original problem once again.
Last year, the girl’s middle school relay team ran the 4× 100 meters is 53.87 and won the regional championship.This year, there are four new girls on the team and they have set a goal of running the 4×100 in a faster time thanthe girls did the year before.
Jessica is the lead runner on the team. The second runner is Karin. The third runner is Tasha and the fourth runnerand fastest runner is Uniqua. All four girls worked and trained hard. They didn’t know each prior to making theteam, so it took the girls most of the season to get to know each other’s strengths and weaknesses. Their coach, Ms.Sutter worked hard to help the girls work through their differences while maintaining a good attitude. Ms. Sutterdoesn’t put up with a lot of nonsense and all of the runners show respect to her and their team mates.
Because of their hard work, the relay team made it all the way to the Regional championship.
“Just be sure to run your best race,” Ms. Sutter told them prior to the start.
All four girls shook hands and prepared to run. Here are their individual times:
Jessica = 13.00
Karin = 14.10
Tasha = 14.23
Uniqua = 12.40
Did the girls accomplish their goal of running the relay faster than the previous team?
First, we can write an equation to figure out the time of the race.
j+ k+ t +u < 53.87
The girls want to have a time that is less than 53.87. In this way, we are going to be combining comparing decimalsand adding decimals.
Next, we fill in the given times for each girl into the equation.
13.00+14.10+14.23+12.40 < 53.87
Now, we can line up the decimal point to add the values.
109

2.4. Decimal Addition www.ck12.org
13.00
14.10
14.23
+ 12.40
53.73
The time of the relay is 53.73.
Now we can compare this with the previous team’s time.
53.73 <53.87
This is a true statement. The girls have beaten the previous relay team’s time. They also achieved a medal atthe Regional Championship!!
Guided Practice
Here is one for you to try on your own.
Round each value to the nearest tenth and then find the sum.
4.56,3.47,2.04,6.21
Answer
First, we round each to the nearest tenth.
4.56 = 4.6
3.47 = 3.5
2.04 = 2.0
6.21 = 6.2
Now we add them up to find the sum.
16.3
110
www.ck12.org Chapter 2. Using Decimals
This is our answer.
Video Review
MEDIAClick image to the left or use the URL below.URL: http://www.ck12.org/flx/render/embeddedobject/5325
This is a James Sousa video on adding and subtracting decimals.
MEDIAClick image to the left or use the URL below.URL: http://www.ck12.org/flx/render/embeddedobject/5465
This is a James Sousa video on adding decimals.
Explore More
Directions: Find each sum.
1. 29.451 + 711.36
2. 0.956 + 0.9885
3. 13.69 + 42.23
4. 58.744 + 12.06 + 8.8
5. 67.90 + 1.2 + 3.456
Directions: Round to the nearest tenth, then find the sum.
6. 88.95 + 23.451
7. 690.026 + 831.163
8. 3.27 + 7.818
9. .99 + .909 + .048
10. 5.67 + 3.45 + 1.23
Directions: Round to the nearest hundredth, then find the sum.
11. 511.51109 + 99.0986
12. .744 + 7.005 + .7071
13. 32.368 + 303.409
14. 1.0262 + 1.0242
15. 1.309 + 3.4590
111
2.5. Decimal Addition Using Front-End Estimation www.ck12.org
2.5 Decimal Addition Using Front-End Estima-tion
Here you’ll learn to estimate decimal sums using front-end estimation.
Have you ever gone to dinner with a friend?
Jessica and Daniella went to dinner. Jessica ordered a pasta dish with shrimp and lobster for $25.25 and Daniellaordered a steak dish for $18.95.
Without adding the exact values, can you estimate the total cost of both meals?
This Concept is about front-end estimation. Pay attention and you can use it to estimate the sum of thesemeals.
Guidance
What is estimation?
Estimation is a method for finding an approximate solution to a problem.
For example, the sum of 22 and 51 is exactly 73. We can estimate the sum by rounding to the tens place and adding20 + 50. Then we can say the sum of 22 and 51 is “about 70.” Before we perform an operation, an estimate gives usa rough idea of what our answer will be.
Estimation is also useful to check answers. If, after you solve a problem, you estimate to get a general idea of whatan answer should be, you know if your answer is reasonable. You could say that an estimate is an “educated guess.”
By “educated guess” we don’t mean a guess that is out of nowhere. You have to have a method to figuring out the
112

www.ck12.org Chapter 2. Using Decimals
answer or estimate. Rounding numbers before adding is one way to find an estimate.
Front-end estimation is another way. Like rounding, front-end estimation uses place value; unlike rounding, itdoesn’t involve any changing of values.
There are three steps to front-end estimation.
First, you add the front end, or left-most digits, to get a general estimate of the sum. Next, to refine the first estimate,you add the digits directly to the right of the front-end digits.
Finally you add the two sums together.
Front-End Estimation for Addition:
1. Add the front (leftmost) digits.2. Add the digits directly to the right of the front-end.3. Add the estimates from steps 1 and 2.
Write these steps in your notebook and then continue with the Concept.
Use front-end estimation to find the sum of 6.819 and 4.621.
We are going to use front-end estimation to add 6.819 and 4.621. Let’s begin by lining up the decimal points andtaking a closer look at the numbers. Then we’ll follow the steps of front-end estimation.
6.819
4.621
1. Front-end estimation tells us to add the front or leftmost digits first, so we want to add the ones place.
6+4 = 10.
2. Next, to refine that estimate, we’ll add the digits directly to the right of the front-end digits, or the tenths place.
.8+ .6 = 1.4
3. Finally, we add our two estimates together.
10+1.4 = 11.4.
Note: The original numbers extended to the thousandth place, but we don’t need to show this by adding unnec-essary zeros to our answer. Where decimals end, it is assumed that zeros extend on to infinity.
Practice using front-end estimation to find the following sums.
Example A
3.5+2.34 =
Solution: 5.84
113
2.5. Decimal Addition Using Front-End Estimation www.ck12.org
Example B
12.671+8.123 =
Solution: 20.7
Example C
15.67+9.345 =
Solution: 24.9
Here is the original problem once again.
Jessica and Daniella went to dinner. Jessica ordered a pasta dish with shrimp and lobster for $25.25 and Daniellaordered a steak dish for $18.95.
Without adding the exact values, can you estimate the total cost of both meals?
To estimate this sum, we simply add the front-ends of each price.
18+25 = 43
The total cost of the two dinners is approximately $43.00.
Guided Practice
Here is one for you to try on your own.
Use front-end estimation to find the following sum.
2.93474 + 9.72155
First, we add the front-ends of the whole numbers and decimals.
.7+ .9 = 1.6
2+9 = 11
Now put these two sums together.
Our answer is 12.6
Video Review
MEDIAClick image to the left or use the URL below.URL: http://www.ck12.org/flx/render/embeddedobject/54781
This is a supporting video on estimating with decimals.
Explore More
Directions: Use front-end estimation to find the following sums.
114
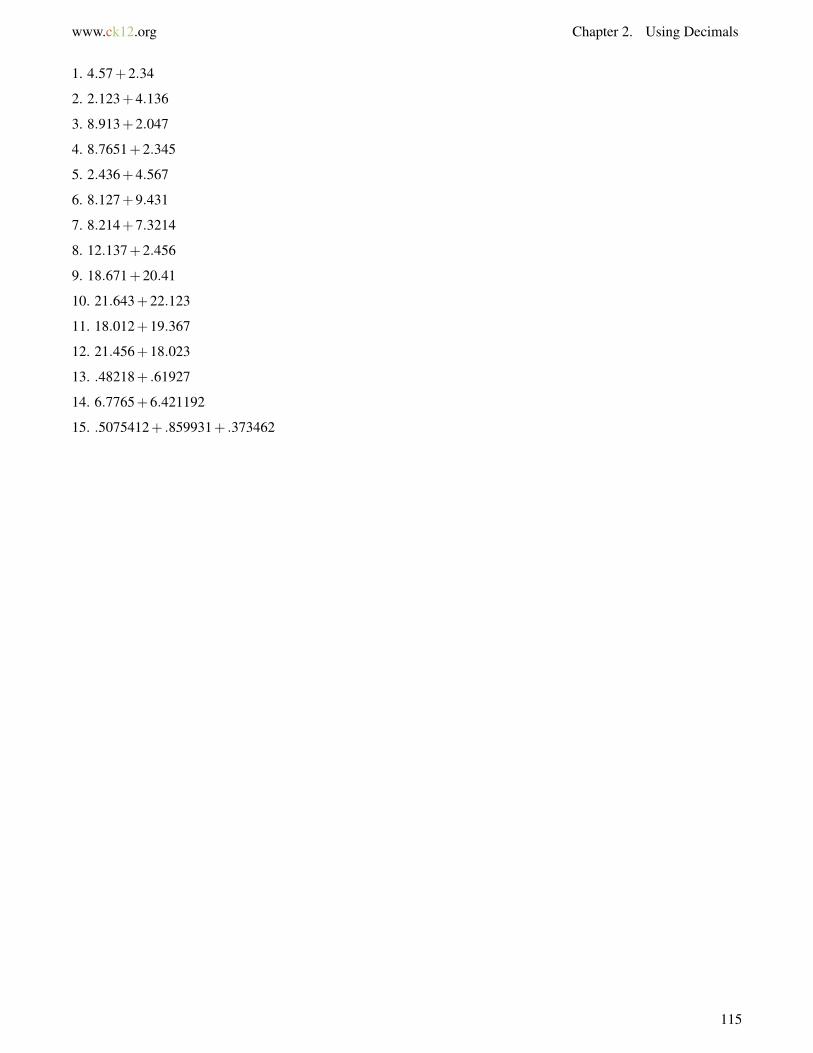
www.ck12.org Chapter 2. Using Decimals
1. 4.57+2.34
2. 2.123+4.136
3. 8.913+2.047
4. 8.7651+2.345
5. 2.436+4.567
6. 8.127+9.431
7. 8.214+7.3214
8. 12.137+2.456
9. 18.671+20.41
10. 21.643+22.123
11. 18.012+19.367
12. 21.456+18.023
13. .48218+ .61927
14. 6.7765+6.421192
15. .5075412+ .859931+ .373462
115

2.6. Commutative Property of Addition with Decimals www.ck12.org
2.6 Commutative Property of Addition withDecimals
Here you’ll learn to identify and apply the commutative and associative properties of addition in decimal operationswith numerical and variable expressions.
Have you ever trained for a running event?
While training, Travis had a daily routine. On Monday, began his day with a 3.2 mile run followed by 1.2 miles ofsprints on the track at school. On Tuesday, he began with the sprints and then ran 3.2 miles.
Except for the order, was his training any different?
Which mathematical property does this represent?
This Concept is about identifying the commutative and associative properties of addition in decimal opera-tions. By the end of it, you will know which property is illustrated in this situation.
Guidance
Previously we worked on decimals. Now we need to examine decimal addition through the lens of the two mathe-matical properties which pertain to addition: the Commutative Property of Addition and the Associative Propertyof Addition.
In the examples that we worked with in the Decimal Addition Using Front-End Estimation Concept, we added threedecimal addends in the order in which they appeared. What would happen if we added them in a different order?Would the sum change?
The Commutative Property of Addition states that the order of the addends does not change the sum .
Let’s test the property using simple whole numbers.
4+5+9 = 18 5+4+9 = 18 9+5+4 = 18
4+9+5 = 18 5+9+4 = 18 9+4+5 = 18
As you can see, we can add the three addends (4, 5, and 9) in many different orders. The Commutative Property ofAddition works also works for four, five, six addends, and it works for decimal addends, too.
What about the Associative Property of Addition?
The Associative Property of Addition states that the way in which addends are grouped does not change thesum . The Associative Property uses parentheses to help us with the grouping. When parentheses are inserted intoa problem, according to the order of operations, you perform that operation first. What happens if you move theparentheses? This is where the Associative Property comes in.
Once again, let’s test the property using simple whole numbers.
(4+5)+9 = 18 (5+4)+9 = 18 (9+5)+4 = 18
Clearly, the different way the addends are grouped has no effect on the sum. The Associate Property of Additionworks for multiple addends as well as decimal addends.
116
www.ck12.org Chapter 2. Using Decimals
These two properties are extremely useful for solving equations. An equation is a mathematical statement thattwo expressions are equal. For example, we can say that 15+7 = 24−2 since both sides of the equation equal 22.
A variable equation is an equation such as 12+ x = 14. It is called a variable equation because it includes analgebraic unknown, or a variable.
Find the value for x in the following equation, 71.321+42.29 = x+71.321
Here is where we can use the Commutative Property of Addition. We know that one side of the equation is equal tothe other side of the equation therefore we just substitute the given value in for x since the second addend did notchange
Our answer is x is equal to 42.29.
We can use the Associative Property for both expressions and equations. Let’s look at an expression.
Find the value when x is 2 and y is 3. (x+4)− y
This is a variable expression. Notice that there are two given values for x and y, but that those values could be anynumbers. The key here is that we could move the parentheses and the two variable expressions would have the samevalue. We can find the value of this expression by substituting 2 and 3 into the expression.
(2+4)−3
The value of this variable expression is 3.
What happens if we move the parentheses?
x+(4− y)
We substitute the given values in for x and y.
2+(4−3)
The value of this expression is 3.
Because of the Associative Property, both variable expressions have the same value regardless of the group-ings.
Now it’s time for you to identify which property is being used in the following examples.
Example A
3.4+3.2+5.6 = 5.6+3.4+3.2
Solution: Commutative Property of Addition
Example B
(3.4+3.2)+5.6 = 3.4+(3.2+5.6)
Solution: Associative Property of Addition
Example C
True or false. When using the Associative property the order of the numbers always changes.
Solution: False, only the position of the grouping symbols changes.
Here is the original problem once again.
117

2.6. Commutative Property of Addition with Decimals www.ck12.org
While training, Travis had a daily routine. On Monday, began his day with a 3.2 mile run followed by 1.2 miles ofsprints on the track at school. On Tuesday, he began with the sprints and then ran 3.2 miles.
Except for the order, was his training any different?
Which mathematical property does this represent?
When you look at Travis’ training schedule, you will see that the components are exactly the same. He ran the samedistance on and off the track. The order of the elements did change.
This is an illustration of the Commutative Property of Addition.
Guided Practice
Here is one for you to try on your own.
Hassan’s recipe for potato soup calls for 14.25 kilograms of potatoes. He already has 6.12 kilograms. How manymore kilograms of potatoes does he need to buy?
Answer
In this problem, we are trying to find the number of kilograms of potatoes Hassan needs to buy.
Let’s call that value x.
We know how many kilograms he already has, and we know the total kilograms he needs, so we can write theequation
6.12+ x = 14.25.
Now we can solve for the value of x using mental math. x needs to be a value that, when added to 6.15, equals 14.25.
Let’s begin with the whole numbers. 6+6 = 12; 6+8 = 14; the whole number portion of x is 8.
Now let’s look at the decimals. .12+?= .25. The decimal parts differ in both tenths and hundredths, but if we thinkof them as whole numbers it is easier to see their relationship 12+13 = 25, so .12+ .13 = .25.
Combining the whole number portion of x and the decimal portion of x(8+ .13), we get 8.13.x = 8.13. Rememberto put the units of measurement in your answer!
The answer is 8.13 kilograms.
Video Review
MEDIAClick image to the left or use the URL below.URL: http://www.ck12.org/flx/render/embeddedobject/54784
Khan Academy Video on Associative Law of Addition
118

www.ck12.org Chapter 2. Using Decimals
MEDIAClick image to the left or use the URL below.URL: http://www.ck12.org/flx/render/embeddedobject/54785
Khan Academy Video on Commutative Law of Addition
Explore More
Directions: Identify the property illustrated in each number sentence.
1. 4.5+(x+ y)+2.6 = (4.5+ x)+ y+2.6
2. 3.2+ x+ y+5.6 = x+3.2+ y+5.6
3. 1.5+(2.3+ y)+5.6 = (1.5+2.3)+ y+5.6
4. 3.2+5.6+1.3+2.6 = 3.2+2.6+5.6+1.3
5. 4.5+15.6 = 15.6+4.5
6. (x+ y)+5.6 = x+(y+5.6)
7. 17.5+18.9+2 = 2+17.5+18.9
8. (x+ y)+ z = x+(y+ z)
Directions: Find the value of x in the following equations.
9. .8603+ .292 = x+ .8603
10. (2.65+ x)+19.35 = 22+2.115
11. .306+1.076 = (.782+ x)+ .294
12. 6.174+76.41 = 76.41+ x
Directions: Solve each problem.
13. Lamont measures the amount of water he drinks. His results for four consecutive days were as follows: 0.6liters, 0.72 liters, 0.84 liters, 0.96 liters. If the pattern continues, how much water will Lamont drink on the fifth day?
14. Barbara is starting a jewelry making enterprise. At the supply store, she spent $19.19 on beads and $6.81 onwire and clasps. If she left the store with $24.50, how much did she start with?
15. A playground has a length of 18.36 yards and a width of 12.24 yards. What is the perimeter of the playground?(Remember: P = l + l +w+w.)
119
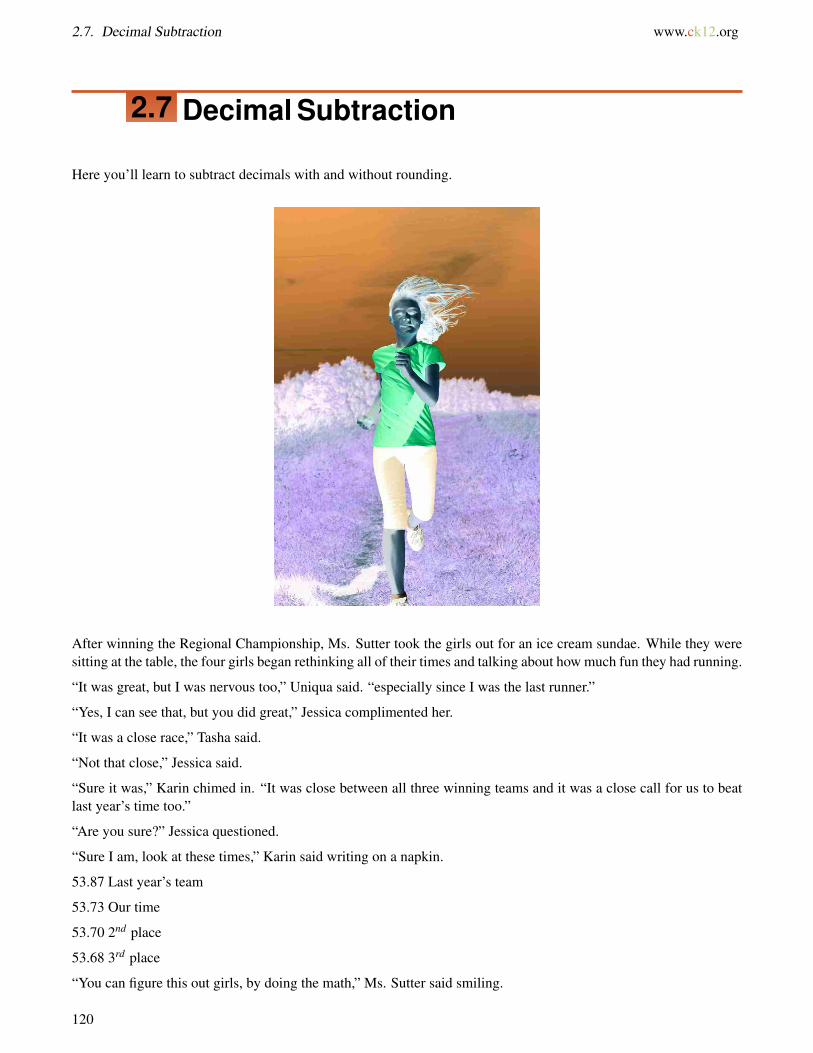
2.7. Decimal Subtraction www.ck12.org
2.7 Decimal Subtraction
Here you’ll learn to subtract decimals with and without rounding.
After winning the Regional Championship, Ms. Sutter took the girls out for an ice cream sundae. While they weresitting at the table, the four girls began rethinking all of their times and talking about how much fun they had running.
“It was great, but I was nervous too,” Uniqua said. “especially since I was the last runner.”
“Yes, I can see that, but you did great,” Jessica complimented her.
“It was a close race,” Tasha said.
“Not that close,” Jessica said.
“Sure it was,” Karin chimed in. “It was close between all three winning teams and it was a close call for us to beatlast year’s time too.”
“Are you sure?” Jessica questioned.
“Sure I am, look at these times,” Karin said writing on a napkin.
53.87 Last year’s team
53.73 Our time
53.70 2nd place
53.68 3rd place
“You can figure this out girls, by doing the math,” Ms. Sutter said smiling.
120
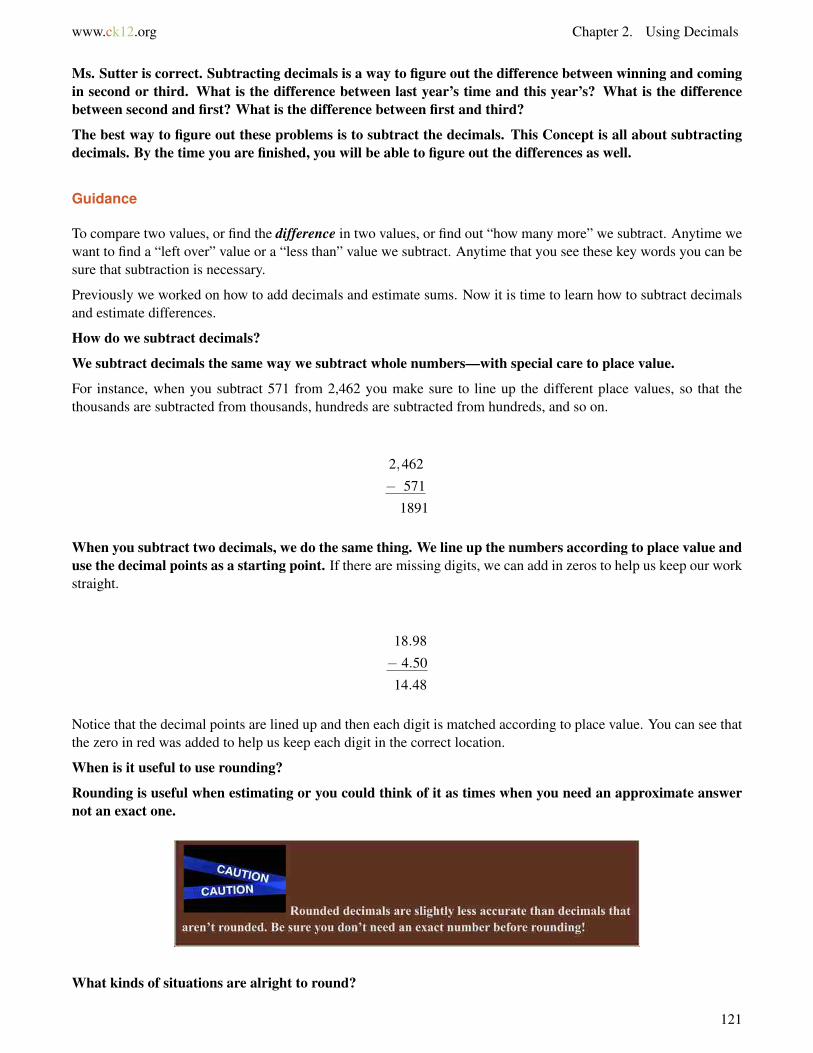
www.ck12.org Chapter 2. Using Decimals
Ms. Sutter is correct. Subtracting decimals is a way to figure out the difference between winning and comingin second or third. What is the difference between last year’s time and this year’s? What is the differencebetween second and first? What is the difference between first and third?
The best way to figure out these problems is to subtract the decimals. This Concept is all about subtractingdecimals. By the time you are finished, you will be able to figure out the differences as well.
Guidance
To compare two values, or find the difference in two values, or find out “how many more” we subtract. Anytime wewant to find a “left over” value or a “less than” value we subtract. Anytime that you see these key words you can besure that subtraction is necessary.
Previously we worked on how to add decimals and estimate sums. Now it is time to learn how to subtract decimalsand estimate differences.
How do we subtract decimals?
We subtract decimals the same way we subtract whole numbers—with special care to place value.
For instance, when you subtract 571 from 2,462 you make sure to line up the different place values, so that thethousands are subtracted from thousands, hundreds are subtracted from hundreds, and so on.
2,462
− 571
1891
When you subtract two decimals, we do the same thing. We line up the numbers according to place value anduse the decimal points as a starting point. If there are missing digits, we can add in zeros to help us keep our workstraight.
18.98
− 4.50
14.48
Notice that the decimal points are lined up and then each digit is matched according to place value. You can see thatthe zero in red was added to help us keep each digit in the correct location.
When is it useful to use rounding?
Rounding is useful when estimating or you could think of it as times when you need an approximate answernot an exact one.
What kinds of situations are alright to round?
121
2.7. Decimal Subtraction www.ck12.org
One time that we can use rounding is if the decimals are too long for pencil calculations. An approximate answer issufficient. Also, if the problem itself tells us that we don’t need an exact answer. The question might use words likeclose to or approximate.
In these cases, we round the decimals before we subtract. Look for clues in the problem to tell you whether ornot to round before subtracting. If you are asked to round, make sure you round to the right place!
Round the numbers to the nearest tenth then find the difference, 72.953 - 52.418
This problem asks us to round each number to the tenth place before subtracting.
Underline the number we are rounding to and bold or circle the number directly to the right of it.
We are rounding to the tenth place, so round to the place directly to the right of the decimal place.
The bolded number in the hundredths place, is the one to look at when deciding to round up or down.
72.9 53→ rounded to the tenth place→ 73.0
52.4 18→ rounded to the tenth place→ 52.4
Now that the numbers are rounded, we line up the decimal places, and subtract.
73.0
− 52.4
20.6
While rounding doesn’t give us an exact answer, you can see that it simplifies the subtraction!
Now it’s your turn to try a few. Find each difference.
Example A
5.674−2.5 =
Solution: 3.174
Example B
Take 5.67 from 12.378
Solution: 6.708
Example C
Round to the nearest tenth and then subtract, 8.356−1.258
Solution: 8.4−1.3 = 7.1
Now back to the original problem.
After winning the Regional Championship, Ms. Sutter took the girls out for an ice cream sundae. While they weresitting at the table, the four girls began rethinking all of their times and talking about how much fun they had running.
“It was great, but I was nervous too,” Uniqua said. “especially since I was the last runner.”
“Yes, I can see that, but you did great,” Jessica complimented her.
“It was a close race,” Tasha said.
122
www.ck12.org Chapter 2. Using Decimals
“Not that close,” Jessica said.
“Sure it was,” Karin chimed in. “It was close between all three winning teams and it was a close call for us to beatlast year’s time too.”
“Are you sure?” Jessica questioned.
“Sure I am, look at these times,” Karin said writing on a napkin.
53.87 Last year’s team
53.73 Our time
53.70 2nd place
53.68 3rd place
“You can figure this out girls, by doing the math,” Ms. Sutter said smiling.
Ms. Sutter is correct. Subtracting decimals is a way to figure out the difference between winning and coming insecond or third. What is the difference between last year’s time and this year’s? What is the difference betweensecond and first? What is the difference between first and third?
First, we find the difference between last year’s time and this year’s time. We subtract one time from theother. We line up our decimal points and subtract.
53.87
− 53.73
.14
The girls beat the previous year’s time by fourteen hundredths of a second. Wow, that is close!
Next, we look at the times between first and second place.
53.73
− 53.70
.03
The difference between first and second place was very close! The girls only won by three hundredths of asecond.
Finally, we can look at the difference between the first and third place finishes.
53.73−53.68 = .05
Wow! The first three teams had very close finishes!
Guided Practice
Here is one for you to try on your own.
Subtract 4.56−2.37
Answer
To subtract, we simply line up the digits according to place value and subtract.
2.19
This is our answer.
123
2.7. Decimal Subtraction www.ck12.org
Video Review
MEDIAClick image to the left or use the URL below.URL: http://www.ck12.org/flx/render/embeddedobject/5467
This is a James Sousa video on subtracting decimals.
Explore More
Directions: Find each difference.
1. 6.57 - 5.75
2. .0826 - .044
3. 19.315 - 6.8116
4. 2056.04 - 2044.1
5. 303.45 - 112.05
6. 16.576 - 8.43
7. 199.2 - 123.45
8. 1.0009 - .234
9. 789.12 - .876
10. 102.03 - .27
Directions: Find the difference after rounding each decimal to the nearest hundredth.
11. 63.385 - 50.508
12. .535 - .361
13. 747.005 - 47.035
14. .882 - .546
15. .9887 - .0245
124
www.ck12.org Chapter 2. Using Decimals
2.8 Decimal Subtraction Using Front-End Esti-mation
Here you’ll learn to estimate decimal differences using front-end estimation.
Remember the track question from the Decimal Subtraction Concept? Take a look.
The girls had won the Championship and had been re-thinking their times over a sundae.
Here are the times.
53.87 The winning time last year
53.73 The girls’ winning time this year
What is the difference between the two times?
You could simply subtract, but can you use front-end estimation to calculate the difference?
This Concept is all about how to use front-end estimation to find differences. Pay attention and you can dothis too at the end of the Concept.
Guidance
You probably use estimation—the process of finding an approximate solution to a problem—without even thinkingabout it. When you figure out how much money you might need to bring to the movies, you use estimation. Whenyou figure out how long you might wait for the bus, or how far it is to the corner store, you’re estimating values.
There are many different techniques for estimating, some of which provide “better” estimates than others.Rounding numbers before performing an operation is one way to find an estimate.
125

2.8. Decimal Subtraction Using Front-End Estimation www.ck12.org
Front-end estimation is another way to estimate.
Good question! Let’s review the steps to using front-end estimation.
The steps to front-end estimation when estimating decimal differences are a little different.
Because subtraction often requires regrouping, we need to subtract the two leftmost digits at the same time. All youdo is subtract the two front end—or leftmost—digits. If we were working with whole numbers, we would then needto insert zeros for the other place values. When working with decimals, however, we don’t need to do this. Wherethere are blank spaces at the end of decimals, zeros are assumed so put them in anyway.
Here are the steps:
Front-End Estimation for Subtraction:
–Subtract the two (leftmost) digits at the same time
Make a few notes on front-end estimation then continue.
Use front-end estimation to find the difference. 0.55373 - 0.27449
We’re going to use front-end estimation to subtract 0.27449 from 0.55373. Let’s line up our decimal points and takea closer look at the numbers. Then we’ll perform front-end estimation.
0.55373
0.27449
Front-end estimation tells us to subtract the two front or leftmost digits at the same time, so we want to subtract thetenths and hundredths places.
126
www.ck12.org Chapter 2. Using Decimals
0.55
− 0.27
0.28
The original numbers extended to the hundred-thousandth place, you should put them in to convince yourself thatyou could keep writing zeros to infinity but the value of the decimal will remain the same, so we don’t need to showthis.
Use front-end estimation to find the difference, 4.032 - 0.82
Let’s begin by lining up the decimal places—adding zeros as necessary—take a close look at the numbers. Thenwe’ll perform front-end estimation.
4.038
0.820
Front-end estimation tells us to subtract the two front or leftmost digits at the same time, so we want to subtract theones and the tenths places.
4.0
− 0.8
3.2
One of the numbers extended to the thousandth place but we hide the unnecessary zeros in our answer. Wheredecimals end, it is assumed that zeros extend on to infinity.
Use front-end estimation to find the following differences.
Example A
4.6712−1.34 =
Solution: 3.3
Example B
6.789−3.45 =
Solution: 3.3
Example C
5.023−2.346 =
Solution: 2.7
Now back to the original problem. Here it is once again.
127

2.8. Decimal Subtraction Using Front-End Estimation www.ck12.org
The girls had won the Championship and had been re-thinking their times over a sundae.
Here are the times.
53.87 The winning time last year
53.73 The girls’ winning time this year
What is the difference between the two times?
To find the difference using front-end estimation, we simply use the first two digits of each value. But because theyare the same and would equal 0, we are going to use the tenths place and the hundredths place.
.87
.73
.14
The difference between the two winning times is .14
Guided Practice
Here is one for you to try on your own.
Use front - end estimation to find this difference.
.22281− .1946
Answer
To work with this problem, we simply subtract the first two places after the decimal point. We are going to workwith the tenths and hundredths places.
.22
128
www.ck12.org Chapter 2. Using Decimals
.19
.22− .19 = .03
This is our answer.
Explore More
Directions: Use front-end estimation to estimate the following differences.
1. 4.57−2.34
2. 2.123−1.136
3. 8.913−2.047
4. 8.7651−2.345
5. 2.436−1.267
6. 18.527−9.431
7. 8.414−7.3214
8. 12.637−2.456
9. .671− .41
10. .643− .123
11. .912− .367
12. .456− .023
13. .48218− .1927
14. 10.5765−6.421192
15. .5075412− .45601
129
2.9. Inverse Property of Addition in Decimal Equations www.ck12.org
2.9 Inverse Property of Addition in DecimalEquations
Here you’ll learn to identify and apply the inverse property of addition in decimal operations with variable andnumerical expressions.
Have you ever ran a half marathon? Well, Kelly ran one and then ran a 5k too. Take a look.
Kelly ran a half marathon in 2.01 hours. She ran a 5k on the next day. Her total time for both races was 2.29 hours.
What was Kelly’s time for the 5k?
Can you write an equation with a variable that shows these values?
Then can you use the inverse property of addition to solve it?
Use this Concept to learn all about the inverse property of addition in decimal situations. Then you will beable to accomplish this task.
Guidance
The word “ inverse ” is one that is used in mathematics.
In fact, as you get into higher levels of math, you will see the word “inverse” used more often.
What do we mean when we use the word inverse?
The word inverse means opposite. Sometimes numbers are opposites of each other, and sometimes operations areopposites of each other too. Subtraction is called the inverse, or opposite, of addition. If you’ve ever used addition tocheck subtraction calculations, you already have a certain idea of the relationship between addition and subtraction.
The inverse property of addition states that for every number x,x+(−x) = 0. In other words, when you add x toits opposite, −x (also known as the additive inverse), the result is zero.
Adding a negative number is the same as subtracting that number.
Let’s put whole numbers in place of x to make the property clear: 3+(−3) = 0.
The inverse property of addition may seem obvious, but it has important implications for our ability to solve variableequations which aren’t easily solved using mental math—such as variable equations involving decimals.
Remember back to our work with equations and expressions in an earlier Concept?
Think about an equation. An equation is a number sentence where one expression is equal to another expression. Theinverse property of addition lets us add or subtract the same number to both sides of the equation without changingthe solution to the equation. This technique is called an inverse operation and it lets us get the variable x alone onone side of the equation so that we can find its value. Take a look at how it’s done.
x+5 = 15
x+5−5 = 15−5→ inverse operation means we subtract 5 from both sides
x = 10
Notice how, on the left side of the equation, +5−5 = 0, and cancels itself out leaving the x alone on the left side.
Our answer is that x is equal to 10.
Now let’s look at one where the two expressions in the equation are decimals.
130
www.ck12.org Chapter 2. Using Decimals
x+39.517 = 50.281
First, we need to isolate the variable. To do this, we can use the inverse operation. This is an addition problem,so we use subtraction to get the variable by itself. We subtract 39.517 from both sides of the equation.
x+39.517 = 50.281
x+39.517−39.517 = 50.281−39.517→ inverse operations: subtract 39.517 from both sides
x = 10.764
Notice how we subtracted 39.517 from both sides of the equation. Remember, both expressions on either sideof an equation must be equal at all times. Whatever operation you perform to one side of the equation, you mustperform to the other side.
In this instance, on the left side of the equation, +39.517−39.517 = 0, and cancels itself out leaving the x aloneon the left side. On the right side of the equation, 50.281 - 39.517 gives us the value of x.
Our answer is that x is equal to 10.764.
x−43.27 = 182.205
First, we need to isolate the variable. To do this, we can use the inverse operation. Notice that this is asubtraction problem. To isolate the variable we are going to use the inverse of subtraction which is addition.
x−43.27 = 182.205
x−43.27+43.27 = 182.205+43.27→ inverse operations: add 43.27 to both sides
x = 225.475
Notice how we added 43.27 to both sides of the equation. Remember, both expressions on either side of anequation must be equal at all times. Whatever operation you perform to one side of the equation, you mustperform to the other side. In this instance on the left side of the equation −43.27+ 43.27 = 0, and cancels itselfout leaving the x alone on the left side. On the right side of the equation, 182.205 + 43.27 gives us the value of x.
Our answer is that x is equal to 225.475.
Use the inverse property of addition to solve each equation.
Example A
x+5.678 = 12.765
Solution: 7.087
Example B
x−4.32 = 19.87
Solution: 24.19
Example C
x+123.578 = 469.333
131
2.9. Inverse Property of Addition in Decimal Equations www.ck12.org
Solution: 345.755
Here is the original problem once again. Use what you have learned to solve it.
Kelly ran a half marathon in 2.01 hours. She ran a 5k on the next day. Her total time for both races was 2.29 hours.
What was Kelly’s time for the 5k?
Can you write an equation with a variable that shows these values?
Then can you use the inverse property of addition to solve it?
First, let’s write an equation using the given information. We don’t know the time for the 5k, so this is our variable.
x+2.01 = 2.29
Now we can use the inverse operation for addition to solve.
x = 2.29−2.01
x = .28hours
Kelly ran the 5k in .28 hours, or 16.8 minutes.
Guided Practice
Here is one for you to try on your own.
At Saturday’s track meet, Liz ran 1.96 kilometers less than Sonya. Liz ran 1.258 kilometers. How many kilometersdid Sonya run?
Answer
The key words “less than” are a clue that this might be a subtraction equation.
In this problem, we are trying to find out the number of kilometers Sonya ran. We’ll give that value the variable x.We know how many kilometers Liz ran, and we know the subtraction relationship between the Liz’s distance andSonya’s distance, so we can write the equation x−1.96 = 1.258. Now we can solve for the value of x using inverseoperations.
x−1.96 = 1.258
x−1.96+1.96 = 1.258+1.96→ inverse operation, add 1.96 to both sides
x = 3.218
Remember to put the units of measurement in your answer!
The answer is 3.218 kilometers.
Video Review
MEDIAClick image to the left or use the URL below.URL: http://www.ck12.org/flx/render/embeddedobject/57625
This is a Khan Academy video on the inverse property of addition.
132
www.ck12.org Chapter 2. Using Decimals
Explore More
Directions: Solve each equation for the missing variable using the inverse operation.
1. x+2.39 = 7.01
2. x+5.64 = 17.22
3. x+8.07 = 18.12
4. x+14.39 = 17.342
5. x+21.3 = 87.12
6. x+31.9 = 77.22
7. x+18.77 = 97.12
8. x+21.31 = 27.09
9. x+18.11 = 87.22
10. 818.703 = 614.208+ x
11. x+55.27 = 100.95
Directions: Use equations to solve each word problem. Each answer should have an equation and a value for thevariable.
12. Jamal’s leek and potato soup calls for 2.45 kg more potatoes than leeks. Jamal uses 4.05 kg of potatoes. Howmany kilograms of leeks does he use? Write an equation and solve.
13. The distance east from Waterville to Longford is 67.729 kilometers. The distance west from Waterville toTranstown is 61.234 kilometers. What is the difference between the two distances? Write an equation and solve.
14. Sabrina spent $25.62 at the book fair. When she left the fair, she had $6.87. How much did money did she taketo the fair? Write an equation and solve.
15. Mr. Bodin has 11.25 liters of a cleaning solution, which is a combination of soap and water. If there are 2.75liters of soap in the solution, how many liters of water are in the solution? Write an equation and solve.
133
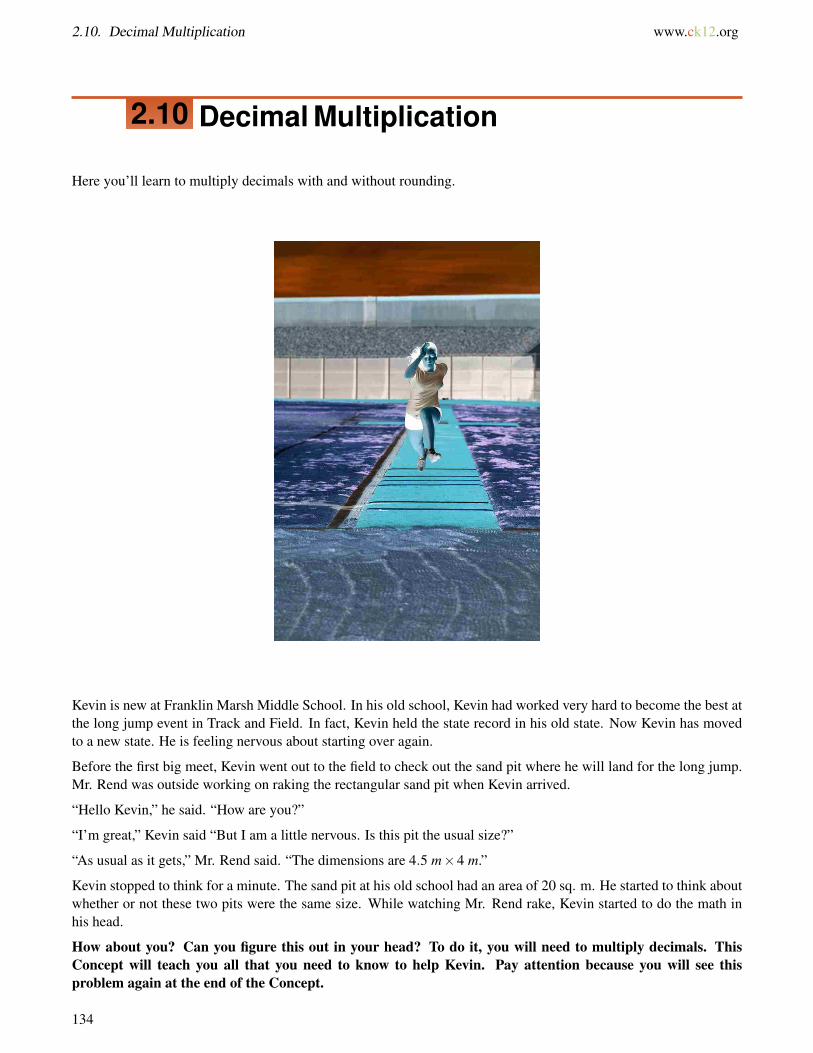
2.10. Decimal Multiplication www.ck12.org
2.10 Decimal Multiplication
Here you’ll learn to multiply decimals with and without rounding.
Kevin is new at Franklin Marsh Middle School. In his old school, Kevin had worked very hard to become the best atthe long jump event in Track and Field. In fact, Kevin held the state record in his old state. Now Kevin has movedto a new state. He is feeling nervous about starting over again.
Before the first big meet, Kevin went out to the field to check out the sand pit where he will land for the long jump.Mr. Rend was outside working on raking the rectangular sand pit when Kevin arrived.
“Hello Kevin,” he said. “How are you?”
“I’m great,” Kevin said “But I am a little nervous. Is this pit the usual size?”
“As usual as it gets,” Mr. Rend said. “The dimensions are 4.5 m×4 m.”
Kevin stopped to think for a minute. The sand pit at his old school had an area of 20 sq. m. He started to think aboutwhether or not these two pits were the same size. While watching Mr. Rend rake, Kevin started to do the math inhis head.
How about you? Can you figure this out in your head? To do it, you will need to multiply decimals. ThisConcept will teach you all that you need to know to help Kevin. Pay attention because you will see thisproblem again at the end of the Concept.
134
www.ck12.org Chapter 2. Using Decimals
Guidance
Using addition, subtraction, and multiplication gives us flexibility in solving real-world decimal problems. We haveexplored decimals: rounding, adding and subtracting, estimating sums and differences, writing equations and solvereal-world problems. In this lesson, we investigate decimals and the properties that govern multiplication. Let’s lookat some statements that use multiplication.
Jeff made five times more per hour than Alex; Peter ran twice as many kilometers as Ellen;
Audrey collected three times as many grams of strawberries as Trey; the length is three times as long as the width.
All these scenarios describe multiplication relationships between decimals.
How do we multiply decimals to find a product ?
Multiplying decimals is exactly like multiplying whole numbers—with one important difference.
There is a decimal point in your answer.
Follow these steps for decimal multiplication.
1. Line up the numbers on the right. Do not line up the decimal points, just the numbers.2. Multiply each digit just like usual3. Count the number of places after the decimal point in each original number.4. Then, in your answer, count the same number of places from right to left and place the decimal point in the
product.
Let’s walk through a simple multiplication problem.
3.25×1.2
3.25 → 2 decimal place
× 1.2 → 1 decimal places
650
+ 3250
3.900 → 3 decimal places (2 decimal places in 3.25 and 1 in 1.2 = 3 decimal places)
In our final product or answer in a multiplication problem, we can hide the extra zeros.
Our answer is 3.25×1.2 = 3.9.
Sometimes, it will make sense to round decimals to a certain place before multiplying. When you do this, youapply the same rules as you used when you were adding and subtracting. The key to rounding is to be surethat you aren’t looking for an exact answer. When you need an approximate answer, rounding is an excellentmethod of estimating.
Round the numbers to the nearest hundredth then find the product
3.748×8.095
This problem asks us to round each number to the hundredth place before multiplying.
As we have done in the past, to make the rounding steps clear, we underline the number we’re rounding to and boldor circle the number directly to the right of it. We’re rounding to the hundredth place, so we’ll round to the secondplace to the right of the decimal place. The bolded number, the thousandths place, is the one to look at when decidingto round up or down.
3.74 8→ rounded to the hundredth place→ 3.75
135
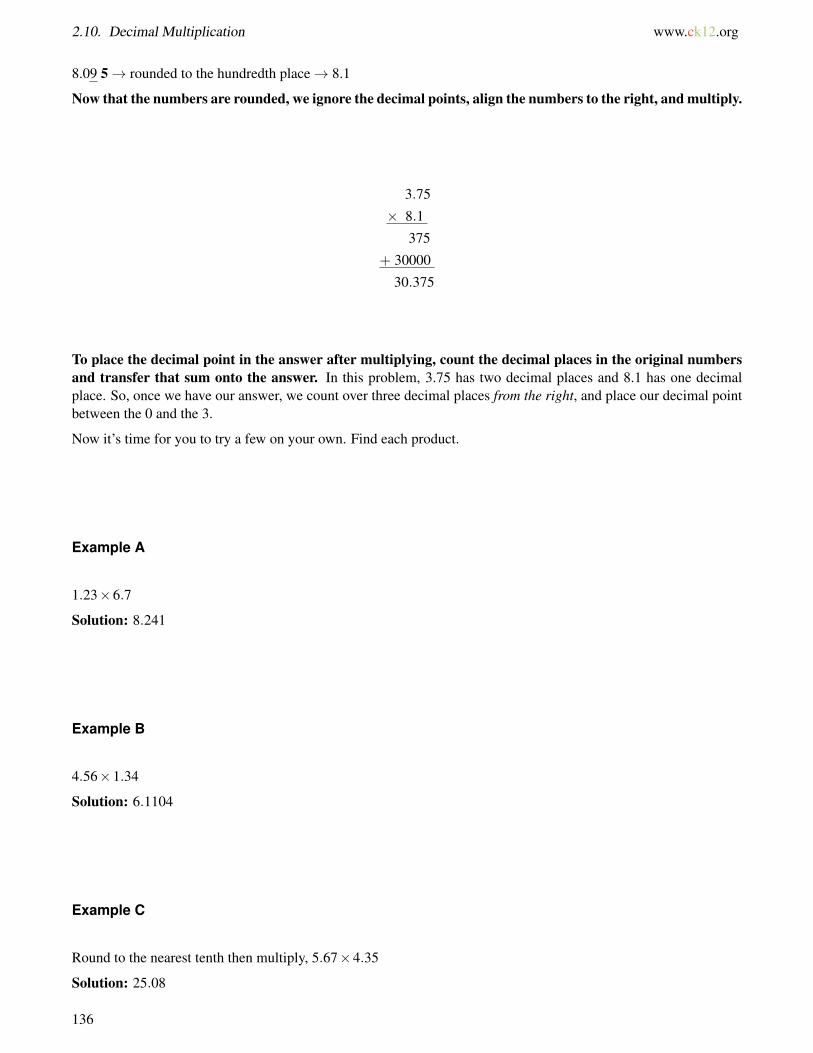
2.10. Decimal Multiplication www.ck12.org
8.09 5→ rounded to the hundredth place→ 8.1
Now that the numbers are rounded, we ignore the decimal points, align the numbers to the right, and multiply.
3.75
× 8.1
375
+ 30000
30.375
To place the decimal point in the answer after multiplying, count the decimal places in the original numbersand transfer that sum onto the answer. In this problem, 3.75 has two decimal places and 8.1 has one decimalplace. So, once we have our answer, we count over three decimal places from the right, and place our decimal pointbetween the 0 and the 3.
Now it’s time for you to try a few on your own. Find each product.
Example A
1.23×6.7
Solution: 8.241
Example B
4.56×1.34
Solution: 6.1104
Example C
Round to the nearest tenth then multiply, 5.67×4.35
Solution: 25.08
136
www.ck12.org Chapter 2. Using Decimals
Here is the original problem once again.
Kevin is new at Franklin Marsh Middle School. In his old school, Kevin had worked very hard to become the best atthe long jump event in Track and Field. In fact, Kevin held the state record in his old state. Now Kevin has movedto a new state. He is feeling nervous about starting over again.
Before the first big meet, Kevin went out to the field to check out the sand pit where he will land for the long jump.Mr. Rend was outside working on raking the rectangular sand pit when Kevin arrived.
“Hello Kevin,” he said. “How are you?”
“I’m great,” Kevin said “But I am a little nervous. Is this pit the usual size?”
“As usual as it gets,” Mr. Rend said. “The dimensions are 4.5 m×4 m.”
Kevin stopped to think for a minute. The sand pit at his old school had an area of 20 sq. m. He started to think aboutwhether or not these two pits were the same size. While watching Mr. Rend rake, Kevin started to do the math inhis head.
To solve this problem, we need to figure out if the two sand pits are the same size. First, we can round thedimensions to make the multiplication easier. This will give us an estimate and not an exact answer.
4.5 rounds up to 5
4 stays the same
5×4 = 20 sq.meters
If we rounded, the pits would be the same size. Since the dimension is 4.5 and not 5, we know that the pit issmaller than the one at Kevin’s old school. We can multiply 4.5×5 and get the exact dimension of the pit.
137
2.10. Decimal Multiplication www.ck12.org
4.5
× 4
18.0
The area of the sand pit is 18 sq. meters.
Kevin thought about this for a minute. The difference wouldn’t be that large. Kevin would be fine during thecompetition!
Guided Practice
Here is one for you to try on your own.
Round to the nearest tenth and then multiply.
5.68×1.38
Answer
First, round each value to the nearest tenth.
5.68 = 5.7
1.38 = 1.4
5.7×1.4 = 7.98
This is our answer.
Video Review
MEDIAClick image to the left or use the URL below.URL: http://www.ck12.org/flx/render/embeddedobject/5330
This is a James Sousa video on multiplying decimals.
Explore More
Directions: Find the products.
1. 12.7×0.8
2. 0.552×0.3
3. 6.09×3.34
4. 25.6×0.72
5. 56.71× .34
6. .45×4.3
138
www.ck12.org Chapter 2. Using Decimals
7. 1.234×7.8
Directions: Find the product after rounding each decimal to the nearest tenth.
8. 33.076×5.228
9. 9.29×0.6521
10. 4.5513×4.874
11. 12.48×7.95
12. 14.56×4.52
13. 8.76×1.24
14. 9.123×6.789
15. 9.3323×8.719
139
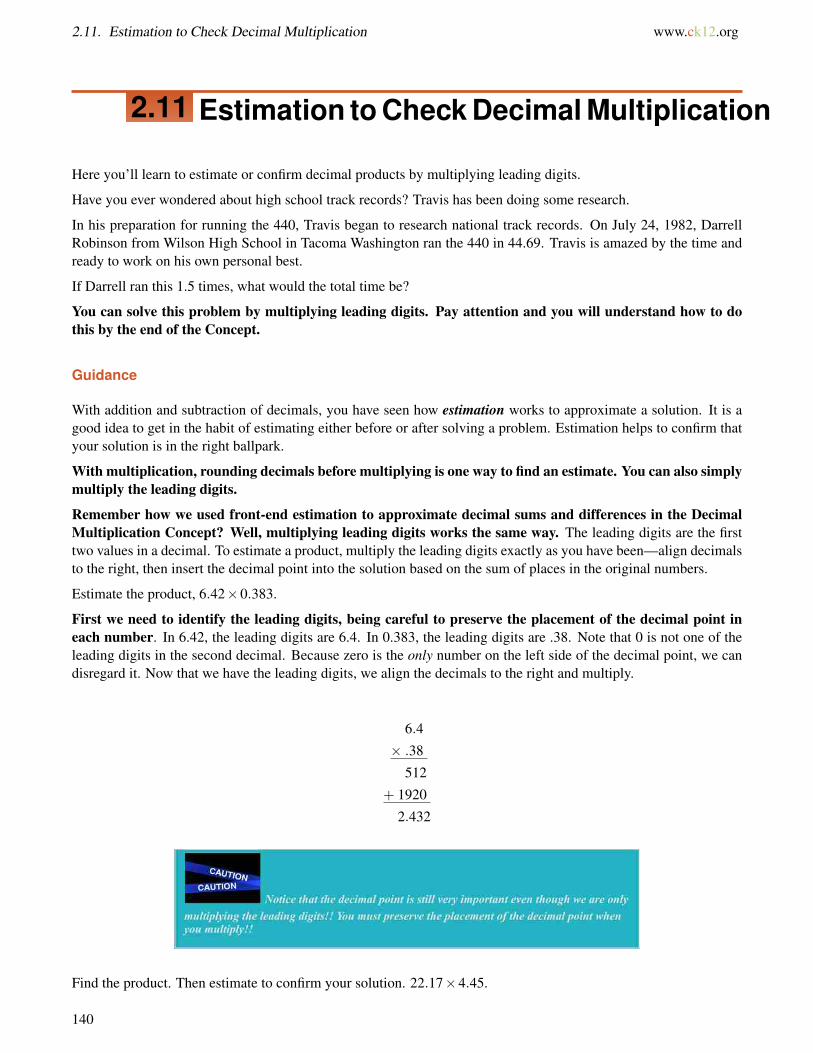
2.11. Estimation to Check Decimal Multiplication www.ck12.org
2.11 Estimation to Check Decimal Multiplication
Here you’ll learn to estimate or confirm decimal products by multiplying leading digits.
Have you ever wondered about high school track records? Travis has been doing some research.
In his preparation for running the 440, Travis began to research national track records. On July 24, 1982, DarrellRobinson from Wilson High School in Tacoma Washington ran the 440 in 44.69. Travis is amazed by the time andready to work on his own personal best.
If Darrell ran this 1.5 times, what would the total time be?
You can solve this problem by multiplying leading digits. Pay attention and you will understand how to dothis by the end of the Concept.
Guidance
With addition and subtraction of decimals, you have seen how estimation works to approximate a solution. It is agood idea to get in the habit of estimating either before or after solving a problem. Estimation helps to confirm thatyour solution is in the right ballpark.
With multiplication, rounding decimals before multiplying is one way to find an estimate. You can also simplymultiply the leading digits.
Remember how we used front-end estimation to approximate decimal sums and differences in the DecimalMultiplication Concept? Well, multiplying leading digits works the same way. The leading digits are the firsttwo values in a decimal. To estimate a product, multiply the leading digits exactly as you have been—align decimalsto the right, then insert the decimal point into the solution based on the sum of places in the original numbers.
Estimate the product, 6.42×0.383.
First we need to identify the leading digits, being careful to preserve the placement of the decimal point ineach number. In 6.42, the leading digits are 6.4. In 0.383, the leading digits are .38. Note that 0 is not one of theleading digits in the second decimal. Because zero is the only number on the left side of the decimal point, we candisregard it. Now that we have the leading digits, we align the decimals to the right and multiply.
6.4
× .38
512
+ 1920
2.432
Find the product. Then estimate to confirm your solution. 22.17×4.45.
140
www.ck12.org Chapter 2. Using Decimals
This problem asks us to perform two operations—straight decimal multiplication followed by estimation.Let’s start multiplying just as we’ve learned: aligning the decimals to the right and multiplying as if they were wholenumbers.
22.17
× 4.45
11085
88680
+ 886800
98.6565
Note the placement of the decimal point in the answer. The original factors both have two decimal places, soonce we have our answer, we count over four decimal places from the right, and place the decimal point between the8 and the 6.
Now that we have multiplied to find the answer, we can use estimation to check our product to be sure thatit is accurate. We can use the method multiplying leading digits. First, we reduce the numbers to their leadingdigits, remaining vigilant as to the placement of the decimal point. The leading digits of 22.17 are 22. The leadingdigits of 4.45 are 4.4. Now we can multiply.
22
× 4.4
88
+ 880
96.8
If you look at the two solutions, 98.6 and 96.8, you can see that they are actually very close. Our estimate isvery close to the actual answer. We can trust that our answer is accurate.
Find each product. Use multiplying leading digits to check your answer.
141
2.11. Estimation to Check Decimal Multiplication www.ck12.org
Example A
67.9×1.2
Solution:80.4
Example B
5.321×2.301
Solution: 12.19
Example C
8.713×9.1204
Solution: 79.17
Here is the original problem once again.
In his preparation for running the 440, Travis began to research national track records. On July 24, 1982, DarrellRobinson from Wilson High School in Tacoma Washington ran the 440 in 44.69. Travis is amazed by the time andready to work on his own personal best.
If Darrell ran this 1.5 times, what would the total time be?
To figure this out, we can first write a problem showing only the leading digits.
44×1.5
Next, we multiply.
66
If Darrell had run this distance 1.5 times, his total time would be about 66 minutes.
Guided Practice
Here is one for you to try on your own.
.4561× .32109
Answer
To multiply by using leading digits, we need to identify the leading digits first.
.45
.32
Now we multiply.
.45× .32 = .144
This is our answer.
Video Review
142
www.ck12.org Chapter 2. Using Decimals
MEDIAClick image to the left or use the URL below.URL: http://www.ck12.org/flx/render/embeddedobject/57630
This is a Khan Academy video on multiplying decimals.
Explore More
Directions: Estimate the products by multiplying the leading digits.
1. 7.502×0.9281
2. 46.14×2.726
3. 0.39828×0.16701
4. 83.243×6.517
5. 5.67× .987
6. 7.342×1.325
7. 17.342× .325
8. .34291×1.525
9. .5342× .87325
10. .38942× .9825
11. 7.567×3.325
12. 12.342×11.325
13. 21.342×14.555
14. .110342× .098325
15. 37.1342×1.97325
143

2.12. Commutative Property of Multiplication with Decimals www.ck12.org
2.12 Commutative Property of Multiplicationwith Decimals
Here you’ll learn to identify and apply the commutative and associative properties of multiplication in decimaloperations using numerical and variable expressions.
Have you ever been on a long car trip?
One day during their visit, Marc and Kara went on a ride out to the Berkshires with their grandparents. The car thatthey drove in gets 25 miles per gallon and they traveled 160.5 miles. They traveled the same distance on the wayback.
How many gallons of gas were needed for the trip?
Do you know how to write this as an expression?
How about as an equation?
Can you solve it?
This Concept is about using the commutative property of multiplication in decimal operations. You will beable to answer these questions at the end of the Concept.
Guidance
Previously we worked on multiplying decimals, now we can apply two mathematical properties which govern mul-tiplication. Remember the Commutative Property of Addition with Decimals Concept? Well, both propertiesalso relate to multiplication.
The Commutative Property of Multiplication states that the order of the factors does not change the product. The Commutative Property of Multiplication works also works for four, five, six factors. It works for decimalfactors, too. Let’s test the property using simple whole numbers.
2×3 = 6 2×3×4 = 24 3×2×4 = 24 4×3×2 = 24
3×2 = 6 2×4×3 = 24 3×4×2 = 24 4×2×3 = 24
As you see, when there are two factors (2 and 3) and when there are three factors (2, 3, and 4), the order ofthe factors does not change the solution.
144
www.ck12.org Chapter 2. Using Decimals
Many people commute to work each day. If you think about it, the Commutative Property applies here too. Itdoesn’t matter whether people take a train, subway, bus or car the end destination is the same. The result doesn’tchange no matter how you get there.
What about the Associative Property of Multiplication?
From the order of operations, we know that operations in parentheses must be completed before any other operation,but the Associative Property of Multiplication states that the way in which factors are grouped does not changethe product. The Associate Property of Multiplication works for multiple addends as well as decimal addends. Onceagain, let’s test the property using simple whole numbers.
(2×3)×4 = 24 (2×4)×3 = 24 (3×4)×2 = 24
That is a great question. It is one that we can answer by thinking about expressions and equations. We havelearned how to simplify expressions and how to solve equations. These two properties are extremely usefulfor simplifying expressions and solving equations.
Recall that an algebraic expression is a mathematical phrase involving letters, numbers, and operation sym-bols. An equation is a mathematical statement that two expressions are equal.
Let’s apply this.
Simplify 29.3(12.4x)
When you simplify an expression, you perform all the operations you can—without knowing the value ofthe variable. Remember, the Commutative Property of Multiplication states that it doesn’t matter what order wemultiply the factors and the Associative Property of Multiplication states that the way in which the factors aregrouped doesn’t change the product. To simplify these expressions then, we want to multiply all the decimals wecan and put the variable beside the product.
If we simplify this expression, we multiply the number parts and add the variable to the end.
Our answer is 363.32x.
Notice that we are simplifying here not solving!!
145

2.12. Commutative Property of Multiplication with Decimals www.ck12.org
Solve for the value of x in the following equation, (0.3x)×0.4 = 0.144
The first thing to notice is that we are solving this equation, not simplifying. Next, we apply the properties. TheAssociate Property of Multiplication tells us that we can ignore the parentheses. The Commutative Propertyof Multiplication tells us that it doesn’t matter which order we multiply. So let’s start by multiplying 0.3×0.4.As usual, we align the numbers to the right and ignore the decimal points until we have our answer.
0.3
× 0.4
0.12
Because each of the factors has one decimal place, our answer has two decimal places. We add the zero in theones place to make the decimal places clearer.
Now that we know the product of two of the decimals on the left side of the equation, we can write a simplerequation.
0.12x = 0.144.
We know that the equal sign indicates that both sides of the equation have the same value. So x must be a factor that,when multiplied by 0.12 equals 0.144.
Let’s solve using mental math. What do you recognize about 0.12 and 0.144? 12×12 = 144, so x must be someversion of 12. The product (0.144) has three decimal places, so x must have one decimal place, because the otherfactor (0.12) has two decimal places.
x must be 1.2. Let’s double-check.
0.12
× 1.2
24
+ 120
0.144
x = 1.2
Our answer is 1.2.
Use the two properties as you simplify and solve for the missing variable.
Example A
Solve 4.5x(3) = 27
Solution:x = 2
Example B
Simplify 3.45y when y = 2.3
Solution:7.935
146
www.ck12.org Chapter 2. Using Decimals
Example C
Solve 3.4x = 23.8
Solution:x = 7
Here is the original problem once again.
One day during their visit, Marc and Kara went on a ride out to the Berkshires with their grandparents. The car thatthey drove in gets 25 miles per gallon and they traveled 160.5 miles. They traveled the same distance on the wayback.
How many gallons of gas were needed for the trip?
Do you know how to write this as an expression?
How about as an equation?
Can you solve it?
First, let’s write an expression to describe the situation.
We know the number of miles per gallon and the number of gallons is our unknown.
25g
Then we know how many miles were traveled. This helps change our expression to an equation.
25g = 160.5
We can solve it by using the inverse property of multiplication. We divide 160.5 by 25. This will tell us how manygallons were needed for the trip.
6.42
It was a little less than 6 and a half gallons of gasoline for the trip.
Guided Practice
Here is one for you to try on your own.
Simplify the following expression.
4.5(9.2)y
Answer
To simplify this expression, we can multiply the two decimals first.
4.5(9.2) = 41.4
Next, we add the variable.
Our final answer is 41.4y.
Video Review
147
2.12. Commutative Property of Multiplication with Decimals www.ck12.org
MEDIAClick image to the left or use the URL below.URL: http://www.ck12.org/flx/render/embeddedobject/54833
This is a video on the commutative law of multiplication.
MEDIAClick image to the left or use the URL below.URL: http://www.ck12.org/flx/render/embeddedobject/57619
This is a video on the associative law of multiplication
Explore More
Directions: Simplify the following expressions.
1. (4.21×8.8)× p
2. 16.14×q×6.2
3. 3.6(91.7x)
4. 5.3r(2.8)
5. 5.6x(3.8)
6. 2.4y(2.8)
7. 6.7x(3.1)
8. 8.91r(2.3)
9. 5.67y(2.8)
10. 4.53x(2.2)
11. 5.6(2.8x)
12. 9.2y(3.2)
13. 4.5x(2.3)
14. 15.4x(12.8)
15. 18.3y(14.2)
148
www.ck12.org Chapter 2. Using Decimals
2.13 Decimal Division
Here you’ll learn to divide decimals with and without rounding.
Have you ever volunteered at an animal shelter? Well, look at what Leah did during her time at the shelter.
On Saturday, Leah went to the animal shelter to volunteer. She was in charge of feeding a bunch dogs. She wasgiven 26.5 pounds of dog food and a .5 pound scoop to use to fill each dog bowl.
Given this amount of food and the size of the scoop, how many dog bowls could she fill?
To figure this out, you will need to know how to divide decimals. This Concept will teach you what you needto know.
Guidance
Division is useful any time that you want to split up an object or a group of objects. We divide all the time. In thereal world division is very important. While you have been dividing whole numbers since elementary school, now itis time for you to learn how to divide decimals.
Dividing decimals is like dividing whole numbers. Dividing a divisor into a dividend gives a quotient.quotient
divisor)dividend
Division of decimals also has special rules for how to deal with the decimal point.
Our place-value system is based on 10. Anytime we multiply by 10, we can move the decimal point to the right thenumber of places per multiple of 10.
4.55×10 = 45.5
Notice that we multiplied by 10 so we moved the decimal point one place to the right.
4.55×100 = 455.
Notice that here we multiplied by 100, so we moved the decimal point two places to the right because 10×10is 100. Two tens = two decimal places.
The first step to dividing decimals is to move the divisor’s decimal point all the way to the right.
When we move the decimal point in the divisor to the right until it is a whole number, we also move a decimal pointthe same number of places in the dividend.
2.3)4.6
2.3 is our divisor and 4.6 is the dividend. We need to make the divisor into a whole number. To do this, we onlyhave to move the decimal point one place to the right. That is the same as multiplying by 10.
2.3×10 = 23
If we do this to the divisor, we have to do it to the dividend too. We multiply the dividend by 10 to move thedecimal one place to the right.
4.6×10 = 46
Now we can divide.2
23)46
149
2.13. Decimal Division www.ck12.org
Our answer is 2.
What if there aren’t enough places in the dividend to move the decimal point?
If there aren’t enough places in the dividend, then we can add zeros.
2.25)9
First, we need to make the divisor into a whole number. There are two places after the decimal point, so weneed to multiply by 100.
2.25×100 = 225
We also have to do this with the dividend. To move the decimal point two places after the nine, we have to addtwo zero.
9×100 = 900
Now we can divide.4
225)900
Our answer is 4.
Take a few notes on how to move the decimal point in the divisor and dividend and then continue the Concept.
You have already seen how rounding can help us when estimating in addition, subtraction and multiplicationproblems. Rounding can also be useful when dividing. Sometimes, you will need to round before dividing andsometimes, you will need to round after dividing.
Pay attention and be sure to round to the designated place only.
Round each number to the nearest tenth, then divide, 67.521÷2.243
This problem asks us to round each number to the tenth place before dividing.
The rounding steps: underline the number we’re rounding to and bold or circle the number directly to the right ofit.
We’re rounding to the tenth place, so we’ll round to the place directly to the right of the decimal place.
The bolded number, the hundredths place, is the one to look at when deciding to round up or down.
150
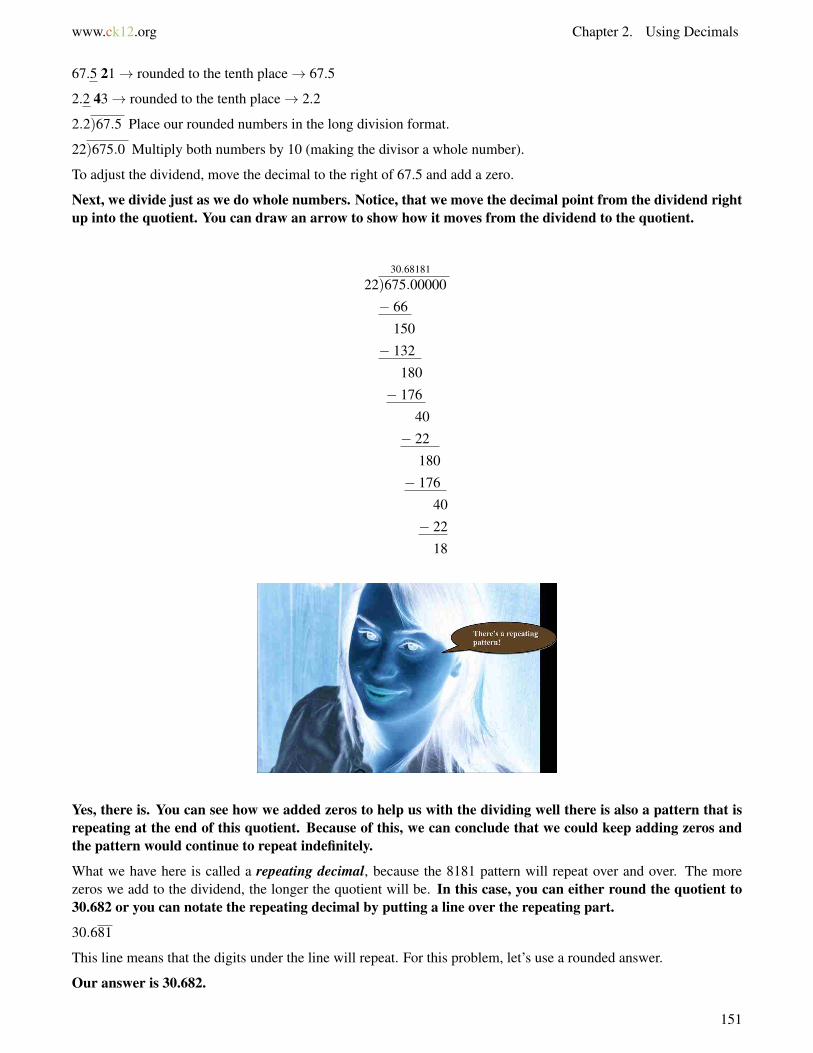
www.ck12.org Chapter 2. Using Decimals
67.5 21→ rounded to the tenth place→ 67.5
2.2 43→ rounded to the tenth place→ 2.2
2.2)67.5 Place our rounded numbers in the long division format.
22)675.0 Multiply both numbers by 10 (making the divisor a whole number).
To adjust the dividend, move the decimal to the right of 67.5 and add a zero.
Next, we divide just as we do whole numbers. Notice, that we move the decimal point from the dividend rightup into the quotient. You can draw an arrow to show how it moves from the dividend to the quotient.
30.68181
22)675.00000
− 66
150
− 132
180
− 176
40
− 22
180
− 176
40
− 22
18
Yes, there is. You can see how we added zeros to help us with the dividing well there is also a pattern that isrepeating at the end of this quotient. Because of this, we can conclude that we could keep adding zeros andthe pattern would continue to repeat indefinitely.
What we have here is called a repeating decimal, because the 8181 pattern will repeat over and over. The morezeros we add to the dividend, the longer the quotient will be. In this case, you can either round the quotient to30.682 or you can notate the repeating decimal by putting a line over the repeating part.
30.681
This line means that the digits under the line will repeat. For this problem, let’s use a rounded answer.
Our answer is 30.682.
151
2.13. Decimal Division www.ck12.org
Now try a few on your own. Divide each to find a quotient.
Example A
3.96÷1.2
Solution: 3.3
Example B
24.288÷9.6
Solution: 2.53
Example C
Round to the nearest tenth, then divide, 4.721÷2.465
Solution: 4.7÷2.5 = 1.88
Here is the original problem once again.
On Saturday, Leah went to the animal shelter to volunteer. She was in charge of feeding a bunch dogs. She wasgiven 26.5 pounds of dog food and a .5 pound scoop to use to fill each dog bowl.
Given this amount of food and the size of the scoop, how many dog bowls could she fill?
To figure this out, we can begin by writing a division problem.
We divide the number of pounds of dog food by the scoop.
26.5÷ .5
Now we divide.
53
Leah can fill 53 dog bowls before she runs out of food.
Guided Practice
Here is a real world example for you to solve. It uses the formula for area that you learned in an earlier Concept.
The Landry’s living room has an area of 97.92 m2 and a length of 13.6 meters. What is the width of the living room?
Answer
Remember the formula for finding the area of a rectangle?
A = lw.
In this problem, we are given the area and the length. We need to substitute those values into the formula and solvefor the width.
152
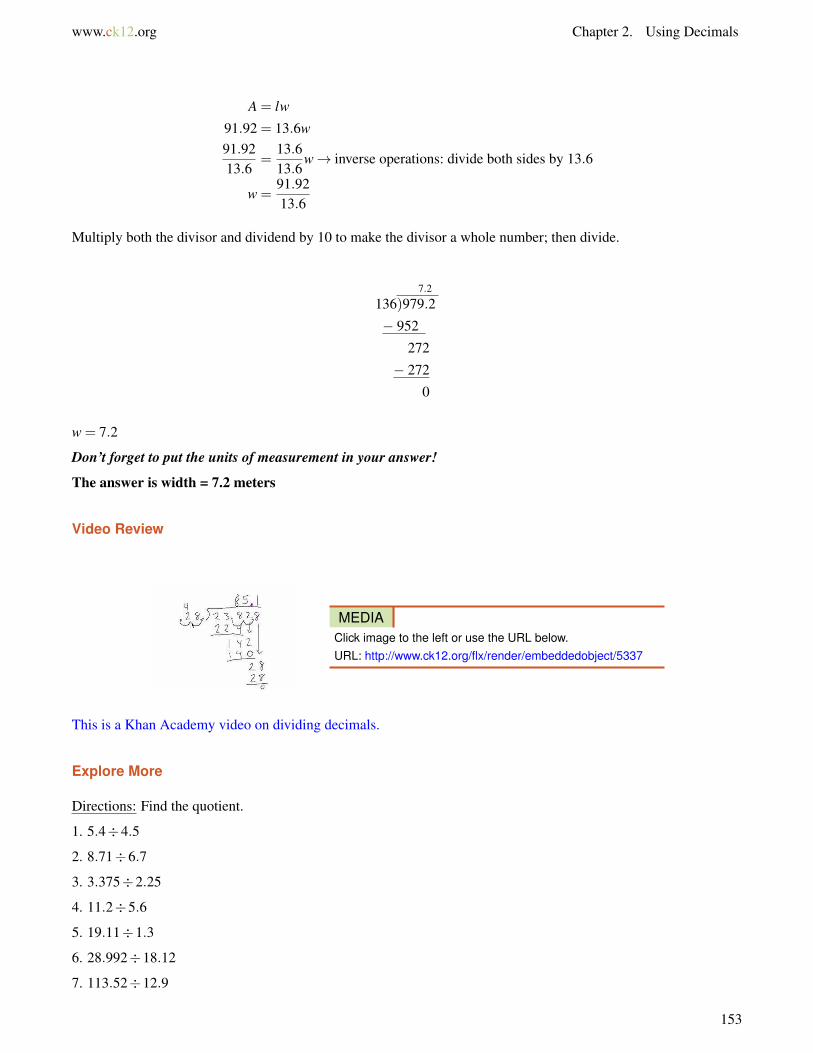
www.ck12.org Chapter 2. Using Decimals
A = lw
91.92 = 13.6w91.9213.6
=13.613.6
w→ inverse operations: divide both sides by 13.6
w =91.9213.6
Multiply both the divisor and dividend by 10 to make the divisor a whole number; then divide.
7.2
136)979.2
− 952
272
− 272
0
w = 7.2
Don’t forget to put the units of measurement in your answer!
The answer is width = 7.2 meters
Video Review
MEDIAClick image to the left or use the URL below.URL: http://www.ck12.org/flx/render/embeddedobject/5337
This is a Khan Academy video on dividing decimals.
Explore More
Directions: Find the quotient.
1. 5.4÷4.5
2. 8.71÷6.7
3. 3.375÷2.25
4. 11.2÷5.6
5. 19.11÷1.3
6. 28.992÷18.12
7. 113.52÷12.9
153
2.13. Decimal Division www.ck12.org
8. 31.93÷3.1
9. 46.125÷6.15
10. 84.28÷17.2
Directions: Find the quotient then rounding each answer to the nearest hundredth.
11. 113.409÷25.21
12. 81.862÷6.4
13. 377.15÷1.54
14. 9.17÷4.5
15. 7.56÷2.12
154
www.ck12.org Chapter 2. Using Decimals
2.14 Estimation to Check Decimal Division
Here you’ll learn to estimate and confirm decimal quotients by dividing leading digits.
Have you ever been to a science lab?
While at the science museum, Marc enjoyed looking at the scientists that were working in the lab. They wereworking with microscopes and tiny fragments of materials. Marc wasn’t even sure what they were working on, butit was fascinating to see real scientists at work in a lab.
On the board there was this problem written.
.36007809÷ .0234
Marc is curious how to figure this out. He knows that there is a short-cut, but isn’t sure what it is.
To figure this out, Marc can divide leading digits. This Concept will show you how to confirm decimalquotients by dividing leading digits.
Guidance
Estimation is a process by which we approximate solutions. Estimating either before or after solving a problemhelps to generalize or confirm a solution.
Rounding decimals before division is one way to find an estimate. You can also simply divide the leading digits.
Previously we worked on how to estimate products by multiplying the leading digits.
Estimating quotients works the same way. Leading digits are the first two values in a decimal. To estimate a quotient,divide the leading digits exactly as you have been—move the decimal point in the divisor to make it a whole number,adjust the decimal point in the dividend accordingly, then divide, inserting the decimal point in the solution in linewith its position in the dividend.
Estimate the quotient. 7.882÷ .4563
To estimate, we are going to work with only the leading digits, or the first two.
Let’s examine the decimals and reduce them to their leading digits.
7.882→ 7.8 and .4563→ .45.
Now let’s move the decimal point in the divisor and dividend.
In long-division form, we have .45)7.8 so we’re going to multiply both numbers by 100 and move the decimalpoints two places to the right: 45)780 . Notice how we added a zero to the end of the dividend to make the move ofthe decimal point possible.
Now we can divide.
155
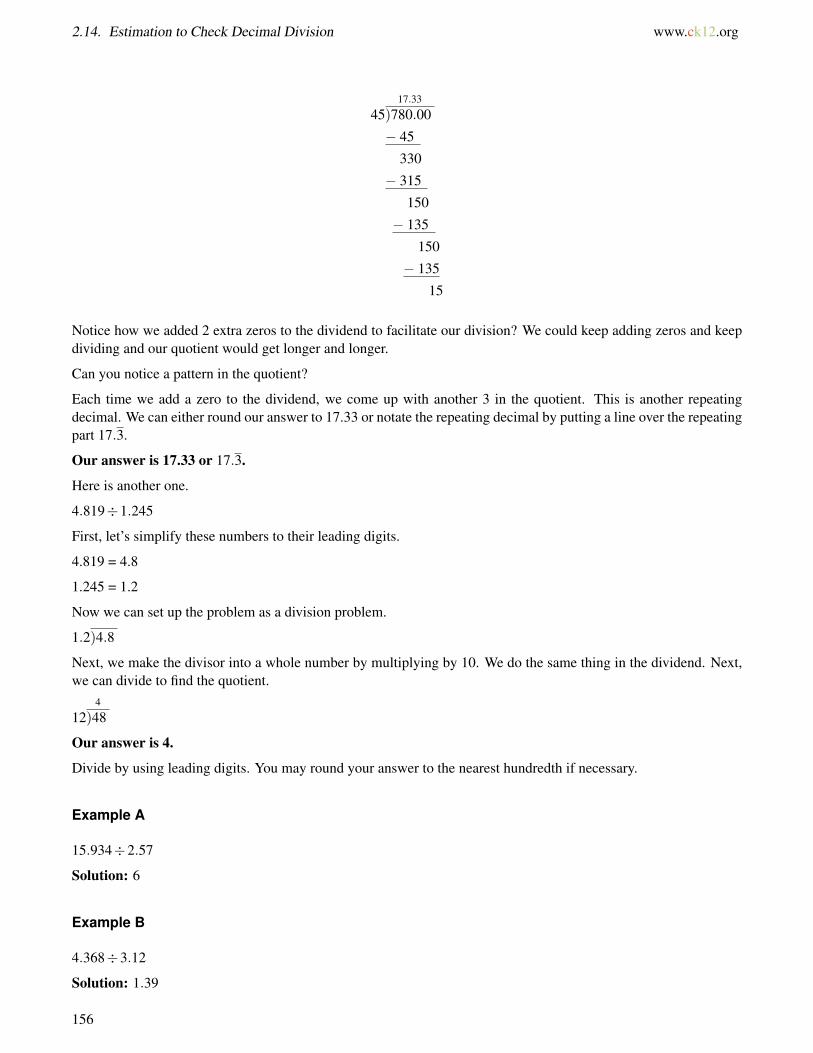
2.14. Estimation to Check Decimal Division www.ck12.org
17.33
45)780.00
− 45
330
− 315
150
− 135
150
− 135
15
Notice how we added 2 extra zeros to the dividend to facilitate our division? We could keep adding zeros and keepdividing and our quotient would get longer and longer.
Can you notice a pattern in the quotient?
Each time we add a zero to the dividend, we come up with another 3 in the quotient. This is another repeatingdecimal. We can either round our answer to 17.33 or notate the repeating decimal by putting a line over the repeatingpart 17.3.
Our answer is 17.33 or 17.3.
Here is another one.
4.819÷1.245
First, let’s simplify these numbers to their leading digits.
4.819 = 4.8
1.245 = 1.2
Now we can set up the problem as a division problem.
1.2)4.8
Next, we make the divisor into a whole number by multiplying by 10. We do the same thing in the dividend. Next,we can divide to find the quotient.
4
12)48
Our answer is 4.
Divide by using leading digits. You may round your answer to the nearest hundredth if necessary.
Example A
15.934÷2.57
Solution: 6
Example B
4.368÷3.12
Solution: 1.39
156
www.ck12.org Chapter 2. Using Decimals
Example C
6.16÷1.12
Solution: 5.55
Here is the original problem once again.
While at the science museum, Marc enjoyed looking at the scientists that were working in the lab. They wereworking with microscopes and tiny fragments of materials. Marc wasn’t even sure what they were working on, butit was fascinating to see real scientists at work in a lab.
On the board there was this problem written.
.36007809÷ .0234
Marc is curious how to figure this out. He knows that there is a short - cut, but isn’t sure what it is.
First, we can identify the leading digits.
.36007809 = .36
.0234 = .02
Now we write our new division problem.
.36÷ .02
Next, we divide.
Our answer is 18.
Guided Practice
Here is one for you to try on your own.
Divide by using leading digits. Round the quotient to the nearest tenth if necessary.
6.4256÷2.2453
Answer
First, we identify the leading digits.
6.4
1.2
Now we can set up a division problem and divide.
6.4÷2.2 = 2.9090909
Notice the repeating pattern in the quotient, but we can round to the nearest tenth.
2.9
This is our answer.
Explore More
Directions: Estimate the quotient by dividing the leading digits. You can round your answer to the nearest tenthwhen necessary.
1. 4.992÷ .07123
2. 1.8921÷6.0341
157
2.14. Estimation to Check Decimal Division www.ck12.org
3. 26.2129÷1.3612
4. 1.00765÷ .25
5. 36.2129÷2.5612
6. .42129÷ .15612
7. 6.4129÷2.2612
8. 26.2129÷13.5612
9. 8.2129÷2.2612
10. 42.2129÷8.2612
11. 16.2129÷4.1612
12. 19.0029÷3.599
13. .45632÷ .09123
14. 8.765÷1.098
15. .145632÷ .701023
158
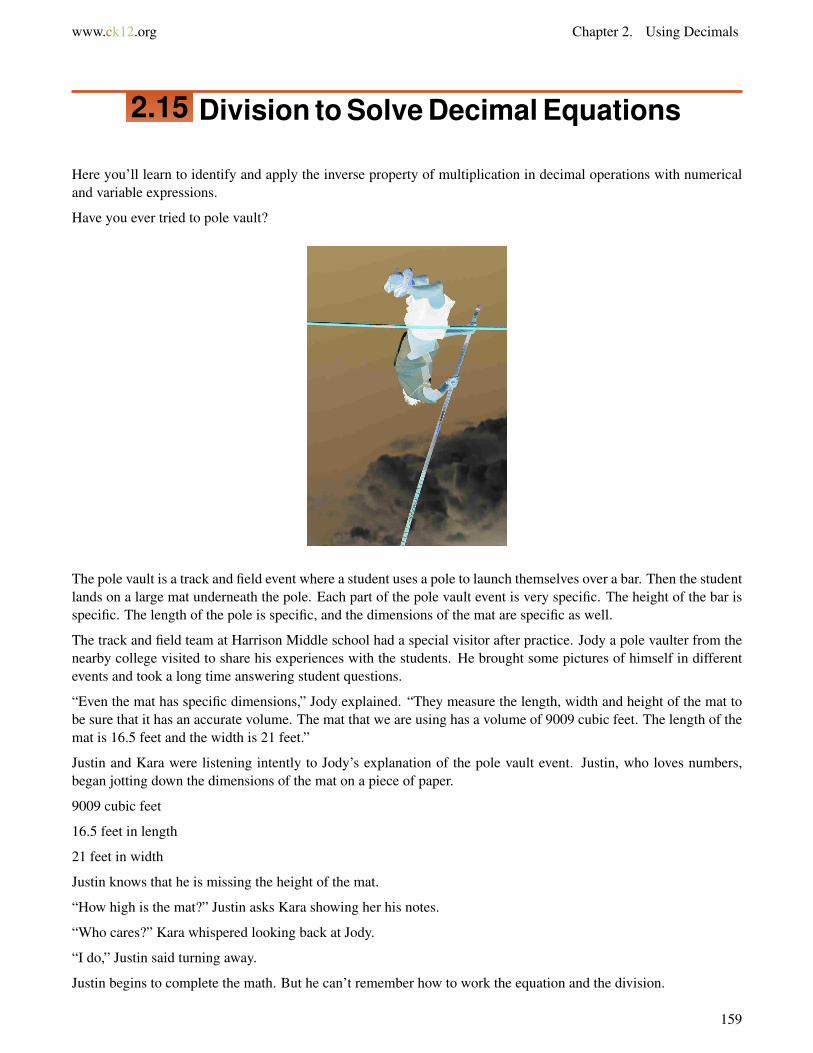
www.ck12.org Chapter 2. Using Decimals
2.15 Division to Solve Decimal Equations
Here you’ll learn to identify and apply the inverse property of multiplication in decimal operations with numericaland variable expressions.
Have you ever tried to pole vault?
The pole vault is a track and field event where a student uses a pole to launch themselves over a bar. Then the studentlands on a large mat underneath the pole. Each part of the pole vault event is very specific. The height of the bar isspecific. The length of the pole is specific, and the dimensions of the mat are specific as well.
The track and field team at Harrison Middle school had a special visitor after practice. Jody a pole vaulter from thenearby college visited to share his experiences with the students. He brought some pictures of himself in differentevents and took a long time answering student questions.
“Even the mat has specific dimensions,” Jody explained. “They measure the length, width and height of the mat tobe sure that it has an accurate volume. The mat that we are using has a volume of 9009 cubic feet. The length of themat is 16.5 feet and the width is 21 feet.”
Justin and Kara were listening intently to Jody’s explanation of the pole vault event. Justin, who loves numbers,began jotting down the dimensions of the mat on a piece of paper.
9009 cubic feet
16.5 feet in length
21 feet in width
Justin knows that he is missing the height of the mat.
“How high is the mat?” Justin asks Kara showing her his notes.
“Who cares?” Kara whispered looking back at Jody.
“I do,” Justin said turning away.
Justin begins to complete the math. But he can’t remember how to work the equation and the division.
159
2.15. Division to Solve Decimal Equations www.ck12.org
This is where you come in. Pay attention to this Concept. By the end of it, you will need to help Justin withhis dilemma.
Guidance
Sometimes division is called the inverse, or opposite, of multiplication. This means that division will “undo”multiplication.
5×6 = 30
30÷6 = 5
See how that works? You can multiply two factors to get a product. Then when you divide the product by one factor,you get the other factor.
The Inverse Property of Multiplication states that for every number x,x(1
x
)= 1.
In other words, when you multiply x by its opposite, 1x (also known as the multiplicative inverse), the result is one.
Let’s put whole numbers in place of x to make the property clear: 3×(1
3
)= 3
3 = 1. The Inverse Property ofMultiplication may seem obvious, but it has important implications for our ability to solve variable equations whicharen’t easily solved using mental math—such as variable equations involving decimals.
How does this apply to our work with equations?
With equations, the two expressions on either side of the equal sign must be equal at all times. The InverseProperty of Multiplication lets us multiply or divide the same number to both sides of the equation withoutchanging the solution to the equation. This technique is called an inverse operation and it lets us get the variablex alone on one side of the equation so that we can find its value. Take a look at how it’s done.
5x = 155x5
=155→ inverse operation = divide 5 from both sides
x = 3
Remember how we said that division can “undo” multiplication? Well, this is a situation where that has happened.
Notice how, on the left side of the equation, 55 = 1, leaving the x alone on the left side. This is very instinctual to us.
Once you have been working with equations, it comes naturally that when you divide a number by itself the answeris 1 and that has the variable be by itself on that side of the equals. After a while, we don’t even think about it, but itis still important to point out.
Solve 2.7x = 3.78
160
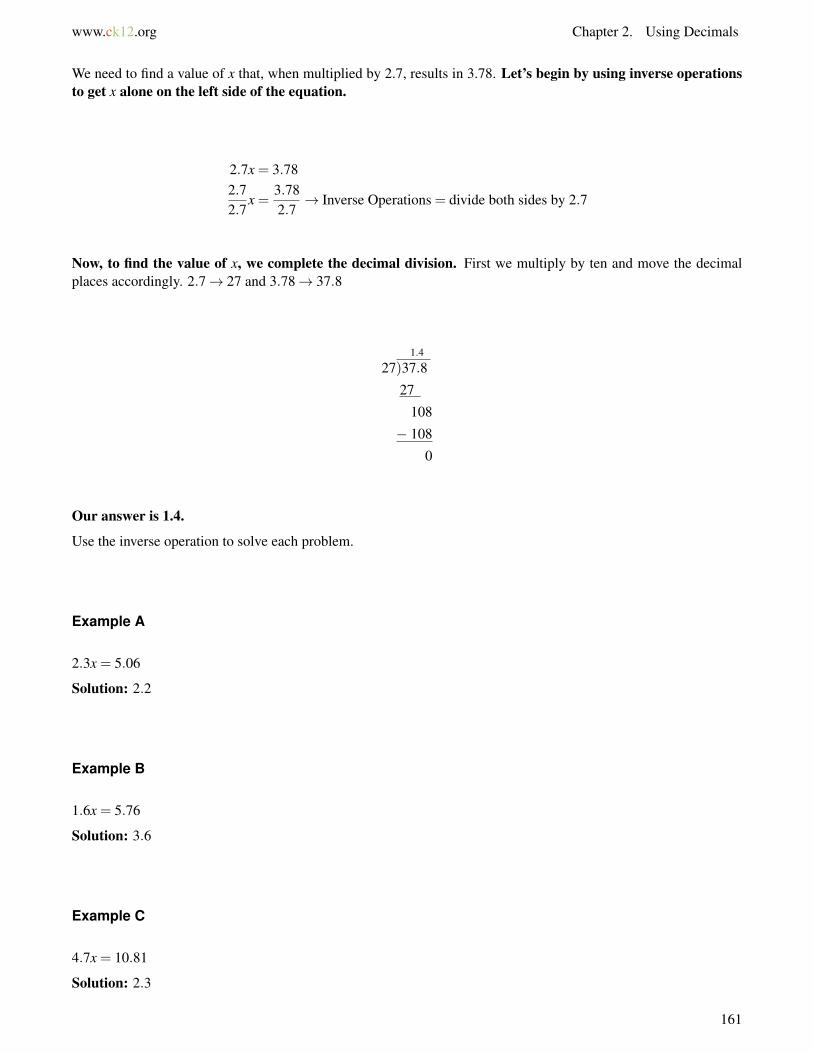
www.ck12.org Chapter 2. Using Decimals
We need to find a value of x that, when multiplied by 2.7, results in 3.78. Let’s begin by using inverse operationsto get x alone on the left side of the equation.
2.7x = 3.782.72.7
x =3.782.7→ Inverse Operations = divide both sides by 2.7
Now, to find the value of x, we complete the decimal division. First we multiply by ten and move the decimalplaces accordingly. 2.7→ 27 and 3.78→ 37.8
1.4
27)37.8
27
108
− 108
0
Our answer is 1.4.
Use the inverse operation to solve each problem.
Example A
2.3x = 5.06
Solution: 2.2
Example B
1.6x = 5.76
Solution: 3.6
Example C
4.7x = 10.81
Solution: 2.3
161

2.15. Division to Solve Decimal Equations www.ck12.org
Here is the original problem once again.
The pole vault is a track and field event where a student uses a pole to launch themselves over a bar. Then the studentlands on a large mat underneath the pole. Each part of the pole vault event is very specific. The height of the bar isspecific. The length of the pole is specific, and the dimensions of the mat are specific as well.
The track and field team at Harrison Middle school had a special visitor after practice. Jody a pole vaulter from thenearby college visited to share his experiences with the students. He brought some pictures of himself in differentevents and took a long time answering student questions.
“Even the mat has specific dimensions,” Jody explained. “They measure the length, width and height of the mat tobe sure that it has an accurate volume. The mat that we are using has a volume of 9009 cubic feet. The length of themat is 16.5 feet and the width is 21 feet.”
Justin and Kara were listening intently to Jody’s explanation of the pole vault event. Justin, who loves numbers,began jotting down the dimensions of the mat on a piece of paper.
9009 cubic feet
16.5 feet in length
21 feet in width
Justin knows that he is missing the height of the mat.
“How high is the mat?” Justin asks Kara showing her his notes.
“Who cares?” Kara whispered looking back at Jody.
“I do, some things are worth figuring out,” Justin said turning away.
Justin begins to complete the math. But he can’t remember how to work the equation and the division.
To solve this problem of height, we need to remember that the formula for volume is length times width timesheight. Justin has the measurements for the volume and for the length and the width. He is missing the height.Justin can write the following formula.
V = lwh
9009 = 16.5×21×h
162
www.ck12.org Chapter 2. Using Decimals
Next, we multiply 16.5×21 to begin our equation.
16.5×21 = 346.5
We can write this equation.
9009 = 346.5h
Now we divide 9009 by 346.5.
h = 26 f eet
The height of the mat is equal to 26 feet.
Guided Practice
Here is one for you to try on your own.
Divide.
4.5x = 12.6
Answer
To solve this problem, we simply divide 12.6 by 4.5.
2.8
This is our answer.
Video Review
MEDIAClick image to the left or use the URL below.URL: http://www.ck12.org/flx/render/embeddedobject/57631
This is a video on the inverse property of multiplication.
Explore More
Directions: Solve the following problems using what you have learned about dividing decimals and equations. Writean equation when necessary.
1. Solve 3.7x = 7.77
2. Solve 3.1x = 10.23
3. Solve 7.2x = 29.52
4. Solve 2.7x = 11.34
5. Solve 1.2x = 6.72
6. Solve 11x = 27.5
7. Solve 6.7x = 42.21
163
2.15. Division to Solve Decimal Equations www.ck12.org
8. Solve 8.2x = 51.66
9. Solve 1.9x = 12.92
10. Solve 5.7x = 54.72
11. Solve .55x = .31955
12. Solve 9.8x = 114.66
13. In a week of track practice, Rose ran 3.12 times more than Jamie. If Rose ran 17.16 kilometers, how manykilometers did Jamie run? Write an equation and solve.
14. Ling’s flower bed has an area of 23.12 m2 and a width of 3.4 meters. What is the length of Ling’s flower bed?Write an equation and solve.
15. A jet airplane travels 6.5 times faster than a car. If the jet travels at 627.51 kilometers per hour, how fast is thecar? Write an equation and solve.
164
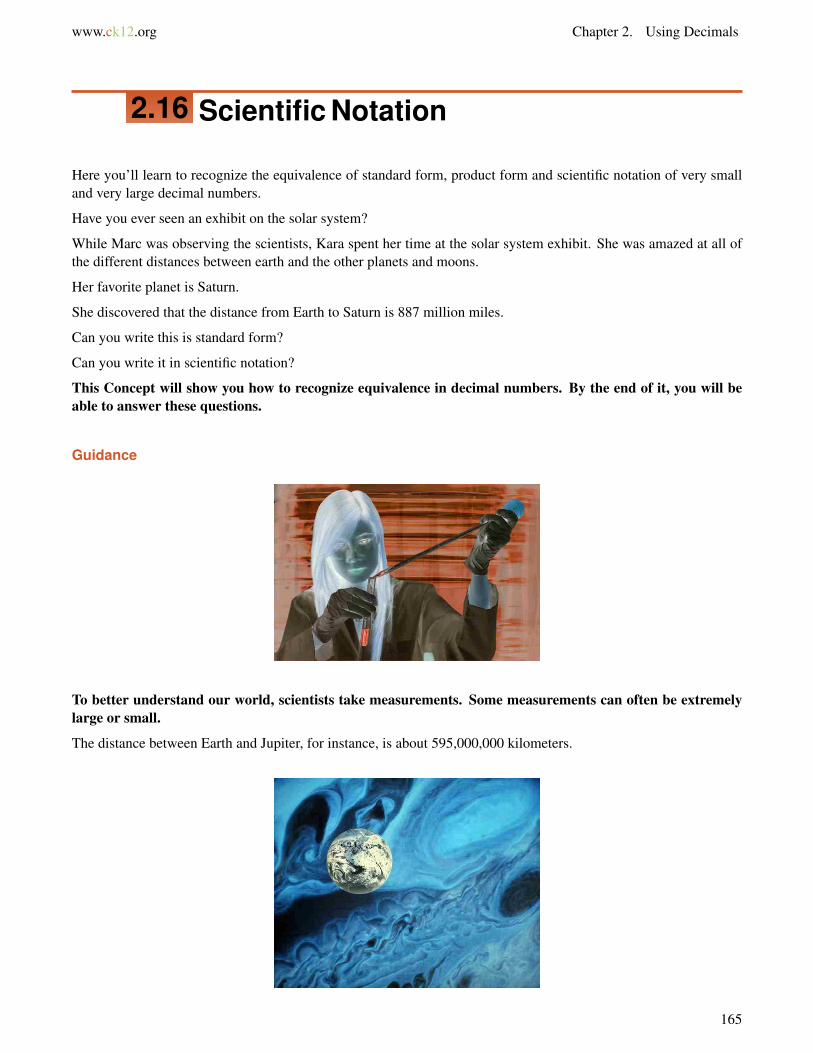
www.ck12.org Chapter 2. Using Decimals
2.16 Scientific Notation
Here you’ll learn to recognize the equivalence of standard form, product form and scientific notation of very smalland very large decimal numbers.
Have you ever seen an exhibit on the solar system?
While Marc was observing the scientists, Kara spent her time at the solar system exhibit. She was amazed at all ofthe different distances between earth and the other planets and moons.
Her favorite planet is Saturn.
She discovered that the distance from Earth to Saturn is 887 million miles.
Can you write this is standard form?
Can you write it in scientific notation?
This Concept will show you how to recognize equivalence in decimal numbers. By the end of it, you will beable to answer these questions.
Guidance
To better understand our world, scientists take measurements. Some measurements can often be extremelylarge or small.
The distance between Earth and Jupiter, for instance, is about 595,000,000 kilometers.
165
2.16. Scientific Notation www.ck12.org
The diameter of an insect’s cell is about .000000000017 meters.
Scientific notation is a way to represent very large and very small numbers. Scientific notation makes it easierto read, write, and calculate extreme numbers.
How do we work with scientific notation?
To understand scientific notation, we need to first back up a bit and think about some of the things that wehave already learned.
Do you remember working with powers? Exponential notation is a way to write multiplication as a power.
In a power like 23, 2 is the base and 3 is the exponent. In expanded form, 23 is written 2(2)(2), we multiply 2 by 2,three times.
Scientific notation relies on the exponential notation—powers of 10—to rewrite numbers in a simpler form.Let’s look at powers of 10 once again.
Our place-value system is based on these powers of 10.
10(10) = 100
100(10) = 1,000
1000(10) = 10,000 and so on.
Now let’s think about that original distance that we introduced between Earth and Jupiter.
The distance is 595,000,000. This is the number written in standard form.
We could also write this number using an exponent. Look at all those zeros. If we count them, there are 8 zeros. Thedistance could also be written as 5.95×10⁸. When we write a number as a factor and a product of 10 and a power,we call this scientific notation.
Write 560,000 in scientific notation.
To begin with, we take the first two numbers and convert this to a decimal.
56 becomes 5.6
Now we can think about how we would multiply 5.6 times a power of 10 to get 560,000. There are 5 decimalplaces involved.
Our answer is 5.6×10⁵
166
www.ck12.org Chapter 2. Using Decimals
Well, it has to do with the way that the decimal point is moving. If it moves to the left, then the power of tenis positive. If it moves to the right, then the power of ten is negative. In the last problem, our decimal movedto the left to 5.6. Now let’s look at one where it moves to the right.
The diameter of the insect’s gland cell is .000000000017.
.000000000017 is the standard form of the number. Notice that that is a very tiny decimal. To write this in scientificnotation, we have to move the decimal point 11 places to the right.
.000000000017 becomes 1.7
We moved the decimal 11 places, so that is our exponent.
Now we write the whole thing as a product of the decimal and a power of ten.
Our answer is 1.7×10⁻¹¹.
We can also work the other way around. We can take a number in scientific notation and rewrite it in standardform. To do this, we have to work backwards. Pay close attention to whether the exponent is negative orpositive, and this will tell you which way to move the decimal point.
Write 1.2×10⁴ in standard form.
First, we notice that the exponent is positive. This means that we move the decimal four places to the right.
1.2×10⁴ becomes 12,000.
Our answer is 12,000.
Now it’s time for you to try a few on your own.
Example A
Write 450,000,000 in scientific notation.
Solution:4.5×10⁸
167
2.16. Scientific Notation www.ck12.org
Example B
Write 3.4×10⁵ in standard form.
Solution:340,000
Example C
Write 6.7×10⁻⁹ in standard form.
Solution: .0000000067
Here is the original problem once again.
While Marc was observing the scientists, Kara spent her time at the solar system exhibit. She was amazed at all ofthe different distances between earth and the other planets and moons.
Her favorite planet is Saturn.
She discovered that the distance from Earth to Saturn is 887 million miles.
Can you write this is standard form?
Can you write it in scientific notation?
First, let’s start with standard form. We can write 887 million by adding in six zeros and some commas.
887,000,000
Then, we can write it in scientific notation by writing it as a product of a base ten power.
8.87×10⁸
Now our work is complete.
Guided Practice
Here is one for you to try on your own.
Write 4.5×10⁻⁶ in standard form.
Answer
First, notice that the exponent is negative. This means that we move the decimal six places to the left.
4.5×10⁻⁶ becomes .0000045.
Our answer is .0000045
Video Review
MEDIAClick image to the left or use the URL below.URL: http://www.ck12.org/flx/render/embeddedobject/5469
This is a James Sousa video on scientific notation.
168
www.ck12.org Chapter 2. Using Decimals
Explore More
Directions: Write each number in scientific notation.
1. 0.0000000056731
2. 24,010,000,000
3. 960,000,000,000,000,000
4. 0.0000001245
5. 36,000,000
6. .00098
7. .000000034
8. 345,000,000
Directions: Write each number in standard form.
9. 3.808×10¹¹
10. 2.1×10⁻⁶
11. 5.912×10⁸
12. 6.78×10⁻⁶
13. 5.7×10⁹
14. 4.5×10⁻⁵
15. 3.21×10⁷
169
2.17. Comparison of Numbers in Scientific Notation www.ck12.org
2.17 Comparison of Numbers in Scientific Nota-tion
Here you’ll learn to compare and order numbers in scientific notation.
Jennifer is writing a paper for English class on different distances in track and field. She has decided to focus herpaper on middle and long distances and has made a list of every distance longer than 1 mile. Here is her list.
1,500 m
2000 m
3,000 m
5,000 m
10,000 m
20,000 m
25,000 m
30,000 m
She has also learned about scientific notation in math class. She has decided to write each distance in scientificnotation. That way she can add a twist to her paper and surprise both her English and her math teacher.
Think about how Jennifer can accomplish this goal. If you were to rewrite each distance in scientific notation,how would you do it? This Concept will teach you all that you need to know about scientific notation. Let’sget started.
Guidance
Previously we worked on how to compare and order whole numbers and decimals.
Numbers in scientific notation can be compared and ordered as well. In scientific notation, the number withthe greater power of 10 is always the larger number.
Take 9.6×10³ compared to 2.2×10⁵. Let’s look at the numbers in standard form to illustrate the point.
9.6×10³→ 9,600 and 2.2×10⁵→ 220,000, therefore, 9.6×10³ < 2.2×10⁵
170
www.ck12.org Chapter 2. Using Decimals
Remember to apply what you know about negative numbers to scientific notation with negative powers. Whencomparing the same number to the powers of 10−7 and 10−11, for example, the number to the power of -7 is thegreater value, because −7 >−11.
If the powers of 10 are the same, then we look to the decimals to compare.
Finally, when comparing a number in standard form to a number in scientific notation, convert the number in standardform to scientific notation; then compare.
Compare 8.43×10⁶ and 2.38×10⁸
First, notice that both of the exponents are positive and they are different, so we can simply compare the exponent.The larger the exponent is the larger the number. Here is our answer.
8.43×10⁶ < 2.38×10⁸
Compare 3.2×10⁻¹⁰ and 1.2×10⁻⁹
First, notice that both of the exponents are negative. Therefore, we have to compare the greater exponent as thelarger number. This is a little bit backwards, but remember that negative numbers are larger the closer that they areto zero. Therefore, negative 9 is greater than negative 10.
3.2×10⁻¹⁰ < 1.2×10⁻⁹
Compare 5.65×10⁵ and 5.56×10⁵
First, notice that the exponents are the same here. Therefore, we compare the decimals.
5.65×10⁵ > 5.56×10⁵
When ordering numbers in scientific notation, we do the same work as with comparing. Break the numbers downby looking at the exponents and then write them in order according to the directions.
Now it’s time for you to try a few on your own.
Example A
4.5×10⁷ and 4.5×10⁹
Solution: <
Example B
5.6×10⁻³ and 7.8×10⁻⁵
Solution: >
Example C
8.9×10² and 9.8×10²
Solution:
171
2.17. Comparison of Numbers in Scientific Notation www.ck12.org
Here is the original problem once again.
Jennifer is writing a paper for English class on different distances in track and field. She has decided to focus herpaper on middle and long distances and has made a list of every distance longer than 1 mile. Here is her list.
1,500 m
2000 m
3,000 m
5,000 m
10,000 m
20,000 m
25,000 m
30,000 m
She has also learned about scientific notation in math class. She has decided to write each distance in scientificnotation. That way she can add a twist to her paper and surprise both her English and her math teacher.
To write each distance in scientific notation, Jennifer will need to use powers of 10. Let’s look at the firstdistance.
1,500 m can be changed to 1.5×10³ since we moved the decimal point three places to the left, the exponent ispositive.
In fact, we will be moving all of the decimal points to the left in this problem. Here are the other distanceswritten in scientific notation.
2×10³
3×10³
5×10³
1×10⁴ or 10×103
2×10⁴
2.5×10⁴
3×10⁴
Here is our list of answers.
172

www.ck12.org Chapter 2. Using Decimals
Guided Practice
Here is one for you to try on your own.
Compare 3.4×10⁵ and 34,000,000
Answer
First, notice that you have one value in scientific notation and one in standard notation.
We should write them both in the same form to make the comparison easier.
Let’s write the first value in standard notation.
3.4×105 = 340,000
Now we compare the two values.
340,000 < 34,000,000
This is our answer.
Video Review
MEDIAClick image to the left or use the URL below.URL: http://www.ck12.org/flx/render/embeddedobject/5470
This James Sousa video is an animation on scientific notation.
Explore More
Directions: Compare the following. Write <, >, or = for each ___.
1. 2.1×10⁶ 8.9×10⁵
2. 0.00000212 2.12×10⁻⁵
3. 4.26×10¹⁰ 4,260,000,000
4. 7.2×10⁻³ 12.5×10⁻¹
5. 2.1×10⁵ 3.1×10⁴
6. 8.1×10⁶ 8.9×10⁵
7. 7.2×10⁻⁴ 8.9×10⁻⁵
8. 3.3×10² 3.1×10³
9. 12.1×10⁴ 18.9×10²
10. 5.5×10⁶ 5.51×10⁶
11. 16.1×10³ 18.9×10²
Directions: Where necessary, convert to scientific notation. Order the following from greatest to least.
12. 9.2×10¹⁰, 6.4×10¹⁵, 2.1×10²⁰, 1.7×10¹⁵
173
2.17. Comparison of Numbers in Scientific Notation www.ck12.org
13. 5.63×10⁻⁵, 4.16×10⁻³, 3.42×10⁻⁶, 8.71×10⁻³
14. 2.12×10⁻⁵, 0.0000202, 2.02×10⁻⁴, 0.0000221
15. 86,102,000, 8.61×10⁸, 86,120,000, 8.61×10⁷
174
www.ck12.org Chapter 2. Using Decimals
2.18 Operations with Numbers in Scientific No-tation
Here you’ll learn to find sums, differences, products and quotients of numbers in scientific notation.
Remember Kara’s study of the solar system in the Comparison of Numbers in Scientific Notation Concept?
Well, after gathering information, Kara decided to add some distances together. She decided to add the distancesfrom Earth to Saturn with the distance from Earth to Jupiter.
Here is what she wrote.
5.95×10⁸ +8.87×10⁸
Do you know the sum?
This Concept will teach you how to add, subtract, multiply and divide values written in scientific notation.
Guidance
Scientific notation makes reading and writing very large and very small numbers easier; it makes computationwith such numbers easier as well.
Let’s start with addition and subtraction. Before performing addition or subtraction on scientific notation, theexponents must be the same. Matching the exponents involves a simple case of moving the decimal point—a processyou’ve completed many times in making the divisor a whole number before dividing decimals. Let’s see how it’sdone in the following addition problem. Note how we use parentheses to group the scientific notation on either sideof the addition sign.
(5.7×10⁴)+(4.87×10⁵)
We want to make both of these exponents the same. To make both exponents 5’s, we move the decimal pointin 5.7 one place to the left by multiplying by 10.
(.57×105)+(4.87×10⁵)
Now we can add the decimal parts of the problem. The power of 10 stays the same.
(.57×105)+(4.87×10⁵)
(.57+4.87)×105
5.44×10⁵
Our answer is 5.44×10⁵.
Subtraction works the same way as addition: Before performing the subtraction operation, the exponentsmust be the same.
Multiplication and division in scientific notation is a little different.
Do you remember simplifying exponents?
(x3)x4
To multiply the exponents, we add the powers. (x3)x4 = x3+4 = x7. Multiplying scientific notation is similar: Youmultiply the decimals and add the exponents.
175

2.18. Operations with Numbers in Scientific Notation www.ck12.org
(3.4×10−2)× (6.2×106)
(3.4×6.2)× (10−2+6)
21.08×10⁴
Division of scientific notation is identical to multiplication—except you divide the decimals and subtract theexponents. Let’s try it out.
(8.4×10⁵)÷ (1.4×10⁻²)
(8.4÷1.4)× (105−(−2))→ Remember subtracting a negative is the same as adding it.
6×10⁷
Now it’s time for you to try a few on your own.
Example A
Add (3.4×10³ +5.6×10⁴)
Solution: 39.6×10⁴
Example B
Multiply (1.2×10⁴)(3.4×10⁴)
Solution:4.08×10⁸
Example C
Subtract (5.6×10⁴−3.2×10⁴)
Solution: 2.4×10⁴
Here is the original problem once again.
Well, after gathering information, Kara decided to add some distances together. She decided to add the distancesfrom Earth to Saturn with the distance from Earth to Jupiter.
Here is what she wrote.
5.95×10⁸ +8.87×10⁸
Do you know the sum?
First, notice that the exponent is the same in both values. Therefore, we can simply add the decimals.
5.95+8.87 = 14.82
Now we add the rest of the scientific notation.
14.82×10⁸
This is our answer.
176
www.ck12.org Chapter 2. Using Decimals
Guided Practice
Here is one for you to try on your own.
At its closest, the planet Neptune is 4,300,000,000 kilometers away from Earth. A group of astronauts from Earthwant to make it to Neptune is 20,000 days. If they travel the same amount of kilometers each day, how manykilometers will they travel each day? Convert both numbers to scientific notation before solving.
Answer
Let’s begin by converting both numbers to scientific notation.
The distance between Earth and Neptune, in scientific notation, is 4.3×10⁹. The number of days the astronauts wantto travel in scientific notation is 2.0×10⁴.
We want to divide the distance evenly among the days, so we know we need to divide. Remember: To dividenumbers in scientific notation, you divide the decimals and subtract the exponents.
4.3×10⁹÷2.0×10⁴
(4.3÷2.0)×109−4
2.15×10⁵
Remember to put the units of measurement in your answer!
Our answer is 2.15×10⁵ km or 215,000 kilometers.
Video Review
MEDIAClick image to the left or use the URL below.URL: http://www.ck12.org/flx/render/embeddedobject/5472
This is a James Sousa video about writing decimal numbers given scientific notation.
MEDIAClick image to the left or use the URL below.URL: http://www.ck12.org/flx/render/embeddedobject/5473
This is a James Sousa video about multiplying values that are in scientific notation.
177
2.18. Operations with Numbers in Scientific Notation www.ck12.org
MEDIAClick image to the left or use the URL below.URL: http://www.ck12.org/flx/render/embeddedobject/5474
This is a James Sousa video about dividing numbers that are in scientific notation.
Explore More
Directions: Add, subtract, multiply or divide
1. 3.4×10³ +5.4×10³
2. 5.4×10⁴−1.3×10⁴
3. 6.7×10⁵ +5.4×10⁵
4. 13.4×10³−5.4×10³
5. 6.4×103×5.1×103
6. 12.4×10⁵÷2×10³
7. 5.4×10⁵ +4.4×10⁵
8. 12.2×10³−10.1×10³
9. 5.6×10³ +4.5×10³
10. 3.3×104×1.2×102
11. 24.6×10⁵÷6×10³
12. 266×10−6 +8.6×10⁻⁶
13. 7.14×10⁴−5.5×10⁴
14. (2.56×10−3)× (3.8×106)
15. (4.97×10⁸)÷ (7×10⁵)
178
www.ck12.org Chapter 2. Using Decimals
2.19 Metric System
Here you’ll learn to identify equivalence among metric units of measure.
Karina’s seventh grade class is reading a book about Greek history. Karina is fascinated by the Greek Gods and withall of the mythology surrounding them. The class has decided to focus on the sporting events of the Greek Godssince often the stories of mythology are studied in fifth or sixth grade. Their teacher, Ms. Harris thinks this will bea good focus for the class.
“The first javelin was thrown in 708 BC by Hercules, the son of Zeus,” Ms. Harris said at the beginning of class.
“The javelin was originally 2.3 to 2.4 meters long and weighed about 400 grams. Then later, the weight and lengthof the javelin changed,” Ms. Harris stopped lecturing and began scanning through her notes.
“Hmmm.. I can’t seem to find the place where I wrote down the new dimensions of the javelin,” She said. “Alright,that will be your homework. Also, figure out the difference between the javelin of the past and the present.”
Karina hurried out of the class and during study hall began scouring the library for information. She found a greatbook on track and field and began reading all of the information.
She discovered that the new length of the javelin is 2.6 meters and is 800 grams in weight. Now she needs to figureout the difference.
Measuring metrics and performing operations with metric measurements is what this Concept is all about. Itis perfect timing for Karina too. At the end of the Concept, you will be able to help her with her homework.
Guidance
Previously we worked with powers of 10. Let’s review some of the places where you have seen powers of ten.
Our place-value system—on both the left and right sides of the decimal point—is based on powers of 10. Thisfact helps us manipulate numbers so they are easier to use in operations. When adding, we add tens to the leftplace-value, and when subtracting we borrow tens and regroup them to the right place-value.
In dividing decimals, we multiply the divisor and dividend by 10 until the divisor is a whole number. In scientificnotation, we use powers of 10 to convert numbers to a simpler form.
This brings us to measurement and the metric system. The metric system of measurement is also based onpowers of 10.
The metric system includes units of length (meters), weight (grams), and volume (liter).
179

2.19. Metric System www.ck12.org
Look at the metric chart below to get an idea of the base-ten relationship among metric units. There are manydecimal places, but you will get an idea of which units of measure are larger and which are smaller. This will helpyou as you learn about equivalence, or about determining which values are equal.
Notice that the metric system has units of length, weight and volume. Our customary system does too, butfamiliarizing yourself with the metric system is helpful especially when traveling or working in the sciences.
Metric Units of Length
millimeter (mm) .1 cm .001 m .000001 km
centimeter (cm) 10 mm .01 m .00001 km
meter (m) 1000 mm 100 cm .001 km
kilometer (km) 1,000,000 mm 100,000 cm 1000 m
Metric Units of Mass
milligram (mg) .1 cg .001 g .000001 kg
centigram (cg) 10 mg .01 g .00001 kg
gram (g) 1000 mg 100 cg .001 kg
kilogram (kg) 1,000,000 mg 100,000 cg 1000 g
Metric Units of Volume
milliliter (ml) .1 cl .001 l .000001 kl
centiliter (cl) 10 ml .01 l .00001 kl
liter (l) 1000 ml 100 cl .001 kl
kiloliter (kl) 1,000,000 ml 100,000 cl 1000 l
You aren’t. Remember all of that isn’t realistic. However, you can learn the prefixes of each measurementunit and that can help you in the long run.
180
www.ck12.org Chapter 2. Using Decimals
milli - means one-thousandth;
centi - means one-hundredth,
kilo - means one thousand.
Notice that the first two represent a decimal, you can tell because the “th” is used at the end of the definition.The prefix kilo means one thousand and this is not in decimal form.
Now let’s look at some equivalent measures.
Write down these notes before continuing with the lesson.
How can we convert different units of measurement?
You can move back and forth among the metric units by multiplying or dividing by powers of 10.
To get from kilometers to meters, multiply by 1,000.
To get from meters to centimeters, multiply by 100.
To get from meters to millimeters, multiply by 1,000.
Working backwards, to get from kilometers to meters, divide by 1,000.
To get from meters to centimeters, divide by 100.
To get from meters to millimeters, divide by 1,000.
To get from kilometers to millimeters, divide by 1,000,000 (1,000×1,000)
Let’s look at how we can use this information.
Fill in the blanks with the equivalent measurement.
100 centiliter = ___ liter
10 centimeters = ___ meters
1 kilogram = ___ centigrams
1 milligram = ___ centigram
181

2.19. Metric System www.ck12.org
To figure these out, look back at the conversion chart and at the operations needed to convert one unit toanother. Whether you are multiplying or dividing, you will need the correct number to multiply or divide by.
There are 100 centiliters in 1 liter.
There are 100 centimeters in a meter. We divide by 100. 10 divided by 100 = .1
10 centimeters = .1 meters
There are 1,000 kilograms in a gram. We multiply 1× 1,000 = 1,000 grams; there are 100 centigrams in a gram;1,000×100 = 100,000
1 kilogram = 100,000 centigrams
There are 10 milligrams in a centigram 1÷10 = .1
1 milligram = .1 centigram
Notice that when we go from a smaller unit to a larger unit, we divide. When we go from a larger unit to asmaller unit we multiply.
Convert 23 kilograms into grams.
We start by noticing that we are going from a larger unit to a smaller unit. Therefore, we are going to multiply.There are 100 grams in 1 kilogram. There are 23 kilograms in this problem.
23×1000 = 23,000
23 kilograms = 23,000 grams.
Convert the following units to their equivalent.
Example A
10 centigrams = _____ grams
Solution: .1 grams
Example B
1 meter = _____ millimeters
Solution: 1000 millimeters
Example C
15 kilometers = _____ meters
Solution: 15,000 meters.
182

www.ck12.org Chapter 2. Using Decimals
Now back to the javelin dimensions.
Reread the original problem. Then help Karina with her problem.
Karina’s seventh grade class is reading a book about Greek history. Karina is fascinated by the Greek Gods and withall of the mythology surrounding them. The class has decided to focus on the sporting events of the Greek Godssince often the stories of mythology are studied in fifth or sixth grade. Their teacher, Ms. Harris thinks this will bea good focus for the class.
“The first javelin was thrown in 708 BC by Hercules, the son of Zeus,” Ms. Harris said at the beginning of class.
“The javelin was originally 2.3 to 2.4 meters long and weighed about 400 grams. Then later, the weight and lengthof the javelin changed,” Ms. Harris stopped lecturing and began scanning through her notes.
“Hmmm.. I can’t seem to find the place where I wrote down the new dimensions of the javelin,” She said. “Alright,that will be your homework. Also, figure out the difference between the javelin of the past and the present.”
Karina hurried out of the class and during study hall began scouring the library for information. She found a greatbook on track and field and began reading all of the information.
She discovered that the new length of the javelin is 2.6 meters and is 800 grams in weight. Now she needs to figureout the difference.
To figure out the difference, Karina needs to subtract the old length with the new length. The old length wasbetween 2.3 and 2.4. Karina decides to find the average of the range of numbers. To find the average, you addthe values and divide by the number of terms in the series
2.3+2.4 = 4.7÷2 = 2.35
Next, she subtracts 2.35 from the original javelin length.
2.6
−2.35
.25
There is a difference of 14 of a meter or .25 of a meter.
Next, we can figure the weight difference.
400 grams was the old weight and 800 grams is the new weight. The new weight of the javelin is twice theweight of the old javelin.
Karina finishes her homework and makes a note of the fact that while the length of the javelin didn’t doublethat the weight of it did!
Guided Practice
Here is one for you to try on your own.
Convert 25,000 meters into kilometers.
Answer
First, notice that we are going from a larger unit to a smaller unit, so we need to divide.
There are 1000 meters in 1 kilometer.
183
2.19. Metric System www.ck12.org
25,000÷1000 = 25
25,000 meters = 25 kilometers
This is our answer.
Video Review
MEDIAClick image to the left or use the URL below.URL: http://www.ck12.org/flx/render/embeddedobject/5342
This is a James Sousa video on metric system conversions and equivalence.
Explore More
Directions: Fill in the blanks with the equivalent measurement.
1. 1,000 centimeters = ___ meters
2. 10 kiloliters = ___ centiliters
3. 1,000 milligrams = ___ centigrams
4. 100 milliliters = ___ centiliters
Directions: Fill in the blanks with the equivalent measurement.
5. 200 milligrams = ___ kilograms
6. 20 centimeters = ___ meters
7. 2 liters = ___ kiloliters
8. 2,000 centigrams = ___ kilograms
Directions: Fill in the blanks with the equivalent measurements for 180.76 centimeters.
9. ___ meters
10. ___ millimeters
11. ___ kilometers
Directions: Fill in the blanks with the equivalent measurements for 0.4909 kiloliters.
12. ___ liters
13. ___ centiliters
14. ___ milliliters
15. How many liters in one kiloliter?
184
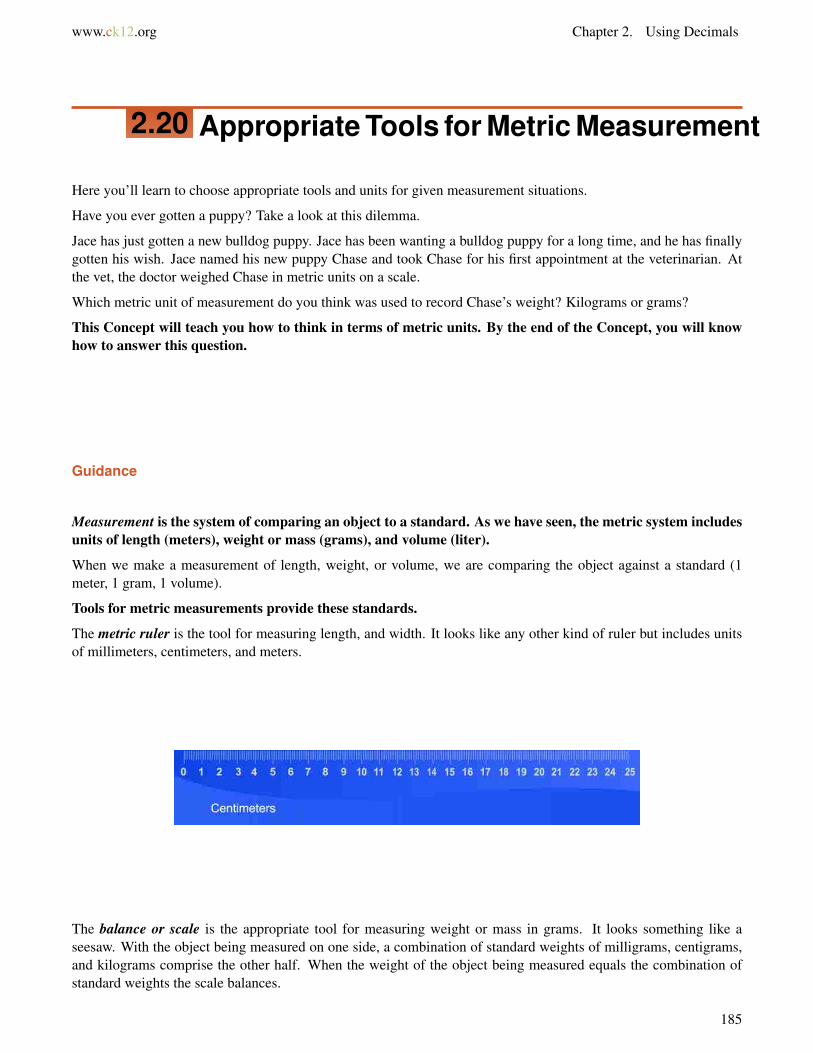
www.ck12.org Chapter 2. Using Decimals
2.20 Appropriate Tools for Metric Measurement
Here you’ll learn to choose appropriate tools and units for given measurement situations.
Have you ever gotten a puppy? Take a look at this dilemma.
Jace has just gotten a new bulldog puppy. Jace has been wanting a bulldog puppy for a long time, and he has finallygotten his wish. Jace named his new puppy Chase and took Chase for his first appointment at the veterinarian. Atthe vet, the doctor weighed Chase in metric units on a scale.
Which metric unit of measurement do you think was used to record Chase’s weight? Kilograms or grams?
This Concept will teach you how to think in terms of metric units. By the end of the Concept, you will knowhow to answer this question.
Guidance
Measurement is the system of comparing an object to a standard. As we have seen, the metric system includesunits of length (meters), weight or mass (grams), and volume (liter).
When we make a measurement of length, weight, or volume, we are comparing the object against a standard (1meter, 1 gram, 1 volume).
Tools for metric measurements provide these standards.
The metric ruler is the tool for measuring length, and width. It looks like any other kind of ruler but includes unitsof millimeters, centimeters, and meters.
The balance or scale is the appropriate tool for measuring weight or mass in grams. It looks something like aseesaw. With the object being measured on one side, a combination of standard weights of milligrams, centigrams,and kilograms comprise the other half. When the weight of the object being measured equals the combination ofstandard weights the scale balances.
185

2.20. Appropriate Tools for Metric Measurement www.ck12.org
A graduated cylinder measures volume. It looks like a drinking glass that has marks for volume on the side—milliliters,centiliters, and liters.
Now we can look at choosing the best tool to measure different objects. You have to think of the object and unit ofmeasure that will be used to measure the object.
Look at this one.
Choose the appropriate tool for making the following measurements.
a) The weight of a golf ball
b) The height of a person
c) The volume of water in a chemical solution
d) The width of a table
Now, let’s think about each item and which tool would be the best choice for measuring.
a) The weight of a golf ball would be measured by the scale.
186

www.ck12.org Chapter 2. Using Decimals
b) The height of a person would be length, so we would use a metric ruler or metric tape measure for this measure-ment.
c) The volume of water would be measured by a graduated cylinder.
d) The width of a table would be length, so that would be a metric ruler or metric tape.
Thinking about what is being measured whether it is length, weight or volume can help you in selecting thecorrect/best tool.
To find an accurate measurement, it is important to choose the right tool, but it is equally important to choose theright unit of measurement. You wouldn’t want to measure the volume of a swimming pool in milliliters—the numberwould be too high! The goal in choosing a unit of measure is finding the standard that most closely matches themeasure of the object.
This procedure is somewhat subjective. It helps to have some real-world measurement benchmarks to act as yourown personal standard.
Length:
• A grain of sand is about 1 millimeter long• A paperclip is about 1 centimeter wide• A table could be about 1 meter tall• A road could be about 1 kilometer long
Weight:
• A speck of dust could weigh about 1 milligram• A paperclip weighs about 1 gram• A kitten could weigh about 1 kilogram
Volume:
• An eyedropper holds about 1 milliliter• A juice box holds about 25 centiliters• A soda bottle holds about 1 liter• A kid’s pool could hold about 1 kiloliter
Now let’s practice. Identify the best tool to measure each item.
Example A
A bag of flour
Solution: Scale
Example B
The length of a table
Solution: Ruler or tape measure
Example C
The amount of water in a pitcher
187
2.20. Appropriate Tools for Metric Measurement www.ck12.org
Solution: Graduated measuring cylinder
Here is the original problem once again.
Jace has just gotten a new bulldog puppy. Jace has been wanting a bulldog puppy for a long time, and he has finallygotten his wish. Jace named his new puppy Chase and took Chase for his first appointment at the veterinarian. Atthe vet, the doctor weighed Chase in metric units on a scale.
Which metric unit of measurement do you think was used to record Chase’s weight? Kilograms or grams?
Chase is a puppy and doesn’t weight a lot. Let’s review the different metric units that we use for measuring weight.A milligram is for very tiny things such as a bean or a dust particle. A gram measures slightly heavier things like apaperclip or a pencil. A kilogram is used for things with definite weight, like a kitten or a dog.
The vet would have measured Chase in kilograms.
Guided Practice
Here is a problem for you to try on your own.
Imogene is buying material for a costume. She buys 3.15 meters of purple material at $4.12 a meter, 2.25 meters ofyellow material at $8.63 a meter; and .5 meters of gold ribbon at $1.30 a meter. How much does she spend on hercostume? (Be sure to round your prices to the nearest hundredth.)
Answer
This problem asks us to find the total Imogene spent on her costume. We know the measurements of the threematerials and the cost of each type of material, so we need to multiply all three measurements by their cost and addthem together.
3.15($4.12)+2.25($8.63)+0.5($1.30)
$12.98+$19.42+$0.65
Imogene spent $33.05 on her costumes.
Video Review
MEDIAClick image to the left or use the URL below.URL: http://www.ck12.org/flx/render/embeddedobject/5342
This is a James Sousa video on metric unit conversion.
Explore More
Directions: Choose the appropriate tool for the following measurements.
1. the volume of a water balloon
2. the length of a basketball court
188
www.ck12.org Chapter 2. Using Decimals
3. the weight of an apple
4. the volume of a milk carton
Directions: Choose the appropriate unit for the following measurements:
5. the distance between two towns
6. the weight of a peanut
7. the length of a hand
8. the volume of a raindrop
9. the weight of a person
10. the weight of a bag of sand
11. The height of a table
Directions: Solve each problem.
12. The town square has a length of 39.2 meters and a width of 17.5 meters. What is the perimeter of the square?[Remember: P = 2l +2w]
13. A pharmacist mixing cough syrup mixes 1,550 milliliters of syrup, 725 milliliters of cherry flavor, and 1.25 litersof water. Once mixed, what is the total volume of the cough syrup in liters?
14. A stable houses horses with the following weights. Arnaud: 331.6 kg; Josie: 331,061 g; Max: 331,612 g; Taboo:331.61 kg. Order the horses from greatest to least weight.
15. At the farmer’s market, Josh bought 1.5 kilograms of oranges, 150 grams of grapes, and 15,000 centigrams ofapples. How many grams of fruit did he buy in all?
189
2.21. Conversions of Length, Mass, Capacity in Metric Units www.ck12.org
2.21 Conversions of Length, Mass, Capacity inMetric Units
Here you’ll learn to convert among metric units of measure using powers of 10.
While Kara was at the exhibit on the solar system, she also noticed that the exhibit listed distances in metric units aswell as standard units.
The distance from Earth to Saturn is 1,427,000,000 km.
Can you convert this measure to meters?
This Concept is about converting among metric units of measure. You will know how to solve this dilemmaby the end of it.
Guidance
As we have seen in our previous work, the metric system of measurement is based on powers of 10. Whenyou have a measurement in one unit, we convert it to another unit by either multiplying or dividing by somepower of 10.
To get from kilometers to meters, multiply by 1,000. Working backwards, to get from kilometers to meters, divideby 1,000. To get from kilometers to millimeters, we divide by 1,000,000 (1,000×1,000). When converting amongmeasurements, use prefixes as a guide in multiplying or dividing by powers of 10.
Then you can ask yourself, “Am I moving from a smaller unit to a larger unit, or from a larger unit to asmaller unit?”
If the units you’re converting to are smaller, multiply .
If the units you’re converting to are larger, divide .
Now try to do some conversions without using the conversion chart. If you remember the rules of moving thedecimal point, you should be able to do these quite easily. Keep in mind the relationship between the powersof 10 and moving the decimal point to the right or left.
Dividing by 1,000, for instance, has the same effect as moving the decimal point three places to the left.Similarly, multiplying by 1,000 has the same effect as moving the decimal point three places to the right.
Here is one to look at.
Convert the following measurements to centimeters, 525 meters
There are 100 centimeters in a meter, so to go from meters to centimeters, we multiply by 100 or move thedecimal point two places to the right.
The answer is 52,500 cm.
Let’s look at another one.
Convert the following measurements into kilograms, 95231 milligrams
To move from milligrams to kilograms, we divide by 1,000,000 (1,000 milligrams in a gram × 1,000 grams ina kilogram), or move the decimal point six places to the left.
Our answer is .095231 kg.
Now it is time to practice what you have learned. Here is a table to help you.
190
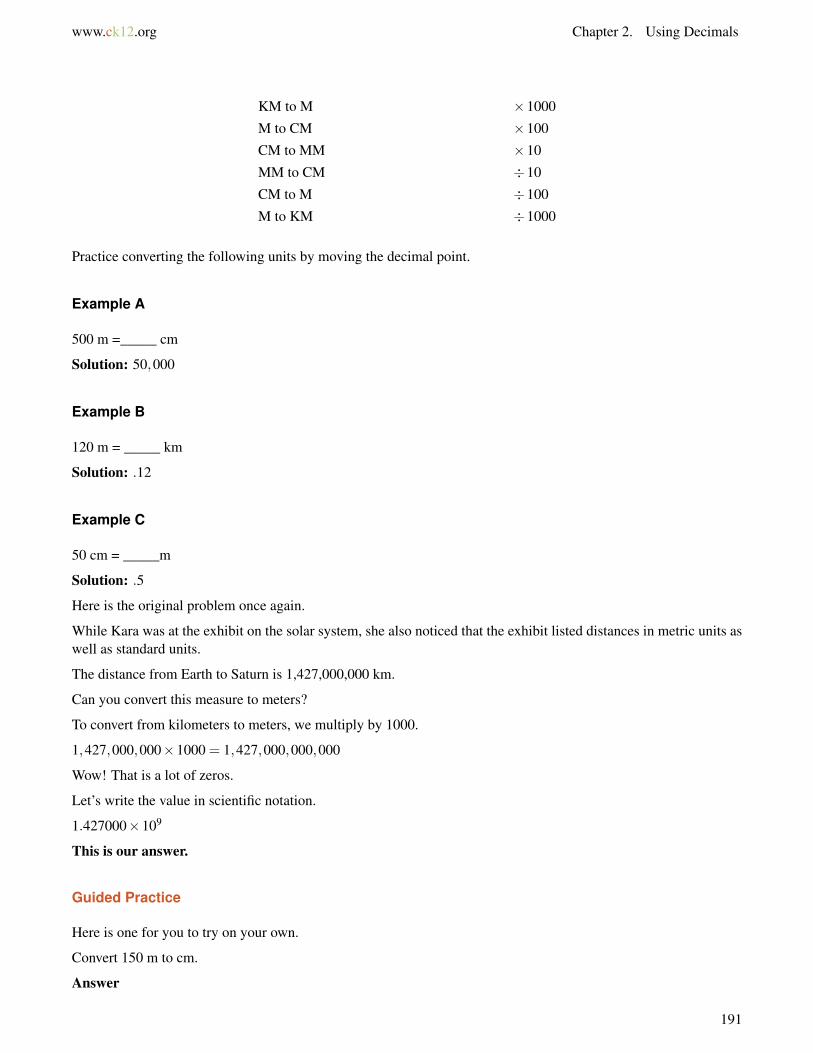
www.ck12.org Chapter 2. Using Decimals
KM to M ×1000
M to CM ×100
CM to MM ×10
MM to CM ÷10
CM to M ÷100
M to KM ÷1000
Practice converting the following units by moving the decimal point.
Example A
500 m =_____ cm
Solution: 50,000
Example B
120 m = _____ km
Solution: .12
Example C
50 cm = _____m
Solution: .5
Here is the original problem once again.
While Kara was at the exhibit on the solar system, she also noticed that the exhibit listed distances in metric units aswell as standard units.
The distance from Earth to Saturn is 1,427,000,000 km.
Can you convert this measure to meters?
To convert from kilometers to meters, we multiply by 1000.
1,427,000,000×1000 = 1,427,000,000,000
Wow! That is a lot of zeros.
Let’s write the value in scientific notation.
1.427000×10⁹
This is our answer.
Guided Practice
Here is one for you to try on your own.
Convert 150 m to cm.
Answer
191

2.21. Conversions of Length, Mass, Capacity in Metric Units www.ck12.org
To convert these units, we are going from a larger unit to a smaller unit.
When we convert from meters to centimeters, we multiply by 100.
150×100 = 15,000
This is our answer.
Video Review
MEDIAClick image to the left or use the URL below.URL: http://www.ck12.org/flx/render/embeddedobject/5318
This is a James Sousa video on converting between metric units of measure.
Explore More
Directions: Convert the following metric units of length.
1. 10 cm to millimeters
2. 100 kilometers to meters
3. 453 meters to kilometers
4. 1,567 kilometers to meters
5. 6700 centimeters to meters
6. 7.8 meters to centimeters
Directions: Convert the following measurements into milliliters.
7. 65.57 liters
8. 28.203 centiliters
9. 0.009761 kiloliters
Directions: Convert the following measurements into centigrams.
10. 29.467 grams
11. 0.0562 milligrams
12. .0450584 kilograms
Directions: Convert the following measurements into kiloliters.
13. 89.96 liters
14. 45,217 milliliters
15. 3,120,700 centiliters
192

www.ck12.org Chapter 2. Using Decimals
2.22 Comparison of Metric Measurements
Here you’ll learn to compare and order given metric units of measure.
Are you familiar with the shot put? Take a look at this dilemma.
When Marcus was in sixth grade he thought that he was a runner. So, he tried out for the track team and his loveof running and determination made him an easy choice for the team. All that first year, Marcus ran. Then in thehurdles, Marcus had a fall and hurt his knee. Marcus was devastated. He thought his life of track and field was over.
While his ankle healed, Marcus watched his team mates practice. One day after practice, Marcus picked up the shotput and threw it across the field. His coach was watching and Marcus found a new way to participate.
“Sometimes life is like that,” his coach Mr. Samuels said. “You think you are going to be doing one thing andsomething else crosses your path.
This year, Marcus is on the shot put team. His team is trying to figure out which field they should use to practice in.There are several different fields available, but the team is large, so they are looking for a field with a width of 45.65meters.
Field A—0.004565 kilometers
Field B—45,650 millimeters
Field C—456.5 centimeters
Field D—456,500 millimeters
Which field should his team choose? Marcus is puzzled and you may be too. This Concept will teach you allabout converting units of measure and comparing them. By the end of it, you will be able to help Marcusfigure out the best option for his shot put team.
Guidance
Knowing how to convert between metric units of measure makes comparing and ordering measurements possible.
193
2.22. Comparison of Metric Measurements www.ck12.org
Previously we worked on how to compare decimals.
You line up the decimal points and compare the place values from left to right. Because units of measure ofteninvolve decimals, comparing measurements is similar. But to compare measurements, they have to have the sameunit!
Compare 4.56 g to 4.59 g.
First, we have to be sure that these are the same unit of measure. Both are in grams, so we can look at the numbersto determine which is larger. 4.56 is less than 4.59, so we have our answer.
The answer is 4.56 g <4.59 g.
Compare 4.56 g to 4.59 g.
First, we have to be sure that these are the same unit of measure. Both are in grams, so we can look at the numbersto determine which is larger. 4.56 is less than 4.59, so we have our answer.
The answer is 4.56 g <4.59 g.
Once you understand how to compare units, ordering them becomes quite simple. Just remember that you alwayshave to convert the units so that they are the same!
Practice comparing metric units of measure.
Example A
45 cm _______ 500 mm
Solution: <
Example B
2 km _______ 400 m
Solution: >
Example C
6 l ________ 60,000 ml
Solution: <
Now back to the shot put and the teams.
194
www.ck12.org Chapter 2. Using Decimals
Here is the original problem once again.
When Marcus was in sixth grade he thought that he was a runner. So, he tried out for the track team and his loveof running and determination made him an easy choice for the team. All that first year, Marcus ran. Then in thehurdles, Marcus had a fall and hurt his knee. Marcus was devastated. He thought his life of track and field was over.
While his ankle healed, Marcus watched his team mates practice. One day after practice, Marcus picked up the shotput and threw it across the field. His coach was watching and Marcus found a new way to participate.
“Sometimes life is like that,” his coach Mr. Samuels said. “You think you are going to be doing one thing andsomething else crosses your path.
This year, Marcus is on the shot put team. His team is trying to figure out which field they should use to practice in.There are several different fields available, but the team is large, so they are looking for a field with a width of 45.65meters.
Field A—0.004565 kilometers
Field B—45,650 millimeters
Field C—456.5 centimeters
Field D—456,500 millimeters
Which field should his team choose?
First, we need to look at each unit of measurement to determine the best option for Marcus and his team. Thisproblem asks us to compare the widths of these fields against 45.65 meters. Let’s begin by converting the widths ofthe each field into meters.
• Field A has a width of 0.004565 kilometers. To convert to meters, we multiply by 1,000 or move the decimalpoint three places to the right. 0.004565 kilometers = 4.565 meters.
• Field B has a width of 45,650 millimeters. To convert to meters, we divide by 1,000 or move the decimal pointthree places to the left. 45,650÷1,000 = 45.65 meters.
• Field C has a width of 456.5 centimeters. To convert to meters, we divide by 100 or move the decimal pointtwo places to the left. 456.5 centimeters÷100 = 4.565 meters.
• Field D has a width of 456,500 millimeters. To convert to meters, we divide by 1,000 or move the decimalpoint three places to the left. 456,500 millimeters = 456.5 meters.
Now we can compare the widths of the fields against 45.65 meters. Only Field B has the right width.
195

2.22. Comparison of Metric Measurements www.ck12.org
The solution is Field B.
Guided Practice
Here is one for you to try on your own.
Compare 743 km to 74,300,000 mm
Answer
The first thing to notice is that these two units of measure are not the same. Therefore, we have to convert both ofthem to the same unit to compare them. We can convert both measurements to kilometers.
Multiply kilometers by 1,000,000 to get millimeters.
743×1,000,000 = 743,000,000
Our answer is that 743 km >74,300,000 mm.
Explore More
Directions: Compare or order the following measurements. Write <, >, or = for each ___.
1. 14 km ___ 56 m
2. 1.23 m ___ 123 kilometers
3. 3.4 km ___ 340 m
4. 18 g ___ .18 kilograms
5. 27 m ____ 2700 kilometers
6. 14 l ____ 2100 ml
7. 5 g ____ .0005 kg
8. 18 mm _____ .18 cm
9. 2.3 km ____ 2700 m
10. 3.48 cl ___ 0.348 l
11. 57.21 kg ___ 572,100 cg
12. 91.17 mm ___ 0.09117 m
13. 4.4 cl ___ 0.44 ml
14. Order the following measurements from least to greatest: 79,282 kg, 7,838,200 cg, 7,938,200 mg, 79,382 g.
15. Order the following measurements from least to greatest: 2,261,000 cl, 21,061 l, 21.06 kl, 21,161,000 ml
196
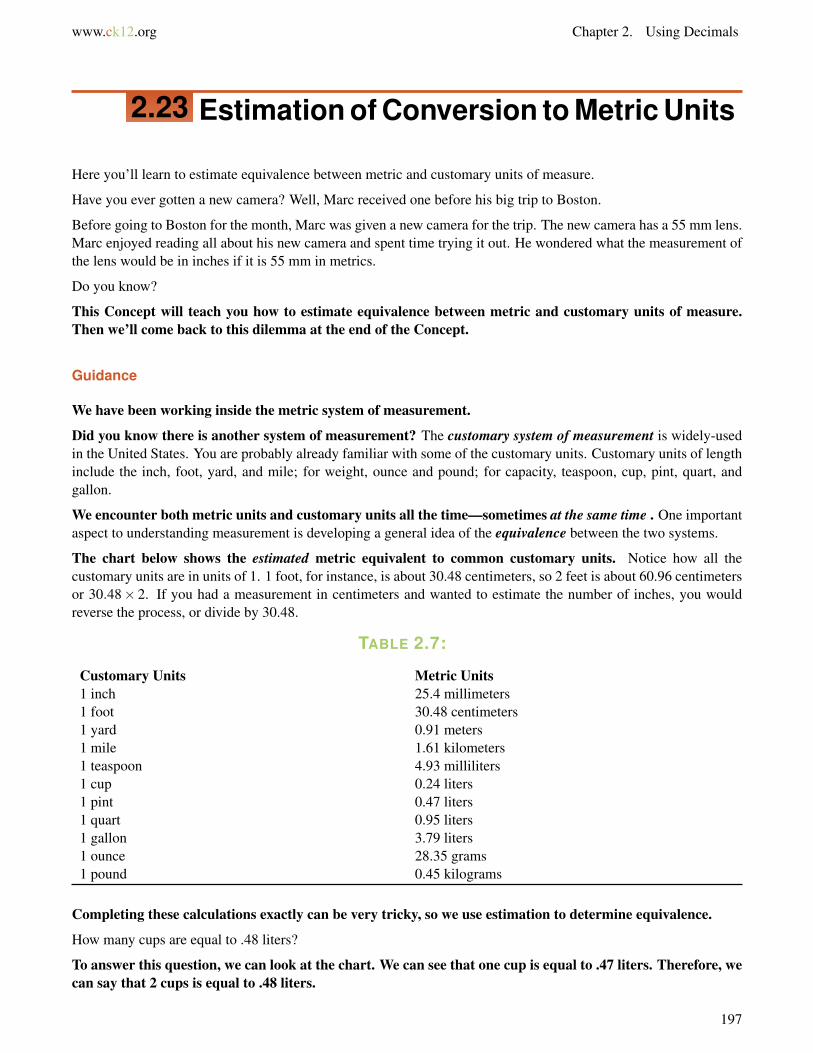
www.ck12.org Chapter 2. Using Decimals
2.23 Estimation of Conversion to Metric Units
Here you’ll learn to estimate equivalence between metric and customary units of measure.
Have you ever gotten a new camera? Well, Marc received one before his big trip to Boston.
Before going to Boston for the month, Marc was given a new camera for the trip. The new camera has a 55 mm lens.Marc enjoyed reading all about his new camera and spent time trying it out. He wondered what the measurement ofthe lens would be in inches if it is 55 mm in metrics.
Do you know?
This Concept will teach you how to estimate equivalence between metric and customary units of measure.Then we’ll come back to this dilemma at the end of the Concept.
Guidance
We have been working inside the metric system of measurement.
Did you know there is another system of measurement? The customary system of measurement is widely-usedin the United States. You are probably already familiar with some of the customary units. Customary units of lengthinclude the inch, foot, yard, and mile; for weight, ounce and pound; for capacity, teaspoon, cup, pint, quart, andgallon.
We encounter both metric units and customary units all the time—sometimes at the same time . One importantaspect to understanding measurement is developing a general idea of the equivalence between the two systems.
The chart below shows the estimated metric equivalent to common customary units. Notice how all thecustomary units are in units of 1. 1 foot, for instance, is about 30.48 centimeters, so 2 feet is about 60.96 centimetersor 30.48× 2. If you had a measurement in centimeters and wanted to estimate the number of inches, you wouldreverse the process, or divide by 30.48.
TABLE 2.7:
Customary Units Metric Units1 inch 25.4 millimeters1 foot 30.48 centimeters1 yard 0.91 meters1 mile 1.61 kilometers1 teaspoon 4.93 milliliters1 cup 0.24 liters1 pint 0.47 liters1 quart 0.95 liters1 gallon 3.79 liters1 ounce 28.35 grams1 pound 0.45 kilograms
Completing these calculations exactly can be very tricky, so we use estimation to determine equivalence.
How many cups are equal to .48 liters?
To answer this question, we can look at the chart. We can see that one cup is equal to .47 liters. Therefore, wecan say that 2 cups is equal to .48 liters.
197
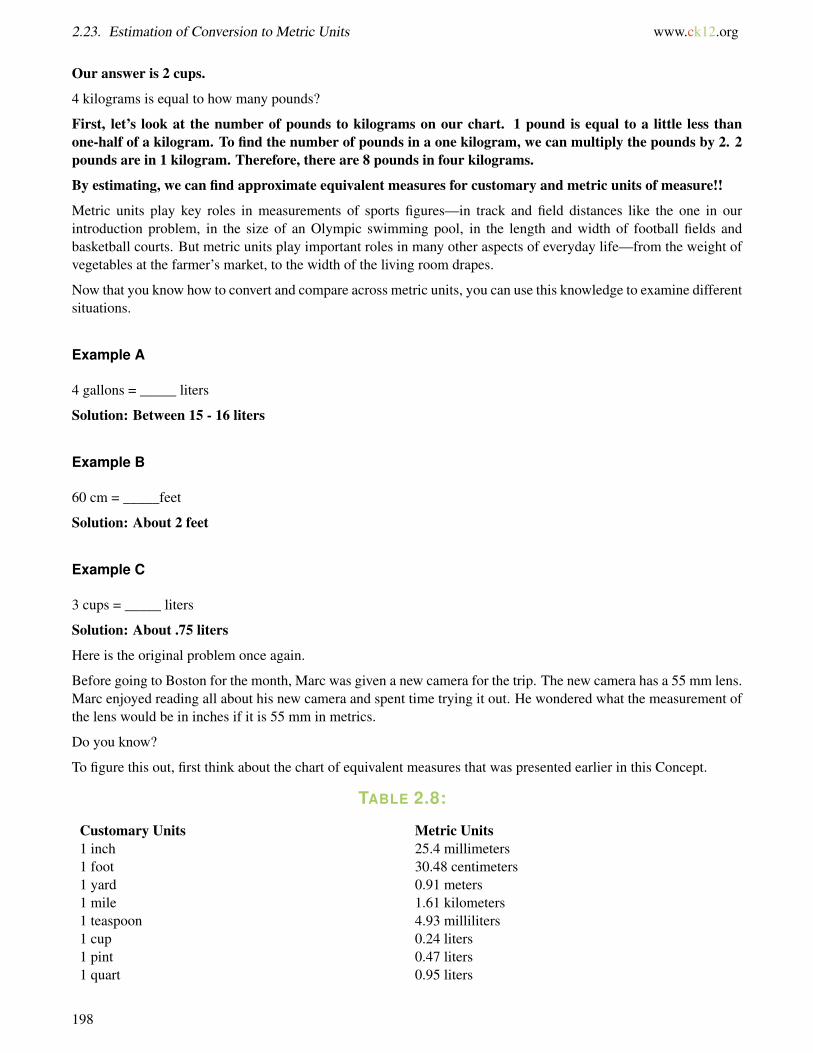
2.23. Estimation of Conversion to Metric Units www.ck12.org
Our answer is 2 cups.
4 kilograms is equal to how many pounds?
First, let’s look at the number of pounds to kilograms on our chart. 1 pound is equal to a little less thanone-half of a kilogram. To find the number of pounds in a one kilogram, we can multiply the pounds by 2. 2pounds are in 1 kilogram. Therefore, there are 8 pounds in four kilograms.
By estimating, we can find approximate equivalent measures for customary and metric units of measure!!
Metric units play key roles in measurements of sports figures—in track and field distances like the one in ourintroduction problem, in the size of an Olympic swimming pool, in the length and width of football fields andbasketball courts. But metric units play important roles in many other aspects of everyday life—from the weight ofvegetables at the farmer’s market, to the width of the living room drapes.
Now that you know how to convert and compare across metric units, you can use this knowledge to examine differentsituations.
Example A
4 gallons = _____ liters
Solution: Between 15 - 16 liters
Example B
60 cm = _____feet
Solution: About 2 feet
Example C
3 cups = _____ liters
Solution: About .75 liters
Here is the original problem once again.
Before going to Boston for the month, Marc was given a new camera for the trip. The new camera has a 55 mm lens.Marc enjoyed reading all about his new camera and spent time trying it out. He wondered what the measurement ofthe lens would be in inches if it is 55 mm in metrics.
Do you know?
To figure this out, first think about the chart of equivalent measures that was presented earlier in this Concept.
TABLE 2.8:
Customary Units Metric Units1 inch 25.4 millimeters1 foot 30.48 centimeters1 yard 0.91 meters1 mile 1.61 kilometers1 teaspoon 4.93 milliliters1 cup 0.24 liters1 pint 0.47 liters1 quart 0.95 liters
198
www.ck12.org Chapter 2. Using Decimals
TABLE 2.8: (continued)
Customary Units Metric Units1 gallon 3.79 liters1 ounce 28.35 grams1 pound 0.45 kilograms
If one inch equals 25.4 mm, then how many inches does 55 millimeters represent?
We can use mental math to figure this out.
55 mm is a little more than 2(25.4).
We can say then that 55 mm is about two inches. This is our answer.
Guided Practice
Here is one for you to try on your own.
At the Harvest Festival, Jocelyn is trying to buy the largest pumpkin. Covert the mass of the following pumpkinsinto the same unit and order the pumpkins from greatest to least.
Pumpkin J—5.67 kg
Pumpkin K—5,510,000 mg
Pumpkin L—567,100 cg
Pumpkin M—5,800 g
Answer
This problem asks us to order the pumpkins from greatest to least mass. In order to do so, we need to get all of thepumpkins into the same units. We’ll covert them to grams because grams is a good middle-point between the units.
• Pumpkin J has a mass of 5.67 kg. To convert to grams, we need to multiply by 1,000 or move the decimalpoint three places to the right. 5.67 kg→ 5,670 grams.
• Pumpkin K has a mass of 5,510,000 mg. To convert to grams, we need to divide by 1,000 or move the decimalpoint three places to the left. 5,510,000 mg→ 5,510 grams.
• Pumpkin L has a mass of 567,100 cg. To convert to grams, we need to divide by 100 or move the decimalpoint two places to the left. 567,100 cg→ 5,671 grams.
• Pumpkin M is already in grams→ 5,800 grams.
The answer is Pumpkin M, Pumpkin L, Pumpkin J, Pumpkin K.
Video Review
MEDIAClick image to the left or use the URL below.URL: http://www.ck12.org/flx/render/embeddedobject/5401
This is a Khan Academy Video on customary and metric units of measurement.
199
2.23. Estimation of Conversion to Metric Units www.ck12.org
Explore More
Directions: Estimate a metric equivalent for the following customary measurements. You may round to the nearesthundredth if necessary.
1. 5 cups to liters
2. 5 yards to meters
3. 6 inches to mm
4. 15 pounds to kg
5. 1 cup to liters
6. 4 miles to km
7. 5 feet to cm
8. 12 feet to cm
9. 8 inches to mm
10. 28.5 ounces to grams
11. 11.75 inches to millimeters
12. 8 quarts to liters
13. 15 pounds to kilograms
Directions: Solve the following problems.
14. To join the swim team, Jessica swam every day. The distances she swam for the first four days were as follows:1.65 km, 1,750 m, 185,000 cm, 1,950,000 mm. If the pattern continues, how many kilometers will she swim on thefifth day?
15. Mrs. Roth is moving to a new apartment. She can lift exactly 22.5 kg. Which of the following objects can shelift: box of books (23,500 g), statue (2,450,000 cg), computer (2,550,000 mg), potted plant (22.55 kg)?
Summary
Having completed this chapter, students are now ready to move on to the next Chapter. Each Concept has providedstudents with an opportunity to engage and practice skills in many Concepts including comparing and ordering deci-mals, decimal operations, rounding decimals, commutative and associative properties of addition and multiplication,the inverse property, scientific notation, metric system of measurement, converting and comparing metric units ofmeasurement, and equivalence between customary and metric units of measurement.
200
www.ck12.org Chapter 3. Using Fractions
CHAPTER 3 Using FractionsChapter Outline
3.1 EQUIVALENT FRACTIONS
3.2 MIXED NUMBER AND FRACTION ESTIMATION
3.3 FRACTION AND MIXED NUMBER COMPARISON
3.4 ADDITION OF FRACTIONS
3.5 ESTIMATION OF SUMS OF MIXED NUMBERS AND FRACTIONS
3.6 COMMUTATIVE PROPERTY OF ADDITION WITH FRACTIONS
3.7 SUBTRACTION OF FRACTIONS
3.8 ESTIMATION WITH MIXED NUMBER/FRACTION SUBTRACTION
3.9 INVERSE PROPERTY OF ADDITION IN FRACTION EQUATIONS
3.10 PRODUCTS OF MIXED NUMBERS
3.11 PRODUCT ESTIMATION WITH MIXED NUMBERS/FRACTIONS
3.12 COMMUTATIVE PROPERTY WITH PRODUCTS OF FRACTIONS
3.13 DIVISION OF FRACTIONS
3.14 QUOTIENT ESTIMATION WITH MIXED NUMBERS/FRACTIONS
3.15 FRACTIONS AS DECIMALS
3.16 REPEATING DECIMALS
3.17 DECIMALS AS FRACTIONS
3.18 POSITIVE AND NEGATIVE FRACTION AND DECIMAL COMPARISON
3.19 UNITED STATES CUSTOMARY UNITS
3.20 APPROPRIATE TOOLS FOR CUSTOMARY MEASUREMENT
3.21 CONVERSION OF CUSTOMARY UNITS OF MEASUREMENT
3.22 CONVERSION ESTIMATION BETWEEN SYSTEMS OF MEASURE
Introduction
In Math 7, the learning content is divided into Concepts. Each Concept is complete and whole providing focusedlearning on an indicated objective. Theme-based Concepts provide students with experiences that integrate thecontent of each Concept. Students are given opportunities to practice the skills of each Concept through real-worldsituations, examples, guided practice and independent practice sections. There are also video links provided to givestudents an audio/visual way of connecting with the content. In this Chapter, students will engage with Conceptson comparing and ordering fractions, operations with fractions, mixed numbers, operations with mixed number,relationships between fractions and decimals, measuring with customary units of measurement and convertingcustomary units of measurement.
201

3.1. Equivalent Fractions www.ck12.org
3.1 Equivalent Fractions
Here you’ll learn to identify equivalent proper fractions, mixed numbers and improper fractions.
Have you ever had a bake sale at school? It can be a great fundraiser. Take a look at this dilemma.
The Seventh grade class is having a bake sale to raise money for class projects and trips. Madison has decided tobake her favorite kind of cookie for the sale. She loves linzer cookies with jam inside.
“What are you doing?” asks her brother Kyle coming into the kitchen.
“I’m making cookies for the bake sale,” Madison explains as she takes out the flour and the measuring cups.
“Can I help?” Kyle asks.
“Sure, now we need 2 12 cups of flour. Here is the 1
2 measuring cup, but I can’t find the 1 cup measuring cup. That’sokay though because I can measure five 1
2 cups full of flour and that will be 2 12 cups,” She explains to Kyle.
“You could also use the 13 measuring cup and fill it up 8 times,” Kyle says picking up the 1
3 measuring cup.
“I don’t think so,” Madison says. “I think that is too much flour.”
“No it isn’t,” Kyle argues.
Who is correct? To figure out whether 2 12 cups of flour is equal to eight 1
3 cups of flour, you will need tounderstand how to compare and figure out equivalent fractions. Pay attention during this Concept and bythe end of it, you will know who is correct and who needs to rethink their figuring.
Guidance
This Concept is all about fractions. To understand fractions, you will need to think about whole numbers too.Without whole numbers, it is impossible to understand fractions because a fraction is a part of a whole.
Whole numbers are numbers like 1, 8, 56, and 278—numbers that don’t contain fractional parts. Not all numbersare whole.
A Fraction describes a part of a whole number. You are certainly familiar with fractions in your everyday dealingswith cooking. Consider a recipe that calls for 1
2 cup of chocolate chips. You know that 12 cup represents one-half of
a whole cup.34 or 3
4
202
www.ck12.org Chapter 3. Using Fractions
A fraction has certain parts. What are those parts?
The number written below the bar in a fraction is the denominator, which tells how many parts the whole is dividedinto. The numerator is the number above the bar in a fraction, which tells how many parts of the whole you have.In the recipe that calls for 1
2 cup, the denominator is 2, so we know that one whole cup is divided into 2 parts. Thenumerator is 1, so we know that we need 1 of the 2 parts of the whole cup. Notice that the fraction can be written upand down with one number on top of the other or using a slash. With a slash, the first number is the top number ornumerator and the bottom number is the second number.
A whole can be divided into an infinite number of parts. You can divide 1 cup of flour into thirds, sixths, tenths,and so on. Fractions which describe the same part of a whole are called equivalent fractions. Remember thatthe word equivalent means equal. For instance, if you measure out 2
4 cup of flour, 36 cup of flour or 1
2 cup of flour,you will have the same amount of flour.
Therefore 24 ,
36 and 1
2 are all equivalent fractions.
When we have been given a fraction, we can create a fraction that is equivalent to that fraction. We call this makingequal fractions or making equivalent fractions.
How do we do make equivalent fractions?
The first way is to work on simplifying the fraction to make a fraction smaller.
To simplify a fraction, we can reduce the number in the numerator and denominator by dividing them by the samenumber. For example, 4
8 can be rewritten as 12 by dividing both the numerator and the denominator by 4. Note
that not all fractions can be rewritten by dividing. If the only number that both the numerator and denominator aredivisible by is 1, then the fraction is said to be in its simplest form.
Simplify 618
To simplify this fraction, we look for a number that we can divide into both the numerator and the denom-inator. In this case, the number is 6. We call 6 the Greatest Common Factor (GCF) of the numerator and thedenominator. To simplify, we divide the numerator and the denominator by 6.6÷618÷6 = 1
3
The answer is 13 .
The second way is through multiplying. We can create an equivalent fraction by multiplying the numeratorand denominator by the same number. It doesn’t matter which number you choose, as long as the numbersare the same numbers.
Create an equivalent fraction for 78 .
To do this, we need to multiply the numerator and the denominator by the same number. Let’s choose 2.7×28×2 = 14
16
The answer is 1416 .
Write four equivalent fractions for 812 .
203
3.1. Equivalent Fractions www.ck12.org
First, let’s see if we can reduce the numbers in the numerator and denominator. Are there any numbers,which can be divided into both 8 and 12? 8 and 12 are both divisible by 2 and 4. So, the fraction 8
12 is not inits simplest form.
812
=8÷212÷2
=46
812
=8÷412÷4
=23
When we divide both the numerator and the denominator by 2, we get 46 as an equivalent fraction. When we
divide the numerator and the denominator by 4, we get 23 as an equivalent fraction.
To find more equivalent fractions, we can multiply the numerator and denominator of 812 by any number.
Let’s multiply by 3. We get 2436 as an equivalent fraction to 8
12 . If we multiply the numerator and denominatorby 5, we get 40
60 as an equivalent fraction to 812 .
812
=8×312×3
=2436
812
=8×512×5
=4060
The answer is 23 ,
46 ,
2436 ,
4060 .
Notice that creating equivalent fractions in this example involved both simplifying and multiplying!!
There are other types of fractions too.
Sometimes when working with fractions, you use numbers which consist of a whole number and a fraction.This is called a mixed number. For example, if a recipe calls for more than 1 cup of flour but less than 2 cups offlour, you need to use a mixed number to describe exactly how much flour you need. A mixed number is writtenas a whole number with a fraction to the right of it. Some common mixed numbers include: 1 1
2 or 2 23 .
When the numerator of a fraction is greater than or equal to the denominator, you have an improper fraction. Improper fractions are greater than or equal to 1.22 ,
33 , and 10
10 are all improper fractions that equal 1.
Why is this? Well, to understand this, you have to think about what the numerator and the denominator mean. Thedenominator is how many parts the whole is divided into. The numerator is how many of those parts you have. Ifyou have two out of two parts, then you have the whole thing.52 ,
83 , and 11
4 are all fractions that are greater than 1. These are called improper fractions.
Mixed numbers and Improper Fractions can be equivalent or equal to each other.
Improper fractions can be written as mixed numbers by dividing the numerator by the denominator and keepingthe remainder as the numerator. Mixed numbers can be rewritten as improper fractions by multiplying the wholenumber in the mixed number by the denominator and adding the product to the numerator.92 = 4 1
2
These two quantities are equal. This improper fraction is equal to the mixed number.
Write 3 23 as an improper fraction.
Remember, to write a mixed number as an improper fraction, we first multiply the whole number (3) by thedenominator in the fraction, 3×3 = 9. Next, we add this number to the numerator of the fraction, 9+2 = 11.We put this new number over the original denominator and we have our improper fraction.
204
www.ck12.org Chapter 3. Using Fractions
Our answer is that 3 23 can be written as the improper fraction 11
3 .
Practice working with equivalent fractions.
Example A
Simplify 1012
Solution: 56
Example B
Create an equivalent fraction for 56
Solution: 1012
Example C
Write 152 as a mixed number
Solution: 7 12
Here is the original problem once again.
The Seventh grade class is having a bake sale to raise money for class projects and trips. Madison has decided tobake her favorite kind of cookie for the sale. She loves linzer cookies with jam inside.
“What are you doing?” asks her brother Kyle coming into the kitchen.
“I’m making cookies for the bake sale,” Madison explains taking out the flour and the measuring cups.
“Can I help?” Kyle asks.
“Sure, now we need 2 12 cups of flour. Here is the 1
2 measuring cup, but I can’t find the 1 cup measuring cup. That’sokay though because I can measure five 1
2 cups full of flour and that will be 2 12 cups,” She explains to Kyle.
“You could also use the 13 measuring cup and fill it up 8 times,” Kyle says picking up the 1
3 measuring cup.
“I don’t think so,” Madison says. “I think that is too much flour.”
“No it isn’t,” Kyle argues.
To solve this problem, we need to compare Madison’s measurement with Kyle’s measurement.
Madison’s measurement is 2 12 .
Kyle’s measurement is 8 one-third cups which is 83 .
Next, we compare the two quantities. Kyle thinks that his measurement is equal to Madison’s. To see if he iscorrect, we convert the improper fraction to a mixed number. That will make our comparison much easier.
205
3.1. Equivalent Fractions www.ck12.org
83 = 2 2
3
Now we compare 2 12 < 2 2
3 .
Madison is correct. If she uses Kyle’s measurement technique, she will have too much flour! Kyle needs toremember that two-thirds is greater than one-half.
You can check this by taking the fraction part of each and rewriting them with a common denominator.
12=
36
23=
46
You can see that two-thirds is greater than one-half.
Guided Practice
Here is one for you to try on your own.
Write 73 as a mixed number.
Answer
To write an improper fraction as a mixed number, we divide the numerator by the denominator. 7÷ 3 = 2R1. Tofinish, we write the remainder above the original denominator and write the whole number part of the quotient to theleft of this new fraction.
Our answer is that 73 can be written as the mixed number 2 1
3 .
Video Review
MEDIAClick image to the left or use the URL below.URL: http://www.ck12.org/flx/render/embeddedobject/57620
This is a James Sousa video on fractions.
Explore More
1. Write four equivalent fractions for 68 .
Directions: Write the following mixed numbers as improper fractions
2. 2 58
3. 3 25
4. 1 17
5. 5 49
206
www.ck12.org Chapter 3. Using Fractions
Directions: Write the following improper fractions as mixed numbers.
6. 2928
7. 125
8. 92
9. 178
10. 223
Directions: Write three equivalent fractions for each of the following fractions.
11. 23
12. 1228
13. 34
14. 910
15. 78
207
3.2. Mixed Number and Fraction Estimation www.ck12.org
3.2 Mixed Number and Fraction Estimation
Here you’ll learn to approximate fractions and mixed numbers using common benchmarks.
Remember the seventh grade bake sale from the Equivalent Fractions Concept? Well, look at this situation.
Sam baked 8 912 batches of cookies for the bake sale. When he brought them to school, Tracy asked how many
batches he had made.
When Sam told her, she wrote 9 batches of cookies on the check sheet.
How did Tracy know that Sam’s quantity was close to 9 batches? Do you know?
This Concept will teach you how to approximate mixed numbers and fractions using benchmarks. By the endof it, you will know how Tracy came to this conclusion.
Guidance
Because a whole can be divided into an infinite number of parts, it is sometimes difficult to get a good sense of thevalue of a fraction or mixed number when the denominator of the fraction is large. In order to get an approximatesense of the value of a fraction, we compare the complicated fraction with several simpler fractions, orbenchmarks. The three basic fraction benchmarks are: 0, 1
2 and 1.
When approximating the value of a fraction or mixed number, ask yourself which of these benchmarks is thenumber closest to?
Let’s look at how to apply benchmarks.
What is the approximate size of 1718 ?
To begin with, we need to determine whether the fraction is closest to 0, one-half or 1 whole. The denominator is 18and the numerator is 17. The numerator is close in value to the denominator. The value of 17
18 is closest to 1 because1818 would be equal to one.
Our answer is 1.
That’s right. When you are looking for a benchmark, you want to choose the one that makes the most sense.
208
www.ck12.org Chapter 3. Using Fractions
What is the benchmark for 2449 ?
First, we can look at the relationship between the numerator and the denominator. The numerator in thiscase is almost half the denominator. Therefore the correct benchmark is one-half.
The answer is one-half.
What about mixed numbers?
We can identify benchmarks for mixed numbers too. The difference is that rather than zero, we look to thewhole number of the mixed number, the half and the whole number next in consecutive order.
What is the benchmark for 7 18 ?
Here we have 7 and one-eighth. Is this closer to 7, 7 12 or 8? If you think about it logically, one-eighth is a very
small fraction. There is only one part out of eight. Therefore, it makes sense for our benchmark to be 7.
The answer is 7.
Choose the correct benchmark for each example.
Example A
112
Solution: 0
Example B
56
Solution: 1
Example C
9 39
Solution: 9
Here is the original problem once again.
Sam baked 8 912 batches of cookies for the bake sale. When he brought them to school, Tracy asked how many
batches he had made.
When Sam told her, she wrote 9 batches of cookies on the check sheet.
How did Tracy know that Sam’s quantity was close to 9 batches? Do you know?
To figure out Tracy’s decision, let’s look at the fraction part of the mixed number of batches.
8 912
9 is more than half of 12, so rounded up to 9 batches. If the fraction part of 12 would have been less than half, thenTracy would have rounded down to 8 batches.
Tracy thought about this and rounded up to 9.
This is our answer.
209

3.2. Mixed Number and Fraction Estimation www.ck12.org
Guided Practice
Here is one for you to try on your own.
Name the common benchmark for this fraction.47
Answer
To begin, we have to look at the relationship between 4 and 7. 4 is a little more than half of seven. Because of this,we can say that this fraction is closest to one - half.12 is the appropriate benchmark.
Explore More
Directions: Approximate the value of the following fractions using the benchmarks 0, 12 and 1.
1. 910
2. 1120
3. 232
4. 2122
5. 123
6. 11100
7. 23
8. 1428
9. 1630
10. 1821
Directions: Approximate the value of the following mixed numbers.
11. 2 7980
12. 6 110
13. 43 715
14. 8 799
15. 6 2122
210

www.ck12.org Chapter 3. Using Fractions
3.3 Fraction and Mixed Number Comparison
Here you’ll learn to compare and order fractions and mixed numbers.
Have you ever had to organize all kinds of baked goods for a bake sale? Well, this is the task that Tracy is taking on.
Tracy has organized all of the baked goods that students have made. She has brownies, pies, a couple of cakes andlots of cookies. Sam baked 8 9
12 batches of cookies. Kelly baked 8 612 batches of cookies.
Who baked more cookies?
In order to figure this out, you will need to know how to compare and order fractions and mixed numbers.Pay attention to this Concept and you will see this problem again at the end of it.
Guidance
Previously we worked on fractions and approximation, you can easily compare and order fractions using thistechnique. By figuring out the benchmark, you can determine which fractions are larger or smaller than each other.This is the best way to approximate fractions as you compare and order them.
Sometimes, however, you can’t always rely on the approximation technique when comparing and ordering fractions.This is true when two fractions have the same benchmark, or when they have different denominators. In order to beexact when comparing and ordering fractions, you have to find a common denominator for all of the fractions. Then,compare or order the fractions by looking at the value of the numerator. This will give you an exact comparison.
Use approximation to order 78 . 2
5 ,358 ,
129 and 29
30 from greatest to least.
We begin by getting an approximate sense of the value of each of the fractions in the group by comparingeach fraction with the common benchmarks 0, 1
2 and 1.
Because the number 7, which is the numerator in the fraction 78 is very close in value to the denominator (8), we say
that 78 is approximately 1.
In the fraction, 25 , the numerator is approximately 1
2 of the denominator. So, we say that 25 is about 1
2 .
The number 3 58 is the only mixed number in the group, so we can see immediately that this number is larger than all
of the other numbers in the group because it is greater than 1.
In the fraction, 129 , the denominator is much greater than the numerator, so 1
29 is closest to the benchmark 0.
The numerator of 29 in the fraction 2930 is close in value to the denominator, 30, so 29
30 is approximately 1.
Now that we have the approximate values of each fraction in the group, we write the fractions in a preliminarygreatest to least order with the benchmarks in parentheses: 3 5
8
(3 1
2
), 7
8(1),2930(1),
25
(12
), 1
29(0).
This approximation technique helps with most of the fractions in the group, but there are two fractions whichare close to 1. We know that both 7
8 and 2930 are less than 1, but which of the two fractions is closest to 1? One helpful
way to determine which fraction is closest to 1 is to draw two number lines between 0 and 1, arranged so that onenumber line is above the other. Divide the top number line into eight equal parts (eighths) and the bottom numberline into thirty equal parts (thirtieths).
211
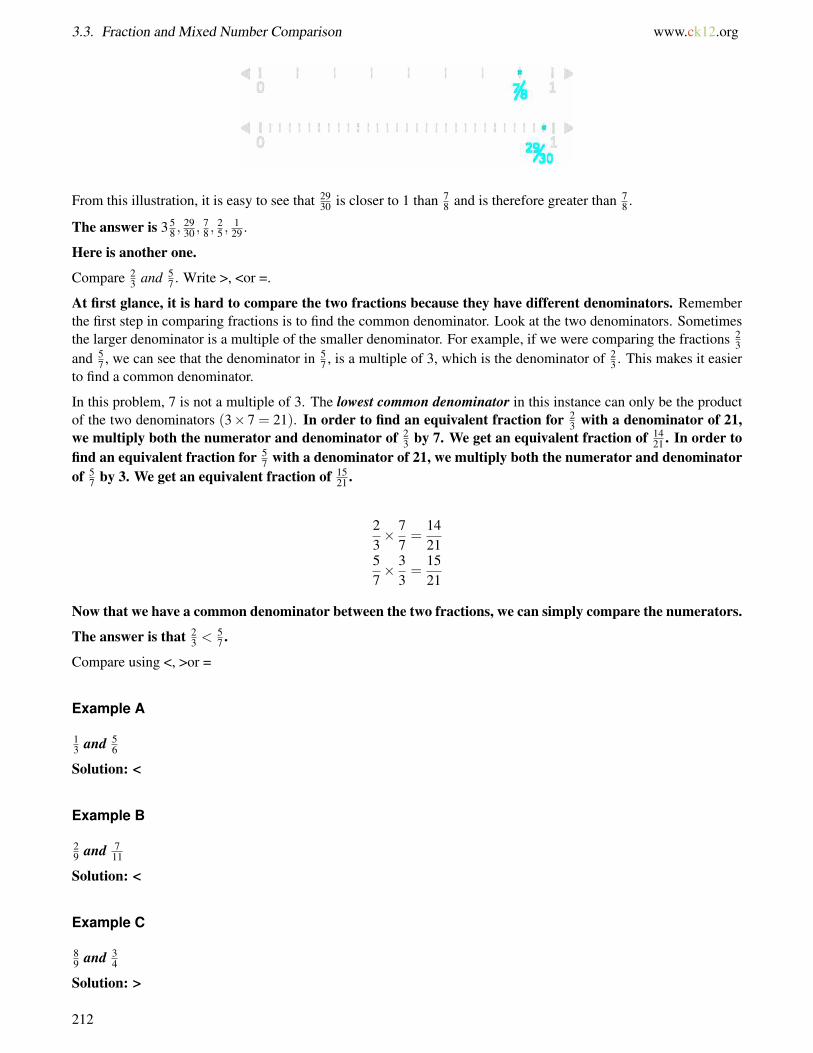
3.3. Fraction and Mixed Number Comparison www.ck12.org
From this illustration, it is easy to see that 2930 is closer to 1 than 7
8 and is therefore greater than 78 .
The answer is 3 58 ,
2930 ,
78 ,
25 ,
129 .
Here is another one.
Compare 23 and 5
7 . Write >, <or =.
At first glance, it is hard to compare the two fractions because they have different denominators. Rememberthe first step in comparing fractions is to find the common denominator. Look at the two denominators. Sometimesthe larger denominator is a multiple of the smaller denominator. For example, if we were comparing the fractions 2
3and 5
7 , we can see that the denominator in 57 , is a multiple of 3, which is the denominator of 2
3 . This makes it easierto find a common denominator.
In this problem, 7 is not a multiple of 3. The lowest common denominator in this instance can only be the productof the two denominators (3× 7 = 21). In order to find an equivalent fraction for 2
3 with a denominator of 21,we multiply both the numerator and denominator of 2
3 by 7. We get an equivalent fraction of 1421 . In order to
find an equivalent fraction for 57 with a denominator of 21, we multiply both the numerator and denominator
of 57 by 3. We get an equivalent fraction of 15
21 .
23× 7
7=
1421
57× 3
3=
1521
Now that we have a common denominator between the two fractions, we can simply compare the numerators.
The answer is that 23 < 5
7 .
Compare using <, >or =
Example A
13 and 5
6
Solution: <
Example B
29 and 7
11
Solution: <
Example C
89 and 3
4
Solution: >
212
www.ck12.org Chapter 3. Using Fractions
Remember the bake sale? Here is the original problem once again.
Tracy has organized all of the baked goods that students have made. She has brownies, pies, a couple of cakes andlots of cookies. Sam baked 8 9
12 batches of cookies. Kelly baked 8 612 batches of cookies.
Who baked more cookies?
To figure out who baked more cookies, let’s write out a problem comparing the two mixed numbers.
8 912 _____ 8 6
12
The fraction parts of these two mixed numbers have a common denominator. Because baking cookies involvesdozens, both Sam and Kelly wrote the fraction part of their cookies in twelfths. Therefore, we can compare thenumerators.
9 > 6
8 912 >8 6
12
Sam baked more cookies than Kelly.
This is our answer.
Guided Practice
Here is one for you to try on your own.
In the long jump contest, Peter jumped 5 38 feet, Sharon jumped 6 3
5 feet and Juan jumped 6 27 feet. Now order their
jump distances from greatest to least.
Answer
The problem asks us to order the jump distances from greatest to least. We have three mixed numbers, so we shouldlook first at the whole number parts of the mixed numbers to see if we can compare the jump distances.
Peter jumped more than 5 feet, but less than 6 feet. Sharon jumped more than 6 feet, but less than 7 feet. Juan alsojumped more than 6 feet, but less than 7 feet.
213
3.3. Fraction and Mixed Number Comparison www.ck12.org
Simply by comparing the whole numbers, we can see that Peter jumped the shortest distance because he jumped lessthan 6 feet. Because Sharon and Juan both jumped between 6 and 7 feet, we need to compare the fractional part oftheir jumps. Sharon jumped 3
5 of a foot more than 6 feet and Juan jumped 27 of a foot more than 6 feet. In order to
compare these two fractions, we have to find a common denominator. The lowest common denominator for thesetwo fractions is 35. We get an equivalent fraction of 21
35 for 35 when we multiply both the numerator and denominator
by 7. We get an equivalent fraction of 1035 for 2
7 when we multiply both the numerator and denominator by 5. Nowwe can order the distances.
The answer is Sharon 6 35 f t., Juan 6 2
7 f t., Peter 5 38 f t.
Video Review
MEDIAClick image to the left or use the URL below.URL: http://www.ck12.org/flx/render/embeddedobject/54781
This is a Khan Academy video on comparing fractions.
Explore More
Directions: Compare each pair of fractions or mixed numbers. Write >, <or =.
1. 25 and 3
5 .
2. 26 and 1
6 .
3. 45 and 3
5 .
4. 215 and 13
15 .
5. 25 and 3
7 .
6. 15 and 1
7 .
7. 1215 and 13
30 .
8. 45 and 7
9 .
9. 38 and 4
7 .
10. 12 and 3
6 .
Directions: Write each set in order from least to greatest.
11. 56 ,
13 ,
49
12. 67 ,
14 ,
23
13. 66 ,
45 ,
23
14. 12 ,
35 ,
23
15. 27 ,
14 ,
36
16. 16 ,
29 ,
25
Directions: Solve these two problems.
214
www.ck12.org Chapter 3. Using Fractions
17. Brantley is making an asparagus souffle, which calls for 3 37 cup of cheese, 3 2
3 cup of asparagus and 2 25 cup of
parsley. Using approximation order the ingredients from largest amount used to least amount used
18. Geraldine is putting in a pool table in her living room. She wants to put it against the longest wall of the room.Wall A is 12 4
9 feet and wall B is 12 25 feet. Against which wall will Geraldine put her pool table?
215
3.4. Addition of Fractions www.ck12.org
3.4 Addition of Fractions
Here you’ll learn how to add fractions and mixed numbers.
Do you like to eat pies? How about muffins? Take a look at this dilemma.
Teri and Ren are both in the seventh grade. They are baking pies and muffins for the bake sale. Teri has decided tomake a blueberry pie and Ren has decided to make blueberry muffins. While Teri works on making her pie crusts.Ren offers to go to the grocery store with his Mom to get the blueberries that they will need.
Teri tells Ren that she needs 5 12 cups of blueberries for the pie. Plus she will need an additional 1
4 of a cup fordecorating the top of the pie. Ren know that he will need 1 1
3 cups of blueberries for his pie.
If blueberries come in pints and there are two cups in one pint, how many pints of blueberries will Ren need to buyat the store?
Ren takes out a piece of paper and a pencil.
This is where you come in. You will learn all about adding fractions and mixed numbers in this Concept.
Guidance
Adding fractions and mixed numbers is as easy as adding whole numbers. The only trick is to make sure thatthe fractions we are adding have the same denominator.
Imagine adding 12 cup of flour to 1
3 cup of flour. We know that my new mixture of flour is more than 12 cup of flour
216
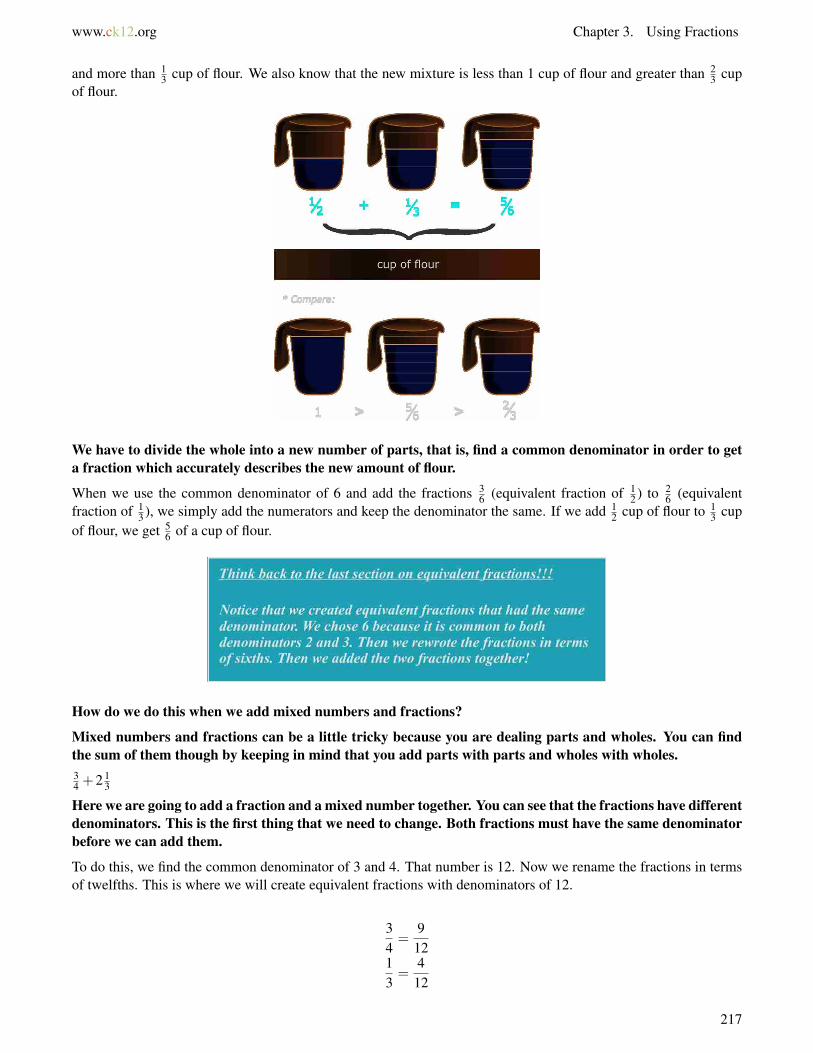
www.ck12.org Chapter 3. Using Fractions
and more than 13 cup of flour. We also know that the new mixture is less than 1 cup of flour and greater than 2
3 cupof flour.
We have to divide the whole into a new number of parts, that is, find a common denominator in order to geta fraction which accurately describes the new amount of flour.
When we use the common denominator of 6 and add the fractions 36 (equivalent fraction of 1
2 ) to 26 (equivalent
fraction of 13 ), we simply add the numerators and keep the denominator the same. If we add 1
2 cup of flour to 13 cup
of flour, we get 56 of a cup of flour.
How do we do this when we add mixed numbers and fractions?
Mixed numbers and fractions can be a little tricky because you are dealing parts and wholes. You can findthe sum of them though by keeping in mind that you add parts with parts and wholes with wholes.34 +2 1
3
Here we are going to add a fraction and a mixed number together. You can see that the fractions have differentdenominators. This is the first thing that we need to change. Both fractions must have the same denominatorbefore we can add them.
To do this, we find the common denominator of 3 and 4. That number is 12. Now we rename the fractions in termsof twelfths. This is where we will create equivalent fractions with denominators of 12.
34=
912
13=
412
217
3.4. Addition of Fractions www.ck12.org
Now we can add them. When the denominators are the same, we have to add the numerators only.912 +
412 = 13
12
We can change 1312 into the mixed number 1 1
12 .
Now we had a 2 from the original mixed number. We add this to our sum so far.
The answer is 3 112 .
Here our answer is in simplest form so we leave it alone. If you can simplify an answer you must do so or theanswer is incorrect.
Here are the steps.
Adding Mixed Numbers
1. Add the fractions.2. Add the whole numbers3. Add the sum of the fractions to the whole numbers4. Be sure that your answer is in simplest form.
Write these steps down in your notebook.
Now it’s time for you to practice adding fractions and mixed numbers on your own.
Example A
9 12 +22 1
4
Solution: 31 34
Example B
2 13 +8 2
3
Solution:11
Example C
5 13 +
17
Solution:5 1021
Now back to the blueberries. Remember that Ren had just taken out a pencil and paper. Here is how Ren beganthinking his way through the problem.
218
www.ck12.org Chapter 3. Using Fractions
First, we will need to find the sum of the blueberries. We will figure out how many cups of blueberries bothTeri and Ren will need for their recipes.
5 12 +
14 +1 1
3
Next, we need to rename each fraction with a common denominator. We can use 12 as our common denomi-nator.
5 612 +
312 +1 4
12
If we add the fraction parts, we get a sum of 1312 . This improper fraction changes to 1 1
12 .
Next we add this to our whole numbers.
The sum of the blueberries is 7 112 .
Now we have to figure out how many pints Ren will need to purchase. There are two cups in a pint. To haveenough blueberries, Ren will need to purchase 4 pints of blueberries. There will be some left over, but havingsome left over is better than not having enough!!
Guided Practice
Here is one for you to try on your own.
Donte is making a costume with blue, red and black fabric. He has 6 12 yards of blue fabric, 3 2
3 yards of red fabricand 5 4
5 yards of black fabric, how many yards of fabric does Donte have altogether?
Answer
Let’s look at the problem carefully and define the values that we know and the value or values that we want to know.
We know that Donte has 3 types of fabric (blue, red and black) and we know also the lengths of each type of fabric.We want to find out how much fabric Donte has altogether. If we represent this problem in an equation, it wouldlook like this:
Length of blue fabric + length of red fabric + length of black fabric = total length of fabric
Since we know the lengths of the individual colors of fabric, we can rewrite the expression like this:
6 12 +3 2
3 +5 45 = total length of fabric.
If we add the mixed numbers together, we will learn what we want to find out. First, we will add the first two mixednumbers. We use the common denominator of 6 for the fractions and we find the sum of the two mixed numbers:
6 36 +3 4
6 = 9 76
Notice that seven-sixths is improper meaning that it is larger than one whole. We can convert this improperfraction to a mixed number.
9 76 = 10 1
6
Now we can this new mixed number, 10 16 to the length of the black fabric, 5 4
5 yards.
We use the common denominator of 30 for the fractions and we find the sum of these mixed numbers. 10 530 +5 24
30 =15 29
30
We can use the exact sum or we can say that Donte has just about 16 yards of fabric.
Video Review
219

3.4. Addition of Fractions www.ck12.org
MEDIAClick image to the left or use the URL below.URL: http://www.ck12.org/flx/render/embeddedobject/57621
This is a James Sousa video on adding fractions with like denominators.
MEDIAClick image to the left or use the URL below.URL: http://www.ck12.org/flx/render/embeddedobject/5373
This is a James Sousa video on adding fractions with unlike denominators.
Explore More
Directions: Add the following fractions and mixed numbers. Simplify when necessary.
1. 37 +
114
2. 34 +
13
3. 25 +
310
4. 19 +
16
5. 2 35 +
1720
6. 8 512 +2 1
6
7. 1 23 +1 3
4
8. 2 15 +4 14
15
9. 2 15 +4 2
15
10. 12 15 +4 6
15
11. 2 23 +4 1
6
12. 3 410 +6 1
9
13. 2 130 +
1215
14. 4 12 +14 4
5
15. 16 89 +14 9
12
220
www.ck12.org Chapter 3. Using Fractions
3.5 Estimation of Sums of Mixed Numbers andFractions
Here you’ll learn to estimate the sums of fractions and mixed numbers.
Remember the blueberries from the Addition of Fractions Concept? Well, there is another blueberry dilemma here.
Teri and Ren finished baking pies and muffins and have moved on to scones.
Teri tells Ren that they need 4 34 cups of blueberries for the scones. Plus she will need an additional 3
4 of a cup fordecorating the topping.
About how many blueberries are need in all?
You can figure out an estimate of this sum. Pay attention to this Concept and you will learn exactly how to dothis.
Guidance
Estimation is a method for finding an approximate solution to a problem.
The sum of 22 and 51 is exactly 73. We can estimate the sum by rounding to the tens place and adding 20+ 50.Then we can say the sum of 22 and 51 is “about 70.”
Previously we worked with three benchmarks (0, 12 and 1) to get a sense of the approximate value of different
fractions. We can use this same technique to estimate sums of two or more fractions and mixed numbers.
First, we approximate the value of each fraction or mixed number using the benchmarks 0, 12 and 1.
Next, we find the sum of the approximate values.
When you are approximating the value of mixed numbers, first figure out the approximate value of the fraction andthen add it to the whole number. For example, the approximate value of 2 3
4 is 3 because the approximate value of 34
is 1(2+1 = 3).
Even when you are asked to find an exact answer, estimation is a useful way to get an idea of a reasonable solutionto a problem. Once you have finished solving for an exact answer to a problem, you can check your answer againstthe estimate. Refer back to the following steps if necessary.
Estimating sums of fractions and mixed numbers:
1. Approximate the value of each of the fractions or mixed numbers by using the benchmarks 0, 12 and 1
221
3.5. Estimation of Sums of Mixed Numbers and Fractions www.ck12.org
2. Add these approximate values to get an estimated sum
Write these steps in your notebook and then continue with the Concept.
Estimate the following sum, 59 +
177
First, we approximate the value of the individual fractions. 59 is approximately 1
2 and 177 is approximately 0.
Now, we rewrite the problem substituting the approximate values: 12 +
0.59 + 1
77 is about 12 .
Estimate the following sum, 3 67 +1 4
9
First, we approximate the value of each of the mixed numbers. The approximate value of 3 67 is 4 because the
approximate value of the fraction 67 is 1(3+1= 4). The approximate value of 1 4
9 is 1 12 because the approximate
value of 49 is 1
2 . We rewrite the problem with the approximate values of the mixed numbers and it looks likethis: 4+1 1
2 . We estimate that the sum of 3 67 and 1 4
9 is about 5 12 .
Try a few on your own. Estimate the following sums.
Example A
67 +
12
Solution: 1+ 12 = 1 1
2
Example B
2930 +7 8
10
Solution: 8+1 = 9
Example C
1 12 +3 5
6
Solution:1 12 +1 = 2 1
2
Now back to the blueberries.
222
www.ck12.org Chapter 3. Using Fractions
Teri and Ren finished baking pies and muffins and have moved on t0 scones.
Teri tells Ren that they need 4 34 cups of blueberries for the scones. Plus she will need an additional 3
4 of a cup fordecorating the topping.
About how many blueberries are need in all?
To figure out this estimate, we must first use benchmarks to estimate each fraction or mixed number.
4 34 = 5
34 = 1
5+1 = 6
Teri and Ren will need about 6 cups of blueberries. This is our estimate.
Guided Practice
Here is one for you to try on your own.1820 +5 9
10
Answer
First, we have to estimate each fraction or mixed number by using the common benchmarks.1820 = 1
5 910 = 6
Here is our solution.
1+6 = 7
This is our estimate of the sum.
Video Review
MEDIAClick image to the left or use the URL below.URL: http://www.ck12.org/flx/render/embeddedobject/5381
223
3.5. Estimation of Sums of Mixed Numbers and Fractions www.ck12.org
This is a James Sousa video on adding mixed numbers. It is a supporting video for this Concept.
Explore More
Directions: Estimate the sums.
1. 129 +
45
2. 911 +
410
3. 25 +
1213
4. 271 +
129
5. 129 +
45
6. 320 +
1415
7. 67 +
15
8. 918 +
56
9. 1213 +
125
10. 79 +
130
Directions: Estimate the sums.
11. 3 67 +2 10
11
12. 8 112 +6 3
7
13. 2 910 +3 1
17
14. 1 212 +
4446
15. 8 129 +10 4
5
224
www.ck12.org Chapter 3. Using Fractions
3.6 Commutative Property of Addition withFractions
Here you’ll learn to apply the commutative and associative properties of addition in fraction operations with numer-ical and variable expressions.
Have you ever combined ingredients to make a cake? Sometimes it matters which order you put them in, but often ifyou keep the dry ingredients separate from the wet ingredients, then it doesn’t make a difference to the final product.
Sammi is baking a cake. She begins by combining the dry ingredients. She adds 12 cup of white flour and then
rereads the recipe to see that she need another 2 14 cups of white flour. The dough looks sticky, so she puts a bit of
whole wheat flour in too. It is just a small bit to even out the recipe.
Can you write an expression to show how Sammi added the flour? Can you simplify it?
This Concept will show you how to use the Commutative Property of Addition in fraction operations. Youwill be able to write an expressions and simplify it by the end of the Concept.
Guidance
Now that we know the basics of adding fractions, we can use two mathematical properties of addition to help ussolve more complicated problems.
The Commutative Property of Addition states that the order of the addends does not change the sum. Let’s testthe property using simple whole numbers.
4+5+9 = 18 5+4+9 = 18 9+5+4 = 18
4+9+5 = 18 5+9+4 = 18 9+4+5 = 18
As you can see, we can add the three addends (4, 5, and 9) in many different orders. The Commutative Property ofAddition works also works for four, five, six addends.
It works for fraction addends, too. This means that the order that you add fractions in does not change thesum of the fractions.
Parentheses are grouping symbols used in math to let us know which operations to complete first. The order ofoperations tells us that operations in parentheses must be completed before any other operation. The AssociativeProperty of Addition states that the way in which addends are grouped does not change the sum. Once again,let’s test the property using simple whole numbers.
(4+5)+9 = 18 (5+4)+9 = 18 (9+5)+4 = 18
Clearly, the different way the addends are grouped has no effect on the sum. The Associative Property ofAddition works for multiple addends as well as fraction addends.
How do we use these properties when adding fractions?
These two properties are extremely useful when adding fractions. If you are adding three fractions and two of thefractions have like denominators, you can add those two fractions together and then find a common denominatorwith the third. This can be a big time saver.
225

3.6. Commutative Property of Addition with Fractions www.ck12.org
When you are working with variable expressions or with expressions which contain an algebraic unknown(like x) you can use the commutative and associative properties of addition to simplify the expression.
Simplify the following variable expressions using the associative and commutative properties of addition.
3 23 + x+ 1
3
To simplify means to make smaller. We are going to simplify this expression. We use the Commutative Property ofAddition to do this.
That’s a great question. If you think about it, because it doesn’t matter which order you add fractions in, you canadd the mixed number and the fraction and ignore the x. This will help you to simplify the expression. Let’s add thetwo numbers together.
3 23 +
13 = 4
One-third plus two-thirds is three-thirds which is the same as one. We add one to the whole number three and getfour.
Our simplified expression is 4+ x.310 +
(14 + x
)To simplify this expression, we are going to use the Associative Property of Addition. The hint is that thereare parentheses in this expression.
226

www.ck12.org Chapter 3. Using Fractions
That’s a good question. We use that property because we can change the grouping. You know from the orderof operations that operations inside the parentheses are done first. Well, you can’t complete this operation inthe grouping symbol because you don’t know what x is. But if you change the grouping, you can simplify theexpression.( 3
10 +14
)+ x
Now we add three-tenths and one-fourth.
310
=620
14=
520
620
+5
20=
1120
Our answer is 1120 + x.
Simplify each expression using the Commutative and Associative Properties of Addition. Be sure your answers arein simplest form.
Example A
23 + y+ 1
5
Solution: 1315 + y
Example B
12 +
(12 + x
)Solution:1+ x
227
3.6. Commutative Property of Addition with Fractions www.ck12.org
Example C
x+ 49 +
29
Solution:x+ 23
Here is the original problem once again.
Sammi is baking a cake. She begins by combining the dry ingredients. She adds 12 cup of white flour and then
rereads the recipe to see that she need another 2 14 cups of white flour. The dough looks sticky, so she puts a bit of
whole wheat flour in too. It is just a small bit to even out the recipe.
Can you write an expression to show how Sammi added the flour? Can you simplify it?
Now let’s write an expression including the two fractions and the little bit of whole wheat flour is x because themeasurement is not clear.12 +2 1
4 + x
Next, we can simplify it by adding the fractions.
2 34 + x
This is our answer.
Guided Practice
Here is one for you to try on your own.
Simplify. Be sure your answer is in simplest form.37 + y+ 2
7
Answer
To simplify this, using the commutative property, we add the fractions.37 +
27 = 5
7
Now we put the variable into the final expression.
y+ 57
This is our answer.
Video Review
MEDIAClick image to the left or use the URL below.URL: http://www.ck12.org/flx/render/embeddedobject/57624
This is a James Sousa video on adding and subtracting fractions. It is a supporting video for this Concept.
228
www.ck12.org Chapter 3. Using Fractions
MEDIAClick image to the left or use the URL below.URL: http://www.ck12.org/flx/render/embeddedobject/54784
Khan Academy Video on Associative Law of Addition
MEDIAClick image to the left or use the URL below.URL: http://www.ck12.org/flx/render/embeddedobject/54785
Khan Academy Video on Commutative Law of Addition
Explore More
Directions: Add.
1. 16 +
26 + y
2. 14 + x+4 3
4
3. 29 + y+ 5
9
4. 2 78 + x+1 1
8
Directions: Simplify the expressions using the associative and commutative properties of addition.
5. x+3 23 +5 1
6
6. 14 + x+ 5
8
7.(1
9 + x)+ 2
9
8. 2 114 +
(x+3 5
7
)9. 3 1
4 +(x+1 2
3
)10. 2 1
10 +(x+3 1
3
)11. 4 1
2 +(x+2 1
6
)12. 3 1
9 +(x+2 2
18
)Directions: Write an expression or an equation for each situation and then solve. There are two parts to each problem.
13. One-third of the CDs in Joseph’s CD collection are classical music CDs. Two-sevenths of the CDs are hip-hopCDs. What fraction of Joseph’s collection is classical and hip-hop.
14. Naira is making pinecone stew. First, she mixes 3 15 cups of chopped pinecones with 1 1
2 cups of mud. For thesnail sauce on top, she uses another 1 3
8 cups of chopped pinecones. How much chopped pinecone does Naira use forher recipe?
15. Jennifer is trying to determine if the cheerleading squad has enough ribbon for the pep rally on Friday. Kurtcontributes 9 1
6 feet of gold ribbon. Estelle contributes 34 foot of red ribbon. Aaron brings in 5 2
7 feet of gold ribbon atthe last minute. How much ribbon does the cheerleading squad have?
229

3.6. Commutative Property of Addition with Fractions www.ck12.org
16. Marcus and Anita are trying to complete the project. They finished 14 of the project on Saturday. They got another
four-sevenths of the project done on Tuesday. If the project needs to be finished by Thursday, write an algebraicexpression that shows how much of the project needs to be completed, how much they have done on Saturday, howmuch they have done on Tuesday and how much they need to do on Wednesday.
230
www.ck12.org Chapter 3. Using Fractions
3.7 Subtraction of Fractions
Here you’ll learn to subtract fractions and mixed numbers.
Have you ever picked fresh peaches? Have you ever made a peach pie?
Jesse has decided to make peach pie for the bake sale. His recipe calls for 2 12 pounds of peaches. Jesse’s older
brother Jeff drives him to the farmer’s market to pick up his peaches. When Jesse gets there, he is amazed at howfast paced the market is. There are several people working behind the counter and they seem to be adding up all ofthe figures in their heads. Jesse is amazed. He loves math but he can’t even imagine adding up so many numbers inhis head at one time.
Jesse is fascinated. So much so that he loses his focus and puts many, many peaches in his cloth bag. When the girlweighs it, Jesse watches her add up the math in her head. She tells Jesse how much and he pays her. Then she handsJesse back the bag.
“How many pounds is this?” Jesse asks.
“You bought 6 14 pounds of peaches,” She says focusing on another customer.
Jesse is surprised. He knows that he wasn’t paying very good attention, but he has a lot more peaches than he needs.How much more does he have? After Jesse makes his pie, how many pounds of peaches will be left over?
To figure this out, you will need to understand how to subtract fractions and mixed numbers. Pay closeattention because this Concept will cover all that you need to know. You will see this problem again at the endof the Concept and you will be ready to solve it!
231

3.7. Subtraction of Fractions www.ck12.org
Guidance
In real life, we use fractions all the time. Let’s say you are cutting a piece of wood 3 34 feet long and you need to cut
12 foot off of the piece of wood. What do you need to do to figure out how much wood you have left, after you makethe cut? You guessed it. Subtraction is the key. Subtracting fractions and mixed numbers is a skill that you are goingto need to use all the time.
How do we subtract fractions and mixed numbers?
If you know how to add fractions, then you already know how to subtract them. The key is to make sure that thefractions that you are subtracting have the same denominator. If the fractions have the same denominator,then subtract the numerators just like you subtract whole numbers and keep the denominator the same inyour answer.69 −
29
Notice that the denominators are the same, so we can simply subtract the numerators.
6−2 = 4
Our answer is 49 .
If the denominators are not the same, make sure to find the lowest or least common denominator first and then doyour subtracting. Think about the first example with sawing wood. If you subtract 1
2 foot from a piece of wood thatis 3 3
4 feet long, you have to find a common denominator first.
We can choose 4 as the least common denominator and rename each fraction in terms of fourths. To do this, wecreate equivalent fractions. If you use the equivalent fraction 2
4 for 12 , then you have the same denominator as the
fraction in 3 34 .
3 34 −
24 = 3 1
4
This problem actually uses a mixed number and a fraction. We can also subtract two mixed numbers. We dothis in the same way. We subtract the fractions and then subtract the whole numbers.
4 56 −1 4
6
First, we subtract the fraction parts. These fractions have the same denominator, so we can simply subtractthe numerators.
5−4 = 1 the fraction here is 16
Next, we subtract the whole numbers.
4−1
Our final answer is 3 16 .
Sometimes, when you subtract mixed numbers, you will have to do an extra step. Think about this one.
232

www.ck12.org Chapter 3. Using Fractions
Imagine you are cutting, or subtracting, 1 34 feet of wood from a piece of wood that is 3 1
2 feet long. Your subtractionproblem looks like this: 3 1
2 −1 34 .
After you find a common denominator, your subtraction problem now looks like this.
3 24 −1 3
4
Take a deep breath and don’t panic! This is where you use your expertise at converting mixed numbers toimproper fractions. After you have a common denominator for the fractions, multiply the whole number ofthe mixed number by the denominator of the fraction. Add this product to the numerator of the fraction.
324=
(3×4)+24
=144
134=
(4×1)+34
=74
Your new subtraction problem for the example looks like this.144 −
74
Now you simply subtract the numerators and you get 74 . Now you convert this back into a mixed number. Do
you remember how to do this?
Don’t forget to rewrite the difference as a mixed number and keep the fraction in lowest terms.
Here are the steps for subtracting mixed numbers.
Subtracting Mixed Numbers:
1. Make sure the fractions have a common denominator.
233
3.7. Subtraction of Fractions www.ck12.org
2. If the fraction to the left of the minus sign is smaller than the fraction to the right of the minus sign–convert both mixed numbers into improper fractions
3. Subtract the improper fractions4. Rewrite the difference as a mixed number.
Take a few minutes to write these steps down in your notebooks.
Subtract the following fractions and mixed numbers. Be sure that your answer is in lowest terms.
Example A
1012 −
612
Solution: 412 = 1
3
Example B
67 −
34
Solution: 328
Example C
4 14 −
34
Solution: 24 = 1
2
234
www.ck12.org Chapter 3. Using Fractions
Here is the original problem once again.
Jesse has decided to make peach pie for the bake sale. His recipe calls for 2 12 pounds of peaches. Jesse’s older
brother Jeff drives him to the farmer’s market to pick up his peaches. When Jesse gets there, he is amazed at howfast paced the market is. There are several people working behind the counter and they seem to be adding up all ofthe figures in their heads. Jesse is amazed. He loves math but he can’t even imagine adding up so many numbers inhis head at one time.
Jesse is fascinated. So much so that he loses his focus and puts many, many peaches in his cloth bag. When the girlweighs it, Jesse watches her add up the math in her head. She tells Jesse how much and he pays her. Then she handsJesse back the bag.
“How many pounds is this?” Jesse asks.
“You bought 6 14 pounds of peaches,” She says focusing on another customer.
Jesse is surprised. He knows that he wasn’t paying very good attention, but he has a lot more peaches than he needs.How much does he have? After Jesse makes his pie, how many pounds of peaches will be left over?
To solve this problem, we will need to subtract the number of pounds that Jesse needs for his recipe from thenumber of pounds that he purchases.
6 14 −2 1
2
These fractions have different denominators, so we need to rename them in terms of a common denominator.The lowest common denominator here is 4.
6 14 is all set.
2 12 = 2 2
4
We can rewrite the problem.
6 14 −2 2
4
Next, we have to convert these to improper fractions because we can’t subtract two-fourths from one-fourth.254 −
104 = 15
4
To write it in simplest form, we convert this improper fraction to a mixed number.
Our answer is 3 34 pounds of peaches left over.
235

3.7. Subtraction of Fractions www.ck12.org
Guided Practice
Here is one for you to try on your own.
Benito works in a bakery and has baked the world’s longest loaf of cinnamon bread. His loaf measures 11 58 feet.
He cuts a piece of bread 1 12 feet for his friend Pamela and he cuts another piece 2 2
3 feet for his friend Serena. Howmuch bread does he have left?
Answer
Let’s take careful inventory of the information that the problem gives us. We know that the whole loaf of bread is11 5
8 feet. Pamela gets a piece 1 12 feet, that is her piece and Serena gets a piece 2 2
3 feet long, that is her piece.
This is our given information.
What do we want to find out? We want to know the length of the bread after he cuts Pamela and Serena’s pieces(loaf after cutting = x).
Let’s write an equation to show the relationship between the values:
Whole loaf –Pamela’s piece –Serena’s piece = loaf after cutting
When we substitute the given values, we have the following equation.
11 58 −1 1
2 −2 23 = x
Now, we simply solve from left to right. First, find a common denominator between the fractions in 11 58 and 1 1
2 .Let’s use 8, so we solve 11 5
8 −1 48 = 10 1
8 .
Next, we can simplify the problem.
10 18 −2 2
3 = x
The lowest common denominator for the fractions is going to be 24. We simplify the problem further.
10 324 −2 16
24 = x
You can already see that you will have to convert the mixed numbers to improper fractions. Simplify again.
24324− 64
24= x
x =17924
Next, we just convert the answer to a mixed number and write in simplest terms.
Solution: 7 1124 feet or about 7 1
2 feet
Video Review
MEDIAClick image to the left or use the URL below.URL: http://www.ck12.org/flx/render/embeddedobject/5382
This is a James Sousa video on subtracting mixed numbers
236
www.ck12.org Chapter 3. Using Fractions
MEDIAClick image to the left or use the URL below.URL: http://www.ck12.org/flx/render/embeddedobject/57622
This is a James Sousa video on subtracting fractions
Explore More
Directions: Subtract.
1. 710 −
14
2. 48 −
12
3. 47 −
121
4. 34 −
18
5. 3 110 −
15
6. 4 38 −3 1
4
7. 2 16 −1 1
3
8. 9 12 −7 1
7
Directions: Estimate the difference
9. 1416 −
111
10. 2860 −
613
11. 67 −
2145
12. 3233 −
512
13. 14 2021 −3 18
19
14. 2 149 −1 13
14
15. 3 221 −2 6
11
16. 4 817 −
7173
237
3.8. Estimation with Mixed Number/Fraction Subtraction www.ck12.org
3.8 Estimation with Mixed Number/FractionSubtraction
Here you’ll learn to estimate differences of fractions and mixed numbers.
Remember Jesse and the peaches from the Subtraction of Fractions Concept? Well, what if you had estimated thedifference? Would this have worked?
Here is the problem once again.
Jesse has decided to make peach pie for the bake sale. His recipe calls for 2 12 pounds of peaches. Jesse’s older
brother Jeff drives him to the farmer’s market to pick up his peaches. When Jesse gets there, he is amazed at howfast paced the market is. There are several people working behind the counter and they seem to be adding up all ofthe figures in their heads. Jesse is amazed. He loves math but he can’t even imagine adding up so many numbers inhis head at one time.
Jesse is fascinated. So much so that he loses his focus and puts many, many peaches in his cloth bag. When the girlweighs it, Jesse watches her add up the math in her head. She tells Jesse how much and he pays her. Then she handsJesse back the bag.
“How many pounds is this?” Jesse asks.
“You bought 6 14 pounds of peaches,” She says focusing on another customer.
Jesse is surprised. He knows that he wasn’t paying very good attention, but he has a lot more peaches than he needs.How much more does he have? After Jesse makes his pie, how many pounds of peaches will be left over?
In this Concept you will learn how to estimate using benchmarks and figure out the difference.
Guidance
Estimation is a method for finding an approximate solution to a problem. For example, 52− 21 is exactly 31. Wecan estimate the difference by rounding to the tens place and subtracting 50−20. Then we can say that 52−21 is“about 30.”
238
www.ck12.org Chapter 3. Using Fractions
To approximate the values of fractions, we compare the fractions in relation to three benchmarks, 0, 12 and 1.
Is the fraction closer to 0, 12 or 1? If it’s closer to 1, we say that the value of the fraction is “about 1.”
We can use these approximate values of fractions to estimate the differences of fractions and mixed numbers.
First, we approximate the value of each fraction or mixed number using the benchmarks 0, 12 and 1.
Next, we find the difference between the approximate values.
Even when you are asked to find an exact answer, estimation is a useful way to get an idea of a reasonablesolution to a problem. Once you have finished solving for an exact answer of a problem, you can check youranswer against the estimate. Refer back to the following steps if necessary.
Estimate the difference between 78 −
49
First, we need to rewrite each fraction in terms of its benchmark. Seven-eighths is almost one, so we can say thatthe best benchmark is 1. Four - ninths is a little less than one-half, so we can use one-half as the benchmark.
Next, to find the best estimate, we subtract the benchmarks.
1− 12 = 1
2
Our estimate is one-half.
We can also estimate differences of mixed numbers.
Estimate the difference between 5 1416 −5 1
16
First, we need to rewrite each of these in terms of a benchmark. Now we use the whole numbers of 5 and 6 as ourstarting points. Five and fourteen-sixteenths is close to 6. We use 6 as our benchmark for the first mixed number.
Five and one-sixteenth is closest to five. We use 5 as our second benchmark.
Now we subtract the benchmarks to find an accurate estimate.
6−5 = 1
Our estimate is 1.
Use benchmarks to estimate the differences.
Example A
6 56 −
910
Solution: 6
Example B
89 −
17
Solution:1
Example C
4 45 −1 2
5
Solution: 4
Now we can solve Jesse’s dilemma using estimation. Here is the original problem once again.
239
3.8. Estimation with Mixed Number/Fraction Subtraction www.ck12.org
Jesse has decided to make peach pie for the bake sale. His recipe calls for 2 12 pounds of peaches. Jesse’s older
brother Jeff drives him to the farmer’s market to pick up his peaches. When Jesse gets there, he is amazed at howfast paced the market is. There are several people working behind the counter and they seem to be adding up all ofthe figures in their heads. Jesse is amazed. He loves math but he can’t even imagine adding up so many numbers inhis head at one time.
Jesse is fascinated. So much so that he loses his focus and puts many, many peaches in his cloth bag. When the girlweighs it, Jesse watches her add up the math in her head. She tells Jesse how much and he pays her. Then she handsJesse back the bag.
“How many pounds is this?” Jesse asks.
“You bought 6 14 pounds of peaches,” She says focusing on another customer.
Jesse is surprised. He knows that he wasn’t paying very good attention, but he has a lot more peaches than he needs.How much more does he have? After Jesse makes his pie, how many pounds of peaches will be left over?
To work through this problem, we must first figure out the benchmark for each mixed number.
Jesse bought 6 14 pounds of peaches.
This can simply be estimated at 6 pounds.
Jesse needed 2 12 pounds of peaches.
We want to figure out how many pounds he will have left over.
6−2 12
Now you would think that this answer is 4 pounds, but we have the extra one - half to consider.
The estimate is that Jesse will have 3 12 pounds of peaches left over.
Guided Practice
Here is one for you to try on your own.
Estimate the difference.
4 115 −2 3
4
Answer
240
www.ck12.org Chapter 3. Using Fractions
To begin, we have to figure out the benchmark for each value.
4 115 = 4
2 34 = 3
4−3 = 1
Our answer is 1.
Video Review
MEDIAClick image to the left or use the URL below.URL: http://www.ck12.org/flx/render/embeddedobject/5382
This is a James Sousa video on subtracting mixed numbers. It is a supporting video for this Concept.
Explore More
Directions: Estimate each difference by using benchmarks.
1. 1416 −
111
2. 2860 −
613
3. 67 −
2145
4. 3233 −
512
5. 3233 −
112
6. 14 2021 −3 18
19
7. 2 149 −1 13
14
8. 3 221 −2 6
11
9. 4 817 −
7173
10. 2 149 −1 13
14
11. 12 34 −11 1
14
12. 23 68 −14 3
4
13. 18 19 −12 3
10
14. 22 12 −5 12
34
15. 27 15 −18 7
8
241
3.9. Inverse Property of Addition in Fraction Equations www.ck12.org
3.9 Inverse Property of Addition in FractionEquations
Here you’ll learn to identify and apply the inverse property of addition in fraction operations.
Have you ever made a pie crust?
Scott made a crust for a peach pie. He couldn’t find the recipe, so he decided to work off of his memory of the lasttime he’d made a pie with his mom. He added 3
4 of a cup of flour, but the dough was too sticky to work with. Afterhe’d added more flour, he realized that he had used 1 3
4 cups of flour.
Given this information, can you write an equation to show how Scott added the flour?
Can you solve it using an inverse operation?
This Concept will teach you exactly how to do this.
Guidance
Do you remember the problem in the Estimation with Mixed Number/Fraction Subtraction Concept whereTeri was making the blueberry pie?
Imagine that the recipe calls for 3 34 cups of blueberries. You look in the refrigerator and you find 1 1
2 cups ofblueberries. You need to go to the store to buy the rest of the blueberries you need for the recipe. This is theproblem that you are now going to tackle.
Let’s consider the information that you know and the information that you don’t know. You know: the amountof blueberries required by the recipe = 3 3
4 cups; the amount of blueberries in your refrigerator = 1 12 cups. You don’t
know the amount of blueberries you need to buy at the store. Let’s call that x, since it’s an unknown. If we write anequation to model the relationship between these amounts, it looks like this.
blueberries in refrigerator + blueberries you buy at the store = blueberries required for the pie recipe
When you insert the values (numerical and unknown) into the equation, it looks like this.
1 12 + x = 3 3
4
This is how we can write an equation to solve a real-world problem.
How do we solve this equation and figure out the value of the variable?
We can use the Inverse Property of Addition to help us in solving equations.
The Inverse Property of Addition states that a number and its opposite is equal to 0. Let’s test it out.
242
www.ck12.org Chapter 3. Using Fractions
5+(−5) = 0
Even if you can’t remember how to work with negative numbers, you can still think this through and have it makesense. We have five and we add taking away five. Well, that answer is 0.
What does this have to do with solving equations?
Well, to solve an equation, we need to get the variable by itself on one side of the equals. In the example above, thex is on one side with one and one-half. We need to move one and one-half to the other side of the equals. We cando this by using the Inverse Property of Addition. To get the x alone, we need to have zero on the same side of theequation with it. Here is how we use the Inverse Property of Addition.
112+ x = 3
34(
−112
)+1
12+ x = 3
34−1
12
0+ x = 334−1
12
x = 334−1
12
Now we can simply subtract the mixed numbers. First, we need to rename each fraction in terms of fourths. Threeand three-fourths is all set. We convert one and one-half to one and two-fourths.
Our answer is 2 14 .
Solve each equation using the Inverse Property of Addition. Be sure that your answer is in simplest form.
Example A
17 + x = 5
7
Solution: 47
Example B
46 + y = 5
6
Solution: 16
Example C
y+ 36 = 5
6
Solution: 26 = 1
3
Here is the original problem once again.
Scott made a crust for a peach pie. He couldn’t find the recipe, so he decided to work off of his memory of the lasttime he’d made a pie with his mom. He added 3
4 of a cup of flour, but the dough was too sticky to work with. Afterhe’d added more flour, he realized that he had used 1 3
4 cups of flour.
Given this information, can you write an equation to show how Scott added the flour?
Can you solve it using an inverse operation?
To write this equation, we use the fractions from the dilemma.
243
3.9. Inverse Property of Addition in Fraction Equations www.ck12.org
34 + x = 1 3
4
Notice that we used a variable for the unknown amount of flour that Scott added. We have the total amount of flourat the end of the equation.
Now we can use an inverse operation and solve.
x = 1 34 −
34 = 1
x = 1
Scott added 1 cup of flour to the three - fourths he started with.
Guided Practice
Here is one for you to try on your own.
x+ 23 = 5
6
Answer
First, we have to write an equation showing how we can solve this equation using an inverse operation.
x = 56 −
23
Now we need to rename these fractions with a common denominator.
x = 56 −
46
x = 16
This is our answer.
Video Review
MEDIAClick image to the left or use the URL below.URL: http://www.ck12.org/flx/render/embeddedobject/57625
This is a Khan Academy video on the inverse property of addition.
Explore More
Directions: Solve for x.
1. x+ 25 = 5
5
2. x+ 28 = 6
8
3. x+ 39 = 4
9
4. x+ 57 = 6
7
5. x+ 1012 = 11
12
6. x+ 315 = 10
15
244
www.ck12.org Chapter 3. Using Fractions
7. x+ 913 = 12
13
8. x+ 614 = 12
14
9. x+ 15 = 6
10
10. x+ 12 = 11
12
11. x−1 12 = 4
12. 2 14 + x = 3 3
4
13. x− 78 = 2 3
4
14. Ludmilla, Brent and Rudy have 8 56 feet of taffy that they have to sell to raise money for the school drama club.
Brent has already sold 3 23 feet of taffy and Rudy plans to sell exactly 2 3
4 feet. How much taffy does Ludmilla haveto sell, if they sell all of the taffy?
15. Ron, Jung-Ho and Sarah have a lawn mowing business. Today they are cutting an enormous lawn. Sarah agreesto start and will mow 3
8 of the lawn. Ron will only mow 17 of the lawn, but he’s willing to work during the hottest
time of the day. How much of the lawn is Jung-Ho responsible for completing?
245
3.10. Products of Mixed Numbers www.ck12.org
3.10 Products of Mixed Numbers
Here you’ll learn to multiply fractions and mixed numbers.
Remember the bake sale from the Inverse Property of Addition in Fraction Equations Concept? Take a look at thisdilemma.
There are 24 students in Mrs. Carroll’s seventh grade homeroom. Of the 24 students, three-fourths of the studentsparticipated in making food for the bake sale. The other students helped with signs and with actually selling theproducts at the bake sale. A few of them also brought in juice boxes to sell.
Of the three-fourths that baked, one-half of them made cookies. Michelle is trying to keep track of who did what forthe bake sale. She has created a list and is writing down what each student’s participation has been.
This is where she is puzzled. Michelle wants to figure out three different things. How many students baked for thebake sale, how many students baked cookies, and what fraction of the class baked cookies?
To figure these things out, Michelle will need to know how to multiply fractions. In this Concept, you willlearn all about multiplying fractions.
Guidance
Previously we worked on how to add and subtract fractions, but when you have a fraction and you want to figureout a part of that fraction, you need to multiply. Remember, that a fraction is a part of a whole. Sometimes it istricky to figure out when to multiply fractions when you are faced with a real-world problem. First, let’s learn howto actually multiply fractions and then we can look at applying this to some real-world problems.
Multiplying fractions is always at least a two-step process.
First, you line up two fractions next two each other, and then you are ready to start multiplying.12 ·
45
246
www.ck12.org Chapter 3. Using Fractions
Notice that we used a dot to show that we were multiplying.
You will multiply twice. First, multiply the numerators and write the product of the numerators above afraction bar. Next, multiply the denominators and write that product underneath the fraction bar. You don’thave to find a common denominator. You do, however, have to reduce your answer to simplest terms. We usuallythink of multiplying as increasing, but don’t be surprised to get a product that is smaller than one of the factors thatyou are multiplying.
Let’s try this out.12 ·
45 = 1×4
2×5 = 410
Now we have a fraction called 410 . What next?
That’s right, it isn’t. We can simplify the fraction four-tenths, but dividing the top and the bottom number bythe greatest common factor. The greatest common factor of four and ten is two. We divide the numerator and thedenominator by two.410 = 4÷2
10÷2 = 25
Our final answer is 25 .
What about a fraction and a whole number?
When you multiply a fraction and a whole number, we have to make the whole number into a fraction. Then youcan multiply across just as you normally would with two fractions and simplify your answer if possible.
5 · 12 = 5
1 ·12 = 5
2 = 2 12
How do we multiply mixed numbers?
Because mixed numbers involve wholes and parts, multiplying mixed numbers requires an extra step. Re-member improper fractions? It’s essential that you convert mixed numbers to improper fractions before you multiply.Once you have the mixed numbers in the improper fraction form, multiply the numerators together and then multiplythe denominators together. If you have an improper fraction as your product, you can convert it back to a mixednumber to write your final answer.
3 12 ·2
13
247

3.10. Products of Mixed Numbers www.ck12.org
First, we convert each to an improper fraction.
312=
72
213=
73
Next, we multiply the two improper fractions.72 ·
73 = 49
6
Now we can convert this improper fraction to a mixed number.496 = 8 1
6
Our final answer is 8 16 .
Sometimes, when you multiply fractions or mixed numbers, you can end up with very large numbers. Whenthis happens, you can simplify BEFORE multiplying. You simplify on the diagonals by using the greatestcommon factor of the numbers on the diagonals.29 ·
1830
If we look at the numbers on the diagonals, we can see that there are greatest common factors both ways.The greatest common factor of two and thirty is 2. We can divide both by two to simplify them. The greatestcommon factor of 9 and 18 is 9. We can divide both by 9. Let’s simplify on the diagonals now.
���@@@
29· 18
30=
11· 2
15
Now we multiply across for our final answer.
The answer is 215
Multiply. Be sure that your answer is in simplest form.
Example A
13 ·
56
Solution: 518
Example B
1820 ·
49
Solution: 25
Example C
2 15 ·3
12
Solution:7 710
248
www.ck12.org Chapter 3. Using Fractions
Here is the original problem once again.
There are 24 students in Mrs. Carroll’s seventh grade homeroom. Of the 24 students, three-fourths of the studentsparticipated in making food for the bake sale. The other students helped with signs and with actually selling theproducts at the bake sale. A few of them also brought in juice boxes to sell.
Of the three-fourths that baked, one-half of them made cookies. Michelle is trying to keep track of who did what forthe bake sale. She has created a list and is writing down what each student’s participation has been.
This is where she is puzzled. Michelle wants to figure out three different things. How many students baked for thebake sale, how many students baked cookies, and what fraction of the class baked cookies?
First, let’s figure out how many students baked for the bake sale. We need to figure out three-fourths of 24.Let’s write this as a multiplication problem.34 ·24 = 3
4 ·241
Next, we can simplify on the diagonals before multiplying. We can simplify four and twenty-four by dividingby four.31 ·
61 = 18
18 students out of 24 students baked for the bake sale.
Next, we want to find out how many baked cookies out of the three-fourths. We need to find out how many isone-half of 18? We can set this up as a multiplication problem.12 ·
181 = 18
2 = 9
Nine students made cookies.
Michelle’s final question is what fraction of the class made cookies. Here is our multiplication problem.12 ·
34 = 3
8
Three-eighths of the students made cookies.
Guided Practice
Here is one for you to try on your own.
249
3.10. Products of Mixed Numbers www.ck12.org
Dierdre claims that it takes her only 6 34 hours to complete her homework every night. Carlos thinks he can finish his
homework in 23 that time. How long does Carlos think it will take him to complete his homework?
Answer
We want to know the length of time Carlos thinks he needs to complete his homework.
What’s the relationship of this length of time to the length of time Dierdre takes to finish her homework? If we letD = the amount of time it takes for Dierdre to complete her homework, then we would say that the length of time ittakes Carlos to finish his homework is 2
3 ·D. That’s a simple multiplication problem. We solve 6 34 ·
23 .
We convert all mixed numbers to improper fractions, 6 34 = 27
4 . 274 ·
23 = 4 1
2 .
Carlos thinks that he can complete his homework in 4 12 hours.
Video Review
MEDIAClick image to the left or use the URL below.URL: http://www.ck12.org/flx/render/embeddedobject/5478
This is a James Sousa video on multiplying fractions and simplifying products.
MEDIAClick image to the left or use the URL below.URL: http://www.ck12.org/flx/render/embeddedobject/5392
This is a James Sousa video on multiplying mixed numbers.
Explore More
Directions: Multiply.
1. 14 ·
37
2. 56 ·
23
3. 310 ·
1012
4. 47 ·
23
5. 13 ·2
23
6. 2 57 ·1
15
7. 2 310 ·2
14
8. 7 15 ·
111
9. 4 58 ·2
250
www.ck12.org Chapter 3. Using Fractions
10. 17 ·
16
11. 3 56 ·1
23
12. 15 ·
712
Directions: Multiply.
13. 23 ·
912 ·
67
14. 13 ·1
45 ·
34
15.(4
9 ·58
)· 3
7
16. 1012 ·
(3 1
5 ·710
)
251
3.11. Product Estimation with Mixed Numbers/Fractions www.ck12.org
3.11 Product Estimation with Mixed Num-bers/Fractions
Here you’ll learn to estimate the products of fractions and mixed numbers.
Remember how Michelle was working with bake sale statistics in the Products of Mixed Numbers Concept? Well,look at this dilemma.
Michelle knows that 34 of the cookies left were peanut butter cookies. There were 5 3
4 of a dozen cookies left.Michelle wants to know what 3
4 of 5 34 is, then she will know about how many of the left - over cookies were peanut
butter.
Do you know how to do this?
Because Michelle doesn’t need an exact amount, we can estimate the product.
This Concept will teach you how to estimate the products of fractions and mixed numbers.
Guidance
By now you are very familiar with estimation as a tool for getting an approximate sense of the value of numbers,sums of numbers and differences of numbers.
Now, we are going to add our knowledge of estimation to get approximate answers for products of fractions.
Just like rounding whole numbers, we can find approximate values of fractions by comparing the fractions to threebenchmarks, 0, 1
2 and 1.
Is the fraction closer to 0, 12 or 1? If it’s closest to one-half, we say that the value of the fraction is “about 1
2 .”
We can use these approximate values of fractions to estimate the products of fractions and mixed numbers.
First, we approximate the value of each fraction or mixed number using the benchmarks 0, 12 and 1. Next, we find
the product of the approximate values. Even when you are asked to find an exact answer, estimation is a usefulway to get an idea of a reasonable solution to a problem. Once you have finished solving for an exact answer of aproblem, you can check your answer against the estimate. Refer back to the following steps if necessary.1920 ·
67
First, we have to take each fraction and find its benchmark. Nineteen-twentieths is close to 1. Six-sevenths isalso close to one.
1×1 = 1
We can say that 1920 ·
67 is approximately 1.
What about mixed numbers?
Mixed numbers work the same way except that your benchmarks will have whole numbers in them too. Let’s lookat an example.
3 68 ·5
110
Three and six-eighths is closest to 4.
Five and one-tenths is closest to 5.
4×5 = 20
We can say that 3 68 ·5
110 is approximately 20.
252
www.ck12.org Chapter 3. Using Fractions
Now it’s time to try a few on your own. Estimate each product using benchmarks.
Example A
612 ·
1011
Solution: 12
Example B
910 ·
56
Solution: 1
Example C
4 18 ·2
1113
Solution: 12
Here is the original problem once again.
Michelle knows that 34 of the cookies left were peanut butter cookies. There were 5 3
4 of a dozen cookies left.Michelle wants to know what 3
4 of 5 34 is, then she will know about how many of the left - over cookies were peanut
butter.
Do you know how to do this?
Because Michelle doesn’t need an exact amount, we can estimate the product.
To begin, we have to use benchmarks for the dozens left in the problem. We need to find three - fourths of thatnumber, so we don’t use a benchmark for three - fourths. If we did, we would end up with a value larger than thenumber of dozens left over.
5 34 = 6
Now we multiply.
6× 34 = 4 1
2 dozens left were peanut butter.
This is our answer.
Guided Practice
Here is one for you to try on your own.
4 56 ×2 1
9
Answer
First, let’s use a benchmark for each mixed number.
4 56 = 5
2 19 = 2
5×2 = 10
Our answer is 10.
253
3.11. Product Estimation with Mixed Numbers/Fractions www.ck12.org
Video Review
MEDIAClick image to the left or use the URL below.URL: http://www.ck12.org/flx/render/embeddedobject/5391
This is a James Sousa video on multiplying fractions. It is a supporting video to this Concept.
Explore More
Directions: Estimate the product.
1. 19 ·
45
2. 12 · 67
3. 1837 ·
1011
4. 1315 ·
49
5. 6 23 ·2
611
6. 5 2729 ·3
118
7. 4 67 ·1
47
8. 4 1516 ·7
221
9. 4 1516 ·7
221
10. 3 56 ·1
121
11. 6 1516 ·7
19
12. 5 1112 ·3
1280
13. 4 1860 ·7
121
14. 13 45 ·6
110
15. 15 1113 ·11 9
10
254
www.ck12.org Chapter 3. Using Fractions
3.12 Commutative Property with Products ofFractions
Here you’ll learn to identify and apply the commutative and associative properties of multiplication in fractionoperations with variable and numerical expressions.
Now back to the bake sale. Have you ever made a casserole?
Richard is baking 2 12 casseroles for the bake sale. Victoria does not think this will be enough food. She thinks he
should bake at least 6 78 times this amount.
How many casseroles does Victoria think Richard needs to bake?
To figure this out, you will need to write an equation and solve it. Does the order of the fractions matter in thisequation?
Why or why not?
This Concept will teach you about the commutative and associative properties of multiplication. You will beable to complete this dilemma by the end of the Concept.
Guidance
Previously we worked with commutative and associative properties of addition. Knowing how the mechanismof addition works helped us solve more complicated addition problems involving fractions. The properties ofmultiplication are a lot like the properties of addition. In this lesson, we are going to discover how to use thecommutative property of multiplication and the associative property of multiplication.
The Commutative Property of Multiplication states that the order of the factors does not change the product.Let’s test the property using simple whole numbers.
1 ·2 ·3 = 6 2 ·1 ·3 = 6 2 ·3 ·1 = 6
3 ·2 ·1 = 6 3 ·1 ·2 = 6 1 ·3 ·2 = 6
As you can see, we can multiply the three factors (1, 2, and 3) in many different orders. The Commutative Propertyof multiplication works also works for four, five, six factors. It works for fraction addends, too.
The Associative Property of Multiplication states that the way in which factors are grouped does not change theproduct. Notice that we use parentheses as the grouping symbol just as we did with addition. Once again, let’s testthe property using simple whole numbers.
(1 ·3) ·2 = 6 (2 ·3) ·1 = 6 (2 ·1) ·3 = 6
Clearly, the different way the factors are grouped has no effect on the final product. The associative property ofmultiplication works for multiple factors as well as fraction factors.
These two properties are extremely useful when multiplying fractions. If you are multiplying three fractionsand two of the fractions contain factors that you can cancel out, you can multiply those two fractions togetherand have a new fraction in simplest terms, then simply multiply your new simpler fraction with the thirdfraction.68 ·
12 ·
1618
255
3.12. Commutative Property with Products of Fractions www.ck12.org
Here the easiest thing to do is to simplify the first and the third fraction. We can rearrange the fractions thanks to theCommutative Property to make our work simpler.68 ·
1618 ·
12
Now we can simplify on the diagonals of the first two fractions.
6 and 18 have the greatest common factor of 6.
8 and 16 have the greatest common factor of 8.11 ·
23 ·
12
Now we multiply across.26
Finally we simplify.
Our final answer is 13 .
Did you notice that we could have simplified the 2’s on the diagonal?
How do we apply this to variable expressions?
When you are working with variable expressions or expressions which contain an algebraic unknown (like x)you can use the commutative and associative properties of multiplication to simplify the expression. Let’s seehow it works.23 · x ·
78
We can use the Commutative Property of Multiplication to move the fractions together. Then we can find the productof the two fractions and then we will have simplified the expression. Notice that we can’t solve the expressionbecause we don’t know the value of x.23 ·
78 · x
We can simplify the two and the eight on the diagonals before we multiply.13 ·
74 · x
Our simplified expressions is 712 · x.
Here is one where the associative property will be very useful.(x · 1
2
)· 3
5
Here we can move the grouping symbol or the parentheses to include the two fractions. Then we can multiply thetwo fractions and that will give us our simplified expression. Notice that we can’t solve this because we don’t knowthe value of the variable.
x ·(1
2 ·35
)Our simplified expression is x · 3
10 .
Use the Commutative Property and the Associative Property to simplify each expression.
Example A
(x · 4
5
)· 1
2
Solution: 25 x
256
www.ck12.org Chapter 3. Using Fractions
Example B
67 · x ·
13
Solution: 27 x
Example C
Solve this problem. Be sure your answer is in simplest form.23 ×
49
Solution: 827
Here is the original problem once again.
Richard is baking 2 12 casseroles for the bake sale. Victoria does not think this will be enough food. She thinks he
should bake at least 6 78 times this amount.
How many casseroles does Victoria think Richard needs to bake?
To figure this out, you will need to write an equation and solve it. Does the order of the fractions matter in thisequation?
Why or why not?
First, let’s write an equation to solve the problem. We want to know the product of the two values, so we are goingto multiply.
2 12 ×6 7
8 = x
Does it matter the order of the values?
Because of the commutative property of multiplication, the order that we write the values does not matter.
Now we can solve it.
First, change each mixed number to an improper fraction and rewrite the problem.52 ×
558
Now we multiply.27516
Next, we divide to figure out the mixed number.
17 316 casseroles
This is our final answer.
Guided Practice
Here is one for you to try on your own.
Solve and simplify.23 ·
912 ·
67
Answer
To solve this problem, we are going to multiply these three fractions together. If we cross simplify first, we end upwith the following problem.11 ·
31 ·
17
257
3.12. Commutative Property with Products of Fractions www.ck12.org
Now we multiply across.37
This is our answer.
Video Review
MEDIAClick image to the left or use the URL below.URL: http://www.ck12.org/flx/render/embeddedobject/54833
This is a video on the commutative law of multiplication.
MEDIAClick image to the left or use the URL below.URL: http://www.ck12.org/flx/render/embeddedobject/57619
This is a video on the associative law of multiplication
Explore More
Directions: Multiply.
1. 23 ·
912 ·
67
2. 13 ·1
45 ·
34
3.(4
9 ·58
)· 3
7
4. 1012 ·
(3 1
5 ·7
10
)5. 1
3 ·9
18 ·67
6. 45 ·
920 ·
12
7. 13 ·
412 ·
29
Directions: Simplify the following expressions using the commutative and associative properties of multiplication.
8. 78 · x ·
45
9. x ·2 23 ·
56
10. 58 ·
(1 2
3 · x)
11. 68 · x ·
23
12. 58 · x ·
45
13. 310 · x ·
45
258

www.ck12.org Chapter 3. Using Fractions
Directions: Solve each problem.
14. Crazy Sal’s is having a Delirious Discount Sale. He is selling everything in his store for 38 of the marked price.
Rowena finds a t-shirt that is marked at $36. How much will she pay for the shirt at the discounted price?
15. Dan is cutting plywood for his science fair project. He cuts a board that is 3 14 feet long. After he cuts it, he
realizes that he really needs a piece about 23 of this length. How long will the new piece of wood that Dan cuts be?
259
3.13. Division of Fractions www.ck12.org
3.13 Division of Fractions
Here you’ll learn to divide fractions and mixed numbers.
Have you ever been to a bakery? Have you ever had a chance to bake at a bakery?
Marcella is a student in Mr. Carroll’s seventh grade class. Her Uncle Aldo owns a bakery. Uncle Aldo has told theclass that they can have some extra bread dough on his baking day. He said that he usually has some extra and if afew students wish to come into the bakery, that they can take the extra dough and make some bread to sell at the bakesale. Mr. Carroll thinks it is a great idea and assigns four students the task of baking bread on a Saturday morning.
On Saturday, Marcella, Juan, Julia and Christopher head to the bakery. Marcella’s Mom drives them over and thestudents plan on baking all morning. When they arrive and walk in the door, they are overcome with the smell offresh bread baking.
“Come on in kids. Here is the extra dough that you can bake with,” He says handing a huge bowl of dough to Juan.
Uncle Aldo gives the students 8 14 pounds of dough.
“Each loaf takes three-quarters of a pound. You can use that scale and get to work. I’ll be over here if you have anyquestions.”
The students look at the bowl and dough and the scale.
“How many loaves can we make from this?” Juan asks picking up a bread pan.
“I’m not sure,” Marcella answers. “I guess we need to do a little math.”
They certainly do, and you will too. Pay attention throughout this Concept and you will know how to solvethis problem.
260
www.ck12.org Chapter 3. Using Fractions
Guidance
By now you have a pretty solid understanding of how fractions work. You can add, subtract and multiply fractions.Of course, it will also be extremely helpful to learn to divide fractions. There are plenty of real-world situations inwhich you can use your expertise at dividing fractions.
Dividing fractions is a lot like multiplying fractions. In fact, it’s exactly like multiplying fractions! Remember thatwhen you divide two numbers, one number is the dividend and the other number is the divisor. For example, inthe division problem a÷ b,a is the dividend and b is the divisor. To divide two fractions, you simply multiply thedividend by the inverted divisor. How do you invert the divisor ? Just flip the fraction over! 1
2 inverted becomes21 ,
34 inverted becomes 4
3 . This inverted fraction is also called a reciprocal.
Let’s divide.68 ÷
12
In this problem, one-half is the divisor. We need to flip the divisor so that we multiply by the reciprocal. Here is arhyme to help you remember
When dividing fractions, never wonder why
Flip the second and multiply
Now we rewrite the problem as a multiplication problem.68 ·
21
Next, we multiply across.128 = 1 4
8
Our last step is to simplify the fraction part of the mixed number.
Our answer is 1 12 .
How do we divide mixed numbers?
Just like with multiplying fractions, if you are dividing mixed numbers, you have to first convert the mixed numberto an improper fraction. Remember how multiplying by fractions usually gave us a product that was smaller thanone of the factors? Well, with dividing you usually get an answer that is larger than the divisor or the dividend. Buteither way, the rhyme is still going to apply here too.
4 13 ÷2 1
6
First, we convert both of these mixed numbers to improper fractions. Let’s rewrite the problem with these numbers.133 ÷
136
Now we change this to a multiplication problem by multiplying by the reciprocal.133 ·
613
Next, we can simplify on the diagonals.
����Z
ZZZ
133· 6
13=
11· 2
1= 2
Our answer is 2.
Now it’s time for you to try a few on your own.
261
3.13. Division of Fractions www.ck12.org
Example A
510 ÷
12
Solution: 1
Example B
68 ÷
14
Solution: 3
Example C
6 14 ÷1 1
2
Solution:4 16
Here is the original problem once again.
Marcella is a student in Mr. Carroll’s seventh grade class. Her Uncle Aldo owns a bakery. Uncle Aldo has told theclass that they can have some extra bread dough on his baking day. He said that he usually has some extra and if afew students wish to come into the bakery, that they can take the extra dough and make some bread to sell at the bakesale. Mr. Carroll thinks it is a great idea and assigns four students the task of baking bread on a Saturday morning.
On Saturday, Marcella, Juan, Julia and Christopher head to the bakery. Marcella’s Mom drives them over and thestudents plan on baking all morning. When they arrive and walk in the door, they are overcome with the smell offresh bread baking.
“Come on in kids. Here is the extra dough that you can bake with,” He says handing a huge bowl of dough to Juan.
Uncle Aldo gives the students 8 14 pounds of dough.
262
www.ck12.org Chapter 3. Using Fractions
“Each loaf takes three-quarters of a pound. You can use that scale and get to work. I’ll be over here if you have anyquestions.”
The students look at the bowl and dough and the scale.
“How many loaves can we make from this?” Juan asks picking up a bread pan.
“I’m not sure,” Marcella answers. “I guess we need to do a little math.”
The students want to figure out how many loaves they can make from the extra dough. To do this, we canwrite this equation.
Pounds of dough ÷ # of pounds needed per loaf = number of loaves
Now we can fill in the given values.
8 14 ÷
34 = x
Next, we convert the mixed number to an improper fraction.254 ÷
34
Now we can rewrite this as a multiplication problem, simplify and solve it.254 ·
43 = 25
1 ·13 = 25
3 = 8 13
The students can make 8 loaves of bread and they will have 13 of a pound of dough left over.
Guided Practice
Here is one for you to try on your own.
Trina is building a sailboat. She needs 8 planks that are 34 foot in length. She has a piece of wood that is 6 1
2 feetlong. How many planks can she cut from this board and does she have enough to make her sailboat?
Answer
Let’s assess the information that the problem has given us. We know that we need planks that are 34 foot in length
and we know that we need 8 of them. But, we are not really sure, if we have 8 planks because we are working witha piece of wood that is 6 1
2 feet long. How many 34 foot planks can be obtained from a 6 1
2 foot long board? That’s asimple division problem. We set the problem up like this.
Total length of wood ÷ length of plank needed = number of planks
Let’s plug in the values: 6 12 ÷
34 = number of planks.
We convert 6 12 to an improper fraction and we set up the division problem as a multiplication problem with inverted
divisor.132 ·
43
We can cancel out the factors of 2 to get a new multiplication problem, which looks like this.131 ·
23
We get 263 or 8 2
3 .
Trina can cut 8 23 planks from the piece of wood that she has. She has enough to make her sailboat.
Video Review
263
3.13. Division of Fractions www.ck12.org
MEDIAClick image to the left or use the URL below.URL: http://www.ck12.org/flx/render/embeddedobject/5395
This is a James Sousa video on dividing fractions.
MEDIAClick image to the left or use the URL below.URL: http://www.ck12.org/flx/render/embeddedobject/57623
This is a James Sousa video on applying fraction division.
Explore More
Directions: Divide.
1. 110 ÷
34
2. 59 ÷
16
3. 15 ÷
58
4. 23 ÷
14
5. 2÷ 12
6. 1 13 ÷3 1
8
7. 5 45 ÷1 1
5
8. 2 14 ÷
17
9. 4 58 ÷2
10. 17 ÷
16
11. 3 56 ÷1 2
3
12. 6 15 ÷
712
13. 15 ÷
712
14. 9 15 ÷
312
15. 4 15 ÷
89
264
www.ck12.org Chapter 3. Using Fractions
3.14 Quotient Estimation with Mixed Num-bers/Fractions
Here you’ll learn to estimate quotients of fractions and mixed numbers.
Have you ever made something out of cloth? Take a look at this dilemma.
Casey is going to make a new sleeping bag. She has 5 34 yards of material. She needs to divide this in half.
About how many yards of material will be in each section after she divides the material?
This Concept is about estimating quotients of fractions and mixed numbers. You will be able to answer thisquestion by the end of the Concept.
Guidance
In real-world situations, we use estimation every day. In every real-world problem that involves math, the solutionis usually estimated before an exact answer is found. “I think we’ll need about 3 1
2 of the long pieces of wood.”“Stephen estimates that the project will take about 36 1
4 hours.” Observe your language as you engage in everydayactivities. You are probably using estimation all of the time. Now that you already know how to estimate sums,differences and products of fractions, we are going to see how easy it is to use estimation with division of fractions,too.
Estimating quotients of fractions is pretty similar to estimating products of fractions, but there is one difference. Asyou already know, when finding exact quotients in dividing fractions, the first step is to invert the divisor andrewrite the problem as a multiplication problem. You have to complete this same first step when you estimatequotients of fractions. Once you invert the divisor and rewrite as a multiplication problem, you find approximatevalues for the fractions using the three benchmarks, 0, 1
2 and 1. Is the fraction closer to 0, 12 or 1? If it’s closest to
12 , we say that the value of the fraction is “about 1
2 .” Once we identify the approximate value of both fractions, wesimply multiply and we will have the estimate quotient.
Estimate 78 ÷
13
First, we have to rewrite this as a multiplication problem. Then we can use benchmarks to estimate the product.78 ·
31
Now we can use benchmarks. Seven-eighths is close to 1. Three over one is close to three.
1×3 = 378 ÷
13 is an estimate of 3.
265
3.14. Quotient Estimation with Mixed Numbers/Fractions www.ck12.org
Three does make sense as an answer if you think about what a division problem is asking. A division problemis asking how many groups or how many in each groups. In other words, this problem is asking how manygroups can you divide seven-eighths into if you divide that quantity into thirds. You can divide it into threegroups.
What about estimating with dividing mixed numbers?
Working with mixed numbers is a little bit different, but we are still simply answering the question, “what is areasonable answer for this division problem?” When estimating quotients where the dividend is a mixed number,we first estimate the value of the dividend and the divisor before we convert to an improper fraction or divide.Consider a divisor that is 6 1
29 . 6 129 is really just 6. It is a lot easier to divide by 6 than to convert to an improper
fraction and invert. Making a lot of work defeats the purpose of estimating. If you do have a fraction in yourestimated divisor, you will go ahead and convert to an improper fraction and multiply. Consider a divisor that is 6 15
29 .We approximate this at 6 1
2 . Now we can convert to an improper fraction of 132 and multiply. We always approximate
the value of mixed numbers before we convert to improper fractions or invert.
2 23 ÷1 7
8
Since we are dividing with mixed numbers, let’s approximate the values of the mixed numbers before wedivide. 2 2
3 is about 3 and 1 78 is about 2. The problem rewritten with the approximate values looks like this: 3÷ 2.
We can simply invert the divisor and rewrite as a multiplication problem, 3 · 12 .
Our answer is that 2 23 ÷1 7
8 is about 1 12 .
Now it’s time for you to try a few. Estimate each quotient.
Example A
910 ÷
113
Solution: 1
Example B
5 56 ÷2 3
4
Solution: 2
Example C
89 ÷
12
266
www.ck12.org Chapter 3. Using Fractions
Solution: 2
Here is the original problem once again.
Casey is going to make a new sleeping bag. She has 5 34 yards of material. She needs to divide this in half.
About how many yards of material will be in each section after she divides the material?
To figure this out, first we can write the problem out using a division sign.
5 34 ÷2
Now to estimate, we don’t need an exact quotient, so we can round the length of the material to help us with theestimate.
5 34 = 6
Next, divide.
6÷2 = 3
There will be approximately 3 yards in each section of the material.
Guided Practice
Here is one for you to try on your own.
Estimate the following quotient.
7 78 ÷4
Answer
First, let’s round 7 78 . It rounds up to 8.
8÷4 = 2
Our estimate is 2.
Video Review
MEDIAClick image to the left or use the URL below.URL: http://www.ck12.org/flx/render/embeddedobject/5395
This is a James Sousa video on dividing fractions.
MEDIAClick image to the left or use the URL below.URL: http://www.ck12.org/flx/render/embeddedobject/57623
This is a James Sousa video on applying fraction division.
267

3.14. Quotient Estimation with Mixed Numbers/Fractions www.ck12.org
Explore More
Directions: Estimate the quotient.
1. 56 ÷
136
2. 1112 ÷
67
3. 1837 ÷
1011
4. 1315 ÷
49
5. 7 23 ÷2 1
11
6. 5 2729 ÷3 1
18
7. 12÷ 67
8. 9 19 ÷2 4
5
9. 11 23 ÷2 6
11
10. 8 23 ÷3 1
11
11. 9 23 ÷2 1
15
12. 16 113 ÷2 1
9
13. 26 14 ÷13 2
30
14. 44 34 ÷15 1
20
15. 26 113 ÷2 1
18
268
www.ck12.org Chapter 3. Using Fractions
3.15 Fractions as Decimals
Here you’ll learn to write fractions and mixed numbers as terminating decimals.
Have you ever eaten a portion of a pie and wondered how much you actually ate? Well, look at what Daniel ate.
Daniel loves peach pie. At the bake sale, he bought an entire peach pie. Then he went home, poured himself a glassof milk and ate 3
8 of the pie.
What is this fraction as a decimal?
Do you know how to figure this out?
This Concept will teach you how to write fractions and mixed numbers as terminating decimals. You willknow how to write Daniel’s part of the pie by the end of the Concept.
Guidance
Previously we worked on fractions and their corresponding operations, now it’s time to discover how they relate todecimals.
Fractions and decimals are related because they are both ways of describing numbers that are not wholes. In essence,a fraction is simply another way of describing what a decimal describes. They both represents parts of a whole andboth can show the same part in a different way. The fraction shows us the part using the fraction bar comparing partto whole and the decimal shows us the part using place value. To start off, we’ll see how fractions can be convertedinto decimals and how decimals can be converted into fractions.
How do we convert fractions to decimals and decimals to fractions?
First, remember that fractions and decimals are different ways of writing the same thing. Both show us howto represent a part of a whole. Think about how we talk about fractions and decimals because this will becomeuseful as we convert them.
Say this value out loud 0.1. You can say “point one” or you can say “one tenth.” Does the second versionsound a little bit familiar? It sounds like the fraction 1
10 . It turns out that 0.1 = 110 .
269
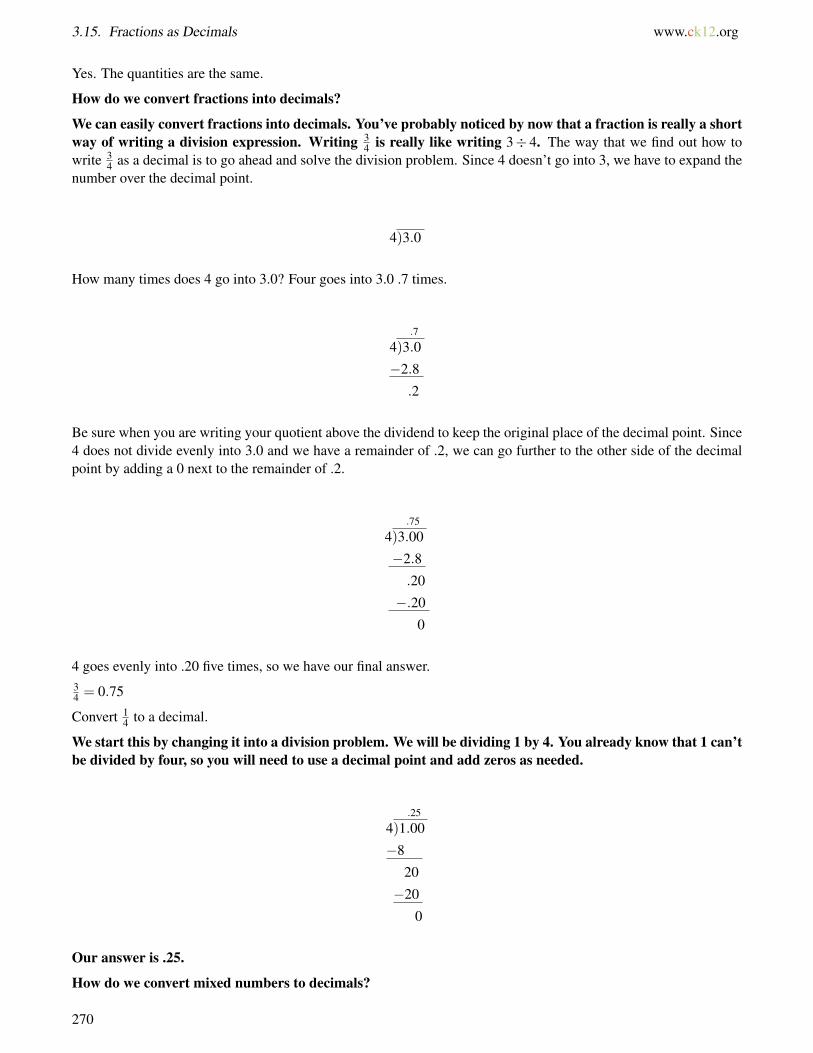
3.15. Fractions as Decimals www.ck12.org
Yes. The quantities are the same.
How do we convert fractions into decimals?
We can easily convert fractions into decimals. You’ve probably noticed by now that a fraction is really a shortway of writing a division expression. Writing 3
4 is really like writing 3÷ 4. The way that we find out how towrite 3
4 as a decimal is to go ahead and solve the division problem. Since 4 doesn’t go into 3, we have to expand thenumber over the decimal point.
4)3.0
How many times does 4 go into 3.0? Four goes into 3.0 .7 times.
.7
4)3.0
−2.8
.2
Be sure when you are writing your quotient above the dividend to keep the original place of the decimal point. Since4 does not divide evenly into 3.0 and we have a remainder of .2, we can go further to the other side of the decimalpoint by adding a 0 next to the remainder of .2.
.75
4)3.00
−2.8
.20
−.20
0
4 goes evenly into .20 five times, so we have our final answer.34 = 0.75
Convert 14 to a decimal.
We start this by changing it into a division problem. We will be dividing 1 by 4. You already know that 1 can’tbe divided by four, so you will need to use a decimal point and add zeros as needed.
.25
4)1.00
−8
20
−20
0
Our answer is .25.
How do we convert mixed numbers to decimals?
270
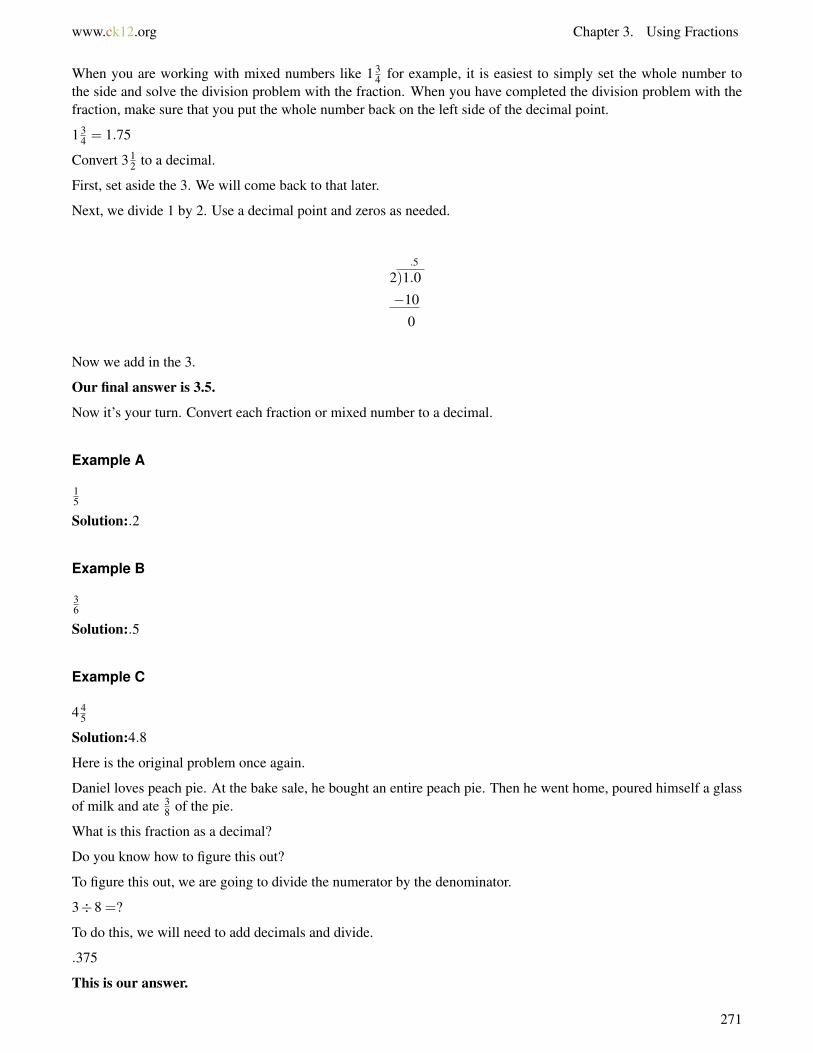
www.ck12.org Chapter 3. Using Fractions
When you are working with mixed numbers like 1 34 for example, it is easiest to simply set the whole number to
the side and solve the division problem with the fraction. When you have completed the division problem with thefraction, make sure that you put the whole number back on the left side of the decimal point.
1 34 = 1.75
Convert 3 12 to a decimal.
First, set aside the 3. We will come back to that later.
Next, we divide 1 by 2. Use a decimal point and zeros as needed.
.5
2)1.0
−10
0
Now we add in the 3.
Our final answer is 3.5.
Now it’s your turn. Convert each fraction or mixed number to a decimal.
Example A
15
Solution:.2
Example B
36
Solution:.5
Example C
4 45
Solution:4.8
Here is the original problem once again.
Daniel loves peach pie. At the bake sale, he bought an entire peach pie. Then he went home, poured himself a glassof milk and ate 3
8 of the pie.
What is this fraction as a decimal?
Do you know how to figure this out?
To figure this out, we are going to divide the numerator by the denominator.
3÷8 =?
To do this, we will need to add decimals and divide.
.375
This is our answer.
271
3.15. Fractions as Decimals www.ck12.org
Guided Practice
Here is one for you to try on your own.
Convert the following mixed number to a decimal.
4 35
Answer
First, convert the mixed number to an improper fraction.
4 35 = 23
5
Now, we divide the numerator by the denominator.
23÷5 = 4.6
This is our answer.
Video Review
MEDIAClick image to the left or use the URL below.URL: http://www.ck12.org/flx/render/embeddedobject/5366
This is a James Sousa video on writing fractions as terminating decimals.
Explore More
Directions: Write each fraction or mixed number as a decimal.
1. 35
2. 12
3. 45
4. 34
5. 38
6. 78
7. 2 14
8. 5 25
9. 6 48
10. 11 58
11. 10 12
12. 18 34
13. 12 45
14. 19 34
272

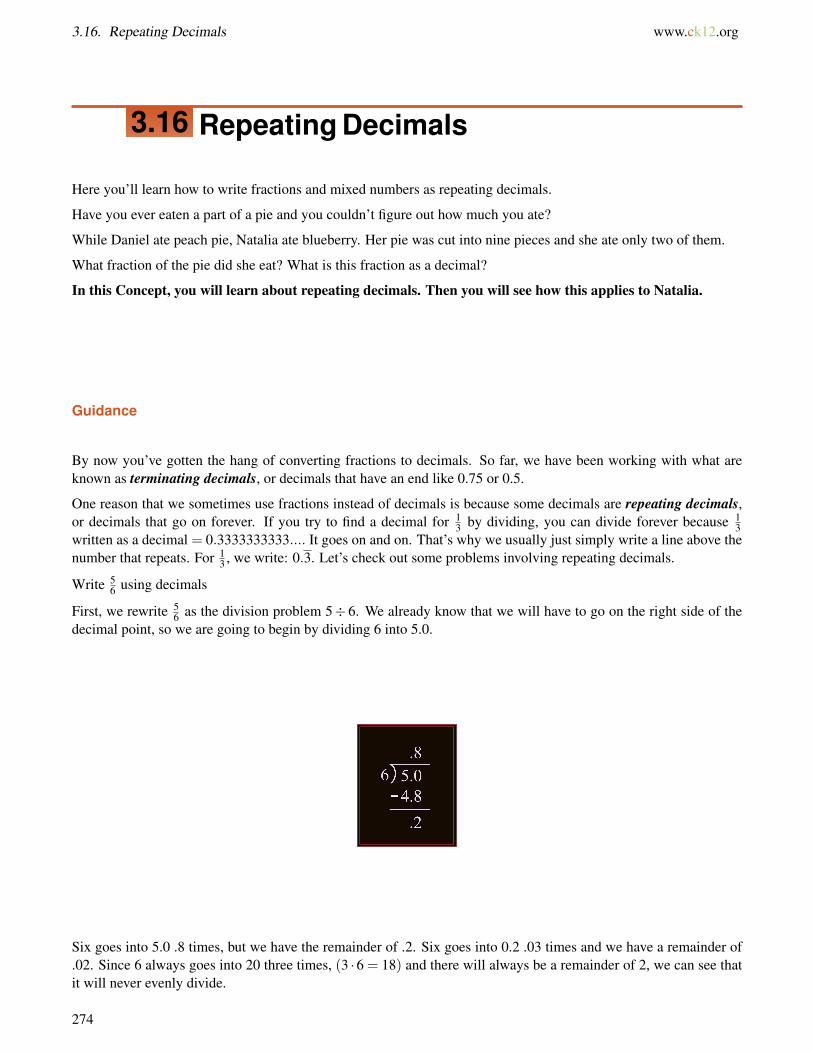
3.16. Repeating Decimals www.ck12.org
3.16 Repeating Decimals
Here you’ll learn how to write fractions and mixed numbers as repeating decimals.
Have you ever eaten a part of a pie and you couldn’t figure out how much you ate?
While Daniel ate peach pie, Natalia ate blueberry. Her pie was cut into nine pieces and she ate only two of them.
What fraction of the pie did she eat? What is this fraction as a decimal?
In this Concept, you will learn about repeating decimals. Then you will see how this applies to Natalia.
Guidance
By now you’ve gotten the hang of converting fractions to decimals. So far, we have been working with what areknown as terminating decimals, or decimals that have an end like 0.75 or 0.5.
One reason that we sometimes use fractions instead of decimals is because some decimals are repeating decimals,or decimals that go on forever. If you try to find a decimal for 1
3 by dividing, you can divide forever because 13
written as a decimal = 0.3333333333.... It goes on and on. That’s why we usually just simply write a line above thenumber that repeats. For 1
3 , we write: 0.3. Let’s check out some problems involving repeating decimals.
Write 56 using decimals
First, we rewrite 56 as the division problem 5÷6. We already know that we will have to go on the right side of the
decimal point, so we are going to begin by dividing 6 into 5.0.
Six goes into 5.0 .8 times, but we have the remainder of .2. Six goes into 0.2 .03 times and we have a remainder of.02. Since 6 always goes into 20 three times, (3 ·6 = 18) and there will always be a remainder of 2, we can see thatit will never evenly divide.
274
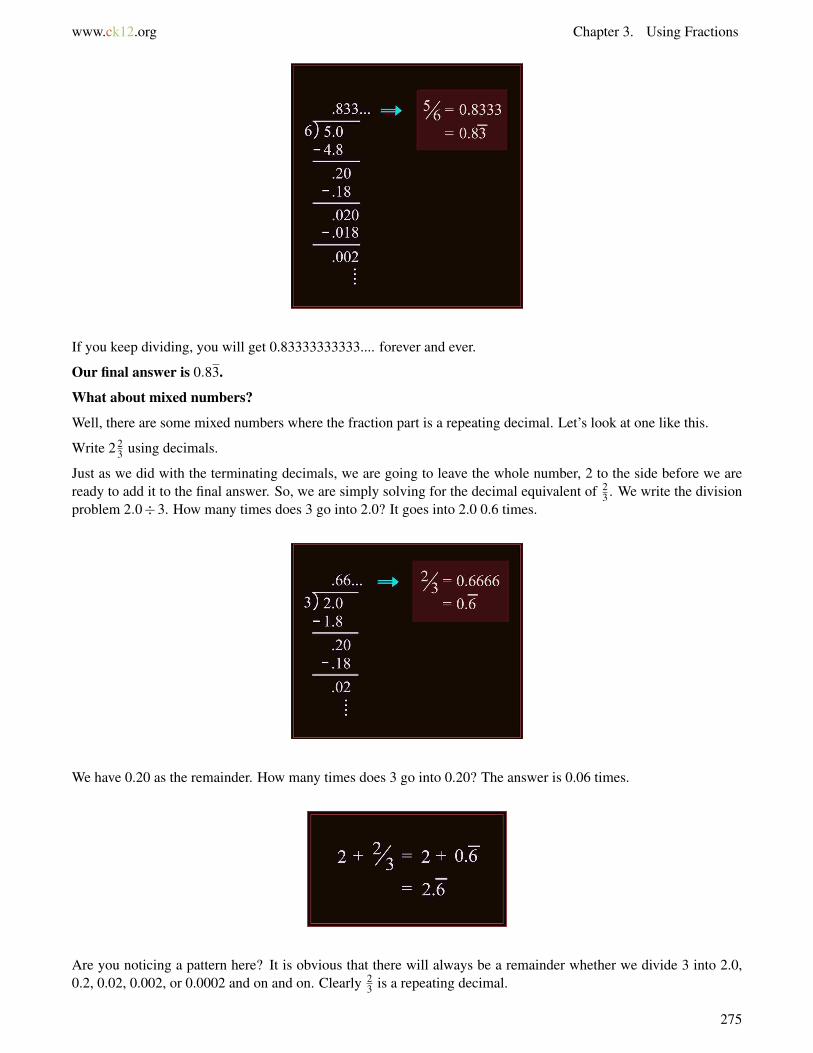
www.ck12.org Chapter 3. Using Fractions
If you keep dividing, you will get 0.83333333333.... forever and ever.
Our final answer is 0.83.
What about mixed numbers?
Well, there are some mixed numbers where the fraction part is a repeating decimal. Let’s look at one like this.
Write 2 23 using decimals.
Just as we did with the terminating decimals, we are going to leave the whole number, 2 to the side before we areready to add it to the final answer. So, we are simply solving for the decimal equivalent of 2
3 . We write the divisionproblem 2.0÷3. How many times does 3 go into 2.0? It goes into 2.0 0.6 times.
We have 0.20 as the remainder. How many times does 3 go into 0.20? The answer is 0.06 times.
Are you noticing a pattern here? It is obvious that there will always be a remainder whether we divide 3 into 2.0,0.2, 0.02, 0.002, or 0.0002 and on and on. Clearly 2
3 is a repeating decimal.
275
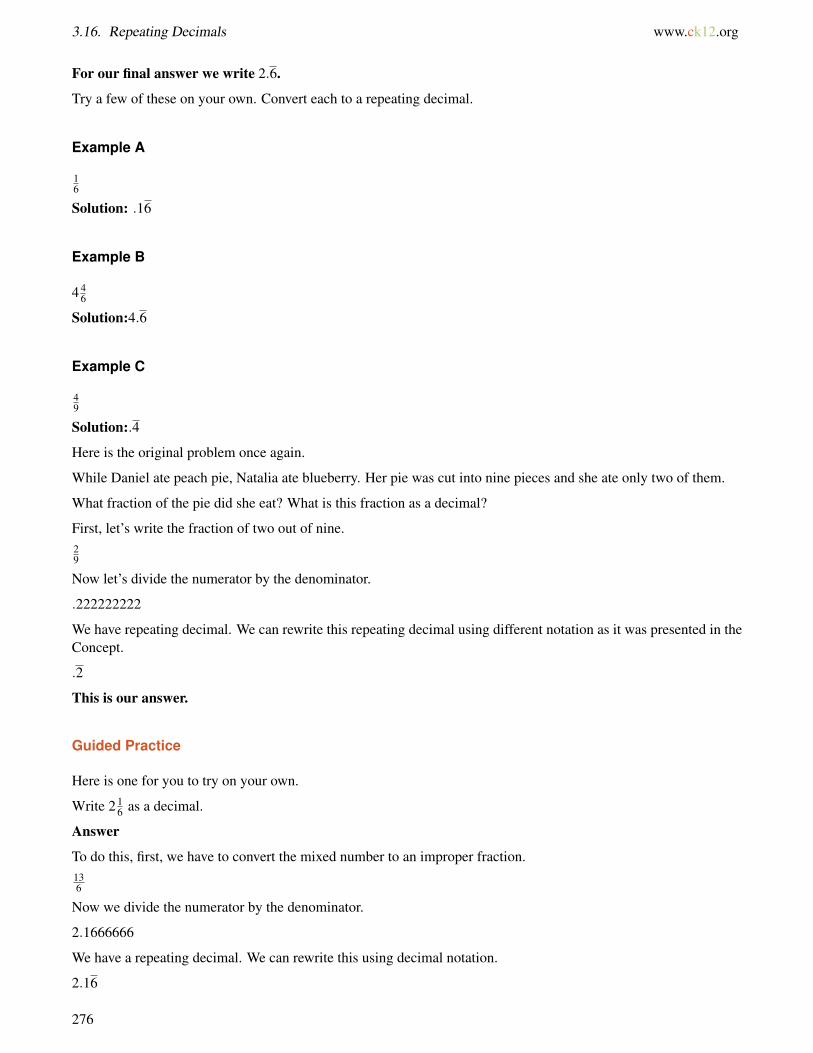
3.16. Repeating Decimals www.ck12.org
For our final answer we write 2.6.
Try a few of these on your own. Convert each to a repeating decimal.
Example A
16
Solution: .16
Example B
4 46
Solution:4.6
Example C
49
Solution:.4
Here is the original problem once again.
While Daniel ate peach pie, Natalia ate blueberry. Her pie was cut into nine pieces and she ate only two of them.
What fraction of the pie did she eat? What is this fraction as a decimal?
First, let’s write the fraction of two out of nine.29
Now let’s divide the numerator by the denominator.
.222222222
We have repeating decimal. We can rewrite this repeating decimal using different notation as it was presented in theConcept.
.2
This is our answer.
Guided Practice
Here is one for you to try on your own.
Write 2 16 as a decimal.
Answer
To do this, first, we have to convert the mixed number to an improper fraction.136
Now we divide the numerator by the denominator.
2.1666666
We have a repeating decimal. We can rewrite this using decimal notation.
2.16
276
www.ck12.org Chapter 3. Using Fractions
This is our answer.
Video Review
MEDIAClick image to the left or use the URL below.URL: http://www.ck12.org/flx/render/embeddedobject/5368
This is a James Sousa video on writing fractions as repeating decimals.
Explore More
Directions: Write each fraction or mixed number as a repeating decimal or terminating decimal.
1. 23
2. 56
3. 5 13
4. 13
5. 34
6. 16
7. 18
8. 37
9. 26
10. 4 23
11. 7 13
12. 6 56
13. 8 12
14. 9 23
15. 11 15
277
3.17. Decimals as Fractions www.ck12.org
3.17 Decimals as Fractions
Here you’ll learn to write decimals as fractions.
Have you ever had a friend who loved math so much that they included it into all of their conversations? Well, lookat Jessie and Fiona.
Jessie loves math. She and Fiona were discussing the bake sale, and Jessie had to put in some math.
"I think I will eat .75 of a whole cake," She said grinning.
Fiona looked wryly at her friend.
Do you know what this amount of cake is as a fraction?
This Concept is about writing decimals as fractions. You will be able to figure this out by the end of theConcept.
Guidance
Previously we worked on writing fractions as decimals, it will be good to know how to go back the other wayand write decimals as fractions.
Consider again the decimal 0.1. We already know that we can say that this number is “one-tenth.” It’s very easy torewrite decimals as fractions because decimals are already expressed as fractions with a denominator that is a factorof ten.
0.1 = 110 ,0.01 = 1
100
We can also say that 0.86 = 86100 .
To convert decimals to fractions, we write the number to the right of the decimal place over a denominatorequivalent to the last place value of the decimal number. So, if we have 0.877, we would write 877
1000 .
If we have simply 0.6, we can write 610 , or in simplest terms, 3
5 . Always make sure to put your fraction insimplest terms.
Convert 0.35 to a fraction.
Start by saying the decimal to yourself out loud. To say 0.35 out loud, we can say “35 hundredths,” so we can goahead and write the fraction down.35100
That’s a big fraction. We want to make our lives a little bit easier, so we will reduce the fraction to simplest terms.This fraction expressed in simplest terms is 7
20 .
Our final answer is 720 .
Here is another one.
Convert 2.4 to a mixed number.
Just as we leave aside the whole number when converting mixed numbers to decimals, we will leave aside thenumbers to the left of the decimal point when converting decimals to fractions. So, in this case, we just have tofind out what 0.4 is expressed as a fraction.
Let’s write it directly as the fraction “four tenths” or 410 . Can we simplify it? You bet. 4
10 = 25 .
278
www.ck12.org Chapter 3. Using Fractions
2.4 expressed as a mixed number = 2 25 .
Now it’s your turn to try a few. Write each decimal as a fraction or mixed number.
Example A
.5
Solution: 510
Example B
.67
Solution: 67100
Example C
3.21
Solution: 3 21100
Here is the original problem once again.
Jessie loves math. She and Fiona were discussing the bake sale, and Jessie had to put in some math.
"I think I will eat .75 of a whole cake," She said grinning.
Fiona looked wryly at her friend.
Do you know what this amount of cake is as a fraction?
To figure this out, we can change the decimal to a fraction with a base ten denominator.
This decimal has two decimal places represented. That means hundredths.
Here is the decimal as a fraction with a base ten denominator.
.75 = 75100
Now we can simplify the fraction.75100 = 3
4
This is our answer.
Guided Practice
Here is one for you to try on your own.
Write the following decimal as a fraction or mixed number in simplest form.
5.25
Answer
First, you can see that this decimal has wholes and parts, so it will become a mixed number.
5 is the whole.
.25 is the parts.
.25 = 25100 = 1
4
279

3.17. Decimals as Fractions www.ck12.org
Our answer is 5 14 .
Video Review
MEDIAClick image to the left or use the URL below.URL: http://www.ck12.org/flx/render/embeddedobject/57618
This is a James Sousa video on how to convert a decimal to a fraction.
Explore More
Directions: Write each decimal as a fraction in simplest form.
1. .3
2. .4
3. .2
4. .53
5. .55
6. .08
7. .25
8. .23
9. .876
10. .512
11. 74.34
12. 3.88
13. 5.6
14. 12.8
15. 23.06
16. .987
280
www.ck12.org Chapter 3. Using Fractions
3.18 Positive and Negative Fraction and Deci-mal Comparison
Here you’ll learn to compare and order decimals and fractions.
Take a look at this dilemma.
At the bake sale, the seventh grade has set up two tables full of baked goods. There was so much baked that theyalso have extras on reserve. The students have decided to run the bake sale for three days so that they can try to selltheir good throughout all three lunch periods at school. They hope to raise a lot of money.
Derek and Keisha have been assigned the task of keeping track of sales. They need to keep track of how much ofeach item is sold. For example, if there are twelve cupcakes and six of them sell, then they could write one-half asthe statistic for cupcakes. The students think that if they keep track of each item sold, that they will have a good ideaof which items are the big sellers.
The first day goes smoothly. Derek and Keisha each keep track of one table and they split the third table in half. Atthe end of the sale day, they sit down to compare notes.
Derek has written these amounts down.
Peach pie .10
Cupcakes .75
Brownies .50
Bread .25
Keisha has written these amounts down.
Blueberry pie 12
Chocolate cookies 14
Blueberry muffins 13
Double Fudge Brownies 34
Apple pie 56
They are surprised to see that one of them has written all of the data in decimals while the other has written all ofthe data in fraction form. To figure out which items were the biggest sellers they will have to order their data.
281
3.18. Positive and Negative Fraction and Decimal Comparison www.ck12.org
Derek needs to write his decimals in order from greatest to least and Keisha needs to write her fractions in orderfrom greatest to least.
This Concept will teach you all you need to know about comparing and ordering fractions and decimals.
Guidance
Eventually, you will be able to convert common fractions to decimals and common decimals to fractions in yourhead. You already know some of the classics like 0.5 = 1
2 .
Knowing this off the top of your head will make it easy for you to compare and order between fractions and decimals.For now, we will use our expertise at converting to compare and order. It’s always helpful to check.
Compare 14 and 0.25 using <, >or =
To compare a fraction to a decimal or a decimal to a fraction, we will need to convert one of them, so thatwe can compare a fraction to a fraction or a decimal to a decimal. For this one, I will convert 1
4 to a decimal. Idivide 1.0 by 4. 4 goes into 1.0 .2 times. There is also a remainder of 0.20 and 4 goes into 0.20 0.05 times. Now weknow that 1
4 written as a decimal is 0.25.
We compare it as 14 = 0.25.
Here is another one.
Compare 1 220 and 1.30
Our work in estimating the value of fractions and rounding decimals can be helpful when comparing fractionsand decimals because you can look at a fraction or a decimal and quickly have a sense of what the approximatevalue is. Take a look at the mixed number 1 2
20 . Don’t be intimidated by the large denominator, it looks like we cansimplify it. If we simplify it to 1 1
10 .
Now we can take 1.30 and make it a mixed number. 1.30 becomes 1 310 .
Our final answer is that 1 220 < 1.30.
We can use all of these strategies when ordering fractions and decimals too. Be sure that they are in the same formand then order them from least to greatest or from greatest to least.
Now it’s time for you to try a few on your own. Compare using <,>or =.
Example A
.5 and 14
Solution: >
Example B
3 35 and 3.56
Solution: >
Example C
28 and .25
Solution: =
Let’s go back to our original problem now and apply what we have learned.
282
www.ck12.org Chapter 3. Using Fractions
Here is the original problem once again.
At the bake sale, the seventh grade has set up two tables full of baked goods. There was so much baked that theyalso have extras on reserve. The students have decided to run the bake sale for three days so that they can try to selltheir good throughout all three lunch periods at school. They hope to raise a lot of money.
Derek and Keisha have been assigned the task of keeping track of sales. They need to keep track of how much ofeach item is sold. For example, if there are twelve cupcakes and six of them sell, then they could write one-half asthe statistic for cupcakes. The students think that if they keep track of each item sold, that they will have a good ideaof which items are the big sellers.
The first day goes smoothly. Derek and Keisha each keep track of one table and they split the third table in half. Atthe end of the sale day, they sit down to compare notes.
Derek has written these amounts down.
Peach pie .10
Cupcakes .75
Brownies .50
Bread .25
Keisha has written these amounts down.
Blueberry pie 12
Chocolate cookies 14
Blueberry muffins 13
Double Fudge Brownies 34
Apple pie 56
They are surprised to see that one of them has written all of the data in decimals while the other has written all ofthe data in fraction form. To figure out which items were the biggest sellers they will have to order their data.
Derek needs to write his decimals in order from greatest to least and Keisha needs to write her fractions in orderfrom greatest to least.
First, Derek needs to write his data in order from greatest to least.
Cupcakes .75
Brownies .50
Bread .25
283
3.18. Positive and Negative Fraction and Decimal Comparison www.ck12.org
Peach Pie .10
Next, Keisha needs to write her data in order from greatest to least.
Apple pie 56
Double Fudge Brownies 34
Blueberry Pie 12
Chocolate Cookies 14
Blueberry Muffins 13
Given this information, the top seller were the apple pies, the double fudge brownies, the cupcakes and thebrownies. Derek and Keisha report their sales to their teacher and they decide to put out more of those itemsfor day two of the bake sale.
Guided Practice
Here is one for you to try on your own.
Compare the following values using <, >or =.
.45 and 610
Answer
To compare these two values, let’s convert the fraction into a decimal.610 = .6
Now we can easily compare.
.45 < .6
This is our answer.
Video Review
MEDIAClick image to the left or use the URL below.URL: http://www.ck12.org/flx/render/embeddedobject/57626
This is a James Sousa video on ordering decimals and fractions from least to greatest.
Explore More
Directions: Compare the following decimals and fractions using <, >or =
1. 13 and .5
2. 610 and .9
3. .25 and 110
284
www.ck12.org Chapter 3. Using Fractions
4. .16 and 33100
5. 35 and .6
6. 315 and .15
7. 67 and .99
8. 34 and .75
9. 19 and .33
10. 710 and .8
Directions: Write the following values in order from least to greatest.
11. .25, 13 , .54
12. .55, 34 , .613
13. .252, 19 , .31
14. .05, 78 , .546
15. .09, 110 , .88
285
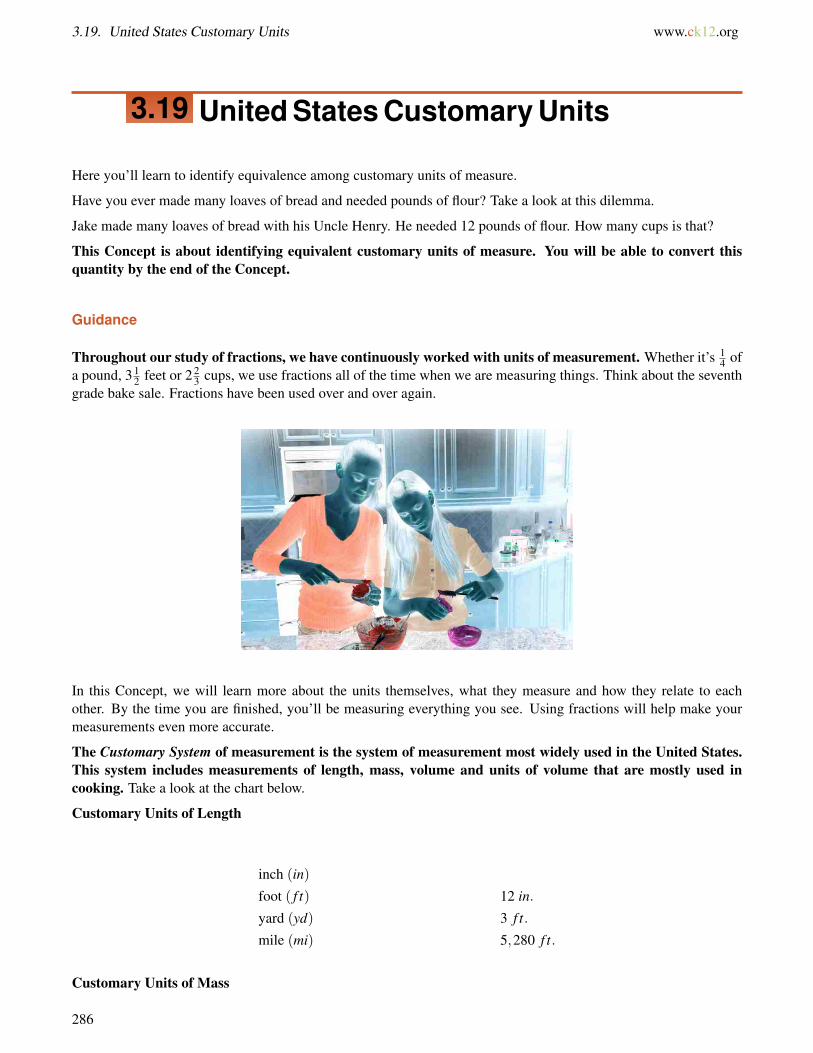
3.19. United States Customary Units www.ck12.org
3.19 United States Customary Units
Here you’ll learn to identify equivalence among customary units of measure.
Have you ever made many loaves of bread and needed pounds of flour? Take a look at this dilemma.
Jake made many loaves of bread with his Uncle Henry. He needed 12 pounds of flour. How many cups is that?
This Concept is about identifying equivalent customary units of measure. You will be able to convert thisquantity by the end of the Concept.
Guidance
Throughout our study of fractions, we have continuously worked with units of measurement. Whether it’s 14 of
a pound, 3 12 feet or 2 2
3 cups, we use fractions all of the time when we are measuring things. Think about the seventhgrade bake sale. Fractions have been used over and over again.
In this Concept, we will learn more about the units themselves, what they measure and how they relate to eachother. By the time you are finished, you’ll be measuring everything you see. Using fractions will help make yourmeasurements even more accurate.
The Customary System of measurement is the system of measurement most widely used in the United States.This system includes measurements of length, mass, volume and units of volume that are mostly used incooking. Take a look at the chart below.
Customary Units of Length
inch (in)
foot ( f t) 12 in.
yard (yd) 3 f t.
mile (mi) 5,280 f t.
Customary Units of Mass
286
www.ck12.org Chapter 3. Using Fractions
ounce (oz)
pound (lb) 16 oz.
Customary Units of Volume
ounce (oz)
cup (c) 8 oz.
pint (pt) 16 oz.
quart (qt) 32 oz.
gallon (gal) 4 qt.
Customary Units of Volume Used in Cooking
teaspoon (tsp)
tablespoon (tbsp) 3 tsp.
cup (c) 16 tbsp.
Unlike the metric system, there is not a specific way of relating the customary units of measurement to eachother. If a foot is 12 inches, you might expect that the next largest measurement unit of length, a yard, to be 12 feet.However, this is not the case. A yard instead, is 3 feet.
Nevertheless, there are relationships among the units of measurement. For now, it is helpful to refer to the abovechart when working with customary units of measurement. As you get more and more familiar with the units andthe various measurement tools, you will acquire an automatic sense of measurement and how the various units relateto each other. Let’s look at some examples that deal with equivalence or equal measures.
6 feet = ___ yards
We are going to convert feet into yards. There are three feet in one yard. If we divide 6 feet by 3 feet, we will havethe correct number of yards.
6÷3 = 2
6 feet = 2 yards
2 tablespoons = ___ teaspoons
We are going to convert tablespoons to teaspoons. To do this, we multiply. There are three teaspoons in onetablespoon.
2×3 = 6
2 tablespoons = 6 teaspoons
287
3.19. United States Customary Units www.ck12.org
There is a hint.
If we go from a larger unit to a smaller unit, we multiply. If we go from a larger unit to a smaller unit, we divide.
Make a note of this rule and then continue with the Concept.
Try a few of these equivalents on your own.
Example A
12 pounds = ______ ounces
Solution:192
Example B
6 yards = ______ feet
Solution: 18
Example C
48 inches = _____ feet
288

www.ck12.org Chapter 3. Using Fractions
Solution:4
Here is the original problem once again.
Jake made many loaves of bread with his Uncle Henry. He needed 12 pounds of flour. How many cups is that?
There are 8 ounces in 1 cup.
There are 16 ounces in 1 pound.
This means that there are 2 cups in one pound.
If Jake used 12 pounds, then we can multiply to find the answer.
12×2 = 24 cups.
This is our answer.
Guided Practice
Here is one for you to try on your own.
How many fluid ounces is there in 1 gallon?
Answer
There are 32 ounces in 1 quart.
There are four quarts in one gallon.
We can multiply to figure out this problem. Take a look.
32×4 = 128ounces
This is our answer.
Video Review
MEDIAClick image to the left or use the URL below.URL: http://www.ck12.org/flx/render/embeddedobject/5479
This is a James Sousa video on equivalent customary units of length.
MEDIAClick image to the left or use the URL below.URL: http://www.ck12.org/flx/render/embeddedobject/5402
This is a James Sousa video on equivalent customary units of capacity.
289
3.19. United States Customary Units www.ck12.org
MEDIAClick image to the left or use the URL below.URL: http://www.ck12.org/flx/render/embeddedobject/5403
This is a James Sousa video on equivalent customary units of mass.
Explore More
Directions: Fill in the blanks with the equivalent measurement.
1. 6 pints = ___ quarts
2. 2 cups = ___ tablespoons
3. 3 12 pounds = ___ ounces
4. 12 mile = ___ feet
5. 56 ounces = ___ pounds
6. 24 inches = ___ feet
7. 5 12 feet = ___ inches
8. 12 pound = ___ ounces
Directions: Fill in the blanks with the equivalent measurements for 3 yards.
9. ___ inches
10. ___ feet
Directions: Fill in the blanks with the equivalent measurements for 4 cups.
11. ___ tablespoons
12. ___ teaspoons
13. ___ pounds
14. ___ ounces
15. ___ pints
290
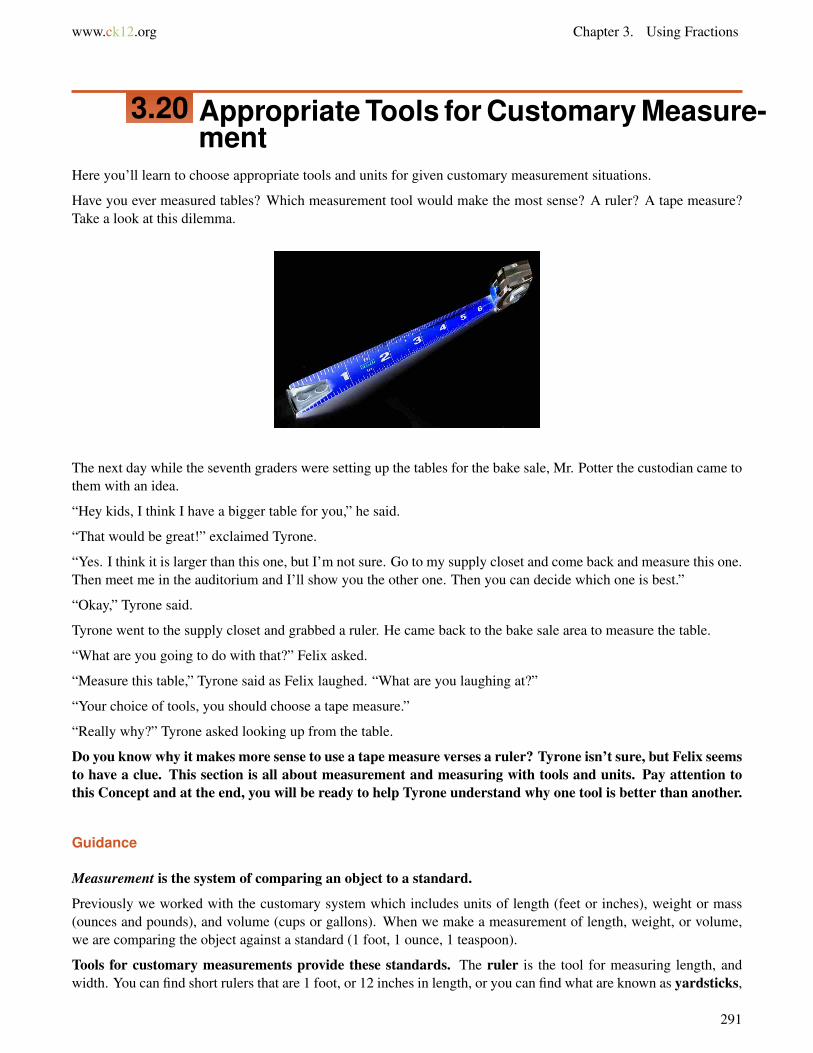
www.ck12.org Chapter 3. Using Fractions
3.20 Appropriate Tools for Customary Measure-ment
Here you’ll learn to choose appropriate tools and units for given customary measurement situations.
Have you ever measured tables? Which measurement tool would make the most sense? A ruler? A tape measure?Take a look at this dilemma.
The next day while the seventh graders were setting up the tables for the bake sale, Mr. Potter the custodian came tothem with an idea.
“Hey kids, I think I have a bigger table for you,” he said.
“That would be great!” exclaimed Tyrone.
“Yes. I think it is larger than this one, but I’m not sure. Go to my supply closet and come back and measure this one.Then meet me in the auditorium and I’ll show you the other one. Then you can decide which one is best.”
“Okay,” Tyrone said.
Tyrone went to the supply closet and grabbed a ruler. He came back to the bake sale area to measure the table.
“What are you going to do with that?” Felix asked.
“Measure this table,” Tyrone said as Felix laughed. “What are you laughing at?”
“Your choice of tools, you should choose a tape measure.”
“Really why?” Tyrone asked looking up from the table.
Do you know why it makes more sense to use a tape measure verses a ruler? Tyrone isn’t sure, but Felix seemsto have a clue. This section is all about measurement and measuring with tools and units. Pay attention tothis Concept and at the end, you will be ready to help Tyrone understand why one tool is better than another.
Guidance
Measurement is the system of comparing an object to a standard.
Previously we worked with the customary system which includes units of length (feet or inches), weight or mass(ounces and pounds), and volume (cups or gallons). When we make a measurement of length, weight, or volume,we are comparing the object against a standard (1 foot, 1 ounce, 1 teaspoon).
Tools for customary measurements provide these standards. The ruler is the tool for measuring length, andwidth. You can find short rulers that are 1 foot, or 12 inches in length, or you can find what are known as yardsticks,
291
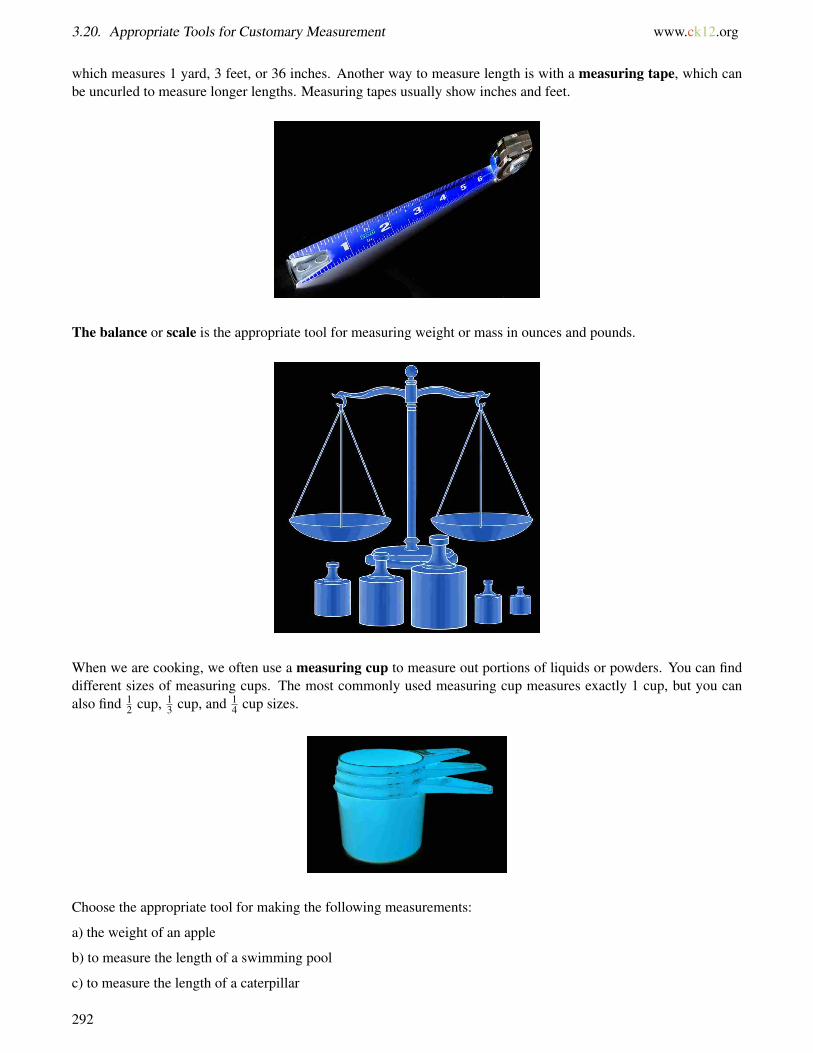
3.20. Appropriate Tools for Customary Measurement www.ck12.org
which measures 1 yard, 3 feet, or 36 inches. Another way to measure length is with a measuring tape, which canbe uncurled to measure longer lengths. Measuring tapes usually show inches and feet.
The balance or scale is the appropriate tool for measuring weight or mass in ounces and pounds.
When we are cooking, we often use a measuring cup to measure out portions of liquids or powders. You can finddifferent sizes of measuring cups. The most commonly used measuring cup measures exactly 1 cup, but you canalso find 1
2 cup, 13 cup, and 1
4 cup sizes.
Choose the appropriate tool for making the following measurements:
a) the weight of an apple
b) to measure the length of a swimming pool
c) to measure the length of a caterpillar
292

www.ck12.org Chapter 3. Using Fractions
If you think about each item, it becomes easy to determine the best tool for each measurement.
The answers are:
a) Balance or scale
b) Yardstick or measuring tape
c) Ruler
We use our system of measurement to help us complete essential tasks in everyday life. If you are building ahouse, you will have to decide how long and how wide your house will be. If you are baking a key lime pie, youwill need to know how many cups of lime juice to use.
Using the correct units of measurement makes our lives easier. You can measure the distance from your houseto Paris, France in inches, but that’s a lot of inches! That’s why we measure that distance in miles.
When you need to measure something, always consider the most reasonable unit to use before measuring. Ifyou choose a unit that is too small, you will get a large number that is hard to keep track of. If you choose aunit that is too large, it will be more difficult to be precise in your measurement.
The volume of jar of jam
Think about volume. We want to measure the volume or the amount of jam in a jar. Since a jar is small, we can useounces to measure.
Ounce is the answer.
A part of figuring out the unit of measurement is to use common sense. We have to think about what we aremeasuring, how we are measuring, and then you will be able to figure out the correct unit of measurement.
Choose the best tool for each measure.
Example A
Milk for a recipe
Solution: A measuring cup
Example B
A garden plot
Solution: A measuring tape
Example C
A bunch of bananas
Solution: A scale
293
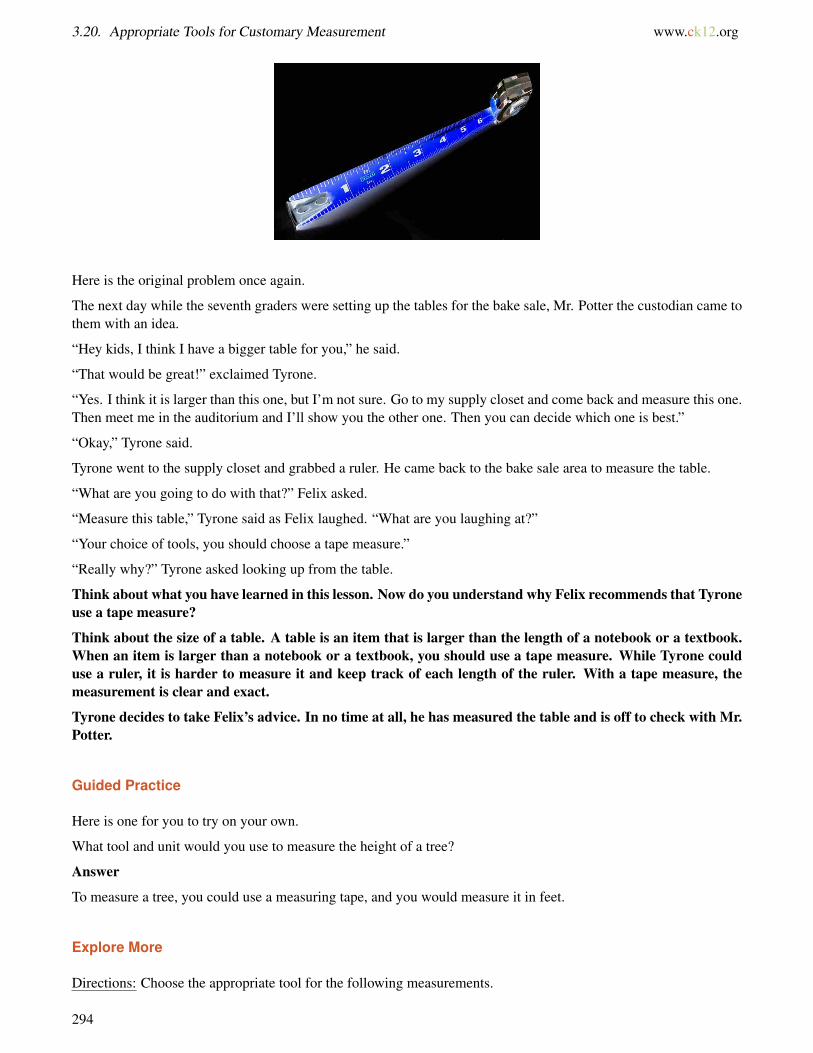
3.20. Appropriate Tools for Customary Measurement www.ck12.org
Here is the original problem once again.
The next day while the seventh graders were setting up the tables for the bake sale, Mr. Potter the custodian came tothem with an idea.
“Hey kids, I think I have a bigger table for you,” he said.
“That would be great!” exclaimed Tyrone.
“Yes. I think it is larger than this one, but I’m not sure. Go to my supply closet and come back and measure this one.Then meet me in the auditorium and I’ll show you the other one. Then you can decide which one is best.”
“Okay,” Tyrone said.
Tyrone went to the supply closet and grabbed a ruler. He came back to the bake sale area to measure the table.
“What are you going to do with that?” Felix asked.
“Measure this table,” Tyrone said as Felix laughed. “What are you laughing at?”
“Your choice of tools, you should choose a tape measure.”
“Really why?” Tyrone asked looking up from the table.
Think about what you have learned in this lesson. Now do you understand why Felix recommends that Tyroneuse a tape measure?
Think about the size of a table. A table is an item that is larger than the length of a notebook or a textbook.When an item is larger than a notebook or a textbook, you should use a tape measure. While Tyrone coulduse a ruler, it is harder to measure it and keep track of each length of the ruler. With a tape measure, themeasurement is clear and exact.
Tyrone decides to take Felix’s advice. In no time at all, he has measured the table and is off to check with Mr.Potter.
Guided Practice
Here is one for you to try on your own.
What tool and unit would you use to measure the height of a tree?
Answer
To measure a tree, you could use a measuring tape, and you would measure it in feet.
Explore More
Directions: Choose the appropriate tool for the following measurements.
294
www.ck12.org Chapter 3. Using Fractions
1. The weight of a violin
2. The volume of a small amount of oregano
3. The volume of a glass of milk
4. The length of one side of your desk
5. Sugar for a cup of coffee
6. The amount of sugar needed for a cake
7. The weight of a person
Directions: Choose the appropriate unit for the following measurements.
8. The length of a football field
9. The volume of a car’s gas tank
10. The length of an insect
11. The weight of a tennis shoe
12. The distance a person runs in 1 hour
13. The amount of water in a large drum
14. The amount of water in a pool
15. The size of a child’s foot
295

3.21. Conversion of Customary Units of Measurement www.ck12.org
3.21 Conversion of Customary Units of Mea-surement
Here you’ll learn to convert and compare customary units of measure using factors and multiples.
Remember the tables that Mr. Potter suggested? Take a look at this dilemma.
Tyrone has his first measurement done when he meets Mr. Potter in the auditorium. He has written the measurementof the first table on the paper.
The first table is 8′×4′.
When Tyrone arrives at the auditorium, Mr. Potter has another table all clean and set up for Tyrone to check out.
“I think this one is larger than the other one,” Mr. Potter says. “It measures 96′′×30′′.”
Tyrone looks at the table. He doesn’t think this one looks larger, but he can’t be sure.
On his paper he writes.
Table 2 = 96′′×30′′
To figure out which table is larger, Tyrone will need to convert customary units of measure. Then he will need tocompare them.
This Concept will teach you all that you need to know about how to do this. When finished, you will knowwhich table is larger and so will Tyrone.
Guidance
Imagine that you are cooking with a recipe that calls for 13 tablespoons of whipping cream. Since you are cookingfor a large banquet you need to make 4 times what the recipe makes. So you are multiplying all of the ingredientquantities by 4 and combining them in a very large bowl. You realize that this requires you to use 52 tablespoons ofwhipping cream. To measure out 1 tablespoon 52 times will take forever!
Don’t worry, though.
You can convert tablespoons to a larger unit of measurement like cups and be able to measure out thewhipping cream in larger quantities.
Look at the chart of customary units again.
Customary Units of Length
296
www.ck12.org Chapter 3. Using Fractions
inch (in)
foot ( f t) 12 in.
yard (yd) 3 f t.
Mile (mi) 5,280 f t.
Customary Units of Mass
ounce (oz)
pound (lb) 16 oz.
Customary Units of Volume
ounce (oz)
cup (c) 8 oz.
pint (pt) 16 oz.
quart (qt) 32 oz.
gallon (gal) 4 qt.
Customary Units of Volume Used in Cooking
teaspoon (tsp)
tablespoon (tbsp) 3 tsp.
cup (c) 16 tbsp.
Do you notice a relationship between the various units of volume? If we have 8 ounces of a liquid, we have 1cup of it. If we have 16 ounces of a liquid, we have 1 pint of it, or 2 cups of it. If we have 2 pints of a liquid, wehave 1 quart, or 4 cups, or 32 ounces of it.
We just looked at volume relationships by going from ounces to quarts, let’s look at a larger quantity and break itdown to smaller parts. If we have 1 cup, how many teaspoons do we have? 1 cup is 16 tablespoons and 1 tablespoonis 3 teaspoons, so 1 cup is 16 ·3 teaspoons. 1 cup is 48 teaspoons.
Once we know how the different units of measurement relate to each other it is easy to convert among them.Don’t forget that 12 inches is equal to 1 foot. As you work more with measurements, it will be helpful for you tolearn many of these relationships by heart.
Convert 374 inches into feet.
There are 12 inches in 1 foot, so to go from inches to feet we divide 374 by 12.
Our answer is 31 16 feet.
Notice this rule again.
If you go from a smaller unit to a larger unit, we divide. If we go from a larger unit to a smaller unit, we multiply.
Dividing and multiplying any units always has to do with factors and multiples of different numbers.
297
3.21. Conversion of Customary Units of Measurement www.ck12.org
Studying measurement is particularly helpful because you learn to estimate more accurately what thingsaround you measure. You catch a bass that weighs about 10 pounds, or your book bag filled with books weighsabout 25 pounds. Maybe your good friend is about 5 1
2 feet tall or your bicycle is 4 feet long.
Once you start measuring things, you can compare different quantities. Is the distance from your house toschool farther than the distance from your house to the grocery store? Does your math book weigh more than yourhistory book?
To be accurate in comparing and ordering with measurements, it is essential that you are comparing usingthe same unit. So, if you compare pounds and ounces, you should convert ounces to pounds and then comparepounds to pounds. Or, you can convert pounds to ounces and compare ounces to ounces.
Compare 4 12 lbs ___ 74 oz.
First, notice that we have two different units of measurement. To accurately compare these two quantities, we needto make them both into the same unit. We can do this by multiplying. Multiply the pounds by 16 to get ounces.
4 12 ·16 = 72 oz.
Our answer is that 4 12 lbs < 74 oz.
Compare 62 ft. ___ 744 in.
First, we need to convert the units so that they are both the same. We can do this by converting inches to feet. Theinches measurement is so large, that it is difficult to get an idea the exact size. Divide inches by 12 to get feet.
744÷12 = 62 f eet
Our answer is that 62 ft. = 744 inches.
You can also use this information when ordering units of measurement from least to greatest and from greatestto least.
Now it’s time for you to practice. Convert these measurements into quarts.
Example A
82 pints
Solution: 41 quarts
298
www.ck12.org Chapter 3. Using Fractions
Example B
80 ounces
Solution:2.5 quarts
Example C
8 12 gallons
Solution:34 quarts
Here is the original problem once again.
Tyrone has his first measurement done when he meets Mr. Potter in the auditorium. He has written the measurementof the first table on the paper.
The first table is 8′×4′.
When Tyrone arrives at the auditorium, Mr. Potter has another table all clean and set up for Tyrone to check out.
“I think this one is larger than the other one,” Mr. Potter says. “It measures 96′′×30′′.”
Tyrone looks at the table. He doesn’t think this one looks larger, but he can’t be sure.
On his paper he writes.
Table 2 = 96′′×30′′
To figure out which table is larger, Tyrone will need to convert customary units of measure. Then he will need tocompare them.
To figure out which table is larger, Tyrone needs to convert both tables to the same unit of measure. One hasbeen measured in inches and one has been measured in feet. Tyrone will convert both tables to inches.
He takes his measurements from table one.
8′×4′
There are 12 inches in 1 foot, so if he multiplies each by 12 they will be converted to inches.
8×12 = 96′′
The length of both tables is the same. Let’s check out the width.
4×12 = 48′′
The first table is 96′′×48′′.
The second table is 96′′×30′′.
299
3.21. Conversion of Customary Units of Measurement www.ck12.org
Tyrone shows his math to Mr. Potter. The first table that the students already have is the larger of the twotables. Tyrone thanks Mr. Potter, but decides to stick with the first table.
Guided Practice
Here is one for you to try on your own.
Henrietta is having her 8 best friends over for a luncheon. She wants to prepare salads on which she uses exactly7 tablespoons of Romano cheese. If she is preparing 8 salads, how many cups of Romano cheese does Henriettarequire?
Answer
We know that each salad requires 7 tablespoons and that Henrietta is making 8 salads. To find out the total amountof Romano cheese she needs in tablespoons, we multiply 7 by 8 to get 56 tablespoons. Now we need to convert 56tablespoons to cups. There are 16 tablespoons in a cup, so we need to divide 56 by 16.
56÷16 = 3 12
Henrietta will need 3 12 cups of Romano cheese.
Video Review
MEDIAClick image to the left or use the URL below.URL: http://www.ck12.org/flx/render/embeddedobject/5479
This is a James Sousa video on equivalent customary units of length.
MEDIAClick image to the left or use the URL below.URL: http://www.ck12.org/flx/render/embeddedobject/5402
This is a James Sousa video on equivalent customary units of capacity.
MEDIAClick image to the left or use the URL below.URL: http://www.ck12.org/flx/render/embeddedobject/5403
This is a James Sousa video on equivalent customary units of mass.
300
www.ck12.org Chapter 3. Using Fractions
Explore More
Directions: Convert the following measurements into yards. You may round to the nearest tenth when necessary.
1. 195 inches
2. 0.2 miles
3. 88 feet
4. 90 feet
5. 900 feet
Directions: Convert the following measurements into pounds.
6. 2,104 ounces
7. 96 ounces
8. 3 tons
9. 15 tons
Directions: Convert the following measurements into pints.
10. 102 quarts
11. 57 ounces
12. 9.5 gallons
13. 4 quarts
14. 18 quarts
15. 67 gallons
301
3.22. Conversion Estimation between Systems of Measure www.ck12.org
3.22 Conversion Estimation between Systemsof Measure
Here you’ll learn to estimate equivalence between customary and metric units of measure.
Have you ever measured liquid?
Let’s say that you wanted to make a cake which needed 2 cups of milk. Could you estimate a conversion of two cupsof milk to liters?
This Concept will teach you how to estimate between customary and metric units of measurement.
Guidance
While you encounter the Customary System of measurement all of the time in your everyday life, there is anothersystem of measurement that is also widely used. This system is known as the Metric System. In other countriespeople use the metric system for the same things that we use the customary system for. We might weigh grapesusing pounds, but in France they use grams to weigh grapes. You may measure the length of one side of yourbackyard in feet, but in Beijing they use meters. Even in the United States, the metric system is frequently usedespecially in science.
You may find yourself in a situation where you need to convert between the metric system and the customarysystem. Take a look at the chart below. It shows the estimated customary equivalent to common metric units.
TABLE 3.1:
Metric Units Customary Units1 centimeter 0.39 inches1 meter 3.28 feet1 kilometer 0.62 miles1 milliliter 0.2 teaspoons1 liter 4.23 cups1 gram 0.04 ounces1 kilogram 2.2 pounds
Using this chart can help us to estimate the equivalence between metric units of measurement and customaryunits of measurement. Let’s look at a problem.
Estimate the equivalent measures from 14 centimeters to inches.
A centimeter is equal to about 0.39 inches, so we multiply 14 ·0.39 = 5.46 inches
Estimate the equivalent measures from 7.7 pounds to kilograms.
There are 2.2 pounds in 1 kilogram, so we divide the number of pounds by the number of pounds in 1kilogram. 7.7÷2.2 = 3.5
The answer is 3.5 kilograms.
If you keep this chart in mind, you will always be able to estimate measures. If you do this enough, you willbe able to figure some of them out without the chart.
302
www.ck12.org Chapter 3. Using Fractions
Most runners know that a 5k race is about 3.1 miles. Where as a 10k is 6.2 miles.
Here are a few for you to try on your own. Estimate each equivalent metric measure.
Example A
.16 ounces = ____ grams
Solution: 4 grams
Example B
6 pounds = ____ kilograms
Solution: 3 kilograms
Example C
12 feet = ____ meters
Solution: 3 meters
Here is the original problem once again.
Let’s say that you wanted to make a cake which needed 2 cups of milk. Could you estimate a conversion of two cupsof milk to liters?
To convert cups to liters, let’s think about how many cups equals 1 liter.
4.23 cups is equal to 1 liter.
Our recipe calls for a little less than half the cups needed to equal 1 liter.
Therefore, we can say that 2 cups is approximately equal to .5 liters.
This is our answer.
Guided Practice
Here is one for you to try on your own.
How many cups is 16 liters?
Answer
303
3.22. Conversion Estimation between Systems of Measure www.ck12.org
To figure this out, we can use the equivalent measure of cups to liters.
4.23 cups = 1 liter
We can round down to 4 cups = 1 liters to estimate accurately.
Now we want to figure out the number of cups in 16 liters, so we can multiply to figure this out.
4×16 = 64
There are about 64 cups in 16 liters.
Video Review
MEDIAClick image to the left or use the URL below.URL: http://www.ck12.org/flx/render/embeddedobject/5401
This is a Khan Academy video on customary and metric units of measurement.
Explore More
Directions: Estimate a customary equivalent for the following metric measurements.
1. 4 kilograms to pounds
2. 7.5 meters to feet
3. 6 liters to cups
4. 13.25 kilometers to miles
5. 6 kilometers to miles
6. 8 liters to cups
7. 20 kilograms to pounds
8. 12 meters to feet
Directions: Estimate a metric equivalent for the following customary measurements, round to the nearest hundredthwhere necessary.
9. 4 quarts to liters
10. 34 ounces to grams
11. 52 pounds to kilograms
12. 9 inches to centimeters
13. 14 feet to meters
14. 16 cups to liters
15. 5 miles to kilometers
304

www.ck12.org Chapter 3. Using Fractions
Summary
Having completed this chapter, students are now ready to move on to the next Chapter. Each Concept has providedstudents with an opportunity to engage and practice skills in many Concepts including comparing and orderingfractions, operations with fractions, mixed numbers, operations with mixed number, relationships between fractionsand decimals, measuring with customary units of measurement and converting customary units of measurement.
305
www.ck12.org
CHAPTER 4 Using IntegersChapter Outline
4.1 INTEGERS THAT REPRESENT DIFFERENT SITUATIONS
4.2 ABSOLUTE VALUE OF INTEGERS
4.3 COMPARISON OF INTEGERS WITH ABSOLUTE VALUE
4.4 SUMS OF INTEGERS ON A NUMBER LINE
4.5 SUMS OF INTEGERS USING ABSOLUTE VALUE
4.6 SIMPLIFY VARIABLE EXPRESSIONS INVOLVING INTEGER ADDITION
4.7 DIFFERENCES OF INTEGERS USING A NUMBER LINE
4.8 DIFFERENCES OF INTEGERS USING ABSOLUTE VALUE
4.9 SIMPLIFY VARIABLE EXPRESSIONS INVOLVING INTEGER SUBTRACTION
4.10 INTEGER MULTIPLICATION
4.11 SIMPLIFY VARIABLE EXPRESSIONS INVOLVING INTEGER MULTIPLICATION
4.12 INTEGER DIVISION
4.13 SIMPLIFY VARIABLE EXPRESSIONS INVOLVING INTEGER DIVISION
4.14 PROPERTIES OF RATIONAL NUMBERS
4.15 COMPARISON OF RATIONAL NUMBERS
4.16 EXPRESSIONS AND THE DISTRIBUTIVE PROPERTY
4.17 POINTS IN THE COORDINATE PLANE
4.18 SCATTER PLOTS
Introduction
In Math 7, the learning content is divided into Concepts. Each Concept is complete and whole providing focusedlearning on an indicated objective. Theme-based Concepts provide students with experiences that integrate thecontent of each Concept. Students are given opportunities to practice the skills of each Concept through real-worldsituations, examples, guided practice and independent practice sections. There are also video links provided to givestudents an audio/visual way of connecting with the content. In this Chapter, students will engage with Concepts oncomparing and ordering integers, operations with integers, rational numbers, the distributive property, the coordinateplane, integers and real-world situations, absolute value and scatter plots.
306
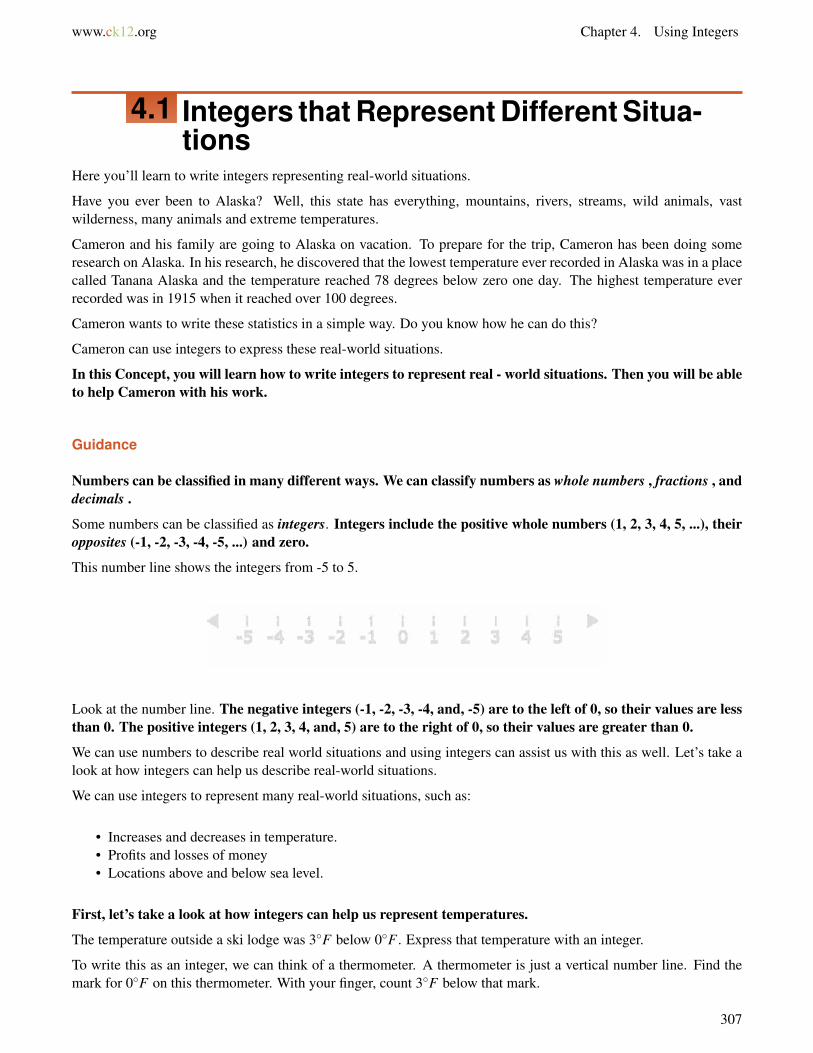
www.ck12.org Chapter 4. Using Integers
4.1 Integers that Represent Different Situa-tions
Here you’ll learn to write integers representing real-world situations.
Have you ever been to Alaska? Well, this state has everything, mountains, rivers, streams, wild animals, vastwilderness, many animals and extreme temperatures.
Cameron and his family are going to Alaska on vacation. To prepare for the trip, Cameron has been doing someresearch on Alaska. In his research, he discovered that the lowest temperature ever recorded in Alaska was in a placecalled Tanana Alaska and the temperature reached 78 degrees below zero one day. The highest temperature everrecorded was in 1915 when it reached over 100 degrees.
Cameron wants to write these statistics in a simple way. Do you know how he can do this?
Cameron can use integers to express these real-world situations.
In this Concept, you will learn how to write integers to represent real - world situations. Then you will be ableto help Cameron with his work.
Guidance
Numbers can be classified in many different ways. We can classify numbers as whole numbers , fractions , anddecimals .
Some numbers can be classified as integers. Integers include the positive whole numbers (1, 2, 3, 4, 5, ...), theiropposites (-1, -2, -3, -4, -5, ...) and zero.
This number line shows the integers from -5 to 5.
Look at the number line. The negative integers (-1, -2, -3, -4, and, -5) are to the left of 0, so their values are lessthan 0. The positive integers (1, 2, 3, 4, and, 5) are to the right of 0, so their values are greater than 0.
We can use numbers to describe real world situations and using integers can assist us with this as well. Let’s take alook at how integers can help us describe real-world situations.
We can use integers to represent many real-world situations, such as:
• Increases and decreases in temperature.• Profits and losses of money• Locations above and below sea level.
First, let’s take a look at how integers can help us represent temperatures.
The temperature outside a ski lodge was 3◦F below 0◦F . Express that temperature with an integer.
To write this as an integer, we can think of a thermometer. A thermometer is just a vertical number line. Find themark for 0◦F on this thermometer. With your finger, count 3◦F below that mark.
307
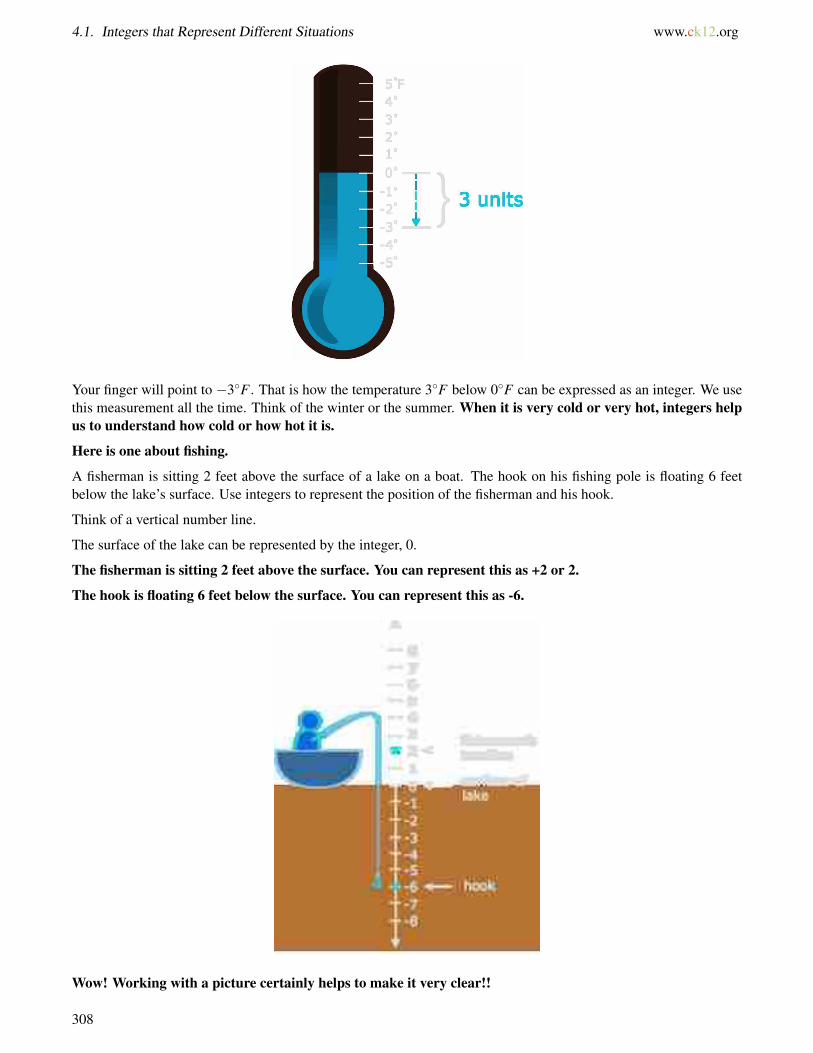
4.1. Integers that Represent Different Situations www.ck12.org
Your finger will point to −3◦F . That is how the temperature 3◦F below 0◦F can be expressed as an integer. We usethis measurement all the time. Think of the winter or the summer. When it is very cold or very hot, integers helpus to understand how cold or how hot it is.
Here is one about fishing.
A fisherman is sitting 2 feet above the surface of a lake on a boat. The hook on his fishing pole is floating 6 feetbelow the lake’s surface. Use integers to represent the position of the fisherman and his hook.
Think of a vertical number line.
The surface of the lake can be represented by the integer, 0.
The fisherman is sitting 2 feet above the surface. You can represent this as +2 or 2.
The hook is floating 6 feet below the surface. You can represent this as -6.
Wow! Working with a picture certainly helps to make it very clear!!
308

www.ck12.org Chapter 4. Using Integers
Mr. Marsh invested in the stock market and had a loss of $45 yesterday. Mrs. Marsh also invested in the stockmarket. Her investment showed a gain of $20 yesterday. Represent these situations with integers.
Think of a number line from -$50 to $50. The $0 mark represents neither a gain nor a loss on an investment.
Use a negative integer to represent a loss. Mr. Marsh lost $45 on his investment. This can be represented as-$45.
Use a positive integer to represent a gain. Mrs. Marsh’s investment showed a gain of $20. This can berepresented as +$20 or $20, because positive integers can be written with or without a positive (+) sign.
Do you get the idea? You can look for key words that indicate a positive or a negative number. When you lookat a problem, identify any words that might tell you whether you are going to write a positive or a negativenumber. Think back at the last three situations and write down any key words that you notice.
Write an integer for each example.
Example A
An increase of $200.00
Solution: +200.00
309
4.1. Integers that Represent Different Situations www.ck12.org
Example B
Down 10%
Solution:−10%
Example C
50 feet below sea level
Solution:−50
Now back to Cameron and his Alaska research. Here is the original problem once again.
Have you ever been to Alaska? Well, this state has everything, mountains, rivers, streams, wild animals, vastwilderness, many animals and extreme temperatures.
Cameron and his family are going to Alaska on vacation. To prepare for the trip, Cameron has been doing someresearch on Alaska. In his research, he discovered that the lowest temperature ever recorded in Alaska was in a placecalled Tanana Alaska and the temperature reached 78 degrees below zero one day. The highest temperature everrecorded was in 1915 when it reached over 100 degrees.
Cameron wants to write these statistics in a simple way. Do you know how he can do this?
Cameron can use integers to express these real-world situations.
To express these two scenarios as integers, we can write each using positive and negative signs.
The lowest temperature can be written as −78◦.
The highest temperature can be written as +100◦.
This is a way to express real-world situations using integers.
Guided Practice
Here is one for you to try on your own.
Express the following situation using integers.
John gained fifteen dollars, but then he lost 20 dollars.
Answer
To begin, we use a positive integer to represent the gain and a negative integer to represent the loss.
+15 represents the gain.
−20 represents the loss.
This is our answer.
Video Review
310
www.ck12.org Chapter 4. Using Integers
MEDIAClick image to the left or use the URL below.URL: http://www.ck12.org/flx/render/embeddedobject/5272
This James Sousa video is an introduction to integers.
Explore More
Directions: Write each as an integer.
1. 10 degrees below zero
2. 50◦F
3. A loss of $20.00
4. 35 feet below the surface
5. 120 feet below sea level
6. An altitude of 15,000 feet
Directions: Use two integers and an operation to represent each situation.
7. A loss of 20 and a gain of 15.
8. A gain of 15, then a loss of twenty.
9. A gain of 20 and a gain of 35.
10. A loss of 19 and another loss of 30.
11. An altitude of 30,000 feet and another height of 15,000 feet
12. A loss of 15,000 feet and another loss of 12,000 feet.
13. A depth of 60 feet and a resting stop at 15 feet below the surface of the water.
14. A depth of 15 feet and then another descent of 20 feet below the surface of the water.
15. The hikers climbed to 1500 feet and then hiked another 1000 feet.
311
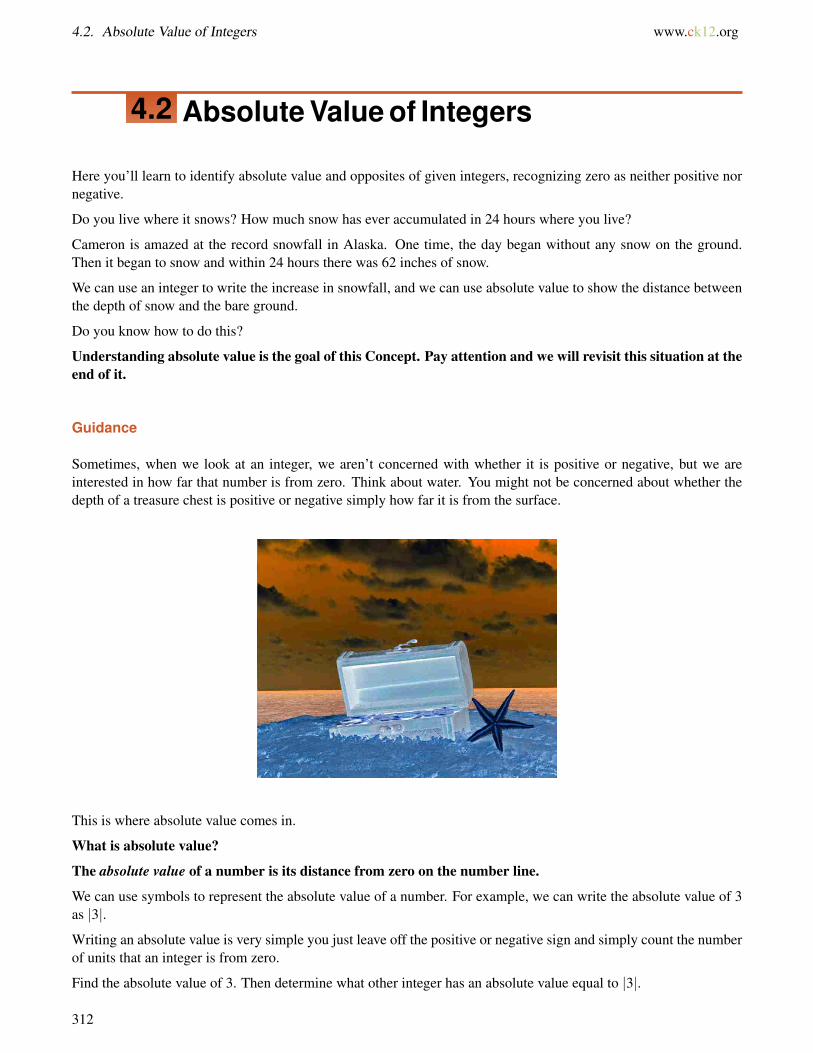
4.2. Absolute Value of Integers www.ck12.org
4.2 Absolute Value of Integers
Here you’ll learn to identify absolute value and opposites of given integers, recognizing zero as neither positive nornegative.
Do you live where it snows? How much snow has ever accumulated in 24 hours where you live?
Cameron is amazed at the record snowfall in Alaska. One time, the day began without any snow on the ground.Then it began to snow and within 24 hours there was 62 inches of snow.
We can use an integer to write the increase in snowfall, and we can use absolute value to show the distance betweenthe depth of snow and the bare ground.
Do you know how to do this?
Understanding absolute value is the goal of this Concept. Pay attention and we will revisit this situation at theend of it.
Guidance
Sometimes, when we look at an integer, we aren’t concerned with whether it is positive or negative, but we areinterested in how far that number is from zero. Think about water. You might not be concerned about whether thedepth of a treasure chest is positive or negative simply how far it is from the surface.
This is where absolute value comes in.
What is absolute value?
The absolute value of a number is its distance from zero on the number line.
We can use symbols to represent the absolute value of a number. For example, we can write the absolute value of 3as |3|.
Writing an absolute value is very simple you just leave off the positive or negative sign and simply count the numberof units that an integer is from zero.
Find the absolute value of 3. Then determine what other integer has an absolute value equal to |3|.
312
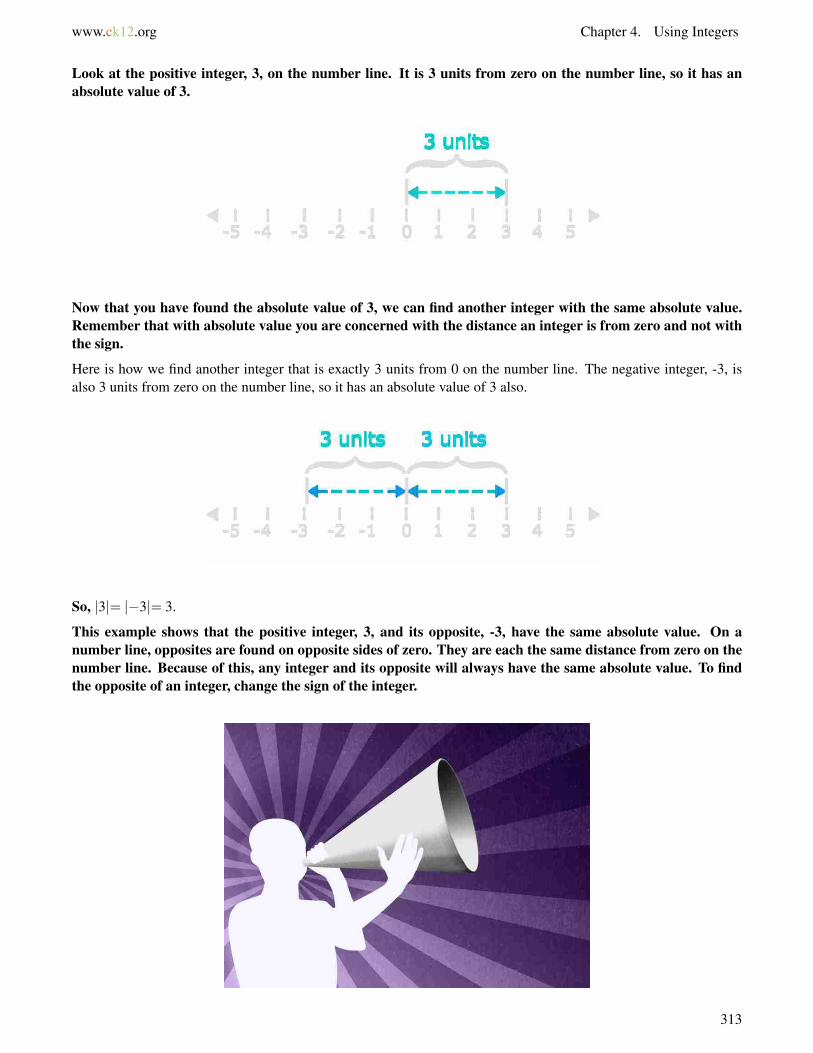
www.ck12.org Chapter 4. Using Integers
Look at the positive integer, 3, on the number line. It is 3 units from zero on the number line, so it has anabsolute value of 3.
Now that you have found the absolute value of 3, we can find another integer with the same absolute value.Remember that with absolute value you are concerned with the distance an integer is from zero and not withthe sign.
Here is how we find another integer that is exactly 3 units from 0 on the number line. The negative integer, -3, isalso 3 units from zero on the number line, so it has an absolute value of 3 also.
So, |3|= |−3|= 3.
This example shows that the positive integer, 3, and its opposite, -3, have the same absolute value. On anumber line, opposites are found on opposite sides of zero. They are each the same distance from zero on thenumber line. Because of this, any integer and its opposite will always have the same absolute value. To findthe opposite of an integer, change the sign of the integer.
313
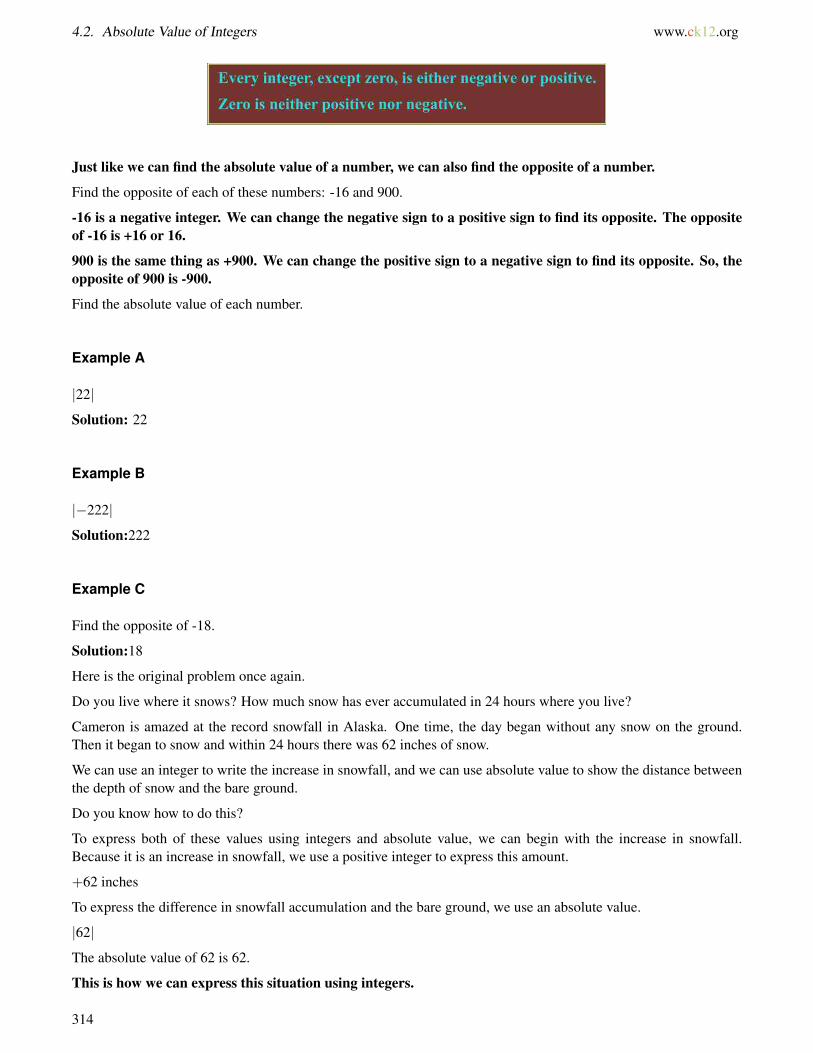
4.2. Absolute Value of Integers www.ck12.org
Just like we can find the absolute value of a number, we can also find the opposite of a number.
Find the opposite of each of these numbers: -16 and 900.
-16 is a negative integer. We can change the negative sign to a positive sign to find its opposite. The oppositeof -16 is +16 or 16.
900 is the same thing as +900. We can change the positive sign to a negative sign to find its opposite. So, theopposite of 900 is -900.
Find the absolute value of each number.
Example A
|22|
Solution: 22
Example B
|−222|
Solution:222
Example C
Find the opposite of -18.
Solution:18
Here is the original problem once again.
Do you live where it snows? How much snow has ever accumulated in 24 hours where you live?
Cameron is amazed at the record snowfall in Alaska. One time, the day began without any snow on the ground.Then it began to snow and within 24 hours there was 62 inches of snow.
We can use an integer to write the increase in snowfall, and we can use absolute value to show the distance betweenthe depth of snow and the bare ground.
Do you know how to do this?
To express both of these values using integers and absolute value, we can begin with the increase in snowfall.Because it is an increase in snowfall, we use a positive integer to express this amount.
+62 inches
To express the difference in snowfall accumulation and the bare ground, we use an absolute value.
|62|
The absolute value of 62 is 62.
This is how we can express this situation using integers.
314
www.ck12.org Chapter 4. Using Integers
Guided Practice
Here is one for you to try on your own.
|−234|
Answer
To identify the absolute value of this number, we have to think about the number of units it is from zero. Rememberthat absolute value does not concern positive or negative, but the distance that a value is from zero.
|−234|= 234
This is our answer.
Video Review
MEDIAClick image to the left or use the URL below.URL: http://www.ck12.org/flx/render/embeddedobject/5272
This James Sousa video is an introduction to integers includes absolute value.
Explore More
Directions: Write the opposite of each integer.
1. 20
2. -7
3. 22
4. -34
5. 0
6. -9
7. 14
8. 25
Directions: Find the absolute value of each number.
9. |13|
10. |−11|
11. |−5|
12. |17|
13. |−9|
315
4.3. Comparison of Integers with Absolute Value www.ck12.org
4.3 Comparison of Integers with AbsoluteValue
Here you’ll learn to compare and order integers on a number line and by using inequality symbols.
This year, Cameron and his family are going to Alaska, but last year they were in a warmer place. Take a look.
Cameron and his parents are all scuba divers. Cameron learned to scuba dive two years ago when he was eleven. Kidsbetween the ages of 11 and 14 can become junior divers and become certified junior divers through an organizationcalled PADI. Since Cameron learned to dive, he has looked forward to his family’s diving vacation each year whenthey all take off to someplace warm and scuba dive.
One week before the big trip to the Caribbean, Cameron began looking through his dive book. A dive book is abook where divers keep track of their dives. They chart the depth that they went, the time they were underwater, andanything cool that they saw.
As a junior diver, Cameron is only allowed to travel to a maximum depth of 40 feet.
Here are Cameron’s dive depths from his last trip when he went diving in Jamaica.
15 feet deep
40 feet deep
25 feet deep
36 feet deep
30 feet deep
Integers can help a scuba divers in a real-world situation like this. Since Cameron traveled below the surface, wecan use integers to write each of his depths. Then we can write them in order from least to greatest.
To do this, you will need to know about integers. Pay attention to this Concept, and at the end of it, you willknow how to help Cameron figure out his diving depths.
Guidance
Now that you know about absolute value, opposites, zero and integers, we can work on learning how tocompare and order integers. Often, the easiest way to do this is by using a number line.
316
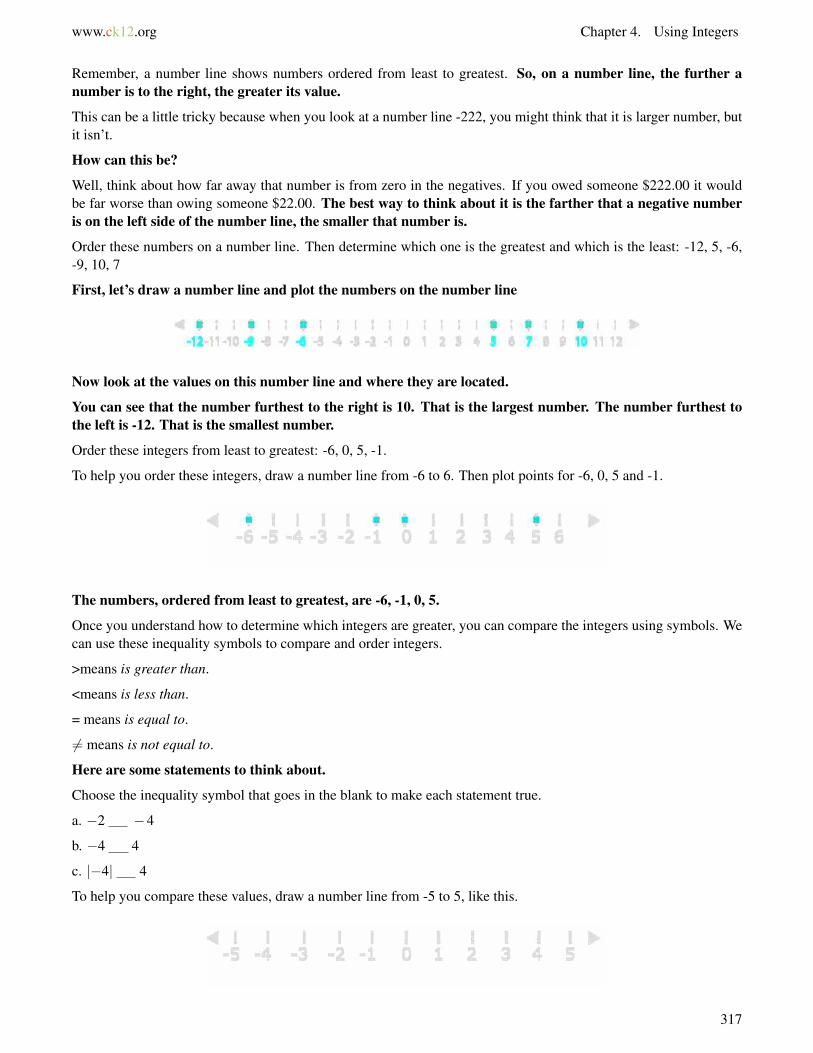
www.ck12.org Chapter 4. Using Integers
Remember, a number line shows numbers ordered from least to greatest. So, on a number line, the further anumber is to the right, the greater its value.
This can be a little tricky because when you look at a number line -222, you might think that it is larger number, butit isn’t.
How can this be?
Well, think about how far away that number is from zero in the negatives. If you owed someone $222.00 it wouldbe far worse than owing someone $22.00. The best way to think about it is the farther that a negative numberis on the left side of the number line, the smaller that number is.
Order these numbers on a number line. Then determine which one is the greatest and which is the least: -12, 5, -6,-9, 10, 7
First, let’s draw a number line and plot the numbers on the number line
Now look at the values on this number line and where they are located.
You can see that the number furthest to the right is 10. That is the largest number. The number furthest tothe left is -12. That is the smallest number.
Order these integers from least to greatest: -6, 0, 5, -1.
To help you order these integers, draw a number line from -6 to 6. Then plot points for -6, 0, 5 and -1.
The numbers, ordered from least to greatest, are -6, -1, 0, 5.
Once you understand how to determine which integers are greater, you can compare the integers using symbols. Wecan use these inequality symbols to compare and order integers.
>means is greater than.
<means is less than.
= means is equal to.
6= means is not equal to.
Here are some statements to think about.
Choose the inequality symbol that goes in the blank to make each statement true.
a. −2 −4
b. −4 4
c. |−4| 4
To help you compare these values, draw a number line from -5 to 5, like this.
317
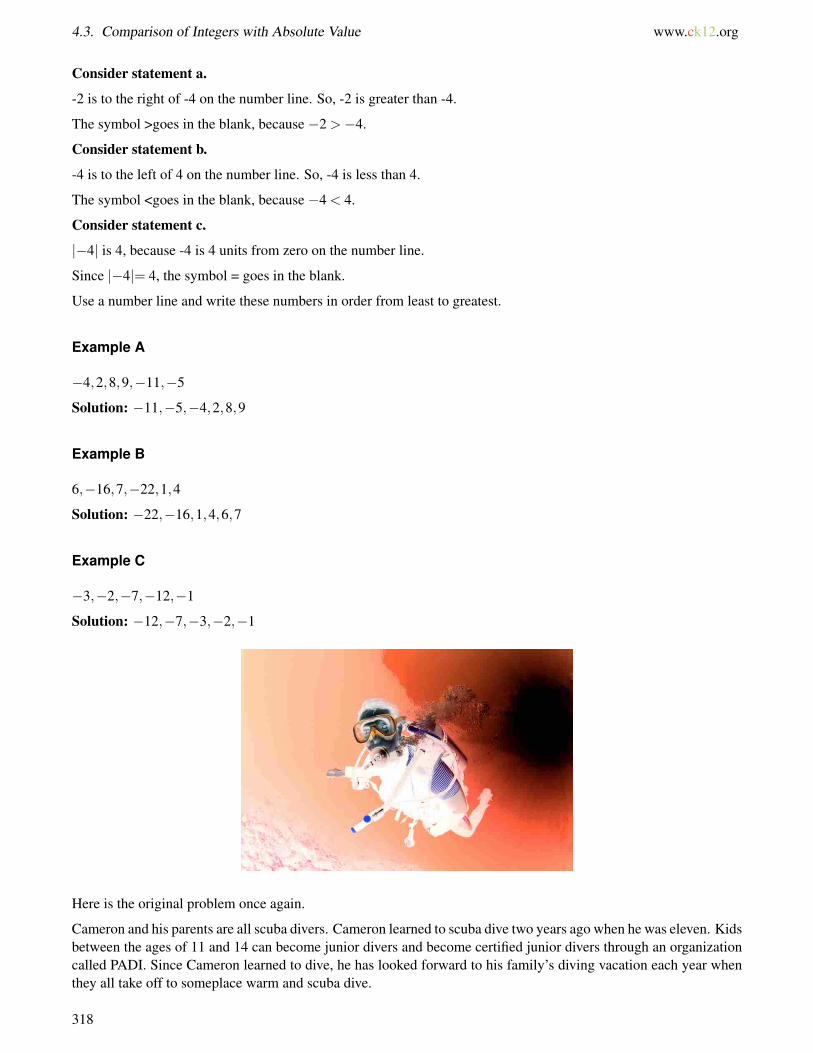
4.3. Comparison of Integers with Absolute Value www.ck12.org
Consider statement a.
-2 is to the right of -4 on the number line. So, -2 is greater than -4.
The symbol >goes in the blank, because −2 >−4.
Consider statement b.
-4 is to the left of 4 on the number line. So, -4 is less than 4.
The symbol <goes in the blank, because −4 < 4.
Consider statement c.
|−4| is 4, because -4 is 4 units from zero on the number line.
Since |−4|= 4, the symbol = goes in the blank.
Use a number line and write these numbers in order from least to greatest.
Example A
−4,2,8,9,−11,−5
Solution: −11,−5,−4,2,8,9
Example B
6,−16,7,−22,1,4
Solution: −22,−16,1,4,6,7
Example C
−3,−2,−7,−12,−1
Solution: −12,−7,−3,−2,−1
Here is the original problem once again.
Cameron and his parents are all scuba divers. Cameron learned to scuba dive two years ago when he was eleven. Kidsbetween the ages of 11 and 14 can become junior divers and become certified junior divers through an organizationcalled PADI. Since Cameron learned to dive, he has looked forward to his family’s diving vacation each year whenthey all take off to someplace warm and scuba dive.
318
www.ck12.org Chapter 4. Using Integers
One week before the big trip to the Caribbean, Cameron began looking through his dive book. A dive book is abook where divers keep track of their dives. They chart the depth that they went, the time they were underwater, andanything cool that they saw.
As a junior diver, Cameron is only allowed to travel to a maximum depth of 40 feet.
Here are Cameron’s dive depths from his last trip when he went diving in Jamaica.
15 feet deep
40 feet deep
25 feet deep
36 feet deep
30 feet deep
Integers can help scuba divers in a real-world situation like this. Since Cameron traveled below the surface, we canuse integers to write each of his depths. Then we can write them in order from least to greatest.
First, let’s write each of Cameron’s depths as an integer. Depth is a word that tells us that we are going belowthe surface of the water. If the surface is zero, then anything below the surface would be represented by anegative number. Cameron’s depths are all negative numbers.
-25
-30
-15
-36
-40
We can order these integers from least to greatest by thinking of the deepest dive as the least and the diveclosest to the surface, zero, as the greatest.
-40, -36, -30, -25, -15
Guided Practice
Here is one for you to try on your own.
Compare using <, >or =.
−22 and −32
Answer
To compare these two values, let’s think about the distance that they are from zero. The farther a value is from zero,the smaller that value.
In this case, −32 is farther away from zero. It is the smaller value.
−22 >−32
This is our answer.
Video Review
319

4.3. Comparison of Integers with Absolute Value www.ck12.org
MEDIAClick image to the left or use the URL below.URL: http://www.ck12.org/flx/render/embeddedobject/5483
This is a James Sousa video on comparing integers.
Explore More
Directions: Compare the following integers using inequality symbols.
1. −17 −19
2. −9 −11
3. 4 −3
4. 5 7
5. 9 −9
6. −12 −23
7. |−9| |8|
8. |9| |−9|
9. |−2| |−7|
10. |−12| 12
11. |−22| |22|
12. |14| |−7|
13. |88| |90|
14. |−88| |−92|
15. |−27| |27|
320
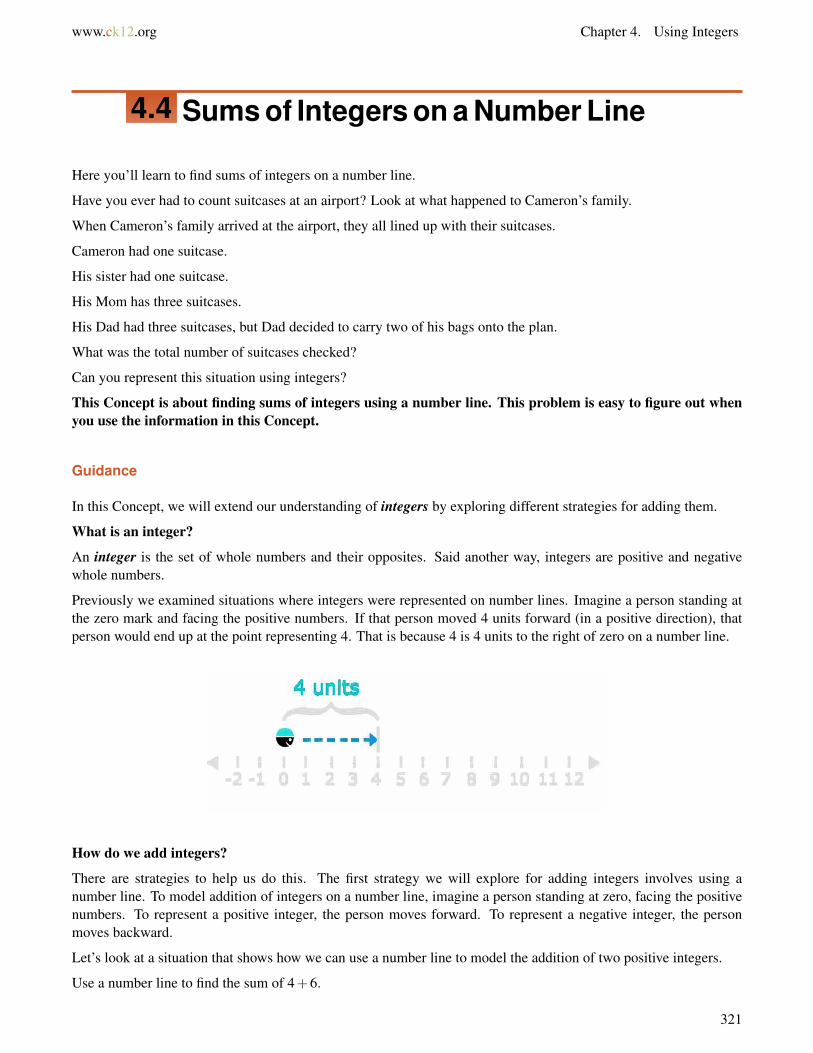
www.ck12.org Chapter 4. Using Integers
4.4 Sums of Integers on a Number Line
Here you’ll learn to find sums of integers on a number line.
Have you ever had to count suitcases at an airport? Look at what happened to Cameron’s family.
When Cameron’s family arrived at the airport, they all lined up with their suitcases.
Cameron had one suitcase.
His sister had one suitcase.
His Mom has three suitcases.
His Dad had three suitcases, but Dad decided to carry two of his bags onto the plan.
What was the total number of suitcases checked?
Can you represent this situation using integers?
This Concept is about finding sums of integers using a number line. This problem is easy to figure out whenyou use the information in this Concept.
Guidance
In this Concept, we will extend our understanding of integers by exploring different strategies for adding them.
What is an integer?
An integer is the set of whole numbers and their opposites. Said another way, integers are positive and negativewhole numbers.
Previously we examined situations where integers were represented on number lines. Imagine a person standing atthe zero mark and facing the positive numbers. If that person moved 4 units forward (in a positive direction), thatperson would end up at the point representing 4. That is because 4 is 4 units to the right of zero on a number line.
How do we add integers?
There are strategies to help us do this. The first strategy we will explore for adding integers involves using anumber line. To model addition of integers on a number line, imagine a person standing at zero, facing the positivenumbers. To represent a positive integer, the person moves forward. To represent a negative integer, the personmoves backward.
Let’s look at a situation that shows how we can use a number line to model the addition of two positive integers.
Use a number line to find the sum of 4+6.
321
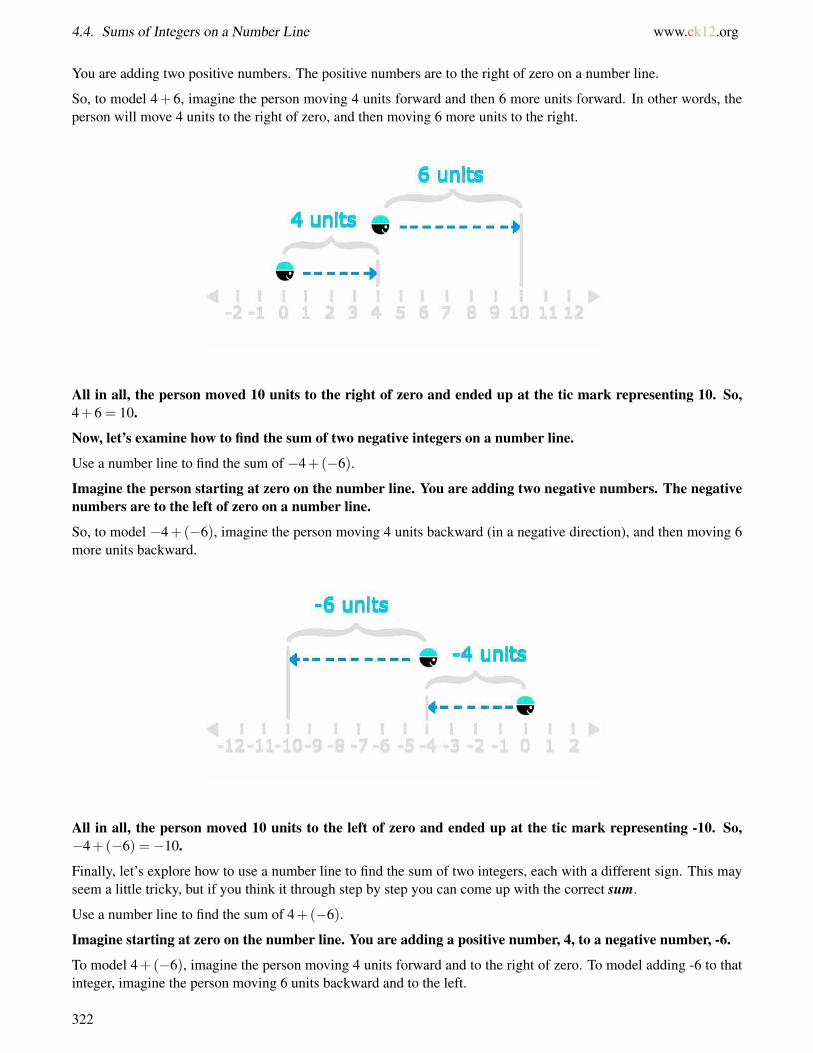
4.4. Sums of Integers on a Number Line www.ck12.org
You are adding two positive numbers. The positive numbers are to the right of zero on a number line.
So, to model 4+6, imagine the person moving 4 units forward and then 6 more units forward. In other words, theperson will move 4 units to the right of zero, and then moving 6 more units to the right.
All in all, the person moved 10 units to the right of zero and ended up at the tic mark representing 10. So,4+6 = 10.
Now, let’s examine how to find the sum of two negative integers on a number line.
Use a number line to find the sum of −4+(−6).
Imagine the person starting at zero on the number line. You are adding two negative numbers. The negativenumbers are to the left of zero on a number line.
So, to model −4+(−6), imagine the person moving 4 units backward (in a negative direction), and then moving 6more units backward.
All in all, the person moved 10 units to the left of zero and ended up at the tic mark representing -10. So,−4+(−6) =−10.
Finally, let’s explore how to use a number line to find the sum of two integers, each with a different sign. This mayseem a little tricky, but if you think it through step by step you can come up with the correct sum.
Use a number line to find the sum of 4+(−6).
Imagine starting at zero on the number line. You are adding a positive number, 4, to a negative number, -6.
To model 4+(−6), imagine the person moving 4 units forward and to the right of zero. To model adding -6 to thatinteger, imagine the person moving 6 units backward and to the left.
322
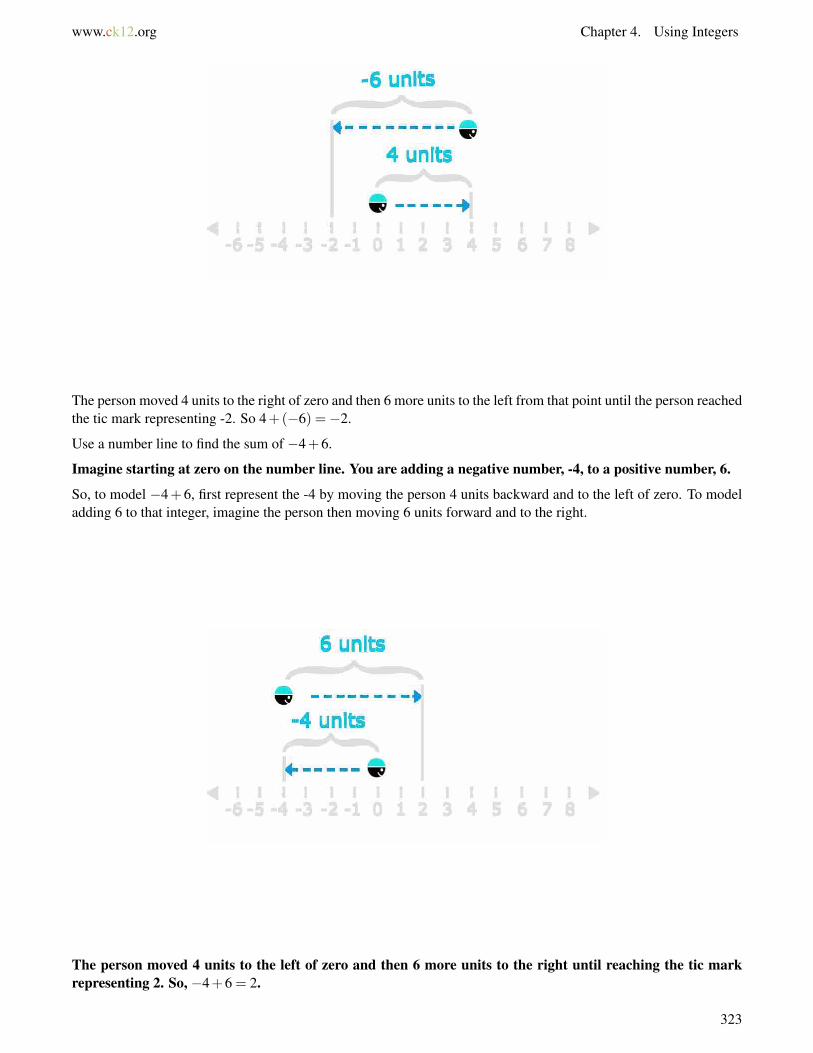
www.ck12.org Chapter 4. Using Integers
The person moved 4 units to the right of zero and then 6 more units to the left from that point until the person reachedthe tic mark representing -2. So 4+(−6) =−2.
Use a number line to find the sum of −4+6.
Imagine starting at zero on the number line. You are adding a negative number, -4, to a positive number, 6.
So, to model −4+6, first represent the -4 by moving the person 4 units backward and to the left of zero. To modeladding 6 to that integer, imagine the person then moving 6 units forward and to the right.
The person moved 4 units to the left of zero and then 6 more units to the right until reaching the tic markrepresenting 2. So, −4+6 = 2.
323
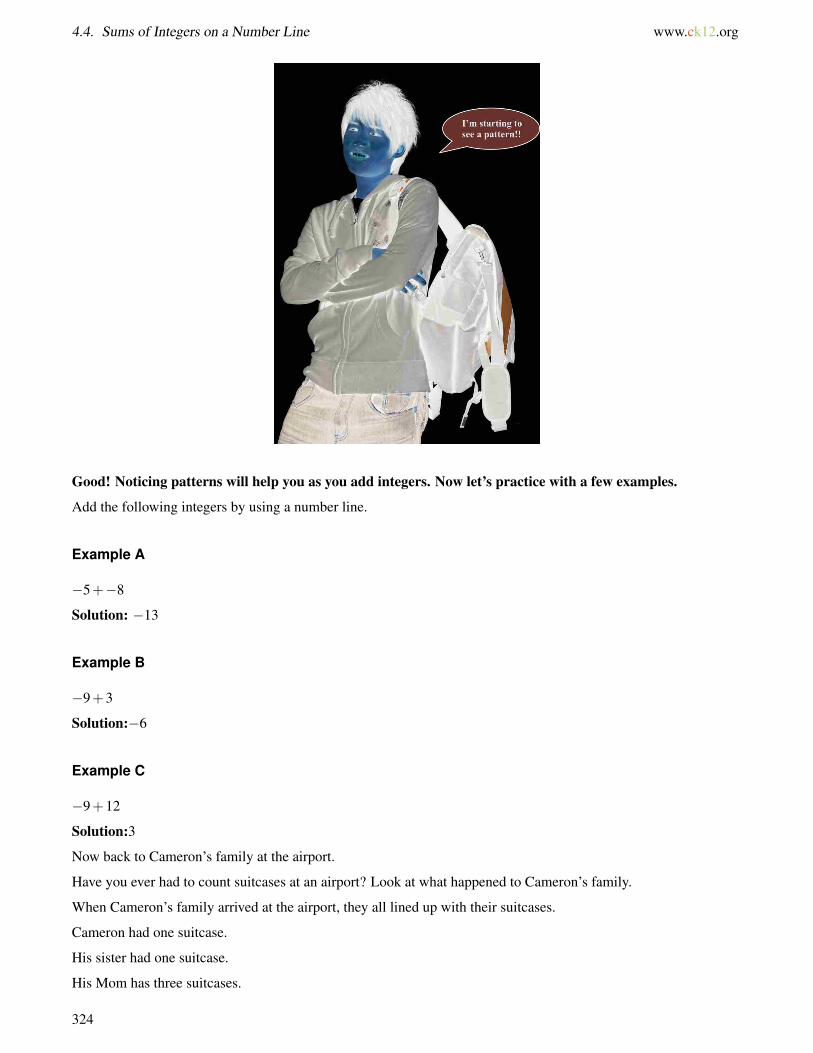
4.4. Sums of Integers on a Number Line www.ck12.org
Good! Noticing patterns will help you as you add integers. Now let’s practice with a few examples.
Add the following integers by using a number line.
Example A
−5+−8
Solution: −13
Example B
−9+3
Solution:−6
Example C
−9+12
Solution:3
Now back to Cameron’s family at the airport.
Have you ever had to count suitcases at an airport? Look at what happened to Cameron’s family.
When Cameron’s family arrived at the airport, they all lined up with their suitcases.
Cameron had one suitcase.
His sister had one suitcase.
His Mom has three suitcases.
324
www.ck12.org Chapter 4. Using Integers
His Dad had three suitcases, but Dad decided to carry two of his bags onto the plan.
What was the total number of suitcases checked?
Can you represent this situation using integers?
To represent the situation using integers, let’s write it all out as a number sentence to solve.
1+1+3+3+−2
Now we add them up.
6suitcases were checked on the plane.
This is our answer.
Guided Practice
Here is one for you to try on your own.
Use a number line to figure out the following sum.
−8+3+−2
Answer
To figure this out, we move our values on the number line. If the value added is positive, then we move to the right.If it is negative, then we move to the left.
We start at −8.
Then we move to the right three units.
Then we move back to the left two units.
Our answer is −7.
Video Review
MEDIAClick image to the left or use the URL below.URL: http://www.ck12.org/flx/render/embeddedobject/5277
This is a James Sousa video about finding sums of integers on a number line.
Explore More
Directions: Add the integers using a number line as your guide.
325

4.4. Sums of Integers on a Number Line www.ck12.org
1. 2+5
2. (−4)+4
3. (−3)+(−3)
4. 8+(−6)
5. −8+(−6)
6. −2+(−6)
7. 8+5+(−2)
8. 5+(−6)+2
9. 2+(−2)+7
10. −2+(−6)+5
11. −8+3+(−4)
12. −6+6+(−5)
13. −8+(−8)+3
14. −7+(−6)+3
15. −9+(−6)+11
326
www.ck12.org Chapter 4. Using Integers
4.5 Sums of Integers Using Absolute Value
Here you’ll learn to add two or more integers using absolute value.
Molly lives in Alaska. The temperature outside her home at 6:00 A.M. one day last February was −2◦F . Six hourslater, the temperature had risen by 5◦F . What was the temperature six hours later?
Guidance
Previously we worked with number lines to add integers. Using a number line is one strategy for adding integers.
Now let’s look at another strategy.
Another strategy for adding integers involves using absolute values. An absolute value is the distance or the numberof units that a number is from zero. Remember, with absolute value, the sign doesn’t matter. You will see the symbol| | with an integer in the middle when absolute value is required.
Here are the steps to the absolute value strategy.
• To add two integers with the same sign, add their absolute values. Then give the answer the same signas the two original integers.
• To add two integers with different signs, subtract the lesser absolute value from the greater absolutevalue. Then give the answer the same sign as the integer with the greater absolute value.
Take a few minutes to write these steps down in your notebook. Then continue.
How do we apply these steps?
Let’s see what this looks like in action.
Find the sum of −13+(−12).
Both integers being added have the same sign––a negative sign. So, add their absolute values.
Since |−13|= 13 and |−12|= 12, add those values.
13+12 = 25.
Give that answer, 25, the same sign as the original two integers––a negative sign.
So −13+(−12) =−25.
Now you have seen this strategy with two negative numbers. Next, let’s see how it applies with a negative and apositive number.
Find the sum of 13+(−12).
327
4.5. Sums of Integers Using Absolute Value www.ck12.org
The two integers being added have different signs. So, subtract their absolute values.
|13|= 13 and |−12|= 12, so subtract the lesser absolute value from the greater absolute value :
13−12 = 1.
Give that answer, 1, the same sign as the integer with the greater absolute value. 13>12, so 13 has a greater absolutevalue than -12. Give the answer a positive sign.
So, 13+(−12) = 1.
What happens if we are finding the sum of more than two integers?
You can use this same strategy to add three or more integers. When adding three or more integers, remember thatthe associative property of addition states that the grouping of numbers being added does not matter.
Find the sum of 7+2+(−10).
According to the associative property of addition, the integers being added can be grouped in any way. Here is oneway to group numbers. Notice that we used brackets because parentheses are helpful when separating a negativesign and an addition sign. Brackets can mean the same thing as parentheses in thee examples.
[7+2]+ (−10)
If you group the numbers this way, you will add 7+2 first. Then you will add (-10) to that sum.
To add 7+2, first notice that both integers have the same sign––a positive sign. So, add their absolute values.
|7|+|2|= 7+2 = 9
Since the two original integers both had positive signs, give the sum a positive sign.
[7+2]+ (−10) = 9+(−10)
Now, add 9+(−10). Since both integers have different signs, find the absolute value of each integer.
|9|= 9 and |−10|= 10, so subtract the lesser absolute value from the greater absolute value.
10−9 = 1
Give that answer, 1, the same sign as the integer with the greater absolute value. 10 > 9, so -10 has a greater absolutevalue than 9. Give the answer a negative sign.
So, 7+2+(−10) = 9+(−10) =−1.
Could I use a number line too?
Sure. A number line would have worked too. It just would have involved the step of drawing the number line andthen working through the math. Either way, you would still end up with the same answer.
Let’s practice using this method of adding integers.
Example A
−4+7+−5
Solution:−2
Example B
−9+−12+8
Solution:−13
328
www.ck12.org Chapter 4. Using Integers
Example C
−12+29+−18
Solution:−1
Now let’s go back to the problem from the beginning of the Concept.
Molly lives in Alaska. The temperature outside her home at 6:00 A.M. one day last February was −2◦F . Six hourslater, the temperature had risen by 5◦F . What was the temperature six hours later?
The problem says that the temperature had risen six hours later. This means that the temperature hadincreased , so you should add. To find the new temperature, you can add the amount of the increase tothe previous temperatures.
You can find the temperature six hours later by using one of these equations.
−2◦F +5◦F =?
or −2+5 =?
Both integers have different signs. So, find the absolute values of both integers. Then subtract the integerwith the lesser absolute value from the absolute value of the integer with the greater absolute value.
|−2|= 2 and |5|= 5, so subtract: 5−2 = 3.
Since 5 > 2, and 5◦F has a positive sign, the temperature six hours later must be 3◦F .
Guided Practice
Here is one for you to try on your own.
Find the sum of these integers.
−12+−18
Answer
To find this sum, we can add the absolute value of each integer since both integers are negative.
12+18 = 30
Now we add a negative sign.
−12+−18 =−30
This is our answer.
Video Review
MEDIAClick image to the left or use the URL below.URL: http://www.ck12.org/flx/render/embeddedobject/5278
This is a James Sousa video on adding integers.
329
4.5. Sums of Integers Using Absolute Value www.ck12.org
Explore More
Directions: Use absolute values to find each sum.
1. 20+(−9)
2. −6+(−9)
3. 4+(−9)
4. −12+(−19)
5. −2+(−5)
6. −11+(−13)
7. −30+(−40)
8. −8+3+(−9)
9. 6+1+(−9)
10. (−8)+−20
11. (−6)+8+(−4)
12. (2)+8+(−12)
13. 5+7+(−15)
14. −5+−7+(−15)
15. −15+−17+(12)
330
www.ck12.org Chapter 4. Using Integers
4.6 Simplify Variable Expressions InvolvingInteger Addition
Here you’ll learn to evaluate and simplify variable expressions involving integer addition.
Have you ever been diving? Have you been to the Caribbean?
Last year, on his first day in the Caribbean, Cameron did his dive test and passed with flying colors. A dive test isdone in a pool prior to diving. It lets the dive master know that you understand what you are doing and can handleyourself under the water. Scuba diving is exciting, but you have to know what you are doing to do it well.
The second day, Cameron and his Dad went for their first two dives. On the first dive, Cameron traveled to a depth of25 feet. Then he and his Dad saw a stingray and followed it for a while and traveled down another 10 feet. Camerontook a few pictures of the stingray too.
Then they traveled back to the boat for some surface time to eat and rest before going on the second dive. On hissecond dive, Cameron did a shallow dive of only 15 feet. He loved seeing the beautiful coral and even spotted a seacucumber.
When they returned to the boat, Cameron began calculating his total depth and his total time for the day.
To calculate Cameron’s total depth for the day, you will need to know how to add integers. This Concept willgive you all that you need to know!!
Guidance
An expression is a number sentence that contains numbers and operations. An expression is not solved it is evaluatedbecause there isn’t an equals sign in an expression. Some expressions include variables. These expressions are calledvariable expressions. A variable is a symbol or letter that is used to represent one or more numbers.
Variable expressions can be combined when there is a common term or a like term.
5x+7x
We can simplify or combine this variable expression because it has two common variables. The x’s arecommon so we can find the sum of the variable expression.
The answer is 12x.
9y+8x
This variable expression can not be combined or simplified. It does not have like terms. The x and the y aredifferent, so we can not do anything with this expression. It is in simplest form.
331
4.6. Simplify Variable Expressions Involving Integer Addition www.ck12.org
Sometimes, expressions will include both variables and integers. You can use what you know about how toadd integers to help you find the value of expressions with variables.
Find the sum −4a+(−a).
Since −4a and −a both have the same variable, they are like terms. Use what you know about how to addintegers to help you add the terms.
Both terms have the same sign, a negative sign. So, find the absolute values of both integers. Then add those absolutevalues to combine the terms. Remember, −a =−1a.
|−4|= 4 and |−1|= 1, so add 4a+1a = 5a.
Since both terms had negative signs, give the answer a negative sign.
The sum of −4a+(−a) is −5a.
Find the sum −3t +9t.
Since −3t and 9t both have the same variable, they are like terms. Use what you know about how to addintegers to help you add the terms.
Both like terms have different signs. So, find the absolute values of both integers. Then subtract the term whoseinteger has the lesser absolute value from the other term.
|−3|= 3 and |9|= 9, so subtract: 9t−3t = 6t.
Since 9 > 3, and 9t has a positive sign, give the answer a positive sign.
The answer is −3t +9t = 6t.
Working with variable expressions may seem tricky, but if you first determine if you have like terms and thenuse the strategies you have learned for finding integer sums, you will be able to simplify each expression.
Simplify each variable expression.
Example A
−8x+−5x
Solution:−13x
Example B
−19y+5y
Solution:−14y
Example C
−6y+2y+−3y
Solution:−7y
332

www.ck12.org Chapter 4. Using Integers
Here is the original problem once again.
Last year,on his first day in the Caribbean, Cameron did his dive test and passed with flying colors. A dive test isdone in a pool prior to diving. It lets the dive master know that you understand what you are doing and can handleyourself under the water. Scuba diving is exciting, but you have to know what you are doing to do it well.
The second day, Cameron and his Dad went for their first two dives. On the first dive, Cameron traveled to a depth of25 feet. Then he and his Dad saw a stingray and followed it for a while and traveled down another 10 feet. Camerontook a few pictures of the stingray too.
Then they traveled back to the boat for some surface time to eat and rest before going on the second dive. On hissecond dive, Cameron did a shallow dive of only 15 feet. He loved seeing the beautiful coral and even spotted a seacucumber.
When they returned to the boat, Cameron began calculating his total depth and his total time for the day.
To help Cameron calculate his total depth, we can write the following equation.
Depth of dive 1 + depth of dive 2 = total depth
Remember that depth is below the surface, so we use negative numbers to represent these integers.
On dive 1, Cameron went -25 ft and then -10 ft.
On dive 2, Cameron went -15 ft.
Now we can substitute these values into the equation.
−25+−10+−15 =−50
Cameron’s total depth for the day was -50 feet.
Guided Practice
Here is one for you to try on your own.
Simplify 7z+(−3z).
Answer
We combine like terms in this problem, but keep in mind that there are positive and negative values.
7z+(−3z) = 4z
This is our answer.
333
4.6. Simplify Variable Expressions Involving Integer Addition www.ck12.org
Video Review
MEDIAClick image to the left or use the URL below.URL: http://www.ck12.org/flx/render/embeddedobject/5262
This is a James Sousa video on evaluating variable expressions.
Explore More
Directions: Simplify each variable expression.
1. 7z+(−3z)
2. 17z+(−15z)
3. 5x+(−3x)
4. 8y+(2y)
5. 12x+(−13x)
6. 9z+(−9z)
7. 14a+(−3a)
8. 22y+(−33y)
9. (−10d)+(−d)+2
10. 8x+(−4x)−5
11. 7y+(−3y)
12. 16x+(−22x)
13. 5a+(−a)+7a
Directions: Solve each real-world problem.
14. A plane is flying at an altitude that is 2, 500 feet above sea level. If the plane increases its altitude by 500 feetmore, what will be its new altitude?
15. The temperature on a mountaintop at midnight was −8◦F . By 3:00 A.M., the temperature had risen by 3◦F .What is the temperature at 3:00 A.M.?
334
www.ck12.org Chapter 4. Using Integers
4.7 Differences of Integers Using a NumberLine
Here you’ll learn to find differences of integers on a number line.
Have you ever watched a game show?
While on the airplane, Cameron enjoyed watching a game show. During the game show, contestants could earnpoints and could face penalties too.
One contestant had eight penalties, but then two of the penalties were taken away.
Do you know the final count of penalties for this contestant?
You will need to find differences of integers to figure this out.
This Concept is about finding differences of integers on a number line. You will learn how to accomplish thistask during this Concept.
Guidance
We can subtract integers by using a strategy. Using a strategy will allow us to find the difference between twointegers. Remember that the word “difference” is a key word that means the answer in a subtraction problem.
Do you know what an integer is?
An integer is the set of whole numbers and their opposites. Essentially, we can think of integers as positive andnegative whole numbers.
Previously we worked with number lines to add integers. Well, a similar strategy can be used to subtract integers aswell. Let’s look at how to do this.
We will explore for subtracting integers involves using a number line, this is the first strategy. When using a numberline to model subtraction, imagine a person standing at 0, facing the positive numbers on the line. The person willthen move forward or backward to show the first quantity in the problem.
To model subtracting a number from that quantity, imagine that person turning and facing the negativenumbers. Imagining the person turn around distinguishes the operation of subtraction from the operation ofaddition. (In Lesson 4.2, the person never turned around and faced the opposite direction because you wereadding.)
To subtract a positive number, the person moves forward. To subtract a negative number, the person movesbackward.
This first problem shows how we can use a number line to model the subtraction of two positive integers.
Use a number line to find the difference of 4−3.
You are subtracting two positive integers.
So, to model 4−3, imagine the person moving 4 units to the right of zero. This shows the quantity, 4.
Next, imagine the person turning around.
Since you are subtracting a positive integer, 3, the person moves forward. After turning around, imagine that personmoving 3 units forward, or to the left.
335
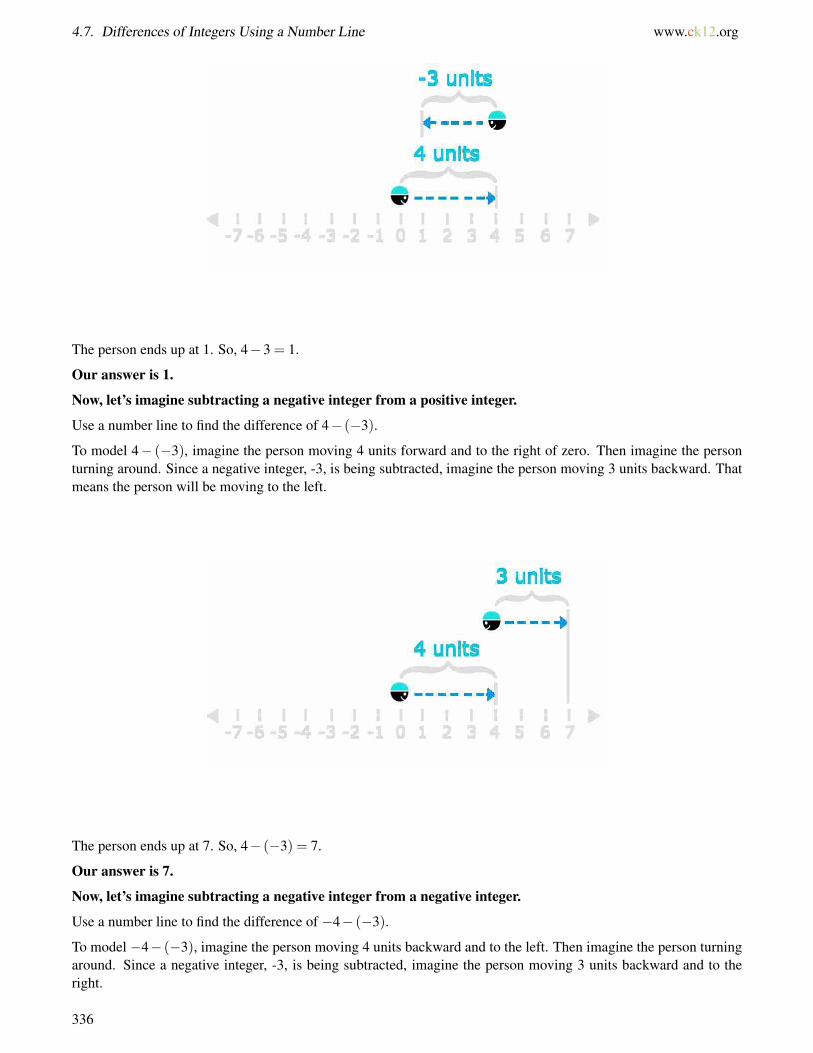
4.7. Differences of Integers Using a Number Line www.ck12.org
The person ends up at 1. So, 4−3 = 1.
Our answer is 1.
Now, let’s imagine subtracting a negative integer from a positive integer.
Use a number line to find the difference of 4− (−3).
To model 4− (−3), imagine the person moving 4 units forward and to the right of zero. Then imagine the personturning around. Since a negative integer, -3, is being subtracted, imagine the person moving 3 units backward. Thatmeans the person will be moving to the left.
The person ends up at 7. So, 4− (−3) = 7.
Our answer is 7.
Now, let’s imagine subtracting a negative integer from a negative integer.
Use a number line to find the difference of −4− (−3).
To model −4− (−3), imagine the person moving 4 units backward and to the left. Then imagine the person turningaround. Since a negative integer, -3, is being subtracted, imagine the person moving 3 units backward and to theright.
336
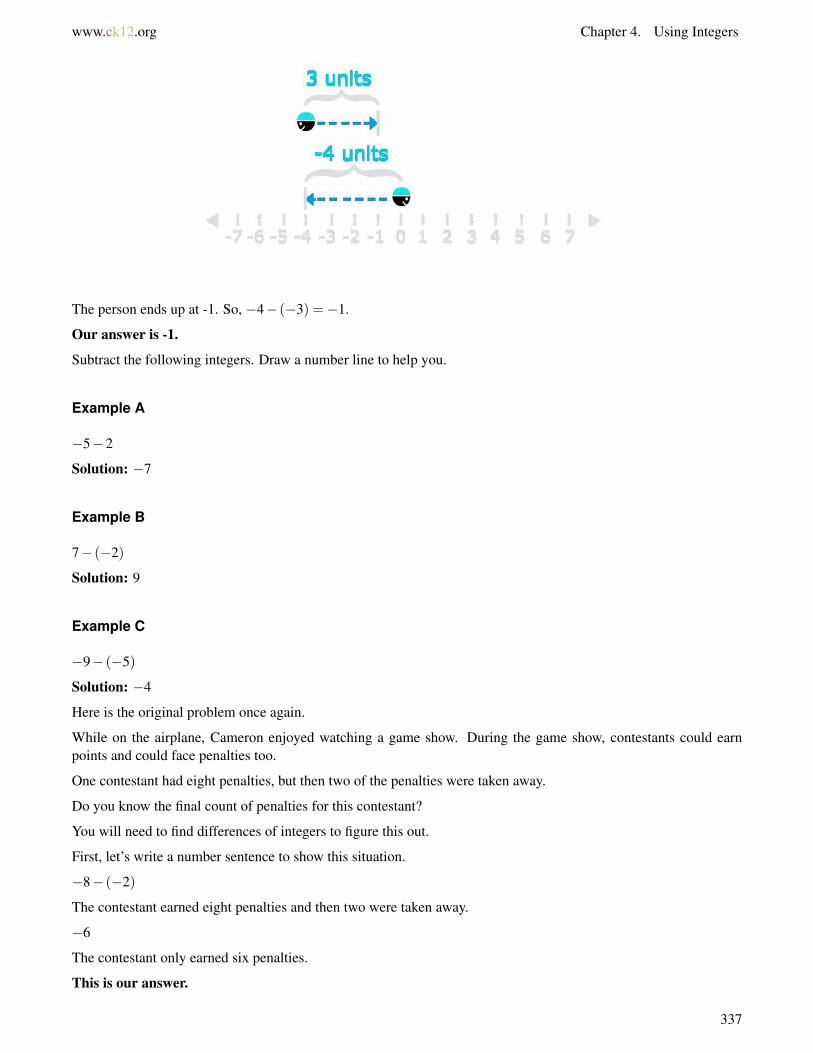
www.ck12.org Chapter 4. Using Integers
The person ends up at -1. So, −4− (−3) =−1.
Our answer is -1.
Subtract the following integers. Draw a number line to help you.
Example A
−5−2
Solution: −7
Example B
7− (−2)
Solution: 9
Example C
−9− (−5)
Solution: −4
Here is the original problem once again.
While on the airplane, Cameron enjoyed watching a game show. During the game show, contestants could earnpoints and could face penalties too.
One contestant had eight penalties, but then two of the penalties were taken away.
Do you know the final count of penalties for this contestant?
You will need to find differences of integers to figure this out.
First, let’s write a number sentence to show this situation.
−8− (−2)
The contestant earned eight penalties and then two were taken away.
−6
The contestant only earned six penalties.
This is our answer.
337
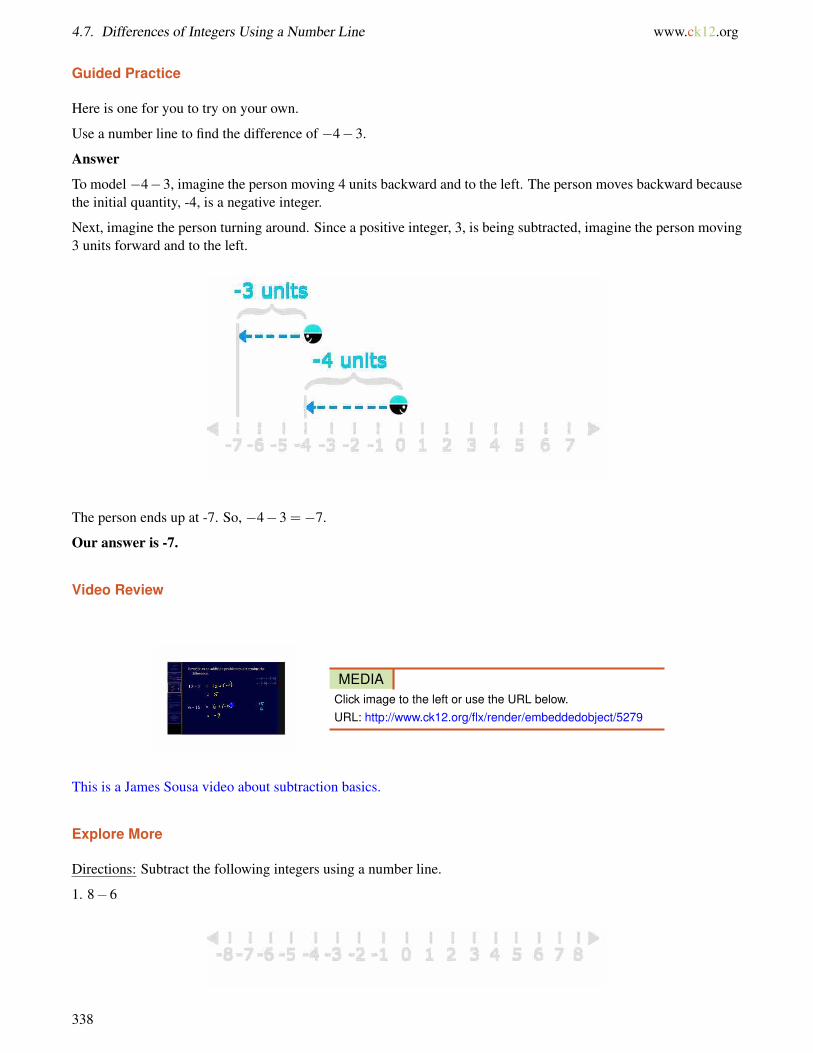
4.7. Differences of Integers Using a Number Line www.ck12.org
Guided Practice
Here is one for you to try on your own.
Use a number line to find the difference of −4−3.
Answer
To model −4−3, imagine the person moving 4 units backward and to the left. The person moves backward becausethe initial quantity, -4, is a negative integer.
Next, imagine the person turning around. Since a positive integer, 3, is being subtracted, imagine the person moving3 units forward and to the left.
The person ends up at -7. So, −4−3 =−7.
Our answer is -7.
Video Review
MEDIAClick image to the left or use the URL below.URL: http://www.ck12.org/flx/render/embeddedobject/5279
This is a James Sousa video about subtraction basics.
Explore More
Directions: Subtract the following integers using a number line.
1. 8−6
338

www.ck12.org Chapter 4. Using Integers
2. −5−3
3. −3− (−6)
4. 2− (−5)
5. −6−3
6. 8− (−3)
7. −7− (−7)
8. −5−4
9. 1− (−8)
339
4.7. Differences of Integers Using a Number Line www.ck12.org
10. −4−7
Directions: Subtract these integers without a number line.
11. −24−37
12. −34− (−7)
13. −44− (−37)
14. −82− (−7)
15. −64−97
340
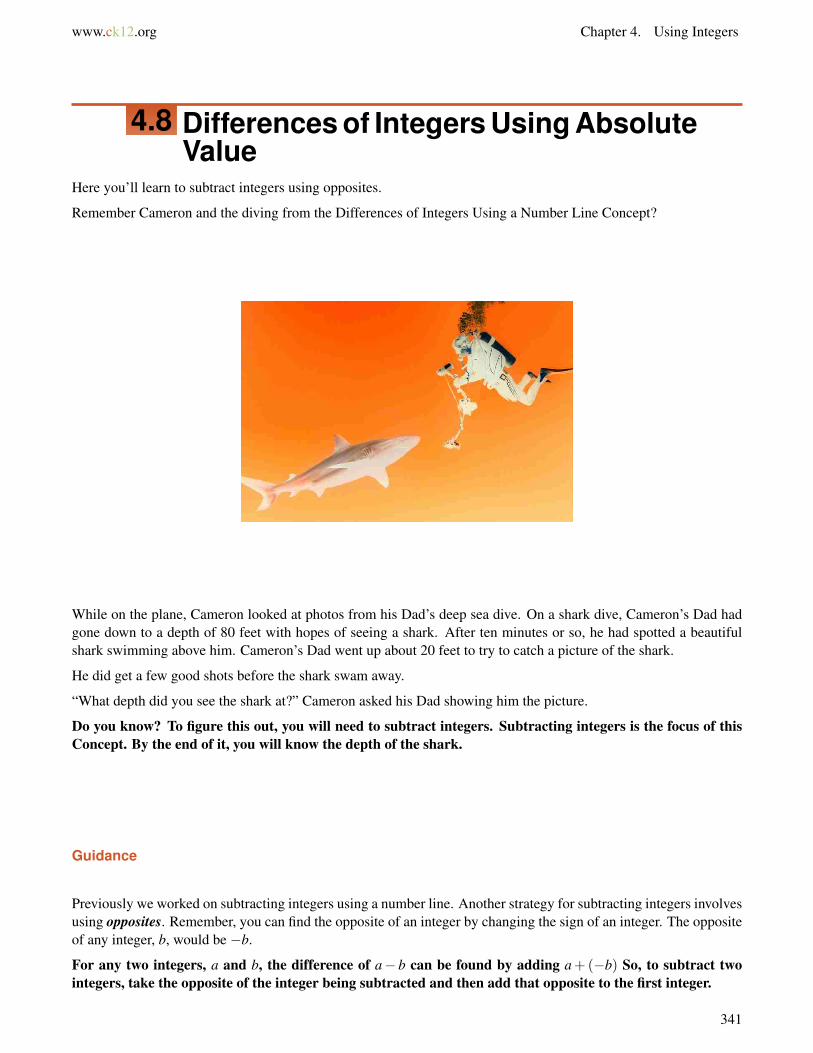
www.ck12.org Chapter 4. Using Integers
4.8 Differences of Integers Using AbsoluteValue
Here you’ll learn to subtract integers using opposites.
Remember Cameron and the diving from the Differences of Integers Using a Number Line Concept?
While on the plane, Cameron looked at photos from his Dad’s deep sea dive. On a shark dive, Cameron’s Dad hadgone down to a depth of 80 feet with hopes of seeing a shark. After ten minutes or so, he had spotted a beautifulshark swimming above him. Cameron’s Dad went up about 20 feet to try to catch a picture of the shark.
He did get a few good shots before the shark swam away.
“What depth did you see the shark at?” Cameron asked his Dad showing him the picture.
Do you know? To figure this out, you will need to subtract integers. Subtracting integers is the focus of thisConcept. By the end of it, you will know the depth of the shark.
Guidance
Previously we worked on subtracting integers using a number line. Another strategy for subtracting integers involvesusing opposites. Remember, you can find the opposite of an integer by changing the sign of an integer. The oppositeof any integer, b, would be −b.
For any two integers, a and b, the difference of a− b can be found by adding a+(−b) So, to subtract twointegers, take the opposite of the integer being subtracted and then add that opposite to the first integer.
341

4.8. Differences of Integers Using Absolute Value www.ck12.org
Sure.
For any two integers, a and b, the difference of a− b can be found by adding a+(−b). So, to subtract twointegers, take the opposite of the integer being subtracted and then add that opposite to the first integer.
Write this down in your notebook and then continue with the Concept.
Find the difference of 5− (−8).
The integer being subtracted is -8. The opposite of that integer is 8, so add 8 to 5.
5− (−8) = 5+8 = 13.
So, the difference of 5− (−8) is 13.
Our answer is 13.
Find the difference of −12− (−2).
The integer being subtracted is -2. The opposite of that integer is 2, so add 2 to -12.
−12− (−2) =−12+2.
Add as you would add any integers with different signs.
|−12|= 12 and |2|= 2, so subtract the lesser absolute value from the greater absolute value.
12−2 = 10
Give that answer the same sign as the integer with the greater absolute value. 12 > 2, so -12 has a greater absolutevalue than 2. Give the answer a negative sign.
So, the difference of −12− (−2) is -10.
Our answer is -10.
Find the difference of −20−3.
342
www.ck12.org Chapter 4. Using Integers
The integer being subtracted is 3. The opposite of that integer is -3, so add -3 to -20.
−20−3 =−20+(−3).
Add as you would add any integers with the same sign––a negative sign.
|−20|= 20 and |−3|= 3, so add their absolute values:
20+3 = 23
Give that answer the same sign as the two original integers, a negative sign.
So, the difference of −20−3 is -23.
Our answer is -23.
Now take a few minutes to practice what you have learned. Find the differences using opposites.
Example A
−5−7
Solution: −12
Example B
8− (−4)
Solution: 12
Example C
−12− (−8)
Solution: −4
Here is the original problem once again.
343
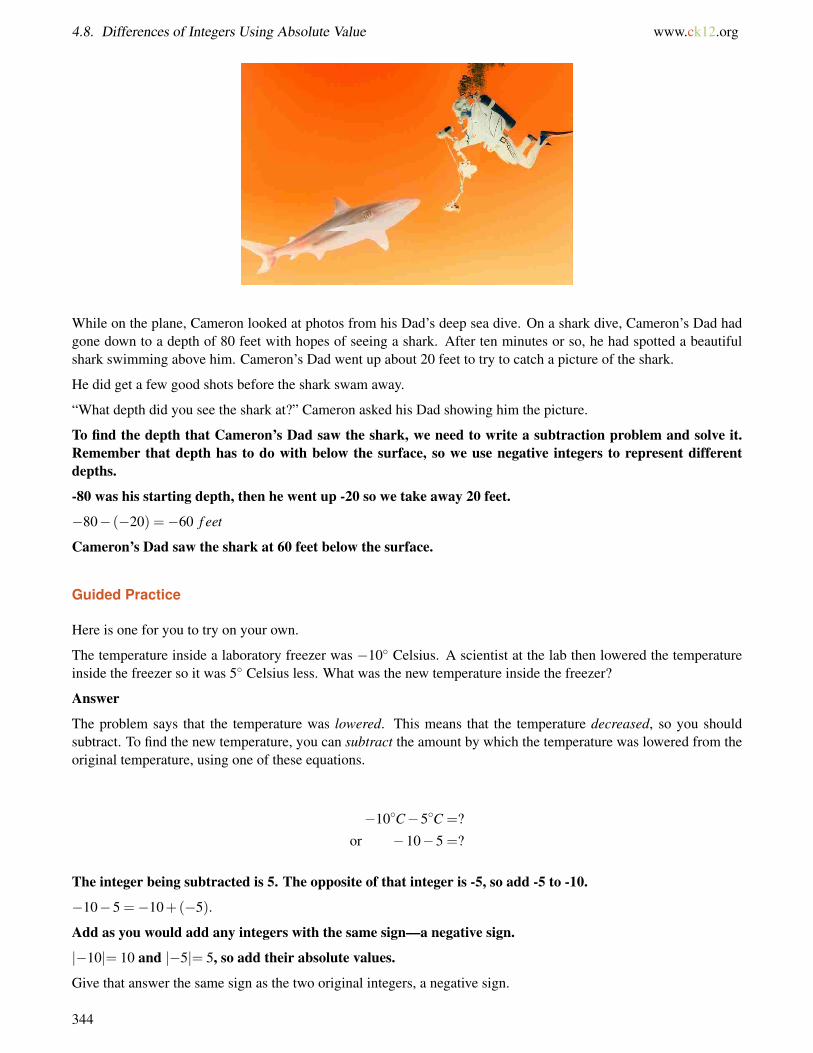
4.8. Differences of Integers Using Absolute Value www.ck12.org
While on the plane, Cameron looked at photos from his Dad’s deep sea dive. On a shark dive, Cameron’s Dad hadgone down to a depth of 80 feet with hopes of seeing a shark. After ten minutes or so, he had spotted a beautifulshark swimming above him. Cameron’s Dad went up about 20 feet to try to catch a picture of the shark.
He did get a few good shots before the shark swam away.
“What depth did you see the shark at?” Cameron asked his Dad showing him the picture.
To find the depth that Cameron’s Dad saw the shark, we need to write a subtraction problem and solve it.Remember that depth has to do with below the surface, so we use negative integers to represent differentdepths.
-80 was his starting depth, then he went up -20 so we take away 20 feet.
−80− (−20) =−60 f eet
Cameron’s Dad saw the shark at 60 feet below the surface.
Guided Practice
Here is one for you to try on your own.
The temperature inside a laboratory freezer was −10◦ Celsius. A scientist at the lab then lowered the temperatureinside the freezer so it was 5◦ Celsius less. What was the new temperature inside the freezer?
Answer
The problem says that the temperature was lowered. This means that the temperature decreased, so you shouldsubtract. To find the new temperature, you can subtract the amount by which the temperature was lowered from theoriginal temperature, using one of these equations.
−10◦C−5◦C =?
or −10−5 =?
The integer being subtracted is 5. The opposite of that integer is -5, so add -5 to -10.
−10−5 =−10+(−5).
Add as you would add any integers with the same sign––a negative sign.
|−10|= 10 and |−5|= 5, so add their absolute values.
Give that answer the same sign as the two original integers, a negative sign.
344

www.ck12.org Chapter 4. Using Integers
10+5 = 15
So, the difference of −10−5 is -15.
This means that the new temperature inside the freezer must be −15◦ Celsius.
Video Review
MEDIAClick image to the left or use the URL below.URL: http://www.ck12.org/flx/render/embeddedobject/5280
This is a James Sousa video on subtracting integers.
Explore More
Directions: Find each difference using opposites.
1. 15−7
2. −7−12
3. 0−4
4. 13− (−9)
5. −21−4
6. 33− (−4)
7. −11− (−8)
8. 18−28
9. 28− (−8)
10. 13−18
11. −21− (−8)
12. −9− (−38)
13. 22−8
14. 25−38
15. 19− (−19)
345

4.9. Simplify Variable Expressions Involving Integer Subtraction www.ck12.org
4.9 Simplify Variable Expressions InvolvingInteger Subtraction
Here you’ll learn to evaluate and simplify variable expressions involving subtraction.
Molly is working on her math homework. She is puzzled about a problem. Take a look.
How would you solve this problem?
14x−2x when x =−2
Do you know how to do this?
This Concept will show you how to evaluate variable expressions involving subtraction. We’ll come back tothis one at the end of the Concept.
Guidance
Do you know what a variable expression is?
A variable expression is a math phrase that has numbers, variables and operations in it. In a variable expression wecan have like and unlike terms. Like terms can be combined or simplified and unlike terms can not be combined orsimplified.
6x+(−4x)
These two terms are alike because they both have x’s with them. In the last lesson, you learned how to add like termsin a variable expression.
The answer is 2x.
You can use what you know about how to subtract integers to help you find the value of expressions with variables,too.
Remember, you can only subtract like terms in an expression that has variables.
Find the difference −10n− (−8n)
Since −10n and −8n both have the same variable, they are like terms. Use what you know about how tosubtract integers to help you.
The term being subtracted is −8n. The integer -8 is part of that term. The opposite of that integer is 8, so add 8n to−10n.
−10n− (−8n) =−10n+8n
Both like terms have different signs. So, find the absolute values of both integers. Then subtract the term whoseinteger has the lesser absolute value from the other term.
|−10|= 10 and |8|= 8
Now subtract 10n−8n = 2n.
Since 10>8, and −10n has a negative sign, give the answer a negative sign.
The difference of −10n− (−8n) is −2n.
Remember you can only combine terms that are alike.
We can also evaluate this expression when we are given a value. Let’s say that n = 5 in the last problem.
First, we simplify the expression, then we evaluate it using the given value.
346

www.ck12.org Chapter 4. Using Integers
−2n =−2(5) =−10
This is our answer.
Use what you have learned to simplify each expression and evaluate when necessary.
Example A
−4y−6y when y = 2
Solution:−20
Example B
18x− (−4x)
Solution:22x
Example C
−9a− (−3a) then evaluate if a = 2
Solution:−12
Here is the original problem once again.
Molly is working on her math homework. She is puzzled about a problem. Take a look.
How would you solve this problem?
14x−2x when x =−2
Do you know how to do this?
First, let’s combine like terms.
14x−2x = 12x
Now we substitute the given value for x into the expression.
12(−2) =−24
This is the answer.
Guided Practice
Here is one for you to try on your own.
33b− (−18b)+7
Answer
To simplify this expression, we combine the like terms.
In this case, 33b and −18b are like terms.
33b− (−18b) = 51b
Now we add the final term.
51b+7
Because the two terms left are not alike, we can’t simplify these terms any further.
347
4.9. Simplify Variable Expressions Involving Integer Subtraction www.ck12.org
Video Review
MEDIAClick image to the left or use the URL below.URL: http://www.ck12.org/flx/render/embeddedobject/57654
This is a Khan Academy video on evaluating variable expressions.
Explore More
Directions: Simplify each variable expression.
1. −8m−3m
2. (−7c)− (−c)
3. −19a− (−4a)
4. 12a− (−4a)
5. 6a− (4a)
6. 19a− (24a)
7. 13z− (−4z)
8. −20x− (14x)
9. −19a− (18a)
10. 56x−22x
11. 34y− (−6y)
12. 88z− (−44x)
13. −19a− (−4a)−8x
14. −19a− (−4a)−8x−2
15. −19a− (−4a)−5y−2y
348
www.ck12.org Chapter 4. Using Integers
4.10 Integer Multiplication
Here you’ll learn to multiply integers.
Have you ever calculated temperature? Take a look at this dilemma.
As Cameron gets ready for his dive one morning, he notices that the temperature at the resort is already 87◦.
“It is going to be a hot one!” Jesse the boat driver comments heading down to the dock.
Cameron gets his suit and his gear and climbs aboard. The ride out to the dive site is wonderful with the windblowing in his hair. The water is clear and sparkling under the hot sun.
Cameron knows that the water temperature changes about −2◦ every 10 feet. He wears a light skin suit because ofthis. Not only can it feel a bit chilly after the warm surface temperature, but it can also protect you against a randomjellyfish.
If Cameron dives to 40 feet, what will the temperature be at that depth?
This Concept will teach you how to use multiplying integers to solve a problem like this one. You will need tomultiply and then subtract to figure out what the temperature is on Cameron’s dive.
349
4.10. Integer Multiplication www.ck12.org
Guidance
Previously we worked on how to add and subtract integers, and now it is time to tackle multiplying them. Rememberthat an integer is the set of whole numbers and their opposites. There are a few vocabulary words that help us whenmultiplying. The first is a factor. The numbers that are multiplied are called factors. The second is product. Wemultiply two or more factors to get a product.
Below are some multiplication facts for 5. Notice that the products show a pattern. Suppose you did not know theproduct of 5×0. How could you use the pattern shown below to determine that product?
5×4 = 20
5×3 = 15
5×2 = 10
5×1 = 5
5×0 =?
Notice that each product shown is 5 less than the previous product. So, you can subtract 5 from the previous product,5, to find the missing product. Since 5−5 = 0, the product of 5×0 must be 0.
There are patterns that we can see when we multiply integers. Analyzing patterns like these can help usmultiply positive and negative integers.
How do analyze these patterns?
First, we can notice that the pattern for the multiplication facts of 5 continues beyond zero. Up until this time inmath, we have only looked at the positive products. But now, we know about the negative numbers, so we can lookat continuing the facts. Let’s see how patterns can help us find the products of integers.
Use a pattern to find the missing products below.
5×4 = 20
5×3 = 15
5×2 = 10
5×1 = 5
5×0 = 0
5× (−1) =?
5× (−2) =?
You already know the pattern for this sequence of products. You can subtract 5 from the previous product tofind the next product. Remember, subtracting 5 is the same thing as adding its opposite -5. Try adding -5 tothe previous products to find the next products.
To find the product of 5× (−1), add 0+(−5)
|0|= 0 and |−5|= 5, so subtract the lesser absolute value from the greater absolute value :
5−0 = 5.
The integer with the greater absolute value is -5, so give the answer a negative sign.
0+(−5) =−5, so 5× (−1) =−5
To find the product of 5× (−2), add -5 to the previous product, which is also -5.
350
www.ck12.org Chapter 4. Using Integers
In other words, add: −5+(−5)
Both integers have the same sign, so add their absolute values.
|−5|= 5, so add.
5+5 = 10.
Give that answer a negative sign.
−5+(−5) =−10, so 5× (−2) =−10
Now we have our completed multiplication facts
5×4 = 20
5×3 = 15
5×2 = 10
5×1 = 5
5×0 = 0
5× (−1) =−5
5× (−2) =−10
Each product is 5 less than the previous product.
You may also notice that depending on what you are multiplying the sign changes.
Here are a few rules that we can conclude from the pattern.
• When 5, a positive integer, is multiplied by a positive integer, the product is positive.• When 5, a positive integer, is multiplied by zero, the product is zero.• When 5, a positive integer, is multiplied by a negative integer, the product is negative.
Now that you understand the rules, we can work on applying them when actually multiplying integers.
351
4.10. Integer Multiplication www.ck12.org
Refer back to the rules as you work, but the key to becoming GREAT at multiplying integers is to commit theserules to memory!
(−4)(−3)
Here we have negative four times a negative three. First, we multiply the terms, remember that a set of parenthesesnext to another set means multiplication.
4×3 = 12
Next, we figure out the sign.
A negative times a negative is a positive.
Our answer is -12.
−5 ·8
Here we have a negative five times a positive eight. Remember that a dot can also mean multiplication.
5×8 = 40
Next, we figure out the sign.
A negative times a positive is a negative.
Our answer is -40.
What about multiplying more than one term?
We can do this easily. The key is to work from left to right and remember that the sign of each product canchange with each factor.
(−8)(−3)(−2)
Here we have three negative terms being multiplied. First, let’s multiply the first two terms to get a product.
−8×−3 = 24
Now we multiply that product times the factor negative two.
24×−2 =−48
Our answer is -48.
Now it’s time to try a few on your own. Find each product.
Example A
−9(−3)
Solution: 27
Example B
(−3)(12)
Solution: −36
Example C
(−4)(3)(−2)
Solution: 24
352
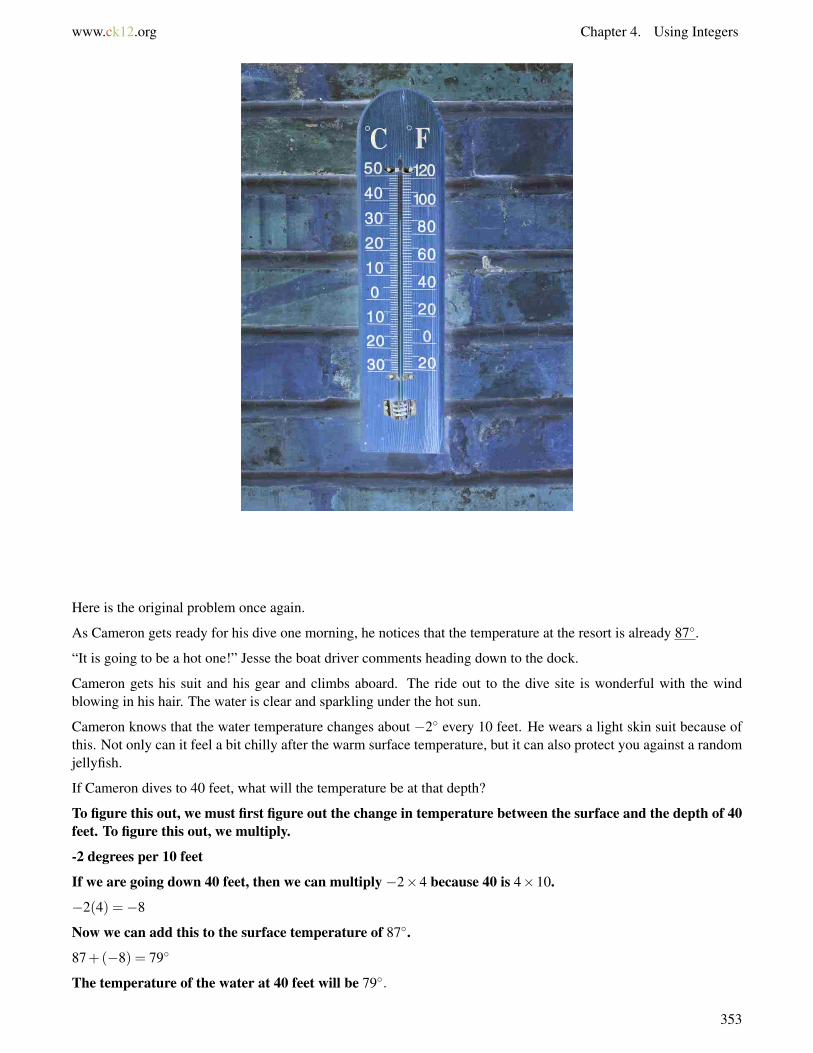
www.ck12.org Chapter 4. Using Integers
Here is the original problem once again.
As Cameron gets ready for his dive one morning, he notices that the temperature at the resort is already 87◦.
“It is going to be a hot one!” Jesse the boat driver comments heading down to the dock.
Cameron gets his suit and his gear and climbs aboard. The ride out to the dive site is wonderful with the windblowing in his hair. The water is clear and sparkling under the hot sun.
Cameron knows that the water temperature changes about −2◦ every 10 feet. He wears a light skin suit because ofthis. Not only can it feel a bit chilly after the warm surface temperature, but it can also protect you against a randomjellyfish.
If Cameron dives to 40 feet, what will the temperature be at that depth?
To figure this out, we must first figure out the change in temperature between the surface and the depth of 40feet. To figure this out, we multiply.
-2 degrees per 10 feet
If we are going down 40 feet, then we can multiply −2×4 because 40 is 4×10.
−2(4) =−8
Now we can add this to the surface temperature of 87◦.
87+(−8) = 79◦
The temperature of the water at 40 feet will be 79◦.
353
4.10. Integer Multiplication www.ck12.org
Guided Practice
Here is one for you to try on your own.
The number of students voting in a school election has been decreasing at a rate of 15 students per year. Representthe change in the number of students voting over the next 3 years as an integer.
Answer
First, represent the decrease in the number of students voting as an integer.
The problem states that the number of students voting has been decreasing by 15 students each year. To show adecrease, use a negative integer -15.
To represent the decrease in the number of students voting over the next 3 years, multiply the number of years bythe integer representing the decrease.
3× (−15) =?
Find the product to solve the problem.
3×15 = 45, so 3× (−15) =−45
The change in the number of students voting over the next 3 years can be represented as -45.
Video Review
MEDIAClick image to the left or use the URL below.URL: http://www.ck12.org/flx/render/embeddedobject/5282
This is a James Sousa video on multiplying and dividing integers.
Explore More
Directions: Use integer rules to find each product.
1. (−3)(9)
2. 8(−9)
3. 12×8
4. (−4)(7)
5. (−2) · (−11)
6. 3 · (−25)
7. 5× (−6)× (−1)
8. (−8)(−7)
9. (−2)(3)(−4)
10. (9)(1)(−1)
11. (−9)(2)(−1)
354

www.ck12.org Chapter 4. Using Integers
12. (−12)(1)(−2)
13. (−9)(3)(−2)
14. (−8)(3)(2)
15. (−11)(2)(−2)
355
4.11. Simplify Variable Expressions Involving Integer Multiplication www.ck12.org
4.11 Simplify Variable Expressions InvolvingInteger Multiplication
Here you’ll learn to evaluate and simplify variable expressions involving integer multiplication.
Have you ever been skiing?
In Alaska, Molly and her family went on a skiing trip. There are four people in Molly’s family. When they got there,they saw that four other families of four were also there. Molly isn’t sure how much a lift ticket costs. This is anunknown variable in this situation.
Can you write a variable expression involving integer multiplication to figure out how many people will need lifttickets?
Well, if you aren’t sure how to do this, don’t worry, you will learn all about it in this Concept.
Guidance
Do you know what a variable expression is?
A variable expression is a math phrase using numbers, operations and variables. A variable expression can alsocontain like terms. A like term is a term that is common between one or more terms in the equation. When you havelike terms, we can combine them using addition and subtraction.
Pay attention! Here is a change!
How does this happen?
Find the value of this expression 3z · (−2)
356
www.ck12.org Chapter 4. Using Integers
The Commutative Property of Multiplication states that the order in which factors are multiplied does notmatter.
3z · (−2) =−2 ·3z
The Associative Property of Multiplication states that you can group the factors being multiplied in any order.
−2 ·3z =−2 ·3 · z = (−2 ·3) · z
Now we can multiply the integers. Since -2 and 3z have different signs, the product will be negative.
2 ·3 = 6, so (−2) ·3 =−6 and (−2 ·3) · z =−6z
The value of the expression is −6z.
Find the value of this expression (−5)(−2m)(n)
The Associative Property of Multiplication states that you can group the factors being multiplied in any order.
(−5)(−2m)(n) = (−5) · (−2) ·m ·n
Now we can multiply the integers. Since -5 and -2 are both negative, the product will be positive.
−5 ·−2 = 5 ·2 = 10, so (−5) · (−2) ·m ·n = 10 ·mn = 10mn
The value of the expression is 10mn.
Multiply the following variable expressions.
Example A
3x(4y)
Solution:12xy
Example B
−6a(−4b)
Solution:24ab
Example C
−4z(10)
Solution:−40z
Here is the original problem once again.
In Alaska, Molly and her family went on a skiing trip. There are four people in Molly’s family. When they got there,they saw that four other families of four were also there. Molly isn’t sure how much a lift ticket costs. This is anunknown variable in this situation.
Can you write a variable expression involving integer multiplication to show how many people will need lift tickets?
To write this variable expression, let’s write down what we know first.
We know that there are four people in Molly’s family who will all need lift tickets.
4x
This is the first part of the variable expression because we don’t know the price of the lift ticket.
Then there are four groups like Molly’s family. We can multiply the variable expression by 4.
357
4.11. Simplify Variable Expressions Involving Integer Multiplication www.ck12.org
4(4x)
Now we can simplify.
16x
This is the number of people who will need lift tickets.
Guided Practice
Here is one for you to try on your own.
The temperature outside Fred’s house is dropping at a rate of 2◦F each hour. Represent the total change in thetemperature over the next 5 hours as an integer.
Answer
First, let’s write an expressing to represent the situation.
(−2)(5) =−10
The temperature change was −10◦.
Video Review
MEDIAClick image to the left or use the URL below.URL: http://www.ck12.org/flx/render/embeddedobject/5282
This is a James Sousa video on multiplying integers. It is a supporting video for this Concept.
Explore More
Directions: Multiply each variable expression.
1. (−7k)(−6)
2. (−8)(3a)(b)
3. −6a(b)(c)
4. −8a(6b)
5. (12y)(−3x)(−1)
6. −8x(4)
7. −a(5)(−4b)
8. −2ab(12c)
9. −12ab(12c)
10. 8x(12z)
11. −2a(−14c)
358

www.ck12.org Chapter 4. Using Integers
12. −12ab(11c)
13. −22ab(−2c)
14. 18ab(12)
15. −21a(−3b)
359
4.12. Integer Division www.ck12.org
4.12 Integer Division
Here you’ll learn to divide integers.
Cameron and his new diving partner Gina are going to be buddies on a 40 foot dive. Gina is a new diver and is stilllearning to make a descent. Cameron can make a free descent quite easily. This means that he doesn’t hold ontoanything as he descends to the appropriate depth. Gina will hold onto the anchor line. Then they will meet on thebottom.
Cameron has decided to slow down his descent and to go down with Gina. He will do his free descent next to herdescent holding onto the rope. He looks at his watch and sets the timer before they descend.
When they reach the bottom, Cameron looks at his watch. He sees that the descent took them 2 minutes. Not badat all considering that Gina is a beginner. Cameron and Gina meet up with the group and check in with the DiveMaster. Then they are off for a beautiful dive!
How far did Cameron and Gina descend per minute?
To answer this question, you will need to understand how to divide integers. Pay attention and you will beable to answer these questions at the end of the Concept.
Guidance
Previously we worked with the products of integers. Another important step in learning how to compute with integersis learning how to divide them. You can look for patterns in a sequence of quotients just as you can look for patternsin a sequence of products. These patterns will help you to understand the rules for dividing integers.
Let’s look at some integer patterns with division. We are looking at quotients. A quotient is the answer in adivision problem.
Use a pattern to find the missing quotients below.
360
www.ck12.org Chapter 4. Using Integers
6÷2 = 3
4÷2 = 2
2÷2 = 1
0÷2 = 0
−2÷2 =?
−4÷2 =?
Look for a pattern among the quotients. Remember that a pattern has a rule that makes it repeat in a certain way.Look at the pattern below.
This pattern uses shapes and not numbers, but there is still a rule that has it happen the way that it does.
Now look at the number pattern.
You will see that you can subtract 1 from the previous quotient to find the next quotient. Remember, sub-tracting 1 is the same thing as adding its opposite, -1. Try adding -1 to the previous quotients to find the nextquotients.
To find the quotient of −2÷2, add 0+(−1)
|0|= 0 and |−1|= 1, so subtract the lesser absolute value from the greater absolute value.
1−0 = 1
The integer with the greater absolute value is -1, so give the answer a negative sign.
0+(−1) =−1, so −2÷2 =−1
To find the quotient of −4÷2, add −1+(−1)
Both integers have the same sign, so add their absolute values.
|−1|= 1, so add
1+1 = 2
Give that answer a negative sign.
−1+(−1) =−2, so −4÷2 =−2.
This shows the completed division facts.
361
4.12. Integer Division www.ck12.org
6÷2 = 3
4÷2 = 2
2÷2 = 1
0÷2 = 0
−2÷2 =−1
−4÷2 =−2
Each quotient is still 1 less than the previous quotient.
What conclusions can we draw from this pattern?
You may notice the following.
• When a positive integer is divided by a positive integer, 2, the quotient is positive.• When zero is divided by a positive integer, 2, the quotient is zero.• When a negative integer is divided by a positive integer, 2, the quotient is negative.
These are the beginnings of our rules for dividing integers.
Let’s look at another pattern to complete these rules.
Look at the number facts below. Analyze the pattern of quotients shown.
9÷ (−3) =−3
6÷ (−2) =−3
3÷ (−1) =−3
0÷0 = unde f ined
−3÷ (−1) = 3
−6÷ (−2) = 3
−9÷ (−3) = 3
What do you notice about these facts?
You may notice the following rules.
• When a positive integer is divided by a negative integer, the quotient is negative.• When zero is divided by zero, the quotient is undefined , not zero. (Note: Any number divided by zero
is considered undefined.)• When a negative integer is divided by a negative integer, the quotient is positive.
Now we can use these rules to divide integers. Just like with the rules for multiplying, becoming great at dividingintegers will require that you memorize these rules.
362

www.ck12.org Chapter 4. Using Integers
Next, let’s apply these rules to dividing integers.
Find the quotient (−33)÷ (−3)
To find this quotient, we need to divide two negative integers.
Divide the integers without paying attention to their signs. The quotient will be positive.
(−33)÷ (−3) = 33÷3 = 11
The quotient is 11.
Find the quotient (−20)÷5.
To find this quotient, we need to divide two integers with different signs.
Divide the integers without paying attention to their signs. Give the quotient a negative sign.
20÷5 = 4, so (−20)÷5 =−4.
The quotient is -4.
These problems used a division sign, but remember we can also show division using a fraction bar where thenumerator is divided by the denominator.
Now, it’s time for you to practice applying these rules while figuring out quotients.
Example A
−12÷−3
Solution: 4
Example B
18−3
Solution: −6
Example C
−24÷8
363
4.12. Integer Division www.ck12.org
Solution: −3
Here is the original problem once again.
Cameron and his new diving partner Gina are going to be buddies on a 40 foot dive. Gina is a new diver and is stilllearning to make a descent. Cameron can make a free descent quite easily. This means that he doesn’t hold ontoanything as he descends to the appropriate depth. Gina will hold onto the anchor line. Then they will meet on thebottom.
Cameron has decided to slow down his descent and to go down with Gina. He will do his free descent next to herdescent holding onto the rope. He looks at his watch and sets the timer before they descend.
When they reach the bottom, Cameron looks at his watch. He sees that the descent took them 2 minutes. Not badat all considering that Gina is a beginner. Cameron and Gina meet up with the group and check in with the DiveMaster. Then they are off for a beautiful dive!!
How far did Cameron and Gina descend per minute?
First, we need to write integers to represent the depth and the time.
-40 feet is the depth
2 minutes is the time
We dive the depth by the time to find out the number of feet per minute.
−40÷2 =−20
Cameron and Gina traveled -20 feet per minute.
Guided Practice
Here is one for you to try on your own.
On 3 consecutive plays, a football team lost a total of 30 yards. The team lost the same number of yards on eachplay. Represent the number of yards lost on each play as a negative integer.
Answer
First, represent the total number of yards lost as an integer.
Since the integer shows a loss of 30 yards, use a negative integer -30.
To represent the loss for each of the 3 plays, divide the integer representing the total number of yards lost by 3.
We write this equation and then fill in the given values
364
www.ck12.org Chapter 4. Using Integers
Total yards lost ÷ number of plays = yds lost on each play
−30÷3 =?
To find this quotient, we need to divide two integers with different signs.
Divide the integers without paying attention to their signs. Give the quotient a negative sign.
30÷3 = 10, so (−30)÷3 =−10.
The integer -10 represents the number of yards lost on each play.
Video Review
MEDIAClick image to the left or use the URL below.URL: http://www.ck12.org/flx/render/embeddedobject/5286
This is a James Sousa video on dividing integers.
Explore More
Directions: Find each quotient.
1. −18÷6
2. −18÷−6
3. 48÷8
4. 64÷ (−8)
5. −28÷ (−4)
6. −35÷7
7. −80÷ (−4)
8. −50÷10
9. −18÷−2
10. 42÷−6
11. −72÷9
12. −48÷−12
13. −16÷4
14. −22÷−11
15. 72÷−12
365
4.13. Simplify Variable Expressions Involving Integer Division www.ck12.org
4.13 Simplify Variable Expressions InvolvingInteger Division
Here you’ll learn to evaluate and simplify variable expressions involving integer division.
Have you ever had to do homework while on vacation?
Molly was working on her homework in the ski lodge. She had one more problem to do before she could go backout for another run on the mountain.
Here is the problem.−12x−3
Molly isn’t sure how to work with this problem. She knows that it involves integers, variables and division.
This Concept will teach you how to help Molly with her dilemma.
Guidance
Previously we used variable expressions with addition, subtraction and multiplication. Now we are going to applydivision of integers with variable expressions. Remember that a variable expression is a math phrase that usesnumbers, variables and operations.
Find the value of this expression −18x÷ (−2)
It may help you to rewrite the problem like this using a fraction bar to divide. Now you can see which values can bedivided.−18x−2
Then separate out the integers like this.−18x−2 = −18·x
−2 = −18−2 · x
Notice that we can divide the integers. The x remains alone because there isn’t another x. We separate it out. Thenwe divide the integer part and add the x to the answer.
Since −18÷ (−2) = 18÷2 = 9, we know that −18−2 · x = 9 · x = 9x
So, the value of the expression is 9x.
Let’s look at another problem where there is a matching variable too.
−24y÷2y
Next, we rewrite the expression using a fraction bar.−24y
2y
Now, we can separate the terms.
−242· y
y−24÷2 =−12
y÷ y = 1 because the y’s cancel each other out
−12(1) =−12
366
www.ck12.org Chapter 4. Using Integers
The value of the expression is -12.
Now it’s time for you to try a few on your own.
Example A
−14a÷−7
Solution:2a
Example B
28ab÷−7b
Solution:−4a
Example C
−6x÷−2
Solution:3x
Here is the original problem once again.
Molly was working on her homework in the ski lodge. She had one more problem to do before she could go backout for another run on the mountain.
Here is the problem.−12x−3
Molly isn’t sure how to work with this problem. She knows that it involves integers, variables and division.
Molly is correct.
First, let’s complete the division of the numbers. We can follow the rules for dividing integers and divide negative12 by negative 3. That answer is 4.
Because there isn’t another x to work with, we can simply add that to our quotient.
4x
This is the answer.
Guided Practice
Here is one for you to try on your own.
−18ab÷9b
Answer
First, rewrite the expression using a fraction bar.−18ab−9b
Next, separate out the terms.
367
4.13. Simplify Variable Expressions Involving Integer Division www.ck12.org
−18−9· ab
b−18÷−9 = 2
ab÷b = a Notice that the b’s cancel, but the a doesn’t. It is left as part of the final expression.
Our final answer is 2a.
Video Review
MEDIAClick image to the left or use the URL below.URL: http://www.ck12.org/flx/render/embeddedobject/5286
This is a James Sousa video on dividing integers. It is a supporting video for this Concept
Explore More
Directions: Find each quotient with variable expressions.
1. 36t÷ (−9)
2. −56n÷ (−7)
3. −22n÷−11n
4. −28n÷7
5. 18xy÷2x
6. 72t÷ (−9t)
7. 48xy÷ (−8y)
8. 54xy÷ (−9xy)
9. 16a÷ (4a)
10. −16ab÷ (−4b)
11. −99xy÷ (−9x)
12. 121a÷ (11b)
13. −144xy÷ (−12)
14. −169y÷ (−13x)
15. −225xy÷ (5z)
368
www.ck12.org Chapter 4. Using Integers
4.14 Properties of Rational Numbers
Here you’ll learn to identify a rational number as the ratio of two integers.
Have you ever compared numbers?
Molly has spent the day skiing. She did 12 runs on the diamond trails and was very pleased with her speed andability. She felt that out of the 12 runs, that 9 of them were particularly good.
She wrote 912 .
Besides being a fraction, this is another type of number too.
Do you know what it is?
This Concept will help you to understand rational numbers.
Guidance
Some numbers are considered rational numbers. A rational number is a number that can be written as a ratio.
What is a ratio?
A ratio is a comparison of two numbers. For example, you might discover that the ratio of boys to girls in yourclass one day was 12 to 13. That same ratio could be also be expressed using a colon, 12 : 13, or as a fraction, 12
13 .
In fact, any number that can be written as the ratio of two integers is classified as a rational number. Let’s take acloser look at how to identify rational numbers now.
How can we determine if an integer is a rational number?
That is a good question. Let’s look at a value and see if we can write it as a ratio.
10
This number can be written as a ratio. Each whole number can be written over 1. That means that it can be writtenin the form of a ratio. Notice that the fraction bar is a way to tell if the integer can be written as a ratio.
10 is a rational number.
−23
This fraction is a rational number. Notice that it is written as a ratio already. We are comparing the numerator andthe denominator. Yes, it is negative. But that is okay, because we can have negative fractions. We call them rationalnumbers.
−23 is a rational number.
What about a decimal?
.687
This decimal can be written as a rational number over 1000. This is a rational number too.
.687 is a rational number.
Are there any others?
Yes. Terminating decimals and repeating decimals are also rational numbers.
• Terminating decimals, which are decimals with a set number of digits, are always rational. For example,
369
4.14. Properties of Rational Numbers www.ck12.org
0.007 is a terminating decimal, so it is rational.• Repeating decimals, which are decimals in which one or more digits repeat, are always rational. For example,
0.3̄ is a repeating decimal in which the digit 3 repeats forever, so it is rational.
Are there any numbers that are not rational?
Yes. Some decimals don’t terminate and they don’t repeat. They just go on and on and on forever. These area special group of numbers called irrational numbers . They are not rational numbers. You will learn moreabout them in another Concept.
Determine whether each is a rational number.
Example A
−4
Solution: Yes
Example B
13
Solution: Yes
Example C
.89765....
Solution: No, it does not terminate or repeat.
Here is the original problem once again.
Molly has spent the day skiing. She did 12 runs on the diamond trails and was very pleased with her speed andability. She felt that out of the 12 runs, that 9 of them were particularly good.
She wrote 912 .
Besides being a fraction, this is another type of number too.
Do you know what it is?
Molly’s comparison is a rational number. It is a ratio that is written in fraction form.
Other types of rational numbers are negative numbers, fractions, terminating and repeating decimals.
Guided Practice
Here is one for you to try on your own.
Show that the following number is rational by writing it as a ratio in fraction form.
.85
Answer
We can say that this is eighty -five hundredths.
Next, we convert it to a fraction.85100
370

www.ck12.org Chapter 4. Using Integers
This is a rational number.
Video Review
MEDIAClick image to the left or use the URL below.URL: http://www.ck12.org/flx/render/embeddedobject/57616
This is a James Sousa video on identifying sets of real numbers including rational numbers.
Explore More
Directions: Rewrite each number as the ratio of two integers to prove that each number is rational.
1.−11
2. 3 16
3. 9
4. .08
5. −.34
6..678
7. 45
8.−19
9. 25
10. .17
11. .2347
12. −17
13. 347
14. 87
15. −97
371
4.15. Comparison of Rational Numbers www.ck12.org
4.15 Comparison of Rational Numbers
Here you’ll learn to compare and order rational numbers on a number line.
Remember the diving that Cameron was doing in the Integer Division Concept? Take a look at this dilemma.
On the dive boat one morning, Cameron began talking with another boy named Chet. Chet and his family were fromColorado and Chet was just two years older than Cameron. The boys struck up a great conversation about divingand fish and the things that they had seen on their dives.
After a little while, they spotted some dolphins swimming with the boat. This is something that can often happen asdolphins love the rushing that the motor makes on the back of the boat.
“Did you know that they can swim .83 miles in one minute?” Chet asked Cameron.
“Really, no I didn’t know that. I do know that a swordfish can swim almost one-half mile in a minute. I think theexact number is 9
20 of a mile.”
“Wow, which one can swim the farthest in one minute?” Chet asked thinking carefully through the math.
By the time they reached the dive site, Cameron had figured out which one can swim the farthest in one minute.
Have you? The numbers that the boys are using are called rational numbers. When you understand rationalnumbers, you will also understand how to figure out which one can swim the farthest in one minute. Payattention, and this Concept on rational numbers will teach you all that you need to know.
Guidance
Previously we worked with rational numbers. Now that you know how to identify a rational number, you may needto compare or order them from time to time. For example, what if you have a loss of 1
2 compared to a loss of .34.You would need to figure this out.
Placing the numbers on a number line can help you do this.
Let’s review the inequality symbols which can help us compare and order rational numbers:
>means is greater than.
<means is less than.
= means is equal to.
372
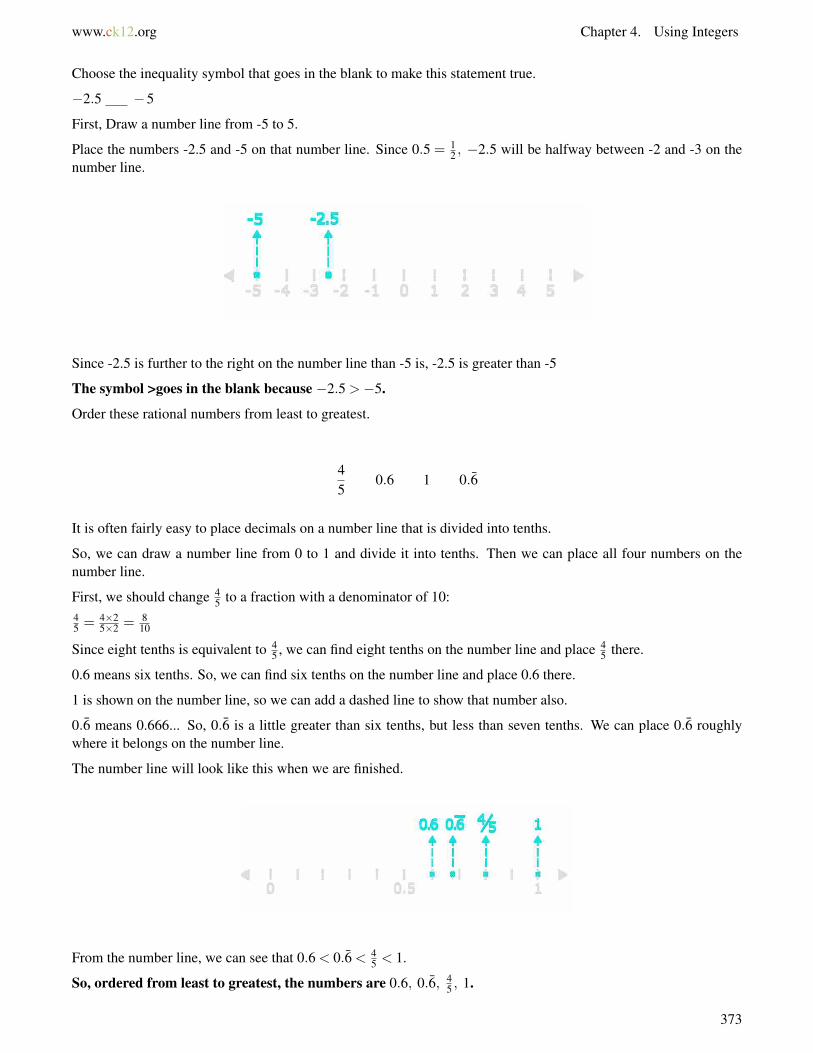
www.ck12.org Chapter 4. Using Integers
Choose the inequality symbol that goes in the blank to make this statement true.
−2.5 −5
First, Draw a number line from -5 to 5.
Place the numbers -2.5 and -5 on that number line. Since 0.5 = 12 , −2.5 will be halfway between -2 and -3 on the
number line.
Since -2.5 is further to the right on the number line than -5 is, -2.5 is greater than -5
The symbol >goes in the blank because −2.5 >−5.
Order these rational numbers from least to greatest.
45
0.6 1 0.6̄
It is often fairly easy to place decimals on a number line that is divided into tenths.
So, we can draw a number line from 0 to 1 and divide it into tenths. Then we can place all four numbers on thenumber line.
First, we should change 45 to a fraction with a denominator of 10:
45 = 4×2
5×2 = 810
Since eight tenths is equivalent to 45 , we can find eight tenths on the number line and place 4
5 there.
0.6 means six tenths. So, we can find six tenths on the number line and place 0.6 there.
1 is shown on the number line, so we can add a dashed line to show that number also.
0.6̄ means 0.666... So, 0.6̄ is a little greater than six tenths, but less than seven tenths. We can place 0.6̄ roughlywhere it belongs on the number line.
The number line will look like this when we are finished.
From the number line, we can see that 0.6 < 0.6̄ < 45 < 1.
So, ordered from least to greatest, the numbers are 0.6, 0.6̄, 45 , 1.
373
4.15. Comparison of Rational Numbers www.ck12.org
Yes. That is how you can be sure that the numbers are in the correct order. Remember, they are all rationalnumbers!!
Compare the following rational numbers.
Example A
−.7 − 710
Solution: =
Example B
.34 12
Solution: <
Example C
67 −10
Solution: >
Here is the original problem once again.
374
www.ck12.org Chapter 4. Using Integers
On the dive boat one morning, Cameron began talking with another boy named Chet. Chet and his family were fromColorado and Chet was just two years older than Cameron. The boys struck up a great conversation about divingand fish and the things that they had seen on their dives.
After a little while, they spotted some dolphins swimming with the boat. This is something that can often happen asdolphins love the rushing that the motor makes on the back of the boat.
“Did you know that they can swim .83 miles in one minute?” Chet asked Cameron.
“Really, no I didn’t know that. I do know that a swordfish can swim almost one-half mile in a minute. I think theexact number is 9
20 of a mile.”
“Wow, which one can swim the farthest in one minute?” Chet asked thinking carefully through the math.
By the time they reached the dive site, Cameron had figured out which one can swim the farthest in one minute.
To figure out which one can swim the farthest in one minute, we will need to compare these two rationalnumbers.
A dolphin = .83 of a mile in one minute
A swordfish = 920 of a mile in one minute
To figure this out, we first need to change the fraction into a decimal so that both numbers are in the sameform.920 = 45
100 = .45
Next, we compare .83 to .45.
.83 >.45
A dolphin can swim farther than a swordfish in one minute.
Guided Practice
Here is one for you to try on your own.
Compare these two rational numbers.
−45 and −.25
Answer
To accurate compare these two values, we need to write them into the same form.
We can convert -.25 into a fraction or −45 into a decimal.
Let’s convert -.25 into a fraction.
− 25100 =−1
4
Now we can compare.
This is tricky! Negative four-fifths is almost a whole. It is less because negative one-fourth is closer to one.
−45 <−.25
This is our answer.
Video Review
375
4.15. Comparison of Rational Numbers www.ck12.org
MEDIAClick image to the left or use the URL below.URL: http://www.ck12.org/flx/render/embeddedobject/5489
This is a Khan Academy video on comparing rational numbers.
Explore More
Directions: Choose the inequality symbol (>, <, or =) that goes in the blank to make each statement true.
1. 1.1 1 110
2. −2 1 13
3. 25 0.3
4. −.34 − 310
5. 5.6 5.7
6. −8 −12
7. −34 − .75
8. 18.4 18.2
9. −.356 −1 110
10. 5.678888 6 510
11. −.509 − 5091000
12. .87 810
13. −4 −14
14. 1.212 1.232
Directions: Place each rational number on the number line below. Then list these rational numbers in order fromgreatest to least.
15. 12 0.9 0 0.9̄
376
www.ck12.org Chapter 4. Using Integers
4.16 Expressions and the Distributive Property
Here you’ll use the distributive property to write and evaluate equivalent numerical and algebraic expressions.
Have you ever been starving after physical activity?
One day after diving, Cameron and some of the kids that he has met at the resort decide to eat some hotdogs on thebeach. Cameron takes everyone’s order and heads to the hot dog stand. He figures that he will get a tray. Each ofthe kids has given him a few dollars and Cameron thinks that he has enough money to get everything.
When he gets to the stand, he checks the prices. Cameron needs to buy 9 hotdogs. The hotdogs are $1.50 for a plaindog plus 1.00 for cheese and sauce. Everyone wants cheese and sauce, so Cameron needs to buy nine hotdogs withcheese and sauce.
Given these numbers, how much will Cameron spend?
Cameron isn’t sure. He takes a napkin and asks for a pen so that he can figure it all out. He has $25.00. Does hehave enough?
The Distributive Property will be very helpful to Cameron.
What is the Distributive Property? Well, this is the Concept that will teach you all about it. Pay attention andat the end of this Concept you will help Cameron to get some lunch.
Guidance
The Distributive Property states that when a factor is multiplied by the sum of two numbers, we can multiply eachof the two numbers by that factor and then add them. You will see a term outside of the parentheses and then youwill know that we are dealing with the Distributive Property.
6(3+5)
5(x+3)
You can use the Distributive Property to write equivalent expressions. You know that equivalent means equal. Well,we can write equivalent numerical and algebraic expressions using the Distributive Property.
377
4.16. Expressions and the Distributive Property www.ck12.org
How do we write an equivalent numerical expression?
You write an equivalent numerical expression by writing the expression without the parentheses. To do this,we multiply the term outside the parentheses with both terms inside the parentheses.
5(2+3)
Here we multiply five times 2 and times 3. Because this is over addition, the addition sign stays between the twoterms.
5(2+3) = 5(2)+5(3)
This is an equivalent numerical expression.
How do we write equivalent algebraic expressions?
Well, an algebraic expression is going to involve numbers, operations, variables and sometimes exponents too.We simply take the term outside the parentheses and multiply it with both of the terms inside the parentheses.
4(x+3)
Here we multiply four times x and four times 3. Because this is over addition, the addition sign stays in the middle.
4(x+3) = 4(x)+4(3)
This is an equivalent algebraic expression.
Take a few minutes to write down the steps in using the Distributive Property.
You can also use the Distributive Property to evaluate an expression. You might have caught yourself tryingto do that in the last Concept. Well, the first step is to write an equivalent expression as we did in the lastsection and then we can simplify our work.
Let’s start with a numerical expression. Because a numerical expression does not contain a variable, we will beable to figure out an answer for the expression.
7(2+3)
First, we write an equivalent expression.
7(2+3) = 7(2)+7(3)
Next, we multiply each part and then we add the products.
14+21
Our answer is 35.
This works the same way if there was subtraction involved.
3(3−2)
First, we write an equivalent expression.
3(3)−3(2)
378

www.ck12.org Chapter 4. Using Integers
Next, we evaluate the expression.
9−6
Our answer is 3.
How does this work with an algebraic expression?
We can follow the same procedure, but keep in mind that an algebraic expression will have variables in it. Therefore,we can simplify the expression, but not necessarily solve it.
2(x+6)
First, we write an equivalent expression.
2(x)+2(6)
Next, we simplify each part of the expression.
2x+12
This is our answer.
5(y−2)
First, we write an equivalent expression.
5(y)−5(2)
Next, we simplify each part of the expression.
5y−10
This is our answer.
Write an equivalent expression for each using the Distributive Property.
Example A
6(5+2)
Solution: 42
Example B
3(x−5)
Solution: 3x−15
Example C
8(9+ y)
Solution: 72+8y
379
4.16. Expressions and the Distributive Property www.ck12.org
Here is the original problem once again.
One day after diving, Cameron and some of the kids that he has met at the resort decide to eat some hotdogs on thebeach. Cameron takes everyone’s order and heads to the hot dog stand. He figures that he will get a tray. Each ofthe kids has given him a few dollars and Cameron thinks that he has enough money to get everything.
When he gets to the stand, he checks the prices. Cameron needs to buy 9 hotdogs. The hot dogs are $1.50 for a plaindog plus 1.00 for cheese and sauce. Everyone wants cheese and sauce, so Cameron needs to buy nine hot dogs withcheese and sauce.
Given these numbers, how much will Cameron spend?
Cameron isn’t sure. He takes a napkin and asks for a pen so that he can figure it all out. He has $25.00. Does hehave enough?
The Distributive Property will be very helpful to Cameron.
Think about the Distributive Property. Let’s use it to write an expression to help Cameron.
9(1.50+1.00)
Next, we can distribute the 9.
9(1.50)+9(1.00)
9×1.50 = 13.50
9×1 = 9
13.50+9.00
= $22.50
Cameron will spend $22.50 on the hotdogs. Out of $25.00, he will have $2.50 change.
Guided Practice
Here is one for you to try on your own.
Liam has a rectangular backyard that is 20 yards long and 18 yards wide. He wants to use a part of his yard that is20 yards by 8 yards for a vegetable garden. If he does this, what will be the area of the section of the yard that willnot be used as a garden?
Let’s start by drawing a diagram of Liam’s backyard to help us understand this problem better.
380
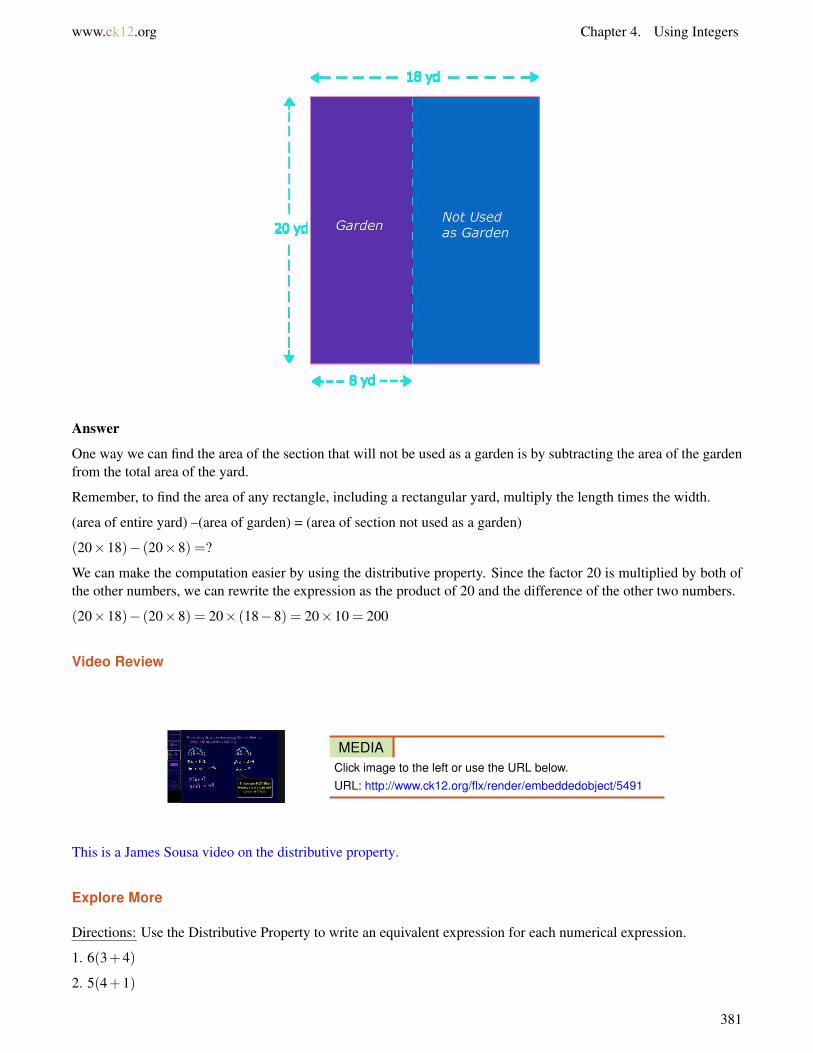
www.ck12.org Chapter 4. Using Integers
Answer
One way we can find the area of the section that will not be used as a garden is by subtracting the area of the gardenfrom the total area of the yard.
Remember, to find the area of any rectangle, including a rectangular yard, multiply the length times the width.
(area of entire yard) –(area of garden) = (area of section not used as a garden)
(20×18)− (20×8) =?
We can make the computation easier by using the distributive property. Since the factor 20 is multiplied by both ofthe other numbers, we can rewrite the expression as the product of 20 and the difference of the other two numbers.
(20×18)− (20×8) = 20× (18−8) = 20×10 = 200
Video Review
MEDIAClick image to the left or use the URL below.URL: http://www.ck12.org/flx/render/embeddedobject/5491
This is a James Sousa video on the distributive property.
Explore More
Directions: Use the Distributive Property to write an equivalent expression for each numerical expression.
1. 6(3+4)
2. 5(4+1)
381
4.16. Expressions and the Distributive Property www.ck12.org
3. 12(3+5)
4. 6(7+8)
5. 2(4+5)
6. 3(5−2)
7. 6(7−3)
8. 5(4−2)
9. 7(5−1)
10. 6(9−3)
Directions: Use the Distributive Property to write an equivalent expression for each variable expression.
11. 5(x+3)
12. 6(y−2)
13. 5(x+9)
14. 8(a+b)
15. 7(x− y)
382
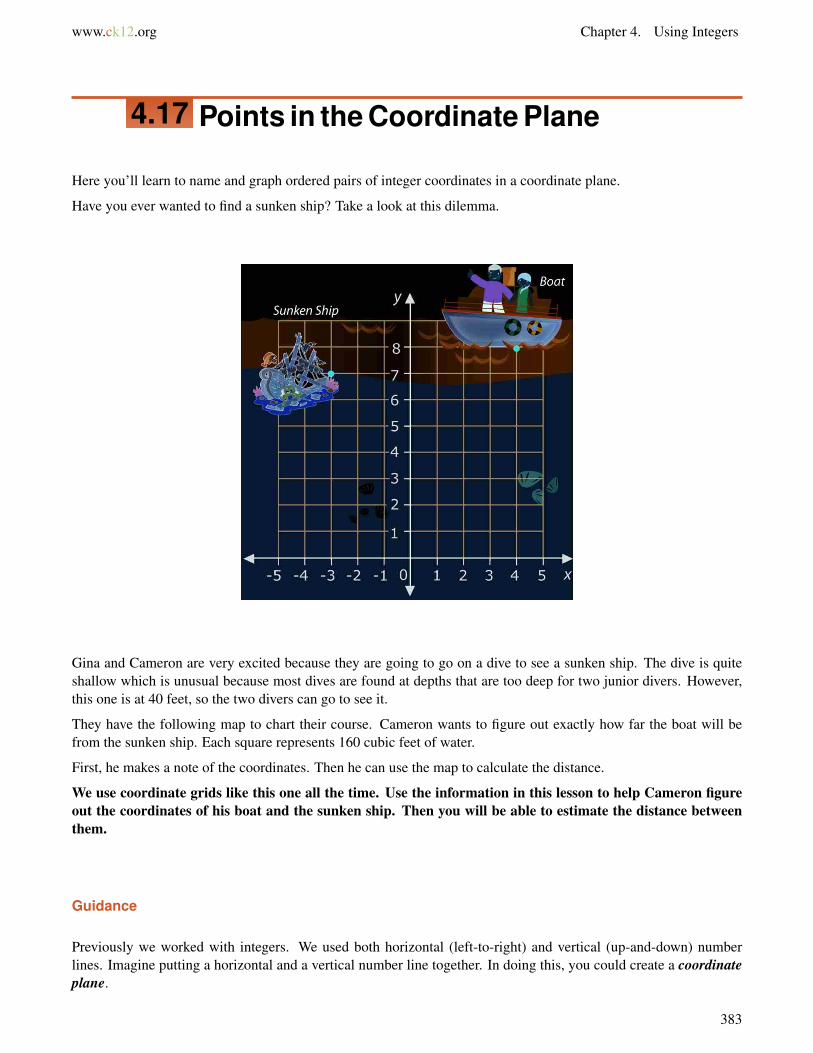
www.ck12.org Chapter 4. Using Integers
4.17 Points in the Coordinate Plane
Here you’ll learn to name and graph ordered pairs of integer coordinates in a coordinate plane.
Have you ever wanted to find a sunken ship? Take a look at this dilemma.
Gina and Cameron are very excited because they are going to go on a dive to see a sunken ship. The dive is quiteshallow which is unusual because most dives are found at depths that are too deep for two junior divers. However,this one is at 40 feet, so the two divers can go to see it.
They have the following map to chart their course. Cameron wants to figure out exactly how far the boat will befrom the sunken ship. Each square represents 160 cubic feet of water.
First, he makes a note of the coordinates. Then he can use the map to calculate the distance.
We use coordinate grids like this one all the time. Use the information in this lesson to help Cameron figureout the coordinates of his boat and the sunken ship. Then you will be able to estimate the distance betweenthem.
Guidance
Previously we worked with integers. We used both horizontal (left-to-right) and vertical (up-and-down) numberlines. Imagine putting a horizontal and a vertical number line together. In doing this, you could create a coordinateplane.
383
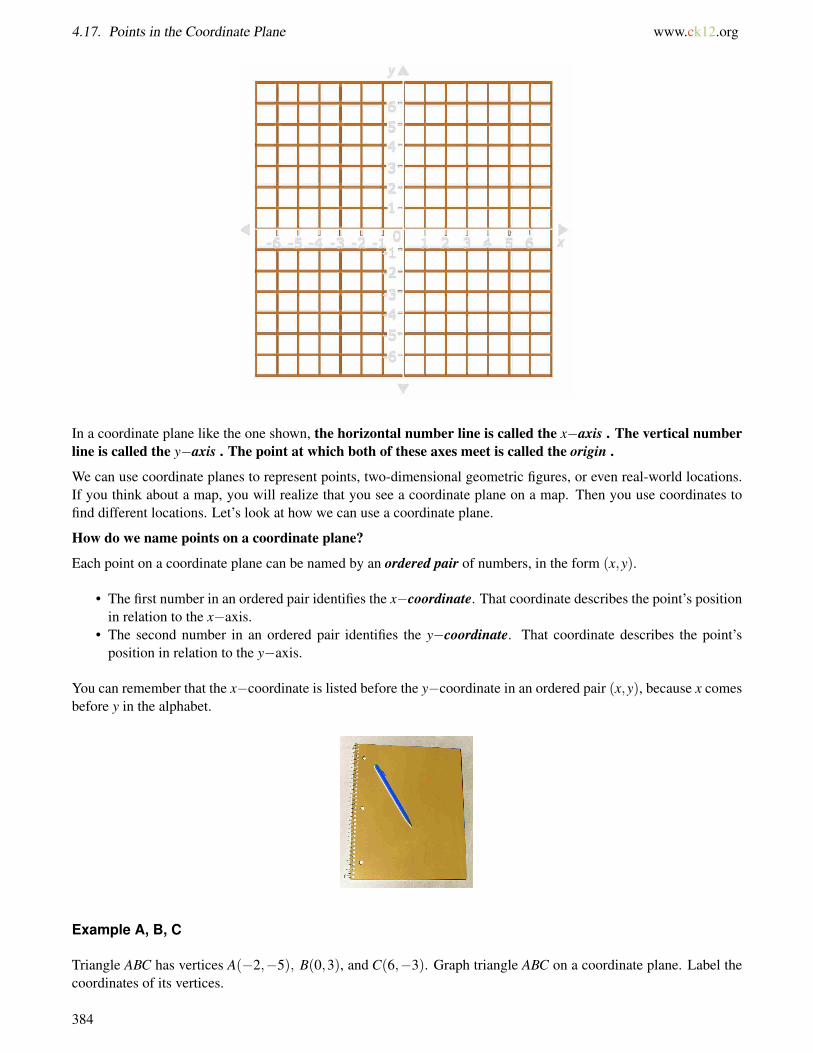
4.17. Points in the Coordinate Plane www.ck12.org
In a coordinate plane like the one shown, the horizontal number line is called the x−axis . The vertical numberline is called the y−axis . The point at which both of these axes meet is called the origin .
We can use coordinate planes to represent points, two-dimensional geometric figures, or even real-world locations.If you think about a map, you will realize that you see a coordinate plane on a map. Then you use coordinates tofind different locations. Let’s look at how we can use a coordinate plane.
How do we name points on a coordinate plane?
Each point on a coordinate plane can be named by an ordered pair of numbers, in the form (x,y).
• The first number in an ordered pair identifies the x−coordinate. That coordinate describes the point’s positionin relation to the x−axis.
• The second number in an ordered pair identifies the y−coordinate. That coordinate describes the point’sposition in relation to the y−axis.
You can remember that the x−coordinate is listed before the y−coordinate in an ordered pair (x,y), because x comesbefore y in the alphabet.
Example A, B, C
Triangle ABC has vertices A(−2,−5), B(0,3), and C(6,−3). Graph triangle ABC on a coordinate plane. Label thecoordinates of its vertices.
384
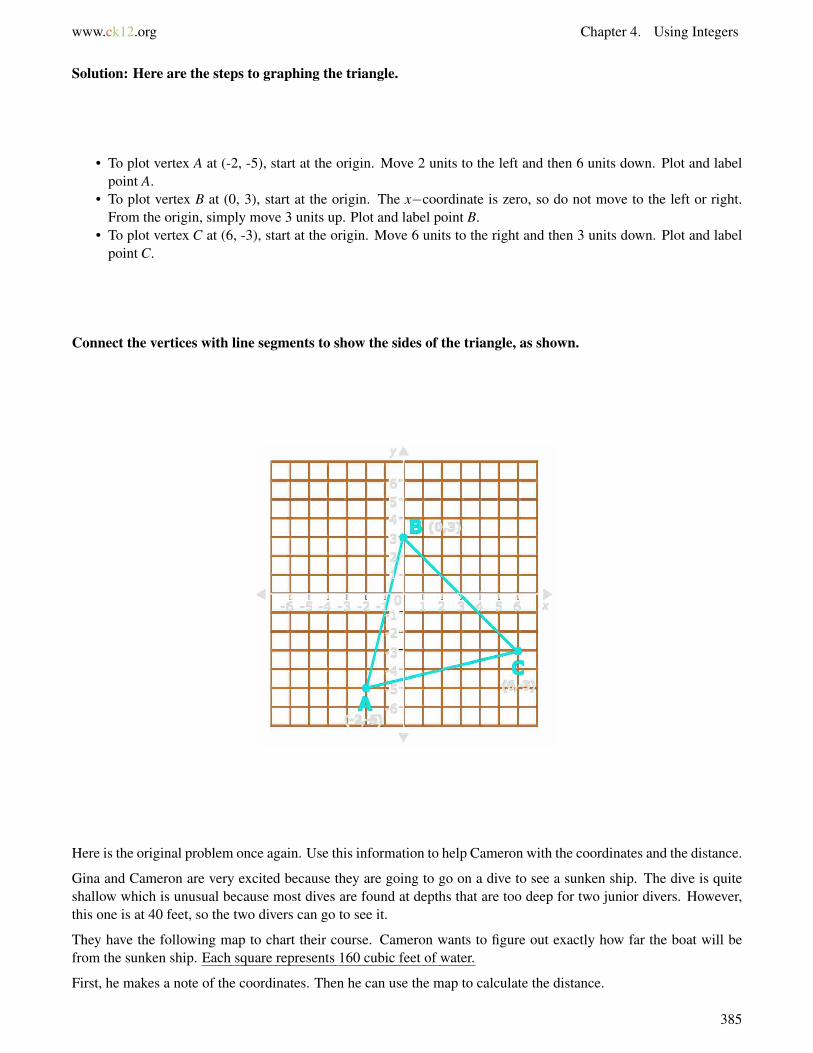
www.ck12.org Chapter 4. Using Integers
Solution: Here are the steps to graphing the triangle.
• To plot vertex A at (-2, -5), start at the origin. Move 2 units to the left and then 6 units down. Plot and labelpoint A.
• To plot vertex B at (0, 3), start at the origin. The x−coordinate is zero, so do not move to the left or right.From the origin, simply move 3 units up. Plot and label point B.
• To plot vertex C at (6, -3), start at the origin. Move 6 units to the right and then 3 units down. Plot and labelpoint C.
Connect the vertices with line segments to show the sides of the triangle, as shown.
Here is the original problem once again. Use this information to help Cameron with the coordinates and the distance.
Gina and Cameron are very excited because they are going to go on a dive to see a sunken ship. The dive is quiteshallow which is unusual because most dives are found at depths that are too deep for two junior divers. However,this one is at 40 feet, so the two divers can go to see it.
They have the following map to chart their course. Cameron wants to figure out exactly how far the boat will befrom the sunken ship. Each square represents 160 cubic feet of water.
First, he makes a note of the coordinates. Then he can use the map to calculate the distance.
385
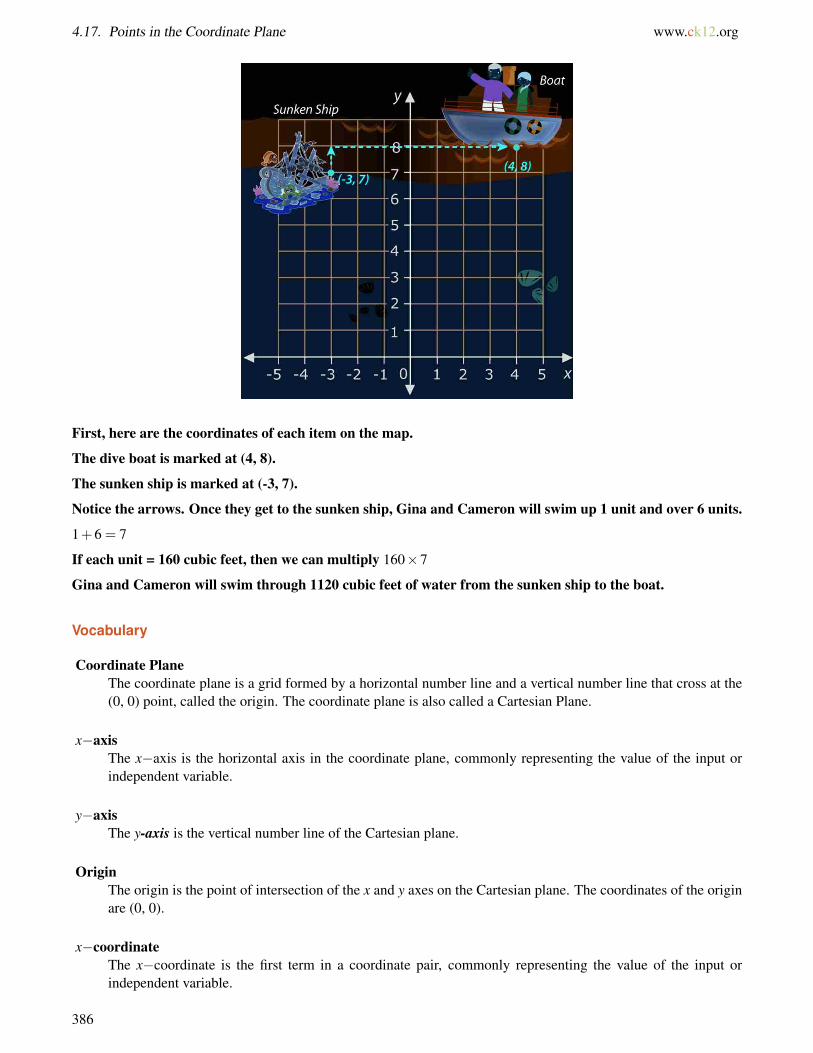
4.17. Points in the Coordinate Plane www.ck12.org
First, here are the coordinates of each item on the map.
The dive boat is marked at (4, 8).
The sunken ship is marked at (-3, 7).
Notice the arrows. Once they get to the sunken ship, Gina and Cameron will swim up 1 unit and over 6 units.
1+6 = 7
If each unit = 160 cubic feet, then we can multiply 160×7
Gina and Cameron will swim through 1120 cubic feet of water from the sunken ship to the boat.
Vocabulary
Coordinate PlaneThe coordinate plane is a grid formed by a horizontal number line and a vertical number line that cross at the(0, 0) point, called the origin. The coordinate plane is also called a Cartesian Plane.
x−axisThe x−axis is the horizontal axis in the coordinate plane, commonly representing the value of the input orindependent variable.
y−axisThe y-axis is the vertical number line of the Cartesian plane.
OriginThe origin is the point of intersection of the x and y axes on the Cartesian plane. The coordinates of the originare (0, 0).
x−coordinateThe x−coordinate is the first term in a coordinate pair, commonly representing the value of the input orindependent variable.
386
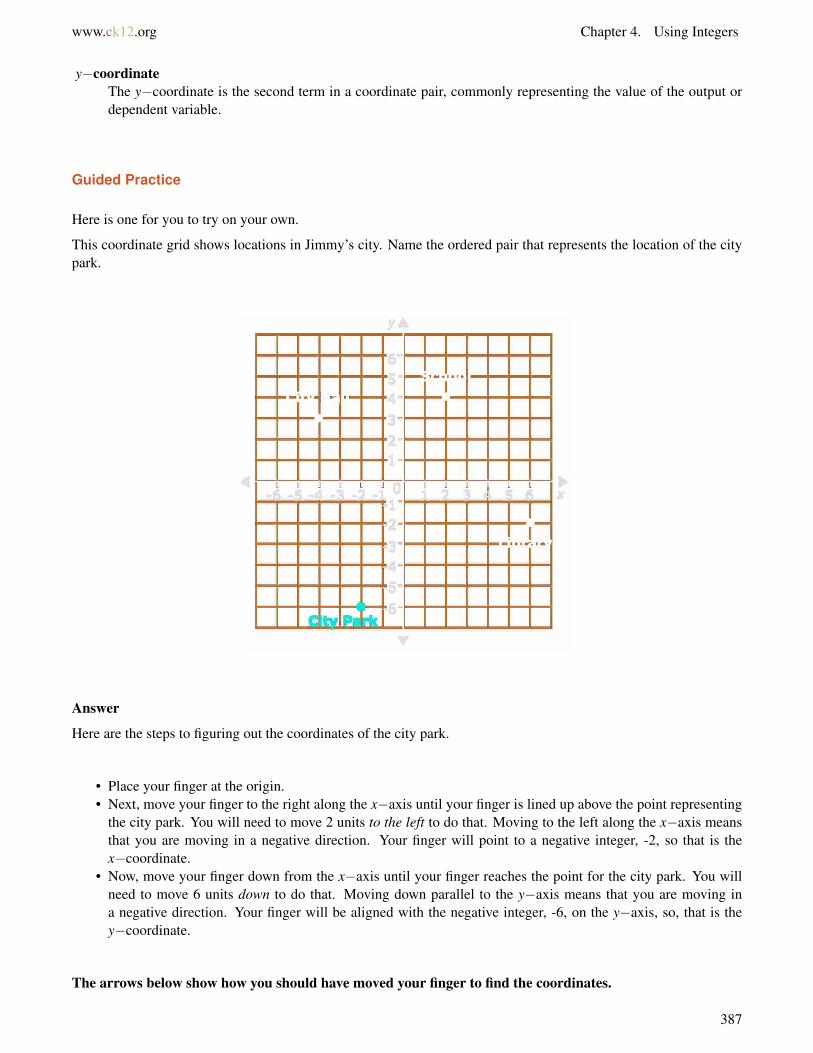
www.ck12.org Chapter 4. Using Integers
y−coordinateThe y−coordinate is the second term in a coordinate pair, commonly representing the value of the output ordependent variable.
Guided Practice
Here is one for you to try on your own.
This coordinate grid shows locations in Jimmy’s city. Name the ordered pair that represents the location of the citypark.
Answer
Here are the steps to figuring out the coordinates of the city park.
• Place your finger at the origin.• Next, move your finger to the right along the x−axis until your finger is lined up above the point representing
the city park. You will need to move 2 units to the left to do that. Moving to the left along the x−axis meansthat you are moving in a negative direction. Your finger will point to a negative integer, -2, so that is thex−coordinate.
• Now, move your finger down from the x−axis until your finger reaches the point for the city park. You willneed to move 6 units down to do that. Moving down parallel to the y−axis means that you are moving ina negative direction. Your finger will be aligned with the negative integer, -6, on the y−axis, so, that is they−coordinate.
The arrows below show how you should have moved your finger to find the coordinates.
387
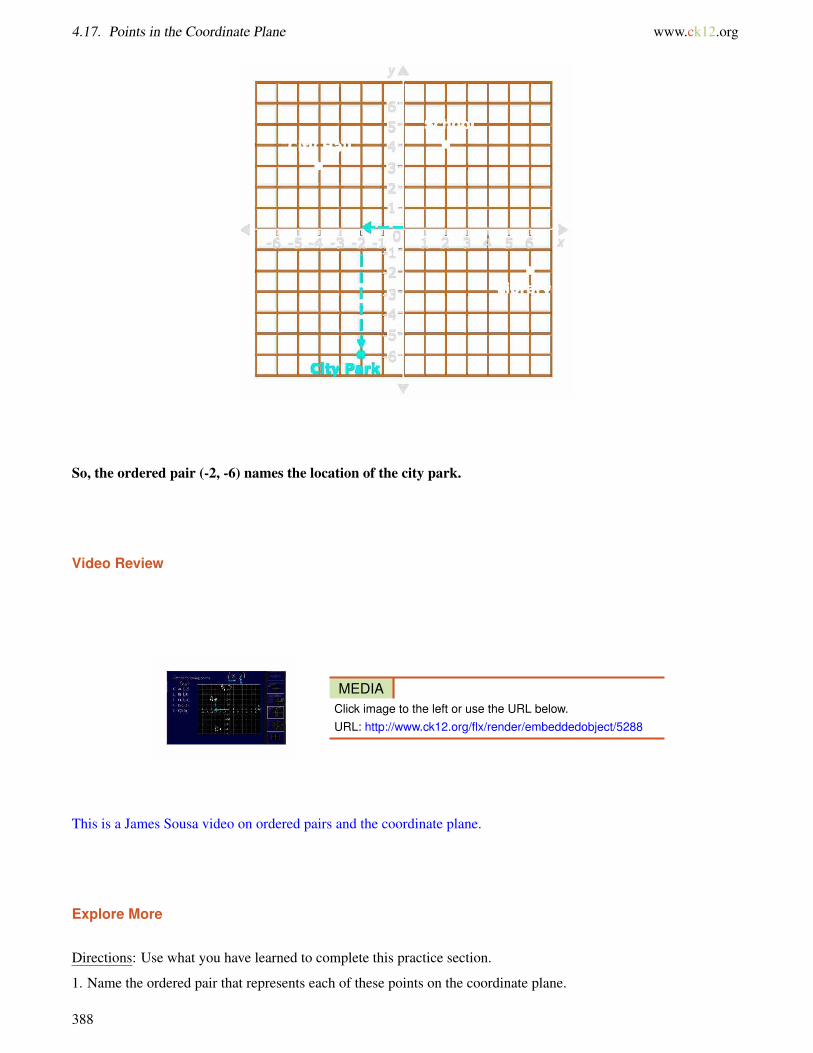
4.17. Points in the Coordinate Plane www.ck12.org
So, the ordered pair (-2, -6) names the location of the city park.
Video Review
MEDIAClick image to the left or use the URL below.URL: http://www.ck12.org/flx/render/embeddedobject/5288
This is a James Sousa video on ordered pairs and the coordinate plane.
Explore More
Directions: Use what you have learned to complete this practice section.
1. Name the ordered pair that represents each of these points on the coordinate plane.
388
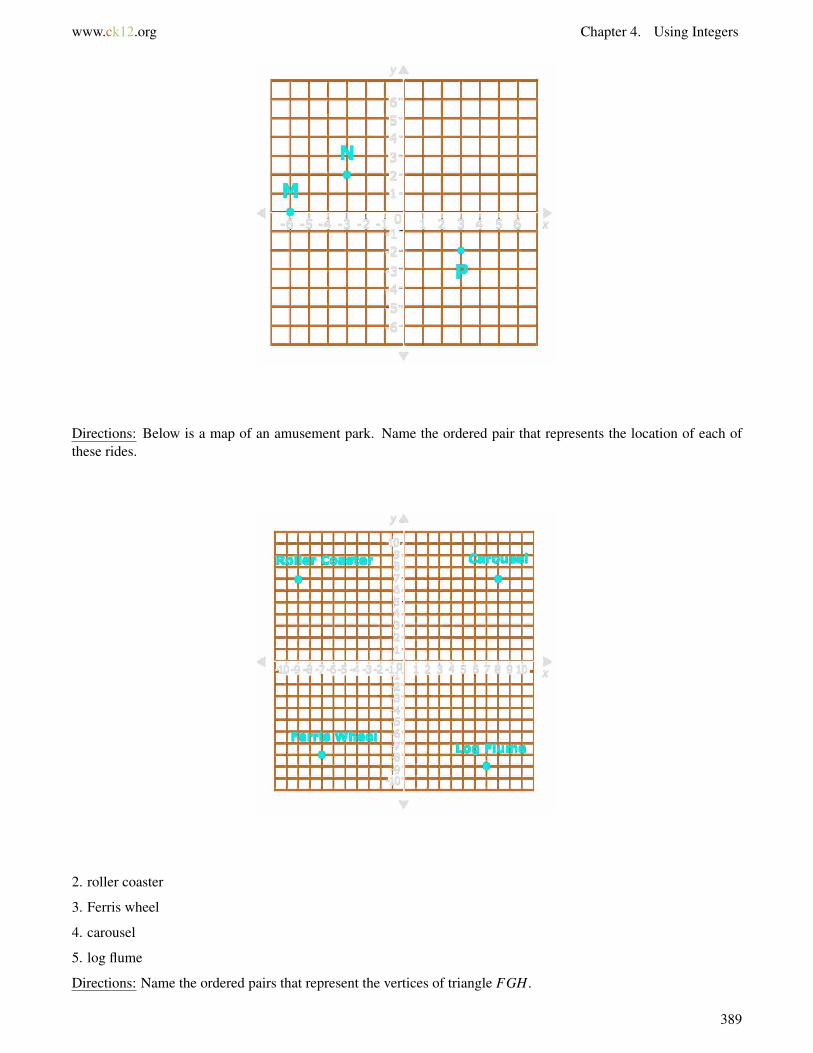
www.ck12.org Chapter 4. Using Integers
Directions: Below is a map of an amusement park. Name the ordered pair that represents the location of each ofthese rides.
2. roller coaster
3. Ferris wheel
4. carousel
5. log flume
Directions: Name the ordered pairs that represent the vertices of triangle FGH.
389
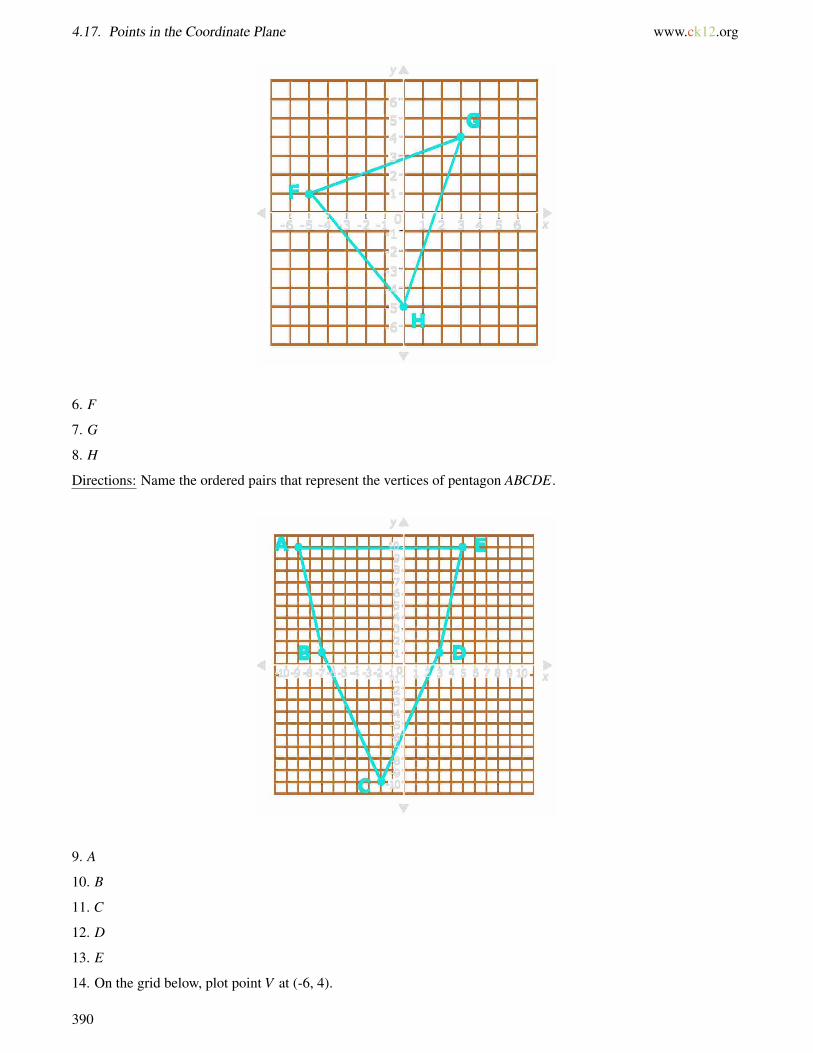
4.17. Points in the Coordinate Plane www.ck12.org
6. F
7. G
8. H
Directions: Name the ordered pairs that represent the vertices of pentagon ABCDE.
9. A
10. B
11. C
12. D
13. E
14. On the grid below, plot point V at (-6, 4).
390
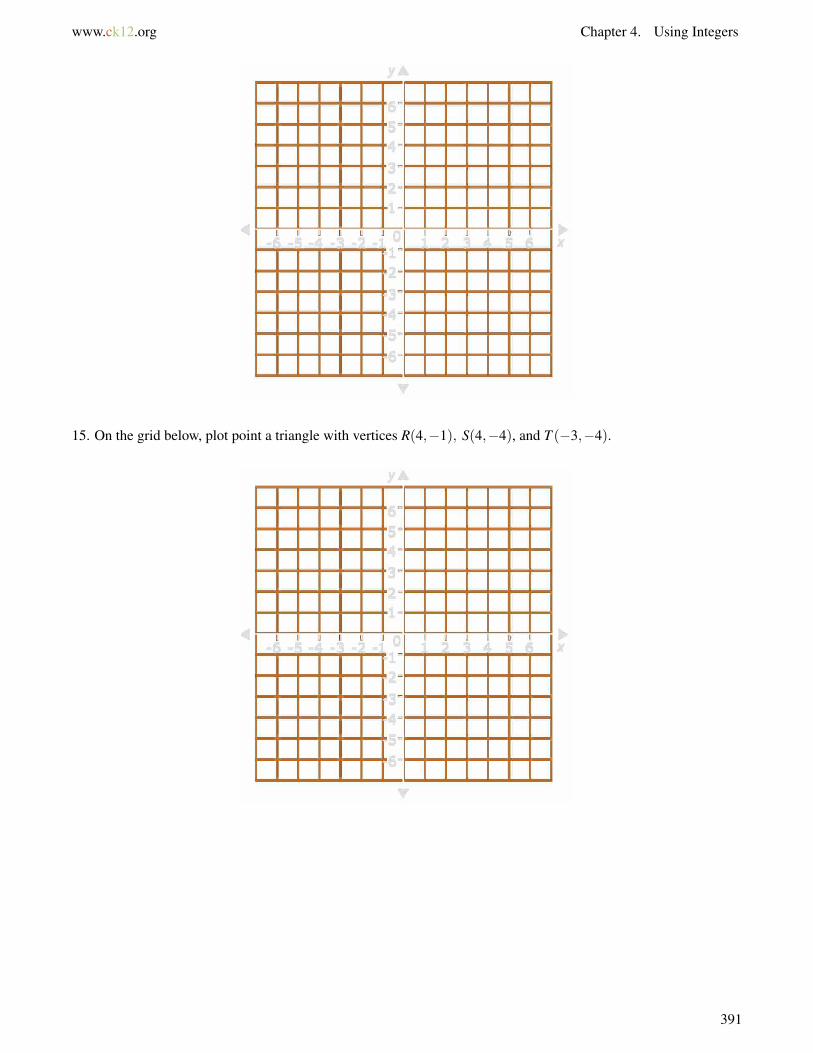
www.ck12.org Chapter 4. Using Integers
15. On the grid below, plot point a triangle with vertices R(4,−1), S(4,−4), and T (−3,−4).
391
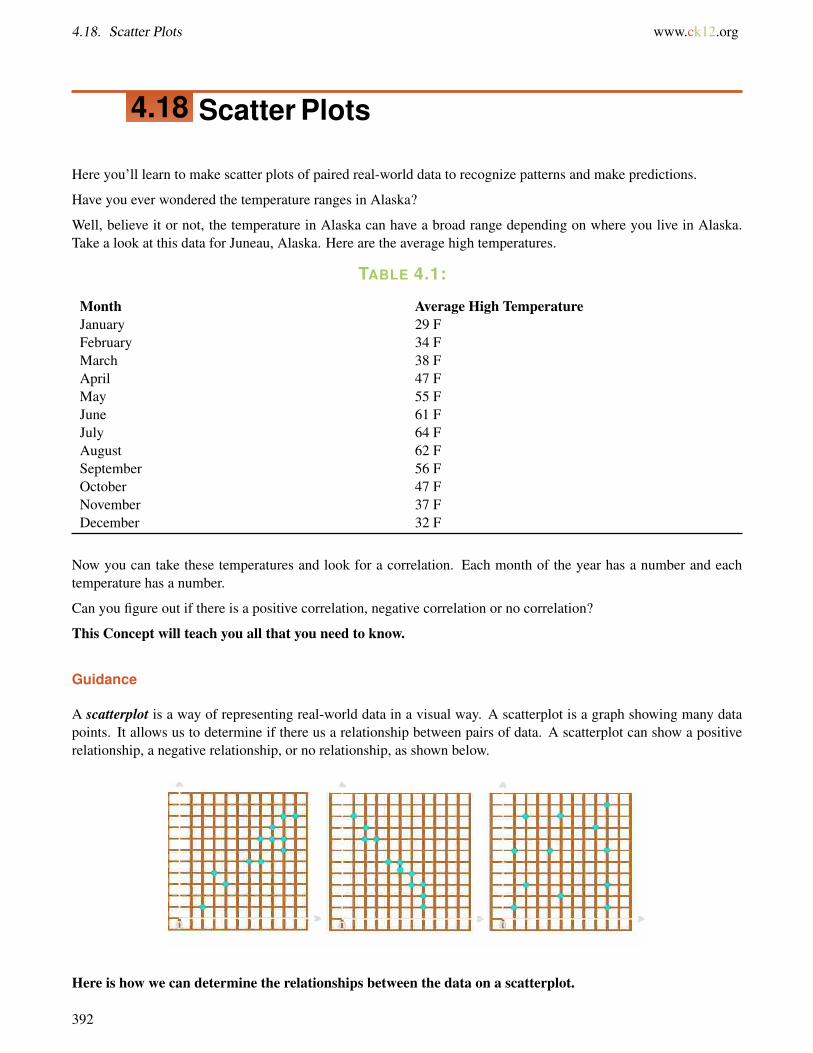
4.18. Scatter Plots www.ck12.org
4.18 Scatter Plots
Here you’ll learn to make scatter plots of paired real-world data to recognize patterns and make predictions.
Have you ever wondered the temperature ranges in Alaska?
Well, believe it or not, the temperature in Alaska can have a broad range depending on where you live in Alaska.Take a look at this data for Juneau, Alaska. Here are the average high temperatures.
TABLE 4.1:
Month Average High TemperatureJanuary 29 FFebruary 34 FMarch 38 FApril 47 FMay 55 FJune 61 FJuly 64 FAugust 62 FSeptember 56 FOctober 47 FNovember 37 FDecember 32 F
Now you can take these temperatures and look for a correlation. Each month of the year has a number and eachtemperature has a number.
Can you figure out if there is a positive correlation, negative correlation or no correlation?
This Concept will teach you all that you need to know.
Guidance
A scatterplot is a way of representing real-world data in a visual way. A scatterplot is a graph showing many datapoints. It allows us to determine if there us a relationship between pairs of data. A scatterplot can show a positiverelationship, a negative relationship, or no relationship, as shown below.
Here is how we can determine the relationships between the data on a scatterplot.
392
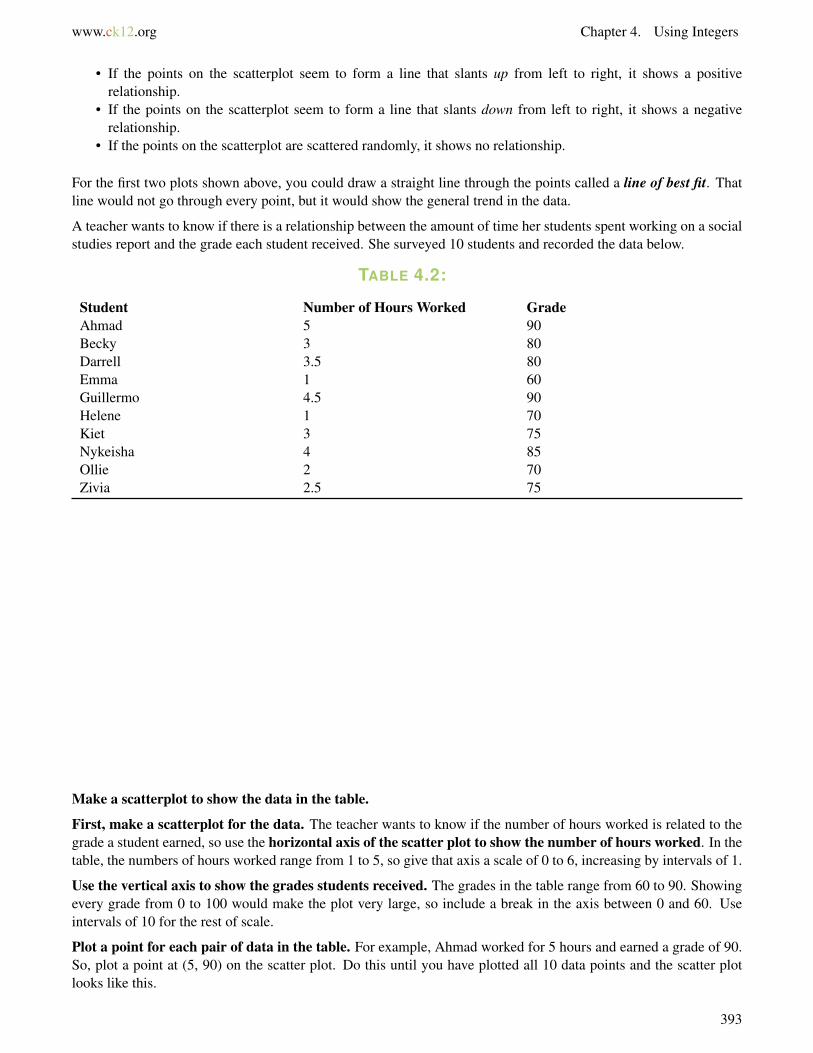
www.ck12.org Chapter 4. Using Integers
• If the points on the scatterplot seem to form a line that slants up from left to right, it shows a positiverelationship.
• If the points on the scatterplot seem to form a line that slants down from left to right, it shows a negativerelationship.
• If the points on the scatterplot are scattered randomly, it shows no relationship.
For the first two plots shown above, you could draw a straight line through the points called a line of best fit. Thatline would not go through every point, but it would show the general trend in the data.
A teacher wants to know if there is a relationship between the amount of time her students spent working on a socialstudies report and the grade each student received. She surveyed 10 students and recorded the data below.
TABLE 4.2:
Student Number of Hours Worked GradeAhmad 5 90Becky 3 80Darrell 3.5 80Emma 1 60Guillermo 4.5 90Helene 1 70Kiet 3 75Nykeisha 4 85Ollie 2 70Zivia 2.5 75
Make a scatterplot to show the data in the table.
First, make a scatterplot for the data. The teacher wants to know if the number of hours worked is related to thegrade a student earned, so use the horizontal axis of the scatter plot to show the number of hours worked. In thetable, the numbers of hours worked range from 1 to 5, so give that axis a scale of 0 to 6, increasing by intervals of 1.
Use the vertical axis to show the grades students received. The grades in the table range from 60 to 90. Showingevery grade from 0 to 100 would make the plot very large, so include a break in the axis between 0 and 60. Useintervals of 10 for the rest of scale.
Plot a point for each pair of data in the table. For example, Ahmad worked for 5 hours and earned a grade of 90.So, plot a point at (5, 90) on the scatter plot. Do this until you have plotted all 10 data points and the scatter plotlooks like this.
393
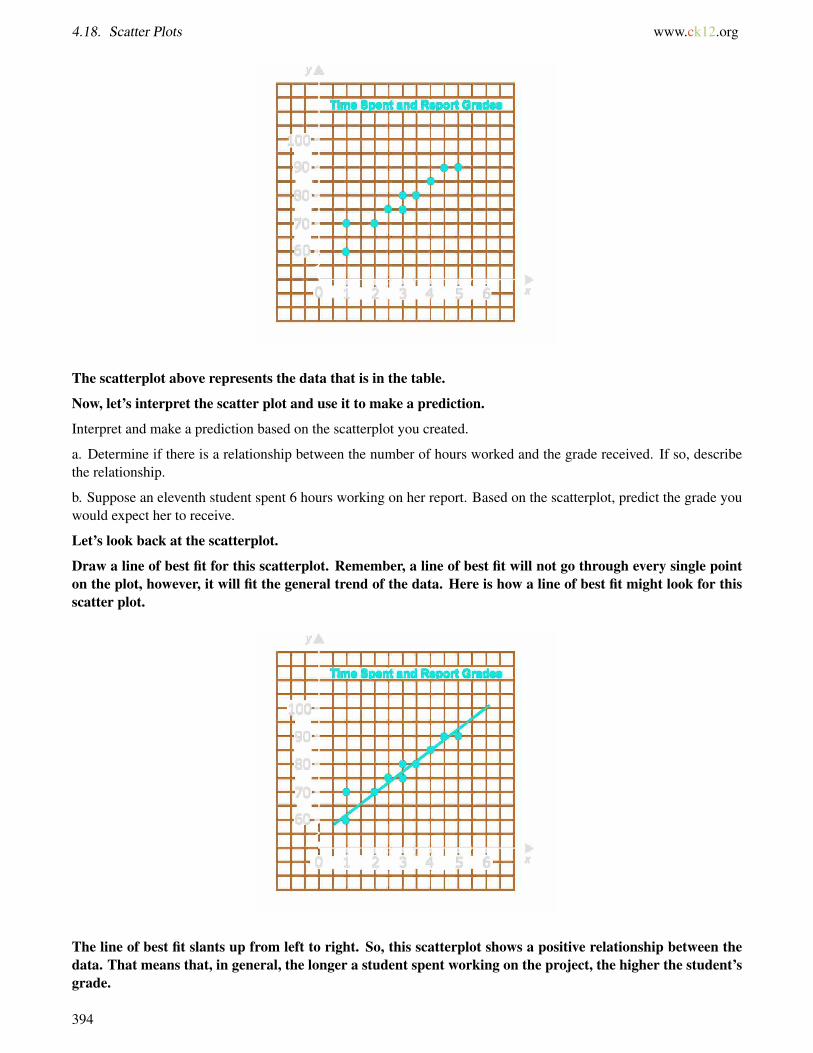
4.18. Scatter Plots www.ck12.org
The scatterplot above represents the data that is in the table.
Now, let’s interpret the scatter plot and use it to make a prediction.
Interpret and make a prediction based on the scatterplot you created.
a. Determine if there is a relationship between the number of hours worked and the grade received. If so, describethe relationship.
b. Suppose an eleventh student spent 6 hours working on her report. Based on the scatterplot, predict the grade youwould expect her to receive.
Let’s look back at the scatterplot.
Draw a line of best fit for this scatterplot. Remember, a line of best fit will not go through every single pointon the plot, however, it will fit the general trend of the data. Here is how a line of best fit might look for thisscatter plot.
The line of best fit slants up from left to right. So, this scatterplot shows a positive relationship between thedata. That means that, in general, the longer a student spent working on the project, the higher the student’sgrade.
394
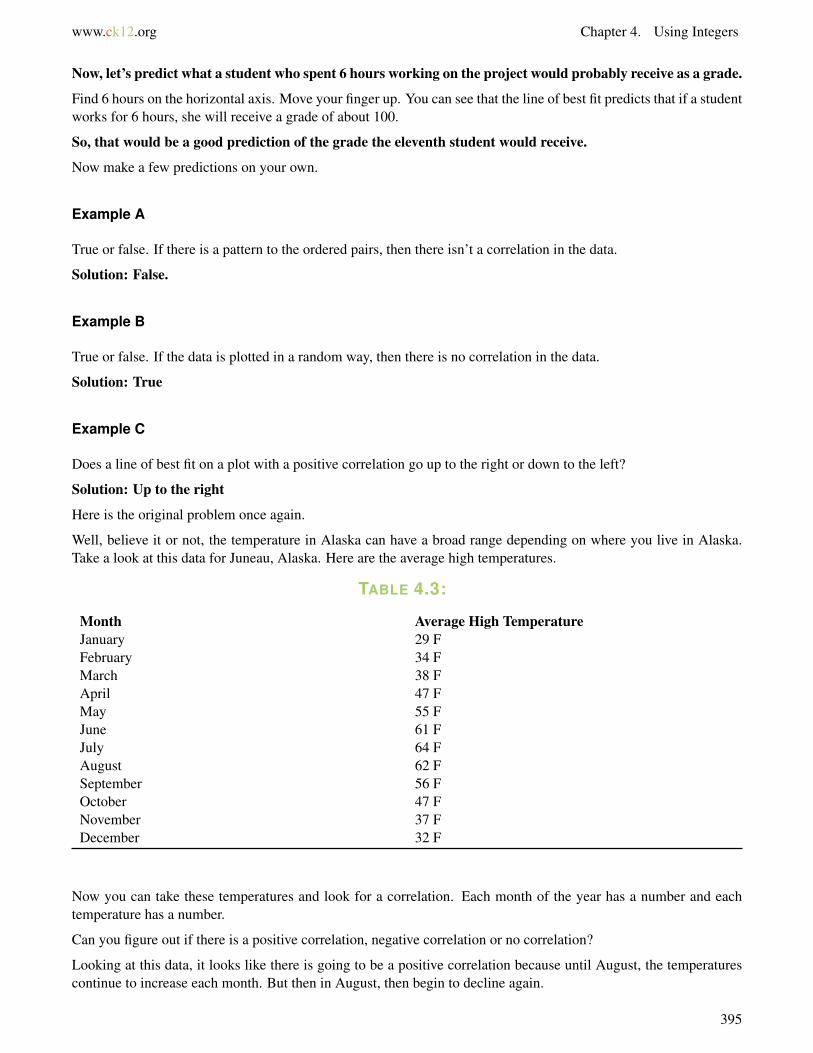
www.ck12.org Chapter 4. Using Integers
Now, let’s predict what a student who spent 6 hours working on the project would probably receive as a grade.
Find 6 hours on the horizontal axis. Move your finger up. You can see that the line of best fit predicts that if a studentworks for 6 hours, she will receive a grade of about 100.
So, that would be a good prediction of the grade the eleventh student would receive.
Now make a few predictions on your own.
Example A
True or false. If there is a pattern to the ordered pairs, then there isn’t a correlation in the data.
Solution: False.
Example B
True or false. If the data is plotted in a random way, then there is no correlation in the data.
Solution: True
Example C
Does a line of best fit on a plot with a positive correlation go up to the right or down to the left?
Solution: Up to the right
Here is the original problem once again.
Well, believe it or not, the temperature in Alaska can have a broad range depending on where you live in Alaska.Take a look at this data for Juneau, Alaska. Here are the average high temperatures.
TABLE 4.3:
Month Average High TemperatureJanuary 29 FFebruary 34 FMarch 38 FApril 47 FMay 55 FJune 61 FJuly 64 FAugust 62 FSeptember 56 FOctober 47 FNovember 37 FDecember 32 F
Now you can take these temperatures and look for a correlation. Each month of the year has a number and eachtemperature has a number.
Can you figure out if there is a positive correlation, negative correlation or no correlation?
Looking at this data, it looks like there is going to be a positive correlation because until August, the temperaturescontinue to increase each month. But then in August, then begin to decline again.
395

4.18. Scatter Plots www.ck12.org
We can say that there is no correlation to this data.
Guided Practice
Here is one for you to try on your own.
Look at the following set of ordered pairs. Would this scatter plot have a positive correlation, negative correlation orno correlation?
(1, 2)(3, 5)(7, 10)(9, 15)(4, 8)
Answer
This scatter plot will have no correlation because there is not a pattern to the values.
Video Review
MEDIAClick image to the left or use the URL below.URL: http://www.ck12.org/flx/render/embeddedobject/57655
This is a James Sousa video on scatter plots and includes a technology integration.
Explore More
Directions: This scatterplot shows the relationship between the last digit of ten students’ phone numbers and theirvocabulary quiz scores.
1. Does this scatterplot show a positive relationship, a negative relationship, or no relationship?
396
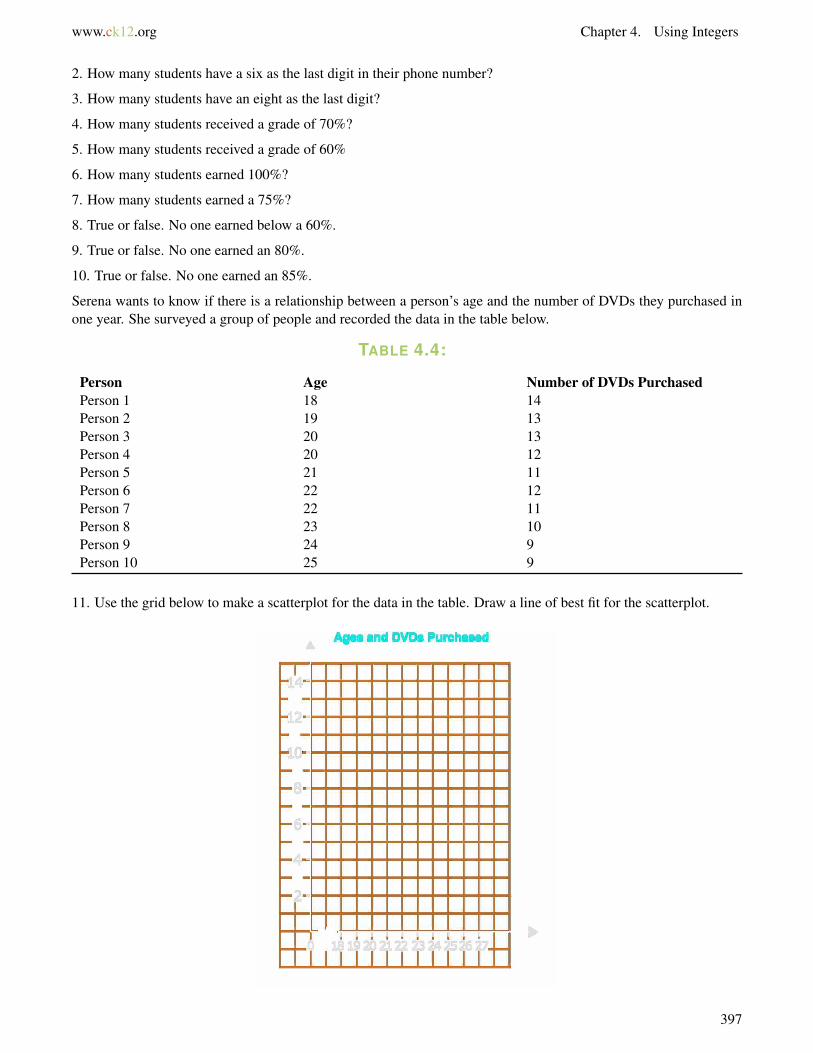
www.ck12.org Chapter 4. Using Integers
2. How many students have a six as the last digit in their phone number?
3. How many students have an eight as the last digit?
4. How many students received a grade of 70%?
5. How many students received a grade of 60%
6. How many students earned 100%?
7. How many students earned a 75%?
8. True or false. No one earned below a 60%.
9. True or false. No one earned an 80%.
10. True or false. No one earned an 85%.
Serena wants to know if there is a relationship between a person’s age and the number of DVDs they purchased inone year. She surveyed a group of people and recorded the data in the table below.
TABLE 4.4:
Person Age Number of DVDs PurchasedPerson 1 18 14Person 2 19 13Person 3 20 13Person 4 20 12Person 5 21 11Person 6 22 12Person 7 22 11Person 8 23 10Person 9 24 9Person 10 25 9
11. Use the grid below to make a scatterplot for the data in the table. Draw a line of best fit for the scatterplot.
397
4.18. Scatter Plots www.ck12.org
12. True or false. The scatterplot shows a negative correlation.
13. True or false. The scatterplot shows no correlation.
14. True or false. The scatterplot shows a positive correlation.
15. If the trend in the scatterplot continues, predict the number of DVDs you would expect a 27-year-old person tobuy in one year.
Summary
Having completed this chapter, students are now ready to move on to the next Chapter. Each Concept has providedstudents with an opportunity to engage and practice skills in many Concepts including comparing and orderingintegers, operations with integers, rational numbers, the distributive property, the coordinate plane, integers andreal-world situations, absolute value and scatter plots.
398
www.ck12.org Chapter 5. Using Ratios, Rates and Proportions
CHAPTER 5 Using Ratios, Rates andProportions
Chapter Outline5.1 EQUIVALENT RATIOS
5.2 RATIOS IN SIMPLEST FORM
5.3 COMPARISON OF RATIOS IN DECIMAL FORM
5.4 IDENTIFICATION AND WRITING OF EQUIVALENT RATES
5.5 UNIT RATES
5.6 COMPARISON OF UNIT RATES
5.7 SLOPE
5.8 SLOPE OF A LINE USING TWO POINTS
5.9 PROPORTIONS
5.10 PROPORTIONS WITH VARIABLE IN THE NUMERATOR
5.11 PROPORTIONS USING CROSS PRODUCTS
5.12 PROPORTIONS WITH VARIABLE IN THE DENOMINATOR
5.13 SCALE DISTANCES OR DIMENSIONS
5.14 UNIT SCALE TO FIND ACTUAL DIMENSIONS
5.15 SCALE FACTOR TO FIND ACTUAL DIMENSIONS
5.16 PROBLEM SOLVING PLAN, PROPORTIONS
5.17 CONVERSION USING UNIT ANALYSIS
Introduction
In Math 7, the learning content is divided into Concepts. Each Concept is complete and whole providing focusedlearning on an indicated objective. Theme-based Concepts provide students with experiences that integrate thecontent of each Concept. Students are given opportunities to practice the skills of each Concept through real-worldsituations, examples, guided practice and independent practice sections. There are also video links provided to givestudents an audio/visual way of connecting with the content. In this Chapter, students will engage with Conceptson ratios, rates, unit rates, slope, identifying proportions, writing proportions, solving proportions, unit scale, scalefactor, problem solving with unit analysis and problem solving with proportions.
399
5.1. Equivalent Ratios www.ck12.org
5.1 Equivalent Ratios
Here you’ll learn to identify and write different forms of equivalent ratios among rational numbers.
Have you ever participated in a reading contest or challenge?
Kayla and Torrey are both in Mrs. Henderson’s seventh grade Language arts class. On the first day of school, Mrs.Henderson posed a reading challenge to the class. The challenge is to see how many books they can each readthroughout the entire year. The books would be read in silent reading or outside of school and the honor systemwould be employed. Each student is to keep track of the title and author of each book as they read it. At the end ofthe year, they would celebrate their accomplishments with a pizza party and students can earn extra credit towardstheir final grade. While some students were hesitant to take on the challenge, all loved the promise of a pizza partyand extra credit. Mrs. Henderson won them over.
Kayla and Torrey have been participating in the challenge since day one. By October, eight weeks into school, Kaylahad already finished 6 books.
“I have six read,” Kayla said biting into her sandwich at lunch.
“I think I am reading at the same pace,” Torrey said. “After four weeks, I had already finished 3 books.”
“Are you sure,” Kayla asked.
“Well, I need to count, but I am pretty sure that we have both finished reading the same number of books.”
Is Torrey correct? Have the girls each read the same number of books now that 8 weeks have passed?
To figure this out, you will need to use equivalent ratios. Equivalent ratios are the topic of this first Concept,pay attention and you be able to figure out the book dilemma at the end of the Concept.
400
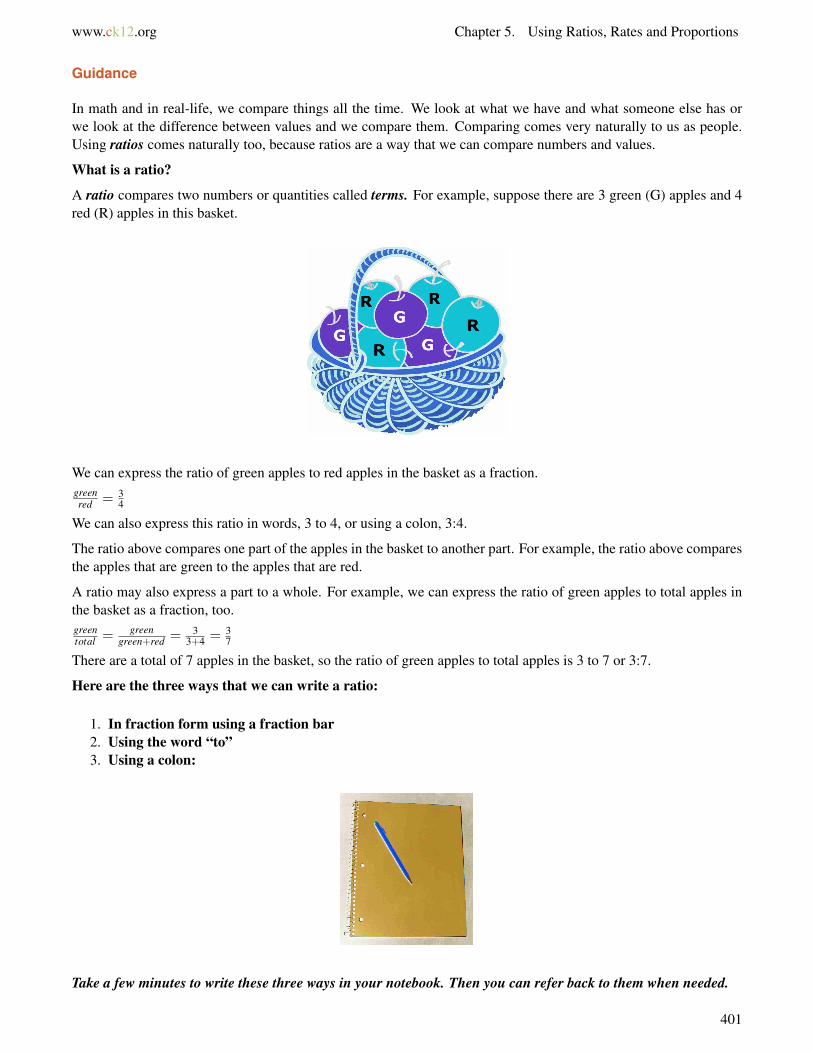
www.ck12.org Chapter 5. Using Ratios, Rates and Proportions
Guidance
In math and in real-life, we compare things all the time. We look at what we have and what someone else has orwe look at the difference between values and we compare them. Comparing comes very naturally to us as people.Using ratios comes naturally too, because ratios are a way that we can compare numbers and values.
What is a ratio?
A ratio compares two numbers or quantities called terms. For example, suppose there are 3 green (G) apples and 4red (R) apples in this basket.
We can express the ratio of green apples to red apples in the basket as a fraction.greenred = 3
4
We can also express this ratio in words, 3 to 4, or using a colon, 3:4.
The ratio above compares one part of the apples in the basket to another part. For example, the ratio above comparesthe apples that are green to the apples that are red.
A ratio may also express a part to a whole. For example, we can express the ratio of green apples to total apples inthe basket as a fraction, too.greentotal = green
green+red = 33+4 = 3
7
There are a total of 7 apples in the basket, so the ratio of green apples to total apples is 3 to 7 or 3:7.
Here are the three ways that we can write a ratio:
1. In fraction form using a fraction bar2. Using the word “to”3. Using a colon:
Take a few minutes to write these three ways in your notebook. Then you can refer back to them when needed.
401
5.1. Equivalent Ratios www.ck12.org
Now that you know how to write a ratio, let’s think about equivalent ratios.
A ratio shows the relationship between two quantities. Equivalent ratios can be used to show the same relationshipbetween two quantities. Remember that the word “equivalent” means equal.
Because we can write ratios in fraction form, we can use what we know about finding equivalent fractions tohelp us identify equivalent ratios. Here is where simplifying fractions is going to help us. We can simplifyratios to discover equivalence just as we can simplify fractions.
Determine if these two ratios are equivalent 23 and 10
15 .
We can start by simplifying the larger of the two fractions. If they simplify to the same numbers, then we know thatthe two ratios are equivalent.
10÷515÷5
=23
23=
23
These are both equal ratios.
Simplifying is one way to check for equivalence. We can also create equivalent ratios by multiplying just aswe would make equivalent fractions.
Change 23 to a ratio with 15 as the second term (the denominator).
Since 3×5 = 15, multiply both terms of the ratio 23 by 5.
23 = 2×5
3×5 = 1015
This shows that the ratio 23 is equivalent to the ratio 10
15 .
So, the two ratios listed above are equivalent.
Determine if these two ratios are equivalent 7:6 and 13:12.
Rewrite the ratios as fractions 76 and 13
12 .
Change 76 to a ratio with 12 as the second term.
Since 6×2 = 12, multiply both terms of the ratio 76 by 2.
76 = 7×2
6×2 = 1412
When the second term (the denominator) is 12, the equivalent ratio for 76 is 14
12 , not 1312 .
So, 7:6 and 13:12 are not equivalent ratios.
’Another way to determine if two ratios are equivalent is to cross multiply the terms in the ratio. If the crossproducts are equal, then the two ratios are equivalent. If the cross products are not equal, then the two ratios arenot equivalent.
Determine whether or not each pair of ratios is equivalent. Write yes or no.
Example A
34 and 9
12
Solution: Yes
402
www.ck12.org Chapter 5. Using Ratios, Rates and Proportions
Example B
56 and 20
30
Solution: No
Example C
45 and 8
10
Solution: Yes
Now it is time to apply what you have learned in this lesson to our original problem. Here it is again.
Kayla and Torrey are both in Mrs. Henderson’s seventh grade Language arts class. On the first day of school, Mrs.Henderson posed a reading challenge to the class. The challenge is to see how many books they can each readthroughout the entire year. The books would be read in silent reading or outside of school and the honor systemwould be employed. Each student is to keep track of the title and author of each book as they read it. At the end ofthe year, they would celebrate their accomplishments with a pizza party and students can earn extra credit towardstheir final grade. While some students were hesitant to take on the challenge, all loved the promise of a pizza partyand extra credit. Mrs. Henderson won them over.
Kayla and Torrey have been participating in the challenge since day one. By October, eight weeks into school, Kaylahad already finished 6 books.
“I have six read,” Kayla said biting into her sandwich at lunch.
“I think I am reading at the same pace,” Torrey said. “After four weeks, I had already finished 3 books.”
“Are you sure,” Kayla asked.
“Well, I need to count, but I am pretty sure that we have both finished reading the same number of books.”
Is Torrey correct? Have the girls each read the same number of books now that 8 weeks have passed?
To solve this problem, we need to figure out if the girls have been reading the same number of books in thesame number of weeks. First, let’s write a ratio that compares Kayla’s books read to the number of weeks.
Kayla read 6 books in 8 weeks.booksweeks =
68
Torrey said that she believes that she is reading on the same pace as Kayla. She says that she read 3 booksafter four weeks.booksweeks =
34
403
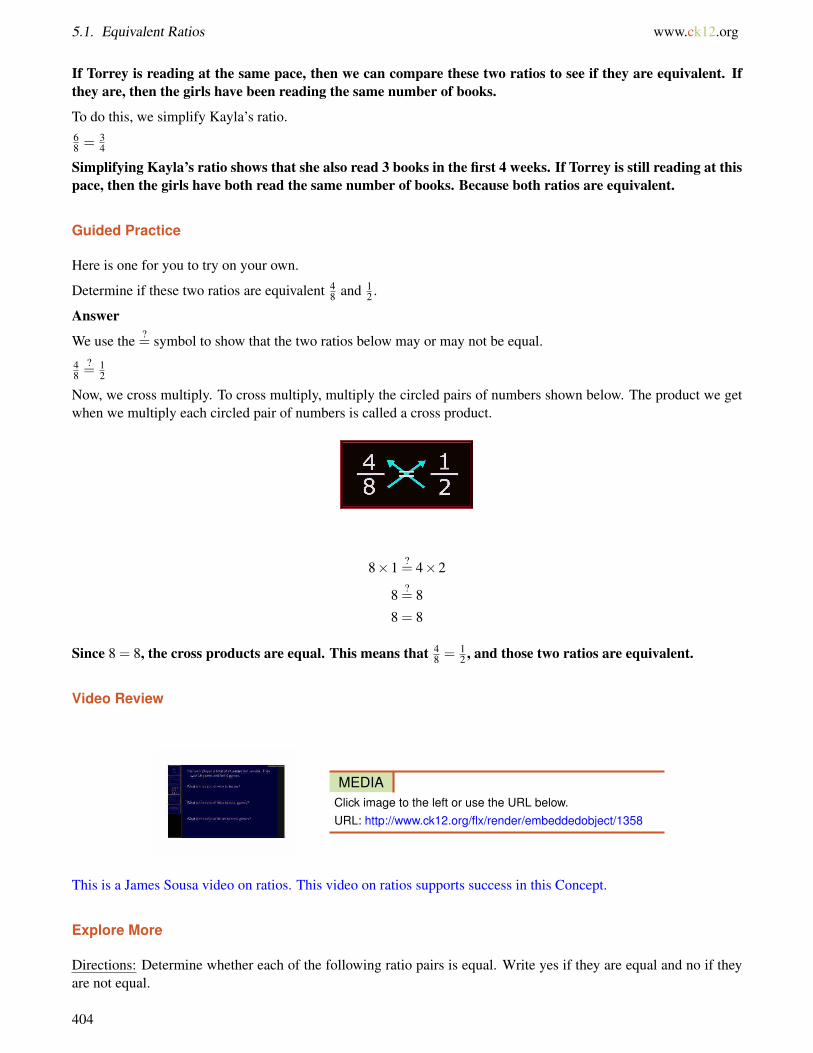
5.1. Equivalent Ratios www.ck12.org
If Torrey is reading at the same pace, then we can compare these two ratios to see if they are equivalent. Ifthey are, then the girls have been reading the same number of books.
To do this, we simplify Kayla’s ratio.68 = 3
4
Simplifying Kayla’s ratio shows that she also read 3 books in the first 4 weeks. If Torrey is still reading at thispace, then the girls have both read the same number of books. Because both ratios are equivalent.
Guided Practice
Here is one for you to try on your own.
Determine if these two ratios are equivalent 48 and 1
2 .
Answer
We use the ?= symbol to show that the two ratios below may or may not be equal.
48
?= 1
2
Now, we cross multiply. To cross multiply, multiply the circled pairs of numbers shown below. The product we getwhen we multiply each circled pair of numbers is called a cross product.
8×1 ?= 4×2
8 ?= 8
8 = 8
Since 8 = 8, the cross products are equal. This means that 48 = 1
2 , and those two ratios are equivalent.
Video Review
MEDIAClick image to the left or use the URL below.URL: http://www.ck12.org/flx/render/embeddedobject/1358
This is a James Sousa video on ratios. This video on ratios supports success in this Concept.
Explore More
Directions: Determine whether each of the following ratio pairs is equal. Write yes if they are equal and no if theyare not equal.
404
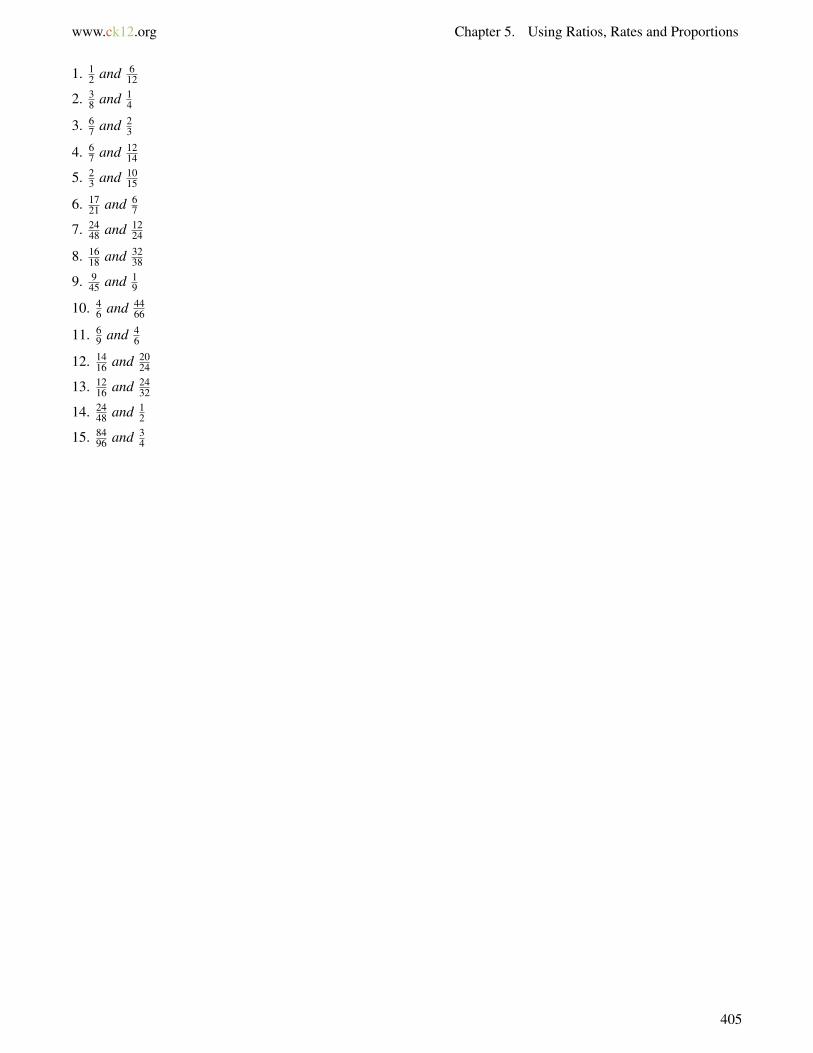
www.ck12.org Chapter 5. Using Ratios, Rates and Proportions
1. 12 and 6
12
2. 38 and 1
4
3. 67 and 2
3
4. 67 and 12
14
5. 23 and 10
15
6. 1721 and 6
7
7. 2448 and 12
24
8. 1618 and 32
38
9. 945 and 1
9
10. 46 and 44
66
11. 69 and 4
6
12. 1416 and 20
24
13. 1216 and 24
32
14. 2448 and 1
2
15. 8496 and 3
4
405

5.2. Ratios in Simplest Form www.ck12.org
5.2 Ratios in Simplest Form
Here you’ll learn to write ratios in simplest form.
Have you ever had a goal that you wanted to meet?
Joanna has a goal of reading 16 books in the first semester of the new school year. By Halloween, she had read fourout of 16 books.
Joanna wants to use a ratio to express her progress. What is the simplest way to write this ratio?
This Concept is about simplifying ratios. By the end of it, you will be able to complete this task.
Guidance
Previously we worked on how to simplify ratios that are in fraction form to see if they are equivalent or not. We willexplore this further in this section.
What does it mean to simplify?
To simplify means to make smaller. When we simplify, we make a fraction smaller. It is still equivalent to the largerform of the fraction, but it is simpler.
How do we simplify a ratio in fraction form?
To write a ratio in simplest form, find the greatest common factor of both terms in the ratio. The greatest commonfactor of two numbers is the greatest number that divides both numbers evenly. Then, divide both terms of the ratioby the greatest common factor.
This is basically the same procedure you use to rewrite a fraction in simplest form.
Write this ratio in simplest form 2024 .
First, find the greatest common factor of the terms 20 and 24.
The factors of 20 are 1, 2, 4, 5, 10, and 20.
The factors of 24 are 1, 2, 3, 4, 6, 8, 12, and 24.
The factors that both 20 and 24 have in common are 1, 2 and 4.
The greatest of those common factors is 4, so divide both terms by 4 to write the ratio in simplest form.2024 = 20÷4
24÷4 = 56
So, the simplest form of the ratio 2024 is 5
6 .
How is this useful when working with ratios?
It is useful because we can simplify ratios in fraction form to see if they are equivalent. We can also use a simplifiedratio to find an equivalent ratio. To do this, you can multiply both terms of the original ratio by the same number tofind an equivalent ratio.
Write three equivalent ratios for this ratio 1:9.
The ratio 1:9 or 19 is already in simplest form. Notice that we wrote the ratio into fraction form so that it is easier to
work with.
406
www.ck12.org Chapter 5. Using Ratios, Rates and Proportions
Now, we will write three equivalent ratios by multiplying both terms by the same number.
It does not matter which numbers we choose to multiply the terms. Let’s multiply by 2, first.19 = 1×2
9×2 = 218 or 2 : 18
Let’s multiply by 5, next.19 = 1×5
9×5 = 545 or 5 : 45
Let’s multiply by 100, next.19 = 1×100
9×100 = 100900 or 100 : 900
So, three ratios that are equivalent to 1:9 are 2:18, 5:45, and 100:900.
Now it’s time for you to try a few on your own.
Example A
Simplify this ratio: 14:16
Solution: 7 : 8
Example B
Simplify this ratio: 3 to 18
Solution: 1 to 6
Example C
Write an equivalent ratio: 4 to 5
Solution: 8 to 10
Now back to Joanna and the books.
Joanna has a goal of reading 16 books in the first semester of the new school year. By Halloween, she had read fourout of 16 books.
407
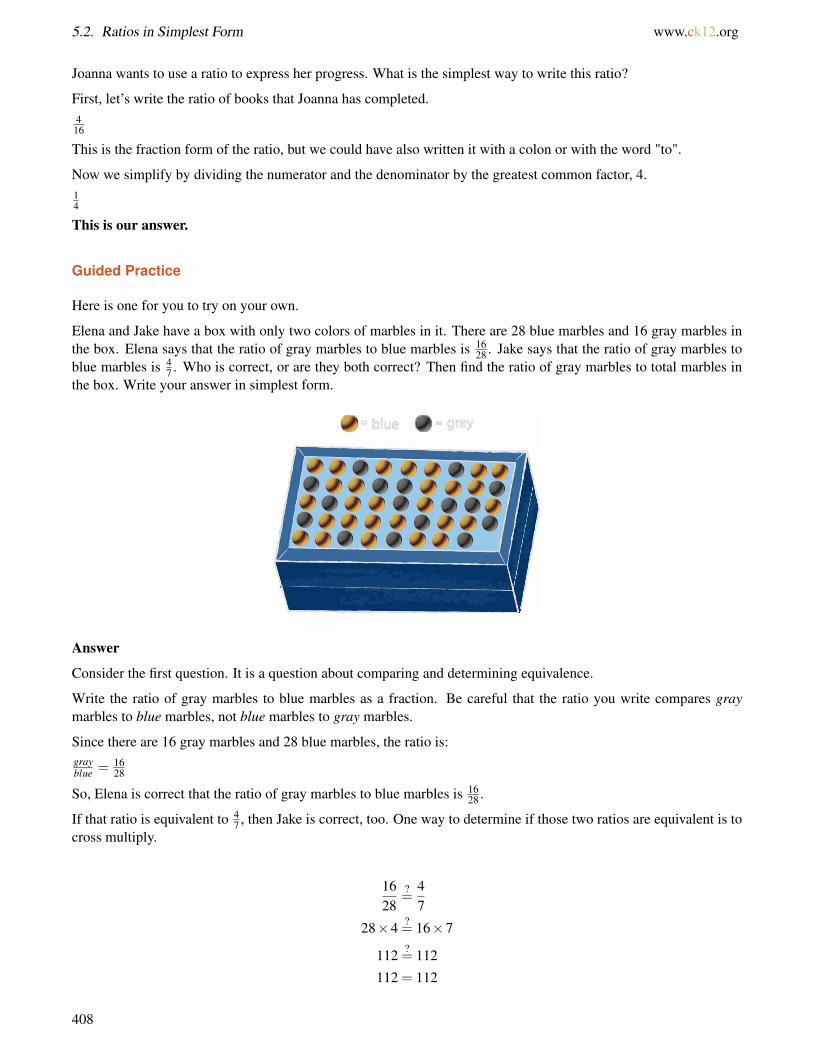
5.2. Ratios in Simplest Form www.ck12.org
Joanna wants to use a ratio to express her progress. What is the simplest way to write this ratio?
First, let’s write the ratio of books that Joanna has completed.416
This is the fraction form of the ratio, but we could have also written it with a colon or with the word "to".
Now we simplify by dividing the numerator and the denominator by the greatest common factor, 4.14
This is our answer.
Guided Practice
Here is one for you to try on your own.
Elena and Jake have a box with only two colors of marbles in it. There are 28 blue marbles and 16 gray marbles inthe box. Elena says that the ratio of gray marbles to blue marbles is 16
28 . Jake says that the ratio of gray marbles toblue marbles is 4
7 . Who is correct, or are they both correct? Then find the ratio of gray marbles to total marbles inthe box. Write your answer in simplest form.
Answer
Consider the first question. It is a question about comparing and determining equivalence.
Write the ratio of gray marbles to blue marbles as a fraction. Be careful that the ratio you write compares graymarbles to blue marbles, not blue marbles to gray marbles.
Since there are 16 gray marbles and 28 blue marbles, the ratio is:grayblue = 16
28
So, Elena is correct that the ratio of gray marbles to blue marbles is 1628 .
If that ratio is equivalent to 47 , then Jake is correct, too. One way to determine if those two ratios are equivalent is to
cross multiply.
1628
?=
47
28×4 ?= 16×7
112 ?= 112
112 = 112
408
www.ck12.org Chapter 5. Using Ratios, Rates and Proportions
Since the cross products are equal, the two ratios are equivalent.
So, the answer to the first question is that Elena and Jake are both correct.
Now let’s think about the second part of the question. To figure this out, we need to figure out the ratio ofgray marbles to total marbles in the box.graytotal =
graygray+blue =
1616+28 = 16
44
Write that ratio in simplest form.
The factors of 16 are: 1, 2, 4, 8, and 16.
The factors of 44 are: 1, 2, 4, 11, 22, and 44.
The greatest common factor of 16 and 24 is 4. So, divide both terms by 4.1644 = 16÷4
44÷4 = 411
The ratio of gray marbles to total marbles, written in simplest form, is 411 .
Video Review
MEDIAClick image to the left or use the URL below.URL: http://www.ck12.org/flx/render/embeddedobject/5409
This James Sousa video is about writing ratios in simplest form. It includes fractions and decimals.
Explore More
Directions: Simplify each ratio. Write the simplified version in the same form of the ratio.
1. 3 to 6
2. 5:20
3. 18 to 22
4. 1820
5. 2555
6. 6 to 42
7. 18 to 10
8. 12 to 4
9. 16:8
10. 24 to 16
11. 18 to 36
12. 54 to 9
13. 81:27
409

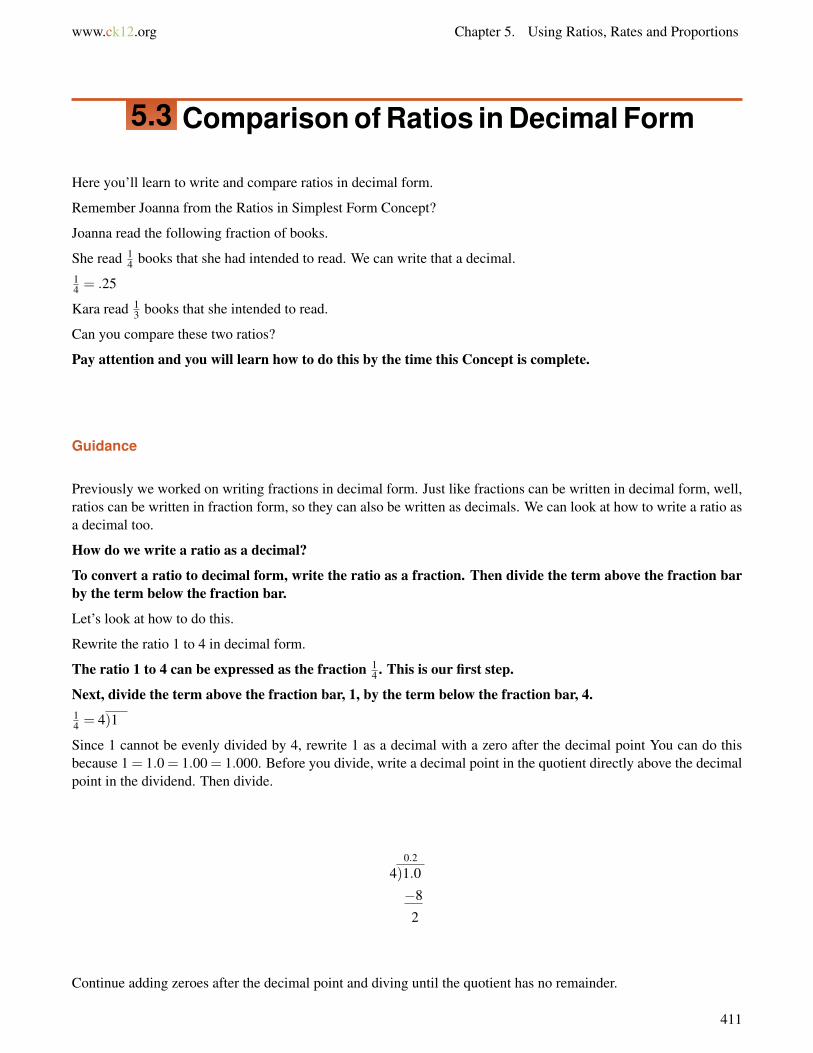
www.ck12.org Chapter 5. Using Ratios, Rates and Proportions
5.3 Comparison of Ratios in Decimal Form
Here you’ll learn to write and compare ratios in decimal form.
Remember Joanna from the Ratios in Simplest Form Concept?
Joanna read the following fraction of books.
She read 14 books that she had intended to read. We can write that a decimal.
14 = .25
Kara read 13 books that she intended to read.
Can you compare these two ratios?
Pay attention and you will learn how to do this by the time this Concept is complete.
Guidance
Previously we worked on writing fractions in decimal form. Just like fractions can be written in decimal form, well,ratios can be written in fraction form, so they can also be written as decimals. We can look at how to write a ratio asa decimal too.
How do we write a ratio as a decimal?
To convert a ratio to decimal form, write the ratio as a fraction. Then divide the term above the fraction barby the term below the fraction bar.
Let’s look at how to do this.
Rewrite the ratio 1 to 4 in decimal form.
The ratio 1 to 4 can be expressed as the fraction 14 . This is our first step.
Next, divide the term above the fraction bar, 1, by the term below the fraction bar, 4.14 = 4)1
Since 1 cannot be evenly divided by 4, rewrite 1 as a decimal with a zero after the decimal point You can do thisbecause 1 = 1.0 = 1.00 = 1.000. Before you divide, write a decimal point in the quotient directly above the decimalpoint in the dividend. Then divide.
0.2
4)1.0
−8
2
Continue adding zeroes after the decimal point and diving until the quotient has no remainder.
411
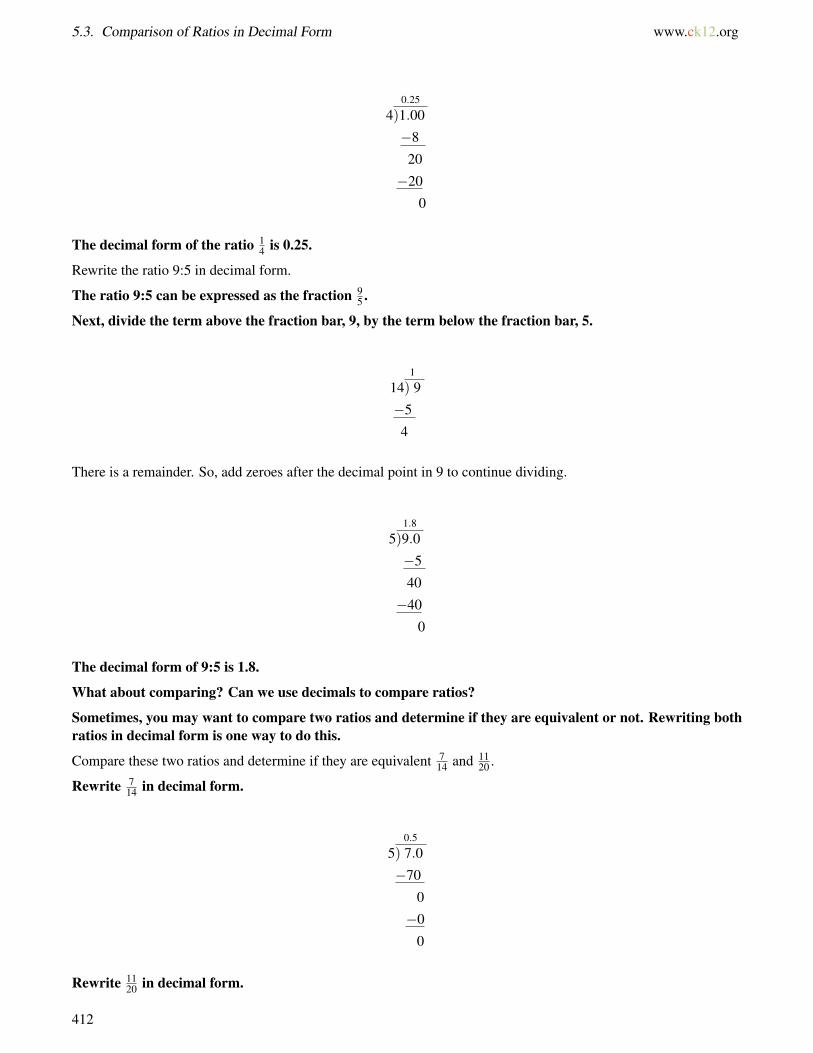
5.3. Comparison of Ratios in Decimal Form www.ck12.org
0.25
4)1.00
−8
20
−20
0
The decimal form of the ratio 14 is 0.25.
Rewrite the ratio 9:5 in decimal form.
The ratio 9:5 can be expressed as the fraction 95 .
Next, divide the term above the fraction bar, 9, by the term below the fraction bar, 5.
1
14) 9
−5
4
There is a remainder. So, add zeroes after the decimal point in 9 to continue dividing.
1.8
5)9.0
−5
40
−40
0
The decimal form of 9:5 is 1.8.
What about comparing? Can we use decimals to compare ratios?
Sometimes, you may want to compare two ratios and determine if they are equivalent or not. Rewriting bothratios in decimal form is one way to do this.
Compare these two ratios and determine if they are equivalent 714 and 11
20 .
Rewrite 714 in decimal form.
0.5
5) 7.0
−70
0
−0
0
Rewrite 1120 in decimal form.
412
www.ck12.org Chapter 5. Using Ratios, Rates and Proportions
0.55
20)11.00
−100
100
−100
0
To compare the ratios in decimal form, give each decimal the same number of decimal places. In other words,give 0.5 two decimal places: 0.5 = 0.50.
Now compare. Since both decimals have a 0 in the ones place and a 5 in the tenths place, compare the digitsin the hundredths place.
0.50
0.55
Since 0 < 5,0.50 < 0.55. So, the ratios, 714 and 11
20 , are not equivalent.
In fact, 714 < 11
20 .
Write each ratio as a decimal.
Example A
5 to 10
Solution: .5
Example B
4 to 10
Solution: .4
Example C
Compare 6 to 10 and 1 to 4
Solution: >
Now back to the book comparison. Here is the original problem once again.
Joanna read the following fraction of books.
She read 14 books that she had intended to read. We can write that a decimal.
14 = .25
Kara read 13 books that she intended to read.
Can you compare these two ratios?
First, let’s write a statement so that we can compare the decimals.
413
5.3. Comparison of Ratios in Decimal Form www.ck12.org
.25 and 13 = .33
One-third becomes a repeating decimal, but for our purposes we can round to the hundredths place.
.25 < .33
This is our answer.
Guided Practice
Here is one for you to try on your own.
Write this ratio as a decimal.35
Answer
To do this, we divide 3 by 5.
3÷5 = .6
This is our answer.
Video Review
MEDIAClick image to the left or use the URL below.URL: http://www.ck12.org/flx/render/embeddedobject/5409
This is a James Sousa video on simplifying ratios in decimal and fraction form and is a supporting video to this Concept.
Explore More
Directions: Write each ratio as a decimal. Round to the nearest hundredth when necessary.
1. 1 to 4
2. 3 to 6
3. 3:4
4. 8 to 5
5. 7 to 28
6. 8 to 10
7. 9 to 100
8. 15:20
9. 18:50
10. 3 to 10
414
www.ck12.org Chapter 5. Using Ratios, Rates and Proportions
11. 6 to 8
12. 15 to 35
Directions: Compare the following ratios using <, >or =.
13. .55 ____1 to 2
14. 3:8 _____ 4 to 9
15. 1 to 2 _____ 4:8
415
5.4. Identification and Writing of Equivalent Rates www.ck12.org
5.4 Identification and Writing of EquivalentRates
Here you’ll learn to identify and write equivalent rates.
Have you ever tried to figure out a better buy?
Kyle went to the bookstore. There was a big sale going on. In one corner of the store, you could buy four books fortwelve dollars. In another part of the bookstore, you could buy three books for nine dollars. Kyle thinks that this isthe same deal.
Is he correct?
To answer this question, you will need to understand equivalent rates. This is the information that will bepresented in this Concept.
Guidance
What is a rate?
A rate is a special kind of ratio. It compares two different types of units, such as dollars and pounds.
Suppose you are buying turkey at a supermarket, and you pay $12 for 2 pounds of turkey. That is an example of arate. The turkey you bought cost $6 per pound for the turkey. That is another example of a rate.
Notice the word “per”. This word signals us that we are talking about a rate.
We use rates all the time. We use them when shopping for example, per pound. We use them with gasoline, thinkper mile. We use them with speed, per gallon or with pricing, $4.00 per yard of material.
Sometimes, two rates are equivalent or equal.
How can we tell if two rates are equivalent?
Two rates are equivalent if they show the same relationship between two units of measure. We can use thesame strategies to find equivalent rates that we use to find equivalent ratio.
Determine if these two rates are equivalent 40 miles in 2 hours, and 80 miles in 4 hours.
416
www.ck12.org Chapter 5. Using Ratios, Rates and Proportions
You can think of this as the distance and time of two different cars. Did they both travel at an equal rate?
First, express each rate as a fraction. Be sure to keep the terms consistent. That is, if the first ratio comparesmiles to hours, the second ratio should also compare miles to hours.
40 miles in 2 hours =40mi2h
=402
80 miles in 4 hours =80mi4h
=804
Change the ratio, 402 , to a ratio with 4 as the second term, or denominator.
Since 2×2 = 4, multiply both terms of the ratio 402 by 2.
402 = 40×2
2×2 = 804
This shows that the ratio 804 is equivalent to the ratio 40
2 .
This means that the rate 80 miles in 4 hours is equivalent to the rate 40 miles in 2 hours.
The two cars traveled at the same rate.
You can also cross multiply to determine if two rates are equivalent. Let’s look at an example where thisstrategy is applied.
Determine if these two rates are equivalent 5 meters every 3 seconds and 20 meters every 18 seconds.
You can think of this in terms of speed. The machine wound 5 meters of wire in three seconds. A secondmachine wound 20 meters of wire in 18 seconds. Did they wind the wire at the same rate?
First, cross multiply to determine if the rates are equivalent or not.
5m3sec
?=
20m18sec
53
?=
2018
3×20 ?= 5×18
60 ?= 90
60 6= 90
Since the cross products are not equal, the rates are not equivalent.
Determine if each rate is equivalent to the other rate.
417
5.4. Identification and Writing of Equivalent Rates www.ck12.org
Example A
3 feet in 9 seconds and 6 feet in 18 seconds
Solution: Equal
Example B
5 miles in 30 minutes and 6 miles in 42 minutes
Solution: Not Equal
Example C
5 pounds for $20.00 and 8 pounds for $32.00
Solution: Equal
Now back to the books.
Kyle went to the bookstore. There was a big sale going on. In one corner of the store, you could buy four books fortwelve dollars. In another part of the bookstore, you could buy three books for nine dollars dollars. Kyle thinks thatthis is the same deal.
Is he correct?
To figure this out, we can write two ratios and compare them. Let’s use each deal as our ratios.412 and 3
9
Simplifying these two ratios will show us that they both are equal to 13 .
These two ratios are equivalent.
Guided Practice
Here is one for you to try on your own.
Write an equivalent rate for 3 out of 10.
Answer
We can do this by creating any equal ratio. We do this by multiplying both values in the ratio by the same number.
Here are some possible answer.
6 to 20
9 to 30
12 to 40
15 to 50
There are many possible answers.
Video Review
418
www.ck12.org Chapter 5. Using Ratios, Rates and Proportions
MEDIAClick image to the left or use the URL below.URL: http://www.ck12.org/flx/render/embeddedobject/5411
This is a James Sousa video on rates and unit rates.
Explore More
Directions: Write an equivalent rate for each rate.
1. 2 for $10.00
2. 3 for $15.00
3. 5 gallons for $12.50
4. 16 pounds for $40.00
5. 18 inches for $2.00
6. 5 pounds of blueberries for $20.00
7. 40 miles in 80 minutes
8. 20 miles in 4 hours
9. 10 feet in 2 minutes
10. 12 pounds in 6 weeks
Directions: Write each rate as a fraction and simplify it.
11. 2 for $10.00
12. 3 for $15.00
13. 5 gallons for $25.00
14. 40 pounds for $80.00
15. 18 inches for $2.00
419
5.5. Unit Rates www.ck12.org
5.5 Unit Rates
Here you’ll learn to find unit rates.
Remember the reading challenge?
Manuel loves to read. He found a series of mystery books that take place in the world of medieval knights, and hehas been working his way through the series. There are twelve books in the series.
After the first 5 weeks of school, Manuel has finished 8 of the 12 books.
“How many have you finished?” his sister Sarina asked at breakfast.
“I have read 8 out of 12,” Manuel said. “I have four more to go to finish the series.”
“How long is that going to take you?” Sarina asked.
Manuel had to think for a few minutes about this. Then he took out his notebook to do some figuring.
Think about this with Manuel. At this rate, how many books is he reading per week? How many weeks will it takehim to read all 12?
To figure out this problem, you will need to know about rates and unit rates. In this Concept, you will learneverything that you need to know to solve this problem. By the end, you will be able to help Manuel keeptrack of books.
Guidance
There is a special kind of rate which is called a unit rate.
A unit rate has a denominator of 1, meaning that it is the measure for one of whatever you are talking about:1 mile, 1 pound, 1 foot, etc.
When we talk about unit rates, we are talking about singular measurement and single rates.
420
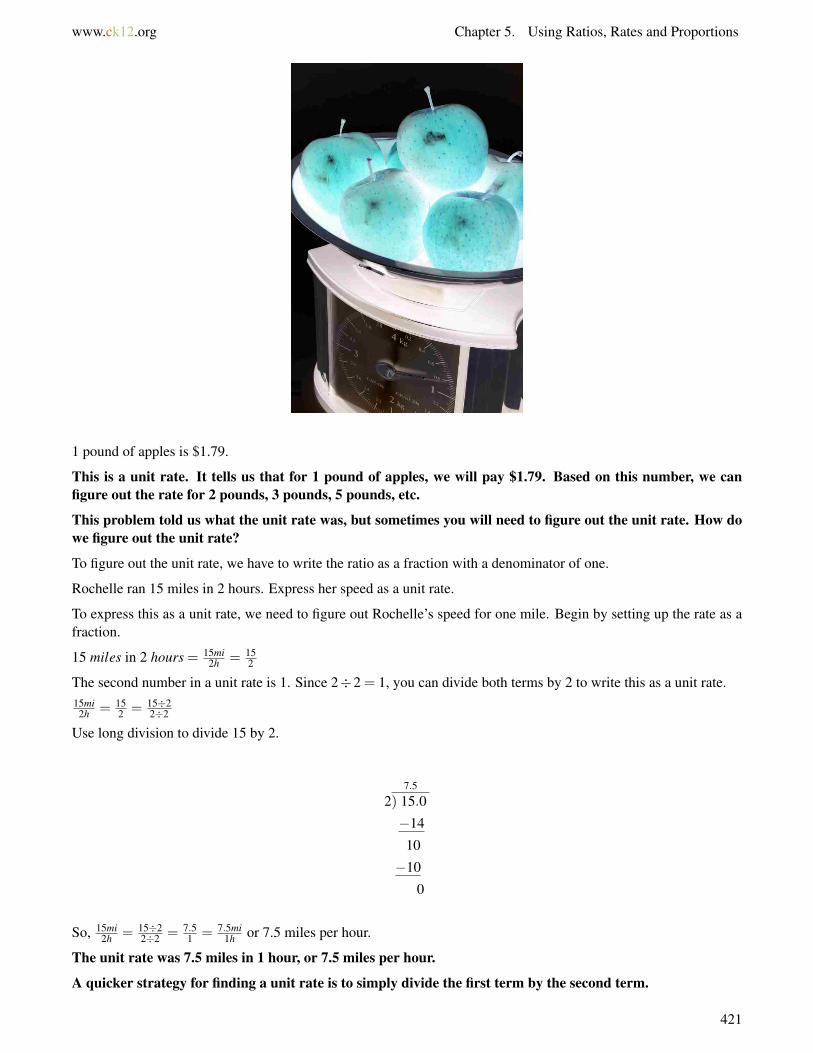
www.ck12.org Chapter 5. Using Ratios, Rates and Proportions
1 pound of apples is $1.79.
This is a unit rate. It tells us that for 1 pound of apples, we will pay $1.79. Based on this number, we canfigure out the rate for 2 pounds, 3 pounds, 5 pounds, etc.
This problem told us what the unit rate was, but sometimes you will need to figure out the unit rate. How dowe figure out the unit rate?
To figure out the unit rate, we have to write the ratio as a fraction with a denominator of one.
Rochelle ran 15 miles in 2 hours. Express her speed as a unit rate.
To express this as a unit rate, we need to figure out Rochelle’s speed for one mile. Begin by setting up the rate as afraction.
15 miles in 2 hours = 15mi2h = 15
2
The second number in a unit rate is 1. Since 2÷2 = 1, you can divide both terms by 2 to write this as a unit rate.15mi
2h = 152 = 15÷2
2÷2
Use long division to divide 15 by 2.
7.5
2) 15.0
−14
10
−10
0
So, 15mi2h = 15÷2
2÷2 = 7.51 = 7.5mi
1h or 7.5 miles per hour.
The unit rate was 7.5 miles in 1 hour, or 7.5 miles per hour.
A quicker strategy for finding a unit rate is to simply divide the first term by the second term.
421

5.5. Unit Rates www.ck12.org
Notice that to find the unit rate in the first situation, you could have simply divided 15 miles by 2 hours to find theunit rate in miles per hour. Notice that that is exactly what we did. The only difference is that we showed why thatstrategy works by writing the original rate as a fraction and then showing how to simplify it to find an equivalent ratewith a 1 in the denominator.
Try this out on this one.
Kyle ran 4 miles in 28 minutes. How fast did he run per mile?
“Per mile” let’s us know that we are looking for his rate for 1 mile. That is the unit rate.
We write a fraction ratio and divide.
minmiles
=284
28÷4 = 771
Kevin ran 1 mile in 7 minutes. That is the unit rate.
Try a few on your own. Find each unit rate.
Example A
5 pounds of apples for $2.00
Solution: 1 pound for $.40
Example B
45 miles for 3 gallons of gasoline
Solution: 15 miles for 1 gallon
Example C
18 inches in 2 minutes
Solution: 9 inches in 1 minute
422
www.ck12.org Chapter 5. Using Ratios, Rates and Proportions
Here is the original problem once again.
Manuel loves to read. He found a series of mystery books that take place in the world of medieval knights, and hehas been working his way through the series. There are twelve books in the series.
After the first 5 weeks of school, Manuel has finished 8 of the 12 books.
“How many have you finished?” his sister Sarina asked at breakfast.
“I have read 8 out of 12,” Manuel said. “I have four more to go to finish the series.”
“How long is that going to take you?” Sarina asked.
Manuel had to think for a few minutes about this. Then he took out his notebook to do some figuring.
Think about this with Manuel. At this rate, how many books is he reading per week? How many weeks will it takehim to read all 12?
There are two questions here to figure out. Let’s tackle the first one. We need to figure out how many booksManuel is reading per week. The word “per” lets us know that we want to figure out the number of books forone week. Let’s write a ratio to compare books read to weeks.8 books5 weeks
Next, we need to figure that out for 1 week. To do this, we divide 8 by 5.1.6
5)8.0
Manuel reads 1.6 books per week. We could also say that he reads a little more than 1 12 books per week.
Given this rate, how long will it take him to read 12 books? We can set up a pair of ratios to figure this out.1.6 books
1 week = 12 booksx weeks
If we divide 12 by 1.6, we will have the number of weeks.7.5
1.6)12.00
It will take Manuel 7 12 weeks to finish the series. In 2 1
2 more weeks he will finish the series.
Guided Practice
Here is one for you to try on your own.
Maria ran 5 miles in 60 minutes. Her brother Mario ran the same distance in half the time. What is Mario’s rate permile?
Answer
To figure this out, first notice that we are looking for Mario’s unit rate. To find this, we need to start with figuringout Maria’s. Then we know that Mario ran the same distance in half the time, so we can say that Mario’s unit rate isone-half of Maria’s. This means that the time that it takes Maria to run 1 mile, that Mario runs 1 mile in one-half thetime.12 (Maria’s unit rate) = Mario’s unit rate
First, we need to figure out Maria’s unit rate.60 min5 miles =
12 min1 mile
Maria runs 1 mile in 12 minutes.
Mario runs the same distance in half the time. Mario runs one mile in 6 minutes.
423
5.5. Unit Rates www.ck12.org
Video Review
MEDIAClick image to the left or use the URL below.URL: http://www.ck12.org/flx/render/embeddedobject/5411
This is a James Sousa video on rates and unit rates.
Explore More
Directions: Write a unit rate for each ratio.
1. 2 for $10.00
2. 3 for $15.00
3. 5 gallons for $12.50
4. 16 pounds for $40.00
5. 18 inches for $2.00
6. 5 pounds of blueberries for $20.00
7. 40 miles in 80 minutes
8. 20 miles in 4 hours
9. 10 feet in 2 minutes
10. 12 pounds in 6 weeks
11. 14 pounds for $7.00
12. 18 miles in 3 hours
13. 21 inches of cloth costs $7.00
14. 45 miles on 3 gallons of gasoline
15. 200 miles in four hours
424
www.ck12.org Chapter 5. Using Ratios, Rates and Proportions
5.6 Comparison of Unit Rates
Here you’ll learn to compare unit rates.
Remember the book challenge from the Unit Rates Concept?
Kelly read 8 books in three weeks. Marc read 10 books in 4 weeks.
Who has the faster rate?
To figure this out, you will need to write and compare unit rates. This Concept will teach you just how to dothat.
Guidance
Sometimes, it is helpful to compare unit rates. For example, a unit price is a type of unit rate. In real life, youmay want to compare two unit prices to determine which one is the better buy.
Felicia needs to buy sugar. She could buy a 16-ounce box of sugar for $1.12, or she could buy a 24-ounce box ofsugar for $1.44. Which is the better buy? How many cents per ounce cheaper is that buy?
Find the unit price per ounce for the 16-ounce box. Remember, you can find the unit price by dividing thefirst term by the second term.
$1.12 for 16 oz =$1.1216oz
$0.07
16)$1.12
−1.12
0
Find the unit price per ounce for the 24-ounce box.
$1.44 for 24 oz =$1.4424oz
$0.06
24)$1.44
−1.44
0
Since $0.06 <$0.07, the 24-ounce box has a cheaper unit price, $0.06 per ounce.
Subtract to find how much cheaper per ounce the better buy is $0.07 - $0.06 = $0.01
So, the 24-ounce box of sugar is the better buy. Felicia will pay $0.01 less per ounce if she buys the 24-ounce box.
Once you can figure out the unit rate, you can easily compare which unit rate is greater and which is less.
Now it’s time for you to compare a few unit rates on your own. Use <,>,or =.
Example A
3 to 1 ____ 6 to 2
Solution: =
425

5.6. Comparison of Unit Rates www.ck12.org
Example B
4 to 5 ____ 1620
Solution: =
Example C
18 to 3 ____ 15 to 5
Solution: >
Here is the original dilemma once again.
Kelly read 8 books in three weeks. Marc read 10 books in 4 weeks.
Who has the faster rate?
To figure this out, we have to turn each rate into a unit rate. We do this by dividing.
Kelly 83 = 2.6
1
Kelly read more than 2 1/2 books per week.
Marc 104 = 2.5
1
Marc read 2 1/2 books per week.
Kelly has the faster reading rate.
Guided Practice
Here is one for you to try on your own.
Marc put labels on 80 boxes in 6 minutes. Jeff put labels on 90 boxes in 8 minutes.
Who has the better rate?
Answer
To compare these two rates, we have to figure out the unit rates. This will tell us how many each man can do in oneminutes.
To figure this out, we write a ratio and divide.806 = 13.3
1
908 = 11.25
1
Marc has a better rate because he puts more labels on per minute.
Video Review
MEDIAClick image to the left or use the URL below.URL: http://www.ck12.org/flx/render/embeddedobject/5412
426
www.ck12.org Chapter 5. Using Ratios, Rates and Proportions
This is a James Sousa video on finding unit rates. It is a support video to this Concept.
Explore More
Directions: Determine whether each is equivalent or not.
1. 60 units in 3 minutes and 80 units in 4 minutes
2. $16 for 8 pounds and $22 for 10 pounds
3. 50 kilometers in 2 hours and 75 kilometers in 3 hours
Directions: Solve each problem.
4. Max paid $45 for 15 gallons of gasoline. What was the cost per gallon of gasoline?
5. Mr. Brown paid $8.28 for 12 cans of green beans. Express this cost as a unit price.
6. A train travels 480 kilometers in 3 hours. Express this speed as a unit rate.
7. Mrs. Jenkins paid $50 for 40 square feet of carpeting. What was the cost per square foot for the carpeting?
8. A copy machine can produce 310 copies in 5 minute. How many copies can the machine produce per minute?
Nadia needs to buy some cheddar cheese. An 8-ounce package of cheddar cheese costs $2.40. A 12-ounce packageof cheddar cheese costs $3.36.
9. Find the unit price for the 8-ounce package.
10. Find the unit price for the 12-ounce package.
11. Which is the better buy? How many cents per ounce cheaper is the better buy?
Joe drove 141 miles in 3 hours. His cousin Amy drove 102 miles in 2 hours. Assume both cousins were driving atconstant speeds.
12. How fast was Joe driving, in miles per hour?
13. How fast was Amy driving, in miles per hour?
14. Who was driving at a faster rate of speed?
15. How much faster was the faster person traveling?
427
5.7. Slope www.ck12.org
5.7 Slope
Here you’ll learn to recognize the slope of a line as the ratio of the vertical rise to the horizontal run and distinguishbetween types of slopes.
Have you ever thought of slope connected with books and reading? I know it sounds interesting. Take a look at thisdilemma.
Five of the students in Mrs. Henderson’s class have been tracking the number of books that they have read and havebeen comparing their results. During the first week, all five finished one book. After the second week, all five hadfinished two books. During the third week, all five had finished three books. After ten weeks, all five had finishedten books.
What is their rate? If you were to draw the rate of change on a graph comparing books to weeks, what would thegraph look like?
To understand this problem, you have to understand slope and graphs. All of this will be shown in thisConcept. At the end, you will understand how to show these values on a graph.
428
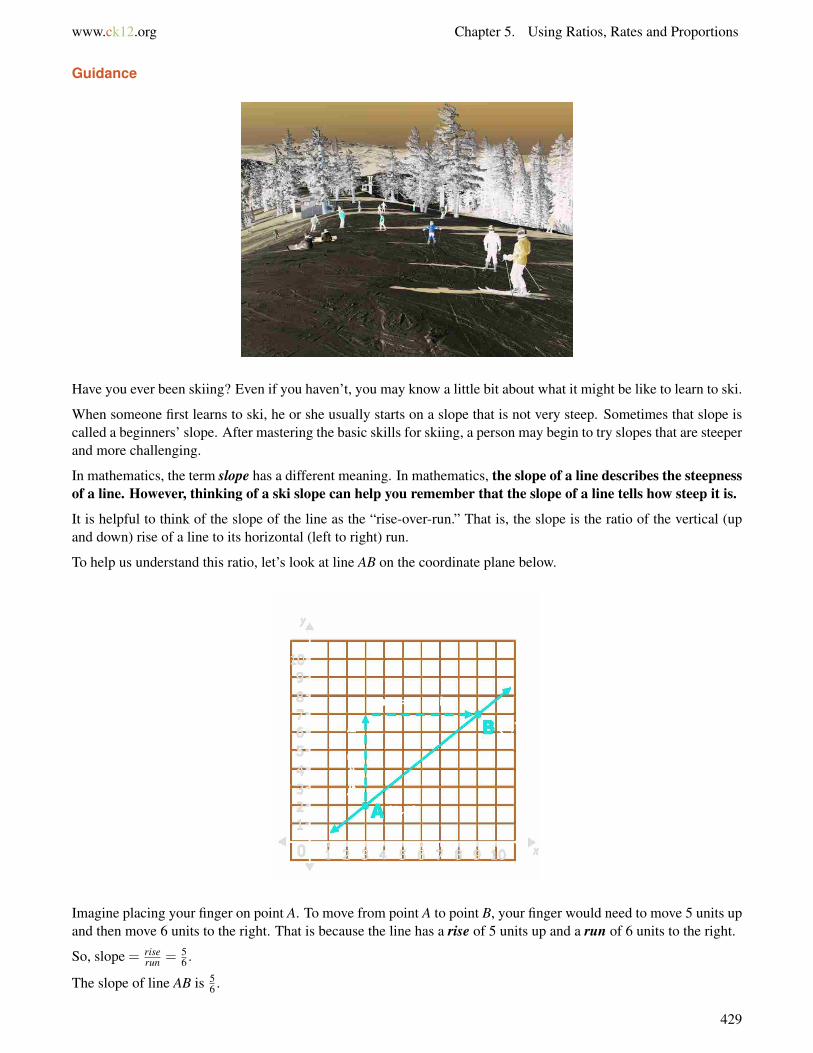
www.ck12.org Chapter 5. Using Ratios, Rates and Proportions
Guidance
Have you ever been skiing? Even if you haven’t, you may know a little bit about what it might be like to learn to ski.
When someone first learns to ski, he or she usually starts on a slope that is not very steep. Sometimes that slope iscalled a beginners’ slope. After mastering the basic skills for skiing, a person may begin to try slopes that are steeperand more challenging.
In mathematics, the term slope has a different meaning. In mathematics, the slope of a line describes the steepnessof a line. However, thinking of a ski slope can help you remember that the slope of a line tells how steep it is.
It is helpful to think of the slope of the line as the “rise-over-run.” That is, the slope is the ratio of the vertical (upand down) rise of a line to its horizontal (left to right) run.
To help us understand this ratio, let’s look at line AB on the coordinate plane below.
Imagine placing your finger on point A. To move from point A to point B, your finger would need to move 5 units upand then move 6 units to the right. That is because the line has a rise of 5 units up and a run of 6 units to the right.
So, slope = riserun = 5
6 .
The slope of line AB is 56 .
429
5.7. Slope www.ck12.org
Line AB has a slope of 56 , which is a positive slope.
Notice that line AB slants up from left to right!
Knowing some basic information about the slope of a line can tell you about its slant.
• A line that slants up from left to right has a positive slope.• A line that slants down from left to right has a negative slope.
Determine if the slope of each line shown below is positive or negative.
a.
430
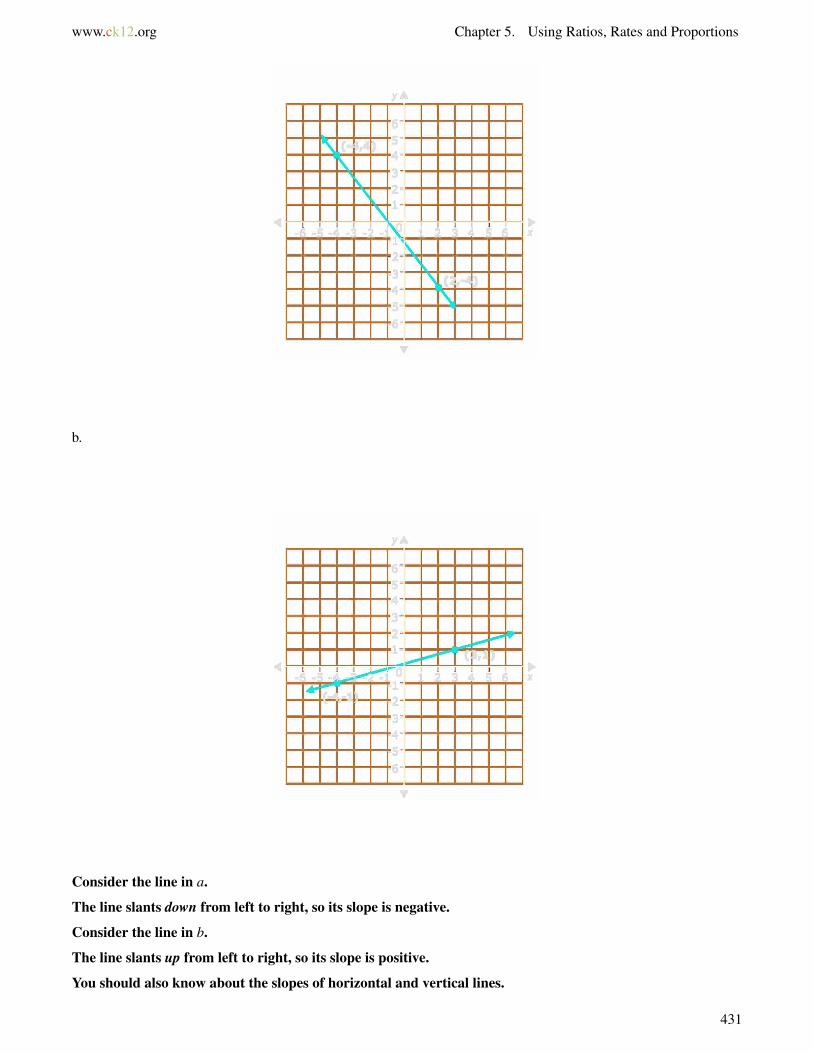
www.ck12.org Chapter 5. Using Ratios, Rates and Proportions
b.
Consider the line in a.
The line slants down from left to right, so its slope is negative.
Consider the line in b.
The line slants up from left to right, so its slope is positive.
You should also know about the slopes of horizontal and vertical lines.
431
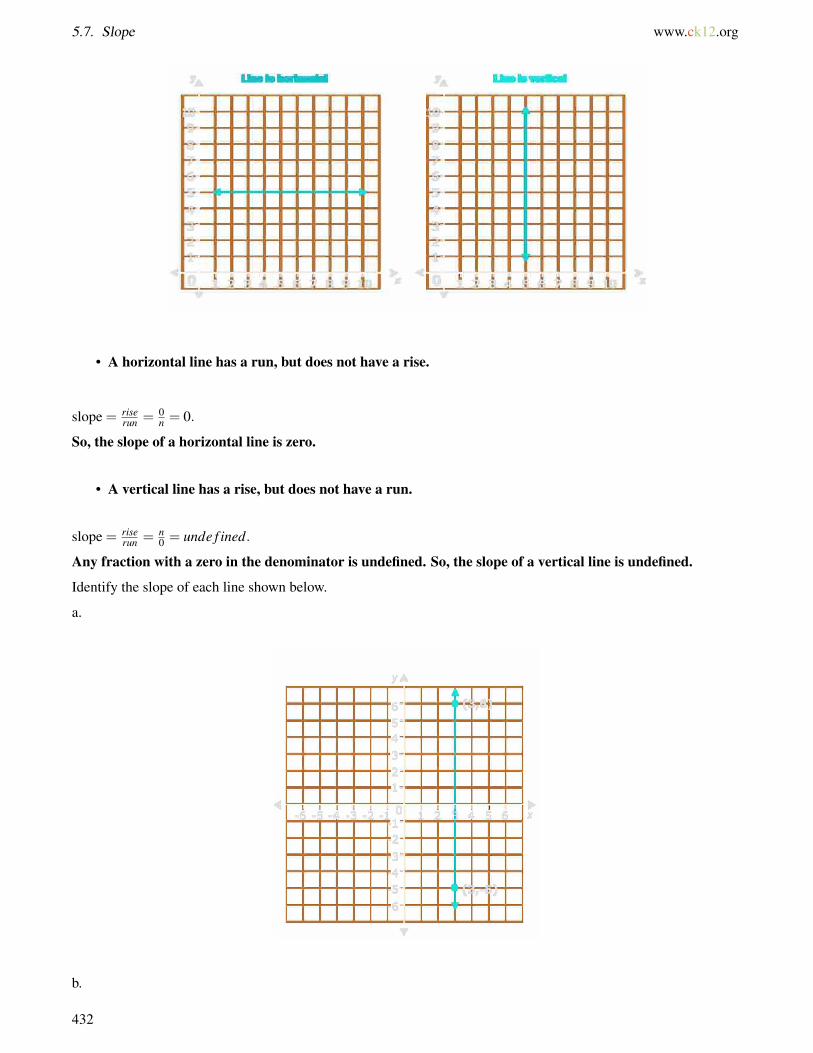
5.7. Slope www.ck12.org
• A horizontal line has a run, but does not have a rise.
slope = riserun = 0
n = 0.
So, the slope of a horizontal line is zero.
• A vertical line has a rise, but does not have a run.
slope = riserun = n
0 = unde f ined.
Any fraction with a zero in the denominator is undefined. So, the slope of a vertical line is undefined.
Identify the slope of each line shown below.
a.
b.
432
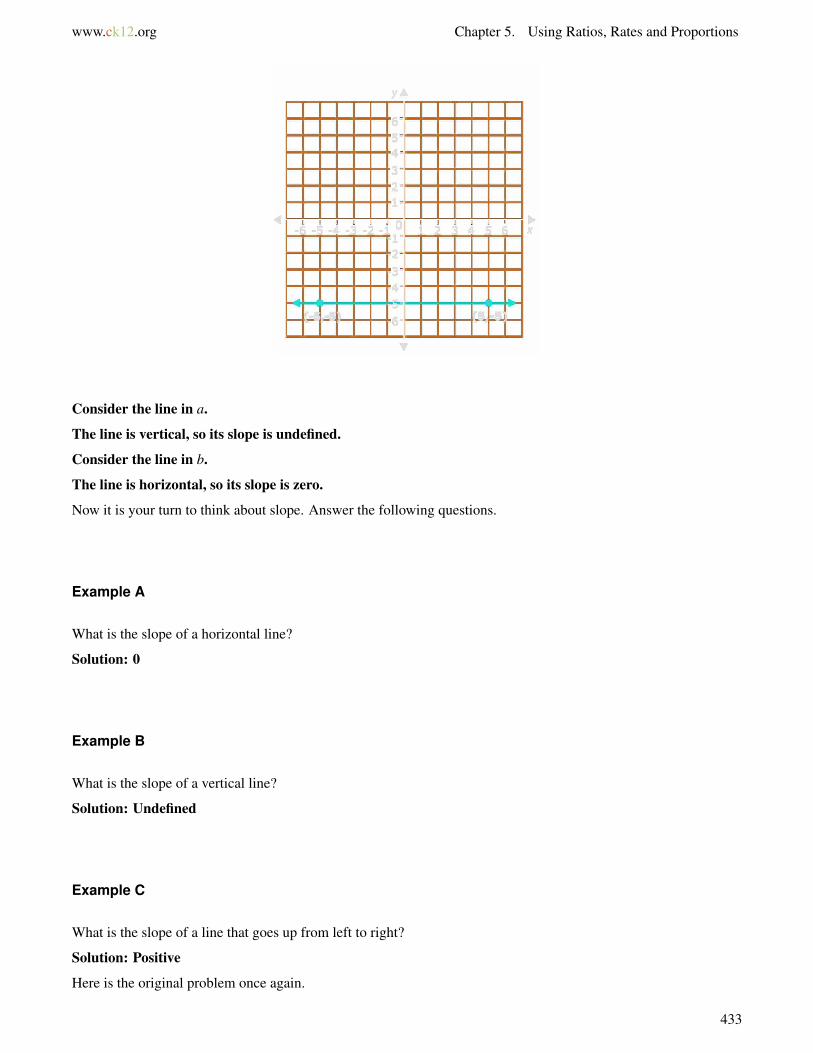
www.ck12.org Chapter 5. Using Ratios, Rates and Proportions
Consider the line in a.
The line is vertical, so its slope is undefined.
Consider the line in b.
The line is horizontal, so its slope is zero.
Now it is your turn to think about slope. Answer the following questions.
Example A
What is the slope of a horizontal line?
Solution: 0
Example B
What is the slope of a vertical line?
Solution: Undefined
Example C
What is the slope of a line that goes up from left to right?
Solution: Positive
Here is the original problem once again.
433
5.7. Slope www.ck12.org
Five of the students in Mrs. Henderson’s class have been tracking the number of books that they have read and havebeen comparing their results. During the first week, all five finished one book. After the second week, all five hadfinished two books. During the third week, all five had finished three books. After ten weeks, all five had finishedten books.
What is their rate? If you were to draw the rate of change on a graph comparing books to weeks, what would thegraph look like?
If you read the problem carefully you’ll see that the rate of the students is one book per week.
Let’s list their weeks and books in a table.
TABLE 5.1:
week books1 12 13 14 15 16 17 18 19 110 1
Now, let’s create a graph to show these results.
434

www.ck12.org Chapter 5. Using Ratios, Rates and Proportions
Guided Practice
Here is one for you to try on your own.
Is this slope positive, negative or undefined?
Answer
This line is vertical, therefore the slope of the line is undefined.
Video Review
435
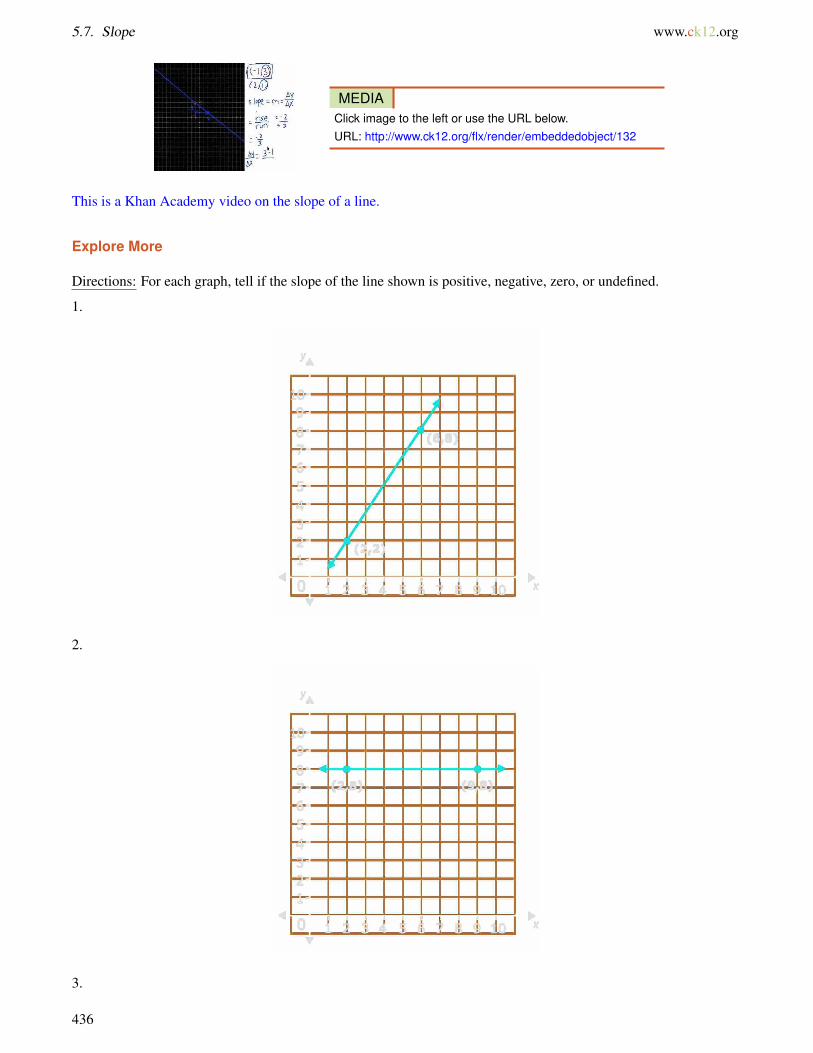
5.7. Slope www.ck12.org
MEDIAClick image to the left or use the URL below.URL: http://www.ck12.org/flx/render/embeddedobject/132
This is a Khan Academy video on the slope of a line.
Explore More
Directions: For each graph, tell if the slope of the line shown is positive, negative, zero, or undefined.
1.
2.
3.
436
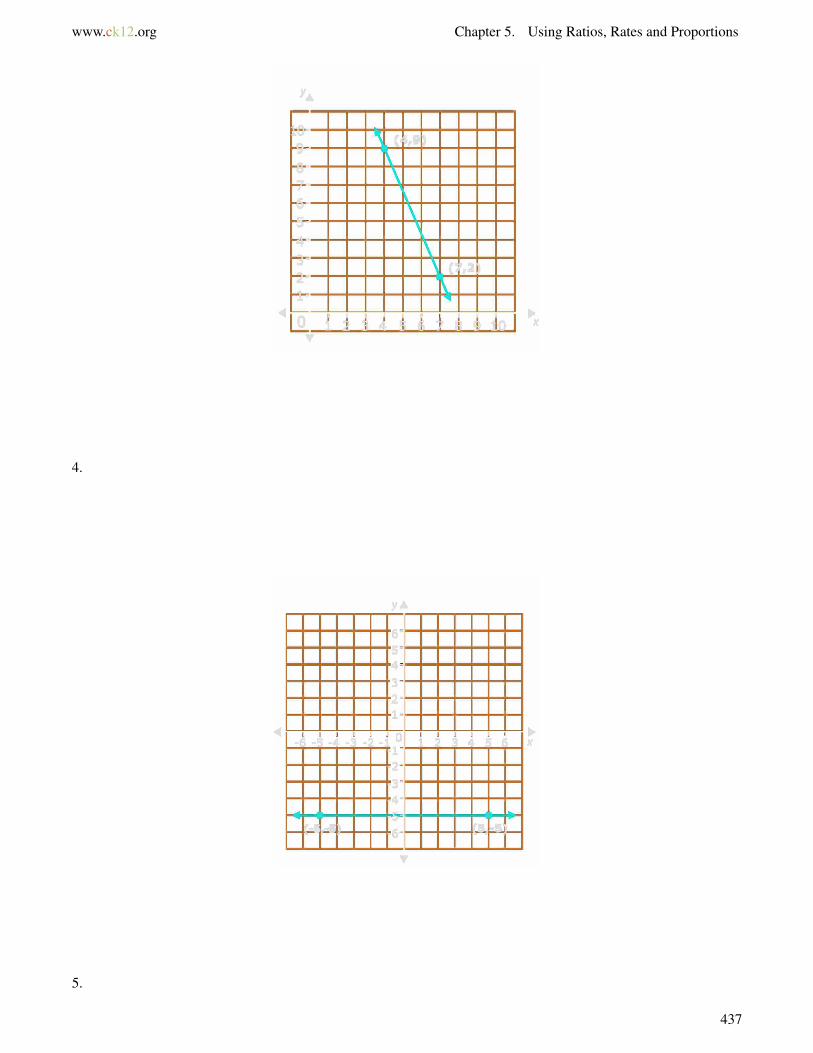
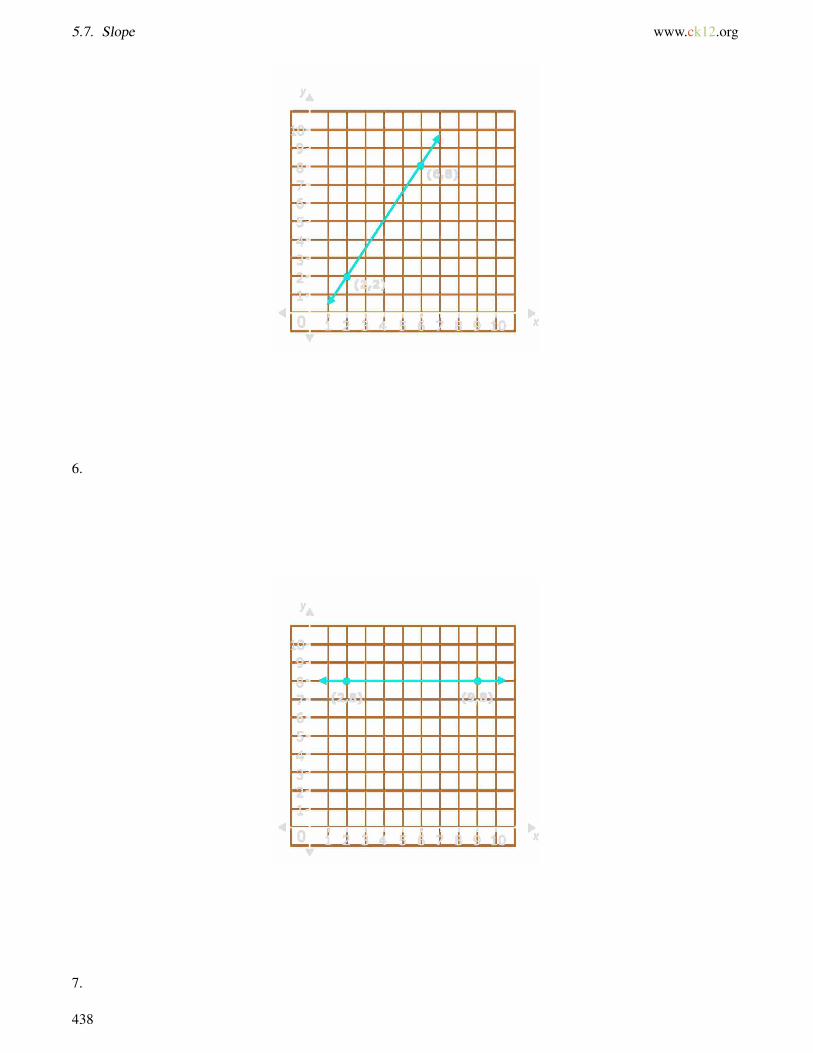
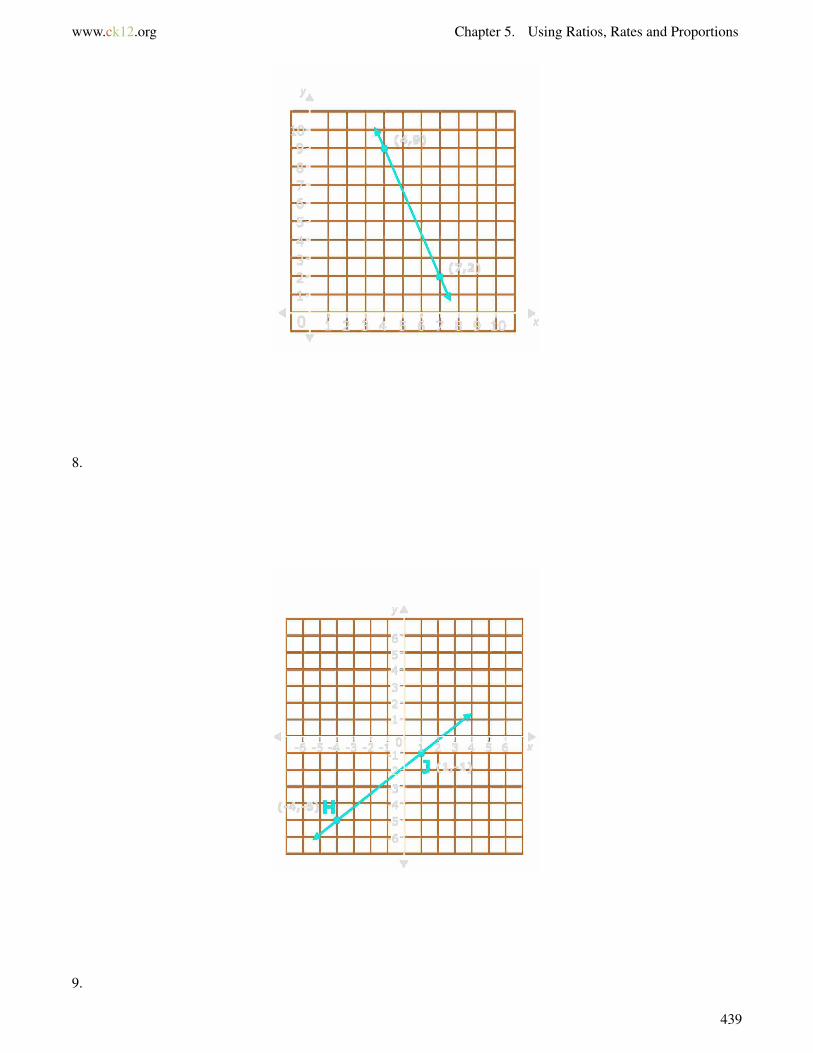
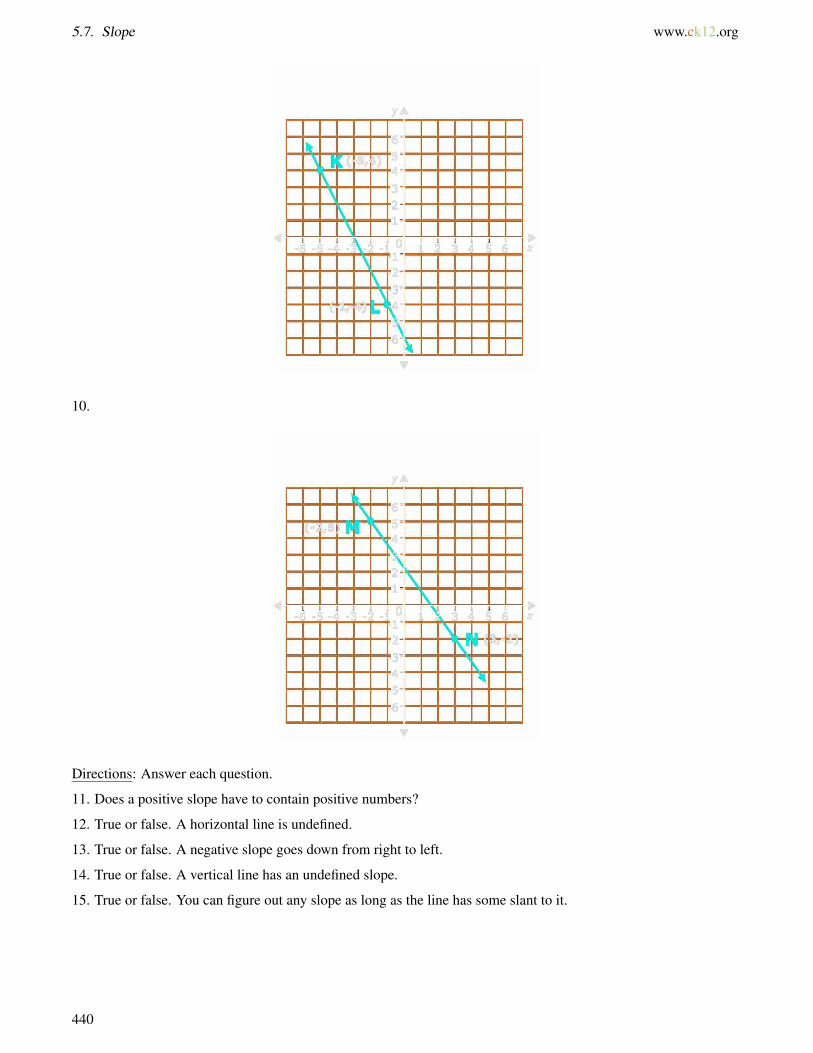
5.7. Slope www.ck12.org
10.
Directions: Answer each question.
11. Does a positive slope have to contain positive numbers?
12. True or false. A horizontal line is undefined.
13. True or false. A negative slope goes down from right to left.
14. True or false. A vertical line has an undefined slope.
15. True or false. You can figure out any slope as long as the line has some slant to it.
440
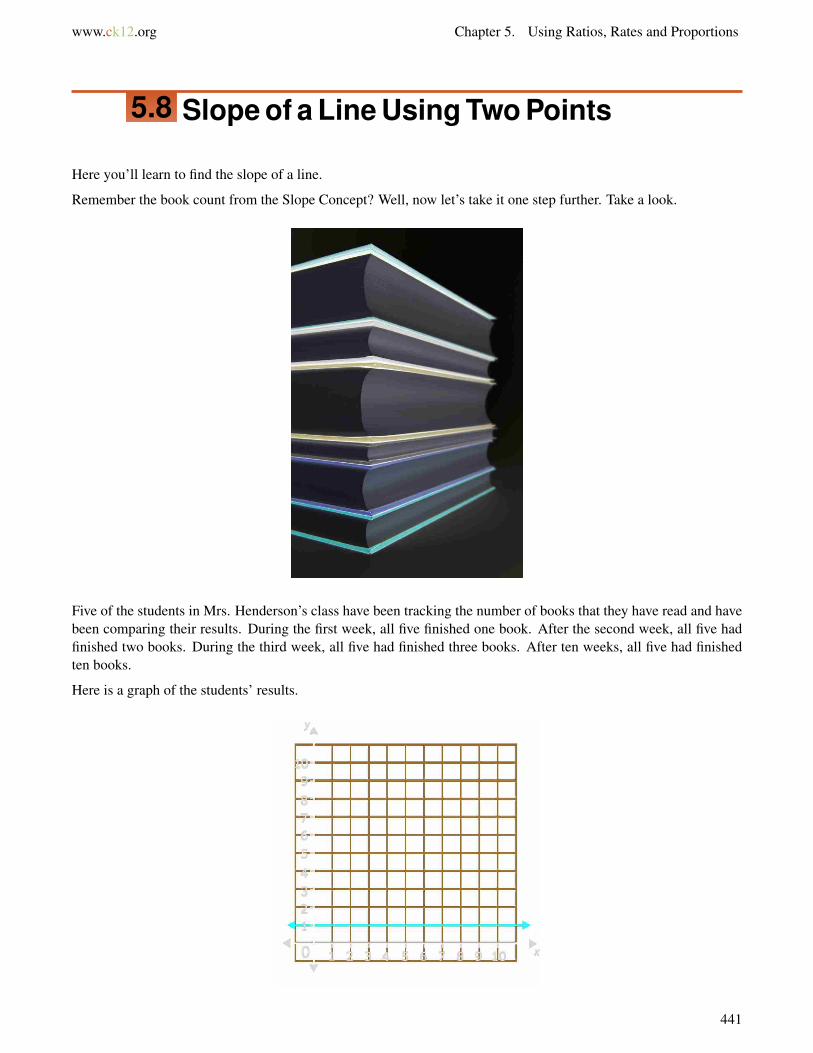
www.ck12.org Chapter 5. Using Ratios, Rates and Proportions
5.8 Slope of a Line Using Two Points
Here you’ll learn to find the slope of a line.
Remember the book count from the Slope Concept? Well, now let’s take it one step further. Take a look.
Five of the students in Mrs. Henderson’s class have been tracking the number of books that they have read and havebeen comparing their results. During the first week, all five finished one book. After the second week, all five hadfinished two books. During the third week, all five had finished three books. After ten weeks, all five had finishedten books.
Here is a graph of the students’ results.
441
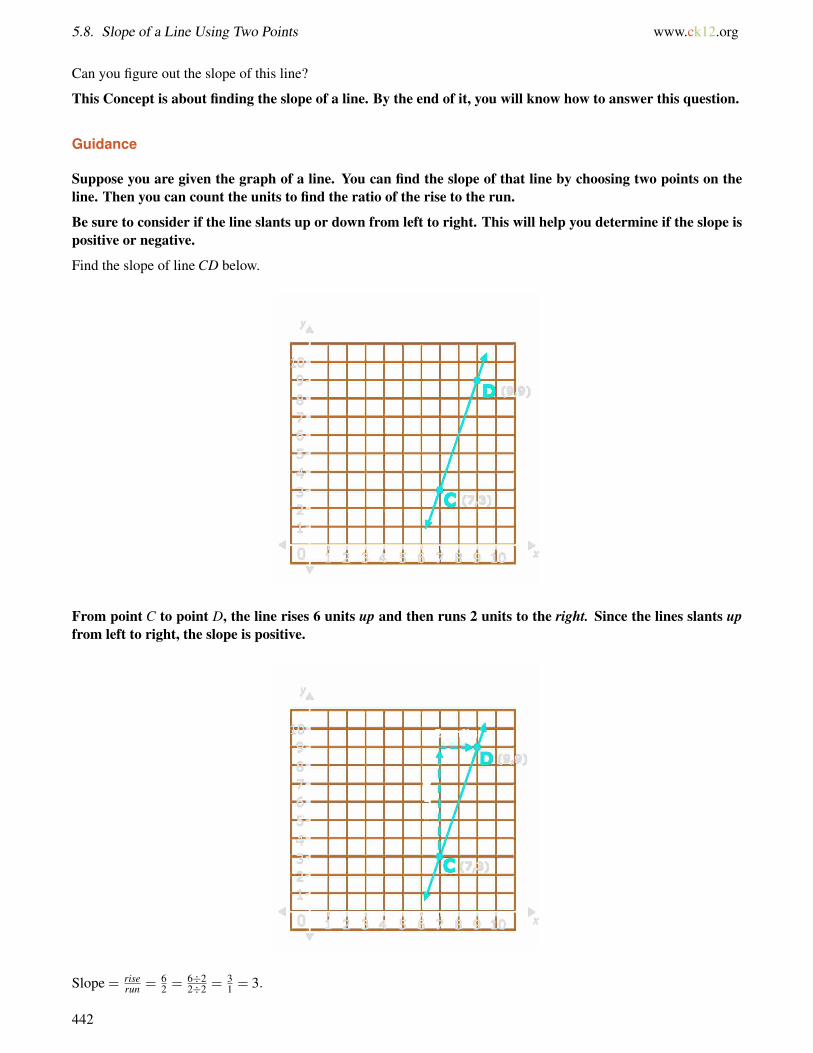
5.8. Slope of a Line Using Two Points www.ck12.org
Can you figure out the slope of this line?
This Concept is about finding the slope of a line. By the end of it, you will know how to answer this question.
Guidance
Suppose you are given the graph of a line. You can find the slope of that line by choosing two points on theline. Then you can count the units to find the ratio of the rise to the run.
Be sure to consider if the line slants up or down from left to right. This will help you determine if the slope ispositive or negative.
Find the slope of line CD below.
From point C to point D, the line rises 6 units up and then runs 2 units to the right. Since the lines slants upfrom left to right, the slope is positive.
Slope = riserun = 6
2 = 6÷22÷2 = 3
1 = 3.
442

www.ck12.org Chapter 5. Using Ratios, Rates and Proportions
The slope of line CD is 3.
Find the slope of line FG below.
From point F to point G, the rise is 4 units down and then 3 units to the right. Since the line slants down from left toright, the slope is negative. You can think of a rise of 4 units down as a negative rise, and represent it as -4.
Slope = riserun = −4
3 =−43 .
The slope of line FG is −43 .
Remember, the slope represents a ratio, not an improper fraction. We cannot say that the slope of line FG is−1 1
3 .
We know that we can think of the slope of a line as the ratio riserun . We can use this ratio to draw a line with a
specific slope.
Draw a line that goes through a point at (–4, –1) and has a slope of 37 .
Here are the steps to drawing a line with a given slope.
443
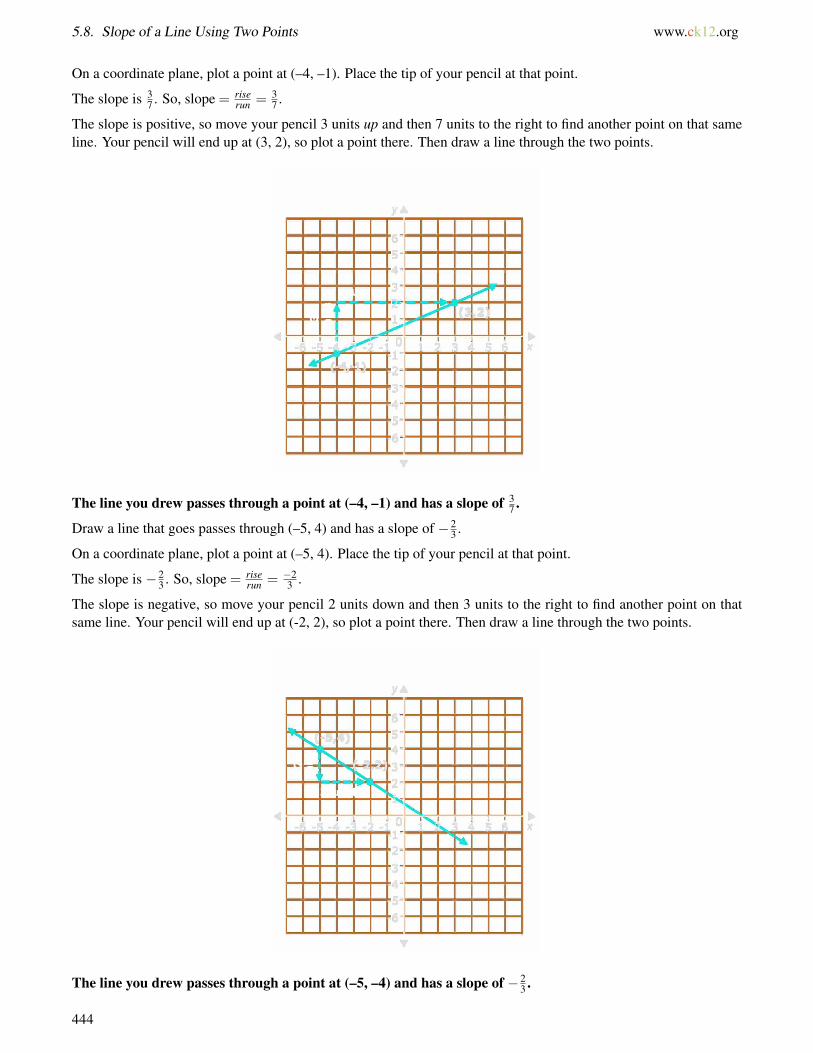
5.8. Slope of a Line Using Two Points www.ck12.org
On a coordinate plane, plot a point at (–4, –1). Place the tip of your pencil at that point.
The slope is 37 . So, slope = rise
run = 37 .
The slope is positive, so move your pencil 3 units up and then 7 units to the right to find another point on that sameline. Your pencil will end up at (3, 2), so plot a point there. Then draw a line through the two points.
The line you drew passes through a point at (–4, –1) and has a slope of 37 .
Draw a line that goes passes through (–5, 4) and has a slope of −23 .
On a coordinate plane, plot a point at (–5, 4). Place the tip of your pencil at that point.
The slope is −23 . So, slope = rise
run = −23 .
The slope is negative, so move your pencil 2 units down and then 3 units to the right to find another point on thatsame line. Your pencil will end up at (-2, 2), so plot a point there. Then draw a line through the two points.
The line you drew passes through a point at (–5, –4) and has a slope of −23 .
444
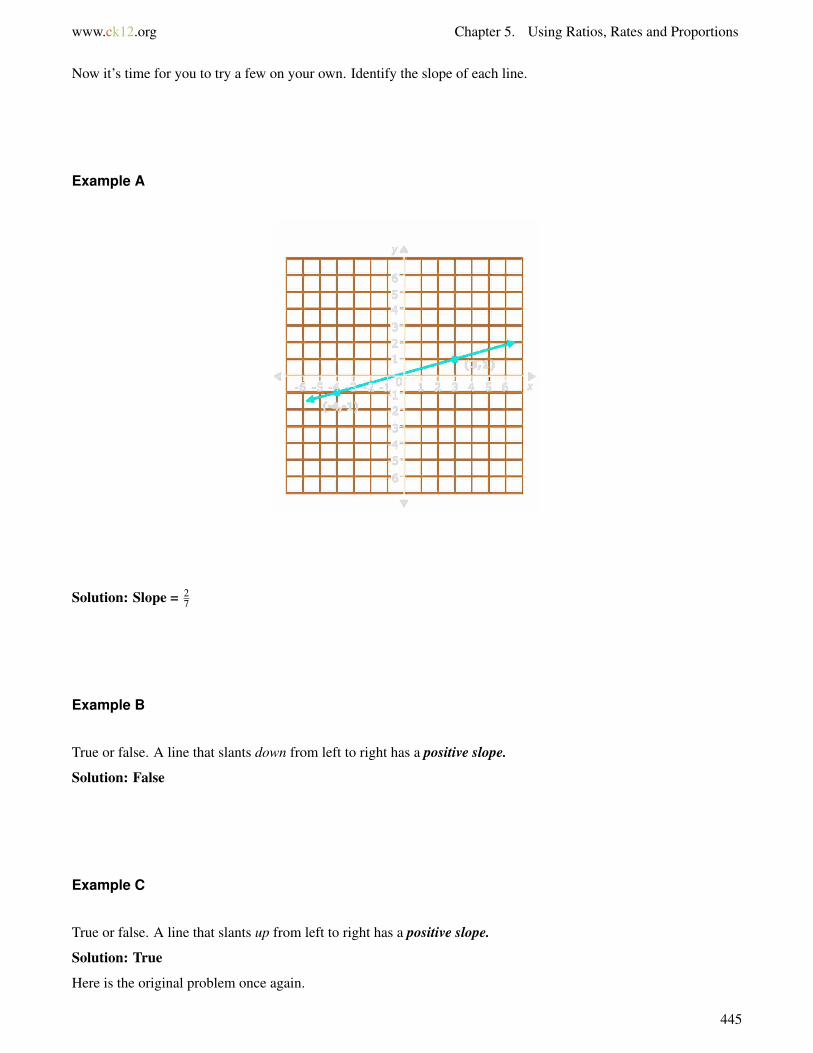
www.ck12.org Chapter 5. Using Ratios, Rates and Proportions
Now it’s time for you to try a few on your own. Identify the slope of each line.
Example A
Solution: Slope = 27
Example B
True or false. A line that slants down from left to right has a positive slope.
Solution: False
Example C
True or false. A line that slants up from left to right has a positive slope.
Solution: True
Here is the original problem once again.
445
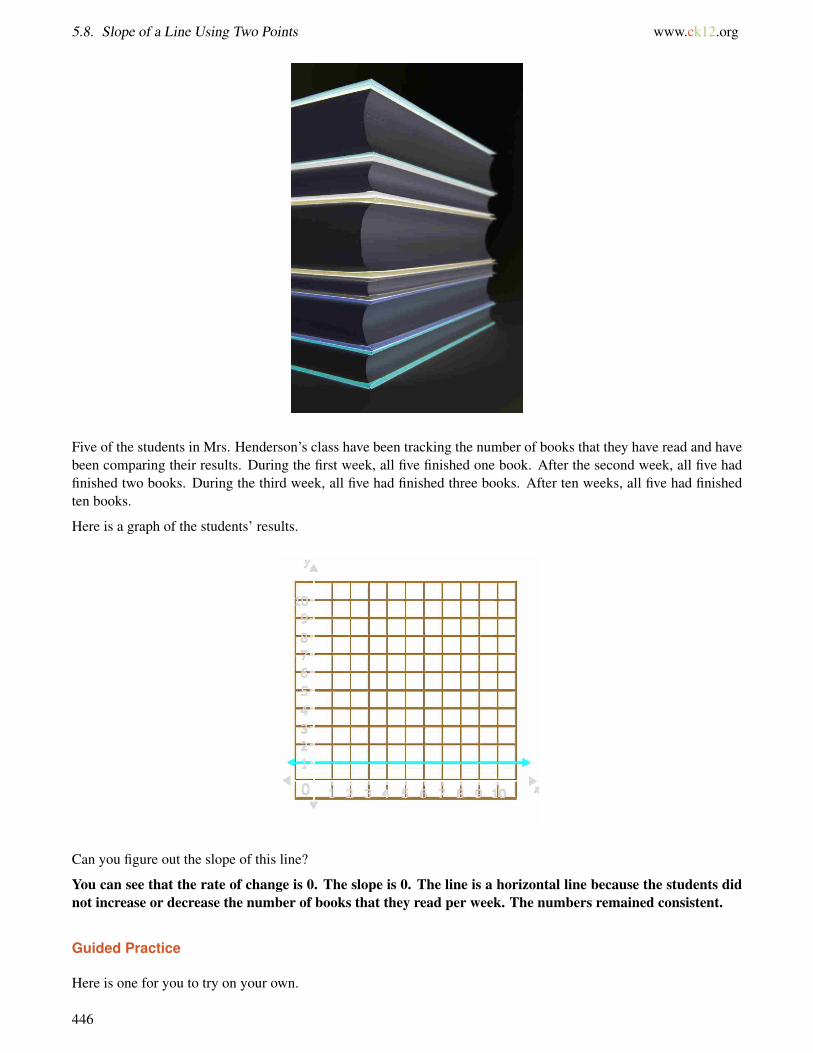
5.8. Slope of a Line Using Two Points www.ck12.org
Five of the students in Mrs. Henderson’s class have been tracking the number of books that they have read and havebeen comparing their results. During the first week, all five finished one book. After the second week, all five hadfinished two books. During the third week, all five had finished three books. After ten weeks, all five had finishedten books.
Here is a graph of the students’ results.
Can you figure out the slope of this line?
You can see that the rate of change is 0. The slope is 0. The line is a horizontal line because the students didnot increase or decrease the number of books that they read per week. The numbers remained consistent.
Guided Practice
Here is one for you to try on your own.
446

www.ck12.org Chapter 5. Using Ratios, Rates and Proportions
Define this slope.
Answer
This line is vertical. It goes up, but doesn’t have a particular rise or run that you can calculate.
The slope is undefined. This is our answer.
Video Review
MEDIAClick image to the left or use the URL below.URL: http://www.ck12.org/flx/render/embeddedobject/132
This is a Khan Academy video on the slope of a line.
Explore More
Directions: Find the slope of each line shown.
1.
447
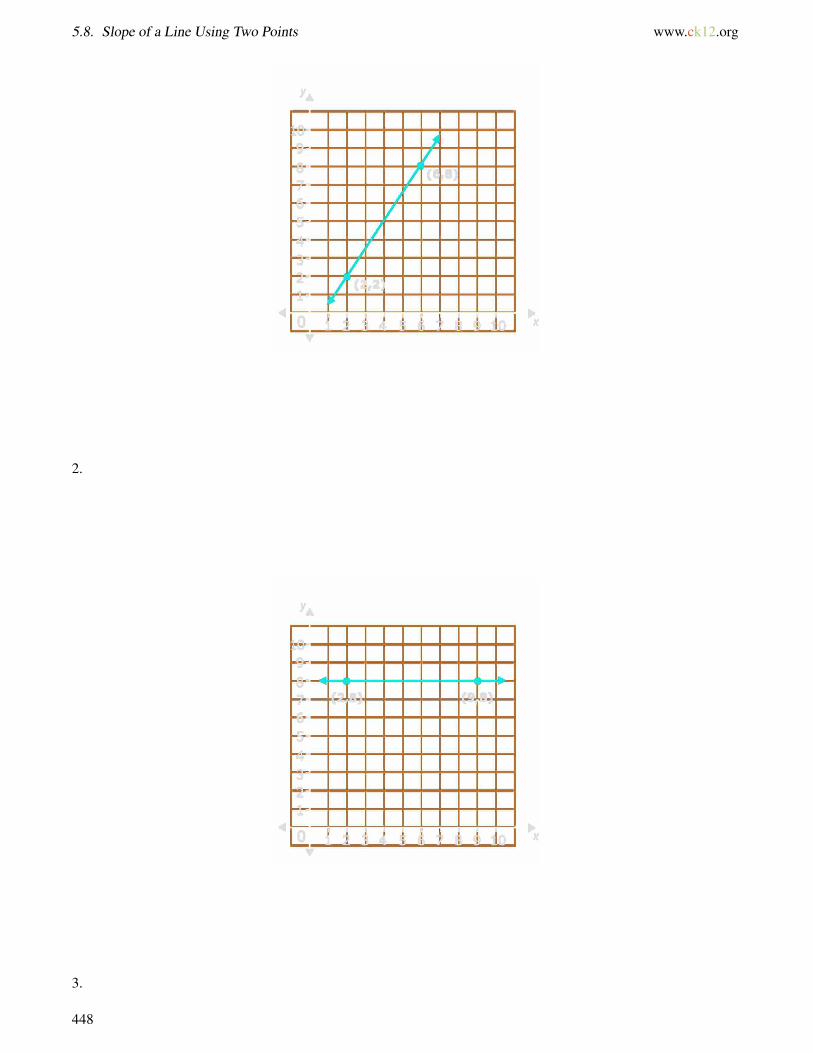


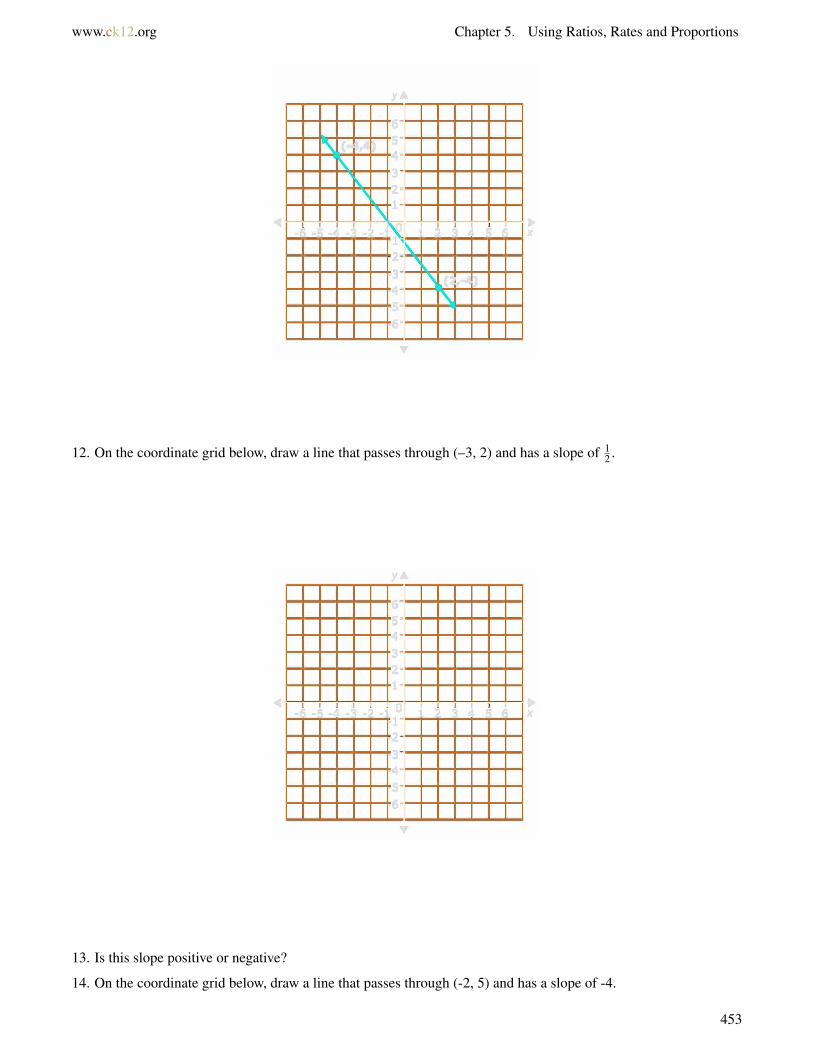
www.ck12.org Chapter 5. Using Ratios, Rates and Proportions
12. On the coordinate grid below, draw a line that passes through (–3, 2) and has a slope of 12 .
13. Is this slope positive or negative?
14. On the coordinate grid below, draw a line that passes through (-2, 5) and has a slope of -4.
453
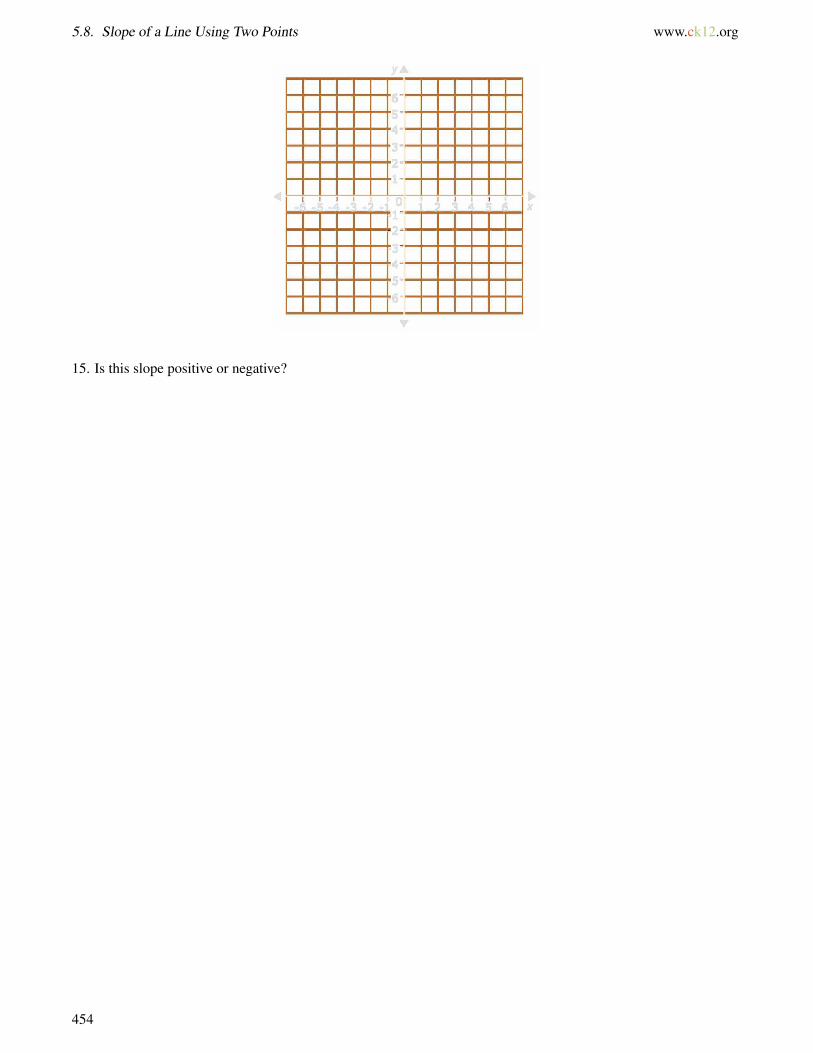
5.8. Slope of a Line Using Two Points www.ck12.org
15. Is this slope positive or negative?
454
www.ck12.org Chapter 5. Using Ratios, Rates and Proportions
5.9 Proportions
Here you’ll learn to recognize proportions as a statement of equivalent ratios.
The students are still actively reading books. Take a look at this situation.
Manuel was reading all of the medieval books on knights. Well after he finished reading the series, he loaned it tohis friend Rafael. Rafael is enjoying the series as much as Manuel did.
Rafael had finished 9 of the 12 books. It took Manuel read three-fourths of the books in the same time. Are Rafaeland Manuel reading at the same rate?
To figure this out, you will need to write two proportions and figure out if they are equal. This Concept willteach you how to do this.
Guidance
Remember ratios? Think back to what you have already learned about ratios.
A ratio represents a comparison between two quantities. We can write ratios in fraction form, using a colon orusing the word “to”.
455

5.9. Proportions www.ck12.org
We also learned that equivalent ratios are two ratios that are equal. The numbers in the ratios may not be the same,but the comparison of quantities is the same.
Equivalent ratios are directly related to proportions.
What is a proportion?
A proportion states that two ratios are equivalent. Here is an example of a proportion.12 = 2
4
This proportion shows that the ratios 12 and 2
4 are equivalent. In other words, a proportion is made up of twoequivalent ratios.
In the situation above, we knew all of the parts of the two ratios that made up the proportion. Sometimes, we willknow three of the numbers, but not four of them. When this happens, we have to use a variable and solve for themissing number.
Look at this proportion.12 = n
12
Notice that the first term of the second ratio––its numerator––is a variable. Suppose we wanted to find the value ofthis variable. We could do that by using proportional reasoning.
Proportional reasoning is when we figure out a missing value in a proportion by thinking about the relation-ship between the numbers in the two ratios.
Use proportional reasoning to solve for n : 12 = n
12 .
To figure this out, we need to figure out a relationship between either numerators or denominators. Theproportion does not show the relationship between the first terms in the ratios––the numerators of the fractions.However, we can determine the relationship between the second terms in the ratios––the denominators of thefractions.
We can ask ourselves: “what number, when multiplied by 2, results in 12?”
Since 2×6 = 12, we can multiply both the numerator and the denominator of 12 by 6 to find the value of n.
12 = 1×6
2×6 = 612 = n
12
This shows that when the second term (the denominator) of the ratio is 12, the first term (the numerator) is 6.
The value of n is 6.
456
www.ck12.org Chapter 5. Using Ratios, Rates and Proportions
Good for you! Mental math is very helpful when looking at proportional reasoning. When you can figure outthe relationship between numbers, then you can solve for the missing value of the variable.
Use proportional reasoning to solve for x : 1535 = x
7 .
Which relationship can we use to figure out the variable? This proportion does not show the relationship betweenthe first terms in the ratios––the numerators of the fractions. We need to find the relationship between the secondterms in the ratios––the denominators of the fractions.
We can ask ourselves, “what number can we divide 35 to get 7?”
Since 35÷5 = 7, we can divide both the numerator and the denominator of 1535 by 5 to find the value of x.
1535 = 15÷5
35÷5 = 37 = x
7
This shows that when the second term (the denominator) of the ratio is 7, the first term (the numerator) is 3.
The value of x is 3.
Use proportional reasoning to find the value of each unknown variable.
Example A
23 = x
6
Solution: x = 4
Example B
1224 = 24
z
Solution: z = 48
Example C
y5 = 14
20
457
5.9. Proportions www.ck12.org
Solution: 3.5
Here is the original problem once again.
Manuel was reading all of the medieval books on knights. Well after he finished reading the series, he loaned it tohis friend Rafael. Rafael is enjoying the series as much as Manuel did.
Rafael had finished 9 of the 12 books. It took Manuel read three-fourths of the books in the same time. Are Rafaeland Manuel reading at the same rate?
To determine if they are reading at the same rate, we have to write two ratios to describe each pace.
Rafael 912
Manuel 34
Now let’s write these as a statement of equal ratios.912 = 3
4
These are equal.
The boys are reading at the same rate.
Guided Practice
Here is one for you to try on your own.
Use equal ratios to solve for z : z9 = 32
36 .
Answer
The problem does not show the relationship between the first terms in the ratios––the numerators of the fractions.
We need to find the relationship between the second terms in the ratios––the denominators of the fractions.
We can ask ourselves “what number, when multiplied by 9, results in 36?”
9×4 = 36z9=
z×49×4
=3236
.
From this, we can see that z×4 = 32.
We must ask ourselves, “what number, when multiplied by 4, results in 32?”
458

www.ck12.org Chapter 5. Using Ratios, Rates and Proportions
8×4 = 32 , so z = 8.
This is our answer.
Video Review
MEDIAClick image to the left or use the URL below.URL: http://www.ck12.org/flx/render/embeddedobject/5416
This James Sousa video is an introduction to proportions.
Explore More
Directions: Look at each pair of ratios. Tell whether or not these ratios form a proportion.
1. 12 and 4
8
2. 37 and 6
14
3. 52 and 10
6
4. 31 and 9
3
5. 29 and 1.5
4.5
6. 49 and 8
10
7. 14 and 5
20
8. 34 and 9
10
Directions: Use proportional reasoning to find the value of the variable in each proportion.
9. 14 = a
20
10. 1530 = x
2
11. 29 = n
63
12. z7 = 12
21
13. 35 = t
60
14. k72 = 5
12
15. x32 = 4
8
459
5.10. Proportions with Variable in the Numerator www.ck12.org
5.10 Proportions with Variable in the Numerator
Here you’ll learn to solve proportions with the variable in the numerator using Algebra.
Do you like to read short books or long books?
Candice loves to read really long books. The first one that she selected was over 800 pages. The next one was 825pages. She is not a very fast reader, but she enjoys all of the details that are put in really long books. Often, shewalks through the bookstore looking at books that have tons of pages then when she finds one that seems to be theright size, she takes it off the shelf to see if she is interested in the topic.
After 12 weeks, Candice had finished reading two books. She was very proud of herself given that she had read over1600 pages in all. Thinking back, Candice thought about her reading. She had finished the first and second books inabout the same length of time.
Given this, how long did it take Candice to read 1 book?
Because Candice read the two books in the same amount of time, you can use a proportion to solve thisproblem. Proportions are formed by equal ratios. Use this Concept to learn about proportions then you willbe able figure out the time that it took Candice to read one big book.
Guidance
Sometimes, it is difficult to use proportional reasoning alone to figure out the missing variable in a proportion. Whenthis happens, we can use algebra to figure out the missing variable.
Using algebra involves thinking of multiplication or division in relationship to the values in the proportion. Some-times, you will be multiplying as we did in the last section and sometimes, you will be dividing. Either way, we willbe using our algebraic thinking to figure out the variable.
460

www.ck12.org Chapter 5. Using Ratios, Rates and Proportions
Find the value of x x10 = 24
30
Here we can begin by looking at the relationship between the denominators. You can see that 10×3 = 30.
Now we aren’t looking for the multiple of the first numerator, but we have the second numerator. We have to do theinverse operation of multiplication to figure out the value of the variable.
We have been given the value 24 as a numerator. The inverse operation for multiplication is division.
We can divide 24 by 3 to find the other numerator.
24÷3 = 8
The value of x is 8.
Sometimes, we will have equivalent proportions. This means that two proportions are equal to each other. Whenthis happens, you will have a total of four ratios, but each of them will be equivalent. Let’s look at an example.
12=
24
36=
612
Each of these ratios is the same quantity. Therefore, they are all equivalent.
They have been set up as two proportions, but they are all equivalent proportions.
Why would we have equivalent proportions?
Well, you can think of real-life situations that would represent equivalent proportions. Real-life situations that mighthave equivalent proportions are found in situations like cooking.
Tania and her mother are making cookies for a party. They aren’t sure if how many people are coming to the party.
461
5.10. Proportions with Variable in the Numerator www.ck12.org
They aren’t sure if they should double, triple or quadruple the ingredients. The ratio of sugar to flour is 13 . How will
this change if they double, triple or quadruple the recipe?
Now think about this. We can figure out that the ratios will all be equivalent because we are starting with thesame measurement. We are beginning with 1
3 . To double it we multiply each value by 2. To triple we multiplyby 3, to quadruple by four.
13=
26
39=
412
Notice that the relationships between the ratios in the second proportion isn’t crystal clear, but they are stillequivalent.
Use inverse operations to find the value of each unknown variable.
Example A
25 = 6
x
Solution: x = 15
Example B
a9 = 20
36
Solution:a = 5
Example C
4b = 24
36
Solution:b = 6
462
www.ck12.org Chapter 5. Using Ratios, Rates and Proportions
Here is the original problem once again.
Candice loves to read really long books. The first one that she selected was over 800 pages. The next one was 825pages. She is not a very fast reader, but she enjoys all of the details that are put in really long books. Often, shewalks through the bookstore looking at books that have tons of pages then when she finds one that seems to be theright size, she takes it off the shelf to see if she is interested in the topic.
After 12 weeks, Candice had finished reading two books. She was very proud of herself given that she had read over1600 pages in all. Thinking back, Candice thought about her reading. She had finished the first and second books inabout the same length of time.
Given this, how long did it take Candice to read one book?
First, let’s write a proportion to show that it took Candice 12 weeks to read two books.12 weeks2 books
Next, she read the two books in the same amount of time, so we can set up a proportion to show that theseratios are equal.12 weeks2 books = x
1 book
Now we can look at the relationship between the denominators and determine the missing numerator.
2÷2 = 1
We can do that to the numerator.
12÷2 = 6
It took Candice 6 weeks to read one book.
Guided Practice
Here is one for you to try on your own.
At the vet’s office, the ratio of cats to dogs in the waiting room is 2 to 3. If there are 6 dogs in the waiting room, setup a proportion that could be used to find c, the number of cats in the waiting room.
463
5.10. Proportions with Variable in the Numerator www.ck12.org
Answer
One way to set up a proportion for this problem would be to write two equivalent ratios, each comparing cats todogs. Then we can solve it for the number of cats.
The ratio of cats to dogs is 2 to 3. So, we can express this ratio as a fraction.catsdogs =
23
Let’s write a second ratio comparing cats to dogs in the waiting room. We know that there are a total of 6 dogs inthe waiting room. We don’t know the total number of cats. So, we can use the variable c, to represent the unknownnumber of cats and set up a second equivalent ratio.catsdogs =
c6
Since these two ratios are equivalent, we can put them together to form a proportion.23 = c
6 .
To find the total number of cats in the vet’s office, solve this proportion for c. The proportion does not show therelationship between the first terms in the ratios––the numerators of the fractions.
We need to find the relationship between the second terms in the ratios––the denominators of the fractions.
We can ask ourselves: what number, when multiplied by 3, results in 6?
Since 3×2 = 6, we can multiply by 2 to find the value of c.23 = 2×2
3×2 = 46 = c
6
So, the value of c is 4. That means that there are 4 cats in the waiting room.
Video Review
Here is a video for review.
MEDIAClick image to the left or use the URL below.URL: http://www.ck12.org/flx/render/embeddedobject/5416
This James Sousa video is about solving proportions.
Explore More
Directions: Solve the following proportions.
1. 12 = x
8
2. 12 = 5
x
3. 13 = 4
x
4. 23 = x
6
5. 12 = x
16
6. 56 = x
12
464

www.ck12.org Chapter 5. Using Ratios, Rates and Proportions
7. 1416 = x
8
8. 12 = x
18
9. 14 = x
20
10. 14 = x
24
11. 36 = x
18
12. 45 = x
2.5
13. 37 = x
21
14. 38 = x
48
15. 18 = x
18
465
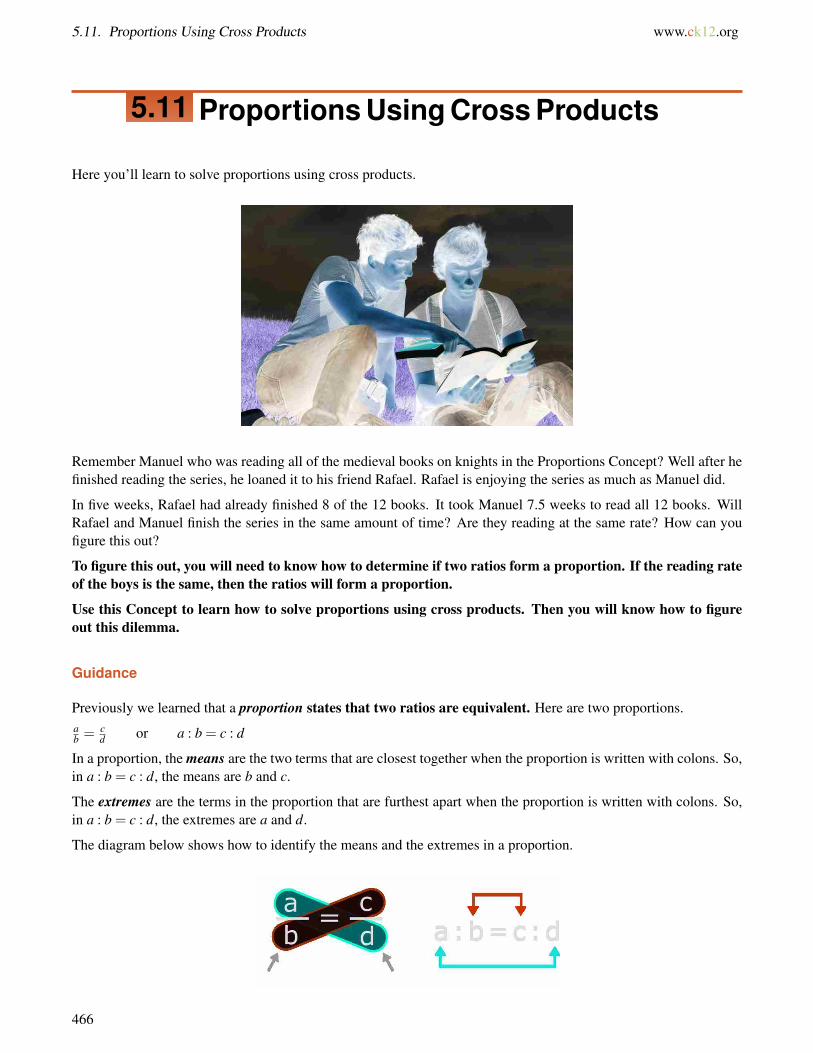
5.11. Proportions Using Cross Products www.ck12.org
5.11 Proportions Using Cross Products
Here you’ll learn to solve proportions using cross products.
Remember Manuel who was reading all of the medieval books on knights in the Proportions Concept? Well after hefinished reading the series, he loaned it to his friend Rafael. Rafael is enjoying the series as much as Manuel did.
In five weeks, Rafael had already finished 8 of the 12 books. It took Manuel 7.5 weeks to read all 12 books. WillRafael and Manuel finish the series in the same amount of time? Are they reading at the same rate? How can youfigure this out?
To figure this out, you will need to know how to determine if two ratios form a proportion. If the reading rateof the boys is the same, then the ratios will form a proportion.
Use this Concept to learn how to solve proportions using cross products. Then you will know how to figureout this dilemma.
Guidance
Previously we learned that a proportion states that two ratios are equivalent. Here are two proportions.ab = c
d or a : b = c : d
In a proportion, the means are the two terms that are closest together when the proportion is written with colons. So,in a : b = c : d, the means are b and c.
The extremes are the terms in the proportion that are furthest apart when the proportion is written with colons. So,in a : b = c : d, the extremes are a and d.
The diagram below shows how to identify the means and the extremes in a proportion.
466
www.ck12.org Chapter 5. Using Ratios, Rates and Proportions
In the last lesson, you learned how to solve proportions by using proportional reasoning. We can also solve aproportion for a variable in another way. This is where the cross products property of proportions comes in.
What is the Cross Products Property of Proportions?
The Cross Products Property of Proportions states that the product of the means is equal to the product of theextremes. You can find these cross products by cross multiplying, as shown below.
ab=
cd
b · c = a ·d
a4 = 6
8
To solve this, we can multiply the means and the extremes.
a ·8 = 4 ·68a = 24
Next, we solve the equation for the missing variable. To do this, we use the inverse operation. Multiplication isin the problem, so we use division to solve it. We divide both sides by 8.
8a8
=248
a = 3
Our answer is 3.
Solve for each variable in the numerator by using cross products.
Example A
x5 = 6
10
Solution:x = 3
Example B
a9 = 15
27
Solution:a = 5
Example C
b4 = 12
16
Solution:b = 3
467
5.11. Proportions Using Cross Products www.ck12.org
Here is the original problem once again.
Remember Manuel who was reading all of the medieval books on knights? Well after he finished reading the series,he loaned it to his friend Rafael. Rafael is enjoying the series as much as Manuel did.
In five weeks, Rafael had already finished 8 of the 12 books. It took Manuel 7.5 weeks to read all 12 books. WillRafael and Manuel finish the series in the same amount of time? Are they reading at the same rate? How can youfigure this out?
Let’s write a proportion to solve this problem.8 books5 weeks =
12 books7.5 weeks
Next, we can use cross products to see if the two ratios form a proportion. If they do, then the two boys willfinish the series in the same amount of time.
8×7.5 = 60
5×12 = 60
The two cross products are equal so the two ratios form a proportion. The two boys will finish the series ofbooks in the same amount of time.
Guided Practice
Here is one for you to try on your own.
The ratio of boys to girls in the school chorus is 4 to 5. There are a total of 20 boys in the chorus. How many totalstudents are in the chorus?
Answer
The ratio given, 4 to 5, compares boys to girls. However, the question asks for the total number of students in thechorus.
One way to set up a proportion for this problem would be to write two equivalent ratios, each comparing boys tototal students.
The ratio of boys to girls is 4 to 5. We can use this ratio to find the ratio of boys to total students.boystotal =
boysboys+girls =
44+5 = 4
9
You know that there are 20 boys in the chorus. The total number of students is unknown, so represent that as x.boystotal =
20x
468
www.ck12.org Chapter 5. Using Ratios, Rates and Proportions
Get those ratios equal to form a proportion. Then cross multiply to solve for x.
49=
20x
9 ·20 = 4 · x180 = 4x180
4=
4x4
45 = x
So, there are a total of 45 students in the school chorus.
Video Review
MEDIAClick image to the left or use the URL below.URL: http://www.ck12.org/flx/render/embeddedobject/5417
This is a James Sousa video on solving proportions.
Explore More
Directions: Use cross products to find the value of the variable in each proportion.
1. 610 = x
5
2. 23 = x
9
3. 49 = a
45
4. 78 = a
4
5. b8 = 5
16
6. 63 = x
9
7. 4x = 8
10
8. 1.5y = 3
9
9. 411 = c
33
10. 26 = 5
y
11. 210 = 5
x
12. 412 = 6
n
13. 5r =
70126
14. 414 = 14
k
469
5.11. Proportions Using Cross Products www.ck12.org
15. 8w = 6
3
16. 25 = 17
a
470
www.ck12.org Chapter 5. Using Ratios, Rates and Proportions
5.12 Proportions with Variable in the Denomina-tor
Here you’ll learn to solve proportions with a variable in the denominator using cross products.
Remember Rafael from the Proportions Using Cross Products Concept? Well, he has found a few authors that helikes and so he is very invested in reading.
In six weeks, Rafael read 8 books. If he continues to read at this same pace, how many books will he read in 9weeks?
Here is a proportion to describe this situation.weeksbooks =
weeksbooks
This Concept will teach you how to fill in the given information and solve this problem.
Guidance
In an earlier Concept, you learned to use cross products to solve when the variable is in the numerator. What aboutwhen the variable is in the denominator?
You can use cross products to solve these proportions as well.
Use the cross products property of proportions to solve for r : 28 = 7
r .
The cross product property of proportions states that the product of the means is equal to the product of theextremes.
The means in this proportion are 8 and 7. The extremes are 2 and r. Find the cross products and solve for r.
28=
7r
8 ·7 = 2 · r56 = 2r
In 2r, the 2 and the r are being multiplied. The opposite of multiplication is division. So, to find the value of r,divide both sides of the equation by 2.
471

5.12. Proportions with Variable in the Denominator www.ck12.org
56 = 2r562
=2r2
28 = r
The value of r is 28.
Use the cross products property of proportions to solve for s 4s =
1015 .
The means in this proportion are s and 10. The extremes are 4 and 15. Find the cross products and solve fors.
4s=
1015
s ·10 = 4 ·15
10s = 6010s10
=6010
s = 6
The value of s is 6.
Now try a few on your own. Solve by using cross products.
Example A
47 = 16
x
Solution: x = 28
Example B
59 = 35
y
Solution: y = 63
Example C
9a = 18
33
Solution: x = 16.5
Here is the original problem once again.
472
www.ck12.org Chapter 5. Using Ratios, Rates and Proportions
In six weeks, Rafael read 8 books. If he continues to read at this same pace, how many books will he read in 9weeks?
Here is a proportion to describe this situation.weeksbooks =
weeksbooks
Now let’s fill in what we know.68 = 9x
Use cross products and algebra to solve.
6x = 72
x = 12
At this rate, Rafael will have read 12 books in that time.
Guided Practice
Here is one for you to try on your own.
Each pencil sold at the school store costs the same price. Caryn paid $1.12 for 14 pencils at the school store. Arnobalso bought pencils, but he paid $0.48 for the pencils he buys. Write a proportion to represent n, the number ofpencils that Arnob bought.
Answer
When setting up a proportion, we must be sure to use consistent terms. One way to set up a proportion would be towrite two equivalent ratios, each comparing the total price to the number of pencils.
We know that Caryn paid $1.12 for 14 pencils. So, one ratio could be this one.price
pencils =1.1214
We know that Arnob paid $0.48. The number of pencils he bought is unknown, so we can use n to represent thatnumber.
pricepencils =
0.48n
Since these two ratios are equivalent, we can put them together to form a proportion.1.1214 = 0.48
n
The proportion above could be used to find n, the number of pencils Arnob bought.
If Jake joined the two in shopping for pencils and purchased some of the same pencils, he would also havea ratio that would be equivalent to these two ratios. The situation is the same. Everyone is purchasing
473
5.12. Proportions with Variable in the Denominator www.ck12.org
pencils. The pencils cost the same amount. Therefore, we have equivalent proportions as we compare pencilspurchased with pencil price.
Video Review
MEDIAClick image to the left or use the URL below.URL: http://www.ck12.org/flx/render/embeddedobject/5417
This is a James Sousa video on solving proportions.
Explore More
Directions: Solve each proportion using cross products and algebra.
1. 35 = 6
x
2. 510 = 15
x
3. 67 = 12
x
4. 67 = 36
x
5. 911 = 81
x
6. 412 = 16
x
7. 1617 = 32
x
8. 1415 = 28
x
9. 1315 = 39
x
10. 1415 = 7
x
11. 1819 = 9
x
12. 2225 = 11
x
13. 1418 = 42
x
14. 2112 = 42
x
15. 1923 = 9.5
x
474
www.ck12.org Chapter 5. Using Ratios, Rates and Proportions
5.13 Scale Distances or Dimensions
Here you’ll learn to recognize unit scale as a ratio between units of measure of scale dimensions to actual dimensions.
Have you ever built a bookcase?
Jeremy and his Grandpa are going to build him a new bookcase. Given all of the reading that Jeremy has been doingin Mrs. Henderson’s class, he is definitely in need of a new bookcase.
There is one wall in Jeremy’s room that is the perfect size for bookcase. He and his Grandpa have decided that abookcase that is 36” long by 36” wide by 48” high is the best size for the bookcase. Jeremy decides to draw a designof the bookcase first.
He chooses a unit scale of 1 inch1 f oot .
Jeremy begins to figure out how to draw the bookcase design given the unit scale. Do you know how to do it? Usingthis unit scale and the actual measurements of the bookcase, how big will each dimension of the drawing be?
This Concept is all about unit scale. Pay close attention and you will know how to help Jeremy at the end ofthe Concept.
Guidance
Previously we worked on ratios and proportions. Remember that a ratio compares two quantities. Ratios canbe written as fractions, with a colon or with the word “to”. A proportion is created when two ratios areequivalent or equal.
There are many real-life applications of ratios and proportions. One such application is when we use maps ordrawings or models of real-life things.
If you think about this it makes perfect sense. We can’t really draw 500 miles so we use a scale to help us to represent500 miles in a sensible way. We can’t really draw a building that is 20 stories high, so we use a scale to help us todraw it in a sensible way. We can’t really build a life-size model of a home or a car, so we use a scale to help us tobuild a model of that real thing.
475
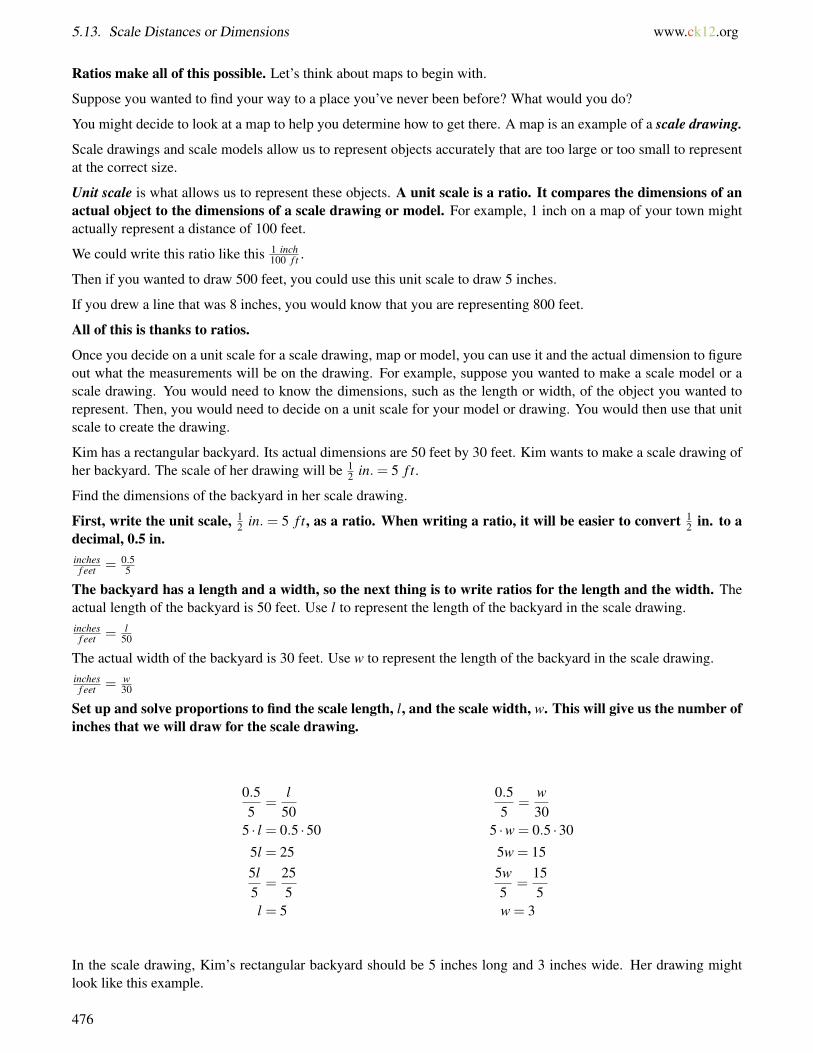
5.13. Scale Distances or Dimensions www.ck12.org
Ratios make all of this possible. Let’s think about maps to begin with.
Suppose you wanted to find your way to a place you’ve never been before? What would you do?
You might decide to look at a map to help you determine how to get there. A map is an example of a scale drawing.
Scale drawings and scale models allow us to represent objects accurately that are too large or too small to representat the correct size.
Unit scale is what allows us to represent these objects. A unit scale is a ratio. It compares the dimensions of anactual object to the dimensions of a scale drawing or model. For example, 1 inch on a map of your town mightactually represent a distance of 100 feet.
We could write this ratio like this 1 inch100 f t .
Then if you wanted to draw 500 feet, you could use this unit scale to draw 5 inches.
If you drew a line that was 8 inches, you would know that you are representing 800 feet.
All of this is thanks to ratios.
Once you decide on a unit scale for a scale drawing, map or model, you can use it and the actual dimension to figureout what the measurements will be on the drawing. For example, suppose you wanted to make a scale model or ascale drawing. You would need to know the dimensions, such as the length or width, of the object you wanted torepresent. Then, you would need to decide on a unit scale for your model or drawing. You would then use that unitscale to create the drawing.
Kim has a rectangular backyard. Its actual dimensions are 50 feet by 30 feet. Kim wants to make a scale drawing ofher backyard. The scale of her drawing will be 1
2 in.= 5 f t.
Find the dimensions of the backyard in her scale drawing.
First, write the unit scale, 12 in. = 5 f t, as a ratio. When writing a ratio, it will be easier to convert 1
2 in. to adecimal, 0.5 in.inches
f eet = 0.55
The backyard has a length and a width, so the next thing is to write ratios for the length and the width. Theactual length of the backyard is 50 feet. Use l to represent the length of the backyard in the scale drawing.inches
f eet = l50
The actual width of the backyard is 30 feet. Use w to represent the length of the backyard in the scale drawing.inches
f eet = w30
Set up and solve proportions to find the scale length, l, and the scale width, w. This will give us the number ofinches that we will draw for the scale drawing.
0.55
=l
500.55
=w30
5 · l = 0.5 ·50 5 ·w = 0.5 ·30
5l = 25 5w = 155l5=
255
5w5
=155
l = 5 w = 3
In the scale drawing, Kim’s rectangular backyard should be 5 inches long and 3 inches wide. Her drawing mightlook like this example.
476

www.ck12.org Chapter 5. Using Ratios, Rates and Proportions
Now it’s time for you to practice. Use the scale 12 in = 5 f t to figure out the dimensions of the scale drawing given
the actual dimensions.
Example A
If the yard is 10 feet by 20 feet.
Solution: 1 inch x 2 inches
Example B
If the yard is 25 feet by 45 feet.
Solution: 1.5" x 4.5"
Example C
If the yard is 60 feet by 100 feet.
Solution: 6" x 10"
477
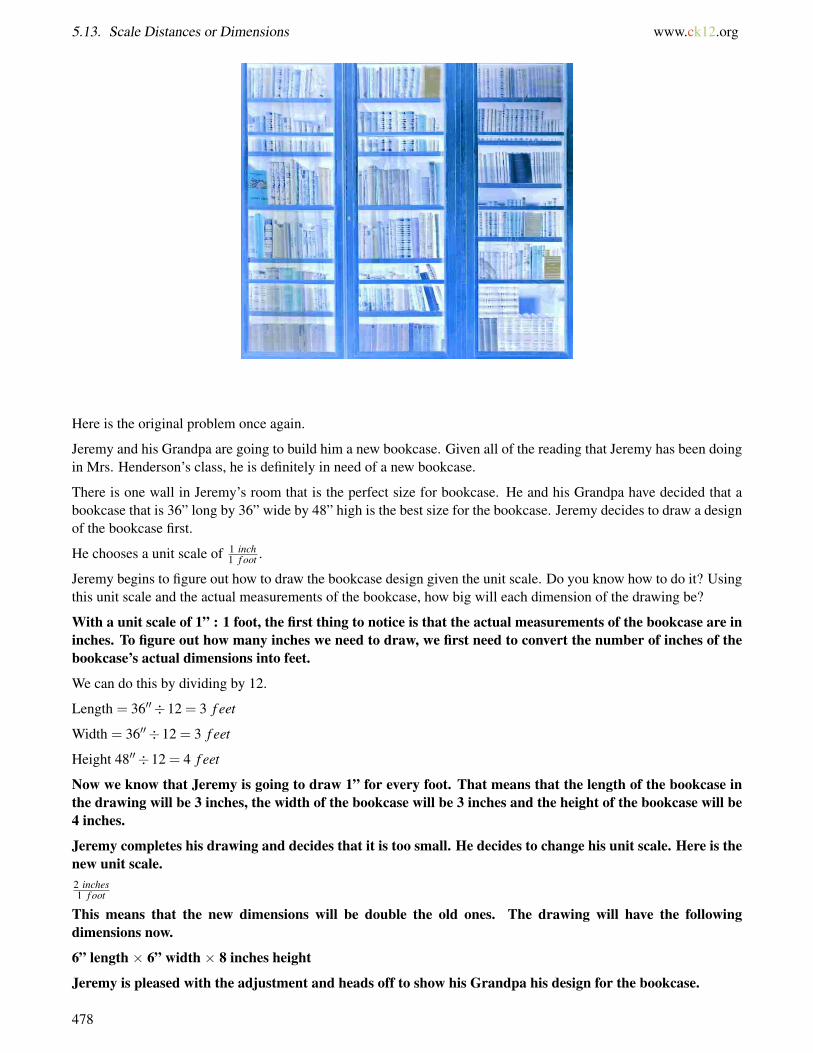
5.13. Scale Distances or Dimensions www.ck12.org
Here is the original problem once again.
Jeremy and his Grandpa are going to build him a new bookcase. Given all of the reading that Jeremy has been doingin Mrs. Henderson’s class, he is definitely in need of a new bookcase.
There is one wall in Jeremy’s room that is the perfect size for bookcase. He and his Grandpa have decided that abookcase that is 36” long by 36” wide by 48” high is the best size for the bookcase. Jeremy decides to draw a designof the bookcase first.
He chooses a unit scale of 1 inch1 f oot .
Jeremy begins to figure out how to draw the bookcase design given the unit scale. Do you know how to do it? Usingthis unit scale and the actual measurements of the bookcase, how big will each dimension of the drawing be?
With a unit scale of 1” : 1 foot, the first thing to notice is that the actual measurements of the bookcase are ininches. To figure out how many inches we need to draw, we first need to convert the number of inches of thebookcase’s actual dimensions into feet.
We can do this by dividing by 12.
Length = 36′′÷12 = 3 f eet
Width = 36′′÷12 = 3 f eet
Height 48′′÷12 = 4 f eet
Now we know that Jeremy is going to draw 1” for every foot. That means that the length of the bookcase inthe drawing will be 3 inches, the width of the bookcase will be 3 inches and the height of the bookcase will be4 inches.
Jeremy completes his drawing and decides that it is too small. He decides to change his unit scale. Here is thenew unit scale.2 inches1 f oot
This means that the new dimensions will be double the old ones. The drawing will have the followingdimensions now.
6” length × 6” width × 8 inches height
Jeremy is pleased with the adjustment and heads off to show his Grandpa his design for the bookcase.
478
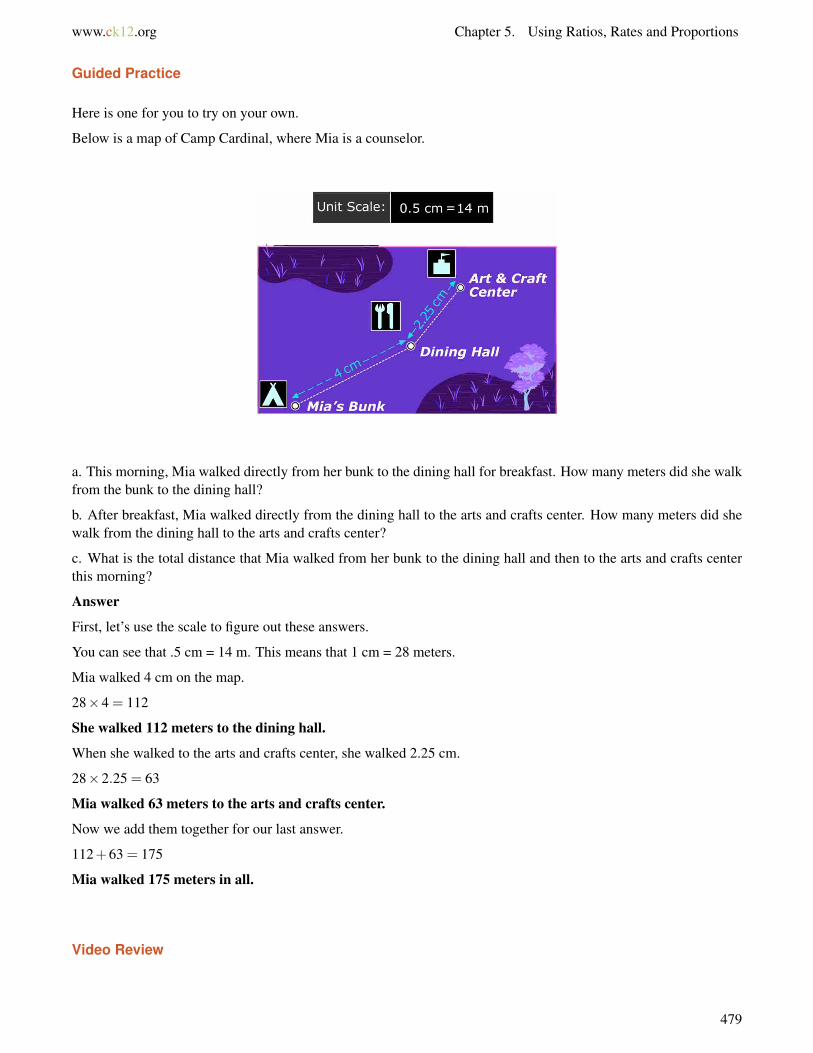
www.ck12.org Chapter 5. Using Ratios, Rates and Proportions
Guided Practice
Here is one for you to try on your own.
Below is a map of Camp Cardinal, where Mia is a counselor.
a. This morning, Mia walked directly from her bunk to the dining hall for breakfast. How many meters did she walkfrom the bunk to the dining hall?
b. After breakfast, Mia walked directly from the dining hall to the arts and crafts center. How many meters did shewalk from the dining hall to the arts and crafts center?
c. What is the total distance that Mia walked from her bunk to the dining hall and then to the arts and crafts centerthis morning?
Answer
First, let’s use the scale to figure out these answers.
You can see that .5 cm = 14 m. This means that 1 cm = 28 meters.
Mia walked 4 cm on the map.
28×4 = 112
She walked 112 meters to the dining hall.
When she walked to the arts and crafts center, she walked 2.25 cm.
28×2.25 = 63
Mia walked 63 meters to the arts and crafts center.
Now we add them together for our last answer.
112+63 = 175
Mia walked 175 meters in all.
Video Review
479
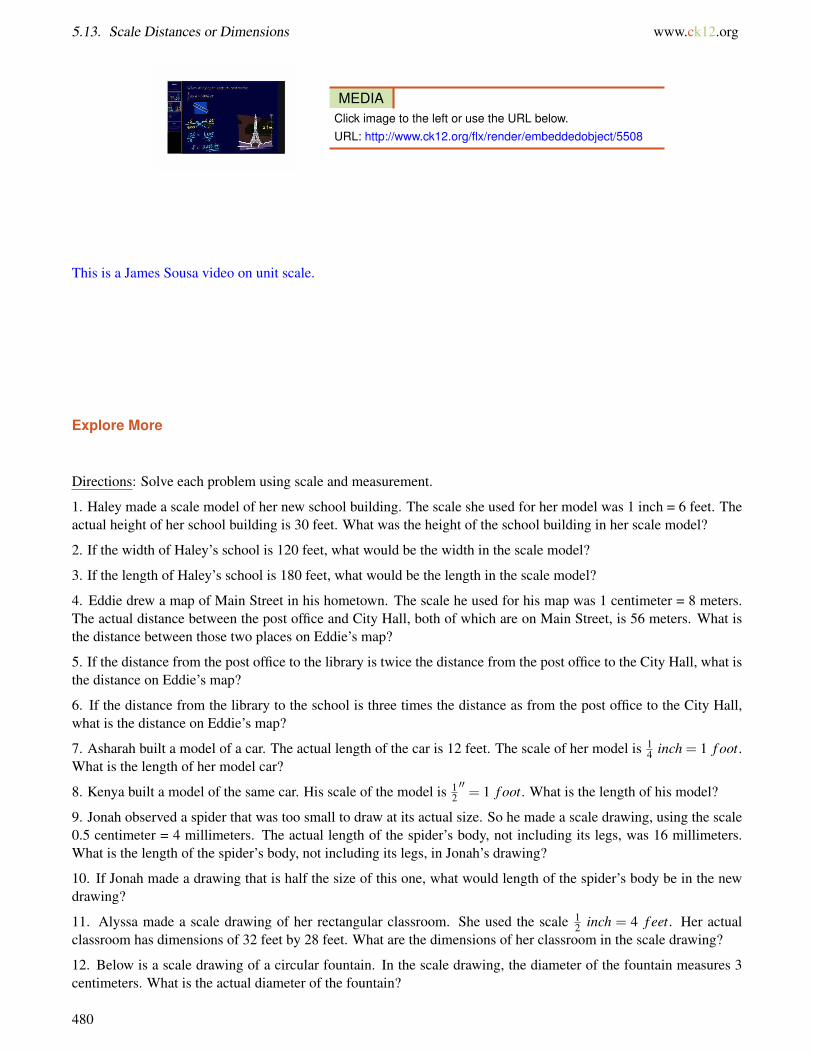
5.13. Scale Distances or Dimensions www.ck12.org
MEDIAClick image to the left or use the URL below.URL: http://www.ck12.org/flx/render/embeddedobject/5508
This is a James Sousa video on unit scale.
Explore More
Directions: Solve each problem using scale and measurement.
1. Haley made a scale model of her new school building. The scale she used for her model was 1 inch = 6 feet. Theactual height of her school building is 30 feet. What was the height of the school building in her scale model?
2. If the width of Haley’s school is 120 feet, what would be the width in the scale model?
3. If the length of Haley’s school is 180 feet, what would be the length in the scale model?
4. Eddie drew a map of Main Street in his hometown. The scale he used for his map was 1 centimeter = 8 meters.The actual distance between the post office and City Hall, both of which are on Main Street, is 56 meters. What isthe distance between those two places on Eddie’s map?
5. If the distance from the post office to the library is twice the distance from the post office to the City Hall, what isthe distance on Eddie’s map?
6. If the distance from the library to the school is three times the distance as from the post office to the City Hall,what is the distance on Eddie’s map?
7. Asharah built a model of a car. The actual length of the car is 12 feet. The scale of her model is 14 inch = 1 f oot.
What is the length of her model car?
8. Kenya built a model of the same car. His scale of the model is 12′′= 1 f oot. What is the length of his model?
9. Jonah observed a spider that was too small to draw at its actual size. So he made a scale drawing, using the scale0.5 centimeter = 4 millimeters. The actual length of the spider’s body, not including its legs, was 16 millimeters.What is the length of the spider’s body, not including its legs, in Jonah’s drawing?
10. If Jonah made a drawing that is half the size of this one, what would length of the spider’s body be in the newdrawing?
11. Alyssa made a scale drawing of her rectangular classroom. She used the scale 12 inch = 4 f eet. Her actual
classroom has dimensions of 32 feet by 28 feet. What are the dimensions of her classroom in the scale drawing?
12. Below is a scale drawing of a circular fountain. In the scale drawing, the diameter of the fountain measures 3centimeters. What is the actual diameter of the fountain?
480
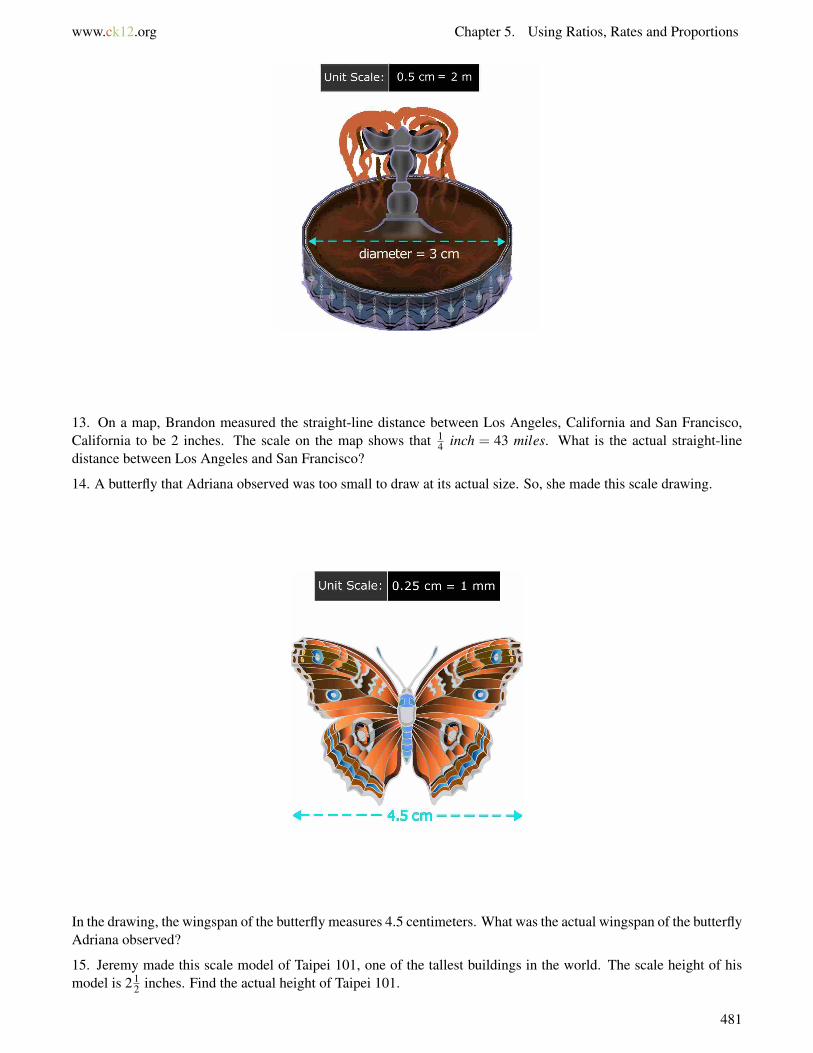
www.ck12.org Chapter 5. Using Ratios, Rates and Proportions
13. On a map, Brandon measured the straight-line distance between Los Angeles, California and San Francisco,California to be 2 inches. The scale on the map shows that 1
4 inch = 43 miles. What is the actual straight-linedistance between Los Angeles and San Francisco?
14. A butterfly that Adriana observed was too small to draw at its actual size. So, she made this scale drawing.
In the drawing, the wingspan of the butterfly measures 4.5 centimeters. What was the actual wingspan of the butterflyAdriana observed?
15. Jeremy made this scale model of Taipei 101, one of the tallest buildings in the world. The scale height of hismodel is 2 1
2 inches. Find the actual height of Taipei 101.
481
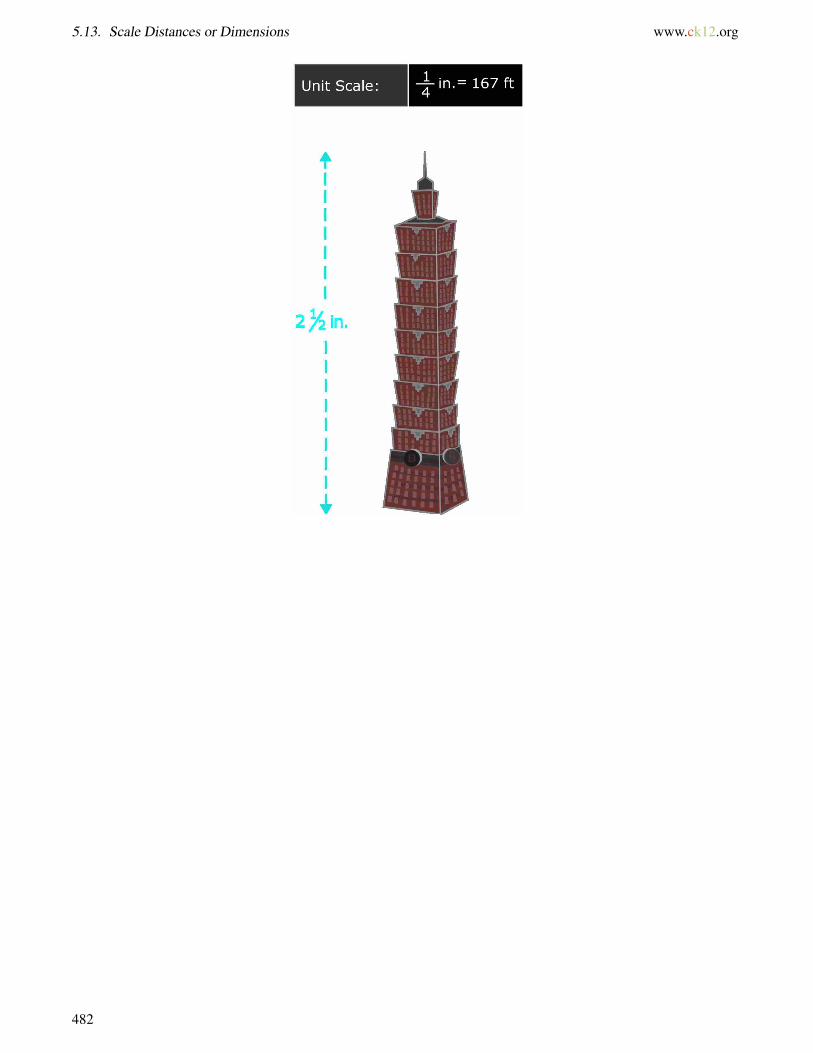
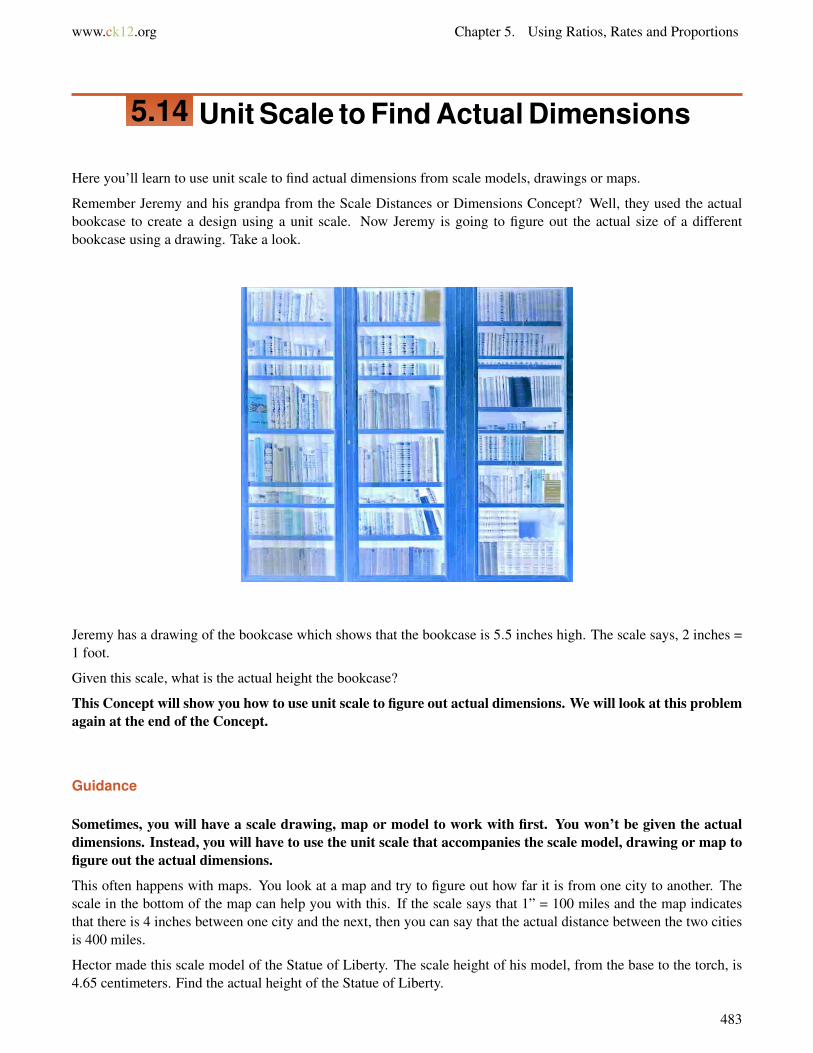
www.ck12.org Chapter 5. Using Ratios, Rates and Proportions
5.14 Unit Scale to Find Actual Dimensions
Here you’ll learn to use unit scale to find actual dimensions from scale models, drawings or maps.
Remember Jeremy and his grandpa from the Scale Distances or Dimensions Concept? Well, they used the actualbookcase to create a design using a unit scale. Now Jeremy is going to figure out the actual size of a differentbookcase using a drawing. Take a look.
Jeremy has a drawing of the bookcase which shows that the bookcase is 5.5 inches high. The scale says, 2 inches =1 foot.
Given this scale, what is the actual height the bookcase?
This Concept will show you how to use unit scale to figure out actual dimensions. We will look at this problemagain at the end of the Concept.
Guidance
Sometimes, you will have a scale drawing, map or model to work with first. You won’t be given the actualdimensions. Instead, you will have to use the unit scale that accompanies the scale model, drawing or map tofigure out the actual dimensions.
This often happens with maps. You look at a map and try to figure out how far it is from one city to another. Thescale in the bottom of the map can help you with this. If the scale says that 1” = 100 miles and the map indicatesthat there is 4 inches between one city and the next, then you can say that the actual distance between the two citiesis 400 miles.
Hector made this scale model of the Statue of Liberty. The scale height of his model, from the base to the torch, is4.65 centimeters. Find the actual height of the Statue of Liberty.
483
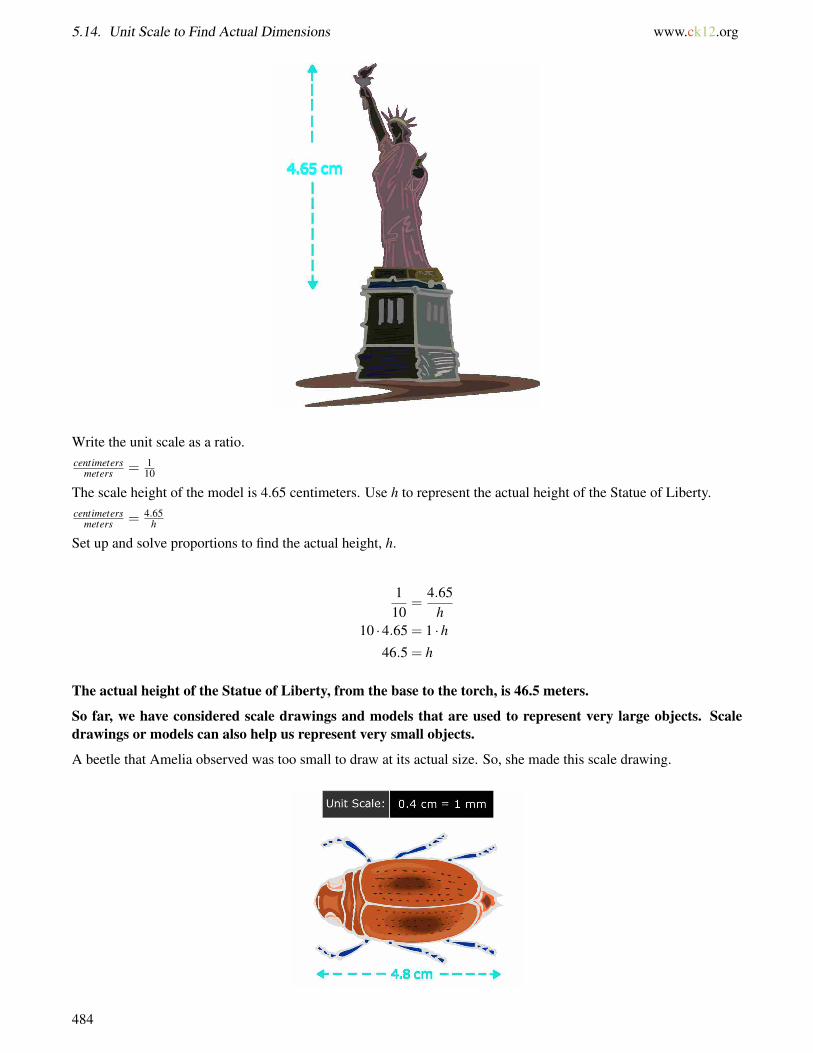
5.14. Unit Scale to Find Actual Dimensions www.ck12.org
Write the unit scale as a ratio.centimeters
meters = 110
The scale height of the model is 4.65 centimeters. Use h to represent the actual height of the Statue of Liberty.centimeters
meters = 4.65h
Set up and solve proportions to find the actual height, h.
110
=4.65
h10 ·4.65 = 1 ·h
46.5 = h
The actual height of the Statue of Liberty, from the base to the torch, is 46.5 meters.
So far, we have considered scale drawings and models that are used to represent very large objects. Scaledrawings or models can also help us represent very small objects.
A beetle that Amelia observed was too small to draw at its actual size. So, she made this scale drawing.
484

www.ck12.org Chapter 5. Using Ratios, Rates and Proportions
In her drawing, the length of the beetle was 4.8 cm. What was the length of the actual beetle?
Write the unit scale, 0.4 cm = 1 mm, as a ratio.centimetersmillimeters =
0.41
In the scale drawing, the beetle has a length of 4.8 centimeters. Use m to represent the actual length, in millimeters,of the beetle.centimetersmillimeters =
4.8m
Set up and solve a proportion to find the actual length, m.
0.41
=4.8m
1 ·4.8 = 0.4 ·m4.8 = 0.4m4.80.4
=0.4m0.4
12 = m
The actual length of the beetle Amelia observed was 12 millimeters.
Now it’s your turn. Use unit scale 1" = 200 miles to find the actual dimensions of distance on the map.
Example A
500 miles
Solution: 2.5 inches
Example B
600 miles
Solution: 3 inches
Example C
3000 miles
Solution: 15 inches
Here is the original problem once again.
485
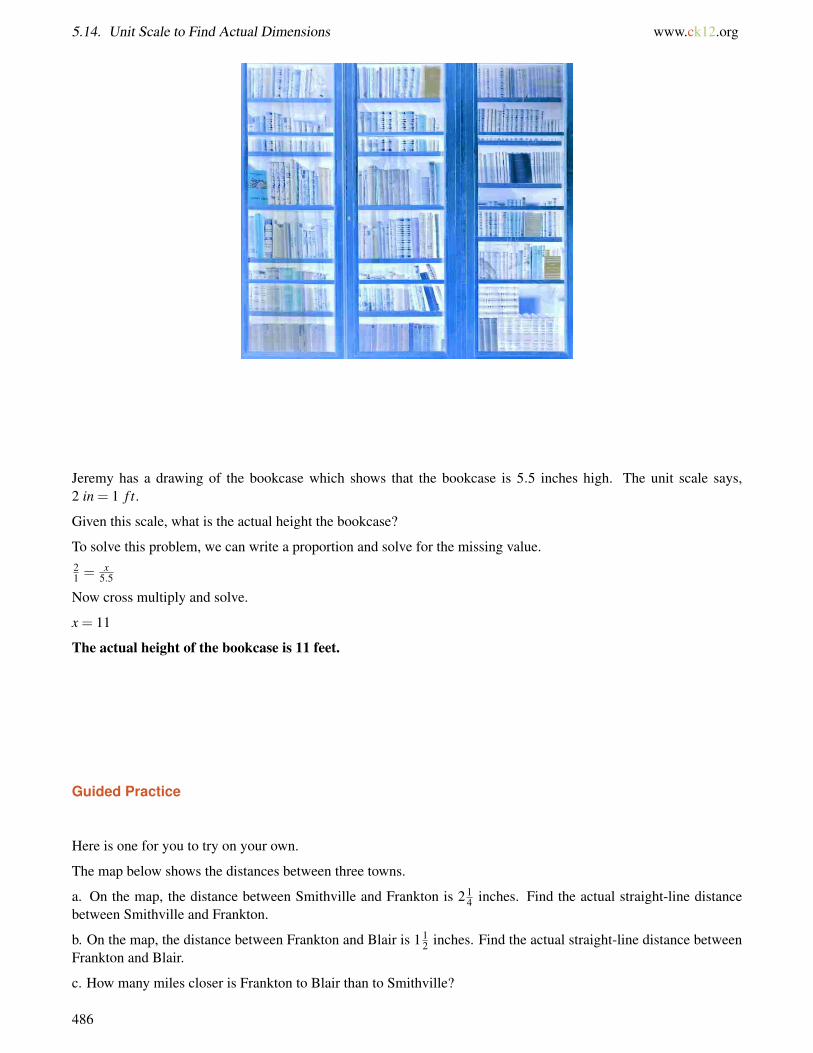
5.14. Unit Scale to Find Actual Dimensions www.ck12.org
Jeremy has a drawing of the bookcase which shows that the bookcase is 5.5 inches high. The unit scale says,2 in = 1 f t.
Given this scale, what is the actual height the bookcase?
To solve this problem, we can write a proportion and solve for the missing value.21 = x
5.5
Now cross multiply and solve.
x = 11
The actual height of the bookcase is 11 feet.
Guided Practice
Here is one for you to try on your own.
The map below shows the distances between three towns.
a. On the map, the distance between Smithville and Frankton is 2 14 inches. Find the actual straight-line distance
between Smithville and Frankton.
b. On the map, the distance between Frankton and Blair is 1 12 inches. Find the actual straight-line distance between
Frankton and Blair.
c. How many miles closer is Frankton to Blair than to Smithville?
486
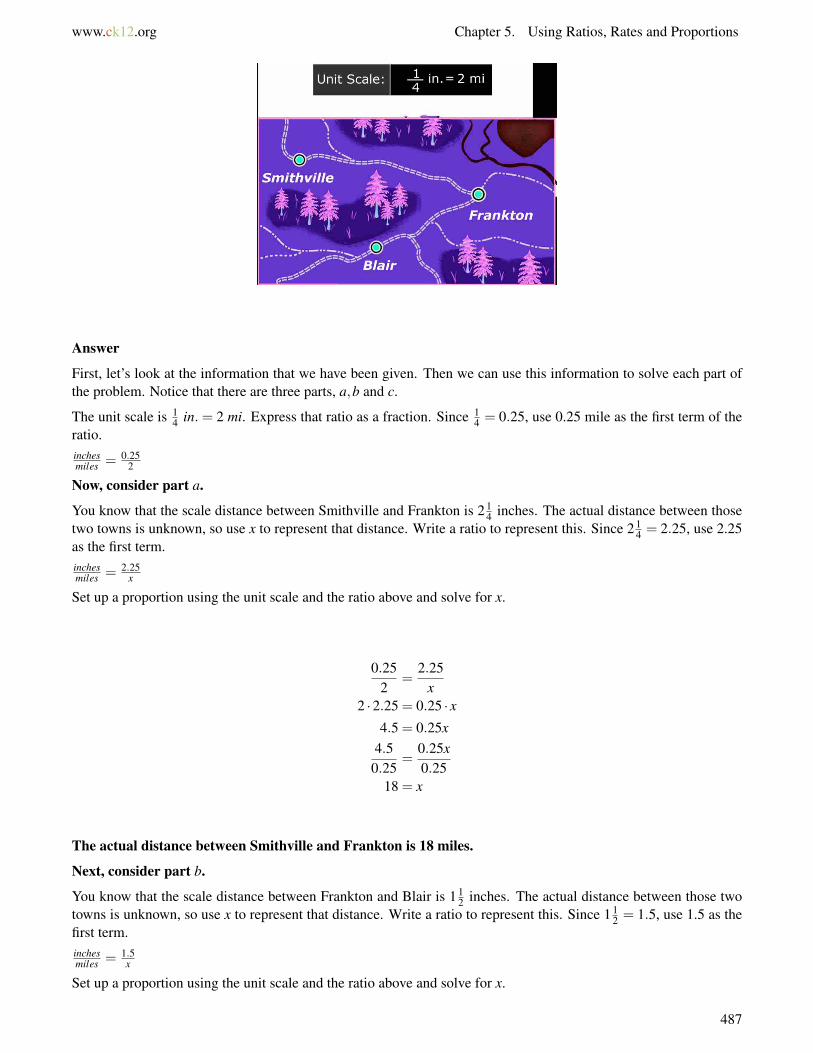
www.ck12.org Chapter 5. Using Ratios, Rates and Proportions
Answer
First, let’s look at the information that we have been given. Then we can use this information to solve each part ofthe problem. Notice that there are three parts, a,b and c.
The unit scale is 14 in.= 2 mi. Express that ratio as a fraction. Since 1
4 = 0.25, use 0.25 mile as the first term of theratio.inchesmiles = 0.25
2
Now, consider part a.
You know that the scale distance between Smithville and Frankton is 2 14 inches. The actual distance between those
two towns is unknown, so use x to represent that distance. Write a ratio to represent this. Since 2 14 = 2.25, use 2.25
as the first term.inchesmiles = 2.25
x
Set up a proportion using the unit scale and the ratio above and solve for x.
0.252
=2.25
x2 ·2.25 = 0.25 · x
4.5 = 0.25x4.50.25
=0.25x0.25
18 = x
The actual distance between Smithville and Frankton is 18 miles.
Next, consider part b.
You know that the scale distance between Frankton and Blair is 1 12 inches. The actual distance between those two
towns is unknown, so use x to represent that distance. Write a ratio to represent this. Since 1 12 = 1.5, use 1.5 as the
first term.inchesmiles = 1.5
x
Set up a proportion using the unit scale and the ratio above and solve for x.
487
5.14. Unit Scale to Find Actual Dimensions www.ck12.org
0.252
=1.5x
2 ·1.5 = 0.25 · x3 = 0.25x
30.25
=0.25x0.25
12 = x
The actual distance between Frankton and Blair is 12 miles.
Finally, consider part c.
We know that Smithville is 18 miles from Frankton, and that Blair is 12 miles from Frankton. So, we can subtractto find out how much closer Frankton is to Blair than to Smithville.
18−12 = 6
Frankton is 6 miles closer to Blair than to Smithville.
Video Review
MEDIAClick image to the left or use the URL below.URL: http://www.ck12.org/flx/render/embeddedobject/5508
This is a James Sousa video on unit scale.
Explore More
Directions: Use the given scale to determine the actual distance.
Given: Scale 1” = 100 miles
1. How many miles is 2” on the map?
2. How many miles is 2 12 inch on the map?
3. How many miles is 14 inch on the map?
4. How many miles is 10 inches on the map?
5. How many miles is 11 inches on the map?
6. How many miles is 12.5 inches on the map?
7. How many miles is 12 inch on the map?
8. How many miles is 5 14 inch on the map?
Given: 1 cm = 20 mi
9. How many miles is 2 cm on the map?
488

www.ck12.org Chapter 5. Using Ratios, Rates and Proportions
10. How many miles is 4 cm on the map?
11. How many miles is 8.5 cm on the map?
12. How many miles is 19 cm on the map?
13. How many miles is 13 cm on the map?
14. How many miles is 12 cm on the map?
15. How many miles is 1 12 cm on the map?
489
5.15. Scale Factor to Find Actual Dimensions www.ck12.org
5.15 Scale Factor to Find Actual Dimensions
Here you’ll learn to use scale factor to find actual dimensions from scale models, drawings or maps.
Remember the reading challenge? Take a look at this dilemma.
Mrs. Henderson is thrilled with the progress that her students are making in the reading challenge. As a reward, shehas decided to make a small reading corner in the back of her room. She has gotten a few bean bag chairs donatedand one small couch. When the students arrived on Monday morning, they were thrilled.
“Wow! This is awesome!” they exclaimed as they took turns trying out the furniture.
“Next, we need a small rug,” Mrs. Henderson said.
On the board she drew a rectangle.
“This rug has a scale factor of 110 . If the length of the rug is 6” in this drawing and the width is 3”, then what is the
area of the rug?”
“Mrs. Henderson, this isn’t math,” Jessica said smiling.
“A little math never hurt anyone, let’s get started.”
While the students work on this problem, it is your turn to learn about scale factor in this Concept.
Guidance
The relationship between the dimensions on a scale drawing or model and the actual dimensions of the objectbeing represented is described by a ratio. One type of ratio that could be used is called a unit scale , in whichunits of measure are used to relate scale dimensions to actual dimensions. For example, a unit scale for a scaledrawing might be: 1 centimeter = 2 meters.
Another ratio that could be used is called a scale factor. Like a unit scale, a scale factor relates the scaledimensions to actual dimensions however it does so without regard to specific units.
A scale factor for a scale drawing might be 1200 .
If you think about the unit scale that we just introduced, 1 centimeter to 2 meters, the scale factor would be 1to 2.
Let’s look at how we can work with scale factors when given actual dimensions.
490
www.ck12.org Chapter 5. Using Ratios, Rates and Proportions
Suppose you wanted to make a scale model or a scale drawing. You would need to know the dimensions of theobject you wanted to represent. Then, you could choose a scale factor for your model or drawing. You would thenuse that scale factor to create the drawing.
Since a scale factor disregards units of measure, you will need to convert units of length to solve problems involvingscale drawings and models. Knowing the unit conversions in this table can help you convert units of length.
TABLE 5.2:
Customary Units of Length Metric Units of Length1 foot (ft) = 12 inches (in.) 1 meter (m) = 100 centimeters (cm) = 100 millimeters
(mm)1 yard (yd) = 3 feet (ft)1 mile (mi) = 1760 yards (yd) = 5280 feet (ft) 1 kilometer (km) = 1000 meters (m)
Write these conversions down in your notebook and then continue. This way you can refer back to them as youwork.
A small airplane has a wingspan of 16 feet. Finn wants to make a scale model of the airplane. The scale factor forhis model will be 1
48 . Find the wingspan of his model airplane in inches.
The scale factor compares the dimensions of the scale model to the dimensions of the actual airplane.scaleactual =
148
The actual wingspan of the airplane is 16 feet. Use w to represent the unknown wingspan of the modelairplane.scaleactual =
w16
Set up and solve a proportion to find w, the wingspan of the scale model.
491
5.15. Scale Factor to Find Actual Dimensions www.ck12.org
148
=w16
48 ·w = 1 ·16
48w = 1648w48
=1648
w =1648
=16÷1648÷16
=13
The wingspan of the model airplane will be 13 foot.
The question asks for the wingspan in inches. So, convert 13 foot to inches.
We know that 1 foot = 12 inches. One way to find the number of inches in 13 foot is to multiply 1
3 by 12.
13
f oot =13×12 =
13× 12
1=
123
= 4 inches
The wingspan of the model airplane will be 4 inches, or 13 foot.
The longest side of a triangular flower bed is 5.5 meters long. Leah wants to make a scale drawing of the flowerbed. The scale factor for her drawing will be 1
200 . What will be the length of the longest side of the flower bed in herdrawing?
The scale factor compares the dimensions of the scale drawing to the dimensions of the actual flower bed.scaleactual =
1200
The actual length of the flower bed is 5.5 meters. Use l to represent the unknown length of the flower bed inthe scale drawing.scaleactual =
l5.5
Set up and solve a proportion to find the scale length, l.
1200
=l
5.5200 · l = 1 ·5.5
200l = 5.5200l200
=5.5200
l = 0.0275
If you were unsure of how to divide 5.5 by 200, here is how you could have done it:
492
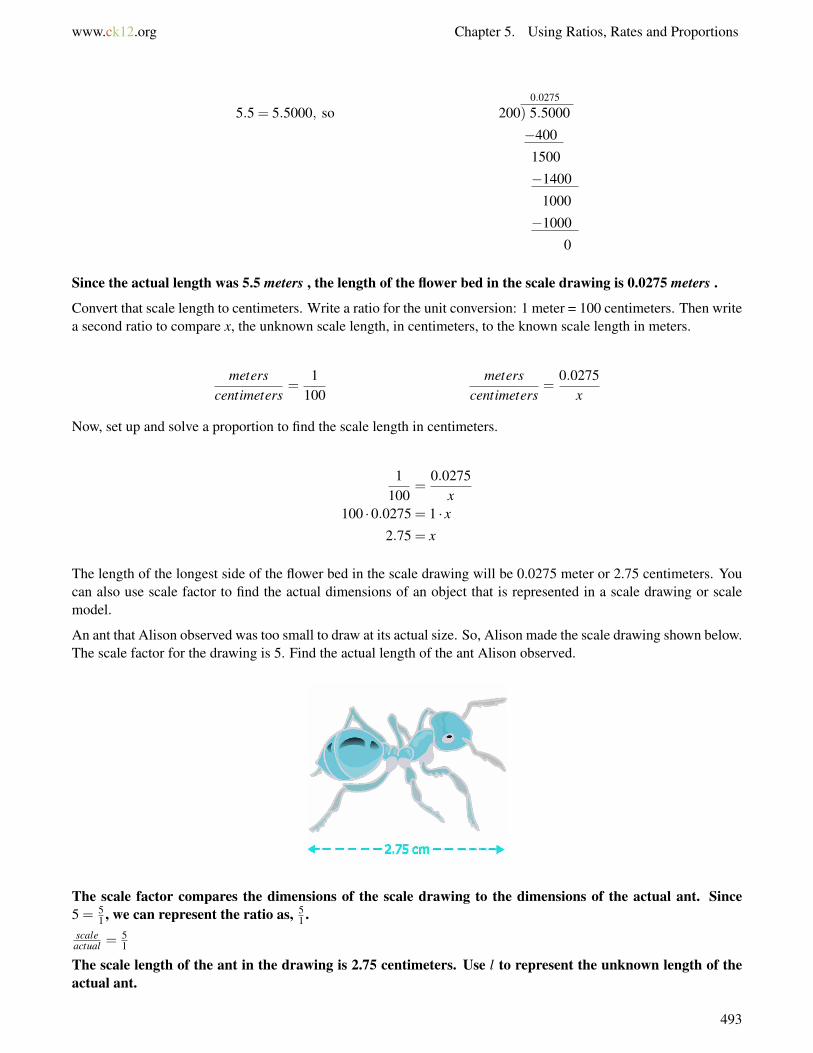
www.ck12.org Chapter 5. Using Ratios, Rates and Proportions
5.5 = 5.5000, so0.0275
200) 5.5000
−400
1500
−1400
1000
−1000
0
Since the actual length was 5.5 meters , the length of the flower bed in the scale drawing is 0.0275 meters .
Convert that scale length to centimeters. Write a ratio for the unit conversion: 1 meter = 100 centimeters. Then writea second ratio to compare x, the unknown scale length, in centimeters, to the known scale length in meters.
meterscentimeters
=1
100meters
centimeters=
0.0275x
Now, set up and solve a proportion to find the scale length in centimeters.
1100
=0.0275
x100 ·0.0275 = 1 · x
2.75 = x
The length of the longest side of the flower bed in the scale drawing will be 0.0275 meter or 2.75 centimeters. Youcan also use scale factor to find the actual dimensions of an object that is represented in a scale drawing or scalemodel.
An ant that Alison observed was too small to draw at its actual size. So, Alison made the scale drawing shown below.The scale factor for the drawing is 5. Find the actual length of the ant Alison observed.
The scale factor compares the dimensions of the scale drawing to the dimensions of the actual ant. Since5 = 5
1 , we can represent the ratio as, 51 .
scaleactual =
51
The scale length of the ant in the drawing is 2.75 centimeters. Use l to represent the unknown length of theactual ant.
493
5.15. Scale Factor to Find Actual Dimensions www.ck12.org
scaleactual =
2.75l
Set up and solve a proportion to find the actual length, l.
51=
2.75l
1 ·2.75 = 5 · l2.75 = 5l2.75
5=
5l5
0.55 = l
Since the scale length you used was 2.75 centimeters , the length of the actual ant was 0.55 centimeter .
Convert that scale length to millimeters. Use the unit conversion, 1 centimeter = 10 millimeters, to write aratio.centimetersmillimeters =
110
Then write a second ratio to compare x, the unknown scale length, in millimeters, to the known scale length incentimeters.centimetersmillimeters =
0.55x
Now, set up and solve a proportion to find the scale length in centimeters.
110
=0.55
x10 ·0.55 = 1 · x
5.5 = x
The actual length of the ant was 0.55 centimeter or 5.5 millimeters.
Use the scale factor of 1 to 3 to figure out the actual dimensions given the following scale dimensions.
Example A
9 inches
Solution: 27 inches
Example B
12 mm
Solution: 36 mm
Example C
15 inches
Solution: 45 mm
494
www.ck12.org Chapter 5. Using Ratios, Rates and Proportions
Here is the original problem once again.
Mrs. Henderson is thrilled with the progress that her students are making in the reading challenge. As a reward, shehas decided to make a small reading corner in the back of her room. She has gotten a few bean bag chairs donatedand one small couch. When the students arrived on Monday morning, they were thrilled.
“Wow! This is awesome!” they exclaimed as they took turns trying out the furniture.
“Next, we need a small rug,” Mrs. Henderson said.
On the board she drew a rectangle.
“This rug has a scale factor of 110 . If the length of the rug is 6” in this drawing and the width is 3”, then what is the
area of the rug?”
“Mrs. Henderson, this isn’t math,” Jessica said smiling.
“A little math never hurt anyone, let’s get started.”
First, we need to figure out the actual length of the rug and the actual width of the rug given the drawing andthe scale factor. Here is our proportion for the length.110 = 6
l
Notice that we use “l” for the missing length. We use cross products and find that the length is 60 inches.
Next, we find the width.110 = 3
w
We use cross products to find that the width is 30 inches.
Next, we want to find the area of the rug. We want to find it in square feet. First, we need to convert the lengthand width to feet from inches.
60÷12 = 5 f eet
30÷12 = 2.5 f eet
The area is found by multiplying length times width.
5×2.5 = 12.5 square feet
This is the area of the rug.
495
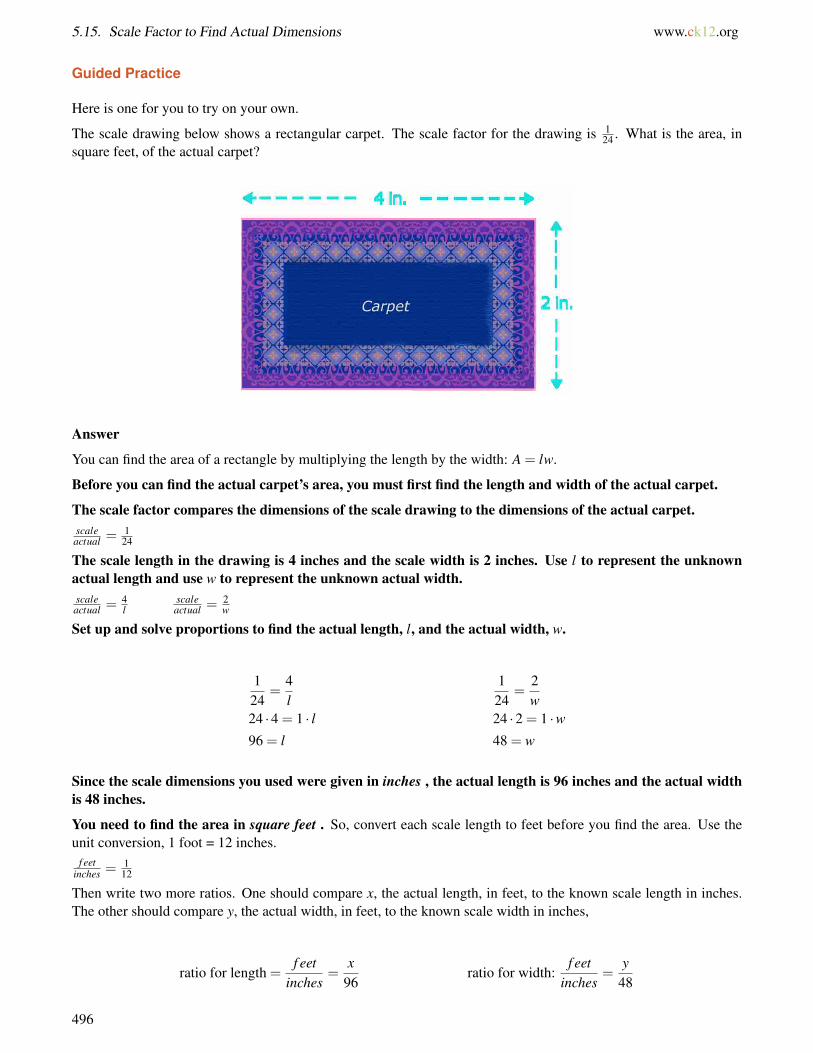
5.15. Scale Factor to Find Actual Dimensions www.ck12.org
Guided Practice
Here is one for you to try on your own.
The scale drawing below shows a rectangular carpet. The scale factor for the drawing is 124 . What is the area, in
square feet, of the actual carpet?
Answer
You can find the area of a rectangle by multiplying the length by the width: A = lw.
Before you can find the actual carpet’s area, you must first find the length and width of the actual carpet.
The scale factor compares the dimensions of the scale drawing to the dimensions of the actual carpet.scaleactual =
124
The scale length in the drawing is 4 inches and the scale width is 2 inches. Use l to represent the unknownactual length and use w to represent the unknown actual width.scaleactual =
4l
scaleactual =
2w
Set up and solve proportions to find the actual length, l, and the actual width, w.
124
=4l
124
=2w
24 ·4 = 1 · l 24 ·2 = 1 ·w96 = l 48 = w
Since the scale dimensions you used were given in inches , the actual length is 96 inches and the actual widthis 48 inches.
You need to find the area in square feet . So, convert each scale length to feet before you find the area. Use theunit conversion, 1 foot = 12 inches.
f eetinches =
112
Then write two more ratios. One should compare x, the actual length, in feet, to the known scale length in inches.The other should compare y, the actual width, in feet, to the known scale width in inches,
ratio for length =f eet
inches=
x96
ratio for width:f eet
inches=
y48
496
www.ck12.org Chapter 5. Using Ratios, Rates and Proportions
Now, set up and solve proportions to convert the dimensions to feet.
112
=x
96112
=y
4812 · x = 1 ·96 12 · y = 1 ·48
12x = 96 12y = 4812x12
=9612
12y12
=4812
x = 8 x = 4
Now, calculate the area in square feet.
A = lw = 8 f t ·4 f t = 32 f t2
The area of the carpet is 32 square feet.
You may wonder why we converted the dimensions from inches to feet before finding the area. You might wonderif we could have simply found the area, in square inches, and then converted the area to square feet. We could have,but if we did, we would have needed to be careful to convert from square inches to square feet.
The area in square inches is:
A = lw = 96 in. ·48 in.= 4608 in.2
How do we convert from square inches to square feet?
We know that 1 foot = 12 inches and 1 f t2 = 1 f t ·1 f t. We can use that information to find out how many squareinches are in 1 square foot:
1 f t2 = 1 f t×1 f t = 12 in.×12 in.= 144 in.2
So, we could set up and solve a proportion to convert 4,608 square inches to square feet, using the ratio: 1 squarefoot = 144 square inches.
1144
=a
4608144 ·a = 1 ·4608
144a = 4608144a144
=4608144
a = 32
We would get the same answer, 32 square feet, for the area of the carpet using this method. If you choose to solveproblems this way, just be sure to remember that even though 1 foot = 12 inches, 1 square foot = 144 square inches,not 12 square inches.
Video Review
497
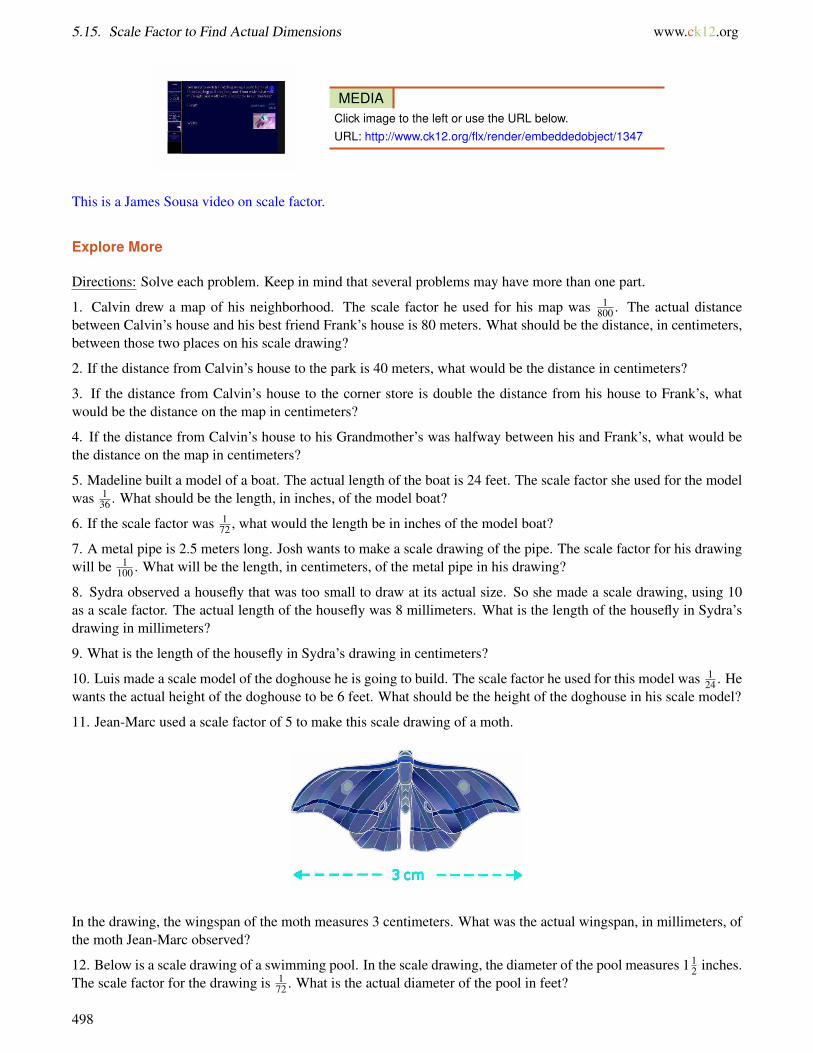
5.15. Scale Factor to Find Actual Dimensions www.ck12.org
MEDIAClick image to the left or use the URL below.URL: http://www.ck12.org/flx/render/embeddedobject/1347
This is a James Sousa video on scale factor.
Explore More
Directions: Solve each problem. Keep in mind that several problems may have more than one part.
1. Calvin drew a map of his neighborhood. The scale factor he used for his map was 1800 . The actual distance
between Calvin’s house and his best friend Frank’s house is 80 meters. What should be the distance, in centimeters,between those two places on his scale drawing?
2. If the distance from Calvin’s house to the park is 40 meters, what would be the distance in centimeters?
3. If the distance from Calvin’s house to the corner store is double the distance from his house to Frank’s, whatwould be the distance on the map in centimeters?
4. If the distance from Calvin’s house to his Grandmother’s was halfway between his and Frank’s, what would bethe distance on the map in centimeters?
5. Madeline built a model of a boat. The actual length of the boat is 24 feet. The scale factor she used for the modelwas 1
36 . What should be the length, in inches, of the model boat?
6. If the scale factor was 172 , what would the length be in inches of the model boat?
7. A metal pipe is 2.5 meters long. Josh wants to make a scale drawing of the pipe. The scale factor for his drawingwill be 1
100 . What will be the length, in centimeters, of the metal pipe in his drawing?
8. Sydra observed a housefly that was too small to draw at its actual size. So she made a scale drawing, using 10as a scale factor. The actual length of the housefly was 8 millimeters. What is the length of the housefly in Sydra’sdrawing in millimeters?
9. What is the length of the housefly in Sydra’s drawing in centimeters?
10. Luis made a scale model of the doghouse he is going to build. The scale factor he used for this model was 124 . He
wants the actual height of the doghouse to be 6 feet. What should be the height of the doghouse in his scale model?
11. Jean-Marc used a scale factor of 5 to make this scale drawing of a moth.
In the drawing, the wingspan of the moth measures 3 centimeters. What was the actual wingspan, in millimeters, ofthe moth Jean-Marc observed?
12. Below is a scale drawing of a swimming pool. In the scale drawing, the diameter of the pool measures 1 12 inches.
The scale factor for the drawing is 172 . What is the actual diameter of the pool in feet?
498
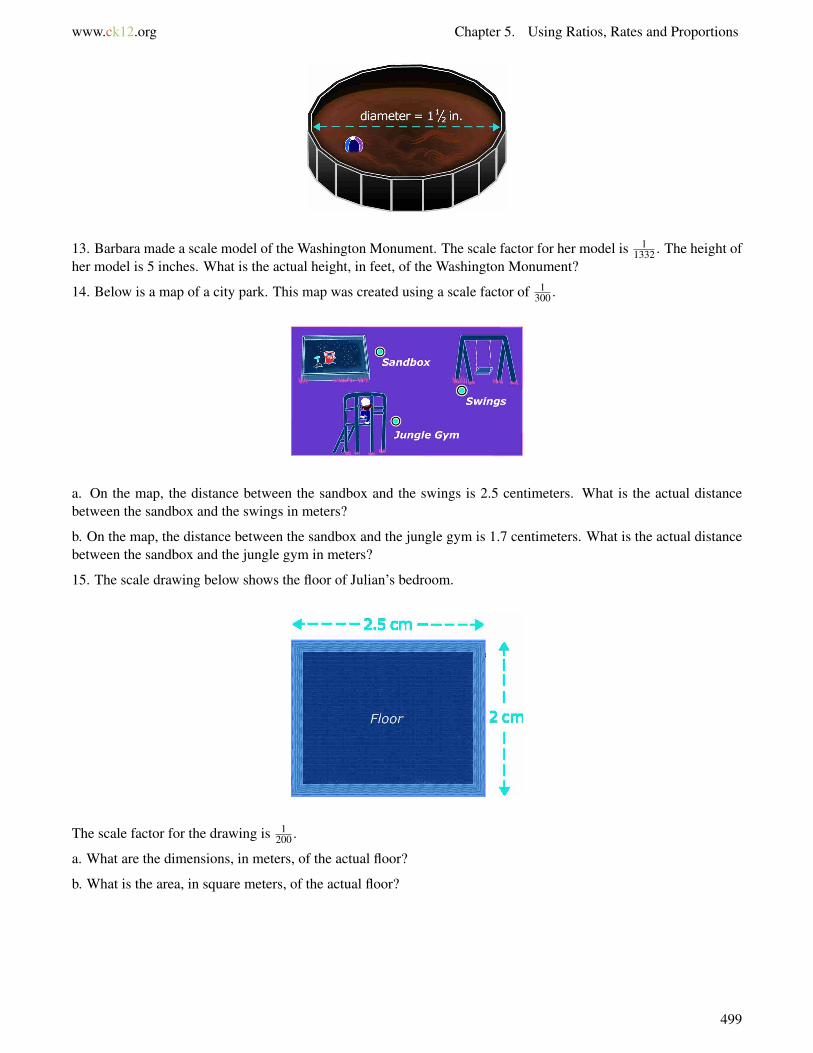
www.ck12.org Chapter 5. Using Ratios, Rates and Proportions
13. Barbara made a scale model of the Washington Monument. The scale factor for her model is 11332 . The height of
her model is 5 inches. What is the actual height, in feet, of the Washington Monument?
14. Below is a map of a city park. This map was created using a scale factor of 1300 .
a. On the map, the distance between the sandbox and the swings is 2.5 centimeters. What is the actual distancebetween the sandbox and the swings in meters?
b. On the map, the distance between the sandbox and the jungle gym is 1.7 centimeters. What is the actual distancebetween the sandbox and the jungle gym in meters?
15. The scale drawing below shows the floor of Julian’s bedroom.
The scale factor for the drawing is 1200 .
a. What are the dimensions, in meters, of the actual floor?
b. What is the area, in square meters, of the actual floor?
499
5.16. Problem Solving Plan, Proportions www.ck12.org
5.16 Problem Solving Plan, Proportions
Here you’ll learn to develop and use the strategy: write a proportion.
After a whole year of reading, the students in Mrs. Henderson’s class are ready to tally up the number of books thatwere read. The students read a total of 544 books. There were many different types of books that were read. A fewof the students took everyone’s lists and organized them into categories. Then they tallied the number of books ineach category and composed a list.
History 12 books
Adventure 250 books
Romance 100 books
Mystery 120 books
Nature/Science 62 books
Then the students began comparing the number of books in each category. They compared the three largest categorieswith each other. They compared romance to adventure, mystery to romance, and mystery to adventure.
Given what you have learned about ratios and proportions answer each of the following questions.
What is the ratio of romance books to adventure books? Write your answer in simplest form too.
What is the ratio of mystery to romance books? Write your answer in simplest form.
What is the ratio of mystery to adventure? Write your answer in simplest form.
Do any of these ratios form a proportion? Why or why not?
Take a few minutes to write down your answers. Now go through the Concept and check your answers at the end.
Guidance
As you already know, some types of problems can be solved by writing and solving a proportion. However, how youchoose to solve the proportion may vary. Sometimes, it may be easier to use proportional reasoning. Other times,cross multiplying may be easier.
Let’s look at two different situations where you can use a proportion.
500

www.ck12.org Chapter 5. Using Ratios, Rates and Proportions
On a map, Sonia measured the straight-line distance between Baltimore, Maryland and Washington D.C. to be 2centimeters. The scale on the map shows that 1 centimeter = 28 kilometers. What is the actual straight-line distancebetween Baltimore and Washington D.C.?
This problem involves a map, which is a type of scale drawing. It makes sense to use proportions to solve it.The unit scale, 1 centimeter = 28 kilometers, can be represented as a ratio. We can also write a ratio that comparesthe scale distance, 2 centimeters, to the unknown actual distance, d.centimeterskilometers = 1
28centimeterskilometers = 2
d
These are equivalent ratios, so we can use them to write a proportion.128 = 2
d
Consider which strategy to use. Should we solve for d by using proportional reasoning? Or should we crossmultiply?
Either strategy will work, but look at the terms in the numerators. The relationship between those two terms iseasy to see––we can multiply 1 by 2 to get 2. So, the computation will probably be simpler if we use proportionalreasoning and multiply both terms of the first ratio by 2.128 = 1×2
28×2 = 256 = 2
d
From the work above, we can see that when the first term is 2, the second term is 56. So, d = 56.
The actual distance between Baltimore and Washington D.C. is 56 kilometers.
Sometimes, it is easier to use the cross product property of proportions than to use proportional reasoning.This is especially true when the relationship between a pair of terms in a proportion is not immediatelyobvious.
501
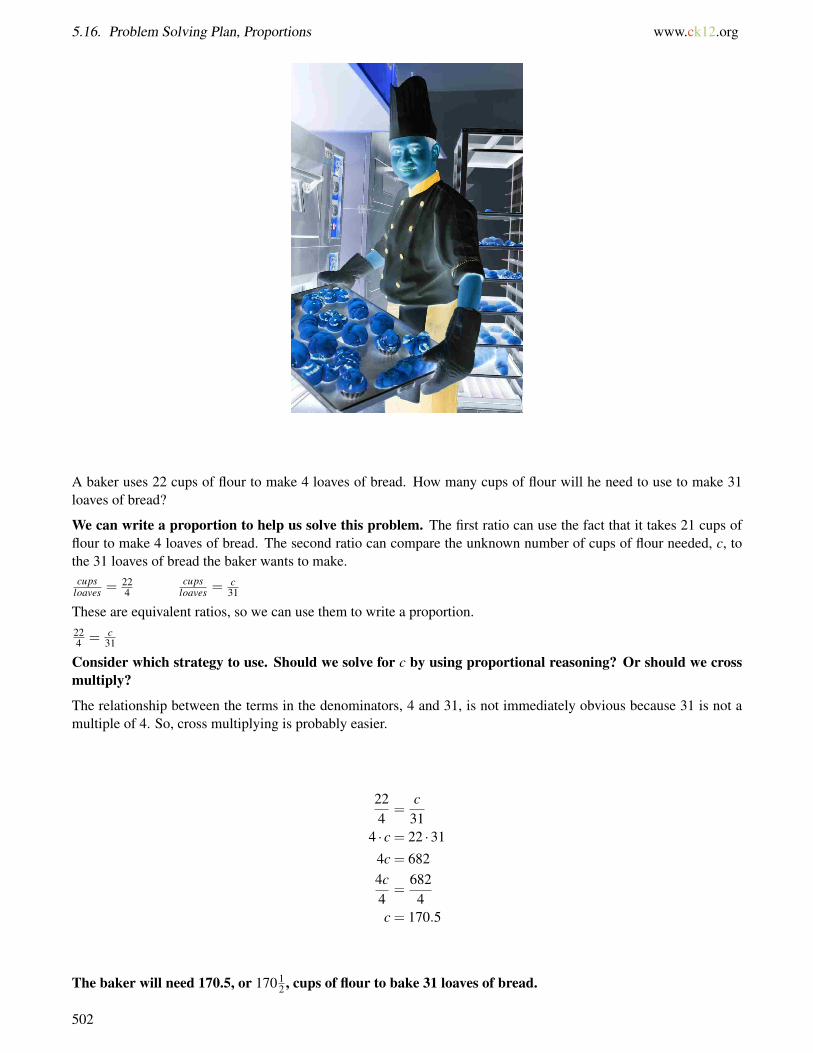
5.16. Problem Solving Plan, Proportions www.ck12.org
A baker uses 22 cups of flour to make 4 loaves of bread. How many cups of flour will he need to use to make 31loaves of bread?
We can write a proportion to help us solve this problem. The first ratio can use the fact that it takes 21 cups offlour to make 4 loaves of bread. The second ratio can compare the unknown number of cups of flour needed, c, tothe 31 loaves of bread the baker wants to make.cups
loaves =224
cupsloaves =
c31
These are equivalent ratios, so we can use them to write a proportion.224 = c
31
Consider which strategy to use. Should we solve for c by using proportional reasoning? Or should we crossmultiply?
The relationship between the terms in the denominators, 4 and 31, is not immediately obvious because 31 is not amultiple of 4. So, cross multiplying is probably easier.
224
=c
314 · c = 22 ·31
4c = 6824c4
=6824
c = 170.5
The baker will need 170.5, or 170 12 , cups of flour to bake 31 loaves of bread.
502
www.ck12.org Chapter 5. Using Ratios, Rates and Proportions
Now it is time for you to try a few on your own. Use the information from the baker above.
Example A
How many cups for 6 loaves?
Solution: 33 cups
Example B
How many loaves for 55 cups?
Solution: 10 loaves
Example C
If the baker made half as many loaves to start with, how many cups would he have needed?
Solution: 11 cups
Here is the original problem again. It is time to check your answers.
After a whole year of reading, the students in Mrs. Henderson’s class are ready to tally up the number of books thatwere read. The students read a total of 544 books. There were many different types of books that were read. A fewof the students took everyone’s lists and organized them into categories. Then they tallied the number of books ineach category and composed a list.
History 12 books
Adventure 250 books
Romance 100 books
Mystery 120 books
Nature/Science 62 books
Then the students began comparing the number of books in each category. They compared the three largest categorieswith each other. They compared romance to adventure, mystery to romance, and mystery to adventure.
Given what you have learned about ratios and proportions answer each of the following questions.
What is the ratio of romance books to adventure books? Write your answer in simplest form too.
503
5.16. Problem Solving Plan, Proportions www.ck12.org
100250 = 2
5
What is the ratio of mystery to romance books? Write your answer in simplest form.120100 = 6
5
What is the ratio of mystery to adventure? Write your answer in simplest form.120250 = 12
25
Do any of these ratios form a proportion? Why or why not?
None of these ratios form a proportion because none of them are equal.
Take a few minutes to go over your answers with a friend.
Guided Practice
Here is one for you to try on your own.
Use a proportion to solve the following problem.
If a person can run 3 miles in 18 minutes, how long will it take the same person to run 21 miles if it is at the samerate?
Answer
In this problem, we are comparing miles and time. That is our ratio. Let’s set it up.milestime = miles
time
Next we fill in the given information.318 = 21
x
Now we cross multiply and solve.
3x = 378
x = 126
The person would run 21 miles in 126 minutes, a little over two hours.
Video Review
MEDIAClick image to the left or use the URL below.URL: http://www.ck12.org/flx/render/embeddedobject/1360
This is a James Sousa video on problem solving with proportions.
Explore More
Directions: Use what you have learned to solve each problem. Consider more than one strategy for solving eachproblem. Then choose the strategy you think will work best and use it to solve the problem.
504
www.ck12.org Chapter 5. Using Ratios, Rates and Proportions
1. A jar contains only pennies and nickels. The ratio of pennies to nickels in the jar is 2 to 7. If there are 14 nickelsin the jar, how many pennies are in the jar?
2. Anya charges $40 for 5 hours of babysitting. Lionel charges $14 for 2 hours of babysitting. Which babysittercharges the cheapest rate?
3. On a map, Derek measured the straight-line distance between Toronto, Canada and Niagara Falls, New York tobe 2 inches. The scale on the map shows that 1
2 inch = 11 miles. What is the actual straight-line distance betweenToronto and Niagara Falls?
4. A desk is 120 centimeters long. What is the length of the desk in meters? Use this unit conversion: 1 meter = 100centimeters.
5. On a field trip, the ratio of teachers to students is 1 : 25. If there are 5 teachers on the field trip, how many studentsare on the trip?
6. Kara bought 5 pounds of Brand X roast beef for $43. Cameron bought 3 pounds of Brand Y roast beef for $27.Which brand of roast beef is the better buy?
7. If two inches on a map are equal to three miles, how many miles are represented by four inches?
8. If eight inches on a map are equal to ten miles, how many miles are 16 inches equal to?
9. Casey drew a design for bedroom. On the picture, she used one inch to represent five feet. If her bedroom wall isten feet long, how many inches will Casey draw on her diagram to represent this measurement?
10. If two inches are equal to twelve feet, how many inches would be equal to 36 feet?
11. If four inches are equal to sixteen feet, how many feet are two inches equal to?
12. The carpenter chose a scale of 6” for every twelve feet. Given this measurement, how many feet would berepresented by 3”?
13. If 9 inches are equal to 27 feet, how many feet are equal to three inches?
14. If four inches are equal to 8 feet, how many feet are equal to two inches?
15. If six inches are equal to ten feet, how many inches are five feet equal to?
505
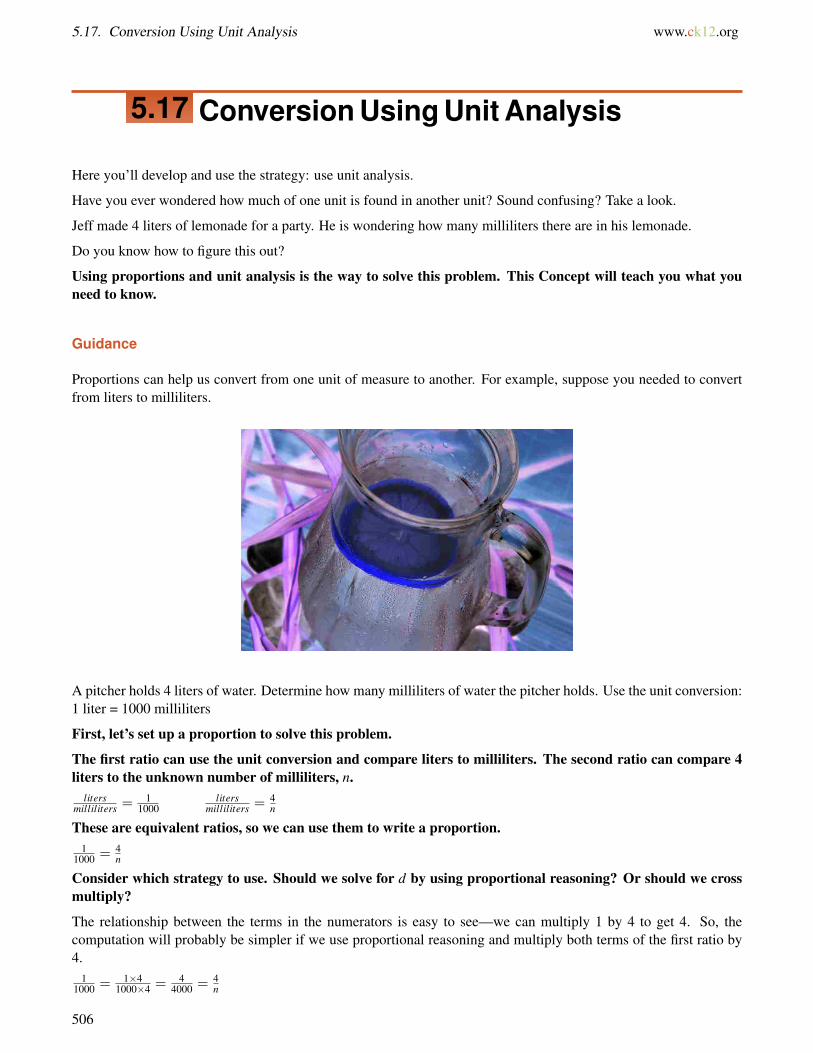
5.17. Conversion Using Unit Analysis www.ck12.org
5.17 Conversion Using Unit Analysis
Here you’ll develop and use the strategy: use unit analysis.
Have you ever wondered how much of one unit is found in another unit? Sound confusing? Take a look.
Jeff made 4 liters of lemonade for a party. He is wondering how many milliliters there are in his lemonade.
Do you know how to figure this out?
Using proportions and unit analysis is the way to solve this problem. This Concept will teach you what youneed to know.
Guidance
Proportions can help us convert from one unit of measure to another. For example, suppose you needed to convertfrom liters to milliliters.
A pitcher holds 4 liters of water. Determine how many milliliters of water the pitcher holds. Use the unit conversion:1 liter = 1000 milliliters
First, let’s set up a proportion to solve this problem.
The first ratio can use the unit conversion and compare liters to milliliters. The second ratio can compare 4liters to the unknown number of milliliters, n.
litersmilliliters =
11000
litersmilliliters =
4n
These are equivalent ratios, so we can use them to write a proportion.1
1000 = 4n
Consider which strategy to use. Should we solve for d by using proportional reasoning? Or should we crossmultiply?
The relationship between the terms in the numerators is easy to see––we can multiply 1 by 4 to get 4. So, thecomputation will probably be simpler if we use proportional reasoning and multiply both terms of the first ratio by4.
11000 = 1×4
1000×4 = 44000 = 4
n
506
www.ck12.org Chapter 5. Using Ratios, Rates and Proportions
From the work above, we can see that when the first term is 4, the second term is 4000. So, n = 4000.
The pitcher holds 4000 milliliters of water.
Another strategy for solving a problem like the one with the pitcher is to use unit analysis. In unit analysis, wewrite ratios as fractions, just as we do when we write a proportion. However, in unit analysis, we do not wantthe terms in the fractions to be consistent. Instead, the units in the fractions are written so that certain unitscancel one another out.
This will be easier to understand if we consider an example. Let’s go back to the last example with the litersand the pitcher. We can use unit analysis to solve it.
The problem requires us to convert 4 liters to milliliters. Our answer should be in milliliters, so the number ofmilliliters is unknown.
The measure we are given is 4 liters.
We know that 1 liter (L) = 1000 milliliters (mL). This can be expressed as either 1L1000mL or 1000mL
1L . Each of these is apossible conversion factor by which we might multiply 4 liters.
We should start by writing 4 liters as a fraction over 1. We can do this because 4L = 4L1 .
4L1
We want our answer to be in milliliters, not in liters. So, we want the liters to cancel each other out. Since liters isin the numerator of the fraction above, we should make sure that liters is in the denominator of the conversion factorwe use, like this:4L1 ×
1000mL1L
Since liters appears in the numerator of one factor and in the denominator of another factor, we can cancel them out,like this:
4SL1× 1000mL
1SL
Now we can multiply what is left as we would multiply any fractions.41 ×
1000mL1 = 4×1000mL
1×1 = 4000mL1 = 4000mL
The pitcher holds 4000 milliliters of water.
Now it’s your turn to try a few conversions.
507

5.17. Conversion Using Unit Analysis www.ck12.org
Example A
How many milliliters in 2.5 liters? Write a proportion and solve.
Solution: 2500 mL
Example B
How many meters in 11 kilometers? Write a proportion and solve.
Solution: 11,000 meters
Example C
How many inches are there in 18 feet? Use a proportion and solve.
Solution: 216 inches
Here is the original problem once again.
Jeff made 4 liters of lemonade for a party. He is wondering how many milliliters there are in his lemonade.
Do you know how to figure this out?
To figure this out, we can start with the unit scale from liters to milliliters.1
1000
This means that there are 1000 milliliters in 1 liter.
Now we can set up a proportion.1
1000 = 4x
Cross multiply and solve.
4000
There are 4000 mL in the lemonade container.
Guided Practice
Here is one for you to try on your own.
Arnaldo needs to buy olive oil. He could buy a 15-ounce bottle of Brand A olive oil for $3, or he could buy a20-ounce bottle of Brand B olive oil for $5. Which is the better buy?
Answer
One way to solve this problem is to find the unit price for each bottle.
Find the unit price for the 15-ounce bottle. Remember, you can find the unit price by dividing the first term by thesecond term.
508
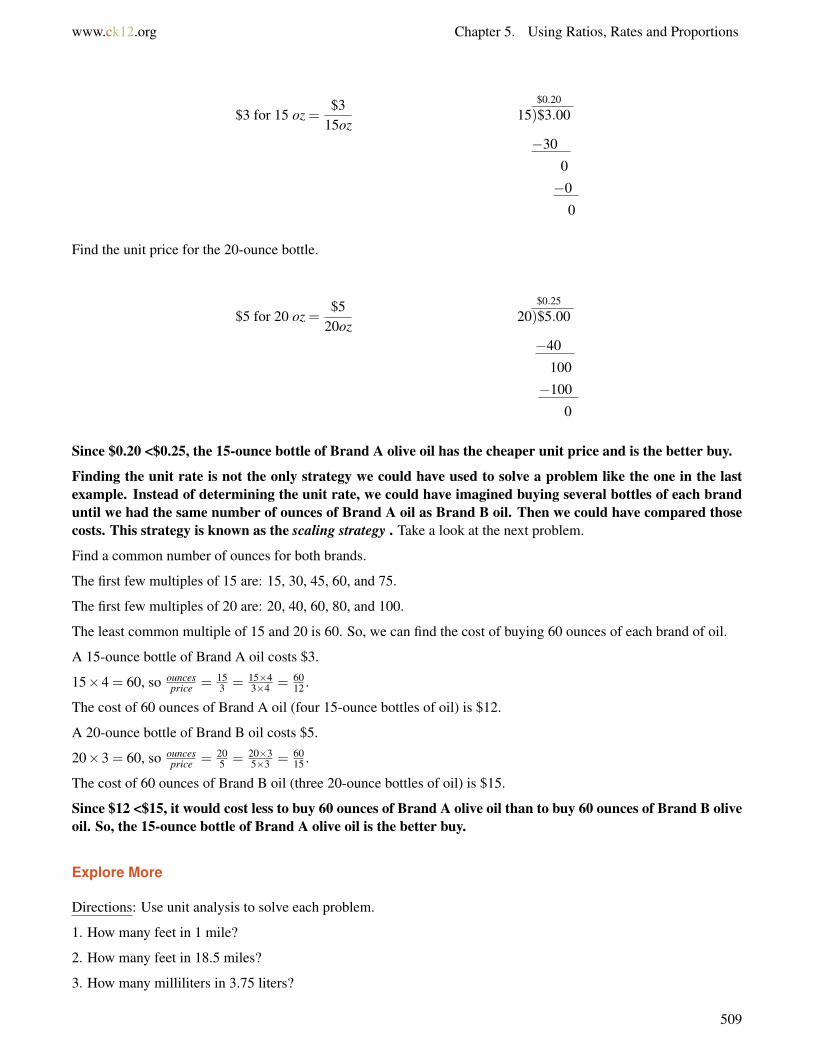
www.ck12.org Chapter 5. Using Ratios, Rates and Proportions
$3 for 15 oz =$3
15oz
$0.20
15)$3.00
−30
0
−0
0
Find the unit price for the 20-ounce bottle.
$5 for 20 oz =$5
20oz
$0.25
20)$5.00
−40
100
−100
0
Since $0.20 <$0.25, the 15-ounce bottle of Brand A olive oil has the cheaper unit price and is the better buy.
Finding the unit rate is not the only strategy we could have used to solve a problem like the one in the lastexample. Instead of determining the unit rate, we could have imagined buying several bottles of each branduntil we had the same number of ounces of Brand A oil as Brand B oil. Then we could have compared thosecosts. This strategy is known as the scaling strategy . Take a look at the next problem.
Find a common number of ounces for both brands.
The first few multiples of 15 are: 15, 30, 45, 60, and 75.
The first few multiples of 20 are: 20, 40, 60, 80, and 100.
The least common multiple of 15 and 20 is 60. So, we can find the cost of buying 60 ounces of each brand of oil.
A 15-ounce bottle of Brand A oil costs $3.
15×4 = 60, so ouncesprice = 15
3 = 15×43×4 = 60
12 .
The cost of 60 ounces of Brand A oil (four 15-ounce bottles of oil) is $12.
A 20-ounce bottle of Brand B oil costs $5.
20×3 = 60, so ouncesprice = 20
5 = 20×35×3 = 60
15 .
The cost of 60 ounces of Brand B oil (three 20-ounce bottles of oil) is $15.
Since $12 <$15, it would cost less to buy 60 ounces of Brand A olive oil than to buy 60 ounces of Brand B oliveoil. So, the 15-ounce bottle of Brand A olive oil is the better buy.
Explore More
Directions: Use unit analysis to solve each problem.
1. How many feet in 1 mile?
2. How many feet in 18.5 miles?
3. How many milliliters in 3.75 liters?
509

5.17. Conversion Using Unit Analysis www.ck12.org
4. How many milliliters in 18.25 liters?
5. How many pounds in 3 tons?
6. How many pounds in 2.5 tons?
7. How many pounds in 4.75 tons?
8. How many feet in 18 yards?
9. How many inches in 4 feet?
10. How many inches in 8.75 feet?
11. How many milliliters in 29.5 liters?
Directions: Solve each problem.
12. Fred needs to buy vanilla extract to bake a cake. He could buy a 4-ounce bottle of vanilla extract for $8, or a6-ounce bottle of vanilla extra for $15. Which bottle is the better buy?
13. A rope is 3 yards long. How many inches long is the rope? Use these unit conversions: 1 yard = 3 feet and 1foot = 12 inches.
14. At the farmer’s market, Maureen can buy 6 ears of corn for $3. At that price, how much would it cost to buy 9ears of corn?
15. James bought a 128-ounce bottle of apple juice. How many pints of apple juice did James buy? Use these unitconversions: 1 cup = 8 fluid ounces and 1 pint = 2 cups.
Summary
Having completed this chapter, students are now ready to move on to the next Chapter. Each Concept has providedstudents with an opportunity to engage and practice skills in many Concepts including ratios, rates, unit rates, slope,identifying proportions, writing proportions, solving proportions, unit scale, scale factor, problem solving with unitanalysis and problem solving with proportions.
510
www.ck12.org Chapter 6. Using Percents
CHAPTER 6 Using PercentsChapter Outline
6.1 PERCENTS
6.2 PERCENTS AS FRACTIONS
6.3 FRACTIONS AS PERCENTS
6.4 PERCENT OF A NUMBER
6.5 PROPORTIONS TO FIND PERCENT, P
6.6 PROPORTIONS TO FIND PART A
6.7 PROPORTIONS TO FIND BASE B
6.8 PERCENTS AS DECIMALS
6.9 DECIMALS AS PERCENTS
6.10 SMALL AND LARGE PERCENTS AS DECIMALS
6.11 PERCENT EQUATION TO FIND PART A
6.12 PERCENT EQUATION TO FIND PERCENT
6.13 PERCENT EQUATION TO FIND THE BASE B
6.14 PERCENT OF INCREASE
6.15 PERCENT OF DECREASE
6.16 PERCENT OF CHANGE
6.17 PRICES INVOLVING DISCOUNTS
6.18 PRICES INVOLVING SALES TAX
6.19 TOTAL BILL INCLUDING TIP AND TAX
6.20 SIMPLE INTEREST EQUATION TO FIND INTEREST RATE
6.21 SIMPLE INTEREST
6.22 INTERPRETATION OF CIRCLE GRAPHS
6.23 CIRCLE GRAPHS TO DISPLAY DATA
Introduction
In Math 7, the learning content is divided into Concepts. Each Concept is complete and whole providing focusedlearning on an indicated objective. Theme-based Concepts provide students with experiences that integrate thecontent of each Concept. Students are given opportunities to practice the skills of each Concept through real-worldsituations, examples, guided practice and independent practice sections. There are also video links provided to givestudents an audio/visual way of connecting with the content. In this Chapter, students will engage with Concepts onrecognizing percents, percents and fractions, percents and proportions, the percent equation, percents as decimals,percent of increase, percent of decrease, percent of change, tips, taxes, interest and circle graphs.
511
6.1. Percents www.ck12.org
6.1 Percents
Here you’ll learn to recognize percent as a ratio whose denominator is 100.
Have you ever thought about percentages? Have you ever thought about them in connection to a candy store?
Randy loves gummy worms. In looking at a package of gummy worms, he has figured out that 45% of the gummyworms in a bag are red ones.
"Look at the red ones," he told his friend Sasha.
"I like red ones too," Sasha commented.
"Yes, but only 45% of this bag are red," Randy explained.
Do you know how many worms that is out of 100?
Percents are out of 100. Because Randy calculated the number of red gummy worms out of 100, he used apercent. You can also write this value as a ratio. This Concept will teach you how to tackle this dilemma.
Guidance
In an earlier Concept, you learned that a ratio is a comparison of two numbers and that a ratio can be written inthree ways.
Think about this. If there are 13 red jelly beans and 15 yellow jelly beans in a jar, the ratio of red jelly beans toyellow jelly beans can be written as 13 to 15, 13:15, or 13
15 . Each of these ratios is read as “thirteen to fifteen.”
A percent is a type of ratio. You may have worked with percents before, but now we are going to apply them directlyto ratios. Hopefully, you will see percents in a new way.
What is a percent?
A percent is a ratio that compares a number to 100. Percent means “per hundred” and the symbol for percentis %. 100% represents the ratio 100 to 100 or 100
100 . Therefore, the value of 100% is 1.
If there are 100 jelly beans in a jar and 19 are black, we can say that 19100 or 19% of the jelly beans in the jar are black.
Look at the following examples to better understand percents.
Write a ratio and a percent that describes the shaded part.
512

www.ck12.org Chapter 6. Using Percents
The figure shows the ratio of 37 shaded squares to 100 squares.
We can write the ratio as 37 to 100, 37:100, or 37100 .
When the denominator of a ratio in fraction form is 100, you can express the ratio as a percent.37100 = 37%
The ratio that describes the shaded part is 37 to 100, 37:100, or 37100 , and the percent is 37%.
This is a visual way of showing a percent as a ratio. We can use the picture to write the ratio and the percent.
Let’s look at another situation that uses a real-life item.
There were 100 questions on a test and Amanda answered 92 of them correctly. What percent did she answercorrectly? What percent did she answer incorrectly?
Amanda answered 92 out of 100 questions correctly. We can write this as the ratio 92100 . Since the denominator is
100, we can write this in percent form as 92%.
Since there were 100 questions on the test and Amanda answered 92 correctly, she answered 100 –92, or 8 out of100 incorrectly. We can write this as the ratio 8
100 and as the percent 8%.
Amanda answered 92% of the questions correctly and 8% incorrectly.
Practice what you have learned by writing a percent for each example.
Example A
Karen ate 12 out of 100 blueberries.
Solution: 12%
Example B
Joey answered 92 questions correctly out of 100 questions on his test.
Solution: 92%
Example C
Sarah gathered 25 roses out of 100 flowers.
Solution:25%
Remember Randy and the gummy worms? Here is the original problem once again.
513
6.1. Percents www.ck12.org
Randy loves gummy worms. In looking at a package of gummy worms, he has figured out that 45% of the gummyworms in a bag are red ones.
"Look at the red ones," he told his friend Sasha.
"I like red ones too," Sasha commented.
"Yes, but only 45% of this bag are red," Randy explained.
Do you know how many worms that is out of 100?
To answer this question, let’s first write the percent.
45%
A percent is out of 100, so we can say that this percent means that out of 100 gummy worms that 45 of them are red.
Here is a ratio.
45 out of 100
This is our answer.
Guided Practice
Here is one for you to try on your own.
Write this percent as a ratio.
12%
Answer
To write this as a ratio, we change the 12% to 12 out of 100.
Now we can write that ratio in fraction form.12100
This is our answer.
Video Review
Here is a video for review.
MEDIAClick image to the left or use the URL below.URL: http://www.ck12.org/flx/render/embeddedobject/5421
This James Sousa video is an introduction to percents.
Explore More
Directions: Write each percent as a ratio with a denominator of 100.
1. 10%
514
www.ck12.org Chapter 6. Using Percents
2. 6%
3. 22%
4. 41%
5. 33%
6. 70%
7. 77%
8. 19%
9. 25%
10. 15%
11. 7%
12. 29%
13. 88%
14. 92%
15. 90%
515
6.2. Percents as Fractions www.ck12.org
6.2 Percents as Fractions
Here you’ll learn to write percents as fractions in simplest form.
Remember Randy? Here is the gummy worm dilemma once again.
Randy loves gummy worms. In looking at a package of gummy worms, he has figured out that 45% of the gummyworms in a bag are red ones.
"Look at the red ones," he told his friend Sasha.
"I like red ones too," Sasha commented.
"Yes, but only 45% of this bag are red," Randy explained.
Do you know how many worms that is out of 100?
In the last Concept, we wrote this percent as a fraction with a denominator of 100.45100
Now we can simplify this ratio.
This is what you will learn how to do in this Concept.
Guidance
In the last Concept you saw how you can write a percent as a ratio. Well, remember that one of the ways of writinga ratio is to write it in fraction form. Fractions can be simplified. Therefore, we can write percents as fractionsand reduce them to simplest form.
To write a percent as a fraction, we write the percent as a ratio with a denominator of 100. We can then writethe fraction in simplest form, if possible.
Write 80% as a fraction in simplest form.
First, write the percent as a fraction with a denominator of 100.80100
Next, we can simplify this fraction. You can start by canceling a zero in the numerator and one in the denominator.
8A010A0
Now we have eight-tenths to simplify.810 = 4
5
Our final answer is that 80% can be written as the fraction 45 .
516

www.ck12.org Chapter 6. Using Percents
Yes. Because they are both parts of a whole, we can interchange the way that we write them. A percent canbe written as a fraction and a fraction can be written as a percent too.
Write 12% as a fraction in simplest form.
First, write the percent as a fraction out of 100.12100
Next, we simplify this fraction. The greatest common factor is 4, so we divide the numerator and thedenominator by 4.12÷4100÷4 = 3
25
12% can be written as the fraction 325 .
Now it’s time for you to try a few on your own.
Example A
18%
Solution: 18100 = 9
50
Example B
20%
Solution: 20100 = 1
5
Example C
4%
Solution: 4100 = 1
25
Now you are ready to simplify. Here is the gummy worm situation once again.
Randy loves gummy worms. In looking at a package of gummy worms, he has figured out that 45% of the gummyworms in a bag are red ones.
"Look at the red ones," he told his friend Sasha.
"I like red ones too," Sasha commented.
517

6.2. Percents as Fractions www.ck12.org
"Yes, but only 45% of this bag are red," Randy explained.
Do you know how many worms that is out of 100?
In the last Concept, we wrote this percent as a fraction with a denominator of 100.45100
Now we can simplify this ratio.
To do this, we divide the numerator and denominator by the greatest common factor.
The greatest common factor of 45 and 100 is 5.920
This is our answer.
Guided Practice
Here is one for you to try on your own.
Write this percent as a fraction in simplest form.
33%
Answer
First, we can write it as a fraction with a denominator of 100.33100
There isn’t a greatest common factor for 33 and 100, so this is the fraction in simplest form.
Our work is complete.
Video Review
Here is a video for review.
MEDIAClick image to the left or use the URL below.URL: http://www.ck12.org/flx/render/embeddedobject/5423
This James Sousa video relates fractions, decimals and percents.
Explore More
Directions: Write each percent as a fraction in simplest form.
1. 10%
2. 6%
3. 22%
4. 41%
518
www.ck12.org Chapter 6. Using Percents
5. 33%
6. 70%
7. 77%
8. 19%
9. 12%
10. 20%
11. 5%
12. 25%
13. 40%
14. 60%
15. 90%
519
6.3. Fractions as Percents www.ck12.org
6.3 Fractions as Percents
Here you’ll learn to write fractions as percents.
Have you ever thought about a statistic in terms of percent? Take a look at this dilemma.
After conducting a survey of middle school students, Justin learned that 19 out of 50 students will attend summercamp. This is his statistic.
What is this statistic as a percent?
This Concept is about writing fractions as percents. You will be able to complete this problem at the end ofthe Concept.
Guidance
A fraction can be written as a percent if it has a denominator of 100. Sometimes, you will be given a fractionwith a denominator of 100 and sometimes you will have to rewrite the fraction to have denominator of 100 beforeyou write it as a percent.
9100
This fraction is already written with a denominator of 100, so we can just change it to a percent.9
100 = 9%
What do we do if a fraction does not have a denominator of 100?
This is where your work with proportions and equal ratios comes in. Remember that a proportion is two equalratios. We can write a proportion for a fraction by creating a second fraction equal to the first that has adenominator of 100. Then we solve the proportion. It sounds trickier than it is. Let’s look at an example.
Write 35 as a percent.
To start with, notice that the denominator is not 100. Therefore, we need to create a new fraction equivalentto this one with a denominator of 100.35 = x
100
Wow! Here is a proportion. Next, think back to solving proportions. We can cross multiply to find the valueof x.
5x = 300
x = 6035=
60100
Now we have a fraction with a denominator of 100. We can write it as a percent.
Our answer is that 35 is equal to 60%.
What about if we had an improper fraction?
To work with an improper fraction, you have to think about what that means. An improper fraction is greaterthan 1, so the percent would be greater than 100%. Sometimes in life we can have numbers that are greater than100%. Most often they aren’t, but it is important to understand how to work with a percent that is greater than 100.
520
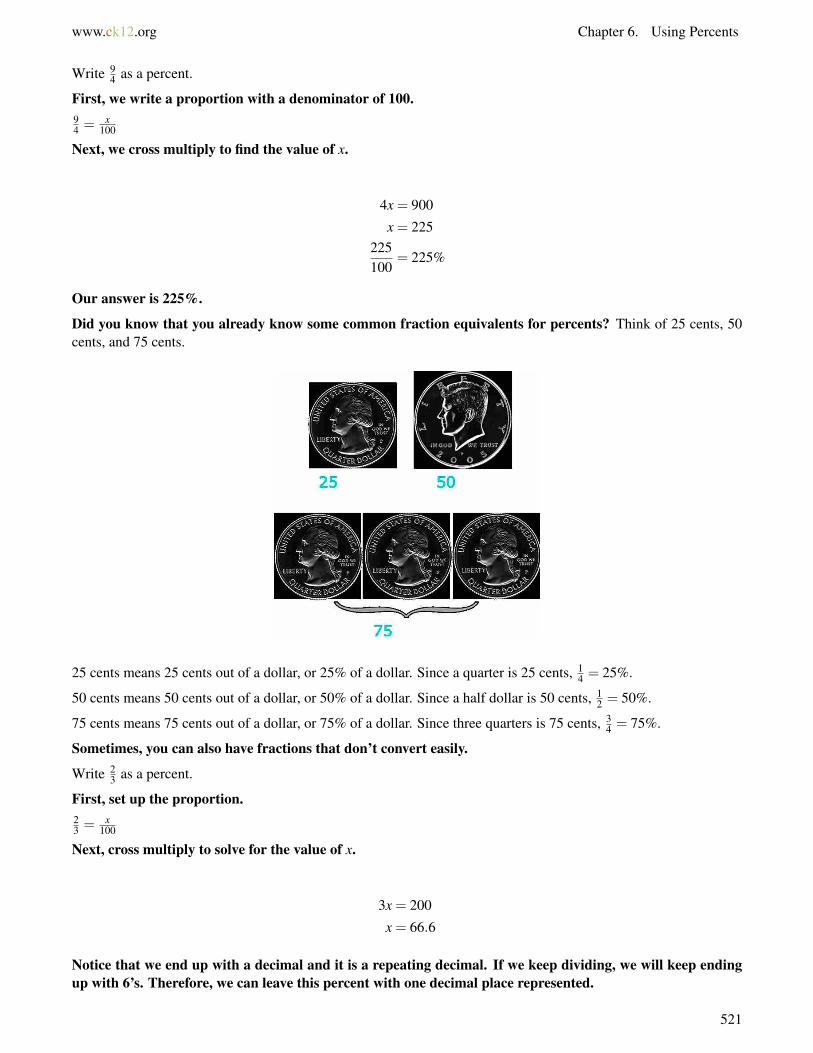
www.ck12.org Chapter 6. Using Percents
Write 94 as a percent.
First, we write a proportion with a denominator of 100.94 = x
100
Next, we cross multiply to find the value of x.
4x = 900
x = 225225100
= 225%
Our answer is 225%.
Did you know that you already know some common fraction equivalents for percents? Think of 25 cents, 50cents, and 75 cents.
25 cents means 25 cents out of a dollar, or 25% of a dollar. Since a quarter is 25 cents, 14 = 25%.
50 cents means 50 cents out of a dollar, or 50% of a dollar. Since a half dollar is 50 cents, 12 = 50%.
75 cents means 75 cents out of a dollar, or 75% of a dollar. Since three quarters is 75 cents, 34 = 75%.
Sometimes, you can also have fractions that don’t convert easily.
Write 23 as a percent.
First, set up the proportion.23 = x
100
Next, cross multiply to solve for the value of x.
3x = 200
x = 66.6
Notice that we end up with a decimal and it is a repeating decimal. If we keep dividing, we will keep endingup with 6’s. Therefore, we can leave this percent with one decimal place represented.
521
6.3. Fractions as Percents www.ck12.org
Our answer is 66.6%.
Sometimes, you will see fractions like this, but you will get used to them and often you can learn the percentequivalent of these fractions by heart.
Write each fraction as a percent.
Example A
14
Solution: 25%
Example B
25
Solution: 40%
Example C
440
Solution: 10%
Here is the original problem once again.
After conducting a survey of middle school students, Justin learned that 19 out of 50 students will attend summercamp. This is his statistic.
What is this statistic as a percent?
To figure this out, we first have to write this statistic as a fraction.
19 out of 50 becomes 1950 .
Now we can take this fraction and rename it as a proportion out of 100.1950 = x
100
We can use equal fractions to solve.
50 x 2 = 100
19 x 2 = 3838100 = 38%
This is our answer.
Guided Practice
Here is one for you to try on your own.
James ate three out of ten pieces of pizza. What percent did he eat? What percent didn’t he eat?
Answer
To figure this out, first let’s write a fraction to show the part of the pizza that James did eat.310
522
www.ck12.org Chapter 6. Using Percents
Next, we convert that to a fraction out of 100.310 = 30
100
Now we can write it as a percent.
30%
James ate 30% of the pizza.
James did not each 70% of the pizza.
Video Review
Here is a video for review.
MEDIAClick image to the left or use the URL below.URL: http://www.ck12.org/flx/render/embeddedobject/5423
This James Sousa video relates fractions, decimals and percents.
Explore More
Directions: Write each fraction as a percent.
1. 12
2. 14
3. 34
4. 11100
5. 15
6. 48
7. 17100
8. 125100
9. 250100
10. 233100
11. 2750
12. 1836
13. 2150
14. 2050
15. 3060
523
6.4. Percent of a Number www.ck12.org
6.4 Percent of a Number
Here you’ll learn to find the percent of a number using fraction multiplication.
Taylor’s family owns a candy store. During her winter vacation, Taylor has the opportunity to work in the candystore and earn some extra money. Since candy is one of her favorite things, she never turns down an opportunity tohelp out in the store.
The first day that Taylor worked in the store, a family with three small children came into the store. The little childreneach wanted gummy bears to eat. Since there weren’t enough gummy bears in the jar, Taylor had to open a new bagof them. The bag said 400 on it.
Taylor took out the bag and began to open it.
“Please give us 25% of the bag,” the Mom said smiling.
Taylor looked at the bag and then back up at the Mom. She took out a piece of paper and a pencil.
“You can estimate,” she said smiling.
Taylor estimated 25% or 14 of the bag. The family paid and then left smiling.
After they had left, Taylor began thinking about how many gummy bears would be 25%. She picked up the penciland began to do some figuring.
This Concept is all about percents. To work with a percent you have to understand how they relate to partsand fractions. Pay attention and by the end of the lesson, you will be able to do some gummy bear arithmetic.
Guidance
The table below shows the fraction equivalents for common percents.
5% 10% 20% 25% 30% 40% 50% 60% 70% 75% 80% 90%120
110
15
14
310
25
12
35
710
34
45
910
The word “of” in a percent problem means to multiply. If you know the fraction equivalents for common
524
www.ck12.org Chapter 6. Using Percents
percents, you can use this information to find the percent of a number by multiplying the fraction by thenumber. If you want to find a part of a whole using a percent, you use multiplication to solve this.
Find 40% of 45.
40% of 45 means 40%×45.
Look at the chart. The fraction 25 is equivalent to 40%.
40%×45 = 25 ×45 = 2
�51
×9
��451 = 18
1 = 18
Our answer is that 40% of 45 = 18
What about if the percent is not on the chart?
For a percent that is not on the chart, change the percent to a fraction in simplest form.
Find 85% of 20.
85% of 20 means 85%×20.
85% =85100
=85÷5
100÷5=
1710
85%×20 =1720×20 =
17��20
1
×1��201
=171
= 17
The answer is that 85% of 20 is 17.
Now it’s time for you to try a few on your own.
Example A
What is 10% of 50?
Solution: 5
Example B
What is 25% of 80?
Solution: 20
Example C
What is 22% of 100?
Solution: 22
525
6.4. Percent of a Number www.ck12.org
Here is the original problem once again.
Taylor’s family owns a candy store. During her winter vacation, Taylor has the opportunity to work in the candystore and earn some extra money. Since candy is one of her favorite things, she never turns down an opportunity tohelp out in the store.
The first day that Taylor worked in the store, a family with three small children came into the store. The little childreneach wanted gummy bears to eat. Since there weren’t enough gummy bears in the jar, Taylor had to open a new bagof them. The bag said 400 on it.
Taylor took out the bag and began to open it.
“Please give us 25% of the bag,” the Mom said smiling.
Taylor looked at the bag and then back up at the Mom. She took out a piece of paper and a pencil.
“You can estimate,” she said smiling.
Taylor estimated 25% or 14 of the bag. The family paid and then left smiling.
After they had left, Taylor began thinking about how many gummy bears would be 25%. She picked up the penciland began to do some figuring.
Taylor wants to figure out how many gummy bears 25% is out of 400.
To do this, she needs to multiply. 25% of 400 means 25% times 400.
We can change 25% to the fraction 14 .
Here is our new problem.
1
�4��4001 = 1
1 ×100
1 = 100
Our answer is that 25% of 400 is 100. The exact number would have been 100 gummy bears.
“Wow!” thought Taylor, “That is a lot of candy. I hope they remember to brush their teeth.”
Guided Practice
Here is one for you to try on your own.
What is 18% of 50?
Answer
To figure this out, we change the percent to a fraction and create a proportion.18100 = x
50
526
www.ck12.org Chapter 6. Using Percents
Now we use cross products and solve.
100x = 900
x = 9
18% of 50 is 9.
Video Review
Here is a video for review.
MEDIAClick image to the left or use the URL below.URL: http://www.ck12.org/flx/render/embeddedobject/5509
This James Sousa video is about solving percent problems.
Explore More
Directions: Use fraction multiplication to find each percent of a number.
1. 10% of 25
2. 20% of 30
3. 25% of 80
4. 30% of 90
5. 75% of 200
6. 8% of 10
7. 10% of 100
8. 19% of 20
9. 15% of 30
10. 12% of 30
11. 15% of 45
12. 25% of 85
13. 45% of 60
14. 50% of 200
15. 55% of 300
527
6.5. Proportions to Find Percent, P www.ck12.org
6.5 Proportions to Find Percent, P
Here you’ll learn to use a proportions to find percent, p.
Taylor’s younger brother Max decided to visit her at the candy store. Max is only seven and can be a handfulsometimes, so while Taylor loves to see him, she was a little hesitant to have him in the shop. Plus, what seven yearold doesn’t love candy.
Taylor gave Max a small bag to put some candy in. She figured he would take a few pieces, but ended up with awhole bunch of candy.
“How many did you take?” Taylor asked him looking in the bag.
“I took 40 pieces,” Max said grinning. “I won’t eat it all now. I will save some for later.”
Taylor looked into the bag. There were 10 candy canes, 16 peanut butter cups and a whole bunch of jelly beans.
She gave Max the bag and watched him walk away chewing.
“I hope I don’t get into trouble for this,” Taylor murmured to herself.
Think about the candy in Max’s bag. It makes for some great math problems. If there are 40 pieces of candy, whatpercent of Max’s bag is made up of candy canes? What percent of his bag is made up of peanut butter cups?
Use this Concept to learn all about calculating percents.
Guidance
First, let’s review what a percent is.
A percent is a part of a whole out of 100 .
We can write a percent as a fraction with a denominator of 100.
We can use a proportion to figure out a percent.
Look at this proportion, ab = p
100 .
We can say that “a is the amount to the base, b, and p is the percent out of 100.”
That may sound a little tricky, but if you get used to thinking in this way, you will find that this is very helpful whensolving for one of the missing parts of the proportion. Since percent statements always involve three numbers, given
528
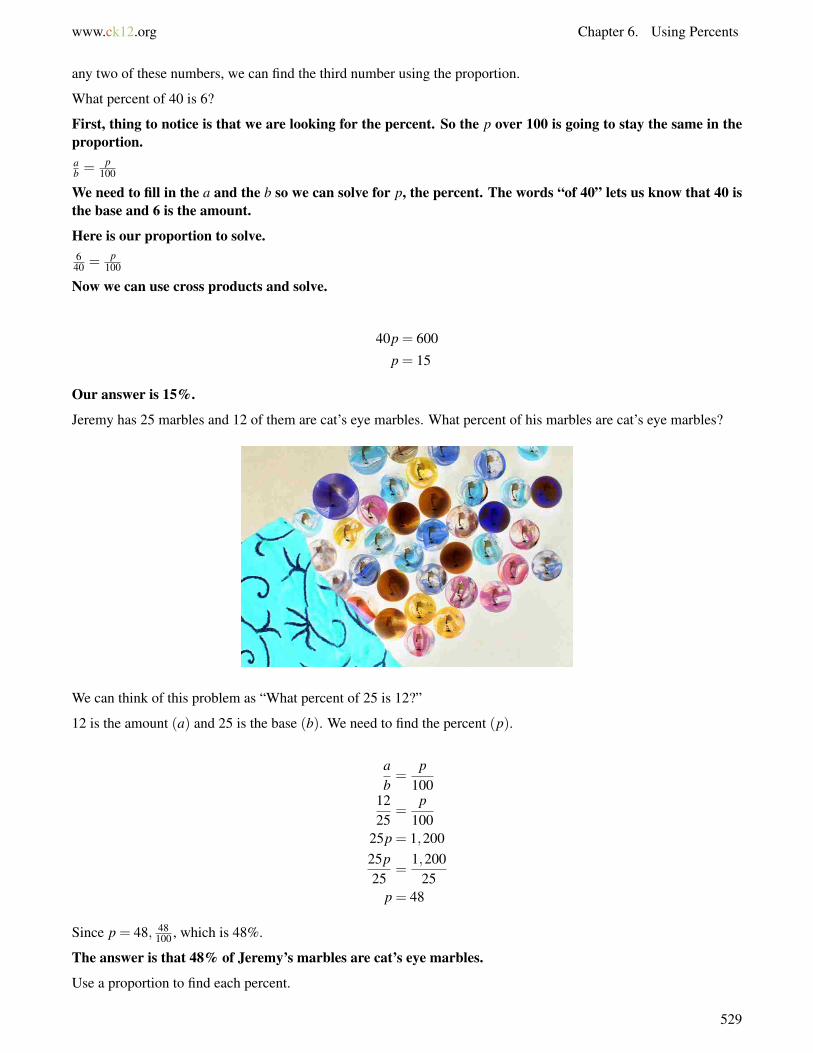
www.ck12.org Chapter 6. Using Percents
any two of these numbers, we can find the third number using the proportion.
What percent of 40 is 6?
First, thing to notice is that we are looking for the percent. So the p over 100 is going to stay the same in theproportion.ab = p
100
We need to fill in the a and the b so we can solve for p, the percent. The words “of 40” lets us know that 40 isthe base and 6 is the amount.
Here is our proportion to solve.640 = p
100
Now we can use cross products and solve.
40p = 600
p = 15
Our answer is 15%.
Jeremy has 25 marbles and 12 of them are cat’s eye marbles. What percent of his marbles are cat’s eye marbles?
We can think of this problem as “What percent of 25 is 12?”
12 is the amount (a) and 25 is the base (b). We need to find the percent (p).
ab=
p100
1225
=p
10025p = 1,20025p25
=1,200
25p = 48
Since p = 48, 48100 , which is 48%.
The answer is that 48% of Jeremy’s marbles are cat’s eye marbles.
Use a proportion to find each percent.
529
6.5. Proportions to Find Percent, P www.ck12.org
Example A
What percent of 20 is 2?
Solution: 10%
Example B
What percent of 30 is 6?
Solution:20%
Example C
What percent of 45 is 15?
Solution:33.3%
Here is the original problem once again. Reread it and use what you have learned about percents to figure out thequestions at the end of the problem.
Taylor’s younger brother Max decided to visit her at the candy store. Max is only seven and can be a handfulsometimes, so while Taylor loves to see him, she was a little hesitant to have him in the shop. Plus, what seven yearold doesn’t love candy.
Taylor gave Max a small bag to put some candy in. She figured he would take a few pieces, but ended up with awhole bunch of candy.
“How many did you take?” Taylor asked him looking in the bag.
“I took 40 pieces,” Max said grinning. “I won’t eat it all now. I will save some for later.”
Taylor looked into the bag. There were 10 candy canes, 16 peanut butter cups and a whole bunch of jelly beans.
She gave Max the bag and watched him walk away chewing.
“I hope I don’t get into trouble for this,” Taylor murmured to herself.
Think about the candy in Max’s bag. It makes for some great math problems. If there are 40 pieces of candy, whatpercent of Max’s bag is made up of candy canes? What percent of his bag is made up of peanut butter cups?
First, let’s figure out the percents.
We start with candy canes. There are 10 out of 40. There is our first ratio, and now we need to find thepercent.
530
www.ck12.org Chapter 6. Using Percents
1040
=p
100p = 25%
25% of the bag is candy canes.
Next, let’s look at the peanut butter cups. 16 out of 40 are peanut butter cups.
1640
=p
10040p = 1600
p = 40%
40% of the bag is peanut butter cups.
Guided Practice
Here is one for you to try on your own.
What percent of 300 is 40?
Answer
To figure this out, we can use the following percent proportion.ab = p
100
Now we can fill in the given information.40300 = p
100
Now we can cross multiply and divide.
300p = 4000
p = 13.3%
This is the answer.
Video Review
Here is a video for review.
MEDIAClick image to the left or use the URL below.URL: http://www.ck12.org/flx/render/embeddedobject/5512
This James Sousa video is about using a proportion to find a percent.
531
6.5. Proportions to Find Percent, P www.ck12.org
Explore More
Directions: Find each percent using a proportion.
1. What percent of 18 is 9?
2. What percent of 20 is 4?
3. What percent of 28 is 7?
4. What percent of 30 is 6?
5. What percent of 9 is 3?
6. What percent of 36 is 18?
7. What percent of 40 is 8?
8. What percent of 48 is 12?
9. What percent of 50 is 30?
10. What percent of 80 is 60?
11. What percent of 90 is 12?
12. What percent of 75 is 25?
13. What percent of 60 is 12?
14. What percent of 50 is 40?
15. What percent of 88 is 11?
532

www.ck12.org Chapter 6. Using Percents
6.6 Proportions to Find Part a
Here you’ll learn to use a proportion to find part a.
Remember the candy percents? Well, there were also jelly beans in that bag. Look at it again.
Taylor’s younger brother Max decided to visit her at the candy store. Max is only seven and can be a handfulsometimes, so while Taylor loves to see him, she was a little hesitant to have him in the shop. Plus, what seven yearold doesn’t love candy.
Taylor gave Max a small bag to put some candy in. She figured he would take a few pieces, but ended up with awhole bunch of candy.
“How many did you take?” Taylor asked him looking in the bag.
“I took 40 pieces,” Max said grinning. “I won’t eat it all now. I will save some for later.”
Taylor looked into the bag. There were 10 candy canes, 16 peanut butter cups and a whole bunch of jelly beans.
She gave Max the bag and watched him walk away chewing.
“I hope I don’t get into trouble for this,” Taylor murmured to herself.
Once you know all of the other percents, you will know what percent of the bag are jelly beans. Given that percent,how many jelly beans are in the bag?
Let’s look at the percents we discovered in the last Concept.
We start with candy canes. There are 10 out of 40. There is our first ratio, and now we need to find thepercent.
1040
=p
100p = 25%
25% of the bag is candy canes.
Next, let’s look at the peanut butter cups. 16 out of 40 are peanut butter cups.
533
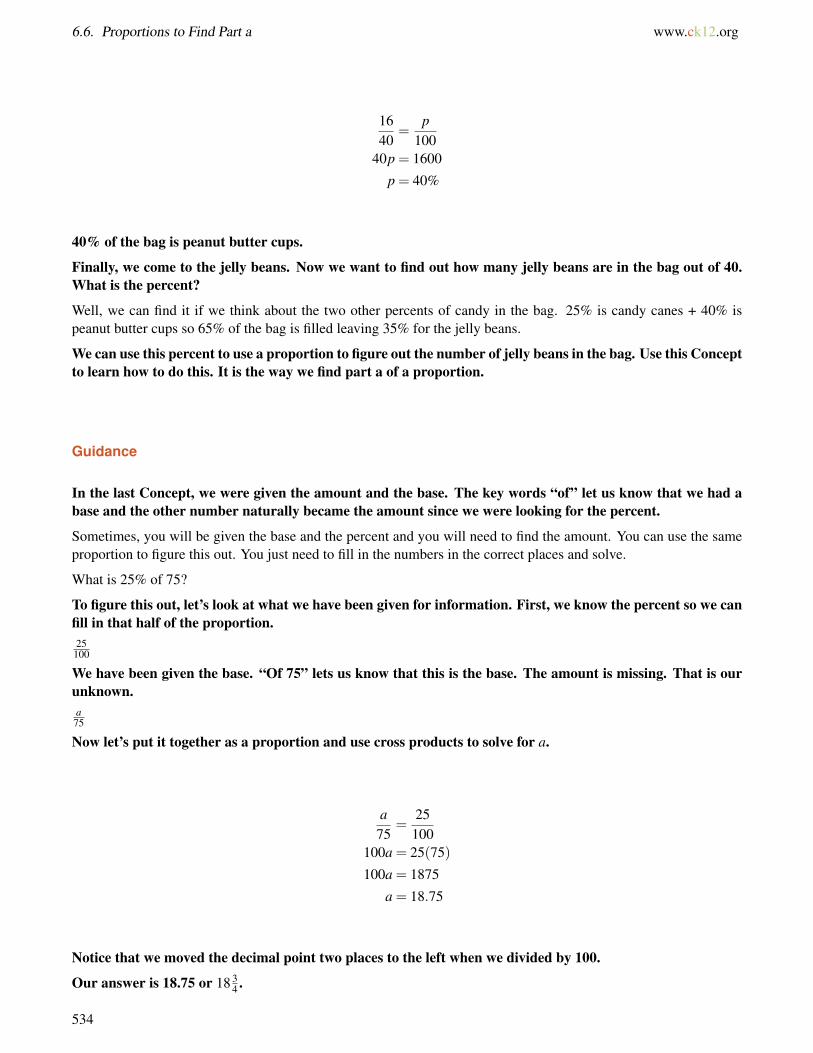
6.6. Proportions to Find Part a www.ck12.org
1640
=p
10040p = 1600
p = 40%
40% of the bag is peanut butter cups.
Finally, we come to the jelly beans. Now we want to find out how many jelly beans are in the bag out of 40.What is the percent?
Well, we can find it if we think about the two other percents of candy in the bag. 25% is candy canes + 40% ispeanut butter cups so 65% of the bag is filled leaving 35% for the jelly beans.
We can use this percent to use a proportion to figure out the number of jelly beans in the bag. Use this Conceptto learn how to do this. It is the way we find part a of a proportion.
Guidance
In the last Concept, we were given the amount and the base. The key words “of” let us know that we had abase and the other number naturally became the amount since we were looking for the percent.
Sometimes, you will be given the base and the percent and you will need to find the amount. You can use the sameproportion to figure this out. You just need to fill in the numbers in the correct places and solve.
What is 25% of 75?
To figure this out, let’s look at what we have been given for information. First, we know the percent so we canfill in that half of the proportion.25100
We have been given the base. “Of 75” lets us know that this is the base. The amount is missing. That is ourunknown.a75
Now let’s put it together as a proportion and use cross products to solve for a.
a75
=25
100100a = 25(75)
100a = 1875
a = 18.75
Notice that we moved the decimal point two places to the left when we divided by 100.
Our answer is 18.75 or 18 34 .
534
www.ck12.org Chapter 6. Using Percents
Notice that there isn’t a percent sign here because we were looking for an amount not a percent!! This can tripup some students so always pay attention to what you are looking for!!!
Mr. Green bought both vegetable and flowering plants for his garden. He bought 40 plants and 35% were floweringplants. How many flowering plants did he buy?
We can think of this problem as “What is 35% of 40?”
40 is the base (b) and 35 is the percent (p). We need to find the amount (a).
First, let’s set up the proportion.a40 = 35
100
Now we can use cross products to solve for the amount.
100a = 35(40)
100a = 1400
a = 14
Mr. Green bought 14 flowering plants.
Now it’s time for you to try a few.
535
6.6. Proportions to Find Part a www.ck12.org
Example A
What is 20% of 30?
Solution:6
Example B
What is 16% of 50?
Solution: 8
Example C
What is 22% of 80?
Solution: 17.6
Now back to the jelly beans. Here is the original problem once again.
Taylor’s younger brother Max decided to visit her at the candy store. Max is only seven and can be a handfulsometimes, so while Taylor loves to see him, she was a little hesitant to have him in the shop. Plus, what seven yearold doesn’t love candy.
Taylor gave Max a small bag to put some candy in. She figured he would take a few pieces, but ended up with awhole bunch of candy.
“How many did you take?” Taylor asked him looking in the bag.
“I took 40 pieces,” Max said grinning. “I won’t eat it all now. I will save some for later.”
Taylor looked into the bag. There were 10 candy canes, 16 peanut butter cups and a whole bunch of jelly beans.
She gave Max the bag and watched him walk away chewing.
“I hope I don’t get into trouble for this,” Taylor murmured to herself.
Once you know all of the other percents, you will know what percent of the bag are jelly beans. Given that percent,how many jelly beans are in the bag?
Let’s look at the percents we discovered in the last Concept.
We start with candy canes. There are 10 out of 40. There is our first ratio, and now we need to find thepercent.
536
www.ck12.org Chapter 6. Using Percents
1040
=p
100p = 25%
25% of the bag is candy canes.
Next, let’s look at the peanut butter cups. 16 out of 40 are peanut butter cups.
1640
=p
10040p = 1600
p = 40%
40% of the bag is peanut butter cups.
Finally, we come to the jelly beans. Now we want to find out how many jelly beans are in the bag out of 40.What is the percent?
Well, we can find it if we think about the two other percents of candy in the bag. 25% is candy canes + 40% ispeanut butter cups so 65% of the bag is filled leaving 35% for the jelly beans.
a40
=35
100100a = 35(40)
100a = 1400
a = 14
There are 14 jelly beans in the bag.
Guided Practice
Here is one for you to try on your own.
What number is 15% of 60?
Answer
To figure this out, let’s set up a proportion. Remember, the missing part is variable a.15100 = a
60
Now we can cross multiply and solve.
100a = 900
a = 9
This is our answer.
Video Review
Here is a video for review.
537

6.6. Proportions to Find Part a www.ck12.org
MEDIAClick image to the left or use the URL below.URL: http://www.ck12.org/flx/render/embeddedobject/5510
This James Sousa video is about solving a percent problem by using a proportion.
Explore More
Directions: Find each missing amount.
1. What number is 25% of 18?
2. What number is 10% of 20?
3. What number is 45% of 16?
4. What number is 20% of 44?
5. What number is 30% of 100?
6. What number is 25% of 60?
7. What number is 40% of 80?
8. What number is 40% of 60?
9. What number is 50% of 120?
10. What number is 5% of 12?
11. What number is 5% of 20?
12. What number is 16% of 80?
13. What number is 25% of 23?
14. What number is 50% of 17?
15. What number is 30% of 33?
538

www.ck12.org Chapter 6. Using Percents
6.7 Proportions to Find Base b
Here you’ll learn to use cross products of proportions to find base, b.
Have you ever tried to figure out a part of a whole? There are many different ways to do this, but you can useproportions. Take a look.
Kelsey bought a box of chocolates from the candy store. There were 6 caramels in the box. This was 25% of thetotal chocolates in the box.
How many chocolates were there in the box?
Six is 25% of what number?
This Concept is all about using the cross products of proportions to find a base. You will be able to solve thisproblem by the end of the Concept.
Guidance
You have solved problems where you needed to find the percent. You have solved problems where you needed tofind the amount. Now we are going to use cross products to solve for the base.
When you see the words “OF WHAT NUMBER?” you know that you are going to be solving for b, the base.
33 is 15% of what number?
Remember that the number following the word “of” is the base. Since there is no number there, we need tofind the base (b). 33 is the amount (a) and 15 is the percent (p).
ab=
p100
33b
=15100
15b = 3,30015b15
=3,300
15b = 220
Our answer is 220.
539
6.7. Proportions to Find Base b www.ck12.org
Six students in Miss Lang’s third period math class got A’s on their math test. This was 24% of the class. How manystudents are in Miss Lang’s third period math class?
We can think of this problem as “6 is 24% of what number?” First, let’s set up the proportion.6b = 24
100
Next, we use cross products to solve for b.
24b = 600
b = 600÷24
b = 25
There are 25 students in the third period math class.
Practice finding the base in the following problems.
Example A
6 is 25% of what number?
Solution: 24
Example B
12 is 8% of what number?
Solution: 150
Example C
22 is 11% of what number?
Solution: 200
Here is the original problem once again.
Kelsey bought a box of chocolates from the candy store. There were 6 caramels in the box. This was 25% of thetotal chocolates in the box.
540
www.ck12.org Chapter 6. Using Percents
How many chocolates were there in the box?
Six is 25% of what number?
To figure this out, let’s write a proportion.6x = 25
100
Now we can cross multiply and solve.
25x = 600
x = 24
There were 24 chocolates in Kelsey’s box.
Guided Practice
Here is one for you to try on your own.
6 is 17% of what number?
Answer
To figure this out, let’s write a proportion.6x = 17
100
Now we cross multiply and divide.
17x = 600
35.29
In this answer, we can round to the nearest whole number.
Our answer is approximate. It is 35.
Video Review
Here is a video for review.
MEDIAClick image to the left or use the URL below.URL: http://www.ck12.org/flx/render/embeddedobject/5511
This is a James Sousa video about solving proportions to find the base.
Explore More
Directions: Find each missing base.
1. 5 is 10% of what number?
2. 7 is 10% of what number?
3. 10 is 20% of what number?
541
6.7. Proportions to Find Base b www.ck12.org
4. 16 is 40% of what number?
5. 8 is 25% of what number?
6. 14 is 50% of what number?
7. 25 is 5% of what number?
8. 4 is 80% of what number?
9. 18 is 25% of what number?
10. 9 is 3% of what number?
11. 15 is 20% of what number?
12. 18 is 13% of what number?
13. 15 is 12.5% of what number?
14. 18 is 55% of what number?
15. 22 is 5.5% of what number?
542
www.ck12.org Chapter 6. Using Percents
6.8 Percents as Decimals
Here you’ll learn to write percents as decimals.
Taylor is learning a lot about money from working in the candy store. Her Dad took out a ledger one day to showTaylor how he keeps track of which candies are selling and which ones aren’t. He also keeps track of the sales ofcandy each month to figure out how much to reorder.
Last month, lollipops were the big hit. Taylor’s Dad put out 500 lollipops on the first of the month and they sold all500 during the course of the month.
“Last month we sold 100% of the lollipops, I put out 750 this month,” he told her.
As the month went on, Taylor noticed that the lollipops were selling just as well as they had the month before. Atthe end of the month her Dad wrote down the statistics in his ledger.
“We sold all 750 plus another 25%,” Taylor’s Dad told her.
Taylor thought about this. Wow! That is a lot of lollipops.
Taylor began thinking about the sales in terms of percents.
100% of the lollipops were sold.
Plus they sold an additional 25%
What is the total percentage sold? How can a percent be greater than 100? What would this be as a decimal?
As Taylor grapples with these questions, you can too. You will be able to figure this out at the end of thisConcept.
Guidance
In an earlier Concept, you were able to see the connection between fractions and percents. Well, decimals alsorepresent a part of a whole just like fractions and percents. Therefore, you can convert a decimal to a percent and apercent back to a decimal again.
A decimal organizes numbers according to place value. When you write a decimal as a percent, you will alsokeep track of the place value.
A percent is a part of a whole out of 100. Well, so is a decimal.
543

6.8. Percents as Decimals www.ck12.org
How?
Let’s see if we can make better sense of the connection between a decimal and a percent.
.52
This decimal states that we have 52 hundredths, Wow! There is the connection right there. The percent signmeans “out of 100” so we have 52 hundredths or we have 52 parts out of 100.
Once you see the connection, then we can write this as a percent.
.52 = 52%
Both mean that we have 52 parts out of 100.
That is a very good question! If you look at the conversion carefully, you can see that we moved the decimal pointtwo places to the right. Why? We did that because we want to show hundredths. Percent is out of 100, so the % signis the same as the two decimal places.
Now that you see the connection, let’s look at how we do this.
How do we write a percent as a decimal?
Here are the steps:
Step 1: Drop the % symbol.
Step 2: Move the decimal point two places to the left. Add zeros to the right of the decimal point as placeholders, ifnecessary.
544
www.ck12.org Chapter 6. Using Percents
Take a few minutes to write these steps in your notebook.
Now let’s look at another one.
Write 25% as a decimal.
First, we drop the % sign.
25
Next, we move the decimal point two places to the left. This is the hundredths place remember that two placesis hundredths. We just dropped the percent sign which means out of 100 so we have to put that into ouranswer.
.25
Our answer is .25
Write 9% as a decimal.
First, we drop the % sign.
9
Next, we move the decimal point two places to the left. Because nine is only one digit we have add a placeholder zero to show the two decimal places.
.09
Our answer is .09
Now it’s time for you to try a few on your own. Write each percent as a decimal.
Example A
35%
Solution:.35
Example B
2%
Solution:.02
Example C
18.7%
Solution:.187
545
6.8. Percents as Decimals www.ck12.org
Here is the original problem once again.
Taylor is learning a lot about money from working in the candy store. Her Dad took out a ledger one day to showTaylor how he keeps track of which candies are selling and which ones aren’t. He also keeps track of the sales ofcandy each month to figure out how much to reorder.
Last month, lollipops were the big hit. Taylor’s Dad put out 500 lollipops on the first of the month and they sold all500 during the course of the month.
“Last month we sold 100% of the lollipops, I put out 750 this month,” he told her.
As the month went on, Taylor noticed that the lollipops were selling just as well as they had the month before. Atthe end of the month her Dad wrote down the statistics in his ledger.
"We sold all 750 plus another 25%,” Taylor’s Dad told her.
Taylor thought about this. Wow! That is a lot of lollipops.
Taylor began thinking about the sales in terms of percents.
100% of the lollipops were sold.
Plus they sold an additional 25%
What is the total percentage sold? How can a percent be greater than 100? What would this be as a decimal?
First, let’s figure out the total percentage of lollipops sold.
100% + 25% = 125% of the lollipops were sold.
It may seem strange that numbers can be over 100%, but in the case of the lollipops you can understand howthis happens. They sold all that they had put out and then put out even more lollipops. This happens in salesall the time. Sales are often increased over 100%. This is a very good thing for business.
How is this written as a decimal?
125% = _______
First, drop the percent sign.
125
Next, move the decimal point two places to the left.
1.25
This is the answer.
546
www.ck12.org Chapter 6. Using Percents
Guided Practice
Here is one for you to try on your own.
Write 35.5% as a decimal.
Answer
First, we drop the % sign.
35.5
Next, we move the decimal point two places to the left.
.355
Our answer is .355.
Video Review
Here is a video for review.
MEDIAClick image to the left or use the URL below.URL: http://www.ck12.org/flx/render/embeddedobject/5423
This James Sousa video relates fractions, decimals and percents.
Explore More
Directions: Write the following percents as decimals.
1. 12%
2. 15%
3. 3%
4. 67%
5. 18%
6. 78%
7. 34%
8. 7%
9. 6%
10. 36%
11. 28%
12. 33.5%
13. 18.5%
14. 13.25%
547


www.ck12.org Chapter 6. Using Percents
6.9 Decimals as Percents
Here you’ll learn to write decimals as percents.
Have you ever eaten sour lemon candies? Have you ever counted them?
At the candy store, .125 of the jar of sour lemon candies were purchased by a customer. Jake was working at thetime and was amazed that only a small portion of the lemon candies went home with the customer.
Can you write this decimal as a percent?
What percent of the jar was purchased?
To figure this out, you will need to know how to write decimals as percents. This Concept will teach you whatyou need to know.
Guidance
Just like we can write percents as decimals, we can also write decimals as percents. You saw a situation like this inthe last Concept. In a way, you reverse the steps from turning a percent to a decimal to turn a decimal to a percent.
Follow these steps to write a percent as a decimal
Step 1: Move the decimal point two places to the right. Add zeros to the right of the decimal point asplaceholders, if necessary.
Step 2: Write a % symbol after the resulting number
Take a few minutes to write these notes in your notebook. Then continue.
Let’s apply these steps.
Write .78 as a percent.
This decimal is written in hundredths, so all we have to do is move the decimal two places to the right and adda percent sign.
.78 = 78%
Write .6 as a percent.
This decimal is written in tenths. When we move the decimal two places to the right, we will need to add azero place holder.
.6 = 60%
Write .345 as a percent.
549
6.9. Decimals as Percents www.ck12.org
This decimal is written in thousandths. We only need to move the decimal two places to the right to make it apercent, so we will move it two places and add a percent sign.
.345 = 34.5%
Notice that sometimes we can have a decimal in a percent. It means that we have 34 and one-half percent in thiscase. Don’t let that throw you off-not all percents are whole percents!
Write each decimal as a percent.
Example A
.45
Solution:45%
Example B
2.5
Solution:250%
Example C
.875
Solution:87.5%
Here is the original problem once again.
At the candy store, .125 of the jar of sour lemon candies were purchased by a customer. Jake was working at thetime and was amazed that only a small portion of the lemon candies went home with the customer.
Can you write this decimal as a percent?
What percent of the jar was purchased?
To write this as a percent, we know that we need to move the decimal point two places, representing hundredths, andadd a percent sign.
.125 = 12.5%
The customer purchased 12.5% of the lemon candies.
Guided Practice
Here is one for you to try on your own.
Write 3.5 as a percent.
Answer
This decimal is written with a whole number and five tenths. We still move the decimal to the right two places.Notice that because we have a whole number that the percent will be greater than 100.
3.5 = 350%
This is our answer.
550
www.ck12.org Chapter 6. Using Percents
Video Review
Here is a video for review.
MEDIAClick image to the left or use the URL below.URL: http://www.ck12.org/flx/render/embeddedobject/5424
This James Sousa video relates fractions, decimals and percents.
Explore More
Directions: Write the following decimals as percents.
1. .45
2. .3
3. .675
4. .9
5. .08
6. .785
7. .22
8. .095
9. .54
10. .275
11. .04
12. .045
13. .112
14. 4.6
15. .672
551

6.10. Small and Large Percents as Decimals www.ck12.org
6.10 Small and Large Percents as Decimals
Here you’ll learn to rewrite percents less than one or greater than 100 as decimals.
Do you have a favorite color of jelly beans? Sasha loves red ones. Take a look.
Sasha loves jelly beans. In fact, she loves red jelly beans. When Sasha went to the candy store, she looked into aglass jar full of jelly beans and was shocked to discover that there were only a few red ones to be seen.
Because she was curious, Sasha bought a whole bag of the jelly beans.
When she got home, she counted 567 jelly beans.
There were only 2 red jelly beans in the whole bag.
Sasha wrote 2 out of 567 on a piece of paper.
Sasha wrote down .3%.
Can you write this as percent as a decimal?
This Concept is about writing percents less than one as a decimal. You will learn how to do this in thisConcept.
Guidance
Sometimes, we will have a percent that is part of one whole. These percents are a decimal that is a tiny percent.
Let’s look at one.
.5%
This is another way of saying 12 of a percent. It is smaller than one.
We can also have a percent that is greater than one hundred. This is a very large percent-so large that it is larger thanone whole.
Here is one of those percents.
300%
This percent is 300% or three times 100 percent. Wow! That is a large percentage!
Let’s look at changing these percents to decimals.
552
www.ck12.org Chapter 6. Using Percents
Think back, remember the steps?
1. Drop the % sign.2. Move the decimal point two places to the right. Use zero placeholders as needed.
Now let’s apply the steps.
Write .5% as a decimal.
First, drop the percent sign.
.5
Next, move the decimal point two places to the left.
.005
The answer is .005.
Write 350% as a decimal.
First, drop the percent sign.
350
Next, move the decimal point two places to the left.
3.5
The answer is 3.5
Write each percent as a decimal.
Example A
.25%
Solution:.0025
Example B
450%
Solution:4.5
Example C
675%
Solution: 6.75
Here is the original problem once again.
Sasha loves jelly beans. In fact, she loves red jelly beans. When Sasha went to the candy store, she looked into aglass jar full of jelly beans and was shocked to discover that there were only a few red ones to be seen.
Because she was curious, Sasha bought a whole bag of the jelly beans.
When she got home, she counted 567 jelly beans.
There were only 2 red jelly beans in the whole bag.
Sasha wrote 2 out of 567 on a piece of paper.
553
6.10. Small and Large Percents as Decimals www.ck12.org
Sasha wrote down .3%.
Can you write this as percent as a decimal?
To write this as a decimal, we can drop the percent sign and move the decimal point two places to the left.
.3% becomes .003
This is the answer.
Guided Practice
Here is one for you to try on your own.
A company which produces light bulbs is very proud of the fact that only 0.02% of each shipment is defective. Writethis percent as a decimal.
Answer
To write this as a decimal we simply follow the steps. First, drop the percent sign.
.02
Next, move the decimal point two places to the left.
.0002
The answer is .0002.
Explore More
Directions: Rewrite each percent as a decimal.
1. .34%
2. .5%
3. 350%
4. 650%
5. .30%
6. .10%
7. .09%
8. .22%
9. 230%
10. 500%
11. 700%
12. .012%
13. .04%
14. .6%
15. .16%
554
www.ck12.org Chapter 6. Using Percents
6.11 Percent Equation to Find Part a
Here you’ll use the percent equation to find part a.
Do you like jelly beans? Take a look at this dilemma.
Taylor’s younger brother Max decided to visit her at the candy store. Max is only seven and can be a handfulsometimes, so while Taylor loves to see him, she was a little hesitant to have him in the shop. Plus, what seven yearold doesn’t love candy.
Taylor gave Max a small bag to put some candy in. She figured he would take a few pieces, but ended up with awhole bunch of candy.
“How many did you take?” Taylor asked him looking in the bag.
“I took 40 pieces,” Max said grinning. “I won’t eat it all now. I will save some for later.”
Taylor looked into the bag. There were candy canes, peanut butter cups and a whole bunch of jelly beans.
She gave Max the bag and watched him walk away chewing.
“I hope I don’t get into trouble for this,” Taylor murmured to herself.
In looking in the bag, Taylor discovered that 15% of Max’s bag was peanut butter cups. If he put 40 pieces of candyin his bag, how many pieces of candy were peanut butter cups?
We can say this another way using a percent equation.
What is 15% of 40?
This Concept will teach you how to use the percent equation to find part a. Then we will come back to thisdilemma at the end of the Concept.
Guidance
Think about the proportion that you just learned to find the percent of a number.ab = p
100
When we used this proportion in problem solving, we multiplied b and p and a and 100. Then we divided the productof b and p by 100.
555
6.11. Percent Equation to Find Part a www.ck12.org
Let’s look at a statement that uses this proportion.
What is 35% of 6?
First, we fill in the proportion.a6 = 35
100
Next, we multiply and solve for a.
100a = 35(6)
100a = 210
a = 2.1
Notice that by dividing by 100, we moved the decimal place two places.
Hmmmm. This is the same two places that the percent is represented by. This means that if we changed thepercent to a decimal FIRST, that we could skip a step and use an equation to find the missing value.
Take a look at the same problem.
What is 35% of 6?
First, change 35% to a decimal.
35% = .35
Now we multiply it times 6, the base and find a the amount. Look at this equation.
a = p%(b)
a = .35(6)
a = 2.1
Notice that we got the same answer as when we used the proportion. It just simplifies the process.
Let’s look at another one.
What is 25% of 50?
First, change 25% to a decimal.
25% = .25
Now use the equation.
a = p%(b)
a = .25(50)
a = 12.5
The answer is 12.5.
Use the equation to find each amount. Include decimals in your answer.
Example A
What is 20% of 16?
Solution: 3.2
556
www.ck12.org Chapter 6. Using Percents
Example B
What is 5% of 40?
Solution:2
Example C
What is 15% of 65?
Solution:9.75
Here is the original problem once again.
Taylor’s younger brother Max decided to visit her at the candy store. Max is only seven and can be a handfulsometimes, so while Taylor loves to see him, she was a little hesitant to have him in the shop. Plus, what seven yearold doesn’t love candy.
Taylor gave Max a small bag to put some candy in. She figured he would take a few pieces, but ended up with awhole bunch of candy.
“How many did you take?” Taylor asked him looking in the bag.
“I took 40 pieces,” Max said grinning. “I won’t eat it all now. I will save some for later.”
Taylor looked into the bag. There were candy canes, peanut butter cups and a whole bunch of jelly beans.
She gave Max the bag and watched him walk away chewing.
“I hope I don’t get into trouble for this,” Taylor murmured to herself.
In looking in the bag, Taylor discovered that 15% of Max’s bag was peanut butter cups. If he put 40 pieces of candyin his bag, how many pieces of candy were peanut butter cups?
We can say this another way using a percent equation.
What is 15% of 40?
To figure this out, we can convert 15% into a decimal.
15% = .15
Next, we multiply .15 by 40.
40× .15 = 6
Six pieces of candy in the bag were peanut butter cups.
557
6.11. Percent Equation to Find Part a www.ck12.org
Guided Practice
Here is one for you to try on your own.
What is 32% of 200?
Answer
To figure this out, first we change the percent to a decimal.
32% = .32
Next, we multiply this decimal by 200.
200× .32 = 64
32% of 200 is 64.
Video Review
Here is a video for review.
MEDIAClick image to the left or use the URL below.URL: http://www.ck12.org/flx/render/embeddedobject/5428
This is a James Sousa video on using the percent equation to find part a of a percent problem.
Explore More
Directions: Use the percent equation to find each amount.
1. What is 20% of 18?
2. What is 10% of 30?
3. What is 5% of 90?
4. What is 12% of 27?
5. What is 18% of 30?
6. What is 50% of 88?
7. What is 75% of 12?
8. What is 75% of 90?
9. What is 22% of 40?
10. What is 25% of 60?
11. What is 8% of 15?
12. What is 99% of 200?
13. What is 90% of 12?
14. What is 18.5% of 230?
558

6.12. Percent Equation to Find Percent www.ck12.org
6.12 Percent Equation to Find Percent
Here you’ll use the percent equation to find the percent.
On Saturday, Taylor’s parents decided to have a big sale at the candy store. They advertised in the local newspapersand on Saturday morning they were ready for a big crowd. Taylor was responsible for counting all of the people whocame into the store between 10 am when they opened and Noon.
Taylor sat on a stool at the front of the store and counted people as they came in. She was pleasant and enjoyedseeing all of the different shoppers. She only counted adults or teenagers not little kids with their parents since mostparents would be doing the buying instead of the little children. Most people bought something, but a few just camein to look around.
At lunch, she compared her data with her brother Henry who was helping with the sales at the cash register.
“How many people did you count?” Henry asked.
“I counted 30 adults. How many sales were there?”
“There were 24 sales.”
“That’s not bad. Most people bought something. What percent ended up buying something?” Taylor asked Henry.
Just as Henry was about to answer her, he got called back into the store. Taylor sat there eating her sandwich thinkingabout the percentages.
What percent of the people who came into the store made a purchase?
What percent did not purchase anything?
In this Concept, you will learn how to use an equation to solve problems like this one. Pay attention and atthe end you will be able to help Taylor with the problem.
Guidance
We can use the percent equation from the last Concept to find the percent of a number. When you look at thisproblem, you will be given the amount and the base, but the percent will be a mystery. Let’s think about how to dothis.
Here is the percent equation once again.
560
www.ck12.org Chapter 6. Using Percents
a = p%b
Now let’s look at how to apply this.
What percent of 70 is 14?
First, we have the a and the b and we are missing the percent. We can fill the given information into theformula.
a = pb
14 = p70
Now we can figure out what number times seventy is 14. Since the operation is multiplication, we can do theopposite and divide. This is using the inverse operation.
1470
= p
.2 = p
Now we change the decimal to a percent.
Our answer is 20%.
Don’t forget to change the decimal to a percent when you are looking for a percent!!
Use the equation to find the missing percent. You may round when necessary.
Example A
What percent of 50 is 15?
Solution: 30%
Example B
What percent of 80 is 25?
Solution: 31%
Example C
What percent of 100 is 12?
Solution: 12%
561
6.12. Percent Equation to Find Percent www.ck12.org
Here is the original problem once again. Use what you have learned to solve this problem.
On Saturday, Taylor’s parents decided to have a big sale at the candy store. They advertised in the local newspapersand on Saturday morning they were ready for a big crowd. Taylor was responsible for counting all of the people whocame into the store between 10 am when they opened and Noon.
Taylor sat on a stool at the front of the store and counted people as they came in. She was pleasant and enjoyedseeing all of the different shoppers. She only counted adults or teenagers not little kids with their parents since mostparents would be doing the buying instead of the little children. Most people bought something, but a few just camein to look around.
At lunch, she compared her data with her brother Henry who was helping with the sales at the cash register.
“How many people did you count?” Henry asked.
“I counted 30 adults. How many sales were there?”
“There were 24 sales.”
“That’s not bad. Most people bought something. What percent ended up buying something?” Taylor asked Henry.
Just as Henry was about to answer her, he got called back into the store. Taylor sat there eating her sandwich thinkingabout the percentages.
What percent of the people who came into the store made a purchase?
What percent did not purchase anything?
First, notice that we are looking for a percent.
30 is the base and 24 is the amount. Let’s fill in the given information and solve for the percent that did purchase atthe store.
24 = 30p2430
= p
.8 = p
80% = p
80% purchased something at the store.
What percent did not purchase something?
100% - 80% = 20%
20% did not purchase anything at the store.
562
www.ck12.org Chapter 6. Using Percents
Guided Practice
Here is one for you to try on your own.
What percent of 250 is 130?
Answer
To figure this out, we can write the following equation.
250p = 130
Now we divide 130 by 250.
130÷250 = .52
Next, we convert .52 to a percent.
The answer is 52%.
Video Review
Here is a video for review.
MEDIAClick image to the left or use the URL below.URL: http://www.ck12.org/flx/render/embeddedobject/5430
This is a James Sousa video on using the percent equation to find the percent.
Explore More
Directions: Use the percent equation to find each percent. You may round your answer to the nearest whole percentif necessary.
1. What percent of 18 is 9?
2. What percent of 20 is 10?
3. What percent of 60 is 15?
4. What percent of 80 is 20?
5. What percent of 25 is 10?
6. What percent of 70 is 35?
7. What percent of 36 is 18?
8. What percent of 100 is 25?
9. What percent of 10 is 5?
10. What percent of 98 is 90?
11. What percent of 100 is 14?
12. What percent of 200 is 90?
563

6.12. Percent Equation to Find Percent www.ck12.org
13. What percent of 150 is 99?
14. What percent of 125 is 88?
15. What percent of 133 is 13?
564
www.ck12.org Chapter 6. Using Percents
6.13 Percent Equation to Find the Base b
Here you’ll use the percent equation to find the base, b.
Have you ever watched a hockey game? Well, while it was slow at the candy store, Taylor’s Uncle let her watch thegame in the office. Here is what happened.
In the hockey game, the Falcons attempted many shots. 15% of shots were goals making 6 goals total.
How many attempts did the team make?
To figure this out you will need to know how to use the percent equation to find base, b. This Concept willteach you how to do this.
Guidance
When you know the percent and the amount, you can use the equation to find the base, b.
Let’s look apply the percent equation to this problem.
3 is 50% of what number?
Remember, that the words “of what number” let you know that you are looking for the base.
Let’s fill in the other given information into our equation. First, let’s change the percent to a decimal.
50 = .50
Now let’s work on the equation.
3 = .50b
Next, we can use the inverse operation and solve for b.
3.50
= b
6 = b
The answer is 6.
565

6.13. Percent Equation to Find the Base b www.ck12.org
9 is 75% of what number?
First, let’s change 75% to a decimal.
75% = .75
Next, let’s fill the given values into the equation.
9 = .75b
Now we can solve for b using the inverse operation.
9.75
= b
12 = b
Our answer is 12.
Find the base for each problem.
Example A
8 is 20% of what number?
Solution: 40
Example B
15 is 30% of what number?
Solution: 50
Example C
22 is 40% of what number?
Solution: 55
Here is the original problem once again.
In the hockey game, the Falcons attempted many shots. 15% of shots were goals making 6 goals total.
566
www.ck12.org Chapter 6. Using Percents
How many attempts did the team make?
To figure this out you will need to know how to use the percent equation to find base, b. This Concept willteach you how to do this.
Think: 15% is the percent. Six goals is the number of goals, or part a. How many shots did the team take?This is part b.
First, write the percent as a decimal.
15% = .15
Now we can write an equation using this statement.
6 is 15% of what number?
6 = .15x
Now we can use the inverse operation to divide.
6÷ .15 = x
40
The Falcons made 40 attempts to score their 6 goals.
Guided Practice
Here is one for you to try on your own.
The Cougars basketball team won 21 games. If that number is 70% of the games that the team played, how manygames did they play?
Answer
Think: 70% is the percent. 21 is the amount of games that they won. You want to find the base.
First, we can take 70% and write it as a decimal.
70% = .70
Next, we can write the given information into an equation and solve it using the inverse operation.
21 = .70b21.70
= b
30 = b
The team played 30 games in all.
Video Review
Here is a video for review.
567
6.13. Percent Equation to Find the Base b www.ck12.org
MEDIAClick image to the left or use the URL below.URL: http://www.ck12.org/flx/render/embeddedobject/5429
This a James Sousa video on how to find the base, b using the percent equation.
Explore More
Directions: Use the percent equation to find each base.
1. 5 is 10% of what number?
2. 15 is 30% of what number?
3. 18 is 20% of what number?
4. 12 is 50% of what number?
5. 15 is 40% of what number?
6. 14 is 20% of what number?
7. 80 is 25% of what number?
8. 60 is 30% of what number?
9. 45 is 40% of what number?
10. 16 is 25% of what number?
11. 60 is 18% of what number?
12. 25 is 30% of what number?
13. 21 is 15% of what number?
14. 55 is 10% of what number?
15. 67 is 20% of what number?
568

www.ck12.org Chapter 6. Using Percents
6.14 Percent of Increase
Here you’ll learn to find a percent of increase.
Have you ever overheard an adult conversation?
Taylor overheard her Aunt Alicia talking with her Uncle about stocks. Aunt Alicia had 150 shares of XYZ stock.She just bought more shares of the same stock and now has a total of 225 shares.
What is the percent of increase in the number of shares?
You will learn how to find the percent of increase in this Concept. We will revisit the problem at the end ofthe Concept.
Guidance
Sometimes, we have a price that has been increased a specific amount, or we can observe that over time a price hasincreased. We think of past pricing in this way.
The cost of a postage stamp has increased over time. In fact, some people think that the cost has increased toomuch. When we compare a past price and an increased current price, we can figure out the percent that a price hasincreased. We call this the percent of increase.
How do we calculate the percent of increase?
The percent of increase from one amount to another is the ratio of the amount of increase to the originalamount.
To find the percent of increase, follow these steps
Step 1: Find the amount of increase by subtracting the original price from the new price.
Step 2: Write a fraction in which the numerator is the amount of increase and the denominator is the original amount.
Percent of increase =Amount of increase
Original amount
Step 3: Write the fraction as a percent.
569
6.14. Percent of Increase www.ck12.org
Take a few minutes to write down these steps for finding the Percent of Increase.
Now let’s apply these steps..
Find the percent of increase from 20 to 35.
Step 1: Subtract 20 from 35. 35−20 = 15
Step 2: Percent of increase = Amount of increaseOriginal amount = 15
20
Step 3:
TABLE 6.1:
One Way Another Way1520 = x
1001520 = 15÷5
20÷5 = 34
20x = 1,5000.75
4)3.00 ← Divide to 2 decimal places.��20x��20 = 1,500
20 0.75 = 75%x = 7575
100 = 75%
The percent of increase from 20 to 35 is 75%.
Notice that we could solve for the percent in two different ways. One was to use a proportion and the other was tosimply divide. Either way, you will get the same answer.
Find the percent of increase from 24 to 72.
Step 1: Subtract 24 from 72. 72−24 = 48
Step 2: Percent of increase = Amount of increaseOriginal amount = 48
24
Step 3:
TABLE 6.2:
One Way Another Way4824 = x
1004824 = 2
24x = 4,800 2 = 200%��24x��24 = 4,800
24
x = 200200100 = 200%
The percent of increase from 24 to 72 is 200%.
570
www.ck12.org Chapter 6. Using Percents
Yes. Sometimes the percent of increase can be greater than 100%!!
Find the percent of increase. You may round to the nearest whole percent when needed.
Example A
From 45 to 50
Solution: 11%
Example B
From $1.00 to $1.75
Solution: 75%
Example C
From 34 to 60
Solution: 76%
Here is the original problem once again.
Taylor overheard her Aunt Alicia talking with her Uncle about stocks. Aunt Alicia had 150 shares of XYZ stock.She just bought more shares of the same stock and now has a total of 225 shares.
What is the percent of increase in the number of shares?
First, we figure out the amount of the increase by subtracting.
225−150 = 75
Next, we divide this number by the original amount.
75÷150 = .5
Finally, we can convert the decimal to a percent.
.5 = 50%
571
6.14. Percent of Increase www.ck12.org
This is the percent of the increase.
Guided Practice
Here is one for you to try on your own.
Marcy went from running 15 miles to running 18 miles. What was the percent of the increase?
Answer
First, we have to figure out the amount of the increase. We do this by subtracting.
18−15 = 3
Now we can use this equation.
percent of increase = amount of increaseoriginal amount
Next, we fill in the missing values.
% = 315
% = .2
20%
This is the percent of increase.
Video Review
Here is a video for review.
MEDIAClick image to the left or use the URL below.URL: http://www.ck12.org/flx/render/embeddedobject/5517
This is a James Sousa video on finding a percent of increase.
Explore More
Directions: Find the percent of increase given the original amount. You may round to the nearest whole percentwhen necessary.
1. From 25 to 40
2. From 15 to 30
3. From 18 to 50
4. From 22 to 80
5. From 16 to 18
6. From 3 to 10
7. From 85 to 100
572

www.ck12.org Chapter 6. Using Percents
8. From 75 to 90
9. From 26 to 36
10. From 100 to 125
11. From 100 to 150
12. From 125 to 175
13. From 175 to 200
14. From 200 to 225
15. From 225 to 275
573
6.15. Percent of Decrease www.ck12.org
6.15 Percent of Decrease
Here you’ll learn to find a percent of decrease.
Taylor’s Mom is confused about their sales. In one month, the sales have decreased instead of increased in the store.This decrease has happened despite the fact that they have added many new products to their inventory.
“I just don’t understand it,” her Mom said at breakfast. “Last month, we had a terrific month with $15,000 in sales.This month it was only $12,500.”
“We can’t keep losing business,” her Dad said drinking his coffee.
“I wonder how much of a loss it actually is,” thought Taylor. “Maybe if we can figure out why the sales decreased,then we can increase them again.
Taylor began figuring out the percent of the decrease. She started by subtracting, but then got stuck.
Taylor needs some help and this Concept will do the trick. You will learn all about calculating the percentof increase and the percent of decrease in this Concept. Pay attention and you can help Taylor with herarithmetic at the end of the Concept.
Guidance
Prices can increase. Costs can increase. Numbers can increase. We can find the percent of increase when dealingwith an increase. All of these things can also decrease. When there has been a decrease from an original amount toa new amount, we can find the percent of decrease.
How do we find the percent of decrease?
The percent of decrease from one amount to another is the ratio of the amount of decrease to the originalamount.
To find the percent of decrease, follow these steps
Step 1: Find the amount of decrease by subtracting the two numbers.
Step 2: Write a fraction in which the numerator is the amount of decrease and the denominator is the originalamount.
574

www.ck12.org Chapter 6. Using Percents
Percent of decrease =Amount of decrease
Original amount
Step 3: Write the fraction as a percent.
Take a few minutes to write the steps to finding the percent of decrease in your notebook.
Now let’s look at how to apply these steps.
Find the percent of decrease from 50 to 40.
Step 1: Subtract 40 from 50. 50−40 = 10
Step 2: Percent of decrease = Amount of decreaseOriginal amount = 10
50
Step 3:
TABLE 6.3:
One Way Another Way1050 = x
1001050 = 10÷10
50÷10 = 15
50x = 1,0000.20
5)1.00 ← Divide to 2 decimal places.��50x��50 = 1,000
50 0.20 = 20%x = 2020
100 = 20%
The percent of decrease from 50 to 40 is 20%.
Find the percent of decrease from 200 to 170.
Step 1: Subtract 170 from 200. 200−170 = 30
Step 2: Percent of decrease = Amount of decreaseOriginal amount = 30
200
Step 3:
TABLE 6.4:
One Way Another Way30
200 = x100
30200 = 30÷10
200÷10 = 320
200x = 1,8000.15
20)3.00��200x��200 = 3,000
200 0.15 = 15%x = 15
575
6.15. Percent of Decrease www.ck12.org
TABLE 6.4: (continued)
One Way Another Way15
100 = 15%
The percent of decrease from 200 to 170 is 15%.
Find the percent of each decrease.
Example A
From 10 to 5
Solution: 50%
Example B
From 25 to 15
Solution: 40%
Example C
From 125 to 70
Solution: 44%
Here is the original problem once again.
Taylor’s Mom is confused about their sales. In one month, the sales have decreased instead of increased in the store.This decrease has happened despite the fact that they have added many new products to their inventory.
“I just don’t understand it,” her Mom said at breakfast. “Last month, we had a terrific month with $15,000 in sales.This month it was only $12,500.”
“We can’t keep losing business,” her Dad said drinking his coffee.
“I wonder how much of a loss it actually is,” thought Taylor. “Maybe if we can figure out why the sales decreased,then we can increase them again.
Taylor began figuring out the percent of the decrease. She started by subtracting, but then got stuck.
Let’s use what we have learned to help Taylor. She was right by starting with subtraction.
576
www.ck12.org Chapter 6. Using Percents
15,000−12,500 = 2500
Next, we divide the difference by the original amount.
2500÷15,000 = .1666666
We can round this decimal up to .17 and now convert it to a percent.
.17 = 17%
The amount of the decrease is about 17%.
Guided Practice
Here is one for you to try on your own.
Jessie’s work schedule went from 20 hours to 18 hours. What was the percent of the decrease?
Answer
To figure this out, we subtract to find the difference.
20−18 = 2
Next, we divide that number by the original amount.
2÷20 = .1
Finally, we convert this decimal to a percent.
.1 = 10%
The percent of decrease was 10%.
Video Review
Here is a video for review.
MEDIAClick image to the left or use the URL below.URL: http://www.ck12.org/flx/render/embeddedobject/5516
This is a James Sousa video on percent of decrease.
Explore More
Directions: Find the percent of decrease given the original amount. You may round to the nearest whole percentwhen necessary or leave your answer as a decimal.
1. From 25 to 10
2. From 30 to 11
3. From 18 to 8
4. From 30 to 28
577
6.15. Percent of Decrease www.ck12.org
5. From 12 to 8
6. From 90 to 85
7. From 200 to 150
8. From 97 to 90
9. From 56 to 45
10. From 15 to 2
11. From 220 to 110
12. From 75 to 66
13. From 180 to 121
14. From 1500 to 1275
15. From 18,000 to 900
578
www.ck12.org Chapter 6. Using Percents
6.16 Percent of Change
Here you’ll learn to use percent of change to find a new amount.
Have you ever had to go to work when it was very cold?
Jenny put on her parka and headed to work at the candy store. At noon the temperature was 40◦F . At 6:00 P.M. thetemperature dropped to 32◦F .
What was the percent of change in the temperature?
This Concept is about using a percent of change to find a new amount. Use what you learn to figure out thisConcept.
Guidance
If we are given the percent of increase or the percent of decrease and the original amount, we can find the newamount by using the following formula.
Amount of change = percent of change × original amount
Let’s apply this to a problem.
Find the new number when 75 is decreased by 40%?
First find the amount of change.
Amount of change = percent of change×original amount
= 40%×75
= 0.40×75
= 30
Since the original number is being decreased, we subtract the amount of change from the original number tofind the new number. 75−30 = 45
When 75 is decreased by 40%, the new number is 45.
Find the new number when 28 is increased by 125%.
First find the amount of change.
Amount of change = percent of change×original amount
= 125%×28
= 1.25×28
= 35
Since the original number is being increased, we add the amount of change to the original number to find thenew number. 28+35 = 63
When 28 is increased by 125%, the new number is 63.
Now it’s your turn to try a few. Find each new amount.
579
6.16. Percent of Change www.ck12.org
Example A
Find the new number when 45 is increased by 10%.
Solution: 49.5
Example B
Find the new number when 80 is decreased by 15%.
Solution:68
Example C
Find the new number when 50 is increased by 25%.
Solution:62.5
Here is the original problem once again.
Jenny put on her parka and headed to work at the candy store. At noon the temperature was 40◦F . At 6:00 P.M. thetemperature dropped to 32◦F .
What was the percent of change in the temperature?
First, figure out the amount of the change.
The amount of change is 40−32 = 8.
Percent of increase or decrease =Amount of changeOriginal amount
=840
=15= 0.20 = 20%
The temperature decreased by 20%.
Guided Practice
Here is one for you to try on your own.
The population of Westville grew from 25,000 to 27,000 in two years. What was the percent of increase for thisperiod of time?
Answer
First, find the amount of the change by subtracting.
The amount of change is 27,000−25,000 = 2,000
Next, find the percent of the increase.
Percent of increase or decrease =Amount of changeOriginal amount
=2,000
25,000=
225
= 0.08 = 8%
The population increased 8% over this period of time.
580
www.ck12.org Chapter 6. Using Percents
Video Review
Here is a video for review.
MEDIAClick image to the left or use the URL below.URL: http://www.ck12.org/flx/render/embeddedobject/5515
This is a James Sousa video on the percent of change.
Explore More
Directions: Find the percent of change and then use it to find a new amount.
1. 25 decreased by 10%
2. 30 decreased by 15%
3. 18 decreased by 10%
4. 30 decreased by 9%
5. 12 decreased by 12%
6. 90 decreased by 14%
7. 200 decreased by 80%
8. 97 decreased by 11%
9. 56 decreased by 25%
10. 15 decreased by 20%
11. 220 decreased by 5%
12. 75 decreased by 10%
13. 180 decreased by 18%
14. 1500 decreased by 12%
15. 18,000 decreased by 24%
581
6.17. Prices Involving Discounts www.ck12.org
6.17 Prices Involving Discounts
Here you’ll learn to find prices involving markups and discounts.
One afternoon while Taylor is working in the candy store, a couple decided to purchase some chocolates. They spenta lot of time looking through all of the boxes, but finally decided on a large assorted box of some very lovely darkchocolates.
“That is a good choice,” Taylor said. “That box is also on sale for 15% off.”
“Terrific,” said the man.
Taylor took the chocolates and went to the cash register. As she went to put in the pricing, she noticed that therewasn’t anything happening on the screen. She walked to the kitchen in the back where her Mom was working.
“Mom, the register won’t work,” Taylor said.
“Well I am in the middle of making taffy. You’ll have to do the math in your head,” her Mom responded.
Taylor walked back in and picked up a piece of paper and a pencil.
The original price of the chocolates was $26.50.
There is a 15% discount.
Given the discount, what was the new price for the chocolates?
Use what you will learn in this Concept to help Taylor figure this out.
Guidance
In this Concept, you will learn how to use percents in everyday life.
A store owner buys an item at a wholesale cost and marks it up by adding a percent of the price to the price he paidfor it. If we buy that item when it is on sale, we can find the amount of the discount if we know the rate of discountthat the store is offering. On some items that we buy, we pay a sales tax that is a percent of the price. When we eatout in a restaurant, we leave a tip that is a percent of the amount of the meal.
Let’s begin by thinking about markups and discounts.
A markup is an increase in the price of an item. A discount is a decrease in the price of an item. Both of thesecan be expressed as an amount of money or as a percent of the original price of the item.
582
www.ck12.org Chapter 6. Using Percents
Why would someone use a markup?
A markup is often how a store or a business makes a profit. They buy merchandise at one price and sell it for anotherprice. The difference in the price they bought it at and the price they sell it at is the profit margin.
Why would someone use a discount?
Stores discount items all the time. Often, they are still making a profit, but they discount and item a specificpercentage to try to sell more of that item.
To figure out a discount or a markup, we need to know the percent of change. What is a percent of change?
The percent of change is the percent that the price is changing by. If the markup is 10%, then that is the percentof change. If the discount is 10%, then that is the percent of change.
We can use the following formula:
Percent of change × original amount = amount of the change
Write this formula in your notebook and then continue with the lesson.
A camera store buys a camera for $149 and marks up the price by 35%. What price does the camera sell for?
First, find the amount of the markup.
583
6.17. Prices Involving Discounts www.ck12.org
Amount of change = percent of change×original amount
= 35%×$149
= 0.35×$149
= $52.15
The markup is $52.15.
Now find the selling price by adding the markup to the wholesale price.
$149+$52.15 = $201.15
The selling price is $201.15
A camera that normally sells for $189 is on sale at a 20% discount. What is the sale price?
First, find the amount of the discount.
Amount of change = percent of change×original amount
= 20%×$189
= 0.20×$189
= $37.80
The discount is $37.80.
Now find the sale price by subtracting the discount from the original price.
$189−$37.80 = $151.20
The sale price is $151.20.
Find the markup or discount of each price.
Example A
A camera store buys a camera for $159.00 and marks it up 10%. What is the new price of the camera?
Solution: $174.90
584
www.ck12.org Chapter 6. Using Percents
Example B
A chair that costs $199.00 is on sale for 15% off. What is the price of the chair?
Solution: $170.05
Example C
A shirt that costs $15.00 is on sale for 30% off. What is the price of the shirt?
Solution:$10.50
Here is the original problem once again.
One afternoon while Taylor is working in the candy store, a couple decided to purchase some chocolates. They spenta lot of time looking through all of the boxes, but finally decided on a large assorted box of some very lovely darkchocolates.
“That is a good choice,” Taylor said. “That box is also on sale for 15% off.”
“Terrific,” said the man.
Taylor took the chocolates and went to the cash register. As she went to put in the pricing, she noticed that therewasn’t anything happening on the screen. She walked to the kitchen in the back where her Mom was working.
“Mom, the register won’t work,” Taylor said.
“Well I am in the middle of making taffy. You’ll have to do the math in your head,” her Mom responded.
Taylor walked back in and picked up a piece of paper and a pencil.
The original price of the chocolates was $26.50.
There is a 15% discount.
First, figure out the discount.
26.50× .15 = 3.975
Round up to 3.98
Next, subtract this discount from the original price.
26.50−3.98 = $22.52
This is the cost of the chocolates.
585
6.17. Prices Involving Discounts www.ck12.org
Guided Practice
Here is one for you to try on your own.
A pair of shoes with a wholesale price of $40 was marked up 50%. During a sale, the shoes were discounted 33%.What was the sale price?
Answer
First find the amount of markup.
Amount of change = percent of change×original amount
= 50%×$40
= 0.50×$40
= $20
The markup is $20.
Now find the selling price by adding the markup to the wholesale price.
The selling price is $40+$20 = $60.
Now find the amount of discount.
Amount of change = percent of change×original amount
= 33%×$60
= 0.33×$60
= $19.80
The discount is $19.80.
Now find the sale price by subtracting the discount from the selling price.
$60−$19.80 = $40.20
The sale price is $40.20.
Video Review
Here is a video for review.
MEDIAClick image to the left or use the URL below.URL: http://www.ck12.org/flx/render/embeddedobject/57647
This is a James Sousa video on discounts and markups.
586

www.ck12.org Chapter 6. Using Percents
Explore More
Directions: Here is a list of wholesale prices. Figure out each sale price if the markup is 20%.
1. $19.00
2. $12.00
3. $18.00
4. $25.00
5. $13.50
6. $9.95
7. $45.00
8. $90.00
9. $85.00
10. $17.00
Directions: Each item is discounted 15%. Figure out each new sale price; the original prices are listed below.
11. $55.00
12. $35.50
13. $18.00
14. $8.75
15. $25.00
587
6.18. Prices Involving Sales Tax www.ck12.org
6.18 Prices Involving Sales Tax
Here you’ll learn to estimate appropriate tips.
Have you ever had to calculate a tip in a restaurant?
Sasha and Keith went out for lunch. Their total bill was $16.60. Both Sasha and Keith were puzzled when it cameto calculating the tip. They decided to give the waiter a 15% tip.
Do you know how to calculate this?
What range would be an acceptable tip?
This Concept is about estimate appropriate tips. You will learn how to tackle this problem.
Guidance
When you go to a restaurant, it is customary to tip the server. If you have help at the airport, it is customary to tipthe server. If you have someone carry your bags at a hotel, it is customary to tip the bellhop.
What is a tip?
A tip is an amount of money that is given to a worker such as a waiter or waitress who performs a service for you. Acommon tip amount is 15% of the cost of the meal or other service. Since you don’t usually calculate a tip exactly,we can estimate the amount of a tip.
Follow these steps to estimate a 15% tip
Step 1: Round the total bill to the nearest whole dollar amount.
Step 2: Find 10% of this amount by moving the decimal point one place to the left.
Step 3: Find half of the amount you found in Step 2. This will give you 5% of the total cost.
Step 4: Add the 10% amount and the 5% amount together.
Take a few minutes to write these steps in your notebook.
Now let’s apply these steps to a few situations.
Estimate a 15% tip on a meal whose cost is $29.75.
588
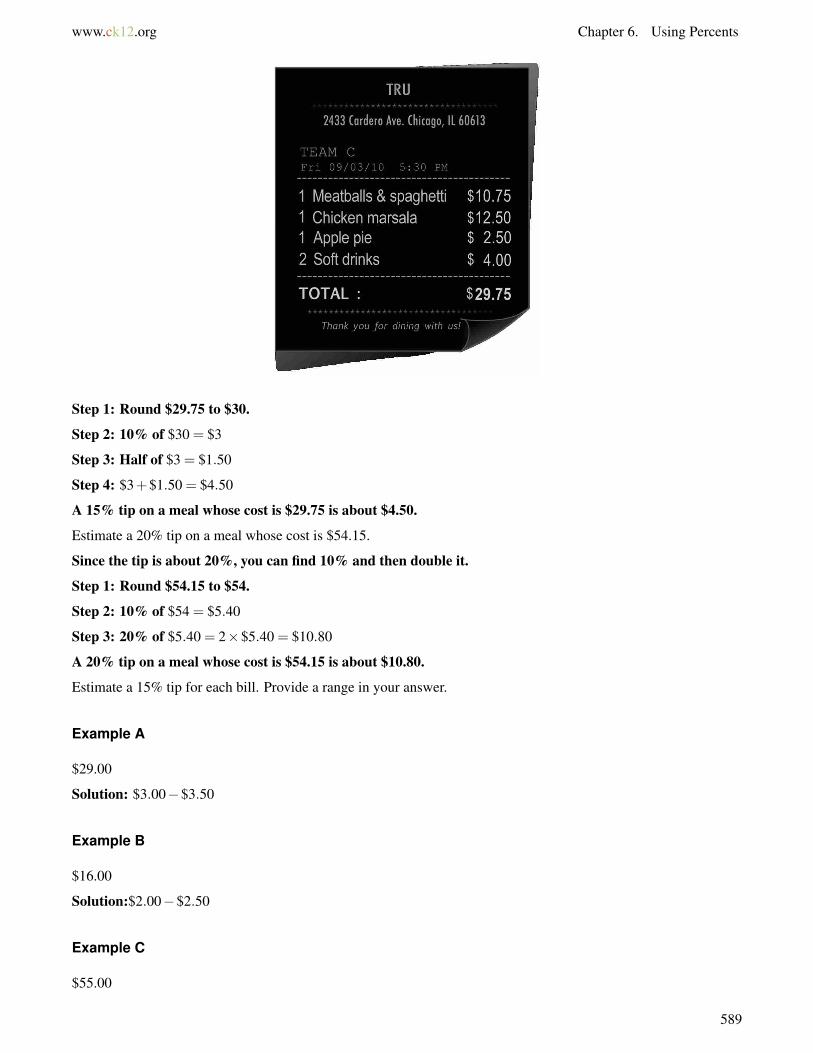
www.ck12.org Chapter 6. Using Percents
Step 1: Round $29.75 to $30.
Step 2: 10% of $30 = $3
Step 3: Half of $3 = $1.50
Step 4: $3+$1.50 = $4.50
A 15% tip on a meal whose cost is $29.75 is about $4.50.
Estimate a 20% tip on a meal whose cost is $54.15.
Since the tip is about 20%, you can find 10% and then double it.
Step 1: Round $54.15 to $54.
Step 2: 10% of $54 = $5.40
Step 3: 20% of $5.40 = 2×$5.40 = $10.80
A 20% tip on a meal whose cost is $54.15 is about $10.80.
Estimate a 15% tip for each bill. Provide a range in your answer.
Example A
$29.00
Solution: $3.00−$3.50
Example B
$16.00
Solution:$2.00−$2.50
Example C
$55.00
589
6.18. Prices Involving Sales Tax www.ck12.org
Solution:$8.00−$8.50
Here is the original problem once again.
Sasha and Keith went out for lunch. Their total bill was $16.60. Both Sasha and Keith were puzzled when it cameto calculating the tip. They decided to give the waiter a 15% tip.
Do you know how to calculate this?
What range would be an acceptable tip?
To figure this out, first let’s round up.
16.60 becomes 17.00
Now take 10% of that figure.
1.70
Half of that is .85.
If we add the two together, we get an estimate of 2.55.
A reasonable tip would be between $2.50−$3.00.
Guided Practice
Here is one for you to try on your own.
Estimate a 20% tip on a restaurant bill of $38.95.
Answer
You can start by thinking about 10% of this bill. Since that involves simply moving the decimal point, we can saythat the estimate of 10% is $3.85.
Now 20% is double that.
We can say that an estimate of a 20% tip is in a range from $7.50−$8.00.
This is our answer.
Video Review
Here is a video for review.
MEDIAClick image to the left or use the URL below.URL: http://www.ck12.org/flx/render/embeddedobject/57648
This is a James Sousa video on calculating a tip.
Explore More
Directions: Estimate a tip of 20% for each amount.
1. A tip on $15.00
590
www.ck12.org Chapter 6. Using Percents
2. A tip on $28.00
3. A tip on $25.00
4. A tip on $35.00
5. A tip on $45.00
6. A tip on $50.00
7. A tip on $90.00
8. A tip on $120.00
9. A tip on $125.00
10. A tip on $110.50
11. A tip on $130.75
12. A tip on $135.50
13. A tip on $98.78
14. A tip on $89.67
15. A tip on $100.20
591
6.19. Total Bill Including Tip and Tax www.ck12.org
6.19 Total Bill Including Tip and Tax
Here you’ll learn to find total bills involving tips and taxes.
Have you ever tried to calculate tips and taxes after going out to eat?
Taylor and her Dad went out to a restaurant for dinner. It had been a long day at the candy store, and they were bothhungry. The cost of the meal was $25.75.
Taylor and her Dad began to figure out the total bill given a 7% sales tax and a 15% tip.
Do you know how to do this? Can you figure out the total bill including tax and tip?
This Concept will teach you how to find total bills involving tips and taxes. Then you can finish this problemat the end of the Concept.
Guidance
You just finished figuring out a tip. When you calculate the tip, then you add this amount back to the total ofthe bill for the final cost of the meal. Sometimes, the tip is left in cash on the table. When this happens, you don’thave to add it to the price of the meal. However, when using a credit card, you have to add the tip to the total to besure that the server receives his/her tip.
What about taxes?
Taxes are monies that are collected by the government to help pay for services such as schools, libraries, roads,and police and fire protection. A sales tax is a tax bought on something in a store. The rate of sales tax is givenas a percent. You can find the amount of sales tax by using the following formula:
Amount of sales tax = price × rate of sales tax
After you calculate the amount of a tax using the percentage and the formula, you have to add it to an originalamount. With sales tax, this is especially important. Let’s look at a few examples.
Emily bought a jacket for $85. If the sales tax is 7.5%, find the total cost of the jacket.
First find the amount of sales tax.
592
www.ck12.org Chapter 6. Using Percents
7.5% of $85 = 0.075×$85 = $6.375
You need to round $6.375 to the nearest penny, which is $6.38.
Add the price of the jacket and the sales tax.
$85+$6.38 = $91.38
The total cost of the jacket is $91.38.
Mr. and Mrs. Green and their four children went out to dinner. The cost of the meal was $72. The restaurant addeda tip of 18% to the bill. What was the total cost of the dinner?
First find the amount of the tip.
18% of $72 = 0.18×$72 = $12.96
Add the cost of the meal and the tip.
$72+$12.96 = $84.96
The total cost of the dinner was $84.96.
Find the total amount of each bill.
Example A
5% sales tax on a $65.00 item.
Solution: $68.25
Example B
20% tip on a bill of $30.00
Solution:$36.00
Example C
10% sales tax on a $150.00 item.
Solution: $165.00
Here is the original problem once again.
Taylor and her Dad went out to a restaurant for dinner. It had been a long day at the candy store, and they were bothhungry. The cost of the meal was $25.75.
Taylor and her Dad began to figure out the total bill given a 7% sales tax and a 15% tip.
Do you know how to do this? Can you figure out the total bill including tax and tip?
First, let’s figure out the sales tax. To do this, we convert the percent to a decimal and multiply by the total cost ofthe meal.
.07×25.75 = 1.80
Next, we figure out the tip. Convert the percent to a decimal and multiply by the cost of the meal.
.15×25.75 = 3.86
Now we add it all up.
25.75+1.80+3.86 = 31.41
593
6.19. Total Bill Including Tip and Tax www.ck12.org
Their total bill was $31.41 including the tip.
Guided Practice
Here is one for you to try on your own.
Brandon bought a T-shirt for $8.99 and a pair of shorts for $11.99. If the rate of sales tax is 7%, how much did hespend?
Answer
First find the total cost of the items purchased.
$8.99+$11.99 = $20.98
Next find the amount of sales tax. First, convert the percent to a decimal and multiply by the total cost.
20.98× .07 = 1.47
Notice that we rounded up to 1.47.
Now add this to the cost of the items.
20.98+1.47 = $22.45
This is the answer.
Video Review
Here is a video for review.
MEDIAClick image to the left or use the URL below.URL: http://www.ck12.org/flx/render/embeddedobject/57648
This is a James Sousa video on calculating a tip.
Explore More
Directions: Calculate the total amount paid including sales tax if the sales tax is 4% and there is a tip of 20%.
1. Total: $56.75
2. Total: $43.25
3. Total: $65.00
4. Total: $25.50
5. Total: $18.75
6. Total: $59.00
7. Total: $21.50
8. Total: $44.50
594

www.ck12.org Chapter 6. Using Percents
9. Total: $12.50
10. Total: $43.00
11. Total: $89.50
12. Total: $99.35
13. Total: $235.75
14. Total: $300.50
15. Total: $678.25
595
6.20. Simple Interest Equation to Find Interest Rate www.ck12.org
6.20 Simple Interest Equation to Find InterestRate
Here you’ll learn to use the simple interest equation to find an interest rate.
Have you ever borrowed money? Look at this dilemma.
While shopping at the candy store, a woman began complaining about paying interest on a loan. She said that shehad paid $450.00 over 2 years after borrowing $2500. Taylor listened and thought about this dilemma.
Using the given information, can you figure out the interest rate?
This Concept will teach you how to do this. We’ll revisit this problem at the end of the Concept.
Guidance
This Concept is all about borrowing money, paying money back and the fees associated with borrowing money. Thisis where you will learn all about interest.
What is interest?
Interest is a charge for money that is borrowed. When you borrow money, you pay the lender interest forborrowing the money. When you deposit money into a saving account at a bank, the bank pays you interest since thebank is borrowing money from you. So interest can be something that you have to pay or that is paid to you.
The amount of money that is invested or borrowed is called the principal. If you borrow $500.00 this is theprincipal. It is the initial amount before any interest is added on.
The rate of interest is the percent charged or earned. We also have to consider the time in years that the moneyis borrowed or deposited when computing interest.
How do we calculate interest?
We can calculate interest by using an equation. Here is the equation.
Interest = Principal× rate× time
I = Prt
Take a few minutes to write this equation down in your notebook.
If you know the amount of interest, the principal, and the time in years, you can find the interest rate.
596

www.ck12.org Chapter 6. Using Percents
If you deposit $2,000 at USA Savings Bank, at the end of 2 years you will have received $240 in simple interest.What is the interest rate at USA Savings Bank?
I = Prt
$240 = $2,000× r×2 ← Substitute values.
$240 = $4,000× r ← Simplify.
0.06 = r ← Solve for r.
Change 0.06 to the percent 6%.
The interest rate is 6%.
If you borrow $3,600 from USA Savings Bank for 18 months, at the end of the 18 months you will repay $4,059 tothe bank. What is the interest rate for this loan?
The amount to be repaid includes the principal plus the interest. Subtract the principal from the amount tobe repaid to find the amount of the interest.
$4,059−$3,600 = $459
Since there are 12 months in a year, 18 months is 1812 or 1 1
2 years.
I = Prt
$459 = $3,600× r×112
← Substitute values.
$459 = $5,400× r ← Simplify.
0.085 = r ← Solve for r.
Change 0.085 to the percent 8.5%.
597
6.20. Simple Interest Equation to Find Interest Rate www.ck12.org
The interest rate is 8.5%.
Find the interest rate for each problem.
Example A
Jesse borrowed $500.00. At the end of the year he paid back $50.00 in interest. What was the interest rate?
Solution:10%
Example B
Karen earned $200.00 in two years of simple interest on her initial investment of $400.00. What was the interestrate?
Solution:25%
Example C
principal: $5,600; time: 9 months; simple interest: $357
Solution:8.5%
Here is the original problem once again.
While shopping at the candy store, a woman began complaining about paying interest on a loan. She said that shehad paid $450.00 over 2 years after borrowing $2500. Taylor listened and thought about this dilemma.
Using the given information, can you figure out the interest rate?
To figure this out, let’s use the formula for finding simple interest.
I = PRT
Now fill in the given information.
450 = 2500(2)r
Next, we multiply.
450 = 5000r4505000 = r
r = .09 = 9%
The woman has an interest rate of 9%.
Guided Practice
Here is one for you to try on your own.
Wanda borrowed $5,000.00 from the bank. At the end of three years, she had paid $450.00 in interest. What isWanda’s interest rate?
Answer
To figure this out, we can use the formula for finding simple interest.
I = PRT
Next, we fill in what we know.
598

www.ck12.org Chapter 6. Using Percents
450 = 5000(3)r
We are trying to figure out the rate, so that is our variable.
450 = 15000r450
15000 = .03
The interest rate was 3%.
Video Review
Here is a video for review.
MEDIAClick image to the left or use the URL below.URL: http://www.ck12.org/flx/render/embeddedobject/5523
This is a James Sousa video on calculating simple interest.
Explore More
Directions: Find the simple interest on each amount.
1. $500.00 at 4% for 2 years
2. $200.00 at 5% for 3 years
3. $5000.00 at 2% for 2 years
4. $600.00 at 10% for 1 year
5. $1200.00 at 4% for 2 years
6. $1500.00 at 3% for 1 year
7. $2300.00 at 2% for 2 years
8. $500.00 at 4% for 2 years
9. $2500.00 at 5% for 5 years
10. $1500.00 at 11% for 2 years
11. $3500 at 3% for 5 years
12. $3500 at 4% for 15 years
13. $13,000 at 4.5% for 6 years
14. $23,000 at 3.5% for 10 years
15. $50,000 at 2.5% for 20 years
599
6.21. Simple Interest www.ck12.org
6.21 Simple Interest
Here you’ll solve real - world problems involving simple interest.
Since Taylor has been working at the candy store, she has had her eye on a new bike. She has saved $56.00, but thebike is being sold for $156.00.
Taylor wouldn’t mind waiting except for the fact that several of her friends are going to go on a big bike ride on theweekend and she wants to go with them. She has decided to ask her brother if she can borrow the money.
The one catch is that he wants to charge her interest. Her brother will loan her the $100.00, but he wants to chargeher 15% interest per month.
“I don’t think that is very fair,” Taylor tells him when he presents the deal.
“It isn’t that much more that you have to pay back.”
Taylor disagrees. How much is 15% interest on $100.00?
This Concept will teach you all about simple interest and about how to calculate simple interest. By the endof the Concept, you will understand how to figure out the interest.
Guidance
Now that you know how to find the interest rate, we can use the equation to calculate the amount of time it takes toearn a specific amount of interest.
Ben deposited $1,200 in a certificate of deposit (CD) at an interest rate of 5.5%. He earned $198 in simple interest.How long was the CD for?
I = Prt
$198 = $1,200×5.5%× t ← Substitute values.
$198 = $1,200×0.055× t ←Write the percent as a decimal.
$198 = 66× t ← Simplify.
3 = t ← Solve for t.
The CD was for 3 years.
600
www.ck12.org Chapter 6. Using Percents
We can also use the equation to figure out the amount of the interest.
Troy deposited $400 into his savings account. How much interest will he receive at the end of one year if the interestrate is 3%?
First we write the equation. Then we substitute the given values and solve.
I = Prt
= $400×3%×1 ← Substitute values.
= $400×0.03×1 ←Write the percent as a decimal.
= $12 ← Solve for I.
Troy will receive $12 in interest at the end of one year.
Courtney borrowed $7,500 for 4 years at an annual interest rate of 8%. How much interest will she pay on the loan?
I = Prt
= $7,500×8%×4 ← Substitute values.
= $7,500×0.08×4 ←Write the percent as a decimal.
= $2,400 ← Solve for I.
Courtney will pay $2,400 interest on the loan.
Once you know the interest, you can go back and add it to the Principal. Let’s go back to Troy.
Troy deposited $400 into his savings account. We know that at the end of the year he received $12.00 in interest.We can add the amounts together to find the new balance.
400+12 = $412.00
The new balance is $412.00.
In the second example, Courtney borrowed $7,500 and will pay $2400 interest on the loan. Here is the total she willpay to pay back the loan. We add the interest and the Principal.
7500+2400 = $9,900
The new balance is $9,900.
Now it’s time for you to try a few on your own. Figure out the number of years or time.
Example A
John earned $96.00 on a $1200 deposit at 2% interest rate.
Solution: 4 years
Example B
Karen paid $48.00 on $600.00 at a 4% interest rate.
Solution: 2 years
601
6.21. Simple Interest www.ck12.org
Example C
Eric earned $130.00 on a $2000 deposit at a 1% interest rate.
Solution: 6.5 years
Here is the original problem once again. Figure out the interest.
Since Taylor has been working at the candy store, she has had her eye on a new bike. She has saved $56.00, but thebike is being sold for $156.00.
Taylor wouldn’t mind waiting except for the fact that several of her friends are going to go on a big bike ride on theweekend and she wants to go with them. She has decided to ask her brother if she can borrow the money.
The one catch is that he wants to charge her interest. Her brother will loan her the $100.00, but he wants to chargeher 15% interest per month.
“I don’t think that is very fair,” Taylor tells him when he presents the deal.
“It isn’t that much more that you have to pay back.”
Taylor disagrees. How much is 15% interest on $100.00?
To figure this out we multiply the 15% times $100.00.
.15×100 = $15.00 per month.
If it takes her 3 months to pay him back, she will have to pay $45.00 in interest.
“No thanks,” Taylor says to her brother. “That isn’t a very good deal. I am going to ask Dad for a loan. I am surethat he won’t charge me interest.”
Taylor grinned at her brother and went off to find her Dad.
Guided Practice
Here is one for you to try on your own.
Joanna borrowed $500 at an interest rate of 8%. At the end of the loan period, she had to pay back $530. How longwas the loan for?
Answer
The amount to be repaid includes the principal plus the interest. Subtract the principal from the amount to be repaidto find the amount of the interest.
$530−$500 = $30
602
www.ck12.org Chapter 6. Using Percents
I = Prt
$30 = $500×8%× t ← Substitute values.
$30 = $500×0.08× t ←Write the percent as a decimal.
$30 = $40× t ← Simplify.34= t ← Solve for t.
34 of a year is 3
4 of 12 months, or 9 months.
The loan was for 9 months.
Video Review
Here is a video for review.
MEDIAClick image to the left or use the URL below.URL: http://www.ck12.org/flx/render/embeddedobject/5523
This is a James Sousa video on calculating simple interest.
Explore More
Directions: Calculate the simple interest for each amount.
1. $1500.00 at 3% for 1 year
2. $2300.00 at 2% for 2 years
3. $500.00 at 4% for 2 years
4. $2500.00 at 5% for 5 years
5. $1500.00 at 11% for 2 years
6. $3500 at 3% for 5 years
7. $3500 at 4% for 15 years
8. $2300 at 2% for 3 years
9. $5500 at 5% for 6.5 years
10. $12,000 at 4% for 5 years
Directions: Find the length of time for each loan.
11. principal: $1,250; interest rate: 6%; simple interest: $300
12. principal: $4,800; interest rate: 7.5%; simple interest: $900
Directions: Solve each problem.
603
6.21. Simple Interest www.ck12.org
13. Juan invested $5,000 in an account that pays 5% interest. If interest is paid 4 times a year, how much is eachinterest payment?
14. Sophie put $330 in a savings account at a simple interest rate of 4% per year. Avi put $290 in a savings accountat a simple interest rate of 5% per year. Who will have earned more interest after 2 years? How much more?
15. Madison invested in a certificate of deposit for 4 years at a 6% interest rate. At the end of the 4 years, the valueof the certificate of deposit was $3,100. How much did Madison deposit originally?
604

www.ck12.org Chapter 6. Using Percents
6.22 Interpretation of Circle Graphs
Here you’ll learn to interpret circle graphs using given data.
The chart shows the Patrick family’s monthly budget. Make a circle graph to display their budget. Then find howmuch the family budgets for in each category if their monthly income is $2,500.
Rent and utilities - 35%
Food - 25%
Savings - 10%
Transportation - 15%
Clothing - 10%
Other - 5%
What does the family budget look like? Can you interpret where and how they spend their money?
This Concept is all about interpreting circle graphs. Use it to answer these questions at the end of the Concept.
Guidance
In a circle graph, the circle represents the whole. A circle graph can be used to compare the parts with thewhole. It is a useful way to visually display data. Each of the parts is called a sector.
Let’s look at how data is expressed in a circle graph.
The circle graph shows how the students at Grandville Middle School voted for a school mascot. Which mascot gotthe least number of votes?
605
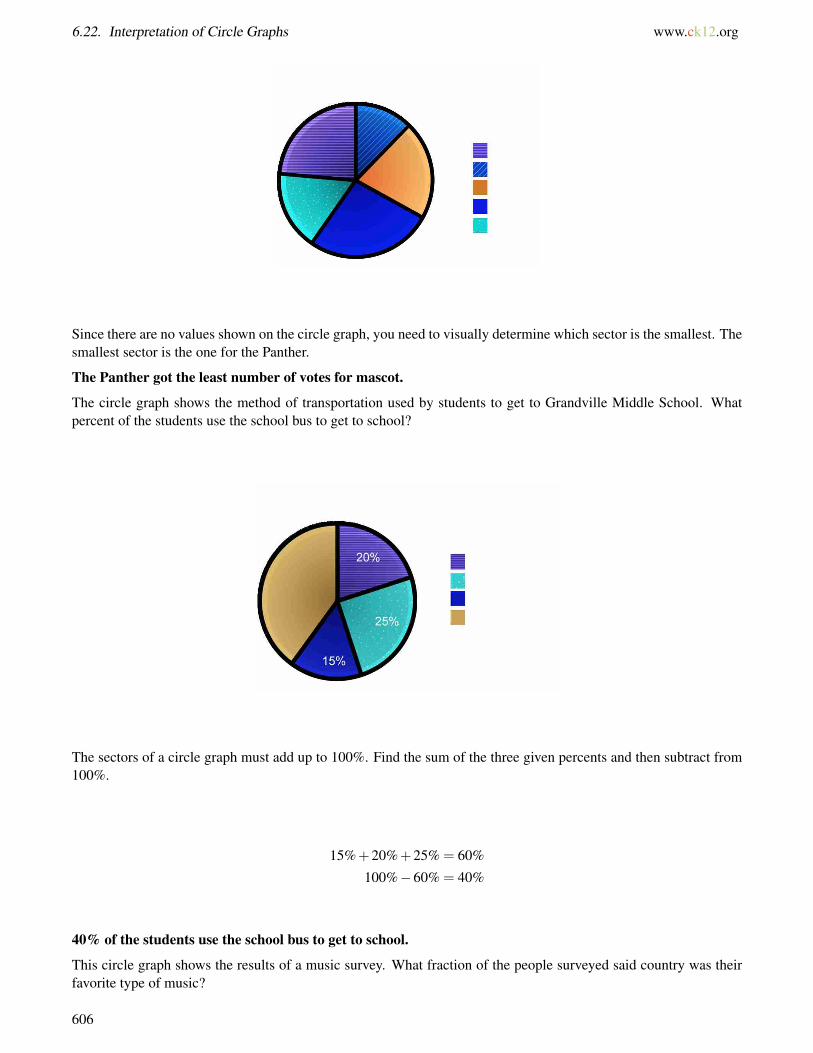
6.22. Interpretation of Circle Graphs www.ck12.org
Since there are no values shown on the circle graph, you need to visually determine which sector is the smallest. Thesmallest sector is the one for the Panther.
The Panther got the least number of votes for mascot.
The circle graph shows the method of transportation used by students to get to Grandville Middle School. Whatpercent of the students use the school bus to get to school?
The sectors of a circle graph must add up to 100%. Find the sum of the three given percents and then subtract from100%.
15%+20%+25% = 60%
100%−60% = 40%
40% of the students use the school bus to get to school.
This circle graph shows the results of a music survey. What fraction of the people surveyed said country was theirfavorite type of music?
606
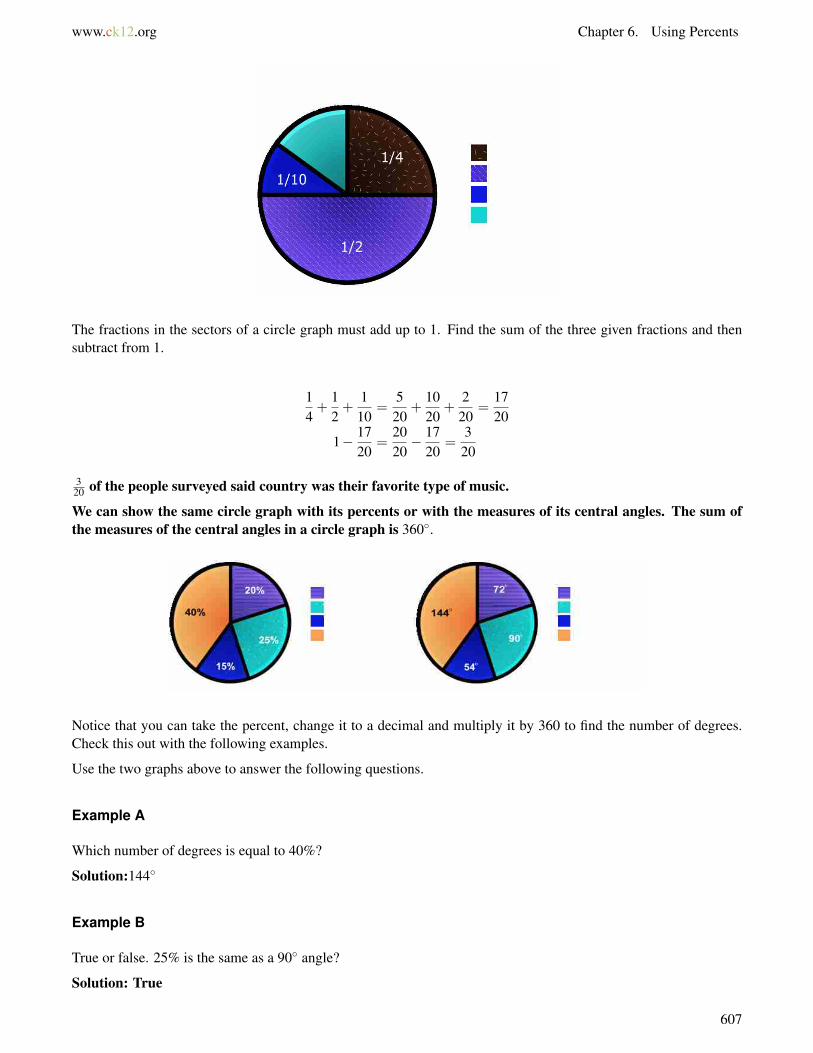
www.ck12.org Chapter 6. Using Percents
The fractions in the sectors of a circle graph must add up to 1. Find the sum of the three given fractions and thensubtract from 1.
14+
12+
110
=520
+1020
+220
=1720
1− 1720
=2020− 17
20=
320
320 of the people surveyed said country was their favorite type of music.
We can show the same circle graph with its percents or with the measures of its central angles. The sum ofthe measures of the central angles in a circle graph is 360◦.
Notice that you can take the percent, change it to a decimal and multiply it by 360 to find the number of degrees.Check this out with the following examples.
Use the two graphs above to answer the following questions.
Example A
Which number of degrees is equal to 40%?
Solution:144◦
Example B
True or false. 25% is the same as a 90◦ angle?
Solution: True
607
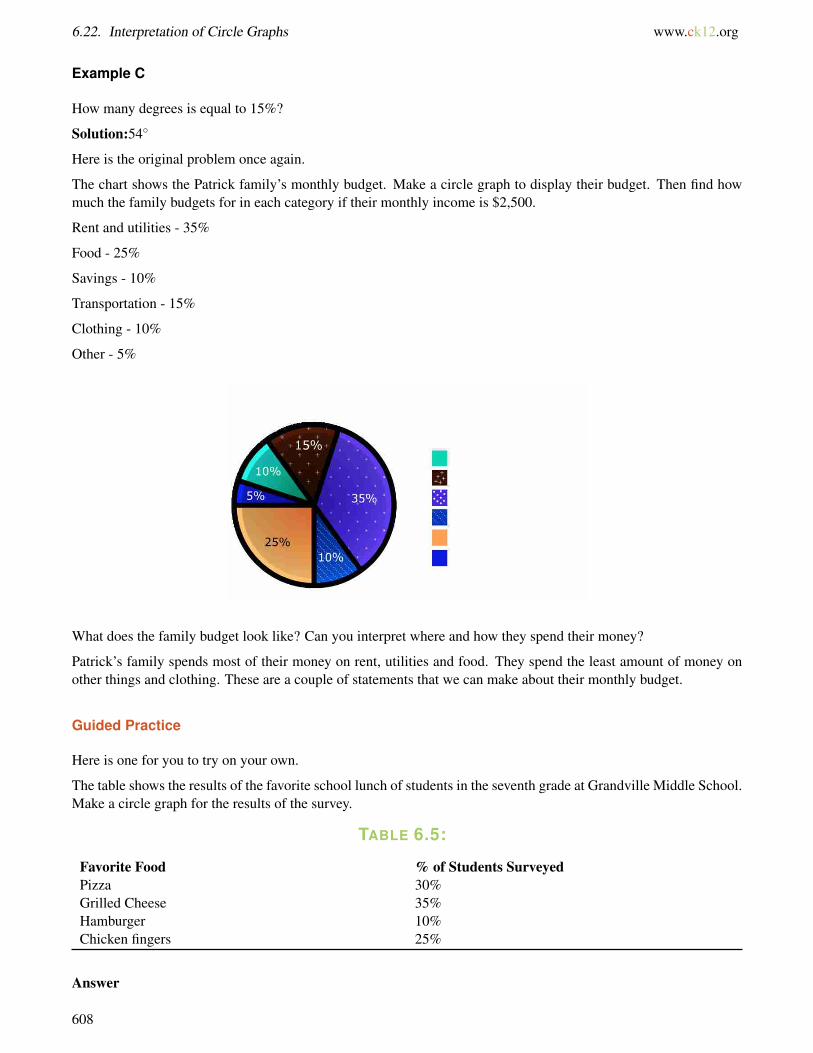
6.22. Interpretation of Circle Graphs www.ck12.org
Example C
How many degrees is equal to 15%?
Solution:54◦
Here is the original problem once again.
The chart shows the Patrick family’s monthly budget. Make a circle graph to display their budget. Then find howmuch the family budgets for in each category if their monthly income is $2,500.
Rent and utilities - 35%
Food - 25%
Savings - 10%
Transportation - 15%
Clothing - 10%
Other - 5%
What does the family budget look like? Can you interpret where and how they spend their money?
Patrick’s family spends most of their money on rent, utilities and food. They spend the least amount of money onother things and clothing. These are a couple of statements that we can make about their monthly budget.
Guided Practice
Here is one for you to try on your own.
The table shows the results of the favorite school lunch of students in the seventh grade at Grandville Middle School.Make a circle graph for the results of the survey.
TABLE 6.5:
Favorite Food % of Students SurveyedPizza 30%Grilled Cheese 35%Hamburger 10%Chicken fingers 25%
Answer
608
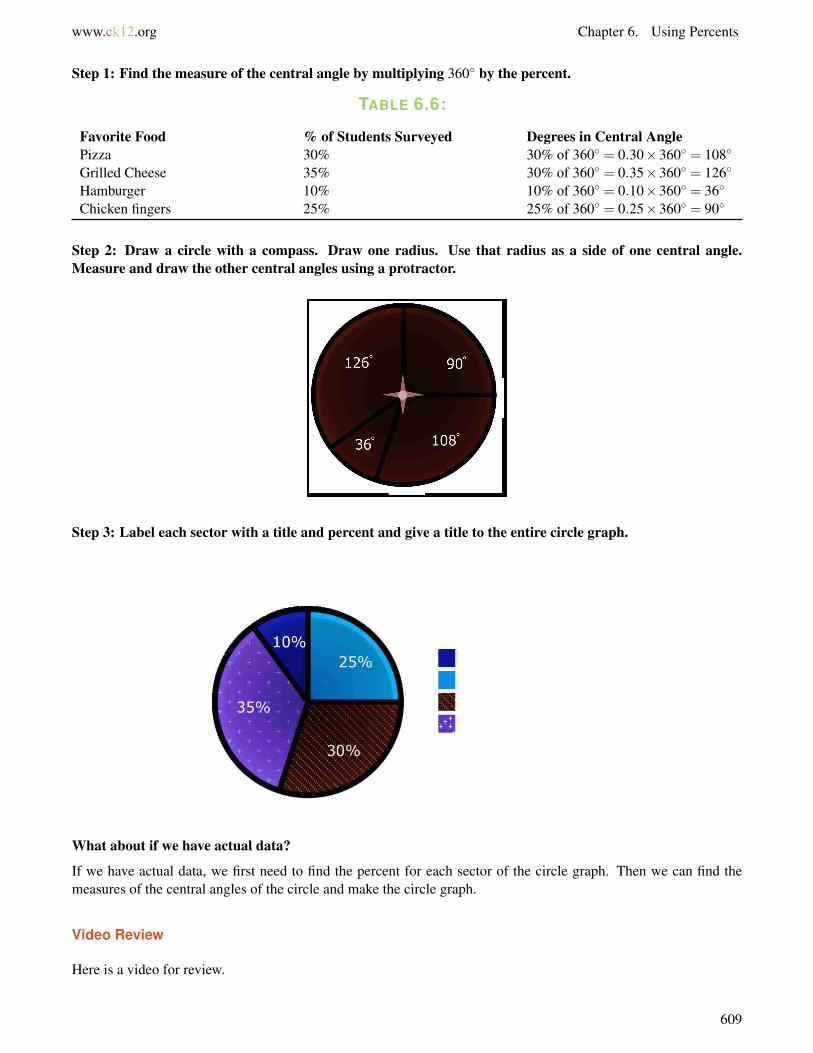
www.ck12.org Chapter 6. Using Percents
Step 1: Find the measure of the central angle by multiplying 360◦ by the percent.
TABLE 6.6:
Favorite Food % of Students Surveyed Degrees in Central AnglePizza 30% 30% of 360◦ = 0.30×360◦ = 108◦
Grilled Cheese 35% 30% of 360◦ = 0.35×360◦ = 126◦
Hamburger 10% 10% of 360◦ = 0.10×360◦ = 36◦
Chicken fingers 25% 25% of 360◦ = 0.25×360◦ = 90◦
Step 2: Draw a circle with a compass. Draw one radius. Use that radius as a side of one central angle.Measure and draw the other central angles using a protractor.
Step 3: Label each sector with a title and percent and give a title to the entire circle graph.
What about if we have actual data?
If we have actual data, we first need to find the percent for each sector of the circle graph. Then we can find themeasures of the central angles of the circle and make the circle graph.
Video Review
Here is a video for review.
609

6.22. Interpretation of Circle Graphs www.ck12.org
MEDIAClick image to the left or use the URL below.URL: http://www.ck12.org/flx/render/embeddedobject/5289
This is a Khan Academy video on reading circle graphs.
Explore More
Directions: Use the survey to answer each question.
A survey of 300 people asked them to name their favorite spectator sport. The results are shown in the circle graphbelow.
1. What was the most favorite spectator sport of the people surveyed?
2. What was the least favorite spectator sport of the people surveyed?
3. What percent of the people surveyed said that football was their favorite spectator sport?
4. How many people said that basketball was their favorite spectator sport?
5. How many more people said that soccer was their favorite sport than ice hockey?
6. The table shows the how much money the students in the seventh grade have raised so far for a class trip. Make acircle graph that shows the data.
TABLE 6.7:
Fundraiser AmountCar wash $150Book sale $175Bake sale $100Plant sale $75
7. Make a list of 5 popular ice cream flavors. Then survey your classmates asking them which of the 5 flavors istheir favorite ice cream flavor. Use the data to make a circle graph.
8. Use a newspaper to locate a circle graph of some data. Then write five questions about the data.
610

www.ck12.org Chapter 6. Using Percents
This circle graph shows the results of a survey taken among students about their favorite school lunches. Use thegraph to answer the following questions.
9. What percent of the students enjoy soup as a lunch?
10. What is the favorite choice of students for school lunch?
11. What is the least favorite choice?
12. What percent of the students enjoy salad?
13. What percent of the students did not choose salad as a favorite choice?
14. What percent of the students chose either pizza or tacos as their favorite choice?
15. What percent of the students chose chicken sandwich and pizza as their favorite choice?
16. What percent of the students did not choose chicken or pizza?
17. What is your favorite choice for lunch?
18. If you could add a food choice to this survey, what would it be?
611
6.23. Circle Graphs to Display Data www.ck12.org
6.23 Circle Graphs to Display Data
Here you’ll learn to make circle graphs given data.
One day while Taylor was in the candy store, she saw a chart that her Dad had made sitting on the counter.
“What’s this mean?” she asked looking at the chart.
“That is a chart that shows our best sellers. Every other candy sells less than 10%, so I don’t usually include it.These are the top sellers. I keep track of our inventory each month and determine which candies were the top sellers.Then I create a graph of the data,” he explained.
“Where is the graph?”
“I haven’t made it yet.”
“I could do that,” Taylor said smiling.
“Terrific! Go right ahead.”
Taylor was so excited. She could finally put all of her math to work. She knew that a circle graph would be the bestway to show the percentages. Here is the chart.
Lollipops - 55%
Licorice - 10%
Chocolates - 20%
Gummy Bears - 15%
Taylor started to work on the circle graph and she thought that she knew what she was doing, but then she got stuck.She couldn’t remember how to change each percentage into a number of degrees.
This is where you come in. It is your turn to help Taylor. Pay attention to this Concept and you will know howto create the circle graph in the end.
Guidance
Creating a circle graph may seem tricky, but if you think about circle graphs it can become easier to figure out. First,notice that in the graphs at the end of the last Concept, that each percentage was converted to a specific number ofdegrees.
612
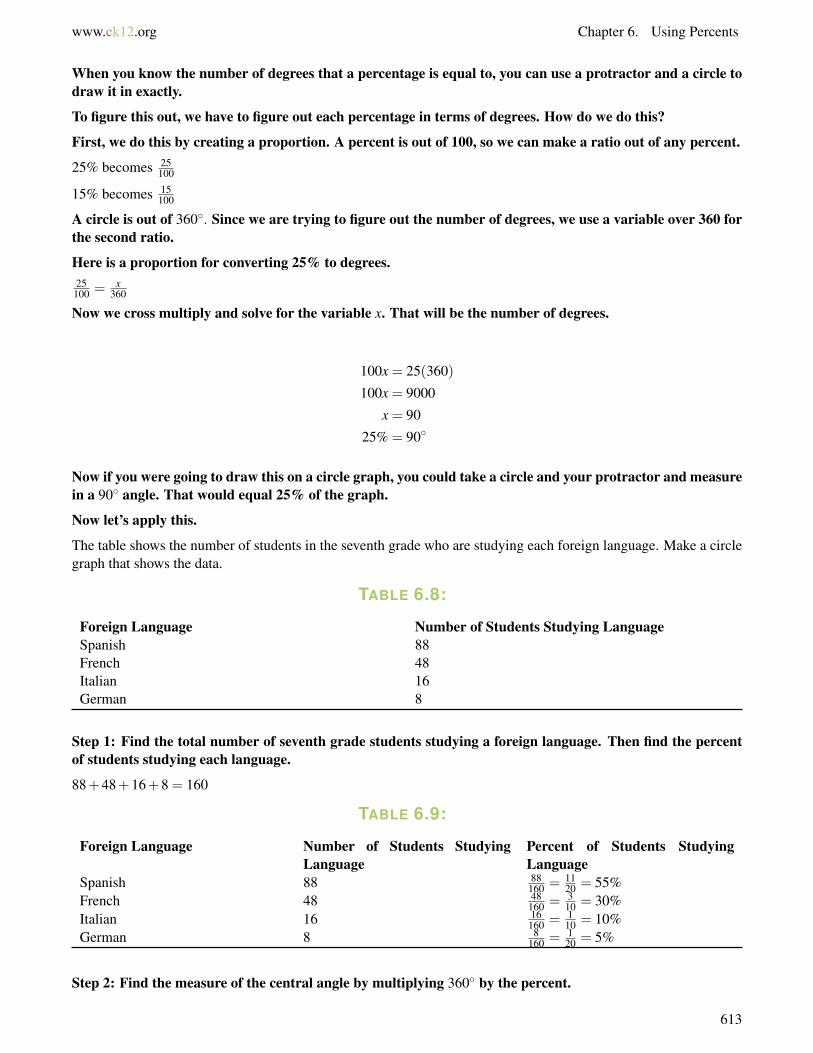
www.ck12.org Chapter 6. Using Percents
When you know the number of degrees that a percentage is equal to, you can use a protractor and a circle todraw it in exactly.
To figure this out, we have to figure out each percentage in terms of degrees. How do we do this?
First, we do this by creating a proportion. A percent is out of 100, so we can make a ratio out of any percent.
25% becomes 25100
15% becomes 15100
A circle is out of 360◦. Since we are trying to figure out the number of degrees, we use a variable over 360 forthe second ratio.
Here is a proportion for converting 25% to degrees.25100 = x
360
Now we cross multiply and solve for the variable x. That will be the number of degrees.
100x = 25(360)
100x = 9000
x = 90
25% = 90◦
Now if you were going to draw this on a circle graph, you could take a circle and your protractor and measurein a 90◦ angle. That would equal 25% of the graph.
Now let’s apply this.
The table shows the number of students in the seventh grade who are studying each foreign language. Make a circlegraph that shows the data.
TABLE 6.8:
Foreign Language Number of Students Studying LanguageSpanish 88French 48Italian 16German 8
Step 1: Find the total number of seventh grade students studying a foreign language. Then find the percentof students studying each language.
88+48+16+8 = 160
TABLE 6.9:
Foreign Language Number of Students StudyingLanguage
Percent of Students StudyingLanguage
Spanish 88 88160 = 11
20 = 55%French 48 48
160 = 310 = 30%
Italian 16 16160 = 1
10 = 10%German 8 8
160 = 120 = 5%
Step 2: Find the measure of the central angle by multiplying 360◦ by the percent.
613
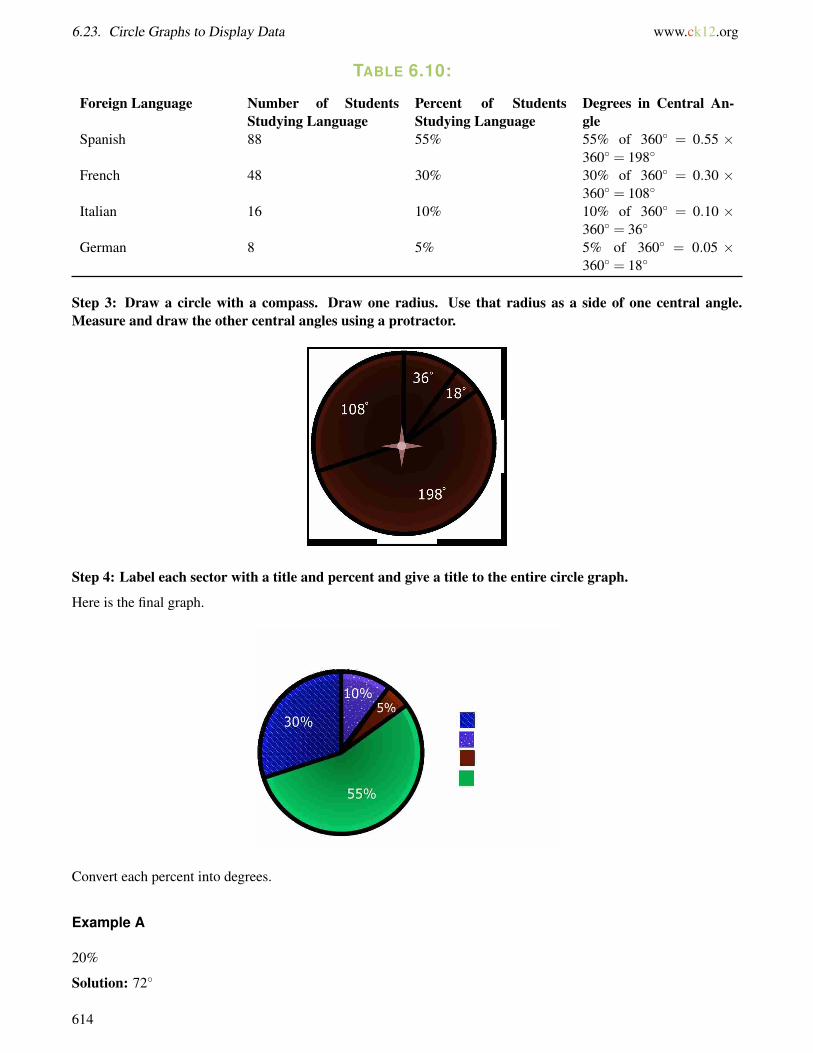
6.23. Circle Graphs to Display Data www.ck12.org
TABLE 6.10:
Foreign Language Number of StudentsStudying Language
Percent of StudentsStudying Language
Degrees in Central An-gle
Spanish 88 55% 55% of 360◦ = 0.55 ×360◦ = 198◦
French 48 30% 30% of 360◦ = 0.30 ×360◦ = 108◦
Italian 16 10% 10% of 360◦ = 0.10 ×360◦ = 36◦
German 8 5% 5% of 360◦ = 0.05 ×360◦ = 18◦
Step 3: Draw a circle with a compass. Draw one radius. Use that radius as a side of one central angle.Measure and draw the other central angles using a protractor.
Step 4: Label each sector with a title and percent and give a title to the entire circle graph.
Here is the final graph.
Convert each percent into degrees.
Example A
20%
Solution: 72◦
614
www.ck12.org Chapter 6. Using Percents
Example B
40%
Solution:144◦
Example C
75%
Solution:270◦
Here is the original problem once again. Use what you have learned to help Taylor make the circle graph.
One day while Taylor was in the candy store, she saw a chart that her Dad had made sitting on the counter.
“What’s this mean?” she asked looking at the chart.
“That is a chart that shows our best sellers. Every other candy sells less than 10%, so I don’t usually include it.These are the top sellers. I keep track of our inventory each month and determine which candies were the top sellers.Then I create a graph of the data,” he explained.
“Where is the graph?”
“I haven’t made it yet.”
“I could do that,” Taylor said smiling.
“Terrific! Go right ahead.”
Taylor was so excited. She could finally put all of her math to work. She knew that a circle graph would be the bestway to show the percentages. Here is the chart.
Lollipops - 55%
Licorice - 10%
Chocolates - 20%
Gummy Bears - 15%
Taylor started to work on the circle graph and she thought that she knew what she was doing, but then she got stuck.She couldn’t remember how to change each percentage into a number of degrees.
First, we need to convert each percentage to a number of degrees. We can do this by multiplying each decimalby 360.
615
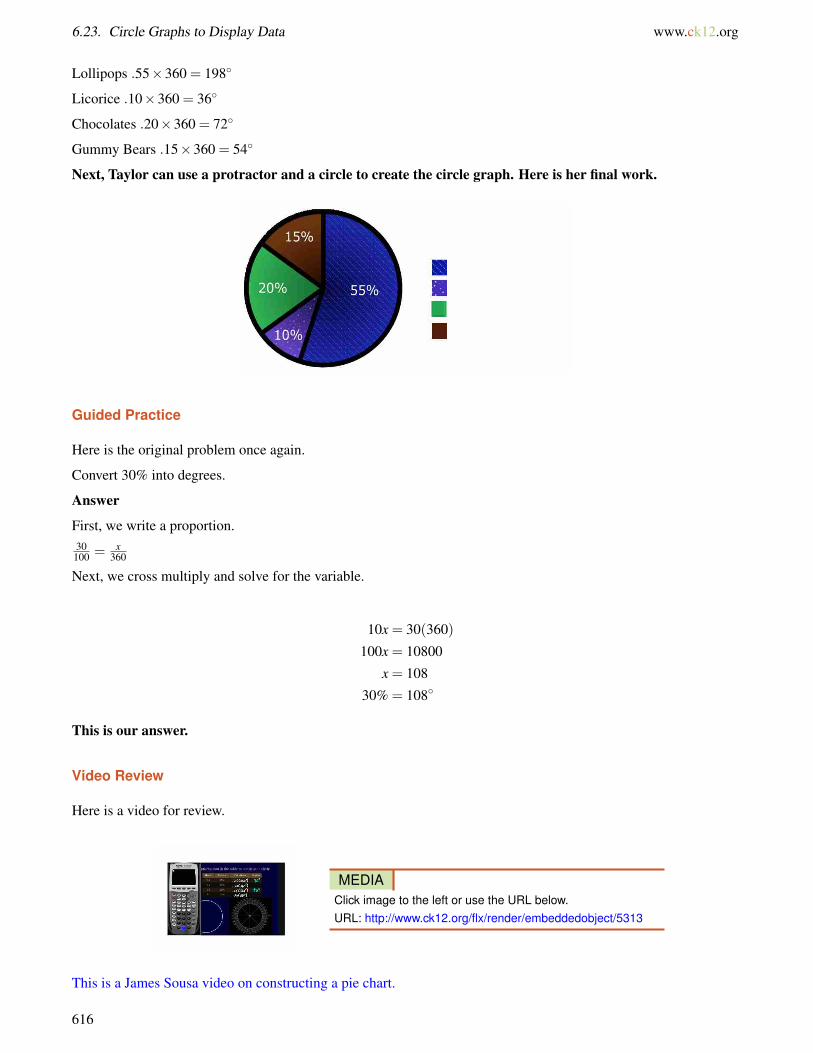
6.23. Circle Graphs to Display Data www.ck12.org
Lollipops .55×360 = 198◦
Licorice .10×360 = 36◦
Chocolates .20×360 = 72◦
Gummy Bears .15×360 = 54◦
Next, Taylor can use a protractor and a circle to create the circle graph. Here is her final work.
Guided Practice
Here is the original problem once again.
Convert 30% into degrees.
Answer
First, we write a proportion.30100 = x
360
Next, we cross multiply and solve for the variable.
10x = 30(360)
100x = 10800
x = 108
30% = 108◦
This is our answer.
Video Review
Here is a video for review.
MEDIAClick image to the left or use the URL below.URL: http://www.ck12.org/flx/render/embeddedobject/5313
This is a James Sousa video on constructing a pie chart.
616
www.ck12.org Chapter 6. Using Percents
Explore More
Directions: Use what you have learned to tackle each problem.
1. The table shows the how much money the students in the seventh grade have raised so far for a class trip. Make acircle graph that shows the data.
TABLE 6.11:
Fundraiser AmountCar wash $150Book sale $175Bake sale $100Plant sale $75
2. Make a list of 5 popular ice cream flavors. Then survey your classmates asking them which of the 5 flavors istheir favorite ice cream flavor. Use the data to make a circle graph.
3. Use a newspaper to locate a circle graph of some data. Then write five questions about the data.
Directions: Look at each percentage and then use a proportion to find the equivalent number of degrees. You mayround your answer when necessary.
4. 12%
5. 25%
6. 28%
7. 42%
8. 19%
9. 80%
10. 90%
11. 34%
12. 15%
13. 5%
14. 10%
15. 78%
Summary
Having completed this chapter, students are now ready to move on to the next Chapter. Each Concept has providedstudents with an opportunity to engage and practice skills in many Concepts including recognizing percents, percentsand fractions, percents and proportions, the percent equation, percents as decimals, percent of increase, percent ofdecrease, percent of change, tips, taxes, interest and circle graphs.
617
www.ck12.org
CHAPTER 7 Equations, Inequalities andFunctions
Chapter Outline7.1 ADDITION AND SUBTRACTION PHRASES AS EQUATIONS
7.2 MULTIPLICATION AND DIVISION PHRASES AS EQUATIONS
7.3 SINGLE VARIABLE EQUATIONS FROM VERBAL MODELS
7.4 SIMPLIFY SUMS OR DIFFERENCES OF SINGLE VARIABLE EXPRESSIONS
7.5 SIMPLIFY PRODUCTS OR QUOTIENTS OF SINGLE VARIABLE EXPRESSIONS
7.6 SIMPLIFY VARIABLE EXPRESSIONS INVOLVING MULTIPLE OPERATIONS
7.7 SINGLE VARIABLE ADDITION EQUATIONS
7.8 SINGLE VARIABLE SUBTRACTION EQUATIONS
7.9 SINGLE VARIABLE MULTIPLICATION EQUATIONS
7.10 SINGLE VARIABLE DIVISION EQUATIONS
7.11 TWO-STEP EQUATIONS FROM VERBAL MODELS
7.12 TWO-STEP EQUATIONS AND PROPERTIES OF EQUALITY
7.13 INEQUALITIES ON A NUMBER LINE
7.14 ONE-STEP INEQUALITIES
7.15 DOMAIN AND RANGE OF A FUNCTION
7.16 INPUT-OUTPUT TABLES FOR FUNCTION RULES
7.17 FUNCTION RULES FOR INPUT-OUTPUT TABLES
7.18 GRAPHS OF LINEAR EQUATIONS
7.19 LINEAR AND NON-LINEAR FUNCTION DISTINCTION
7.20 LINEAR AND NON-LINEAR PATTERNS OF CHANGE
Introduction
In Math 7, the learning content is divided into Concepts. Each Concept is complete and whole providing focusedlearning on an indicated objective. Theme-based Concepts provide students with experiences that integrate thecontent of each Concept. Students are given opportunities to practice the skills of each Concept through real-worldsituations, examples, guided practice and independent practice sections. There are also video links provided to givestudents an audio/visual way of connecting with the content. In this Chapter, students will engage with Concepts onwriting expressions and equations, simplifying expressions, solving one-step equations, solving two-step equations,solving inequalities, identifying and understanding functions and graphing functions.
618
www.ck12.org Chapter 7. Equations, Inequalities and Functions
7.1 Addition and Subtraction Phrases as Equa-tions
Here you’ll learn to write addition and subtraction phrases as single variable equations.
Have you ever been to Boston? Have you ever spent the summer with your grandparents?
Kara and her twin brother Marc are going to be spending one month in Boston with their grandparents. They arevery excited! Not only is it summer in Boston and the weather will be terrific, but Boston has a fantastic subwaysystem called the T and they will be able to ride it to get all around.
Kara is very excited about visiting the museums, but Marc who is a huge baseball fan is hoping for a trip to FenwayPark before the month is up. Seeing the Red Sox play would be a huge bonus!
Kara has earned $125.00 babysitting and has some birthday money too.
Before the trip, she counted her savings and realized that she has $54.25.
You can write an equation to show the unknown in this dilemma.
This Concept will teach you how to write addition and subtraction phrases as single variable equations.
Guidance
An expression shows how numbers and/or variables are connected by operations, such as addition, subtrac-tion, multiplication, and division. Notice that an expression does not have an equal sign. This is because the valueof the variable in each expression can change, or you could say that we can evaluate an expression using differentgiven values for the variable.
50−2 4−a 12z4x3
Three of the expressions above include variables, such as a,z, and x.
An expression that includes one or more variables is called an algebraic expression. Each variable in an algebraicexpression can have a different value. Once again, you will not see an equal sign with an algebraic expression. Wecan use algebraic expressions to represent words or phrases.
Often in word problems or in other situations in math, you will be given a set of words or a phrase that you willneed to rewrite as an expression. When you do this, you will be looking for words that mean different operations orthings in math. This way you can write an expression that correctly represents the words or phrase.
We are going to start with addition and subtraction phrases. Take a look at this chart.
TABLE 7.1:
Addition Expressions Subtraction Expressions1 plus a 1+a 4 less d 4−d2 and b 2+b 6 less than g g−63 more than c 3+ c h fewer than 7 7−h
The bolded key words in the phrases above provide clues about whether or not you should write an additionor a subtraction expression. While key words can be a helpful guide, it is important not to rely on them totally.It is always most important to think about which operation makes the most sense for a particular situation.
619
7.1. Addition and Subtraction Phrases as Equations www.ck12.org
Write these key words in your notebook and then continue with the Concept.
Abdul has $5 more than Xavier has. Let x stand for the number of dollars Xavier has. Write an algebraic expressionto show the number of dollars Abdul has.
The phrase is “$5 more than Xavier.” Use a number, an operation sign, or a variable to represent each part of thatphrase.
$5 more than Xavier
↓ ↓ ↓5 + x
Notice that in this phrase, the key words “more than” means you should write an addition expression.
So, the expression 5+ x represents the number of dollars Abdul has. We also could have written this as. x+ 5because addition is commutative. That means, the order in which numbers are added does not matter.
Our answer is x+5.
Here is another one.
6 less than a number
Notice the key words “less than” which means subtraction.
A number means a variable.
Because it says “6 less than a number,” the 6 will follow the variable.
x−6
Our answer is x−6.
Remember, sometimes writing an expression is not as simple as relying on key words.
Lian is x inches shorter than Hannah. Hannah is 65 inches tall. Write an algebraic expression to show Lian’s heightin inches.
The phrase is “x inches shorter than Hannah.” You also know that Hannah’s height is 65 inches.
There are no key words, so you need to think about what makes sense. If Lian is shorter than Hannah, herheight will be less than 65 inches. So, write a subtraction expression. Use 65 to represent Hannah’s height. SinceLian’s height is less than Hannah’s height, you will need to subtract x inches from Hannah’s height to representLian’s height.
620

www.ck12.org Chapter 7. Equations, Inequalities and Functions
x inches shorter than Hannah.
2 ↓ 2
2 ↓ 2
2 ↓ 2
65 − x
The answer is 65− x.
If you knew what any of these expressions were equal to, then you could use an equals sign and write an equation.Take a look at these examples.
Write an equation for each phrase.
Example A
A number plus five is ten
Solution: x+5 = 10
Example B
Six more than a number is eighteen.
Solution: x+6 = 18
Example C
Fifteen less than a number is twenty
Solution: x−15 = 20
Here is the original problem once again.
Kara and her twin brother Marc are going to be spending one month in Boston with their grandparents. They arevery excited! Not only is it summer in Boston and the weather will be terrific, but Boston has a fantastic subwaysystem called the T and they will be able to ride it to get all around.
Kara is very excited about visiting the museums, but Marc who is a huge baseball fan is hoping for a trip to FenwayPark before the month is up. Seeing the Red Sox play would be a huge bonus!
Kara has earned $125.00 babysitting and has some birthday money too.
Before the trip, she counted her savings and realized that she has $54.25.
You can write an equation to show the unknown in this dilemma.
To write an equation for this dilemma, we can include what we know and what we don’t know.
We know that Kara earned $125.00 babysitting.
We don’t know how much money she received from her birthday. This is our unknown.
We do know the total amount of money.
Here is our equation.
125+ x = 54.25
621
7.1. Addition and Subtraction Phrases as Equations www.ck12.org
This is our answer.
Guided Practice
Here is one for you to try on your own.
Write an equation to represent: Four less than an unknown number is eighteen.
Answer
To figure this out, we can first identify the operation as subtraction because of the key words less than.
Next, notice that the statement is four less than, so the four is being taken away from the unknown number.
Now we can write the equation.
x−4 = 18
This is our answer.
Video Review
MEDIAClick image to the left or use the URL below.URL: http://www.ck12.org/flx/render/embeddedobject/5291
This James Sousa video is an introduction to writing variable expressions.
Explore More
Directions: Write an expression for each phrase.
1. 5 more than a number
2. A number plus six
3. 8 and a number
4. Seven less than a number
5. Eight take a way four
6. Nine more than a number
Directions: Write a simple equation for each phrase.
7. Five less than a number is ten.
8. Eight take away four is a number.
9. Five and a number is twelve.
10. Sixteen less than an unknown number is eighty.
11. Twenty and a number is fifty - five.
12. A number and fifteen is forty.
622

www.ck12.org Chapter 7. Equations, Inequalities and Functions
13. A number and twelve is sixty.
14. Fifteen less than a number is ninety.
15. Sixty less than a number is eighty.
623
7.2. Multiplication and Division Phrases as Equations www.ck12.org
7.2 Multiplication and Division Phrases asEquations
Here you’ll learn to write multiplication and division phrases as single variable equations.
Have you ever been to a major league baseball game?
Kara and her twin brother Marc are going to be spending one month in Boston with their grandparents. They arevery excited! Not only is it summer in Boston and the weather will be terrific, but Boston has a fantastic subwaysystem called the T and they will be able to ride it to get all around.
Kara is very excited about visiting the museums, but Marc who is a huge baseball fan is hoping for a trip to FenwayPark before the month is up. Seeing the Red Sox play would be a huge bonus!
On the first day, the twins’ Grandpa told them that they were going to spend the day learning how to ride the subway.Given that the twins are 14 and that they will be traveling together, Grandpa feels comfortable that they will be fine.After a quick discussion on safety, they were ready to go.
Grandpa said that each ride on the subway would cost .85 for a teenager. They would be riding to the BostonCommon and back, and they may take another ride too.
Kara goes upstairs to get her money and tries to figure out how much they will need in all. She is having a toughtime because she doesn’t know how many train rides they will take in all. She tells Marc what she is trying to figureout.
“Well until we know the number of rides, you can’t figure out the total,” he says. “But you can write an expression.”
An expression? How can Kara do this? What does an expression mean? Why would you want one?
This Concept is all about expressions and equations. Learning how to write expressions can be very helpfulwhen you have a variable that can change such as the number of train rides. Pay attention and at the endof the Concept you will be able to help Kara write an expression to show the amount of money needed formultiple train rides.
Guidance
Previously we worked on writing expressions. Just as you can write addition and subtraction expressions from wordsor phrases, you can also write multiplication and division expressions. Once again, you can use key words to help
624
www.ck12.org Chapter 7. Equations, Inequalities and Functions
you with this. The more familiar you become with the key words that identify a multiplication or division expression,the better you will become at writing expressions.
Here are some statements of how words or phrases can be translated into multiplication or division expressions.
TABLE 7.2:
MultiplicationExpressions
Division Expressions
9 times k 9× k or 9k 8 divided into n groups 8÷n or 8n
twice as much as m 2×m or 2m q shared equally by 3people
q÷3 or q3
half of r r÷2 or r2
one-third of p p÷3 or p3
The bolded key words in the phrases above provide clues about whether or not you should write a multipli-cation or a division expression. Remember, key words can be a helpful guide, but you should always thinkabout which operation makes sense for a particular situation.
Write these key words in your notebook and then continue with the Concept.
Write an algebraic expression to represent this phrase: 3 times a number, t.
The phrase is “3 times a number, t.” Use a number, an operation sign, or a variable to represent each part of thatphrase.
3 times a number, t
↓ ↓ ↓3 × t
Notice that in this phrase, the key word “times” means you should write a multiplication expression.
So, the expression 3× t or 3t represents the phrase. We also could have written this as t×3 because multiplicationis commutative. That means, the order in which numbers are multiplied does not matter.
625
7.2. Multiplication and Division Phrases as Equations www.ck12.org
Here is another one.
Mr. Warren separated 30 students into n equal groups. Write an algebraic expression to represent the number ofstudents in each group.
The phrase is “ separated 30 students into n equal groups.”
Think about what makes sense. Separating 30 students into n equal groups means dividing 30 students into nequal groups. So, write a division expression.
separated 30 students into n equal groups
↓ ↓ ↓30 ÷ n
Division is not commutative. The order in which we divide numbers matters. So, while 30÷n represents the numberof students in each group, n÷30 does not.
The answer is 30÷n.
Sometimes an expression becomes an equation when there is a quantity that it equals.
30÷n = 5
This is an equation that we can solve by using the inverse operation. But this Concept is about writing equations notsolving them, so we can stop here.
Write a multiplication or division equation for each phrase.
Example A
Four times a number is eight.
Solution: 4x = 8
Example B
Sixteen divided into a number of groups is two.
Solution: 16x = 2
626
www.ck12.org Chapter 7. Equations, Inequalities and Functions
Example C
The product of five and a number is fifteen.
Solution: 5x = 15
Here is the original problem once again.
On the first day visiting their grandparents, the twins were told them that they were going to spend the day learninghow to ride the subway. Given that the Kara and Marc are 14 and that they will be traveling together, Grandpa feelscomfortable that they will be fine. After a quick discussion on safety, they were ready to go.
Grandpa said that each ride on the subway would cost .85 for a teenager. They would be riding to the BostonCommon and back, and they may take another ride too.
Kara goes upstairs to get her money and tries to figure out how much they will need in all. She is having a toughtime because she doesn’t know how many train rides they will take in all. She tells Marc what she is trying to figureout.
“Well until we know the number of rides, you can’t figure out the total,” he says. “But you can write an expression.”
An expression? How can Kara do this? What does an expression mean? Why would you want one?
Now that you know what an expression is, you can write one to help Kara figure out the amount of moneydepending on the number of train rides.
The amount of money per ride does not vary. It costs .85 per ride for a teenager.
The number of train rides does vary. This is where a variable is very useful. It can change according to thenumber of train rides. Let’s use x.
The expression is .85x.
If Kara changes the variable x according to the number of train rides that she and Marc take, then she canfigure out the cost per day of riding the train.
If they go on four train rides for example, here is the expression.
.85(4)
Evaluating this expression, the cost would be $3.40.
Expressions are very helpful for figuring out different problems with changeable parts like this one.
627
7.2. Multiplication and Division Phrases as Equations www.ck12.org
Guided Practice
Here is one for you to try on your own.
Write a single variable equation for the following phrase.
Keith bought tickets to the movies. The tickets were $8.50 each. Keith spent a total of $34.00. Write an equation toshow this dilemma.
Answer
To begin, we can identify our unknown as the number of tickets Keith bought. Let’s use t to represent this unknownnumber.
The cost of each ticket was $8.50.
Now we can write an equation.
8.50t = 34.00
This is our answer.
Video Review
MEDIAClick image to the left or use the URL below.URL: http://www.ck12.org/flx/render/embeddedobject/5292
This is a James Sousa video on writing variable expressions. It can be used as an introduction to writing single variable equations.
Explore More
Directions: Write an equation for each phrase.
1. The product of four and a number is twelve.
2. Six times a number is thirty.
3. Twelve times a number is forty-eight.
4. Fourteen times by a number is twenty-eight.
5. The product of five and a number is thirty.
6. Eight times a number is sixty-four.
7. Twenty divided by a number is four.
8. Eighty divided by a number is four.
9. Nineteen times an unknown number is ninety-five.
10. Thirteen times an unknown number is thirty-nine.
11. Twelve divided into groups is six.
12. An unknown number divided by two is eight.
628

www.ck12.org Chapter 7. Equations, Inequalities and Functions
13. An unknown number divided by seven is fourteen.
14. An unknown number times five is thirty- five.
15. An unknown number divided by twelve is twelve.
629
7.3. Single Variable Equations from Verbal Models www.ck12.org
7.3 Single Variable Equations from VerbalModels
Here you’ll learn to write single variable equations from verbal models.
Have you ever known anyone with a stamp collection? Take a look at this dilemma.
Kelvin has twice as many stamps in his collection as Murray has in his. If Kelvin has 60 stamps in his collection,write an equation to represent m, the number of stamps in Murray’s collection.
To do this, you will need to know how to write single variable equations from verbal models. Pay attention tothis Concept and you will learn all that you need to know.
Guidance
What is the difference between an equation and an expression? Well, an expression is a phrase without anequal sign. This means that the variable in an expression can be changed and the expression can be evaluateddifferently. An equation has an equal sign. Therefore one side of an equation is equal to a value on the otherside.
Now, let’s examine how to write equations.
The same key words that helped you write expressions may also help you write equations. Here are some additionalkey words that you may find helpful.
TABLE 7.3:
Key Words for Addition or Multi-plication Equations
Key Words for Subtraction Equa-tions
Key Words for Division Equa-tions
how many all togetherhow many in allhow many total
how many morehow many fewerhow many lefthow much change
how many in each
Take a few minutes to write down these key words and phrases in your notebook.
Now let’s apply this information.
Four times a number is twelve.
First, notice that we have the word “times” which means to multiply. We also have the word “is” which is akey word for equals.
4 times x = 12
630

www.ck12.org Chapter 7. Equations, Inequalities and Functions
The equation is 4x = 12.
Seven less than a number is fourteen.
First, notice we have the words “less than” which means subtraction. Then we have the word “is” which is akey word for equals.
x−7 = 14
The answer is x−7 = 14.
Write an equation for each verbal phrase.
Example A
Six and a number is twenty.
Solution: 6+ x = 20
Example B
Eighteen divided by a number is three.
Solution: 18÷ x = 3
Example C
Five times a number is twenty-five.
Solution: 5y = 25
Here is the original problem once again.
Kelvin has twice as many stamps in his collection as Murray has in his. If Kelvin has 60 stamps in his collection,write an equation to represent m, the number of stamps in Murray’s collection.
Use a number, an operation sign, a variable, or an equal sign to represent each part of that problem. SinceKelvin has 60 stamps in his collection, represent the number of stamps in Kelvin’s collection as 60.
Kelvin has twice as many stamps...as Murray.
↓ ↓ ↓60 = 2m
This equation 60 = 2m, represents m, the number of stamps in Murray’s collection.
Guided Practice
Here is one for you to try on your own.
Carrie made 3 liters of lemonade for a party. After the party, she had 0.5 liter of lemonade left. Write an equation torepresent n, the number of liters of lemonade that her guests drank.
Answer
Use a number, an operation sign, a variable, or an equal sign to represent each part of that problem. Since thequestion tells us how many liters of lemonade were left after the party, write a subtraction equation.
631
7.3. Single Variable Equations from Verbal Models www.ck12.org
Since she had 0.5 liter of lemonade left, n is the number of liters that were drunk at the party. For this problem, itmay help to write an equation in words and then translate those words into an algebraic equation.
(number of liters made) − (number of liters guests drank) = (number of liters left)
↓ ↓ ↓ ↓ ↓3 − n = 0.5
This equation, 3− n = 0.5, represents n, the number of liters of lemonade that Carrie’s guests drank duringthe party.
Video Review
MEDIAClick image to the left or use the URL below.URL: http://www.ck12.org/flx/render/embeddedobject/57643
This is a Khan Academy video about single variable equation problems. It is a support to this Concept.
Explore More
Directions: Write an equation for each verbal model.
1. Ten times a number is thirty.
2. Five times a number is fifteen.
3. A number and seven is eleven.
4. A number divided by three is twelve.
5. A number and eighteen is thirty.
6. A number divided by twelve is fourteen.
7. Seven times a number is forty-nine.
8. A number divided by thirteen is seven.
9. Eight times a number is equal to sixty-four.
Directions: Write an algebraic expression for each situation below.
10. Arturo has 8 fewer stickers in his collection than Julissa has in hers. Let j represent the number of stickers inJulissa’s collection. Write an expression to represent the number of stickers in Arturo’s collection.
11. Let c represent the number of cookies on a plate. Three friends share all the cookies on the plate equally. Writean expression to represent the number of cookies each friend has after they are shared equally.
12. Carly is twice as old as her sister. Let s represent her sister’s age in years. Write an expression to representCarly’s age in years.
13. The length of a rectangle is 3 inches longer than its width. Let w stand for the width in inches. Write anexpression to represent the length in inches.
632

www.ck12.org Chapter 7. Equations, Inequalities and Functions
Directions: Write an algebraic equation for each word problem below.
14. The chorus teacher divides all the students in the chorus into 3 equal groups. Each of the groups has 6 studentsin it. Write an equation that could be used to represent n, the total number of students in the chorus.
15. Matt’s dog weighs 30 pounds. His dog weighs 20 pounds more than his cat. Write an equation that could beused to represent c, the weight, in pounds, of Matt’s cat.
633
7.4. Simplify Sums or Differences of Single Variable Expressions www.ck12.org
7.4 Simplify Sums or Differences of SingleVariable Expressions
Here you’ll learn to simplify sums or differences of single variable expressions.
Have you ever had to order ice cream for a group of people?
Well, Marc is doing just that. He has taken orders for himself, his sister, his grandparents and two of their friends.
Here is what he was told.
Two vanilla ice cream cones
Three more vanilla ice cream cones
Then another vanilla ice cream cone
We can write Marc’s order as a variable expression.
2v+3v+ v
This is a way of writing Marc’s ice cream order as a variable expression.
Can you simplify this expression?
This Concept will teach you how to simplify single variable expressions. At the end of it, you will be able tosimplify Marc’s order for him.
Guidance
Previously we worked on writing expressions. An expression shows how numbers and/or variables are connectedby operations, such as addition, subtraction, multiplication, and division.
If an expression has only numbers, you can find its numerical value. However, if an expression includesvariables and you do not know the values of those variables, you can simplify the expression. To simplifymeans to make smaller or simpler. Let’s take a look at how to simplify expressions now.
Let’s apply this information.
6a+3a
When adding expressions with variables, it is important to remember that only like terms can be combined. Forexample, 6a and 3a are like terms because both terms include the variable a. So, we can combine them.
6a+3a
9a
6a+3
However, 6a and 3 are not like terms because only one term includes the variable a. So, we cannot combinethem. The expression 6a+3 cannot be simplified any further.
You can use what you know about like terms and what you know about addition and subtraction to help you simplifyexpressions with variables.
Here is another one.
Find the difference 15d−2d.
634
www.ck12.org Chapter 7. Equations, Inequalities and Functions
Since 15d and 2d both have the same variable, they are like terms. To find the difference, subtract thenumerical parts of the terms the same way you would subtract any whole numbers.
15d−2d = 13d
The difference is 13d.
We can also see examples that have decimals or even fractions in them. Remember back to your work with rationalnumbers.
Find the sum 0.4x+1.3x.
Since 0.4x and 1.3x both have the same variable, they are like terms. To find the sum, add the numerical partsof the terms the same way you would add any decimals.
0.4x+1.3x = 1.7x
The sum is 1.7x.
Don’t forget that the word SUM means addition and the word DIFFERENCE means subtraction.
Simplify each sum or difference when possible.
Example A
3a+12a
Solution: 15a
Example B
16x−2x
Solution: 14x
Example C
7y+2x
Solution: Terms are not alike. It is in simplest form.
Here is the original problem once again.
635
7.4. Simplify Sums or Differences of Single Variable Expressions www.ck12.org
Have you ever had to order ice cream for a group of people?
Well, Marc is doing just that. He has taken orders for himself, his sister, his grandparents and two of their friends.
Here is what he was told.
Two vanilla ice cream cones
Three more vanilla ice cream cones
Then another vanilla ice cream cone
We can write Marc’s order as a variable expression.
2v+3v+ v
This is a way of writing Marc’s ice cream order as a variable expression.
Can you simplify this expression?
If you look at this expression you will see that the variables are all the same. This is because everyone orderedvanilla ice cream cones. Therefore, we can simply add the terms.
2v+3v+ v = 6v
This is the answer.
Guided Practice
Here is one for you to try on your own.
Simplify each expression.
5a+4a−2a+6a
Answer
To simplify this expression, we follow the order of operations and combine like terms in order from left to right.Here is what the expression looks like after the first two terms have been combined.
9a−2a+6a
Now, we can perform the subtraction.
7a+6a
Finally, we add the last two terms.
13a
This is our answer.
Video Review
MEDIAClick image to the left or use the URL below.URL: http://www.ck12.org/flx/render/embeddedobject/5525
This is a James Sousa video on combining like terms.
636
www.ck12.org Chapter 7. Equations, Inequalities and Functions
Explore More
Directions: Simplify each sum or difference by combining like terms.
1. 6a+7a
2. 7x−2x
3. 6y+12y
4. 8a+12a
5. 12y−7y
6. 8a+15a
7. 13b−9b
8. 22x+19x
9. 45y−12y
10. 16a+18a+9a
11. 14x−6x+2x
12. 21a+14a−15a
13. 33b+13b+8b
14. 45x+67x−29x
15. 92y+6y−54y
637
7.5. Simplify Products or Quotients of Single Variable Expressions www.ck12.org
7.5 Simplify Products or Quotients of SingleVariable Expressions
Here you’ll learn to simplify products or quotients of single variable expressions.
Have you ever had a stamp collection?
Marc has twice as many stamps in his collection as his Grandfather has in his. Write an expression to represent m,the number of stamps in his Grandfather’s collection.
To solve this problem, you will need to know how to write a single variable expression. Pay attention to thisConcept, and you will know how to do this by the end of the Concept.
Guidance
Previously we learned that when you add and subtract terms in an expression, you can only combine like terms.
However, you can multiply or divide terms whether they are like terms or not.
For example, 6a and 3a are like terms because both terms include the variable a. We can multiply them to simplifyan expression like this.
6a×3a = 18×a×a = 18a2.
However, even though 6a and 3 are not like terms, we can still multiply them, like this.
6a×3 = 18a.
The Commutative and Associative Properties of Multiplication may help you understand how to multiply expressionswith variables. Remember, the Commutative property states that factors can be multiplied in any order. TheAssociative property states that the grouping of factors does not matter.
Let’s apply this information.
6a(3a)
We can take these two terms and multiply them together.
First, we multiply the number parts.
6×3 = 18
Next, we multiply the variables.
a ·a = a2
Our answer is 18a2.
638
www.ck12.org Chapter 7. Equations, Inequalities and Functions
Here is another one.
5x(8y)
Even though these two terms are different, we can still multiply them together.
First, we multiply the number parts.
5×8 = 40
Next, we multiply the variables.
x · y = xy
Our answer is 40xy.
Find the product 4z× 12 .
4z and 12 are not like terms, however, you can multiply terms even if they are not like terms.
Use the commutative and associative properties to rearrange the factors to make it easier to see how they can bemultiplied.
According to the commutative property, the order of the factors does not matter.
So, 4z× 12 = 1
2 ×4z.
According to the associative property, the grouping of the factors does not matter. Group the factors so that thenumbers are multiplied first.
So, 12 ×4z = 1
2 ×4× z =(1
2 ×4)× z.
Now, multiply.(12 ×4
)× z =
(12 ×
41
)× z = 4
2 × z = 2× z = 2z.
The product is 2z.
Remember that the word PRODUCT means multiplication and the word QUOTIENT means division.
Here is one that uses division.
Find the quotient 42c÷7.
It may help you to rewrite the problem like this 42c7 . Then separate out the numbers and variables like this.
42c7 = 42·c
7 = 427 · c
Now, divide 42 by 7 to find the quotient.
639

7.5. Simplify Products or Quotients of Single Variable Expressions www.ck12.org
427 · c = 6 · c = 6c
The quotient is 6c.
Now it’s your turn. Find each product or quotient.
Example A
6a(9a)
Solution: 54a2
Example B
15b5b
Solution: 3
Example C
20c4
Solution: 5c
Here is the original problem once again.
Marc has twice as many stamps in his collection as his Grandfather has in his. Write an expression to represent m,the number of stamps in his Grandfather’s collection.
To write this, we simply use the variable and the fact that Marc has twice as many stamps.
2m
This term represents Marc’s stamps.
Guided Practice
Here is one for you to try on your own.
Find the quotient 50g÷10g.
Answer
It may help you to rewrite the problem like this 50g10g . Then separate out the numbers and variables like this.
50g10g = 50·g
10·g = 5010 ·
gg
Now, divide 50 by 10 and divide g by g to find the quotient. Since any number over itself is equal to 1, you knowthat g
g = 1.
5010 ·
gg = 5.1 = 5
The quotient is 5.
Video Review
640

www.ck12.org Chapter 7. Equations, Inequalities and Functions
MEDIAClick image to the left or use the URL below.URL: http://www.ck12.org/flx/render/embeddedobject/5528
This is a James Sousa video on combining like terms by multiplying.
Explore More
Directions: Simplify each product or quotient.
1. 6a(4a)
2. 9x(2)
3. 14y(2y)
4. 16a(a)
5. 22x(2x)
6. 18b(2)
7. 21a7
8. 22b2b
9. 25xx
10. 45a5a
11. 15x3x
12. 18y9
13. 22y11y
14. 15x3y
15. 82x2x
641
7.6. Simplify Variable Expressions Involving Multiple Operations www.ck12.org
7.6 Simplify Variable Expressions InvolvingMultiple Operations
Here you’ll learn to simplify variable expressions involving multiple operations.
Have you ever calculated train fare? Take a look at this dilemma.
Kara is very excited that she has figured out an expression to calculate the total train fare. She heads downstairs andshares her findings with her Grandpa.
.85x
“See Grandpa, if I put the number of rides in for x, then we can figure out the total cost,” Kara explains.
“That is great work Kara, but what about me? That will work great when it is just you and Marc, but I am ridingwith you today. Seniors ride for .60 per ride.”
Wow! Kara hadn’t even thought of that. Now she has a whole new dilemma.
“I’ve got it,” she said writing some notes on a piece of paper.
Kara began to write an expression and then she thought that she could combine the terms of the expression.
Do you have an idea what Kara is writing? Think about the expression that she wrote for teen fares and trainrides. Now we are going to add to that and simplify. This Concept will teach you all about how this works.Focus on the information in the Concept and you will see this problem again at the end of it.
Guidance
Sometimes, you may need to simplify algebraic expressions that involve more than one operation. Use what youknow about simplifying sums, differences, products, or quotients of algebraic expressions to help you do this.
When evaluating expressions, it is also important to keep in mind the order of operations. Let’s review this orderbelow.
• First, do the computation inside grouping symbols, such as parentheses.• Second, evaluate any exponents.• Third, multiply and divide in order from left to right.• Finally, add and subtract in order from left to right.
642
www.ck12.org Chapter 7. Equations, Inequalities and Functions
That’s good because the order of operations is always useful in mathematics!! Now let’s look at an example.
Now let’s apply this information.
Simplify this expression 7n+8n ·3
According to the order of operations, you should multiply before you add.
7n+8n ·3 = 7n+(8n ·3).
Separate out the factors and use the commutative property to help you multiply.
7n+(8n ·3) = 7n+(8 ·n ·3)+7n+(8 ·3 ·n) = 7n+(24 ·n) = 7n+24n
Since 7n and 24n are like terms, add them.
7n+24n = 31n.
The answer is 31n.
Simplify this expression 10p−7p+8p÷2p.
According to the order of operations, you should divide before you subtract or add.
10p−7p+8p÷2p = 10p−7p+(8p÷2p).
It may help you to rewrite the division as 8p2p and then separate out the numbers and variables like this.
10p−7p+(
8p2p
)= 10p−7p+
(8·p2·p
)= 10p−7p+
(82 ·
pp
)= 10p−7p+(4 ·1) = 10p−7p+4
The order of operations says to add and subtract in order from left to right. So, subtract the like terms 10p and 7pnext.
10p−7p+4 = 3p+4.
Since 3p and 4 are not like terms, those terms cannot be combined. So, the expression cannot be simplified further.
The expression, when simplified, is 3p+4. This is our final answer.
Simplify each expression.
643
7.6. Simplify Variable Expressions Involving Multiple Operations www.ck12.org
Example A
4a+9a−7
Solution: 13a−7
Example B
14x2 +9x
Solution: 16x
Example C
6b−2b+5b−8
Solution: 9b−8
Here is the original problem once again.
Kara is very excited that she has figured out an expression to figure out the total train fare. She heads downstairs andshares her findings with her Grandpa.
.85x
“See Grandpa, if I put the number of rides in for x, then we can figure out the total cost,” Kara explains.
“That is great work Kara, but what about me? That will work great when it is just you and Marc, but I am ridingwith you today. Seniors ride for .60 per ride.”
Wow! Kara hadn’t even thought of that. Now she has a whole new dilemma.
“I’ve got it,” she said writing some notes on a piece of paper.
Kara began to write an expression and then she thought that she could combine the terms of the expression.
To write an expression that includes Grandpa, Kara can begin with the first expression that she wrote.
.85x this accounts for the teen fare and the number of rides which is unknown so we use x.
Next, we have to include Grandpa. Seniors ride for .60 per ride. The number of rides is still unknown, so wecan use x for that too.
.60x
Since they will be riding together, we can add the two terms.
.85x+ .60x
644
www.ck12.org Chapter 7. Equations, Inequalities and Functions
Next, we can simplify the expression.
Since both are riding the train together, the number of rides will stay the same. We can add the moneyamounts and keep the x the same in the simplified expression.
.85+ .60 = 1.45
Our answer is 1.45x.
If Kara multiplies the number of train rides that the three of them take times $1.45 then she will have thetotal amount of money needed or spent riding the train.
Guided Practice
Here is one for you to try on your own.
Samera has twice as many pets as Amit has. Kyra has 4 times as many pets as Amit has. Let a represent the numberof pets Amit has.
a. Write an expression to represent the number of pets Samera has.
b. Write an expression to represent the number of pets Kyra has.
c. Write an expression to represent the number of pets Samera and Kyra have all together.
Answer
Consider part a first.
The phrase “twice as many pets as Amit” shows how many pets Samera has. Use a number, an operation sign, or avariable to represent each part of that phrase.
twice as many pets as Amit
↓ ↓2× a
So, the expression 2×a or 2a represents the number of pets Samera has.
Consider part b next.
The phrase “4 times as many pets as Amit” shows how many pets Kyra has. Use a number, an operation sign, or avariable to represent each part of that phrase.
4 times as many pets as Amit
↓ ↓ ↓4 × a
So, the expression 4×a or 4a represents the number of pets Kyra has.
Finally, consider part c.
To find the number of pets Samera and Kyra have “all together,” write an addition expression.
(number of pets Samera has) + (number of pets Kyra has)
↓ ↓ ↓2a + 4a
645
7.6. Simplify Variable Expressions Involving Multiple Operations www.ck12.org
Simplify the expression.
2a+4a = 6a
The number of pets Samera and Kyra have all together can be represented by the expression 6a.
Video Review
MEDIAClick image to the left or use the URL below.URL: http://www.ck12.org/flx/render/embeddedobject/5525
This is a James Sousa video about combining like terms to simplify an expression.
Explore More
Directions: Simplify each variable expression involving multiple operations.
1. 6a+4a−2b
2. 16b−4b ·2
3. 22a÷2+14a
4. 19x−5x ·2
5. 16y−12y÷2
6. 16a−4a−12b
7. 26a+14a+12b+2b
8. 36a+4a−2b+5b
9. 18a+4a+12y
10. 46a+34a−12b+14b
11. 16y+4y−2x
12. 6x+4x+2x+4y−19z
13. 26y−12y÷2
14. 36y−12y÷12
15. 46y+12y÷2
646
www.ck12.org Chapter 7. Equations, Inequalities and Functions
7.7 Single Variable Addition Equations
Here you’ll learn to solve single variable addition equations.
Have you ever been to Harvard Square?
Marc went to lunch with his friend Tony. He bought a day pass for the train and met Tony in Harvard Square forlunch. When he left the house, Marc counted his money and found that he had $15.50 in his pocket. He met Tonyin Harvard Square. They had a terrific time walking around and they both loved looking around in the skateboardshop. That was the best.
After walking around for a while, they stopped for lunch and each ate a sandwich. On the way back home later Marcreached into his pocket and found that he only had .35 left from the original $15.50. He began calculating in hishead.
That meant that he had spent $15.15 between the day pass and the sandwich. If the day pass was $9.00, how muchdid Marc spend on lunch?
The best way to figure this problem out is with an equation. This Concept will teach you all about solvingaddition and subtraction equations so that by the end of the Concept you will understand how to help Marcfigure out the price of his lunch.
Guidance
A variable may be used to represent a particular number. For example, in the algebraic equation below, the variablex represents only one possible number.
x+3 = 5
What number does x represent? We can find out by asking ourselves a question. “What number, when added to 3,equals 5?”
We can solve this one using mental math. Mental math is one strategy for figuring out an unknown variable.
2+3 = 5,x must be equal to 2.
When we determine the value for a variable in an equation, we are solving that equation. If the equationinvolves a simple number fact, such as 2+3 = 5, then we can solve the equation as we did above.
647
7.7. Single Variable Addition Equations www.ck12.org
However, to solve a more complex equation, such as x+ 34 = 72, we need to use a different strategy besidesmental math. Let’s take a look at one strategy for solving an equation now.
When mental math is not an option, one strategy for solving an equation is to isolate the variable in the equation.Isolating the variable means getting the variable by itself on one side of the equal (=) sign.
One way to isolate the variable is to use inverse operations. Inverse operations undo one another. For example,addition is the inverse of subtraction, and vice versa. Multiplication is the inverse of division, and vice versa.
How do we do that?
To solve an equation in which a variable is added to a number, we can use the inverse operation––subtraction. Wecan subtract the number that is being added to the variable from both sides of the equation.
We must subtract the number from both sides of the equation because of the Subtraction Property of Equality,which states:
if a = b, then a− c = b− c.
If you subtract a number, c, from one side of an equation, you must subtract that same number, c, from theother side, too, to keep the values on both sides equal.
Solve for x. x+34 = 72.
In the equation, 34 is added to x. So, we can subtract 34 from both sides of the equation to solve for x.
x+34 = 72
x+34−34 = 72−34
x+0 = 38
x = 38
The value of x is 38.
Solve for b 1.5+b = 3.5
In the equation, 1.5 is added to b. So, we can subtract 1.5 from both sides of the equation to solve for b.
1.5+b = 3.5
1.5−1.5+b = 3.5−1.5
0+b = 2.0
b = 2
The value of b is 2.
The Subtraction Property of Equality states that as long as you subtract the same quantity to both sides of anequation, that the equation will remain equal.
Each of these properties makes use of an inverse operation. If the operation in the equation is addition, then you usethe Subtraction Property of Equality.
Solve each addition equation for the missing variable.
Example A
x+36 = 90
Solution: x = 54
648

www.ck12.org Chapter 7. Equations, Inequalities and Functions
Example B
x+27 = 35
Solution: x = 8
Example C
y+1.7 = 6.5
Solution: y = 4.8
Here is the original problem once again.
Marc went to lunch with his friend Tony. He bought a day pass for the train and met Tony in Harvard Square forlunch. When he left the house, Marc counted his money and found that he had $15.50 in his pocket. He met Tonyin Harvard Square. They had a terrific time walking around and they both loved looking around in the skateboardshop. That was the best.
After walking around for a while, they stopped for lunch and each ate a sandwich. On the way back home later Marcreached into his pocket and found that he only had .35 left from the original $15.50. He began calculating in hishead.
That meant that he had spent $15.15 between the day pass and the sandwich. If the day pass was $9.00, how muchdid Marc spend on lunch?
To figure out the price of lunch, we need to write an equation.
Lunch is our unknown quantity. We can use l for the price of lunch.
We know that Marc spent $9.00 on a day pass.
We also know that the total spent was $15.15.
Now we can write an equation to solve for the price of lunch.
l +9 = 15.15
We can solve this by subtracting 9 from both sides of the equation.
l +9−9 = 15.15−9
l = $6.15
The cost of Marc’s lunch is $6.15.
649
7.7. Single Variable Addition Equations www.ck12.org
Guided Practice
Here is the original problem once again.
The number of gray tiles in a bag is 4 more than the number of blue tiles in the bag. There are 11 gray tiles in thebag.
Answer
Write an equation to represent b, the number of blue tiles in the bag.
Use a number, an operation sign, a variable, or an equal sign to represent each part of the problem. Since there are11 gray tiles in the bag, represent the number of gray tiles as 11.
T he number o f gray tiles . . . is 4 more than the number o f blue tiles . . .
↓ ↓ ↓ ↓ ↓11 = 4 + b
This equation, 11 = 4+b, represents b, the number of blue tiles in the bag.Solve the equation to find the number ofblue tiles in the bag.
11 = 4+b
11−4 = 4−4+b
7 = 0+b
7 = b
There are 7 blue tiles in the bag.
Video Review
MEDIAClick image to the left or use the URL below.URL: http://www.ck12.org/flx/render/embeddedobject/5295
This is a James Sousa video on solving single variable addition equations.
Explore More
Directions: Solve each single-variable addition equation.
1. x+7 = 14
2. y+17 = 34
3. a+27 = 34
4. x+30 = 47
650
www.ck12.org Chapter 7. Equations, Inequalities and Functions
5. x+45 = 53
6. x+18 = 24
7. a+38 = 74
8. b+45 = 80
9. c+54 = 75
10. y+197 = 423
11. y+297 = 523
12. y+397 = 603
13. y+97 = 405
14. y+94 = 102
15. y+87 = 323
651
7.8. Single Variable Subtraction Equations www.ck12.org
7.8 Single Variable Subtraction Equations
Here you’ll learn to solve single variable subtraction equations.
Remember Marc and his lunch from the Single Variable Addition Equations Concept?
Previously we figured out that Marc spent $6.15 on lunch. After Marc had paid for his lunch, he bought an ice creamcone. It cost $3.15. If Marc received $5.85 back as change, how much did he give the cashier?
You can write a single variable subtraction equation to represent this dilemma.
Solving the equation will give you a solution to the problem presented.
Pay attention and you will learn how to do this in this Concept.
Guidance
To solve an equation in which a number is subtracted from a variable, we can use the inverse of subtrac-tion––addition. We can add that number to both sides of the equation to solve it.
You can think about this as working backwards from the operation. If we have a problem with addition, wesubtract. If we have a problem with subtraction, we add.
We must add the number to both sides of the equation because of the Addition Property of Equality, which states:
if a = b, then a+ c = b+ c.
So, if you add a number, c, to one side of an equation, you must add that same number, c, to the other side, too, tokeep the values on both sides equal.
Let’s apply this information to a problem.
Solve for a. a−15 = 18.
In the equation, 15 is subtracted from a. So, we can add 15 to both sides of the equation to solve for a.
a−15 = 18
a−15+15 = 18+15
a+(−15+15) = 33
a+0 = 33
a = 33
Notice how we rewrote the subtraction as adding a negative integer.
The value of a is 33.
Here is another one.
Solve for k. k− 13 = 2
3 .
In the equation, 13 is subtracted from k. So, we can add 1
3 to both sides of the equation to solve for k.
652
www.ck12.org Chapter 7. Equations, Inequalities and Functions
k− 13=
23
k− 13+
13=
23+
13
k+(−1
3+
13
)=
33
k+0 =33
k =33= 1
The value of k is 1.
Again, we are using a property. The Subtraction Property of Equality states that as long as you subtract thesame quantity to both sides of an equation, that the equation will remain equal.
Each of these properties makes use of an inverse operation. If the operation in the equation is addition, then youuse the Subtraction Property of Equality. If the operation in the equation is subtraction, then you use the AdditionProperty of Equality.
Solve each equation.
Example A
x−44 = 22
Solution: 66
Example B
x−1.3 = 5.6
Solution: 6.9
Example C
y− 14 = 2
4
Solution: 34
Here is the original problem once again.
Previously we figured out that Marc spent $6.15 on lunch. After Marc had paid for his lunch, he bought an ice creamcone. It cost $3.15. If Marc received $5.85 back as change, how much did he give the cashier?
You can write a single variable subtraction equation to represent this dilemma.
653
7.8. Single Variable Subtraction Equations www.ck12.org
Solving the equation will give you a solution to the problem presented.
First, let’s write the equation.
Our unknown is the amount of money Marc gave the cashier. Let’s call that x.
x
Then we know that the ice cream cone cost $3.15.
x−3.15
Marc received $5.85 in change.
x−3.15 = 5.85
Now we can solve this equation.
x = 5.85+3.15
x = $9.00
This is our answer.
Guided Practice
Here is one for you to try on your own.
Harry earned $19.50 this week. That is $6.50 less than he earned last week.
a. Write an equation to represent m, the amount of money, in dollars, that he earned last week.
b. Determine how much money Harry earned last week.
Answer
Consider part a first.
Use a number, an operation sign, a variable, or an equal sign to represent each part of the problem.
Harry earned $19.50 this week. That is $6.50 less than . . . last week.
↓ ↓ 2 ↓ 2
↓ ↓ 2 ↓ 2
↓ ↓ 2 ↓ 2
19.50 = m − 6.50
This equation, 19.50 = m−6.50, represents m, the number of dollars earned last week.
Next, consider part b.
Solve the equation to find the number of blue tiles in the bag.
19.50 = m−6.50
19.50+6.50 = m−6.50+6.50
26.00 = m+(−6.50+6.50)
26 = m+0
26 = m
Harry earned $26.00 last week.
654
www.ck12.org Chapter 7. Equations, Inequalities and Functions
Video Review
MEDIAClick image to the left or use the URL below.URL: http://www.ck12.org/flx/render/embeddedobject/5295
This is a James Sousa video on solving single variable subtraction equations.
Explore More
Directions: Solve each single-variable subtraction equation.
1. x−8 = 9
2. x−18 = 29
3. a−9 = 29
4. a−4 = 30
5. b−14 = 27
6. b−13 = 50
7. y−23 = 57
8. y−15 = 27
9. x−9 = 32
10. c−19 = 32
11. x−1.9 = 3.2
12. y−2.9 = 4.5
13. c−6.7 = 8.9
14. c−1.23 = 3.54
15. c−5.67 = 8.97
655
7.9. Single Variable Multiplication Equations www.ck12.org
7.9 Single Variable Multiplication Equations
Here you’ll learn to solve single variable multiplication equations.
While visiting their grandparents, Kara has been handling the money for their rides on the subway. For the past twodays, Marc has been watching her calculating and handing out money. Then when they were coming back from themall, Marc noticed something on a sign about a day pass and a month long pass.
“How much money do we have set aside for the subway?” Marc asked Kara the day after he saw the sign.
“We have $45.00 each allotted for the subway,” she said.
“Well, a day pass is $9.00. But a month long pass is $20.00. I think that is a better deal,” he told her.
“Let’s figure out how many days we can ride for $9.00 per day.”
Kara wrote the following equation on a piece of paper.
9x = 45
Solving equations is essentially for Kara and Marc at this point in time. Then they will know whether day passes ora month long pass is the way to go.
You can figure this out too. Solving equations is what you will learn in this Concept. Take what you learn andthen apply it back to this problem. At the end of the Concept, you will know which train option makes themost sense.
Guidance
Previously we worked on solving equations with addition and subtraction in them. We can also have equations withmultiplication and division in them. These single-variable equations can be solved for the value of the variable. Wewant to solve the equation and figure out what the variable is equal to.
How does this work?
656
www.ck12.org Chapter 7. Equations, Inequalities and Functions
In the algebraic equation below, the variable z represents only one possible number.
z×2 = 8
What number does z represent? We can find out by asking ourselves: what number, when multiplied by 2, equals 8?
Since 4×2 = 8,z must be equal to 4. We solved this equation using mental math.
When we determine the value for a variable in an equation, we are solving that equation. If the equationinvolves a simple number fact, such as 4×2 = 8, then we can solve the problem as we did above using mental math.
What happens when we have a more challenging equation to solve?
Some equations are more complex and mental math will not get the job done. To solve a more complex equation,such as z×7 = 105, we need to use a different strategy. Let’s take a look at one strategy for solving an equation now.
One strategy for solving an equation is to use inverse operations to isolate the variable. Isolating the variablemeans getting the variable by itself on one side of the equal (=) sign.
To solve an equation in which a variable is multiplied by a number, we can use the inverse operation ofmultiplication––division. We can divide both sides of the equation by that number to find the value of the variable.
We must divide both sides of the equation by that number because of the Division Property of Equality, whichstates:
if a = b and c 6= 0, then ac = b
c .
That is very simple. If you divide one side of an equation by a nonzero number, c, you must divide the otherside of the equation by that same number, c, to keep the values on both sides equal.
Let’s apply this information.
z×7 = 105.
In the equation, z is multiplied by 7. So, we can divide both sides of the equation by 7 to solve for z.
657
7.9. Single Variable Multiplication Equations www.ck12.org
z×7 = 105z×7
7=
1057
z× 77= 15
z×1 = 15
z = 15
It may help to separate out the factors like we did above.
Having divided both sides by 7, we can see that the value of z is 15.
Here is another one.
−8r = 128
In the equation, -8 is multiplied by r. So, we can divide both sides of the equation by -8 to solve for r.
−8r = 128−8r−8
=128−8
We need to use what we know about dividing integers to help us solve this problem.
−8r−8
=128−8
1r =−16
r =−16
The value of r is -16.
Remember the integer rules for dividing positive and negative numbers? Let’s review.
Remember that a property is a rule for performing operations in mathematics that makes our lives simpler. Theseproperties are no exception. If you can look at an equation, see that it is a multiplication equation and know thatdivision is the way to solve it, then the property of the Division Property of Equality is being utilized.
Now you can practice a few of these on your own. Solve each problem for the missing variable.
658
www.ck12.org Chapter 7. Equations, Inequalities and Functions
Example A
−4x = 12
Solution: x =−3
Example B
8a = 64
Solution: a = 8
Example C
9b = 81
Solution: b = 9
Here is the original problem once again.
While visiting their grandparents, Kara has been handling the money for their rides on the subway. For the past twodays, Marc has been watching her calculating and handing out money. Then when they were coming back from themall, Marc noticed something on a sign about a day pass and a month long pass.
“How much money do we have set aside for the subway?” Marc asked Kara the day after he saw the sign.
“We have $45.00 each allotted for the subway,” she said.
“Well, a day pass is $9.00. But a month long pass is $20.00. I think that is a better deal,” he told her.
“Let’s figure out how many days we can ride for $9.00 per day.”
Kara wrote the following equation on a piece of paper.
9x = 45
Solving equations is essentially for Kara and Marc at this point in time. Then they will know whether day passes ora month long pass is the way to go.
659
7.9. Single Variable Multiplication Equations www.ck12.org
First, let’s solve the equation and figure out how many days Kara and Marc can purchase day passes giventheir budget.
9x = 459x9
=459
x = 5
According to this, they can purchase day passes for only five days.
A month long pass is $20.00 each. This is a much better deal for them.
20(2) = $40.00
The total subway fares will cost them $40.00 instead of $45.00.
Kara and Marc purchase month long passes the very next morning.
Guided Practice
Here is one for you to try on your own.
Sarvenaz earns $8 for each hour she works. She earned a total of $168 last week.
a. Write an equation to represent h, the number of hours she worked last week.
b. Determine how many hours Sarvenaz worked last week.
Answer
Consider part a first.
Use a number, an operation sign, a variable, or an equal sign to represent each part of that problem. She earns $8for each hour she works, so you could multiply the number of hours she worked by $8 to find the total amount sheearned. Write a multiplication equation.
$8 f or each hour . . .She earned a total o f $168 last week.
↓ ↓ ↓8h = 168
So, this equation, 8h = 168, represents h, the number of hours she worked last week.
Next, consider part b.
Solve the equation to find h, the number of hours she worked last week.
8h = 1688h8
=1688
1h = 21
h = 21
Sarvenaz worked 21 hours last week.
660

www.ck12.org Chapter 7. Equations, Inequalities and Functions
Video Review
MEDIAClick image to the left or use the URL below.URL: http://www.ck12.org/flx/render/embeddedobject/5297
This is a James Sousa video on solving single variable multiplication equations.
Explore More
Directions: Solve each single-variable multiplication equation for the missing value.
1. 4x = 16
2. 6x = 72
3. −6x = 72
4. −3y = 24
5. −3y =−24
6. −5x =−45
7. −1.4x = 2.8
8. 3.5a = 7
9. 7a =−49
10. 14b =−42
11. 24b =−48
12. −24b =−48
13. 34b =−102
14. 84x = 252
15. −84x =−252
661
7.10. Single Variable Division Equations www.ck12.org
7.10 Single Variable Division Equations
Here you’ll learn to solve single variable division equations.
Have you ever been to a theater with limited seating? Well, Marc and Kara had this happen with their grandparents.
Marc and Kara went to see a play with their grandparents. When they arrived at the theater, the manager dividedtheir group and several other people into six smaller groups. Each of these groups was lead to a section of the theaterwhere there were empty seats. Each group had six people in it.
If this was the division, how many people did the manager divide up to start with?
Write a division equation and solve it to complete this dilemma.
This Concept is all about single variable division equations. You will know how to do this by the end of theConcept.
Guidance
Sometimes, you will see equations that have division in them. We can use a fraction bar to show division.
To solve an equation in which a variable is divided by a number, we can use the inverse of division––multiplication.We can multiply both sides of the equation by that number to solve it.
We must multiply both sides of the equation by that number because of the Multiplication Property of Equality,which states:
if a = b and c 6= 0, then a× c = b× c.
So, if you multiply one side of an equation by a nonzero number, c, you must multiply the other side of the equationby that same number, c, to keep the values on both sides equal.
Now let’s apply this information.
k÷ (−4) = 12.
In the equation, k is divided by -4. So, we can multiply both sides of the equation by -4 to solve for k. You will needto use what you know about multiplying integers to help you solve this problem. It may help to rewrite k÷ (−4) as
k−4 .
k÷ (−4) = 12k−4
= 12
k−4× (−4) = 12× (−4)
k−4× −4
1=−48
k��−4×��−41
=−48
k1=−48
k =−48
662

www.ck12.org Chapter 7. Equations, Inequalities and Functions
The –4’s will cancel each other out when they are divided. Then we multiply.
The value of k is –48.
Remember the rules for multiplying integers will apply when working with these equations! Think back and usethem as you work.
n1.5 = 10
In the equation, n is divided by 1.5. So, we can multiply both sides of the equation by 1.5 to solve for n.
n1.5
= 10n
1.5×1.5 = 10×1.5
n1.5× 1.5
1= 15
n��1.5��1.51
= 15n1= 15
n = 15
The value of n is 15.
When an equation has division in it, you can use the Multiplication Property of Equality to solve it, and then theproperty has been useful. Always remember to think about the inverse operations and associate them with thedifferent properties. This will help you to keep it all straight and not get mixed up.
Now it is time for you to practice solving a few of these equations.
Solve each equation for the missing variable.
Example A
x−2 = 5
Solution: x =−10
Example B
y5 = 6
Solution: y = 30
Example C
b−4 =−3
Solution: b = 12
Here is the original problem once again.
Marc and Kara went to see a play with their grandparents. When they arrived at the theater, the manager dividedtheir group and several other people into six smaller groups. Each of these groups was lead to a section of the theaterwhere there were empty seats. Each group had six people in it too.
663
7.10. Single Variable Division Equations www.ck12.org
If this was the division, how many people did the manager divide up to start with?
Write a division equation and solve it to complete this dilemma.
First, we can write an equation.
Some number of people divided by six is six.x6 = 6
Now we can solve it by multiplying.
6×6 = 36
x = 36
This is our answer.
Guided Practice
Here is one for you to try on your own.
Three friends evenly split the total cost of the bill for their lunch. The amount each friend paid for his share was$4.25.
a. Write an equation to represent c, the total cost, in dollars, of the bill for lunch.
b. Determine the total cost of the bill.
Answer
Consider part a first.
Use a number, an operation sign, a variable, or an equal sign to represent each part of the problem. Because thefriends split the bill evenly, write a division equation to represent the problem.
T hree f riends evenly split the total cost . . .amount each f riend paid was $4.25 . . .
2 ↓ 2 ↓ ↓2 ↓ 2 ↓ ↓2 ↓ 2 ↓ ↓c ÷ 3 = 4.25
This equation, c÷3 = 4.25, represents c, the total cost of the lunch bill.
Next, consider part b.
Solve the equation to find the total cost, in dollars, of the lunch bill.
c÷3 = 4.25c3= 4.25
c3×3 = 4.25×3
c
�3× �3
1= 12.75
c = 12.75
The total cost of the lunch bill was $12.75.
664

www.ck12.org Chapter 7. Equations, Inequalities and Functions
Video Review
MEDIAClick image to the left or use the URL below.URL: http://www.ck12.org/flx/render/embeddedobject/5297
This is a James Sousa video on solving single variable division equations.
Explore More
Directions: Solve each single-variable division equation for the missing value.
1. x5 = 2
2. y7 = 3
3. b9 =−4
4. b8 =−10
5. b8 = 20
6. x−3 =−10
7. y18 =−20
8. a−9 =−9
9. x11 =−12
10. x3 =−3
11. x5 =−8
12. x1.3 = 3
13. x2.4 = 4
14. x6 = 1.2
15. y1.5 = 3
665
7.11. Two-Step Equations from Verbal Models www.ck12.org
7.11 Two-Step Equations from Verbal Models
Here you’ll learn to write two-step equations from verbal models.
Have you ever tried to earn money by babysitting?
Kara worked on earning money for her trip to Boston. For each babysitting job she took on, Kara charged $2 for busfare plus an additional $6 for each hour she worked. On Saturday, Kara earned $26 for the one babysitting job.
Write an equation to represent h, the total number of hours that Kara babysat during her $26 job.
Do you know how to do this?
This Concept will teach you how to write two-step equations from verbal models. You will know how to dothis by the end of the Concept.
Guidance
Previously we worked on solving single variable equations. Here is a single variable equation.
3x = 15
Now if you think about this equation, you only had to perform one operation to solve it. We used an inverse oropposite operation to solve it. Since this is a multiplication equation, we used division to solve for the unknownvariable. We could say that we performed one-step to solve this equation. The one-step was to divide. We callan equation where one operation is needed to solve for the unknown variable a one-step equation.
What happens when there is more than one operation needed to solve an equation?
When this happens, we have two-step equation. A two-step equation has more than one operation in it. Let’s lookat a few two-step equations.
3x+5 = 20x3−2 = 5
If you look at both of these equations, you will see that there are two operations present in each. The first equationhas multiplication and addition. The second equation has division and subtraction. You will see other variationsof two-step equations too, but this gives you an idea of a few different situations.
Before we begin solving equations, let’s look at how we can write a two-step equation from a verbal model.
First, let’s think about some of the words that mean addition, subtraction, multiplication and division. Iden-tifying these key words is going to assist us when writing equations from verbal models. Remember that averbal model uses words.
666
www.ck12.org Chapter 7. Equations, Inequalities and Functions
TABLE 7.4:
Addition Subtraction Multiplication DivisionSumAddedAltogetherIn allPlusand
DifferenceLess thanMore thanTake awaysubtract
ProductTimesGroups of
QuotientSplit UpDivided
Take a few minutes to write down these key words in your notebook.
Now apply this information.
Six times a number plus five is forty-one.
First, identify any key words that identify operations.
Six times a number plus five is forty-one.
Next, begin to translate the words into an equation.
Six = 6
Times = x
A number = variable
Plus = +
Five = 5
Is means =
Forty-one = 41
Next, we put it altogether.
6x+5 = 41
Here is another one.
Four less than two times a number is equal to eight.
First, identify any key words that identify operations.
Four less than two times a number is equal to eight.
Now we can translate each part.
Four becomes 4
Less than means subtraction
Two becomes 2
667

7.11. Two-Step Equations from Verbal Models www.ck12.org
Times = x
A number = variable
Is equal to means =
Eight = 8
Notice that the one tricky part is in the words “less than” because it is less than two times a number, the two timesa number needs to come first in the equation. Then we can subtract.
Put it altogether.
2x−4 = 8
Now it’s time for you to try a few on your own. Write an equation for each situation.
Example A
The product of five and a number plus three is twenty-three.
Solution: 5x+3 = 23
Example B
Six times a number minus four is thirty-two.
Solution: 6y−4 = 32
Example C
A number, y, divided by 3 plus seven is ten.
Solution: y3 +7 = 10
Here is the original problem once again.
Kara worked on earning money for her trip to Boston. For each babysitting job she took on, Kara charged $2 for busfare plus an additional $6 for each hour she worked. On Saturday, Kara earned $26 for the one babysitting job.
Write an equation to represent h, the total number of hours that Kara babysat during her $26 job.
Do you know how to do this?
To begin, Kara worked an unknown amount of hours. This is our variable. We can call this h.
She earns six dollars an hour. We multiply that times the unknown number of hours.
6h
Kara also charges $2.00 for bus fare.
6h+2
She earned twenty -six dollars.
6h+2 = 26
This is our equation.
668
www.ck12.org Chapter 7. Equations, Inequalities and Functions
Guided Practice
Here is one for you to try on your own.
Write an equation for this statement.
A number divided by two and six is equal to fourteen.
Answer
First, look for key words that identify operations.
A number divided by two and six is equal to fourteen.
Next, translate each word into an equation.
A number means variable
Divided means ÷
By two means 2 is our divisor
And means addition
Six means 6
Is means =
Fourteen means 14
Put it altogether.x2 +6 = 14
Explore More
Directions: Write the following two-step equations from verbal models.
1. Two times a number plus seven is nineteen.
2. Three times a number and five is twenty.
3. Six times a number and ten is forty-six.
4. Seven less than two times a number is twenty-one.
5. Eight less than three times a number is sixteen.
6. A number divided by two plus seven is ten.
7. A number divided by three and six is eleven.
8. Two less than a number divided by four is ten.
9. Four times a number and eight is twenty.
10. Five times a number take away three is twelve.
11. Two times a number and seven is twenty-nine.
12. Four times a number and two is twenty-six.
13. Negative three time a number take a way four is equal to negative ten.
14. Negative two times a number and eight is equal to negative twelve.
15. Negative five times a number minus eight is equal to seventeen.
669
7.12. Two-Step Equations and Properties of Equality www.ck12.org
7.12 Two-Step Equations and Properties ofEquality
Here you’ll learn to solve two-step equations.
Have you ever been to a Red Sox game?
Marc is going to get his wish. After much ado, his Grandpa managed to pull a few strings and get tickets for the RedSox game. Marc can hardly wait for Saturday’s game.
“I hope that it is as good as I think it will be,” Marc said.
“Well for $535.00 I hope we don’t get rained out.”
“Five hundred thirty-five dollars!? Wow, that is a lot of money!” Marc exclaimed.
“Yes, but that does include a $15.00 service fee. I was able to secure four tickets and that is all that matters. Don’tworry Marc having your dream come true is worth the money.”
“Thanks Grandpa,” Marc said smiling.
Afterwards, Marc began to wonder what the price of each ticket really was. He knew that they got field box seatsand that they had to be pretty expensive given the final bill. How could he figure out the ticket price?
This is where a two-step equation will help Marc. This Concept will teach you all about writing and solvingtwo-step equations. When finished, you will know how to figure out the ticket price with Marc.
Guidance
Previously we worked on writing a two-step single variable equation. Now it is time to learn how to solve them.When we solve the equation, we will be looking for the value of the variable in the equation.
670
www.ck12.org Chapter 7. Equations, Inequalities and Functions
Sometimes, you will be able to solve a two-step equation using mental math. When the numbers are smalland are all positive integers, you might be able to solve them in your head. This is the first method that we aregoing to look at.
3x+3 = 9
Here the numbers are small. You can probably look at this one and say to yourself, “What number timesthree plus three is nine?” The logical answer is 2.
You can check your work by substituting 2 in for x to see if both sides of the equation are the same. If they are, thenwe can say that the equation balances and your work is accurate.
3(2)+3 = 9
6+3 = 9
9 = 9
The answer checks out. The value of x is 2.
That is a great question! This is where our second strategy comes in.
When you have a two-step equation that you can’t figure out in your head, you must use the strategy isolatethe variable.
671
7.12. Two-Step Equations and Properties of Equality www.ck12.org
2+3n = 11.
Notice that there are two terms on the left side of the equation, 2 and 3n. Our first step should be to use inverseoperations to get the term that includes a variable, 3n, by itself on one side of the equal (=) sign.
In the equation, 2 is added to 3n. So, we can use the inverse of addition, which is subtraction, and subtract 2from both sides of the equation. We need to subtract 2 from both sides of the equation because of the SubtractionProperty of Equality. That property states that in order to keep the values on both sides of the equation equal,whatever we subtract from one side of the equation must also be subtracted from the other side.
Let’s see what happens when we subtract 2 from both sides of the equation.
2+3n = 11
2−2+3n = 11−2
0+3n = 9
3n = 9
Now, the term that includes a variable, 3n, is by itself on one side of the equation.
We can now use inverse operations to get the n by itself. Since 3n means 3× n, we can use the inverse ofmultiplication––division. We can divide both sides of the equation by 3. We need to divide both sides of theequation by 3 because of the Division Property of Equality. That property states that if we divide one side of theequation by a number, we must divide the other side of the equation by the same number in order to keep the valueson both sides of the equation equal.
Let’s see what happens when we divide both sides of the equation by 3.
3n = 93n3
=93
1n = 3
n = 3
The value of n is 3.
2x−5 = 11
First, notice that there are two terms on the left side of the equal sign. To solve this equation, we want toisolate the variable and get x alone. Let’s start with the term that is not connected to the x. That is the subtract five.
We use the Addition Property of Equality to cancel out the -5. We do this by using the inverse operation and byadding 5 to both sides of the equation. Remember because of the properties of equality what we do to one side ofthe equals must match on the other side.
2x−5+5 = 11+5
2x+0 = 16
2x = 16
Now we have a problem that is a multiplication problem. We can use the Division Property of Equality tosolve for x by dividing both sides of the equation by 2. Think about this and it makes perfect sense. Since wewant to figure out what number times two is sixteen we can divide sixteen by two to figure it out.
672

www.ck12.org Chapter 7. Equations, Inequalities and Functions
2x2
=162
x = 8
The value of x is 8.x5 −8 = 17.
Notice that there are two terms on the left side of the equation, x5 and 8. Our first step should be to use inverse
operations to get the term that includes a variable, x5 , by itself on one side of the equal (=) sign.
In the equation, 8 is subtracted from x5 . So, we can use the inverse of subtraction, which is addition, and add 8
to both sides of the equation. We need to add 8 to both sides of the equation because of the Addition Property ofEquality. That property states that in order to keep the values on both sides of the equation equal, whatever we addto one side of the equation must also be added to the other side.
Let’s see what happens when we add 8 to both sides of the equation.
x5−8 = 17
x5−8+8 = 17+8
x5+(−8+8) = 25
x5+0 = 25
x5= 25
Now, the term that includes a variable, x5 , is by itself on one side of the equation.
We can now use inverse operations to get the x by itself. Since x5 means x÷ 5, we can use the inverse of
division––multiplication. We can multiply both sides of the equation by 5. We need to multiply both sides of theequation by 5 because of the Multiplication Property of Equality. That property states that if we multiply one sideof the equation by a number, we must multiply the other side of the equation by the same number in order to keepthe values on both sides of the equation equal.
Let’s see what happens when we multiply both sides of the equation by 5.
x5= 25
x5×5 = 25×5
x�5× �5
1= 125
x1= 125
x = 125
The value of x is 125.
Just like when you solved one-step equations, you use properties to solve two-step equations too.
Let’s review those properties and when you use them.
673
7.12. Two-Step Equations and Properties of Equality www.ck12.org
Subtraction Property of Equality is used when you have an equation with addition in it. It states that you cansubtract the same quantity from both sides of an equation and it will still balance.
Addition Property of Equality is used when you have an equation with subtraction in it. It states that you can addthe same quantity to both sides of an equation and it will still balance.
Division Property of Equality is used when you have an equation with multiplication in it. It states that you candivide the quantities on both sides of an equation by the same value and the equation will still balance.
Multiplication Property of Equality is used when you have an equation with division in it. It states that you canmultiply the quantities on both sides of an equation by the same value and the equation will still balance.
As you continue to work on equations be sure to keep these properties in mind. They will be useful to help youremember which operations solve equations.
Now it’s time for you solve a few on your own.
Example A
5x+7 = 32
Solution: x = 5
Example B
3a+9 = 39
Solution: a = 10
Example C
y4 −8 = 4
Solution: y = 3
Here is the original problem once again.
Marc is going to get his wish. After much ado, his Grandpa managed to pull a few strings and get tickets for the RedSox game. Marc can hardly wait for Saturday’s game.
“I hope that it is as good as I think it will be,” Marc said.
674
www.ck12.org Chapter 7. Equations, Inequalities and Functions
“Well for $535.00 I hope we don’t get rained out.”
“Five hundred thirty-five dollars!! Wow, that is a lot of money!” Marc exclaimed.
“Yes, but that does include a $15.00 service fee. I was able to secure four tickets and that is all that matters. Don’tworry Marc having your dream come true is worth the money.”
“Thanks Grandpa,” Marc said smiling.
Afterwards, Marc began to wonder what the price of each ticket really was. He knew that they got field box seatsand that they had to be pretty expensive given the final bill. How could he figure out the ticket price?
To figure out the ticket price we need to write and solve a two-step equation. Let’s look at what we know.
4 tickets at x cost
+$15.00 service fee
= $535.00
Now let’s write the equation.
4x+15 = 535
We start by subtracting 15 from both sides.
4x+15−15 = 535−15
4x = 5204x4
=5204
x = $130.00
Each ticket costs $130.00.
Guided Practice
Here is one for you to try on your own.
A landscaper charges $35 for each landscaping job plus $20 for each hour worked. She charged $95 for onelandscaping job.
a. Write an algebraic equation to represent h, the number of hours that the landscaper worked on that $95 job.
b. How many hours did that job take?
Answer
Consider part a first.
Use a number, an operation sign, a variable, or an equal sign to represent each part of the problem. The landscaperearned $20 for each hour worked on that job, so you could multiply $20 by h, the number of hours worked, to findhow the landscaper charged for her worktime.
$35 f or each landscaping job plus $20 f or each hour worked . . .charged $95 f or one . . . job.
↓ ↓ ↓ ↓ ↓35 + 20h = 95
So, this equation, 35+20h = 95, represents h, the number of hours the landscaper worked on the $95 job.
675
7.12. Two-Step Equations and Properties of Equality www.ck12.org
Next, consider part b.
Solve the equation to find the number of hours the landscaper worked on that job.
First, subtract 35 from each side.
35+20h = 95
35−35+20h = 95−35
0+20h = 60
20h = 60
Next, divide both sides by 20.
20h = 6020h20
=6020
1h = 3
h = 3
The landscaper worked for 3 hours on the $95 job.
Video Review
MEDIAClick image to the left or use the URL below.URL: http://www.ck12.org/flx/render/embeddedobject/5532
This is a James Sousa video on solving two-step equations.
Explore More
Directions: Solve each two-step equation for the unknown variable.
1. 3x+2 = 14
2. 6y+5 = 29
3. 7x+3 = 24
4. 5x+7 = 42
5. 6y+1 = 43
6. 9a+7 = 88
7. 11b+12 = 56
8. 12x−3 = 21
676
www.ck12.org Chapter 7. Equations, Inequalities and Functions
9. 4y−5 = 19
10. 3a−9 = 21
11. 5b−8 = 37
12. 7x−10 = 39
13. 6x−12 = 30
Directions: Write an expression and/or solve each problem.
14. Augusta sells t-shirts at the school store. On Tuesday, Augusta sold 7 less than twice the number of t-shirts shesold on Monday. She sold 3 t-shirts on Tuesday. Write an algebraic equation to represent m, the number of t-shirtsAugust sold on Monday.
15. There are 19 green marbles in a box. The number of green marbles in the box is 6 more than half the number ofred marbles in the box. Write an algebraic equation to represent r, the number of red marbles in the box.
677
7.13. Inequalities on a Number Line www.ck12.org
7.13 Inequalities on a Number Line
Here you’ll learn to graph inequalities on a number line.
Have you ever wanted to make a certain amount of money babysitting?
Kara has figured out that if she works a certain number of hours that she will make enough money for her vacation.Kara earns six dollars an hour and she charges an additional two dollars for bus fare when she babysits. Kara wantsto make more than thirty dollars for any babysitting job that she does.
She wants to figure out how many hours she needs to work to earn $30.00 or more for each babysitting job. Here isan equation to help you figure this out.
6h+2≥ 32
This equation shows six dollars times the number of hours plus the two dollars bus fare is greater than or equal tothirty-two dollars. Thirty-two includes the two dollars for bus fare.
Do you know how to figure this out?
Can you graph the inequality on a number line?
You will learn how to do this in this Concept.
Guidance
Previously we worked on variables and balancing an equation. Let’s think about equations. An equation is anumber statement with an equal sign. The equal sign tells us that the quantity on one side of the equation is equalthe quantity on the other side of the equation. We can solve an equation by figuring out the quantity that will makethe equation a true statement.
x+5 = 12
If we think about this equation, we can use mental math and we know that the unknown quantity is equal to 7. If wesubstitute 7 in for x, we will have a true statement.
7+5 = 12
12 = 12
Our equation is balanced because one side is equal to the other side. Notice that there is one answer for x thatmakes this a true statement.
What is an inequality?
An inequality is a mathematical statement that can be equal, but can also be unequal.
We use the following symbols to show that we are working with an inequality.
> means greater than
< means less than
≥ means greater than or equal to
≤ means less than or equal to
How do we apply these symbols?
678
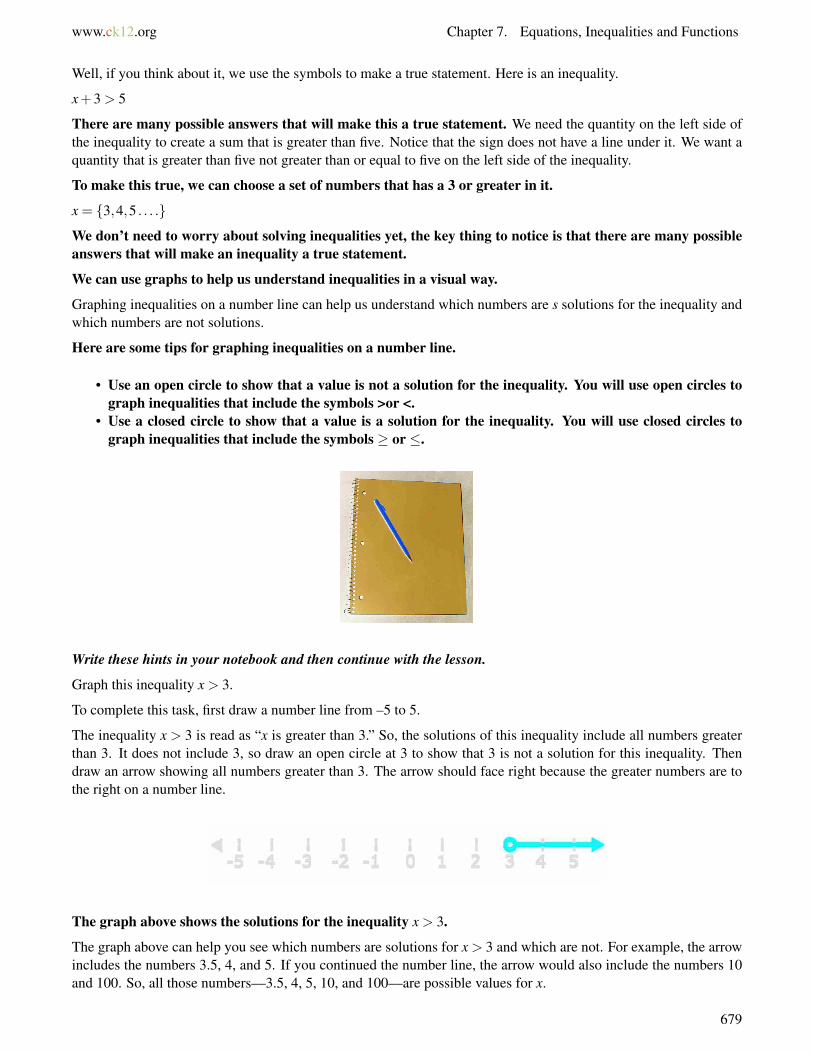
www.ck12.org Chapter 7. Equations, Inequalities and Functions
Well, if you think about it, we use the symbols to make a true statement. Here is an inequality.
x+3 > 5
There are many possible answers that will make this a true statement. We need the quantity on the left side ofthe inequality to create a sum that is greater than five. Notice that the sign does not have a line under it. We want aquantity that is greater than five not greater than or equal to five on the left side of the inequality.
To make this true, we can choose a set of numbers that has a 3 or greater in it.
x = {3,4,5 . . . .}
We don’t need to worry about solving inequalities yet, the key thing to notice is that there are many possibleanswers that will make an inequality a true statement.
We can use graphs to help us understand inequalities in a visual way.
Graphing inequalities on a number line can help us understand which numbers are s solutions for the inequality andwhich numbers are not solutions.
Here are some tips for graphing inequalities on a number line.
• Use an open circle to show that a value is not a solution for the inequality. You will use open circles tograph inequalities that include the symbols >or <.
• Use a closed circle to show that a value is a solution for the inequality. You will use closed circles tograph inequalities that include the symbols ≥ or ≤.
Write these hints in your notebook and then continue with the lesson.
Graph this inequality x > 3.
To complete this task, first draw a number line from –5 to 5.
The inequality x > 3 is read as “x is greater than 3.” So, the solutions of this inequality include all numbers greaterthan 3. It does not include 3, so draw an open circle at 3 to show that 3 is not a solution for this inequality. Thendraw an arrow showing all numbers greater than 3. The arrow should face right because the greater numbers are tothe right on a number line.
The graph above shows the solutions for the inequality x > 3.
The graph above can help you see which numbers are solutions for x > 3 and which are not. For example, the arrowincludes the numbers 3.5, 4, and 5. If you continued the number line, the arrow would also include the numbers 10and 100. So, all those numbers––3.5, 4, 5, 10, and 100––are possible values for x.
679
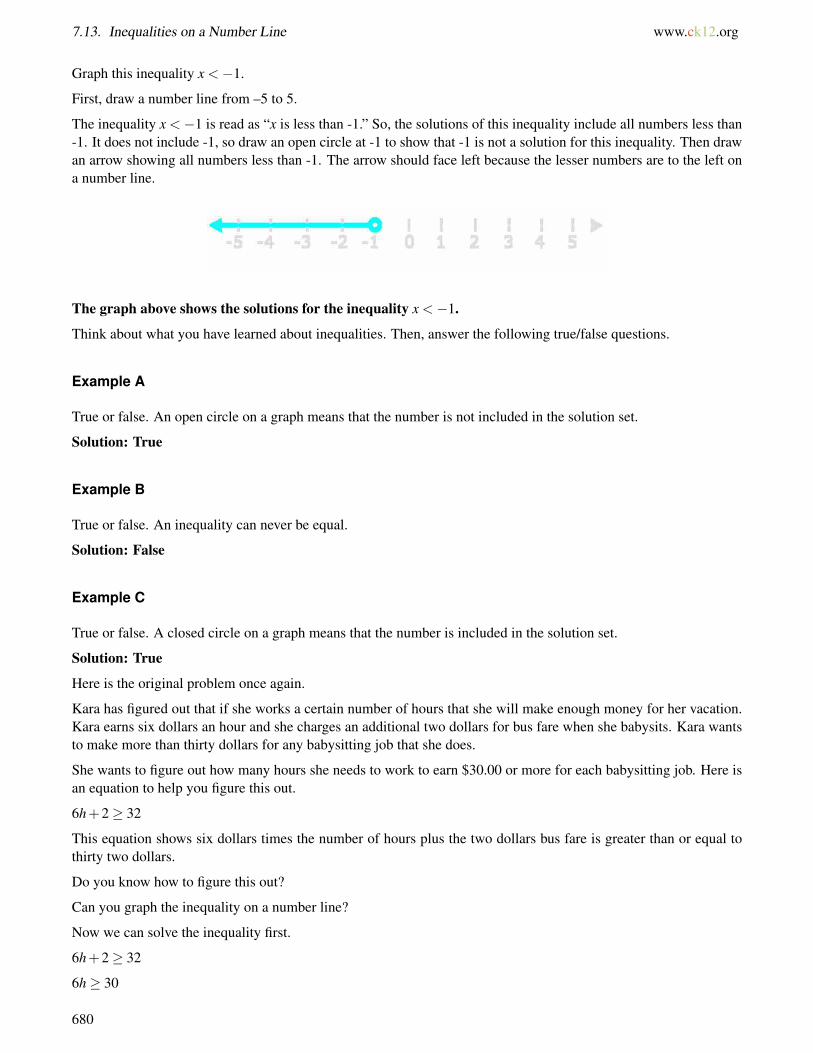
7.13. Inequalities on a Number Line www.ck12.org
Graph this inequality x <−1.
First, draw a number line from –5 to 5.
The inequality x <−1 is read as “x is less than -1.” So, the solutions of this inequality include all numbers less than-1. It does not include -1, so draw an open circle at -1 to show that -1 is not a solution for this inequality. Then drawan arrow showing all numbers less than -1. The arrow should face left because the lesser numbers are to the left ona number line.
The graph above shows the solutions for the inequality x <−1.
Think about what you have learned about inequalities. Then, answer the following true/false questions.
Example A
True or false. An open circle on a graph means that the number is not included in the solution set.
Solution: True
Example B
True or false. An inequality can never be equal.
Solution: False
Example C
True or false. A closed circle on a graph means that the number is included in the solution set.
Solution: True
Here is the original problem once again.
Kara has figured out that if she works a certain number of hours that she will make enough money for her vacation.Kara earns six dollars an hour and she charges an additional two dollars for bus fare when she babysits. Kara wantsto make more than thirty dollars for any babysitting job that she does.
She wants to figure out how many hours she needs to work to earn $30.00 or more for each babysitting job. Here isan equation to help you figure this out.
6h+2≥ 32
This equation shows six dollars times the number of hours plus the two dollars bus fare is greater than or equal tothirty two dollars.
Do you know how to figure this out?
Can you graph the inequality on a number line?
Now we can solve the inequality first.
6h+2≥ 32
6h≥ 30
680
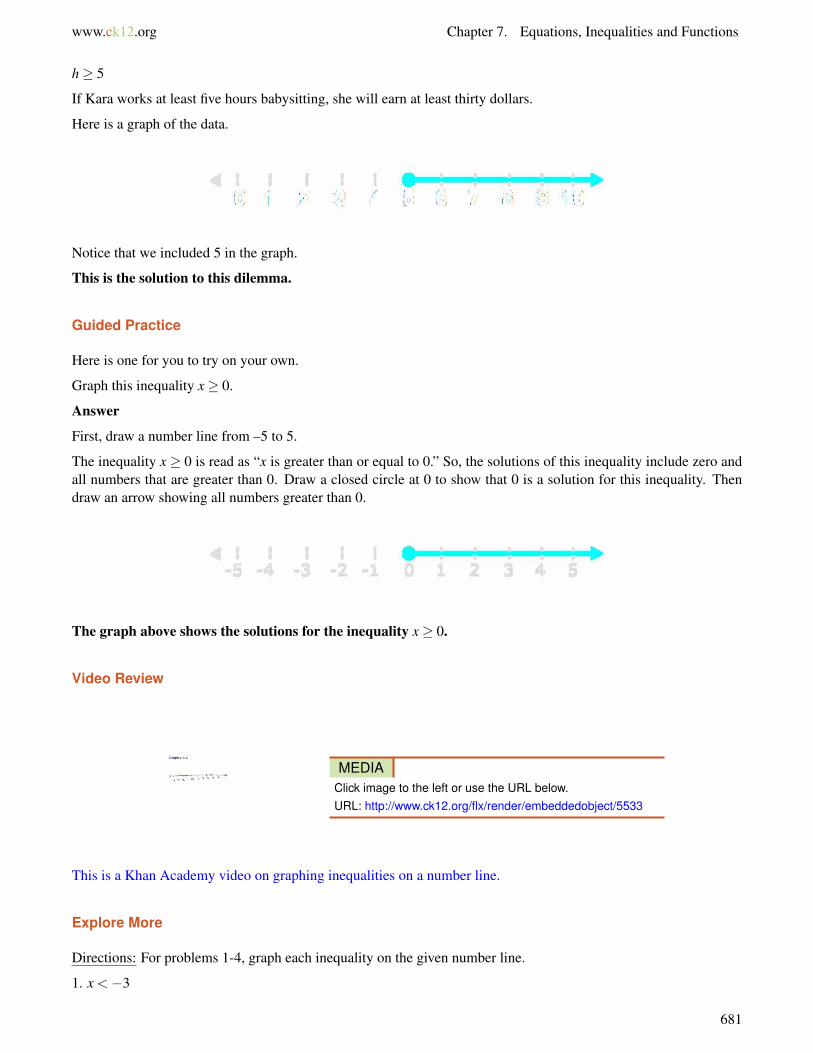
www.ck12.org Chapter 7. Equations, Inequalities and Functions
h≥ 5
If Kara works at least five hours babysitting, she will earn at least thirty dollars.
Here is a graph of the data.
Notice that we included 5 in the graph.
This is the solution to this dilemma.
Guided Practice
Here is one for you to try on your own.
Graph this inequality x≥ 0.
Answer
First, draw a number line from –5 to 5.
The inequality x≥ 0 is read as “x is greater than or equal to 0.” So, the solutions of this inequality include zero andall numbers that are greater than 0. Draw a closed circle at 0 to show that 0 is a solution for this inequality. Thendraw an arrow showing all numbers greater than 0.
The graph above shows the solutions for the inequality x≥ 0.
Video Review
MEDIAClick image to the left or use the URL below.URL: http://www.ck12.org/flx/render/embeddedobject/5533
This is a Khan Academy video on graphing inequalities on a number line.
Explore More
Directions: For problems 1-4, graph each inequality on the given number line.
1. x <−3
681
7.13. Inequalities on a Number Line www.ck12.org
2. x >−5
3. n≤ 2
4. 1≤ n
Directions: For problems 5-15, solve each inequality and then graph its solution on the given number line.
5. x+3 > 9
6. n+2 < 7
7. n+4 < 6
8. x−1 > 4
682
www.ck12.org Chapter 7. Equations, Inequalities and Functions
9. x−3≤ 5
10. x+6 > 7
11. 2x≤ 4
12. 3x > 9
13. 4x+1 < 9
14. 2x−1 > 5
15. 3x+2≤ 8
683
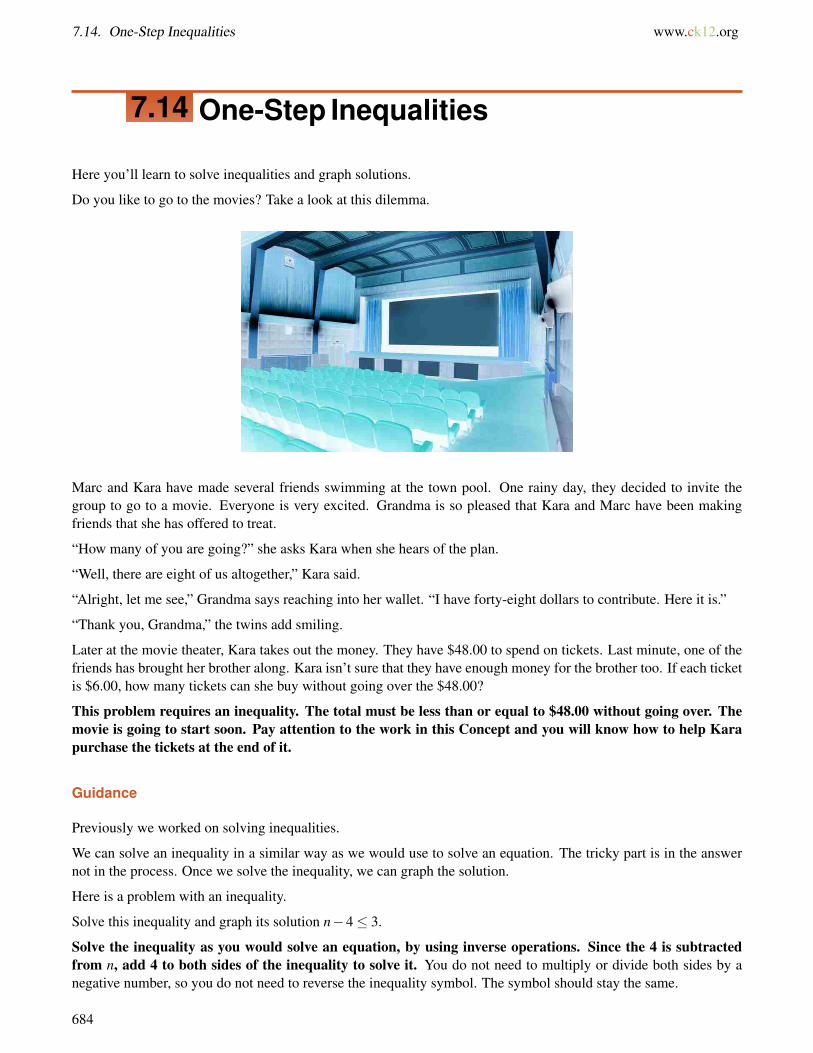
7.14. One-Step Inequalities www.ck12.org
7.14 One-Step Inequalities
Here you’ll learn to solve inequalities and graph solutions.
Do you like to go to the movies? Take a look at this dilemma.
Marc and Kara have made several friends swimming at the town pool. One rainy day, they decided to invite thegroup to go to a movie. Everyone is very excited. Grandma is so pleased that Kara and Marc have been makingfriends that she has offered to treat.
“How many of you are going?” she asks Kara when she hears of the plan.
“Well, there are eight of us altogether,” Kara said.
“Alright, let me see,” Grandma says reaching into her wallet. “I have forty-eight dollars to contribute. Here it is.”
“Thank you, Grandma,” the twins add smiling.
Later at the movie theater, Kara takes out the money. They have $48.00 to spend on tickets. Last minute, one of thefriends has brought her brother along. Kara isn’t sure that they have enough money for the brother too. If each ticketis $6.00, how many tickets can she buy without going over the $48.00?
This problem requires an inequality. The total must be less than or equal to $48.00 without going over. Themovie is going to start soon. Pay attention to the work in this Concept and you will know how to help Karapurchase the tickets at the end of it.
Guidance
Previously we worked on solving inequalities.
We can solve an inequality in a similar way as we would use to solve an equation. The tricky part is in the answernot in the process. Once we solve the inequality, we can graph the solution.
Here is a problem with an inequality.
Solve this inequality and graph its solution n−4≤ 3.
Solve the inequality as you would solve an equation, by using inverse operations. Since the 4 is subtractedfrom n, add 4 to both sides of the inequality to solve it. You do not need to multiply or divide both sides by anegative number, so you do not need to reverse the inequality symbol. The symbol should stay the same.
684
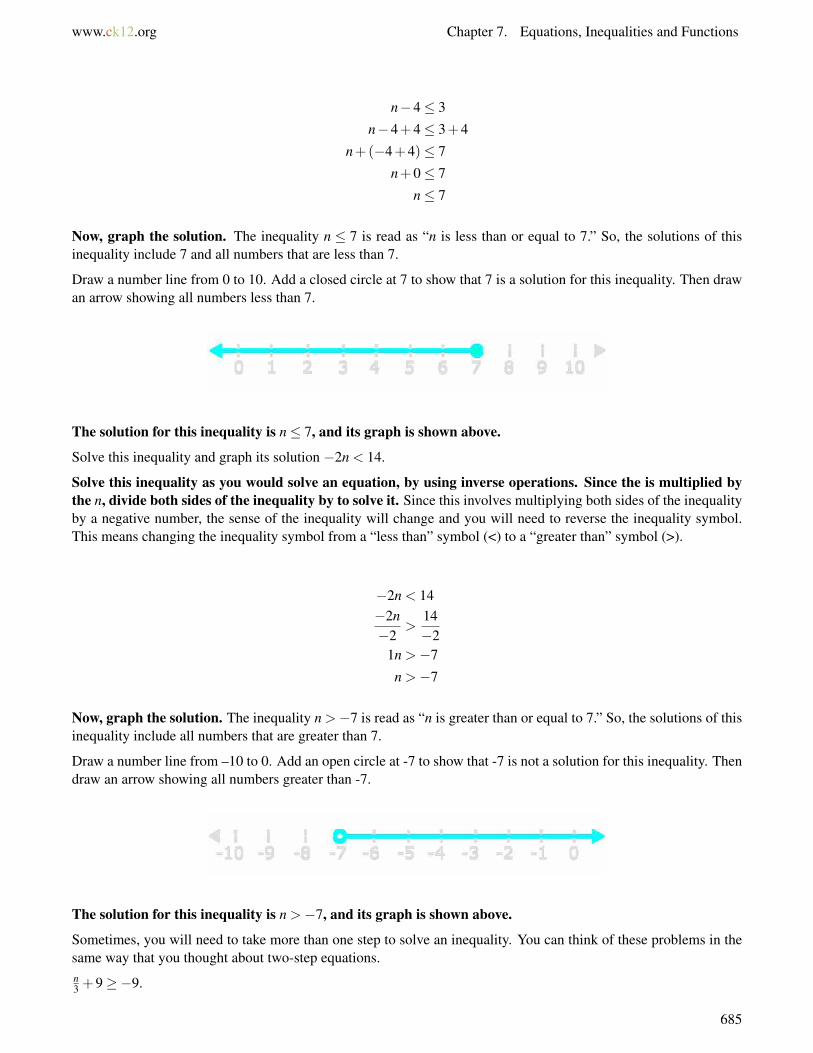
www.ck12.org Chapter 7. Equations, Inequalities and Functions
n−4≤ 3
n−4+4≤ 3+4
n+(−4+4)≤ 7
n+0≤ 7
n≤ 7
Now, graph the solution. The inequality n ≤ 7 is read as “n is less than or equal to 7.” So, the solutions of thisinequality include 7 and all numbers that are less than 7.
Draw a number line from 0 to 10. Add a closed circle at 7 to show that 7 is a solution for this inequality. Then drawan arrow showing all numbers less than 7.
The solution for this inequality is n≤ 7, and its graph is shown above.
Solve this inequality and graph its solution −2n < 14.
Solve this inequality as you would solve an equation, by using inverse operations. Since the is multiplied bythe n, divide both sides of the inequality by to solve it. Since this involves multiplying both sides of the inequalityby a negative number, the sense of the inequality will change and you will need to reverse the inequality symbol.This means changing the inequality symbol from a “less than” symbol (<) to a “greater than” symbol (>).
−2n < 14−2n−2
>14−2
1n >−7
n >−7
Now, graph the solution. The inequality n >−7 is read as “n is greater than or equal to 7.” So, the solutions of thisinequality include all numbers that are greater than 7.
Draw a number line from –10 to 0. Add an open circle at -7 to show that -7 is not a solution for this inequality. Thendraw an arrow showing all numbers greater than -7.
The solution for this inequality is n >−7, and its graph is shown above.
Sometimes, you will need to take more than one step to solve an inequality. You can think of these problems in thesame way that you thought about two-step equations.n3 +9≥−9.
685
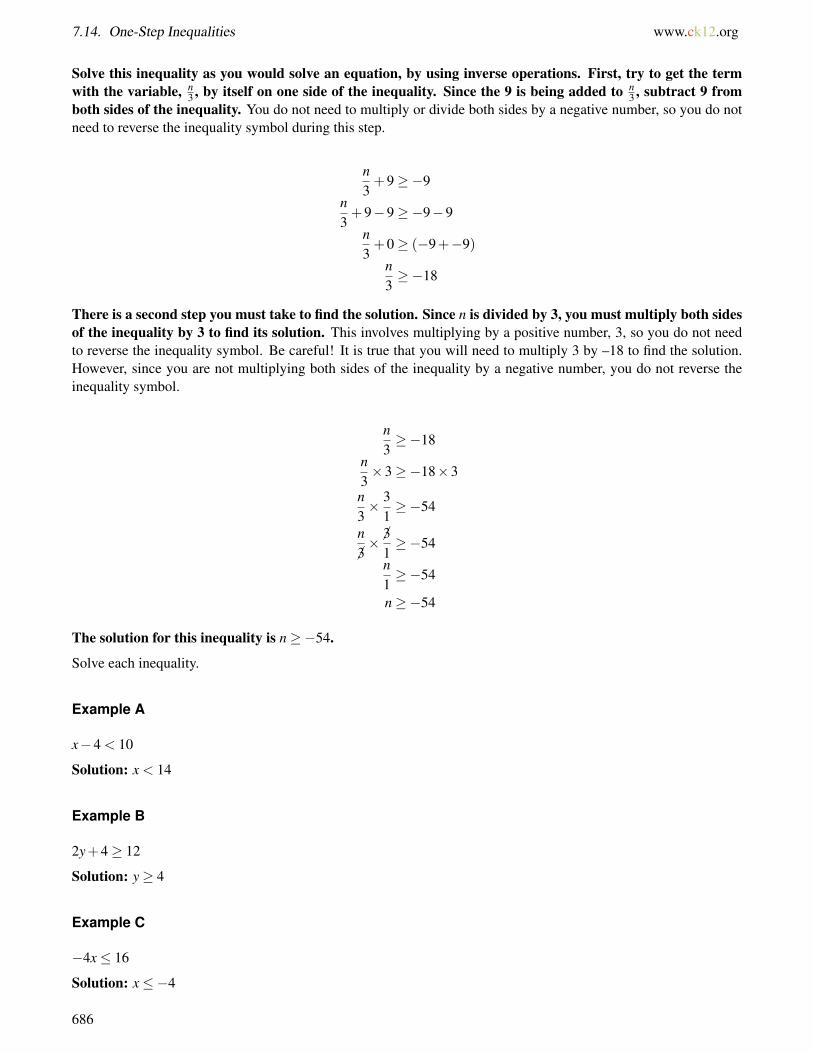
7.14. One-Step Inequalities www.ck12.org
Solve this inequality as you would solve an equation, by using inverse operations. First, try to get the termwith the variable, n
3 , by itself on one side of the inequality. Since the 9 is being added to n3 , subtract 9 from
both sides of the inequality. You do not need to multiply or divide both sides by a negative number, so you do notneed to reverse the inequality symbol during this step.
n3+9≥−9
n3+9−9≥−9−9
n3+0≥ (−9+−9)
n3≥−18
There is a second step you must take to find the solution. Since n is divided by 3, you must multiply both sidesof the inequality by 3 to find its solution. This involves multiplying by a positive number, 3, so you do not needto reverse the inequality symbol. Be careful! It is true that you will need to multiply 3 by –18 to find the solution.However, since you are not multiplying both sides of the inequality by a negative number, you do not reverse theinequality symbol.
n3≥−18
n3×3≥−18×3
n3× 3
1≥−54
n
�3× �3
1≥−54
n1≥−54
n≥−54
The solution for this inequality is n≥−54.
Solve each inequality.
Example A
x−4 < 10
Solution: x < 14
Example B
2y+4≥ 12
Solution: y≥ 4
Example C
−4x≤ 16
Solution: x≤−4
686
www.ck12.org Chapter 7. Equations, Inequalities and Functions
Here is the original problem once again. Use what you have learned about inequalities and about solving inequalitiesto help you with the movie tickets.
Marc and Kara have made several friends swimming at the town pool. One rainy day, they decided to invite thegroup to go to a movie. Everyone is very excited. Grandma is so pleased that Kara and Marc have been makingfriends that she has offered to treat.
“How many of you are going?” she asks Kara when she hears of the plan.
“Well, there are eight of us altogether,” Kara said.
“Alright, let me see,” Grandma says reaching into her wallet. “I have forty-eight dollars to contribute. Here it is.”
“Thank you Grandma,” the twins add smiling.
Later at the movie theater, Kara takes out the money. They have $48.00 to spend on tickets. Last minute, one of thefriends has brought her brother along. Kara isn’t sure that they have enough money for the brother too. If each ticketis $6.00, how many tickets can she buy without going over the $48.00?
To figure this out, we need to write an inequality. The original group consisted of 8 kids without the extrabrother. Each ticket is $6.00. We can use this in our inequality. If we have money left over, then we will knowwhether or not we can pay for him too.
We need to be less than or equal to $48.00.
Here is the inequality.
6x≤ 48
Now we can solve the inequality. The x represents the number of tickets that we can purchase if they are $6.00each.
6x≤ 486x6≤ 48
x≤ 8
This shows that the kids can purchase less than or equal to 8 tickets with the $48.00. They don’t have enoughto pay for the brother too.
Kara tells the group this information and they all chip in with their own money. All of the kids are able toattend the movie thanks to the generosity of the group.
687
7.14. One-Step Inequalities www.ck12.org
Guided Practice
Here is one for you to try on your own.
Antonio is buying milk for a breakfast event. Each container of milk costs $3. At most, he can spend $12 on milkfor the event.
a. Write an inequality to represent, c, the number of containers of milk he can buy.
b. Could Antonio buy 4 containers of milk for the event? Explain.
Answer
Consider part a first.
Use a number, an operation sign, a variable, or an inequality symbol to represent each part of the problem. Sinceeach container of milk costs $3, you can find the total cost, in dollars, of the milk he buys by multiplying 3 by thenumber of containers. The key words “at most” indicate that you should use a ≤ symbol.
Each container . . .costs $3. At most, he can spend $12 . . .
↓ ↓ ↓c×3 ≤ 12
You may also want to consider that the value of c must be an integer greater than or equal to 0. Think about why thatis for a moment.
The reason that the value of c must be an integer greater than or equal to zero is because Antonio cannot buy anegative number of containers nor can he buy a fraction of a container. Neither of those situations makes sense inreal life. When using inequalities to represent real-life situations, you should always think about which values wouldmake sense for the variable and which values would not make sense.
Next, consider part b.
Solve the inequality to help you.
c×3≤ 12c×3
3≤ 12
3
c× 33≤ 4
c×1≤ 4
c≤ 4
According to the inequality above, the number of containers, c, that he can buy must be less than or equal to 4.
Since 4 is a solution for this inequality, and since 4 is an integer that is greater than 0, he could buy 4 containersof milk.
688
www.ck12.org Chapter 7. Equations, Inequalities and Functions
Video Review
MEDIAClick image to the left or use the URL below.URL: http://www.ck12.org/flx/render/embeddedobject/57645
This is a Khan Academy video on solving and graphing inequalities. It goes into more advanced content too.
Explore More
Directions: Solve each inequality.
1. x+4 < 10
2. x−3≥ 7
3. b+5≤ 15
4. a−7≥ 14
5. 4y > 20
6. 6x≤ 18
7. −4y <−12
8. −5x <−20
9. x2 = 10
10. x5 ≤ 6
11. 2x+5≥ 7
12. 3y−2≤ 4
13. 3a−7 > 11
689

www.ck12.org Chapter 7. Equations, Inequalities and Functions
7.15 Domain and Range of a Function
Here you’ll learn to identify the domain and range of a simple linear function.
Remember Kara and Marc from the One-Step Inequalities Concept? Well, they are still in Boston with theirgrandparents.
Kara and Marc decided to spend one morning helping out at a car wash to benefit a club that their grandparents haveparticipated in for year.
The car wash was a busy place. At the beginning there weren’t any cars, but between 9 a.m. and 10 a.m. the classwashed 5 cars. From 10 to 11 a.m., the class washed 10 cars, from 11 a.m. to 12 p.m. the class washed 15 cars andfrom 12 to 1 p.m. the class washed 20 cars.
Marc kept track of the cars washed each hour.
Hour 1 - 5 cars
Hour 2 - 10 cars
Hour 3 - 15 cars
Hour 4 - 20 cars
Can you write this list as ordered pairs? Can you identify the domain and range of the function?
This Concept will teach you how to do this.
Guidance
We use the word “function” all the time in everyday speech. We say things like “It’s a function of time” or “It’s afunction of price.” This is a real life application of a mathematical concept called a function. You will learn how toapply functions to real-world examples, but first let’s look at what a function is and how we can understand it better.
What is a function?
A function is a set of ordered pairs in which the first element in any pair corresponds to exactly one secondelement.
For example, look at this set of ordered pairs. Notice that braces, {}, are used to surround the set of ordered pairs.
{(0,5),(1,6),(2,7),(3,8)}↑↑
691

7.15. Domain and Range of a Function www.ck12.org
In (1, 6), 1 is the first element and
6 is the second element.
Each of the first elements––0, 1, 2, and 3––corresponds to exactly one second element. So, this set of orderedpairs represents a function.
Let’s take a look at another set of ordered pairs.
{(2,4),(5,3),(6,7),(2,8)}2 2
The first element, 2, corresponds
to two different second elements––4 and 8.
Since one of the first elements corresponds to two different second elements, the set of ordered pairs abovedoes not represent a function.
We can use these criteria to determine whether or not a series of ordered pairs forms a function.
Now that you know how to identify a function, let’s look at some of the key words associated with functions.
1. Domain2. Range
The domain of a function is the set of all the first elements in a function. The range is the set of all the secondelements in a function.
Let’s look at a set of ordered pairs and identify the domain and range of the series.
The ordered pairs below represent a function
{(0, -10), (2, -8), (4, -6), (6, -4)}
a. Identify the domain of the function.
b. Identify the range of the function.
Consider part a first.
The domain is the set of all the first elements in the function. These first elements are underlined below.
{(0,−10),(2,−8),(4,−6),(6,−4)}
The domain of this function is {0, 2, 4, 6}.
Next, consider part b.
The range is the set of all the second elements in the function. These second elements are underlined below.
{(0,−10),(2,−8),(4,−6),(6,−4)}
The range of this function is {-10, -8, -6, -4}.
Now it’s your turn. Identify the domain and range of each function.
Example A
(1, 3) (2, 4) (5, 7) (9, 11)
Solution: Domain {1,2,5,9}, Range {3,4,7,11}
692
www.ck12.org Chapter 7. Equations, Inequalities and Functions
Example B
(8, 12) (9, 22) (4, 7) (2, 5)
Solution: Domain {8,9,4,2}, Range {12,22,7,5}
Example C
(8, 9) (3, 5) (7, 6) (10, 12)
Solution: Domain {8,3,7,10}, Range {9,5,6,12}
Here is the original problem once again.
Kara and Marc decided to spend one morning helping out at a car wash to benefit a club that their grandparents haveparticipated in for year.
The car wash was a busy place. At the beginning there weren’t any cars, but between 9 a.m. and 10 a.m. the classwashed 5 cars. From 10 to 11 a.m., the class washed 10 cars, from 11 a.m. to 12 p.m. the class washed 15 cars andfrom 12 to 1 p.m. the class washed 20 cars.
Marc kept track of the cars washed each hour.
Hour 1 - 5 cars
Hour 2 - 10 cars
Hour 3 - 15 cars
Hour 4 - 20 cars
Can you write this list as ordered pairs? Can you identify the domain and range of the function?
First, use the hours as the domain and the number of cars as the range.
(1, 5) (2, 10) (3, 15) (4, 20)
The domain is {1, 2, 3, 4}.
The range is {5, 10, 15, 20}.
This is our answer.
Guided Practice
Here is one for you to try on your own.
Write the domain and range of this set.
(1, 3) (3, 9) (4, 6) (5, 12)
Answer
693
7.15. Domain and Range of a Function www.ck12.org
The first value of each ordered pair represents the domain.
Domain {1, 3, 4, 5}
The second value of each ordered pair represents the range.
Range {3, 9, 6, 12}
This is our answer.
Video Review
MEDIAClick image to the left or use the URL below.URL: http://www.ck12.org/flx/render/embeddedobject/57646
This is a Khan Academy video on the domain and range of a function.
Explore More
Directions: Identify whether or not each series of ordered pairs forms a function.
1. (1, 3)(2, 6)(2, 5) (3, 7)
2. (2, 5) (3, 6) (4, 7) (5, 8)
3. (6, 1) (7, 2) (8, 3)
4. (5, 2) (5, 3) (5, 4) (5, 5)
5. (81, 19)(75, 18) (76, 18) (77, 19)
Directions: Name the domain in numbers 1 –5.
6.
7.
8.
9.
10.
Directions: Name the range in numbers 1 –5.
11.
12.
13.
14.
15.
694
www.ck12.org Chapter 7. Equations, Inequalities and Functions
7.16 Input-Output Tables for Function Rules
Here you’ll learn to evaluate a given function rule using an input-output table.
Remember the car wash from the Domain and Range of a Function Concept? Well, here is the problem once again.
Kara and Marc decided to spend one morning helping out at a car wash to benefit a club that their grandparents haveparticipated in for a year.
The car wash was a busy place. At the beginning there weren’t any cars, but between 9 a.m. and 10 a.m. the classwashed 5 cars. From 10 to 11 a.m., the class washed 10 cars, from 11 a.m. to 12 p.m. the class washed 15 cars andfrom 12 to 1 p.m. the class washed 20 cars.
Marc kept track of the cars washed each hour.
Hour 1 - 5 cars
Hour 2 - 10 cars
Hour 3 - 15 cars
Hour 4 - 20 cars
The number of cars washed is connected to the number of hours worked. One is a function of the other.
Look at this list and write a function rule.
Then figure out how many cars would be washed in the fifth hour of the car wash.
This Concept will show you how to accomplish this task.
Guidance
An input-output table, like the one shown below, can also be used to represent a function. Because of that, we canalso call this kind of a table a function table.
TABLE 7.5:
Input number (x) Output number (y)0 01 32 63 9
Each pair of numbers in the table is related by the same function rule. That rule is: multiply each input number
695
7.16. Input-Output Tables for Function Rules www.ck12.org
(x−value) by 3 to find each output number (y−value). You can use a rule like this to find other values for thisfunction, too.
Working with function tables and function rules is a lot like being a detective! You have to use the clue of thefunction rule to complete a table! Patterns are definitely involved in this work.
Now let’s look at how we can use a function rule to complete a table.
The rule for the input-output table below is: add 1.5 to each input number to find its corresponding output number.Use this rule to find the corresponding output numbers for the given input numbers in the table.
TABLE 7.6:
Input number (x) Output number (y)012.5510
To find each missing output number, add 1.5 to each input number. Then write that output number in the table.
TABLE 7.7:
Input number (x) Output number (y)0 1.5 ← 0+1.5 = 1.51 2.5 ← 1.0+1.5 = 2.52.5 4 ← 2.5+1.5 = 4.05 6.5 ← 5.0+1.5 = 6.510 11.5 ← 10.0+1.5 = 11.5
The table above shows five ordered pairs that match the given function rule. Let’s write the answer in ordered pairs.
The answer is (0, 1.5) (1, 2.5) (2.5, 4) (5, 6.5) (10, 11.5).
Now let’s look at how to create a function table given a rule.
The rule for a function is: multiply each x−value by 4 and then subtract 2 to find each y−value. Make a functiontable that shows three ordered pairs of values for a function that follows this rule.
First, choose three x−values for the table. You may choose any numbers, but let’s select some small numbersthat will be easy to work with, such as 1, 2, and 3. Then, to find the y−values, multiply each of those values by
696
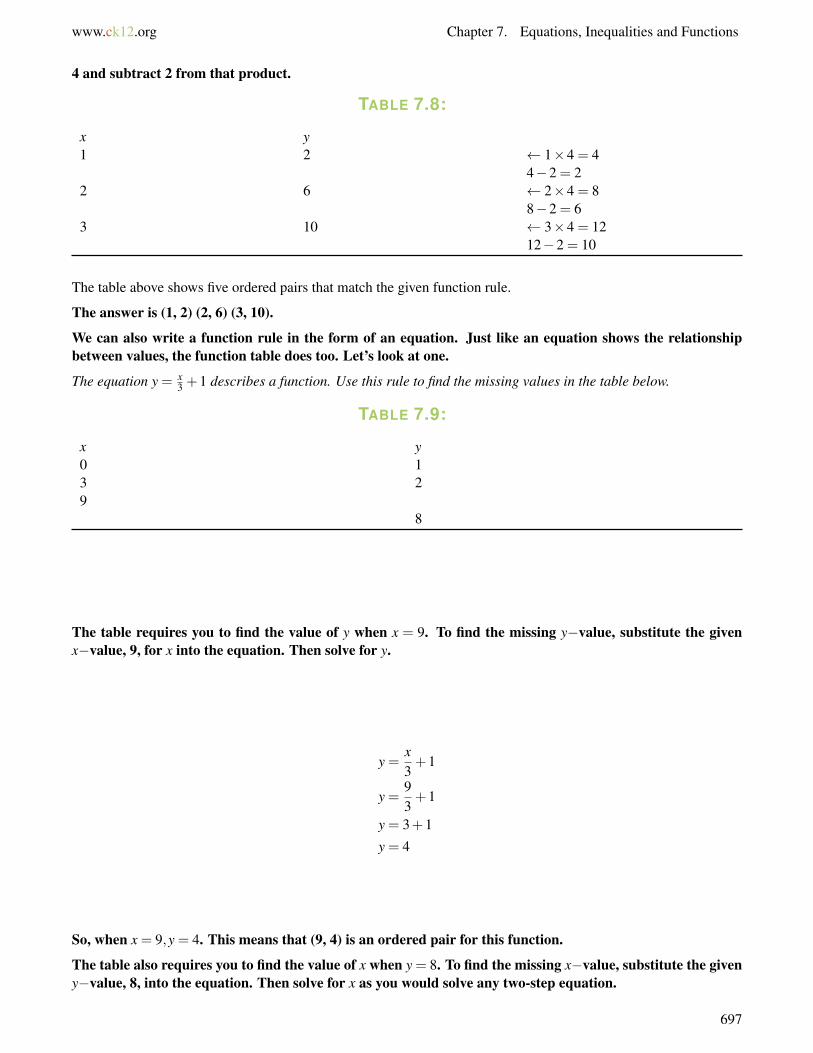
www.ck12.org Chapter 7. Equations, Inequalities and Functions
4 and subtract 2 from that product.
TABLE 7.8:
x y1 2 ← 1×4 = 4
4−2 = 22 6 ← 2×4 = 8
8−2 = 63 10 ← 3×4 = 12
12−2 = 10
The table above shows five ordered pairs that match the given function rule.
The answer is (1, 2) (2, 6) (3, 10).
We can also write a function rule in the form of an equation. Just like an equation shows the relationshipbetween values, the function table does too. Let’s look at one.
The equation y = x3 +1 describes a function. Use this rule to find the missing values in the table below.
TABLE 7.9:
x y0 13 29
8
The table requires you to find the value of y when x = 9. To find the missing y−value, substitute the givenx−value, 9, for x into the equation. Then solve for y.
y =x3+1
y =93+1
y = 3+1
y = 4
So, when x = 9,y = 4. This means that (9, 4) is an ordered pair for this function.
The table also requires you to find the value of x when y = 8. To find the missing x−value, substitute the giveny−value, 8, into the equation. Then solve for x as you would solve any two-step equation.
697
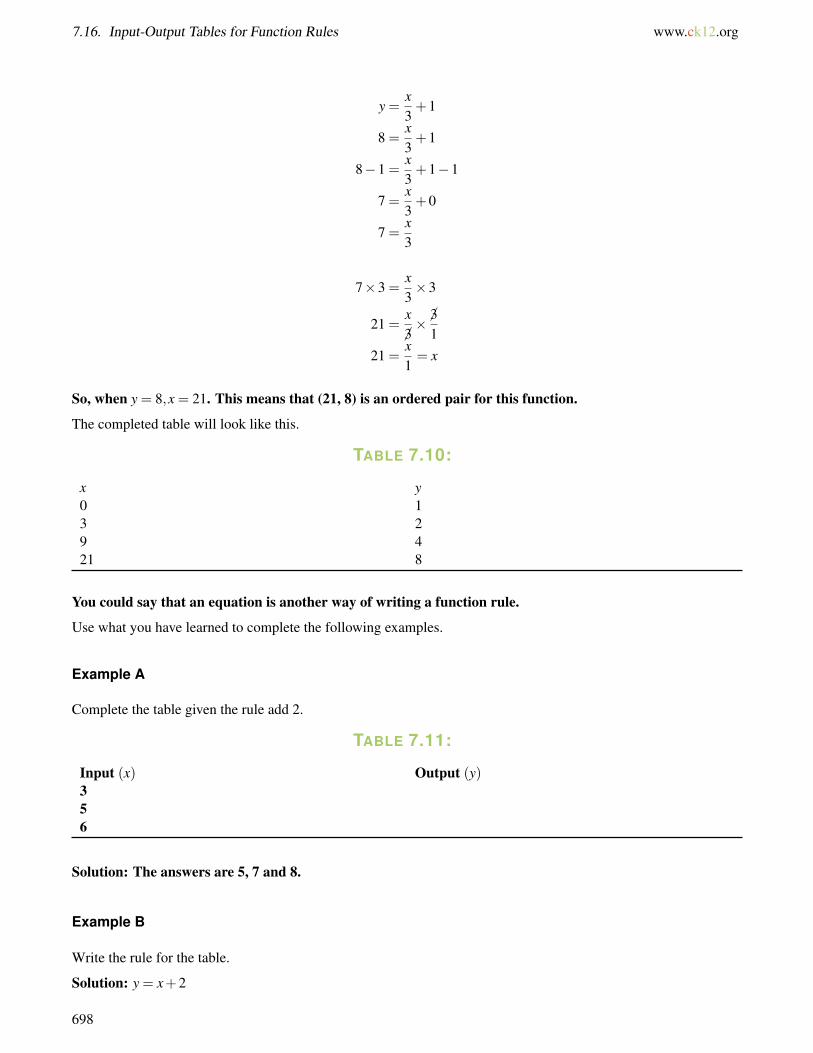
7.16. Input-Output Tables for Function Rules www.ck12.org
y =x3+1
8 =x3+1
8−1 =x3+1−1
7 =x3+0
7 =x3
7×3 =x3×3
21 =x
�3× �3
121 =
x1= x
So, when y = 8,x = 21. This means that (21, 8) is an ordered pair for this function.
The completed table will look like this.
TABLE 7.10:
x y0 13 29 421 8
You could say that an equation is another way of writing a function rule.
Use what you have learned to complete the following examples.
Example A
Complete the table given the rule add 2.
TABLE 7.11:
Input (x) Output (y)356
Solution: The answers are 5, 7 and 8.
Example B
Write the rule for the table.
Solution: y = x+2
698
www.ck12.org Chapter 7. Equations, Inequalities and Functions
Example C
Create a function table given the rule y = x÷2+3. Use three values.
Solution: Look at the data below.
TABLE 7.12:
Input (x) Output (y)2 44 56 5
Here is the original problem once again.
Kara and Marc decided to spend one morning helping out at a car wash to benefit a club that their grandparents haveparticipated in for year.
The car wash was a busy place. At the beginning there weren’t any cars, but between 9 a.m. and 10 a.m. the classwashed 5 cars. From 10 to 11 a.m., the class washed 10 cars, from 11 a.m. to 12 p.m. the class washed 15 cars andfrom 12 to 1 p.m. the class washed 20 cars.
Marc kept track of the cars washed each hour.
Hour 1 - 5 cars
Hour 2 - 10 cars
Hour 3 - 15 cars
Hour 4 - 20 cars
The number of cars washed is connected to the number of hours worked. One is a function of the other.
Look at this list and write a function rule.
Then figure out how many cars would be washed in the fifth hour of the car wash.
To write the rule, notice that each hour the number of cars increased by 5.
We can use multiplication to show this rule.
y = 5x
This rule works for all of the values.
Then we can evaluate using the fifth hour.
5(5) = 25
Given this rule, 25 cars will be washed in hour five.
699
7.16. Input-Output Tables for Function Rules www.ck12.org
Guided Practice
Here is one for you to try on your own.
At the amusement park, Taylor noticed that there seemed to be a pattern for people who won the dart throwing game.She was so curious that she watched people play the game for a few hours. When 12 people played, there were only6 winners. When ten people played, there were five winners.
This is a table to represent the data that Taylor collected.
TABLE 7.13:
Input Output12 610 58 46 34 2
Can you write a rule for this data?
Answer
We can accomplish this task by looking at what happened to the x value to get the y value.
Notice that the x value was divided by 2.x2 = y
This is our rule.
Video Review
MEDIAClick image to the left or use the URL below.URL: http://www.ck12.org/flx/render/embeddedobject/57644
This Khan Academy video is an introduction to functions.
Explore More
Directions: Use the given rule or equation to complete the table.
1. The rule for the input-output below table is: multiply each input number by 7 and then add 2 to find each outputnumber. Use this rule to find the corresponding output numbers for the given input numbers in the table. Fill in thetable with those numbers.
TABLE 7.14:
Input number (x) Output number (y)0
700
www.ck12.org Chapter 7. Equations, Inequalities and Functions
TABLE 7.14: (continued)
Input number (x) Output number (y)1234
2. The rule for this function table is: subtract 6 from each x−value to find each y−value. Use this rule to find themissing numbers in the table. Fill in the table with those numbers.
TABLE 7.15:
x y06
716
3. The equation y = x2 −1 describes a function. Use this rule to find the missing values in the table below.
TABLE 7.16:
x y2 04 18
6
Directions: Check each function rule with the table. If it works write "yes" if not, write "no".
4. 2x
TABLE 7.17:
Input Output1 32 53 7
5. 3x−1
TABLE 7.18:
Input Output1 22 53 84 11
6. 2x+1
701
7.16. Input-Output Tables for Function Rules www.ck12.org
TABLE 7.19:
Input Output1 32 43 65 10
7. 4x
TABLE 7.20:
Input Output0 01 42 83 12
8. 6x−3
TABLE 7.21:
Input Output1 32 93 15
9. 2x
TABLE 7.22:
Input Output0 01 22 43 6
10. 3x−3
TABLE 7.23:
Input Output1 02 34 95 12
Directions: Create a table for each rule.
11. 7x
12. 3x+1
13. 5x−3
702

www.ck12.org Chapter 7. Equations, Inequalities and Functions
14. 4x+3
15. 4x−5
703
7.17. Function Rules for Input-Output Tables www.ck12.org
7.17 Function Rules for Input-Output Tables
Here you’ll learn to write a function rule from an input-output table.
The month has flown by and in two days Marc and Kara will head home. They have had a terrific time in Boston andwhile they are happy to be heading home they are also sad to leave. For a final trip, Grandma and Grandpa decide tomake a trip to the amusement park. Everyone is excited.
At the amusement park, different rides take a different number of tickets. Kara and Marc figure out that there are 9rides that they would like to ride. These are their favorites and any others are just a bonus. Most often the teens willneed three tickets for each ride. Each ride is a function of the number of tickets needed. Marc and Kara go up to theticket booth and come back with 21 tickets each. If they each have 21 tickets, how many rides can they go on forthose tickets?
Because each ride is a function of the number of tickets, you will need to know about functions to figureout this problem. Pay attention to this Concept and at the end you will be able to help with the day at theamusement park.
Guidance
Previously we worked with a given function rule or an equation. Now it is time to use those detective skills andfigure out the rule from a given table.
704
www.ck12.org Chapter 7. Equations, Inequalities and Functions
Thinking like a detective looking for clues will help you write function rules.
One strategy that might be helpful in this task is to use guess and check to figure out the relationship betweenthe values in the domain and the values in the range. Remember the x values are the domain and the y valuesare the range.
Identify the rule for this input-output table. Describe the rule in words.
TABLE 7.24:
Input number (x) Output number (y)10 120 230 340 4
Use guess and check to determine how to each pair of values is related.
First, notice that each output number (y−value) is less than its corresponding input number (x−value). Thereare two operations that help numbers become smaller. So, the rule will involve either subtraction or division.
Look for a subtraction rule first.
Consider the ordered pair (10, 1).
10− 1 = 9, so the rule could be to subtract 9 from each input number to find the corresponding output number.Check to see if that rule works for the other pairs of values in the table.
Consider the ordered pair (20, 2).
20−1 = 19, not 2, so that rule does not work all the pairs of values in the table.
Look for a division rule next.
Consider the ordered pair (10, 1) again.
10÷10 = 1, so the rule could be to divide each input number by 10 to find the corresponding output number. Checkto see if that rule works for the other pairs of values in the table.
Consider the ordered pair (20, 2).
20÷10 = 2, so the rule works for that ordered pair.
Consider the ordered pair (30, 3).
30÷10 = 3, so the rule works for that ordered pair.
Consider the ordered pair (40, 4).
40÷10 = 4, so the rule works for that ordered pair.
The rule for this function table is to divide each input number (x−value) by 10 to find its corresponding outputnumber (y−value).
In this example, we wrote the function rule in words. We can also use an equation to express a function rule. Thinkabout this past example.
The rule was “Divide each x value by 10 and that will give you the y value.”
We could write x10 = y.
This would have been the same rule expressed as an equation.
Let’s look at another situation where we will write an equation to represent a function rule.
705
7.17. Function Rules for Input-Output Tables www.ck12.org
Identify the rule for this function table. Describe the rule in words. Then write an equation to represent therelationship between the pairs of values in the table.
TABLE 7.25:
x y1 52 103 154 20
Use guess and check to determine how each pair of values is related.
Notice that each y−value is greater than its corresponding x−value. So, the rule will involve either additionor multiplication.
Look for an addition rule first.
Consider the ordered pair (1, 5).
1+4 = 5, so the rule could be to add 4 to each x−value to find the corresponding y-value. Check to see if that ruleworks for the other pairs of values in the table.
Consider the ordered pair (2, 10).
2+5 = 7, not 10, so that rule does not work all the pairs of values in the table.
Look for a multiplication rule next. Each y−value in the table is 5 more than the previous y−value, so the rule mayinvolve multiplying by 5.
Consider the ordered pair (1, 5).
1×5 = 5, so the rule could be to multiply each x−value by 5 to find the corresponding y−value. Check to see if thatrule works for the other pairs of values in the table.
Consider the ordered pair (2, 10).
2×5 = 10, so the rule works for that ordered pair.
Consider the ordered pair (3, 15).
3×5 = 15, so the rule works for that ordered pair.
Consider the ordered pair (4, 20).
4×5 = 20, so the rule works for that ordered pair.
The rule for this function table is multiply each x−value by 5 to find its corresponding y−value.
Now that we have a rule in words, let’s write an equation to show the same relationship. Remember, to findeach y−value, you must multiply each x−value by 5. So, the equation would be:
y = x ·5 or y = 5x.
706

www.ck12.org Chapter 7. Equations, Inequalities and Functions
Yes it is. You will also become better at figuring out the rules over time.
One thing to consider is that sometimes, a function rule will involve more than one step. In other words, it will havetwo operations in it, not just one.
Look at each function table and write each rule as an equation.
Example A
TABLE 7.26:
x y5 107 149 18
Solution: 2x
Example B
TABLE 7.27:
x y3 54 76 11
Solution: 2x−1
Example C
TABLE 7.28:
x y2 14 2
707
7.17. Function Rules for Input-Output Tables www.ck12.org
TABLE 7.28: (continued)
x y6 3
Solution: x2
Here is the original problem once again.
The month has flown by and in two days Marc and Kara will head home. They have had a terrific time in Boston andwhile they are happy to be heading home they are also sad to leave. For a final trip, Grandma and Grandpa decide tomake a trip to the amusement park. Everyone is excited.
At the amusement park, different rides take a different number of tickets. Kara and Marc figure out that there are 9rides that they would like to ride. These are their favorites and any others are just a bonus. Most often the teens willneed three tickets for each ride. Each ride is a function of the number of tickets needed. Marc and Kara go up to theticket booth and come back with 21 tickets each. If they each have 21 tickets, how many rides can they go on forthose tickets?
The first thing to note is that each ride is a function of the number of tickets needed. We can call the ride xand the ticket number y.
You know from this lesson that one of the best ways to work with a function is through a function table. Let’sbuild one now.
TABLE 7.29:
x Rides y Tickets
We can say that 1 ride is equal to 3 tickets. Let’s choose some other ride numbers and work our way up to 21tickets.
TABLE 7.30:
x Rides y Tickets1 32 63 9
21
708
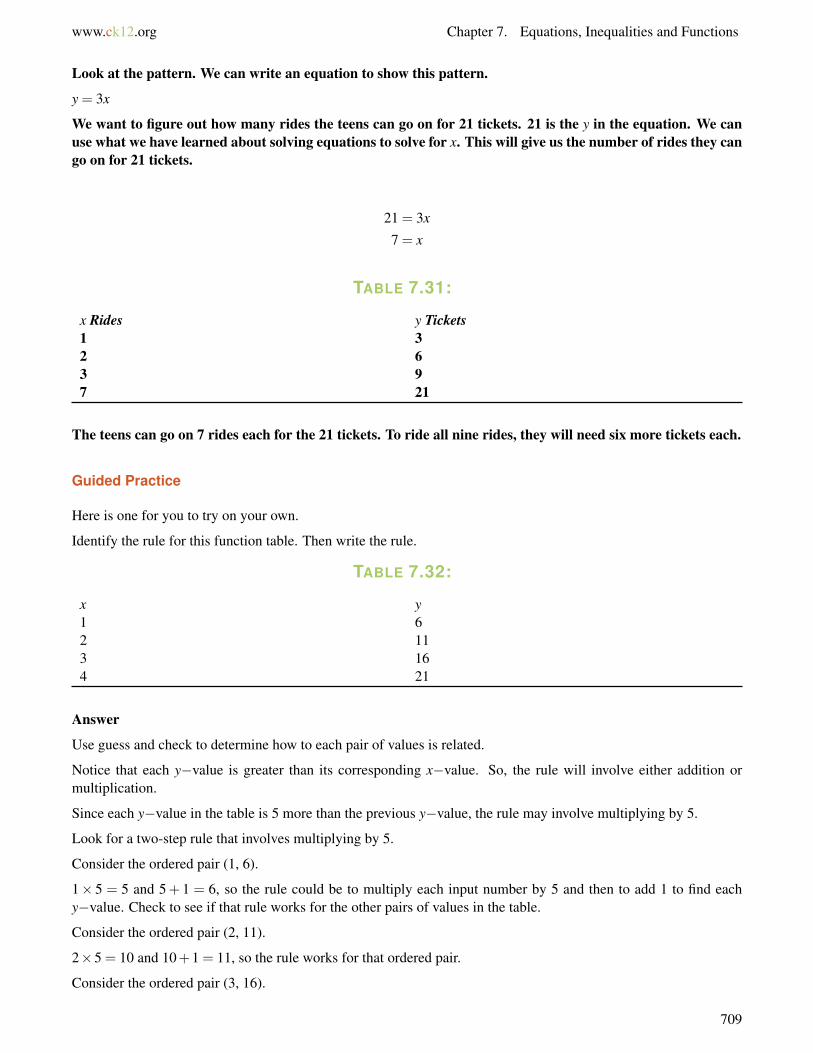
www.ck12.org Chapter 7. Equations, Inequalities and Functions
Look at the pattern. We can write an equation to show this pattern.
y = 3x
We want to figure out how many rides the teens can go on for 21 tickets. 21 is the y in the equation. We canuse what we have learned about solving equations to solve for x. This will give us the number of rides they cango on for 21 tickets.
21 = 3x
7 = x
TABLE 7.31:
x Rides y Tickets1 32 63 97 21
The teens can go on 7 rides each for the 21 tickets. To ride all nine rides, they will need six more tickets each.
Guided Practice
Here is one for you to try on your own.
Identify the rule for this function table. Then write the rule.
TABLE 7.32:
x y1 62 113 164 21
Answer
Use guess and check to determine how to each pair of values is related.
Notice that each y−value is greater than its corresponding x−value. So, the rule will involve either addition ormultiplication.
Since each y−value in the table is 5 more than the previous y−value, the rule may involve multiplying by 5.
Look for a two-step rule that involves multiplying by 5.
Consider the ordered pair (1, 6).
1× 5 = 5 and 5+ 1 = 6, so the rule could be to multiply each input number by 5 and then to add 1 to find eachy−value. Check to see if that rule works for the other pairs of values in the table.
Consider the ordered pair (2, 11).
2×5 = 10 and 10+1 = 11, so the rule works for that ordered pair.
Consider the ordered pair (3, 16).
709
7.17. Function Rules for Input-Output Tables www.ck12.org
3×5 = 15 and 15+1 = 16, so the rule works for that ordered pair.
Consider the ordered pair (4, 21).
4×5 = 20 and 20+1 = 21, so the rule works for that ordered pair.
The rule for this function table is to multiply each x−value by 5 and then add 1 to find its correspondingy−value.
Now that we have a rule in words, let’s write an equation to show the same relationship. Remember, to findeach y−value, we must multiply each x−value by 5 and then add 1. So, the equation would be
y = 5x+1
Video Review
MEDIAClick image to the left or use the URL below.URL: http://www.ck12.org/flx/render/embeddedobject/5542
This James Sousa video is about writing a function rule from an input - output table.
Explore More
Directions: Determine the rule for each table. Use that rule to answer the questions.
Look at this table
TABLE 7.33:
Input number (x) Output number (y)1 32 43 54 6
1. Identify the rule.
2. Write an equation for the rule.
Look at this table.
TABLE 7.34:
x y1 22 43 64 8
3. Describe the rule in words.
710
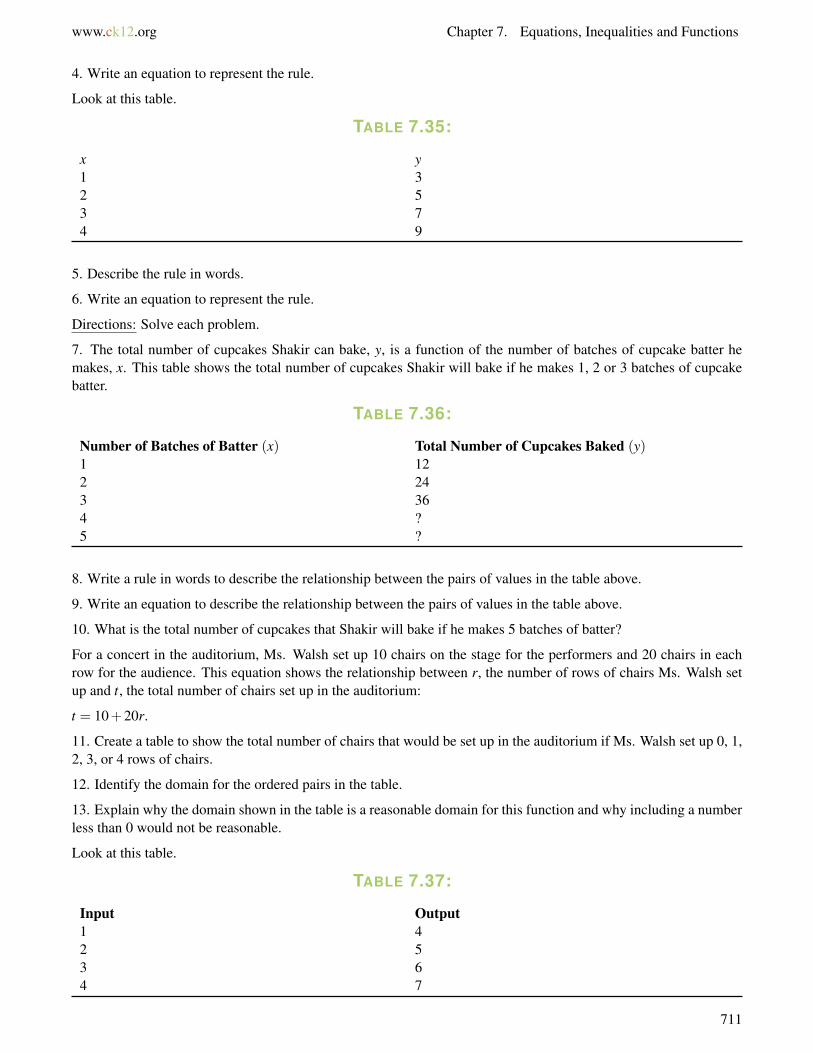
www.ck12.org Chapter 7. Equations, Inequalities and Functions
4. Write an equation to represent the rule.
Look at this table.
TABLE 7.35:
x y1 32 53 74 9
5. Describe the rule in words.
6. Write an equation to represent the rule.
Directions: Solve each problem.
7. The total number of cupcakes Shakir can bake, y, is a function of the number of batches of cupcake batter hemakes, x. This table shows the total number of cupcakes Shakir will bake if he makes 1, 2 or 3 batches of cupcakebatter.
TABLE 7.36:
Number of Batches of Batter (x) Total Number of Cupcakes Baked (y)1 122 243 364 ?5 ?
8. Write a rule in words to describe the relationship between the pairs of values in the table above.
9. Write an equation to describe the relationship between the pairs of values in the table above.
10. What is the total number of cupcakes that Shakir will bake if he makes 5 batches of batter?
For a concert in the auditorium, Ms. Walsh set up 10 chairs on the stage for the performers and 20 chairs in eachrow for the audience. This equation shows the relationship between r, the number of rows of chairs Ms. Walsh setup and t, the total number of chairs set up in the auditorium:
t = 10+20r.
11. Create a table to show the total number of chairs that would be set up in the auditorium if Ms. Walsh set up 0, 1,2, 3, or 4 rows of chairs.
12. Identify the domain for the ordered pairs in the table.
13. Explain why the domain shown in the table is a reasonable domain for this function and why including a numberless than 0 would not be reasonable.
Look at this table.
TABLE 7.37:
Input Output1 42 53 64 7
711

7.17. Function Rules for Input-Output Tables www.ck12.org
14. What is the rule?
15. Write an equation to represent the rule.
712
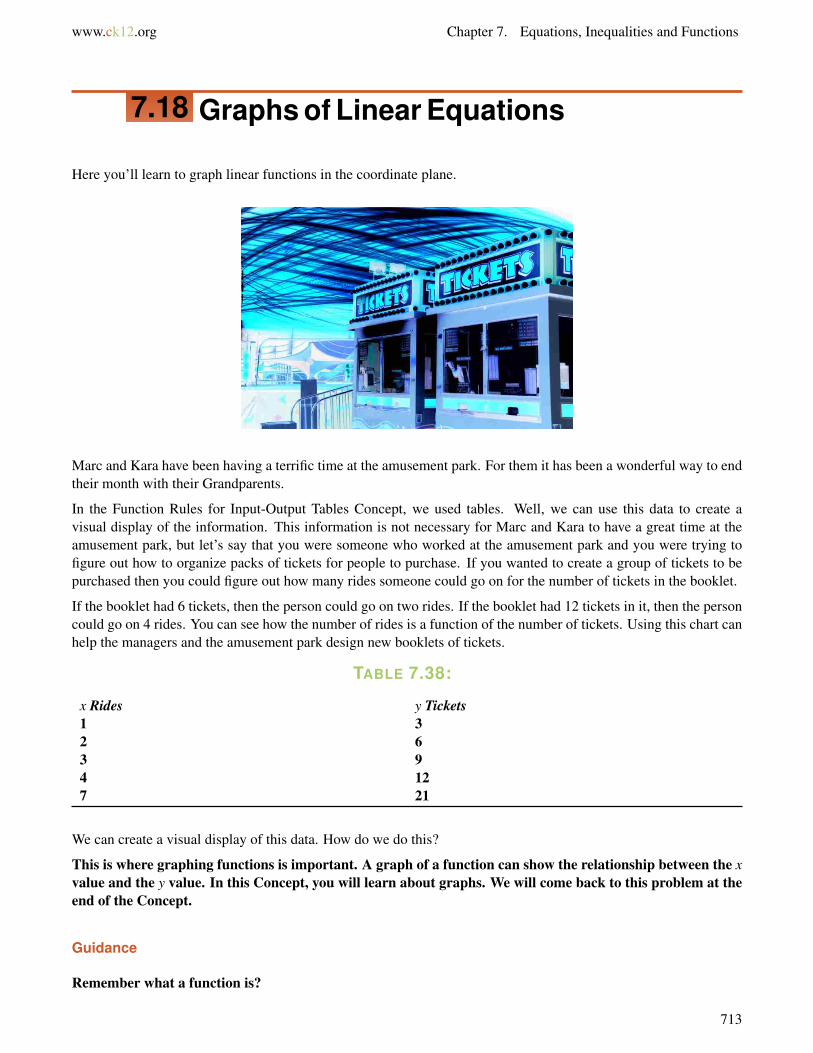
www.ck12.org Chapter 7. Equations, Inequalities and Functions
7.18 Graphs of Linear Equations
Here you’ll learn to graph linear functions in the coordinate plane.
Marc and Kara have been having a terrific time at the amusement park. For them it has been a wonderful way to endtheir month with their Grandparents.
In the Function Rules for Input-Output Tables Concept, we used tables. Well, we can use this data to create avisual display of the information. This information is not necessary for Marc and Kara to have a great time at theamusement park, but let’s say that you were someone who worked at the amusement park and you were trying tofigure out how to organize packs of tickets for people to purchase. If you wanted to create a group of tickets to bepurchased then you could figure out how many rides someone could go on for the number of tickets in the booklet.
If the booklet had 6 tickets, then the person could go on two rides. If the booklet had 12 tickets in it, then the personcould go on 4 rides. You can see how the number of rides is a function of the number of tickets. Using this chart canhelp the managers and the amusement park design new booklets of tickets.
TABLE 7.38:
x Rides y Tickets1 32 63 94 127 21
We can create a visual display of this data. How do we do this?
This is where graphing functions is important. A graph of a function can show the relationship between the xvalue and the y value. In this Concept, you will learn about graphs. We will come back to this problem at theend of the Concept.
Guidance
Remember what a function is?
713
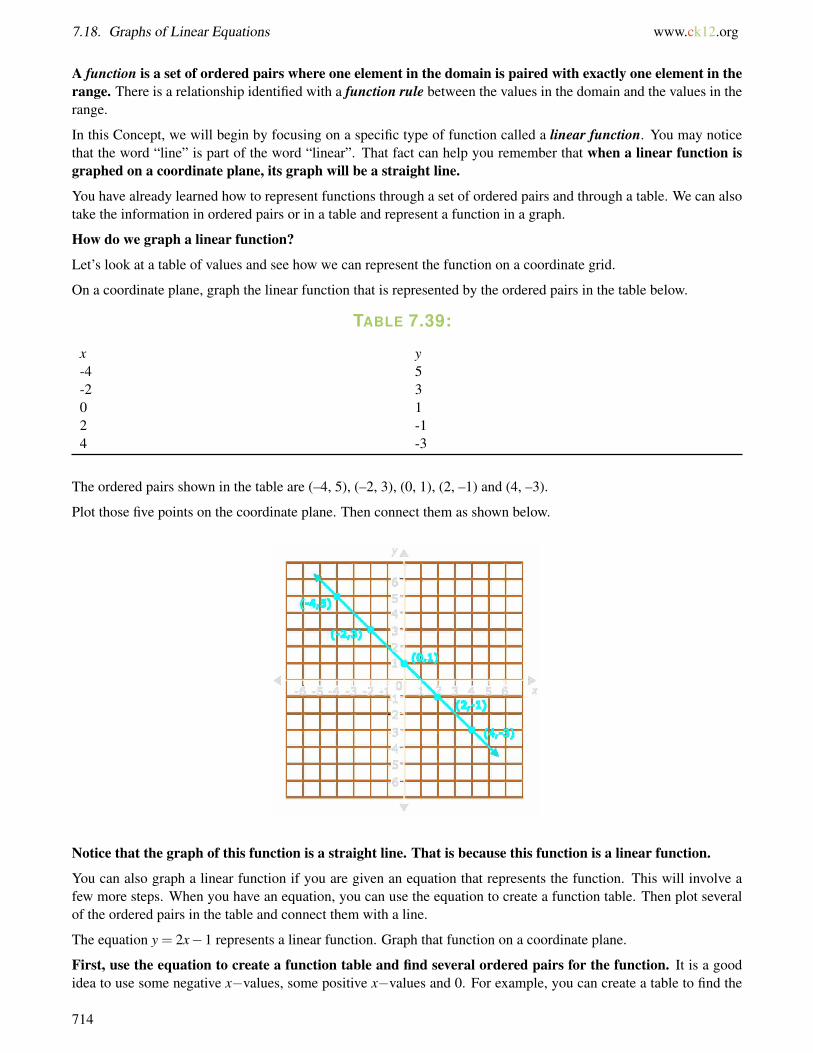
7.18. Graphs of Linear Equations www.ck12.org
A function is a set of ordered pairs where one element in the domain is paired with exactly one element in therange. There is a relationship identified with a function rule between the values in the domain and the values in therange.
In this Concept, we will begin by focusing on a specific type of function called a linear function. You may noticethat the word “line” is part of the word “linear”. That fact can help you remember that when a linear function isgraphed on a coordinate plane, its graph will be a straight line.
You have already learned how to represent functions through a set of ordered pairs and through a table. We can alsotake the information in ordered pairs or in a table and represent a function in a graph.
How do we graph a linear function?
Let’s look at a table of values and see how we can represent the function on a coordinate grid.
On a coordinate plane, graph the linear function that is represented by the ordered pairs in the table below.
TABLE 7.39:
x y-4 5-2 30 12 -14 -3
The ordered pairs shown in the table are (–4, 5), (–2, 3), (0, 1), (2, –1) and (4, –3).
Plot those five points on the coordinate plane. Then connect them as shown below.
Notice that the graph of this function is a straight line. That is because this function is a linear function.
You can also graph a linear function if you are given an equation that represents the function. This will involve afew more steps. When you have an equation, you can use the equation to create a function table. Then plot severalof the ordered pairs in the table and connect them with a line.
The equation y = 2x−1 represents a linear function. Graph that function on a coordinate plane.
First, use the equation to create a function table and find several ordered pairs for the function. It is a goodidea to use some negative x−values, some positive x−values and 0. For example, you can create a table to find the
714
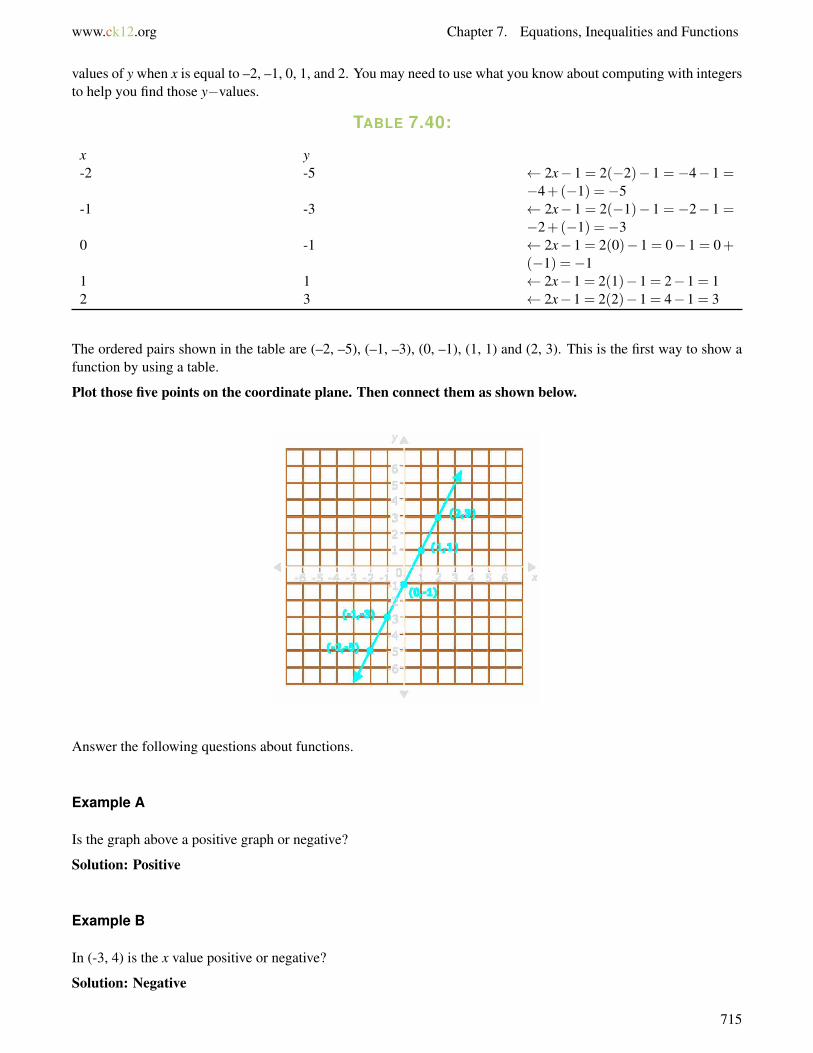
www.ck12.org Chapter 7. Equations, Inequalities and Functions
values of y when x is equal to –2, –1, 0, 1, and 2. You may need to use what you know about computing with integersto help you find those y−values.
TABLE 7.40:
x y-2 -5 ← 2x− 1 = 2(−2)− 1 = −4− 1 =
−4+(−1) =−5-1 -3 ← 2x− 1 = 2(−1)− 1 = −2− 1 =
−2+(−1) =−30 -1 ← 2x−1 = 2(0)−1 = 0−1 = 0+
(−1) =−11 1 ← 2x−1 = 2(1)−1 = 2−1 = 12 3 ← 2x−1 = 2(2)−1 = 4−1 = 3
The ordered pairs shown in the table are (–2, –5), (–1, –3), (0, –1), (1, 1) and (2, 3). This is the first way to show afunction by using a table.
Plot those five points on the coordinate plane. Then connect them as shown below.
Answer the following questions about functions.
Example A
Is the graph above a positive graph or negative?
Solution: Positive
Example B
In (-3, 4) is the x value positive or negative?
Solution: Negative
715
7.18. Graphs of Linear Equations www.ck12.org
Example C
In (-6, -7), which value is y value?
Solution: −7
Here is the original problem once again. Reread it and look at the graph at the end of it. Notice how the data fromthe table is represented in a visual way.
Marc and Kara have been having a terrific time at the amusement park. For them it has been a wonderful way to endtheir month with their Grandparents.
Think about the table from the last section. We can use this data to create a visual display of the information. Thisinformation is not necessary for Marc and Kara to have a great time at the amusement park, but let’s say that youwere someone who worked at the amusement park and you were trying to figure out how to organize packs of ticketsfor people to purchase. If you wanted to create a group of tickets to be purchased then you could figure out howmany rides someone could go on for the number of tickets in the booklet.
If the booklet had 6 tickets, then the person could go on two rides. If the booklet had 12 tickets in it, then the personcould go on 4 rides. You can see how the number of rides is a function of the number of tickets. Using this chart canhelp the managers and the amusement park design new booklets of tickets.
TABLE 7.41:
x Rides y Tickets1 32 63 94 127 21
We can create a visual display of this data. How do we do this?
Here is a graph representing the data from the table.
716
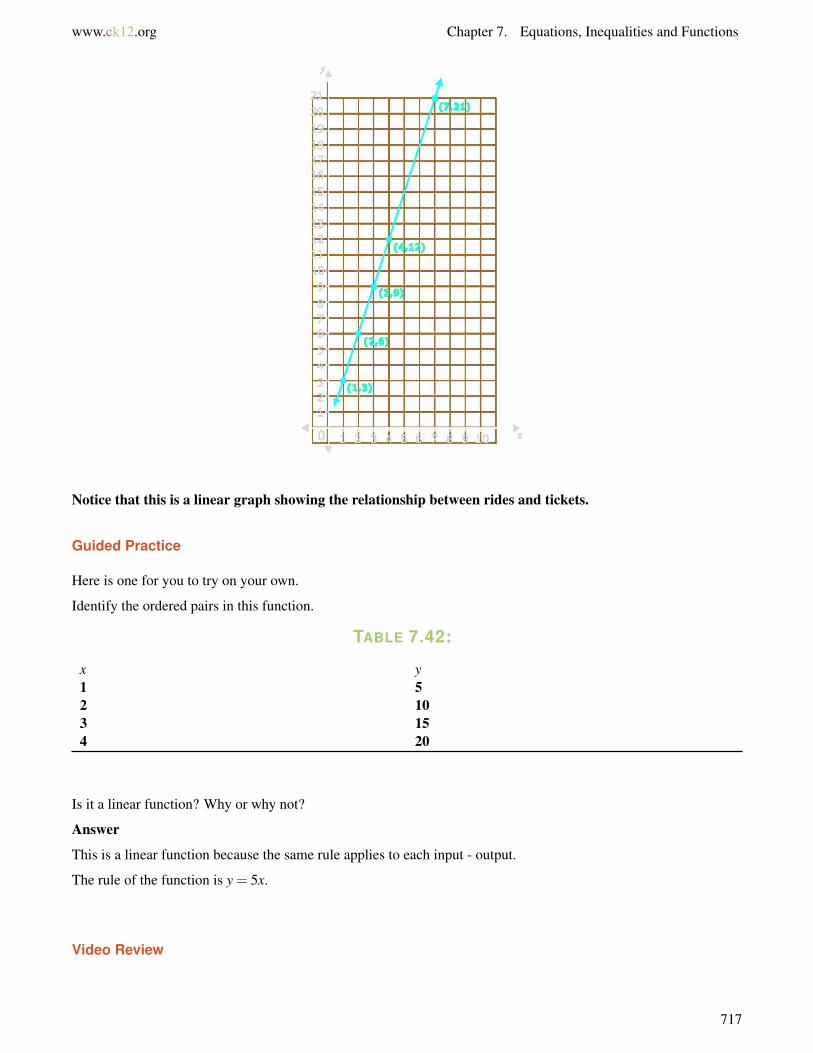
www.ck12.org Chapter 7. Equations, Inequalities and Functions
Notice that this is a linear graph showing the relationship between rides and tickets.
Guided Practice
Here is one for you to try on your own.
Identify the ordered pairs in this function.
TABLE 7.42:
x y1 52 103 154 20
Is it a linear function? Why or why not?
Answer
This is a linear function because the same rule applies to each input - output.
The rule of the function is y = 5x.
Video Review
717

7.18. Graphs of Linear Equations www.ck12.org
MEDIAClick image to the left or use the URL below.URL: http://www.ck12.org/flx/render/embeddedobject/5545
This is a James Sousa video on how to graph a linear function in the coordinate plane.
Explore More
Directions: On your own graph each function in the coordinate plane. Identify each rule. There are two answers foreach problem.
1.
TABLE 7.43:
Input Output1 42 53 64 7
2.
TABLE 7.44:
Input Output2 43 64 85 10
3.
TABLE 7.45:
Input Output1 32 64 125 15
4.
TABLE 7.46:
Input Output9 77 55 33 1
718
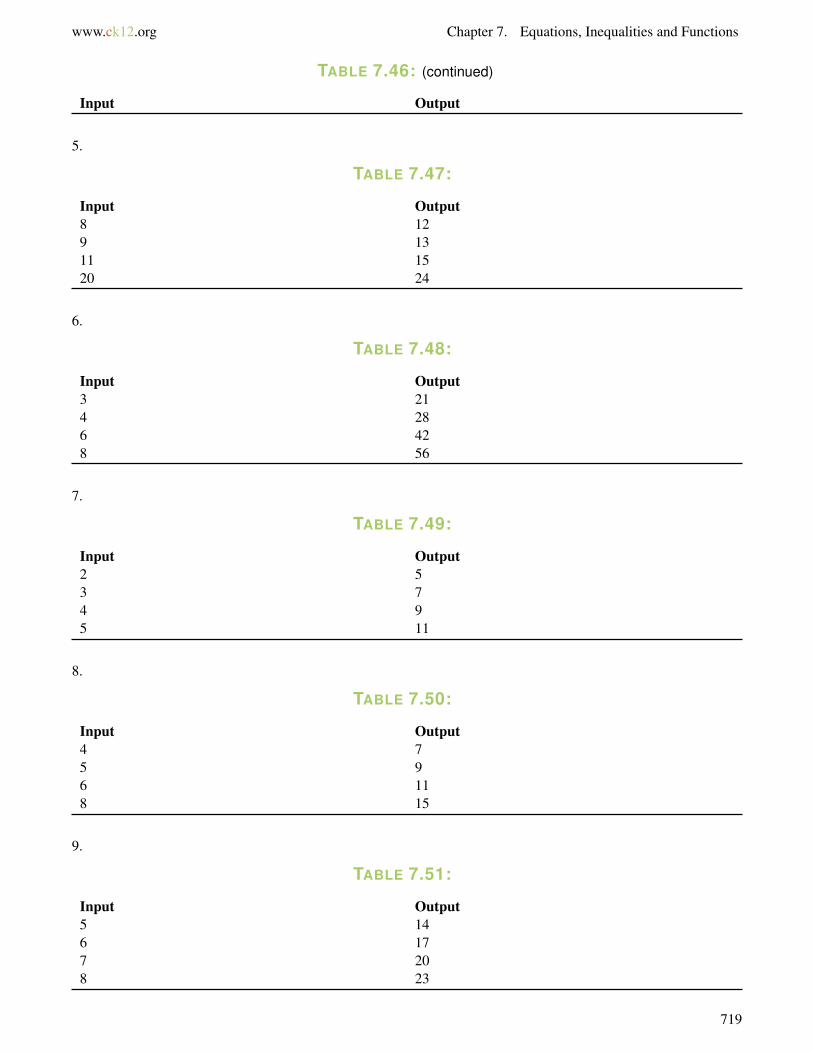
www.ck12.org Chapter 7. Equations, Inequalities and Functions
TABLE 7.46: (continued)
Input Output
5.
TABLE 7.47:
Input Output8 129 1311 1520 24
6.
TABLE 7.48:
Input Output3 214 286 428 56
7.
TABLE 7.49:
Input Output2 53 74 95 11
8.
TABLE 7.50:
Input Output4 75 96 118 15
9.
TABLE 7.51:
Input Output5 146 177 208 23
719

7.18. Graphs of Linear Equations www.ck12.org
10.
TABLE 7.52:
Input Output4 165 206 248 32
720
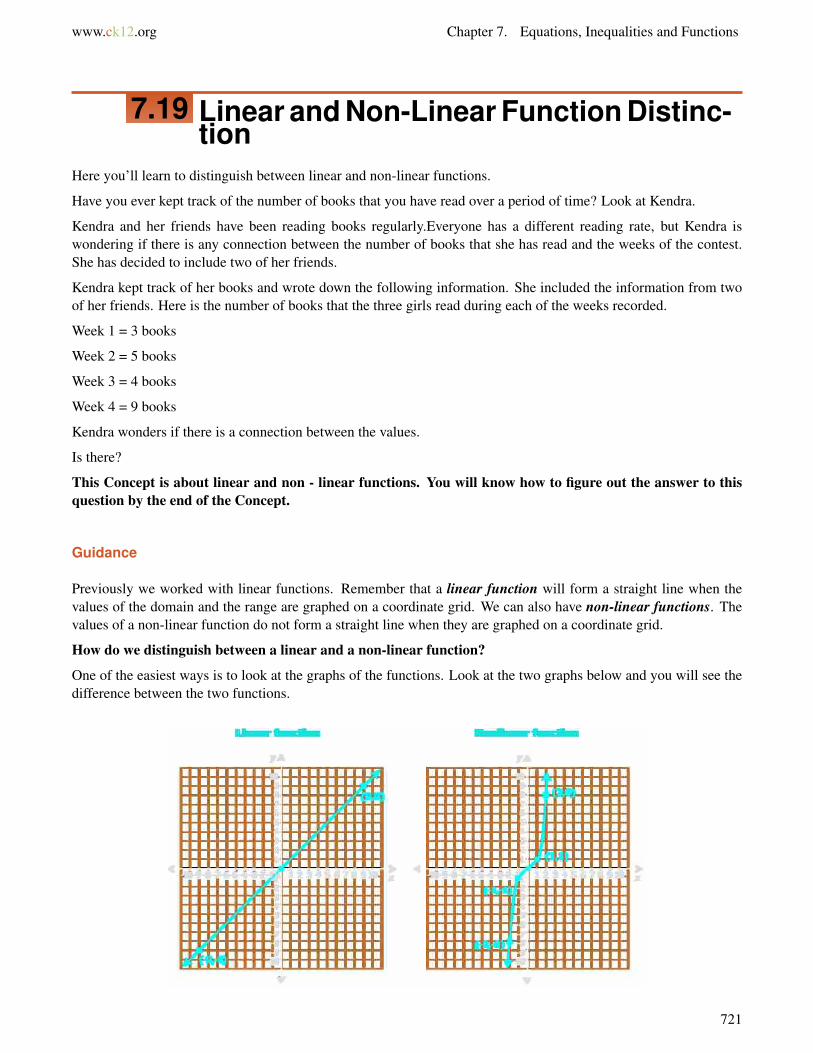
www.ck12.org Chapter 7. Equations, Inequalities and Functions
7.19 Linear and Non-Linear Function Distinc-tion
Here you’ll learn to distinguish between linear and non-linear functions.
Have you ever kept track of the number of books that you have read over a period of time? Look at Kendra.
Kendra and her friends have been reading books regularly.Everyone has a different reading rate, but Kendra iswondering if there is any connection between the number of books that she has read and the weeks of the contest.She has decided to include two of her friends.
Kendra kept track of her books and wrote down the following information. She included the information from twoof her friends. Here is the number of books that the three girls read during each of the weeks recorded.
Week 1 = 3 books
Week 2 = 5 books
Week 3 = 4 books
Week 4 = 9 books
Kendra wonders if there is a connection between the values.
Is there?
This Concept is about linear and non - linear functions. You will know how to figure out the answer to thisquestion by the end of the Concept.
Guidance
Previously we worked with linear functions. Remember that a linear function will form a straight line when thevalues of the domain and the range are graphed on a coordinate grid. We can also have non-linear functions. Thevalues of a non-linear function do not form a straight line when they are graphed on a coordinate grid.
How do we distinguish between a linear and a non-linear function?
One of the easiest ways is to look at the graphs of the functions. Look at the two graphs below and you will see thedifference between the two functions.
721

7.19. Linear and Non-Linear Function Distinction www.ck12.org
The first graph above shows a linear function because its graph is a straight line. The second graph shows a nonlinearfunction. Notice that the graph of this function is not a straight line. It is curved.
A nonlinear function does not have to look exactly like the function graphed above. Any function whose graph isnot a straight line is a nonlinear function.
The equation y = x2 represents a function.
a. Graph that function on a coordinate plane.
b. Is the function linear or nonlinear?
First, consider part a.
Then use the equation to create a function table and find several ordered pairs for the function. Then you willbe able to use the ordered pairs to graph the function.
You will need to use what you know about computing with integers and what you know about evaluating exponentsto create the table.
TABLE 7.53:
x y-2 4 ← y = x2 = (−2)2 = (−2) · (−2) =
4-1 1 ← y = x2 = (−1)2 = (−1) · (−1) =
10 0 ¬ y = x2 = (0)2 = 0×0 = 01 1 ¬ y = x2 = (1)2 = 1×1 = 12 4 ¬ y = x2 = (2)2 = 2×2 = 4
The ordered pairs shown in the table are (–2, 4), (–1, 1), (0, 0), (1, 1) and (2, 4).
Plot those five points on the coordinate plane. Then connect them. Notice that you cannot connect these points witha straight line. You will need to draw a curved line to connect them.
Consider part b next.
Look at the function you graphed. The graph is curved. Since the graph is not a straight line, the equationy = x2 represents a nonlinear function.
722
www.ck12.org Chapter 7. Equations, Inequalities and Functions
Now it’s your turn. Look at each set of ordered pairs and determine whether or not each forms a linear or non- linearfunction.
Example A
(0, 2)(1, 3)(2, 4)(3, 5)
Solution: Linear Function
Example B
(9, 6)(2, 7)(3, 5)(5, 9)
Solution: Non-linear function
Example C
(10, 8)(8, 6)(6, 4)(4, 2)
Solution: Linear Function
Here is the original problem once again.
Kendra and her friends have been reading books regularly. Everyone has a different reading rate, but Kendra iswondering if there is any connection between the number of books that she has read and the weeks of the contest.She has decided to include two of her friends.
Kendra kept track of her books and wrote down the following information. She included the information from twoof her friends. Here is the number of books that the three girls read during each of the weeks recorded.
Week 1 = 3 books
Week 2 = 5 books
Week 3 = 4 books
Week 4 = 9 books
Kendra wonders if there is a connection between the values.
Is there?
To figure this out, we can see if this is a linear or non-linear function. For there to be a linear, there will need to be apattern between the week and the number of books.
Here is a graph of the function.
723
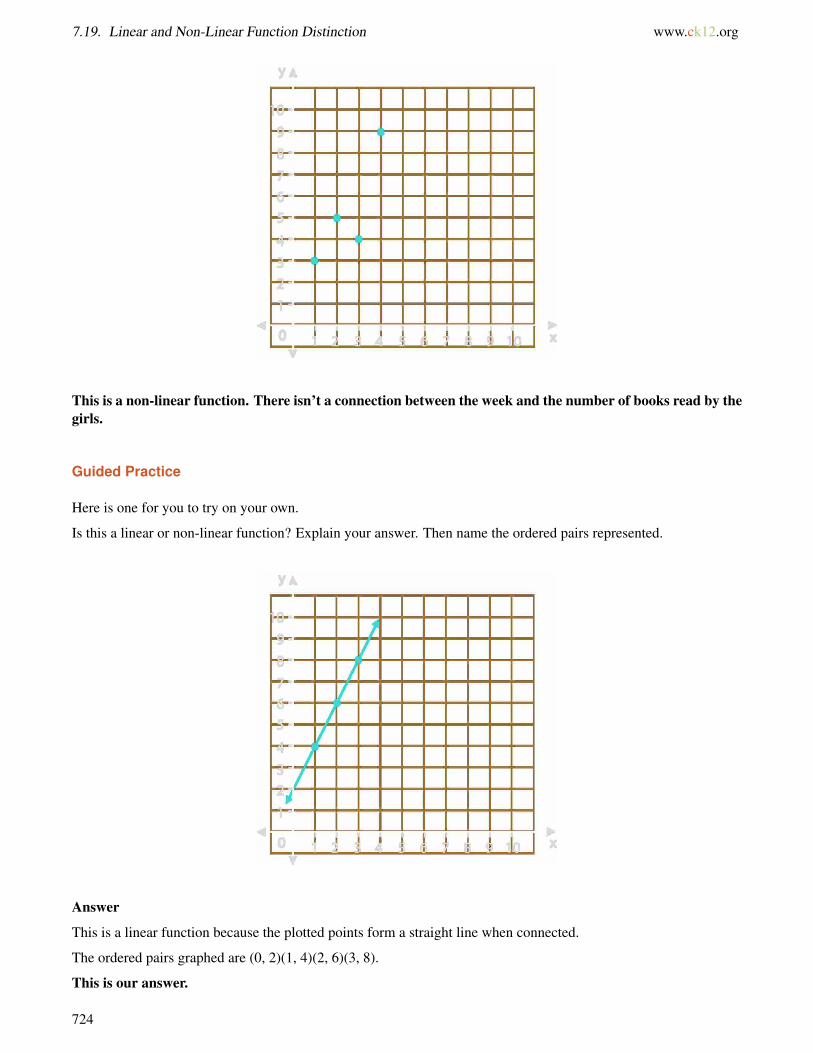
7.19. Linear and Non-Linear Function Distinction www.ck12.org
This is a non-linear function. There isn’t a connection between the week and the number of books read by thegirls.
Guided Practice
Here is one for you to try on your own.
Is this a linear or non-linear function? Explain your answer. Then name the ordered pairs represented.
Answer
This is a linear function because the plotted points form a straight line when connected.
The ordered pairs graphed are (0, 2)(1, 4)(2, 6)(3, 8).
This is our answer.
724
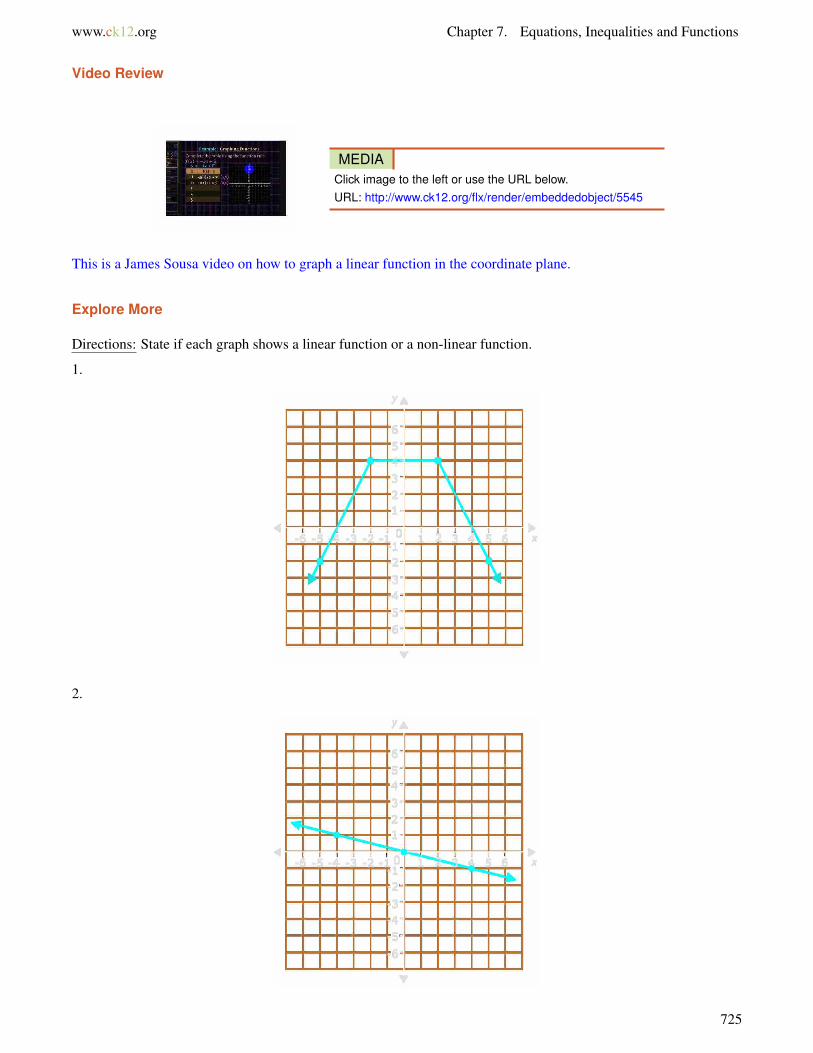
www.ck12.org Chapter 7. Equations, Inequalities and Functions
Video Review
MEDIAClick image to the left or use the URL below.URL: http://www.ck12.org/flx/render/embeddedobject/5545
This is a James Sousa video on how to graph a linear function in the coordinate plane.
Explore More
Directions: State if each graph shows a linear function or a non-linear function.
1.
2.
725
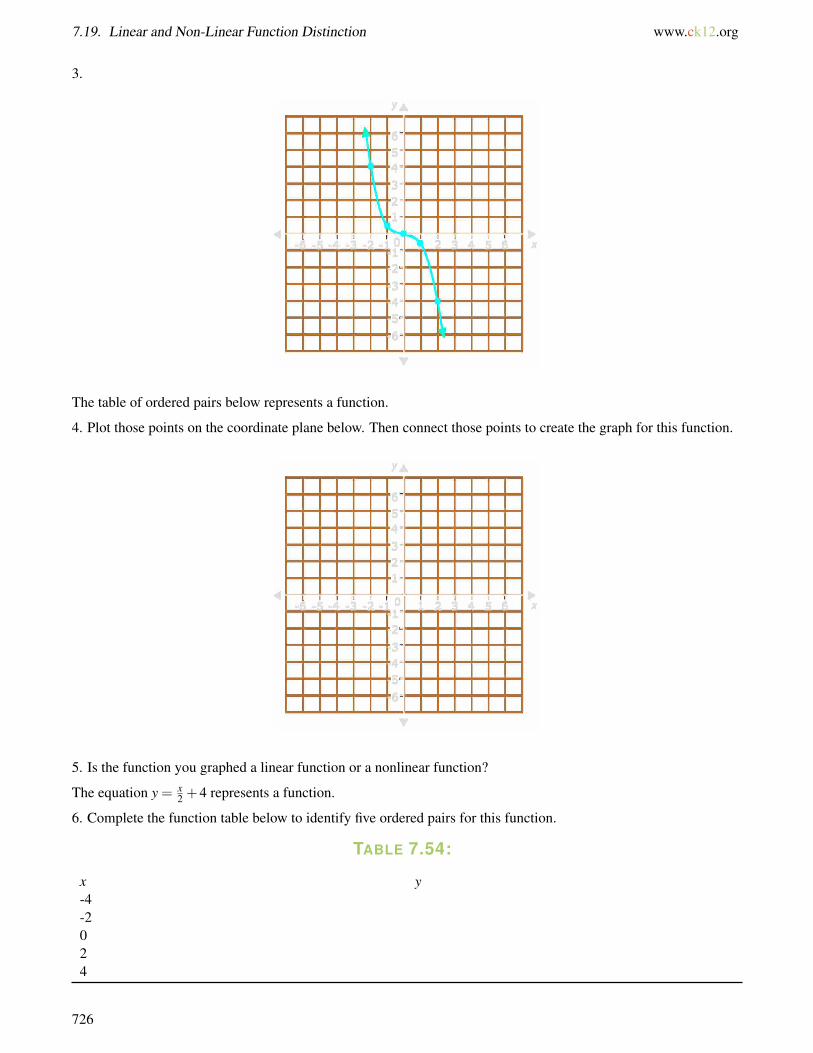
7.19. Linear and Non-Linear Function Distinction www.ck12.org
3.
The table of ordered pairs below represents a function.
4. Plot those points on the coordinate plane below. Then connect those points to create the graph for this function.
5. Is the function you graphed a linear function or a nonlinear function?
The equation y = x2 +4 represents a function.
6. Complete the function table below to identify five ordered pairs for this function.
TABLE 7.54:
x y-4-2024
726
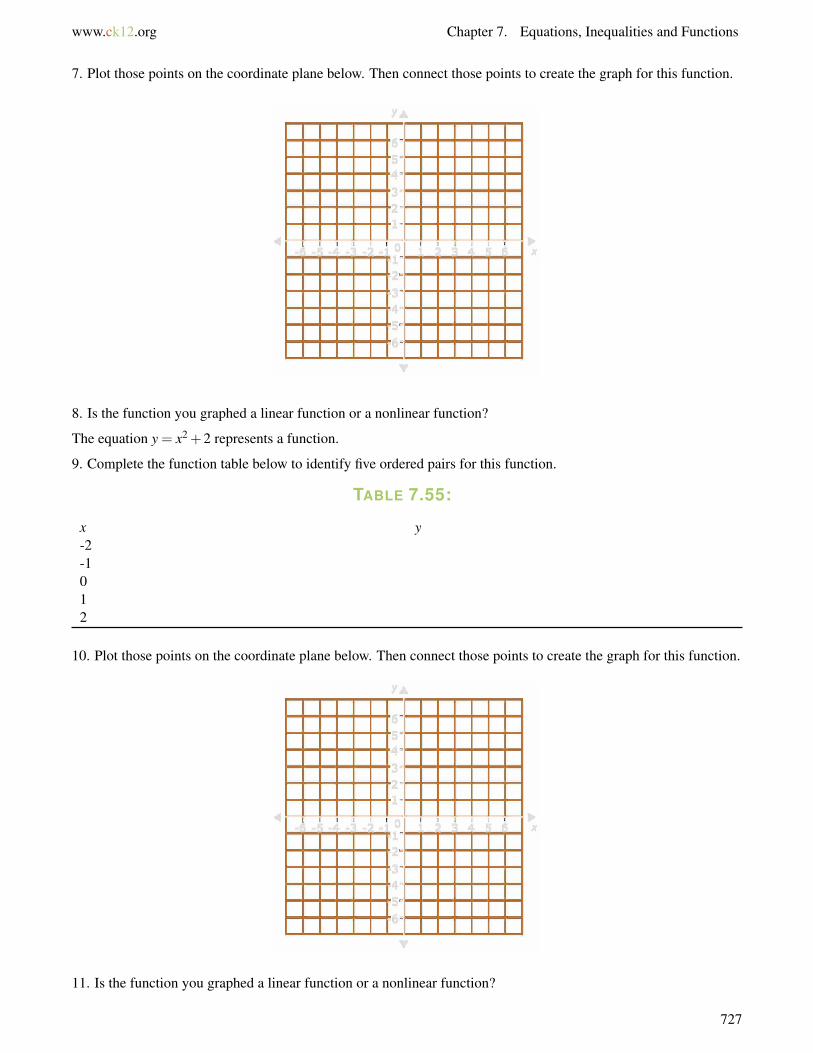
www.ck12.org Chapter 7. Equations, Inequalities and Functions
7. Plot those points on the coordinate plane below. Then connect those points to create the graph for this function.
8. Is the function you graphed a linear function or a nonlinear function?
The equation y = x2 +2 represents a function.
9. Complete the function table below to identify five ordered pairs for this function.
TABLE 7.55:
x y-2-1012
10. Plot those points on the coordinate plane below. Then connect those points to create the graph for this function.
11. Is the function you graphed a linear function or a nonlinear function?
727
7.19. Linear and Non-Linear Function Distinction www.ck12.org
The rule for a linear function is: add 1 to each x−value to find each y−value.
12. Write an equation to represent this linear function.
13. Graph the function on this coordinate plane.
The rule for a linear function is: multiply each x−value by 2 and then subtract 2 to find each y−value.
14. Write an equation to represent this linear function.
15. Graph the function on this coordinate plane.
728

www.ck12.org Chapter 7. Equations, Inequalities and Functions
7.20 Linear and Non-Linear Patterns of Change
Here you’ll learn to model and solve real-world problems involving patterns of change and linear functions.
Have you ever thought of roller coasters? Marc loves them.
Marc loves roller coasters. He can’t wait to ride some of the roller coasters at an amusement park in New Hampshire.Marc thinks that the speed of the roller coaster is a function of its height.
After doing some research, here is what Marc discovers.
The Timber Terror Roller Coaster
Height = 85 f t
Speed = 55 mph
Kingda Ka Roller Coaster
Height = 456 f eet
Speed = 128 mph
Top Thrill Dragster Roller Coaster
Height = 420 f t.
Speed = 120 mph
Create a table and figure out if Marc’s information is linear or non-linear.
This Concept will teach you how to solve real-world problems involving patterns of change.
Guidance
Linear functions can allow us to represent real-world situations. Specifically, linear functions can help us understandsituations in which two pairs of values are related by a rule.
We can represent the problem with a function table, an equation, or a graph. Representing a problem in more thanone way can sometimes help us understand how to solve it.
This table shows how the total cost of buying tomatoes at the farmer’s market changes depending on the number ofpounds of tomatoes purchased.
729

7.20. Linear and Non-Linear Patterns of Change www.ck12.org
TABLE 7.56:
Number of Pounds Purchased (x) Total Cost in Dollars (y)1 22 43 64 ?5 ?
a. Write an equation to describe the relationship between the pairs of values in the table above.
b. Create a graph to represent the relationship between the number of pounds of tomatoes purchased, x, and the totalcost, y.
c. Determine the cost of buying 5 pounds of tomatoes at the farmer’s market.
Consider part a first.
Use guess and check to determine how to each pair of values is related.
For example, notice that each y−value is greater than its corresponding x−value. So, the rule will involveeither addition or multiplication.
Since each y−value in the table is 2 more than its previous y−value, the rule may involve multiplying by 2.
Look for a rule that involves multiplying by 2.
Consider the ordered pair (1, 2).
1×2 = 2, so the rule could be to multiply each x−value by 2 to find its corresponding y−value. Check to see if thatrule works for the other pairs of values in the table.
Consider the ordered pair (2, 4).
2×2 = 4, so the rule works for that ordered pair.
Consider the ordered pair (3, 6).
3×2 = 6, so the rule works for that ordered pair.
So, the rule for this function table is: multiply each x−value by 2 to find its corresponding y−value.
Now that we have a rule in words, let’s write an equation to show the same relationship. Remember, to findeach y−value, you must multiply each x−value by 2. So, the equation would be y = 2x
Next, consider part b.
First, let’s consider how the graph for this function should look. We should use the horizontal axis to show thenumber of pounds, x.
We should use the vertical axis to show the total cost, y, in dollars.
Consider how to number the axes. The x−values represent the number of pounds of tomatoes purchased. Since noone can buy a negative number of pounds of tomatoes, the graph should only show x−values that are greater thanor equal to 0. So, we can number each axis starting from 0. The greatest x−value we must show is 3. The greatesty−value we must show is 6. So, the numbers on the vertical axis must go up to at least 6. Let’s allow some room forthe graph to be extended and number each axis from 0 to 10.
730
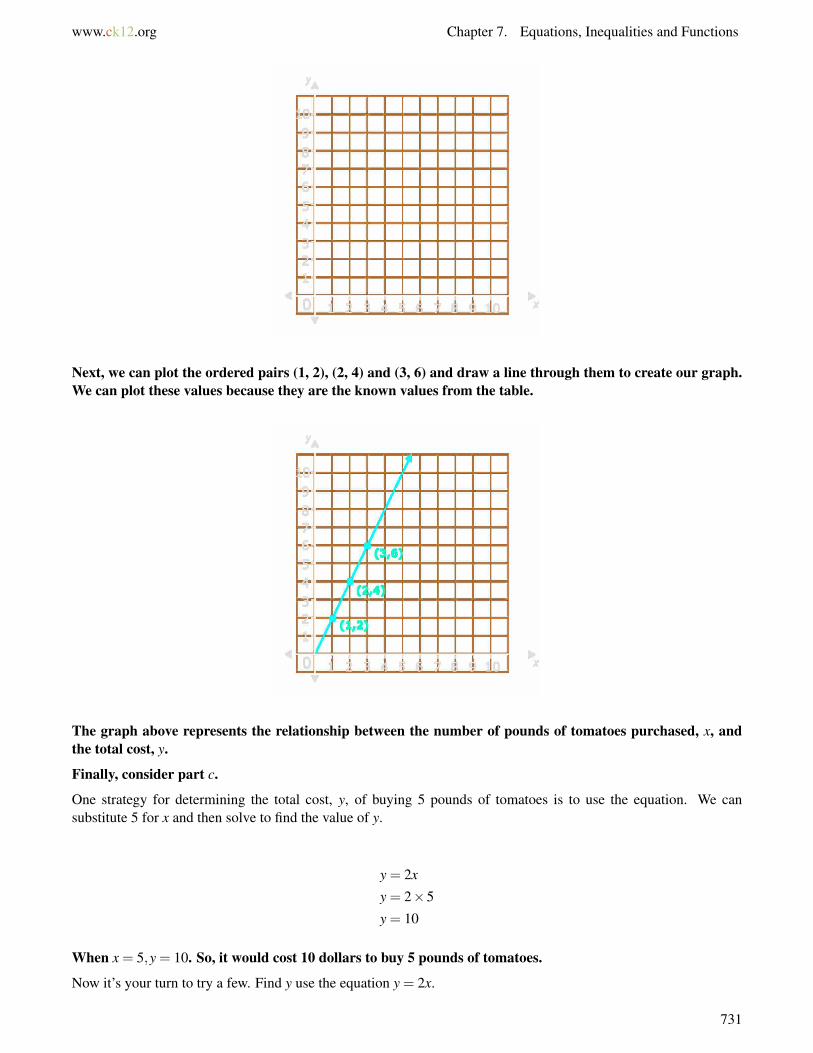
www.ck12.org Chapter 7. Equations, Inequalities and Functions
Next, we can plot the ordered pairs (1, 2), (2, 4) and (3, 6) and draw a line through them to create our graph.We can plot these values because they are the known values from the table.
The graph above represents the relationship between the number of pounds of tomatoes purchased, x, andthe total cost, y.
Finally, consider part c.
One strategy for determining the total cost, y, of buying 5 pounds of tomatoes is to use the equation. We cansubstitute 5 for x and then solve to find the value of y.
y = 2x
y = 2×5
y = 10
When x = 5,y = 10. So, it would cost 10 dollars to buy 5 pounds of tomatoes.
Now it’s your turn to try a few. Find y use the equation y = 2x.
731
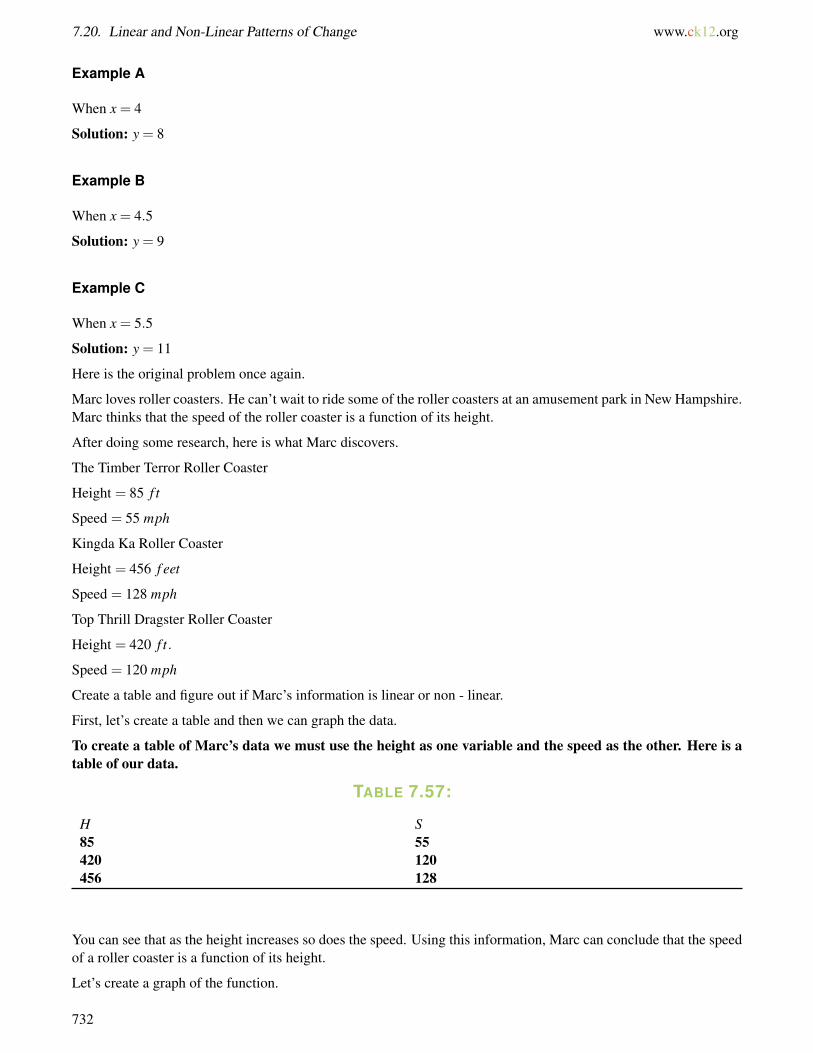
7.20. Linear and Non-Linear Patterns of Change www.ck12.org
Example A
When x = 4
Solution: y = 8
Example B
When x = 4.5
Solution: y = 9
Example C
When x = 5.5
Solution: y = 11
Here is the original problem once again.
Marc loves roller coasters. He can’t wait to ride some of the roller coasters at an amusement park in New Hampshire.Marc thinks that the speed of the roller coaster is a function of its height.
After doing some research, here is what Marc discovers.
The Timber Terror Roller Coaster
Height = 85 f t
Speed = 55 mph
Kingda Ka Roller Coaster
Height = 456 f eet
Speed = 128 mph
Top Thrill Dragster Roller Coaster
Height = 420 f t.
Speed = 120 mph
Create a table and figure out if Marc’s information is linear or non - linear.
First, let’s create a table and then we can graph the data.
To create a table of Marc’s data we must use the height as one variable and the speed as the other. Here is atable of our data.
TABLE 7.57:
H S85 55420 120456 128
You can see that as the height increases so does the speed. Using this information, Marc can conclude that the speedof a roller coaster is a function of its height.
Let’s create a graph of the function.
732
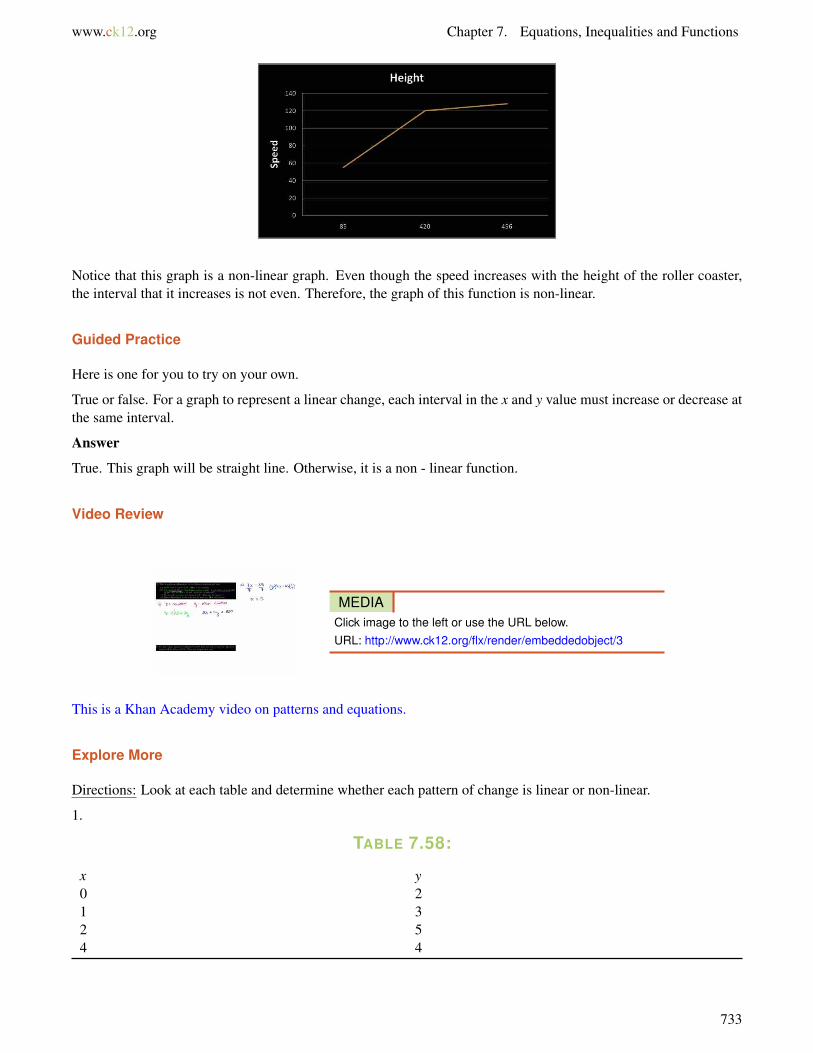
www.ck12.org Chapter 7. Equations, Inequalities and Functions
Notice that this graph is a non-linear graph. Even though the speed increases with the height of the roller coaster,the interval that it increases is not even. Therefore, the graph of this function is non-linear.
Guided Practice
Here is one for you to try on your own.
True or false. For a graph to represent a linear change, each interval in the x and y value must increase or decrease atthe same interval.
Answer
True. This graph will be straight line. Otherwise, it is a non - linear function.
Video Review
MEDIAClick image to the left or use the URL below.URL: http://www.ck12.org/flx/render/embeddedobject/3
This is a Khan Academy video on patterns and equations.
Explore More
Directions: Look at each table and determine whether each pattern of change is linear or non-linear.
1.
TABLE 7.58:
x y0 21 32 54 4
733
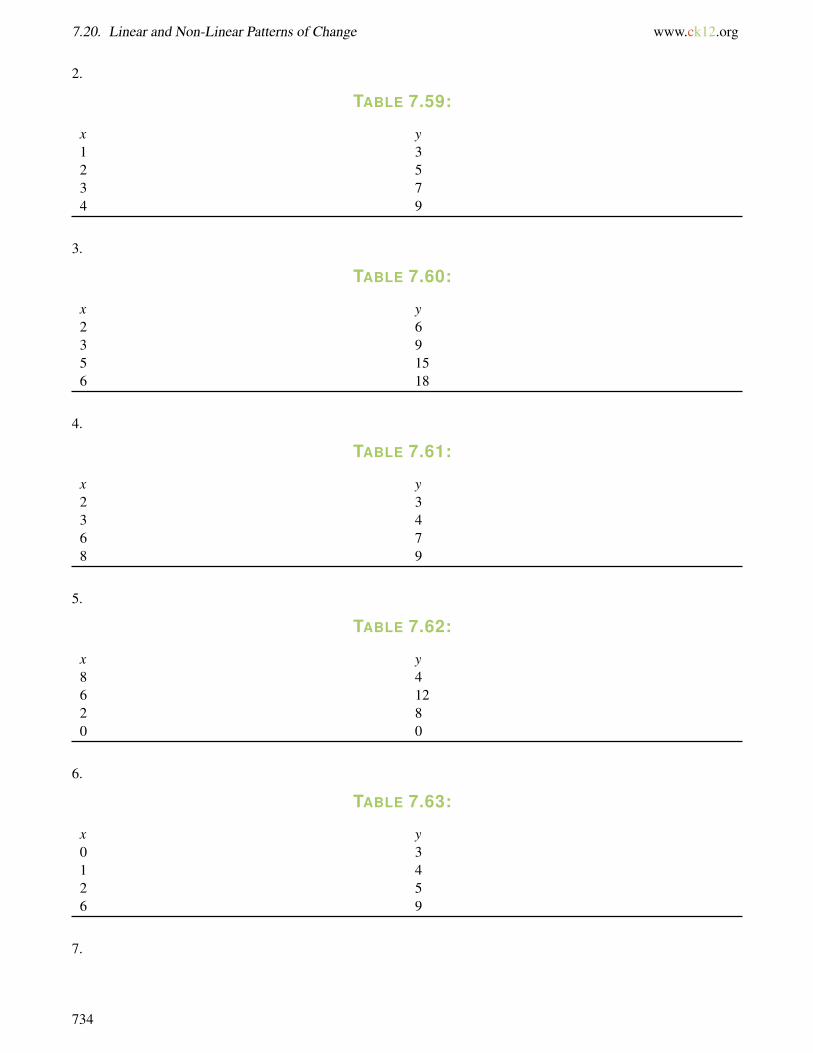
7.20. Linear and Non-Linear Patterns of Change www.ck12.org
2.
TABLE 7.59:
x y1 32 53 74 9
3.
TABLE 7.60:
x y2 63 95 156 18
4.
TABLE 7.61:
x y2 33 46 78 9
5.
TABLE 7.62:
x y8 46 122 80 0
6.
TABLE 7.63:
x y0 31 42 56 9
7.
734
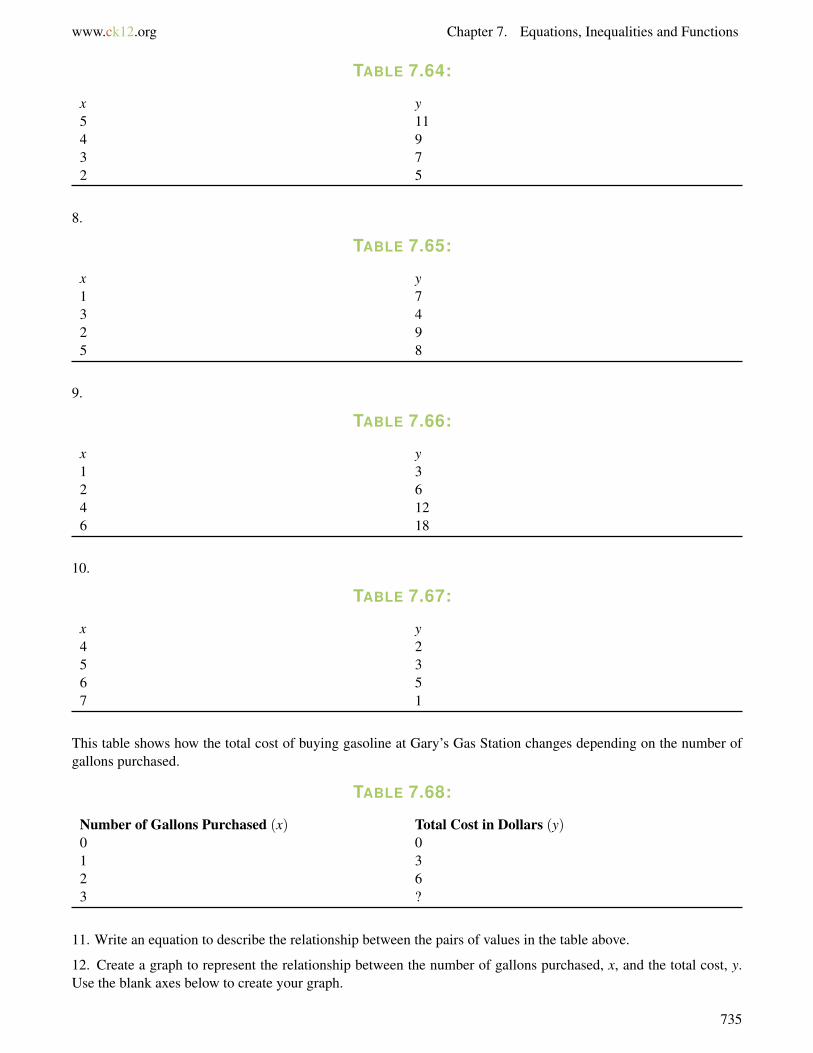
www.ck12.org Chapter 7. Equations, Inequalities and Functions
TABLE 7.64:
x y5 114 93 72 5
8.
TABLE 7.65:
x y1 73 42 95 8
9.
TABLE 7.66:
x y1 32 64 126 18
10.
TABLE 7.67:
x y4 25 36 57 1
This table shows how the total cost of buying gasoline at Gary’s Gas Station changes depending on the number ofgallons purchased.
TABLE 7.68:
Number of Gallons Purchased (x) Total Cost in Dollars (y)0 01 32 63 ?
11. Write an equation to describe the relationship between the pairs of values in the table above.
12. Create a graph to represent the relationship between the number of gallons purchased, x, and the total cost, y.Use the blank axes below to create your graph.
735
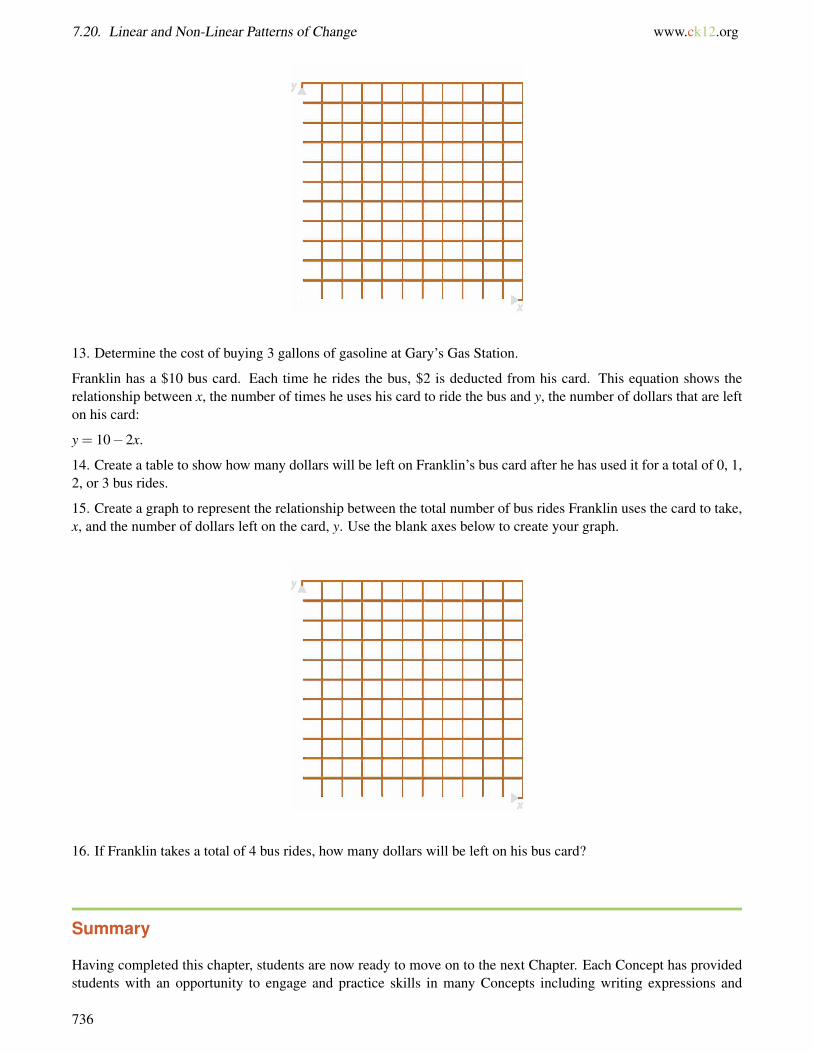
7.20. Linear and Non-Linear Patterns of Change www.ck12.org
13. Determine the cost of buying 3 gallons of gasoline at Gary’s Gas Station.
Franklin has a $10 bus card. Each time he rides the bus, $2 is deducted from his card. This equation shows therelationship between x, the number of times he uses his card to ride the bus and y, the number of dollars that are lefton his card:
y = 10−2x.
14. Create a table to show how many dollars will be left on Franklin’s bus card after he has used it for a total of 0, 1,2, or 3 bus rides.
15. Create a graph to represent the relationship between the total number of bus rides Franklin uses the card to take,x, and the number of dollars left on the card, y. Use the blank axes below to create your graph.
16. If Franklin takes a total of 4 bus rides, how many dollars will be left on his bus card?
Summary
Having completed this chapter, students are now ready to move on to the next Chapter. Each Concept has providedstudents with an opportunity to engage and practice skills in many Concepts including writing expressions and
736

www.ck12.org Chapter 7. Equations, Inequalities and Functions
equations, simplifying expressions, solving one-step equations, solving two-step equations, solving inequalities,identifying and understanding functions and graphing functions.
737

www.ck12.org
CHAPTER 8 GeometryChapter Outline
8.1 ANGLE CLASSIFICATION
8.2 ANGLE PAIRS
8.3 SUPPLEMENTARY AND COMPLEMENTARY ANGLE PAIRS
8.4 VERTICAL ANGLES
8.5 PARALLEL AND PERPENDICULAR LINES
8.6 CORRESPONDING ANGLES
8.7 TRIANGLE SUM THEOREM
8.8 TRIANGLE CLASSIFICATION
8.9 QUADRILATERAL CLASSIFICATION
8.10 POLYGON CLASSIFICATION
8.11 REGULAR AND IRREGULAR POLYGONS
8.12 CONGRUENT FIGURES
8.13 SIMILARITY
8.14 SCALE FACTOR OF SIMILAR POLYGONS
8.15 UNKNOWN MEASURES OF SIMILAR FIGURES
8.16 RIGID TRANSFORMATIONS
8.17 LINES OF SYMMETRY
8.18 TRANSFORMATION CLASSIFICATION
8.19 TRANSLATIONS, ROTATIONS, AND REFLECTIONS
Introduction
In Math 7, the learning content is divided into Concepts. Each Concept is complete and whole providing focusedlearning on an indicated objective. Theme-based Concepts provide students with experiences that integrate thecontent of each Concept. Students are given opportunities to practice the skills of each Concept through real-world situations, examples, guided practice and independent practice sections. There are also video links providedto give students an audio/visual way of connecting with the content. In this Chapter, students will engage withConcepts on classifying angles, identifying angles, angle measures, complementary angles, supplementary angles,vertical angles, adjacent angles, parallel lines, perpendicular lines, intersecting lines, corresponding angles, triangles,congruent figures, similar figures, indirect measurement, symmetry and transformations.
738

www.ck12.org Chapter 8. Geometry
8.1 Angle Classification
Here you’ll learn to classify angles as acute, obtuse, right or straight.
Have you ever been on a field trip to an art museum?
Mrs. Gilson is taking her math class to the art museum on a field trip. Before leaving for the museum, Mrs. Gilsonposed some questions to her class.
“Does anyone know why we are going to an art museum for math class?” She asked.
Matt, who tended to like to make jokes, was the first one to speak up.
“So we can count the paintings?” he joked.
Mrs. Gilson smiled as if she was expecting just such an answer. She looked around and waited for any otherresponses. Kyle was the next one to speak.
“I think it has to do with geometry. Isn’t most art based on some kind of geometry?” he asked.
“Very nice, and yes you are correct. We can find geometry in many different paintings forms and figures. Some ofthe first painters, sculptures, actually all kinds of artists used geometry to design their work. Here is a slide that wecan look at together,” Mrs. Gilson said putting an image up on the board from the computer.
“This is to help you practice before we go,” Mrs. Gilson explained. “This is a piece of a stained glass window. Youcan see the flowers in the painting, but can you see the geometry? Take out your notebooks and make a note of anyplace that you see angles. Let’s start with angles after all it is a building block of geometry.”
The students all took out their notebooks and began to work.
While the students make their notes, you make some notes too. What do you already know about angles?
This Concept is all about identifying angles as right, straight, acute and obtuse. After you learn about theseclassifications, you will be able to identify each type of angle in the stained glass. Pay attention and at the endof the Concept you will be able to find the geometry in the stained glass.
739
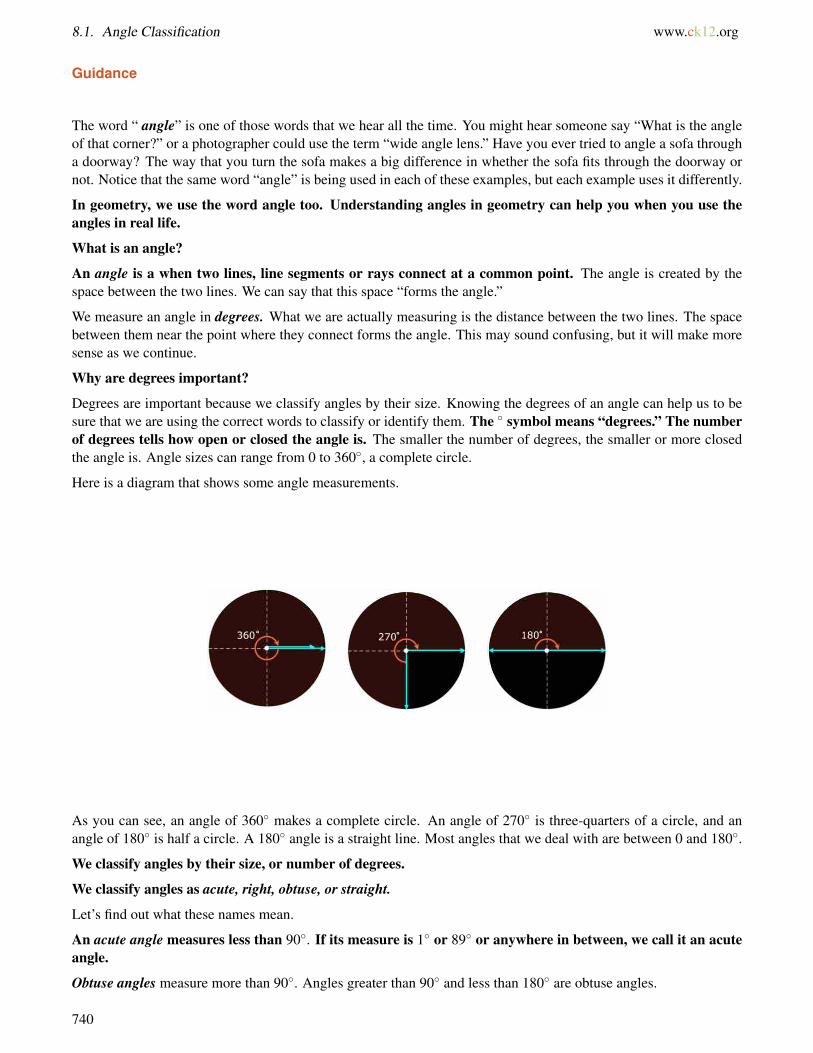
8.1. Angle Classification www.ck12.org
Guidance
The word “ angle” is one of those words that we hear all the time. You might hear someone say “What is the angleof that corner?” or a photographer could use the term “wide angle lens.” Have you ever tried to angle a sofa througha doorway? The way that you turn the sofa makes a big difference in whether the sofa fits through the doorway ornot. Notice that the same word “angle” is being used in each of these examples, but each example uses it differently.
In geometry, we use the word angle too. Understanding angles in geometry can help you when you use theangles in real life.
What is an angle?
An angle is a when two lines, line segments or rays connect at a common point. The angle is created by thespace between the two lines. We can say that this space “forms the angle.”
We measure an angle in degrees. What we are actually measuring is the distance between the two lines. The spacebetween them near the point where they connect forms the angle. This may sound confusing, but it will make moresense as we continue.
Why are degrees important?
Degrees are important because we classify angles by their size. Knowing the degrees of an angle can help us to besure that we are using the correct words to classify or identify them. The ◦ symbol means “degrees.” The numberof degrees tells how open or closed the angle is. The smaller the number of degrees, the smaller or more closedthe angle is. Angle sizes can range from 0 to 360◦, a complete circle.
Here is a diagram that shows some angle measurements.
As you can see, an angle of 360◦ makes a complete circle. An angle of 270◦ is three-quarters of a circle, and anangle of 180◦ is half a circle. A 180◦ angle is a straight line. Most angles that we deal with are between 0 and 180◦.
We classify angles by their size, or number of degrees.
We classify angles as acute, right, obtuse, or straight.
Let’s find out what these names mean.
An acute angle measures less than 90◦. If its measure is 1◦ or 89◦ or anywhere in between, we call it an acuteangle.
Obtuse angles measure more than 90◦. Angles greater than 90◦ and less than 180◦ are obtuse angles.
740
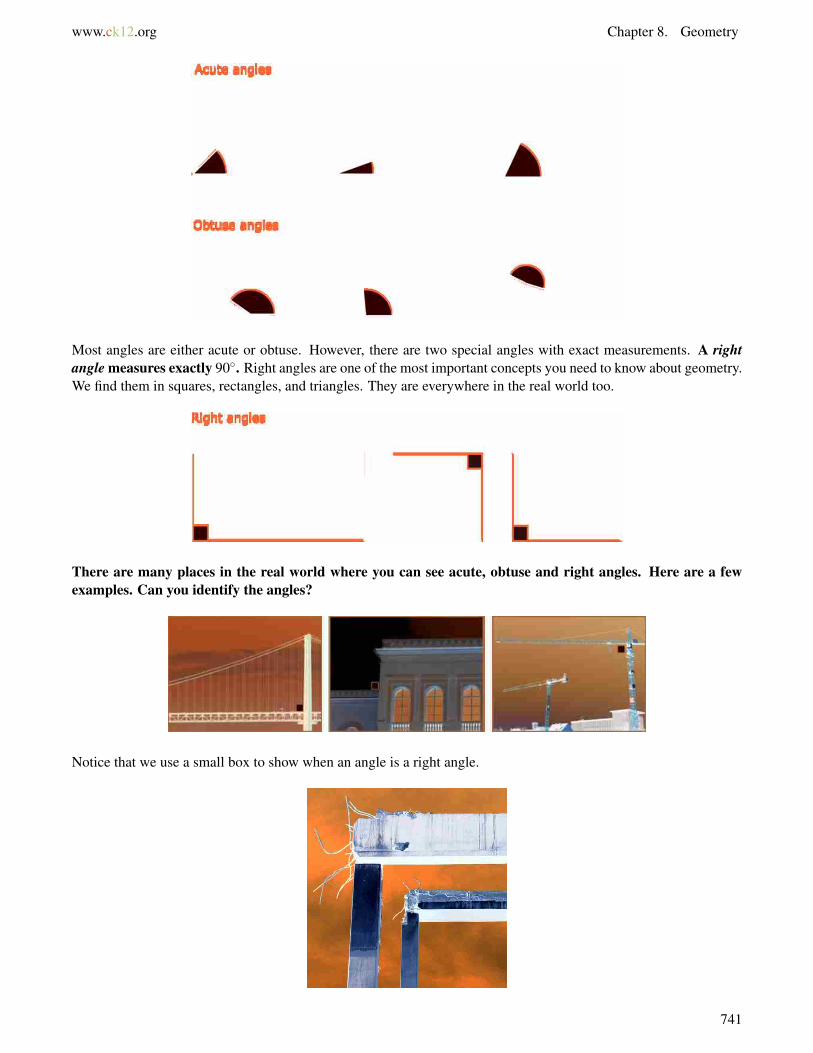
www.ck12.org Chapter 8. Geometry
Most angles are either acute or obtuse. However, there are two special angles with exact measurements. A rightangle measures exactly 90◦. Right angles are one of the most important concepts you need to know about geometry.We find them in squares, rectangles, and triangles. They are everywhere in the real world too.
There are many places in the real world where you can see acute, obtuse and right angles. Here are a fewexamples. Can you identify the angles?
Notice that we use a small box to show when an angle is a right angle.
741
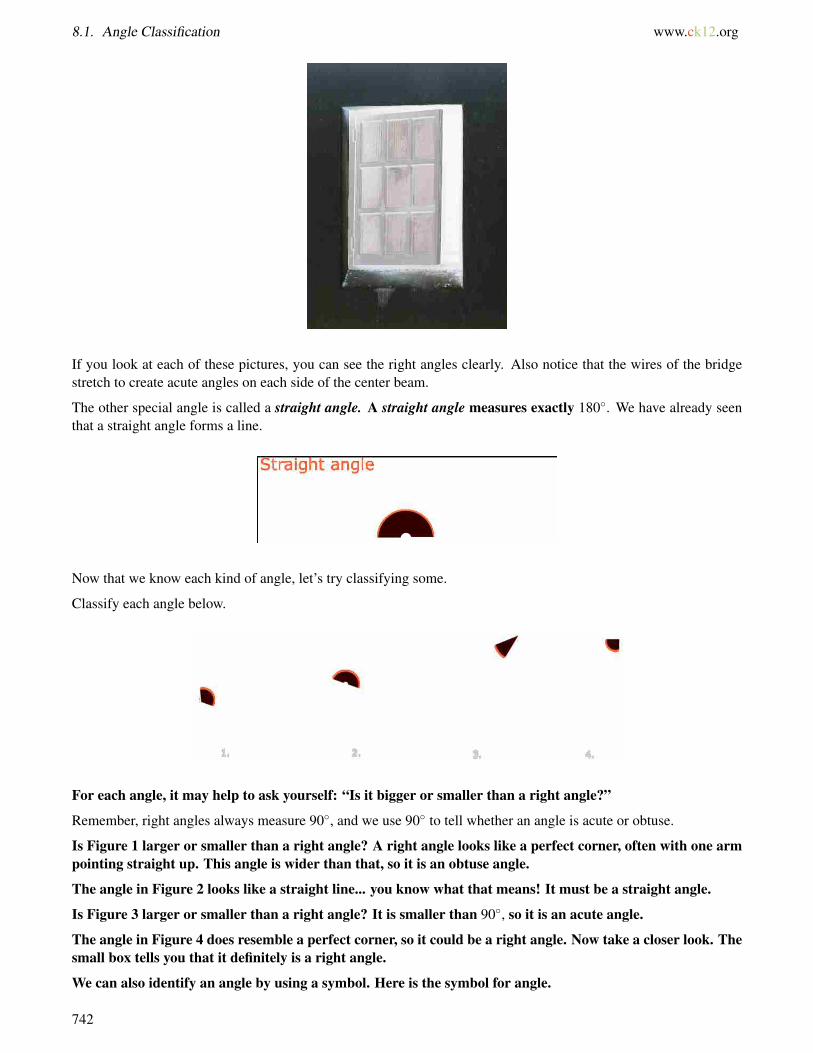
8.1. Angle Classification www.ck12.org
If you look at each of these pictures, you can see the right angles clearly. Also notice that the wires of the bridgestretch to create acute angles on each side of the center beam.
The other special angle is called a straight angle. A straight angle measures exactly 180◦. We have already seenthat a straight angle forms a line.
Now that we know each kind of angle, let’s try classifying some.
Classify each angle below.
For each angle, it may help to ask yourself: “Is it bigger or smaller than a right angle?”
Remember, right angles always measure 90◦, and we use 90◦ to tell whether an angle is acute or obtuse.
Is Figure 1 larger or smaller than a right angle? A right angle looks like a perfect corner, often with one armpointing straight up. This angle is wider than that, so it is an obtuse angle.
The angle in Figure 2 looks like a straight line... you know what that means! It must be a straight angle.
Is Figure 3 larger or smaller than a right angle? It is smaller than 90◦, so it is an acute angle.
The angle in Figure 4 does resemble a perfect corner, so it could be a right angle. Now take a closer look. Thesmall box tells you that it definitely is a right angle.
We can also identify an angle by using a symbol. Here is the symbol for angle.
742
www.ck12.org Chapter 8. Geometry
6 A
This means “Angle A”. You will see this symbol used when we work with angles.
Identify each type of angle described.
Example A
An angle greater than 90◦
Solution: Obtuse
Example B
An angle that measures 15◦
Solution: Acute
Example C
An angle that measures exactly 90◦
Solution: Right
Now you have learned all about angles. Here is the original problem once again. Reread it and then pay attention toMrs. Gilson’s instructions.
Mrs. Gilson is taking her math class to the art museum on a field trip. Before leaving for the museum, Mrs. Gilsonposed some questions to her class.
“Does anyone know why we are going to an art museum for math class?” She asked.
Matt, who tended to like to make jokes, was the first one to speak up.
“So we can count the paintings?” he joked.
Mrs. Gilson smiled as if she was expecting just such an answer. She looked around and waited for any otherresponses. Kyle was the next one to speak.
“I think it has to do with geometry. Isn’t most art based on some kind of geometry?” he asked.
“Very nice, and yes you are correct. We can find geometry in many different paintings forms and figures. Some ofthe first painters, sculptures, actually all kinds of artists used geometry to design their work. Here is a slide that wecan look at together,” Mrs. Gilson said putting an image up on the board from the computer.
743

8.1. Angle Classification www.ck12.org
“This is to help you practice before we go,” Mrs. Gilson explained. “This is a piece of a stained glass window. Youcan see the flowers in the painting, but can you see the geometry? Take out your notebooks and make a note of anyplace that you see angles. Let’s start with angles after all it is a building block of geometry.”
The students all took out their notebooks and began to work.
Can you find an example of each of the different types of angles in this stained glass? Make a few notes inyour notebook. It may be helpful to draw them too.
While the students worked, Mrs. Gilson walked around the room. When most seemed finished, Mrs. Gilson gavethe students this instruction.
“Now find a partner and share the angles that you found in the painting.”
You do this too. Find a partner and share the angles that you found. This is the best way to check your workfor accuracy. If you and your partner both selected the same angle, then choose a new one together.
Guided Practice
Here is one for you to try on your own.
True or false. An acute angle can also be a right angle.
Answer
False. An acute angle measures 90 degrees while a right angle measures exactly 90 degrees.
Video Review
MEDIAClick image to the left or use the URL below.URL: http://www.ck12.org/flx/render/embeddedobject/1275
This is a James Sousa video on the types of angles.
744
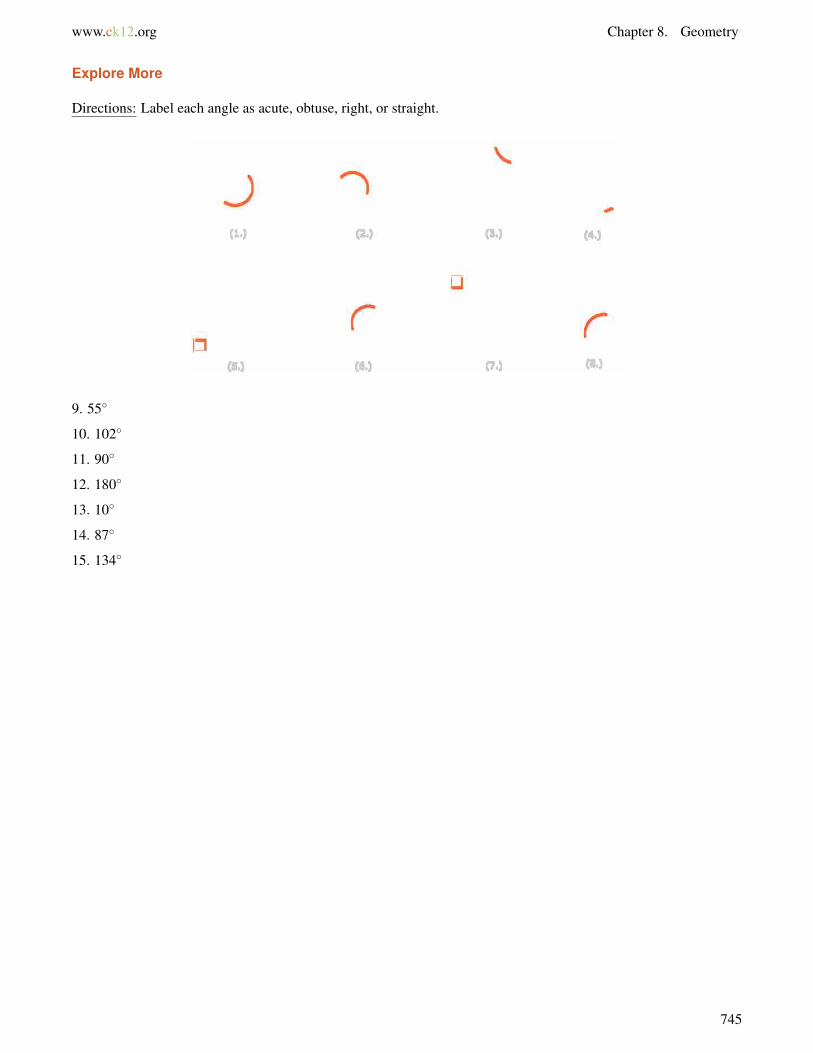
www.ck12.org Chapter 8. Geometry
Explore More
Directions: Label each angle as acute, obtuse, right, or straight.
9. 55◦
10. 102◦
11. 90◦
12. 180◦
13. 10◦
14. 87◦
15. 134◦
745
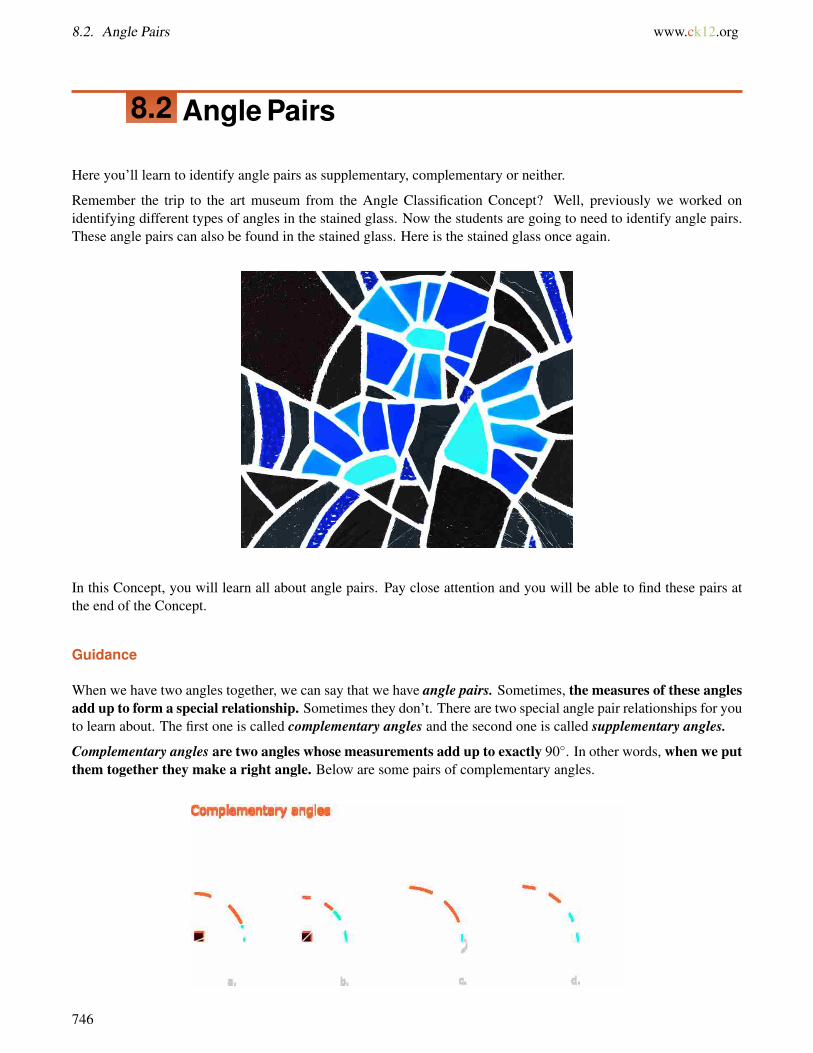
8.2. Angle Pairs www.ck12.org
8.2 Angle Pairs
Here you’ll learn to identify angle pairs as supplementary, complementary or neither.
Remember the trip to the art museum from the Angle Classification Concept? Well, previously we worked onidentifying different types of angles in the stained glass. Now the students are going to need to identify angle pairs.These angle pairs can also be found in the stained glass. Here is the stained glass once again.
In this Concept, you will learn all about angle pairs. Pay close attention and you will be able to find these pairs atthe end of the Concept.
Guidance
When we have two angles together, we can say that we have angle pairs. Sometimes, the measures of these anglesadd up to form a special relationship. Sometimes they don’t. There are two special angle pair relationships for youto learn about. The first one is called complementary angles and the second one is called supplementary angles.
Complementary angles are two angles whose measurements add up to exactly 90◦. In other words, when we putthem together they make a right angle. Below are some pairs of complementary angles.
746
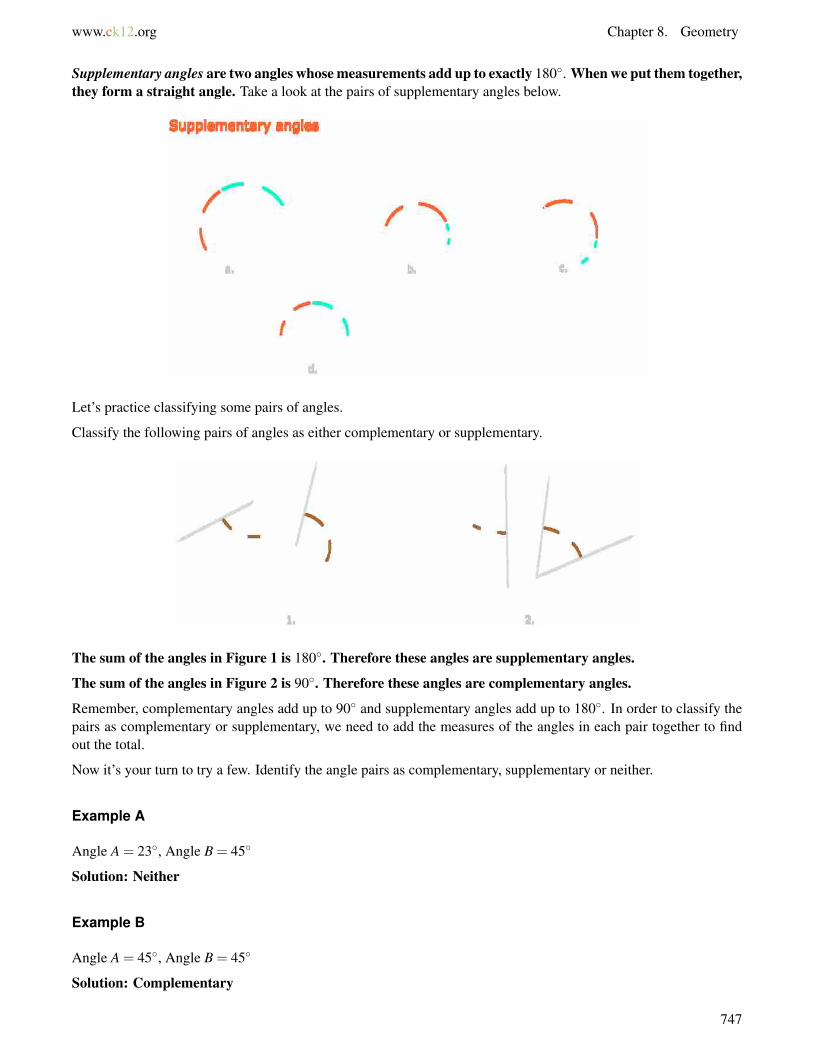
www.ck12.org Chapter 8. Geometry
Supplementary angles are two angles whose measurements add up to exactly 180◦. When we put them together,they form a straight angle. Take a look at the pairs of supplementary angles below.
Let’s practice classifying some pairs of angles.
Classify the following pairs of angles as either complementary or supplementary.
The sum of the angles in Figure 1 is 180◦. Therefore these angles are supplementary angles.
The sum of the angles in Figure 2 is 90◦. Therefore these angles are complementary angles.
Remember, complementary angles add up to 90◦ and supplementary angles add up to 180◦. In order to classify thepairs as complementary or supplementary, we need to add the measures of the angles in each pair together to findout the total.
Now it’s your turn to try a few. Identify the angle pairs as complementary, supplementary or neither.
Example A
Angle A = 23◦, Angle B = 45◦
Solution: Neither
Example B
Angle A = 45◦, Angle B = 45◦
Solution: Complementary
747
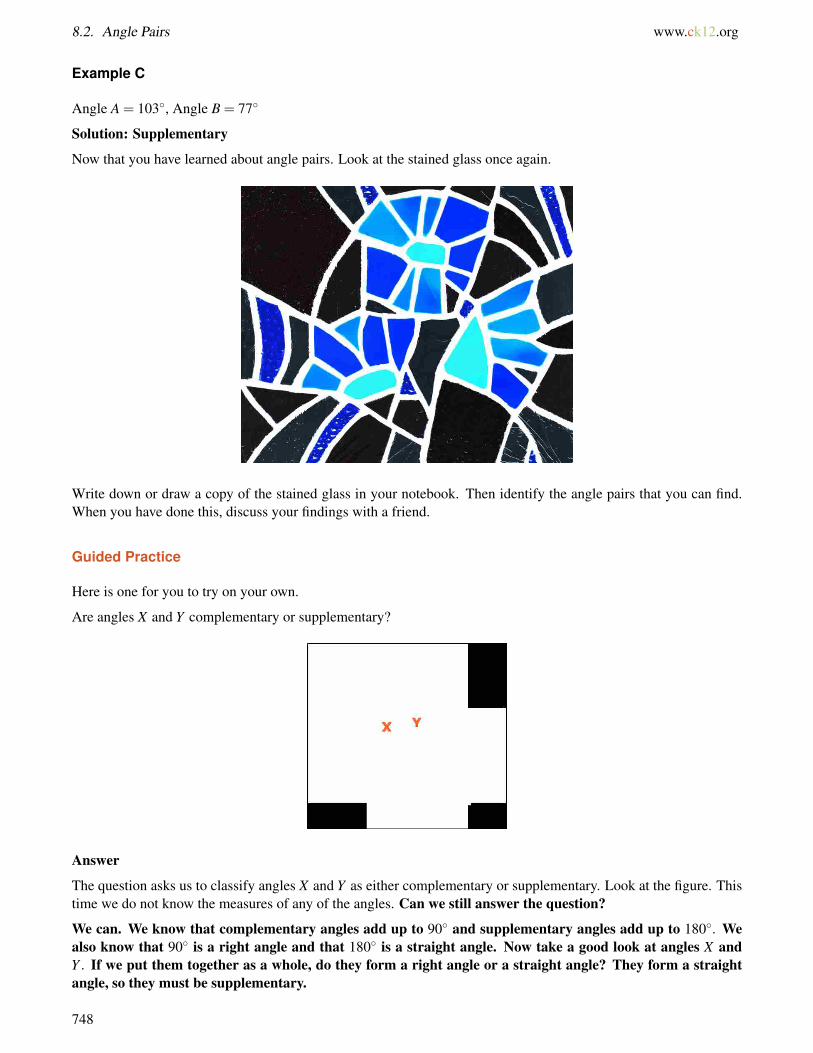
8.2. Angle Pairs www.ck12.org
Example C
Angle A = 103◦, Angle B = 77◦
Solution: Supplementary
Now that you have learned about angle pairs. Look at the stained glass once again.
Write down or draw a copy of the stained glass in your notebook. Then identify the angle pairs that you can find.When you have done this, discuss your findings with a friend.
Guided Practice
Here is one for you to try on your own.
Are angles X and Y complementary or supplementary?
Answer
The question asks us to classify angles X and Y as either complementary or supplementary. Look at the figure. Thistime we do not know the measures of any of the angles. Can we still answer the question?
We can. We know that complementary angles add up to 90◦ and supplementary angles add up to 180◦. Wealso know that 90◦ is a right angle and that 180◦ is a straight angle. Now take a good look at angles X andY . If we put them together as a whole, do they form a right angle or a straight angle? They form a straightangle, so they must be supplementary.
748
www.ck12.org Chapter 8. Geometry
Video Review
MEDIAClick image to the left or use the URL below.URL: http://www.ck12.org/flx/render/embeddedobject/1275
This is a James Sousa video on the types of angles.
Explore More
Directions: Identify whether the pairs below are complementary or supplementary or neither.
1.
2.
3.
749
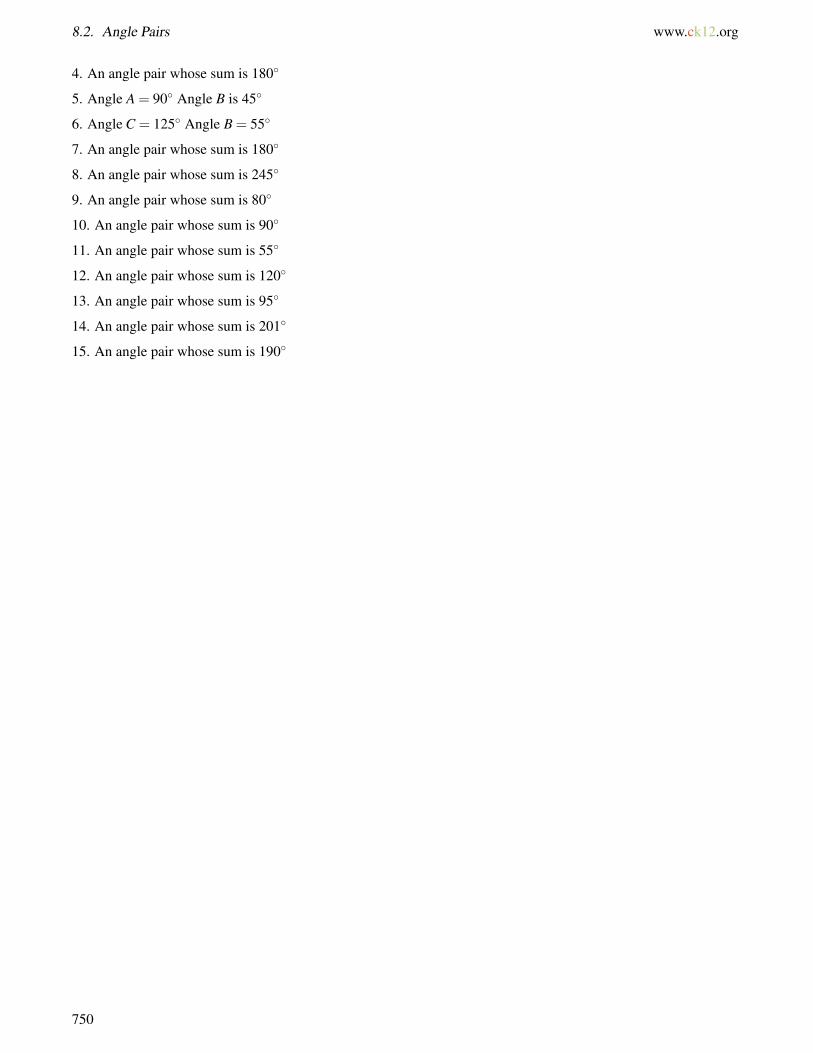
8.2. Angle Pairs www.ck12.org
4. An angle pair whose sum is 180◦
5. Angle A = 90◦ Angle B is 45◦
6. Angle C = 125◦ Angle B = 55◦
7. An angle pair whose sum is 180◦
8. An angle pair whose sum is 245◦
9. An angle pair whose sum is 80◦
10. An angle pair whose sum is 90◦
11. An angle pair whose sum is 55◦
12. An angle pair whose sum is 120◦
13. An angle pair whose sum is 95◦
14. An angle pair whose sum is 201◦
15. An angle pair whose sum is 190◦
750
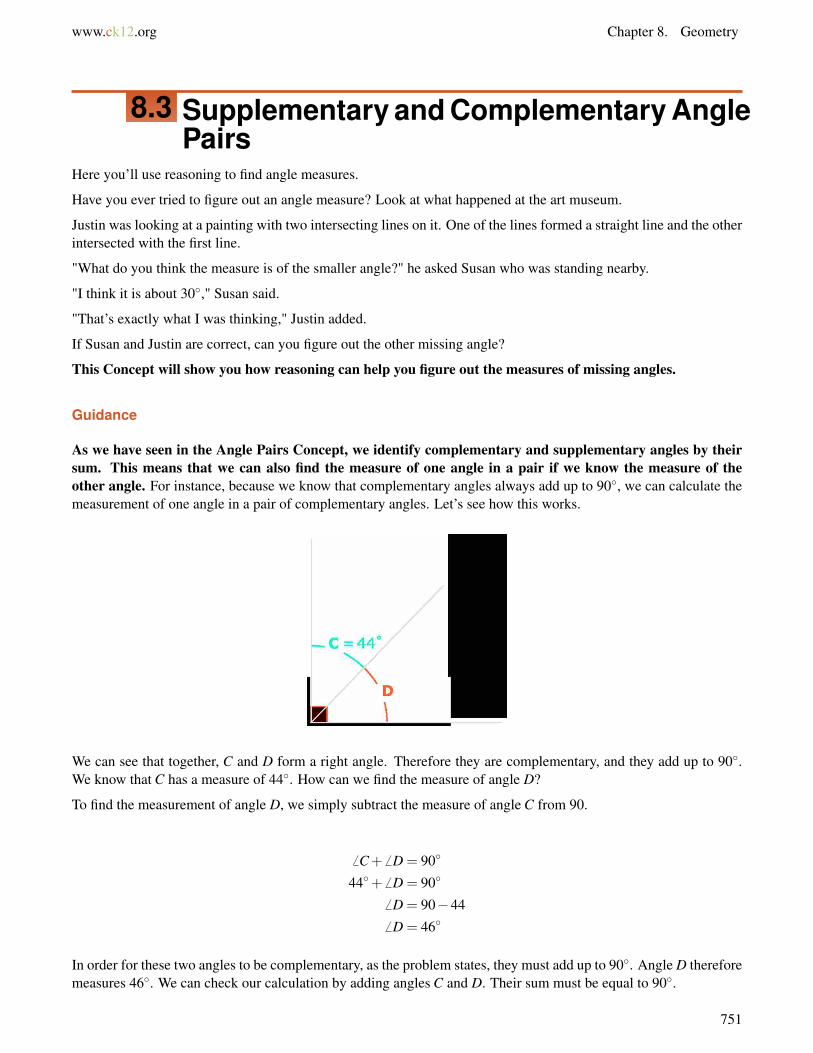
www.ck12.org Chapter 8. Geometry
8.3 Supplementary and Complementary AnglePairs
Here you’ll use reasoning to find angle measures.
Have you ever tried to figure out an angle measure? Look at what happened at the art museum.
Justin was looking at a painting with two intersecting lines on it. One of the lines formed a straight line and the otherintersected with the first line.
"What do you think the measure is of the smaller angle?" he asked Susan who was standing nearby.
"I think it is about 30◦," Susan said.
"That’s exactly what I was thinking," Justin added.
If Susan and Justin are correct, can you figure out the other missing angle?
This Concept will show you how reasoning can help you figure out the measures of missing angles.
Guidance
As we have seen in the Angle Pairs Concept, we identify complementary and supplementary angles by theirsum. This means that we can also find the measure of one angle in a pair if we know the measure of theother angle. For instance, because we know that complementary angles always add up to 90◦, we can calculate themeasurement of one angle in a pair of complementary angles. Let’s see how this works.
We can see that together, C and D form a right angle. Therefore they are complementary, and they add up to 90◦.We know that C has a measure of 44◦. How can we find the measure of angle D?
To find the measurement of angle D, we simply subtract the measure of angle C from 90.
6 C+ 6 D = 90◦
44◦+ 6 D = 90◦
6 D = 90−446 D = 46◦
In order for these two angles to be complementary, as the problem states, they must add up to 90◦. Angle D thereforemeasures 46◦. We can check our calculation by adding angles C and D. Their sum must be equal to 90◦.
751
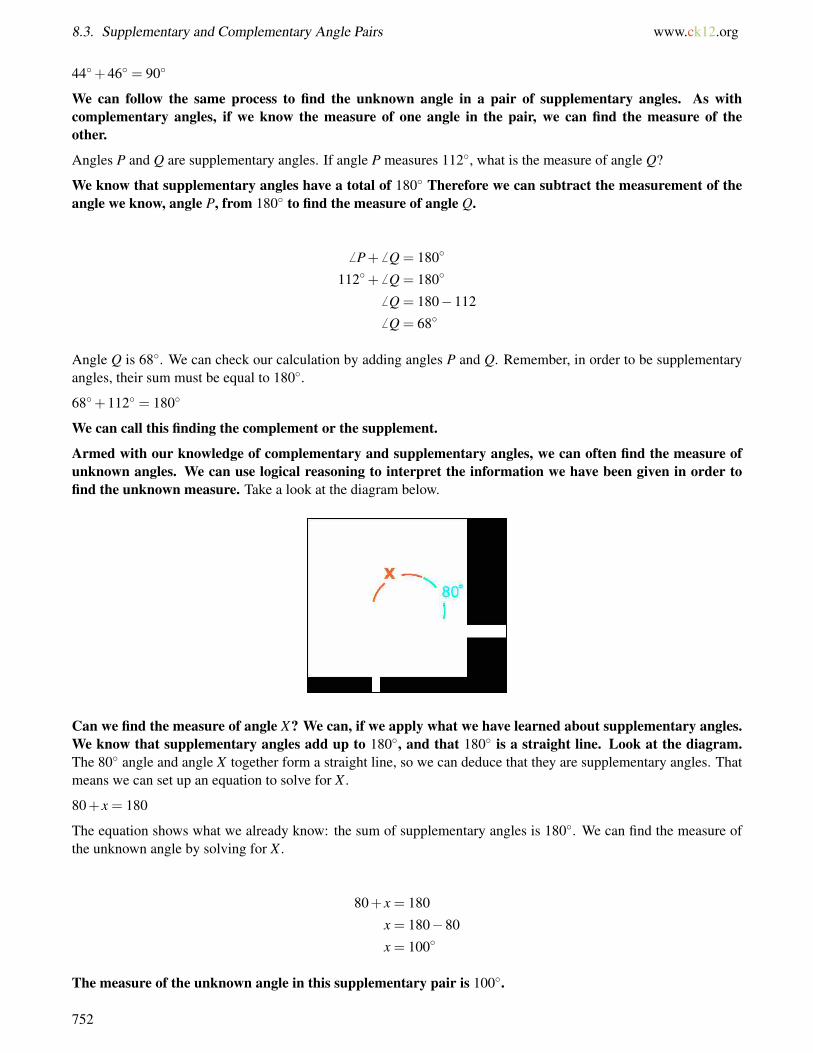
8.3. Supplementary and Complementary Angle Pairs www.ck12.org
44◦+46◦ = 90◦
We can follow the same process to find the unknown angle in a pair of supplementary angles. As withcomplementary angles, if we know the measure of one angle in the pair, we can find the measure of theother.
Angles P and Q are supplementary angles. If angle P measures 112◦, what is the measure of angle Q?
We know that supplementary angles have a total of 180◦ Therefore we can subtract the measurement of theangle we know, angle P, from 180◦ to find the measure of angle Q.
6 P+ 6 Q = 180◦
112◦+ 6 Q = 180◦
6 Q = 180−1126 Q = 68◦
Angle Q is 68◦. We can check our calculation by adding angles P and Q. Remember, in order to be supplementaryangles, their sum must be equal to 180◦.
68◦+112◦ = 180◦
We can call this finding the complement or the supplement.
Armed with our knowledge of complementary and supplementary angles, we can often find the measure ofunknown angles. We can use logical reasoning to interpret the information we have been given in order tofind the unknown measure. Take a look at the diagram below.
Can we find the measure of angle X? We can, if we apply what we have learned about supplementary angles.We know that supplementary angles add up to 180◦, and that 180◦ is a straight line. Look at the diagram.The 80◦ angle and angle X together form a straight line, so we can deduce that they are supplementary angles. Thatmeans we can set up an equation to solve for X .
80+ x = 180
The equation shows what we already know: the sum of supplementary angles is 180◦. We can find the measure ofthe unknown angle by solving for X .
80+ x = 180
x = 180−80
x = 100◦
The measure of the unknown angle in this supplementary pair is 100◦.
752

www.ck12.org Chapter 8. Geometry
We can check our work by putting this value in for X in the equation.
80+100 = 180
Now it’s time for you to apply what you have learned. Find the complement or supplement in each example.
Example A
Angles A and B are complementary. Angle A is 33◦. Find the measure of angle B.
Solution: 57◦
Example B
Angles C and D are supplementary. Angle C is 59◦. Find the measure of angle D.
Solution: 121◦
Example C
Angles A and B are supplementary. Angle A is 169◦. Find the measure of angle B.
Solution: 11◦
Here is the original problem once again.
Justin was looking at a painting with two intersecting lines on it. One of the lines formed a straight line and the otherintersected with the first line.
"What do you think the measure is of the smaller angle?" he asked Susan who was standing nearby.
"I think it is about 30◦," Susan said.
"That’s exactly what I was thinking," Justin added.
If Susan and Justin are correct, can you figure out the other missing angle?
To figure this out, we can use reasoning and the dilemma to hunt for clues. First, notice that the painting had onestraight line. We know that the measure of a straight line is 180circ. Given this, we can write an equation.
x+30 = 180
The 30 is the measure of the angle that Justin and Susan figure out.
Now we can solve for the unknown variable.
x = 150◦
This is our answer.
Guided Practice
Here is one for you to try on your own.
What is the measure of angle R?
753

8.3. Supplementary and Complementary Angle Pairs www.ck12.org
Answer
How can we use what we have learned to find the measure of angle R? Can we determine whether the two angleshave a relationship with each other? Together, they form a right angle. They must be a pair of complementary angles,so we know their sum is 90◦. Again, we can set up an equation to solve for R, the unknown angle.
R+22 = 90
This equation represents what we know, that the sum of these two complementary angles is 90◦. Now we solve forR.
R+22 = 90
R = 90−22
R = 68◦
The measure of the unknown angle is 68◦. We can check our answer by putting this value in for R in the equation.
68+22 = 90◦
Video Review
MEDIAClick image to the left or use the URL below.URL: http://www.ck12.org/flx/render/embeddedobject/1274
This is a James Sousa video on complementary and supplementary angles.
Explore More
Directions: Find the measure of missing angle for each pair of complementary or supplementary angles.
1. Angles A and B are complementary. Angle A is 63◦. Find the measure of angle B.
2. Angles A and B are complementary. Angle A is 83◦. Find the measure of angle B.
3. Angles A and B are complementary. Angle A is 3◦. Find the measure of angle B.
754
www.ck12.org Chapter 8. Geometry
4. Angles A and B are complementary. Angle A is 23◦. Find the measure of angle B.
5. Angles A and B are complementary. Angle A is 70◦. Find the measure of angle B.
6. Angles A and B are complementary. Angle A is 29◦. Find the measure of angle B.
7. Angles A and B are complementary. Angle A is 66◦. Find the measure of angle B.
8. Angles A and B are complementary. Angle A is 87◦. Find the measure of angle B.
9. Angles A and B are supplementary. Angle A is 33◦. Find the measure of angle B.
10. Angles A and B are supplementary. Angle A is 103◦. Find the measure of angle B.
11. Angles A and B are supplementary. Angle A is 73◦. Find the measure of angle B.
12. Angles A and B are supplementary. Angle A is 78◦. Find the measure of angle B.
13. Angles A and B are supplementary. Angle A is 99◦. Find the measure of angle B.
14. Angles A and B are supplementary. Angle A is 110◦. Find the measure of angle B.
15. Angles A and B are supplementary. Angle A is 127◦. Find the measure of angle B.
755
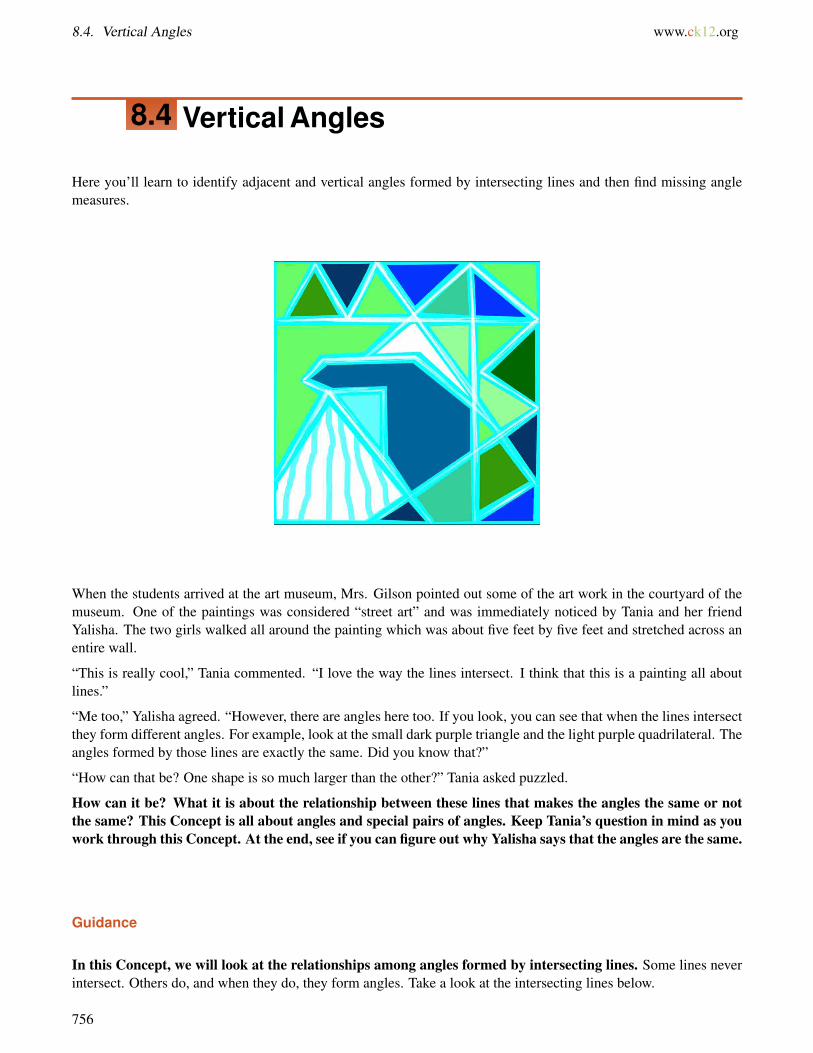
8.4. Vertical Angles www.ck12.org
8.4 Vertical Angles
Here you’ll learn to identify adjacent and vertical angles formed by intersecting lines and then find missing anglemeasures.
When the students arrived at the art museum, Mrs. Gilson pointed out some of the art work in the courtyard of themuseum. One of the paintings was considered “street art” and was immediately noticed by Tania and her friendYalisha. The two girls walked all around the painting which was about five feet by five feet and stretched across anentire wall.
“This is really cool,” Tania commented. “I love the way the lines intersect. I think that this is a painting all aboutlines.”
“Me too,” Yalisha agreed. “However, there are angles here too. If you look, you can see that when the lines intersectthey form different angles. For example, look at the small dark purple triangle and the light purple quadrilateral. Theangles formed by those lines are exactly the same. Did you know that?”
“How can that be? One shape is so much larger than the other?” Tania asked puzzled.
How can it be? What it is about the relationship between these lines that makes the angles the same or notthe same? This Concept is all about angles and special pairs of angles. Keep Tania’s question in mind as youwork through this Concept. At the end, see if you can figure out why Yalisha says that the angles are the same.
Guidance
In this Concept, we will look at the relationships among angles formed by intersecting lines. Some lines neverintersect. Others do, and when they do, they form angles. Take a look at the intersecting lines below.
756
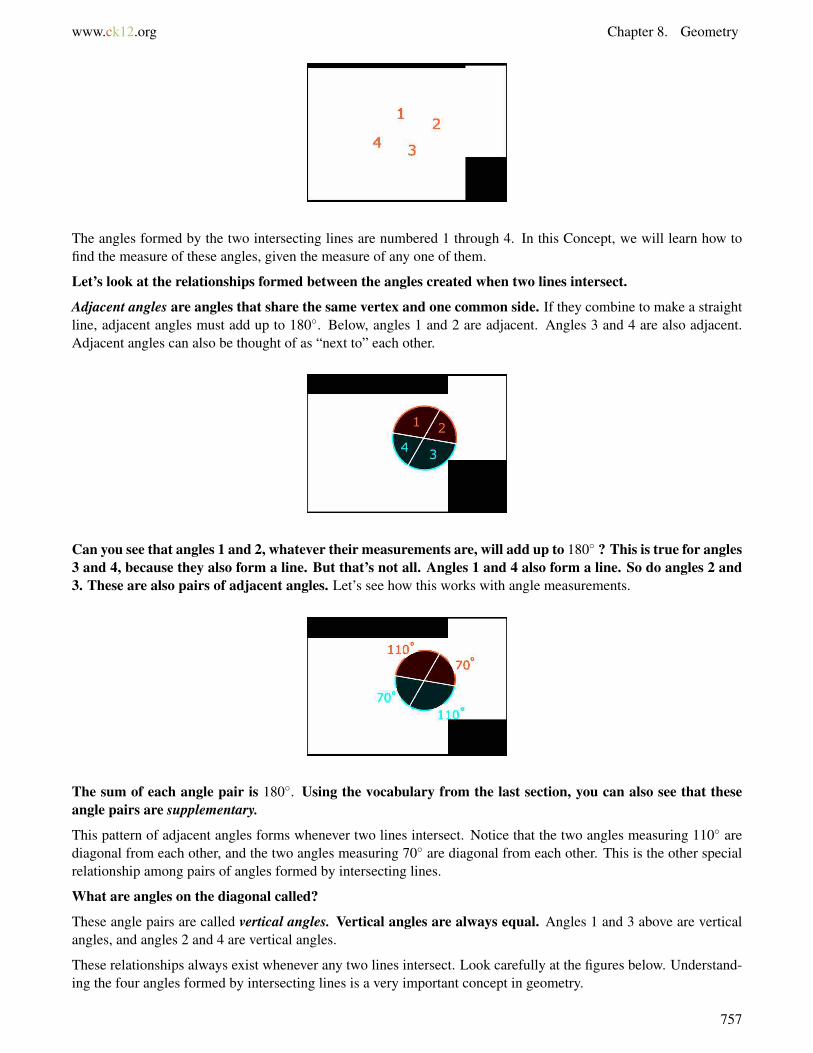
www.ck12.org Chapter 8. Geometry
The angles formed by the two intersecting lines are numbered 1 through 4. In this Concept, we will learn how tofind the measure of these angles, given the measure of any one of them.
Let’s look at the relationships formed between the angles created when two lines intersect.
Adjacent angles are angles that share the same vertex and one common side. If they combine to make a straightline, adjacent angles must add up to 180◦. Below, angles 1 and 2 are adjacent. Angles 3 and 4 are also adjacent.Adjacent angles can also be thought of as “next to” each other.
Can you see that angles 1 and 2, whatever their measurements are, will add up to 180◦ ? This is true for angles3 and 4, because they also form a line. But that’s not all. Angles 1 and 4 also form a line. So do angles 2 and3. These are also pairs of adjacent angles. Let’s see how this works with angle measurements.
The sum of each angle pair is 180◦. Using the vocabulary from the last section, you can also see that theseangle pairs are supplementary.
This pattern of adjacent angles forms whenever two lines intersect. Notice that the two angles measuring 110◦ arediagonal from each other, and the two angles measuring 70◦ are diagonal from each other. This is the other specialrelationship among pairs of angles formed by intersecting lines.
What are angles on the diagonal called?
These angle pairs are called vertical angles. Vertical angles are always equal. Angles 1 and 3 above are verticalangles, and angles 2 and 4 are vertical angles.
These relationships always exist whenever any two lines intersect. Look carefully at the figures below. Understand-ing the four angles formed by intersecting lines is a very important concept in geometry.
757
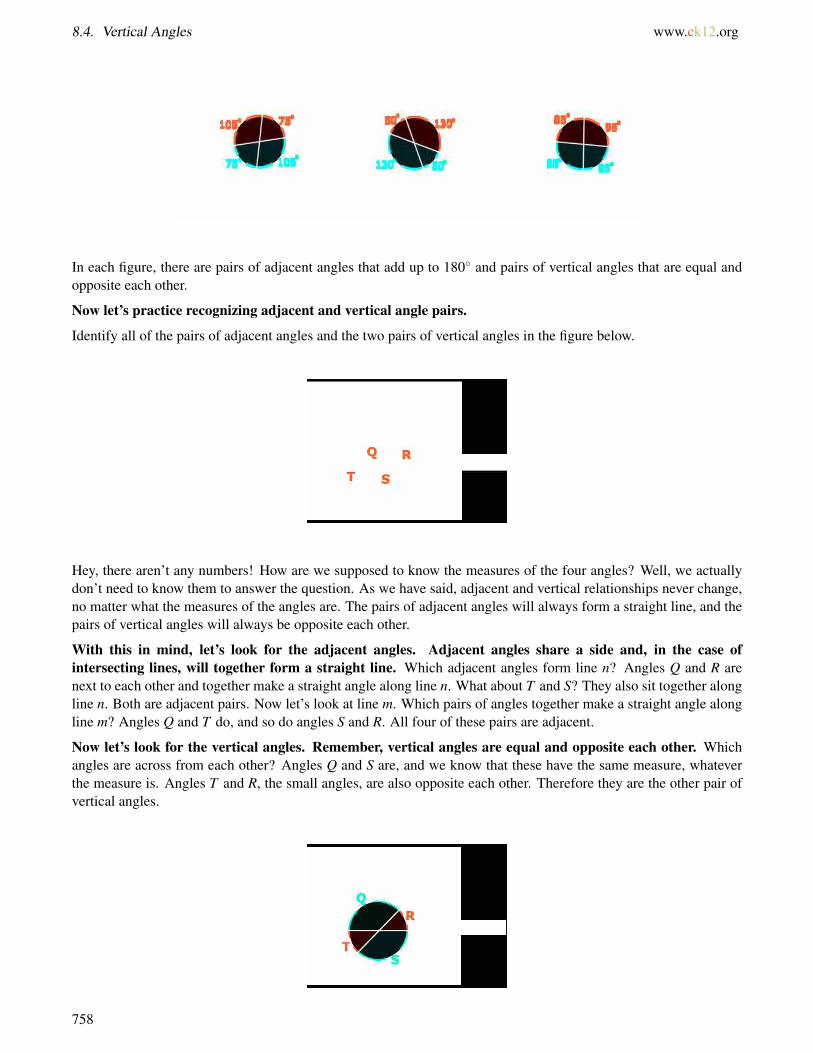
8.4. Vertical Angles www.ck12.org
In each figure, there are pairs of adjacent angles that add up to 180◦ and pairs of vertical angles that are equal andopposite each other.
Now let’s practice recognizing adjacent and vertical angle pairs.
Identify all of the pairs of adjacent angles and the two pairs of vertical angles in the figure below.
Hey, there aren’t any numbers! How are we supposed to know the measures of the four angles? Well, we actuallydon’t need to know them to answer the question. As we have said, adjacent and vertical relationships never change,no matter what the measures of the angles are. The pairs of adjacent angles will always form a straight line, and thepairs of vertical angles will always be opposite each other.
With this in mind, let’s look for the adjacent angles. Adjacent angles share a side and, in the case ofintersecting lines, will together form a straight line. Which adjacent angles form line n? Angles Q and R arenext to each other and together make a straight angle along line n. What about T and S? They also sit together alongline n. Both are adjacent pairs. Now let’s look at line m. Which pairs of angles together make a straight angle alongline m? Angles Q and T do, and so do angles S and R. All four of these pairs are adjacent.
Now let’s look for the vertical angles. Remember, vertical angles are equal and opposite each other. Whichangles are across from each other? Angles Q and S are, and we know that these have the same measure, whateverthe measure is. Angles T and R, the small angles, are also opposite each other. Therefore they are the other pair ofvertical angles.
758
www.ck12.org Chapter 8. Geometry
We can use what we have learned about adjacent and vertical angles to find the measure of an unknown angle formedby intersecting lines. We know that adjacent angles add up to 180◦ and that vertical angles are equal. Therefore ifwe are given the measure of one angle, we can use its relationship to another angle to find the measure of the secondangle.
Find the measure of angle B below.
We know that one angle measures 50, and we want to find the measure of angle B.
First we need to determine how these two angles are related. Is angle B adjacent or vertical to the known angle?It is opposite, so these two angles are vertical angles. And we already know that vertical angles are always equal,so angle B must also be 50◦.
Here is another one.
Find the measure of 6 Q below.
759
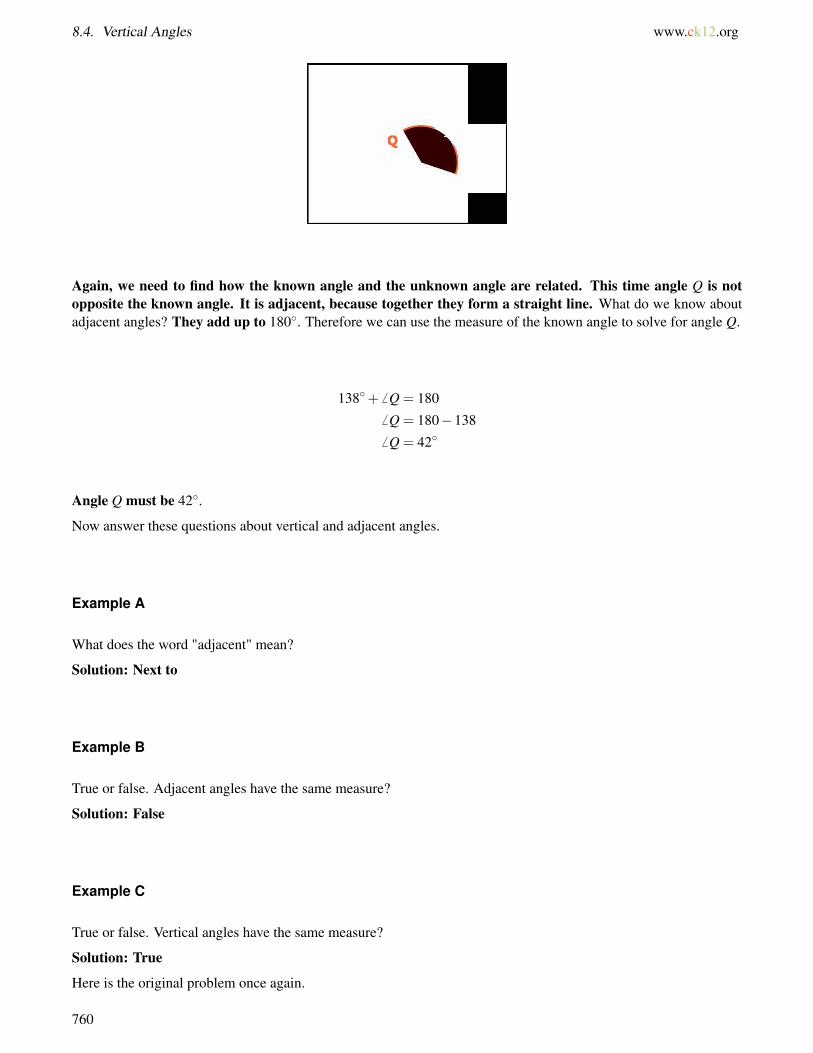
8.4. Vertical Angles www.ck12.org
Again, we need to find how the known angle and the unknown angle are related. This time angle Q is notopposite the known angle. It is adjacent, because together they form a straight line. What do we know aboutadjacent angles? They add up to 180◦. Therefore we can use the measure of the known angle to solve for angle Q.
138◦+ 6 Q = 1806 Q = 180−1386 Q = 42◦
Angle Q must be 42◦.
Now answer these questions about vertical and adjacent angles.
Example A
What does the word "adjacent" mean?
Solution: Next to
Example B
True or false. Adjacent angles have the same measure?
Solution: False
Example C
True or false. Vertical angles have the same measure?
Solution: True
Here is the original problem once again.
760

www.ck12.org Chapter 8. Geometry
Have you been thinking about Tania’s question? Reread this situation and then write down your answer to herquestion. Are these two angles the same or aren’t they? Why or why not?
When the students arrived at the art museum, Mrs. Gilson pointed out some of the art work in the courtyard of themuseum. One of the paintings was considered “street art” and was immediately noticed by Tania and her friendYalisha. The two girls walked all around the painting which was about five feet by five feet and stretched across anentire wall.
“This is really cool,” Tania commented. “I love the way the lines intersect. I think that this is a painting all aboutlines.”
“Me too,” Yalisha agreed. “However, there are angles here too. If you look, you can see that when the lines intersectthey form different angles. For example, look at the small dark purple triangle and the light purple quadrilateral. Theangles formed by those lines are exactly the same. Did you know that?”
“How can that be? One shape is so much larger than the other?” Tania asked puzzled.
Let’s think about Tania’s question. The size of the angles isn’t a function of whether or not the shapes arelarge or not. It has to do with the intersection of the lines. Remember how Tania commented that she thoughtthat the painting was all about lines, well, here is where her point is valid.
First, think about what type of angles are formed by the two intersecting lines. We have vertical angles. Anytime two lines intersect, the opposing angles formed by the intersection of those two lines is considered verticalangles. Vertical angles are congruent. Therefore, Yalisha’s comment is accurate.
Now look at the painting again. Can you find a pair of adjacent angles? Can you find another pair of verticalangles? Make a few notes in your notebook.
Guided Practice
Here is one for you to try on your own.
Two lines intersect. One vertical angle has a measure of 45◦ What is the measure of the angle adjacent to it?
Answer
To figure this out, we can use what we know about vertical and adjacent angles.
Two lines are intersecting, the number of degrees in a straight line is 180◦.
The known angle is 45◦. Therefore, we can subtract this angle from 180 to find the number of degrees in the anglenext to the vertical angles.
761

8.4. Vertical Angles www.ck12.org
180−45 = 145
The adjacent angle has a measure of 145◦.
Video Review
MEDIAClick image to the left or use the URL below.URL: http://www.ck12.org/flx/render/embeddedobject/57635
This is a James Sousa video on complementary and supplementary angles.
Explore More
Directions: Identify whether the lines below are parallel, perpendicular, or just intersecting.
1.
2.
3.
762

www.ck12.org Chapter 8. Geometry
4.
5. Lines that will never intersect.
6. Lines that intersect at a 90◦ angle.
7. Lines that cross at one point.
Directions: Tell whether the pairs of angles are adjacent or vertical.
8.
9.
10.
763
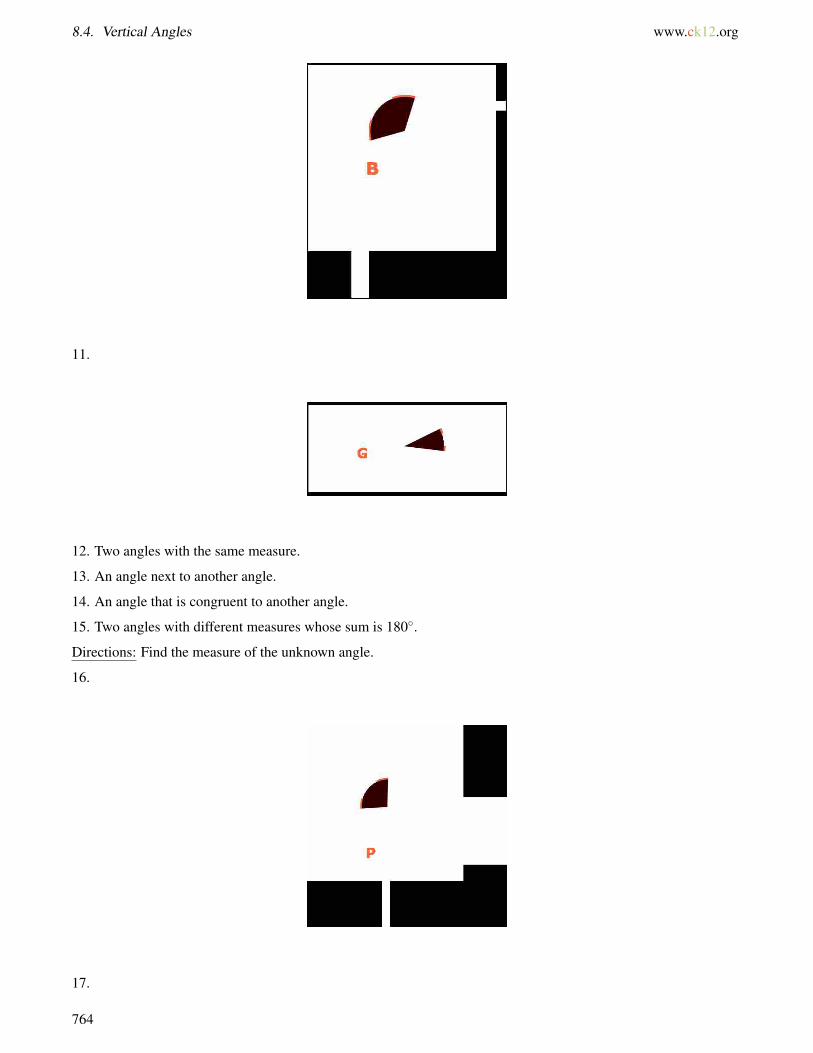
8.4. Vertical Angles www.ck12.org
11.
12. Two angles with the same measure.
13. An angle next to another angle.
14. An angle that is congruent to another angle.
15. Two angles with different measures whose sum is 180◦.
Directions: Find the measure of the unknown angle.
16.
17.
764
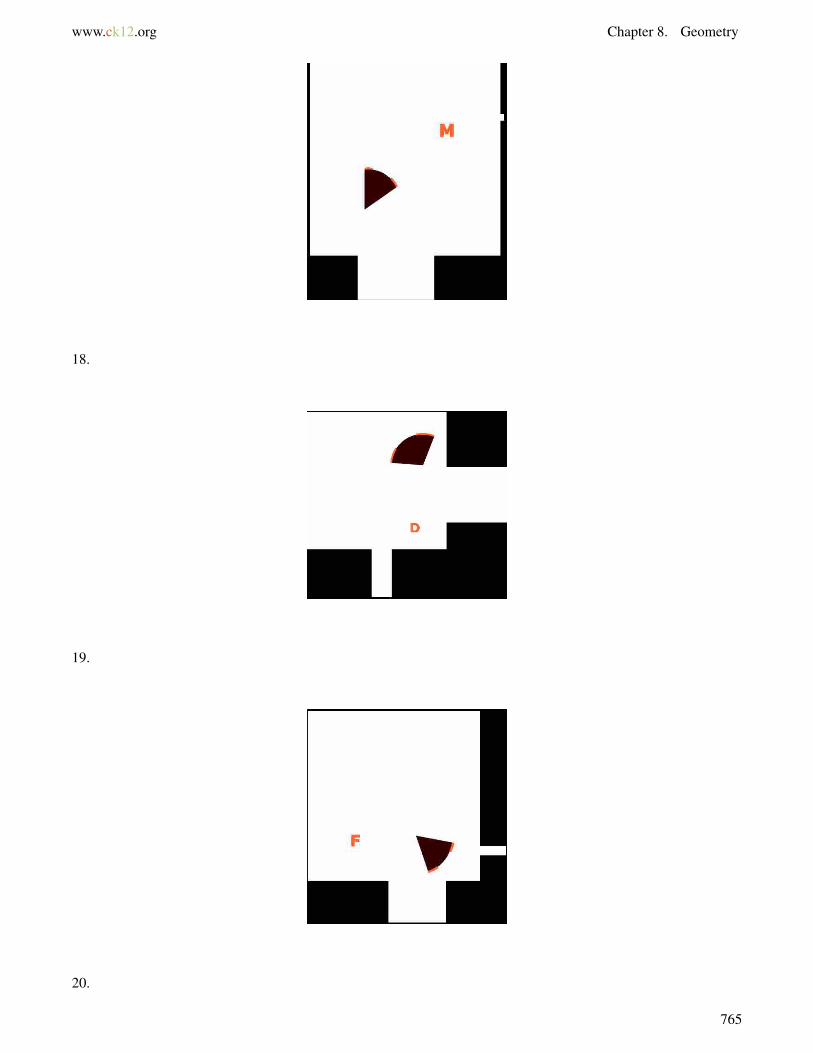

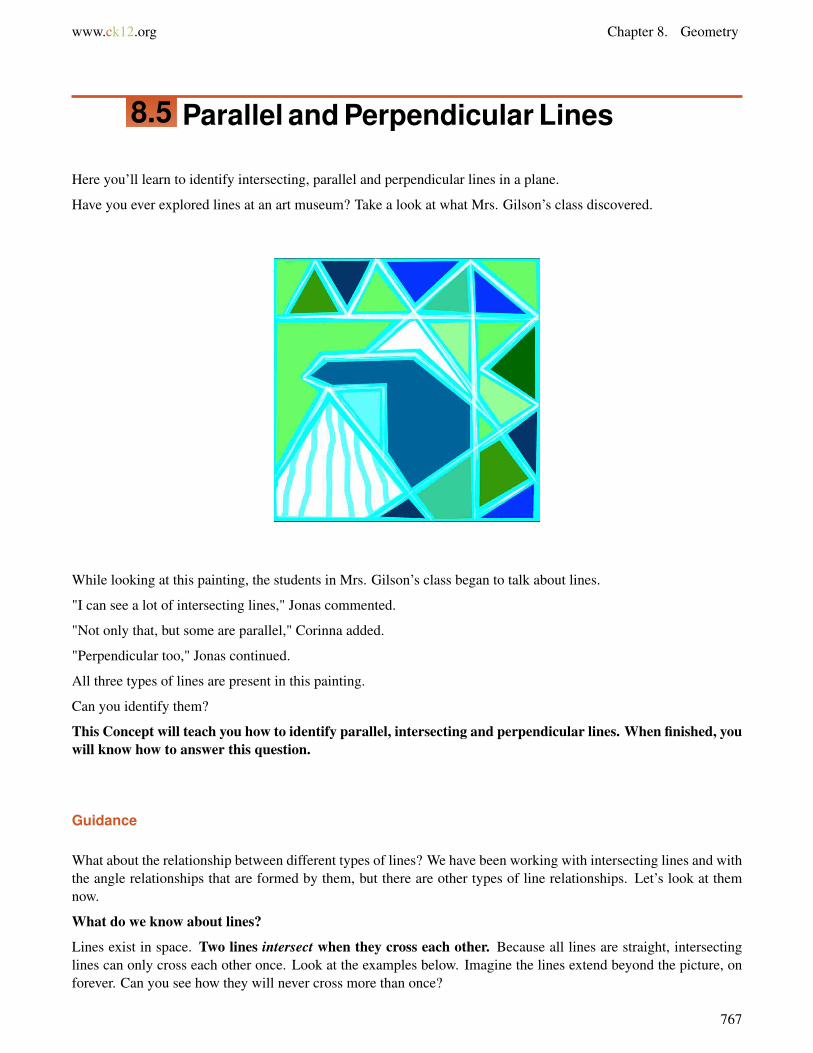
www.ck12.org Chapter 8. Geometry
8.5 Parallel and Perpendicular Lines
Here you’ll learn to identify intersecting, parallel and perpendicular lines in a plane.
Have you ever explored lines at an art museum? Take a look at what Mrs. Gilson’s class discovered.
While looking at this painting, the students in Mrs. Gilson’s class began to talk about lines.
"I can see a lot of intersecting lines," Jonas commented.
"Not only that, but some are parallel," Corinna added.
"Perpendicular too," Jonas continued.
All three types of lines are present in this painting.
Can you identify them?
This Concept will teach you how to identify parallel, intersecting and perpendicular lines. When finished, youwill know how to answer this question.
Guidance
What about the relationship between different types of lines? We have been working with intersecting lines and withthe angle relationships that are formed by them, but there are other types of line relationships. Let’s look at themnow.
What do we know about lines?
Lines exist in space. Two lines intersect when they cross each other. Because all lines are straight, intersectinglines can only cross each other once. Look at the examples below. Imagine the lines extend beyond the picture, onforever. Can you see how they will never cross more than once?
767
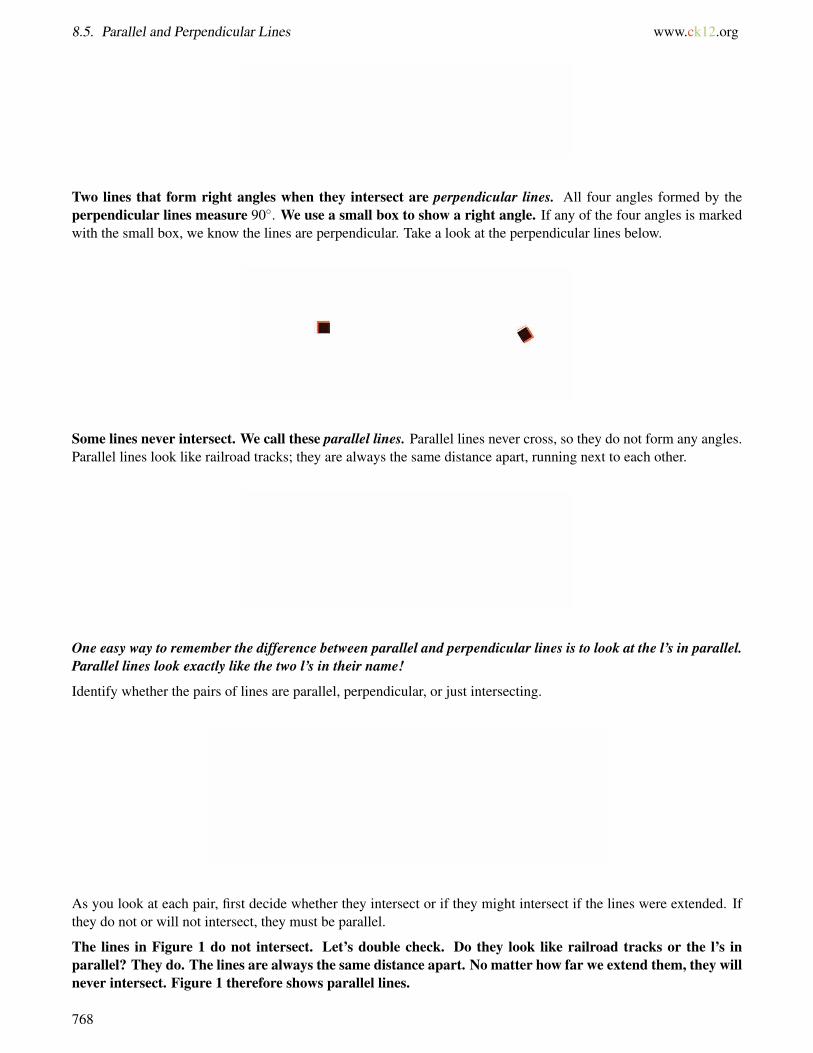
8.5. Parallel and Perpendicular Lines www.ck12.org
Two lines that form right angles when they intersect are perpendicular lines. All four angles formed by theperpendicular lines measure 90◦. We use a small box to show a right angle. If any of the four angles is markedwith the small box, we know the lines are perpendicular. Take a look at the perpendicular lines below.
Some lines never intersect. We call these parallel lines. Parallel lines never cross, so they do not form any angles.Parallel lines look like railroad tracks; they are always the same distance apart, running next to each other.
One easy way to remember the difference between parallel and perpendicular lines is to look at the l’s in parallel.Parallel lines look exactly like the two l’s in their name!
Identify whether the pairs of lines are parallel, perpendicular, or just intersecting.
As you look at each pair, first decide whether they intersect or if they might intersect if the lines were extended. Ifthey do not or will not intersect, they must be parallel.
The lines in Figure 1 do not intersect. Let’s double check. Do they look like railroad tracks or the l’s inparallel? They do. The lines are always the same distance apart. No matter how far we extend them, they willnever intersect. Figure 1 therefore shows parallel lines.
768
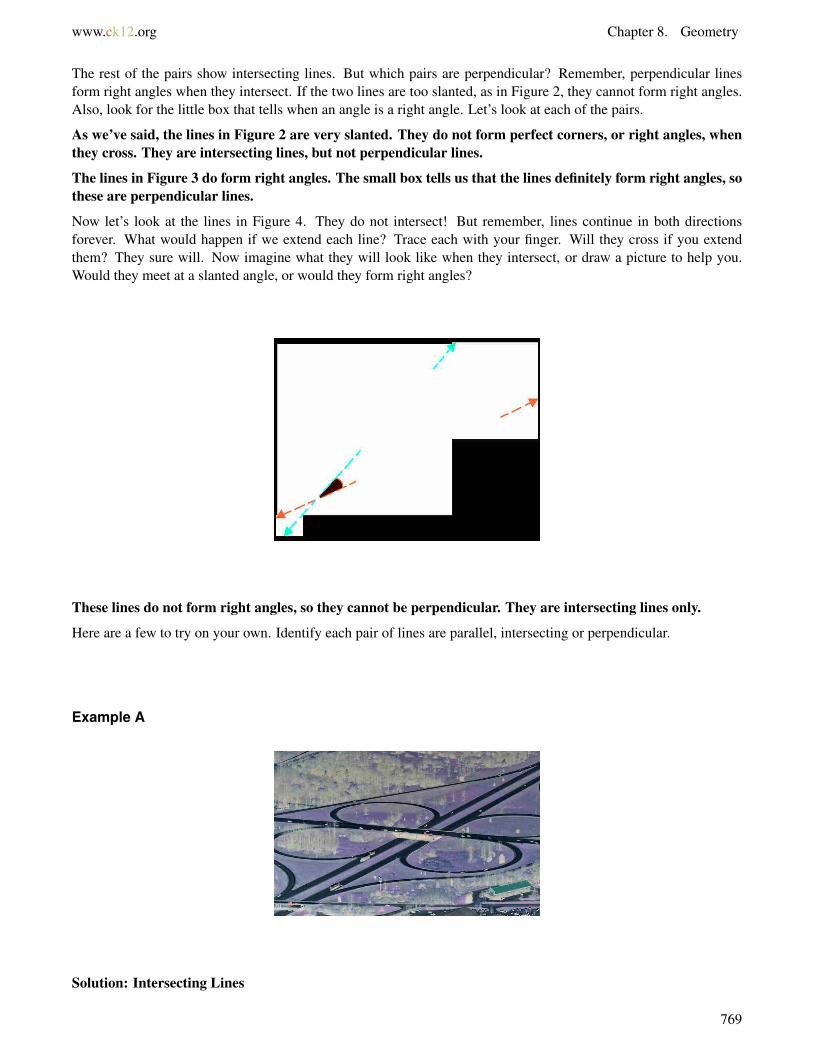
www.ck12.org Chapter 8. Geometry
The rest of the pairs show intersecting lines. But which pairs are perpendicular? Remember, perpendicular linesform right angles when they intersect. If the two lines are too slanted, as in Figure 2, they cannot form right angles.Also, look for the little box that tells when an angle is a right angle. Let’s look at each of the pairs.
As we’ve said, the lines in Figure 2 are very slanted. They do not form perfect corners, or right angles, whenthey cross. They are intersecting lines, but not perpendicular lines.
The lines in Figure 3 do form right angles. The small box tells us that the lines definitely form right angles, sothese are perpendicular lines.
Now let’s look at the lines in Figure 4. They do not intersect! But remember, lines continue in both directionsforever. What would happen if we extend each line? Trace each with your finger. Will they cross if you extendthem? They sure will. Now imagine what they will look like when they intersect, or draw a picture to help you.Would they meet at a slanted angle, or would they form right angles?
These lines do not form right angles, so they cannot be perpendicular. They are intersecting lines only.
Here are a few to try on your own. Identify each pair of lines are parallel, intersecting or perpendicular.
Example A
Solution: Intersecting Lines
769

8.5. Parallel and Perpendicular Lines www.ck12.org
Example B
Solution: Parallel lines
Example C
Solution: Parallel lines
Here is the original problem once again.
While looking at this painting, the students in Mrs. Gilson’s class began to talk about lines.
"I can see a lot of intersecting lines," Jonas commented.
"Not only that, but some are parallel," Corinna added.
770
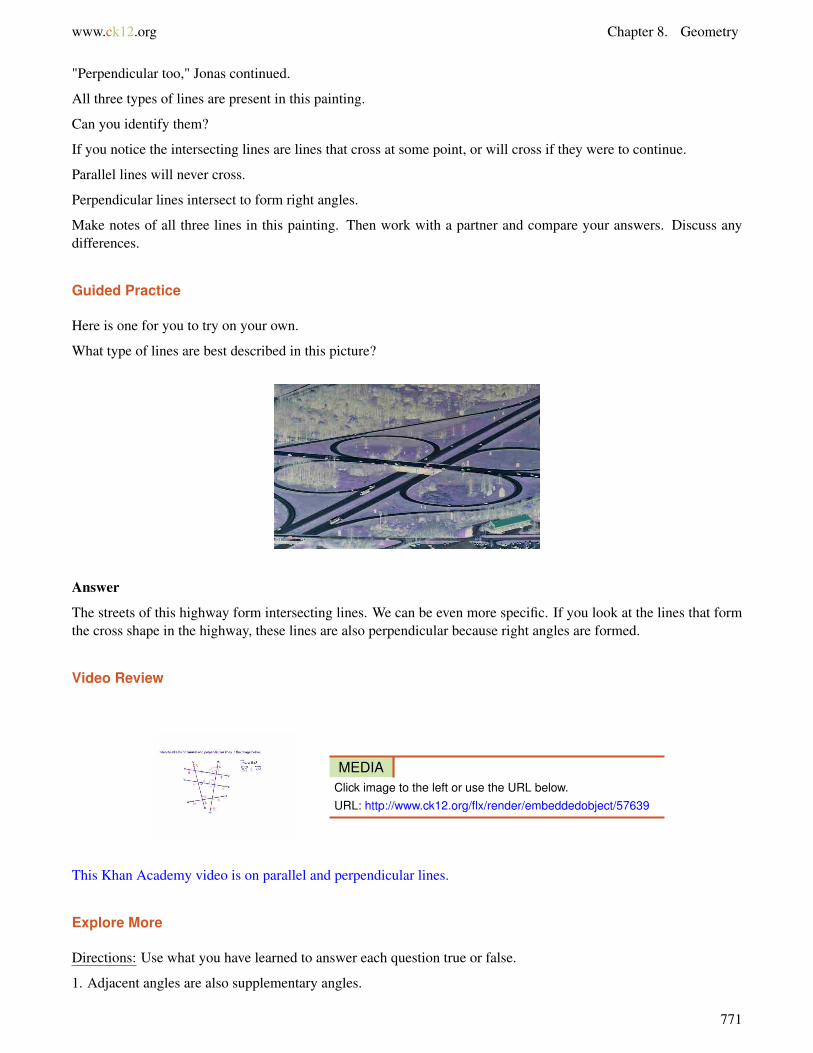
www.ck12.org Chapter 8. Geometry
"Perpendicular too," Jonas continued.
All three types of lines are present in this painting.
Can you identify them?
If you notice the intersecting lines are lines that cross at some point, or will cross if they were to continue.
Parallel lines will never cross.
Perpendicular lines intersect to form right angles.
Make notes of all three lines in this painting. Then work with a partner and compare your answers. Discuss anydifferences.
Guided Practice
Here is one for you to try on your own.
What type of lines are best described in this picture?
Answer
The streets of this highway form intersecting lines. We can be even more specific. If you look at the lines that formthe cross shape in the highway, these lines are also perpendicular because right angles are formed.
Video Review
MEDIAClick image to the left or use the URL below.URL: http://www.ck12.org/flx/render/embeddedobject/57639
This Khan Academy video is on parallel and perpendicular lines.
Explore More
Directions: Use what you have learned to answer each question true or false.
1. Adjacent angles are also supplementary angles.
771
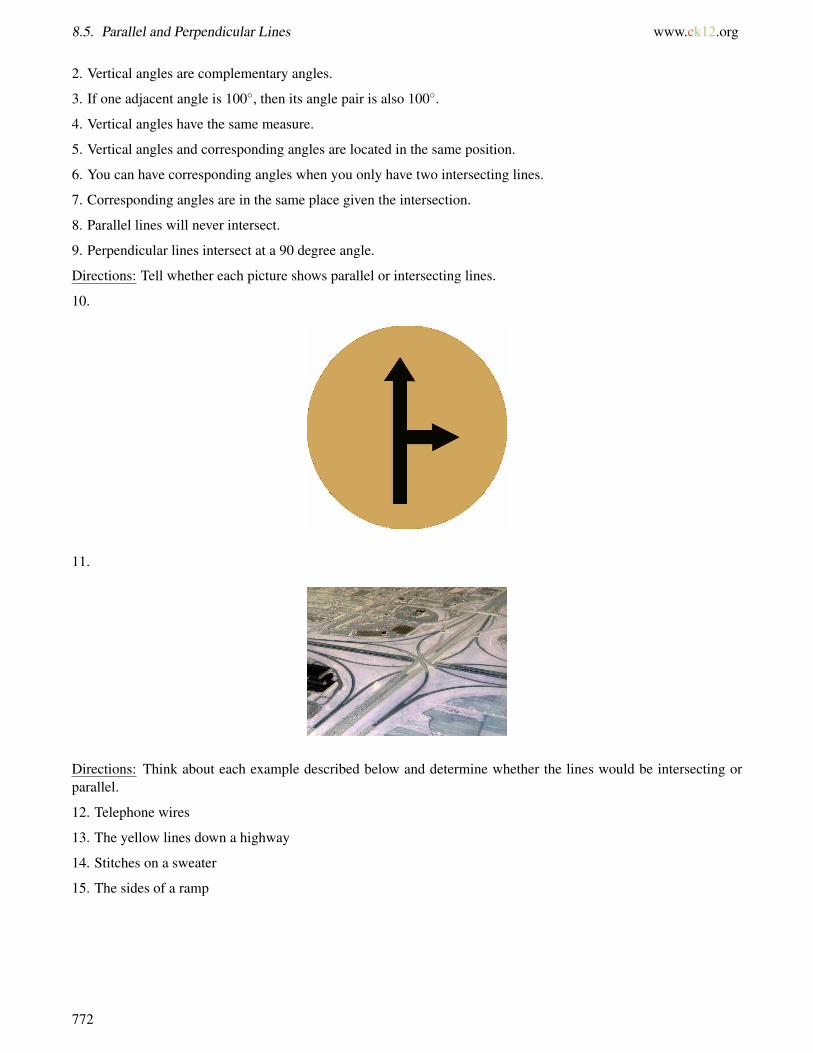
8.5. Parallel and Perpendicular Lines www.ck12.org
2. Vertical angles are complementary angles.
3. If one adjacent angle is 100◦, then its angle pair is also 100◦.
4. Vertical angles have the same measure.
5. Vertical angles and corresponding angles are located in the same position.
6. You can have corresponding angles when you only have two intersecting lines.
7. Corresponding angles are in the same place given the intersection.
8. Parallel lines will never intersect.
9. Perpendicular lines intersect at a 90 degree angle.
Directions: Tell whether each picture shows parallel or intersecting lines.
10.
11.
Directions: Think about each example described below and determine whether the lines would be intersecting orparallel.
12. Telephone wires
13. The yellow lines down a highway
14. Stitches on a sweater
15. The sides of a ramp
772
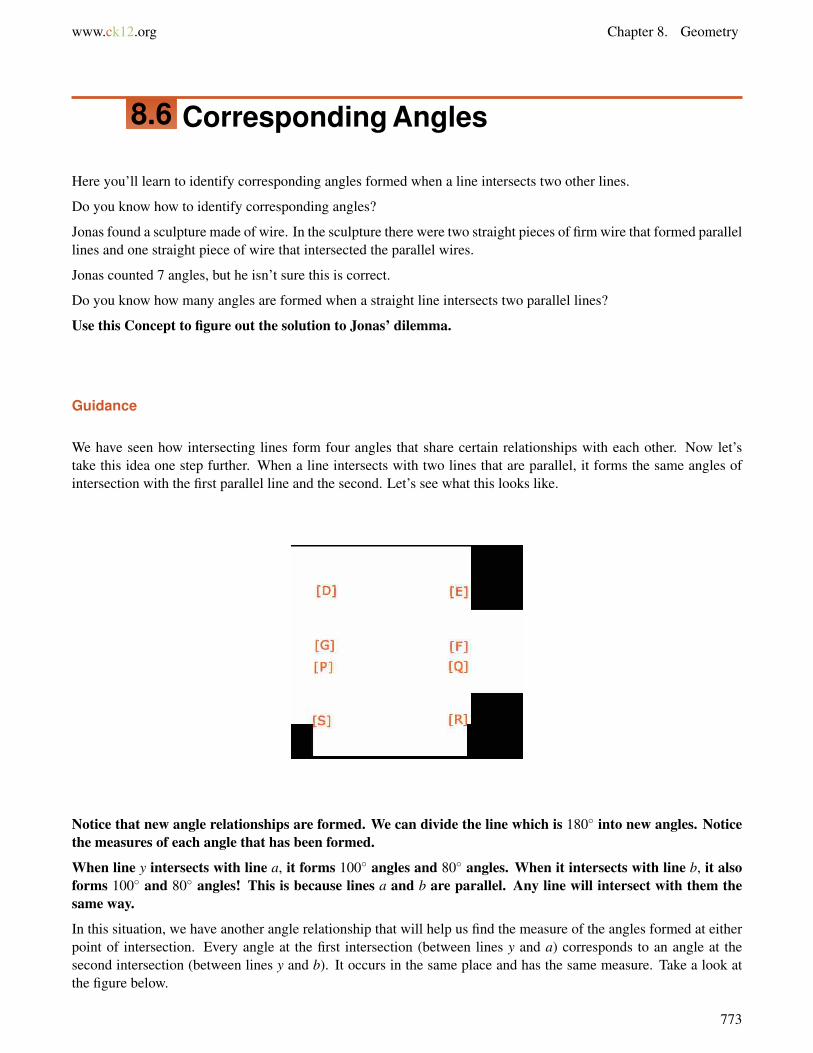
www.ck12.org Chapter 8. Geometry
8.6 Corresponding Angles
Here you’ll learn to identify corresponding angles formed when a line intersects two other lines.
Do you know how to identify corresponding angles?
Jonas found a sculpture made of wire. In the sculpture there were two straight pieces of firm wire that formed parallellines and one straight piece of wire that intersected the parallel wires.
Jonas counted 7 angles, but he isn’t sure this is correct.
Do you know how many angles are formed when a straight line intersects two parallel lines?
Use this Concept to figure out the solution to Jonas’ dilemma.
Guidance
We have seen how intersecting lines form four angles that share certain relationships with each other. Now let’stake this idea one step further. When a line intersects with two lines that are parallel, it forms the same angles ofintersection with the first parallel line and the second. Let’s see what this looks like.
Notice that new angle relationships are formed. We can divide the line which is 180◦ into new angles. Noticethe measures of each angle that has been formed.
When line y intersects with line a, it forms 100◦ angles and 80◦ angles. When it intersects with line b, it alsoforms 100◦ and 80◦ angles! This is because lines a and b are parallel. Any line will intersect with them thesame way.
In this situation, we have another angle relationship that will help us find the measure of the angles formed at eitherpoint of intersection. Every angle at the first intersection (between lines y and a) corresponds to an angle at thesecond intersection (between lines y and b). It occurs in the same place and has the same measure. Take a look atthe figure below.
773
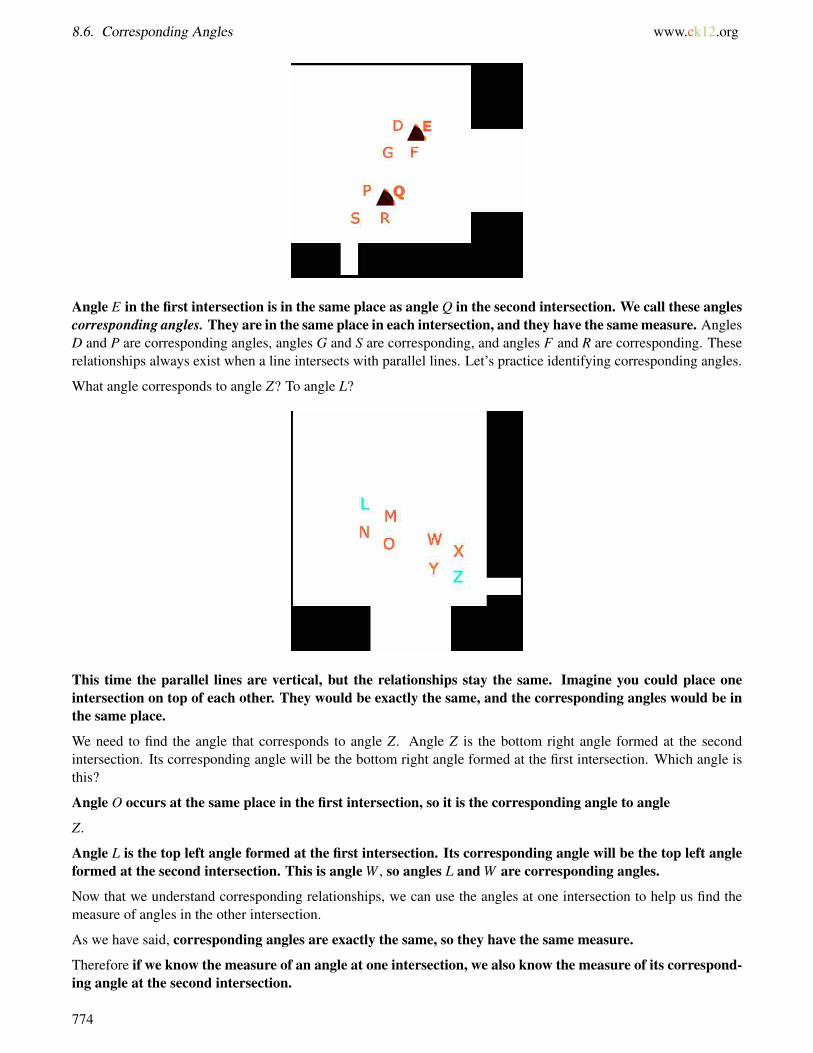
8.6. Corresponding Angles www.ck12.org
Angle E in the first intersection is in the same place as angle Q in the second intersection. We call these anglescorresponding angles. They are in the same place in each intersection, and they have the same measure. AnglesD and P are corresponding angles, angles G and S are corresponding, and angles F and R are corresponding. Theserelationships always exist when a line intersects with parallel lines. Let’s practice identifying corresponding angles.
What angle corresponds to angle Z? To angle L?
This time the parallel lines are vertical, but the relationships stay the same. Imagine you could place oneintersection on top of each other. They would be exactly the same, and the corresponding angles would be inthe same place.
We need to find the angle that corresponds to angle Z. Angle Z is the bottom right angle formed at the secondintersection. Its corresponding angle will be the bottom right angle formed at the first intersection. Which angle isthis?
Angle O occurs at the same place in the first intersection, so it is the corresponding angle to angle
Z.
Angle L is the top left angle formed at the first intersection. Its corresponding angle will be the top left angleformed at the second intersection. This is angle W , so angles L and W are corresponding angles.
Now that we understand corresponding relationships, we can use the angles at one intersection to help us find themeasure of angles in the other intersection.
As we have said, corresponding angles are exactly the same, so they have the same measure.
Therefore if we know the measure of an angle at one intersection, we also know the measure of its correspond-ing angle at the second intersection.
774
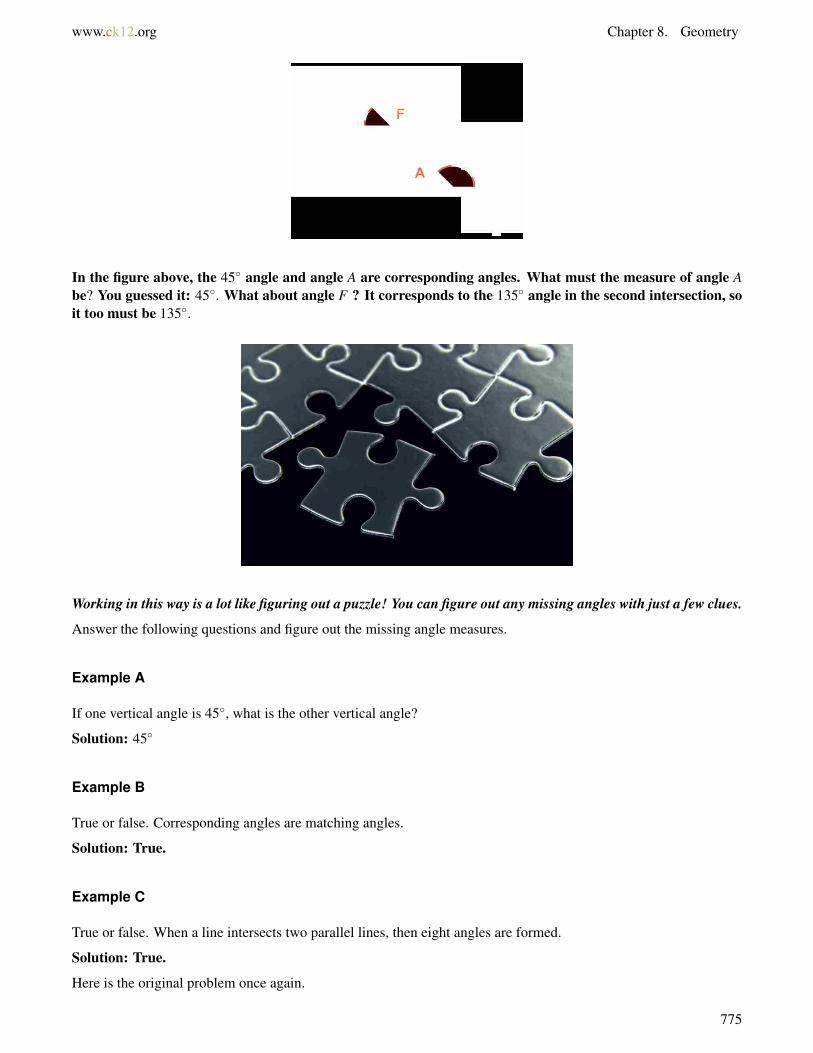
www.ck12.org Chapter 8. Geometry
In the figure above, the 45◦ angle and angle A are corresponding angles. What must the measure of angle Abe? You guessed it: 45◦. What about angle F ? It corresponds to the 135◦ angle in the second intersection, soit too must be 135◦.
Working in this way is a lot like figuring out a puzzle! You can figure out any missing angles with just a few clues.
Answer the following questions and figure out the missing angle measures.
Example A
If one vertical angle is 45◦, what is the other vertical angle?
Solution: 45◦
Example B
True or false. Corresponding angles are matching angles.
Solution: True.
Example C
True or false. When a line intersects two parallel lines, then eight angles are formed.
Solution: True.
Here is the original problem once again.
775
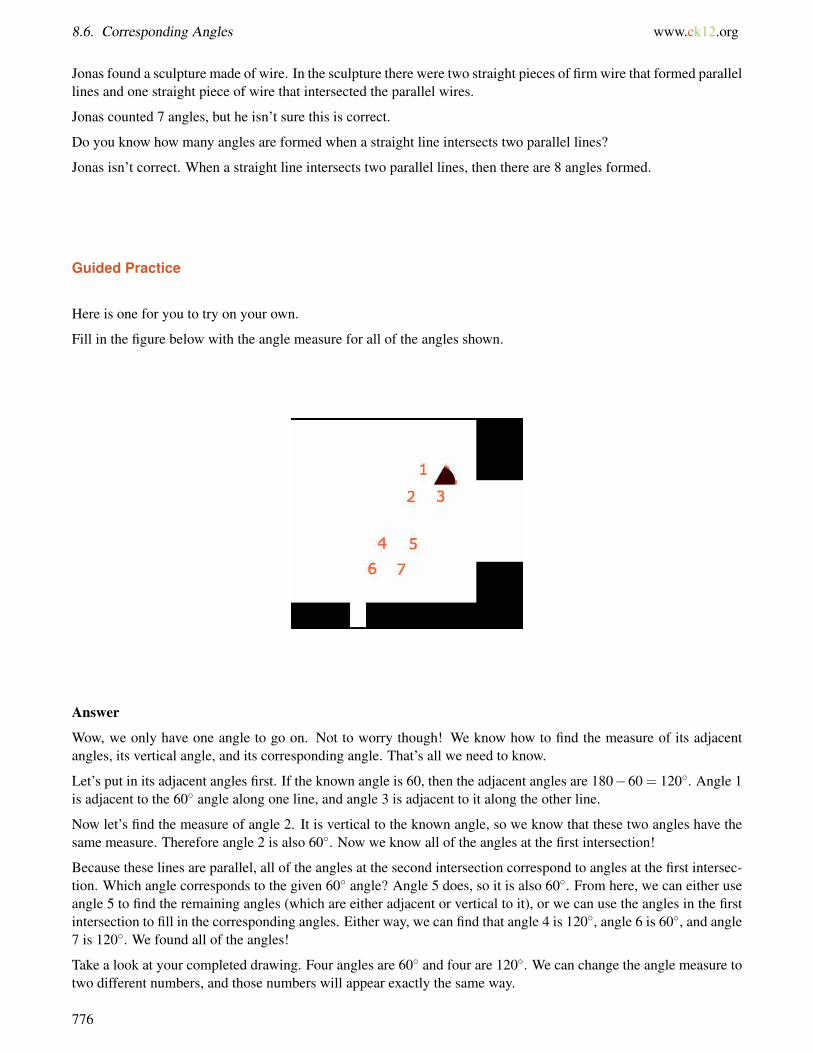
8.6. Corresponding Angles www.ck12.org
Jonas found a sculpture made of wire. In the sculpture there were two straight pieces of firm wire that formed parallellines and one straight piece of wire that intersected the parallel wires.
Jonas counted 7 angles, but he isn’t sure this is correct.
Do you know how many angles are formed when a straight line intersects two parallel lines?
Jonas isn’t correct. When a straight line intersects two parallel lines, then there are 8 angles formed.
Guided Practice
Here is one for you to try on your own.
Fill in the figure below with the angle measure for all of the angles shown.
Answer
Wow, we only have one angle to go on. Not to worry though! We know how to find the measure of its adjacentangles, its vertical angle, and its corresponding angle. That’s all we need to know.
Let’s put in its adjacent angles first. If the known angle is 60, then the adjacent angles are 180−60 = 120◦. Angle 1is adjacent to the 60◦ angle along one line, and angle 3 is adjacent to it along the other line.
Now let’s find the measure of angle 2. It is vertical to the known angle, so we know that these two angles have thesame measure. Therefore angle 2 is also 60◦. Now we know all of the angles at the first intersection!
Because these lines are parallel, all of the angles at the second intersection correspond to angles at the first intersec-tion. Which angle corresponds to the given 60◦ angle? Angle 5 does, so it is also 60◦. From here, we can either useangle 5 to find the remaining angles (which are either adjacent or vertical to it), or we can use the angles in the firstintersection to fill in the corresponding angles. Either way, we can find that angle 4 is 120◦, angle 6 is 60◦, and angle7 is 120◦. We found all of the angles!
Take a look at your completed drawing. Four angles are 60◦ and four are 120◦. We can change the angle measure totwo different numbers, and those numbers will appear exactly the same way.
776
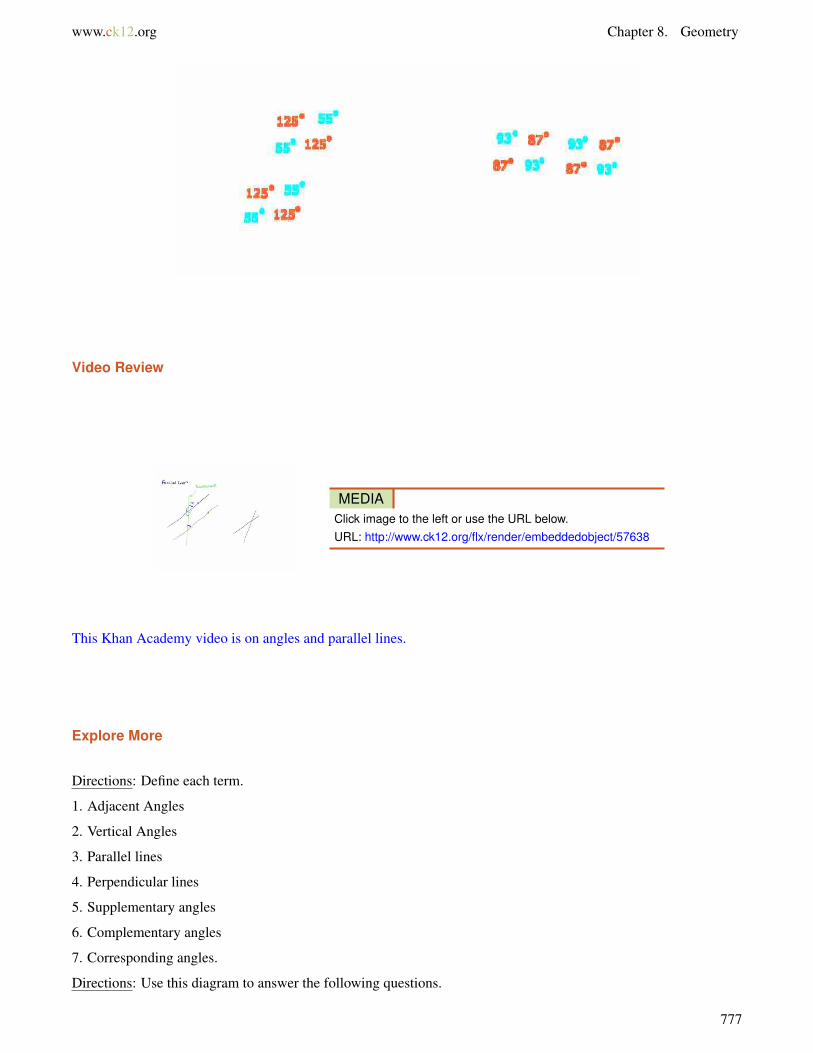
www.ck12.org Chapter 8. Geometry
Video Review
MEDIAClick image to the left or use the URL below.URL: http://www.ck12.org/flx/render/embeddedobject/57638
This Khan Academy video is on angles and parallel lines.
Explore More
Directions: Define each term.
1. Adjacent Angles
2. Vertical Angles
3. Parallel lines
4. Perpendicular lines
5. Supplementary angles
6. Complementary angles
7. Corresponding angles.
Directions: Use this diagram to answer the following questions.
777
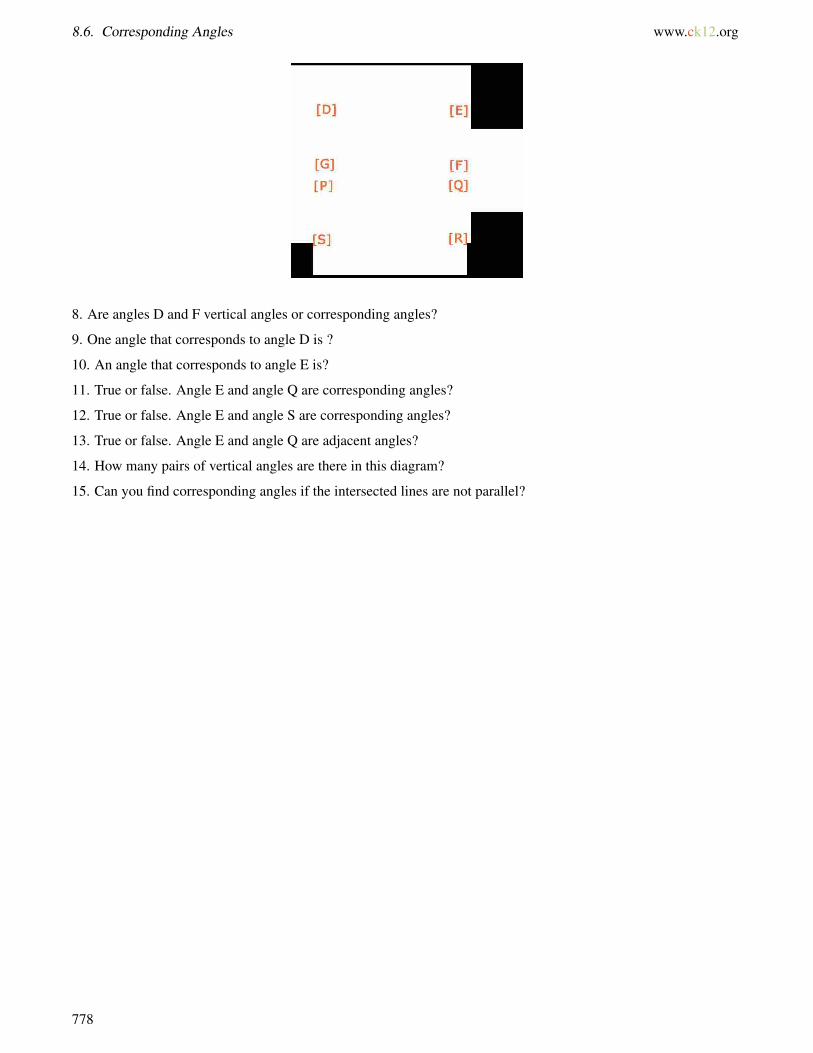
8.6. Corresponding Angles www.ck12.org
8. Are angles D and F vertical angles or corresponding angles?
9. One angle that corresponds to angle D is ?
10. An angle that corresponds to angle E is?
11. True or false. Angle E and angle Q are corresponding angles?
12. True or false. Angle E and angle S are corresponding angles?
13. True or false. Angle E and angle Q are adjacent angles?
14. How many pairs of vertical angles are there in this diagram?
15. Can you find corresponding angles if the intersected lines are not parallel?
778
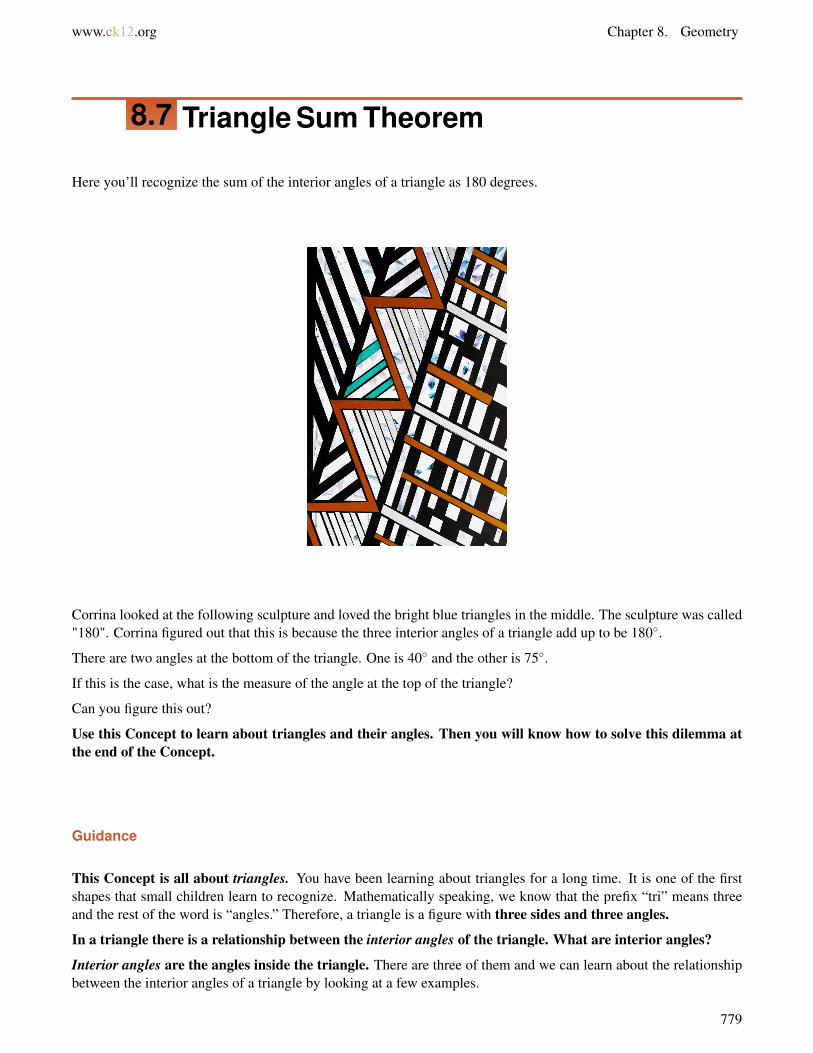
www.ck12.org Chapter 8. Geometry
8.7 Triangle Sum Theorem
Here you’ll recognize the sum of the interior angles of a triangle as 180 degrees.
Corrina looked at the following sculpture and loved the bright blue triangles in the middle. The sculpture was called"180". Corrina figured out that this is because the three interior angles of a triangle add up to be 180◦.
There are two angles at the bottom of the triangle. One is 40◦ and the other is 75◦.
If this is the case, what is the measure of the angle at the top of the triangle?
Can you figure this out?
Use this Concept to learn about triangles and their angles. Then you will know how to solve this dilemma atthe end of the Concept.
Guidance
This Concept is all about triangles. You have been learning about triangles for a long time. It is one of the firstshapes that small children learn to recognize. Mathematically speaking, we know that the prefix “tri” means threeand the rest of the word is “angles.” Therefore, a triangle is a figure with three sides and three angles.
In a triangle there is a relationship between the interior angles of the triangle. What are interior angles?
Interior angles are the angles inside the triangle. There are three of them and we can learn about the relationshipbetween the interior angles of a triangle by looking at a few examples.
779
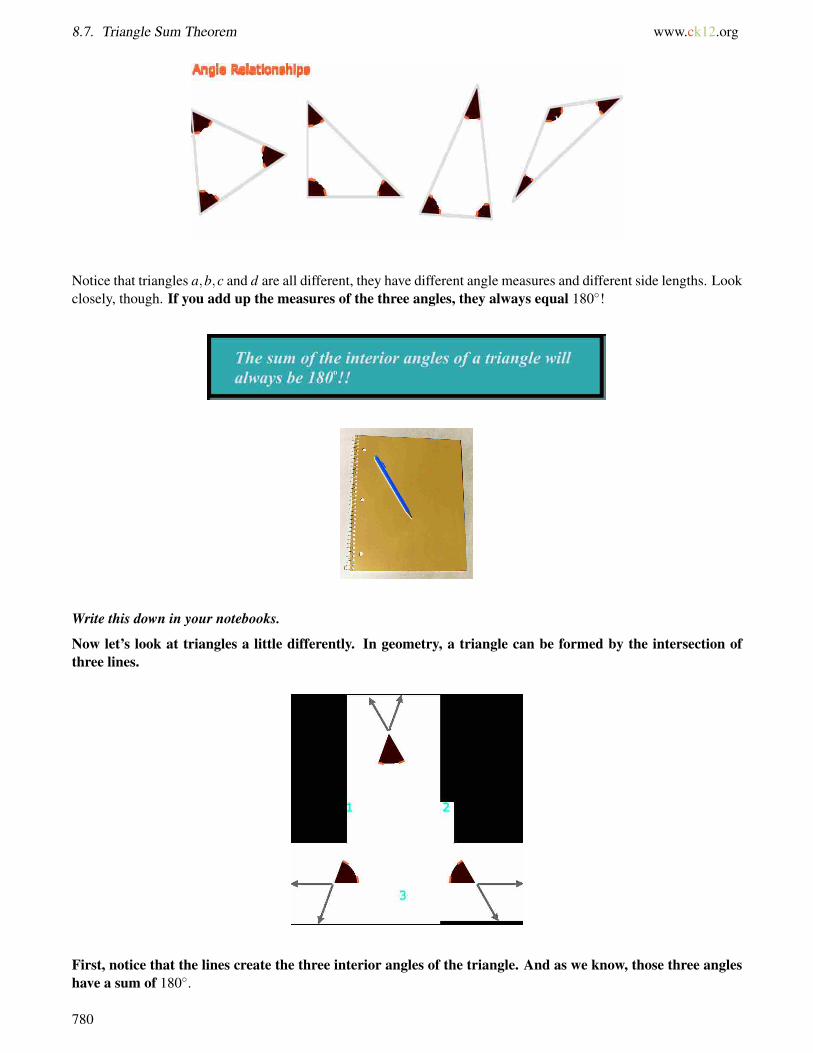
8.7. Triangle Sum Theorem www.ck12.org
Notice that triangles a,b,c and d are all different, they have different angle measures and different side lengths. Lookclosely, though. If you add up the measures of the three angles, they always equal 180◦!
Write this down in your notebooks.
Now let’s look at triangles a little differently. In geometry, a triangle can be formed by the intersection ofthree lines.
First, notice that the lines create the three interior angles of the triangle. And as we know, those three angleshave a sum of 180◦.
780

www.ck12.org Chapter 8. Geometry
Next notice that if we extend any side of the triangle, then it stretches beyond the triangle. Now we have apair of angles, an interior angle and an exterior angle.
An exterior angle is the angle formed outside of the edge of the triangle.
Here is a clearer example of an exterior angle.
As you can see, the interior angle and the exterior angle form a line. Therefore their sum must be 180◦.
The adjacent angle to the interior angle is 120◦. If the exterior and the interior angle form a straight line, then theirsum is 180◦. We can set up an equation and solve for the measure of x.
120+ x = 180
x = 180−120
x = 60◦
The missing measure of the interior angle is 60◦.
We could also figure this out another way. Take a look at the other given interior angles of the triangle. They are 50◦
and 70◦. Their sum is also 120◦!
In fact, the sum of any two interior angles in a triangle is always equal to the exterior angle of the third angle.
But, we can use this information to figure out the missing third interior angle. If the sum of the two interior anglesis 120, we can use the same equation to solve for the third missing angle.
120+ x = 180
x = 180−120
x = 60◦
Notice that both methods will help you to find the correct measure of a missing interior angle.
What is the measure of angle S in the figure below?
781
8.7. Triangle Sum Theorem www.ck12.org
We can see that angle S is an exterior angle. However, we do not know what its adjacent interior angle is. Can westill find the measure of angle S? We can. As we have just learned, the other two interior angles have a sumequal to the measure of the third angle’s exterior angle. Therefore angle S must be equal to the sum of thetwo angles we have been given.
S = 30+35
S = 65◦
Incidentally, we can also find the measure of the third angle in the triangle by using the exterior angle. We know thatthe sum of this angle and angle S must be 180◦. If S is 65◦, then the angle must be 180−65 = 115◦.
We also know that the sum of the three interior angles of a triangle is 180◦, so we could also find the missingangle by adding the two known angles and then subtracting from 180◦.
6 1+ 6 2+ 6 3 = 180◦
30+35+ 6 3 = 180◦
65+ 6 3 = 180◦
6 3 = 180−656 3 = 115◦
Use what you have learned to answer each question.
Example A
If the sum of two angles of a triangle is 150◦, then what is the sum of the third angle?
Solution: 30◦
Example B
If the sum of two of the angles is 75◦, then what is the measure of the third angle’s exterior angle?
Solution: 105◦
Example C
Angle A = 33◦, Angle B = 65◦, what is the measure of Angle C?
Solution: 82◦
Here is the original problem once again.
782
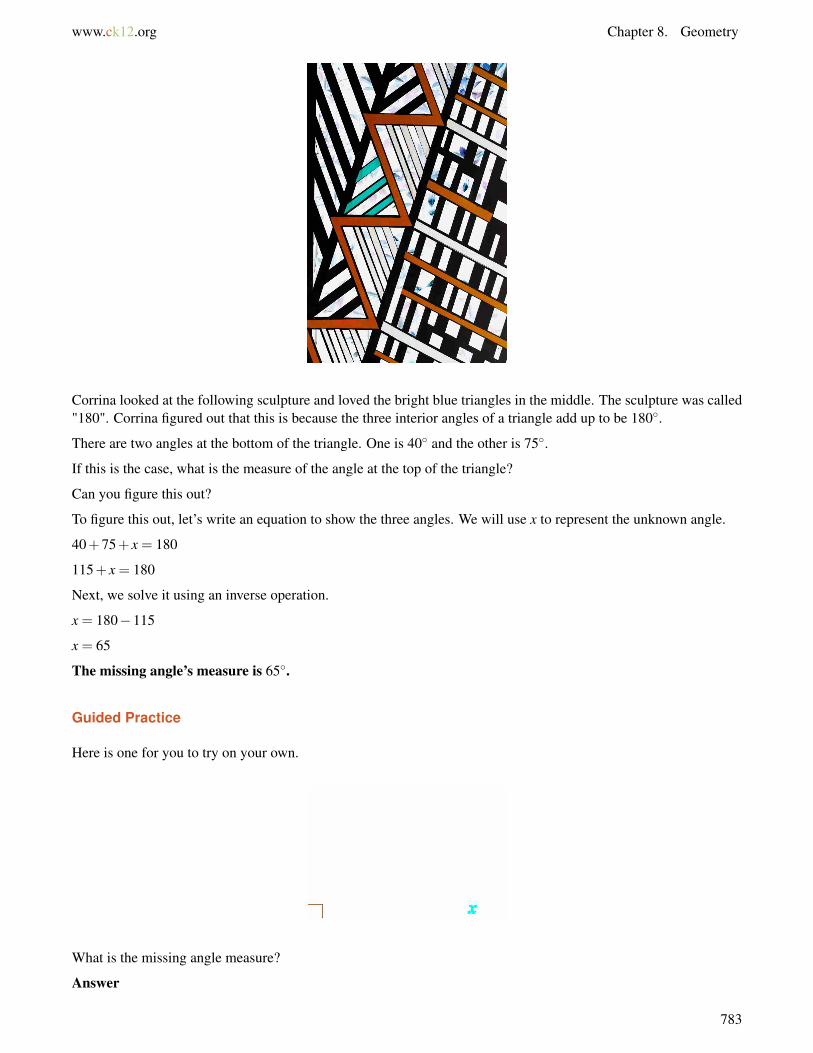
www.ck12.org Chapter 8. Geometry
Corrina looked at the following sculpture and loved the bright blue triangles in the middle. The sculpture was called"180". Corrina figured out that this is because the three interior angles of a triangle add up to be 180◦.
There are two angles at the bottom of the triangle. One is 40◦ and the other is 75◦.
If this is the case, what is the measure of the angle at the top of the triangle?
Can you figure this out?
To figure this out, let’s write an equation to show the three angles. We will use x to represent the unknown angle.
40+75+ x = 180
115+ x = 180
Next, we solve it using an inverse operation.
x = 180−115
x = 65
The missing angle’s measure is 65◦.
Guided Practice
Here is one for you to try on your own.
What is the missing angle measure?
Answer
783
8.7. Triangle Sum Theorem www.ck12.org
Now we can tell that this is a right triangle and that one of the angles is equal to 90 degrees. To figure out the measureof the missing angle, we have used a variable to represent the unknown quantity. Here is our equation.
55+90+ x = 180
145+ x = 180
180−145 = x
x = 35◦.
Our answer is 35◦.
Video Review
MEDIAClick image to the left or use the URL below.URL: http://www.ck12.org/flx/render/embeddedobject/57636
This Khan Academy video is on angles and parallel lines.
Explore More
Directions: Find the measure of the missing angle in each triangle.
1.
20+70+ x = 180◦
2.
60+60+ x = 180◦
3.
90+15+ x = 180◦
4.
100+45+ x = 180◦
5.
10+105+ x = 180◦
6.
120+45+ x = 180◦
784
www.ck12.org Chapter 8. Geometry
7.
145+5+ x = 180◦
8.
150+20+ x = 180◦
9.
110+45+ x = 180◦
10.
60+40+ x = 180◦
11.
70+50+ x = 180◦
12.
80+45+ x = 180◦
13.
50+45+ x = 180◦
14.
30+55+ x = 180◦
15.
75+55+ x = 180◦
785
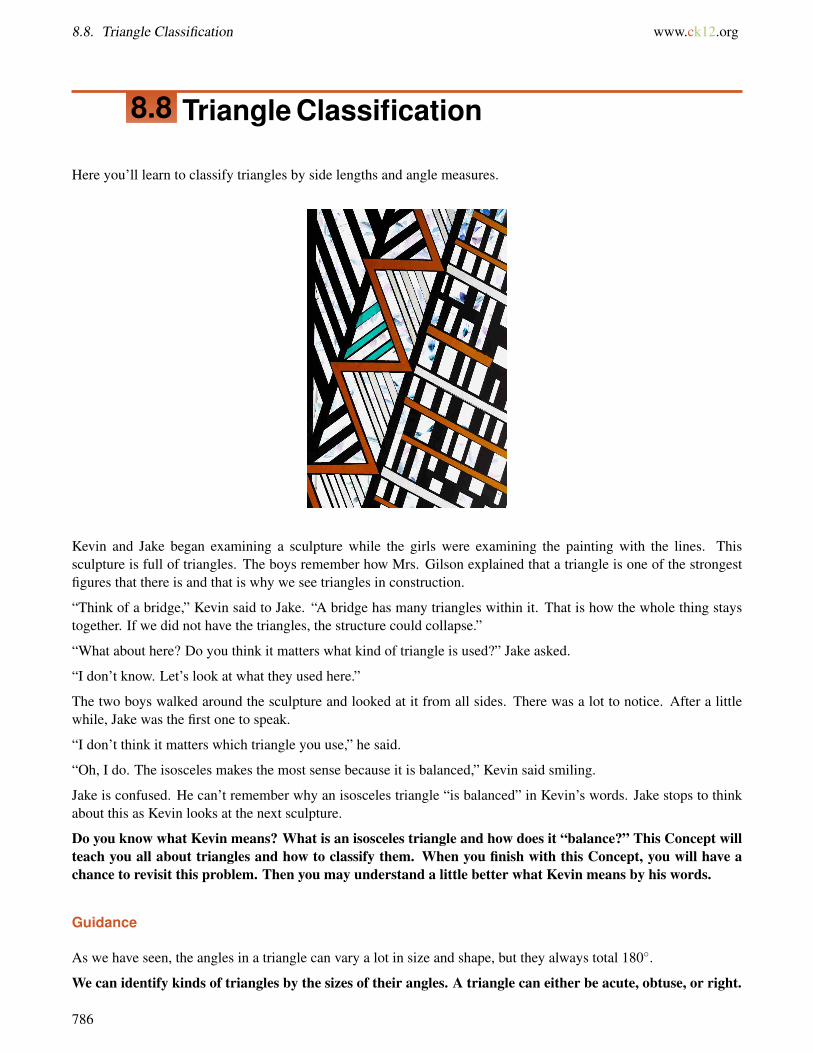
8.8. Triangle Classification www.ck12.org
8.8 Triangle Classification
Here you’ll learn to classify triangles by side lengths and angle measures.
Kevin and Jake began examining a sculpture while the girls were examining the painting with the lines. Thissculpture is full of triangles. The boys remember how Mrs. Gilson explained that a triangle is one of the strongestfigures that there is and that is why we see triangles in construction.
“Think of a bridge,” Kevin said to Jake. “A bridge has many triangles within it. That is how the whole thing staystogether. If we did not have the triangles, the structure could collapse.”
“What about here? Do you think it matters what kind of triangle is used?” Jake asked.
“I don’t know. Let’s look at what they used here.”
The two boys walked around the sculpture and looked at it from all sides. There was a lot to notice. After a littlewhile, Jake was the first one to speak.
“I don’t think it matters which triangle you use,” he said.
“Oh, I do. The isosceles makes the most sense because it is balanced,” Kevin said smiling.
Jake is confused. He can’t remember why an isosceles triangle “is balanced” in Kevin’s words. Jake stops to thinkabout this as Kevin looks at the next sculpture.
Do you know what Kevin means? What is an isosceles triangle and how does it “balance?” This Concept willteach you all about triangles and how to classify them. When you finish with this Concept, you will have achance to revisit this problem. Then you may understand a little better what Kevin means by his words.
Guidance
As we have seen, the angles in a triangle can vary a lot in size and shape, but they always total 180◦.
We can identify kinds of triangles by the sizes of their angles. A triangle can either be acute, obtuse, or right.
786
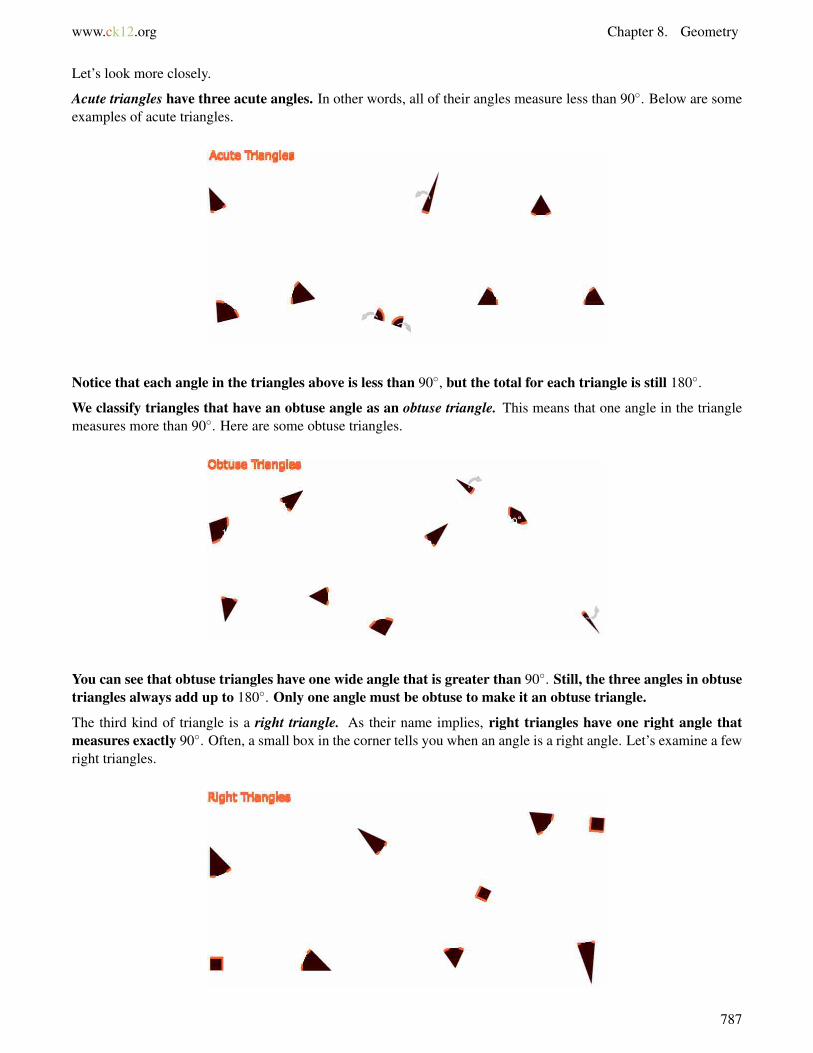
www.ck12.org Chapter 8. Geometry
Let’s look more closely.
Acute triangles have three acute angles. In other words, all of their angles measure less than 90◦. Below are someexamples of acute triangles.
Notice that each angle in the triangles above is less than 90◦, but the total for each triangle is still 180◦.
We classify triangles that have an obtuse angle as an obtuse triangle. This means that one angle in the trianglemeasures more than 90◦. Here are some obtuse triangles.
You can see that obtuse triangles have one wide angle that is greater than 90◦. Still, the three angles in obtusetriangles always add up to 180◦. Only one angle must be obtuse to make it an obtuse triangle.
The third kind of triangle is a right triangle. As their name implies, right triangles have one right angle thatmeasures exactly 90◦. Often, a small box in the corner tells you when an angle is a right angle. Let’s examine a fewright triangles.
787
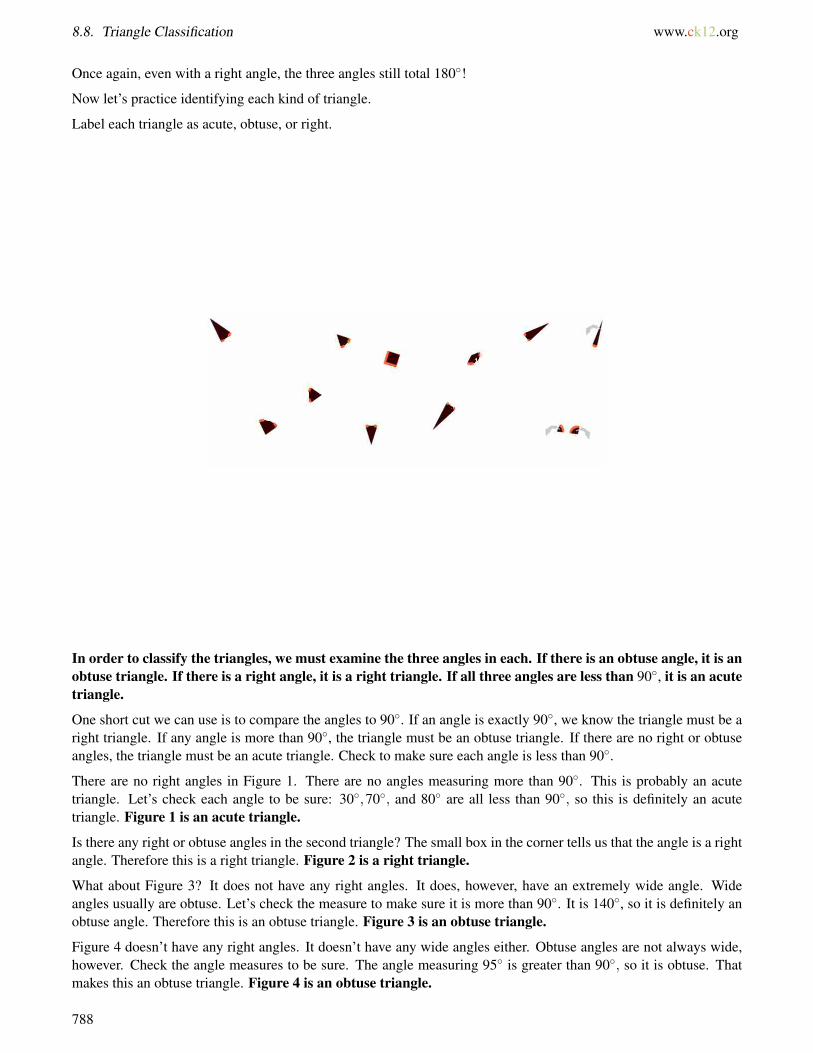
8.8. Triangle Classification www.ck12.org
Once again, even with a right angle, the three angles still total 180◦!
Now let’s practice identifying each kind of triangle.
Label each triangle as acute, obtuse, or right.
In order to classify the triangles, we must examine the three angles in each. If there is an obtuse angle, it is anobtuse triangle. If there is a right angle, it is a right triangle. If all three angles are less than 90◦, it is an acutetriangle.
One short cut we can use is to compare the angles to 90◦. If an angle is exactly 90◦, we know the triangle must be aright triangle. If any angle is more than 90◦, the triangle must be an obtuse triangle. If there are no right or obtuseangles, the triangle must be an acute triangle. Check to make sure each angle is less than 90◦.
There are no right angles in Figure 1. There are no angles measuring more than 90◦. This is probably an acutetriangle. Let’s check each angle to be sure: 30◦,70◦, and 80◦ are all less than 90◦, so this is definitely an acutetriangle. Figure 1 is an acute triangle.
Is there any right or obtuse angles in the second triangle? The small box in the corner tells us that the angle is a rightangle. Therefore this is a right triangle. Figure 2 is a right triangle.
What about Figure 3? It does not have any right angles. It does, however, have an extremely wide angle. Wideangles usually are obtuse. Let’s check the measure to make sure it is more than 90◦. It is 140◦, so it is definitely anobtuse angle. Therefore this is an obtuse triangle. Figure 3 is an obtuse triangle.
Figure 4 doesn’t have any right angles. It doesn’t have any wide angles either. Obtuse angles are not always wide,however. Check the angle measures to be sure. The angle measuring 95◦ is greater than 90◦, so it is obtuse. Thatmakes this an obtuse triangle. Figure 4 is an obtuse triangle.
788
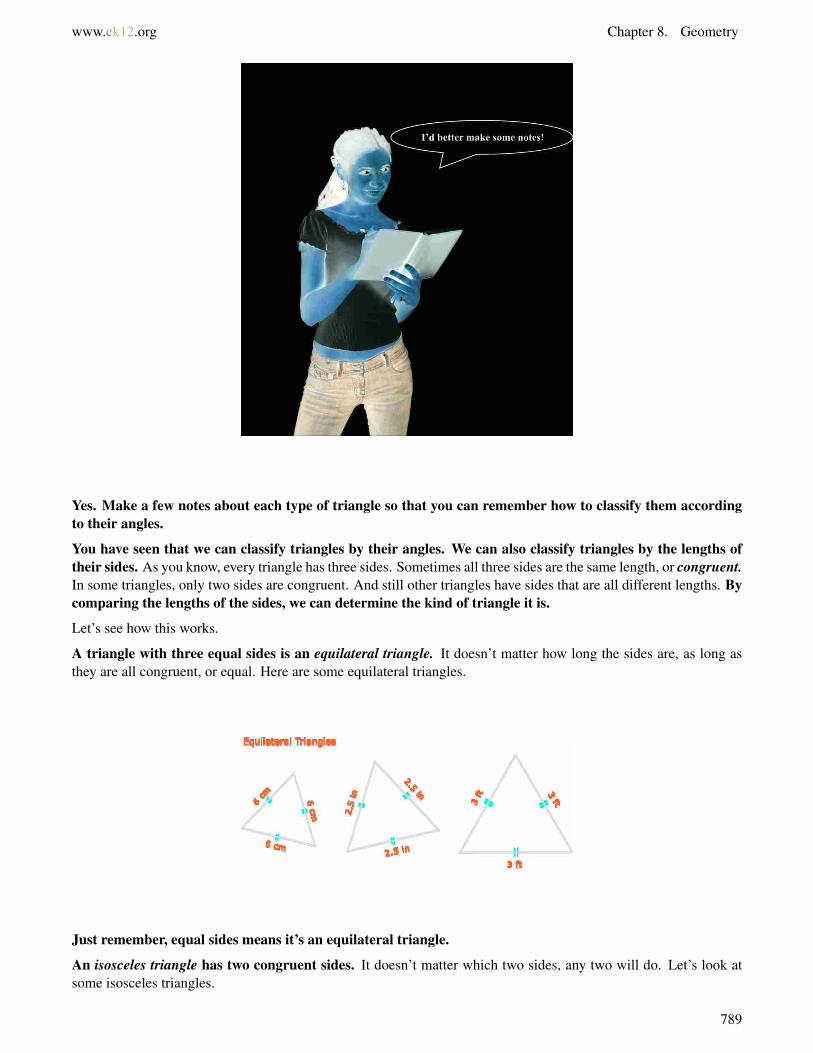
www.ck12.org Chapter 8. Geometry
Yes. Make a few notes about each type of triangle so that you can remember how to classify them accordingto their angles.
You have seen that we can classify triangles by their angles. We can also classify triangles by the lengths oftheir sides. As you know, every triangle has three sides. Sometimes all three sides are the same length, or congruent.In some triangles, only two sides are congruent. And still other triangles have sides that are all different lengths. Bycomparing the lengths of the sides, we can determine the kind of triangle it is.
Let’s see how this works.
A triangle with three equal sides is an equilateral triangle. It doesn’t matter how long the sides are, as long asthey are all congruent, or equal. Here are some equilateral triangles.
Just remember, equal sides means it’s an equilateral triangle.
An isosceles triangle has two congruent sides. It doesn’t matter which two sides, any two will do. Let’s look atsome isosceles triangles.
789
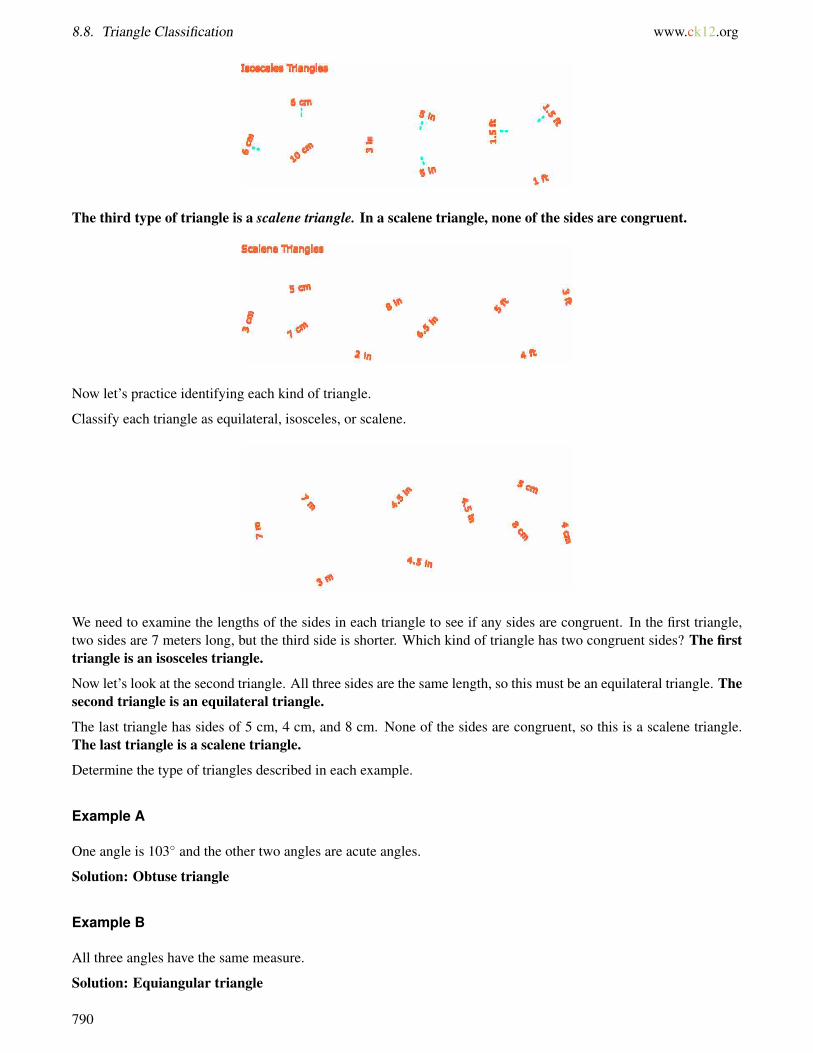
8.8. Triangle Classification www.ck12.org
The third type of triangle is a scalene triangle. In a scalene triangle, none of the sides are congruent.
Now let’s practice identifying each kind of triangle.
Classify each triangle as equilateral, isosceles, or scalene.
We need to examine the lengths of the sides in each triangle to see if any sides are congruent. In the first triangle,two sides are 7 meters long, but the third side is shorter. Which kind of triangle has two congruent sides? The firsttriangle is an isosceles triangle.
Now let’s look at the second triangle. All three sides are the same length, so this must be an equilateral triangle. Thesecond triangle is an equilateral triangle.
The last triangle has sides of 5 cm, 4 cm, and 8 cm. None of the sides are congruent, so this is a scalene triangle.The last triangle is a scalene triangle.
Determine the type of triangles described in each example.
Example A
One angle is 103◦ and the other two angles are acute angles.
Solution: Obtuse triangle
Example B
All three angles have the same measure.
Solution: Equiangular triangle
790
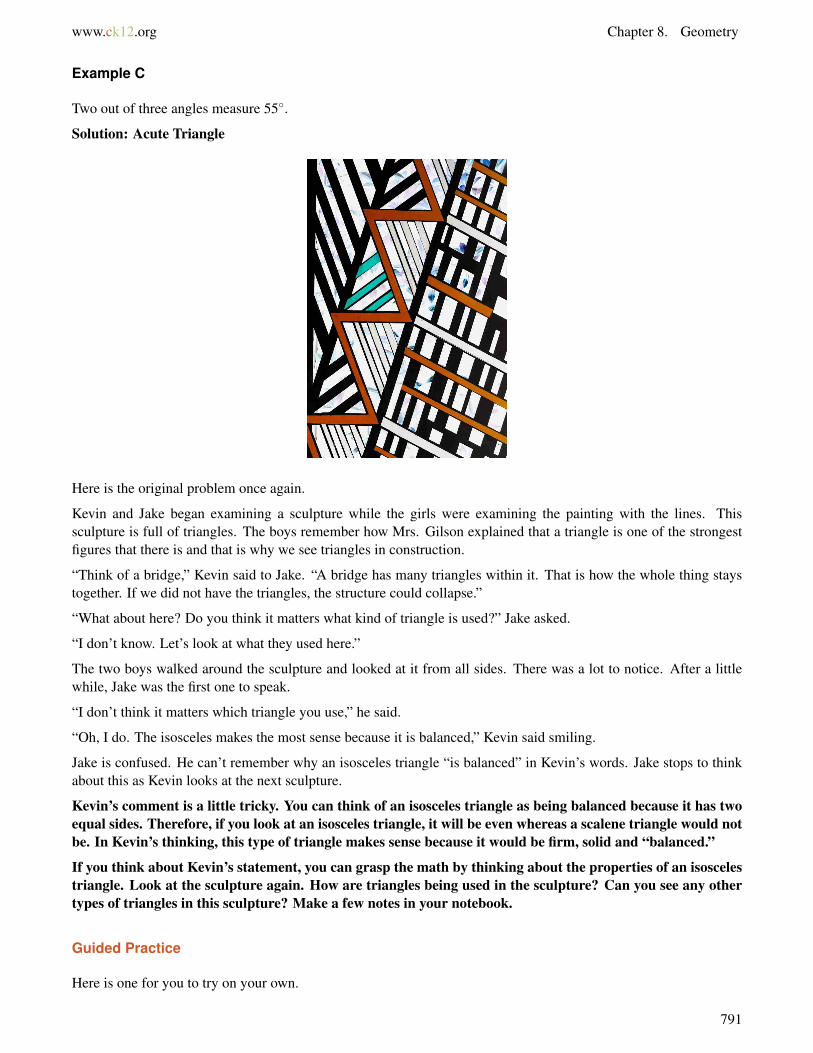
www.ck12.org Chapter 8. Geometry
Example C
Two out of three angles measure 55◦.
Solution: Acute Triangle
Here is the original problem once again.
Kevin and Jake began examining a sculpture while the girls were examining the painting with the lines. Thissculpture is full of triangles. The boys remember how Mrs. Gilson explained that a triangle is one of the strongestfigures that there is and that is why we see triangles in construction.
“Think of a bridge,” Kevin said to Jake. “A bridge has many triangles within it. That is how the whole thing staystogether. If we did not have the triangles, the structure could collapse.”
“What about here? Do you think it matters what kind of triangle is used?” Jake asked.
“I don’t know. Let’s look at what they used here.”
The two boys walked around the sculpture and looked at it from all sides. There was a lot to notice. After a littlewhile, Jake was the first one to speak.
“I don’t think it matters which triangle you use,” he said.
“Oh, I do. The isosceles makes the most sense because it is balanced,” Kevin said smiling.
Jake is confused. He can’t remember why an isosceles triangle “is balanced” in Kevin’s words. Jake stops to thinkabout this as Kevin looks at the next sculpture.
Kevin’s comment is a little tricky. You can think of an isosceles triangle as being balanced because it has twoequal sides. Therefore, if you look at an isosceles triangle, it will be even whereas a scalene triangle would notbe. In Kevin’s thinking, this type of triangle makes sense because it would be firm, solid and “balanced.”
If you think about Kevin’s statement, you can grasp the math by thinking about the properties of an isoscelestriangle. Look at the sculpture again. How are triangles being used in the sculpture? Can you see any othertypes of triangles in this sculpture? Make a few notes in your notebook.
Guided Practice
Here is one for you to try on your own.
791
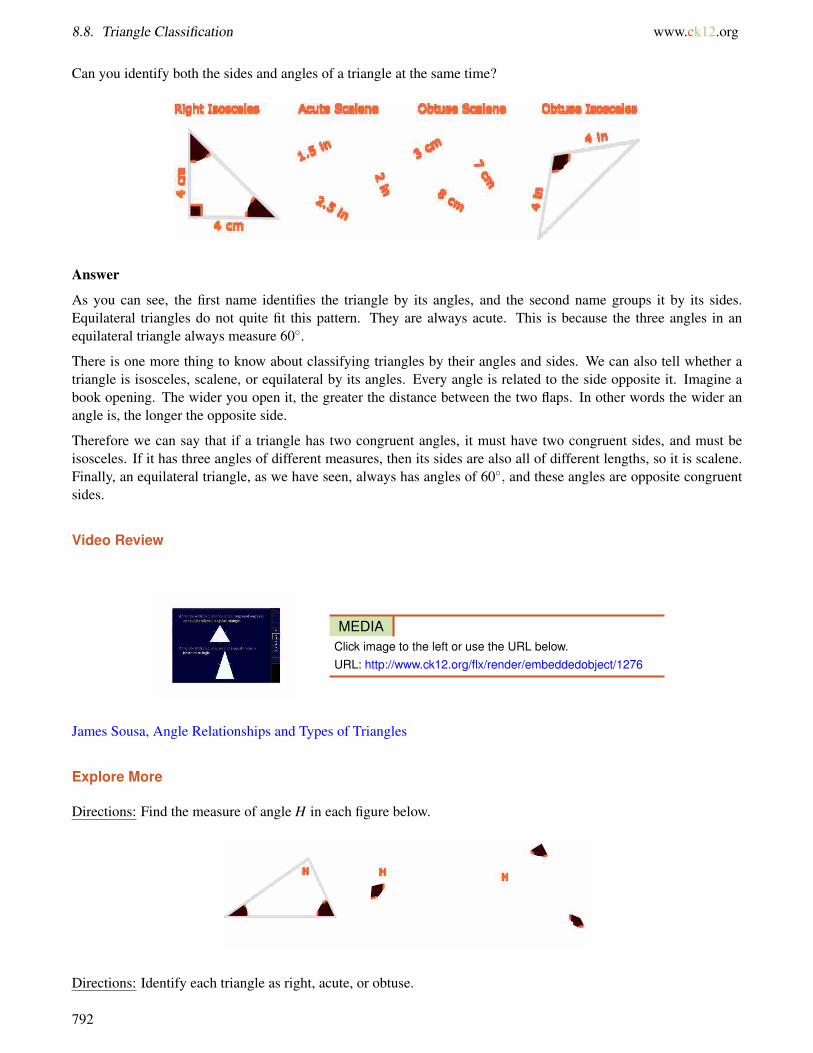
8.8. Triangle Classification www.ck12.org
Can you identify both the sides and angles of a triangle at the same time?
Answer
As you can see, the first name identifies the triangle by its angles, and the second name groups it by its sides.Equilateral triangles do not quite fit this pattern. They are always acute. This is because the three angles in anequilateral triangle always measure 60◦.
There is one more thing to know about classifying triangles by their angles and sides. We can also tell whether atriangle is isosceles, scalene, or equilateral by its angles. Every angle is related to the side opposite it. Imagine abook opening. The wider you open it, the greater the distance between the two flaps. In other words the wider anangle is, the longer the opposite side.
Therefore we can say that if a triangle has two congruent angles, it must have two congruent sides, and must beisosceles. If it has three angles of different measures, then its sides are also all of different lengths, so it is scalene.Finally, an equilateral triangle, as we have seen, always has angles of 60◦, and these angles are opposite congruentsides.
Video Review
MEDIAClick image to the left or use the URL below.URL: http://www.ck12.org/flx/render/embeddedobject/1276
James Sousa, Angle Relationships and Types of Triangles
Explore More
Directions: Find the measure of angle H in each figure below.
Directions: Identify each triangle as right, acute, or obtuse.
792
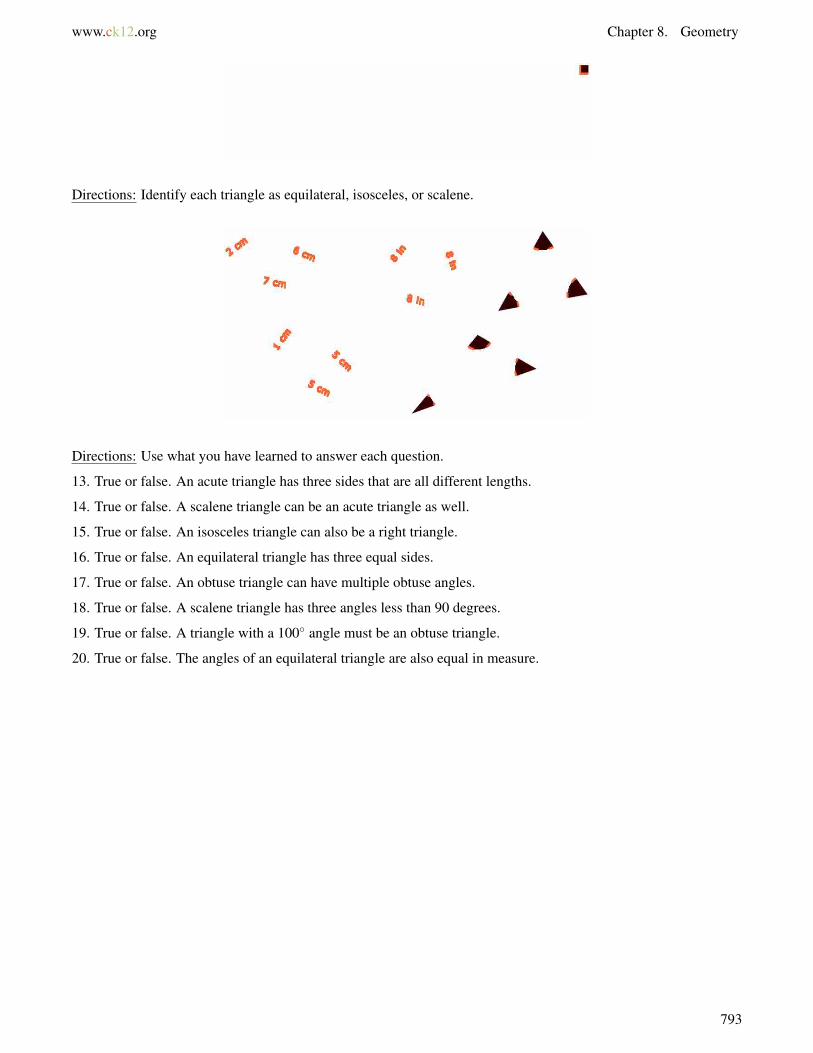
www.ck12.org Chapter 8. Geometry
Directions: Identify each triangle as equilateral, isosceles, or scalene.
Directions: Use what you have learned to answer each question.
13. True or false. An acute triangle has three sides that are all different lengths.
14. True or false. A scalene triangle can be an acute triangle as well.
15. True or false. An isosceles triangle can also be a right triangle.
16. True or false. An equilateral triangle has three equal sides.
17. True or false. An obtuse triangle can have multiple obtuse angles.
18. True or false. A scalene triangle has three angles less than 90 degrees.
19. True or false. A triangle with a 100◦ angle must be an obtuse triangle.
20. True or false. The angles of an equilateral triangle are also equal in measure.
793
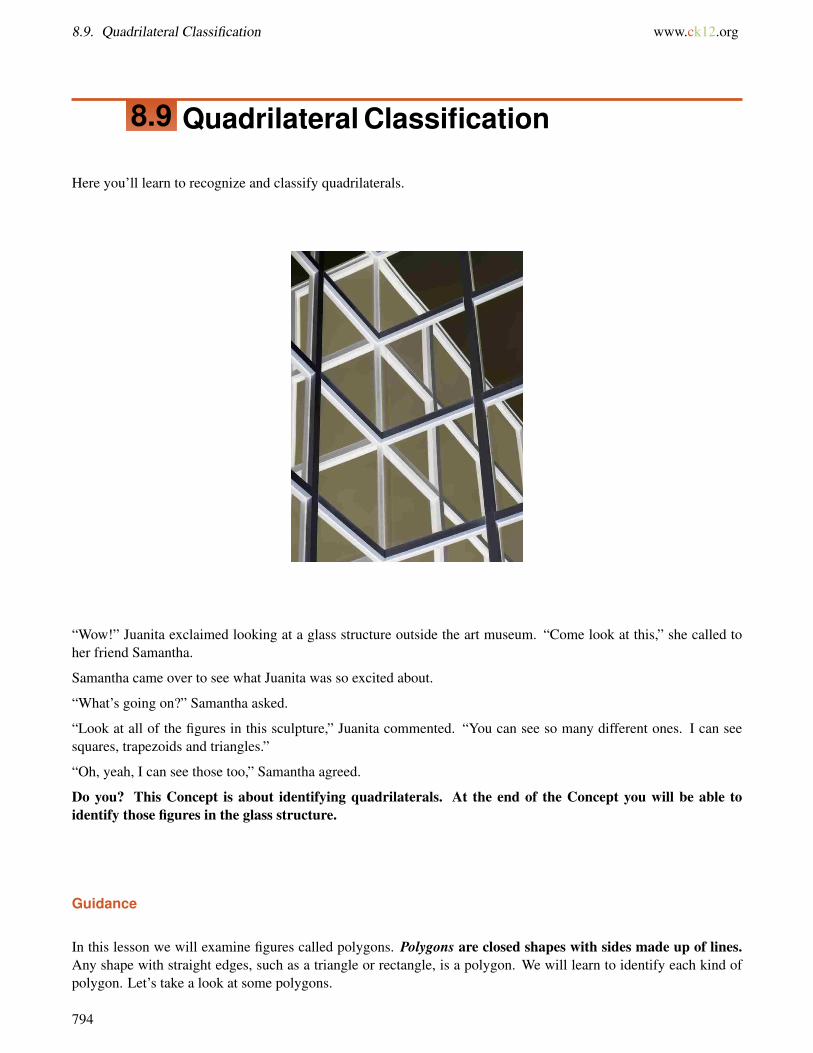
8.9. Quadrilateral Classification www.ck12.org
8.9 Quadrilateral Classification
Here you’ll learn to recognize and classify quadrilaterals.
“Wow!” Juanita exclaimed looking at a glass structure outside the art museum. “Come look at this,” she called toher friend Samantha.
Samantha came over to see what Juanita was so excited about.
“What’s going on?” Samantha asked.
“Look at all of the figures in this sculpture,” Juanita commented. “You can see so many different ones. I can seesquares, trapezoids and triangles.”
“Oh, yeah, I can see those too,” Samantha agreed.
Do you? This Concept is about identifying quadrilaterals. At the end of the Concept you will be able toidentify those figures in the glass structure.
Guidance
In this lesson we will examine figures called polygons. Polygons are closed shapes with sides made up of lines.Any shape with straight edges, such as a triangle or rectangle, is a polygon. We will learn to identify each kind ofpolygon. Let’s take a look at some polygons.
794

www.ck12.org Chapter 8. Geometry
Polygons with four sides, such as rectangles and squares, are called quadrilaterals. Quadrilaterals have specialproperties.
What is a quadrilateral?
The prefix of this word “quad” means four. Therefore, a quadrilateral is a polygon that has four sides. They alsohave four angles, and these four angles always have a sum of 360◦. This is true no matter what shape or sizethe quadrilateral is. Take a look at the quadrilaterals below.
Each figure has four sides and four angles. Notice how different the angles and the sides of the quadrilaterals are,though. Now look closely. If you add up the measures of the four angles in any of the quadrilaterals, they alwaysequal 360◦!
Another important feature of quadrilaterals is that many have one or even two pairs of parallel sides. Look atthese quadrilaterals again.
Can you find the pairs of parallel sides?
795

8.9. Quadrilateral Classification www.ck12.org
We can also classify quadrilaterals even further. You can see that each of the figures above has four sides andfour angles, but each is different based on the lengths of the sides, the angle measures and the types of sides.
Let’s look at the different types of quadrilaterals in detail.
A parallelogram is a quadrilateral with opposite sides parallel. The first figure above is a parallelogram. Thereare a few special features of parallelograms. One is that each pair of parallel sides is congruent. In the first figureabove, the two short sides are the same length and the two long sides are the same length. This special relationshipbetween the pairs of sides affects the angles of a parallelogram. This gives parallelograms their other distinguishingfeature: the angles opposite each other are also congruent. The 70◦ angles are opposite each other, and the 110◦
angles are opposite each other. This relationship exists in any parallelogram, no matter the length of the sides or thesizes of the angle pairs.
There are three special kinds of parallelograms: rectangles, squares, and a rhombus.
A rectangle is a quadrilateral because it has four sides, and it is a parallelogram because it has two pairs of parallel,congruent sides. Now take a look at its angles. All four angles are right angles! Therefore a rectangle is any shapewith two pairs of parallel sides and four right angles (bear in mind that the pairs of angles opposite each other arestill equal!).
A square also has two pairs of parallel sides and four right angles. It is special, though, because all four of its sidesare congruent.
The third special parallelogram is called a rhombus. Like a square, a rhombus has four congruent sides. It does nothave right angles, but it does still have pairs of congruent angles opposite each other. So a rhombus can be a square,but a square isn’t necessarily a rhombus because of the right angles necessary in a square.
Let’s try recognizing and classifying some parallelograms.
Identify the shapes below as a rectangle, square, rhombus, or parallelogram.
796
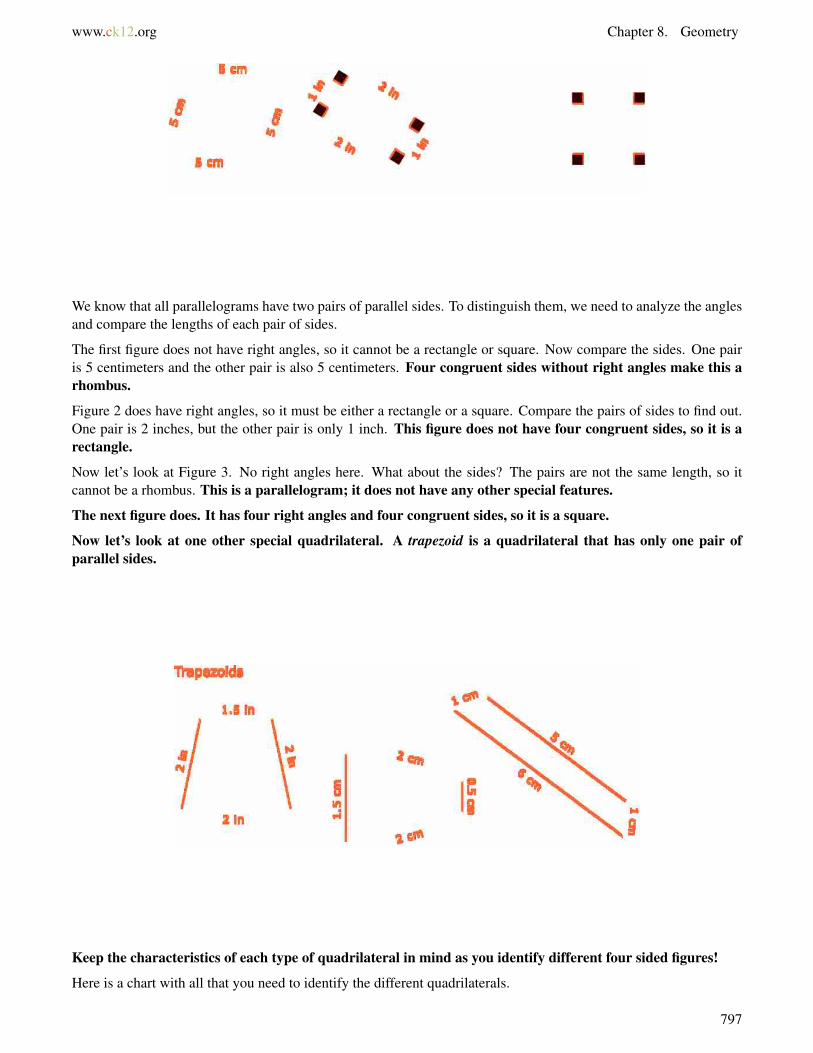
www.ck12.org Chapter 8. Geometry
We know that all parallelograms have two pairs of parallel sides. To distinguish them, we need to analyze the anglesand compare the lengths of each pair of sides.
The first figure does not have right angles, so it cannot be a rectangle or square. Now compare the sides. One pairis 5 centimeters and the other pair is also 5 centimeters. Four congruent sides without right angles make this arhombus.
Figure 2 does have right angles, so it must be either a rectangle or a square. Compare the pairs of sides to find out.One pair is 2 inches, but the other pair is only 1 inch. This figure does not have four congruent sides, so it is arectangle.
Now let’s look at Figure 3. No right angles here. What about the sides? The pairs are not the same length, so itcannot be a rhombus. This is a parallelogram; it does not have any other special features.
The next figure does. It has four right angles and four congruent sides, so it is a square.
Now let’s look at one other special quadrilateral. A trapezoid is a quadrilateral that has only one pair ofparallel sides.
Keep the characteristics of each type of quadrilateral in mind as you identify different four sided figures!
Here is a chart with all that you need to identify the different quadrilaterals.
797
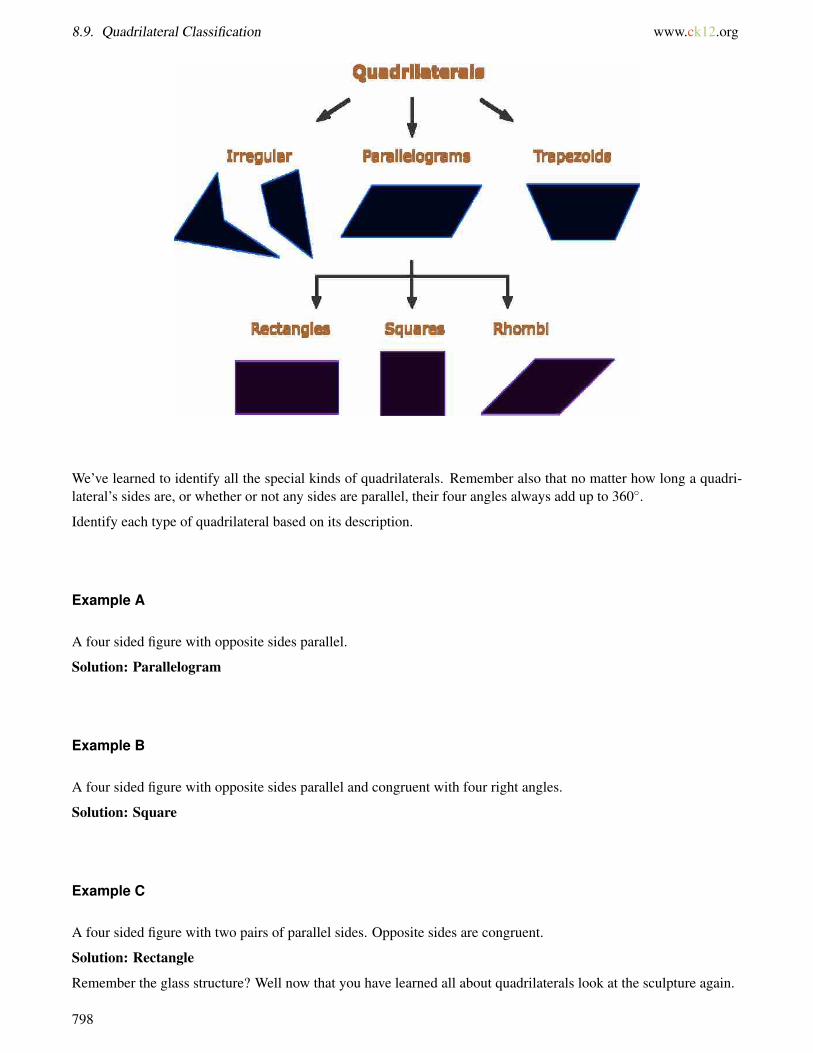
8.9. Quadrilateral Classification www.ck12.org
We’ve learned to identify all the special kinds of quadrilaterals. Remember also that no matter how long a quadri-lateral’s sides are, or whether or not any sides are parallel, their four angles always add up to 360◦.
Identify each type of quadrilateral based on its description.
Example A
A four sided figure with opposite sides parallel.
Solution: Parallelogram
Example B
A four sided figure with opposite sides parallel and congruent with four right angles.
Solution: Square
Example C
A four sided figure with two pairs of parallel sides. Opposite sides are congruent.
Solution: Rectangle
Remember the glass structure? Well now that you have learned all about quadrilaterals look at the sculpture again.
798
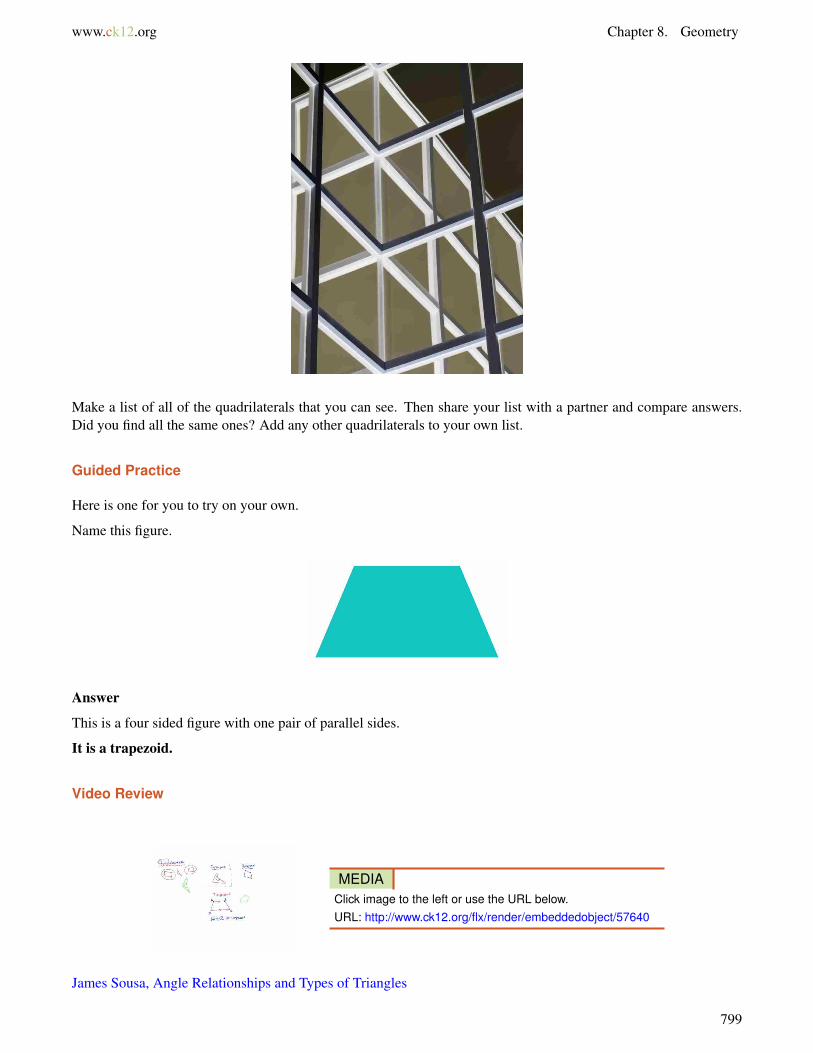
www.ck12.org Chapter 8. Geometry
Make a list of all of the quadrilaterals that you can see. Then share your list with a partner and compare answers.Did you find all the same ones? Add any other quadrilaterals to your own list.
Guided Practice
Here is one for you to try on your own.
Name this figure.
Answer
This is a four sided figure with one pair of parallel sides.
It is a trapezoid.
Video Review
MEDIAClick image to the left or use the URL below.URL: http://www.ck12.org/flx/render/embeddedobject/57640
James Sousa, Angle Relationships and Types of Triangles
799
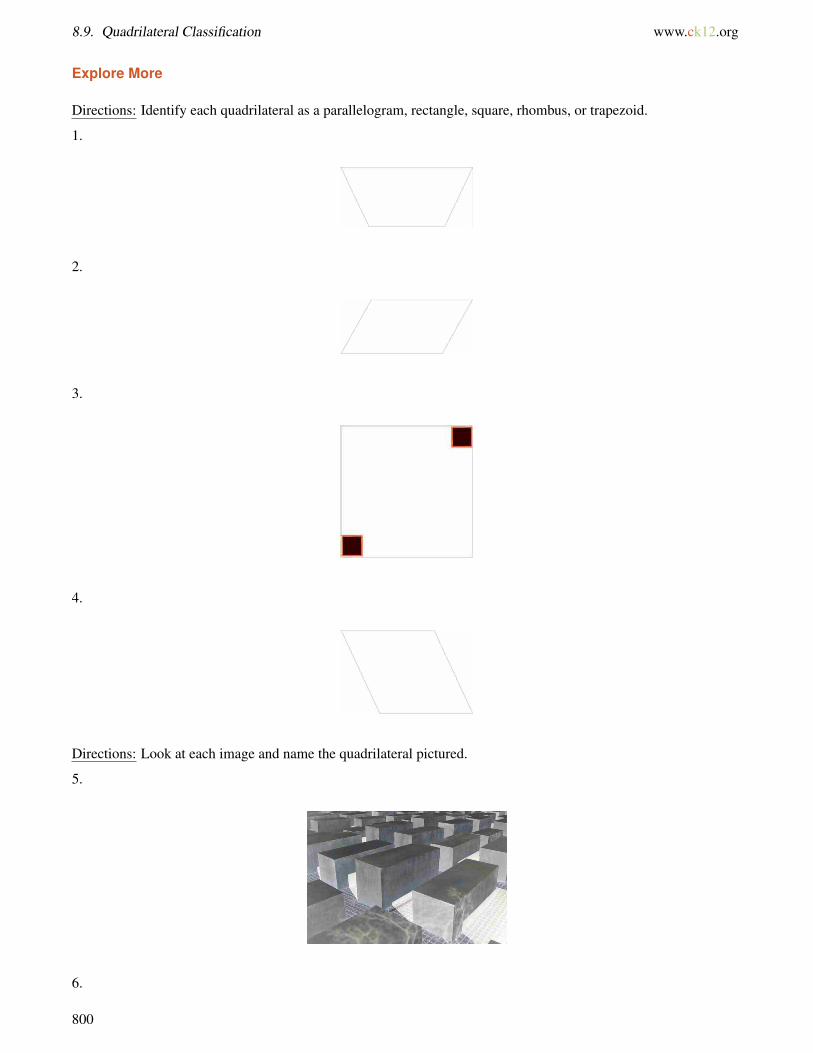
8.9. Quadrilateral Classification www.ck12.org
Explore More
Directions: Identify each quadrilateral as a parallelogram, rectangle, square, rhombus, or trapezoid.
1.
2.
3.
4.
Directions: Look at each image and name the quadrilateral pictured.
5.
6.
800

www.ck12.org Chapter 8. Geometry
7.
8.
9.
Directions: Name the geometric figure described below or answer each question.
10. Has four sides and four angles
11. Has one pair of opposite sides that are parallel
12. Has four right angles and four congruent sides
13. A parallelogram with four right angles.
14. A parallelogram with four congruent sides
15. Has four right angles and opposite sides congruent
801
8.10. Polygon Classification www.ck12.org
8.10 Polygon Classification
Here you’ll learn to recognize and classify polygons.
“Look," said Samantha as she and Juanita looked at the glass sculpture. "I can also see a hexagon, and it is made upof 6 equilateral triangles. That means that the sum of all of the angles of the hexagon is 1080◦.”
“How do you figure that?” Juanita asked shaking her head.
“Just look at it. You see those triangles, well if you add them up you get a sum of 1080◦. Oh, I can’t explain it,”Samantha said seeing Juanita’s confused look.
Can you explain it? To explain Samantha’s theory, you have to understand polygons and their angles. ThisConcept will teach you everything that you need to know to work through this problem. Take a few notes asyou go through the Concept. At the end of it, you will need what you have learned to solve this problem.
Guidance
In the Quadrilateral Classification Concept, we mentioned the word “polygon.” A polygon is a closed figure madeup of lines and angles. Now we are going to look at polygons in more detail.
We classify polygons by the number of sides and the number of angles in it.
Here is a table with information on some of the different types of polygons.
802

www.ck12.org Chapter 8. Geometry
TABLE 8.1:
Polygon Name Polygon Number of Angles andSides
Sum of Interior Angles
triangle 3 180◦
rectangle/square 4 360◦
pentagon 5 540◦
hexagon 6 720◦
heptagon 7 900◦
octagon 8 1,080◦
803
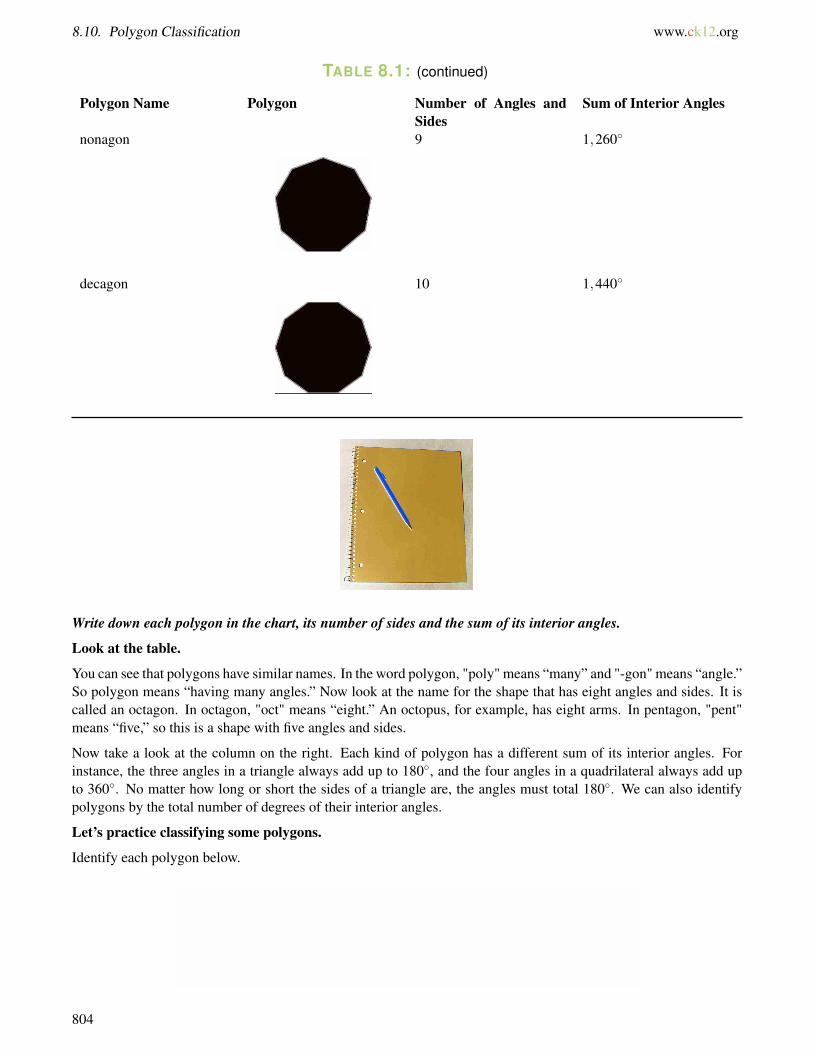
8.10. Polygon Classification www.ck12.org
TABLE 8.1: (continued)
Polygon Name Polygon Number of Angles andSides
Sum of Interior Angles
nonagon 9 1,260◦
decagon 10 1,440◦
Write down each polygon in the chart, its number of sides and the sum of its interior angles.
Look at the table.
You can see that polygons have similar names. In the word polygon, "poly" means “many” and "-gon" means “angle.”So polygon means “having many angles.” Now look at the name for the shape that has eight angles and sides. It iscalled an octagon. In octagon, "oct" means “eight.” An octopus, for example, has eight arms. In pentagon, "pent"means “five,” so this is a shape with five angles and sides.
Now take a look at the column on the right. Each kind of polygon has a different sum of its interior angles. Forinstance, the three angles in a triangle always add up to 180◦, and the four angles in a quadrilateral always add upto 360◦. No matter how long or short the sides of a triangle are, the angles must total 180◦. We can also identifypolygons by the total number of degrees of their interior angles.
Let’s practice classifying some polygons.
Identify each polygon below.
804
www.ck12.org Chapter 8. Geometry
Count the number of angles or sides. The first figure has six angles and sides. Check the table. Six angles and sidesmake it a hexagon.
You may already recognize the next figure. A triangle is a polygon that has three angles and sides.
Figure 3 is more unusual. It has nine angles and sides. This means it is a nonagon. Non-means “nine.”
The next figure has five angles and sides. Look at the table. A polygon having five angles and sides is called apentagon.
You may recognize this shape too. It’s a rectangle. All rectangles are four-sided polygons. And, as we have learned,they are also called quadrilaterals. Quad means “four.”
Count the number of angles or sides in the last figure. It has seven angles and sides. This makes it a heptagon.Hept-means “seven.”
Use what you have learned to identify each polygon described.
Example A
The sum of the interior angles is 180◦.
Solution: Triangle
Example B
It has seven sides.
Solution: Heptagon
Example C
It has five sides and five angles.
Solution: Pentagon
Guided Practice
Here is one for you to try on your own.
Morgan stitched a geometric figure into part of a quilt she is sewing. She measured the angles to help her knowwhere to stitch. The sum of the angle measures was 1,080◦. What kind of polygon did she stitch?
Answer
In this dilemma, we have no easy way of knowing how many angles or sides the figure has. What do we know?We know that the sum of the interior angles, however many there are, is 1,080◦. Only one polygon has angles thatalways add up to this amount. Check the table above.
Morgan must have stitched an octagon. Now we know that the distinguishing properties of an octagon are not onlythat it has eight sides and angles, but that its eight angles must have a sum of 1,080◦.
Video Review
805
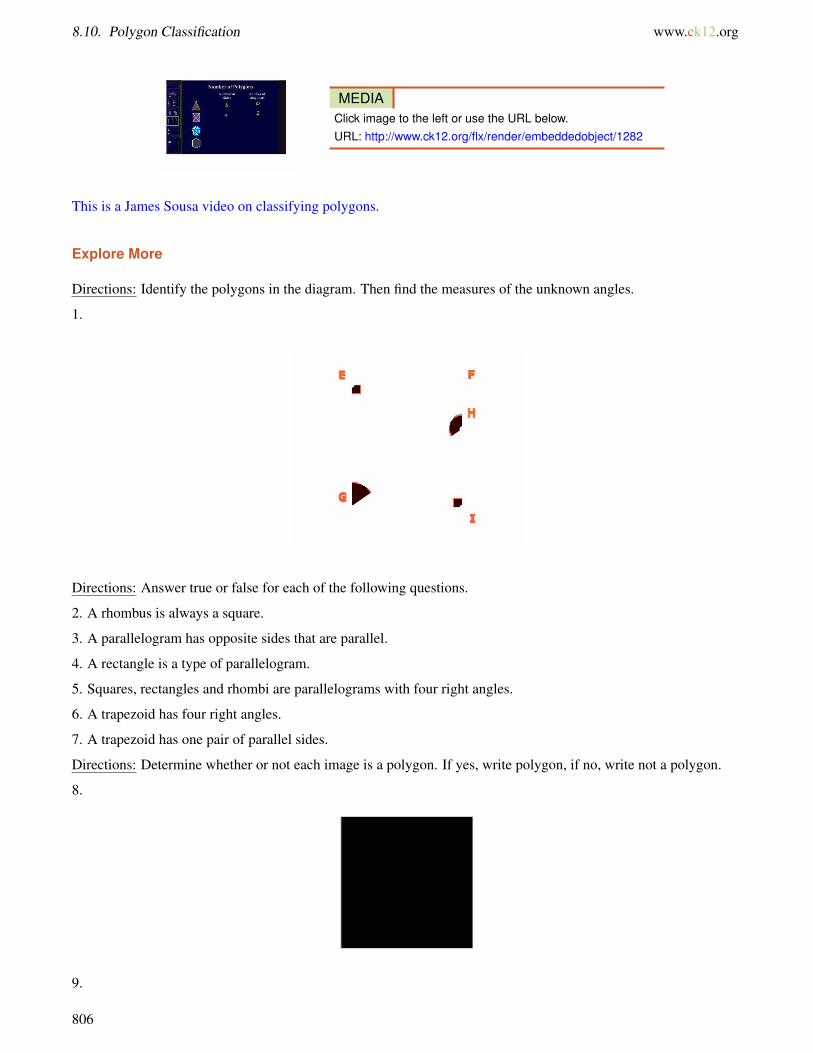
8.10. Polygon Classification www.ck12.org
MEDIAClick image to the left or use the URL below.URL: http://www.ck12.org/flx/render/embeddedobject/1282
This is a James Sousa video on classifying polygons.
Explore More
Directions: Identify the polygons in the diagram. Then find the measures of the unknown angles.
1.
Directions: Answer true or false for each of the following questions.
2. A rhombus is always a square.
3. A parallelogram has opposite sides that are parallel.
4. A rectangle is a type of parallelogram.
5. Squares, rectangles and rhombi are parallelograms with four right angles.
6. A trapezoid has four right angles.
7. A trapezoid has one pair of parallel sides.
Directions: Determine whether or not each image is a polygon. If yes, write polygon, if no, write not a polygon.
8.
9.
806


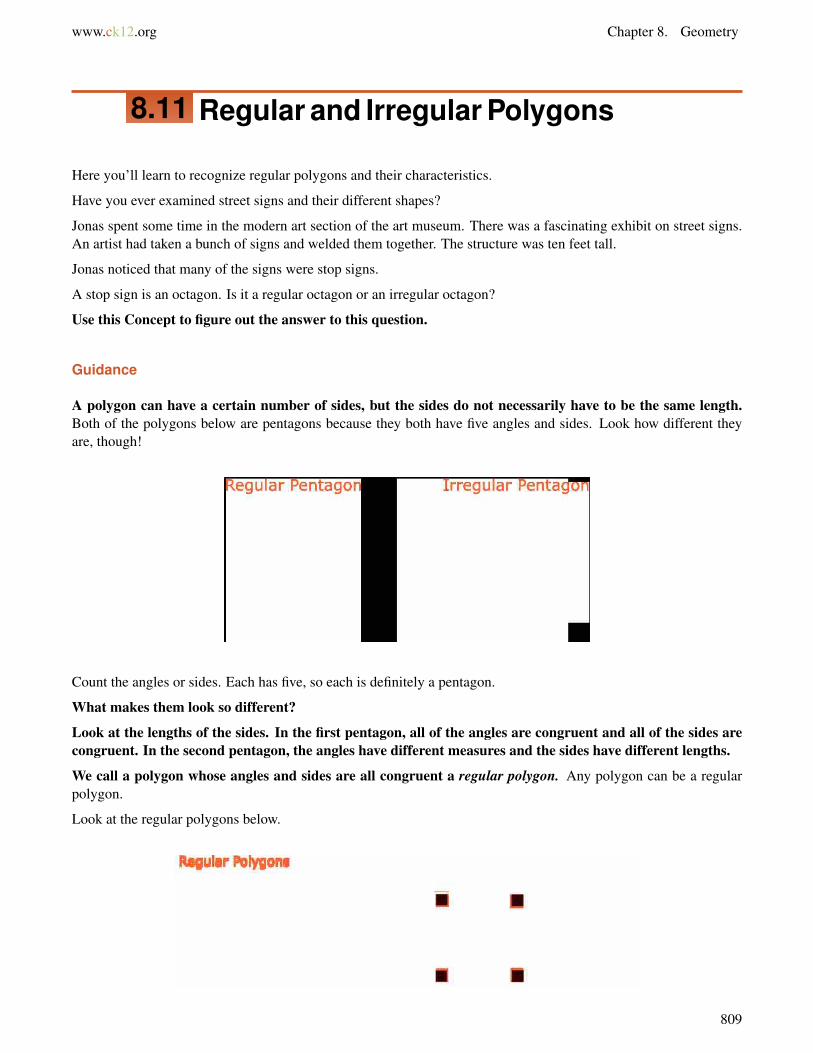
www.ck12.org Chapter 8. Geometry
8.11 Regular and Irregular Polygons
Here you’ll learn to recognize regular polygons and their characteristics.
Have you ever examined street signs and their different shapes?
Jonas spent some time in the modern art section of the art museum. There was a fascinating exhibit on street signs.An artist had taken a bunch of signs and welded them together. The structure was ten feet tall.
Jonas noticed that many of the signs were stop signs.
A stop sign is an octagon. Is it a regular octagon or an irregular octagon?
Use this Concept to figure out the answer to this question.
Guidance
A polygon can have a certain number of sides, but the sides do not necessarily have to be the same length.Both of the polygons below are pentagons because they both have five angles and sides. Look how different theyare, though!
Count the angles or sides. Each has five, so each is definitely a pentagon.
What makes them look so different?
Look at the lengths of the sides. In the first pentagon, all of the angles are congruent and all of the sides arecongruent. In the second pentagon, the angles have different measures and the sides have different lengths.
We call a polygon whose angles and sides are all congruent a regular polygon. Any polygon can be a regularpolygon.
Look at the regular polygons below.
809
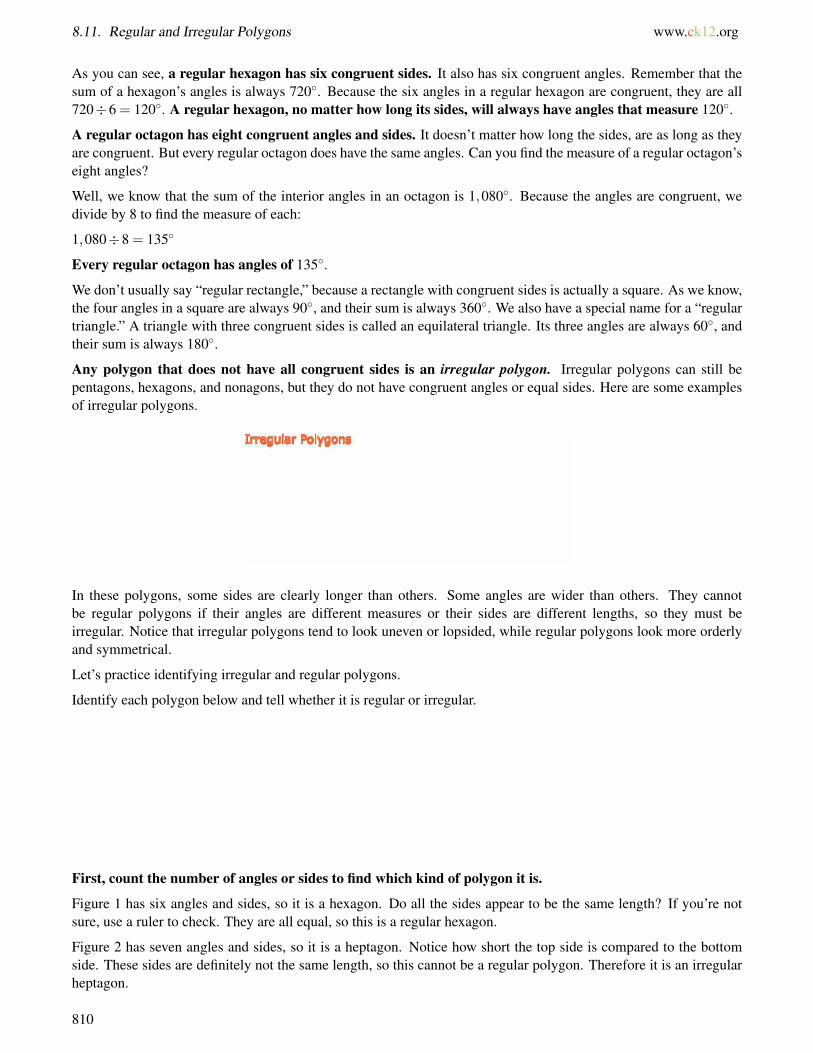
8.11. Regular and Irregular Polygons www.ck12.org
As you can see, a regular hexagon has six congruent sides. It also has six congruent angles. Remember that thesum of a hexagon’s angles is always 720◦. Because the six angles in a regular hexagon are congruent, they are all720÷6 = 120◦. A regular hexagon, no matter how long its sides, will always have angles that measure 120◦.
A regular octagon has eight congruent angles and sides. It doesn’t matter how long the sides, are as long as theyare congruent. But every regular octagon does have the same angles. Can you find the measure of a regular octagon’seight angles?
Well, we know that the sum of the interior angles in an octagon is 1,080◦. Because the angles are congruent, wedivide by 8 to find the measure of each:
1,080÷8 = 135◦
Every regular octagon has angles of 135◦.
We don’t usually say “regular rectangle,” because a rectangle with congruent sides is actually a square. As we know,the four angles in a square are always 90◦, and their sum is always 360◦. We also have a special name for a “regulartriangle.” A triangle with three congruent sides is called an equilateral triangle. Its three angles are always 60◦, andtheir sum is always 180◦.
Any polygon that does not have all congruent sides is an irregular polygon. Irregular polygons can still bepentagons, hexagons, and nonagons, but they do not have congruent angles or equal sides. Here are some examplesof irregular polygons.
In these polygons, some sides are clearly longer than others. Some angles are wider than others. They cannotbe regular polygons if their angles are different measures or their sides are different lengths, so they must beirregular. Notice that irregular polygons tend to look uneven or lopsided, while regular polygons look more orderlyand symmetrical.
Let’s practice identifying irregular and regular polygons.
Identify each polygon below and tell whether it is regular or irregular.
First, count the number of angles or sides to find which kind of polygon it is.
Figure 1 has six angles and sides, so it is a hexagon. Do all the sides appear to be the same length? If you’re notsure, use a ruler to check. They are all equal, so this is a regular hexagon.
Figure 2 has seven angles and sides, so it is a heptagon. Notice how short the top side is compared to the bottomside. These sides are definitely not the same length, so this cannot be a regular polygon. Therefore it is an irregularheptagon.
810

www.ck12.org Chapter 8. Geometry
The next figure has five angles and sides, so it is a pentagon. The angles are all 108◦, so this is a regular pentagonbecause it has congruent angles.
How many sides does this polygon have? It has eight, which makes it an octagon. It looks a bit lopsided, so it’slikely that the sides are not all congruent. Let’s take a look at the angles. Some of them are the same measure, butnot all of them. It cannot be a regular polygon because all of its angles are not congruent; it is an irregular octagon.
We can identify a polygon by the number of sides and angles it has, or by the sum of its interior angles. Thenwe can tell whether it is regular or irregular depending on whether all the angles or sides are congruent.
Now that you know about polygons, we can use this information to analyze polygons and their relationships.
When lines intersect in the geometric plane, they form polygons. We can apply what we know to thesepolygons in order to classify them, find side lengths, or solve for unknown angle measures. Take a look atthe diagram below.
The intersection of these five lines has created several different polygons. First, let’s see if we can find themall.
The largest is AMDE. Within this figure there are two figures. What are they?
One is figure ABCDE. What can we tell about figure ABCDE? First, we can determine what kind of polygon it is.It has five angles and five sides, so it is a pentagon. Two of its angles measure 90◦, and one measures 120◦. Can wefind the measures of the two remaining angles? We can, but to do so, we need to take a look at the third figure.
The third figure is triangle MBC. It has two 60◦ angles. We can use these angles to help us find the measures ofthe unknown angles in the pentagon ABCDE. Angles ABC and MBC are supplementary. In other words, togetherthey form a straight line. A straight line measures 180◦. Therefore the sum of these two angles is 180◦. We simplysubtract to find the measure of ABC.
180−60 = 120◦
Angle ABC is 120◦. Draw a copy of the diagram and fill this information in. Now let’s see if we can find the measureof angle BCD. We now know four of the five angles in figure ABCDE. Because this is a pentagon, we also know thatits interior angles must have a sum of 540◦. We can set up an equation to find the measure of the unknown angle.
90+90+120+120+ 6 BCD = 540◦
420+ 6 BCD = 540◦
6 BCD = 540−4206 BCD = 120◦
The fifth and final angle must measure 120◦. Let’s add up all of the angles in the pentagon to be sure theytotal 540◦.
811
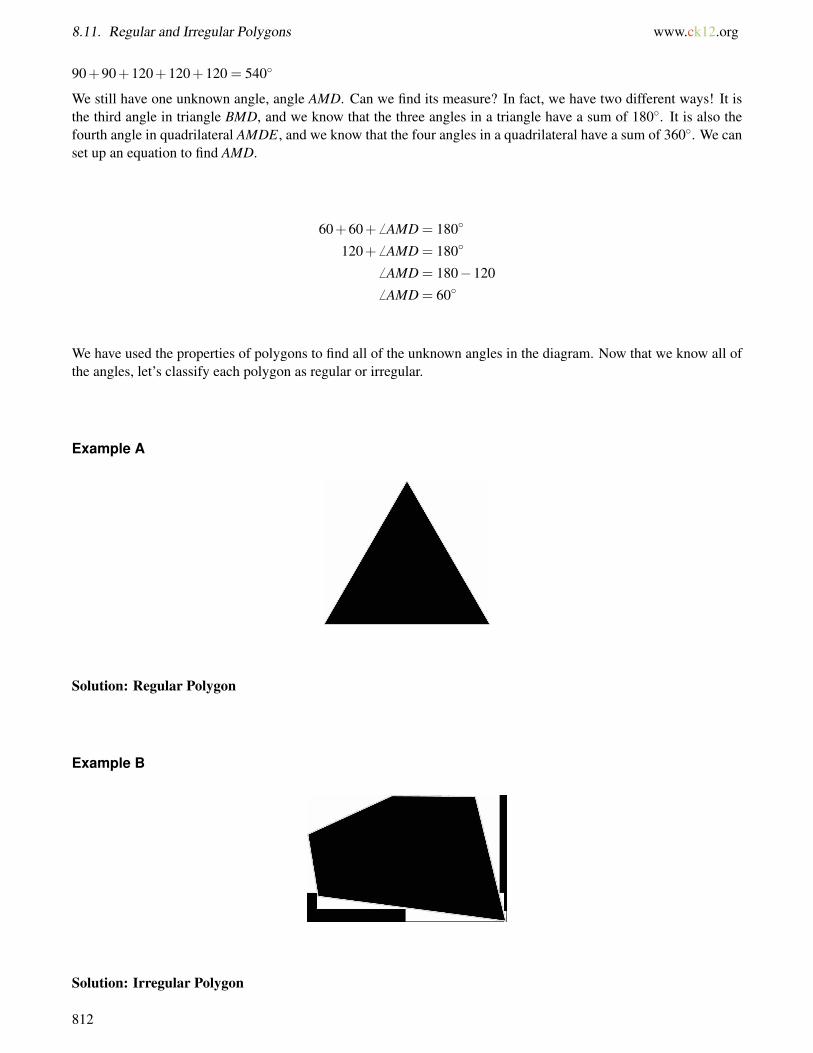
8.11. Regular and Irregular Polygons www.ck12.org
90+90+120+120+120 = 540◦
We still have one unknown angle, angle AMD. Can we find its measure? In fact, we have two different ways! It isthe third angle in triangle BMD, and we know that the three angles in a triangle have a sum of 180◦. It is also thefourth angle in quadrilateral AMDE, and we know that the four angles in a quadrilateral have a sum of 360◦. We canset up an equation to find AMD.
60+60+ 6 AMD = 180◦
120+ 6 AMD = 180◦
6 AMD = 180−1206 AMD = 60◦
We have used the properties of polygons to find all of the unknown angles in the diagram. Now that we know all ofthe angles, let’s classify each polygon as regular or irregular.
Example A
Solution: Regular Polygon
Example B
Solution: Irregular Polygon
812
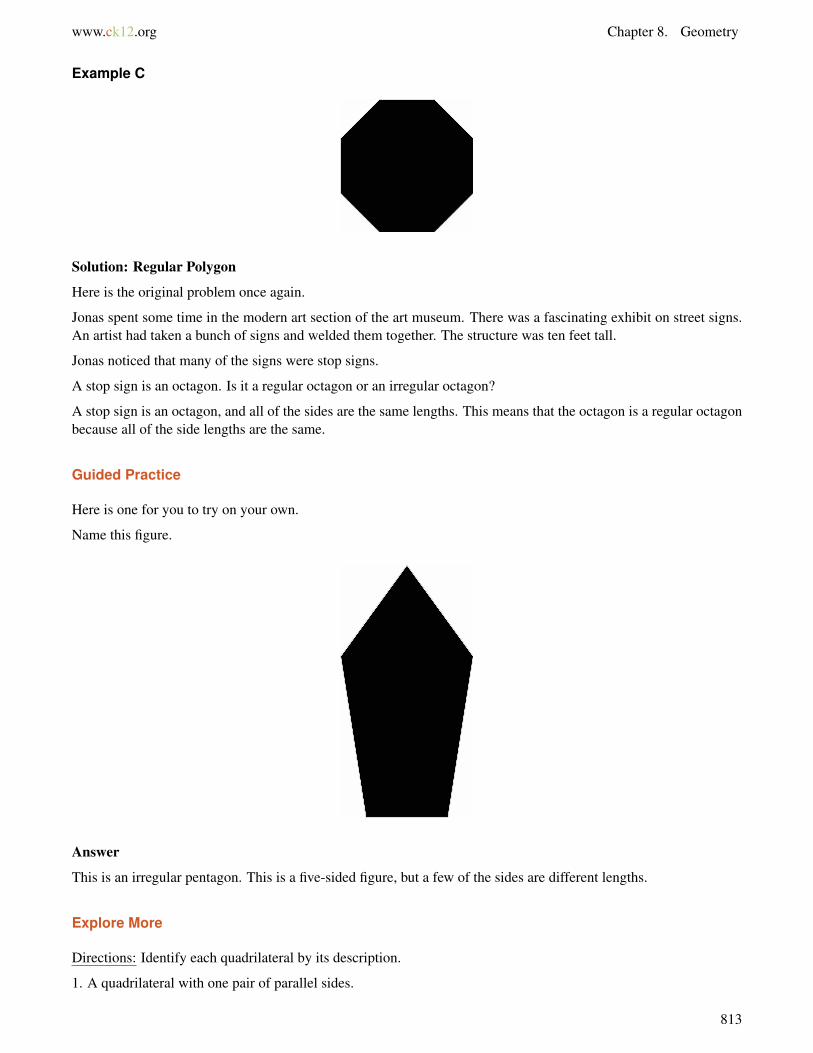
www.ck12.org Chapter 8. Geometry
Example C
Solution: Regular Polygon
Here is the original problem once again.
Jonas spent some time in the modern art section of the art museum. There was a fascinating exhibit on street signs.An artist had taken a bunch of signs and welded them together. The structure was ten feet tall.
Jonas noticed that many of the signs were stop signs.
A stop sign is an octagon. Is it a regular octagon or an irregular octagon?
A stop sign is an octagon, and all of the sides are the same lengths. This means that the octagon is a regular octagonbecause all of the side lengths are the same.
Guided Practice
Here is one for you to try on your own.
Name this figure.
Answer
This is an irregular pentagon. This is a five-sided figure, but a few of the sides are different lengths.
Explore More
Directions: Identify each quadrilateral by its description.
1. A quadrilateral with one pair of parallel sides.
813

8.11. Regular and Irregular Polygons www.ck12.org
2. A quadrilateral with opposites sides congruent and parallel, with four right angles.
3. A quadrilateral with four congruent parallel sides and four right angles.
4. A rectangle with four congruent parallel sides.
Directions: Identify the polygons in the diagram. Then find the measures of the unknown angles.
5.
Directions: Answer true or false for each of the following questions.
6. A rhombus is always a square.
7. A parallelogram has opposite sides that are parallel.
8. A rectangle is a type of parallelogram.
9. Squares, rectangles and rhombi are parallelograms with four right angles.
10. A trapezoid has four right angles.
11. A trapezoid has one pair of parallel sides.
12. A regular polygon has congruent sides and angles.
13. A pentagon can not be an irregular polygon.
Directions: Identify each polygon below.
14. a
15. b
16. c
17. d
814
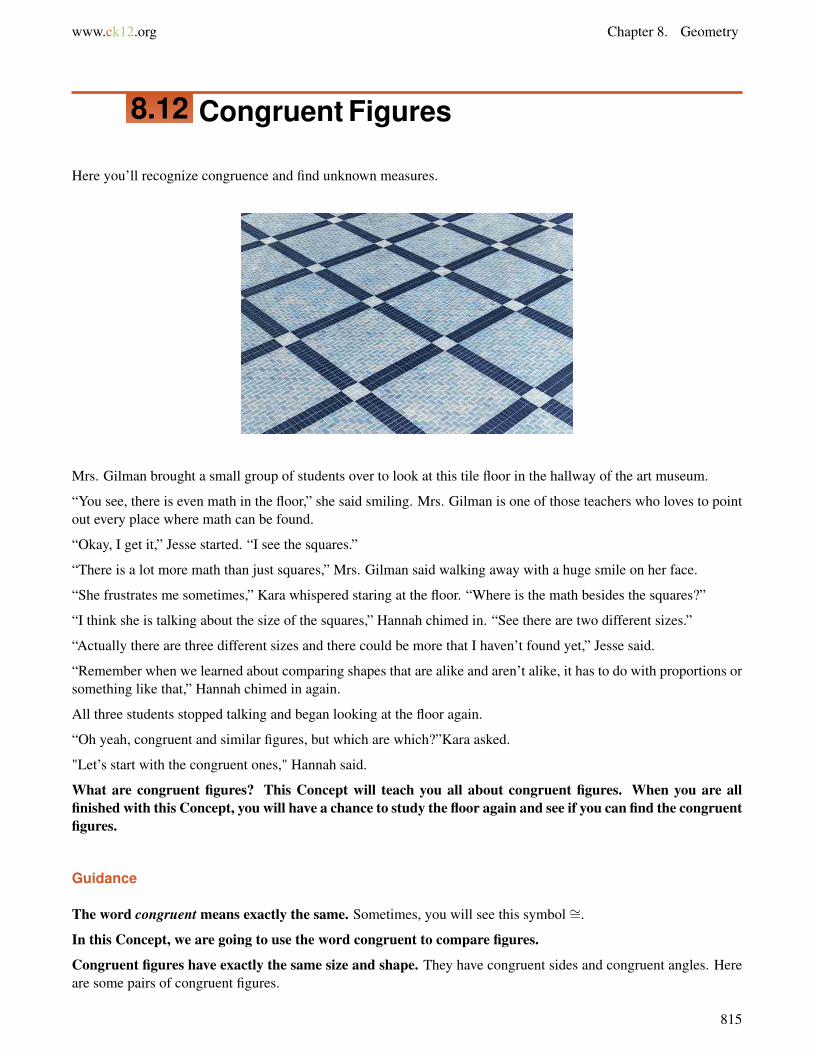
www.ck12.org Chapter 8. Geometry
8.12 Congruent Figures
Here you’ll recognize congruence and find unknown measures.
Mrs. Gilman brought a small group of students over to look at this tile floor in the hallway of the art museum.
“You see, there is even math in the floor,” she said smiling. Mrs. Gilman is one of those teachers who loves to pointout every place where math can be found.
“Okay, I get it,” Jesse started. “I see the squares.”
“There is a lot more math than just squares,” Mrs. Gilman said walking away with a huge smile on her face.
“She frustrates me sometimes,” Kara whispered staring at the floor. “Where is the math besides the squares?”
“I think she is talking about the size of the squares,” Hannah chimed in. “See there are two different sizes.”
“Actually there are three different sizes and there could be more that I haven’t found yet,” Jesse said.
“Remember when we learned about comparing shapes that are alike and aren’t alike, it has to do with proportions orsomething like that,” Hannah chimed in again.
All three students stopped talking and began looking at the floor again.
“Oh yeah, congruent and similar figures, but which are which?”Kara asked.
"Let’s start with the congruent ones," Hannah said.
What are congruent figures? This Concept will teach you all about congruent figures. When you are allfinished with this Concept, you will have a chance to study the floor again and see if you can find the congruentfigures.
Guidance
The word congruent means exactly the same. Sometimes, you will see this symbol ∼=.
In this Concept, we are going to use the word congruent to compare figures.
Congruent figures have exactly the same size and shape. They have congruent sides and congruent angles. Hereare some pairs of congruent figures.
815

8.12. Congruent Figures www.ck12.org
Compare the figures in each pair. They are exactly the same! If you’re not sure, imagine that you could cut out onefigure and place it on top of the other. If they match exactly, they are congruent.
How can we recognize congruence?
We test for congruency by comparing each side and angle of two figures to see if all aspects of both are thesame. If the sides are the same length and the angles are equal, the figures are congruent. Each side and angleof one figure corresponds to a side or angle in the other. We call these corresponding parts. For instance, the toppoint of one triangle corresponds to the top point of the other triangle in a congruent pair.
It is not always easy to see the corresponding parts of two figures. One figure may be rotated differently so that thecorresponding parts appear to be in different places. If you’re not sure, trace one figure and place it on top of theother to see if you can make them match. Let’s see if we can recognize some congruent figures.
Which pair of figures below is congruent?
Let’s analyze one pair at a time to see if we can find any corresponding angles and sides that are congruent.
The figures in the first pair appear to be the same shape, if we rotate one 180◦ so they both point up. Now we cansee all of the corresponding parts, such as the angle at the top and the two long sides on the left and right. This isnot enough to go on, however. We need to compare the measures of the angles and the lengths of the sides. If anyone set of corresponding parts doesn’t match, the figures cannot be congruent.
We only know the measure of one angle in the first two figures. We can compare these angles if they are correspond-ing parts. They are, because if we rotate one figure these angles are in the same place at the top of each figure. Nowcompare their measures. The angle in the first figure is 45◦. The corresponding angle in the second figure is 55◦.Because the angles are different, these two figures are not congruent. Let’s look at the next pair.
The two triangles in the second pair seem to have corresponding parts: a long base and a wide angle at the top.We need to know whether any of these corresponding parts are congruent, however. We know the measure of thetop angle in each figure: it is 110◦ in both. These figures might be congruent, but we need to see if the sides arecongruent to be sure (as we said, similar figures also have congruent angles, but their sides are different lengths). Weknow the measure of each triangle’s base: one is 2 inches and the other is 4 inches. These sides are not congruent,so the triangles are not congruent. Remember, every side and every angle must be the same in order forfigures to be congruent.
That leaves the last pair. Can you find the corresponding parts? If we rotate the second figure 180◦, we have twoshapes that look like the letter L. Now compare the corresponding sides. The bottom side of each is 8 cm, the long
816

www.ck12.org Chapter 8. Geometry
left side of each is 8 cm, two sides are 6 cm, and two sides are 2 cm. All of the angles in both figures are 90◦.Because every side and angle in one figure corresponds to a congruent side and angle in the second, these twofigures are congruent.
What about angle measures of congruent figures?
We know that congruent figures have exactly the same angles and sides. That means we can use the information wehave about one figure in a pair of congruent figures to find the measure of a corresponding angle or side in the otherfigure. Let’s see how this works. Take a look at the congruent figures below.
We have been told these two parallelograms are congruent.
Can you find the corresponding parts?
If not, trace one parallelogram and place it on top of the other. Rotate it until the parts correspond.
Which sides and angles correspond?
We can see that side AB corresponds to side PQ. Because they are congruent, we write.
AB∼= PQ.
What other sides are congruent? Let’s write them out.
AB∼= PQ
BC ∼= QR
AD∼= PS
DC ∼= SR
We can also write down the corresponding angles, which we know must be congruent because the figures arecongruent.
6 A∼= 6 P 6 D∼= 6 S6 B∼= 6 Q 6 C ∼= 6 R
Now that we understand all of the corresponding relationships in the two figures, we can use what we knowabout one figure to find the measure of a side or angle in the second figure.
Can we find the length of side AB?
We do not know the length of AB. However, we do know that it is congruent to PQ, so if we can find the length ofPQ then it will be the same for AB.PQ is 7 centimeters. Therefore AB must also be 7 centimeters long.
Now let’s look at the angles. Can we find the measure of 6 C?
817
8.12. Congruent Figures www.ck12.org
It corresponds to 6 R, but we do not know the measure of 6 R either. Well, we do know the measures of two of theangles in the first parallelogram: 70◦ and 110◦. If we had three, we could subtract from 360◦ to find the fourth,because all quadrilaterals have angles that add up to 360◦. We do not know the measure of 6 B, but this time wedo know the measure of its corresponding angle, 6 Q. These two angles are congruent, so we know that 6 B mustmeasure 70◦. Now we know three of the angles in the first figure, so we can subtract to find the measure of 6 C.
360− (70+110+70) = 6 C
360−250 = 6 C
110◦ = 6 C
We were able to combine the given information from both figures because we knew that they were congruent.
Yes and the more you work on puzzles like this one the easier they will become.
Now it’s time for you to try a few on your own.
Example A
True or false. Congruent figures have the same number of sides and angles.
Solution: True
Example B
True or false. Congruent figures can have one pair of angles with the same measure, but not all angles have the samemeasure.
Solution: False
Example C
True or false. Congruent figures can be different sizes as long as the angle measures are the same.
Solution: False
Now back to the congruent figures at the art museum.
818
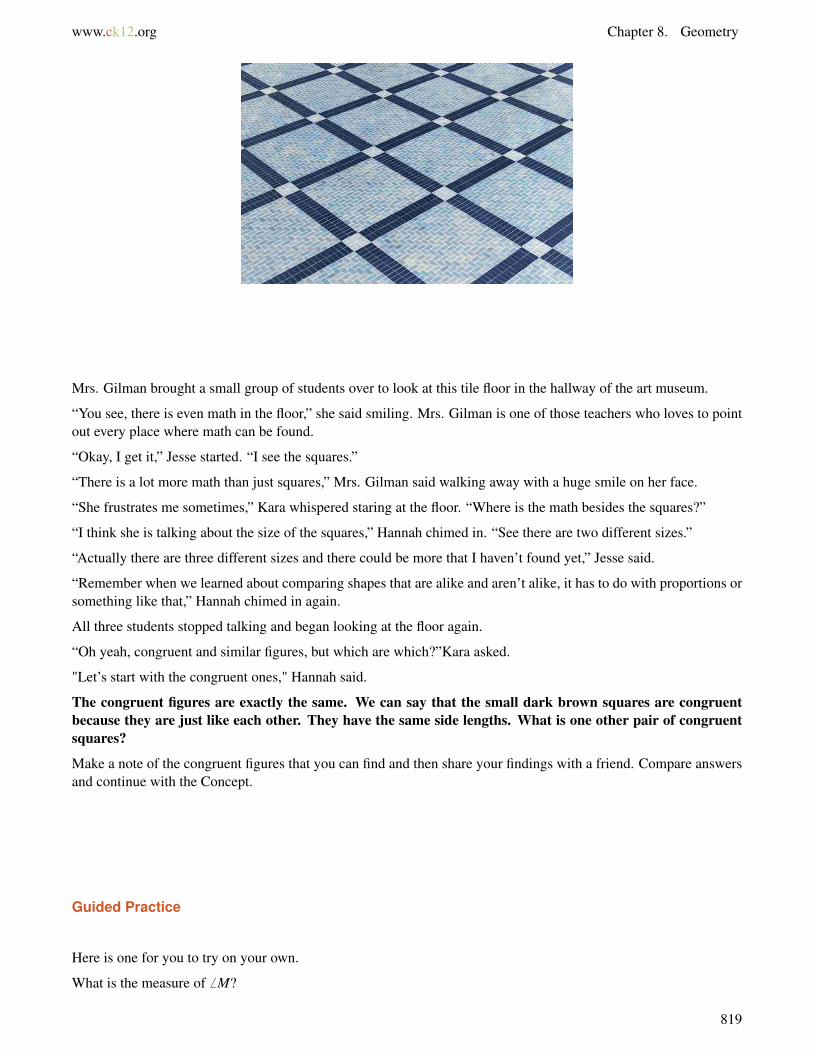
www.ck12.org Chapter 8. Geometry
Mrs. Gilman brought a small group of students over to look at this tile floor in the hallway of the art museum.
“You see, there is even math in the floor,” she said smiling. Mrs. Gilman is one of those teachers who loves to pointout every place where math can be found.
“Okay, I get it,” Jesse started. “I see the squares.”
“There is a lot more math than just squares,” Mrs. Gilman said walking away with a huge smile on her face.
“She frustrates me sometimes,” Kara whispered staring at the floor. “Where is the math besides the squares?”
“I think she is talking about the size of the squares,” Hannah chimed in. “See there are two different sizes.”
“Actually there are three different sizes and there could be more that I haven’t found yet,” Jesse said.
“Remember when we learned about comparing shapes that are alike and aren’t alike, it has to do with proportions orsomething like that,” Hannah chimed in again.
All three students stopped talking and began looking at the floor again.
“Oh yeah, congruent and similar figures, but which are which?”Kara asked.
"Let’s start with the congruent ones," Hannah said.
The congruent figures are exactly the same. We can say that the small dark brown squares are congruentbecause they are just like each other. They have the same side lengths. What is one other pair of congruentsquares?
Make a note of the congruent figures that you can find and then share your findings with a friend. Compare answersand continue with the Concept.
Guided Practice
Here is one for you to try on your own.
What is the measure of 6 M?
819
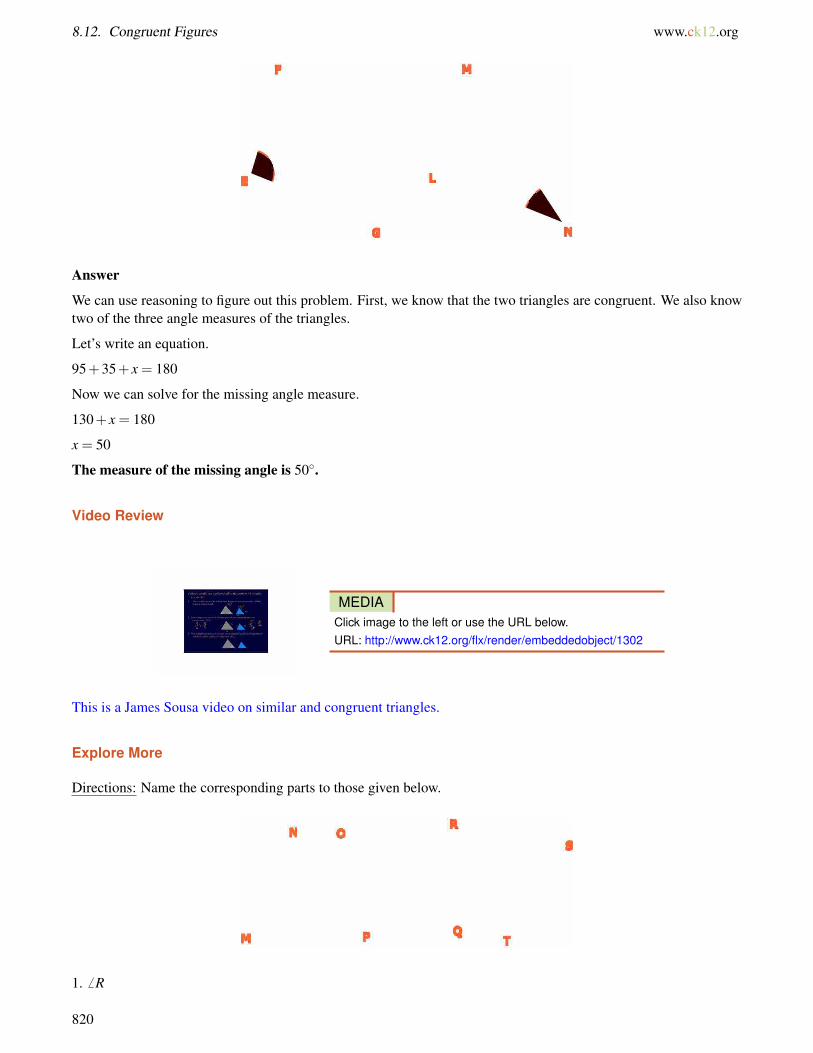
8.12. Congruent Figures www.ck12.org
Answer
We can use reasoning to figure out this problem. First, we know that the two triangles are congruent. We also knowtwo of the three angle measures of the triangles.
Let’s write an equation.
95+35+ x = 180
Now we can solve for the missing angle measure.
130+ x = 180
x = 50
The measure of the missing angle is 50◦.
Video Review
MEDIAClick image to the left or use the URL below.URL: http://www.ck12.org/flx/render/embeddedobject/1302
This is a James Sousa video on similar and congruent triangles.
Explore More
Directions: Name the corresponding parts to those given below.
1. 6 R
820
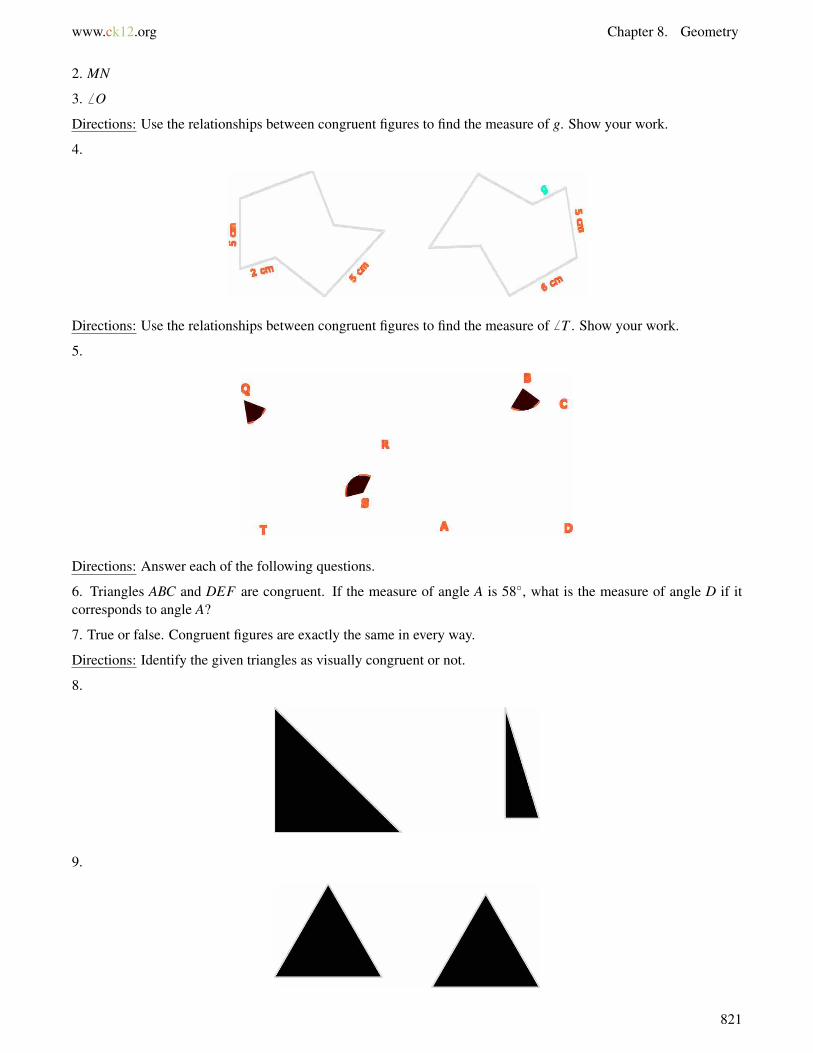
www.ck12.org Chapter 8. Geometry
2. MN
3. 6 O
Directions: Use the relationships between congruent figures to find the measure of g. Show your work.
4.
Directions: Use the relationships between congruent figures to find the measure of 6 T . Show your work.
5.
Directions: Answer each of the following questions.
6. Triangles ABC and DEF are congruent. If the measure of angle A is 58◦, what is the measure of angle D if itcorresponds to angle A?
7. True or false. Congruent figures are exactly the same in every way.
Directions: Identify the given triangles as visually congruent or not.
8.
9.
821
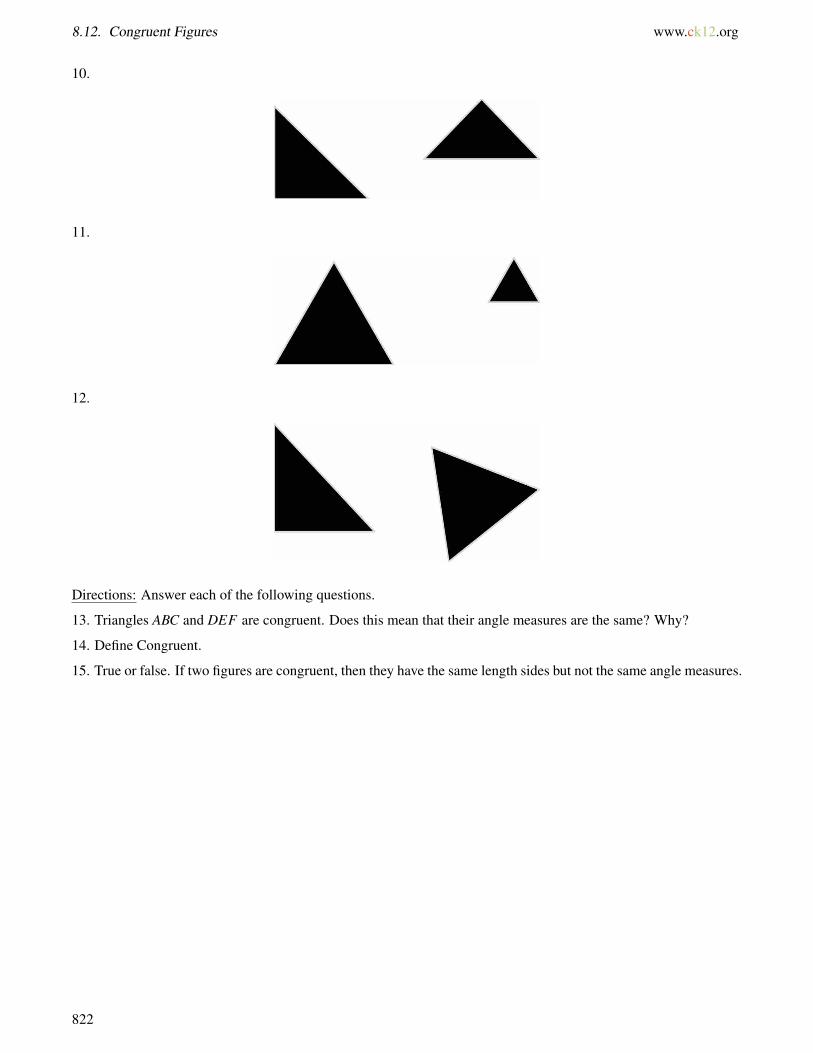
8.12. Congruent Figures www.ck12.org
10.
11.
12.
Directions: Answer each of the following questions.
13. Triangles ABC and DEF are congruent. Does this mean that their angle measures are the same? Why?
14. Define Congruent.
15. True or false. If two figures are congruent, then they have the same length sides but not the same angle measures.
822

www.ck12.org Chapter 8. Geometry
8.13 Similarity
Here you’ll learn to recognize similarity.
Remember the girls who were looking at the congruent figures in the Congruent Figures Concept? Well, now theyare also going to look at similar figures. Here is the problem.
Mrs. Gilman brought a small group of students over to look at this tile floor in the hallway of the art museum.
“You see, there is even math in the floor,” she said smiling. Mrs. Gilman is one of those teachers who loves to pointout every place where math can be found.
“Okay, I get it,” Jesse started. “I see the squares.”
“There is a lot more math than just squares,” Mrs. Gilman said walking away with a huge smile on her face.
“She frustrates me sometimes,” Kara whispered staring at the floor. “Where is the math besides the squares?”
“I think she is talking about the size of the squares,” Hannah chimed in. “See there are two different sizes.”
“Actually there are three different sizes and there could be more that I haven’t found yet,” Jesse said.
“Remember when we learned about comparing shapes that are alike and aren’t alike, it has to do with proportions orsomething like that,” Hannah chimed in again.
All three students stopped talking and began looking at the floor again.
“Oh yeah, congruent and similar figures, but which are which?” Kara asked.
What is the difference between congruent and similar figures? In the last Concept you learned about con-gruent figures, now you will take what you just learned and learn about similar figures too. At the end of theConcept, you will have a good understanding of both similar and congruent figures.
Guidance
Some figures look identical except they are different sizes. The angles even look the same. When we have figuresthat are proportional to each other, we call these figures similar figures. Similar figures have the same anglemeasures but different side lengths.
What is an example of similar figures?
823

8.13. Similarity www.ck12.org
Squares are similar shapes because they always have four 90◦ angles and four equal sides, even if the lengths of theirsides differ. Other shapes can be similar too, if their angles are equal.
Let’s look at some pairs of similar shapes.
Notice that in each pair the figures look the same, but one is smaller than the other. Since they are not thesame size, they are not congruent. However, they have the same angles, so they are similar.
Unlike congruent figures, similar figures are not exactly the same. They do have corresponding features, but onlytheir corresponding angles are congruent; the corresponding sides are not. Thus when we are dealing with pairs ofsimilar figures, we should look at the angles rather than the sides. In similar figures, the angles are congruent,even if the sides are not.
Notice that one angle in each pair of figures corresponds to an angle in the other figure. They have the sameshape but not the same size. Therefore they are similar.
Let’s find the corresponding angles in similar figures.
List the corresponding angles in the figures below.
Angles G and W are both right angles, so they correspond to each other. Imagine you can turn the figures to line upthe right angles. You might even trace the small figure so that you can place it on top of the larger one.
How do the angles line up?
824
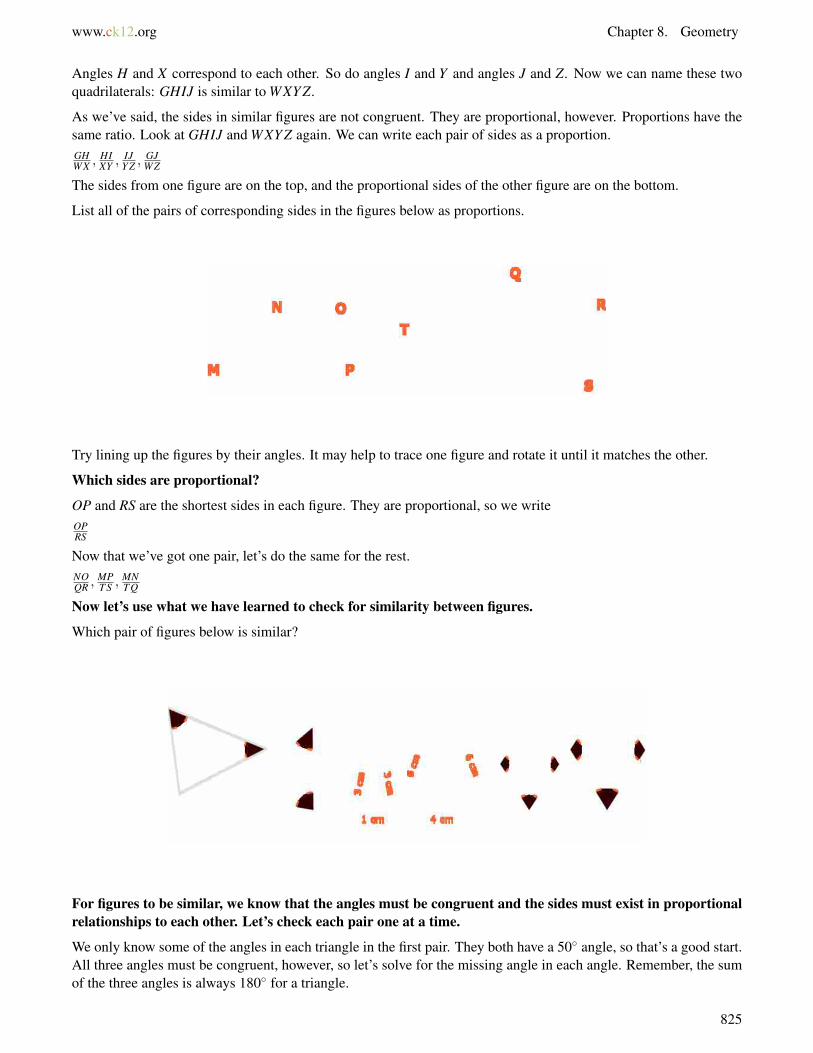
www.ck12.org Chapter 8. Geometry
Angles H and X correspond to each other. So do angles I and Y and angles J and Z. Now we can name these twoquadrilaterals: GHIJ is similar to WXY Z.
As we’ve said, the sides in similar figures are not congruent. They are proportional, however. Proportions have thesame ratio. Look at GHIJ and WXY Z again. We can write each pair of sides as a proportion.GHWX ,
HIXY ,
IJY Z ,
GJWZ
The sides from one figure are on the top, and the proportional sides of the other figure are on the bottom.
List all of the pairs of corresponding sides in the figures below as proportions.
Try lining up the figures by their angles. It may help to trace one figure and rotate it until it matches the other.
Which sides are proportional?
OP and RS are the shortest sides in each figure. They are proportional, so we writeOPRS
Now that we’ve got one pair, let’s do the same for the rest.NOQR ,
MPT S ,
MNT Q
Now let’s use what we have learned to check for similarity between figures.
Which pair of figures below is similar?
For figures to be similar, we know that the angles must be congruent and the sides must exist in proportionalrelationships to each other. Let’s check each pair one at a time.
We only know some of the angles in each triangle in the first pair. They both have a 50◦ angle, so that’s a good start.All three angles must be congruent, however, so let’s solve for the missing angle in each angle. Remember, the sumof the three angles is always 180◦ for a triangle.
825

8.13. Similarity www.ck12.org
Triangle 1 Triangle 2
50+60+ angle 3 = 180 50+80+ angle 3 = 180
110+ angle 3 = 180 130+ angle 3 = 180
angle 3 = 180−110 angle 3 = 180−130
angle 3 = 70◦ angle 3 = 50◦
The angles in the first triangle are 50◦, 60◦, and 70◦. The angles in the second triangle are 50◦, 50◦, and 80◦.These triangles are not similar because their angle measures are different.
Let’s move on to the next pair.
This time we know side lengths, not angles. We need to check whether each set of corresponding sides is propor-tional. First, let’s write out the pairs of proportional corresponding sides63 ,
63 ,
41
The proportions show side lengths from the large triangle on the top and its corresponding side in the small triangleon the bottom. The pairs of sides must have the same proportion in order for the triangles to be similar. We can testwhether the three proportions above are the same by dividing each. If the quotient is the same, the pairs of sidesmust exist in the same proportion to each other.
63= 2
63= 2
41= 4
When we divide, only two pairs of sides have the same proportion (2). The third pair of sides does not exist inthe same proportion as the other two, so these triangles cannot be similar.
That leaves the last pair. We have been given the measures of some of the angles. If all of the corresponding anglesare congruent, then these two figures are similar. We know the measure of three angles in each figure. In fact, theyare all corresponding angles. Therefore the one unknown angle in the first figure corresponds to the unknown anglein the second figure.
As we know, the four angles in a quadrilateral must have a sum of 360◦. Therefore the unknown angle in each figuremust combine with the other three to have this sum. Because the three known angles are the same for both figures,we don’t even need to solve for the fourth to know that it will be the same in both figures. These two figures aresimilar because their angle measures are all congruent.
Now it’s your turn to try a few on your own.
826

www.ck12.org Chapter 8. Geometry
Example A
How many right angles are in the first two figures?
Solution: 4 right angles
Example B
What makes the two squares similar if they both have four right angles?
Solution: The side lengths are different.
Example C
In the triangle pair, are the two triangles similar or congruent? why?
Solution: The triangles are similar because the side lengths are different. The angle measures are the same.
Here is the original problem once again. Reread it and then answer the questions at the end of this passage.
Mrs. Gilman brought a small group of students over to look at this tile floor in the hallway of the art museum.
“You see, there is even math in the floor,” she said smiling. Mrs. Gilman is one of those teachers who loves to pointout every place where math can be found.
“Okay, I get it,” Jesse started. “I see the squares.”
“There is a lot more math than just squares,” Mrs. Gilman said walking away with a huge smile on her face.
“She frustrates me sometimes,” Kara whispered staring at the floor. “Where is the math besides the squares?”
“I think she is talking about the size of the squares,” Hannah chimed in. “See there are two different sizes.”
“Actually there are three different sizes and there could be more that I haven’t found yet,” Jesse said.
“Remember when we learned about comparing shapes that are alike and aren’t alike, it has to do with proportions orsomething like that,” Hannah chimed in again.
All three students stopped talking and began looking at the floor again.
“Oh yeah, congruent and similar figures, but which are which?” Kara asked.
The students are working on which figures in the floor pattern are congruent and which ones are similar.
827
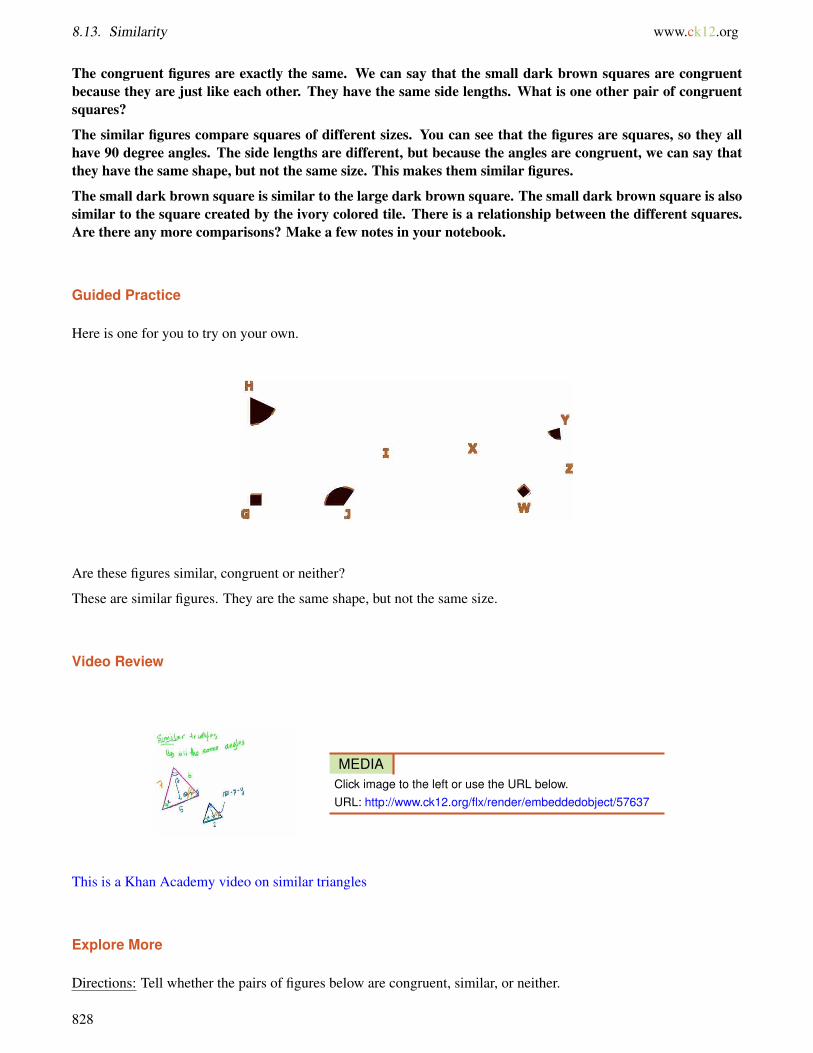
8.13. Similarity www.ck12.org
The congruent figures are exactly the same. We can say that the small dark brown squares are congruentbecause they are just like each other. They have the same side lengths. What is one other pair of congruentsquares?
The similar figures compare squares of different sizes. You can see that the figures are squares, so they allhave 90 degree angles. The side lengths are different, but because the angles are congruent, we can say thatthey have the same shape, but not the same size. This makes them similar figures.
The small dark brown square is similar to the large dark brown square. The small dark brown square is alsosimilar to the square created by the ivory colored tile. There is a relationship between the different squares.Are there any more comparisons? Make a few notes in your notebook.
Guided Practice
Here is one for you to try on your own.
Are these figures similar, congruent or neither?
These are similar figures. They are the same shape, but not the same size.
Video Review
MEDIAClick image to the left or use the URL below.URL: http://www.ck12.org/flx/render/embeddedobject/57637
This is a Khan Academy video on similar triangles
Explore More
Directions: Tell whether the pairs of figures below are congruent, similar, or neither.
828
www.ck12.org Chapter 8. Geometry
7. True or false. If triangles DEF and GHI are similar, then the side lengths are different but the angle measures arethe same.
8. True or false. Similar figures have exactly the same size and shape.
9. Triangles LMN and HIJ are similar. If this is true, then the side lengths are the same, true or false.
10. What is a proportion?
11. True or false. To figure out if two figures are similar, then their side lengths form a proportion.
12. Define similar figures
13. Are the two figures similar or congruent?
14. Define congruent figures.
15. True or false. A proportion is formed by a pair of equal ratios.
829
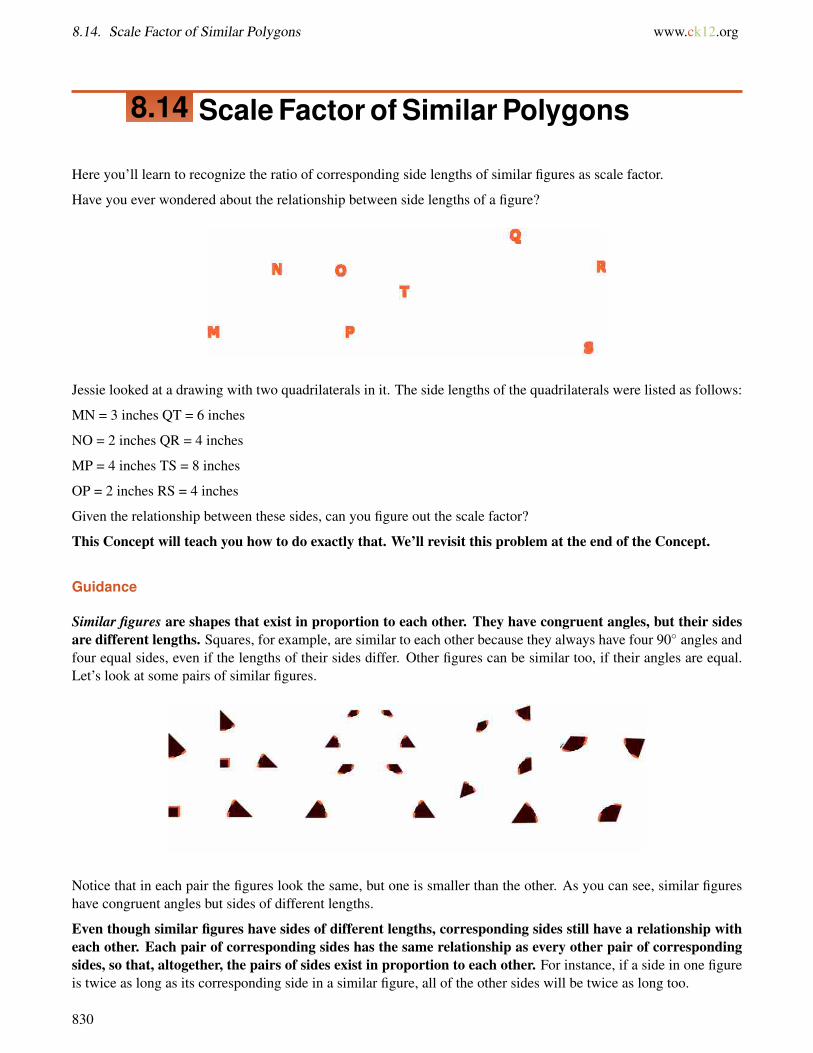
8.14. Scale Factor of Similar Polygons www.ck12.org
8.14 Scale Factor of Similar Polygons
Here you’ll learn to recognize the ratio of corresponding side lengths of similar figures as scale factor.
Have you ever wondered about the relationship between side lengths of a figure?
Jessie looked at a drawing with two quadrilaterals in it. The side lengths of the quadrilaterals were listed as follows:
MN = 3 inches QT = 6 inches
NO = 2 inches QR = 4 inches
MP = 4 inches TS = 8 inches
OP = 2 inches RS = 4 inches
Given the relationship between these sides, can you figure out the scale factor?
This Concept will teach you how to do exactly that. We’ll revisit this problem at the end of the Concept.
Guidance
Similar figures are shapes that exist in proportion to each other. They have congruent angles, but their sidesare different lengths. Squares, for example, are similar to each other because they always have four 90◦ angles andfour equal sides, even if the lengths of their sides differ. Other figures can be similar too, if their angles are equal.Let’s look at some pairs of similar figures.
Notice that in each pair the figures look the same, but one is smaller than the other. As you can see, similar figureshave congruent angles but sides of different lengths.
Even though similar figures have sides of different lengths, corresponding sides still have a relationship witheach other. Each pair of corresponding sides has the same relationship as every other pair of correspondingsides, so that, altogether, the pairs of sides exist in proportion to each other. For instance, if a side in one figureis twice as long as its corresponding side in a similar figure, all of the other sides will be twice as long too.
830

www.ck12.org Chapter 8. Geometry
In this Concept, we are going to use these relationships to find the measures of unknown sides. This method is calledindirect measurement.
Let’s take a step back to similar figures to understand how indirect measurement works.
First, let’s make sure we can recognize corresponding parts of similar figures. Similar figures have exactly thesame angles. Therefore each angle in one figure corresponds to an angle in the other.
These triangles are similar because their angles have the same measures. Which corresponds to which? AngleB is 100◦. Its corresponding angle will also measure 100◦: that makes angle Q its corresponding angle. AnglesA and P correspond, and angles C and R correspond.
Similar figures also have corresponding sides, even though the sides are not congruent. Corresponding sidesare not always easy to spot. We can think of corresponding sides as those which are in the same place in relationto corresponding angles. For instance, side AB, between angles A and B, must correspond to side PQ, because Acorresponds to P and B corresponds to Q.
Corresponding sides also have lengths that are related, even though they are not congruent. Specifically, theside lengths are proportional. In other words, each pair of corresponding sides has the same ratio as everyother pair of corresponding sides. Take a look at the rectangles below.
831
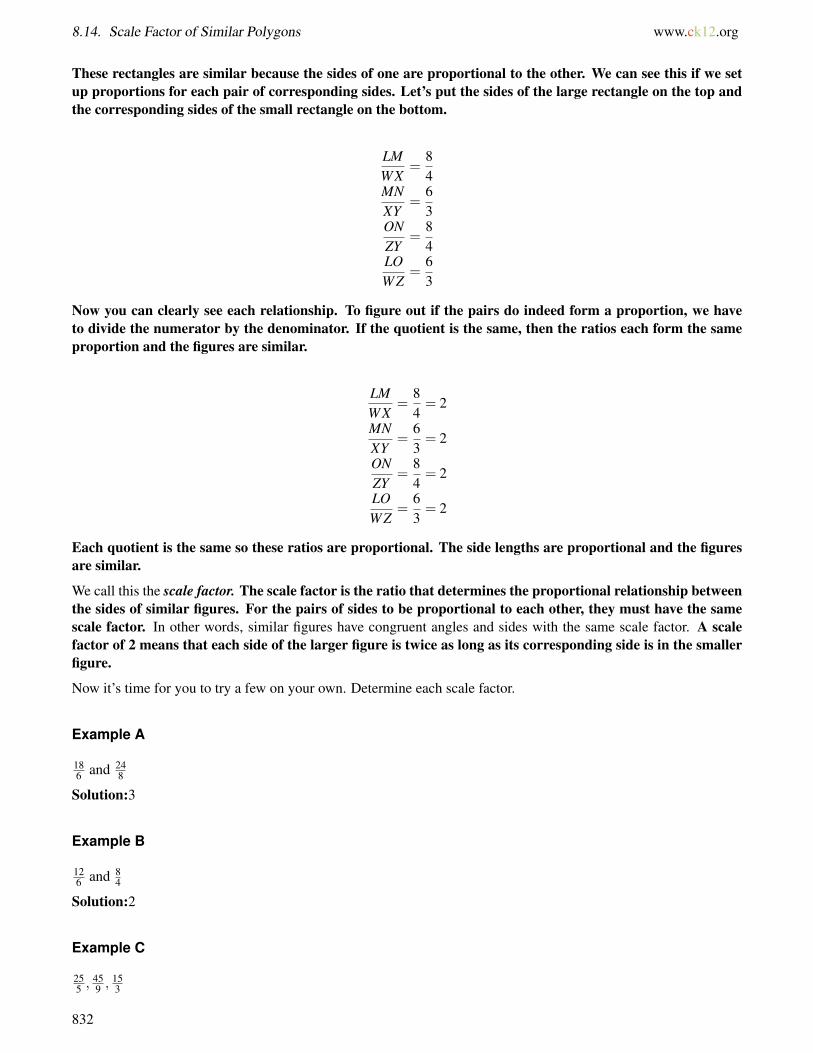
8.14. Scale Factor of Similar Polygons www.ck12.org
These rectangles are similar because the sides of one are proportional to the other. We can see this if we setup proportions for each pair of corresponding sides. Let’s put the sides of the large rectangle on the top andthe corresponding sides of the small rectangle on the bottom.
LMWX
=84
MNXY
=63
ONZY
=84
LOWZ
=63
Now you can clearly see each relationship. To figure out if the pairs do indeed form a proportion, we haveto divide the numerator by the denominator. If the quotient is the same, then the ratios each form the sameproportion and the figures are similar.
LMWX
=84= 2
MNXY
=63= 2
ONZY
=84= 2
LOWZ
=63= 2
Each quotient is the same so these ratios are proportional. The side lengths are proportional and the figuresare similar.
We call this the scale factor. The scale factor is the ratio that determines the proportional relationship betweenthe sides of similar figures. For the pairs of sides to be proportional to each other, they must have the samescale factor. In other words, similar figures have congruent angles and sides with the same scale factor. A scalefactor of 2 means that each side of the larger figure is twice as long as its corresponding side is in the smallerfigure.
Now it’s time for you to try a few on your own. Determine each scale factor.
Example A
186 and 24
8
Solution:3
Example B
126 and 8
4
Solution:2
Example C
255 ,
459 ,
153
832
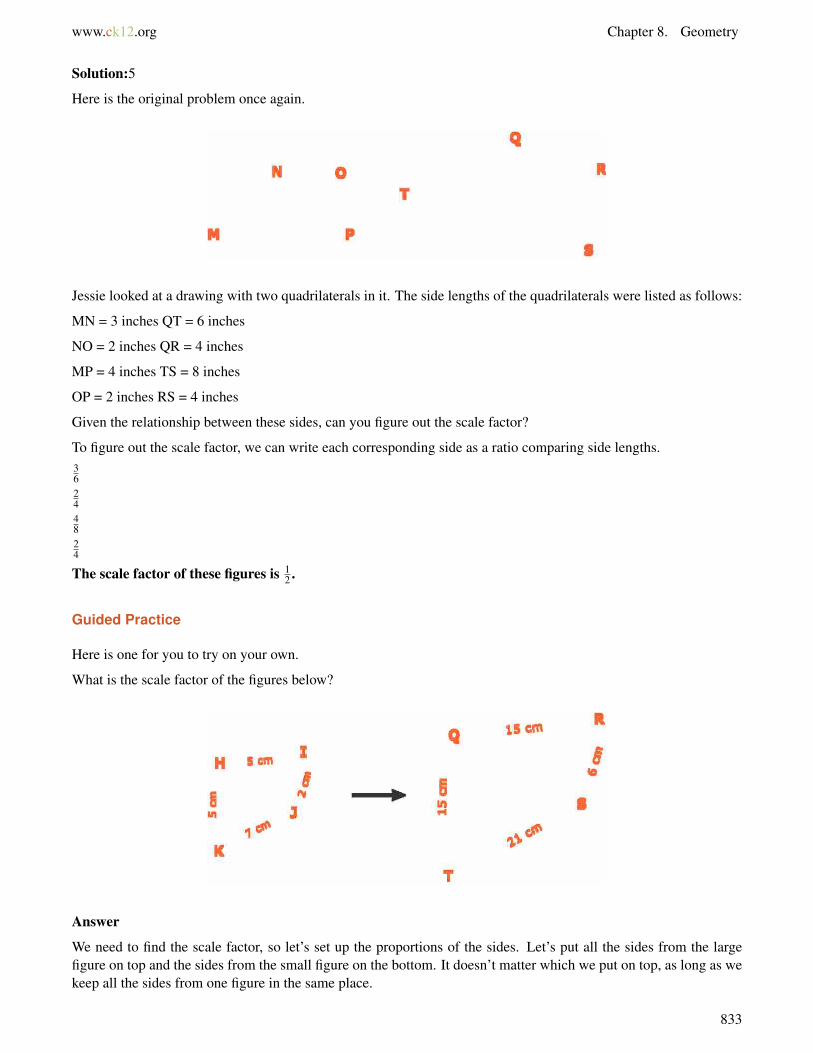
www.ck12.org Chapter 8. Geometry
Solution:5
Here is the original problem once again.
Jessie looked at a drawing with two quadrilaterals in it. The side lengths of the quadrilaterals were listed as follows:
MN = 3 inches QT = 6 inches
NO = 2 inches QR = 4 inches
MP = 4 inches TS = 8 inches
OP = 2 inches RS = 4 inches
Given the relationship between these sides, can you figure out the scale factor?
To figure out the scale factor, we can write each corresponding side as a ratio comparing side lengths.36244824
The scale factor of these figures is 12 .
Guided Practice
Here is one for you to try on your own.
What is the scale factor of the figures below?
Answer
We need to find the scale factor, so let’s set up the proportions of the sides. Let’s put all the sides from the largefigure on top and the sides from the small figure on the bottom. It doesn’t matter which we put on top, as long as wekeep all the sides from one figure in the same place.
833
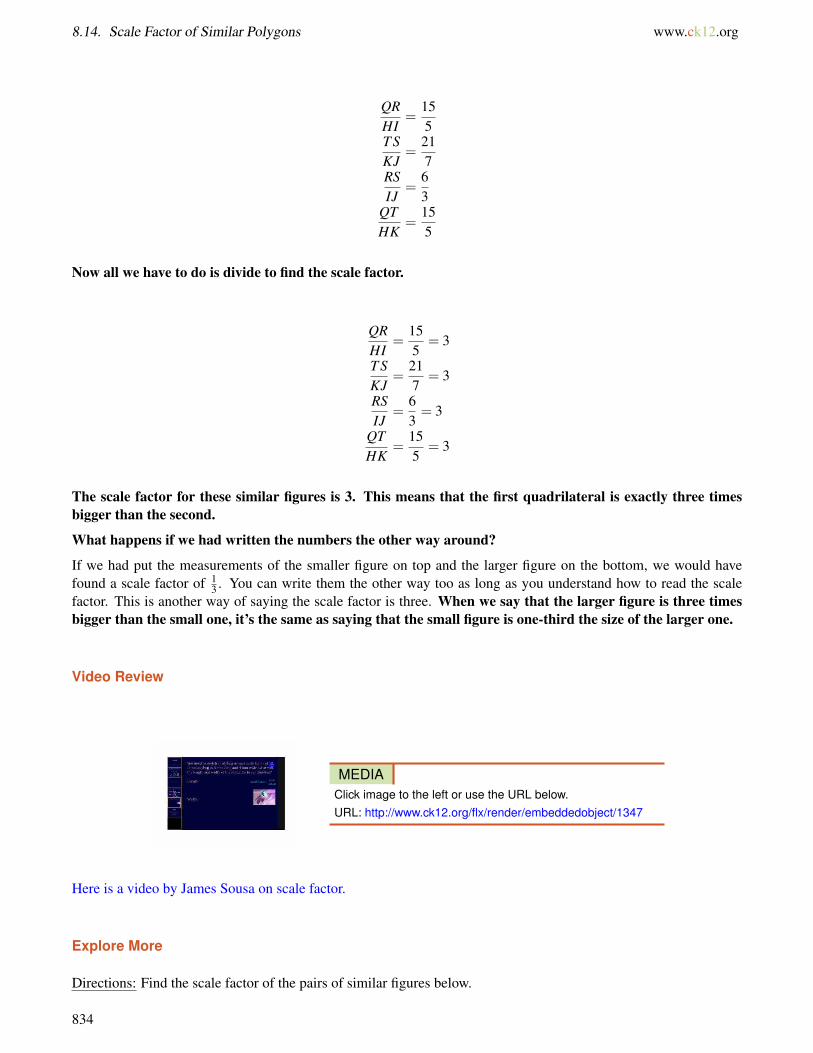
8.14. Scale Factor of Similar Polygons www.ck12.org
QRHI
=155
T SKJ
=217
RSIJ
=63
QTHK
=155
Now all we have to do is divide to find the scale factor.
QRHI
=155
= 3
T SKJ
=217
= 3
RSIJ
=63= 3
QTHK
=155
= 3
The scale factor for these similar figures is 3. This means that the first quadrilateral is exactly three timesbigger than the second.
What happens if we had written the numbers the other way around?
If we had put the measurements of the smaller figure on top and the larger figure on the bottom, we would havefound a scale factor of 1
3 . You can write them the other way too as long as you understand how to read the scalefactor. This is another way of saying the scale factor is three. When we say that the larger figure is three timesbigger than the small one, it’s the same as saying that the small figure is one-third the size of the larger one.
Video Review
MEDIAClick image to the left or use the URL below.URL: http://www.ck12.org/flx/render/embeddedobject/1347
Here is a video by James Sousa on scale factor.
Explore More
Directions: Find the scale factor of the pairs of similar figures below.
834

www.ck12.org Chapter 8. Geometry
Directions: Use each ratio to determine scale factor.
5. 31
6. 82
7. 28
8. 105
9. 124
10. 162
11. 153
12. 244
13. 42
14. 62
15. 39
835
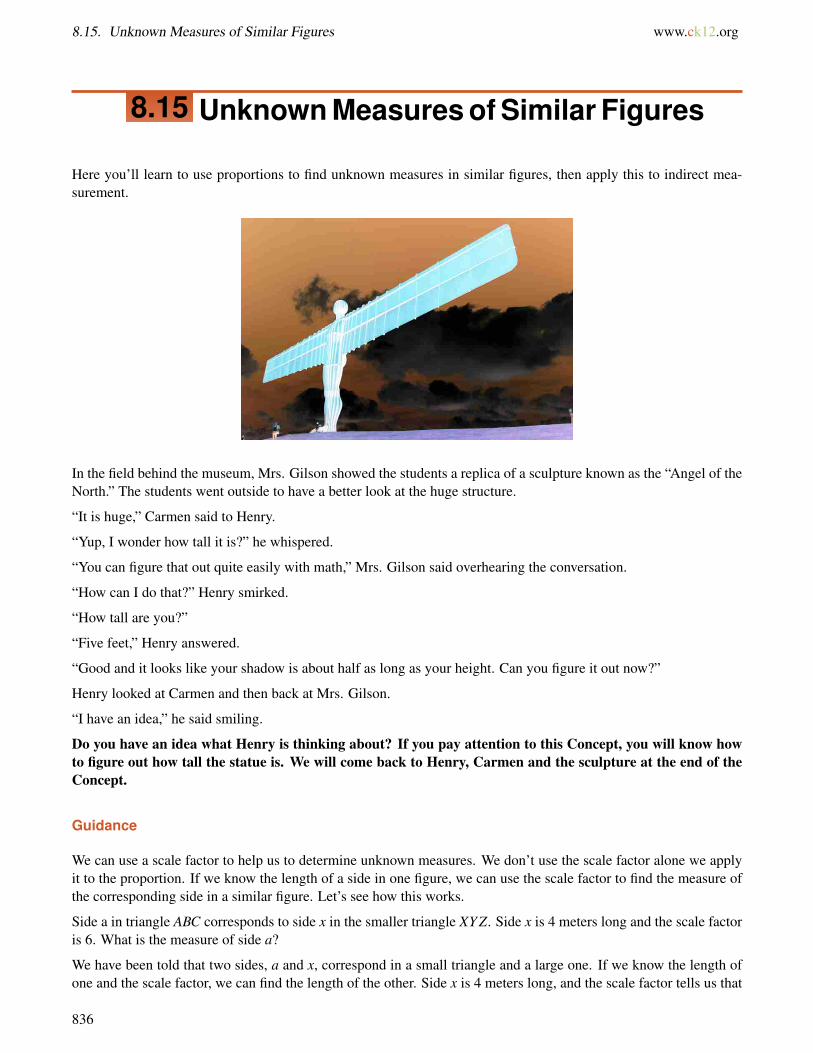
8.15. Unknown Measures of Similar Figures www.ck12.org
8.15 Unknown Measures of Similar Figures
Here you’ll learn to use proportions to find unknown measures in similar figures, then apply this to indirect mea-surement.
In the field behind the museum, Mrs. Gilson showed the students a replica of a sculpture known as the “Angel of theNorth.” The students went outside to have a better look at the huge structure.
“It is huge,” Carmen said to Henry.
“Yup, I wonder how tall it is?” he whispered.
“You can figure that out quite easily with math,” Mrs. Gilson said overhearing the conversation.
“How can I do that?” Henry smirked.
“How tall are you?”
“Five feet,” Henry answered.
“Good and it looks like your shadow is about half as long as your height. Can you figure it out now?”
Henry looked at Carmen and then back at Mrs. Gilson.
“I have an idea,” he said smiling.
Do you have an idea what Henry is thinking about? If you pay attention to this Concept, you will know howto figure out how tall the statue is. We will come back to Henry, Carmen and the sculpture at the end of theConcept.
Guidance
We can use a scale factor to help us to determine unknown measures. We don’t use the scale factor alone we applyit to the proportion. If we know the length of a side in one figure, we can use the scale factor to find the measure ofthe corresponding side in a similar figure. Let’s see how this works.
Side a in triangle ABC corresponds to side x in the smaller triangle XY Z. Side x is 4 meters long and the scale factoris 6. What is the measure of side a?
We have been told that two sides, a and x, correspond in a small triangle and a large one. If we know the length ofone and the scale factor, we can find the length of the other. Side x is 4 meters long, and the scale factor tells us that
836
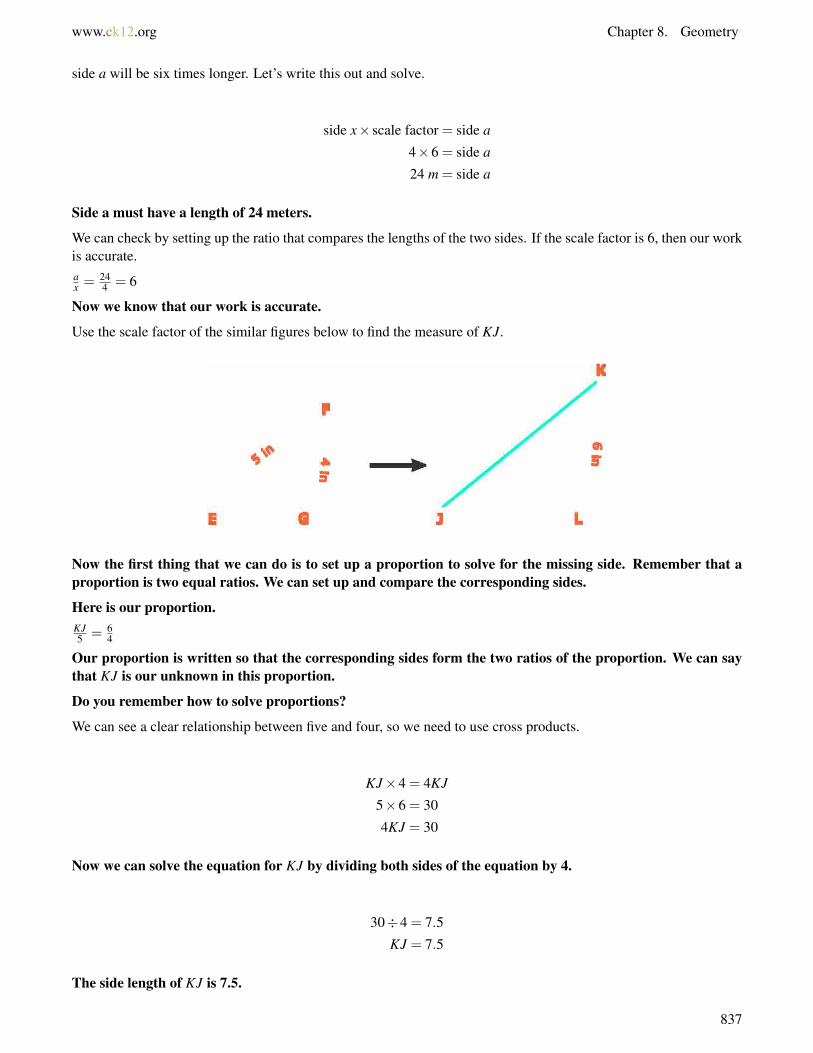
www.ck12.org Chapter 8. Geometry
side a will be six times longer. Let’s write this out and solve.
side x× scale factor = side a
4×6 = side a
24 m = side a
Side a must have a length of 24 meters.
We can check by setting up the ratio that compares the lengths of the two sides. If the scale factor is 6, then our workis accurate.ax = 24
4 = 6
Now we know that our work is accurate.
Use the scale factor of the similar figures below to find the measure of KJ.
Now the first thing that we can do is to set up a proportion to solve for the missing side. Remember that aproportion is two equal ratios. We can set up and compare the corresponding sides.
Here is our proportion.KJ5 = 6
4
Our proportion is written so that the corresponding sides form the two ratios of the proportion. We can saythat KJ is our unknown in this proportion.
Do you remember how to solve proportions?
We can see a clear relationship between five and four, so we need to use cross products.
KJ×4 = 4KJ
5×6 = 30
4KJ = 30
Now we can solve the equation for KJ by dividing both sides of the equation by 4.
30÷4 = 7.5
KJ = 7.5
The side length of KJ is 7.5.
837
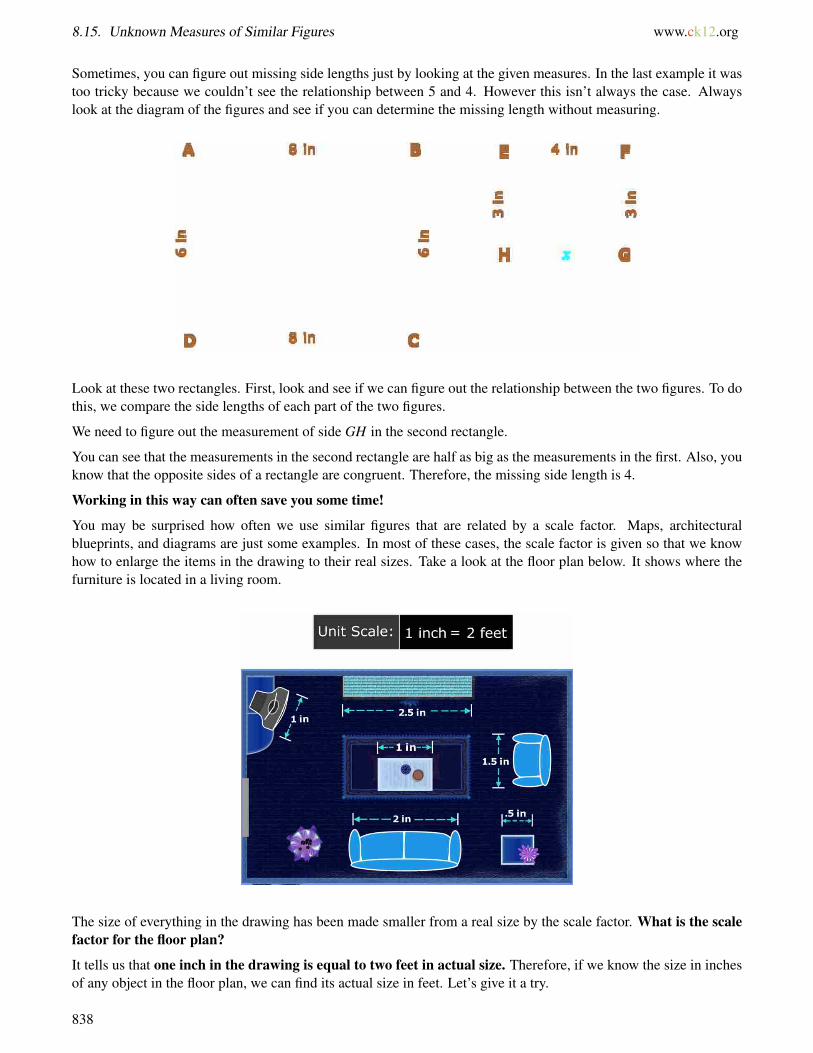
8.15. Unknown Measures of Similar Figures www.ck12.org
Sometimes, you can figure out missing side lengths just by looking at the given measures. In the last example it wastoo tricky because we couldn’t see the relationship between 5 and 4. However this isn’t always the case. Alwayslook at the diagram of the figures and see if you can determine the missing length without measuring.
Look at these two rectangles. First, look and see if we can figure out the relationship between the two figures. To dothis, we compare the side lengths of each part of the two figures.
We need to figure out the measurement of side GH in the second rectangle.
You can see that the measurements in the second rectangle are half as big as the measurements in the first. Also, youknow that the opposite sides of a rectangle are congruent. Therefore, the missing side length is 4.
Working in this way can often save you some time!
You may be surprised how often we use similar figures that are related by a scale factor. Maps, architecturalblueprints, and diagrams are just some examples. In most of these cases, the scale factor is given so that we knowhow to enlarge the items in the drawing to their real sizes. Take a look at the floor plan below. It shows where thefurniture is located in a living room.
The size of everything in the drawing has been made smaller from a real size by the scale factor. What is the scalefactor for the floor plan?
It tells us that one inch in the drawing is equal to two feet in actual size. Therefore, if we know the size in inchesof any object in the floor plan, we can find its actual size in feet. Let’s give it a try.
838
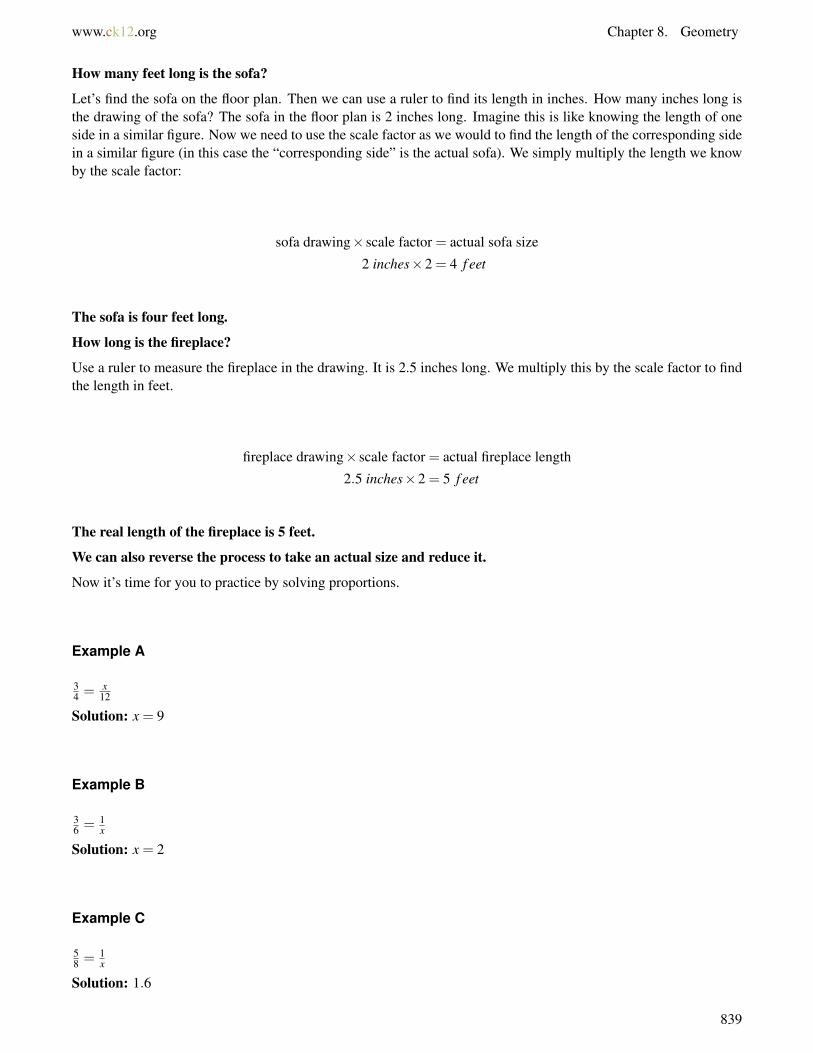
www.ck12.org Chapter 8. Geometry
How many feet long is the sofa?
Let’s find the sofa on the floor plan. Then we can use a ruler to find its length in inches. How many inches long isthe drawing of the sofa? The sofa in the floor plan is 2 inches long. Imagine this is like knowing the length of oneside in a similar figure. Now we need to use the scale factor as we would to find the length of the corresponding sidein a similar figure (in this case the “corresponding side” is the actual sofa). We simply multiply the length we knowby the scale factor:
sofa drawing× scale factor = actual sofa size
2 inches×2 = 4 f eet
The sofa is four feet long.
How long is the fireplace?
Use a ruler to measure the fireplace in the drawing. It is 2.5 inches long. We multiply this by the scale factor to findthe length in feet.
fireplace drawing× scale factor = actual fireplace length
2.5 inches×2 = 5 f eet
The real length of the fireplace is 5 feet.
We can also reverse the process to take an actual size and reduce it.
Now it’s time for you to practice by solving proportions.
Example A
34 = x
12
Solution: x = 9
Example B
36 = 1
x
Solution: x = 2
Example C
58 = 1
x
Solution: 1.6
839

8.15. Unknown Measures of Similar Figures www.ck12.org
Here is the original problem once again.
In the field behind the museum, Mrs. Gilson showed the students a replica of a sculpture known as the “Angel of theNorth.” The students went outside to have a better look at the huge structure.
“It is huge,” Carmen said to Henry.
“Yup, I wonder how tall it is?” he whispered.
“You can figure that out quite easily with math,” Mrs. Gilson said overhearing the conversation.
“How can I do that?” Henry smirked.
“How tall are you?”
“Five feet,” Henry answered.
“Good and it looks like your shadow is about half as long as your height. Can you figure it out now?”
Henry looked at Carmen and then back at Mrs. Gilson.
“I have an idea,” he said smiling.
Let’s think about how Henry and Carmen could figure out the height of the statue. We know that Henry isfive feet tall and that his shadow is half as long as he is tall. Now we can write a ratio to compare Henry’sheight to his shadow’s length.Henry′s height
Shadow′s length = 5 f eet2.5 f eet
Next, we figure out the height of the statue. Henry and Carmen figure out very quickly that they need to figureout the length of the shadow of the statue to figure out the height of the statue. Once they know the length ofthe shadow, they can use proportional reasoning and indirect measurement to figure out the statue’s height.
Approximating 1 foot using a length a little longer than Henry’s sneaker, they measure 32 12 feet. It is not an
exact measure, but they feel that it is very close.
Now they wrote the following proportion.5 f t
2.5 f t =x
32.5 f t
Taking out a notebook, Carmen cross multiplies to solve the proportion.
5(32.5) = 2.5x
162.5 = 2.5x
x = 65
The sculpture is approximately 65 feet tall.
840

www.ck12.org Chapter 8. Geometry
After completing their work, Henry and Carmen check out their answer with the curator of the museum.The statue is actually 65.6 feet tall. Their work was very close to accurate! Indirect measurement was veryuseful!!
Guided Practice
Here is one for you to try on your own.
Chris is making a drawing of his school and the grounds around it. The basketball court is 75 feet long and 40 feetwide. If Chris uses a scale factor in which 1 inch equals 10 feet, what should the dimensions of the basketball courtbe in his drawing?
Answer
First of all, what do we need to find?
We need to know the dimensions (length and width) that the small version of the basketball court should be.
What information have we been given?
We know the actual size of the basketball court, and we know the scale factor Chris is using for his drawing. We canset up an equation to find the drawn dimensions. We’ll have to find the length first and then the width.
drawing length× scale factor = actual basketball court length
drawing length×10 = 75 f eet
drawing length = 75÷10
drawing length = 7.5 inches
The length of the basketball court in Chris’s drawing should be 7.5 inches.
Now let’s use the same process to find the width Chris should draw.
drawing width× scale factor = actual basketball court width
drawing width×10 = 40 f eet
drawing width = 40÷10
drawing width = 4 inches
Great! Now we know that Chris should represent the basketball court as a 4 by 7.5 inch rectangle on hisdrawing.
841
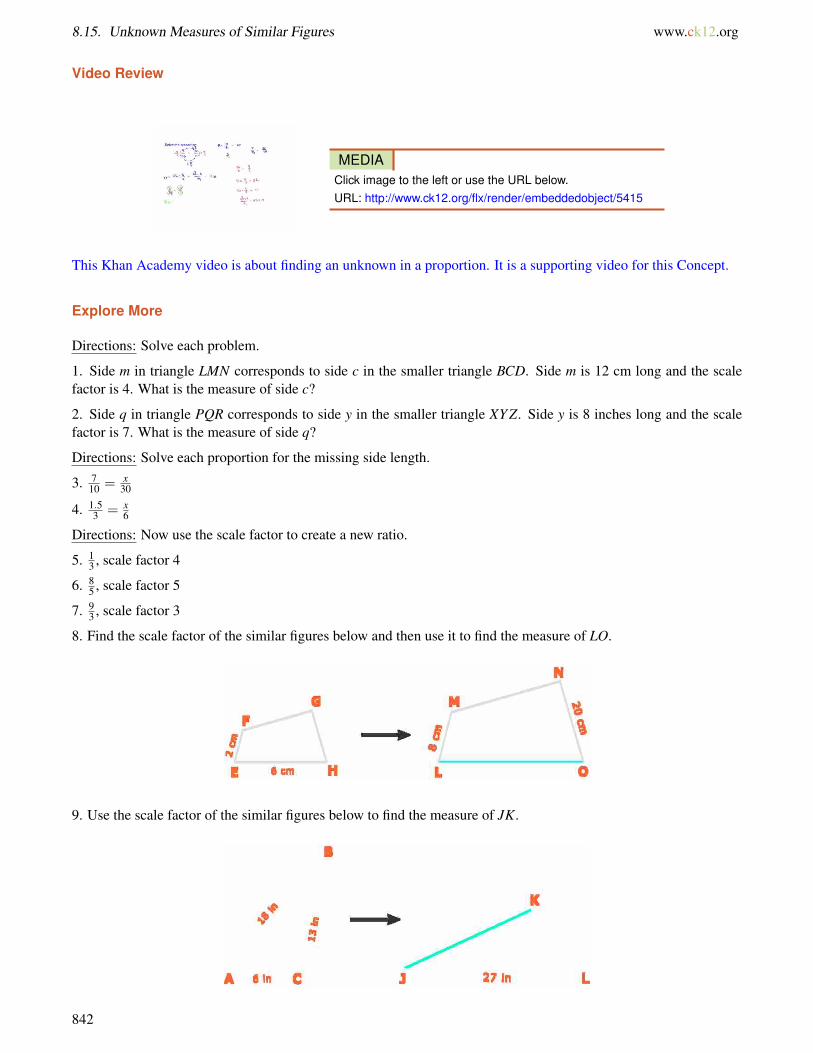
8.15. Unknown Measures of Similar Figures www.ck12.org
Video Review
MEDIAClick image to the left or use the URL below.URL: http://www.ck12.org/flx/render/embeddedobject/5415
This Khan Academy video is about finding an unknown in a proportion. It is a supporting video for this Concept.
Explore More
Directions: Solve each problem.
1. Side m in triangle LMN corresponds to side c in the smaller triangle BCD. Side m is 12 cm long and the scalefactor is 4. What is the measure of side c?
2. Side q in triangle PQR corresponds to side y in the smaller triangle XY Z. Side y is 8 inches long and the scalefactor is 7. What is the measure of side q?
Directions: Solve each proportion for the missing side length.
3. 710 = x
30
4. 1.53 = x
6
Directions: Now use the scale factor to create a new ratio.
5. 13 , scale factor 4
6. 85 , scale factor 5
7. 93 , scale factor 3
8. Find the scale factor of the similar figures below and then use it to find the measure of LO.
9. Use the scale factor of the similar figures below to find the measure of JK.
842
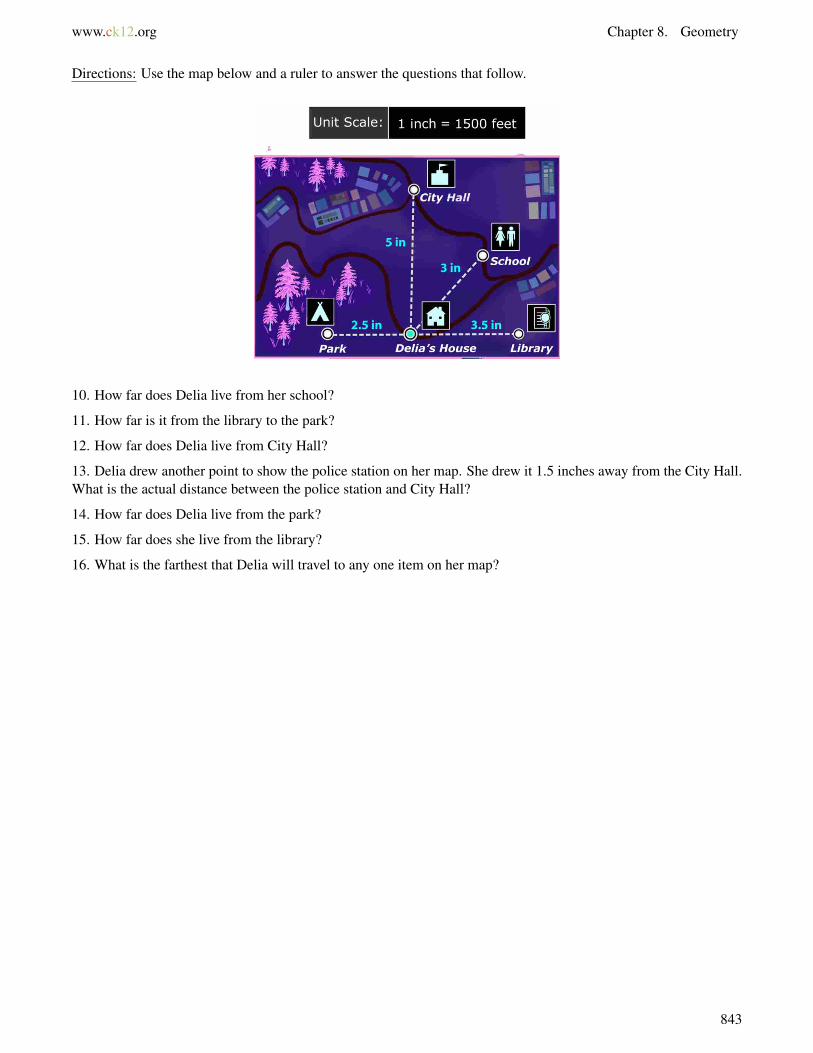
www.ck12.org Chapter 8. Geometry
Directions: Use the map below and a ruler to answer the questions that follow.
10. How far does Delia live from her school?
11. How far is it from the library to the park?
12. How far does Delia live from City Hall?
13. Delia drew another point to show the police station on her map. She drew it 1.5 inches away from the City Hall.What is the actual distance between the police station and City Hall?
14. How far does Delia live from the park?
15. How far does she live from the library?
16. What is the farthest that Delia will travel to any one item on her map?
843
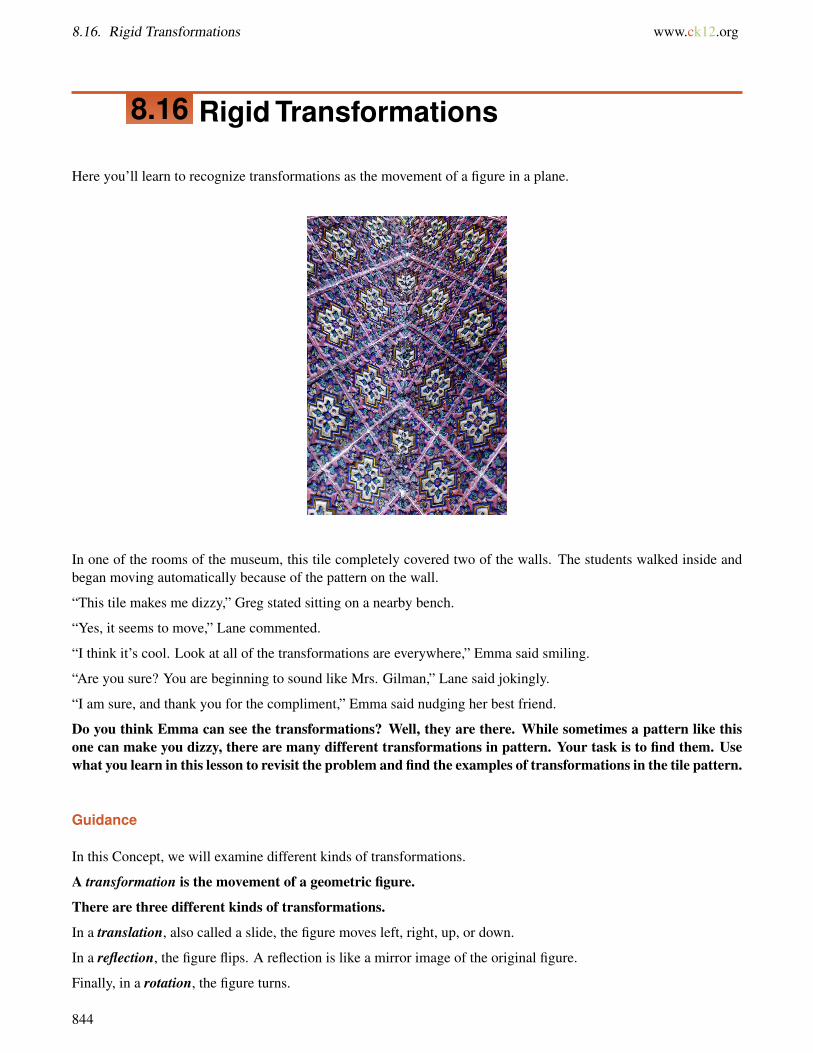
8.16. Rigid Transformations www.ck12.org
8.16 Rigid Transformations
Here you’ll learn to recognize transformations as the movement of a figure in a plane.
In one of the rooms of the museum, this tile completely covered two of the walls. The students walked inside andbegan moving automatically because of the pattern on the wall.
“This tile makes me dizzy,” Greg stated sitting on a nearby bench.
“Yes, it seems to move,” Lane commented.
“I think it’s cool. Look at all of the transformations are everywhere,” Emma said smiling.
“Are you sure? You are beginning to sound like Mrs. Gilman,” Lane said jokingly.
“I am sure, and thank you for the compliment,” Emma said nudging her best friend.
Do you think Emma can see the transformations? Well, they are there. While sometimes a pattern like thisone can make you dizzy, there are many different transformations in pattern. Your task is to find them. Usewhat you learn in this lesson to revisit the problem and find the examples of transformations in the tile pattern.
Guidance
In this Concept, we will examine different kinds of transformations.
A transformation is the movement of a geometric figure.
There are three different kinds of transformations.
In a translation, also called a slide, the figure moves left, right, up, or down.
In a reflection, the figure flips. A reflection is like a mirror image of the original figure.
Finally, in a rotation, the figure turns.
844
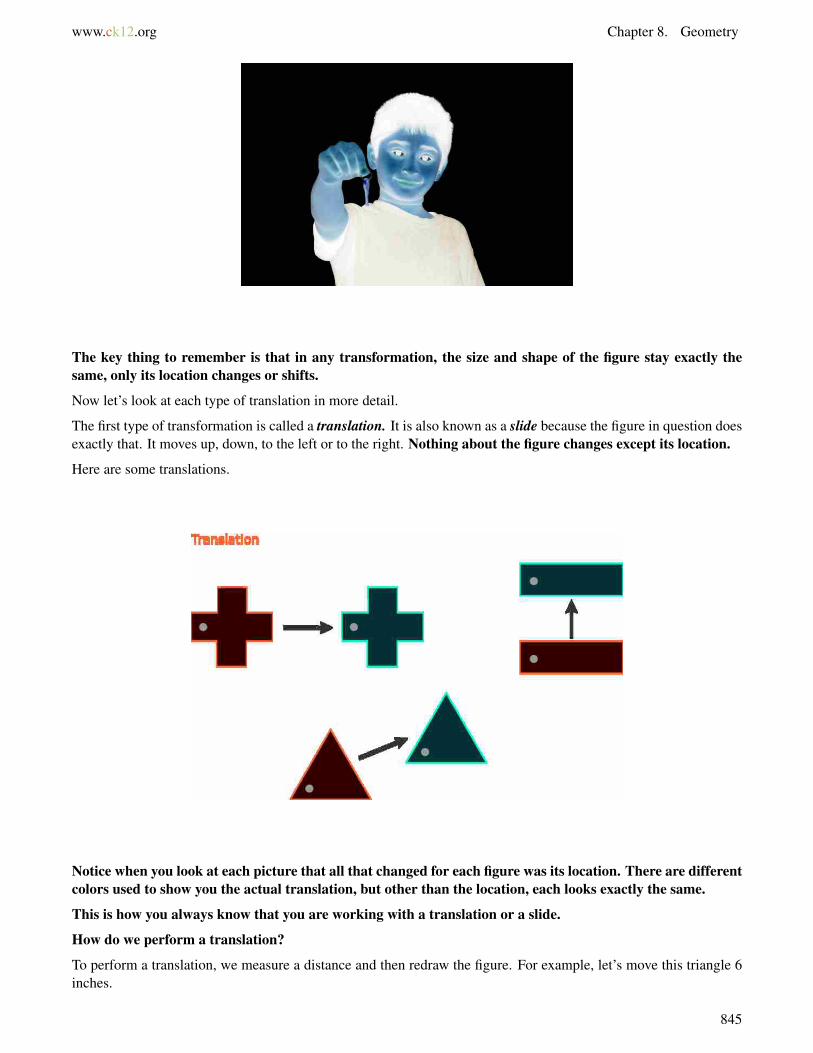
www.ck12.org Chapter 8. Geometry
The key thing to remember is that in any transformation, the size and shape of the figure stay exactly thesame, only its location changes or shifts.
Now let’s look at each type of translation in more detail.
The first type of transformation is called a translation. It is also known as a slide because the figure in question doesexactly that. It moves up, down, to the left or to the right. Nothing about the figure changes except its location.
Here are some translations.
Notice when you look at each picture that all that changed for each figure was its location. There are differentcolors used to show you the actual translation, but other than the location, each looks exactly the same.
This is how you always know that you are working with a translation or a slide.
How do we perform a translation?
To perform a translation, we measure a distance and then redraw the figure. For example, let’s move this triangle 6inches.
845
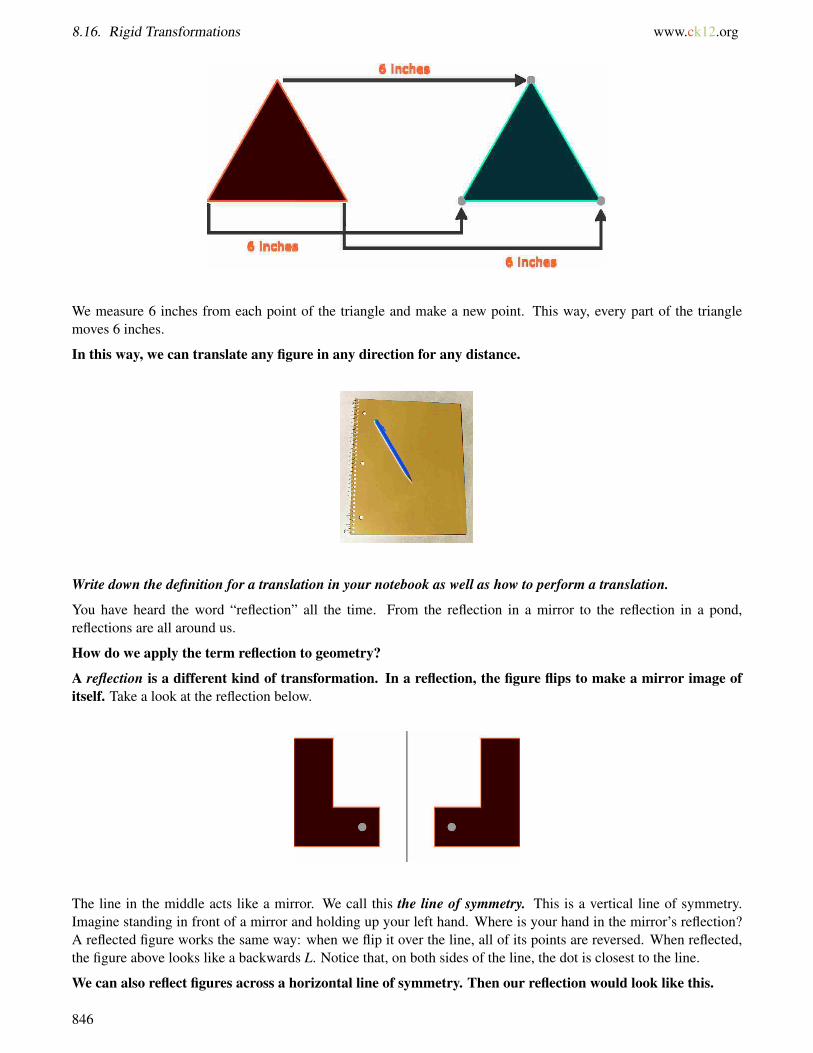
8.16. Rigid Transformations www.ck12.org
We measure 6 inches from each point of the triangle and make a new point. This way, every part of the trianglemoves 6 inches.
In this way, we can translate any figure in any direction for any distance.
Write down the definition for a translation in your notebook as well as how to perform a translation.
You have heard the word “reflection” all the time. From the reflection in a mirror to the reflection in a pond,reflections are all around us.
How do we apply the term reflection to geometry?
A reflection is a different kind of transformation. In a reflection, the figure flips to make a mirror image ofitself. Take a look at the reflection below.
The line in the middle acts like a mirror. We call this the line of symmetry. This is a vertical line of symmetry.Imagine standing in front of a mirror and holding up your left hand. Where is your hand in the mirror’s reflection?A reflected figure works the same way: when we flip it over the line, all of its points are reversed. When reflected,the figure above looks like a backwards L. Notice that, on both sides of the line, the dot is closest to the line.
We can also reflect figures across a horizontal line of symmetry. Then our reflection would look like this.
846
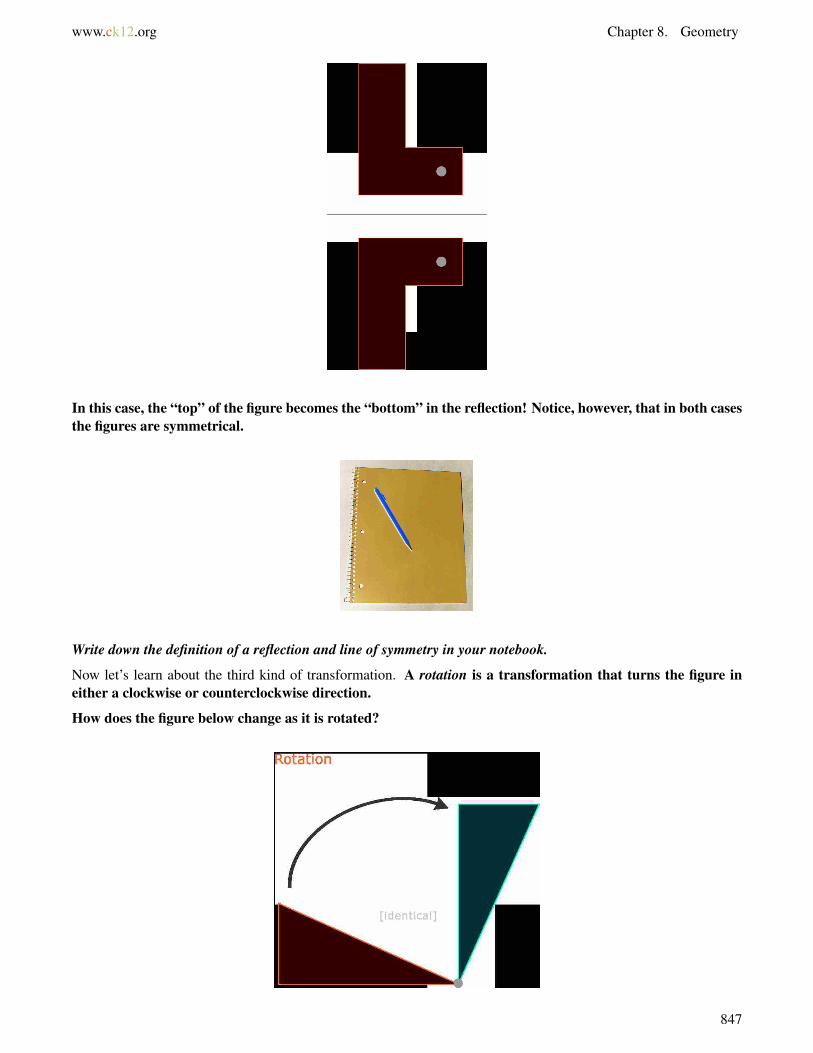
www.ck12.org Chapter 8. Geometry
In this case, the “top” of the figure becomes the “bottom” in the reflection! Notice, however, that in both casesthe figures are symmetrical.
Write down the definition of a reflection and line of symmetry in your notebook.
Now let’s learn about the third kind of transformation. A rotation is a transformation that turns the figure ineither a clockwise or counterclockwise direction.
How does the figure below change as it is rotated?
847
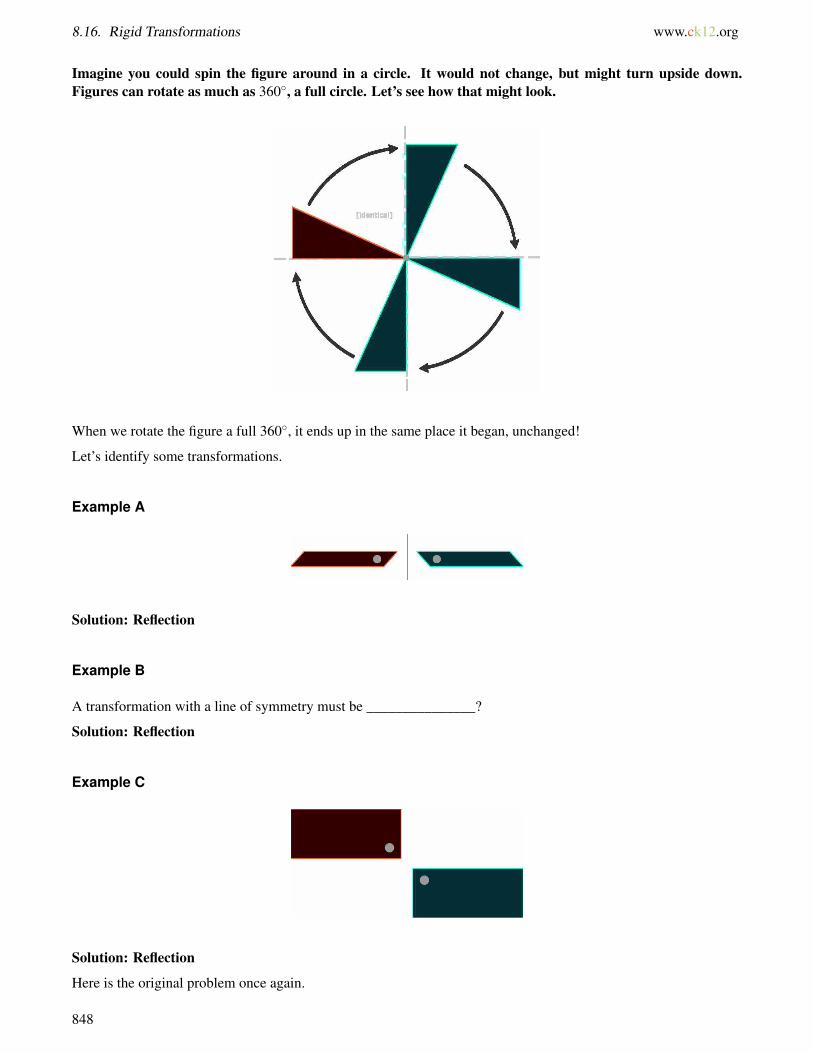
8.16. Rigid Transformations www.ck12.org
Imagine you could spin the figure around in a circle. It would not change, but might turn upside down.Figures can rotate as much as 360◦, a full circle. Let’s see how that might look.
When we rotate the figure a full 360◦, it ends up in the same place it began, unchanged!
Let’s identify some transformations.
Example A
Solution: Reflection
Example B
A transformation with a line of symmetry must be _______________?
Solution: Reflection
Example C
Solution: Reflection
Here is the original problem once again.
848
www.ck12.org Chapter 8. Geometry
In one of the rooms of the museum, this tile completely covered two of the walls. The students walked inside andbegan moving automatically because of the pattern on the wall.
“This tile makes me dizzy,” Greg stated sitting on a nearby bench.
“Yes, it seems to move,” Lane commented.
“I think it’s cool. Look at all of the transformations are everywhere,” Emma said smiling.
“Are you sure? You are beginning to sound like Mrs. Gilman,” Lane said jokingly.
“I am sure, and thank you for the compliment,” Emma said nudging her best friend.
In this tile pattern, make a note of a reflection. Make a note of a translation. Make a note of a figure thatrotates or has rotational symmetry. Make a note of the line of symmetry.
When finished, compare your answers with a partner.
While you won’t find the exact answer here, there are many ways to explore transformations and symmetry byusing this pattern. Work with a partner or with your whole class to figure out the math in this tile pattern.
Guided Practice
Here is one for you to try on your own.
Could this figure be a rotation? Why or why not?
Answer
This figure is congruent in each and every way. This figure could be a rotation.
849

8.16. Rigid Transformations www.ck12.org
Explore More
Directions: Identify the transformations shown below as translations, reflections, or rotations.
Directions: Tell whether the figures below have line symmetry, rotational symmetry, both, or neither.
Directions: Draw the second half of each figure.
850
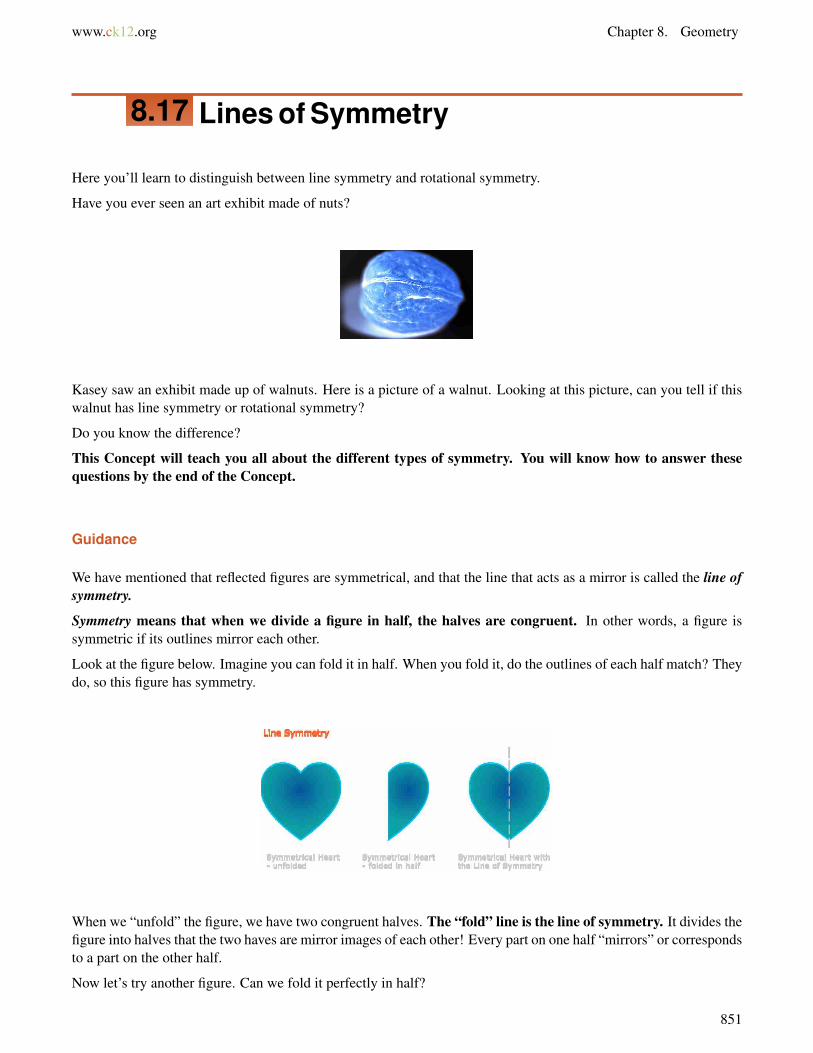
www.ck12.org Chapter 8. Geometry
8.17 Lines of Symmetry
Here you’ll learn to distinguish between line symmetry and rotational symmetry.
Have you ever seen an art exhibit made of nuts?
Kasey saw an exhibit made up of walnuts. Here is a picture of a walnut. Looking at this picture, can you tell if thiswalnut has line symmetry or rotational symmetry?
Do you know the difference?
This Concept will teach you all about the different types of symmetry. You will know how to answer thesequestions by the end of the Concept.
Guidance
We have mentioned that reflected figures are symmetrical, and that the line that acts as a mirror is called the line ofsymmetry.
Symmetry means that when we divide a figure in half, the halves are congruent. In other words, a figure issymmetric if its outlines mirror each other.
Look at the figure below. Imagine you can fold it in half. When you fold it, do the outlines of each half match? Theydo, so this figure has symmetry.
When we “unfold” the figure, we have two congruent halves. The “fold” line is the line of symmetry. It divides thefigure into halves that the two haves are mirror images of each other! Every part on one half “mirrors” or correspondsto a part on the other half.
Now let’s try another figure. Can we fold it perfectly in half?
851
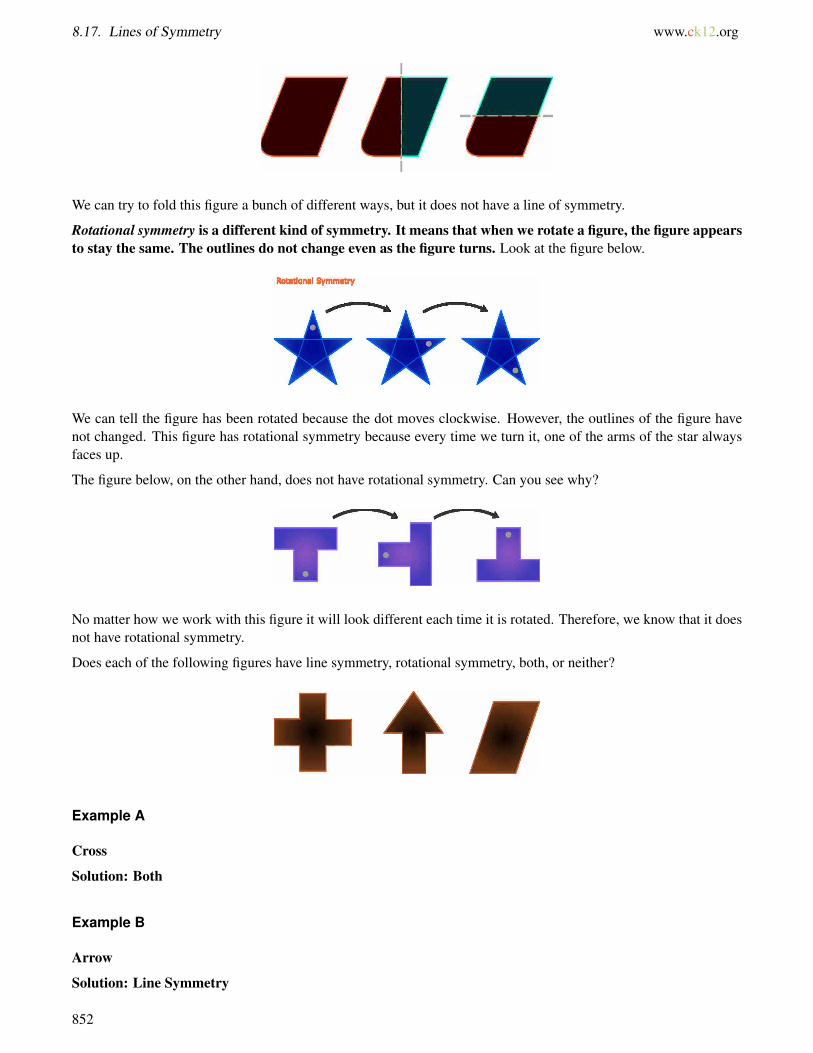
8.17. Lines of Symmetry www.ck12.org
We can try to fold this figure a bunch of different ways, but it does not have a line of symmetry.
Rotational symmetry is a different kind of symmetry. It means that when we rotate a figure, the figure appearsto stay the same. The outlines do not change even as the figure turns. Look at the figure below.
We can tell the figure has been rotated because the dot moves clockwise. However, the outlines of the figure havenot changed. This figure has rotational symmetry because every time we turn it, one of the arms of the star alwaysfaces up.
The figure below, on the other hand, does not have rotational symmetry. Can you see why?
No matter how we work with this figure it will look different each time it is rotated. Therefore, we know that it doesnot have rotational symmetry.
Does each of the following figures have line symmetry, rotational symmetry, both, or neither?
Example A
Cross
Solution: Both
Example B
Arrow
Solution: Line Symmetry
852

www.ck12.org Chapter 8. Geometry
Example C
Quadrilateral
Solution: Both
Here is the original problem once again.
Kasey saw an exhibit made up of walnuts. Here is a picture of a walnut. Looking at this picture, can you tell if thiswalnut has line symmetry or rotational symmetry?
Do you know the difference?
Line symmetry involves dividing a figure in halves. You can split a figure horizontally, vertically or on the diagonalsand one half is a mirror image of the other half.
This walnut does have one vertical line of symmetry. You can only divide it in half vertically and have it create amirror image.
The walnut does not have rotational symmetry. If you turn the walnut, then the view and image of the walnut isdifferent.
The answer is line symmetry.
Guided Practice
Here is one for you to try on your own.
Does this figure have line symmetry, rotational symmetry, both or neither.
Answer
This figure has line symmetry. Take a look.
853

8.17. Lines of Symmetry www.ck12.org
When we can divide a figure or an object into two even matching halves, we say that the figure has line symmetry.
This figure can be divided in one way, vertically. If we tried to divide it horizontally, the two sides would not match.
Divided this way, the top half does not match the bottom half.
This figure does not rotate, but it does have line symmetry.
Video Review
MEDIAClick image to the left or use the URL below.URL: http://www.ck12.org/flx/render/embeddedobject/57634
This is a video on rotational symmetry.
Explore More
Directions: Answer each of the following questions true or false.
1. A reflection has rotational symmetry.
2. A square has line symmetry and rotational symmetry.
3. If a figure is a transformation than it always rotates clockwise.
4. A slide is also called a translation.
5. A flip has a line of symmetry because it is a reflection.
854
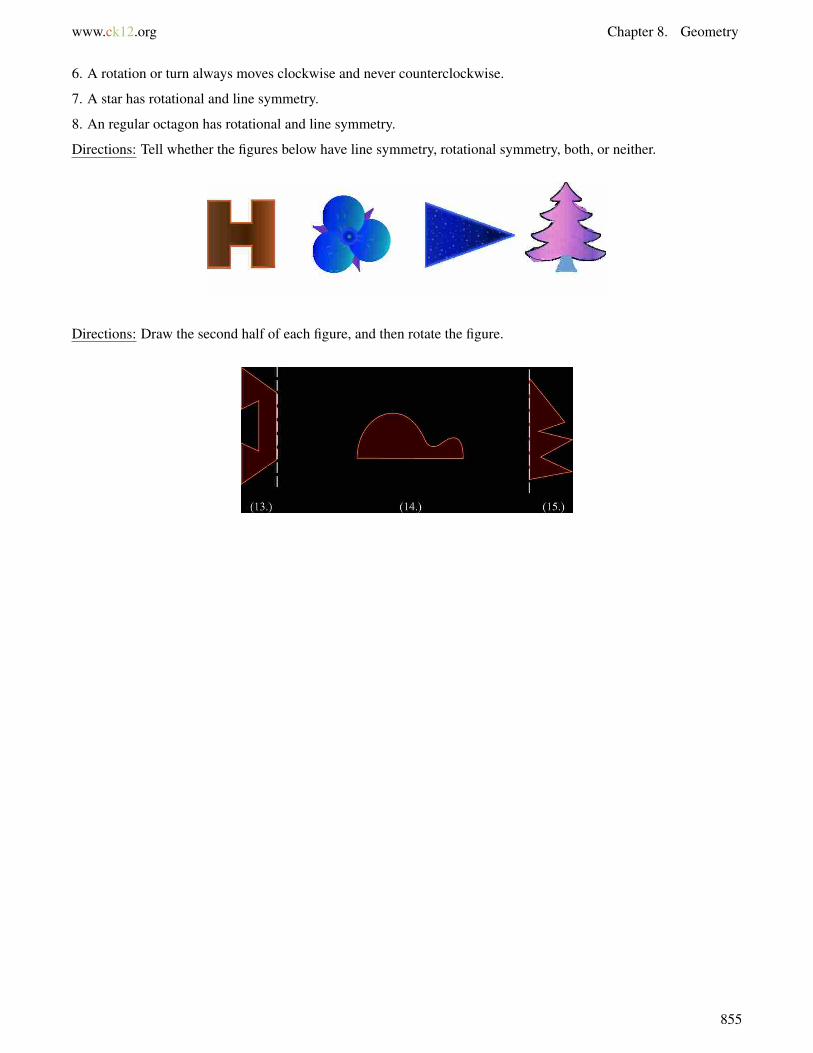
www.ck12.org Chapter 8. Geometry
6. A rotation or turn always moves clockwise and never counterclockwise.
7. A star has rotational and line symmetry.
8. An regular octagon has rotational and line symmetry.
Directions: Tell whether the figures below have line symmetry, rotational symmetry, both, or neither.
Directions: Draw the second half of each figure, and then rotate the figure.
855

8.18. Transformation Classification www.ck12.org
8.18 Transformation Classification
Here you’ll identify and describe transformations in the coordinate plane.
In one room of the museum was a King’s bedroom. The furniture in the room was large and wooden and old withgreat golden cloths. On the walls was a beautiful red, blue and gold pattern.
Jessica thought that the pattern was the most beautiful one that she had ever heard.
“I love this,” she said to Mrs. Gilman. “I want to draw it, but I’m not sure how.”
“Well, you could break it up into a coordinate grid since the pattern repeats itself and use what we have learnedabout transformations to draw it in.”
“How could I get started?” Jessica asked.
“Well, start by drawing the coordinate grid, then use these coordinates for one of the diamonds. See if you can figureit out from there.”
In Jessica’s notebook, Mrs. Gilman wrote down the following coordinates.
(4,1)
(5,2)
(5,0)
(6,1)
Jessica began to draw it in. Then she got stuck.
This is where you come in. This Concept will teach you all about drawing transformations. Follow alongclosely and you can help Jessica draw in the diamonds at the end of the Concept in each quadrant.
Guidance
Previously we worked on how to identify and perform different transformations. Remember that a transformationis when we move a figure in some way, even though we don’t change the figure at all. This Concept will teachyou how to identify and perform transformations in the coordinate plane.
856
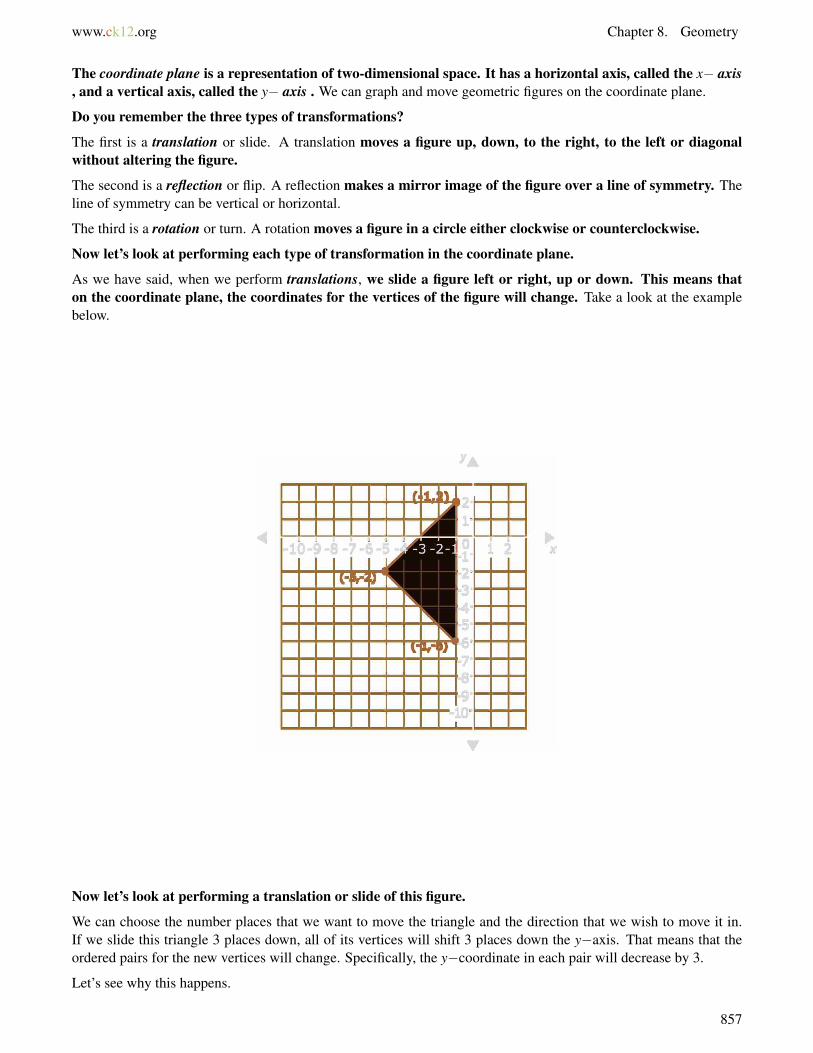
www.ck12.org Chapter 8. Geometry
The coordinate plane is a representation of two-dimensional space. It has a horizontal axis, called the x− axis, and a vertical axis, called the y− axis . We can graph and move geometric figures on the coordinate plane.
Do you remember the three types of transformations?
The first is a translation or slide. A translation moves a figure up, down, to the right, to the left or diagonalwithout altering the figure.
The second is a reflection or flip. A reflection makes a mirror image of the figure over a line of symmetry. Theline of symmetry can be vertical or horizontal.
The third is a rotation or turn. A rotation moves a figure in a circle either clockwise or counterclockwise.
Now let’s look at performing each type of transformation in the coordinate plane.
As we have said, when we perform translations, we slide a figure left or right, up or down. This means thaton the coordinate plane, the coordinates for the vertices of the figure will change. Take a look at the examplebelow.
Now let’s look at performing a translation or slide of this figure.
We can choose the number places that we want to move the triangle and the direction that we wish to move it in.If we slide this triangle 3 places down, all of its vertices will shift 3 places down the y−axis. That means that theordered pairs for the new vertices will change. Specifically, the y−coordinate in each pair will decrease by 3.
Let’s see why this happens.
857
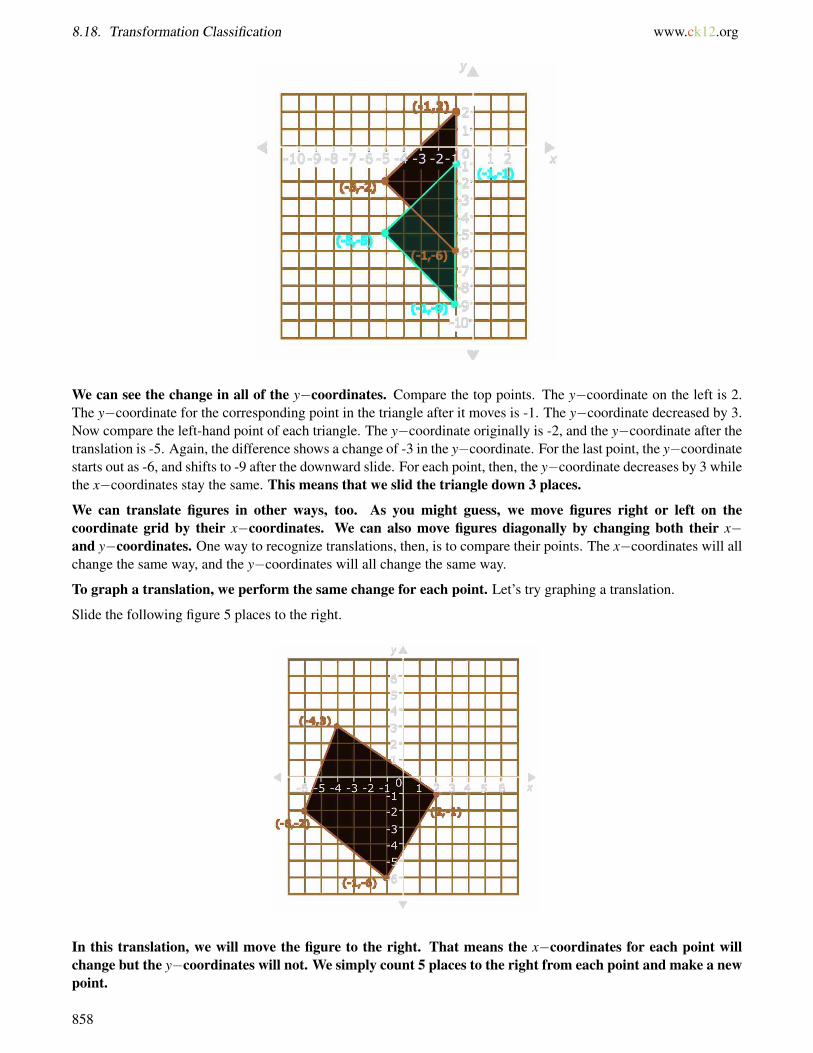
8.18. Transformation Classification www.ck12.org
We can see the change in all of the y−coordinates. Compare the top points. The y−coordinate on the left is 2.The y−coordinate for the corresponding point in the triangle after it moves is -1. The y−coordinate decreased by 3.Now compare the left-hand point of each triangle. The y−coordinate originally is -2, and the y−coordinate after thetranslation is -5. Again, the difference shows a change of -3 in the y−coordinate. For the last point, the y−coordinatestarts out as -6, and shifts to -9 after the downward slide. For each point, then, the y−coordinate decreases by 3 whilethe x−coordinates stay the same. This means that we slid the triangle down 3 places.
We can translate figures in other ways, too. As you might guess, we move figures right or left on thecoordinate grid by their x−coordinates. We can also move figures diagonally by changing both their x−and y−coordinates. One way to recognize translations, then, is to compare their points. The x−coordinates will allchange the same way, and the y−coordinates will all change the same way.
To graph a translation, we perform the same change for each point. Let’s try graphing a translation.
Slide the following figure 5 places to the right.
In this translation, we will move the figure to the right. That means the x−coordinates for each point willchange but the y−coordinates will not. We simply count 5 places to the right from each point and make a newpoint.
858
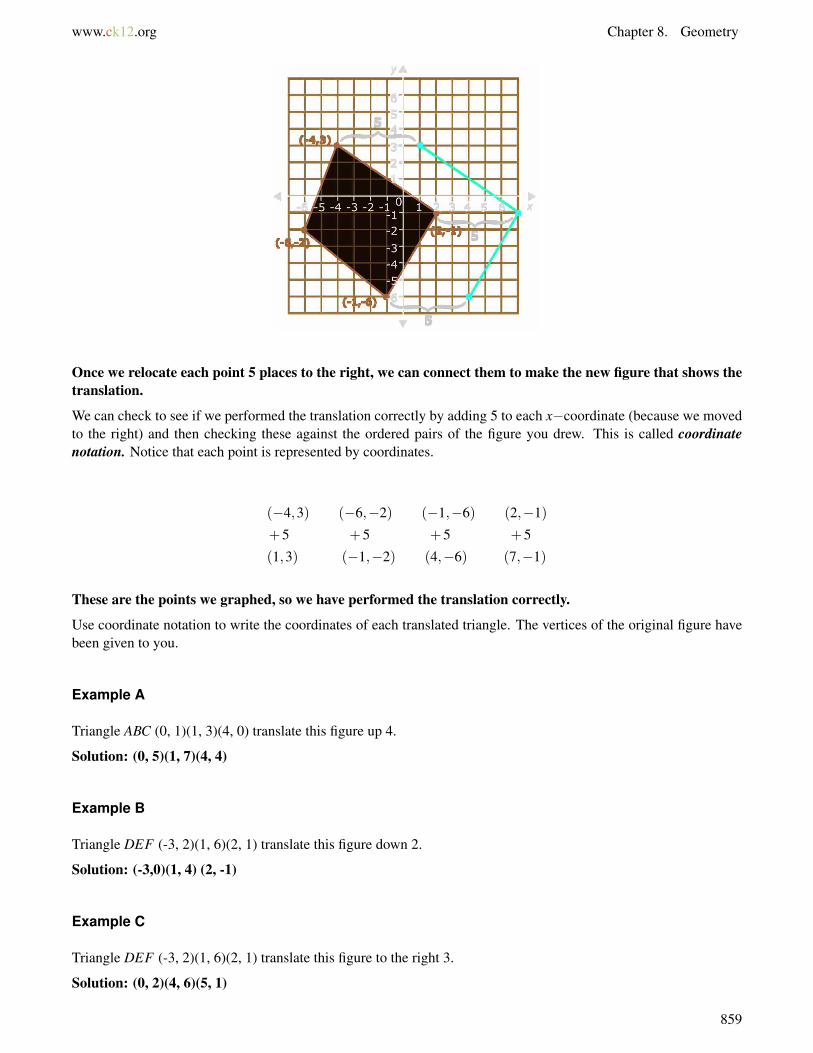
www.ck12.org Chapter 8. Geometry
Once we relocate each point 5 places to the right, we can connect them to make the new figure that shows thetranslation.
We can check to see if we performed the translation correctly by adding 5 to each x−coordinate (because we movedto the right) and then checking these against the ordered pairs of the figure you drew. This is called coordinatenotation. Notice that each point is represented by coordinates.
(−4,3) (−6,−2) (−1,−6) (2,−1)
+5 +5 +5 +5
(1,3) (−1,−2) (4,−6) (7,−1)
These are the points we graphed, so we have performed the translation correctly.
Use coordinate notation to write the coordinates of each translated triangle. The vertices of the original figure havebeen given to you.
Example A
Triangle ABC (0, 1)(1, 3)(4, 0) translate this figure up 4.
Solution: (0, 5)(1, 7)(4, 4)
Example B
Triangle DEF (-3, 2)(1, 6)(2, 1) translate this figure down 2.
Solution: (-3,0)(1, 4) (2, -1)
Example C
Triangle DEF (-3, 2)(1, 6)(2, 1) translate this figure to the right 3.
Solution: (0, 2)(4, 6)(5, 1)
859
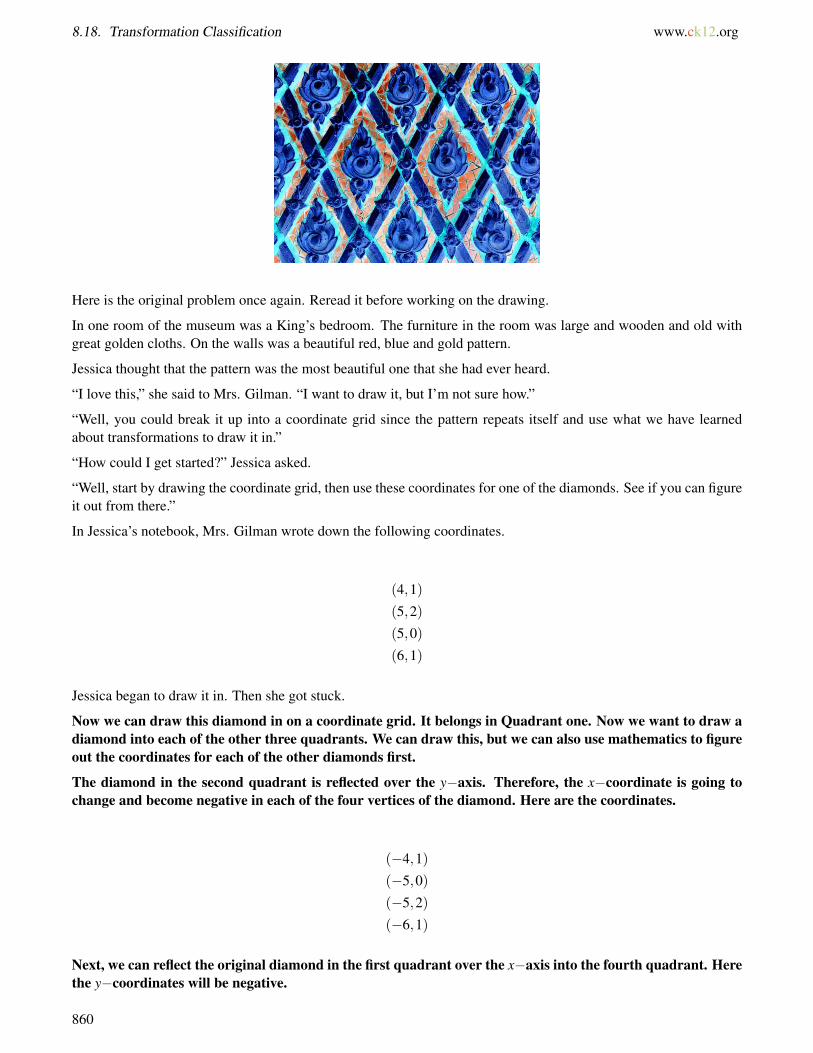
8.18. Transformation Classification www.ck12.org
Here is the original problem once again. Reread it before working on the drawing.
In one room of the museum was a King’s bedroom. The furniture in the room was large and wooden and old withgreat golden cloths. On the walls was a beautiful red, blue and gold pattern.
Jessica thought that the pattern was the most beautiful one that she had ever heard.
“I love this,” she said to Mrs. Gilman. “I want to draw it, but I’m not sure how.”
“Well, you could break it up into a coordinate grid since the pattern repeats itself and use what we have learnedabout transformations to draw it in.”
“How could I get started?” Jessica asked.
“Well, start by drawing the coordinate grid, then use these coordinates for one of the diamonds. See if you can figureit out from there.”
In Jessica’s notebook, Mrs. Gilman wrote down the following coordinates.
(4,1)
(5,2)
(5,0)
(6,1)
Jessica began to draw it in. Then she got stuck.
Now we can draw this diamond in on a coordinate grid. It belongs in Quadrant one. Now we want to draw adiamond into each of the other three quadrants. We can draw this, but we can also use mathematics to figureout the coordinates for each of the other diamonds first.
The diamond in the second quadrant is reflected over the y−axis. Therefore, the x−coordinate is going tochange and become negative in each of the four vertices of the diamond. Here are the coordinates.
(−4,1)
(−5,0)
(−5,2)
(−6,1)
Next, we can reflect the original diamond in the first quadrant over the x−axis into the fourth quadrant. Herethe y−coordinates will be negative.
860

www.ck12.org Chapter 8. Geometry
(4,−1)
(5,0)
(5,−2)
(6,−1)
Finally we can reflect this diamond over the y−axis into the third quadrant. Notice that here the x andy-coordinates will both be negative.
(−4,−1)
(−5,0)
(−5,−2)
(−6,−1)
Did you notice any patterns? Take a minute and create this pattern of diamonds in a coordinate grid. Thenyou will have an even deeper understanding of how a pattern like this one is created.
If you wanted to add in the gold X that crosses through the original pattern could you do it? Explain yourthinking with a friend and then add in the X to the coordinate grid with the diamonds.
Guided Practice
Here is one for you to try on your own.
Slide the following figure 4 places to the left and 2 places up.
Answer
This time we need to perform two movements, both left and up. That means we will change both the x− andy−coordinates of the ordered pairs. We graph each point by counting 4 places to the left first, and from there 2places up (2 places up from where you started, not 2 places up from the y−axis!). Make a mark and repeat thisprocess for each point. Then connect the new points.
861
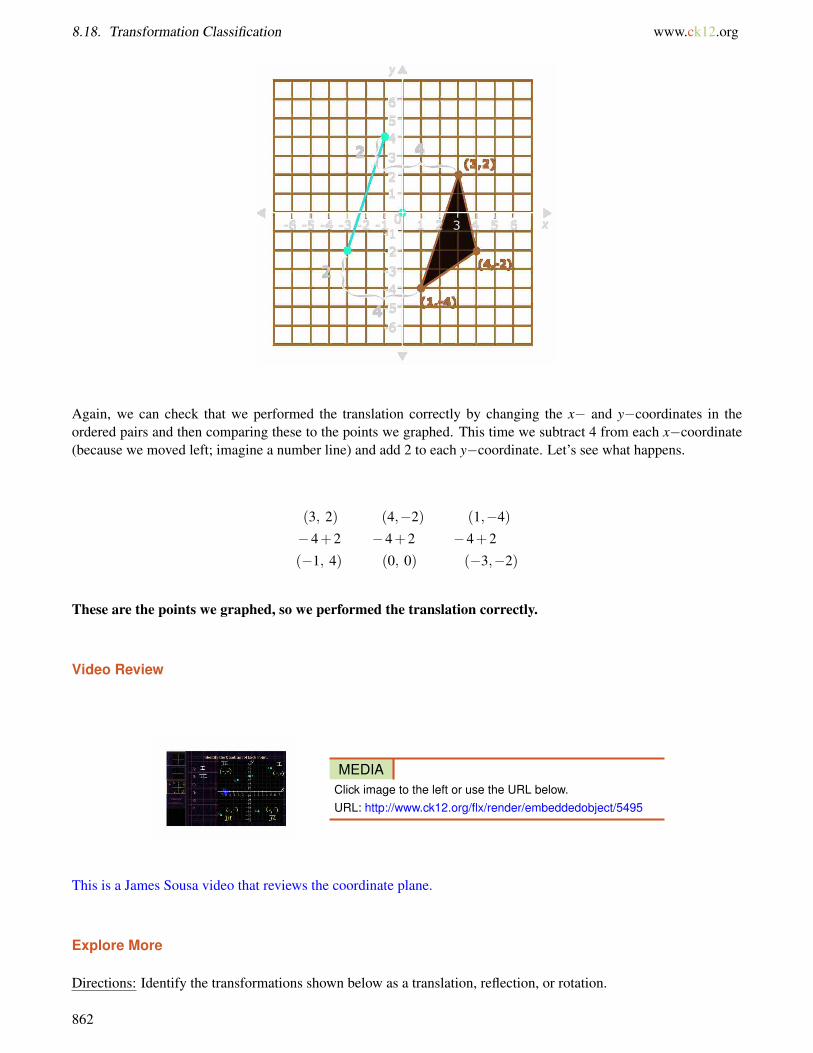
8.18. Transformation Classification www.ck12.org
Again, we can check that we performed the translation correctly by changing the x− and y−coordinates in theordered pairs and then comparing these to the points we graphed. This time we subtract 4 from each x−coordinate(because we moved left; imagine a number line) and add 2 to each y−coordinate. Let’s see what happens.
(3, 2) (4,−2) (1,−4)
−4+2 −4+2 −4+2
(−1, 4) (0, 0) (−3,−2)
These are the points we graphed, so we performed the translation correctly.
Video Review
MEDIAClick image to the left or use the URL below.URL: http://www.ck12.org/flx/render/embeddedobject/5495
This is a James Sousa video that reviews the coordinate plane.
Explore More
Directions: Identify the transformations shown below as a translation, reflection, or rotation.
862
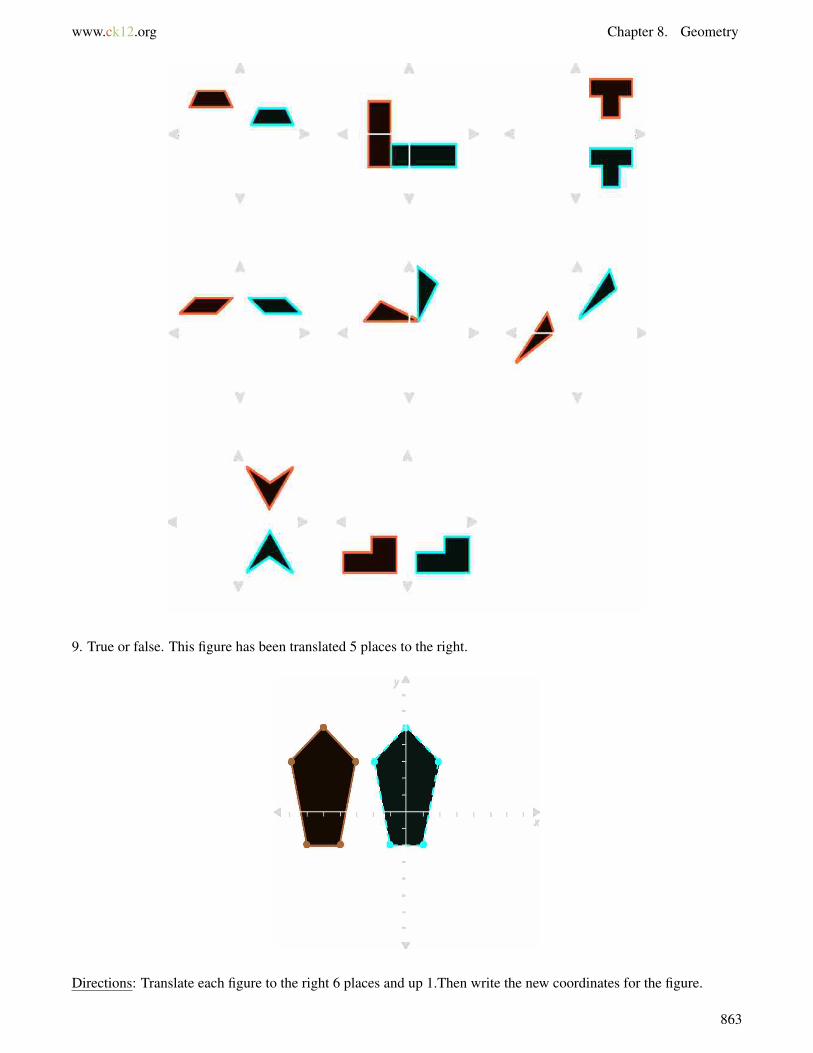
www.ck12.org Chapter 8. Geometry
9. True or false. This figure has been translated 5 places to the right.
Directions: Translate each figure to the right 6 places and up 1.Then write the new coordinates for the figure.
863

8.18. Transformation Classification www.ck12.org
10. Triangle DEF (-1, 2)(1, 6)(2, 1)
11. Triangle DEF (-3, 2)(1, 6)(2, 1)
12. Triangle DEF (0, 2)(1, 6)(2, 1)
13. Triangle DEF (4, -2)(1, 6)(2, 1)
14. Triangle DEF (5, 3)(1, 6)(2, 1)
15. Triangle DEF (4, 4)(1, 6)(2, 1)
864
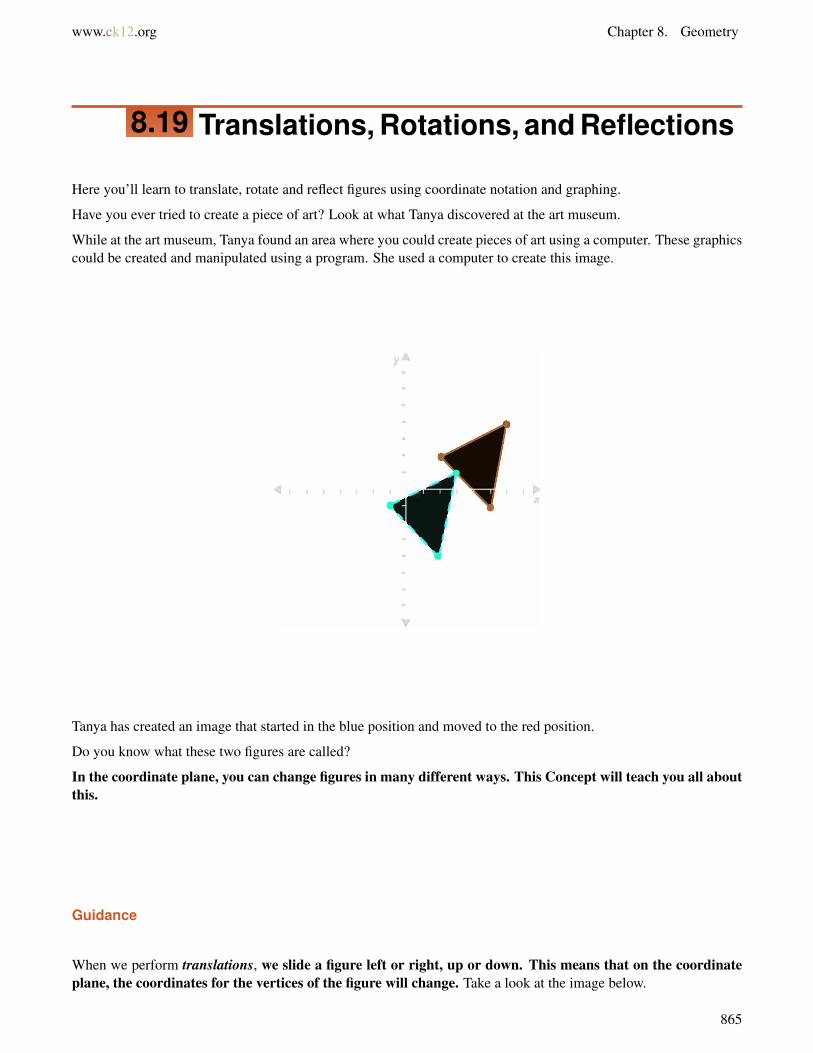
www.ck12.org Chapter 8. Geometry
8.19 Translations, Rotations, and Reflections
Here you’ll learn to translate, rotate and reflect figures using coordinate notation and graphing.
Have you ever tried to create a piece of art? Look at what Tanya discovered at the art museum.
While at the art museum, Tanya found an area where you could create pieces of art using a computer. These graphicscould be created and manipulated using a program. She used a computer to create this image.
Tanya has created an image that started in the blue position and moved to the red position.
Do you know what these two figures are called?
In the coordinate plane, you can change figures in many different ways. This Concept will teach you all aboutthis.
Guidance
When we perform translations, we slide a figure left or right, up or down. This means that on the coordinateplane, the coordinates for the vertices of the figure will change. Take a look at the image below.
865
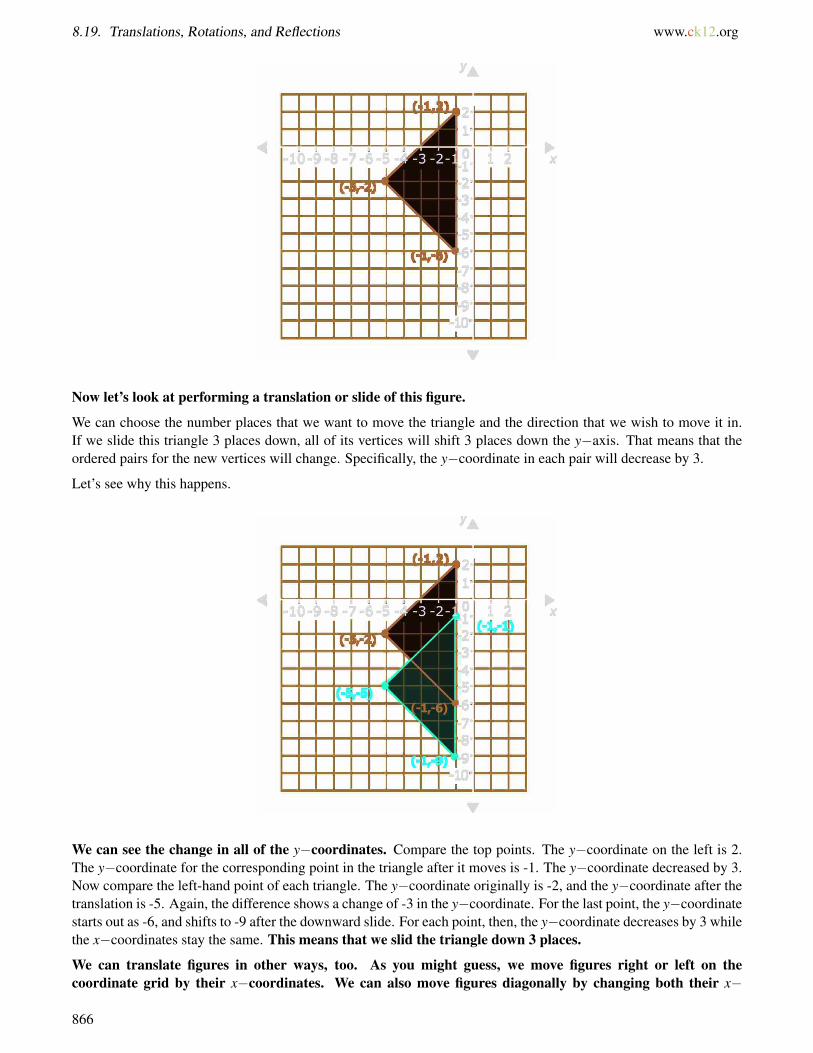
8.19. Translations, Rotations, and Reflections www.ck12.org
Now let’s look at performing a translation or slide of this figure.
We can choose the number places that we want to move the triangle and the direction that we wish to move it in.If we slide this triangle 3 places down, all of its vertices will shift 3 places down the y−axis. That means that theordered pairs for the new vertices will change. Specifically, the y−coordinate in each pair will decrease by 3.
Let’s see why this happens.
We can see the change in all of the y−coordinates. Compare the top points. The y−coordinate on the left is 2.The y−coordinate for the corresponding point in the triangle after it moves is -1. The y−coordinate decreased by 3.Now compare the left-hand point of each triangle. The y−coordinate originally is -2, and the y−coordinate after thetranslation is -5. Again, the difference shows a change of -3 in the y−coordinate. For the last point, the y−coordinatestarts out as -6, and shifts to -9 after the downward slide. For each point, then, the y−coordinate decreases by 3 whilethe x−coordinates stay the same. This means that we slid the triangle down 3 places.
We can translate figures in other ways, too. As you might guess, we move figures right or left on thecoordinate grid by their x−coordinates. We can also move figures diagonally by changing both their x−
866

www.ck12.org Chapter 8. Geometry
and y−coordinates. One way to recognize translations, then, is to compare their points. The x−coordinates will allchange the same way, and the y−coordinates will all change the same way.
To graph a translation, we perform the same change for each point.
We can also identify a reflection by the changes in its coordinates. Recall that in a reflection, the figure flipsacross a line to make a mirror image of itself. Take a look at the reflection below.
We usually reflect a figure across either the x− or the y−axis. In this case, we reflected the figure across they−axis. If we compare the figures in the first example vertex by vertex, we see that the x−coordinates change butthe y−coordinates stay the same. This is because the reflection happens from left to right across the y−axis. Whenwe reflect across the x−axis, the y−coordinates change and the x−coordinates stay the same. Take a look at thisexample.
Now let’s compare some of the vertices. In the figure above the coordinates for the upper-left vertex of the originalfigure are (-5, 5). After we reflect it across the x−axis, the coordinates for the corresponding vertex are (-5, -5).
867
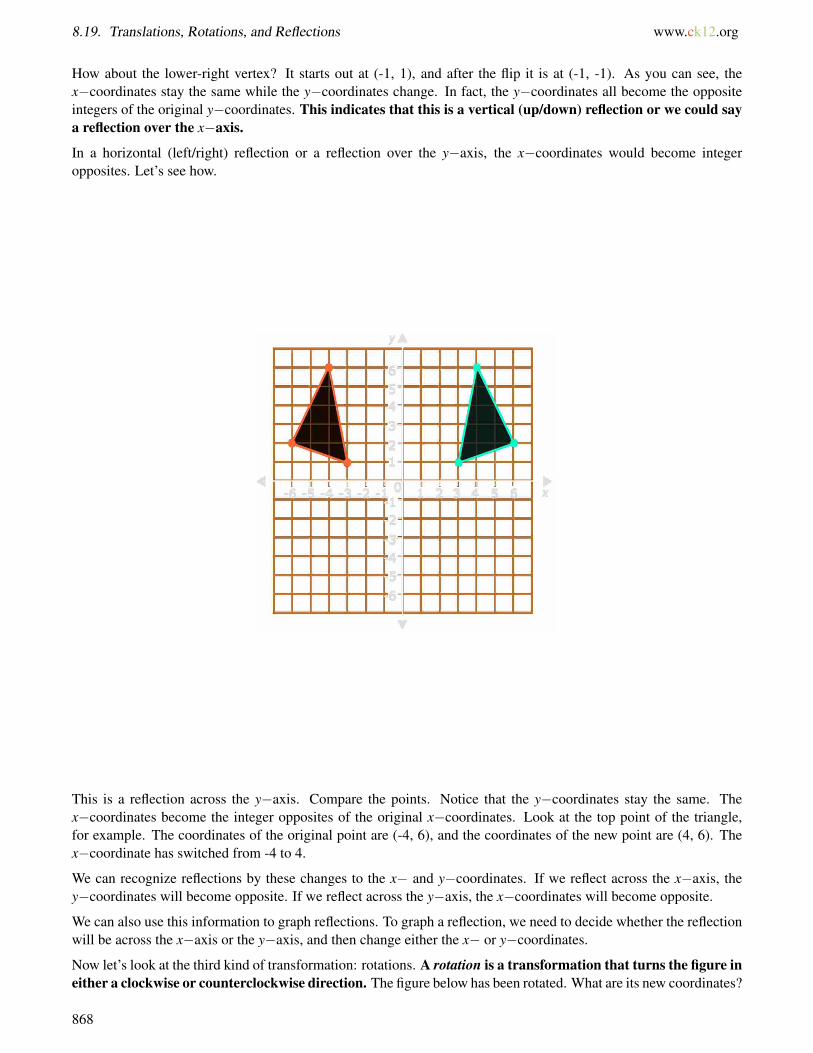
8.19. Translations, Rotations, and Reflections www.ck12.org
How about the lower-right vertex? It starts out at (-1, 1), and after the flip it is at (-1, -1). As you can see, thex−coordinates stay the same while the y−coordinates change. In fact, the y−coordinates all become the oppositeintegers of the original y−coordinates. This indicates that this is a vertical (up/down) reflection or we could saya reflection over the x−axis.
In a horizontal (left/right) reflection or a reflection over the y−axis, the x−coordinates would become integeropposites. Let’s see how.
This is a reflection across the y−axis. Compare the points. Notice that the y−coordinates stay the same. Thex−coordinates become the integer opposites of the original x−coordinates. Look at the top point of the triangle,for example. The coordinates of the original point are (-4, 6), and the coordinates of the new point are (4, 6). Thex−coordinate has switched from -4 to 4.
We can recognize reflections by these changes to the x− and y−coordinates. If we reflect across the x−axis, they−coordinates will become opposite. If we reflect across the y−axis, the x−coordinates will become opposite.
We can also use this information to graph reflections. To graph a reflection, we need to decide whether the reflectionwill be across the x−axis or the y−axis, and then change either the x− or y−coordinates.
Now let’s look at the third kind of transformation: rotations. A rotation is a transformation that turns the figure ineither a clockwise or counterclockwise direction. The figure below has been rotated. What are its new coordinates?
868
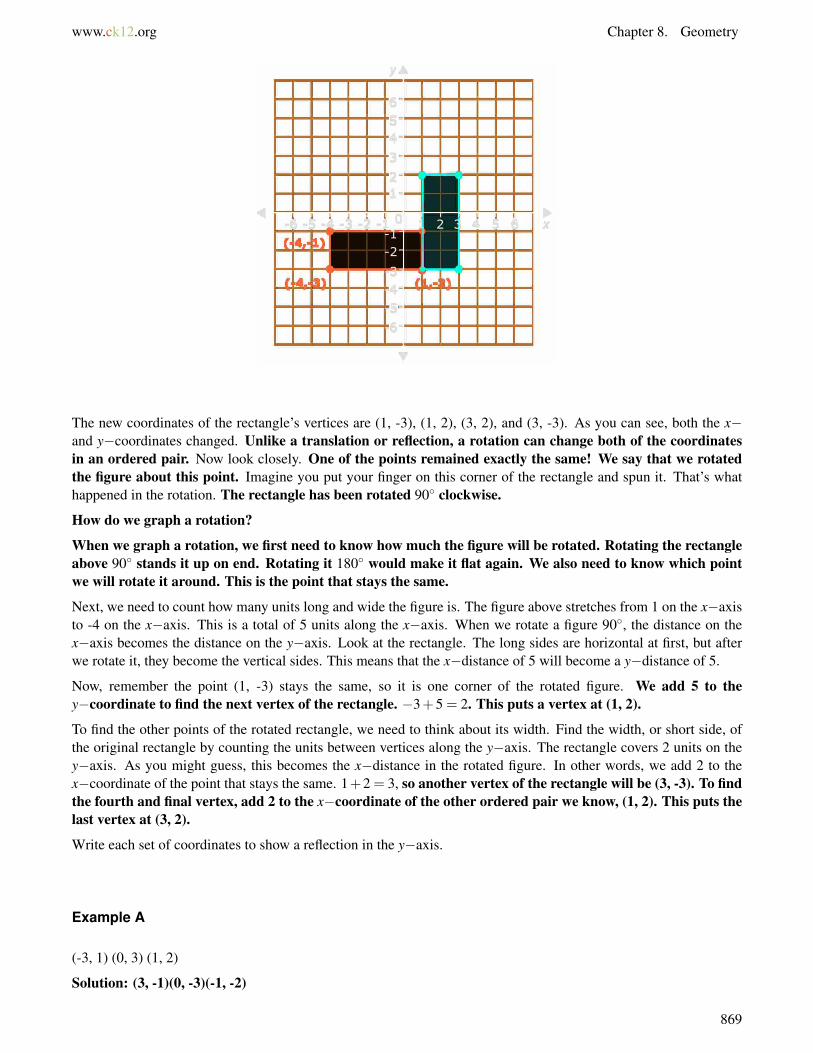
www.ck12.org Chapter 8. Geometry
The new coordinates of the rectangle’s vertices are (1, -3), (1, 2), (3, 2), and (3, -3). As you can see, both the x−and y−coordinates changed. Unlike a translation or reflection, a rotation can change both of the coordinatesin an ordered pair. Now look closely. One of the points remained exactly the same! We say that we rotatedthe figure about this point. Imagine you put your finger on this corner of the rectangle and spun it. That’s whathappened in the rotation. The rectangle has been rotated 90◦ clockwise.
How do we graph a rotation?
When we graph a rotation, we first need to know how much the figure will be rotated. Rotating the rectangleabove 90◦ stands it up on end. Rotating it 180◦ would make it flat again. We also need to know which pointwe will rotate it around. This is the point that stays the same.
Next, we need to count how many units long and wide the figure is. The figure above stretches from 1 on the x−axisto -4 on the x−axis. This is a total of 5 units along the x−axis. When we rotate a figure 90◦, the distance on thex−axis becomes the distance on the y−axis. Look at the rectangle. The long sides are horizontal at first, but afterwe rotate it, they become the vertical sides. This means that the x−distance of 5 will become a y−distance of 5.
Now, remember the point (1, -3) stays the same, so it is one corner of the rotated figure. We add 5 to they−coordinate to find the next vertex of the rectangle. −3+5 = 2. This puts a vertex at (1, 2).
To find the other points of the rotated rectangle, we need to think about its width. Find the width, or short side, ofthe original rectangle by counting the units between vertices along the y−axis. The rectangle covers 2 units on they−axis. As you might guess, this becomes the x−distance in the rotated figure. In other words, we add 2 to thex−coordinate of the point that stays the same. 1+2 = 3, so another vertex of the rectangle will be (3, -3). To findthe fourth and final vertex, add 2 to the x−coordinate of the other ordered pair we know, (1, 2). This puts thelast vertex at (3, 2).
Write each set of coordinates to show a reflection in the y−axis.
Example A
(-3, 1) (0, 3) (1, 2)
Solution: (3, -1)(0, -3)(-1, -2)
869
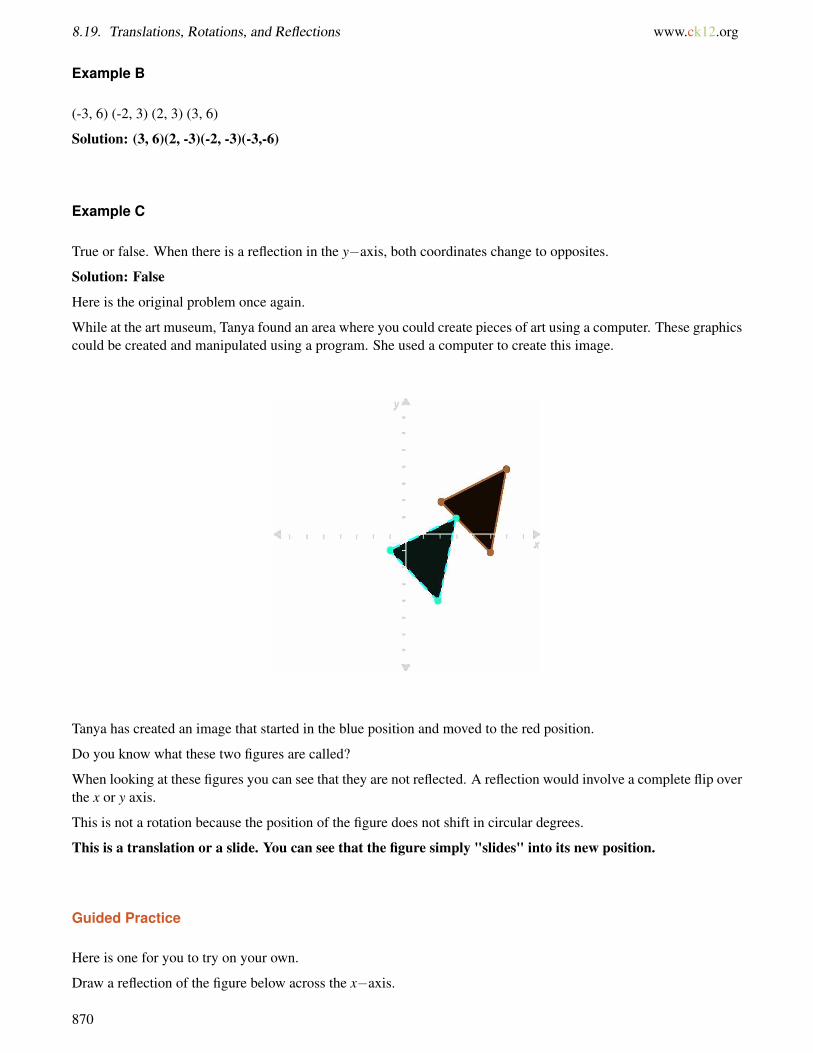
8.19. Translations, Rotations, and Reflections www.ck12.org
Example B
(-3, 6) (-2, 3) (2, 3) (3, 6)
Solution: (3, 6)(2, -3)(-2, -3)(-3,-6)
Example C
True or false. When there is a reflection in the y−axis, both coordinates change to opposites.
Solution: False
Here is the original problem once again.
While at the art museum, Tanya found an area where you could create pieces of art using a computer. These graphicscould be created and manipulated using a program. She used a computer to create this image.
Tanya has created an image that started in the blue position and moved to the red position.
Do you know what these two figures are called?
When looking at these figures you can see that they are not reflected. A reflection would involve a complete flip overthe x or y axis.
This is not a rotation because the position of the figure does not shift in circular degrees.
This is a translation or a slide. You can see that the figure simply "slides" into its new position.
Guided Practice
Here is one for you to try on your own.
Draw a reflection of the figure below across the x−axis.
870
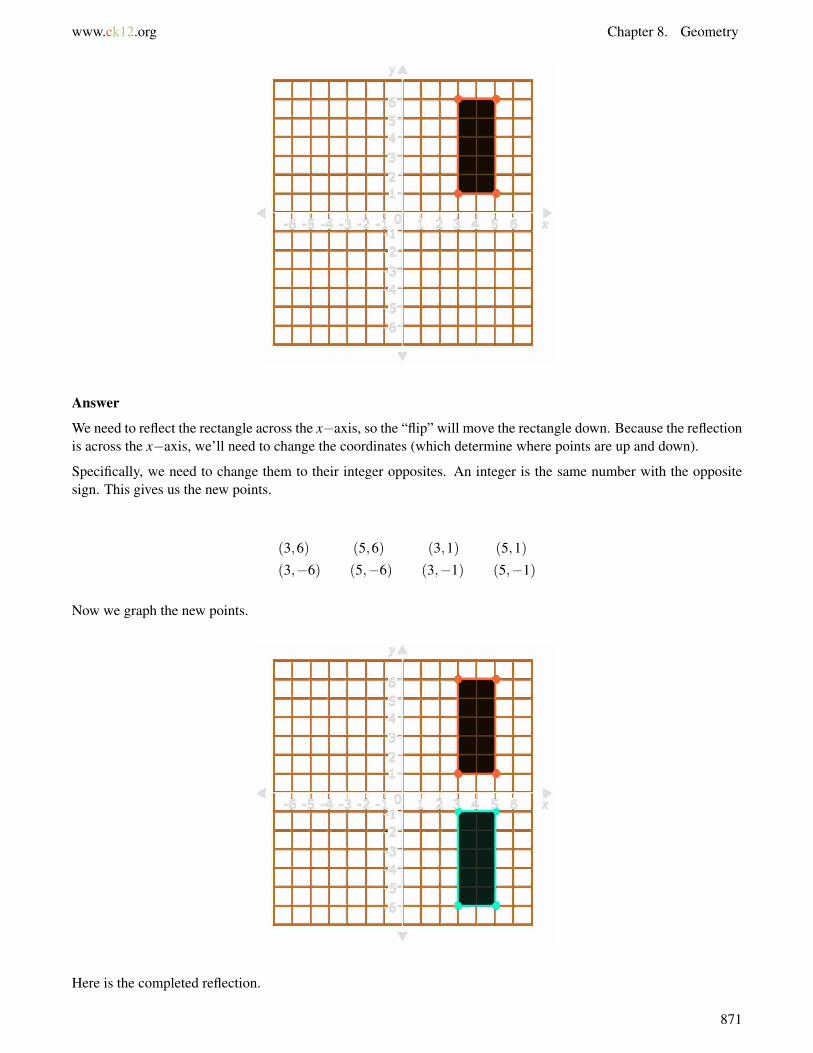
www.ck12.org Chapter 8. Geometry
Answer
We need to reflect the rectangle across the x−axis, so the “flip” will move the rectangle down. Because the reflectionis across the x−axis, we’ll need to change the coordinates (which determine where points are up and down).
Specifically, we need to change them to their integer opposites. An integer is the same number with the oppositesign. This gives us the new points.
(3,6) (5,6) (3,1) (5,1)
(3,−6) (5,−6) (3,−1) (5,−1)
Now we graph the new points.
Here is the completed reflection.
871

8.19. Translations, Rotations, and Reflections www.ck12.org
Explore More
Directions: Use this figure to answer each question. Be sure to write everything in coordinate notation when possible.
1. Translate this figure three units up.
2. Translate this figure four units to the right.
3. Translate this figure five units down.
4. Translate this figure six units to the left.
5. Translate this figure one unit down and two units to the right.
6. Translate this figure two units up and one unit to the left.
7. Translate this figure three units up and one unit to the right.
8. Rotate this figure 180 degrees.
9. Rotate this figure 90 degrees.
10. Reflect this figure over the x axis.
11. Reflect this figure over the y axis.
12. Translate this figure five units up and three units to the right.
13. Translate this figure six units down and four units to the left.
14. True or false. The figure below is an image of a reflection.
872

www.ck12.org Chapter 8. Geometry
15. True or false. This figure has been rotated 180◦.
Summary
Having completed this chapter, students are now ready to move on to the next Chapter. Each Concept has providedstudents with an opportunity to engage and practice skills in many Concepts including classifying angles, identifyingangles, angle measures, complementary angles, supplementary angles, vertical angles, adjacent angles, parallel lines,perpendicular lines, intersecting lines, corresponding angles, triangles, congruent figures, similar figures, indirectmeasurement, symmetry and transformations.
873
www.ck12.org
CHAPTER 9 Distance and AreaChapter Outline
9.1 EVALUATION OF SQUARE ROOTS
9.2 EVALUATION OF PERFECT SQUARE ROOTS
9.3 SIMPLIFICATION OF RADICAL EXPRESSIONS
9.4 EQUATIONS WITH SQUARE ROOTS
9.5 ESTIMATION OF SQUARE ROOTS
9.6 PROPERTIES OF RATIONAL NUMBERS VERSUS IRRATIONAL NUMBERS
9.7 PYTHAGOREAN THEOREM AND ITS CONVERSE
9.8 SOLVING EQUATIONS USING THE PYTHAGOREAN THEOREM
9.9 AREA OF A PARALLELOGRAM
9.10 UNKNOWN DIMENSIONS OF PARALLELOGRAMS
9.11 ESTIMATION OF PARALLELOGRAM AREA IN SCALE DRAWINGS
9.12 TRIANGLE AREA
9.13 UNKNOWN DIMENSIONS OF TRIANGLES
9.14 AREA OF COMPOSITE SHAPES INVOLVING TRIANGLES
9.15 CIRCLE CIRCUMFERENCE
9.16 DIAMETER OR RADIUS OF A CIRCLE GIVEN CIRCUMFERENCE
9.17 AREA OF A CIRCLE
9.18 RADIUS OR DIAMETER OF A CIRCLE GIVEN AREA
9.19 AREAS OF COMBINED FIGURES INVOLVING CIRCLES
Introduction
In Math 7, the learning content is divided into Concepts. Each Concept is complete and whole providing focusedlearning on an indicated objective. Theme-based Concepts provide students with experiences that integrate thecontent of each Concept. Students are given opportunities to practice the skills of each Concept through real-worldsituations, examples, guided practice and independent practice sections. There are also video links provided to givestudents an audio/visual way of connecting with the content. In this Chapter, students will engage with Concepts onsquare roots, the Pythagorean Theorem, area of parallelograms, trapezoids, triangles and circles, circumference ofcircles, irrational numbers and rational numbers.
874
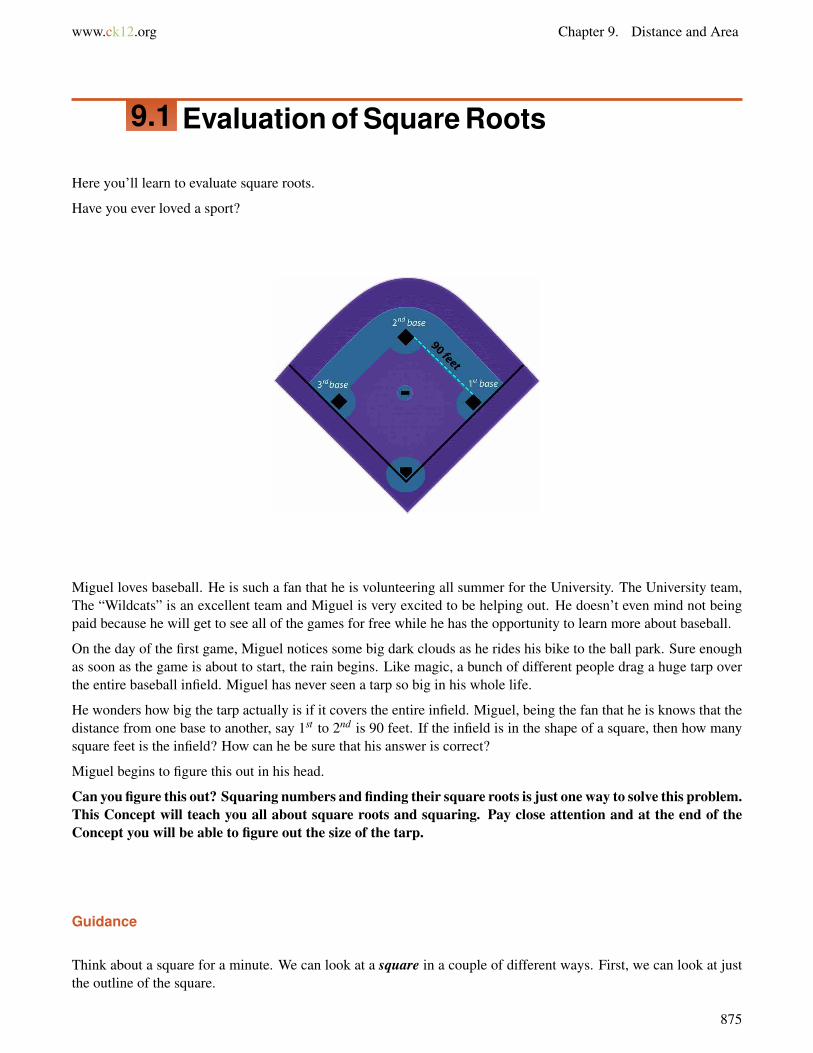
www.ck12.org Chapter 9. Distance and Area
9.1 Evaluation of Square Roots
Here you’ll learn to evaluate square roots.
Have you ever loved a sport?
Miguel loves baseball. He is such a fan that he is volunteering all summer for the University. The University team,The “Wildcats” is an excellent team and Miguel is very excited to be helping out. He doesn’t even mind not beingpaid because he will get to see all of the games for free while he has the opportunity to learn more about baseball.
On the day of the first game, Miguel notices some big dark clouds as he rides his bike to the ball park. Sure enoughas soon as the game is about to start, the rain begins. Like magic, a bunch of different people drag a huge tarp overthe entire baseball infield. Miguel has never seen a tarp so big in his whole life.
He wonders how big the tarp actually is if it covers the entire infield. Miguel, being the fan that he is knows that thedistance from one base to another, say 1st to 2nd is 90 feet. If the infield is in the shape of a square, then how manysquare feet is the infield? How can he be sure that his answer is correct?
Miguel begins to figure this out in his head.
Can you figure this out? Squaring numbers and finding their square roots is just one way to solve this problem.This Concept will teach you all about square roots and squaring. Pay close attention and at the end of theConcept you will be able to figure out the size of the tarp.
Guidance
Think about a square for a minute. We can look at a square in a couple of different ways. First, we can look at justthe outline of the square.
875
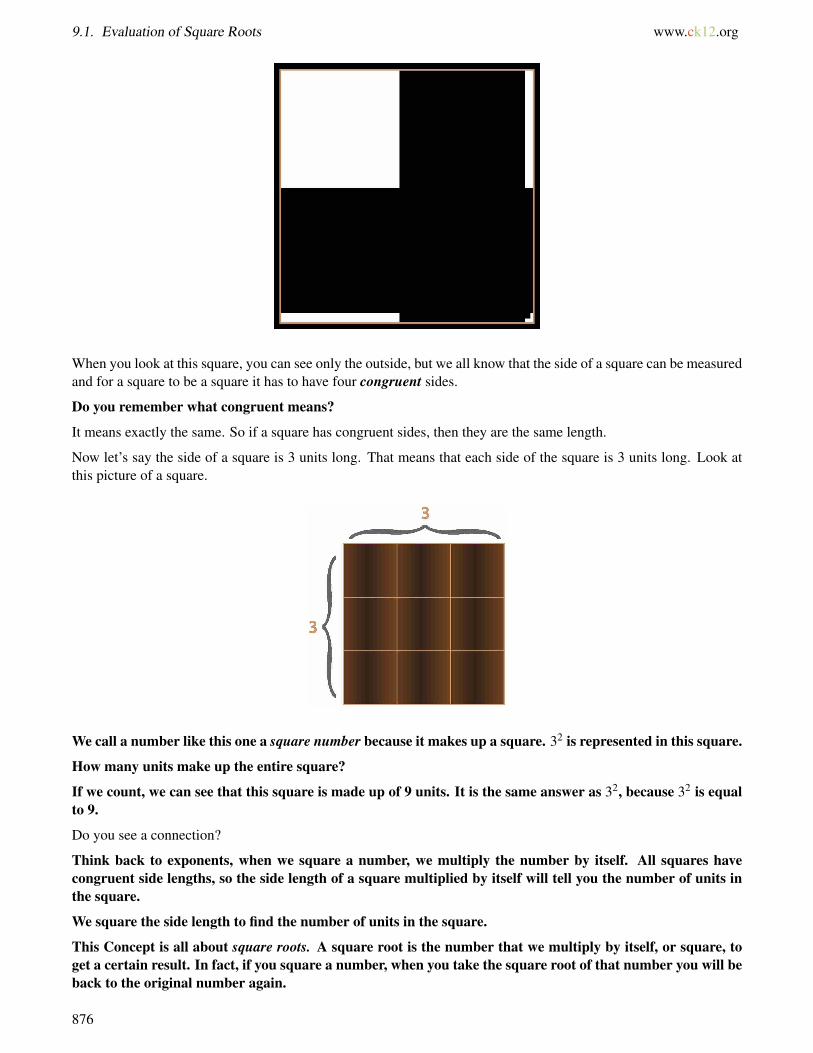
9.1. Evaluation of Square Roots www.ck12.org
When you look at this square, you can see only the outside, but we all know that the side of a square can be measuredand for a square to be a square it has to have four congruent sides.
Do you remember what congruent means?
It means exactly the same. So if a square has congruent sides, then they are the same length.
Now let’s say the side of a square is 3 units long. That means that each side of the square is 3 units long. Look atthis picture of a square.
We call a number like this one a square number because it makes up a square. 32 is represented in this square.
How many units make up the entire square?
If we count, we can see that this square is made up of 9 units. It is the same answer as 32, because 32 is equalto 9.
Do you see a connection?
Think back to exponents, when we square a number, we multiply the number by itself. All squares havecongruent side lengths, so the side length of a square multiplied by itself will tell you the number of units inthe square.
We square the side length to find the number of units in the square.
This Concept is all about square roots. A square root is the number that we multiply by itself, or square, toget a certain result. In fact, if you square a number, when you take the square root of that number you will beback to the original number again.
876

www.ck12.org Chapter 9. Distance and Area
Let’s think about the square that we just looked at. The dimensions of the square is 3× 3. We square the three tofind the units in the square. The square root of the 3× 3 square is 3. This is the value that we would multiplyby itself.
We can find the square root of a number. How do we do this?
Finding the square root is the inverse operation of squaring a number. Inverse operations are simply the oppositeof each other. Subtraction and addition are inverse operations, because one “undoes” the other. Similarly, squaringand finding the square root are inverse operations. When we find the square root, we look for the number that,times itself, will produce a given number.
We also use a symbol to show that we are looking for the square root of a number. Here is the symbol forsquare root.√
9
If this were the problem, we would be looking for the square root of 9.
You could think of this visually as a square that has nine units in it. What would be the length of the side? Itwould be three.
You could also think of it using mental math to solve it. What number times itself is equal to nine. The answeris three.
When we find the square root of a number, we evaluate that square root.√
25
This problem is asking us for the square root of 25. What number times itself is equal to 25? If you don’t knowright away, you can think about this with smaller numbers.
3×3 = 9
4×4 = 16
5×5 = 25
That’s it! The square root of 25 is 5.
We can also evaluate numbers where the square root is not a whole number.√
7
To find the square root of seven, we can think about which two squares it is closest to.
2×2 = 4
3×3 = 9
Seven is between four and nine, so we can say that the square root of seven is between 2 and 3.
Our answer would be that the√
7 is between 2 and 3.
We can get a more exact number, but we aren’t going to worry about that for right now. Here is another one.√
10
The square root of ten is between which two numbers?
3×3 = 9
4×4 = 16
877
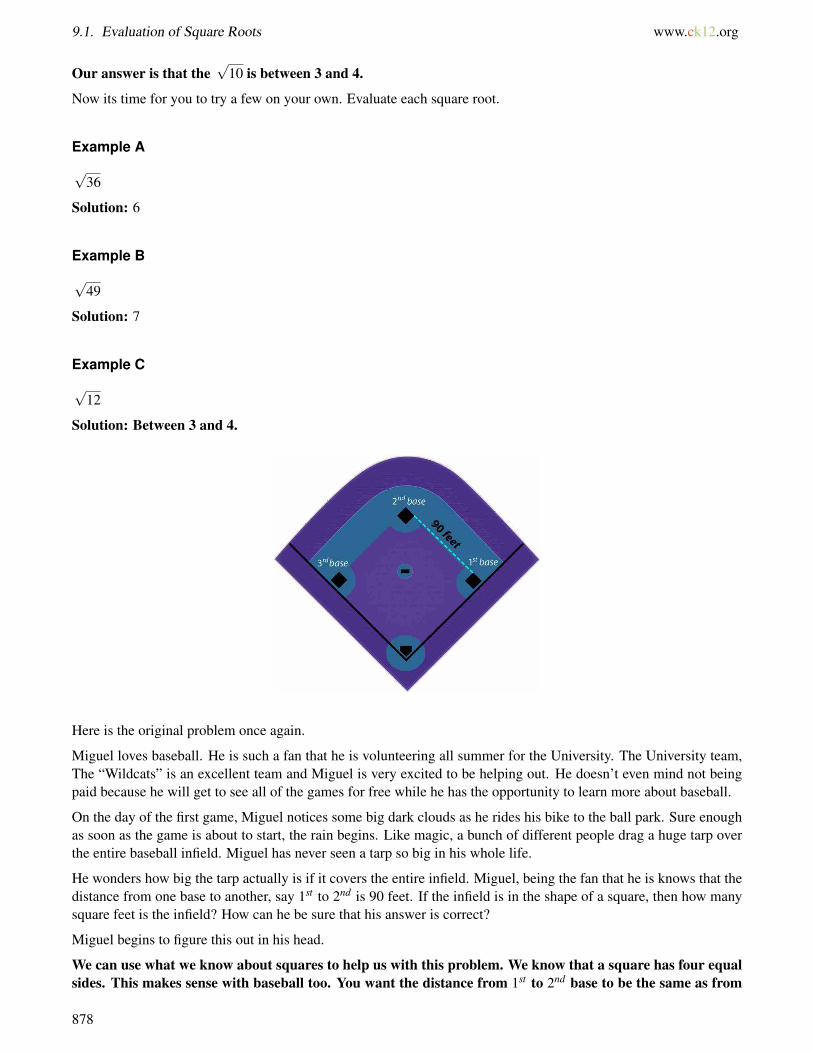
9.1. Evaluation of Square Roots www.ck12.org
Our answer is that the√
10 is between 3 and 4.
Now its time for you to try a few on your own. Evaluate each square root.
Example A√
36
Solution: 6
Example B
√49
Solution: 7
Example C√
12
Solution: Between 3 and 4.
Here is the original problem once again.
Miguel loves baseball. He is such a fan that he is volunteering all summer for the University. The University team,The “Wildcats” is an excellent team and Miguel is very excited to be helping out. He doesn’t even mind not beingpaid because he will get to see all of the games for free while he has the opportunity to learn more about baseball.
On the day of the first game, Miguel notices some big dark clouds as he rides his bike to the ball park. Sure enoughas soon as the game is about to start, the rain begins. Like magic, a bunch of different people drag a huge tarp overthe entire baseball infield. Miguel has never seen a tarp so big in his whole life.
He wonders how big the tarp actually is if it covers the entire infield. Miguel, being the fan that he is knows that thedistance from one base to another, say 1st to 2nd is 90 feet. If the infield is in the shape of a square, then how manysquare feet is the infield? How can he be sure that his answer is correct?
Miguel begins to figure this out in his head.
We can use what we know about squares to help us with this problem. We know that a square has four equalsides. This makes sense with baseball too. You want the distance from 1st to 2nd base to be the same as from
878

www.ck12.org Chapter 9. Distance and Area
3rd to Home. Therefore, if you know the distance from one base to another is 90 feet, then you know eachdistance from base to base.
However, Miguel wants to figure out the size of the tarp. He can do this by squaring the distance from 1st to2nd base. This will give him the area of the square.
902 = 90×90 = 8100 square f eet
This is the size of the tarp.
How can Miguel check the accuracy of his answer? He can do this by finding the square root of the area ofthe tarp. Remember that finding a square root is the inverse operation for squaring a number.√
8100
To complete this, worry about the 81 and not the 8100. 81 is a perfect square. 9×9 = 81 so 90×90 = 8100√
8100 = 90 f t
Miguel’s answer checks out.
Guided Practice
Here is one for you to try on your own.√
64
Answer
What is the square root of 64? What number times itself is 49? Let’s start where we left off with five.
6×6 = 36
7×7 = 49
8×8 = 64
That’s it! The square root of 64 is 8.
Video Review
MEDIAClick image to the left or use the URL below.URL: http://www.ck12.org/flx/render/embeddedobject/57614
This is a Khan Academy video on understanding square roots.
Explore More
Directions: Evaluate each square root.
1.√
16
879
9.1. Evaluation of Square Roots www.ck12.org
2.√
25
3.√
1
4.√
49
5.√
144
6.√
81
7.√
169
8.√
121
9.√
100
10.√
256
Directions: Name the two values each square root is in between.
11.√
12
12.√
14
13.√
30
14.√
40
15.√
50
16.√
62
17.√
70
18.√
101
19.√
5
20.√
15
880

www.ck12.org Chapter 9. Distance and Area
9.2 Evaluation of Perfect Square Roots
Here you’ll learn to recognize perfect square roots.
Have you ever examined a baseball diamond carefully? Look at this diagram.
This diagram shows that the distance from one base to another is 90 feet. Each base has this same measurement.The fact that the distance is equal from one base to another helps to define it as a square. When two sides of a squareare equal, they have an area that forms a special kind of square root.
Take a look.
A = s2
A = 902 = 8100 sq. f t.
Here is a square with a side length of 90 feet. When we multiply this measurement by itself, we have an area of8100 square feet.
Hmmm. Can you figure out the square root of that? This is an example of a perfect square root. Do you know whatthat means?
Use this Concept to learn about perfect square roots. Then we will return to this problem at the end of theConcept.
Guidance
A square root is the number that, times itself, produces a given number. Perfect squares are numbers whose squareroots are whole numbers. The numbers below are perfect squares. Take a good look at them. Can you guess why?
4, 9, 16, 25, 36
Look at them as images.
881
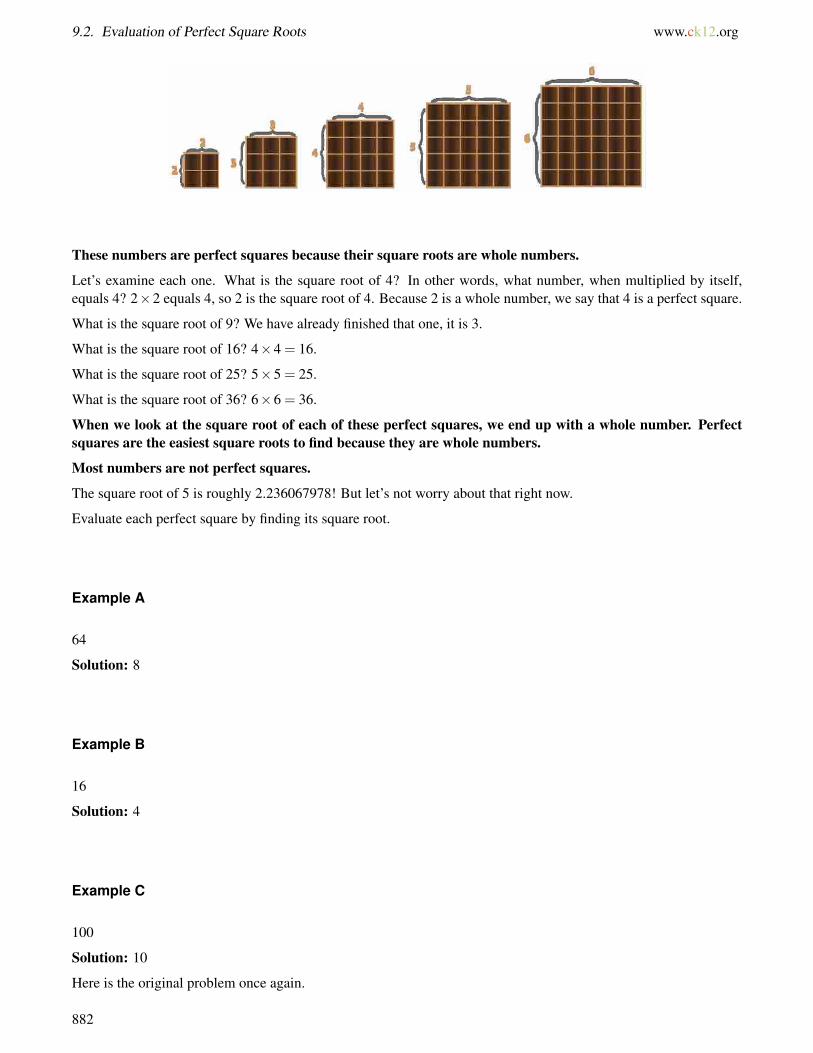
9.2. Evaluation of Perfect Square Roots www.ck12.org
These numbers are perfect squares because their square roots are whole numbers.
Let’s examine each one. What is the square root of 4? In other words, what number, when multiplied by itself,equals 4? 2×2 equals 4, so 2 is the square root of 4. Because 2 is a whole number, we say that 4 is a perfect square.
What is the square root of 9? We have already finished that one, it is 3.
What is the square root of 16? 4×4 = 16.
What is the square root of 25? 5×5 = 25.
What is the square root of 36? 6×6 = 36.
When we look at the square root of each of these perfect squares, we end up with a whole number. Perfectsquares are the easiest square roots to find because they are whole numbers.
Most numbers are not perfect squares.
The square root of 5 is roughly 2.236067978! But let’s not worry about that right now.
Evaluate each perfect square by finding its square root.
Example A
64
Solution: 8
Example B
16
Solution: 4
Example C
100
Solution: 10
Here is the original problem once again.
882
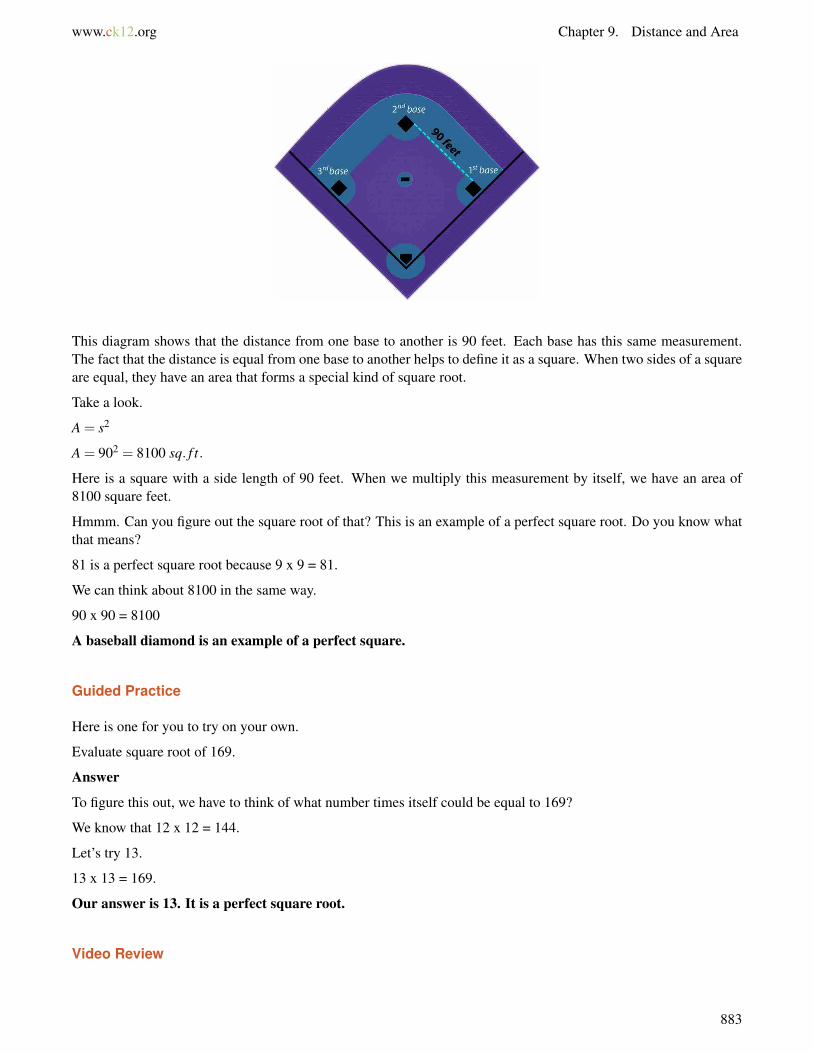
www.ck12.org Chapter 9. Distance and Area
This diagram shows that the distance from one base to another is 90 feet. Each base has this same measurement.The fact that the distance is equal from one base to another helps to define it as a square. When two sides of a squareare equal, they have an area that forms a special kind of square root.
Take a look.
A = s2
A = 902 = 8100 sq. f t.
Here is a square with a side length of 90 feet. When we multiply this measurement by itself, we have an area of8100 square feet.
Hmmm. Can you figure out the square root of that? This is an example of a perfect square root. Do you know whatthat means?
81 is a perfect square root because 9 x 9 = 81.
We can think about 8100 in the same way.
90 x 90 = 8100
A baseball diamond is an example of a perfect square.
Guided Practice
Here is one for you to try on your own.
Evaluate square root of 169.
Answer
To figure this out, we have to think of what number times itself could be equal to 169?
We know that 12 x 12 = 144.
Let’s try 13.
13 x 13 = 169.
Our answer is 13. It is a perfect square root.
Video Review
883

9.2. Evaluation of Perfect Square Roots www.ck12.org
MEDIAClick image to the left or use the URL below.URL: http://www.ck12.org/flx/render/embeddedobject/63
This is a Khan Academy video on understanding square roots.
Explore More
Directions: Evaluate each square root.
1.√
36
2.√
49
3.√
64
4.√
81
5.√
100
6.√
121
7.√
144
8.√
196
9.√
400
10.√
900
11.√
10000
12.√
225
13.√
256
14.√
324
15. What do all of these square roots have in common?
884
www.ck12.org Chapter 9. Distance and Area
9.3 Simplification of Radical Expressions
Here you’ll learn to evaluate radical expressions.
Have you ever watched a baseball game? Have you ever seen a runner run so fast that he passed the intended base?Take a look at what Miguel saw.
Miguel was watching a game on Saturday night. During the fourth inning, the runner ran from second base to thirdbase. He was running to fast that he ran past third base and had to come back to reach the base.
The runner ran 90+√
16.
How far did the runner run?
This situation has been described using a radical expression. You will learn how to evaluate radical expres-sions in this Concept.
Guidance
Sometimes, we can have an expression with a radical in it.
What is a radical?
A radical is the name of the sign that tells us that we are looking for a square root. We can call this “a radical.”Here is a radical symbol.√
y
Here we would be looking for the square root of y.
What is a radical expression?
Remember than an expressions is a number sentence that contains numbers, operations and now radicals. Just as wecan have expressions without radicals, we can have expressions with them too.
Let’s look at one.
2 ·√
4+7
Here we have two times the square root of four plus seven.
That’s a great question! We can evaluate this expression by using the order of operations.
885
9.3. Simplification of Radical Expressions www.ck12.org
P parentheses
E exponents (square roots too)
MD multiplication/division in order from left to right
AS addition/subtraction in order from left to right
According to the order of operations, we evaluate the square root of 4 first.√
4 = 2
Next, we substitute that value into the expression.
2 ·2+7
Next, we complete multiplication/division in order from left to right.
2×2 = 4
Substitute that given value.
4+7 = 11
The answer is 11.
Let’s look at another one.√
4 ·√
16−3
Here we have two radicals in the expression. We can work the same way, by using the order of operations.
Evaluate the radicals first.
√4 = 2
√16 = 4
Substitute these values into the expression.
2 ·4−3
Next, we complete multiplication/division in order from left to right.
2×4 = 8
Finally, we complete the addition/subtraction in order from left to right.
8−3 = 5
The answer is 5.
Evaluate each radical expression.
Example A
6+√
9−√
49+5
Solution: 7
Example B√
64÷√
4+13
Solution: 17
886
www.ck12.org Chapter 9. Distance and Area
Example C
6(7)+√
121−3
Solution: 50
Here is the original problem once again.
Miguel was watching a game on Saturday night. During the fourth inning, the runner ran from second base to thirdbase. He was running to fast that he ran past third base and had to come back to reach the base.
The runner ran 90+√
16.
How far did the runner run?
To figure this out, we have to evaluate the radical expression.
The distance from one base to another is 90 feet.
The extra distance is the√
16. Let’s evaluate that part first.√
16 = 4
Now let’s add that into the original expression.
90+4 = 94
The runner ran 94 feet.
Guided Practice
Here is one for you to try on your own.
Evaluate this radical expression.
8(7)+√
144−9
Answer
First, let’s evaluate the square root.√
144 = 12
Now we can substitute 12 back into the original expression and solve using the order of operations.
8(7)+12−9
56+12−9
68−9 = 59
Our answer is 59.
Video Review
MEDIAClick image to the left or use the URL below.URL: http://www.ck12.org/flx/render/embeddedobject/57613
887
9.3. Simplification of Radical Expressions www.ck12.org
This is a Khan Academy video on radical expressions.
Explore More
Directions: Evaluate each radical expression.
1. 2+√
9+15−2
2. 3 ·4+√
169
3.√
16 ·√
25+√
36
4.√
81 ·12+12
5.√
36+√
49−√
16
6. 6+√
36+25−2
7. 4(5)+√
9−2
8. 15+√
16+5
9. 3(2)+√
25+10
10. 4(7)+√
49−12
11. 2(4)+√
9−8
12. 3(7)+√
25+21
13. 8(3)−√
36+15−2
14. 19+√
144−22
15. 3(4)+√
64+√
25
888
www.ck12.org Chapter 9. Distance and Area
9.4 Equations with Square Roots
Here you’ll learn to solve equations using square roots.
Have you ever thought about the square footage of the infield in baseball?
The infield is the area of the baseball field that has the base lines as boundaries. It is the area contained within thebase lines. The area outside of the base lines is called the outfield. We know that the distance from one base toanother is 90 f t. The shape of the infield is a square. It makes sense to say that the distance from first base to secondbase times the distance from second base to third base will provide us with the measurement for the area of theinfield. We can write the following equation.
y = x2
What is x?
What is y?
Solving this equation requires that you understand how to solve equations by using square roots. Pay attentionand we will return to this equation at the end of the Concept.
Guidance
If we know that the square of a number is equal to a product, then we can write this equation.
y = x2
This is an equation that expresses that if we multiply the value of x by itself, we will end up with the value of y.
We can say that x is the square root of y.
We can use this information to solve equations involving square roots.
x2 = 81
To solve this equation, we want to figure out the value of x. To do this, we can take the square root of bothsides of the equation.
Why would we do this?
Think about it. The x is being squared. We want to get the variable alone. To do this, we need to perform the inverseoperation. The opposite of squaring a number is finding the square root of the number. Therefore, if we take thesquare root of both sides of the equation, then we will get x alone.√
x2 =√
81
Next, we can cancel the square and the square root. They are inverses of each other and they cancel each other out.
HHH√
x2 = x
Now we find the square root of 81. 81 is a perfect square, so the square root of 81 is 9.
x = 9
This is our answer.
Sometimes, you will have a problem that is a little more complicated. Take a look.
889
9.4. Equations with Square Roots www.ck12.org
x2 +3 = 12
We want to find the value of x. First, notice that we have a two step equation. One of the operations is multiplicationwith the square and the other is addition.
Let’s start by subtracting three from both sides.
x2 +3−3 = 12−3
x2 = 9
Now we want to get x alone. To do this, we take the square root of both sides of the equation.
HHH√
x2 =√
9
x = 3
This is our answer.
Sometimes, the equation with have a square root in it and we have to work with that.√
x−1 = 8
Wow! Here we have a variable and a number in a radical. Let’s get rid of the radical first.
To get cancel out the square root of a number, we use the inverse operation. We square both sides of the equation.(√x−1
)2= 82
The square and the square root cancel each other out.
(XXXXX√
x−1)2 = 82
x−1 = 64
Now we can solve for x quite easily. Begin by adding 1 to both sides of the equation.
x−1+1 = 64+1
x = 65
This is our answer.
Now it’s time for you to try a few on your own.
Example A
x2 = 49
Solution: x = 7
Example B
x2 = 64
Solution: x = 8
890

www.ck12.org Chapter 9. Distance and Area
Example C
x2 +2 = 38
Solution: x = 6
Here is the original problem once again.
The infield is the area of the baseball field that has the base lines as boundaries. It is the area contained within thebase lines. The area outside of the base lines is called the outfield. We know that the distance from one base toanother is 90 f t. The shape of the infield is a square. It makes sense to say that the distance from first base to secondbase times the distance from second base to third base will provide us with the measurement for the area of theinfield. We can write the following equation.
y = x2
What is x?
What is y?
Let’s begin by looking at the given information. In the original problem, it is presented that the distance from firstbase to second base times the distance from second base to third base would give the area of the infield. The distancefrom first to second base is the same as the distance from second to third. This is our x measurement.
x = 90 f t
Now we can substitute this value for x.
y = 902
y = 8100 sq. f t.
This is our answer.
Guided Practice
Here is one for you to try on your own.
Evaluate.
x2 +5 = 174
Answer
To start, let’s subtract five from both sides.
x2 +5−5 = 174−5
x2 = 169
Now we take the square root of both sides.√
x2 =√
169
x = 13
This is our answer.
Video Review
891

9.4. Equations with Square Roots www.ck12.org
MEDIAClick image to the left or use the URL below.URL: http://www.ck12.org/flx/render/embeddedobject/57615
This is a James Sousa video on solving equations with one radical.
Explore More
Directions: Solve each equation.
1. x2 = 9
2. x2 = 49
3. x2 = 100
4. x2 = 64
5. x2 = 225
6. x2 = 256
7. x2 +3 = 12
8. x2−5 = 20
9. x2 +3 = 39
10. x2−4 = 60
11. x2 +11 = 92
12.√
x+1 = 10
13. x2 +5 = 41
14. x3 = 8
15. x3 +4 = 31
892
www.ck12.org Chapter 9. Distance and Area
9.5 Estimation of Square Roots
Here you’ll learn to approximate square roots to the nearest given decimal place.
Have you ever done community service?
Miguel is enjoying his time with the Wildcats. The players have all been very friendly to him and Miguel loveshelping out. He gets to hand out towels and water and sometimes collects and organizes equipment.
The Wildcats do a lot of community service. One thing that they do is help out Little League teams. There is onenew ball field being created and the Wildcats are going to help design the infield so that it has the correct dimensions.Miguel has been invited to go along.
When they arrive at the field, Miguel and one of the players Harris take a measure to measure the distance fromhome plate to first base. It measures 58 feet.
“That isn’t correct,” Harris tells Miguel. “The area of the infield for little league is 3600 square feet. Thismeasurement is inaccurate. We’ll have to help them fix it.”
Miguel is puzzled. What is inaccurate about the 58 feet? Does it need to be a longer distance or a shorter one?
To figure this problem out, Miguel will need to use his knowledge of squares and square roots. Pay attentionand you can help Miguel figure this problem out at the end of the lesson.
Guidance
In the Equations with Square Roots Concept, we were introduced to square roots. Remember that the square rootof a number is the number that you multiply by itself to get a product, in essence it is a number that you square.Squaring and square roots are inverse operations. You can square a number to get a product, then take the squareroot of the product to get back to the original number.
62 = 36√
36 = 6
Here you can see the inverse operation between squaring a number and finding the square root of a product.
893
9.5. Estimation of Square Roots www.ck12.org
A number like 36 is a perfect square meaning that the square root is a whole number. Here are some otherperfect squares.
16, 25, 36, 49, 64, 81, 100, 121, 144, 169
Notice that if you find the square root of any of these numbers, you will end up with a whole number as theanswer.
What if a square root is not a whole number?
This can also happen. When it does, we can approximate the square root of the number. There are a couple ofdifferent ways to do this. Let’s take a look.
First, we can approximate the square root using perfect squares.
To do this, we look for the perfect squares that generate a number close to the square root that we are looking for.√
30
If we are looking for the square root of 30, we first need to find two perfect squares near 30. One should be less than30 and one should be more than 30.
5×5 = 25
6×6 = 36
25 is the perfect square less than 30.
36 is the perfect square greater than 30.
Because 30 is between 25 and 30, we can say that the approximate square root of 30 is between 5 and 6. It isprobably close to 5.5.
This is how we can approximate a square root using perfect squares.
The second way of approximating a square root is to use a calculator. Calculators all have a radical sign onthem.√
2
To find the square root of a number, we enter the radical sign, then the value and press enter.
This will give us a decimal approximation of the square root. Many times you will need to round these answers.Let’s look at an example.
We can use 30 again.√
30
Press the radical button.
Now enter the value, 30.
Next, press enter.
Here is our answer on the calculator. 5.477225575.
To find a final answer, we can round to the nearest tenth. To do this, we round the 4 it is in the tenths place. Thenumber after the 4 is 7, so we round up to five.
Our answer is 5.5.
WOW! Notice that this value is the same as the answer that we found when estimating using perfect squares.
The third way of approximating a square root is to use something called “tabular interpolation.” Tabularinterpolation is using a table. To use this table, we find the approximate value of the square root according to
894

www.ck12.org Chapter 9. Distance and Area
research that has been completed by a mathematician.√
17
To find the square root of 17, let’s use a table. Keep in mind that these values have been rounded to the nearestthousandth.
Looking at the table you can see that the square root of 17 is 4.123.
This is our answer.
You can find tables that include numbers all the way up to 100. By finding these tables, you can use them tolocate the square root of numbers 1 to 100.
Choose a method to find an approximate square root of each number. Round your answer to the nearest tenth.
Example A√
11
Solution: 3.3
Example B√
33
Solution: 5.7
Example C√
41
Solution: 6.4
895
9.5. Estimation of Square Roots www.ck12.org
Here is the original problem once again.
Miguel is enjoying his time with the Wildcats. The players have all been very friendly to him and Miguel loveshelping out. He gets to hand out towels and water and sometimes collects and organizes equipment.
The Wildcats do a lot of community service. One thing that they do is help out Little League teams. There is onenew ball field being created and the Wildcats are going to help design the infield so that it has the correct dimensions.Miguel has been invited to go along.
When they arrive at the field, Miguel and one of the players Harris take a measure to measure the distance fromhome plate to first base. It measures 58 feet.
“That isn’t correct,” Harris tells Miguel. “The area of the infield for little league is 3600 square feet. Thismeasurement is inaccurate. We’ll have to help them fix it.”
Miguel is puzzled. What is inaccurate about the 58 feet? Does it need to be a longer distance or a shorter one?
Harris told Miguel that the area of the infield needs to be 3600 square feet for Little League. To figure outwhat is inaccurate about the current measure of 58 feet, Miguel will need to find the square root of 3600square feet.
Finding the square root will give you the measurement of the distance between the bases. This is the distancethat is squared to find the overall area of the infield.√
3600
To find this square root, don’t worry about 3600, drop the zeros and find the square root of 36.
6×6 = 36
Now add back one zero.√
3600 = 60 f eet
The distance between each of the bases should be 60 feet. With a current distance of 58 feet, the distance isshort two feet between each base.
Miguel is ready to help Harris correct the problem thanks to squares and square roots!
Guided Practice
Here is one for you to try on your own.
Approximate this square root to the nearest hundredth.√
65
Answer
896
www.ck12.org Chapter 9. Distance and Area
To figure this out, we can use the table or the calculator.
Using our calculator, we evaluate this square root as:
8.0622577
Now we round to the nearest hundredth.
8.06
This is our answer.
Video Review
MEDIAClick image to the left or use the URL below.URL: http://www.ck12.org/flx/render/embeddedobject/5551
This is a James Sousa video on approximating square roots. It has a technology integration in it.
Explore More
Directions: Find each an approximate answer for each square root. You may round your decimal answer to thenearest tenth.
1. )8
2. )11
3. )24
4. )31
5. )37
6. )43
7. )59
8. )67
9. )73
10. )80
11. )95
12. )99
13. )101
14. )150
15. )136
897

9.6. Properties of Rational Numbers versus Irrational Numbers www.ck12.org
9.6 Properties of Rational Numbers versus Ir-rational Numbers
Here you’ll learn to recognize irrational numbers and the set of real numbers.
Have you ever tiled a room? Miguel’s sister Kelly is working on that very project. Take a look.
Kelly wants to use this tile to finish the floor in her room. The room is a square room and the area of the floor is 324square feet. She wants to put 8” tiles along the edge of the floor.
What is the length of one side of the room? How many tiles can she fit along one side?
This Concept will teach you how to solve a problem just like this one.
Guidance
Previously we worked on finding square roots. When you were finding square roots using a calculator, you probablynoticed that each time you found the square root of a number that was not a perfect square that there were manydecimal places following the decimal point.
This means that the square root of that number was not a whole number. It was a whole number and somefraction of parts.
The key thing to notice about each of the numbers that we worked with in the last section is that they each hadmany decimal places. When we find the square root of a number that is not a perfect square it brings another type ofnumber into our work.√
16 = 4
Sixteen is a perfect square. So the square root is a whole number.√
50
We use a calculator and here is our answer: 7.071067812...
898
www.ck12.org Chapter 9. Distance and Area
Yes. There are a lot of digits after the decimal point, and you can see that the dots after the last digit tell us thatthe numbers go on and on and on. We can round to the nearest tenth to see that 7.1 is a likely approximationfor this square root.
This square root is a decimal that does not end. Numbers like this one are called irrational numbers . Anytimethat you have a decimal that does not repeat and does not end; it is a member of the group of numbers called irrationalnumbers.
Often the little dots at the end of the decimal will let you know that you are working with an irrational number.
Not all numbers are irrational numbers, some are rational numbers. You have learned about rational numbers inanother section of this book. Let’s review what defines a rational number for just a minute.
Rational Numbers are numbers that can be written in the form of ab . They can be whole numbers, fractions,
negative numbers, decimals and repeating decimals.
Here are some rational numbers.
.56 12 .66̄ 33 1
3 9 −23
Irrational numbers complete the group of numbers that are not rational numbers. This means that any decimalthat does not end is irrational. The square root of any number that is not a perfect square is irrational.
There is one famous irrational number. Do you know what it is?
The most famous irrational number is a number called pi or π. We use the number 3.14 to represent pi, butit is really an irrational number without an end point. It just goes on and on and on. Pi is a special ratio thatyou will learn about when we work with circles very soon.
Rational and Irrational Numbers make up the set of Real Numbers. All numbers are considered real numberswhether they are rational or irrational. So, you can look at a number, know that it is a real number and thenclassify it further as rational or irrational.
Identify each of the following numbers are rational or irrational.
Example A
4.567....
Solution: Irrational number
Example B√
25
Solution: Rational number
Example C√
144
Solution: Rational Number
Here is the original problem once again.
Kelly wants to use this tile to finish the floor in her room. The room is a square room and the area of the floor is 324square feet. She wants to put 8” tiles along the edge of the floor. What is the length of one side of the room? Howmany tiles can she fit along one side?
We have to look at what information we have been given.
899
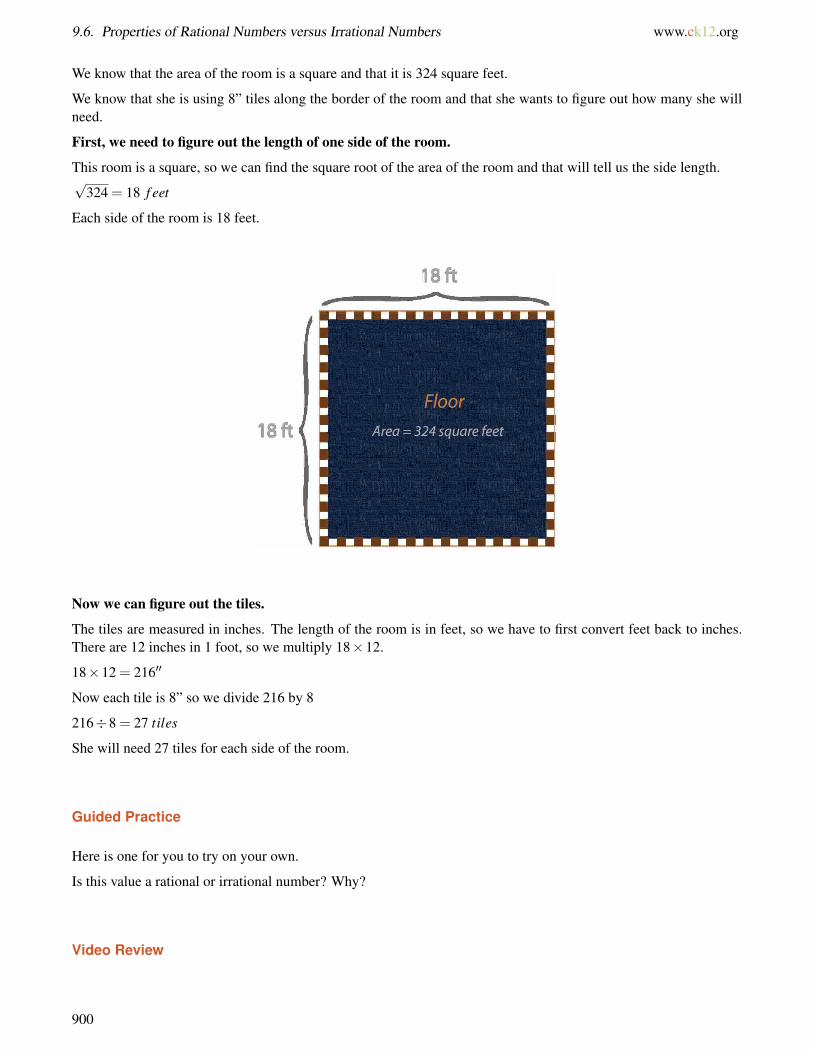
9.6. Properties of Rational Numbers versus Irrational Numbers www.ck12.org
We know that the area of the room is a square and that it is 324 square feet.
We know that she is using 8” tiles along the border of the room and that she wants to figure out how many she willneed.
First, we need to figure out the length of one side of the room.
This room is a square, so we can find the square root of the area of the room and that will tell us the side length.√
324 = 18 f eet
Each side of the room is 18 feet.
Now we can figure out the tiles.
The tiles are measured in inches. The length of the room is in feet, so we have to first convert feet back to inches.There are 12 inches in 1 foot, so we multiply 18×12.
18×12 = 216′′
Now each tile is 8” so we divide 216 by 8
216÷8 = 27 tiles
She will need 27 tiles for each side of the room.
Guided Practice
Here is one for you to try on your own.
Is this value a rational or irrational number? Why?
Video Review
900

www.ck12.org Chapter 9. Distance and Area
MEDIAClick image to the left or use the URL below.URL: http://www.ck12.org/flx/render/embeddedobject/57616
This is a James Sousa video on the set of real numbers.
Explore More
Directions: Identify each of the following numbers as rational or irrational.
1. .345....
2. 2
3. -9
4. -122
5. 3.456....
6.√
25
7.√
16
8.√
12
9.√
38
10. -4.56
11. π
12. −45
13. 9.8712....
14. -19
15. 2,345
901
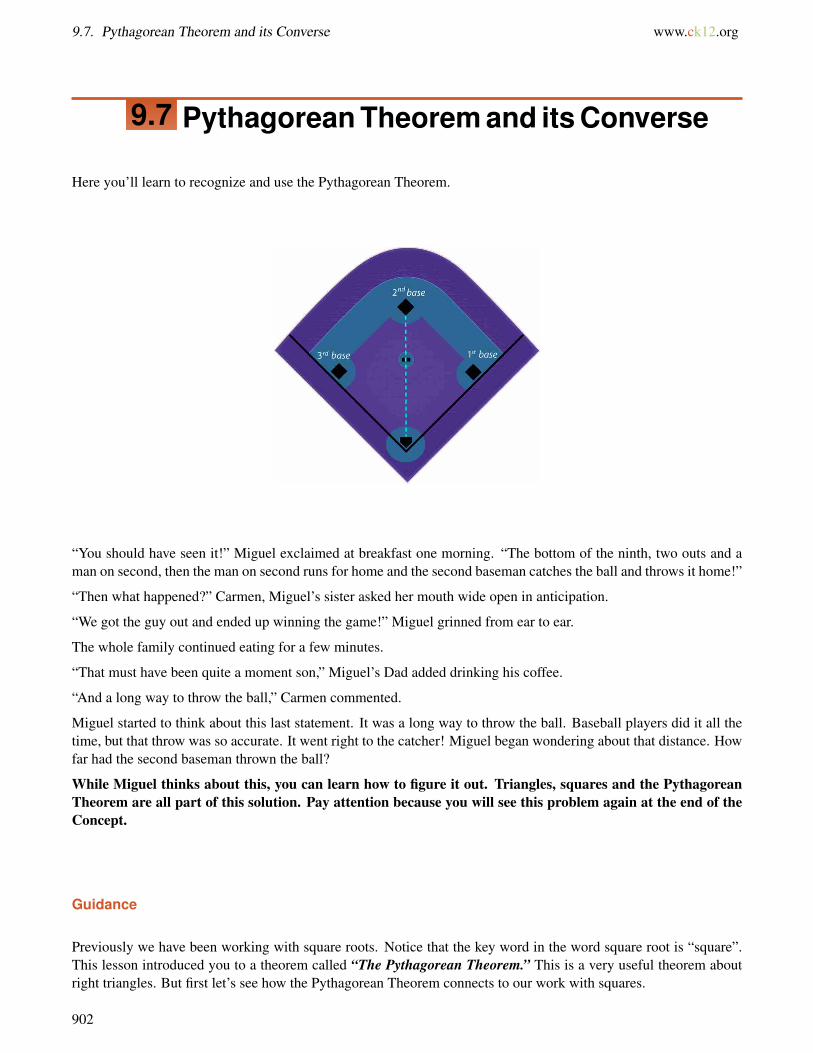
9.7. Pythagorean Theorem and its Converse www.ck12.org
9.7 Pythagorean Theorem and its Converse
Here you’ll learn to recognize and use the Pythagorean Theorem.
“You should have seen it!” Miguel exclaimed at breakfast one morning. “The bottom of the ninth, two outs and aman on second, then the man on second runs for home and the second baseman catches the ball and throws it home!”
“Then what happened?” Carmen, Miguel’s sister asked her mouth wide open in anticipation.
“We got the guy out and ended up winning the game!” Miguel grinned from ear to ear.
The whole family continued eating for a few minutes.
“That must have been quite a moment son,” Miguel’s Dad added drinking his coffee.
“And a long way to throw the ball,” Carmen commented.
Miguel started to think about this last statement. It was a long way to throw the ball. Baseball players did it all thetime, but that throw was so accurate. It went right to the catcher! Miguel began wondering about that distance. Howfar had the second baseman thrown the ball?
While Miguel thinks about this, you can learn how to figure it out. Triangles, squares and the PythagoreanTheorem are all part of this solution. Pay attention because you will see this problem again at the end of theConcept.
Guidance
Previously we have been working with square roots. Notice that the key word in the word square root is “square”.This lesson introduced you to a theorem called “The Pythagorean Theorem.” This is a very useful theorem aboutright triangles. But first let’s see how the Pythagorean Theorem connects to our work with squares.
902

www.ck12.org Chapter 9. Distance and Area
Here is a square. Notice that this square has been divided in half by a diagonal. When we divide a square in half, wecan see that it forms two right triangles.
Think about the work that we have just finished with square roots. We know that we can take the area of a squareand find the square root of it and that will give us the length of one of the sides.
Well, we can use this information to figure out the length of the diagonal. The length of the diagonal has a relationshipwith the length of the sides of a right triangle.
Before we get into all of that, let’s look at the parts of right triangle.
You can see that the sides of the right triangle are labeled a,b and c. Sides a and b are called the legs of thetriangle.
Side c is called the hypotenuse of a right triangle and it is the longest side of the triangle.
Now let’s look at how the Pythagorean Theorem connects all of these pieces together.
What is the Pythagorean Theorem?
The Pythagorean Theorem is a theorem or rule for working with a mathematical principle. It states that if wetake the square of one of the legs of a right triangle and add it to the square of one of the other legs of a righttriangle that we will end up with the square of the length of the hypotenuse.
a2 +b2 = c2
If you think a little broader, you can see that if we square the sides lengths of square, that we will have thetotal units or area of that square. In the same instance, if we square the sides of a right triangle and add thoseproducts together, then we end up with the length of the hypotenuse squared.
When we have right triangle, we are going to be using the Pythagorean Theorem to help us to figure out theside lengths of the triangle.
903
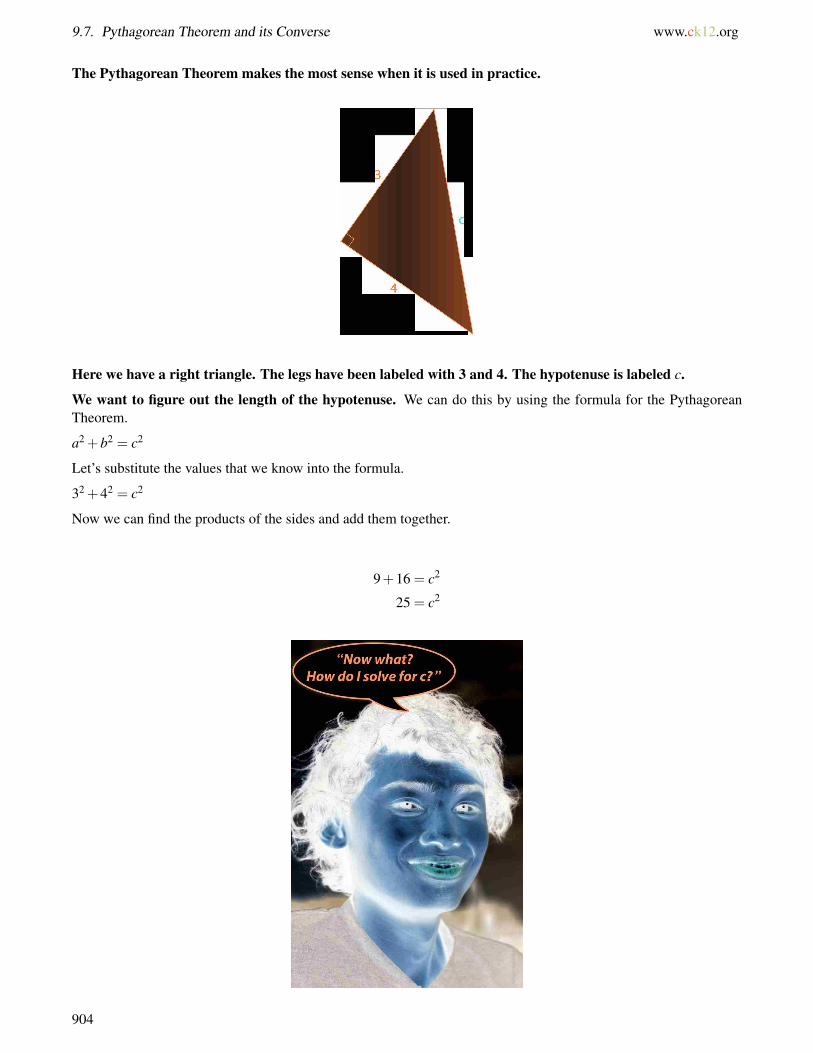
9.7. Pythagorean Theorem and its Converse www.ck12.org
The Pythagorean Theorem makes the most sense when it is used in practice.
Here we have a right triangle. The legs have been labeled with 3 and 4. The hypotenuse is labeled c.
We want to figure out the length of the hypotenuse. We can do this by using the formula for the PythagoreanTheorem.
a2 +b2 = c2
Let’s substitute the values that we know into the formula.
32 +42 = c2
Now we can find the products of the sides and add them together.
9+16 = c2
25 = c2
904
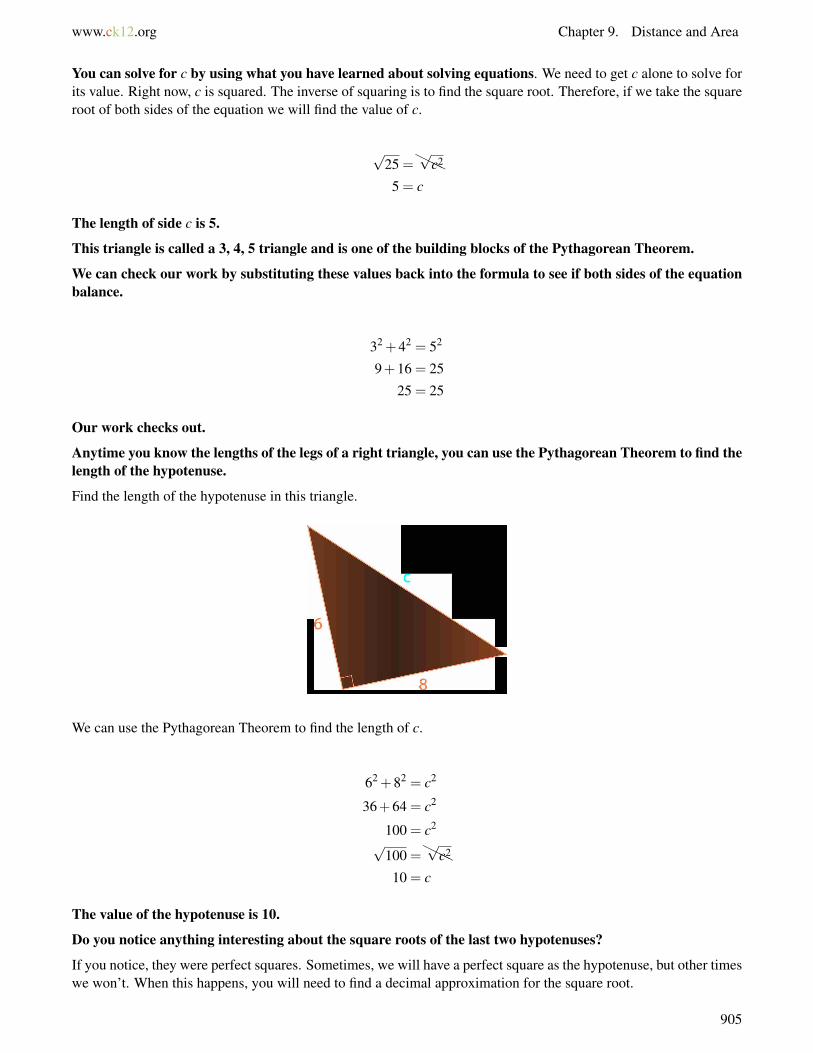
www.ck12.org Chapter 9. Distance and Area
You can solve for c by using what you have learned about solving equations. We need to get c alone to solve forits value. Right now, c is squared. The inverse of squaring is to find the square root. Therefore, if we take the squareroot of both sides of the equation we will find the value of c.
√25 =
HHH√
c2
5 = c
The length of side c is 5.
This triangle is called a 3, 4, 5 triangle and is one of the building blocks of the Pythagorean Theorem.
We can check our work by substituting these values back into the formula to see if both sides of the equationbalance.
32 +42 = 52
9+16 = 25
25 = 25
Our work checks out.
Anytime you know the lengths of the legs of a right triangle, you can use the Pythagorean Theorem to find thelength of the hypotenuse.
Find the length of the hypotenuse in this triangle.
We can use the Pythagorean Theorem to find the length of c.
62 +82 = c2
36+64 = c2
100 = c2
√100 =
HHH√
c2
10 = c
The value of the hypotenuse is 10.
Do you notice anything interesting about the square roots of the last two hypotenuses?
If you notice, they were perfect squares. Sometimes, we will have a perfect square as the hypotenuse, but other timeswe won’t. When this happens, you will need to find a decimal approximation for the square root.
905
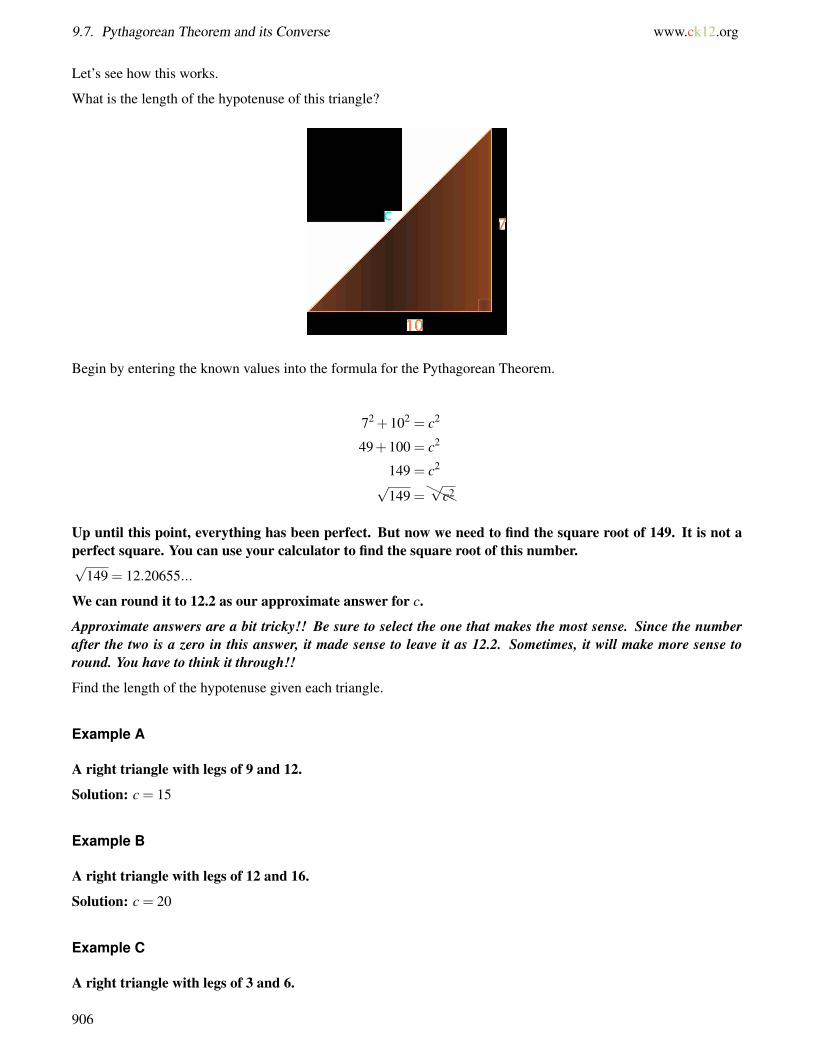
9.7. Pythagorean Theorem and its Converse www.ck12.org
Let’s see how this works.
What is the length of the hypotenuse of this triangle?
Begin by entering the known values into the formula for the Pythagorean Theorem.
72 +102 = c2
49+100 = c2
149 = c2
√149 =
HHH√
c2
Up until this point, everything has been perfect. But now we need to find the square root of 149. It is not aperfect square. You can use your calculator to find the square root of this number.√
149 = 12.20655...
We can round it to 12.2 as our approximate answer for c.
Approximate answers are a bit tricky!! Be sure to select the one that makes the most sense. Since the numberafter the two is a zero in this answer, it made sense to leave it as 12.2. Sometimes, it will make more sense toround. You have to think it through!!
Find the length of the hypotenuse given each triangle.
Example A
A right triangle with legs of 9 and 12.
Solution: c = 15
Example B
A right triangle with legs of 12 and 16.
Solution: c = 20
Example C
A right triangle with legs of 3 and 6.
906
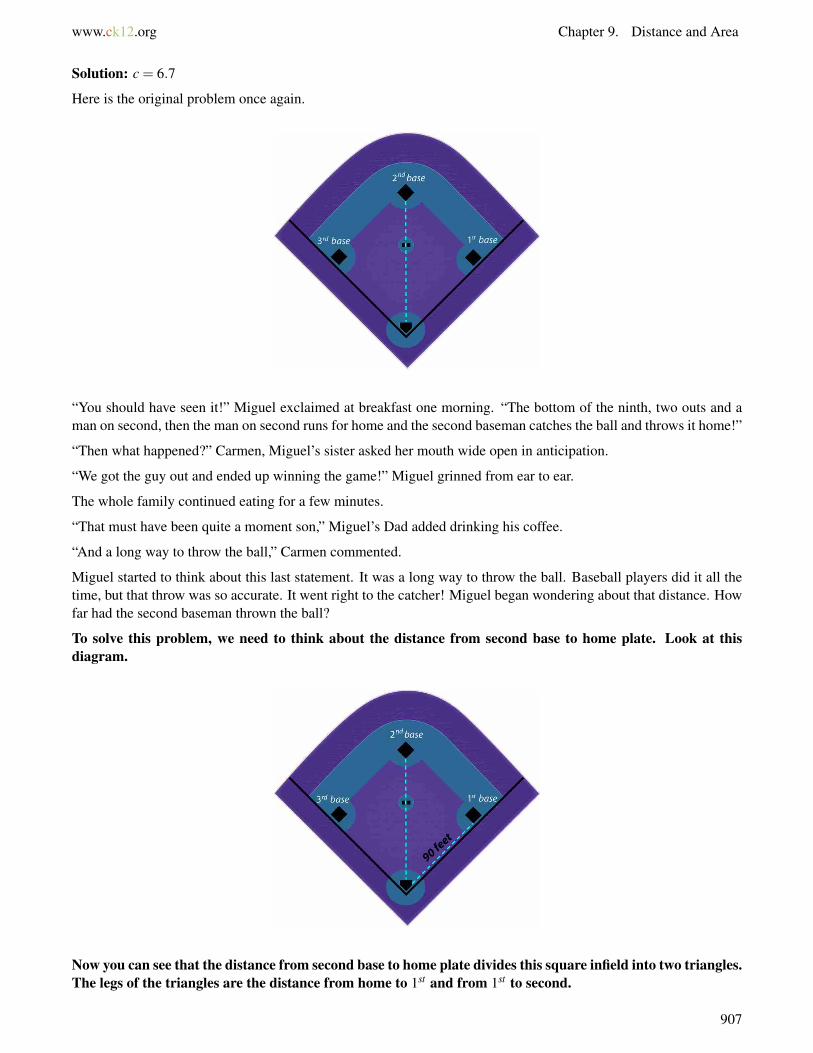
www.ck12.org Chapter 9. Distance and Area
Solution: c = 6.7
Here is the original problem once again.
“You should have seen it!” Miguel exclaimed at breakfast one morning. “The bottom of the ninth, two outs and aman on second, then the man on second runs for home and the second baseman catches the ball and throws it home!”
“Then what happened?” Carmen, Miguel’s sister asked her mouth wide open in anticipation.
“We got the guy out and ended up winning the game!” Miguel grinned from ear to ear.
The whole family continued eating for a few minutes.
“That must have been quite a moment son,” Miguel’s Dad added drinking his coffee.
“And a long way to throw the ball,” Carmen commented.
Miguel started to think about this last statement. It was a long way to throw the ball. Baseball players did it all thetime, but that throw was so accurate. It went right to the catcher! Miguel began wondering about that distance. Howfar had the second baseman thrown the ball?
To solve this problem, we need to think about the distance from second base to home plate. Look at thisdiagram.
Now you can see that the distance from second base to home plate divides this square infield into two triangles.The legs of the triangles are the distance from home to 1st and from 1st to second.
907
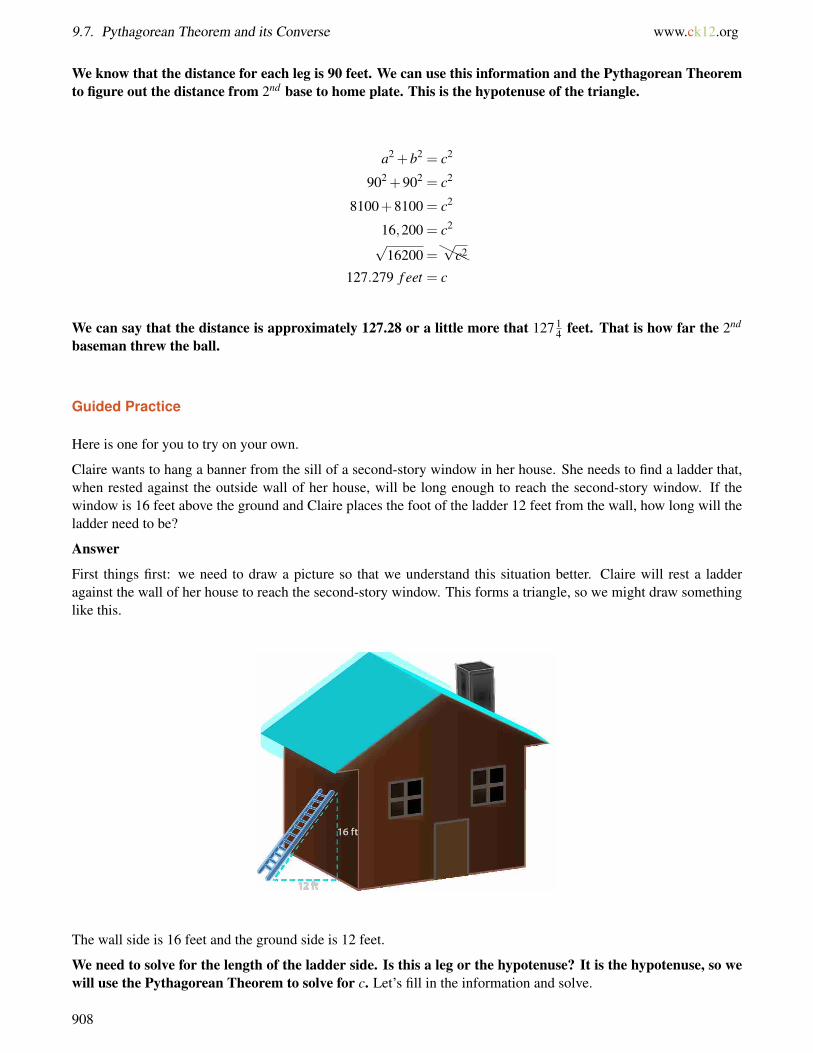
9.7. Pythagorean Theorem and its Converse www.ck12.org
We know that the distance for each leg is 90 feet. We can use this information and the Pythagorean Theoremto figure out the distance from 2nd base to home plate. This is the hypotenuse of the triangle.
a2 +b2 = c2
902 +902 = c2
8100+8100 = c2
16,200 = c2
√16200 =
HHH√
c2
127.279 f eet = c
We can say that the distance is approximately 127.28 or a little more that 127 14 feet. That is how far the 2nd
baseman threw the ball.
Guided Practice
Here is one for you to try on your own.
Claire wants to hang a banner from the sill of a second-story window in her house. She needs to find a ladder that,when rested against the outside wall of her house, will be long enough to reach the second-story window. If thewindow is 16 feet above the ground and Claire places the foot of the ladder 12 feet from the wall, how long will theladder need to be?
Answer
First things first: we need to draw a picture so that we understand this situation better. Claire will rest a ladderagainst the wall of her house to reach the second-story window. This forms a triangle, so we might draw somethinglike this.
The wall side is 16 feet and the ground side is 12 feet.
We need to solve for the length of the ladder side. Is this a leg or the hypotenuse? It is the hypotenuse, so wewill use the Pythagorean Theorem to solve for c. Let’s fill in the information and solve.
908
www.ck12.org Chapter 9. Distance and Area
a2 +b2 = c2
122 +162 = c2
144+256 = c2
400 = c2
√400 =
√c2
20 = c
The square root of 400 is 20 because 20×20 equals 400.
Claire needs a ladder 20 feet long in order to reach the window.
Video Review
MEDIAClick image to the left or use the URL below.URL: http://www.ck12.org/flx/render/embeddedobject/1372
This is a James Sousa video on the Pythagorean Theorem.
Explore More
Directions: Use the Pythagorean Theorem to find the length of side c, the hypotenuse. You may round to the nearesthundredth when necessary.
1. a = 6, b = 8, c =?
2. a = 9, b = 12, c =?
3. a = 12, b = 16, c =?
4. a = 15, b = 20, c =?
5. a = 18, b = 24, c =?
6. a = 24, b = 32, c =?
7. a = 5, b = 7, c =?
8. a = 9, b = 11, c =?
9. a = 10, b = 12, c =?
10. a = 12, b = 8, c =?
11. a = 11, b = 8, c =?
12. a = 9, b = 8, c =?
13. a = 15, b = 7, c =?
14. a = 14, b = 3, c =?
15. a = 12, b = 8, c =?
909
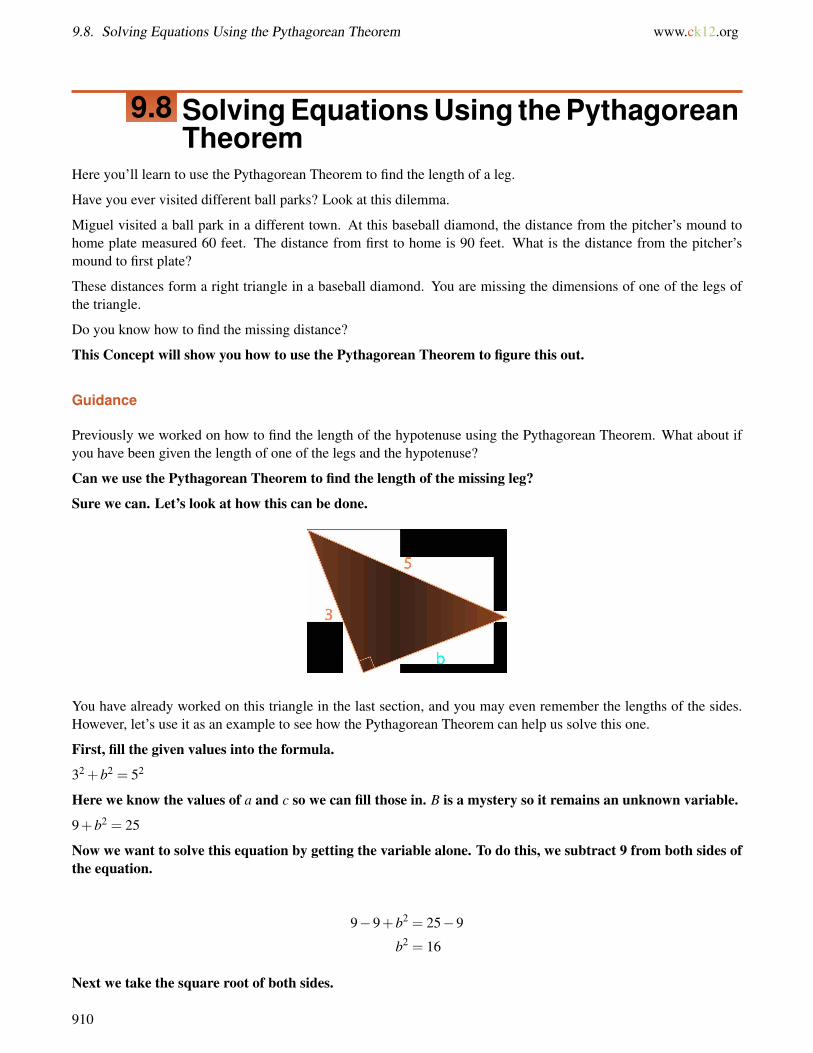
9.8. Solving Equations Using the Pythagorean Theorem www.ck12.org
9.8 Solving Equations Using the PythagoreanTheorem
Here you’ll learn to use the Pythagorean Theorem to find the length of a leg.
Have you ever visited different ball parks? Look at this dilemma.
Miguel visited a ball park in a different town. At this baseball diamond, the distance from the pitcher’s mound tohome plate measured 60 feet. The distance from first to home is 90 feet. What is the distance from the pitcher’smound to first plate?
These distances form a right triangle in a baseball diamond. You are missing the dimensions of one of the legs ofthe triangle.
Do you know how to find the missing distance?
This Concept will show you how to use the Pythagorean Theorem to figure this out.
Guidance
Previously we worked on how to find the length of the hypotenuse using the Pythagorean Theorem. What about ifyou have been given the length of one of the legs and the hypotenuse?
Can we use the Pythagorean Theorem to find the length of the missing leg?
Sure we can. Let’s look at how this can be done.
You have already worked on this triangle in the last section, and you may even remember the lengths of the sides.However, let’s use it as an example to see how the Pythagorean Theorem can help us solve this one.
First, fill the given values into the formula.
32 +b2 = 52
Here we know the values of a and c so we can fill those in. B is a mystery so it remains an unknown variable.
9+b2 = 25
Now we want to solve this equation by getting the variable alone. To do this, we subtract 9 from both sides ofthe equation.
9−9+b2 = 25−9
b2 = 16
Next we take the square root of both sides.
910
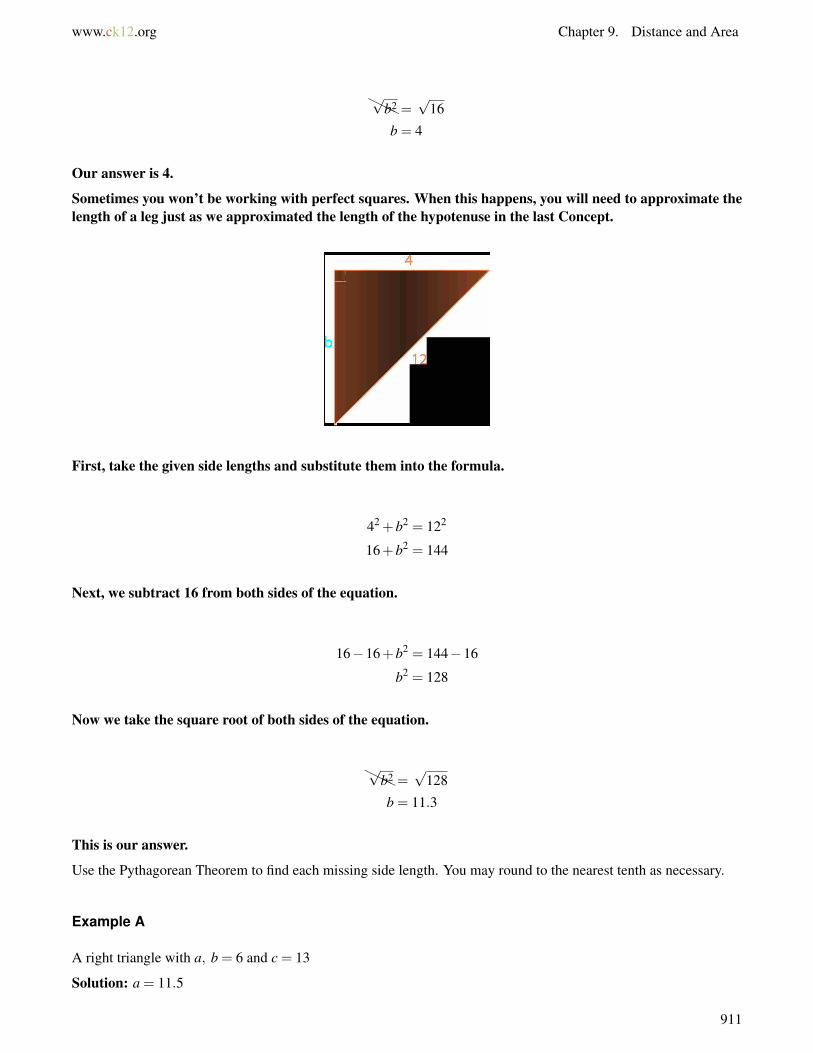
www.ck12.org Chapter 9. Distance and Area
HHH√
b2 =√
16
b = 4
Our answer is 4.
Sometimes you won’t be working with perfect squares. When this happens, you will need to approximate thelength of a leg just as we approximated the length of the hypotenuse in the last Concept.
First, take the given side lengths and substitute them into the formula.
42 +b2 = 122
16+b2 = 144
Next, we subtract 16 from both sides of the equation.
16−16+b2 = 144−16
b2 = 128
Now we take the square root of both sides of the equation.
HHH√
b2 =√
128
b = 11.3
This is our answer.
Use the Pythagorean Theorem to find each missing side length. You may round to the nearest tenth as necessary.
Example A
A right triangle with a, b = 6 and c = 13
Solution: a = 11.5
911
9.8. Solving Equations Using the Pythagorean Theorem www.ck12.org
Example B
A right triangle with a = 8, b, and c = 12
Solution: 8.9
Example C
A right triangle with a = 6, b, and c = 10
Solution: b = 8
Here is the original problem once again.
Miguel visited a ball park in a different town. At this baseball diamond, the distance from the pitcher’s mound tohome plate measured 60 feet. The distance from first to home is 90 feet. What is the distance from the pitcher’smound to first plate?
These distances form a right triangle in a baseball diamond. You are missing the dimensions of one of the legs ofthe triangle.
Do you know how to find the missing distance?
First, let’s write an equation using the Pythagorean Theorem. We’ll call the missing leg, b.
602 +b2 = 902
Now we can solve.
3600+b2 = 8100
b2 = 8100−3600
b2 = 4500√
b2 =√
4500
b = 67.08 = 67.1
The distance is 67.1 feet.
Guided Practice
Here is one for you to try on your own.
Find the length of leg b.
a = 12,b =? ,c = 13
Answer
First use the formula for the Pythagorean Theorem to solve for b.
a2 +b2 = c2
122 +b2 = 132
144+b2 = 169
b2 = 25
b = 5
This is our answer.
912

www.ck12.org Chapter 9. Distance and Area
Video Review
MEDIAClick image to the left or use the URL below.URL: http://www.ck12.org/flx/render/embeddedobject/1372
This is a James Sousa video on the Pythagorean Theorem.
Explore More
Directions: Use the Pythagorean Theorem to find the length of each missing leg. You may round to the nearest tenthwhen necessary.
1. a = 6, b =? , c = 12
2. a = 9, b =? , c = 15
3. a = 4, b =? , c = 5
4. a = 9, b =? , c = 18
5. a = 15, b =? , c = 25
6. a =? , b = 10, c = 12
7. a =? , b = 11, c = 14
8. a =? , b = 13, c = 15
Directions: Use problem solving to write an equation using the Pythagorean Theorem and solve each problem.
Joanna laid a plank of wood down to make a ramp so that she could roll a wheelbarrow over a low wall in hergarden. The wall is 1.5 meters tall, and the plank of wood touches the ground 2 meters from the wall. How long isthe wooden plank?
9. Write the equation.
10. Solve for the answer.
Chris rode his bike 4 miles west and then 3 miles south. What is the shortest distance he can ride back to the pointwhere he started?
11. Write the equation.
12. Solve the problem.
Naomi is cutting triangular patches to make a quilt. Each has a diagonal side of 14.5 inches and a short side of 5.5inches. What is the length of the third side of each triangular patch?
13. Write the equation.
14. Solve the problem.
913
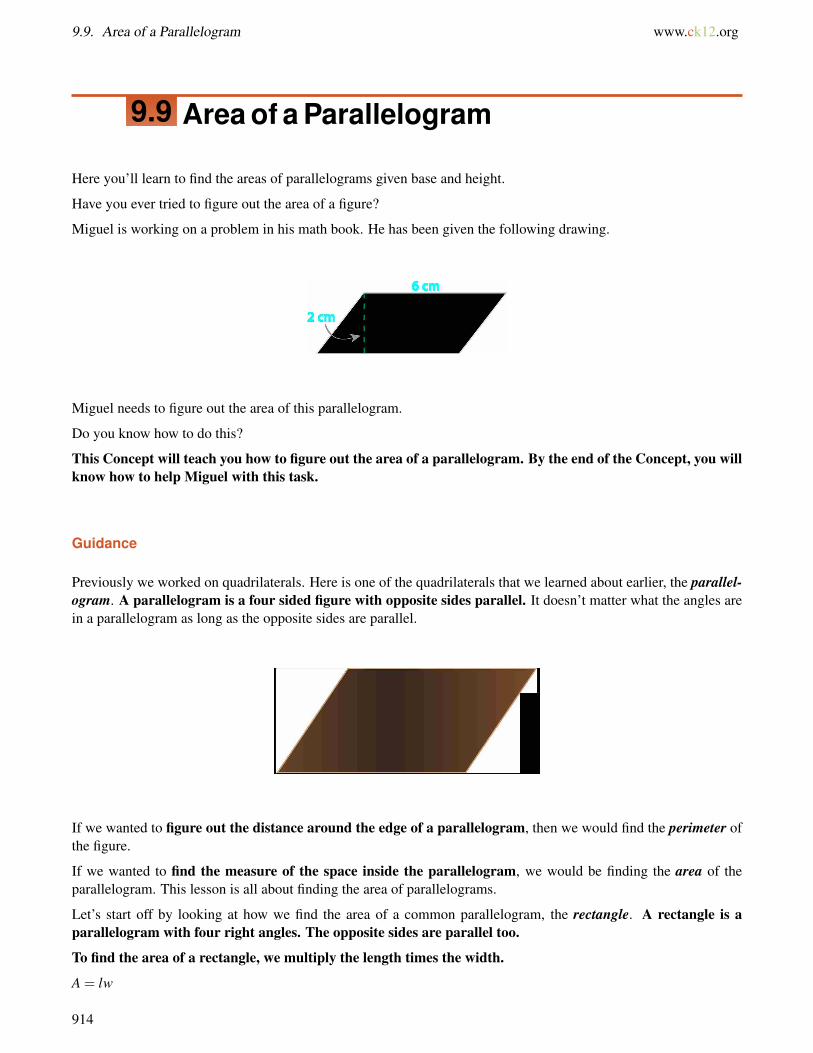
9.9. Area of a Parallelogram www.ck12.org
9.9 Area of a Parallelogram
Here you’ll learn to find the areas of parallelograms given base and height.
Have you ever tried to figure out the area of a figure?
Miguel is working on a problem in his math book. He has been given the following drawing.
Miguel needs to figure out the area of this parallelogram.
Do you know how to do this?
This Concept will teach you how to figure out the area of a parallelogram. By the end of the Concept, you willknow how to help Miguel with this task.
Guidance
Previously we worked on quadrilaterals. Here is one of the quadrilaterals that we learned about earlier, the parallel-ogram. A parallelogram is a four sided figure with opposite sides parallel. It doesn’t matter what the angles arein a parallelogram as long as the opposite sides are parallel.
If we wanted to figure out the distance around the edge of a parallelogram, then we would find the perimeter ofthe figure.
If we wanted to find the measure of the space inside the parallelogram, we would be finding the area of theparallelogram. This lesson is all about finding the area of parallelograms.
Let’s start off by looking at how we find the area of a common parallelogram, the rectangle. A rectangle is aparallelogram with four right angles. The opposite sides are parallel too.
To find the area of a rectangle, we multiply the length times the width.
A = lw
914

www.ck12.org Chapter 9. Distance and Area
To find the area of this rectangle, we use the formula and the given measurements.
A = lw
A = (6 in)(2 in)
A = 12 square inches or in2
Notice that the measurement is in square inches because inches x inches is inches squared.
Write down the formula for finding the area of a rectangle in your notebook. Also be sure to include the statementin the box above.
Not all parallelograms have right angles. That is why some are called squares or rectangles and some are calledparallelograms. The only necessary quality of a parallelogram is that the opposite sides need to be parallel.
How can we find the area of a parallelogram?
Because a parallelogram does not have right angles, multiplying the length and the width is not possible. Notice thatthe side of a parallelogram is at an angle. Because of this, we need to use a different measure to find the area of aparallelogram. We need to use the base and the height.
915
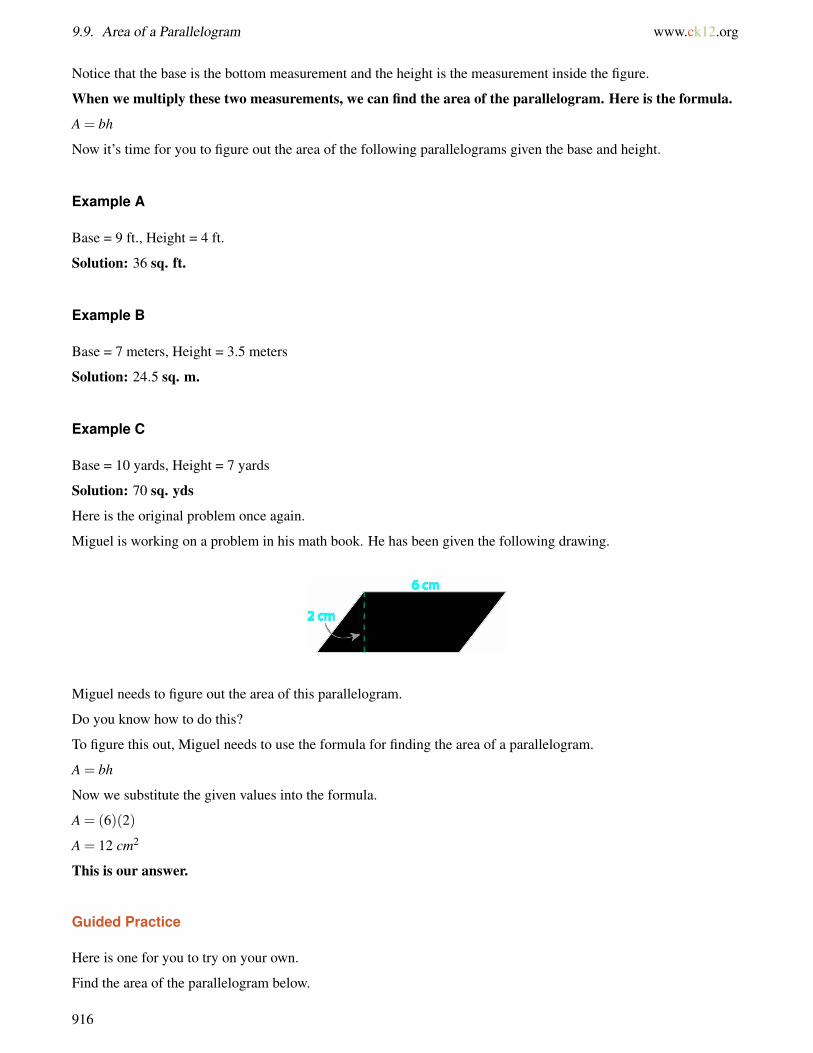
9.9. Area of a Parallelogram www.ck12.org
Notice that the base is the bottom measurement and the height is the measurement inside the figure.
When we multiply these two measurements, we can find the area of the parallelogram. Here is the formula.
A = bh
Now it’s time for you to figure out the area of the following parallelograms given the base and height.
Example A
Base = 9 ft., Height = 4 ft.
Solution: 36 sq. ft.
Example B
Base = 7 meters, Height = 3.5 meters
Solution: 24.5 sq. m.
Example C
Base = 10 yards, Height = 7 yards
Solution: 70 sq. yds
Here is the original problem once again.
Miguel is working on a problem in his math book. He has been given the following drawing.
Miguel needs to figure out the area of this parallelogram.
Do you know how to do this?
To figure this out, Miguel needs to use the formula for finding the area of a parallelogram.
A = bh
Now we substitute the given values into the formula.
A = (6)(2)
A = 12 cm2
This is our answer.
Guided Practice
Here is one for you to try on your own.
Find the area of the parallelogram below.
916
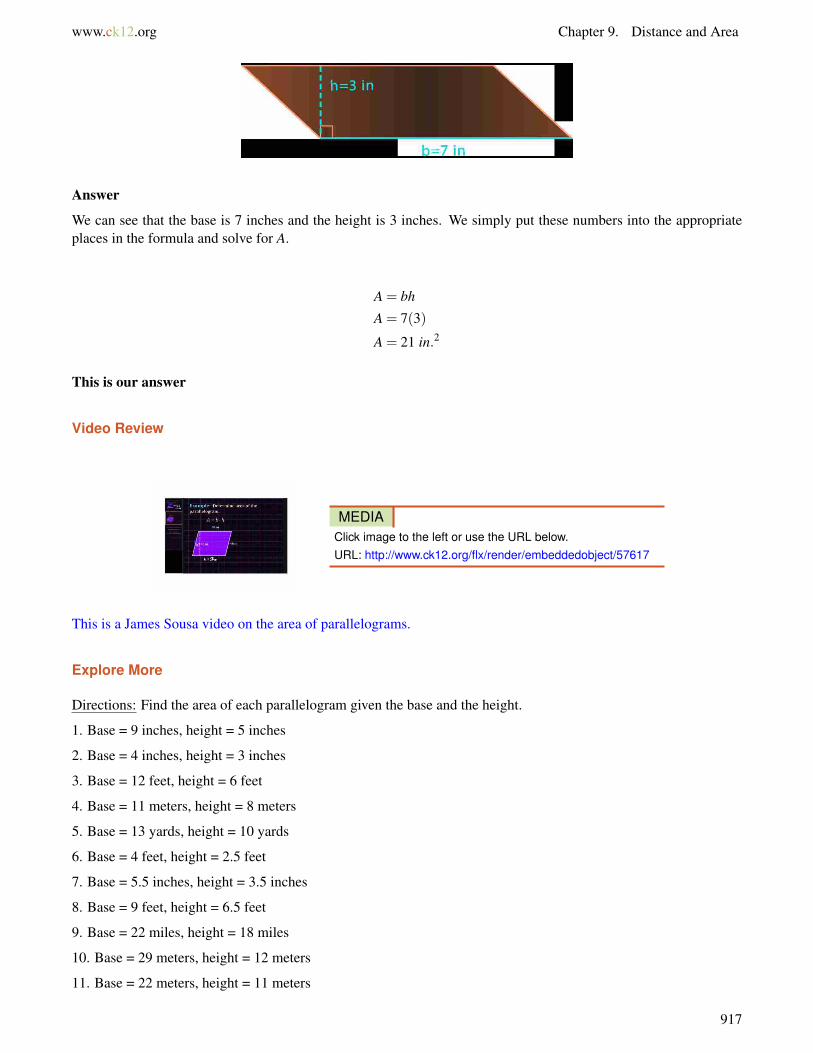
www.ck12.org Chapter 9. Distance and Area
Answer
We can see that the base is 7 inches and the height is 3 inches. We simply put these numbers into the appropriateplaces in the formula and solve for A.
A = bh
A = 7(3)
A = 21 in.2
This is our answer
Video Review
MEDIAClick image to the left or use the URL below.URL: http://www.ck12.org/flx/render/embeddedobject/57617
This is a James Sousa video on the area of parallelograms.
Explore More
Directions: Find the area of each parallelogram given the base and the height.
1. Base = 9 inches, height = 5 inches
2. Base = 4 inches, height = 3 inches
3. Base = 12 feet, height = 6 feet
4. Base = 11 meters, height = 8 meters
5. Base = 13 yards, height = 10 yards
6. Base = 4 feet, height = 2.5 feet
7. Base = 5.5 inches, height = 3.5 inches
8. Base = 9 feet, height = 6.5 feet
9. Base = 22 miles, height = 18 miles
10. Base = 29 meters, height = 12 meters
11. Base = 22 meters, height = 11 meters
917

9.9. Area of a Parallelogram www.ck12.org
12. Base = 39 meters, height = 15 meters
13. Base = 40 meters, height = 25 meters
14. Base = 88 meters, height = 50 meters
15. Base = 79 meters, height = 14 meters
918
www.ck12.org Chapter 9. Distance and Area
9.10 Unknown Dimensions of Parallelograms
Here you’ll find unknown dimensions of parallelograms given area and one other dimension.
Have you ever measured banners in a stadium? Have you ever seen one up close?
One afternoon, Miguel’s assignment is to hang a banner in the stadium. The banner say’s “Go Wildcats” and is theshape of a parallelogram with a yellow background and dark blue border. He has two different places that he can putit. One spot is only 11 feet wide and one spot is 13 feet wide.
Miguel isn’t sure which spot is the best spot for the “Go Wildcats” banner. Wherever he chooses to hang the bannerit needs to fit with a little space on each side so that people don’t bump it as they go past.
The banner is rolled up in a tube. Miguel looks at the label to see that the square footage of the banner is 42 squarefeet. The height of the banner is 3.5 feet. The length of the banner is missing. It seems to have been covered up witha shipping label.
Miguel is a bit frustrated. He isn’t sure that he has enough information to figure out the length of the banner. Heknows that he needs to figure out the length of the banner in order to choose the correct spot to hang it. Miguel takesout a piece of paper to try to figure things out.
Does Miguel have enough information? Can he figure out the length of the banner using the given informa-tion? How long is the banner? Which spot is the best spot?
All of these questions can be answered by using parallelograms and this Concept will teach you all that youneed to know to figure this one out.
Guidance
Sometimes, you will be given the area of the parallelogram and one other dimension such as the base or the height.Then you will have to use the formula and your problem solving skills to figure out the missing dimensions.
A parallelogram has an area of 105 m2. The height of the parallelogram is 7 m. What is its base?
In this problem, we know the area and the height of the parallelogram. We put these numbers into the formulaand solve for the base, b.
919
9.10. Unknown Dimensions of Parallelograms www.ck12.org
A = bh
105 = b(7)
105÷7 = b
15 m = b
By solving for b, we have found that the base of the parallelogram is 15 meters. Let’s check our calculation tobe sure. We can check by putting the base and height into the formula and solving for area
A = bh
A = 15(7)
A = 105 m2
We know the area is 105 m2, so our calculation is correct.
Let’s look at another one.
The area of a parallelogram is 184 square yards and its base is 23 yards. Find its height.
This time we know the area of the parallelogram and its base. We can put these into the formula and solvefor the height, h.
A = bh
184 = 23h
184÷23 = h
8 yd = h
We have found that the parallelogram has a height of 8 yards. Again, let’s use the formula to check our work.
A = bh
A = 23(8)
A = 184 yd2
Our calculation is correct! Whenever we are given two pieces of information about a parallelogram, we canuse the formula for area to find the third measurement.
Find the missing dimension in each parallelogram.
Example A
Base = 8 inches, Area = 32 sq. inches. What is the height?
Solution: 4 inches
Example B
Base = 9.5 inches, Area = 57 sq. inches. What is the height?
Solution: 6 inches
920
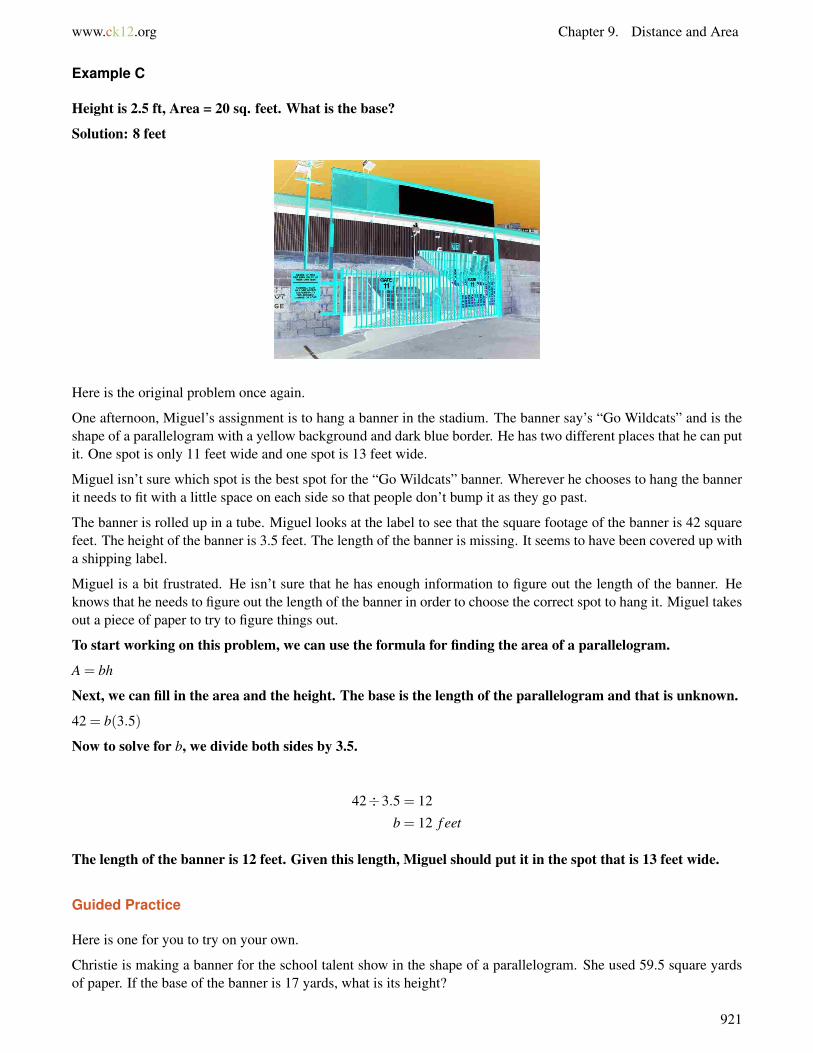
www.ck12.org Chapter 9. Distance and Area
Example C
Height is 2.5 ft, Area = 20 sq. feet. What is the base?
Solution: 8 feet
Here is the original problem once again.
One afternoon, Miguel’s assignment is to hang a banner in the stadium. The banner say’s “Go Wildcats” and is theshape of a parallelogram with a yellow background and dark blue border. He has two different places that he can putit. One spot is only 11 feet wide and one spot is 13 feet wide.
Miguel isn’t sure which spot is the best spot for the “Go Wildcats” banner. Wherever he chooses to hang the bannerit needs to fit with a little space on each side so that people don’t bump it as they go past.
The banner is rolled up in a tube. Miguel looks at the label to see that the square footage of the banner is 42 squarefeet. The height of the banner is 3.5 feet. The length of the banner is missing. It seems to have been covered up witha shipping label.
Miguel is a bit frustrated. He isn’t sure that he has enough information to figure out the length of the banner. Heknows that he needs to figure out the length of the banner in order to choose the correct spot to hang it. Miguel takesout a piece of paper to try to figure things out.
To start working on this problem, we can use the formula for finding the area of a parallelogram.
A = bh
Next, we can fill in the area and the height. The base is the length of the parallelogram and that is unknown.
42 = b(3.5)
Now to solve for b, we divide both sides by 3.5.
42÷3.5 = 12
b = 12 f eet
The length of the banner is 12 feet. Given this length, Miguel should put it in the spot that is 13 feet wide.
Guided Practice
Here is one for you to try on your own.
Christie is making a banner for the school talent show in the shape of a parallelogram. She used 59.5 square yardsof paper. If the base of the banner is 17 yards, what is its height?
921

9.10. Unknown Dimensions of Parallelograms www.ck12.org
Answer
First, let’s make sure we understand the question in the problem. We need to find the height of the parallelogram.This time we are given the area and the base. As we’ve seen, we simply put these numbers into the formula andsolve for the height, h.
A = bh
59.5 = 17h
59.5÷17 = h
3.5 yd = h
The height of the banner is 3.5 feet.
As long as we have any two pieces of the area formula, we can solve for the third.
Video Review
MEDIAClick image to the left or use the URL below.URL: http://www.ck12.org/flx/render/embeddedobject/57617
This is a James Sousa video on the area of parallelograms.
Explore More
Directions: Given the area and one dimension, find the missing dimension.
1. Base = 9 feet, area = 45 sq. ft.
2. Base = 8 in, area = 20 sq. in.
3. Base = 11 feet, area = 99 sq. feet
4. Base = 12 inches, area = 120 sq. inches
5. Base = 4.5 feet, area = 11.25 sq. ft.
6. Height = 3 inches, area = 36 sq. inches
7. Height = 4 feet, area = 72 sq. feet
8. Height = 5 meters, area = 80 sq. meters
9. Area = 22 sq. inches
Base = 11 inches
10. Area = 50 sq. miles
Base = 10 miles
11. Area = 48 sq. inches
922
www.ck12.org Chapter 9. Distance and Area
Base = 8 inches
12. Area = 30 sq. meters
Base = 15 meters
13. Area = 45 sq. feet
Height = 3 feet
14. Area = 88 sq. feet
Height = 8 feet
15. Area = 121 sq. feet
Height = 11 feet
16. Area = 160 sq. miles
Height = 20 miles
17. Area = 90 sq. meters
Height = 30 meters
18. Area = 100 sq. feet
Base = 25 feet
923
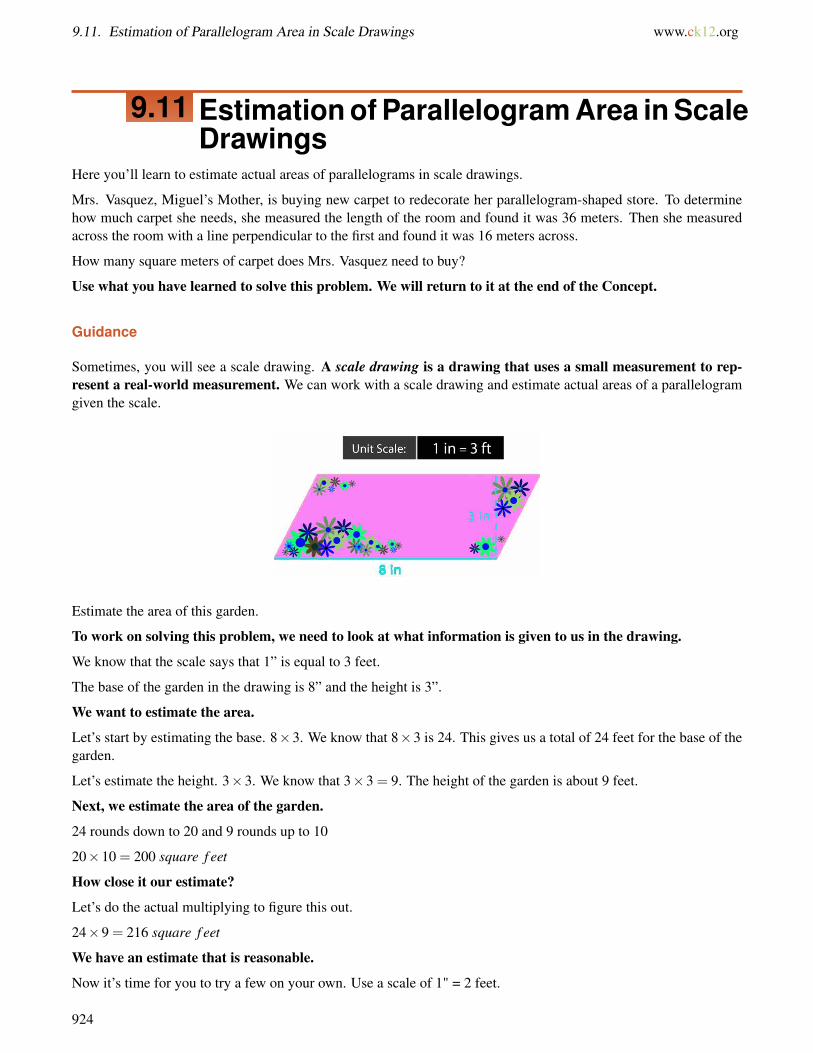
9.11. Estimation of Parallelogram Area in Scale Drawings www.ck12.org
9.11 Estimation of Parallelogram Area in ScaleDrawings
Here you’ll learn to estimate actual areas of parallelograms in scale drawings.
Mrs. Vasquez, Miguel’s Mother, is buying new carpet to redecorate her parallelogram-shaped store. To determinehow much carpet she needs, she measured the length of the room and found it was 36 meters. Then she measuredacross the room with a line perpendicular to the first and found it was 16 meters across.
How many square meters of carpet does Mrs. Vasquez need to buy?
Use what you have learned to solve this problem. We will return to it at the end of the Concept.
Guidance
Sometimes, you will see a scale drawing. A scale drawing is a drawing that uses a small measurement to rep-resent a real-world measurement. We can work with a scale drawing and estimate actual areas of a parallelogramgiven the scale.
Estimate the area of this garden.
To work on solving this problem, we need to look at what information is given to us in the drawing.
We know that the scale says that 1” is equal to 3 feet.
The base of the garden in the drawing is 8” and the height is 3”.
We want to estimate the area.
Let’s start by estimating the base. 8×3. We know that 8×3 is 24. This gives us a total of 24 feet for the base of thegarden.
Let’s estimate the height. 3×3. We know that 3×3 = 9. The height of the garden is about 9 feet.
Next, we estimate the area of the garden.
24 rounds down to 20 and 9 rounds up to 10
20×10 = 200 square f eet
How close it our estimate?
Let’s do the actual multiplying to figure this out.
24×9 = 216 square f eet
We have an estimate that is reasonable.
Now it’s time for you to try a few on your own. Use a scale of 1" = 2 feet.
924
www.ck12.org Chapter 9. Distance and Area
Example A
Base of 6 inches and a height of 4 inches
Solution: 48 square feet
Example B
Base of 9 inches and height of 5 inches
Solution: 90 square feet
Example C
Base of 12 inches and height of 9 inches
Solution: 216 square feet
Here is the original problem once again.
Mrs. Vasquez, Miguel’s Mother is buying new carpet to redecorate her parallelogram-shaped store. To determinehow much carpet she needs, she measured the length of the room and found it was 36 meters. Then she measuredacross the room with a line perpendicular to the first and found it was 16 meters across.
How many square meters of carpet does Mrs. Vasquez need to buy?
Let’s begin by figuring out what the problem is asking us to find. We need to find how much carpet Mrs. Vasquezneeds to cover the floor of her store, so we have to find the area of the store. That means we will use the area formulato solve for A. In order to use the formula, we need to know the base and height of the store.
We know that one side of the store will be 36 meters. Let’s call this the base. We also know that Mrs. Vasquez madea perpendicular line in order to measure the height, or the distance across the room. The height given in the problemis 16 meters. Let’s put this information into the formula and solve for area.
A = bh
A = 36(16)
A = 576 m2
Mrs. Vasquez will need to buy 576 square meters of carpet.
Guided Practice
Here is one for you to try on your own.
If you use the scale 1" = 3 feet, what is the area of a parallelogram with a height of 3 inches and a base of 6 inches?
Answer
To figure this out, we can use the formula for finding the area of a parallelogram. We will work in inches first andthen convert that into square feet.
A = bh
A = (3)(6)
A = 18 sq.in
925
9.11. Estimation of Parallelogram Area in Scale Drawings www.ck12.org
Now if 1" = 3 feet, then we need to take the area of the room in inches and multiply it by three.
A = 18×3 = 54 sq. f eet
This is our answer.
Video Review
MEDIAClick image to the left or use the URL below.URL: http://www.ck12.org/flx/render/embeddedobject/57617
This is a James Sousa video on the area of parallelograms.
MEDIAClick image to the left or use the URL below.URL: http://www.ck12.org/flx/render/embeddedobject/57617
This is a James Sousa video on scale factor. It is a supporting video to this Concept.
Explore More
Directions: For each parallelogram, find each new area using the scale 1" = 2 feet.
1. Base of 6 inches, height of 4 inches
2. Base of 8 inches, height of 6 inches
3. Base of 4 inches, height of 4 inches
4. Base of 5 inches, height of 4 inches
5. Base of 6 inches, height of 6 inches
6. Base of 10 inches, height of 8 inches
7. Base of 11 inches, height of 12 inches
8. Base of 15 inches, height of 9 inches
9. Base of 15 inches, height of 12 inches
Directions: Solve each problem.
10. A parallelogram has an area of 390 square centimeters. If its height is 15 cm, what is its base?
11. What is the height of a parallelogram whose base is 28 inches and area is 1,176 square inches?
12. Donna wants to cover her parallelogram-shaped crafts box in fabric. The base of the lid is 32.7 cm and the heightis 12.2 cm. What is the area of the lid?
926
www.ck12.org Chapter 9. Distance and Area
13. John is planting grass in a patch of lawn that is shaped like a parallelogram. The height of the parallelogram is34 feet. The other border is 65 feet. How many square feet of grass will John plant?
14. Kara and Sharice are in a quilting competition. Both are stitching parallelogram-shaped quilts. So far Kara’s hasan area of 2,278 square inches and a height of 44 inches. Sharice’s quilt has an area of 2,276 square inches and aheight of 47 inches. Whose quilt is longer? By how many inches is it longer?
15. Denise bought a picture frame in the shape of a parallelogram. The area of the picture frame is 36,795 squarecentimeters. If its height is 165 centimeters, what is its base?
927
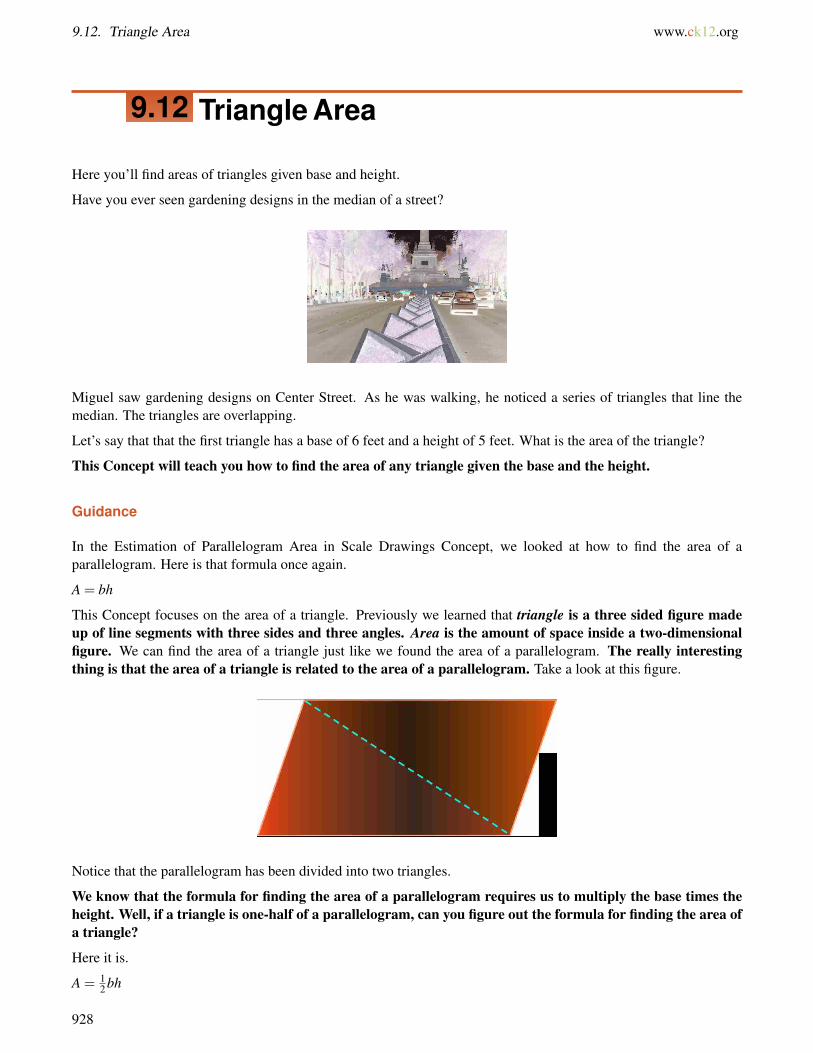
9.12. Triangle Area www.ck12.org
9.12 Triangle Area
Here you’ll find areas of triangles given base and height.
Have you ever seen gardening designs in the median of a street?
Miguel saw gardening designs on Center Street. As he was walking, he noticed a series of triangles that line themedian. The triangles are overlapping.
Let’s say that that the first triangle has a base of 6 feet and a height of 5 feet. What is the area of the triangle?
This Concept will teach you how to find the area of any triangle given the base and the height.
Guidance
In the Estimation of Parallelogram Area in Scale Drawings Concept, we looked at how to find the area of aparallelogram. Here is that formula once again.
A = bh
This Concept focuses on the area of a triangle. Previously we learned that triangle is a three sided figure madeup of line segments with three sides and three angles. Area is the amount of space inside a two-dimensionalfigure. We can find the area of a triangle just like we found the area of a parallelogram. The really interestingthing is that the area of a triangle is related to the area of a parallelogram. Take a look at this figure.
Notice that the parallelogram has been divided into two triangles.
We know that the formula for finding the area of a parallelogram requires us to multiply the base times theheight. Well, if a triangle is one-half of a parallelogram, can you figure out the formula for finding the area ofa triangle?
Here it is.
A = 12 bh
928

www.ck12.org Chapter 9. Distance and Area
It certainly does. With this formula, the area of a triangle will be snap to figure out!
Take a minute to write this formula down in your notebook.
Now that you can identify formula for finding the area of a triangle, let’s look at using it in problem solving.
Find the area of the triangle below.
929
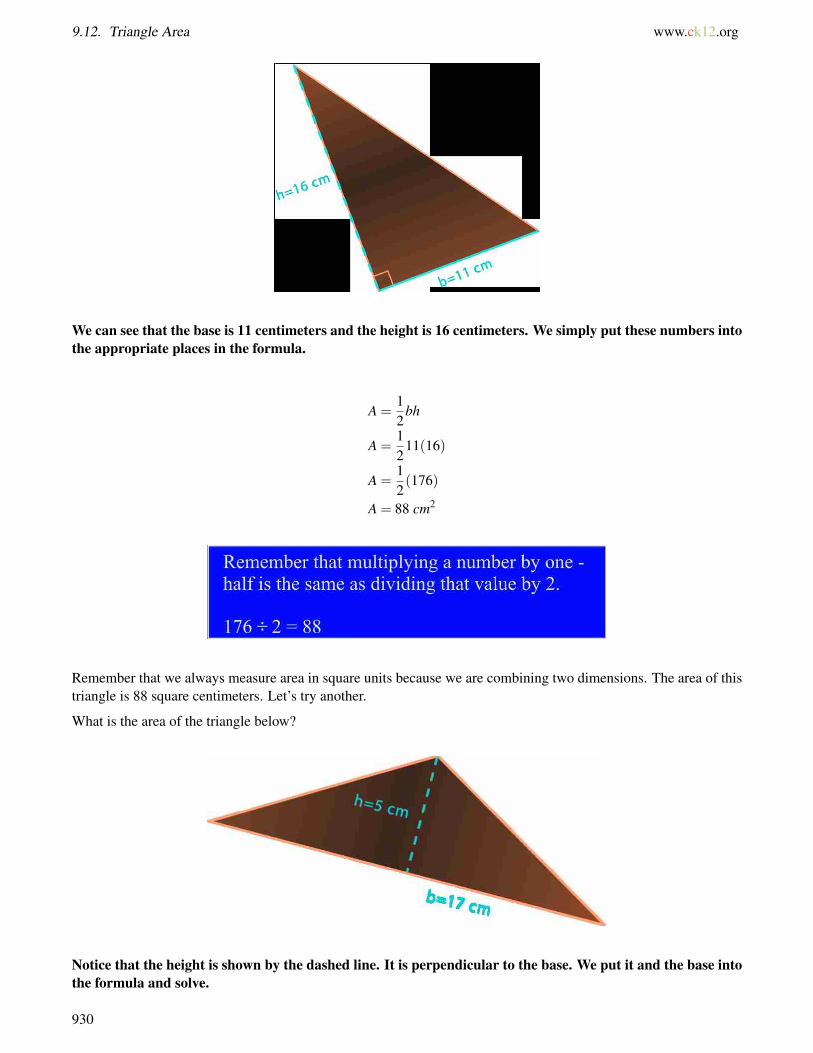
9.12. Triangle Area www.ck12.org
We can see that the base is 11 centimeters and the height is 16 centimeters. We simply put these numbers intothe appropriate places in the formula.
A =12
bh
A =12
11(16)
A =12(176)
A = 88 cm2
Remember that we always measure area in square units because we are combining two dimensions. The area of thistriangle is 88 square centimeters. Let’s try another.
What is the area of the triangle below?
Notice that the height is shown by the dashed line. It is perpendicular to the base. We put it and the base intothe formula and solve.
930
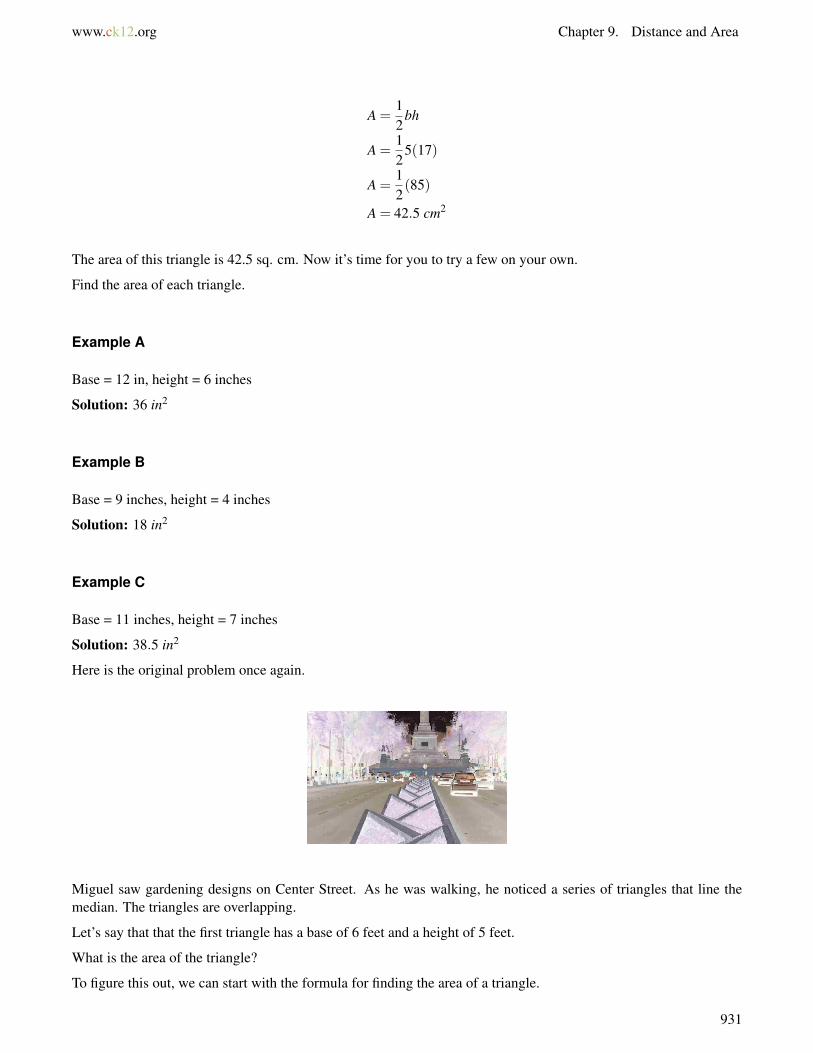
www.ck12.org Chapter 9. Distance and Area
A =12
bh
A =12
5(17)
A =12(85)
A = 42.5 cm2
The area of this triangle is 42.5 sq. cm. Now it’s time for you to try a few on your own.
Find the area of each triangle.
Example A
Base = 12 in, height = 6 inches
Solution: 36 in2
Example B
Base = 9 inches, height = 4 inches
Solution: 18 in2
Example C
Base = 11 inches, height = 7 inches
Solution: 38.5 in2
Here is the original problem once again.
Miguel saw gardening designs on Center Street. As he was walking, he noticed a series of triangles that line themedian. The triangles are overlapping.
Let’s say that that the first triangle has a base of 6 feet and a height of 5 feet.
What is the area of the triangle?
To figure this out, we can start with the formula for finding the area of a triangle.
931

9.12. Triangle Area www.ck12.org
A =12
bh
A =12(6)(5)
A =12(30)
A = 15 square f eet
Let’s say that there are eight triangles in this strip of median. We can take the area of one of the triangles and multiplyit by 8.
15(8) = 120 square feet
This is the area of the median. We were able to use the area of each triangle to find the total area of themedian.
Guided Practice
Here is one for you to try on your own.
What is the area of a triangle with a base of 4.5 f t and a height of 7 f t?
Answer
To figure this out, we can use the formula for finding the area of a triangle.
A = 12 bh
Now we substitute in the given values.
A = 12(4.5)(7)
A = 12(31.5)
A = 15.75 f t2
This is our answer.
Video Review
MEDIAClick image to the left or use the URL below.URL: http://www.ck12.org/flx/render/embeddedobject/5265
This is a James Sousa video on finding the area of a triangle.
Explore More
Directions: Find the area of each triangle given the base and height.
1. Base = 9 in, height = 4 in
932
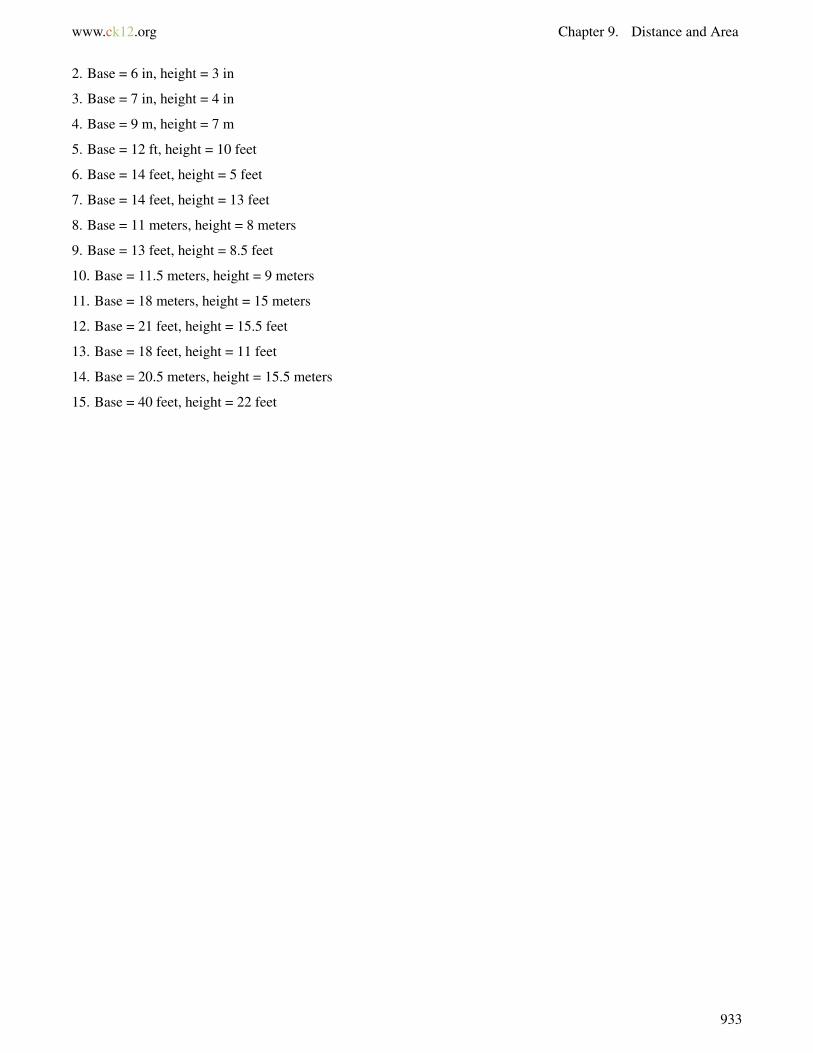
www.ck12.org Chapter 9. Distance and Area
2. Base = 6 in, height = 3 in
3. Base = 7 in, height = 4 in
4. Base = 9 m, height = 7 m
5. Base = 12 ft, height = 10 feet
6. Base = 14 feet, height = 5 feet
7. Base = 14 feet, height = 13 feet
8. Base = 11 meters, height = 8 meters
9. Base = 13 feet, height = 8.5 feet
10. Base = 11.5 meters, height = 9 meters
11. Base = 18 meters, height = 15 meters
12. Base = 21 feet, height = 15.5 feet
13. Base = 18 feet, height = 11 feet
14. Base = 20.5 meters, height = 15.5 meters
15. Base = 40 feet, height = 22 feet
933

9.13. Unknown Dimensions of Triangles www.ck12.org
9.13 Unknown Dimensions of Triangles
Here you’ll learn to find unknown dimensions of triangles given area and one other dimension.
Remember the triangles in the median of the Triangle Area Concept? Take a look.
If one of these triangles has an area of 11.25 f t2 and a base length of 4.5 f t, what is the height of the triangle?
To figure this out, you will need to know how to use a formula and find the missing dimension of a triangle.This Concept will teach you how to do that.
Guidance
Sometimes a problem will give us the area and ask us to find one of the dimensions of the triangle—either its baseor its height. We simply put the information we know in for the appropriate variable in the formula and solve for theunknown measurement.
A triangle has an area of 44 m2. The base of the triangle is 8 m. What is its height?
In this problem, we know the area and the base of the triangle. We put these numbers into the formula andsolve for the height, h.
A =12
bh
44 =12
8h
44÷ 12= 8h
44(2) = 8h
88 = 8h
11 m = h
Remember, when you divide both sides by a fraction, you need to multiply by its reciprocal. To divide by one-halfthen, we multiply by 2. Keep this in mind when you use the area formula.
By solving for h, we have found that the height of the triangle is 11 meters. Let’s check our calculation to be sure.We can check by putting the base and height into the formula and solving for area.
934
www.ck12.org Chapter 9. Distance and Area
A =12
bh
A =12
8(11)
A =12(88)
A = 44 m2
We know from the problem that the area is 44 m2, so our calculation is correct.
Now try a few of these on your own.
Given the area and one other dimension, find the missing dimension of each triangle.
Example A
Base = 4 inches, Area = 6 sq. inches, what is the height?
Solution: h = 3inches
Example B
Base = 5 feet, Area = 7.5 sq. feet, what is the height?
Solution: h = 3 f eet
Example C
Base = 7 meters, Area = 17.5 sq. meters, what is the height?
Solution: h = 5meters
Here is the original problem once again.
If one of these triangles has an area of 11.25 f t2 and a base length of 4.5 f t, what is the height of the triangle?
To figure this out, we can use the formula for finding the area of a triangle.
A = 12 bh
Now substitute in the given values.
11.25 = 12 4.5h
11.25 = 2.25h
935
9.13. Unknown Dimensions of Triangles www.ck12.org
11.25 div2.25 = h
h = 5 f t
This is our answer.
Guided Practice
Here is one for you to try on your own.
Find the missing base of the triangle.
A triangle has an area of 10.5 sq.in and a height of 6 in. What is the measure of the base?
Answer
To figure this out, we can solve for the base by using the formula for area of a triangle.
A = 12 bh
Now we fill in the given information.
10.5 = 12(6)b
10.5 = 3b
b = 3.5
The measure of the base of the triangle is 3.5 in.
Video Review
MEDIAClick image to the left or use the URL below.URL: http://www.ck12.org/flx/render/embeddedobject/5265
This is a James Sousa video on finding the area of a triangle.
Explore More
Directions: Find the missing base or height given the area and one other dimension.
1. Area = 13.5 sq. meters, Base = 9 meters
2. Area = 21 sq. meters, Base = 7 meters
3. Area = 12 sq. meters, Base = 8 meters
4. Area = 33 sq. ft, Base = 11 feet
5. Area = 37.5 sq. ft. Base = 15 feet
6. Area = 60 sq. ft., height = 10 ft.
7. Area = 20.25 sq. in, height = 4.5 in
8. Area = 72 sq. in, height = 8 in
936

www.ck12.org Chapter 9. Distance and Area
9. Area = 22.5 sq. feet, height = 5 feet
10. Area = 12 sq. in, height = 4 in
11. Area = 45 sq. in, height = 9 in
12. Area = 84 sq. ft, height = 12 ft
13. Area = 144 sq. in, height = 16 in
14. Area = 144.5 sq. ft, height = 17 ft.
15. Area = 123.5 sq. in, height = 19 in
937

9.14. Area of Composite Shapes Involving Triangles www.ck12.org
9.14 Area of Composite Shapes Involving Trian-gles
Here you’ll learn to find areas of combined figures involving triangles.
Have you ever had a favorite team?
Miguel loves watching the games when the Wildcats play. He loves when they win, but he is such a fan of baseballthat he doesn’t even mind when they lose. Miguel cheers when the players run towards home plate.
He watched them slide in and run across it.
“Home plate is such an interesting shape,” he thinks to himself one day.
He decides to do a little research on the design of home plate. Here is what he finds out.
Home plate is a pentagon which can be divided up. The base of home plate is 17 inches wide. The sides of homeplate are each 8.5 inches. The distance from the tip of home plate to the base is also 17 inches.
Miguel thinks that this is very interesting information. He wonders if he can figure out the area of the figure. It ismade up of a rectangle and a triangle.
As Miguel works on this, you work on it too. You know how to find the area of a rectangle already, but whatabout a triangle?
This Concept will teach you how to find the area of a triangle and add that to the rectangle. When finished,you can work on figuring out home.
Guidance
Previously we worked on how to find the area of a triangle. You can use that information to figure out the area offigures that are made up of more than one shape. Remember that we could divide a parallelogram into two triangles?If we know the area of the triangles, we can add their areas together to find the area of the parallelogram. We can dothis for all kinds of figures. If we can divide the figure into triangles, we can find the area of each triangle and addthe areas together.
Also, we have seen that we can apply the formula for finding the area of triangles to different kinds of situations.Sometimes we need to solve for the area, but other times we may need to find the height or the base. We can useinformation given about a larger figure whenever that information corresponds to the height, base, or area of one ofthe triangles contained within it. Let’s try one to get a better idea of how this works.
938
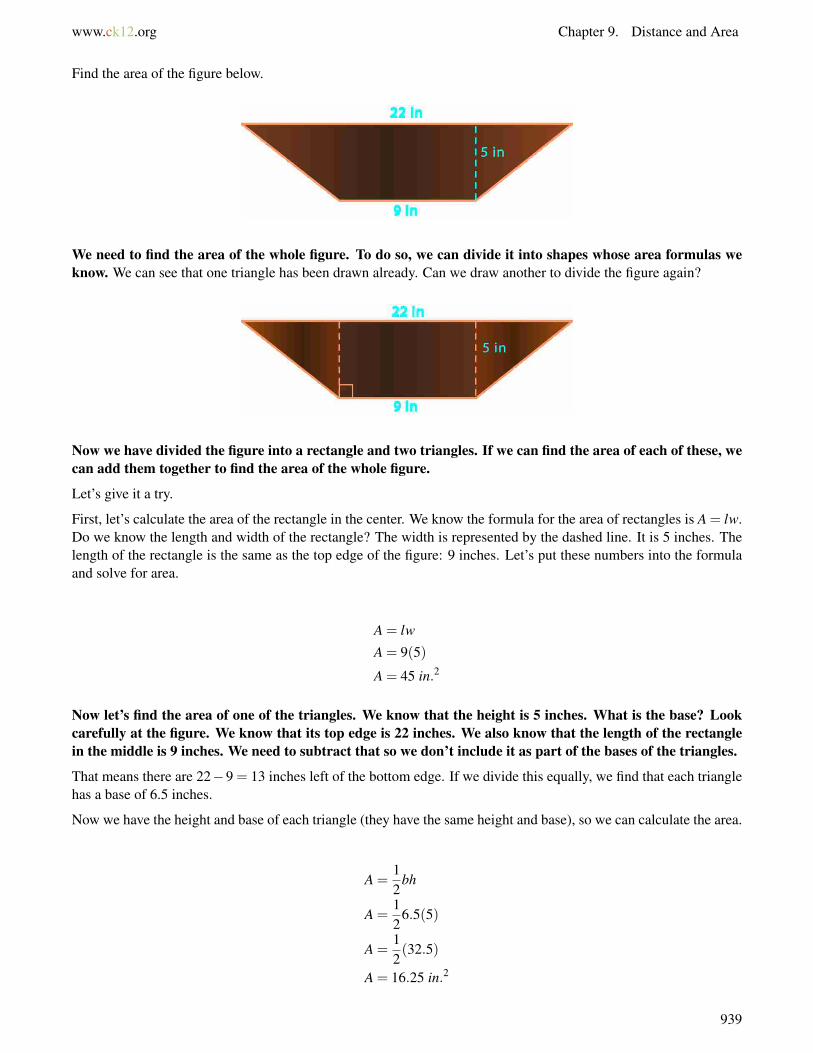
www.ck12.org Chapter 9. Distance and Area
Find the area of the figure below.
We need to find the area of the whole figure. To do so, we can divide it into shapes whose area formulas weknow. We can see that one triangle has been drawn already. Can we draw another to divide the figure again?
Now we have divided the figure into a rectangle and two triangles. If we can find the area of each of these, wecan add them together to find the area of the whole figure.
Let’s give it a try.
First, let’s calculate the area of the rectangle in the center. We know the formula for the area of rectangles is A = lw.Do we know the length and width of the rectangle? The width is represented by the dashed line. It is 5 inches. Thelength of the rectangle is the same as the top edge of the figure: 9 inches. Let’s put these numbers into the formulaand solve for area.
A = lw
A = 9(5)
A = 45 in.2
Now let’s find the area of one of the triangles. We know that the height is 5 inches. What is the base? Lookcarefully at the figure. We know that its top edge is 22 inches. We also know that the length of the rectanglein the middle is 9 inches. We need to subtract that so we don’t include it as part of the bases of the triangles.
That means there are 22−9 = 13 inches left of the bottom edge. If we divide this equally, we find that each trianglehas a base of 6.5 inches.
Now we have the height and base of each triangle (they have the same height and base), so we can calculate the area.
A =12
bh
A =12
6.5(5)
A =12(32.5)
A = 16.25 in.2
939
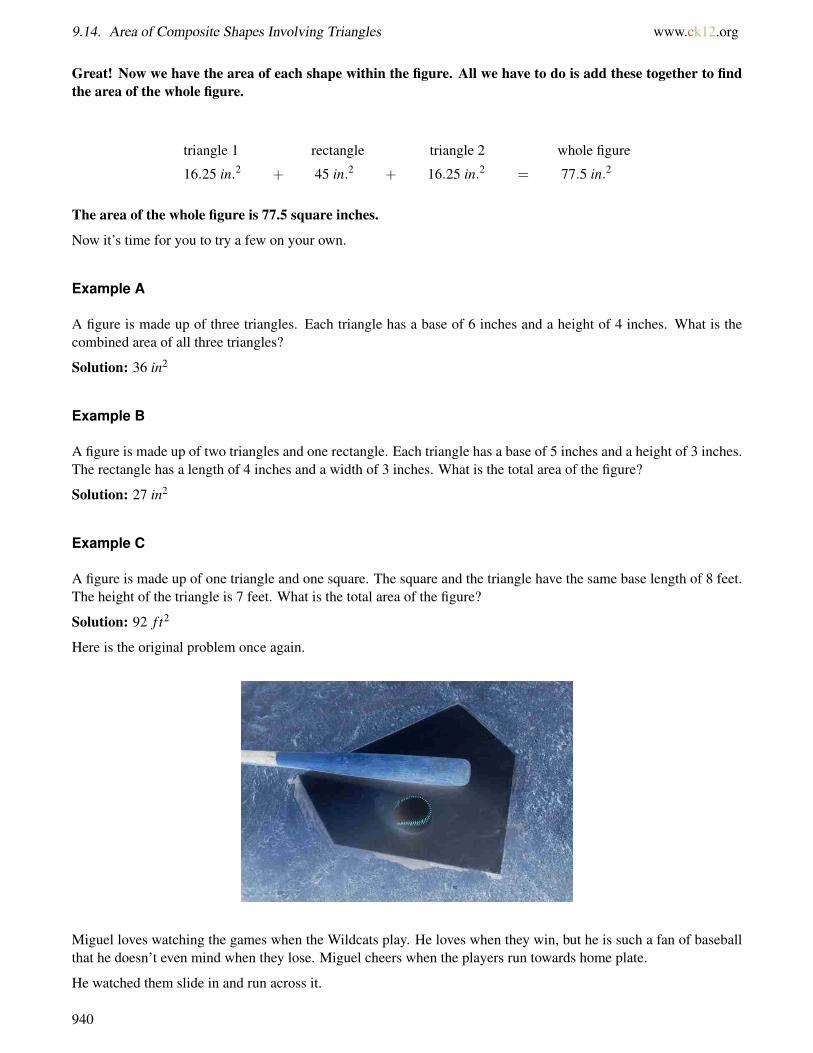
9.14. Area of Composite Shapes Involving Triangles www.ck12.org
Great! Now we have the area of each shape within the figure. All we have to do is add these together to findthe area of the whole figure.
triangle 1 rectangle triangle 2 whole figure
16.25 in.2 + 45 in.2 + 16.25 in.2 = 77.5 in.2
The area of the whole figure is 77.5 square inches.
Now it’s time for you to try a few on your own.
Example A
A figure is made up of three triangles. Each triangle has a base of 6 inches and a height of 4 inches. What is thecombined area of all three triangles?
Solution: 36 in2
Example B
A figure is made up of two triangles and one rectangle. Each triangle has a base of 5 inches and a height of 3 inches.The rectangle has a length of 4 inches and a width of 3 inches. What is the total area of the figure?
Solution: 27 in2
Example C
A figure is made up of one triangle and one square. The square and the triangle have the same base length of 8 feet.The height of the triangle is 7 feet. What is the total area of the figure?
Solution: 92 f t2
Here is the original problem once again.
Miguel loves watching the games when the Wildcats play. He loves when they win, but he is such a fan of baseballthat he doesn’t even mind when they lose. Miguel cheers when the players run towards home plate.
He watched them slide in and run across it.
940
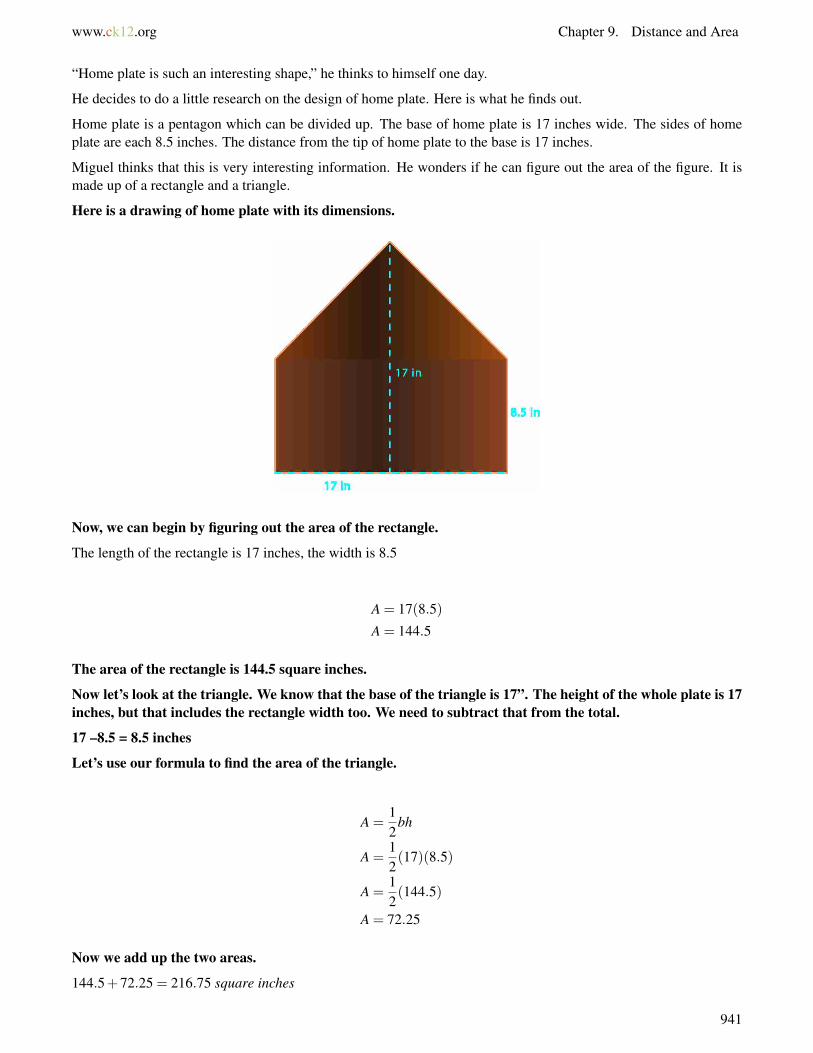
www.ck12.org Chapter 9. Distance and Area
“Home plate is such an interesting shape,” he thinks to himself one day.
He decides to do a little research on the design of home plate. Here is what he finds out.
Home plate is a pentagon which can be divided up. The base of home plate is 17 inches wide. The sides of homeplate are each 8.5 inches. The distance from the tip of home plate to the base is 17 inches.
Miguel thinks that this is very interesting information. He wonders if he can figure out the area of the figure. It ismade up of a rectangle and a triangle.
Here is a drawing of home plate with its dimensions.
Now, we can begin by figuring out the area of the rectangle.
The length of the rectangle is 17 inches, the width is 8.5
A = 17(8.5)
A = 144.5
The area of the rectangle is 144.5 square inches.
Now let’s look at the triangle. We know that the base of the triangle is 17”. The height of the whole plate is 17inches, but that includes the rectangle width too. We need to subtract that from the total.
17 –8.5 = 8.5 inches
Let’s use our formula to find the area of the triangle.
A =12
bh
A =12(17)(8.5)
A =12(144.5)
A = 72.25
Now we add up the two areas.
144.5+72.25 = 216.75 square inches
941
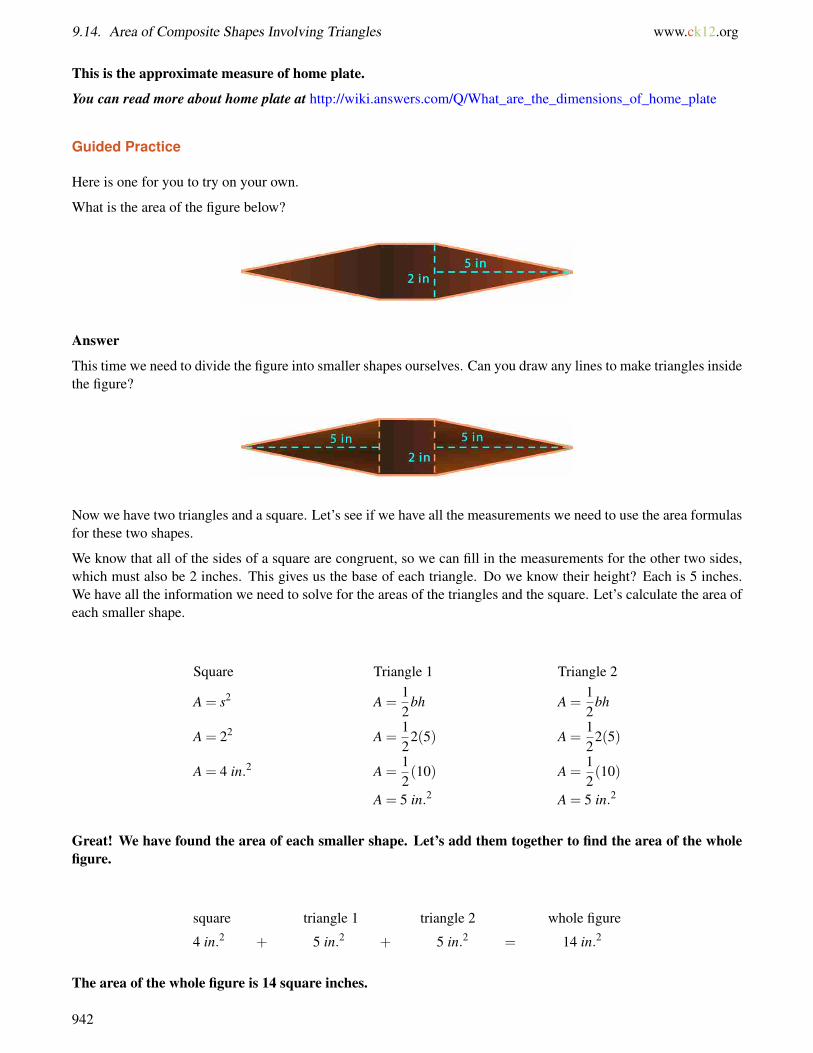
9.14. Area of Composite Shapes Involving Triangles www.ck12.org
This is the approximate measure of home plate.
You can read more about home plate at http://wiki.answers.com/Q/What_are_the_dimensions_of_home_plate
Guided Practice
Here is one for you to try on your own.
What is the area of the figure below?
Answer
This time we need to divide the figure into smaller shapes ourselves. Can you draw any lines to make triangles insidethe figure?
Now we have two triangles and a square. Let’s see if we have all the measurements we need to use the area formulasfor these two shapes.
We know that all of the sides of a square are congruent, so we can fill in the measurements for the other two sides,which must also be 2 inches. This gives us the base of each triangle. Do we know their height? Each is 5 inches.We have all the information we need to solve for the areas of the triangles and the square. Let’s calculate the area ofeach smaller shape.
Square Triangle 1 Triangle 2
A = s2 A =12
bh A =12
bh
A = 22 A =12
2(5) A =12
2(5)
A = 4 in.2 A =12(10) A =
12(10)
A = 5 in.2 A = 5 in.2
Great! We have found the area of each smaller shape. Let’s add them together to find the area of the wholefigure.
square triangle 1 triangle 2 whole figure
4 in.2 + 5 in.2 + 5 in.2 = 14 in.2
The area of the whole figure is 14 square inches.
942
www.ck12.org Chapter 9. Distance and Area
Video Review
MEDIAClick image to the left or use the URL below.URL: http://www.ck12.org/flx/render/embeddedobject/5265
This is a James Sousa video on finding the area of a triangle. It is a supporting video for this Concept.
Explore More
Directions: Find the area of each combined figure.
1. A figure is made up of a triangle and a square. The square and the triangle have the same base of 7 inches. Thetriangle has a height of 5 inches, what is the total area of the figure?
2. A figure is made up of a triangle and a rectangle. The triangle has a height of 8 inches and a base of 9 inches. Therectangle has dimensions of 7 inches x 9 inches. What is the area of the figure?
3. A figure is made up of four triangles. Each triangle has a base of 7 inches and a height of 9 inches. What is thetotal area of the figure?
4. A figure is made up of three triangles. Each triangle has a base of 5 feet and a height of 4.5 feet. What is the totalarea of the figure?
5. A figure is made up of two triangles and a square. The triangles and the square have the same base length of 5feet. The triangles have a height of 4 feet. What is the total area of the figure?
6. A figure is made up of two triangles and a square. The triangles and the square have the same base length of 8feet. The triangles have a height of 7 feet. What is the total area of the figure?
7. A figure is made up of one square and one triangle. The square has a side length of 9 feet. The triangle has a baseof 7 feet and a height of 6 feet. What is the total area of the figure?
8. A figure is made up of two triangles. The triangles have the same base of 15 inches. One triangle has a height of9 inches and one has a height of 11 inches. What is the total area of the figure?
9. A figure is made up of a triangle and a rectangle. The triangle has a height of 8.5 inches and a base of 10 inches.The rectangle has dimensions of 9 inches x 10 inches. What is the area of the figure?
10. A figure is made up of a triangle and a rectangle. The triangle has a height of 11 inches and a base of 9.5 inches.The rectangle has dimensions of 12 inches x 14 inches. What is the area of the figure?
Directions: Solve each problem.
11. Julius drew a triangle that had a base of 15 inches and a height of 11 inches. What is the area of the triangleJulius drew?
12. A triangle has an area of 108 square centimeters. If its height is 9 cm, what is its base?
13. What is the height of a triangle whose base is 36 inches and area is 234 square inches?
14. Tina is painting a triangular sign.. The height of the sign is 32 feet. The base is 27 feet. How many square feetwill Tracy paint?
15. Tina drew a picture of a triangle with a base of 6 inches and a height of 5.5 inches. What is the area of thetriangle?
943
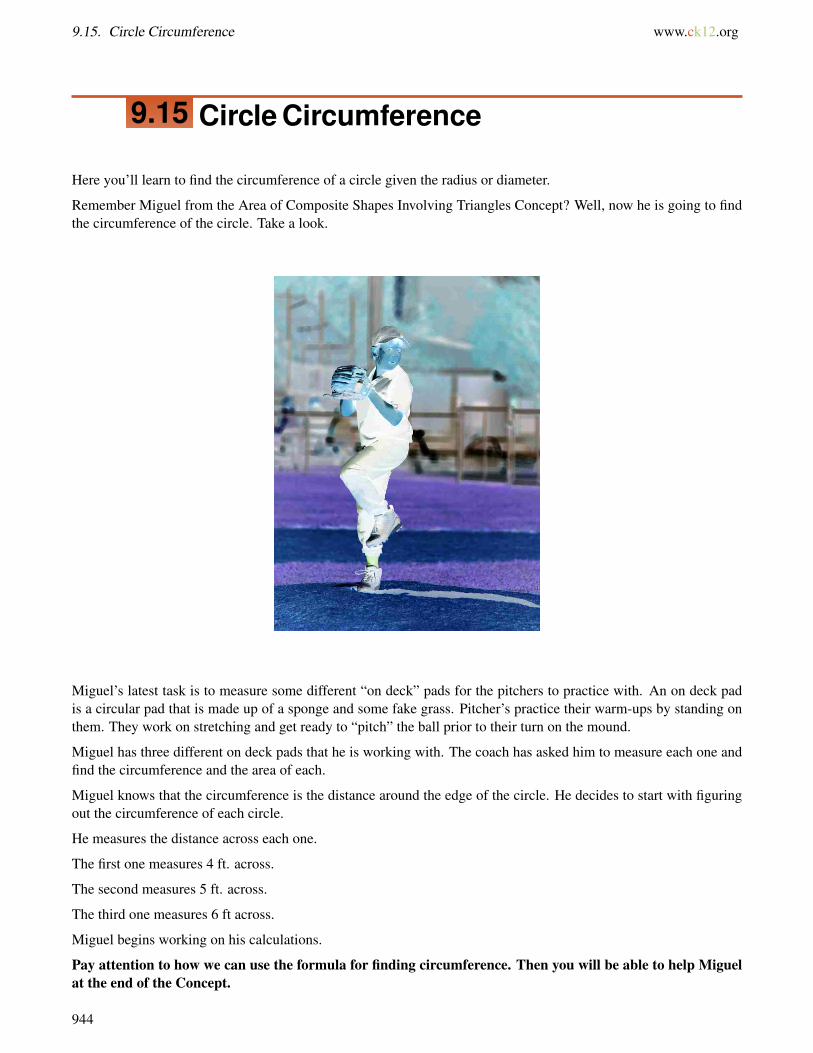
9.15. Circle Circumference www.ck12.org
9.15 Circle Circumference
Here you’ll learn to find the circumference of a circle given the radius or diameter.
Remember Miguel from the Area of Composite Shapes Involving Triangles Concept? Well, now he is going to findthe circumference of the circle. Take a look.
Miguel’s latest task is to measure some different “on deck” pads for the pitchers to practice with. An on deck padis a circular pad that is made up of a sponge and some fake grass. Pitcher’s practice their warm-ups by standing onthem. They work on stretching and get ready to “pitch” the ball prior to their turn on the mound.
Miguel has three different on deck pads that he is working with. The coach has asked him to measure each one andfind the circumference and the area of each.
Miguel knows that the circumference is the distance around the edge of the circle. He decides to start with figuringout the circumference of each circle.
He measures the distance across each one.
The first one measures 4 ft. across.
The second measures 5 ft. across.
The third one measures 6 ft across.
Miguel begins working on his calculations.
Pay attention to how we can use the formula for finding circumference. Then you will be able to help Miguelat the end of the Concept.
944
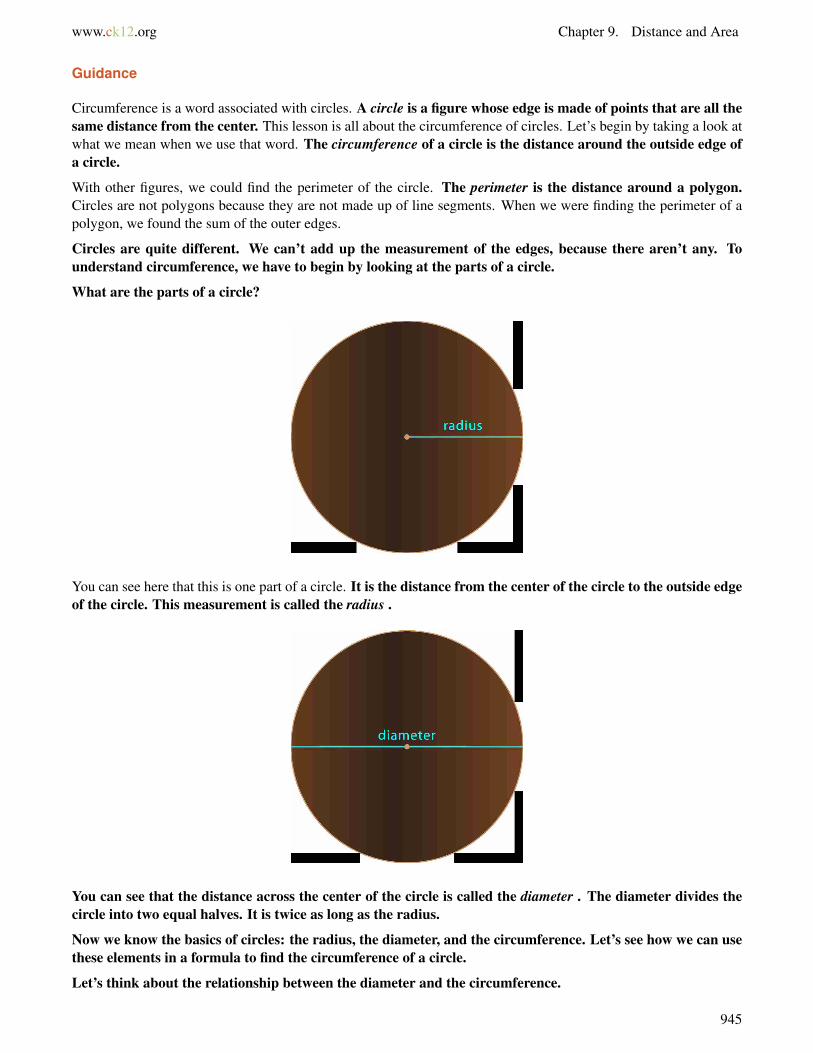
www.ck12.org Chapter 9. Distance and Area
Guidance
Circumference is a word associated with circles. A circle is a figure whose edge is made of points that are all thesame distance from the center. This lesson is all about the circumference of circles. Let’s begin by taking a look atwhat we mean when we use that word. The circumference of a circle is the distance around the outside edge ofa circle.
With other figures, we could find the perimeter of the circle. The perimeter is the distance around a polygon.Circles are not polygons because they are not made up of line segments. When we were finding the perimeter of apolygon, we found the sum of the outer edges.
Circles are quite different. We can’t add up the measurement of the edges, because there aren’t any. Tounderstand circumference, we have to begin by looking at the parts of a circle.
What are the parts of a circle?
You can see here that this is one part of a circle. It is the distance from the center of the circle to the outside edgeof the circle. This measurement is called the radius .
You can see that the distance across the center of the circle is called the diameter . The diameter divides thecircle into two equal halves. It is twice as long as the radius.
Now we know the basics of circles: the radius, the diameter, and the circumference. Let’s see how we can usethese elements in a formula to find the circumference of a circle.
Let’s think about the relationship between the diameter and the circumference.
945
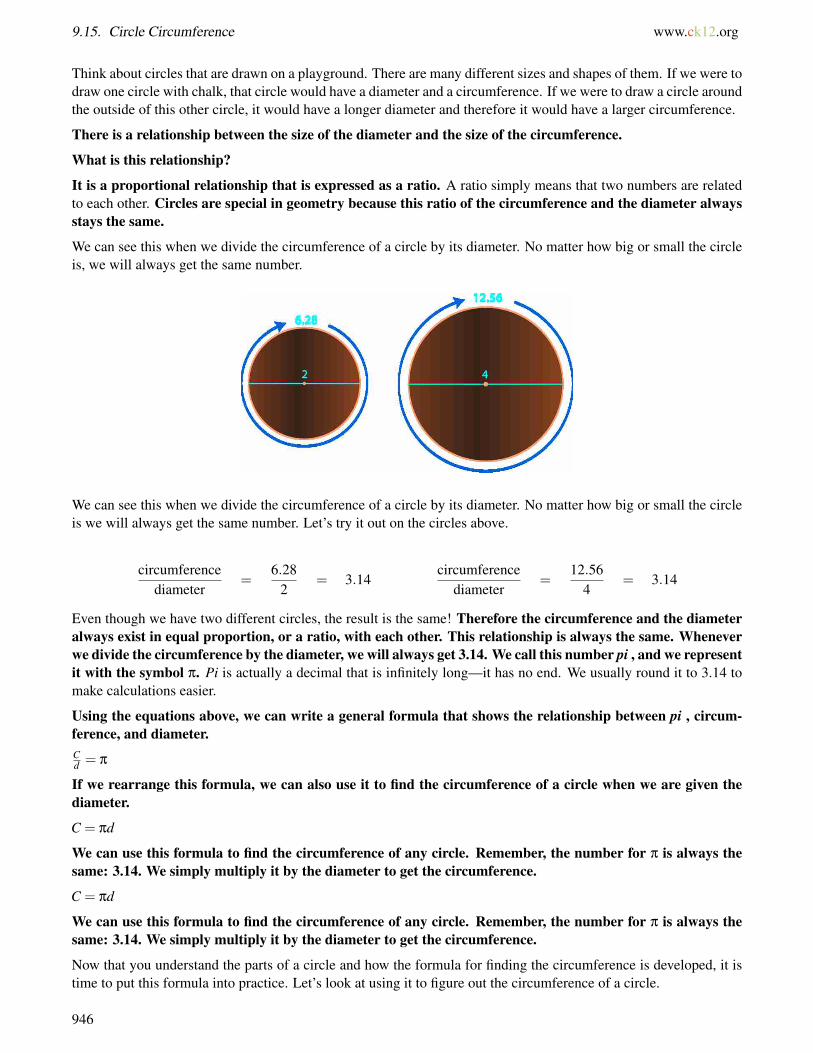
9.15. Circle Circumference www.ck12.org
Think about circles that are drawn on a playground. There are many different sizes and shapes of them. If we were todraw one circle with chalk, that circle would have a diameter and a circumference. If we were to draw a circle aroundthe outside of this other circle, it would have a longer diameter and therefore it would have a larger circumference.
There is a relationship between the size of the diameter and the size of the circumference.
What is this relationship?
It is a proportional relationship that is expressed as a ratio. A ratio simply means that two numbers are relatedto each other. Circles are special in geometry because this ratio of the circumference and the diameter alwaysstays the same.
We can see this when we divide the circumference of a circle by its diameter. No matter how big or small the circleis, we will always get the same number.
We can see this when we divide the circumference of a circle by its diameter. No matter how big or small the circleis we will always get the same number. Let’s try it out on the circles above.
circumferencediameter
=6.28
2= 3.14
circumferencediameter
=12.56
4= 3.14
Even though we have two different circles, the result is the same! Therefore the circumference and the diameteralways exist in equal proportion, or a ratio, with each other. This relationship is always the same. Wheneverwe divide the circumference by the diameter, we will always get 3.14. We call this number pi , and we representit with the symbol π. Pi is actually a decimal that is infinitely long—it has no end. We usually round it to 3.14 tomake calculations easier.
Using the equations above, we can write a general formula that shows the relationship between pi , circum-ference, and diameter.Cd = π
If we rearrange this formula, we can also use it to find the circumference of a circle when we are given thediameter.
C = πd
We can use this formula to find the circumference of any circle. Remember, the number for π is always thesame: 3.14. We simply multiply it by the diameter to get the circumference.
C = πd
We can use this formula to find the circumference of any circle. Remember, the number for π is always thesame: 3.14. We simply multiply it by the diameter to get the circumference.
Now that you understand the parts of a circle and how the formula for finding the circumference is developed, it istime to put this formula into practice. Let’s look at using it to figure out the circumference of a circle.
946
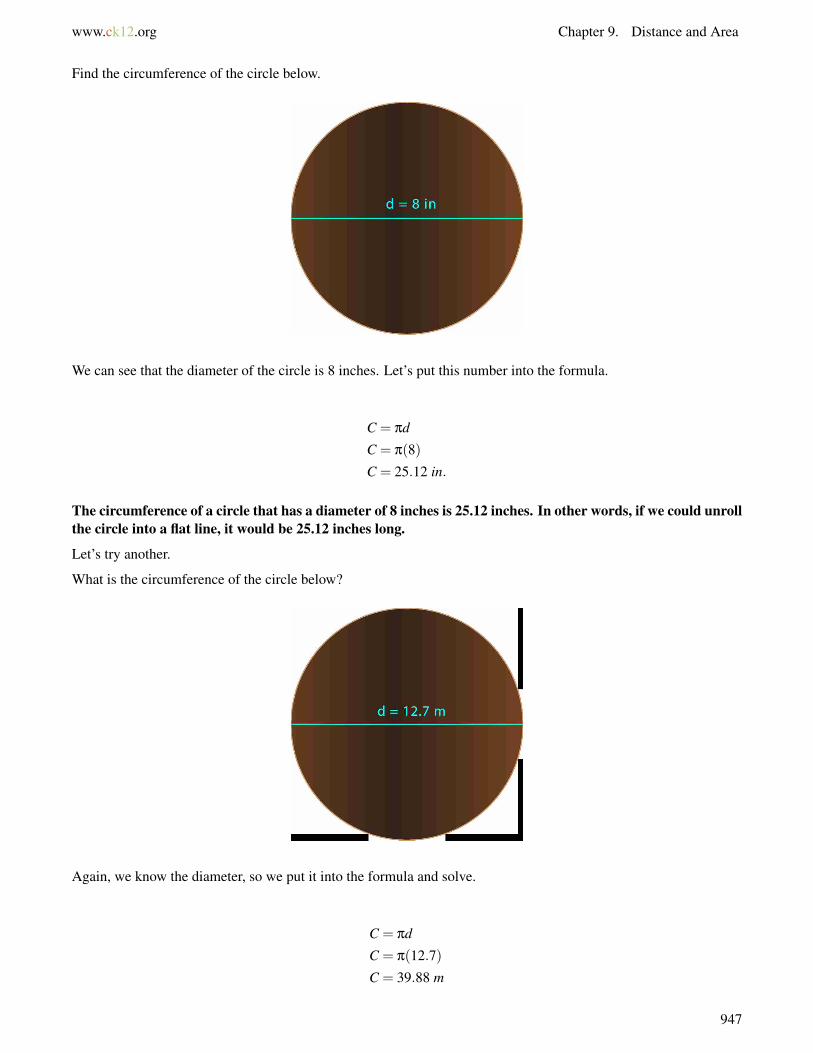
www.ck12.org Chapter 9. Distance and Area
Find the circumference of the circle below.
We can see that the diameter of the circle is 8 inches. Let’s put this number into the formula.
C = πd
C = π(8)
C = 25.12 in.
The circumference of a circle that has a diameter of 8 inches is 25.12 inches. In other words, if we could unrollthe circle into a flat line, it would be 25.12 inches long.
Let’s try another.
What is the circumference of the circle below?
Again, we know the diameter, so we put it into the formula and solve.
C = πd
C = π(12.7)
C = 39.88 m
947
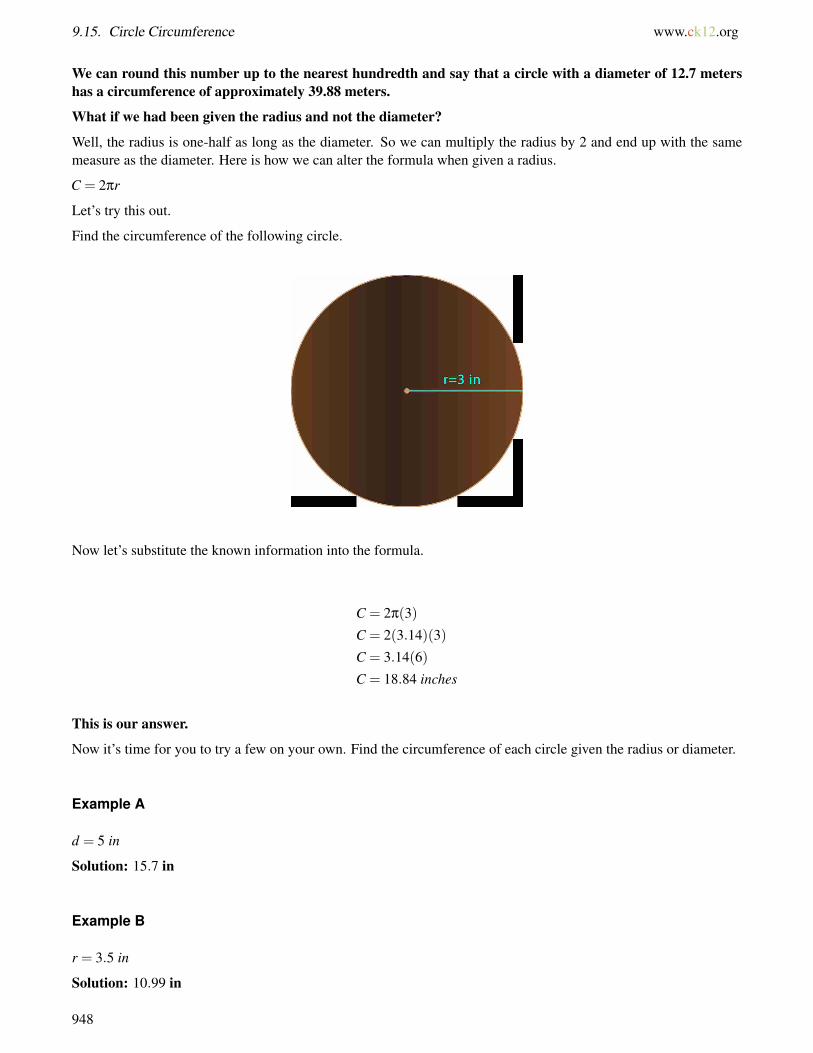
9.15. Circle Circumference www.ck12.org
We can round this number up to the nearest hundredth and say that a circle with a diameter of 12.7 metershas a circumference of approximately 39.88 meters.
What if we had been given the radius and not the diameter?
Well, the radius is one-half as long as the diameter. So we can multiply the radius by 2 and end up with the samemeasure as the diameter. Here is how we can alter the formula when given a radius.
C = 2πr
Let’s try this out.
Find the circumference of the following circle.
Now let’s substitute the known information into the formula.
C = 2π(3)
C = 2(3.14)(3)
C = 3.14(6)
C = 18.84 inches
This is our answer.
Now it’s time for you to try a few on your own. Find the circumference of each circle given the radius or diameter.
Example A
d = 5 in
Solution: 15.7 in
Example B
r = 3.5 in
Solution: 10.99 in
948

www.ck12.org Chapter 9. Distance and Area
Example C
d = 10 f t
Solution: 31.4 inches
Here is the original problem once again.
Miguel’s latest task is to measure some different “on deck” pads for the pitchers to practice with. An on deck padis a circular pad that is made up of a sponge and some fake grass. Pitcher’s practice their warm-ups by standing onthem. They work on stretching and get ready to “pitch” the ball prior to their turn on the mound.
Miguel has three different on deck pads that he is working with. The coach has asked him to measure each one andfind the circumference and the area of each.
Miguel knows that the circumference is the distance around the edge of the circle. He decides to start with figuringout the circumference of each circle.
He measures the distance across each one.
The first one measures 4 ft. across.
The second measures 5 ft. across.
The third one measures 6 ft across.
Miguel begins working on his calculations.
Let’s start with the first on deck pad. It measures 4 feet across. That is our diameter. We multiply that times3.14 to find the circumference.
C = πd
C = 3.14(4)
C = 12.56 f t
949

9.15. Circle Circumference www.ck12.org
Next, we work on the deck pad with a diameter of five feet.
C = πd
C = 3.14(5)
C = 15.7 f t
Finally we work on the deck pad with a diameter of 6 feet.
C = πd
C = 3.14(6)
C = 18.84 f t
Miguel jots down these dimensions. Now he is ready to figure out the area of each on deck pad.
Guided Practice
Here is one for you to try on your own.
Samuel baked a pie in a 9-inch pie pan. What is the circumference of the pie?
Answer
Let’s begin by figuring out what the problem is asking us to find. We need to find the circumference of the pie, sowe will use the formula to solve for C. In order to use the formula, we need to know either the diameter or the radiusof the pie. The problem tells us that the diameter of the pie is 9 inches. Let’s put this information into the formulaand solve for the circumference.
C = πd
C = π(9)
C = 28.26 in.
The circumference of the pie is 28.26 inches.
Video Review
MEDIAClick image to the left or use the URL below.URL: http://www.ck12.org/flx/render/embeddedobject/5267
This is a James Sousa video on determining the circumference of a circle.
950

www.ck12.org Chapter 9. Distance and Area
Explore More
Directions: Find the circumference of each circle given the radius or the diameter.
1. radius = 2 in
2. diameter = 4 ft
3. radius = 4.5 in
4. diameter = 8 meters
5. radius = 12 inches
6. diameter = 12 mm
7. radius = 14 mm
8. diameter = 13 feet
9. radius = 10 inches
10. diameter = 7.5 feet
11. radius = 2.5 inches
12. radius = 5.6 feet
13. diameter = 3.75 feet
14. diameter = 4.5 feet
15. diameter = 10.75 meters
951

9.16. Diameter or Radius of a Circle Given Circumference www.ck12.org
9.16 Diameter or Radius of a Circle Given Cir-cumference
Here you’ll learn to find the diameter or radius given the circumference.
Have you ever been swimming? Do you know anyone whose favorite sport is swimming?
Miguel loves baseball, but Terrence loves swimming. Terrence swam around the edge of a circular pool and foundthat it took him 176 strokes to swim one complete time around the pool.
About how many strokes will it take him to swim across the pool?
You can use what you have already learned about circumference to figure this out, but you will need to think of it ina different way.
Do you know how to do this?
This Concept will teach you exactly how to figure out this problem.
Guidance
Sometimes a problem will give us the circumference of a circle and ask us to find either its diameter or itsradius. We can still use the formula for circumference. All we have to do is put the information we have intothe appropriate place in the formula and solve for the unknown quantity.
A circle has a circumference of 20.72 m. What is its diameter?
In this problem, we are given the circumference and we need to find the diameter. We put these numbers intothe formula and solve for d.
C = πd
20.72 = πd
20.72÷π = d
6.6 = d
By solving for d, we have found that the diameter of the circle is 6.6 meters.
Let’s check our calculation to be sure. We can check by putting the diameter into the formula and solving for thecircumference:
C = πd
C = π(6.6)
C = 20.72 m
We know the circumference is 20.72 meters, so our calculation is correct.
The circumference of a circle is 147.58 yards. Find its radius.
Again, we have been given the circumference. Read carefully! This time we need to find the radius, not thediameter. We can use the formula for radii and solve for r.
952
www.ck12.org Chapter 9. Distance and Area
C = 2πr
147.58 = 2πr
147.58 = 6.28r
147.58÷6.28 = r
23.5 yd = r
We have found that the circle has a radius of 23.5 yards.
This time let’s try checking our work by using the other formula to find the diameter. Remember the diameter istwice the length of the radius.
C = πd
147.58 = πd
147.58÷π = d
47 yd = d
We have found that the diameter of the circle is 47 yards. The radius must be half this length, or 47÷2 = 23.5yards.
Our calculation is correct!
Whenever we are given the circumference, we can use the formula to solve for the diameter or the radius. Thenumber for pi always stays the same, so we only need one piece of information about a circle to find the othermeasurement.
Find the missing dimension.
Example A
The circumference is 28.26 inches. What is the diameter?
Solution: 9 inches
Example B
The circumference is 21.98 feet. What is the radius?
Solution: 3.5 feet
Example C
The circumference is 34.54 meters. What is the diameter?
Solution: 11 meters
Here is the original problem once again.
Miguel loves baseball, but Terrence loves swimming. Terrence swam around the edge of a circular pool and foundthat it took him 176 strokes to swim one complete time around the pool.
About how many strokes will it take him to swim across the pool?
953
9.16. Diameter or Radius of a Circle Given Circumference www.ck12.org
You can use what you have already learned about circumference to figure this out, but you will need to think of it ina different way.
Do you know how to do this?
To figure this out, first let’s write down the formula for finding the circumference of a circle.
C = (3.14)d
We have been given the number of strokes that it took Terrence to get around the pool. This is the circumference.
176 = (3.14)d
Now we want to figure out the number of strokes it will take him to get across the pool. This is the diameter.
Let’s solve the problem by dividing.
176÷3.14 = d
d = 56
It will take Terrence 56 strokes to cross the pool.
Guided Practice
Here is one for you to try on your own.
Maria wants to paste some ribbon around a circular mirror to make a border. The mirror is 40 inches across. If theribbon is sold by the inch and costs $0.15 per inch, how much will Maria need to spend to buy enough ribbon?
Answer
What is this problem asking us to find? We need to find how much money Maria will spend on the ribbon.
In order to determine this, we first need to know how much ribbon is necessary to go around the mirror. Therefore weneed to find the circumference of the mirror. We know that it is 40 inches across. Is this the radius or the diameter?It is the diameter, so we can put this information into the formula and solve for the circumference.
C = πd
C = π(40)
C = 125.6 in.
The circumference of the mirror is 125.6 inches, so Maria will need 125.6 inches of ribbon to put around it.
We’re not done yet, however. Remember, we need to find how much money she will spend to buy the ribbon.
Because the ribbon is sold by the inch, Maria will need to buy 126 inches. We know that it is sold at $0.15 an inch,so we simply multiply the number of inches by the cost per inch.
126 inches×$0.15 per inch = $18.90
Maria will need to spend $18.90 in order to buy enough ribbon to go around her mirror.
Video Review
954
www.ck12.org Chapter 9. Distance and Area
MEDIAClick image to the left or use the URL below.URL: http://www.ck12.org/flx/render/embeddedobject/5267
This is a James Sousa video on determining the circumference of a circle.
Explore More
Directions: Given the circumference, find the diameter.
1. Circumference = 15.7 ft.
2. Circumference = 20.41 in
3. Circumference = 21.98 m
4. Circumference = 4.71 cm
5. Circumference = 47.1 ft
Directions: Given the circumference, find the radius.
6. Circumference = 43.96 in
7. Circumference = 15.7 m
8. Circumference = 14.13 in
9. Circumference = 20.41 cm
10. Circumference = 12.56 ft.
Directions: Solve each problem.
11. What is the circumference of a circle whose diameter is 32.5 meters?
12. A circle has a radius of 67 centimeters. What is its circumference?
13. What is the circumference of a circle whose radius is 7.23 feet?
14. What is the diameter of a circle whose circumference is 172.7 inches?
15. A circle has a circumference of 628 centimeters. What is the radius of the circle?
16. The circumference of a circular table is 40.82 feet. What is the radius of the rug?
17. Workers at the zoo are building five circular pens for the elephants. Each pen has a diameter of 226 meters. Howmuch fence will the workers need in order to surround all three pens?
18. Mrs. Golding has a circular mirror with a frame around it. The frame is 4 inches wide. If the diameter of themirror and the frame together is 48 inches, what is the circumference of just the mirror?
955
9.17. Area of a Circle www.ck12.org
9.17 Area of a Circle
Here you’ll find the area of a circle given the radius or diameter.
Do you remember Miguel from the Diameter or Radius of a Circle Given Circumference Concept? He had justfinished working on figuring out the circumference of three different on deck pads for the pitchers to use while theywarm up. Let’s look at his dilemma again before we look at the area of the pads.
Miguel’s latest task is to measure some different “on deck” pads for the pitchers to practice with. An on deck padis a circular pad that is made up of a sponge and some fake grass. Pitcher’s practice their warm-ups by standing onthem. They work on stretching and get ready to “pitch” the ball prior to their turn on the mound.
Miguel has three different on deck pads that he is working with. The coach has asked him to measure each one andfind the circumference and the area of each.
Miguel knows that the circumference is the distance around the edge of the circle. He decides to start with figuringout the circumference of each circle.
He measures the distance across each one.
The first one measures 4 ft. across.
The second measures 5 ft. across.
The third one measures 6 ft across.
Miguel has completed the first part of this assignment. He knows the circumference of each pad. Now he has tofigure out the area of each. Miguel isn’t sure how to do this. He can’t remember how to find the area of a circle.Miguel needs some help.
This is where you come in use this Concept to help you learn how to find the area of a circle. When finished,we’ll come back to this problem and you can help Miguel figure out the area of each on deck pad.
Guidance
You have learned how to calculate the circumference of a circle. Let’s take a few minutes to review the termsassociated with circles.
956

www.ck12.org Chapter 9. Distance and Area
A circle is a set of connected points equidistant from a center point. The diameter is the distance across thecenter of the circle and the radius is the distance from the center of the circle to the edge.
We also know that the number pi, π, is the ratio of the diameter to the circumference. We use 3.14 to representpi in operations.
What does all of this have to do with area?
Well, to find the area of a figure, we need to figure out the measurement of the space contained inside a two-dimensional figure. This is the measurement area. This is also the measurement inside a circle. You learned how tofind the circumference of a circle, now let’s look at using these parts to find the area of the circle.
How do we find the area of a circle?
The area of a circle is found by taking the measurement of the radius, squaring it and multiplying it by pi.
Here is the formula.
A = πr2
Write this formula down in your notebook.
We already know that the symbol π represents the number 3.14, so all we need to know to find the area of a circle isits radius. We simply put this number into the formula in place of r and solve for the area, A.
Let’s try it out.
What is the area of the circle below?
We know that the radius of the circle is 12 centimeters. We put this number into the formula and solve for A.
957
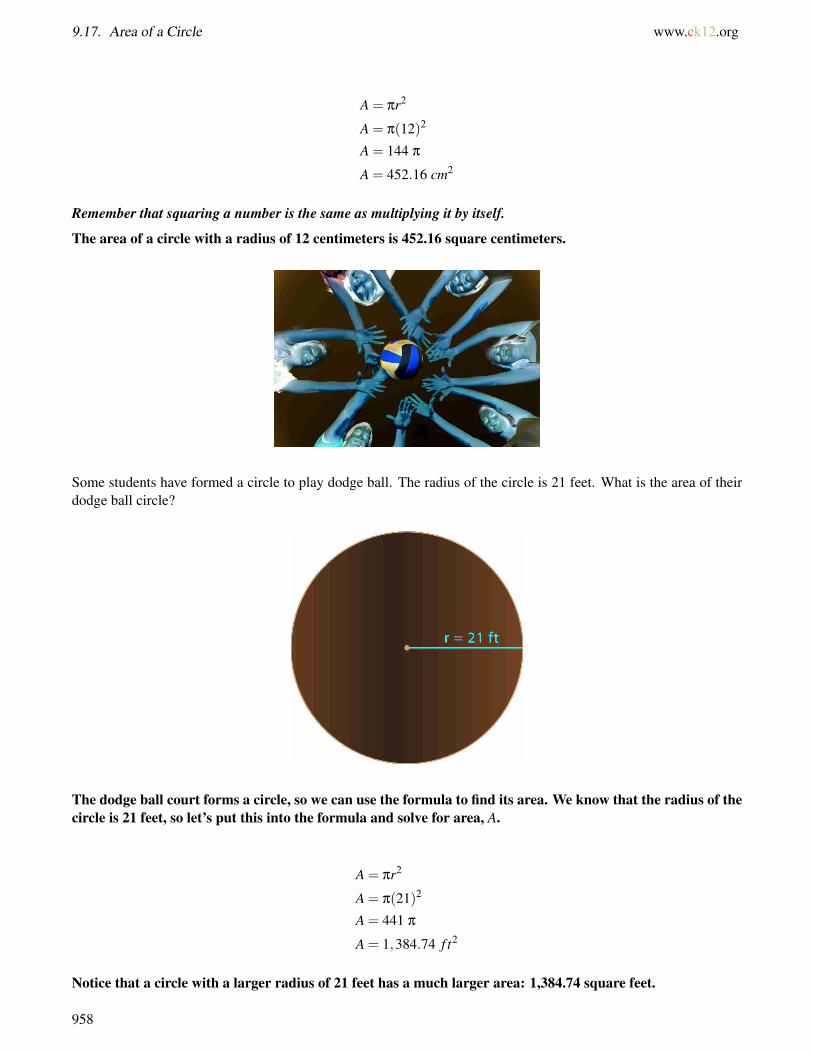
9.17. Area of a Circle www.ck12.org
A = πr2
A = π(12)2
A = 144 π
A = 452.16 cm2
Remember that squaring a number is the same as multiplying it by itself.
The area of a circle with a radius of 12 centimeters is 452.16 square centimeters.
Some students have formed a circle to play dodge ball. The radius of the circle is 21 feet. What is the area of theirdodge ball circle?
The dodge ball court forms a circle, so we can use the formula to find its area. We know that the radius of thecircle is 21 feet, so let’s put this into the formula and solve for area, A.
A = πr2
A = π(21)2
A = 441 π
A = 1,384.74 f t2
Notice that a circle with a larger radius of 21 feet has a much larger area: 1,384.74 square feet.
958
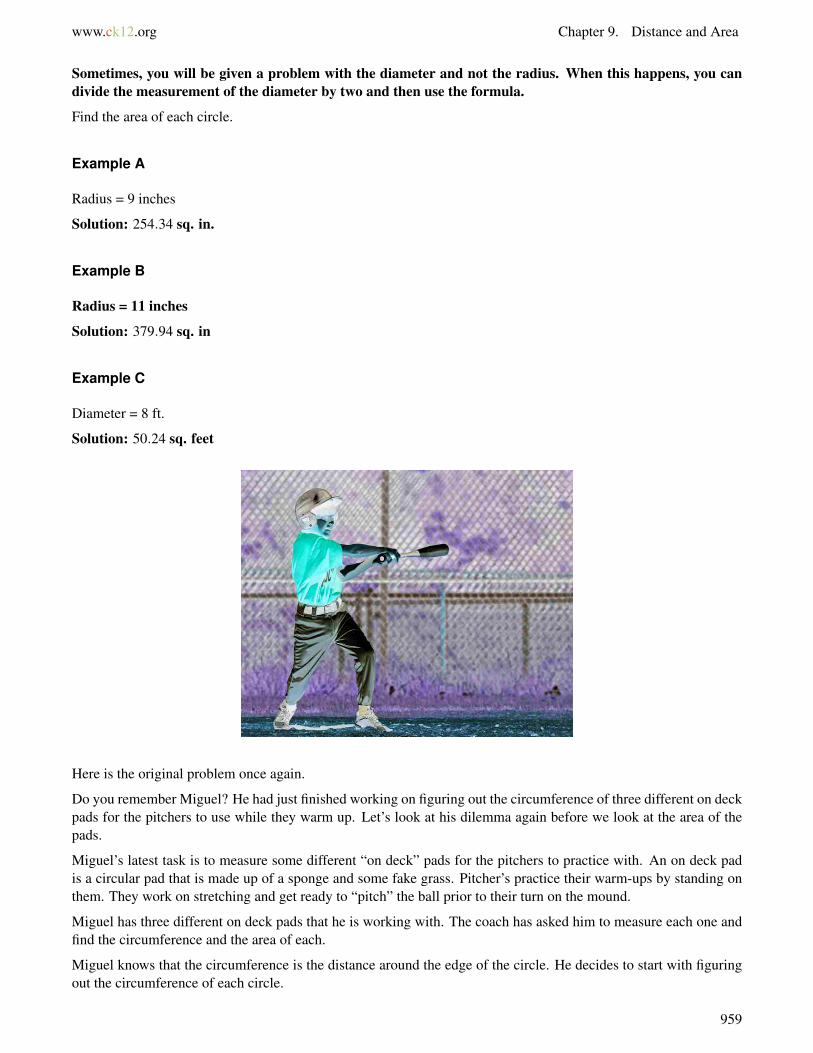
www.ck12.org Chapter 9. Distance and Area
Sometimes, you will be given a problem with the diameter and not the radius. When this happens, you candivide the measurement of the diameter by two and then use the formula.
Find the area of each circle.
Example A
Radius = 9 inches
Solution: 254.34 sq. in.
Example B
Radius = 11 inches
Solution: 379.94 sq. in
Example C
Diameter = 8 ft.
Solution: 50.24 sq. feet
Here is the original problem once again.
Do you remember Miguel? He had just finished working on figuring out the circumference of three different on deckpads for the pitchers to use while they warm up. Let’s look at his dilemma again before we look at the area of thepads.
Miguel’s latest task is to measure some different “on deck” pads for the pitchers to practice with. An on deck padis a circular pad that is made up of a sponge and some fake grass. Pitcher’s practice their warm-ups by standing onthem. They work on stretching and get ready to “pitch” the ball prior to their turn on the mound.
Miguel has three different on deck pads that he is working with. The coach has asked him to measure each one andfind the circumference and the area of each.
Miguel knows that the circumference is the distance around the edge of the circle. He decides to start with figuringout the circumference of each circle.
959

9.17. Area of a Circle www.ck12.org
He measures the distance across each one.
The first one measures 4 ft. across.
The second measures 5 ft. across.
The third one measures 6 ft across.
Miguel has completed the first part of this assignment. He knows the circumference of each pad. Now he has tofigure out the area of each. Miguel isn’t sure how to do this. He can’t remember how to find the area of a circle.Miguel needs some help.
Now it’s time to help Miguel figure out each area.
The first one has a diameter of 4 feet, so it has a radius of 2 ft. Here is the area of the first pad.
A = πr2
A = 3.14(22)
A = 12.56 sq. f eet
The second pad has a diameter of 5 feet, so it has a radius of 2.5 feet.
A = πr2
A = 3.14(2.52)
A = 19.63 sq. f eet
The third pad has a diameter of 6 feet, so it has a radius of 3 feet.
A = πr2
A = 3.14(32)
A = 28.26 sq. f eet
Miguel is very pleased with his work. He is sure that his coach will be pleased with his efforts as well!
Guided Practice
Here is one for you to try on your own.
Find the area of a circle with a diameter of 10 in.
Answer
First, we divide the measurement in half to find the radius.
10÷2 = 5 in
Now we use the formula.
A = πr2
A = 3.14(52)
A = 3.14(25)
A = 78.5 square inches
960
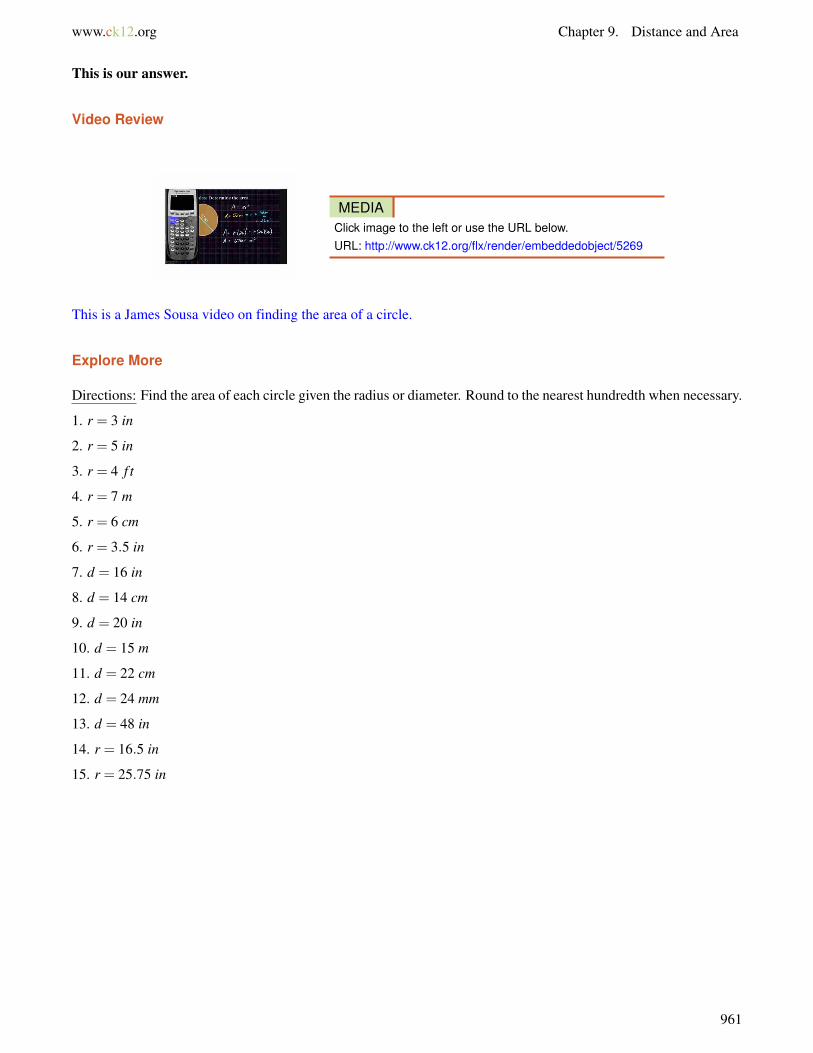
www.ck12.org Chapter 9. Distance and Area
This is our answer.
Video Review
MEDIAClick image to the left or use the URL below.URL: http://www.ck12.org/flx/render/embeddedobject/5269
This is a James Sousa video on finding the area of a circle.
Explore More
Directions: Find the area of each circle given the radius or diameter. Round to the nearest hundredth when necessary.
1. r = 3 in
2. r = 5 in
3. r = 4 f t
4. r = 7 m
5. r = 6 cm
6. r = 3.5 in
7. d = 16 in
8. d = 14 cm
9. d = 20 in
10. d = 15 m
11. d = 22 cm
12. d = 24 mm
13. d = 48 in
14. r = 16.5 in
15. r = 25.75 in
961
9.18. Radius or Diameter of a Circle Given Area www.ck12.org
9.18 Radius or Diameter of a Circle Given Area
Here you’ll learn to find the radius or diameter of a circle given the area.
Remember Terrence and his swimming in the Area of a Circle Concept? Take a look at this problem.
Terrence swam in a pool with an area of 452.16 sq. feet. What is the diameter of this pool?
To figure this out, you will need to know how to problem solve to find the radius or diameter of a circle. ThisConcept will teach you how to do this.
Guidance
We have seen that when we are given the radius or the diameter of a circle, we can find its area. We can also use theformula to find the radius or diameter if we know the area. Let’s see how this works.
The area of a circle is 113.04 square inches. What is its radius?
This time we know the area and we need to find the radius. We can put the number for area into the formulaand use it to solve for the radius, r.
A = πr2
113.04 = πr2
113.04÷π = r2
36 = r2
√36 = r
6 in.= r
Let’s look at what we did to solve this. To solve this problem we needed to isolate the variable r. First, we dividedboth sides by π, or 3.14. Then, to remove the exponent, we took the square root of both sides. A square root is anumber that, when multiplied by itself, gives the number shown. We know that 6 is the square root of 36 because6×6 = 36.
The radius of a circle with an area of 113.04 square inches is 6 inches.
What is the diameter of a circle whose area is 379.94 cm2?
What is this problem asking us to find? We need to find the diameter (not the radius!). What information isgiven in the problem? We know the area. Therefore we can use the formula to solve for the radius, r. Oncewe know the radius, we can find the diameter. Let’s give it a try.
A = πr2
379.94 = πr2
379.94÷π = r2
121 = r2
√121 = r
11 cm = r
962
www.ck12.org Chapter 9. Distance and Area
The radius of a circle with an area of 379.94 square centimeters is 11 centimeters.
Remember, this problem asked us to find the diameter, so we’re not done yet. How can we find the diameter?
The diameter is always twice the length of the radius, so the diameter of this circle is 11×2 = 22 centimeters.
As we have seen, we can use the area formula whenever we are given information about a circle. If we know thediameter or radius, we can solve for the area, A. If we are given the area, we can solve for the radius, r. If we knowthe radius, we can also find the diameter.
Find the radius of each circle.
Example A
Area = 153.86 sq. in.
Solution: 7 inches
Example B
Area = 379.94 sq. ft.
Solution: 11 ft.
Example C
452.16 sq. m
Solution: 12 meters
Here is the original problem once again.
Terrence swam in a pool with an area of 452.16 sq. feet. What is the diameter of this pool?
To figure this out, we need to use the formula for area and then solve using the given information.
A = πr2
452.16 = πr2
452.16÷π = r2
144 = r2
√169 = r
12 f t.= r
We need to find the diameter of the pool. We can figure this out by doubling the radius.
The diameter of the pool is 24 feet.
Guided Practice
Here is one for you to try on your own.
What is the radius of a circle with an area of 530.66 sq. inches?
Answer
963
9.18. Radius or Diameter of a Circle Given Area www.ck12.org
To figure this out, we use the formula for finding the area of circle, then we solve using our given information.
A = πr2
530.66 = πr2
530.66÷π = r2
169 = r2
√169 = r
13 in.= r
The radius of this circle is 13 inches.
Video Review
MEDIAClick image to the left or use the URL below.URL: http://www.ck12.org/flx/render/embeddedobject/5269
This is a James Sousa video on finding the radius or diameter given an area.
Explore More
Directions: Find each radius given the area of the circle.
1. 12.56 sq. in.
2. 78.5 sq. m
3. 200.96 sq. cm
4. 254.34 sq. in
5. 7.07 sq. ft.
6. 28.26 sq. m
Directions: Find each diameter given the area of the circle.
7. 12.56 sq. in.
8. 78.5 sq. m
9. 200.96 sq. cm
10. 254.34 sq. in
11. 7.07 sq. ft.
12. 28.26 sq. m
13. 615.44 sq. feet
14. 176.625 sq. m
964

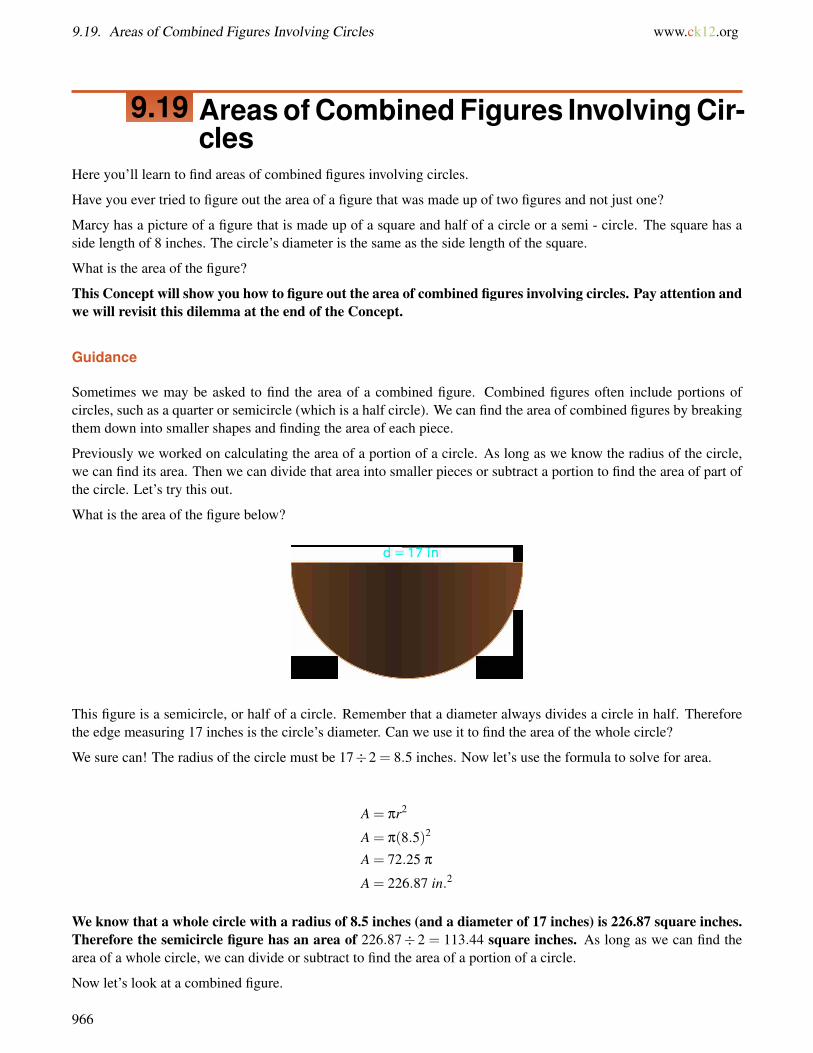
9.19. Areas of Combined Figures Involving Circles www.ck12.org
9.19 Areas of Combined Figures Involving Cir-cles
Here you’ll learn to find areas of combined figures involving circles.
Have you ever tried to figure out the area of a figure that was made up of two figures and not just one?
Marcy has a picture of a figure that is made up of a square and half of a circle or a semi - circle. The square has aside length of 8 inches. The circle’s diameter is the same as the side length of the square.
What is the area of the figure?
This Concept will show you how to figure out the area of combined figures involving circles. Pay attention andwe will revisit this dilemma at the end of the Concept.
Guidance
Sometimes we may be asked to find the area of a combined figure. Combined figures often include portions ofcircles, such as a quarter or semicircle (which is a half circle). We can find the area of combined figures by breakingthem down into smaller shapes and finding the area of each piece.
Previously we worked on calculating the area of a portion of a circle. As long as we know the radius of the circle,we can find its area. Then we can divide that area into smaller pieces or subtract a portion to find the area of part ofthe circle. Let’s try this out.
What is the area of the figure below?
This figure is a semicircle, or half of a circle. Remember that a diameter always divides a circle in half. Thereforethe edge measuring 17 inches is the circle’s diameter. Can we use it to find the area of the whole circle?
We sure can! The radius of the circle must be 17÷2 = 8.5 inches. Now let’s use the formula to solve for area.
A = πr2
A = π(8.5)2
A = 72.25 π
A = 226.87 in.2
We know that a whole circle with a radius of 8.5 inches (and a diameter of 17 inches) is 226.87 square inches.Therefore the semicircle figure has an area of 226.87÷ 2 = 113.44 square inches. As long as we can find thearea of a whole circle, we can divide or subtract to find the area of a portion of a circle.
Now let’s look at a combined figure.
966
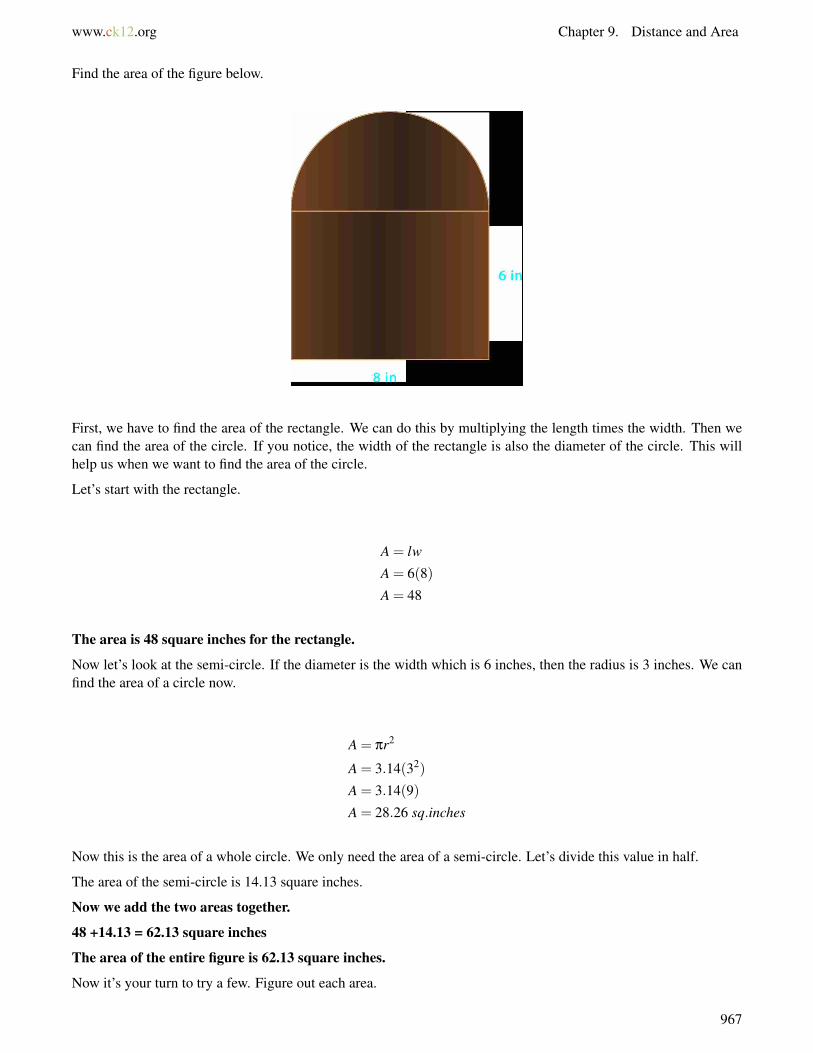
www.ck12.org Chapter 9. Distance and Area
Find the area of the figure below.
First, we have to find the area of the rectangle. We can do this by multiplying the length times the width. Then wecan find the area of the circle. If you notice, the width of the rectangle is also the diameter of the circle. This willhelp us when we want to find the area of the circle.
Let’s start with the rectangle.
A = lw
A = 6(8)
A = 48
The area is 48 square inches for the rectangle.
Now let’s look at the semi-circle. If the diameter is the width which is 6 inches, then the radius is 3 inches. We canfind the area of a circle now.
A = πr2
A = 3.14(32)
A = 3.14(9)
A = 28.26 sq.inches
Now this is the area of a whole circle. We only need the area of a semi-circle. Let’s divide this value in half.
The area of the semi-circle is 14.13 square inches.
Now we add the two areas together.
48 +14.13 = 62.13 square inches
The area of the entire figure is 62.13 square inches.
Now it’s your turn to try a few. Figure out each area.
967
9.19. Areas of Combined Figures Involving Circles www.ck12.org
Example A
Two semi - circles with a square in the middle. The square has a side length of 6 inches. The semi - circles have thesame diameter as the side length.
Solution: 149.04 in2
Example B
A rectangle with a length of 5 feet and a width of 3 feet connected to a semi - circle with the same diameter as thewidth.
Solution: 29.13 f t2
Example C
A square with a side length of 4 mm and a semi - circle with a diameter of the same side length as the square.
Solution: 41.12 mm2
Here is the original problem once again.
Marcy has a picture of a figure that is made up of a square and half of a circle or a semi - circle. The square has aside length of 8 inches. The circle’s diameter is the same as the side length of the square.
What is the area of the figure?
To figure this out, we can first figure out the area of the square.
A = s2
A = 82
A = 64 in2
This is the area of the square.
Next, we have to figure out the area of half of a circle. Let’s figure out the area of the whole circle first.
A = πr2
A = π82
A = 200.96 in2
This is the area of the whole circle. We only need half of this area, so we divide this number by 2.
200.96÷2 = 100.48
Now, we add the two areas together.
100.48+64 = 164.48 in2
This is our answer.
Guided Practice
Here is one for you to try on your own.
Johann drew a design for a new sign for the cafe at school. The sign is made up of a square and a semi - circle. Thesquare has a side length of 9 inches. The semi - circle has the same diameter as the square.
What is the area of the sign?
968

www.ck12.org Chapter 9. Distance and Area
Answer
First, we have to figure out two different measurements for area and add them together. Let’s start with the square.
A = s2
A = 92
A = 81 in2
Next, we figure out the area of the half circle. Look at how the formula for the area of a circle can be adjusted.
A = 12 [πr2]
A = 12 [3.14(92)]
A = 12(254.34)
A = 127.17 in2
This is the area of half of the circle.
Now we add these areas together.
127.17+81 = 208.17 in2
This is our answer.
Video Review
MEDIAClick image to the left or use the URL below.URL: http://www.ck12.org/flx/render/embeddedobject/57612
This is a James Sousa video about finding the area of a combined figure.
Explore More
Directions: Find the area of each combined figure.
1. A square and a semi-circle. The square has a side length of 11 mm. The diameter of the circle matches thesquare’s side.
2. A square and a semi-circle. The square has a side length of 8.5 inches. The diameter of the circle matches thesquare’s side.
3. A square and a semi-circle. The square has a side length of 7.25 inches. The diameter of the circle matches thesquare’s side.
4. A square and a semi-circle. The square has a side length of 13 feet. The diameter of the circle matches thesquare’s side.
5. A square and a semi-circle. The square has a side length of 15.5 feet. The diameter of the circle matches thesquare’s side.
6. A rectangle and a semi-circle. The rectangle has a length of 8 feet and a width of 5 feet. The diameter of thecircle matches the width.
969

9.19. Areas of Combined Figures Involving Circles www.ck12.org
7. A rectangle and a semi-circle. The rectangle has a length of 8.5 feet and a width of 6 feet. The diameter of thecircle matches the width.
8. A rectangle and a semi-circle. The rectangle has a length of 9 inches and a width of 4.5 inches. The diameter ofthe circle matches the length.
9. A rectangle and a semi-circle. The rectangle has a length of 7 feet and a width of 4 feet. The diameter of thecircle matches the length.
10. A rectangle and a semi-circle. The rectangle has a length of 5.5 feet and a width of 3.5 feet. The diameter of thecircle matches the width.
11. A triangle and a semi-circle. The triangle has a base of 5 inches and a height of 4 inches. The diameter of thecircle matches the base of the triangle.
12. A triangle and a semi - circle. The triangle has a base of 7 inches and a height of 6 inches. The diameter of thecircle matches the base of the triangle.
13. A triangle and a semi - circle. The triangle has a base of 5.5 inches and a height of 4 inches. The diameter of thecircle matches the base of the triangle.
Directions: Solve each problem.
14. Rob is painting large polka dots on a sheet for the backdrop of the school musical. He painted 16 polka dots,each with a radius of 3 feet. What is the total area that the polka dots cover?
15. The librarian is having the library at her school carpeted. The library is a circular room with a diameter of 420feet. How many square feet of carpet will she need to order?
Summary
Having completed this chapter, students are now ready to move on to the next Chapter. Each Concept has providedstudents with an opportunity to engage and practice skills in many Concepts including square roots, the PythagoreanTheorem, area of parallelograms, trapezoids, triangles and circles, circumference of circles, irrational numbers andrational numbers.
970
www.ck12.org Chapter 10. Surface Area and Volume
CHAPTER 10 Surface Area and VolumeChapter Outline
10.1 CLASSIFICATION OF SOLID FIGURES
10.2 FACES, EDGES, AND VERTICES OF SOLIDS
10.3 CROSS-SECTIONS AND NETS
10.4 SURFACE AREA OF RECTANGULAR PRISMS
10.5 SURFACE AREA OF TRIANGULAR PRISMS
10.6 SURFACE AREA OF CYLINDERS
10.7 HEIGHTS OF CYLINDERS GIVEN SURFACE AREA
10.8 SURFACE AREA OF PYRAMIDS
10.9 SURFACE AREA OF CONES
10.10 VOLUME OF RECTANGULAR PRISMS
10.11 VOLUME OF TRIANGULAR PRISMS
10.12 VOLUME OF CYLINDERS
10.13 HEIGHTS OF CYLINDERS GIVEN VOLUME
10.14 VOLUME OF PYRAMIDS
10.15 VOLUME OF CONES
Introduction
In Math 7, the learning content is divided into Concepts. Each Concept is complete and whole providing focusedlearning on an indicated objective. Theme-based Concepts provide students with experiences that integrate thecontent of each Concept. Students are given opportunities to practice the skills of each Concept through real-worldsituations, examples, guided practice and independent practice sections. There are also video links provided to givestudents an audio/visual way of connecting with the content. In this Chapter, students will engage with Concepts onclassifying solid figures, representing solid figures, surface area and volume with prisms, cylinders, pyramids andcones.
971
10.1. Classification of Solid Figures www.ck12.org
10.1 Classification of Solid Figures
Here you’ll learn to classify solid figures as prisms, cylinders, pyramids, cones or spheres.
Candice and Trevor have gotten a job working at the mall for the holiday season. They are both going to be workingin the wrapping station. During the holidays, the mall offers free gift wrapping. People can come through and havetheir gifts wrapped. If they want to make a donation they can and that money is used to help needy families.
Candice and Trevor both show up on their first day for training. Mrs. Scott, the manager of the wrapping stationshows them both where they will be working.
“First, we need to show you some great techniques for wrapping presents,” Mrs. Scott explains. “There are someways that are more effective and useful than others.”
Candice and Trevor both take a seat in front of a bunch of different items.
There is a round bottle of perfume, a shoe box, a soccer ball and a magician’s hat with a round bottom and a point atthe top.
“What kinds of shapes to do you see here?” Mrs. Scott asked the two.
Before seeing Candice and Trevor’s answers, think about this question yourself. Based on the descriptions,how would you classify these objects? Make a few notes in your notebook.
In this Concept, you will learn how to classify three-dimensional solids. By the end of this Concept, you willknow how Candice and Trevor can classify each item.
Guidance
Previously we worked on plane figures which are two-dimensional figures. This means that they have only lengthand width. Even a circle which has a circumference and a diameter is still a plane figure. It does not have depth.
This lesson will focus on solid figures and solid figures are three-dimensional figures.
How is a solid figure different from a plane figure?
A solid figure has length, width and height, whereas a plane figure only has length and width.
Let’s look at some plane figures.
972
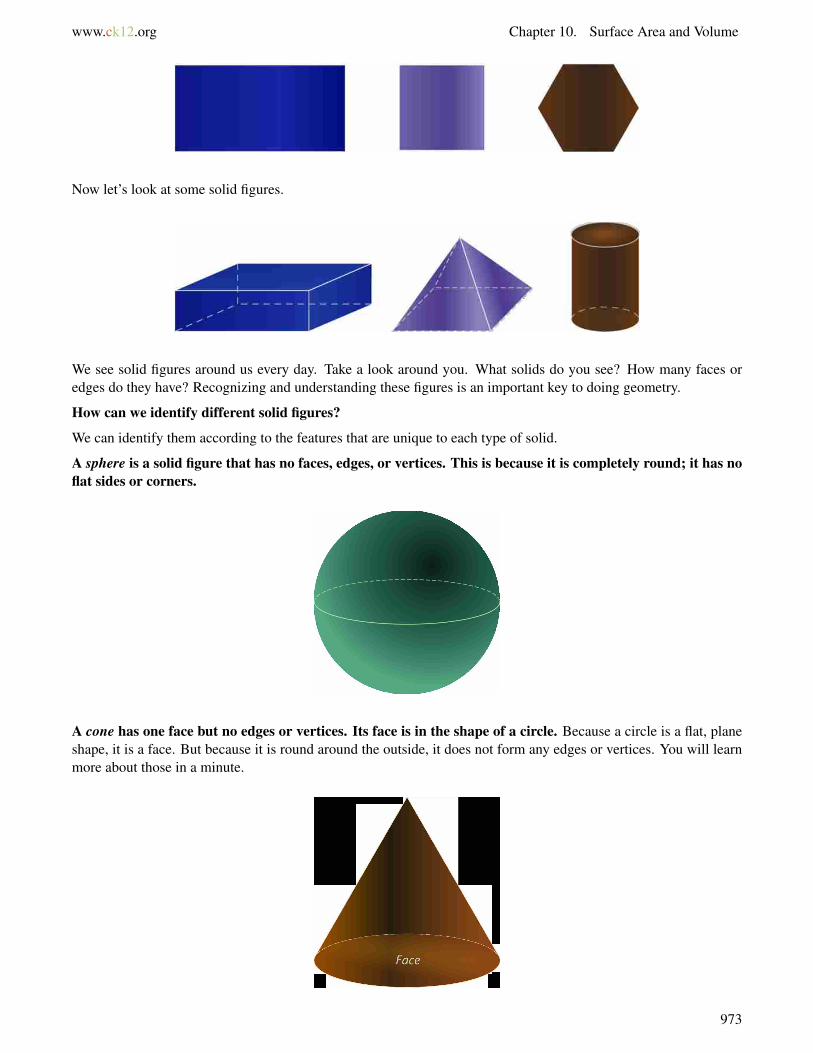
www.ck12.org Chapter 10. Surface Area and Volume
Now let’s look at some solid figures.
We see solid figures around us every day. Take a look around you. What solids do you see? How many faces oredges do they have? Recognizing and understanding these figures is an important key to doing geometry.
How can we identify different solid figures?
We can identify them according to the features that are unique to each type of solid.
A sphere is a solid figure that has no faces, edges, or vertices. This is because it is completely round; it has noflat sides or corners.
A cone has one face but no edges or vertices. Its face is in the shape of a circle. Because a circle is a flat, planeshape, it is a face. But because it is round around the outside, it does not form any edges or vertices. You will learnmore about those in a minute.
973
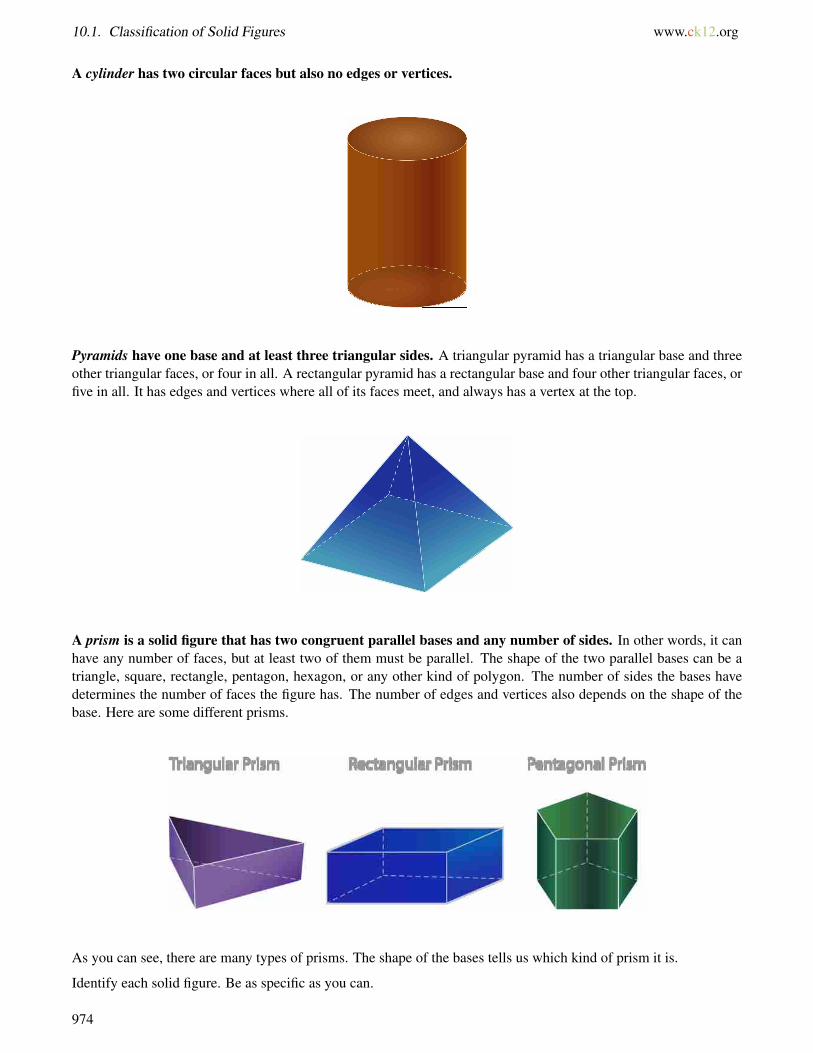
10.1. Classification of Solid Figures www.ck12.org
A cylinder has two circular faces but also no edges or vertices.
Pyramids have one base and at least three triangular sides. A triangular pyramid has a triangular base and threeother triangular faces, or four in all. A rectangular pyramid has a rectangular base and four other triangular faces, orfive in all. It has edges and vertices where all of its faces meet, and always has a vertex at the top.
A prism is a solid figure that has two congruent parallel bases and any number of sides. In other words, it canhave any number of faces, but at least two of them must be parallel. The shape of the two parallel bases can be atriangle, square, rectangle, pentagon, hexagon, or any other kind of polygon. The number of sides the bases havedetermines the number of faces the figure has. The number of edges and vertices also depends on the shape of thebase. Here are some different prisms.
As you can see, there are many types of prisms. The shape of the bases tells us which kind of prism it is.
Identify each solid figure. Be as specific as you can.
974
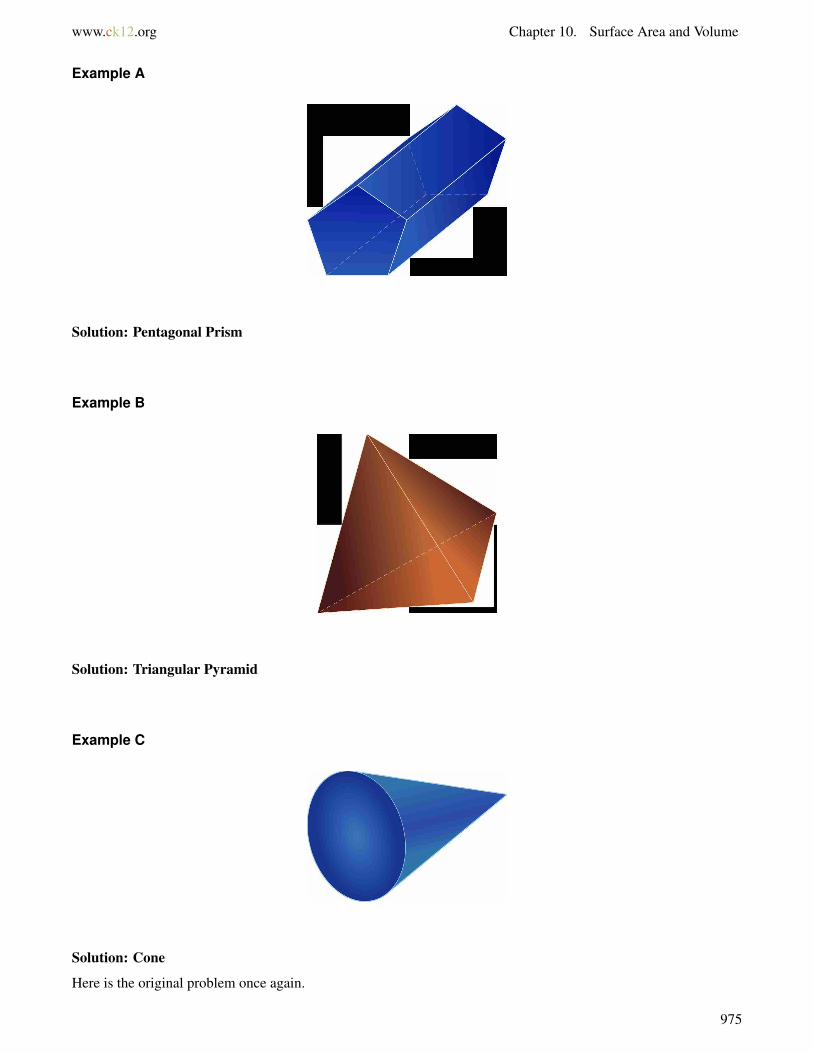
www.ck12.org Chapter 10. Surface Area and Volume
Example A
Solution: Pentagonal Prism
Example B
Solution: Triangular Pyramid
Example C
Solution: Cone
Here is the original problem once again.
975
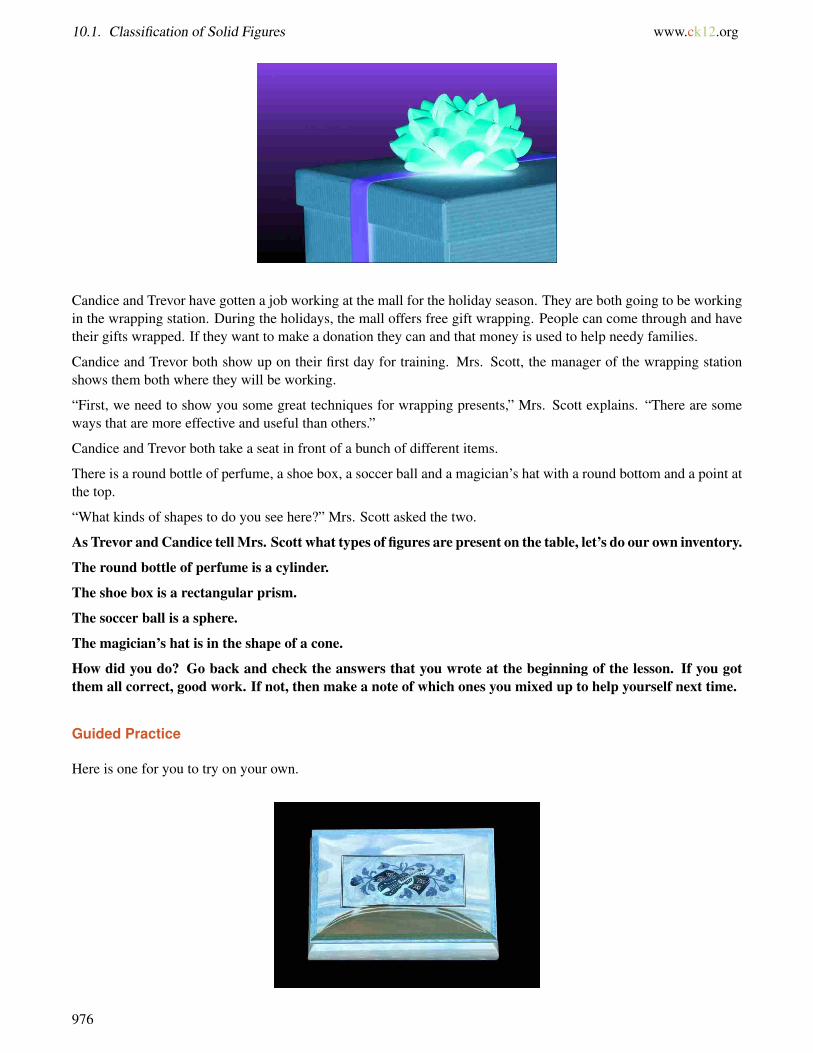
10.1. Classification of Solid Figures www.ck12.org
Candice and Trevor have gotten a job working at the mall for the holiday season. They are both going to be workingin the wrapping station. During the holidays, the mall offers free gift wrapping. People can come through and havetheir gifts wrapped. If they want to make a donation they can and that money is used to help needy families.
Candice and Trevor both show up on their first day for training. Mrs. Scott, the manager of the wrapping stationshows them both where they will be working.
“First, we need to show you some great techniques for wrapping presents,” Mrs. Scott explains. “There are someways that are more effective and useful than others.”
Candice and Trevor both take a seat in front of a bunch of different items.
There is a round bottle of perfume, a shoe box, a soccer ball and a magician’s hat with a round bottom and a point atthe top.
“What kinds of shapes to do you see here?” Mrs. Scott asked the two.
As Trevor and Candice tell Mrs. Scott what types of figures are present on the table, let’s do our own inventory.
The round bottle of perfume is a cylinder.
The shoe box is a rectangular prism.
The soccer ball is a sphere.
The magician’s hat is in the shape of a cone.
How did you do? Go back and check the answers that you wrote at the beginning of the lesson. If you gotthem all correct, good work. If not, then make a note of which ones you mixed up to help yourself next time.
Guided Practice
Here is one for you to try on your own.
976
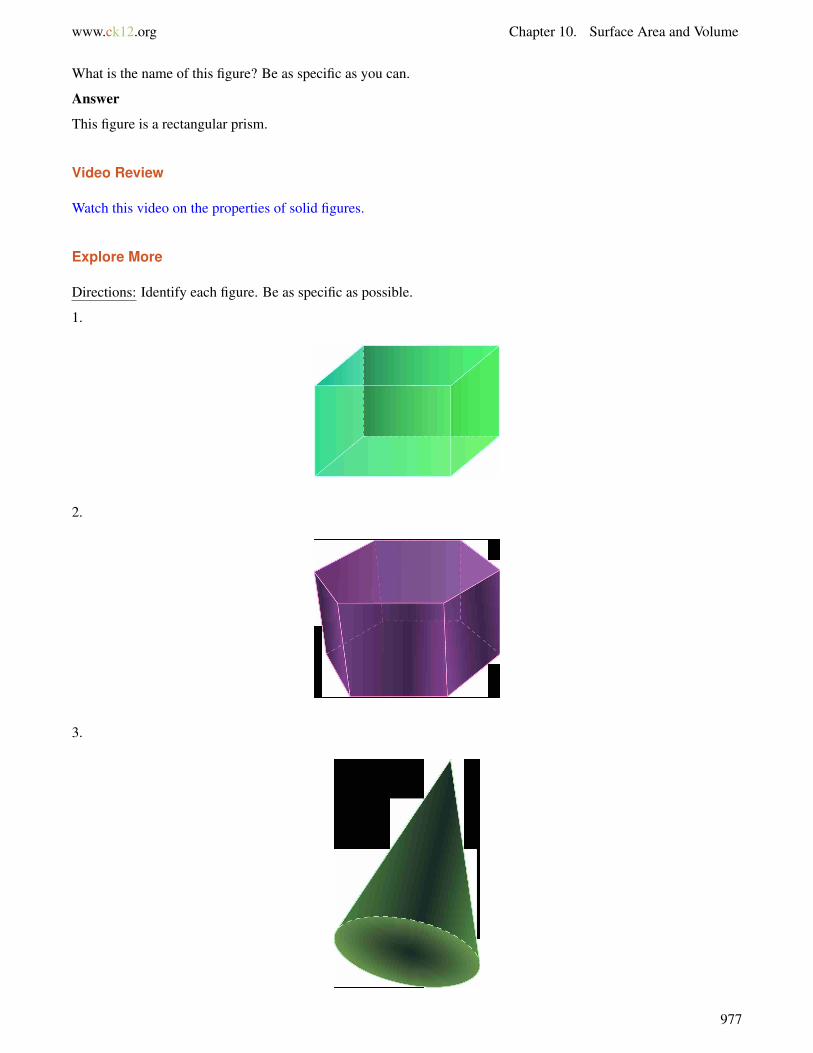
www.ck12.org Chapter 10. Surface Area and Volume
What is the name of this figure? Be as specific as you can.
Answer
This figure is a rectangular prism.
Video Review
Watch this video on the properties of solid figures.
Explore More
Directions: Identify each figure. Be as specific as possible.
1.
2.
3.
977
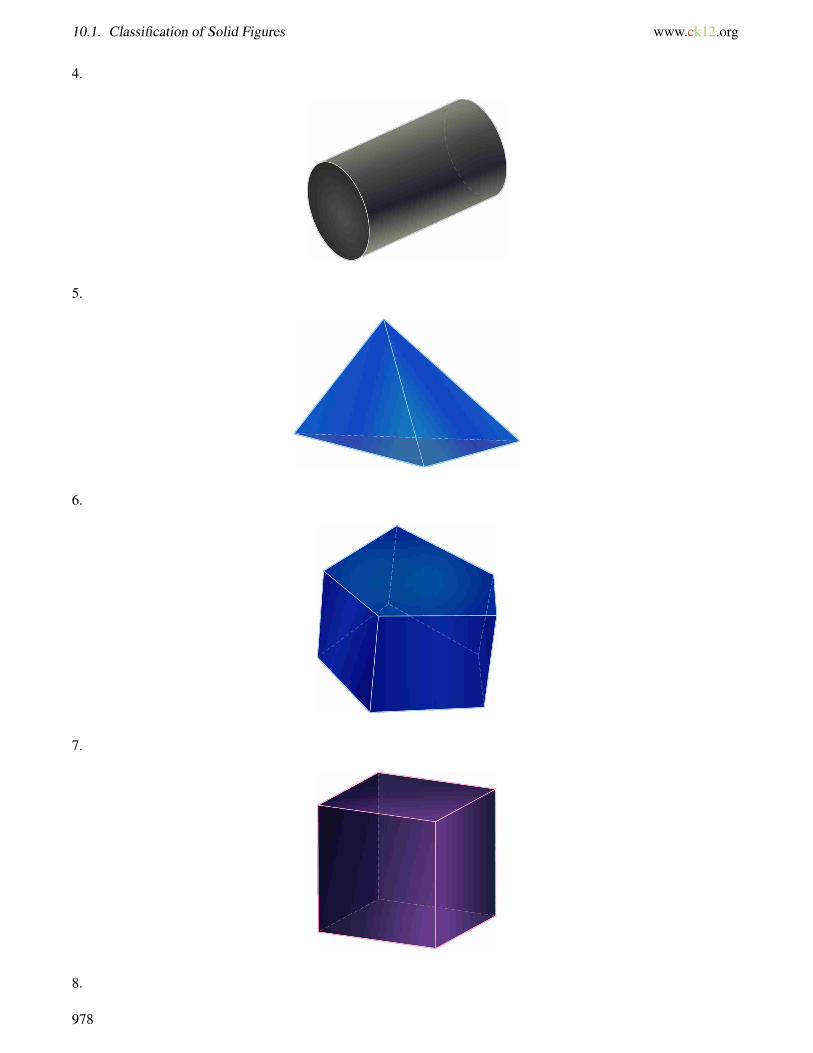
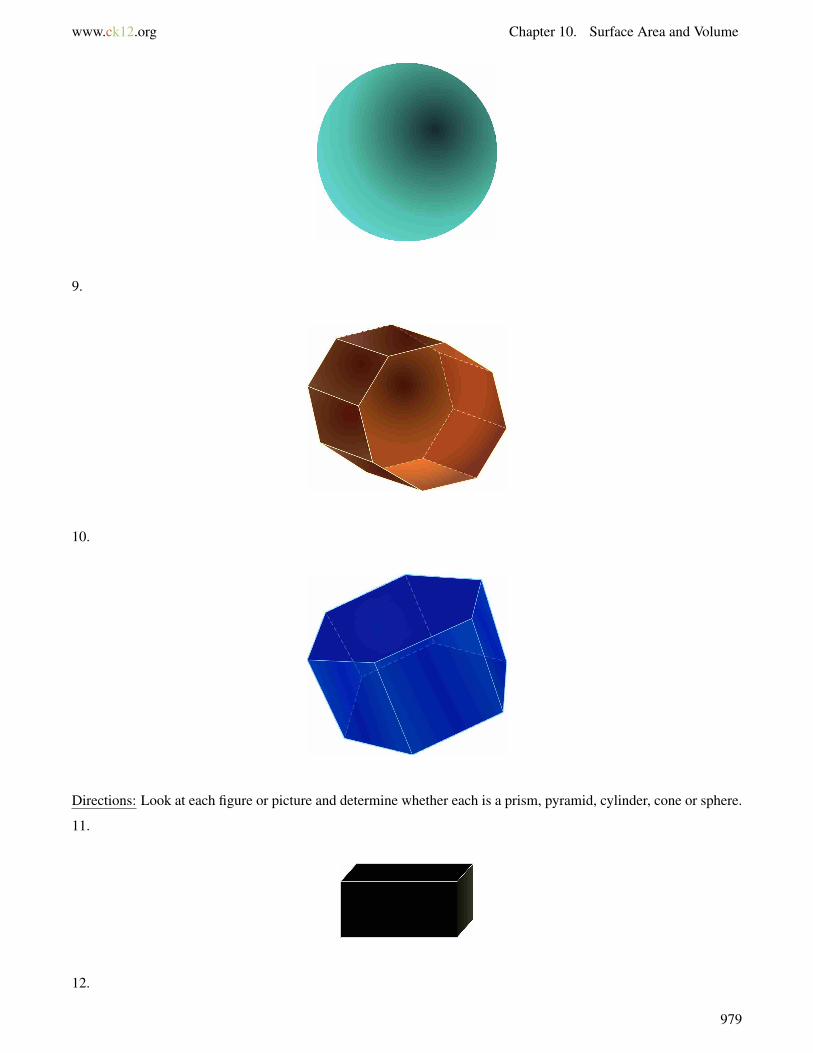
www.ck12.org Chapter 10. Surface Area and Volume
9.
10.
Directions: Look at each figure or picture and determine whether each is a prism, pyramid, cylinder, cone or sphere.
11.
12.
979

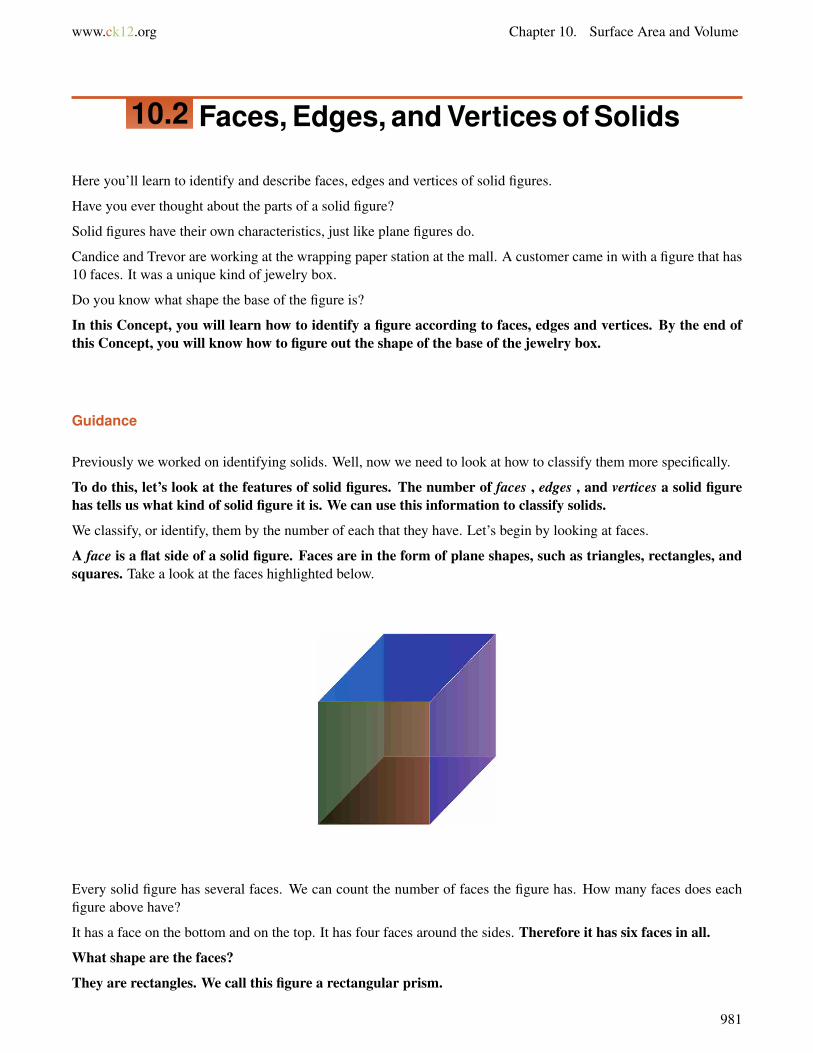
www.ck12.org Chapter 10. Surface Area and Volume
10.2 Faces, Edges, and Vertices of Solids
Here you’ll learn to identify and describe faces, edges and vertices of solid figures.
Have you ever thought about the parts of a solid figure?
Solid figures have their own characteristics, just like plane figures do.
Candice and Trevor are working at the wrapping paper station at the mall. A customer came in with a figure that has10 faces. It was a unique kind of jewelry box.
Do you know what shape the base of the figure is?
In this Concept, you will learn how to identify a figure according to faces, edges and vertices. By the end ofthis Concept, you will know how to figure out the shape of the base of the jewelry box.
Guidance
Previously we worked on identifying solids. Well, now we need to look at how to classify them more specifically.
To do this, let’s look at the features of solid figures. The number of faces , edges , and vertices a solid figurehas tells us what kind of solid figure it is. We can use this information to classify solids.
We classify, or identify, them by the number of each that they have. Let’s begin by looking at faces.
A face is a flat side of a solid figure. Faces are in the form of plane shapes, such as triangles, rectangles, andsquares. Take a look at the faces highlighted below.
Every solid figure has several faces. We can count the number of faces the figure has. How many faces does eachfigure above have?
It has a face on the bottom and on the top. It has four faces around the sides. Therefore it has six faces in all.
What shape are the faces?
They are rectangles. We call this figure a rectangular prism.
981
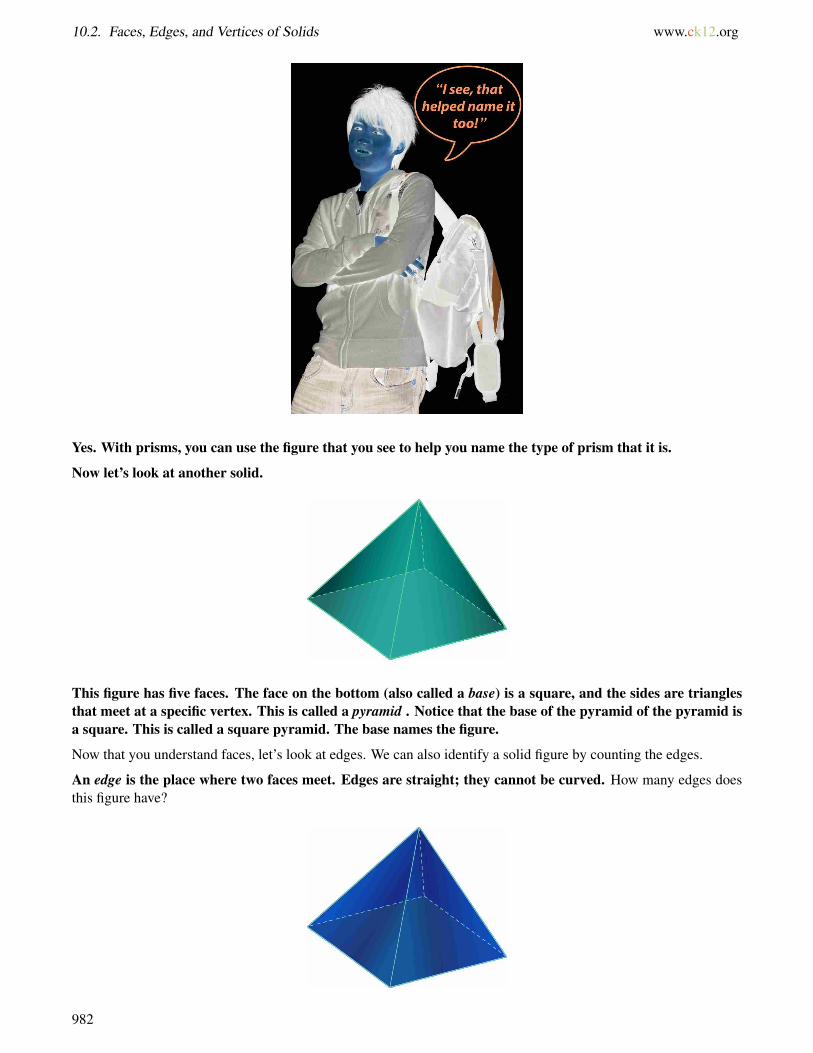
10.2. Faces, Edges, and Vertices of Solids www.ck12.org
Yes. With prisms, you can use the figure that you see to help you name the type of prism that it is.
Now let’s look at another solid.
This figure has five faces. The face on the bottom (also called a base) is a square, and the sides are trianglesthat meet at a specific vertex. This is called a pyramid . Notice that the base of the pyramid of the pyramid isa square. This is called a square pyramid. The base names the figure.
Now that you understand faces, let’s look at edges. We can also identify a solid figure by counting the edges.
An edge is the place where two faces meet. Edges are straight; they cannot be curved. How many edges doesthis figure have?
982
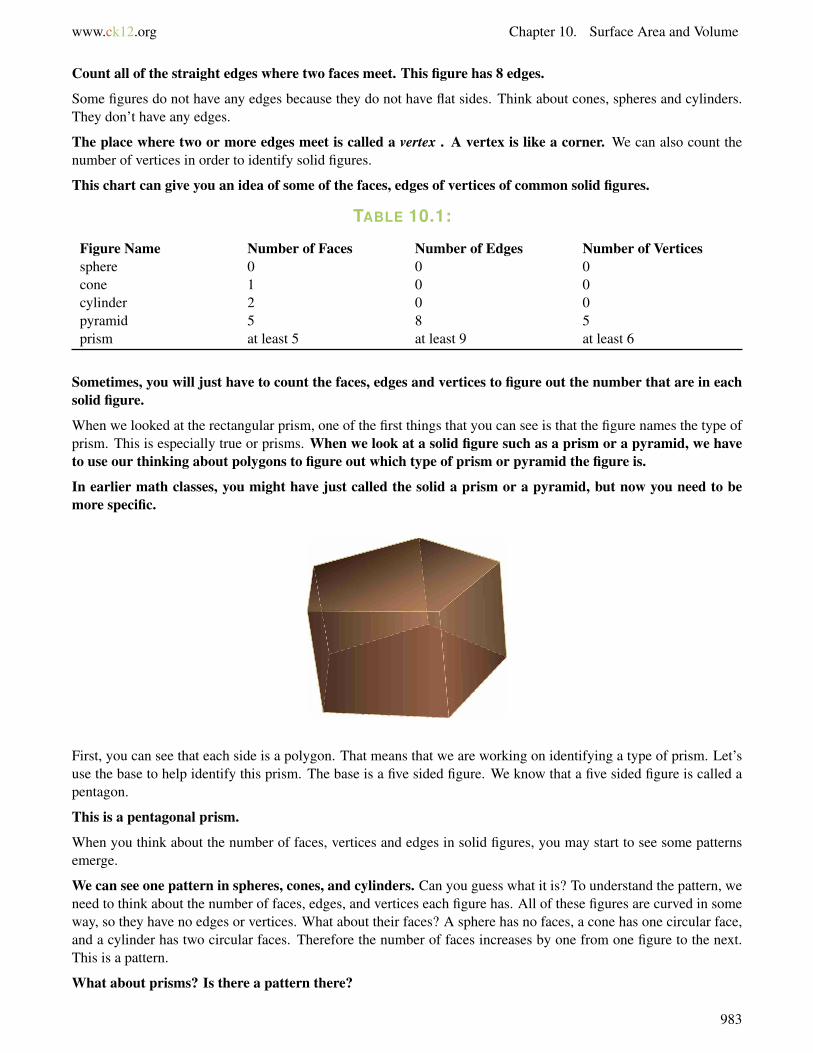
www.ck12.org Chapter 10. Surface Area and Volume
Count all of the straight edges where two faces meet. This figure has 8 edges.
Some figures do not have any edges because they do not have flat sides. Think about cones, spheres and cylinders.They don’t have any edges.
The place where two or more edges meet is called a vertex . A vertex is like a corner. We can also count thenumber of vertices in order to identify solid figures.
This chart can give you an idea of some of the faces, edges of vertices of common solid figures.
TABLE 10.1:
Figure Name Number of Faces Number of Edges Number of Verticessphere 0 0 0cone 1 0 0cylinder 2 0 0pyramid 5 8 5prism at least 5 at least 9 at least 6
Sometimes, you will just have to count the faces, edges and vertices to figure out the number that are in eachsolid figure.
When we looked at the rectangular prism, one of the first things that you can see is that the figure names the type ofprism. This is especially true or prisms. When we look at a solid figure such as a prism or a pyramid, we haveto use our thinking about polygons to figure out which type of prism or pyramid the figure is.
In earlier math classes, you might have just called the solid a prism or a pyramid, but now you need to bemore specific.
First, you can see that each side is a polygon. That means that we are working on identifying a type of prism. Let’suse the base to help identify this prism. The base is a five sided figure. We know that a five sided figure is called apentagon.
This is a pentagonal prism.
When you think about the number of faces, vertices and edges in solid figures, you may start to see some patternsemerge.
We can see one pattern in spheres, cones, and cylinders. Can you guess what it is? To understand the pattern, weneed to think about the number of faces, edges, and vertices each figure has. All of these figures are curved in someway, so they have no edges or vertices. What about their faces? A sphere has no faces, a cone has one circular face,and a cylinder has two circular faces. Therefore the number of faces increases by one from one figure to the next.This is a pattern.
What about prisms? Is there a pattern there?
983
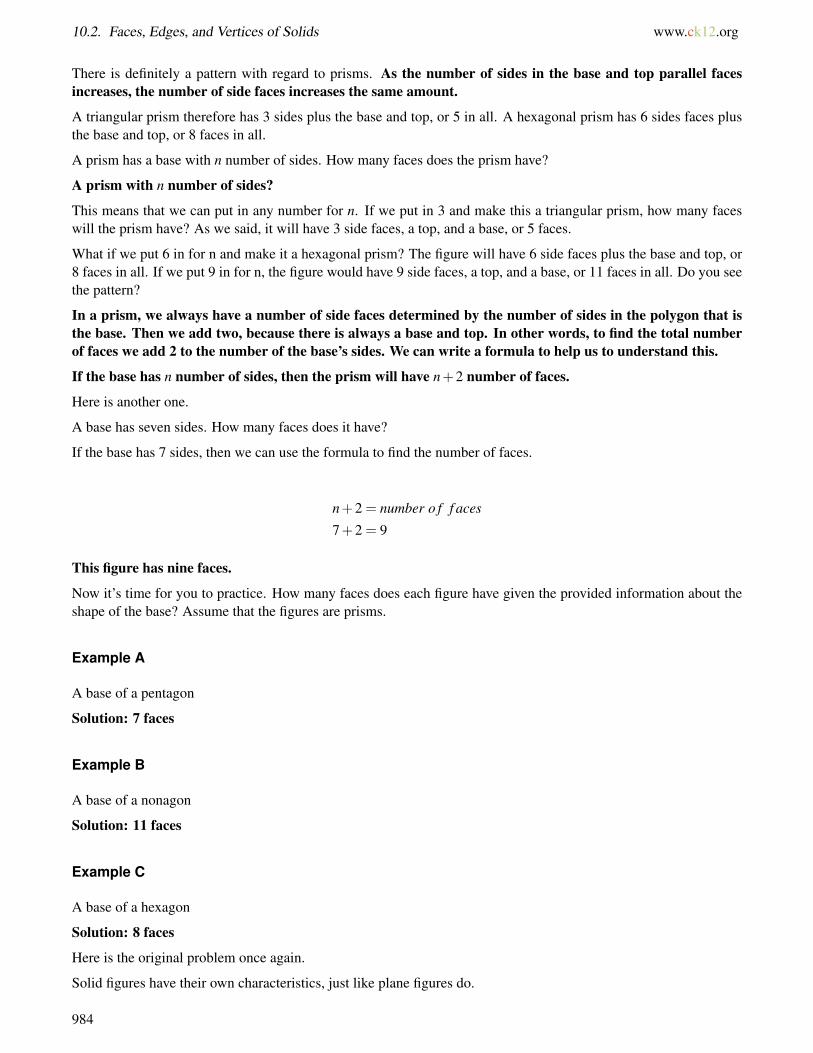
10.2. Faces, Edges, and Vertices of Solids www.ck12.org
There is definitely a pattern with regard to prisms. As the number of sides in the base and top parallel facesincreases, the number of side faces increases the same amount.
A triangular prism therefore has 3 sides plus the base and top, or 5 in all. A hexagonal prism has 6 sides faces plusthe base and top, or 8 faces in all.
A prism has a base with n number of sides. How many faces does the prism have?
A prism with n number of sides?
This means that we can put in any number for n. If we put in 3 and make this a triangular prism, how many faceswill the prism have? As we said, it will have 3 side faces, a top, and a base, or 5 faces.
What if we put 6 in for n and make it a hexagonal prism? The figure will have 6 side faces plus the base and top, or8 faces in all. If we put 9 in for n, the figure would have 9 side faces, a top, and a base, or 11 faces in all. Do you seethe pattern?
In a prism, we always have a number of side faces determined by the number of sides in the polygon that isthe base. Then we add two, because there is always a base and top. In other words, to find the total numberof faces we add 2 to the number of the base’s sides. We can write a formula to help us to understand this.
If the base has n number of sides, then the prism will have n+2 number of faces.
Here is another one.
A base has seven sides. How many faces does it have?
If the base has 7 sides, then we can use the formula to find the number of faces.
n+2 = number o f f aces
7+2 = 9
This figure has nine faces.
Now it’s time for you to practice. How many faces does each figure have given the provided information about theshape of the base? Assume that the figures are prisms.
Example A
A base of a pentagon
Solution: 7 faces
Example B
A base of a nonagon
Solution: 11 faces
Example C
A base of a hexagon
Solution: 8 faces
Here is the original problem once again.
Solid figures have their own characteristics, just like plane figures do.
984
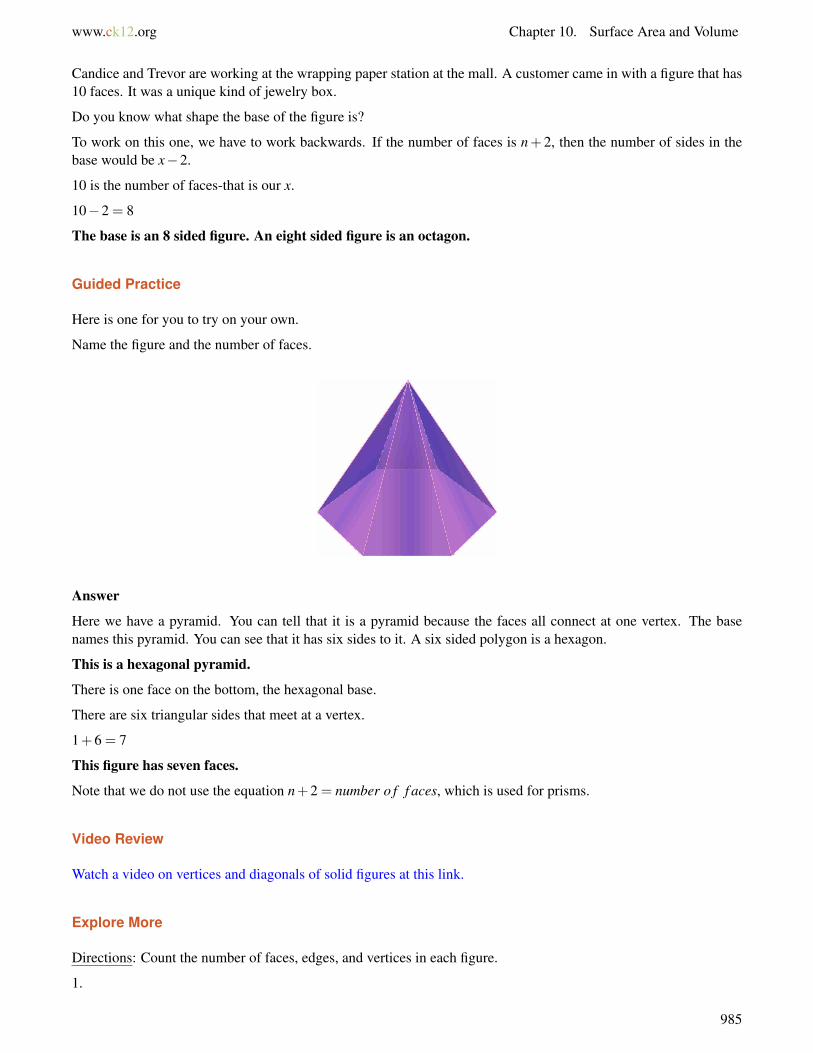
www.ck12.org Chapter 10. Surface Area and Volume
Candice and Trevor are working at the wrapping paper station at the mall. A customer came in with a figure that has10 faces. It was a unique kind of jewelry box.
Do you know what shape the base of the figure is?
To work on this one, we have to work backwards. If the number of faces is n+ 2, then the number of sides in thebase would be x−2.
10 is the number of faces-that is our x.
10−2 = 8
The base is an 8 sided figure. An eight sided figure is an octagon.
Guided Practice
Here is one for you to try on your own.
Name the figure and the number of faces.
Answer
Here we have a pyramid. You can tell that it is a pyramid because the faces all connect at one vertex. The basenames this pyramid. You can see that it has six sides to it. A six sided polygon is a hexagon.
This is a hexagonal pyramid.
There is one face on the bottom, the hexagonal base.
There are six triangular sides that meet at a vertex.
1+6 = 7
This figure has seven faces.
Note that we do not use the equation n+2 = number o f f aces, which is used for prisms.
Video Review
Watch a video on vertices and diagonals of solid figures at this link.
Explore More
Directions: Count the number of faces, edges, and vertices in each figure.
1.
985

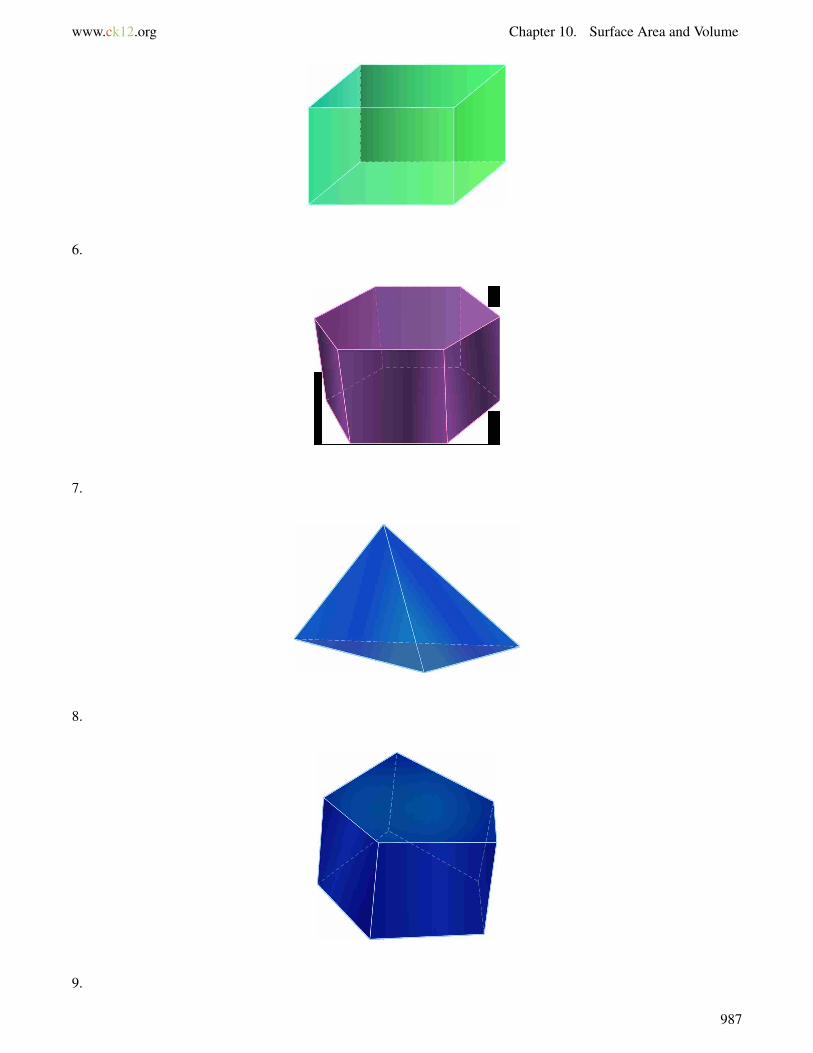
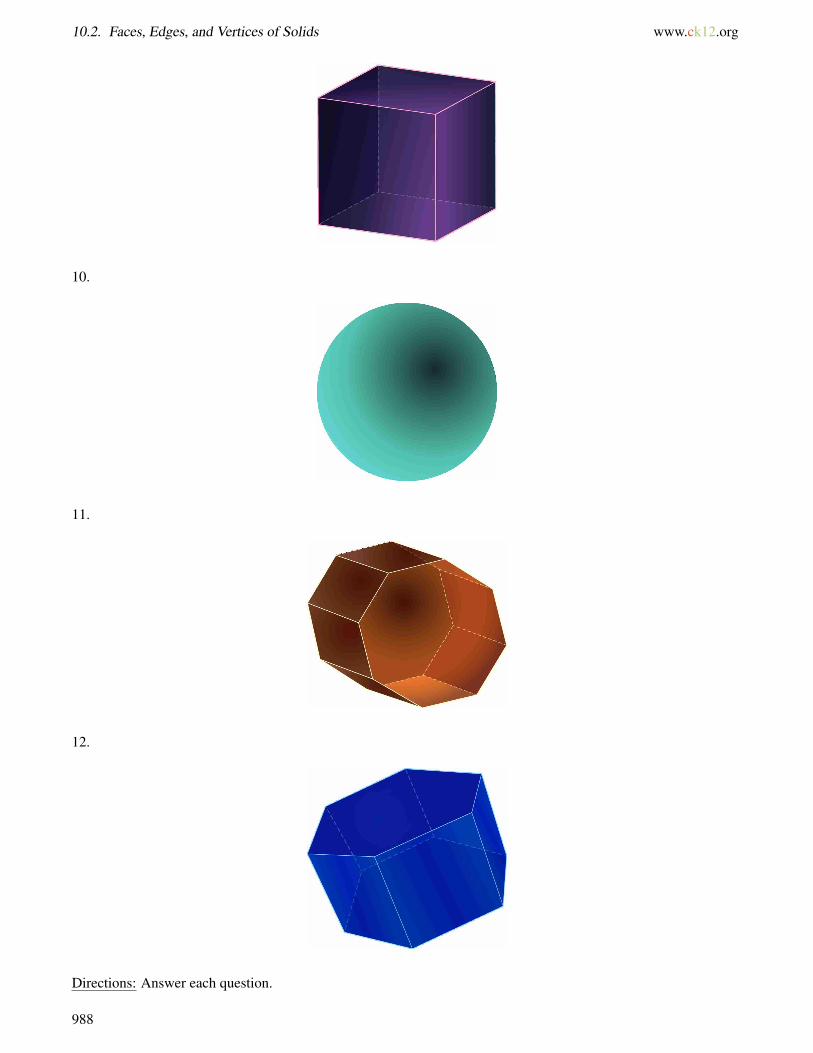
10.2. Faces, Edges, and Vertices of Solids www.ck12.org
10.
11.
12.
Directions: Answer each question.
988

www.ck12.org Chapter 10. Surface Area and Volume
13. A figure has one circular face, no edges, and no vertices. What kind of figure is it?
14. A figure has one pair of parallel sides that are circular. What kind of figure is it?
15. Decagons are polygons that have ten sides. How many faces does a decagonal prism have?
16. A hexagon has six sides. How many faces does a hexagonal prism have?
17. A heptagon has seven sides. How many faces does a heptagonal prism have?
989

10.3. Cross-Sections and Nets www.ck12.org
10.3 Cross-Sections and Nets
Here you’ll learn to draw two-dimensional representations of solid figures.
On their second day at the mall, Candice and Trevor were taken to the back store room where there were tons ofboxes. Only these boxes weren’t put together, they were all flat.
“This is where we keep boxes for wrapping,” Mrs. Scott told them.
“That is a lot of boxes,” Trevor said looking at all of the piles of boxes.
“Yes and they all have gotten mixed up. We need you to sort them. Put all of the square boxes in one pile and allof the rectangular boxes in another pile. Then we will be able to get to the box that we need when the time comes,”Mrs. Scott instructed.
“We can do that,” Candice said.
Trevor did not look as certain.
“Alright. I’ll come back and check on you in a little while,” Mrs. Scott said walking away.
“What do you mean, we can do that?” Trevor asked Candice after Mrs. Scott had left.
“It’s easy. The square ones look like the nets of cubes-you know from math class. The other boxes look likerectangular prisms.”
Trevor is puzzled. He can’t remember what a net for a cube looks like.
Do you know? What is the difference between a net for a cube and a net for a rectangular prism?
This Concept is all about nets and two-dimensional representations of three-dimensional figures. By the endof the Concept, you will know how to identify the net of cube from the net of a rectangular prism.
Guidance
Think about the solid figures that you learned about in the Faces, Edges, and Vertices of Solids Concept. Solidfigures are three-dimensional figures that have height, width and length. Here are some of the solid figures thatyou learned about in the last Concept.
990
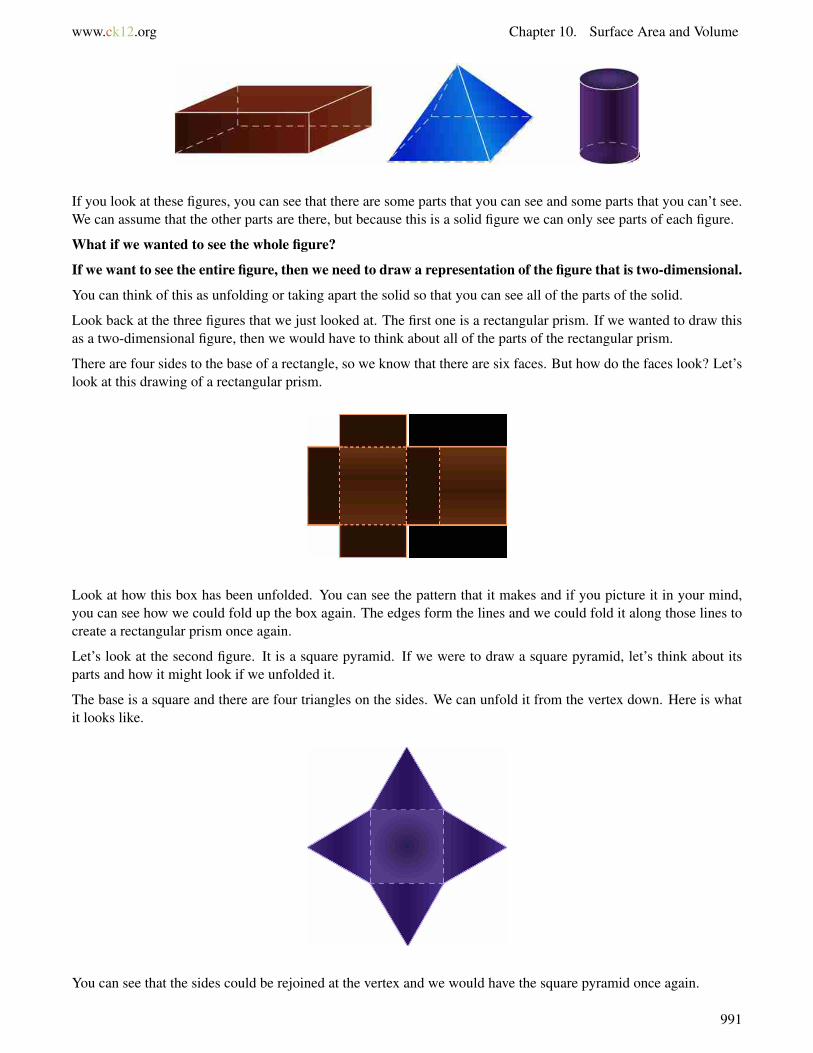
www.ck12.org Chapter 10. Surface Area and Volume
If you look at these figures, you can see that there are some parts that you can see and some parts that you can’t see.We can assume that the other parts are there, but because this is a solid figure we can only see parts of each figure.
What if we wanted to see the whole figure?
If we want to see the entire figure, then we need to draw a representation of the figure that is two-dimensional.
You can think of this as unfolding or taking apart the solid so that you can see all of the parts of the solid.
Look back at the three figures that we just looked at. The first one is a rectangular prism. If we wanted to draw thisas a two-dimensional figure, then we would have to think about all of the parts of the rectangular prism.
There are four sides to the base of a rectangle, so we know that there are six faces. But how do the faces look? Let’slook at this drawing of a rectangular prism.
Look at how this box has been unfolded. You can see the pattern that it makes and if you picture it in your mind,you can see how we could fold up the box again. The edges form the lines and we could fold it along those lines tocreate a rectangular prism once again.
Let’s look at the second figure. It is a square pyramid. If we were to draw a square pyramid, let’s think about itsparts and how it might look if we unfolded it.
The base is a square and there are four triangles on the sides. We can unfold it from the vertex down. Here is whatit looks like.
You can see that the sides could be rejoined at the vertex and we would have the square pyramid once again.
991
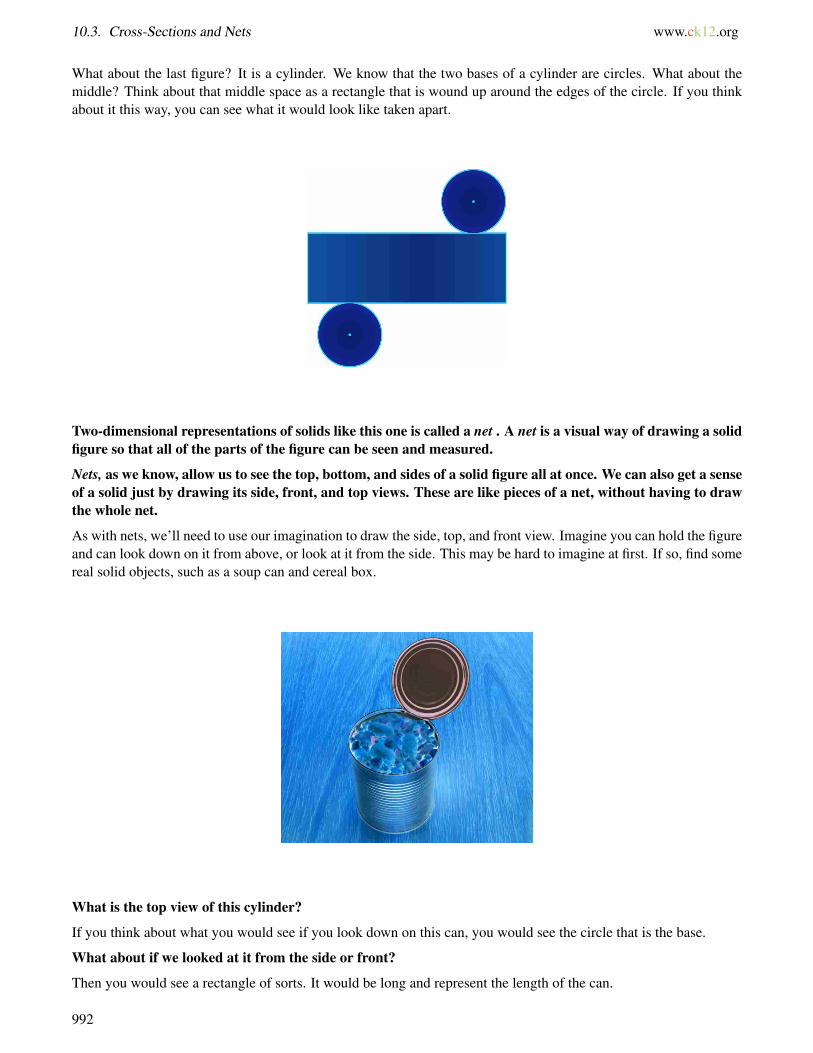
10.3. Cross-Sections and Nets www.ck12.org
What about the last figure? It is a cylinder. We know that the two bases of a cylinder are circles. What about themiddle? Think about that middle space as a rectangle that is wound up around the edges of the circle. If you thinkabout it this way, you can see what it would look like taken apart.
Two-dimensional representations of solids like this one is called a net . A net is a visual way of drawing a solidfigure so that all of the parts of the figure can be seen and measured.
Nets, as we know, allow us to see the top, bottom, and sides of a solid figure all at once. We can also get a senseof a solid just by drawing its side, front, and top views. These are like pieces of a net, without having to drawthe whole net.
As with nets, we’ll need to use our imagination to draw the side, top, and front view. Imagine you can hold the figureand can look down on it from above, or look at it from the side. This may be hard to imagine at first. If so, find somereal solid objects, such as a soup can and cereal box.
What is the top view of this cylinder?
If you think about what you would see if you look down on this can, you would see the circle that is the base.
What about if we looked at it from the side or front?
Then you would see a rectangle of sorts. It would be long and represent the length of the can.
992

www.ck12.org Chapter 10. Surface Area and Volume
Look at this figure. It is a cereal box, but we can also think of it given its geometric properties. It is a rectangularprism. We know that a rectangular prism is made up of rectangles, but would we see a rectangle from each view?Yes. We would, but the position of the rectangle would change depending on the view.
Here is a top view.
Here is a side view.
993

10.3. Cross-Sections and Nets www.ck12.org
Here is a front view and a back view.
You can imagine that because of the dimensions of the rectangle, that you would be able to see any of the differentparts of the figure and draw them too.
What about a cone?
Cones can be tricky because of what you would see. If you look at the side, you would see a triangle. If you lookfrom the bottom up, you would see a circle.
What about from the top down?
If you think about this, you would see a circle with a point in the middle.
994
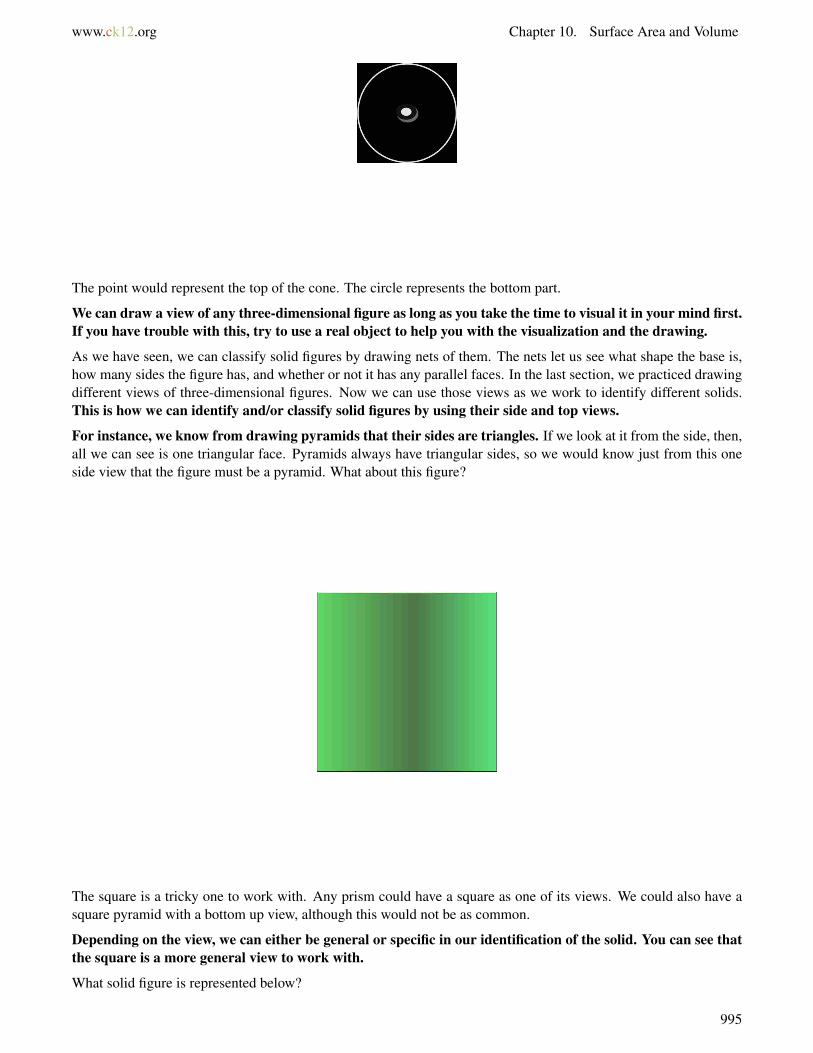
www.ck12.org Chapter 10. Surface Area and Volume
The point would represent the top of the cone. The circle represents the bottom part.
We can draw a view of any three-dimensional figure as long as you take the time to visual it in your mind first.If you have trouble with this, try to use a real object to help you with the visualization and the drawing.
As we have seen, we can classify solid figures by drawing nets of them. The nets let us see what shape the base is,how many sides the figure has, and whether or not it has any parallel faces. In the last section, we practiced drawingdifferent views of three-dimensional figures. Now we can use those views as we work to identify different solids.This is how we can identify and/or classify solid figures by using their side and top views.
For instance, we know from drawing pyramids that their sides are triangles. If we look at it from the side, then,all we can see is one triangular face. Pyramids always have triangular sides, so we would know just from this oneside view that the figure must be a pyramid. What about this figure?
The square is a tricky one to work with. Any prism could have a square as one of its views. We could also have asquare pyramid with a bottom up view, although this would not be as common.
Depending on the view, we can either be general or specific in our identification of the solid. You can see thatthe square is a more general view to work with.
What solid figure is represented below?
995
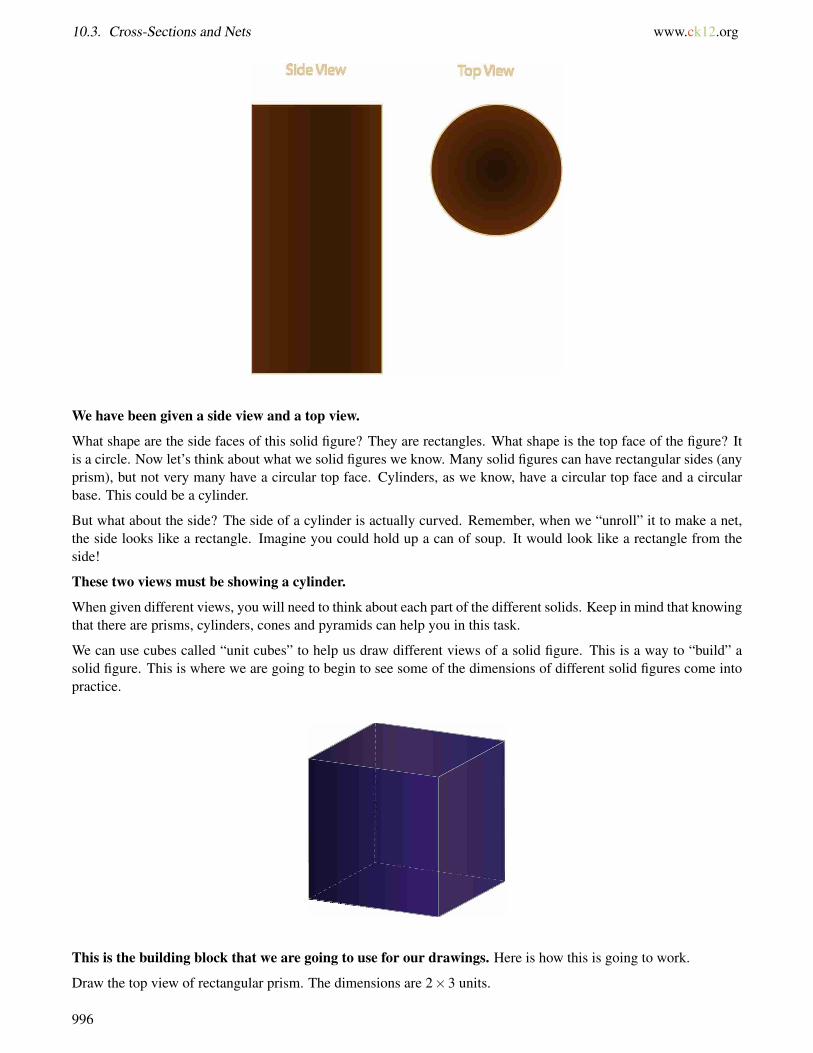
10.3. Cross-Sections and Nets www.ck12.org
We have been given a side view and a top view.
What shape are the side faces of this solid figure? They are rectangles. What shape is the top face of the figure? Itis a circle. Now let’s think about what we solid figures we know. Many solid figures can have rectangular sides (anyprism), but not very many have a circular top face. Cylinders, as we know, have a circular top face and a circularbase. This could be a cylinder.
But what about the side? The side of a cylinder is actually curved. Remember, when we “unroll” it to make a net,the side looks like a rectangle. Imagine you could hold up a can of soup. It would look like a rectangle from theside!
These two views must be showing a cylinder.
When given different views, you will need to think about each part of the different solids. Keep in mind that knowingthat there are prisms, cylinders, cones and pyramids can help you in this task.
We can use cubes called “unit cubes” to help us draw different views of a solid figure. This is a way to “build” asolid figure. This is where we are going to begin to see some of the dimensions of different solid figures come intopractice.
This is the building block that we are going to use for our drawings. Here is how this is going to work.
Draw the top view of rectangular prism. The dimensions are 2×3 units.
996
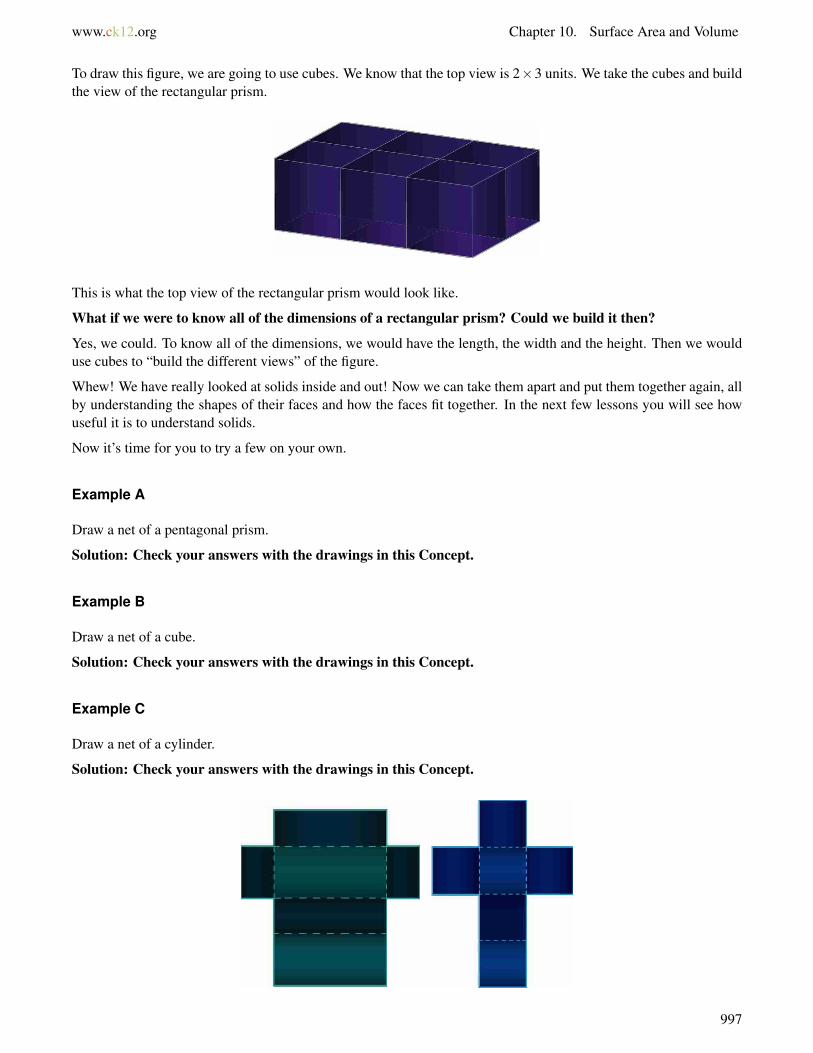
www.ck12.org Chapter 10. Surface Area and Volume
To draw this figure, we are going to use cubes. We know that the top view is 2×3 units. We take the cubes and buildthe view of the rectangular prism.
This is what the top view of the rectangular prism would look like.
What if we were to know all of the dimensions of a rectangular prism? Could we build it then?
Yes, we could. To know all of the dimensions, we would have the length, the width and the height. Then we woulduse cubes to “build the different views” of the figure.
Whew! We have really looked at solids inside and out! Now we can take them apart and put them together again, allby understanding the shapes of their faces and how the faces fit together. In the next few lessons you will see howuseful it is to understand solids.
Now it’s time for you to try a few on your own.
Example A
Draw a net of a pentagonal prism.
Solution: Check your answers with the drawings in this Concept.
Example B
Draw a net of a cube.
Solution: Check your answers with the drawings in this Concept.
Example C
Draw a net of a cylinder.
Solution: Check your answers with the drawings in this Concept.
997
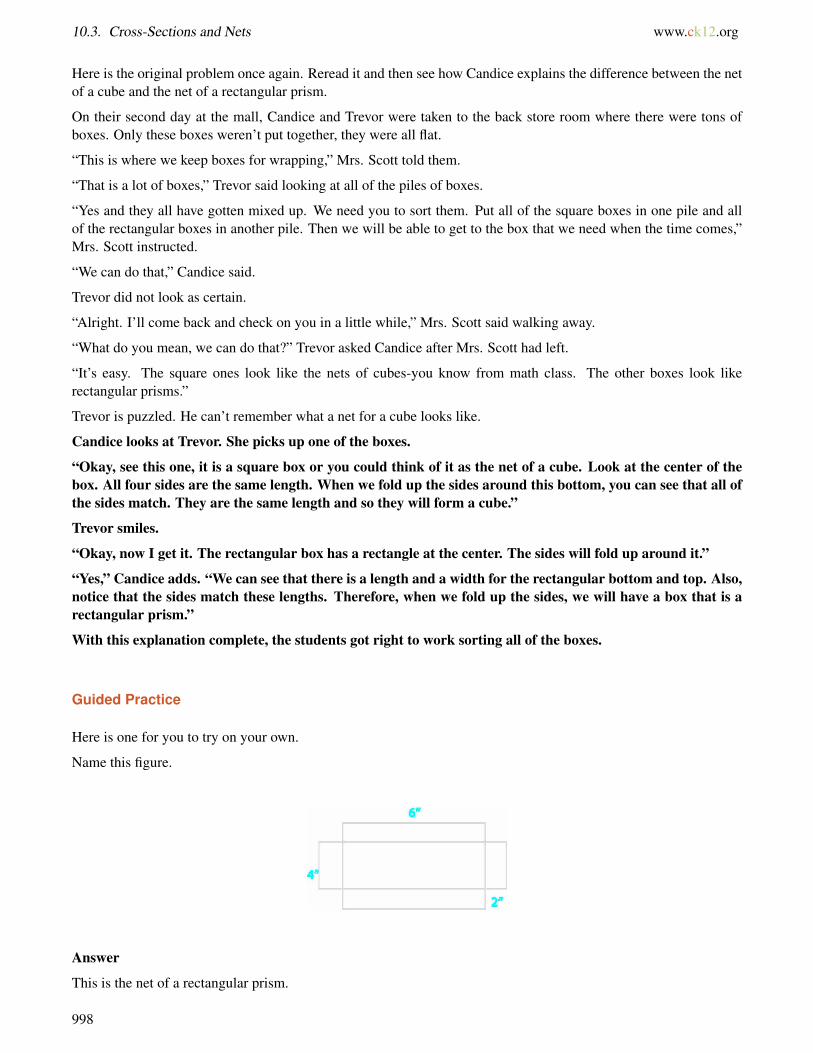
10.3. Cross-Sections and Nets www.ck12.org
Here is the original problem once again. Reread it and then see how Candice explains the difference between the netof a cube and the net of a rectangular prism.
On their second day at the mall, Candice and Trevor were taken to the back store room where there were tons ofboxes. Only these boxes weren’t put together, they were all flat.
“This is where we keep boxes for wrapping,” Mrs. Scott told them.
“That is a lot of boxes,” Trevor said looking at all of the piles of boxes.
“Yes and they all have gotten mixed up. We need you to sort them. Put all of the square boxes in one pile and allof the rectangular boxes in another pile. Then we will be able to get to the box that we need when the time comes,”Mrs. Scott instructed.
“We can do that,” Candice said.
Trevor did not look as certain.
“Alright. I’ll come back and check on you in a little while,” Mrs. Scott said walking away.
“What do you mean, we can do that?” Trevor asked Candice after Mrs. Scott had left.
“It’s easy. The square ones look like the nets of cubes-you know from math class. The other boxes look likerectangular prisms.”
Trevor is puzzled. He can’t remember what a net for a cube looks like.
Candice looks at Trevor. She picks up one of the boxes.
“Okay, see this one, it is a square box or you could think of it as the net of a cube. Look at the center of thebox. All four sides are the same length. When we fold up the sides around this bottom, you can see that all ofthe sides match. They are the same length and so they will form a cube.”
Trevor smiles.
“Okay, now I get it. The rectangular box has a rectangle at the center. The sides will fold up around it.”
“Yes,” Candice adds. “We can see that there is a length and a width for the rectangular bottom and top. Also,notice that the sides match these lengths. Therefore, when we fold up the sides, we will have a box that is arectangular prism.”
With this explanation complete, the students got right to work sorting all of the boxes.
Guided Practice
Here is one for you to try on your own.
Name this figure.
Answer
This is the net of a rectangular prism.
998
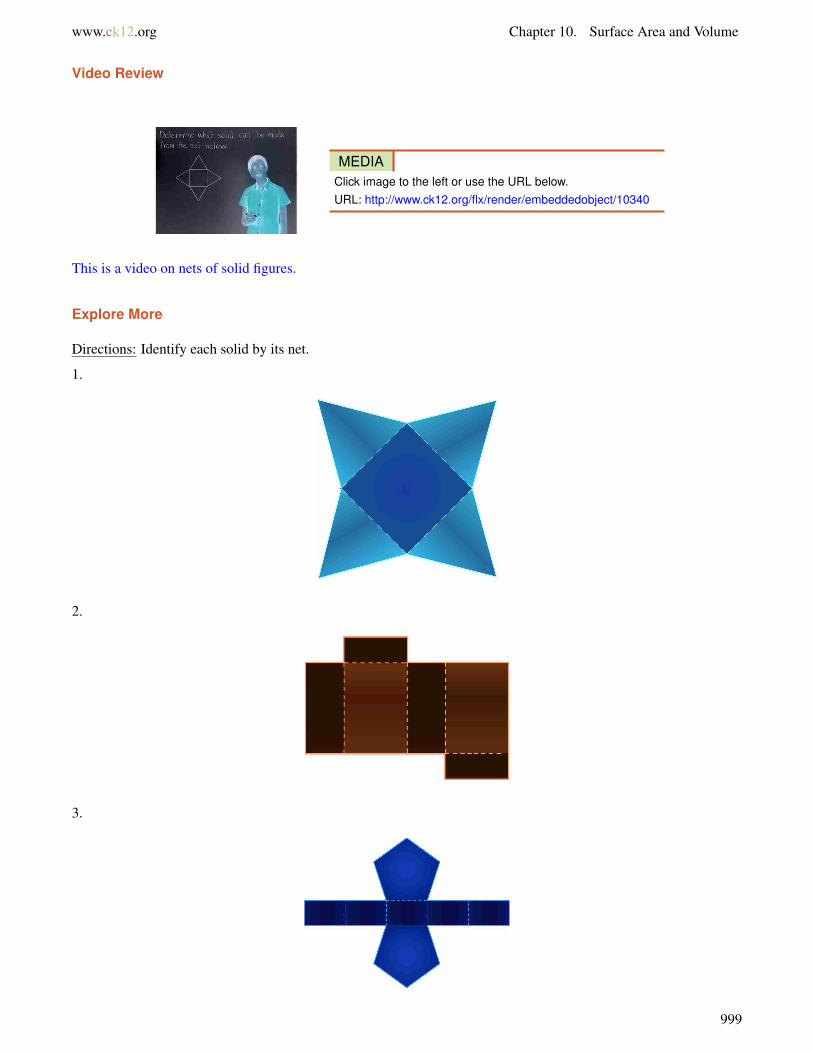
www.ck12.org Chapter 10. Surface Area and Volume
Video Review
MEDIAClick image to the left or use the URL below.URL: http://www.ck12.org/flx/render/embeddedobject/10340
This is a video on nets of solid figures.
Explore More
Directions: Identify each solid by its net.
1.
2.
3.
999

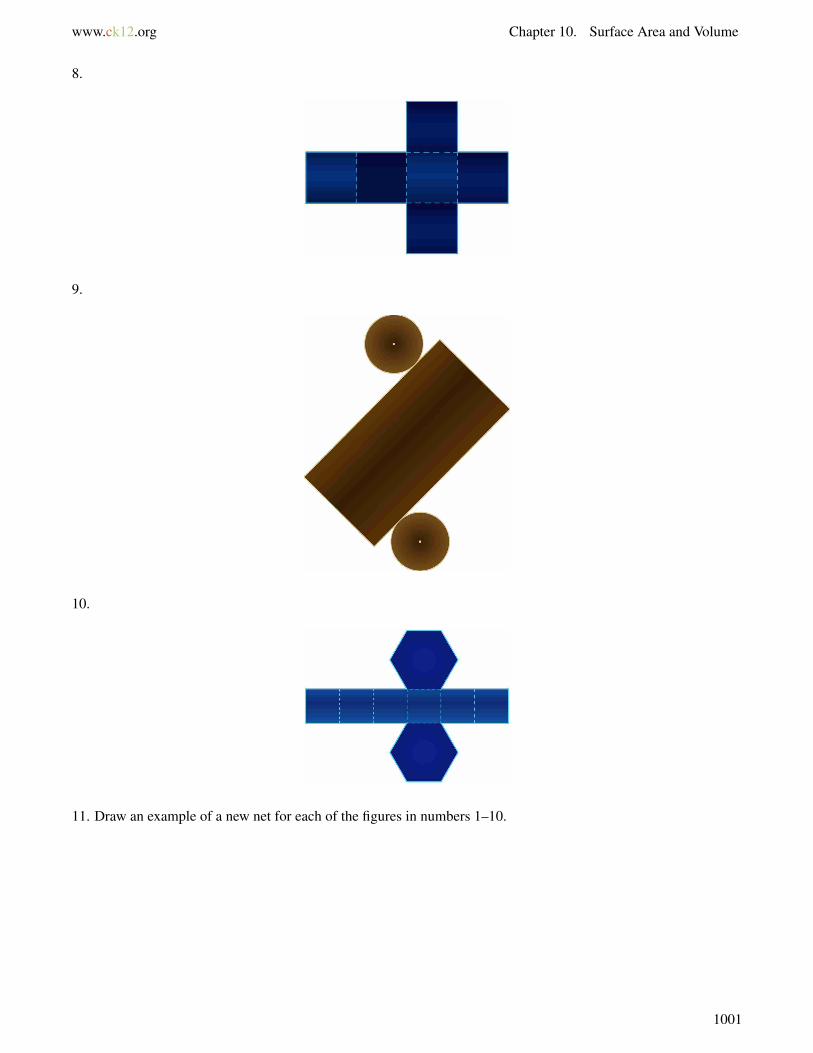
www.ck12.org Chapter 10. Surface Area and Volume
8.
9.
10.
11. Draw an example of a new net for each of the figures in numbers 1–10.
1001
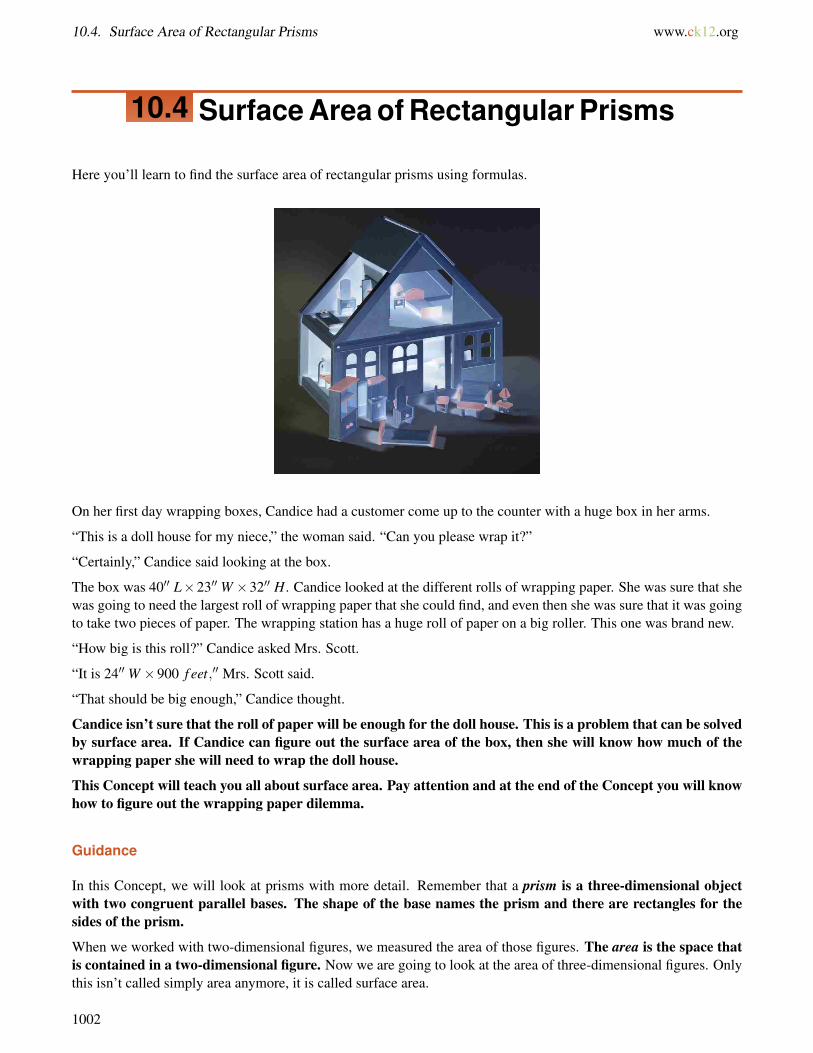
10.4. Surface Area of Rectangular Prisms www.ck12.org
10.4 Surface Area of Rectangular Prisms
Here you’ll learn to find the surface area of rectangular prisms using formulas.
On her first day wrapping boxes, Candice had a customer come up to the counter with a huge box in her arms.
“This is a doll house for my niece,” the woman said. “Can you please wrap it?”
“Certainly,” Candice said looking at the box.
The box was 40′′ L×23′′W ×32′′ H. Candice looked at the different rolls of wrapping paper. She was sure that shewas going to need the largest roll of wrapping paper that she could find, and even then she was sure that it was goingto take two pieces of paper. The wrapping station has a huge roll of paper on a big roller. This one was brand new.
“How big is this roll?” Candice asked Mrs. Scott.
“It is 24′′ W ×900 f eet,′′ Mrs. Scott said.
“That should be big enough,” Candice thought.
Candice isn’t sure that the roll of paper will be enough for the doll house. This is a problem that can be solvedby surface area. If Candice can figure out the surface area of the box, then she will know how much of thewrapping paper she will need to wrap the doll house.
This Concept will teach you all about surface area. Pay attention and at the end of the Concept you will knowhow to figure out the wrapping paper dilemma.
Guidance
In this Concept, we will look at prisms with more detail. Remember that a prism is a three-dimensional objectwith two congruent parallel bases. The shape of the base names the prism and there are rectangles for thesides of the prism.
When we worked with two-dimensional figures, we measured the area of those figures. The area is the space thatis contained in a two-dimensional figure. Now we are going to look at the area of three-dimensional figures. Onlythis isn’t called simply area anymore, it is called surface area.
1002
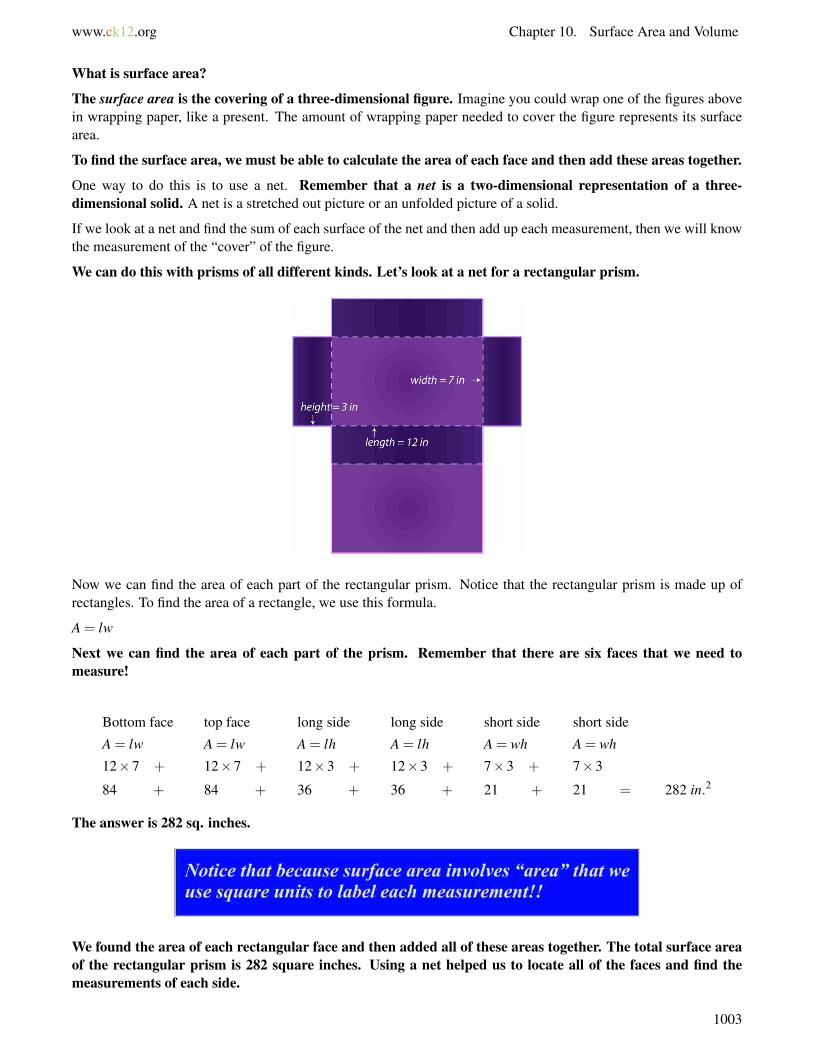
www.ck12.org Chapter 10. Surface Area and Volume
What is surface area?
The surface area is the covering of a three-dimensional figure. Imagine you could wrap one of the figures abovein wrapping paper, like a present. The amount of wrapping paper needed to cover the figure represents its surfacearea.
To find the surface area, we must be able to calculate the area of each face and then add these areas together.
One way to do this is to use a net. Remember that a net is a two-dimensional representation of a three-dimensional solid. A net is a stretched out picture or an unfolded picture of a solid.
If we look at a net and find the sum of each surface of the net and then add up each measurement, then we will knowthe measurement of the “cover” of the figure.
We can do this with prisms of all different kinds. Let’s look at a net for a rectangular prism.
Now we can find the area of each part of the rectangular prism. Notice that the rectangular prism is made up ofrectangles. To find the area of a rectangle, we use this formula.
A = lw
Next we can find the area of each part of the prism. Remember that there are six faces that we need tomeasure!
Bottom face top face long side long side short side short side
A = lw A = lw A = lh A = lh A = wh A = wh
12×7 + 12×7 + 12×3 + 12×3 + 7×3 + 7×3
84 + 84 + 36 + 36 + 21 + 21 = 282 in.2
The answer is 282 sq. inches.
We found the area of each rectangular face and then added all of these areas together. The total surface areaof the rectangular prism is 282 square inches. Using a net helped us to locate all of the faces and find themeasurements of each side.
1003
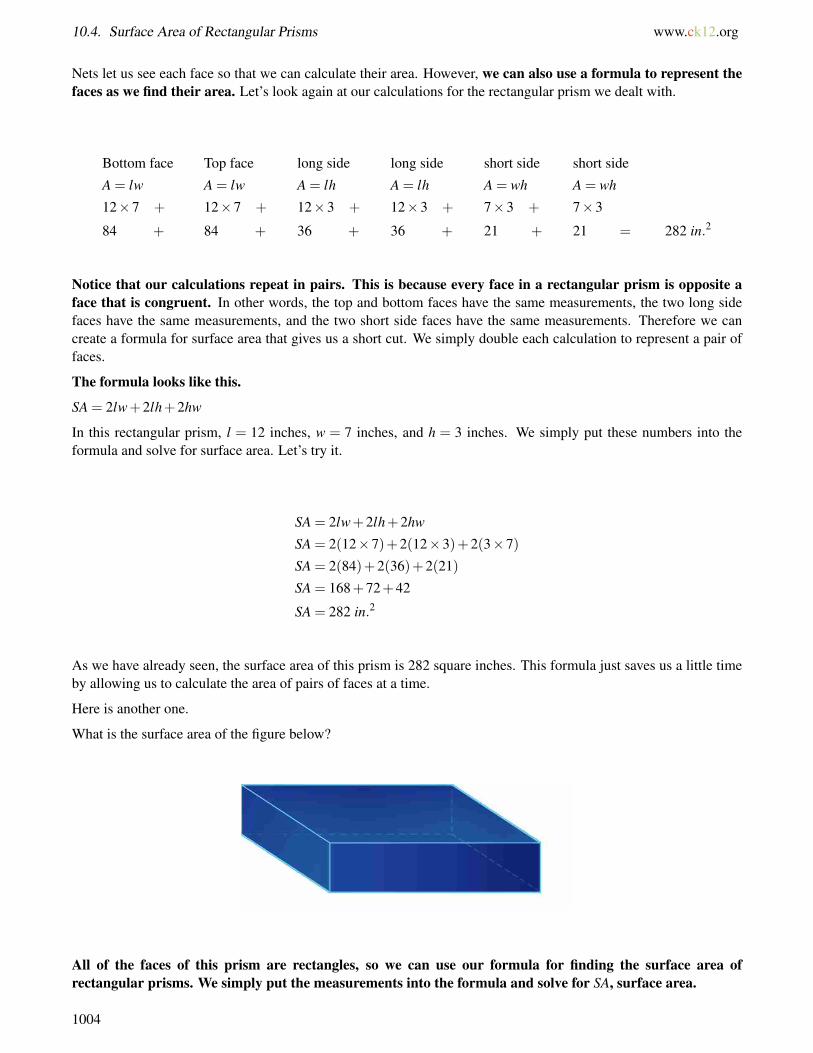
10.4. Surface Area of Rectangular Prisms www.ck12.org
Nets let us see each face so that we can calculate their area. However, we can also use a formula to represent thefaces as we find their area. Let’s look again at our calculations for the rectangular prism we dealt with.
Bottom face Top face long side long side short side short side
A = lw A = lw A = lh A = lh A = wh A = wh
12×7 + 12×7 + 12×3 + 12×3 + 7×3 + 7×3
84 + 84 + 36 + 36 + 21 + 21 = 282 in.2
Notice that our calculations repeat in pairs. This is because every face in a rectangular prism is opposite aface that is congruent. In other words, the top and bottom faces have the same measurements, the two long sidefaces have the same measurements, and the two short side faces have the same measurements. Therefore we cancreate a formula for surface area that gives us a short cut. We simply double each calculation to represent a pair offaces.
The formula looks like this.
SA = 2lw+2lh+2hw
In this rectangular prism, l = 12 inches, w = 7 inches, and h = 3 inches. We simply put these numbers into theformula and solve for surface area. Let’s try it.
SA = 2lw+2lh+2hw
SA = 2(12×7)+2(12×3)+2(3×7)
SA = 2(84)+2(36)+2(21)
SA = 168+72+42
SA = 282 in.2
As we have already seen, the surface area of this prism is 282 square inches. This formula just saves us a little timeby allowing us to calculate the area of pairs of faces at a time.
Here is another one.
What is the surface area of the figure below?
All of the faces of this prism are rectangles, so we can use our formula for finding the surface area ofrectangular prisms. We simply put the measurements into the formula and solve for SA, surface area.
1004
www.ck12.org Chapter 10. Surface Area and Volume
SA = 2lw+2lh+2hw
SA = 2(21×14)+2(21×5)+2(5×14)
SA = 2(294)+2(105)+2(70)
SA = 588+210+140
SA = 938 cm2
This rectangular prism has a surface area of 938 square centimeters. If you’re not sure which measurements gowith which side of the prism, try drawing a net.
Let’s practice using this formula. Try a few problems on your own.
Example A
Length of 8 in, width of 4 inches, height of 6 inches
Solution: 208 in2
Example B
Length of 5 ft, width of 4 ft, height of 2 ft
Solution: 108 f t2
Example C
Length of 11 m, width of 8 m, height of 7 m
Solution: 442 m2
Here is the original problem once again.
On her first day wrapping boxes, Candice had a customer come up to the counter with a huge box in her arms.
“This is a doll house for my niece,” the woman said. “Can you please wrap it?”
1005
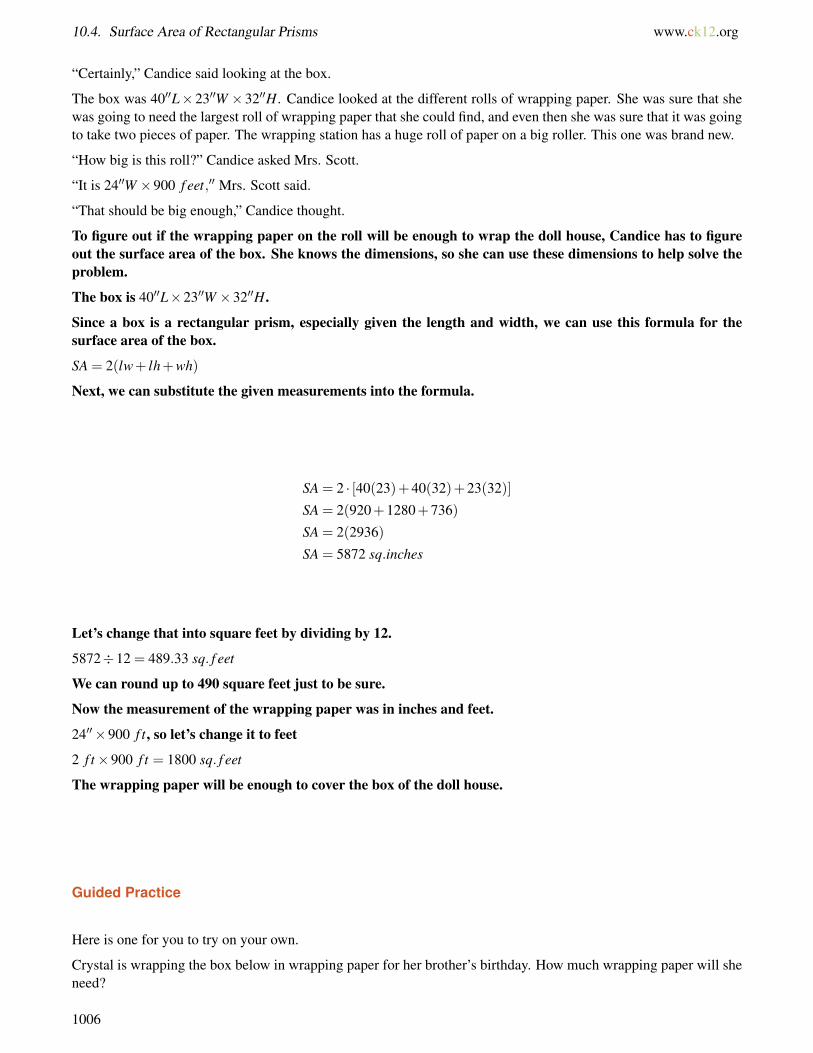
10.4. Surface Area of Rectangular Prisms www.ck12.org
“Certainly,” Candice said looking at the box.
The box was 40′′L×23′′W ×32′′H. Candice looked at the different rolls of wrapping paper. She was sure that shewas going to need the largest roll of wrapping paper that she could find, and even then she was sure that it was goingto take two pieces of paper. The wrapping station has a huge roll of paper on a big roller. This one was brand new.
“How big is this roll?” Candice asked Mrs. Scott.
“It is 24′′W ×900 f eet,′′ Mrs. Scott said.
“That should be big enough,” Candice thought.
To figure out if the wrapping paper on the roll will be enough to wrap the doll house, Candice has to figureout the surface area of the box. She knows the dimensions, so she can use these dimensions to help solve theproblem.
The box is 40′′L×23′′W ×32′′H.
Since a box is a rectangular prism, especially given the length and width, we can use this formula for thesurface area of the box.
SA = 2(lw+ lh+wh)
Next, we can substitute the given measurements into the formula.
SA = 2 · [40(23)+40(32)+23(32)]
SA = 2(920+1280+736)
SA = 2(2936)
SA = 5872 sq.inches
Let’s change that into square feet by dividing by 12.
5872÷12 = 489.33 sq. f eet
We can round up to 490 square feet just to be sure.
Now the measurement of the wrapping paper was in inches and feet.
24′′×900 f t, so let’s change it to feet
2 f t×900 f t = 1800 sq. f eet
The wrapping paper will be enough to cover the box of the doll house.
Guided Practice
Here is one for you to try on your own.
Crystal is wrapping the box below in wrapping paper for her brother’s birthday. How much wrapping paper will sheneed?
1006
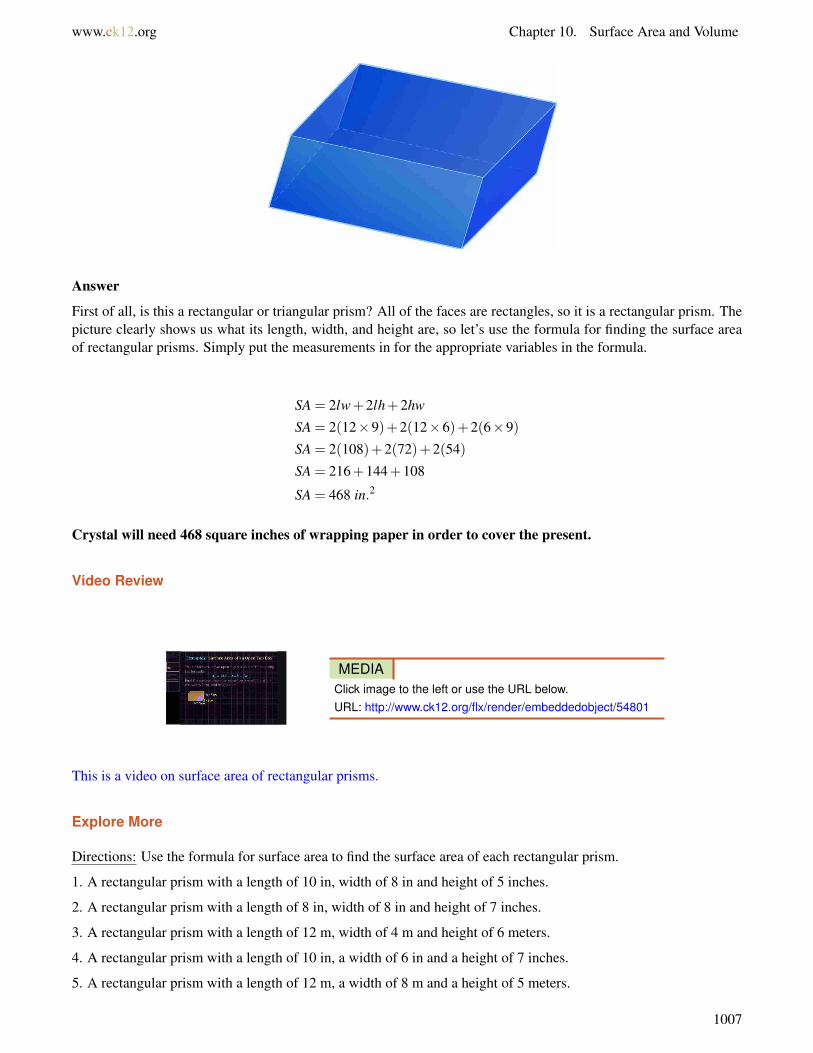
www.ck12.org Chapter 10. Surface Area and Volume
Answer
First of all, is this a rectangular or triangular prism? All of the faces are rectangles, so it is a rectangular prism. Thepicture clearly shows us what its length, width, and height are, so let’s use the formula for finding the surface areaof rectangular prisms. Simply put the measurements in for the appropriate variables in the formula.
SA = 2lw+2lh+2hw
SA = 2(12×9)+2(12×6)+2(6×9)
SA = 2(108)+2(72)+2(54)
SA = 216+144+108
SA = 468 in.2
Crystal will need 468 square inches of wrapping paper in order to cover the present.
Video Review
MEDIAClick image to the left or use the URL below.URL: http://www.ck12.org/flx/render/embeddedobject/54801
This is a video on surface area of rectangular prisms.
Explore More
Directions: Use the formula for surface area to find the surface area of each rectangular prism.
1. A rectangular prism with a length of 10 in, width of 8 in and height of 5 inches.
2. A rectangular prism with a length of 8 in, width of 8 in and height of 7 inches.
3. A rectangular prism with a length of 12 m, width of 4 m and height of 6 meters.
4. A rectangular prism with a length of 10 in, a width of 6 in and a height of 7 inches.
5. A rectangular prism with a length of 12 m, a width of 8 m and a height of 5 meters.
1007
10.4. Surface Area of Rectangular Prisms www.ck12.org
6. A rectangular prism with a length of 9 ft, a width of 7 feet and a height of 6 feet.
7. A rectangular prism with a length of 10 m, a width of 8 m and a height of 2 m.
8. A rectangular prism with a length of 6 ft, a width of 5 feet and a height of 3 feet.
9. A rectangular prism with a length of 3 feet, a width of 6 feet and a height of 2 feet.
10. A rectangular prism with a length of 4 feet, a width of 4 feet and a height of 4 feet.
11. A rectangular prism with a length of 12 feet, a width of 9 feet and a height of 7 feet.
12. A rectangular prism with a length of 14 feet, a width of 11 feet and a height of 10 feet.
13. A rectangular prism with a length of 18 feet, a width of 16 feet and a height of 12 feet.
14. A rectangular prism with a length of 22 meters, a width of 18 meters and a height of 10 meters.
15. A rectangular prism with a length of 21 meters, a width of 18 meters and a height of 17 meters.
1008

www.ck12.org Chapter 10. Surface Area and Volume
10.5 Surface Area of Triangular Prisms
Here you’ll learn to find the surface area of triangular prisms using formulas.
Have you ever seen a triangular prism?
Jesse bought a kaleidoscope for his sister for her birthday. Here is a picture of its shape.
To wrap this figure, Jesse will need to cover it with wrapping paper.
What is the surface area of this triangular prism?
This Concept is about figuring out the surface area of triangular prisms. By the end of the Concept you willknow how to figure this out.
Guidance
Remember the prisms in the Surface Area of Rectangular Prisms Concept? A prism is a three-dimensional objectwith two congruent parallel bases. The shape of the base names the prism and there are rectangles for thesides of the prism.
When we worked with two-dimensional figures, we measured the area of those figures. The area is the space thatis contained in a two-dimensional figure. Now we are going to look at the area of three-dimensional figures. Onlythis isn’t called simply area anymore, it is called surface area.
What is surface area?
The surface area is the covering of a three-dimensional figure. Imagine you could wrap one of the figures abovein wrapping paper, like a present. The amount of wrapping paper needed to cover the figure represents its surfacearea.
To find the surface area, we must be able to calculate the area of each face and then add these areas together.
One way to do this is to use a net. Remember that a net is a two-dimensional representation of a three-dimensional solid. A net is a stretched out picture or an unfolded picture of a solid.
If we look at a net and find the sum of each surface of the net and then add up each measurement, then we will knowthe measurement of the “cover” of the figure.
What is the surface area of the figure below?
1009
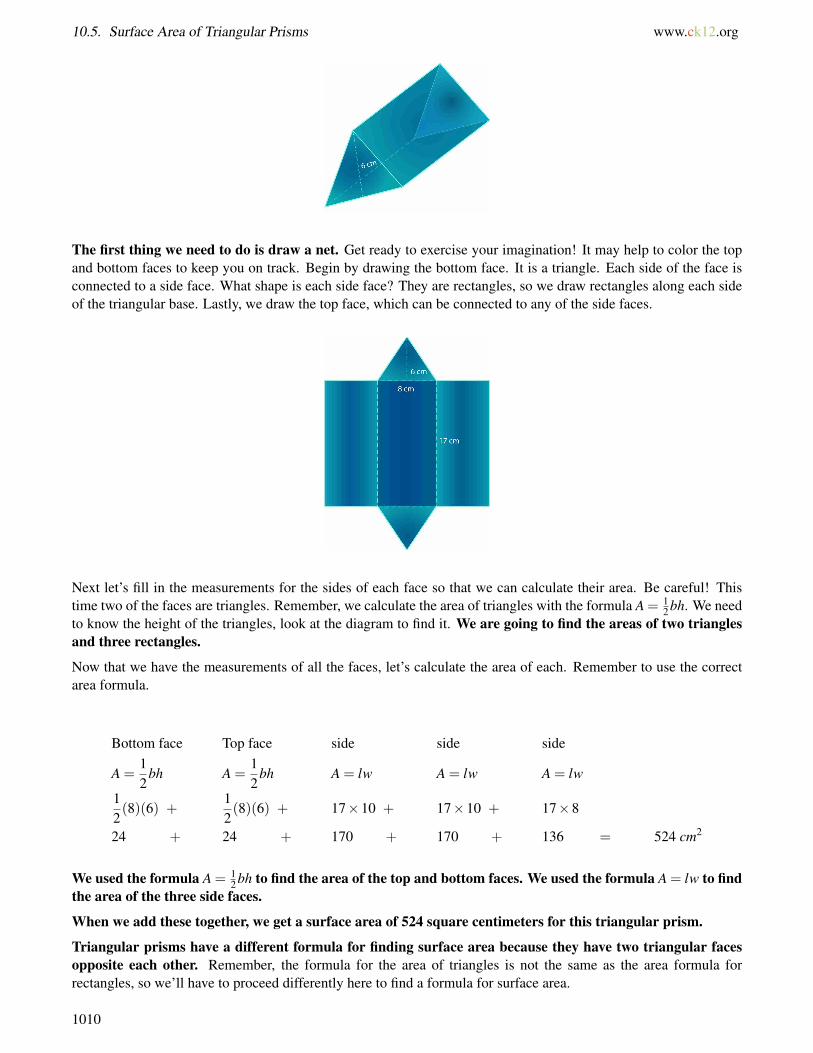
10.5. Surface Area of Triangular Prisms www.ck12.org
The first thing we need to do is draw a net. Get ready to exercise your imagination! It may help to color the topand bottom faces to keep you on track. Begin by drawing the bottom face. It is a triangle. Each side of the face isconnected to a side face. What shape is each side face? They are rectangles, so we draw rectangles along each sideof the triangular base. Lastly, we draw the top face, which can be connected to any of the side faces.
Next let’s fill in the measurements for the sides of each face so that we can calculate their area. Be careful! Thistime two of the faces are triangles. Remember, we calculate the area of triangles with the formula A = 1
2 bh. We needto know the height of the triangles, look at the diagram to find it. We are going to find the areas of two trianglesand three rectangles.
Now that we have the measurements of all the faces, let’s calculate the area of each. Remember to use the correctarea formula.
Bottom face Top face side side side
A =12
bh A =12
bh A = lw A = lw A = lw
12(8)(6) +
12(8)(6) + 17×10 + 17×10 + 17×8
24 + 24 + 170 + 170 + 136 = 524 cm2
We used the formula A = 12 bh to find the area of the top and bottom faces. We used the formula A = lw to find
the area of the three side faces.
When we add these together, we get a surface area of 524 square centimeters for this triangular prism.
Triangular prisms have a different formula for finding surface area because they have two triangular facesopposite each other. Remember, the formula for the area of triangles is not the same as the area formula forrectangles, so we’ll have to proceed differently here to find a formula for surface area.
1010
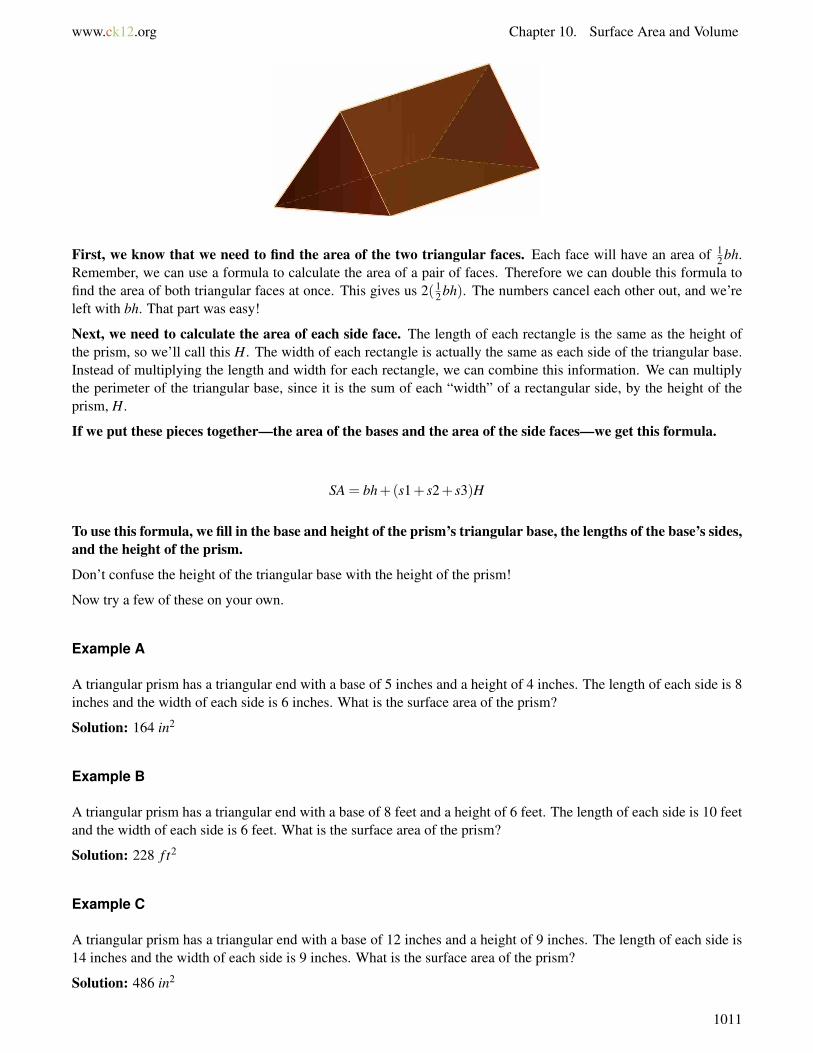
www.ck12.org Chapter 10. Surface Area and Volume
First, we know that we need to find the area of the two triangular faces. Each face will have an area of 12 bh.
Remember, we can use a formula to calculate the area of a pair of faces. Therefore we can double this formula tofind the area of both triangular faces at once. This gives us 2(1
2 bh). The numbers cancel each other out, and we’releft with bh. That part was easy!
Next, we need to calculate the area of each side face. The length of each rectangle is the same as the height ofthe prism, so we’ll call this H. The width of each rectangle is actually the same as each side of the triangular base.Instead of multiplying the length and width for each rectangle, we can combine this information. We can multiplythe perimeter of the triangular base, since it is the sum of each “width” of a rectangular side, by the height of theprism, H.
If we put these pieces together—the area of the bases and the area of the side faces—we get this formula.
SA = bh+(s1+ s2+ s3)H
To use this formula, we fill in the base and height of the prism’s triangular base, the lengths of the base’s sides,and the height of the prism.
Don’t confuse the height of the triangular base with the height of the prism!
Now try a few of these on your own.
Example A
A triangular prism has a triangular end with a base of 5 inches and a height of 4 inches. The length of each side is 8inches and the width of each side is 6 inches. What is the surface area of the prism?
Solution: 164 in2
Example B
A triangular prism has a triangular end with a base of 8 feet and a height of 6 feet. The length of each side is 10 feetand the width of each side is 6 feet. What is the surface area of the prism?
Solution: 228 f t2
Example C
A triangular prism has a triangular end with a base of 12 inches and a height of 9 inches. The length of each side is14 inches and the width of each side is 9 inches. What is the surface area of the prism?
Solution: 486 in2
1011
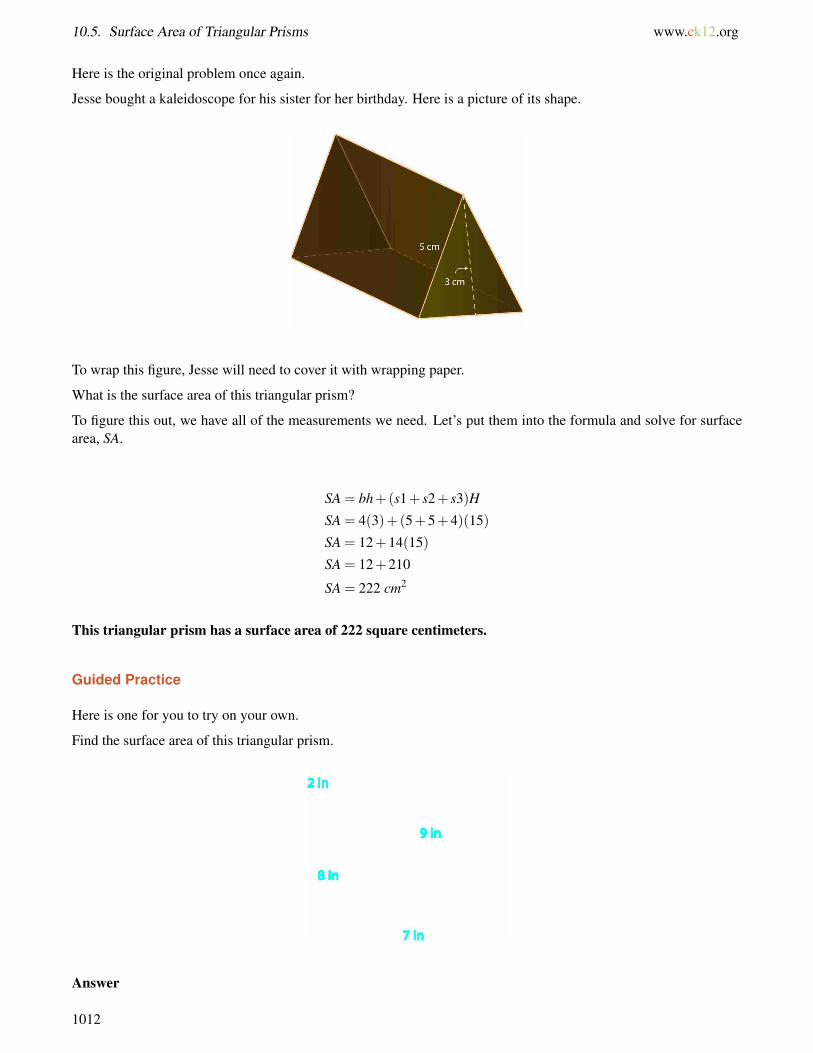
10.5. Surface Area of Triangular Prisms www.ck12.org
Here is the original problem once again.
Jesse bought a kaleidoscope for his sister for her birthday. Here is a picture of its shape.
To wrap this figure, Jesse will need to cover it with wrapping paper.
What is the surface area of this triangular prism?
To figure this out, we have all of the measurements we need. Let’s put them into the formula and solve for surfacearea, SA.
SA = bh+(s1+ s2+ s3)H
SA = 4(3)+(5+5+4)(15)
SA = 12+14(15)
SA = 12+210
SA = 222 cm2
This triangular prism has a surface area of 222 square centimeters.
Guided Practice
Here is one for you to try on your own.
Find the surface area of this triangular prism.
Answer
1012
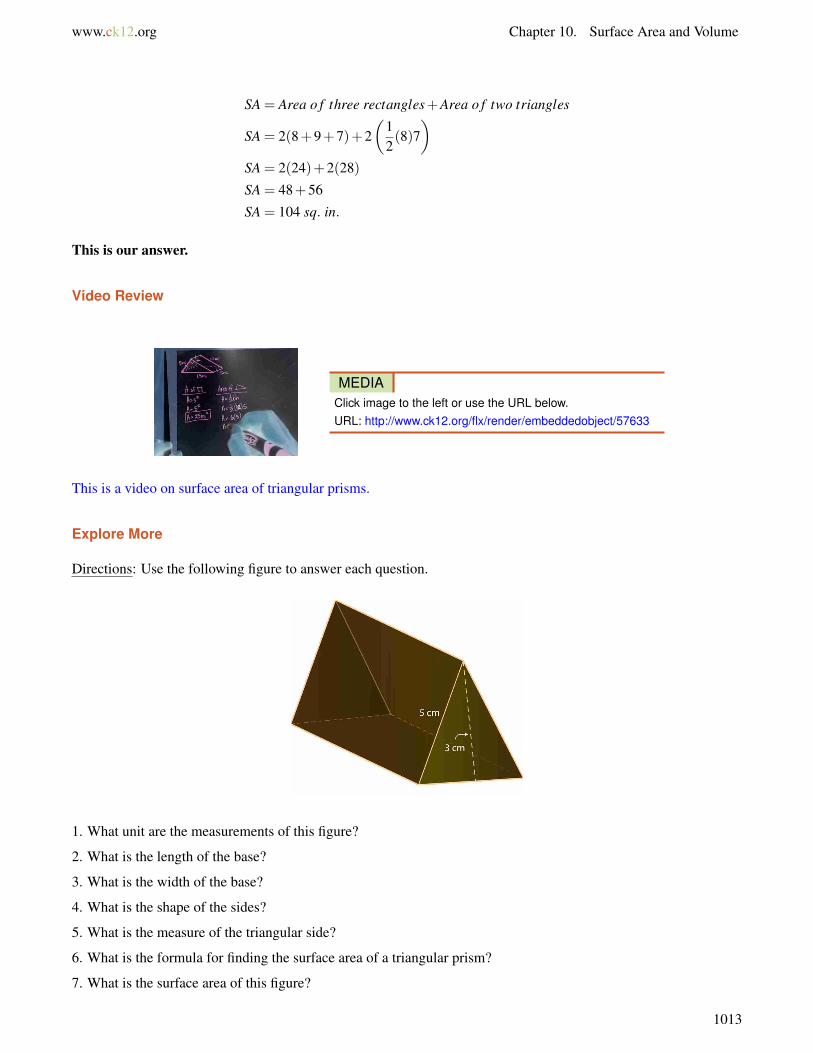
www.ck12.org Chapter 10. Surface Area and Volume
SA = Area o f three rectangles+Area o f two triangles
SA = 2(8+9+7)+2(
12(8)7
)SA = 2(24)+2(28)
SA = 48+56
SA = 104 sq. in.
This is our answer.
Video Review
MEDIAClick image to the left or use the URL below.URL: http://www.ck12.org/flx/render/embeddedobject/57633
This is a video on surface area of triangular prisms.
Explore More
Directions: Use the following figure to answer each question.
1. What unit are the measurements of this figure?
2. What is the length of the base?
3. What is the width of the base?
4. What is the shape of the sides?
5. What is the measure of the triangular side?
6. What is the formula for finding the surface area of a triangular prism?
7. What is the surface area of this figure?
1013
10.5. Surface Area of Triangular Prisms www.ck12.org
Directions: Find the surface area of each triangular prism.
8. A triangular prism has a triangular end with a base of 4 inches and a height of 3 inches. The length of each sideis 5 inches and the width of each side is 3 inches. What is the surface area of the prism?
9. A triangular prism has a triangular end with a base of 4 feet and a height of 5 feet. The length of each side is 6feet and the width of each side is 5 feet. What is the surface area of the prism?
10. A triangular prism has a triangular end with a base of 3 inches and a height of 3 inches. The length of each sideis 4 inches and the width of each side is 3 inches. What is the surface area of the prism?
11. A triangular prism has a triangular end with a base of 6 meters and a height of 5 meters. The length of each sideis 8 meters and the width of each side is 5 meters. What is the surface area of the prism?
12. A triangular prism has a triangular end with a base of 15 feet and a height of 10 feet. The length of each side is12 feet and the width of each side is 10 feet. What is the surface area of the prism?
13. A triangular prism has a triangular end with a base of 9 inches and a height of 7 inches. The length of each sideis 9 inches and the width of each side is 7 inches. What is the surface area of the prism?
14. A triangular prism has a triangular end with a base of 8 inches and a height of 6 inches. The length of each sideis 15 inches and the width of each side is 6 inches. What is the surface area of the prism?
15. A triangular prism has a triangular end with a base of 5.5 feet and a height of 4 feet. The length of each side is 9feet and the width of each side is 5 feet. What is the surface area of the prism?
1014
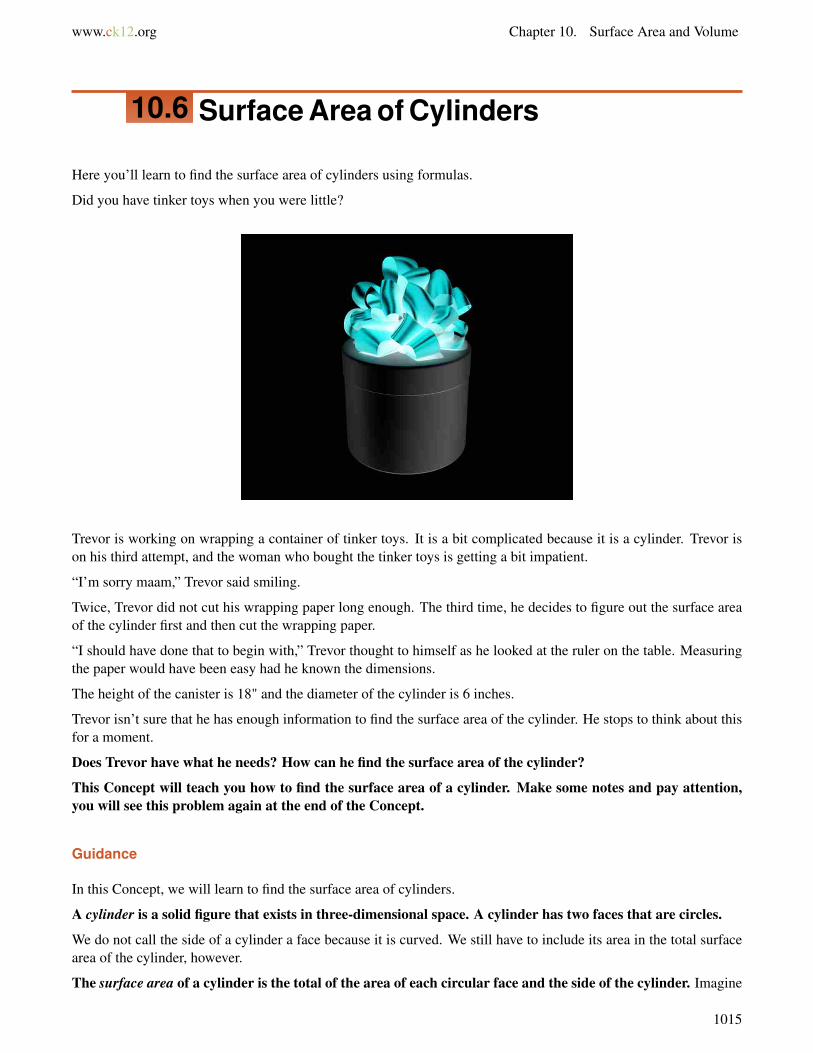
www.ck12.org Chapter 10. Surface Area and Volume
10.6 Surface Area of Cylinders
Here you’ll learn to find the surface area of cylinders using formulas.
Did you have tinker toys when you were little?
Trevor is working on wrapping a container of tinker toys. It is a bit complicated because it is a cylinder. Trevor ison his third attempt, and the woman who bought the tinker toys is getting a bit impatient.
“I’m sorry maam,” Trevor said smiling.
Twice, Trevor did not cut his wrapping paper long enough. The third time, he decides to figure out the surface areaof the cylinder first and then cut the wrapping paper.
“I should have done that to begin with,” Trevor thought to himself as he looked at the ruler on the table. Measuringthe paper would have been easy had he known the dimensions.
The height of the canister is 18" and the diameter of the cylinder is 6 inches.
Trevor isn’t sure that he has enough information to find the surface area of the cylinder. He stops to think about thisfor a moment.
Does Trevor have what he needs? How can he find the surface area of the cylinder?
This Concept will teach you how to find the surface area of a cylinder. Make some notes and pay attention,you will see this problem again at the end of the Concept.
Guidance
In this Concept, we will learn to find the surface area of cylinders.
A cylinder is a solid figure that exists in three-dimensional space. A cylinder has two faces that are circles.
We do not call the side of a cylinder a face because it is curved. We still have to include its area in the total surfacearea of the cylinder, however.
The surface area of a cylinder is the total of the area of each circular face and the side of the cylinder. Imagine
1015
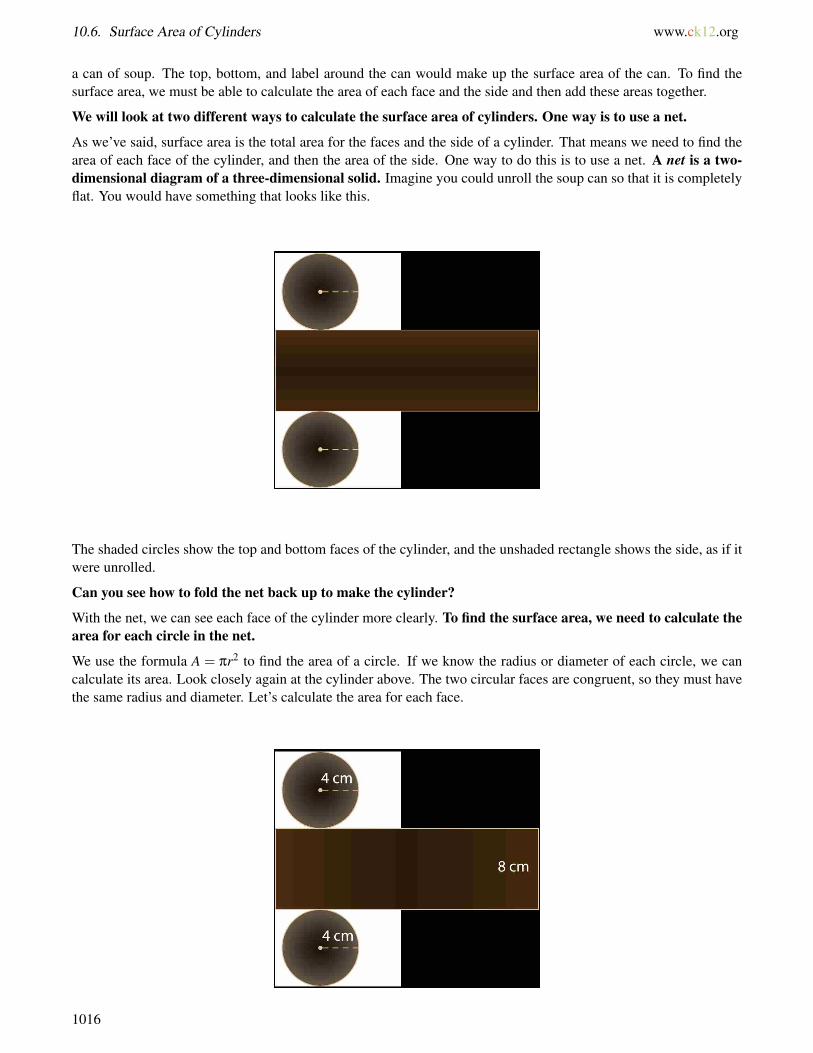
10.6. Surface Area of Cylinders www.ck12.org
a can of soup. The top, bottom, and label around the can would make up the surface area of the can. To find thesurface area, we must be able to calculate the area of each face and the side and then add these areas together.
We will look at two different ways to calculate the surface area of cylinders. One way is to use a net.
As we’ve said, surface area is the total area for the faces and the side of a cylinder. That means we need to find thearea of each face of the cylinder, and then the area of the side. One way to do this is to use a net. A net is a two-dimensional diagram of a three-dimensional solid. Imagine you could unroll the soup can so that it is completelyflat. You would have something that looks like this.
The shaded circles show the top and bottom faces of the cylinder, and the unshaded rectangle shows the side, as if itwere unrolled.
Can you see how to fold the net back up to make the cylinder?
With the net, we can see each face of the cylinder more clearly. To find the surface area, we need to calculate thearea for each circle in the net.
We use the formula A = πr2 to find the area of a circle. If we know the radius or diameter of each circle, we cancalculate its area. Look closely again at the cylinder above. The two circular faces are congruent, so they must havethe same radius and diameter. Let’s calculate the area for each face.
1016

www.ck12.org Chapter 10. Surface Area and Volume
bottom face top face
A = πr2 A = πr2
A = π(4)2 A = π(4)2
A = 16π A = 16π
A = 50.24 cm2 A = 50.24 cm2
The area of each circular face is 50.24 square centimeters.
Now we need to find the area of the side. The net shows us that, when we “unroll” the cylinder, the side is actuallya rectangle. Recall that the formula we use to find the area of a rectangle is A = lw. For cylinders, the width of therectangle is the same as the height of the cylinder. In this case, the height of the cylinder is 8 centimeters.
What about the length? The length is actually the same as the perimeter of the circle, which we call itscircumference. When we “roll” up the side, it fits exactly once around the circle. To find the area of the cylinder’sside, then, we multiply the circumference of the circle by the height of the cylinder. We find the circumference ofa circle with the formula C = 2πr, and then we multiply it by the height. Let’s try it.
C = 2πr
C = 2π4
C = 8π
C = 25.12×6 = 150.72 cm2
Now we know the area of both circular faces and the side. Let’s add them together to find the surface area ofthe cylinder.
bottom face top face side surface area
50.24 cm2 + 50.24 cm2 + 150.72 cm2 = 251.2 cm2
The total surface area of the cylinder is 251.72 square centimeters.
What is the surface area of the figure below?
The first thing we need to do is draw a net. Get ready to exercise your imagination! It may help to color thetop and bottom faces to keep you on track. Begin by drawing the bottom face. It is a circle with a radius of 7
1017
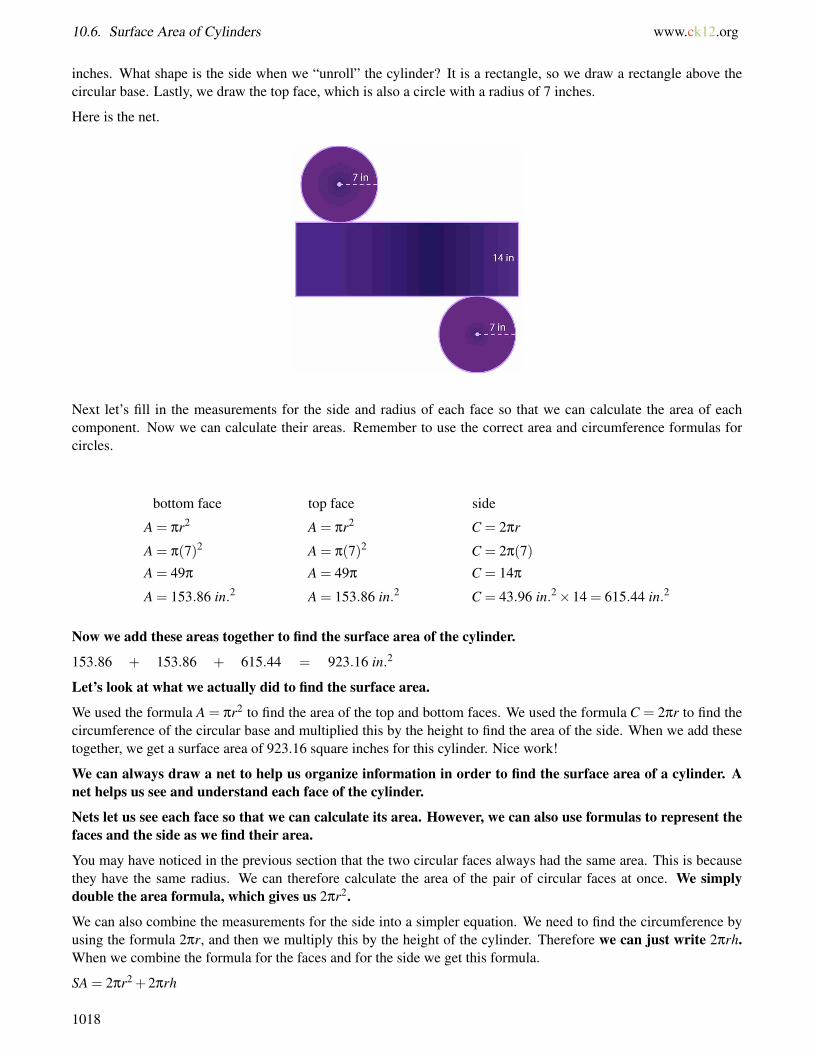
10.6. Surface Area of Cylinders www.ck12.org
inches. What shape is the side when we “unroll” the cylinder? It is a rectangle, so we draw a rectangle above thecircular base. Lastly, we draw the top face, which is also a circle with a radius of 7 inches.
Here is the net.
Next let’s fill in the measurements for the side and radius of each face so that we can calculate the area of eachcomponent. Now we can calculate their areas. Remember to use the correct area and circumference formulas forcircles.
bottom face top face side
A = πr2 A = πr2 C = 2πr
A = π(7)2 A = π(7)2 C = 2π(7)
A = 49π A = 49π C = 14π
A = 153.86 in.2 A = 153.86 in.2 C = 43.96 in.2×14 = 615.44 in.2
Now we add these areas together to find the surface area of the cylinder.
153.86 + 153.86 + 615.44 = 923.16 in.2
Let’s look at what we actually did to find the surface area.
We used the formula A = πr2 to find the area of the top and bottom faces. We used the formula C = 2πr to find thecircumference of the circular base and multiplied this by the height to find the area of the side. When we add thesetogether, we get a surface area of 923.16 square inches for this cylinder. Nice work!
We can always draw a net to help us organize information in order to find the surface area of a cylinder. Anet helps us see and understand each face of the cylinder.
Nets let us see each face so that we can calculate its area. However, we can also use formulas to represent thefaces and the side as we find their area.
You may have noticed in the previous section that the two circular faces always had the same area. This is becausethey have the same radius. We can therefore calculate the area of the pair of circular faces at once. We simplydouble the area formula, which gives us 2πr2.
We can also combine the measurements for the side into a simpler equation. We need to find the circumference byusing the formula 2πr, and then we multiply this by the height of the cylinder. Therefore we can just write 2πrh.When we combine the formula for the faces and for the side we get this formula.
SA = 2πr2 +2πrh
1018
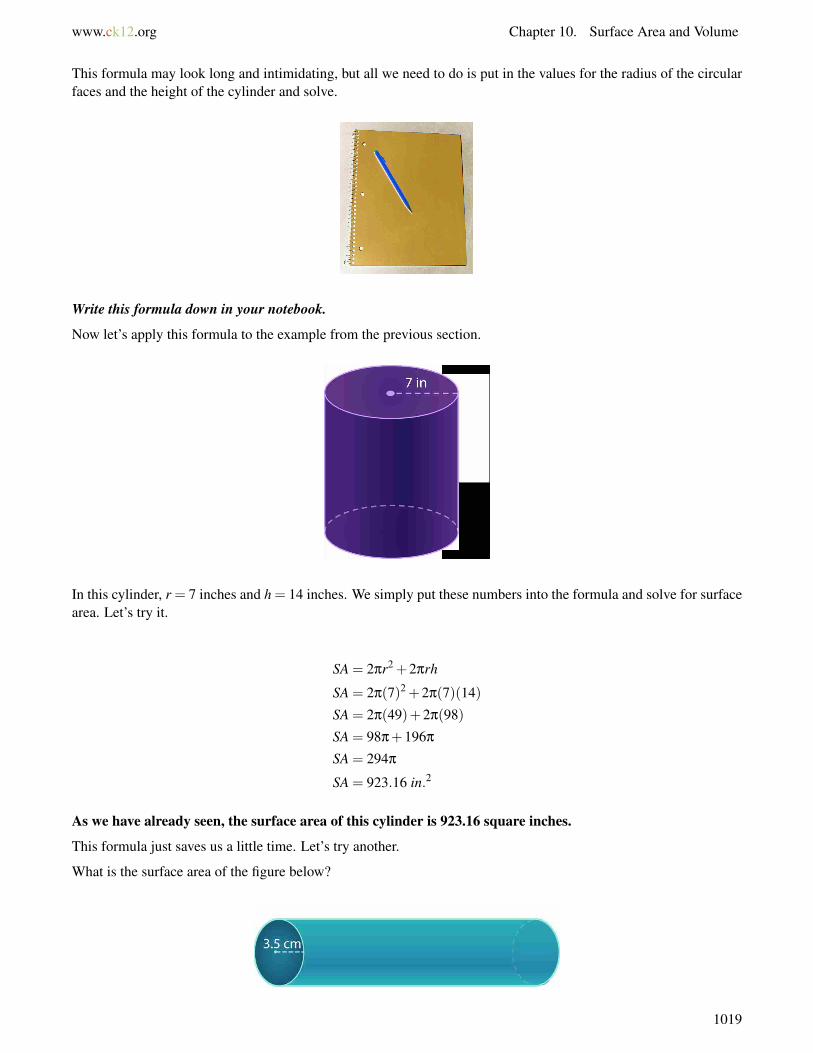
www.ck12.org Chapter 10. Surface Area and Volume
This formula may look long and intimidating, but all we need to do is put in the values for the radius of the circularfaces and the height of the cylinder and solve.
Write this formula down in your notebook.
Now let’s apply this formula to the example from the previous section.
In this cylinder, r = 7 inches and h = 14 inches. We simply put these numbers into the formula and solve for surfacearea. Let’s try it.
SA = 2πr2 +2πrh
SA = 2π(7)2 +2π(7)(14)
SA = 2π(49)+2π(98)
SA = 98π+196π
SA = 294π
SA = 923.16 in.2
As we have already seen, the surface area of this cylinder is 923.16 square inches.
This formula just saves us a little time. Let’s try another.
What is the surface area of the figure below?
1019
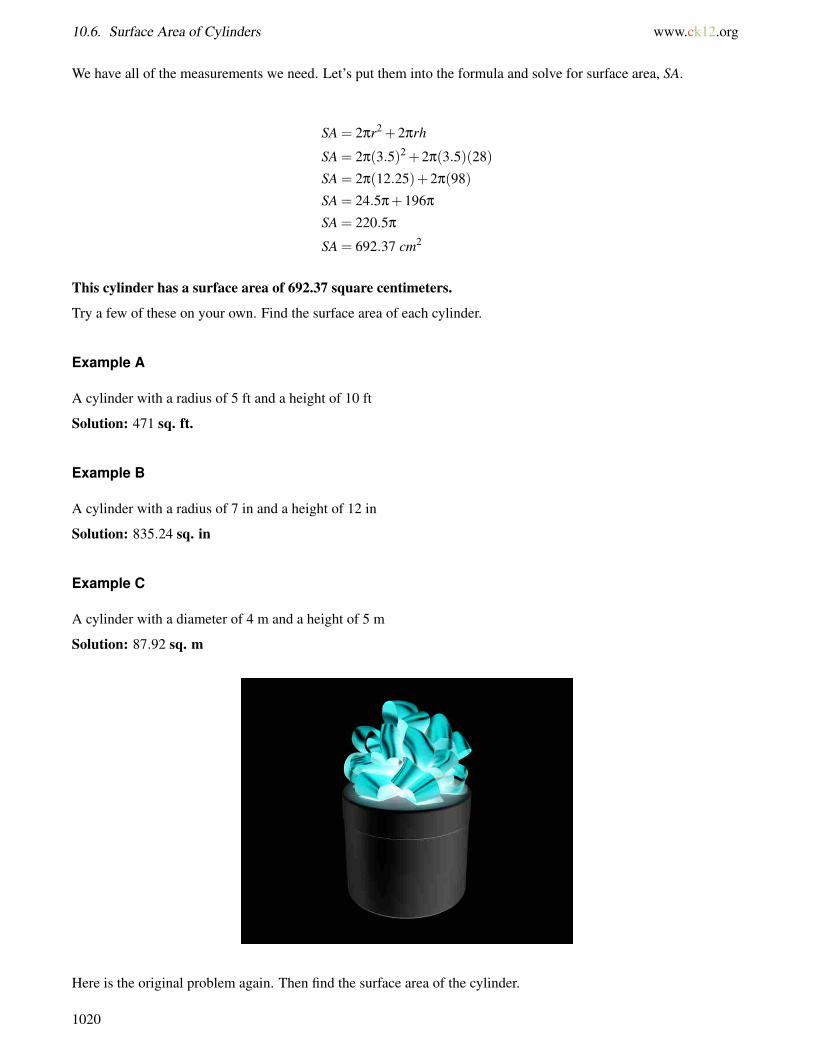
10.6. Surface Area of Cylinders www.ck12.org
We have all of the measurements we need. Let’s put them into the formula and solve for surface area, SA.
SA = 2πr2 +2πrh
SA = 2π(3.5)2 +2π(3.5)(28)
SA = 2π(12.25)+2π(98)
SA = 24.5π+196π
SA = 220.5π
SA = 692.37 cm2
This cylinder has a surface area of 692.37 square centimeters.
Try a few of these on your own. Find the surface area of each cylinder.
Example A
A cylinder with a radius of 5 ft and a height of 10 ft
Solution: 471 sq. ft.
Example B
A cylinder with a radius of 7 in and a height of 12 in
Solution: 835.24 sq. in
Example C
A cylinder with a diameter of 4 m and a height of 5 m
Solution: 87.92 sq. m
Here is the original problem again. Then find the surface area of the cylinder.
1020

www.ck12.org Chapter 10. Surface Area and Volume
Trevor is working on wrapping a container of tinker toys. It is a bit complicated because it is a cylinder. Trevor ison his third attempt, and the woman who bought the tinker toys is getting a bit impatient.
“I’m sorry maam,” Trevor said smiling.
Twice, Trevor did not cut his wrapping paper long enough. The third time, he decides to figure out the surface areaof the cylinder first and then cut the wrapping paper.
“I should have done that to begin with,” Trevor thought to himself as he looked at the ruler on the table. Measuringthe paper would have been easy had he known the dimensions.
The height of the canister is 18" and the diameter of the cylinder is 6 inches.
Trevor isn’t sure that he has enough information to find the surface area of the cylinder. He stops to think about thisfor a moment.
We can use the formula for finding the surface area of a cylinder to help us to find the surface area of thiscylinder.
SA = 2πrh+2πr2
Now we can take the dimensions and then substitute them into the formula. The first thing to notice is thatthe diameter of the canister has been given and we need the radius of the cylinder. The radius is one-half ofthe diameter.
6÷2 = 3 inches
Now we can substitute them into the formula.
SA = 2(3.14)(3)(18)+2(3.14)(32)
SA = 339.12+56.52
SA = 395.64 sq.inches
We can divide this measurement by 12 and we will know how many square feet of wrapping paper will beneeded.
395.64÷12 = 32.97 or 33 sq. f eet
Guided Practice
Here is one for you to try on your own.
Mrs. Johnson is wrapping a cylindrical package in brown paper so that she can mail it to her son. The package is 22centimeters tall and 11 centimeters across. How much paper will she need to cover the package?
1021

10.6. Surface Area of Cylinders www.ck12.org
Answer
The picture clearly shows us the height and diameter of the cylinder, so let’s use the formula for finding the surfacearea. But be careful—we have been given the diameter, not the radius. We need to divide it by 2 to find the radius:11÷2 = 5.5. Now we have the radius and height, so we can put these in for the appropriate variables in the formula.
SA = 2πr2 +2πrh
SA = 2π(5.52)+2π(5.5)(22)
SA = 2π(30.25)+2π(121)
SA = 60.5π+242π
SA = 302.5π
SA = 949.85 cm2
Mrs. Johnson will need 949.85 square centimeters of brown paper in order to wrap the entire package.
Video Review
MEDIAClick image to the left or use the URL below.URL: http://www.ck12.org/flx/render/embeddedobject/5270
This is a video on surface area of cylinders.
Explore More
Directions: Find the surface area of each cylinder given its height and radius.
1. r = 1 m, h = 3 m
2. r = 2 cm, h = 4 cm
3. r = 6 in, h = 10 in
4. r = 4 in, h = 6 in
5. r = 5 in, h = 10 in
6. r = 8 f t, h = 6 f t
7. r = 10 m, h = 15 m
8. r = 9 cm, h = 12 cm
9. r = 6 m, h = 8 m
10. r = 2 cm, h = 3 cm
Directions: Find the surface area of each cylinder given its height and diameter.
11. d = 8 m, h = 11 m
1022

www.ck12.org Chapter 10. Surface Area and Volume
12. d = 10 in, h = 14 in
13. d = 8 cm, h = 10 cm
14. d = 12 m, h = 15 m
15. d = 15 in, h = 20 in
1023
10.7. Heights of Cylinders Given Surface Area www.ck12.org
10.7 Heights of Cylinders Given Surface Area
Here you’ll learn to find the heights of cylinders given surface area and one other dimension.
What if you know the surface area of a cylinder, but don’t know the height? Look at this dilemma.
Candice is going to use modge podge to decorate the outside of a cylindrical canister. She wants to make it into adecorative pencil holder as a gift for her Mom. Modge podge is a glue - like substance that helps to adhere tissuepaper or other decorative pieces of paper to an object.
Candice’s canister has a radius of 3 inches and has a surface area of 207.3 in2.
What is the height of the canister?
Use this Concept to learn about how to figure out the height of a cylinder given the radius and surface area.
Guidance
Sometimes we may be given the surface area of a cylinder and need to find its height. We simply fill theinformation we know into the surface area formula. This time, instead of solving for SA, we solve for h, theheight of the cylinder.
Let’s look at how we can apply this information.
The surface area of a cylinder with a radius of 3 inches is 78π square inches. What is the height of the cylinder?
We know that the radius of the cylinder is 3 inches. We also know that the surface area of the cylinder is 78π
square inches. Sometimes a problem will include pi in the amount because it is more precise. We’ll see thatthis also makes our calculations easier. All we have to do is put 78π into the formula in place of SA. Then wecan use the formula to solve for the height, h.
SA = 2πr2 +2πrh
78π = 2π(32)+2π(3)h
78π = 2π(9)+6πh
78π = 18π+6πh
78π−18π = 6πh Subtract 18π from both sides.
60π = 6πh
60π÷6π = h Divide both sides by 6π.
10 in.= h
We used the formula to find that a cylinder with a radius of 3 inches and a surface area of 78π has a height of10 inches.
We can check our work by putting the height into the formula and solving for surface area.
1024

www.ck12.org Chapter 10. Surface Area and Volume
SA = 2π(32)+2π(3)(10)
SA = 2π(9)+2π(30)
SA = 18π+60π
SA = 78π
This is the surface area given in the problem, so our answer is correct. Let’s look at another example.
Now try a few of these on your own.
Find the height in each problem.
Example A
SA = 48π, r = 3 in
Solution: 2 in
Example B
SA = 60π, r = 2 in
Solution: 5 in
Example C
SA = 80π, r = 4 m
Solution: 2 m
Here is the original problem once again.
Candice is going to use modge podge to decorate the outside of a cylindrical canister. She wants to make it into adecorative pencil holder as a gift for her Mom. Modge podge is a glue - like substance that helps to adhere tissuepaper or other decorative pieces of paper to an object.
Candice’s canister has a radius of 3 inches and has a surface area of 207.24 in2.
What is the height of the canister?
To figure this out, let’s use the formula.
SA = 2πr2 +2πrh
66π = 2π(32)+2π(3)h
66π = 2π(9)+6πh
66π = 18π+6πh
66π−18π = 6πh Subtract 18π from both sides.
66π = 6πh
66π÷6π = h Divide both sides by 6π.
8 in.= h
The height of the cylinder is 8 in.
1025

10.7. Heights of Cylinders Given Surface Area www.ck12.org
Guided Practice
Here is one for you to try on your own.
Mrs. Javitz bought a container of oatmeal in the shape of the cylinder. If the container has a radius of 5 cm and asurface area of 170π, what is its height?
Answer
Once again, we have been given the surface area as a function of pi. That’s no problem we simply put the wholenumber, 170π, in for SA in the formula. We also know that the container has a radius of 5 centimeters, so we can usethe formula to solve for h, the height of the container.
SA = 2πr2 +2πrh
170π = 2π(52)+2π(5)h
170π = 2π(25)+10πh
170π = 50π+10πh
170π−50π = 10πh Subtract 50π from both sides.
120π = 10πh
120π÷10π = h Divide both sides by 10π.
12 cm = h
The oatmeal container must have a height of 12 centimeters.
Video Review
MEDIAClick image to the left or use the URL below.URL: http://www.ck12.org/flx/render/embeddedobject/5270
Khan Academy, Cylinder Volume and Surface Area
1026
www.ck12.org Chapter 10. Surface Area and Volume
Explore More
Directions: Find the height of each cylinder given the surface area and one other dimension.
1. r = 5 in
SA = 376.8 in2
2. r = 6 in
SA = 527.52 in2
3. r = 5.5 in
SA = 336.765 in2
4. r = 4 cm
SA = 251.2 cm2
5. r = 5 m
SA = 471 m2
6. r = 2 cm
SA = 87.92 cm2
7. r = 2 cm
SA = 113.04 cm2
8. d = 4 m
SA = 125.6 m2
9. d = 8 cm
SA = 904.32 cm2
10. d = 6 cm
SA = 395.64 cm2
11. r = 3 cm
SA = 226.08 cm2
12. r = 14 cm
SA = 2637.6 cm2
13. r = 18 cm
SA = 4295.52 cm2
14. r = 12 cm
SA = 1959.36 cm2
15. r = 13 cm
SA = 3428.88 cm2
1027
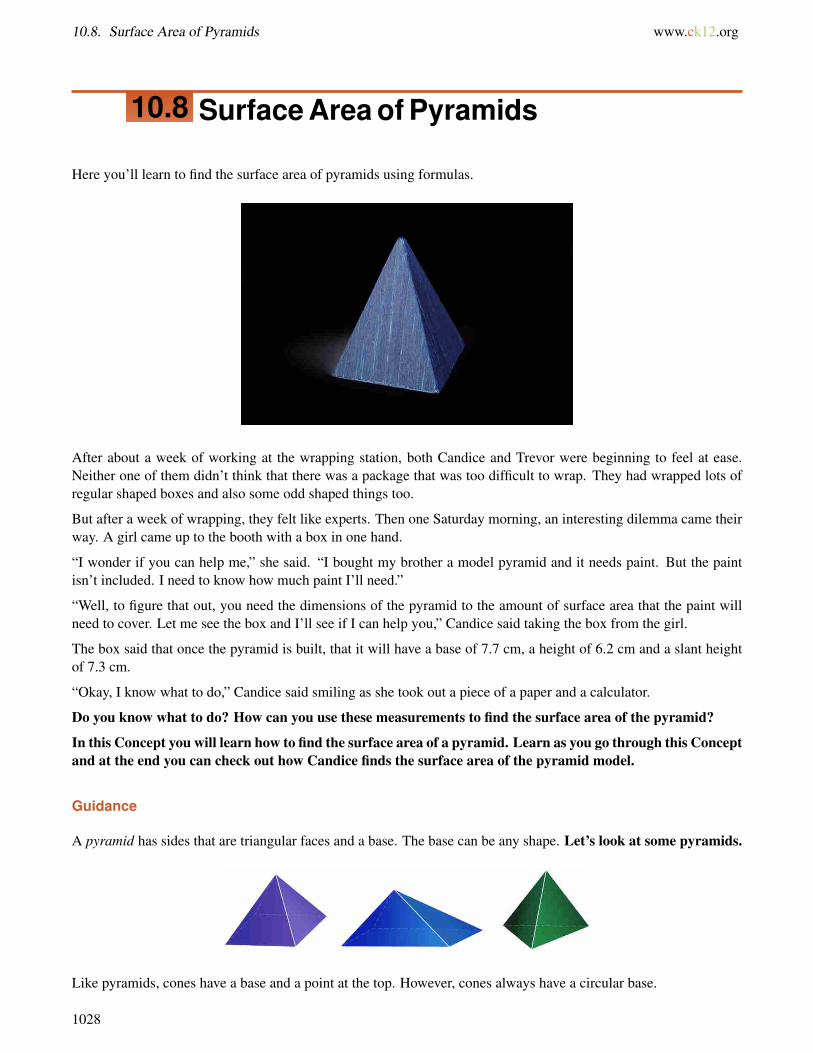
10.8. Surface Area of Pyramids www.ck12.org
10.8 Surface Area of Pyramids
Here you’ll learn to find the surface area of pyramids using formulas.
After about a week of working at the wrapping station, both Candice and Trevor were beginning to feel at ease.Neither one of them didn’t think that there was a package that was too difficult to wrap. They had wrapped lots ofregular shaped boxes and also some odd shaped things too.
But after a week of wrapping, they felt like experts. Then one Saturday morning, an interesting dilemma came theirway. A girl came up to the booth with a box in one hand.
“I wonder if you can help me,” she said. “I bought my brother a model pyramid and it needs paint. But the paintisn’t included. I need to know how much paint I’ll need.”
“Well, to figure that out, you need the dimensions of the pyramid to the amount of surface area that the paint willneed to cover. Let me see the box and I’ll see if I can help you,” Candice said taking the box from the girl.
The box said that once the pyramid is built, that it will have a base of 7.7 cm, a height of 6.2 cm and a slant heightof 7.3 cm.
“Okay, I know what to do,” Candice said smiling as she took out a piece of a paper and a calculator.
Do you know what to do? How can you use these measurements to find the surface area of the pyramid?
In this Concept you will learn how to find the surface area of a pyramid. Learn as you go through this Conceptand at the end you can check out how Candice finds the surface area of the pyramid model.
Guidance
A pyramid has sides that are triangular faces and a base. The base can be any shape. Let’s look at some pyramids.
Like pyramids, cones have a base and a point at the top. However, cones always have a circular base.
1028
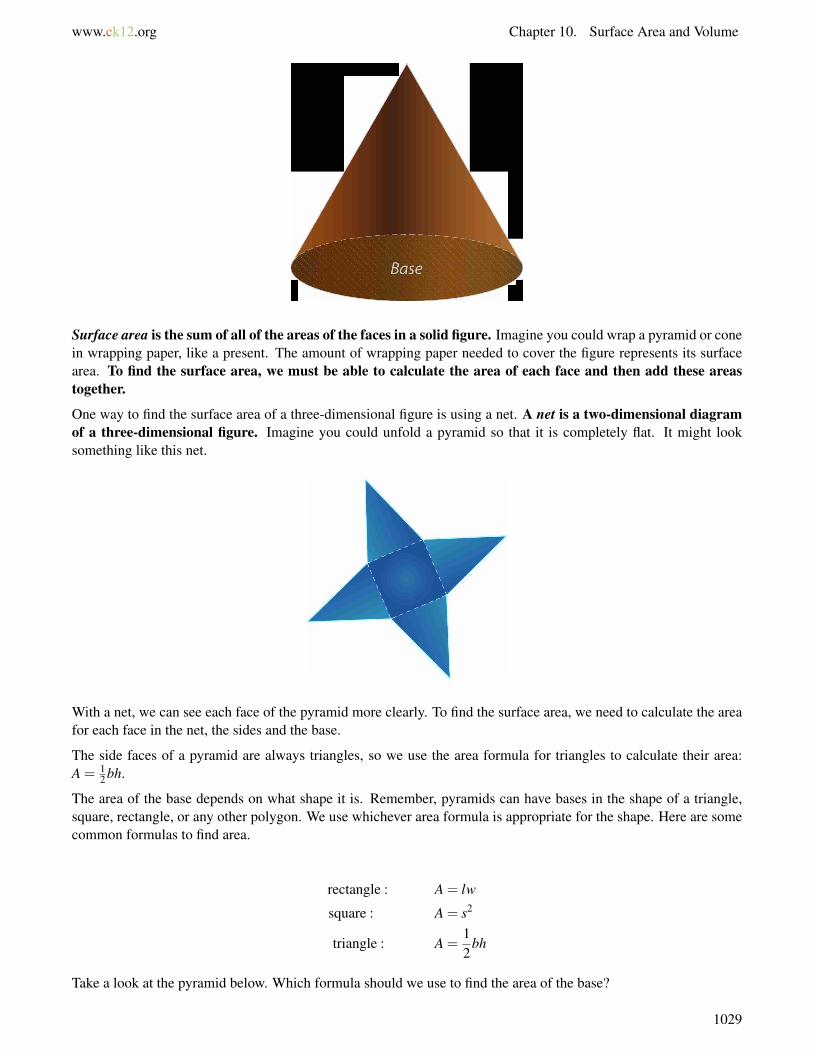
www.ck12.org Chapter 10. Surface Area and Volume
Surface area is the sum of all of the areas of the faces in a solid figure. Imagine you could wrap a pyramid or conein wrapping paper, like a present. The amount of wrapping paper needed to cover the figure represents its surfacearea. To find the surface area, we must be able to calculate the area of each face and then add these areastogether.
One way to find the surface area of a three-dimensional figure is using a net. A net is a two-dimensional diagramof a three-dimensional figure. Imagine you could unfold a pyramid so that it is completely flat. It might looksomething like this net.
With a net, we can see each face of the pyramid more clearly. To find the surface area, we need to calculate the areafor each face in the net, the sides and the base.
The side faces of a pyramid are always triangles, so we use the area formula for triangles to calculate their area:A = 1
2 bh.
The area of the base depends on what shape it is. Remember, pyramids can have bases in the shape of a triangle,square, rectangle, or any other polygon. We use whichever area formula is appropriate for the shape. Here are somecommon formulas to find area.
rectangle : A = lw
square : A = s2
triangle : A =12
bh
Take a look at the pyramid below. Which formula should we use to find the area of the base?
1029
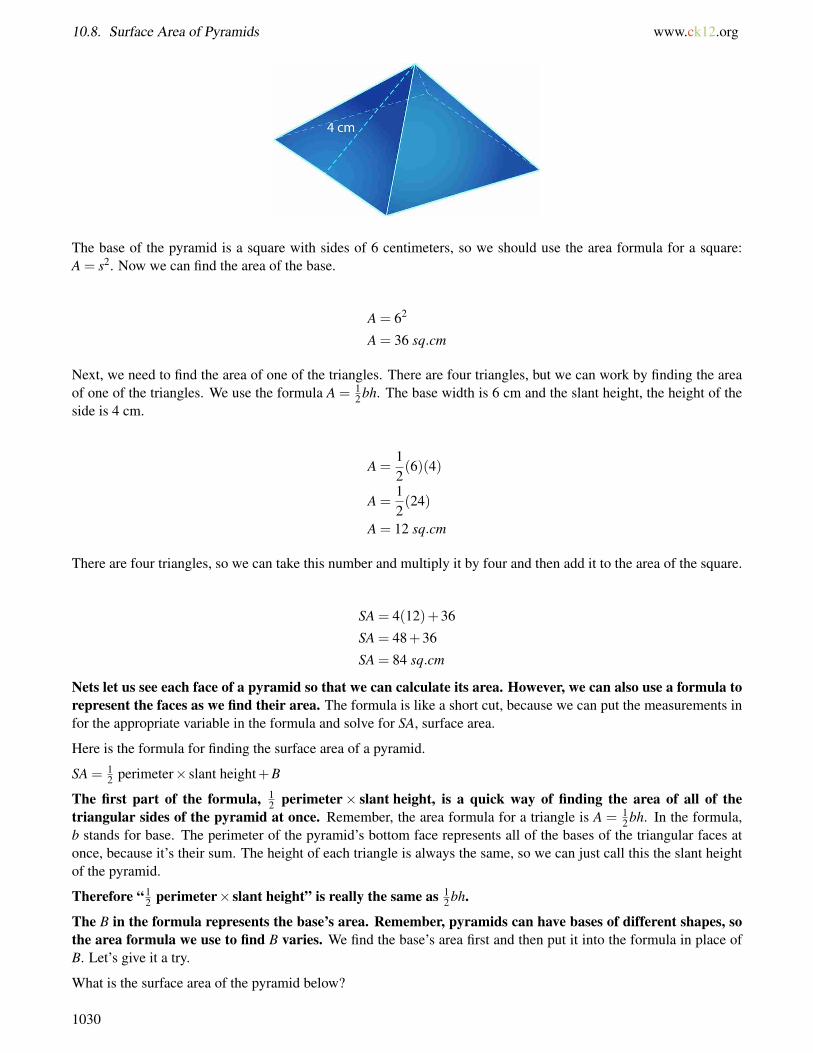
10.8. Surface Area of Pyramids www.ck12.org
The base of the pyramid is a square with sides of 6 centimeters, so we should use the area formula for a square:A = s2. Now we can find the area of the base.
A = 62
A = 36 sq.cm
Next, we need to find the area of one of the triangles. There are four triangles, but we can work by finding the areaof one of the triangles. We use the formula A = 1
2 bh. The base width is 6 cm and the slant height, the height of theside is 4 cm.
A =12(6)(4)
A =12(24)
A = 12 sq.cm
There are four triangles, so we can take this number and multiply it by four and then add it to the area of the square.
SA = 4(12)+36
SA = 48+36
SA = 84 sq.cm
Nets let us see each face of a pyramid so that we can calculate its area. However, we can also use a formula torepresent the faces as we find their area. The formula is like a short cut, because we can put the measurements infor the appropriate variable in the formula and solve for SA, surface area.
Here is the formula for finding the surface area of a pyramid.
SA = 12 perimeter× slant height+B
The first part of the formula, 12 perimeter× slant height, is a quick way of finding the area of all of the
triangular sides of the pyramid at once. Remember, the area formula for a triangle is A = 12 bh. In the formula,
b stands for base. The perimeter of the pyramid’s bottom face represents all of the bases of the triangular faces atonce, because it’s their sum. The height of each triangle is always the same, so we can just call this the slant heightof the pyramid.
Therefore “ 12 perimeter× slant height” is really the same as 1
2 bh.
The B in the formula represents the base’s area. Remember, pyramids can have bases of different shapes, sothe area formula we use to find B varies. We find the base’s area first and then put it into the formula in place ofB. Let’s give it a try.
What is the surface area of the pyramid below?
1030

www.ck12.org Chapter 10. Surface Area and Volume
This is a square pyramid. The four sides of the base are all 8 inches, so the perimeter of the base is 8× 4 =32 inches. We also know we will need to use the area formula for squares to find B, the base’s area.
B = s2
B = (8)2
B = 64 in.2
Now we have all the information that we need. We can put it into the formula and solve for SA, surface area.
SA =12
perimeter× slant height+B
SA =
[12(32)×3
]+64
SA = (16×3)+64
SA = 48+64
SA = 112 in.2
The surface area of the pyramid is 112 square inches.
Here is another one.
Find the surface area of the figure below.
First of all, what kind of pyramid is this? It is a triangular pyramid because its base is a triangle. That meanswe need to use the area formula for triangles to find B. The base’s sides are all the same length, so we cancalculate the perimeter by multiplying 16×3 = 48. Now let’s find B.
1031
10.8. Surface Area of Pyramids www.ck12.org
B =12
bh
B =12(16)(13.86)
B = 8(13.86)
B = 110.88 cm2
Now we’re ready to put all of the information into the formula. Let’s see what happens.
SA =12
perimeter× slant height+B
SA =
[12(48)×6
]+110.88
SA = (24×6)+110.88
SA = 144+110.88
SA = 254.88 cm2
The surface area of this triangular pyramid is 254.88 square centimeters.
Write this formula down in your notebook.
Try a few of these on your own.
Find the surface area of each pyramid.
Example A
A square pyramid with side of 6 cm, slant height of 5 cm
Solution: 96 cm2
Example B
A rectangular pyramid with a length of 6 in, a width of 4 in and a slant height of 3 in
Solution: 54 in2
1032

www.ck12.org Chapter 10. Surface Area and Volume
Example C
A square pyramid with side of 8 in, slant height of 9 in
Solution: 208 in2
Here is the original problem once again.
After about a week of working at the wrapping station, both Candice and Trevor were beginning to feel at ease.Neither one of them didn’t think that there was a package that was too difficult to wrap. They had wrapped lots ofregular shaped boxes and also some odd shaped things too.
But after a week of wrapping, they felt like experts. Then one Saturday morning, an interesting dilemma came theirway. A girl came up to the booth with a box in one hand.
“I wonder if you can help me,” she said. “I bought my brother a model pyramid and it needs paint. But the paintisn’t included. I need to know how much paint I’ll need.”
“Well, to figure that out, you need the dimensions of the pyramid to the amount of surface area that the paint willneed to cover. Let me see the box and I’ll see if I can help you,” Candice said taking the box from the girl.
The box said that once the pyramid is built, that it will have a base of 7.7 cm, a height of 6.2 cm and a slant heightof 7.3 cm.
“Okay, I know what to do,” Candice said smiling as she took out a piece of a paper and a calculator.
First, Candice needs to find the surface area of the base. She can use this formula.
A = 12 bh
A = 12(7.7)(6.2)
A = 23.87 sq.cm
Now she can use the formula for surface area.
SA = 12 P× sh+B
SA = 12(23.1)×7.3+23.87
SA = 84.315+23.87
SA = 108.19 cm2
The surface area of the pyramid is 108.19 sq. cm.
“You need to find paint that stretches across 108.19 sq. cm. That will give him just enough. Try the hobbyshop. They will help you,” Candice said writing the figure on a piece of paper as she handed it to the girl.
1033
10.8. Surface Area of Pyramids www.ck12.org
The girl smiled and thanked her. Candice felt good about her ability to use math to figure out the problem.
Guided Practice
Here is one for you to try on your own.
Find the surface area of the following triangular pyramid.
Base of 8 cm, height of 7 cm, and a slant height of 6 cm.
Answer
First, we need to find the surface area of each of the four lateral faces. She can use this formula.
A =12
bh
A = 4[
12(8)(7)
]A = 112 sq.cm
Now she can find the area of the base.
A = s2
A = 8(8)
A = 64 sq.cm
The surface area of the pyramid is 176 sq. cm.
Video Review
Watch this video about the surface area of pyramids.
Explore More
Directions: Find the surface area of each square pyramid. Remember that b means base and sh means slant height.
1. b = 4 in, sh = 5 in
2. b = 4 in, sh = 6 in
3. b = 6 in, sh = 8 in
4. b = 5 in, sh = 7 in
5. b = 7 m, sh = 9 m
6. b = 8 m, sh = 10 m
7. b = 9 cm, sh = 11 cm
8. b = 11 m, sh = 13 m
9. b = 6 in, sh = 9 in
10. b = 10 cm, sh = 12 cm
1034

www.ck12.org Chapter 10. Surface Area and Volume
Directions: Find the surface area of each rectangular pyramid.
11. l = 10 in,w = 8 in,sh = 6 in
12. l = 12 f t,w = 8 f t,sh = 10 f t
13. l = 4 in,w = 2 in,sh = 3 in
14. l = 16 m,w = 12 m,sh = 11 m
15. l = 15 in,w = 10 in,sh = 12 in
1035
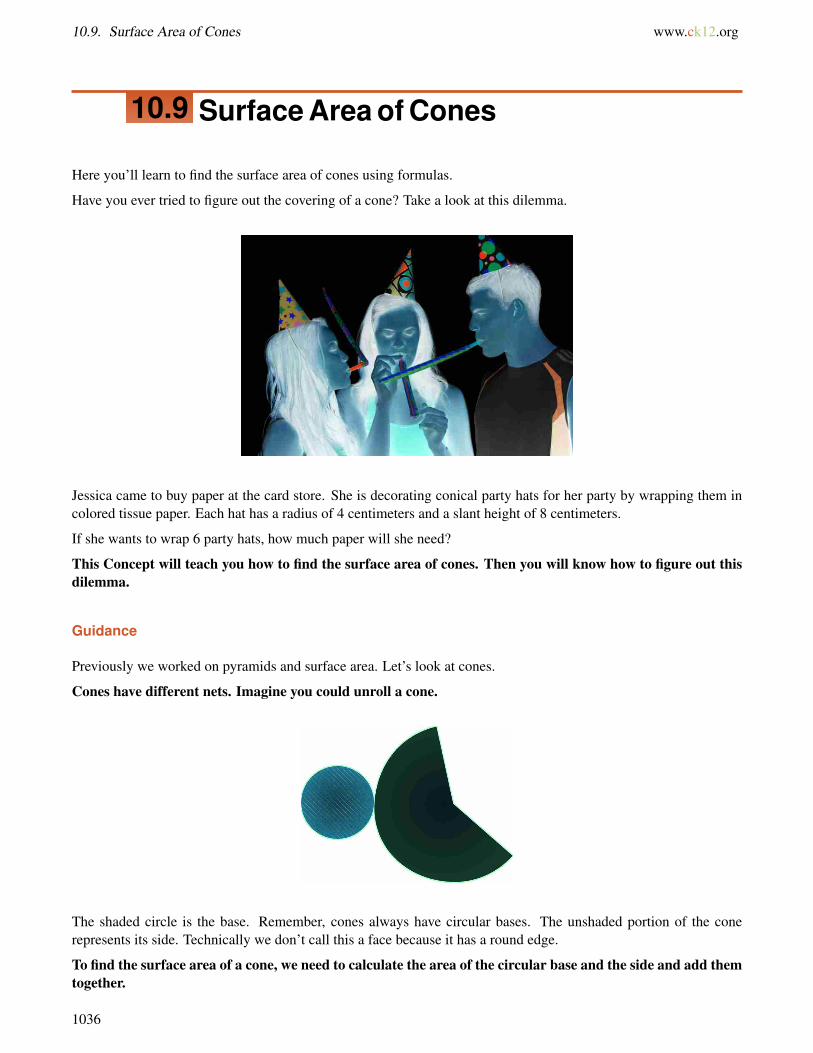
10.9. Surface Area of Cones www.ck12.org
10.9 Surface Area of Cones
Here you’ll learn to find the surface area of cones using formulas.
Have you ever tried to figure out the covering of a cone? Take a look at this dilemma.
Jessica came to buy paper at the card store. She is decorating conical party hats for her party by wrapping them incolored tissue paper. Each hat has a radius of 4 centimeters and a slant height of 8 centimeters.
If she wants to wrap 6 party hats, how much paper will she need?
This Concept will teach you how to find the surface area of cones. Then you will know how to figure out thisdilemma.
Guidance
Previously we worked on pyramids and surface area. Let’s look at cones.
Cones have different nets. Imagine you could unroll a cone.
The shaded circle is the base. Remember, cones always have circular bases. The unshaded portion of the conerepresents its side. Technically we don’t call this a face because it has a round edge.
To find the surface area of a cone, we need to calculate the area of the circular base and the side and add themtogether.
1036
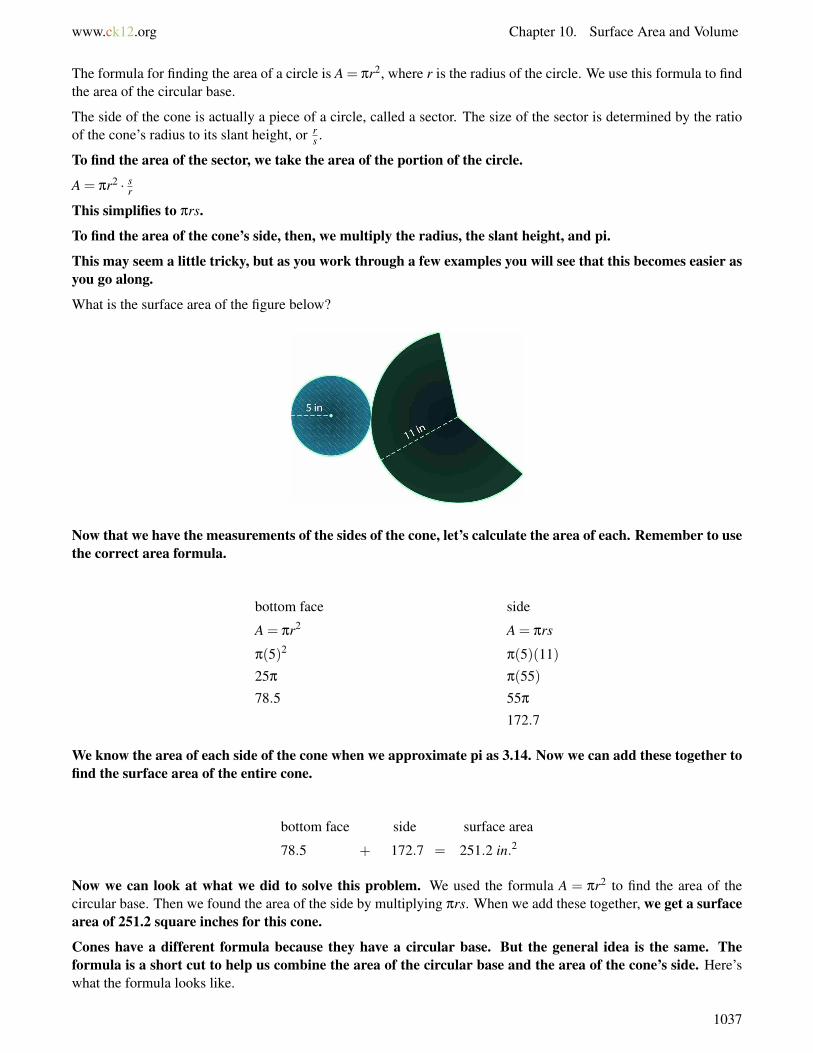
www.ck12.org Chapter 10. Surface Area and Volume
The formula for finding the area of a circle is A = πr2, where r is the radius of the circle. We use this formula to findthe area of the circular base.
The side of the cone is actually a piece of a circle, called a sector. The size of the sector is determined by the ratioof the cone’s radius to its slant height, or r
s .
To find the area of the sector, we take the area of the portion of the circle.
A = πr2 · sr
This simplifies to πrs.
To find the area of the cone’s side, then, we multiply the radius, the slant height, and pi.
This may seem a little tricky, but as you work through a few examples you will see that this becomes easier asyou go along.
What is the surface area of the figure below?
Now that we have the measurements of the sides of the cone, let’s calculate the area of each. Remember to usethe correct area formula.
bottom face side
A = πr2 A = πrs
π(5)2π(5)(11)
25π π(55)
78.5 55π
172.7
We know the area of each side of the cone when we approximate pi as 3.14. Now we can add these together tofind the surface area of the entire cone.
bottom face side surface area
78.5 + 172.7 = 251.2 in.2
Now we can look at what we did to solve this problem. We used the formula A = πr2 to find the area of thecircular base. Then we found the area of the side by multiplying πrs. When we add these together, we get a surfacearea of 251.2 square inches for this cone.
Cones have a different formula because they have a circular base. But the general idea is the same. Theformula is a short cut to help us combine the area of the circular base and the area of the cone’s side. Here’swhat the formula looks like.
1037
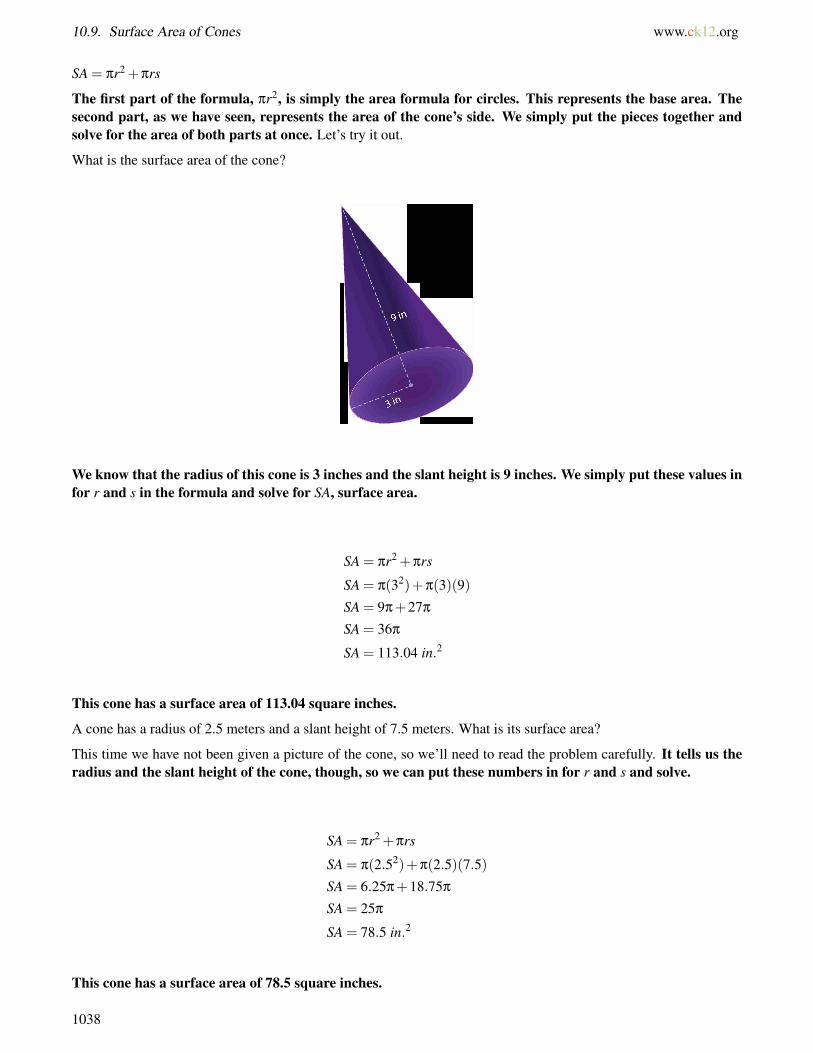
10.9. Surface Area of Cones www.ck12.org
SA = πr2 +πrs
The first part of the formula, πr2, is simply the area formula for circles. This represents the base area. Thesecond part, as we have seen, represents the area of the cone’s side. We simply put the pieces together andsolve for the area of both parts at once. Let’s try it out.
What is the surface area of the cone?
We know that the radius of this cone is 3 inches and the slant height is 9 inches. We simply put these values infor r and s in the formula and solve for SA, surface area.
SA = πr2 +πrs
SA = π(32)+π(3)(9)
SA = 9π+27π
SA = 36π
SA = 113.04 in.2
This cone has a surface area of 113.04 square inches.
A cone has a radius of 2.5 meters and a slant height of 7.5 meters. What is its surface area?
This time we have not been given a picture of the cone, so we’ll need to read the problem carefully. It tells us theradius and the slant height of the cone, though, so we can put these numbers in for r and s and solve.
SA = πr2 +πrs
SA = π(2.52)+π(2.5)(7.5)
SA = 6.25π+18.75π
SA = 25π
SA = 78.5 in.2
This cone has a surface area of 78.5 square inches.
1038
www.ck12.org Chapter 10. Surface Area and Volume
Take a few minutes to write this formula down in your notebooks.
Now try a few of these on your own.
Find the surface area of each cone.
Example A
Radius = 4 in, slant height = 6 in
Solution: 125.6 in2
Example B
Radius = 3.5 in, slant height = 5 in
Solution: 93.42 in2
Example C
Radius = 5 m, slant height = 7 m
Solution: 188.4 m2
You’re right! Just be sure to put the numbers in the correct place in the formula!
Now back to Jessica and the hats.
1039
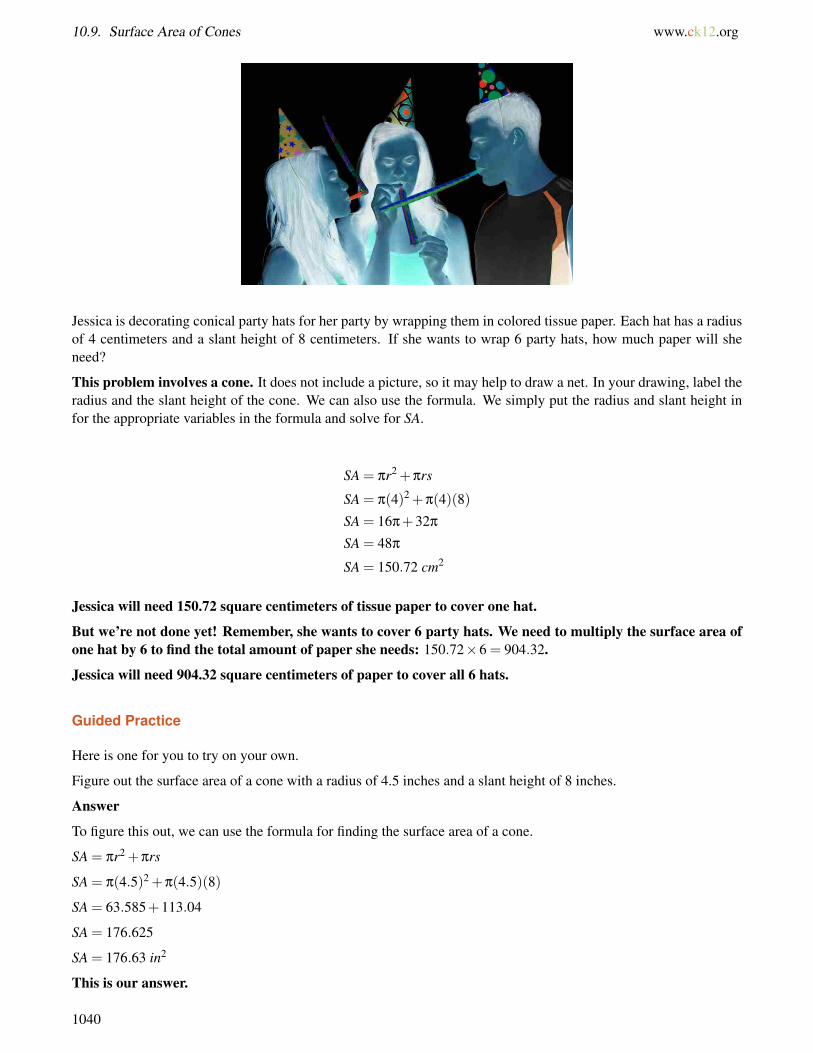
10.9. Surface Area of Cones www.ck12.org
Jessica is decorating conical party hats for her party by wrapping them in colored tissue paper. Each hat has a radiusof 4 centimeters and a slant height of 8 centimeters. If she wants to wrap 6 party hats, how much paper will sheneed?
This problem involves a cone. It does not include a picture, so it may help to draw a net. In your drawing, label theradius and the slant height of the cone. We can also use the formula. We simply put the radius and slant height infor the appropriate variables in the formula and solve for SA.
SA = πr2 +πrs
SA = π(4)2 +π(4)(8)
SA = 16π+32π
SA = 48π
SA = 150.72 cm2
Jessica will need 150.72 square centimeters of tissue paper to cover one hat.
But we’re not done yet! Remember, she wants to cover 6 party hats. We need to multiply the surface area ofone hat by 6 to find the total amount of paper she needs: 150.72×6 = 904.32.
Jessica will need 904.32 square centimeters of paper to cover all 6 hats.
Guided Practice
Here is one for you to try on your own.
Figure out the surface area of a cone with a radius of 4.5 inches and a slant height of 8 inches.
Answer
To figure this out, we can use the formula for finding the surface area of a cone.
SA = πr2 +πrs
SA = π(4.5)2 +π(4.5)(8)
SA = 63.585+113.04
SA = 176.625
SA = 176.63 in2
This is our answer.
1040
www.ck12.org Chapter 10. Surface Area and Volume
Video Review
Watch this video about the surface area of cones.
Explore More
Directions: Find the surface area of each cone. Remember that sh means slant height and r means radius.
1. r = 4 in, sh = 5 in
2. r = 5 m, sh = 7 m
3. r = 3 cm, sh = 6 cm
4. r = 5 mm, sh = 8 mm
5. r = 8 in, sh = 10 in
6. r = 11 cm, sh = 14 cm
7. r = 12 in, sh = 16 in
8. r = 3.5 cm, sh = 6 cm
9. r = 4.5 mm, sh = 7 mm
10. r = 6 cm, sh = 8 cm
11. r = 7.5 cm, sh = 9 cm
12. r = 10 cm, sh = 12 cm
13. r = 16 cm, sh = 18 cm
14. r = 13 cm, sh = 20 cm
15. r = 15.5 cm, sh = 18.5 cm
1041
10.10. Volume of Rectangular Prisms www.ck12.org
10.10 Volume of Rectangular Prisms
Here you’ll learn to find volumes of rectangular prisms using formulas.
Have you ever had a job with many tasks?
One of the tasks that Candice and Trevor have is to fill boxes with packing peanuts when wrapping something that isfragile. The boxes can hold a good amount of packing peanuts. Each day, one of the students goes to the storeroomto get a big bag of packing peanuts. Then they work on filling 5 –10 boxes half-way full of packing peanuts so thatthey are ready to go when the time comes.
“I wonder how much one box holds,” Candice asked Trevor one morning.
“I think that would depend on the box. I think that a tall skinny box would hold less than a wide flat box,” Trevorsaid challenging her.
“I don’t. Think about it. Tall may seem like it would hold more, but you can spread out the peanuts in the wide flatbox. I think the wide flat one will hold more.”
“Let’s test it out,” Candice said. “We can fill them and then go back and count all of the peanuts.”
“There is an easier way than that. We can use the dimensions and figure out the volume of each box.”
Candice is a bit puzzled by that. She thinks that counting all of the peanuts would be a quicker way to work. Thetwo begin a short argument and decide to try out both methods. Candice begins filling boxes and Trevor begins towork it through mathematically.
Here are the dimensions of the two boxes:
The tall box has a length of 5 inches, a width of 4 inches and a height of 18 inches.
The wide flat box has a length of 12 inches, a width of 6 inches, and a height of 5 inches.
Do you have a prediction which one has the greater volume? This Concept is all about figuring out the volumeof prisms. Pay close attention and you will learn how to figure this out by the end of the Concept.
Guidance
You have heard the world “volume” before in everyday life. We can talk about the volume of water in a pool or in aglass or in a pitcher. This Concept will focus on how we can find the volume of a prism.
A prism is a three-dimensional figure with two congruent parallel bases and rectangular faces for sides. Theprism is named by the polygon which makes up its base.
Volume is the measure of how much three-dimensional space it takes up or holds.
1042
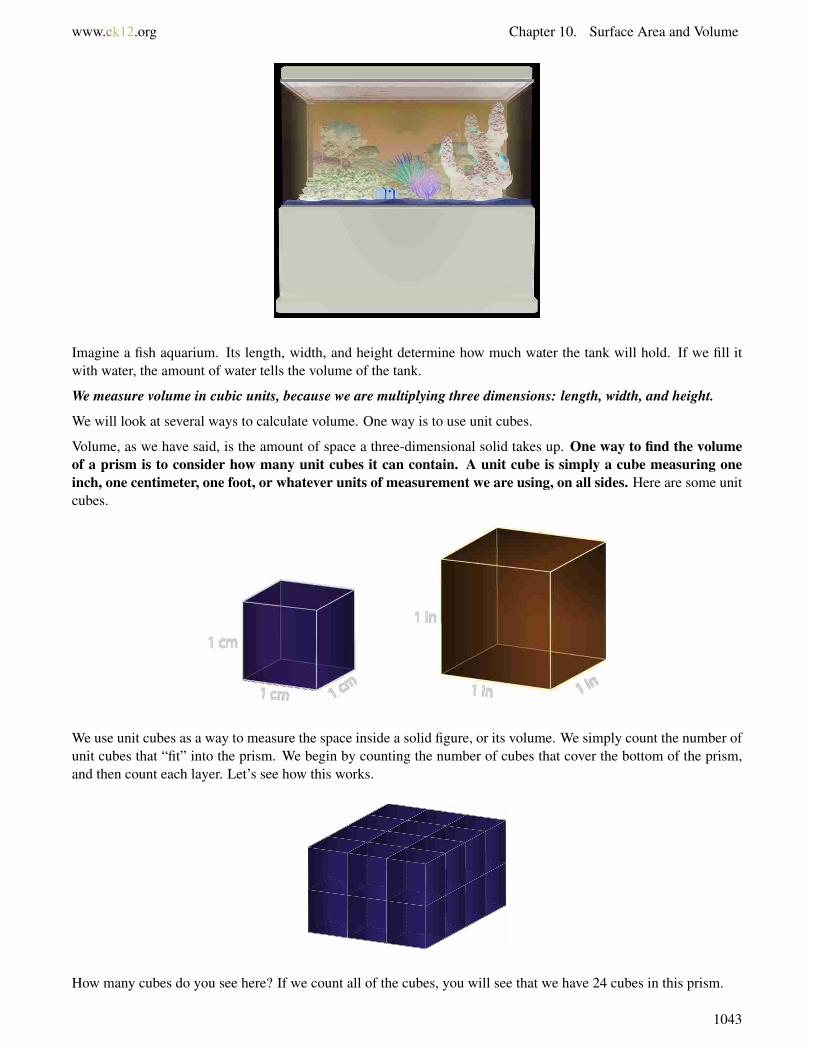
www.ck12.org Chapter 10. Surface Area and Volume
Imagine a fish aquarium. Its length, width, and height determine how much water the tank will hold. If we fill itwith water, the amount of water tells the volume of the tank.
We measure volume in cubic units, because we are multiplying three dimensions: length, width, and height.
We will look at several ways to calculate volume. One way is to use unit cubes.
Volume, as we have said, is the amount of space a three-dimensional solid takes up. One way to find the volumeof a prism is to consider how many unit cubes it can contain. A unit cube is simply a cube measuring oneinch, one centimeter, one foot, or whatever units of measurement we are using, on all sides. Here are some unitcubes.
We use unit cubes as a way to measure the space inside a solid figure, or its volume. We simply count the number ofunit cubes that “fit” into the prism. We begin by counting the number of cubes that cover the bottom of the prism,and then count each layer. Let’s see how this works.
How many cubes do you see here? If we count all of the cubes, you will see that we have 24 cubes in this prism.
1043
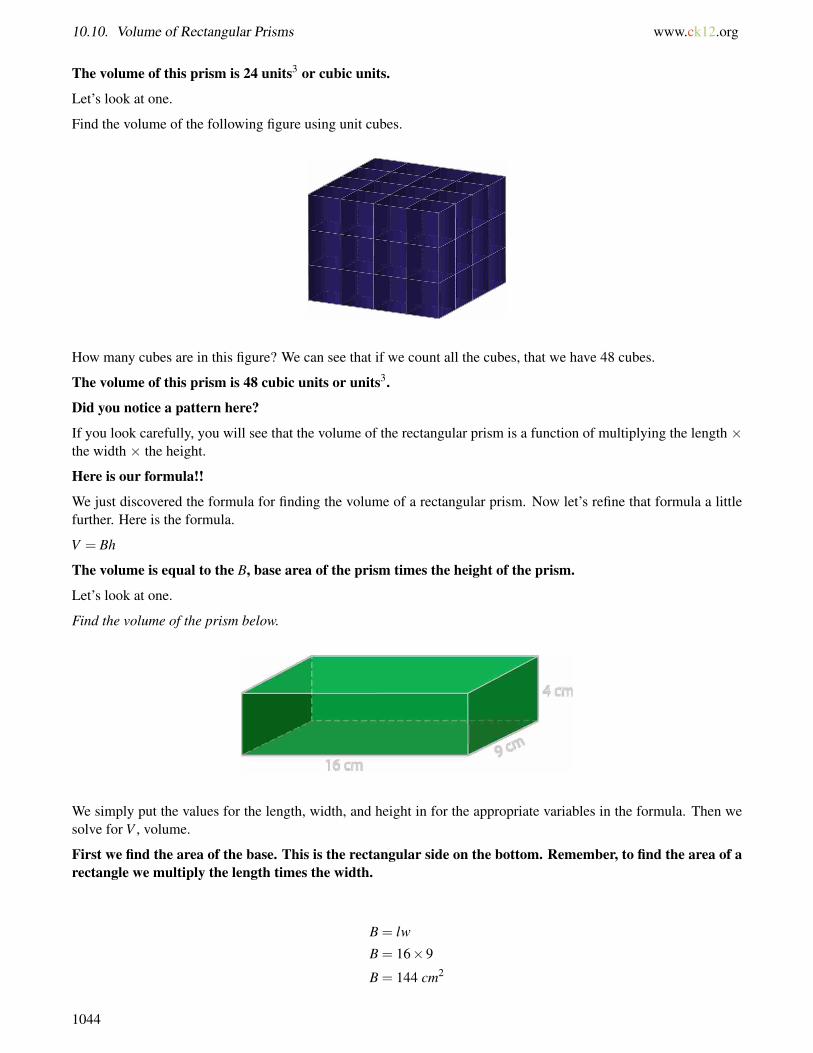
10.10. Volume of Rectangular Prisms www.ck12.org
The volume of this prism is 24 units3 or cubic units.
Let’s look at one.
Find the volume of the following figure using unit cubes.
How many cubes are in this figure? We can see that if we count all the cubes, that we have 48 cubes.
The volume of this prism is 48 cubic units or units3.
Did you notice a pattern here?
If you look carefully, you will see that the volume of the rectangular prism is a function of multiplying the length ×the width × the height.
Here is our formula!!
We just discovered the formula for finding the volume of a rectangular prism. Now let’s refine that formula a littlefurther. Here is the formula.
V = Bh
The volume is equal to the B, base area of the prism times the height of the prism.
Let’s look at one.
Find the volume of the prism below.
We simply put the values for the length, width, and height in for the appropriate variables in the formula. Then wesolve for V , volume.
First we find the area of the base. This is the rectangular side on the bottom. Remember, to find the area of arectangle we multiply the length times the width.
B = lw
B = 16×9
B = 144 cm2
1044
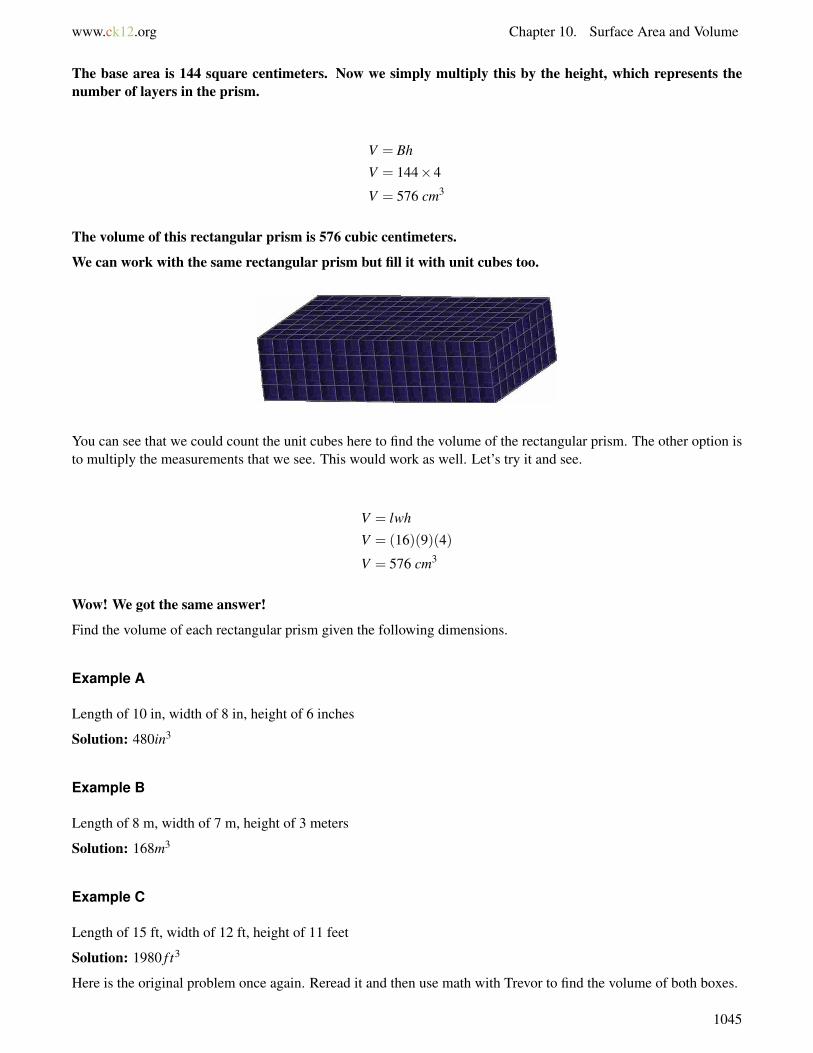
www.ck12.org Chapter 10. Surface Area and Volume
The base area is 144 square centimeters. Now we simply multiply this by the height, which represents thenumber of layers in the prism.
V = Bh
V = 144×4
V = 576 cm3
The volume of this rectangular prism is 576 cubic centimeters.
We can work with the same rectangular prism but fill it with unit cubes too.
You can see that we could count the unit cubes here to find the volume of the rectangular prism. The other option isto multiply the measurements that we see. This would work as well. Let’s try it and see.
V = lwh
V = (16)(9)(4)
V = 576 cm3
Wow! We got the same answer!
Find the volume of each rectangular prism given the following dimensions.
Example A
Length of 10 in, width of 8 in, height of 6 inches
Solution: 480in3
Example B
Length of 8 m, width of 7 m, height of 3 meters
Solution: 168m3
Example C
Length of 15 ft, width of 12 ft, height of 11 feet
Solution: 1980 f t3
Here is the original problem once again. Reread it and then use math with Trevor to find the volume of both boxes.
1045
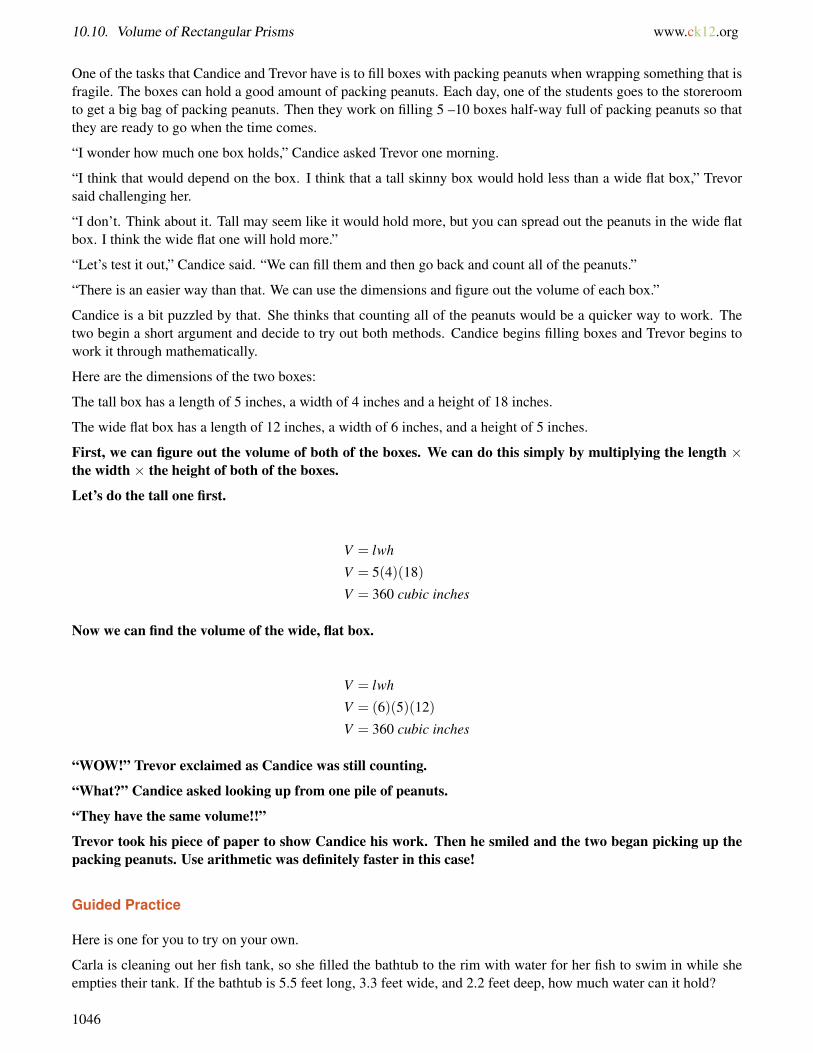
10.10. Volume of Rectangular Prisms www.ck12.org
One of the tasks that Candice and Trevor have is to fill boxes with packing peanuts when wrapping something that isfragile. The boxes can hold a good amount of packing peanuts. Each day, one of the students goes to the storeroomto get a big bag of packing peanuts. Then they work on filling 5 –10 boxes half-way full of packing peanuts so thatthey are ready to go when the time comes.
“I wonder how much one box holds,” Candice asked Trevor one morning.
“I think that would depend on the box. I think that a tall skinny box would hold less than a wide flat box,” Trevorsaid challenging her.
“I don’t. Think about it. Tall may seem like it would hold more, but you can spread out the peanuts in the wide flatbox. I think the wide flat one will hold more.”
“Let’s test it out,” Candice said. “We can fill them and then go back and count all of the peanuts.”
“There is an easier way than that. We can use the dimensions and figure out the volume of each box.”
Candice is a bit puzzled by that. She thinks that counting all of the peanuts would be a quicker way to work. Thetwo begin a short argument and decide to try out both methods. Candice begins filling boxes and Trevor begins towork it through mathematically.
Here are the dimensions of the two boxes:
The tall box has a length of 5 inches, a width of 4 inches and a height of 18 inches.
The wide flat box has a length of 12 inches, a width of 6 inches, and a height of 5 inches.
First, we can figure out the volume of both of the boxes. We can do this simply by multiplying the length ×the width × the height of both of the boxes.
Let’s do the tall one first.
V = lwh
V = 5(4)(18)
V = 360 cubic inches
Now we can find the volume of the wide, flat box.
V = lwh
V = (6)(5)(12)
V = 360 cubic inches
“WOW!” Trevor exclaimed as Candice was still counting.
“What?” Candice asked looking up from one pile of peanuts.
“They have the same volume!!”
Trevor took his piece of paper to show Candice his work. Then he smiled and the two began picking up thepacking peanuts. Use arithmetic was definitely faster in this case!
Guided Practice
Here is one for you to try on your own.
Carla is cleaning out her fish tank, so she filled the bathtub to the rim with water for her fish to swim in while sheempties their tank. If the bathtub is 5.5 feet long, 3.3 feet wide, and 2.2 feet deep, how much water can it hold?
1046

www.ck12.org Chapter 10. Surface Area and Volume
Answer
First of all, what is the problem asking us to find? We need to find the volume of the bathtub. Is a bath tub arectangular or a triangular prism? It is a rectangular prism, so we’ll need to use the area formula for rectangles tofind B.
B = lw
B = 5.5×3.3
B = 18.15 f t2
Now we put this value into the volume formula and solve:
V = Bh
V = 18.15×2.2
V = 39.93 f t3
Carla’s bathtub can hold 39.93 cubic feet of water.
Video Review
MEDIAClick image to the left or use the URL below.URL: http://www.ck12.org/flx/render/embeddedobject/54800
This is a Khan Academy video on solid geometry volume.
Explore More
Directions: Find the volume of each rectangular prism. Remember to label your answer in cubic units.
1. Length = 5 in, width = 3 in, height = 4 in
2. Length = 7 m, width = 6 m, height = 5 m
3. Length = 8 cm, width = 4 cm, height = 9 cm
4. Length = 8 cm, width = 4 cm, height = 12 cm
5. Length = 10 ft, width = 5 ft, height = 6 ft
6. Length = 9 m, width = 8 m, height = 11 m
7. Length = 5.5 in, width = 3 in, height = 5 in
8. Length = 6.6 cm, width = 5 cm, height = 7 cm
9. Length = 7 ft, width = 4 ft, height = 6 ft
10. Length = 15 m, width = 8 m, height = 10 m
1047

10.10. Volume of Rectangular Prisms www.ck12.org
11. Length = 10.5 m, width = 11 m, height = 4 m
12. Length = 12 ft, width = 12 ft, height = 8 ft
13. Length = 16 in, width = 8 in, height = 8 in
14. Length = 12 m, width = 12 m, height = 12 m
15. Length = 24 in, width = 6 in, height = 6 in
1048

www.ck12.org Chapter 10. Surface Area and Volume
10.11 Volume of Triangular Prisms
Here you’ll find volumes of triangular prisms using formulas.
Have you ever been to an aquarium?
On their day off, Candice and Trevor went to the aquarium. The Berryville Aquarium has a shark tank in the shapeof a triangular prism. There is only one shark in the tank, so right now the tank is only 2
3 full.
How many cubic feet of water are in the tank?
To figure this out, you will need to know how to calculate the volume of triangular prisms. Pay close attentionand you will see this problem again at the end of the Concept.
Guidance
Previously we worked with rectangular prisms, now we are going to look at volume with triangular prisms.
What is the difference between a rectangular prism and a triangular prism?
A rectangular prism has two parallel faces that are rectangles, then the other faces are rectangles as well. With atriangular prism, the two parallel faces are triangles and then the other faces are still rectangles. Here is a picture ofa triangular prism.
1049
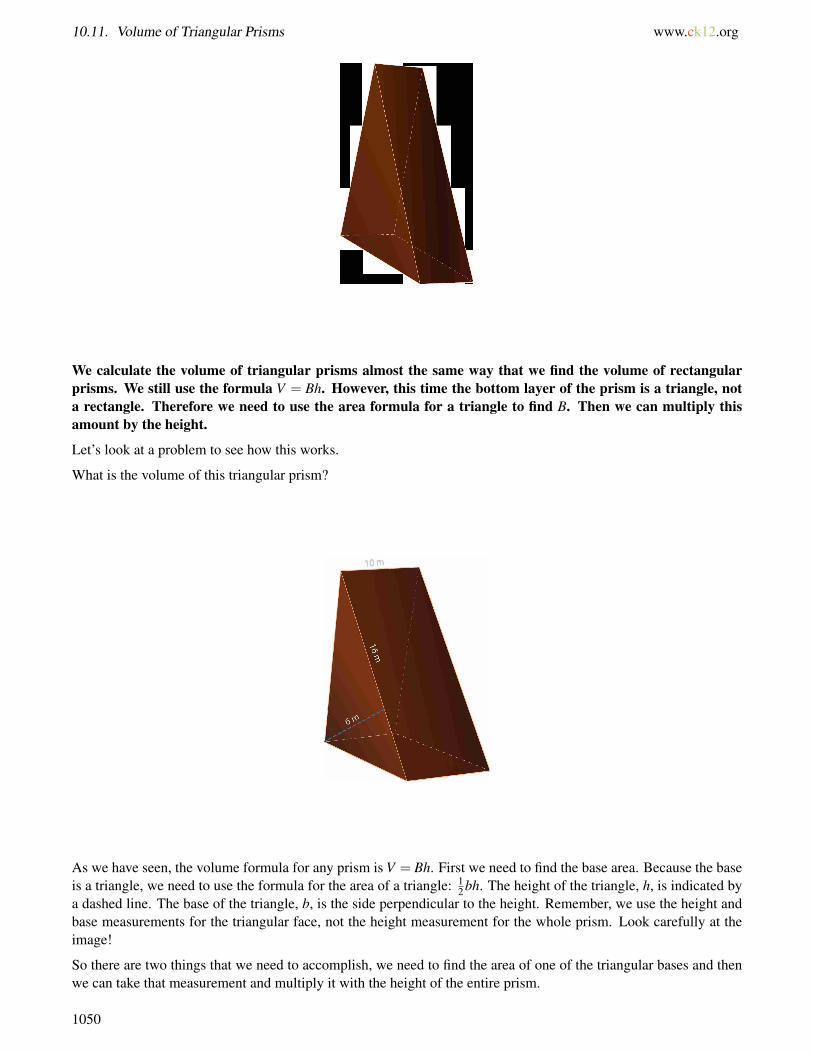
10.11. Volume of Triangular Prisms www.ck12.org
We calculate the volume of triangular prisms almost the same way that we find the volume of rectangularprisms. We still use the formula V = Bh. However, this time the bottom layer of the prism is a triangle, nota rectangle. Therefore we need to use the area formula for a triangle to find B. Then we can multiply thisamount by the height.
Let’s look at a problem to see how this works.
What is the volume of this triangular prism?
As we have seen, the volume formula for any prism is V = Bh. First we need to find the base area. Because the baseis a triangle, we need to use the formula for the area of a triangle: 1
2 bh. The height of the triangle, h, is indicated bya dashed line. The base of the triangle, b, is the side perpendicular to the height. Remember, we use the height andbase measurements for the triangular face, not the height measurement for the whole prism. Look carefully at theimage!
So there are two things that we need to accomplish, we need to find the area of one of the triangular bases and thenwe can take that measurement and multiply it with the height of the entire prism.
1050
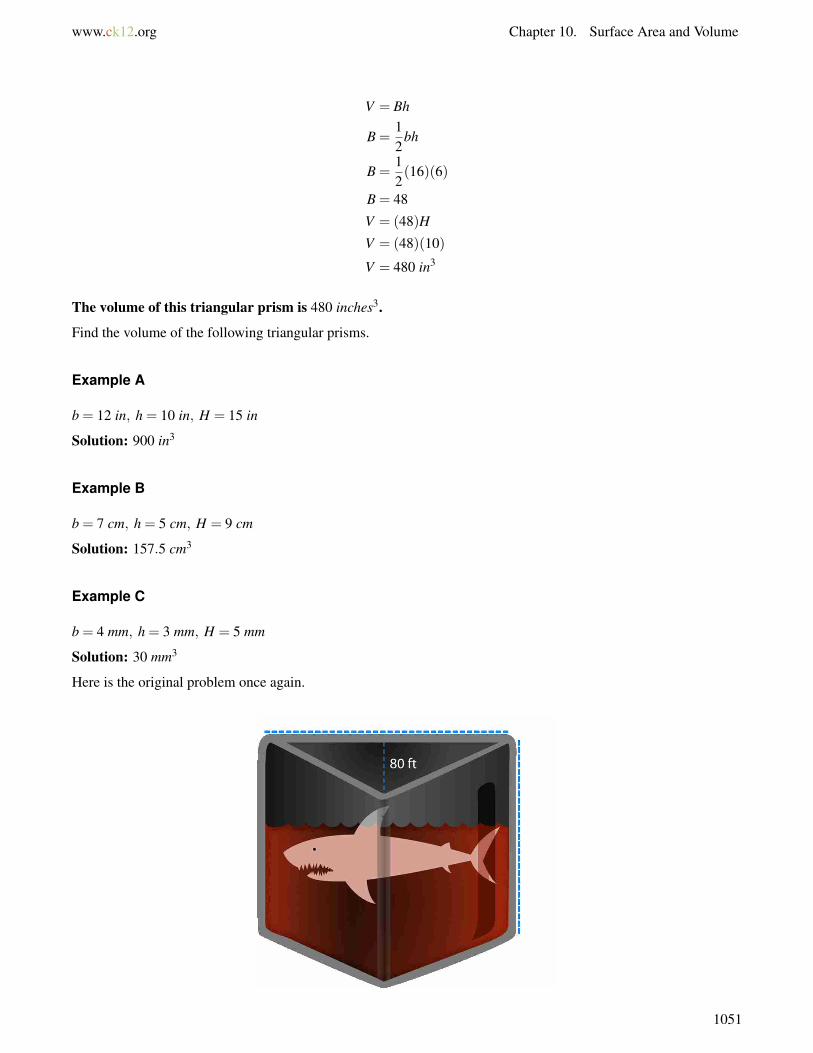
www.ck12.org Chapter 10. Surface Area and Volume
V = Bh
B =12
bh
B =12(16)(6)
B = 48
V = (48)H
V = (48)(10)
V = 480 in3
The volume of this triangular prism is 480 inches3.
Find the volume of the following triangular prisms.
Example A
b = 12 in, h = 10 in, H = 15 in
Solution: 900 in3
Example B
b = 7 cm, h = 5 cm, H = 9 cm
Solution: 157.5 cm3
Example C
b = 4 mm, h = 3 mm, H = 5 mm
Solution: 30 mm3
Here is the original problem once again.
1051
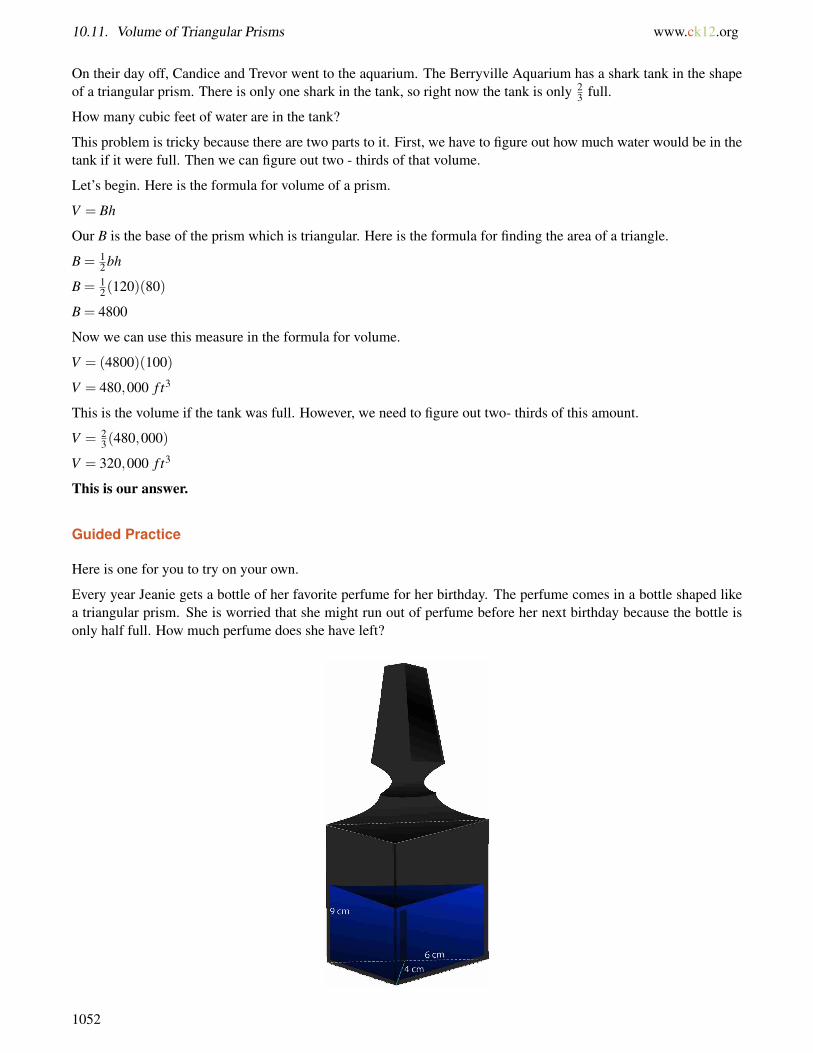
10.11. Volume of Triangular Prisms www.ck12.org
On their day off, Candice and Trevor went to the aquarium. The Berryville Aquarium has a shark tank in the shapeof a triangular prism. There is only one shark in the tank, so right now the tank is only 2
3 full.
How many cubic feet of water are in the tank?
This problem is tricky because there are two parts to it. First, we have to figure out how much water would be in thetank if it were full. Then we can figure out two - thirds of that volume.
Let’s begin. Here is the formula for volume of a prism.
V = Bh
Our B is the base of the prism which is triangular. Here is the formula for finding the area of a triangle.
B = 12 bh
B = 12(120)(80)
B = 4800
Now we can use this measure in the formula for volume.
V = (4800)(100)
V = 480,000 f t3
This is the volume if the tank was full. However, we need to figure out two- thirds of this amount.
V = 23(480,000)
V = 320,000 f t3
This is our answer.
Guided Practice
Here is one for you to try on your own.
Every year Jeanie gets a bottle of her favorite perfume for her birthday. The perfume comes in a bottle shaped likea triangular prism. She is worried that she might run out of perfume before her next birthday because the bottle isonly half full. How much perfume does she have left?
1052
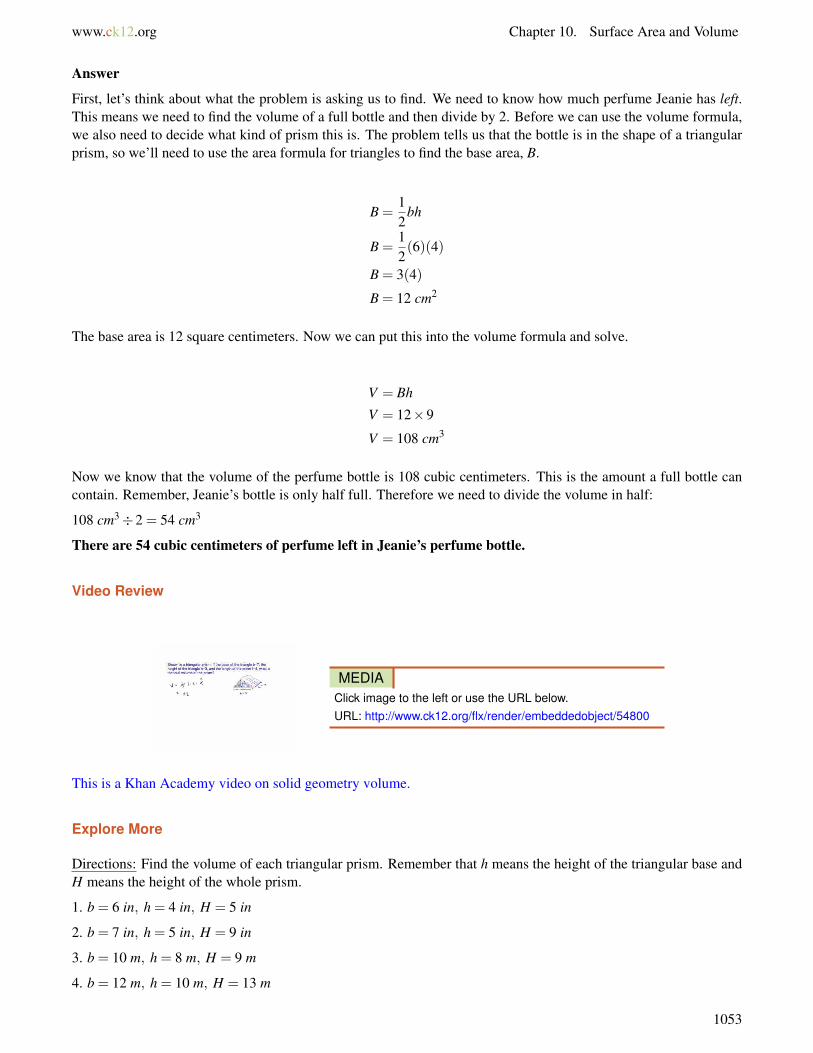
www.ck12.org Chapter 10. Surface Area and Volume
Answer
First, let’s think about what the problem is asking us to find. We need to know how much perfume Jeanie has left.This means we need to find the volume of a full bottle and then divide by 2. Before we can use the volume formula,we also need to decide what kind of prism this is. The problem tells us that the bottle is in the shape of a triangularprism, so we’ll need to use the area formula for triangles to find the base area, B.
B =12
bh
B =12(6)(4)
B = 3(4)
B = 12 cm2
The base area is 12 square centimeters. Now we can put this into the volume formula and solve.
V = Bh
V = 12×9
V = 108 cm3
Now we know that the volume of the perfume bottle is 108 cubic centimeters. This is the amount a full bottle cancontain. Remember, Jeanie’s bottle is only half full. Therefore we need to divide the volume in half:
108 cm3÷2 = 54 cm3
There are 54 cubic centimeters of perfume left in Jeanie’s perfume bottle.
Video Review
MEDIAClick image to the left or use the URL below.URL: http://www.ck12.org/flx/render/embeddedobject/54800
This is a Khan Academy video on solid geometry volume.
Explore More
Directions: Find the volume of each triangular prism. Remember that h means the height of the triangular base andH means the height of the whole prism.
1. b = 6 in, h = 4 in, H = 5 in
2. b = 7 in, h = 5 in, H = 9 in
3. b = 10 m, h = 8 m, H = 9 m
4. b = 12 m, h = 10 m, H = 13 m
1053
10.11. Volume of Triangular Prisms www.ck12.org
5. b = 8 cm, h = 6 cm, H = 9 cm
6. b = 9 cm, h = 7 cm, H = 8 cm
7. b = 5.5 mm, h = 4 mm, H = 4 mm
8. b = 11 cm, h = 9 cm, H = 8 cm
9. b = 20 f t, h = 17 f t, H = 19 f t.
10. b = 20 f t, h = 18 f t, H = 15 f t.
11. b = 18 f t, h = 16 f t, H = 17 f t.
12. b = 24 f t, h = 21 f t, H = 19 f t.
13. b = 24.5 f t, h = 18 f t, H = 16 f t.
14. b = 99 f t, h = 80 f t, H = 75 f t.
15. b = 100 f t, h = 80 f t, H = 110 f t.
1054
www.ck12.org Chapter 10. Surface Area and Volume
10.12 Volume of Cylinders
Here you’ll learn to find volumes of cylinders using formulas.
“I need a new sports bottle and I have two picked out, but I am trying to figure out which one is better,” Trevor toldCandice one morning between wrapping jobs.
“What makes one better than the other?” Candice asked.
“Well, I want one that holds the most volume,” Trevor said.
“Can’t you figure that out by the number of ounces on the package?” Candice asked.
“Well, I could. But I want to know the cubic inches,” Trevor said. “The one with more cubic inches would be thebetter choice. I want to use math to figure it out.”
“Alright, well you need the height and the radius of each bottle to do it that way. It definitely seems like more workto me, but I can get using math to test it all out.”
“Here are the dimensions that I have,” Trevor said taking out a piece of paper. He handed it to Candice.
On the paper Trevor has written the following dimensions.
Bottle #1 –Height = 7.5" Diameter = 5"
Bottle #2 –Height = 9" Diameter = 3"
“First, you need the radius, so divide each diameter in half,” Candice said looking at the paper.
While Trevor works on this, you will need to take some time to learn about volume and cylinders. In thisConcept, you will learn to use formulas to find the volume of cylinders. Then at the end of the Concept, youwill be able to help Candice and Trevor with the sports bottle dilemma.
Guidance
In this Concept we will learn to find the volume of cylinders. A cylinder is a solid shape that exists in three-dimensional space. A cylinder has two faces that are circles. We do not call the side of a cylinder a face becauseit is curved. We still have to include its area in the total surface area of the cylinder, however. We see cylinders ineveryday life all the time. Here is the basic shape of a cylinder, think about how many other places you can see themin the world around you.
1055

10.12. Volume of Cylinders www.ck12.org
The volume of a cylinder is the measure of how much three-dimensional space it takes up or holds. Imagine athermos. Its size determines how much water the thermos will hold. If we fill it with water, the amount of watertells the volume of the thermos. We measure volume in cubic units, because we are multiplying three dimensions:length, width, and height. The width of the thermos is the same as the diameter of the circular faces.
There are different ways to examine and think about volume. One way is to use unit cubes. Look at thisdiagram of a cylinder to understand this concept.
Here you can see that the unit cubes are being used to fill up the cylinder. Remember that because we are talkingabout volume, we are measuring the space contained inside the cylinder. This can be tricky with a cylinder becausethe bases are round-squares aren’t exactly round, so we should find another way to measure the volume of a cylinder.
Let’s think about what information we are going to need to gather to figure out the volume of a cylinder. We knowthat the two bases are circular, so we are going to need to know the area of the circle to figure out how much spacecan be contained on top of it. A cylinder is tall or has height, so we are going to need to know the height of thecylinder. Then we will know how high the space is inside the cylinder.
First, let’s think about the area of the circular bases. To find the area of a circle, we can use the followingformula.
A = πr2
But we also have the height (h) of the cylinder to figure into this calculation. If we put all of these partstogether, we have the following formula.
V = πr2h
1056
www.ck12.org Chapter 10. Surface Area and Volume
Take a minute and copy this formula down in your notebook.
Now let’s look at applying this formula as we work in a few situations.
Find the volume of a cylinder with a radius of 5 cm and a height of 7 cm.
We can start by substituting the values of the cylinder into our formula.
V = πr2h
V = (3.14)(52)(7)
V = (3.14)(25)(7)
V = 549.5 cm3
This is our answer. Notice that we measured the volume of the cylinder in cubic units because we aremultiplying three different measurements.
Let’s look at another one.
Find the volume of a cylinder with a diameter of 12 inches and a height of 8 inches.
First, notice that we have been given the diameter and not the radius. We can divide twelve inches in half andthat will give us the radius of the circular base of the cylinder.
Radius = 6 inches.
Now we can substitute the values into the formula and solve for the volume.
V = πr2h
V = (3.14)(36)(8)
V = 904.32 in3
This is our answer.
Find the volume of each cylinder.
Example A
radius = 3 in, height = 7 in
Solution: 197.82 in3
Example B
radius = 2.5 mm, height = 4 mm
1057
10.12. Volume of Cylinders www.ck12.org
Solution: 78.5 mm3
Example C
diameter = 14 in, height = 9 in
Solution: 1384.74in3
Here is the original problem once again. Think about what you have learned as Trevor and Candice figure out thevolume of each sports bottle.
“I need a new sports bottle and I have two picked out, but I am trying to figure out which one is better,” Trevor toldCandice one morning between wrapping jobs.
“What makes one better than the other?” Candice asked.
“Well, I want one that holds the most volume,” Trevor said.
“Can’t you figure that out by the number of ounces on the package?”Candice asked.
“Well, I could. But I want to know the cubic inches,” Trevor said. “The one with more cubic inches would be thebetter choice. I want to use math to figure it out.”
“Alright, well you need the height and the radius of each bottle to do it that way. It definitely seems like more workto me, but I can get using math to test it all out.”
“Here are the dimensions that I have,” Trevor said taking out a piece of paper. He handed it to Candice.
On the paper Trevor has written the following dimensions.
Bottle #1 –Height = 7.5" Diameter = 5"
Bottle #2 –Height = 9" Diameter = 3"
“First, you need the radius, so divide each diameter in half,” Candice said looking at the paper.
After dividing each diameter, here are the new dimensions.
Bottle #1 = H = 7.5" Radius = 2.5"
Bottle #2 = H = 9" Radius = 1.5"
Next, we use the formula to find the volume of bottle #1.
1058
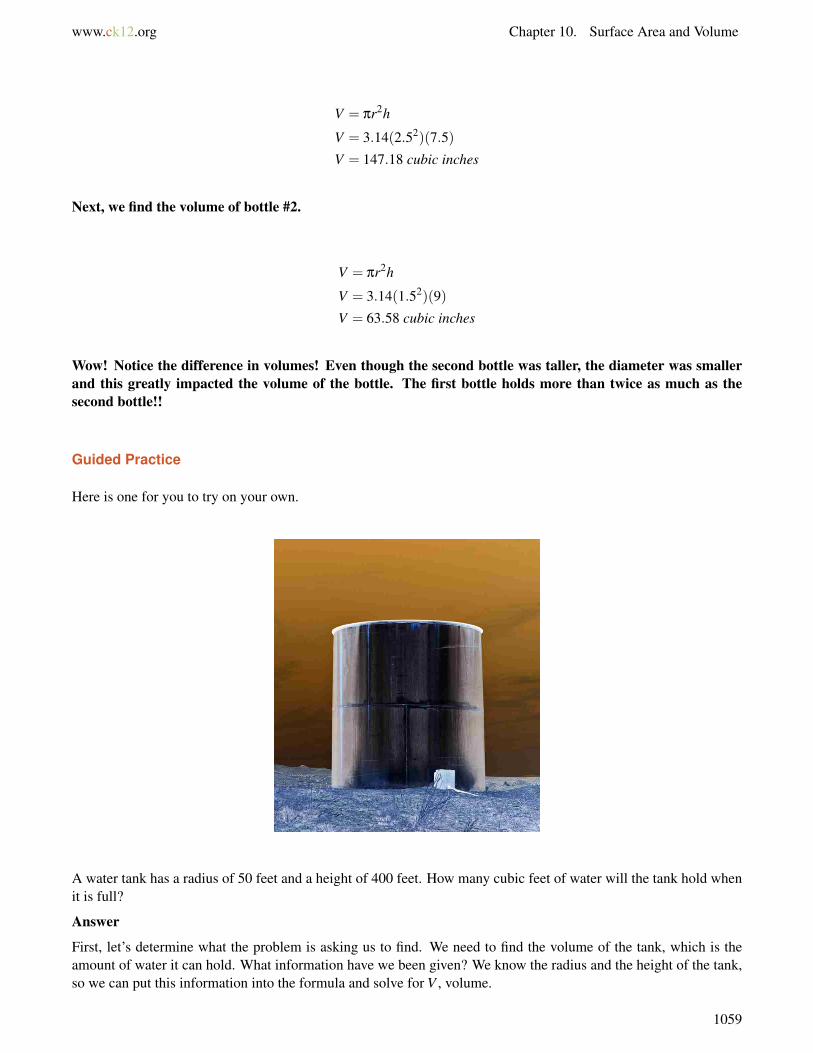
www.ck12.org Chapter 10. Surface Area and Volume
V = πr2h
V = 3.14(2.52)(7.5)
V = 147.18 cubic inches
Next, we find the volume of bottle #2.
V = πr2h
V = 3.14(1.52)(9)
V = 63.58 cubic inches
Wow! Notice the difference in volumes! Even though the second bottle was taller, the diameter was smallerand this greatly impacted the volume of the bottle. The first bottle holds more than twice as much as thesecond bottle!!
Guided Practice
Here is one for you to try on your own.
A water tank has a radius of 50 feet and a height of 400 feet. How many cubic feet of water will the tank hold whenit is full?
Answer
First, let’s determine what the problem is asking us to find. We need to find the volume of the tank, which is theamount of water it can hold. What information have we been given? We know the radius and the height of the tank,so we can put this information into the formula and solve for V , volume.
1059
10.12. Volume of Cylinders www.ck12.org
V = πr2h
V = π(50)2(400)
V = π(2,500)(400)
V = 1,000,000π
V = 3,140,000 in.3
The water tank will hold more than 3 million cubic feet of water!
Video Review
MEDIAClick image to the left or use the URL below.URL: http://www.ck12.org/flx/render/embeddedobject/54800
This is a Khan Academy video on solid geometry volume.
Explore More
Directions: Given the radius and height of each cylinder, find its volume.
1. r = 5 in, h = 8 in
2. r = 4 in, h = 7 in
3. r = 3 f t, h = 5 f t
4. r = 3 f t, h = 8 f t
5. r = 4 cm, h = 9 cm
6. r = 6 m, h = 12 m
7. r = 7 in, h = 14 in
8. r = 5 m, h = 10 m
9. r = 2 m, h = 11 m
10. r = 3 cm, h = 12 cm
11. r = 6 cm, h = 11 cm
12. r = 4 m, h = 14 m
13. r = 13 cm, h = 26 cm
14. r = 8 in, h = 14 in
15. r = 4.5 cm, h = 16.5 cm
1060
www.ck12.org Chapter 10. Surface Area and Volume
10.13 Heights of Cylinders Given Volume
Here you’ll learn to find heights of cylinders given volume and one other dimension.
Have you ever been in a pool that had an interesting shape?
The cylindrical pool in Trevor’s backyard holds 15,700 cubic feet of water. If the diameter of the pool is 50 feet,how deep is the pool?
To figure this out, you will need to know how to use the volume of a cylinder to find another dimension. Usethis Concept and you will know how to figure out the solution to this dilemma.
Guidance
Sometimes, you will know the volume of a cylinder and you won’t know the height of it. Think about a water towerthat is cylindrical in shape. We might know how much volume the tank will hold, but not the height of it. When thishappens, we can use our formula to find the missing height of the cylinder.
A cylinder with a radius of 2 inches has a volume of125.6 cubic inches. What is the height of the cylinder?
What is the problem asking us to find? We need to solve for the height of the cylinder. The problem tells usthe volume and the radius. We put these into the formula and then solve for h, the height.
V = πr2h
125.6 = π(2)2h
125.6 = 4πh
125.6 = 12.56 h
125.6÷12.56 = h
10 in.= h
The height of the cylinder is 10 inches.
We used the volume formula to solve for h and found that the height of the cylinder is 10 inches. We can checkour work by putting this number in for the height. We should get a volume of 125.6 cubic inches.
V = πr2h
V = π(2)2(10)
V = π(4)(10)
V = 40π
V = 125.6 in.3
Our calculation was correct! Let’s look at another example.
What is the height of a cylinder that has a radius of 6 cm and a volume of 904.32 cm3?
Again, we have been given the volume and the radius. We put this information into the formula and solve forh, the height.
1061
10.13. Heights of Cylinders Given Volume www.ck12.org
V = πr2h
904.32 = π(6)2h
904.32 = 36πh
904.32 = 113.04 h
904.32÷113.04 = h
8 cm = h
The height of this cylinder is 8 centimeters.
Find the height of each cylinder given the radius and volume.
Example A
r = 6 in, Volume = 904.32 in3
Solution: h = 8 in
Example B
r = 3 m, Volume = 254.34 m3
Solution: h = 9 m
Example C
r = 5 f t, Volume = 785 f t3
Solution: h = 10 f t
Here is the original problem once again.
The cylindrical pool in Trevor’s backyard holds 15,700 cubic feet of water. If the diameter of the pool is 50 feet,how deep is the pool?
To figure this out, we use the formula for finding the volume of a cylinder.
V = πr2h
Next, we fill in the given information. Notice we have been given a diameter of 50 feet. We need to radius, so wedivide the diameter in half. While the problem is asking for depth, the height would be the depth of the pool becausethe pool is cylindrical in shape.
15,700 = (3.14)(252)h
15,700 = 1962.5h
15,700÷1962.5 = h
8 = h
The depth of the pool is eight feet.
1062
www.ck12.org Chapter 10. Surface Area and Volume
Guided Practice
Javier wants to construct a cylindrical container to hold enough water for his pet fish. He read that the fish needs tolive in 2,110.08 cubic inches of water. If he constructs a tank with a diameter of 16 inches, how tall must he make itso that it holds the right amount of water?
Again, the first thing we need to do is decide what the problem is asking us to find. We need to know how tall Javiermust make the tank. In other words, we need to find the height of the cylinder.
What information have we been given? We know that the tank must hold 2,110.08 cubic inches of water. This isthe volume. What about the radius? We know that the diameter of the tank will be 16 inches, so the radius will be16÷2 = 8 inches. We put the radius and volume into the volume formula and solve for h, the height.
V = πr2h
2,110.08 = π(8)2h
2,110.08 = 64πh
2,110.08 = 200.96h
2,110.08÷200.96 = h
10.5 in.= h
In order for his tank to hold 2,110.08 cubic inches of water, Javier must make his tank 10.5 inches tall.
Video Review
MEDIAClick image to the left or use the URL below.URL: http://www.ck12.org/flx/render/embeddedobject/5270
This is a Khan Academy video on the volume of cylinders.
Explore More
Directions: Given the volume and the radius, find the height of each cylinder.
1. r = 6 in, V = 904.32 in3
2. r = 5 in, V = 706.5 in3
3. r = 7 f t, V = 2307.9 f t3
4. r = 8 f t, V = 4019.2 f t3
5. r = 7 f t, V = 1538.6 f t3
6. r = 12 m, V = 6330.24 m3
7. r = 9 m, V = 4069.49 m3
8. r = 10 m, V = 5652 m3
1063

10.13. Heights of Cylinders Given Volume www.ck12.org
9. r = 12 in, V = 11304 in3
10. r = 11 f t, V = 3039.52 f t3
11. r = 10 in, V = 1570 in3
12. r = 9.5 in, V = 1700.31 in3
13. r = 8 m, V = 1808.64 m3
14. r = 14 f t, V = 5538.96 f t3
15. r = 13.5 in, V = 4005.85 in3
1064
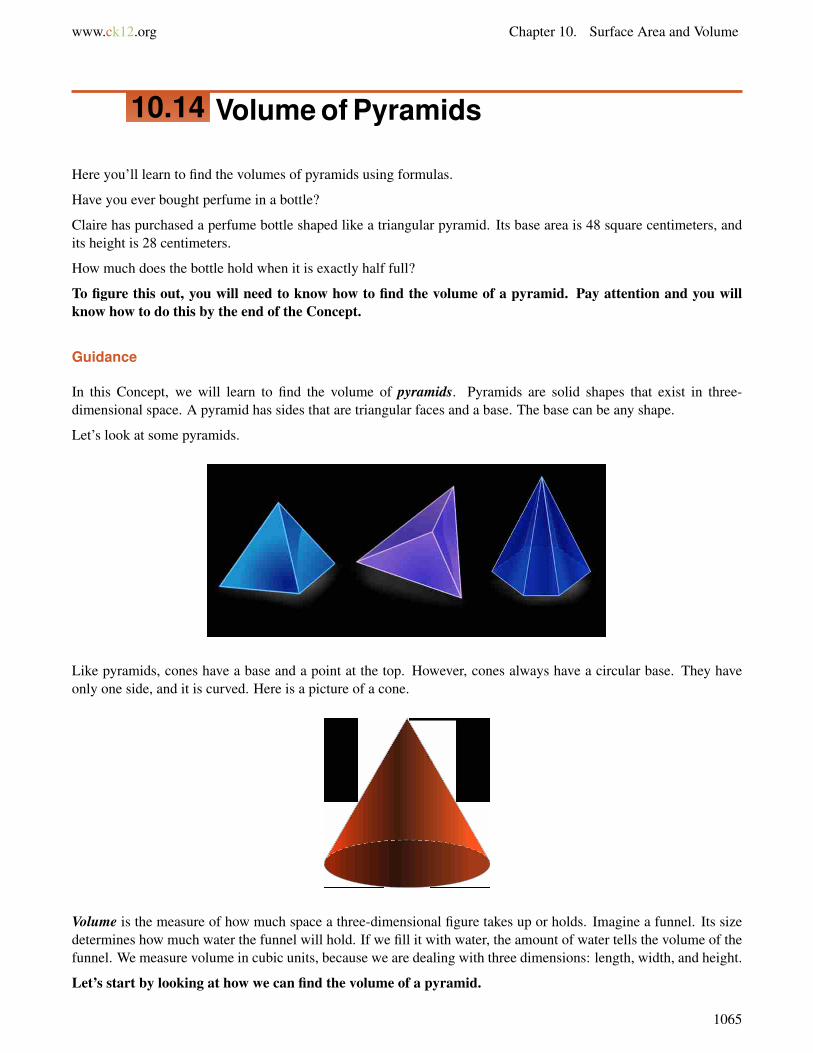
www.ck12.org Chapter 10. Surface Area and Volume
10.14 Volume of Pyramids
Here you’ll learn to find the volumes of pyramids using formulas.
Have you ever bought perfume in a bottle?
Claire has purchased a perfume bottle shaped like a triangular pyramid. Its base area is 48 square centimeters, andits height is 28 centimeters.
How much does the bottle hold when it is exactly half full?
To figure this out, you will need to know how to find the volume of a pyramid. Pay attention and you willknow how to do this by the end of the Concept.
Guidance
In this Concept, we will learn to find the volume of pyramids. Pyramids are solid shapes that exist in three-dimensional space. A pyramid has sides that are triangular faces and a base. The base can be any shape.
Let’s look at some pyramids.
Like pyramids, cones have a base and a point at the top. However, cones always have a circular base. They haveonly one side, and it is curved. Here is a picture of a cone.
Volume is the measure of how much space a three-dimensional figure takes up or holds. Imagine a funnel. Its sizedetermines how much water the funnel will hold. If we fill it with water, the amount of water tells the volume of thefunnel. We measure volume in cubic units, because we are dealing with three dimensions: length, width, and height.
Let’s start by looking at how we can find the volume of a pyramid.
1065
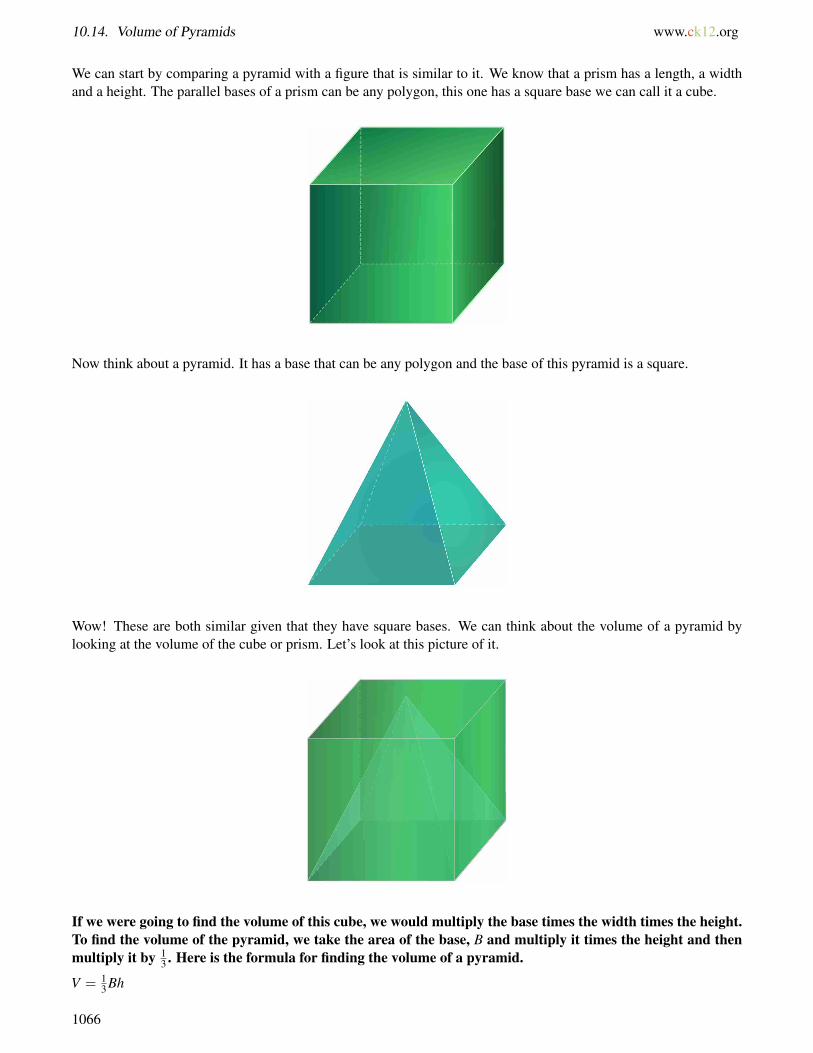
10.14. Volume of Pyramids www.ck12.org
We can start by comparing a pyramid with a figure that is similar to it. We know that a prism has a length, a widthand a height. The parallel bases of a prism can be any polygon, this one has a square base we can call it a cube.
Now think about a pyramid. It has a base that can be any polygon and the base of this pyramid is a square.
Wow! These are both similar given that they have square bases. We can think about the volume of a pyramid bylooking at the volume of the cube or prism. Let’s look at this picture of it.
If we were going to find the volume of this cube, we would multiply the base times the width times the height.To find the volume of the pyramid, we take the area of the base, B and multiply it times the height and thenmultiply it by 1
3 . Here is the formula for finding the volume of a pyramid.
V = 13 Bh
1066
www.ck12.org Chapter 10. Surface Area and Volume
Yes it does. Thinking about the volume of the pyramid in this way will help you to understand the formulaand why it works.
Take a few minutes and copy this formula down in your notebooks. Make sure to note that this is the formula forfinding the volume of a pyramid.
Now that we have the formula and some understanding about the volume of a pyramid, let’s put what we havelearned to work. We can use the information that we have gathered so far to find the volume of different pyramids.
One thing to keep in mind is that pyramids can be tricky because they can have many different bases. Look at theformula again.
V = 13 Bh
That capital B means that we need to find the area of the base. If the base is a square, we will need to use oneformula. If the base is a triangle, we would need to use a different formula and so on. Making sure that we have thecorrect formula is essential in our work with pyramids.
Let’s look at applying this information.
What is the volume of the pyramid below?
1067

10.14. Volume of Pyramids www.ck12.org
First, let’s decide what shape the base of the pyramid is. One side is 10 centimeters and the other is 6centimeters, so it must be a rectangle. We need to use the area formula for rectangles to find B, the basearea.
B = lw
B = 10(6)
B = 60 cm2
The area of this pyramid’s base is 60 square centimeters. Now we multiply this by the height and 13 , according
to the formula.
V =13
Bh
V =13(60)(15)
V = 20(15)
V = 300 cm3
The volume of the pyramid is 300 cubic centimeters.
Remember, we measure volume in three dimensions, so we write the answer in cubic units with a3.
Find the volume of the figure below.
1068
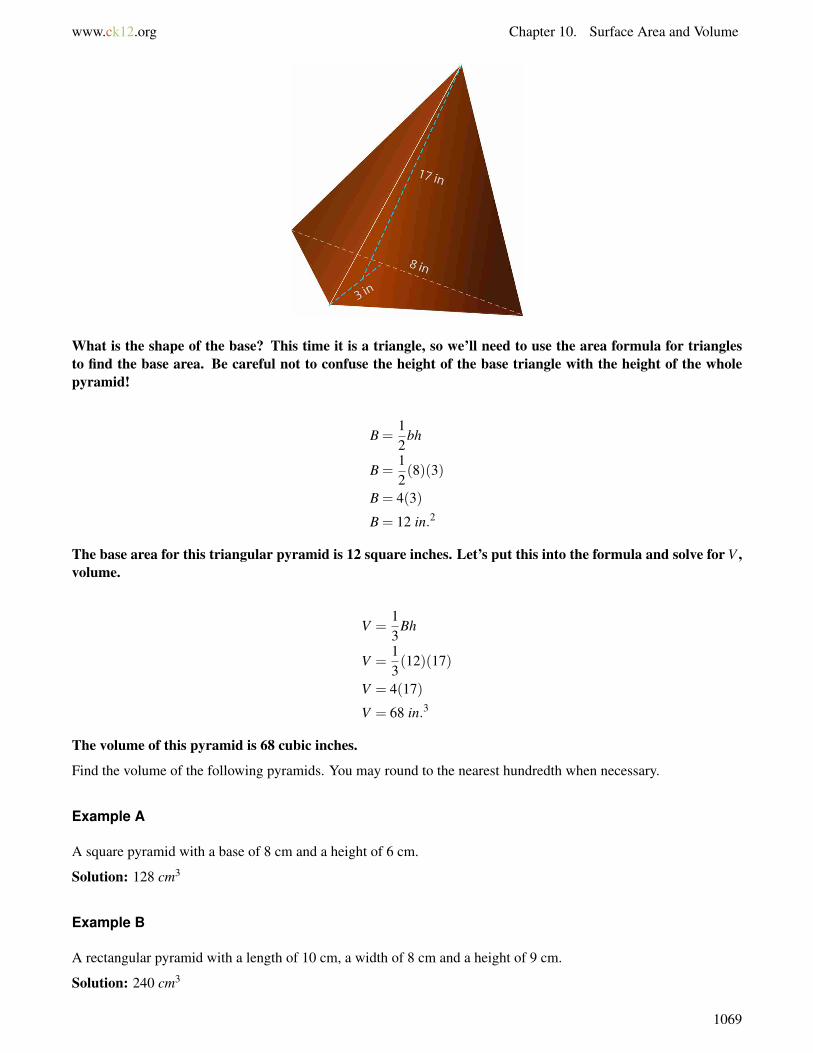
www.ck12.org Chapter 10. Surface Area and Volume
What is the shape of the base? This time it is a triangle, so we’ll need to use the area formula for trianglesto find the base area. Be careful not to confuse the height of the base triangle with the height of the wholepyramid!
B =12
bh
B =12(8)(3)
B = 4(3)
B = 12 in.2
The base area for this triangular pyramid is 12 square inches. Let’s put this into the formula and solve for V ,volume.
V =13
Bh
V =13(12)(17)
V = 4(17)
V = 68 in.3
The volume of this pyramid is 68 cubic inches.
Find the volume of the following pyramids. You may round to the nearest hundredth when necessary.
Example A
A square pyramid with a base of 8 cm and a height of 6 cm.
Solution: 128 cm3
Example B
A rectangular pyramid with a length of 10 cm, a width of 8 cm and a height of 9 cm.
Solution: 240 cm3
1069

10.14. Volume of Pyramids www.ck12.org
Example C
A square pyramid with a base of 5.5 in and a height of 4 in.
Solution: 40.33 in3
Here is the original problem once again.
Claire has purchased a perfume bottle shaped like a triangular pyramid. Its base area is 48 square centimeters, andits height is 28 centimeters.
How much does the bottle hold when it is exactly half full?
First, notice that we have been given the area of the base of the perfume bottle. We don’t have to figure that out.That is the capital B in our formula.
V = 13 Bh
Now let’s solve for the full volume of the bottle.
V = 13(48)(28)
V = 13(1344)
V = 448 cm3
This is the volume of a full bottle. However, the problem tells us that we need to figure out the volume if the bottleis half full. We can divide our volume by 2.
V = 448÷2 = 224
The volume of a half full bottle of perfume is 224 cm3.
Guided Practice
Felice bought the candle below for her friend’s birthday. The package says that the candle burns one hour for every20 cubic centimeters of wax. How many hours will it take the entire candle to burn?
First, let’s determine what the problem is asking us to find. We need to find the number of hours the candlewill burn. This depends on how big the candle is, so first we need to find its volume. The volume of the candleis the amount of wax it holds. What information have we been given? We know the dimensions of the base,which is a square, so let’s use the area formula for squares to find the base area.
1070
www.ck12.org Chapter 10. Surface Area and Volume
B = s2
B = (12)2
B = 144 cm2
The base area of the pyramid is 144 square centimeters. We can put this information into the formula andsolve for V , volume.
V =13
Bh
V =13(144)(24)
V = 48(24)
V = 1,152 cm3
Now we know that the candle contains 1,152 cubic centimeters of wax. But we’re not done yet! Remember,we need to find how many hours the candle will burn. Look back at the problem. It tells us that the candleburns one hour for every 20 cubic centimeters of wax. To find how many hours the candle will burn, we needto divide the total volume of wax by 20.
1,152÷20 = 57.6
The candle will burn for 57.6 hours.
Video Review
Watch this video to learn more about the volume of pyramids.
Explore More
Directions: Find the volume of each of the following pyramids.
1. A square pyramid with a base of 6 ft and a height of 9 ft.
2. A square pyramid with a base of 8 m and a height of 10 m.
3. A square pyramid with a base of 11 in and a height of 13 in.
4. A square pyramid with a base of 9 ft and a height of 14 ft.
5. A square pyramid with a base of 4.5 in and a height of 5 inches.
6. A rectangular pyramid with a base length of 4 in, a base width of 3 in and a height of 5 in.
7. A rectangular pyramid with a base length of 5 ft, a base width of 4 ft and a height of 6 ft.
8. A rectangular pyramid with a base length of 7 m, a base width of 4 m and a height of 9 m.
9. A triangular pyramid with a base length of 5 in and a base height of 4 inches with a pyramid height of 6 inches.
10. A triangular pyramid with a base length of 8 ft and a base height of 7 ft with a pyramid height of 9 ft.
11. A square pyramid with a base of 8 feet and height of 4 feet.
12. A rectangular pyramid with a length of 5 inches, a width of 4 inches and a height of 6 inches.
13. A square pyramid with a base of 3.5 feet and a height of 6.5 feet.
1071

10.14. Volume of Pyramids www.ck12.org
14. A square pyramid with a base of 6.5 feet and a height of 8.5 feet.
15. A rectangular pyramid with a width of 4 feet, a length of 6 feet and a height of 7.5 feet.
1072

www.ck12.org Chapter 10. Surface Area and Volume
10.15 Volume of Cones
Here you’ll learn to find volumes of cones using formulas.
Candice and Trevor have been working together for two weeks are getting to be like siblings. Every day there seemsto be an argument of some kind that erupts between the two of them. Today, it was about ice cream cones.
“I think that a plain cone with a pointed bottom holds more ice cream,” Trevor said reaching for more tape.
“I don’t. A sugar cone with a pointed bottom definitely holds more.”
“We can solve this easily if we had the dimensions.”
“Well, on your break walk down to the ice cream parlor and figure this out,” Candice instructed.
So on his break Trevor did exactly that. He walked down to the ice cream corner and came back with somedimensions on a piece of paper.
“Here we go, now you figure out the volume of the sugar cone and I’ll do the plain one.”
Here are the dimensions that they have to work with:
Plain Cone = H = 3.25′′ D = 2.5′′
Sugar Cone = H = 4.5′′ D = 2′′
The two got right down to work.
Now it’s your turn. You will learn all about the volume of cones and pyramids in this Concept. By the end ofit, you will know which cone holds the most ice cream.
Guidance
To figure out the volume of a cone, let’s first look at how we can compare it with another solid figure. The closestsolid figure to a cone is a cylinder. Think about it. Both of them have circular bases. While a cylinder has twocircular bases, a cone only has one. But they are both figures that we can compare.
Here is a cylinder and the formula for finding the volume of a cylinder.
1073
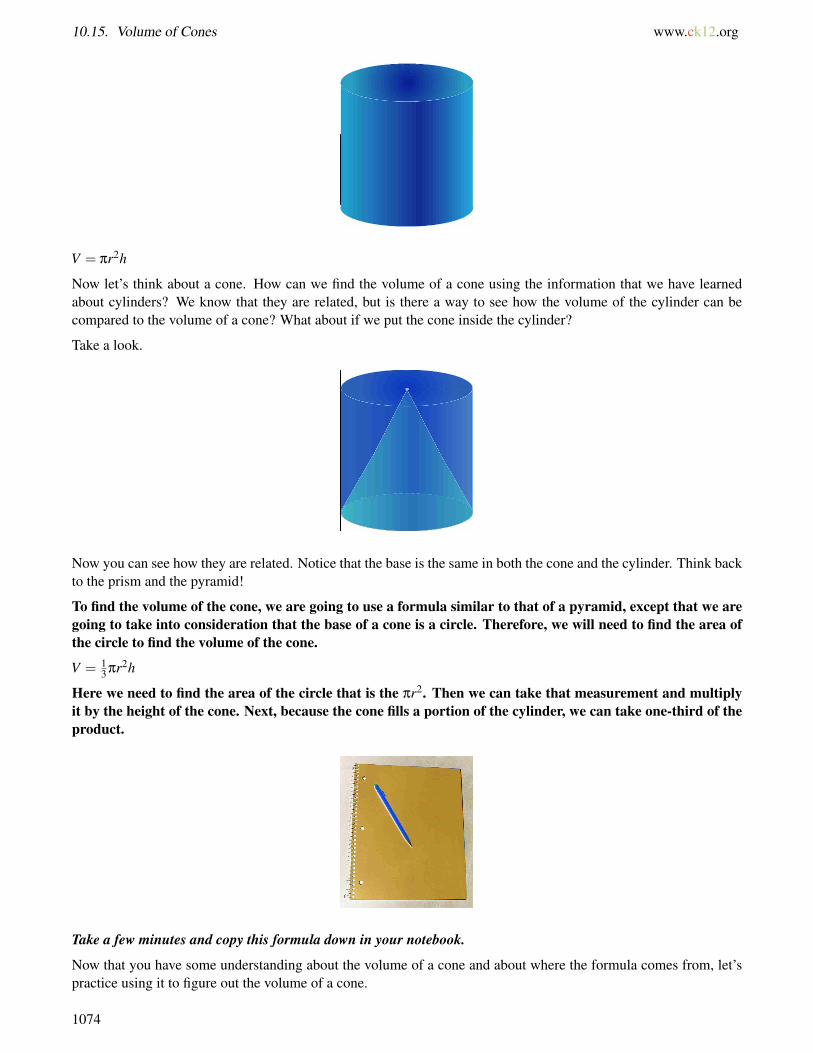
10.15. Volume of Cones www.ck12.org
V = πr2h
Now let’s think about a cone. How can we find the volume of a cone using the information that we have learnedabout cylinders? We know that they are related, but is there a way to see how the volume of the cylinder can becompared to the volume of a cone? What about if we put the cone inside the cylinder?
Take a look.
Now you can see how they are related. Notice that the base is the same in both the cone and the cylinder. Think backto the prism and the pyramid!
To find the volume of the cone, we are going to use a formula similar to that of a pyramid, except that we aregoing to take into consideration that the base of a cone is a circle. Therefore, we will need to find the area ofthe circle to find the volume of the cone.
V = 13 πr2h
Here we need to find the area of the circle that is the πr2. Then we can take that measurement and multiplyit by the height of the cone. Next, because the cone fills a portion of the cylinder, we can take one-third of theproduct.
Take a few minutes and copy this formula down in your notebook.
Now that you have some understanding about the volume of a cone and about where the formula comes from, let’spractice using it to figure out the volume of a cone.
1074
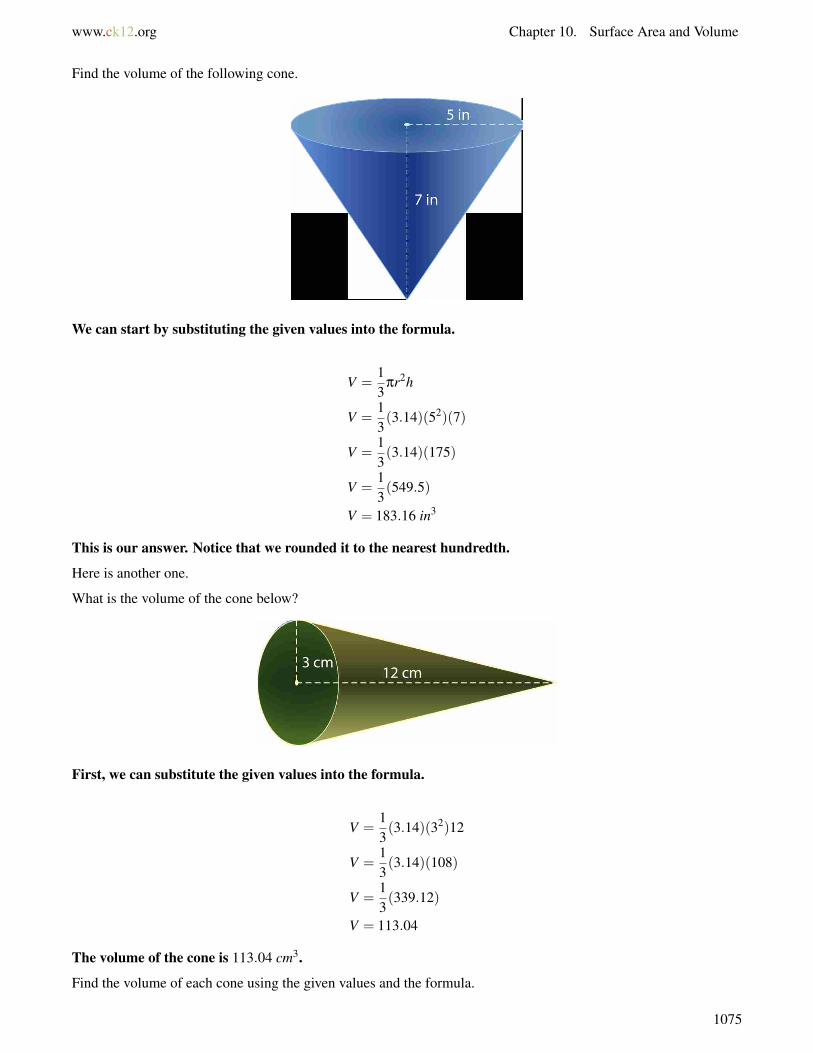
www.ck12.org Chapter 10. Surface Area and Volume
Find the volume of the following cone.
We can start by substituting the given values into the formula.
V =13
πr2h
V =13(3.14)(52)(7)
V =13(3.14)(175)
V =13(549.5)
V = 183.16 in3
This is our answer. Notice that we rounded it to the nearest hundredth.
Here is another one.
What is the volume of the cone below?
First, we can substitute the given values into the formula.
V =13(3.14)(32)12
V =13(3.14)(108)
V =13(339.12)
V = 113.04
The volume of the cone is 113.04 cm3.
Find the volume of each cone using the given values and the formula.
1075
10.15. Volume of Cones www.ck12.org
Example A
A cone with a radius of 2 inches and a height of 4 inches. You may round to the nearest hundredth as needed.
Solution: 16.74 in3
Example B
A cone with a radius of 5 ft and a height of 8 ft.
Solution: 209.33 f t3
Example C
A cone with a radius of 4 m and a height of 9 m.
Solution: 150.72 m3
Here is the original problem once again.
Candice and Trevor have been working together for two weeks are getting to be like siblings. Every day there seemsto be an argument of some kind that erupts between the two of them. Today, it was about ice cream cones.
“I think that a plain cone with a pointed bottom holds more ice cream,” Trevor said reaching for more tape.
“I don’t. A sugar cone with a pointed bottom definitely holds more.”
“We can solve this easily if we had the dimensions.”
“Well, on your break walk down to the ice cream parlor and figure this out,” Candice instructed.
So on his break Trevor did exactly that. He walked down to the ice cream corner and came back with somedimensions on a piece of paper.
“Here we go, now you figure out the volume of the sugar cone and I’ll do the plain one.”
Here are the dimensions that they have to work with:
Plain Cone = H = 3.25′′ D = 2.5′′
Sugar Cone = H = 4.5′′ D = 2′′
The two got right down to work.
Trevor started with the plain cone. Here is the formula that he used.
1076
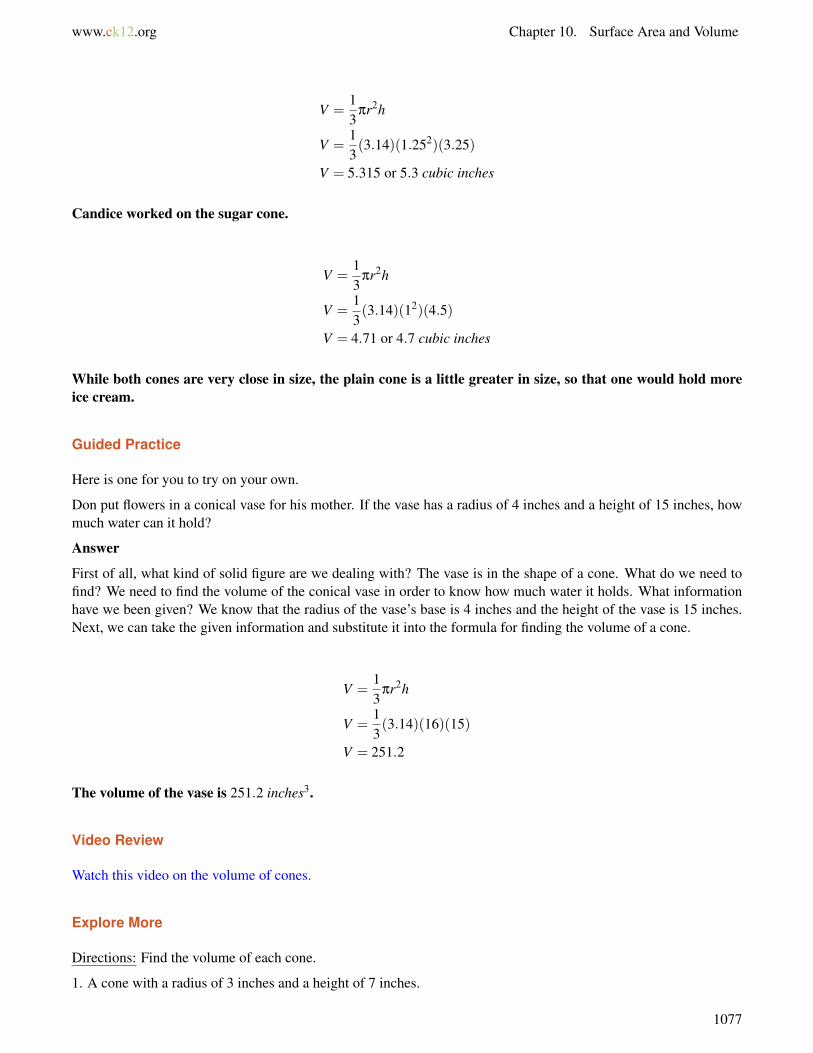
www.ck12.org Chapter 10. Surface Area and Volume
V =13
πr2h
V =13(3.14)(1.252)(3.25)
V = 5.315 or 5.3 cubic inches
Candice worked on the sugar cone.
V =13
πr2h
V =13(3.14)(12)(4.5)
V = 4.71 or 4.7 cubic inches
While both cones are very close in size, the plain cone is a little greater in size, so that one would hold moreice cream.
Guided Practice
Here is one for you to try on your own.
Don put flowers in a conical vase for his mother. If the vase has a radius of 4 inches and a height of 15 inches, howmuch water can it hold?
Answer
First of all, what kind of solid figure are we dealing with? The vase is in the shape of a cone. What do we need tofind? We need to find the volume of the conical vase in order to know how much water it holds. What informationhave we been given? We know that the radius of the vase’s base is 4 inches and the height of the vase is 15 inches.Next, we can take the given information and substitute it into the formula for finding the volume of a cone.
V =13
πr2h
V =13(3.14)(16)(15)
V = 251.2
The volume of the vase is 251.2 inches3.
Video Review
Watch this video on the volume of cones.
Explore More
Directions: Find the volume of each cone.
1. A cone with a radius of 3 inches and a height of 7 inches.
1077
10.15. Volume of Cones www.ck12.org
2. A cone with a radius of 5 ft and a height of 9 ft.
3. A cone with a radius of 6 meters and a height of 10 meters.
4. A cone with a radius of 10 inches and a height of 12 inches.
5. A cone with a radius of 12 mm and a height of 14 mm.
6. A cone with a radius of 5 ft and a height of 12 feet.
7. A cone with a radius of 4.5 inches and a height of 7 inches.
8. A cone with a radius of 3.5 inches and a height of 5.5 inches.
9. A cone with a radius of 7 cm and a height of 13 cm.
10. A cone with a radius of 8 cm and a height of 11 cm.
11. A cone with a radius of 7.5 inches and a height of 11 inches.
12. A cone with a radius of 11.5 inches and a height of 15 inches.
13. A cone with a radius of 12.5 feet and a height of 15 feet.
Directions: Solve each word problem.
14. A cone has a radius of 6 meters and a height of 14 meters. What is its volume?
15. The containers of icing for Tina’s cake decorator are cones. Each container has a radius of 2.4 inches and aheight of 7 inches. If Tina buys containers of red, yellow, and blue icing, how much icing will she buy?
Summary
Having completed this chapter, students are now ready to move on to the next Chapter. Each Concept has providedstudents with an opportunity to engage and practice skills in many Concepts including classifying solid figures,representing solid figures, surface area and volume with prisms, cylinders, pyramids and cones.
1078
www.ck12.org Chapter 11. Data and Statistics
CHAPTER 11 Data and StatisticsChapter Outline
11.1 MEAN
11.2 MEDIAN
11.3 MODE
11.4 RANGE OF SPREAD/DISPERSION
11.5 BAR GRAPHS
11.6 MULTIPLE BAR GRAPHS
11.7 LINE GRAPHS
11.8 MULTIPLE LINE GRAPHS
11.9 STEM-AND-LEAF PLOTS
11.10 BOX-AND-WHISKER PLOTS
11.11 FREQUENCY TABLES TO ORGANIZE AND DISPLAY DATA
11.12 HISTOGRAMS
11.13 IDENTIFICATION OF MISLEADING STATISTICS
11.14 DATA DISPLAY CHOICES
11.15 DISPLAYING BY TYPE OF DATA
Introduction
In Math 7, the learning content is divided into Concepts. Each Concept is complete and whole providing focusedlearning on an indicated objective. Theme-based Concepts provide students with experiences that integrate thecontent of each Concept. Students are given opportunities to practice the skills of each Concept through real-worldsituations, examples, guided practice and independent practice sections. There are also video links provided to givestudents an audio/visual way of connecting with the content. In this Chapter, students will engage with Conceptson mean, median, mode, range, bar graphs, line graphs, stem-and-leaf plots, box-and-whisker plots, histograms,misleading statistics, data displays and problem solving with surveys.
1079

11.1. Mean www.ck12.org
11.1 Mean
Here you’ll learn to find the mean of a set of data.
Have you ever heard of the Iditarod?
The students in Mr. Hawkins class are studying about the Iditarod. Some of the students had never heard of theIditarod before, so Mr. Hawkins started off his class by showing them this video about the race.
http://www.iditarod.com/
The students sat through the video in awe. When it was over, the room was so quiet that you could have heard a pindrop. Marcus was the first one to raise his hand.
“How far is it?” he asked.
“That is a great question,” Mr. Hawkins said. “The race is 1,150 miles from Anchorage Alaska to Nome Alaska.Men and women have finished it and won it too. This year, there were 10 men who finished on top. One finished in8 days and the rest in 9 days.”
“How fast did they go?” Karen asked from the back of the room. “I mean, you can’t go very fast on a dog sled,right?”
“Well, for you and me it might not seem fast, but for those dogs I am sure that it is. This leads us to a great mathproblem. Here are the speeds of the top 10 finishers. What is the average speed here?”
Mr. Hawkins wrote these speeds on the board.
4.81 mph, 4.79 mph, 4.76 mph, 4.67 mph, 4.66 mph, 4.64 mph, 4.62 mph, 4.6 mph, 4.58 mph, 4.55 mph.
“Take out a piece of paper and figure this out.”
Marcus took out a piece of paper, but he couldn’t remember how to figure out the average score.
If you remember how to do it, figure it out now. Then go through this Concept to begin learning all aboutdata and statistics. When you are finished this Concept, you can check your work with Marcus’ work and seeif you have the correct average speed. Look for this problem again at the end of the Concept.
Guidance
Data is one of those words that we hear all the time, especially in math class. We hear about collecting data,
1080
www.ck12.org Chapter 11. Data and Statistics
organizing data, analyzing data, etc. But....
What is data?
Data is numerical information collected in a set.
When we look at data in math and science, we look at information that has been gathered over time or that has beengathered to evaluate a topic. Learning to look at data is part of the work of people in math and science. Analyzingdata can help scientists predict future events too.
We can analyze numerical data several different ways. We can look for the mean, the median, the mode andthe range of a set of data.
Let’s start with the mean .
The mean is sometimes referred to as the average of a set of data. The mean is the sum of the data valuesdivided by the number of data values. You often hear about averages with grades or speeds. What is youraverage grade in math class? That number determines your final grade or the grade that you received on atest or quiz. We use averages all the time. Let’s look at the steps to figuring out the mean or average throughthis problem.
Find the mean for the set of data: 47, 56, 51, 45, and 41.
Step 1: Add the data values to determine the sum.
47+56+51+45+41 = 240
Step 2: Divide the sum by the number of data values in the set. In this case, there are five numbers in the data set,therefore divide the sum by five.
240÷5 = 48
The mean is 48.
Take a few minutes and write these steps for finding the mean of a set of values down in your notebook.
You can see that when we follow the steps that we can find the mean or average of a set of numbers quiteeasily. Let’s look at another one.
1081
11.1. Mean www.ck12.org
The chart below depicts the daily temperature in San Diego for the first seven days in August. Calculate the meantemperature for the first seven days in August.
TABLE 11.1:
Date: Temperature:Sunday 8/1 88◦FMonday 8/2 83◦FTuesday 8/3 87◦FWednesday 8/4 89◦FThursday 8/5 82◦FFriday 8/6 79◦FSaturday 8/7 87◦F
Step 1: Add to determine the sum of the data values.
88+83+87+89+82+79+87 = 595
Step 2: Divide the sum, 595 by 7 because there are seven numbers in the given data set.
595÷7 = 85
The mean temperature for the first week in August was 85◦F .
This was a real life example of how averages help us figure out weather. If you think about the weather forecast,you will often hear data mentioned. The meteorologist will talk about average snowfall or average temperature oraverage rainfall.
Sometimes, an average will not be an even number. When this happens, you can round to the nearest whole number.
Now it’s your turn to practice. Find the mean for each data set below. You may round when necessary.
Example A
11,13,14,15,16,22,24,25,30,32
Solution: 20
Example B
34,36,38,41,43,44,50,53,50,50,62,66
Solution: 47
Example C
8,16,24,32,40
Solution: 24
1082
www.ck12.org Chapter 11. Data and Statistics
Here is the original problem once again. Reread it and then compare your answer for the mean with the givensolution.
The students in Mr. Hawkins class are studying about the Iditarod. Some of the students had never heard of theIditarod before, so Mr. Hawkins started off his class by showing them this video about the race.
http://www.iditarod.com/
The students sat through the video in awe. When it was over, the room was so quiet that you could have heard a pindrop. Marcus was the first one to raise his hand.
“How far is it?” he asked.
“That is a great question,” Mr. Hawkins said. “The race is 1,150 miles from Anchorage Alaska to Nome Alaska.Men and women have finished it and won it too. This year, there were 10 men who finished on top. One finished in8 days and the rest in 9 days.”
“How fast did they go?” Karen asked from the back of the room. “I mean, you can’t go very fast on a dog sled,right?”
“Well, for you and me it might not seem fast, but for those dogs I am sure that it is. This leads us to a great mathproblem. Here are the speeds of the top 10 finishers. What is the average speed here?”
Mr. Hawkins wrote these speeds on the board.
4.81 mph, 4.79 mph, 4.76 mph, 4.67 mph, 4.66 mph, 4.64 mph, 4.62 mph, 4.6 mph, 4.58 mph, 4.55 mph.
“Take out a piece of paper and figure this out.”
Marcus took out a piece of paper, but he couldn’t remember how to figure out the average score.
By now you understand that the average is the same thing as the mean. The students have been asked to findthe mean speed of the dog sleds on the 2010 Iditarod. They have been given the speeds of the top ten finishers.This is the data that we will use to figure out the mean.
First, add up all of the speeds.
4.81+4.79+4.76+4.67+4.66+4.64+4.62+4.6+4.58+4.55 = 46.68
Next, we divide this sum by 10 because there were ten dog sleds, so there were 10 different speeds.
46.68÷10 = 4.668 rounds to 4.67
The average speed is 4.67 mph.
1083
11.1. Mean www.ck12.org
Guided Practice
Here is one for you to try on your own.
John has the following quiz scores.
78, 90, 83, 88, 67, 90, 84, 69, 56
Given these scores, what is his average for the quarter?
Answer
To begin, add up all of the scores.
78+90+83+88+67+90+84+69+56 = 705
Next, we divide by the number of scores.
705÷9 = 78.3
John’s average is a 78.
Video Review
MEDIAClick image to the left or use the URL below.URL: http://www.ck12.org/flx/render/embeddedobject/5450
This is a Khan Academy video on mean, median and mode.
Explore More
Directions: Find the mean for each set of data. You may round to the nearest hundredth when necessary.
1. 4, 5, 4, 5, 3, 3, 6, 7, 8
2. 6, 7, 8, 3, 2, 4, 9, 10, 11, 12
3. 11, 10, 9, 13, 14, 16, 20, 22, 22
4. 21, 23, 25, 22, 22, 27, 18, 20
5. 27, 29, 29, 32, 30, 32, 31
6. 34, 35, 34, 37, 38, 39, 39
7. 43, 44, 43, 46, 39, 50
8. 122, 100, 134, 156, 144, 110, 120, 123, 130
9. 224, 222, 220, 222, 224, 224
10. 540, 542, 544, 550, 548, 547
11. 762, 890, 900, 789, 780, 645, 700
12. 300, 400, 342, 345, 403, 302
13. 200, 199, 203, 255, 245, 230, 211
1084

www.ck12.org Chapter 11. Data and Statistics
14. 1009, 1000, 1200, 1209, 1208, 1217
15. 2300, 2456, 2341, 2400, 2541, 2321
1085
11.2. Median www.ck12.org
11.2 Median
Here you’ll learn to find the median of a set of data.
Have you ever wondered how fast a sled dog can travel?
Alaskan sled dogs travel varying speeds during the Iditarod. These strong, wonderful animals can travel at an averagespeed of anywhere from 5 to 15 miles per hours.
Here are some speeds from the last Iditarod.
10 mph
12 mph
8 mph
15 mph
9 mph
8 mph
7 mph
12 mph
Given these speeds, what was the median speed on the journey?
To answer this question, you will need to know how to identify and calculate a median. Pay attention and youwill learn how to do this in this Concept.
Guidance
Previously we worked on the mean of a set of data, now let’s move on to the median. If you think about the word“median” you can think about the median in a road or street. The median of a street is in the middle of the street.Just like the median of a road, the median of a set of data is the middle value of the set of numbers.
The median is the middle number when the values are arranged in order from the least to the greatest.
Notice that a key to finding the median is that the values must be arranged in order from least to greatest. If theyare not arranged in this way, you will not be able to determine an accurate median score!!!
Here is one to work on.
Find the median for the set of data: 47, 56, 51, 45, and 41.
Step 1: Arrange the data values in order from least to greatest.
41, 45, 47, 51, 56
1086

www.ck12.org Chapter 11. Data and Statistics
Step 2: Determine the number in the middle of the data set. 47 is the median because it is the data value in themiddle of the data set.
The median of the data set is 47.
Median scores are used when analyzing temperature. Take a look.
The chart below depicts the daily temperature in San Diego for the first seven days in August. Determine the mediantemperature.
TABLE 11.2:
Date: Temperature:Sunday 8/1 88◦FMonday 8/2 83◦FTuesday 8/3 87◦FWednesday 8/4 89◦FThursday 8/5 82◦FFriday 8/6 79◦FSaturday 8/7 87◦F
Step 1: Arrange the temperatures in order from least to greatest.
79, 82, 83, 87, 87, 88, 89
Step 2: Determine the data value in the middle of the data set. In this case, 87 is the median temperature.
The answer is 87◦F .
Here is a situation about test scores.
Katie’s first four test scores are 75%, 81%, 80%, and 84%. Determine the median of Katie’s test scores.
Step 1: Arrange the test scores in order from least to greatest.
75, 80, 81, 84
Step 2: In this case, there are two data values in the middle of the data set. To find the median, find the average ofthe two data values. Recall that to find the mean, determine the sum of the numbers and then divide by two.
80+81 = 161
161÷2 = 80.5
The median of Katie’s test scores is 80.5%.
Sometimes, you will have median scores that are not whole numbers. When this happens, be sure to includethe decimal in your answer. This means that the median score is between two whole numbers.
1087
11.2. Median www.ck12.org
Take a few minutes and write the steps to figuring out the median score down in your notebook.
Find the median score for each data set.
Example A
12,14,15,16,18,20
Solution: 15.5
Example B
14,18,19,34,32,30,41,50
Solution: 31
Example C
5,10,23,20,7,9,11,18,35,16,22
Solution: 16
Here is the original problem once again.
Alaskan sled dogs travel varying speeds during the Iditarod. These strong, wonderful animals can travel at an averagespeed of anywhere from 5 to 15 miles per hours.
Here are some speeds from the last Iditarod.
10 mph
12 mph
8 mph
15 mph
9 mph
8 mph
7 mph
12 mph
Given these speeds, what was the median speed on the journey?
First, let’s write these speeds in order from least to greatest.
7, 8, 8, 9, 10, 12, 12, 15
Now we can find the middle speed. Because there is an even number of speeds, we are looking for a value between9 and 10.
The median speed is 9.5 mph.
Guided Practice
Here is one for you to try on your own.
Find the median.
1088
www.ck12.org Chapter 11. Data and Statistics
12, 14, 16, 11, 19, 12, 15, 16, 17, 22, 21
Answer
First, let’s write these values in order from least to greatest.
11, 12, 12, 14, 15, 16, 16, 17, 19, 21, 22
The median value is 16.
Video Review
MEDIAClick image to the left or use the URL below.URL: http://www.ck12.org/flx/render/embeddedobject/5450
This is a Khan Academy video on mean, median and mode.
Explore More
Directions: Find the median for each set of numbers.
1. 2, 1, 3, 4, 2, 1, 5, 6, 7, 2, 3
2. 11, 12, 17, 18, 21, 12, 13, 13
3. 20, 22, 21, 24, 25, 20, 19
4. 18, 17, 19, 21, 22, 20, 18, 17
5. 19, 29, 39, 49, 59, 69, 79, 89
6. 4, 5, 4, 5, 3, 3, 2, 3, 3, 2
7. 6, 7, 8, 3, 2, 4
8. 11, 10, 9, 13, 14, 16
9. 21, 23, 25, 22, 22, 27
10. 27, 29, 29, 32, 30, 32, 31
11. 34, 35, 34, 37, 38, 39, 39
12. 43, 44, 43, 46, 39, 50
13. 122, 100, 134, 156, 144, 110
14. 224, 222, 220, 222, 224, 224
15. 540, 542, 544, 550, 548, 547
1089
11.3. Mode www.ck12.org
11.3 Mode
Here you’ll learn to find the mode of a set of data.
Remember the sled dogs from the Median Concept? Well, let’s look at the speeds once again.
Alaskan sled dogs travel varying speeds during the Iditarod. These strong, wonderful animals can travel at an averagespeed of anywhere from 5 to 15 miles per hours.
Here are some speeds from the last Iditarod.
10 mph
12 mph
8 mph
15 mph
9 mph
8 mph
7 mph
12 mph
Which speed is the mode of this data set?
This Concept is about figuring out the mode of a data set. You will be able to answer this question by the endof the Concept.
Guidance
Previously we worked on finding the mean and the median, now we can find the mode of a set of data too.
The mode is the value that occurs the most times in a set of data.
Mode sounds like most and that can be an easy way to remember it.
Let’s look at how to find the mode.
The chart below depicts the daily temperature in San Diego for the first seven days in August. Determine the modefor this set of data.
TABLE 11.3:
Date: Temperature:Sunday 8/1 88◦FMonday 8/2 83◦FTuesday 8/3 87◦FWednesday 8/4 89◦FThursday 8/5 82◦FFriday 8/6 79◦FSaturday 8/7 87◦F
To find the mode, look for the number that occurs most often. In this case, 87 is the mode because it appearstwice in the set of data.
1090
www.ck12.org Chapter 11. Data and Statistics
The mode is 87◦F .
Now we can find the mode of a set of test scores.
Katie’s first four test scores are 75%, 81%, 80%, and 84%. Determine the mode of Katie’s test scores.
In this case, there is not one number that occurs more than another. Therefore, there is no mode.
Mode = none
Here is another situation where the mode is a useful tool in analyzing data.
Miguel measured the height of eight students in his class in inches. Determine the mode of his classmate’s heights.
51 45 47 51 50 56 52 50
In this case, there are two data values that appear most often, 51 and 50.
The modes of Miguel’s data are 51 and 50.
Name the mode of each data set.
Example A
2,3,3,5,6,7,8,9,3
Solution: 3
Example B
12,15,67,45,44,88,90
Solution: No Mode
Example C
13,13,45,45,67,89,13,67,67,67,13
Solution: 67
Here is the original problem once again.
Alaskan sled dogs travel varying speeds during the Iditarod. These strong, wonderful animals can travel at an averagespeed of anywhere from 5 to 15 miles per hours.
Here are some speeds from the last Iditarod.
10 mph
12 mph
8 mph
15 mph
9 mph
8 mph
7 mph
12 mph
Which speed is the mode of this data set?
1091
11.3. Mode www.ck12.org
There are two speeds that occurred the most in this data set.
The first one is 8 mph - a rather slow speed.
The second one is 12 mph - a rather fast speed.
Guided Practice
Here is one for you to try on your own.
Name the mode in this data set.
2, 4, 5, 6, 2, 3, 4, 2, 2, 2, 7, 8, 9
Answer
Remember, when looking for the mode, we are looking for the value that occurs the most times.
The mode of this set of values is 2.
Video Review
MEDIAClick image to the left or use the URL below.URL: http://www.ck12.org/flx/render/embeddedobject/5450
This is a Khan Academy video on mean, median and mode.
Explore More
Directions: Identify the mode for the following sets of data.
1. 2, 3, 3, 3, 2, 2, 2, 5, 6, 7, 7, 7, 7
2. 4, 5, 6, 6, 6, 7, 3, 2, 6, 5, 5
3. 23, 22, 22, 24, 25, 25, 25, 21, 20, 22, 27
4. 123, 120, 121, 120, 121, 125, 121, 121
5. 678, 600, 655, 655, 600, 678, 600, 600
6. 4, 5, 4, 5, 3, 3, 4, 4, 4, 4, 6
7. 6, 7, 8, 3, 2, 4, 4, 7, 7, 7
8. 11, 10, 9, 13, 14, 16, 11, 10, 11
9. 21, 23, 25, 22, 22, 27, 21, 22, 21, 21
10. 27, 29, 29, 32, 30, 32, 31, 33, 33, 33, 33
11. 34, 35, 34, 37, 38, 39, 39, 34, 34
12. 43, 44, 43, 46, 39, 50, 43, 43, 51, 51
13. 122, 100, 134, 156, 144, 110, 110
1092

www.ck12.org Chapter 11. Data and Statistics
14. 224, 222, 220, 222, 224, 224, 221, 222, 223, 225
15. 540, 542, 544, 550, 548, 547, 547, 550, 550, 548
1093
11.4. Range of Spread/Dispersion www.ck12.org
11.4 Range of Spread/Dispersion
Here you’ll learn to find the range of a set of data.
Think about those sled dogs from the Mode Concept one more time. We are going to analyze the data about speedsin a new way.
Alaskan sled dogs travel varying speeds during the Iditarod. These strong, wonderful animals can travel at an averagespeed of anywhere from 5 to 15 miles per hours.
Here are some speeds from the last Iditarod.
10 mph
12 mph
8 mph
15 mph
9 mph
8 mph
7 mph
12 mph
Now let’s think about range. What is the range of the data?
This Concept will teach you how to figure out the range of a data set. We will come back to this problem atthe end of the Concept.
Guidance
The range of a set of data is the difference between the greatest and least values.
To find the range of a set of data, subtract the largest data value from the smallest data value.
Let’s look at how to apply this in a problem.
Determine the range for the set of data: 47, 56, 51, 45, and 41.
Subtract the largest data value, in this case 56 from the smallest data value of 41.
56−41 = 15
The difference between the largest and smallest number is 15, therefore the range for this set of data is 15.
Now let’s look at another one.
The chart below depicts the daily temperature in San Diego for the first seven days in August. Identify the range intemperatures.
TABLE 11.4:
Date: Temperature:Sunday 8/1 88◦FMonday 8/2 83◦FTuesday 8/3 87◦F
1094

www.ck12.org Chapter 11. Data and Statistics
TABLE 11.4: (continued)
Date: Temperature:Wednesday 8/4 89◦FThursday 8/5 82◦FFriday 8/6 79◦FSaturday 8/7 87◦F
Subtract the largest value 89 from the smallest value 79.
89−79 = 10
The range in temperatures is 10◦F .
Find the range of each data set.
Example A
12,14,15,16,18,20
Solution: 8
Example B
14,18,19,34,32,30,41,50
Solution: 36
Example C
5,10,23,20,7,9,11,18,35,16,22
Solution: 30
Here is the original problem once again.
Alaskan sled dogs travel varying speeds during the Iditarod. These strong, wonderful animals can travel at an averagespeed of anywhere from 5 to 15 miles per hours.
Here are some speeds from the last Iditarod.
10 mph
12 mph
8 mph
15 mph
9 mph
8 mph
7 mph
12 mph
Now let’s think about range. What is the range of the data?
To find the range, we must figure out the difference between the greatest and smallest values in the data set.
The greatest value is 15.
1095
11.4. Range of Spread/Dispersion www.ck12.org
The smallest value is 8
Now we find the difference.
15−8 = 7
The range of this data set is 7.
Guided Practice
Here is one for you to try on your own.
Think back to earlier Concepts about mean, median and mode. Now add what you have learned to range.
Should mean, median, mode, or range be determined to best analyze the following set of data?
TABLE 11.5: Number of minutes it took five students to complete a math test.
Student: Number of minutes:1 292 323 404 335 38
Answer
Since there is not a number that occurs most often, the mode is not the best way to analyze the data.
Calculating the range of this data just allows one to see the difference between the students who finished the examfirst and last.
In this case, determining the mean is the best way to analyze this data. The mean gives the average amountof time it took for the five students to complete the exam. In this case, the mean is 34.4 minutes. It can also behelpful to look at the median of this data, 33. In this case, the mean and median are close in value.
Remember to think about what the data describes and what your objective is in analyzing the data and thiswill help you to choose the best method for analyzing the data.
Video Review
MEDIAClick image to the left or use the URL below.URL: http://www.ck12.org/flx/render/embeddedobject/54798
This is a Khan Academy video on range.
Explore More
Directions: Analyze each data set.
1096
www.ck12.org Chapter 11. Data and Statistics
32 29 40 35 42 25 40
1. Mean –
2. Median –
3. Mode –
4. Range –
The weekly paychecks for ten part-time employees are: $140, $132, $200, $150, $175, $200, $180, $95, $145, and$155.
5. Mean –
6. Median –
7. Mode –
8. Range –
The data set below depicts the number of points LeBron James scored in the last five NBA games.
25 27 25 29 22
9. Mean –
10. Median –
11. Mode –
12. Range –
Here is the number of days that it took the mushers of the Iditarod to finish the race in 2010.
8 days, 9 days, 9 days, 9 days, 9 days, 9 days, 9 days, 9 days, 9 days, 9 days
13. Mean –
14. Median –
15. Mode –
16. Range –
1097
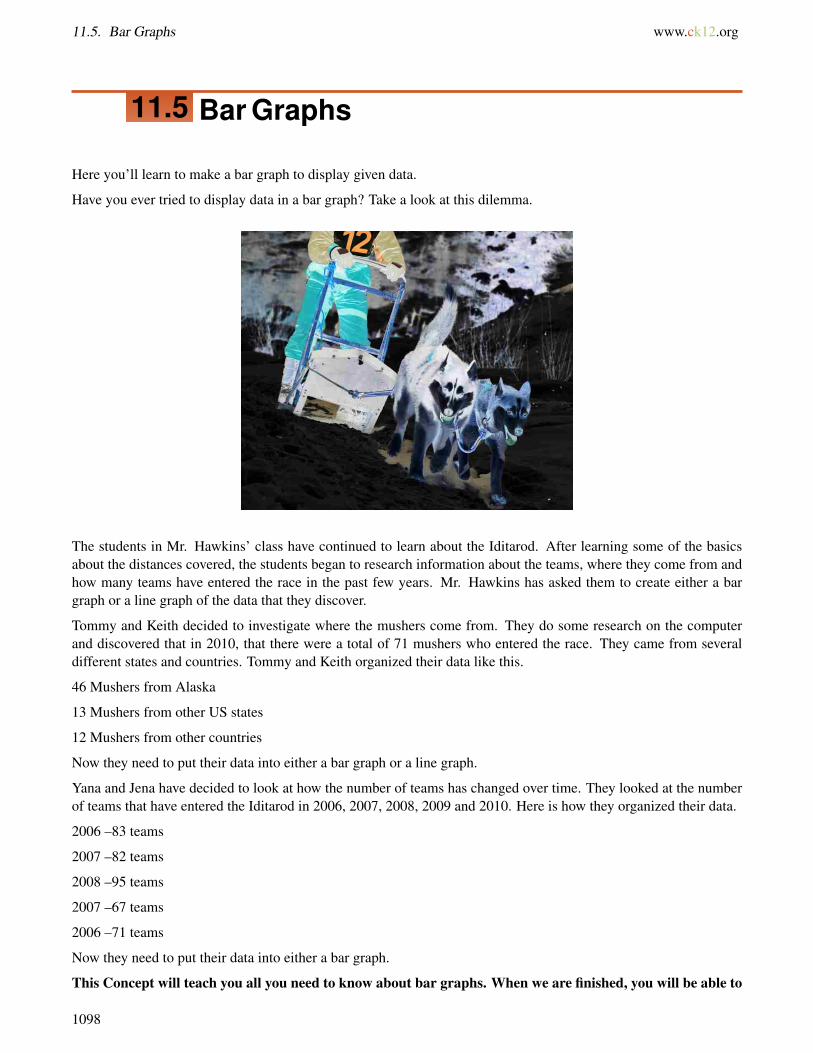
11.5. Bar Graphs www.ck12.org
11.5 Bar Graphs
Here you’ll learn to make a bar graph to display given data.
Have you ever tried to display data in a bar graph? Take a look at this dilemma.
The students in Mr. Hawkins’ class have continued to learn about the Iditarod. After learning some of the basicsabout the distances covered, the students began to research information about the teams, where they come from andhow many teams have entered the race in the past few years. Mr. Hawkins has asked them to create either a bargraph or a line graph of the data that they discover.
Tommy and Keith decided to investigate where the mushers come from. They do some research on the computerand discovered that in 2010, that there were a total of 71 mushers who entered the race. They came from severaldifferent states and countries. Tommy and Keith organized their data like this.
46 Mushers from Alaska
13 Mushers from other US states
12 Mushers from other countries
Now they need to put their data into either a bar graph or a line graph.
Yana and Jena have decided to look at how the number of teams has changed over time. They looked at the numberof teams that have entered the Iditarod in 2006, 2007, 2008, 2009 and 2010. Here is how they organized their data.
2006 –83 teams
2007 –82 teams
2008 –95 teams
2007 –67 teams
2006 –71 teams
Now they need to put their data into either a bar graph.
This Concept will teach you all you need to know about bar graphs. When we are finished, you will be able to
1098
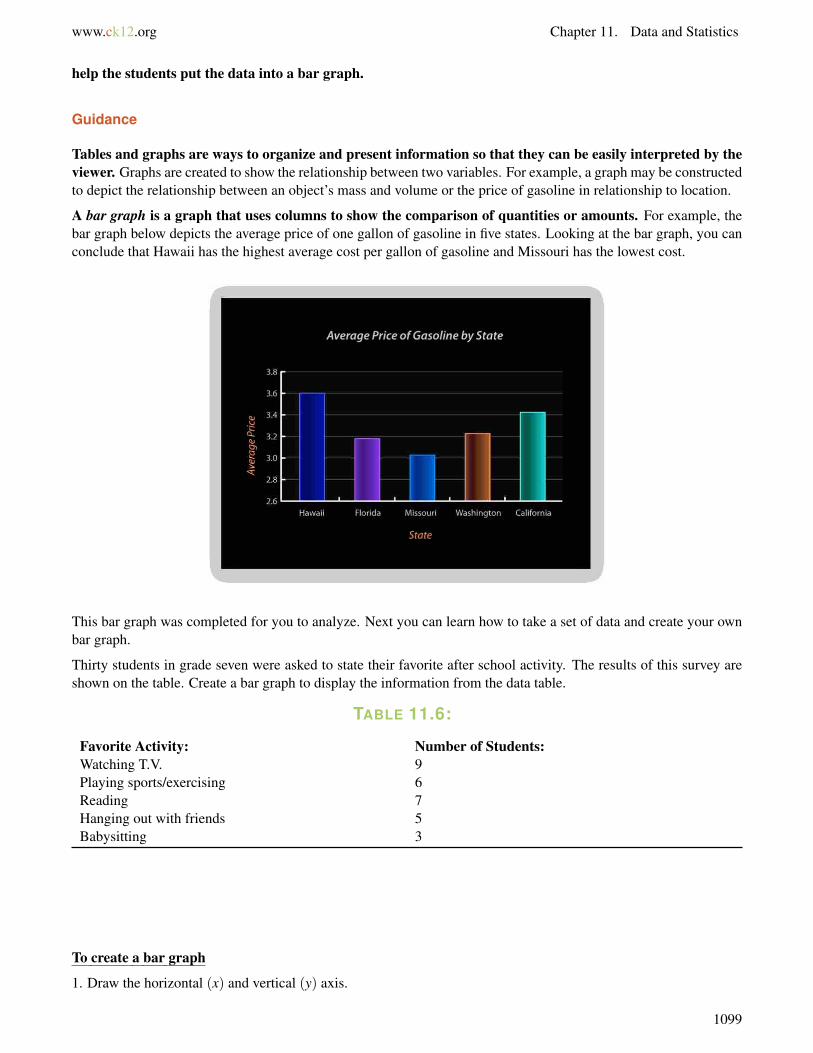
www.ck12.org Chapter 11. Data and Statistics
help the students put the data into a bar graph.
Guidance
Tables and graphs are ways to organize and present information so that they can be easily interpreted by theviewer. Graphs are created to show the relationship between two variables. For example, a graph may be constructedto depict the relationship between an object’s mass and volume or the price of gasoline in relationship to location.
A bar graph is a graph that uses columns to show the comparison of quantities or amounts. For example, thebar graph below depicts the average price of one gallon of gasoline in five states. Looking at the bar graph, you canconclude that Hawaii has the highest average cost per gallon of gasoline and Missouri has the lowest cost.
This bar graph was completed for you to analyze. Next you can learn how to take a set of data and create your ownbar graph.
Thirty students in grade seven were asked to state their favorite after school activity. The results of this survey areshown on the table. Create a bar graph to display the information from the data table.
TABLE 11.6:
Favorite Activity: Number of Students:Watching T.V. 9Playing sports/exercising 6Reading 7Hanging out with friends 5Babysitting 3
To create a bar graph
1. Draw the horizontal (x) and vertical (y) axis.
1099
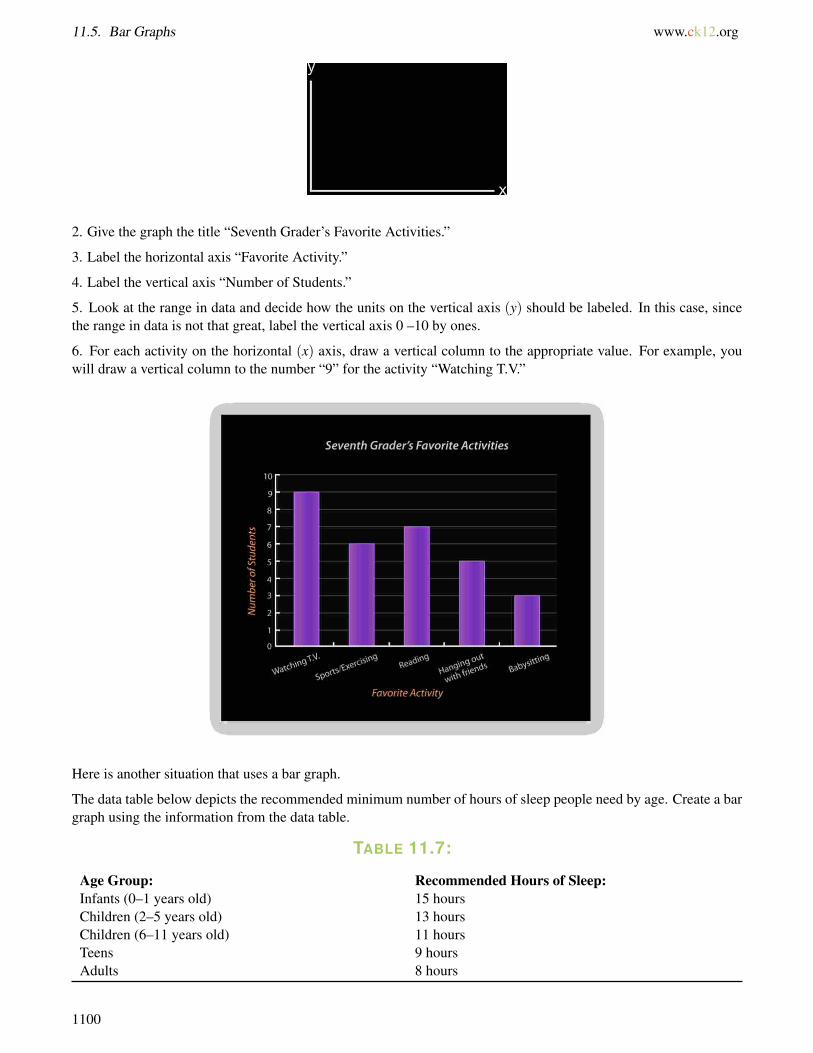
11.5. Bar Graphs www.ck12.org
2. Give the graph the title “Seventh Grader’s Favorite Activities.”
3. Label the horizontal axis “Favorite Activity.”
4. Label the vertical axis “Number of Students.”
5. Look at the range in data and decide how the units on the vertical axis (y) should be labeled. In this case, sincethe range in data is not that great, label the vertical axis 0 –10 by ones.
6. For each activity on the horizontal (x) axis, draw a vertical column to the appropriate value. For example, youwill draw a vertical column to the number “9” for the activity “Watching T.V.”
Here is another situation that uses a bar graph.
The data table below depicts the recommended minimum number of hours of sleep people need by age. Create a bargraph using the information from the data table.
TABLE 11.7:
Age Group: Recommended Hours of Sleep:Infants (0–1 years old) 15 hoursChildren (2–5 years old) 13 hoursChildren (6–11 years old) 11 hoursTeens 9 hoursAdults 8 hours
1100
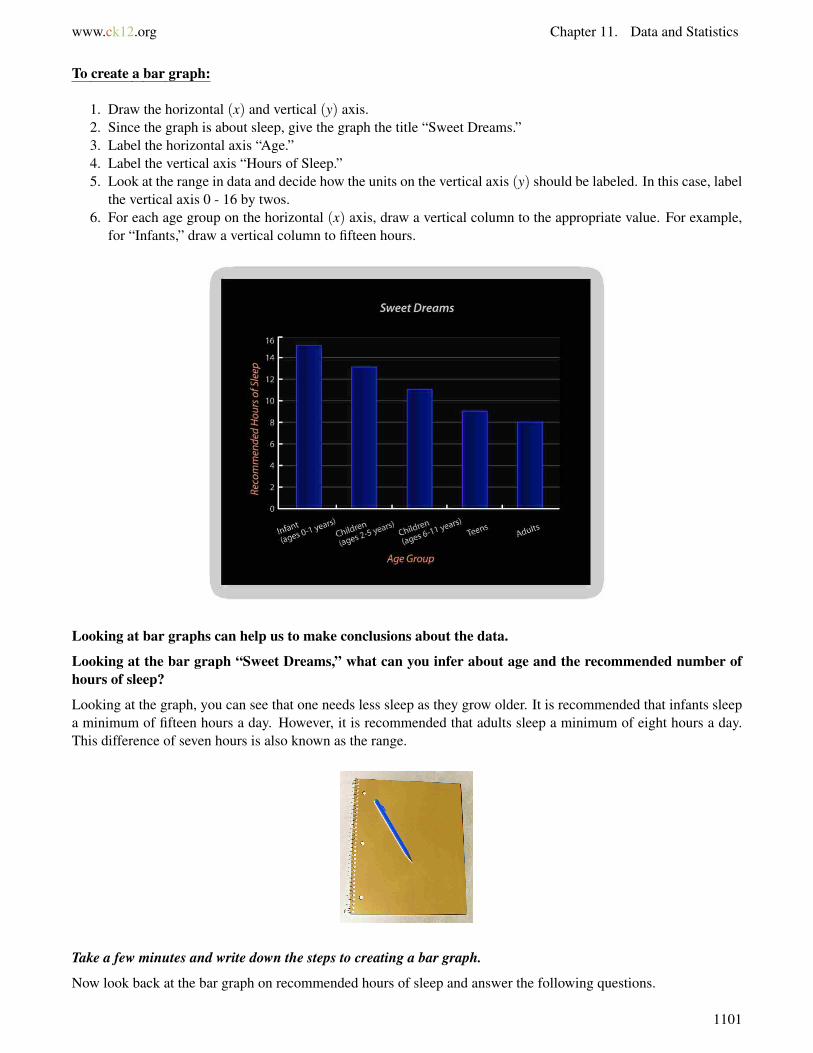
www.ck12.org Chapter 11. Data and Statistics
To create a bar graph:
1. Draw the horizontal (x) and vertical (y) axis.2. Since the graph is about sleep, give the graph the title “Sweet Dreams.”3. Label the horizontal axis “Age.”4. Label the vertical axis “Hours of Sleep.”5. Look at the range in data and decide how the units on the vertical axis (y) should be labeled. In this case, label
the vertical axis 0 - 16 by twos.6. For each age group on the horizontal (x) axis, draw a vertical column to the appropriate value. For example,
for “Infants,” draw a vertical column to fifteen hours.
Looking at bar graphs can help us to make conclusions about the data.
Looking at the bar graph “Sweet Dreams,” what can you infer about age and the recommended number ofhours of sleep?
Looking at the graph, you can see that one needs less sleep as they grow older. It is recommended that infants sleepa minimum of fifteen hours a day. However, it is recommended that adults sleep a minimum of eight hours a day.This difference of seven hours is also known as the range.
Take a few minutes and write down the steps to creating a bar graph.
Now look back at the bar graph on recommended hours of sleep and answer the following questions.
1101
11.5. Bar Graphs www.ck12.org
Example A
What is the difference between recommended hours of infant sleep and a 2 - 5 year old child’s sleep?
Solution: 2 hours
Example B
What is the recommended hours of sleep for an adult?
Solution: 8 hours
Example C
What is the recommended hours of sleep for a teen?
Solution: 9 hours
Here is the original problem once again. Reread it and then look at the graphs created.
The students in Mr. Hawkins’ class have continued to learn about the Iditarod. After learning some of the basicsabout the distances covered, the students began to research information about the teams, where they come from andhow many teams have entered the race in the past few years. Mr. Hawkins has asked them to create either a bargraph or a line graph of the data that they discover.
Tommy and Keith decided to investigate where the mushers come from. They do some research on the computerand discovered that in 2010, that there were a total of 71 mushers who entered the race. They came from severaldifferent states and countries. Tommy and Keith organized their data like this.
46 Mushers from Alaska
13 Mushers from other US states
12 Mushers from other countries
Now they need to put their data into either a bar graph or a line graph.
Yana and Jena have decided to look at how the number of teams has changed over time. They looked at the numberof teams that have entered the Iditarod in 2006, 2007, 2008, 2009 and 2010. Here is how they organized their data.
1102

www.ck12.org Chapter 11. Data and Statistics
2006 –83 teams
2007 –82 teams
2008 –95 teams
2007 –67 teams
2006 –71 teams
Now they need to put their data into either a bar graph or a line graph.
Let’s start with the boys. They are looking at the number of mushers from different places. Nothing ischanging in their data over time-therefore it makes the most sense for them to use a bar graph. They are alsolooking at the frequency of mushers from each location. Here is a bar graph that best shows their data.
Next, we can look at the girls. The girls are looking at how the number of teams that has entered the Iditarodhas changed over time. They are comparing data that has changed. When we compare data and how itchanges, we use a line graph. That is the best way to show this data.
1103

11.5. Bar Graphs www.ck12.org
Guided Practice
Here is one for you to try on your own.
Look at this graph at the number of hours students volunteered in different grades. In which grade did studentsvolunteer the most?
Answer
The students in the sixth grade volunteered the most hours.
Video Review
1104
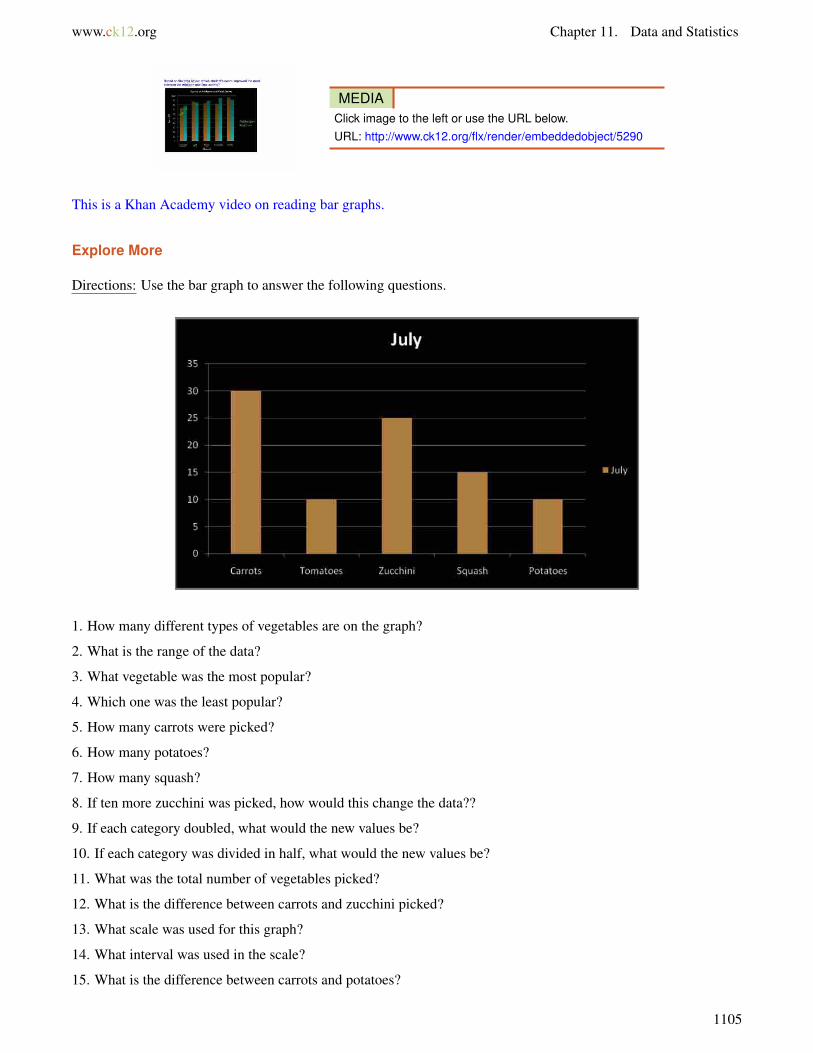
www.ck12.org Chapter 11. Data and Statistics
MEDIAClick image to the left or use the URL below.URL: http://www.ck12.org/flx/render/embeddedobject/5290
This is a Khan Academy video on reading bar graphs.
Explore More
Directions: Use the bar graph to answer the following questions.
1. How many different types of vegetables are on the graph?
2. What is the range of the data?
3. What vegetable was the most popular?
4. Which one was the least popular?
5. How many carrots were picked?
6. How many potatoes?
7. How many squash?
8. If ten more zucchini was picked, how would this change the data??
9. If each category doubled, what would the new values be?
10. If each category was divided in half, what would the new values be?
11. What was the total number of vegetables picked?
12. What is the difference between carrots and zucchini picked?
13. What scale was used for this graph?
14. What interval was used in the scale?
15. What is the difference between carrots and potatoes?
1105
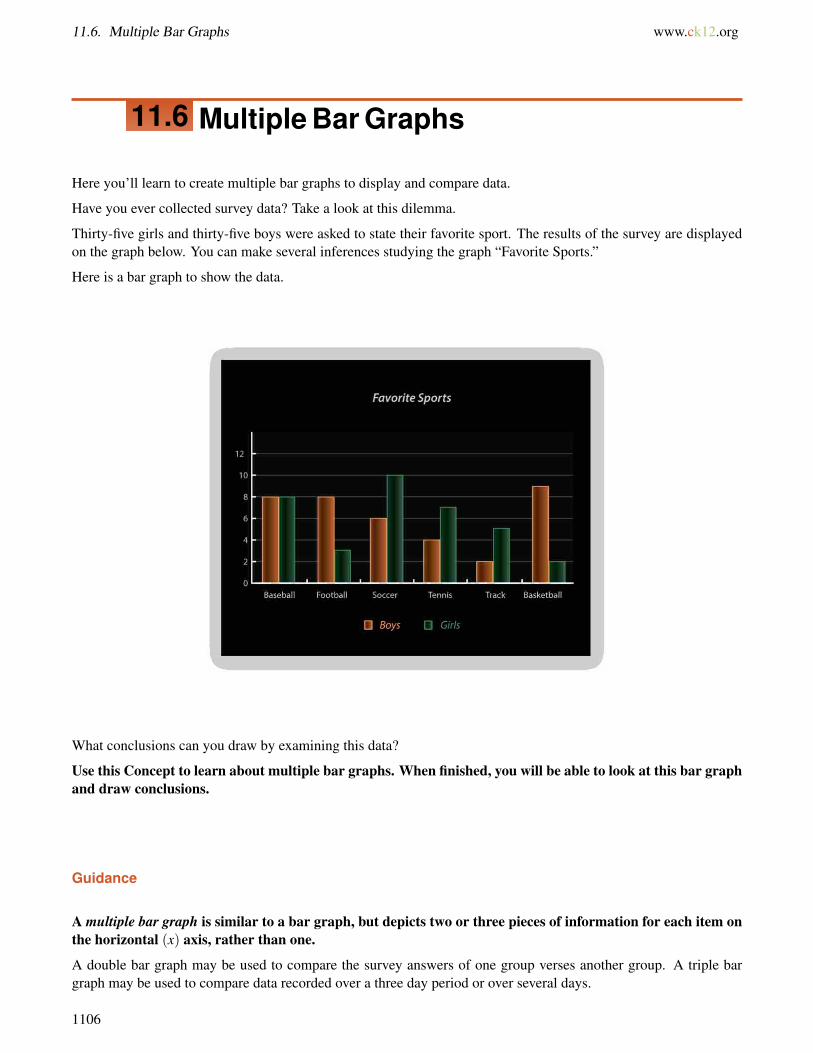
11.6. Multiple Bar Graphs www.ck12.org
11.6 Multiple Bar Graphs
Here you’ll learn to create multiple bar graphs to display and compare data.
Have you ever collected survey data? Take a look at this dilemma.
Thirty-five girls and thirty-five boys were asked to state their favorite sport. The results of the survey are displayedon the graph below. You can make several inferences studying the graph “Favorite Sports.”
Here is a bar graph to show the data.
What conclusions can you draw by examining this data?
Use this Concept to learn about multiple bar graphs. When finished, you will be able to look at this bar graphand draw conclusions.
Guidance
A multiple bar graph is similar to a bar graph, but depicts two or three pieces of information for each item onthe horizontal (x) axis, rather than one.
A double bar graph may be used to compare the survey answers of one group verses another group. A triple bargraph may be used to compare data recorded over a three day period or over several days.
1106
www.ck12.org Chapter 11. Data and Statistics
Frank’s Farm Stand kept track of the number of pounds of vegetables sold over a three-day period. The results arelisted on the table below. Create a multiple bar graph to display and compare the amounts of vegetables sold overthe three day period.
TABLE 11.8:
Type of Vegetable: Pounds Sold: Day One Pounds Sold: Day Two Pounds Sold: Day ThreeSquash 32 lbs. 36 lbs. 36 lbs.Zucchini 40 lbs. 33 lbs. 37 lbs.Corn 56 lbs. 65 lbs. 67 lbs.Carrots 28 lbs. 25 lbs. 23 lbs.Romaine Lettuce 27 lbs. 31 lbs. 34 lbs.Tomatoes 44 lbs. 54 lbs. 58 lbs.
To create a multiple bar graph:
1. Draw the horizontal (x) and vertical (y) axis.2. Give the graph the title “Frank’s Farm Stand.”3. Label the horizontal axis “Vegetables.”4. Label the vertical axis “Pounds Sold.”5. Look at the range in data and decide how the units on the vertical axis (y) should be labeled. In this case, label
the vertical axis 0 - 80 by tens.6. For each vegetable on the horizontal (x) axis, draw a vertical column to the appropriate value three times, one
column representing day one, a second column for day two, and a third column for day three.7. Choose three colors, one to represent the values for day one, one for the values for day two, and finally one to
represent the values for day three.
1107

11.6. Multiple Bar Graphs www.ck12.org
You can also draw conclusions about data from multiple bar graphs. These comparisons can help you todiscover patterns and trends about statistics.
Looking at the bar graph “Frank’s Farm Stand Sales,” what can you infer about the difference in sales overthe three day period?
It is apparent that sales of squash, corn, romaine lettuce, and tomatoes increased over the three day period. Zucchinisales dropped on day two, but increased on day three. However, carrot sales declined on day two and again on daythree. Note that the same amount of carrots and romaine lettuce were sold on day one.
Taylor created a table to compare the amount of gravitational pull on each planet compared to that on Earth. Createa multiple bar graph to display the information from Taylor’s chart.
TABLE 11.9:
Planet Name: Planet’s Gravitational Pull: Earth’s Gravitational Pull:Mercury 0.38 m/s 1.0 m/sVenus 0.91 m/s 1.0 m/sMars 0.38 m/s 1.0 m/sJupiter 2.54 m/s 1.0 m/s
1108
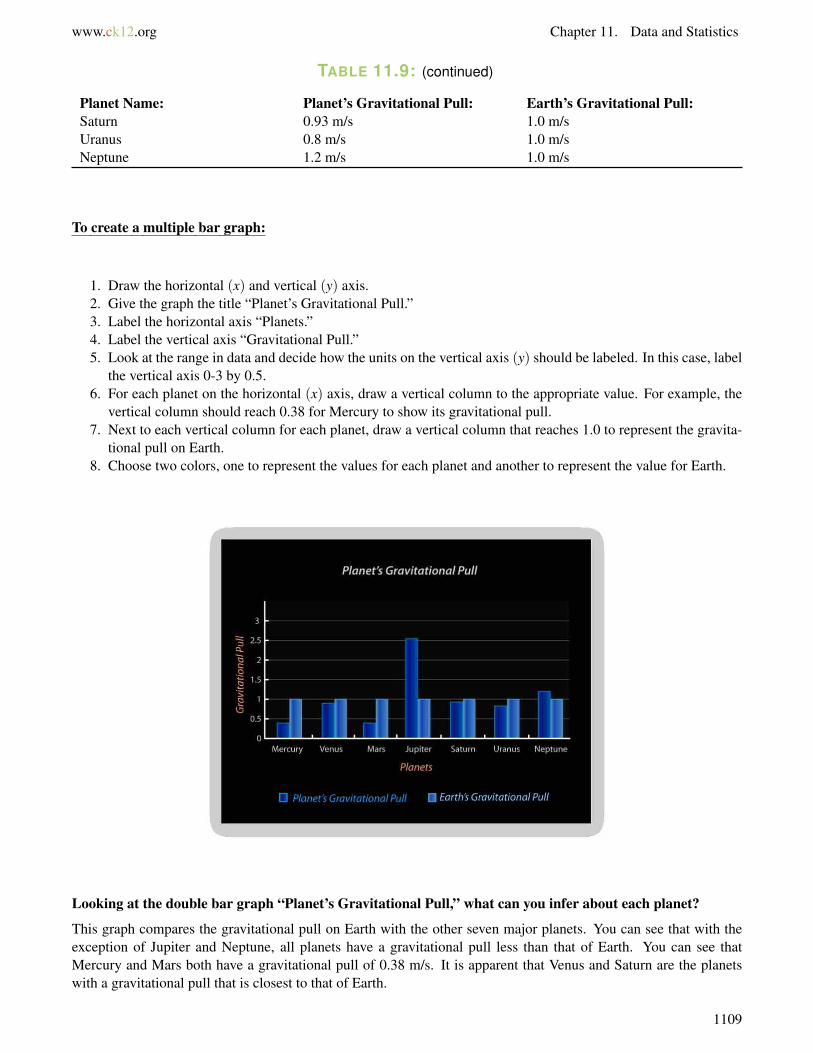
www.ck12.org Chapter 11. Data and Statistics
TABLE 11.9: (continued)
Planet Name: Planet’s Gravitational Pull: Earth’s Gravitational Pull:Saturn 0.93 m/s 1.0 m/sUranus 0.8 m/s 1.0 m/sNeptune 1.2 m/s 1.0 m/s
To create a multiple bar graph:
1. Draw the horizontal (x) and vertical (y) axis.2. Give the graph the title “Planet’s Gravitational Pull.”3. Label the horizontal axis “Planets.”4. Label the vertical axis “Gravitational Pull.”5. Look at the range in data and decide how the units on the vertical axis (y) should be labeled. In this case, label
the vertical axis 0-3 by 0.5.6. For each planet on the horizontal (x) axis, draw a vertical column to the appropriate value. For example, the
vertical column should reach 0.38 for Mercury to show its gravitational pull.7. Next to each vertical column for each planet, draw a vertical column that reaches 1.0 to represent the gravita-
tional pull on Earth.8. Choose two colors, one to represent the values for each planet and another to represent the value for Earth.
Looking at the double bar graph “Planet’s Gravitational Pull,” what can you infer about each planet?
This graph compares the gravitational pull on Earth with the other seven major planets. You can see that with theexception of Jupiter and Neptune, all planets have a gravitational pull less than that of Earth. You can see thatMercury and Mars both have a gravitational pull of 0.38 m/s. It is apparent that Venus and Saturn are the planetswith a gravitational pull that is closest to that of Earth.
1109
11.6. Multiple Bar Graphs www.ck12.org
Write down the steps to creating multiple bar graphs in your notebook.
Now use the graph on planets to answer the following questions.
Example A
Which planet has the greatest difference between the earth’s gravitational pull and the planet’s gravitational pull?
Solution: Jupiter
Example B
What is the measurement of the earth’s gravitational pull for Saturn?
Solution: 1
Example C
Which has the greatest planet gravitational pull, Neptune or Pluto?
Solution: Neptune
Here is the original problem once again.
Thirty-five girls and thirty-five boys were asked to state their favorite sport. The results of the survey are displayedon the graph below. You can make several inferences studying the graph “Favorite Sports.”
Here is a bar graph to show the data.
1110
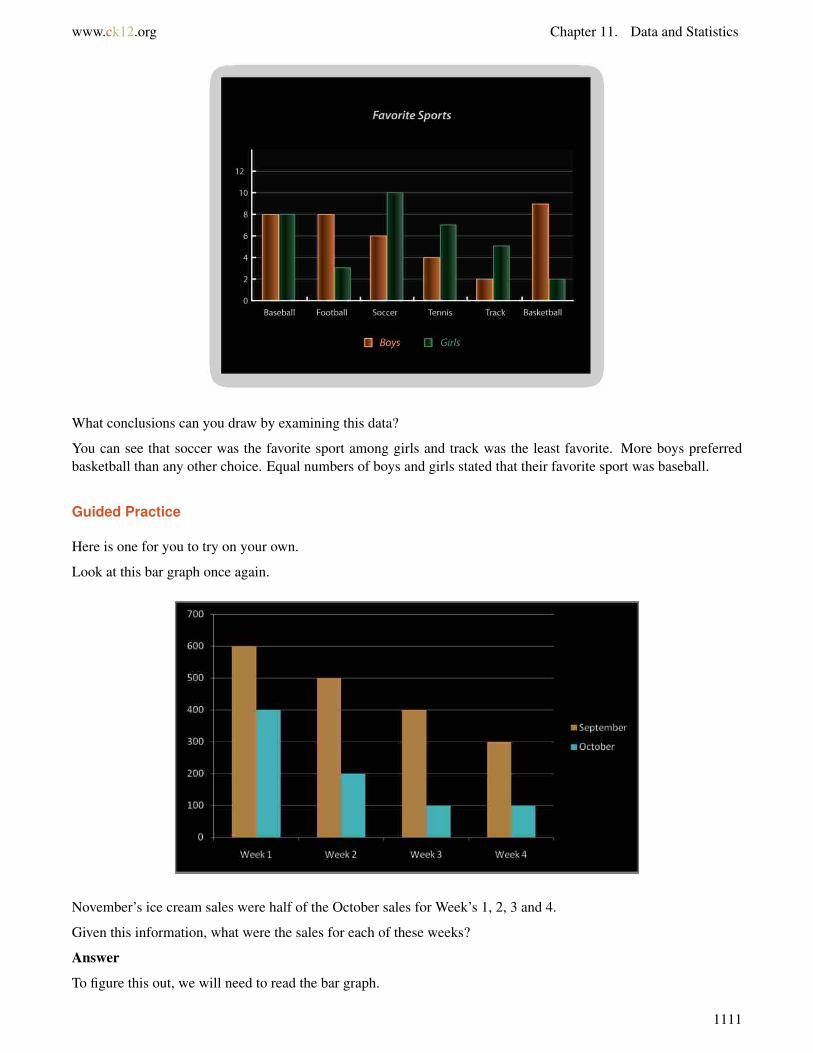
www.ck12.org Chapter 11. Data and Statistics
What conclusions can you draw by examining this data?
You can see that soccer was the favorite sport among girls and track was the least favorite. More boys preferredbasketball than any other choice. Equal numbers of boys and girls stated that their favorite sport was baseball.
Guided Practice
Here is one for you to try on your own.
Look at this bar graph once again.
November’s ice cream sales were half of the October sales for Week’s 1, 2, 3 and 4.
Given this information, what were the sales for each of these weeks?
Answer
To figure this out, we will need to read the bar graph.
1111

11.6. Multiple Bar Graphs www.ck12.org
Here are the October sales.
Week 1 = 400
Week 2 = 200
Week 3 = 100
Week 4 = 100
Which means the sales for November were the following:
Week 1 = 200
Week 2 = 100
Week 3 = 50
Week 4 = 50
Video Review
MEDIAClick image to the left or use the URL below.URL: http://www.ck12.org/flx/render/embeddedobject/5290
This is a Khan Academy video on reading bar graphs. This is a supporting video for this Concept.
Explore More
Directions: The multiple bar graph below depicts the number of Major League Baseball teams in each state, as wellas the number of World Series Championships won by each state. Use the graph to answer the questions.
1112
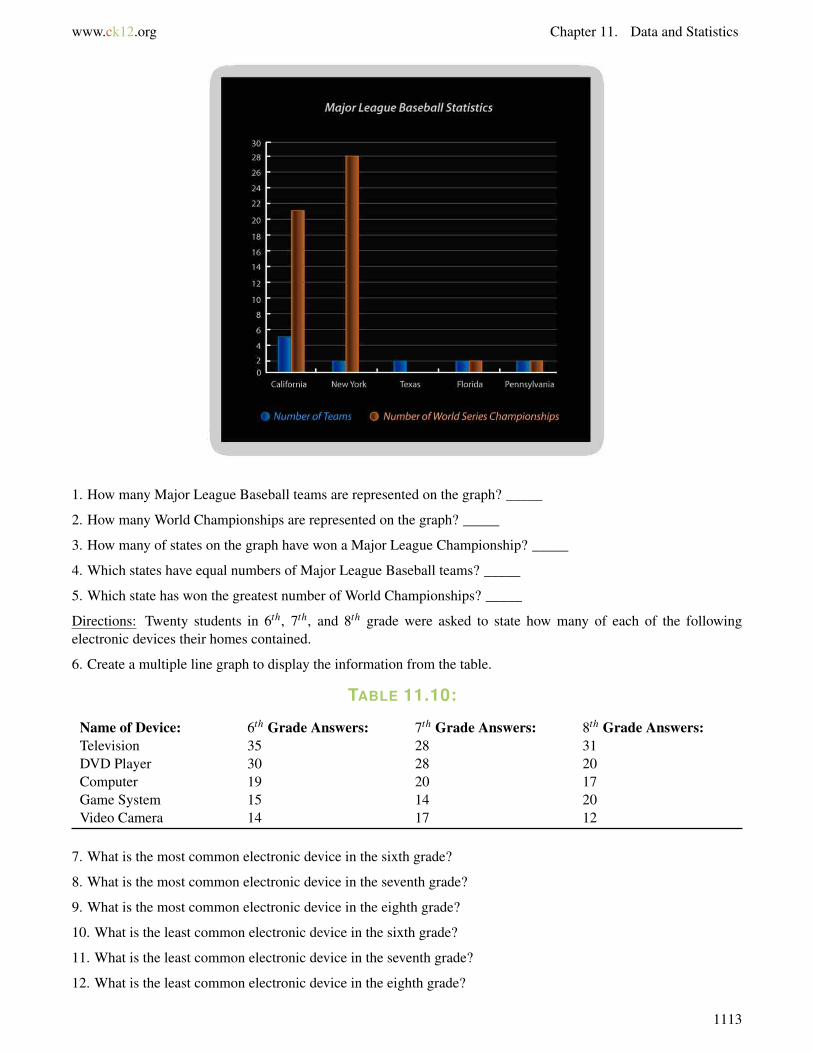
www.ck12.org Chapter 11. Data and Statistics
1. How many Major League Baseball teams are represented on the graph? _____
2. How many World Championships are represented on the graph? _____
3. How many of states on the graph have won a Major League Championship? _____
4. Which states have equal numbers of Major League Baseball teams? _____
5. Which state has won the greatest number of World Championships? _____
Directions: Twenty students in 6th, 7th, and 8th grade were asked to state how many of each of the followingelectronic devices their homes contained.
6. Create a multiple line graph to display the information from the table.
TABLE 11.10:
Name of Device: 6th Grade Answers: 7th Grade Answers: 8th Grade Answers:Television 35 28 31DVD Player 30 28 20Computer 19 20 17Game System 15 14 20Video Camera 14 17 12
7. What is the most common electronic device in the sixth grade?
8. What is the most common electronic device in the seventh grade?
9. What is the most common electronic device in the eighth grade?
10. What is the least common electronic device in the sixth grade?
11. What is the least common electronic device in the seventh grade?
12. What is the least common electronic device in the eighth grade?
1113
11.6. Multiple Bar Graphs www.ck12.org
13. What is the difference between the number of sixth graders who watch tv and the number of seventh graders?
14. What is the difference between the number of seventh graders who watch tv and the number of eighth graders?
15. True or false. For computer use, seventh graders have the highest number.
1114
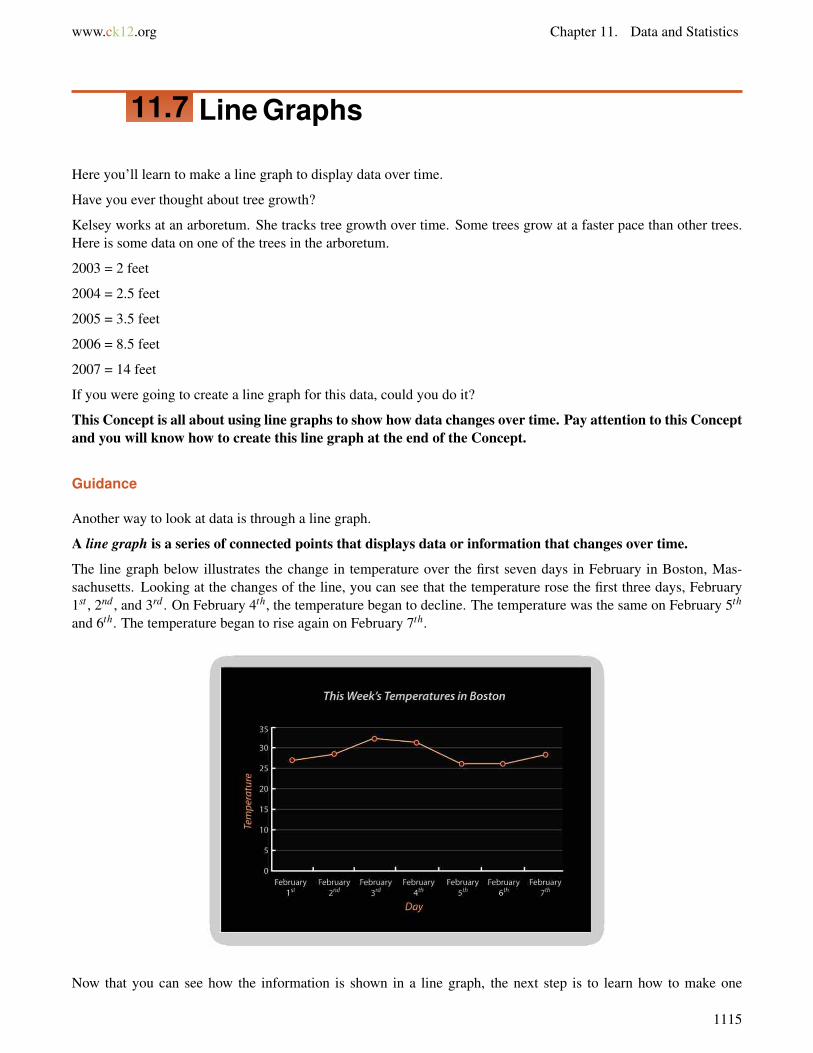
www.ck12.org Chapter 11. Data and Statistics
11.7 Line Graphs
Here you’ll learn to make a line graph to display data over time.
Have you ever thought about tree growth?
Kelsey works at an arboretum. She tracks tree growth over time. Some trees grow at a faster pace than other trees.Here is some data on one of the trees in the arboretum.
2003 = 2 feet
2004 = 2.5 feet
2005 = 3.5 feet
2006 = 8.5 feet
2007 = 14 feet
If you were going to create a line graph for this data, could you do it?
This Concept is all about using line graphs to show how data changes over time. Pay attention to this Conceptand you will know how to create this line graph at the end of the Concept.
Guidance
Another way to look at data is through a line graph.
A line graph is a series of connected points that displays data or information that changes over time.
The line graph below illustrates the change in temperature over the first seven days in February in Boston, Mas-sachusetts. Looking at the changes of the line, you can see that the temperature rose the first three days, February1st , 2nd , and 3rd . On February 4th, the temperature began to decline. The temperature was the same on February 5th
and 6th. The temperature began to rise again on February 7th.
Now that you can see how the information is shown in a line graph, the next step is to learn how to make one
1115
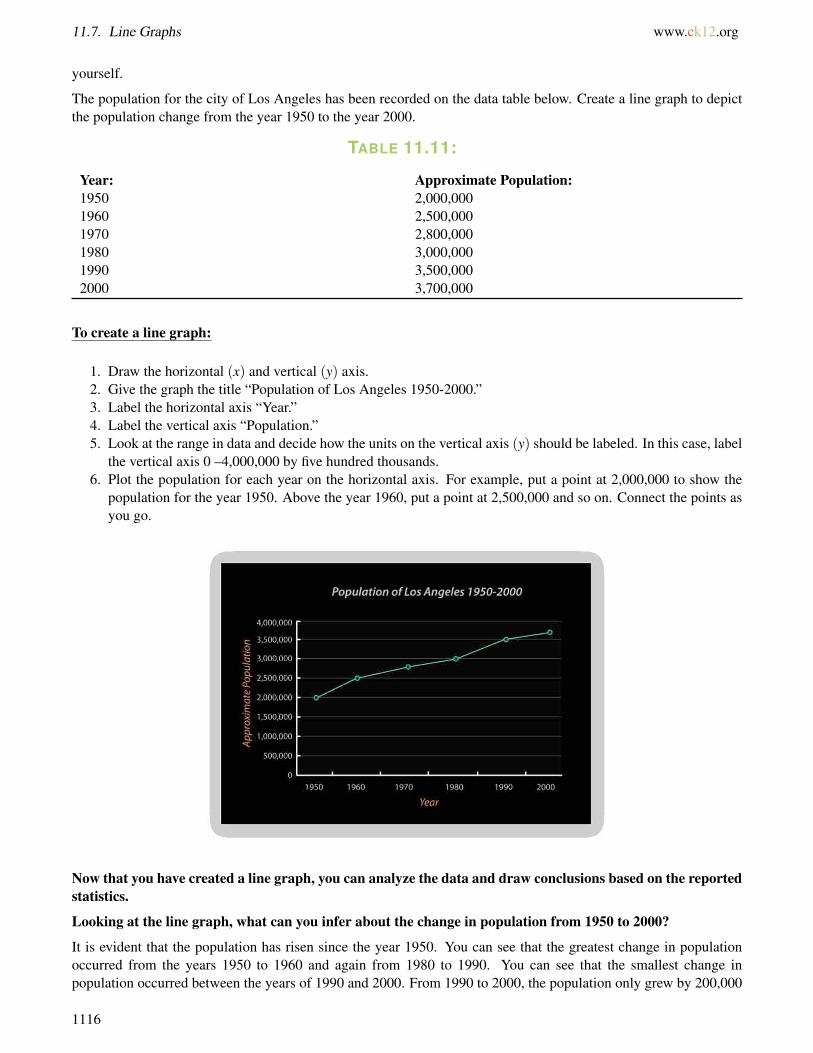
11.7. Line Graphs www.ck12.org
yourself.
The population for the city of Los Angeles has been recorded on the data table below. Create a line graph to depictthe population change from the year 1950 to the year 2000.
TABLE 11.11:
Year: Approximate Population:1950 2,000,0001960 2,500,0001970 2,800,0001980 3,000,0001990 3,500,0002000 3,700,000
To create a line graph:
1. Draw the horizontal (x) and vertical (y) axis.2. Give the graph the title “Population of Los Angeles 1950-2000.”3. Label the horizontal axis “Year.”4. Label the vertical axis “Population.”5. Look at the range in data and decide how the units on the vertical axis (y) should be labeled. In this case, label
the vertical axis 0 –4,000,000 by five hundred thousands.6. Plot the population for each year on the horizontal axis. For example, put a point at 2,000,000 to show the
population for the year 1950. Above the year 1960, put a point at 2,500,000 and so on. Connect the points asyou go.
Now that you have created a line graph, you can analyze the data and draw conclusions based on the reportedstatistics.
Looking at the line graph, what can you infer about the change in population from 1950 to 2000?
It is evident that the population has risen since the year 1950. You can see that the greatest change in populationoccurred from the years 1950 to 1960 and again from 1980 to 1990. You can see that the smallest change inpopulation occurred between the years of 1990 and 2000. From 1990 to 2000, the population only grew by 200,000
1116

www.ck12.org Chapter 11. Data and Statistics
people. Judging by the trend of the graph, you could predict that the population of Los Angeles will continueto increase over time.
The Electronic Energies Alliance recorded the average cost of one gallon of gasoline in the United States for theyears 2000-2007. Present the information on the data table on a line graph.
TABLE 11.12:
Year: Average Cost of One Gallon of Gasoline2000 $1.572001 $1.102002 $1.462003 $1.592004 $2.032005 $2.252006 $3.302007 $3.00
To create a line graph:
1. Draw the horizontal (x) and vertical (y) axis.
2. Give the graph the title “Change in Cost of Gasoline 2000-2007.”
3. Label the horizontal axis “Year.”
4. Label the vertical axis “Cost of Gasoline.”
5. Look at the range in data and decide how the units on the vertical axis (y) should be labeled. In this case, labelthe vertical axis 0 –3.5 by 0.5.
6. Plot the price of gasoline for each year on the horizontal axis. For example, put a point slightly above 1.5 to showthat the cost of one gallon of gas in the year 2000 was $1.59. Place a point slightly above 1 to show that they cost ofone gallon of gas in the year 2001 was $1.10. Use a straight edge to connect the points as you go.
Looking at the line graph, what can you conclude about the cost of gasoline from the years 2000-2007?
The price of a gallon of gasoline has increased approximately $1.50 over eight years. You notice that the price of agallon of gasoline dropped in the years 2001 and 2007, but increased in all other years.
1117
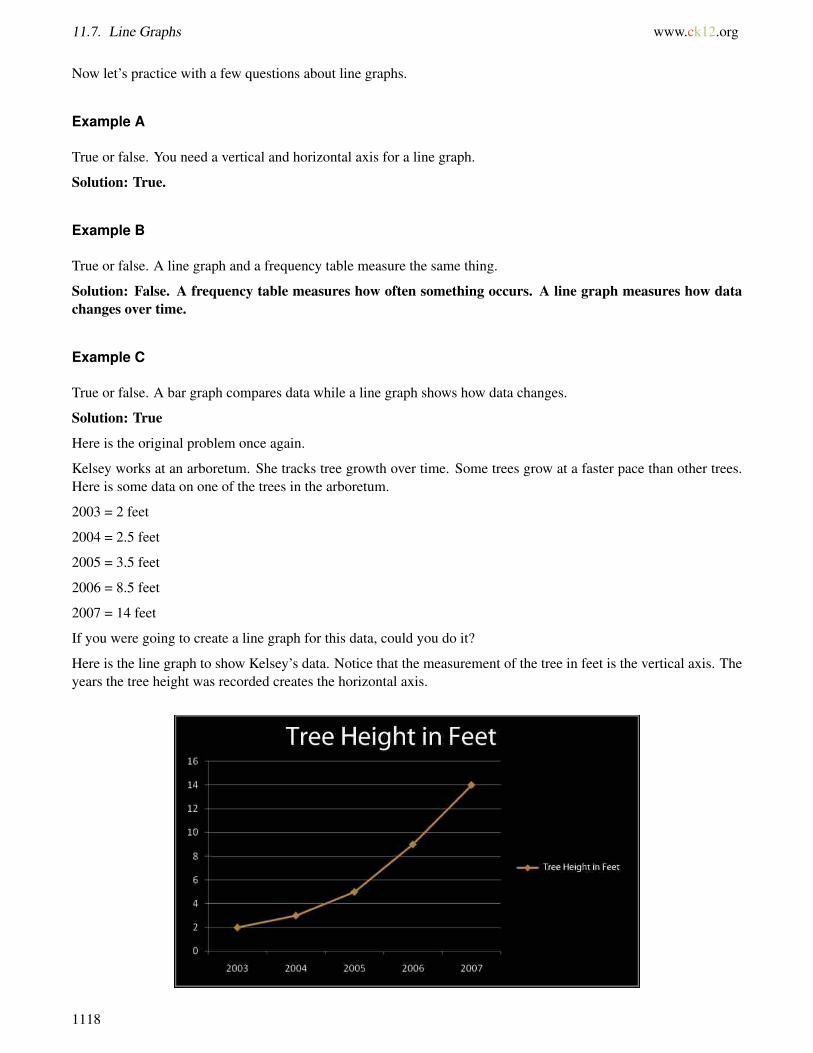
11.7. Line Graphs www.ck12.org
Now let’s practice with a few questions about line graphs.
Example A
True or false. You need a vertical and horizontal axis for a line graph.
Solution: True.
Example B
True or false. A line graph and a frequency table measure the same thing.
Solution: False. A frequency table measures how often something occurs. A line graph measures how datachanges over time.
Example C
True or false. A bar graph compares data while a line graph shows how data changes.
Solution: True
Here is the original problem once again.
Kelsey works at an arboretum. She tracks tree growth over time. Some trees grow at a faster pace than other trees.Here is some data on one of the trees in the arboretum.
2003 = 2 feet
2004 = 2.5 feet
2005 = 3.5 feet
2006 = 8.5 feet
2007 = 14 feet
If you were going to create a line graph for this data, could you do it?
Here is the line graph to show Kelsey’s data. Notice that the measurement of the tree in feet is the vertical axis. Theyears the tree height was recorded creates the horizontal axis.
1118
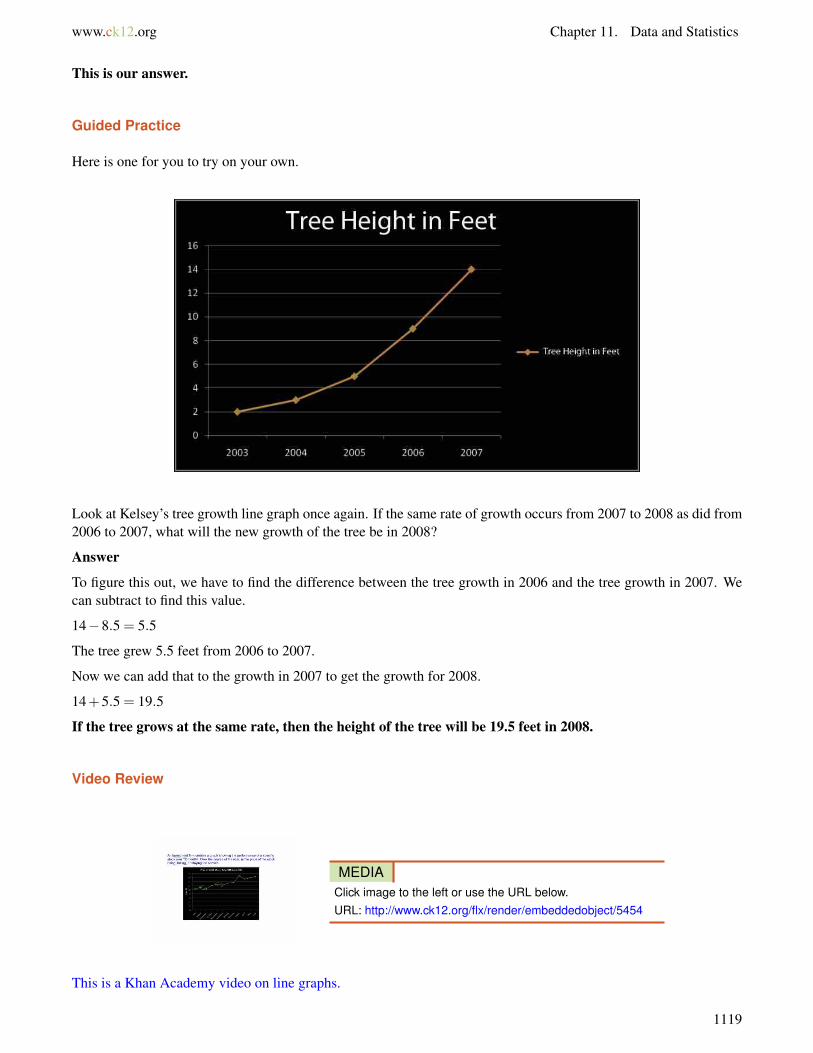
www.ck12.org Chapter 11. Data and Statistics
This is our answer.
Guided Practice
Here is one for you to try on your own.
Look at Kelsey’s tree growth line graph once again. If the same rate of growth occurs from 2007 to 2008 as did from2006 to 2007, what will the new growth of the tree be in 2008?
Answer
To figure this out, we have to find the difference between the tree growth in 2006 and the tree growth in 2007. Wecan subtract to find this value.
14−8.5 = 5.5
The tree grew 5.5 feet from 2006 to 2007.
Now we can add that to the growth in 2007 to get the growth for 2008.
14+5.5 = 19.5
If the tree grows at the same rate, then the height of the tree will be 19.5 feet in 2008.
Video Review
MEDIAClick image to the left or use the URL below.URL: http://www.ck12.org/flx/render/embeddedobject/5454
This is a Khan Academy video on line graphs.
1119
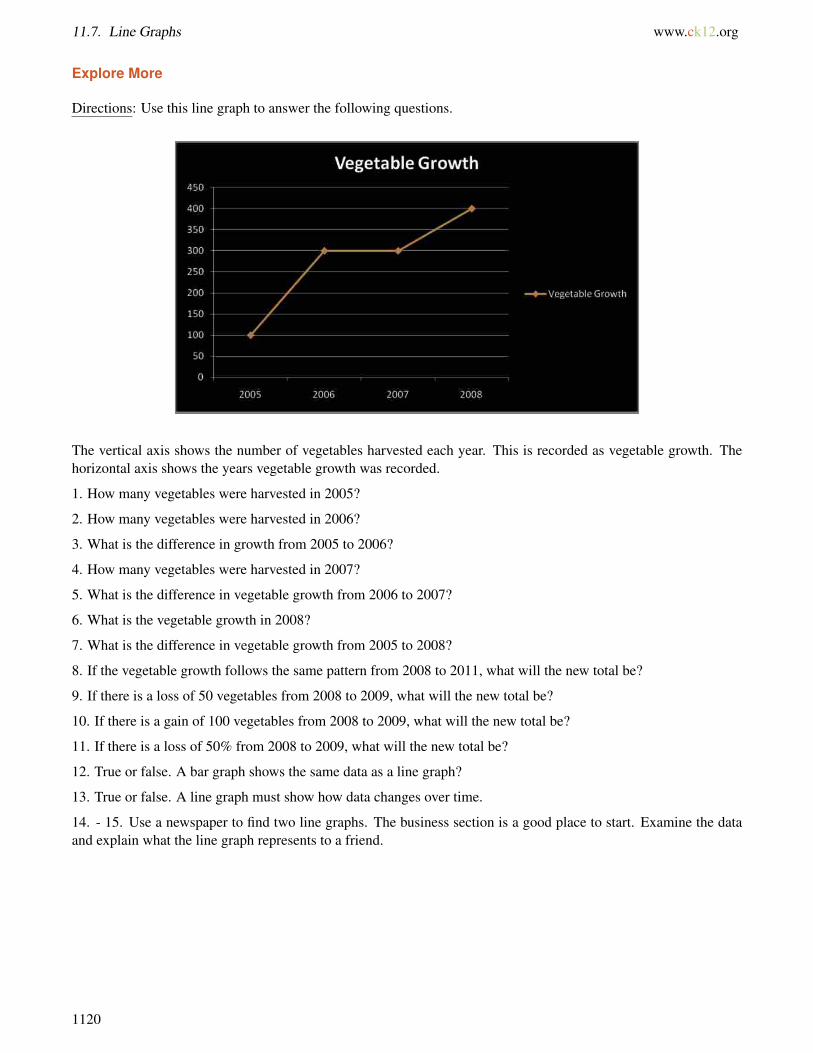
11.7. Line Graphs www.ck12.org
Explore More
Directions: Use this line graph to answer the following questions.
The vertical axis shows the number of vegetables harvested each year. This is recorded as vegetable growth. Thehorizontal axis shows the years vegetable growth was recorded.
1. How many vegetables were harvested in 2005?
2. How many vegetables were harvested in 2006?
3. What is the difference in growth from 2005 to 2006?
4. How many vegetables were harvested in 2007?
5. What is the difference in vegetable growth from 2006 to 2007?
6. What is the vegetable growth in 2008?
7. What is the difference in vegetable growth from 2005 to 2008?
8. If the vegetable growth follows the same pattern from 2008 to 2011, what will the new total be?
9. If there is a loss of 50 vegetables from 2008 to 2009, what will the new total be?
10. If there is a gain of 100 vegetables from 2008 to 2009, what will the new total be?
11. If there is a loss of 50% from 2008 to 2009, what will the new total be?
12. True or false. A bar graph shows the same data as a line graph?
13. True or false. A line graph must show how data changes over time.
14. - 15. Use a newspaper to find two line graphs. The business section is a good place to start. Examine the dataand explain what the line graph represents to a friend.
1120
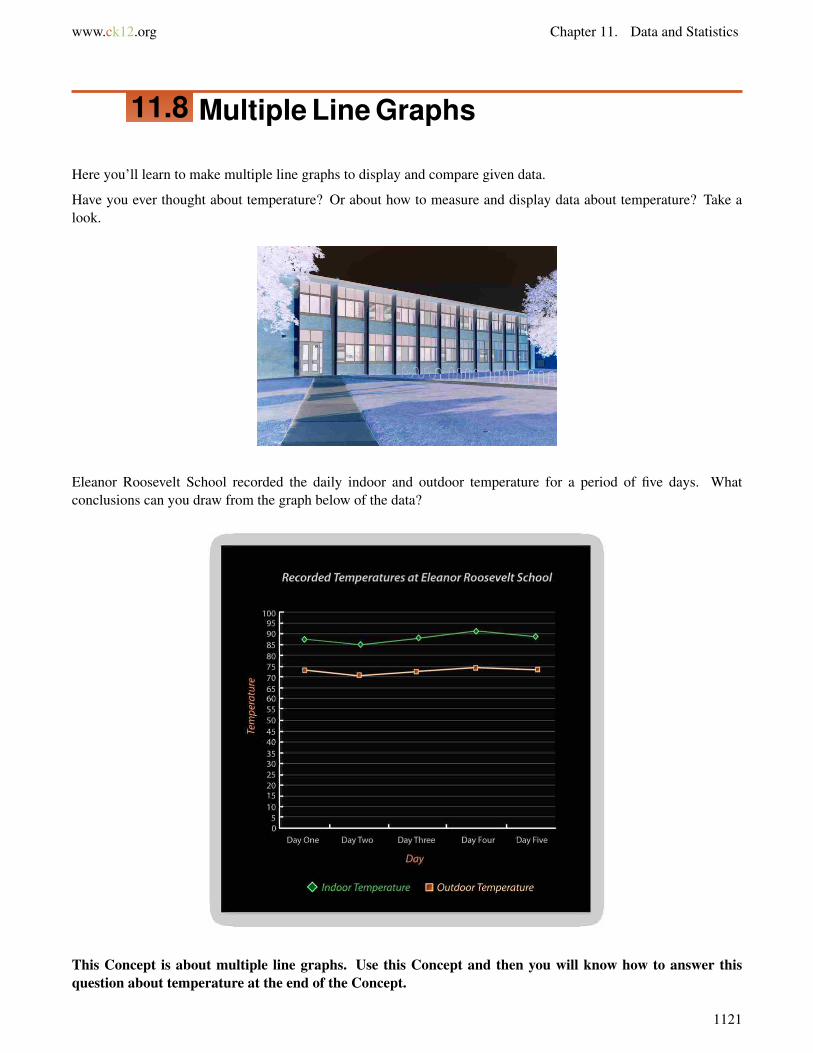
www.ck12.org Chapter 11. Data and Statistics
11.8 Multiple Line Graphs
Here you’ll learn to make multiple line graphs to display and compare given data.
Have you ever thought about temperature? Or about how to measure and display data about temperature? Take alook.
Eleanor Roosevelt School recorded the daily indoor and outdoor temperature for a period of five days. Whatconclusions can you draw from the graph below of the data?
This Concept is about multiple line graphs. Use this Concept and then you will know how to answer thisquestion about temperature at the end of the Concept.
1121
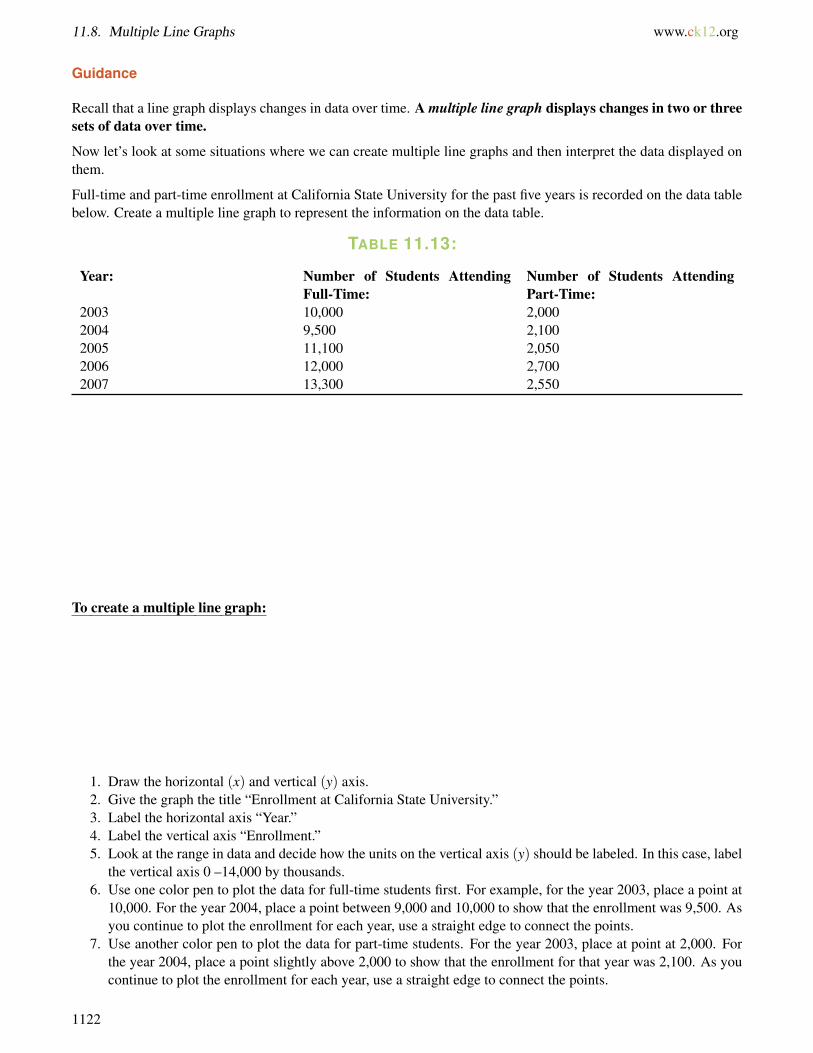
11.8. Multiple Line Graphs www.ck12.org
Guidance
Recall that a line graph displays changes in data over time. A multiple line graph displays changes in two or threesets of data over time.
Now let’s look at some situations where we can create multiple line graphs and then interpret the data displayed onthem.
Full-time and part-time enrollment at California State University for the past five years is recorded on the data tablebelow. Create a multiple line graph to represent the information on the data table.
TABLE 11.13:
Year: Number of Students AttendingFull-Time:
Number of Students AttendingPart-Time:
2003 10,000 2,0002004 9,500 2,1002005 11,100 2,0502006 12,000 2,7002007 13,300 2,550
To create a multiple line graph:
1. Draw the horizontal (x) and vertical (y) axis.2. Give the graph the title “Enrollment at California State University.”3. Label the horizontal axis “Year.”4. Label the vertical axis “Enrollment.”5. Look at the range in data and decide how the units on the vertical axis (y) should be labeled. In this case, label
the vertical axis 0 –14,000 by thousands.6. Use one color pen to plot the data for full-time students first. For example, for the year 2003, place a point at
10,000. For the year 2004, place a point between 9,000 and 10,000 to show that the enrollment was 9,500. Asyou continue to plot the enrollment for each year, use a straight edge to connect the points.
7. Use another color pen to plot the data for part-time students. For the year 2003, place at point at 2,000. Forthe year 2004, place a point slightly above 2,000 to show that the enrollment for that year was 2,100. As youcontinue to plot the enrollment for each year, use a straight edge to connect the points.
1122
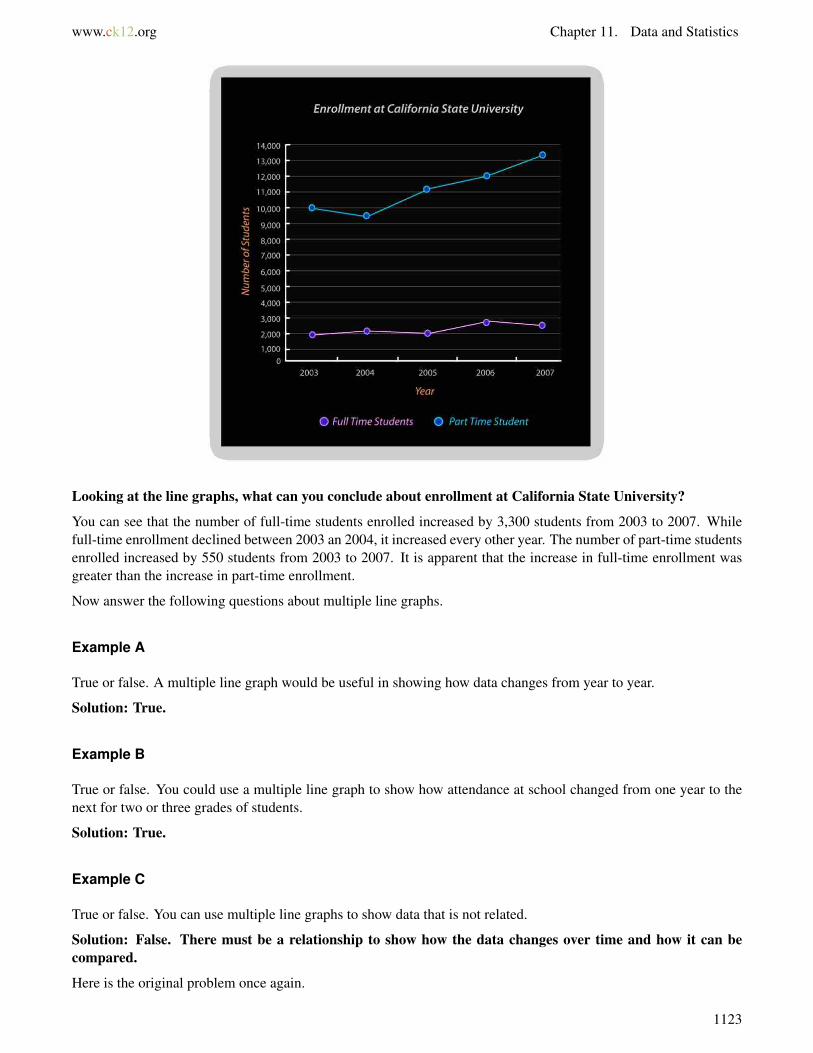
www.ck12.org Chapter 11. Data and Statistics
Looking at the line graphs, what can you conclude about enrollment at California State University?
You can see that the number of full-time students enrolled increased by 3,300 students from 2003 to 2007. Whilefull-time enrollment declined between 2003 an 2004, it increased every other year. The number of part-time studentsenrolled increased by 550 students from 2003 to 2007. It is apparent that the increase in full-time enrollment wasgreater than the increase in part-time enrollment.
Now answer the following questions about multiple line graphs.
Example A
True or false. A multiple line graph would be useful in showing how data changes from year to year.
Solution: True.
Example B
True or false. You could use a multiple line graph to show how attendance at school changed from one year to thenext for two or three grades of students.
Solution: True.
Example C
True or false. You can use multiple line graphs to show data that is not related.
Solution: False. There must be a relationship to show how the data changes over time and how it can becompared.
Here is the original problem once again.
1123
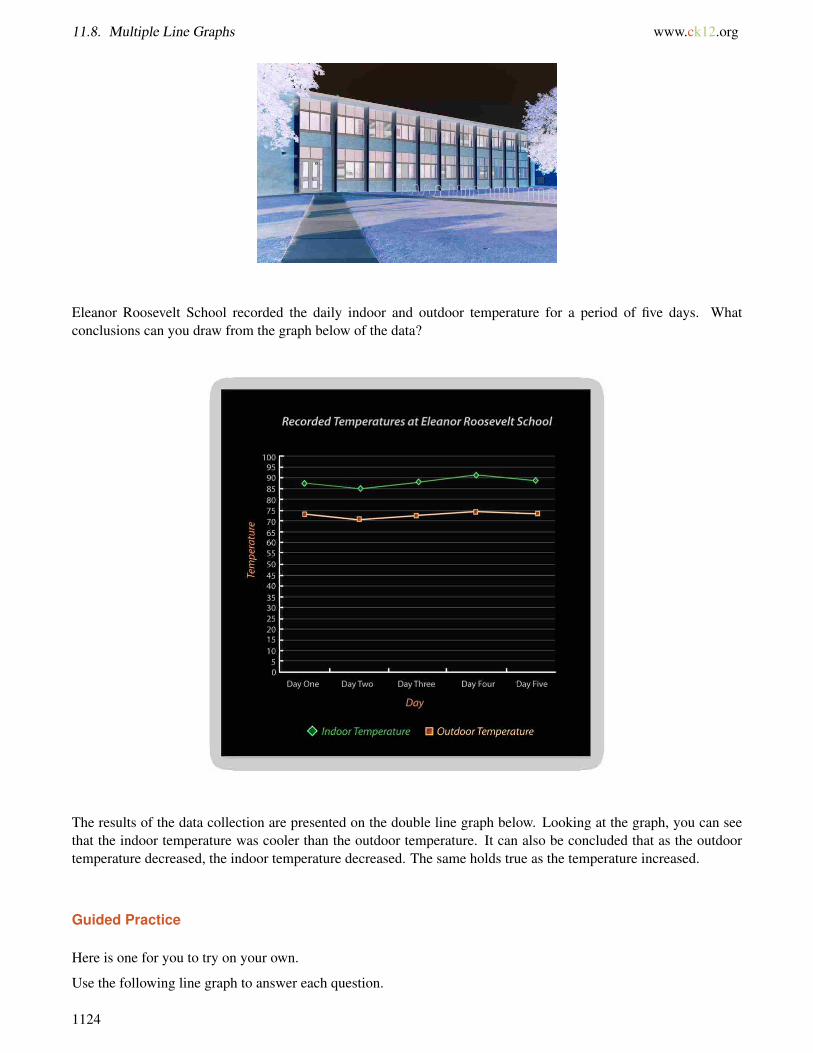
11.8. Multiple Line Graphs www.ck12.org
Eleanor Roosevelt School recorded the daily indoor and outdoor temperature for a period of five days. Whatconclusions can you draw from the graph below of the data?
The results of the data collection are presented on the double line graph below. Looking at the graph, you can seethat the indoor temperature was cooler than the outdoor temperature. It can also be concluded that as the outdoortemperature decreased, the indoor temperature decreased. The same holds true as the temperature increased.
Guided Practice
Here is one for you to try on your own.
Use the following line graph to answer each question.
1124
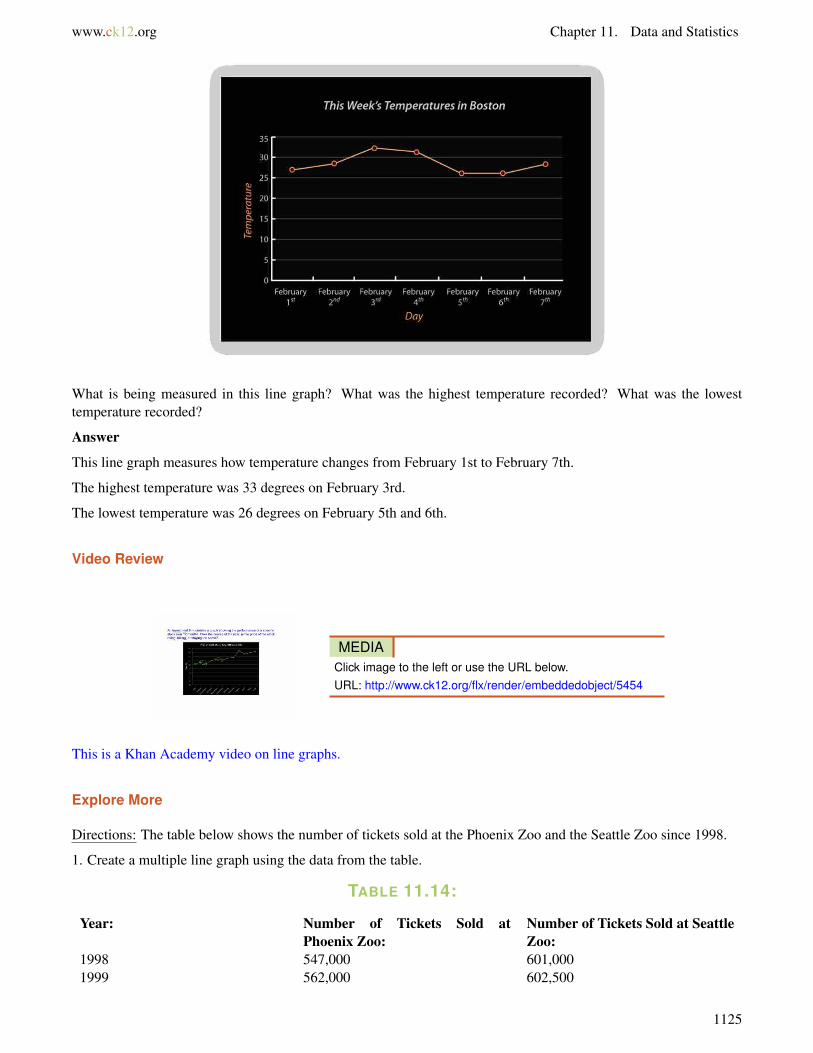
www.ck12.org Chapter 11. Data and Statistics
What is being measured in this line graph? What was the highest temperature recorded? What was the lowesttemperature recorded?
Answer
This line graph measures how temperature changes from February 1st to February 7th.
The highest temperature was 33 degrees on February 3rd.
The lowest temperature was 26 degrees on February 5th and 6th.
Video Review
MEDIAClick image to the left or use the URL below.URL: http://www.ck12.org/flx/render/embeddedobject/5454
This is a Khan Academy video on line graphs.
Explore More
Directions: The table below shows the number of tickets sold at the Phoenix Zoo and the Seattle Zoo since 1998.
1. Create a multiple line graph using the data from the table.
TABLE 11.14:
Year: Number of Tickets Sold atPhoenix Zoo:
Number of Tickets Sold at SeattleZoo:
1998 547,000 601,0001999 562,000 602,500
1125
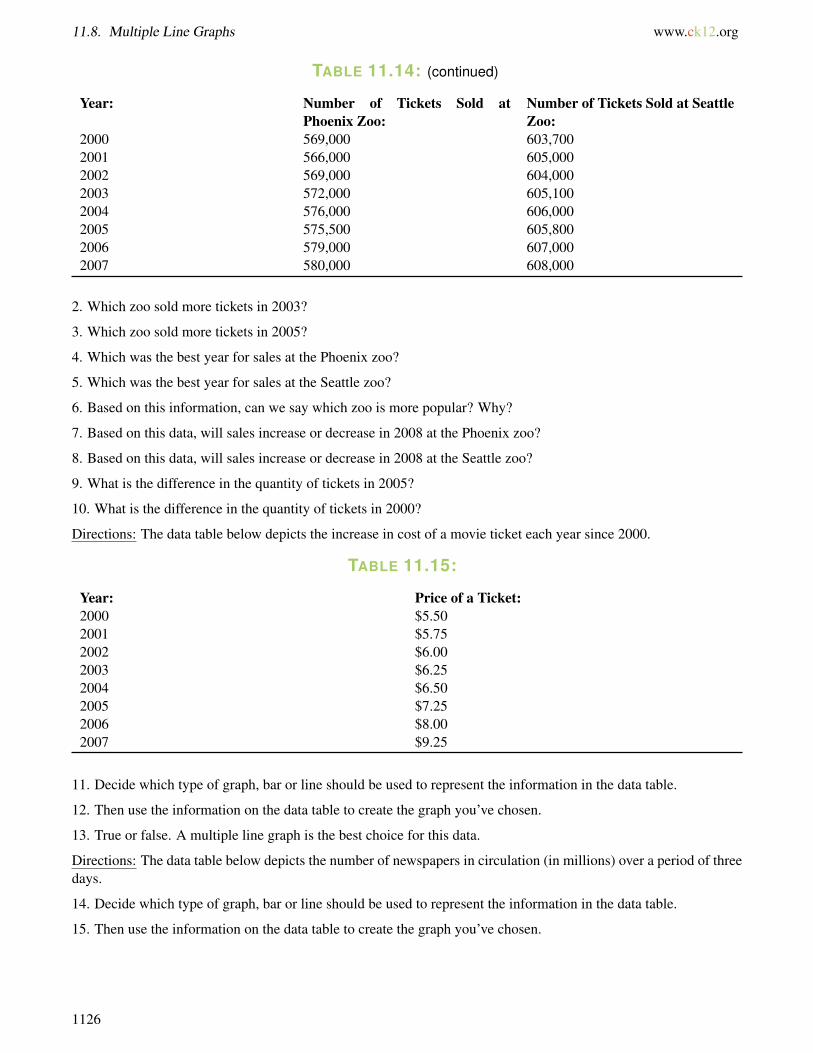
11.8. Multiple Line Graphs www.ck12.org
TABLE 11.14: (continued)
Year: Number of Tickets Sold atPhoenix Zoo:
Number of Tickets Sold at SeattleZoo:
2000 569,000 603,7002001 566,000 605,0002002 569,000 604,0002003 572,000 605,1002004 576,000 606,0002005 575,500 605,8002006 579,000 607,0002007 580,000 608,000
2. Which zoo sold more tickets in 2003?
3. Which zoo sold more tickets in 2005?
4. Which was the best year for sales at the Phoenix zoo?
5. Which was the best year for sales at the Seattle zoo?
6. Based on this information, can we say which zoo is more popular? Why?
7. Based on this data, will sales increase or decrease in 2008 at the Phoenix zoo?
8. Based on this data, will sales increase or decrease in 2008 at the Seattle zoo?
9. What is the difference in the quantity of tickets in 2005?
10. What is the difference in the quantity of tickets in 2000?
Directions: The data table below depicts the increase in cost of a movie ticket each year since 2000.
TABLE 11.15:
Year: Price of a Ticket:2000 $5.502001 $5.752002 $6.002003 $6.252004 $6.502005 $7.252006 $8.002007 $9.25
11. Decide which type of graph, bar or line should be used to represent the information in the data table.
12. Then use the information on the data table to create the graph you’ve chosen.
13. True or false. A multiple line graph is the best choice for this data.
Directions: The data table below depicts the number of newspapers in circulation (in millions) over a period of threedays.
14. Decide which type of graph, bar or line should be used to represent the information in the data table.
15. Then use the information on the data table to create the graph you’ve chosen.
1126
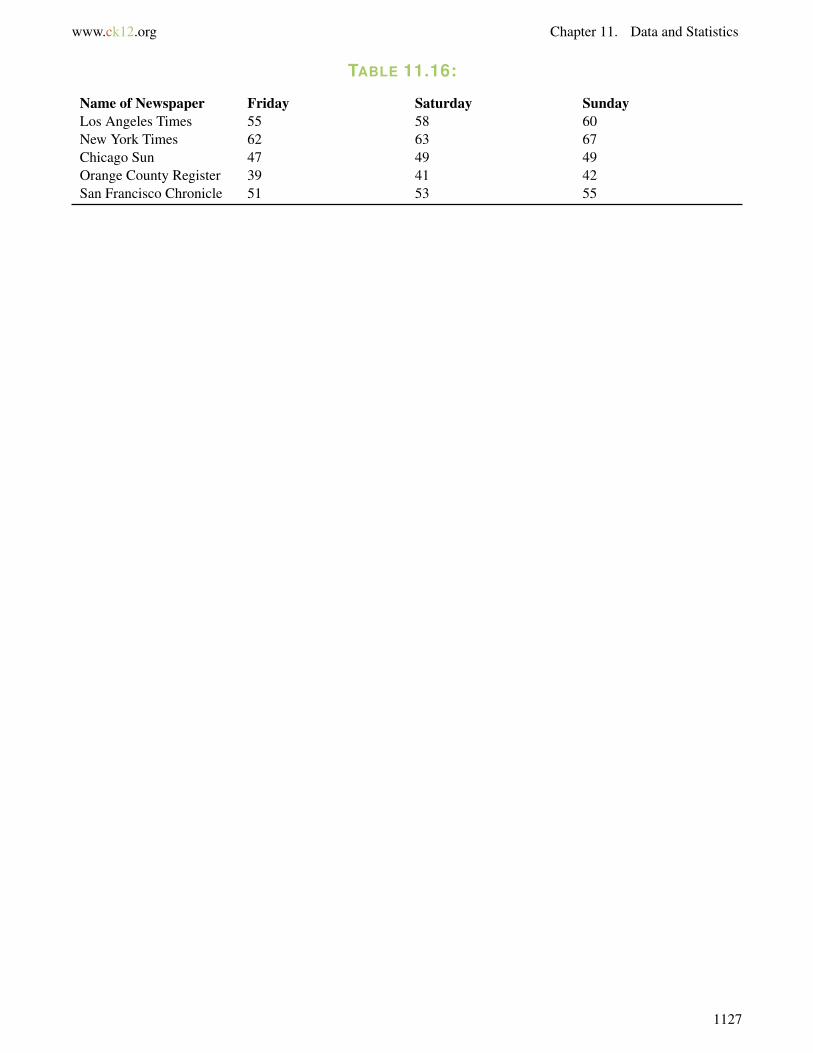
www.ck12.org Chapter 11. Data and Statistics
TABLE 11.16:
Name of Newspaper Friday Saturday SundayLos Angeles Times 55 58 60New York Times 62 63 67Chicago Sun 47 49 49Orange County Register 39 41 42San Francisco Chronicle 51 53 55
1127
11.9. Stem-and-Leaf Plots www.ck12.org
11.9 Stem-and-Leaf Plots
Here you’ll learn to draw and use stem-and-leaf plots.
Have you ever examined the route of a race? Well, the students are now looking at the route of the Iditarod. Take alook.
During the third day of class on the Iditarod, the students began to examine the routes on the map. The race beginsin Anchorage Alaska and travels 1150 miles of rough terrain to the city of Nome Alaska where it finishes.
While racing, the teams face all kinds of wild weather. There can be blizzards, ice and unbelievable winds not tomention that the surrounds can be woods or frozen tundra.
“Wow, can you imagine being out there and not seeing anyone?” Sam said to his friend Juan.
“I think they do see people at the checkpoints, isn’t that right Mr. Hawkins?” Juan asked as Mr. Hawkins walkedaround the room.
“Yes Juan. The mushers all have to check in at the checkpoints. It helps the race officials to keep track of everyoneas well as check on the dogs, refuel, any precaution can be taken there.”
“How many are there?”
“Well, there are 24, and you can figure out the distances and organize them in a data display. That is the next taskthat you are all going to work on,” Mr. Hawkins said taking out a giant ruler. “Then I want you to figure out themedian distance of the checkpoints.”
Juan took out a piece of paper and wrote down the distances that are between each check point. Here are his notes.
20, 29. 52, 34, 45, 30, 48, 75, 54, 18, 25, 59, 112, 52, 52, 42, 90, 42, 48, 48, 28, 18, 55, 22
Juan wants to create a stem-and-leaf plot to show the data. He knows that once he arranges the data in a stem-and-leafplot, that it can help him to find the median distance between two checkpoints.
Do you have an idea how Juan can do this? Have you ever created a stem-and-leaf plot? Take the time to learnabout them during this Concept. At the end of the Concept, you will see how Juan created his data display.
Guidance
In this Concept, you will learn another way to display data. This way of organizing and displaying data helps us tosee values according to their size and we can order them accordingly. Think about the base ten number system of10,100,1000 etc. We can organize numbers by ones, tens, hundreds and thousands. In fact, you think about numbers
1128
www.ck12.org Chapter 11. Data and Statistics
in this way when we work with decimals. Now we are going to look at how to look at the stem of a number so thatwe can organize it for a visual display of data.
A stem-and-leaf plot organizes data in order. In a stem-and-leaf plot each data value is split into a stem and aleaf.
The leaf is the last digit to the right. The stem is the remaining digits to the left. For the number 243, the stemis 24 and the leaf is 3.
Yes it does. Identifying the leaf will help you to know what the stem is and this will assist you in creating an accuratestem-and-leaf plot.
Construct a stem-and-leaf plot for the data below.
Science test scores for third period (out of 100%):
97, 92, 77, 82, 96, 75, 68, 80, 79, 96
Step 1: Arrange the data in order from least to greatest.
68, 75, 77, 79, 80, 82, 85, 92, 96, 96
Step 2: Separate each number into a stem and a leaf.
TABLE 11.17:
Stem Leaf6 87 5 7 98 0 29 2 6 6 7
Step 3: Create a key and give the stem-and-leaf plot a title.
Answer
Science Test Scores: 3rd Period
1129

11.9. Stem-and-Leaf Plots www.ck12.org
TABLE 11.18:
Stem Leaf6 87 5 7 98 0 29 2 6 6 7Key: 6|8 = 68
If we were to analyze this data, you could see that most of the values cluster around the stem of 9. There aremore numbers in this category.
Here is another situation where a stem-and-leaf plot is helpful.
Three friends began a babysitting service over the summer. The amount of money they made for each appointmentis listed on the data table below. Use the information on the data table to create a stem-and-leaf plot.
TABLE 11.19:
Date: Amount Made:June 26, 2006 $17.00June 27, 2006 $12.00July 5, 2005 $22.00July 9, 2005 $23.00July 15, 2006 $18.00July 22, 2006 $31.00August 1, 2006 $40.00August 5, 2006 $35.00August 13, 2006 $19.00August 20, 2006 $8.00
Step 1: Arrange the data values in order from least to greatest.
Since the data values are to the nearest whole number, arrange the data without the decimal points.
8, 12, 17, 18, 19, 22, 23, 31, 35, 40
Step 2: Separate each value into a stem and a leaf.
TABLE 11.20:
Stem Leaf0 8
1130
www.ck12.org Chapter 11. Data and Statistics
TABLE 11.20: (continued)
Stem Leaf1 2 7 8 92 2 33 1 54 0
Step 3: Create a key and give the stem-and-leaf plot a title.
Answer
TABLE 11.21: Babysitting Fund
Stem Leaf0 81 2 7 8 92 2 33 1 54 0Key: 0|8 = 8
Now that you know how to create a stem-and-leaf plot, let’s look at how we can use it to analyze data and drawconclusions. First, let’s review some of the vocabulary words that we used in the first lesson of this chapter.
The mean is sometimes also called the average of a set of data. To find the mean, add the data values and then dividethe sum by the number of data values.
The median is the data value in the middle when the data is ordered from least to greatest. Since the data is orderedfrom least to greatest on a stem-and-leaf plot, find the data value in the middle of the stem-and-leaf plot.
The mode is the data value that occurs most often. On a stem-and-leaf plot, the mode is the most repeated leaf.
The range is the difference between the highest and the lowest data value.
Data from a stem-and-leaf plot can be used to determine the mean, median, mode, and range for a set of data.Let’s look at how we can do this.
The stem-and-leaf plot below depicts the weight (in pounds) of the ten trout caught in a fishing competition.Determine the mean, median, mode, and range of the data on the stem-and-leaf plot.
TABLE 11.22: Weight of Trout Caught
Stem Leaf2 9
1131
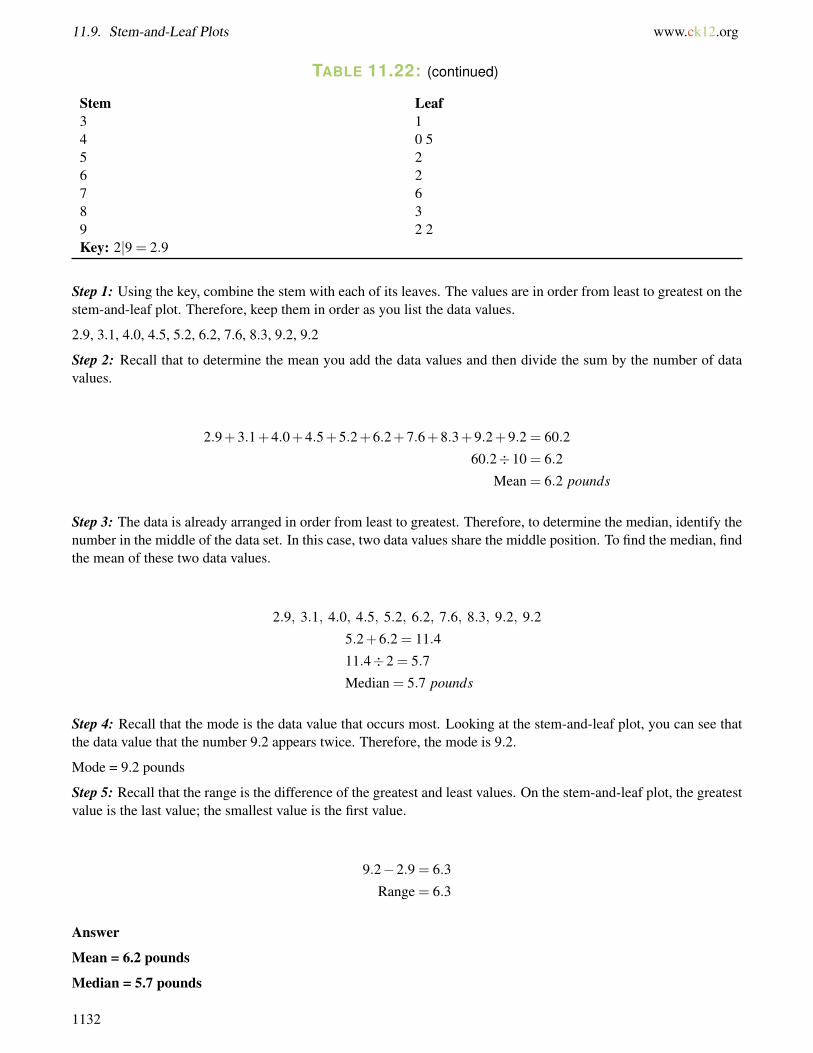
11.9. Stem-and-Leaf Plots www.ck12.org
TABLE 11.22: (continued)
Stem Leaf3 14 0 55 26 27 68 39 2 2Key: 2|9 = 2.9
Step 1: Using the key, combine the stem with each of its leaves. The values are in order from least to greatest on thestem-and-leaf plot. Therefore, keep them in order as you list the data values.
2.9, 3.1, 4.0, 4.5, 5.2, 6.2, 7.6, 8.3, 9.2, 9.2
Step 2: Recall that to determine the mean you add the data values and then divide the sum by the number of datavalues.
2.9+3.1+4.0+4.5+5.2+6.2+7.6+8.3+9.2+9.2 = 60.2
60.2÷10 = 6.2
Mean = 6.2 pounds
Step 3: The data is already arranged in order from least to greatest. Therefore, to determine the median, identify thenumber in the middle of the data set. In this case, two data values share the middle position. To find the median, findthe mean of these two data values.
2.9, 3.1, 4.0, 4.5, 5.2, 6.2, 7.6, 8.3, 9.2, 9.2
5.2+6.2 = 11.4
11.4÷2 = 5.7
Median = 5.7 pounds
Step 4: Recall that the mode is the data value that occurs most. Looking at the stem-and-leaf plot, you can see thatthe data value that the number 9.2 appears twice. Therefore, the mode is 9.2.
Mode = 9.2 pounds
Step 5: Recall that the range is the difference of the greatest and least values. On the stem-and-leaf plot, the greatestvalue is the last value; the smallest value is the first value.
9.2−2.9 = 6.3
Range = 6.3
Answer
Mean = 6.2 pounds
Median = 5.7 pounds
1132

www.ck12.org Chapter 11. Data and Statistics
Mode = 9.2 pounds
Range = 6.3 pounds
Now answer a few questions about stem-and-leaf plots on your own.
Example A
What is the stem of the number 25?
Solution: 2
Example B
What is the leaf of the number 56?
Solution: 6
Example C
What is the stem of the number 89?
Solution: 8
Here is the original problem once again. Reread it and then create your own stem-and-leaf plot. Compare your workwith Juan’s.
During the third day of class on the Iditarod, the students began to examine the routes on the map. The race beginsin Anchorage Alaska and travels 1150 miles of rough terrain to the city of Nome Alaska where it finishes.
While racing, the teams face all kinds of wild weather. There can be blizzards, ice and unbelievable winds not tomention that the surrounds can be woods or frozen tundra.
“Wow, can you imagine being out there and not seeing anyone?” Sam said to his friend Juan.
“I think they do see people at the checkpoints, isn’t that right Mr. Hawkins?” Juan asked as Mr. Hawkins walkedaround the room.
“Yes Juan. The mushers all have to check in at the checkpoints. It helps the race officials to keep track of everyoneas well as check on the dogs, refuel, any precaution can be taken there.”
“How many are there?”
“Well, there are 24, and you can figure out the distances and organize them in a data display. That is the next taskthat you are all going to work on,” Mr. Hawkins said taking out a giant ruler. “Then I want you to figure out the
1133

11.9. Stem-and-Leaf Plots www.ck12.org
median distance of the checkpoints.”
Juan took out a piece of paper and wrote down the distances that are between each check point. Here are his notes.
20, 29. 52, 34, 45, 30, 48, 75, 54, 18, 25, 59, 112, 52, 52, 42, 90, 42, 48, 48, 28, 18, 55, 22
Juan wants to create a stem-and-leaf plot to show the data. He knows that once he arranges the data in a stem-and-leafplot, that it can help him to find the median distance between two checkpoints.
Now Juan is ready to create his stem-and-leaf plot. He begins by organizing his data in order from least togreatest.
18, 18, 20, 22, 25, 28, 29, 30, 34, 42, 42, 45, 48, 48, 48, 52, 52, 52, 54, 55, 59, 75, 90, 112
Next, he can organize the data in stems and leaves.
TABLE 11.23:
Stem Leaves1 8 82 0 2 5 8 93 0 44 2 2 5 8 8 85 2 2 2 4 5 967 589 51011 2
Juan can see that the median distance centers in the 40 –50’s mile zone. He makes these notes.
42, 42, 45, 48, 48, 48, 52, 52, 52, 54, 55, 59
The median distance is between 48 and 52 miles. Since there isn’t a check point with a distance of 50 miles, itis accurate to say that the median is both 48 and 52 miles.
Guided Practice
Here is one for you to try on your own.
Make a stem-and-leaf plot to represent this data.
14, 16, 17, 18, 18, 20, 22, 24, 29, 31, 33
Answer
We have three stems: 1, 2, 3.
Here is the stem-and-leaf plot.
TABLE 11.24: Annual DVD Sales (in millions)
Stem Leaf1 4 6 7 8 82 0 2 4 93 1 3Key: 2|0 = 20
1134
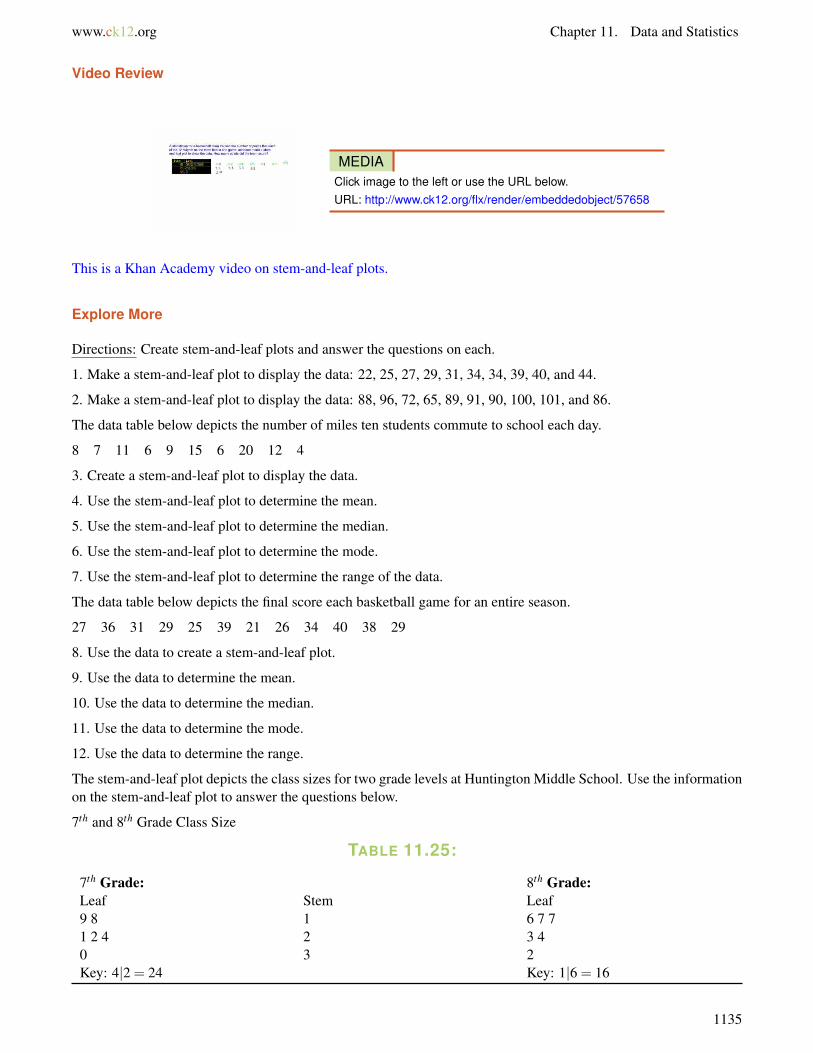
www.ck12.org Chapter 11. Data and Statistics
Video Review
MEDIAClick image to the left or use the URL below.URL: http://www.ck12.org/flx/render/embeddedobject/57658
This is a Khan Academy video on stem-and-leaf plots.
Explore More
Directions: Create stem-and-leaf plots and answer the questions on each.
1. Make a stem-and-leaf plot to display the data: 22, 25, 27, 29, 31, 34, 34, 39, 40, and 44.
2. Make a stem-and-leaf plot to display the data: 88, 96, 72, 65, 89, 91, 90, 100, 101, and 86.
The data table below depicts the number of miles ten students commute to school each day.
8 7 11 6 9 15 6 20 12 4
3. Create a stem-and-leaf plot to display the data.
4. Use the stem-and-leaf plot to determine the mean.
5. Use the stem-and-leaf plot to determine the median.
6. Use the stem-and-leaf plot to determine the mode.
7. Use the stem-and-leaf plot to determine the range of the data.
The data table below depicts the final score each basketball game for an entire season.
27 36 31 29 25 39 21 26 34 40 38 29
8. Use the data to create a stem-and-leaf plot.
9. Use the data to determine the mean.
10. Use the data to determine the median.
11. Use the data to determine the mode.
12. Use the data to determine the range.
The stem-and-leaf plot depicts the class sizes for two grade levels at Huntington Middle School. Use the informationon the stem-and-leaf plot to answer the questions below.
7th and 8th Grade Class Size
TABLE 11.25:
7th Grade: 8th Grade:Leaf Stem Leaf9 8 1 6 7 71 2 4 2 3 40 3 2Key: 4|2 = 24 Key: 1|6 = 16
1135
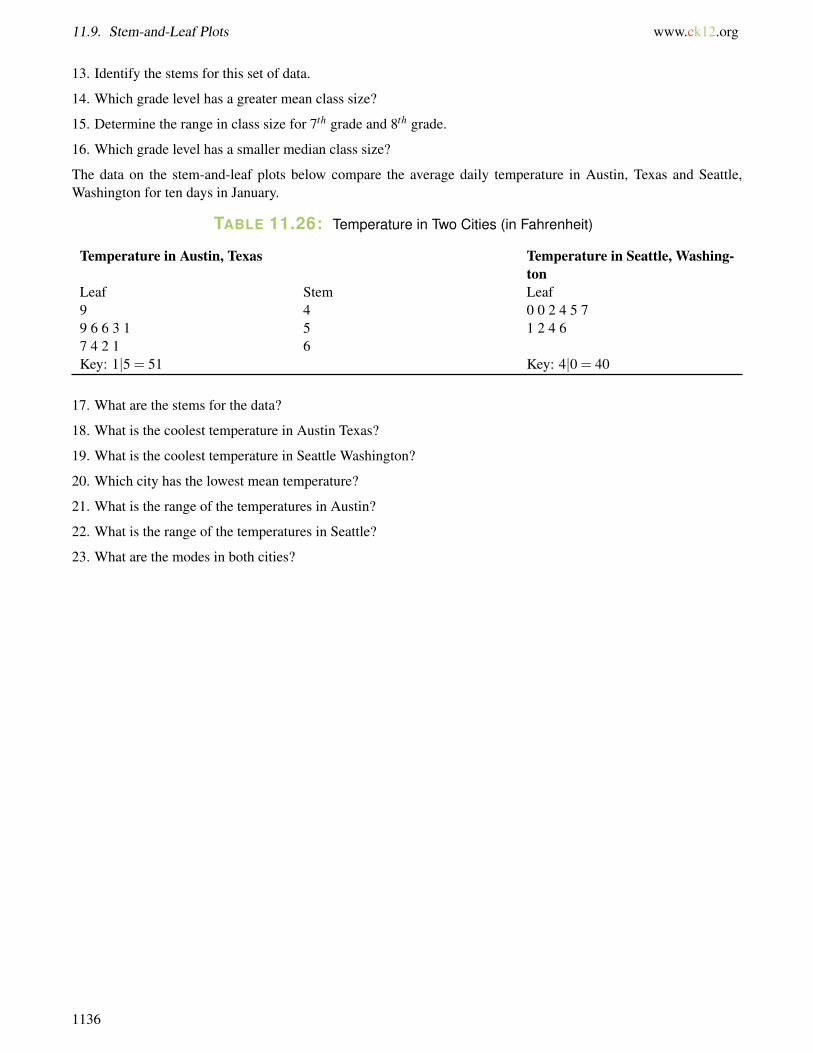
11.9. Stem-and-Leaf Plots www.ck12.org
13. Identify the stems for this set of data.
14. Which grade level has a greater mean class size?
15. Determine the range in class size for 7th grade and 8th grade.
16. Which grade level has a smaller median class size?
The data on the stem-and-leaf plots below compare the average daily temperature in Austin, Texas and Seattle,Washington for ten days in January.
TABLE 11.26: Temperature in Two Cities (in Fahrenheit)
Temperature in Austin, Texas Temperature in Seattle, Washing-ton
Leaf Stem Leaf9 4 0 0 2 4 5 79 6 6 3 1 5 1 2 4 67 4 2 1 6Key: 1|5 = 51 Key: 4|0 = 40
17. What are the stems for the data?
18. What is the coolest temperature in Austin Texas?
19. What is the coolest temperature in Seattle Washington?
20. Which city has the lowest mean temperature?
21. What is the range of the temperatures in Austin?
22. What is the range of the temperatures in Seattle?
23. What are the modes in both cities?
1136
www.ck12.org Chapter 11. Data and Statistics
11.10 Box-and-Whisker Plots
Here you’ll learn to draw and use box-and-whisker plots.
Have you ever studied sled dogs?
Kelly loves dogs. She has been researching the sled dogs connected with the Iditarod. She has noticed that the dogsare very well loved by the mushers who care for them and that there seems to be a very unique connection betweenthem.
Kelly was pleased to see that there are veterinary services for the dogs along the trail route. Here the dogs can receivemedical attention if they become injured along the way.
Most of the teams begin with between 12 and 16 dogs, but most don’t finish with that many. Some of the dogs canbecome tired or hurt, and sometimes a dog can die along the journey too.
Kelly did some research about the 2010 dog teams and discovered that the top ten teams had arrived back withsomewhere between 7 and 13 dogs.
She wrote these statistics down in her notebook.
11, 11, 12, 10, 9, 10, 13, 7, 9, 7
Kelly wants to create a display of this information. She has decided to create a box-and-whisker plot to show thenumber of dogs who finished in 2010 in the top 10 teams.
Do you have an idea how to do this? If you do, then draw a box-and-whisker plot now in your notebookusing this data. If not, then pay attention to this Concept and you will learn all that you need to know aboutbox-and-whisker plots.
Guidance
Previously we learned all about different ways to analyze and display data. Now we are going to learn about a newone it is called a box-and-whisker plot.
A box-and-whisker plot depicts the distribution of data items.
Recall that the median is the middle number when the data is arranged in order from the least to greatest. The medianseparates the data into two equal parts. On a box-and-whisker plot, the median represents half or fifty percentof all of the data points.
1137
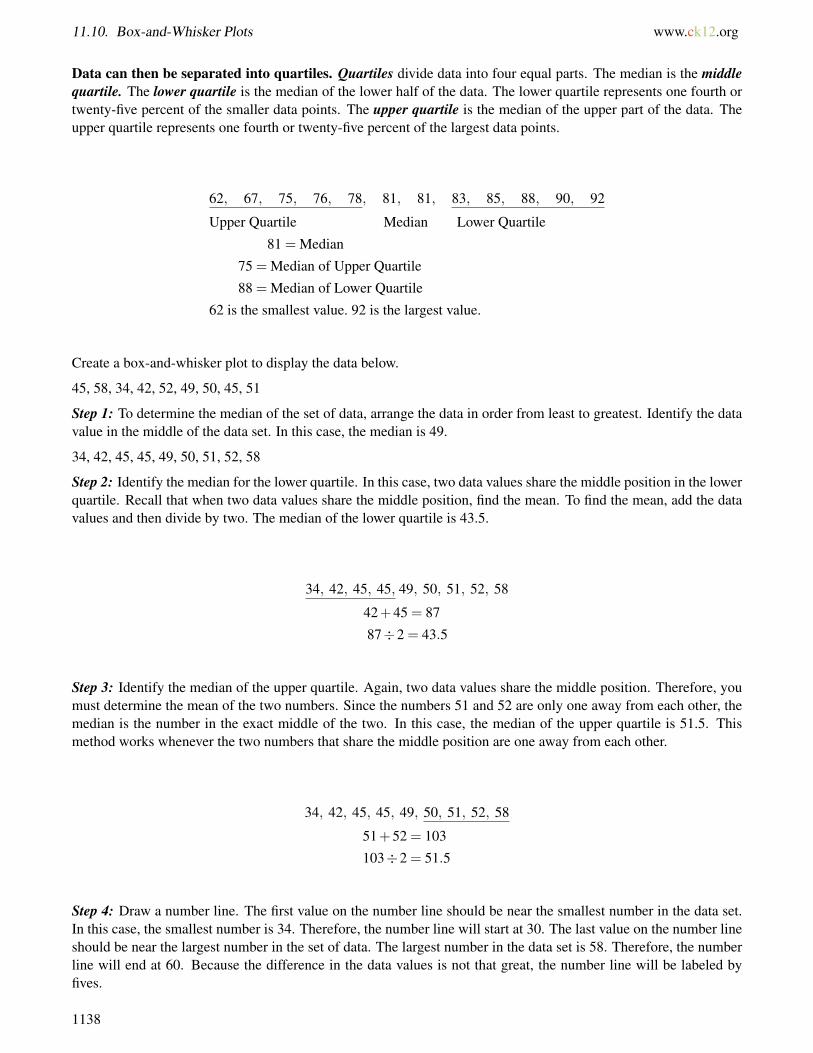
11.10. Box-and-Whisker Plots www.ck12.org
Data can then be separated into quartiles. Quartiles divide data into four equal parts. The median is the middlequartile. The lower quartile is the median of the lower half of the data. The lower quartile represents one fourth ortwenty-five percent of the smaller data points. The upper quartile is the median of the upper part of the data. Theupper quartile represents one fourth or twenty-five percent of the largest data points.
62, 67, 75, 76, 78, 81, 81, 83, 85, 88, 90, 92
Upper Quartile Median Lower Quartile
81 = Median
75 = Median of Upper Quartile
88 = Median of Lower Quartile
62 is the smallest value. 92 is the largest value.
Create a box-and-whisker plot to display the data below.
45, 58, 34, 42, 52, 49, 50, 45, 51
Step 1: To determine the median of the set of data, arrange the data in order from least to greatest. Identify the datavalue in the middle of the data set. In this case, the median is 49.
34, 42, 45, 45, 49, 50, 51, 52, 58
Step 2: Identify the median for the lower quartile. In this case, two data values share the middle position in the lowerquartile. Recall that when two data values share the middle position, find the mean. To find the mean, add the datavalues and then divide by two. The median of the lower quartile is 43.5.
34, 42, 45, 45, 49, 50, 51, 52, 58
42+45 = 87
87÷2 = 43.5
Step 3: Identify the median of the upper quartile. Again, two data values share the middle position. Therefore, youmust determine the mean of the two numbers. Since the numbers 51 and 52 are only one away from each other, themedian is the number in the exact middle of the two. In this case, the median of the upper quartile is 51.5. Thismethod works whenever the two numbers that share the middle position are one away from each other.
34, 42, 45, 45, 49, 50, 51, 52, 58
51+52 = 103
103÷2 = 51.5
Step 4: Draw a number line. The first value on the number line should be near the smallest number in the data set.In this case, the smallest number is 34. Therefore, the number line will start at 30. The last value on the number lineshould be near the largest number in the set of data. The largest number in the data set is 58. Therefore, the numberline will end at 60. Because the difference in the data values is not that great, the number line will be labeled byfives.
1138
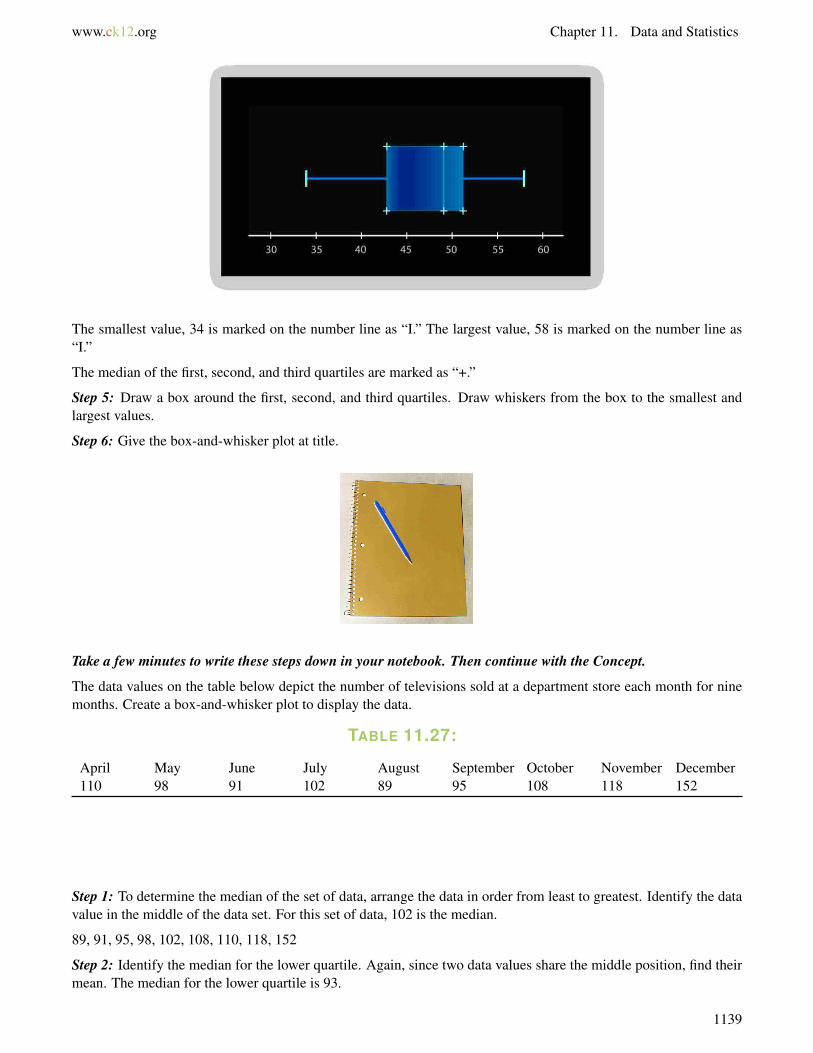
www.ck12.org Chapter 11. Data and Statistics
The smallest value, 34 is marked on the number line as “I.” The largest value, 58 is marked on the number line as“I.”
The median of the first, second, and third quartiles are marked as “+.”
Step 5: Draw a box around the first, second, and third quartiles. Draw whiskers from the box to the smallest andlargest values.
Step 6: Give the box-and-whisker plot at title.
Take a few minutes to write these steps down in your notebook. Then continue with the Concept.
The data values on the table below depict the number of televisions sold at a department store each month for ninemonths. Create a box-and-whisker plot to display the data.
TABLE 11.27:
April May June July August September October November December110 98 91 102 89 95 108 118 152
Step 1: To determine the median of the set of data, arrange the data in order from least to greatest. Identify the datavalue in the middle of the data set. For this set of data, 102 is the median.
89, 91, 95, 98, 102, 108, 110, 118, 152
Step 2: Identify the median for the lower quartile. Again, since two data values share the middle position, find theirmean. The median for the lower quartile is 93.
1139
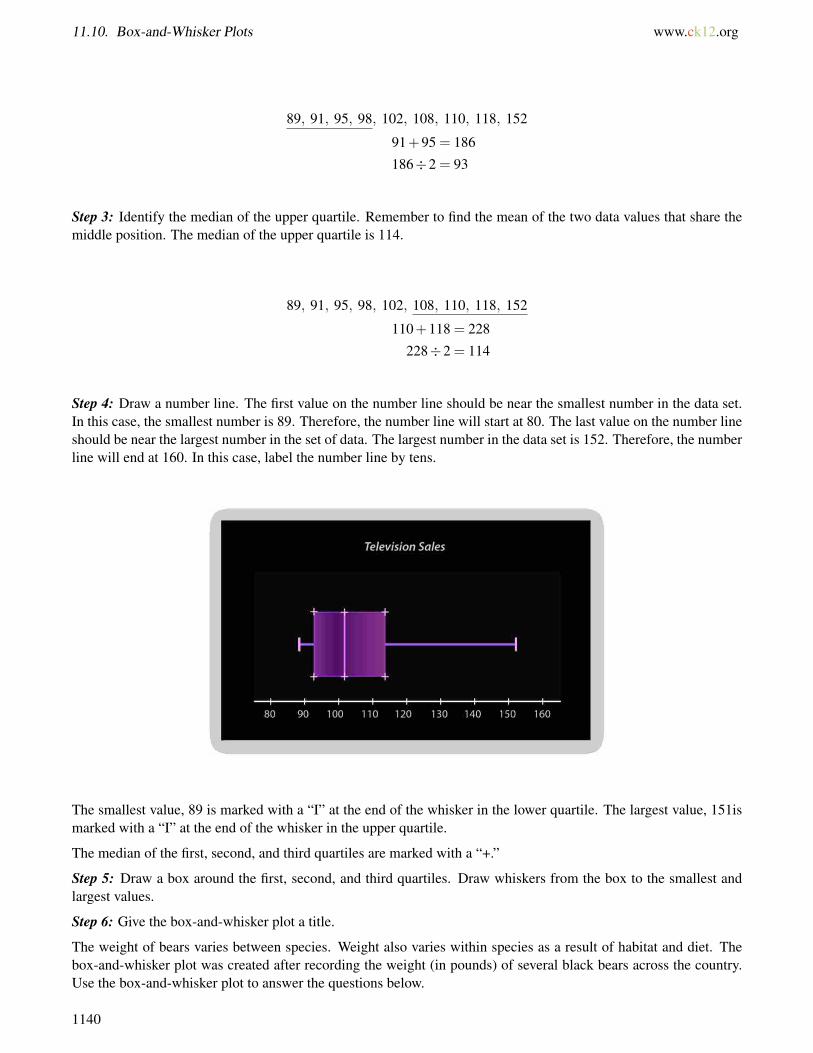
11.10. Box-and-Whisker Plots www.ck12.org
89, 91, 95, 98, 102, 108, 110, 118, 152
91+95 = 186
186÷2 = 93
Step 3: Identify the median of the upper quartile. Remember to find the mean of the two data values that share themiddle position. The median of the upper quartile is 114.
89, 91, 95, 98, 102, 108, 110, 118, 152
110+118 = 228
228÷2 = 114
Step 4: Draw a number line. The first value on the number line should be near the smallest number in the data set.In this case, the smallest number is 89. Therefore, the number line will start at 80. The last value on the number lineshould be near the largest number in the set of data. The largest number in the data set is 152. Therefore, the numberline will end at 160. In this case, label the number line by tens.
The smallest value, 89 is marked with a “I” at the end of the whisker in the lower quartile. The largest value, 151ismarked with a “I” at the end of the whisker in the upper quartile.
The median of the first, second, and third quartiles are marked with a “+.”
Step 5: Draw a box around the first, second, and third quartiles. Draw whiskers from the box to the smallest andlargest values.
Step 6: Give the box-and-whisker plot a title.
The weight of bears varies between species. Weight also varies within species as a result of habitat and diet. Thebox-and-whisker plot was created after recording the weight (in pounds) of several black bears across the country.Use the box-and-whisker plot to answer the questions below.
1140
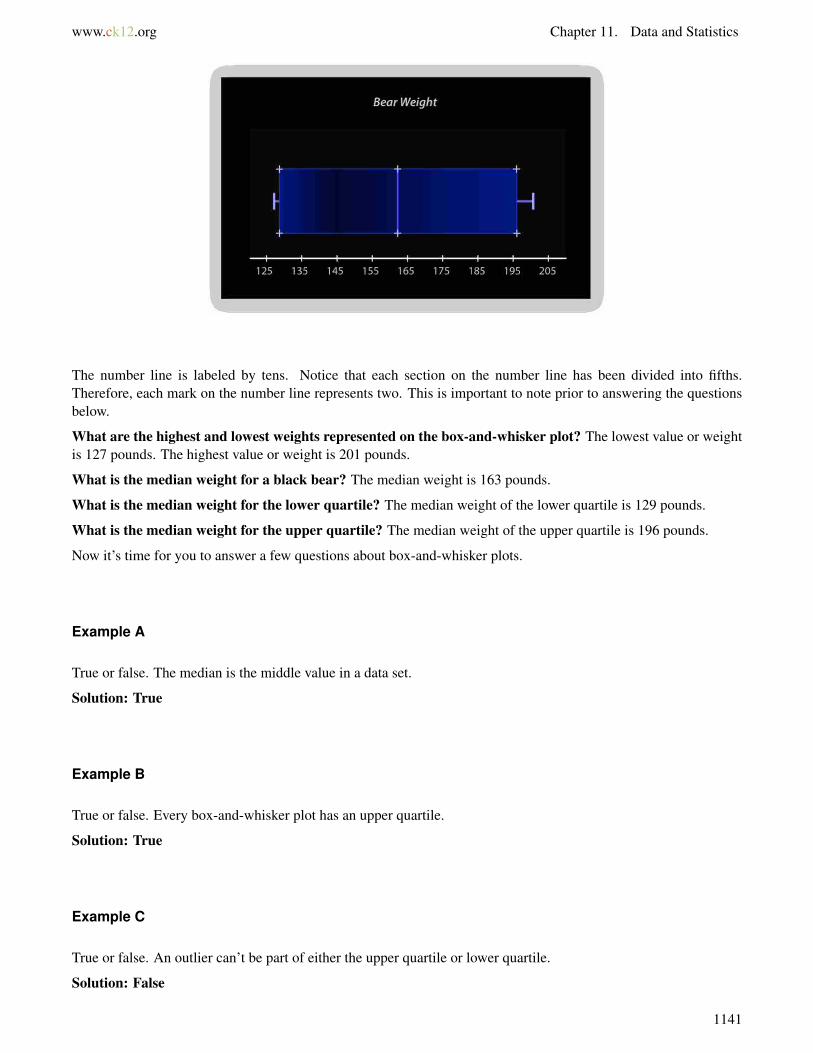
www.ck12.org Chapter 11. Data and Statistics
The number line is labeled by tens. Notice that each section on the number line has been divided into fifths.Therefore, each mark on the number line represents two. This is important to note prior to answering the questionsbelow.
What are the highest and lowest weights represented on the box-and-whisker plot? The lowest value or weightis 127 pounds. The highest value or weight is 201 pounds.
What is the median weight for a black bear? The median weight is 163 pounds.
What is the median weight for the lower quartile? The median weight of the lower quartile is 129 pounds.
What is the median weight for the upper quartile? The median weight of the upper quartile is 196 pounds.
Now it’s time for you to answer a few questions about box-and-whisker plots.
Example A
True or false. The median is the middle value in a data set.
Solution: True
Example B
True or false. Every box-and-whisker plot has an upper quartile.
Solution: True
Example C
True or false. An outlier can’t be part of either the upper quartile or lower quartile.
Solution: False
1141
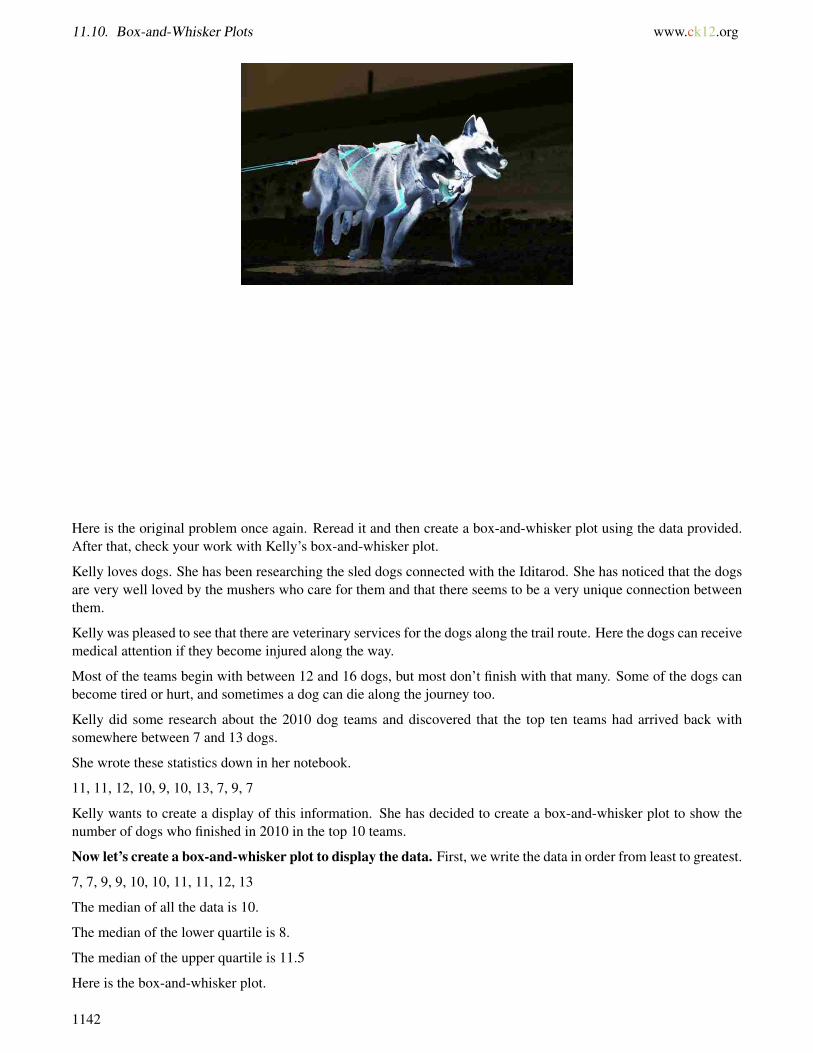
11.10. Box-and-Whisker Plots www.ck12.org
Here is the original problem once again. Reread it and then create a box-and-whisker plot using the data provided.After that, check your work with Kelly’s box-and-whisker plot.
Kelly loves dogs. She has been researching the sled dogs connected with the Iditarod. She has noticed that the dogsare very well loved by the mushers who care for them and that there seems to be a very unique connection betweenthem.
Kelly was pleased to see that there are veterinary services for the dogs along the trail route. Here the dogs can receivemedical attention if they become injured along the way.
Most of the teams begin with between 12 and 16 dogs, but most don’t finish with that many. Some of the dogs canbecome tired or hurt, and sometimes a dog can die along the journey too.
Kelly did some research about the 2010 dog teams and discovered that the top ten teams had arrived back withsomewhere between 7 and 13 dogs.
She wrote these statistics down in her notebook.
11, 11, 12, 10, 9, 10, 13, 7, 9, 7
Kelly wants to create a display of this information. She has decided to create a box-and-whisker plot to show thenumber of dogs who finished in 2010 in the top 10 teams.
Now let’s create a box-and-whisker plot to display the data. First, we write the data in order from least to greatest.
7, 7, 9, 9, 10, 10, 11, 11, 12, 13
The median of all the data is 10.
The median of the lower quartile is 8.
The median of the upper quartile is 11.5
Here is the box-and-whisker plot.
1142
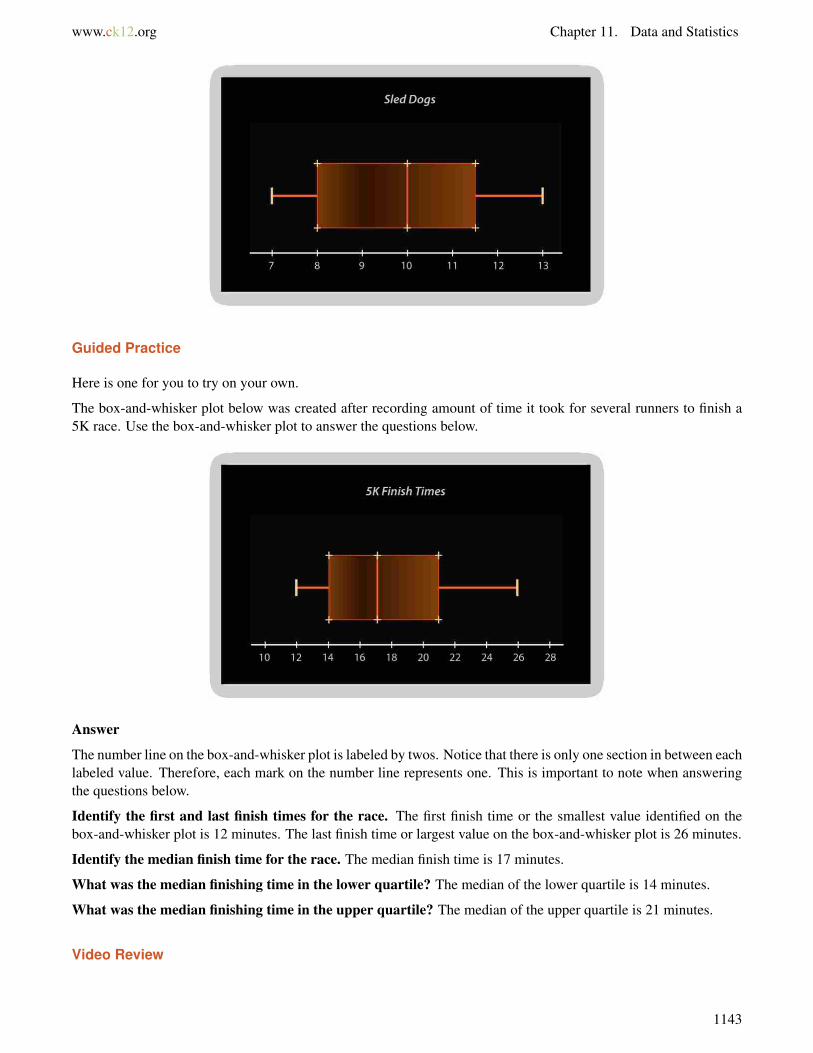
www.ck12.org Chapter 11. Data and Statistics
Guided Practice
Here is one for you to try on your own.
The box-and-whisker plot below was created after recording amount of time it took for several runners to finish a5K race. Use the box-and-whisker plot to answer the questions below.
Answer
The number line on the box-and-whisker plot is labeled by twos. Notice that there is only one section in between eachlabeled value. Therefore, each mark on the number line represents one. This is important to note when answeringthe questions below.
Identify the first and last finish times for the race. The first finish time or the smallest value identified on thebox-and-whisker plot is 12 minutes. The last finish time or largest value on the box-and-whisker plot is 26 minutes.
Identify the median finish time for the race. The median finish time is 17 minutes.
What was the median finishing time in the lower quartile? The median of the lower quartile is 14 minutes.
What was the median finishing time in the upper quartile? The median of the upper quartile is 21 minutes.
Video Review
1143
11.10. Box-and-Whisker Plots www.ck12.org
MEDIAClick image to the left or use the URL below.URL: http://www.ck12.org/flx/render/embeddedobject/5455
This is a Khan Academy video on box-and-whisker plots.
Explore More
Directions: Use each set of data to work with box-and-whisker plots.
12, 13, 15, 17, 21, 22, 24, 26, 28, 30, 31
1. What is the median of the set of data?
2. What is the median of the lower quartile?
3. What is the median of the upper quartile?
4. What is the lowest value whisker?
5. What is the highest value whisker?
6. Use the data to create a box-and-whisker plot.
26, 27, 29, 30, 32, 35, 41, 42, 44
7. What is the median of the set of data?
8. What is the median of the lower quartile?
9. What is the median of the upper quartile?
10. What is the lowest value whisker?
11. What is the highest value whisker?
12. Use the data to create a box-and-whisker plot.
100, 105, 107, 109.110, 120
13. What is the median of the data?
14. What is the median of the lower quartile?
15. What is the median of the upper quartile?
16. What is the lowest value whisker?
17. What is the highest value whisker?
1144
www.ck12.org Chapter 11. Data and Statistics
11.11 Frequency Tables to Organize and DisplayData
Here you’ll learn to make a frequency table to organize and display data.
How long is the Iditarod? Do you know? Take a look at this dilemma.
Jasper is curious about how many days it takes a musher to finish the Iditarod. Looking online, he has discoveredthat the average is from 10 –15 days, but that isn’t specific enough for him.
“I want to know more details about it,” he tells Mr. Hawkins first thing on Monday morning.
“Well, you have to narrow down your findings. I would suggest you look at the final standings from 2010. Then youcan create a frequency table and a histogram.”
“Alright, that’s a good idea,” Jasper says.
Jasper begins his research on the Iditarod website. He makes notes on the number of days that it took the mushersin the 2010 Iditarod to finish.
• 1 musher took 8 days• 18 mushers took 9 days• 16 mushers took 10 days• 6 mushers took 11 days• 9 mushers took 12 days• 4 mushers took 13 days
Jasper wants to organize this data in a frequency table. However, he is stuck on how to do it. Do you know? ThisConcept will teach you all about creating frequency tables using given data. By the end of the Concept, you willunderstand how to help Jasper.
Guidance
Previously we worked on different ways to display data. In this Concept, you will learn about frequency tables andhistograms. Let’s start by looking at frequency tables.
1145
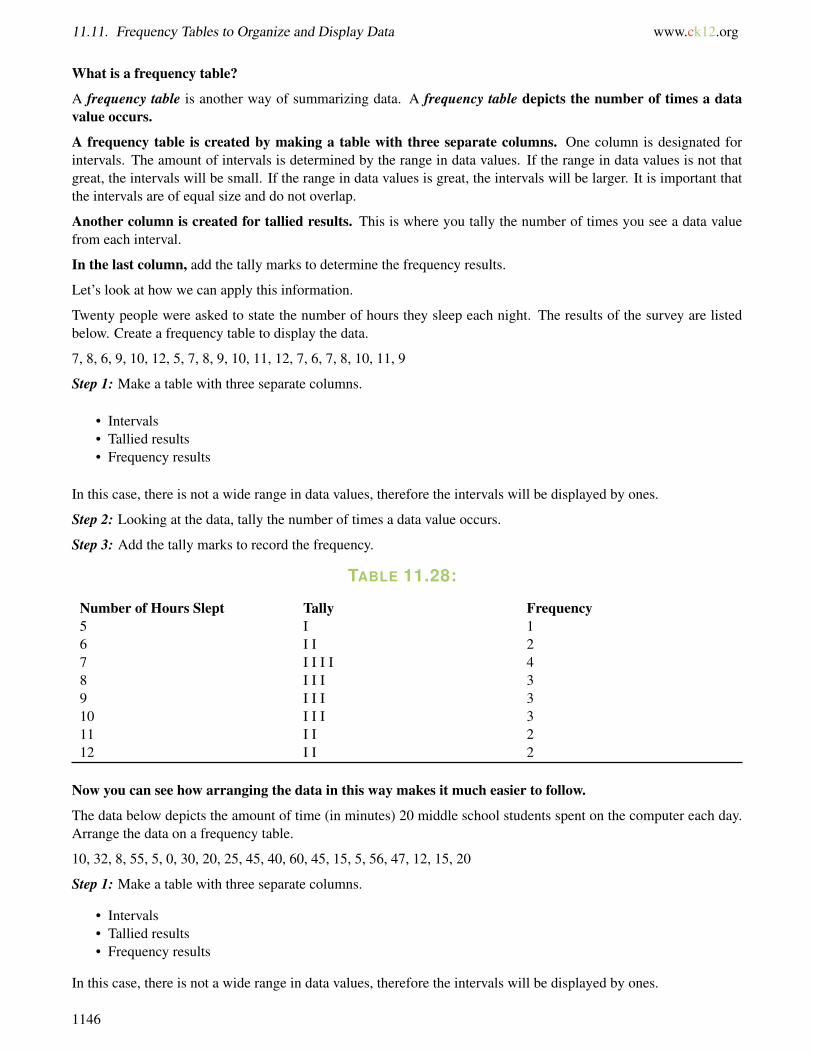
11.11. Frequency Tables to Organize and Display Data www.ck12.org
What is a frequency table?
A frequency table is another way of summarizing data. A frequency table depicts the number of times a datavalue occurs.
A frequency table is created by making a table with three separate columns. One column is designated forintervals. The amount of intervals is determined by the range in data values. If the range in data values is not thatgreat, the intervals will be small. If the range in data values is great, the intervals will be larger. It is important thatthe intervals are of equal size and do not overlap.
Another column is created for tallied results. This is where you tally the number of times you see a data valuefrom each interval.
In the last column, add the tally marks to determine the frequency results.
Let’s look at how we can apply this information.
Twenty people were asked to state the number of hours they sleep each night. The results of the survey are listedbelow. Create a frequency table to display the data.
7, 8, 6, 9, 10, 12, 5, 7, 8, 9, 10, 11, 12, 7, 6, 7, 8, 10, 11, 9
Step 1: Make a table with three separate columns.
• Intervals• Tallied results• Frequency results
In this case, there is not a wide range in data values, therefore the intervals will be displayed by ones.
Step 2: Looking at the data, tally the number of times a data value occurs.
Step 3: Add the tally marks to record the frequency.
TABLE 11.28:
Number of Hours Slept Tally Frequency5 I 16 I I 27 I I I I 48 I I I 39 I I I 310 I I I 311 I I 212 I I 2
Now you can see how arranging the data in this way makes it much easier to follow.
The data below depicts the amount of time (in minutes) 20 middle school students spent on the computer each day.Arrange the data on a frequency table.
10, 32, 8, 55, 5, 0, 30, 20, 25, 45, 40, 60, 45, 15, 5, 56, 47, 12, 15, 20
Step 1: Make a table with three separate columns.
• Intervals• Tallied results• Frequency results
In this case, there is not a wide range in data values, therefore the intervals will be displayed by ones.
1146
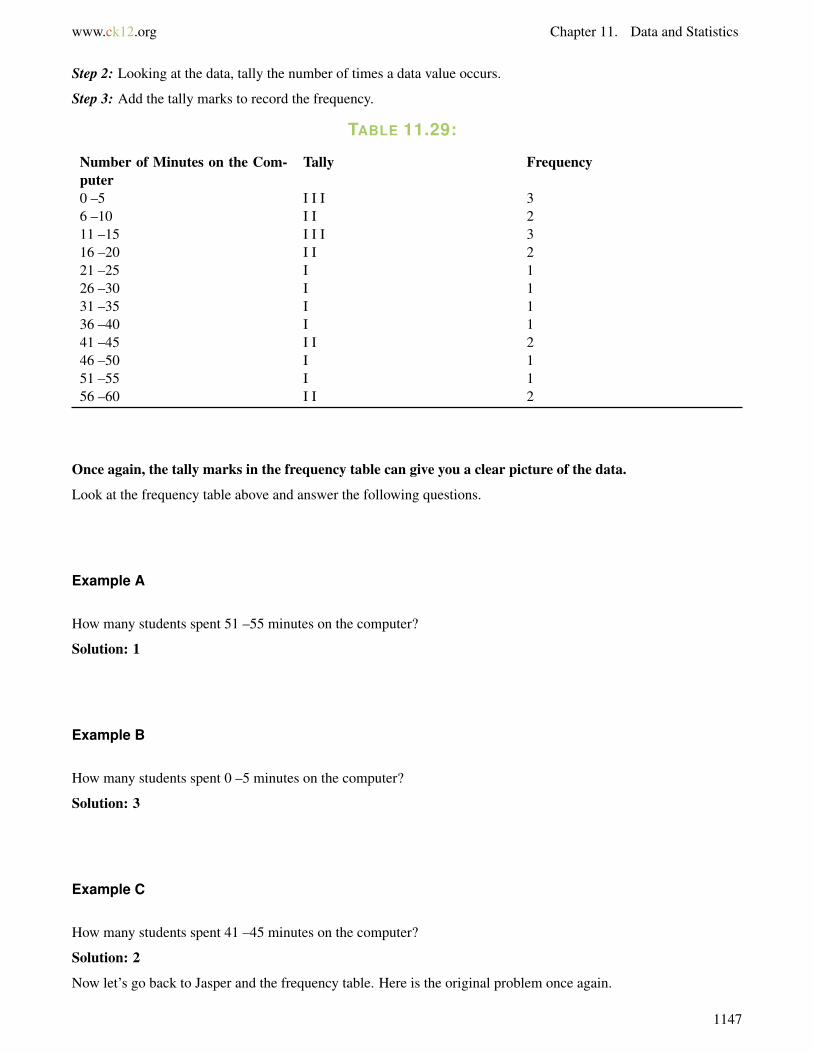
www.ck12.org Chapter 11. Data and Statistics
Step 2: Looking at the data, tally the number of times a data value occurs.
Step 3: Add the tally marks to record the frequency.
TABLE 11.29:
Number of Minutes on the Com-puter
Tally Frequency
0 –5 I I I 36 –10 I I 211 –15 I I I 316 –20 I I 221 –25 I 126 –30 I 131 –35 I 136 –40 I 141 –45 I I 246 –50 I 151 –55 I 156 –60 I I 2
Once again, the tally marks in the frequency table can give you a clear picture of the data.
Look at the frequency table above and answer the following questions.
Example A
How many students spent 51 –55 minutes on the computer?
Solution: 1
Example B
How many students spent 0 –5 minutes on the computer?
Solution: 3
Example C
How many students spent 41 –45 minutes on the computer?
Solution: 2
Now let’s go back to Jasper and the frequency table. Here is the original problem once again.
1147
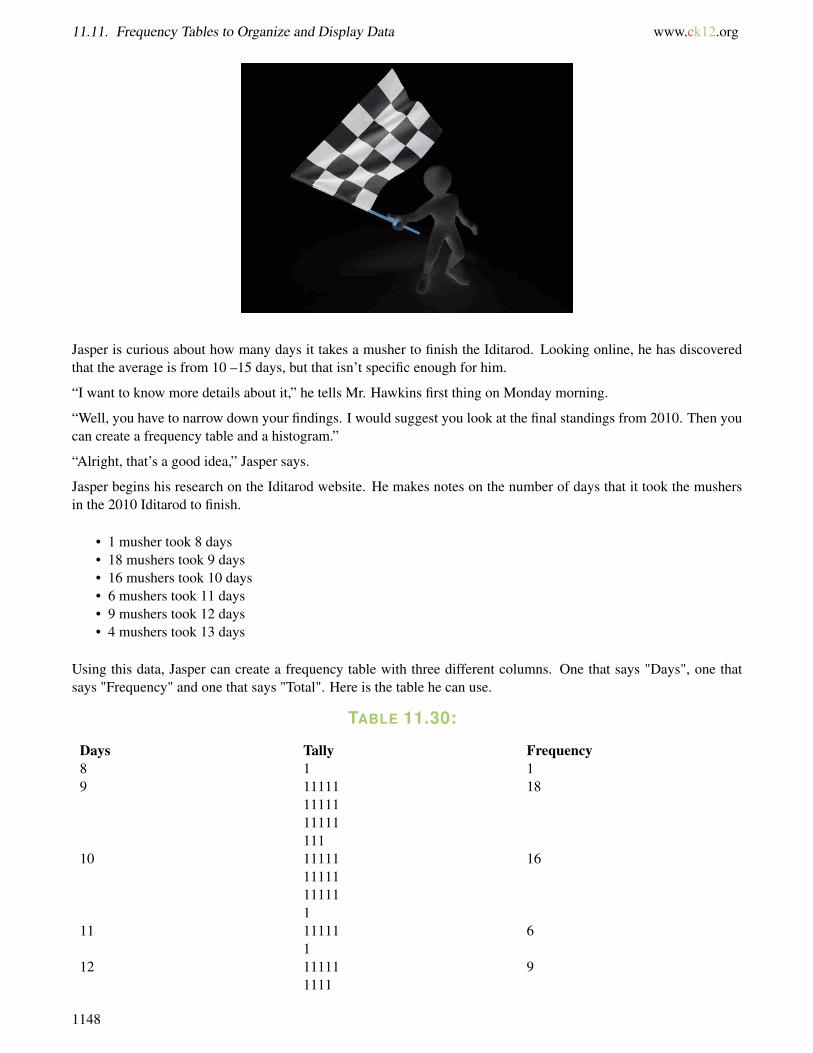
11.11. Frequency Tables to Organize and Display Data www.ck12.org
Jasper is curious about how many days it takes a musher to finish the Iditarod. Looking online, he has discoveredthat the average is from 10 –15 days, but that isn’t specific enough for him.
“I want to know more details about it,” he tells Mr. Hawkins first thing on Monday morning.
“Well, you have to narrow down your findings. I would suggest you look at the final standings from 2010. Then youcan create a frequency table and a histogram.”
“Alright, that’s a good idea,” Jasper says.
Jasper begins his research on the Iditarod website. He makes notes on the number of days that it took the mushersin the 2010 Iditarod to finish.
• 1 musher took 8 days• 18 mushers took 9 days• 16 mushers took 10 days• 6 mushers took 11 days• 9 mushers took 12 days• 4 mushers took 13 days
Using this data, Jasper can create a frequency table with three different columns. One that says "Days", one thatsays "Frequency" and one that says "Total". Here is the table he can use.
TABLE 11.30:
Days Tally Frequency8 1 19 11111 18
1111111111111
10 11111 1611111111111
11 11111 61
12 11111 91111
1148
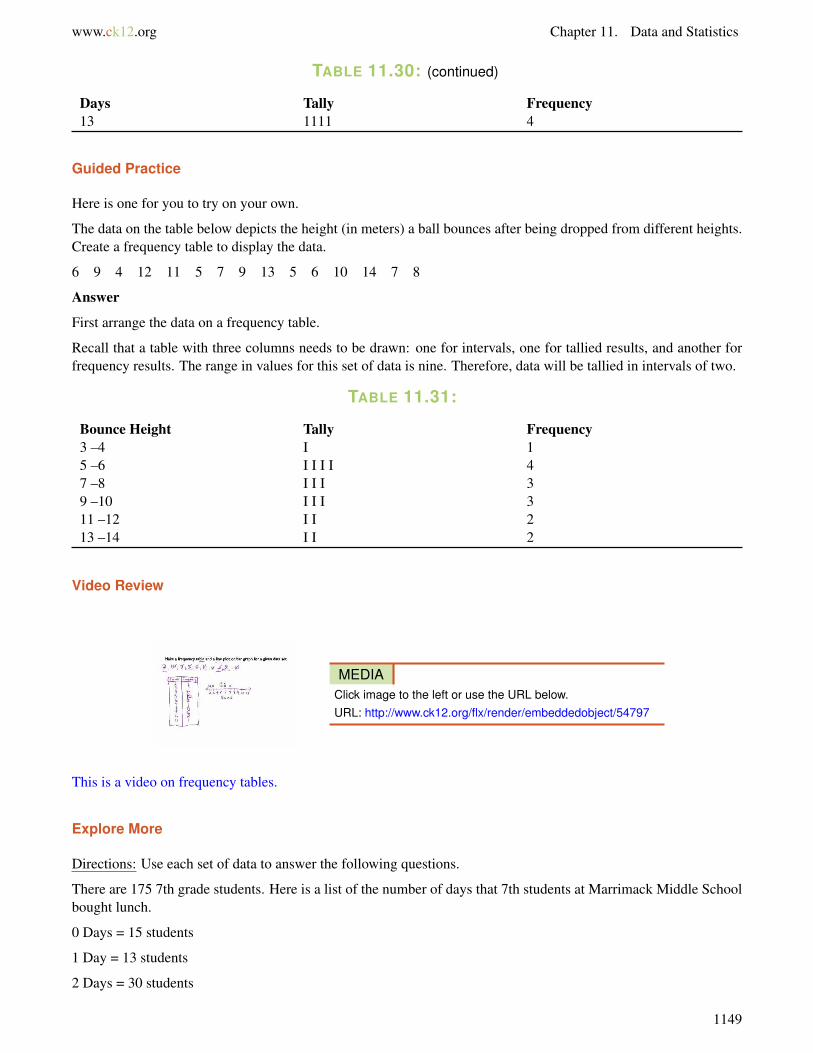
www.ck12.org Chapter 11. Data and Statistics
TABLE 11.30: (continued)
Days Tally Frequency13 1111 4
Guided Practice
Here is one for you to try on your own.
The data on the table below depicts the height (in meters) a ball bounces after being dropped from different heights.Create a frequency table to display the data.
6 9 4 12 11 5 7 9 13 5 6 10 14 7 8
Answer
First arrange the data on a frequency table.
Recall that a table with three columns needs to be drawn: one for intervals, one for tallied results, and another forfrequency results. The range in values for this set of data is nine. Therefore, data will be tallied in intervals of two.
TABLE 11.31:
Bounce Height Tally Frequency3 –4 I 15 –6 I I I I 47 –8 I I I 39 –10 I I I 311 –12 I I 213 –14 I I 2
Video Review
MEDIAClick image to the left or use the URL below.URL: http://www.ck12.org/flx/render/embeddedobject/54797
This is a video on frequency tables.
Explore More
Directions: Use each set of data to answer the following questions.
There are 175 7th grade students. Here is a list of the number of days that 7th students at Marrimack Middle Schoolbought lunch.
0 Days = 15 students
1 Day = 13 students
2 Days = 30 students
1149
11.11. Frequency Tables to Organize and Display Data www.ck12.org
3 Days = 21 students
4 Days = 35 students
5 Days = 60 students
1. How many students are in the 7th grade?
2. What is the most popular number of days?
3. What is the least popular number of days?
4. Create a frequency table to show the data.
5. Were any students left out of the count?
6. How do you know?
7. Create a frequency table to display the data below.
2, 5, 3, 1, 6, 5, 7, 8, 3, 1
8. Were there any numbers not represented?
9. What is the most popular number or numbers?
Directions: The following frequency table shows data regarding the number of people who attended different moviesin one week. Use the following frequency table to answer each question.
TABLE 11.32:
# of People at the movies per week Frequency20 450 385 390 5120 2
10. If we were to create a list of this data, is the following list correct or incorrect?
20, 20, 20, 20, 50, 50, 50, 90, 90, 90, 85, 85, 85, 120, 120
11. Would you consider the list in number 1 to be organized or unorganized data?
12. How many showings had 90 people or more in attendance?
13. How many showings had less than 50 people in attendance?
14. How many showings had less than 70 people in attendance?
15. True or false. This data also tells you which showings had the most people in attendance.
16. True or false. There were two showings that had 78 people in attendance.
1150
www.ck12.org Chapter 11. Data and Statistics
11.12 Histograms
Here you’ll learn to make a histogram given a frequency table.
Remember how Jasper made a frequency table in the Frequency Tables to Organize and Display Data Concept?Well, now he is going to take this frequency table and try to make a histogram. Take a look.
Jasper is curious about how many days it takes a musher to finish the Iditarod. Looking online, he has discoveredthat the average is from 10 –15 days, but that isn’t specific enough for him.
“I want to know more details about it,” he tells Mr. Hawkins first thing on Monday morning.
“Well, you have to narrow down your findings. I would suggest you look at the final standings from 2010. Then youcan create a frequency table and a histogram.”
“Alright, that’s a good idea,” Jasper says.
Jasper begins his research on the Iditarod website. He makes notes on the number of days that it took the mushersin the 2010 Iditarod to finish. Here is the frequency table that he created with his findings.
TABLE 11.33:
Days Tally Frequency8 I I9 I I I I I 18
I I I I II I I I II I I
10 I I I I I 16I I I I II I I I II
I I I I I I I 6I
12 I I I I I 9I I I I
1151
11.12. Histograms www.ck12.org
TABLE 11.33: (continued)
Days Tally Frequency13 I I I I 4
Next, Jasper began making his histogram. But as soon as he started to draw it, something did not look right.
Jasper could use some help. In this Concept, you will learn how to take a frequency table and make ahistogram out of it. Pay close attention and at the end of this Concept you will be able to help Jasper createhis visual display.
Guidance
Frequency tables are a great way to record and organize data. Once you have created a frequency table, we can makea histogram to present a visual display of the information in the frequency table.
What is a histogram?
A histogram shows the frequency of data values on a graph. Like a frequency table, data is grouped inintervals of equal size that do not overlap. Like a bar graph, the height of each bar depicts the frequency ofthe data values. A histogram differs from a bar graph in that the vertical columns are drawn with no spacein between them.
Now let’s look at creating a histogram from a frequency table.
Create a histogram using the results on the frequency table below.
TABLE 11.34: Hours Slept Each Night
Number of Hours Slept Tally Frequency5 I 16 I I 27 I I I I 48 I I I 39 I I I 310 I I I 311 I I 212 I I 2
To create a histogram:
1. Draw the horizontal (x) and vertical (y) axis.
2. Give the graph the title “Hours Slept Each Night.”
3. Label the horizontal axis “Hours.” List the intervals across the horizontal axis.
1152
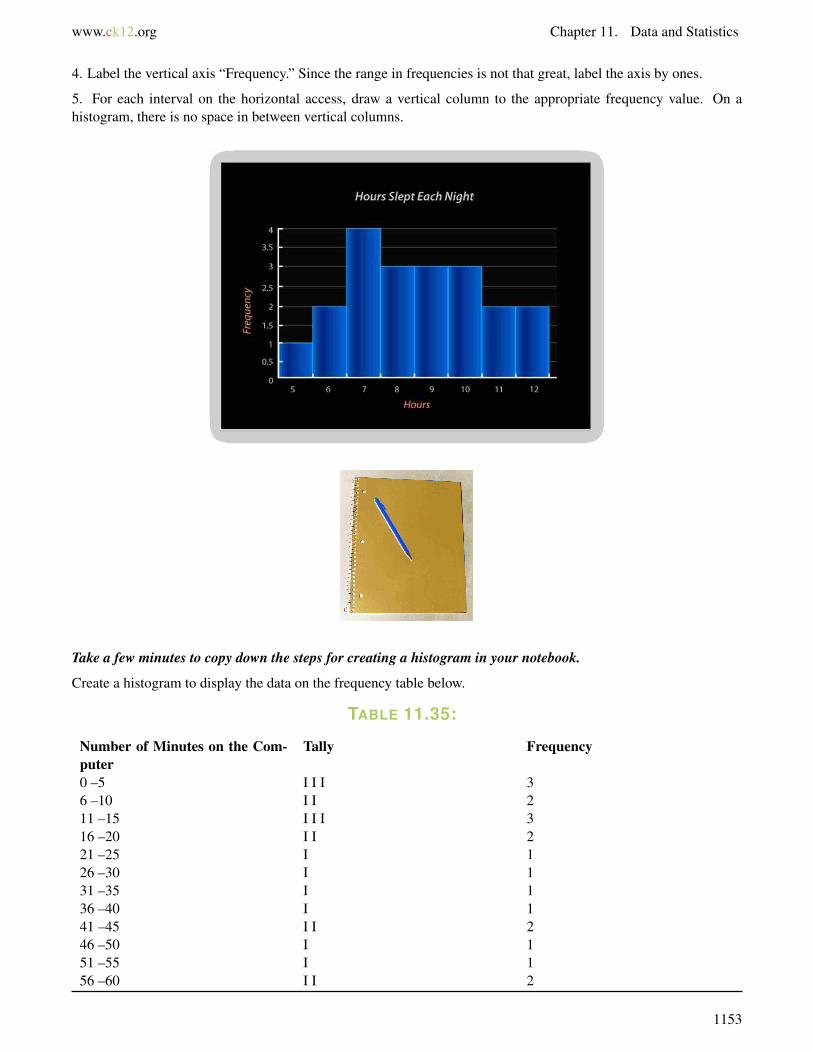
www.ck12.org Chapter 11. Data and Statistics
4. Label the vertical axis “Frequency.” Since the range in frequencies is not that great, label the axis by ones.
5. For each interval on the horizontal access, draw a vertical column to the appropriate frequency value. On ahistogram, there is no space in between vertical columns.
Take a few minutes to copy down the steps for creating a histogram in your notebook.
Create a histogram to display the data on the frequency table below.
TABLE 11.35:
Number of Minutes on the Com-puter
Tally Frequency
0 –5 I I I 36 –10 I I 211 –15 I I I 316 –20 I I 221 –25 I 126 –30 I 131 –35 I 136 –40 I 141 –45 I I 246 –50 I 151 –55 I 156 –60 I I 2
1153
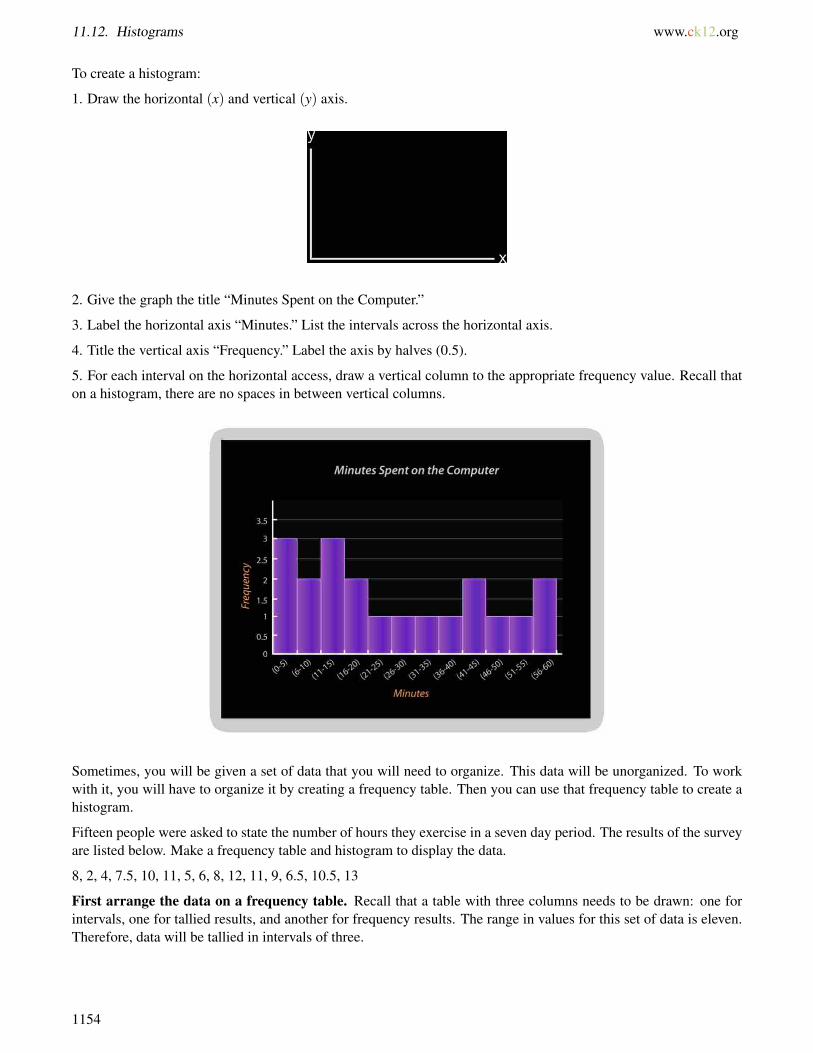
11.12. Histograms www.ck12.org
To create a histogram:
1. Draw the horizontal (x) and vertical (y) axis.
2. Give the graph the title “Minutes Spent on the Computer.”
3. Label the horizontal axis “Minutes.” List the intervals across the horizontal axis.
4. Title the vertical axis “Frequency.” Label the axis by halves (0.5).
5. For each interval on the horizontal access, draw a vertical column to the appropriate frequency value. Recall thaton a histogram, there are no spaces in between vertical columns.
Sometimes, you will be given a set of data that you will need to organize. This data will be unorganized. To workwith it, you will have to organize it by creating a frequency table. Then you can use that frequency table to create ahistogram.
Fifteen people were asked to state the number of hours they exercise in a seven day period. The results of the surveyare listed below. Make a frequency table and histogram to display the data.
8, 2, 4, 7.5, 10, 11, 5, 6, 8, 12, 11, 9, 6.5, 10.5, 13
First arrange the data on a frequency table. Recall that a table with three columns needs to be drawn: one forintervals, one for tallied results, and another for frequency results. The range in values for this set of data is eleven.Therefore, data will be tallied in intervals of three.
1154

www.ck12.org Chapter 11. Data and Statistics
TABLE 11.36:
Hours of Exercise Tally Frequency0 –2 I 13 –5 I I 26 –8 I I I I I 59 –11 I I I I I 512 –14 I I 2
Next, the data needs to be displayed on a histogram. Recall that a horizontal (x) and vertical (y) axis needs to bedrawn. List the intervals across the horizontal axis. Name this axis “Hours of Exercise.” Label the vertical axis byones. Title the vertical axis “Frequency.” For each set of intervals, draw vertical columns the appropriate frequency.Color in the vertical columns and ensure that no space is between them. Title the graph “Hours of Exercise.”
Now let’s make some conclusions based on the information displayed in the histogram.
Looking at the histogram above, you can that equal numbers of people reported that they exercise between six andeight and nine and eleven hours each week. Two people stated that they exercise between three and five hours perweek. Two people reported that they exercise between twelve and fourteen hours per week. Zero to two is the hourswith the least frequency.
Look at this frequency table and use it to complete the following questions.
TABLE 11.37:
Number of Sodas Tally Frequency0 –3 I I I I I I I I 84 –7 I I I I I I I 78 –11 I I I 312 –15 I I 2
Example A
Which category is the most popular?
Solution: 0 - 3 Sodas
1155
11.12. Histograms www.ck12.org
Example B
Which category is the least popular?
Solution: 12 - 15 sodas
Example C
What is the difference between the greatest number of sodas and the least?
Solution: 8 - 3 = 5
Now back to Jasper and the histogram.
Here is the original problem once again. Reread it and then look at the histogram created from the frequency table.
Jasper is curious about how many days it takes a musher to finish the Iditarod. Looking online, he has discoveredthat the average is from 10 –15 days, but that isn’t specific enough for him.
“I want to know more details about it,” he tells Mr. Hawkins first thing on Monday morning.
“Well, you have to narrow down your findings. I would suggest you look at the final standings from 2010. Then youcan create a frequency table and a histogram.”
“Alright, that’s a good idea,” Jasper says.
Jasper begins his research on the Iditarod website. He makes notes on the number of days that it took the mushersin the 2010 Iditarod to finish. Here is the frequency table that he created with his findings.
TABLE 11.38:
Days Tally Frequency8 1 19 11111 18
1111111111111
10 11111 1611111111111
11 11111 61
12 11111 91111
13 1111 4
Next, Jasper began making his histogram. But as soon as he started to draw it, something did not look right.
Then Jasper began to notice that he needed to put the number of mushers on the y axis and the number ofdays on the x axis. He included each day instead of a range of days since there were only six possible optionsfor days to finish.
Here is Jasper’s final histogram.
1156

www.ck12.org Chapter 11. Data and Statistics
Guided Practice
Here is one for you to try on your own.
The data on the table below depicts the height (in meters) a ball bounces after being dropped from different heights.Create a frequency table and histogram to display the data.
6 9 4 12 11 5 7 9 13 5 6 10 14 7 8
Answer
First arrange the data on a frequency table.
Recall that a table with three columns needs to be drawn: one for intervals, one for tallied results, and another forfrequency results. The range in values for this set of data is nine. Therefore, data will be tallied in intervals of two.
TABLE 11.39:
Bounce Height Tally Frequency3 –4 I 15 –6 I I I I 47 –8 I I I 39 –10 I I I 311 –12 I I 213 –14 I I 2
1157
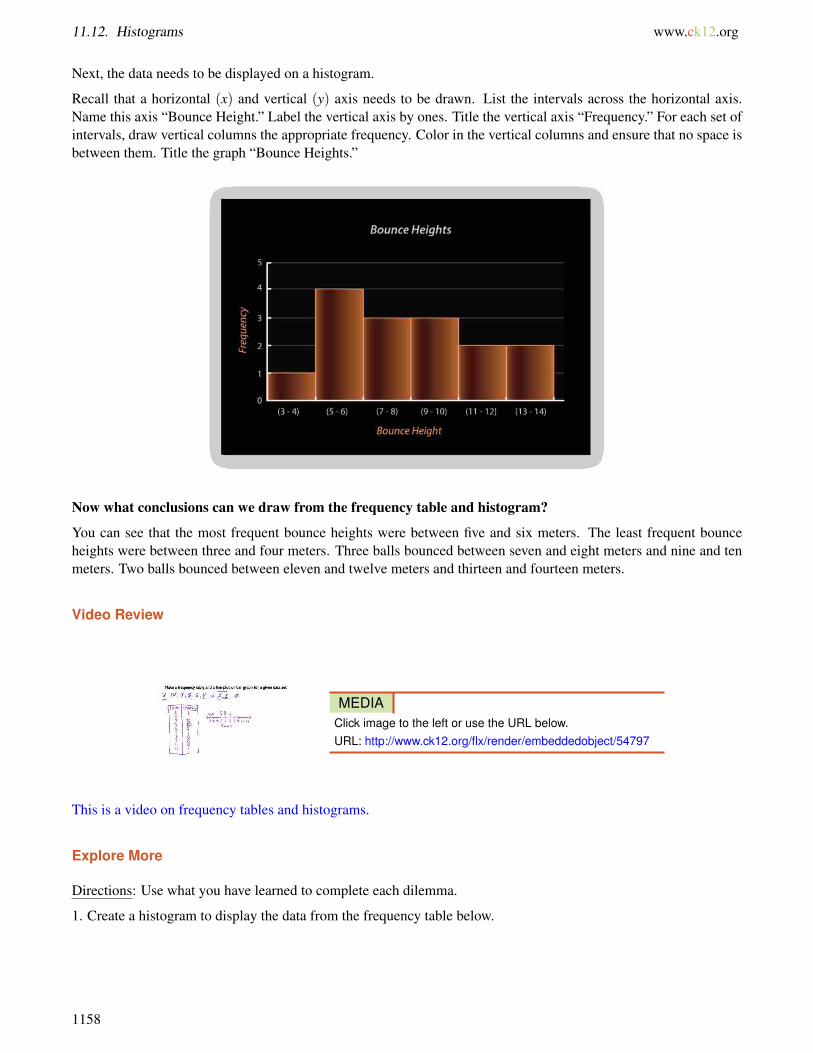
11.12. Histograms www.ck12.org
Next, the data needs to be displayed on a histogram.
Recall that a horizontal (x) and vertical (y) axis needs to be drawn. List the intervals across the horizontal axis.Name this axis “Bounce Height.” Label the vertical axis by ones. Title the vertical axis “Frequency.” For each set ofintervals, draw vertical columns the appropriate frequency. Color in the vertical columns and ensure that no space isbetween them. Title the graph “Bounce Heights.”
Now what conclusions can we draw from the frequency table and histogram?
You can see that the most frequent bounce heights were between five and six meters. The least frequent bounceheights were between three and four meters. Three balls bounced between seven and eight meters and nine and tenmeters. Two balls bounced between eleven and twelve meters and thirteen and fourteen meters.
Video Review
MEDIAClick image to the left or use the URL below.URL: http://www.ck12.org/flx/render/embeddedobject/54797
This is a video on frequency tables and histograms.
Explore More
Directions: Use what you have learned to complete each dilemma.
1. Create a histogram to display the data from the frequency table below.
1158
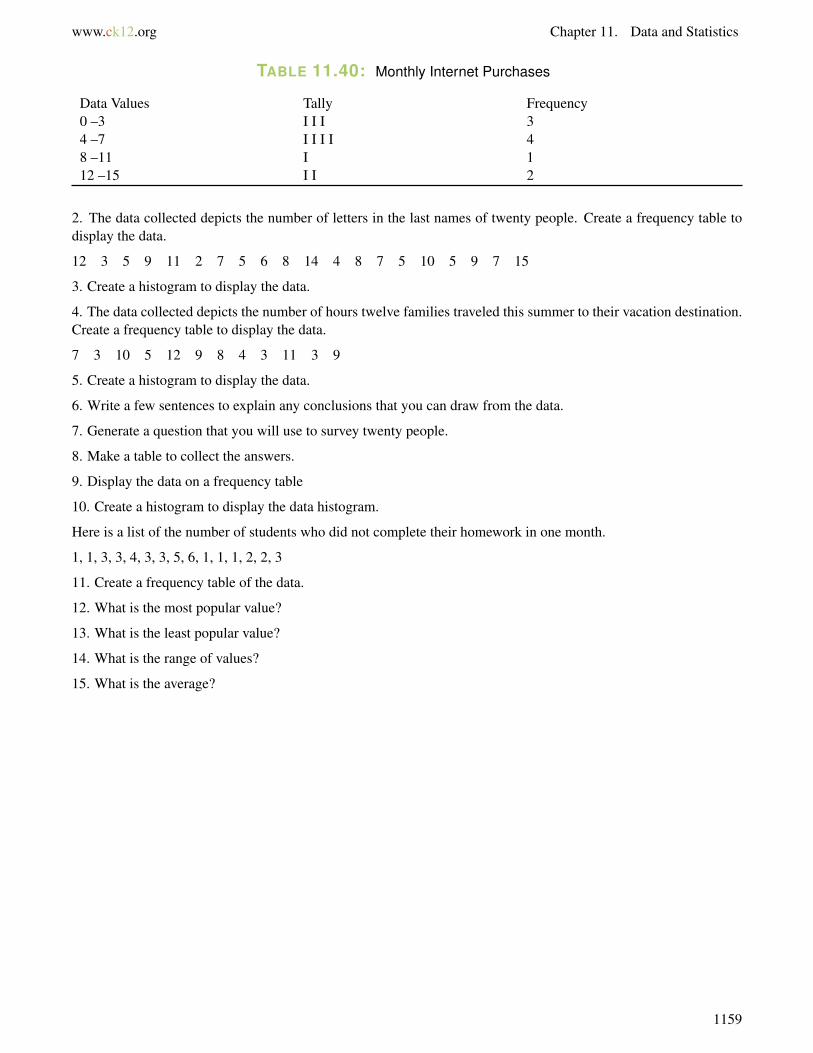
www.ck12.org Chapter 11. Data and Statistics
TABLE 11.40: Monthly Internet Purchases
Data Values Tally Frequency0 –3 I I I 34 –7 I I I I 48 –11 I 112 –15 I I 2
2. The data collected depicts the number of letters in the last names of twenty people. Create a frequency table todisplay the data.
12 3 5 9 11 2 7 5 6 8 14 4 8 7 5 10 5 9 7 15
3. Create a histogram to display the data.
4. The data collected depicts the number of hours twelve families traveled this summer to their vacation destination.Create a frequency table to display the data.
7 3 10 5 12 9 8 4 3 11 3 9
5. Create a histogram to display the data.
6. Write a few sentences to explain any conclusions that you can draw from the data.
7. Generate a question that you will use to survey twenty people.
8. Make a table to collect the answers.
9. Display the data on a frequency table
10. Create a histogram to display the data histogram.
Here is a list of the number of students who did not complete their homework in one month.
1, 1, 3, 3, 4, 3, 3, 5, 6, 1, 1, 1, 2, 2, 3
11. Create a frequency table of the data.
12. What is the most popular value?
13. What is the least popular value?
14. What is the range of values?
15. What is the average?
1159
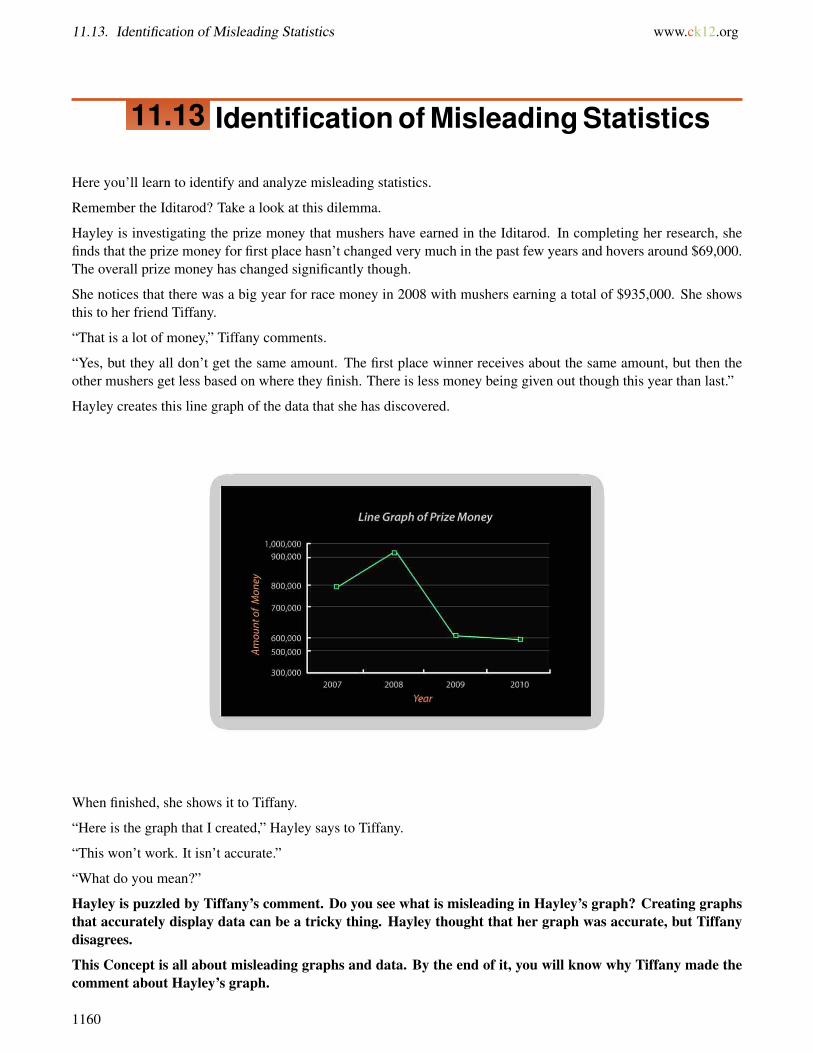
11.13. Identification of Misleading Statistics www.ck12.org
11.13 Identification of Misleading Statistics
Here you’ll learn to identify and analyze misleading statistics.
Remember the Iditarod? Take a look at this dilemma.
Hayley is investigating the prize money that mushers have earned in the Iditarod. In completing her research, shefinds that the prize money for first place hasn’t changed very much in the past few years and hovers around $69,000.The overall prize money has changed significantly though.
She notices that there was a big year for race money in 2008 with mushers earning a total of $935,000. She showsthis to her friend Tiffany.
“That is a lot of money,” Tiffany comments.
“Yes, but they all don’t get the same amount. The first place winner receives about the same amount, but then theother mushers get less based on where they finish. There is less money being given out though this year than last.”
Hayley creates this line graph of the data that she has discovered.
When finished, she shows it to Tiffany.
“Here is the graph that I created,” Hayley says to Tiffany.
“This won’t work. It isn’t accurate.”
“What do you mean?”
Hayley is puzzled by Tiffany’s comment. Do you see what is misleading in Hayley’s graph? Creating graphsthat accurately display data can be a tricky thing. Hayley thought that her graph was accurate, but Tiffanydisagrees.
This Concept is all about misleading graphs and data. By the end of it, you will know why Tiffany made thecomment about Hayley’s graph.
1160
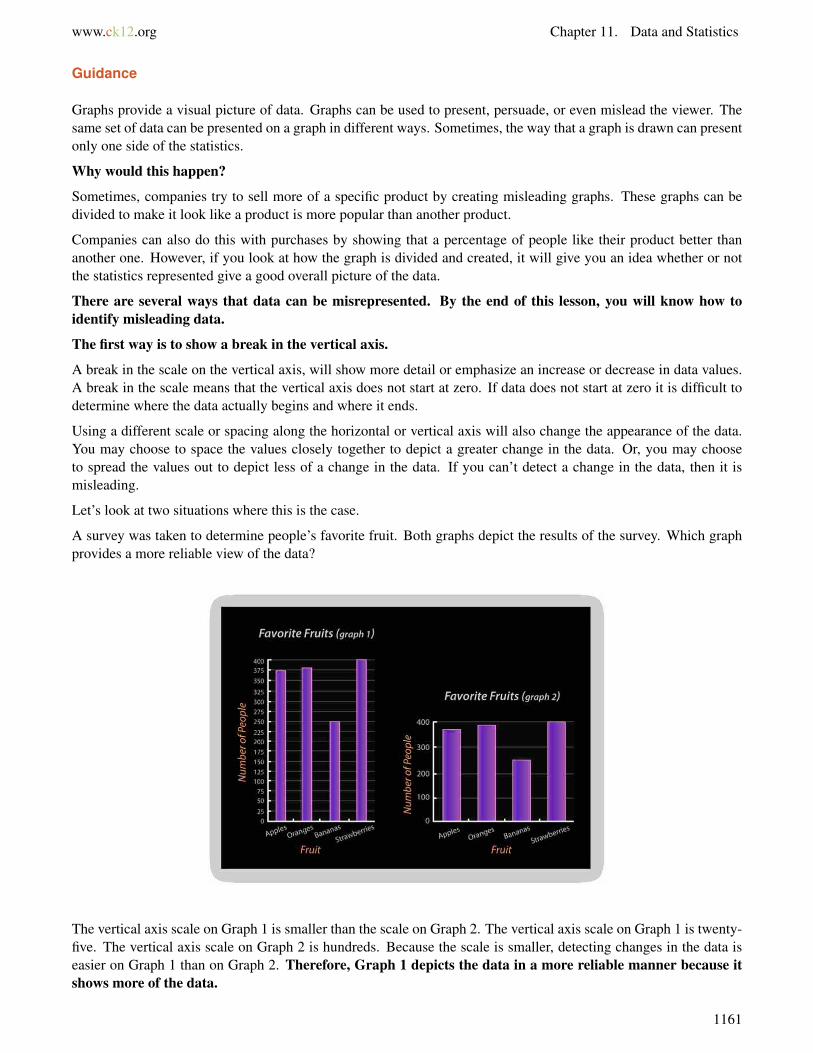
www.ck12.org Chapter 11. Data and Statistics
Guidance
Graphs provide a visual picture of data. Graphs can be used to present, persuade, or even mislead the viewer. Thesame set of data can be presented on a graph in different ways. Sometimes, the way that a graph is drawn can presentonly one side of the statistics.
Why would this happen?
Sometimes, companies try to sell more of a specific product by creating misleading graphs. These graphs can bedivided to make it look like a product is more popular than another product.
Companies can also do this with purchases by showing that a percentage of people like their product better thananother one. However, if you look at how the graph is divided and created, it will give you an idea whether or notthe statistics represented give a good overall picture of the data.
There are several ways that data can be misrepresented. By the end of this lesson, you will know how toidentify misleading data.
The first way is to show a break in the vertical axis.
A break in the scale on the vertical axis, will show more detail or emphasize an increase or decrease in data values.A break in the scale means that the vertical axis does not start at zero. If data does not start at zero it is difficult todetermine where the data actually begins and where it ends.
Using a different scale or spacing along the horizontal or vertical axis will also change the appearance of the data.You may choose to space the values closely together to depict a greater change in the data. Or, you may chooseto spread the values out to depict less of a change in the data. If you can’t detect a change in the data, then it ismisleading.
Let’s look at two situations where this is the case.
A survey was taken to determine people’s favorite fruit. Both graphs depict the results of the survey. Which graphprovides a more reliable view of the data?
The vertical axis scale on Graph 1 is smaller than the scale on Graph 2. The vertical axis scale on Graph 1 is twenty-five. The vertical axis scale on Graph 2 is hundreds. Because the scale is smaller, detecting changes in the data iseasier on Graph 1 than on Graph 2. Therefore, Graph 1 depicts the data in a more reliable manner because itshows more of the data.
1161
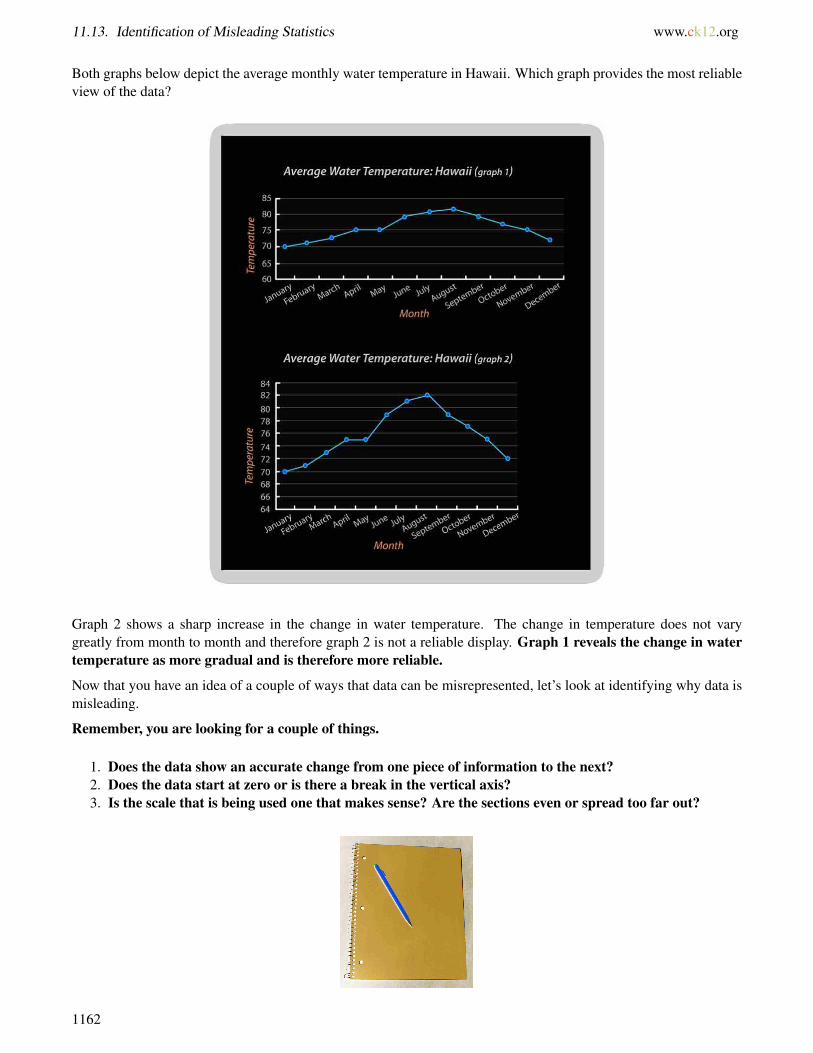
11.13. Identification of Misleading Statistics www.ck12.org
Both graphs below depict the average monthly water temperature in Hawaii. Which graph provides the most reliableview of the data?
Graph 2 shows a sharp increase in the change in water temperature. The change in temperature does not varygreatly from month to month and therefore graph 2 is not a reliable display. Graph 1 reveals the change in watertemperature as more gradual and is therefore more reliable.
Now that you have an idea of a couple of ways that data can be misrepresented, let’s look at identifying why data ismisleading.
Remember, you are looking for a couple of things.
1. Does the data show an accurate change from one piece of information to the next?2. Does the data start at zero or is there a break in the vertical axis?3. Is the scale that is being used one that makes sense? Are the sections even or spread too far out?
1162
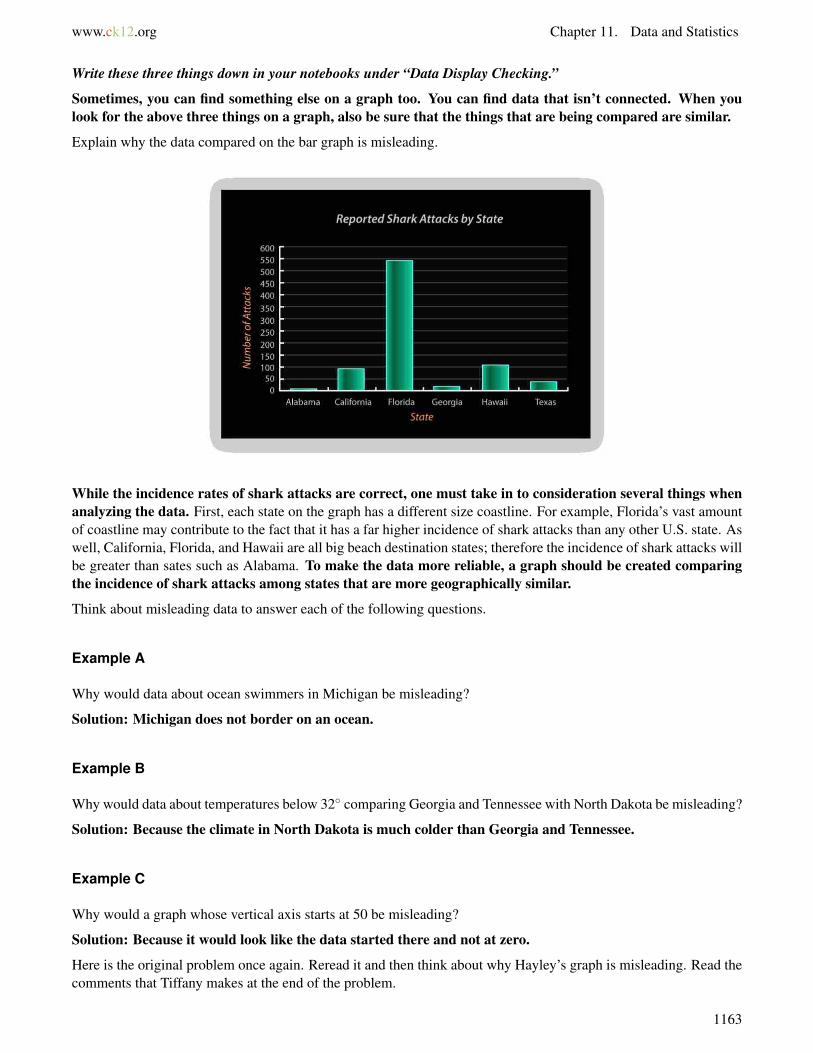
www.ck12.org Chapter 11. Data and Statistics
Write these three things down in your notebooks under “Data Display Checking.”
Sometimes, you can find something else on a graph too. You can find data that isn’t connected. When youlook for the above three things on a graph, also be sure that the things that are being compared are similar.
Explain why the data compared on the bar graph is misleading.
While the incidence rates of shark attacks are correct, one must take in to consideration several things whenanalyzing the data. First, each state on the graph has a different size coastline. For example, Florida’s vast amountof coastline may contribute to the fact that it has a far higher incidence of shark attacks than any other U.S. state. Aswell, California, Florida, and Hawaii are all big beach destination states; therefore the incidence of shark attacks willbe greater than sates such as Alabama. To make the data more reliable, a graph should be created comparingthe incidence of shark attacks among states that are more geographically similar.
Think about misleading data to answer each of the following questions.
Example A
Why would data about ocean swimmers in Michigan be misleading?
Solution: Michigan does not border on an ocean.
Example B
Why would data about temperatures below 32◦ comparing Georgia and Tennessee with North Dakota be misleading?
Solution: Because the climate in North Dakota is much colder than Georgia and Tennessee.
Example C
Why would a graph whose vertical axis starts at 50 be misleading?
Solution: Because it would look like the data started there and not at zero.
Here is the original problem once again. Reread it and then think about why Hayley’s graph is misleading. Read thecomments that Tiffany makes at the end of the problem.
1163
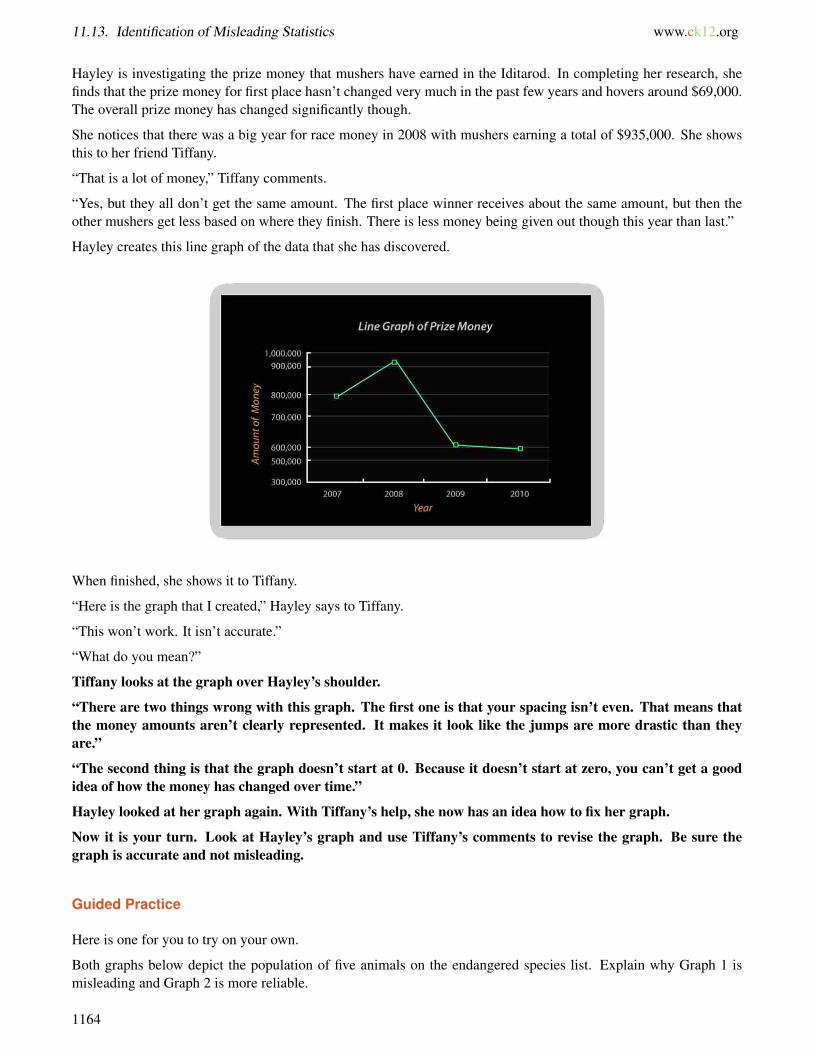
11.13. Identification of Misleading Statistics www.ck12.org
Hayley is investigating the prize money that mushers have earned in the Iditarod. In completing her research, shefinds that the prize money for first place hasn’t changed very much in the past few years and hovers around $69,000.The overall prize money has changed significantly though.
She notices that there was a big year for race money in 2008 with mushers earning a total of $935,000. She showsthis to her friend Tiffany.
“That is a lot of money,” Tiffany comments.
“Yes, but they all don’t get the same amount. The first place winner receives about the same amount, but then theother mushers get less based on where they finish. There is less money being given out though this year than last.”
Hayley creates this line graph of the data that she has discovered.
When finished, she shows it to Tiffany.
“Here is the graph that I created,” Hayley says to Tiffany.
“This won’t work. It isn’t accurate.”
“What do you mean?”
Tiffany looks at the graph over Hayley’s shoulder.
“There are two things wrong with this graph. The first one is that your spacing isn’t even. That means thatthe money amounts aren’t clearly represented. It makes it look like the jumps are more drastic than theyare.”
“The second thing is that the graph doesn’t start at 0. Because it doesn’t start at zero, you can’t get a goodidea of how the money has changed over time.”
Hayley looked at her graph again. With Tiffany’s help, she now has an idea how to fix her graph.
Now it is your turn. Look at Hayley’s graph and use Tiffany’s comments to revise the graph. Be sure thegraph is accurate and not misleading.
Guided Practice
Here is one for you to try on your own.
Both graphs below depict the population of five animals on the endangered species list. Explain why Graph 1 ismisleading and Graph 2 is more reliable.
1164

www.ck12.org Chapter 11. Data and Statistics
Answer
Graph 1 has a break in the scale on the vertical axis. You can see that the scale begins at 1,000. This providesa distorted and misleading view of the data.
Video Review
MEDIAClick image to the left or use the URL below.URL: http://www.ck12.org/flx/render/embeddedobject/126
This is a video on statistics. It is a supporting video for this Concept.
Explore More
Directions: Answer each question regarding misleading data.
1165

11.13. Identification of Misleading Statistics www.ck12.org
1. Is this a misleading graph?
2. What is one thing that makes it a misleading graph?
3. What is one thing that you could do to fix this graph?
The data table below depicts the amount of time students at different grade levels spend on homework and studying.Ensure that the second graph shows that time spent on homework in twelfth grade is triple that of sixth grade.
TABLE 11.41:
Grade Time6th 1.757th 28th 2.259th 2.510th 2.7511th 312th 3.5
4. Use the data below to create two bar graphs. One that shows the data accurately, that time spent on homework intwelfth grade is double that of sixth grade.
5. Ensure that the second graph shows that time spent on homework in twelfth grade is triple that of sixth grade.
6. If the students doubled the time that they spend on homework in the 7th grade, how many hours would they bespending?
7. If the students in the 11th grade spent half as much time on homework, how many more hours of free time wouldthey gain?
8. True or false. All students spend at least one hour on homework.
The data table below depicts the sales tax rate for several U.S. states.
TABLE 11.42:
State Sales Tax Rate (%)Alaska 0Alabama 4.0Arizona 5.6California 6.25New Jersey 7.0
1166

www.ck12.org Chapter 11. Data and Statistics
9. Use the information on the data table to create two graphs. One graph should depict the data accurately. On thisgraph, the sales tax rate for New Jersey is almost double the sales tax rate in Alabama.
10. The second graph should present the data in a misleading manner to suggest that the sales tax rate in New Jerseyis more than triple the tax rate in Alabama.
11. Which state has the highest state tax?
12. If Alaska doesn’t have a state tax, does it make sense to put it on the list?
The data below depicts the daily temperature in Juneau, Alaska for ten days.
64 60 57 55 49 57 58 60 59 56
13. Draw a line graph that depicts a sharp decrease in temperature.
14. Draw another line graph that depicts the decrease accurately.
15. What is the highest temperature on the list?
16. What is the lowest temperature on the list?
17. –20. Look through a newspaper and choose three different graphs. Then write a few sentences about each oneexplaining how the data represented is or is not misleading and why.
1167
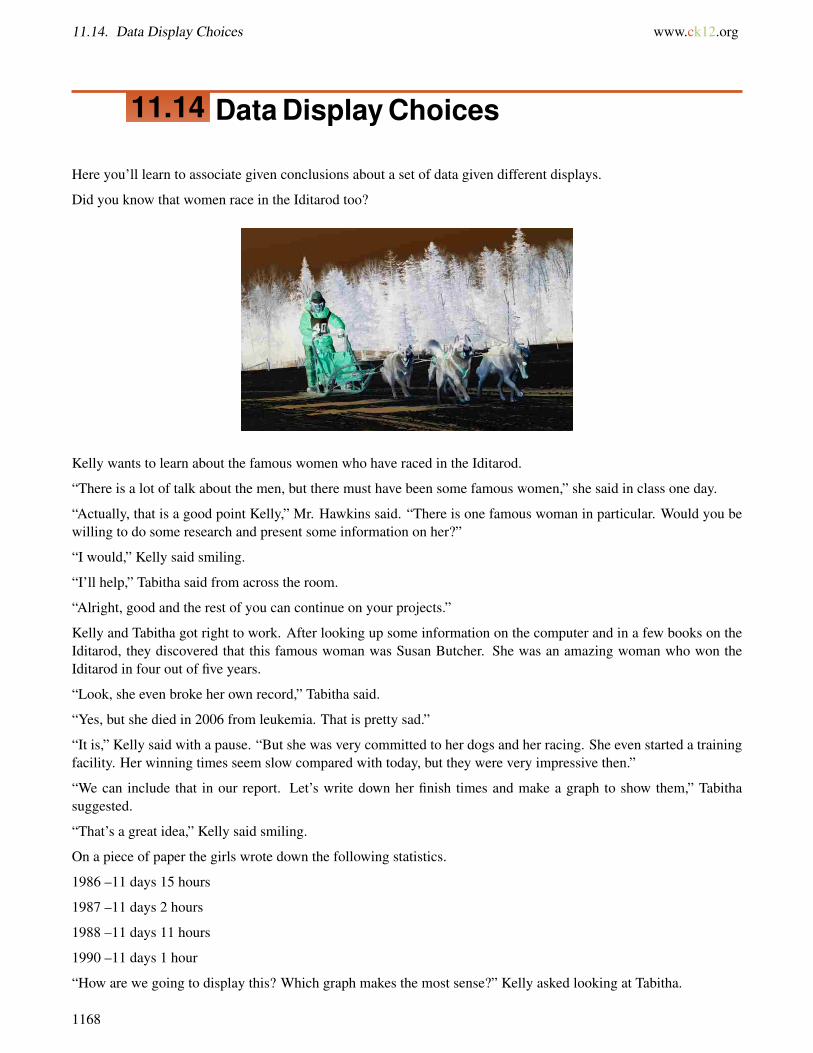
11.14. Data Display Choices www.ck12.org
11.14 Data Display Choices
Here you’ll learn to associate given conclusions about a set of data given different displays.
Did you know that women race in the Iditarod too?
Kelly wants to learn about the famous women who have raced in the Iditarod.
“There is a lot of talk about the men, but there must have been some famous women,” she said in class one day.
“Actually, that is a good point Kelly,” Mr. Hawkins said. “There is one famous woman in particular. Would you bewilling to do some research and present some information on her?”
“I would,” Kelly said smiling.
“I’ll help,” Tabitha said from across the room.
“Alright, good and the rest of you can continue on your projects.”
Kelly and Tabitha got right to work. After looking up some information on the computer and in a few books on theIditarod, they discovered that this famous woman was Susan Butcher. She was an amazing woman who won theIditarod in four out of five years.
“Look, she even broke her own record,” Tabitha said.
“Yes, but she died in 2006 from leukemia. That is pretty sad.”
“It is,” Kelly said with a pause. “But she was very committed to her dogs and her racing. She even started a trainingfacility. Her winning times seem slow compared with today, but they were very impressive then.”
“We can include that in our report. Let’s write down her finish times and make a graph to show them,” Tabithasuggested.
“That’s a great idea,” Kelly said smiling.
On a piece of paper the girls wrote down the following statistics.
1986 –11 days 15 hours
1987 –11 days 2 hours
1988 –11 days 11 hours
1990 –11 days 1 hour
“How are we going to display this? Which graph makes the most sense?” Kelly asked looking at Tabitha.
1168
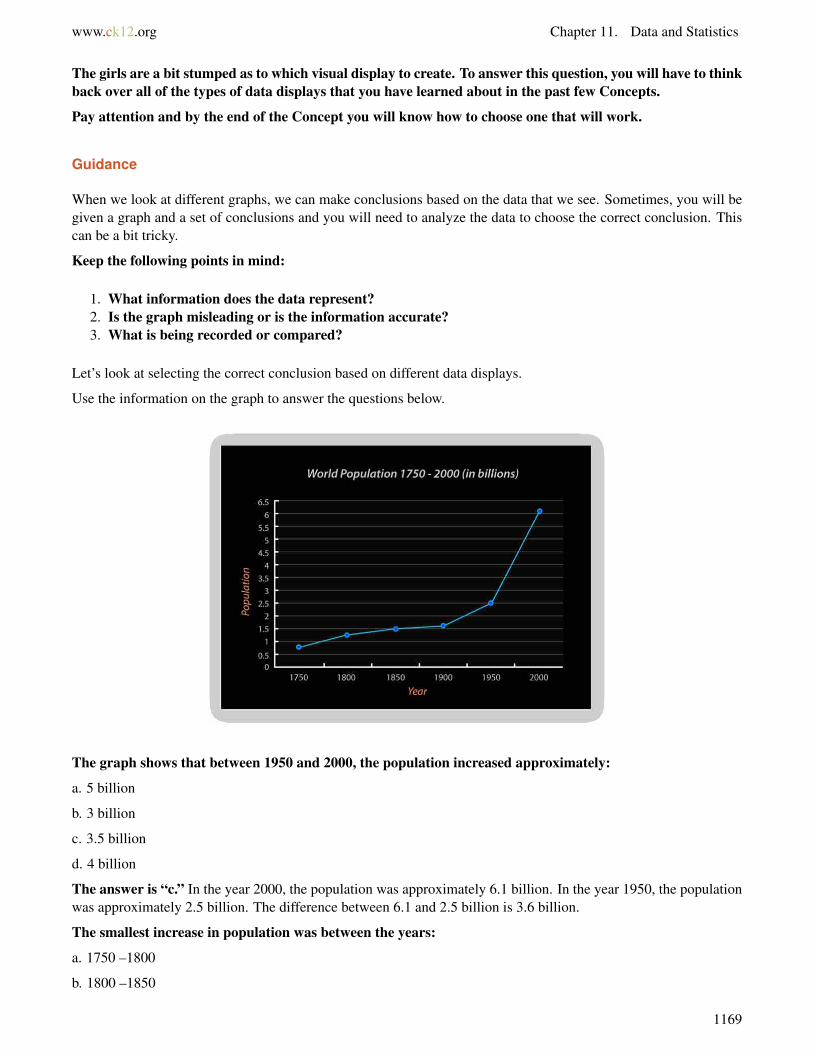
www.ck12.org Chapter 11. Data and Statistics
The girls are a bit stumped as to which visual display to create. To answer this question, you will have to thinkback over all of the types of data displays that you have learned about in the past few Concepts.
Pay attention and by the end of the Concept you will know how to choose one that will work.
Guidance
When we look at different graphs, we can make conclusions based on the data that we see. Sometimes, you will begiven a graph and a set of conclusions and you will need to analyze the data to choose the correct conclusion. Thiscan be a bit tricky.
Keep the following points in mind:
1. What information does the data represent?2. Is the graph misleading or is the information accurate?3. What is being recorded or compared?
Let’s look at selecting the correct conclusion based on different data displays.
Use the information on the graph to answer the questions below.
The graph shows that between 1950 and 2000, the population increased approximately:
a. 5 billion
b. 3 billion
c. 3.5 billion
d. 4 billion
The answer is “c.” In the year 2000, the population was approximately 6.1 billion. In the year 1950, the populationwas approximately 2.5 billion. The difference between 6.1 and 2.5 billion is 3.6 billion.
The smallest increase in population was between the years:
a. 1750 –1800
b. 1800 –1850
1169
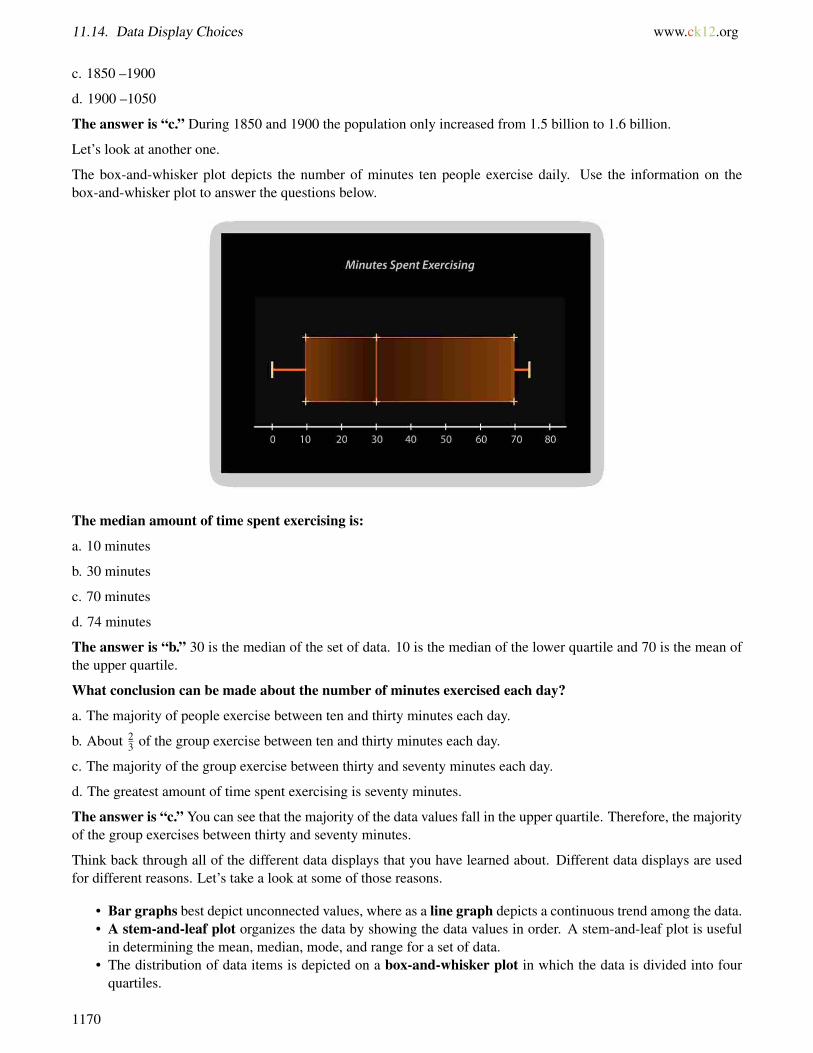
11.14. Data Display Choices www.ck12.org
c. 1850 –1900
d. 1900 –1050
The answer is “c.” During 1850 and 1900 the population only increased from 1.5 billion to 1.6 billion.
Let’s look at another one.
The box-and-whisker plot depicts the number of minutes ten people exercise daily. Use the information on thebox-and-whisker plot to answer the questions below.
The median amount of time spent exercising is:
a. 10 minutes
b. 30 minutes
c. 70 minutes
d. 74 minutes
The answer is “b.” 30 is the median of the set of data. 10 is the median of the lower quartile and 70 is the mean ofthe upper quartile.
What conclusion can be made about the number of minutes exercised each day?
a. The majority of people exercise between ten and thirty minutes each day.
b. About 23 of the group exercise between ten and thirty minutes each day.
c. The majority of the group exercise between thirty and seventy minutes each day.
d. The greatest amount of time spent exercising is seventy minutes.
The answer is “c.” You can see that the majority of the data values fall in the upper quartile. Therefore, the majorityof the group exercises between thirty and seventy minutes.
Think back through all of the different data displays that you have learned about. Different data displays are usedfor different reasons. Let’s take a look at some of those reasons.
• Bar graphs best depict unconnected values, where as a line graph depicts a continuous trend among the data.• A stem-and-leaf plot organizes the data by showing the data values in order. A stem-and-leaf plot is useful
in determining the mean, median, mode, and range for a set of data.• The distribution of data items is depicted on a box-and-whisker plot in which the data is divided into four
quartiles.
1170

www.ck12.org Chapter 11. Data and Statistics
• A histogram shows the frequency of data on a graph.
The data table below depicts the amount of money Mary had in her savings account each month over the course ofone year. Choose the most appropriate display for the data.
TABLE 11.43:
Month DepositJanuary $40.00February $75.00March $145.00April $175.00May $178.00June $237.00July $240.00August $250.00September $260.00October $270.00November $275.00December $280.00
Since the data table depicts data values over time, a line graph would most appropriately display the data.
The table below depicts the mean temperature (measured in Kelvin) of each planet in our solar system. Use whatyou have learned in the past Concepts to display the data from the table on a bar and line graph, a stem-and-leaf plot,a box-and-whisker plot, and a histogram.
TABLE 11.44:
Planet Mean Temperature (Kelvin)Mercury 452Venus 726Earth 305Mars 285Jupiter 120Saturn 59Uranus 48Neptune 37
1171
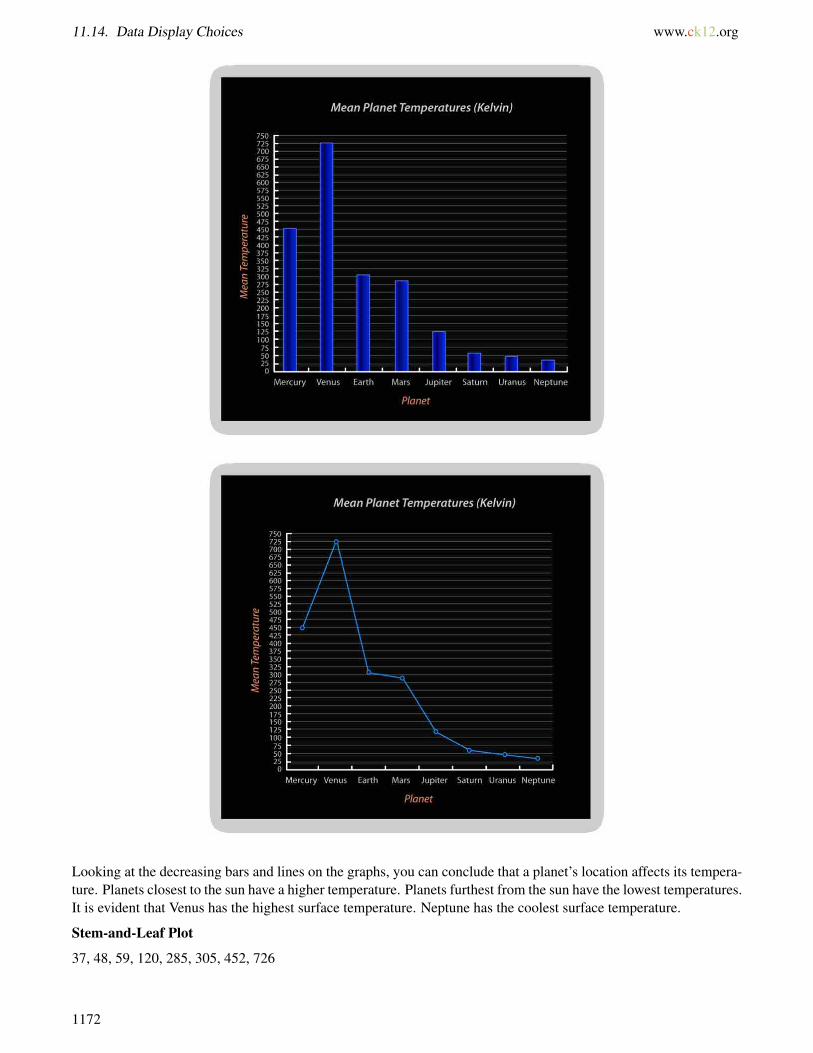
11.14. Data Display Choices www.ck12.org
Looking at the decreasing bars and lines on the graphs, you can conclude that a planet’s location affects its tempera-ture. Planets closest to the sun have a higher temperature. Planets furthest from the sun have the lowest temperatures.It is evident that Venus has the highest surface temperature. Neptune has the coolest surface temperature.
Stem-and-Leaf Plot
37, 48, 59, 120, 285, 305, 452, 726
1172
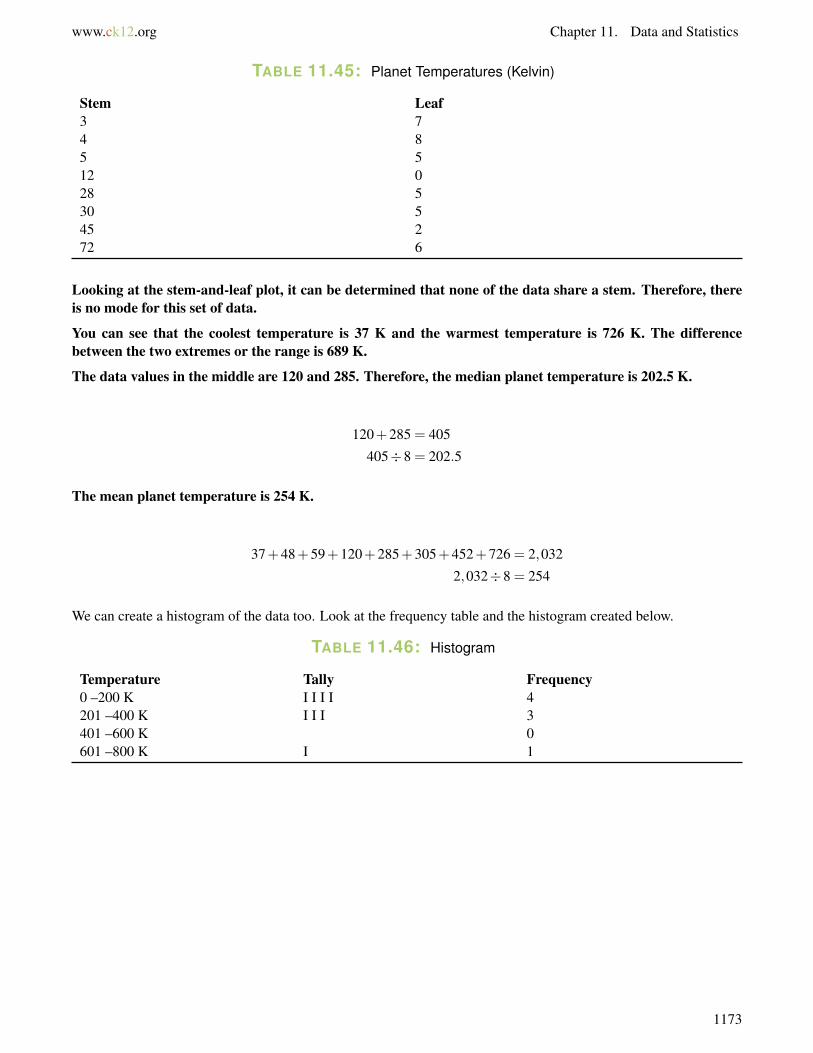
www.ck12.org Chapter 11. Data and Statistics
TABLE 11.45: Planet Temperatures (Kelvin)
Stem Leaf3 74 85 512 028 530 545 272 6
Looking at the stem-and-leaf plot, it can be determined that none of the data share a stem. Therefore, thereis no mode for this set of data.
You can see that the coolest temperature is 37 K and the warmest temperature is 726 K. The differencebetween the two extremes or the range is 689 K.
The data values in the middle are 120 and 285. Therefore, the median planet temperature is 202.5 K.
120+285 = 405
405÷8 = 202.5
The mean planet temperature is 254 K.
37+48+59+120+285+305+452+726 = 2,032
2,032÷8 = 254
We can create a histogram of the data too. Look at the frequency table and the histogram created below.
TABLE 11.46: Histogram
Temperature Tally Frequency0 –200 K I I I I 4201 –400 K I I I 3401 –600 K 0601 –800 K I 1
1173
11.14. Data Display Choices www.ck12.org
Now it’s time to draw some conclusions based on our data displays.
Looking at the histogram, it is apparent that most temperatures fall between zero and two hundred Kelvin. Threeplanets have surface temperatures that fall between two hundred one Kelvin and four hundred Kelvin. None of theplanets have a surface temperature between four hundred one and six hundred Kelvin. One planet has a temperaturebetween six hundred one and eight hundred Kelvin.
By looking at the same data in different ways, we become very familiar with the data. One visual way maymake more sense to you than another. No matter which ones you create, you can use visual displays of data toanswer questions and draw conclusions. Here is the original problem once again. Reread the problem andunderline any important information.
Kelly wants to learn about the famous women who have raced in the Iditarod.
“There is a lot of talk about the men, but there must have been some famous women,” she said in class one day.
“Actually, that is a good point Kelly,” Mr. Hawkins said. “There is one famous woman in particular. Would you bewilling to do some research and present some information on her?”
“I would,” Kelly said smiling.
“I’ll help,” Tabitha said from across the room.
“Alright, good and the rest of you can continue on your projects.”
Kelly and Tabitha got right to work. After looking up some information on the computer and in a few books on theIditarod, they discovered that this famous woman was Susan Butcher. She was an amazing woman who won the
1174
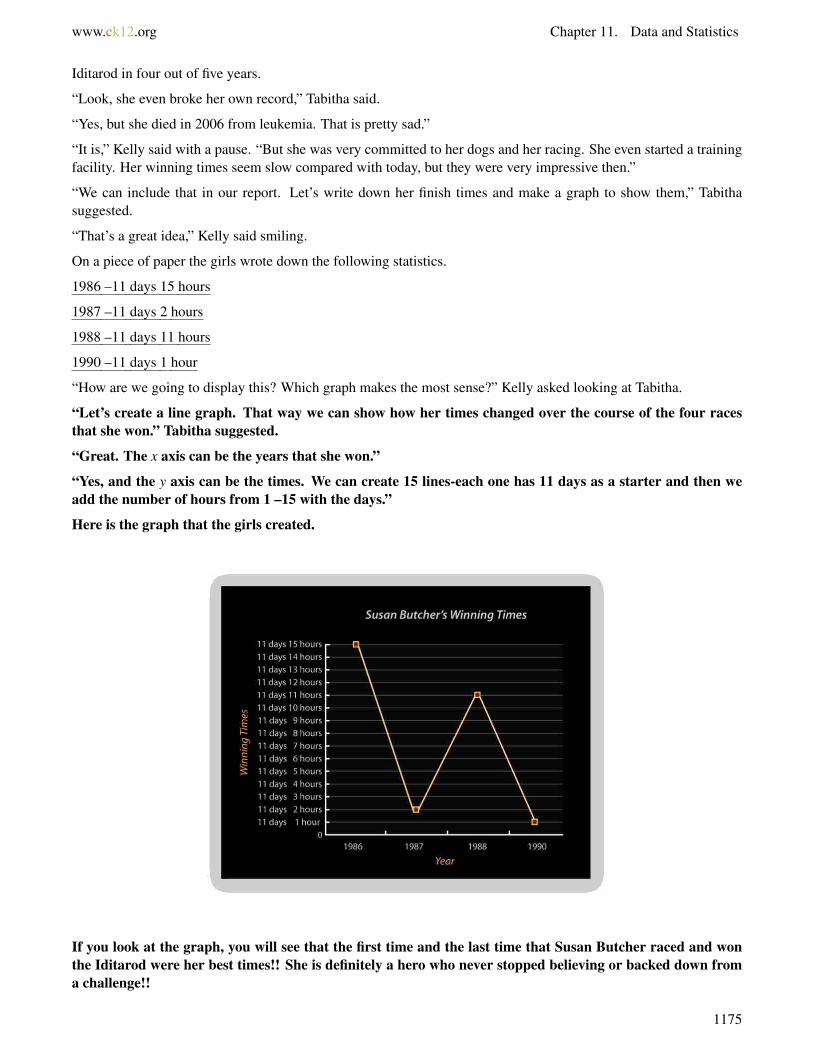
www.ck12.org Chapter 11. Data and Statistics
Iditarod in four out of five years.
“Look, she even broke her own record,” Tabitha said.
“Yes, but she died in 2006 from leukemia. That is pretty sad.”
“It is,” Kelly said with a pause. “But she was very committed to her dogs and her racing. She even started a trainingfacility. Her winning times seem slow compared with today, but they were very impressive then.”
“We can include that in our report. Let’s write down her finish times and make a graph to show them,” Tabithasuggested.
“That’s a great idea,” Kelly said smiling.
On a piece of paper the girls wrote down the following statistics.
1986 –11 days 15 hours
1987 –11 days 2 hours
1988 –11 days 11 hours
1990 –11 days 1 hour
“How are we going to display this? Which graph makes the most sense?” Kelly asked looking at Tabitha.
“Let’s create a line graph. That way we can show how her times changed over the course of the four racesthat she won.” Tabitha suggested.
“Great. The x axis can be the years that she won.”
“Yes, and the y axis can be the times. We can create 15 lines-each one has 11 days as a starter and then weadd the number of hours from 1 –15 with the days.”
Here is the graph that the girls created.
If you look at the graph, you will see that the first time and the last time that Susan Butcher raced and wonthe Iditarod were her best times!! She is definitely a hero who never stopped believing or backed down froma challenge!!
1175
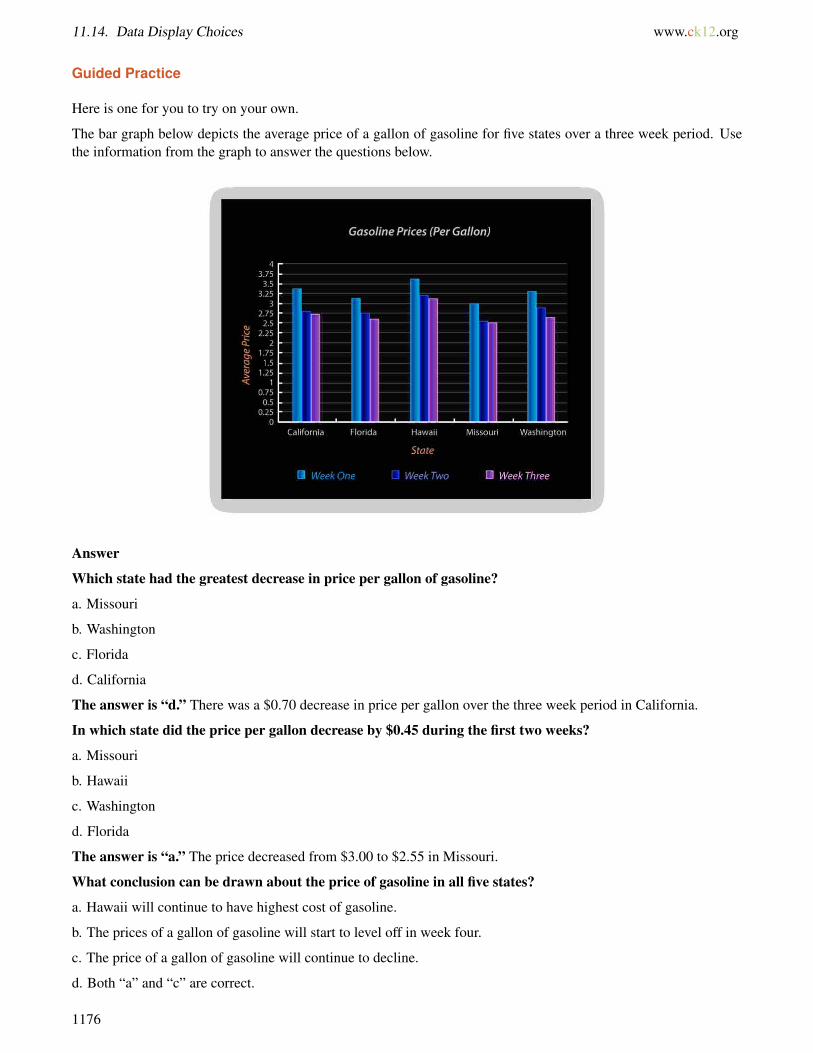
11.14. Data Display Choices www.ck12.org
Guided Practice
Here is one for you to try on your own.
The bar graph below depicts the average price of a gallon of gasoline for five states over a three week period. Usethe information from the graph to answer the questions below.
Answer
Which state had the greatest decrease in price per gallon of gasoline?
a. Missouri
b. Washington
c. Florida
d. California
The answer is “d.” There was a $0.70 decrease in price per gallon over the three week period in California.
In which state did the price per gallon decrease by $0.45 during the first two weeks?
a. Missouri
b. Hawaii
c. Washington
d. Florida
The answer is “a.” The price decreased from $3.00 to $2.55 in Missouri.
What conclusion can be drawn about the price of gasoline in all five states?
a. Hawaii will continue to have highest cost of gasoline.
b. The prices of a gallon of gasoline will start to level off in week four.
c. The price of a gallon of gasoline will continue to decline.
d. Both “a” and “c” are correct.
1176
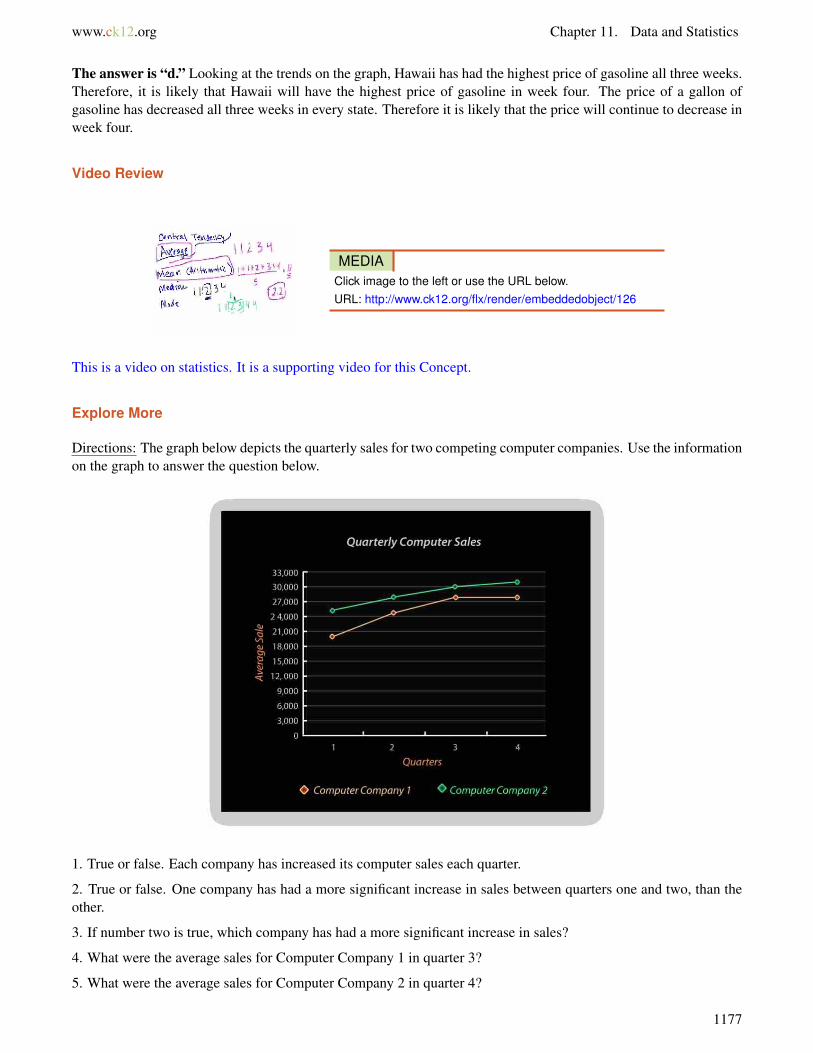
www.ck12.org Chapter 11. Data and Statistics
The answer is “d.” Looking at the trends on the graph, Hawaii has had the highest price of gasoline all three weeks.Therefore, it is likely that Hawaii will have the highest price of gasoline in week four. The price of a gallon ofgasoline has decreased all three weeks in every state. Therefore it is likely that the price will continue to decrease inweek four.
Video Review
MEDIAClick image to the left or use the URL below.URL: http://www.ck12.org/flx/render/embeddedobject/126
This is a video on statistics. It is a supporting video for this Concept.
Explore More
Directions: The graph below depicts the quarterly sales for two competing computer companies. Use the informationon the graph to answer the question below.
1. True or false. Each company has increased its computer sales each quarter.
2. True or false. One company has had a more significant increase in sales between quarters one and two, than theother.
3. If number two is true, which company has had a more significant increase in sales?
4. What were the average sales for Computer Company 1 in quarter 3?
5. What were the average sales for Computer Company 2 in quarter 4?
1177
11.14. Data Display Choices www.ck12.org
6. Which company did not show much of a change in profits from quarter 3 to quarter 4?
7. What were those average earnings?
The data table below depicts the final score for ten football games played this past season.
48 56 42 59 62 45 36 58 49 50
8. What is the most appropriate display for the data?
9. Create a display of that data.
The data below depicts the number of hours students in seventh grade spent working on a science project.
#1 #2 #3 #4 #5 #6 #7 #8 #9 #10
12 14 11 15 16 13 10 9 16 8
10. Create a bar graph of the data.
11. Create a line graph of the data.
The data table below depicts the amount of weekly allowance received by fifteen teenagers.
25 15 20 30 10 5 8 12 18 23 27 15 18 25 10
12. Create a frequency table of the data.
13. Create a histogram of the data.
14. Create a box-and-whisker plot of the data.
The data table below depicts the magnitude of the last ten earthquakes that occurred in Sacramento, Califor-nia.
3.8 4.2 4.3 5.1 3.6 4.6 3.6 3.5 4.1 4.5
15. Create a stem-and-leaf plot of the data.
16. Create a histogram of the data.
1178
www.ck12.org Chapter 11. Data and Statistics
11.15 Displaying by Type of Data
Here you’ll learn to collect, organize and display real-world survey data.
Have you ever conducted a survey?
After all of this research about the Iditarod, Thomas is inspired. He wants to conduct a survey of his classmatesabout the Iditarod.
First, Thomas has to decide upon a question. He wants to know how many 7th graders would be willing to race inthe Iditarod when they are 18 years old. He knows that a good survey question will use who, what, when, where orhow. He decides to use this question.
“Would you be willing to race in the Iditarod in Alaska when you are 18 years old?”
After learning about the youngest person to ever race in the Iditarod, Thomas decided to make his question veryspecific for age. The youngest person to ever race in the Iditarod was Dallas Seavey in 2005. He was just 18 yearsold. He has raced it several times since.
Now that Thomas has his question, he needs to figure out which sample he is going to use. He wants to survey 7th
graders like himself. Thomas only wants to survey 7th graders so that his sample will be accurate.
Thomas knows of two great places to survey students. He has narrowed it down to either the 7th grade adventureprogram or the 7th grade lunch in the cafeteria. His concern about the adventure program is that not all of the studentsare enrolled in it. With the cafeteria, every student in the 7th grade attends lunch at the same time.
Thomas is puzzled. He begins to think carefully about which group is the best survey.
What do you think? Do you have an idea why one sample group might be better versus another? This Conceptis all about surveys. You will learn all about them and why one sample creates a more accurate report. By theend of this Concept, you will know how to help Thomas with his dilemma.
Guidance
Surveys are used to collect information about a population or group of individuals. When a company would liketo know if a group of people will purchase a new product, they create a survey. When a teacher would like to knowif her students will participate in an after school science club, she creates a survey.
1179
11.15. Displaying by Type of Data www.ck12.org
The first step in surveying a group of people is to write an unbiased question. Good survey questions are shortand concise and usually begin with “Who, What, When, Where, Why, or How.”
The next step is to choose a random sample of participants. In a random sample, each member of a group hasan equal chance at being asked to participate in the survey.
After the results of the survey are in, statisticians analyze the data and use it to make estimates about groupsof people.
Then you can create a visual display of the data.
You have had lots of opportunities to graph data taken from surveys. In this lesson, you will learn to devise a surveyquestion, to choose a random sample of participants, to choose an appropriate display for the survey results, and toanalyze the data to make predictions about a group of individuals.
Write down the steps to conducting a survey in your notebook. There are four steps to the process.
Now let’s look at a situation that involves a survey.
Twenty-five households were asked to participate in a survey in which they were asked to approximate the numberof hours they watch T.V. each day. The results of the survey are listed on the table below. Determine the mostappropriate display for the given data.
4 7 2 1 0 5 3 4 5 2 1 0 3 4 5 6 3 2 1 2 3 6 4 5 4
A frequency table and histogram will depict the most and least frequent number of hours of televisionwatched.
TABLE 11.47:
Interval (Hours of Television) Tally Frequency0 –1 I I I I I 52 –3 I I I I I I I I 84 –5 I I I I I I I I I 96 –7 I I I 3
1180
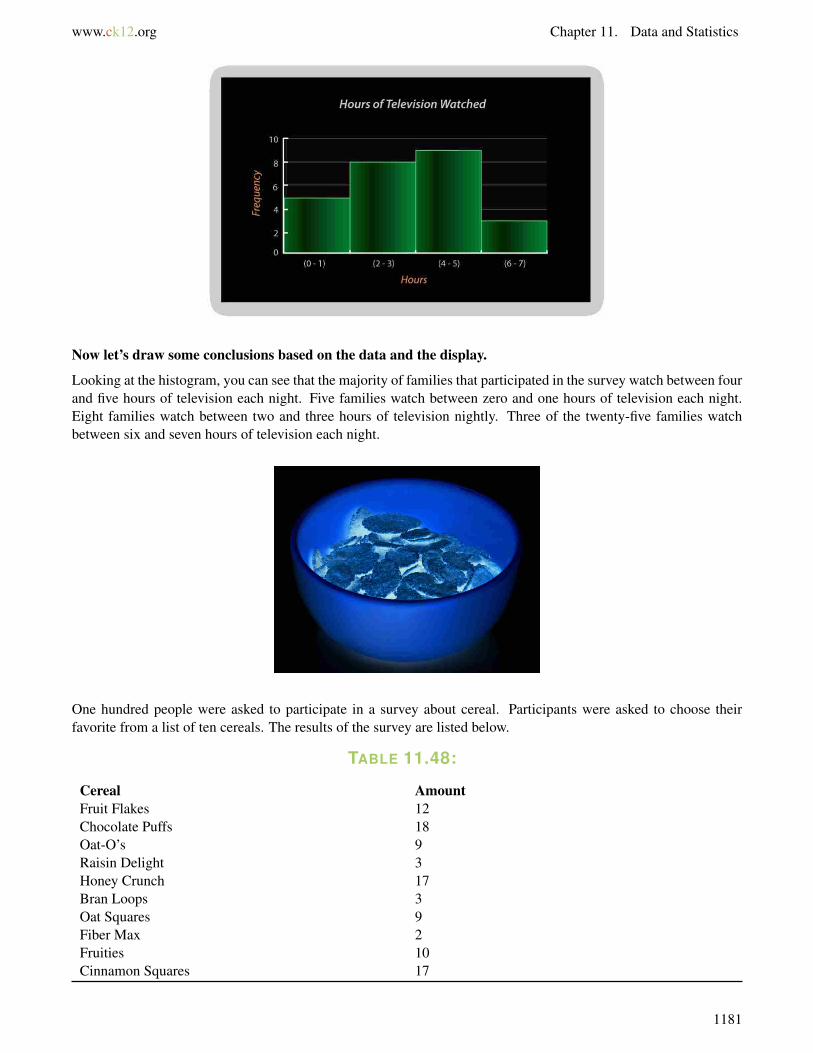
www.ck12.org Chapter 11. Data and Statistics
Now let’s draw some conclusions based on the data and the display.
Looking at the histogram, you can see that the majority of families that participated in the survey watch between fourand five hours of television each night. Five families watch between zero and one hours of television each night.Eight families watch between two and three hours of television nightly. Three of the twenty-five families watchbetween six and seven hours of television each night.
One hundred people were asked to participate in a survey about cereal. Participants were asked to choose theirfavorite from a list of ten cereals. The results of the survey are listed below.
TABLE 11.48:
Cereal AmountFruit Flakes 12Chocolate Puffs 18Oat-O’s 9Raisin Delight 3Honey Crunch 17Bran Loops 3Oat Squares 9Fiber Max 2Fruities 10Cinnamon Squares 17
1181
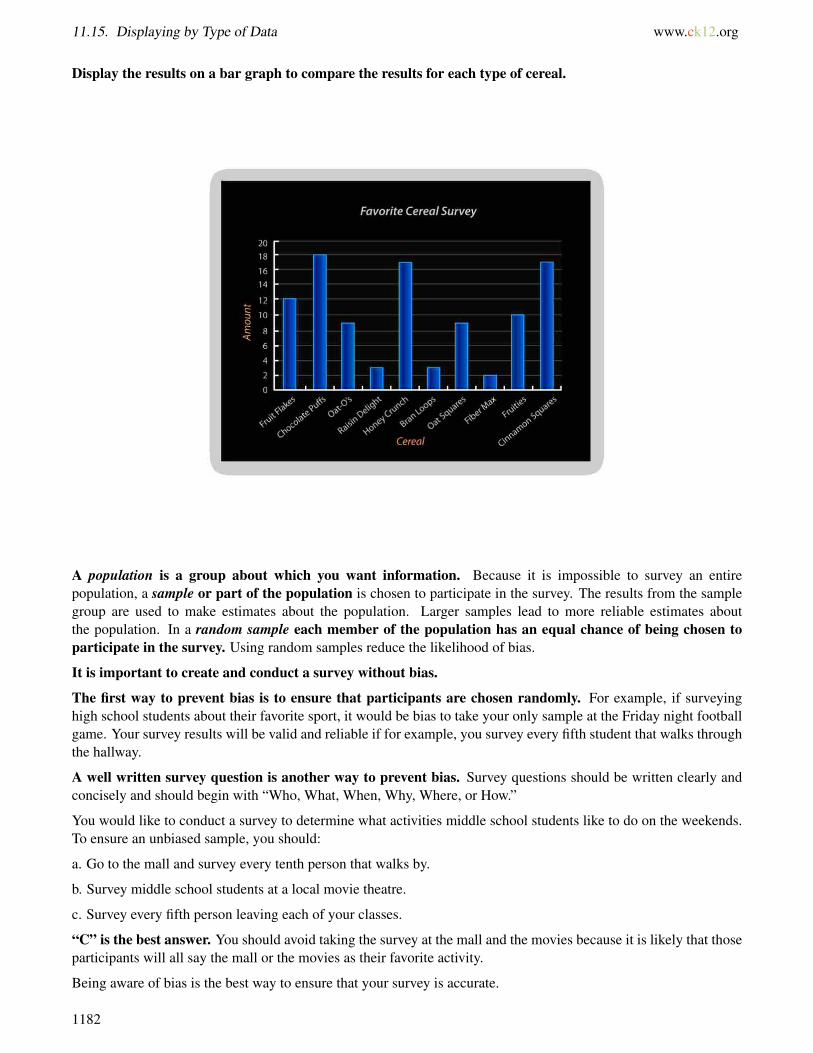
11.15. Displaying by Type of Data www.ck12.org
Display the results on a bar graph to compare the results for each type of cereal.
A population is a group about which you want information. Because it is impossible to survey an entirepopulation, a sample or part of the population is chosen to participate in the survey. The results from the samplegroup are used to make estimates about the population. Larger samples lead to more reliable estimates aboutthe population. In a random sample each member of the population has an equal chance of being chosen toparticipate in the survey. Using random samples reduce the likelihood of bias.
It is important to create and conduct a survey without bias.
The first way to prevent bias is to ensure that participants are chosen randomly. For example, if surveyinghigh school students about their favorite sport, it would be bias to take your only sample at the Friday night footballgame. Your survey results will be valid and reliable if for example, you survey every fifth student that walks throughthe hallway.
A well written survey question is another way to prevent bias. Survey questions should be written clearly andconcisely and should begin with “Who, What, When, Why, Where, or How.”
You would like to conduct a survey to determine what activities middle school students like to do on the weekends.To ensure an unbiased sample, you should:
a. Go to the mall and survey every tenth person that walks by.
b. Survey middle school students at a local movie theatre.
c. Survey every fifth person leaving each of your classes.
“C” is the best answer. You should avoid taking the survey at the mall and the movies because it is likely that thoseparticipants will all say the mall or the movies as their favorite activity.
Being aware of bias is the best way to ensure that your survey is accurate.
1182
www.ck12.org Chapter 11. Data and Statistics
Here is the original problem once again. Reread it and then read the conclusion to the problem at the end.
After all of this research about the Iditarod, Thomas is inspired. He wants to conduct a survey of his classmatesabout the Iditarod.
First, Thomas has to decide upon a question. He wants to know how many 7th graders would be willing to race inthe Iditarod when they are 18 years old. He knows that a good survey question will use who, what, when, where orhow. He decides to use this question.
“Would you be willing to race in the Iditarod in Alaska when you are 18 years old?”
After learning about the youngest person to ever race in the Iditarod, Thomas decided to make his question veryspecific for age. The youngest person to ever race in the Iditarod was Dallas Seavey in 2005. He was just 18 yearsold. He has raced it several times since.
Now that Thomas has his question, he needs to figure out which sample he is going to use. He wants to survey 7th
graders like himself. Thomas only wants to survey 7th graders so that his sample will be accurate.
Thomas knows of two great places to survey students. He has narrowed it down to either the 7th grade adventureprogram or the 7th grade lunch in the cafeteria. His concern about the adventure program is that not all of the studentsare enrolled in it. With the cafeteria, every student in the 7th grade attends lunch at the same time.
Thomas is puzzled. He begins to think carefully about which group is the best survey.
When Thomas began to think about the two groups, he started to develop some ideas why one might be abetter survey group than the other. He started with the adventure group.
Adventure Group
-loves outdoor adventure
-probably has heard of the Iditarod
-enthusiastic about outdoor challenges
-not everyone is registered-not an accurate sample of all of the 7th grade
Then Thomas began to think about his question. Because he wants to know how many 7th graders would bewilling to race in the Iditarod when they are 18 years old, he needs to sample the largest group of 7th gradersthat he can.
Because every 7th grader eats lunch at the same time in the cafeteria, asking every other person in line forlunch the question will give Thomas a lot of information for his survey.
Then he call tally his results and report his findings.
1183
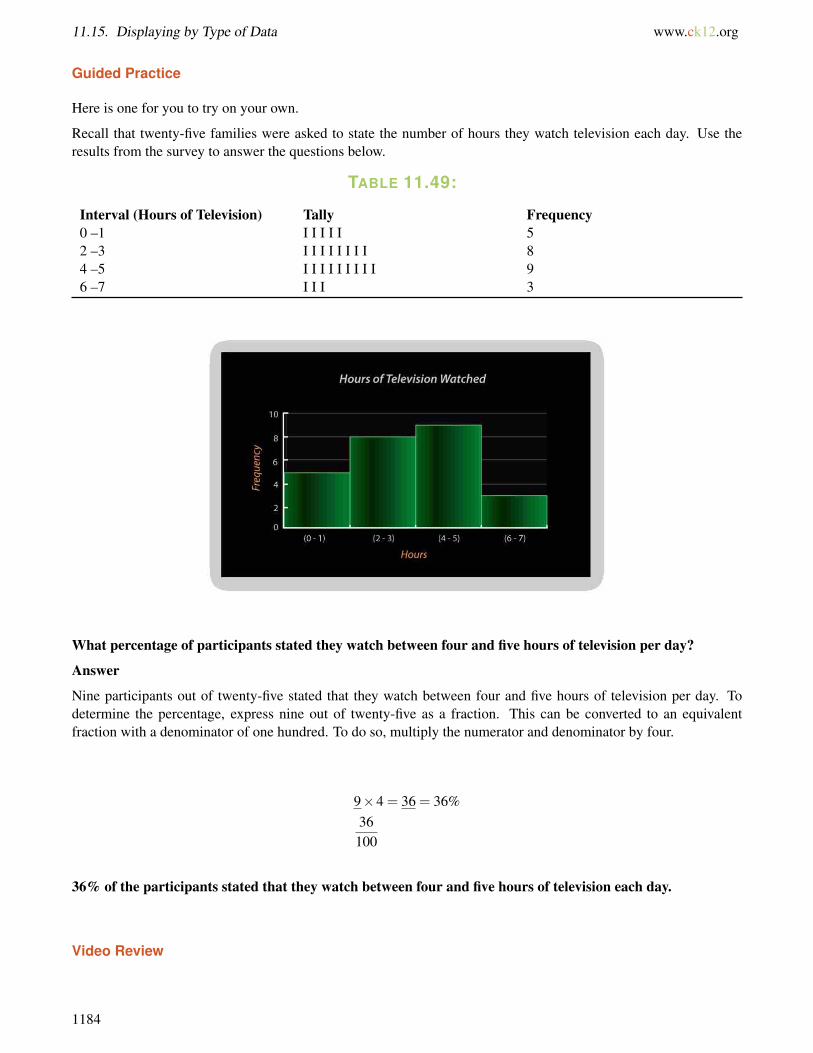
11.15. Displaying by Type of Data www.ck12.org
Guided Practice
Here is one for you to try on your own.
Recall that twenty-five families were asked to state the number of hours they watch television each day. Use theresults from the survey to answer the questions below.
TABLE 11.49:
Interval (Hours of Television) Tally Frequency0 –1 I I I I I 52 –3 I I I I I I I I 84 –5 I I I I I I I I I 96 –7 I I I 3
What percentage of participants stated they watch between four and five hours of television per day?
Answer
Nine participants out of twenty-five stated that they watch between four and five hours of television per day. Todetermine the percentage, express nine out of twenty-five as a fraction. This can be converted to an equivalentfraction with a denominator of one hundred. To do so, multiply the numerator and denominator by four.
9×4 = 36 = 36%36
100
36% of the participants stated that they watch between four and five hours of television each day.
Video Review
1184
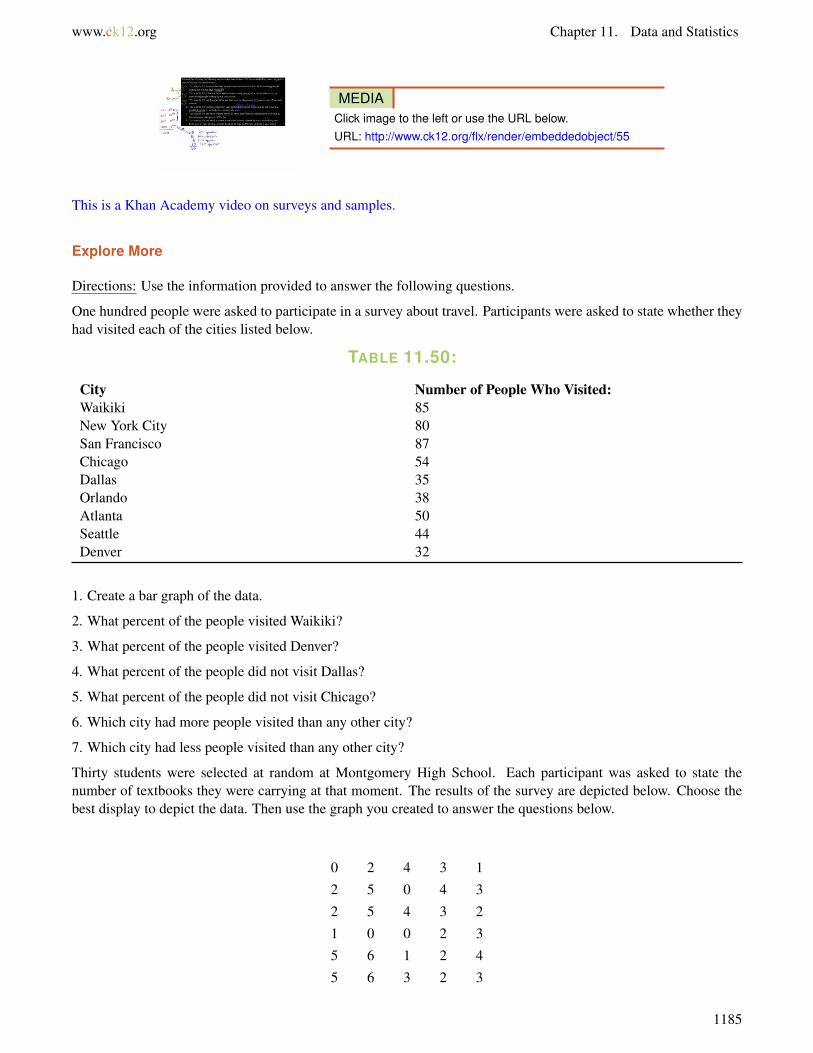
www.ck12.org Chapter 11. Data and Statistics
MEDIAClick image to the left or use the URL below.URL: http://www.ck12.org/flx/render/embeddedobject/55
This is a Khan Academy video on surveys and samples.
Explore More
Directions: Use the information provided to answer the following questions.
One hundred people were asked to participate in a survey about travel. Participants were asked to state whether theyhad visited each of the cities listed below.
TABLE 11.50:
City Number of People Who Visited:Waikiki 85New York City 80San Francisco 87Chicago 54Dallas 35Orlando 38Atlanta 50Seattle 44Denver 32
1. Create a bar graph of the data.
2. What percent of the people visited Waikiki?
3. What percent of the people visited Denver?
4. What percent of the people did not visit Dallas?
5. What percent of the people did not visit Chicago?
6. Which city had more people visited than any other city?
7. Which city had less people visited than any other city?
Thirty students were selected at random at Montgomery High School. Each participant was asked to state thenumber of textbooks they were carrying at that moment. The results of the survey are depicted below. Choose thebest display to depict the data. Then use the graph you created to answer the questions below.
0 2 4 3 1
2 5 0 4 3
2 5 4 3 2
1 0 0 2 3
5 6 1 2 4
5 6 3 2 3
1185

11.15. Displaying by Type of Data www.ck12.org
8. Which graph is the best display of the data?
9. Create that graph here.
10. What percent of the students had the most common amount of books in their backpack?
11. What percent of the students had between four and seven books in their backpack?
12. How many students had 1 book in their backpacks?
13. How many students had 0 books in their backpacks?
14. What percent had 1 book?
15. What percent had 0 books?
Create a survey question. Decide who will be the sample population. Write a few sentences to describe who willtake part in the survey and how you will administer the survey. Administer the survey, record the results on a table.Choose the most appropriate display for the data. Use these questions for guidance.
16. What is your sample population?
17. How many people are in the sample?
18. Does your question use who, what, when, where or how?
19. Is your sample biased, why or why not?
20. Are your results what you expected?
Summary
Having completed this chapter, students are now ready to move on to the next Chapter. Each Concept has providedstudents with an opportunity to engage and practice skills in many Concepts including mean, median, mode, range,bar graphs, line graphs, stem-and-leaf plots, box-and-whisker plots, histograms, misleading statistics, data displaysand problem solving with surveys.
1186
www.ck12.org Chapter 12. Probability
CHAPTER 12 ProbabilityChapter Outline
12.1 DEFINITION OF PROBABILITY
12.2 MEASUREMENT OF PROBABILITY
12.3 EMPIRICAL PROBABILITY
12.4 MUTUALLY EXCLUSIVE EVENTS
12.5 MUTUALLY INCLUSIVE EVENTS
12.6 COMPLEMENT RULE FOR PROBABILITY
12.7 COUNTING EVENTS
12.8 SAMPLE SPACES AND EVENTS
12.9 ADDITIVE AND MULTIPLICATIVE RULES FOR PROBABILITY
12.10 BASIC COUNTING RULES
12.11 COUNTING RULE TO CALCULATE PROBABILITIES
12.12 PERMUTATIONS
12.13 PERMUTATION PROBLEMS
12.14 COMBINATIONS
12.15 COMBINATION PROBLEMS
12.16 INDEPENDENT EVENTS
12.17 PROBABILITY OF INDEPENDENT EVENTS
12.18 DEPENDENT EVENTS
Introduction
In Math 7, the learning content is divided into Concepts. Each Concept is complete and whole providing focusedlearning on an indicated objective. Theme-based Concepts provide students with experiences that integrate thecontent of each Concept. Students are given opportunities to practice the skills of each Concept through real-worldsituations, examples, guided practice and independent practice sections. There are also video links provided to givestudents an audio/visual way of connecting with the content. In this Chapter, students will engage with Conceptson writing and calculating theoretical probability, experimental probability, disjoint events, complementary events,overlapping events, tree diagrams, sample spaces, the Counting Principle, factorials, permutations, combinations,tree diagrams, independent and dependent events.
1187
12.1. Definition of Probability www.ck12.org
12.1 Definition of Probability
Here you’ll learn to calculate simple theoretical probability.
Have you ever been in a talent show? Take a look at this dilemma.
Since the opening of J.S. Middle School, a tradition has been the end of the year talent show. The school opened tenyears ago, and within that time there have been 8 talent shows. There were two years when the school was not ableto host one because there was flooding or repairs were being done in auditorium.
“I wonder if we are going to have the talent show this year,” Carmen asked at lunch one day.
“I am sure that we are,” Tyler said biting into his ham sandwich. “After all, there were only two years that the talentshow did not happen and that was because of the circumstances.”
“Well, are there any circumstances this year?”
“I don’t think so. The probability is high that it is going to happen.”
“What is the probability of the talent show happening?” Carmen asked taking a sip of milk.
Before Tyler answers, let’s think about this. What is the probability of the event happening?
To answer this question, you need to know about probability. This Concept will teach you how to figure outprobability by thinking about favorable outcomes and total outcomes. By the end of the Concept, you willknow how to answer this question.
Guidance
Probability is something that you hear about all the time. Anytime you talk about the chances that something willor won’t happen, you are talking about probability. The trick about probability is that it isn’t just about talking. It isalso about math. There are mathematical ways of figuring out the likelihood that an event is going to or not going tooccur. But let’s start with an understanding of probability.
What is probability?
Probability is the likelihood that an event will occur. It is a mathematical way of calculating how likely an eventis likely to occur. An event is a result of an experiment or activity that might include such things as:
• flipping a coin
1188
www.ck12.org Chapter 12. Probability
• spinning a spinner• rolling a number cube• choosing an item from a jar or bag
How do we calculate probability?
We calculate probability by looking at the ratio of favorable outcomes to total outcomes in a given situation. In ratioform, the probability of an event is:
P(event) = favorable outcomes : total outcomes
Write this ratio down in your notebook.
An outcome is a possible result of some event occurring. For example, when you flip a coin, “heads” is one outcome;tails is a second outcome. Total outcomes are computed simply by counting all possible outcomes.
Keep in mind as you go through this Concept that all outcomes used are presumed to be “fair.” That is –when youflip a coin, the outcomes of heads or tails are equally likely. When you spin a spinner, sections are all of equal sizeand equally likely to be landed on. When you toss a number cube, faces of the cube are the same size and againequally likely to be landed on. And so on.
For flipping a coin:
total outcomes = heads, tails
= 2 total outcomes
For tossing a number cube:
total outcomes = · 1 · · 2 · · · 3 · · · · 4 · · · · · 5 · · · · · · 6= 6 total outcomes
For selecting a day of the week:
1189

12.1. Definition of Probability www.ck12.org
total outcomes = Monday, Tuesday, Wednesday, Thursday, Friday, Saturday, Sunday
= 7 total outcomes
Favorable outcomes are the specific outcomes you are looking for.
For flipping a coin and having it come up heads:
favorable outcomes = heads, tails
= 1 favorable outcome
For tossing a number cube and having it come with up an even number:
favorable outcomes = · 1 · · 2 · · · 3 · · · · 4 · · · · · 5 · · · · · · 6= 3 favorable outcomes
For randomly choosing a date and have it land on a weekday:
favorable outcomes = Sunday, Monday, Tuesday, Wednesday, Thursday, Friday, Saturday
= 5 favorable outcomes
To write a ratio, we compare the favorable outcome to the total outcomes. Comparing favorable outcomes topossible total outcomes is what we call theoretical probability.
Now that you know how to think about theoretical probability, we can look at calculating some simpleprobabilities. Remember, that we are going to be writing ratios that compare favorable outcomes with totaloutcomes.
The probability of any event is written as P(event). So:
P(A) is the probability that event A will occur.
P(heads) is the probability that heads will turn up on a flipped coin.
P(5) is the probability that a number cube will turn up as 5
Here is another one.
What is the probability of flipping heads on a coin?
To work through this probability, we are going to be writing a ratio that compares the number of favorableoutcomes with the total number of outcomes.
Favorable outcome = 1 since there is one heads on a coin
Total outcomes = 2 since there is the possibility of heads or tails
The answer is 1:2.
1190
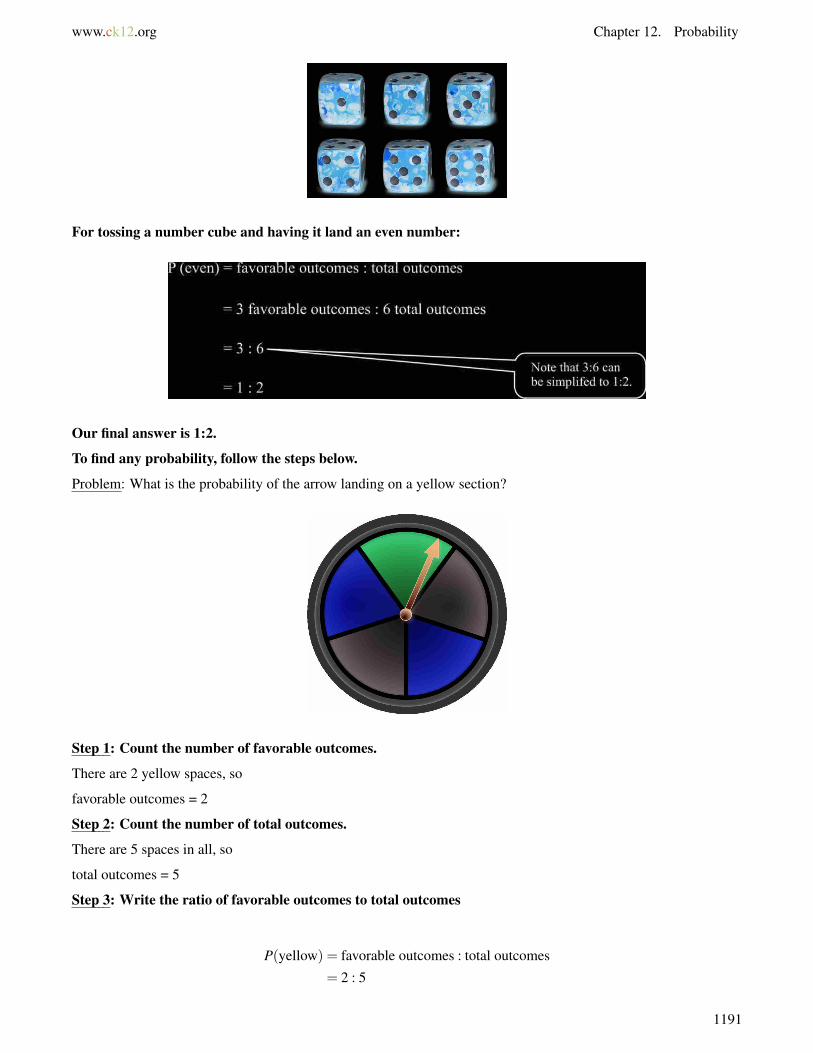
www.ck12.org Chapter 12. Probability
For tossing a number cube and having it land an even number:
Our final answer is 1:2.
To find any probability, follow the steps below.
Problem: What is the probability of the arrow landing on a yellow section?
Step 1: Count the number of favorable outcomes.
There are 2 yellow spaces, so
favorable outcomes = 2
Step 2: Count the number of total outcomes.
There are 5 spaces in all, so
total outcomes = 5
Step 3: Write the ratio of favorable outcomes to total outcomes
P(yellow) = favorable outcomes : total outcomes
= 2 : 5
1191
12.1. Definition of Probability www.ck12.org
Take a few minutes to write these steps in your notebook.
Write each theoretical probability. Be sure to simplify the ratio when necessary.
Example A
What is the probability of rolling a 1 or a 3 on a number cube?
Solution: 2:6 or 1:3
Example B
If there are four blue marbles and one red marble in a bag, what is the probability of pulling out a red one?
Solution: 1:5
Example C
What is the probability of pulling out a blue one?
Solution: 4:5
Here is the original problem once again. Reread it and then answer the following questions about probability.
Since the opening of J.S. Middle School, a tradition has been the end of the year talent show. The school opened tenyears ago, and within that time there have been 8 talent shows. There were two years when the school was not ableto host one because there was flooding or repairs were being done in auditorium.
“I wonder if we are going to have the talent show this year,” Carmen asked at lunch one day.
1192
www.ck12.org Chapter 12. Probability
“I am sure that we are,” Tyler said biting into his ham sandwich. “After all, there were only two years that the talentshow did not happen and that was because of the circumstances.”
“Well, are there any circumstances this year?”
“I don’t think so. The probability is high that is going to happen.”
“What is the probability of the talent show happening?” Carmen asked taking a sip of milk.
To think about the probability of the talent show happening, we can take the data from the past ten years andcreate a ratio.
Probability = f avorable outcomestotal outcomes
In the past ten years, there have been 8 talent shows. There have been ten possible years to calculate with.These are the total outcomes. Here is our ratio.
8:10
Guided Practice
Here is one for you to try on your own.
What is the probability of the arrow landing on a silver or pink section?
Answer
Step 1: Count the number of favorable outcomes.
There are 2 silver spaces and 1 pink space, so
favorable outcomes = 3
Step 2: Count the number of total outcomes.
There are 5 spaces in all, so
total outcomes = 5
Step 3: Write the ratio of favorable outcomes to total outcomes
P(silver or pink) = favorable outcomes : total outcomes = 3 : 5
This is our answer.
Video Review
MEDIAClick image to the left or use the URL below.URL: http://www.ck12.org/flx/render/embeddedobject/57627
This is a Khan Academy video on probability.
Explore More
Directions: Answer each question or solve each problem as it connects to probability.
1193
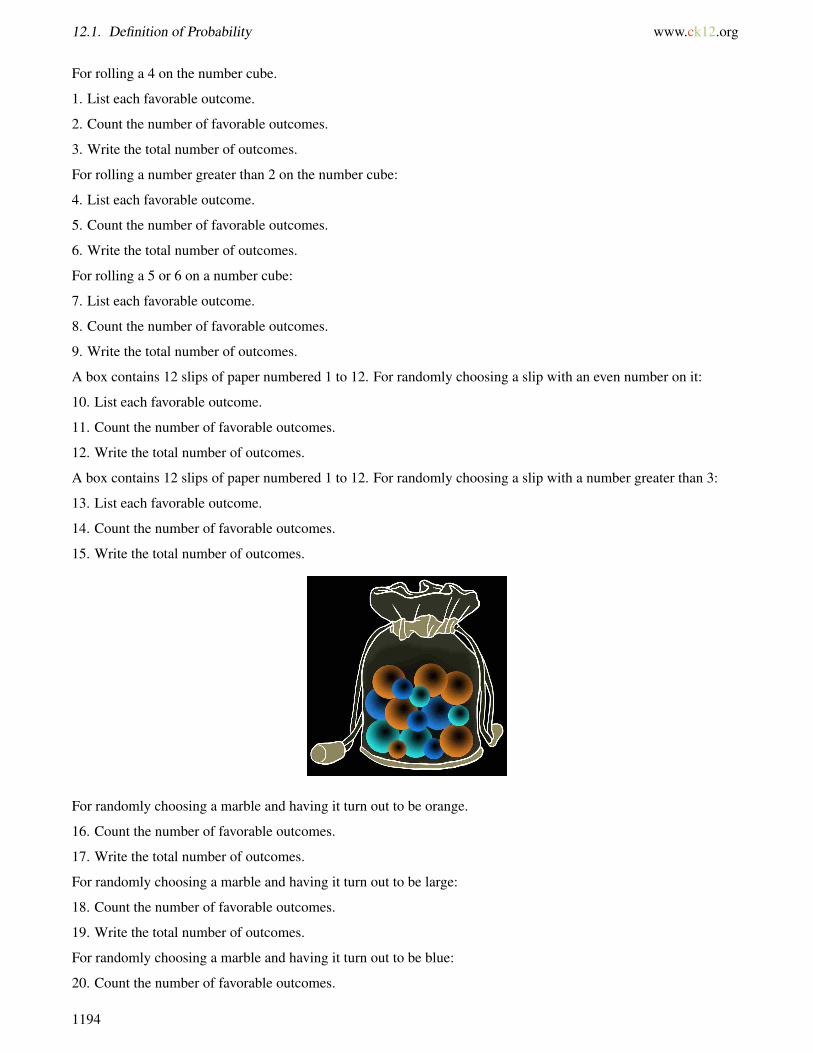
12.1. Definition of Probability www.ck12.org
For rolling a 4 on the number cube.
1. List each favorable outcome.
2. Count the number of favorable outcomes.
3. Write the total number of outcomes.
For rolling a number greater than 2 on the number cube:
4. List each favorable outcome.
5. Count the number of favorable outcomes.
6. Write the total number of outcomes.
For rolling a 5 or 6 on a number cube:
7. List each favorable outcome.
8. Count the number of favorable outcomes.
9. Write the total number of outcomes.
A box contains 12 slips of paper numbered 1 to 12. For randomly choosing a slip with an even number on it:
10. List each favorable outcome.
11. Count the number of favorable outcomes.
12. Write the total number of outcomes.
A box contains 12 slips of paper numbered 1 to 12. For randomly choosing a slip with a number greater than 3:
13. List each favorable outcome.
14. Count the number of favorable outcomes.
15. Write the total number of outcomes.
For randomly choosing a marble and having it turn out to be orange.
16. Count the number of favorable outcomes.
17. Write the total number of outcomes.
For randomly choosing a marble and having it turn out to be large:
18. Count the number of favorable outcomes.
19. Write the total number of outcomes.
For randomly choosing a marble and having it turn out to be blue:
20. Count the number of favorable outcomes.
1194

www.ck12.org Chapter 12. Probability
21. Write the total number of outcomes.
For randomly choosing a marble and having it turn out to be small:
22. Count the number of favorable outcomes.
23. Write the total number of outcomes.
For randomly choosing a marble and having it turn out to be orange and large:
24. Count the number of favorable outcomes.
25 Write the total number of outcomes.
1195
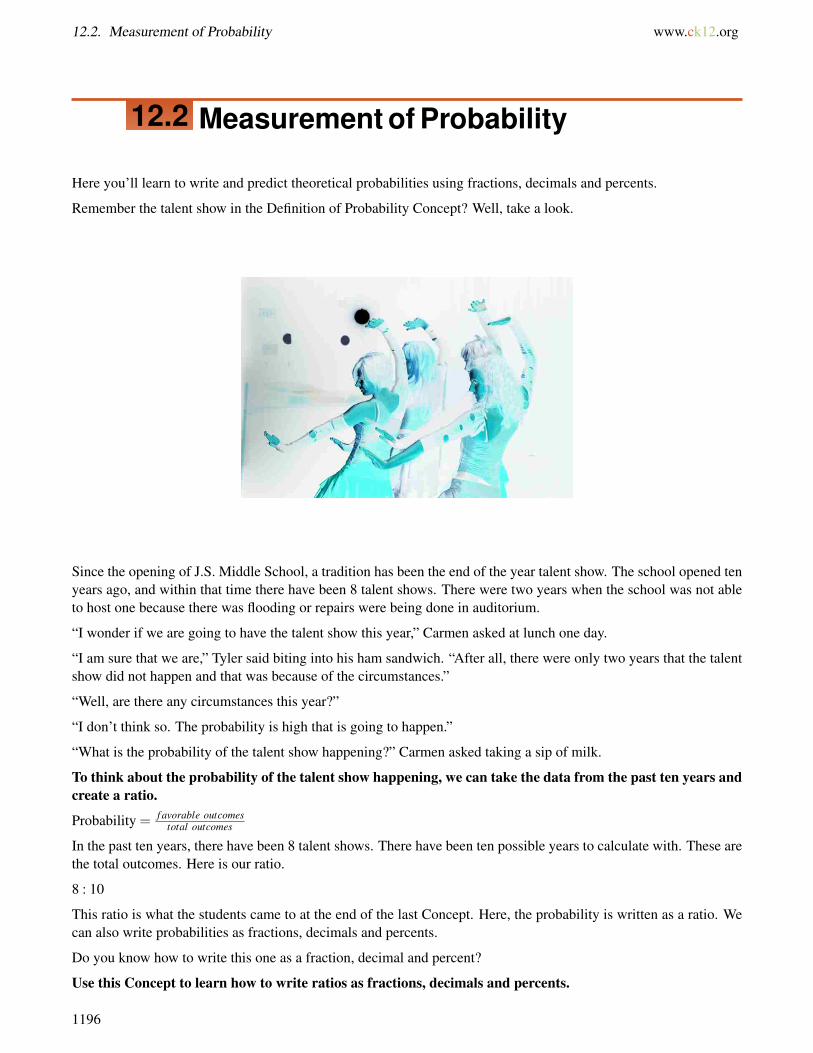
12.2. Measurement of Probability www.ck12.org
12.2 Measurement of Probability
Here you’ll learn to write and predict theoretical probabilities using fractions, decimals and percents.
Remember the talent show in the Definition of Probability Concept? Well, take a look.
Since the opening of J.S. Middle School, a tradition has been the end of the year talent show. The school opened tenyears ago, and within that time there have been 8 talent shows. There were two years when the school was not ableto host one because there was flooding or repairs were being done in auditorium.
“I wonder if we are going to have the talent show this year,” Carmen asked at lunch one day.
“I am sure that we are,” Tyler said biting into his ham sandwich. “After all, there were only two years that the talentshow did not happen and that was because of the circumstances.”
“Well, are there any circumstances this year?”
“I don’t think so. The probability is high that is going to happen.”
“What is the probability of the talent show happening?” Carmen asked taking a sip of milk.
To think about the probability of the talent show happening, we can take the data from the past ten years andcreate a ratio.
Probability = f avorable outcomestotal outcomes
In the past ten years, there have been 8 talent shows. There have been ten possible years to calculate with. These arethe total outcomes. Here is our ratio.
8 : 10
This ratio is what the students came to at the end of the last Concept. Here, the probability is written as a ratio. Wecan also write probabilities as fractions, decimals and percents.
Do you know how to write this one as a fraction, decimal and percent?
Use this Concept to learn how to write ratios as fractions, decimals and percents.
1196
www.ck12.org Chapter 12. Probability
Guidance
Previously we worked on calculating a theoretical probability. Now we can look at the different forms that probabil-ities can take.
Remember back to our work with ratios in an earlier chapter? You learned that ratios can be written asfractions, decimals and percents.
1:2 can be written as 12 or as a decimal of .50 or as a percent of 50%
Because probability is written as a ratio, we can also write probabilities as fractions, decimals and/or percents.
Here is a situation with probabilities.
A bag contains 5 black ping pong balls, 8 white ping pong balls, and 7 yellow ping pong balls. What is the probabilityof drawing a black ping pong ball from the bag?
First, let’s look at writing a ratio.
P(black) =favorable outcomes
total outcomesfavorable outcomes = 5
total outcomes = 20
P(black) = 5 : 20
= 1 : 4
Now that we have a ratio, we can easily take this ratio and write it as a fraction. Notice that the first value in the ratiobecomes the numerator and the second number becomes the denominator.
1:4 becomes 14
Next, we can take this and convert it to a decimal. There are two ways to do this.
The first way is to divide the numerator by the denominator..25
4)1.00
The decimal is .25.
The second way is to write a proportion. We can convert one-fourth to a proportion out of 100.
14=
2100
14=
25100
Now we can write it as a decimal.
.25
The proportion shows us how to convert the decimal to a percent easily.
.25 or 25100 = 25%
Now we have written the probability all four possible ways.
Let’s look at another one.
Thinking about the bag with the ping pong balls, what is the probability of choosing a yellow ping pong ball?
1197
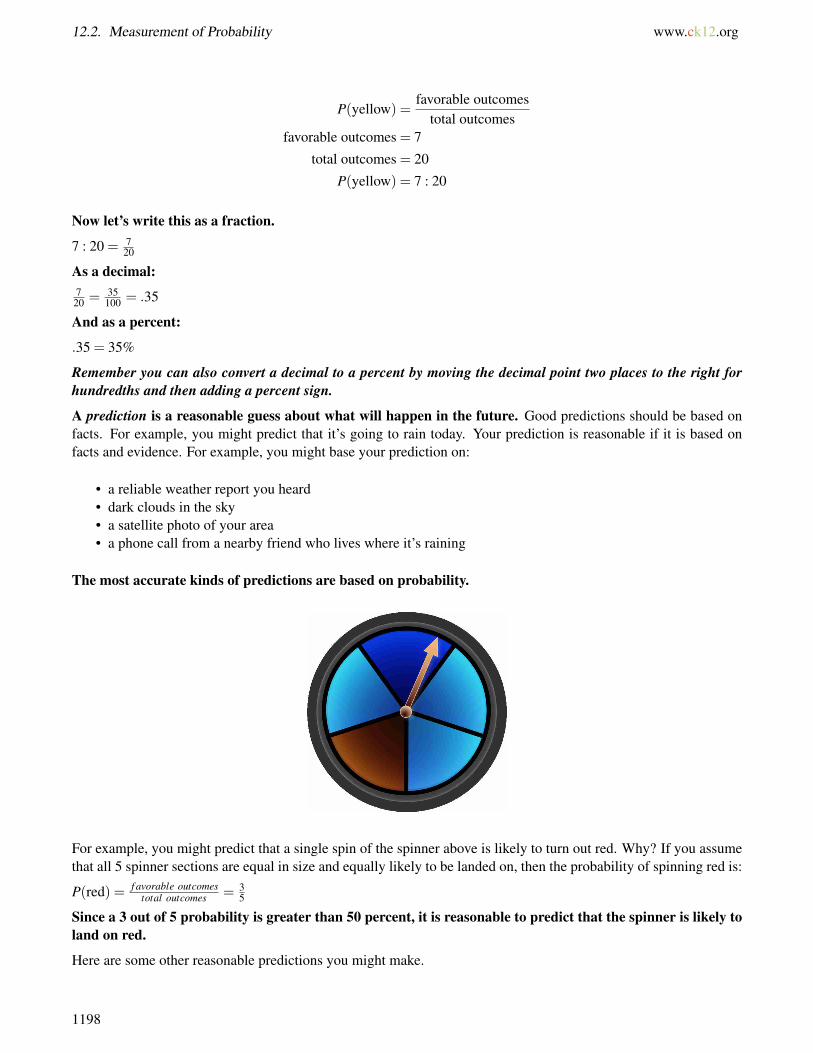
12.2. Measurement of Probability www.ck12.org
P(yellow) =favorable outcomes
total outcomesfavorable outcomes = 7
total outcomes = 20
P(yellow) = 7 : 20
Now let’s write this as a fraction.
7 : 20 = 720
As a decimal:720 = 35
100 = .35
And as a percent:
.35 = 35%
Remember you can also convert a decimal to a percent by moving the decimal point two places to the right forhundredths and then adding a percent sign.
A prediction is a reasonable guess about what will happen in the future. Good predictions should be based onfacts. For example, you might predict that it’s going to rain today. Your prediction is reasonable if it is based onfacts and evidence. For example, you might base your prediction on:
• a reliable weather report you heard• dark clouds in the sky• a satellite photo of your area• a phone call from a nearby friend who lives where it’s raining
The most accurate kinds of predictions are based on probability.
For example, you might predict that a single spin of the spinner above is likely to turn out red. Why? If you assumethat all 5 spinner sections are equal in size and equally likely to be landed on, then the probability of spinning red is:
P(red) = f avorable outcomestotal outcomes = 3
5
Since a 3 out of 5 probability is greater than 50 percent, it is reasonable to predict that the spinner is likely toland on red.
Here are some other reasonable predictions you might make.
1198

www.ck12.org Chapter 12. Probability
TABLE 12.1:
Reasonable Prediction ReasonThe spinner is more likely to land on red than blue. There are 3 red sections and only 1 blue section.The spinner is equally likely to land on blue or yellow. There spinner has an equal number of blue and yellow
sections –one each.On the average, a ratio of about 4 of 5 spins are likelyturn up blue or red.
Four out of 5 sections are blue or red.
Most of the time the spinner will not land on blue oryellow.
Blue and yellow combined make up fewer than half ofthe sections.
Not all predictions are reasonable.
For example, take a look at these unreasonable predictions.
TABLE 12.2:
Unreasonable Prediction ReasonThe spinner is more likely to land on blue before itlands on red.
There are fewer blue sections (1) than red sections (3).
The spinner will never land on blue before it lands onred.
The spinner can land on blue before it lands on red; itjust isn’t likely to occur.
Three out of every 5 spins will always be red. On the average, 3 of 5 spins will be red, but on anygiven series of spins anything can happen.
When making predictions it’s best to keep in mind that probability predicts only what is likely to happen. Allevents are subject to chance. On any given event, anything can happen. If you flip a coin 4 times, you are most likelyto land on heads twice and tails twice.
However, that doesn’t mean that on any given pair of 4 flips you might land on heads zero times, or you might landon heads 4 times. Neither event is likely, but both are possible and each will happen from time to time.
So now you might ask –what good is probability for making predictions if you can’t rely on it to be true everytime? In fact, the value of probability is very limited in the short term. But over the long term, predictions based onprobability are usually highly accurate.
In general, the greater the number of outcomes you have, the closer a prediction based on probability is likelyto be.
Now it’s your turn to practice. Write each ratio as a fraction, decimal and percent.
Example A
1 : 5
Solution: 15 , .2,20%
Example B
2 : 4
Solution: 12 , .5,50%
1199
12.2. Measurement of Probability www.ck12.org
Example C
4 : 5
Solution: 45 , .8,80%
Here is the original problem once again.
Since the opening of J.S. Middle School, a tradition has been the end of the year talent show. The school opened tenyears ago, and within that time there have been 8 talent shows. There were two years when the school was not ableto host one because there was flooding or repairs were being done in auditorium.
“I wonder if we are going to have the talent show this year,” Carmen asked at lunch one day.
“I am sure that we are,” Tyler said biting into his ham sandwich. “After all, there were only two years that the talentshow did not happen and that was because of the circumstances.”
“Well, are there any circumstances this year?”
“I don’t think so. The probability is high that is going to happen.”
“What is the probability of the talent show happening?” Carmen asked taking a sip of milk.
To think about the probability of the talent show happening, we can take the data from the past ten years andcreate a ratio.
Probability = f avorable outcomestotal outcomes
In the past ten years, there have been 8 talent shows. There have been ten possible years to calculate with. These arethe total outcomes. Here is our ratio.
8 : 10
This ratio is what the students came to at the end of the last Concept. Here, the probability is written as a ratio. Wecan also write probabilities as fractions, decimals and percents.
Do you know how to write this one as a fraction, decimal and percent?
Now we want to write the ratio as a fraction, a decimal and a percent. Here is the ratio once again.
8 : 10
We can convert this to a fraction and simplify it.810 = 4
5
Now we can convert eight to ten to a decimal.
8 : 10 = .8
1200
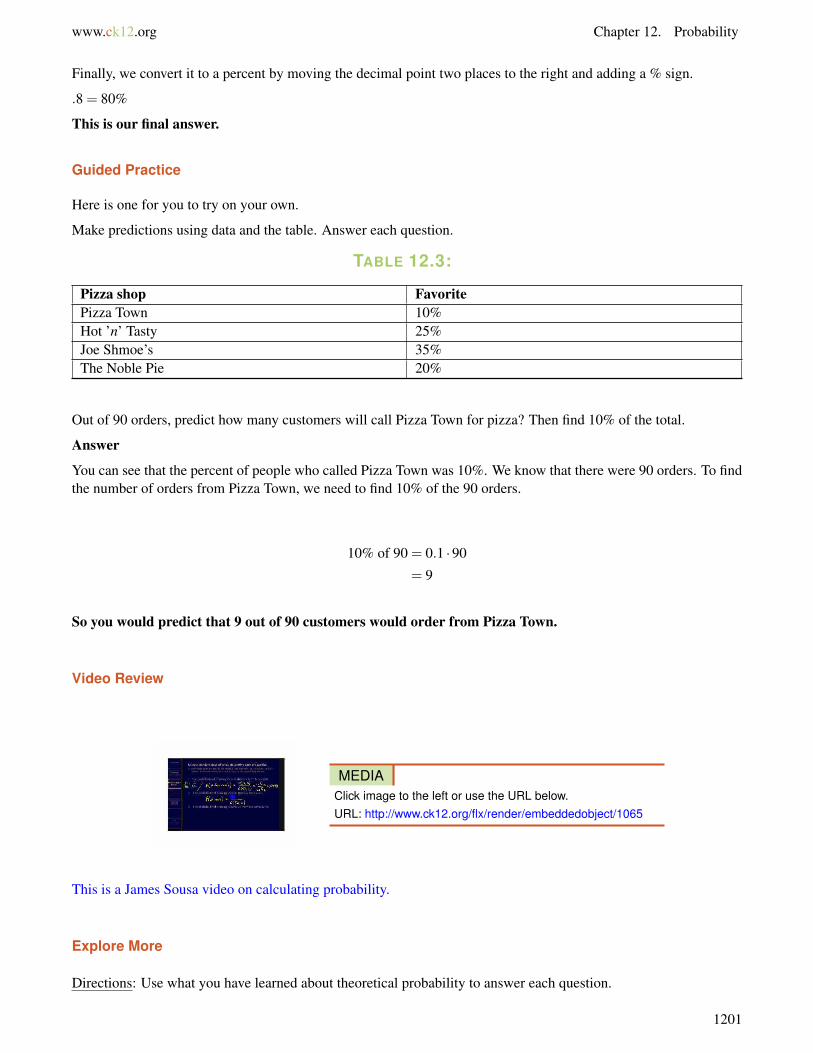
www.ck12.org Chapter 12. Probability
Finally, we convert it to a percent by moving the decimal point two places to the right and adding a % sign.
.8 = 80%
This is our final answer.
Guided Practice
Here is one for you to try on your own.
Make predictions using data and the table. Answer each question.
TABLE 12.3:
Pizza shop FavoritePizza Town 10%Hot ’n’ Tasty 25%Joe Shmoe’s 35%The Noble Pie 20%
Out of 90 orders, predict how many customers will call Pizza Town for pizza? Then find 10% of the total.
Answer
You can see that the percent of people who called Pizza Town was 10%. We know that there were 90 orders. To findthe number of orders from Pizza Town, we need to find 10% of the 90 orders.
10% of 90 = 0.1 ·90
= 9
So you would predict that 9 out of 90 customers would order from Pizza Town.
Video Review
MEDIAClick image to the left or use the URL below.URL: http://www.ck12.org/flx/render/embeddedobject/1065
This is a James Sousa video on calculating probability.
Explore More
Directions: Use what you have learned about theoretical probability to answer each question.
1201
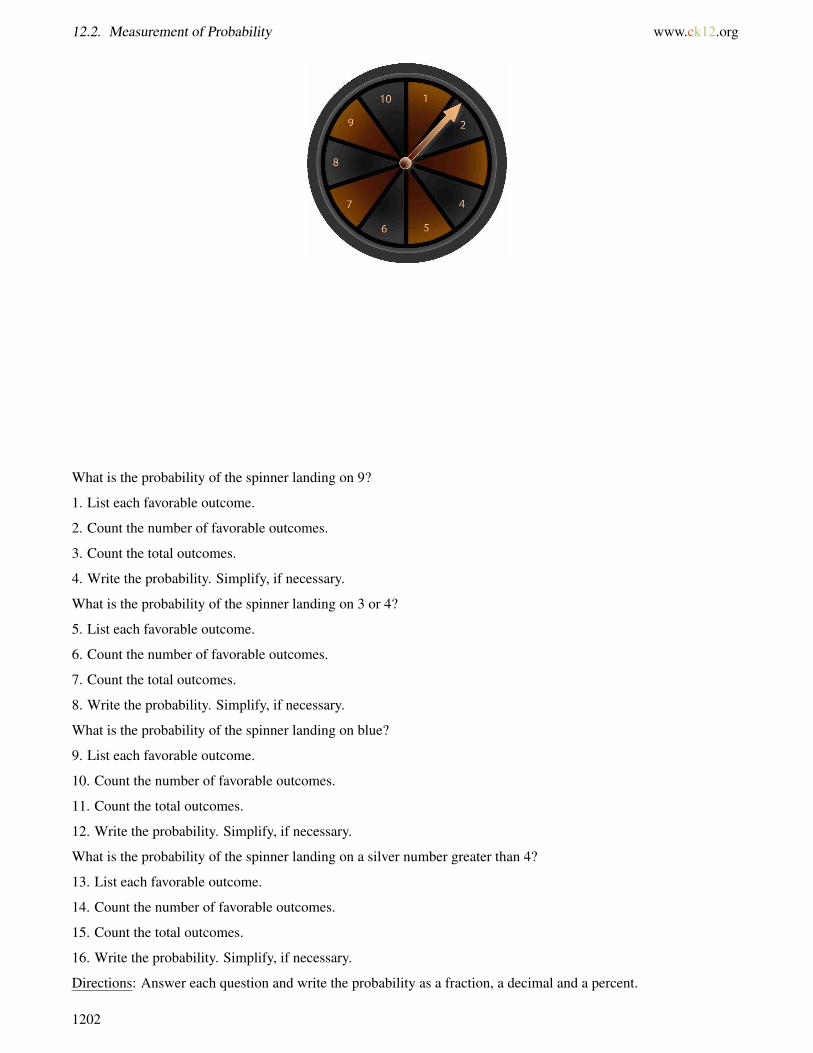
12.2. Measurement of Probability www.ck12.org
What is the probability of the spinner landing on 9?
1. List each favorable outcome.
2. Count the number of favorable outcomes.
3. Count the total outcomes.
4. Write the probability. Simplify, if necessary.
What is the probability of the spinner landing on 3 or 4?
5. List each favorable outcome.
6. Count the number of favorable outcomes.
7. Count the total outcomes.
8. Write the probability. Simplify, if necessary.
What is the probability of the spinner landing on blue?
9. List each favorable outcome.
10. Count the number of favorable outcomes.
11. Count the total outcomes.
12. Write the probability. Simplify, if necessary.
What is the probability of the spinner landing on a silver number greater than 4?
13. List each favorable outcome.
14. Count the number of favorable outcomes.
15. Count the total outcomes.
16. Write the probability. Simplify, if necessary.
Directions: Answer each question and write the probability as a fraction, a decimal and a percent.
1202
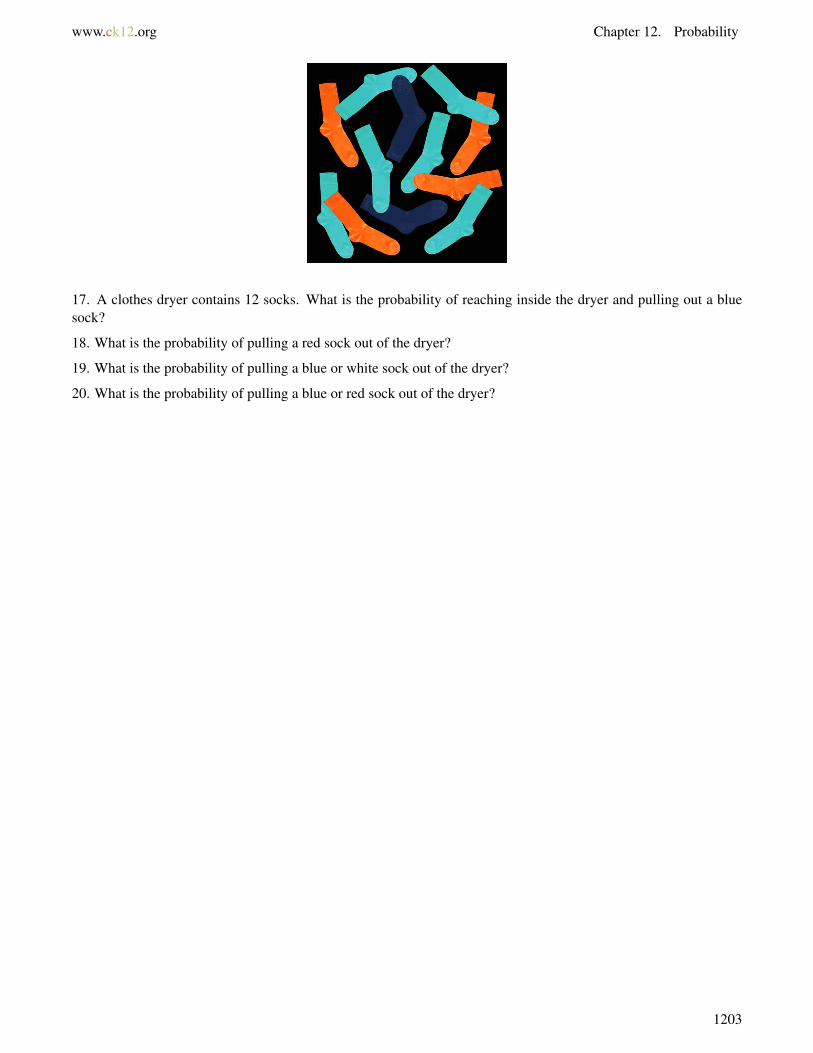
www.ck12.org Chapter 12. Probability
17. A clothes dryer contains 12 socks. What is the probability of reaching inside the dryer and pulling out a bluesock?
18. What is the probability of pulling a red sock out of the dryer?
19. What is the probability of pulling a blue or white sock out of the dryer?
20. What is the probability of pulling a blue or red sock out of the dryer?
1203
12.3. Empirical Probability www.ck12.org
12.3 Empirical Probability
Here you’ll learn to recognize and calculate simple experimental probability.
Have you ever tried juggling?
Tyler loves juggling. He has been juggling for a long time and loves working on his juggling. He can juggle threeballs very easily and can also juggle rings and pins. He very rarely drops anything or makes a mistake.
Tyler has decided to enter his juggling into the Talent show. After practicing for a long time, he has decided to workon juggling four balls instead of three.
“I know this will help me to be a winner,” he tells his Mom.
“It is very impressive, Ty,” She says. “Are you able to do it without dropping any?”
“Well, I’m not sure. Maybe I should do an experiment and see how I am doing.”
Tyler asks his older sister Liz to help him calculate his juggling experiment. Tyler figures that he can attempt tojuggle for three minutes without dropping any balls. He figures twenty attempts will give him a good idea of how hewill do in the show.
Liz helps Tyler keep track.
She notes that after 20 attempts, that Tyler dropped a ball three times. The other 17 times he was able to juggle forthree minutes without dropping anything.
Liz writes this down.
20 attempts
17 successes
3 drops
“How did I do? What is the probability that I will drop a ball?” Tyler asks Liz.
While Tyler and Liz figure out the experimental probability of his dropping a ball, you can take some time to
1204
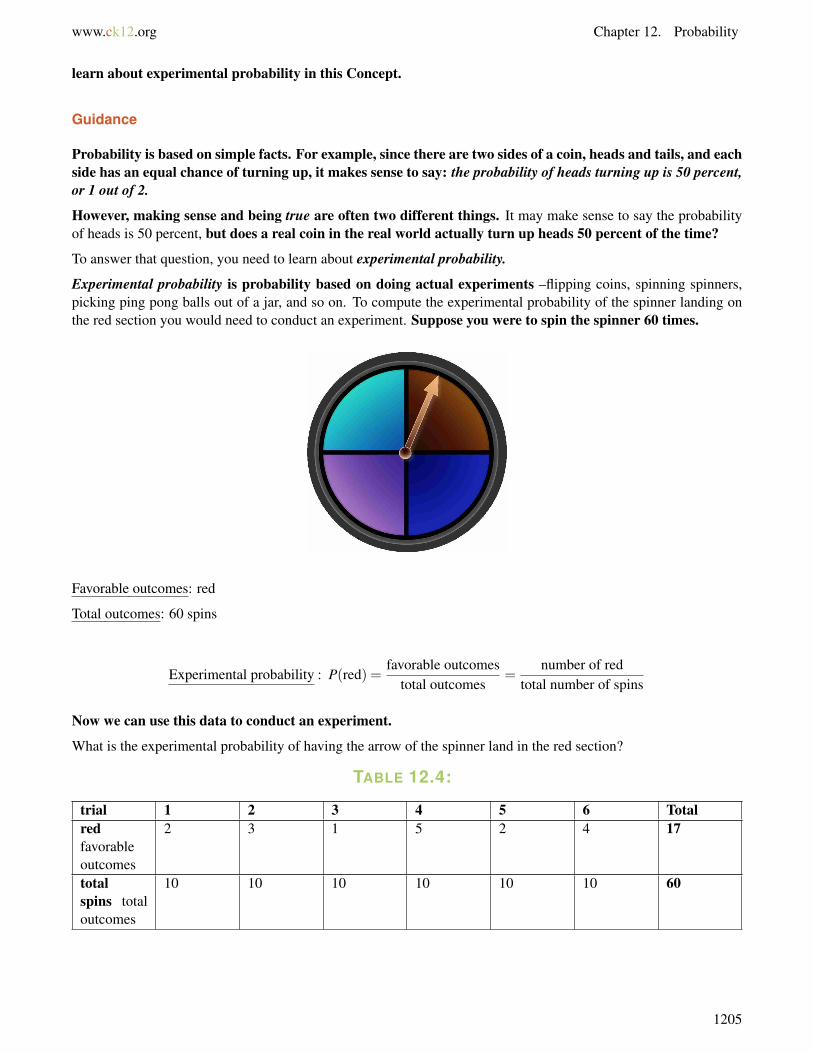
www.ck12.org Chapter 12. Probability
learn about experimental probability in this Concept.
Guidance
Probability is based on simple facts. For example, since there are two sides of a coin, heads and tails, and eachside has an equal chance of turning up, it makes sense to say: the probability of heads turning up is 50 percent,or 1 out of 2.
However, making sense and being true are often two different things. It may make sense to say the probabilityof heads is 50 percent, but does a real coin in the real world actually turn up heads 50 percent of the time?
To answer that question, you need to learn about experimental probability.
Experimental probability is probability based on doing actual experiments –flipping coins, spinning spinners,picking ping pong balls out of a jar, and so on. To compute the experimental probability of the spinner landing onthe red section you would need to conduct an experiment. Suppose you were to spin the spinner 60 times.
Favorable outcomes: red
Total outcomes: 60 spins
Experimental probability : P(red) =favorable outcomes
total outcomes=
number of redtotal number of spins
Now we can use this data to conduct an experiment.
What is the experimental probability of having the arrow of the spinner land in the red section?
TABLE 12.4:
trial 1 2 3 4 5 6 Totalredfavorableoutcomes
2 3 1 5 2 4 17
totalspins totaloutcomes
10 10 10 10 10 10 60
1205

12.3. Empirical Probability www.ck12.org
TABLE 12.4: (continued)
trial 1 2 3 4 5 6 Totalexperimentalprobabil-ity: ratio offavorableoutcomesto totaloutcomes
x x x x x x 17:60
Solve the problem by spinning the spinner 60 times in 6 trials of 10 spins each as shown in the table above. Thenfollow the steps below.
Step 1: Total up the number of favorable outcomes –the number of times the spinner landed on red. This is shownin red in the final column of the table as 17.
Step 2: Add up the number of total outcomes –the total number of spins. This is shown in red in the final column ofthe table as 60.
Step 3: Compute the experimental probability –the ratio of favorable outcomes to total outcomes in percent form.The experimental probability, in ratio form, is 17 to 60.
The answer is 17:60.
A number cube was rolled in a probability experiment 40 times. The results are shown in the table. Compute theexperimental probability of rolling a 5.
TABLE 12.5:
dots onnumbercube
· ·· · · · ····
· · ···
· · ·· · ·
Total
1 2 3 4 5 6number oftimes cubelanded
��|||| |||| ��|||| ��|||| ��|||| ��|||| x
| |||| ||| | ||total fromtally
6 4 9 8 6 7 40
favorableoutcomes
x x x x 6 x 6
experimentalprobabil-ity: ratio offavorableoutcomesto totaloutcomes
x x x x x x 6:40 = 3:20
Step 1: Add up the tallies to get the number of total number of outcomes. This is shown in red as 40 in the third rowof the table.
Step 2: Find the number of favorable outcomes –the number of times the number cube landed on 5. This is shownin red and highlighted.
1206
www.ck12.org Chapter 12. Probability
Step 3: Compute the experimental probability by finding the ratio of favorable outcomes to total outcomes. Theexperimental probability of rolling a 5 is 6 to 40. In simplified form, this is a 3:20 ratio.
Most probability experiments are conducted as a process of testing a hypothesis. A hypothesis is a statementthat you want to test to see if it’s true.
Here are some examples of hypotheses.
• A flipped coin comes up heads 50 percent of the time. True or false?• A number cube will land on three 1
6 th of the time. True or false?• It rains more on the weekend than it does on weekdays. True or false?• You perform better on math tests when you get a good night’s sleep. True or false?
Clearly, some hypotheses are easier to test than others. It’s much easier to flip coins or roll number cubes than it isto measure weekend rain data or see how sleep affects math test results. To see how experimental probability ismeasured, consider the hypothesis below.
• A flipped coin will land on heads 12 , or 50 percent of the time. True or false?
To compute the experimental probability of the hypothesis you would need to conduct an experiment. Suppose youwere to flip the coin 50 times. To find out how often it lands on heads, follow the steps below.
Step 1: State your hypothesis.
The coin will land on heads 12 , or 50 percent of the time.
Step 1: Compute the theoretical probability
Find the probability of flipping a coin and having it turn up heads. To do this, you need to identify:
• favorable outcomes –the number of times the coin is likely to land on heads• total outcomes –the total number of flips
Step 2: Make a prediction.
Use theoretical probability to make a prediction. Since there are 2 different outcomes, and 1 of those outcomes isheads, it make sense to predict that heads will come up 1 out of 2, or 50 percent of the time. (If you need practice inchanging ratios to decimals and percents, see 12.1.3.)
P(heads) =favorable outcomes
total outcomes=
12=⇒ prediction:heads = 50%
Step 3: Conduct an experiment and collect data. You can use a tally table like the one shown below. Fill in yourpredicted values first. Then tally as you conduct the experiment.
1207

12.3. Empirical Probability www.ck12.org
TABLE 12.6:
trial 1 2 3 4 5 Prediction Totaltally |||| �
�||||| ||| x xheads 25total flips 50
Here is what your completed table might look like.
TABLE 12.7:
trial 1 2 3 4 5 Prediction Totaltally |||| �
�||||| ||| ��||||| �
�||||| x x|
heads 4 5 3 6 5 25 23total 10 10 10 10 10 50 50flips
Step 4: Analyze your data and see how well it agrees with your prediction.
You can see that 23 out of 50 flips came up heads. Does your data agree with your prediction? Not perfectly, but 23is close to 25, so your results are fairly close to your prediction.
To see how close you are, compare the experimental probability with your prediction in percent form.
Prediction : 50% Experimental probability : 2350 = 46%
You can see that your experimental probability of 46% agrees fairly well with your predicted probabilityof 50 percent. In general, the more total outcomes you include in your experiment, the more likely yourexperimental probability is to agree with your predicted probability.
Now it’s time for you to practice writing an experimental probability for each situation.
Jennifer attempted to juggle three pins for five minutes. She made five attempts and dropped a club twice.
Example A
Write a probability that shows attempts to successes.
Solution: 35
Example B
Write a probability that shows drops out of successes.
Solution: 25
Example C
What is the percent of success?
Solution: 35 = 60%
Here is the original problem once again.
1208
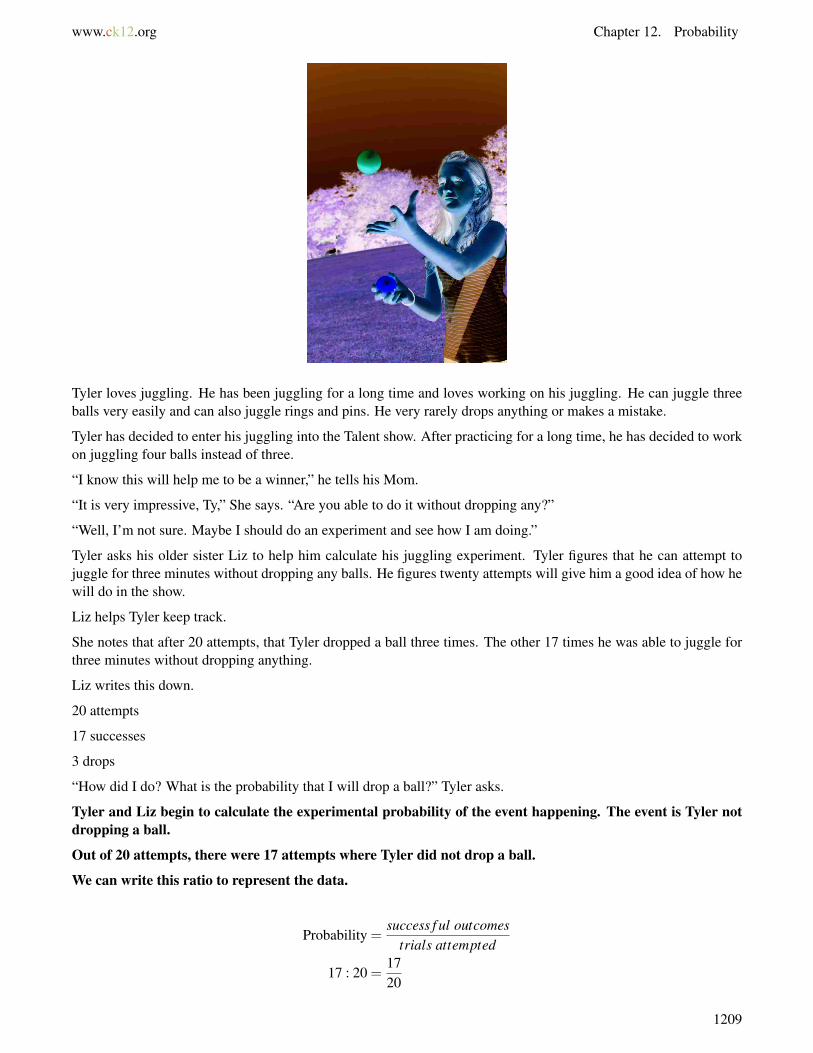
www.ck12.org Chapter 12. Probability
Tyler loves juggling. He has been juggling for a long time and loves working on his juggling. He can juggle threeballs very easily and can also juggle rings and pins. He very rarely drops anything or makes a mistake.
Tyler has decided to enter his juggling into the Talent show. After practicing for a long time, he has decided to workon juggling four balls instead of three.
“I know this will help me to be a winner,” he tells his Mom.
“It is very impressive, Ty,” She says. “Are you able to do it without dropping any?”
“Well, I’m not sure. Maybe I should do an experiment and see how I am doing.”
Tyler asks his older sister Liz to help him calculate his juggling experiment. Tyler figures that he can attempt tojuggle for three minutes without dropping any balls. He figures twenty attempts will give him a good idea of how hewill do in the show.
Liz helps Tyler keep track.
She notes that after 20 attempts, that Tyler dropped a ball three times. The other 17 times he was able to juggle forthree minutes without dropping anything.
Liz writes this down.
20 attempts
17 successes
3 drops
“How did I do? What is the probability that I will drop a ball?” Tyler asks.
Tyler and Liz begin to calculate the experimental probability of the event happening. The event is Tyler notdropping a ball.
Out of 20 attempts, there were 17 attempts where Tyler did not drop a ball.
We can write this ratio to represent the data.
Probability =success f ul outcomes
trials attempted
17 : 20 =1720
1209
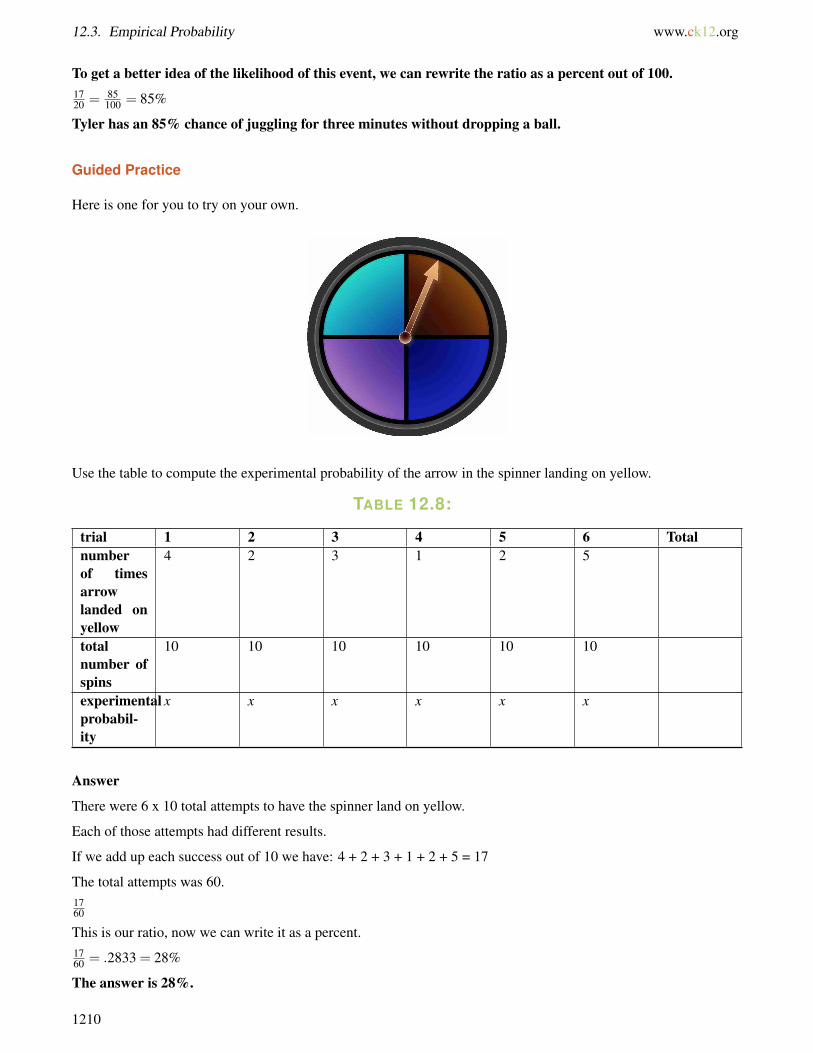
12.3. Empirical Probability www.ck12.org
To get a better idea of the likelihood of this event, we can rewrite the ratio as a percent out of 100.1720 = 85
100 = 85%
Tyler has an 85% chance of juggling for three minutes without dropping a ball.
Guided Practice
Here is one for you to try on your own.
Use the table to compute the experimental probability of the arrow in the spinner landing on yellow.
TABLE 12.8:
trial 1 2 3 4 5 6 Totalnumberof timesarrowlanded onyellow
4 2 3 1 2 5
totalnumber ofspins
10 10 10 10 10 10
experimentalprobabil-ity
x x x x x x
Answer
There were 6 x 10 total attempts to have the spinner land on yellow.
Each of those attempts had different results.
If we add up each success out of 10 we have: 4 + 2 + 3 + 1 + 2 + 5 = 17
The total attempts was 60.1760
This is our ratio, now we can write it as a percent.1760 = .2833 = 28%
The answer is 28%.
1210
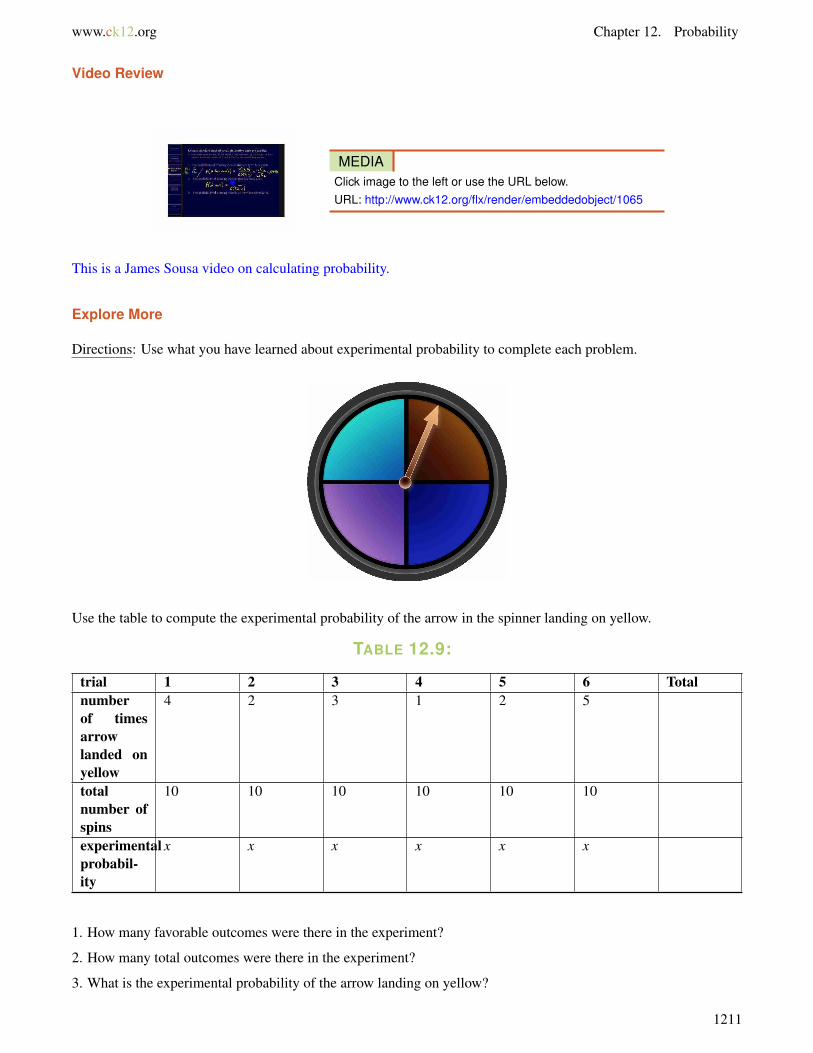
www.ck12.org Chapter 12. Probability
Video Review
MEDIAClick image to the left or use the URL below.URL: http://www.ck12.org/flx/render/embeddedobject/1065
This is a James Sousa video on calculating probability.
Explore More
Directions: Use what you have learned about experimental probability to complete each problem.
Use the table to compute the experimental probability of the arrow in the spinner landing on yellow.
TABLE 12.9:
trial 1 2 3 4 5 6 Totalnumberof timesarrowlanded onyellow
4 2 3 1 2 5
totalnumber ofspins
10 10 10 10 10 10
experimentalprobabil-ity
x x x x x x
1. How many favorable outcomes were there in the experiment?
2. How many total outcomes were there in the experiment?
3. What is the experimental probability of the arrow landing on yellow?
1211

12.3. Empirical Probability www.ck12.org
Use the table to compute the experimental probability of the arrow in the spinner above landing on blue or green.
TABLE 12.10:
trial 1 2 3 4 5 Totalnumber oftimes arrowlanded onblue orgreen
4 5 6 5 4
total spins 10 10 10 10 10experimentalprobability
x x x x x
4. How many favorable outcomes were there in the experiment?
5. How many total outcomes were there in the experiment?
6. What is the experimental probability of the arrow landing on yellow?
Use the table to compute the experimental probability of the arrow landing on any color but blue.
TABLE 12.11:
trial 1 2 3 4 5 Totalnumber oftimes arrowlanded onany colorbut blue
15 17 14 16 16
total spins 20 20 20 20 20experimentalprobability
7. How many favorable outcomes were there in the experiment?
8. How many total outcomes were there in the experiment?
9. What is the experimental probability of the arrow landing on yellow?
A number cube was rolled in a probability experiment 40 times. The results are shown in the table. Compute theexperimental probability of rolling a 2.
TABLE 12.12:
dots onnumbercube
· ·· · · · ····
· · ···
· · ·· · ·
Total
1 2 3 4 5 6number oftimes cubelanded
��|||| ��|||| ��|||| ��|||| ��|||| |||| x
|||| ||| | || |total fromtally
9 8 6 7 6 4
1212
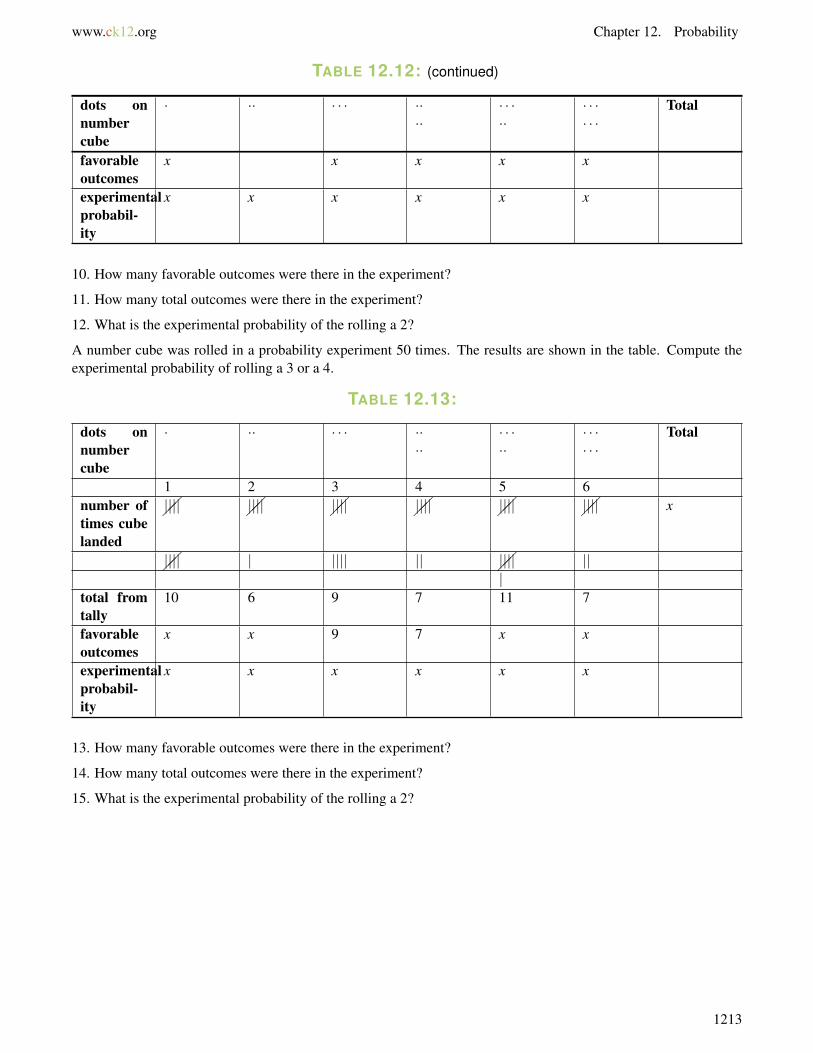
www.ck12.org Chapter 12. Probability
TABLE 12.12: (continued)
dots onnumbercube
· ·· · · · ····
· · ···
· · ·· · ·
Total
favorableoutcomes
x x x x x
experimentalprobabil-ity
x x x x x x
10. How many favorable outcomes were there in the experiment?
11. How many total outcomes were there in the experiment?
12. What is the experimental probability of the rolling a 2?
A number cube was rolled in a probability experiment 50 times. The results are shown in the table. Compute theexperimental probability of rolling a 3 or a 4.
TABLE 12.13:
dots onnumbercube
· ·· · · · ····
· · ···
· · ·· · ·
Total
1 2 3 4 5 6number oftimes cubelanded
��|||| ��|||| ��|||| ��|||| ��|||| ��|||| x
��|||| | |||| || ��|||| |||
total fromtally
10 6 9 7 11 7
favorableoutcomes
x x 9 7 x x
experimentalprobabil-ity
x x x x x x
13. How many favorable outcomes were there in the experiment?
14. How many total outcomes were there in the experiment?
15. What is the experimental probability of the rolling a 2?
1213

12.4. Mutually Exclusive Events www.ck12.org
12.4 Mutually Exclusive Events
Here you’ll learn to recognize disjoint events as having no outcomes in common.
Remember Tyler and the juggling in the Empirical Probability Concept?
Now that Tyler knows the probability of his successfully juggling four balls for three minutes, he is certain that thisis one of the things that he will do for the talent show. After all, he has an 85% probability that he will be successful.Those are very good odds.
Tyler also knows how to balance a pole on his chin. He can do this for 4 minutes without dropping it. Tyler doesa similar experiment as he did with the juggling balls and discovers that he has a 75% probability of being able tobalance the pole for four minutes. He is a bit concerned about his odds.
“I am not sure if I should do anything,” he tells Liz after figuring out the probability.
“What do you mean?”
“I mean that if my balancing is that off, maybe I shouldn’t do the juggling either.”
“Why not? Juggling and balancing are disjoint events,” Liz said smiling.
Disjoint events? Tyler isn’t sure what she means. He stops to think about this for minute.
Do you know what Liz means?
This Concept is all about different events and their relationships to each other. When we look at events,knowing how they are related can help us in our work. Take some time to learn about them and then we’llrevisit this problem at the end of the Concept.
Guidance
Your Aunt Betsy is having a baby! As a mathematician, you realize that this is an opportunity to explore disjointevents. Disjoint events are two events that have no outcomes in common. Here are two events that have nooutcomes in common.
• Event B: Having a baby boy.• Event G: Having a baby girl.
Disjoint events are either-or events.
For example, consider flipping a coin. The two events–flipping heads or flipping tails–have no outcomes in common.You either flip heads or you flip tails.
1214
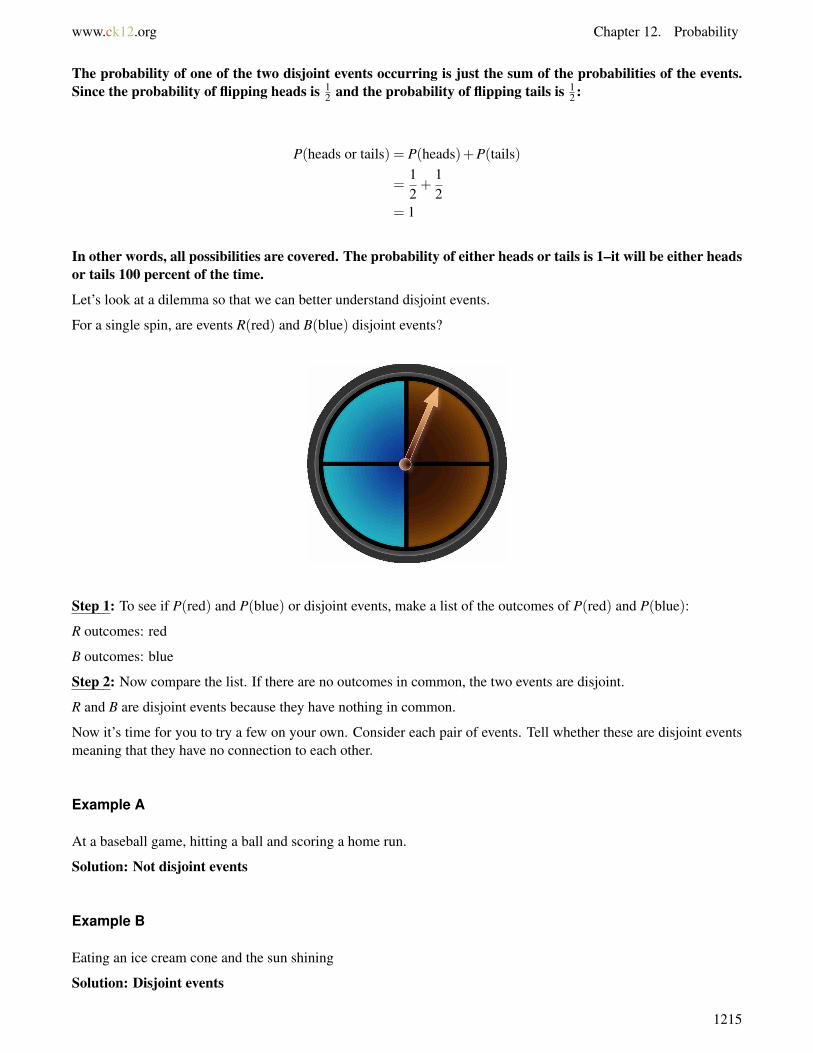
www.ck12.org Chapter 12. Probability
The probability of one of the two disjoint events occurring is just the sum of the probabilities of the events.Since the probability of flipping heads is 1
2 and the probability of flipping tails is 12 :
P(heads or tails) = P(heads)+P(tails)
=12+
12
= 1
In other words, all possibilities are covered. The probability of either heads or tails is 1–it will be either headsor tails 100 percent of the time.
Let’s look at a dilemma so that we can better understand disjoint events.
For a single spin, are events R(red) and B(blue) disjoint events?
Step 1: To see if P(red) and P(blue) or disjoint events, make a list of the outcomes of P(red) and P(blue):
R outcomes: red
B outcomes: blue
Step 2: Now compare the list. If there are no outcomes in common, the two events are disjoint.
R and B are disjoint events because they have nothing in common.
Now it’s time for you to try a few on your own. Consider each pair of events. Tell whether these are disjoint eventsmeaning that they have no connection to each other.
Example A
At a baseball game, hitting a ball and scoring a home run.
Solution: Not disjoint events
Example B
Eating an ice cream cone and the sun shining
Solution: Disjoint events
1215
12.4. Mutually Exclusive Events www.ck12.org
Example C
Wearing sneakers and running a marathon
Solution: Not disjoint events
Here is the original problem once again. Reread it and then look at Liz’s explanation of disjoint events.
Now that Tyler knows the probability of his successfully juggling four balls for three minutes, he is certain that thisis one of the things that he will do for the talent show. After all, he has an 85% probability that he will be successful.Those are very good odds.
Tyler also knows how to balance a pole on his chin. He can do this for 4 minutes without dropping it. Tyler doesa similar experiment as he did with the juggling balls and discovers that he has a 75% probability of being able tobalance the pole for four minutes. He is a bit concerned about his odds.
“I am not sure if I should do anything,” he tells Liz after figuring out the probability.
“What do you mean?”
“I mean that if my balancing is that off, maybe I shouldn’t do the juggling either.”
“Why not? Juggling and balancing are disjoint events,” Liz said smiling.
“What do you mean?” Tyler asks.
“Disjoint events are events where the outcome of one event does not affect the results of the other event. Howyou did juggling does not impact how you do balancing. You can still accomplish one or both of them. Howyou do in each of the events is separate. Does that make sense?”
“Yes. I think I will try both even though my probability of successfully balancing is less than successfullyjuggling,” Tyler decides.
Guided Practice
Here is one for you to try on your own.
Are these disjoint events? Explain your thinking.
It is going to rain today. I enjoy sailing.
Answer
These are disjoint events. There isn’t a connection between it raining and the fact that the person "I" likes sailing.These events are not connected, therefore they are disjoint events.
Video Review
1216
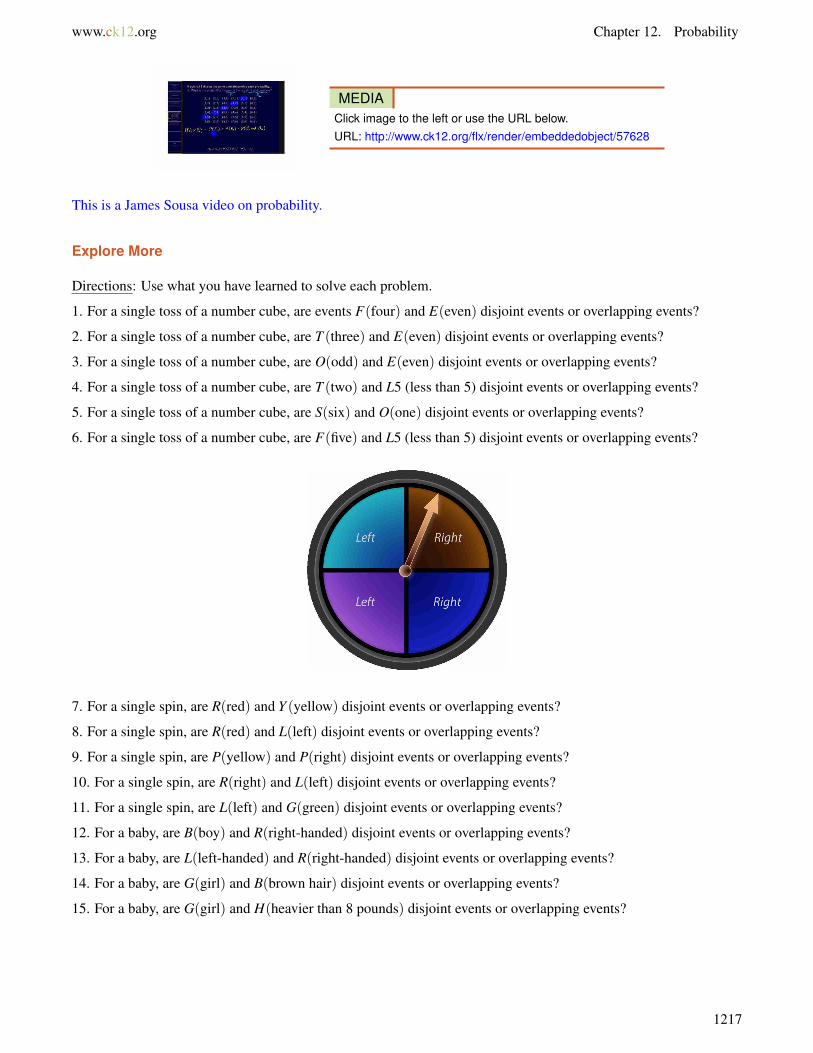
www.ck12.org Chapter 12. Probability
MEDIAClick image to the left or use the URL below.URL: http://www.ck12.org/flx/render/embeddedobject/57628
This is a James Sousa video on probability.
Explore More
Directions: Use what you have learned to solve each problem.
1. For a single toss of a number cube, are events F(four) and E(even) disjoint events or overlapping events?
2. For a single toss of a number cube, are T (three) and E(even) disjoint events or overlapping events?
3. For a single toss of a number cube, are O(odd) and E(even) disjoint events or overlapping events?
4. For a single toss of a number cube, are T (two) and L5 (less than 5) disjoint events or overlapping events?
5. For a single toss of a number cube, are S(six) and O(one) disjoint events or overlapping events?
6. For a single toss of a number cube, are F(five) and L5 (less than 5) disjoint events or overlapping events?
7. For a single spin, are R(red) and Y (yellow) disjoint events or overlapping events?
8. For a single spin, are R(red) and L(left) disjoint events or overlapping events?
9. For a single spin, are P(yellow) and P(right) disjoint events or overlapping events?
10. For a single spin, are R(right) and L(left) disjoint events or overlapping events?
11. For a single spin, are L(left) and G(green) disjoint events or overlapping events?
12. For a baby, are B(boy) and R(right-handed) disjoint events or overlapping events?
13. For a baby, are L(left-handed) and R(right-handed) disjoint events or overlapping events?
14. For a baby, are G(girl) and B(brown hair) disjoint events or overlapping events?
15. For a baby, are G(girl) and H(heavier than 8 pounds) disjoint events or overlapping events?
1217
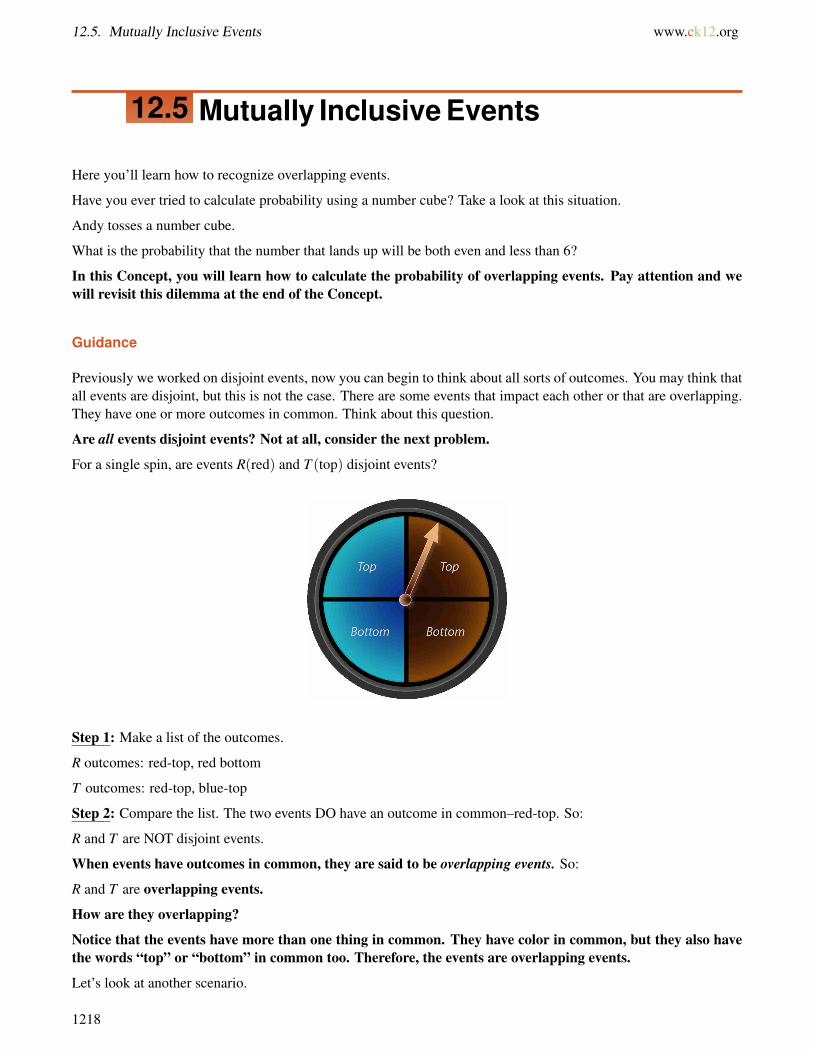
12.5. Mutually Inclusive Events www.ck12.org
12.5 Mutually Inclusive Events
Here you’ll learn how to recognize overlapping events.
Have you ever tried to calculate probability using a number cube? Take a look at this situation.
Andy tosses a number cube.
What is the probability that the number that lands up will be both even and less than 6?
In this Concept, you will learn how to calculate the probability of overlapping events. Pay attention and wewill revisit this dilemma at the end of the Concept.
Guidance
Previously we worked on disjoint events, now you can begin to think about all sorts of outcomes. You may think thatall events are disjoint, but this is not the case. There are some events that impact each other or that are overlapping.They have one or more outcomes in common. Think about this question.
Are all events disjoint events? Not at all, consider the next problem.
For a single spin, are events R(red) and T (top) disjoint events?
Step 1: Make a list of the outcomes.
R outcomes: red-top, red bottom
T outcomes: red-top, blue-top
Step 2: Compare the list. The two events DO have an outcome in common–red-top. So:
R and T are NOT disjoint events.
When events have outcomes in common, they are said to be overlapping events. So:
R and T are overlapping events.
How are they overlapping?
Notice that the events have more than one thing in common. They have color in common, but they also havethe words “top” or “bottom” in common too. Therefore, the events are overlapping events.
Let’s look at another scenario.
1218
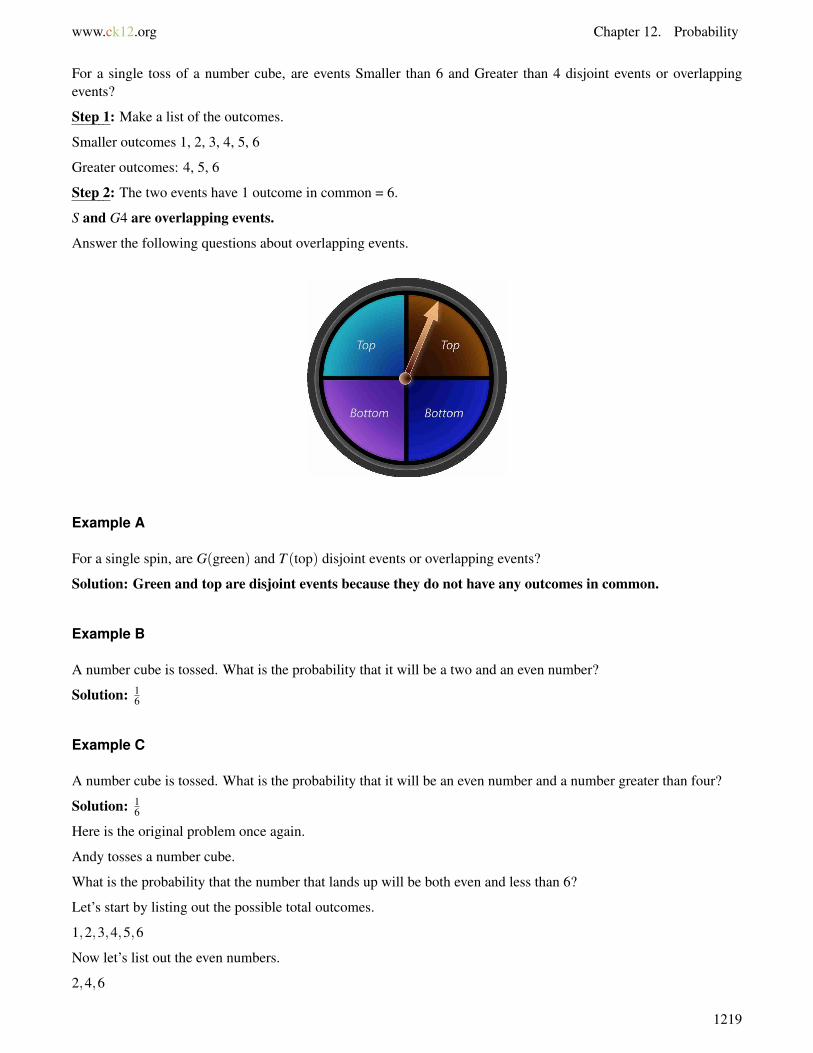
www.ck12.org Chapter 12. Probability
For a single toss of a number cube, are events Smaller than 6 and Greater than 4 disjoint events or overlappingevents?
Step 1: Make a list of the outcomes.
Smaller outcomes 1, 2, 3, 4, 5, 6
Greater outcomes: 4, 5, 6
Step 2: The two events have 1 outcome in common = 6.
S and G4 are overlapping events.
Answer the following questions about overlapping events.
Example A
For a single spin, are G(green) and T (top) disjoint events or overlapping events?
Solution: Green and top are disjoint events because they do not have any outcomes in common.
Example B
A number cube is tossed. What is the probability that it will be a two and an even number?
Solution: 16
Example C
A number cube is tossed. What is the probability that it will be an even number and a number greater than four?
Solution: 16
Here is the original problem once again.
Andy tosses a number cube.
What is the probability that the number that lands up will be both even and less than 6?
Let’s start by listing out the possible total outcomes.
1,2,3,4,5,6
Now let’s list out the even numbers.
2,4,6
1219
12.5. Mutually Inclusive Events www.ck12.org
Next we can list the numbers less than 6.
1,2,3,4,5
There are two numbers that overlap.26 = 1
3
This is our probability.
Guided Practice
Here is one for you to try on your own.
A number cube is tossed. What is the probability that the number that lands up will be both odd and greater than 3?
Answer
Step 1: List the odd outcomes, outcomes greater than 3, and total outcomes. Mark the overlapping outcomes (ifthey exist).
odd outcomes: 1, 3, 5
>3 outcomes: 4, 5, 6
total outcomes: 1, 2, 3, 4, 5, 6
Step 2: Find the ratio of favorable outcomes to total outcomes.
Notice that there is only one overlapping outcome. This is the favorable outcome.
P(odd and > 3) = f avorable outcomestotal outcomes = 1
6
Notice that we can find the ratio by combining the overlapping outcomes.
Video Review
MEDIAClick image to the left or use the URL below.URL: http://www.ck12.org/flx/render/embeddedobject/57628
1220
www.ck12.org Chapter 12. Probability
This is a James Sousa video on probability.
Explore More
Directions: Write the probability of each overlapping event occurring.
Eight colored scarves are put into a bag. They are red, yellow, blue, green, purple, orange, brown and black.
1. What is the probability of pulling out a red scarf?
2. What is the probability of pulling out a primary color?
3. What is the probability of pulling out a primary color and is either red or blue?
4. What is the probability of pulling out a primary color and is either blue or green?
5. What is the probability of pulling out a complementary color?
6. What is the probability of pulling out a complementary color and is either green or purple?
A number cube numbered 1 - 12 is rolled.
7. What is the probability of rolling an even number?
8. What is the probability of rolling an odd number?
9. What is the probability of rolling an even number or a number less than four?
10. What is the probability of rolling an even number or a number greater than 10?
11. What is the probability of rolling an odd number or a number greater than 5?
12. What is the probability or rolling an odd number or a one?
13. What is the probability of rolling an odd number or a number less than 8?
14. What is the probability of rolling an even number or a number less than 11?
15. What is the probability of rolling an odd number or a number greater than 9?
1221
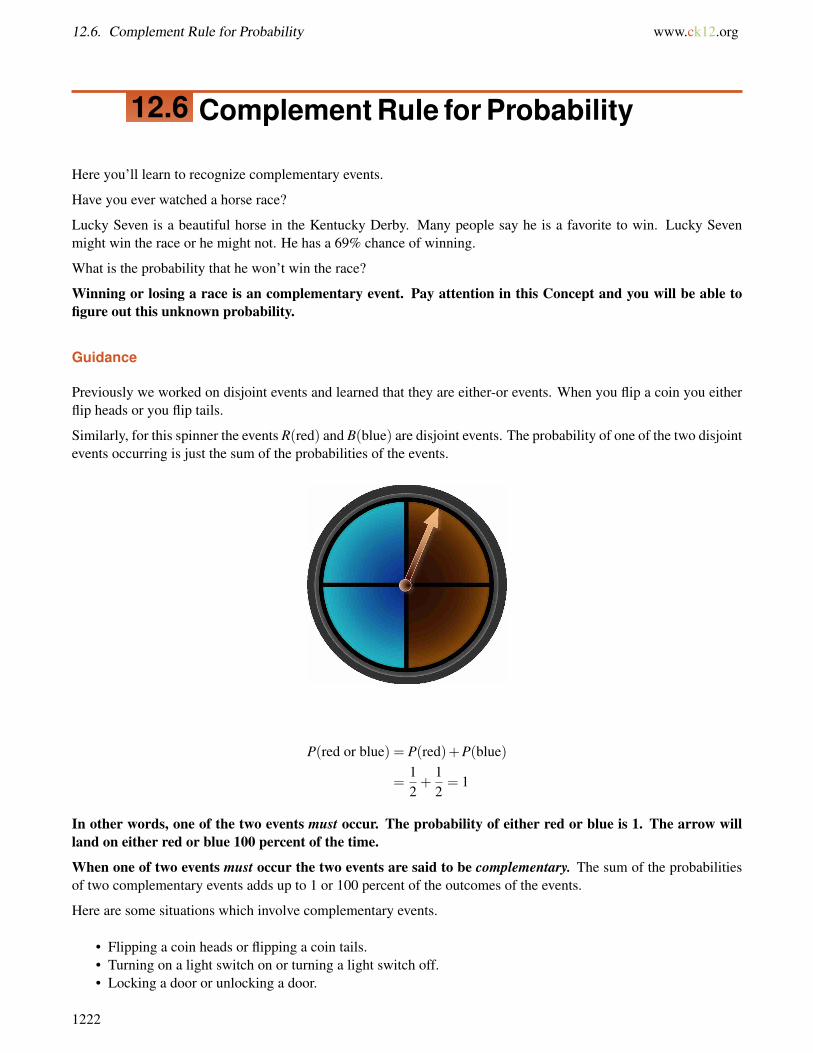
12.6. Complement Rule for Probability www.ck12.org
12.6 Complement Rule for Probability
Here you’ll learn to recognize complementary events.
Have you ever watched a horse race?
Lucky Seven is a beautiful horse in the Kentucky Derby. Many people say he is a favorite to win. Lucky Sevenmight win the race or he might not. He has a 69% chance of winning.
What is the probability that he won’t win the race?
Winning or losing a race is an complementary event. Pay attention in this Concept and you will be able tofigure out this unknown probability.
Guidance
Previously we worked on disjoint events and learned that they are either-or events. When you flip a coin you eitherflip heads or you flip tails.
Similarly, for this spinner the events R(red) and B(blue) are disjoint events. The probability of one of the two disjointevents occurring is just the sum of the probabilities of the events.
P(red or blue) = P(red)+P(blue)
=12+
12= 1
In other words, one of the two events must occur. The probability of either red or blue is 1. The arrow willland on either red or blue 100 percent of the time.
When one of two events must occur the two events are said to be complementary. The sum of the probabilitiesof two complementary events adds up to 1 or 100 percent of the outcomes of the events.
Here are some situations which involve complementary events.
• Flipping a coin heads or flipping a coin tails.• Turning on a light switch on or turning a light switch off.• Locking a door or unlocking a door.
1222

www.ck12.org Chapter 12. Probability
Though some complementary events are “50-50” events, such as flipping a coin, not all complementary eventsare “50-50.”
For the spinner shown:
P(blue or yellow) = P(blue)+P(yellow)
=34+
14
= 1
For the spinner above, the events B(blue) and Y (yellow) are complementary because their probabilities addup to 1. But the two complements are not equal in size.
Note that some disjoint events are NOT complementary events. Here, R(red) and B(blue) are disjoint events.However, their probabilities do NOT add up to 1 or 100 percent:
P(red or blue) = P(red)+P(blue)
=14+
14
=12
Since the sum of any two complements is 1, if you know the probability of one complement, you can find theprobability of the other.
1223
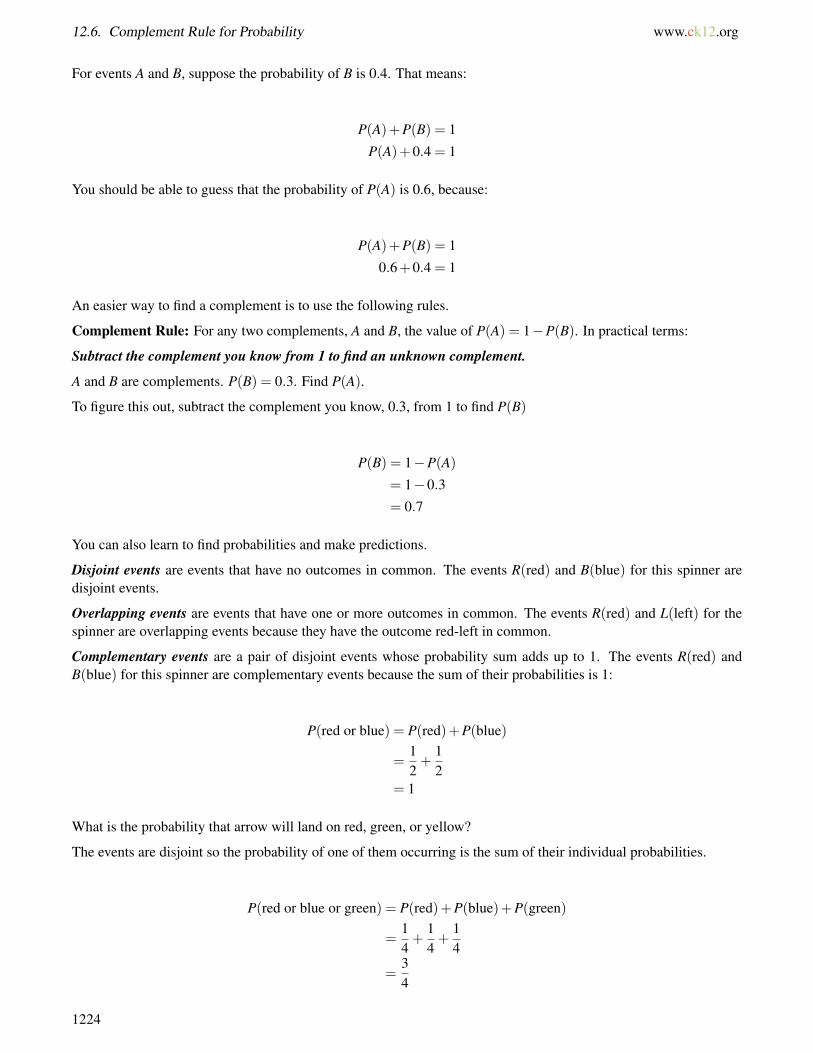
12.6. Complement Rule for Probability www.ck12.org
For events A and B, suppose the probability of B is 0.4. That means:
P(A)+P(B) = 1
P(A)+0.4 = 1
You should be able to guess that the probability of P(A) is 0.6, because:
P(A)+P(B) = 1
0.6+0.4 = 1
An easier way to find a complement is to use the following rules.
Complement Rule: For any two complements, A and B, the value of P(A) = 1−P(B). In practical terms:
Subtract the complement you know from 1 to find an unknown complement.
A and B are complements. P(B) = 0.3. Find P(A).
To figure this out, subtract the complement you know, 0.3, from 1 to find P(B)
P(B) = 1−P(A)
= 1−0.3
= 0.7
You can also learn to find probabilities and make predictions.
Disjoint events are events that have no outcomes in common. The events R(red) and B(blue) for this spinner aredisjoint events.
Overlapping events are events that have one or more outcomes in common. The events R(red) and L(left) for thespinner are overlapping events because they have the outcome red-left in common.
Complementary events are a pair of disjoint events whose probability sum adds up to 1. The events R(red) andB(blue) for this spinner are complementary events because the sum of their probabilities is 1:
P(red or blue) = P(red)+P(blue)
=12+
12
= 1
What is the probability that arrow will land on red, green, or yellow?
The events are disjoint so the probability of one of them occurring is the sum of their individual probabilities.
P(red or blue or green) = P(red)+P(blue)+P(green)
=14+
14+
14
=34
1224

www.ck12.org Chapter 12. Probability
We can find the probability of an event when we add the probabilities together.
The probability of the Mets winning tonight’s game is 0.6. Predict how likely it is for the Mets to lose tonight’sgame.
Winning the game and losing the game are complementary events. So you can use the rule:
P(lose) = 1−P(win)
= 1−0.6
= 0.4
We can write this answer as 40%. There is a 40% chance that the Mets will win tonight.
Here are a few problems for you to try on your own.
Example A
A and C are complements. If C is .67, find A.
Solution: .33
Example B
If the Yankees have a 45% chance of winning tonight, what is the probability that they won’t win?
Solution: 55%
Example C
D and E are complements. If D is .2, what is E?
Solution: .8
Here is the original problem once again.
Lucky Seven is a beautiful horse in the Kentucky Derby. Many people say he is a favorite to win. Lucky Sevenmight win the race or he might not. He has a 69% chance of winning.
What is the probability that he won’t win the race?
Complementary events have a sum of 1 or 100%. We know the probability of Lucky Seven winning. It is 69%. Wecan subtract this from 100 to find the probability of him losing.
100−69 = 31
Lucky Seven has a 31% chance of losing the race.
Guided Practice
Here is one for you to try on your own.
Y and Z are complements. If the probability of Y occurring is 14%, what is the probability of Z occurring?
Answer
To figure this out, first you have to remember that complementary events have a sum of 1 or 100%. We know that Yis 14%. We can subtract from 1 or 100% to find Z.
1225
12.6. Complement Rule for Probability www.ck12.org
100−14 = 86
The probability of Z occurring is 86%.
Video Review
MEDIAClick image to the left or use the URL below.URL: http://www.ck12.org/flx/render/embeddedobject/54795
This is a Khan Academy video on complementary events.
Explore More
Directions: Find the complement.
1. A and B are complements. P(B) = 0.15. Find P(A).
2. C and D are complements. P(C) = 0.8. Find P(D).
3. G and H are complements. P(H) = 49%. Find P(G).
4. T and S are complements. P(T ) = 38 . Find P(S).
5. L and K are complements. P(K) = 0.07. Find P(L).
6. A and B are complements. P(B) = 0.125. Find P(A).
7. N and M are complements. P(N) = 96.1%. Find P(M).
8. Q and Z are complements. P(Q) = 15 . Find P(Z).
Directions: Write complementary or not complementary.
9. Percentage of votes that 2 candidates get in a 2-candidate election
10. Percentage of votes that 3 candidates get in a 3-candidate election
11. Winning a game or losing a game
12. Choosing an odd or even number
13. Choosing a number between 1 and 5
14. Passing or failing a test
15. Choosing a color of paint
1226
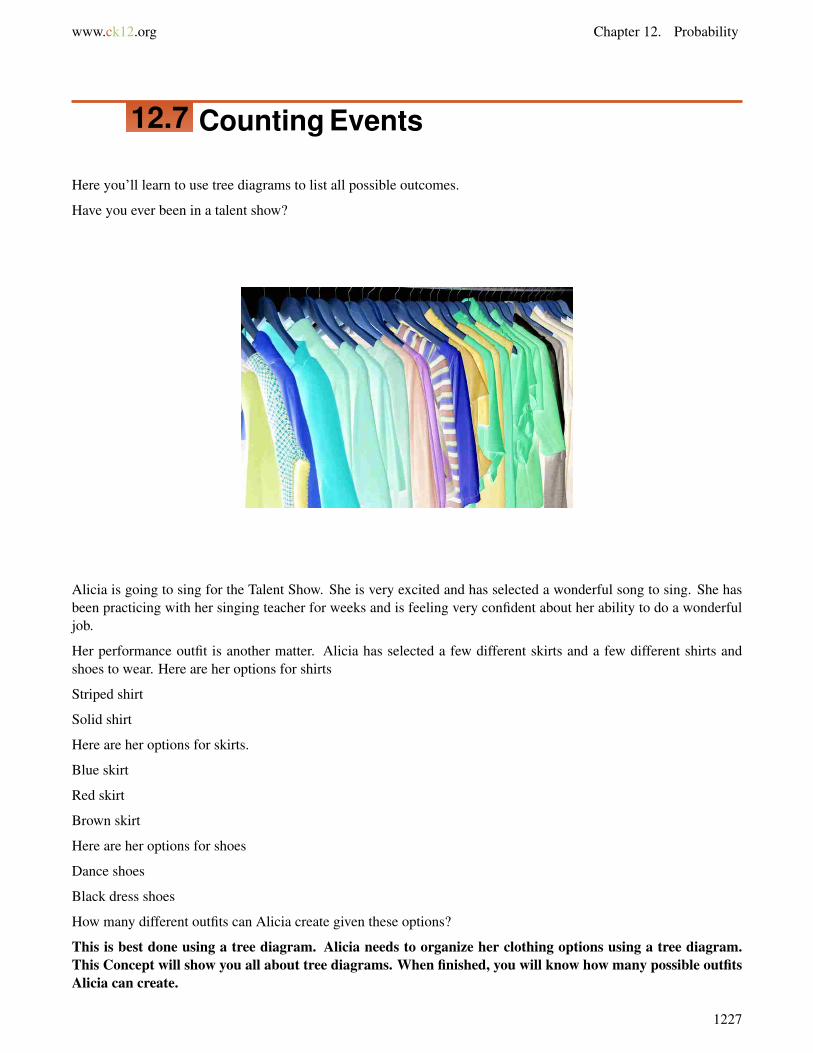
www.ck12.org Chapter 12. Probability
12.7 Counting Events
Here you’ll learn to use tree diagrams to list all possible outcomes.
Have you ever been in a talent show?
Alicia is going to sing for the Talent Show. She is very excited and has selected a wonderful song to sing. She hasbeen practicing with her singing teacher for weeks and is feeling very confident about her ability to do a wonderfuljob.
Her performance outfit is another matter. Alicia has selected a few different skirts and a few different shirts andshoes to wear. Here are her options for shirts
Striped shirt
Solid shirt
Here are her options for skirts.
Blue skirt
Red skirt
Brown skirt
Here are her options for shoes
Dance shoes
Black dress shoes
How many different outfits can Alicia create given these options?
This is best done using a tree diagram. Alicia needs to organize her clothing options using a tree diagram.This Concept will show you all about tree diagrams. When finished, you will know how many possible outfitsAlicia can create.
1227

12.7. Counting Events www.ck12.org
Guidance
Nadia’s soccer team has 2 games to play this weekend. How many outcomes are there for Nadia’s team?
A good way to find the total number of outcomes for events is to make a tree diagram. A tree diagram is abranching diagram that shows all possible outcomes for an event.
To make a tree diagram, split the different events into either-or choices. You can list the choices in any order. Hereis a tree diagram for game 1 and game 2.
1228
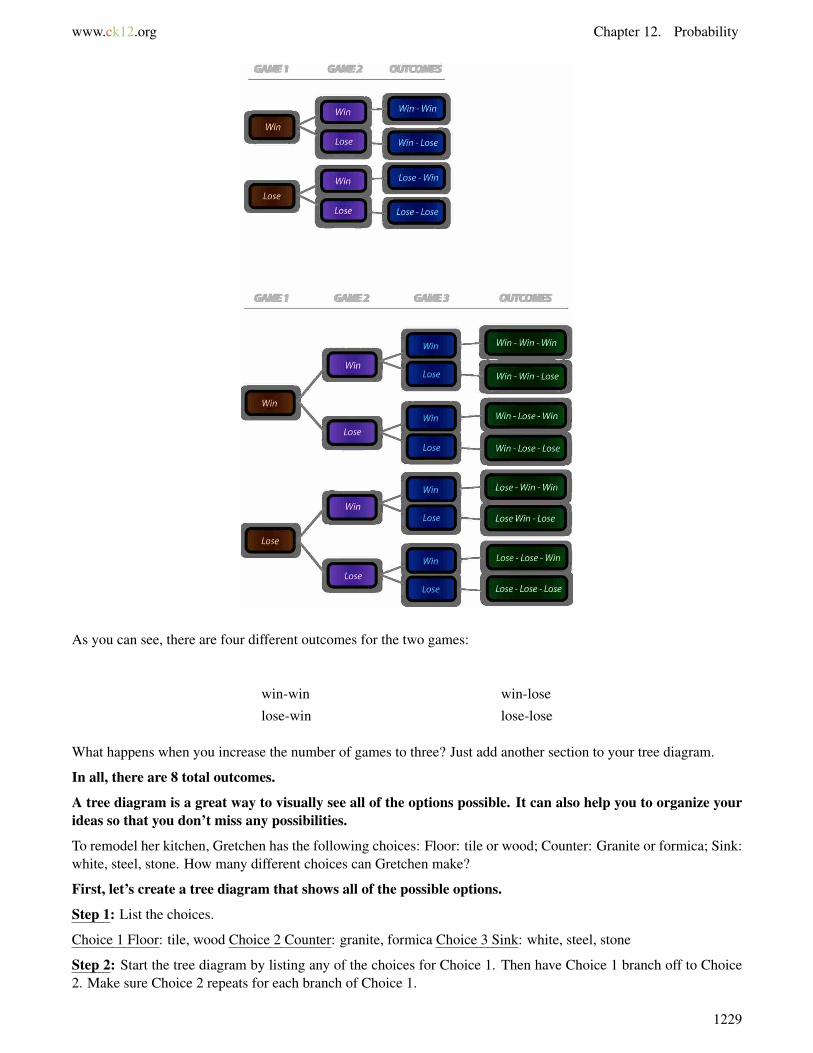
www.ck12.org Chapter 12. Probability
As you can see, there are four different outcomes for the two games:
win-win win-lose
lose-win lose-lose
What happens when you increase the number of games to three? Just add another section to your tree diagram.
In all, there are 8 total outcomes.
A tree diagram is a great way to visually see all of the options possible. It can also help you to organize yourideas so that you don’t miss any possibilities.
To remodel her kitchen, Gretchen has the following choices: Floor: tile or wood; Counter: Granite or formica; Sink:white, steel, stone. How many different choices can Gretchen make?
First, let’s create a tree diagram that shows all of the possible options.
Step 1: List the choices.
Choice 1 Floor: tile, wood Choice 2 Counter: granite, formica Choice 3 Sink: white, steel, stone
Step 2: Start the tree diagram by listing any of the choices for Choice 1. Then have Choice 1 branch off to Choice2. Make sure Choice 2 repeats for each branch of Choice 1.
1229

12.7. Counting Events www.ck12.org
Step 3: Fill in the third choice. We have left some of the spaces for you to fill in. Double click to check youranswers.
Step 4: Fill in the outcomes. Again some of the spaces are left for you to fill in. Double click to check your answers.
1230
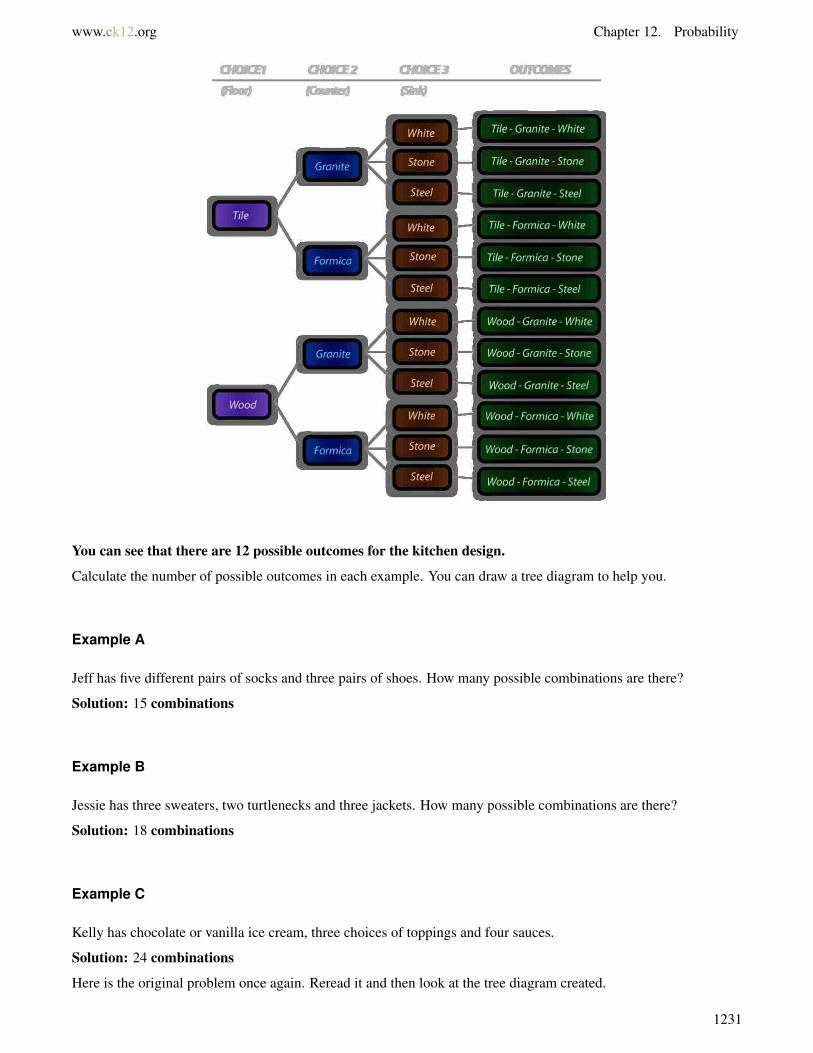
www.ck12.org Chapter 12. Probability
You can see that there are 12 possible outcomes for the kitchen design.
Calculate the number of possible outcomes in each example. You can draw a tree diagram to help you.
Example A
Jeff has five different pairs of socks and three pairs of shoes. How many possible combinations are there?
Solution: 15 combinations
Example B
Jessie has three sweaters, two turtlenecks and three jackets. How many possible combinations are there?
Solution: 18 combinations
Example C
Kelly has chocolate or vanilla ice cream, three choices of toppings and four sauces.
Solution: 24 combinations
Here is the original problem once again. Reread it and then look at the tree diagram created.
1231
12.7. Counting Events www.ck12.org
Alicia is going to sing for the Talent Show. She is very excited and has selected a wonderful song to sing. She hasbeen practicing with her singing teacher for weeks and is feeling very confident about her ability to do a wonderfuljob.
Her performance outfit is another matter. Alicia has selected a few different skirts and a few different shirts andshoes to wear. Here are her options for shirts
Striped shirt
Solid shirt
Here are her options for skirts.
Blue skirt
Red skirt
Brown skirt
Here are her options for shoes
Dance shoes
Black dress shoes
How many different outfits can Alicia create given these options?
This is best done using a tree diagram. Alicia needs to organize her clothing options using a tree diagram. Todo this, we can take each option and create a diagram to show all of the options.
1232
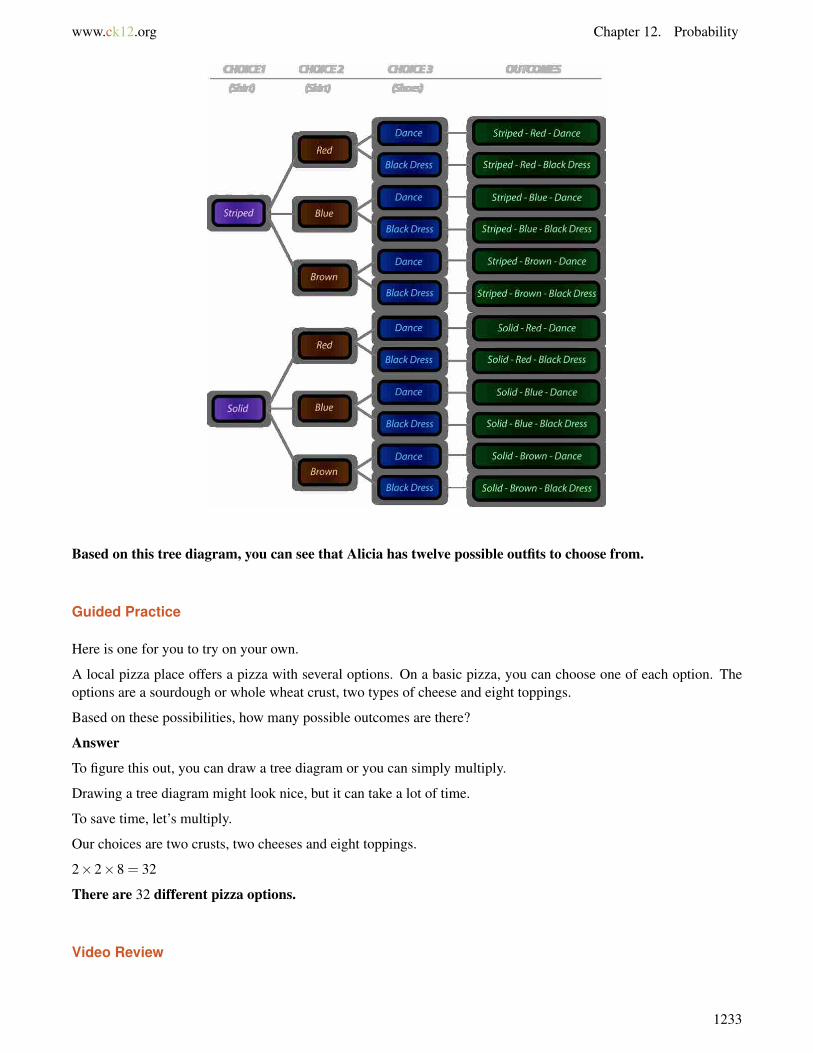
www.ck12.org Chapter 12. Probability
Based on this tree diagram, you can see that Alicia has twelve possible outfits to choose from.
Guided Practice
Here is one for you to try on your own.
A local pizza place offers a pizza with several options. On a basic pizza, you can choose one of each option. Theoptions are a sourdough or whole wheat crust, two types of cheese and eight toppings.
Based on these possibilities, how many possible outcomes are there?
Answer
To figure this out, you can draw a tree diagram or you can simply multiply.
Drawing a tree diagram might look nice, but it can take a lot of time.
To save time, let’s multiply.
Our choices are two crusts, two cheeses and eight toppings.
2×2×8 = 32
There are 32 different pizza options.
Video Review
1233
12.7. Counting Events www.ck12.org
MEDIAClick image to the left or use the URL below.URL: http://www.ck12.org/flx/render/embeddedobject/54787
This is a Khan Academy video on probability and outcomes.
Explore More
Directions: Use Tree Diagrams and figure out the total number of possible outcomes for each situation.
1. The Triplex Theater has 3 different movies tonight: Bucket of Fun, Bozo the Great, and Pickle Man. Each moviehas an early and late show. How many different movie choices are there?
2. Raccoon Stadium offers the following seating plans for football games:
• lower deck, middle loge, or upper bleachers• center, side, end-zone
How many different kinds of seats can you buy?
3. Cell-Gel cell phone company offers the following choices:
• Free internet plan or Pay internet plan• 1200, 2000, or 3000 minutes• Premium or standard phone
How many different kinds of plans can you get?
4. Jen’s soccer team is playing 4 games next week. How many different outcomes are there for the four games?
5. The e-Box laptop computer offers the following options.
• Screen: small, medium, or large• Memory: standard 1 GB, extra 2 GB• Colors: pearl, blue, black
How many different combinations are there for options?
6. Jesse has four pairs of pants and three shirts. How many different outfits can he make?
7. If Jesse adds three sweaters, how many different outfits can he make now?
8. Kyle has selected three different paint colors and two trim colors for his bedroom. How many different colorcombinations can he create?
9. There are four teams playing in a tournament. Each team will play two sports. How many different combinationsare there for teams and sports?
10. Candice can choose between the following electives.
• German• Gymnastics• Chorus
1234

www.ck12.org Chapter 12. Probability
• French
If she can choose two electives, how many different options are there of choices?
11. If we add Track to her options, how many two elective options are there?
12. Miles is making a salad. He wants to put three things on it. Here are his choices.
Tomatoes
Pickles
Onions
Cucumbers
Peppers
How many different salads can he create given these options?
13. If Miles adds cheese, how many different salads can he create given these options?
14. Muffins can have two additions to them. Here are the choices: blueberries, raspberries, nuts, cherries, strawber-ries. How many muffin combinations can there be?
15. If we add apples and cranberries, how many combinations can there be now?
1235
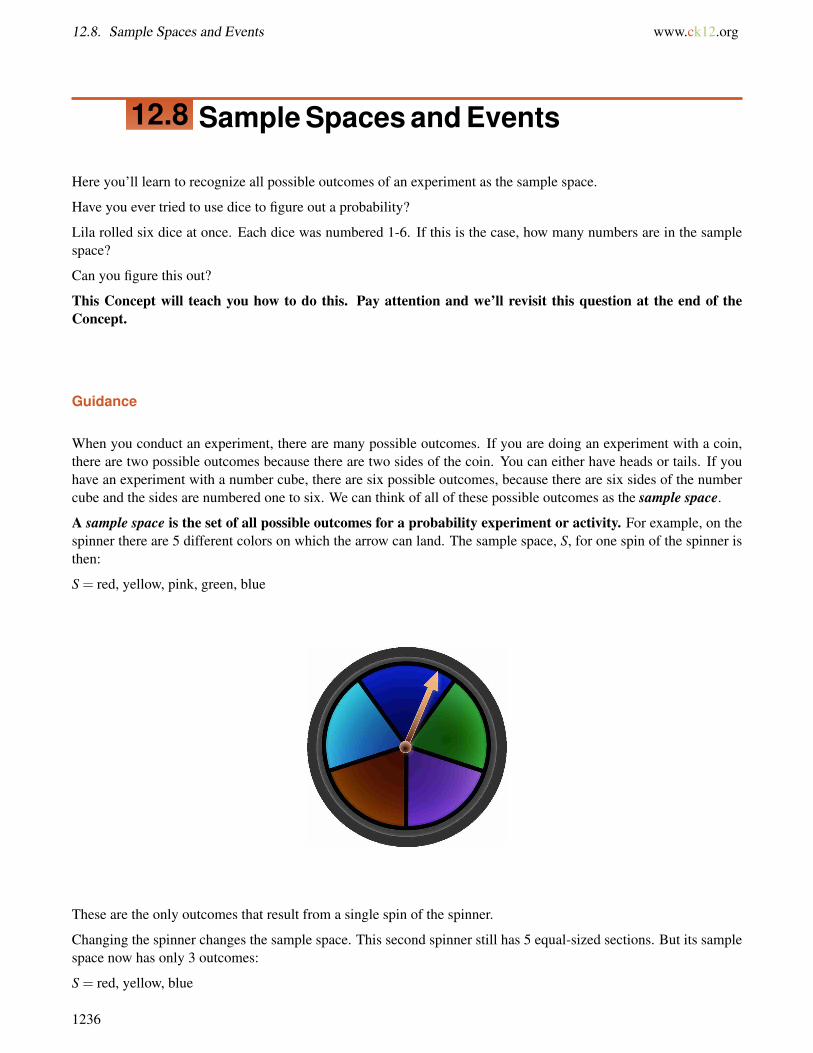
12.8. Sample Spaces and Events www.ck12.org
12.8 Sample Spaces and Events
Here you’ll learn to recognize all possible outcomes of an experiment as the sample space.
Have you ever tried to use dice to figure out a probability?
Lila rolled six dice at once. Each dice was numbered 1-6. If this is the case, how many numbers are in the samplespace?
Can you figure this out?
This Concept will teach you how to do this. Pay attention and we’ll revisit this question at the end of theConcept.
Guidance
When you conduct an experiment, there are many possible outcomes. If you are doing an experiment with a coin,there are two possible outcomes because there are two sides of the coin. You can either have heads or tails. If youhave an experiment with a number cube, there are six possible outcomes, because there are six sides of the numbercube and the sides are numbered one to six. We can think of all of these possible outcomes as the sample space.
A sample space is the set of all possible outcomes for a probability experiment or activity. For example, on thespinner there are 5 different colors on which the arrow can land. The sample space, S, for one spin of the spinner isthen:
S = red, yellow, pink, green, blue
These are the only outcomes that result from a single spin of the spinner.
Changing the spinner changes the sample space. This second spinner still has 5 equal-sized sections. But its samplespace now has only 3 outcomes:
S = red, yellow, blue
1236
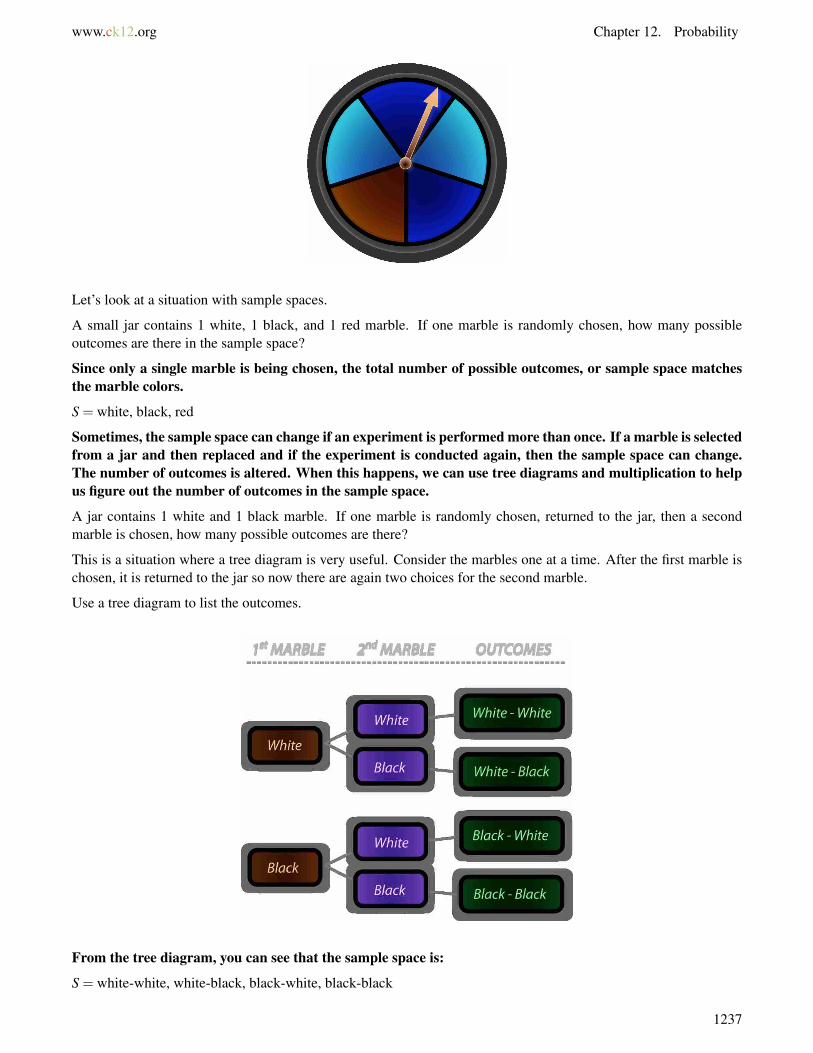
www.ck12.org Chapter 12. Probability
Let’s look at a situation with sample spaces.
A small jar contains 1 white, 1 black, and 1 red marble. If one marble is randomly chosen, how many possibleoutcomes are there in the sample space?
Since only a single marble is being chosen, the total number of possible outcomes, or sample space matchesthe marble colors.
S = white, black, red
Sometimes, the sample space can change if an experiment is performed more than once. If a marble is selectedfrom a jar and then replaced and if the experiment is conducted again, then the sample space can change.The number of outcomes is altered. When this happens, we can use tree diagrams and multiplication to helpus figure out the number of outcomes in the sample space.
A jar contains 1 white and 1 black marble. If one marble is randomly chosen, returned to the jar, then a secondmarble is chosen, how many possible outcomes are there?
This is a situation where a tree diagram is very useful. Consider the marbles one at a time. After the first marble ischosen, it is returned to the jar so now there are again two choices for the second marble.
Use a tree diagram to list the outcomes.
From the tree diagram, you can see that the sample space is:
S = white-white, white-black, black-white, black-black
1237
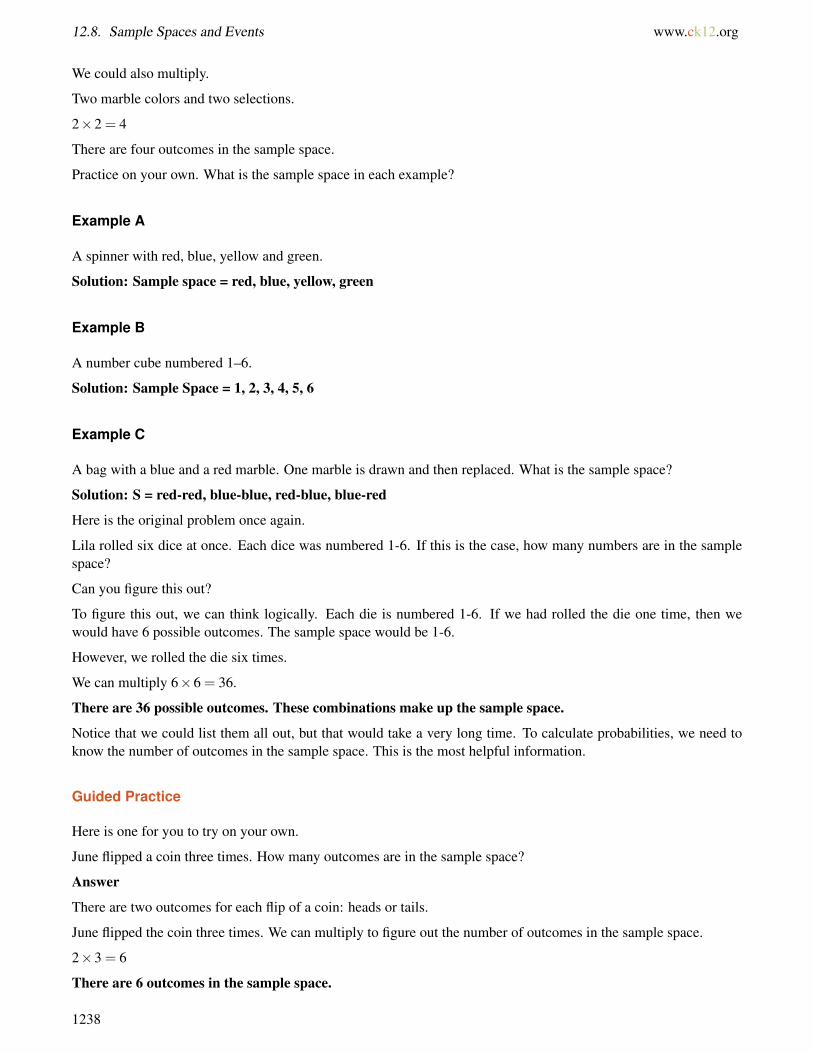
12.8. Sample Spaces and Events www.ck12.org
We could also multiply.
Two marble colors and two selections.
2×2 = 4
There are four outcomes in the sample space.
Practice on your own. What is the sample space in each example?
Example A
A spinner with red, blue, yellow and green.
Solution: Sample space = red, blue, yellow, green
Example B
A number cube numbered 1–6.
Solution: Sample Space = 1, 2, 3, 4, 5, 6
Example C
A bag with a blue and a red marble. One marble is drawn and then replaced. What is the sample space?
Solution: S = red-red, blue-blue, red-blue, blue-red
Here is the original problem once again.
Lila rolled six dice at once. Each dice was numbered 1-6. If this is the case, how many numbers are in the samplespace?
Can you figure this out?
To figure this out, we can think logically. Each die is numbered 1-6. If we had rolled the die one time, then wewould have 6 possible outcomes. The sample space would be 1-6.
However, we rolled the die six times.
We can multiply 6×6 = 36.
There are 36 possible outcomes. These combinations make up the sample space.
Notice that we could list them all out, but that would take a very long time. To calculate probabilities, we need toknow the number of outcomes in the sample space. This is the most helpful information.
Guided Practice
Here is one for you to try on your own.
June flipped a coin three times. How many outcomes are in the sample space?
Answer
There are two outcomes for each flip of a coin: heads or tails.
June flipped the coin three times. We can multiply to figure out the number of outcomes in the sample space.
2×3 = 6
There are 6 outcomes in the sample space.
1238
www.ck12.org Chapter 12. Probability
Video Review
MEDIAClick image to the left or use the URL below.URL: http://www.ck12.org/flx/render/embeddedobject/116635
Khan Academy Probability Space
Explore More
Directions: Answer the following questions about sample spaces.
1. What is the sample space for a single toss of a number cube?
2. What is the sample space for a single flip of a coin?
3. A coin is flipped two times. List all possible outcomes for the two flips.
4. A coin is flipped three times in a row. List all possible outcomes for the two flips.
5. A bag contains 3 ping pong balls: 1 red, 1 blue, and 1 green. What is the sample space for drawing a single ballfrom the bag?
6. A bag contains 3 ping pong balls: 1 red, 1 blue, and 1 green. What is the sample space for drawing a single ball,returning the ball to the bag, then drawing a second ball?
7. What is the sample space for a single spin of the with red, blue, yellow and green sections spinner?
8. What is the sample space for 2 spins of the first spinner?
9. What is the sample space for three spins of the spinner?
10. A box contains 3 socks: 1 black, 1 white, and 1 brown. What is the sample space for drawing a single sock,NOT returning the sock to the box, then drawing a second sock?
11. A box contains 3 socks: 1 black, 1 white, and 1 brown. What is the sample space for drawing all 3 socks fromthe box, one at a time, without returning any of the socks to the box?
12. A box contains 3 black socks. What is the sample space for drawing all 2 socks from the box, one at a time,without returning any of the socks to the box?
13. A box contains 2 black socks and 1 white sock. What is the sample space for drawing all 2 socks from the box,one at a time, without returning any of the socks to the box?
14. True or false. A sample space is the total possible outcomes.
15. True or false. A sample space is a percentage.
1239
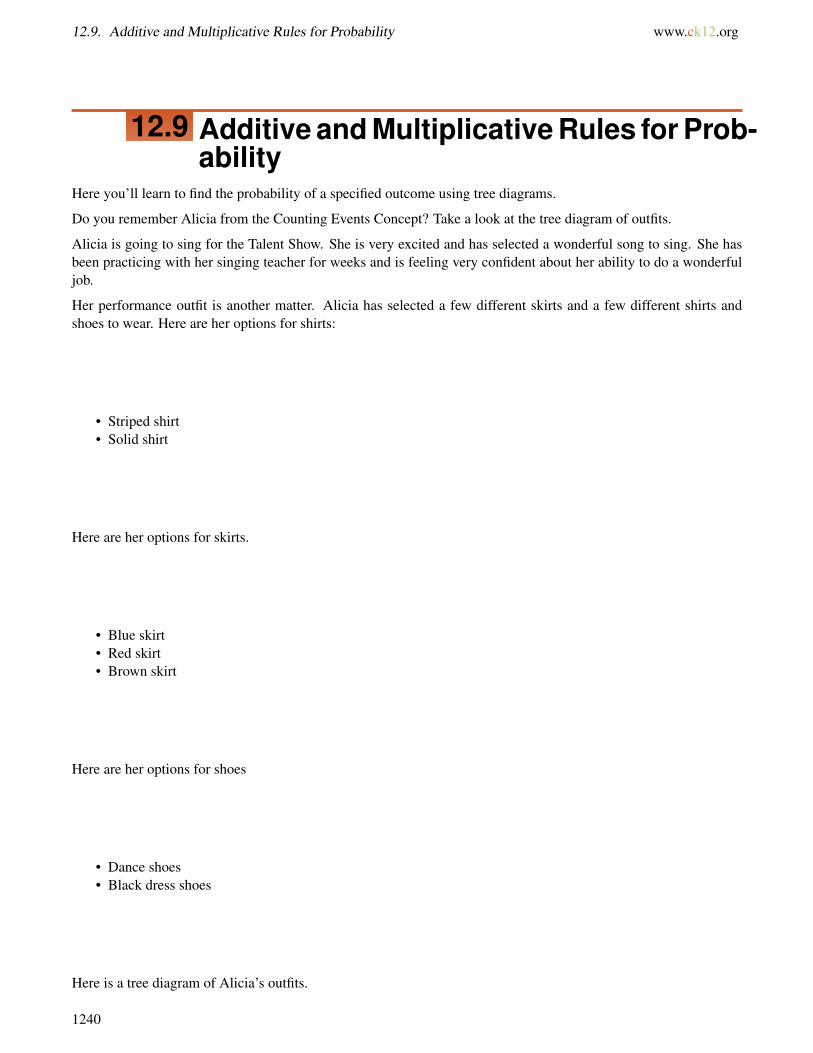
12.9. Additive and Multiplicative Rules for Probability www.ck12.org
12.9 Additive and Multiplicative Rules for Prob-ability
Here you’ll learn to find the probability of a specified outcome using tree diagrams.
Do you remember Alicia from the Counting Events Concept? Take a look at the tree diagram of outfits.
Alicia is going to sing for the Talent Show. She is very excited and has selected a wonderful song to sing. She hasbeen practicing with her singing teacher for weeks and is feeling very confident about her ability to do a wonderfuljob.
Her performance outfit is another matter. Alicia has selected a few different skirts and a few different shirts andshoes to wear. Here are her options for shirts:
• Striped shirt• Solid shirt
Here are her options for skirts.
• Blue skirt• Red skirt• Brown skirt
Here are her options for shoes
• Dance shoes• Black dress shoes
Here is a tree diagram of Alicia’s outfits.
1240
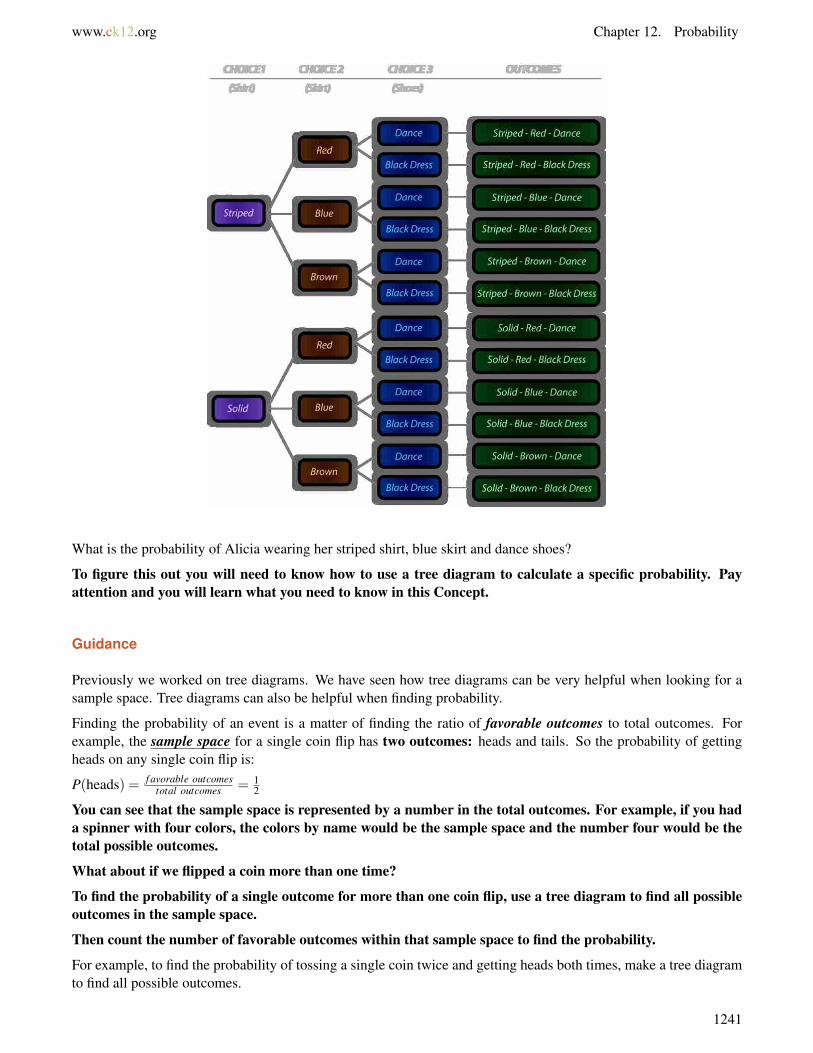
www.ck12.org Chapter 12. Probability
What is the probability of Alicia wearing her striped shirt, blue skirt and dance shoes?
To figure this out you will need to know how to use a tree diagram to calculate a specific probability. Payattention and you will learn what you need to know in this Concept.
Guidance
Previously we worked on tree diagrams. We have seen how tree diagrams can be very helpful when looking for asample space. Tree diagrams can also be helpful when finding probability.
Finding the probability of an event is a matter of finding the ratio of favorable outcomes to total outcomes. Forexample, the sample space for a single coin flip has two outcomes: heads and tails. So the probability of gettingheads on any single coin flip is:
P(heads) = f avorable outcomestotal outcomes = 1
2
You can see that the sample space is represented by a number in the total outcomes. For example, if you hada spinner with four colors, the colors by name would be the sample space and the number four would be thetotal possible outcomes.
What about if we flipped a coin more than one time?
To find the probability of a single outcome for more than one coin flip, use a tree diagram to find all possibleoutcomes in the sample space.
Then count the number of favorable outcomes within that sample space to find the probability.
For example, to find the probability of tossing a single coin twice and getting heads both times, make a tree diagramto find all possible outcomes.
1241
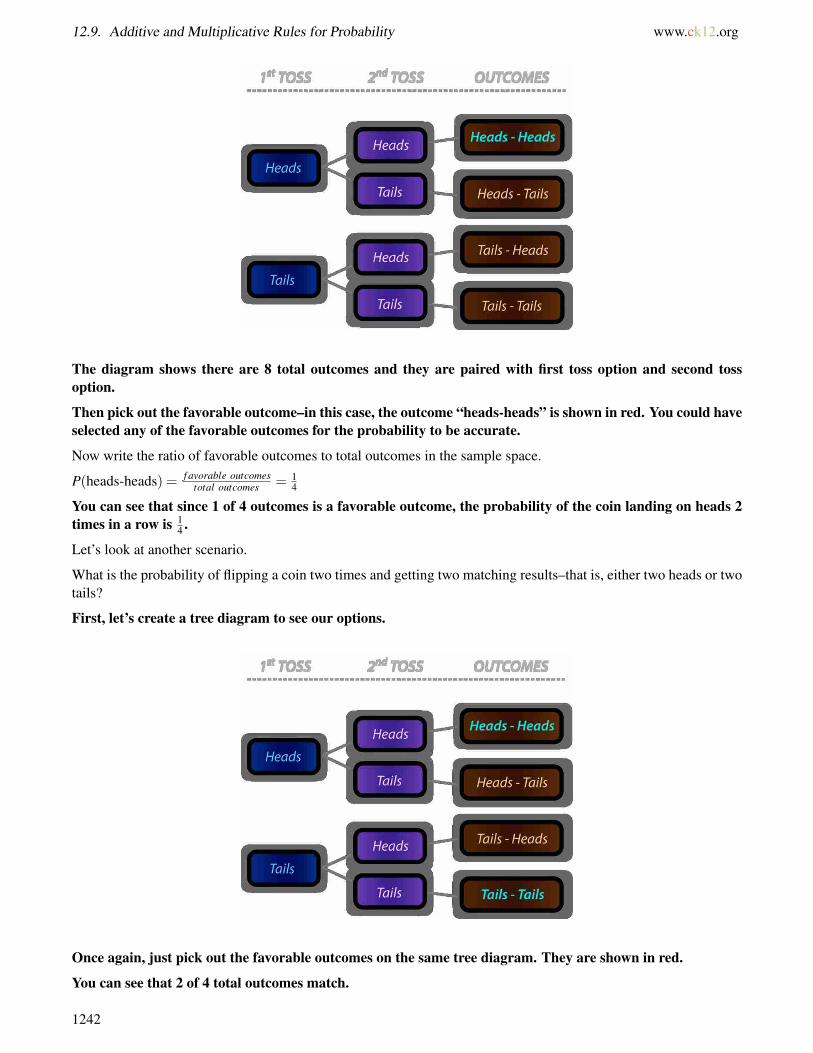
12.9. Additive and Multiplicative Rules for Probability www.ck12.org
The diagram shows there are 8 total outcomes and they are paired with first toss option and second tossoption.
Then pick out the favorable outcome–in this case, the outcome “heads-heads” is shown in red. You could haveselected any of the favorable outcomes for the probability to be accurate.
Now write the ratio of favorable outcomes to total outcomes in the sample space.
P(heads-heads) = f avorable outcomestotal outcomes = 1
4
You can see that since 1 of 4 outcomes is a favorable outcome, the probability of the coin landing on heads 2times in a row is 1
4 .
Let’s look at another scenario.
What is the probability of flipping a coin two times and getting two matching results–that is, either two heads or twotails?
First, let’s create a tree diagram to see our options.
Once again, just pick out the favorable outcomes on the same tree diagram. They are shown in red.
You can see that 2 of 4 total outcomes match.
1242
www.ck12.org Chapter 12. Probability
P(2 heads or 2 tails) = f avorable outcomestotal outcomes = 2
4 = 12
You can see that the probability of flipping two heads or two tails is 1:2.
Try a few on your own.
Example A
Look at the tree diagram above. What is the probability of it being heads and then tails?
Solution: 14
Example B
What is the probability of tails then heads?
Solution: 14
Example C
What is Example A and B as a percent?
Solution: 25%
Here is the original problem once again.
Alicia is going to sing for the Talent Show. She is very excited and has selected a wonderful song to sing. She hasbeen practicing with her singing teacher for weeks and is feeling very confident about her ability to do a wonderfuljob.
Her performance outfit is another matter. Alicia has selected a few different skirts and a few different shirts andshoes to wear. Here are her options for shirts
Striped shirt
Solid shirt
Here are her options for skirts.
Blue skirt
Red skirt
Brown skirt
Here are her options for shoes
Dance shoes
Black dress shoes
Here is a tree diagram of Alicia’s outfits.
1243

12.9. Additive and Multiplicative Rules for Probability www.ck12.org
What is the probability of Alicia wearing her striped shirt, blue skirt and dance shoes?
There are twelve possible outcomes, but only one is the striped shirt, blue skirt and dance shoes.
Our answer is 112 .
Guided Practice
Here is one for you to try on your own.
What is the probability of a win-win-win?
1244

www.ck12.org Chapter 12. Probability
Answer
There are eight possible outcomes for the teams.
There is one option for a win-win-win in all three games.
The probability is 18 .
Video Review
MEDIAClick image to the left or use the URL below.URL: http://www.ck12.org/flx/render/embeddedobject/5461
This is a James Sousa video on probability.
1245

12.9. Additive and Multiplicative Rules for Probability www.ck12.org
Explore More
Directions: Answer each question. Use tree diagrams when necessary.
1. What is the probability that the arrow of the spinner will land on red on a single spin?
2. If the spinner is spun two times in a row, what is the probability that the arrow will land on red both times?
3. If the spinner is spun two times in a row, what is the probability that the spinner will land on the same color twice?
4. If the spinner is spun two times in a row, what is the probability that the arrow will land on red at least one time?
5. If the spinner is spun two times in a row, what is the probability that the spinner will land on a different color bothtimes?
6. If the spinner is spun two times in a row, what is the probability that the arrow will land on blue or green at leastone time?
7. Two cards, the Ace and King of hearts, are taken from a deck, shuffled, and placed face down. What is theprobability that a single card chosen at random will be an Ace?
8. If one card is chosen from the 2-card stack above, then returned to the stack and a second card is chosen, what isthe probability that both cards will be Kings?
9. If one card is chosen from the 2-card stack above, then returned to the stack and a second card is chosen, what isthe probability that both cards will match?
10. If one card is chosen from the 2-card stack above, then returned to the stack and a second card is chosen, whatis the probability that both cards NOT match?
Directions: Look at the tree diagram and figure out each probability as a ratio.
1246
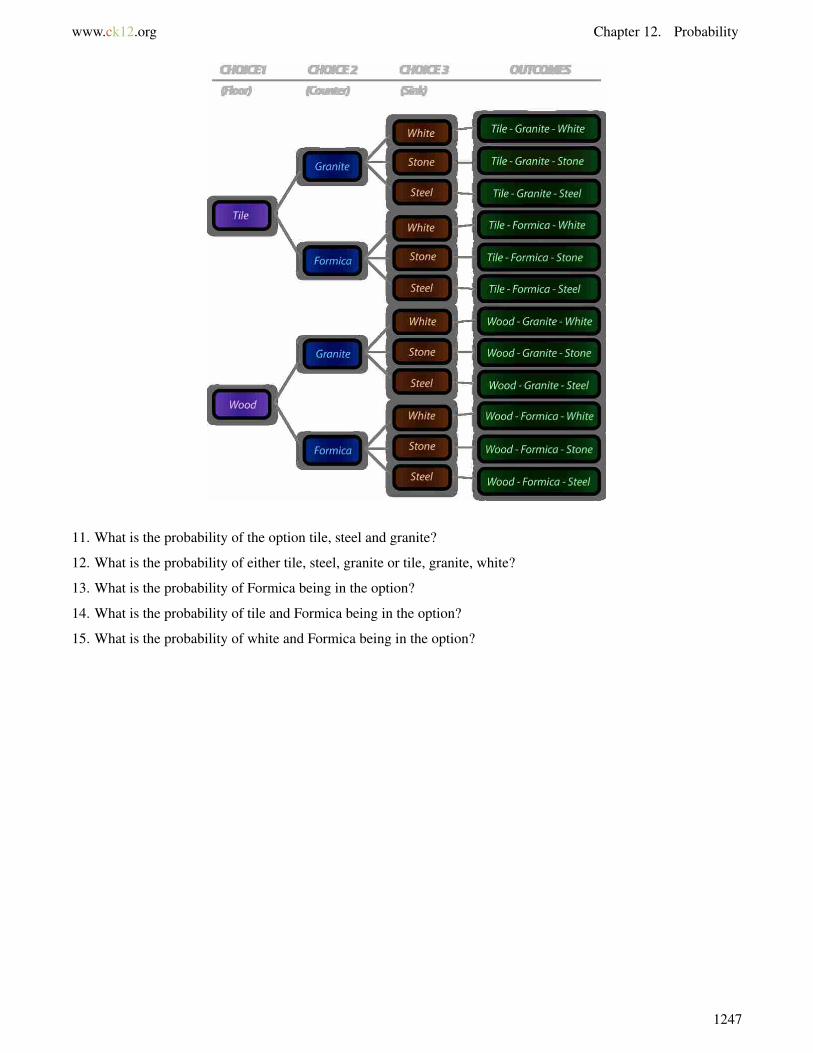
www.ck12.org Chapter 12. Probability
11. What is the probability of the option tile, steel and granite?
12. What is the probability of either tile, steel, granite or tile, granite, white?
13. What is the probability of Formica being in the option?
14. What is the probability of tile and Formica being in the option?
15. What is the probability of white and Formica being in the option?
1247
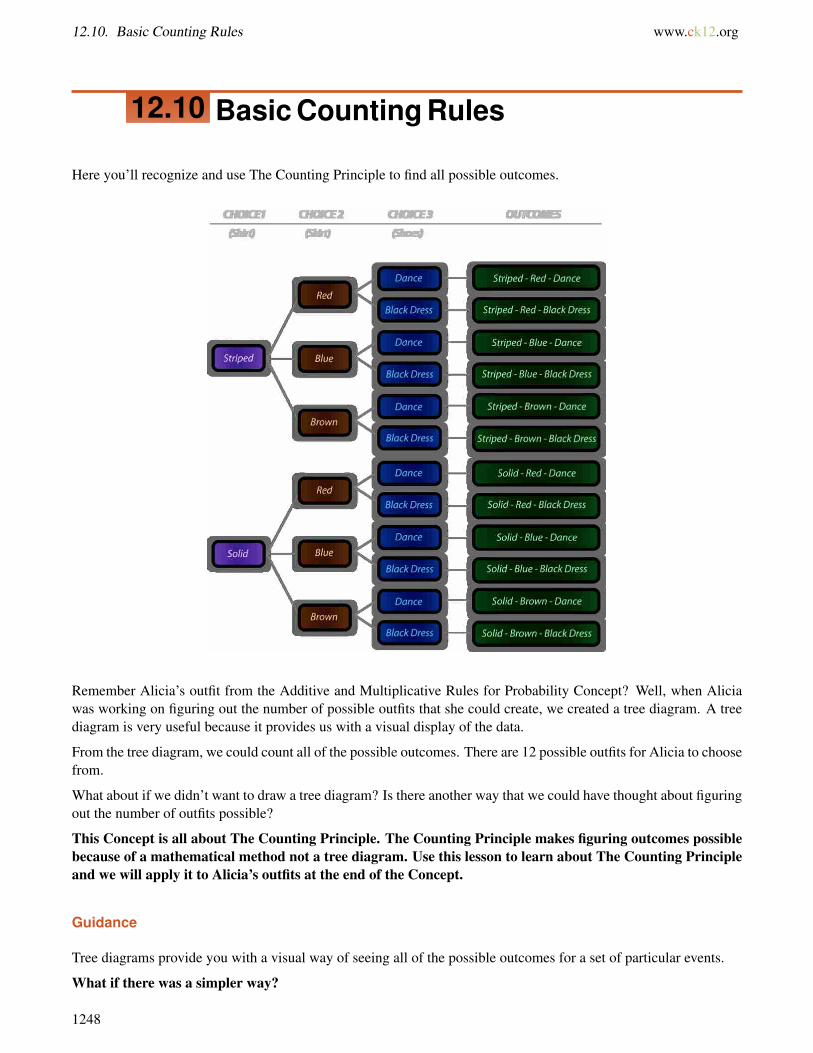
12.10. Basic Counting Rules www.ck12.org
12.10 Basic Counting Rules
Here you’ll recognize and use The Counting Principle to find all possible outcomes.
Remember Alicia’s outfit from the Additive and Multiplicative Rules for Probability Concept? Well, when Aliciawas working on figuring out the number of possible outfits that she could create, we created a tree diagram. A treediagram is very useful because it provides us with a visual display of the data.
From the tree diagram, we could count all of the possible outcomes. There are 12 possible outfits for Alicia to choosefrom.
What about if we didn’t want to draw a tree diagram? Is there another way that we could have thought about figuringout the number of outfits possible?
This Concept is all about The Counting Principle. The Counting Principle makes figuring outcomes possiblebecause of a mathematical method not a tree diagram. Use this lesson to learn about The Counting Principleand we will apply it to Alicia’s outfits at the end of the Concept.
Guidance
Tree diagrams provide you with a visual way of seeing all of the possible outcomes for a set of particular events.
What if there was a simpler way?
1248
www.ck12.org Chapter 12. Probability
Sometimes, you don’t want to have to draw a tree diagram to figure out all of the possible outcomes for a series ofevents. When this happens, we can use another principle to figure out the possible outcomes.
Molly’s All Star Farm Breakfast features 3 choices of eggs–scrambled, fried, or omelet–plus a choice of bacon orsausage. You can use a tree diagram to find that there are 6 different choices, or outcomes, for the breakfast.
What if we wanted to look at this in another way?
We could look at the number of possible breakfast options in terms of outcomes.
For the first choice there are 3 different outcomes. For the second choice there are 2 different outcomes.
3 outcomes ·2 outcomes = 6 outcomes
1249

12.10. Basic Counting Rules www.ck12.org
Yes they are. That is because this is a new principle to figure out the total possible outcomes of a series ofevents. We call in the Counting Principle.
Counting Principle: The number of choices or outcomes for two independent events, A and B taken together, is theproduct of the total number of outcomes for each event.
Total outcomes for A and B = (number of outcomes for A) · (number of outcomes for B)
Now that you know what the Counting Principle is, you can practice using it. The Counting Principle will workfor 2, 3 even 4 different events. Just follow the procedure of using multiplication to find the number of possibleoutcomes.
Now let’s apply the Counting Principle to a scenario.
For buying gum you have the following choices:
• 3 flavor choices–spearmint, peppermint, cinnamon• 2 sugarless choices–sugarless or non-sugarless• 2 bubble choices–bubble gum or regular
To find the number of gum choices you have you could make a tree diagram, or you could simply use theCounting Principle:
3 choices ·2 choices ·2 choices = 12 choices
To check our answer, we can write out all of the possible options for gum:
1250
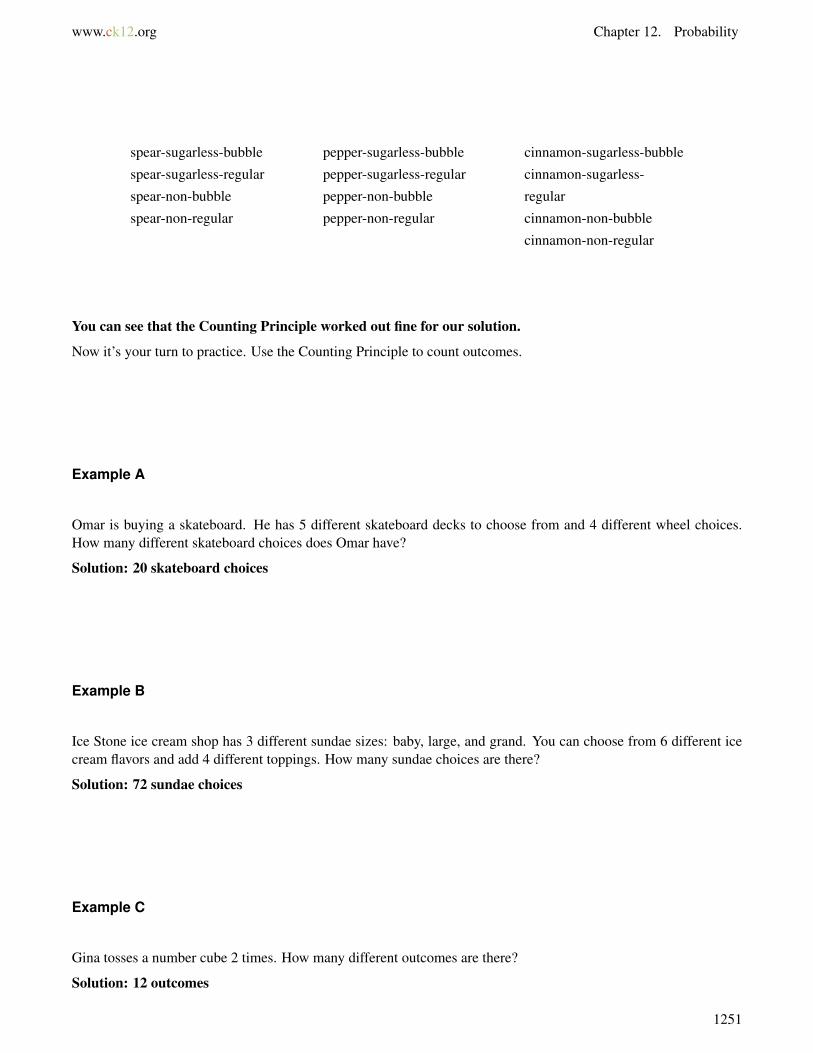
www.ck12.org Chapter 12. Probability
spear-sugarless-bubble pepper-sugarless-bubble cinnamon-sugarless-bubble
spear-sugarless-regular pepper-sugarless-regular cinnamon-sugarless-
spear-non-bubble pepper-non-bubble regular
spear-non-regular pepper-non-regular cinnamon-non-bubble
cinnamon-non-regular
You can see that the Counting Principle worked out fine for our solution.
Now it’s your turn to practice. Use the Counting Principle to count outcomes.
Example A
Omar is buying a skateboard. He has 5 different skateboard decks to choose from and 4 different wheel choices.How many different skateboard choices does Omar have?
Solution: 20 skateboard choices
Example B
Ice Stone ice cream shop has 3 different sundae sizes: baby, large, and grand. You can choose from 6 different icecream flavors and add 4 different toppings. How many sundae choices are there?
Solution: 72 sundae choices
Example C
Gina tosses a number cube 2 times. How many different outcomes are there?
Solution: 12 outcomes
1251
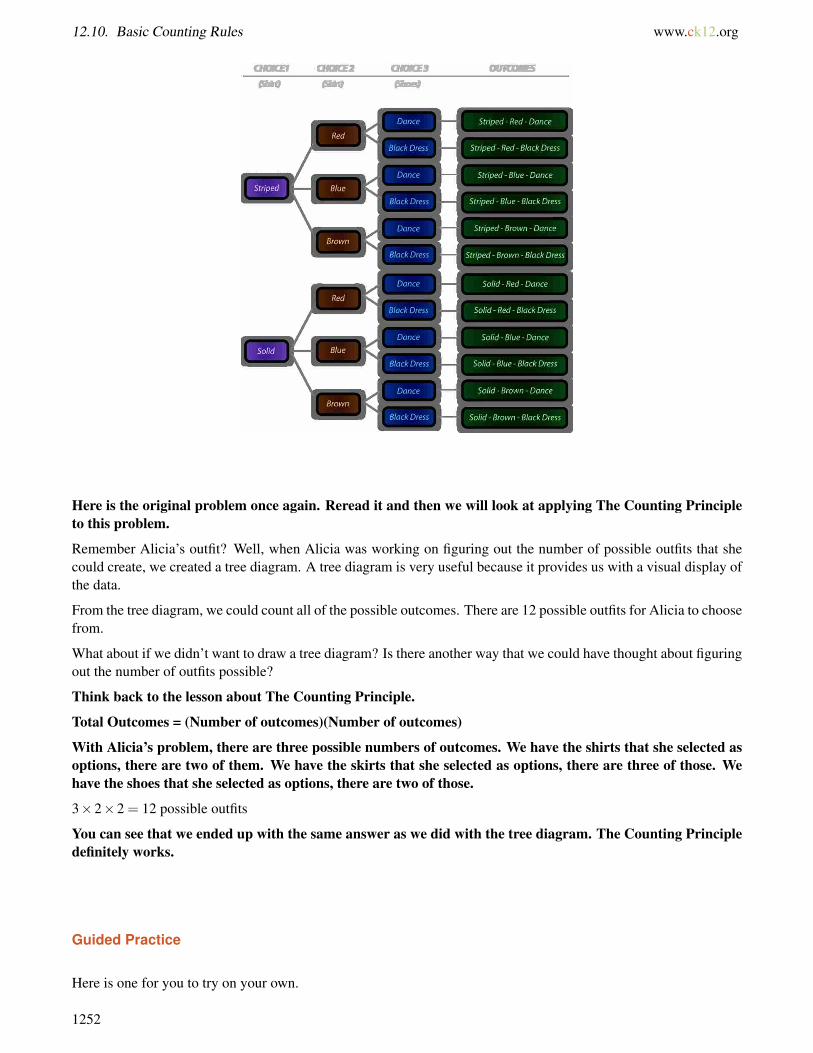
12.10. Basic Counting Rules www.ck12.org
Here is the original problem once again. Reread it and then we will look at applying The Counting Principleto this problem.
Remember Alicia’s outfit? Well, when Alicia was working on figuring out the number of possible outfits that shecould create, we created a tree diagram. A tree diagram is very useful because it provides us with a visual display ofthe data.
From the tree diagram, we could count all of the possible outcomes. There are 12 possible outfits for Alicia to choosefrom.
What about if we didn’t want to draw a tree diagram? Is there another way that we could have thought about figuringout the number of outfits possible?
Think back to the lesson about The Counting Principle.
Total Outcomes = (Number of outcomes)(Number of outcomes)
With Alicia’s problem, there are three possible numbers of outcomes. We have the shirts that she selected asoptions, there are two of them. We have the skirts that she selected as options, there are three of those. Wehave the shoes that she selected as options, there are two of those.
3×2×2 = 12 possible outfits
You can see that we ended up with the same answer as we did with the tree diagram. The Counting Principledefinitely works.
Guided Practice
Here is one for you to try on your own.
1252

www.ck12.org Chapter 12. Probability
You’re buying a sweater and have the following choices.
• 5 different color choices–black, yellow, blue, red, green• 3 different material choices–wool, cotton, fleece• 4 different style choices–v-neck, crew, button-down, turtle
To find the number of sweater choices you have you could make a tree diagram, or you could simply use theCounting Principle:
5 choices ·3 choices ·4 choices = 60 choices
Video Review
MEDIAClick image to the left or use the URL below.URL: http://www.ck12.org/flx/render/embeddedobject/5461
This is a James Sousa video on probability.
Explore More
Directions: Use the Counting Principle to solve each problem.
1. The Cubs have 3 games left to play this year. How many different outcomes can there be for the three games?
2. Svetlana tosses a coin 4 times in a row. How many outcomes are there for the 4 tosses?
3. For a new tennis racquet, Danny can choose from 8 different brands, 3 different head sizes, and 4 different gripsizes. How many different racquet choices does Danny have?
4. Gina tosses a number cube 3 times. How many different outcomes are possible?
5. Gina tosses a number cube. Buster flips a coin. How many different outcomes are possible for the two events?
1253
12.10. Basic Counting Rules www.ck12.org
6. Buster flips a coin. Daoud chooses a card from a deck of 52 cards. How many different outcomes are possible forthe two events?
7. Rex spins a spinner that has red, blue, and yellow sections two times. How many different outcomes are possible?
8. Daoud chooses a card from a deck of 52 cards, replaces the card in the deck, then chooses a second card. Howmany different outcomes are possible?
9. Patsy’s Pizza features 3 different pizza types, 14 different toppings, and 2 different sizes. How many differentpizzas can you order?
10. Spud has a 2-letter password for his computer using letters only. If there are 26 different letters in the alphabet,how many different passwords are possible?
11. Doreen has a 3-digit password for her computer using digits only. If there are 10 different digits (including zero),how many different passwords are possible?
12. Sebastian has a 3-letter password for his computer using vowels (A, E, O, I, U) only. How many differentpasswords are possible?
13. If Sebastian had a two - letter password, how many different passwords are possible?
14. If Sebastian had a four - letter password, how many different passwords are possible?
15. If Sebastian had a five - letter password, how many different passwords are possible?
1254
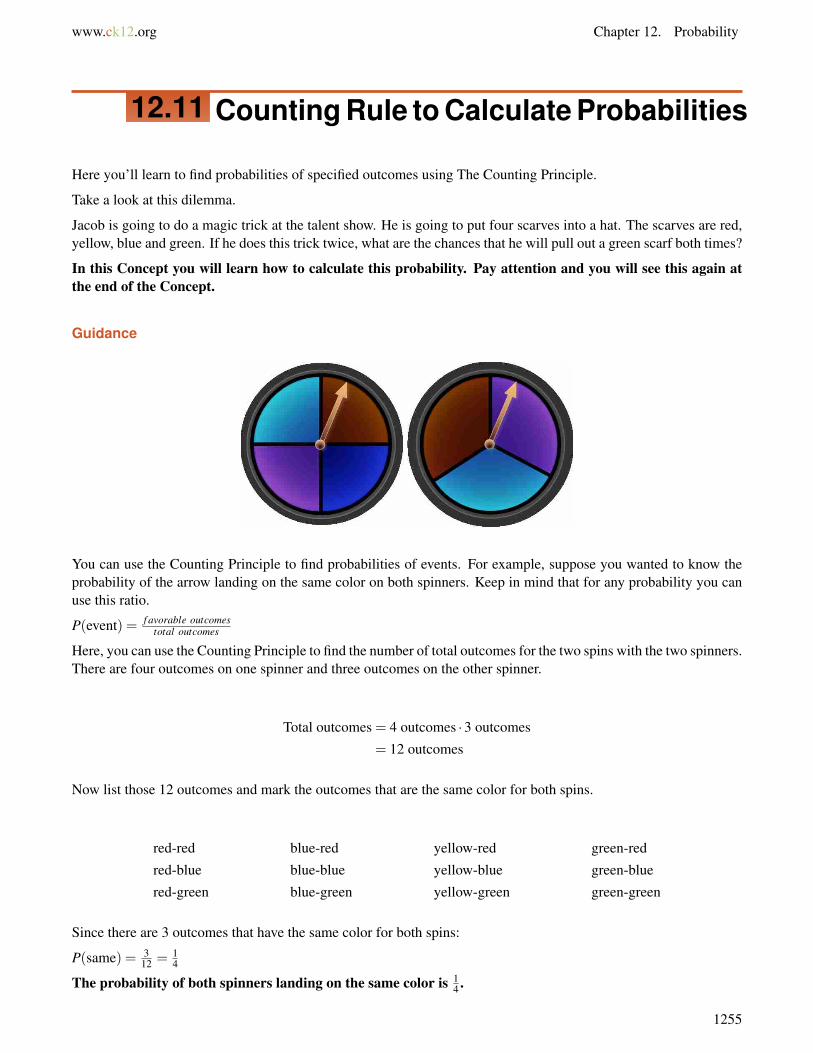
www.ck12.org Chapter 12. Probability
12.11 Counting Rule to Calculate Probabilities
Here you’ll learn to find probabilities of specified outcomes using The Counting Principle.
Take a look at this dilemma.
Jacob is going to do a magic trick at the talent show. He is going to put four scarves into a hat. The scarves are red,yellow, blue and green. If he does this trick twice, what are the chances that he will pull out a green scarf both times?
In this Concept you will learn how to calculate this probability. Pay attention and you will see this again atthe end of the Concept.
Guidance
You can use the Counting Principle to find probabilities of events. For example, suppose you wanted to know theprobability of the arrow landing on the same color on both spinners. Keep in mind that for any probability you canuse this ratio.
P(event) = f avorable outcomestotal outcomes
Here, you can use the Counting Principle to find the number of total outcomes for the two spins with the two spinners.There are four outcomes on one spinner and three outcomes on the other spinner.
Total outcomes = 4 outcomes ·3 outcomes
= 12 outcomes
Now list those 12 outcomes and mark the outcomes that are the same color for both spins.
red-red blue-red yellow-red green-red
red-blue blue-blue yellow-blue green-blue
red-green blue-green yellow-green green-green
Since there are 3 outcomes that have the same color for both spins:
P(same) = 312 = 1
4
The probability of both spinners landing on the same color is 14 .
1255
12.11. Counting Rule to Calculate Probabilities www.ck12.org
You can also apply the Counting Principle to a variety of different probability problems.
Example
Anna flips a coin 3 times in a row. What is the probability that she will get heads all 3 times?
Step 1: Rather than draw a tree diagram, to find the number of total outcomes you can simply multiply the numberof outcomes for each flip
Total outcomes = 2 outcomes ·2 outcomes ·2 outcomes
= 8 outcomes
Step 2: Now list all 8 outcomes and find the number of ways Anna can get heads all 3 times. Clearly, there is onlyone arrangement in which all 3 flips result in heads.
heads-heads-heads tails-heads-heads
heads-heads-tails tails-heads-tails
heads-tails-heads tails-tails-heads
heads-tails-tails tails-tails-tails
Step 3: Find the ratio of favorable outcomes to total outcomes:
P(red-red-red) = 18
Use the Counting Principle to find each probability.
Example A
Abra flips a coin 2 times. What is the probability that both flips will match?
Solution: 24 = 1
2
Example B
Abra flips a coin 2 times. What is the probability that both flips will NOT match?
Solution: 24 = 1
2
Example C
Abra flips a coin 3 times. What is the probability that all 3 flips will match?
Solution: 28 = 1
4
Here is the original problem once again.
Jacob is going to do a magic trick at the talent show. He is going to put four scarves into a hat. The scarves are red,yellow, blue and green. If he does this trick twice, what are the chances that he will pull out a green scarf both times?
There are four possible outcomes in this trick.
Jacob will perform the trick twice.
2×4 = 8
1256
www.ck12.org Chapter 12. Probability
There are 8 outcomes possible.
Two of these outcomes could have the scarf chosen be green.28 = 1
4
This is our answer.
Guided Practice
Here is one for you to try on your own.
If Sam flips a coin five times. What is the probability of having it come up heads all at the same time?
Answer
First, let’s figure out the total number of outcomes.
There can be two possible outcomes each time Sam flips the coin.
2×5 = 10
There are 10 possible outcomes.
This can only happen one time.
Our answer is 110 .
Video Review
MEDIAClick image to the left or use the URL below.URL: http://www.ck12.org/flx/render/embeddedobject/5461
This is a James Sousa video on probability.
Explore More
Directions: Find probabilities using the Counting Principle.
1. Abra flips a coin 3 times. What is the probability that all 3 flips will NOT match?
2. Abra flips a coin 3 times. What is the probability that heads will come up exactly 2 times?
1257
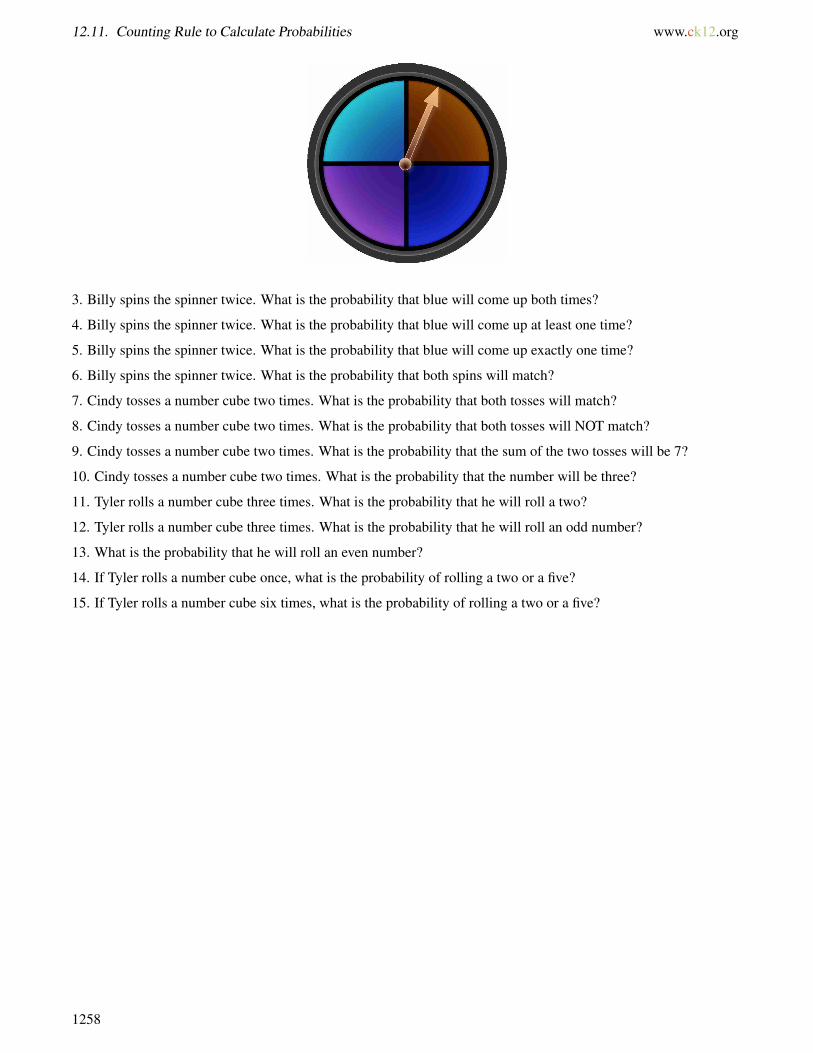
12.11. Counting Rule to Calculate Probabilities www.ck12.org
3. Billy spins the spinner twice. What is the probability that blue will come up both times?
4. Billy spins the spinner twice. What is the probability that blue will come up at least one time?
5. Billy spins the spinner twice. What is the probability that blue will come up exactly one time?
6. Billy spins the spinner twice. What is the probability that both spins will match?
7. Cindy tosses a number cube two times. What is the probability that both tosses will match?
8. Cindy tosses a number cube two times. What is the probability that both tosses will NOT match?
9. Cindy tosses a number cube two times. What is the probability that the sum of the two tosses will be 7?
10. Cindy tosses a number cube two times. What is the probability that the number will be three?
11. Tyler rolls a number cube three times. What is the probability that he will roll a two?
12. Tyler rolls a number cube three times. What is the probability that he will roll an odd number?
13. What is the probability that he will roll an even number?
14. If Tyler rolls a number cube once, what is the probability of rolling a two or a five?
15. If Tyler rolls a number cube six times, what is the probability of rolling a two or a five?
1258
www.ck12.org Chapter 12. Probability
12.12 Permutations
Here you’ll learn to recognize and identify permutations.
Have you ever created an event at school? Look at this collaboration.
Greg and Joanna are in charge of creating an order for the Talent Show. There are 6 sixth graders, 10 seventh gradersand 6 eighth graders who have entered the contest.
The order that the students perform in makes a difference, and the sixth graders will all perform together. Then theseventh graders will perform and finally the eighth graders will perform.
Greg and Joanna begin with the sixth graders. Since there are six sixth graders who are performing and order doesmake a difference, how many different arrangements of the order are possible?
“I don’t have a clue how to figure this out,” Joanna says to Greg.
“I think I do, let me get a piece of paper.”
While Greg gets a piece of paper, it is time for you to think about this problem. Solving it has to do withsomething called a “permutation.” This lesson is all about permutations and how to figure them out.
Pay attention and at the end of the Concept you will know how to help Greg and Joanna figure out the orderof sixth graders.
Guidance
You can make all kinds of combinations. Let’s say that you are making a pizza with pepperoni, mushrooms andpeppers. It doesn’t matter which order you put the toppings on the pizza. You will still have the same pizza.
Sometimes, order does make a difference. When you arrange different objects or events and order is important,we call this a permutation.
This Concept is all about permutations.
Think about spelling.
Consider the word CAT. Clearly, order is important when you spell a word. You can write all of the correct letters,but if you don’t put them in the correct order, you don’t spell CAT. For example, here are some orders of C, A, andT that don’t spell CAT;
Incorrect orders: ACT,ATC,CTA,TAC,TCA
Correct orders: CAT
This is a situation where a permutation makes a difference. We can also use permutations to solve problems. To usepermutations to solve problems, you need to be able to identify the problems in which order, or the arrangement ofitems, matters.
Tomás wants to know how many 3-digit numbers he can write using the digits 7, 8, and 9 without repeating any ofthe digits. Does order matter for this problem?
Step 1: Write out a single order.
789
Step 2: Now rearrange the order. Did you change the outcome? If so, then order matters.
1259
12.12. Permutations www.ck12.org
798
This is different from the original number
Each arrangement of digits is a different permutation.
The softball coach needs to determine how many different batting lineups she can make out of her first three batters,Able, Baker, and Chan. Does order matter for this problem?
Step 1: Write out a single lineup.
Able, Baker, Chan
Step 2: Now rearrange the lineup. Did you change the outcome? If so, then order matters.
Able, Chan, Baker–this order is different from the original
Each arrangement of batters is a different permutation.
Write whether or not order is important for each scenario and why.
Example A
How many 3-letter words can Brenda write using the letters E,T,A without repeating letters?
Solution: Order is important
Example B
Five different cars entered the race painted the following colors: red, orange, blue, white, purple? In how manydifferent ways can the cars finish the race?
Solution: Order is important
Example C
At the breakfast buffet you can take any three of the following: eggs, pancakes, potatoes, cereal, waffles. How manydifferent 3-item breakfasts can you get?
Solution: Order is not important
Here is the original problem once again. Reread it and then work through figuring out the permutation.
Greg and Joanna are in charge of creating an order for the Talent Show. There are 6 sixth graders, 10 seventh gradersand 6 eighth graders who have entered the contest.
The order that the students perform in makes a difference, and the sixth graders will all perform together. Then theseventh graders will perform and finally the eighth graders will perform.
Greg and Joanna begin with the sixth graders. Since there are six sixth graders who are performing and order doesmake a difference, how many different arrangements of the order are possible?
“I don’t have a clue how to figure this out,” Joanna says to Greg.
“I think I do, let me get a piece of paper.”
Greg takes out a piece of paper and writes this on it.
6 sixth graders
6×5×4×3×2×1 = the number o f possible arrangements
1260
www.ck12.org Chapter 12. Probability
“You see, it makes a difference, so we can use a factorial,” Greg explains. “Now we will know how manypossible arrangements of sixth graders there are.”
6×5×4×3×2×1 = 720
There are 720 possible combinations. Greg and Joanna probably need to narrow this down a little furtherbecause that is a lot of possible arrangements. They decide to make singers one category. That will help themwith possible combinations.
Guided Practice
Here is one for you to try on your own.
Henry has a combination lock. He can program the combination of his lock using the numbers 1, 5 and 18. Henrycan only choose one arrangement of the numbers.
Is this a permutation? Why?
Answer
Henry and his combination lock is an example of a permutation because there is only one way to order the numbersand order does make a difference.
Video Review
MEDIAClick image to the left or use the URL below.URL: http://www.ck12.org/flx/render/embeddedobject/5305
This is a James Sousa video on permutations.
Explore More
Directions: Decide whether or not order matters for each of the following scenarios. Briefly explain your reasoning.
1. Doug is going to use the following 5 letters to create his new 3-letter computer password: B, F, G, L, and T. Howmany different passwords can he create if he doesn’t repeat any letters?
2. Violin players in the orchestra include Jerry, Kerry, Barry, Mary, Sherry, Harry, Terri, and Perry. How manydifferent 3-person trios can you make?
3. The 3 different numbers for Arun’s lock are 14, 35, and 20. How many different combinations must Arun trybefore he’ll be sure he can open his lock?
4. Mr. Chen has decided that he’s going to give Nikki, Mickey, and Hickey awards for the essay contest. What hedoesn’t know is who will get 1st prize, 2nd prize, and 3rd prize. How many different ways can Mr. Chen give outthe prizes?
5. Five candidates are running for 2 student senate seats: Bo, Jo, Mo, Zo, and Ro. How many different pairs ofsenators can there be?
6. Five skaters are competing in the County Championship Finals: Miller, Diller, Hiller, Giller, and Stiller? Howmany different ways can they finish first, second, third, fourth, and fifth?
1261

12.12. Permutations www.ck12.org
Directions: Find the number of permutations for each problem.
7. How many 3-letter words can Brenda write using the letters A, B, and C without repeating any of the letters?
8. How many 4-digit numbers can Brenda write using the digits 1, 3, 5, 7 without repeating any of the digits?
9. Doug, Eileen, Francesca, and Garth all entered the swimming race. In how many different orders can the fourracers finish?
10. Miguel is serving soup, salad, pasta, and fish for dinner. In how many different orders can he serve the fourdishes?
11. Mike has 4 different playing cards: Ace, King, Jack, and Ten. How many different 4-card arrangements can hemake?
12. Marlena strung 5 charms on a bracelet–a star, a fish, a diamond, a moon, and a baby shoe. Into how manydifferent orders can she arrange the 5 charms?
13. Michelle forgot her 6-letter computer password. She knows she used the letters H, I, J, K, L, and M in thepassword and that she didn’t repeat any of the letters. How many different passwords must she try before she is sureto hit the correct one?
14. Seven skaters are competing in the County Championship Finals. In how many different orders can they finishfirst, second, third, fourth, fifth, sixth, and seventh?
15. If there are eight skaters competing, how does this change the number of permutations?
1262
www.ck12.org Chapter 12. Probability
12.13 Permutation Problems
Here you’ll learn to count and evaluate permutations.
Have you ever tried to arrange a group of children?
Kelly is working as a camp counselor. She has to arrange a group of 8 children into the lake three at a time. Theorder of the children doesn’t matter, but the number of children that she can take swimming at one time does matter.
How many different combinations of children are there?
Do you know how to figure this out?
This Concept is about counting and evaluating permutations. By the end of it, you will be able to help Kellywith her problem.
Guidance
Once you decide that the order does matter, you know that you are working with a permutation. It is helpful to knowhow to calculate permutations.
Let’s look at a situation to see how to do this.
The softball coach needs to determine how many different batting lineups she can make out of her first three batters,Able, Baker, and Chan. How many different batting orders are there?
One way to look at this problem is as the product of 3 different choices. For choice 1 you can select any of thethree batters, Able, Baker, or Chan.
Choice 1×Choice 2×Choice 3 = Possible Number of Choices
3 is the Choice 1 because you have 3 batters to choose from.
2 is Choice 2 because you selected one batter for Choice 1 leaving 2 choices.
1 is Choice 3 because that is all that is left.
Here is the answer:
3×2×1 = 6
There are six possible choices.
Using the Counting Principle you can multiply the three choices together to get the total number of choices, orpermutations, as 6. Here are the 6 different batting lineups.
Able-Baker-Chan Baker-Able-Chan Chan-Able-Baker
Able-Chan-Baker Baker-Chan-Able Chan-Baker-Able
Notice that order is important here. Each of the 6 choices, or permutations, is a unique and different batting order.For example, Able-Baker-Chan is not the same lineup as Able-Chan-Baker.
What happens when you increase the number of players in your lineups by adding Davis? How many differentlineups are there now? Starting over, you can now see that there are 4 choices for the first batter, followed by 3choices, 2 choices, and 1 choice.
4×3×2×1 = 24 possible choices
1263

12.13. Permutation Problems www.ck12.org
Let’s look at another situation.
How many different arrangements of the letters A,B,C,D, and E can you make without repeating any of the letters?
This is very much like the Able, Baker, Chan, Davis problem only it adds a fifth item. Notice how this extraitem increases the total by a huge amount. In fact, there are exactly 5 times as many permutations of 5 items thanthere were of 4 items above.
5 · 4 · 3 · 2 · 1 = 120
choice 1 choice 2 choice 3 choice 4 choice 5 total choices
You can see how the product of all of the choices was figured out in this problem.
You learned how to count permutations that of a certain amount of choices where all of the choices were used eachtime. For instance, when you completed the batter line up of three batters in order, you could count the permutationslike this.
3×2×1 = 6 possible permutations
What happens if you were to have four players, but you only wanted to put three in the line up?
This changes the way that we count permutations.
To accomplish this task, you start counting at 4 and then find the product of the next two values as well.
4×3×2 = 24 permutations
Notice that we don’t include the 1 because there are four batters taken three at a time. We will still have thecorrect number of permutations if we leave out the 1.
Let’s look at another one.
What will happen if Elvis joins team? Now, with 5 players to choose from, how many different 3-player battingorders are there?
Again, draw a box diagram to show that you still have 3 different choices to make. But this time you have 5different players for your first choice, 4 players for your second choice, and 3 players for your third choice.
5×4×3 = 60 options
You can use this method to find any permutation no matter how many options there are.
Taken 4 at a time, how many different arrangements of the letters A,B,C,D,E, and F are there?
First, notice that there are six possible letter choices to work with. You want to take them four at a time.
6×5×4×3 = 360 possible options
Notice that you don’t have to see all 360 options to know that your answer is accurate! If you followed the methodof counting permutations, then your answer is accurate.
You just figured out permutations by arranging numbers. Sometimes you used boxes to organize the numbers andsometimes you just wrote out the multiplication problem. We can use permutation notation to help us know whenwe are working with a permutation.
What is permutation notation?
Permutation notation involves something called a factorial . A factorial is a way of writing a number to show thatwe are going to be looking for the product of a series of numbers.
The symbol for a factorial is an exclamation sign.
Here are some factorials.
1264

www.ck12.org Chapter 12. Probability
8! = 8− factorial
11! = 11− factorial
29! = 29− factorial
2! = 2− factorial, and so on
To compute factorials, simply rewrite the number before the exclamation point and all of the whole numbersthat come before it.
4! = 4 ·3 ·2 ·17! = 7 ·6 ·5 ·4 ·3 ·2 ·12! = 2 ·1
11! = 11 ·10 ·9 ·8 ·7 ·6 ·5 ·4 ·3 ·2 ·1
What are the values of these factorial numbers? To find out, simply multiply.
4! = 4 ·3 ·2 ·1 = 24
5! = 5 ·4 ·3 ·2 ·1 = 120
7! = 7 ·6 ·5 ·4 ·3 ·2 ·1 = 5040
That is all that you need to know. As long as you remember how to find the product of a factorial, you will alwaysknow a short cut for permutations!
Now that you’ve learned how to work with factorials, you are ready see how to use them to calculate permu-tations. Suppose you have 5 letters –A,B,C,D, and E. You want to know how many permutations there are if youtake 3 letters at a time and find all arrangements of them. In permutation notation you write this as:
5P3⇐= 5 items taken 3 at a time
In general, permutations are written as:
nPr⇐= n items taken r at a time
To compute nPr you write:
nPr =n!
(n−r)! =⇐= total items!
⇐= (total items-items taken at a time)!To compute 5P3 just fill in the numbers:
5P3 =5!
(5−3)!=
⇐= total items!⇐= (total items-items taken at a time)!
5P3 =5(4)(3)(2)(1)
2(1)=
1202
= 60
There are 60 possible permutations.
You can use this formula anytime that you are looking to figure out permutations!
Now try a few of these on your own.
1265

12.13. Permutation Problems www.ck12.org
Example A
3P2
Solution: 6 possible combinations
Example B
5P4
Solution: 120 possible combinations
Example C
9P2
Solution: 72 possible combinations
Here is the original problem once again.
Kelly is working as a camp counselor. She has to arrange a group of 8 children into the lake three at a time. Theorder of the children doesn’t matter, but the number of children that she can take swimming at one time does matter.
How many different combinations of children are there?
To figure this out, we can use permutation notation.
We have eight children taken swimming three at a time.
8P3
To compute 8P3 just fill in the numbers:
8P3 =8!
(8−3)!=
⇐= total items!⇐= (total items-items taken at a time)!
8P3 =8(7)(6)(5)(4)(3)(2)(1)
5(4)(3)(2)(1)=
10080120
= 84
There are 84 possible combinations of children.
Guided Practice
Here is one for you to try on your own.
9P5
Answer
Notice that this problem is written in permutation notation. We have figure it out using this notation.
To compute 9P5 just fill in the numbers:
9P5 =9!
(9−5)!=
⇐= total items!⇐= (total items-items taken at a time)!
9P5 =9(8)(7)(6)(5)(4)(3)(2)(1)
(4)(3)(2)(1)=
36288024
= 15,120
1266
www.ck12.org Chapter 12. Probability
There are 15,120 possible combinations.
Video Review
MEDIAClick image to the left or use the URL below.URL: http://www.ck12.org/flx/render/embeddedobject/5305
This is a James Sousa video on permutations.
Explore More
Directions: Count all of the permutations.
1. Three marbles–red, blue, yellow,–are in a jar. In how many different orders can you pull two of the marbles outof the jar (without replacing either of the marbles in the jar)?
2. A green marble is added to the jar above, giving red, blue, yellow and green marbles. In how many differentorders can you pull three of the marbles out of the jar (without replacing any of the marbles in the jar)?
3. In a jar with 4 marbles–red, blue, yellow, and green–how many different orders will you have if you pull just 2marbles from the jar (without replacing either of the marbles in the jar)?
4. In a jar with 5 marbles–red, blue, yellow, green, and white–how many different orders will you have if you pull 3marbles from the jar?
5. How many 4-digit arrangements can you make of the digits 1, 2, 3, 4, 5 if you don’t repeat any digit?
6. A TV channel has 6 different 1-hour shows to fill 3 hours of time for Thursday night. How many different programlineups can the channel present?
7. Seven ski racers compete in the finals of the slalom event. In how many different orders can the top 3 skiersfinish?
8. Seven ski racers compete in the finals of the downhill event. In how many different orders can the top 4 skiersfinish?
Directions: Solve each factorial.
9. 5!
10. 3!
11. 6!
12. 4!
Directions: Use permutation notation and the formula to find each permutation.
13. 4P2
14. 4P3
15. 5P4
16. 6P3
1267

12.14. Combinations www.ck12.org
12.14 Combinations
Here you’ll learn to recognize and identify combinations.
Have you ever been on a decorating committee?
The decorating committee is getting the stage ready for the Talent Show. There was a bunch of different decoratingsupplies ordered, and the students on the committee are working on figuring out the best way to decorate the stage.
They have four different colors of streamers to use to decorate.
Red
Blue
Green
Yellow
“I think four is too many colors. How about if we choose three of the four colors to decorate with?” Keith asks thegroup.
“I like that idea,” Sara chimes in. “How many ways can we decorate the stage if we do that?”
The group begins to figure this out on a piece of paper.
Is this a combination or a permutation?
Use what you will learn in this Concept to answer this question.
Guidance
In the Permutation Problems Concept, you saw that order is important for some groups of items but not importantfor others. Consider a list of three words: HOPS, SHOP, and POSH.
• For the spelling of each individual word, order is important. The words HOPS, SHOP, and POSH all use thesame letters, but spell out very different words.
• For the list itself, order is not important. Whether the words are presented in one order–such as HOPS, SHOP,POSH, or another order, such as SHOP, POSH, HOPS, or a third order, such as POSH, HOPS, SHOP–makesno difference. As long as the list includes all 3 words, the order of the 3 words doesn’t matter.
1268
www.ck12.org Chapter 12. Probability
A combination is a collection of items in which order, or how the items are arranged, is not important. Thecollection of one order of the items is not functionally different than any other order.
Combinations and permutations are related. To solve problems in which order matters, you use permutations. Tosolve problems in which order does NOT matter, use combinations.
Take a look at this situation.
The winning 3-digit lottery numbers are drawn from a drum as 641, 224, and 806. Does order matter in the way thethree winning numbers are drawn?
Step 1: Write out a single order.
641, 224, 806
Step 2: Now rearrange the order. Did you change the outcome? If so, then order matters.
224,806,641⇐= different order, same 3 winning numbers
Order does NOT matter for this problem. Use combinations.
Write the difference between combinations and permutations down in your notebook.
Here is another one.
A bag has 4 marbles: red, blue, yellow, and green. In how many different ways can you reach into the bag and drawout 1 marble, then return the marble to the bag and draw out a second marble?
Step 1: Write out a single order.
red, blue
Step 2: Now rearrange the order. Did you change the outcome? If so, then order matters.
blue, red⇐= different order, meaning is DIFFERENT
Order DOES matter for this problem. Use permutations.
Write whether you would use combinations or permutations for each example.
Example A
Cesar the dog-walker has 5 dogs but only 3 leashes. How many different ways can Cesar take a walk with all 3 dogsat once?
Solution: Combination
Example B
Five different horses entered the Kentucky Derby. How many different ways can the horses finish the race?
1269
12.14. Combinations www.ck12.org
Solution: Combination
Example C
How many different 5-player teams can you choose from a total of 8 basketball players?
Solution: Combination
Here is the original problem once again.
The decorating committee is getting the stage ready for the Talent Show. There was a bunch of different decoratingsupplies ordered, and the students on the committee are working on figuring out the best way to decorate the stage.
They have four different colors of streamers to use to decorate.
Red
Blue
Green
Yellow
“I think four is too many colors. How about if we choose three of the four colors to decorate with?” Keith asks thegroup.
“I like that idea,” Sara chimes in. “How many ways can we decorate the stage if we do that?”
The group begins to figure this out on a piece of paper.
Combinations are arrangements where order does not make a difference. The decorating committee isselected three colors from the possible four options. Therefore, the order of the colors doesn’t matter. This isa combination.
Guided Practice
Here is one for you to try on your own.
Is this a permutation or a combination?
Mario’s gym locker uses the numbers 14, 6, and 32. How many different arrangements of the three numbers mustMario try to be sure he opens his locker?
There is only one way that the numbers can be arranged to open Mario’s locker. This is a permutation becauseorder does matter.
1270
www.ck12.org Chapter 12. Probability
Video Review
MEDIAClick image to the left or use the URL below.URL: http://www.ck12.org/flx/render/embeddedobject/5306
This is a James Sousa video on combinations.
Explore More
Directions: Write whether you are more likely to use permutations or combinations for each of the followingexamples.
1. A bag has 4 marbles: red, blue, yellow, and green. In how many different ways can you reach into the bag anddraw out 2 marbles at once and drop them in a cup?
2. A bag contains 5 slips of paper with letters A,B,C,D, and E written on them. Pull out one slip, mark down theletter and replace it in the bag. Do this 3 times so you have written 3 letters. How many different ways can you writethe 3 letters?
3. Eight candidates are running for the 4-person Student Council. How many different Student Councils are possible?
4. Mark’s gym locker uses the numbers 24, 36, and 2. How many different arrangements of the three numbers mustMark try to be sure he opens his locker?
5. Five horn players are running for 2 seats in a jazz band. How many different ways can the two horn players bechosen?
Directions: Identify each situation as a permutation or combination.
6. The medals awarded for a swimming meet.
7. The order that you put toppings on a pizza.
8. The numbers that open a combination lock.
9. The way that you organize your clothing in a drawer.
10. A baseball line up according to ability.
11. A group of people organized randomly.
12. Walking five dogs three at a time.
13. Walking five dogs with a specific order.
14. Nine candidates are running for the 5-person Student Council. How many different Student Councils arepossible?
15. Twelve candidates are running for the 6-person Student Council. How many different Student Councils arepossible?
1271
12.15. Combination Problems www.ck12.org
12.15 Combination Problems
Here you’ll learn to count and evaluate combinations.
Remember the decorations in Combinations Concept? Take a look once again.
The decorating committee is getting the stage ready for the Talent Show. There was a bunch of different decoratingsupplies ordered, and the students on the committee are working on figuring out the best way to decorate the stage.
They have four different colors of streamers to use to decorate.
Red
Blue
Green
Yellow
“I think four is too many colors. How about if we choose three of the four colors to decorate with?” Keith asks thegroup.
“I like that idea,” Sara chimes in. “How many ways can we decorate the stage if we do that?”
The group begins to figure this out on a piece of paper.
Combinations are arrangements where order does not make a difference. The decorating committee is selected threecolors from the possible four options. Therefore, the order of the colors doesn’t matter.
Combinations are the way to solve this problem. Look at the information in this Concept to learn how tofigure out the possible combinations.
Guidance
Once you figure out if you are going to be using permutations or combinations, it is necessary to count thecombinations.
There are several different ways to count combinations. When counting, try to keep the following in mind:
• Go one by one through the items. Don’t stop your list until you’ve covered every possible link of one item toall other items.
1272
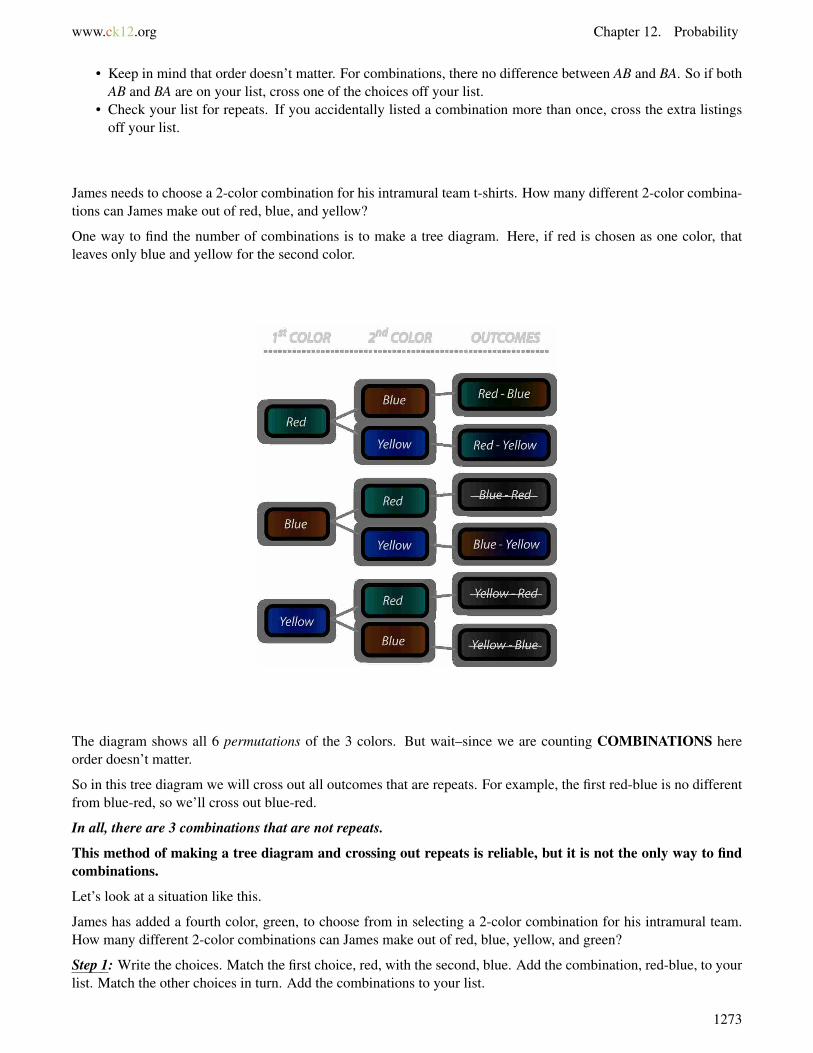
www.ck12.org Chapter 12. Probability
• Keep in mind that order doesn’t matter. For combinations, there no difference between AB and BA. So if bothAB and BA are on your list, cross one of the choices off your list.
• Check your list for repeats. If you accidentally listed a combination more than once, cross the extra listingsoff your list.
James needs to choose a 2-color combination for his intramural team t-shirts. How many different 2-color combina-tions can James make out of red, blue, and yellow?
One way to find the number of combinations is to make a tree diagram. Here, if red is chosen as one color, thatleaves only blue and yellow for the second color.
The diagram shows all 6 permutations of the 3 colors. But wait–since we are counting COMBINATIONS hereorder doesn’t matter.
So in this tree diagram we will cross out all outcomes that are repeats. For example, the first red-blue is no differentfrom blue-red, so we’ll cross out blue-red.
In all, there are 3 combinations that are not repeats.
This method of making a tree diagram and crossing out repeats is reliable, but it is not the only way to findcombinations.
Let’s look at a situation like this.
James has added a fourth color, green, to choose from in selecting a 2-color combination for his intramural team.How many different 2-color combinations can James make out of red, blue, yellow, and green?
Step 1: Write the choices. Match the first choice, red, with the second, blue. Add the combination, red-blue, to yourlist. Match the other choices in turn. Add the combinations to your list.
1273
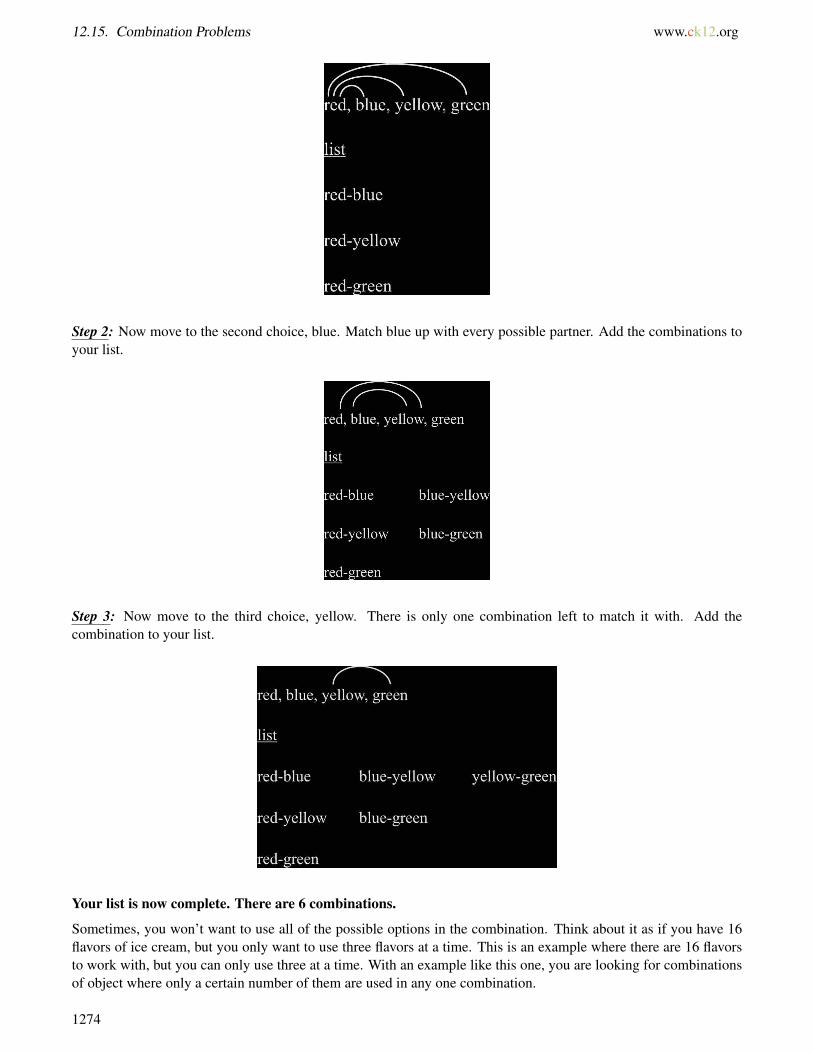
12.15. Combination Problems www.ck12.org
Step 2: Now move to the second choice, blue. Match blue up with every possible partner. Add the combinations toyour list.
Step 3: Now move to the third choice, yellow. There is only one combination left to match it with. Add thecombination to your list.
Your list is now complete. There are 6 combinations.
Sometimes, you won’t want to use all of the possible options in the combination. Think about it as if you have 16flavors of ice cream, but you only want to use three flavors at a time. This is an example where there are 16 flavorsto work with, but you can only use three at a time. With an example like this one, you are looking for combinationsof object where only a certain number of them are used in any one combination.
1274
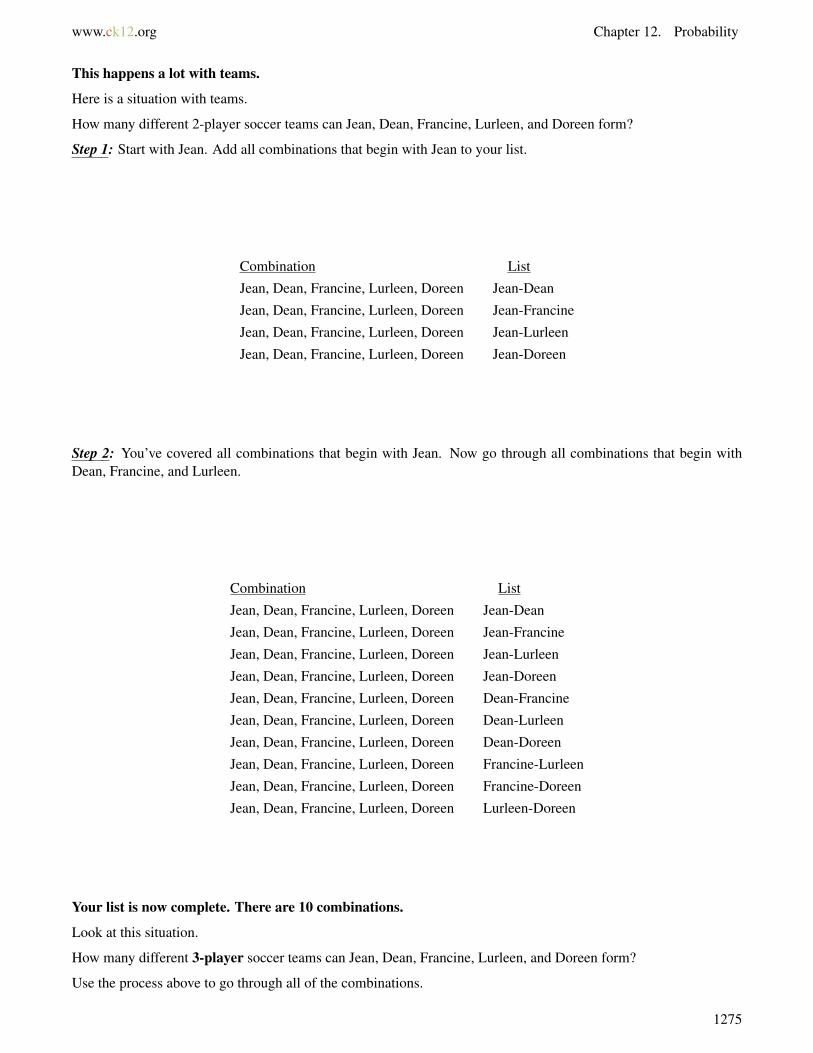
www.ck12.org Chapter 12. Probability
This happens a lot with teams.
Here is a situation with teams.
How many different 2-player soccer teams can Jean, Dean, Francine, Lurleen, and Doreen form?
Step 1: Start with Jean. Add all combinations that begin with Jean to your list.
Combination List
Jean, Dean, Francine, Lurleen, Doreen Jean-Dean
Jean, Dean, Francine, Lurleen, Doreen Jean-Francine
Jean, Dean, Francine, Lurleen, Doreen Jean-Lurleen
Jean, Dean, Francine, Lurleen, Doreen Jean-Doreen
Step 2: You’ve covered all combinations that begin with Jean. Now go through all combinations that begin withDean, Francine, and Lurleen.
Combination List
Jean, Dean, Francine, Lurleen, Doreen Jean-Dean
Jean, Dean, Francine, Lurleen, Doreen Jean-Francine
Jean, Dean, Francine, Lurleen, Doreen Jean-Lurleen
Jean, Dean, Francine, Lurleen, Doreen Jean-Doreen
Jean, Dean, Francine, Lurleen, Doreen Dean-Francine
Jean, Dean, Francine, Lurleen, Doreen Dean-Lurleen
Jean, Dean, Francine, Lurleen, Doreen Dean-Doreen
Jean, Dean, Francine, Lurleen, Doreen Francine-Lurleen
Jean, Dean, Francine, Lurleen, Doreen Francine-Doreen
Jean, Dean, Francine, Lurleen, Doreen Lurleen-Doreen
Your list is now complete. There are 10 combinations.
Look at this situation.
How many different 3-player soccer teams can Jean, Dean, Francine, Lurleen, and Doreen form?
Use the process above to go through all of the combinations.
1275
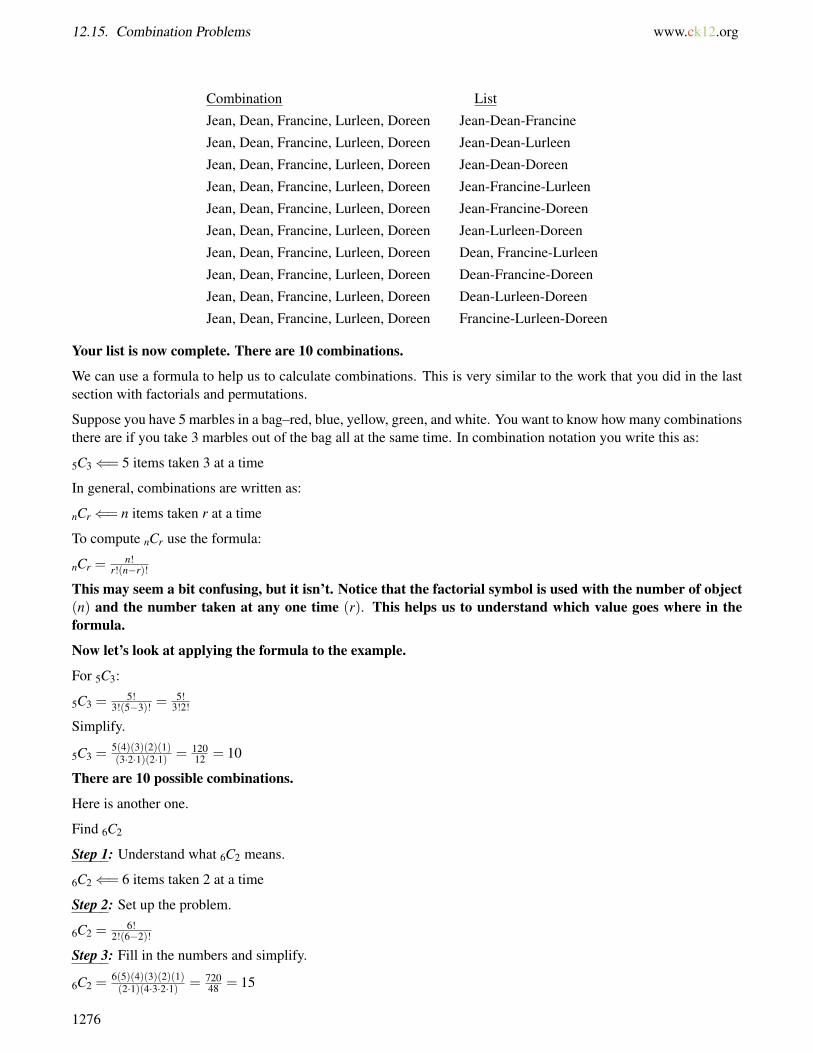
12.15. Combination Problems www.ck12.org
Combination List
Jean, Dean, Francine, Lurleen, Doreen Jean-Dean-Francine
Jean, Dean, Francine, Lurleen, Doreen Jean-Dean-Lurleen
Jean, Dean, Francine, Lurleen, Doreen Jean-Dean-Doreen
Jean, Dean, Francine, Lurleen, Doreen Jean-Francine-Lurleen
Jean, Dean, Francine, Lurleen, Doreen Jean-Francine-Doreen
Jean, Dean, Francine, Lurleen, Doreen Jean-Lurleen-Doreen
Jean, Dean, Francine, Lurleen, Doreen Dean, Francine-Lurleen
Jean, Dean, Francine, Lurleen, Doreen Dean-Francine-Doreen
Jean, Dean, Francine, Lurleen, Doreen Dean-Lurleen-Doreen
Jean, Dean, Francine, Lurleen, Doreen Francine-Lurleen-Doreen
Your list is now complete. There are 10 combinations.
We can use a formula to help us to calculate combinations. This is very similar to the work that you did in the lastsection with factorials and permutations.
Suppose you have 5 marbles in a bag–red, blue, yellow, green, and white. You want to know how many combinationsthere are if you take 3 marbles out of the bag all at the same time. In combination notation you write this as:
5C3⇐= 5 items taken 3 at a time
In general, combinations are written as:
nCr⇐= n items taken r at a time
To compute nCr use the formula:
nCr =n!
r!(n−r)!
This may seem a bit confusing, but it isn’t. Notice that the factorial symbol is used with the number of object(n) and the number taken at any one time (r). This helps us to understand which value goes where in theformula.
Now let’s look at applying the formula to the example.
For 5C3:
5C3 =5!
3!(5−3)! =5!
3!2!
Simplify.
5C3 =5(4)(3)(2)(1)(3·2·1)(2·1) = 120
12 = 10
There are 10 possible combinations.
Here is another one.
Find 6C2
Step 1: Understand what 6C2 means.
6C2⇐= 6 items taken 2 at a time
Step 2: Set up the problem.
6C2 =6!
2!(6−2)!
Step 3: Fill in the numbers and simplify.
6C2 =6(5)(4)(3)(2)(1)(2·1)(4·3·2·1) = 720
48 = 15
1276
www.ck12.org Chapter 12. Probability
There are 15 possible combinations.
Find the number of combinations in each example.
Example A
5C2
Solution: 30
Example B
4C3
Solution: 1
Example C
6C4
Solution: 15
Here is the original problem once again.
The decorating committee is getting the stage ready for the Talent Show. There was a bunch of different decoratingsupplies ordered, and the students on the committee are working on figuring out the best way to decorate the stage.
They have four different colors of streamers to use to decorate.
Red
Blue
Green
Yellow
“I think four is too many colors. How about if we choose three of the four colors to decorate with?” Keith asks thegroup.
“I like that idea,” Sara chimes in. “How many ways can we decorate the stage if we do that?”
The group begins to figure this out on a piece of paper.
1277
12.15. Combination Problems www.ck12.org
Combinations are arrangements where order does not make a difference. The decorating committee isselected three colors from the possible four options. Therefore, the order of the colors doesn’t matter.
We can use combination notation to figure out this problem.
4C3 =4!
3!(4−3)! =4(3)(2)(1)(3·2·1)(1) =
246 = 4
There are four possible ways to decorate the stage.
Now that the students have this information, they can look at their color choices and vote on which combina-tion they like best.
Guided Practice
Here is one for you to try on your own.
5C4
Answer
5C4 =5!
4!(5−4)! =5(4)(3)(2)(1)(4×3×2×1)1 = 120
24 = 5
This is our answer.
Video Review
MEDIAClick image to the left or use the URL below.URL: http://www.ck12.org/flx/render/embeddedobject/1401
This is a Khan Academy video on calculating combinations.
Explore More
Directions: Evaluate each factorial.
1. 5!
2. 4!
3. 3!
4. 8!
5. 9!
6. 6!
Directions: Evaluate each combination using combination notation.
7. 7C2
8. 7C6
9. 8C4
1278

www.ck12.org Chapter 12. Probability
10. 9C6
11. 8C3
12. 10C7
13. 12C9
14. 11C9
15. 16C14
1279
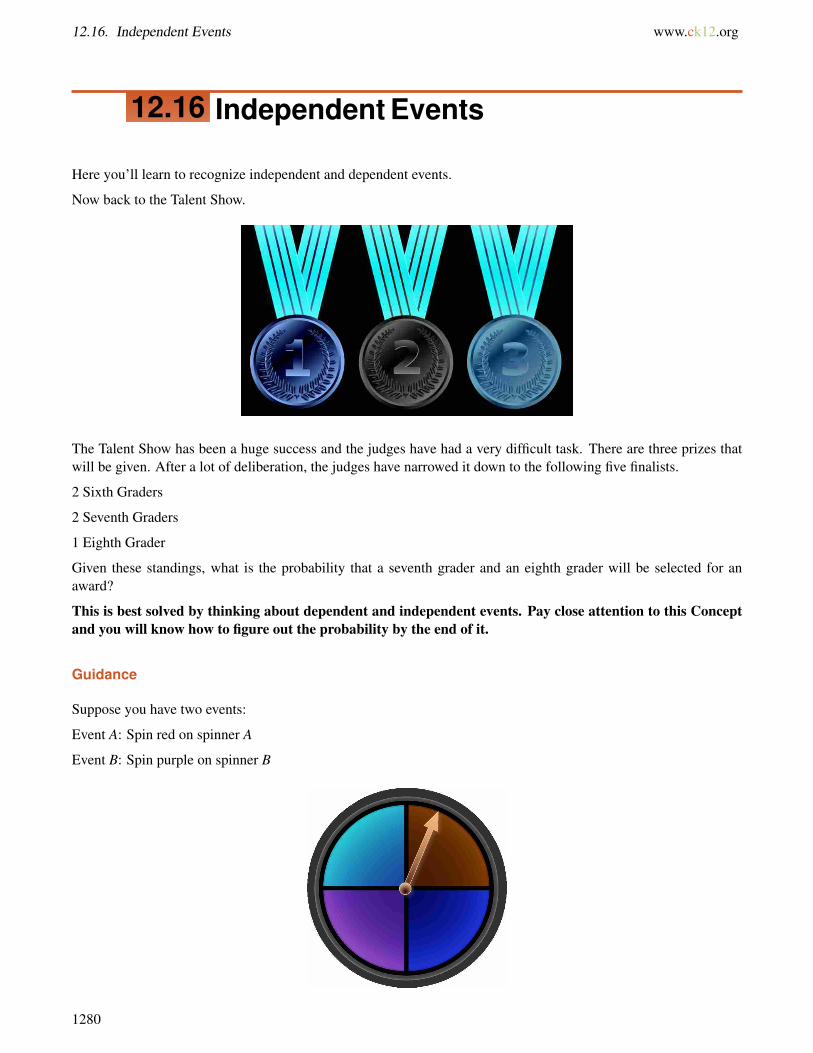
12.16. Independent Events www.ck12.org
12.16 Independent Events
Here you’ll learn to recognize independent and dependent events.
Now back to the Talent Show.
The Talent Show has been a huge success and the judges have had a very difficult task. There are three prizes thatwill be given. After a lot of deliberation, the judges have narrowed it down to the following five finalists.
2 Sixth Graders
2 Seventh Graders
1 Eighth Grader
Given these standings, what is the probability that a seventh grader and an eighth grader will be selected for anaward?
This is best solved by thinking about dependent and independent events. Pay close attention to this Conceptand you will know how to figure out the probability by the end of it.
Guidance
Suppose you have two events:
Event A: Spin red on spinner A
Event B: Spin purple on spinner B
1280
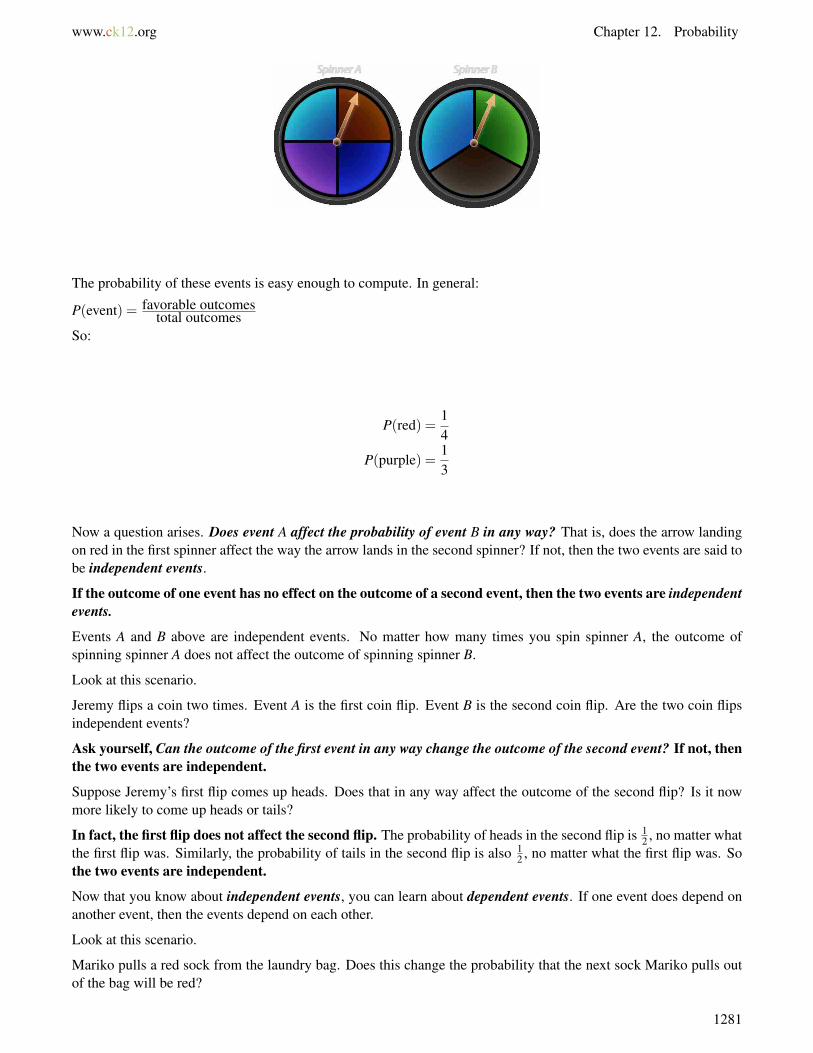
www.ck12.org Chapter 12. Probability
The probability of these events is easy enough to compute. In general:
P(event) = favorable outcomestotal outcomes
So:
P(red) =14
P(purple) =13
Now a question arises. Does event A affect the probability of event B in any way? That is, does the arrow landingon red in the first spinner affect the way the arrow lands in the second spinner? If not, then the two events are said tobe independent events.
If the outcome of one event has no effect on the outcome of a second event, then the two events are independentevents.
Events A and B above are independent events. No matter how many times you spin spinner A, the outcome ofspinning spinner A does not affect the outcome of spinning spinner B.
Look at this scenario.
Jeremy flips a coin two times. Event A is the first coin flip. Event B is the second coin flip. Are the two coin flipsindependent events?
Ask yourself, Can the outcome of the first event in any way change the outcome of the second event? If not, thenthe two events are independent.
Suppose Jeremy’s first flip comes up heads. Does that in any way affect the outcome of the second flip? Is it nowmore likely to come up heads or tails?
In fact, the first flip does not affect the second flip. The probability of heads in the second flip is 12 , no matter what
the first flip was. Similarly, the probability of tails in the second flip is also 12 , no matter what the first flip was. So
the two events are independent.
Now that you know about independent events, you can learn about dependent events. If one event does depend onanother event, then the events depend on each other.
Look at this scenario.
Mariko pulls a red sock from the laundry bag. Does this change the probability that the next sock Mariko pulls outof the bag will be red?
1281
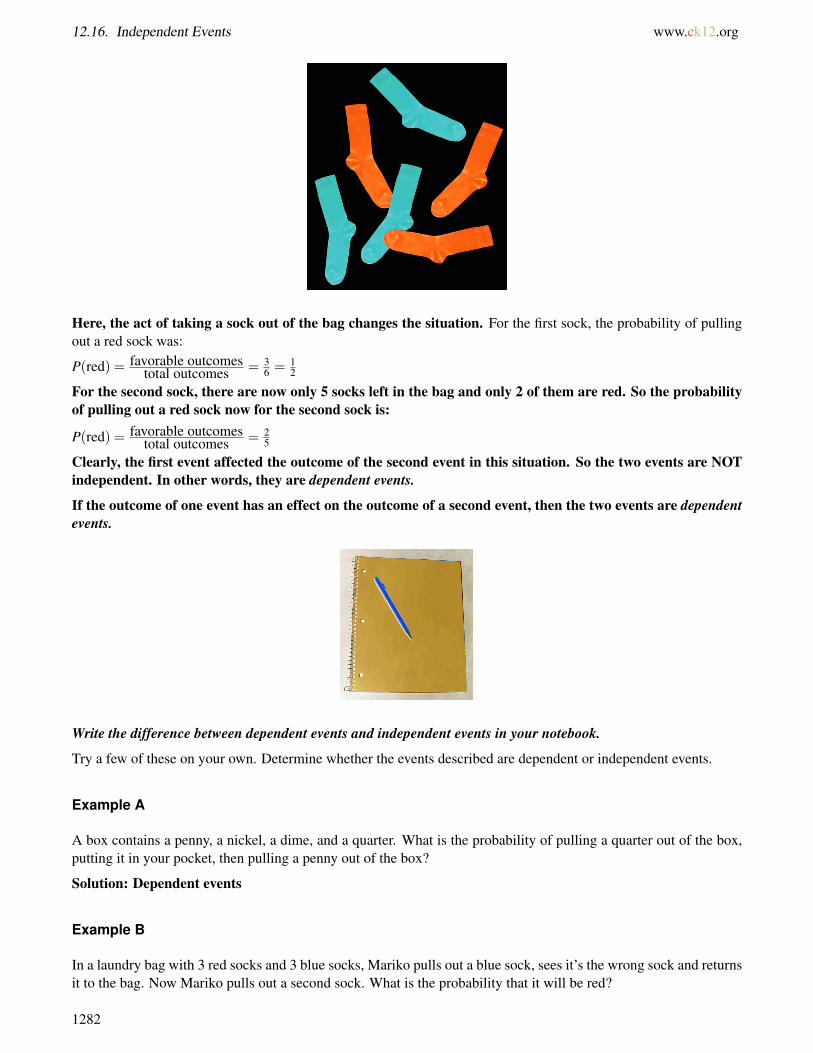
12.16. Independent Events www.ck12.org
Here, the act of taking a sock out of the bag changes the situation. For the first sock, the probability of pullingout a red sock was:
P(red) = favorable outcomestotal outcomes = 3
6 = 12
For the second sock, there are now only 5 socks left in the bag and only 2 of them are red. So the probabilityof pulling out a red sock now for the second sock is:
P(red) = favorable outcomestotal outcomes = 2
5
Clearly, the first event affected the outcome of the second event in this situation. So the two events are NOTindependent. In other words, they are dependent events.
If the outcome of one event has an effect on the outcome of a second event, then the two events are dependentevents.
Write the difference between dependent events and independent events in your notebook.
Try a few of these on your own. Determine whether the events described are dependent or independent events.
Example A
A box contains a penny, a nickel, a dime, and a quarter. What is the probability of pulling a quarter out of the box,putting it in your pocket, then pulling a penny out of the box?
Solution: Dependent events
Example B
In a laundry bag with 3 red socks and 3 blue socks, Mariko pulls out a blue sock, sees it’s the wrong sock and returnsit to the bag. Now Mariko pulls out a second sock. What is the probability that it will be red?
1282
www.ck12.org Chapter 12. Probability
Solution: Independent events
Example C
In a laundry bag with 3 red socks and 3 blue socks, Mariko pulls out a blue sock and keeps it out. Now Mariko pullsout a second sock. What is the probability that it will be blue?
Solution: Dependent events
Here is the original problem once again. Reread it and then begin to work on figuring out the probabilityquestion.
The Talent Show has been a huge success and the judges have had a very difficult task. There are three prizes thatwill be given. After a lot of deliberation, the judges have narrowed it down to the following five finalists.
2 Sixth Graders
2 Seventh Graders
1 Eighth Grader
Given these standings, what is the probability that a seventh grader and an eighth grader will be selected for anaward?
Before we even begin to figure out the probability, we first need to decide if these are independent events ordependent events.
Think about it this way, if we select a seventh grader for an award, then the number of possible finalists forthe next award changes from 5 to 4. One event depends on the other event. Therefore, these are dependentevents.
To figure out the probability of dependent events, we can multiply. We want to figure out the probability of aseventh and an eighth grader being selected for an award.
P(7thand 8th) = 25 ·
14
We have 2 out of 5 for seventh graders. Then once a seventh grader is selected, we go to four finalists. One isan eighth grader, so we have a 1 out of 4 chance of having an eighth grader for an award.
Next, we multiply.
P(7thand 8th) = 25 ·
14 = 3
20
What is this as a percent?320 = 15
100 = 15%
There is only a 15% chance of both a seventh grader and an eighth grader as award winners!
1283

12.16. Independent Events www.ck12.org
Guided Practice
Here is one for you to try on your own.
Does this situation describe dependent or independent events?
Kelsey has a drawer full of earrings and necklaces. She has four pairs of earrings and six necklaces in the drawer.Kelsey first takes out a necklace. She isn’t happy with it, so she puts it back into the drawer. What is the probabilityof pulling another necklace?
This situation describes independent events because Kelsey put the necklace back in the drawer.
Video Review
MEDIAClick image to the left or use the URL below.URL: http://www.ck12.org/flx/render/embeddedobject/57629
This is a Khan Academy video on independent events.
MEDIAClick image to the left or use the URL below.URL: http://www.ck12.org/flx/render/embeddedobject/1384
This is a Khan Academy video on dependent events.
Explore More
Directions: Write whether each pair of events is dependent or independent.
1. A: Mike rolls a number cube. B: Leah spins a red-blue-green spinner.
2. A: In a game of Go Fish, the probability of one player drawing a Queen from the deck. B: On the next player’sturn, the probability of drawing a Queen.
3. A: The probability that a randomly ordered pizza will be large. B: The probability that the same randomly orderedpizza will be deep-dish.
4. A: The probability that a randomly ordered 2-topping pizza will have pepperoni. B: The probability that the samerandomly ordered 2-topping pizza will have mushrooms.
5. A: The probability of flipping a coin tails 5 times in a row. B: The probability of the sixth flip turning out to beheads.
6. A: In a 4-team league, the probability of the Rockets finishing in first place. B: In a 4-team league, the probabilityof the Sharks finishing in first place.
1284
www.ck12.org Chapter 12. Probability
7. A: On a roll of a number cube, the probability of rolling 6. B: On a second roll of a number cube, the probabilityof rolling 6.
8. A: In a spelling bee, the probability of the first contestant being given the word khaki from a list of 10 words. B:In a spelling bee, the probability of the second contestant getting the word khaki from the same list of words.
9. A: The probability that it will snow on Tuesday. B: The probability that Tuesday will fall on an odd day of themonth.
10. A: The probability that it will be below 32 degrees on Tuesday. B: The probability that it will snow on Tuesday.
11. A: The probability that it will snow on Tuesday. B: The probability that school will be cancelled on Tuesday.
12. A: The probability that the first Wednesday in June will fall on an even day of the month. B: The probabilitythat the first Thursday in June will fall on an even day of the month.
13. A: The probability that the first Wednesday in June will fall on an even day of the month. B: The probabilitythat the first Thursday in June will be sunny.
14. A: The probability that a coin will land on heads. B: The probability that a number cube will land on 5.
15. A: The probability that the first spin of a red-blue-green spinner will land on green. B: The probability that thesecond spin of a red-blue-green spinner will land on green.
1285
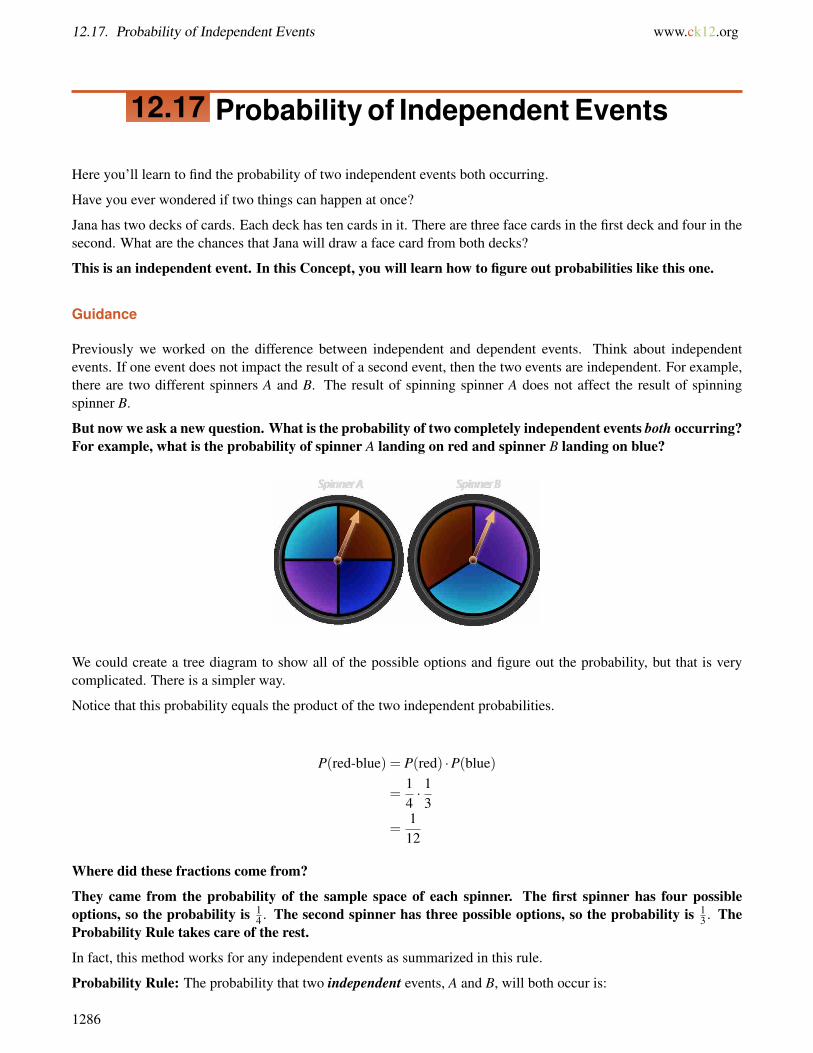
12.17. Probability of Independent Events www.ck12.org
12.17 Probability of Independent Events
Here you’ll learn to find the probability of two independent events both occurring.
Have you ever wondered if two things can happen at once?
Jana has two decks of cards. Each deck has ten cards in it. There are three face cards in the first deck and four in thesecond. What are the chances that Jana will draw a face card from both decks?
This is an independent event. In this Concept, you will learn how to figure out probabilities like this one.
Guidance
Previously we worked on the difference between independent and dependent events. Think about independentevents. If one event does not impact the result of a second event, then the two events are independent. For example,there are two different spinners A and B. The result of spinning spinner A does not affect the result of spinningspinner B.
But now we ask a new question. What is the probability of two completely independent events both occurring?For example, what is the probability of spinner A landing on red and spinner B landing on blue?
We could create a tree diagram to show all of the possible options and figure out the probability, but that is verycomplicated. There is a simpler way.
Notice that this probability equals the product of the two independent probabilities.
P(red-blue) = P(red) ·P(blue)
=14· 1
3
=112
Where did these fractions come from?
They came from the probability of the sample space of each spinner. The first spinner has four possibleoptions, so the probability is 1
4 . The second spinner has three possible options, so the probability is 13 . The
Probability Rule takes care of the rest.
In fact, this method works for any independent events as summarized in this rule.
Probability Rule: The probability that two independent events, A and B, will both occur is:
1286
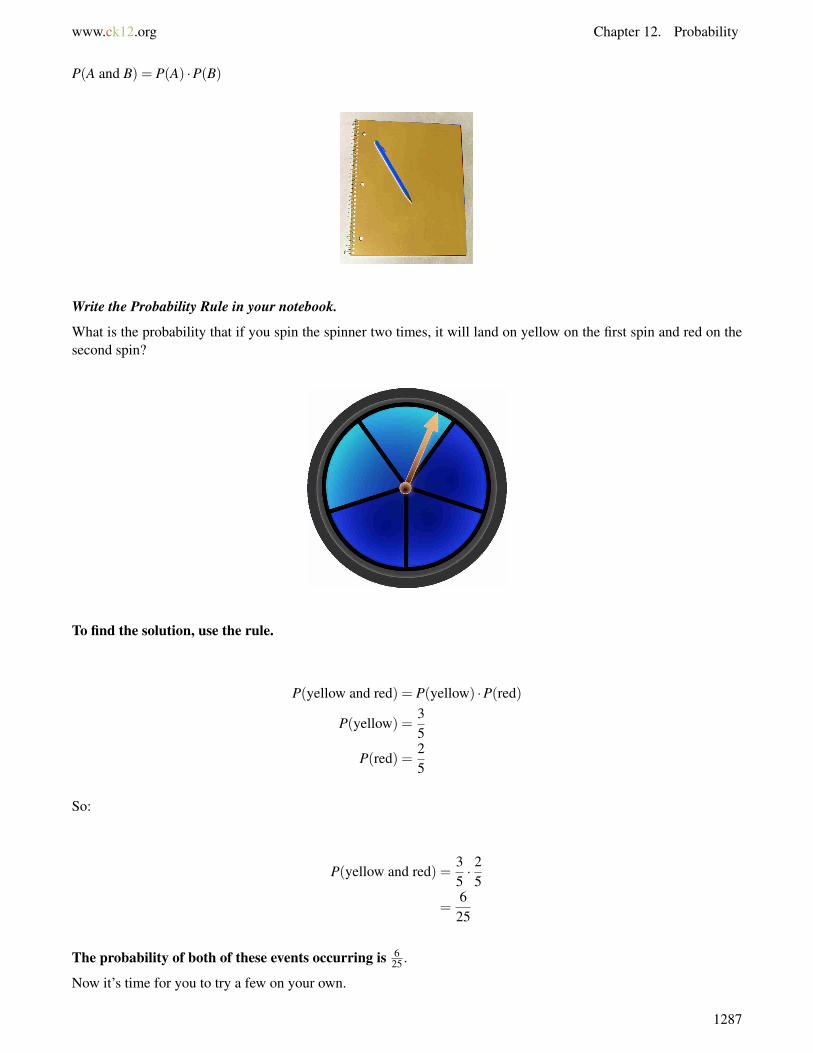
www.ck12.org Chapter 12. Probability
P(A and B) = P(A) ·P(B)
Write the Probability Rule in your notebook.
What is the probability that if you spin the spinner two times, it will land on yellow on the first spin and red on thesecond spin?
To find the solution, use the rule.
P(yellow and red) = P(yellow) ·P(red)
P(yellow) =35
P(red) =25
So:
P(yellow and red) =35· 2
5
=6
25
The probability of both of these events occurring is 625 .
Now it’s time for you to try a few on your own.
1287
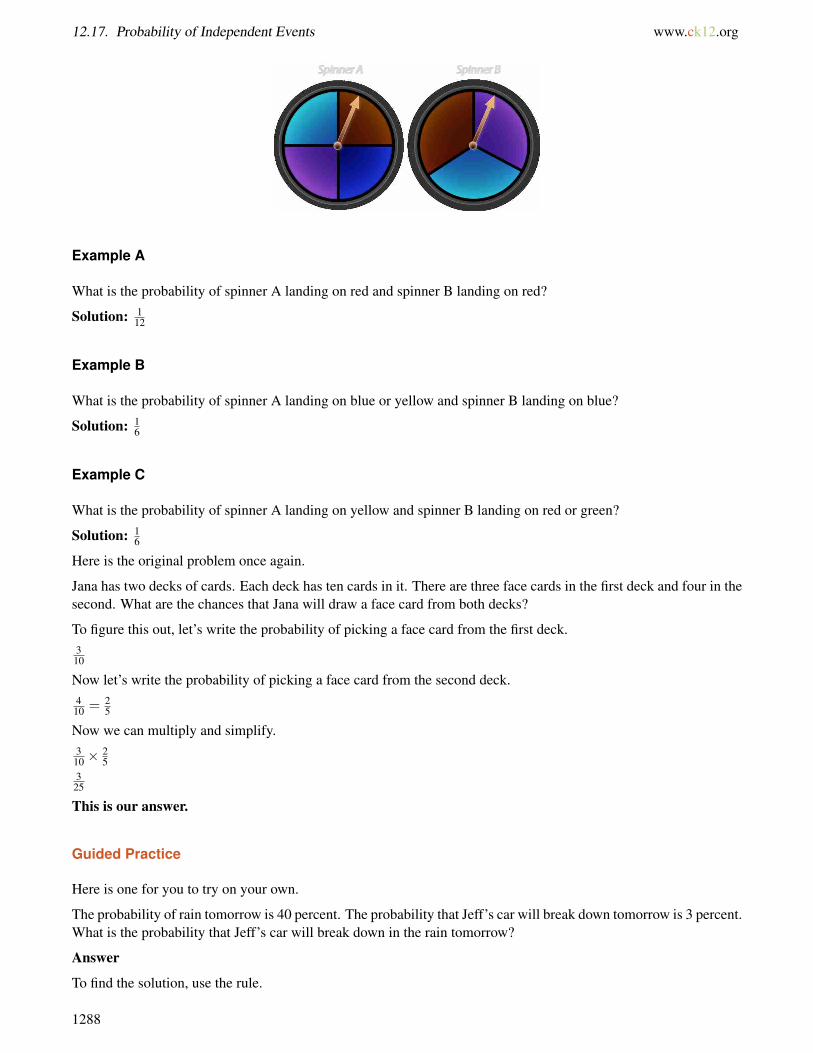
12.17. Probability of Independent Events www.ck12.org
Example A
What is the probability of spinner A landing on red and spinner B landing on red?
Solution: 112
Example B
What is the probability of spinner A landing on blue or yellow and spinner B landing on blue?
Solution: 16
Example C
What is the probability of spinner A landing on yellow and spinner B landing on red or green?
Solution: 16
Here is the original problem once again.
Jana has two decks of cards. Each deck has ten cards in it. There are three face cards in the first deck and four in thesecond. What are the chances that Jana will draw a face card from both decks?
To figure this out, let’s write the probability of picking a face card from the first deck.310
Now let’s write the probability of picking a face card from the second deck.410 = 2
5
Now we can multiply and simplify.310 ×
25
325
This is our answer.
Guided Practice
Here is one for you to try on your own.
The probability of rain tomorrow is 40 percent. The probability that Jeff’s car will break down tomorrow is 3 percent.What is the probability that Jeff’s car will break down in the rain tomorrow?
Answer
To find the solution, use the rule.
1288

www.ck12.org Chapter 12. Probability
P(rain and break) = P(rain) ·P(break)
P(rain) = 40% =40100
=25
P(break) = 3% =3
100
So:
P(rain and break) =25· 3
100
=3
250
You can see that the probability is very small.
Video Review
MEDIAClick image to the left or use the URL below.URL: http://www.ck12.org/flx/render/embeddedobject/5463
This is a Khan Academy video on the probability of independent events.
Explore More
Directions: Solve each problem.
1. Mia spins the spinner two times. What is the probability that the arrow will land on 2 both times?
2. Mia spins the spinner two times. What is the probability that the arrow will land on 2 on the first spin and 3 onthe second spin?
1289
12.17. Probability of Independent Events www.ck12.org
3. Mia spins the spinner two times. What is the probability that the arrow will land on an even number on the firstspin and an odd number on the second spin?
4. Mia spins the spinner two times. What is the probability that the arrow will land on an odd number on the firstspin and a number less than 4 on the second spin?
5. A laundry bag has 8 black socks and 2 white socks. If you pull out a sock, then put it back in the bag and pull outa second sock, what is the probability that both socks will be black? Write your answer as a decimal.
6. A laundry bag has 8 black socks and 2 white socks. If you pull out a sock, then put it back in the bag and pull outa second sock, what is the probability that both socks will be white? Write your answer as a decimal.
7. A laundry bag has 8 black socks and 2 white socks. If you pull out a sock, then put it back in the bag and pull outa second sock, what is the probability that the first sock will be black and the second sock will be white? Write youranswer as a decimal.
8. Dirk has two 52-card decks. Each deck has 4 Aces, 4 Kings, 4 Queens, and so on. What is the probability thatDirk will pick an Ace out of each deck?
9. Dirk has two 52-card decks. Each deck has 4 Aces, 4 Kings, 4 Queens, and so on. What is the probability thatDirk will pick a face card (Jack, Queen, King) out of each deck?
10. Dirk has two 52-card decks. Each deck has 4 Aces, 4 Kings, 4 Queens, and so on. What is the probability thatDirk will pick a card lower than a Jack out of each deck?
11. Karina flips a coin 3 times. What is the probability that she will flip heads 3 times in a row?
12. Karina flips a coin 4 times. What is the probability that she will flip heads 4 times in a row?
13. Karina flips a coin 4 times. What is the probability that she will NOT flip heads 4 times in a row?
14. Karina flips a coin 5 times. What is the probability that she will flip heads once?
15. Karina flips a coin 5 times. What is the probability that she will flip tails once?
1290
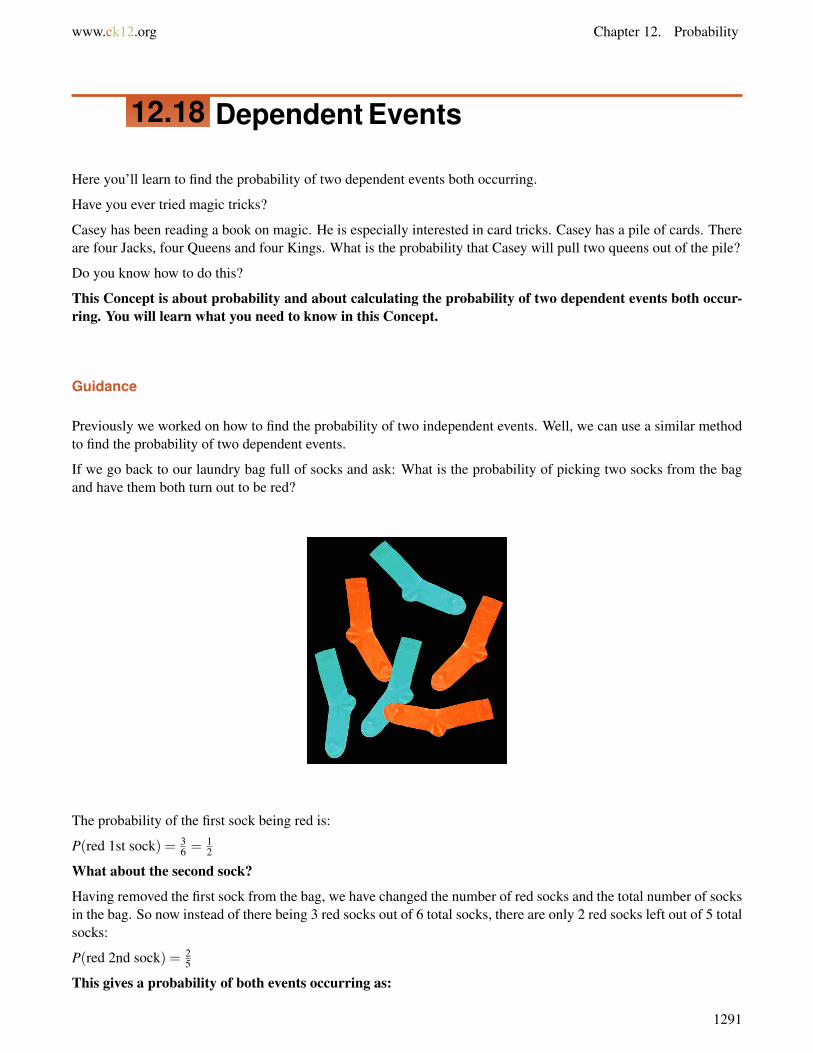
www.ck12.org Chapter 12. Probability
12.18 Dependent Events
Here you’ll learn to find the probability of two dependent events both occurring.
Have you ever tried magic tricks?
Casey has been reading a book on magic. He is especially interested in card tricks. Casey has a pile of cards. Thereare four Jacks, four Queens and four Kings. What is the probability that Casey will pull two queens out of the pile?
Do you know how to do this?
This Concept is about probability and about calculating the probability of two dependent events both occur-ring. You will learn what you need to know in this Concept.
Guidance
Previously we worked on how to find the probability of two independent events. Well, we can use a similar methodto find the probability of two dependent events.
If we go back to our laundry bag full of socks and ask: What is the probability of picking two socks from the bagand have them both turn out to be red?
The probability of the first sock being red is:
P(red 1st sock) = 36 = 1
2
What about the second sock?
Having removed the first sock from the bag, we have changed the number of red socks and the total number of socksin the bag. So now instead of there being 3 red socks out of 6 total socks, there are only 2 red socks left out of 5 totalsocks:
P(red 2nd sock) = 25
This gives a probability of both events occurring as:
1291
12.18. Dependent Events www.ck12.org
P(red 1st sock and red 2nd sock) = P(red 1st sock) ·P(red 2nd sock)
=12· 2
5
=210
=15
The same general method works for calculating any two (or more) dependent events.
A stack of 8 cards has 4 Jacks and 4 Queens. What is the probability of picking 2 Jacks from the stack at random?
Use the Probability Rule to find the probability of the two dependent events.
The probability of the 1st Jack is:
P(1st Jack) = 58
Once the 1st Jack is taken, the probability of 2nd Jack is only 4 of 7 because there are only 4 Jacks left out of 7 totalcards:
P(2nd Jack) = 47
So:
P(1st Jack and 2nd Jack) = P(1st Jack) ·P(2nd Jack)
=58· 4
7
=514
The answer is 514 .
We can use the Probability Rule to find the probability of both independent and dependent events!
Try a few of these on your own.
A bag has three red marbles, three yellow marbles and four blue marbles.
1292
www.ck12.org Chapter 12. Probability
Example A
What is the probability of pulling two red marbles out of the bag?
Solution: 115
Example B
What is the probability of pulling out two blue marbles?
Solution: 215
Example C
What is the probability of pulling out two yellow marbles?
Solution: 115
Here is the original problem once again.
Casey has been reading a book on magic. He is especially interested in card tricks. Casey has a pile of cards. Thereare four Jacks, four Queens and four Kings. What is the probability that Casey will pull two queens out of the pile?
To figure this out let’s begin by writing a ratio to show the number of queens compared to the total number of cards.412
This is the chance of pulling the first queen.
Next, we can write the probability of the second queen.311
Now we can multiply them.312 ×
311 = 9
132
We can simplify this fraction.344
Finally, we can change this to a percent.
.068 = 6.8%
This is the answer.
Guided Practice
Here is one for you to try on your own.
There are five girls and eight boys in a group. Mrs. Marsh is going to choose two students randomly to lead the line.What is the probability that she will choose two boys?
Answer
To figure this out, we first have to figure out the total number of students.
5+8 = 13
Next, we write a ratio to show the chances of her picking the first boy.813
1293
12.18. Dependent Events www.ck12.org
Next, we write the ratio of choosing the second boy.712
Now we multiply.813 ×
712
1439
This is our answer.
Video Review
MEDIAClick image to the left or use the URL below.URL: http://www.ck12.org/flx/render/embeddedobject/1384
This is a Khan Academy video on dependent events.
Explore More
Directions: Use this description to figure out the probability of each dependent event.
A box has eight kittens in it. Three calico, two white and three black.
1. What is the probability of choosing two white kittens?
2. What is the probability of choosing three black kittens?
3. What is the probability of choosing two black kittens?
4. What is the probability of choosing two calico kittens?
5. What is the probability of choosing three calico kittens?
6. What is the probability of choosing one white and then one black kitten?
7. What is the probability of choosing two calico and one black?
8. What is the probability of choosing one calico and one white kitten?
9. What is the probability of choosing a striped kitten?
10. What is the probability of choosing one white kitten and two black kittens?
Directions: Solve each problem.
11. A clothes dryer contains 5 black socks and 1 white sock. What is the probability of taking two socks, one afteranother, out of the dryer and having them both be black?
12. A clothes dryer contains 4 black socks and 2 white socks. What is the probability of taking two socks out of thedryer and having them both be black?
13. A clothes dryer contains 3 black socks and 3 white socks. What is the probability of taking two socks out of thedryer and having them both be black?
14. A clothes dryer contains 3 black socks and 3 white socks. What is the probability of taking two socks out of thedryer and having the first one be black and the second one be white?
1294

www.ck12.org Chapter 12. Probability
15. Bob bought two theater box tickets. The computer randomly assigns the tickets in one of 5 seats: end seat A,middle seat B, middle seat C, middle seat D, or end seat E. What is the probability that the first ticket is A and thesecond ticket is seat B?
Summary
Having completed this chapter, students are now finished with this book. Each Concept has provided students with anopportunity to engage and practice skills in many Concepts including writing and calculating theoretical probability,experimental probability, disjoint events, complementary events, overlapping events, tree diagrams, sample spaces,the Counting Principle, factorials, permutations, combinations, tree diagrams, independent and dependent events.
1295