17 ck ecogen lect1.handout.pptx - evolution and genomics
TRANSCRIPT

1/20/17
1
Lies, damn lies, and …. genomics�
you, your data, your perceptions and reality�
�
Christopher West Wheat �
Goal of this lecture�
• Present a critical view of ecological genomics�
• Make you uncomfortable by sharing my nightmares�
• Encourage you to critically assess findings and your expectations in light of publication biases�

1/20/17
2
Disclaimer �I’m a positive person�
� I love my job and the work we all do �
� I’m just sharing scrumptious food for thought �
What if …..�50% of your
favorite studies had conclusions that were just
wrong? How would that
affect your expectaAons and work?
1/20/17
3
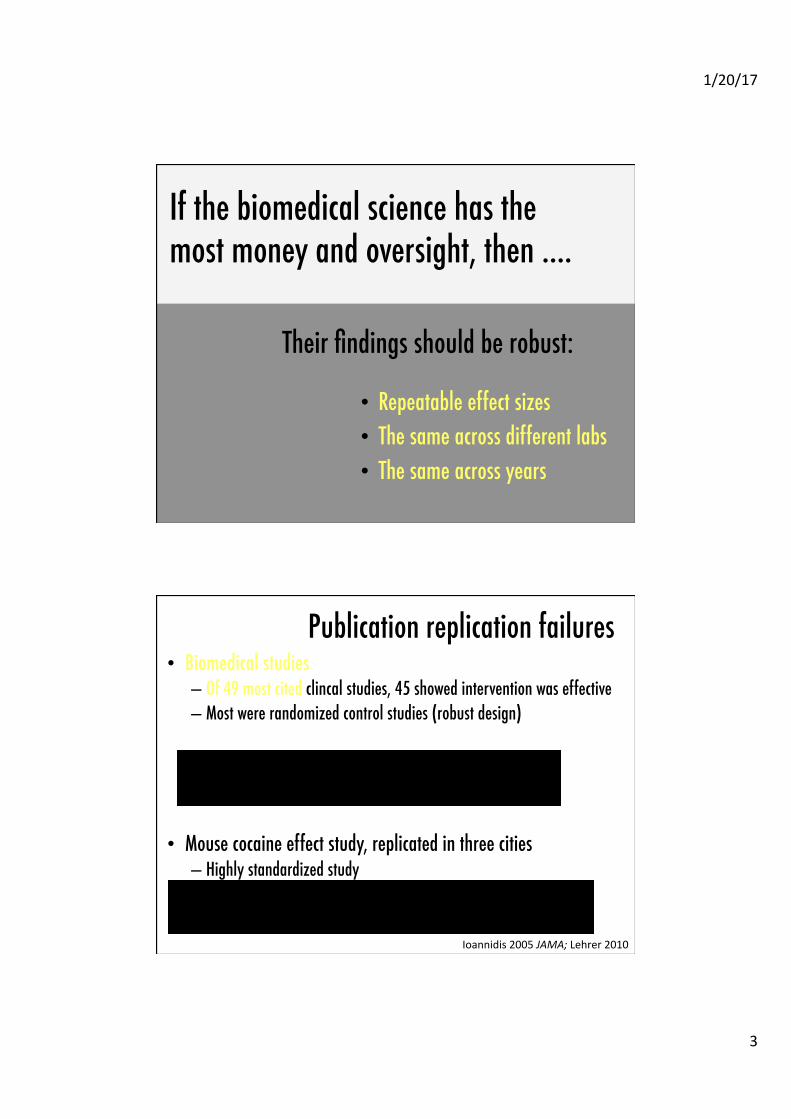
If the biomedical science has the most money and oversight, then …. �
Their findings should be robust:��
• Repeatable effect sizes�• The same across different labs�• The same across years�
Publication replication failures�• Biomedical studies�– Of 49 most cited clincal studies, 45 showed intervention was effective�– Most were randomized control studies (robust design) �
Of the 34 that were later replicated, 41% were directly contradicted or had much lower effect sizes.�
�• Mouse cocaine effect study, replicated in three cities�– Highly standardized study�Average movement was 600 cm, 701 cm, and > 5000 cm in the three study sites�
Ioannidis 2005 JAMA; Lehrer 2010
1/20/17
4
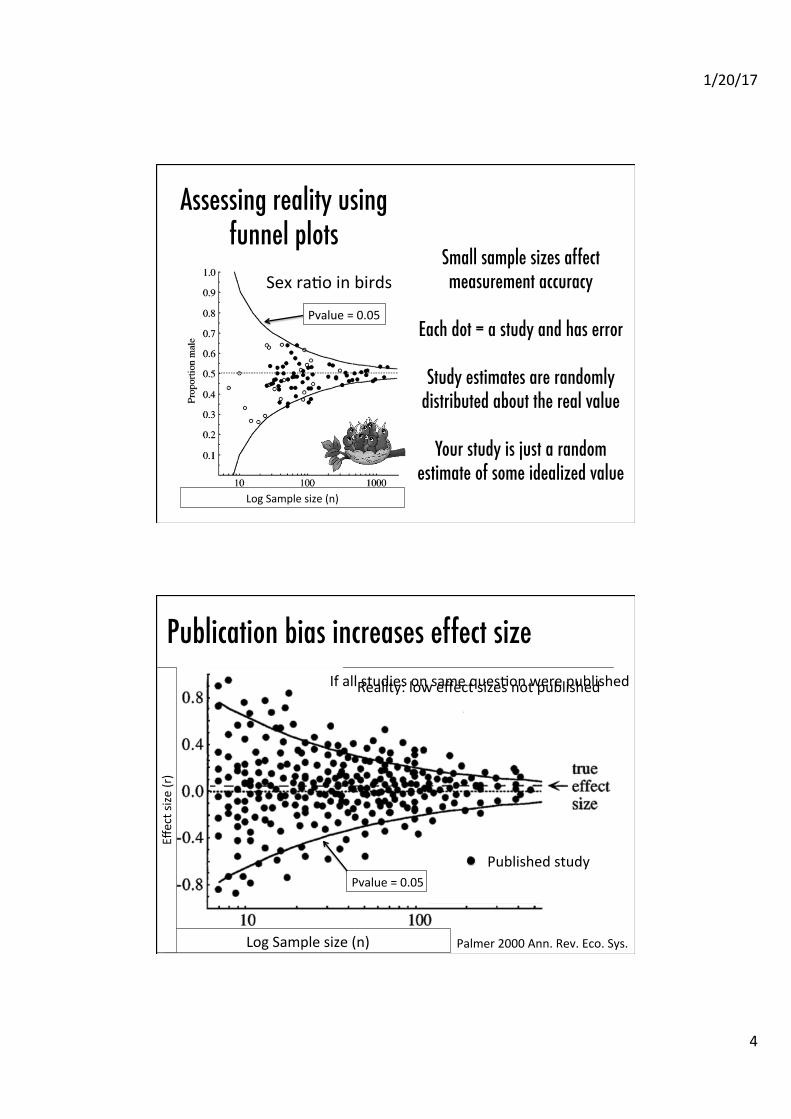
Assessing reality using funnel plots�
Log Sample size (n)
Sex raAo in birds
Pvalue = 0.05
Small sample sizes affect measurement accuracy�
�Each dot = a study and has error �
�Study estimates are randomly
distributed about the real value��
Your study is just a random estimate of some idealized value�
rbias is the sig. correlaAon between effect and sample size
Palmer 2000 Ann. Rev. Eco. Sys.
Publication bias increases effect size�
Log Sample size (n)
Effect size
(r)
Pvalue = 0.05 Published study
If all studies on same quesAon were published Reality: low effect sizes not published
1/20/17
5
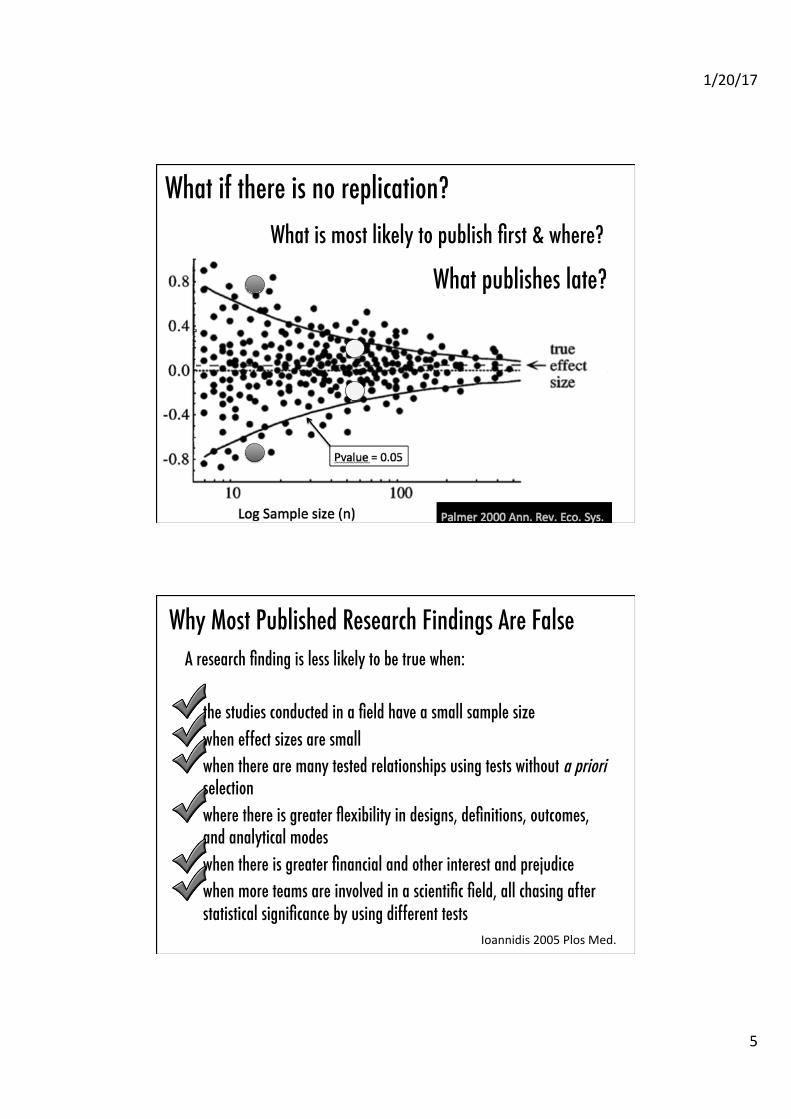
What if there is no replication?�What is most likely to publish first & where?�
What publishes late?�
Why Most Published Research Findings Are False�A research finding is less likely to be true when:��• the studies conducted in a field have a small sample size�• when effect sizes are small �• when there are many tested relationships using tests without a priori
selection�• where there is greater flexibility in designs, definitions, outcomes,
and analytical modes�• when there is greater financial and other interest and prejudice�• when more teams are involved in a scientific field, all chasing after
statistical significance by using different tests�Ioannidis 2005 Plos Med.
1/20/17
6
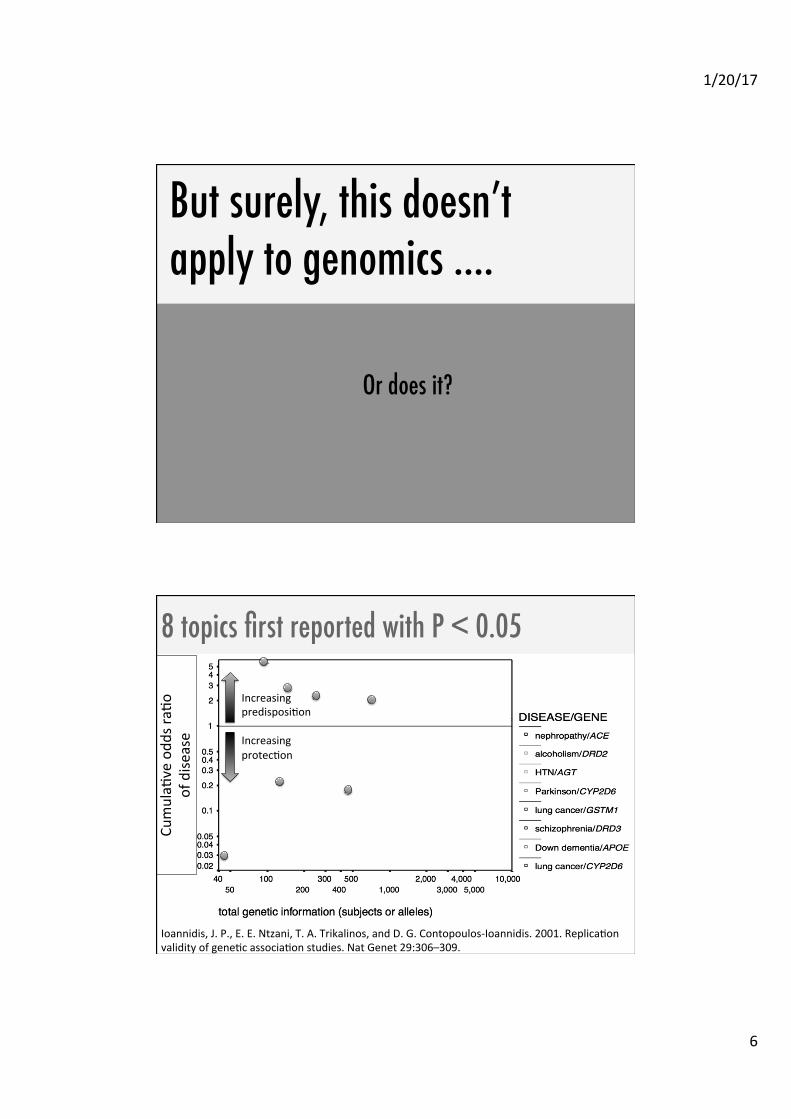
But surely, this doesn’t apply to genomics …. �
Or does it?�
8 topics first reported with P < 0.05 �
• �
Ioannidis, J. P., E. E. Ntzani, T. A. Trikalinos, and D. G. Contopoulos-‐Ioannidis. 2001. ReplicaAon validity of geneAc associaAon studies. Nat Genet 29:306–309.
CumulaA
ve odd
s raA
o
of dise
ase
Increasing predisposiAon Increasing protecAon
1/20/17
7
There are lies, damn lies, and …. genomics?�
But wait, is that fair?� � Are these really lies?�
Where does this bias come from?�
• Population heterogeneity�– Space and time�
• Publication bias�– Large & significant effects publish fast and with high
impact �– Small & non-significant effects publish slow with low
impact �

1/20/17
8
Where does this bias come from?�
YOU!! Its arises from humans doing science�The way we think �
The way our institutions work �
And me …. All of us
Apophenia�A universal human tendency to seek patterns in random information and view this as important �
Story telling of Type 1 errors ��
Celebration of the false positives�
1/20/17
9
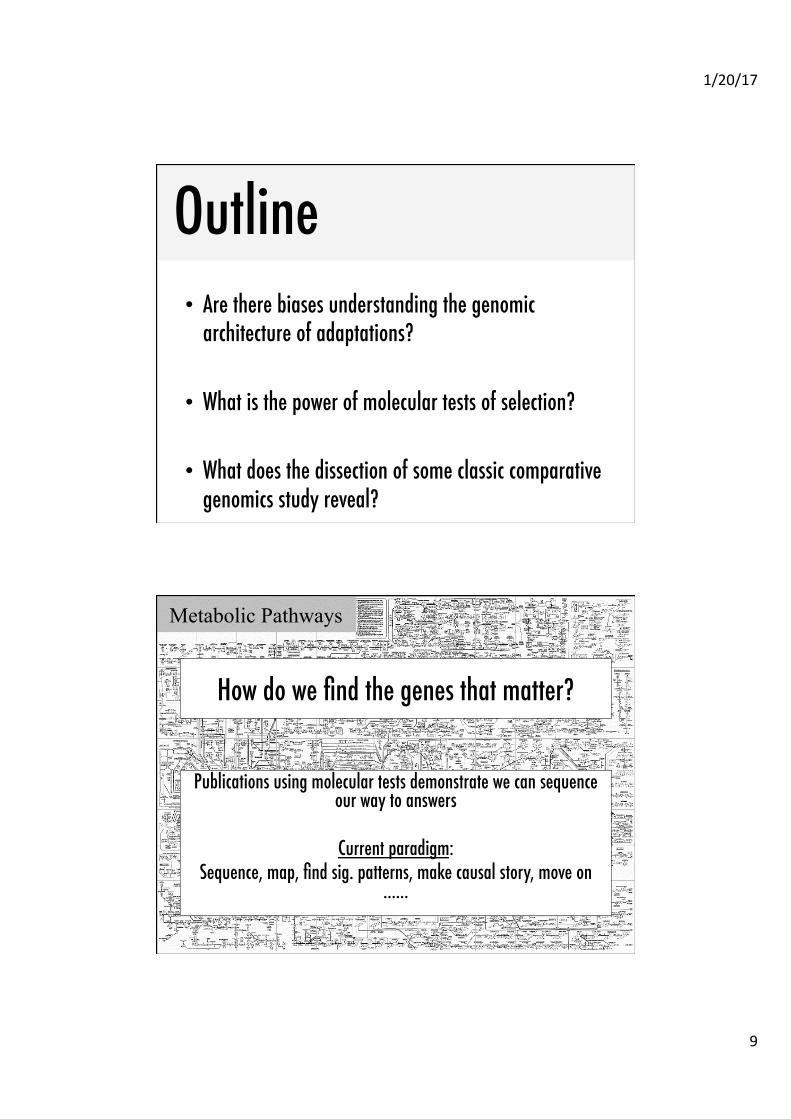
Outline�• Are there biases understanding the genomic
architecture of adaptations?�
• What is the power of molecular tests of selection?�
• What does the dissection of some classic comparative genomics study reveal?�
Metabolic Pathways
How do we find the genes that matter?�
Publications using molecular tests demonstrate we can sequence our way to answers�
�Current paradigm:�
Sequence, map, find sig. patterns, make causal story, move on …… �
1/20/17
10
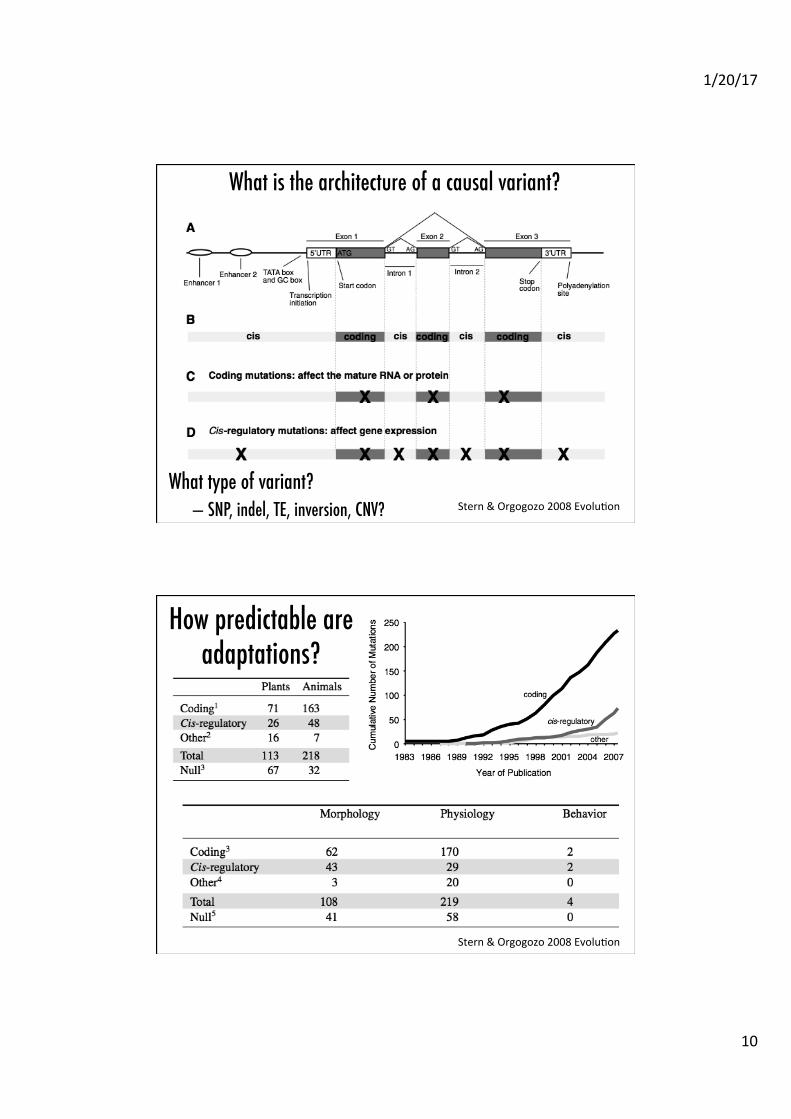
What is the architecture of a causal variant?�
What type of variant?�– SNP, indel, TE, inversion, CNV?�
�Stern & Orgogozo 2008 EvoluAon
How predictable are adaptations?�
Stern & Orgogozo 2008 EvoluAon
1/20/17
11
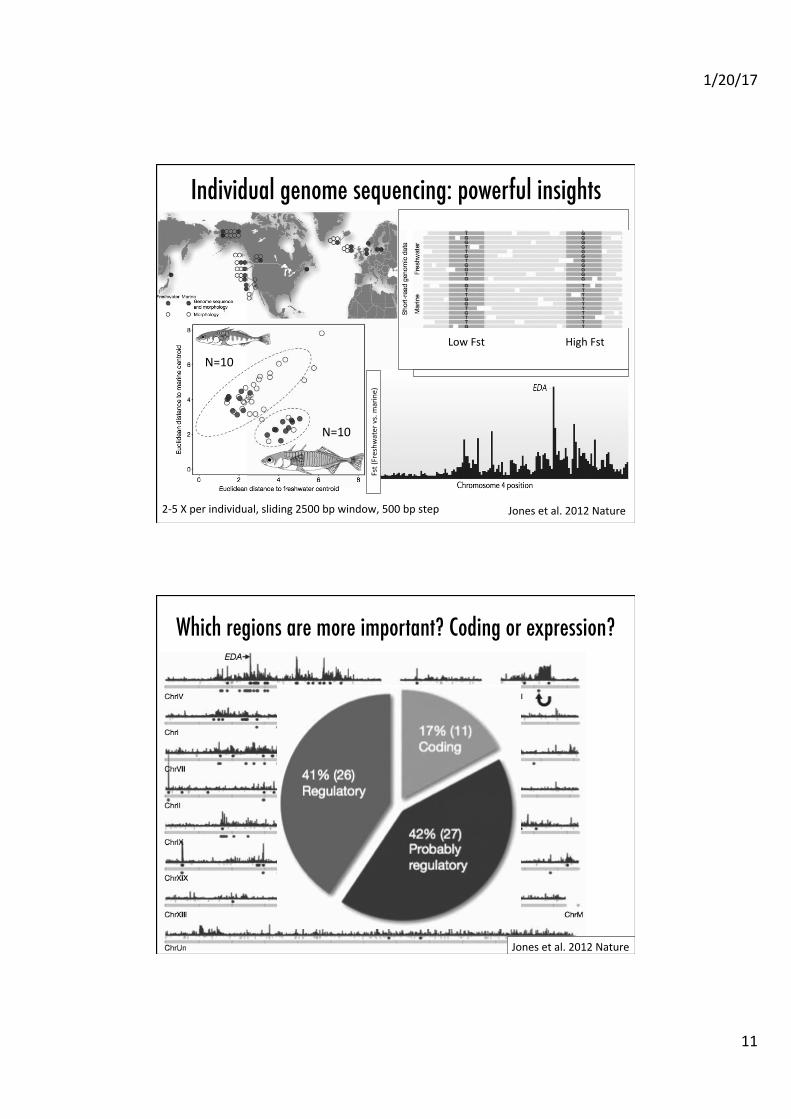
Fst (Freshw
ater vs. m
arine)
Individual genome sequencing: powerful insights�
Jones et al. 2012 Nature 2-‐5 X per individual, sliding 2500 bp window, 500 bp step
N=10
N=10 Low Fst High Fst
Which regions are more important? Coding or expression?�
Jones et al. 2012 Nature
1/20/17
12
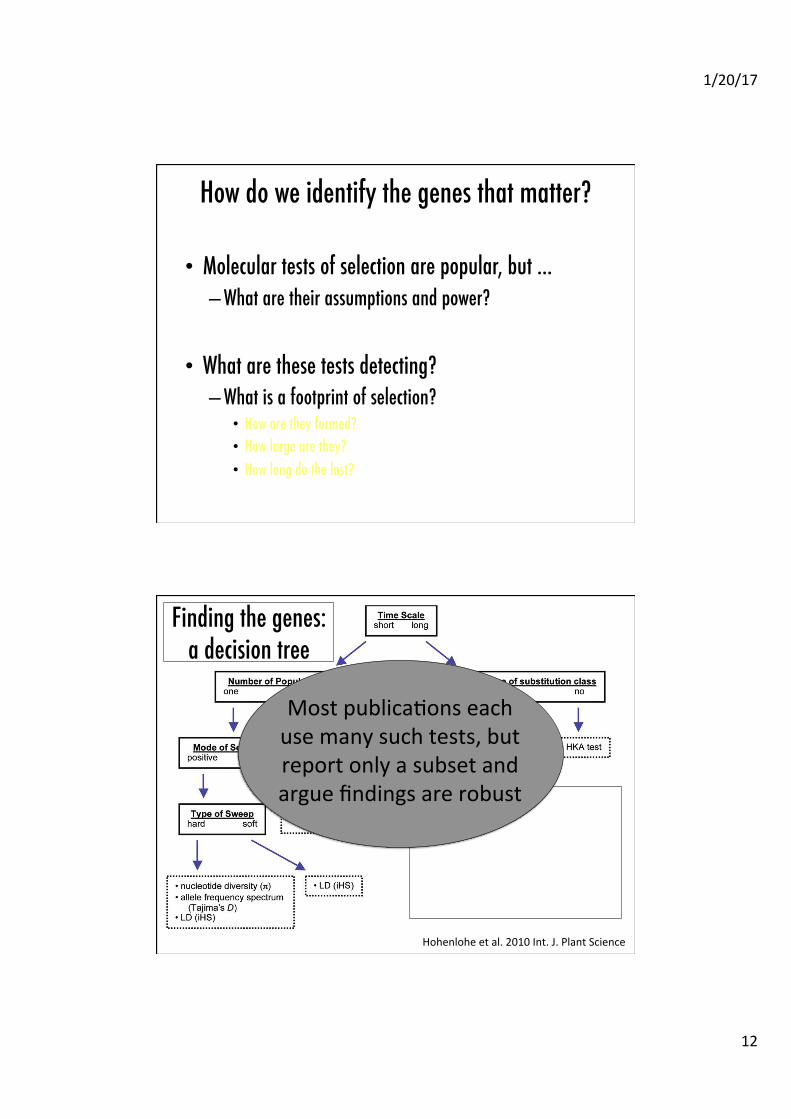
How do we identify the genes that matter?��
• Molecular tests of selection are popular, but … �– What are their assumptions and power?�
�• What are these tests detecting?�– What is a footprint of selection?�• How are they formed?�• How large are they?�• How long do the last?�
Hohenlohe et al. 2010 Int. J. Plant Science Fig. 1.A, Decision tree summarizing the major biological considerations in using populationgenomics to test for selection (solid outline) and the classes of statistical tests that are mostappropriate for each case (dotted outline). See box 1 for descriptions of particular tests. B,Conceptual view of the timescale during which different classes of tests are best able todetect selection. A selective sweep is shown in red. Tests based on substitution rates (e.g.,dN/dS) have a potentially long life span but require multiple amino acid substitutions. Timeis in units of effective population size. Based on Hudson et al. (1987),Pennings andHermisson (2006b),Sabeti et al. (2006), and Oleksyk et al. (2010; but note that these lattertwo references focused on applications to human populations).
Hohenlohe et al. Page 18
Int J Plant Sci. Author manuscript; available in PMC 2011 January 6.
NIH
-PA
Author M
anuscriptN
IH-P
A A
uthor Manuscript
NIH
-PA
Author M
anuscript
Finding the genes: a decision tree�
Most publicaAons each use many such tests, but report only a subset and argue findings are robust

1/20/17
13
Power is the probability that the test will reject the null hypothesis when the alternative hypothesis is
TRUE ��
Using a t-test, you would want power > 90% at reasonable sample size, right?�
What is staAsAcal power?
What power do we have to detect evolution by
natural selection?�
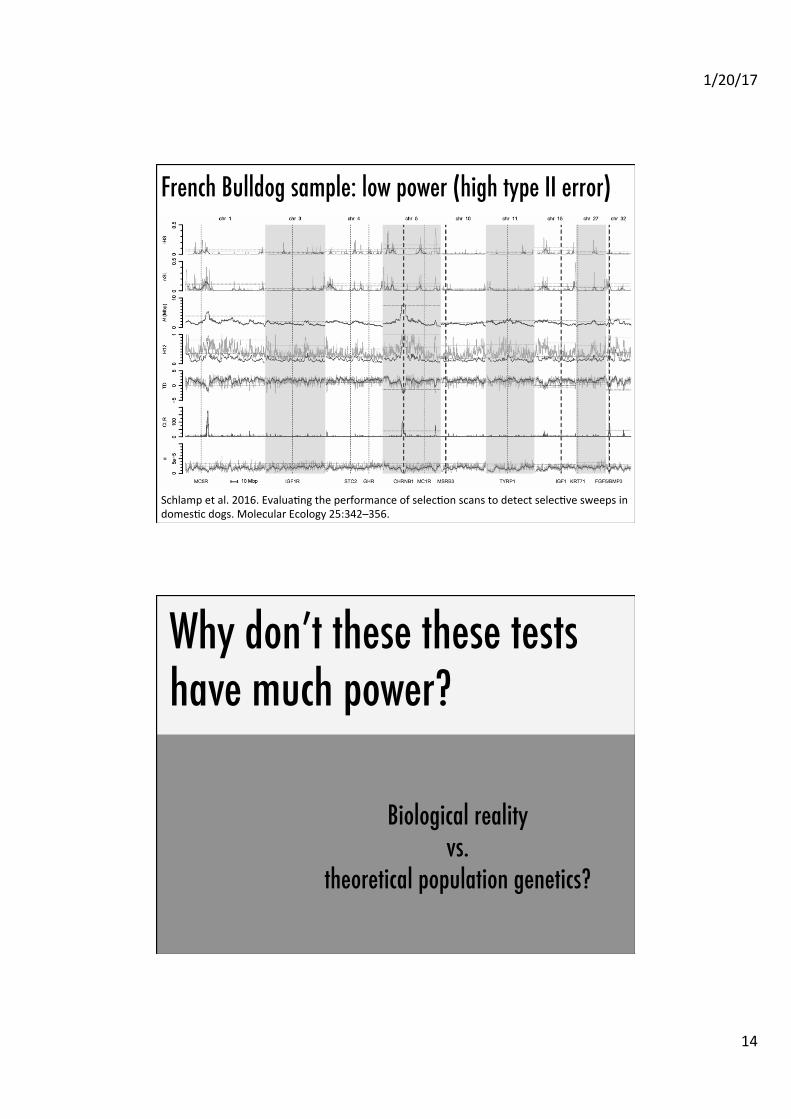
Breed specific morphologies�Test set of Schlamp et al. 2016:�• 25 breeds�• 12 causal loci �• N = 25 / breed�• 7 tests of selection�– iHS,nSL,H,TajD, etc.�
von Holdt et al. 2010. Nature
How accurate are molecular tests of selection detect?�
1/20/17
14
French Bulldog sample: low power (high type II error) �
• �
Schlamp et al. 2016. EvaluaAng the performance of selecAon scans to detect selecAve sweeps in domesAc dogs. Molecular Ecology 25:342–356.
Why don’t these these tests have much power? �
Biological reality �vs. �
theoretical population genetics?�
1/20/17
15
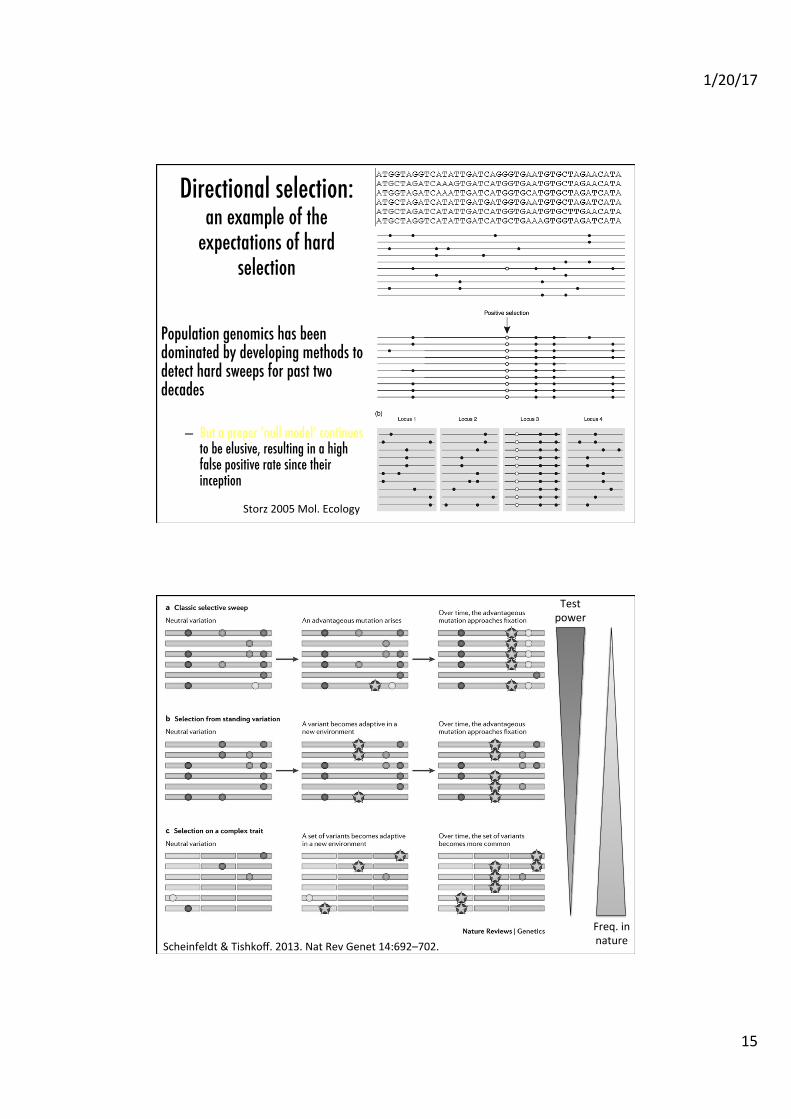
Directional selection:�an example of the
expectations of hard selection�
Population genomics has been dominated by developing methods to detect hard sweeps for past two decades��
– But a proper ‘null model’ continues to be elusive, resulting in a high false positive rate since their inception�
Storz 2005 Mol. Ecology
• �
Scheinfeldt & Tishkoff. 2013. Nat Rev Genet 14:692–702.
Test power
Freq. in nature
1/20/17
16
• �
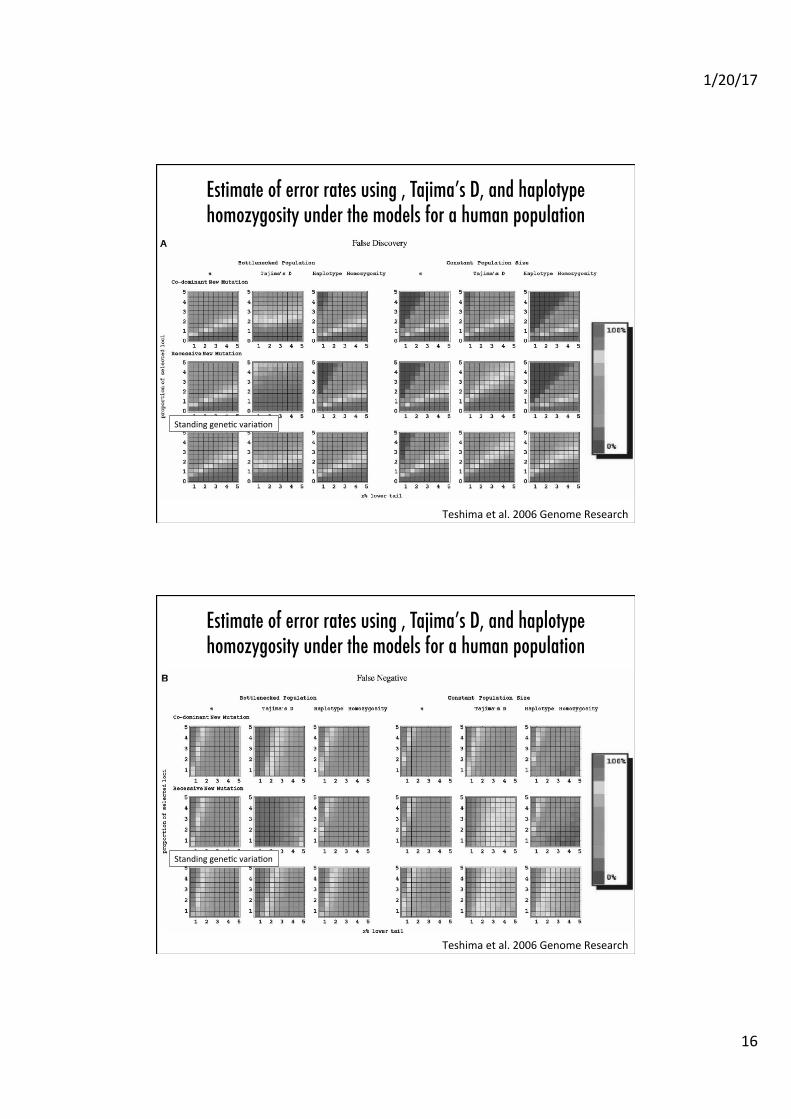
Estimate of error rates using , Tajima’s D, and haplotype homozygosity under the models for a human population�
Teshima et al. 2006 Genome Research
Standing geneAc variaAon
Estimate of error rates using , Tajima’s D, and haplotype homozygosity under the models for a human population�
• �
Teshima et al. 2006 Genome Research
Standing geneAc variaAon

1/20/17
17
Simulation conclusions�• Simulations suggest �– empirical approaches will identify several interesting candidates�– But will also miss many—in some cases, most—loci of interest �
• False-discovery rate is higher when �– directional selection involves a recessive rather than a co-
dominant allele�– when it acts on a previously neutral rather than a new allele�– Demographic size changes rather than constant population size�
Genomic scans yield an unrepresentaAve subset of loci that contribute to adaptaAons
• Are still chasing an elusive null model ….�– Each performs better than previous ones under a
specific set of conditions, all have poor null model �
• But … under realistic biological conditions, they all �– Have very low power (high type II error rates) �– Have high false positive rates�
Molecular tests … �BASED ON 20 YEARS OF PUBLICATIONS�

1/20/17
18
How common were hard sweeps in our history?�
Messer and Petrov 2013 TREE
• “classic sweeps were not a dominant mode of human adaptation over the past 250,000 years” �
• “much local adaptation has occurred by selection acting on existing variation rather than new mutation” �
How common are hard sweeps in nature?�• “we argue that soft sweeps might be the dominant mode of
adaptation in many species” �
1000 Genomes PC 2010 Science Hernandez et al. 2011 Science
Burke et al. 2010 Nature
The lab?�• “Signatures of selection … [are] not associated with ‘classic’ sweeps
… More parsimonious explanations include [selection on standing variation]” �
Certainly not everyone agrees …. �
• This is an important read, critical of �– assumptions underlying soft sweep (selection on standing variation) �– the low power of molecular tests to detect hard & soft sweeps�
1/20/17
19
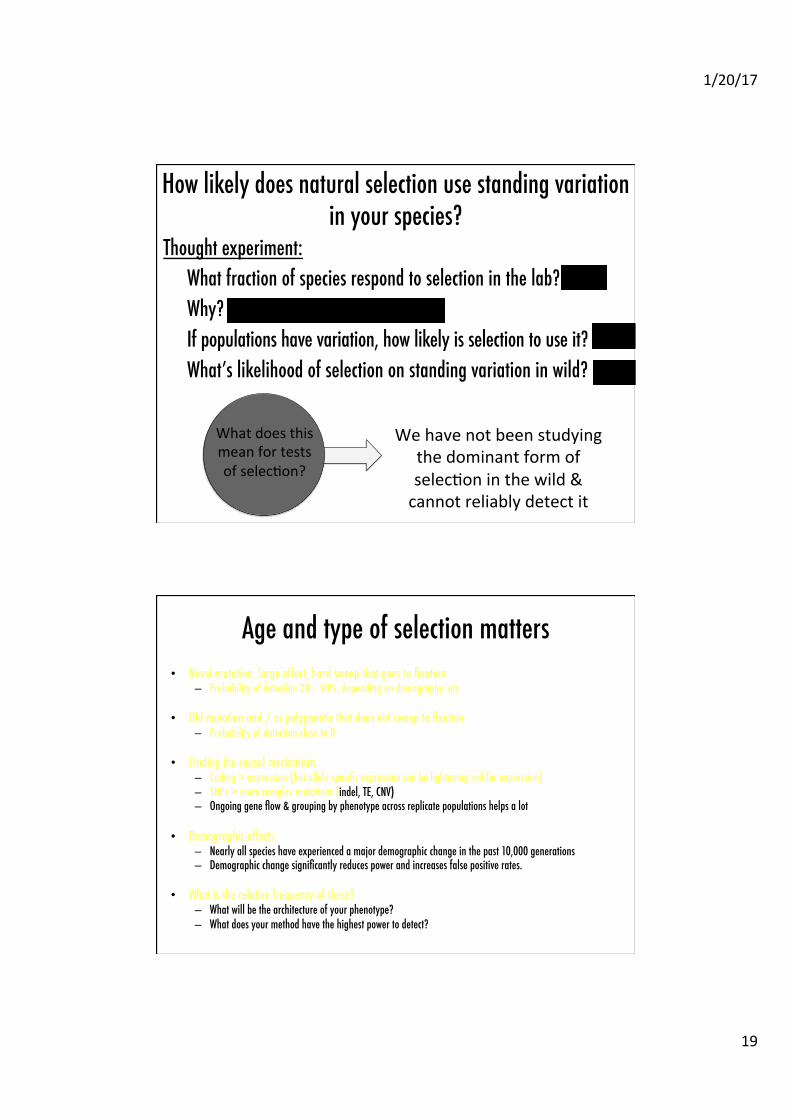
We have not been studying the dominant form of selecAon in the wild & cannot reliably detect it
How likely does natural selection use standing variation in your species?�
What does this mean for tests of selecAon?
Thought experiment:� What fraction of species respond to selection in the lab? 90%� Why? existing variation in population� If populations have variation, how likely is selection to use it? 90%� What’s likelihood of selection on standing variation in wild?� 80%�
Age and type of selection matters�• Novel mutation, large effect, hard sweep that goes to fixation�
– Probability of detection 20 – 90%, depending on demography, etc.�
• Old mutation and / or polygenetic that does not sweep to fixation�– Probability of detection close to 0 �
• Finding the causal mechanism�– Coding > expression (but allele specific expression can be lightening rod for expression) �– SNPs > more complex mutations (indel, TE, CNV) �– Ongoing gene flow & grouping by phenotype across replicate populations helps a lot �
• Demographic effects�– Nearly all species have experienced a major demographic change in the past 10,000 generations�– Demographic change significantly reduces power and increases false positive rates.�
• What is the relative frequency of these?�– What will be the architecture of your phenotype?�– What does your method have the highest power to detect?�
1/20/17
20
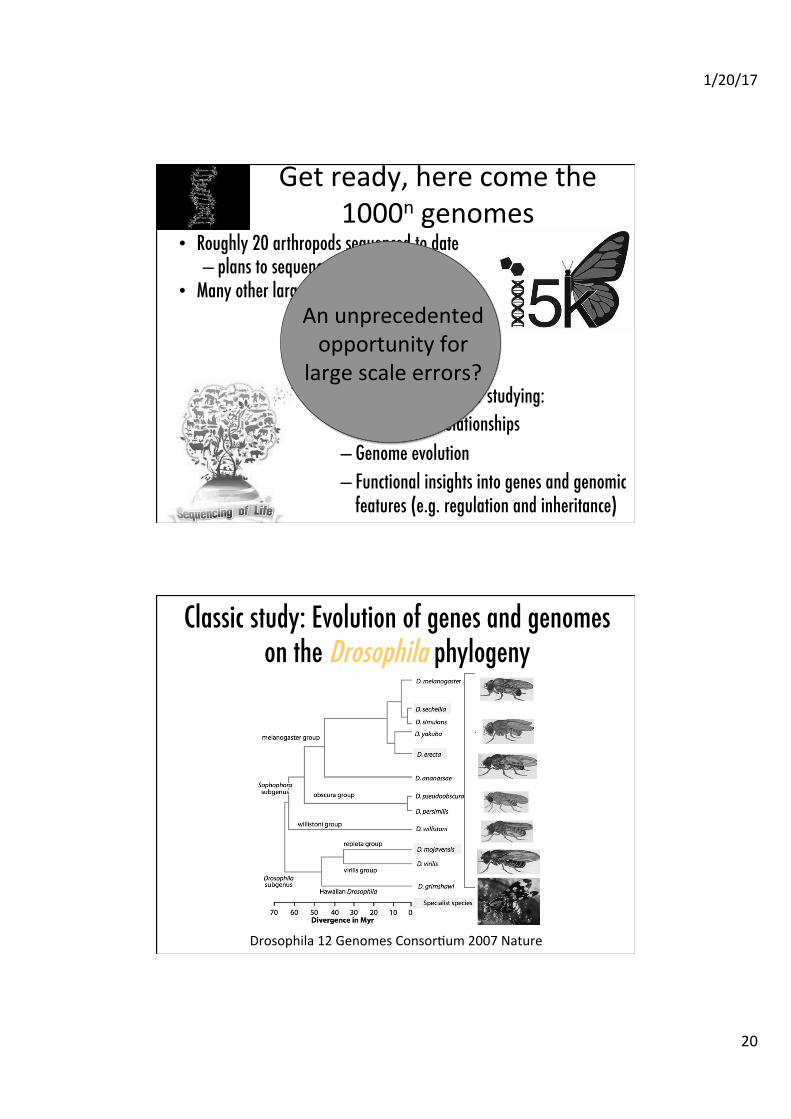
Get ready, here come the 1000n genomes
• Roughly 20 arthropods sequenced to date�– plans to sequence 5,000 more�
• Many other large scale projects coming online��
• Unprecedented data for studying:�– Phylogenetic relationships�– Genome evolution�– Functional insights into genes and genomic
features (e.g. regulation and inheritance) �
An unprecedented opportunity for
large scale errors?
Drosophila 12 Genomes ConsorAum 2007 Nature
Classic study: Evolution of genes and genomes on the Drosophila phylogeny�
1/20/17
21
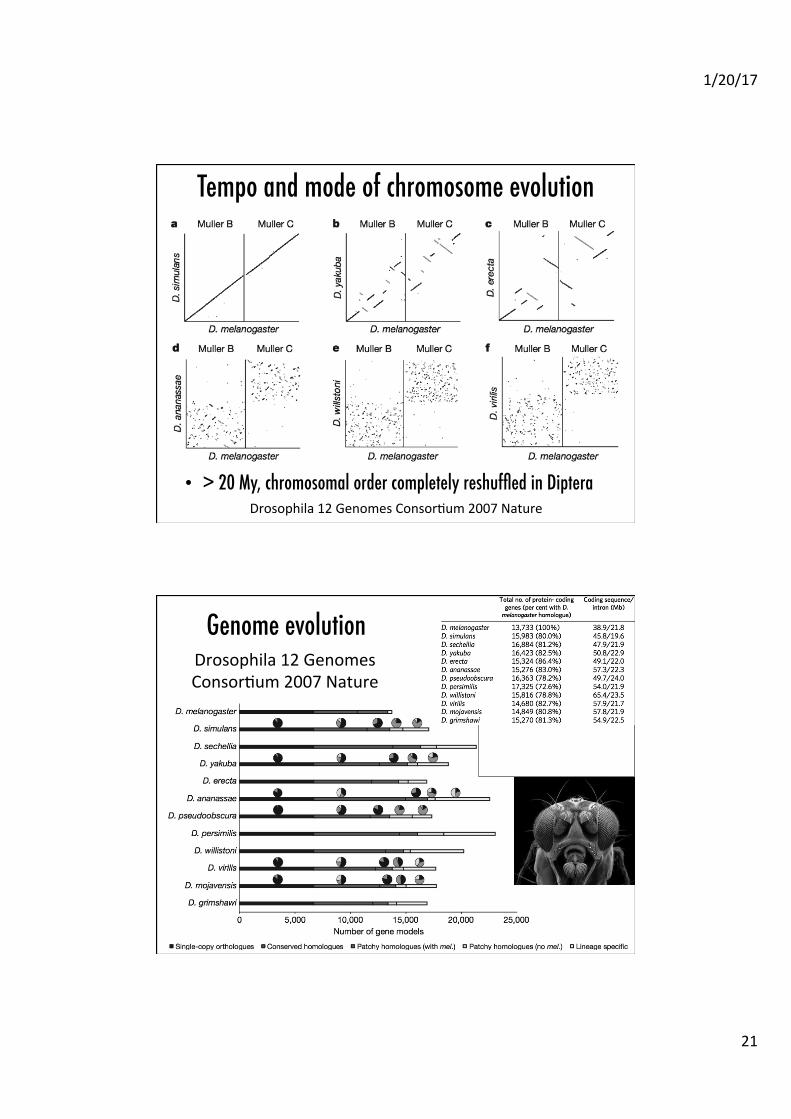
Tempo and mode of chromosome evolution�
• > 20 My, chromosomal order completely reshuffled in Diptera �Drosophila 12 Genomes ConsorAum 2007 Nature
Genome evolution�Drosophila 12 Genomes ConsorAum 2007 Nature
1/20/17
22
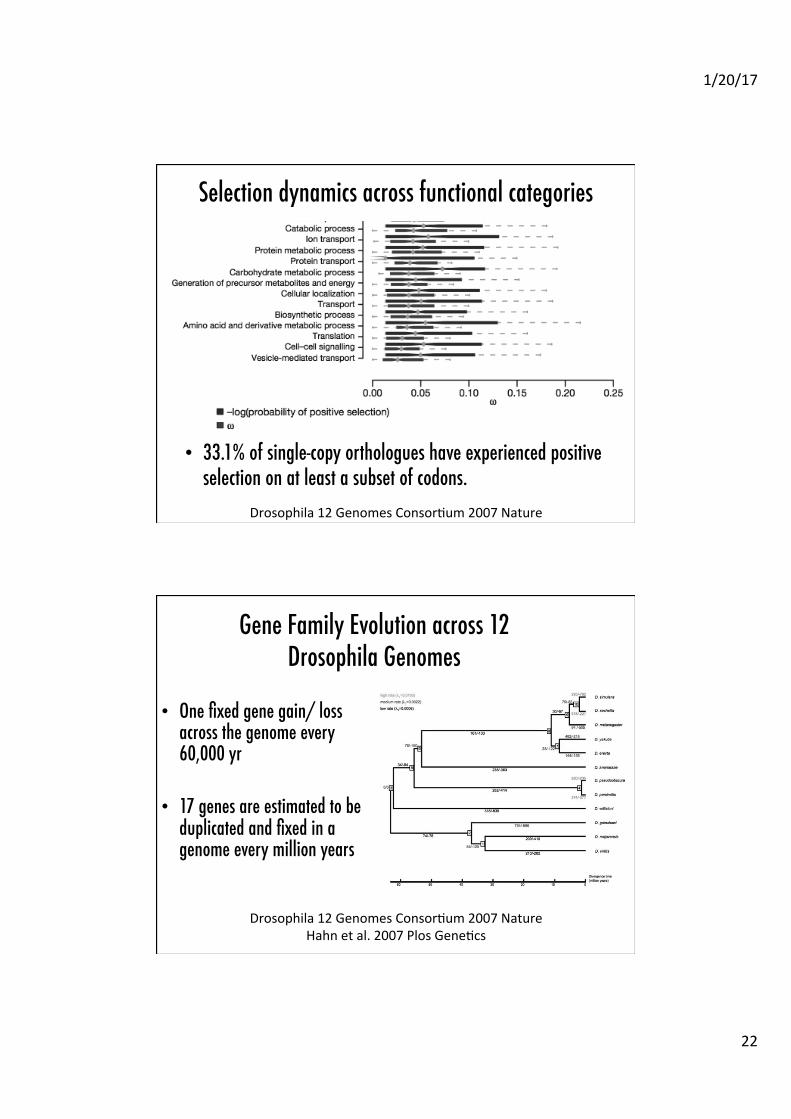
Selection dynamics across functional categories�
• 33.1% of single-copy orthologues have experienced positive selection on at least a subset of codons.�
Drosophila 12 Genomes ConsorAum 2007 Nature
Drosophila 12 Genomes ConsorAum 2007 Nature Hahn et al. 2007 Plos GeneAcs
Gene Family Evolution across 12 Drosophila Genomes �
• One fixed gene gain/ loss across the genome every 60,000 yr �
• 17 genes are estimated to be duplicated and fixed in a genome every million years�

1/20/17
23
Comparative Genomics : a house of cards?�
• Data scale is too large to thoroughly assess errors … �– Perhaps the findings are just …. wrong �
• All conclusions, at some stage, rest upon �– Simple bioinformatics�– Assumptions that get incorporated into seemingly unbiased methods�
Lets exploring two pillars of these studies, their error and repercussions�– Gene alignments in detecting positive selection�– Calibrations in temporal analysis�
Published studies allow … �
�
Follow up studies to reveal limitations��
But, must have enough details to be repeatable�
1/20/17
24
s
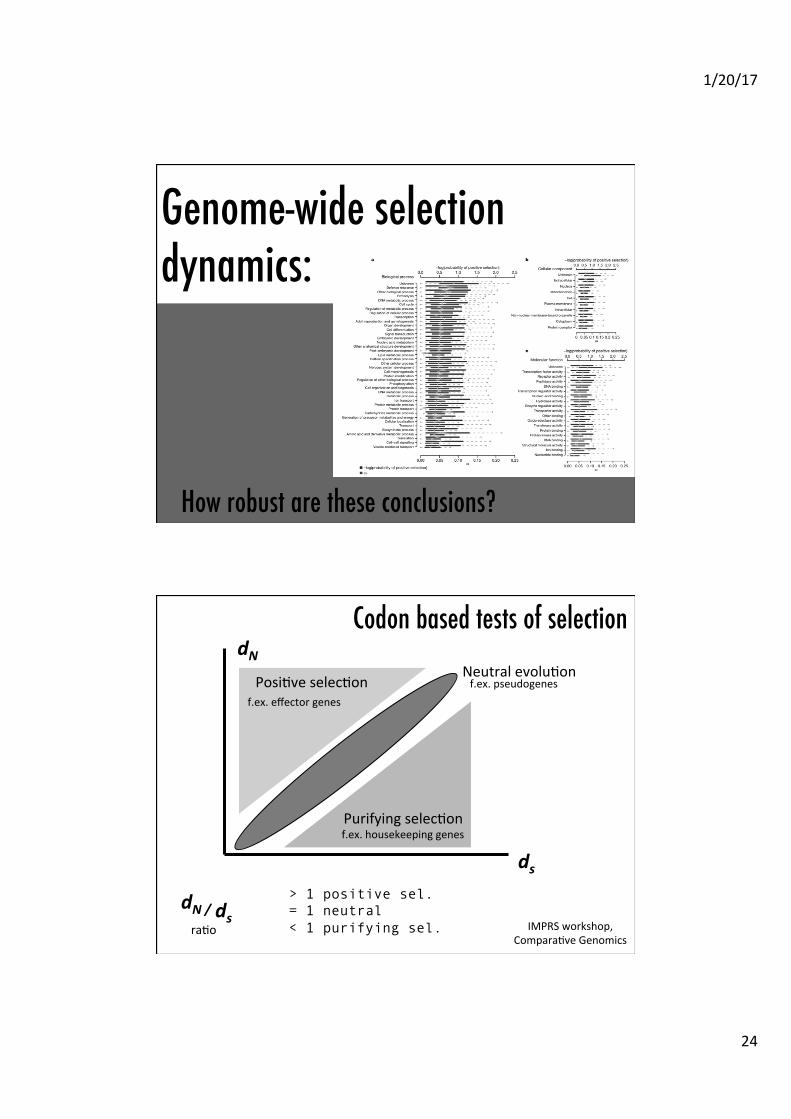
Genome-wide selection dynamics: �
How robust are these conclusions?�
33.1% of single-copy orthologues have experienced positive selection
on at least a subset of codons.�
Codon based tests of selection�
Neutral evoluAon
Purifying selecAon
PosiAve selecAon f.ex. effector genes
f.ex. housekeeping genes
f.ex. pseudogenes
ds
dN
IMPRS workshop, ComparaAve Genomics
dN / ds > 1 positive sel. = 1 neutral < 1 purifying sel. raAo
1/20/17
25
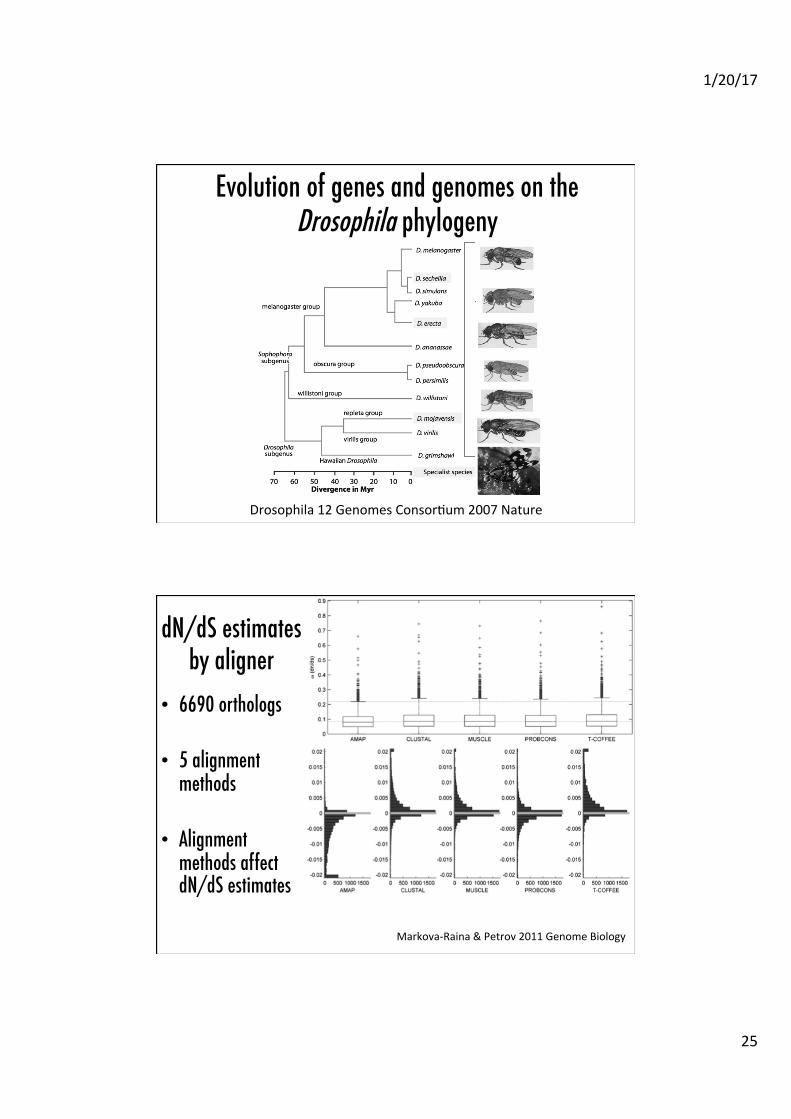
Drosophila 12 Genomes ConsorAum 2007 Nature
Evolution of genes and genomes on the Drosophila phylogeny�
dN/dS estimates by aligner �
Markova-‐Raina & Petrov 2011 Genome Biology
• 6690 orthologs �
• 5 alignment methods�
• Alignment methods affect dN/dS estimates �
1/20/17
26
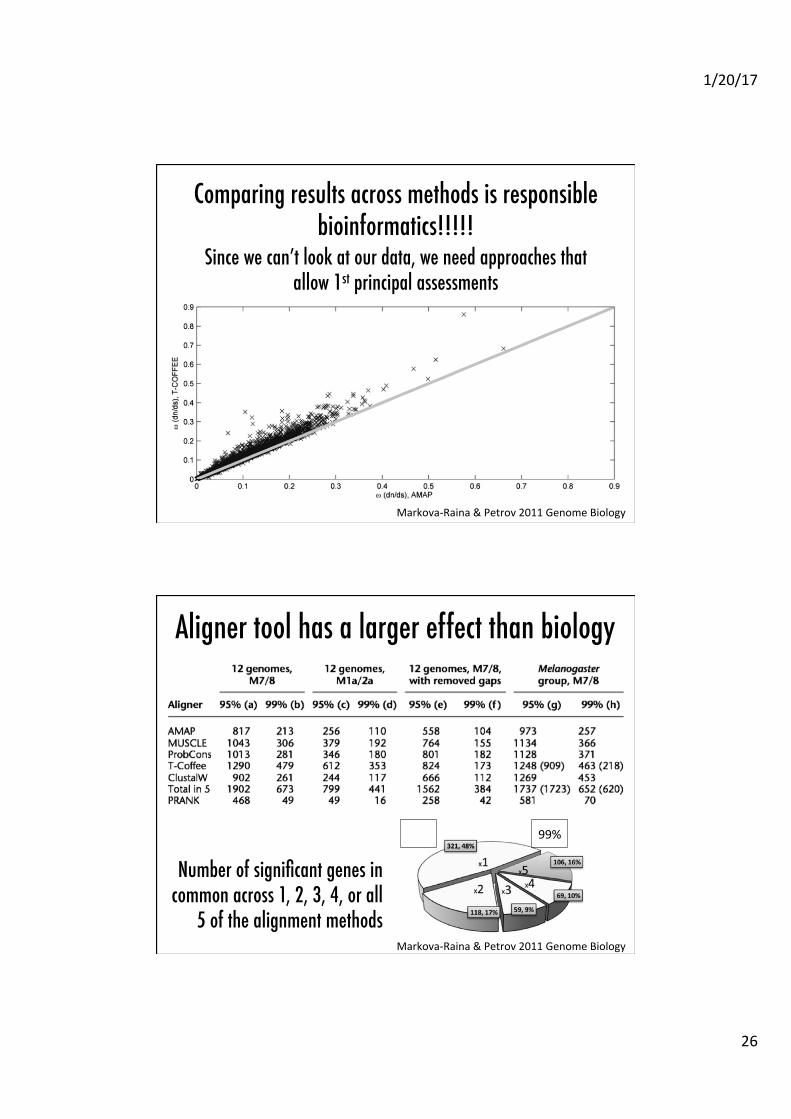
Comparing results across methods is responsible bioinformatics!!!!!�
Since we can’t look at our data, we need approaches that allow 1st principal assessments�
Markova-‐Raina & Petrov 2011 Genome Biology
Aligner tool has a larger effect than biology�
Markova-‐Raina & Petrov 2011 Genome Biology
Number of significant genes in common across 1, 2, 3, 4, or all
5 of the alignment methods�
99%
1/20/17
27
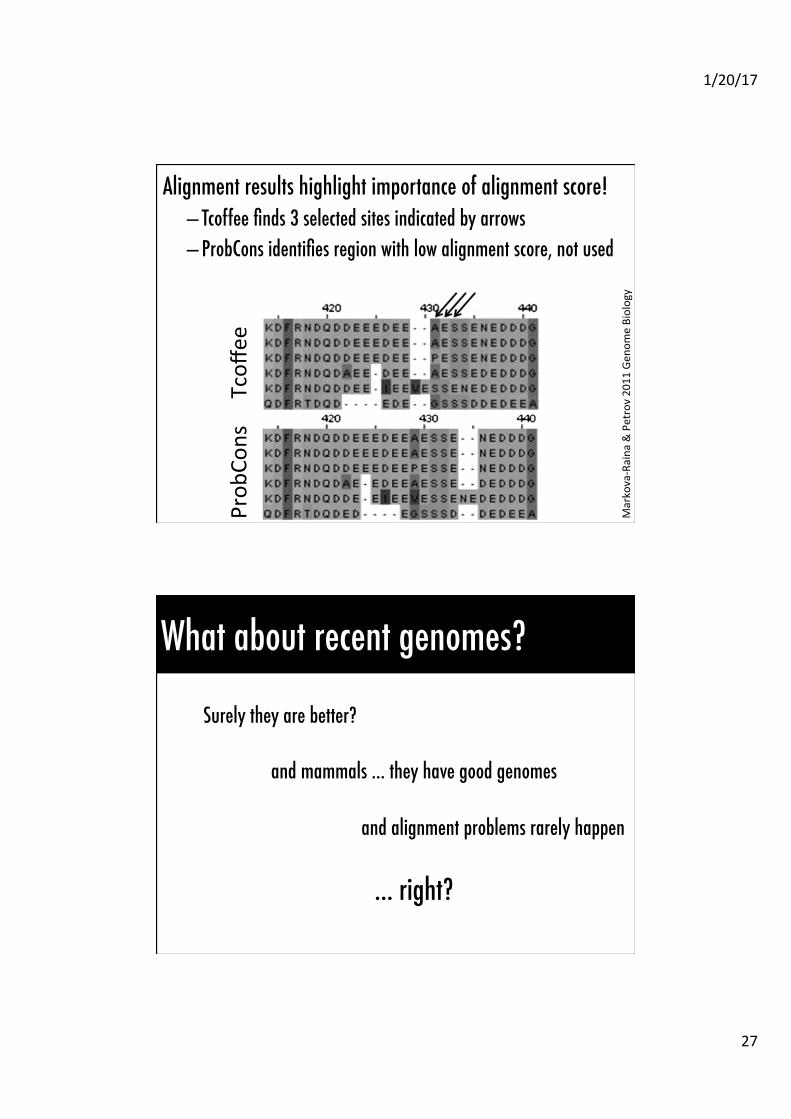
Alignment results highlight importance of alignment score!�– Tcoffee finds 3 selected sites indicated by arrows�– ProbCons identifies region with low alignment score, not used�
Markova-‐Raina & Petrov 20
11 Gen
ome Biology
Prob
Cons Tcoffe
e
What about recent genomes?�
Surely they are better?�
and mammals … they have good genomes��
and alignment problems rarely happen��
… right?� �
1/20/17
28
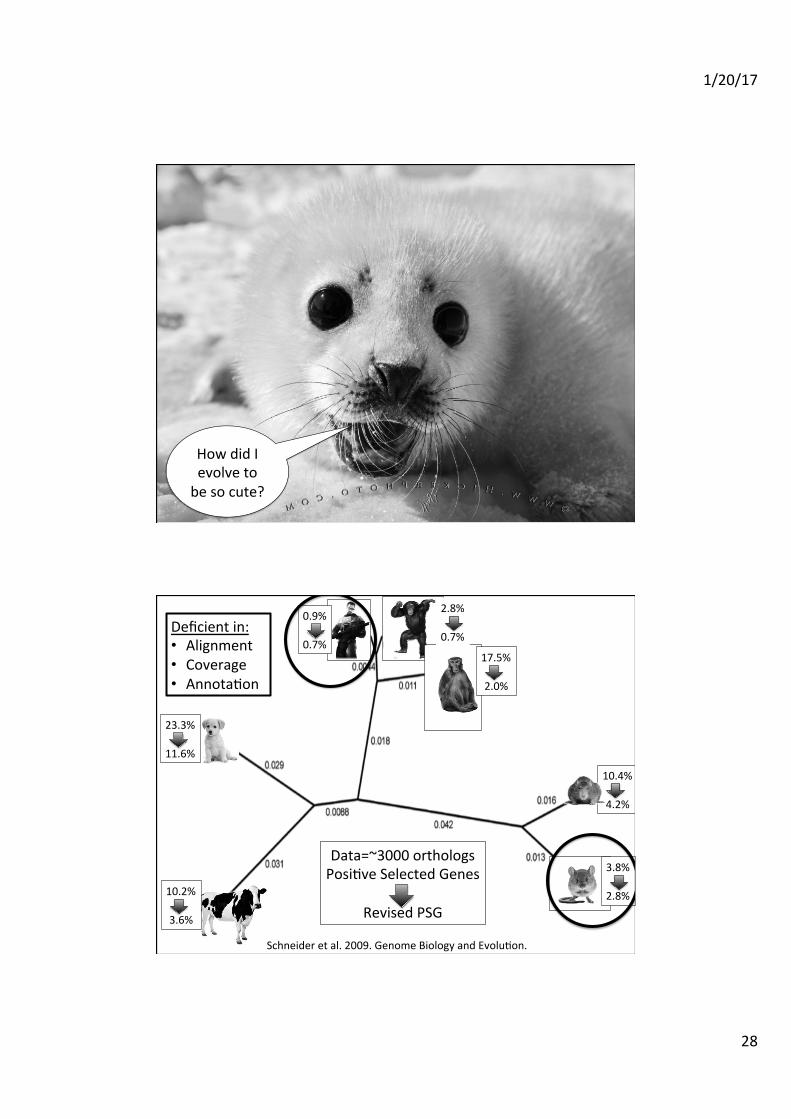
What about recent genomes on cute mammals?�
• �
How did I evolve to be so cute?
• �
Schneider et al. 2009. Genome Biology and EvoluAon.
23.3% 11.6%
10.2%
3.6%
0.9% 0.7%
2.8% 0.7%
17.5%
2.0%
10.4%
4.2%
3.8%
2.8%
Data=~3000 orthologs PosiAve Selected Genes
Revised PSG
Deficient in: • Alignment • Coverage • AnnotaAon
1/20/17
29
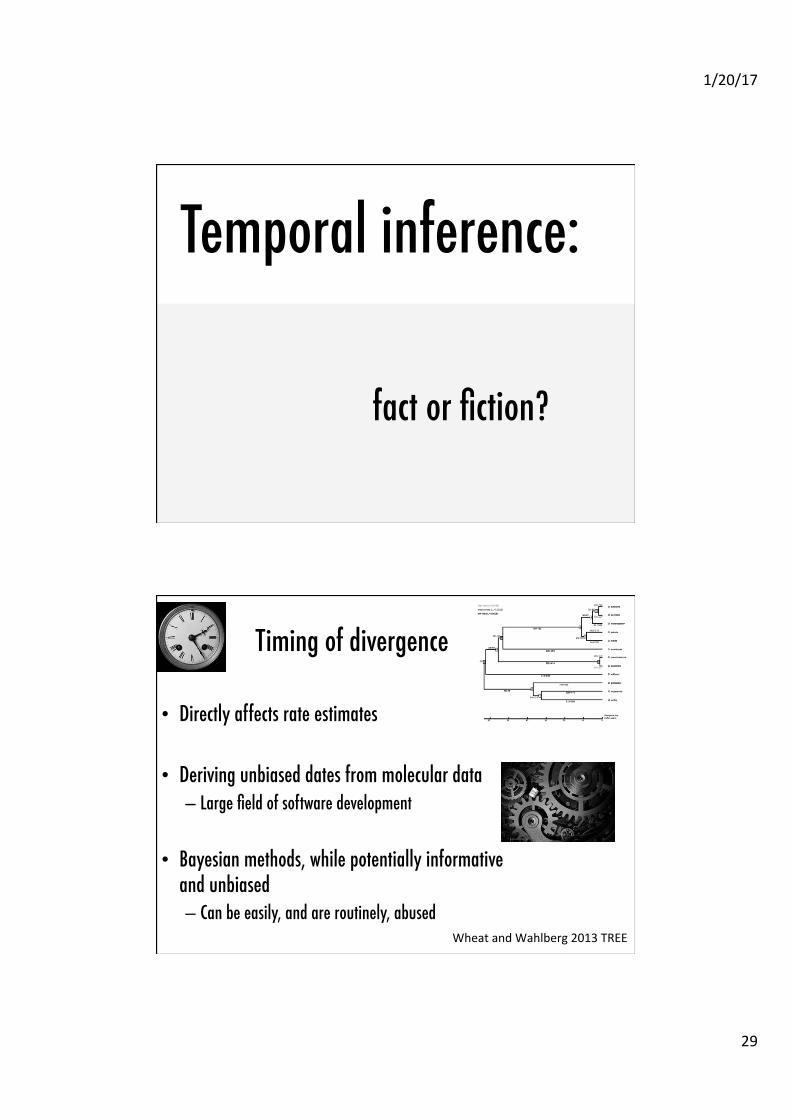
Temporal inference:�
fact or fiction?�
Timing of divergence�
• Directly affects rate estimates�
• Deriving unbiased dates from molecular data�– Large field of software development �
• Bayesian methods, while potentially informative and unbiased�– Can be easily, and are routinely, abused�
Wheat and Wahlberg 2013 TREE
1/20/17
30
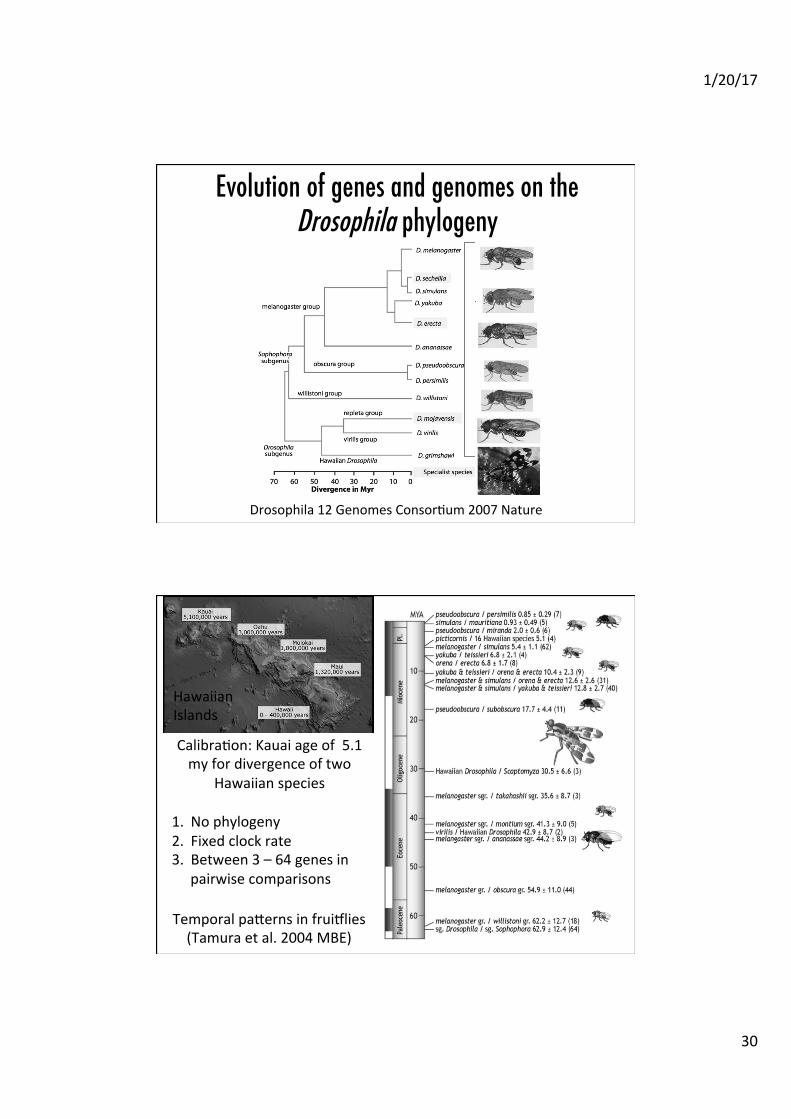
Drosophila 12 Genomes ConsorAum 2007 Nature
Evolution of genes and genomes on the Drosophila phylogeny�
CalibraAon: Kauai age of 5.1 my for divergence of two
Hawaiian species
1. No phylogeny 2. Fixed clock rate 3. Between 3 – 64 genes in
pairwise comparisons
Temporal paoerns in fruiplies (Tamura et al. 2004 MBE)
Hawaiian Islands
1/20/17
31
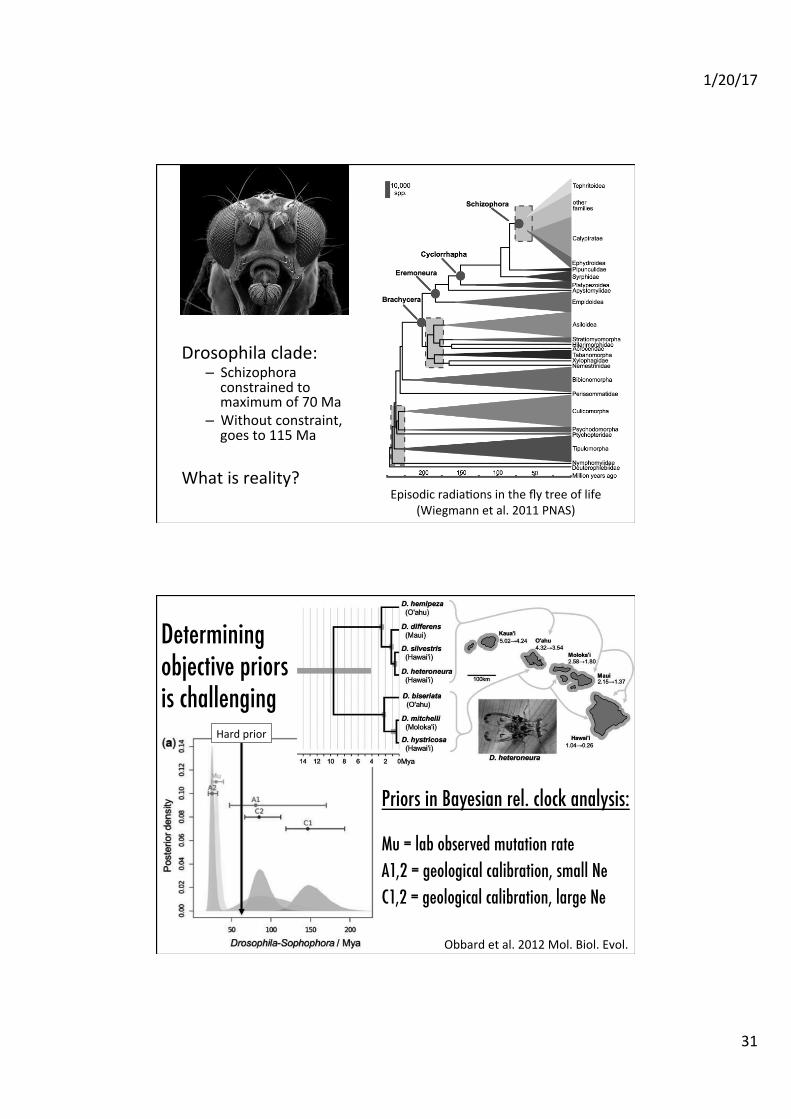
Episodic radiaAons in the fly tree of life (Wiegmann et al. 2011 PNAS)
Drosophila clade: – Schizophora constrained to maximum of 70 Ma
– Without constraint, goes to 115 Ma
What is reality?
Determining objective priors is challenging�
Priors in Bayesian rel. clock analysis:��
Mu = lab observed mutation rate�A1,2 = geological calibration, small Ne�C1,2 = geological calibration, large Ne��
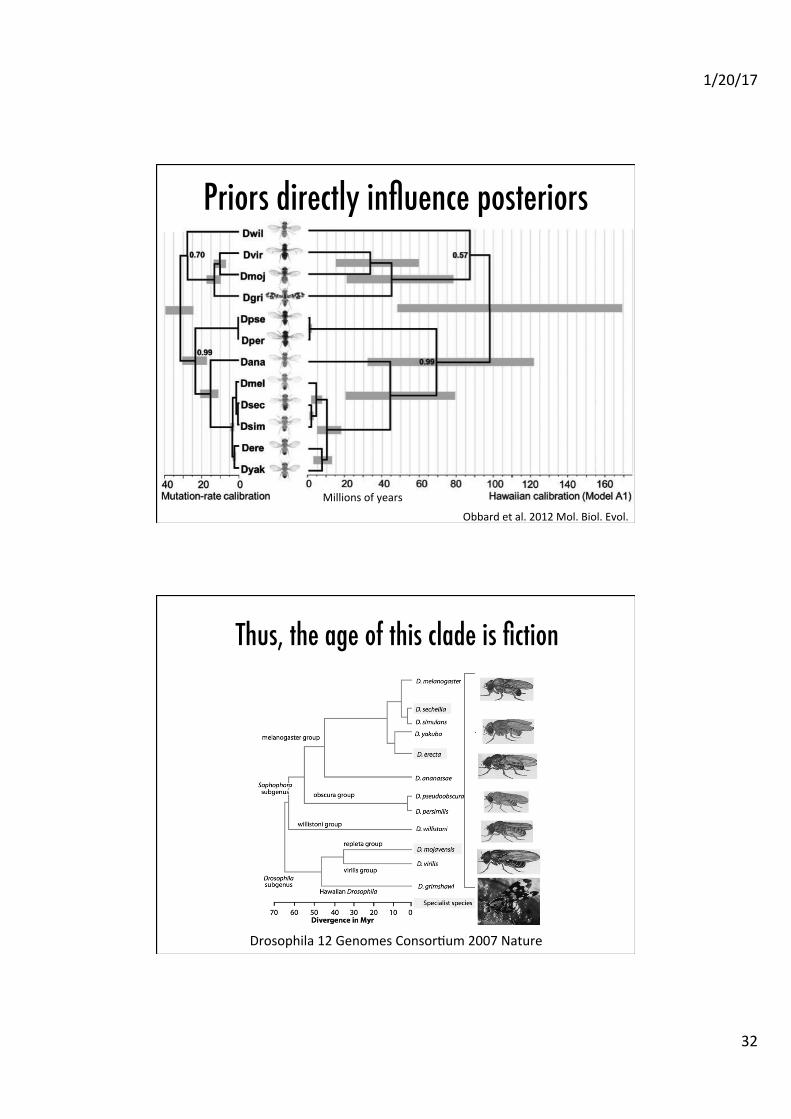
Obbard et al. 2012 Mol. Biol. Evol.
Hard prior
1/20/17
32
Priors directly influence posteriors�
Obbard et al. 2012 Mol. Biol. Evol.
Millions of years
Drosophila 12 Genomes ConsorAum 2007 Nature
Thus, the age of this clade is fiction�
1/20/17
33
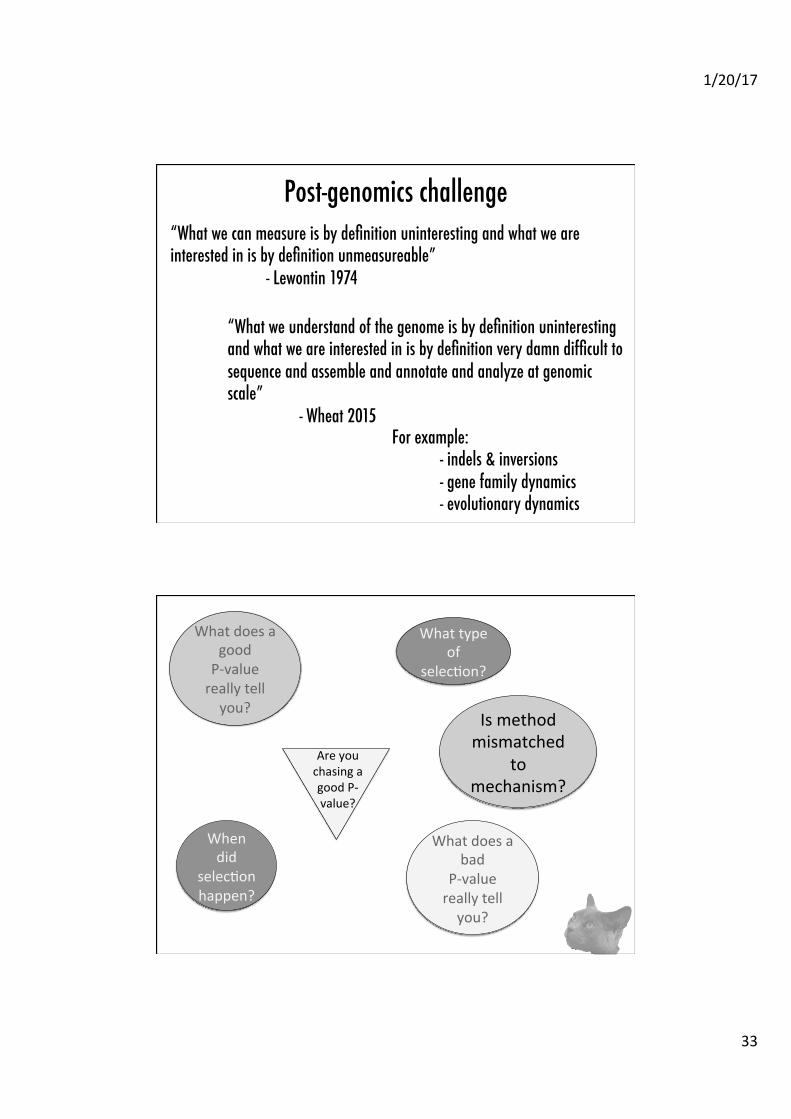
Post-genomics challenge�“What we can measure is by definition uninteresting and what we are interested in is by definition unmeasureable” �
- Lewontin 1974 ��
“What we understand of the genome is by definition uninteresting and what we are interested in is by definition very damn difficult to sequence and assemble and annotate and analyze at genomic scale”�
- Wheat 2015 ��
�For example:�
- indels & inversions� - gene family dynamics � - evolutionary dynamics
What does a good P-‐value really tell you?
What does a bad
P-‐value really tell you?
When did
selecAon happen?
What type of
selecAon?
Is method mismatched
to mechanism?
Are you chasing a good P-‐value?
1/20/17
34
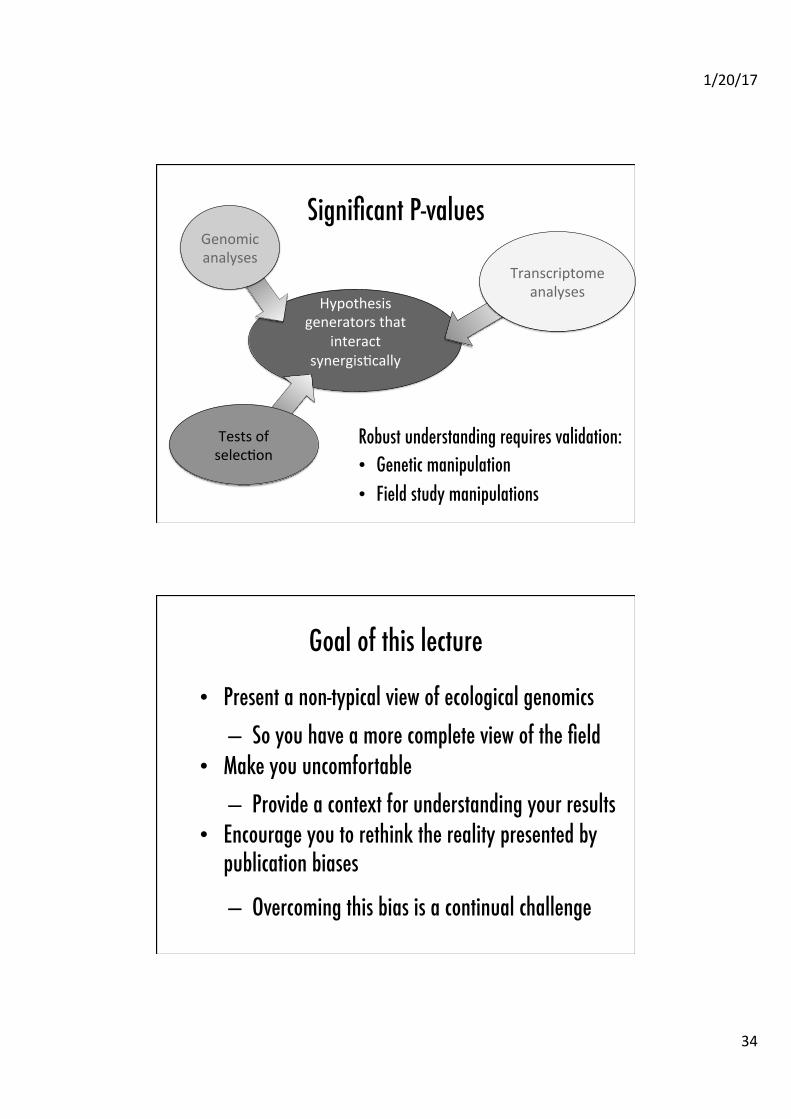
Significant P-values�
Robust understanding requires validation:�• Genetic manipulation�• Field study manipulations�
Hypothesis generators that
interact synergisAcally
Transcriptome analyses
Genomic analyses
Tests of selecAon
Goal of this lecture�
• Present a non-typical view of ecological genomics�
• Make you uncomfortable�
• Encourage you to rethink the reality presented by publication biases�
– So you have a more complete view of the field�
– Provide a context for understanding your results�
– Overcoming this bias is a continual challenge��

1/20/17
35