china feihe (6186 hk)
TRANSCRIPT
CMB International Securities | Equity Research | Company Initiation
PLEASE READ THE ANALYST CERTIFICATION AND IMPORTANT DISCLOSURES ON LAST PAGE
MORE REPORTS FROM BLOOMBERG: RESP CMBR <GO> OR http://www.cmbi.com.hk
China Dairy Sector
Albert Yip
(852) 3900 0838
Xu Hanbo
(852) 3761 8725
Stock Data
Mkt Cap (HK$ mn) 156,333
Avg 3 mths t/o (HK$ mn) 395.54
52w High/Low (HK$) 19.48/ 8.08
Total Issued Shares (mn) 8,933.3
Source: Bloomberg
Shareholding Structure
Leng Youbin 49.90%
Morgan Stanley 10.72%
Source: HKEx
Share Performance
Absolute Relative
1-mth -0.9% -0.4%
3-mth -0.5% -9.4%
6-mth 10.3% 3.3%
Source: Bloomberg
12-mth Price Performance
Source: Bloomberg
Auditor: Ernst & Young
0
2
4
6
8
10
12
14
16
18
20
12/2019 3/2020 6/2020 9/2020
6186 HK HSI (rebased)(HK$)
BUY (Initiation)
Target Price HK$24.00
Up/Downside +37%
Current Price HK$17.50
1
23 Dec 2020
Feihe is the No.1 IMF market player in China with 18% market share in Sep 2020. We think its effective marketing strategies, flattened and in-depth distribution system and product freshness are key reasons for it to keep gaining market share. We believe Feihe will diversity its product offerings and introduce more super-premium products to capture the premiumization trend. We forecast Feihe to post 32% adj. EPS CAGR from FY19 to FY22E led by 38% CAGR of high-end IMF sales, higher than peers’ average of 15%. We initiate coverage of Feihe with Buy rating and TP of HK$24.00 based on 23.7x FY21E P/E.
Effective marketing initiatives. The Company perceives itself as the pioneer in IMF market to position its brand as “Most suitable for Chinese Babies”. It has a nationwide sales team of >2,000 ppl organizing and participating in online and offline seminars to educate consumers on Feihe products. Through training program, conversion rate of seminars reaches 20-30%. Such high conversion rate justifies further spending on more events. According to the Company, the second player only organized around 50,000 seminars in 2019, just one-tenth of the Company’s.
Flattened and in-depth distribution system. Feihe operates a single-layer distribution system which allows it to effectively monitor channel sales and inventory and react quicker than competitors adopting multi-layer system. Distributors’ profitability of single-layer system could be higher and better incentivized too. In addition, Feihe has an in-depth network of over 1,900 offline customers covering 119,000+ retail POS, which cannot be matched by many competitors.
Target 30% market share in 2023. The Company expects to further gain market share from int’l brands in tier 1-2 cities and from small brands in lower-tier cities. It will extend its product offerings to fast-growing A2 milk and goat milk and introduce more super-premium products to capture the premiumization trend.
Initiate at Buy. Our TP HK$24.00 is based on 23.7x FY21E P/E, at 40% premium on Chinese IMF peers’ average of 16.9x P/E in FY21E. We think such valuation is justified because (1) Feihe is the sector leader which is gaining market share; (2) its 32% adj. EPS CAGR from FY19 to FY22E is the highest among peers. Key risks: (1) weaker-than-expected sales; (2) slump of China’s new borns; (3) keen competition and (4) food safety issues.
Earnings Summary
(YE 31 Dec) FY18A FY19A FY20E FY21E FY22E
Revenue (RMB mn) 10,392 13,722 19,186 24,801 30,200
YoY growth (%) 77 32 40 29 22
Net profit (RMB mn) 2,242 3,935 5,883 7,603 9,284
Adj. net profit (RMB mn) 2,244 4,000 5,883 7,603 9,284
Adj. EPS (RMB) na 0.448 0.659 0.851 1.039
YoY growth (%) na na 47 29 22
Consensus EPS (RMB) na na 0.648 0.832 1.021
Adj. P/E (x) na 34.5 23.5 17.2 14.1
P/B (x) na 10.6 7.8 5.8 4.5
Yield (%) na 1.1 1.5 2.0 2.5
Net cash (RMB mn) 4,966 11,718 13,257 18,540 24,875
Source: Company data, Bloomberg, CMBIS estimates
China Feihe (6186 HK)
Well positioned to gain market share
23 Dec 2020
PLEASE READ THE ANALYST CERTIFICATION AND IMPORTANT DISCLOSURES ON LAST PAGE 2
Contents
Focus Charts ............................................................................................ 3
Company Overview .................................................................................. 4
Competitive Advantages ......................................................................... 5
Leading brand with fast-growing super-premium products ................................. 5
Effective marketing initiatives .................................................................................. 6
Flattened and in-depth distribution network .......................................................... 7
Produced by quality fresh milk ................................................................................ 9
The infant milk formula market in China .............................................. 10
Industry consolidation driven by favorable policies ...........................................10
Growth drivers of IMF market in China .................................................................10
Entry barriers of IMF market in China ...................................................................11
Retail sales value by domestic brands and international brands ......................11
Growth driven by premiumization .........................................................................13
Maternity specialty stores and e-commerce channels gaining market share
from traditional and KA channels ..........................................................................13
Lower-tier cities to gain market share ...................................................................14
Growth drivers ....................................................................................... 16
Further gain market share in tier 1-2 cities and Southern China .......................16
Increase market share in lower-tier cities .............................................................17
Expand product portfolio and further premiumization ........................................17
Control upstream fresh milk source ......................................................................18
Financial forecast .................................................................................. 19
Strong 1H20 results .................................................................................................19
32% adj. EPS CAGR from FY19 to FY22E .............................................................19
Peers comparison .................................................................................. 21
Market leader with the highest GPM ......................................................................21
Most in-depth penetration compared to peers .....................................................21
Effective selling expenses to promote sales ........................................................21
Valuation ................................................................................................. 23
Stronger adj. EPS CAGR than peers in FY19-22E ................................................23
Initiate at Buy with TP of HK$24.00 .......................................................................23
Financial Summary ................................................................................ 25
23 Dec 2020
PLEASE READ THE ANALYST CERTIFICATION AND IMPORTANT DISCLOSURES ON LAST PAGE 3
Focus Charts
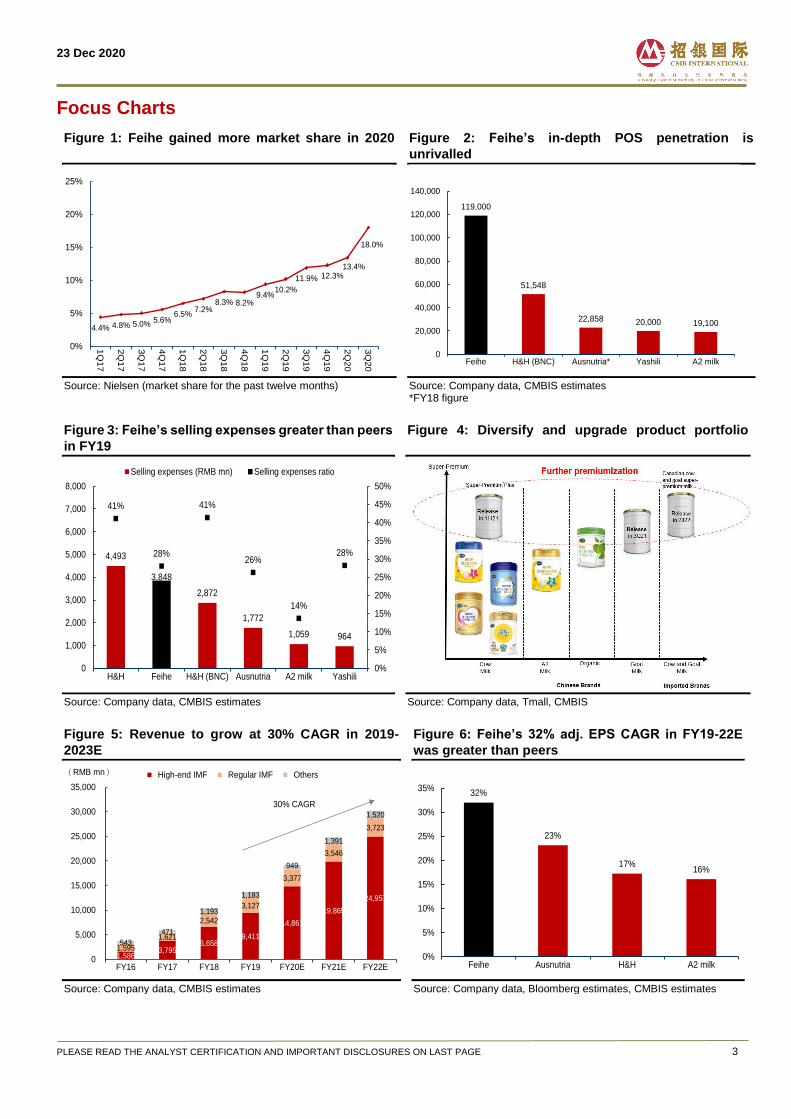
Figure 1: Feihe gained more market share in 2020
Source: Nielsen (market share for the past twelve months)
Figure 2: Feihe’s in-depth POS penetration is
unrivalled
Source: Company data, CMBIS estimates *FY18 figure
Figure 3: Feihe’s selling expenses greater than peers
in FY19
Source: Company data, CMBIS estimates
Figure 4: Diversify and upgrade product portfolio
Source: Company data, Tmall, CMBIS
Figure 5: Revenue to grow at 30% CAGR in 2019-
2023E
Source: Company data, CMBIS estimates
Figure 6: Feihe’s 32% adj. EPS CAGR in FY19-22E
was greater than peers
Source: Company data, Bloomberg estimates, CMBIS estimates
4.4% 4.8% 5.0%5.6%
6.5%7.2%
8.3% 8.2%9.4%
10.2%
11.9% 12.3%13.4%
18.0%
0%
5%
10%
15%
20%
25%
1Q
17
2Q
17
3Q
17
4Q
17
1Q
18
2Q
18
3Q
18
4Q
18
1Q
19
2Q
19
3Q
19
4Q
19
2Q
20
3Q
20
119,000
51,548
22,858 20,000 19,100
0
20,000
40,000
60,000
80,000
100,000
120,000
140,000
Feihe H&H (BNC) Ausnutria* Yashili A2 milk
4,493
3,848
2,872
1,772
1,059 964
41%
28%
41%
26%
14%
28%
0%
5%
10%
15%
20%
25%
30%
35%
40%
45%
50%
0
1,000
2,000
3,000
4,000
5,000
6,000
7,000
8,000
H&H Feihe H&H (BNC) Ausnutria A2 milk Yashili
Selling expenses (RMB mn) Selling expenses ratio
1,586 3,795
6,658 9,411
14,861
19,865
24,957
1,595
1,621
2,542
3,127
3,377
3,546
3,723
543
471
1,193
1,183
949
1,391
1,520
0
5,000
10,000
15,000
20,000
25,000
30,000
35,000
FY16 FY17 FY18 FY19 FY20E FY21E FY22E
High-end IMF Regular IMF Others(RMB mn)
30% CAGR
32%
23%
17%16%
0%
5%
10%
15%
20%
25%
30%
35%
Feihe Ausnutria H&H A2 milk
23 Dec 2020
PLEASE READ THE ANALYST CERTIFICATION AND IMPORTANT DISCLOSURES ON LAST PAGE 4
Company Overview
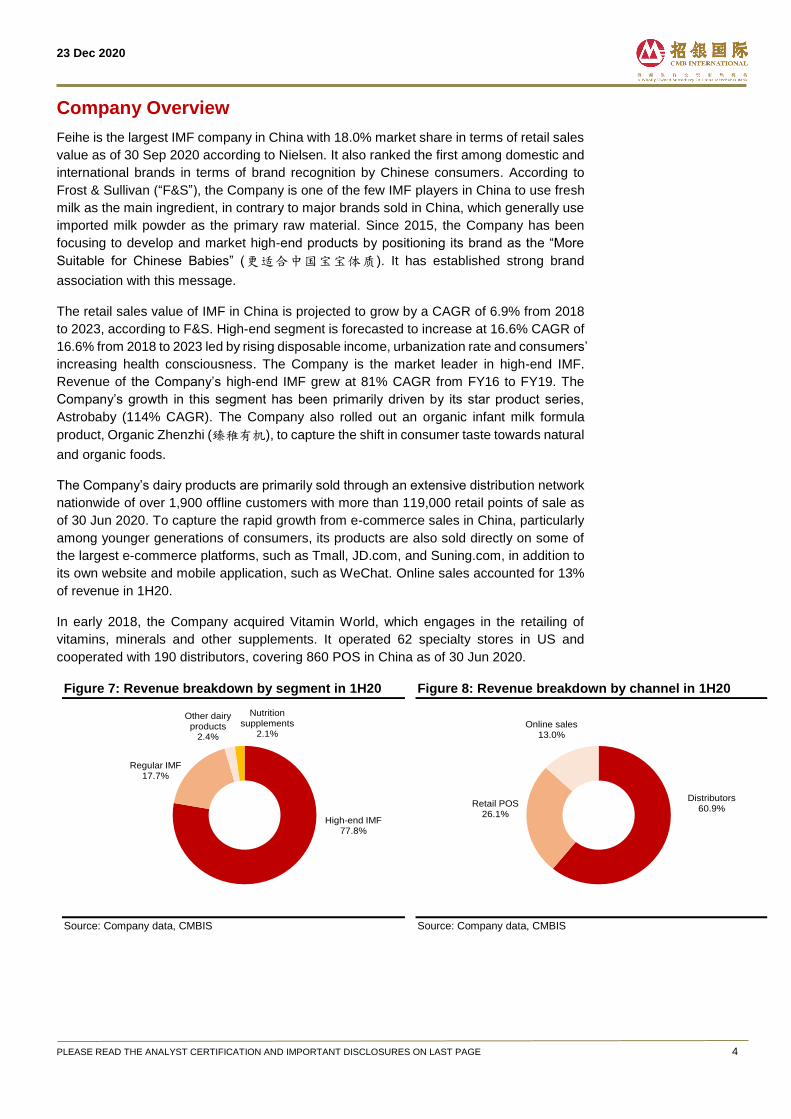
Feihe is the largest IMF company in China with 18.0% market share in terms of retail sales
value as of 30 Sep 2020 according to Nielsen. It also ranked the first among domestic and
international brands in terms of brand recognition by Chinese consumers. According to
Frost & Sullivan (“F&S”), the Company is one of the few IMF players in China to use fresh
milk as the main ingredient, in contrary to major brands sold in China, which generally use
imported milk powder as the primary raw material. Since 2015, the Company has been
focusing to develop and market high-end products by positioning its brand as the “More
Suitable for Chinese Babies” (更适合中国宝宝体质). It has established strong brand
association with this message.
The retail sales value of IMF in China is projected to grow by a CAGR of 6.9% from 2018
to 2023, according to F&S. High-end segment is forecasted to increase at 16.6% CAGR of
16.6% from 2018 to 2023 led by rising disposable income, urbanization rate and consumers’
increasing health consciousness. The Company is the market leader in high-end IMF.
Revenue of the Company’s high-end IMF grew at 81% CAGR from FY16 to FY19. The
Company’s growth in this segment has been primarily driven by its star product series,
Astrobaby (114% CAGR). The Company also rolled out an organic infant milk formula
product, Organic Zhenzhi (臻稚有机), to capture the shift in consumer taste towards natural
and organic foods.
The Company’s dairy products are primarily sold through an extensive distribution network
nationwide of over 1,900 offline customers with more than 119,000 retail points of sale as
of 30 Jun 2020. To capture the rapid growth from e-commerce sales in China, particularly
among younger generations of consumers, its products are also sold directly on some of
the largest e-commerce platforms, such as Tmall, JD.com, and Suning.com, in addition to
its own website and mobile application, such as WeChat. Online sales accounted for 13%
of revenue in 1H20.
In early 2018, the Company acquired Vitamin World, which engages in the retailing of
vitamins, minerals and other supplements. It operated 62 specialty stores in US and
cooperated with 190 distributors, covering 860 POS in China as of 30 Jun 2020.
Figure 7: Revenue breakdown by segment in 1H20
Source: Company data, CMBIS
Figure 8: Revenue breakdown by channel in 1H20
Source: Company data, CMBIS
High-end IMF77.8%
Regular IMF17.7%
Other dairy products
2.4%
Nutrition supplements
2.1%
Distributors60.9%
Retail POS26.1%
Online sales13.0%
23 Dec 2020
PLEASE READ THE ANALYST CERTIFICATION AND IMPORTANT DISCLOSURES ON LAST PAGE 5
Competitive Advantages
Leading brand with fast-growing super-premium products
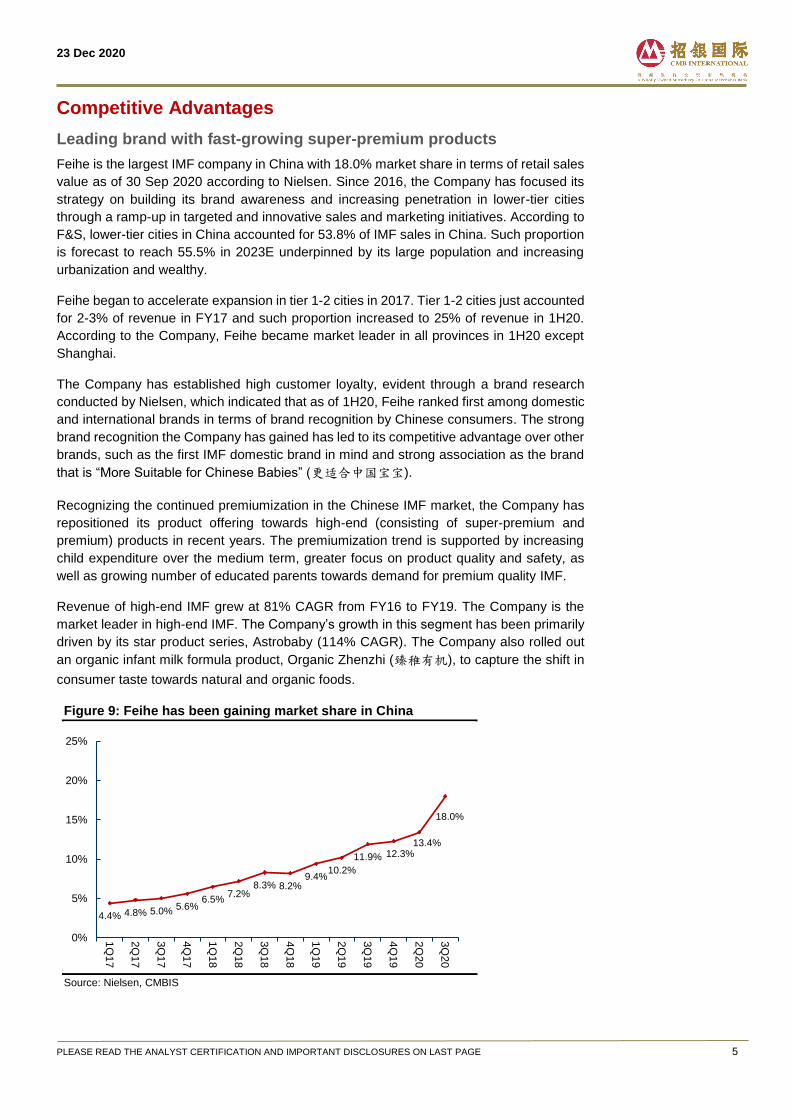
Feihe is the largest IMF company in China with 18.0% market share in terms of retail sales
value as of 30 Sep 2020 according to Nielsen. Since 2016, the Company has focused its
strategy on building its brand awareness and increasing penetration in lower-tier cities
through a ramp-up in targeted and innovative sales and marketing initiatives. According to
F&S, lower-tier cities in China accounted for 53.8% of IMF sales in China. Such proportion
is forecast to reach 55.5% in 2023E underpinned by its large population and increasing
urbanization and wealthy.
Feihe began to accelerate expansion in tier 1-2 cities in 2017. Tier 1-2 cities just accounted
for 2-3% of revenue in FY17 and such proportion increased to 25% of revenue in 1H20.
According to the Company, Feihe became market leader in all provinces in 1H20 except
Shanghai.
The Company has established high customer loyalty, evident through a brand research
conducted by Nielsen, which indicated that as of 1H20, Feihe ranked first among domestic
and international brands in terms of brand recognition by Chinese consumers. The strong
brand recognition the Company has gained has led to its competitive advantage over other
brands, such as the first IMF domestic brand in mind and strong association as the brand
that is “More Suitable for Chinese Babies” (更适合中国宝宝).
Recognizing the continued premiumization in the Chinese IMF market, the Company has
repositioned its product offering towards high-end (consisting of super-premium and
premium) products in recent years. The premiumization trend is supported by increasing
child expenditure over the medium term, greater focus on product quality and safety, as
well as growing number of educated parents towards demand for premium quality IMF.
Revenue of high-end IMF grew at 81% CAGR from FY16 to FY19. The Company is the
market leader in high-end IMF. The Company’s growth in this segment has been primarily
driven by its star product series, Astrobaby (114% CAGR). The Company also rolled out
an organic infant milk formula product, Organic Zhenzhi (臻稚有机), to capture the shift in
consumer taste towards natural and organic foods.
Figure 9: Feihe has been gaining market share in China
Source: Nielsen, CMBIS
4.4% 4.8% 5.0%5.6%
6.5%7.2%
8.3% 8.2%9.4%
10.2%
11.9% 12.3%13.4%
18.0%
0%
5%
10%
15%
20%
25%
1Q
17
2Q
17
3Q
17
4Q
17
1Q
18
2Q
18
3Q
18
4Q
18
1Q
19
2Q
19
3Q
19
4Q
19
2Q
20
3Q
20
23 Dec 2020
PLEASE READ THE ANALYST CERTIFICATION AND IMPORTANT DISCLOSURES ON LAST PAGE 6
Effective marketing initiatives
Through 58 years of dedicated operation in the IMF market in China as well as effective
and innovative, online and offline marketing techniques, Feihe has become one of the most
widely recognized brands among Chinese consumers. Since 2015, the Company has been
focusing to develop and market high-end products by positioning its brand as the “More
Suitable for Chinese Babies” (更适合中国宝宝体质). It has established strong brand
association with this message. Its marketing strategy consists of three key components:
1) Effective and innovative face-to-face seminars
The Company organizes three types of face-to-face seminars including:
Mother’s Love (妈妈的爱 ) seminars introduced in August 2016 to provide free
information to consumers on topics related to pregnancy and childrearing;
Carnival (嘉年华), to introduce its products in regions where the Company has low
brand presence, and involve several areas of interactions including early education
on pregnancy and childrearing, nutritional information, and games;
Shows (秀), in which sales representatives set up booths with a recreational area to
educate parents about its products while their children engage in recreational
activities.
According to the Company, the spending on these offline events contributed 8% of revenue
in FY19. The Company has sales team of >2,000 people which is spread across the country.
Our channel checks find that the Company prepares event proposals for distributors to
choose and bears the events expenses. Distributors work with maternity specialty stores
to invite potential customers to join the events. The Company’s sales staffs attend these
events and educate potential customers on Feihe products. The conversion rate of these
events is around 20-30% now (vs 1-2% in the beginning) thanks to training program. Only
high conversion rate can guarantee return and justify further increase of offline events.
Number of events organized by the second player was just around 50,000 in 2019, much
less than the Company’s 500,000.
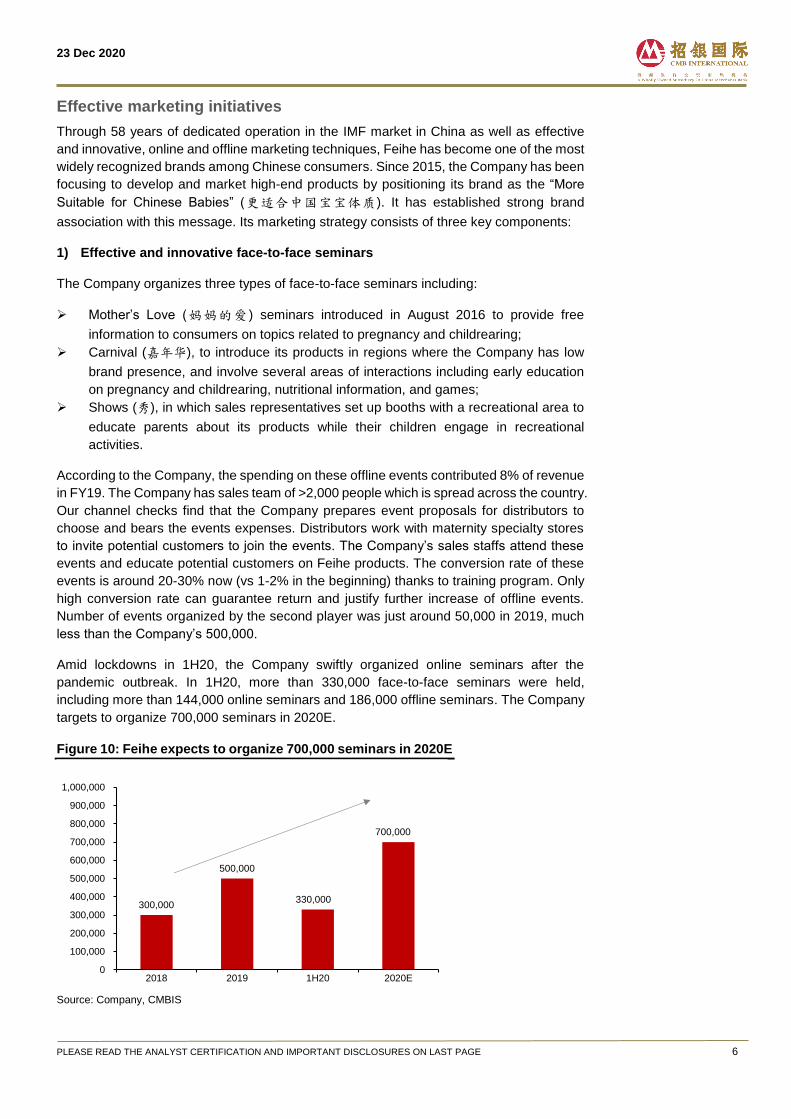
Amid lockdowns in 1H20, the Company swiftly organized online seminars after the
pandemic outbreak. In 1H20, more than 330,000 face-to-face seminars were held,
including more than 144,000 online seminars and 186,000 offline seminars. The Company
targets to organize 700,000 seminars in 2020E.
Figure 10: Feihe expects to organize 700,000 seminars in 2020E
Source: Company, CMBIS
300,000
500,000
330,000
700,000
0
100,000
200,000
300,000
400,000
500,000
600,000
700,000
800,000
900,000
1,000,000
2018 2019 1H20 2020E
23 Dec 2020
PLEASE READ THE ANALYST CERTIFICATION AND IMPORTANT DISCLOSURES ON LAST PAGE 7
2) Maximize online interactivity with consumers
The Company has created user-oriented virtual communities on its WeChat accounts to
serve its members whereby the Company publishes customized articles and information to
them based on their pregnancy stage or child’s age. Moreover, its online membership
system grants member access to consultancy services provided by nutritionists, doctors
and other experts, as well as providing special promotional offers to consumers.
3) Targeted and results-driven exposure on media
The Company engages in traditional media advertising on major television networks to
spread its message to a wider audience of viewers. For example, the Company requires
certain of its advertisers, such as Hunan Province Cable TV’s Happy Camp (快乐大本营)
television program, to actively promote its brand. The Company also places advertisements
in MTR station, bus, etc.
The appointment of international celebrity, Zhang Ziyi (章子怡) as its brand ambassador,
whom herself is a mother, has also enhanced its brand image in the local and international
markets.
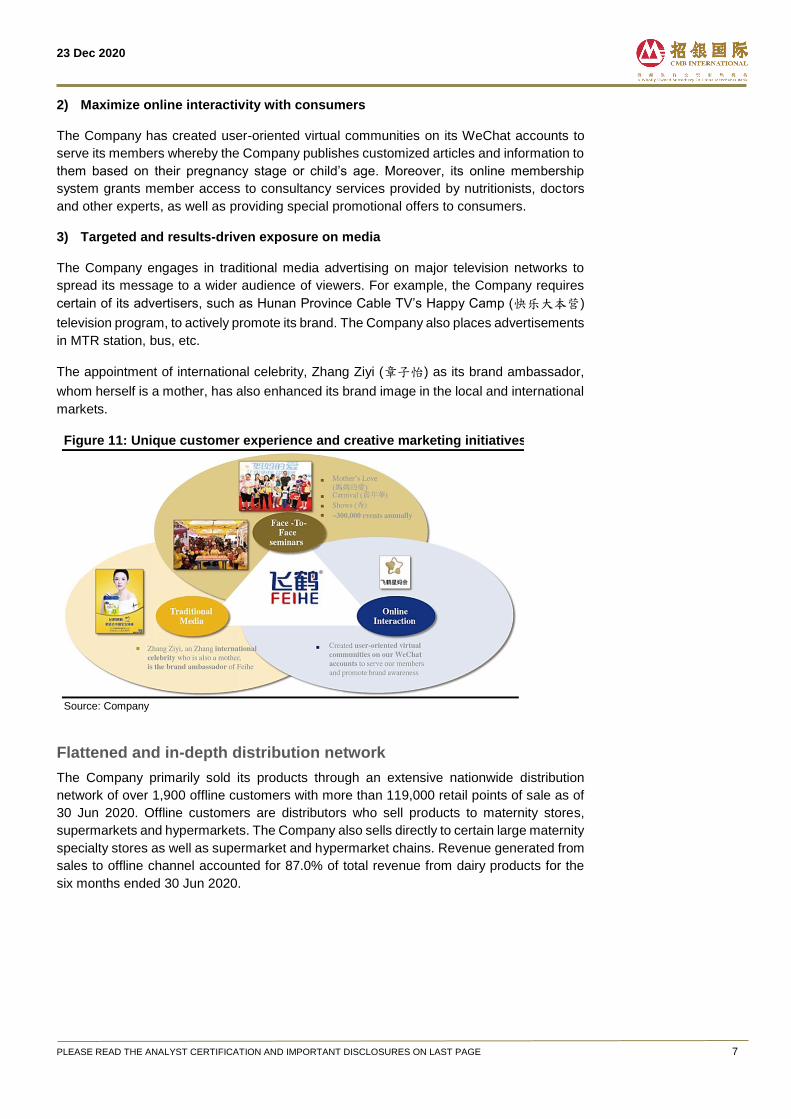
Figure 11: Unique customer experience and creative marketing initiatives
Source: Company
Flattened and in-depth distribution network
The Company primarily sold its products through an extensive nationwide distribution
network of over 1,900 offline customers with more than 119,000 retail points of sale as of
30 Jun 2020. Offline customers are distributors who sell products to maternity stores,
supermarkets and hypermarkets. The Company also sells directly to certain large maternity
specialty stores as well as supermarket and hypermarket chains. Revenue generated from
sales to offline channel accounted for 87.0% of total revenue from dairy products for the
six months ended 30 Jun 2020.
23 Dec 2020
PLEASE READ THE ANALYST CERTIFICATION AND IMPORTANT DISCLOSURES ON LAST PAGE 8
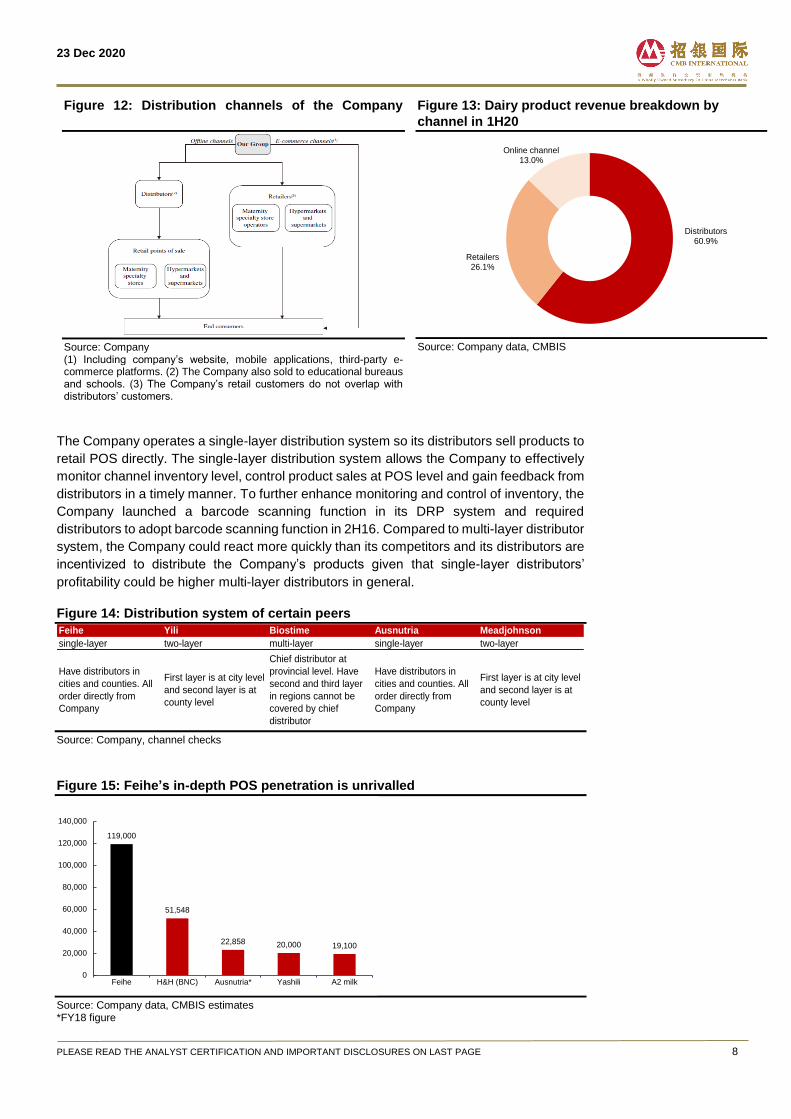
Figure 12: Distribution channels of the Company
Source: Company (1) Including company’s website, mobile applications, third-party e-commerce platforms. (2) The Company also sold to educational bureaus and schools. (3) The Company’s retail customers do not overlap with distributors’ customers.
Figure 13: Dairy product revenue breakdown by
channel in 1H20
Source: Company data, CMBIS
The Company operates a single-layer distribution system so its distributors sell products to
retail POS directly. The single-layer distribution system allows the Company to effectively
monitor channel inventory level, control product sales at POS level and gain feedback from
distributors in a timely manner. To further enhance monitoring and control of inventory, the
Company launched a barcode scanning function in its DRP system and required
distributors to adopt barcode scanning function in 2H16. Compared to multi-layer distributor
system, the Company could react more quickly than its competitors and its distributors are
incentivized to distribute the Company’s products given that single-layer distributors’
profitability could be higher multi-layer distributors in general.
Figure 14: Distribution system of certain peers
Source: Company, channel checks
Figure 15: Feihe’s in-depth POS penetration is unrivalled
Source: Company data, CMBIS estimates *FY18 figure
Distributors60.9%
Retailers26.1%
Online channel13.0%
Feihe Yili Biostime Ausnutria Meadjohnson
single-layer two-layer multi-layer single-layer two-layer
Have distributors in
cities and counties. All
order directly from
Company
First layer is at city level
and second layer is at
county level
Chief distributor at
provincial level. Have
second and third layer
in regions cannot be
covered by chief
distributor
Have distributors in
cities and counties. All
order directly from
Company
First layer is at city level
and second layer is at
county level
119,000
51,548
22,858 20,000 19,100
0
20,000
40,000
60,000
80,000
100,000
120,000
140,000
Feihe H&H (BNC) Ausnutria* Yashili A2 milk
23 Dec 2020
PLEASE READ THE ANALYST CERTIFICATION AND IMPORTANT DISCLOSURES ON LAST PAGE 9
Produced by quality fresh milk
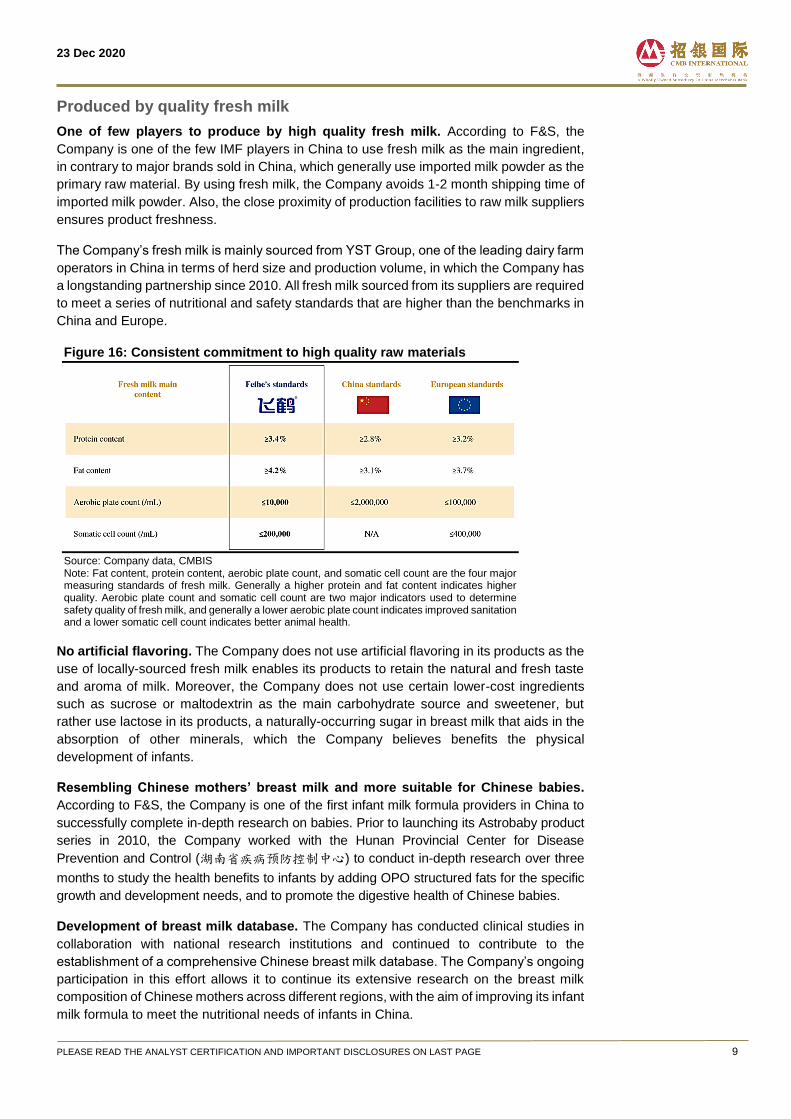
One of few players to produce by high quality fresh milk. According to F&S, the
Company is one of the few IMF players in China to use fresh milk as the main ingredient,
in contrary to major brands sold in China, which generally use imported milk powder as the
primary raw material. By using fresh milk, the Company avoids 1-2 month shipping time of
imported milk powder. Also, the close proximity of production facilities to raw milk suppliers
ensures product freshness.
The Company’s fresh milk is mainly sourced from YST Group, one of the leading dairy farm
operators in China in terms of herd size and production volume, in which the Company has
a longstanding partnership since 2010. All fresh milk sourced from its suppliers are required
to meet a series of nutritional and safety standards that are higher than the benchmarks in
China and Europe.
Figure 16: Consistent commitment to high quality raw materials
Source: Company data, CMBIS Note: Fat content, protein content, aerobic plate count, and somatic cell count are the four major measuring standards of fresh milk. Generally a higher protein and fat content indicates higher quality. Aerobic plate count and somatic cell count are two major indicators used to determine safety quality of fresh milk, and generally a lower aerobic plate count indicates improved sanitation and a lower somatic cell count indicates better animal health.
No artificial flavoring. The Company does not use artificial flavoring in its products as the
use of locally-sourced fresh milk enables its products to retain the natural and fresh taste
and aroma of milk. Moreover, the Company does not use certain lower-cost ingredients
such as sucrose or maltodextrin as the main carbohydrate source and sweetener, but
rather use lactose in its products, a naturally-occurring sugar in breast milk that aids in the
absorption of other minerals, which the Company believes benefits the physical
development of infants.
Resembling Chinese mothers’ breast milk and more suitable for Chinese babies.
According to F&S, the Company is one of the first infant milk formula providers in China to
successfully complete in-depth research on babies. Prior to launching its Astrobaby product
series in 2010, the Company worked with the Hunan Provincial Center for Disease
Prevention and Control (湖南省疾病预防控制中心) to conduct in-depth research over three
months to study the health benefits to infants by adding OPO structured fats for the specific
growth and development needs, and to promote the digestive health of Chinese babies.
Development of breast milk database. The Company has conducted clinical studies in
collaboration with national research institutions and continued to contribute to the
establishment of a comprehensive Chinese breast milk database. The Company’s ongoing
participation in this effort allows it to continue its extensive research on the breast milk
composition of Chinese mothers across different regions, with the aim of improving its infant
milk formula to meet the nutritional needs of infants in China.
23 Dec 2020
PLEASE READ THE ANALYST CERTIFICATION AND IMPORTANT DISCLOSURES ON LAST PAGE 10
The infant milk formula market in China
Industry consolidation driven by favorable policies
The Administrative Measures for the Registration of Product Formulas of Infant Formula
Milk Powder (“婴幼儿配方乳粉产品配方注册管理办法”) was promulgated by the CFDA on
6 Jun 2016 and became effective on 1 Oct 2016. According to the Measures, the product
formulas of the infant formula milk powder produced, sold and imported to China shall be
approved and registered with CFDA. If the same enterprise applies for the registration of
two or more product formulas for the same age group, there shall be a significant difference
between the product formulas and the difference shall be scientifically proved.
The Measures requires IMF companies to provide details of the product formula, safety
standard of raw materials, production technologies, product quality inspection report, proof
of capabilities of R&D, production and quality inspection etc. In addition, each licensed
factory is limited to three approved recipes. Given such limitations, licensed factories would
only keep top three approved recipes in terms of sales and terminate the production of
remaining recipes, we expect the Measures will accelerate the rising of market
concentration ratio. Before the Measures took effect, there were more than 3,000 brands
(domestic and foreign manufacturers). As at 30 Jun 2019, 423 brands and 1,253 recipes
were totally approved, according to Euromonitor and CITIC Agricultural Fund.
Major IMF brands can lift their investment in raw milk sources and R&D to expand their
number of approved recipes and strengthen marketing initiatives and channel penetration
to increase sales, further squeezing the market shares of smaller IMF players.
The NDRC published the Action Plan for the Promotion of Domestic IMF (“国产婴幼儿配方
乳粉提升行动方案”) in May 2019, targeting to improve the quality of domestic IMF brands
and keep self-sufficiency ratio at >60%, enhance market shares of domestic IMF brands
and promote industry consolidation. The Plan will strictly review the attributes of new IMF
manufacturers and encourage enterprises to merge or acquire outdated production
capacities, accelerate the upgrade of production technologies and facilities of enterprises
whose annual production capacities less than 1,000 tonnes or annual sales less than
RMB50mn for three consecutive years.
Growth drivers of IMF market in China
The following are key market drivers and trends of the infant milk formula market in China:
Increase in consumer confidence of domestic IMF brands With the enhancement in the quality management regime of China’s dairy industry and the
increased competitiveness of domestic IMF brands, consumers’ confidence and preference
for domestic IMF brands continued to increase.
Growth of the high-end infant milk formula segment Due to increasing urbanization, rising disposable income and growing health awareness,
the demand for high-end infant milk formula products, particularly super-premium products,
is expected to be the driving force of the overall infant milk formula industry in China.
Increasing urbanization and rising disposable income The increase in the urbanization rate and the per capita annual disposable income of
Chinese residents will enhance the purchasing power of consumers, allowing them to
purchase more infant milk formula products, especially high-end products. Lower-tier cities
as well as rural areas in China are becoming more urbanized and wealthy, and families in
23 Dec 2020
PLEASE READ THE ANALYST CERTIFICATION AND IMPORTANT DISCLOSURES ON LAST PAGE 11
such regions are increasingly able to afford higher-quality infant milk formula. In general,
these regions have larger populations and therefore higher potential for consumption
growth.
Low level of exclusive breastfeeding rate The rate of infants that are fed exclusively with breast milk for the first six months after birth
was 29% in 2019. The increasing resemblance of infant milk formula to breast milk,
availability of infant milk formula and inconvenience of breastfeeding for working mothers
are among the primary factors that have influenced a mother’s choice of whether or not to
breastfeed her baby. With China’s continued economic growth and urbanization process,
breastfeeding rates are expected to remain at low levels, creating more demand for infant
milk formula.
Entry barriers of IMF market in China
The following are main entry barriers of the infant milk formula market in China:
Established brand recognition and reputation for quality and safety The melamine incident in 2008 eroded consumers’ confidence in domestically produced
infant milk formula brands. As brand reputation is a very valuable asset for a company,
many leading domestic brands have devoted significant time, financial resources and
marketing efforts towards promoting the safety of their products. New market players and
competitors without the necessary resources or time investment may face challenges in
establishing brand presence and reputation.
Extensive policies, laws and regulations Following the melamine incident in 2008, the PRC Government strengthened the
supervision of the infant milk formula market by implementing more stringent policies and
regulations on the quality and safety of infant milk formula products and the raw materials
used in such products. These policies and regulations have created major entry barriers
for new market players, including (i) high qualification standards that companies must meet
to produce infant milk formula products and (ii) high safety requirements that necessitate
strong production and quality control management as well as operating experience.
Strong sales network The success of infant milk formula players is largely dependent on the ability to build a
strong sales network and coverage. Market players that have established sales channels
and close relationships with distributors, retailers and emerging e-commerce platforms are
better positioned to capture greater market share while also reducing marketing costs.
Continued investment in research and development Unlike the manufacture of other dairy products, the production of infant milk formula
involves substantial scientific research, often over extended periods of time, and requires
the use of a significant amount of technology and know-how, stringent quality control
procedures, as well as highly specialized personnel and skilled workers. Market players
that have robust research and development capacity and ability to invest in such efforts, or
that are able to collaborate with leading research institutions to develop new products and
technologies are in a better position to capture greater market share.
Retail sales value by domestic brands and international brands
The infant milk formula market in China represents infant milk formula products sold by
domestic and international brands in China, excluding cross-border purchases by Chinese
consumers. According to F&S, the retail sales value of China’s infant milk formula market
23 Dec 2020
PLEASE READ THE ANALYST CERTIFICATION AND IMPORTANT DISCLOSURES ON LAST PAGE 12
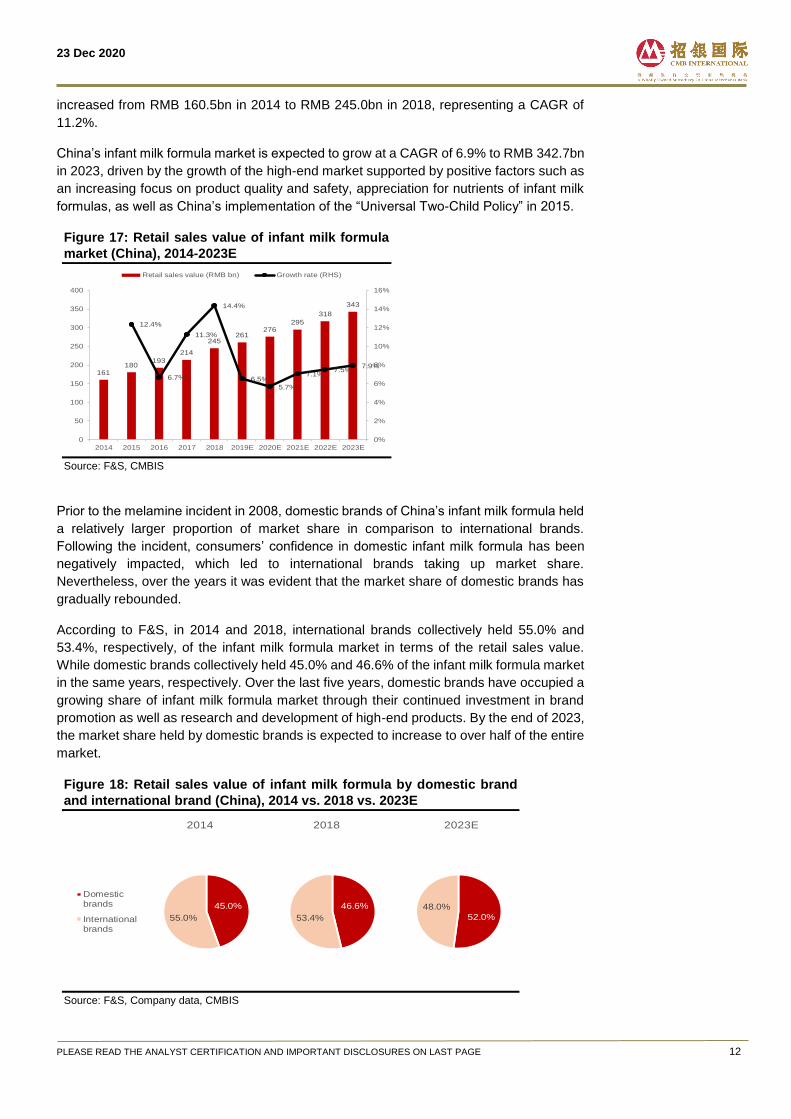
increased from RMB 160.5bn in 2014 to RMB 245.0bn in 2018, representing a CAGR of
11.2%.
China’s infant milk formula market is expected to grow at a CAGR of 6.9% to RMB 342.7bn
in 2023, driven by the growth of the high-end market supported by positive factors such as
an increasing focus on product quality and safety, appreciation for nutrients of infant milk
formulas, as well as China’s implementation of the “Universal Two-Child Policy” in 2015.
Figure 17: Retail sales value of infant milk formula
market (China), 2014-2023E
Source: F&S, CMBIS
Prior to the melamine incident in 2008, domestic brands of China’s infant milk formula held
a relatively larger proportion of market share in comparison to international brands.
Following the incident, consumers’ confidence in domestic infant milk formula has been
negatively impacted, which led to international brands taking up market share.
Nevertheless, over the years it was evident that the market share of domestic brands has
gradually rebounded.
According to F&S, in 2014 and 2018, international brands collectively held 55.0% and
53.4%, respectively, of the infant milk formula market in terms of the retail sales value.
While domestic brands collectively held 45.0% and 46.6% of the infant milk formula market
in the same years, respectively. Over the last five years, domestic brands have occupied a
growing share of infant milk formula market through their continued investment in brand
promotion as well as research and development of high-end products. By the end of 2023,
the market share held by domestic brands is expected to increase to over half of the entire
market.
Figure 18: Retail sales value of infant milk formula by domestic brand
and international brand (China), 2014 vs. 2018 vs. 2023E
Source: F&S, Company data, CMBIS
161180
193
214
245261
276295
318
343
12.4%
6.7%
11.3%
14.4%
6.5%
5.7%
7.1%7.5%
7.9%
0%
2%
4%
6%
8%
10%
12%
14%
16%
0
50
100
150
200
250
300
350
400
2014 2015 2016 2017 2018 2019E 2020E 2021E 2022E 2023E
Retail sales value (RMB bn) Growth rate (RHS)
52.0%
48.0%
2023E
Domesticbrands
Internationalbrands
46.6%
53.4%
2018
Domesticbrands
Internationalbrands
45.0%
55.0%
2014
Domesticbrands
Internationalbrands
23 Dec 2020
PLEASE READ THE ANALYST CERTIFICATION AND IMPORTANT DISCLOSURES ON LAST PAGE 13
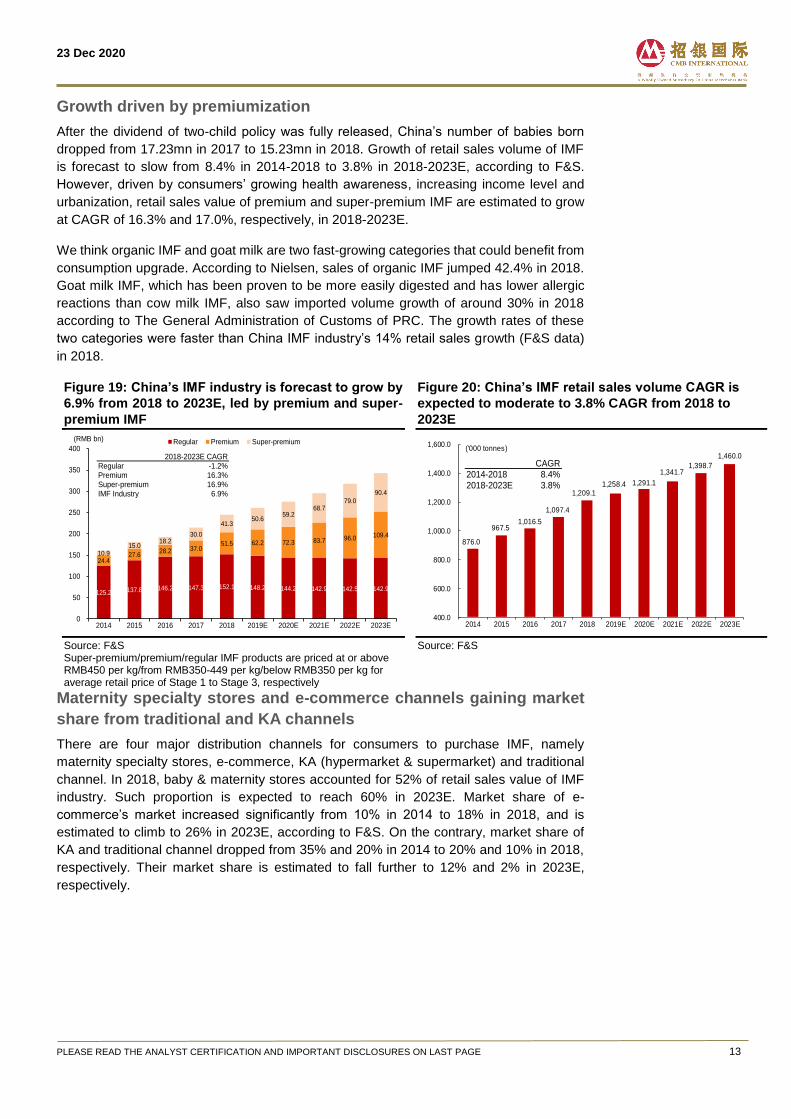
Growth driven by premiumization
After the dividend of two-child policy was fully released, China’s number of babies born
dropped from 17.23mn in 2017 to 15.23mn in 2018. Growth of retail sales volume of IMF
is forecast to slow from 8.4% in 2014-2018 to 3.8% in 2018-2023E, according to F&S.
However, driven by consumers’ growing health awareness, increasing income level and
urbanization, retail sales value of premium and super-premium IMF are estimated to grow
at CAGR of 16.3% and 17.0%, respectively, in 2018-2023E.
We think organic IMF and goat milk are two fast-growing categories that could benefit from
consumption upgrade. According to Nielsen, sales of organic IMF jumped 42.4% in 2018.
Goat milk IMF, which has been proven to be more easily digested and has lower allergic
reactions than cow milk IMF, also saw imported volume growth of around 30% in 2018
according to The General Administration of Customs of PRC. The growth rates of these
two categories were faster than China IMF industry’s 14% retail sales growth (F&S data)
in 2018.
Figure 19: China’s IMF industry is forecast to grow by
6.9% from 2018 to 2023E, led by premium and super-
premium IMF
Source: F&S Super-premium/premium/regular IMF products are priced at or above RMB450 per kg/from RMB350-449 per kg/below RMB350 per kg for average retail price of Stage 1 to Stage 3, respectively
Figure 20: China’s IMF retail sales volume CAGR is
expected to moderate to 3.8% CAGR from 2018 to
2023E
Source: F&S
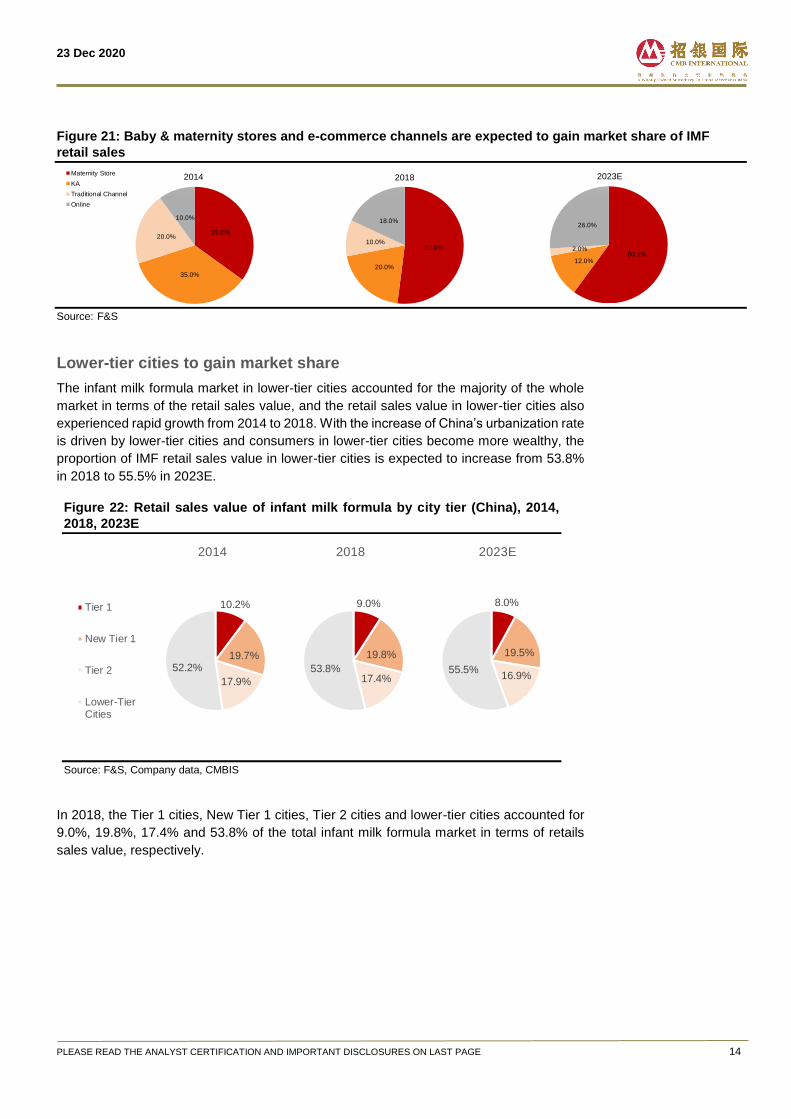
Maternity specialty stores and e-commerce channels gaining market
share from traditional and KA channels
There are four major distribution channels for consumers to purchase IMF, namely
maternity specialty stores, e-commerce, KA (hypermarket & supermarket) and traditional
channel. In 2018, baby & maternity stores accounted for 52% of retail sales value of IMF
industry. Such proportion is expected to reach 60% in 2023E. Market share of e-
commerce’s market increased significantly from 10% in 2014 to 18% in 2018, and is
estimated to climb to 26% in 2023E, according to F&S. On the contrary, market share of
KA and traditional channel dropped from 35% and 20% in 2014 to 20% and 10% in 2018,
respectively. Their market share is estimated to fall further to 12% and 2% in 2023E,
respectively.
125.2 137.8 146.2 147.3 152.1 148.2 144.2 142.9 142.5 142.9
24.427.6
28.2 37.051.5 62.2 72.3 83.7 96.0 109.4
10.915.0
18.230.0
41.350.6
59.268.7
79.0
90.4
0
50
100
150
200
250
300
350
400
2014 2015 2016 2017 2018 2019E 2020E 2021E 2022E 2023E
(RMB bn) Regular Premium Super-premium
2018-2023E CAGRRegular -1.2%Premium 16.3%Super-premium 16.9%IMF Industry 6.9%
876.0
967.5 1,016.5
1,097.4
1,209.1 1,258.4 1,291.1
1,341.7 1,398.7
1,460.0
400.0
600.0
800.0
1,000.0
1,200.0
1,400.0
1,600.0
2014 2015 2016 2017 2018 2019E 2020E 2021E 2022E 2023E
('000 tonnes)
CAGR2014-2018 8.4%2018-2023E 3.8%
23 Dec 2020
PLEASE READ THE ANALYST CERTIFICATION AND IMPORTANT DISCLOSURES ON LAST PAGE 14
Figure 21: Baby & maternity stores and e-commerce channels are expected to gain market share of IMF
retail sales
Source: F&S
Lower-tier cities to gain market share
The infant milk formula market in lower-tier cities accounted for the majority of the whole
market in terms of the retail sales value, and the retail sales value in lower-tier cities also
experienced rapid growth from 2014 to 2018. With the increase of China’s urbanization rate
is driven by lower-tier cities and consumers in lower-tier cities become more wealthy, the
proportion of IMF retail sales value in lower-tier cities is expected to increase from 53.8%
in 2018 to 55.5% in 2023E.
Figure 22: Retail sales value of infant milk formula by city tier (China), 2014,
2018, 2023E
Source: F&S, Company data, CMBIS
In 2018, the Tier 1 cities, New Tier 1 cities, Tier 2 cities and lower-tier cities accounted for
9.0%, 19.8%, 17.4% and 53.8% of the total infant milk formula market in terms of retails
sales value, respectively.
35.0%
35.0%
20.0%
10.0%
2014Maternity Store
KA
Traditional Channel
Online
52.0%
20.0%
10.0%
18.0%
2018
60.0%12.0%
2.0%
26.0%
2023E
8.0%
19.5%
16.9%55.5%
2023E
Tier 1
New Tier 1
Tier 2
Lower-TierCities
9.0%
19.8%
17.4%53.8%
2018
Tier 1
New Tier 1
Tier 2
Lower-TierCities
10.2%
19.7%
17.9%
52.2%
2014
Tier 1
New Tier 1
Tier 2
Lower-TierCities
23 Dec 2020
PLEASE READ THE ANALYST CERTIFICATION AND IMPORTANT DISCLOSURES ON LAST PAGE 15
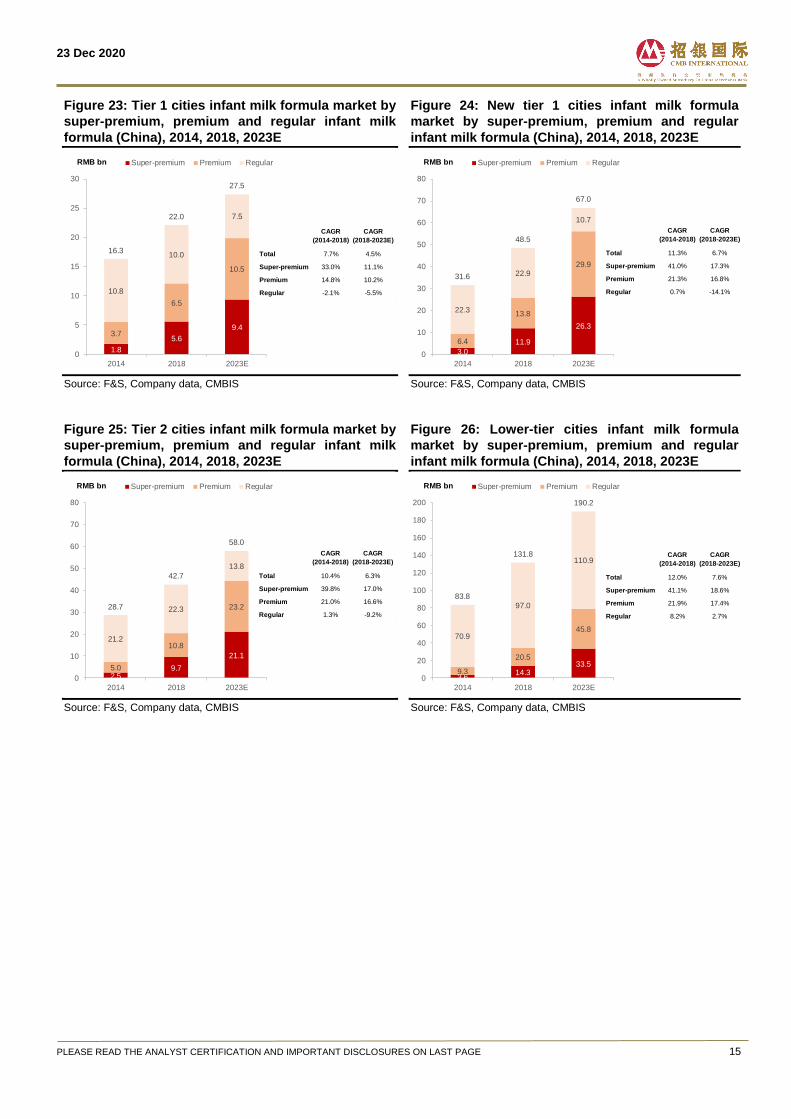
Figure 23: Tier 1 cities infant milk formula market by
super-premium, premium and regular infant milk
formula (China), 2014, 2018, 2023E
Source: F&S, Company data, CMBIS
Figure 24: New tier 1 cities infant milk formula
market by super-premium, premium and regular
infant milk formula (China), 2014, 2018, 2023E
Source: F&S, Company data, CMBIS
Figure 25: Tier 2 cities infant milk formula market by
super-premium, premium and regular infant milk
formula (China), 2014, 2018, 2023E
Source: F&S, Company data, CMBIS
Figure 26: Lower-tier cities infant milk formula
market by super-premium, premium and regular
infant milk formula (China), 2014, 2018, 2023E
Source: F&S, Company data, CMBIS
1.8
5.6
9.43.7
6.5
10.5
10.8
10.0
7.5
16.3
22.0
27.5
0
5
10
15
20
25
30
2014 2018 2023E
Super-premium Premium RegularRMB bn
CAGR
(2014-2018)
CAGR
(2018-2023E)
Total 7.7% 4.5%
Super-premium 33.0% 11.1%
Premium 14.8% 10.2%
Regular -2.1% -5.5%
3.0
11.9
26.3
6.4
13.8
29.9
22.3
22.9
10.7
31.6
48.5
67.0
0
10
20
30
40
50
60
70
80
2014 2018 2023E
Super-premium Premium RegularRMB bn
CAGR
(2014-2018)
CAGR
(2018-2023E)
Total 11.3% 6.7%
Super-premium 41.0% 17.3%
Premium 21.3% 16.8%
Regular 0.7% -14.1%
2.59.7
21.1
5.0
10.8
23.2
21.2
22.3
13.8
28.7
42.7
58.0
0
10
20
30
40
50
60
70
80
2014 2018 2023E
Super-premium Premium RegularRMB bn
CAGR
(2014-2018)
CAGR
(2018-2023E)
Total 10.4% 6.3%
Super-premium 39.8% 17.0%
Premium 21.0% 16.6%
Regular 1.3% -9.2%
3.614.3
33.59.3
20.5
45.870.9
97.0
110.9
83.8
131.8
190.2
0
20
40
60
80
100
120
140
160
180
200
2014 2018 2023E
Super-premium Premium RegularRMB bn
CAGR
(2014-2018)
CAGR
(2018-2023E)
Total 12.0% 7.6%
Super-premium 41.1% 18.6%
Premium 21.9% 17.4%
Regular 8.2% 2.7%
23 Dec 2020
PLEASE READ THE ANALYST CERTIFICATION AND IMPORTANT DISCLOSURES ON LAST PAGE 16
Growth drivers
The Company has set an ambitious target of reaching 30% market share in 2023E. By tier
of cities, the Company expects to reach 20-30% market share in tier 1-2 cities and 40-45%
market share in lower-tier cities. We expect the Company to gain market share in tier 1-2
cities and lower-tier cities from international brands and small domestic brands,
respectively. Apart from IMF, the Company will give more details about its new product
category development plan in 2021.
Further gain market share in tier 1-2 cities and Southern China
Good track record in becoming market leader in upper-tier cities International brands generally have higher market share in tier 1-2 cities. However, the
Company had good track record in breaking into upper-tier cities. For example, the
Company recorded 80% CAGR of revenue in Beijing from 2016 to 2018 and now becomes
the No. 1 brand. The Company firstly entered into the outer region market of Beijing and
established close partnerships with key local retailers like Wumart, Lijia Baby and Leyou.
It cooperated with them on promotions and precise marketing initiatives to enhance brand
awareness, dedicated resources into recruiting qualified sales managers in the regions and
increasing sales representatives coverage at POS and provided them with continuous
training about IMF knowledge. Such efforts differentiate Feihe brand image and services
from international brands.
International brands are losing market share According to our channel checks, although international brands generally have high brand
recognition, we think they have the following shortcomings that let Feihe and other
domestic brands to gain market share:
Fewer advertising and promotion activities;
Lower profitability for distributors;
Small maternity specialty stores are not willing to sell international brands because
their retail prices at online channels are low and volatile.
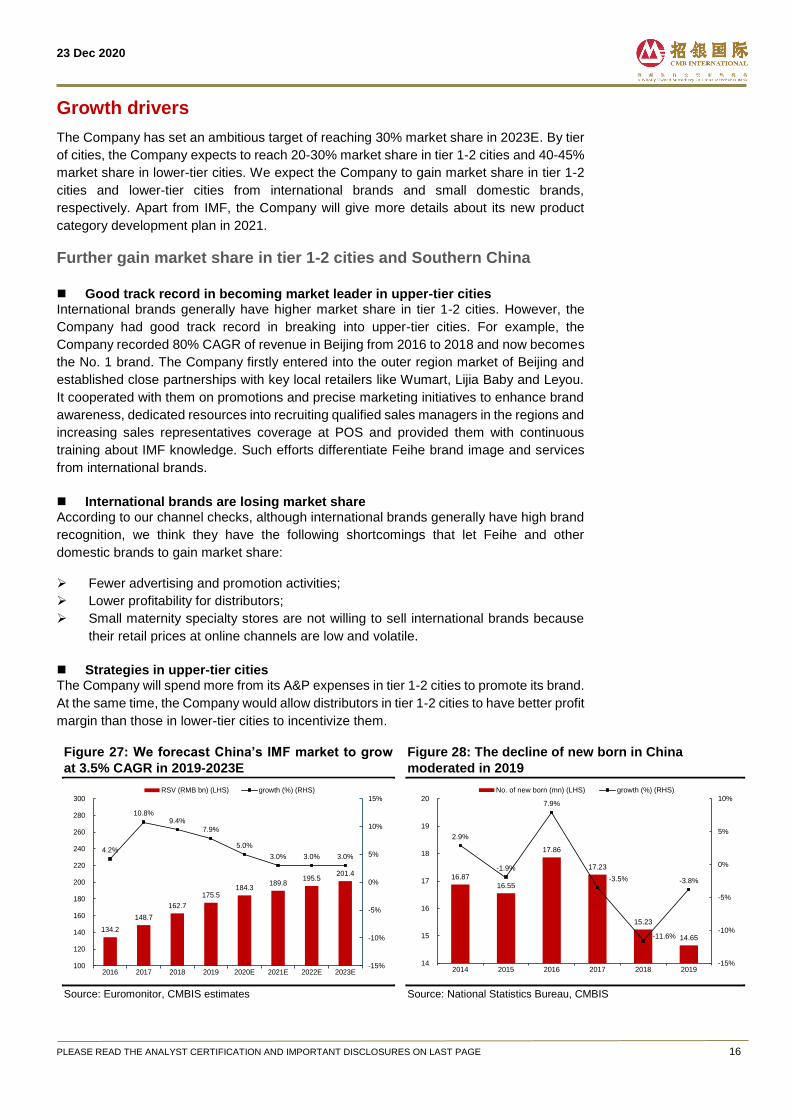
Strategies in upper-tier cities The Company will spend more from its A&P expenses in tier 1-2 cities to promote its brand.
At the same time, the Company would allow distributors in tier 1-2 cities to have better profit
margin than those in lower-tier cities to incentivize them.
Figure 27: We forecast China’s IMF market to grow
at 3.5% CAGR in 2019-2023E
Source: Euromonitor, CMBIS estimates
Figure 28: The decline of new born in China
moderated in 2019
Source: National Statistics Bureau, CMBIS
134.2
148.7
162.7
175.5 184.3
189.8 195.5
201.4
4.2%
10.8%9.4%
7.9%
5.0%
3.0% 3.0% 3.0%
-15%
-10%
-5%
0%
5%
10%
15%
100
120
140
160
180
200
220
240
260
280
300
2016 2017 2018 2019 2020E 2021E 2022E 2023E
RSV (RMB bn) (LHS) growth (%) (RHS)
16.87
16.55
17.86
17.23
15.23
14.65
2.9%
-1.9%
7.9%
-3.5%
-11.6%
-3.8%
-15%
-10%
-5%
0%
5%
10%
14
15
16
17
18
19
20
2014 2015 2016 2017 2018 2019
No. of new born (mn) (LHS) growth (%) (RHS)
23 Dec 2020
PLEASE READ THE ANALYST CERTIFICATION AND IMPORTANT DISCLOSURES ON LAST PAGE 17
Increase market share in lower-tier cities
According to Nielsen, top ten players already took 72.3% market share in 1H20. There is
still room for leading players to take market share from small players. According to the
Company, Feihe had 50-60% market share in stronghold market like Heilongjing. We
believe the competitors in lower-tier cities are mainly domestic brands and small players.
Given the Company’s strong brand recognition, in-depth distribution system and
economies of scale, we think the Company could further take market share from small
players.
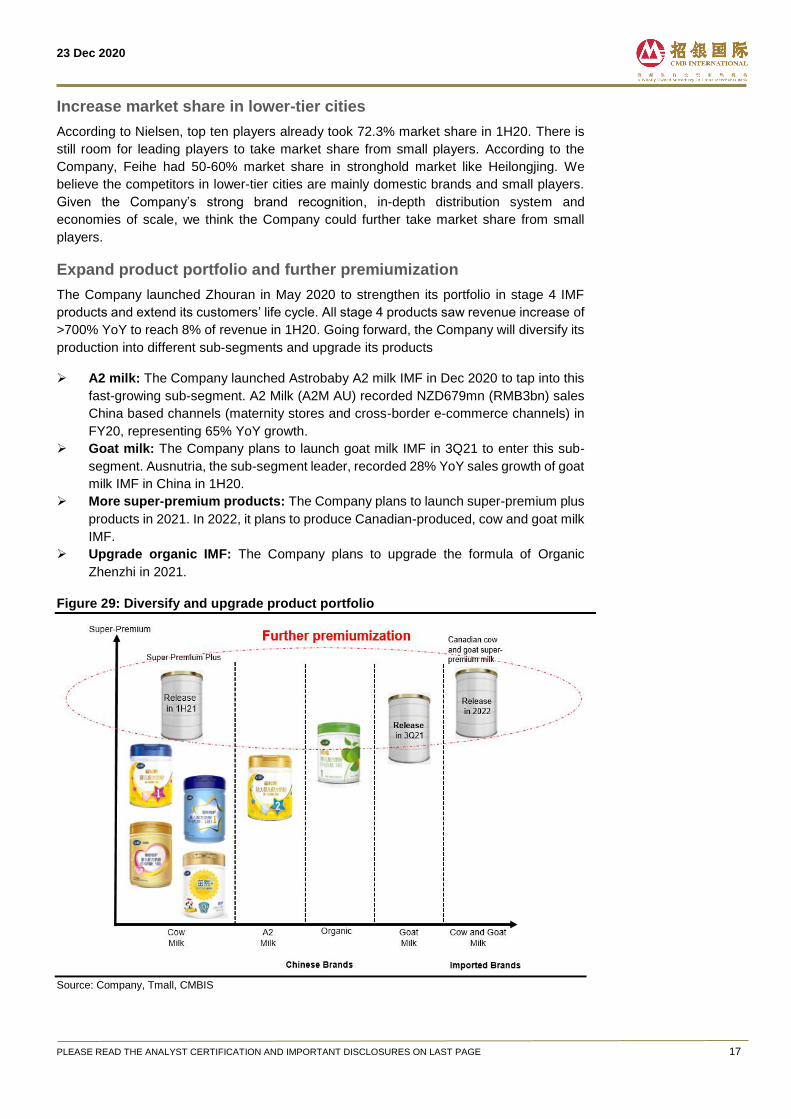
Expand product portfolio and further premiumization
The Company launched Zhouran in May 2020 to strengthen its portfolio in stage 4 IMF
products and extend its customers’ life cycle. All stage 4 products saw revenue increase of
>700% YoY to reach 8% of revenue in 1H20. Going forward, the Company will diversify its
production into different sub-segments and upgrade its products
A2 milk: The Company launched Astrobaby A2 milk IMF in Dec 2020 to tap into this
fast-growing sub-segment. A2 Milk (A2M AU) recorded NZD679mn (RMB3bn) sales
China based channels (maternity stores and cross-border e-commerce channels) in
FY20, representing 65% YoY growth.
Goat milk: The Company plans to launch goat milk IMF in 3Q21 to enter this sub-
segment. Ausnutria, the sub-segment leader, recorded 28% YoY sales growth of goat
milk IMF in China in 1H20.
More super-premium products: The Company plans to launch super-premium plus
products in 2021. In 2022, it plans to produce Canadian-produced, cow and goat milk
IMF.
Upgrade organic IMF: The Company plans to upgrade the formula of Organic
Zhenzhi in 2021.
Figure 29: Diversify and upgrade product portfolio
Source: Company, Tmall, CMBIS
23 Dec 2020
PLEASE READ THE ANALYST CERTIFICATION AND IMPORTANT DISCLOSURES ON LAST PAGE 18
Control upstream fresh milk source
The Company acquired 71.26% equity interest of YST (1431HK), the major fresh milk
provider of the Company, by conditional offer in Dec 2020. Apart from earnings accretion
to the Company, we think there are further synergies between the two companies:
Adjust milk source to support its sales growth. The Company can adjust raw milk
production of YST to support Feihe’s growth in A2 milk and organic IMF products.
Close proximity of dairy farms. The close proximity of its production facilities to its
dairy milk suppliers ensures the freshness is optimally preserved. YST can set up its
farms close to Feihe’s production facilities.
Secure quality fresh milk supply. According to the Company, around 90% of its
fresh milk supply comes from YST. On the other hand, YST supplies about 70-80%
of its fresh milk to Feihe with the remaining to Mengniu and Bright Dairy. Given that
China’s fresh milk supply is quite tight, we observe dairy product companies have
been investing in upstream players to secure raw milk supply. Feihe’s acquisition of
YST secures stable supply of fresh milk.
Reduce exposure to raw milk price fluctuation. We expect raw milk price could
further increase in 2021 and 2022, the consolidation of YST could greatly minimize
the impact on GPM by raw milk price fluctuation.
23 Dec 2020
PLEASE READ THE ANALYST CERTIFICATION AND IMPORTANT DISCLOSURES ON LAST PAGE 19
Financial forecast
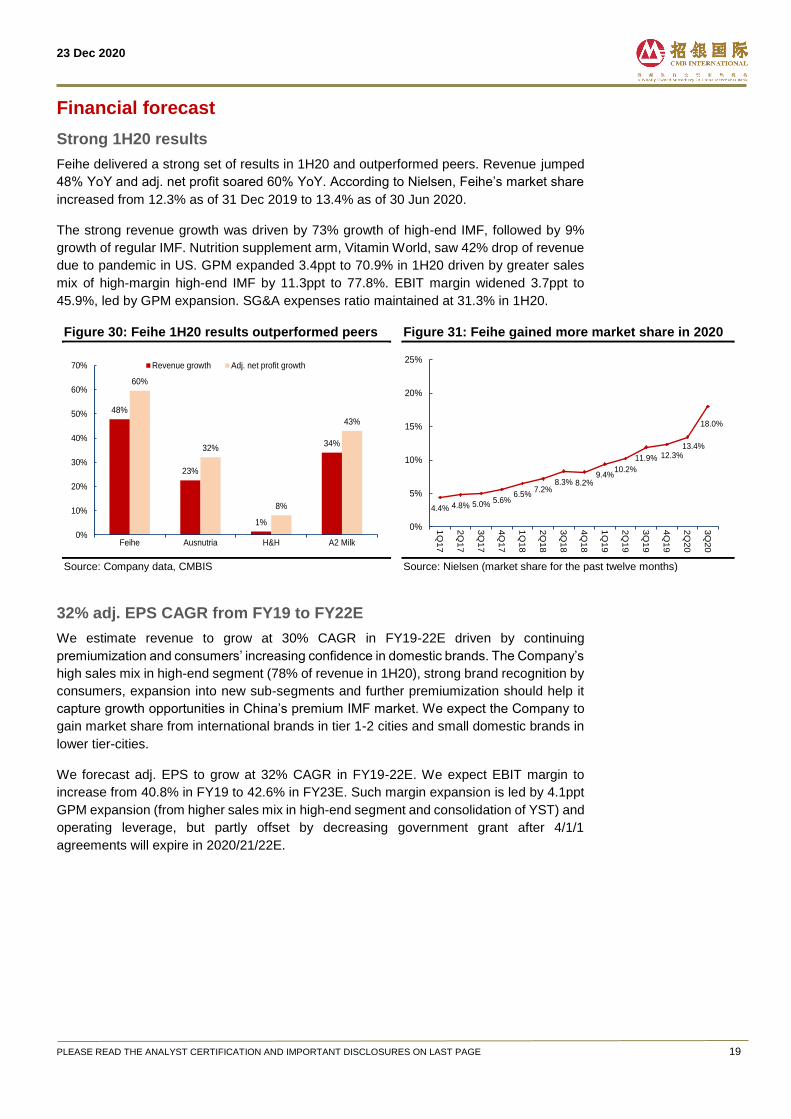
Strong 1H20 results
Feihe delivered a strong set of results in 1H20 and outperformed peers. Revenue jumped
48% YoY and adj. net profit soared 60% YoY. According to Nielsen, Feihe’s market share
increased from 12.3% as of 31 Dec 2019 to 13.4% as of 30 Jun 2020.
The strong revenue growth was driven by 73% growth of high-end IMF, followed by 9%
growth of regular IMF. Nutrition supplement arm, Vitamin World, saw 42% drop of revenue
due to pandemic in US. GPM expanded 3.4ppt to 70.9% in 1H20 driven by greater sales
mix of high-margin high-end IMF by 11.3ppt to 77.8%. EBIT margin widened 3.7ppt to
45.9%, led by GPM expansion. SG&A expenses ratio maintained at 31.3% in 1H20.
Figure 30: Feihe 1H20 results outperformed peers
Source: Company data, CMBIS
Figure 31: Feihe gained more market share in 2020
Source: Nielsen (market share for the past twelve months)
32% adj. EPS CAGR from FY19 to FY22E
We estimate revenue to grow at 30% CAGR in FY19-22E driven by continuing
premiumization and consumers’ increasing confidence in domestic brands. The Company’s
high sales mix in high-end segment (78% of revenue in 1H20), strong brand recognition by
consumers, expansion into new sub-segments and further premiumization should help it
capture growth opportunities in China’s premium IMF market. We expect the Company to
gain market share from international brands in tier 1-2 cities and small domestic brands in
lower tier-cities.
We forecast adj. EPS to grow at 32% CAGR in FY19-22E. We expect EBIT margin to
increase from 40.8% in FY19 to 42.6% in FY23E. Such margin expansion is led by 4.1ppt
GPM expansion (from higher sales mix in high-end segment and consolidation of YST) and
operating leverage, but partly offset by decreasing government grant after 4/1/1
agreements will expire in 2020/21/22E.
48%
23%
1%
34%
60%
32%
8%
43%
0%
10%
20%
30%
40%
50%
60%
70%
Feihe Ausnutria H&H A2 Milk
Revenue growth Adj. net profit growth
4.4% 4.8% 5.0%5.6%
6.5%7.2%
8.3% 8.2%9.4%
10.2%
11.9% 12.3%13.4%
18.0%
0%
5%
10%
15%
20%
25%1
Q1
7
2Q
17
3Q
17
4Q
17
1Q
18
2Q
18
3Q
18
4Q
18
1Q
19
2Q
19
3Q
19
4Q
19
2Q
20
3Q
20
23 Dec 2020
PLEASE READ THE ANALYST CERTIFICATION AND IMPORTANT DISCLOSURES ON LAST PAGE 20
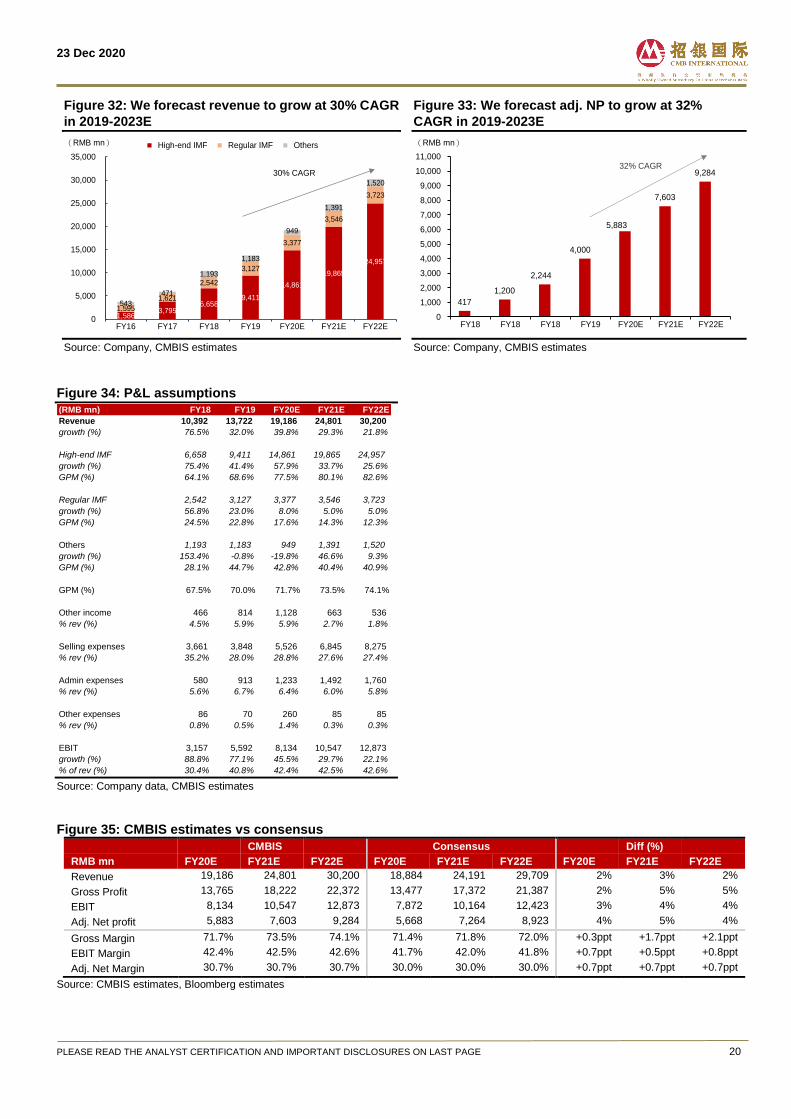
Figure 32: We forecast revenue to grow at 30% CAGR
in 2019-2023E
Source: Company, CMBIS estimates
Figure 33: We forecast adj. NP to grow at 32%
CAGR in 2019-2023E
Source: Company, CMBIS estimates
Figure 34: P&L assumptions
Source: Company data, CMBIS estimates
Figure 35: CMBIS estimates vs consensus
CMBIS Consensus Diff (%)
RMB mn FY20E FY21E FY22E FY20E FY21E FY22E FY20E FY21E FY22E
Revenue 19,186 24,801 30,200 18,884 24,191 29,709 2% 3% 2%
Gross Profit 13,765 18,222 22,372 13,477 17,372 21,387 2% 5% 5%
EBIT 8,134 10,547 12,873 7,872 10,164 12,423 3% 4% 4%
Adj. Net profit 5,883 7,603 9,284 5,668 7,264 8,923 4% 5% 4%
Gross Margin 71.7% 73.5% 74.1% 71.4% 71.8% 72.0% +0.3ppt +1.7ppt +2.1ppt
EBIT Margin 42.4% 42.5% 42.6% 41.7% 42.0% 41.8% +0.7ppt +0.5ppt +0.8ppt
Adj. Net Margin 30.7% 30.7% 30.7% 30.0% 30.0% 30.0% +0.7ppt +0.7ppt +0.7ppt
Source: CMBIS estimates, Bloomberg estimates
1,586 3,795
6,658 9,411
14,861
19,865
24,957
1,595
1,621
2,542
3,127
3,377
3,546
3,723
543
471
1,193
1,183
949
1,391
1,520
0
5,000
10,000
15,000
20,000
25,000
30,000
35,000
FY16 FY17 FY18 FY19 FY20E FY21E FY22E
High-end IMF Regular IMF Others(RMB mn)
30% CAGR
417
1,200
2,244
4,000
5,883
7,603
9,284
0
1,000
2,000
3,000
4,000
5,000
6,000
7,000
8,000
9,000
10,000
11,000
FY18 FY18 FY18 FY19 FY20E FY21E FY22E
(RMB mn)
32% CAGR
(RMB mn) FY18 FY19 FY20E FY21E FY22E
Revenue 10,392 13,722 19,186 24,801 30,200
growth (%) 76.5% 32.0% 39.8% 29.3% 21.8%
High-end IMF 6,658 9,411 14,861 19,865 24,957
growth (%) 75.4% 41.4% 57.9% 33.7% 25.6%
GPM (%) 64.1% 68.6% 77.5% 80.1% 82.6%
Regular IMF 2,542 3,127 3,377 3,546 3,723
growth (%) 56.8% 23.0% 8.0% 5.0% 5.0%
GPM (%) 24.5% 22.8% 17.6% 14.3% 12.3%
Others 1,193 1,183 949 1,391 1,520
growth (%) 153.4% -0.8% -19.8% 46.6% 9.3%
GPM (%) 28.1% 44.7% 42.8% 40.4% 40.9%
GPM (%) 67.5% 70.0% 71.7% 73.5% 74.1%
Other income 466 814 1,128 663 536
% rev (%) 4.5% 5.9% 5.9% 2.7% 1.8%
Selling expenses 3,661 3,848 5,526 6,845 8,275
% rev (%) 35.2% 28.0% 28.8% 27.6% 27.4%
Admin expenses 580 913 1,233 1,492 1,760
% rev (%) 5.6% 6.7% 6.4% 6.0% 5.8%
Other expenses 86 70 260 85 85
% rev (%) 0.8% 0.5% 1.4% 0.3% 0.3%
EBIT 3,157 5,592 8,134 10,547 12,873
growth (%) 88.8% 77.1% 45.5% 29.7% 22.1%
% of rev (%) 30.4% 40.8% 42.4% 42.5% 42.6%
23 Dec 2020
PLEASE READ THE ANALYST CERTIFICATION AND IMPORTANT DISCLOSURES ON LAST PAGE 21
Peers comparison
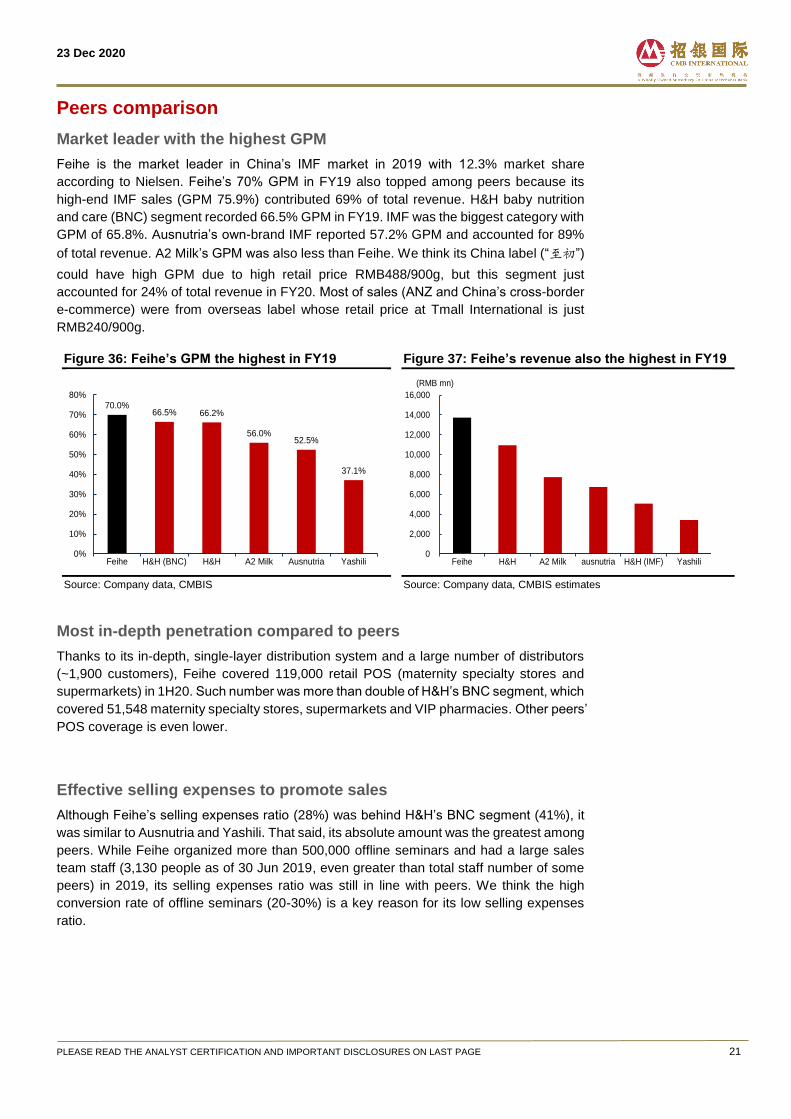
Market leader with the highest GPM
Feihe is the market leader in China’s IMF market in 2019 with 12.3% market share
according to Nielsen. Feihe’s 70% GPM in FY19 also topped among peers because its
high-end IMF sales (GPM 75.9%) contributed 69% of total revenue. H&H baby nutrition
and care (BNC) segment recorded 66.5% GPM in FY19. IMF was the biggest category with
GPM of 65.8%. Ausnutria’s own-brand IMF reported 57.2% GPM and accounted for 89%
of total revenue. A2 Milk’s GPM was also less than Feihe. We think its China label (“至初”)
could have high GPM due to high retail price RMB488/900g, but this segment just
accounted for 24% of total revenue in FY20. Most of sales (ANZ and China’s cross-border
e-commerce) were from overseas label whose retail price at Tmall International is just
RMB240/900g.
Figure 36: Feihe’s GPM the highest in FY19
Source: Company data, CMBIS
Figure 37: Feihe’s revenue also the highest in FY19
Source: Company data, CMBIS estimates
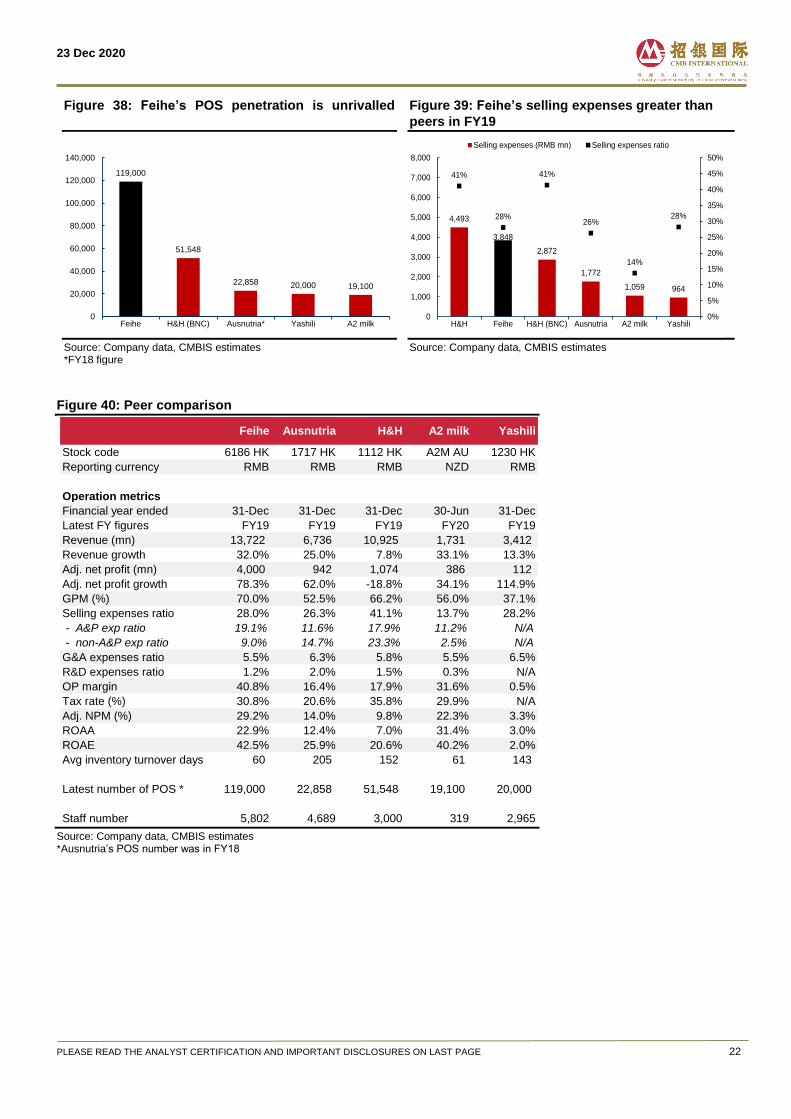
Most in-depth penetration compared to peers
Thanks to its in-depth, single-layer distribution system and a large number of distributors
(~1,900 customers), Feihe covered 119,000 retail POS (maternity specialty stores and
supermarkets) in 1H20. Such number was more than double of H&H’s BNC segment, which
covered 51,548 maternity specialty stores, supermarkets and VIP pharmacies. Other peers’
POS coverage is even lower.
Effective selling expenses to promote sales
Although Feihe’s selling expenses ratio (28%) was behind H&H’s BNC segment (41%), it
was similar to Ausnutria and Yashili. That said, its absolute amount was the greatest among
peers. While Feihe organized more than 500,000 offline seminars and had a large sales
team staff (3,130 people as of 30 Jun 2019, even greater than total staff number of some
peers) in 2019, its selling expenses ratio was still in line with peers. We think the high
conversion rate of offline seminars (20-30%) is a key reason for its low selling expenses
ratio.
70.0%66.5% 66.2%
56.0%52.5%
37.1%
0%
10%
20%
30%
40%
50%
60%
70%
80%
Feihe H&H (BNC) H&H A2 Milk Ausnutria Yashili0
2,000
4,000
6,000
8,000
10,000
12,000
14,000
16,000
Feihe H&H A2 Milk ausnutria H&H (IMF) Yashili
(RMB mn)
23 Dec 2020
PLEASE READ THE ANALYST CERTIFICATION AND IMPORTANT DISCLOSURES ON LAST PAGE 22
Figure 38: Feihe’s POS penetration is unrivalled
Source: Company data, CMBIS estimates *FY18 figure
Figure 39: Feihe’s selling expenses greater than
peers in FY19
Source: Company data, CMBIS estimates
Figure 40: Peer comparison
Source: Company data, CMBIS estimates *Ausnutria’s POS number was in FY18
119,000
51,548
22,858 20,000 19,100
0
20,000
40,000
60,000
80,000
100,000
120,000
140,000
Feihe H&H (BNC) Ausnutria* Yashili A2 milk
4,493
3,848
2,872
1,772
1,059 964
41%
28%
41%
26%
14%
28%
0%
5%
10%
15%
20%
25%
30%
35%
40%
45%
50%
0
1,000
2,000
3,000
4,000
5,000
6,000
7,000
8,000
H&H Feihe H&H (BNC) Ausnutria A2 milk Yashili
Selling expenses (RMB mn) Selling expenses ratio
Feihe Ausnutria H&H A2 milk Yashili
Stock code 6186 HK 1717 HK 1112 HK A2M AU 1230 HK
Reporting currency RMB RMB RMB NZD RMB
Operation metrics
Financial year ended 31-Dec 31-Dec 31-Dec 30-Jun 31-Dec
Latest FY figures FY19 FY19 FY19 FY20 FY19
Revenue (mn) 13,722 6,736 10,925 1,731 3,412
Revenue growth 32.0% 25.0% 7.8% 33.1% 13.3%
Adj. net profit (mn) 4,000 942 1,074 386 112
Adj. net profit growth 78.3% 62.0% -18.8% 34.1% 114.9%
GPM (%) 70.0% 52.5% 66.2% 56.0% 37.1%
Selling expenses ratio 28.0% 26.3% 41.1% 13.7% 28.2%
- A&P exp ratio 19.1% 11.6% 17.9% 11.2% N/A
- non-A&P exp ratio 9.0% 14.7% 23.3% 2.5% N/A
G&A expenses ratio 5.5% 6.3% 5.8% 5.5% 6.5%
R&D expenses ratio 1.2% 2.0% 1.5% 0.3% N/A
OP margin 40.8% 16.4% 17.9% 31.6% 0.5%
Tax rate (%) 30.8% 20.6% 35.8% 29.9% N/A
Adj. NPM (%) 29.2% 14.0% 9.8% 22.3% 3.3%
ROAA 22.9% 12.4% 7.0% 31.4% 3.0%
ROAE 42.5% 25.9% 20.6% 40.2% 2.0%
Avg inventory turnover days 60 205 152 61 143
Latest number of POS * 119,000 22,858 51,548 19,100 20,000
Staff number 5,802 4,689 3,000 319 2,965
23 Dec 2020
PLEASE READ THE ANALYST CERTIFICATION AND IMPORTANT DISCLOSURES ON LAST PAGE 23
Valuation
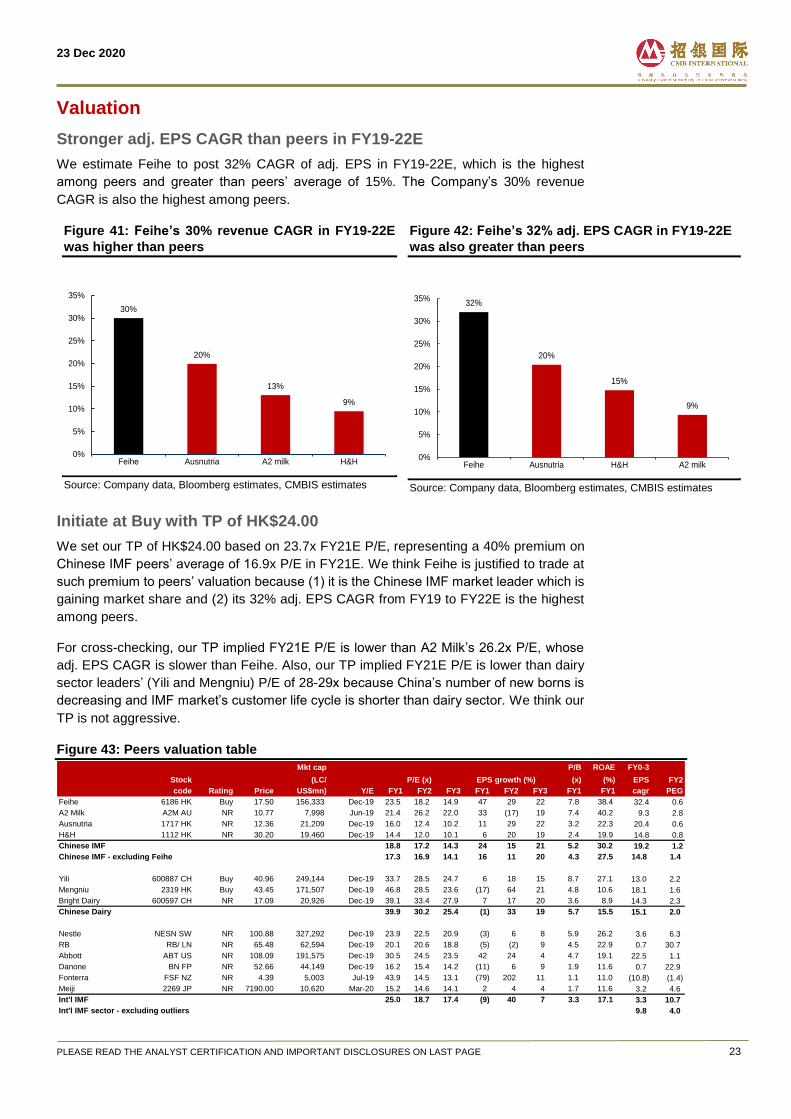
Stronger adj. EPS CAGR than peers in FY19-22E
We estimate Feihe to post 32% CAGR of adj. EPS in FY19-22E, which is the highest
among peers and greater than peers’ average of 15%. The Company’s 30% revenue
CAGR is also the highest among peers.
Figure 41: Feihe’s 30% revenue CAGR in FY19-22E
was higher than peers
Source: Company data, Bloomberg estimates, CMBIS estimates
Figure 42: Feihe’s 32% adj. EPS CAGR in FY19-22E
was also greater than peers
Source: Company data, Bloomberg estimates, CMBIS estimates
Initiate at Buy with TP of HK$24.00
We set our TP of HK$24.00 based on 23.7x FY21E P/E, representing a 40% premium on
Chinese IMF peers’ average of 16.9x P/E in FY21E. We think Feihe is justified to trade at
such premium to peers’ valuation because (1) it is the Chinese IMF market leader which is
gaining market share and (2) its 32% adj. EPS CAGR from FY19 to FY22E is the highest
among peers.
For cross-checking, our TP implied FY21E P/E is lower than A2 Milk’s 26.2x P/E, whose
adj. EPS CAGR is slower than Feihe. Also, our TP implied FY21E P/E is lower than dairy
sector leaders’ (Yili and Mengniu) P/E of 28-29x because China’s number of new borns is
decreasing and IMF market’s customer life cycle is shorter than dairy sector. We think our
TP is not aggressive.
Figure 43: Peers valuation table
30%
20%
13%
9%
0%
5%
10%
15%
20%
25%
30%
35%
Feihe Ausnutria A2 milk H&H
32%
20%
15%
9%
0%
5%
10%
15%
20%
25%
30%
35%
Feihe Ausnutria H&H A2 milk
Mkt cap P/B ROAE FY0-3
Stock (LC/ EPS growth (%) (x) (%) EPS FY2
code Rating Price US$mn) Y/E FY1 FY2 FY3 FY1 FY2 FY3 FY1 FY1 cagr PEG
Feihe 6186 HK Buy 17.50 156,333 Dec-19 23.5 18.2 14.9 47 29 22 7.8 38.4 32.4 0.6
A2 Milk A2M AU NR 10.77 7,998 Jun-19 21.4 26.2 22.0 33 (17) 19 7.4 40.2 9.3 2.8
Ausnutria 1717 HK NR 12.36 21,209 Dec-19 16.0 12.4 10.2 11 29 22 3.2 22.3 20.4 0.6
H&H 1112 HK NR 30.20 19,460 Dec-19 14.4 12.0 10.1 6 20 19 2.4 19.9 14.8 0.8
Chinese IMF 18.8 17.2 14.3 24 15 21 5.2 30.2 19.2 1.2
Chinese IMF - excluding Feihe 17.3 16.9 14.1 16 11 20 4.3 27.5 14.8 1.4
Yili 600887 CH Buy 40.96 249,144 Dec-19 33.7 28.5 24.7 6 18 15 8.7 27.1 13.0 2.2
Mengniu 2319 HK Buy 43.45 171,507 Dec-19 46.8 28.5 23.6 (17) 64 21 4.8 10.6 18.1 1.6
Bright Dairy 600597 CH NR 17.09 20,926 Dec-19 39.1 33.4 27.9 7 17 20 3.6 8.9 14.3 2.3
Chinese Dairy 39.9 30.2 25.4 (1) 33 19 5.7 15.5 15.1 2.0
Nestle NESN SW NR 100.88 327,292 Dec-19 23.9 22.5 20.9 (3) 6 8 5.9 26.2 3.6 6.3
RB RB/ LN NR 65.48 62,594 Dec-19 20.1 20.6 18.8 (5) (2) 9 4.5 22.9 0.7 30.7
Abbott ABT US NR 108.09 191,575 Dec-19 30.5 24.5 23.5 42 24 4 4.7 19.1 22.5 1.1
Danone BN FP NR 52.66 44,149 Dec-19 16.2 15.4 14.2 (11) 6 9 1.9 11.6 0.7 22.9
Fonterra FSF NZ NR 4.39 5,003 Jul-19 43.9 14.5 13.1 (79) 202 11 1.1 11.0 (10.8) (1.4)
Meiji 2269 JP NR 7190.00 10,620 Mar-20 15.2 14.6 14.1 2 4 4 1.7 11.6 3.2 4.6
Int'l IMF 25.0 18.7 17.4 (9) 40 7 3.3 17.1 3.3 10.7
Int'l IMF sector - excluding outliers 9.8 4.0
P/E (x)
23 Dec 2020
PLEASE READ THE ANALYST CERTIFICATION AND IMPORTANT DISCLOSURES ON LAST PAGE 24
Source: Bloomberg estimates, CMBIS estimates
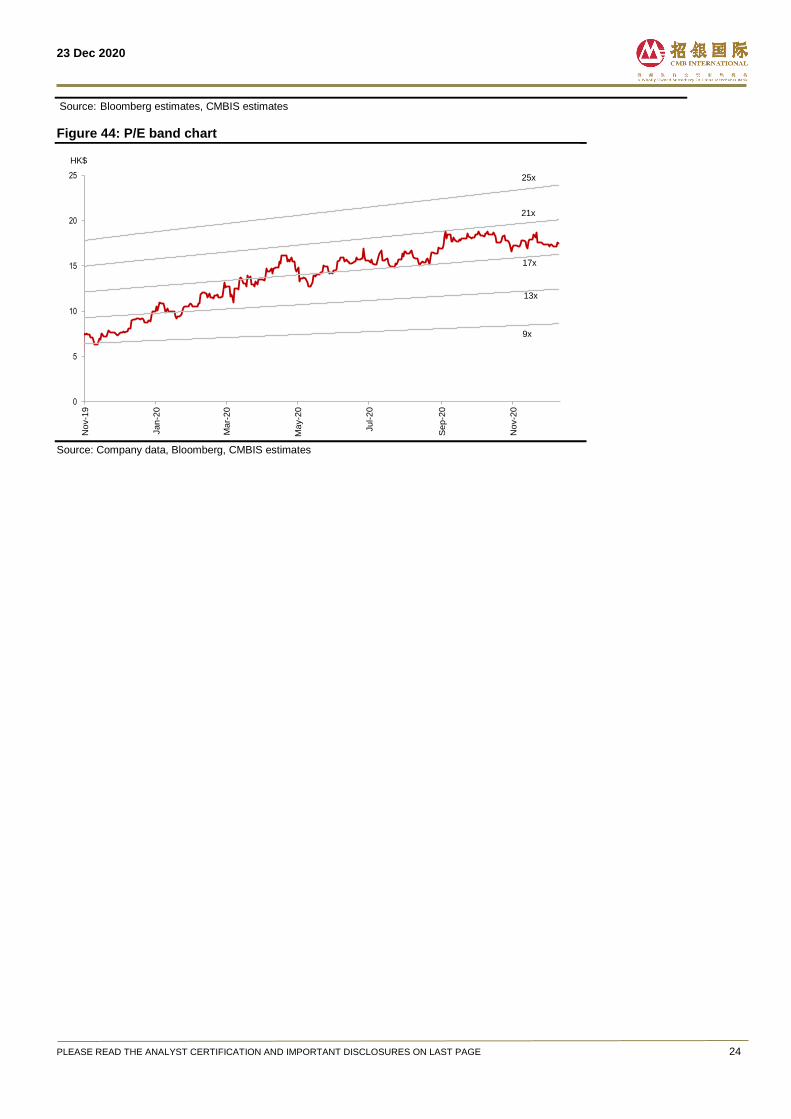
Figure 44: P/E band chart
Source: Company data, Bloomberg, CMBIS estimates
0
5
10
15
20
25
No
v-1
9
Ja
n-2
0
Ma
r-2
0
Ma
y-2
0
Ju
l-2
0
Se
p-2
0
No
v-2
0
HK$
25x
21x
9x
13x
17x
23 Dec 2020
PLEASE READ THE ANALYST CERTIFICATION AND IMPORTANT DISCLOSURES ON LAST PAGE 25
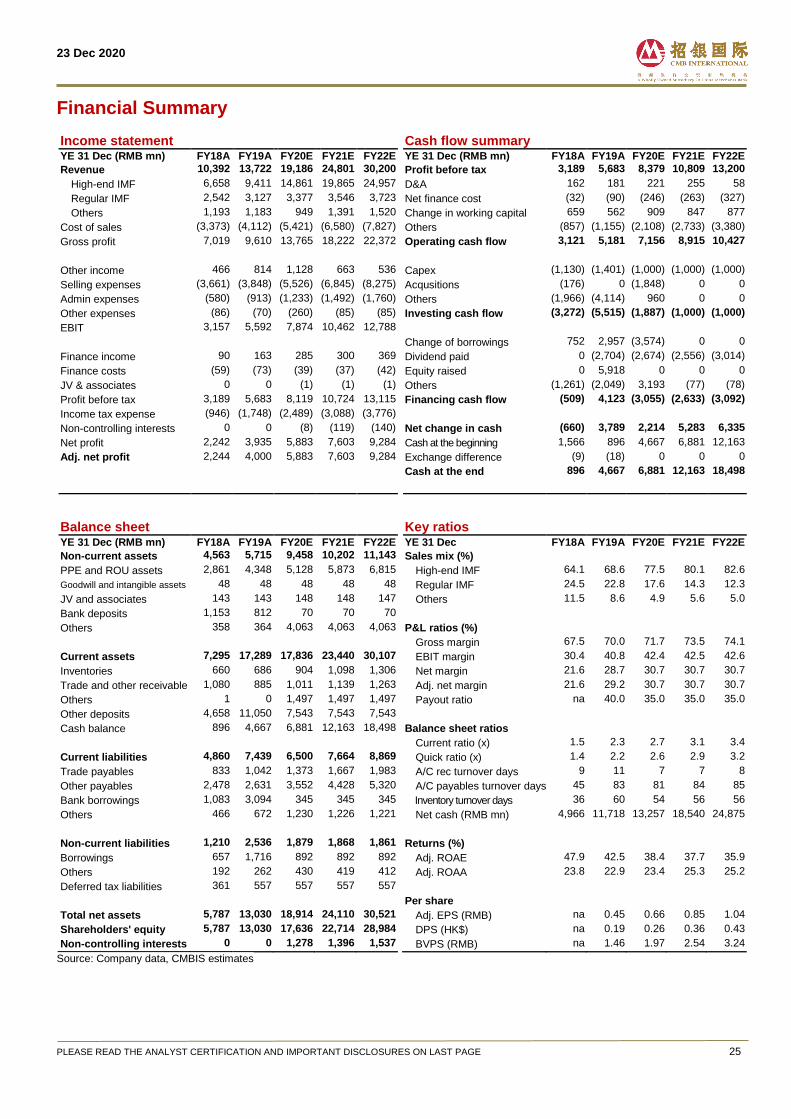
Financial Summary
Income statement Cash flow summary
YE 31 Dec (RMB mn) FY18A FY19A FY20E FY21E FY22E YE 31 Dec (RMB mn) FY18A FY19A FY20E FY21E FY22E
Revenue 10,392 13,722 19,186 24,801 30,200 Profit before tax 3,189 5,683 8,379 10,809 13,200
High-end IMF 6,658 9,411 14,861 19,865 24,957 D&A 162 181 221 255 58
Regular IMF 2,542 3,127 3,377 3,546 3,723 Net finance cost (32) (90) (246) (263) (327)
Others 1,193 1,183 949 1,391 1,520 Change in working capital 659 562 909 847 877
Cost of sales (3,373) (4,112) (5,421) (6,580) (7,827) Others (857) (1,155) (2,108) (2,733) (3,380)
Gross profit 7,019 9,610 13,765 18,222 22,372 Operating cash flow 3,121 5,181 7,156 8,915 10,427
Other income 466 814 1,128 663 536 Capex (1,130) (1,401) (1,000) (1,000) (1,000)
Selling expenses (3,661) (3,848) (5,526) (6,845) (8,275) Acqusitions (176) 0 (1,848) 0 0
Admin expenses (580) (913) (1,233) (1,492) (1,760) Others (1,966) (4,114) 960 0 0
Other expenses (86) (70) (260) (85) (85) Investing cash flow (3,272) (5,515) (1,887) (1,000) (1,000)
EBIT 3,157 5,592 7,874 10,462 12,788
Change of borrowings 752 2,957 (3,574) 0 0
Finance income 90 163 285 300 369 Dividend paid 0 (2,704) (2,674) (2,556) (3,014)
Finance costs (59) (73) (39) (37) (42) Equity raised 0 5,918 0 0 0
JV & associates 0 0 (1) (1) (1) Others (1,261) (2,049) 3,193 (77) (78)
Profit before tax 3,189 5,683 8,119 10,724 13,115 Financing cash flow (509) 4,123 (3,055) (2,633) (3,092)
Income tax expense (946) (1,748) (2,489) (3,088) (3,776)
Non-controlling interests 0 0 (8) (119) (140) Net change in cash (660) 3,789 2,214 5,283 6,335
Net profit 2,242 3,935 5,883 7,603 9,284 Cash at the beginning 1,566 896 4,667 6,881 12,163
Adj. net profit 2,244 4,000 5,883 7,603 9,284 Exchange difference (9) (18) 0 0 0
Cash at the end 896 4,667 6,881 12,163 18,498
Balance sheet Key ratios
YE 31 Dec (RMB mn) FY18A FY19A FY20E FY21E FY22E YE 31 Dec FY18A FY19A FY20E FY21E FY22E
Non-current assets 4,563 5,715 9,458 10,202 11,143 Sales mix (%)
PPE and ROU assets 2,861 4,348 5,128 5,873 6,815 High-end IMF 64.1 68.6 77.5 80.1 82.6
Goodwill and intangible assets 48 48 48 48 48 Regular IMF 24.5 22.8 17.6 14.3 12.3
JV and associates 143 143 148 148 147 Others 11.5 8.6 4.9 5.6 5.0
Bank deposits 1,153 812 70 70 70
Others 358 364 4,063 4,063 4,063 P&L ratios (%)
Gross margin 67.5 70.0 71.7 73.5 74.1
Current assets 7,295 17,289 17,836 23,440 30,107 EBIT margin 30.4 40.8 42.4 42.5 42.6
Inventories 660 686 904 1,098 1,306 Net margin 21.6 28.7 30.7 30.7 30.7
Trade and other receivable 1,080 885 1,011 1,139 1,263 Adj. net margin 21.6 29.2 30.7 30.7 30.7
Others 1 0 1,497 1,497 1,497 Payout ratio na 40.0 35.0 35.0 35.0
Other deposits 4,658 11,050 7,543 7,543 7,543
Cash balance 896 4,667 6,881 12,163 18,498 Balance sheet ratios
Current ratio (x) 1.5 2.3 2.7 3.1 3.4
Current liabilities 4,860 7,439 6,500 7,664 8,869 Quick ratio (x) 1.4 2.2 2.6 2.9 3.2
Trade payables 833 1,042 1,373 1,667 1,983 A/C rec turnover days 9 11 7 7 8
Other payables 2,478 2,631 3,552 4,428 5,320 A/C payables turnover days 45 83 81 84 85
Bank borrowings 1,083 3,094 345 345 345 Inventory turnover days 36 60 54 56 56
Others 466 672 1,230 1,226 1,221 Net cash (RMB mn) 4,966 11,718 13,257 18,540 24,875
Non-current liabilities 1,210 2,536 1,879 1,868 1,861 Returns (%)
Borrowings 657 1,716 892 892 892 Adj. ROAE 47.9 42.5 38.4 37.7 35.9
Others 192 262 430 419 412 Adj. ROAA 23.8 22.9 23.4 25.3 25.2
Deferred tax liabilities 361 557 557 557 557
Per share
Total net assets 5,787 13,030 18,914 24,110 30,521 Adj. EPS (RMB) na 0.45 0.66 0.85 1.04
Shareholders' equity 5,787 13,030 17,636 22,714 28,984 DPS (HK$) na 0.19 0.26 0.36 0.43
Non-controlling interests 0 0 1,278 1,396 1,537 BVPS (RMB) na 1.46 1.97 2.54 3.24
Source: Company data, CMBIS estimates
23 Dec 2020
PLEASE READ THE ANALYST CERTIFICATION AND IMPORTANT DISCLOSURES ON LAST PAGE 26
Disclosures & Disclaimers
Analyst Certification The research analyst who is primary responsible for the content of this research report, in whole or in part, certifies that with respect to the securities or issuer that the analyst covered in this report: (1) all of the views expressed accurately reflect his or her personal views about the subject securities or issuer; and (2) no part of his or her compensation was, is, or will be, directly or indirectly, related to the specific views expressed by that analyst in this report. Besides, the analyst confirms that neither the analyst nor his/her associates (as defined in the code of conduct issued by The Hong Kong Securities and Futures Commission) (1) have dealt in or traded in the stock(s) covered in this research report within 30 calendar days prior to the date of issue of this report; (2) will deal in or trade in the stock(s) covered in this research report 3 business days after the date of issue of this report; (3) serve as an officer of any of the Hong Kong listed companies covered in this report; and (4) have any financial interests in the Hong Kong listed companies covered in this report.
CMBIS Ratings BUY : Stock with potential return of over 15% over next 12 months HOLD : Stock with potential return of +15% to -10% over next 12 months SELL : Stock with potential loss of over 10% over next 12 months NOT RATED : Stock is not rated by CMBIS
OUTPERFORM : Industry expected to outperform the relevant broad market benchmark over next 12 months MARKET-PERFORM : Industry expected to perform in-line with the relevant broad market benchmark over next 12 months UNDERPERFORM : Industry expected to underperform the relevant broad market benchmark over next 12 months
CMB International Securities Limited Address: 45/F, Champion Tower, 3 Garden Road, Hong Kong, Tel: (852) 3900 0888 Fax: (852) 3900 0800
CMB International Securities Limited (“CMBIS”) is a wholly owned subsidiary of CMB International Capital Corporation Limited (a wholly owned subsidiary of China Merchants Bank)
Important Disclosures There are risks involved in transacting in any securities. The information contained in this report may not be suitable for the purposes of all investors. CMBIS does not provide individually tailored investment advice. This report has been prepared without regard to the individual investment objectives, financial position or special requirements. Past performance has no indication of future performance, and actual events may differ materially from that which is contained in the report. The value of, and returns from, any investments are uncertain and are not guaranteed and may fluctuate as a result of their dependence on the performance of underlying assets or other variable market factors. CMBIS recommends that investors should independently evaluate particular investments and strategies, and encourages investors to consult with a professional financial advisor in order to make their own investment decisions. This report or any information contained herein, have been prepared by the CMBIS, solely for the purpose of supplying information to the clients of CMBIS or its affiliate(s) to whom it is distributed. This report is not and should not be construed as an offer or solicitation to buy or sell any security or any interest in securities or enter into any transaction. Neither CMBIS nor any of its affiliates, shareholders, agents, consultants, directors, officers or employees shall be liable for any loss, damage or expense whatsoever, whether direct or consequential, incurred in relying on the information contained in this report. Anyone making use of the information contained in this report does so entirely at their own risk. The information and contents contained in this report are based on the analyses and interpretations of information believed to be publicly available and reliable. CMBIS has exerted every effort in its capacity to ensure, but not to guarantee, their accuracy, completeness, timeliness or correctness. CMBIS provides the information, advices and forecasts on an "AS IS" basis. The information and contents are subject to change without notice. CMBIS may issue other publications having information and/ or conclusions different from this report. These publications reflect different assumption, point-of-view and analytical methods when compiling. CMBIS may make investment decisions or take proprietary positions that are inconsistent with the recommendations or views in this report. CMBIS may have a position, make markets or act as principal or engage in transactions in securities of companies referred to in this report for itself and/or on behalf of its clients from time to time. Investors should assume that CMBIS does or seeks to have investment banking or other business relationships with the companies in this report. As a result, recipients should be aware that CMBIS may have a conflict of interest that could affect the objectivity of this report and CMBIS will not assume any responsibility in respect thereof. This report is for the use of intended recipients only and this publication, may not be reproduced, reprinted, sold, redistributed or published in whole or in part for any purpose without prior written consent of CMBIS. Additional information on recommended securities is available upon request. For recipients of this document in the United Kingdom This report has been provided only to persons (I)falling within Article 19(5) of the Financial Services and Markets Act 2000 (Financial Promotion) Order 2005 (as amended from time to time)(“The Order”) or (II) are persons falling within Article 49(2) (a) to (d) (“High Net Worth Companies, Unincorporated Associations, etc.,) of the Order, and may not be provided to any other person without the prior written consent of CMBIS. For recipients of this document in the United States CMBIS is not a registered broker-dealer in the United States. As a result, CMBIS is not subject to U.S. rules regarding the preparation of research reports and the independence of research analysts. The research analyst who is primary responsible for the content of this research report is not registered or qualified as a research analyst with the Financial Industry Regulatory Authority (“FINRA”). The analyst is not subject to applicable restrictions under FINRA Rules intended to ensure that the analyst is not affected by potential conflicts of interest that could bear upon the reliability of the research report. This report is intended for distribution in the United States solely to "major US institutional investors", as defined in Rule 15a-6 under the US, Securities Exchange Act of 1934, as amended, and may not be furnished to any other person in the United States. Each major US institutional investor that receives a copy of this report by its acceptance hereof represents and agrees that it shall not distribute or provide this report to any other person. Any U.S. recipient of this report wishing to effect any transaction to buy or sell securities based on the information provided in this report should do so only through a U.S.-registered broker-dealer. For recipients of this document in Singapore This report is distributed in Singapore by CMBI (Singapore) Pte. Limited (CMBISG) (Company Regn. No. 201731928D), an Exempt Financial Adviser as defined in the Financial Advisers Act (Cap. 110) of Singapore and regulated by the Monetary Authority of Singapore. CMBISG may distribute reports produced by its respective foreign entities, affiliates or other foreign research houses pursuant to an arrangement under Regulation 32C of the Financial Advisers Regulations. Where the report is distributed in Singapore to a person who is not an Accredited Investor, Expert Investor or an Institutional Investor, as defined in the Securities and Futures Act (Cap. 289) of Singapore, CMBISG accepts legal responsibility for the contents of the report to such persons only to the extent required by law. Singapore recipients should contact CMBISG at +65 6350 4400 for matters arising from, or in connection with the report.