yum china (9987 hk)
TRANSCRIPT
CMB International Securities | Equity Research | Company Initiation
PLEASE READ THE ANALYST CERTIFICATION AND IMPORTANT DISCLOSURES ON LAST PAGE
MORE REPORTS FROM BLOOMBERG: RESP CMBR <GO> OR http://www.cmbi.com.hk
China Catering Sector
Walter Woo
(852) 3761 8776
Stock Data
Mkt Cap (HK$ mn) 187,447
Avg 3 mths t/o (HK$ mn) NA
52w High/Low (HK$) 482.4/385.6
Total Issued Shares (mn) 419.3
Source: Bloomberg
Shareholding Structure
Primavera Capital 5.7%
BlackRock 6.5%
Invesco 9.7%
Management 0.2%
Free Float 77.8%
Source: HKEx
Share Performance
Absolute Relative
1-mth 9.2% 1.3%
3-mth n/a n/a
6-mth n/a n/a
12-mth n/a n/a
Source: Bloomberg
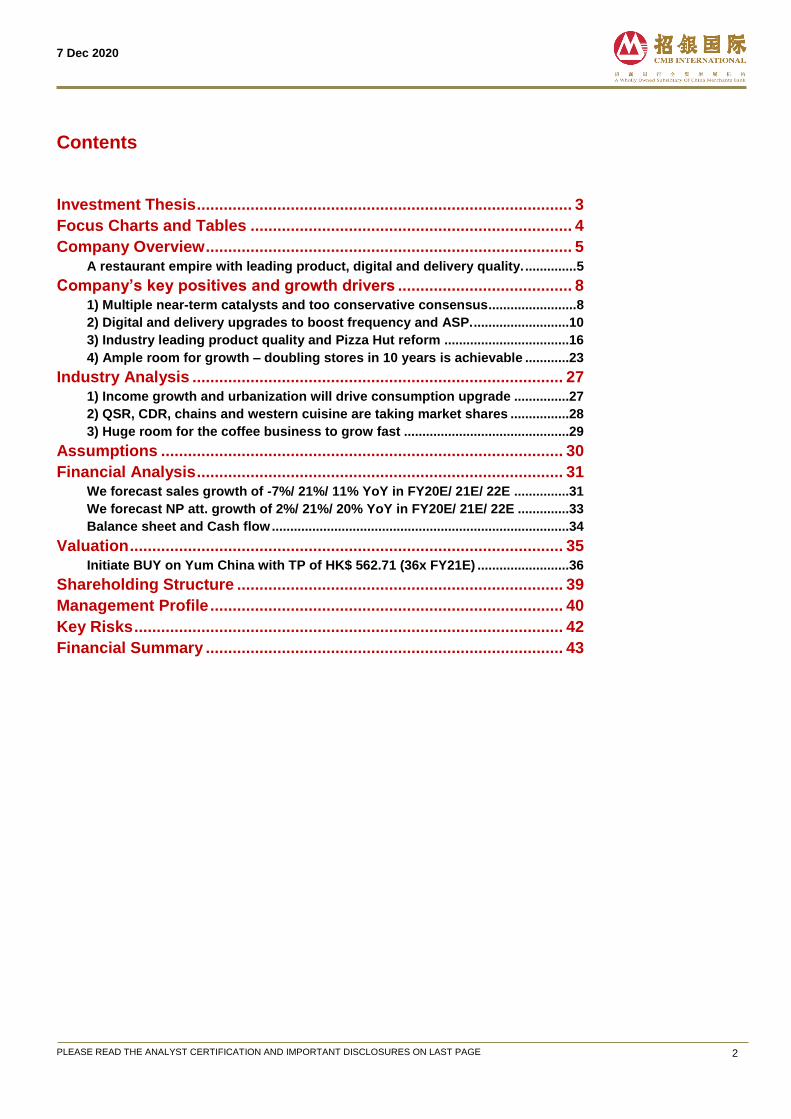
12-mth Price Performance
Source: Bloomberg
Auditor: KPMG
370.0
390.0
410.0
430.0
450.0
470.0
490.0
9/2020 10/2020 11/2020
Stock HSI
(HK$)
BUY (Initiation)
Target Price HK$562.71
Up/Downside +25.9%
Current Price HK$447.00
1
7 Dec 2020
Initiate BUY on YUMC, as we forecast 14% NP CAGR in FY19-22E (even under
drags by COVID-19) vs 13% in FY16-19, driven by: 1) near term favorable food,
staff and rental costs, 2) more new stores and better locations, 3) various longer-
term benefits yield from digital upgrades and 4) Pizza Hut reforms. Our TP of
HK$ 562.71 is based on 36x FY21E P/E, 5% discount to leading China peer’s
avg. but 16% higher than Int’l peers’ avg.. YUMC’s valuation is attractive at 29x
FY21E P/E and 3.3x PEG, well below HDL’s 51x and 5.9x, JMJ’s 45x and 9.1x.
A restaurant empire with leading product, digital and delivery quality. Yum China (“YUMC”) is the largest restaurant group in China by sales in 2019 (~1.4% market share). It owned 9,200 restaurants in China (6,534 KFC/ 2,281 Pizza Hut/ 385 others) and recorded USD 8.8bn sales and USD 700mn NP in FY19.
Multiple near-term catalysts and too conservative consensus. We expect SSSG to turn positive to 14% YoY in FY21E, thanks to: 1) consumption recovery, 2) low base, 3) favourable food and staff cost trends, 4) superior digital and delivery upgrades and 5) better store locations and rental terms. More importantly, we believe our forecast is prudent while consensus is too conservative (CMBI’s FY21E sales is only 10-13% higher vs FY19 and sales per average store for KFC/ Pizza Hut are just 3% higher / 1% lower vs FY19).
Digital and delivery upgrades to boost frequency and ASP. YUMC has vast customer base for big data. We expect the growth drivers to be: 1) customer acquisitions by better user experience and convenience, 2) increase in purchasing frequency from more members, 3) ASP increases thru more upselling and 4) brands’ cross-selling through membership reward system.
Industry leading product quality and Pizza Hut reform. Backed by leading customer satisfaction rating among fried chicken brands, KFC should gain market shares in all tier cities in China. We also see Pizza Hut’s reform successful (menu innovations, return of value for money, stores revamps, etc. since 2017) and yield an impressive 13% restaurant OP CAGR in FY19-22E.
We forecast 8% sales and 14% NP att. CAGR in FY20E-22E. Key drivers are: 1) delivery, 2) increases in members and purchasing frequency, 3) easing food, staff and rental costs, and 4) Pizza Hut’s reform and operating leverage.
Initiate BUY with TP of HK$ 562.71, based on 36x FY21E P/E, 5% discount to leading peers’ average. We find YUMC attractive given a 14% NP CAGR in FY19-22E (impressive enough given drags from COVID-19 and vs 14% in FY17-19). It is trading at 29x FY21E P/E and 3.3x PEG (based on FY20E P/E and FY19-22E NP CAGR), vs HDL’s 53x and 6.2x, JMJ’s 47x and 9.7x.
Earnings Summary (YE 31 Dec) FY18A FY19A FY20E FY21E FY22E
Revenue (USD mn) 8,415 8,776 8,127 9,818 10,930 YoY growth (%) 8.3 4.3 (7.4) 20.8 11.3 Net income (USD mn) 708 713 728 878 1,057 Diluted EPS (USD) 1.78 1.81 1.76 2.02 2.41 YoY growth (%) 77.9 1.8 (2.6) 14.4 19.6 Consensus EPS (USD) n/a n/a 1.47 2.02 2.33 P/E (x) 32.1 31.7 32.7 28.6 23.9 P/B (x) 7.3 6.8 4.0 3.6 3.2 Yield (%) 0.8 0.8 0.3 0.9 1.0 ROE (%) 23.8 22.5 12.2 12.9 13.7 Net gearing (%) Net cash Net cash Net cash Net cash Net cash
Source: Company data, Bloomberg, CMBIS estimates
Yum China (9987 HK)
Digital, delivery, Pizza Hut reform driven growth
7 Dec 2020
PLEASE READ THE ANALYST CERTIFICATION AND IMPORTANT DISCLOSURES ON LAST PAGE 2
Contents
Investment Thesis .................................................................................... 3
Focus Charts and Tables ........................................................................ 4
Company Overview .................................................................................. 5
A restaurant empire with leading product, digital and delivery quality. .............. 5
Company’s key positives and growth drivers ....................................... 8
1) Multiple near-term catalysts and too conservative consensus........................ 8
2) Digital and delivery upgrades to boost frequency and ASP. ..........................10
3) Industry leading product quality and Pizza Hut reform ..................................16
4) Ample room for growth – doubling stores in 10 years is achievable ............23
Industry Analysis ................................................................................... 27
1) Income growth and urbanization will drive consumption upgrade ...............27
2) QSR, CDR, chains and western cuisine are taking market shares ................28
3) Huge room for the coffee business to grow fast .............................................29
Assumptions .......................................................................................... 30
Financial Analysis .................................................................................. 31
We forecast sales growth of -7%/ 21%/ 11% YoY in FY20E/ 21E/ 22E ...............31
We forecast NP att. growth of 2%/ 21%/ 20% YoY in FY20E/ 21E/ 22E ..............33
Balance sheet and Cash flow .................................................................................34
Valuation ................................................................................................. 35
Initiate BUY on Yum China with TP of HK$ 562.71 (36x FY21E) .........................36
Shareholding Structure ......................................................................... 39
Management Profile ............................................................................... 40
Key Risks ................................................................................................ 42
Financial Summary ................................................................................ 43
7 Dec 2020
PLEASE READ THE ANALYST CERTIFICATION AND IMPORTANT DISCLOSURES ON LAST PAGE 3
Investment Thesis
A restaurant empire with leading product, digital and delivery quality. Yum China (“YUMC”) is the largest restaurant group in China, in terms of sales in 2019,
with 1.4% market share. It owned 9,200 restaurants in China (6,534 KFC/ 2,281 Pizza Hut/
385 Others) and generated USD 8.8bn sales and USD 713mn net profit in FY19.
Multiple near-term catalysts and too conservative consensus. We expect SSSG to turn positive in FY21E, thanks to macro factors like: 1) domestic
consumption recovery, 2) low base, 3) favorable food and staff cost trends, plus company
specific factors, including: 1) superior digital and delivery upgrades that bring more
seamless O2O customer experience and 2) better new store location and rental terms.
More importantly, we believe the consensus is too conservative and our forecasts for
FY21E-22E sales are 1-2% higher. CMBI’s FY21E sales is only based on 10-13% growth
vs FY19 while CMBI’s FY21E sales per average store for KFC/ Pizza Hut are just 3%
higher/ 1% lower vs FY19.
Digital and delivery upgrades to boost frequency and ASP. YUMC has a vast customer base, which is excellent for customer analytics through big
data, in order to better suit the customer demand. We expect the growth drivers to be: 1)
more customer and member acquisitions with better users’ experiences (digital orderings
and payments) and convenience (easier delivery), 2) increase in purchasing frequency as
more customers joining as members, 3) ASP increases thru more effective upselling and
4) cross-selling between brands thru the member’s reward system.
Industry leading product quality and Pizza Hut reform. Backed by leading customer satisfaction rating among fried chicken brands in China, we
are confident that KFC can gain market shares in T1 and below cities. We also see Pizza
Hut’s initial transformation (menu innovations, return of value for money, store revamps,
etc.) since 2017 successful and should yield a faster growth and higher margins onwards.
Ample room for growth – doubling stores in 10 years is achievable We see more upside for YUMC’s store expansions (vs consensus). We concur with its
long-term target of 21,000 stores (both KFC and Pizza Hut) in China, derived from 15 stores
per 1mn population. For KFC alone, its store counts can reach 12,000/ 27,000 if we use
Japan/ China tier-1 cities as benchmarks, derived from density of 9/ 19 stores per 1 mn
population. If this is done in 10 years, the implied CAGR would be 9.1%, much higher than
our forecast of 5.8%, based on about 600/ 100 net new stores per year for KFC/ Pizza Hut.
Also, we believe KFC can still expand in Tier-1 and Tier- 2 cities, because: 1) its ASP is
similar vs peers and 2) its store counts are only the largest in 2 tier-1 cities (out of 4) and 3
tier-2 cities (out of 15), where CNHLS and Zhengxin Chicken Steak have more stores.
We project 8% sales and 14% net profit att. CAGR in FY20E-22E. We expect sales drivers in FY20-22E to be: 1) rapid delivery growth, 2) increases in
membership and purchasing frequency and 3) better Pizza Hut SSSG after its menu and
store upgrades; while margin drivers are: 1) favourable food and staff costs , 2) better rental
terms after pandemic and 3) operating leverage yield from successful Pizza Hut reform.
We initiate BUY on YUMC with a TP of HK$ 562.71, based on 36x FY21E P/E. We find YUMC attractive given a 14% NP CAGR in FY19-22E (impressive enough given
drags from COVID-19, vs 14% in FY17-19). It is trading at 29x FY21E P/E and 3.3x PEG
(based on FY20E P/E and FY19-22E NP CAGR), undemanding compared to Haidilao’s
53x and 6.2x, as well as Jiumaojiu’s 47x and 9.7x, and industry’s avg. of 38x and 3.3x.
7 Dec 2020
PLEASE READ THE ANALYST CERTIFICATION AND IMPORTANT DISCLOSURES ON LAST PAGE 4
Focus Charts and Tables
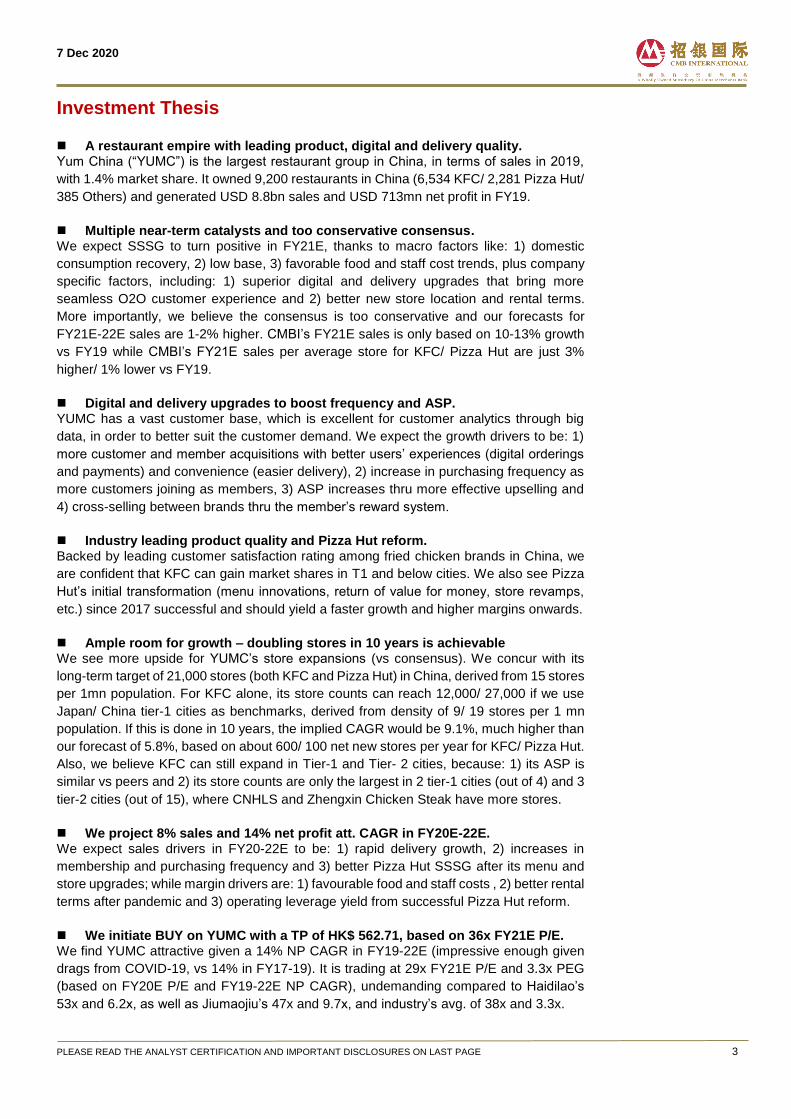
Figure 1: Sales per average store by brand
Source: Company data, CMBIS estimates
Figure 2: China chicken prices and YUMC’s GPM
Source: Ministry of Agriculture, Company data, CMBIS estimates
Figure 3: KFC, PH, Meituan delivery sales growth
Source: Ministry of Agriculture, Company data, CMBIS estimates
Figure 4: Restaurants OP margin by brand
Source: Company data, CMBIS estimates
Figure 5: Number of stores by brand in tier-1 cities
Source: dianping.com, Company data, CMBIS estimates, as at Nov 2020
Figure 6: KFC’s store density by region
Source: dianping.com, Company data, CMBIS estimates
1.21 1.26
1.21 1.04 1.17
1.20
0.99 0.97 0.94
0.81
0.94 1.00
0.60
0.80
1.00
1.20
1.40
FY17 FY18 FY19 FY20E FY21E FY22E
KFC Pizza Hut
(USD mn)
+1%
14
15
16
17
18
19
70.5%
71.5%
72.5%
73.5%
1Q
18
2Q
18
3Q
18
4Q
18
1Q
19
2Q
19
3Q
19
4Q
19
1Q
20
2Q
20
3Q
20
4Q
20E
1Q
21E
2Q
21E
3Q
21E
4Q
21E
GP margins White chicken wholesale prices
(CNY/kg)
-20.0%
10.0%
40.0%
70.0%
100.0%
3Q
18
4Q
18
1Q
19
2Q
19
3Q
19
4Q
19
1Q
20
2Q
20
3Q
20
4Q
20E
1Q
21E
2Q
21E
3Q
21E
4Q
21E
KFC delivery sales growth
PH delivery sales growth
Meituan sales growth
(YoY %)
18.0% 17.9% 17.8%16.5%
18.2% 19.1%
13.9%
10.3% 11.1% 10.8%
13.7%15.0%
16.7%15.7% 16.0%
13.5%15.3% 16.1%
0%
4%
8%
12%
16%
20%
24%
FY17A FY18A FY19A FY20E FY21E FY22E
KFC Pizza hut Total
300 276
400 451
0
150
300
450
600
Shenzhen Guangzhou Shanghai Beijing
KFC China/ 肯德基Zhengxin Chicken Steak/ 正新鸡排CNHLS/ 华莱士Dicos/ 德克士
19.1
4.0 3.8 4.7
15.0
6.4 8.9
12.5 14.8
19.1 22.5
0
5
10
15
20
25
(stores per 1mn people)
(China) (Overseas)
7 Dec 2020
PLEASE READ THE ANALYST CERTIFICATION AND IMPORTANT DISCLOSURES ON LAST PAGE 5
Company Overview
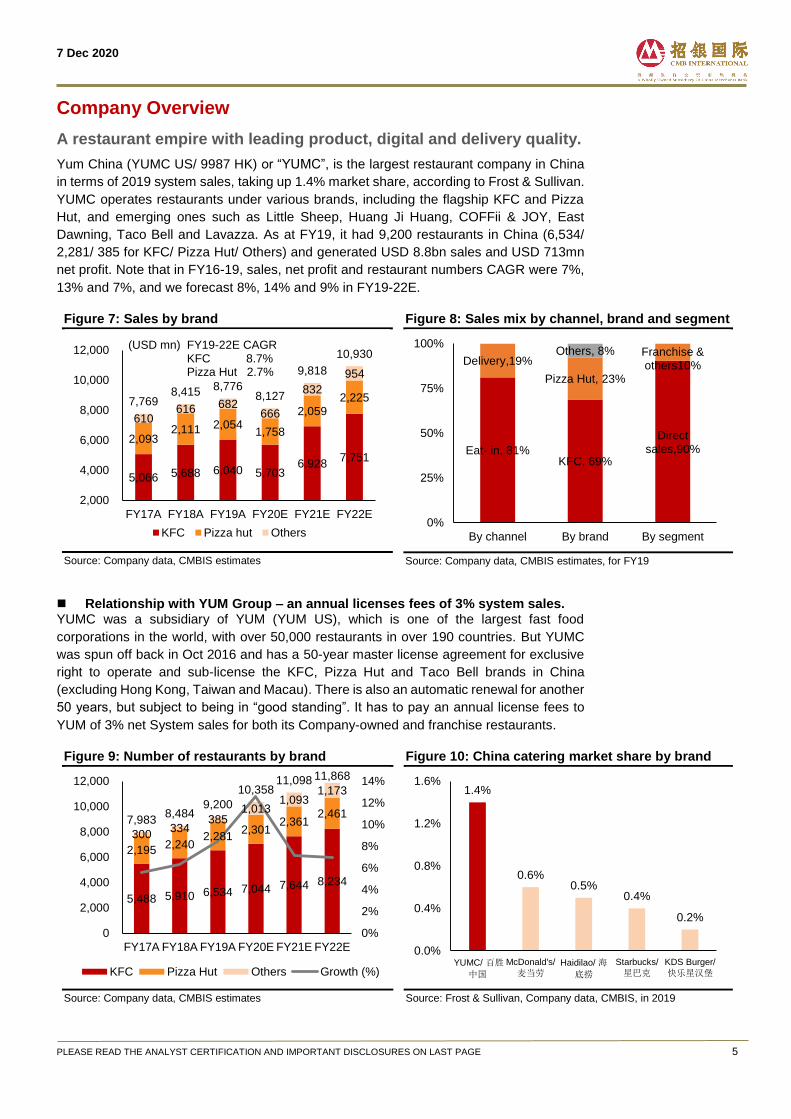
A restaurant empire with leading product, digital and delivery quality.
Yum China (YUMC US/ 9987 HK) or “YUMC”, is the largest restaurant company in China
in terms of 2019 system sales, taking up 1.4% market share, according to Frost & Sullivan.
YUMC operates restaurants under various brands, including the flagship KFC and Pizza
Hut, and emerging ones such as Little Sheep, Huang Ji Huang, COFFii & JOY, East
Dawning, Taco Bell and Lavazza. As at FY19, it had 9,200 restaurants in China (6,534/
2,281/ 385 for KFC/ Pizza Hut/ Others) and generated USD 8.8bn sales and USD 713mn
net profit. Note that in FY16-19, sales, net profit and restaurant numbers CAGR were 7%,
13% and 7%, and we forecast 8%, 14% and 9% in FY19-22E.
Figure 7: Sales by brand
Source: Company data, CMBIS estimates
Figure 8: Sales mix by channel, brand and segment
Source: Company data, CMBIS estimates, for FY19
Relationship with YUM Group – an annual licenses fees of 3% system sales. YUMC was a subsidiary of YUM (YUM US), which is one of the largest fast food
corporations in the world, with over 50,000 restaurants in over 190 countries. But YUMC
was spun off back in Oct 2016 and has a 50-year master license agreement for exclusive
right to operate and sub-license the KFC, Pizza Hut and Taco Bell brands in China
(excluding Hong Kong, Taiwan and Macau). There is also an automatic renewal for another
50 years, but subject to being in “good standing”. It has to pay an annual license fees to
YUM of 3% net System sales for both its Company-owned and franchise restaurants.
Figure 9: Number of restaurants by brand
Source: Company data, CMBIS estimates
Figure 10: China catering market share by brand
Source: Frost & Sullivan, Company data, CMBIS, in 2019
5,066 5,688 6,040 5,703 6,928
7,751
2,093 2,111 2,054
1,758
2,059 2,225
610 616 682
666
832
954
7,769 8,415 8,776
8,127
9,818
10,930
2,000
4,000
6,000
8,000
10,000
12,000
FY17A FY18A FY19A FY20E FY21E FY22E
KFC Pizza hut Others
(USD mn) FY19-22E CAGRKFC 8.7%Pizza Hut 2.7%
Eat- in, 81%KFC, 69%
Direct sales,90%
Delivery,19%
Pizza Hut, 23%
Franchise & others10%
Others, 8%
0%
25%
50%
75%
100%
By channel By brand By segment
5,488 5,910 6,534 7,044 7,644 8,234
2,195 2,240
2,281 2,301
2,361 2,461
300 334
385 1,013
1,093 1,173
7,983 8,484
9,200
10,358 11,098 11,868
0%
2%
4%
6%
8%
10%
12%
14%
0
2,000
4,000
6,000
8,000
10,000
12,000
FY17A FY18A FY19A FY20E FY21E FY22E
KFC Pizza Hut Others Growth (%)
1.4%
0.6%0.5%
0.4%
0.2%
0.0%
0.4%
0.8%
1.2%
1.6%
YUMC/ 百胜
中国
McDonald's/
麦当劳Haidilao/ 海
底捞
Starbucks/
星巴克KDS Burger/
快乐星汉堡
7 Dec 2020
PLEASE READ THE ANALYST CERTIFICATION AND IMPORTANT DISCLOSURES ON LAST PAGE 6
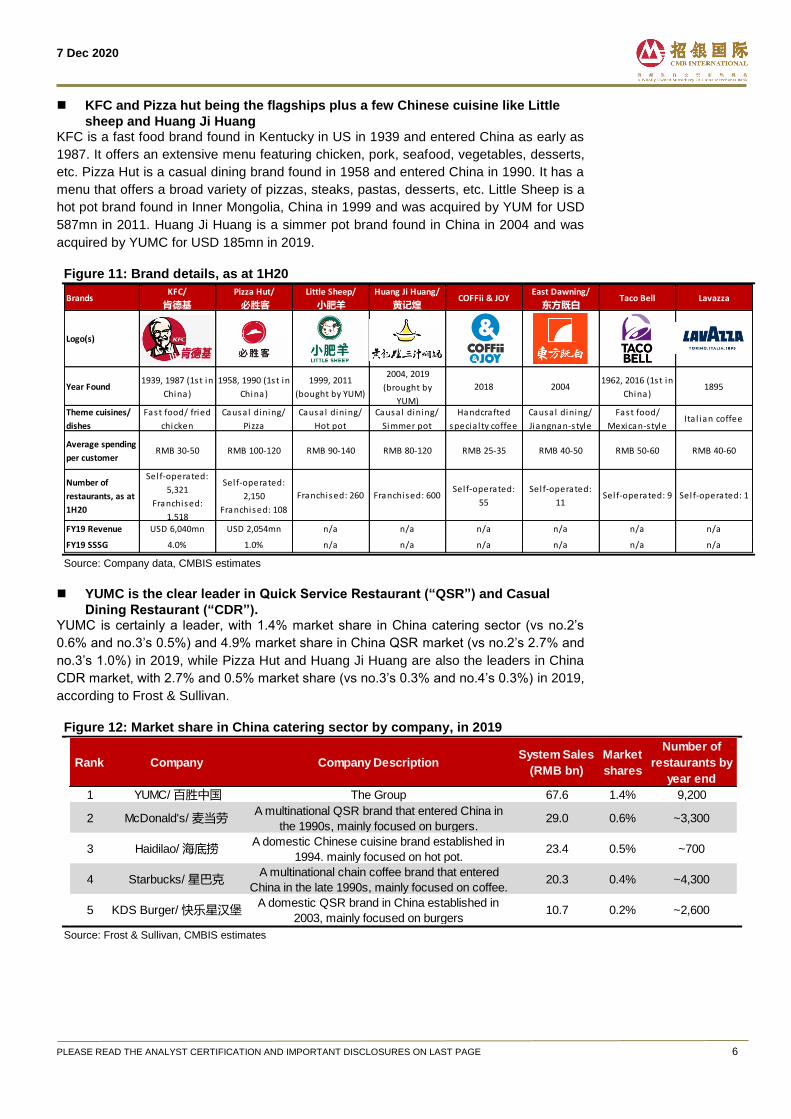
KFC and Pizza hut being the flagships plus a few Chinese cuisine like Little
sheep and Huang Ji Huang KFC is a fast food brand found in Kentucky in US in 1939 and entered China as early as
1987. It offers an extensive menu featuring chicken, pork, seafood, vegetables, desserts,
etc. Pizza Hut is a casual dining brand found in 1958 and entered China in 1990. It has a
menu that offers a broad variety of pizzas, steaks, pastas, desserts, etc. Little Sheep is a
hot pot brand found in Inner Mongolia, China in 1999 and was acquired by YUM for USD
587mn in 2011. Huang Ji Huang is a simmer pot brand found in China in 2004 and was
acquired by YUMC for USD 185mn in 2019.
Figure 11: Brand details, as at 1H20
Source: Company data, CMBIS estimates
YUMC is the clear leader in Quick Service Restaurant (“QSR”) and Casual
Dining Restaurant (“CDR”). YUMC is certainly a leader, with 1.4% market share in China catering sector (vs no.2’s
0.6% and no.3’s 0.5%) and 4.9% market share in China QSR market (vs no.2’s 2.7% and
no.3’s 1.0%) in 2019, while Pizza Hut and Huang Ji Huang are also the leaders in China
CDR market, with 2.7% and 0.5% market share (vs no.3’s 0.3% and no.4’s 0.3%) in 2019,
according to Frost & Sullivan.
Figure 12: Market share in China catering sector by company, in 2019
Source: Frost & Sullivan, CMBIS estimates
BrandsKFC/
肯德基
Pizza Hut/
必胜客
Little Sheep/
小肥羊
Huang Ji Huang/
黄记煌COFFii & JOY
East Dawning/
东方既白Taco Bell Lavazza
Logo(s)
Year Found1939, 1987 (1st in
China)
1958, 1990 (1st in
China)
1999, 2011
(bought by YUM)
2004, 2019
(brought by
YUM)
2018 20041962, 2016 (1st in
China)1895
Theme cuisines/
dishes
Fast food/ fried
chicken
Causal dining/
Pizza
Causal dining/
Hot pot
Causal dining/
Simmer pot
Handcrafted
specia l ty coffee
Causal dining/
Jiangnan-style
Fast food/
Mexican-styleIta l ian coffee
Average spending
per customerRMB 30-50 RMB 100-120 RMB 90-140 RMB 80-120 RMB 25-35 RMB 40-50 RMB 50-60 RMB 40-60
Number of
restaurants, as at
1H20
Sel f-operated:
5,321
Franchised:
1,518
Sel f-operated:
2,150
Franchised: 108
Franchised: 260 Franchised: 600Sel f-operated:
55
Sel f-operated:
11Sel f-operated: 9 Sel f-operated: 1
FY19 Revenue USD 6,040mn USD 2,054mn n/a n/a n/a n/a n/a n/a
FY19 SSSG 4.0% 1.0% n/a n/a n/a n/a n/a n/a
Rank Company Company DescriptionSystem Sales
(RMB bn)
Market
shares
Number of
restaurants by
year end
1 YUMC/ 百胜中国 The Group 67.6 1.4% 9,200
2 McDonald's/ 麦当劳A multinational QSR brand that entered China in
the 1990s, mainly focused on burgers. 29.0 0.6% ~3,300
3 Haidilao/ 海底捞A domestic Chinese cuisine brand established in
1994. mainly focused on hot pot.23.4 0.5% ~700
4 Starbucks/ 星巴克A multinational chain coffee brand that entered
China in the late 1990s, mainly focused on coffee. 20.3 0.4% ~4,300
5 KDS Burger/ 快乐星汉堡A domestic QSR brand in China established in
2003, mainly focused on burgers10.7 0.2% ~2,600
7 Dec 2020
PLEASE READ THE ANALYST CERTIFICATION AND IMPORTANT DISCLOSURES ON LAST PAGE 7
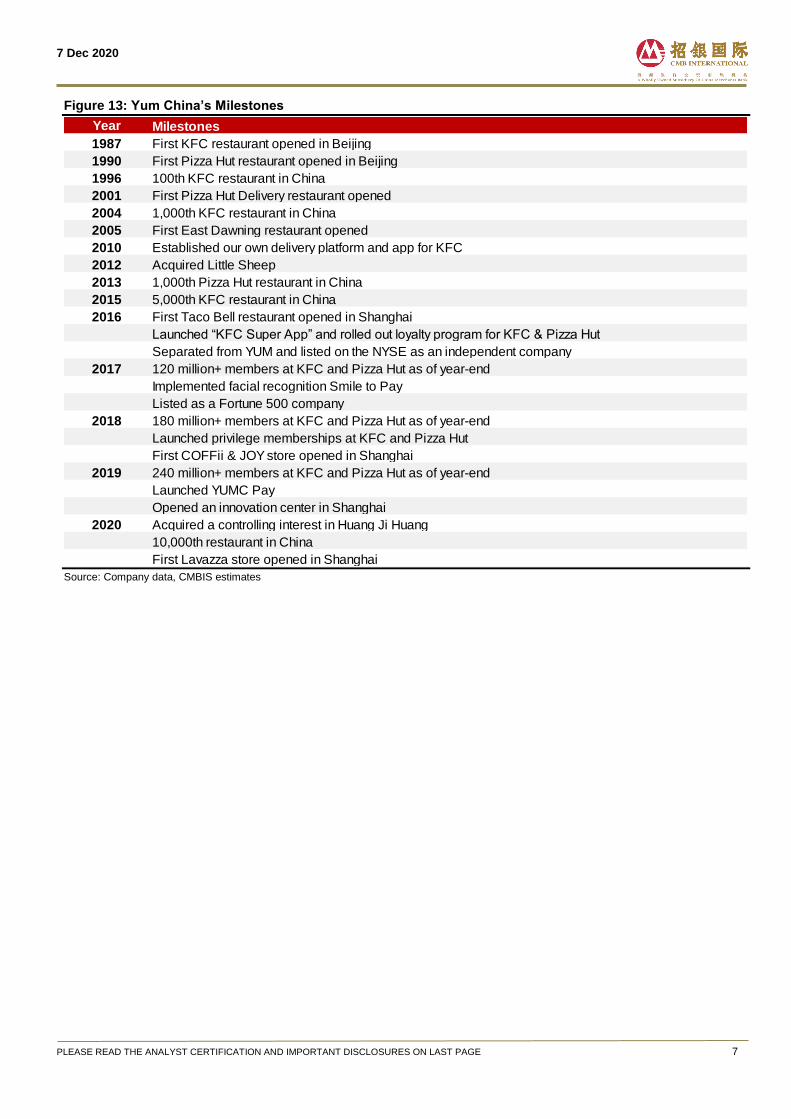
Figure 13: Yum China’s Milestones
Source: Company data, CMBIS estimates
Year Milestones
1987 First KFC restaurant opened in Beijing
1990 First Pizza Hut restaurant opened in Beijing
1996 100th KFC restaurant in China
2001 First Pizza Hut Delivery restaurant opened
2004 1,000th KFC restaurant in China
2005 First East Dawning restaurant opened
2010 Established our own delivery platform and app for KFC
2012 Acquired Little Sheep
2013 1,000th Pizza Hut restaurant in China
2015 5,000th KFC restaurant in China
2016 First Taco Bell restaurant opened in Shanghai
Launched “KFC Super App” and rolled out loyalty program for KFC & Pizza Hut
Separated from YUM and listed on the NYSE as an independent company
2017 120 million+ members at KFC and Pizza Hut as of year-end
Implemented facial recognition Smile to Pay
Listed as a Fortune 500 company
2018 180 million+ members at KFC and Pizza Hut as of year-end
Launched privilege memberships at KFC and Pizza Hut
First COFFii & JOY store opened in Shanghai
2019 240 million+ members at KFC and Pizza Hut as of year-end
Launched YUMC Pay
Opened an innovation center in Shanghai
2020 Acquired a controlling interest in Huang Ji Huang
10,000th restaurant in China
First Lavazza store opened in Shanghai
7 Dec 2020
PLEASE READ THE ANALYST CERTIFICATION AND IMPORTANT DISCLOSURES ON LAST PAGE 8
Company’s key positives and growth drivers
1) Multiple near-term catalysts and too conservative consensus
There are macro positives, such as: 1) healthy recovery of domestic consumption (with the
help from re-shoring), 2) low base, and 3) favourable raw materials trend (e.g. chicken and
pork prices) & less pressure for wage increases. In addition, there are company specific
positives, namely: 1) superior digital and delivery upgrades for seamless O2O customer
experience and 2) ability to secure more and better store locations and rental terms. More
importantly, consensus forecasts are not at all aggressive.
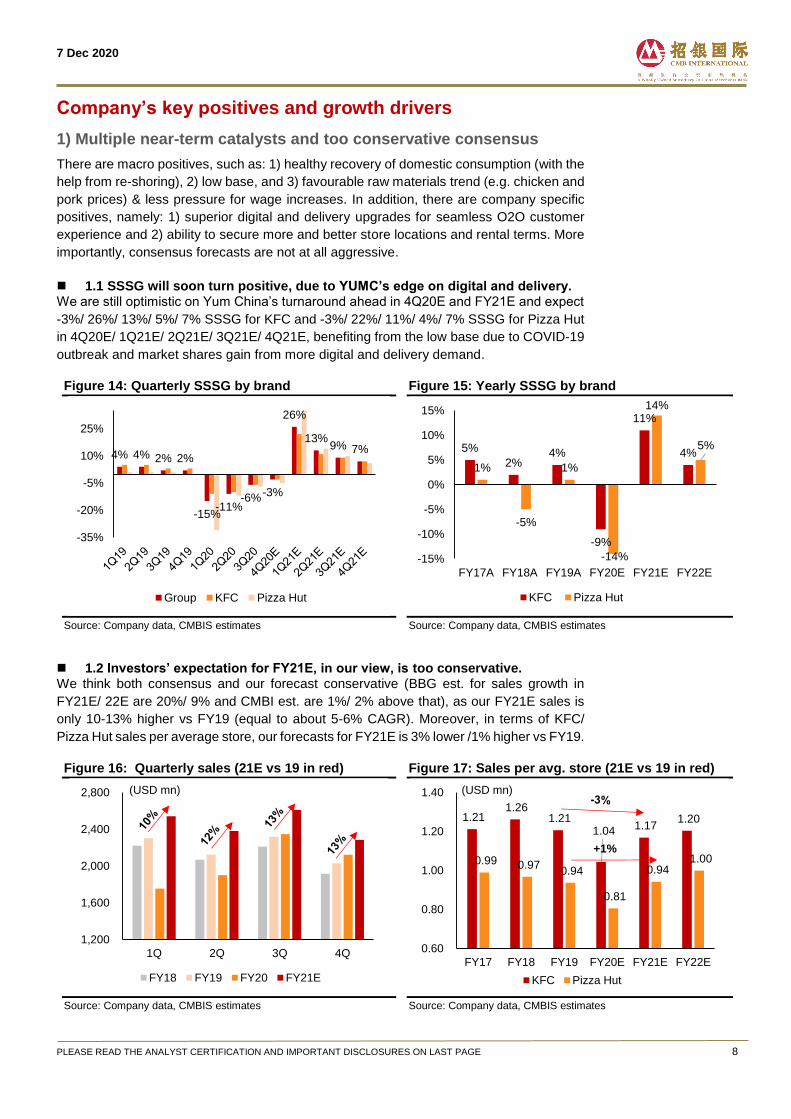
1.1 SSSG will soon turn positive, due to YUMC’s edge on digital and delivery. We are still optimistic on Yum China’s turnaround ahead in 4Q20E and FY21E and expect
-3%/ 26%/ 13%/ 5%/ 7% SSSG for KFC and -3%/ 22%/ 11%/ 4%/ 7% SSSG for Pizza Hut
in 4Q20E/ 1Q21E/ 2Q21E/ 3Q21E/ 4Q21E, benefiting from the low base due to COVID-19
outbreak and market shares gain from more digital and delivery demand.
Figure 14: Quarterly SSSG by brand
Source: Company data, CMBIS estimates
Figure 15: Yearly SSSG by brand
Source: Company data, CMBIS estimates
1.2 Investors’ expectation for FY21E, in our view, is too conservative. We think both consensus and our forecast conservative (BBG est. for sales growth in
FY21E/ 22E are 20%/ 9% and CMBI est. are 1%/ 2% above that), as our FY21E sales is
only 10-13% higher vs FY19 (equal to about 5-6% CAGR). Moreover, in terms of KFC/
Pizza Hut sales per average store, our forecasts for FY21E is 3% lower /1% higher vs FY19.
Figure 16: Quarterly sales (21E vs 19 in red)
Source: Company data, CMBIS estimates
Figure 17: Sales per avg. store (21E vs 19 in red)
Source: Company data, CMBIS estimates
4% 4% 2% 2%
-15%-11%
-6%-3%
26%
13%9% 7%
-35%
-20%
-5%
10%
25%
Group KFC Pizza Hut
5%
2%4%
-9%
11%
4%
1%
-5%
1%
-14%
14%
5%
-15%
-10%
-5%
0%
5%
10%
15%
FY17A FY18A FY19A FY20E FY21E FY22E
KFC Pizza Hut
1,200
1,600
2,000
2,400
2,800
1Q 2Q 3Q 4Q
FY18 FY19 FY20 FY21E
(USD mn)
1.21 1.26
1.21 1.04 1.17
1.20
0.99 0.97 0.94
0.81
0.94 1.00
0.60
0.80
1.00
1.20
1.40
FY17 FY18 FY19 FY20E FY21E FY22E
KFC Pizza Hut
(USD mn)
+1%
7 Dec 2020
PLEASE READ THE ANALYST CERTIFICATION AND IMPORTANT DISCLOSURES ON LAST PAGE 9
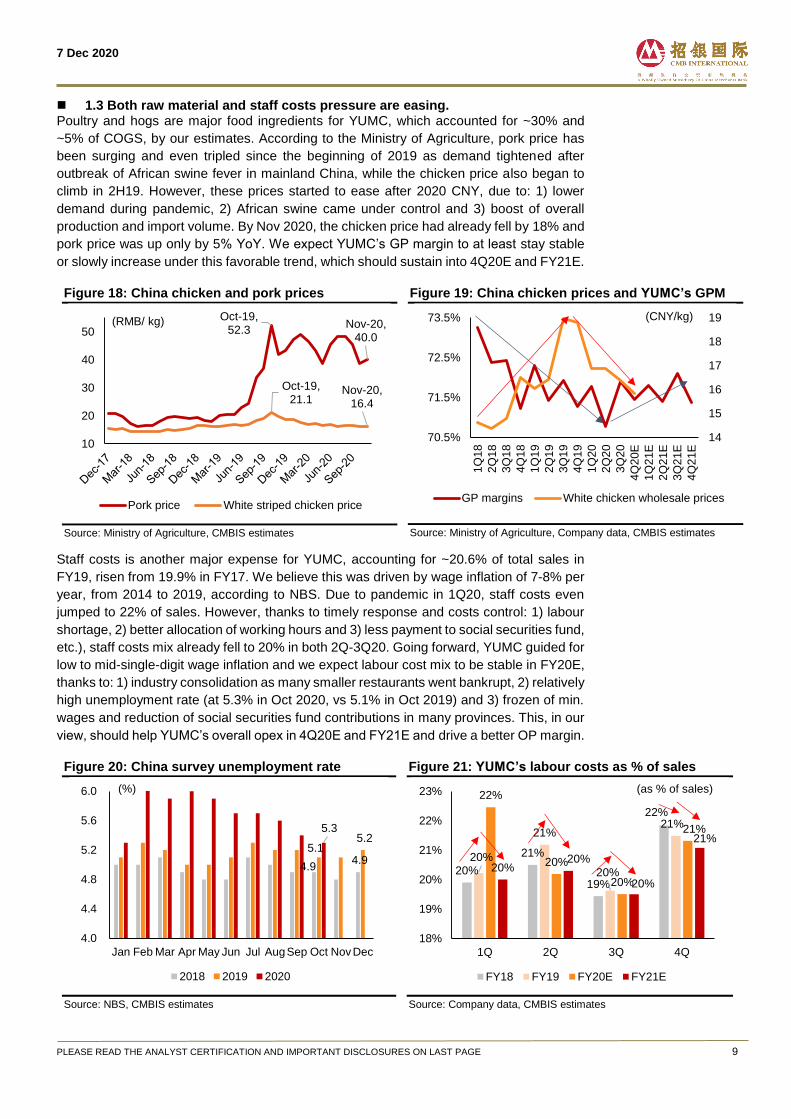
1.3 Both raw material and staff costs pressure are easing. Poultry and hogs are major food ingredients for YUMC, which accounted for ~30% and
~5% of COGS, by our estimates. According to the Ministry of Agriculture, pork price has
been surging and even tripled since the beginning of 2019 as demand tightened after
outbreak of African swine fever in mainland China, while the chicken price also began to
climb in 2H19. However, these prices started to ease after 2020 CNY, due to: 1) lower
demand during pandemic, 2) African swine came under control and 3) boost of overall
production and import volume. By Nov 2020, the chicken price had already fell by 18% and
pork price was up only by 5% YoY. We expect YUMC’s GP margin to at least stay stable
or slowly increase under this favorable trend, which should sustain into 4Q20E and FY21E.
Figure 18: China chicken and pork prices
Source: Ministry of Agriculture, CMBIS estimates
Figure 19: China chicken prices and YUMC’s GPM
Source: Ministry of Agriculture, Company data, CMBIS estimates
Staff costs is another major expense for YUMC, accounting for ~20.6% of total sales in
FY19, risen from 19.9% in FY17. We believe this was driven by wage inflation of 7-8% per
year, from 2014 to 2019, according to NBS. Due to pandemic in 1Q20, staff costs even
jumped to 22% of sales. However, thanks to timely response and costs control: 1) labour
shortage, 2) better allocation of working hours and 3) less payment to social securities fund,
etc.), staff costs mix already fell to 20% in both 2Q-3Q20. Going forward, YUMC guided for
low to mid-single-digit wage inflation and we expect labour cost mix to be stable in FY20E,
thanks to: 1) industry consolidation as many smaller restaurants went bankrupt, 2) relatively
high unemployment rate (at 5.3% in Oct 2020, vs 5.1% in Oct 2019) and 3) frozen of min.
wages and reduction of social securities fund contributions in many provinces. This, in our
view, should help YUMC’s overall opex in 4Q20E and FY21E and drive a better OP margin.
Figure 20: China survey unemployment rate
Source: NBS, CMBIS estimates
Figure 21: YUMC’s labour costs as % of sales
Source: Company data, CMBIS estimates
Oct-19, 52.3
Nov-20, 40.0
Oct-19, 21.1
Nov-20, 16.4
10
20
30
40
50
Pork price White striped chicken price
(RMB/ kg)
14
15
16
17
18
19
70.5%
71.5%
72.5%
73.5%
1Q
18
2Q
18
3Q
18
4Q
18
1Q
19
2Q
19
3Q
19
4Q
19
1Q
20
2Q
20
3Q
20
4Q
20E
1Q
21E
2Q
21E
3Q
21E
4Q
21E
GP margins White chicken wholesale prices
(CNY/kg)
4.9 4.9
5.1 5.2
5.3
4.0
4.4
4.8
5.2
5.6
6.0
Jan Feb Mar Apr May Jun Jul AugSep Oct NovDec
2018 2019 2020
(%)
20%
21%
19%
22%
20%
21%
20%
21%
22%
20%
20%
21%
20%20%
20%
21%
18%
19%
20%
21%
22%
23%
1Q 2Q 3Q 4Q
FY18 FY19 FY20E FY21E
(as % of sales)
7 Dec 2020
PLEASE READ THE ANALYST CERTIFICATION AND IMPORTANT DISCLOSURES ON LAST PAGE 10
2) Digital and delivery upgrades to boost frequency and ASP.
Yum China is the largest restaurant group in China, with massive restaurant network and
enormously large customer base. We believe that this lays the foundation for more
upgrades in both digital and delivery sides, including improvements in: 1) customer
experience (e.g. digital orderings and payments) and convenience (easier delivery), 2)
increase in purchasing frequency as more customers joining as members, 3) upselling the
right product at the right time, thru effective and targeted marketing, and 4) cross-selling
potential between brands, etc. These will drive up both sales volume (customer acquisitions
and purchasing frequency) and ASP (up selling).
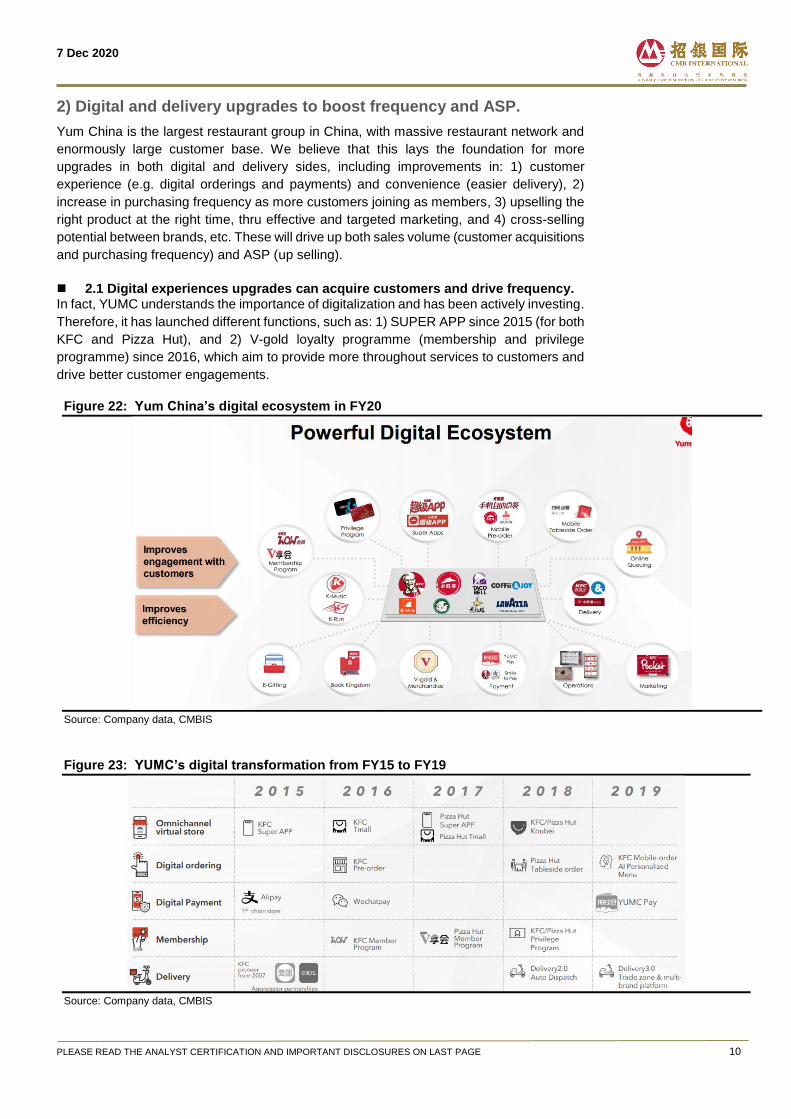
2.1 Digital experiences upgrades can acquire customers and drive frequency. In fact, YUMC understands the importance of digitalization and has been actively investing.
Therefore, it has launched different functions, such as: 1) SUPER APP since 2015 (for both
KFC and Pizza Hut), and 2) V-gold loyalty programme (membership and privilege
programme) since 2016, which aim to provide more throughout services to customers and
drive better customer engagements.
Figure 22: Yum China’s digital ecosystem in FY20
Source: Company data, CMBIS
Figure 23: YUMC’s digital transformation from FY15 to FY19
Source: Company data, CMBIS
7 Dec 2020
PLEASE READ THE ANALYST CERTIFICATION AND IMPORTANT DISCLOSURES ON LAST PAGE 11
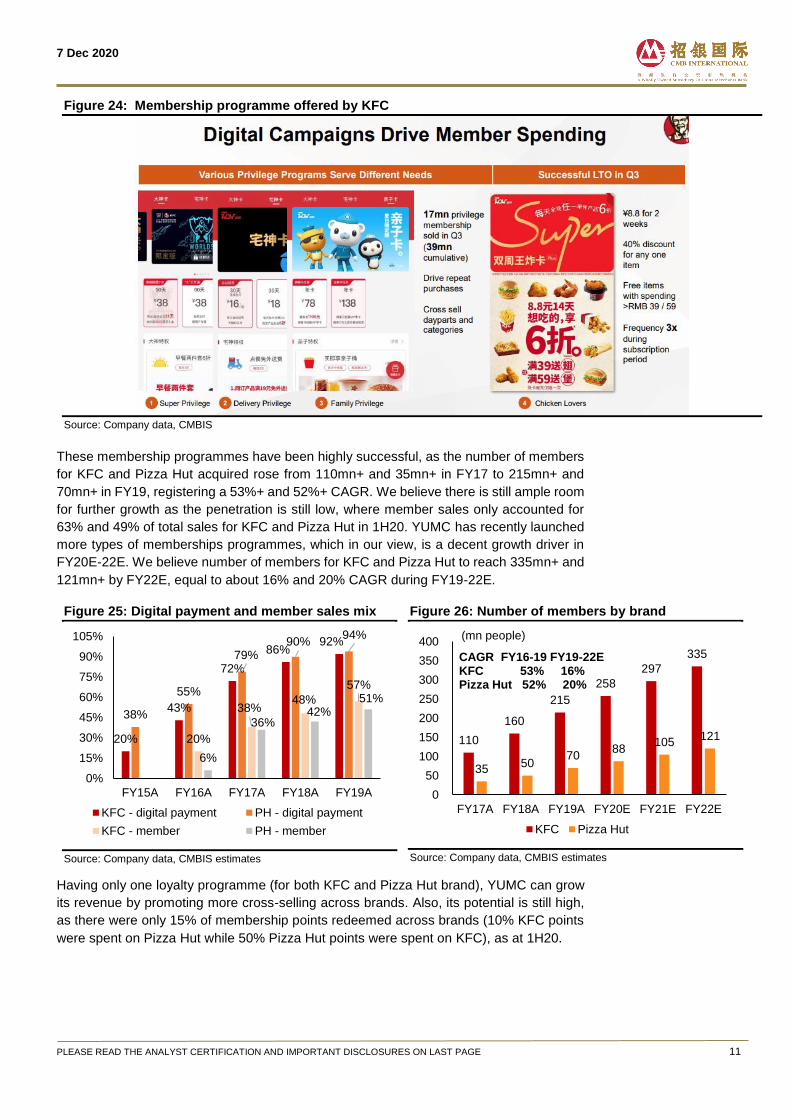
Figure 24: Membership programme offered by KFC
Source: Company data, CMBIS
These membership programmes have been highly successful, as the number of members
for KFC and Pizza Hut acquired rose from 110mn+ and 35mn+ in FY17 to 215mn+ and
70mn+ in FY19, registering a 53%+ and 52%+ CAGR. We believe there is still ample room
for further growth as the penetration is still low, where member sales only accounted for
63% and 49% of total sales for KFC and Pizza Hut in 1H20. YUMC has recently launched
more types of memberships programmes, which in our view, is a decent growth driver in
FY20E-22E. We believe number of members for KFC and Pizza Hut to reach 335mn+ and
121mn+ by FY22E, equal to about 16% and 20% CAGR during FY19-22E.
Figure 25: Digital payment and member sales mix
Source: Company data, CMBIS estimates
Figure 26: Number of members by brand
Source: Company data, CMBIS estimates
Having only one loyalty programme (for both KFC and Pizza Hut brand), YUMC can grow
its revenue by promoting more cross-selling across brands. Also, its potential is still high,
as there were only 15% of membership points redeemed across brands (10% KFC points
were spent on Pizza Hut while 50% Pizza Hut points were spent on KFC), as at 1H20.
20%
43%
72%
86%92%
38%
55%
79%90%
94%
20%
38%48%
57%
6%
36%42%
51%
0%
15%
30%
45%
60%
75%
90%
105%
FY15A FY16A FY17A FY18A FY19A
KFC - digital payment PH - digital payment
KFC - member PH - member
110
160
215
258
297
335
35 50
70 88
105 121
0
50
100
150
200
250
300
350
400
FY17A FY18A FY19A FY20E FY21E FY22E
KFC Pizza Hut
CAGR FY16-19 FY19-22EKFC 53% 16%Pizza Hut 52% 20%
(mn people)
7 Dec 2020
PLEASE READ THE ANALYST CERTIFICATION AND IMPORTANT DISCLOSURES ON LAST PAGE 12
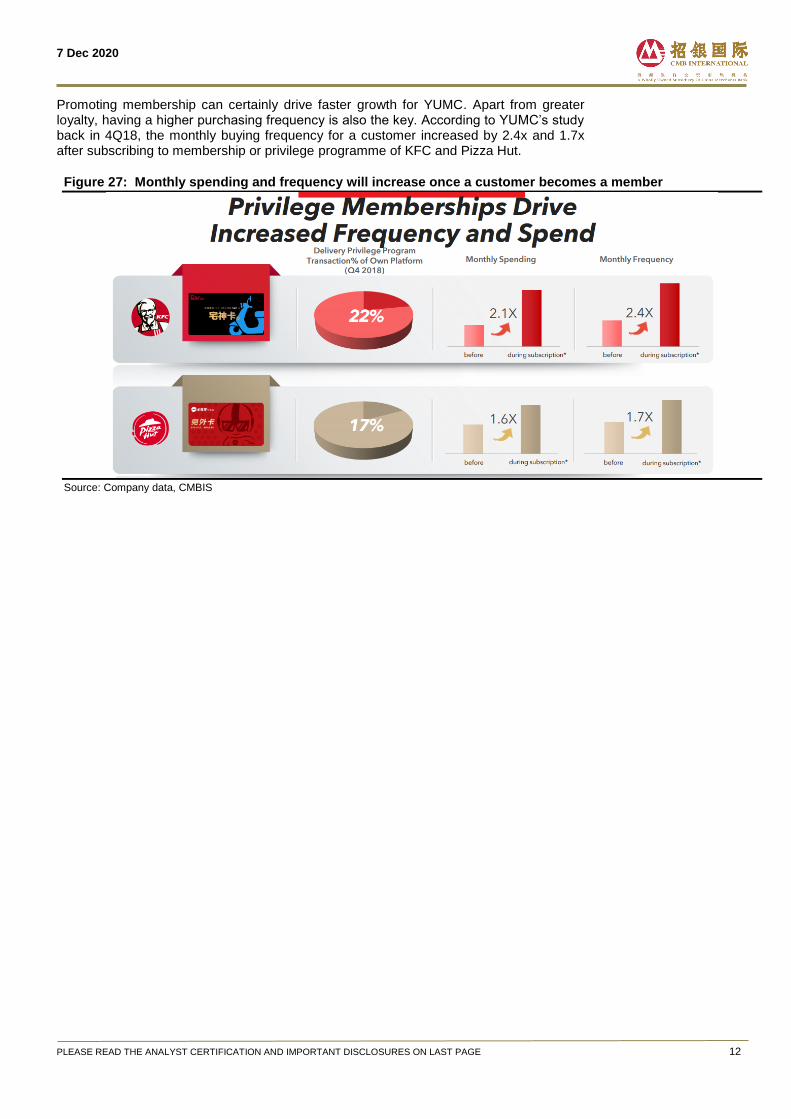
Promoting membership can certainly drive faster growth for YUMC. Apart from greater loyalty, having a higher purchasing frequency is also the key. According to YUMC’s study back in 4Q18, the monthly buying frequency for a customer increased by 2.4x and 1.7x after subscribing to membership or privilege programme of KFC and Pizza Hut.
Figure 27: Monthly spending and frequency will increase once a customer becomes a member
Source: Company data, CMBIS
7 Dec 2020
PLEASE READ THE ANALYST CERTIFICATION AND IMPORTANT DISCLOSURES ON LAST PAGE 13
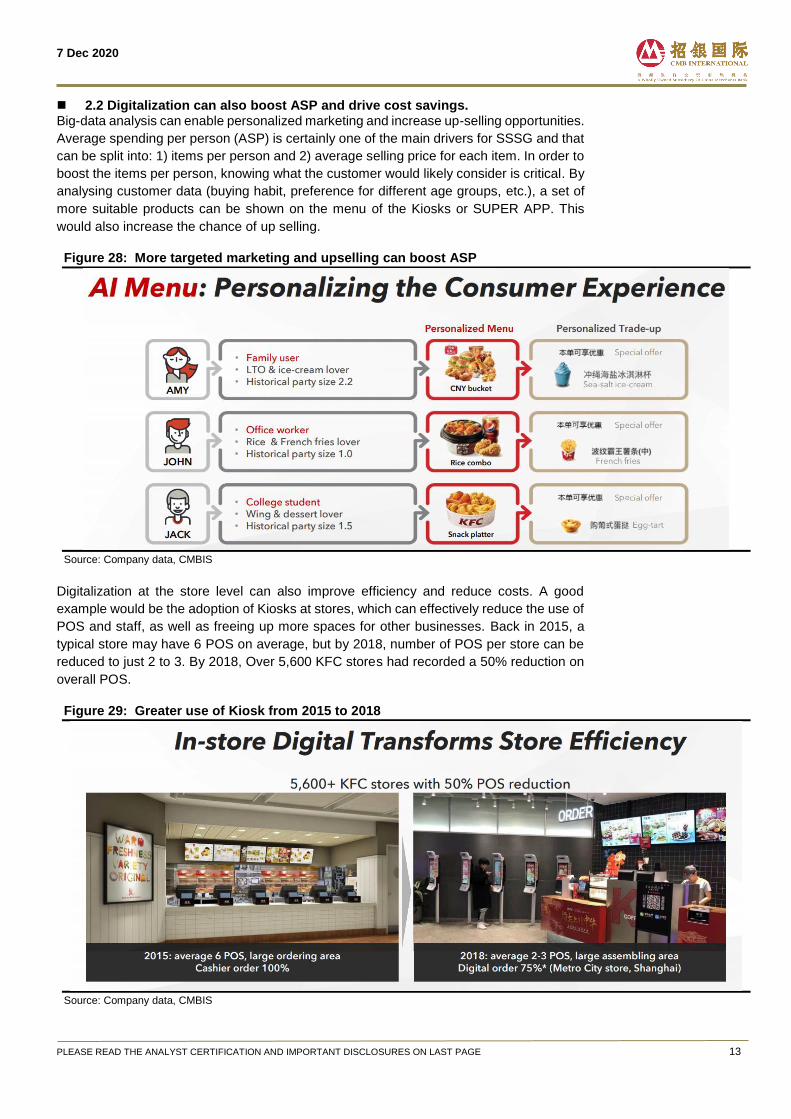
2.2 Digitalization can also boost ASP and drive cost savings. Big-data analysis can enable personalized marketing and increase up-selling opportunities.
Average spending per person (ASP) is certainly one of the main drivers for SSSG and that
can be split into: 1) items per person and 2) average selling price for each item. In order to
boost the items per person, knowing what the customer would likely consider is critical. By
analysing customer data (buying habit, preference for different age groups, etc.), a set of
more suitable products can be shown on the menu of the Kiosks or SUPER APP. This
would also increase the chance of up selling.
Figure 28: More targeted marketing and upselling can boost ASP
Source: Company data, CMBIS
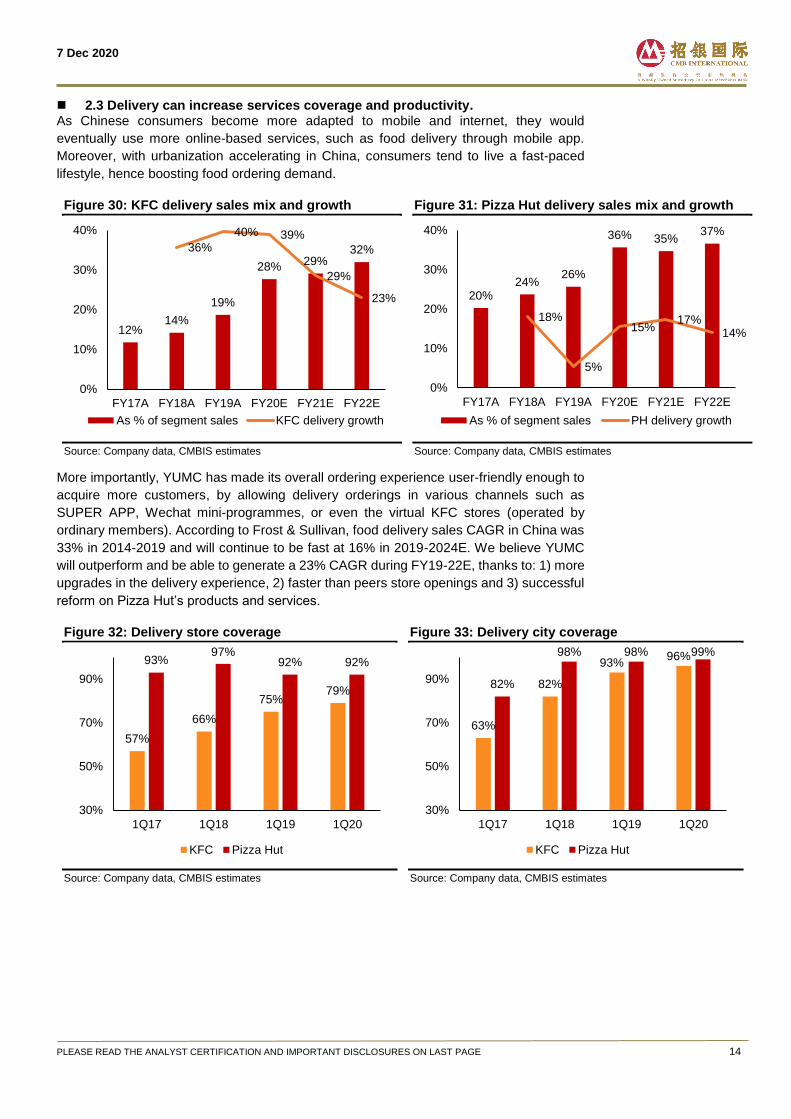
Digitalization at the store level can also improve efficiency and reduce costs. A good
example would be the adoption of Kiosks at stores, which can effectively reduce the use of
POS and staff, as well as freeing up more spaces for other businesses. Back in 2015, a
typical store may have 6 POS on average, but by 2018, number of POS per store can be
reduced to just 2 to 3. By 2018, Over 5,600 KFC stores had recorded a 50% reduction on
overall POS.
Figure 29: Greater use of Kiosk from 2015 to 2018
Source: Company data, CMBIS
7 Dec 2020
PLEASE READ THE ANALYST CERTIFICATION AND IMPORTANT DISCLOSURES ON LAST PAGE 14
2.3 Delivery can increase services coverage and productivity. As Chinese consumers become more adapted to mobile and internet, they would
eventually use more online-based services, such as food delivery through mobile app.
Moreover, with urbanization accelerating in China, consumers tend to live a fast-paced
lifestyle, hence boosting food ordering demand.
Figure 30: KFC delivery sales mix and growth
Source: Company data, CMBIS estimates
Figure 31: Pizza Hut delivery sales mix and growth
Source: Company data, CMBIS estimates
More importantly, YUMC has made its overall ordering experience user-friendly enough to
acquire more customers, by allowing delivery orderings in various channels such as
SUPER APP, Wechat mini-programmes, or even the virtual KFC stores (operated by
ordinary members). According to Frost & Sullivan, food delivery sales CAGR in China was
33% in 2014-2019 and will continue to be fast at 16% in 2019-2024E. We believe YUMC
will outperform and be able to generate a 23% CAGR during FY19-22E, thanks to: 1) more
upgrades in the delivery experience, 2) faster than peers store openings and 3) successful
reform on Pizza Hut’s products and services.
Figure 32: Delivery store coverage
Source: Company data, CMBIS estimates
Figure 33: Delivery city coverage
Source: Company data, CMBIS estimates
12%14%
19%
28% 29%32%36%
40% 39%
29%
23%
0%
10%
20%
30%
40%
FY17A FY18A FY19A FY20E FY21E FY22E
As % of segment sales KFC delivery growth
20%24%
26%
36% 35%37%
18%
5%
15%17%
14%
0%
10%
20%
30%
40%
FY17A FY18A FY19A FY20E FY21E FY22E
As % of segment sales PH delivery growth
57%
66%
75%79%
93%97%
92% 92%
30%
50%
70%
90%
1Q17 1Q18 1Q19 1Q20
KFC Pizza Hut
63%
82%
93%96%
82%
98% 98% 99%
30%
50%
70%
90%
1Q17 1Q18 1Q19 1Q20
KFC Pizza Hut
7 Dec 2020
PLEASE READ THE ANALYST CERTIFICATION AND IMPORTANT DISCLOSURES ON LAST PAGE 15
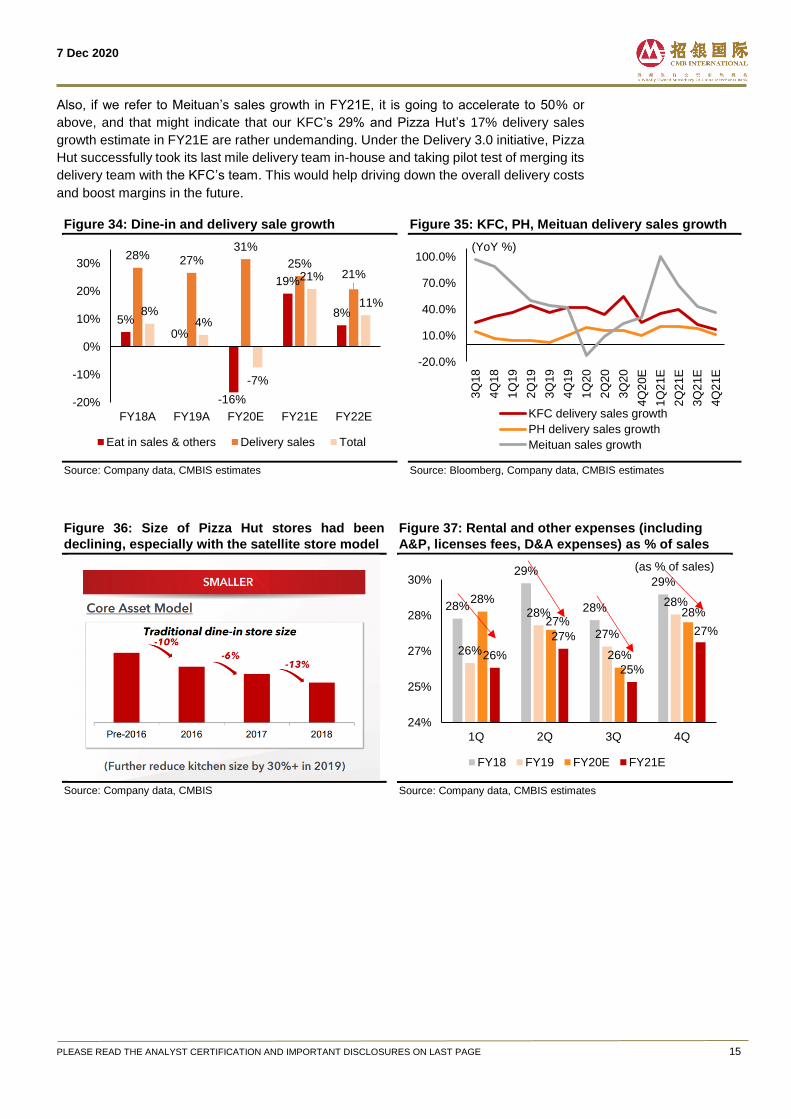
Also, if we refer to Meituan’s sales growth in FY21E, it is going to accelerate to 50% or
above, and that might indicate that our KFC’s 29% and Pizza Hut’s 17% delivery sales
growth estimate in FY21E are rather undemanding. Under the Delivery 3.0 initiative, Pizza
Hut successfully took its last mile delivery team in-house and taking pilot test of merging its
delivery team with the KFC’s team. This would help driving down the overall delivery costs
and boost margins in the future.
Figure 34: Dine-in and delivery sale growth
Source: Company data, CMBIS estimates
Figure 35: KFC, PH, Meituan delivery sales growth
Source: Bloomberg, Company data, CMBIS estimates
Figure 36: Size of Pizza Hut stores had been
declining, especially with the satellite store model
Source: Company data, CMBIS
Figure 37: Rental and other expenses (including
A&P, licenses fees, D&A expenses) as % of sales
Source: Company data, CMBIS estimates
5%
0%
-16%
19%
8%
28% 27%31%
25%21%
8%4%
-7%
21%
11%
-20%
-10%
0%
10%
20%
30%
FY18A FY19A FY20E FY21E FY22E
Eat in sales & others Delivery sales Total
-20.0%
10.0%
40.0%
70.0%
100.0%
3Q
18
4Q
18
1Q
19
2Q
19
3Q
19
4Q
19
1Q
20
2Q
20
3Q
20
4Q
20E
1Q
21E
2Q
21E
3Q
21E
4Q
21E
KFC delivery sales growth
PH delivery sales growth
Meituan sales growth
(YoY %)
28%
29%
28%
29%
26%
28%
27%
28%28%
27%
26%
28%
26%
27%
25%
27%
24%
25%
27%
28%
30%
1Q 2Q 3Q 4Q
FY18 FY19 FY20E FY21E
(as % of sales)
7 Dec 2020
PLEASE READ THE ANALYST CERTIFICATION AND IMPORTANT DISCLOSURES ON LAST PAGE 16
3) Industry leading product quality and Pizza Hut reform
According to customer rating on dianping.com, given KFC’s current product pricing, product
and service quality, its customer satisfaction is the best among the fried chicken brands in
the Tier-1 cities, hence we are confident that KFC can compete effectively and gradually
win shares in the future. Pizza Hut’s transformation is rather successful so far since 2017,
where dine-in traffic started to increase in FY19 after years of decline since FY15. Backed
by 1) menu innovation, 2) return of value for money and 3) store revamp, we remain
confident on a faster growth and better margin in a mid to long term horizon.
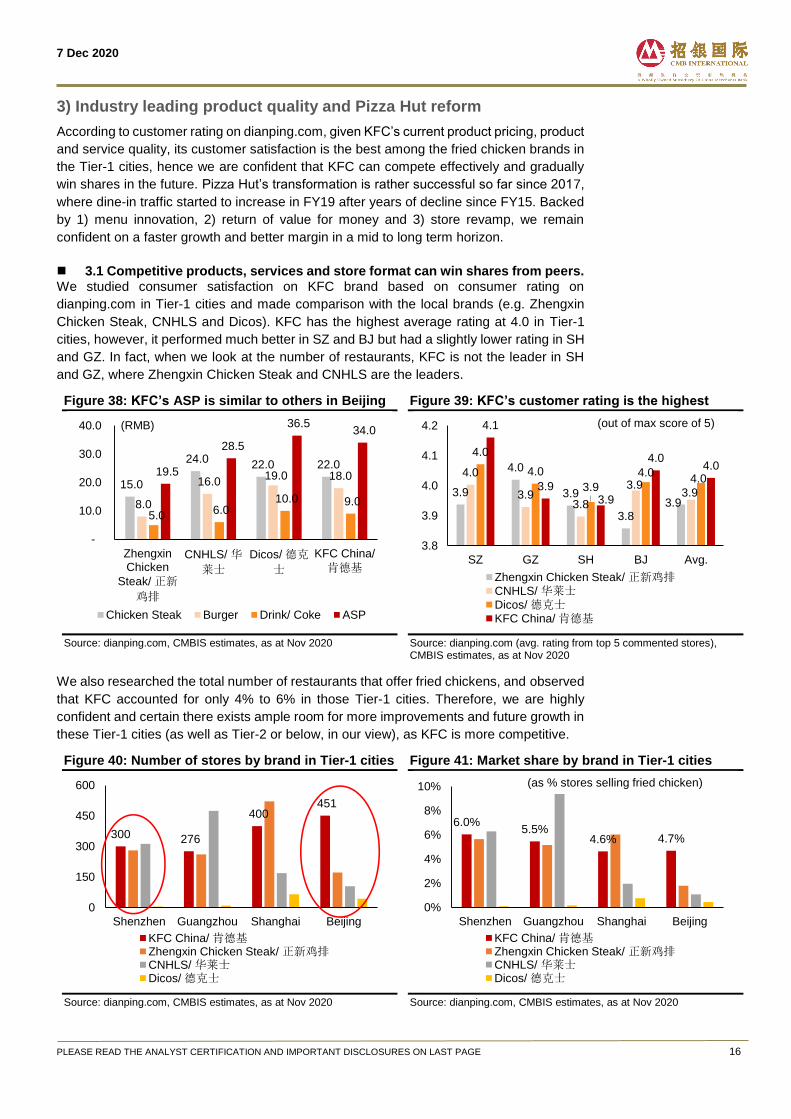
3.1 Competitive products, services and store format can win shares from peers. We studied consumer satisfaction on KFC brand based on consumer rating on
dianping.com in Tier-1 cities and made comparison with the local brands (e.g. Zhengxin
Chicken Steak, CNHLS and Dicos). KFC has the highest average rating at 4.0 in Tier-1
cities, however, it performed much better in SZ and BJ but had a slightly lower rating in SH
and GZ. In fact, when we look at the number of restaurants, KFC is not the leader in SH
and GZ, where Zhengxin Chicken Steak and CNHLS are the leaders.
Figure 38: KFC’s ASP is similar to others in Beijing
Source: dianping.com, CMBIS estimates, as at Nov 2020
Figure 39: KFC’s customer rating is the highest
Source: dianping.com (avg. rating from top 5 commented stores), CMBIS estimates, as at Nov 2020
We also researched the total number of restaurants that offer fried chickens, and observed
that KFC accounted for only 4% to 6% in those Tier-1 cities. Therefore, we are highly
confident and certain there exists ample room for more improvements and future growth in
these Tier-1 cities (as well as Tier-2 or below, in our view), as KFC is more competitive.
Figure 40: Number of stores by brand in Tier-1 cities
Source: dianping.com, CMBIS estimates, as at Nov 2020
Figure 41: Market share by brand in Tier-1 cities
Source: dianping.com, CMBIS estimates, as at Nov 2020
15.0
24.0 22.0 22.0
8.0
16.0 19.0 18.0
5.0 6.0 10.0 9.0
19.5
28.5
36.5 34.0
-
10.0
20.0
30.0
40.0
Zhengxin Chicken
Steak/ 正新
鸡排
CNHLS/ 华
莱士
Dicos/ 德克
士
KFC China/
肯德基
Chicken Steak Burger Drink/ Coke ASP
(RMB)
3.9
4.0
3.9
3.83.9
4.0
3.93.8
3.93.9
4.0
4.0
3.9
4.04.0
4.1
3.93.9
4.04.0
3.8
3.9
4.0
4.1
4.2
SZ GZ SH BJ Avg.
Zhengxin Chicken Steak/ 正新鸡排CNHLS/ 华莱士Dicos/ 德克士KFC China/ 肯德基
(out of max score of 5)
300 276
400 451
0
150
300
450
600
Shenzhen Guangzhou Shanghai Beijing
KFC China/ 肯德基Zhengxin Chicken Steak/ 正新鸡排CNHLS/ 华莱士Dicos/ 德克士
6.0%5.5%
4.6% 4.7%
0%
2%
4%
6%
8%
10%
Shenzhen Guangzhou Shanghai Beijing
KFC China/ 肯德基Zhengxin Chicken Steak/ 正新鸡排CNHLS/ 华莱士Dicos/ 德克士
(as % stores selling fried chicken)
7 Dec 2020
PLEASE READ THE ANALYST CERTIFICATION AND IMPORTANT DISCLOSURES ON LAST PAGE 17
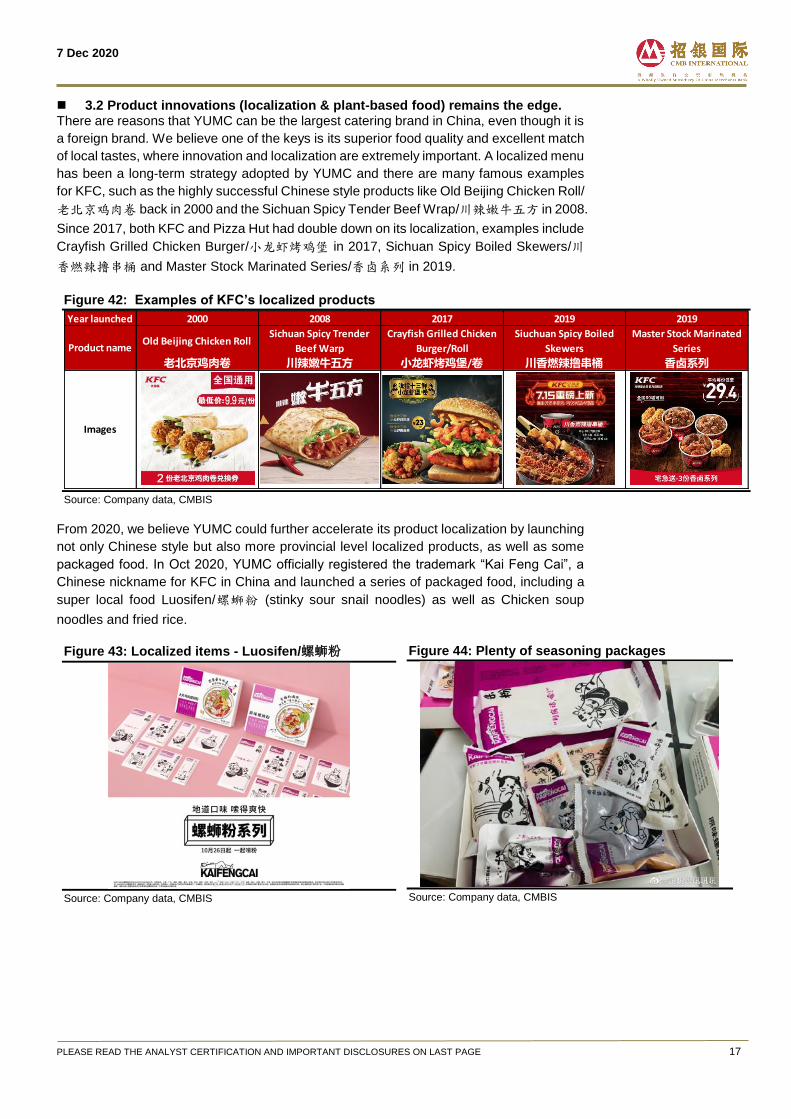
3.2 Product innovations (localization & plant-based food) remains the edge. There are reasons that YUMC can be the largest catering brand in China, even though it is
a foreign brand. We believe one of the keys is its superior food quality and excellent match
of local tastes, where innovation and localization are extremely important. A localized menu
has been a long-term strategy adopted by YUMC and there are many famous examples
for KFC, such as the highly successful Chinese style products like Old Beijing Chicken Roll/
老北京鸡肉卷 back in 2000 and the Sichuan Spicy Tender Beef Wrap/川辣嫩牛五方 in 2008.
Since 2017, both KFC and Pizza Hut had double down on its localization, examples include
Crayfish Grilled Chicken Burger/小龙虾烤鸡堡 in 2017, Sichuan Spicy Boiled Skewers/川
香燃辣撸串桶 and Master Stock Marinated Series/香卤系列 in 2019.
Figure 42: Examples of KFC’s localized products
Source: Company data, CMBIS
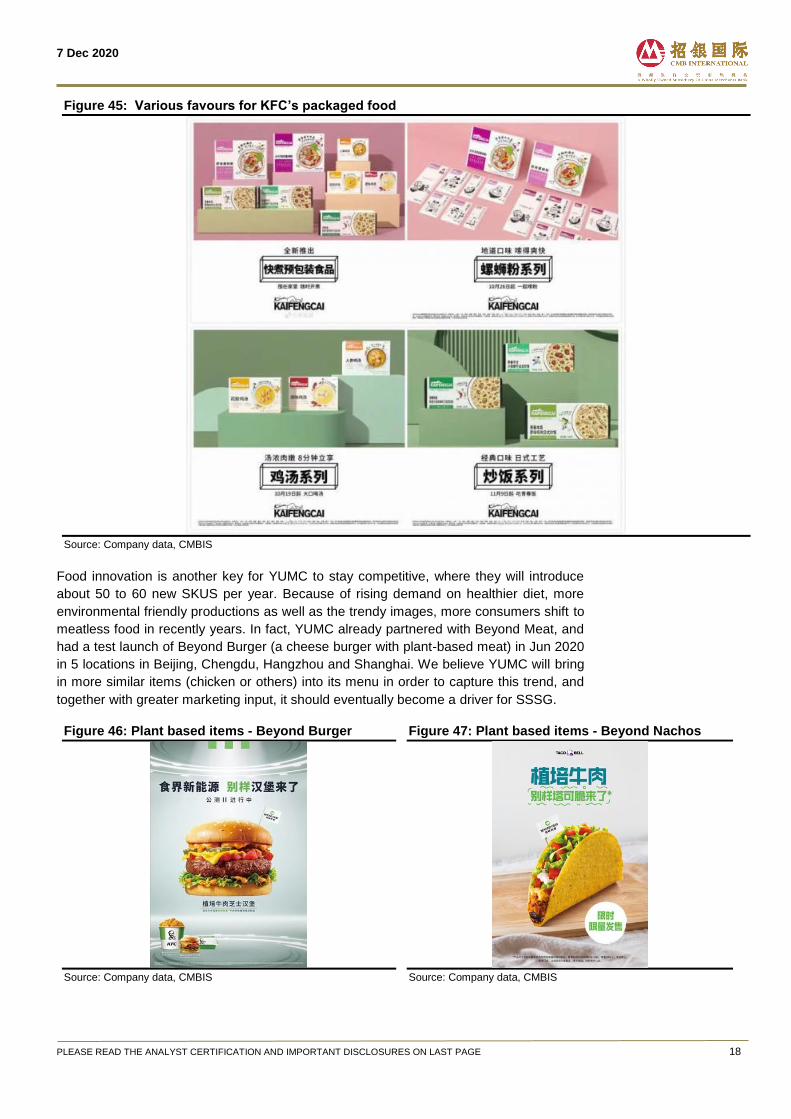
From 2020, we believe YUMC could further accelerate its product localization by launching
not only Chinese style but also more provincial level localized products, as well as some
packaged food. In Oct 2020, YUMC officially registered the trademark “Kai Feng Cai”, a
Chinese nickname for KFC in China and launched a series of packaged food, including a
super local food Luosifen/螺蛳粉 (stinky sour snail noodles) as well as Chicken soup
noodles and fried rice.
Figure 43: Localized items - Luosifen/螺蛳粉
Source: Company data, CMBIS
Figure 44: Plenty of seasoning packages
Source: Company data, CMBIS
Year launched 2000 2008 2017 2019 2019
Old Beijing Chicken RollSichuan Spicy Trender
Beef Warp
Crayfish Grilled Chicken
Burger/Roll
Siuchuan Spicy Boiled
Skewers
Master Stock Marinated
Series
老北京鸡肉卷 川辣嫩牛五方 小龙虾烤鸡堡/卷 川香燃辣撸串桶 香卤系列
Product name
Images
7 Dec 2020
PLEASE READ THE ANALYST CERTIFICATION AND IMPORTANT DISCLOSURES ON LAST PAGE 18
Figure 45: Various favours for KFC’s packaged food
Source: Company data, CMBIS
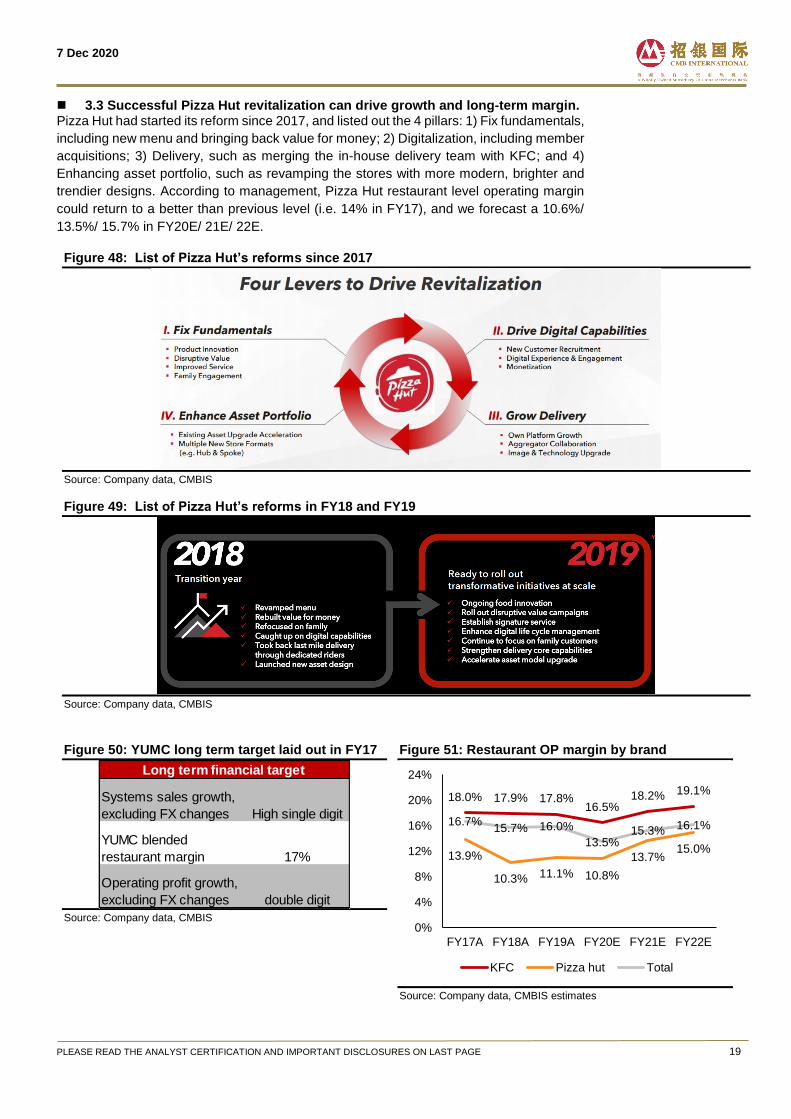
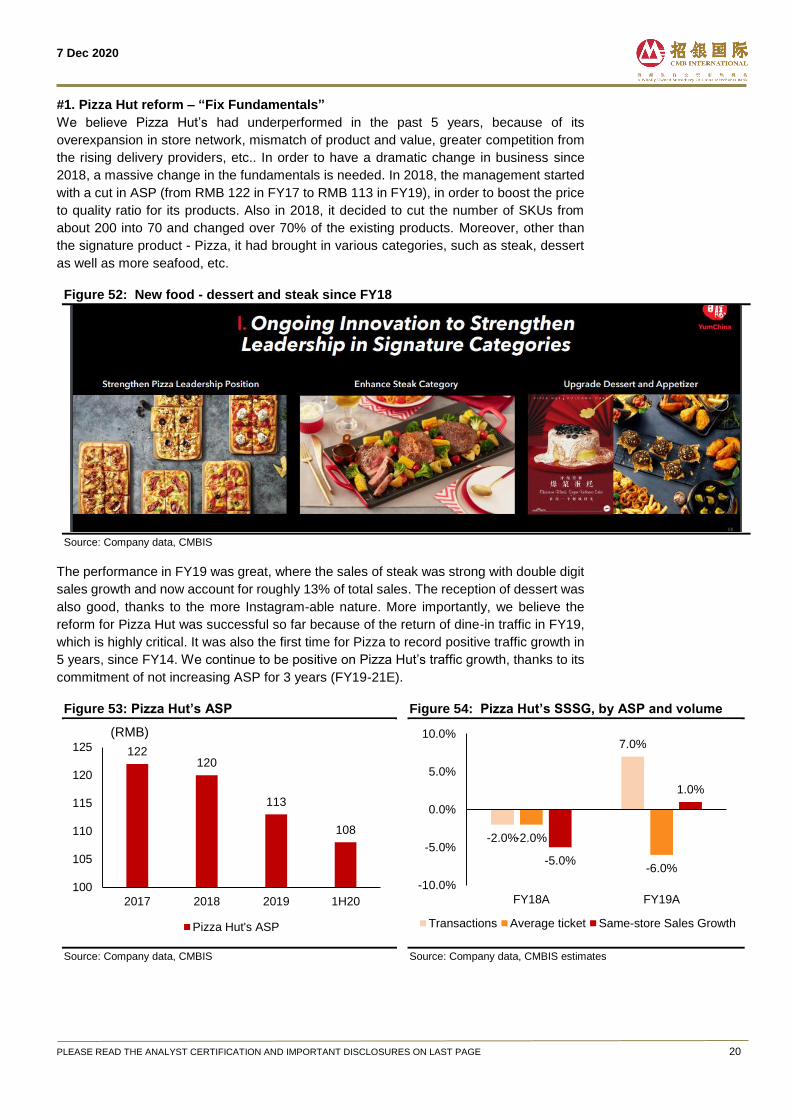
Food innovation is another key for YUMC to stay competitive, where they will introduce
about 50 to 60 new SKUS per year. Because of rising demand on healthier diet, more
environmental friendly productions as well as the trendy images, more consumers shift to
meatless food in recently years. In fact, YUMC already partnered with Beyond Meat, and
had a test launch of Beyond Burger (a cheese burger with plant-based meat) in Jun 2020
in 5 locations in Beijing, Chengdu, Hangzhou and Shanghai. We believe YUMC will bring
in more similar items (chicken or others) into its menu in order to capture this trend, and
together with greater marketing input, it should eventually become a driver for SSSG.
Figure 46: Plant based items - Beyond Burger
Source: Company data, CMBIS
Figure 47: Plant based items - Beyond Nachos
Source: Company data, CMBIS
7 Dec 2020
PLEASE READ THE ANALYST CERTIFICATION AND IMPORTANT DISCLOSURES ON LAST PAGE 19
3.3 Successful Pizza Hut revitalization can drive growth and long-term margin. Pizza Hut had started its reform since 2017, and listed out the 4 pillars: 1) Fix fundamentals,
including new menu and bringing back value for money; 2) Digitalization, including member
acquisitions; 3) Delivery, such as merging the in-house delivery team with KFC; and 4)
Enhancing asset portfolio, such as revamping the stores with more modern, brighter and
trendier designs. According to management, Pizza Hut restaurant level operating margin
could return to a better than previous level (i.e. 14% in FY17), and we forecast a 10.6%/
13.5%/ 15.7% in FY20E/ 21E/ 22E.
Figure 48: List of Pizza Hut’s reforms since 2017
Source: Company data, CMBIS
Figure 49: List of Pizza Hut’s reforms in FY18 and FY19
Source: Company data, CMBIS
Figure 50: YUMC long term target laid out in FY17
Source: Company data, CMBIS
Figure 51: Restaurant OP margin by brand
Source: Company data, CMBIS estimates
Systems sales growth,
excluding FX changes High single digit
YUMC blended
restaurant margin 17%
Operating profit growth,
excluding FX changes double digit
Long term financial target
18.0% 17.9% 17.8%16.5%
18.2% 19.1%
13.9%
10.3% 11.1% 10.8%
13.7%15.0%
16.7%15.7% 16.0%
13.5%15.3% 16.1%
0%
4%
8%
12%
16%
20%
24%
FY17A FY18A FY19A FY20E FY21E FY22E
KFC Pizza hut Total
7 Dec 2020
PLEASE READ THE ANALYST CERTIFICATION AND IMPORTANT DISCLOSURES ON LAST PAGE 20
#1. Pizza Hut reform – “Fix Fundamentals”
We believe Pizza Hut’s had underperformed in the past 5 years, because of its
overexpansion in store network, mismatch of product and value, greater competition from
the rising delivery providers, etc.. In order to have a dramatic change in business since
2018, a massive change in the fundamentals is needed. In 2018, the management started
with a cut in ASP (from RMB 122 in FY17 to RMB 113 in FY19), in order to boost the price
to quality ratio for its products. Also in 2018, it decided to cut the number of SKUs from
about 200 into 70 and changed over 70% of the existing products. Moreover, other than
the signature product - Pizza, it had brought in various categories, such as steak, dessert
as well as more seafood, etc.
Figure 52: New food - dessert and steak since FY18
Source: Company data, CMBIS
The performance in FY19 was great, where the sales of steak was strong with double digit
sales growth and now account for roughly 13% of total sales. The reception of dessert was
also good, thanks to the more Instagram-able nature. More importantly, we believe the
reform for Pizza Hut was successful so far because of the return of dine-in traffic in FY19,
which is highly critical. It was also the first time for Pizza to record positive traffic growth in
5 years, since FY14. We continue to be positive on Pizza Hut’s traffic growth, thanks to its
commitment of not increasing ASP for 3 years (FY19-21E).
Figure 53: Pizza Hut’s ASP
Source: Company data, CMBIS
Figure 54: Pizza Hut’s SSSG, by ASP and volume
Source: Company data, CMBIS estimates
122120
113
108
100
105
110
115
120
125
2017 2018 2019 1H20
Pizza Hut's ASP
(RMB)
-2.0%
7.0%
-2.0%
-6.0%-5.0%
1.0%
-10.0%
-5.0%
0.0%
5.0%
10.0%
FY18A FY19A
Transactions Average ticket Same-store Sales Growth
7 Dec 2020
PLEASE READ THE ANALYST CERTIFICATION AND IMPORTANT DISCLOSURES ON LAST PAGE 21
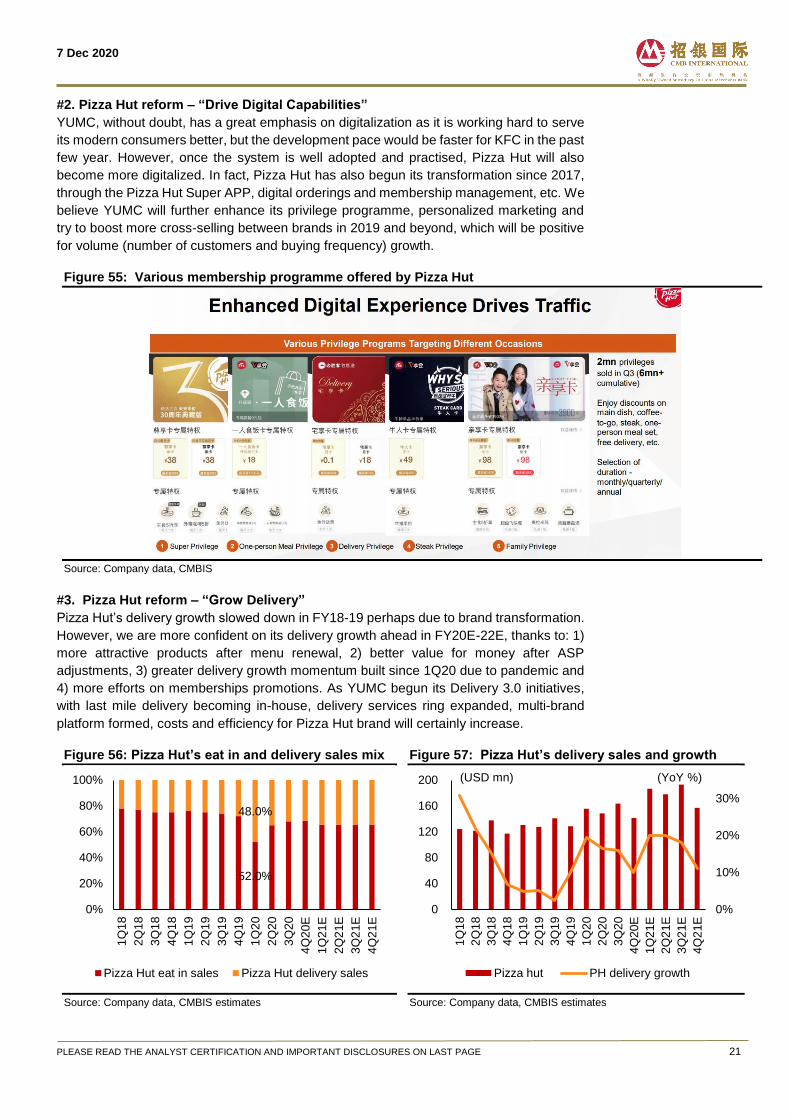
#2. Pizza Hut reform – “Drive Digital Capabilities”
YUMC, without doubt, has a great emphasis on digitalization as it is working hard to serve
its modern consumers better, but the development pace would be faster for KFC in the past
few year. However, once the system is well adopted and practised, Pizza Hut will also
become more digitalized. In fact, Pizza Hut has also begun its transformation since 2017,
through the Pizza Hut Super APP, digital orderings and membership management, etc. We
believe YUMC will further enhance its privilege programme, personalized marketing and
try to boost more cross-selling between brands in 2019 and beyond, which will be positive
for volume (number of customers and buying frequency) growth.
Figure 55: Various membership programme offered by Pizza Hut
Source: Company data, CMBIS
#3. Pizza Hut reform – “Grow Delivery”
Pizza Hut’s delivery growth slowed down in FY18-19 perhaps due to brand transformation.
However, we are more confident on its delivery growth ahead in FY20E-22E, thanks to: 1)
more attractive products after menu renewal, 2) better value for money after ASP
adjustments, 3) greater delivery growth momentum built since 1Q20 due to pandemic and
4) more efforts on memberships promotions. As YUMC begun its Delivery 3.0 initiatives,
with last mile delivery becoming in-house, delivery services ring expanded, multi-brand
platform formed, costs and efficiency for Pizza Hut brand will certainly increase.
Figure 56: Pizza Hut’s eat in and delivery sales mix
Source: Company data, CMBIS estimates
Figure 57: Pizza Hut’s delivery sales and growth
Source: Company data, CMBIS estimates
52.0%
48.0%
0%
20%
40%
60%
80%
100%
1Q
18
2Q
18
3Q
18
4Q
18
1Q
19
2Q
19
3Q
19
4Q
19
1Q
20
2Q
20
3Q
20
4Q
20E
1Q
21E
2Q
21E
3Q
21E
4Q
21E
Pizza Hut eat in sales Pizza Hut delivery sales
0%
10%
20%
30%
0
40
80
120
160
200
1Q
18
2Q
18
3Q
18
4Q
18
1Q
19
2Q
19
3Q
19
4Q
19
1Q
20
2Q
20
3Q
20
4Q
20E
1Q
21E
2Q
21E
3Q
21E
4Q
21E
Pizza hut PH delivery growth
(YoY %)(USD mn)
7 Dec 2020
PLEASE READ THE ANALYST CERTIFICATION AND IMPORTANT DISCLOSURES ON LAST PAGE 22
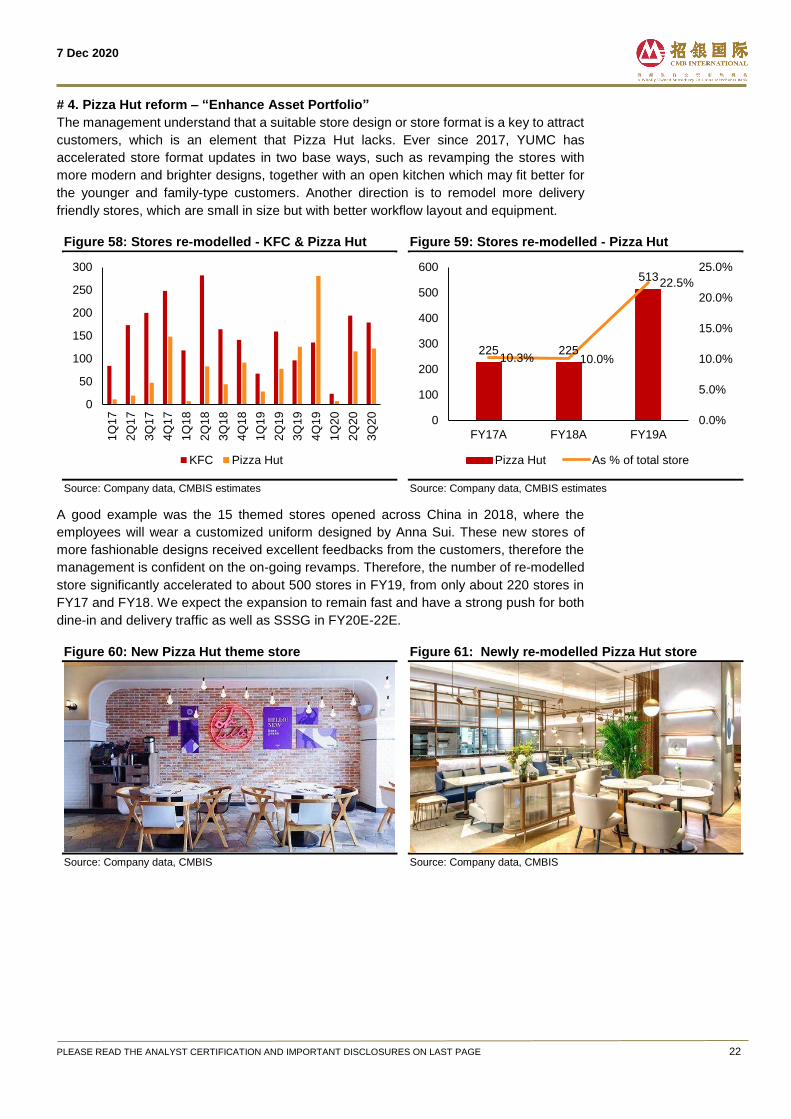
# 4. Pizza Hut reform – “Enhance Asset Portfolio”
The management understand that a suitable store design or store format is a key to attract
customers, which is an element that Pizza Hut lacks. Ever since 2017, YUMC has
accelerated store format updates in two base ways, such as revamping the stores with
more modern and brighter designs, together with an open kitchen which may fit better for
the younger and family-type customers. Another direction is to remodel more delivery
friendly stores, which are small in size but with better workflow layout and equipment.
Figure 58: Stores re-modelled - KFC & Pizza Hut
Source: Company data, CMBIS estimates
Figure 59: Stores re-modelled - Pizza Hut
Source: Company data, CMBIS estimates
A good example was the 15 themed stores opened across China in 2018, where the
employees will wear a customized uniform designed by Anna Sui. These new stores of
more fashionable designs received excellent feedbacks from the customers, therefore the
management is confident on the on-going revamps. Therefore, the number of re-modelled
store significantly accelerated to about 500 stores in FY19, from only about 220 stores in
FY17 and FY18. We expect the expansion to remain fast and have a strong push for both
dine-in and delivery traffic as well as SSSG in FY20E-22E.
Figure 60: New Pizza Hut theme store
Source: Company data, CMBIS
Figure 61: Newly re-modelled Pizza Hut store
Source: Company data, CMBIS
0
50
100
150
200
250
300
1Q
17
2Q
17
3Q
17
4Q
17
1Q
18
2Q
18
3Q
18
4Q
18
1Q
19
2Q
19
3Q
19
4Q
19
1Q
20
2Q
20
3Q
20
KFC Pizza Hut
225 225
513
10.3% 10.0%
22.5%
0.0%
5.0%
10.0%
15.0%
20.0%
25.0%
0
100
200
300
400
500
600
FY17A FY18A FY19A
Pizza Hut As % of total store
7 Dec 2020
PLEASE READ THE ANALYST CERTIFICATION AND IMPORTANT DISCLOSURES ON LAST PAGE 23
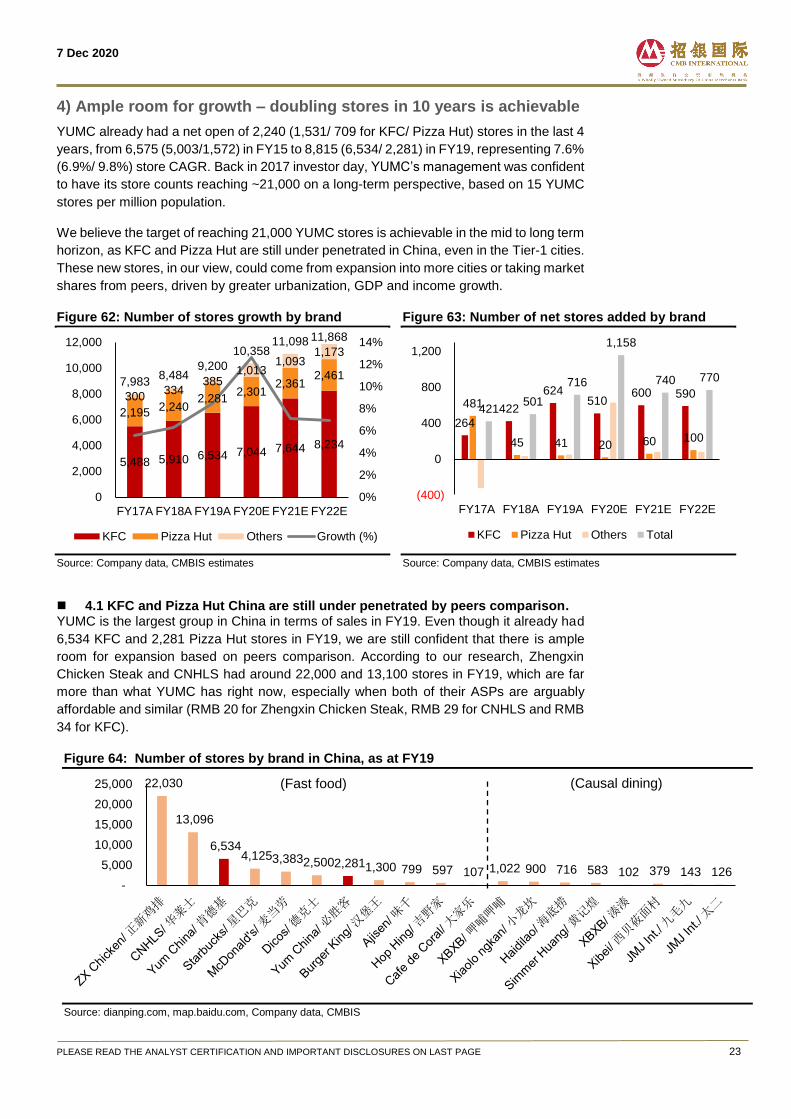
4) Ample room for growth – doubling stores in 10 years is achievable
YUMC already had a net open of 2,240 (1,531/ 709 for KFC/ Pizza Hut) stores in the last 4
years, from 6,575 (5,003/1,572) in FY15 to 8,815 (6,534/ 2,281) in FY19, representing 7.6%
(6.9%/ 9.8%) store CAGR. Back in 2017 investor day, YUMC’s management was confident
to have its store counts reaching ~21,000 on a long-term perspective, based on 15 YUMC
stores per million population.
We believe the target of reaching 21,000 YUMC stores is achievable in the mid to long term
horizon, as KFC and Pizza Hut are still under penetrated in China, even in the Tier-1 cities.
These new stores, in our view, could come from expansion into more cities or taking market
shares from peers, driven by greater urbanization, GDP and income growth.
Figure 62: Number of stores growth by brand
Source: Company data, CMBIS estimates
Figure 63: Number of net stores added by brand
Source: Company data, CMBIS estimates
4.1 KFC and Pizza Hut China are still under penetrated by peers comparison. YUMC is the largest group in China in terms of sales in FY19. Even though it already had
6,534 KFC and 2,281 Pizza Hut stores in FY19, we are still confident that there is ample
room for expansion based on peers comparison. According to our research, Zhengxin
Chicken Steak and CNHLS had around 22,000 and 13,100 stores in FY19, which are far
more than what YUMC has right now, especially when both of their ASPs are arguably
affordable and similar (RMB 20 for Zhengxin Chicken Steak, RMB 29 for CNHLS and RMB
34 for KFC).
Figure 64: Number of stores by brand in China, as at FY19
Source: dianping.com, map.baidu.com, Company data, CMBIS
5,488 5,910 6,534 7,044 7,644 8,234
2,195 2,240
2,281 2,301
2,361 2,461
300 334
385 1,013
1,093 1,173
7,983 8,484
9,200
10,358 11,098 11,868
0%
2%
4%
6%
8%
10%
12%
14%
0
2,000
4,000
6,000
8,000
10,000
12,000
FY17A FY18A FY19A FY20E FY21E FY22E
KFC Pizza Hut Others Growth (%)
264
422
624 510
600 590 481
45 41 20 60 100
421 501
716
1,158
740 770
(400)
0
400
800
1,200
FY17A FY18A FY19A FY20E FY21E FY22E
KFC Pizza Hut Others Total
22,030
13,096
6,534 4,125 3,383 2,500 2,281 1,300 799 597 107 1,022 900 716 583 102 379 143 126
-
5,000
10,000
15,000
20,000
25,000 (Fast food) (Causal dining)
7 Dec 2020
PLEASE READ THE ANALYST CERTIFICATION AND IMPORTANT DISCLOSURES ON LAST PAGE 24
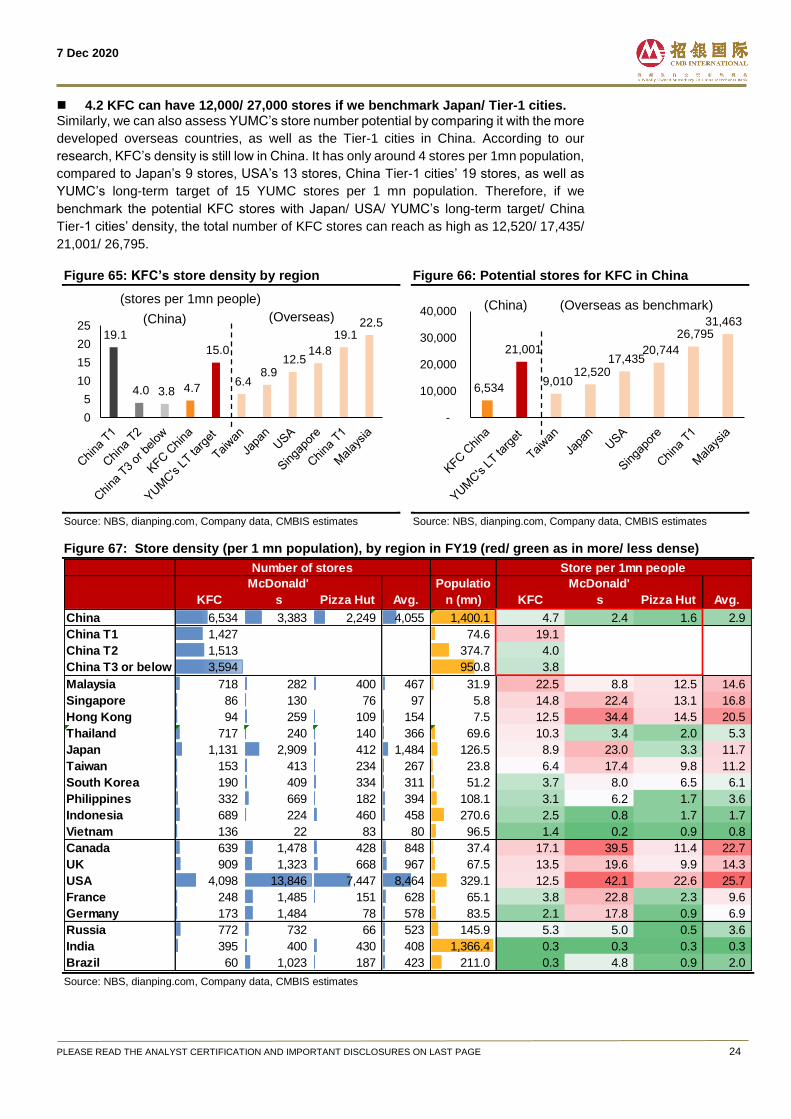
4.2 KFC can have 12,000/ 27,000 stores if we benchmark Japan/ Tier-1 cities. Similarly, we can also assess YUMC’s store number potential by comparing it with the more
developed overseas countries, as well as the Tier-1 cities in China. According to our
research, KFC’s density is still low in China. It has only around 4 stores per 1mn population,
compared to Japan’s 9 stores, USA’s 13 stores, China Tier-1 cities’ 19 stores, as well as
YUMC’s long-term target of 15 YUMC stores per 1 mn population. Therefore, if we
benchmark the potential KFC stores with Japan/ USA/ YUMC’s long-term target/ China
Tier-1 cities’ density, the total number of KFC stores can reach as high as 12,520/ 17,435/
21,001/ 26,795.
Figure 65: KFC’s store density by region
Source: NBS, dianping.com, Company data, CMBIS estimates
Figure 66: Potential stores for KFC in China
Source: NBS, dianping.com, Company data, CMBIS estimates
Figure 67: Store density (per 1 mn population), by region in FY19 (red/ green as in more/ less dense)
Source: NBS, dianping.com, Company data, CMBIS estimates
19.1
4.0 3.8 4.7
15.0
6.4 8.9
12.5 14.8
19.1 22.5
0
5
10
15
20
25
(stores per 1mn people)
(China) (Overseas)
6,534
21,001
9,010 12,520
17,435 20,744
26,795 31,463
-
10,000
20,000
30,000
40,000 (China) (Overseas as benchmark)
KFC
McDonald'
s Pizza Hut Avg.
Populatio
n (mn) KFC
McDonald'
s Pizza Hut Avg.
China 6,534 3,383 2,249 4,055 1,400.1 4.7 2.4 1.6 2.9
China T1 1,427 74.6 19.1
China T2 1,513 374.7 4.0
China T3 or below 3,594 950.8 3.8
Malaysia 718 282 400 467 31.9 22.5 8.8 12.5 14.6
Singapore 86 130 76 97 5.8 14.8 22.4 13.1 16.8
Hong Kong 94 259 109 154 7.5 12.5 34.4 14.5 20.5
Thailand 717 240 140 366 69.6 10.3 3.4 2.0 5.3
Japan 1,131 2,909 412 1,484 126.5 8.9 23.0 3.3 11.7
Taiwan 153 413 234 267 23.8 6.4 17.4 9.8 11.2
South Korea 190 409 334 311 51.2 3.7 8.0 6.5 6.1
Philippines 332 669 182 394 108.1 3.1 6.2 1.7 3.6
Indonesia 689 224 460 458 270.6 2.5 0.8 1.7 1.7
Vietnam 136 22 83 80 96.5 1.4 0.2 0.9 0.8
Canada 639 1,478 428 848 37.4 17.1 39.5 11.4 22.7
UK 909 1,323 668 967 67.5 13.5 19.6 9.9 14.3
USA 4,098 13,846 7,447 8,464 329.1 12.5 42.1 22.6 25.7
France 248 1,485 151 628 65.1 3.8 22.8 2.3 9.6
Germany 173 1,484 78 578 83.5 2.1 17.8 0.9 6.9
Russia 772 732 66 523 145.9 5.3 5.0 0.5 3.6
India 395 400 430 408 1,366.4 0.3 0.3 0.3 0.3
Brazil 60 1,023 187 423 211.0 0.3 4.8 0.9 2.0
Number of stores Store per 1mn people
7 Dec 2020
PLEASE READ THE ANALYST CERTIFICATION AND IMPORTANT DISCLOSURES ON LAST PAGE 25
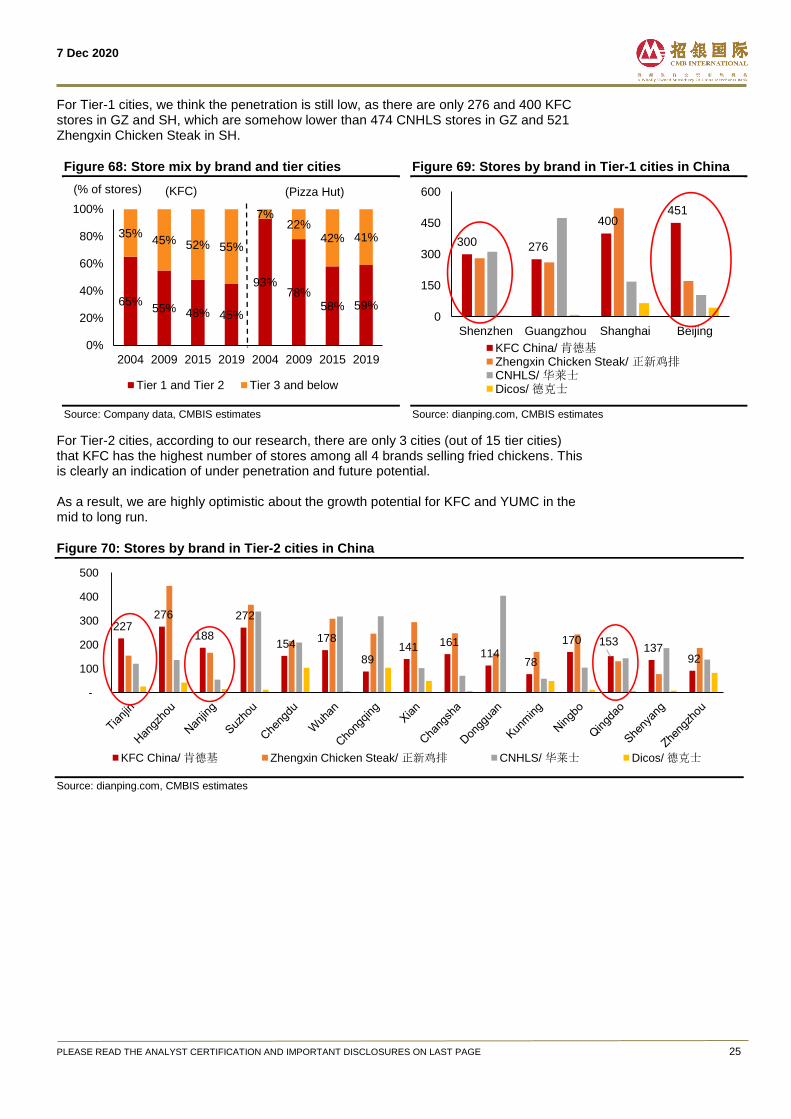
For Tier-1 cities, we think the penetration is still low, as there are only 276 and 400 KFC stores in GZ and SH, which are somehow lower than 474 CNHLS stores in GZ and 521 Zhengxin Chicken Steak in SH.
Figure 68: Store mix by brand and tier cities
Source: Company data, CMBIS estimates
Figure 69: Stores by brand in Tier-1 cities in China
Source: dianping.com, CMBIS estimates
For Tier-2 cities, according to our research, there are only 3 cities (out of 15 tier cities) that KFC has the highest number of stores among all 4 brands selling fried chickens. This is clearly an indication of under penetration and future potential. As a result, we are highly optimistic about the growth potential for KFC and YUMC in the mid to long run.
Figure 70: Stores by brand in Tier-2 cities in China
Source: dianping.com, CMBIS estimates
65%55% 48% 45%
93%78%
58% 59%
35%45% 52% 55%
7%22%
42% 41%
0%
20%
40%
60%
80%
100%
2004 2009 2015 2019 2004 2009 2015 2019
Tier 1 and Tier 2 Tier 3 and below
(KFC) (Pizza Hut)(% of stores)
300 276
400 451
0
150
300
450
600
Shenzhen Guangzhou Shanghai Beijing
KFC China/ 肯德基Zhengxin Chicken Steak/ 正新鸡排CNHLS/ 华莱士Dicos/ 德克士
227 276
188
272
154 178
89 141 161
114 78
170 153 137
92
-
100
200
300
400
500
KFC China/ 肯德基 Zhengxin Chicken Steak/ 正新鸡排 CNHLS/ 华莱士 Dicos/ 德克士
7 Dec 2020
PLEASE READ THE ANALYST CERTIFICATION AND IMPORTANT DISCLOSURES ON LAST PAGE 26
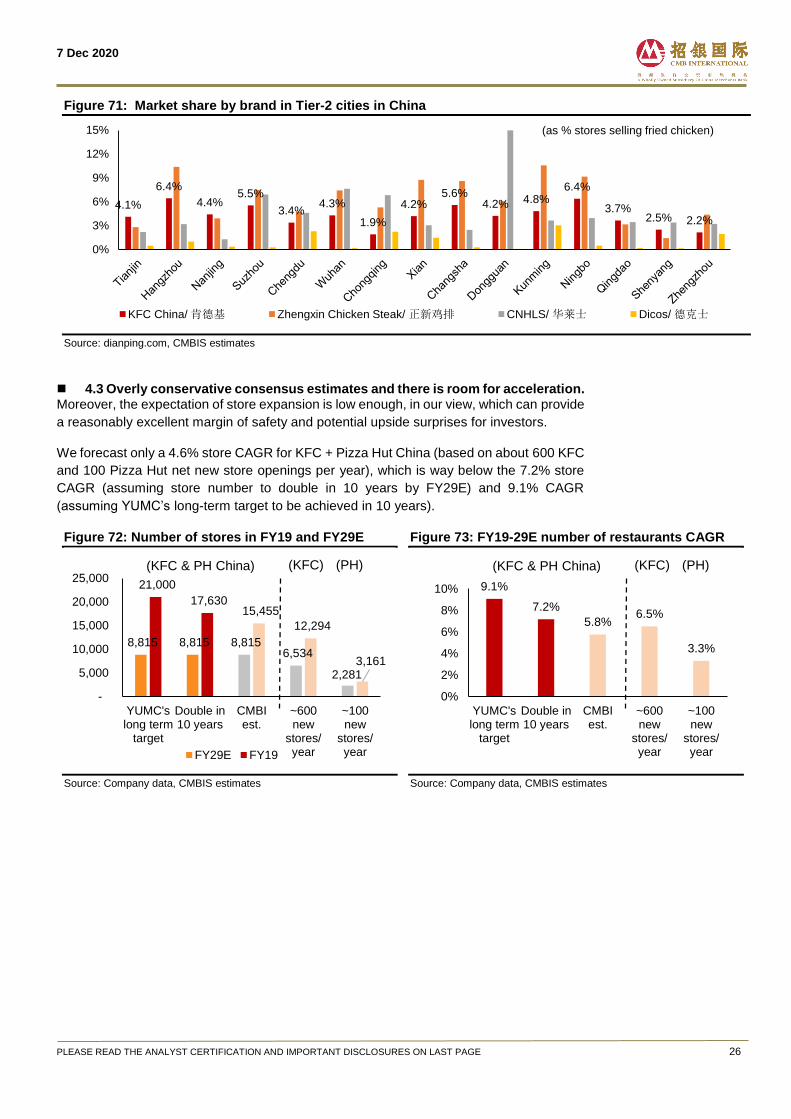
Figure 71: Market share by brand in Tier-2 cities in China
Source: dianping.com, CMBIS estimates
4.3 Overly conservative consensus estimates and there is room for acceleration. Moreover, the expectation of store expansion is low enough, in our view, which can provide
a reasonably excellent margin of safety and potential upside surprises for investors.
We forecast only a 4.6% store CAGR for KFC + Pizza Hut China (based on about 600 KFC
and 100 Pizza Hut net new store openings per year), which is way below the 7.2% store
CAGR (assuming store number to double in 10 years by FY29E) and 9.1% CAGR
(assuming YUMC’s long-term target to be achieved in 10 years).
Figure 72: Number of stores in FY19 and FY29E
Source: Company data, CMBIS estimates
Figure 73: FY19-29E number of restaurants CAGR
Source: Company data, CMBIS estimates
4.1%
6.4%
4.4%5.5%
3.4%4.3%
1.9%
4.2%5.6%
4.2% 4.8%6.4%
3.7%2.5% 2.2%
0%
3%
6%
9%
12%
15%
KFC China/ 肯德基 Zhengxin Chicken Steak/ 正新鸡排 CNHLS/ 华莱士 Dicos/ 德克士
(as % stores selling fried chicken)
8,815 8,815 8,815 6,534
2,281
21,000
17,630 15,455
12,294
3,161
-
5,000
10,000
15,000
20,000
25,000
YUMC'slong term
target
Double in10 years
CMBIest.
~600new
stores/year
~100new
stores/yearFY29E FY19
(KFC & PH China) (KFC) (PH)
9.1%
7.2%
5.8%6.5%
3.3%
0%
2%
4%
6%
8%
10%
YUMC'slong term
target
Double in10 years
CMBIest.
~600new
stores/year
~100new
stores/year
(KFC & PH China) (KFC) (PH)
7 Dec 2020
PLEASE READ THE ANALYST CERTIFICATION AND IMPORTANT DISCLOSURES ON LAST PAGE 27
Industry Analysis
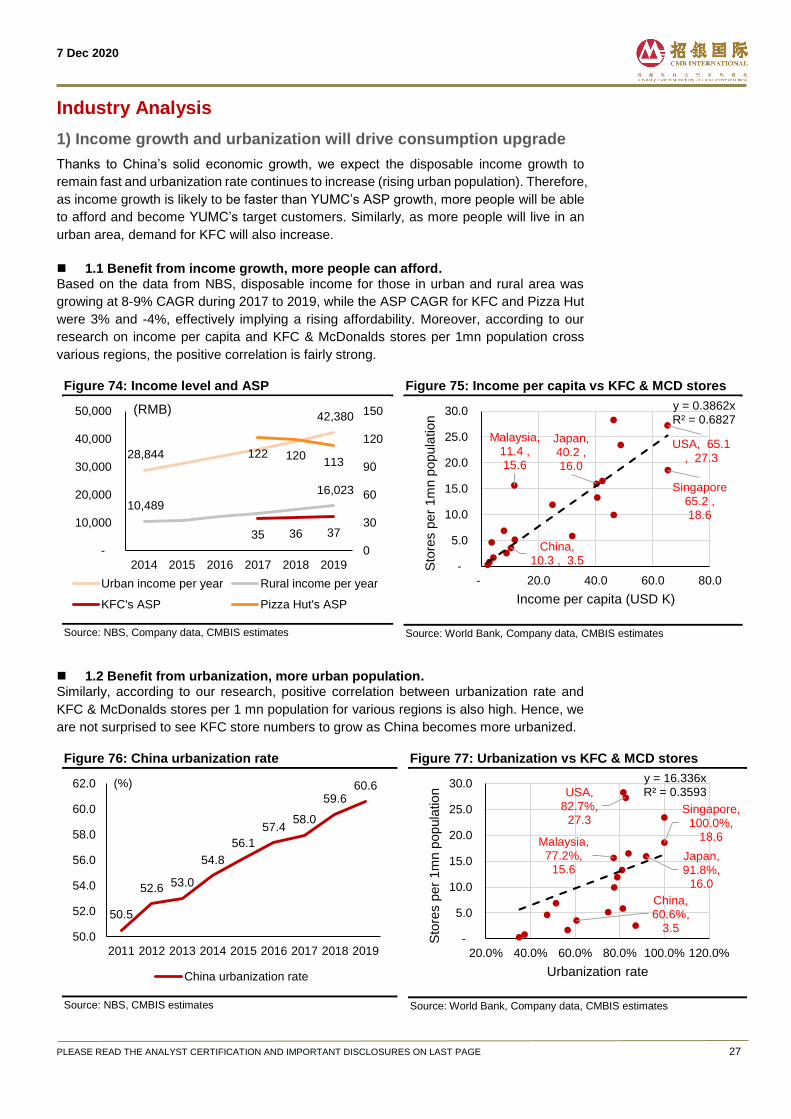
1) Income growth and urbanization will drive consumption upgrade
Thanks to China’s solid economic growth, we expect the disposable income growth to
remain fast and urbanization rate continues to increase (rising urban population). Therefore,
as income growth is likely to be faster than YUMC’s ASP growth, more people will be able
to afford and become YUMC’s target customers. Similarly, as more people will live in an
urban area, demand for KFC will also increase.
1.1 Benefit from income growth, more people can afford. Based on the data from NBS, disposable income for those in urban and rural area was
growing at 8-9% CAGR during 2017 to 2019, while the ASP CAGR for KFC and Pizza Hut
were 3% and -4%, effectively implying a rising affordability. Moreover, according to our
research on income per capita and KFC & McDonalds stores per 1mn population cross
various regions, the positive correlation is fairly strong.
Figure 74: Income level and ASP
Source: NBS, Company data, CMBIS estimates
Figure 75: Income per capita vs KFC & MCD stores
Source: World Bank, Company data, CMBIS estimates
1.2 Benefit from urbanization, more urban population. Similarly, according to our research, positive correlation between urbanization rate and
KFC & McDonalds stores per 1 mn population for various regions is also high. Hence, we
are not surprised to see KFC store numbers to grow as China becomes more urbanized.
Figure 76: China urbanization rate
Source: NBS, CMBIS estimates
Figure 77: Urbanization vs KFC & MCD stores
Source: World Bank, Company data, CMBIS estimates
28,844
42,380
10,489
16,023
35 36 37
122 120113
0
30
60
90
120
150
-
10,000
20,000
30,000
40,000
50,000
2014 2015 2016 2017 2018 2019
Urban income per year Rural income per year
KFC's ASP Pizza Hut's ASP
(RMB)
China, 10.3 , 3.5
Singapore65.2 , 18.6
Japan,40.2 , 16.0
Malaysia,11.4 , 15.6
USA, 65.1 , 27.3
y = 0.3862xR² = 0.6827
-
5.0
10.0
15.0
20.0
25.0
30.0
- 20.0 40.0 60.0 80.0
Sto
res p
er
1m
n p
op
ula
tio
n
Income per capita (USD K)
50.5
52.653.0
54.8
56.1
57.458.0
59.660.6
50.0
52.0
54.0
56.0
58.0
60.0
62.0
2011 2012 2013 2014 2015 2016 2017 2018 2019
China urbanization rate
(%)
China, 60.6%,
3.5
Singapore,100.0%,
18.6
Japan, 91.8%,
16.0
Malaysia,77.2%,
15.6
USA, 82.7%,
27.3
y = 16.336xR² = 0.3593
-
5.0
10.0
15.0
20.0
25.0
30.0
20.0% 40.0% 60.0% 80.0% 100.0% 120.0%
Sto
res p
er
1m
n p
op
ula
tio
n
Urbanization rate
7 Dec 2020
PLEASE READ THE ANALYST CERTIFICATION AND IMPORTANT DISCLOSURES ON LAST PAGE 28
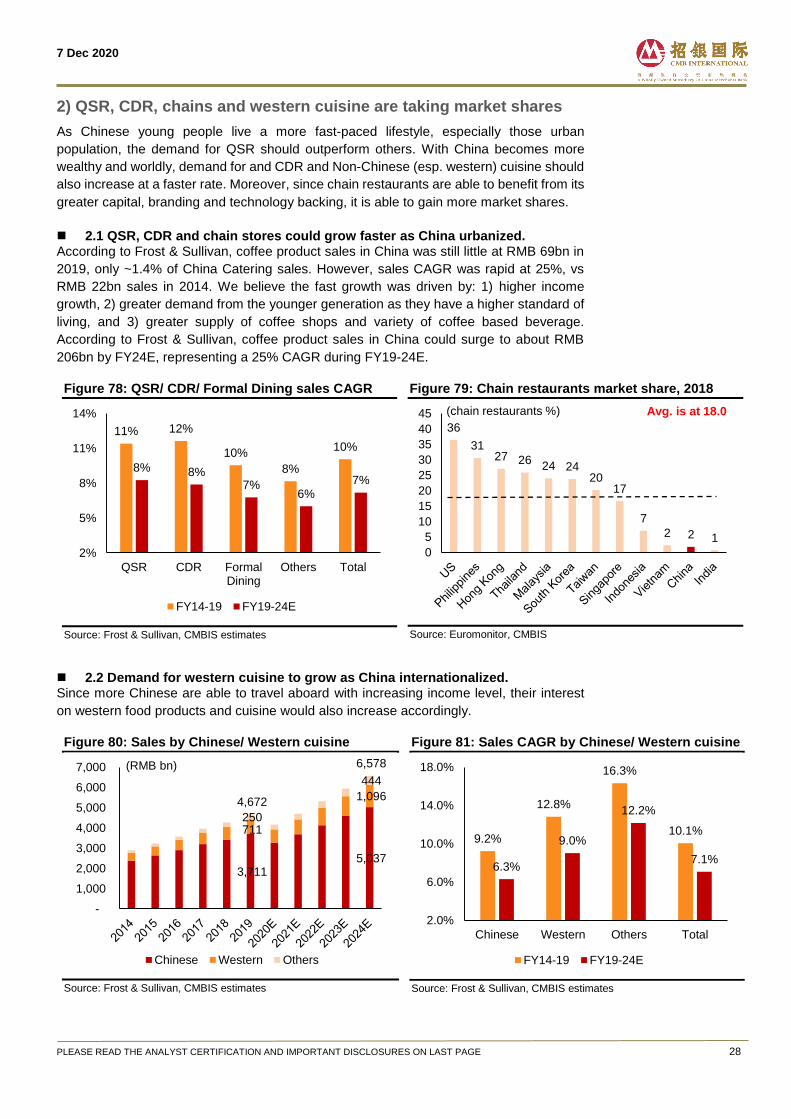
2) QSR, CDR, chains and western cuisine are taking market shares
As Chinese young people live a more fast-paced lifestyle, especially those urban
population, the demand for QSR should outperform others. With China becomes more
wealthy and worldly, demand for and CDR and Non-Chinese (esp. western) cuisine should
also increase at a faster rate. Moreover, since chain restaurants are able to benefit from its
greater capital, branding and technology backing, it is able to gain more market shares.
2.1 QSR, CDR and chain stores could grow faster as China urbanized. According to Frost & Sullivan, coffee product sales in China was still little at RMB 69bn in
2019, only ~1.4% of China Catering sales. However, sales CAGR was rapid at 25%, vs
RMB 22bn sales in 2014. We believe the fast growth was driven by: 1) higher income
growth, 2) greater demand from the younger generation as they have a higher standard of
living, and 3) greater supply of coffee shops and variety of coffee based beverage.
According to Frost & Sullivan, coffee product sales in China could surge to about RMB
206bn by FY24E, representing a 25% CAGR during FY19-24E.
Figure 78: QSR/ CDR/ Formal Dining sales CAGR
Source: Frost & Sullivan, CMBIS estimates
Figure 79: Chain restaurants market share, 2018
Source: Euromonitor, CMBIS
2.2 Demand for western cuisine to grow as China internationalized. Since more Chinese are able to travel aboard with increasing income level, their interest
on western food products and cuisine would also increase accordingly.
Figure 80: Sales by Chinese/ Western cuisine
Source: Frost & Sullivan, CMBIS estimates
Figure 81: Sales CAGR by Chinese/ Western cuisine
Source: Frost & Sullivan, CMBIS estimates
11% 12%
10%
8%
10%
8% 8%7%
6%7%
2%
5%
8%
11%
14%
QSR CDR FormalDining
Others Total
FY14-19 FY19-24E
36
3127 26
24 2420
17
7
2 2 1
0
5
10
15
20
25
30
35
40
45 Avg. is at 18.0 (chain restaurants %)
3,711 5,037
711
1,096
250
444
4,672
6,578
-
1,000
2,000
3,000
4,000
5,000
6,000
7,000
Chinese Western Others
(RMB bn)
9.2%
12.8%
16.3%
10.1%
6.3%
9.0%
12.2%
7.1%
2.0%
6.0%
10.0%
14.0%
18.0%
Chinese Western Others Total
FY14-19 FY19-24E
7 Dec 2020
PLEASE READ THE ANALYST CERTIFICATION AND IMPORTANT DISCLOSURES ON LAST PAGE 29
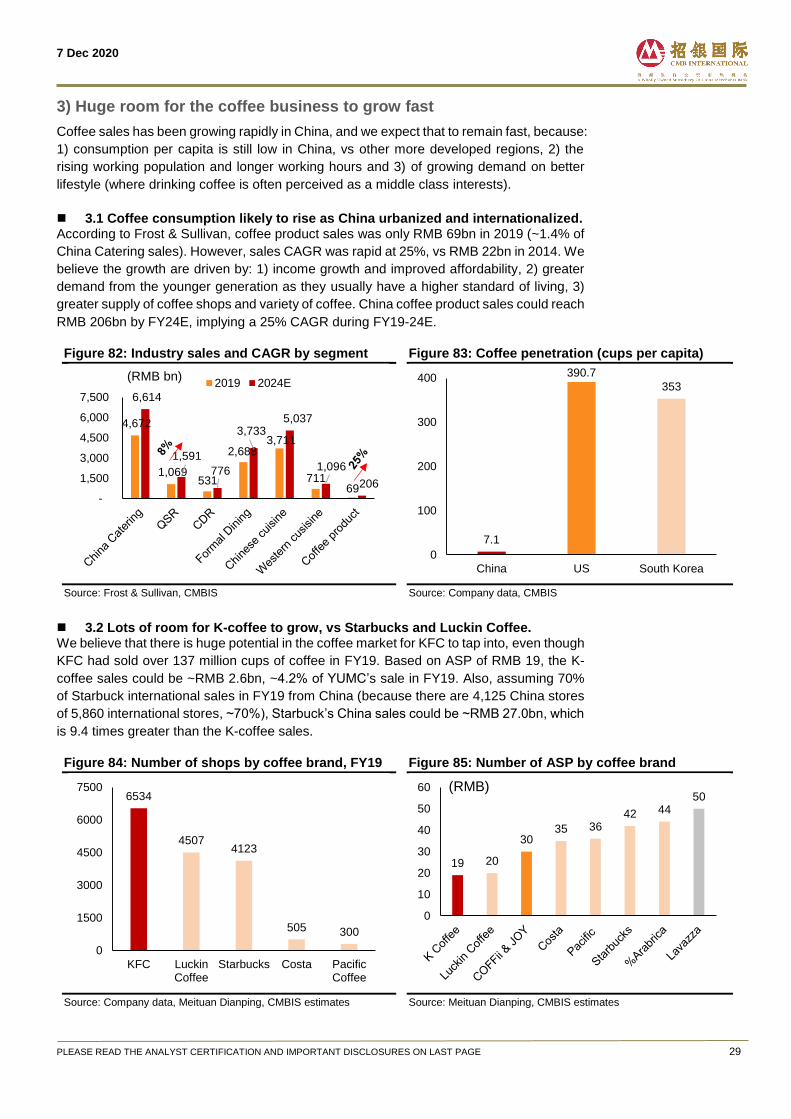
3) Huge room for the coffee business to grow fast
Coffee sales has been growing rapidly in China, and we expect that to remain fast, because:
1) consumption per capita is still low in China, vs other more developed regions, 2) the
rising working population and longer working hours and 3) of growing demand on better
lifestyle (where drinking coffee is often perceived as a middle class interests).
3.1 Coffee consumption likely to rise as China urbanized and internationalized. According to Frost & Sullivan, coffee product sales was only RMB 69bn in 2019 (~1.4% of
China Catering sales). However, sales CAGR was rapid at 25%, vs RMB 22bn in 2014. We
believe the growth are driven by: 1) income growth and improved affordability, 2) greater
demand from the younger generation as they usually have a higher standard of living, 3)
greater supply of coffee shops and variety of coffee. China coffee product sales could reach
RMB 206bn by FY24E, implying a 25% CAGR during FY19-24E.
Figure 82: Industry sales and CAGR by segment
Source: Frost & Sullivan, CMBIS
Figure 83: Coffee penetration (cups per capita)
Source: Company data, CMBIS
3.2 Lots of room for K-coffee to grow, vs Starbucks and Luckin Coffee. We believe that there is huge potential in the coffee market for KFC to tap into, even though
KFC had sold over 137 million cups of coffee in FY19. Based on ASP of RMB 19, the K-
coffee sales could be ~RMB 2.6bn, ~4.2% of YUMC’s sale in FY19. Also, assuming 70%
of Starbuck international sales in FY19 from China (because there are 4,125 China stores
of 5,860 international stores, ~70%), Starbuck’s China sales could be ~RMB 27.0bn, which
is 9.4 times greater than the K-coffee sales.
Figure 84: Number of shops by coffee brand, FY19
Source: Company data, Meituan Dianping, CMBIS estimates
Figure 85: Number of ASP by coffee brand
Source: Meituan Dianping, CMBIS estimates
4,672
1,069 531
2,688 3,711
711 69
6,614
1,591
776
3,733 5,037
1,096
206
-
1,500
3,000
4,500
6,000
7,500
2019 2024E(RMB bn)
7.1
390.7
353
0
100
200
300
400
China US South Korea
6534
45074123
505 300
0
1500
3000
4500
6000
7500
KFC LuckinCoffee
Starbucks Costa PacificCoffee
19 20
3035 36
42 4450
0
10
20
30
40
50
60 (RMB)
7 Dec 2020
PLEASE READ THE ANALYST CERTIFICATION AND IMPORTANT DISCLOSURES ON LAST PAGE 30
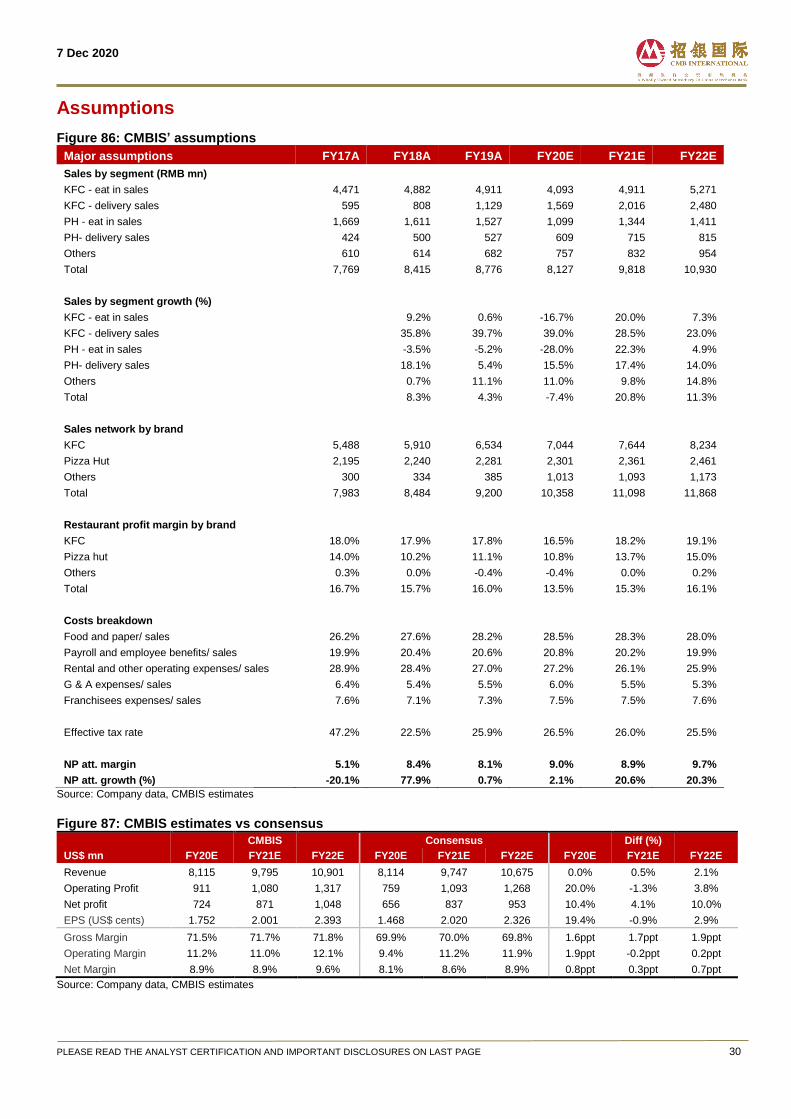
Assumptions
Figure 86: CMBIS’ assumptions
Major assumptions FY17A FY18A FY19A FY20E FY21E FY22E
Sales by segment (RMB mn)
KFC - eat in sales 4,471 4,882 4,911 4,093 4,911 5,271
KFC - delivery sales 595 808 1,129 1,569 2,016 2,480
PH - eat in sales 1,669 1,611 1,527 1,099 1,344 1,411
PH- delivery sales 424 500 527 609 715 815
Others 610 614 682 757 832 954
Total 7,769 8,415 8,776 8,127 9,818 10,930
Sales by segment growth (%)
KFC - eat in sales 9.2% 0.6% -16.7% 20.0% 7.3%
KFC - delivery sales 35.8% 39.7% 39.0% 28.5% 23.0%
PH - eat in sales -3.5% -5.2% -28.0% 22.3% 4.9%
PH- delivery sales 18.1% 5.4% 15.5% 17.4% 14.0%
Others 0.7% 11.1% 11.0% 9.8% 14.8%
Total 8.3% 4.3% -7.4% 20.8% 11.3%
Sales network by brand
KFC 5,488 5,910 6,534 7,044 7,644 8,234
Pizza Hut 2,195 2,240 2,281 2,301 2,361 2,461
Others 300 334 385 1,013 1,093 1,173
Total 7,983 8,484 9,200 10,358 11,098 11,868
Restaurant profit margin by brand
KFC 18.0% 17.9% 17.8% 16.5% 18.2% 19.1%
Pizza hut 14.0% 10.2% 11.1% 10.8% 13.7% 15.0%
Others 0.3% 0.0% -0.4% -0.4% 0.0% 0.2%
Total 16.7% 15.7% 16.0% 13.5% 15.3% 16.1%
Costs breakdown
Food and paper/ sales 26.2% 27.6% 28.2% 28.5% 28.3% 28.0%
Payroll and employee benefits/ sales 19.9% 20.4% 20.6% 20.8% 20.2% 19.9%
Rental and other operating expenses/ sales 28.9% 28.4% 27.0% 27.2% 26.1% 25.9%
G & A expenses/ sales 6.4% 5.4% 5.5% 6.0% 5.5% 5.3%
Franchisees expenses/ sales 7.6% 7.1% 7.3% 7.5% 7.5% 7.6%
Effective tax rate 47.2% 22.5% 25.9% 26.5% 26.0% 25.5%
NP att. margin 5.1% 8.4% 8.1% 9.0% 8.9% 9.7%
NP att. growth (%) -20.1% 77.9% 0.7% 2.1% 20.6% 20.3%
Source: Company data, CMBIS estimates
Figure 87: CMBIS estimates vs consensus
CMBIS Consensus Diff (%)
US$ mn FY20E FY21E FY22E FY20E FY21E FY22E FY20E FY21E FY22E
Revenue 8,115 9,795 10,901 8,114 9,747 10,675 0.0% 0.5% 2.1%
Operating Profit 911 1,080 1,317 759 1,093 1,268 20.0% -1.3% 3.8%
Net profit 724 871 1,048 656 837 953 10.4% 4.1% 10.0%
EPS (US$ cents) 1.752 2.001 2.393 1.468 2.020 2.326 19.4% -0.9% 2.9%
Gross Margin 71.5% 71.7% 71.8% 69.9% 70.0% 69.8% 1.6ppt 1.7ppt 1.9ppt
Operating Margin 11.2% 11.0% 12.1% 9.4% 11.2% 11.9% 1.9ppt -0.2ppt 0.2ppt
Net Margin 8.9% 8.9% 9.6% 8.1% 8.6% 8.9% 0.8ppt 0.3ppt 0.7ppt
Source: Company data, CMBIS estimates
7 Dec 2020
PLEASE READ THE ANALYST CERTIFICATION AND IMPORTANT DISCLOSURES ON LAST PAGE 31
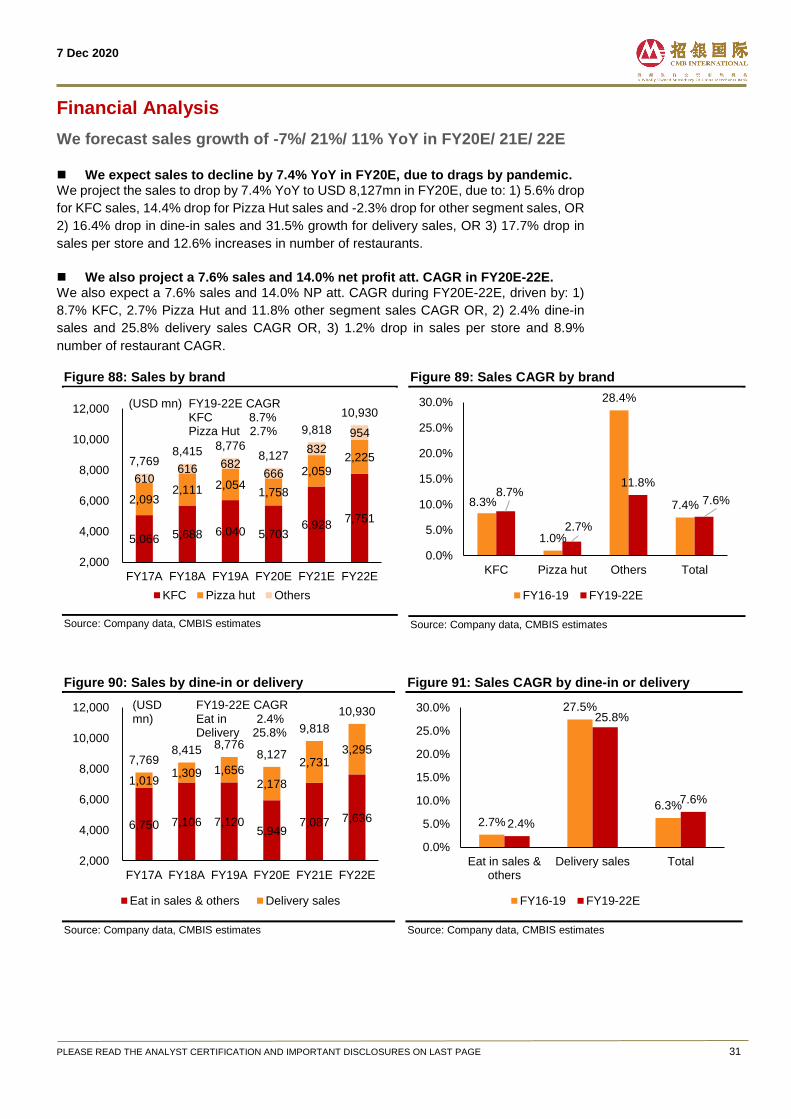
Financial Analysis
We forecast sales growth of -7%/ 21%/ 11% YoY in FY20E/ 21E/ 22E
We expect sales to decline by 7.4% YoY in FY20E, due to drags by pandemic. We project the sales to drop by 7.4% YoY to USD 8,127mn in FY20E, due to: 1) 5.6% drop
for KFC sales, 14.4% drop for Pizza Hut sales and -2.3% drop for other segment sales, OR
2) 16.4% drop in dine-in sales and 31.5% growth for delivery sales, OR 3) 17.7% drop in
sales per store and 12.6% increases in number of restaurants.
We also project a 7.6% sales and 14.0% net profit att. CAGR in FY20E-22E. We also expect a 7.6% sales and 14.0% NP att. CAGR during FY20E-22E, driven by: 1)
8.7% KFC, 2.7% Pizza Hut and 11.8% other segment sales CAGR OR, 2) 2.4% dine-in
sales and 25.8% delivery sales CAGR OR, 3) 1.2% drop in sales per store and 8.9%
number of restaurant CAGR.
Figure 88: Sales by brand
Source: Company data, CMBIS estimates
Figure 89: Sales CAGR by brand
Source: Company data, CMBIS estimates
Figure 90: Sales by dine-in or delivery
Source: Company data, CMBIS estimates
Figure 91: Sales CAGR by dine-in or delivery
Source: Company data, CMBIS estimates
5,066 5,688 6,040 5,703 6,928
7,751
2,093 2,111 2,054
1,758
2,059 2,225
610 616 682
666
832
954
7,769 8,415 8,776
8,127
9,818
10,930
2,000
4,000
6,000
8,000
10,000
12,000
FY17A FY18A FY19A FY20E FY21E FY22E
KFC Pizza hut Others
(USD mn) FY19-22E CAGRKFC 8.7%Pizza Hut 2.7%
8.3%
1.0%
28.4%
7.4%8.7%
2.7%
11.8%
7.6%
0.0%
5.0%
10.0%
15.0%
20.0%
25.0%
30.0%
KFC Pizza hut Others Total
FY16-19 FY19-22E
6,750 7,106 7,120 5,949
7,087 7,636
1,019 1,309 1,656
2,178
2,731 3,295
7,769 8,415 8,776
8,127
9,818
10,930
2,000
4,000
6,000
8,000
10,000
12,000
FY17A FY18A FY19A FY20E FY21E FY22E
Eat in sales & others Delivery sales
(USD mn)
FY19-22E CAGREat in 2.4%Delivery 25.8%
2.7%
27.5%
6.3%
2.4%
25.8%
7.6%
0.0%
5.0%
10.0%
15.0%
20.0%
25.0%
30.0%
Eat in sales &others
Delivery sales Total
FY16-19 FY19-22E
7 Dec 2020
PLEASE READ THE ANALYST CERTIFICATION AND IMPORTANT DISCLOSURES ON LAST PAGE 32
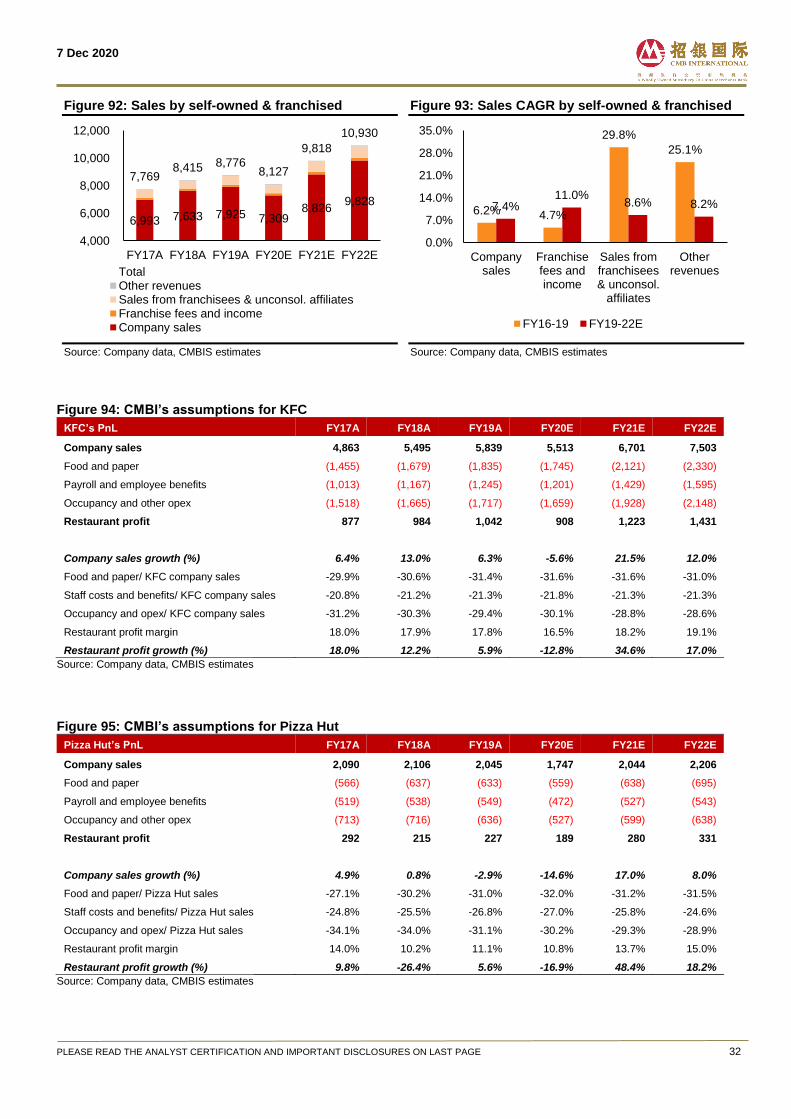
Figure 92: Sales by self-owned & franchised
Source: Company data, CMBIS estimates
Figure 93: Sales CAGR by self-owned & franchised
Source: Company data, CMBIS estimates
Figure 94: CMBI’s assumptions for KFC
KFC’s PnL FY17A FY18A FY19A FY20E FY21E FY22E
Company sales 4,863 5,495 5,839 5,513 6,701 7,503
Food and paper (1,455) (1,679) (1,835) (1,745) (2,121) (2,330)
Payroll and employee benefits (1,013) (1,167) (1,245) (1,201) (1,429) (1,595)
Occupancy and other opex (1,518) (1,665) (1,717) (1,659) (1,928) (2,148)
Restaurant profit 877 984 1,042 908 1,223 1,431
Company sales growth (%) 6.4% 13.0% 6.3% -5.6% 21.5% 12.0%
Food and paper/ KFC company sales -29.9% -30.6% -31.4% -31.6% -31.6% -31.0%
Staff costs and benefits/ KFC company sales -20.8% -21.2% -21.3% -21.8% -21.3% -21.3%
Occupancy and opex/ KFC company sales -31.2% -30.3% -29.4% -30.1% -28.8% -28.6%
Restaurant profit margin 18.0% 17.9% 17.8% 16.5% 18.2% 19.1%
Restaurant profit growth (%) 18.0% 12.2% 5.9% -12.8% 34.6% 17.0%
Source: Company data, CMBIS estimates
Figure 95: CMBI’s assumptions for Pizza Hut
Pizza Hut’s PnL FY17A FY18A FY19A FY20E FY21E FY22E
Company sales 2,090 2,106 2,045 1,747 2,044 2,206
Food and paper (566) (637) (633) (559) (638) (695)
Payroll and employee benefits (519) (538) (549) (472) (527) (543)
Occupancy and other opex (713) (716) (636) (527) (599) (638)
Restaurant profit 292 215 227 189 280 331
Company sales growth (%) 4.9% 0.8% -2.9% -14.6% 17.0% 8.0%
Food and paper/ Pizza Hut sales -27.1% -30.2% -31.0% -32.0% -31.2% -31.5%
Staff costs and benefits/ Pizza Hut sales -24.8% -25.5% -26.8% -27.0% -25.8% -24.6%
Occupancy and opex/ Pizza Hut sales -34.1% -34.0% -31.1% -30.2% -29.3% -28.9%
Restaurant profit margin 14.0% 10.2% 11.1% 10.8% 13.7% 15.0%
Restaurant profit growth (%) 9.8% -26.4% 5.6% -16.9% 48.4% 18.2%
Source: Company data, CMBIS estimates
6,993 7,633 7,925 7,309 8,826
9,828
7,769 8,415 8,776
8,127
9,818
10,930
4,000
6,000
8,000
10,000
12,000
FY17A FY18A FY19A FY20E FY21E FY22E
TotalOther revenuesSales from franchisees & unconsol. affiliatesFranchise fees and incomeCompany sales
6.2% 4.7%
29.8%
25.1%
7.4%11.0%
8.6% 8.2%
0.0%
7.0%
14.0%
21.0%
28.0%
35.0%
Companysales
Franchisefees andincome
Sales fromfranchisees& unconsol.
affiliates
Otherrevenues
FY16-19 FY19-22E
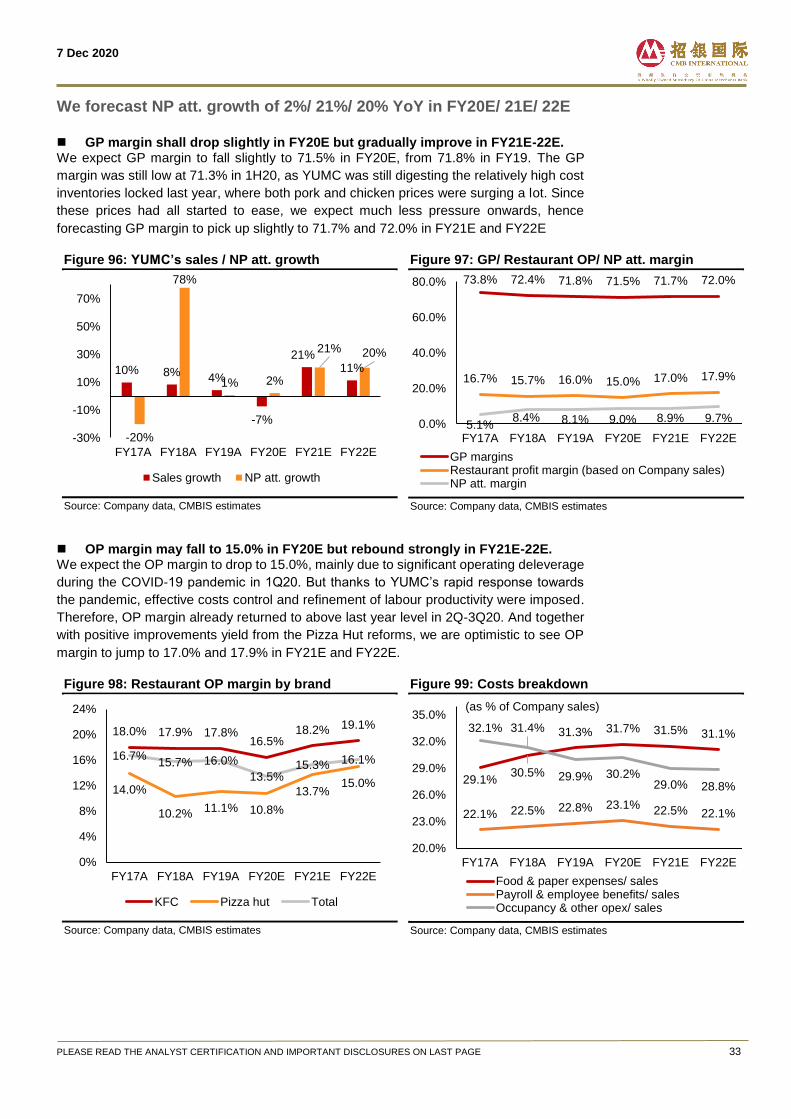
7 Dec 2020
PLEASE READ THE ANALYST CERTIFICATION AND IMPORTANT DISCLOSURES ON LAST PAGE 33
We forecast NP att. growth of 2%/ 21%/ 20% YoY in FY20E/ 21E/ 22E
GP margin shall drop slightly in FY20E but gradually improve in FY21E-22E. We expect GP margin to fall slightly to 71.5% in FY20E, from 71.8% in FY19. The GP
margin was still low at 71.3% in 1H20, as YUMC was still digesting the relatively high cost
inventories locked last year, where both pork and chicken prices were surging a lot. Since
these prices had all started to ease, we expect much less pressure onwards, hence
forecasting GP margin to pick up slightly to 71.7% and 72.0% in FY21E and FY22E
Figure 96: YUMC’s sales / NP att. growth
Source: Company data, CMBIS estimates
Figure 97: GP/ Restaurant OP/ NP att. margin
Source: Company data, CMBIS estimates
OP margin may fall to 15.0% in FY20E but rebound strongly in FY21E-22E. We expect the OP margin to drop to 15.0%, mainly due to significant operating deleverage
during the COVID-19 pandemic in 1Q20. But thanks to YUMC’s rapid response towards
the pandemic, effective costs control and refinement of labour productivity were imposed.
Therefore, OP margin already returned to above last year level in 2Q-3Q20. And together
with positive improvements yield from the Pizza Hut reforms, we are optimistic to see OP
margin to jump to 17.0% and 17.9% in FY21E and FY22E.
Figure 98: Restaurant OP margin by brand
Source: Company data, CMBIS estimates
Figure 99: Costs breakdown
Source: Company data, CMBIS estimates
10% 8% 4%
-7%
21%11%
-20%
78%
1% 2%
21% 20%
-30%
-10%
10%
30%
50%
70%
FY17A FY18A FY19A FY20E FY21E FY22E
Sales growth NP att. growth
73.8% 72.4% 71.8% 71.5% 71.7% 72.0%
16.7% 15.7% 16.0% 15.0% 17.0% 17.9%
5.1%8.4% 8.1% 9.0% 8.9% 9.7%
0.0%
20.0%
40.0%
60.0%
80.0%
FY17A FY18A FY19A FY20E FY21E FY22E
GP marginsRestaurant profit margin (based on Company sales)NP att. margin
18.0% 17.9% 17.8%16.5%
18.2% 19.1%
14.0%
10.2%11.1% 10.8%
13.7%15.0%
16.7%15.7% 16.0%
13.5%15.3% 16.1%
0%
4%
8%
12%
16%
20%
24%
FY17A FY18A FY19A FY20E FY21E FY22E
KFC Pizza hut Total
29.1%30.5%
31.3% 31.7% 31.5% 31.1%
22.1% 22.5% 22.8% 23.1%22.5% 22.1%
32.1% 31.4%
29.9% 30.2%29.0% 28.8%
20.0%
23.0%
26.0%
29.0%
32.0%
35.0%
FY17A FY18A FY19A FY20E FY21E FY22E
Food & paper expenses/ salesPayroll & employee benefits/ salesOccupancy & other opex/ sales
(as % of Company sales)
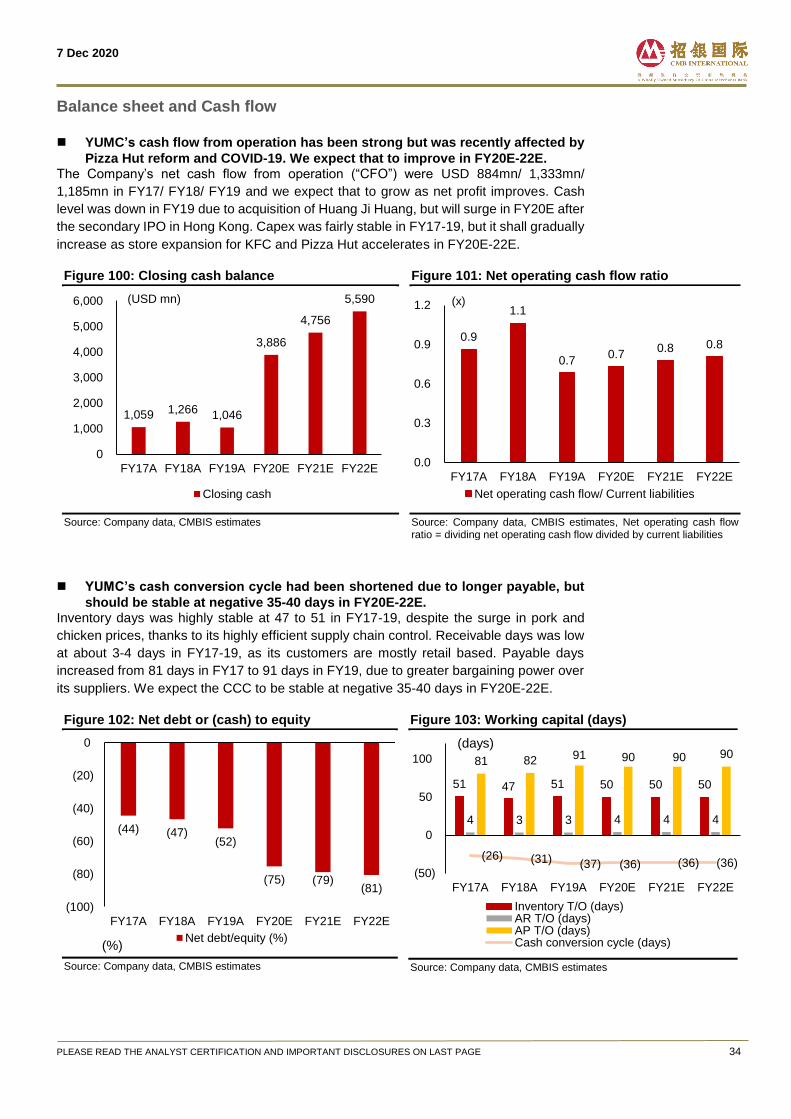
7 Dec 2020
PLEASE READ THE ANALYST CERTIFICATION AND IMPORTANT DISCLOSURES ON LAST PAGE 34
Balance sheet and Cash flow
YUMC’s cash flow from operation has been strong but was recently affected by
Pizza Hut reform and COVID-19. We expect that to improve in FY20E-22E. The Company’s net cash flow from operation (“CFO”) were USD 884mn/ 1,333mn/
1,185mn in FY17/ FY18/ FY19 and we expect that to grow as net profit improves. Cash
level was down in FY19 due to acquisition of Huang Ji Huang, but will surge in FY20E after
the secondary IPO in Hong Kong. Capex was fairly stable in FY17-19, but it shall gradually
increase as store expansion for KFC and Pizza Hut accelerates in FY20E-22E.
Figure 100: Closing cash balance
Source: Company data, CMBIS estimates
Figure 101: Net operating cash flow ratio
Source: Company data, CMBIS estimates, Net operating cash flow ratio = dividing net operating cash flow divided by current liabilities
YUMC’s cash conversion cycle had been shortened due to longer payable, but
should be stable at negative 35-40 days in FY20E-22E. Inventory days was highly stable at 47 to 51 in FY17-19, despite the surge in pork and
chicken prices, thanks to its highly efficient supply chain control. Receivable days was low
at about 3-4 days in FY17-19, as its customers are mostly retail based. Payable days
increased from 81 days in FY17 to 91 days in FY19, due to greater bargaining power over
its suppliers. We expect the CCC to be stable at negative 35-40 days in FY20E-22E.
Figure 102: Net debt or (cash) to equity
Source: Company data, CMBIS estimates
Figure 103: Working capital (days)
Source: Company data, CMBIS estimates
1,059 1,266 1,046
3,886
4,756
5,590
0
1,000
2,000
3,000
4,000
5,000
6,000
FY17A FY18A FY19A FY20E FY21E FY22E
Closing cash
(USD mn)
0.9
1.1
0.7 0.7
0.8 0.8
0.0
0.3
0.6
0.9
1.2
FY17A FY18A FY19A FY20E FY21E FY22E
Net operating cash flow/ Current liabilities
(x)
(44) (47)(52)
(75) (79)(81)
(100)
(80)
(60)
(40)
(20)
0
FY17A FY18A FY19A FY20E FY21E FY22E
Net debt/equity (%)(%)
51 47 51 50 50 50
4 3 3 4 4 4
81 82 91 90 90 90
(26) (31) (37) (36) (36) (36)(50)
0
50
100
FY17A FY18A FY19A FY20E FY21E FY22E
Inventory T/O (days)AR T/O (days)AP T/O (days)Cash conversion cycle (days)
(days)
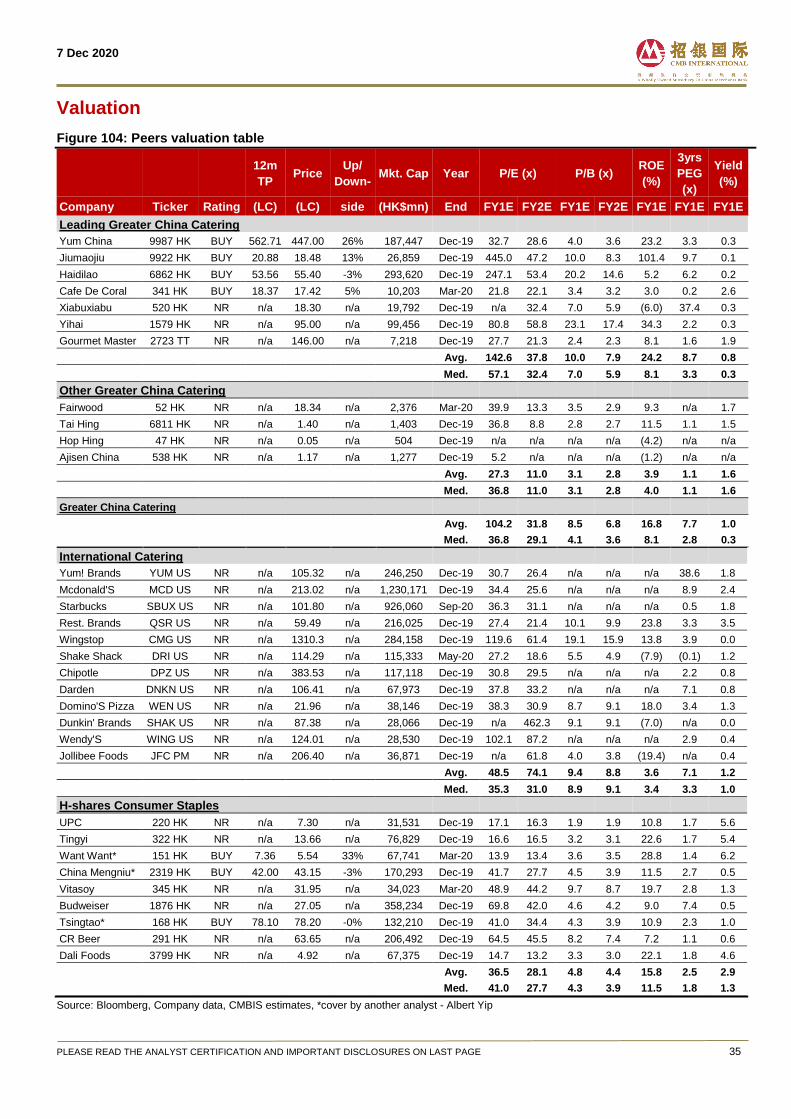
7 Dec 2020
PLEASE READ THE ANALYST CERTIFICATION AND IMPORTANT DISCLOSURES ON LAST PAGE 35
Valuation
Figure 104: Peers valuation table
12m
TP Price
Up/
Down- Mkt. Cap Year P/E (x) P/B (x)
ROE
(%)
3yrs
PEG
(x)
Yield
(%)
Company Ticker Rating (LC) (LC) side (HK$mn) End FY1E FY2E FY1E FY2E FY1E FY1E FY1E
Leading Greater China Catering
Yum China 9987 HK BUY 562.71 447.00 26% 187,447 Dec-19 32.7 28.6 4.0 3.6 23.2 3.3 0.3
Jiumaojiu 9922 HK BUY 20.88 18.48 13% 26,859 Dec-19 445.0 47.2 10.0 8.3 101.4 9.7 0.1
Haidilao 6862 HK BUY 53.56 55.40 -3% 293,620 Dec-19 247.1 53.4 20.2 14.6 5.2 6.2 0.2
Cafe De Coral 341 HK BUY 18.37 17.42 5% 10,203 Mar-20 21.8 22.1 3.4 3.2 3.0 0.2 2.6
Xiabuxiabu 520 HK NR n/a 18.30 n/a 19,792 Dec-19 n/a 32.4 7.0 5.9 (6.0) 37.4 0.3
Yihai 1579 HK NR n/a 95.00 n/a 99,456 Dec-19 80.8 58.8 23.1 17.4 34.3 2.2 0.3
Gourmet Master 2723 TT NR n/a 146.00 n/a 7,218 Dec-19 27.7 21.3 2.4 2.3 8.1 1.6 1.9
Avg. 142.6 37.8 10.0 7.9 24.2 8.7 0.8
Med. 57.1 32.4 7.0 5.9 8.1 3.3 0.3
Other Greater China Catering
Fairwood 52 HK NR n/a 18.34 n/a 2,376 Mar-20 39.9 13.3 3.5 2.9 9.3 n/a 1.7
Tai Hing 6811 HK NR n/a 1.40 n/a 1,403 Dec-19 36.8 8.8 2.8 2.7 11.5 1.1 1.5
Hop Hing 47 HK NR n/a 0.05 n/a 504 Dec-19 n/a n/a n/a n/a (4.2) n/a n/a
Ajisen China 538 HK NR n/a 1.17 n/a 1,277 Dec-19 5.2 n/a n/a n/a (1.2) n/a n/a
Avg. 27.3 11.0 3.1 2.8 3.9 1.1 1.6
Med. 36.8 11.0 3.1 2.8 4.0 1.1 1.6
Greater China Catering
Avg. 104.2 31.8 8.5 6.8 16.8 7.7 1.0
Med. 36.8 29.1 4.1 3.6 8.1 2.8 0.3
International Catering
Yum! Brands YUM US NR n/a 105.32 n/a 246,250 Dec-19 30.7 26.4 n/a n/a n/a 38.6 1.8
Mcdonald'S MCD US NR n/a 213.02 n/a 1,230,171 Dec-19 34.4 25.6 n/a n/a n/a 8.9 2.4
Starbucks SBUX US NR n/a 101.80 n/a 926,060 Sep-20 36.3 31.1 n/a n/a n/a 0.5 1.8
Rest. Brands QSR US NR n/a 59.49 n/a 216,025 Dec-19 27.4 21.4 10.1 9.9 23.8 3.3 3.5
Wingstop CMG US NR n/a 1310.3 n/a 284,158 Dec-19 119.6 61.4 19.1 15.9 13.8 3.9 0.0
Shake Shack DRI US NR n/a 114.29 n/a 115,333 May-20 27.2 18.6 5.5 4.9 (7.9) (0.1) 1.2
Chipotle DPZ US NR n/a 383.53 n/a 117,118 Dec-19 30.8 29.5 n/a n/a n/a 2.2 0.8
Darden DNKN US NR n/a 106.41 n/a 67,973 Dec-19 37.8 33.2 n/a n/a n/a 7.1 0.8
Domino'S Pizza WEN US NR n/a 21.96 n/a 38,146 Dec-19 38.3 30.9 8.7 9.1 18.0 3.4 1.3
Dunkin' Brands SHAK US NR n/a 87.38 n/a 28,066 Dec-19 n/a 462.3 9.1 9.1 (7.0) n/a 0.0
Wendy'S WING US NR n/a 124.01 n/a 28,530 Dec-19 102.1 87.2 n/a n/a n/a 2.9 0.4
Jollibee Foods JFC PM NR n/a 206.40 n/a 36,871 Dec-19 n/a 61.8 4.0 3.8 (19.4) n/a 0.4
Avg. 48.5 74.1 9.4 8.8 3.6 7.1 1.2
Med. 35.3 31.0 8.9 9.1 3.4 3.3 1.0
H-shares Consumer Staples
UPC 220 HK NR n/a 7.30 n/a 31,531 Dec-19 17.1 16.3 1.9 1.9 10.8 1.7 5.6
Tingyi 322 HK NR n/a 13.66 n/a 76,829 Dec-19 16.6 16.5 3.2 3.1 22.6 1.7 5.4
Want Want* 151 HK BUY 7.36 5.54 33% 67,741 Mar-20 13.9 13.4 3.6 3.5 28.8 1.4 6.2
China Mengniu* 2319 HK BUY 42.00 43.15 -3% 170,293 Dec-19 41.7 27.7 4.5 3.9 11.5 2.7 0.5
Vitasoy 345 HK NR n/a 31.95 n/a 34,023 Mar-20 48.9 44.2 9.7 8.7 19.7 2.8 1.3
Budweiser 1876 HK NR n/a 27.05 n/a 358,234 Dec-19 69.8 42.0 4.6 4.2 9.0 7.4 0.5
Tsingtao* 168 HK BUY 78.10 78.20 -0% 132,210 Dec-19 41.0 34.4 4.3 3.9 10.9 2.3 1.0
CR Beer 291 HK NR n/a 63.65 n/a 206,492 Dec-19 64.5 45.5 8.2 7.4 7.2 1.1 0.6
Dali Foods 3799 HK NR n/a 4.92 n/a 67,375 Dec-19 14.7 13.2 3.3 3.0 22.1 1.8 4.6
Avg. 36.5 28.1 4.8 4.4 15.8 2.5 2.9
Med. 41.0 27.7 4.3 3.9 11.5 1.8 1.3
Source: Bloomberg, Company data, CMBIS estimates, *cover by another analyst - Albert Yip
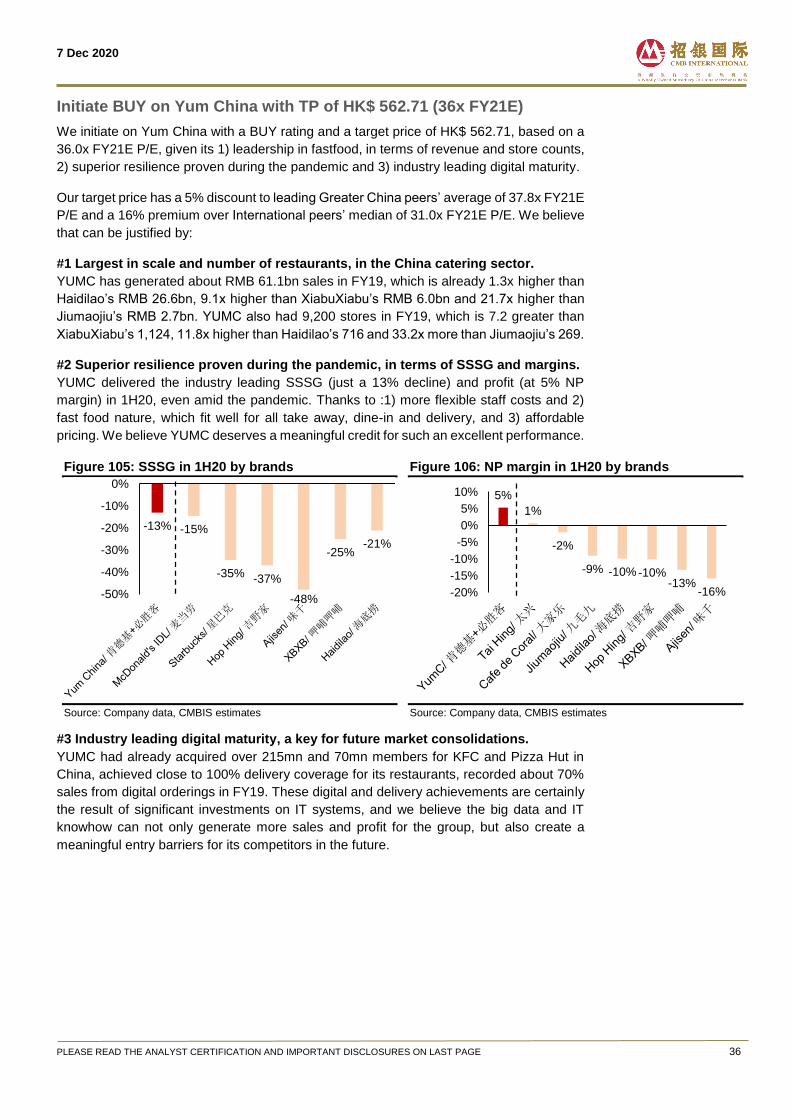
7 Dec 2020
PLEASE READ THE ANALYST CERTIFICATION AND IMPORTANT DISCLOSURES ON LAST PAGE 36
Initiate BUY on Yum China with TP of HK$ 562.71 (36x FY21E)
We initiate on Yum China with a BUY rating and a target price of HK$ 562.71, based on a
36.0x FY21E P/E, given its 1) leadership in fastfood, in terms of revenue and store counts,
2) superior resilience proven during the pandemic and 3) industry leading digital maturity.
Our target price has a 5% discount to leading Greater China peers’ average of 37.8x FY21E
P/E and a 16% premium over International peers’ median of 31.0x FY21E P/E. We believe
that can be justified by:
#1 Largest in scale and number of restaurants, in the China catering sector.
YUMC has generated about RMB 61.1bn sales in FY19, which is already 1.3x higher than
Haidilao’s RMB 26.6bn, 9.1x higher than XiabuXiabu’s RMB 6.0bn and 21.7x higher than
Jiumaojiu’s RMB 2.7bn. YUMC also had 9,200 stores in FY19, which is 7.2 greater than
XiabuXiabu’s 1,124, 11.8x higher than Haidilao’s 716 and 33.2x more than Jiumaojiu’s 269.
#2 Superior resilience proven during the pandemic, in terms of SSSG and margins.
YUMC delivered the industry leading SSSG (just a 13% decline) and profit (at 5% NP
margin) in 1H20, even amid the pandemic. Thanks to :1) more flexible staff costs and 2)
fast food nature, which fit well for all take away, dine-in and delivery, and 3) affordable
pricing. We believe YUMC deserves a meaningful credit for such an excellent performance.
Figure 105: SSSG in 1H20 by brands
Source: Company data, CMBIS estimates
Figure 106: NP margin in 1H20 by brands
Source: Company data, CMBIS estimates
#3 Industry leading digital maturity, a key for future market consolidations.
YUMC had already acquired over 215mn and 70mn members for KFC and Pizza Hut in
China, achieved close to 100% delivery coverage for its restaurants, recorded about 70%
sales from digital orderings in FY19. These digital and delivery achievements are certainly
the result of significant investments on IT systems, and we believe the big data and IT
knowhow can not only generate more sales and profit for the group, but also create a
meaningful entry barriers for its competitors in the future.
-13% -15%
-35% -37%
-48%
-25%-21%
-50%
-40%
-30%
-20%
-10%
0%5%
1%
-2%
-9% -10% -10%-13%
-16%-20%
-15%
-10%
-5%
0%
5%
10%
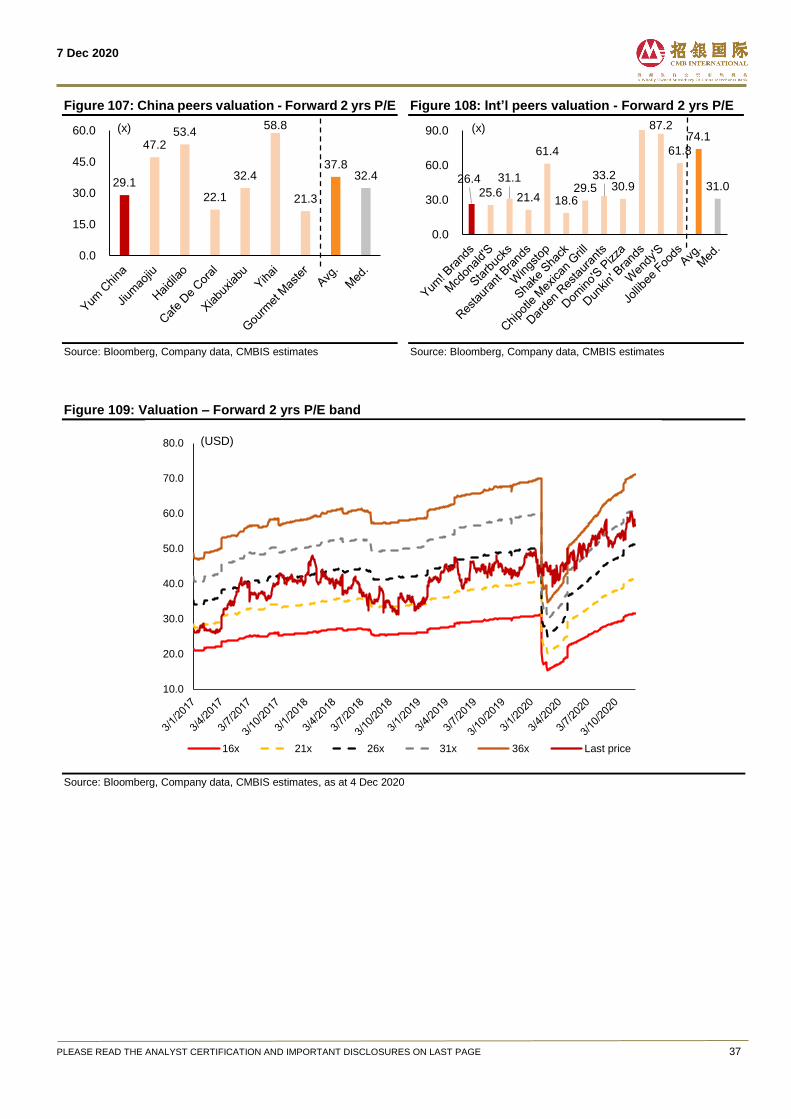
7 Dec 2020
PLEASE READ THE ANALYST CERTIFICATION AND IMPORTANT DISCLOSURES ON LAST PAGE 37
Figure 107: China peers valuation - Forward 2 yrs P/E
Source: Bloomberg, Company data, CMBIS estimates
Figure 108: Int’l peers valuation - Forward 2 yrs P/E
Source: Bloomberg, Company data, CMBIS estimates
Figure 109: Valuation – Forward 2 yrs P/E band
Source: Bloomberg, Company data, CMBIS estimates, as at 4 Dec 2020
29.1
47.2 53.4
22.1
32.4
58.8
21.3
37.8 32.4
0.0
15.0
30.0
45.0
60.0 (x)
26.4 25.6
31.1
21.4
61.4
18.6 29.5
33.2 30.9
87.2
61.8
74.1
31.0
0.0
30.0
60.0
90.0 (x)
10.0
20.0
30.0
40.0
50.0
60.0
70.0
80.0
16x 21x 26x 31x 36x Last price
(USD)
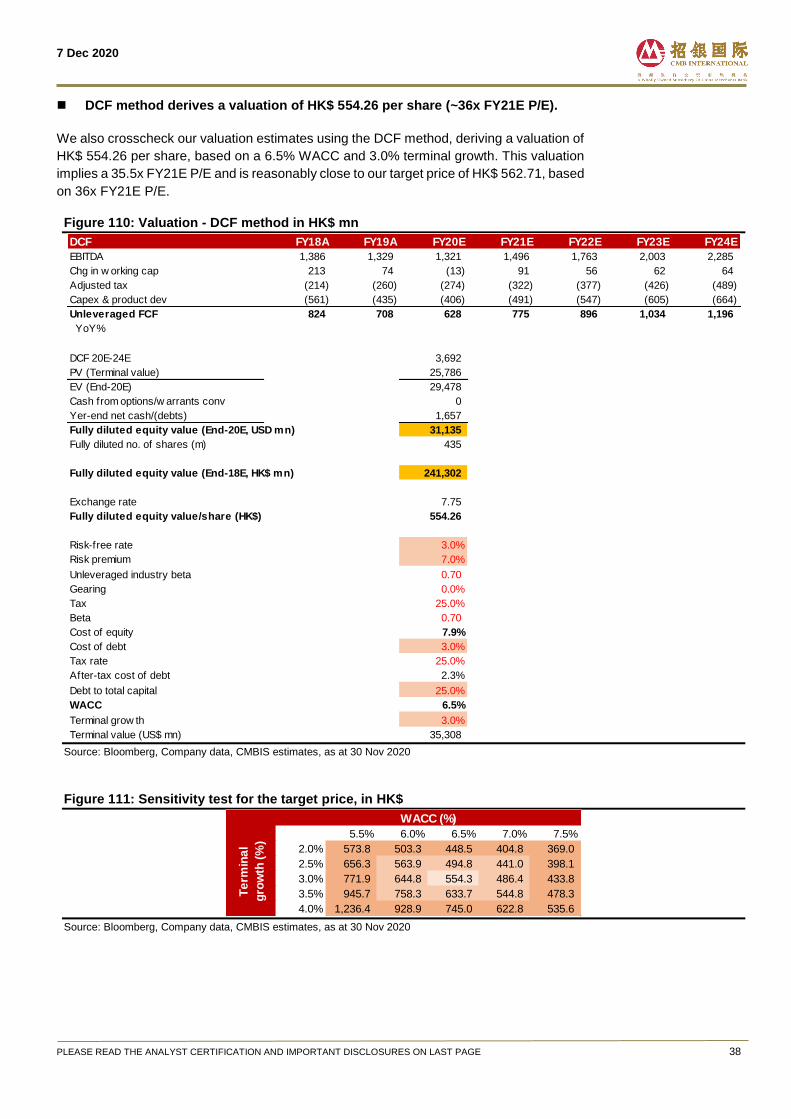
7 Dec 2020
PLEASE READ THE ANALYST CERTIFICATION AND IMPORTANT DISCLOSURES ON LAST PAGE 38
DCF method derives a valuation of HK$ 554.26 per share (~36x FY21E P/E).
We also crosscheck our valuation estimates using the DCF method, deriving a valuation of
HK$ 554.26 per share, based on a 6.5% WACC and 3.0% terminal growth. This valuation
implies a 35.5x FY21E P/E and is reasonably close to our target price of HK$ 562.71, based
on 36x FY21E P/E.
Figure 110: Valuation - DCF method in HK$ mn
Source: Bloomberg, Company data, CMBIS estimates, as at 30 Nov 2020
Figure 111: Sensitivity test for the target price, in HK$
Source: Bloomberg, Company data, CMBIS estimates, as at 30 Nov 2020
DCF FY18A FY19A FY20E FY21E FY22E FY23E FY24E
EBITDA 1,386 1,329 1,321 1,496 1,763 2,003 2,285
Chg in w orking cap 213 74 (13) 91 56 62 64
Adjusted tax (214) (260) (274) (322) (377) (426) (489)
Capex & product dev (561) (435) (406) (491) (547) (605) (664)
Unleveraged FCF 824 708 628 775 896 1,034 1,196
YoY%
DCF 20E-24E 3,692
PV (Terminal value) 25,786
EV (End-20E) 29,478
Cash from options/w arrants conv 0
Yer-end net cash/(debts) 1,657
Fully diluted equity value (End-20E, USD mn) 31,135
Fully diluted no. of shares (m) 435
Fully diluted equity value (End-18E, HK$ mn) 241,302
Exchange rate 7.75
Fully diluted equity value/share (HK$) 554.26
Risk-free rate 3.0%
Risk premium 7.0%
Unleveraged industry beta 0.70
Gearing 0.0%
Tax 25.0%
Beta 0.70
Cost of equity 7.9%
Cost of debt 3.0%
Tax rate 25.0%
After-tax cost of debt 2.3%
Debt to total capital 25.0%
WACC 6.5%
Terminal grow th 3.0%
Terminal value (US$ mn) 35,308
554.26 5.5% 6.0% 6.5% 7.0% 7.5%
2.0% 573.8 503.3 448.5 404.8 369.0
2.5% 656.3 563.9 494.8 441.0 398.1
3.0% 771.9 644.8 554.3 486.4 433.8
3.5% 945.7 758.3 633.7 544.8 478.3
4.0% 1,236.4 928.9 745.0 622.8 535.6
WACC (%)
Te
rmin
al
gro
wth
(%
)
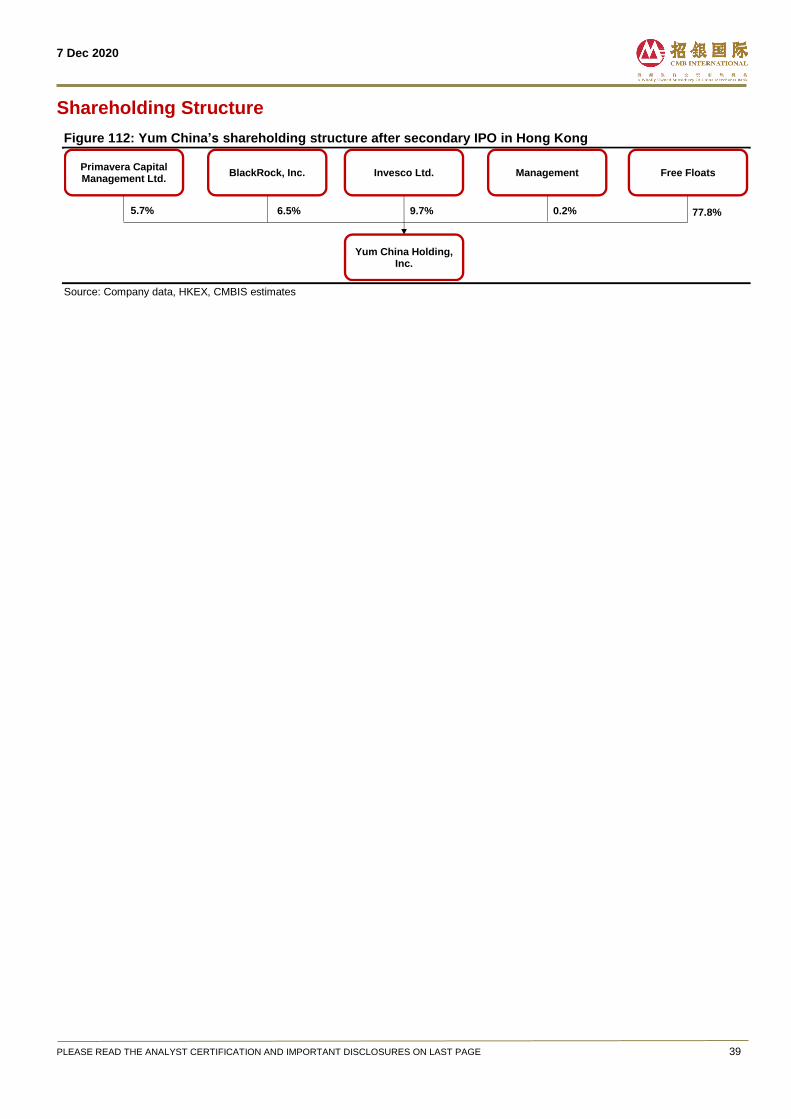
7 Dec 2020
PLEASE READ THE ANALYST CERTIFICATION AND IMPORTANT DISCLOSURES ON LAST PAGE 39
Shareholding Structure
Figure 112: Yum China’s shareholding structure after secondary IPO in Hong Kong
Source: Company data, HKEX, CMBIS estimates
Yum China Holding,Inc.
Invesco Ltd. ManagementBlackRock, Inc. Free Floats
6.5% 9.7% 0.2% 77.8%
Primavera Capital Management Ltd.
5.7%
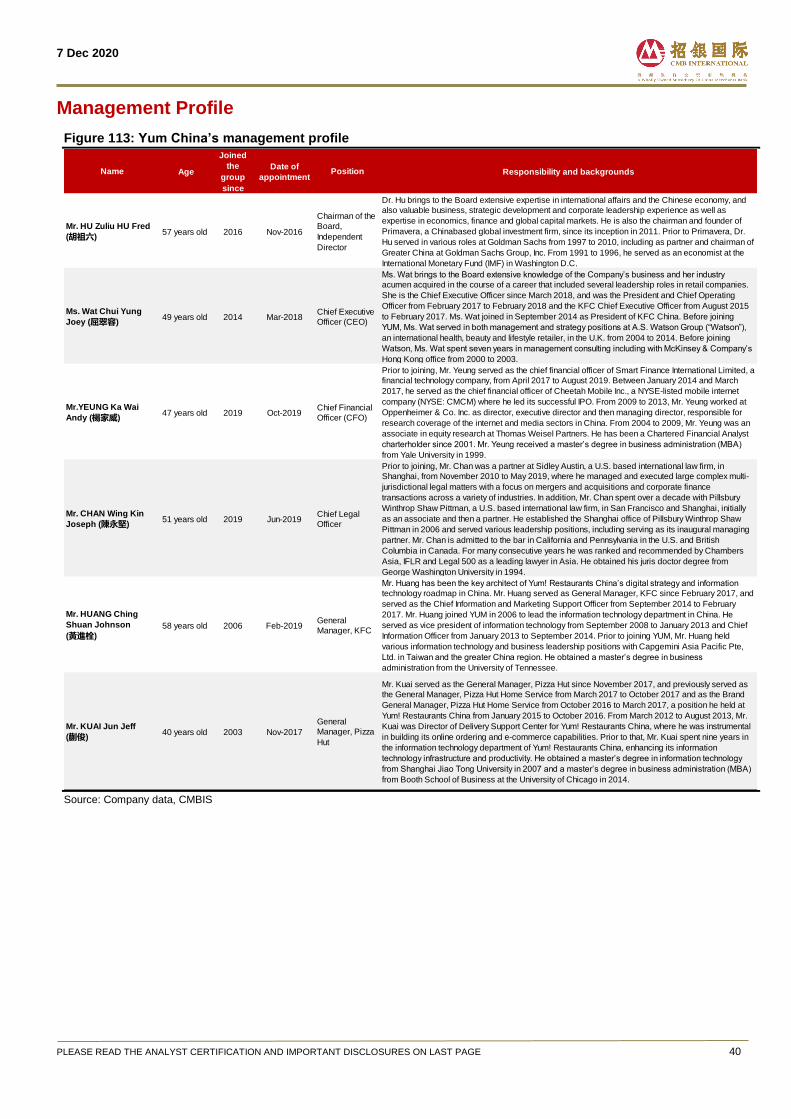
7 Dec 2020
PLEASE READ THE ANALYST CERTIFICATION AND IMPORTANT DISCLOSURES ON LAST PAGE 40
Management Profile
Figure 113: Yum China’s management profile
Source: Company data, CMBIS
Name Age
Joined
the
group
since
Date of
appointmentPosition Responsibility and backgrounds
Mr. HU Zuliu HU Fred
(胡祖六)57 years old 2016 Nov-2016
Chairman of the
Board,
Independent
Director
Dr. Hu brings to the Board extensive expertise in international affairs and the Chinese economy, and
also valuable business, strategic development and corporate leadership experience as well as
expertise in economics, finance and global capital markets. He is also the chairman and founder of
Primavera, a Chinabased global investment firm, since its inception in 2011. Prior to Primavera, Dr.
Hu served in various roles at Goldman Sachs from 1997 to 2010, including as partner and chairman of
Greater China at Goldman Sachs Group, Inc. From 1991 to 1996, he served as an economist at the
International Monetary Fund (IMF) in Washington D.C.
Ms. Wat Chui Yung
Joey (屈翠容)49 years old 2014 Mar-2018
Chief Executive
Officer (CEO)
Ms. Wat brings to the Board extensive knowledge of the Company’s business and her industry
acumen acquired in the course of a career that included several leadership roles in retail companies.
She is the Chief Executive Officer since March 2018, and was the President and Chief Operating
Officer from February 2017 to February 2018 and the KFC Chief Executive Officer from August 2015
to February 2017. Ms. Wat joined in September 2014 as President of KFC China. Before joining
YUM, Ms. Wat served in both management and strategy positions at A.S. Watson Group (“Watson”),
an international health, beauty and lifestyle retailer, in the U.K. from 2004 to 2014. Before joining
Watson, Ms. Wat spent seven years in management consulting including with McKinsey & Company’s
Hong Kong office from 2000 to 2003.
Mr.YEUNG Ka Wai
Andy (楊家威)47 years old 2019 Oct-2019
Chief Financial
Officer (CFO)
Prior to joining, Mr. Yeung served as the chief financial officer of Smart Finance International Limited, a
financial technology company, from April 2017 to August 2019. Between January 2014 and March
2017, he served as the chief financial officer of Cheetah Mobile Inc., a NYSE-listed mobile internet
company (NYSE: CMCM) where he led its successful IPO. From 2009 to 2013, Mr. Yeung worked at
Oppenheimer & Co. Inc. as director, executive director and then managing director, responsible for
research coverage of the internet and media sectors in China. From 2004 to 2009, Mr. Yeung was an
associate in equity research at Thomas Weisel Partners. He has been a Chartered Financial Analyst
charterholder since 2001. Mr. Yeung received a master’s degree in business administration (MBA)
from Yale University in 1999.
Mr. CHAN Wing Kin
Joseph (陳永堅)51 years old 2019 Jun-2019
Chief Legal
Officer
Prior to joining, Mr. Chan was a partner at Sidley Austin, a U.S. based international law firm, in
Shanghai, from November 2010 to May 2019, where he managed and executed large complex multi-
jurisdictional legal matters with a focus on mergers and acquisitions and corporate finance
transactions across a variety of industries. In addition, Mr. Chan spent over a decade with Pillsbury
Winthrop Shaw Pittman, a U.S. based international law firm, in San Francisco and Shanghai, initially
as an associate and then a partner. He established the Shanghai office of Pillsbury Winthrop Shaw
Pittman in 2006 and served various leadership positions, including serving as its inaugural managing
partner. Mr. Chan is admitted to the bar in California and Pennsylvania in the U.S. and British
Columbia in Canada. For many consecutive years he was ranked and recommended by Chambers
Asia, IFLR and Legal 500 as a leading lawyer in Asia. He obtained his juris doctor degree from
George Washington University in 1994.
Mr. HUANG Ching
Shuan Johnson
(黃進栓)
58 years old 2006 Feb-2019General
Manager, KFC
Mr. Huang has been the key architect of Yum! Restaurants China’s digital strategy and information
technology roadmap in China. Mr. Huang served as General Manager, KFC since February 2017, and
served as the Chief Information and Marketing Support Officer from September 2014 to February
2017. Mr. Huang joined YUM in 2006 to lead the information technology department in China. He
served as vice president of information technology from September 2008 to January 2013 and Chief
Information Officer from January 2013 to September 2014. Prior to joining YUM, Mr. Huang held
various information technology and business leadership positions with Capgemini Asia Pacific Pte,
Ltd. in Taiwan and the greater China region. He obtained a master’s degree in business
administration from the University of Tennessee.
Mr. KUAI Jun Jeff
(蒯俊)40 years old 2003 Nov-2017
General
Manager, Pizza
Hut
Mr. Kuai served as the General Manager, Pizza Hut since November 2017, and previously served as
the General Manager, Pizza Hut Home Service from March 2017 to October 2017 and as the Brand
General Manager, Pizza Hut Home Service from October 2016 to March 2017, a position he held at
Yum! Restaurants China from January 2015 to October 2016. From March 2012 to August 2013, Mr.
Kuai was Director of Delivery Support Center for Yum! Restaurants China, where he was instrumental
in building its online ordering and e-commerce capabilities. Prior to that, Mr. Kuai spent nine years in
the information technology department of Yum! Restaurants China, enhancing its information
technology infrastructure and productivity. He obtained a master’s degree in information technology
from Shanghai Jiao Tong University in 2007 and a master’s degree in business administration (MBA)
from Booth School of Business at the University of Chicago in 2014.
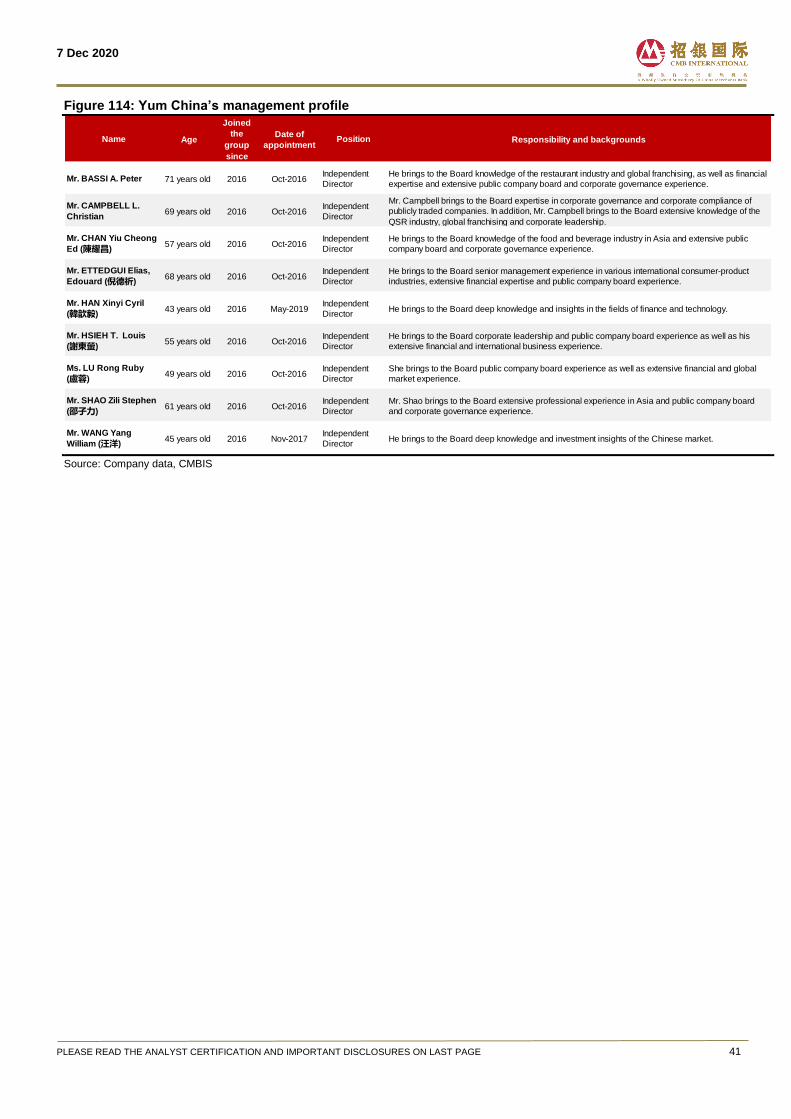
7 Dec 2020
PLEASE READ THE ANALYST CERTIFICATION AND IMPORTANT DISCLOSURES ON LAST PAGE 41
Figure 114: Yum China’s management profile
Source: Company data, CMBIS
Name Age
Joined
the
group
since
Date of
appointmentPosition Responsibility and backgrounds
Mr. BASSI A. Peter 71 years old 2016 Oct-2016Independent
Director
He brings to the Board knowledge of the restaurant industry and global franchising, as well as financial
expertise and extensive public company board and corporate governance experience.
Mr. CAMPBELL L.
Christian 69 years old 2016 Oct-2016
Independent
Director
Mr. Campbell brings to the Board expertise in corporate governance and corporate compliance of
publicly traded companies. In addition, Mr. Campbell brings to the Board extensive knowledge of the
QSR industry, global franchising and corporate leadership.
Mr. CHAN Yiu Cheong
Ed (陳耀昌)57 years old 2016 Oct-2016
Independent
Director
He brings to the Board knowledge of the food and beverage industry in Asia and extensive public
company board and corporate governance experience.
Mr. ETTEDGUI Elias,
Edouard (倪德祈)68 years old 2016 Oct-2016
Independent
Director
He brings to the Board senior management experience in various international consumer-product
industries, extensive financial expertise and public company board experience.
Mr. HAN Xinyi Cyril
(韓歆毅)43 years old 2016 May-2019
Independent
DirectorHe brings to the Board deep knowledge and insights in the fields of finance and technology.
Mr. HSIEH T. Louis
(謝東螢)55 years old 2016 Oct-2016
Independent
Director
He brings to the Board corporate leadership and public company board experience as well as his
extensive financial and international business experience.
Ms. LU Rong Ruby
(盧蓉)49 years old 2016 Oct-2016
Independent
Director
She brings to the Board public company board experience as well as extensive financial and global
market experience.
Mr. SHAO Zili Stephen
(邵子力)61 years old 2016 Oct-2016
Independent
Director
Mr. Shao brings to the Board extensive professional experience in Asia and public company board
and corporate governance experience.
Mr. WANG Yang
William (汪洋)45 years old 2016 Nov-2017
Independent
DirectorHe brings to the Board deep knowledge and investment insights of the Chinese market.
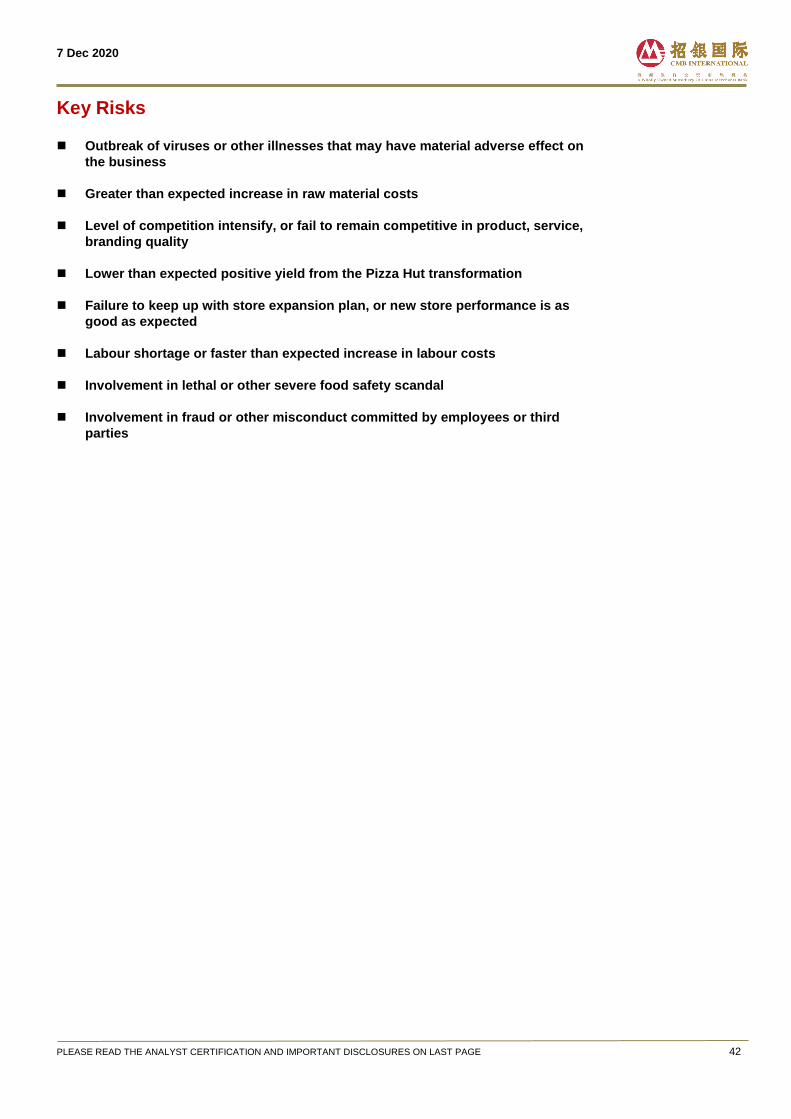
7 Dec 2020
PLEASE READ THE ANALYST CERTIFICATION AND IMPORTANT DISCLOSURES ON LAST PAGE 42
Key Risks
Outbreak of viruses or other illnesses that may have material adverse effect on
the business
Greater than expected increase in raw material costs
Level of competition intensify, or fail to remain competitive in product, service,
branding quality
Lower than expected positive yield from the Pizza Hut transformation
Failure to keep up with store expansion plan, or new store performance is as
good as expected
Labour shortage or faster than expected increase in labour costs
Involvement in lethal or other severe food safety scandal
Involvement in fraud or other misconduct committed by employees or third
parties
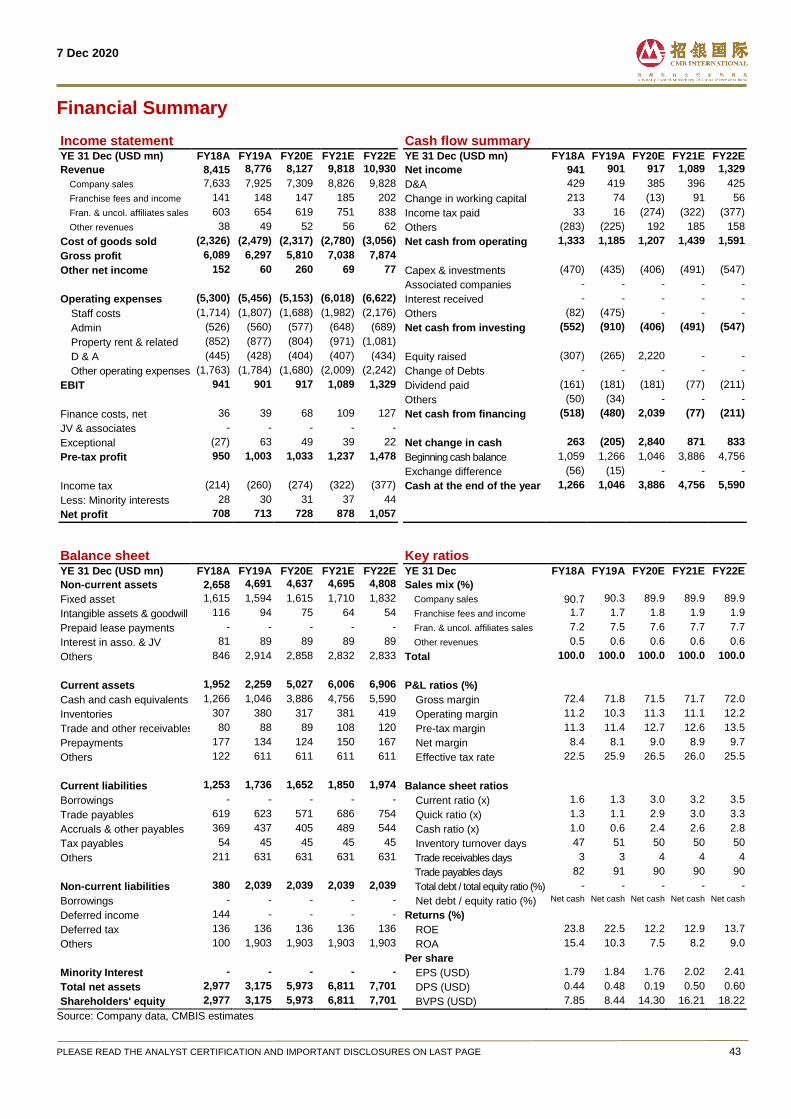
7 Dec 2020
PLEASE READ THE ANALYST CERTIFICATION AND IMPORTANT DISCLOSURES ON LAST PAGE 43
Financial Summary
Income statement Cash flow summary
YE 31 Dec (USD mn) FY18A FY19A FY20E FY21E FY22E YE 31 Dec (USD mn) FY18A FY19A FY20E FY21E FY22E
Revenue 8,415 8,776 8,127 9,818 10,930 Net income 941 901 917 1,089 1,329
Company sales 7,633 7,925 7,309 8,826 9,828 D&A 429 419 385 396 425
Franchise fees and income 141 148 147 185 202 Change in working capital 213 74 (13) 91 56
Fran. & uncol. affiliates sales 603 654 619 751 838 Income tax paid 33 16 (274) (322) (377)
Other revenues 38 49 52 56 62 Others (283) (225) 192 185 158
Cost of goods sold (2,326) (2,479) (2,317) (2,780) (3,056) Net cash from operating 1,333 1,185 1,207 1,439 1,591
Gross profit 6,089 6,297 5,810 7,038 7,874
Other net income 152 60 260 69 77 Capex & investments (470) (435) (406) (491) (547)
Associated companies - - - - -
Operating expenses (5,300) (5,456) (5,153) (6,018) (6,622) Interest received - - - - -
Staff costs (1,714) (1,807) (1,688) (1,982) (2,176) Others (82) (475) - - -
Admin (526) (560) (577) (648) (689) Net cash from investing (552) (910) (406) (491) (547)
Property rent & related (852) (877) (804) (971) (1,081)
D & A (445) (428) (404) (407) (434) Equity raised (307) (265) 2,220 - -
Other operating expenses (1,763) (1,784) (1,680) (2,009) (2,242) Change of Debts - - - - -
EBIT 941 901 917 1,089 1,329 Dividend paid (161) (181) (181) (77) (211)
Others (50) (34) - - -
Finance costs, net 36 39 68 109 127 Net cash from financing (518) (480) 2,039 (77) (211)
JV & associates - - - - -
Exceptional (27) 63 49 39 22 Net change in cash 263 (205) 2,840 871 833
Pre-tax profit 950 1,003 1,033 1,237 1,478 Beginning cash balance 1,059 1,266 1,046 3,886 4,756
Exchange difference (56) (15) - - -
Income tax (214) (260) (274) (322) (377) Cash at the end of the year 1,266 1,046 3,886 4,756 5,590
Less: Minority interests 28 30 31 37 44
Net profit 708 713 728 878 1,057
Balance sheet Key ratios
YE 31 Dec (USD mn) FY18A FY19A FY20E FY21E FY22E YE 31 Dec FY18A FY19A FY20E FY21E FY22E
Non-current assets 2,658 4,691 4,637 4,695 4,808 Sales mix (%)
Fixed asset 1,615 1,594 1,615 1,710 1,832 Company sales 90.7 90.3 89.9 89.9 89.9
Intangible assets & goodwill 116 94 75 64 54 Franchise fees and income 1.7 1.7 1.8 1.9 1.9
Prepaid lease payments - - - - - Fran. & uncol. affiliates sales 7.2 7.5 7.6 7.7 7.7
Interest in asso. & JV 81 89 89 89 89 Other revenues 0.5 0.6 0.6 0.6 0.6
Others 846 2,914 2,858 2,832 2,833 Total 100.0 100.0 100.0 100.0 100.0
Current assets 1,952 2,259 5,027 6,006 6,906 P&L ratios (%)
Cash and cash equivalents 1,266 1,046 3,886 4,756 5,590 Gross margin 72.4 71.8 71.5 71.7 72.0
Inventories 307 380 317 381 419 Operating margin 11.2 10.3 11.3 11.1 12.2
Trade and other receivables 80 88 89 108 120 Pre-tax margin 11.3 11.4 12.7 12.6 13.5
Prepayments 177 134 124 150 167 Net margin 8.4 8.1 9.0 8.9 9.7
Others 122 611 611 611 611 Effective tax rate 22.5 25.9 26.5 26.0 25.5
Current liabilities 1,253 1,736 1,652 1,850 1,974 Balance sheet ratios
Borrowings - - - - - Current ratio (x) 1.6 1.3 3.0 3.2 3.5
Trade payables 619 623 571 686 754 Quick ratio (x) 1.3 1.1 2.9 3.0 3.3
Accruals & other payables 369 437 405 489 544 Cash ratio (x) 1.0 0.6 2.4 2.6 2.8
Tax payables 54 45 45 45 45 Inventory turnover days 47 51 50 50 50
Others 211 631 631 631 631 Trade receivables days 3 3 4 4 4
Trade payables days 82 91 90 90 90
Non-current liabilities 380 2,039 2,039 2,039 2,039 Total debt / total equity ratio (%) - - - - -
Borrowings - - - - - Net debt / equity ratio (%) Net cash Net cash Net cash Net cash Net cash
Deferred income 144 - - - - Returns (%)
Deferred tax 136 136 136 136 136 ROE 23.8 22.5 12.2 12.9 13.7
Others 100 1,903 1,903 1,903 1,903 ROA 15.4 10.3 7.5 8.2 9.0
Per share
Minority Interest - - - - - EPS (USD) 1.79 1.84 1.76 2.02 2.41
Total net assets 2,977 3,175 5,973 6,811 7,701 DPS (USD) 0.44 0.48 0.19 0.50 0.60
Shareholders' equity 2,977 3,175 5,973 6,811 7,701 BVPS (USD) 7.85 8.44 14.30 16.21 18.22
Source: Company data, CMBIS estimates
7 Dec 2020
PLEASE READ THE ANALYST CERTIFICATION AND IMPORTANT DISCLOSURES ON LAST PAGE 44
Disclosures & Disclaimers
Analyst Certification The research analyst who is primary responsible for the content of this research report, in whole or in part, certifies that with respect to the securities or issuer that the analyst covered in this report: (1) all of the views expressed accurately reflect his or her personal views about the subject securities or issuer; and (2) no part of his or her compensation was, is, or will be, directly or indirectly, related to the specific views expressed by that analyst in this report. Besides, the analyst confirms that neither the analyst nor his/her associates (as defined in the code of conduct issued by The Hong Kong Securities and Futures Commission) (1) have dealt in or traded in the stock(s) covered in this research report within 30 calendar days prior to the date of issue of this report; (2) will deal in or trade in the stock(s) covered in this research report 3 business days after the date of issue of this report; (3) serve as an officer of any of the Hong Kong listed companies covered in this report; and (4) have any financial interests in the Hong Kong listed companies covered in this report.
Disclosure CMBIS or its affiliate(s) have investment banking relationship with the issuers covered in this report in preceding 12 months.
CMBIS Ratings BUY : Stock with potential return of over 15% over next 12 months HOLD : Stock with potential return of +15% to -10% over next 12 months SELL : Stock with potential loss of over 10% over next 12 months NOT RATED : Stock is not rated by CMBIS
OUTPERFORM : Industry expected to outperform the relevant broad market benchmark over next 12 months MARKET-PERFORM : Industry expected to perform in-line with the relevant broad market benchmark over next 12 months UNDERPERFORM : Industry expected to underperform the relevant broad market benchmark over next 12 months
CMB International Securities Limited Address: 45/F, Champion Tower, 3 Garden Road, Hong Kong, Tel: (852) 3900 0888 Fax: (852) 3900 0800
CMB International Securities Limited (“CMBIS”) is a wholly owned subsidiary of CMB International Capital Corporation Limited (a wholly owned subsidiary of China Merchants Bank)
Important Disclosures There are risks involved in transacting in any securities. The information contained in this report may not be suitable for the purposes of all investors. CMBIS does not provide individually tailored investment advice. This report has been prepared without regard to the individual investment objectives, financial position or special requirements. Past performance has no indication of future performance, and actual events may differ materially from that which is contained in the report. The value of, and returns from, any investments are uncertain and are not guaranteed and may fluctuate as a result of their dependence on the performance of underlying assets or other variable market factors. CMBIS recommends that investors should independently evaluate particular investments and strategies, and encourages investors to consult with a professional financial advisor in order to make their own investment decisions. This report or any information contained herein, have been prepared by the CMBIS, solely for the purpose of supplying information to the clients of CMBIS or its affiliate(s) to whom it is distributed. This report is not and should not be construed as an offer or solicitation to buy or sell any security or any interest in securities or enter into any transaction. Neither CMBIS nor any of its affiliates, shareholders, agents, consultants, directors, officers or employees shall be liable for any loss, damage or expense whatsoever, whether direct or consequential, incurred in relying on the information contained in this report. Anyone making use of the information contained in this report does so entirely at their own risk. The information and contents contained in this report are based on the analyses and interpretations of information believed to be publicly available and reliable. CMBIS has exerted every effort in its capacity to ensure, but not to guarantee, their accuracy, completeness, timeliness or correctness. CMBIS provides the information, advices and forecasts on an "AS IS" basis. The information and contents are subject to change without notice. CMBIS may issue other publications having information and/ or conclusions different from this report. These publications reflect different assumption, point-of-view and analytical methods when compiling. CMBIS may make investment decisions or take proprietary positions that are inconsistent with the recommendations or views in this report. CMBIS may have a position, make markets or act as principal or engage in transactions in securities of companies referred to in this report for itself and/or on behalf of its clients from time to time. Investors should assume that CMBIS does or seeks to have investment banking or other business relationships with the companies in this report. As a result, recipients should be aware that CMBIS may have a conflict of interest that could affect the objectivity of this report and CMBIS will not assume any responsibility in respect thereof. This report is for the use of intended recipients only and this publication, may not be reproduced, reprinted, sold, redistributed or published in whole or in part for any purpose without prior written consent of CMBIS. Additional information on recommended securities is available upon request. For recipients of this document in the United Kingdom This report has been provided only to persons (I)falling within Article 19(5) of the Financial Services and Markets Act 2000 (Financial Promotion) Order 2005 (as amended from time to time)(“The Order”) or (II) are persons falling within Article 49(2) (a) to (d) (“High Net Worth Companies, Unincorporated Associations, etc.,) of the Order, and may not be provided to any other person without the prior written consent of CMBIS. For recipients of this document in the United States CMBIS is not a registered broker-dealer in the United States. As a result, CMBIS is not subject to U.S. rules regarding the preparation of research reports and the independence of research analysts. The research analyst who is primary responsible for the content of this research report is not registered or qualified as a research analyst with the Financial Industry Regulatory Authority (“FINRA”). The analyst is not subject to applicable restrictions under FINRA Rules intended to ensure that the analyst is not affected by potential conflicts of interest that could bear upon the reliability of the research report. This report is intended for distribution in the United States solely to "major US institutional investors", as defined in Rule 15a-6 under the US, Securities Exchange Act of 1934, as amended, and may not be furnished to any other person in the United States. Each major US institutional investor that receives a copy of this report by its acceptance hereof represents and agrees that it shall not distribute or provide this report to any other person. Any U.S. recipient of this report wishing to effect any transaction to buy or sell securities based on the information provided in this report should do so only through a U.S.-registered broker-dealer. For recipients of this document in Singapore This report is distributed in Singapore by CMBI (Singapore) Pte. Limited (CMBISG) (Company Regn. No. 201731928D), an Exempt Financial Adviser as defined in the Financial Advisers Act (Cap. 110) of Singapore and regulated by the Monetary Authority of Singapore. CMBISG may distribute reports produced by its respective foreign entities, affiliates or other foreign research houses pursuant to an arrangement under Regulation 32C of the Financial Advisers Regulations. Where the report is distributed in Singapore to a person who is not an Accredited Investor, Expert Investor or an Institutional Investor, as defined in the Securities and Futures Act (Cap. 289) of Singapore, CMBISG accepts legal responsibility for the contents of the report to such persons only to the extent required by law. Singapore recipients should contact CMBISG at +65 6350 4400 for matters arising from, or in connection with the report.