characterization of audiovisual binding and fusion in the
TRANSCRIPT
HAL Id: tel-01692029https://tel.archives-ouvertes.fr/tel-01692029
Submitted on 24 Jan 2018
HAL is a multi-disciplinary open accessarchive for the deposit and dissemination of sci-entific research documents, whether they are pub-lished or not. The documents may come fromteaching and research institutions in France orabroad, or from public or private research centers.
L’archive ouverte pluridisciplinaire HAL, estdestinée au dépôt et à la diffusion de documentsscientifiques de niveau recherche, publiés ou non,émanant des établissements d’enseignement et derecherche français ou étrangers, des laboratoirespublics ou privés.
Characterization of audiovisual binding and fusion in theframework of audiovisual speech scene analysis
Ganesh Attigodu Chandrashekara
To cite this version:Ganesh Attigodu Chandrashekara. Characterization of audiovisual binding and fusion in the frame-work of audiovisual speech scene analysis. Psychology. Université Grenoble Alpes, 2016. English.�NNT : 2016GREAS006�. �tel-01692029�
THÈSE Pour obtenir le grade de
DOCTEUR DE L’UNIVERSITÉ GRENOBLE ALPES Spécialité : Sciences Cognitives, Psychologie Cognitive & Neurocognition Arrêté ministériel : 7 août 2006
Présentée par
Ganesh ATTIGODU CHANDRASHEKARA Thèse dirigée par Jean-Luc SCHWARTZ
et codirigée par Frédéric BERTHOMMIER
préparée au sein du Laboratoire Grenoble Images Parole Signal &
Automatique (GIPSA-Lab, UMR 5216)
dans l'École Doctorale Ingénierie pour la Santé, la Cognition et
l’environnement (EDISCE)
Characterization of Audiovisual
Binding and Fusion in the Framework
of Audiovisual Speech Scene Analysis
Thèse soutenue publiquement le 29 février 2016 devant le jury composé de : Mme Anne GUERIN-DUGUE Professeur Université Grenoble Alpes, GIPSA-Lab (Président)
Mr Salvador SOTO-FARACO Professeur, Université Pompeu Fabra, Barcelone (Rapporteur)
Mr Nicolas GRIMAULT Chargé de Recherches CNRS, CRNL Lyon (Rapporteur)
Mr Luc H ARNAL Chercheur, Université de Genève (Examinateur)
Mr Jean-Luc SCHWARTZ Directeur de Recherches CNRS, GIPSA-Lab (Directeur de thèse) Mr Frédéric BERTHOMMIER Chargé de Recherches CNRS, GIPSA-Lab (Co-directeur de thèse)

ABSTRACT
The present doctoral work is focused on a tentative fusion between two separate concepts: Au-
ditory Scene Analysis (ASA) and Audiovisual (AV) fusion in speech perception. We introduce
“Audio Visual Speech Scene Analysis” (AVSSA) as an extension of the two-stage ASA model to-
wards AV scenes, and we propose that a coherence index between the auditory and the visual input
is computed prior to AV fusion, enabling to determine whether the sensory inputs should be bound
together. This is the “two-stage model of AV fusion”. Previous experiments on the modulation of
the McGurk effect by AV coherent vs. incoherent contexts presented before the McGurk target have
provided experimental evidence supporting the two-stage model. In this doctoral work, we further
evaluate the AVSSA process within the two-stage architecture in various dimensions such as intro-
ducing noise, considering multiple sources, assessing neurophysiological correlates and testing in
different populations.
A first set of experiments in younger adults was focused on behavioral characterization of the
AV binding process by introducing noise and results showed that the participants were able to eval-
uate both the level of acoustic noise and AV coherence and to monitor the AV fusion accordingly.
In a second set of behavioral experiments involving competing AV sources, we showed that the
AVSSA process enables to evaluate the coherence between auditory and visual features within a
complex scene, in order to properly associate the adequate components of a given AV speech
source, and provide to the fusion process an assessment of the AV coherence of the extracted
source. It also appears that the modulation of fusion depends on the attentional focus on one source
or the other.
Then an EEG experiment aimed to display a neurophysiological marker of the binding and un-
binding process and showed that an incoherent AV context could modulate the effect of the visual
input on the N1/P2 component. The last set of experiments were focused on measurement of AV
binding and its dynamics in the older population, and provided similar results as in younger adults
though with a higher amount of unbinding. The whole set of results enabled better characterize the
AVSSA process and were embedded in the proposal of an improved neurocognitive architecture for
AV fusion in speech perception.

RESUME
Cette thèse porte sur l’intégration de deux concepts : l’Analyse de Scènes Auditives (ASA) et
la fusion audiovisuelle (AV) en perception de parole. Nous introduisons "l’Analyse de Scènes de
Parole Audio Visuelles" (AVSSA) comme une extension du modèle à deux étages caractéristique
de l’ASA vers des scènes audiovisuelles et nous. proposons qu'un indice de cohérence entre modali-
tés auditive et visuelle est calculé avant la fusion AV, ce qui permet de déterminer si les entrées
sensorielles doivent être cognitivement liées : c’est le « modèle à deux étages » de la fusion AV.
Des expériences antérieures sur la modulation de l'effet McGurk par des contextes AV cohérents vs.
incohérents présentés avant la cible McGurk ont permis de valider le modèle à deux étages. Dans ce
travail de thèse, nous étudions le processus AVSSA au sein de l'architecture à deux étages dans
différentes dimensions telles que l'introduction de bruit, le mélange de sources AV, la recherche de
corrélats neurophysiologiques et l’évaluation sur différentes populations.
Une première série d'expériences chez les jeunes adultes a permis la caractérisation du méca-
nisme de liage AV en introduisant du bruit et les résultats ont montré que les participants étaient en
mesure d'évaluer à la fois le niveau de bruit acoustique et la cohérence AV et de contrôler la fusion
AV en conséquence. Dans une deuxième série d'expériences comportementales impliquant une
compétition entre sources AV, nous avons montré que l’AVSSA permet d'évaluer la cohérence
entre caractéristiques visuelles et auditives dans une scène complexe, afin d'associer les composants
adéquats d'une source de parole AV donné, et de fournir pour le processus de fusion une évaluation
de la cohérence de la source AV extraite. Il apparaît également que la fusion dépend du focus atten-
tionnel sur une source ou l'autre.
Puis une expérience EEG a cherché à mettre en évidence un marqueur neurophysiologique du
processus de liage-déliage et a montré qu’un contexte AV incohérent peut moduler l'effet de l'entrée
visuelle sur la composante N1 / P2. Une dernière série d'expériences a été axée sur l’évaluation du
liage AV et de sa dynamique dans une population âgée, et a fourni des résultats similaires à ceux
des adultes plus jeunes mais avec une plus grande dynamique de déliage. L'ensemble des résultats a
permis de mieux caractériser le processus AVSSA et a été intégré dans la proposition d'une archi-
tecture neurocognitive améliorée pour la fusion AV dans la perception de la parole.

TABLE OF CONTENTS
Abstract ............................................................................................................................. i
Résumé ............................................................................................................................ iii
List of Figures ................................................................................................................... ix
List of Tables .................................................................................................................. xiii
Table of Abbreviations .................................................................................................... xv
1. Introduction ............................................................................................................. 1
Auditory Scene Analysis (ASA) ............................................................................................ 2 1.1
Primitives and schemas ............................................................................................ 2 1.1.1
Computational auditory scene analysis (CASA) ........................................................ 4 1.1.2
Role of Vision in Audio Visual Speech Perception .............................................................. 5 1.2
Contribution of visual cues to intelligibility .............................................................. 5 1.2.1
The McGurk effect and its variations with experimental factors ............................. 8 1.2.2
Contribution of visual cues in older adults and hearing-impaired listeners .......... 10 1.2.3
AV Fusion and its Models .................................................................................................. 13 1.3
Possible architectures for AV fusion ....................................................................... 14 1.3.1
Fuzzy Logical Model of Perception (FLMP) ............................................................. 17 1.3.2
Non-automaticity and influence of cognitive factors on AV perception ................ 19 1.3.3
Weighted Fuzzy Logical Model of Perception (WFLMP) ........................................ 22 1.3.4
Neural Correlates of AV Speech Perception ..................................................................... 22 1.4
Neuroanatomical architectures for multisensory integration ............................... 23 1.4.1
Neurophysiological correlates of AV perception .................................................... 28 1.4.2
Integrating ASA with AV fusion within a Two-Stage Model of AV Speech Perception ..... 34 1.5
The one-stage architecture of AV speech perception ............................................ 34 1.5.1
Binding multisensory information in AV scenes ..................................................... 35 1.5.2
Elements in favor of a two-stage AV process in speech perception ...................... 37 1.5.3
A two-stage model for AV Speech Scene Analysis ................................................. 39 1.5.4
Evidence in favor of the two-stage model .............................................................. 40 1.5.5
Objectives and Plan ........................................................................................................... 44 1.6
2. General Principles-Methods & Materials ................................................................ 46
Participants Information ................................................................................................... 46 2.1
AV Material ....................................................................................................................... 46 2.2
Experimental Paradigm ..................................................................................................... 48 2.3
Contexts .................................................................................................................. 48 2.3.1
Targets .................................................................................................................... 48 2.3.2
Construction of the AV Stimuli ......................................................................................... 49 2.4
Preparation of the auditory stimuli ........................................................................ 50 2.4.1
Preparation of the video stimuli ............................................................................. 50 2.4.2
Final AV film preparation ........................................................................................ 51 2.4.3
Procedure .......................................................................................................................... 51 2.5
Processing of Responses ................................................................................................... 52 2.6
Detection of responses ........................................................................................... 52 2.6.1
Analysis of responses .............................................................................................. 54 2.6.2
Analysis of response time ....................................................................................... 54 2.6.3
Statistical Analysis ............................................................................................................. 55 2.7
Conclusions ....................................................................................................................... 55 2.8
3. Effect of Context, Rebinding and Noise on AV Speech Fusion .................................. 56
Background and Hypothesis ............................................................................................. 56 3.1
Methods and Materials ..................................................................................................... 60 3.2
Participants ............................................................................................................. 60 3.2.1
Stimuli ..................................................................................................................... 60 3.2.2
Procedure ............................................................................................................... 61 3.2.3
Processing of responses and statistical analyses.................................................... 62 3.2.4
Results ............................................................................................................................... 63 3.3
Individual data and No response data .................................................................... 63 3.3.1
Analysis of the proportion of “ba” responses ........................................................ 64 3.3.2
Analysis of response time ....................................................................................... 68 3.3.3
Discussion ......................................................................................................................... 71 3.4
4. AV Integration With Competing Sources in the Framework of AVSSA ...................... 74
Background and Hypothesis ............................................................................................. 74 4.1
Method and Materials ...................................................................................................... 78 4.2
Participants ............................................................................................................. 78 4.2.1
Stimuli ..................................................................................................................... 78 4.2.2
Procedure ............................................................................................................... 80 4.2.3
Processing of response ........................................................................................... 81 4.2.4
Results ............................................................................................................................... 81 4.3
Individual data ........................................................................................................ 81 4.3.1
Experiment A - Without explicit attention focus .................................................... 83 4.3.2
Experiment B - On the interaction between context type and attention focus ..... 85 4.3.3
Discussion ......................................................................................................................... 89 4.4
5. A Possible Neurophysiological Correlate of AV Binding and Unbinding .................... 94
Background and Hypothesis ............................................................................................. 94 5.1
Methods and Materials ..................................................................................................... 96 5.2
Participants ............................................................................................................. 96 5.2.1
Stimuli ..................................................................................................................... 96 5.2.2
Procedure ............................................................................................................... 98 5.2.3
EEG Parameters ...................................................................................................... 99 5.2.4
Analyses .................................................................................................................. 99 5.2.5
Results ............................................................................................................................. 103 5.3
Behavioral analysis ............................................................................................... 103 5.3.1
EEG Analyses ......................................................................................................... 104 5.3.2
Discussion ....................................................................................................................... 110 5.4
Comparison of the Coherent context conditions with previous EEG studies ...... 111 5.4.1
Comparison of the coherent and incoherent context conditions ........................ 112 5.4.2
Possible contamination by visual areas ................................................................ 114 5.4.3
6. Dynamics of AV Binding in Older Adults ................................................................ 117
Background and Hypothesis ........................................................................................... 117 6.1
Methods and Materials ................................................................................................... 120 6.2
Participants ........................................................................................................... 120 6.2.1
Speech, Spatial, and Qualities of hearing scale (SSQ) .......................................... 121 6.2.2
Color-word Stroop test ......................................................................................... 123 6.2.3
Experiment A – Stimuli ......................................................................................... 126 6.2.4
Experiment B - Stimuli .......................................................................................... 127 6.2.5
Procedure ............................................................................................................. 128 6.2.6
Processing of response ......................................................................................... 128 6.2.7
Results ............................................................................................................................. 129 6.3
Individual data and No response data .................................................................. 129 6.3.1
Experiment A: Binding, Unbinding & Rebinding ................................................... 131 6.3.2
Experiment B-On the interaction between context type and attention focus .... 136 6.3.3
Correlations with cognitive variables ................................................................... 139 6.3.4
Discussion ....................................................................................................................... 140 6.4
7. General Discussion ............................................................................................... 143
Summary of the Major Findings of this Work ................................................................. 143 7.1
Behavioral characterization of the AV binding process........................................ 143 7.1.1
Neurophysiological characterization of the binding mechanism ......................... 146 7.1.2
Dynamics of AV binding in older adults ................................................................ 149 7.1.3
Interpretation of the Present Results within the “Two-Stage Model” ........................... 150 7.2
Characterization of the AVSSA process ................................................................ 150 7.2.1
Assessing the “Two-stage” model ........................................................................ 154 7.2.2
Similarity with the theoretical framework by Talsma et al. (2010) ...................... 161 7.2.3
Future Perspectives ........................................................................................................ 162 7.3
References .................................................................................................................... 165
Appendix I- Confusion Matrices ..................................................................................... 183
Appendix II- Speech, Spatial, and Qualities of hearing scale (SSQ)-French Version .......... 186
LIST OF FIGURES
Figure 1-1 Example of an auditory stream segregation experiment. ........................................................ 3
Figure 1-2 Experimental results of Grant and Seitz (2000). ...................................................................... 7
Figure 1-3 The four basic models of AV integration. ............................................................................... 14
Figure 1-4 A PACT architecture for Speech Perception. .......................................................................... 17
Figure 1-5 Summary of Massaro’s FLMP model. ..................................................................................... 18
Figure 1-6 Experimental results of Tiippana et al. (2004). ...................................................................... 21
Figure 1-7 Hypothetical scenarios for cross-modal binding. ................................................................... 26
Figure 1-8 Sensory-motor theoretical model for AV integration. ........................................................... 27
Figure 1-9 Experimental results of Van Wassenhove et al. (2005). ........................................................ 30
Figure 1-10 Experimental results of Alsius et al. (2014). ......................................................................... 33
Figure 1-11 The one-stage model for AV fusion in speech perception. .................................................. 35
Figure 1-12 Illustration of AV correlation. ............................................................................................... 38
Figure 1-13 The two-stage model for AV fusion in speech perception. .................................................. 40
Figure 1-14 Experimental paradigm for assessing the binding/unbinding effect. .................................. 41
Figure 1-15 Experimental results of Nahorna et al. (2012). .................................................................... 42
Figure 1-16 Experimental paradigms for assessing the unbinding and rebinding effects. ..................... 43
Figure 1-17 Experimental results of Nahorna et al. (2015). .................................................................... 44
Figure 2-1 Stimuli preparation for both contexts and targets. ............................................................... 47
Figure 2-2 Experimental paradigm. ......................................................................................................... 49
Figure 2-3 Illustration of image fusion using black image. ...................................................................... 50
Figure 2-4 Example of analysis of response time within the [200-1200ms] time window ..................... 53
Figure 2-5 Classification of responses. .................................................................................................... 54
Figure 3-1 Experimental paradigm for displaying unbinding or rebinding mechanisms. ....................... 57
Figure 3-2 Description of the AV material. .............................................................................................. 60
x
Figure 3-3 Preparation of Audio material ................................................................................................ 61
Figure 3-4 Individual “ba” scores for McGurk targets, ............................................................................ 63
Figure 3-5 Mean number of missed targets. ........................................................................................... 64
Figure 3-6 Proportion of “ba” responses for “McGurk” targets .............................................................. 65
Figure 3-7 Mean response times for “McGurk” and “Ba” targets........................................................... 70
Figure 4-1 Experimental paradigm. ......................................................................................................... 76
Figure 4-2 Description of the AV material. .............................................................................................. 79
Figure 4-3 Illustration of a mixed auditory signal (syllables + sentences). .............................................. 80
Figure 4-4 Individual mean “ba” scores for McGurk targets ................................................................... 82
Figure 4-5 Mean number of missed targets. ........................................................................................... 83
Figure 4-6 The percentage of “ba” responses ......................................................................................... 84
Figure 4-7 Mean response times for “McGurk” and “Ba” targets in Experiment A. ............................... 85
Figure 4-8 The percentage of “ba” responses ......................................................................................... 86
Figure 4-9 Mean response time for all conditions .................................................................................. 88
Figure 4-10 Correlation analysis between audio mixture (characterized by the full band envelope) and
video stimulus .......................................................................................................................................... 90
Figure 4-11 Correlation analysis between audio and video stimulus. .................................................... 91
Figure 5-1 Experimental paradigm for the EEG experiment. .................................................................. 96
Figure 5-2 AV material used in the EEG experiment. .............................................................................. 97
Figure 5-3 Experimental sequence. ......................................................................................................... 98
Figure 5-4 The scalp topography of N1 and P2 for the six conditions ................................................... 102
Figure 5-5 Mean percentage of auditory responses ............................................................................. 104
Figure 5-6 Grand-average of auditory evoked potentials for the six electrodes .................................. 105
Figure 5-7 Mean N1/P2 amplitude and latency in the three conditions. .............................................. 106
Figure 5-8 Topographical distributions of the Grand-average ERPs ..................................................... 109
Figure 6-1 Mean scores (+ SD) for each SSQ items for both subscales. ................................................ 122
Figure 6-2 Mean scores (+ SD) for each SSQ items for both subscales. ................................................ 123
xi
Figure 6-3 Mean reaction time for both Neutral and Incongruent conditions ..................................... 125
Figure 6-4 Description of the AV material for Experiment A................................................................. 126
Figure 6-5 Description of the AV material for Experiment B. ................................................................ 127
Figure 6-6 Individual “ba” scores for McGurk targets ........................................................................... 130
Figure 6-7 Mean number of missed targets .......................................................................................... 131
Figure 6-8 Proportion of “ba” responses for “McGurk” targets ............................................................ 132
Figure 6-9 Proportion of “ba” responses for “McGurk” targets ............................................................ 133
Figure 6-10 Mean response times for “Ba” and “McGurk” targets....................................................... 135
Figure 6-11 Percentage of “ba” responses for “McGurk” targets ......................................................... 137
Figure 6-12 The percentage of “ba” responses for “McGurk” targets .................................................. 138
Figure 6-13 Mean response times for both conditions, ........................................................................ 139
Figure 7-1 Percentage of “ba” responses for “McGurk” targets, .......................................................... 144
Figure 7-2 Percentage of “ba” responses for “McGurk” targets ........................................................... 145
Figure 7-3 Grand-average of auditory evoked potentials for the six electrodes .................................. 147
Figure 7-4 Grand-average of auditory evoked potentials for the six electrodes .................................. 148
Figure 7-5 The percentage of “ba” responses for “McGurk” targets .................................................... 149
Figure 7-6 A possible cognitive architecture for AV binding and fusion in speech perception. ........... 154

xii
LIST OF TABLES
Table 3-1 Number of stimuli presented for each condition in each block .............................................. 62
Table 3-2 Detailed results of the three-way repeated-measures ........................................................... 66
Table 3-3 Post-hoc analysis for response scores for the McGurk target ................................................. 68
Table 3-4 Detailed results of the four-way repeated-measures ANOVA for response times. ................ 70
Table 4-1 Detailed results of the three-way repeated-measures ANOVA .............................................. 87
Table 4-2 Post-hoc analysis for response scores for the McGurk target in Experiment B ...................... 88

xiv
TABLE OF ABBREVIATIONS
ASA Auditory Scene Analysis
AV Audio Visual
AVSSA Audio Visual Speech Scene Analysis
CASA Computational auditory scene analysis
CI Cochlear implants
EEG Electroencephalogram
ERP Event-related potentials
FLMP Fuzzy Logical Model of Perception
MEG Magnetoencephalography
MMN Measured mismatch negativity
PACT Perception-for-Action-Control Theory
PET Positron emission tomography
RSVP Rapid Serial Visual Presentation
SNR Signal-to-noise ratio
STS Superior temporal sulcus
TMS Transcranial magnetic stimulation
VPAM Vision Place Auditory Mode
WFLMP Weighted Fuzzy Logical Model of Perception

xvi
Chapter 1
1. INTRODUCTION
In normal communication, speech is regularly heard in various types of background
noise, which may mask the signal or compete for the attention of the listener. However, in
most of the cases, speech perception will occur in an effortlessness manner in normal hearing
population (that is the “cocktail party effect”). As Cherry (1953) explained, the cocktail party
effect is a psychoacoustic phenomenon that enables the individual to attend selectively and
identify one source of auditory input in a noisy environment. There are numerous attempts to
explain this complex phenomenon from various backgrounds that include cognitive
psychology, psychophysiology, neurobiology, physiology, biophysics, information
technology, and engineering. In the cognitive psychology domain, the Auditory Scene Analy-
sis (ASA) framework developed by Bregman (1990) has led to conceive the complex audito-
ry processing of speech within a two-stage model of auditory perception.
The visual modality may also intervene in speech perception, particularly in adverse
conditions – and the “cocktail party effect” generally involves the vision of the speaking
partner. Audiovisual (AV) speech perception has been the focus of a large series of experi-
mental and theoretical studies in the last thirty years, and led to the development of various
models, which are all typically one-stage, from unisensory feature extraction to bimodal fu-
sion and decision.
Our underlying framework consists in attempting to combine these two research fields
into a single “Audiovisual Speech Scene Analysis” (AVSSA) architecture, based on what we
call a “two-stage model of AV speech perception”. The present work intends to further
2
explore this architecture experimentally in various directions. In the following of this intro-
duction, we will successively review a number of facts and questions about ASA and AV
speech perception. Then we will present our “two-stage model” and introduce the major
questions and directions of this doctoral work.
AUDITORY SCENE ANALYSIS (ASA) 1.1
Primitives and schemas 1.1.1
ASA begins with a first stage in which the acoustic input is decomposed into a collection
of time-frequency regions to which one can automatically attach “primitives” that are primary
featural properties (e.g. in pitch, time, location, timbre, loudness). Global properties of conti-
nuity or coherence in one or the other primitive enable to group some of these time-frequency
regions into possible coherent streams (groups). In a second stage, candidate organizations
undergo a competitive process within which prior knowledge, context and/or task demands
may operate, and the selected source is further processed and finally perceived. The ASA
architecture put forward by Bregman explicitly capitalizes on the Gestalt laws of perceptual
organization (Koffka, 1935) which are the basis for Visual Scene Analysis. The initial group-
ing process is based on primitives that are derived from Gestalt principles exploiting physical
similarity, temporal proximity, spectro-temporal continuity, and more generally any cue re-
lated to “common fate”. This primitive stage is considered pre-attentive and based on auto-
matic bottom-up stream segregation.
Most of Bregman’s works and studies by many others in the corresponding period typi-
cally from the 1980s to the 2000s were mainly focused on the characterization of primitives
and automatic bottom-up stream segregation. The initial primitive-based grouping processes
can be broadly classified as sequential grouping cues and simultaneous grouping cues. Se-
quential grouping cues (or temporal grouping) operate across time and are determined by
similarities/continuities from one moment to the next which are available in the spectrum
3
(Bregman, 1990). Simultaneous grouping cues (or spectral grouping) operate across frequen-
cy in a given region of time and allow to group together simultaneous frequency components
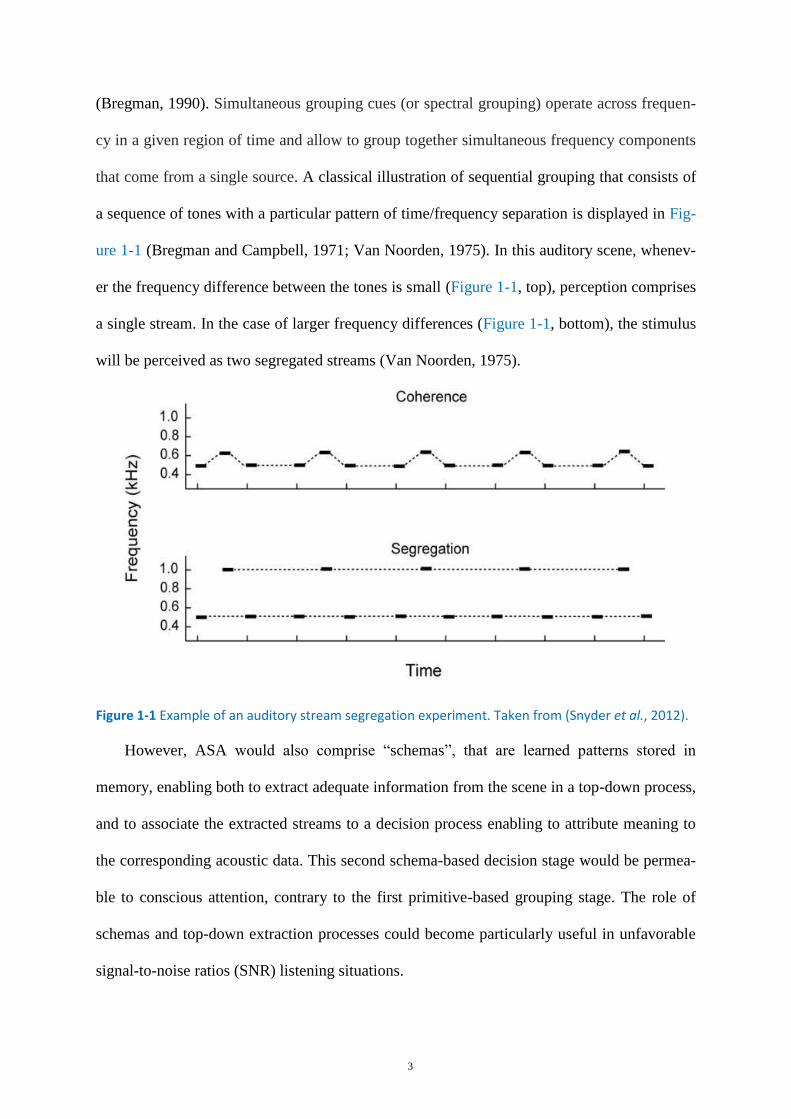
that come from a single source. A classical illustration of sequential grouping that consists of
a sequence of tones with a particular pattern of time/frequency separation is displayed in Fig-
ure 1-1 (Bregman and Campbell, 1971; Van Noorden, 1975). In this auditory scene, whenev-
er the frequency difference between the tones is small (Figure 1-1, top), perception comprises
a single stream. In the case of larger frequency differences (Figure 1-1, bottom), the stimulus
will be perceived as two segregated streams (Van Noorden, 1975).
Figure 1-1 Example of an auditory stream segregation experiment. Taken from (Snyder et al., 2012).
However, ASA would also comprise “schemas”, that are learned patterns stored in
memory, enabling both to extract adequate information from the scene in a top-down process,
and to associate the extracted streams to a decision process enabling to attribute meaning to
the corresponding acoustic data. This second schema-based decision stage would be permea-
ble to conscious attention, contrary to the first primitive-based grouping stage. The role of
schemas and top-down extraction processes could become particularly useful in unfavorable
signal-to-noise ratios (SNR) listening situations.
4
Computational auditory scene analysis (CASA) 1.1.2
The cognitive processes that are supposed to be involved in ASA have inspired since the
80s the development of computational models in the framework of what was called Computa-
tional Auditory Scene Analysis “CASA”. The objective is to elaborate “machine perception”
systems for sound separation with many potential applications including hearing prostheses,
noise-robust automatic speech recognition, etc. The goal of CASA is to mimic
computationally the ASA process applied on an acoustic scene typically recorded through
one or two microphones (Rosenthal and Okuno, 1998). CASA follows the conceptual ASA
architecture with two stages consisting of “primitive labeling” which is followed by “group-
ing” in competing streams before separation or identification of one or several streams. The
process typically begins with sound analysis at the level of the peripheral auditory system
reproducing time-frequency representation of the auditory activity at the output of the cochlea
or within the primary fibers in the auditory nerve. This is followed by the extraction of
primitive features such as periodicity, onsets, offsets, amplitude modulation, or frequency
modulation. Once extracted, features enable the segmentation of the scene into coherent piec-
es and then grouping mechanisms hopefully associate segments from the same sound source,
and combine them to form a separate sound stream (Wang and Brown, 2006). Specific recog-
nition algorithms may then be applied to the extracted streams taking into account the fact
that the information may be incomplete [missing data schemes, glimpsing processes, (Cooke
et al., 2001; Cooke, 2006)]. There have been a lot of proposals of CASA systems over the
years, varying in their architecture, biological motivation, and grouping process, but all of
them obey the two-stage architecture introduced by Bregman and others for defining the ASA
mechanisms in auditory perception: firstly extract sources in the scene, secondly identify the
extracted sources.
5
ROLE OF VISION IN AUDIO VISUAL SPEECH PERCEPTION 1.2
In the process of speech perception, the incoming auditory signal plays a significant role,
but other cues are also available, basically visual and also possibly tactile cues. It makes
speech perception a multisensory rather than unisensory process, requiring multisensory inte-
gration. Whenever the auditory signal is compromised due to external (e.g. noise) or internal
factors (e.g. hearing impairment), the additional cues from the visual or possibly tactile mo-
dality seem to be always beneficial. In most instances, the presentation of visual stimuli in
addition to the auditory input significantly improves the efficiency of speech perception. In
the following sections, some of the main aspects of the role of visual cues in AV speech per-
ception will be discussed.
Contribution of visual cues to intelligibility 1.2.1
After a number of informal and qualitative reports about the efficiency of lip-reading in
adverse listening condition, the first study quantifying the gain provided by visual cues for
speech perception in noise was published by Sumby and Pollack (1954). These authors re-
ported the benefits of visual cues by measuring speech intelligibility at SNRs with and with-
out visual speech information in addition to the auditory signal. They showed that intelligibil-
ity scores were improved due to visual speech cues, and this improvement was larger at low
SNRs. They concluded that visual cues were mostly utilized in poor SNR conditions associ-
ated with lower auditory intelligibility. They claimed that the presence of visual information
associated with the sight of the speaker’s face would enhance the transmitted signal and
hence increase intelligibility, which naturally makes the visual contribution more significant
as the SNR is decreased.
These findings were replicated and supported by many similar studies. All of these
studies confirmed that listeners with normal hearing benefit from the availability of visual
information during speech comprehension tasks whenever auditory information is degraded
6
(Erber, 1969; MacLeod and Summerfield, 1990; Grant and Braida, 1991; Benoit et al., 1994;
Sommers et al., 2005; Ross et al., 2007). The benefit of vision could be due to a number of
phonetic cues that are available in the visual signal itself (Summerfield, 1987; Grant and
Seitz, 1998; Grant et al., 1998). For example, when acoustic cues in place of articulation of a
consonant within a syllable (e.g. /ba/) are degraded, visual cues about bilabial closure availa-
ble on the speaker’s face naturally increase intelligibility. This is what is called “lip-reading”
or “speech reading”. However, vision can intervene in other ways. For example, Munhall et
al. (2004) showed that rhythmic facial and head movements may provide cues conveying
information about the speech envelope. Indeed, head and eyebrow movements as well as lip,
jaw and cheek movements are known to be systematically associated with speech amplitude
and fundamental frequency (Munhall et al., 2001; Munhall et al., 2004).
The visual input also appears to be beneficial to speech detection and cue extraction. Lis-
teners are able to better detect speech that is masked by noise when the auditory input is ac-
companied by its visual counterpart (Grant and Seitz, 2000; Kim and Davis, 2003; Bernstein
et al., 2004; Kim and Davis, 2004). In their two first experiments, Grant and Seitz (2000)
presented spoken sentences in three conditions: auditory-only (A), AV matched (AVM) and
AV unmatched (AVUM). They found improved detection thresholds only when the audio and
visual signals matched. There were no differences between the AVUM condition and the A
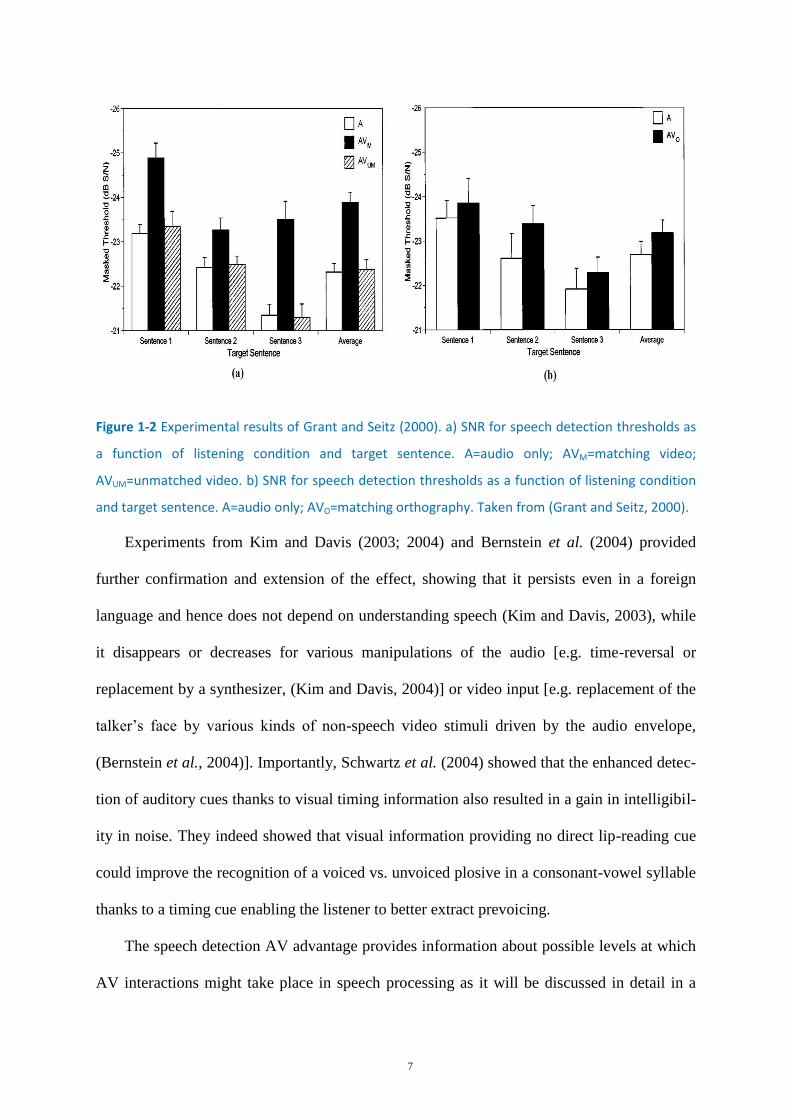
condition (see Figure 1-2a) for detection thresholds. In the second experiment, similar results
were obtained when upcoming auditory stimuli were presented with orthographically
matched stimuli (see Figure 1-2b). However, the gain provided by the visual orthographic
input was much lower (in the second experiment) than the gain provided by the visually
matched lip dynamics (in the first experiment). These results suggest that addition of visual
information cued participants about the content of the auditory stream, which was beneficial
for detection.
7
Figure 1-2 Experimental results of Grant and Seitz (2000). a) SNR for speech detection thresholds as
a function of listening condition and target sentence. A=audio only; AVM=matching video;
AVUM=unmatched video. b) SNR for speech detection thresholds as a function of listening condition
and target sentence. A=audio only; AVO=matching orthography. Taken from (Grant and Seitz, 2000).
Experiments from Kim and Davis (2003; 2004) and Bernstein et al. (2004) provided
further confirmation and extension of the effect, showing that it persists even in a foreign
language and hence does not depend on understanding speech (Kim and Davis, 2003), while
it disappears or decreases for various manipulations of the audio [e.g. time-reversal or
replacement by a synthesizer, (Kim and Davis, 2004)] or video input [e.g. replacement of the
talker’s face by various kinds of non-speech video stimuli driven by the audio envelope,
(Bernstein et al., 2004)]. Importantly, Schwartz et al. (2004) showed that the enhanced detec-
tion of auditory cues thanks to visual timing information also resulted in a gain in intelligibil-
ity in noise. They indeed showed that visual information providing no direct lip-reading cue
could improve the recognition of a voiced vs. unvoiced plosive in a consonant-vowel syllable
thanks to a timing cue enabling the listener to better extract prevoicing.
The speech detection AV advantage provides information about possible levels at which
AV interactions might take place in speech processing as it will be discussed in detail in a
8
next section. It shows that the coherence of AV fluctuations in time may be exploited by the
auditory system to detect important auditory information. Interestingly, AV interactions
based on the coherence of AV information can operate on the other way round, from audition
to vision, as displayed by the study by Alsius and Munhall (2013), in which a visible talking
face, hidden to consciousness by a specific trick based on continuous flash suppression, was
made visible again thanks to coherent auditory speech material.
The enhancement of speech perception by speech reading can be witnessed even when
the signal is clearly audible and intact but difficult to understand [e.g. perception of a native
language when presented using a non-native speech accent (Reisberg et al., 1987; Arnold and
Hill, 2001)]. Arnold and Hill (2001) showed that the listener comprehension increases with
the presence of visual speech information in passages difficult to understand (see also Reis-
berg et al., 1987). The visual cues increase understanding of non-native language speech
sounds even when the target auditory speech is clear (Davis and Kim, 2004; Navarra and
Soto-Faraco, 2007). For example, Navarra and Soto-Faraco (2007) showed that native Span-
ish-dominant bilingual speakers of Spanish and Catalan found it difficult to distinguish the
Catalan phonemes /e/ and /ɛ/ in a unisensory auditory task (“phonological deafness”), but
with the addition of visual information the listeners did show discrimination ability.
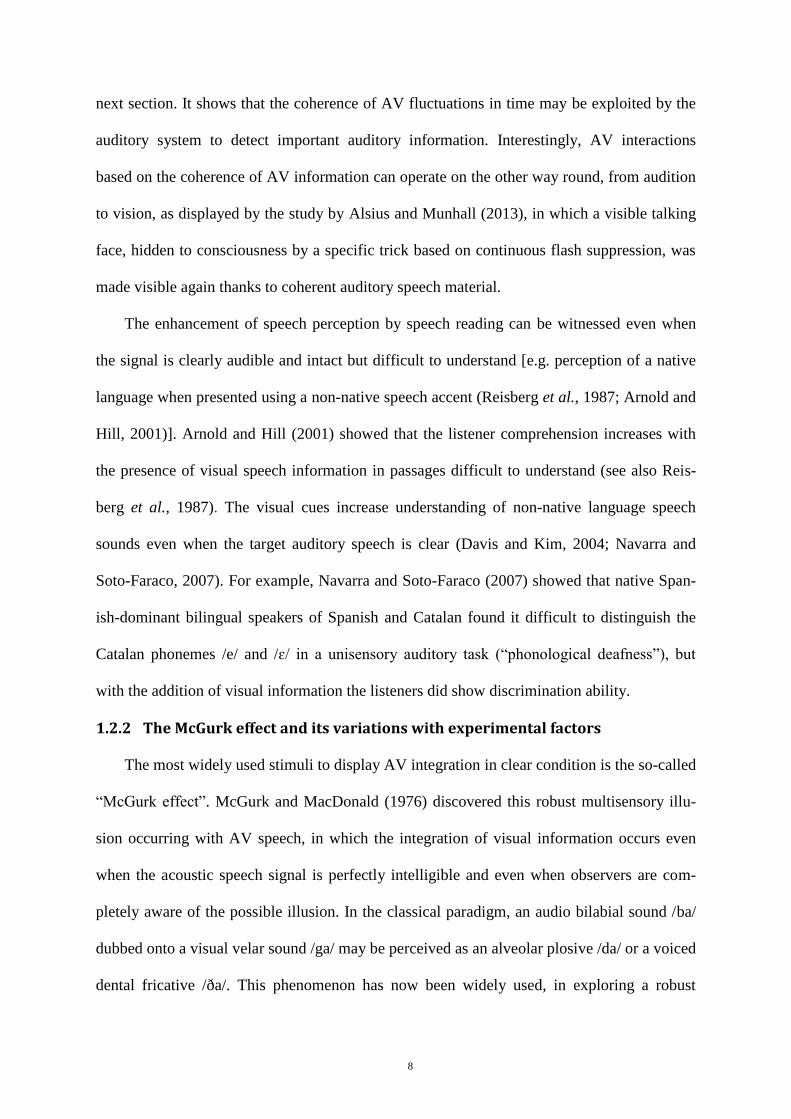
The McGurk effect and its variations with experimental factors 1.2.2
The most widely used stimuli to display AV integration in clear condition is the so-called
“McGurk effect”. McGurk and MacDonald (1976) discovered this robust multisensory illu-
sion occurring with AV speech, in which the integration of visual information occurs even
when the acoustic speech signal is perfectly intelligible and even when observers are com-
pletely aware of the possible illusion. In the classical paradigm, an audio bilabial sound /ba/
dubbed onto a visual velar sound /ga/ may be perceived as an alveolar plosive /da/ or a voiced
dental fricative /ða/. This phenomenon has now been widely used, in exploring a robust
9
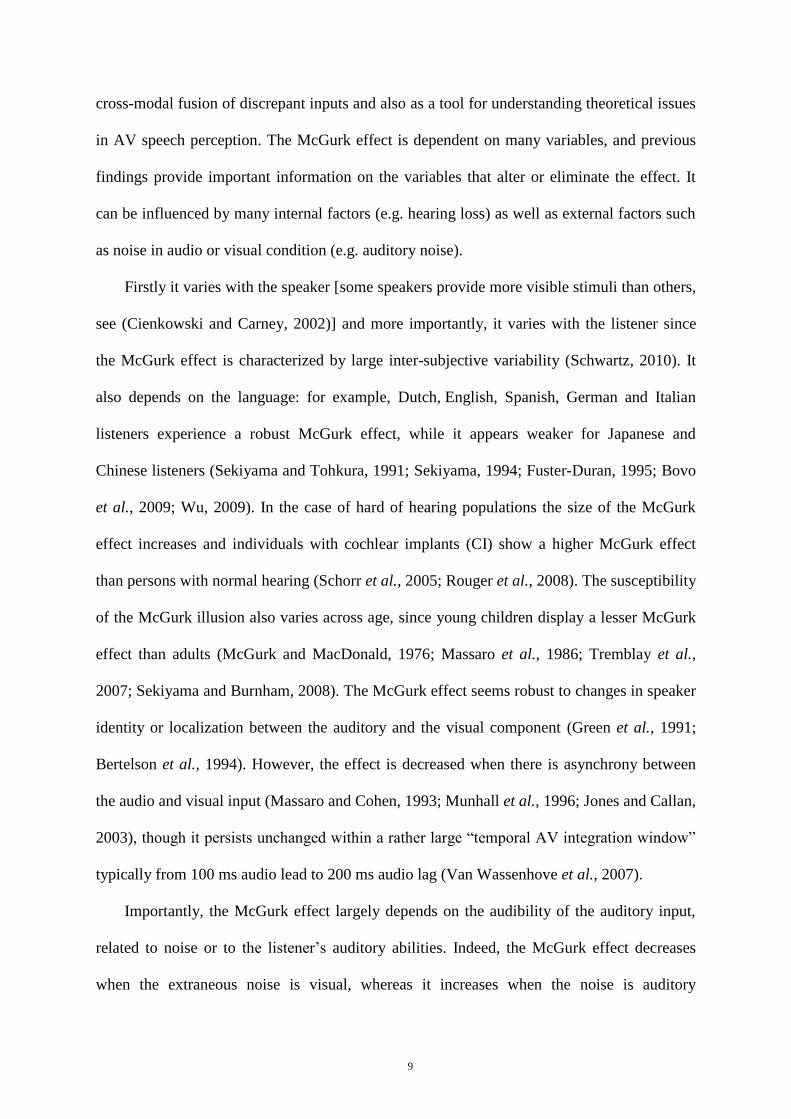
cross-modal fusion of discrepant inputs and also as a tool for understanding theoretical issues
in AV speech perception. The McGurk effect is dependent on many variables, and previous
findings provide important information on the variables that alter or eliminate the effect. It
can be influenced by many internal factors (e.g. hearing loss) as well as external factors such
as noise in audio or visual condition (e.g. auditory noise).
Firstly it varies with the speaker [some speakers provide more visible stimuli than others,
see (Cienkowski and Carney, 2002)] and more importantly, it varies with the listener since
the McGurk effect is characterized by large inter-subjective variability (Schwartz, 2010). It
also depends on the language: for example, Dutch, English, Spanish, German and Italian
listeners experience a robust McGurk effect, while it appears weaker for Japanese and
Chinese listeners (Sekiyama and Tohkura, 1991; Sekiyama, 1994; Fuster-Duran, 1995; Bovo
et al., 2009; Wu, 2009). In the case of hard of hearing populations the size of the McGurk
effect increases and individuals with cochlear implants (CI) show a higher McGurk effect
than persons with normal hearing (Schorr et al., 2005; Rouger et al., 2008). The susceptibility
of the McGurk illusion also varies across age, since young children display a lesser McGurk
effect than adults (McGurk and MacDonald, 1976; Massaro et al., 1986; Tremblay et al.,
2007; Sekiyama and Burnham, 2008). The McGurk effect seems robust to changes in speaker
identity or localization between the auditory and the visual component (Green et al., 1991;
Bertelson et al., 1994). However, the effect is decreased when there is asynchrony between
the audio and visual input (Massaro and Cohen, 1993; Munhall et al., 1996; Jones and Callan,
2003), though it persists unchanged within a rather large “temporal AV integration window”
typically from 100 ms audio lead to 200 ms audio lag (Van Wassenhove et al., 2007).
Importantly, the McGurk effect largely depends on the audibility of the auditory input,
related to noise or to the listener’s auditory abilities. Indeed, the McGurk effect decreases
when the extraneous noise is visual, whereas it increases when the noise is auditory
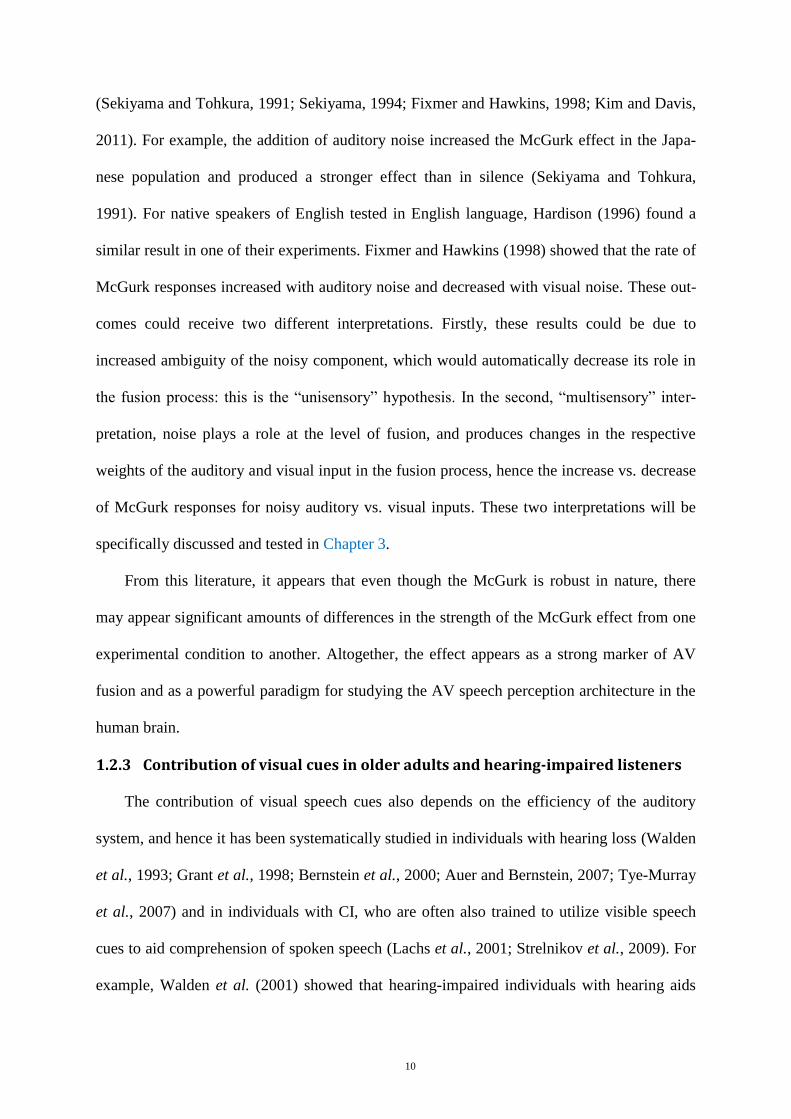
10
(Sekiyama and Tohkura, 1991; Sekiyama, 1994; Fixmer and Hawkins, 1998; Kim and Davis,
2011). For example, the addition of auditory noise increased the McGurk effect in the Japa-
nese population and produced a stronger effect than in silence (Sekiyama and Tohkura,
1991). For native speakers of English tested in English language, Hardison (1996) found a
similar result in one of their experiments. Fixmer and Hawkins (1998) showed that the rate of
McGurk responses increased with auditory noise and decreased with visual noise. These out-
comes could receive two different interpretations. Firstly, these results could be due to
increased ambiguity of the noisy component, which would automatically decrease its role in
the fusion process: this is the “unisensory” hypothesis. In the second, “multisensory” inter-
pretation, noise plays a role at the level of fusion, and produces changes in the respective
weights of the auditory and visual input in the fusion process, hence the increase vs. decrease
of McGurk responses for noisy auditory vs. visual inputs. These two interpretations will be
specifically discussed and tested in Chapter 3.
From this literature, it appears that even though the McGurk is robust in nature, there
may appear significant amounts of differences in the strength of the McGurk effect from one
experimental condition to another. Altogether, the effect appears as a strong marker of AV
fusion and as a powerful paradigm for studying the AV speech perception architecture in the
human brain.
Contribution of visual cues in older adults and hearing-impaired listeners 1.2.3
The contribution of visual speech cues also depends on the efficiency of the auditory
system, and hence it has been systematically studied in individuals with hearing loss (Walden
et al., 1993; Grant et al., 1998; Bernstein et al., 2000; Auer and Bernstein, 2007; Tye-Murray
et al., 2007) and in individuals with CI, who are often also trained to utilize visible speech
cues to aid comprehension of spoken speech (Lachs et al., 2001; Strelnikov et al., 2009). For
example, Walden et al. (2001) showed that hearing-impaired individuals with hearing aids
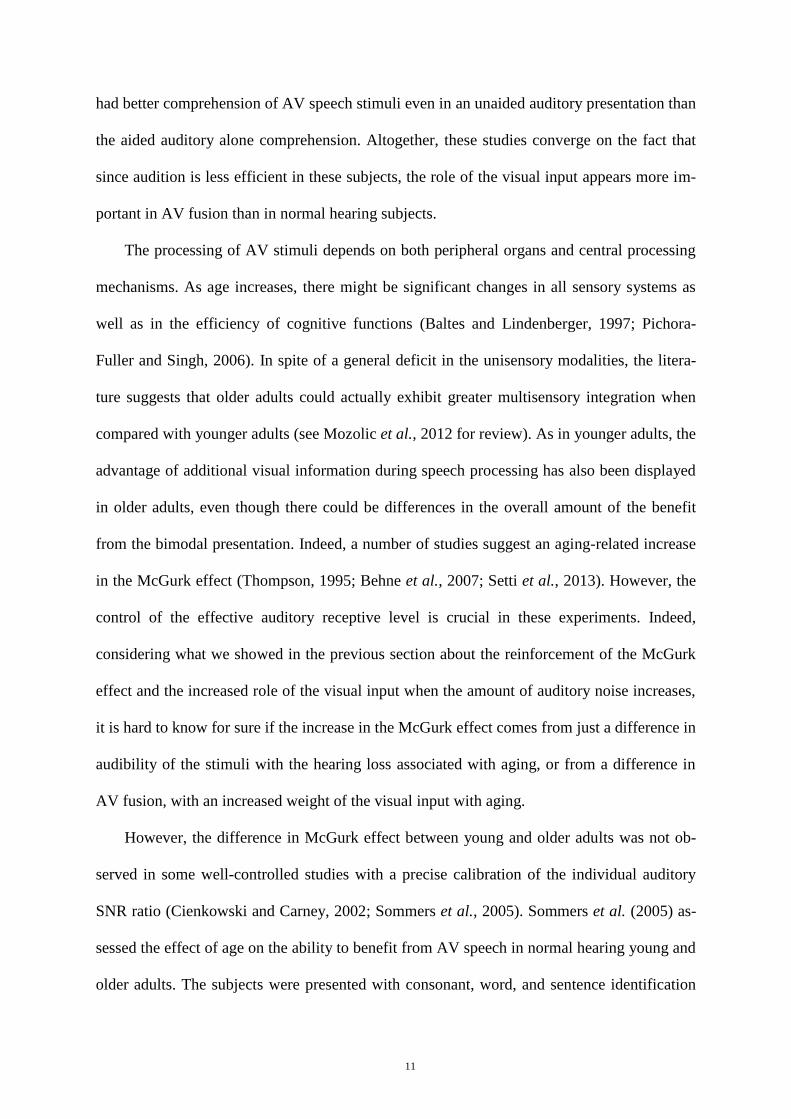
11
had better comprehension of AV speech stimuli even in an unaided auditory presentation than
the aided auditory alone comprehension. Altogether, these studies converge on the fact that
since audition is less efficient in these subjects, the role of the visual input appears more im-
portant in AV fusion than in normal hearing subjects.
The processing of AV stimuli depends on both peripheral organs and central processing
mechanisms. As age increases, there might be significant changes in all sensory systems as
well as in the efficiency of cognitive functions (Baltes and Lindenberger, 1997; Pichora-
Fuller and Singh, 2006). In spite of a general deficit in the unisensory modalities, the litera-
ture suggests that older adults could actually exhibit greater multisensory integration when
compared with younger adults (see Mozolic et al., 2012 for review). As in younger adults, the
advantage of additional visual information during speech processing has also been displayed
in older adults, even though there could be differences in the overall amount of the benefit
from the bimodal presentation. Indeed, a number of studies suggest an aging-related increase
in the McGurk effect (Thompson, 1995; Behne et al., 2007; Setti et al., 2013). However, the
control of the effective auditory receptive level is crucial in these experiments. Indeed,
considering what we showed in the previous section about the reinforcement of the McGurk
effect and the increased role of the visual input when the amount of auditory noise increases,
it is hard to know for sure if the increase in the McGurk effect comes from just a difference in
audibility of the stimuli with the hearing loss associated with aging, or from a difference in
AV fusion, with an increased weight of the visual input with aging.
However, the difference in McGurk effect between young and older adults was not ob-
served in some well-controlled studies with a precise calibration of the individual auditory
SNR ratio (Cienkowski and Carney, 2002; Sommers et al., 2005). Sommers et al. (2005) as-
sessed the effect of age on the ability to benefit from AV speech in normal hearing young and
older adults. The subjects were presented with consonant, word, and sentence identification
12
tasks in all three sensory modalities (A, V, and AV). Results displayed no age differences in
the ability to benefit from combining auditory and visual speech signals after controlling for
age differences in both the visual and the auditory acuity. Other studies obtained a similar
pattern of results on AV performance as a function of sensory modality, in which the
performance on bimodal condition was better (Walden et al., 1993; Cienkowski and Carney,
2002; Hay-McCutcheon et al., 2005; Tye-Murray et al., 2007). Altogether, these studies con-
verge to claim that older adults benefit from an additional visual signal at a level comparable
to younger adults when auditory and visual acuities are adequately controlled.
However, in a recent paper, Sekiyama et al. (2014) compared AV speech perception be-
tween young and older adults by controlling the variables that had been reported to affect the
results of previous results (e.g. age limit and speech material). They conducted two experi-
ments in which the young and older adults were compared either under the same auditory
SNRs or in calibrated SNRs. The visual influence was larger in the older adults when it is
compared with the younger adults not only in the same SNRs condition, but this effect was
seen even in calibrated SNRs. They claim that native Japanese speaking older adults used
more visual speech information when compared wuth the younger adults, and were more
susceptible to the McGurk effect when tested with stimuli containing equivalently intelligible
auditory speech. They correlate this difference in behavior to a slower auditory processing in
older subjects, and relate this correlation to the so-called “visual priming hypothesis”
according to which the visual contribution would be larger when a subject processes visual
speech faster than auditory speech compared to those who process both visual and auditory
speech at the same speed (Sekiyama and Burnham, 2008).
Further works have attempted to disentangle the respective contributions of peripheral
vs. cognitive processes in multisensory integration in older adults. For example, Laurienti et
al. (2006) suggest that the aging brain adapts to changes in the sensory organs in order to
13
enhance as much as possible the robustness of multisensory perception. They compared mul-
tisensory speech discrimination scores between older and younger adults. The reaction time
was better in older adults for AV stimuli. Similarly, Setti et al. (2013) assessed the efficiency
of the McGurk illusion in older vs. younger adults. They created McGurk illusions using
words, with a higher rate of AV illusions in older adults. Then, they asked participants to
recall sentences that were matched with either the unisensory or the McGurk percept. Older
adults recalled more “McGurk sentences” than younger ones. This higher susceptibility to the
McGurk effect in older adults could be due to perceptual rather than cognitive process.
Hugenschmidt et al. (2009) assessed the role of selective attention on AV perception with a
cued multisensory discrimination task aiming to show that the capacity of multisensory inte-
gration can be reduced by attending to a single sensory modality. They found greater multi-
sensory integration in older adults than in younger adults in all conditions and concluded that
age-related decline in top-down mechanisms does not affect the integration process. However
further studies are needed to assess more in detail the possible role of the cognitive decline in
AV integration.
Altogether, the individual variations of the McGurk effect with sensory and cognitive
processes associated with age or deafness are hence particularly relevant to better understand
how AV interactions proceed in the human brain.
AV FUSION AND ITS MODELS 1.3
The first models of speech processing developed in the second half of the last century
were mainly based on the acoustics of speech whereas the potential contributions of the visu-
al speech input were essentially ignored. A number of theories and models emerged in the
literature in the last forty years to provide possible cognitive architectures for AV speech in-
tegration. The major question in these models concerns the levels at which visual speech in-
formation integrates with auditory speech before integration occurs.
14
Possible architectures for AV fusion 1.3.1
The studies in the 1980s and 1990s considered that AV fusion could be either “early” or
“late”, that is it would occur earlier or later than the phonological categorization of the speech
inputs (for review, Summerfield, 1987; Schwartz et al., 1998). Early fusion would require a
pre-phonetic common representation for integration while late fusion would be done at the
level of phonemic labels. Based on the literature on sensory interactions in cognitive psy-
chology, and on sensor fusion in information processing, and capitalizing on the previous
architectures introduced by Summerfield (1987), Schwartz et al. (1998) proposed four basic
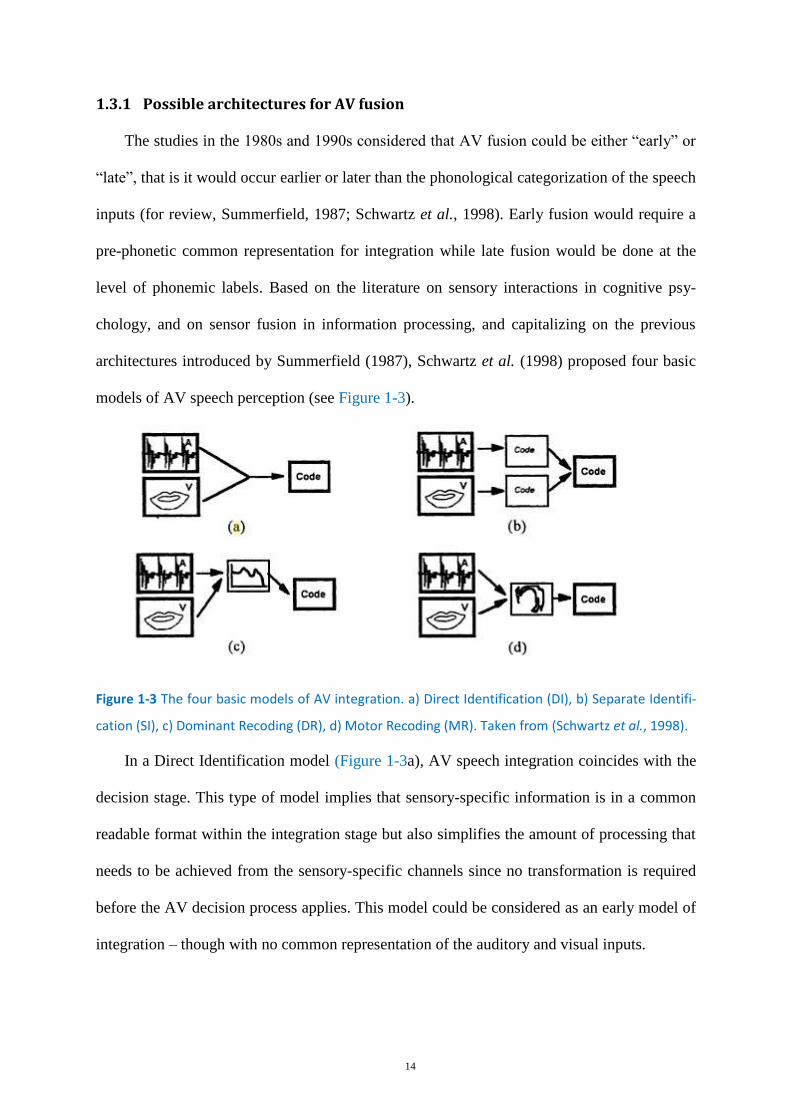
models of AV speech perception (see Figure 1-3).
Figure 1-3 The four basic models of AV integration. a) Direct Identification (DI), b) Separate Identifi-
cation (SI), c) Dominant Recoding (DR), d) Motor Recoding (MR). Taken from (Schwartz et al., 1998).
In a Direct Identification model (Figure 1-3a), AV speech integration coincides with the
decision stage. This type of model implies that sensory-specific information is in a common
readable format within the integration stage but also simplifies the amount of processing that
needs to be achieved from the sensory-specific channels since no transformation is required
before the AV decision process applies. This model could be considered as an early model of
integration – though with no common representation of the auditory and visual inputs.
15
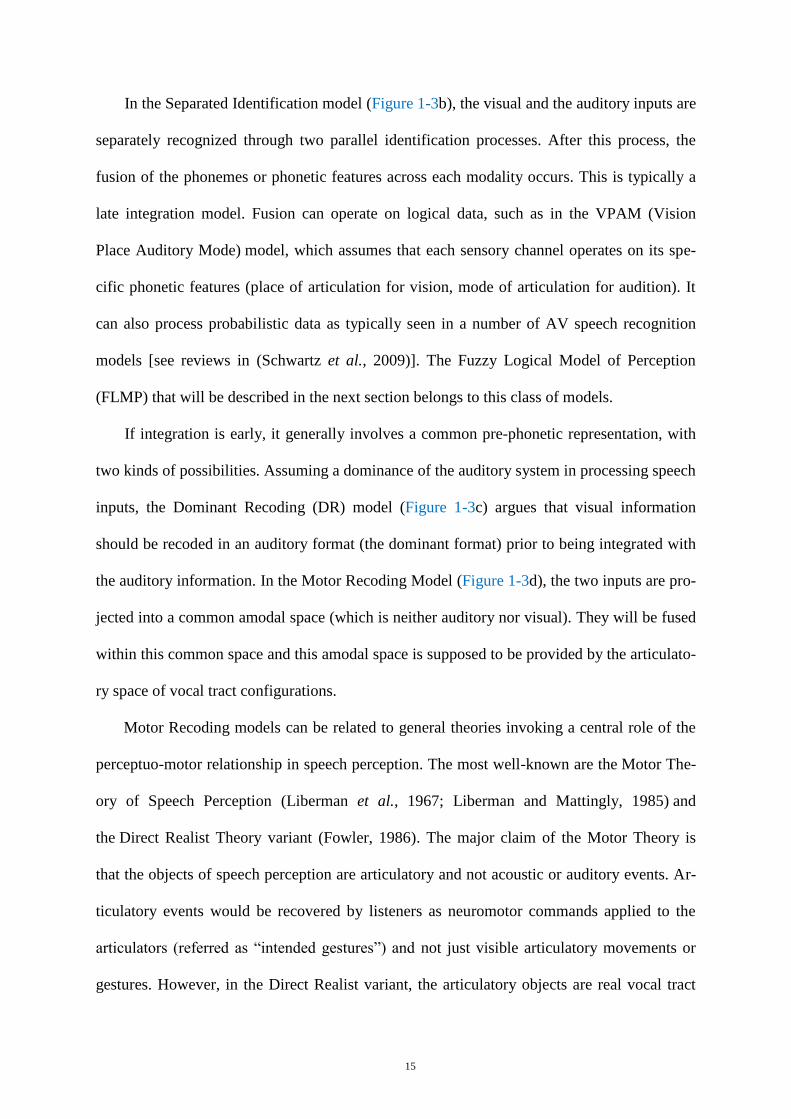
In the Separated Identification model (Figure 1-3b), the visual and the auditory inputs are
separately recognized through two parallel identification processes. After this process, the
fusion of the phonemes or phonetic features across each modality occurs. This is typically a
late integration model. Fusion can operate on logical data, such as in the VPAM (Vision
Place Auditory Mode) model, which assumes that each sensory channel operates on its spe-
cific phonetic features (place of articulation for vision, mode of articulation for audition). It
can also process probabilistic data as typically seen in a number of AV speech recognition
models [see reviews in (Schwartz et al., 2009)]. The Fuzzy Logical Model of Perception
(FLMP) that will be described in the next section belongs to this class of models.
If integration is early, it generally involves a common pre-phonetic representation, with
two kinds of possibilities. Assuming a dominance of the auditory system in processing speech
inputs, the Dominant Recoding (DR) model (Figure 1-3c) argues that visual information
should be recoded in an auditory format (the dominant format) prior to being integrated with
the auditory information. In the Motor Recoding Model (Figure 1-3d), the two inputs are pro-
jected into a common amodal space (which is neither auditory nor visual). They will be fused
within this common space and this amodal space is supposed to be provided by the articulato-
ry space of vocal tract configurations.
Motor Recoding models can be related to general theories invoking a central role of the
perceptuo-motor relationship in speech perception. The most well-known are the Motor The-
ory of Speech Perception (Liberman et al., 1967; Liberman and Mattingly, 1985) and
the Direct Realist Theory variant (Fowler, 1986). The major claim of the Motor Theory is
that the objects of speech perception are articulatory and not acoustic or auditory events. Ar-
ticulatory events would be recovered by listeners as neuromotor commands applied to the
articulators (referred as “intended gestures”) and not just visible articulatory movements or
gestures. However, in the Direct Realist variant, the articulatory objects are real vocal tract
16
movements, or gestures rather than intended gestures. Both theories utilized the visual nature
of speech perception as support and evidence for an amodal – and hence motor – theory of
speech perception. Contrary to these theories, Auditory theories are based on the assumption
that speech processing is primarily based on acoustic cues and auditory representations while
knowledge about the way the articulatory system produces the sound would not play any role
in perception (Diehl et al., 2004). For example, the “Acoustic Invariance Theory” by Stevens
and Blumstein (1978) assumes the existence of invariant acoustic patterns matching the pho-
netic features and providing the phonetic framework for the perceptual processing of speech
sounds.
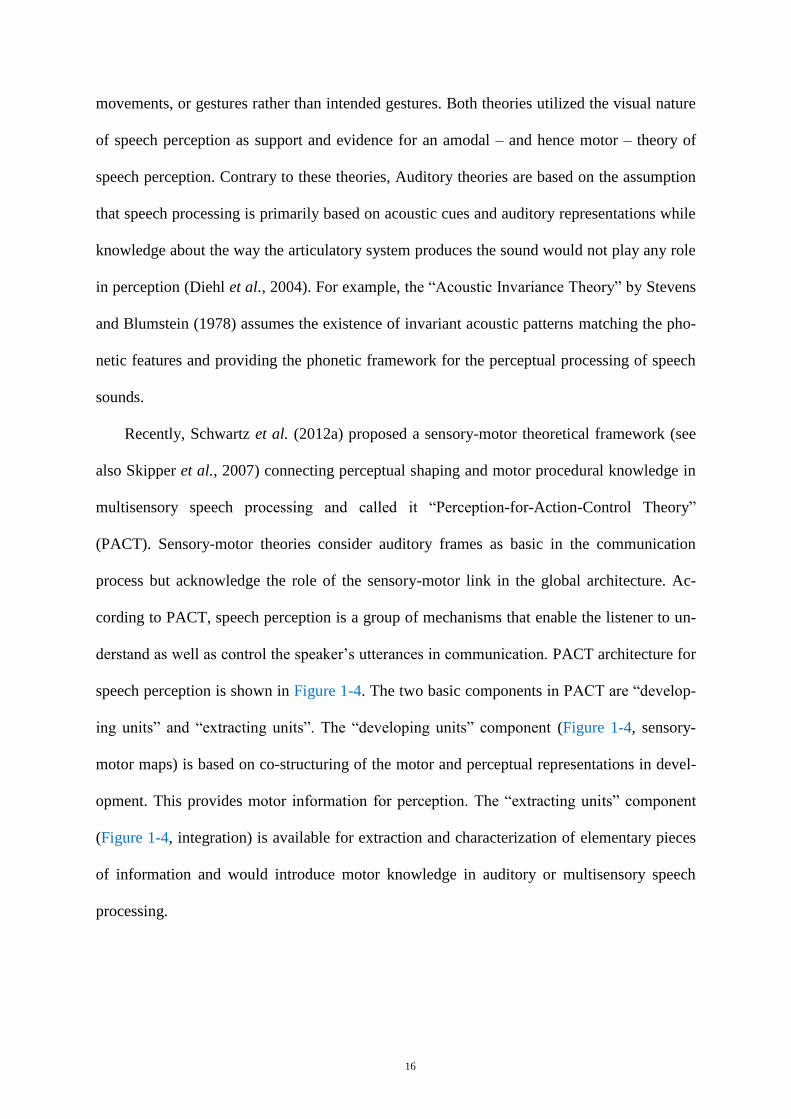
Recently, Schwartz et al. (2012a) proposed a sensory-motor theoretical framework (see
also Skipper et al., 2007) connecting perceptual shaping and motor procedural knowledge in
multisensory speech processing and called it “Perception-for-Action-Control Theory”
(PACT). Sensory-motor theories consider auditory frames as basic in the communication
process but acknowledge the role of the sensory-motor link in the global architecture. Ac-
cording to PACT, speech perception is a group of mechanisms that enable the listener to un-
derstand as well as control the speaker’s utterances in communication. PACT architecture for
speech perception is shown in Figure 1-4. The two basic components in PACT are “develop-
ing units” and “extracting units”. The “developing units” component (Figure 1-4, sensory-
motor maps) is based on co-structuring of the motor and perceptual representations in devel-
opment. This provides motor information for perception. The “extracting units” component
(Figure 1-4, integration) is available for extraction and characterization of elementary pieces
of information and would introduce motor knowledge in auditory or multisensory speech
processing.
17
Figure 1-4 A PACT architecture for Speech Perception. Taken from (Schwartz et al., 2012a).
Fuzzy Logical Model of Perception (FLMP) 1.3.2
In the 1980’s and 1990’s, the Massaro’s group extensively studied AV fusion using
mathematical modeling. They adapted to AV speech the FLMP that Massaro and colleagues
had previously introduced as a very general model of perception, and tested for such prob-
lems as reading (Massaro, 1979; Oden, 1979; Massaro and Hary, 1986), auditory recognition
of syllables and words, or visual perception (Massaro and Cohen, 1976; Oden and Massaro,
1978). This model progressively became the dominant model in AV speech integration until
the late 1990’s (Massaro, 1987; Massaro, 1998; Schwartz et al., 2009).
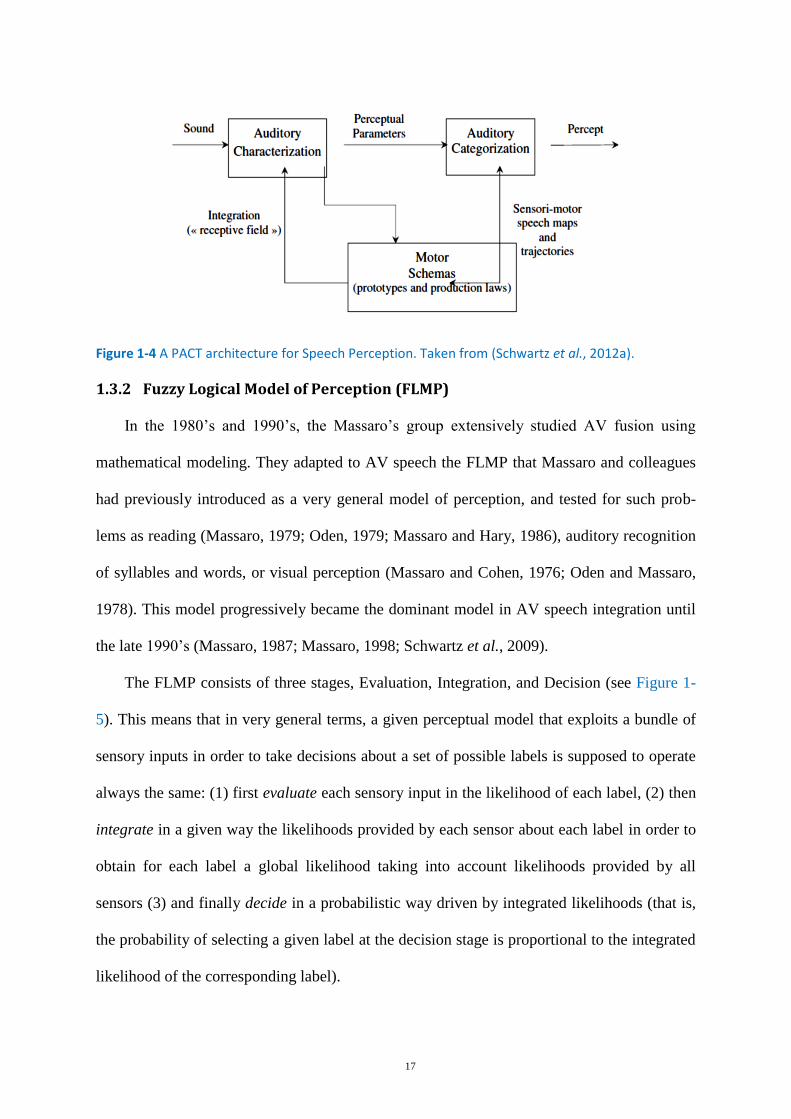
The FLMP consists of three stages, Evaluation, Integration, and Decision (see Figure 1-
5). This means that in very general terms, a given perceptual model that exploits a bundle of
sensory inputs in order to take decisions about a set of possible labels is supposed to operate
always the same: (1) first evaluate each sensory input in the likelihood of each label, (2) then
integrate in a given way the likelihoods provided by each sensor about each label in order to
obtain for each label a global likelihood taking into account likelihoods provided by all
sensors (3) and finally decide in a probabilistic way driven by integrated likelihoods (that is,
the probability of selecting a given label at the decision stage is proportional to the integrated
likelihood of the corresponding label).
18
Figure 1-5 Summary of Massaro’s FLMP model. Taken from (Chen and Massaro, 2004).
The adaptation of FLMP to AV speech perception was straightforward (Massaro, 1987;
1989; Massaro, 1998). In the first stage, speech sound and sight (vocal movements of the
observed speaker) are analyzed in terms of the auditory features (ai) and visual features (vj)
that are contained in the incoming stimulation. These features consist of degrees of support
for each perceptual alternative, that is, ai expresses the support for alternative (i) from the
sound, and vj the support for alternative (j) from the face. In the second stage, the feature in-
formation is integrated so that the decision process in the third stage can make use of the
overall evidence (E) to classify the speech sound.
The FLMP, therefore, combines information at the level of degree of evidence for pho-
nemes – which are typically the various alternatives for which evidence is searched within
each modality – hence, it is a late integration model. A major characteristic of the FLMP is
that the output of the integration process is just a multiplication of unisensory evidence: the
AV evidence for phoneme (i) is the product of the auditory and visual evidence, avi=aivi. A
consequence is that the final decision process, which provides probabilities of responses for
each possible phonemic category, is computed in an automatic way:
PAV(i) = avi / avj = ai vi / ajvj
19
That is, PAV(i) depends just on unisensory evidence ai and vi but not on any other factor
such as the listener, the noise in the environment, the context or whatever else. In fact, the
equation here above has an important property: if one modality is completely ambiguous, e.g.
audition, with all values ai equal to 1/N where N is the number of possible responses, then the
AV probability depends only on the visual input: PAV(i) = vi. This is the way FLMP naturally
adjusts its decision toward the decision of the least ambiguous modality.
FLMP has been shown to be efficient at simulating a number of experimental data relat-
ed to the McGurk effect. This is why it has been so popular in the 90s. However, it received
many criticisms related to its property to either over fit or be inappropriate for the purpose of
predicting integration (Grant, 2002; Schwartz, 2006; 2010). We will see in the next sections
what kinds of problems were posed to FLMP and possible solutions through a variant of
FLMP, called WFLMP.
Non-automaticity and influence of cognitive factors on AV perception 1.3.3
AV fusion has long been considered to be automatic (Massaro, 1987; Soto-Faraco et al.,
2004). The line of evidence came from observations since McGurk and MacDonald (1976)
that subjects experienced the McGurk illusion even when they were aware of the dubbing
process. In the Massaro (1987) study, participants presented with an incongruent AV stimulus
displayed no change in their responses despite specific instruction to focus on one or the oth-
er modality or to use both sources of information.
The hypothesis of automaticity in AV integration was tested by Soto-Faraco et al. (2004)
in a modified (syllable) speeded classification paradigm. Participants were asked to perform a
speeded classification of the first syllable of a disyllabic stimulus while ignoring the second
syllable. However, variation in the second syllable happens to delay the subjects’ responses,
revealing a failure of the selective attention mechanism to focus on the first syllable. Interest-
ingly, McGurk effects introduced in the second syllable also interfered with the speeded clas-
20
sification task. The authors interpreted this as showing that AV integration occurs prior to
attentional selection. Hence, they concluded that these data provided evidence for automatici-
ty.
However, the view on the automaticity of AV fusion has changed over the years (Talsma
et al., 2010). Indeed, a number of further studies suggest that AV speech integration can be
modulated by attention. First of all, the mere fact that the strength of the McGurk effect
seems to depend on language and culture (Sekiyama and Tohkura, 1991; Sekiyama, 1994;
Fuster-Duran, 1995; Bovo et al., 2009; Wu, 2009) suggests that fusion is not automatic but
rather driven by cognitive biases that may act on the integration process. In a more direct
way, a number of studies have manipulated the participants’ attention and indeed shown that
this influences the McGurk effect (Tiippana et al., 2004; Alsius et al., 2005; Talsma and
Woldorff, 2005; Alsius et al., 2007; Soto-Faraco and Alsius, 2007; Talsma et al., 2007;
Andersen et al., 2009; Soto-Faraco and Alsius, 2009; Alsius and Soto-Faraco, 2011; Buchan
and Munhall, 2011; Tiippana et al., 2011; Alsius et al., 2014).
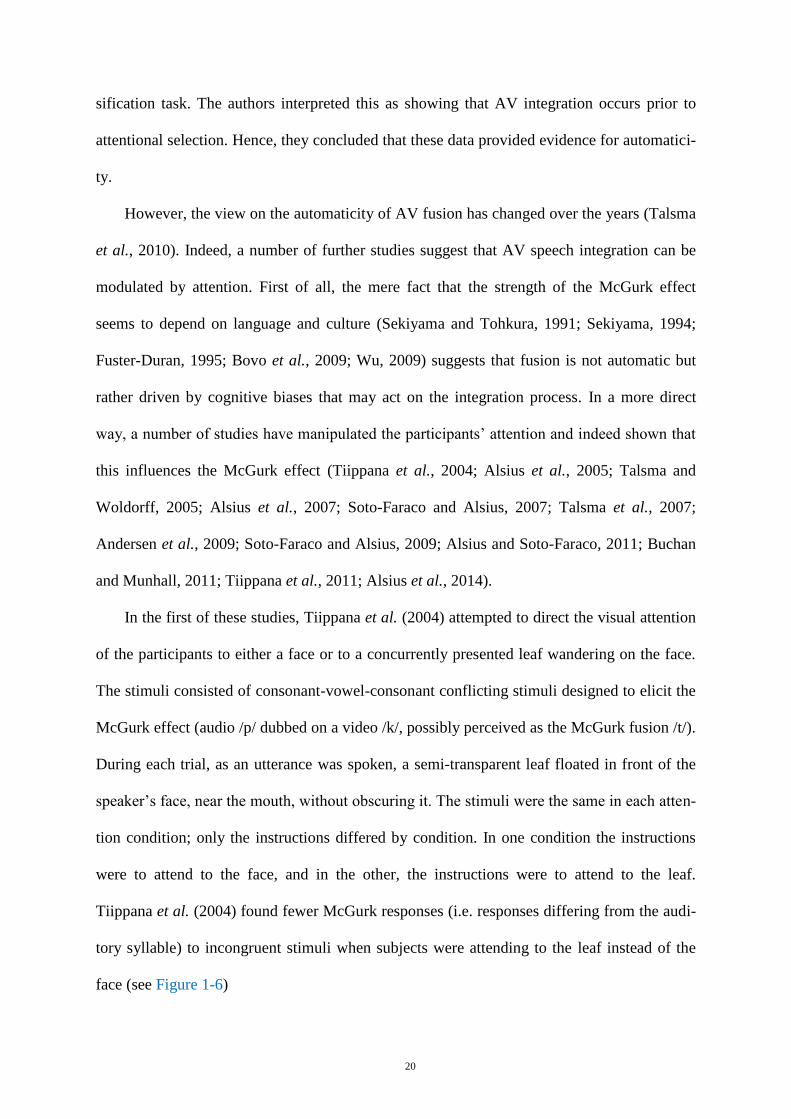
In the first of these studies, Tiippana et al. (2004) attempted to direct the visual attention
of the participants to either a face or to a concurrently presented leaf wandering on the face.
The stimuli consisted of consonant-vowel-consonant conflicting stimuli designed to elicit the
McGurk effect (audio /p/ dubbed on a video /k/, possibly perceived as the McGurk fusion /t/).
During each trial, as an utterance was spoken, a semi-transparent leaf floated in front of the
speaker’s face, near the mouth, without obscuring it. The stimuli were the same in each atten-
tion condition; only the instructions differed by condition. In one condition the instructions
were to attend to the face, and in the other, the instructions were to attend to the leaf.
Tiippana et al. (2004) found fewer McGurk responses (i.e. responses differing from the audi-
tory syllable) to incongruent stimuli when subjects were attending to the leaf instead of the
face (see Figure 1-6)
21
Figure 1-6 Experimental results of Tiippana et al. (2004). Percentage of auditory responses for four
McGurk stimuli when a face or leaf was attended. Taken from (Tiippana et al., 2004).
While the previous experiment consisted of attempting to divide the subject’s attention
between two different streams (the face and the leaf) in the scene in a given modality (vi-
sion), the strategy of the set of experiments proposed by Alsius, Soto-Faraco and coll. was
different. It consisted in loading the AV speech perception task at hand (a classical McGurk
paradigm) by asking the participants to perform a second task at the same time. The concur-
rent task was either auditory or visual (Alsius et al., 2005) or even tactile (Alsius et al.,
2007). Interestingly, in all cases, the concurrent task appeared to decrease significantly and to
a quite large extent the McGurk effect. The conclusion by the authors is that AV fusion does
require a certain attentional state, and an additional cognitive load may decrease this atten-
tional state and, therefore, decrease fusion. A similar conclusion was obtained by Buchan and
Munhall (2012) who applied a working memory task in addition to the AV identification task
at hand in the McGurk paradigm. Altogether these studies revealed that imposing high de-
mands on the attentional system decreased the amount of AV fusion and hence denied the
automaticity of the AV integration process.
22
Weighted Fuzzy Logical Model of Perception (WFLMP) 1.3.4
The data showing a modulation of the McGurk effect with age, language or attention
seem to suggest that fusion is not automatic but rather controlled by the subject in a way de-
pending on her/his cognitive state and cognitive requirements. However, the FLMP appears
to be able to simulate the results of all these experiments, by assuming that the modulating
factor actually changes the unisensory responses rather than the fusion process. Modulation
of the unisensory response can often not be directly shown in the data, which may lead to an
apparent contradiction in the interpretation of the experiment (Tiippana et al., 2004). This is
where the overfitting abilities of the FLMP play a dramatic role (Schwartz, 2006). This led
Schwartz (2010) to introduce a Weighted Fuzzy Logical Model of Perception (WFLMP), in
which fusion would also involve specific weights controlling the role of each modality in the
fusion process. By comparing FLMP with WFLMP in a sounder model comparison frame-
work based on Bayesian Model Selection rather than a comparison of Root Mean Square Er-
ror, Schwartz (2010) was able to show that individual or attentional processes can indeed
modulate the McGurk effect. WFLMP then allows to introduce auditory and visual weights in
the fusion process, that appear to depend on the subject’s individual characteristics
(Schwartz, 2010; Huyse et al., 2013), attentional processes (Schwartz, 2010), or degradation
of the auditory or visual input (Heckmann et al., 2002; Huyse et al., 2013).
NEURAL CORRELATES OF AV SPEECH PERCEPTION 1.4
A number of studies have been searching for potential neuroanatomical and neurophysio-
logical correlates of AV integration in speech perception. The development of neuroimaging
techniques such as functional magnetic resonance imaging (fMRI), transcranial magnetic
stimulation (TMS), positron emission tomography (PET), electroencephalography (EEG),
and magnetoencephalography (MEG) has provided considerable improvement of our
understanding of the processing of auditory, visual and AV speech in the human brain. In the
23
context of such modeling questions as the “early” versus “late” nature of AV integration,
these studies have provided valuable information enabling to better localize multisensory
brain areas and to better specify the temporal sequences of AV information processing.
These developments must be envisioned in the global movement of the neurosciences of
multisensory integration, which progressively abandoned their traditional schema considering
that perceptual processing stays unisensory in the primary sensory cortices and that multisen-
sory interactions do not happen before the secondary cortices and associative areas. The
conception is now completely different, well summarized by the quotation by Driver and
Noesselt (2008) that “In recent years the field of multisensory research has expanded and
altered radically with the realization that multisensory influences are much more pervasive
than classical views assumed and may even affect brain regions, neural responses, and
judgments traditionally considered modality specific”.
Neuroanatomical architectures for multisensory integration 1.4.1
Let us first consider the basic findings of the neuroanatomy of auditory and visual speech
perception in the human brain.
Auditory processing begins in the cortex with the Heschl’s gyrus, planum temporale and
associated auditory cortical regions in the superior temporal gyrus with further processing by
anterior and posterior portions of the superior temporal sulcus (STS), before connecting
inferior frontal regions through tempo-parietal regions in the “dorsal route” on one hand, and
inferior temporal structures in the “ventral route” on the other side (Liegeois-Chauvel et al.,
1999; Hackett et al., 2001; Belin et al., 2002; Scott and Johnsrude, 2003; Poeppel et al.,
2004; Okada et al., 2010). Visual speech is processed in the early visual areas in the occipital
cortex (Ludman et al., 2000; Sekiyama et al., 2003; Hall et al., 2005) before further
processing in the posterior STS and then further front in the cortex, in the inferior frontal
gyrus and premotor cortex (Puce et al., 1998; Nishitani and Hari, 2002; Ruytjens et al.,
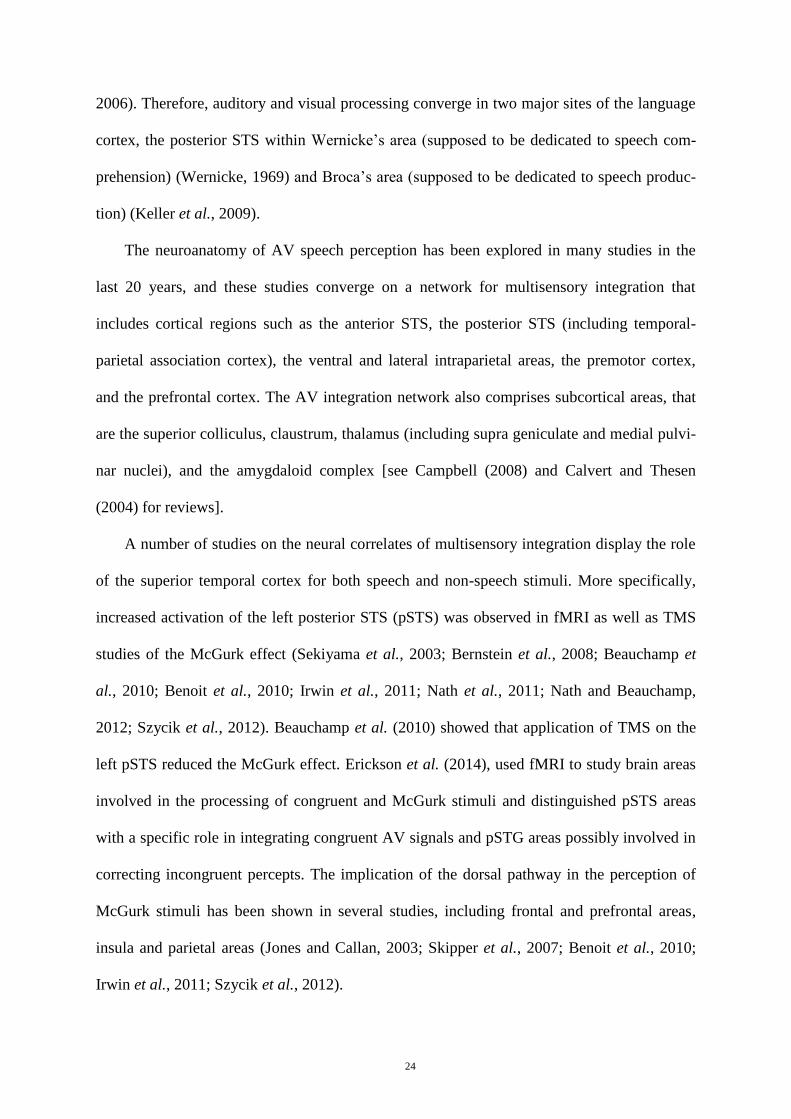
24
2006). Therefore, auditory and visual processing converge in two major sites of the language
cortex, the posterior STS within Wernicke’s area (supposed to be dedicated to speech com-
prehension) (Wernicke, 1969) and Broca’s area (supposed to be dedicated to speech produc-
tion) (Keller et al., 2009).
The neuroanatomy of AV speech perception has been explored in many studies in the
last 20 years, and these studies converge on a network for multisensory integration that
includes cortical regions such as the anterior STS, the posterior STS (including temporal-
parietal association cortex), the ventral and lateral intraparietal areas, the premotor cortex,
and the prefrontal cortex. The AV integration network also comprises subcortical areas, that
are the superior colliculus, claustrum, thalamus (including supra geniculate and medial pulvi-
nar nuclei), and the amygdaloid complex [see Campbell (2008) and Calvert and Thesen
(2004) for reviews].
A number of studies on the neural correlates of multisensory integration display the role
of the superior temporal cortex for both speech and non-speech stimuli. More specifically,
increased activation of the left posterior STS (pSTS) was observed in fMRI as well as TMS
studies of the McGurk effect (Sekiyama et al., 2003; Bernstein et al., 2008; Beauchamp et
al., 2010; Benoit et al., 2010; Irwin et al., 2011; Nath et al., 2011; Nath and Beauchamp,
2012; Szycik et al., 2012). Beauchamp et al. (2010) showed that application of TMS on the
left pSTS reduced the McGurk effect. Erickson et al. (2014), used fMRI to study brain areas
involved in the processing of congruent and McGurk stimuli and distinguished pSTS areas
with a specific role in integrating congruent AV signals and pSTG areas possibly involved in
correcting incongruent percepts. The implication of the dorsal pathway in the perception of
McGurk stimuli has been shown in several studies, including frontal and prefrontal areas,
insula and parietal areas (Jones and Callan, 2003; Skipper et al., 2007; Benoit et al., 2010;
Irwin et al., 2011; Szycik et al., 2012).
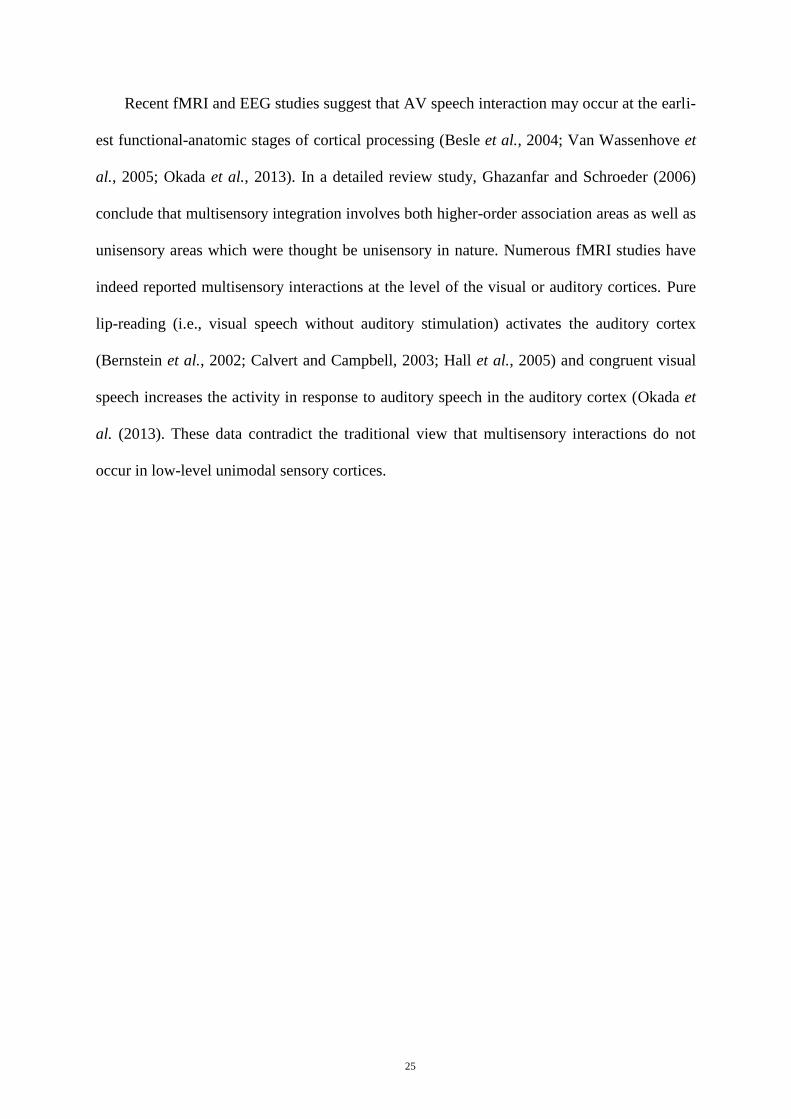
25
Recent fMRI and EEG studies suggest that AV speech interaction may occur at the earli-
est functional-anatomic stages of cortical processing (Besle et al., 2004; Van Wassenhove et
al., 2005; Okada et al., 2013). In a detailed review study, Ghazanfar and Schroeder (2006)
conclude that multisensory integration involves both higher-order association areas as well as
unisensory areas which were thought be unisensory in nature. Numerous fMRI studies have
indeed reported multisensory interactions at the level of the visual or auditory cortices. Pure
lip-reading (i.e., visual speech without auditory stimulation) activates the auditory cortex
(Bernstein et al., 2002; Calvert and Campbell, 2003; Hall et al., 2005) and congruent visual
speech increases the activity in response to auditory speech in the auditory cortex (Okada et
al. (2013). These data contradict the traditional view that multisensory interactions do not
occur in low-level unimodal sensory cortices.
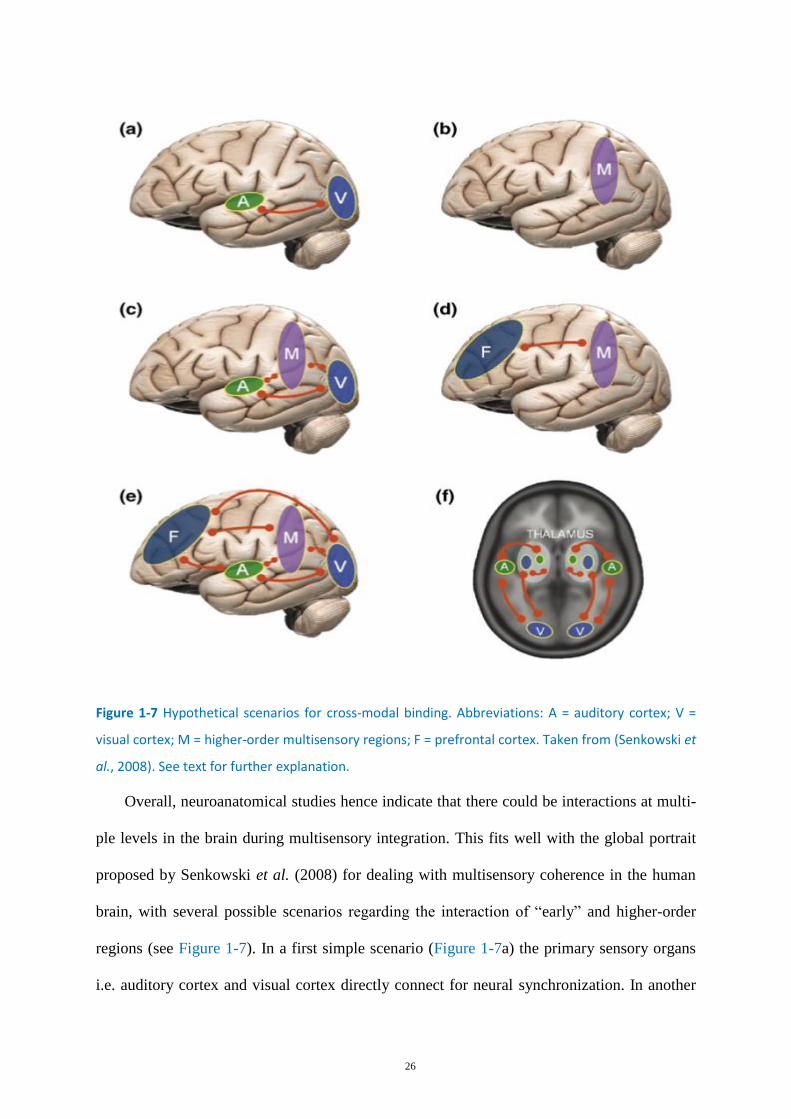
26
Figure 1-7 Hypothetical scenarios for cross-modal binding. Abbreviations: A = auditory cortex; V =
visual cortex; M = higher-order multisensory regions; F = prefrontal cortex. Taken from (Senkowski et
al., 2008). See text for further explanation.
Overall, neuroanatomical studies hence indicate that there could be interactions at multi-
ple levels in the brain during multisensory integration. This fits well with the global portrait
proposed by Senkowski et al. (2008) for dealing with multisensory coherence in the human
brain, with several possible scenarios regarding the interaction of “early” and higher-order
regions (see Figure 1-7). In a first simple scenario (Figure 1-7a) the primary sensory organs
i.e. auditory cortex and visual cortex directly connect for neural synchronization. In another
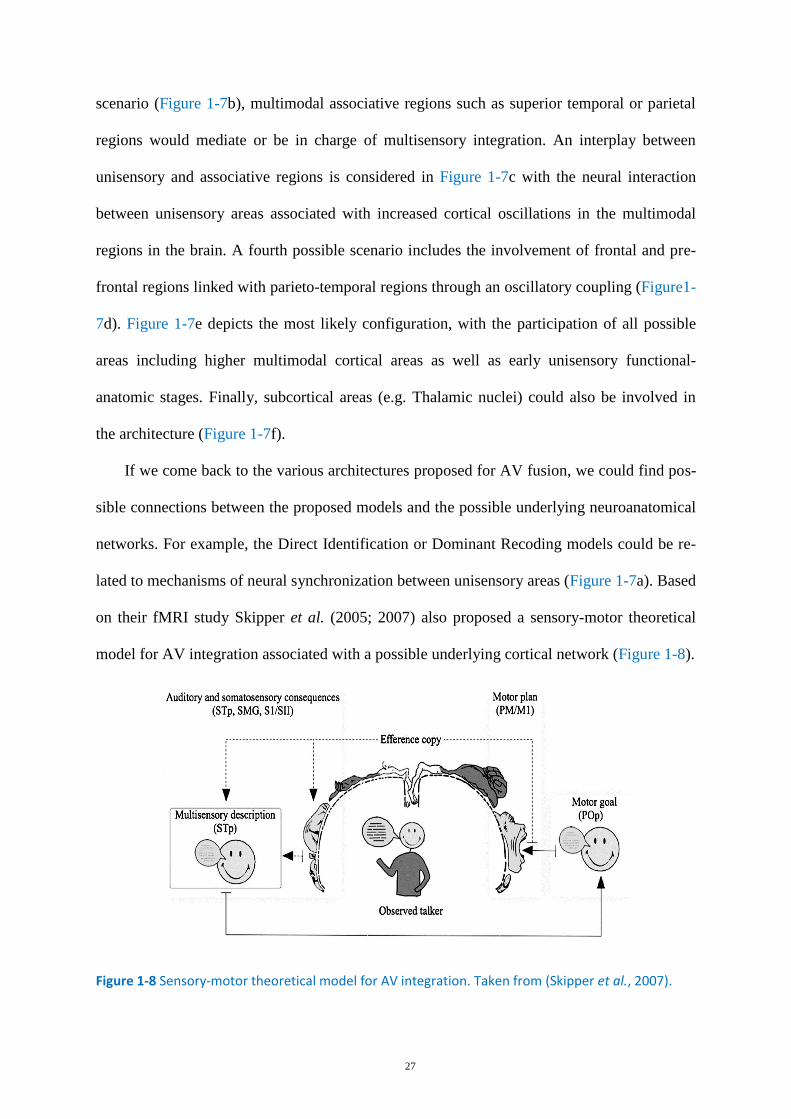
27
scenario (Figure 1-7b), multimodal associative regions such as superior temporal or parietal
regions would mediate or be in charge of multisensory integration. An interplay between
unisensory and associative regions is considered in Figure 1-7c with the neural interaction
between unisensory areas associated with increased cortical oscillations in the multimodal
regions in the brain. A fourth possible scenario includes the involvement of frontal and pre-
frontal regions linked with parieto-temporal regions through an oscillatory coupling (Figure1-
7d). Figure 1-7e depicts the most likely configuration, with the participation of all possible
areas including higher multimodal cortical areas as well as early unisensory functional-
anatomic stages. Finally, subcortical areas (e.g. Thalamic nuclei) could also be involved in
the architecture (Figure 1-7f).
If we come back to the various architectures proposed for AV fusion, we could find pos-
sible connections between the proposed models and the possible underlying neuroanatomical
networks. For example, the Direct Identification or Dominant Recoding models could be re-
lated to mechanisms of neural synchronization between unisensory areas (Figure 1-7a). Based
on their fMRI study Skipper et al. (2005; 2007) also proposed a sensory-motor theoretical
model for AV integration associated with a possible underlying cortical network (Figure 1-8).
Figure 1-8 Sensory-motor theoretical model for AV integration. Taken from (Skipper et al., 2007).
28
This model is based on an “analysis-by-synthesis” mechanism which would take place in
the dorsal pathway. According to Skipper et al. (2007), the cortical regions responsible for
processing of speech are “visual areas, primary auditory cortex (A1), posterior superior
temporal (STp) areas, supramarginal gyrus (SMG), somatosensory cortices (SI/SII), ventral
premotor (PMv) cortex, and the pars opercularis (POp)”. According to this model, the pro-
cessing of speech begins in primary sensory areas such as the auditory and visual cortices,
which should lead to multisensory representations as “multisensory hypotheses” in the multi-
sensory STp areas. These “multisensory hypotheses” would specify a motor goal (STp / POp)
mapped onto motor commands likely to have produced the observed movement, and these
commands would be represented in a somatotopically organized manner, in the ventral pre-
motor cortex PMv and the primary motor cortex M1. The motor commands would then gen-
erate predictions of auditory and somatosensory consequences, and these predictions would
be combined with the primary hypothesis in (STp) for a final decision.
In summary, the neuroanatomical studies on AV integration suggest the involvement of
both primary auditory and visual areas as well as several multisensory areas, with the possi-
bility that pSTS could play a key role in elaborating a common representation before fusion.
Furthermore, the involvement of frontal areas associated with motor knowledge suggests the
existence of a perceptuo-motor link compatible with perceptuo-motor theories of speech per-
ception (Skipper et al., 2007; Schwartz et al., 2012a)
Neurophysiological correlates of AV perception 1.4.2
Neuroimagery data coming from fMRI and PET provide a clear view of the network of
cortical circuits involved in AV integration, but the lack of precise temporal information
makes it difficult to derive from this network strong views about the underlying model, and
more generally about the time course of AV speech perception. This limitation can be
overcome by utilizing electrophysiological tools that measure electrical activity generated by
29
the neurons during multisensory perception and which ensure good temporal resolution at the
level of the millisecond. Recent EEG and MEG studies focused on the influence of the visual
input on the auditory event-related potentials (ERPs), notably on auditory N1 (negative peak,
typically occurring around 100 ms after the sound onset) and P2 responses (positive peak,
typically occurring around 200 ms after the sound onset) considered to be associated with the
processing of the physical and featural attributes of the auditory speech stimulus prior to its
categorization (Naatanen and Winkler, 1999).
In the last ten years, various studies consistently displayed an amplitude reduction of
N1/P2 auditory responses together with a decrease in their onset latency, when the AV re-
sponse was compared with the audio-only response. These studies generally involved
consonant-vowel syllables uttered in isolation, with a natural advance of the visual input
(associated with the phonation preparation) on the sound. Their results suggest that the visual
input modulates and speeds up the neural processing of auditory ERPs as soon as 100 ms
after the sound onset and that AV integration partly occurs at an early processing stage in the
cortical auditory speech processing hierarchy (Besle et al., 2004; Van Wassenhove et al.,
2005; Stekelenburg and Vroomen, 2007; Arnal et al., 2009; Pilling, 2009; Vroomen and
Stekelenburg, 2010; Stekelenburg and Vroomen, 2012; Alsius et al., 2014; Baart et al., 2014;
Knowland et al., 2014; Treille et al., 2014a; b).
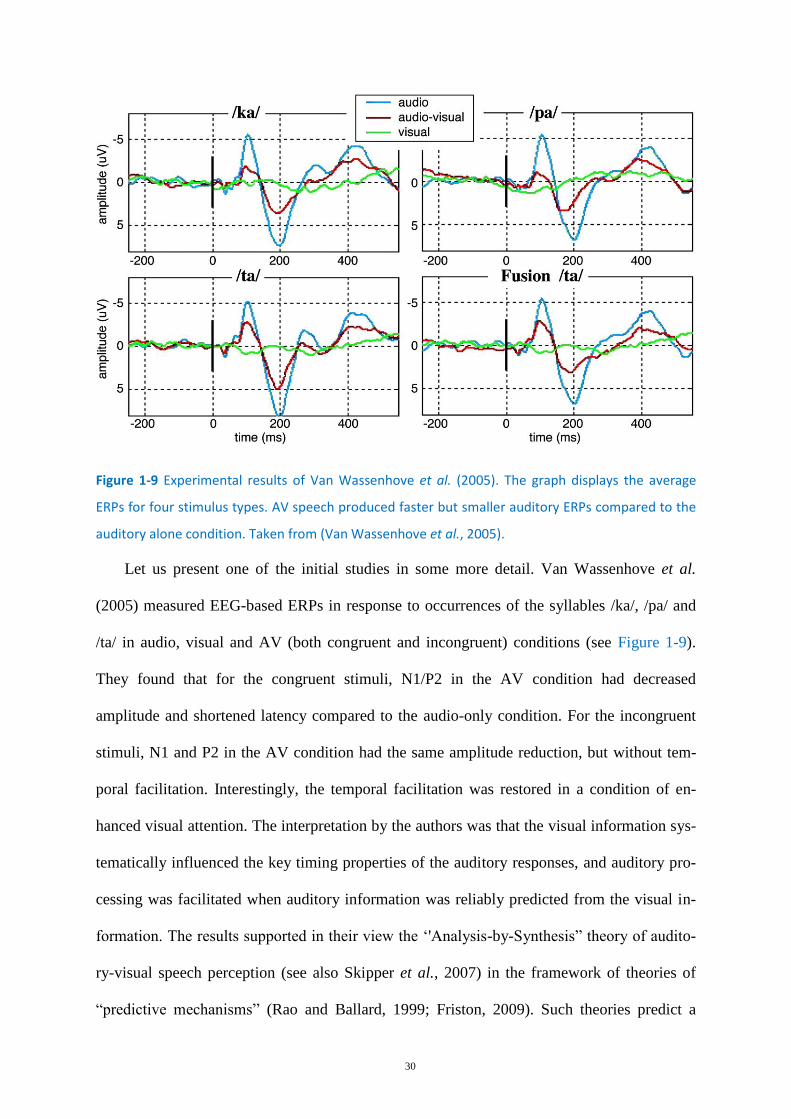
30
Figure 1-9 Experimental results of Van Wassenhove et al. (2005). The graph displays the average
ERPs for four stimulus types. AV speech produced faster but smaller auditory ERPs compared to the
auditory alone condition. Taken from (Van Wassenhove et al., 2005).
Let us present one of the initial studies in some more detail. Van Wassenhove et al.
(2005) measured EEG-based ERPs in response to occurrences of the syllables /ka/, /pa/ and
/ta/ in audio, visual and AV (both congruent and incongruent) conditions (see Figure 1-9).
They found that for the congruent stimuli, N1/P2 in the AV condition had decreased
amplitude and shortened latency compared to the audio-only condition. For the incongruent
stimuli, N1 and P2 in the AV condition had the same amplitude reduction, but without tem-
poral facilitation. Interestingly, the temporal facilitation was restored in a condition of en-
hanced visual attention. The interpretation by the authors was that the visual information sys-
tematically influenced the key timing properties of the auditory responses, and auditory pro-
cessing was facilitated when auditory information was reliably predicted from the visual in-
formation. The results supported in their view the ‘'Analysis-by-Synthesis” theory of audito-
ry-visual speech perception (see also Skipper et al., 2007) in the framework of theories of
“predictive mechanisms” (Rao and Ballard, 1999; Friston, 2009). Such theories predict a
31
large visual effect on auditory ERP’s for stimuli with salient visual dynamics generating
strong predictions and large enhancement in syllable detection, as for the bilabial /pa/. On the
contrary, we should observe less faciliation whenever the visual cues are weaker and provide
a less salient sound predictor such as for the syllable /ka/ where lip movements are small in
speech production. This is indeed what was obtained, with a larger effect of the visual input
for /pa/ than for /ka/.
The role of temporal synchrony relations in the AV N1-P2 effect has then been clearly
demonstrated by the studies of Pilling (2009) and Vroomen and Stekelenburg (2010) who
showed that N1 and P2 amplitude modulations was altered with the introduction of temporal
asynchronies in AV events. Many later EEG and MEG studies replicated the visual N1-P2
modulation effect, though with possible variations in the precise results.
In one of these studies, Arnal et al. (2009) recorded early visual M170, and auditory
M100 (the MEG equivalent of the ERP N1/P2 response in EEG) evoked responses for both
congruent and incongruent AV stimuli. The obtained data lead them to propose the “dual
routing model” including a first direct connection between the visual input and the auditory
cortex and a second route – compatible with most neuroanatomical studies – where feedback
from STS would mediate the link between the auditory and the visual cortices. The visual
reduction in amplitude and latency of the auditory M100 response, rapid and independent of
AV congruence, would be based on visual motion cues conveyed by the direct link (first
route). In the case of incongruent inputs, detection of incongruence, affecting the auditory
responses as soon as 20 ms after latency shortening was detected on M100, suggests that the
initial auditory facilitation by vision through the first route could be followed by a feedback
signal from the second route. This would correspond to the error between the expected and
actual auditory input (prediction error) computed in STS. This analysis was then confirmed
by fMRI data showing that functional connectivity between auditory and visual areas was
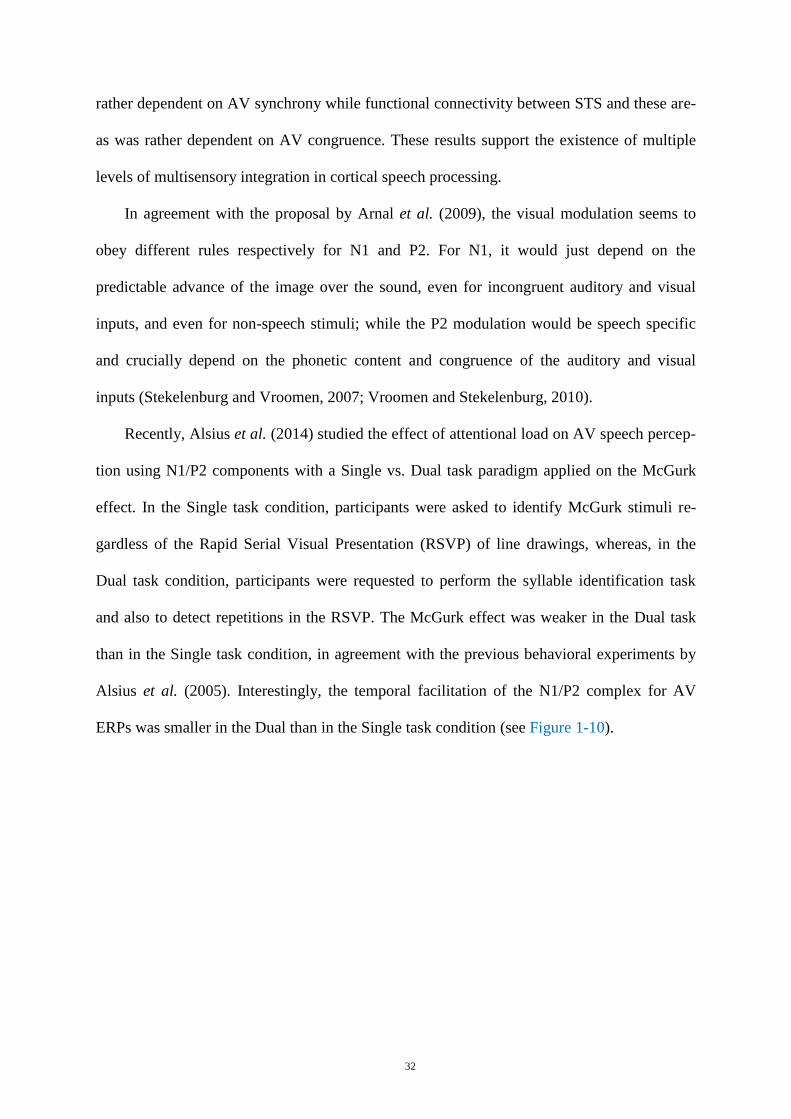
32
rather dependent on AV synchrony while functional connectivity between STS and these are-
as was rather dependent on AV congruence. These results support the existence of multiple
levels of multisensory integration in cortical speech processing.
In agreement with the proposal by Arnal et al. (2009), the visual modulation seems to
obey different rules respectively for N1 and P2. For N1, it would just depend on the
predictable advance of the image over the sound, even for incongruent auditory and visual
inputs, and even for non-speech stimuli; while the P2 modulation would be speech specific
and crucially depend on the phonetic content and congruence of the auditory and visual
inputs (Stekelenburg and Vroomen, 2007; Vroomen and Stekelenburg, 2010).
Recently, Alsius et al. (2014) studied the effect of attentional load on AV speech percep-
tion using N1/P2 components with a Single vs. Dual task paradigm applied on the McGurk
effect. In the Single task condition, participants were asked to identify McGurk stimuli re-
gardless of the Rapid Serial Visual Presentation (RSVP) of line drawings, whereas, in the
Dual task condition, participants were requested to perform the syllable identification task
and also to detect repetitions in the RSVP. The McGurk effect was weaker in the Dual task
than in the Single task condition, in agreement with the previous behavioral experiments by
Alsius et al. (2005). Interestingly, the temporal facilitation of the N1/P2 complex for AV
ERPs was smaller in the Dual than in the Single task condition (see Figure 1-10).
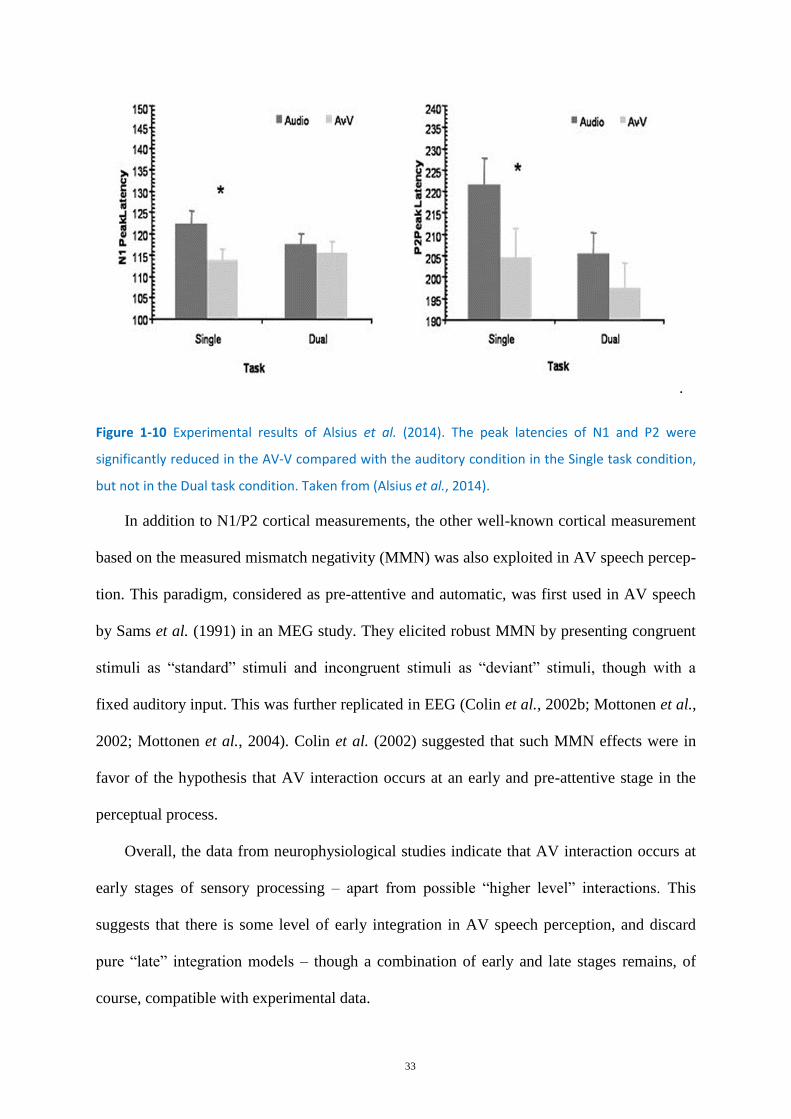
33
.
Figure 1-10 Experimental results of Alsius et al. (2014). The peak latencies of N1 and P2 were
significantly reduced in the AV-V compared with the auditory condition in the Single task condition,
but not in the Dual task condition. Taken from (Alsius et al., 2014).
In addition to N1/P2 cortical measurements, the other well-known cortical measurement
based on the measured mismatch negativity (MMN) was also exploited in AV speech percep-
tion. This paradigm, considered as pre-attentive and automatic, was first used in AV speech
by Sams et al. (1991) in an MEG study. They elicited robust MMN by presenting congruent
stimuli as “standard” stimuli and incongruent stimuli as “deviant” stimuli, though with a
fixed auditory input. This was further replicated in EEG (Colin et al., 2002b; Mottonen et al.,
2002; Mottonen et al., 2004). Colin et al. (2002) suggested that such MMN effects were in
favor of the hypothesis that AV interaction occurs at an early and pre-attentive stage in the
perceptual process.
Overall, the data from neurophysiological studies indicate that AV interaction occurs at
early stages of sensory processing – apart from possible “higher level” interactions. This
suggests that there is some level of early integration in AV speech perception, and discard
pure “late” integration models – though a combination of early and late stages remains, of
course, compatible with experimental data.
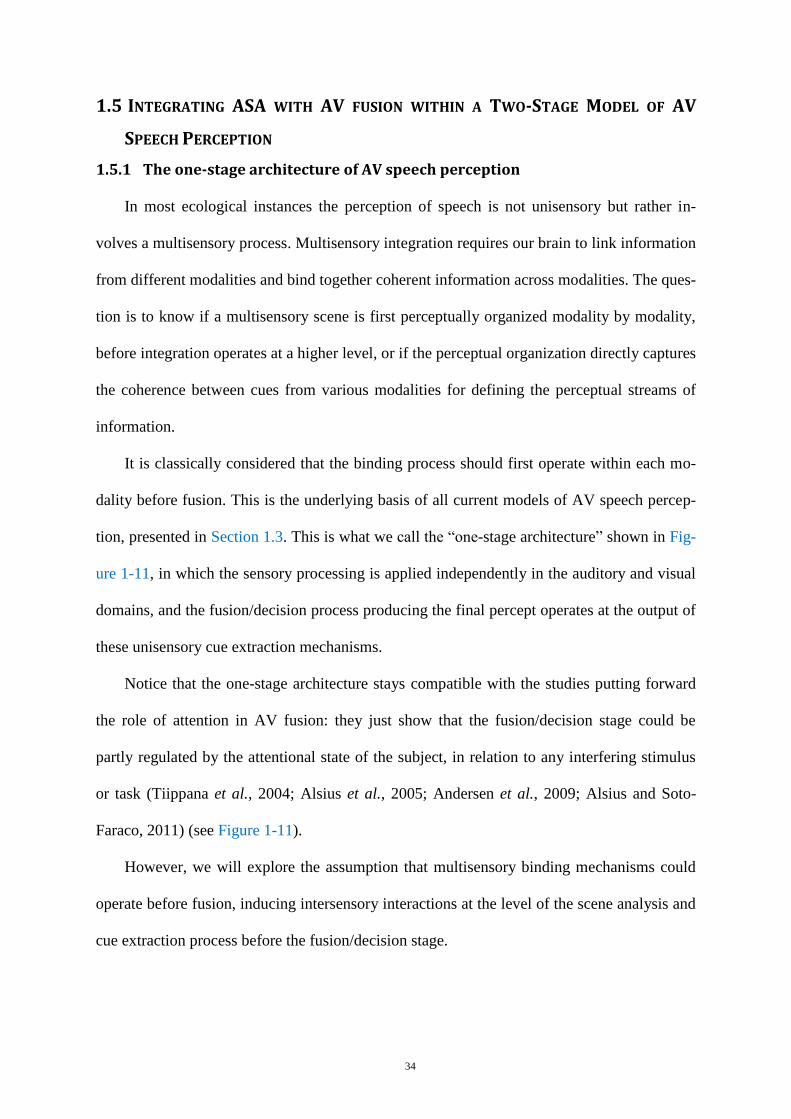
34
INTEGRATING ASA WITH AV FUSION WITHIN A TWO-STAGE MODEL OF AV 1.5
SPEECH PERCEPTION
The one-stage architecture of AV speech perception 1.5.1
In most ecological instances the perception of speech is not unisensory but rather in-
volves a multisensory process. Multisensory integration requires our brain to link information
from different modalities and bind together coherent information across modalities. The ques-
tion is to know if a multisensory scene is first perceptually organized modality by modality,
before integration operates at a higher level, or if the perceptual organization directly captures
the coherence between cues from various modalities for defining the perceptual streams of
information.
It is classically considered that the binding process should first operate within each mo-
dality before fusion. This is the underlying basis of all current models of AV speech percep-
tion, presented in Section 1.3. This is what we call the “one-stage architecture” shown in Fig-
ure 1-11, in which the sensory processing is applied independently in the auditory and visual
domains, and the fusion/decision process producing the final percept operates at the output of
these unisensory cue extraction mechanisms.
Notice that the one-stage architecture stays compatible with the studies putting forward
the role of attention in AV fusion: they just show that the fusion/decision stage could be
partly regulated by the attentional state of the subject, in relation to any interfering stimulus
or task (Tiippana et al., 2004; Alsius et al., 2005; Andersen et al., 2009; Alsius and Soto-
Faraco, 2011) (see Figure 1-11).
However, we will explore the assumption that multisensory binding mechanisms could
operate before fusion, inducing intersensory interactions at the level of the scene analysis and
cue extraction process before the fusion/decision stage.
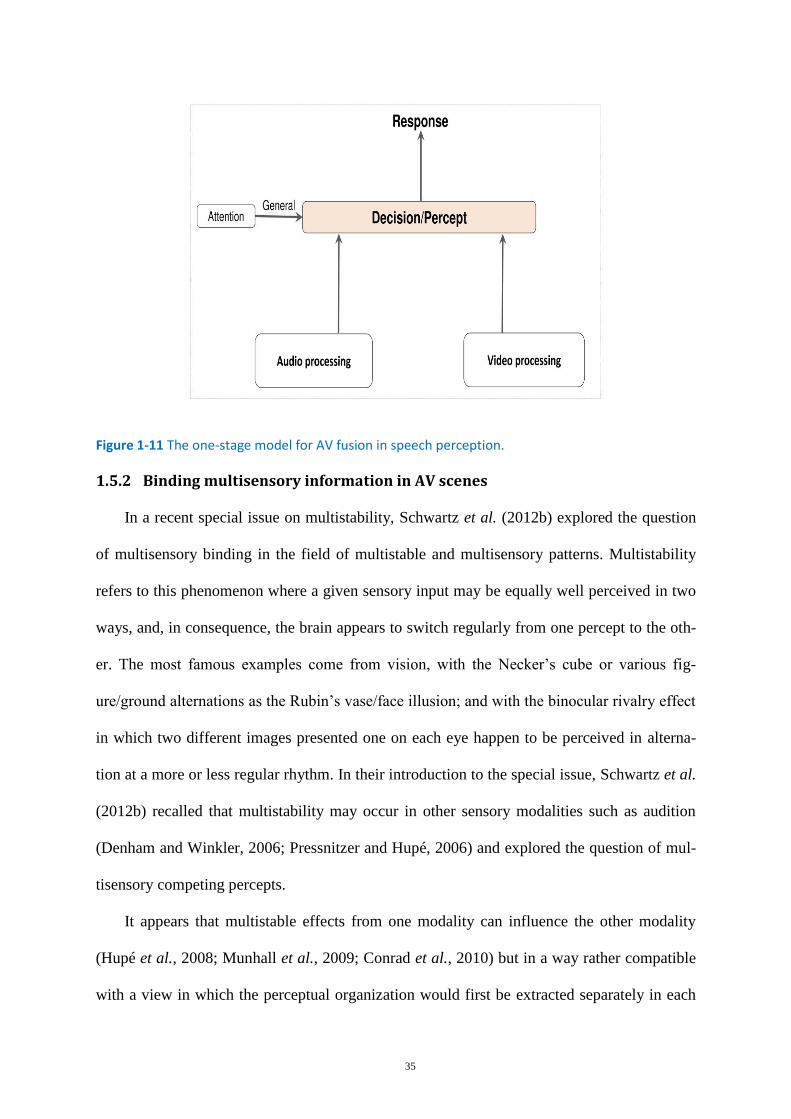
35
Figure 1-11 The one-stage model for AV fusion in speech perception.
Binding multisensory information in AV scenes 1.5.2
In a recent special issue on multistability, Schwartz et al. (2012b) explored the question
of multisensory binding in the field of multistable and multisensory patterns. Multistability
refers to this phenomenon where a given sensory input may be equally well perceived in two
ways, and, in consequence, the brain appears to switch regularly from one percept to the oth-
er. The most famous examples come from vision, with the Necker’s cube or various fig-
ure/ground alternations as the Rubin’s vase/face illusion; and with the binocular rivalry effect
in which two different images presented one on each eye happen to be perceived in alterna-
tion at a more or less regular rhythm. In their introduction to the special issue, Schwartz et al.
(2012b) recalled that multistability may occur in other sensory modalities such as audition
(Denham and Winkler, 2006; Pressnitzer and Hupé, 2006) and explored the question of mul-
tisensory competing percepts.
It appears that multistable effects from one modality can influence the other modality
(Hupé et al., 2008; Munhall et al., 2009; Conrad et al., 2010) but in a way rather compatible
with a view in which the perceptual organization would first be extracted separately in each
36
modality. A nice example is provided by the study of Munhall et al. (2009), where the
authors presented a McGurk stimulus in which the speaker’s face was embedded in the
Rubin’s visual vase/face bistability effect. The authors show that the visual input modifies the
auditory percept only when the subject perceives the input as a face – and they conclude that
visual binding occurs primarily to AV fusion. However, a contrary conclusion is proposed by
Basirat et al. (2012) from their work on the verbal transformation effect. This effect is a
speech multistability phenomenon, in which a given speech input repeated in loop may lead
to the occurrence of a new percept, such as “life” being perceived as “fly”. While the subject
appears to switch regularly between one percept and the other, Basirat et al. (2012), show that
the visual input participates to the switching competition, and conclude that in this case, AV
organization is primary.
Apart from multistability, some behavioral and neurophysiological studies have suggest-
ed that the presentation of a visual stream can affect primary auditory streaming by enhancing
segregation or integration (Rahne et al., 2007; Marozeau et al., 2010; Devergie et al., 2011;
Maddox et al., 2015). For example Rahne et al. (2007) exploit MMN to determine whether
an ambiguous sound organization could be driven toward an integrated or segregated percept
by the simultaneous presentation of visual cues. They used the Van Noorden (1975) auditory
stimuli presented in Figure 1-1, with a sequence of alternating low and high frequency
sounds, which can be perceived as either one stream or two. The visual input was either
synchronous with the low-frequency audio sequence, hence promoting segregation; or a
sequence compatible in time with the alternating low-high audio sequence, hence promoting
integration. The mismatching stimulus was an auditory variant introduced in the low-
frequency stream. The authors found that the MMN was observed only when the visual pat-
tern promoted stream segregation. Devergie et al. (2011) also found intersensory effects on
scene organization in a behavioral experiment dealing with the possible benefit of lip-reading
37
in stream segregation. Their two experiments consisted of sequences of French vowels alter-
nating in fundamental frequency F0, possibly resulting in segregation between the two F0-
streams, in which subjects were instructed to identify the order of items in the 1st experiment
and to detect disruption of temporal isochrony in the 2nd
experiment. The visual speech ges-
tures were synchronized with one auditory F0-sequence. In both experiments, the authors
observed that visual cues did interfere in the task, hence playing a role in the stream segrega-
tion process. Recently, Maddox et al. (2015) studied the effect of AV temporal coherence on
selective listening and confirmed that temporal cues provided by vision can help listeners to
select one sound source from a mixture in the everyday multisource environment. This ex-
tends to AV speech a crucial observation in ASA, that coherence between two cues is crucial
for stream formation – see for example the proposal by Shamma et al. (2011) that the tem-
poral coherence between two auditory features (e.g. pitch, timbre, location) plays a major role
in the auditory stream formation.
However, some other contradictory studies highlight cases where unimodal perceptual
grouping appears to precede multisensory integration (Sanabria et al., 2005; Keetels et al.,
2007). In a task of discrimination of spatial motion direction, Sanabria et al. (2005) displayed
the influence of intramodal visual perceptual in the multisensory integration of motion
information. In a temporal order judgment task, Keetels et al. (2007) showed that grouping of
the auditory information took effect prior to intersensory pairing.
Elements in favor of a two-stage AV process in speech perception 1.5.3
Our portrait of the experimental data on AV speech perception in Sections 1.2 and 1.4
displayed a number of studies concluding that AV interactions could intervene at various
stages of the speech decoding process.
Let us begin by the speech detection advantage, according to which visual cues appear to
improve speech detection and cue extraction during AV perception (Grant and Seitz, 2000;
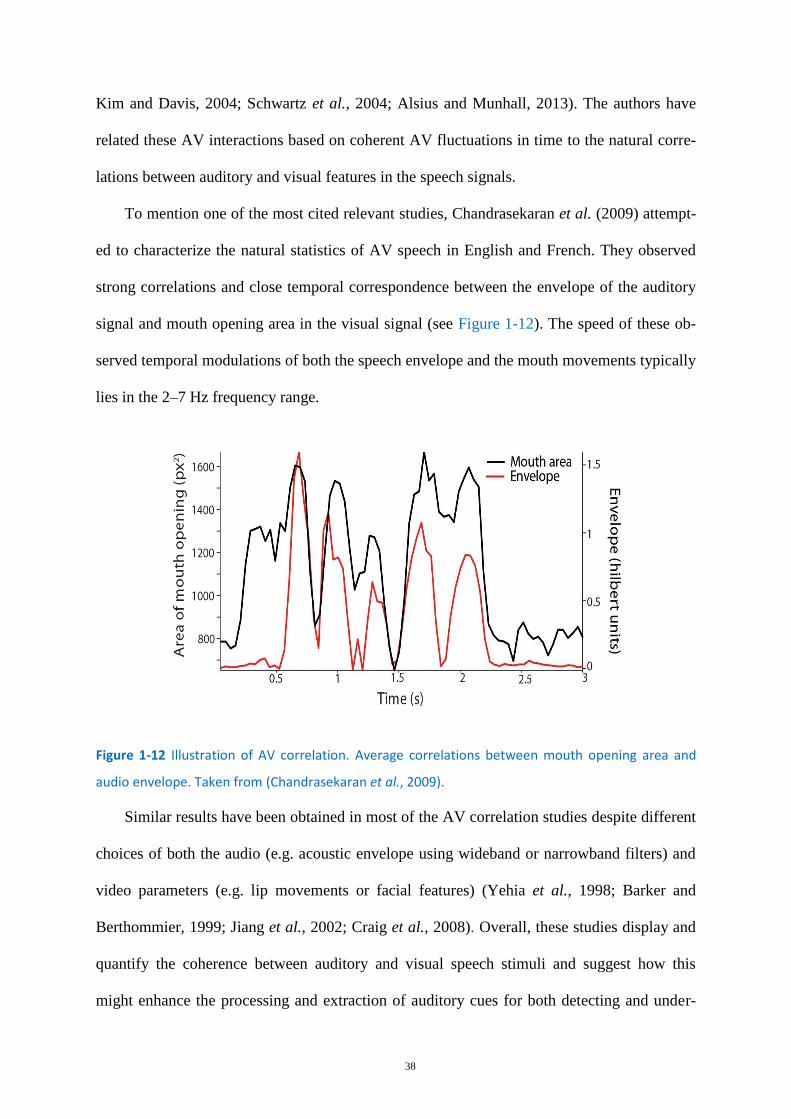
38
Kim and Davis, 2004; Schwartz et al., 2004; Alsius and Munhall, 2013). The authors have
related these AV interactions based on coherent AV fluctuations in time to the natural corre-
lations between auditory and visual features in the speech signals.
To mention one of the most cited relevant studies, Chandrasekaran et al. (2009) attempt-
ed to characterize the natural statistics of AV speech in English and French. They observed
strong correlations and close temporal correspondence between the envelope of the auditory
signal and mouth opening area in the visual signal (see Figure 1-12). The speed of these ob-
served temporal modulations of both the speech envelope and the mouth movements typically
lies in the 2–7 Hz frequency range.
Figure 1-12 Illustration of AV correlation. Average correlations between mouth opening area and
audio envelope. Taken from (Chandrasekaran et al., 2009).
Similar results have been obtained in most of the AV correlation studies despite different
choices of both the audio (e.g. acoustic envelope using wideband or narrowband filters) and
video parameters (e.g. lip movements or facial features) (Yehia et al., 1998; Barker and
Berthommier, 1999; Jiang et al., 2002; Craig et al., 2008). Overall, these studies display and
quantify the coherence between auditory and visual speech stimuli and suggest how this
might enhance the processing and extraction of auditory cues for both detecting and under-
39
standing speech. This provides a scenario in which visual information would be available at
an early stage of auditory processing and help reduce the spectral and temporal uncertainty
prior to AV fusion.
This is also in line with the neurophysiological studies reported in Section 1.4.2 showing
that visual speech can speed up the cortical processing of the auditory input as soon as 100
ms after the stimulus onset. Altogether, these data suggest that the visual speech flow could
modulate ongoing auditory feature processing at various levels (Bernstein et al., 2004;
Bernstein et al., 2008; Arnal et al., 2009; Eskelund et al., 2011).
A two-stage model for AV Speech Scene Analysis 1.5.4
It is in this context that Berthommier (2004) proposed that AV fusion could rely on a
two-stage process, beginning by binding together the appropriate pieces of auditory and
visual information, followed by integration per se (Figure 1-13). This provided a
formalization of a proposal elaborated in Grenoble since the end of the 90s stating that ASA
and multisensory interactions in speech perception should be combined into a single AVSSA
process (Barker et al., 1998; Berthommier, 2004; Schwartz et al., 2004). The basic claim is
that the two-stage analysis-and-decision process at work in ASA should be extended to AV
speech scenes made of mixtures of auditory and visual speech sources. A first AV binding
stage would involve segmenting the scene into AV elements, which should be segregated or
grouped with respect to their common multisensory speech source, either by bottom-up AV
primitives or by learnt top-down AV schemas. This AV binding stage would control the out-
put of the later decision stage, and hence intervene on the output of the AV speech-in-noise
or McGurk paradigms.
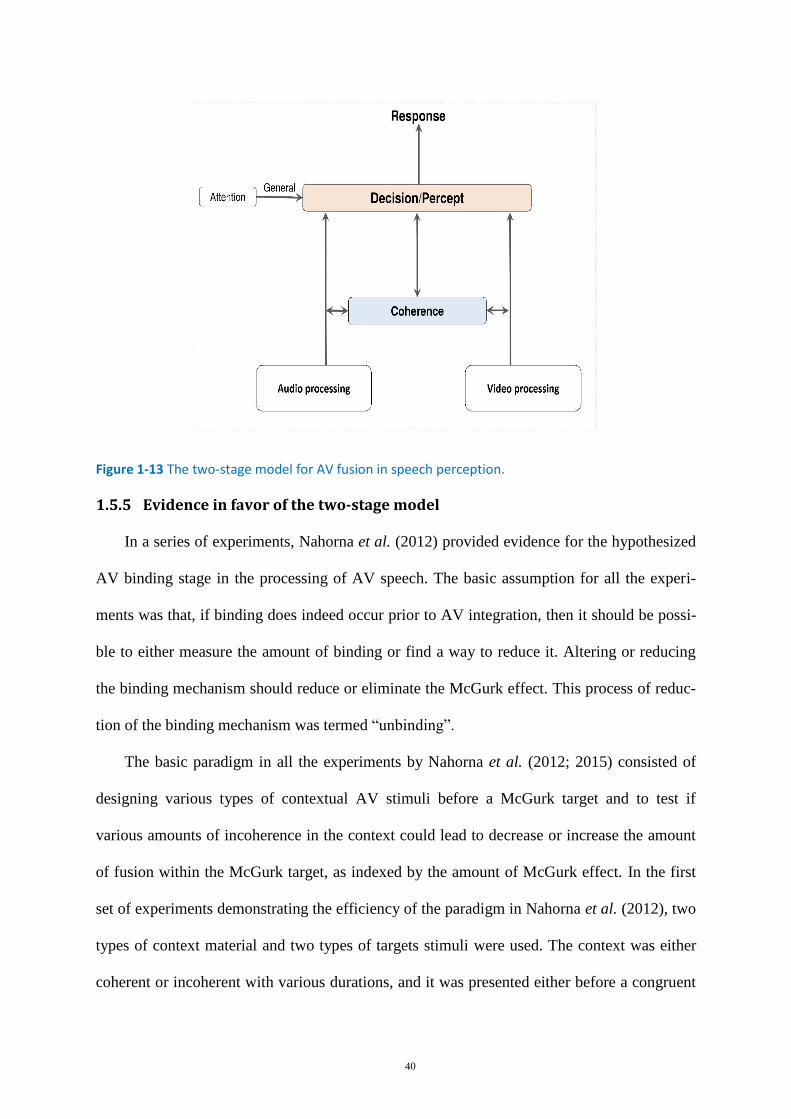
40
Figure 1-13 The two-stage model for AV fusion in speech perception.
Evidence in favor of the two-stage model 1.5.5
In a series of experiments, Nahorna et al. (2012) provided evidence for the hypothesized
AV binding stage in the processing of AV speech. The basic assumption for all the experi-
ments was that, if binding does indeed occur prior to AV integration, then it should be possi-
ble to either measure the amount of binding or find a way to reduce it. Altering or reducing
the binding mechanism should reduce or eliminate the McGurk effect. This process of reduc-
tion of the binding mechanism was termed “unbinding”.
The basic paradigm in all the experiments by Nahorna et al. (2012; 2015) consisted of
designing various types of contextual AV stimuli before a McGurk target and to test if
various amounts of incoherence in the context could lead to decrease or increase the amount
of fusion within the McGurk target, as indexed by the amount of McGurk effect. In the first
set of experiments demonstrating the efficiency of the paradigm in Nahorna et al. (2012), two
types of context material and two types of targets stimuli were used. The context was either
coherent or incoherent with various durations, and it was presented either before a congruent
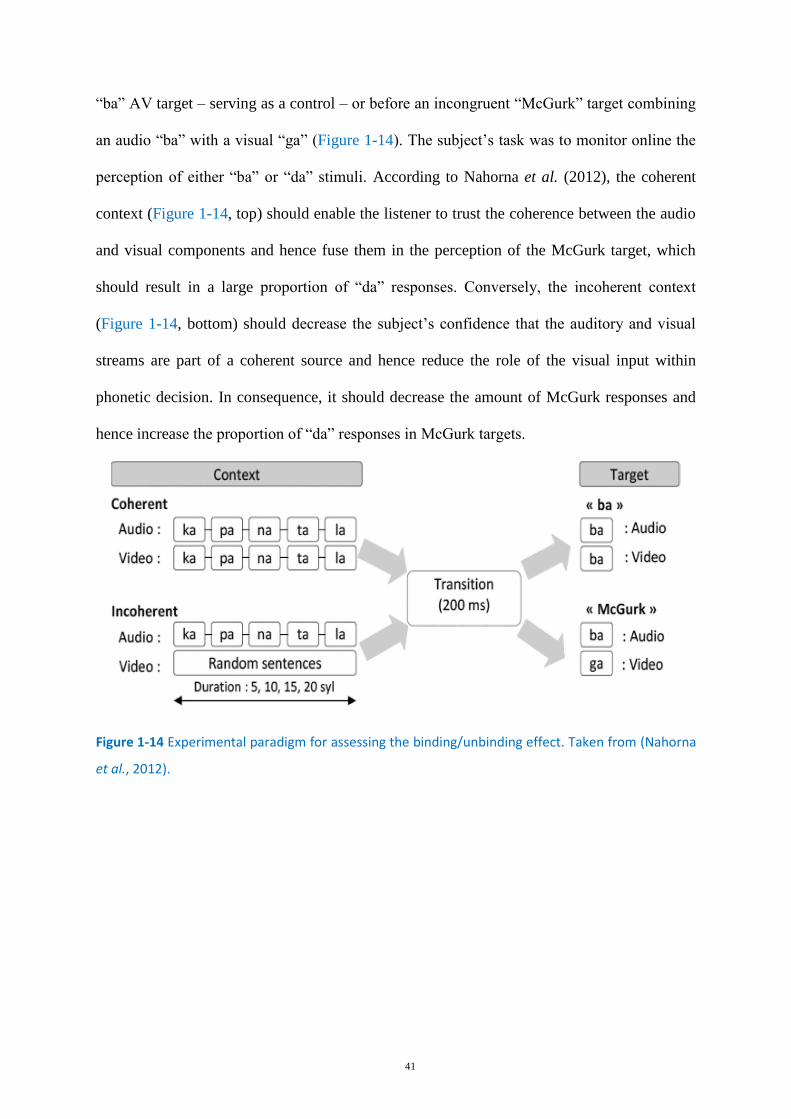
41
“ba” AV target – serving as a control – or before an incongruent “McGurk” target combining
an audio “ba” with a visual “ga” (Figure 1-14). The subject’s task was to monitor online the
perception of either “ba” or “da” stimuli. According to Nahorna et al. (2012), the coherent
context (Figure 1-14, top) should enable the listener to trust the coherence between the audio
and visual components and hence fuse them in the perception of the McGurk target, which
should result in a large proportion of “da” responses. Conversely, the incoherent context
(Figure 1-14, bottom) should decrease the subject’s confidence that the auditory and visual
streams are part of a coherent source and hence reduce the role of the visual input within
phonetic decision. In consequence, it should decrease the amount of McGurk responses and
hence increase the proportion of “da” responses in McGurk targets.
Figure 1-14 Experimental paradigm for assessing the binding/unbinding effect. Taken from (Nahorna
et al., 2012).
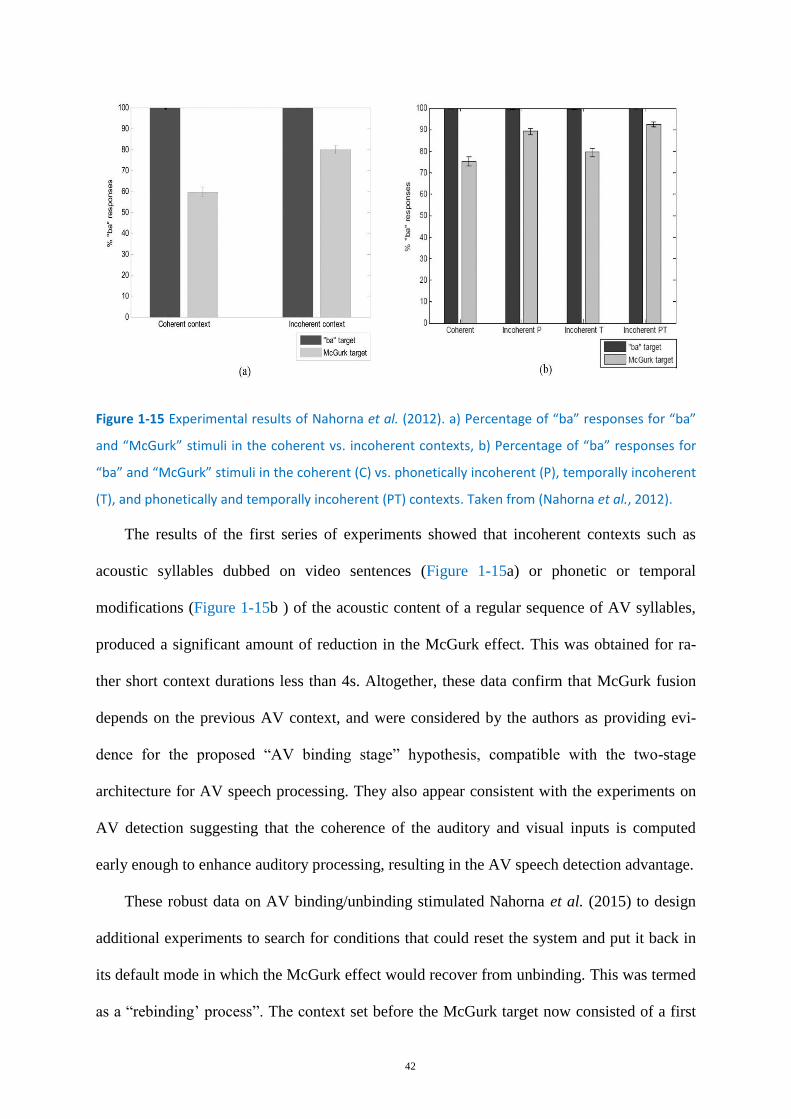
42
Figure 1-15 Experimental results of Nahorna et al. (2012). a) Percentage of “ba” responses for “ba”
and “McGurk” stimuli in the coherent vs. incoherent contexts, b) Percentage of “ba” responses for
“ba” and “McGurk” stimuli in the coherent (C) vs. phonetically incoherent (P), temporally incoherent
(T), and phonetically and temporally incoherent (PT) contexts. Taken from (Nahorna et al., 2012).
The results of the first series of experiments showed that incoherent contexts such as
acoustic syllables dubbed on video sentences (Figure 1-15a) or phonetic or temporal
modifications (Figure 1-15b ) of the acoustic content of a regular sequence of AV syllables,
produced a significant amount of reduction in the McGurk effect. This was obtained for ra-
ther short context durations less than 4s. Altogether, these data confirm that McGurk fusion
depends on the previous AV context, and were considered by the authors as providing evi-
dence for the proposed “AV binding stage” hypothesis, compatible with the two-stage
architecture for AV speech processing. They also appear consistent with the experiments on
AV detection suggesting that the coherence of the auditory and visual inputs is computed
early enough to enhance auditory processing, resulting in the AV speech detection advantage.
These robust data on AV binding/unbinding stimulated Nahorna et al. (2015) to design
additional experiments to search for conditions that could reset the system and put it back in
its default mode in which the McGurk effect would recover from unbinding. This was termed
as a “rebinding’ process”. The context set before the McGurk target now consisted of a first
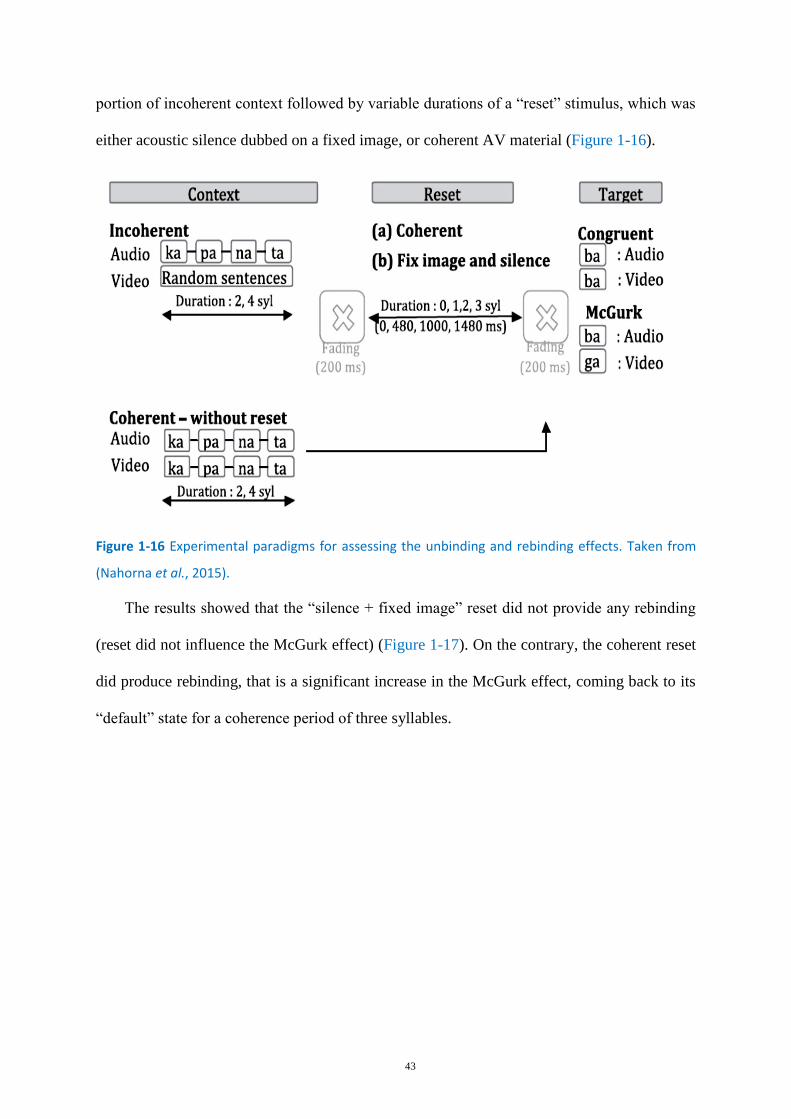
43
portion of incoherent context followed by variable durations of a “reset” stimulus, which was
either acoustic silence dubbed on a fixed image, or coherent AV material (Figure 1-16).
Figure 1-16 Experimental paradigms for assessing the unbinding and rebinding effects. Taken from
(Nahorna et al., 2015).
The results showed that the “silence + fixed image” reset did not provide any rebinding
(reset did not influence the McGurk effect) (Figure 1-17). On the contrary, the coherent reset
did produce rebinding, that is a significant increase in the McGurk effect, coming back to its
“default” state for a coherence period of three syllables.
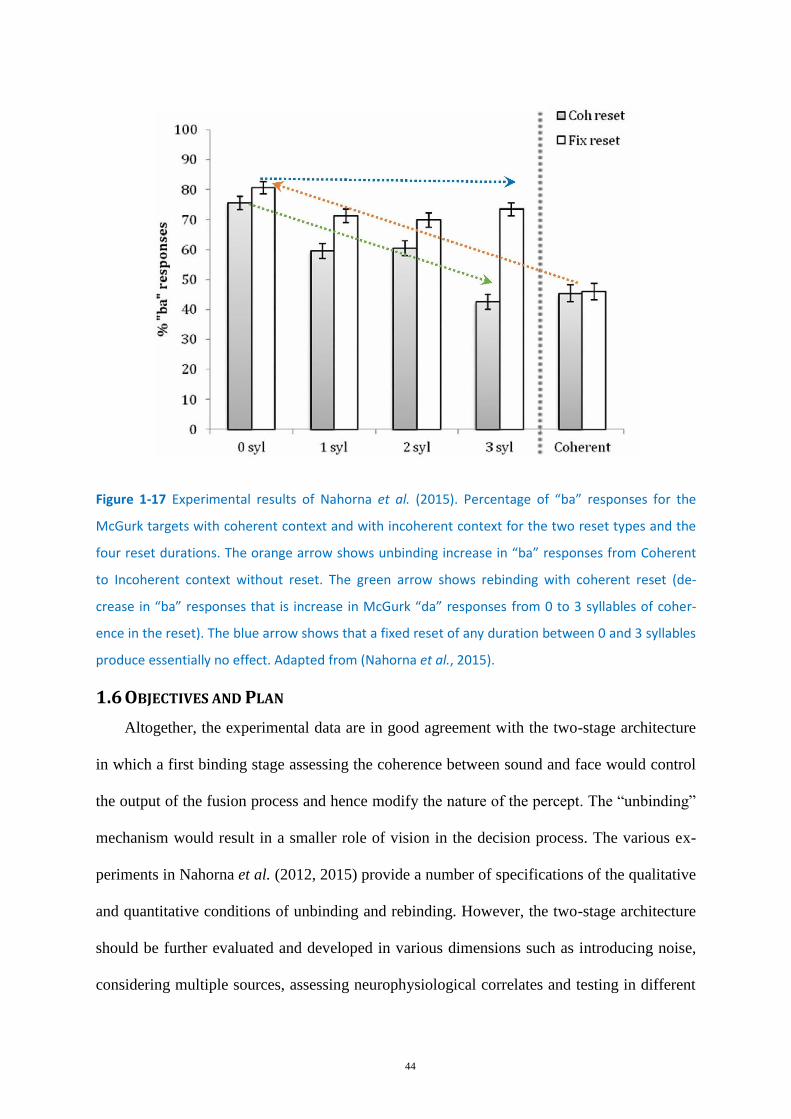
44
Figure 1-17 Experimental results of Nahorna et al. (2015). Percentage of “ba” responses for the
McGurk targets with coherent context and with incoherent context for the two reset types and the
four reset durations. The orange arrow shows unbinding increase in “ba” responses from Coherent
to Incoherent context without reset. The green arrow shows rebinding with coherent reset (de-
crease in “ba” responses that is increase in McGurk “da” responses from 0 to 3 syllables of coher-
ence in the reset). The blue arrow shows that a fixed reset of any duration between 0 and 3 syllables
produce essentially no effect. Adapted from (Nahorna et al., 2015).
OBJECTIVES AND PLAN 1.6
Altogether, the experimental data are in good agreement with the two-stage architecture
in which a first binding stage assessing the coherence between sound and face would control
the output of the fusion process and hence modify the nature of the percept. The “unbinding”
mechanism would result in a smaller role of vision in the decision process. The various ex-
periments in Nahorna et al. (2012, 2015) provide a number of specifications of the qualitative
and quantitative conditions of unbinding and rebinding. However, the two-stage architecture
should be further evaluated and developed in various dimensions such as introducing noise,
considering multiple sources, assessing neurophysiological correlates and testing in different
45
populations. These are the objectives of the experiments described in the present work, aim-
ing at further characterizing the “AVSSA process” within the two-stage model in order to
increase our knowledge of this essential process in speech perception.
The experiments are organized into three parts:
1. Behavioral characterization of the AV binding mechanism and its implications in the
processing of speech-in-noise as well as in competing sources. The goal here is to determine
whether the incoherent AV context that causes unbinding would also modulate the benefit of
vision in noisy conditions and competing sources.
2. Neurophysiological characterization of the binding mechanism. The goal is to search
for neurophysiological correlates of the binding/unbinding process by using an electrophysio-
logical tool (EEG).
3. Studies in specific populations, like aging adults. The precise aim is to report possible
changes in the binding mechanism from younger to older adults. More generally, the question
is to know how binding might depend on subjects, in relation to age, culture, developmental
history, sensory or cognitive deficits, etc.
These studies will be described in four specific chapters corresponding to four sets of
experiments. Since they all involve some stable specifications of paradigms and stimuli, a
preliminary chapter will present these general principles. The document will be concluded by
a discussion attempting to synthesize the main findings of this work inside a possible im-
proved architecture for AV speech perception, and some perspectives will be proposed for
future works.
46
Chapter 2
2. GENERAL PRINCIPLES-METHODS & MATERIALS
The present chapter is dedicated to describe the general principles that were implemented
for stimuli preparation, participant’s selection, methods, and other details on stimuli prepara-
tion. The objective of this chapter is to provide information that is relevant for all experi-
ments in the following chapters.
PARTICIPANTS INFORMATION 2.1
The participants were native French speakers (although no standard tests were used to
measure first or, possibly, second language proficiency), without any reported history of
hearing disorders and with normal or corrected-to-normal vision. They were either normal
hearing adults (18 to 55 years) for the majority of experiments or older adults (60 to 75 years)
in a specific set of experiments. Screening audiometry was performed on older adults to ex-
clude participants with a peripheral hearing loss from the experiments. Written informed
consent was obtained from each participant and all procedures were approved by the Greno-
ble Ethics Board (CERNI). In addition to the informed consent, the participants were also
asked to fill a form with questions about name, age, sex, handedness, native language, vision
and hearing abilities.
AV MATERIAL 2.2
The general objective of the experiments is to test the effect of context on congruent “ba”
or incongruent “McGurk” targets. To achieve this objective, it is required to modulate the
coherence and incoherence in the context and to construct good McGurk stimuli for the tar-
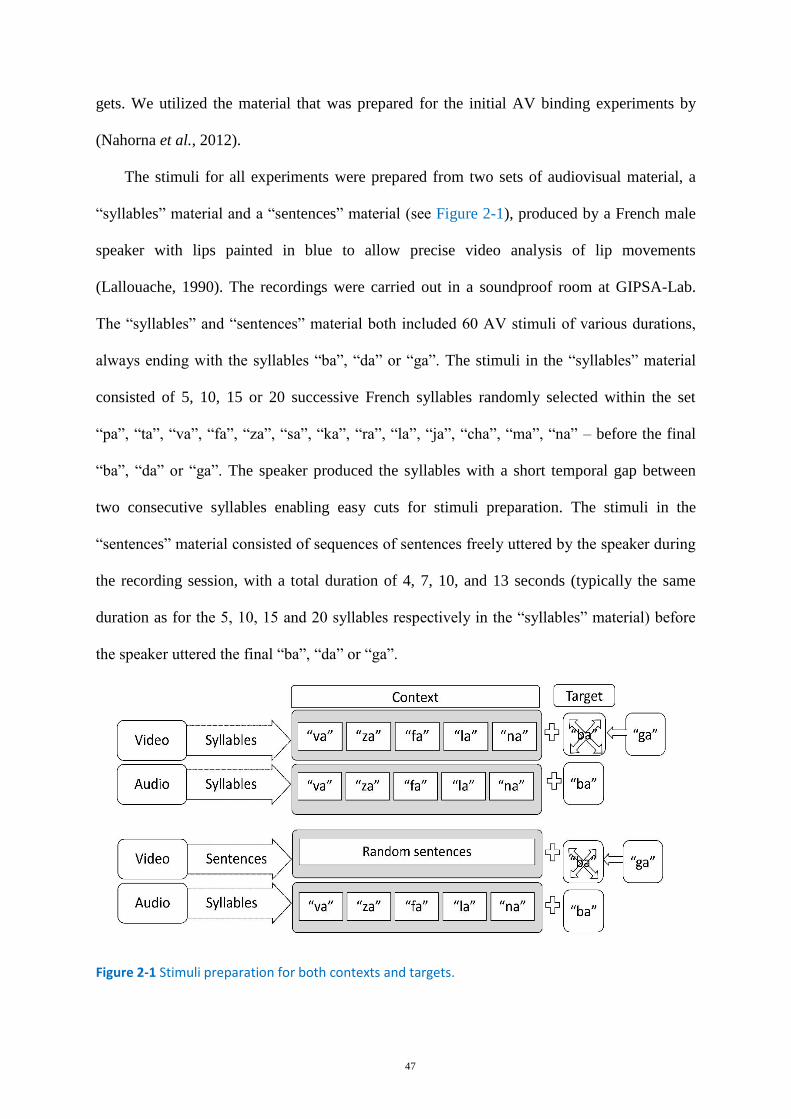
47
gets. We utilized the material that was prepared for the initial AV binding experiments by
(Nahorna et al., 2012).
The stimuli for all experiments were prepared from two sets of audiovisual material, a
“syllables” material and a “sentences” material (see Figure 2-1), produced by a French male
speaker with lips painted in blue to allow precise video analysis of lip movements
(Lallouache, 1990). The recordings were carried out in a soundproof room at GIPSA-Lab.
The “syllables” and “sentences” material both included 60 AV stimuli of various durations,
always ending with the syllables “ba”, “da” or “ga”. The stimuli in the “syllables” material
consisted of 5, 10, 15 or 20 successive French syllables randomly selected within the set
“pa”, “ta”, “va”, “fa”, “za”, “sa”, “ka”, “ra”, “la”, “ja”, “cha”, “ma”, “na” – before the final
“ba”, “da” or “ga”. The speaker produced the syllables with a short temporal gap between
two consecutive syllables enabling easy cuts for stimuli preparation. The stimuli in the
“sentences” material consisted of sequences of sentences freely uttered by the speaker during
the recording session, with a total duration of 4, 7, 10, and 13 seconds (typically the same
duration as for the 5, 10, 15 and 20 syllables respectively in the “syllables” material) before
the speaker uttered the final “ba”, “da” or “ga”.
Figure 2-1 Stimuli preparation for both contexts and targets.
48
These two materials were used to prepare either coherent contexts made of coherent ex-
cerpts from the “syllables” material, or incoherent contexts dubbing sounds from the “sylla-
bles” material with video coming from the “sentences” material. The syllables that were
recorded at the end of each AV sequence were extracted and utilized to construct the target
stimuli. This will be presented in more detail in the next section.
EXPERIMENTAL PARADIGM 2.3
Basically, the general experimental paradigm comprised two types of contexts respec-
tively “coherent” and “incoherent”, and two types of targets respectively “congruent” and
“incongruent” (Figure 2.2).
Contexts 2.3.1
The coherent context was made of 2 or 4 AV syllables extracted from the “syllables” ma-
terial. The incoherent context was prepared by dubbing a sequence of 2 or 4 acoustic sylla-
bles extracted from the “syllables” material (same syllables that were used in preparing the
coherent context) on a video stream extracted from the “sentences” material with the ade-
quate duration. The durations of 2 or 4 syllables have been shown by (Nahorna et al., 2015)
to be sufficient to produce maximal effects of the incoherent context compared with the
coherent one that is a maximal decrease of the McGurk effect. Indeed, longer incoherent con-
texts produce the same decrease compared with coherent context. Sound and video files were
automatically extracted from the AV material with desired length using Matlab (Mathworks,
Natick, MA, USA).
Targets 2.3.2
The targets comprised voiced plosives for behavioral experiments. Voiceless plosive
were used in the targets in the electrophysiological experiment, and their construction will be
discussed in the corresponding chapter. Otherwise, the target was either a congruent AV “ba”
syllable or an incongruent McGurk stimulus with an audio “ba” mounted on a video “ga”.
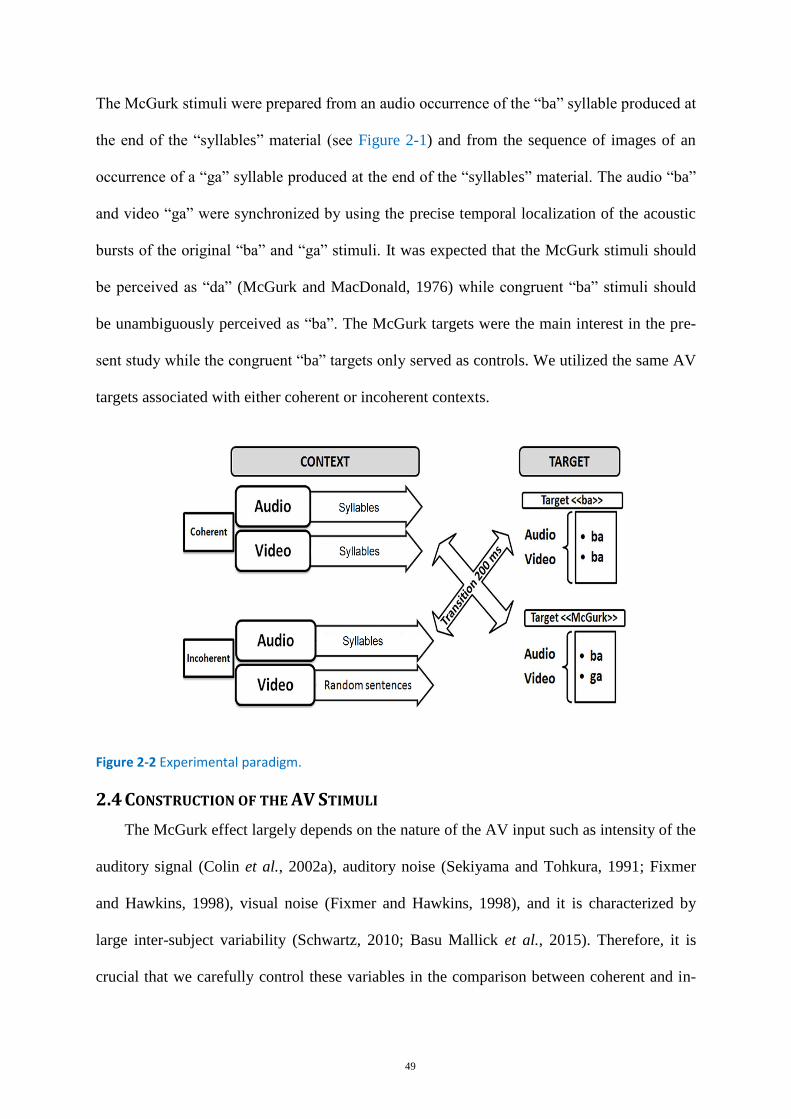
49
The McGurk stimuli were prepared from an audio occurrence of the “ba” syllable produced at
the end of the “syllables” material (see Figure 2-1) and from the sequence of images of an
occurrence of a “ga” syllable produced at the end of the “syllables” material. The audio “ba”
and video “ga” were synchronized by using the precise temporal localization of the acoustic
bursts of the original “ba” and “ga” stimuli. It was expected that the McGurk stimuli should
be perceived as “da” (McGurk and MacDonald, 1976) while congruent “ba” stimuli should
be unambiguously perceived as “ba”. The McGurk targets were the main interest in the pre-
sent study while the congruent “ba” targets only served as controls. We utilized the same AV
targets associated with either coherent or incoherent contexts.
Figure 2-2 Experimental paradigm.
CONSTRUCTION OF THE AV STIMULI 2.4
The McGurk effect largely depends on the nature of the AV input such as intensity of the
auditory signal (Colin et al., 2002a), auditory noise (Sekiyama and Tohkura, 1991; Fixmer
and Hawkins, 1998), visual noise (Fixmer and Hawkins, 1998), and it is characterized by
large inter-subject variability (Schwartz, 2010; Basu Mallick et al., 2015). Therefore, it is
crucial that we carefully control these variables in the comparison between coherent and in-
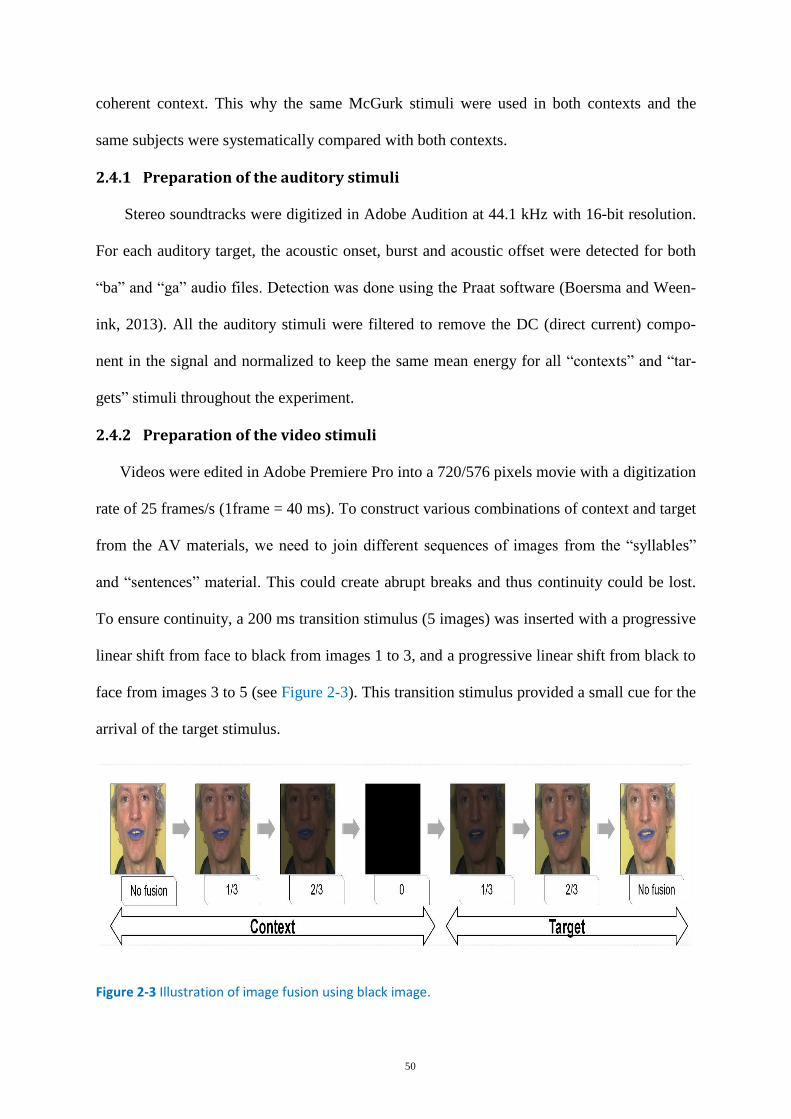
50
coherent context. This why the same McGurk stimuli were used in both contexts and the
same subjects were systematically compared with both contexts.
Preparation of the auditory stimuli 2.4.1
Stereo soundtracks were digitized in Adobe Audition at 44.1 kHz with 16-bit resolution.
For each auditory target, the acoustic onset, burst and acoustic offset were detected for both
“ba” and “ga” audio files. Detection was done using the Praat software (Boersma and Ween-
ink, 2013). All the auditory stimuli were filtered to remove the DC (direct current) compo-
nent in the signal and normalized to keep the same mean energy for all “contexts” and “tar-
gets” stimuli throughout the experiment.
Preparation of the video stimuli 2.4.2
Videos were edited in Adobe Premiere Pro into a 720/576 pixels movie with a digitization
rate of 25 frames/s (1frame = 40 ms). To construct various combinations of context and target
from the AV materials, we need to join different sequences of images from the “syllables”
and “sentences” material. This could create abrupt breaks and thus continuity could be lost.
To ensure continuity, a 200 ms transition stimulus (5 images) was inserted with a progressive
linear shift from face to black from images 1 to 3, and a progressive linear shift from black to
face from images 3 to 5 (see Figure 2-3). This transition stimulus provided a small cue for the
arrival of the target stimulus.
Figure 2-3 Illustration of image fusion using black image.
51
Final AV film preparation 2.4.3
Stimuli were mixed randomly to produce films containing all possible stimuli in a given
experiment. Since the number of syllables in the context varied between 2 and 4, the arrival
of the target remained largely unpredictable – despite the small temporal cue provided by the
200-ms transition stimulus - thus participants needed to stay always focused and attentive to
detect the targets. Since the “ba” targets were only used as controls, we maintained a propor-
tion of ¼ “ba” targets and ¾ “McGurk” targets.
We inserted an 840-ms inter-stimulus silent interval between the end of one target and
the beginning of the next target. The video component of this silent interval was made of the
repetition of the last image of the previous stimulus. Such a short inter-stimulus interval was
selected to put the subjects in a real monitoring task where there was large uncertainty about
the temporal arrival of possible targets, to decrease as much as possible post-decision biases
on target detection.
PROCEDURE 2.5
All experiments were carried out in a soundproof booth, which was located in the Speech
and Cognition Department in GIPSA-Lab. Stimulus presentation was coordinated with the
Presentation® software (Neurobehavioral Systems Inc., Albany, CA). Apart from the EEG
experiment that will be presented in the dedicated EEG experiment section, the participant’s
task was to monitor for the arrival of target stimuli “ba” or “da” within the displayed films,
by pressing as soon as possible the appropriate key (two-alternative-forced-choice identifica-
tion task). This is different from classical speech recognition tests where participants know
when the target stimuli will be presented.
Participants were instructed to look constantly at the screen and, each time a “ba” or a
“da” was perceived, to press the corresponding button immediately. The distance of the par-
ticipant to the screen at about 50 cm from the screen and the intensity of the audio stimulus
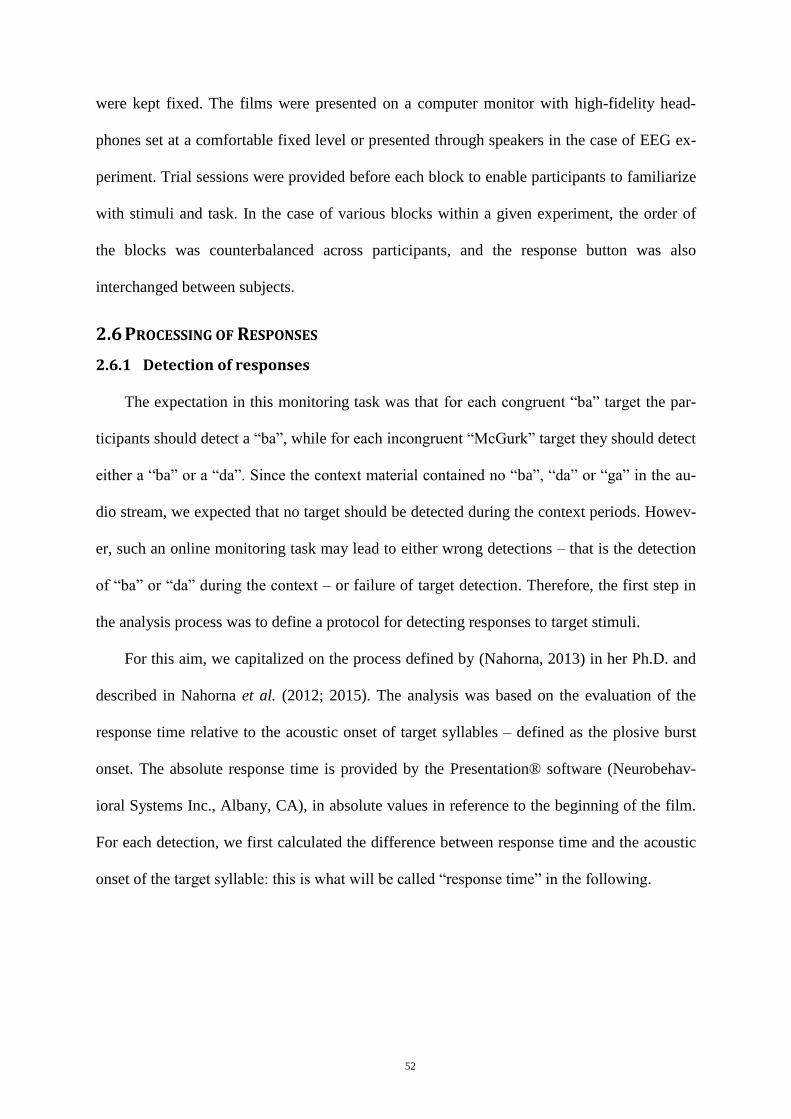
52
were kept fixed. The films were presented on a computer monitor with high-fidelity head-
phones set at a comfortable fixed level or presented through speakers in the case of EEG ex-
periment. Trial sessions were provided before each block to enable participants to familiarize
with stimuli and task. In the case of various blocks within a given experiment, the order of
the blocks was counterbalanced across participants, and the response button was also
interchanged between subjects.
PROCESSING OF RESPONSES 2.6
Detection of responses 2.6.1
The expectation in this monitoring task was that for each congruent “ba” target the par-
ticipants should detect a “ba”, while for each incongruent “McGurk” target they should detect
either a “ba” or a “da”. Since the context material contained no “ba”, “da” or “ga” in the au-
dio stream, we expected that no target should be detected during the context periods. Howev-
er, such an online monitoring task may lead to either wrong detections – that is the detection
of “ba” or “da” during the context – or failure of target detection. Therefore, the first step in
the analysis process was to define a protocol for detecting responses to target stimuli.
For this aim, we capitalized on the process defined by (Nahorna, 2013) in her Ph.D. and
described in Nahorna et al. (2012; 2015). The analysis was based on the evaluation of the
response time relative to the acoustic onset of target syllables – defined as the plosive burst
onset. The absolute response time is provided by the Presentation® software (Neurobehav-
ioral Systems Inc., Albany, CA), in absolute values in reference to the beginning of the film.
For each detection, we first calculated the difference between response time and the acoustic
onset of the target syllable: this is what will be called “response time” in the following.
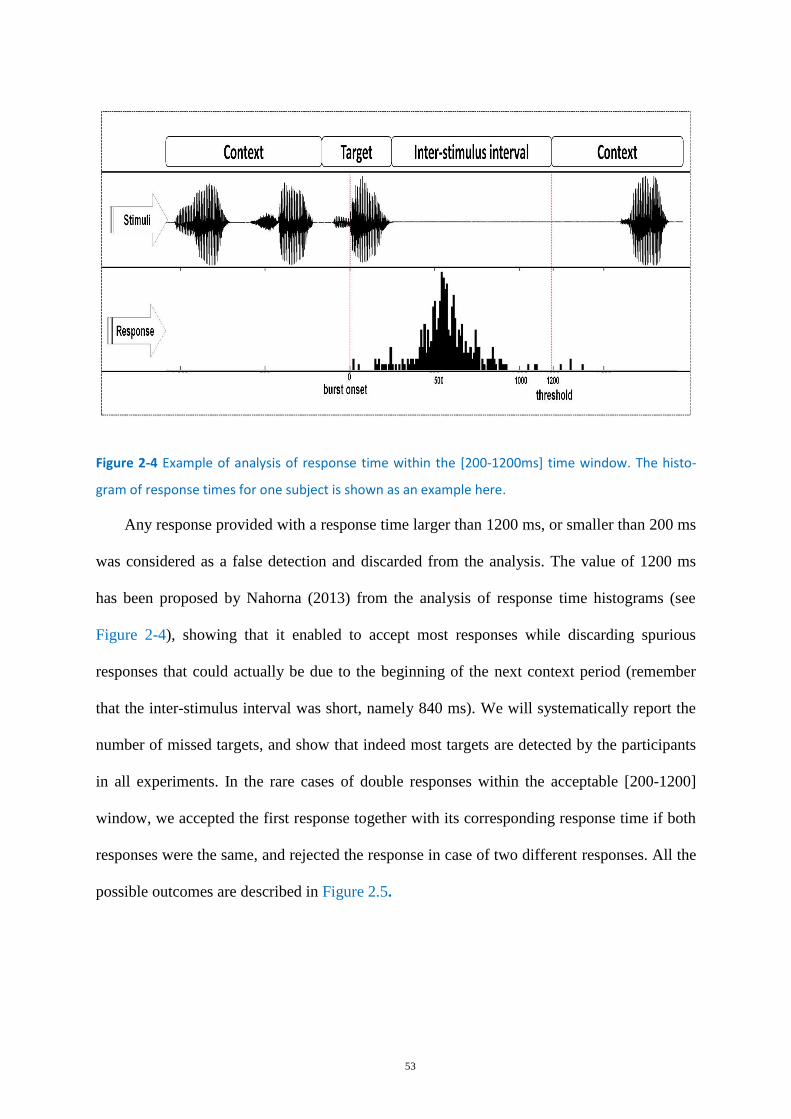
53
Figure 2-4 Example of analysis of response time within the [200-1200ms] time window. The histo-
gram of response times for one subject is shown as an example here.
Any response provided with a response time larger than 1200 ms, or smaller than 200 ms
was considered as a false detection and discarded from the analysis. The value of 1200 ms
has been proposed by Nahorna (2013) from the analysis of response time histograms (see
Figure 2-4), showing that it enabled to accept most responses while discarding spurious
responses that could actually be due to the beginning of the next context period (remember
that the inter-stimulus interval was short, namely 840 ms). We will systematically report the
number of missed targets, and show that indeed most targets are detected by the participants
in all experiments. In the rare cases of double responses within the acceptable [200-1200]
window, we accepted the first response together with its corresponding response time if both
responses were the same, and rejected the response in case of two different responses. All the
possible outcomes are described in Figure 2.5.
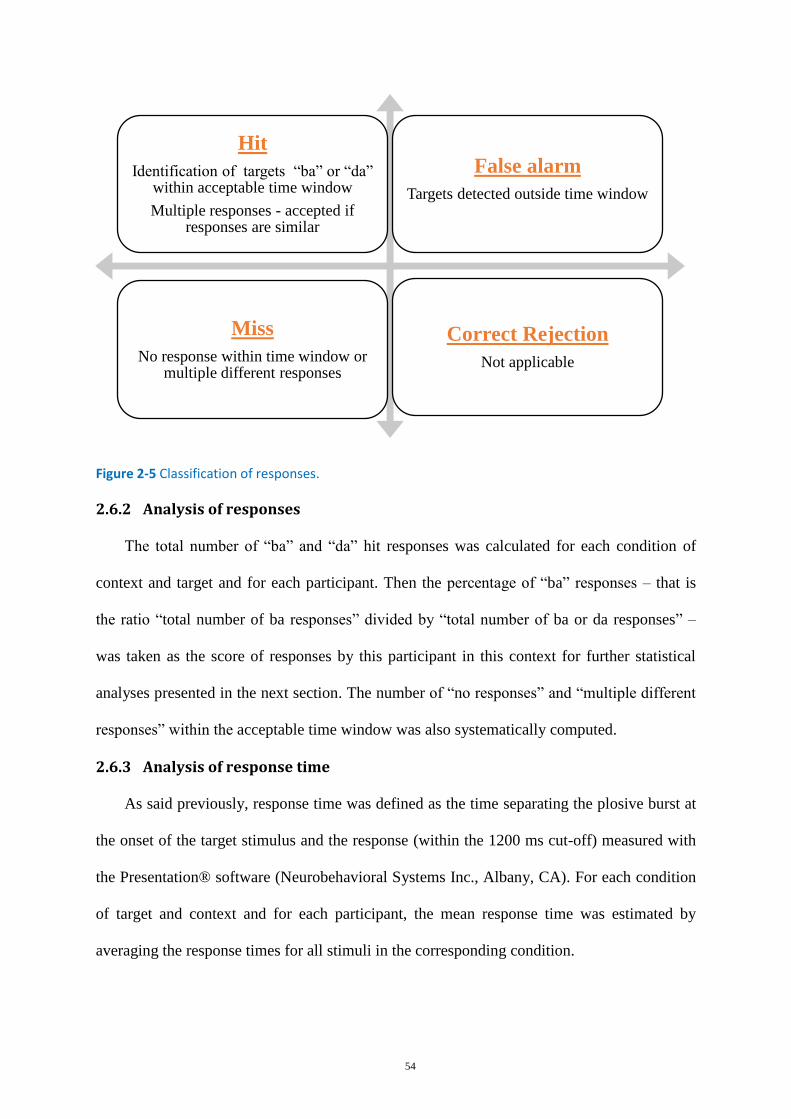
54
Figure 2-5 Classification of responses.
Analysis of responses 2.6.2
The total number of “ba” and “da” hit responses was calculated for each condition of
context and target and for each participant. Then the percentage of “ba” responses – that is
the ratio “total number of ba responses” divided by “total number of ba or da responses” –
was taken as the score of responses by this participant in this context for further statistical
analyses presented in the next section. The number of “no responses” and “multiple different
responses” within the acceptable time window was also systematically computed.
Analysis of response time 2.6.3
As said previously, response time was defined as the time separating the plosive burst at
the onset of the target stimulus and the response (within the 1200 ms cut-off) measured with
the Presentation® software (Neurobehavioral Systems Inc., Albany, CA). For each condition
of target and context and for each participant, the mean response time was estimated by
averaging the response times for all stimuli in the corresponding condition.
Hit
Identification of targets “ba” or “da” within acceptable time window
Multiple responses - accepted if responses are similar
False alarm
Targets detected outside time window
Miss
No response within time window or multiple different responses
Correct Rejection
Not applicable
55
STATISTICAL ANALYSIS 2.7
The suitable statistical analysis was performed on both response scores (“ba/ (ba+da)”
scores) and response times (mean response times) using the SPSS Statistics 17 © IBM soft-
ware. The response scores to the “ba” targets were systematically close to 100%, and not
considered in the analysis since these targets only served as a control stimulus. To ensure
quasi-Gaussian distribution of the variables, the response scores were processed with arcsine
square root transformation [asin (sqrt)] transform, and the mean response times were loga-
rithmically transformed. Then analyses of variance (ANOVAs) were performed on both
transformed response scores and transformed response times, applying a Greenhouse –
Geisser correction in case of violation of the sphericity assumption. Post-hoc analyses with
Bonferroni correction were done when appropriate and were reported at the [(p < 0.05) level].
CONCLUSIONS 2.8
Overall, the present chapter provided general principles and procedures, which are simi-
lar across all the experiments. Of course, the stimuli will be modified as per the requirements
for each experiment and specific modifications of paradigm or processing will be discussed
in detail in each particular chapter. Globally, care was taken to (1) ensure the control of target
and context material – with the same set of targets for the different contexts compared in each
experiment, (2) increase the unpredictability of time arrival of the targets to decrease as much
as possible decision biases in the monitoring procedure, while (3) maintaining the naturalness
of audio and visual stimuli by minimizing distortions through various signal and image
processing techniques. We will now describe in detail the methods and results for each of our
planned experiments.
56
Chapter 3
3. EFFECT OF CONTEXT, REBINDING AND NOISE ON AV SPEECH
FUSION1
BACKGROUND AND HYPOTHESIS 3.1
The major output of the experimental work by Nahorna et al., (2012; 2015) is the
demonstration that context may modulate the McGurk effect. This was interpreted by the
authors as an “unbinding/rebinding” mechanism in the framework of a tentative AVSSA pro-
cess. However, all the experiments done so far have involved a single acoustic source and a
single visual source within context. Of course, the incoherent context material actually corre-
sponds to two differing sources, one syllabic source presented in the auditory modality and
one sentence source presented in the visual modality. However, there is no competition of
sources in individual modalities.
The objective in the first part of this thesis is to go towards more realistic situations in
which there is a competition of sources inside the auditory modality – apart from possible
incoherence between modalities. In a first step, we will consider acoustic noise added to the
acoustic source. However, the acoustic noise will be presented only in the context part.
Therefore, we will exploit the “unbinding/rebinding” paradigm by Nahorna et al. (2015, Ex-
periment 2) presented in Section 1.5.5, though with an important variant, that is the addition
of acoustic noise in the context before the McGurk target (see Figure 3-1).
1 This is an extended version of a paper submitted to the Journal of the Acoustical Society of America.
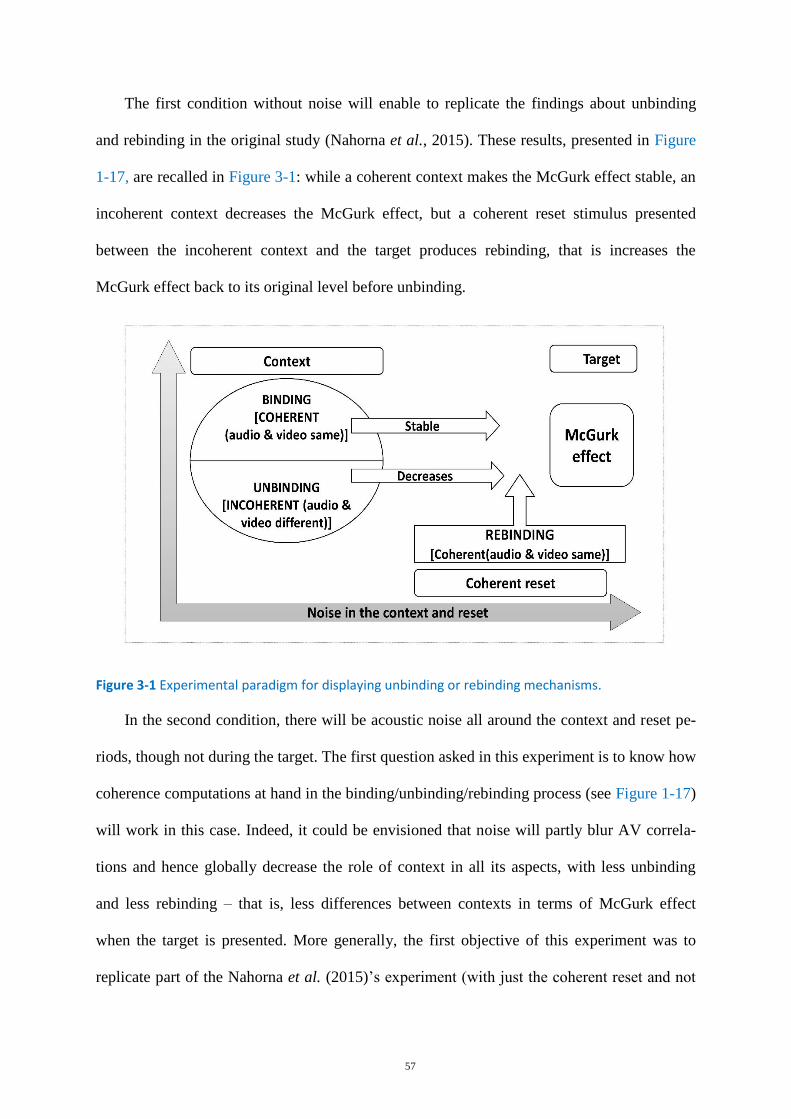
57
The first condition without noise will enable to replicate the findings about unbinding
and rebinding in the original study (Nahorna et al., 2015). These results, presented in Figure
1-17, are recalled in Figure 3-1: while a coherent context makes the McGurk effect stable, an
incoherent context decreases the McGurk effect, but a coherent reset stimulus presented
between the incoherent context and the target produces rebinding, that is increases the
McGurk effect back to its original level before unbinding.
Figure 3-1 Experimental paradigm for displaying unbinding or rebinding mechanisms.
In the second condition, there will be acoustic noise all around the context and reset pe-
riods, though not during the target. The first question asked in this experiment is to know how
coherence computations at hand in the binding/unbinding/rebinding process (see Figure 1-17)
will work in this case. Indeed, it could be envisioned that noise will partly blur AV correla-
tions and hence globally decrease the role of context in all its aspects, with less unbinding
and less rebinding – that is, less differences between contexts in terms of McGurk effect
when the target is presented. More generally, the first objective of this experiment was to
replicate part of the Nahorna et al. (2015)’s experiment (with just the coherent reset and not
58
the fixed reset condition, see Figure 1-16) while assessing how acoustic noise modifies the
computation of AV coherence and hence the magnitude of unbinding/rebinding processes.
There was, however a second objective with more direct potential theoretical conse-
quences, which we will explain now.
The importance of visual cues in the perception of speech-in-noise was discussed in an
earlier section in detail (see Section 1.2). Concerning the McGurk effect, we saw that it ap-
pears to increase when the acoustic component is noisy and decrease when the McGurk stim-
ulus is presented with visual noise (Sekiyama and Tohkura, 1991; Sekiyama, 1994; Fixmer
and Hawkins, 1998; Kim and Davis, 2011). These outcomes could receive two different in-
terpretations.
In the first interpretation, within the framework of the FLMP developed by Massaro
(1998) (see Section 1.3.2), AV fusion is obtained by a multiplicative fusion process between
the unisensory evidence for each possible decision in a given AV speech perception task. The
fusion process is hence conceived as automatic, just dependent on unisensory percepts, and
supposedly optimal in the sense that the less ambiguous a sensory percept, the larger its
weight in the fusion process. FLMP provides good simulations of the McGurk effect
(Massaro, 1998). For FLMP, any changes in the final percept by the addition of noise would
be due to the increasing ambiguity of the noisy component, which would automatically
decrease its role in the fusion process.
In the second interpretation, the subjects would control the weight of the auditory and
visual modalities in the fusion process as a function of noise present in the environment. Ac-
cording to this assumption, fusion would depend not only on the phonetic information con-
tained in each sensory input, but also on a cognitive mechanism by which subjects would
control fusion depending on the conditions of communication (Fixmer and Hawkins, 1998).
This can be captured by the so-called WFLMP presented in Section 1.3.4.
59
If the first assumption were true, then AV fusion would only depend on the unisensory
stimuli and not on any cognitive mechanism by which the listener would adjust the weights
of each modality in the fusion process in relation with noise or any other contextual factor.
However, in the case of the second interpretation the modulation of the fusion mechanism
would depend on the reliability of the auditory and visual channels. The addition of noise
inside the channel would change the reliability of the channel and hence lower its weight sig-
nificantly in fusion. These two interpretations are difficult to disentangle in available McGurk
data, since there is possibly a confounding bias in the way FLMP is tuned to these data (see
Schwartz, 2006).
However, the present experimental paradigm could provide an answer and enable to dis-
criminate between the two previous interpretations. Indeed, since there will be no noise in the
target, if fusion depends only on unisensory percepts as suggested by FLMP, then the
McGurk effect should not change from one condition to the other since the target remains the
same. However, if the subjects are able to estimate the amount of noise during the context
period and hence control the weight of the auditory and visual modalities accordingly in the
fusion process, then application of acoustic noise in the context part should lead them in-
crease the visual weight. This would result in an increase of the McGurk effect.
In summary, we aim to test in this first experiment (1) if acoustic noise will globally de-
crease the unbinding/rebinding processes associated with context, and (2) if acoustic noise
will globally increase the role of the visual input and hence the McGurk effect. The first
question will be tested by looking at possible interactions between context coherence and
noise in response scores. The second question will be tested by looking at a possible increase
of the McGurk effect independently on context coherence.
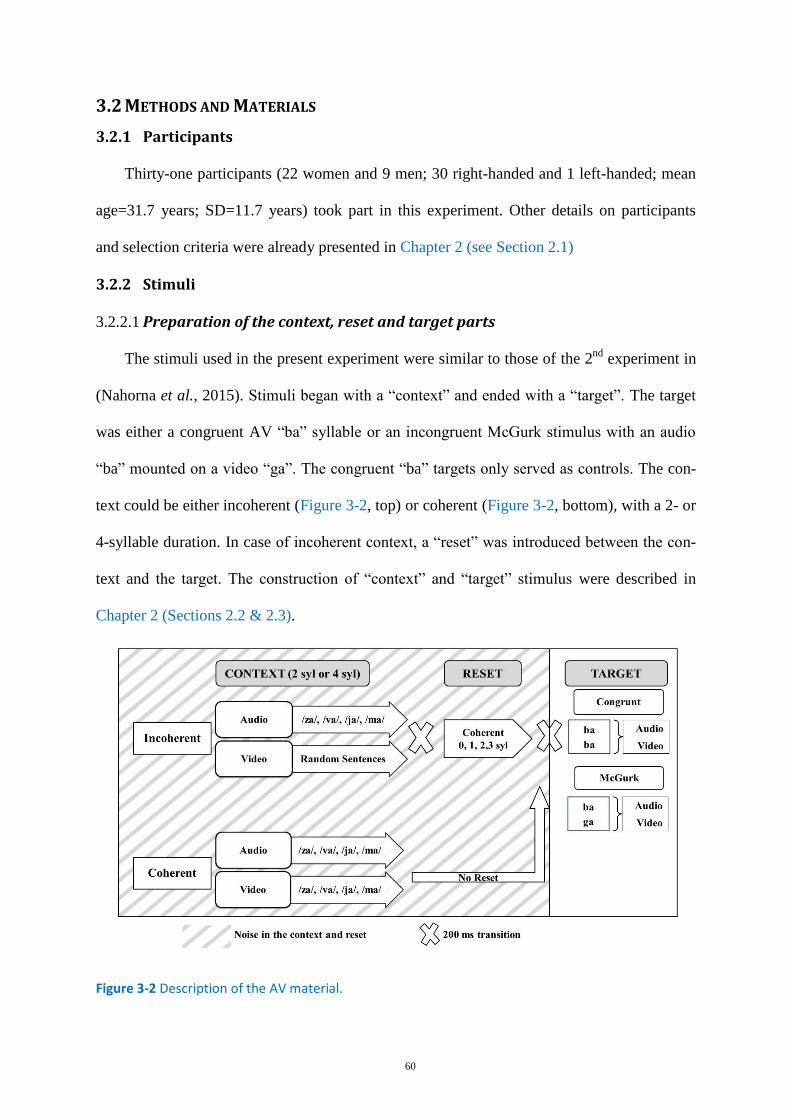
60
METHODS AND MATERIALS 3.2
Participants 3.2.1
Thirty-one participants (22 women and 9 men; 30 right-handed and 1 left-handed; mean
age=31.7 years; SD=11.7 years) took part in this experiment. Other details on participants
and selection criteria were already presented in Chapter 2 (see Section 2.1)
Stimuli 3.2.2
Preparation of the context, reset and target parts 3.2.2.1
The stimuli used in the present experiment were similar to those of the 2nd
experiment in
(Nahorna et al., 2015). Stimuli began with a “context” and ended with a “target”. The target
was either a congruent AV “ba” syllable or an incongruent McGurk stimulus with an audio
“ba” mounted on a video “ga”. The congruent “ba” targets only served as controls. The con-
text could be either incoherent (Figure 3-2, top) or coherent (Figure 3-2, bottom), with a 2- or
4-syllable duration. In case of incoherent context, a “reset” was introduced between the con-
text and the target. The construction of “context” and “target” stimulus were described in
Chapter 2 (Sections 2.2 & 2.3).
Figure 3-2 Description of the AV material.
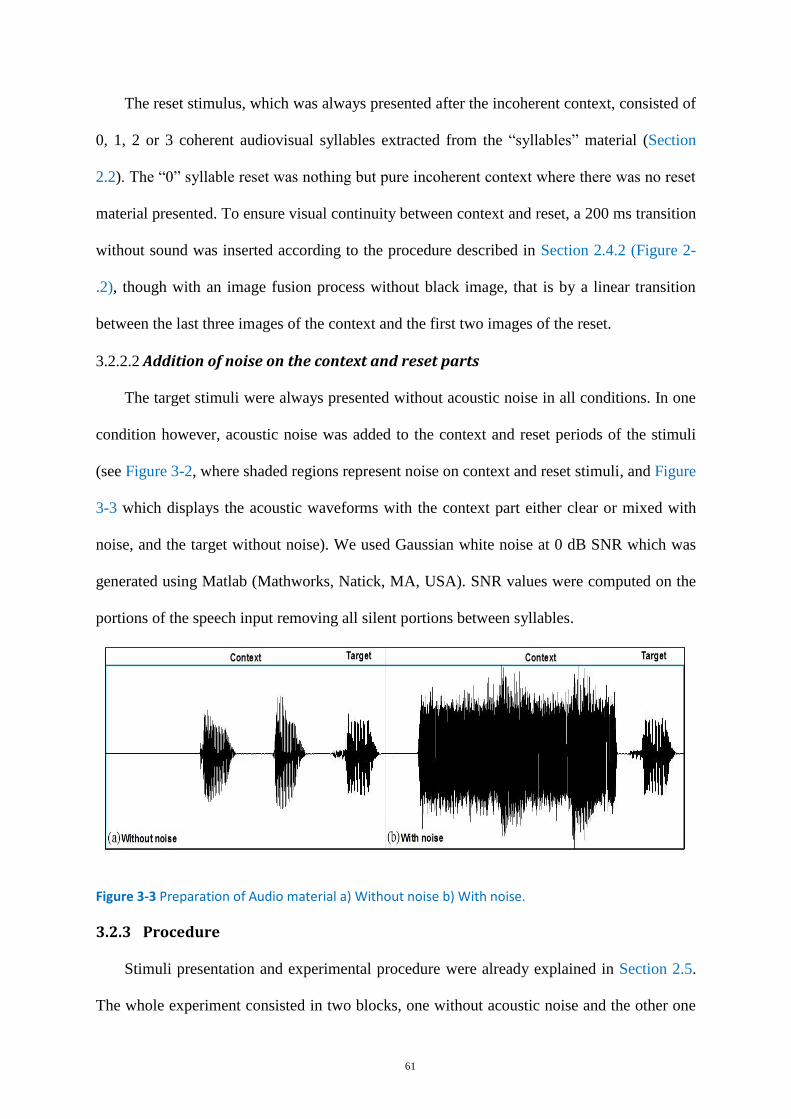
61
The reset stimulus, which was always presented after the incoherent context, consisted of
0, 1, 2 or 3 coherent audiovisual syllables extracted from the “syllables” material (Section
2.2). The “0” syllable reset was nothing but pure incoherent context where there was no reset
material presented. To ensure visual continuity between context and reset, a 200 ms transition
without sound was inserted according to the procedure described in Section 2.4.2 (Figure 2-
.2), though with an image fusion process without black image, that is by a linear transition
between the last three images of the context and the first two images of the reset.
Addition of noise on the context and reset parts 3.2.2.2
The target stimuli were always presented without acoustic noise in all conditions. In one
condition however, acoustic noise was added to the context and reset periods of the stimuli
(see Figure 3-2, where shaded regions represent noise on context and reset stimuli, and Figure
3-3 which displays the acoustic waveforms with the context part either clear or mixed with
noise, and the target without noise). We used Gaussian white noise at 0 dB SNR which was
generated using Matlab (Mathworks, Natick, MA, USA). SNR values were computed on the
portions of the speech input removing all silent portions between syllables.
Figure 3-3 Preparation of Audio material a) Without noise b) With noise.
Procedure 3.2.3
Stimuli presentation and experimental procedure were already explained in Section 2.5.
The whole experiment consisted in two blocks, one without acoustic noise and the other one
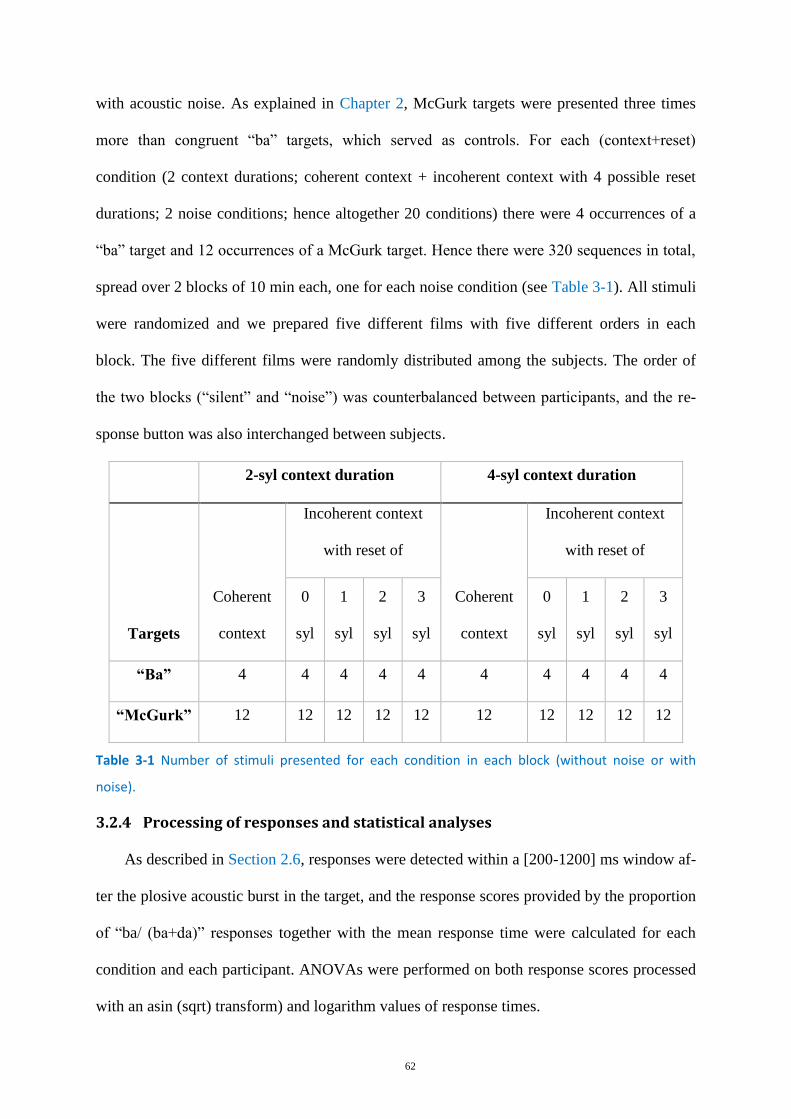
62
with acoustic noise. As explained in Chapter 2, McGurk targets were presented three times
more than congruent “ba” targets, which served as controls. For each (context+reset)
condition (2 context durations; coherent context + incoherent context with 4 possible reset
durations; 2 noise conditions; hence altogether 20 conditions) there were 4 occurrences of a
“ba” target and 12 occurrences of a McGurk target. Hence there were 320 sequences in total,
spread over 2 blocks of 10 min each, one for each noise condition (see Table 3-1). All stimuli
were randomized and we prepared five different films with five different orders in each
block. The five different films were randomly distributed among the subjects. The order of
the two blocks (“silent” and “noise”) was counterbalanced between participants, and the re-
sponse button was also interchanged between subjects.
2-syl context duration 4-syl context duration
Targets
Coherent
context
Incoherent context
with reset of
Coherent
context
Incoherent context
with reset of
0
syl
1
syl
2
syl
3
syl
0
syl
1
syl
2
syl
3
syl
“Ba” 4 4 4 4 4 4 4 4 4 4
“McGurk” 12 12 12 12 12 12 12 12 12 12
Table 3-1 Number of stimuli presented for each condition in each block (without noise or with
noise).
Processing of responses and statistical analyses 3.2.4
As described in Section 2.6, responses were detected within a [200-1200] ms window af-
ter the plosive acoustic burst in the target, and the response scores provided by the proportion
of “ba/ (ba+da)” responses together with the mean response time were calculated for each
condition and each participant. ANOVAs were performed on both response scores processed
with an asin (sqrt) transform) and logarithm values of response times.
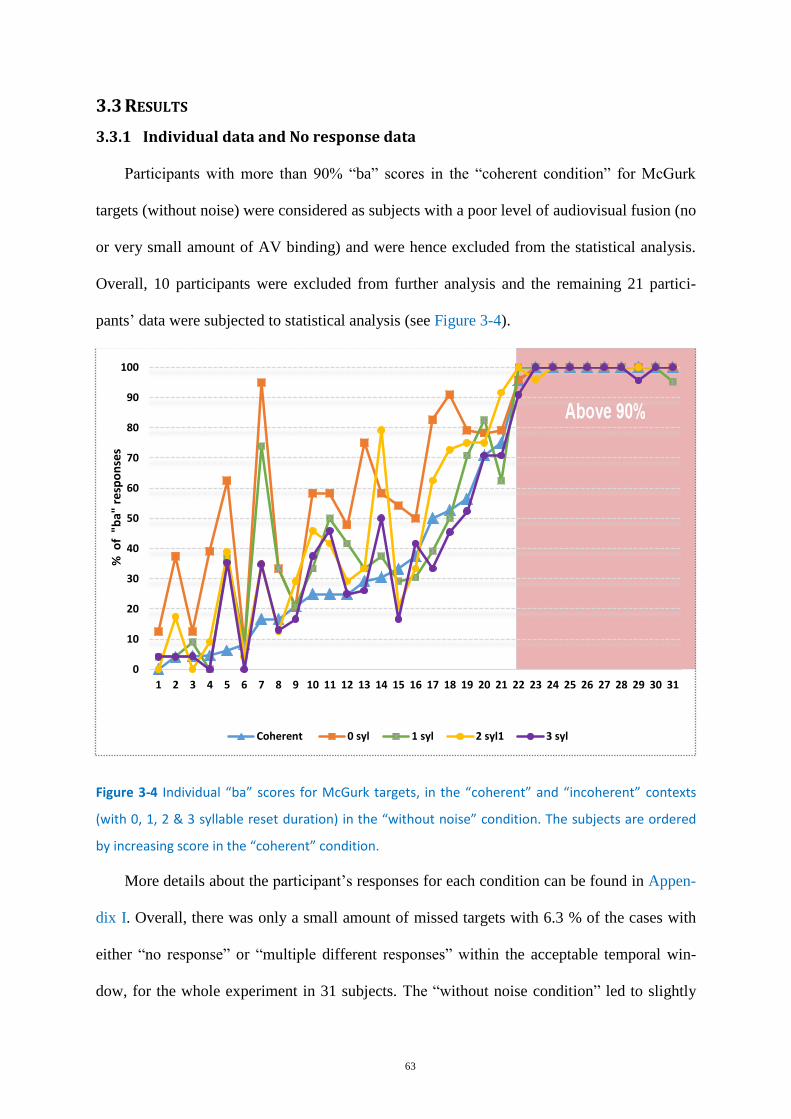
63
RESULTS 3.3
Individual data and No response data 3.3.1
Participants with more than 90% “ba” scores in the “coherent condition” for McGurk
targets (without noise) were considered as subjects with a poor level of audiovisual fusion (no
or very small amount of AV binding) and were hence excluded from the statistical analysis.
Overall, 10 participants were excluded from further analysis and the remaining 21 partici-
pants’ data were subjected to statistical analysis (see Figure 3-4).
Figure 3-4 Individual “ba” scores for McGurk targets, in the “coherent” and “incoherent” contexts
(with 0, 1, 2 & 3 syllable reset duration) in the “without noise” condition. The subjects are ordered
by increasing score in the “coherent” condition.
More details about the participant’s responses for each condition can be found in Appen-
dix I. Overall, there was only a small amount of missed targets with 6.3 % of the cases with
either “no response” or “multiple different responses” within the acceptable temporal win-
dow, for the whole experiment in 31 subjects. The “without noise condition” led to slightly
0
10
20
30
40
50
60
70
80
90
100
1 2 3 4 5 6 7 8 9 10 11 12 13 14 15 16 17 18 19 20 21 22 23 24 25 26 27 28 29 30 31
% o
f "
ba"
re
spo
nse
s
Coherent 0 syl 1 syl 2 syl1 3 syl
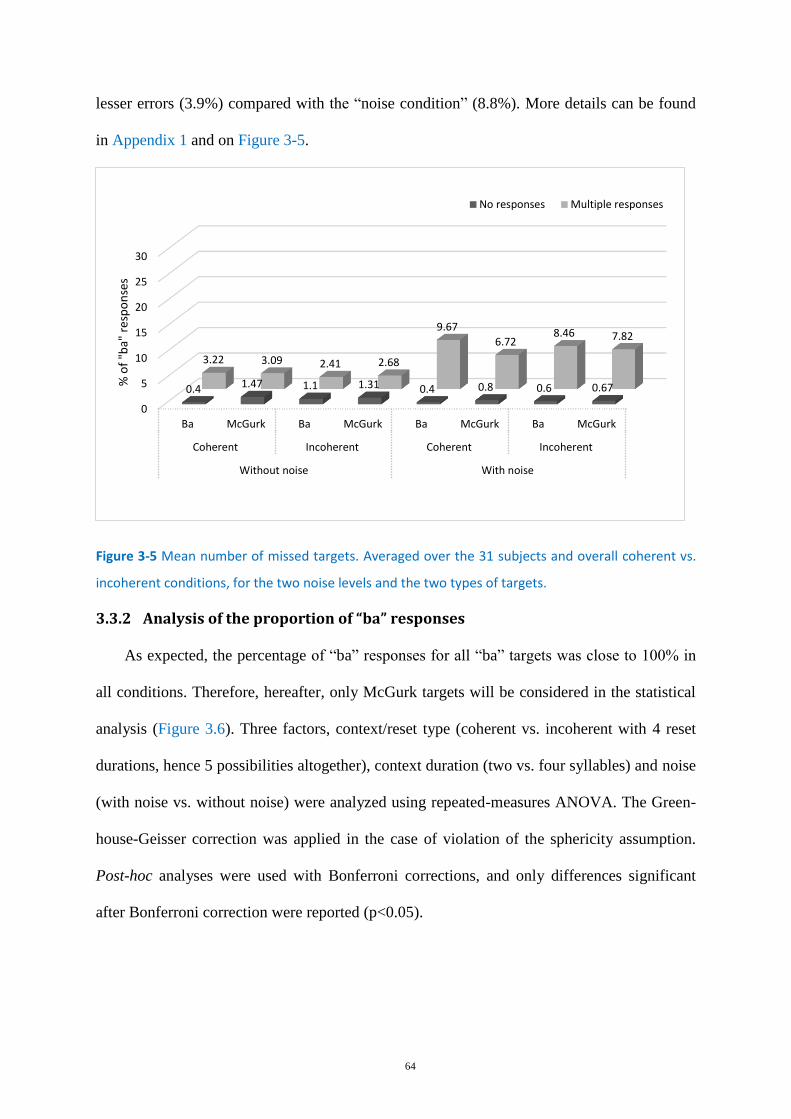
64
lesser errors (3.9%) compared with the “noise condition” (8.8%). More details can be found
in Appendix 1 and on Figure 3-5.
Figure 3-5 Mean number of missed targets. Averaged over the 31 subjects and overall coherent vs.
incoherent conditions, for the two noise levels and the two types of targets.
Analysis of the proportion of “ba” responses 3.3.2
As expected, the percentage of “ba” responses for all “ba” targets was close to 100% in
all conditions. Therefore, hereafter, only McGurk targets will be considered in the statistical
analysis (Figure 3.6). Three factors, context/reset type (coherent vs. incoherent with 4 reset
durations, hence 5 possibilities altogether), context duration (two vs. four syllables) and noise
(with noise vs. without noise) were analyzed using repeated-measures ANOVA. The Green-
house-Geisser correction was applied in the case of violation of the sphericity assumption.
Post-hoc analyses were used with Bonferroni corrections, and only differences significant
after Bonferroni correction were reported (p<0.05).
0
5
10
15
20
25
30
Ba McGurk Ba McGurk Ba McGurk Ba McGurk
Coherent Incoherent Coherent Incoherent
Without noise With noise
0.4 1.47 1.1 1.31 0.4 0.8 0.6 0.67
3.22 3.09 2.41 2.68
9.67
6.72 8.46 7.82
% o
f "b
a" r
esp
on
ses
No responses Multiple responses
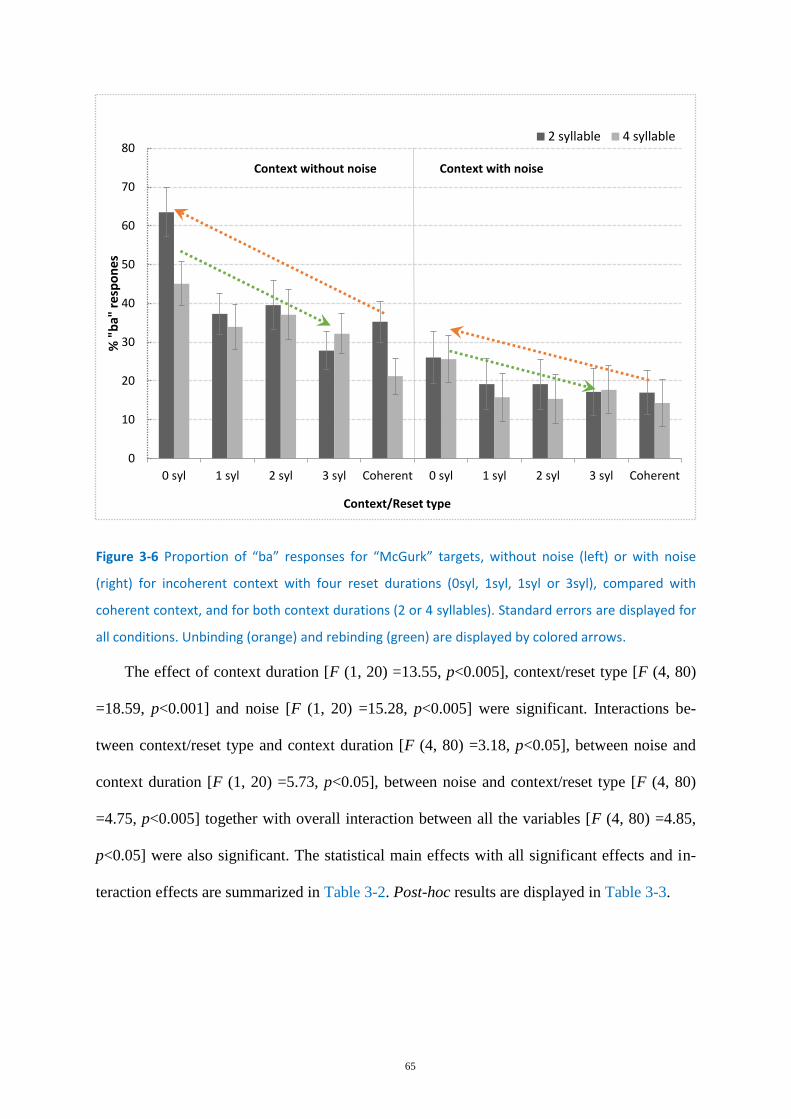
65
Figure 3-6 Proportion of “ba” responses for “McGurk” targets, without noise (left) or with noise
(right) for incoherent context with four reset durations (0syl, 1syl, 1syl or 3syl), compared with
coherent context, and for both context durations (2 or 4 syllables). Standard errors are displayed for
all conditions. Unbinding (orange) and rebinding (green) are displayed by colored arrows.
The effect of context duration [F (1, 20) =13.55, p<0.005], context/reset type [F (4, 80)
=18.59, p<0.001] and noise [F (1, 20) =15.28, p<0.005] were significant. Interactions be-
tween context/reset type and context duration [F (4, 80) =3.18, p<0.05], between noise and
context duration [F (1, 20) =5.73, p<0.05], between noise and context/reset type [F (4, 80)
=4.75, p<0.005] together with overall interaction between all the variables [F (4, 80) =4.85,
p<0.05] were also significant. The statistical main effects with all significant effects and in-
teraction effects are summarized in Table 3-2. Post-hoc results are displayed in Table 3-3.
0
10
20
30
40
50
60
70
80
0 syl 1 syl 2 syl 3 syl Coherent 0 syl 1 syl 2 syl 3 syl Coherent
% "
ba"
res
po
nes
Context/Reset type
2 syllable 4 syllable
Context without noise Context with noise
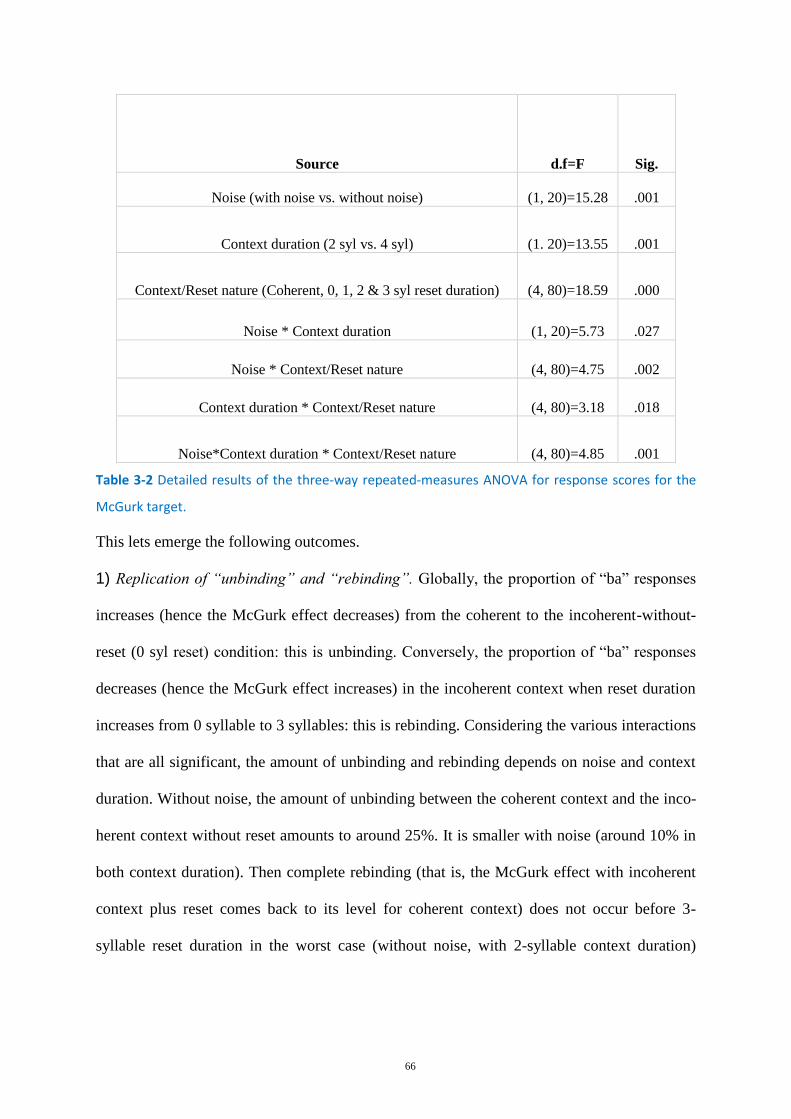
66
Source d.f=F Sig.
Noise (with noise vs. without noise) (1, 20)=15.28 .001
Context duration (2 syl vs. 4 syl) (1. 20)=13.55 .001
Context/Reset nature (Coherent, 0, 1, 2 & 3 syl reset duration) (4, 80)=18.59 .000
Noise * Context duration (1, 20)=5.73 .027
Noise * Context/Reset nature (4, 80)=4.75 .002
Context duration * Context/Reset nature (4, 80)=3.18 .018
Noise*Context duration * Context/Reset nature (4, 80)=4.85 .001
Table 3-2 Detailed results of the three-way repeated-measures ANOVA for response scores for the
McGurk target.
This lets emerge the following outcomes.
1) Replication of “unbinding” and “rebinding”. Globally, the proportion of “ba” responses
increases (hence the McGurk effect decreases) from the coherent to the incoherent-without-
reset (0 syl reset) condition: this is unbinding. Conversely, the proportion of “ba” responses
decreases (hence the McGurk effect increases) in the incoherent context when reset duration
increases from 0 syllable to 3 syllables: this is rebinding. Considering the various interactions
that are all significant, the amount of unbinding and rebinding depends on noise and context
duration. Without noise, the amount of unbinding between the coherent context and the inco-
herent context without reset amounts to around 25%. It is smaller with noise (around 10% in
both context duration). Then complete rebinding (that is, the McGurk effect with incoherent
context plus reset comes back to its level for coherent context) does not occur before 3-
syllable reset duration in the worst case (without noise, with 2-syllable context duration)
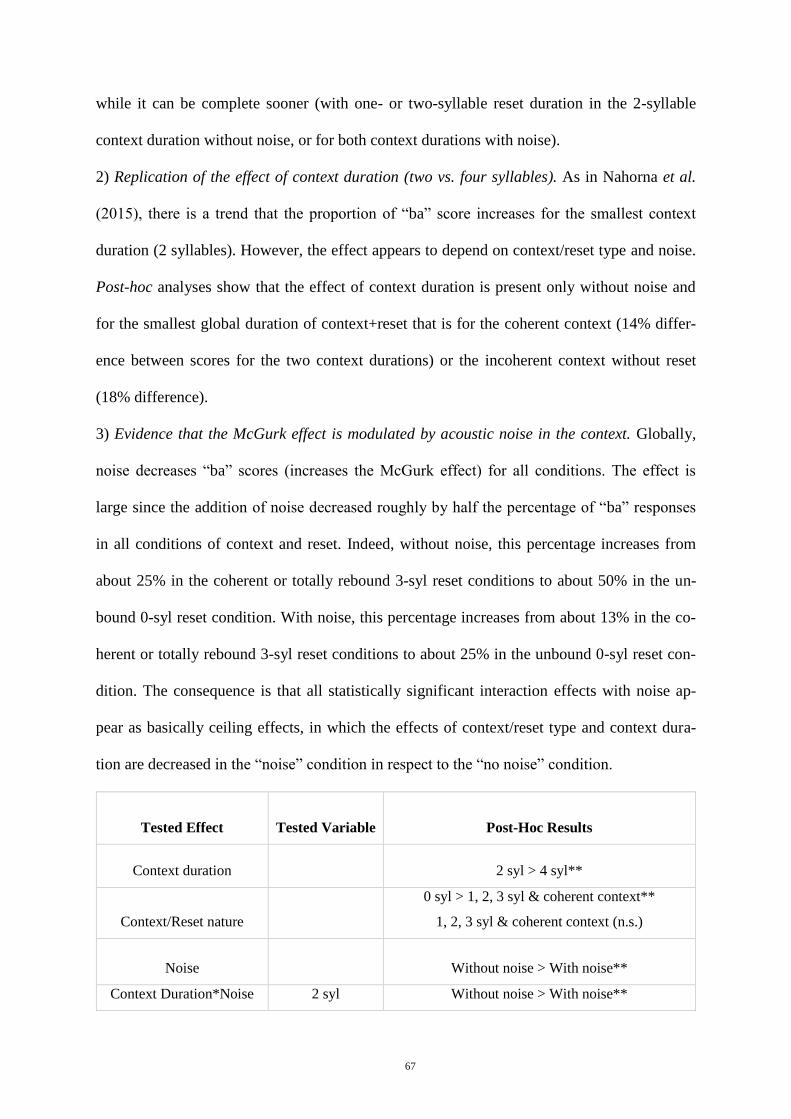
67
while it can be complete sooner (with one- or two-syllable reset duration in the 2-syllable
context duration without noise, or for both context durations with noise).
2) Replication of the effect of context duration (two vs. four syllables). As in Nahorna et al.
(2015), there is a trend that the proportion of “ba” score increases for the smallest context
duration (2 syllables). However, the effect appears to depend on context/reset type and noise.
Post-hoc analyses show that the effect of context duration is present only without noise and
for the smallest global duration of context+reset that is for the coherent context (14% differ-
ence between scores for the two context durations) or the incoherent context without reset
(18% difference).
3) Evidence that the McGurk effect is modulated by acoustic noise in the context. Globally,
noise decreases “ba” scores (increases the McGurk effect) for all conditions. The effect is
large since the addition of noise decreased roughly by half the percentage of “ba” responses
in all conditions of context and reset. Indeed, without noise, this percentage increases from
about 25% in the coherent or totally rebound 3-syl reset conditions to about 50% in the un-
bound 0-syl reset condition. With noise, this percentage increases from about 13% in the co-
herent or totally rebound 3-syl reset conditions to about 25% in the unbound 0-syl reset con-
dition. The consequence is that all statistically significant interaction effects with noise ap-
pear as basically ceiling effects, in which the effects of context/reset type and context dura-
tion are decreased in the “noise” condition in respect to the “no noise” condition.
Tested Effect Tested Variable Post-Hoc Results
Context duration 2 syl > 4 syl**
Context/Reset nature
0 syl > 1, 2, 3 syl & coherent context**
1, 2, 3 syl & coherent context (n.s.)
Noise Without noise > With noise**
Context Duration*Noise 2 syl Without noise > With noise**
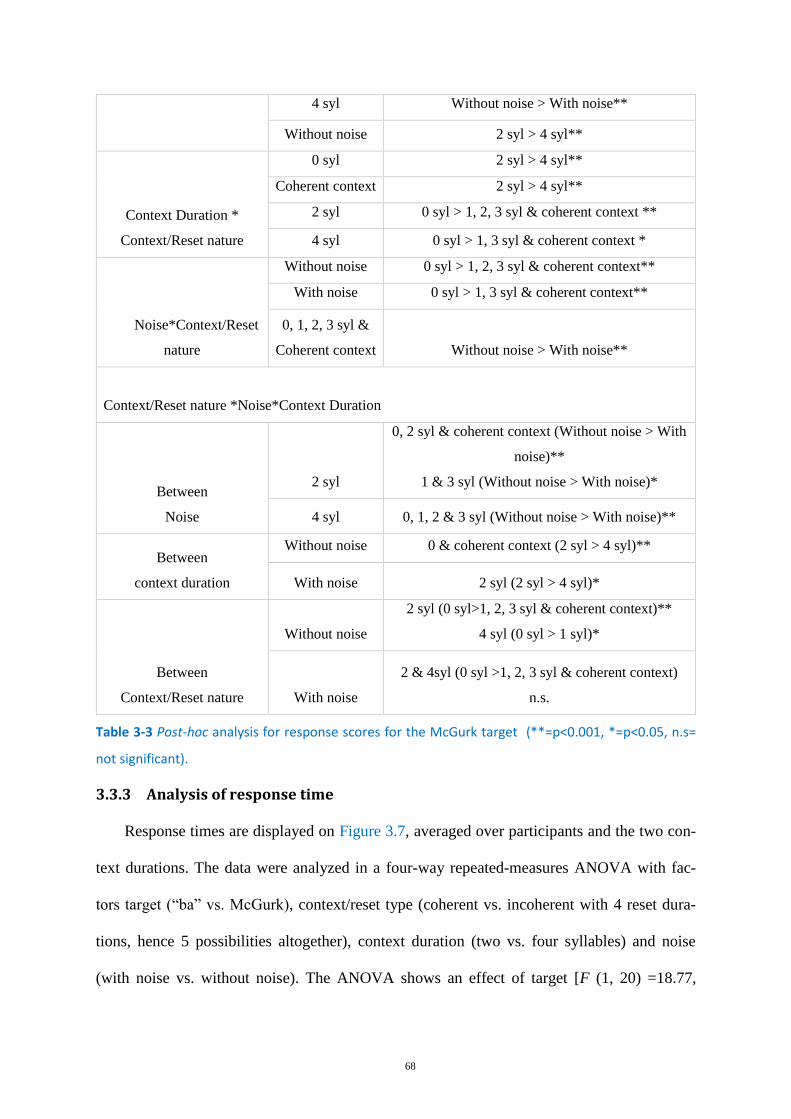
68
4 syl Without noise > With noise**
Without noise 2 syl > 4 syl**
Context Duration *
Context/Reset nature
0 syl 2 syl > 4 syl**
Coherent context 2 syl > 4 syl**
2 syl 0 syl > 1, 2, 3 syl & coherent context **
4 syl 0 syl > 1, 3 syl & coherent context *
Noise*Context/Reset
nature
Without noise 0 syl > 1, 2, 3 syl & coherent context**
With noise 0 syl > 1, 3 syl & coherent context**
0, 1, 2, 3 syl &
Coherent context Without noise > With noise**
Context/Reset nature *Noise*Context Duration
Between
Noise
2 syl
0, 2 syl & coherent context (Without noise > With
noise)**
1 & 3 syl (Without noise > With noise)*
4 syl 0, 1, 2 & 3 syl (Without noise > With noise)**
Between
context duration
Without noise 0 & coherent context (2 syl > 4 syl)**
With noise 2 syl (2 syl > 4 syl)*
Between
Context/Reset nature
Without noise
2 syl (0 syl>1, 2, 3 syl & coherent context)**
4 syl (0 syl > 1 syl)*
With noise
2 & 4syl (0 syl >1, 2, 3 syl & coherent context)
n.s.
Table 3-3 Post-hoc analysis for response scores for the McGurk target (**=p<0.001, *=p<0.05, n.s=
not significant).
Analysis of response time 3.3.3
Response times are displayed on Figure 3.7, averaged over participants and the two con-
text durations. The data were analyzed in a four-way repeated-measures ANOVA with fac-
tors target (“ba” vs. McGurk), context/reset type (coherent vs. incoherent with 4 reset dura-
tions, hence 5 possibilities altogether), context duration (two vs. four syllables) and noise
(with noise vs. without noise). The ANOVA shows an effect of target [F (1, 20) =18.77,
69
p<0.001], noise [F (1, 20) =102.44, p<0.001], context/reset type [F (4, 80) =5.36, p<0.005],
and context duration [F (1, 20) =10.73, p<0.005], but no interaction between any variables
(see Table 3-4).
A first finding is that the responses were quicker for all “ba” targets compared to
“McGurk” targets (65 ms average difference). Importantly, the lack of interaction between
the target and all other variables shows that the effect of AV incongruence in the McGurk
target produces the same amount of delay compared with a congruent “ba” target, whatever
the noise, context/reset type and context duration. This is compatible with a general finding in
all the previous experiments by Nahorna et al. (2012; 2015). The effects of context/reset type
and context duration are also in line with previous findings in Nahorna et al. (2015), with
larger response times for shorter contexts (that is, 2-syllable context duration or context with-
out reset). On average, the 2-syllable context duration led to larger response times than the 4-
syllable context duration by 29 ms, and the context without reset had larger response times
than the context with 3-syllable reset by 25 ms.
Surprisingly, the response was quicker for both targets with noise compared to without
noise, with a large difference equal to 143 ms in average. This might seem surprising, but the
interpretation is straightforward. Indeed, since noise stops soon after the context, it provides a
clear temporal cue for participants regarding arrival of the target stimuli, which results in
quicker responses in the “noise” condition.
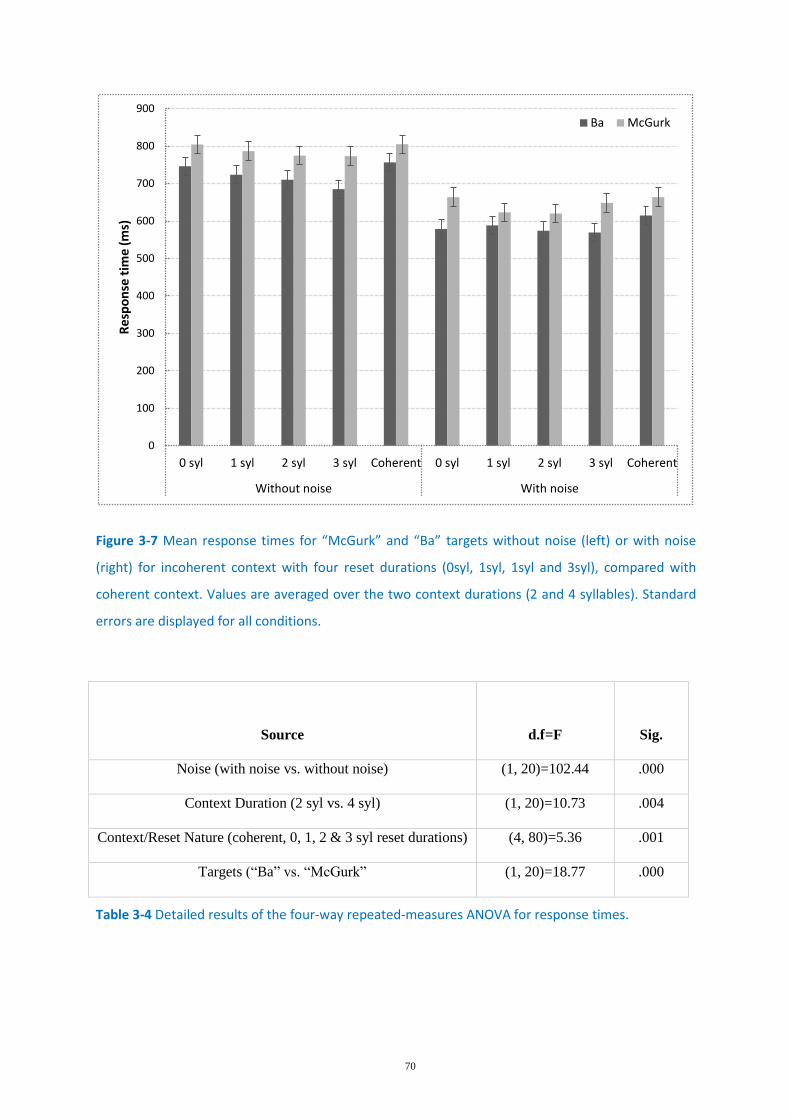
70
Figure 3-7 Mean response times for “McGurk” and “Ba” targets without noise (left) or with noise
(right) for incoherent context with four reset durations (0syl, 1syl, 1syl and 3syl), compared with
coherent context. Values are averaged over the two context durations (2 and 4 syllables). Standard
errors are displayed for all conditions.
Source d.f=F Sig.
Noise (with noise vs. without noise) (1, 20)=102.44 .000
Context Duration (2 syl vs. 4 syl) (1, 20)=10.73 .004
Context/Reset Nature (coherent, 0, 1, 2 & 3 syl reset durations) (4, 80)=5.36 .001
Targets (“Ba” vs. “McGurk” (1, 20)=18.77 .000
Table 3-4 Detailed results of the four-way repeated-measures ANOVA for response times.
0
100
200
300
400
500
600
700
800
900
0 syl 1 syl 2 syl 3 syl Coherent 0 syl 1 syl 2 syl 3 syl Coherent
Without noise With noise
Re
spo
nse
tim
e (
ms)
Ba McGurk
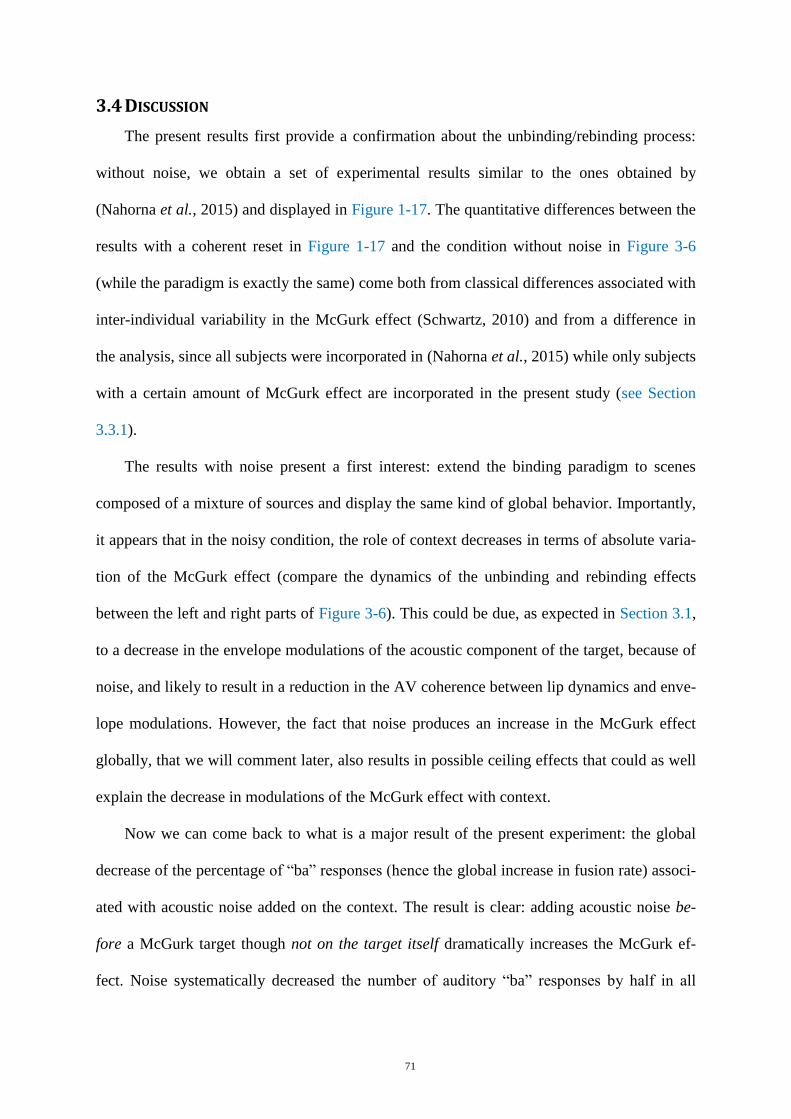
71
DISCUSSION 3.4
The present results first provide a confirmation about the unbinding/rebinding process:
without noise, we obtain a set of experimental results similar to the ones obtained by
(Nahorna et al., 2015) and displayed in Figure 1-17. The quantitative differences between the
results with a coherent reset in Figure 1-17 and the condition without noise in Figure 3-6
(while the paradigm is exactly the same) come both from classical differences associated with
inter-individual variability in the McGurk effect (Schwartz, 2010) and from a difference in
the analysis, since all subjects were incorporated in (Nahorna et al., 2015) while only subjects
with a certain amount of McGurk effect are incorporated in the present study (see Section
3.3.1).
The results with noise present a first interest: extend the binding paradigm to scenes
composed of a mixture of sources and display the same kind of global behavior. Importantly,
it appears that in the noisy condition, the role of context decreases in terms of absolute varia-
tion of the McGurk effect (compare the dynamics of the unbinding and rebinding effects
between the left and right parts of Figure 3-6). This could be due, as expected in Section 3.1,
to a decrease in the envelope modulations of the acoustic component of the target, because of
noise, and likely to result in a reduction in the AV coherence between lip dynamics and enve-
lope modulations. However, the fact that noise produces an increase in the McGurk effect
globally, that we will comment later, also results in possible ceiling effects that could as well
explain the decrease in modulations of the McGurk effect with context.
Now we can come back to what is a major result of the present experiment: the global
decrease of the percentage of “ba” responses (hence the global increase in fusion rate) associ-
ated with acoustic noise added on the context. The result is clear: adding acoustic noise be-
fore a McGurk target though not on the target itself dramatically increases the McGurk ef-
fect. Noise systematically decreased the number of auditory “ba” responses by half in all
72
conditions of context coherence, context duration and reset duration. The fact that this hap-
pens while the target stays unchanged strongly supports the hypothesis that the effect occurs
at the level of the fusion process.
In the framework of FLMP, it could be argued that the effect, in fact, occurs at the level
of the intelligibility of the target components. More precisely, it is difficult to control for the
fact that the intelligibility of the auditory component could be modified by the surrounding
noise, thus automatically decreasing its role in the multiplicative process. However, this is
quite unlikely, for two reasons. Firstly, auditory masking could not explain modification in
intelligibility. Indeed, it is known that forward masking effects decrease to zero after 200 ms
at most (Moore, 2004). Hence, the 200-ms transition component between context/reset and
target ensures that noise in the context/reset cannot decrease the audibility of the acoustic
component of the target stimulus.
A second argument comes from the analysis of response times. Indeed, it appears that
McGurk targets are processed more slowly than congruent “ba” targets, which is not surpris-
ing, but also that the difference in response time is independent of context, reset and noise. It
confirms our previous studies (Nahorna et al., 2012; 2015) together with the interpretation
proposed in these studies, that the increase in response times for McGurk stimuli is at least
partly due to the detection of local AV incoherence, independently on the decision process.
The fact that the difference in response times is the same with and without noise confirms
that the intelligibility of the auditory component is the same in both conditions.
This result adds to a number of previous studies showing that audiovisual fusion is not
entirely automatic, but rather depends on subjects (Schwartz, 2010), language (Sekiyama and
Tohkura, 1991), attention (Tiippana et al., 2004; Alsius et al., 2005) and context coherence
(Nahorna et al., 2012; 2015) (see Section 1.3.3). It suggests that human listeners are able to
73
constantly evaluate the level of noise and the conditions of communication, and to monitor
the audiovisual fusion process accordingly.
It has been proposed that AV fusion and more generally intersensory fusion would be an
optimal process driven by a maximum-likelihood integration mechanism (Massaro, 1998;
Ernst and Banks, 2002). The present data indicate that this process could actually be driven
by other factors than the stimuli themselves. This could be inserted inside maximum-
likelihood computation by adding a prior related to the evaluation of the ambient noise in
each sensory stream, or by other priors expressing the confidence a subject has in the value of
each sensory information in the integration process. This will be further elaborated in the
general discussion (Chapter 7).
74
Chapter 4
4. AV INTEGRATION WITH COMPETING SOURCES IN THE
FRAMEWORK OF AVSSA2
BACKGROUND AND HYPOTHESIS 4.1
At the present stage of this Ph.D. work, the situation is the following. Thanks to the
previous works by Nahorna et al. (2012; 2015), we have reasons to believe that the AV
process comprises, at least, two stages, one constantly evaluating AV coherence, and the
other one performing AV fusion and decision, and that the output of the first stage modulates
the output of the second stage. Modulation is related to the unbinding/rebinding process, by
which the subject would decrease/increase her/his confidence that the audio and video
sources are coherent, and accordingly decrease/increase the visual weight at the fusion stage.
Our results in the previous chapter showed that subjects also constantly evaluate the reli-
ability of the sensory channels (related to the amount of noise) and that the output of this reli-
ability evaluation also intervenes in AV fusion: the less reliable a sensory channel, the small-
er its weight in AV fusion.
In Chapter 1, we have attempted to incorporate the two-stage model inside a theoretical
framework that we termed as AVSSA– extending to AV scenes made of various interacting
speakers the concepts developed by Bregman and others about ASA. We have suggested that
2 This is an extended version of a book chapter
Ganesh AC, Berthommier F, and Schwartz J-L (2016). Audio Visual integration with competing sources in the frame-
work of Audio Visual Speech Scene Analysis in Advances in Experimental Medicine and Technology: Physiology, Psycho-
acoustics and Cognition in Normal and Impaired Hearing, (Springer, New York).
75
the AV box in the first stage of the proposed model could enable to compute an AV primitive
crucial for organizing the AV speech scene.
In the present chapter, we aim to further explore the possibility that a scene analysis pro-
cess would take place in the course of AV fusion. For this aim, we intend to present a context
made of a mixture of sources. In the incoherent context explored by Nahorna et al. (2012;
2015), there were implicitly two sources since the audio and video components were incoher-
ent, but there was only one single audio source and one single video source. In Chapter 3, we
began to play with two audio sources, but one of the sources was stationary noise, which is a
rather specific case of source mixture. We will now present a mixture of two audio sources,
one of them being coherent with the video input. Therefore, we expect that the coherence box
will now serve two roles: 1) compute partial correlations, which could enable the system to
select the audio source coherent with the video input, and 2) assess the binding state modulat-
ing AV fusion.
For this aim, we decided to mix two audio sources which have very different properties
over time, and which are hence likely to lead to very different correlations with their corre-
sponding video counterpart: a syllable stream and a sentence stream (see Figure 4-1).
Indeed, syllables correspond to stronger AV modulations in time and hence stronger AV
coherence than a sentence, as it will be confirmed later. Therefore, the association between
the visual input and the corresponding auditory input should be stronger for syllables than for
sentences. Hence, the coherence of the AV context would be stronger for syllables, and it
would lead to a larger visual weight and more McGurk effect than with the visual sentences.
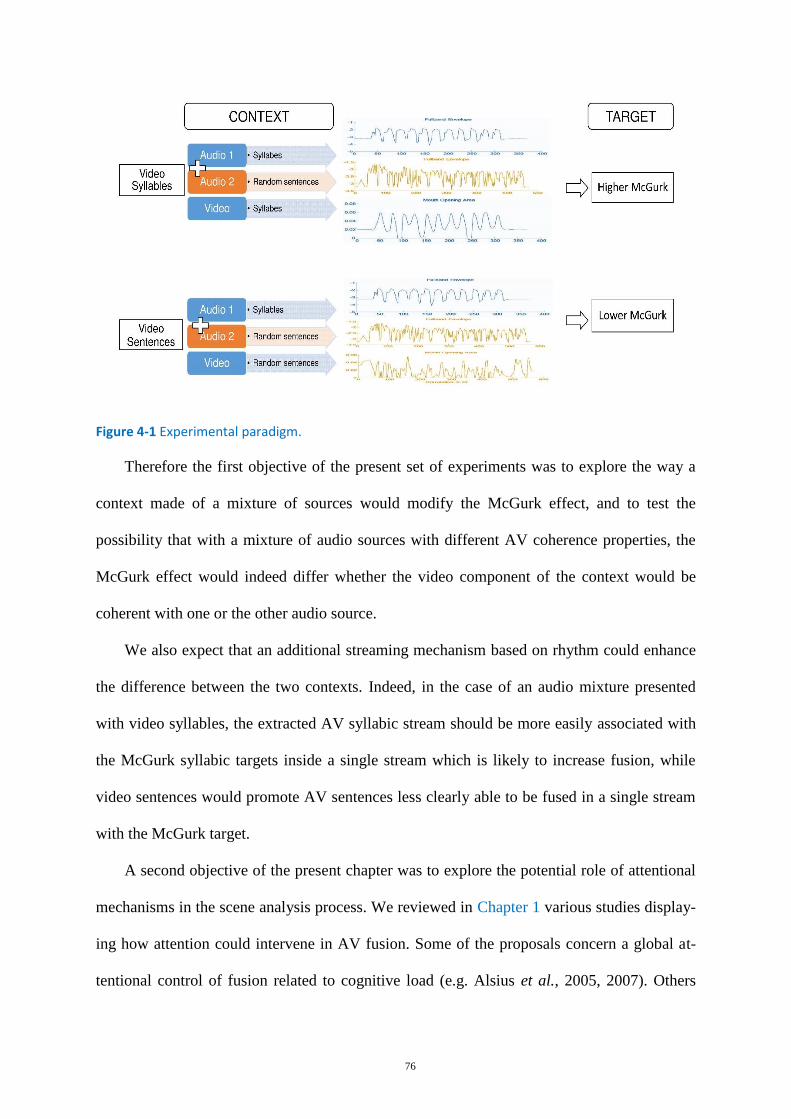
76
Figure 4-1 Experimental paradigm.
Therefore the first objective of the present set of experiments was to explore the way a
context made of a mixture of sources would modify the McGurk effect, and to test the
possibility that with a mixture of audio sources with different AV coherence properties, the
McGurk effect would indeed differ whether the video component of the context would be
coherent with one or the other audio source.
We also expect that an additional streaming mechanism based on rhythm could enhance
the difference between the two contexts. Indeed, in the case of an audio mixture presented
with video syllables, the extracted AV syllabic stream should be more easily associated with
the McGurk syllabic targets inside a single stream which is likely to increase fusion, while
video sentences would promote AV sentences less clearly able to be fused in a single stream
with the McGurk target.
A second objective of the present chapter was to explore the potential role of attentional
mechanisms in the scene analysis process. We reviewed in Chapter 1 various studies display-
ing how attention could intervene in AV fusion. Some of the proposals concern a global at-
tentional control of fusion related to cognitive load (e.g. Alsius et al., 2005, 2007). Others
77
deal with specific attentional biases on a single sensory channel (e.g. vision in Tiippana et al.,
2004).
Our goal here is to go down to the level of a single source. Previous studies by Andersen
et al. (2009) or Alsius and Soto-Faraco (2011) explore the way auditory or visual spatial at-
tention intervene in processing mixtures of auditory and visual speech sources (faces and
voices). Here, considering that our experimental paradigm involves two competing AV
sources, a “sentence” and a “syllable” one, we intend to assess whether attending to one or
the other AV source could modify binding and the McGurk effect. For this aim, in a second
experiment, we attempted to manipulate the participant’s attentional state towards one single
AV source and to measure the influence of attention at the level of the binding process rather
than at the decision level. Therefore, we instructed participants to focus their attention either
on syllables or on sentences in both contexts (“Video syllables” & “Video sentences”)
In this second experiment, our assumption was that the attentional load put on a given
coherent AV source would reinforce binding and hence increase the McGurk effect. We par-
ticularly expected an effect on “Video sentences” supposed to have a rather low binding effi-
ciency and hence to result in low McGurk scores. In this case, we expected that focusing at-
tention on sentences could significantly enhance binding and increase the McGurk effect. On
the contrary, “Video syllables” with their intrinsic good AV coherence would probably bene-
fit less from the attentional process.
In summary, the experiments in this chapter were conducted in two parts, Experiment A
and Experiment B. Within Experiment A, there was no specific instruction given to
participants, and we measured the role of context type (displayed in Figure 4-1) without an
explicit attentional focus on any component. We expected a larger McGurk effect with AV
syllables. In Experiment B, specific instructions were given to put attention either on sylla-
bles or on sentences, and we expected a global increase of the McGurk effect when attention
78
was oriented towards a coherent AV source (syllables or sentences), though possibly with a
larger effect for sentences.
METHOD AND MATERIALS 4.2
Participants 4.2.1
Twenty-nine French participants without hearing or vision problems (22 women and 7
men; 27 right-handed and 2 left-handed; mean age= 29.2 years; SD=10. 4 years) took part in
these experiments. Other details on participants and selection criteria were already presented
in Chapter 2 (see Section 2.1).
Stimuli 4.2.2
The context and target material came from the same AV material as in the previous ex-
periments. The whole experiment consisted of two types of contexts followed by a target. The
target was either a congruent AV “ba” syllable (“ba-target” in the following), serving as a
control, or an incongruent McGurk stimulus with an audio “ba” mounted on a video “ga”
(“McGurk target” in the following). In the present experiment, the important change in the
stimulus was that there were two audio components in the context instead of one as in the
previous experiments by Nahorna et al. (2012; 2015).
There were two types of contexts i.e. “Video syllables” (Figure 4-2, top) and “Video sen-
tences” (Figure 4-2, bottom). In both contexts, the set of audio stimuli was the same. It con-
sisted of a sequence of 2 or 4 syllables (A-syl-2 or A-syl-4) randomly extracted from the AV
“syllables” material mixed with random excerpts of the AV “sentences” material with the
adequate duration (A-sent-2 or A-sent-4). The video component consisted in the video stream
corresponding either to the syllable source A-syl-2 or A-syl-4 (“Video syllables” context) or
to the sentence source A-sent-2 or A-sent-4 (“Video sentences” context). The 2- vs. 4-
syllable duration was selected from earlier experiments by Nahorna et al. (2015), showing
that the effect of incoherent context was maximal (maximal reduction of the McGurk effect)
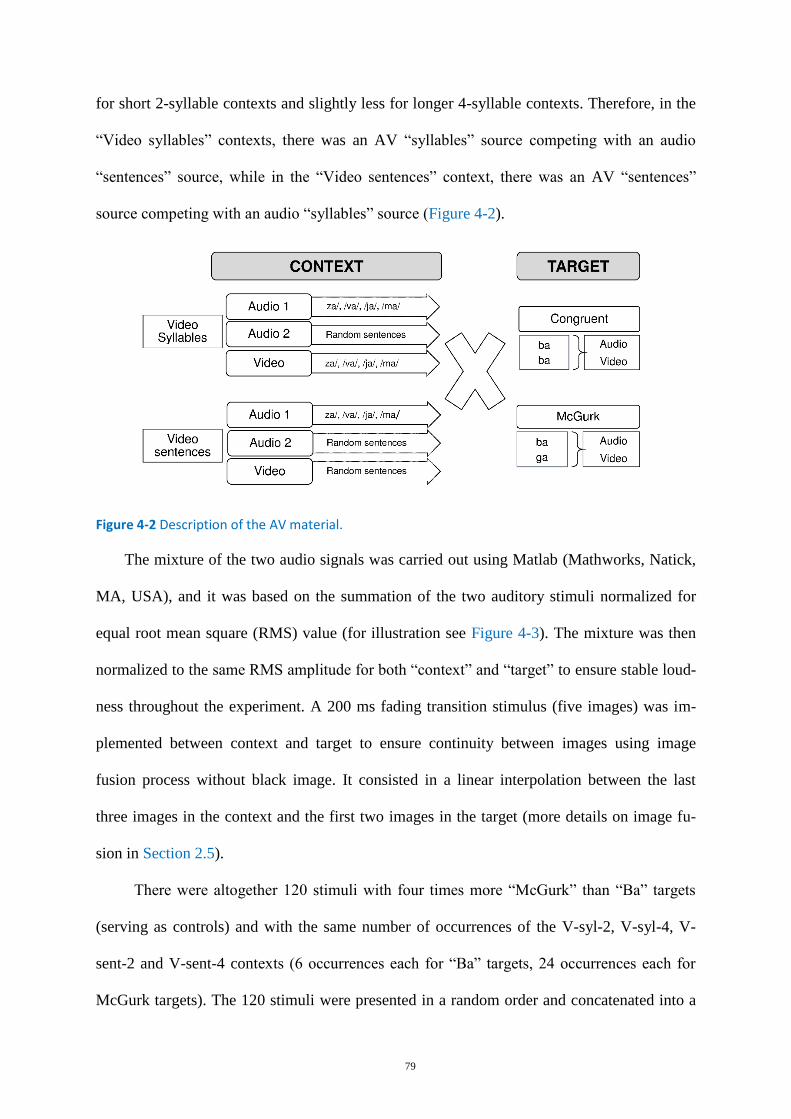
79
for short 2-syllable contexts and slightly less for longer 4-syllable contexts. Therefore, in the
“Video syllables” contexts, there was an AV “syllables” source competing with an audio
“sentences” source, while in the “Video sentences” context, there was an AV “sentences”
source competing with an audio “syllables” source (Figure 4-2).
Figure 4-2 Description of the AV material.
The mixture of the two audio signals was carried out using Matlab (Mathworks, Natick,
MA, USA), and it was based on the summation of the two auditory stimuli normalized for
equal root mean square (RMS) value (for illustration see Figure 4-3). The mixture was then
normalized to the same RMS amplitude for both “context” and “target” to ensure stable loud-
ness throughout the experiment. A 200 ms fading transition stimulus (five images) was im-
plemented between context and target to ensure continuity between images using image
fusion process without black image. It consisted in a linear interpolation between the last
three images in the context and the first two images in the target (more details on image fu-
sion in Section 2.5).
There were altogether 120 stimuli with four times more “McGurk” than “Ba” targets
(serving as controls) and with the same number of occurrences of the V-syl-2, V-syl-4, V-
sent-2 and V-sent-4 contexts (6 occurrences each for “Ba” targets, 24 occurrences each for
McGurk targets). The 120 stimuli were presented in a random order and concatenated into a
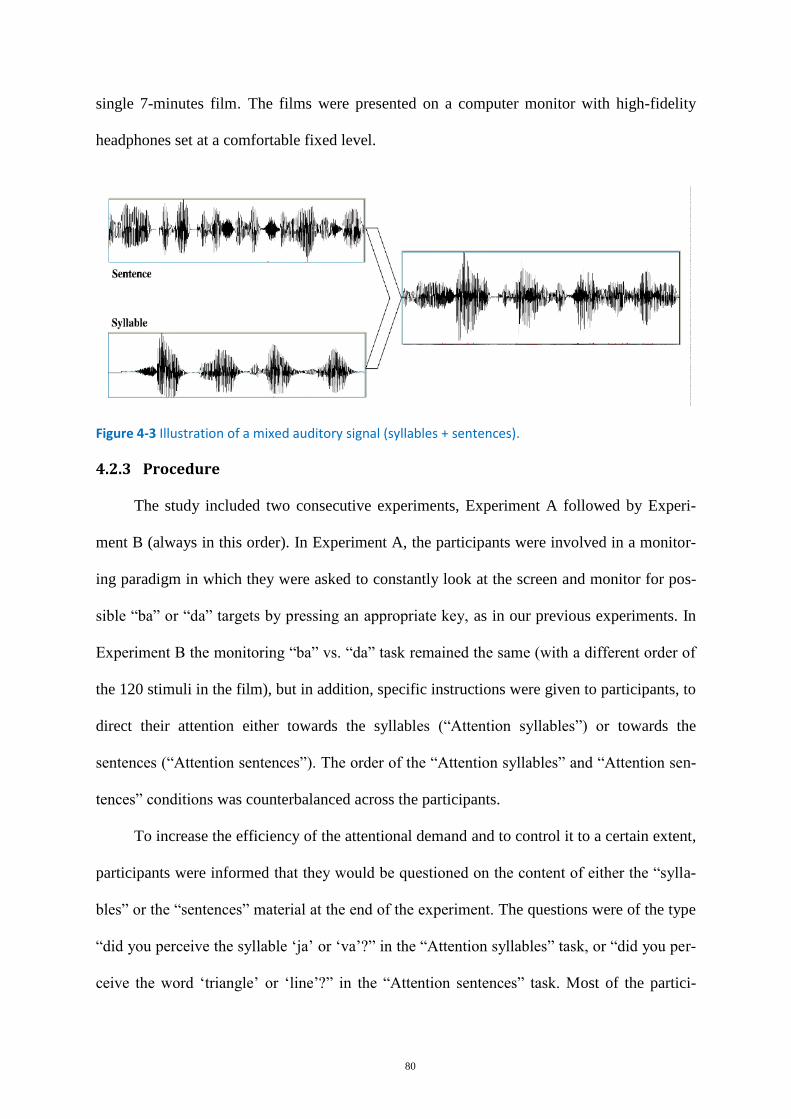
80
single 7-minutes film. The films were presented on a computer monitor with high-fidelity
headphones set at a comfortable fixed level.
Figure 4-3 Illustration of a mixed auditory signal (syllables + sentences).
Procedure 4.2.3
The study included two consecutive experiments, Experiment A followed by Experi-
ment B (always in this order). In Experiment A, the participants were involved in a monitor-
ing paradigm in which they were asked to constantly look at the screen and monitor for pos-
sible “ba” or “da” targets by pressing an appropriate key, as in our previous experiments. In
Experiment B the monitoring “ba” vs. “da” task remained the same (with a different order of
the 120 stimuli in the film), but in addition, specific instructions were given to participants, to
direct their attention either towards the syllables (“Attention syllables”) or towards the
sentences (“Attention sentences”). The order of the “Attention syllables” and “Attention sen-
tences” conditions was counterbalanced across the participants.
To increase the efficiency of the attentional demand and to control it to a certain extent,
participants were informed that they would be questioned on the content of either the “sylla-
bles” or the “sentences” material at the end of the experiment. The questions were of the type
“did you perceive the syllable ‘ja’ or ‘va’?” in the “Attention syllables” task, or “did you per-
ceive the word ‘triangle’ or ‘line’?” in the “Attention sentences” task. Most of the partici-
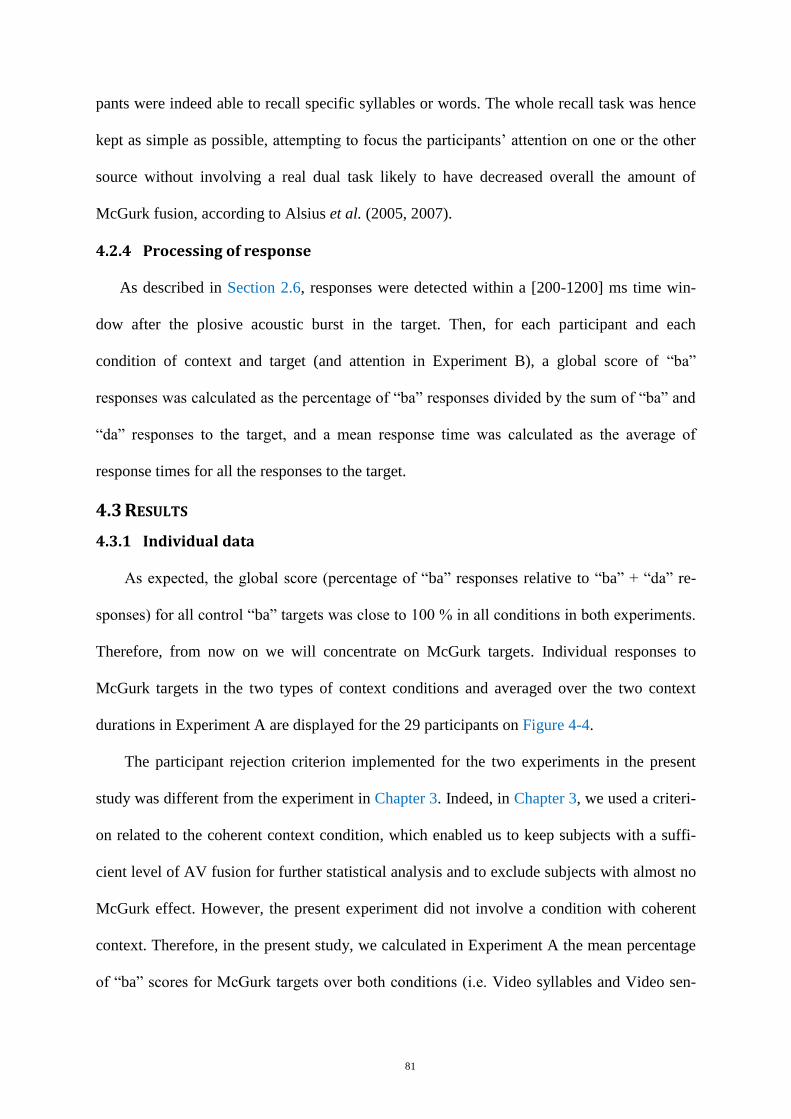
81
pants were indeed able to recall specific syllables or words. The whole recall task was hence
kept as simple as possible, attempting to focus the participants’ attention on one or the other
source without involving a real dual task likely to have decreased overall the amount of
McGurk fusion, according to Alsius et al. (2005, 2007).
Processing of response 4.2.4
As described in Section 2.6, responses were detected within a [200-1200] ms time win-
dow after the plosive acoustic burst in the target. Then, for each participant and each
condition of context and target (and attention in Experiment B), a global score of “ba”
responses was calculated as the percentage of “ba” responses divided by the sum of “ba” and
“da” responses to the target, and a mean response time was calculated as the average of
response times for all the responses to the target.
RESULTS 4.3
Individual data 4.3.1
As expected, the global score (percentage of “ba” responses relative to “ba” + “da” re-
sponses) for all control “ba” targets was close to 100 % in all conditions in both experiments.
Therefore, from now on we will concentrate on McGurk targets. Individual responses to
McGurk targets in the two types of context conditions and averaged over the two context
durations in Experiment A are displayed for the 29 participants on Figure 4-4.
The participant rejection criterion implemented for the two experiments in the present
study was different from the experiment in Chapter 3. Indeed, in Chapter 3, we used a criteri-
on related to the coherent context condition, which enabled us to keep subjects with a suffi-
cient level of AV fusion for further statistical analysis and to exclude subjects with almost no
McGurk effect. However, the present experiment did not involve a condition with coherent
context. Therefore, in the present study, we calculated in Experiment A the mean percentage
of “ba” scores for McGurk targets over both conditions (i.e. Video syllables and Video sen-
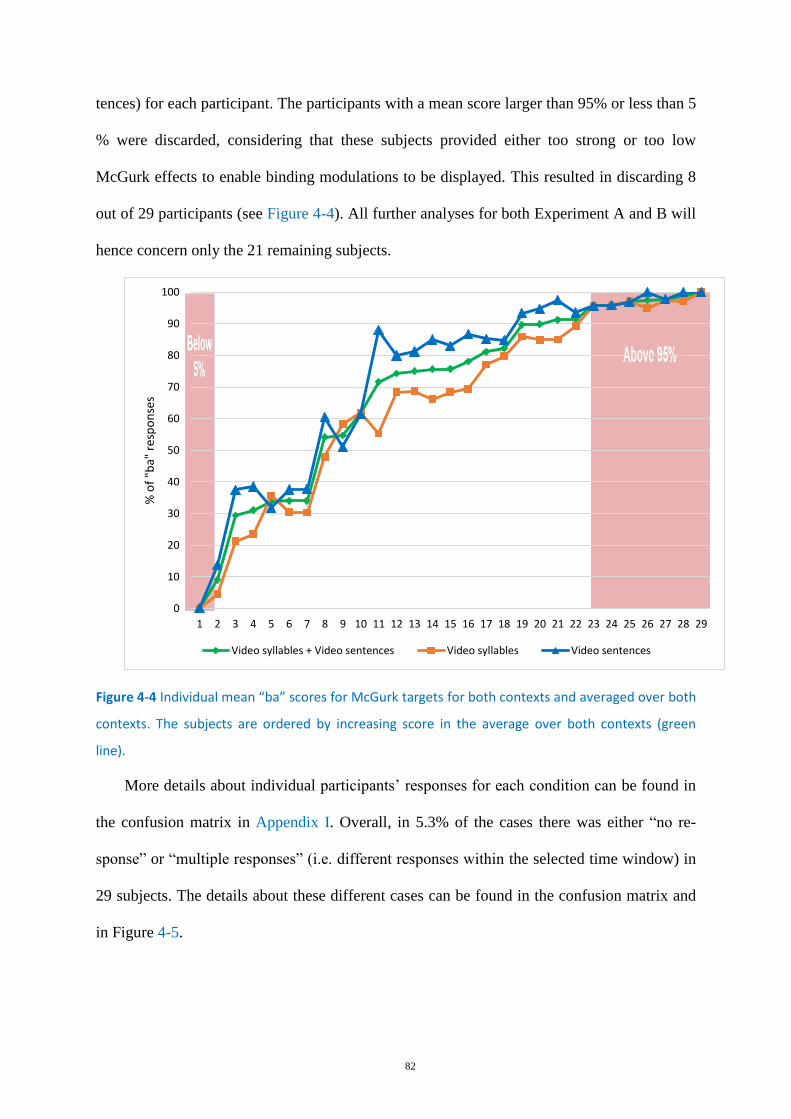
82
tences) for each participant. The participants with a mean score larger than 95% or less than 5
% were discarded, considering that these subjects provided either too strong or too low
McGurk effects to enable binding modulations to be displayed. This resulted in discarding 8
out of 29 participants (see Figure 4-4). All further analyses for both Experiment A and B will
hence concern only the 21 remaining subjects.
Figure 4-4 Individual mean “ba” scores for McGurk targets for both contexts and averaged over both
contexts. The subjects are ordered by increasing score in the average over both contexts (green
line).
More details about individual participants’ responses for each condition can be found in
the confusion matrix in Appendix I. Overall, in 5.3% of the cases there was either “no re-
sponse” or “multiple responses” (i.e. different responses within the selected time window) in
29 subjects. The details about these different cases can be found in the confusion matrix and
in Figure 4-5.
0
10
20
30
40
50
60
70
80
90
100
1 2 3 4 5 6 7 8 9 10 11 12 13 14 15 16 17 18 19 20 21 22 23 24 25 26 27 28 29
% o
f "b
a" r
esp
on
ses
Video syllables + Video sentences Video syllables Video sentences
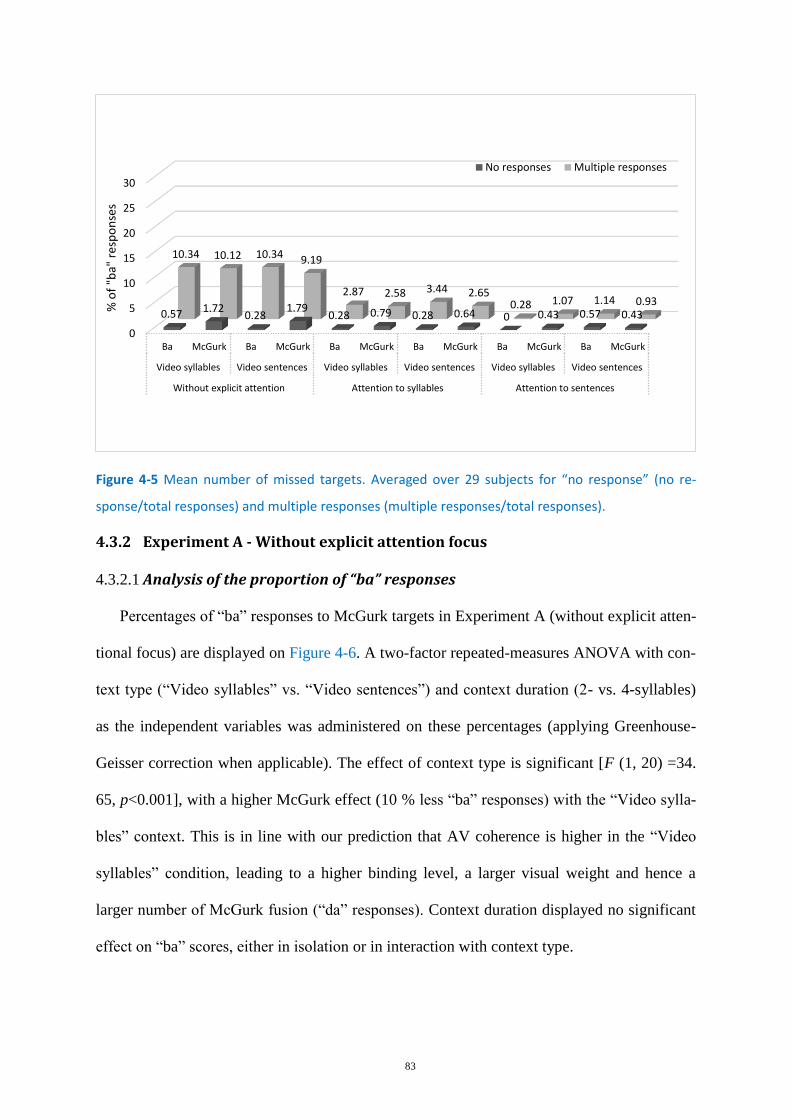
83
Figure 4-5 Mean number of missed targets. Averaged over 29 subjects for “no response” (no re-
sponse/total responses) and multiple responses (multiple responses/total responses).
Experiment A - Without explicit attention focus 4.3.2
Analysis of the proportion of “ba” responses 4.3.2.1
Percentages of “ba” responses to McGurk targets in Experiment A (without explicit atten-
tional focus) are displayed on Figure 4-6. A two-factor repeated-measures ANOVA with con-
text type (“Video syllables” vs. “Video sentences”) and context duration (2- vs. 4-syllables)
as the independent variables was administered on these percentages (applying Greenhouse-
Geisser correction when applicable). The effect of context type is significant [F (1, 20) =34.
65, p<0.001], with a higher McGurk effect (10 % less “ba” responses) with the “Video sylla-
bles” context. This is in line with our prediction that AV coherence is higher in the “Video
syllables” condition, leading to a higher binding level, a larger visual weight and hence a
larger number of McGurk fusion (“da” responses). Context duration displayed no significant
effect on “ba” scores, either in isolation or in interaction with context type.
0
5
10
15
20
25
30
Ba McGurk Ba McGurk Ba McGurk Ba McGurk Ba McGurk Ba McGurk
Video syllables Video sentences Video syllables Video sentences Video syllables Video sentences
Without explicit attention Attention to syllables Attention to sentences
0.57 1.72 0.28
1.79 0.28 0.79 0.28 0.64 0 0.43 0.57 0.43
10.34 10.12 10.34 9.19
2.87 2.58 3.44 2.65 0.28 1.07 1.14 0.93
% o
f "b
a" r
esp
on
ses
No responses Multiple responses
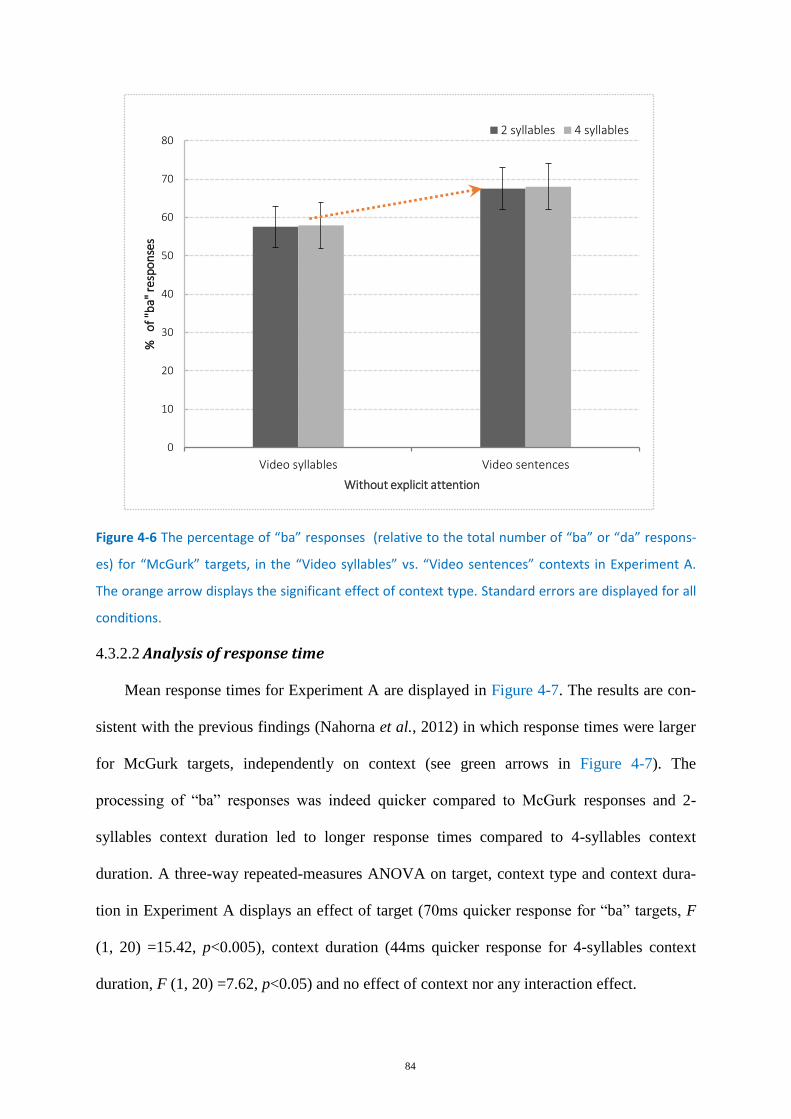
84
Figure 4-6 The percentage of “ba” responses (relative to the total number of “ba” or “da” respons-
es) for “McGurk” targets, in the “Video syllables” vs. “Video sentences” contexts in Experiment A.
The orange arrow displays the significant effect of context type. Standard errors are displayed for all
conditions.
Analysis of response time 4.3.2.2
Mean response times for Experiment A are displayed in Figure 4-7. The results are con-
sistent with the previous findings (Nahorna et al., 2012) in which response times were larger
for McGurk targets, independently on context (see green arrows in Figure 4-7). The
processing of “ba” responses was indeed quicker compared to McGurk responses and 2-
syllables context duration led to longer response times compared to 4-syllables context
duration. A three-way repeated-measures ANOVA on target, context type and context dura-
tion in Experiment A displays an effect of target (70ms quicker response for “ba” targets, F
(1, 20) =15.42, p<0.005), context duration (44ms quicker response for 4-syllables context
duration, F (1, 20) =7.62, p<0.05) and no effect of context nor any interaction effect.
0
10
20
30
40
50
60
70
80
Video syllables Video sentences
%
of
"ba"
re
spo
nse
s
Without explicit attention
2 syllables 4 syllables
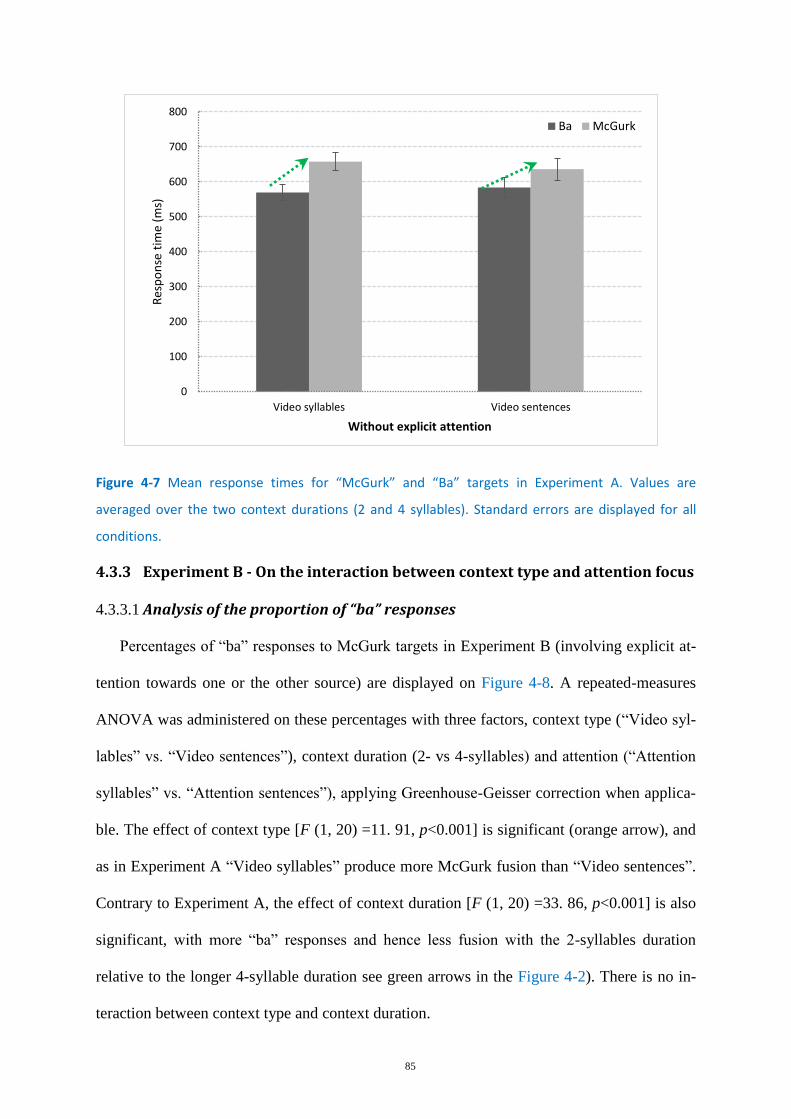
85
Figure 4-7 Mean response times for “McGurk” and “Ba” targets in Experiment A. Values are
averaged over the two context durations (2 and 4 syllables). Standard errors are displayed for all
conditions.
Experiment B - On the interaction between context type and attention focus 4.3.3
Analysis of the proportion of “ba” responses 4.3.3.1
Percentages of “ba” responses to McGurk targets in Experiment B (involving explicit at-
tention towards one or the other source) are displayed on Figure 4-8. A repeated-measures
ANOVA was administered on these percentages with three factors, context type (“Video syl-
lables” vs. “Video sentences”), context duration (2- vs 4-syllables) and attention (“Attention
syllables” vs. “Attention sentences”), applying Greenhouse-Geisser correction when applica-
ble. The effect of context type [F (1, 20) =11. 91, p<0.001] is significant (orange arrow), and
as in Experiment A “Video syllables” produce more McGurk fusion than “Video sentences”.
Contrary to Experiment A, the effect of context duration [F (1, 20) =33. 86, p<0.001] is also
significant, with more “ba” responses and hence less fusion with the 2-syllables duration
relative to the longer 4-syllable duration see green arrows in the Figure 4-2). There is no in-
teraction between context type and context duration.
0
100
200
300
400
500
600
700
800
Video syllables Video sentences
Res
po
nse
tim
e (m
s)
Without explicit attention
Ba McGurk
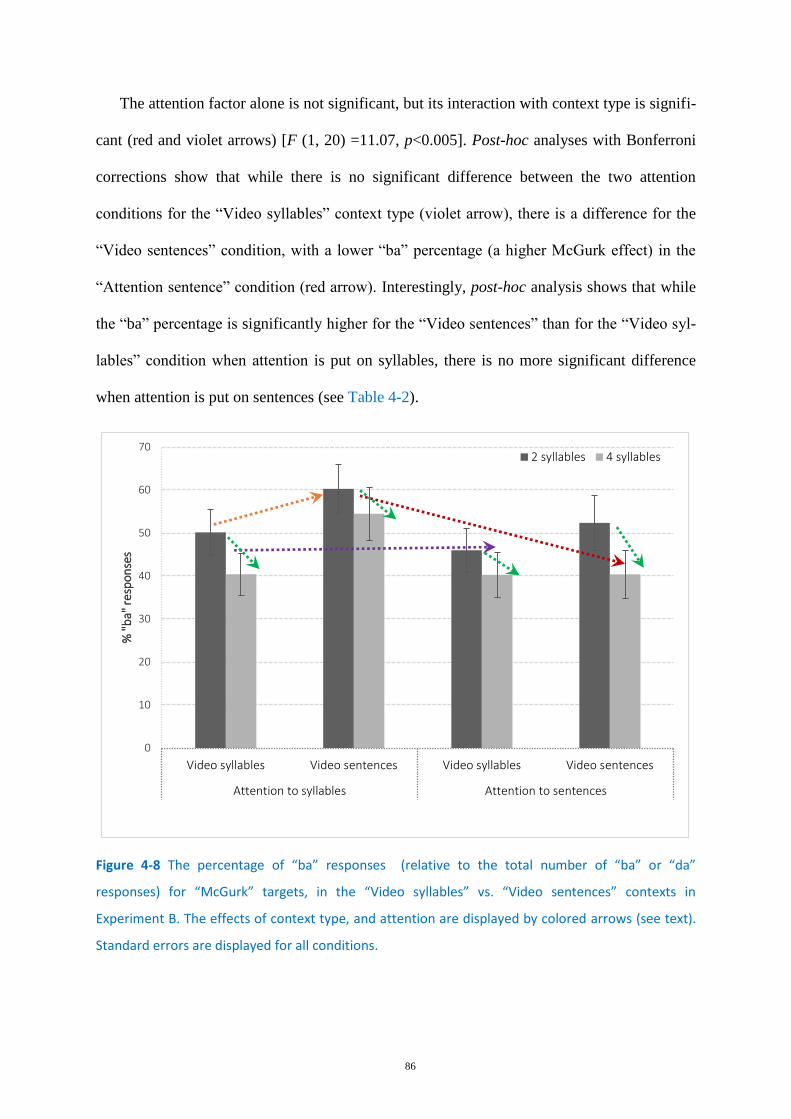
86
The attention factor alone is not significant, but its interaction with context type is signifi-
cant (red and violet arrows) [F (1, 20) =11.07, p<0.005]. Post-hoc analyses with Bonferroni
corrections show that while there is no significant difference between the two attention
conditions for the “Video syllables” context type (violet arrow), there is a difference for the
“Video sentences” condition, with a lower “ba” percentage (a higher McGurk effect) in the
“Attention sentence” condition (red arrow). Interestingly, post-hoc analysis shows that while
the “ba” percentage is significantly higher for the “Video sentences” than for the “Video syl-
lables” condition when attention is put on syllables, there is no more significant difference
when attention is put on sentences (see Table 4-2).
Figure 4-8 The percentage of “ba” responses (relative to the total number of “ba” or “da”
responses) for “McGurk” targets, in the “Video syllables” vs. “Video sentences” contexts in
Experiment B. The effects of context type, and attention are displayed by colored arrows (see text).
Standard errors are displayed for all conditions.
0
10
20
30
40
50
60
70
Video syllables Video sentences Video syllables Video sentences
Attention to syllables Attention to sentences
% "
ba"
re
spo
nse
s
2 syllables 4 syllables
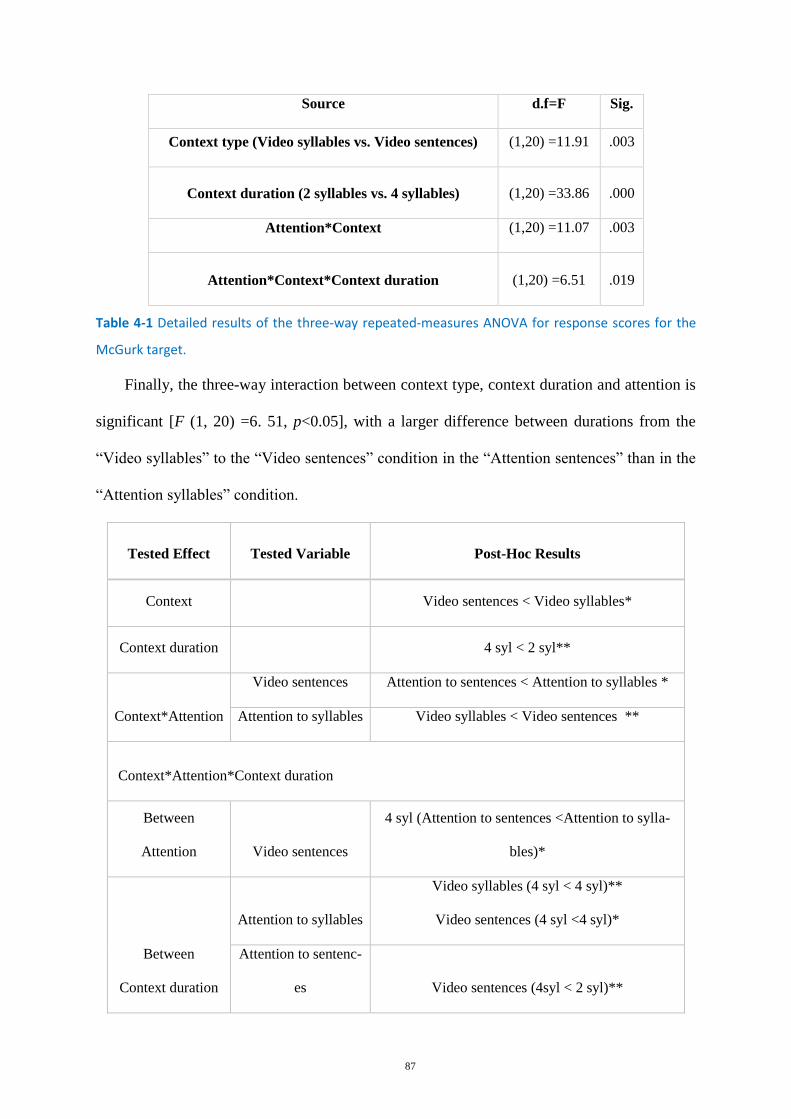
87
Source d.f=F Sig.
Context type (Video syllables vs. Video sentences) (1,20) =11.91 .003
Context duration (2 syllables vs. 4 syllables) (1,20) =33.86 .000
Attention*Context (1,20) =11.07 .003
Attention*Context*Context duration (1,20) =6.51 .019
Table 4-1 Detailed results of the three-way repeated-measures ANOVA for response scores for the
McGurk target.
Finally, the three-way interaction between context type, context duration and attention is
significant [F (1, 20) =6. 51, p<0.05], with a larger difference between durations from the
“Video syllables” to the “Video sentences” condition in the “Attention sentences” than in the
“Attention syllables” condition.
Tested Effect Tested Variable Post-Hoc Results
Context Video sentences < Video syllables*
Context duration 4 syl < 2 syl**
Context*Attention
Video sentences Attention to sentences < Attention to syllables *
Attention to syllables Video syllables < Video sentences **
Context*Attention*Context duration
Between
Attention Video sentences
4 syl (Attention to sentences <Attention to sylla-
bles)*
Between
Context duration
Attention to syllables
Video syllables (4 syl < 4 syl)**
Video sentences (4 syl <4 syl)*
Attention to sentenc-
es Video sentences (4syl < 2 syl)**
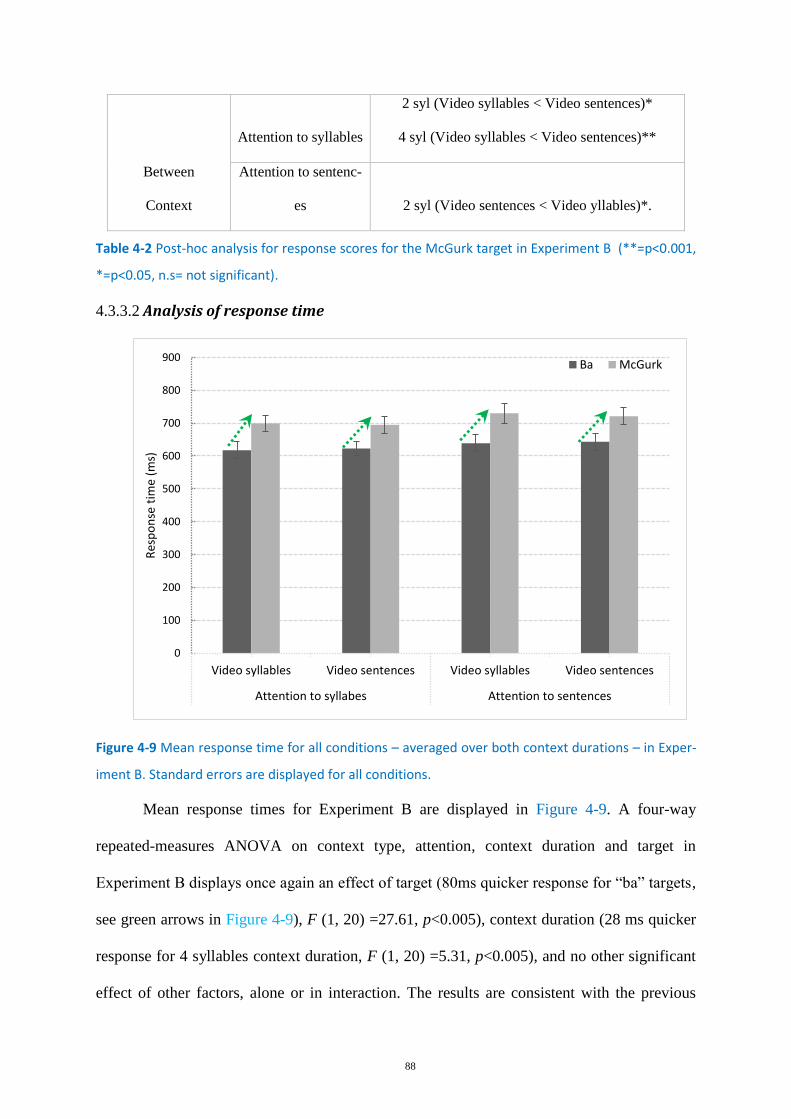
88
Between
Context
Attention to syllables
2 syl (Video syllables < Video sentences)*
4 syl (Video syllables < Video sentences)**
Attention to sentenc-
es 2 syl (Video sentences < Video yllables)*.
Table 4-2 Post-hoc analysis for response scores for the McGurk target in Experiment B (**=p<0.001,
*=p<0.05, n.s= not significant).
Analysis of response time 4.3.3.2
Figure 4-9 Mean response time for all conditions – averaged over both context durations – in Exper-
iment B. Standard errors are displayed for all conditions.
Mean response times for Experiment B are displayed in Figure 4-9. A four-way
repeated-measures ANOVA on context type, attention, context duration and target in
Experiment B displays once again an effect of target (80ms quicker response for “ba” targets,
see green arrows in Figure 4-9), F (1, 20) =27.61, p<0.005), context duration (28 ms quicker
response for 4 syllables context duration, F (1, 20) =5.31, p<0.005), and no other significant
effect of other factors, alone or in interaction. The results are consistent with the previous
0
100
200
300
400
500
600
700
800
900
Video syllables Video sentences Video syllables Video sentences
Attention to syllabes Attention to sentences
Res
po
nse
tim
e (m
s)
Ba McGurk
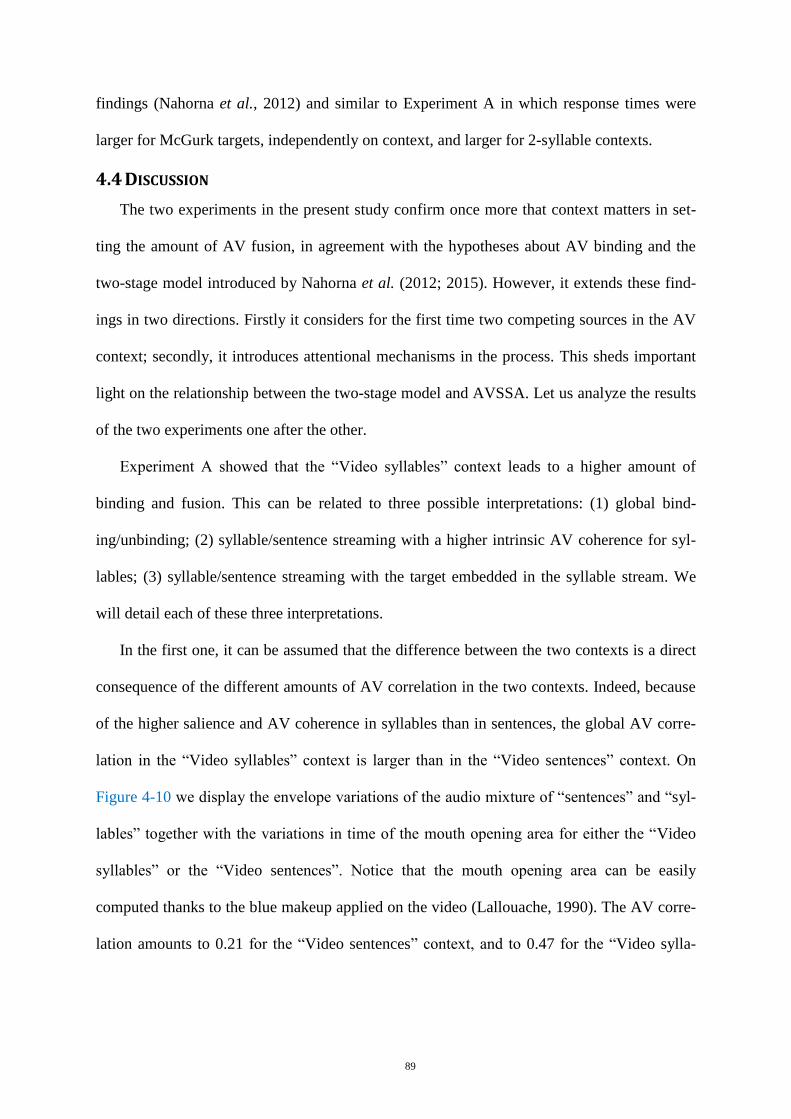
89
findings (Nahorna et al., 2012) and similar to Experiment A in which response times were
larger for McGurk targets, independently on context, and larger for 2-syllable contexts.
DISCUSSION 4.4
The two experiments in the present study confirm once more that context matters in set-
ting the amount of AV fusion, in agreement with the hypotheses about AV binding and the
two-stage model introduced by Nahorna et al. (2012; 2015). However, it extends these find-
ings in two directions. Firstly it considers for the first time two competing sources in the AV
context; secondly, it introduces attentional mechanisms in the process. This sheds important
light on the relationship between the two-stage model and AVSSA. Let us analyze the results
of the two experiments one after the other.
Experiment A showed that the “Video syllables” context leads to a higher amount of
binding and fusion. This can be related to three possible interpretations: (1) global bind-
ing/unbinding; (2) syllable/sentence streaming with a higher intrinsic AV coherence for syl-
lables; (3) syllable/sentence streaming with the target embedded in the syllable stream. We
will detail each of these three interpretations.
In the first one, it can be assumed that the difference between the two contexts is a direct
consequence of the different amounts of AV correlation in the two contexts. Indeed, because
of the higher salience and AV coherence in syllables than in sentences, the global AV corre-
lation in the “Video syllables” context is larger than in the “Video sentences” context. On
Figure 4-10 we display the envelope variations of the audio mixture of “sentences” and “syl-
lables” together with the variations in time of the mouth opening area for either the “Video
syllables” or the “Video sentences”. Notice that the mouth opening area can be easily
computed thanks to the blue makeup applied on the video (Lallouache, 1990). The AV corre-
lation amounts to 0.21 for the “Video sentences” context, and to 0.47 for the “Video sylla-
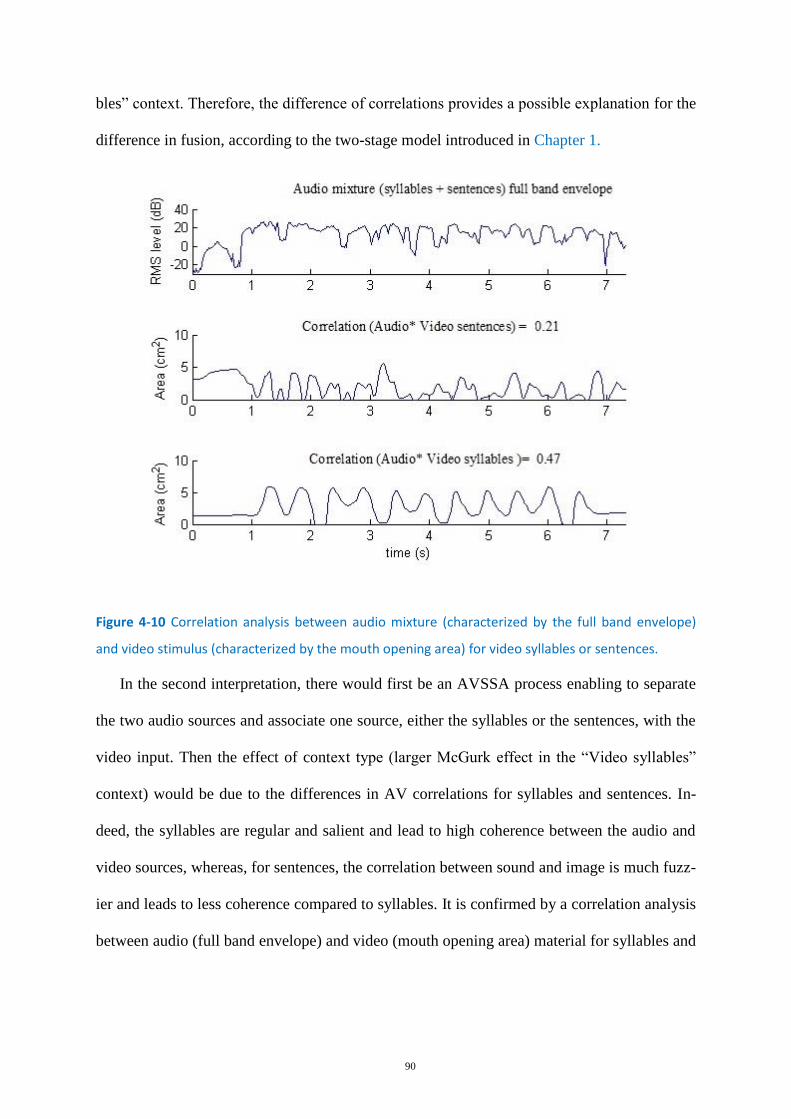
90
bles” context. Therefore, the difference of correlations provides a possible explanation for the
difference in fusion, according to the two-stage model introduced in Chapter 1.
Figure 4-10 Correlation analysis between audio mixture (characterized by the full band envelope)
and video stimulus (characterized by the mouth opening area) for video syllables or sentences.
In the second interpretation, there would first be an AVSSA process enabling to separate
the two audio sources and associate one source, either the syllables or the sentences, with the
video input. Then the effect of context type (larger McGurk effect in the “Video syllables”
context) would be due to the differences in AV correlations for syllables and sentences. In-
deed, the syllables are regular and salient and lead to high coherence between the audio and
video sources, whereas, for sentences, the correlation between sound and image is much fuzz-
ier and leads to less coherence compared to syllables. It is confirmed by a correlation analysis
between audio (full band envelope) and video (mouth opening area) material for syllables and
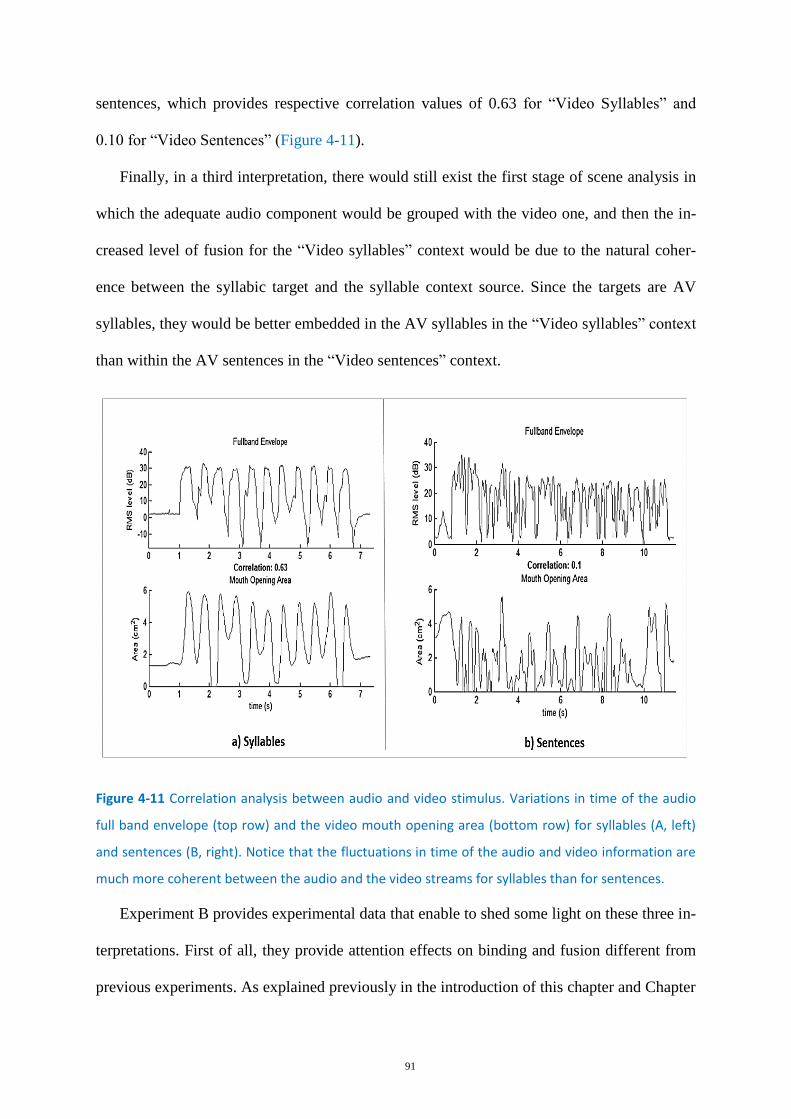
91
sentences, which provides respective correlation values of 0.63 for “Video Syllables” and
0.10 for “Video Sentences” (Figure 4-11).
Finally, in a third interpretation, there would still exist the first stage of scene analysis in
which the adequate audio component would be grouped with the video one, and then the in-
creased level of fusion for the “Video syllables” context would be due to the natural coher-
ence between the syllabic target and the syllable context source. Since the targets are AV
syllables, they would be better embedded in the AV syllables in the “Video syllables” context
than within the AV sentences in the “Video sentences” context.
Figure 4-11 Correlation analysis between audio and video stimulus. Variations in time of the audio
full band envelope (top row) and the video mouth opening area (bottom row) for syllables (A, left)
and sentences (B, right). Notice that the fluctuations in time of the audio and video information are
much more coherent between the audio and the video streams for syllables than for sentences.
Experiment B provides experimental data that enable to shed some light on these three in-
terpretations. First of all, they provide attention effects on binding and fusion different from
previous experiments. As explained previously in the introduction of this chapter and Chapter
92
1, attentional processes have been shown to intervene in AV fusion, either at a global level in
relation to cognitive load (Alsius et al., 2005; 2007) or at the level of a given modality as in.
Tiippana et al. (2004). The study by Andersen et al. (2009) enables to go a step further and
show how attention towards a given source in a particular modality modifies the AV percept.
However, here attention is oriented towards a particular AV source rather than a particular
auditory or visual source. The fact that attention on a particular AV source modifies fusion
suggests that AV speech scene analysis occurs and that its output modulates the fusion pro-
cess as proposed in the two-stage model. This is rather compatible with the second
assumption proposed for Experiment A. Indeed, if fusion modulation were based on global
AV coherence (first assumption), attention could not penetrate this global computation
process. Also, at the output of the scene analysis process, if the continuity between the
syllable context and the syllable target was playing a key role in the difference of fusion
(third assumption), attention towards sentences would have no reason to increase fusion.
Therefore the couple of experiments A and B rather suggests that there is an AV scene
analysis process, providing more coherent context and hence larger fusion for video syllables,
and that attention may enable to increase the perceived coherence of the attended AV source
and hence increase fusion when attention is oriented towards the intrinsically less coherent
AV sentences.
The results are hence in line with our primary hypothesis and show that attention plays a
role only for “Video sentences” but not for “Video syllables”. We suggest that the AV bind-
ing could be pre-attentive in “Video syllables” because of their strong, salient AV co-
modulations making them pop-out as strong bottom-up AV primitives. A number of previous
studies have shown that multisensory interactions may occur in a bottom-up way, whenever
there is strong salience between modalities likely to automatically draw attention (Driver,
1996; Van der Burg et al., 2008; 2009). For example, Van der Burg et al. (2008) display a
93
decrement in the search time for a visual object when it is presented with a simple auditory
pip. Their interpretation is based on a pop-out mechanism in which the auditory pip, tempo-
rally matched with the visual object, would increase its salience without voluntary control of
attention. Alsius and Soto-Faraco (2011) found that attentional intervention was needed in
detecting temporally correlated AV speech in the case of visual distractors, but it was not
required among auditory distractors. In our experiments, the competing sources were
auditory, hence, stimulus-driven bottom-up AV integration mechanisms could occur, particu-
larly in the case of the salient AV coherence of the syllables stream.
In contrast, attention appeared to play a role for “Video sentences”, in which the AV co-
herence was relatively low. This suggests that the attentional focus could enhance AV bind-
ing. Hence, in this case, top-down schemas seem to play a role in integration.
Overall, our results are in line with the global architecture for multisensory integration
proposed by Talsma et al. (2010) introducing bidirectional interplay between attention and
multisensory processing. However, the present study is rather exploratory. It requires a
number of experimental developments and controls, to assess how these potential “bottom-
up” and “top-down” processes could depend on the salience of mixed sources (for example
the relative intensities of the two sources), the nature of their informational content, the
temporal regularity of the syllable stream, etc.
Altogether, the AVSSA process, in which the coherence between auditory and visual fea-
tures would be evaluated in a complex scene, seems to provide a central mechanism in order
to associate the adequate components inside a coherent AV speech source properly. It would
result in both source extraction and fusion modulation. The two experiments in this study
provide confirmation and development to the view that AV fusion in speech perception in-
cludes the first stage of AV speech scene analysis. Their theoretical consequences will be
further analyzed in the general discussion.
94
Chapter 5
5. A POSSIBLE NEUROPHYSIOLOGICAL CORRELATE OF AV BIND-
ING AND UNBINDING3
BACKGROUND AND HYPOTHESIS 5.1
The neurophysiological correlates of AV integration were already extensively discussed
in Section 1.4.2. To summarize, the bimodal presentation of audio and visual signals resulted
in temporal facilitation of the N1/P2 component of the auditory ERPs (Van Wassenhove et
al., 2005; Baart et al., 2014; Knowland et al., 2014) and amplitude reduction of the N1/P2
complex (Klucharev et al., 2003; Van Wassenhove et al., 2005; Pilling, 2009; Baart et al.,
2014; Knowland et al., 2014) compared to auditory alone condition. The interpretation was
generally termed as “predictive mechanisms” (Van Wassenhove et al., 2005), according to
which the visual input, arriving ahead of sound, would enable to predict part of its content
and hence modulate the auditory ERP in amplitude and latency. Importantly, some literature
suggests that the modulation of auditory ERP components by visual speech is different for N1
(possibly based on a non-speech specific anticipation mechanism) and P2 (speech specific
and depending on phonetic content) (Stekelenburg and Vroomen, 2007; Vroomen and
Stekelenburg, 2010).
The influence of the visual input on N1/P2 can be modulated under certain circumstanc-
es, for example, introducing temporal AV asynchrony (Pilling, 2009) or increasing attention
load by imposing a dual task paradigm (Alsius et al., 2014). However, to our knowledge,
3 This is slightly modified version of a paper published in Frontiers in Psychology.
Ganesh AC, Berthommier F, Vilain C, Sato M and Schwartz J-L (2014) A possible neurophysiological correlate of au-
diovisual binding and unbinding in speech perception. Front. Psychol. 5:1340.
95
none of the previous electrophysiological studies have reported the role of context in the AV
integration. Capitalizing on the previous results obtained by Nahorna et al. (2015) and also by
electrophysiological studies on AV interactions, we aimed at determining a possible neuro-
physiological marker of the AV binding/unbinding process in the cortical auditory speech
pathways. Therefore, in the present experiment we will search for a neurophysiological
correlate of early binding/unbinding in AV interactions, by adding either a coherent or an
incoherent AV context before an auditory, congruent AV or incongruent AV speech target
and measuring the effect of context on amplitude and latency of the N1/P2 component of the
ERP response to the target.
The basic assumption of the present study is that with coherent context we should
replicate the results of previous EEG studies on auditory N1/P2 responses (decrease in
amplitude and latency in the AV vs. A condition) (Klucharev et al., 2003; Besle et al., 2004;
Van Wassenhove et al., 2005; Stekelenburg and Vroomen, 2007; Pilling, 2009; Vroomen and
Stekelenburg, 2010; Stekelenburg and Vroomen, 2012; Baart et al., 2014; Knowland et al.,
2014; Treille et al., 2014a; b) (see Figure 5-1 top). However, an incoherent context should
lead to unbinding (as robustly displayed by behavioral data in Nahorna et al. 2012; 2015),
with the consequence that the visual influence on the auditory stimulus should decrease.
Hence, the N1/P2 latency and amplitude in the AV condition should increase (reaching a
value close to their value in the A condition) in the incoherent context compared with the
coherent context (see Figure 5-1 bottom).
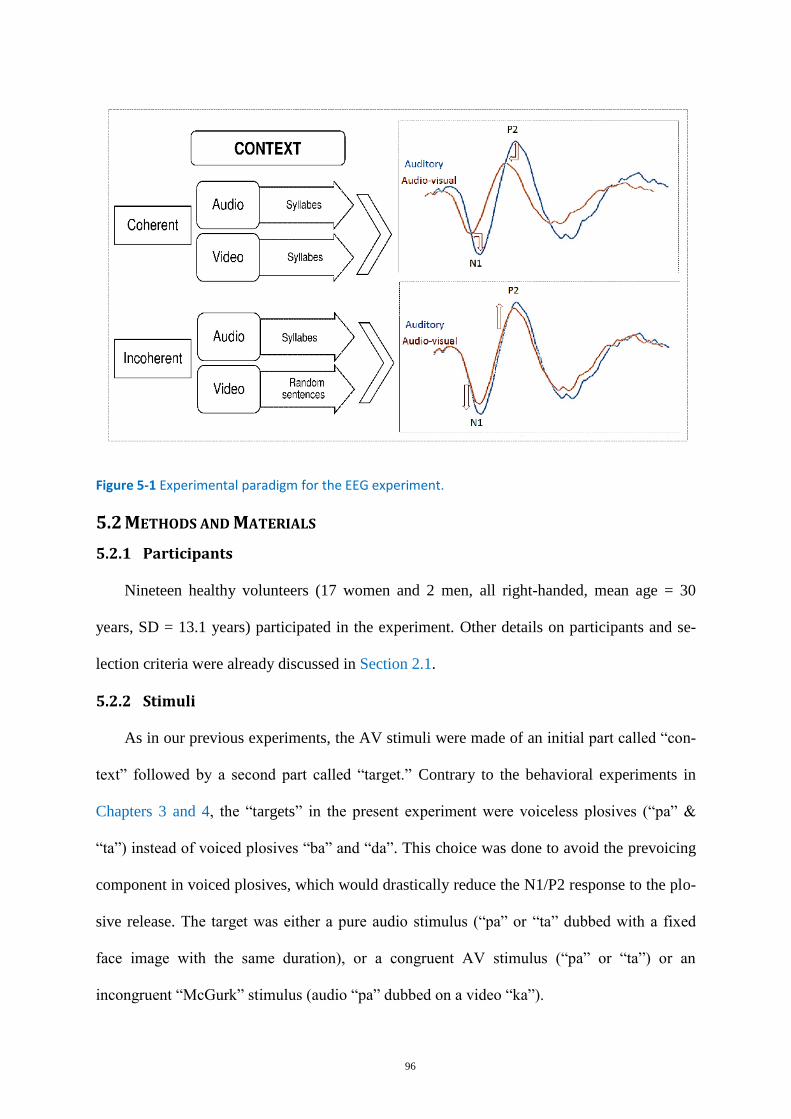
96
Figure 5-1 Experimental paradigm for the EEG experiment.
METHODS AND MATERIALS 5.2
Participants 5.2.1
Nineteen healthy volunteers (17 women and 2 men, all right-handed, mean age = 30
years, SD = 13.1 years) participated in the experiment. Other details on participants and se-
lection criteria were already discussed in Section 2.1.
Stimuli 5.2.2
As in our previous experiments, the AV stimuli were made of an initial part called “con-
text” followed by a second part called “target.” Contrary to the behavioral experiments in
Chapters 3 and 4, the “targets” in the present experiment were voiceless plosives (“pa” &
“ta”) instead of voiced plosives “ba” and “da”. This choice was done to avoid the prevoicing
component in voiced plosives, which would drastically reduce the N1/P2 response to the plo-
sive release. The target was either a pure audio stimulus (“pa” or “ta” dubbed with a fixed
face image with the same duration), or a congruent AV stimulus (“pa” or “ta”) or an
incongruent “McGurk” stimulus (audio “pa” dubbed on a video “ka”).
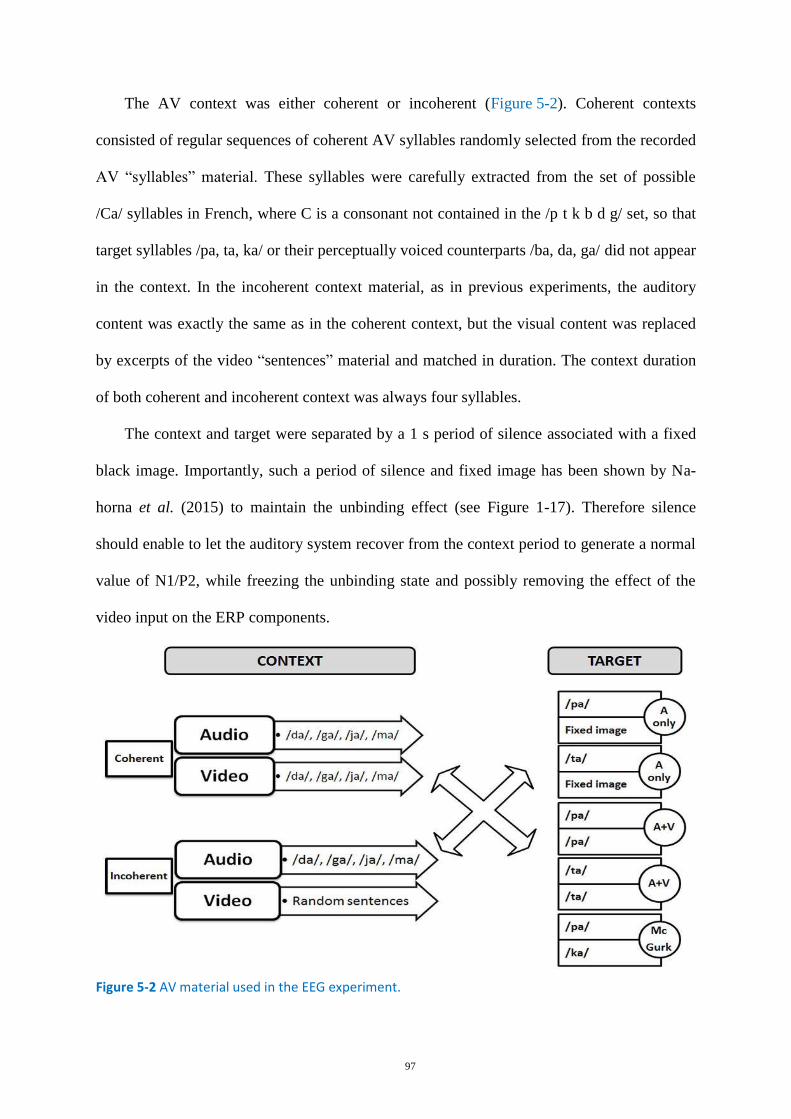
97
The AV context was either coherent or incoherent (Figure 5-2). Coherent contexts
consisted of regular sequences of coherent AV syllables randomly selected from the recorded
AV “syllables” material. These syllables were carefully extracted from the set of possible
/Ca/ syllables in French, where C is a consonant not contained in the /p t k b d g/ set, so that
target syllables /pa, ta, ka/ or their perceptually voiced counterparts /ba, da, ga/ did not appear
in the context. In the incoherent context material, as in previous experiments, the auditory
content was exactly the same as in the coherent context, but the visual content was replaced
by excerpts of the video “sentences” material and matched in duration. The context duration
of both coherent and incoherent context was always four syllables.
The context and target were separated by a 1 s period of silence associated with a fixed
black image. Importantly, such a period of silence and fixed image has been shown by Na-
horna et al. (2015) to maintain the unbinding effect (see Figure 1-17). Therefore silence
should enable to let the auditory system recover from the context period to generate a normal
value of N1/P2, while freezing the unbinding state and possibly removing the effect of the
video input on the ERP components.
Figure 5-2 AV material used in the EEG experiment.
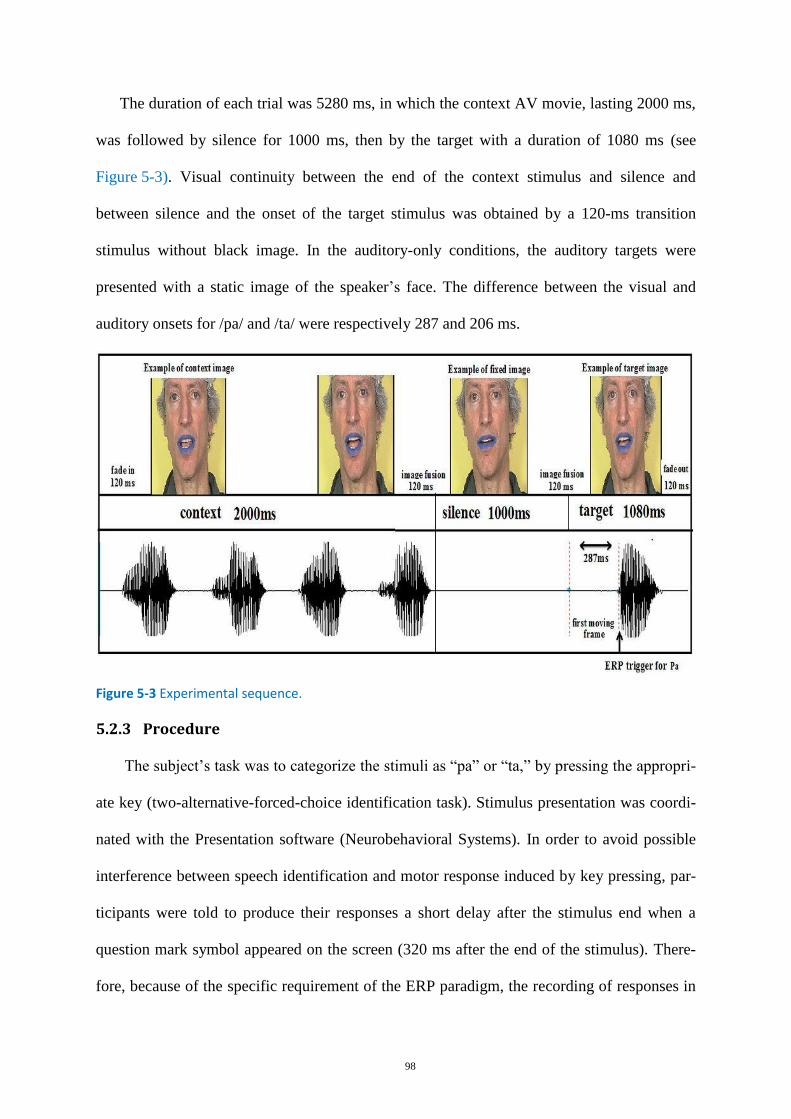
98
The duration of each trial was 5280 ms, in which the context AV movie, lasting 2000 ms,
was followed by silence for 1000 ms, then by the target with a duration of 1080 ms (see
Figure 5-3). Visual continuity between the end of the context stimulus and silence and
between silence and the onset of the target stimulus was obtained by a 120-ms transition
stimulus without black image. In the auditory-only conditions, the auditory targets were
presented with a static image of the speaker’s face. The difference between the visual and
auditory onsets for /pa/ and /ta/ were respectively 287 and 206 ms.
Figure 5-3 Experimental sequence.
Procedure 5.2.3
The subject’s task was to categorize the stimuli as “pa” or “ta,” by pressing the appropri-
ate key (two-alternative-forced-choice identification task). Stimulus presentation was coordi-
nated with the Presentation software (Neurobehavioral Systems). In order to avoid possible
interference between speech identification and motor response induced by key pressing, par-
ticipants were told to produce their responses a short delay after the stimulus end when a
question mark symbol appeared on the screen (320 ms after the end of the stimulus). There-
fore, because of the specific requirement of the ERP paradigm, the recording of responses in
99
the present experiment differed from the online monitoring task used in the previous experi-
ments. There were six conditions, with three targets (audio-only, A vs. AV congruent, AVC
vs. AV incongruent, AVI) and two contexts (coherent vs. incoherent), and altogether 100
repetitions per condition (with 50 “pa” and 50 “ta” in the audio-only or AV congruent targets,
and 100 McGurk stimuli) (see Figure 5-2). This provided 600 occurrences, presented in a
random order inside five experimental blocks altogether. Overall, the experiment lasted more
than one hour, including subject preparation, explanations and pauses between blocks. This
unfortunately removed the possibility to add a specific visual-only condition, since it would
have added two targets – visual congruent and visual incongruent – and hence almost doubled
the experiment duration. We will discuss later what the consequences of this specific choice
could be in the processing and interpretation of EEG data.
EEG Parameters 5.2.4
EEG data were continuously recorded from 64 scalp electrodes (Electro-Cap Internation-
al, Inc., according to the International 10–20 system) using the Biosemi Active Two AD-box
EEG system operating at a 256 Hz sampling rate. Two additional electrodes served as refer-
ence [common mode sense (CMS) active electrode] and ground [driven right leg (DRL) pas-
sive electrode]. One other external reference electrode was put at the top of the nose. Electro-
oculogram measures of the horizontal (HEOG) and vertical (VEOG) eye movements were
recorded using electrodes at the outer canthus of each eye as well as above and below the
right eye. Before the experiment, the impedance of all electrodes was adjusted to get low off-
set voltages and stable DC.
Analyses 5.2.5
All EEG data were processed using the EEGLAB toolbox (Delorme and Makeig, 2004)
implemented in Matlab (Mathworks, Natick, MA, USA). EEG data were first re-referenced
offline to the nose recording and band-pass filtered using a two-way least-squares FIR filter-
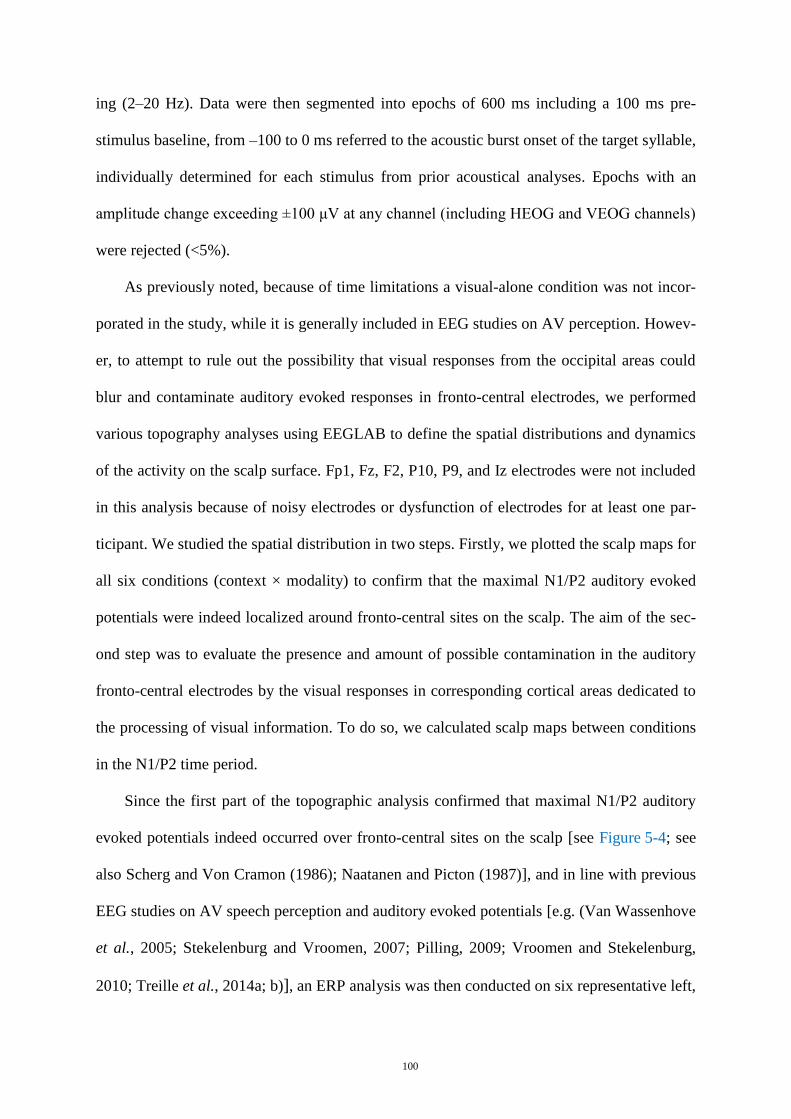
100
ing (2–20 Hz). Data were then segmented into epochs of 600 ms including a 100 ms pre-
stimulus baseline, from –100 to 0 ms referred to the acoustic burst onset of the target syllable,
individually determined for each stimulus from prior acoustical analyses. Epochs with an
amplitude change exceeding ±100 μV at any channel (including HEOG and VEOG channels)
were rejected (<5%).
As previously noted, because of time limitations a visual-alone condition was not incor-
porated in the study, while it is generally included in EEG studies on AV perception. Howev-
er, to attempt to rule out the possibility that visual responses from the occipital areas could
blur and contaminate auditory evoked responses in fronto-central electrodes, we performed
various topography analyses using EEGLAB to define the spatial distributions and dynamics
of the activity on the scalp surface. Fp1, Fz, F2, P10, P9, and Iz electrodes were not included
in this analysis because of noisy electrodes or dysfunction of electrodes for at least one par-
ticipant. We studied the spatial distribution in two steps. Firstly, we plotted the scalp maps for
all six conditions (context × modality) to confirm that the maximal N1/P2 auditory evoked
potentials were indeed localized around fronto-central sites on the scalp. The aim of the sec-
ond step was to evaluate the presence and amount of possible contamination in the auditory
fronto-central electrodes by the visual responses in corresponding cortical areas dedicated to
the processing of visual information. To do so, we calculated scalp maps between conditions
in the N1/P2 time period.
Since the first part of the topographic analysis confirmed that maximal N1/P2 auditory
evoked potentials indeed occurred over fronto-central sites on the scalp [see Figure 5-4; see
also Scherg and Von Cramon (1986); Naatanen and Picton (1987)], and in line with previous
EEG studies on AV speech perception and auditory evoked potentials [e.g. (Van Wassenhove
et al., 2005; Stekelenburg and Vroomen, 2007; Pilling, 2009; Vroomen and Stekelenburg,
2010; Treille et al., 2014a; b)], an ERP analysis was then conducted on six representative left,
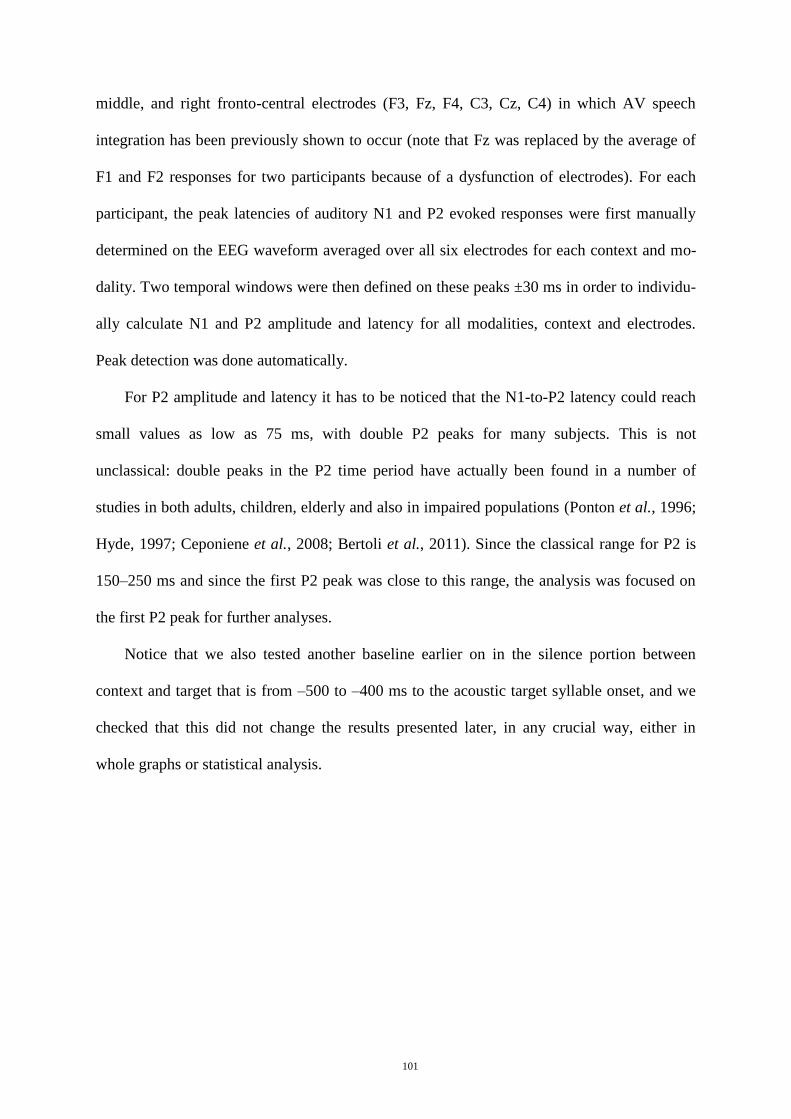
101
middle, and right fronto-central electrodes (F3, Fz, F4, C3, Cz, C4) in which AV speech
integration has been previously shown to occur (note that Fz was replaced by the average of
F1 and F2 responses for two participants because of a dysfunction of electrodes). For each
participant, the peak latencies of auditory N1 and P2 evoked responses were first manually
determined on the EEG waveform averaged over all six electrodes for each context and mo-
dality. Two temporal windows were then defined on these peaks ±30 ms in order to individu-
ally calculate N1 and P2 amplitude and latency for all modalities, context and electrodes.
Peak detection was done automatically.
For P2 amplitude and latency it has to be noticed that the N1-to-P2 latency could reach
small values as low as 75 ms, with double P2 peaks for many subjects. This is not
unclassical: double peaks in the P2 time period have actually been found in a number of
studies in both adults, children, elderly and also in impaired populations (Ponton et al., 1996;
Hyde, 1997; Ceponiene et al., 2008; Bertoli et al., 2011). Since the classical range for P2 is
150–250 ms and since the first P2 peak was close to this range, the analysis was focused on
the first P2 peak for further analyses.
Notice that we also tested another baseline earlier on in the silence portion between
context and target that is from –500 to –400 ms to the acoustic target syllable onset, and we
checked that this did not change the results presented later, in any crucial way, either in
whole graphs or statistical analysis.
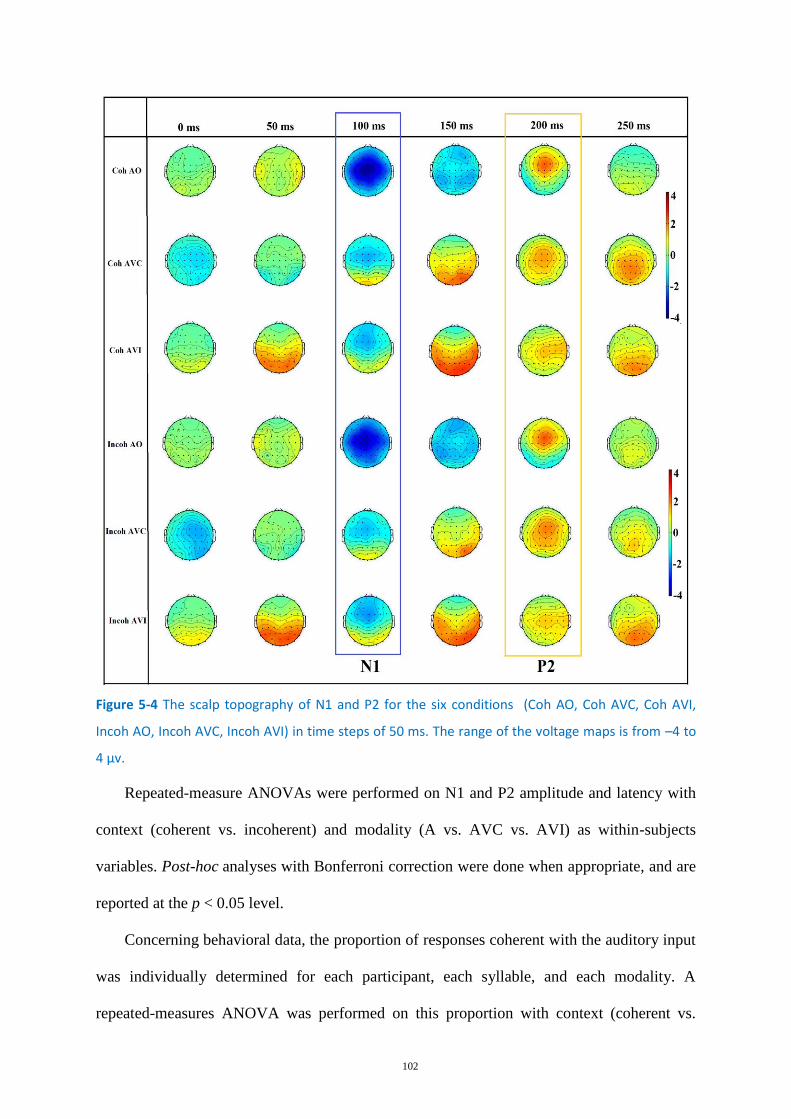
102
Figure 5-4 The scalp topography of N1 and P2 for the six conditions (Coh AO, Coh AVC, Coh AVI,
Incoh AO, Incoh AVC, Incoh AVI) in time steps of 50 ms. The range of the voltage maps is from –4 to
4 μv.
Repeated-measure ANOVAs were performed on N1 and P2 amplitude and latency with
context (coherent vs. incoherent) and modality (A vs. AVC vs. AVI) as within-subjects
variables. Post-hoc analyses with Bonferroni correction were done when appropriate, and are
reported at the p < 0.05 level.
Concerning behavioral data, the proportion of responses coherent with the auditory input
was individually determined for each participant, each syllable, and each modality. A
repeated-measures ANOVA was performed on this proportion with context (coherent vs.
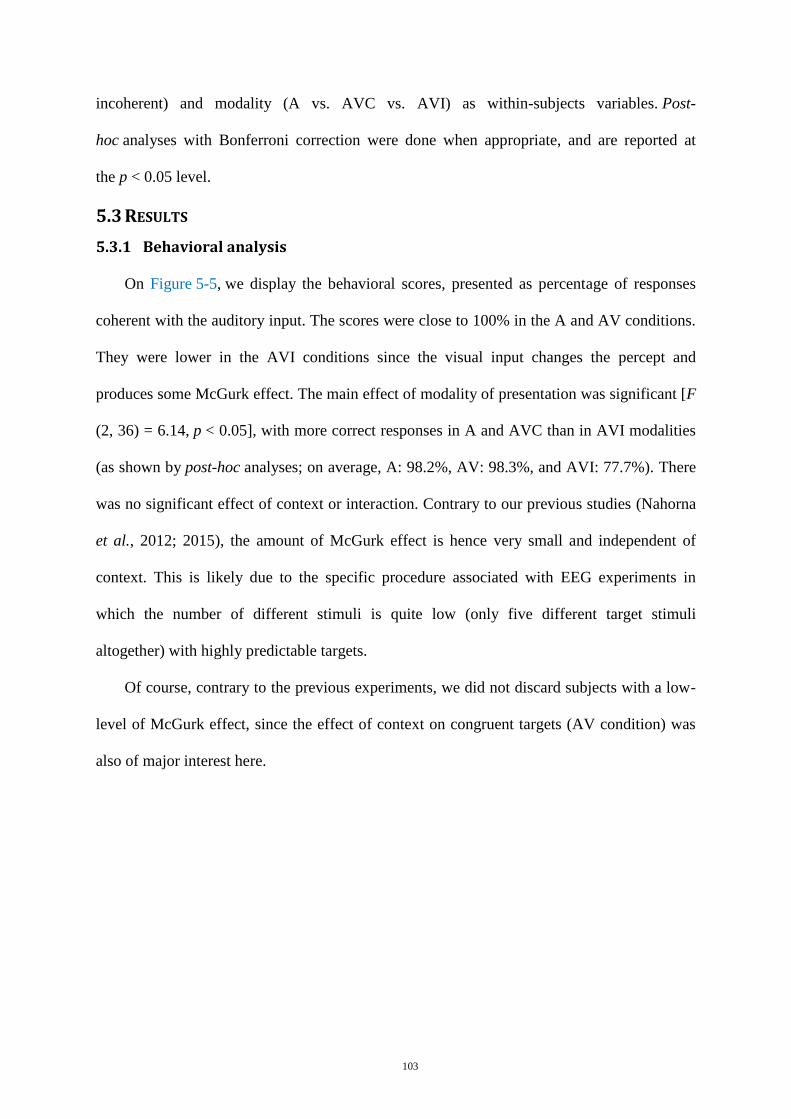
103
incoherent) and modality (A vs. AVC vs. AVI) as within-subjects variables. Post-
hoc analyses with Bonferroni correction were done when appropriate, and are reported at
the p < 0.05 level.
RESULTS 5.3
Behavioral analysis 5.3.1
On Figure 5-5, we display the behavioral scores, presented as percentage of responses
coherent with the auditory input. The scores were close to 100% in the A and AV conditions.
They were lower in the AVI conditions since the visual input changes the percept and
produces some McGurk effect. The main effect of modality of presentation was significant [F
(2, 36) = 6.14, p < 0.05], with more correct responses in A and AVC than in AVI modalities
(as shown by post-hoc analyses; on average, A: 98.2%, AV: 98.3%, and AVI: 77.7%). There
was no significant effect of context or interaction. Contrary to our previous studies (Nahorna
et al., 2012; 2015), the amount of McGurk effect is hence very small and independent of
context. This is likely due to the specific procedure associated with EEG experiments in
which the number of different stimuli is quite low (only five different target stimuli
altogether) with highly predictable targets.
Of course, contrary to the previous experiments, we did not discard subjects with a low-
level of McGurk effect, since the effect of context on congruent targets (AV condition) was
also of major interest here.
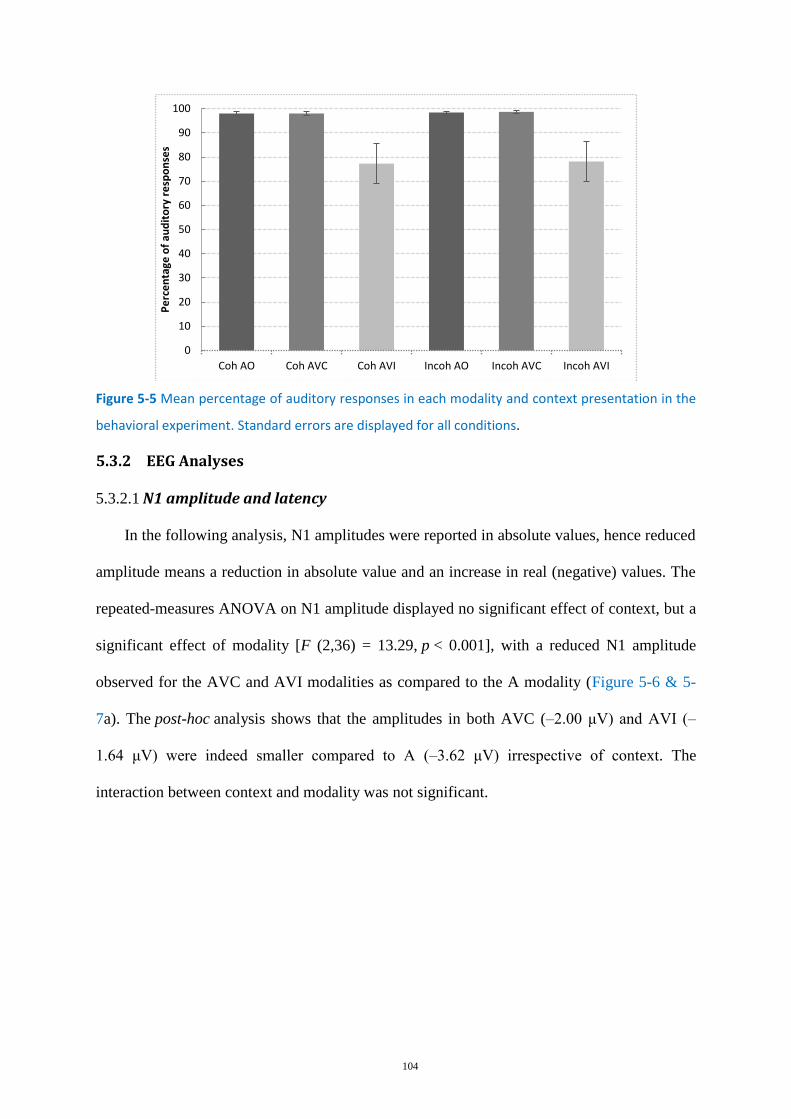
104
Figure 5-5 Mean percentage of auditory responses in each modality and context presentation in the
behavioral experiment. Standard errors are displayed for all conditions.
EEG Analyses 5.3.2
N1 amplitude and latency 5.3.2.1
In the following analysis, N1 amplitudes were reported in absolute values, hence reduced
amplitude means a reduction in absolute value and an increase in real (negative) values. The
repeated-measures ANOVA on N1 amplitude displayed no significant effect of context, but a
significant effect of modality [F (2,36) = 13.29, p < 0.001], with a reduced N1 amplitude
observed for the AVC and AVI modalities as compared to the A modality (Figure 5-6 & 5-
7a). The post-hoc analysis shows that the amplitudes in both AVC (–2.00 μV) and AVI (–
1.64 μV) were indeed smaller compared to A (–3.62 μV) irrespective of context. The
interaction between context and modality was not significant.
0
10
20
30
40
50
60
70
80
90
100
Coh AO Coh AVC Coh AVI Incoh AO Incoh AVC Incoh AVI
Pe
rce
nta
ge o
f au
dit
ory
re
spo
nse
s
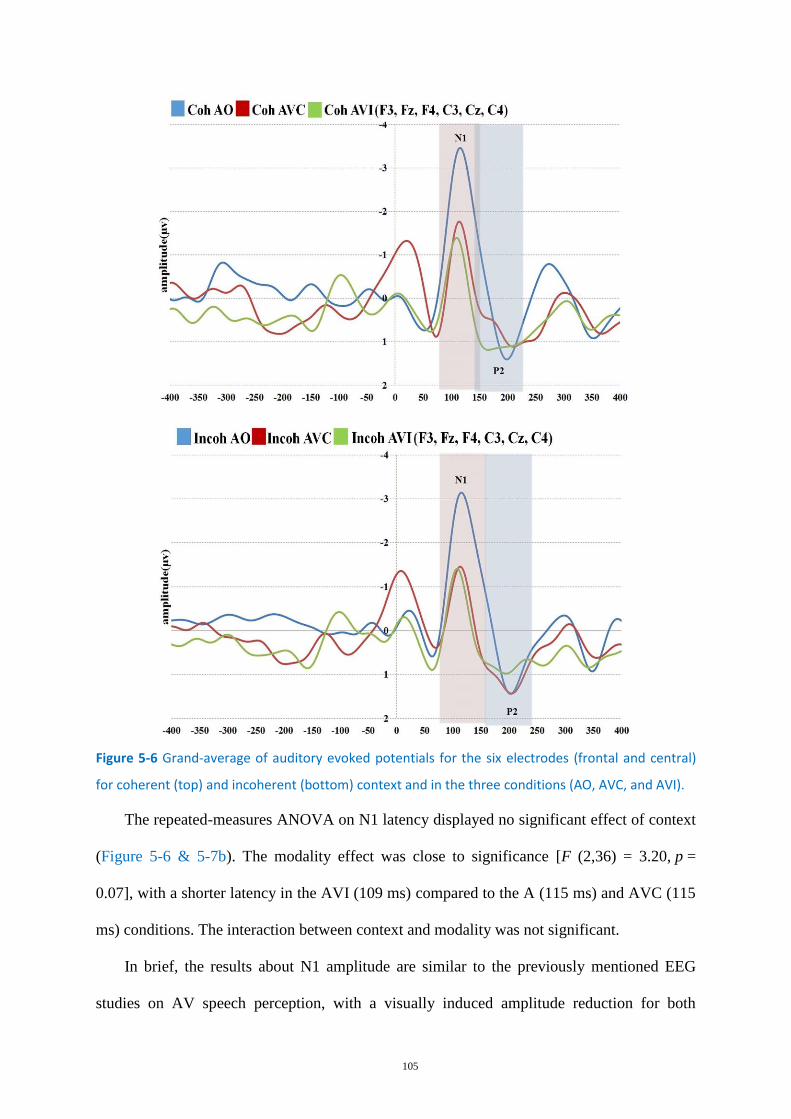
105
Figure 5-6 Grand-average of auditory evoked potentials for the six electrodes (frontal and central)
for coherent (top) and incoherent (bottom) context and in the three conditions (AO, AVC, and AVI).
The repeated-measures ANOVA on N1 latency displayed no significant effect of context
(Figure 5-6 & 5-7b). The modality effect was close to significance [F (2,36) = 3.20, p =
0.07], with a shorter latency in the AVI (109 ms) compared to the A (115 ms) and AVC (115
ms) conditions. The interaction between context and modality was not significant.
In brief, the results about N1 amplitude are similar to the previously mentioned EEG
studies on AV speech perception, with a visually induced amplitude reduction for both
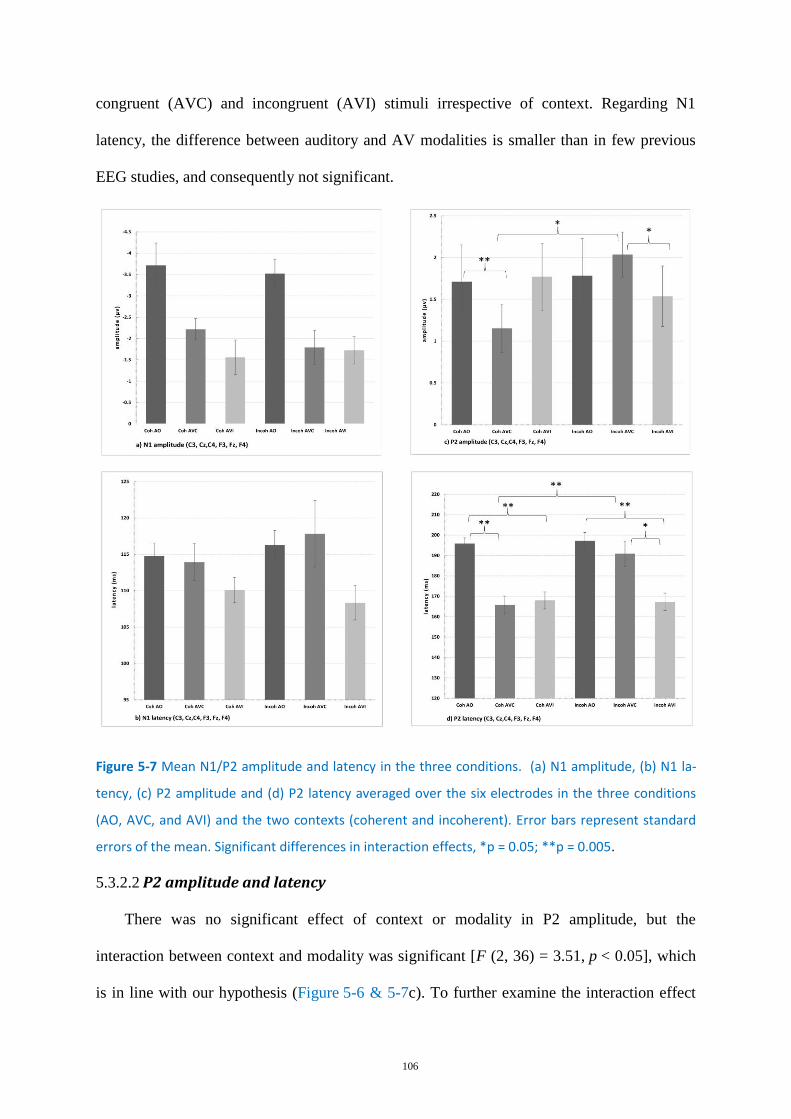
106
congruent (AVC) and incongruent (AVI) stimuli irrespective of context. Regarding N1
latency, the difference between auditory and AV modalities is smaller than in few previous
EEG studies, and consequently not significant.
Figure 5-7 Mean N1/P2 amplitude and latency in the three conditions. (a) N1 amplitude, (b) N1 la-
tency, (c) P2 amplitude and (d) P2 latency averaged over the six electrodes in the three conditions
(AO, AVC, and AVI) and the two contexts (coherent and incoherent). Error bars represent standard
errors of the mean. Significant differences in interaction effects, *p = 0.05; **p = 0.005.
P2 amplitude and latency 5.3.2.2
There was no significant effect of context or modality in P2 amplitude, but the
interaction between context and modality was significant [F (2, 36) = 3.51, p < 0.05], which
is in line with our hypothesis (Figure 5-6 & 5-7c). To further examine the interaction effect
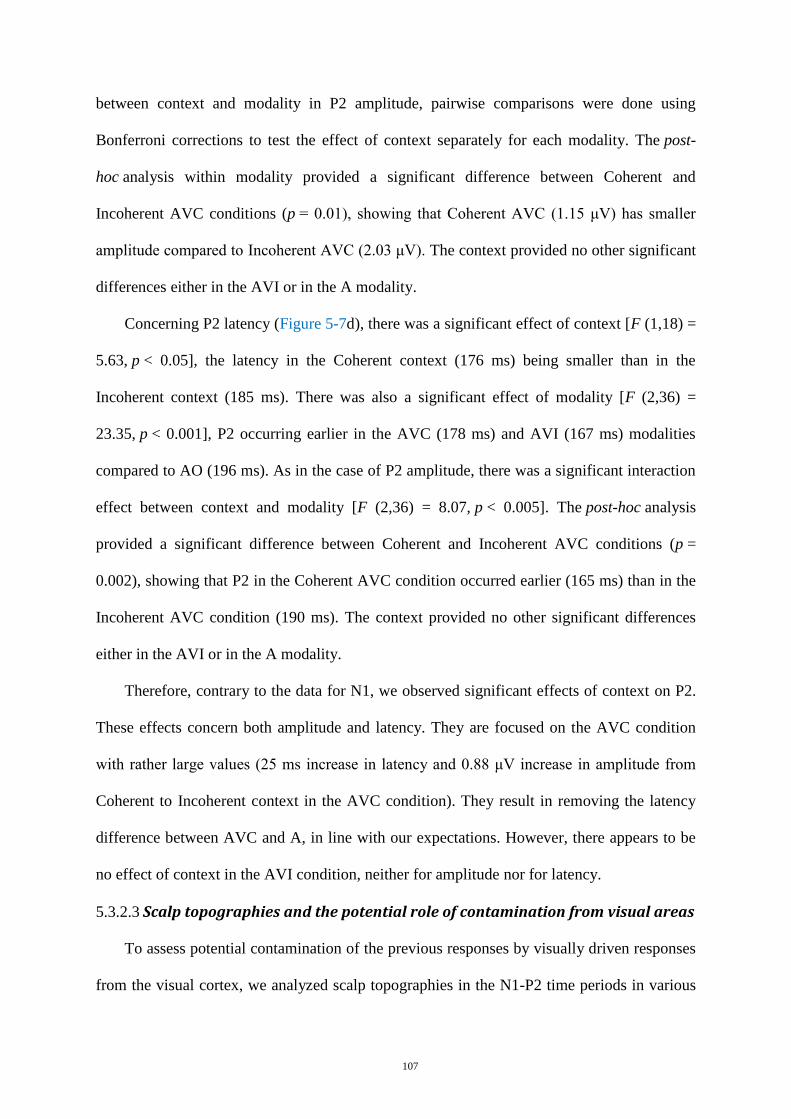
107
between context and modality in P2 amplitude, pairwise comparisons were done using
Bonferroni corrections to test the effect of context separately for each modality. The post-
hoc analysis within modality provided a significant difference between Coherent and
Incoherent AVC conditions (p = 0.01), showing that Coherent AVC (1.15 μV) has smaller
amplitude compared to Incoherent AVC (2.03 μV). The context provided no other significant
differences either in the AVI or in the A modality.
Concerning P2 latency (Figure 5-7d), there was a significant effect of context [F (1,18) =
5.63, p < 0.05], the latency in the Coherent context (176 ms) being smaller than in the
Incoherent context (185 ms). There was also a significant effect of modality [F (2,36) =
23.35, p < 0.001], P2 occurring earlier in the AVC (178 ms) and AVI (167 ms) modalities
compared to AO (196 ms). As in the case of P2 amplitude, there was a significant interaction
effect between context and modality [F (2,36) = 8.07, p < 0.005]. The post-hoc analysis
provided a significant difference between Coherent and Incoherent AVC conditions (p =
0.002), showing that P2 in the Coherent AVC condition occurred earlier (165 ms) than in the
Incoherent AVC condition (190 ms). The context provided no other significant differences
either in the AVI or in the A modality.
Therefore, contrary to the data for N1, we observed significant effects of context on P2.
These effects concern both amplitude and latency. They are focused on the AVC condition
with rather large values (25 ms increase in latency and 0.88 μV increase in amplitude from
Coherent to Incoherent context in the AVC condition). They result in removing the latency
difference between AVC and A, in line with our expectations. However, there appears to be
no effect of context in the AVI condition, neither for amplitude nor for latency.
Scalp topographies and the potential role of contamination from visual areas 5.3.2.3
To assess potential contamination of the previous responses by visually driven responses
from the visual cortex, we analyzed scalp topographies in the N1-P2 time periods in various
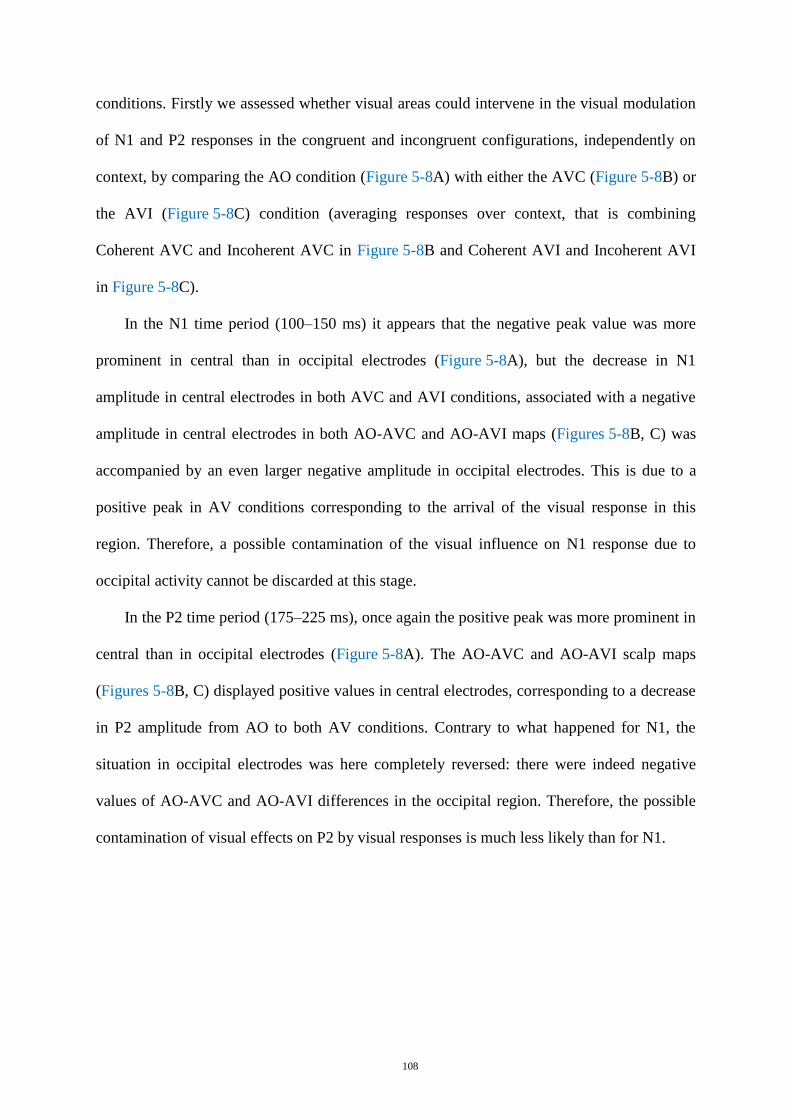
108
conditions. Firstly we assessed whether visual areas could intervene in the visual modulation
of N1 and P2 responses in the congruent and incongruent configurations, independently on
context, by comparing the AO condition (Figure 5-8A) with either the AVC (Figure 5-8B) or
the AVI (Figure 5-8C) condition (averaging responses over context, that is combining
Coherent AVC and Incoherent AVC in Figure 5-8B and Coherent AVI and Incoherent AVI
in Figure 5-8C).
In the N1 time period (100–150 ms) it appears that the negative peak value was more
prominent in central than in occipital electrodes (Figure 5-8A), but the decrease in N1
amplitude in central electrodes in both AVC and AVI conditions, associated with a negative
amplitude in central electrodes in both AO-AVC and AO-AVI maps (Figures 5-8B, C) was
accompanied by an even larger negative amplitude in occipital electrodes. This is due to a
positive peak in AV conditions corresponding to the arrival of the visual response in this
region. Therefore, a possible contamination of the visual influence on N1 response due to
occipital activity cannot be discarded at this stage.
In the P2 time period (175–225 ms), once again the positive peak was more prominent in
central than in occipital electrodes (Figure 5-8A). The AO-AVC and AO-AVI scalp maps
(Figures 5-8B, C) displayed positive values in central electrodes, corresponding to a decrease
in P2 amplitude from AO to both AV conditions. Contrary to what happened for N1, the
situation in occipital electrodes was here completely reversed: there were indeed negative
values of AO-AVC and AO-AVI differences in the occipital region. Therefore, the possible
contamination of visual effects on P2 by visual responses is much less likely than for N1.
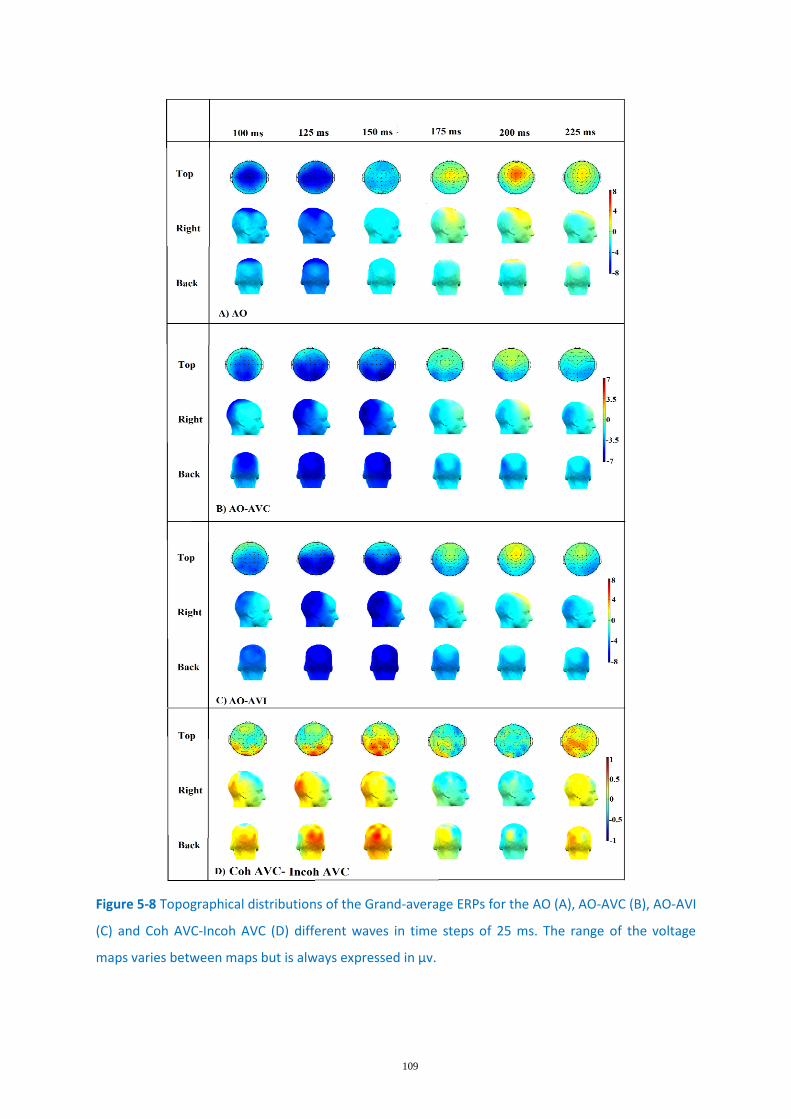
109
Figure 5-8 Topographical distributions of the Grand-average ERPs for the AO (A), AO-AVC (B), AO-AVI
(C) and Coh AVC-Incoh AVC (D) different waves in time steps of 25 ms. The range of the voltage
maps varies between maps but is always expressed in μv.
110
Finally, to directly assess possible contaminations on the major effect of interest that is
the difference between incoherent and coherent contexts in the AVC condition, we computed
scalp topographies for the difference between Coherent AVC and Incoherent AVC conditions
(see Figure 5-8D). The differences were rather small all over these maps, and the topography
differences were globally relatively noisy and make difficult any clear-cut conclusion from
these topographies.
Altogether, the results in the coherent context condition seem partially consistent with
previous findings of EEG studies, if we assume that the Coherent context provides a
condition similar to previous studies with no context. Visual speech in the congruent AVC
and incongruent AVI conditions is associated to both a significant decrease in amplitude for
N1 and in latency for P2. Importantly we found a significant effect of context in the AVC
condition for both amplitude and latency in P2, in line with our prediction. However, scalp
topographies raise a number of questions and doubts on the possibility to unambiguously
interpret these data, in the absence of a visual-only condition. We will now discuss these
results in relation with both previous EEG studies on AV speech perception and with our own
assumptions on AV binding.
DISCUSSION 5.4
Before discussing these findings, it is necessary to consider one important potential
limitation of the present findings. Testing cross-modal interactions usually involve
determining whether the observed response in the bimodal condition differs from the sum of
those observed in the unimodal conditions (e.g., AV ≠ A + V). In the present study, as
previously noted, the visual-alone condition was not obtained because of time limitation.
Although direct comparison between AV and auditory conditions performed in previous EEG
studies on AV speech integration have provided fully coherent results with other studies
111
using an additive model (see Pilling, 2009; Treille et al., 2014a,b; Van Wassenhove et al.,
2005), this limitation is important, and will lead to a specific component of our discussion.
Comparison of the Coherent context conditions with previous EEG studies 5.4.1
A preliminary objective of the study was to replicate the results of previous EEG studies
on N1/P2 in coherent context (Klucharev et al., 2003; Besle et al., 2004; Van Wassenhove et
al., 2005; Stekelenburg and Vroomen, 2007; Pilling, 2009; Stekelenburg and Vroomen, 2012;
Baart et al., 2014; Knowland et al., 2014; Treille et al., 2014a; b). Concerning AV congruent
stimuli AVC, our data are partially in line with previous studies. For the N1 component, we
obtained an amplitude reduction in AVC compared to AO, as in previous studies (Figure 5-
7A), though this amplitude reduction was not accompanied by a latency reduction (Figure 5-
7B), contrary to previous studies. In the P2 component, the decrease in amplitude and latency
(Figure 5-7C, D) from AO to AVC is also in line with previous studies (Van Wassenhove et
al., 2005; Stekelenburg and Vroomen, 2007; Pilling, 2009; Vroomen and Stekelenburg, 2010;
Knowland et al., 2014). Concerning AV incongruent (“McGurk”) stimuli AVI, there was an
amplitude reduction compared to the AO condition for N1 (Figure 5-7A) and the two peaks
also occurred earlier than in the AO condition, not significantly in N1 (Figure 5-7B) but sig-
nificantly in P2 (Figure 5-7C). Here, the output of previous studies is more contrasted. As a
matter of fact, the N1 amplitude and latency values for incongruent stimuli are not available
in the Van Wassenhove et al. (2005) study, whereas in the studies by Stekelenburg and
Vroomen (2007) and Baart et al. (2014) there is no difference between incongruent and
congruent conditions on both amplitude and latency. However, the results for P2 are not
consistent with the previous studies that compared congruent and incongruent stimuli, e.g., in
the study by Stekelenburg and Vroomen (2007) there is an effect of incongruent stimuli on
amplitude but no effect on latency whereas in the study by Van Wassenhove et al.
(2005) there is no amplitude effect but a latency effect. On the contrary, the recent study
112
by Knowland et al. (2014) is in line with the present findings in the incongruent condition for
N1 and P2 amplitude, even though the stimulus for incongruency differs from the present
study. Of course, some of these differences could also be due to various methodological
differences in the analyses, including in the present case the specific choice to systematically
keep the first peak in the P2 region in the case of double peaks responses, which occur for
many subjects (see analyses).
Comparison of the coherent and incoherent context conditions 5.4.2
The primary objective of the study was to test the possible role of an incoherent context
supposed to lead to unbinding as robustly displayed by behavioral data in Nahorna et al.
(2012; 2015) and hence decrease the effects of the visual input on N1/P2 latency and
amplitude.
We obtained no effect of context, either alone or in interaction with modality, for both
N1 amplitude and latency (Figure 5-7). However, we obtained a significant effect of context
for P2, alone for latency, and in interaction with modality for both latency and
amplitude. Post-hoc tests showed that these effects could be due to a suppression of the
decrease in amplitude and latency from AO to AVC when the context is incoherent (Figure 5-
7).
The fact that there is an effect of context on P2 but not on N1 is coherent with the view
that these components could reflect different processing stages, AV effects on N1 possibly
being not speech specific and only driven by visual anticipation independently on AV
phonetic congruence, while P2 would be speech specific, content dependent and modulated
by AV coherence (Stekelenburg and Vroomen, 2007; Baart et al., 2014). In summary, the
visual modality would produce a decrease in N1 amplitude and possibly latency because of
visual anticipation, independently on target congruence and context coherence. A congruent
visual input (AVC) would lead to a decrease in P2 amplitude and latency in the coherent
113
context because of visual predictability and AV speech specific binding. Incoherent context
would suppress this effect because of unbinding due to incoherence.
As for AVI stimuli, there was no context effect, both in behavioral and EEG results.
Actually, it appears that there is almost no AV integration in the present study for
incongruent McGurk stimuli (as shown by behavioral data), which likely explains the lack of
a role of context on EEG for these stimuli. The discrepancy in behavioral data with previous
experiments by Nahorna et al. (2012; 2015) likely comes from differences in the nature and
number of stimuli. The studies by Nahorna et al. (2012; 2015) involved voiced stimuli “ba,”
“da,” and “ga” whereas in the present study the EEG requirement to avoid prevoicing forced
us to select unvoiced stimuli “pa,” “ta,” and “ka.” More importantly, the previous studies
were based on a larger level of unpredictability, the subjects did not know when the targets
would happen in the films, and the coherent and incoherent contexts were systematically
mixed. In the present study, because of the constraints of the EEG paradigm, there was no
temporal uncertainty of the time when the target occurred, and the AV material was highly
restricted, with only ten different stimuli altogether (five different targets and two different
contexts). A perspective would hence be to use more variable stimuli in a further experiment.
The difference between AO and AVI conditions in P2 latency and amplitude could be
related to the fact that the subjects detect an AV incongruence. Indeed, behavioral data
in Nahorna et al. (2012; 2015) consistently display an increase in response times for McGurk
stimuli compared with congruent stimuli, independently of context, and the authors
interpreted this as suggesting that subjects detected the local incongruence independently on
binding per se, while binding would modulate the final decision. In summary, AVI would
produce (i) decrease in N1 amplitude and possibly latency because of visual anticipation; (ii)
decrease of P2 amplitude and latency because of incongruence detection; (iii) but no
114
integration per se, as displayed by behavioral data, and hence no modulation by context and
binding/unbinding mechanisms.
Possible contamination by visual areas 5.4.3
A crucial limitation of the present work is the lack of a visual-only condition. We
consider that this was a necessary evil in such a preliminary study since it was the only way
to be able to assess both congruent and incongruent targets in coherent vs. incoherent
contexts. However, this might have resulted in possible contamination effects from visual
regions that we will discuss now.
Firstly, contamination could be due to visual context. This is, however, rather unlikely
considering that the different contexts finish 1000 ms before the target. We systematically
compared results obtained with two baseline conditions, one far from the end of the context
(–100 to 0 ms) and the other one closer (–500 to –400 ms). It appeared that this baseline
change did not change the current results in any crucial way, either in whole graphs or
statistical analysis, which suggests that the fluctuations in ERP responses before the
apparition of the auditory stimulus at 0 ms do not intervene much in the further analysis of
AV interactions on N1 and P2.
It is more likely that contamination effects could be due to visual responses to the visual
component of the target. This appears particularly likely in the N1 time period, where scalp
maps in the AO-AVC and AO-AVI conditions (Figure 5-8) display larger negative values in
occipital areas than in central electrodes. Therefore, it cannot be ruled out that (some
unknown) part of the visual modulation of the auditory response could be due to propagation
of visual responses from the occipital region.
In the P2 time period, this is much less likely, considering that the pattern of responses is
now completely inverse between central and occipital electrodes, with a decrease of P2
amplitude from AO to AVC or AVI in the first ones, and an increase in the second ones.
115
However, the pattern of scalp difference between Coherent and Incoherent AVC conditions is
complex and fuzzy, and the amplitude differences between conditions are small. Therefore,
we cannot discard the possibility that the modulation of P2 response in the incoherent
compared with coherent context is due to propagation of the visual activity – though we must
remind that in these two conditions, the visual response actually corresponds to exactly the
same visual input, which makes the “visual propagation” hypothesis more unlikely.
Altogether our interpretation of the observed results is that (1) the pattern of EEG
responses we obtained in the N1/P2 time periods is compatible with classical visual effects on
the auditory response in this pattern of time, and with a possible modulation of these effects
by AV context, in line with our assumptions on AV binding; (2) however, the lack of a
visual-only condition impedes to firmly discard other interpretations considering
contamination from visual regions due to responses to the visual component of the stimulus;
and (3) this suggests that more experiments using the same kind of paradigm with AV
context, incorporating visual-only conditions to enable better control of the visual effects are
needed to assess the possibility to exhibit electrophysiological correlates of the
binding/unbinding mechanism in the human brain.
To conclude, we displayed a new paradigm for ERP AV studies based on the role of
context. We presented data about modulation of the auditory response in the N1/P2 time
periods due to the visual input, both in the target and context portions of the stimulus. We
proposed a possible interpretation of the modulations of the N1 and P2 components,
associated to (1) a classical visual modulation generally associated with predictive
mechanisms (see e.g., Van Wassenhove et al., 2005) and (2) possible modifications of this
effect due to incoherent context, in the framework of the two-stage “binding and fusion”
model proposed by Nahorna et al. (2012). However, we also discussed in detail a concurrent
116
interpretation only based on the contamination by visual responses in the visual regions, due
to the impossibility in the present study to incorporate a visual-only condition.
The search for electrophysiological correlates of attentional processes possibly
modifying AV interactions is an important challenge for research on AV speech perception
(see e.g., the recent study by Alsius et al. (2014), measuring the effect of attentional load on
AV speech perception using N1 and P2 responses as cues just as in the present study). We
suggest that binding associated with context should be integrated into general descriptions of
AV modulations of the N1 and P2 components of auditory ERP responses to speech stimuli,
in relation with general and speech specific effects and the role of attention. We will come
back to this in the general discussion in Chapter 7.
117
Chapter 6
6. DYNAMICS OF AV BINDING IN OLDER ADULTS
BACKGROUND AND HYPOTHESIS 6.1
Age is an important factor to consider in terms of an individual’s ability to listen and
communicate because as adults age, their sensory, perceptual and cognitive function decline
(Baltes and Lindenberger, 1997; Pichora-Fuller and Singh, 2006). Presbycusis (age-related
hearing loss) is one of the common disorders seen in older adults, which can affect the ability
to understand speech, especially in noisy situations. Beside age-related hearing loss, there
could appear a decline in auditory processing skills in which most normal hearing older
adults perform more poorly than younger adults, particularly in adverse listening conditions
(CHABA, 1988). In terms of day-to-day listening, many older adults indicate that listening in
noisy situations is a challenging and often exhausting experience. In addition to hearing, sev-
eral studies have shown that older individuals with normal or corrected vision also exhibited
reduced lip-reading skills (Shoop and Binnie, 1979; Dancer et al., 1994; Cienkowski and
Carney, 2002; Sommers et al., 2005; Feld and Sommers, 2009). In spite of a general deficit in
the unisensory modalities, the literature suggests that older adults could actually exhibit
greater multisensory integration when compared with younger adults (see Mozolic et al.,
2012 for review). Various studies which used McGurk stimuli to assess AV fusion have
indeed shown that with aging the McGurk effect increases (Thompson, 1995; Behne et al.,
2007; Setti et al., 2013), whereas some highly controlled studies reported non-significant
differences between young and older adults in AV speech perception (Cienkowski and
Carney, 2002; Sommers et al., 2005). However, a recent behavioral study by Sekiyama et al.
(2014) found that the visual influence was greater in older adults compared with younger
118
ones not only with equal SNRs but also with SNRs calibrated to equalize unisensory perfor-
mance, which seems to confirm that older adults do exhibit more dependency on visual in-
formation. Elements of this debate between two contradictive views were already discussed
in detail in an earlier Section (1.2.3).
The mechanism underlying such a potential increased multisensory integration in older
adults is not yet clear. The literature suggests various possible reasons such as a decline in
cognitive skills not specific to multisensory integration, inverse effectiveness associated with
sensory deficits, the temporal window for integration that changes with aging and failure of
top-down modulation on sensory processing in older adults. Yet, there is a lack of strong evi-
dence to support either one of these explanations individually (see Mozolic et al., 2012 for
review). Our objective in the present chapter was to estimate AV binding and its dynamics in
the older population, capitalizing on the experimental paradigms developed by Nahorna et al.
(2012; 2015) and in the present doctoral work.
Our expectations at the beginning of this work were not completely firm. Our first objec-
tive was to test whether the same kind of binding/unbinding/rebinding processes would be
displayed on seniors. On this basis, we considered it likely that, considering the potential in-
crease in integration in older adults, the modulation by context and attention could display
larger amplitude in older participants. On the other way round, it could be forecast that since
the visual modality is of particular importance for seniors, the visual input would be exploited
and fused even in case of incoherence, hence a decrease in unbinding. Finally, we also won-
dered whether the difficulty displayed by old subjects to process complex AV scenes could
be associated with impaired binding processes.
Therefore, we defined a first objective, which was to measure the binding, unbinding and
rebinding effect in older adults (Experiment A). This first experiment was a replication of our
first experiment on unbinding and rebinding in younger adults (see Chapter 3) which was
119
inspired from Nahorna et al. (2015). It was expected that an incoherent AV context should
decrease the strength of the McGurk effect and increase the amount of auditory responses to
McGurk targets and that a coherent reset stimulus should produce rebinding, which would
reset the default state of binding. In addition, we predicted that there could possibly exist dif-
ferences in time constants and dynamics in the binding/unbinding/rebinding mechanism. In
summary, firstly there should be modulation of the McGurk effect by various contexts and
secondly, the size and dynamics of these effects could be different when compared with a
younger population.
A second objective of the present chapter was to explore the potential role of attentional
mechanisms in the scene analysis process in older adults (Experiment B) and to compare with
the previous results in younger ones (see Chapter 4, Experiment B). Indeed, we recalled in
Chapter 1 how attentional processes may decrease audiovisual fusion, and we showed in
Chapter 4 how selective attention on one AV source in a mixture could modify the binding
process and the output of AV fusion. Interestingly, the increase in multisensory integration in
older adults compared to younger ones could be due to older adult’s deficits in top-down at-
tentional control, decreasing their ability to use selective attention to control the incoming
information and hence increasing multisensory interactions. As a matter of fact, various stud-
ies have displayed attentional deficits in older adults and showed how they get distracted by
multiple stimuli within or across modalities (Andres et al., 2006; Yang and Hasher, 2007;
Healey et al., 2008). However, Hugenschmidt et al. (2009) used a cued multisensory discrim-
ination paradigm to show that selective attention focused on one modality was intact in older
adults and able to reduce integration.
The results of Experiment B in Chapter 4 showed that in young adults, attentional load
put on a given coherent audiovisual source may reinforce binding and increase the McGurk
effect. Therefore, we decided to exploit the same experiment with seniors (it will also be
120
called Experiment B in the present chapter), with the following predictions; 1) the pop-out
effect of “Video syllables” should remain in seniors since it is likely a primitive effect
associated with syllables salience in the used audiovisual material; (2) the attentional effect
for “Video sentences” could be decreased in seniors due to a possible decrease in selective
attention – though the data by Hugenschmidt et al. (2009) suggest that selective attention
could well remain unchanged in older participants.
In summary, the experiments in this chapter were conducted in two parts, Experiment A
and Experiment B. Within Experiment A, we explored the binding, unbinding and rebinding
mechanism in an older population. In Experiment B, specific instructions were given to put
attention either on syllables or on sentences, and we expected partly similar effects of a glob-
al increase of the McGurk effect when attention was oriented towards a coherent AV source
(syllables or sentences), though possibly with quantitative differences between youngers and
elders.
METHODS AND MATERIALS 6.2
Participants 6.2.1
Twenty-five native French speaking older adults participated in the experiments (2 wom-
en and 23 men; from 60 to 75 years, 21 right-handed and 4 left-handed, mean age= 65.32
years; SD=3.92 years). None of them reported any hearing, vision (after correction) or neuro-
logical disorders. Other details on participants and selection criteria were already presented in
Section 2.1.
Further, we performed additional tests on older adults to rule out the participation of
hearing and cognitive impairment factors. All the participants were screened for peripheral
hearing loss using screening pure tone air-conduction audiometry for the frequencies 250–
8000 Hz. The pure tone average (500 Hz, 1000 Hz, and 2000 Hz) for all participants was
lower than 20 dB Hearing level (HL) and 35 dB HL in higher frequencies.
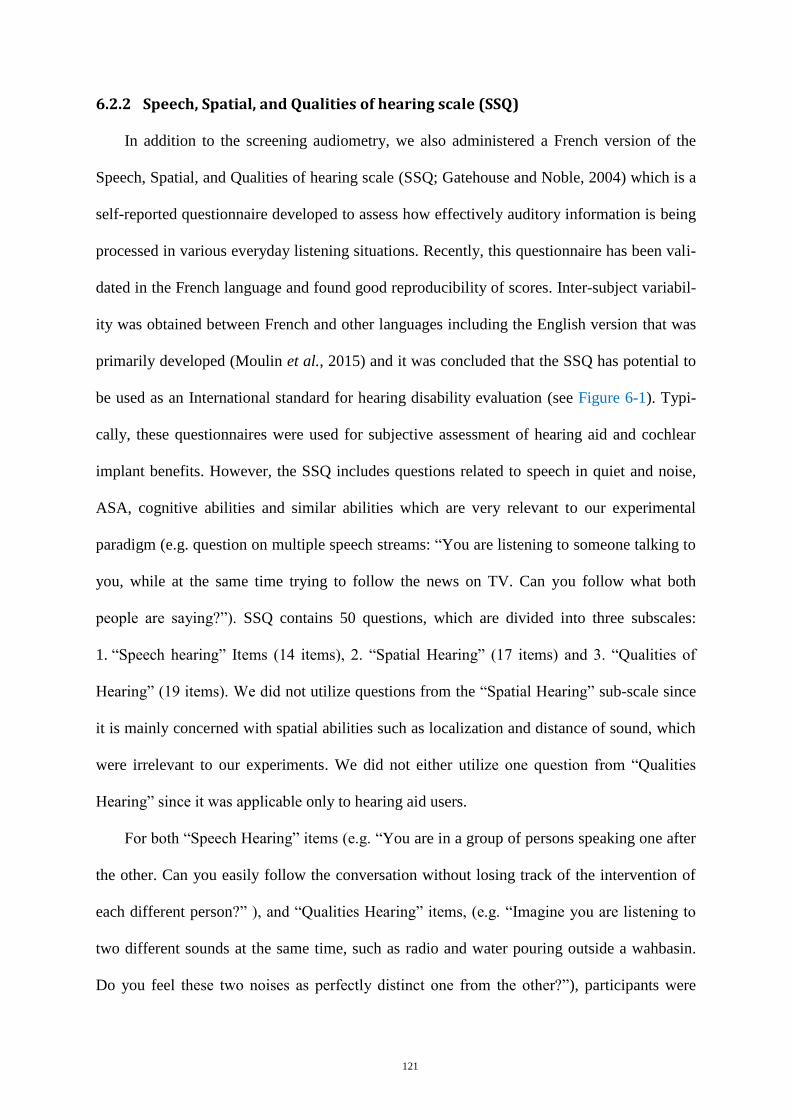
121
Speech, Spatial, and Qualities of hearing scale (SSQ) 6.2.2
In addition to the screening audiometry, we also administered a French version of the
Speech, Spatial, and Qualities of hearing scale (SSQ; Gatehouse and Noble, 2004) which is a
self-reported questionnaire developed to assess how effectively auditory information is being
processed in various everyday listening situations. Recently, this questionnaire has been vali-
dated in the French language and found good reproducibility of scores. Inter-subject variabil-
ity was obtained between French and other languages including the English version that was
primarily developed (Moulin et al., 2015) and it was concluded that the SSQ has potential to
be used as an International standard for hearing disability evaluation (see Figure 6-1). Typi-
cally, these questionnaires were used for subjective assessment of hearing aid and cochlear
implant benefits. However, the SSQ includes questions related to speech in quiet and noise,
ASA, cognitive abilities and similar abilities which are very relevant to our experimental
paradigm (e.g. question on multiple speech streams: “You are listening to someone talking to
you, while at the same time trying to follow the news on TV. Can you follow what both
people are saying?”). SSQ contains 50 questions, which are divided into three subscales:
1. “Speech hearing” Items (14 items), 2. “Spatial Hearing” (17 items) and 3. “Qualities of
Hearing” (19 items). We did not utilize questions from the “Spatial Hearing” sub-scale since
it is mainly concerned with spatial abilities such as localization and distance of sound, which
were irrelevant to our experiments. We did not either utilize one question from “Qualities
Hearing” since it was applicable only to hearing aid users.
For both “Speech Hearing” items (e.g. “You are in a group of persons speaking one after
the other. Can you easily follow the conversation without losing track of the intervention of
each different person?” ), and “Qualities Hearing” items, (e.g. “Imagine you are listening to
two different sounds at the same time, such as radio and water pouring outside a wahbasin.
Do you feel these two noises as perfectly distinct one from the other?”), participants were
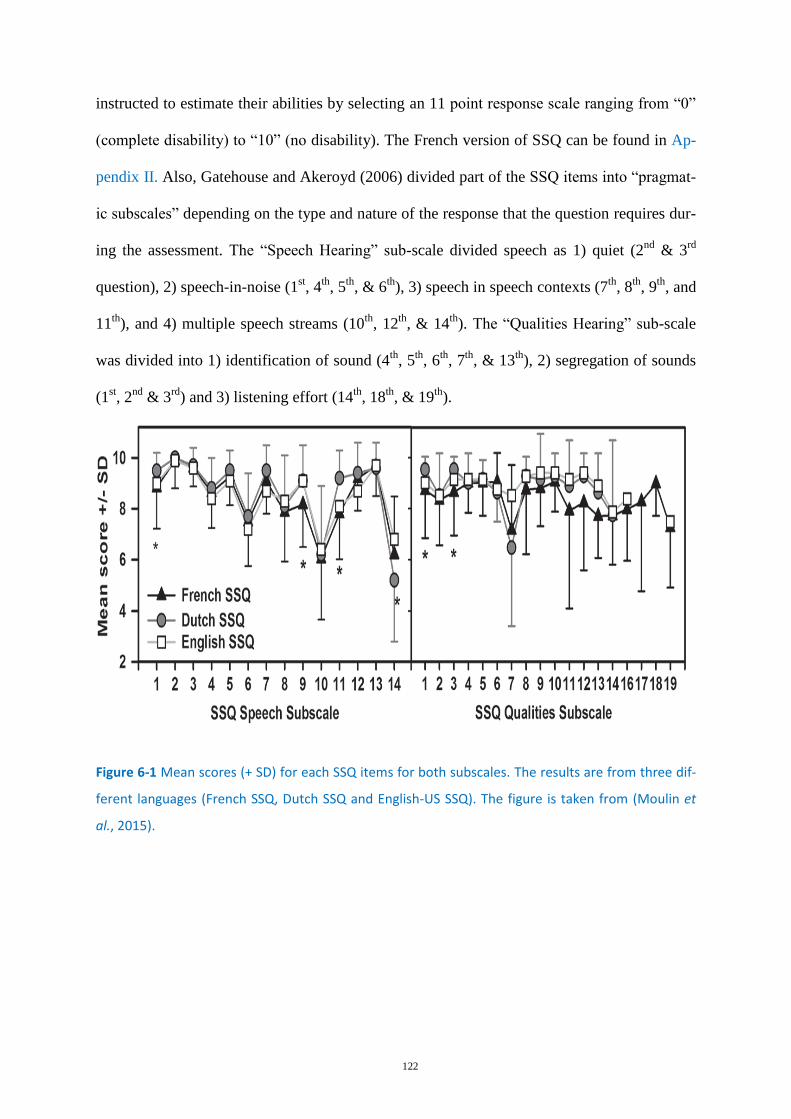
122
instructed to estimate their abilities by selecting an 11 point response scale ranging from “0”
(complete disability) to “10” (no disability). The French version of SSQ can be found in Ap-
pendix II. Also, Gatehouse and Akeroyd (2006) divided part of the SSQ items into “pragmat-
ic subscales” depending on the type and nature of the response that the question requires dur-
ing the assessment. The “Speech Hearing” sub-scale divided speech as 1) quiet (2nd
& 3rd
question), 2) speech-in-noise (1st, 4
th, 5
th, & 6
th), 3) speech in speech contexts (7
th, 8
th, 9
th, and
11th
), and 4) multiple speech streams (10th
, 12th
, & 14th
). The “Qualities Hearing” sub-scale
was divided into 1) identification of sound (4th
, 5th
, 6th
, 7th
, & 13th
), 2) segregation of sounds
(1st, 2
nd & 3
rd) and 3) listening effort (14
th, 18
th, & 19
th).
Figure 6-1 Mean scores (+ SD) for each SSQ items for both subscales. The results are from three dif-
ferent languages (French SSQ, Dutch SSQ and English-US SSQ). The figure is taken from (Moulin et
al., 2015).
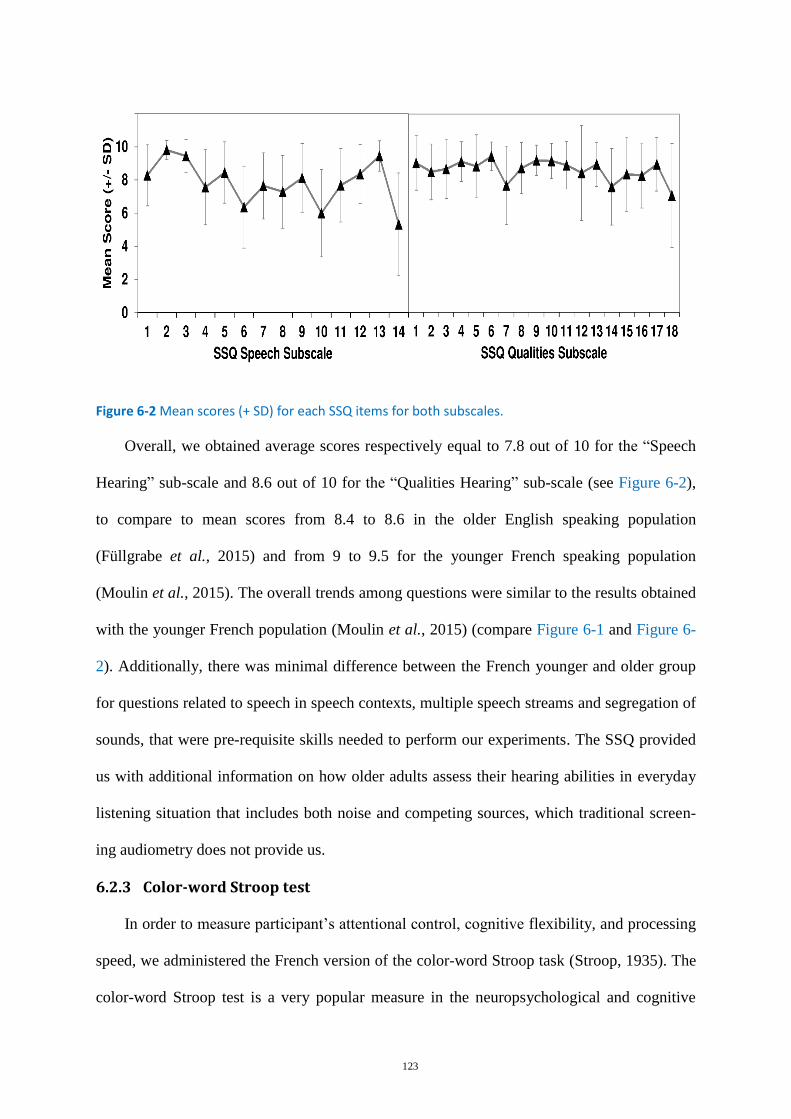
123
Figure 6-2 Mean scores (+ SD) for each SSQ items for both subscales.
Overall, we obtained average scores respectively equal to 7.8 out of 10 for the “Speech
Hearing” sub-scale and 8.6 out of 10 for the “Qualities Hearing” sub-scale (see Figure 6-2),
to compare to mean scores from 8.4 to 8.6 in the older English speaking population
(Füllgrabe et al., 2015) and from 9 to 9.5 for the younger French speaking population
(Moulin et al., 2015). The overall trends among questions were similar to the results obtained
with the younger French population (Moulin et al., 2015) (compare Figure 6-1 and Figure 6-
2). Additionally, there was minimal difference between the French younger and older group
for questions related to speech in speech contexts, multiple speech streams and segregation of
sounds, that were pre-requisite skills needed to perform our experiments. The SSQ provided
us with additional information on how older adults assess their hearing abilities in everyday
listening situation that includes both noise and competing sources, which traditional screen-
ing audiometry does not provide us.
Color-word Stroop test 6.2.3
In order to measure participant’s attentional control, cognitive flexibility, and processing
speed, we administered the French version of the color-word Stroop task (Stroop, 1935). The
color-word Stroop test is a very popular measure in the neuropsychological and cognitive
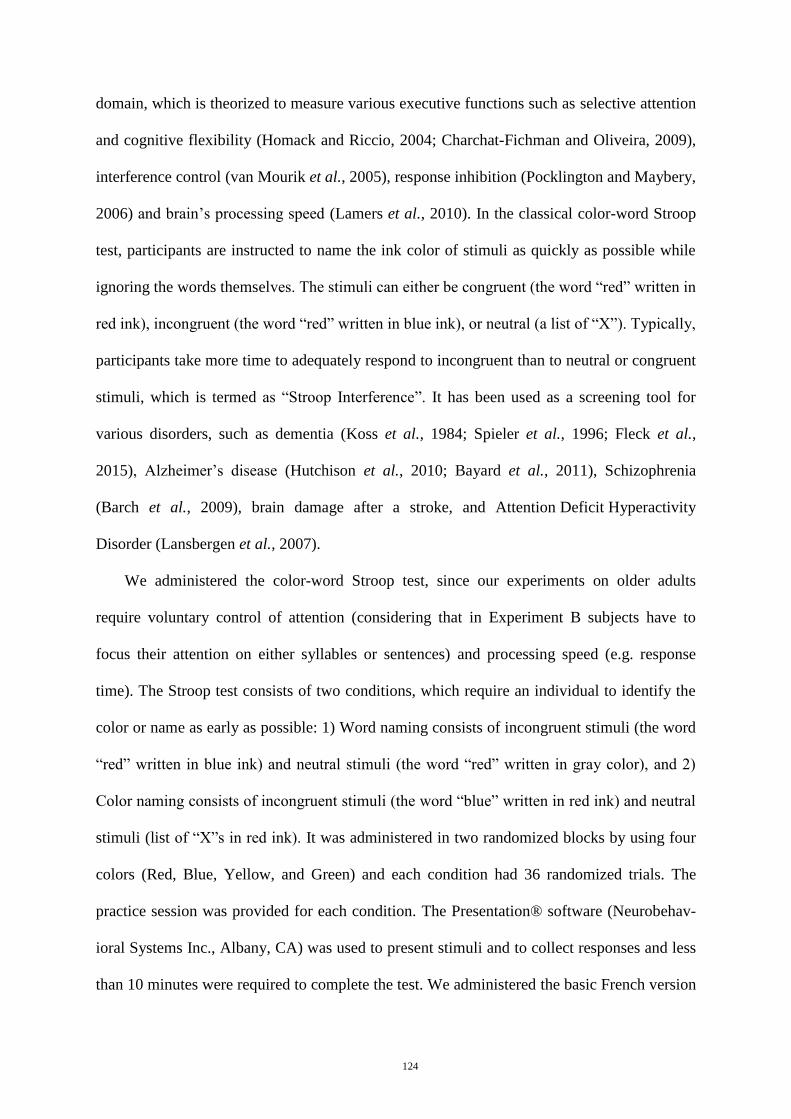
124
domain, which is theorized to measure various executive functions such as selective attention
and cognitive flexibility (Homack and Riccio, 2004; Charchat-Fichman and Oliveira, 2009),
interference control (van Mourik et al., 2005), response inhibition (Pocklington and Maybery,
2006) and brain’s processing speed (Lamers et al., 2010). In the classical color-word Stroop
test, participants are instructed to name the ink color of stimuli as quickly as possible while
ignoring the words themselves. The stimuli can either be congruent (the word “red” written in
red ink), incongruent (the word “red” written in blue ink), or neutral (a list of “X”). Typically,
participants take more time to adequately respond to incongruent than to neutral or congruent
stimuli, which is termed as “Stroop Interference”. It has been used as a screening tool for
various disorders, such as dementia (Koss et al., 1984; Spieler et al., 1996; Fleck et al.,
2015), Alzheimer’s disease (Hutchison et al., 2010; Bayard et al., 2011), Schizophrenia
(Barch et al., 2009), brain damage after a stroke, and Attention Deficit Hyperactivity
Disorder (Lansbergen et al., 2007).
We administered the color-word Stroop test, since our experiments on older adults
require voluntary control of attention (considering that in Experiment B subjects have to
focus their attention on either syllables or sentences) and processing speed (e.g. response
time). The Stroop test consists of two conditions, which require an individual to identify the
color or name as early as possible: 1) Word naming consists of incongruent stimuli (the word
“red” written in blue ink) and neutral stimuli (the word “red” written in gray color), and 2)
Color naming consists of incongruent stimuli (the word “blue” written in red ink) and neutral
stimuli (list of “X”s in red ink). It was administered in two randomized blocks by using four
colors (Red, Blue, Yellow, and Green) and each condition had 36 randomized trials. The
practice session was provided for each condition. The Presentation® software (Neurobehav-
ioral Systems Inc., Albany, CA) was used to present stimuli and to collect responses and less
than 10 minutes were required to complete the test. We administered the basic French version
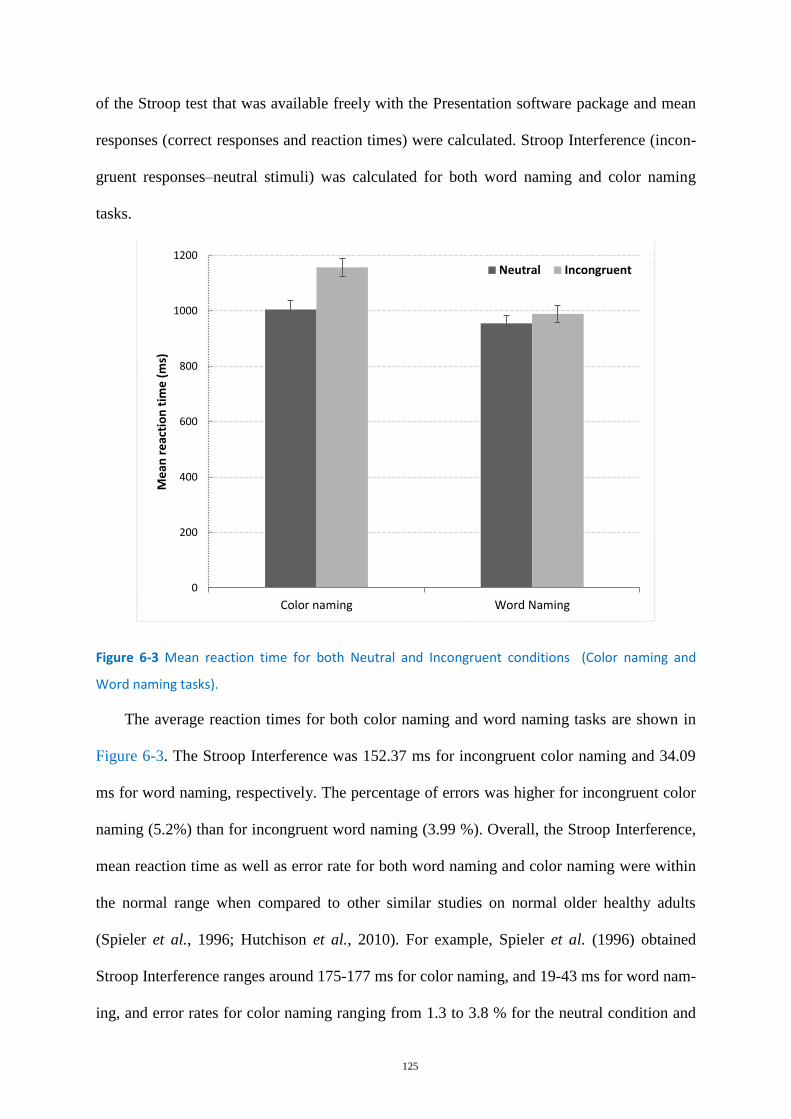
125
of the Stroop test that was available freely with the Presentation software package and mean
responses (correct responses and reaction times) were calculated. Stroop Interference (incon-
gruent responses–neutral stimuli) was calculated for both word naming and color naming
tasks.
Figure 6-3 Mean reaction time for both Neutral and Incongruent conditions (Color naming and
Word naming tasks).
The average reaction times for both color naming and word naming tasks are shown in
Figure 6-3. The Stroop Interference was 152.37 ms for incongruent color naming and 34.09
ms for word naming, respectively. The percentage of errors was higher for incongruent color
naming (5.2%) than for incongruent word naming (3.99 %). Overall, the Stroop Interference,
mean reaction time as well as error rate for both word naming and color naming were within
the normal range when compared to other similar studies on normal older healthy adults
(Spieler et al., 1996; Hutchison et al., 2010). For example, Spieler et al. (1996) obtained
Stroop Interference ranges around 175-177 ms for color naming, and 19-43 ms for word nam-
ing, and error rates for color naming ranging from 1.3 to 3.8 % for the neutral condition and
0
200
400
600
800
1000
1200
Color naming Word Naming
Me
an r
eac
tio
n t
ime
(m
s)
Neutral Incongruent
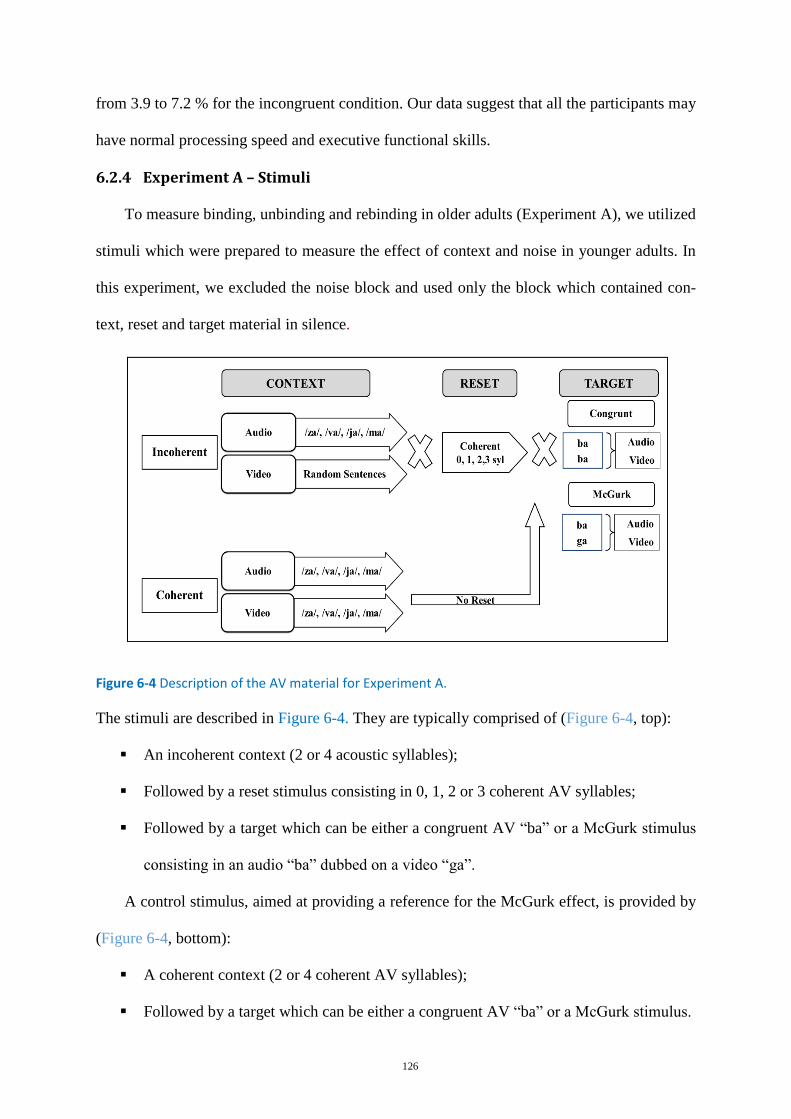
126
from 3.9 to 7.2 % for the incongruent condition. Our data suggest that all the participants may
have normal processing speed and executive functional skills.
Experiment A – Stimuli 6.2.4
To measure binding, unbinding and rebinding in older adults (Experiment A), we utilized
stimuli which were prepared to measure the effect of context and noise in younger adults. In
this experiment, we excluded the noise block and used only the block which contained con-
text, reset and target material in silence.
Figure 6-4 Description of the AV material for Experiment A.
The stimuli are described in Figure 6-4. They are typically comprised of (Figure 6-4, top):
An incoherent context (2 or 4 acoustic syllables);
Followed by a reset stimulus consisting in 0, 1, 2 or 3 coherent AV syllables;
Followed by a target which can be either a congruent AV “ba” or a McGurk stimulus
consisting in an audio “ba” dubbed on a video “ga”.
A control stimulus, aimed at providing a reference for the McGurk effect, is provided by
(Figure 6-4, bottom):
A coherent context (2 or 4 coherent AV syllables);
Followed by a target which can be either a congruent AV “ba” or a McGurk stimulus.
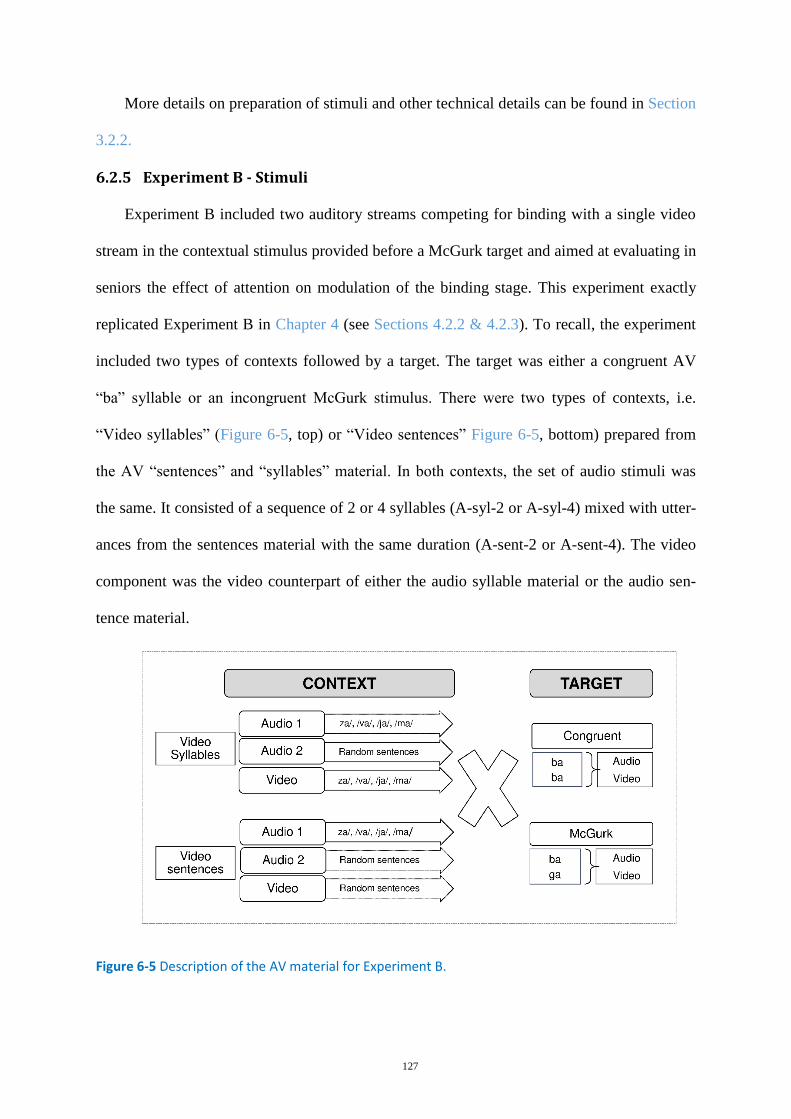
127
More details on preparation of stimuli and other technical details can be found in Section
3.2.2.
Experiment B - Stimuli 6.2.5
Experiment B included two auditory streams competing for binding with a single video
stream in the contextual stimulus provided before a McGurk target and aimed at evaluating in
seniors the effect of attention on modulation of the binding stage. This experiment exactly
replicated Experiment B in Chapter 4 (see Sections 4.2.2 & 4.2.3). To recall, the experiment
included two types of contexts followed by a target. The target was either a congruent AV
“ba” syllable or an incongruent McGurk stimulus. There were two types of contexts, i.e.
“Video syllables” (Figure 6-5, top) or “Video sentences” Figure 6-5, bottom) prepared from
the AV “sentences” and “syllables” material. In both contexts, the set of audio stimuli was
the same. It consisted of a sequence of 2 or 4 syllables (A-syl-2 or A-syl-4) mixed with utter-
ances from the sentences material with the same duration (A-sent-2 or A-sent-4). The video
component was the video counterpart of either the audio syllable material or the audio sen-
tence material.
Figure 6-5 Description of the AV material for Experiment B.
128
Procedure 6.2.6
The study on older adults included two consecutive experiments, Experiment A followed
by Experiment B (always in this order). The films were presented on a computer monitor
with high-fidelity headphones set at a comfortable fixed level.
In Experiment A, the participants were involved in a monitoring paradigm in which they
were asked to constantly look at the screen and monitor for possible “ba” or “da” targets by
pressing an appropriate key, as in previous experiments.
In Experiment B the monitoring “ba” vs. “da” task remained the same (with a different
order of the 120 stimuli in the film), but in addition, specific instructions were given to
participants, either to put more attention to syllables (“Attention syllables”) or to put more
attention to sentences (“Attention sentences”). To increase the efficiency of the attentional
demand and to control it to a certain extent, participants were informed that they would be
questioned on the content of either the “syllables” or the “sentences” material at the end of
the experiment. The questions were of the type “did you perceive the syllable ‘ja’ or ‘va’?” in
the syllables attention task, or “did you perceive the word ‘triangle’ or ‘line’?” in the sentenc-
es attention task. Most participants were indeed able to recall specific syllables or words. The
procedure is described in more detail in Section 4.2.3.
Processing of response 6.2.7
The processing of responses for both experiments was similar to previous experiments
(see Section 2.6 for more details). Correct responses were computed within the [200-1200
ms] window, from which a global behavioral response and a mean response time were calcu-
lated for each participant in each condition and subjected to statistical analysis for each ex-
periment.
Firstly, repeated-measures ANOVAs were performed on the proportions of “ba”
responses over the total number of “ba” plus “da” responses, processed with arcsine square
129
root [asin (sqrt)] transform to ensure quasi-Gaussian distribution of the variables; and
considering response times, ANOVAs were performed on the logarithm of these values for
ensuring normality of the distributions. Then, for each experiment, the transformed propor-
tion of “ba” responses and transformed response times were compared with those obtained
with young adults in similar paradigms (from Chapter 3 for Experiment A and Chapter 4 for
Experiment B) and a Mixed-Model ANOVA was performed between groups. In the Mixed-
Model ANOVA, the assumption of homogeneity of variances was tested using Box’s M test
of equality of covariance matrices and Leven’s test of equality of level variance. The Green-
house-Geisser correction was applied in the case of violation of the sphericity assumption.
Post-hoc analyzes were used with Bonferroni corrections, and only differences significant
after Bonferroni correction were reported (p<0.05).
RESULTS 6.3
Individual data and No response data 6.3.1
The individual data of “ba” scores for McGurk targets are shown in Figure 6-6 for
Experiment A. Similarly to our previous experiments, participants with more than 90% “ba”
scores in the “coherent condition” for McGurk targets in Experiment A were considered as
subjects with a poor level of AV fusion, and hence excluded from the statistical analysis for
both experiments. Overall, 8 participants were excluded (see Figure 6-6), and the remaining
17 participant’s data were subjected to statistical analysis for both Experiments A and B.
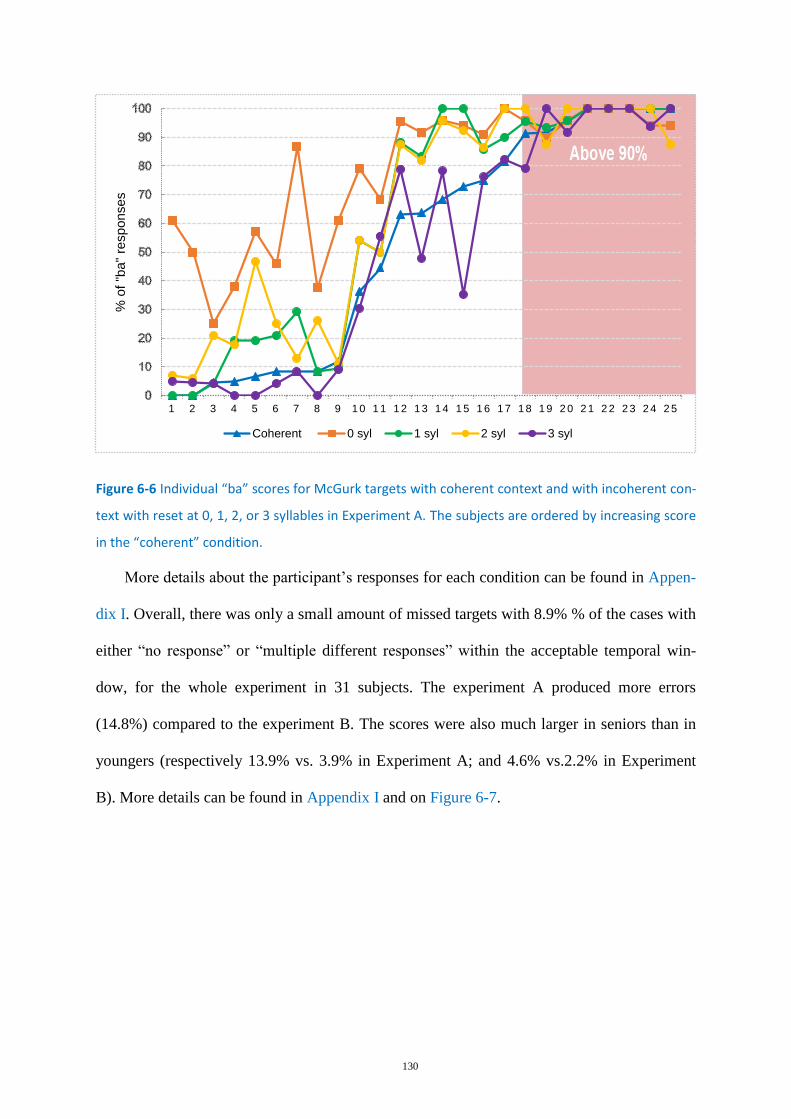
130
Figure 6-6 Individual “ba” scores for McGurk targets with coherent context and with incoherent con-
text with reset at 0, 1, 2, or 3 syllables in Experiment A. The subjects are ordered by increasing score
in the “coherent” condition.
More details about the participant’s responses for each condition can be found in Appen-
dix I. Overall, there was only a small amount of missed targets with 8.9% % of the cases with
either “no response” or “multiple different responses” within the acceptable temporal win-
dow, for the whole experiment in 31 subjects. The experiment A produced more errors
(14.8%) compared to the experiment B. The scores were also much larger in seniors than in
youngers (respectively 13.9% vs. 3.9% in Experiment A; and 4.6% vs.2.2% in Experiment
B). More details can be found in Appendix I and on Figure 6-7.
1 2 3 4 5 6 7 8 9 1 0 1 1 1 2 1 3 1 4 1 5 1 6 1 7 1 8 1 9 2 0 2 1 2 2 2 3 2 4 2 5
% o
f "b
a"
responses
Coherent 0 syl 1 syl 2 syl 3 syl
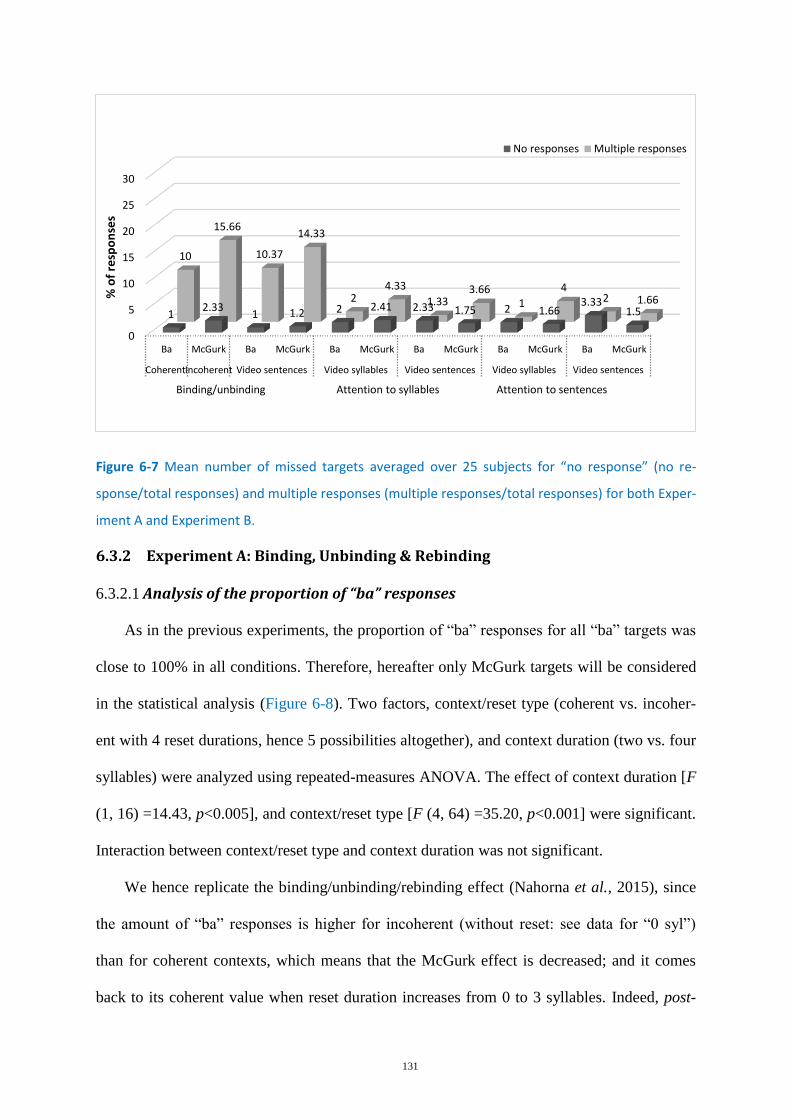
131
Figure 6-7 Mean number of missed targets averaged over 25 subjects for “no response” (no re-
sponse/total responses) and multiple responses (multiple responses/total responses) for both Exper-
iment A and Experiment B.
Experiment A: Binding, Unbinding & Rebinding 6.3.2
Analysis of the proportion of “ba” responses 6.3.2.1
As in the previous experiments, the proportion of “ba” responses for all “ba” targets was
close to 100% in all conditions. Therefore, hereafter only McGurk targets will be considered
in the statistical analysis (Figure 6-8). Two factors, context/reset type (coherent vs. incoher-
ent with 4 reset durations, hence 5 possibilities altogether), and context duration (two vs. four
syllables) were analyzed using repeated-measures ANOVA. The effect of context duration [F
(1, 16) =14.43, p<0.005], and context/reset type [F (4, 64) =35.20, p<0.001] were significant.
Interaction between context/reset type and context duration was not significant.
We hence replicate the binding/unbinding/rebinding effect (Nahorna et al., 2015), since
the amount of “ba” responses is higher for incoherent (without reset: see data for “0 syl”)
than for coherent contexts, which means that the McGurk effect is decreased; and it comes
back to its coherent value when reset duration increases from 0 to 3 syllables. Indeed, post-
0
5
10
15
20
25
30
Ba McGurk Ba McGurk Ba McGurk Ba McGurk Ba McGurk Ba McGurk
CoherentIncoherent Video sentences Video syllables Video sentences Video syllables Video sentences
1 2.33
1 1.2 2 2.41 2.33 1.75 2 1.66 3.33
1.5
10
15.66
10.37
14.33
2 4.33
1.33 3.66
1
4 2 1.66 %
of
resp
on
ses
Binding/unbinding Attention to syllables Attention to sentences
No responses Multiple responses
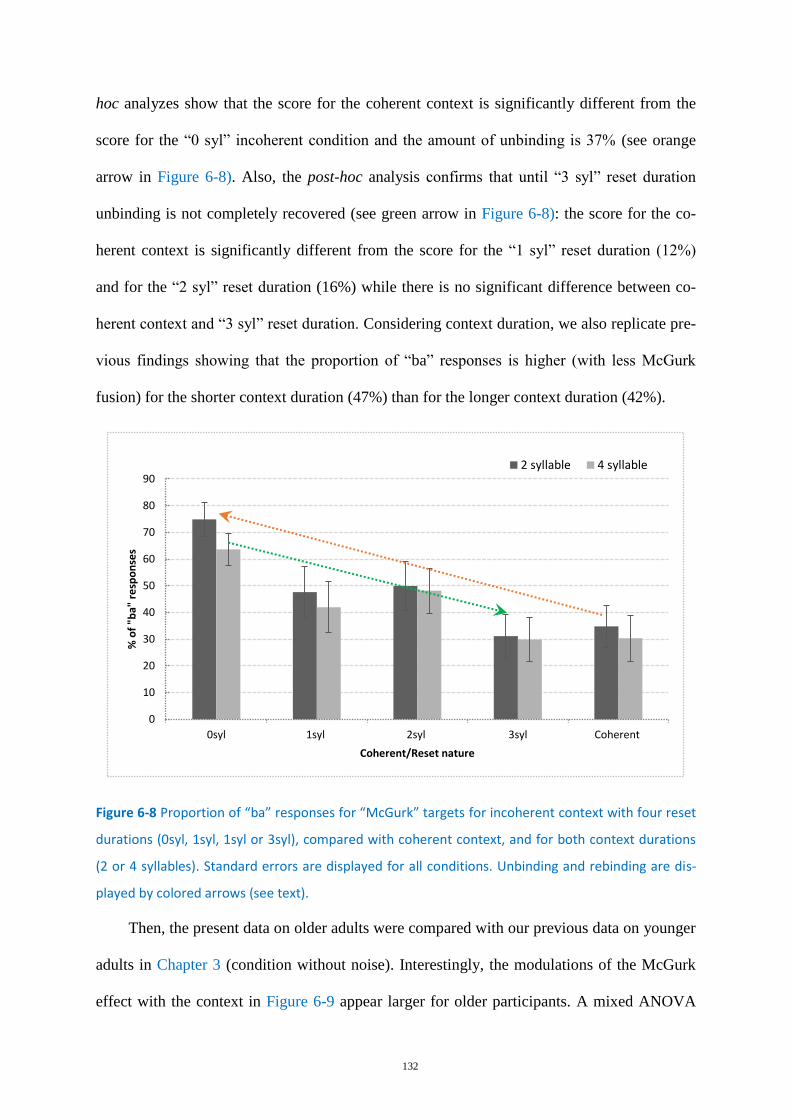
132
hoc analyzes show that the score for the coherent context is significantly different from the
score for the “0 syl” incoherent condition and the amount of unbinding is 37% (see orange
arrow in Figure 6-8). Also, the post-hoc analysis confirms that until “3 syl” reset duration
unbinding is not completely recovered (see green arrow in Figure 6-8): the score for the co-
herent context is significantly different from the score for the “1 syl” reset duration (12%)
and for the “2 syl” reset duration (16%) while there is no significant difference between co-
herent context and “3 syl” reset duration. Considering context duration, we also replicate pre-
vious findings showing that the proportion of “ba” responses is higher (with less McGurk
fusion) for the shorter context duration (47%) than for the longer context duration (42%).
Figure 6-8 Proportion of “ba” responses for “McGurk” targets for incoherent context with four reset
durations (0syl, 1syl, 1syl or 3syl), compared with coherent context, and for both context durations
(2 or 4 syllables). Standard errors are displayed for all conditions. Unbinding and rebinding are dis-
played by colored arrows (see text).
Then, the present data on older adults were compared with our previous data on younger
adults in Chapter 3 (condition without noise). Interestingly, the modulations of the McGurk
effect with the context in Figure 6-9 appear larger for older participants. A mixed ANOVA
0
10
20
30
40
50
60
70
80
90
0syl 1syl 2syl 3syl Coherent
% o
f "b
a" r
esp
on
ses
Coherent/Reset nature
2 syllable 4 syllable
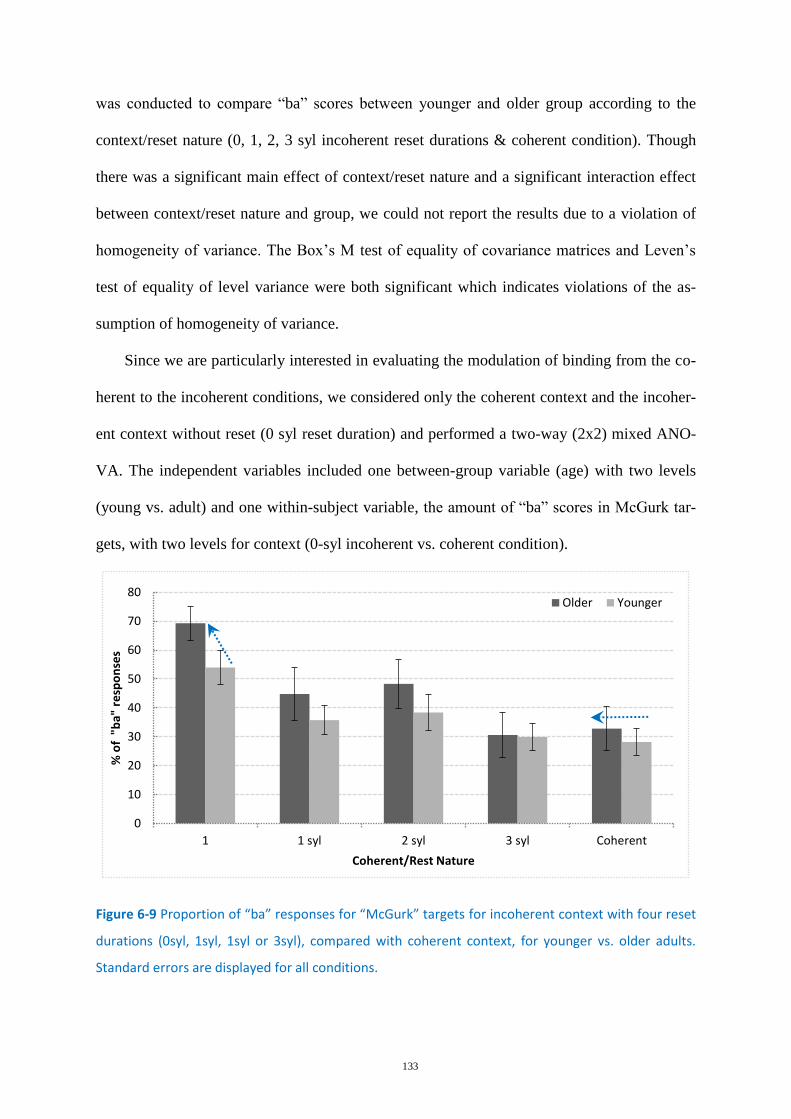
133
was conducted to compare “ba” scores between younger and older group according to the
context/reset nature (0, 1, 2, 3 syl incoherent reset durations & coherent condition). Though
there was a significant main effect of context/reset nature and a significant interaction effect
between context/reset nature and group, we could not report the results due to a violation of
homogeneity of variance. The Box’s M test of equality of covariance matrices and Leven’s
test of equality of level variance were both significant which indicates violations of the as-
sumption of homogeneity of variance.
Since we are particularly interested in evaluating the modulation of binding from the co-
herent to the incoherent conditions, we considered only the coherent context and the incoher-
ent context without reset (0 syl reset duration) and performed a two-way (2x2) mixed ANO-
VA. The independent variables included one between-group variable (age) with two levels
(young vs. adult) and one within-subject variable, the amount of “ba” scores in McGurk tar-
gets, with two levels for context (0-syl incoherent vs. coherent condition).
Figure 6-9 Proportion of “ba” responses for “McGurk” targets for incoherent context with four reset
durations (0syl, 1syl, 1syl or 3syl), compared with coherent context, for younger vs. older adults.
Standard errors are displayed for all conditions.
0
10
20
30
40
50
60
70
80
1 1 syl 2 syl 3 syl Coherent
% o
f "
ba"
re
spo
nse
s
Coherent/Rest Nature
Older Younger
134
In this case, the assumption of homogeneity of variances was not violated since Box’s M
test of equality of covariance matrices and Leven’s test of equality of level variance were not
significant. There was no significant difference between groups, but the context effect was
significant [F (1, 36) =121.84, p<. 0001] and there was a significant interaction between con-
text and groups [F (1, 36) =3.19, p<. 01]. Post-hoc analysis shows that there was a significant
difference between older and younger groups for the incoherent condition “0 syl” reset dura-
tion and a non-significant difference for coherent condition (see blue arrows in Figure 6-9).
Interestingly, since the scores for coherent context were not significantly different between
groups, the larger increase in “ba” score with the incoherent context in older subjects shows
without ambiguity that the dynamics of unbinding by incoherent context is larger for the old-
er participants.
Overall, the results produce three important outcomes. Firstly, they provide a replication
of the “unbinding” and “rebinding” effects in older adults. Secondly, the effect of context
duration (two vs. four syllables) was also replicated. Thirdly and most importantly, the un-
binding effect appears much larger in older adults compared with younger ones. Indeed,
while fusion scores are similar in the coherent context, the increase in “ba” responses due to
unbinding is around 37% in older adults vs. 25 % in younger adults. The rebinding dynamics
seem similar (around 3 syllables) though a direct comparison of the rebinding dynamics be-
tween groups could not be afforded in a mixed ANOVA.
Analysis of response time 6.3.2.2
Response times are displayed in Figure 6-10, averaged over participants and over the two
context durations. The data were analyzed in a two-way repeated-measures ANOVA with
factors target (“ba” vs. McGurk), context duration (2 syllables vs. 4 syllables) and con-
text/reset type (coherent vs. incoherent with 4 reset durations, hence 5 possibilities altogeth-
er). The ANOVA shows an effect of target [F (1, 16) =4.46, p<0.05], context/reset type [F (4,
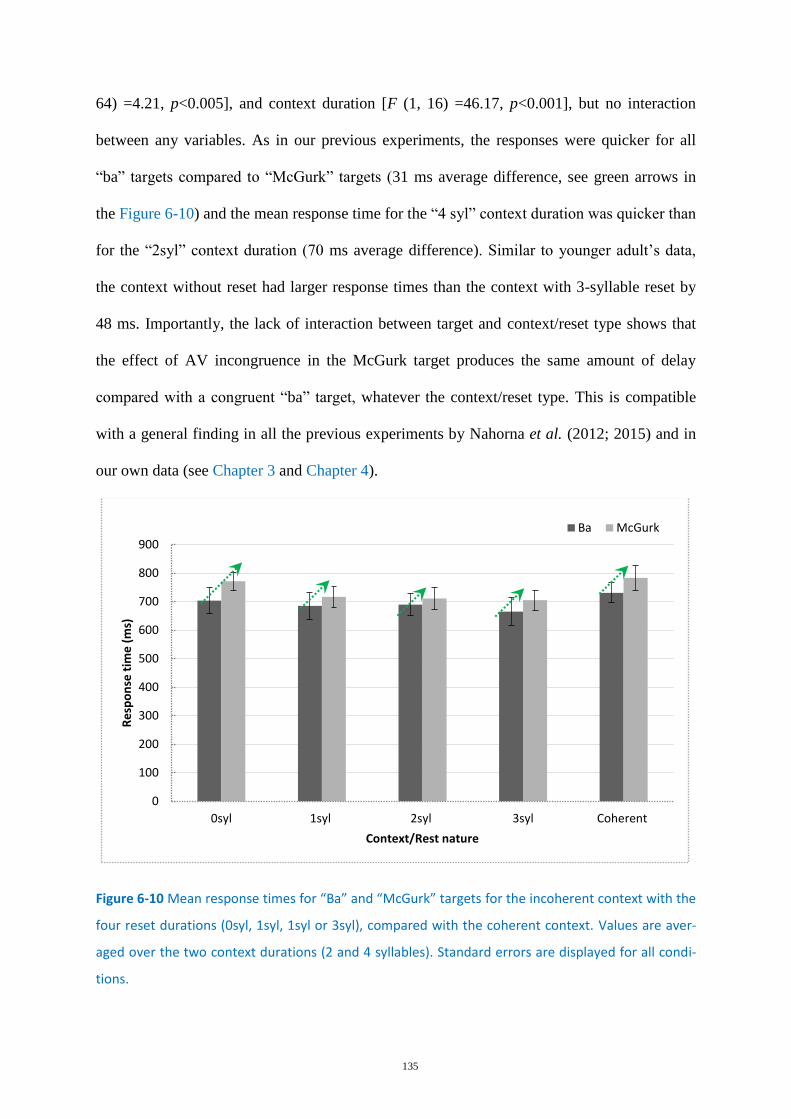
135
64) =4.21, p<0.005], and context duration [F (1, 16) =46.17, p<0.001], but no interaction
between any variables. As in our previous experiments, the responses were quicker for all
“ba” targets compared to “McGurk” targets (31 ms average difference, see green arrows in
the Figure 6-10) and the mean response time for the “4 syl” context duration was quicker than
for the “2syl” context duration (70 ms average difference). Similar to younger adult’s data,
the context without reset had larger response times than the context with 3-syllable reset by
48 ms. Importantly, the lack of interaction between target and context/reset type shows that
the effect of AV incongruence in the McGurk target produces the same amount of delay
compared with a congruent “ba” target, whatever the context/reset type. This is compatible
with a general finding in all the previous experiments by Nahorna et al. (2012; 2015) and in
our own data (see Chapter 3 and Chapter 4).
Figure 6-10 Mean response times for “Ba” and “McGurk” targets for the incoherent context with the
four reset durations (0syl, 1syl, 1syl or 3syl), compared with the coherent context. Values are aver-
aged over the two context durations (2 and 4 syllables). Standard errors are displayed for all condi-
tions.
0
100
200
300
400
500
600
700
800
900
0syl 1syl 2syl 3syl Coherent
Re
spo
nse
tim
e (
ms)
Context/Rest nature
Ba McGurk
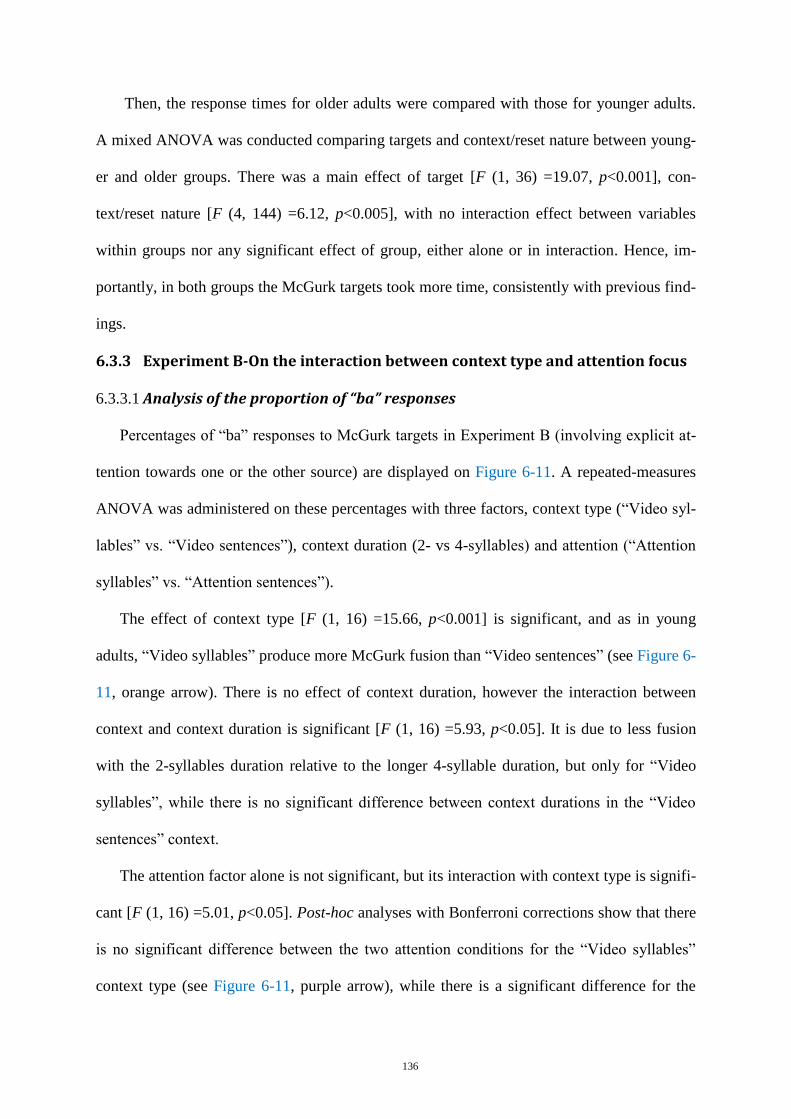
136
Then, the response times for older adults were compared with those for younger adults.
A mixed ANOVA was conducted comparing targets and context/reset nature between young-
er and older groups. There was a main effect of target [F (1, 36) =19.07, p<0.001], con-
text/reset nature [F (4, 144) =6.12, p<0.005], with no interaction effect between variables
within groups nor any significant effect of group, either alone or in interaction. Hence, im-
portantly, in both groups the McGurk targets took more time, consistently with previous find-
ings.
Experiment B-On the interaction between context type and attention focus 6.3.3
Analysis of the proportion of “ba” responses 6.3.3.1
Percentages of “ba” responses to McGurk targets in Experiment B (involving explicit at-
tention towards one or the other source) are displayed on Figure 6-11. A repeated-measures
ANOVA was administered on these percentages with three factors, context type (“Video syl-
lables” vs. “Video sentences”), context duration (2- vs 4-syllables) and attention (“Attention
syllables” vs. “Attention sentences”).
The effect of context type [F (1, 16) =15.66, p<0.001] is significant, and as in young
adults, “Video syllables” produce more McGurk fusion than “Video sentences” (see Figure 6-
11, orange arrow). There is no effect of context duration, however the interaction between
context and context duration is significant [F (1, 16) =5.93, p<0.05]. It is due to less fusion
with the 2-syllables duration relative to the longer 4-syllable duration, but only for “Video
syllables”, while there is no significant difference between context durations in the “Video
sentences” context.
The attention factor alone is not significant, but its interaction with context type is signifi-
cant [F (1, 16) =5.01, p<0.05]. Post-hoc analyses with Bonferroni corrections show that there
is no significant difference between the two attention conditions for the “Video syllables”
context type (see Figure 6-11, purple arrow), while there is a significant difference for the
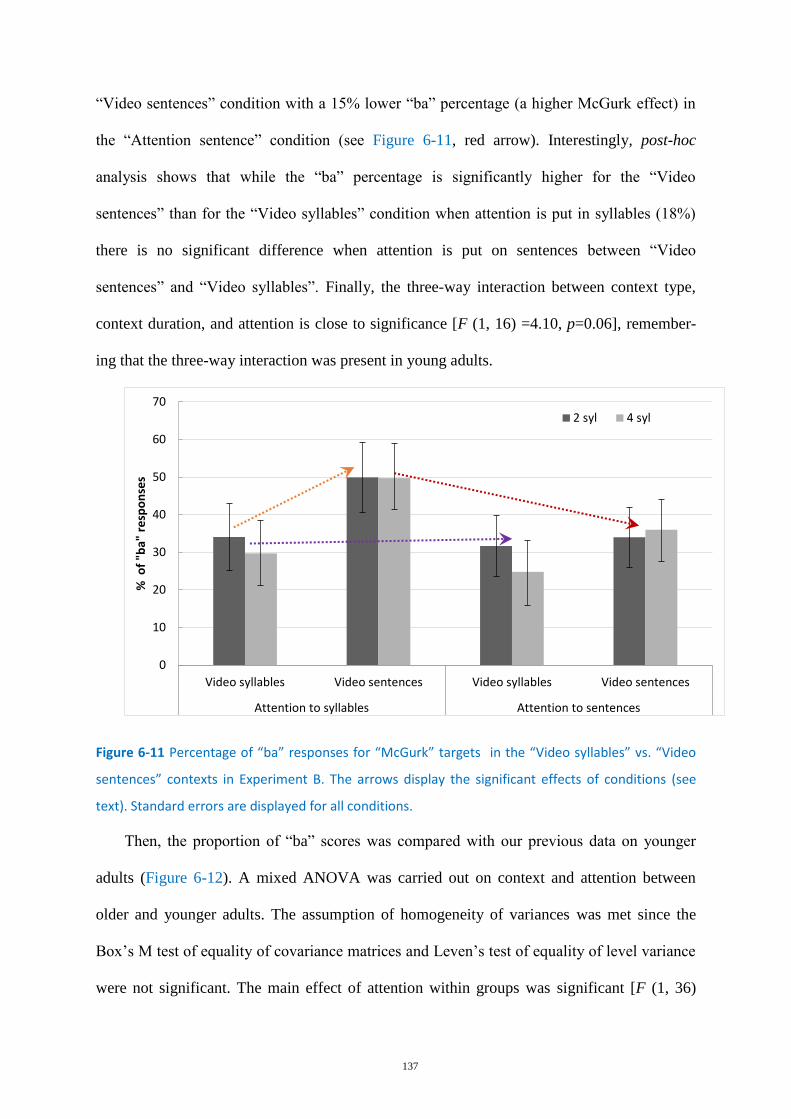
137
“Video sentences” condition with a 15% lower “ba” percentage (a higher McGurk effect) in
the “Attention sentence” condition (see Figure 6-11, red arrow). Interestingly, post-hoc
analysis shows that while the “ba” percentage is significantly higher for the “Video
sentences” than for the “Video syllables” condition when attention is put in syllables (18%)
there is no significant difference when attention is put on sentences between “Video
sentences” and “Video syllables”. Finally, the three-way interaction between context type,
context duration, and attention is close to significance [F (1, 16) =4.10, p=0.06], remember-
ing that the three-way interaction was present in young adults.
Figure 6-11 Percentage of “ba” responses for “McGurk” targets in the “Video syllables” vs. “Video
sentences” contexts in Experiment B. The arrows display the significant effects of conditions (see
text). Standard errors are displayed for all conditions.
Then, the proportion of “ba” scores was compared with our previous data on younger
adults (Figure 6-12). A mixed ANOVA was carried out on context and attention between
older and younger adults. The assumption of homogeneity of variances was met since the
Box’s M test of equality of covariance matrices and Leven’s test of equality of level variance
were not significant. The main effect of attention within groups was significant [F (1, 36)
0
10
20
30
40
50
60
70
Video syllables Video sentences Video syllables Video sentences
Attention to syllables Attention to sentences
% o
f "b
a" r
esp
on
ses
2 syl 4 syl
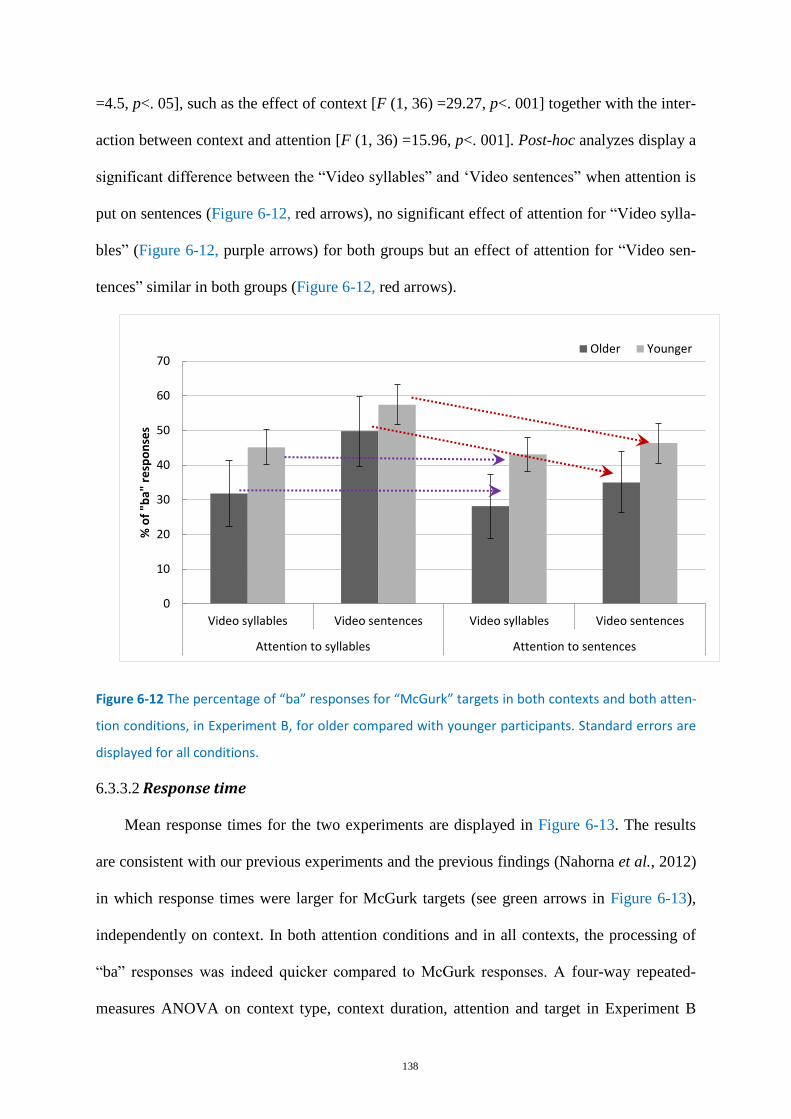
138
=4.5, p<. 05], such as the effect of context [F (1, 36) =29.27, p<. 001] together with the inter-
action between context and attention [F (1, 36) =15.96, p<. 001]. Post-hoc analyzes display a
significant difference between the “Video syllables” and ‘Video sentences” when attention is
put on sentences (Figure 6-12, red arrows), no significant effect of attention for “Video sylla-
bles” (Figure 6-12, purple arrows) for both groups but an effect of attention for “Video sen-
tences” similar in both groups (Figure 6-12, red arrows).
Figure 6-12 The percentage of “ba” responses for “McGurk” targets in both contexts and both atten-
tion conditions, in Experiment B, for older compared with younger participants. Standard errors are
displayed for all conditions.
Response time 6.3.3.2
Mean response times for the two experiments are displayed in Figure 6-13. The results
are consistent with our previous experiments and the previous findings (Nahorna et al., 2012)
in which response times were larger for McGurk targets (see green arrows in Figure 6-13),
independently on context. In both attention conditions and in all contexts, the processing of
“ba” responses was indeed quicker compared to McGurk responses. A four-way repeated-
measures ANOVA on context type, context duration, attention and target in Experiment B
0
10
20
30
40
50
60
70
Video syllables Video sentences Video syllables Video sentences
Attention to syllables Attention to sentences
% o
f "b
a" r
esp
on
ses
Older Younger
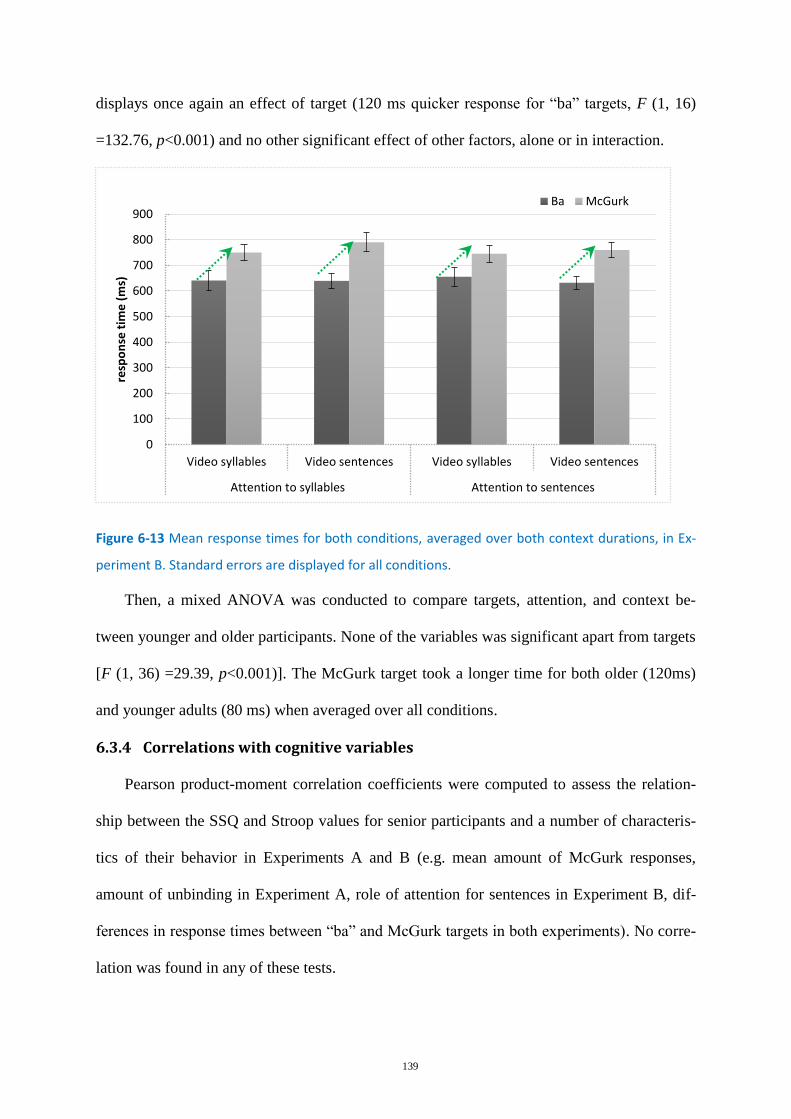
139
displays once again an effect of target (120 ms quicker response for “ba” targets, F (1, 16)
=132.76, p<0.001) and no other significant effect of other factors, alone or in interaction.
Figure 6-13 Mean response times for both conditions, averaged over both context durations, in Ex-
periment B. Standard errors are displayed for all conditions.
Then, a mixed ANOVA was conducted to compare targets, attention, and context be-
tween younger and older participants. None of the variables was significant apart from targets
[F (1, 36) =29.39, p<0.001)]. The McGurk target took a longer time for both older (120ms)
and younger adults (80 ms) when averaged over all conditions.
Correlations with cognitive variables 6.3.4
Pearson product-moment correlation coefficients were computed to assess the relation-
ship between the SSQ and Stroop values for senior participants and a number of characteris-
tics of their behavior in Experiments A and B (e.g. mean amount of McGurk responses,
amount of unbinding in Experiment A, role of attention for sentences in Experiment B, dif-
ferences in response times between “ba” and McGurk targets in both experiments). No corre-
lation was found in any of these tests.
0
100
200
300
400
500
600
700
800
900
Video syllables Video sentences Video syllables Video sentences
Attention to syllables Attention to sentences
resp
on
se t
ime
(m
s)
Ba McGurk
140
DISCUSSION 6.4
The present experiments (Experiment A and Experiment B) replicate the findings of our
previous experiments and confirm once again that context matters in AV integration. The
results in older adults support our hypotheses about AV binding and the two-stage model
introduced by Nahorna et al. (2012; 2015).
Experiment A displays unbinding and rebinding effects in older adult and shows that the
amount of unbinding is larger in older compared with younger adults (Figure 6-9). Important-
ly, the difference between groups occurs with the incoherent context without rebinding, while
there was no statistical difference between groups in the coherent context condition, which
makes a comparison between unbinding effects clearer.
The first difference between both groups in Experiment A could come from unisensory
performances. Concerning auditory perception, to minimize the effect of age-related hearing
loss, we performed audiometry and considered only the participants with good hearing sensi-
tivity. Considering visual perception, we saw previously that lip-reading abilities seem to
diminish as age increases, but this decline is more prominent for words and sentences than
syllables, and rather above 70 years at least for CV utterances (Shoop and Binnie, 1979;
Dancer et al., 1994; Sekiyama et al., 2014). In our experiments, target stimuli were always
syllables with CV contexts and the majority of participants fall under the age of 70’s (out of
17 participants, 9 were under 65 years, 5 were under 70 years, and only 3 were above 70
years). Therefore, it is likely that there was only a minimal effect of aging-related decline in
lip-reading in our data. Finally, the fact that the amount of fusion in the coherent context was
similar between older and younger participants in our data means that the difference is mainly
due to the way the incoherent context and the cognitive inferences it produced were
processed.
141
Indeed, Experiment A suggests that the incoherence of the audio and video streams could
lead older subjects to selectively decrease the role of the visual input in the fusion process
more than younger ones. This seems rather contradictory with the observation that they might
exhibit more dependency on visual information (Sekiyama et al., 2014). Sekiyama et al.
(2014) suggest that this heightened visual influence could be due to a delay in auditory pro-
cessing, in agreement with data showing that older adults exhibit slower auditory processing
for both speech (Tremblay and Ross, 2007) and non-speech (Schroeder et al., 1995) stimuli.
Sekiyama et al. (2014) propose a “visual priming hypothesis” according to which the contri-
bution of visual cues would be larger for individuals who process visual speech faster than
auditory speech when compared to individuals who have the same speed for both modalities
(Sekiyama and Burnham, 2008). In this context, the larger effect of unbinding in older sub-
jects could be related to the fact that under cognitive load, integration reduces (see Alsius et
al. 2005; 2007). Indeed, it could be assumed that in the case of incoherence, a certain amount
of attention is required for keeping audition and vision bound together and hence produce
binding. If the ability to maintain this amount of attention is decreased in seniors, this would
result in less fusion and more unbinding, which is actually what happens in Experiment A. In
our data, it appears that the large AV incoherence in the incoherent context leads the older
subjects to select only the dominant auditory input rather than to attempt to integrate auditory
and visual inputs that seem unlikely to come from the same source. This means that the “vis-
ual priming hypothesis” would depend on the state of the AV coherence mechanism, so that
if coherence appears too low, integration is more or less disrupted.
The results from Experiment B provide a more coherent pattern between older and
younger groups. Attention plays a role only for “Video sentences” but not for “Video sylla-
bles” even in older adults. This shows that in this experiment older adult’s present attentional
control similar to the younger group. As in younger adults, we suggest that in these stimuli
142
AV binding could be pre-attentive in “Video syllables” because of their strong, salient AV
co-modulations making them pop-out as strong bottom-up AV primitives.
Overall, our results are in line with the global architecture for multisensory integration
proposed by Talsma et al. (2010), introducing bidirectional interplay between attention and
multisensory processing. Moreover, both experiments provide additional information on the
AVSSA process in older adults. The two experiments in this study provide confirmation and
development to the view that AV fusion in speech perception includes a first stage of
AVSSA, rather similar in young and in older adults. Their theoretical consequences will be
further analyzed in the general discussion.
143
Chapter 7
7. GENERAL DISCUSSION
In the previous chapters, we have presented our objectives, results, and discussion for
each experiment. In this section, we will propose an overall discussion within the perspec-
tives of our assumptions and goals for the thesis. This will lead us to submit a tentative new
version of our “two-stage model for AV speech perception”, based on the analysis and likely
interpretations of the behavioral and neurophysiological experimental data presented in this
document. We will conclude with a number of possible further developments and perspec-
tives to strengthen the proposed AVSSA process.
SUMMARY OF THE MAJOR FINDINGS OF THIS WORK 7.1
Let us begin by summarizing the main results of our behavioral and EEG experiments in-
to three parts as per our objectives.
Behavioral characterization of the AV binding process 7.1.1
Previous experiments from Nahorna et al. (2012; 2015) demonstrated that AV fusion is
decreased by an incoherent context presented prior to the McGurk stimuli. This effect is ro-
bust, being replicated in various experiments within the two pioneer papers, and it supported
the authors’ assumption about the existence of an “AV binding stage” within the framework
of a “two-stage model” of AV perception. However, the stimuli that were developed by Na-
horna et al. (2012, 2015) always consisted of a single source for each sensory modality. To
assess the functioning of the binding mechanism in more realistic situations involving a
competition between sources inside the audio modality, we first adapted the
“unbinding/rebinding” paradigm by Nahorna et al. (2015, Experiment 2) with an important
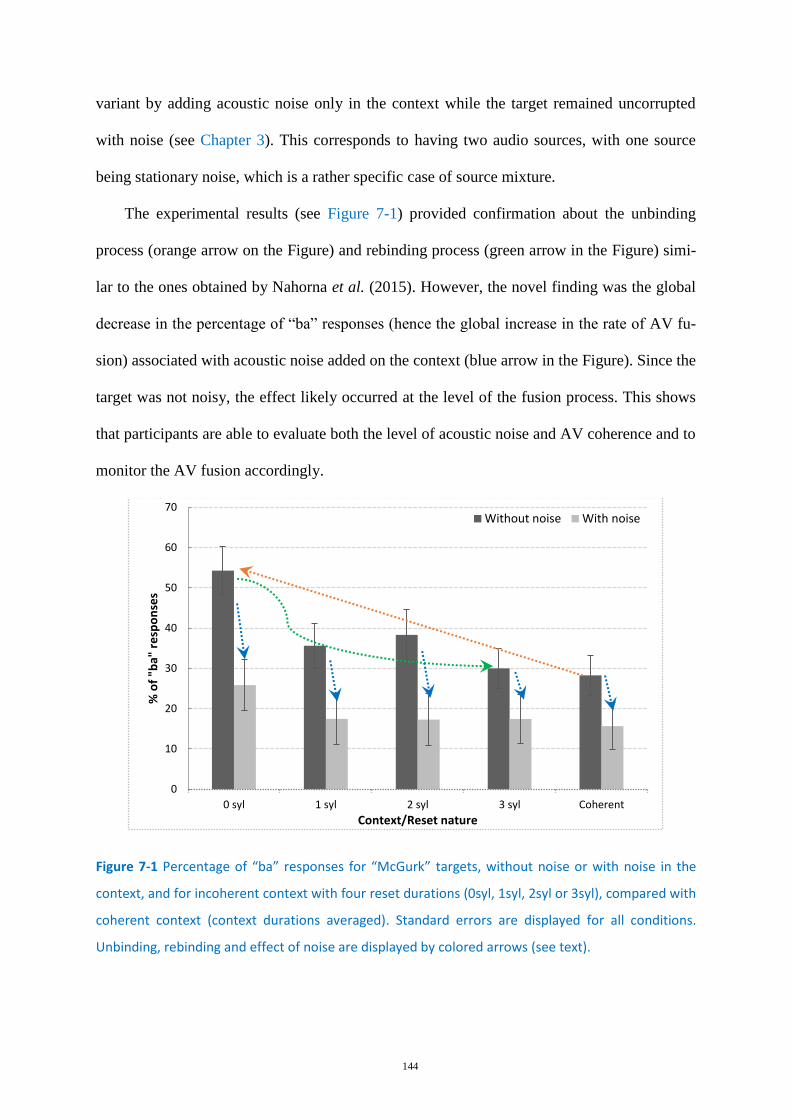
144
variant by adding acoustic noise only in the context while the target remained uncorrupted
with noise (see Chapter 3). This corresponds to having two audio sources, with one source
being stationary noise, which is a rather specific case of source mixture.
The experimental results (see Figure 7-1) provided confirmation about the unbinding
process (orange arrow on the Figure) and rebinding process (green arrow in the Figure) simi-
lar to the ones obtained by Nahorna et al. (2015). However, the novel finding was the global
decrease in the percentage of “ba” responses (hence the global increase in the rate of AV fu-
sion) associated with acoustic noise added on the context (blue arrow in the Figure). Since the
target was not noisy, the effect likely occurred at the level of the fusion process. This shows
that participants are able to evaluate both the level of acoustic noise and AV coherence and to
monitor the AV fusion accordingly.
Figure 7-1 Percentage of “ba” responses for “McGurk” targets, without noise or with noise in the
context, and for incoherent context with four reset durations (0syl, 1syl, 2syl or 3syl), compared with
coherent context (context durations averaged). Standard errors are displayed for all conditions.
Unbinding, rebinding and effect of noise are displayed by colored arrows (see text).
0
10
20
30
40
50
60
70
0 syl 1 syl 2 syl 3 syl Coherent
% o
f "b
a" r
esp
on
ses
Context/Reset nature
Without noise With noise
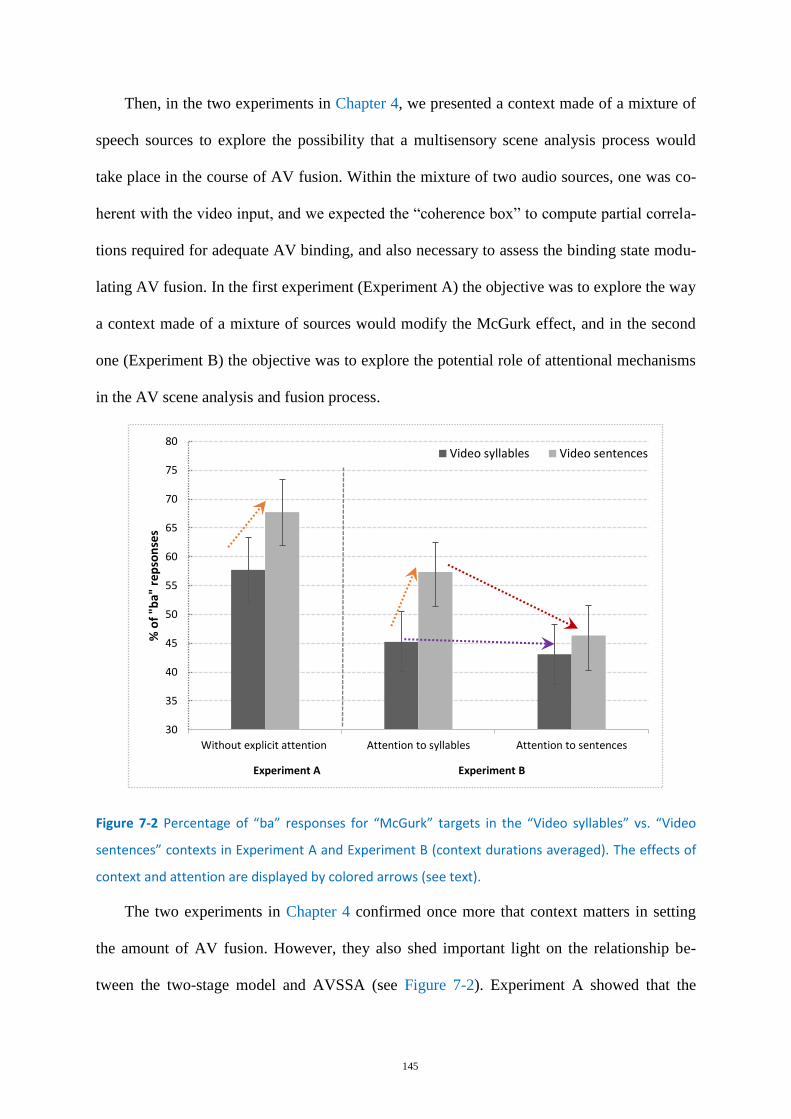
145
Then, in the two experiments in Chapter 4, we presented a context made of a mixture of
speech sources to explore the possibility that a multisensory scene analysis process would
take place in the course of AV fusion. Within the mixture of two audio sources, one was co-
herent with the video input, and we expected the “coherence box” to compute partial correla-
tions required for adequate AV binding, and also necessary to assess the binding state modu-
lating AV fusion. In the first experiment (Experiment A) the objective was to explore the way
a context made of a mixture of sources would modify the McGurk effect, and in the second
one (Experiment B) the objective was to explore the potential role of attentional mechanisms
in the AV scene analysis and fusion process.
Figure 7-2 Percentage of “ba” responses for “McGurk” targets in the “Video syllables” vs. “Video
sentences” contexts in Experiment A and Experiment B (context durations averaged). The effects of
context and attention are displayed by colored arrows (see text).
The two experiments in Chapter 4 confirmed once more that context matters in setting
the amount of AV fusion. However, they also shed important light on the relationship be-
tween the two-stage model and AVSSA (see Figure 7-2). Experiment A showed that the
30
35
40
45
50
55
60
65
70
75
80
Without explicit attention Attention to syllables Attention to sentences
% o
f "b
a" r
ep
son
ses
Experiment A Experiment B
Video syllables Video sentences
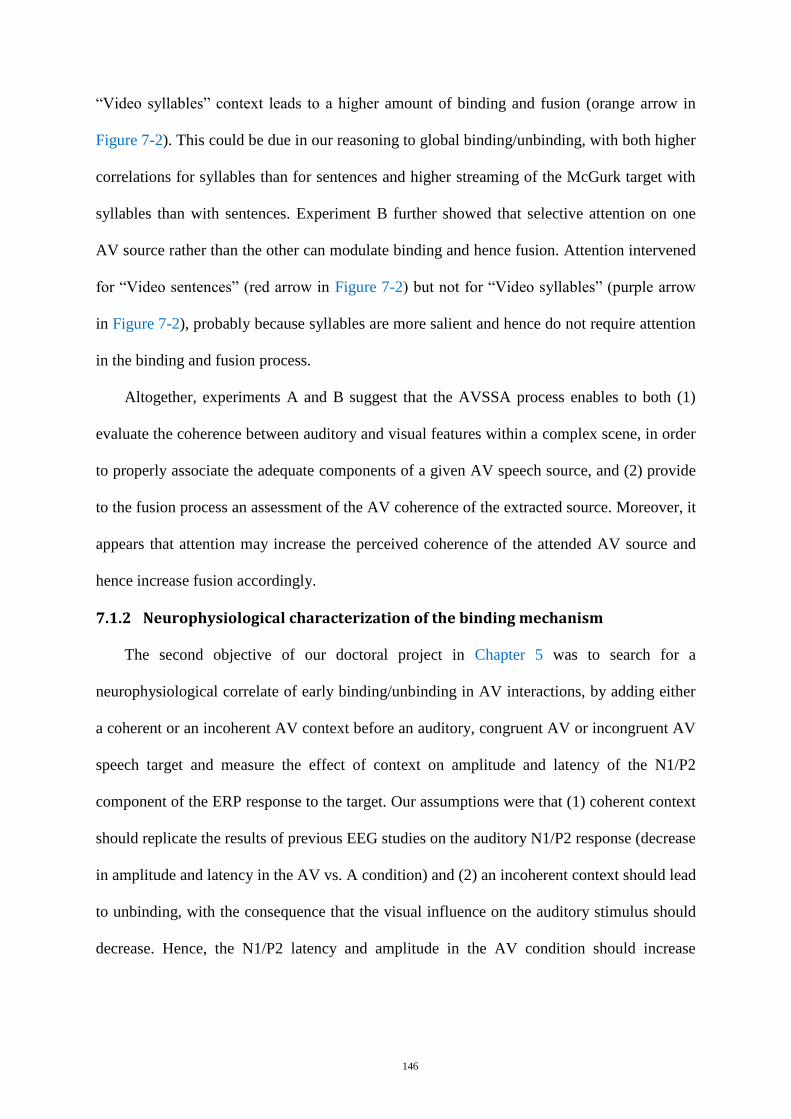
146
“Video syllables” context leads to a higher amount of binding and fusion (orange arrow in
Figure 7-2). This could be due in our reasoning to global binding/unbinding, with both higher
correlations for syllables than for sentences and higher streaming of the McGurk target with
syllables than with sentences. Experiment B further showed that selective attention on one
AV source rather than the other can modulate binding and hence fusion. Attention intervened
for “Video sentences” (red arrow in Figure 7-2) but not for “Video syllables” (purple arrow
in Figure 7-2), probably because syllables are more salient and hence do not require attention
in the binding and fusion process.
Altogether, experiments A and B suggest that the AVSSA process enables to both (1)
evaluate the coherence between auditory and visual features within a complex scene, in order
to properly associate the adequate components of a given AV speech source, and (2) provide
to the fusion process an assessment of the AV coherence of the extracted source. Moreover, it
appears that attention may increase the perceived coherence of the attended AV source and
hence increase fusion accordingly.
Neurophysiological characterization of the binding mechanism 7.1.2
The second objective of our doctoral project in Chapter 5 was to search for a
neurophysiological correlate of early binding/unbinding in AV interactions, by adding either
a coherent or an incoherent AV context before an auditory, congruent AV or incongruent AV
speech target and measure the effect of context on amplitude and latency of the N1/P2
component of the ERP response to the target. Our assumptions were that (1) coherent context
should replicate the results of previous EEG studies on the auditory N1/P2 response (decrease
in amplitude and latency in the AV vs. A condition) and (2) an incoherent context should lead
to unbinding, with the consequence that the visual influence on the auditory stimulus should
decrease. Hence, the N1/P2 latency and amplitude in the AV condition should increase
147
(reaching a value close to their value in the A condition) in the incoherent context compared
with the coherent context.
Figure 7-3 Grand-average of auditory evoked potentials for the six electrodes (frontal and central) on
the left column; and mean N1 and P2 amplitude for coherent vs. incoherent contexts on the right
column.
The main findings are the following. For the N1 component, there was an amplitude re-
duction in both AV congruent and incongruent conditions compared to the audio-only condi-
tion, as in previous studies, and for both coherent and incoherent contexts (Figure 7-3), while
there was no significant effect of the visual input on latency in any condition of target con-
gruence or context coherence (Figure 7-4). For the P2 component, the decrease in amplitude
and latency from the audio-only to the AV congruent condition (Figure 7-3 and Figure 7-4) is
also in line with previous studies. However, the novel finding in our study is the significant
effect of context for P2 between coherent and incoherent contexts in the AV congruent condi-
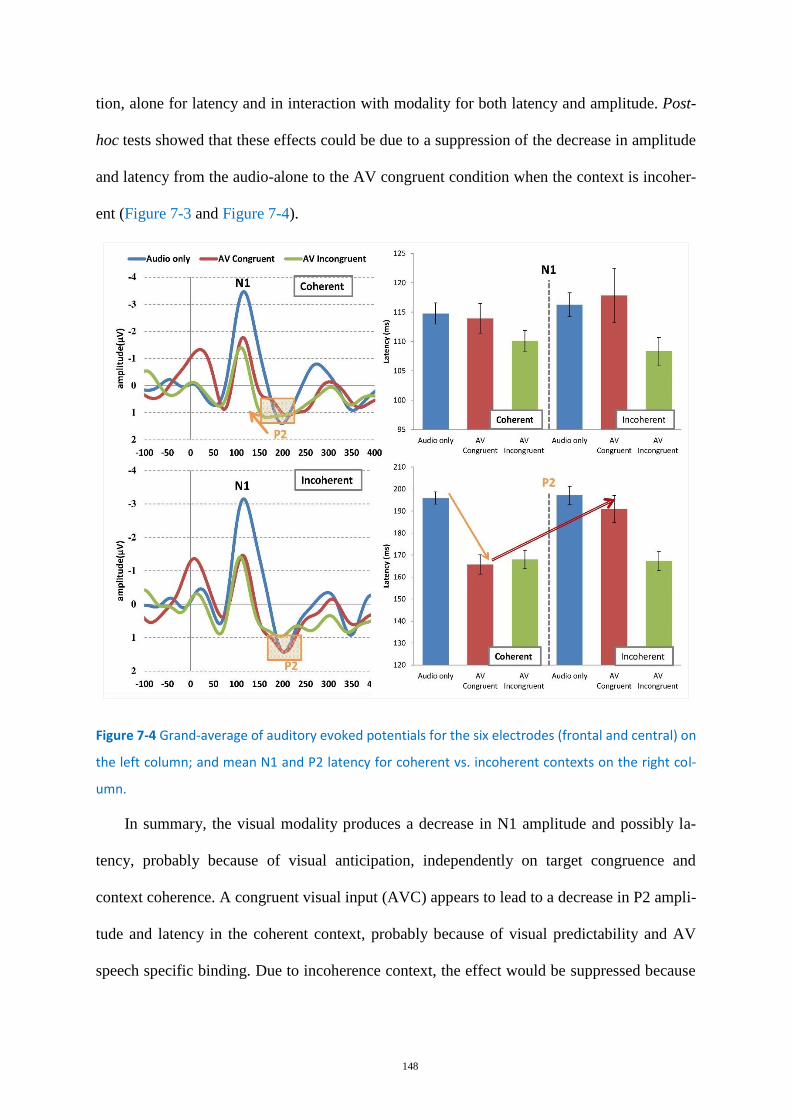
148
tion, alone for latency and in interaction with modality for both latency and amplitude. Post-
hoc tests showed that these effects could be due to a suppression of the decrease in amplitude
and latency from the audio-alone to the AV congruent condition when the context is incoher-
ent (Figure 7-3 and Figure 7-4).
Figure 7-4 Grand-average of auditory evoked potentials for the six electrodes (frontal and central) on
the left column; and mean N1 and P2 latency for coherent vs. incoherent contexts on the right col-
umn.
In summary, the visual modality produces a decrease in N1 amplitude and possibly la-
tency, probably because of visual anticipation, independently on target congruence and
context coherence. A congruent visual input (AVC) appears to lead to a decrease in P2 ampli-
tude and latency in the coherent context, probably because of visual predictability and AV
speech specific binding. Due to incoherence context, the effect would be suppressed because
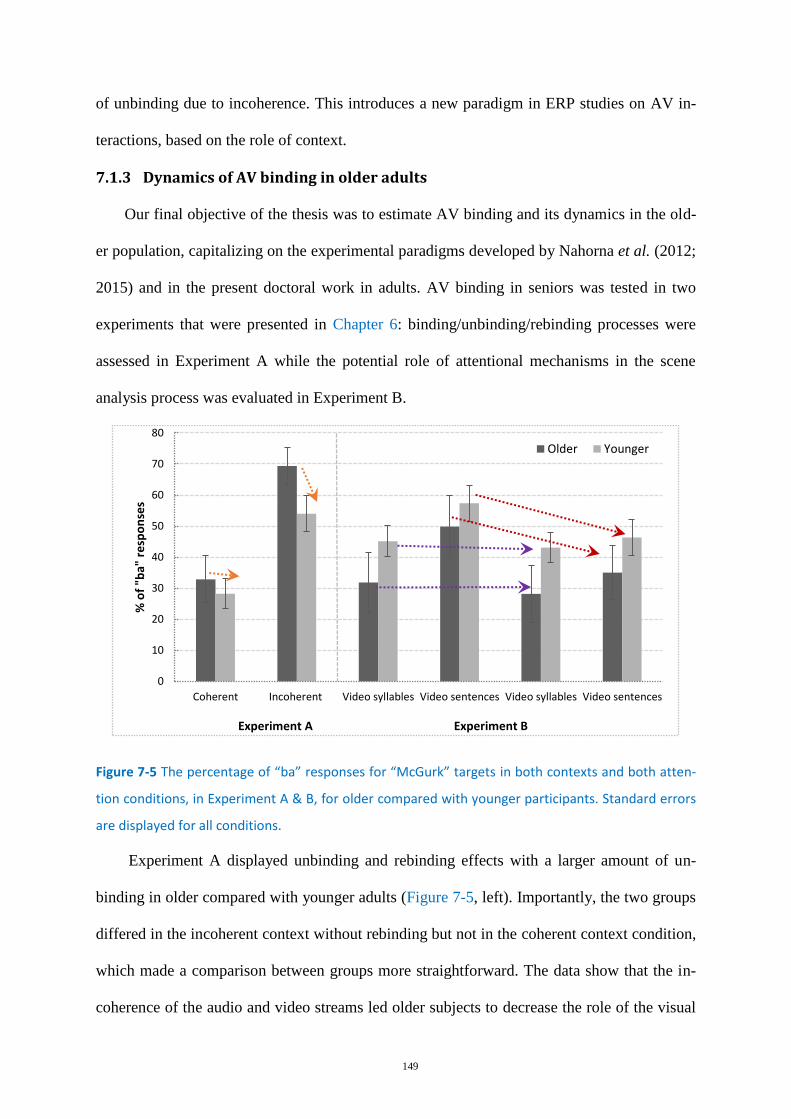
149
of unbinding due to incoherence. This introduces a new paradigm in ERP studies on AV in-
teractions, based on the role of context.
Dynamics of AV binding in older adults 7.1.3
Our final objective of the thesis was to estimate AV binding and its dynamics in the old-
er population, capitalizing on the experimental paradigms developed by Nahorna et al. (2012;
2015) and in the present doctoral work in adults. AV binding in seniors was tested in two
experiments that were presented in Chapter 6: binding/unbinding/rebinding processes were
assessed in Experiment A while the potential role of attentional mechanisms in the scene
analysis process was evaluated in Experiment B.
Figure 7-5 The percentage of “ba” responses for “McGurk” targets in both contexts and both atten-
tion conditions, in Experiment A & B, for older compared with younger participants. Standard errors
are displayed for all conditions.
Experiment A displayed unbinding and rebinding effects with a larger amount of un-
binding in older compared with younger adults (Figure 7-5, left). Importantly, the two groups
differed in the incoherent context without rebinding but not in the coherent context condition,
which made a comparison between groups more straightforward. The data show that the in-
coherence of the audio and video streams led older subjects to decrease the role of the visual
0
10
20
30
40
50
60
70
80
Coherent Incoherent Video syllables Video sentences Video syllables Video sentences
% o
f "b
a" r
esp
on
ses
Experiment A Experiment B
Older Younger
150
input in the fusion process more than younger ones. This could be related to the fact that un-
der cognitive load, integration reduces (see Alsius et al. 2005; 2007). Indeed, it could be as-
sumed that in the case of incoherence, a certain amount of attention is required for keeping
audition and vision bound together and hence produce binding. If the ability to maintain this
amount of attention is decreased in seniors, this would result in less fusion and more
unbinding, which is actually what happens in Experiment A. The lack of difference between
groups in Experiment B (see Figure 7-5, right) could be due to the fact that the attentional
focus on a given source could simplify the task and decrease the unbinding effects for both
groups.
INTERPRETATION OF THE PRESENT RESULTS WITHIN THE “TWO-STAGE MODEL” 7.2
The experiments presented in this doctoral work confirm that the preceding context
modulates AV fusion in both young and old adults, and shed new light on the AVSSA pro-
cess. In the following sections, we will firstly attempt to incorporate our results into the
“binding and fusion” architecture and propose an improved version of the two-stage model
for AV perception by introducing new components based on these results. Then, we will ad-
dress each component of this enhanced cognitive two-stage model for AV integration in rela-
tion to various studies in AV perception, including the outcome of the present work.
Characterization of the AVSSA process 7.2.1
The first set of experiments by Nahorna et al. (2012; 2015) provided primary evidence in
favor of the “two-stage model” in which a first binding stage evaluating the coherence be-
tween sound and face would control the output of the fusion process and hence possibly
change the percept (see Figure 1-14). This “AV binding stage” would enable the brain to as-
sess consistency between auditory and visual features in complex mixtures of competing
sources. From our results, we will attempt to define this process more precisely (see Figure 7-
6, AVSSA process box).
151
1. Channel reliability & AV coherence: The experimental results from Chapter 3 display two
cumulative effects playing a role in AV fusion. Firstly, as in the previous experiments by
Nahorna et al. (2012; 2015), fusion depends on a binding/unbinding/rebinding process con-
trolled by the coherence of the two sensory sources, resulting in decreasing the role of the
visual input if the AV coherence is weak. Secondly, the addition of acoustic noise in the con-
text stimulus before the McGurk target also appears to modify fusion even though there is no
noise in the target. Our interpretation is that addition of acoustic noise contaminated the
channel by making it less reliable, which resulted in an increase of the relative reliability of
the visual input. This suggests that the fusion process also depends on the estimated reliabil-
ity of each sensory channel controlling their relative weights in the final decision.
Altogether, it hence appears that AV fusion is monitored by the output of two evaluation
devices, one estimating AV coherence (and decreasing visual weight in the case of incoher-
ence) and the other estimating channel reliability (and increasing/decreasing channel weights
in relation to their relative reliability): see Figure 7-6. Notice that the dynamics of these ef-
fects can be quite large: noise increased the amount of the McGurk effect in our data by a
factor two (Figure 7-1) and unbinding decreased the amount of the McGurk effect by a factor
two in seniors (Figure 7-4).
2. Scene Analysis and Fusion modulation: Experiment A in Chapter 4 suggests a possible
decomposition of the AVSSA process in the case of an AV scene consisting of multiple sen-
sory inputs. This experiment involved competing auditory sources together with a visual
stream coherent with one of the competing auditory streams. The existence of a larger
amount of fusion for “Video syllables” than for “Video sentences” suggests that two sub-
processes took place here, one enabling AV source extraction (AV streaming) and the other
one computing AV coherence for fusion modulation. This is displayed in Figure 7-6 under
the terms “feature extraction” (see Figure 7-6, Ia) and “AV coherence” (see Figure 7-6, Ib).
152
Under the item “feature extraction” we both mean use of cues from one modality to as-
sist the extraction of cues in another modality, and use of temporal co-modulations to
appropriately associate auditory and visual cues belonging to a single AV source. In the case
of the experiments in Chapter 4, we assume that there is a first stage of unisensory ASA
providing at its output (bottom left box in Figure 7-6) separate audio cues for syllables and
for sentences. The “feature extraction” box (Ia) would enable the subjects to associate audito-
ry cues corresponding to either syllables or sentences with the corresponding visible infor-
mation. The “AV coherence” box (Ib) would then assess the amount of AV coherence for
driving the fusion process. For example, “Video syllables” would lead to a high AV
coherence and hence a good amount of AV fusion. In contrast, the coherence between audio
and video cues for sentences could be relatively lower – considering the fact that the scene
analysis process is never perfect – and hence, the amount of fusion was indeed lower. In
summary, there would be a first stage of low-level AV interactions followed by regular eval-
uation of the coherence of the audio and video components of the extracted AV stream.
3. Attention and AV binding: Various studies have shown that attention could intervene in
AV fusion through either global attentional control of fusion related to cognitive load (e.g.
Alsius et al., 2005; 2007) or specific attentional biases on a single sensory channel, (e.g. vi-
sion in Tiippana et al. 2004). The results from Experiment B in Chapter 4 suggest that atten-
tion may also increase the perceived coherence of the attended AV source and hence increase
fusion accordingly. Attention actually appeared to intervene in a bidirectional interplay,
either “top-down” (in the case of attention to “Video sentences”) with voluntary control on a
particular source, or “bottom-up” (in the case of attention to “Video syllables”) where the
source saliency could pop-out and automatically drive fusion. This led us to modify the two-
stage model by introducing two possible roles for attentional processes: 1) a global effect
with direct modulation of the decision (“General” arrow in Figure 7-6) and 2) an effect at the
153
level of the binding stage, in which orientation towards a particular source can influence the
output of the “AV coherence” stage (“Scene Oriented” arrow in Figure 7-6). This is the way
we interpret the increase in fusion for “Video sentences”: the AV coherence would be intrin-
sically low, but attention towards the sentences would enable the participants to recover some
amount of AV coherence and hence increase the visual weight for more McGurk effect.
4. N1/P2 and AV Binding: In our attempt to find neurophysiological correlates of early bind-
ing/unbinding in AV interactions, we obtained different effects of context for N1 and P2
components suggesting that these elements could reflect different processing stages. It has
been suggested that the AV effects on the N1 component could reflect automatic processes
possibly not speech specific and only driven by visual anticipation independently on AV
phonetic congruence (Stekelenburg and Vroomen, 2007; Baart et al., 2014). This is in agree-
ment with the lack of effect of context on N1. This effect could be associated with the “AV
Feature Extraction” Ia in Figure 7-6. On the contrary, the P2 component would be possibly
speech specific, content dependent and modulated by AV coherence (Stekelenburg and
Vroomen, 2007; Baart et al., 2014). This fits well with the existence of context effects on
both P2 amplitude and latency. This could be part of the “AV coherence” stage Ib in Figure
7-6. This would also fit possibly with the proposal of a dual route for AV speech processing,
by Arnal et al. (2009) as we will discuss later.
5. Older Adults and AV Binding: The experiments on seniors globally confirm the findings
of the earlier studies on younger adults. However, they also suggest that unbinding could re-
sult in increasing cognitive load for fusion – which would possibly be easier to tackle by
younger than by older participants. This could provide an unexpected link between the exper-
iments by Alsius et al. (2005; 2007) on the general role of cognitive load in decreasing fusion
– which means to a certain extent unbinding the sources – and our own experiments on bind-
ing/unbinding/rebinding processes.
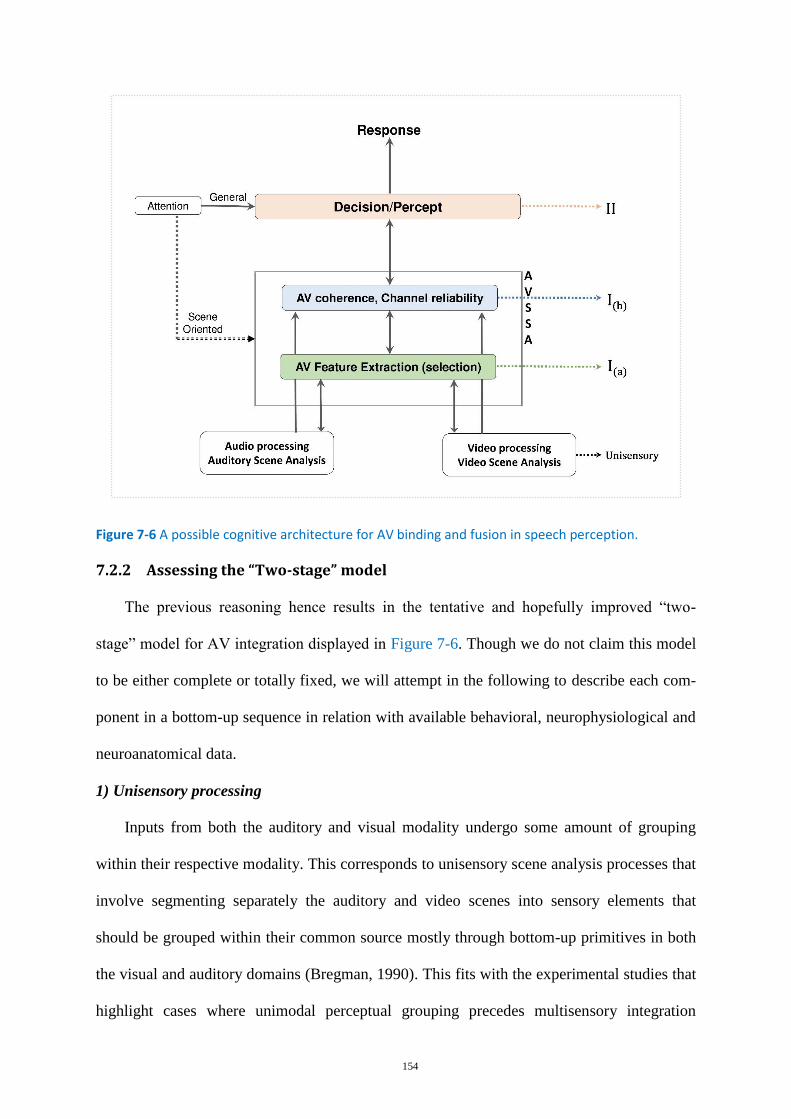
154
Figure 7-6 A possible cognitive architecture for AV binding and fusion in speech perception.
Assessing the “Two-stage” model 7.2.2
The previous reasoning hence results in the tentative and hopefully improved “two-
stage” model for AV integration displayed in Figure 7-6. Though we do not claim this model
to be either complete or totally fixed, we will attempt in the following to describe each com-
ponent in a bottom-up sequence in relation with available behavioral, neurophysiological and
neuroanatomical data.
1) Unisensory processing
Inputs from both the auditory and visual modality undergo some amount of grouping
within their respective modality. This corresponds to unisensory scene analysis processes that
involve segmenting separately the auditory and video scenes into sensory elements that
should be grouped within their common source mostly through bottom-up primitives in both
the visual and auditory domains (Bregman, 1990). This fits with the experimental studies that
highlight cases where unimodal perceptual grouping precedes multisensory integration
155
(Sanabria et al., 2005; Keetels et al., 2007). However, at this stage, each unisensory input
could receive feedback from the other modality through low-level interaction between modal-
ities, as will be discussed in the next section (see the bidirectional arrows to and from the
“AV Feature Extraction” box).
2) AVSSA process as a first stage in AV fusion
In the context of the two-stage model of AV fusion, Nahorna et al. (2012; 2015) incorpo-
rated a “coherence box” as a first processing stage proposing that the brain would continually
evaluate the coherence of both inputs to determine whether they result from the same source.
The results from the present work led us propose to decompose this box into two sub-
processes.
2a) AV Feature Extraction & Selection (Figure 7-6, I a)
Our results from Chapter 4 led us to incorporate an additional sub-stage within AVSSA
process which we termed as “AV Feature Extraction and Selection". This process would be in
charge of correctly associating auditory and visual cues on the basis of low-level temporal co-
modulations. It appears as a necessary step in any experiment involving various AV sources
(e.g. (Alsius and Soto-Faraco, 2011). It would be involved in the experiments related to the
“AV speech detection advantage” showing the benefit of good temporal AV correlations for
the detection or processing of speech in adverse conditions (e.g. Grant and Seitz, 2000; Kim
and Davis, 2004; Schwartz et al., 2004; Alsius and Munhall, 2013).
It could be argued that this stage is mostly non-speech specific, since it consists of low-
level interactions based on timing and not phonetic information. However, it is important to
notice that some studies show an enhanced role of the visual input for natural moving lips
compared with exactly the same temporal information provided in a non-speech mode (e.g. a
bar whose amplitude varies with either lip opening or acoustic envelope: see Bernstein et al.
(2004); Schwartz et al. (2004); Basirat et al. (2012)).
156
A number of studies analyzed the AV co-modulation and particularly correlation in time
between some audio (typically global envelope or envelope of particular spectral bands) and
video (lip or face parameter) cues (e.g. Munhall and Vatikiotis-Bateson, 1998; Yehia et al.,
1998; Barker and Berthommier, 1999; Jiang et al., 2002; Chandrasekaran et al., 2009), and
correlation in time between rms energy (particularly in the mid-to-high frequency energy-
envelope) and lip area has been considered a critical factor in the AV speech detection ad-
vantage (Grant and Seitz, 2000; Kim and Davis, 2004).
Globally, this stage would be in charge of the “AV scene analysis” mechanisms likely to
result in multisensory rather than unisensory grouping, as in the experiments in Chapter 4.
Indeed, various behavioral studies have suggested that the presentation of a visual stream can
enhance segregation or integration by affecting primary auditory streaming (e.g. Rahne et al.,
2007; Marozeau et al., 2010; Devergie et al., 2011; Berthommier and Schwartz., 2011; Mad-
dox et al., 2015).
Neuroanatomical and neurophysiological correlates
We will now attempt to discuss potential neuroanatomical and neurophysiological corre-
lates of the “AV Feature Extraction and Selection” stage – though we acknowledge that it is a
difficult and risky exercise.
It is now increasingly clear that AV interactions, which begin at a pre-cortical stage,
mostly in the superior colliculus (Stein and Meredith, 1993), can occur directly at the level of
primary cortices and then through a number of cortical systems (see Driver and Noesselt,
2008). Various EEG and fMRI data actually suggest that AV speech interactions may occur
at the earliest functional-anatomic stages of cortical processing (e.g. Calvert et al., 1997; Cal-
vert et al., 1999; Besle et al., 2004; Van Wassenhove et al., 2005; Okada et al., 2013). Even
pure lip-reading (i.e., visual speech without auditory stimulation) activates the auditory cortex
(Bernstein et al., 2002; Calvert and Campbell, 2003; Hall et al., 2005) and congruent visual
157
speech increases the activity in response to auditory speech in the auditory cortex (Okada et
al., 2013).
In relation with our own data on the lack of context effects on AV interactions in N1, and
in relation with other studies showing that suppression and speeding-up of the N1 component
are not affected by the AV congruency and mainly depend on anticipatory visual cues
(Stekelenburg and Vroomen, 2007; Baart et al., 2014), it could be suggested that N1 is a
basic correlate of this first AV interaction stage. It remains unclear if processing at this stage
is the result of a direct link between unisensory primary cortices or if it involves a mediating
link through the STS (Calvert et al., 1999; Ghazanfar and Schroeder, 2006), see later the “du-
al route” proposal by Arnal et al. (2009).
2b) AV Coherence and Channel Reliability (Figure 7-6, Ib)
The second sub-box in our model would be in charge of evaluating AV coherence for
constantly monitoring the coherence of the AV input and weighting the visual modality ac-
cordingly. This is a process required by the many studies by Nahorna et al. (2012; 2015) and
our own work demonstrating that context matters, and displaying unbinding/rebinding pro-
cesses in which the lower the internal evaluation of AV coherence, the less bound the audito-
ry and visual inputs and the lower the visual weight in the fusion process. Notice that this
stage should comprise speech specific components, considering the second experiment in
Nahorna et al. (2012) showing that temporal co-modulations are not the only elements in AV
speech binding. Indeed, this experiment displayed unbinding provided by pure phonetic inco-
herence with stimuli keeping a perfect timing of the AV co-modulations of lip opening and
acoustic envelope. Nahorna et al. (2012) suggested that the fine phonetic content of each
stream is determined and exploited in the binding process (see Figure 1-15b), hence the bidi-
rectional arrow to and from the decision process in Figure 7-6.
158
An important and new result in Chapter 3 is the clear demonstration that noise in a given
channel decreases the weight of the channel in the fusion process. This had already been ob-
served for both acoustic noise increasing the role of vision (e.g. Sekiyama and Tohkura,
1991; Sekiyama, 1994; Hardison, 1996; see also the effect of decreasing acoustic intensity on
Colin et al., 2004) and visual noise decreasing the role of vision (Fixmer and Hawkins, 1998;
Kim and Davis, 2011). The new finding here is that the evaluation of the reliability of the
sensory channel seems to be constantly realized and used even at a time when there is no
more noise in the channel – revealing some inertia in the evaluation process. This has already
been introduced in adaptations of computational models for AV speech perception (e.g.
Heckmann et al., 2002; Huyse et al., 2013). The results of Chapter 3 suggest that AV coher-
ence and channel reliability can indeed cooperate to modulate the final fusion and decision
process.
Neuroanatomical and neurophysiological correlates
A number of studies on the neural correlates of multisensory integration display the role
of the superior temporal cortex for both speech and non-speech stimuli. More specifically,
increased activation of the left posterior superior temporal sulcus (pSTS) was observed in
fMRI as well as TMS studies of the McGurk effect (Sekiyama et al., 2003; Bernstein et al.,
2008; Beauchamp et al., 2010; Benoit et al., 2010; Irwin et al., 2011; Nath et al., 2011; Nath
and Beauchamp, 2012; Szycik et al., 2012). In the context of our proposal, the STS is pro-
posed as a likely site for processing the AV temporal correspondence, in relation with prima-
ry sensory cortices (Noesselt et al., 2007), and as a likely site for AV binding in the McGurk
effect (Beauchamp et al., 2010; Nath and Beauchamp, 2012). The supramarginal gyrus
(SMG) could also a possible site for analysis of AV incongruency (Bernstein et al., 2008).
Interestingly, the STS functional connectivity also seems to be implicated in the perception of
noisy speech: indeed, Nath and Beauchamp (2012) displayed an increased functional connec-
159
tivity between the STS and the auditory cortex when the visual channel was noisy, and on the
contrary an increased functional connectivity between the STS and the visual cortex when the
auditory channel was noisy.
Based on a study involving both MEG and fMRI data, Arnal et al. (2009) proposed the
“dual neural routing model” including a first fast corticocortical pathway, not sensitive to AV
incongruence, which would enable a direct connection between the visual input and the audi-
tory cortex. This route could be reflected in the N1 component behavior. The second route is
compatible with the many neuroanatomical studies cited previously, where the connection
between the auditory and the visual cortices would be mediated by a feedback from STS. The
STS would be a pivot in AV interactions, estimating the degree of incoherence between the
auditory and visual inputs and providing feedback to the auditory and visual cortices. This
could reflect the behavior of the P2 component, which would hence reflect the neural conse-
quences of phonetic binding and of the process dedicated to evaluate AV congruency. This
was reflected from our results in Chapter 5 as well as in other studies showing that P2 is con-
tent dependent and is modulated by the visual input only when there is a certain amount of
congruence between the auditory and the visual inputs (Stekelenburg and Vroomen, 2007;
Vroomen and Stekelenburg, 2010; Baart et al., 2014).
3) Attentional Effects on the Fusion and Decision process
Several studies have manipulated the participants’ attention and indeed shown that atten-
tion can influence the McGurk effect (Tiippana et al., 2004; Alsius et al., 2005; Alsius et al.,
2007; Talsma et al., 2007; Andersen et al., 2009; Soto-Faraco and Alsius, 2009; Navarra et
al., 2010; Alsius and Soto-Faraco, 2011; Buchan and Munhall, 2011; Alsius et al., 2014).
Interestingly, all these results were interpreted in the framework of the one-stage model. In-
deed, they showed that the fusion/decision stage could be partly regulated by the attentional
state of the subject, in relation to any interfering stimulus or task. Using our results from Ex-
160
periment B in Chapter 4 on younger adults and from Experiment B in Chapter 6 on older
adults we could demonstrate that attention can intervene at the level of single AV sources and
we suggest that the role of attention should be incorporated into the two-stage model, at two
levels. Firstly we keep of course the global role of attention directly modulating decision (top
arrow from the “Attention” box in Figure 7-6). Secondly, attention can be oriented towards a
particular source and influence the binding process at the level of the “AV coherence” stage
(bottom arrow from the “Attention” box in Figure 7-6). This is likely where the attentional
effects occur in the experiments by Tiippana et al. (2004) or Andersen et al. (2009).
Neuroanatomical and neurophysiological correlates
It is out or our reach to introduce here a complete description of the attentional network
in the brain. However, it is important to notice here the EEG study from Alsius et al. (2014)
in which they evaluated the role of attention in the visual modulation of the N1/P2 compo-
nents. They showed that a visual processing load can modulate early stages of AV pro-
cessing, and suggested that reduced attention due to cognitive load would weaken integration
and hence weaken the visual effects on both N1 and P2. A recent study by Moris Fernandez
et al. (2015) suggests that the STS could also play a major role in attentional effects at hand
in AV integration.
3) Decision/Percept
At the output of the AVSSA process the decision/perception stage produces an output
based on the fusion of the two sensory streams. It has been proposed that AV fusion and more
generally intersensory fusion was an optimal process driven by a maximum-likelihood inte-
gration process (Massaro, 1998; Ernst and Banks, 2002). The data of the present studies and
of a number of other studies reviewed previously show that decision is actually mediated by
AV coherence, channel reliability and attention. This does not show that a maximal-
likelihood process is mistaken, but it indicates that the process is more sophisticated than was
161
conceived previously – particularly in the classical implementations of the FLMP model by
Massaro and coll. More accurate models should indeed introduce a general description of the
whole decision process, taking into account AV coherence, channel reliability and attention.
Neuroanatomical and neurophysiological correlates
Here again, it is out of the reach of the present work to describe in detail the cortical
networks for decision and percept elaboration. But it is important to notice at this stage the
possible neural role of the dorsal route and of the parieto-frontal system in the perception of
incongruent stimuli. The dorsal route which connects sensory and motor regions seems to
have a strong implication in the perception of incongruent and particularly McGurk stimuli,
including frontal and prefrontal areas (Skipper et al., 2007; Benoit et al., 2010; Irwin et al.,
2011), insula (Skipper et al., 2007; Benoit et al., 2010; Szycik et al., 2012), and parietal areas
(Jones and Callan, 2003; Skipper et al., 2007; Hugenschmidt et al., 2009; Benoit et al., 2010)
(see also (Moris Fernandez et al., 2015).
Similarity with the theoretical framework by Talsma et al. (2010) 7.2.3
Our “two-stage” model shares a number of similarities with the theoretical framework
elaborated by Talsma et al. (2010) to explain the interactions between multisensory integra-
tion and attention. As it can be seen on Figure 7-7, the steps in the proposed architecture for
multisensory processing match rather well with our “two-stage” model. The main difference
is that our model is focused on the processing of AV speech and aims to characterize and
develop the AV binding process in light of our experimental data, while the framework
developed by Talsma et al. (2010) aims at being general for multisensory processing and
more focused on the relation between attention and multisensory processing.
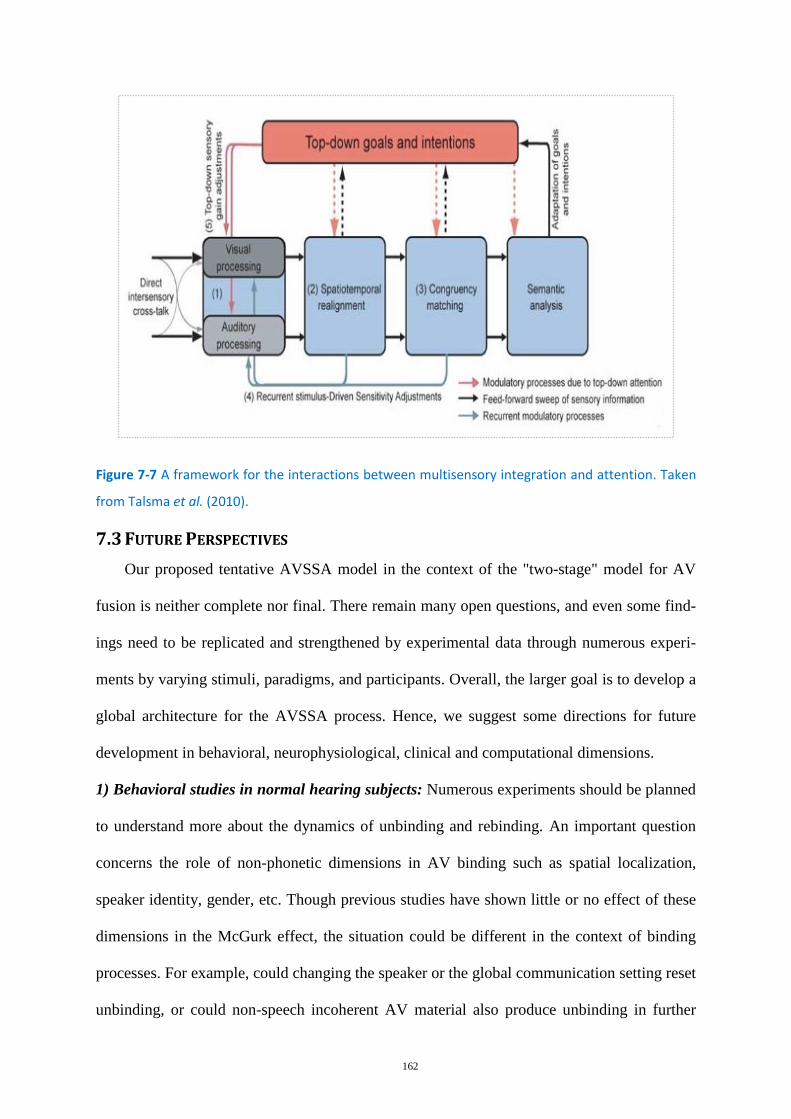
162
Figure 7-7 A framework for the interactions between multisensory integration and attention. Taken
from Talsma et al. (2010).
FUTURE PERSPECTIVES 7.3
Our proposed tentative AVSSA model in the context of the "two-stage" model for AV
fusion is neither complete nor final. There remain many open questions, and even some find-
ings need to be replicated and strengthened by experimental data through numerous experi-
ments by varying stimuli, paradigms, and participants. Overall, the larger goal is to develop a
global architecture for the AVSSA process. Hence, we suggest some directions for future
development in behavioral, neurophysiological, clinical and computational dimensions.
1) Behavioral studies in normal hearing subjects: Numerous experiments should be planned
to understand more about the dynamics of unbinding and rebinding. An important question
concerns the role of non-phonetic dimensions in AV binding such as spatial localization,
speaker identity, gender, etc. Though previous studies have shown little or no effect of these
dimensions in the McGurk effect, the situation could be different in the context of binding
processes. For example, could changing the speaker or the global communication setting reset
unbinding, or could non-speech incoherent AV material also produce unbinding in further
163
AV speech targets? We also plan studies on the role of visual noise to check that visual noise
added on the contextual part of the stimuli would indeed decrease the weight of the visual
input in a further uncorrupted McGurk target.
Another important extension concerns intelligibility in noise, to know if unbinding
mechanisms would also decrease the beneficial effect of lip-reading in noise. This would
enable us to incorporate the two-stage model inside a general model of the cocktail party ef-
fect. In fact, we realized a pilot study to assess such potential binding effects on intelligibility
in noise, though the results were disappointing (with no effect of context on intelligibility).
The difficulty in such an experiment is to find the appropriate paradigm discarding short-term
memory effects in which the visual input might contribute to intelligibility despite a lack of
binding.
2) AV binding experiments in the pediatric population: AV integration is known to depend
on age, not only for seniors as we saw previously but also with children who display less in-
tegration in the first years of age (Sekiyama and Burnham, 2008). In this respect, it would be
interesting to study the development of AV binding and unbinding in children. A set of ex-
periments is planned in collaboration with colleagues in ULB in Brussels (C. Colin, J. Ley-
baert, and C. Bayard).
3) AV binding experiments in HI and CI adults: The next stage should also include testing
the binding process in HI and CI subjects. It is well-known that speech perception in noise is
challenging for older people with presbycusis or for CI subjects. It is our assumption that part
of the problem might result from problems in AV binding, which is a key in the correct asso-
ciation between the audio and the video streams in a complex situation such as what is
referred to as the cocktail party effect. Therefore, we aim to test such subjects to see if inco-
herent contexts do modulate the McGurk effect or the intelligibility of an AV target embed-
ded in noise. This would enable to test the assumption and hopefully, to then propose mecha-
164
nisms for improving the efficiency of the binding mechanism. If the binding/unbinding
mechanisms play a role in multisensory deficits of speech understanding in noise, then we
could provide tools for improvement and rehabilitation of these mechanisms.
4) Extending the EEG studies: Our ERP study in Chapter 5 showed an effect of incoherent
context on AV binding only for congruent stimuli, while the modulation of binding by
context has been displayed in behavioral data on incongruent McGurk stimuli in previous
studies by Nahorna et al. (2012; 2015) or in this work (Chapters 3, 4 and 6). However, the
EEG study in Chapter 5 appears rather preliminary, with a lack of control for pure visual
stimuli, and we plan a further set of EEG experiments to replicate and extend our results to
incongruent targets. In addition, further time-frequency analysis of EEG data and possibly
fMRI studies could produce an enriched support to our behavioral evidence and to our data
on neurophysiological correlates for AV binding.
5) Computer Modeling: A general underlying objective of all this experimental work is to
develop at some stage a computational two-stage model of AV binding and fusion extending
the “Computational ASA” models to AV speech scenes. Such a model would be beneficial in
applications which need automatic recognition in multimodal speech systems.
6) AV binding in languages other than French: The amount of McGurk effect differs from
one language to another, and some languages have a large vs. smaller amount of fusion (for
example, in English, the amount of the McGurk effect is larger than in French). Testing bind-
ing and fusion in different languages could help us estimate the reliability and robustness of
the AV binding mechanism.
165
REFERENCES
Alsius, A., Mottonen, R., Sams, M. E., Soto-Faraco, S., and Tiippana, K. (2014). "Effect of
attentional load on audiovisual speech perception: evidence from ERPs," Front
Psychol 5, 727.
Alsius, A., and Munhall, K. G. (2013). "Detection of audiovisual speech correspondences
without visual awareness," Psychol Sci 24, 423-431.
Alsius, A., Navarra, J., Campbell, R., and Soto-Faraco, S. (2005). "Audiovisual integration of
speech falters under high attention demands," Curr Biol 15, 839-843.
Alsius, A., Navarra, J., and Soto-Faraco, S. (2007). "Attention to touch weakens audiovisual
speech integration," Exp Brain Res 183, 399-404.
Alsius, A., and Soto-Faraco, S. (2011). "Searching for audiovisual correspondence in
multiple speaker scenarios," Exp Brain Res 213, 175-183.
Andersen, T. S., Tiippana, K., Laarni, J., Kojo, I., and Sams, M. (2009). "The role of visual
spatial attention in audiovisual speech perception," Speech Commun 51, 184-193.
Andres, P., Parmentier, F. B., and Escera, C. (2006). "The effect of age on involuntary
capture of attention by irrelevant sounds: a test of the frontal hypothesis of aging,"
Neuropsychologia 44, 2564-2568.
Arnal, L. H., Morillon, B., Kell, C. A., and Giraud, A. L. (2009). "Dual neural routing of
visual facilitation in speech processing," J Neurosci 29, 13445-13453.
Arnold, P., and Hill, F. (2001). "Bisensory augmentation: a speechreading advantage when
speech is clearly audible and intact," Br J Psychol 92, 339-355.
Auer, E. T., Jr., and Bernstein, L. E. (2007). "Enhanced visual speech perception in
individuals with early-onset hearing impairment," J Speech Lang Hear Res 50, 1157-
1165.
Baart, M., Stekelenburg, J. J., and Vroomen, J. (2014). "Electrophysiological evidence for
speech-specific audiovisual integration," Neuropsychologia 53, 115-121.
Baltes, P. B., and Lindenberger, U. (1997). "Emergence of a powerful connection between
sensory and cognitive functions across the adult life span: a new window to the study
of cognitive aging?," Psychol Aging 12, 12-21.
166
Barch, D. M., Braver, T. S., Carter, C. S., Poldrack, R. A., and Robbins, T. W. (2009).
"CNTRICS Final Task Selection: Executive Control," Schizophrenia Bulletin 35,
115-135.
Barker, J., Berthommier, F., and Schwartz, J. L. (1998). "Is primitiveAV coherence an aid to
segment the scene? ," in Proceedings of AVSP 1998 (Terrigal, Australia), pp. 103–
108.
Barker, J. P., and Berthommier, F. (1999). "Evidence of correlation between acoustic and
visual features of speech," in Proc ICPhS (San Francisco: USA.), pp. 199–202.
Basirat, A., Schwartz, J. L., and Sato, M. (2012). "Perceptuo-motor interactions in the
perceptual organization of speech: evidence from the verbal transformation effect,"
Philos Trans R Soc Lond B Biol Sci 367, 965-976.
Basu Mallick, D., J, F. M., and M, S. B. (2015). "Variability and stability in the McGurk
effect: contributions of participants, stimuli, time, and response type," Psychon Bull
Rev 22, 1299-1307.
Bayard, S., Erkes, J., and Moroni, C. (2011). "Victoria Stroop Test: normative data in a
sample group of older people and the study of their clinical applications in the
assessment of inhibition in Alzheimer's disease," Arch Clin Neuropsychol 26, 653-
661.
Beauchamp, M. S., Nath, A. R., and Pasalar, S. (2010). "fMRI-Guided transcranial magnetic
stimulation reveals that the superior temporal sulcus is a cortical locus of the McGurk
effect," J Neurosci 30, 2414-2417.
Behne, D., Wang, Y., Alm, M., Arntsen, I., Eg, R., and Valso, A. (2007). "Changes in
auditory-visual speech perception during adulthood," in Proceedings of AVSP 2007,
p. P34.
Belin, P., Zatorre, R. J., and Ahad, P. (2002). "Human temporal-lobe response to vocal
sounds," Brain Res Cogn Brain Res 13, 17-26.
Benoit, C., Mohamadi, T., and Kandel, S. (1994). "Effects of phonetic context on audio-
visual intelligibility of French," J Speech Hear Res 37, 1195-1203.
Benoit, M. M., Raij, T., Lin, F. H., Jaaskelainen, I. P., and Stufflebeam, S. (2010). "Primary
and multisensory cortical activity is correlated with audiovisual percepts," Hum Brain
Mapp 31, 526-538.
Bernstein, L. E., Auer, E. T., Jr., Moore, J. K., Ponton, C. W., Don, M., and Singh, M.
(2002). "Visual speech perception without primary auditory cortex activation,"
Neuroreport 13, 311-315.
167
Bernstein, L. E., Auer Jr, E. T., and Takayanagi, S. (2004). "Auditory speech detection in
noise enhanced by lipreading," Speech Commun 44, 5-18.
Bernstein, L. E., Demorest, M. E., and Tucker, P. E. (2000). "Speech perception without
hearing," Percept Psychophys 62, 233-252.
Bernstein, L. E., Lu, Z. L., and Jiang, J. (2008). "Quantified acoustic-optical speech signal
incongruity identifies cortical sites of audiovisual speech processing," Brain Res
1242, 172-184.
Bertelson, P., Vroomen, J. H. M., Wiegeraad, G., and de Gelder, B. L. M. F. (1994).
"Exploring the relation between McGurk interference and ventriloquism," in Third
International Congress on Spoken Language Processing (Baixas, France:
International Speech Communication Association (ISCA). Yokohama, Japan,
September 18-22, ), pp. 559-562.
Berthommier, F. (2004). "A phonetically neutral model of the low-level audio-visual
interaction," Speech Commun 44, 31-41.
Bertoli, S., Probst, R., and Bodmer, D. (2011). "Late auditory evoked potentials in elderly
long-term hearing-aid users with unilateral or bilateral fittings," Hear Res 280, 58-69.
Besle, J., Fort, A., Delpuech, C., and Giard, M. H. (2004). "Bimodal speech: early
suppressive visual effects in human auditory cortex," Eur J Neurosci 20, 2225-2234.
Bovo, R., Ciorba, A., Prosser, S., and Martini, A. (2009). "The McGurk phenomenon in
Italian listeners," Acta Otorhinolaryngologica Italica 29, 203-208.
Bregman, A. S. (1990). Auditory scene analysis (MIT Press, Cambridge, MA).
Bregman, A. S., and Campbell, J. (1971). "Primary auditory stream segregation and
perception of order in rapid sequences of tones," J Exp Psychol 89, 244-249.
Buchan, J. N., and Munhall, K. G. (2011). "The influence of selective attention to auditory
and visual speech on the integration of audiovisual speech information," Perception
40, 1164-1182.
Buchan, J. N., and Munhall, K. G. (2012). "The effect of a concurrent working memory task
and temporal offsets on the integration of auditory and visual speech information,"
Seeing Perceiving 25, 87-106.
Calvert, G. A., Brammer, M. J., Bullmore, E. T., Campbell, R., Iversen, S. D., and David, A.
S. (1999). "Response amplification in sensory-specific cortices during crossmodal
binding," Neuroreport 10, 2619-2623.
Calvert, G. A., and Campbell, R. (2003). "Reading speech from still and moving faces: the
neural substrates of visible speech," J Cogn Neurosci 15, 57-70.
168
Calvert, G. A., and Thesen, T. (2004). "Multisensory integration: methodological approaches
and emerging principles in the human brain," J Physiol Paris 98, 191-205.
Campbell, R. (2008). "The processing of audio-visual speech: empirical and neural bases,"
Philos Trans R Soc Lond B Biol Sci 363, 1001-1010.
Ceponiene, R., Westerfield, M., Torki, M., and Townsend, J. (2008). "Modality-specificity of
sensory aging in vision and audition: evidence from event-related potentials," Brain
Res 1215, 53-68.
CHABA (1988). "Speech understanding and aging. Working Group on Speech
Understanding and Aging. Committee on Hearing, Bioacoustics, and Biomechanics,
Commission on Behavioral and Social Sciences and Education, National Research
Council," J Acoust Soc Am 83, 859-895.
Chandrasekaran, C., Trubanova, A., Stillittano, S., Caplier, A., and Ghazanfar, A. A. (2009).
"The Natural Statistics of Audiovisual Speech," PLoS Comput Biol 5, e1000436.
Charchat-Fichman, H., and Oliveira, R. M. (2009). "Performance of 119 Brazilian children
on Stroop paradigm-Victoria version," Arq Neuropsiquiatr 67, 445-449.
Chen, T., and Massaro, D. (2004). "Mandarin speech perception by ear and eye follows a
universal principle," Percept Psychophys 66, 820-836.
Cherry, E. C. (1953). "Some Experiments on the Recognition of Speech, with One and with
Two Ears," J Acoust Soc Am 25, 975-979.
Cienkowski, K. M., and Carney, A. E. (2002). "Auditory-visual speech perception and
aging," Ear Hear 23, 439-449.
Colin, C., Radeau, M., Deltenre, P., Demolin, D., and Soquet, A. (2002a). "The role of sound
intensity and stop-consonant voicing on McGurk fusions and combinations,"
European Journal of Cognitive Psychology 14, 475-491.
Colin, C., Radeau, M., Soquet, A., Demolin, D., Colin, F., and Deltenre, P. (2002b).
"Mismatch negativity evoked by the McGurk-MacDonald effect: a phonetic
representation within short-term memory," Clin Neurophysiol 113, 495-506.
Conrad, V., Bartels, A., Kleiner, M., and Noppeney, U. (2010). "Audiovisual interactions in
binocular rivalry," J Vis 10, 27-27.
Cooke, M. (2006). "A glimpsing model of speech perception in noise," J Acoust Soc Am 119,
1562-1573.
Cooke, M., Green, P., Josifovski, L., and Vizinho, A. (2001). "Robust automatic speech
recognition with missing and unreliable acoustic data," Speech Commun 34, 267-285.
169
Craig, M. S., van Lieshout, P., and Wong, W. (2008). "A linear model of acoustic-to-facial
mapping: model parameters, data set size, and generalization across speakers," J
Acoust Soc Am 124, 3183-3190.
Dancer, J., Krain, M., Thompson, C., Davis, P., and et al. (1994). "A cross-sectional
investigation of speechreading in adults: Effects of age, gender, practice, and
education," The Volta Review 96, 31-40.
Davis, C., and Kim, J. (2004). "Audio-visual interactions with intact clearly audible speech,"
Q J Exp Psychol A 57, 1103-1121.
Delorme, A., and Makeig, S. (2004). "EEGLAB: an open source toolbox for analysis of
single-trial EEG dynamics including independent component analysis," J Neurosci
Methods 134, 9-21.
Denham, S. L., and Winkler, I. (2006). "The role of predictive models in the formation of
auditory streams," Journal of Physiology-Paris 100, 154-170.
Devergie, A., Grimault, N., Gaudrain, E., Healy, E. W., and Berthommier, F. (2011). "The
effect of lip-reading on primary stream segregation," J Acoust Soc Am 130, 283-291.
Diehl, R. L., Lotto, A. J., and Holt, L. L. (2004). "Speech Perception," Annu Rev Psychol 55,
149-179.
Driver, J. (1996). "Enhancement of selective listening by illusory mislocation of speech
sounds due to lip-reading," Nature 381, 66-68.
Driver, J., and Noesselt, T. (2008). "Multisensory Interplay Reveals Crossmodal Influences
on ‘Sensory-Specific’ Brain Regions, Neural Responses, and Judgments," Neuron 57,
11-23.
Erber, N. P. (1969). "Interaction of Audition and Vision in the Recognition of Oral Speech
Stimuli," J Speech Lang Hear Res 12, 423-425.
Erickson, L. C., Zielinski, B. A., Zielinski, J. E. V., Liu, G., Turkeltaub, P. E., Leaver, A. M.,
and Rauschecker, J. P. (2014). "Distinct cortical locations for integration of
audiovisual speech and the McGurk effect," Front Psychol 5, 534.
Ernst, M. O., and Banks, M. S. (2002). "Humans integrate visual and haptic information in a
statistically optimal fashion," Nature 415, 429-433.
Eskelund, K., Tuomainen, J., and Andersen, T. S. (2011). "Multistage audiovisual integration
of speech: dissociating identification and detection," Exp Brain Res 208, 447-457.
Feld, J. E., and Sommers, M. S. (2009). "Lipreading, Processing Speed, and Working
Memory in Younger and Older Adults," J Speech Lang Hear Res 52, 1555-1565.
170
Fixmer, E., and Hawkins, S. (1998). "The influence of quality of information on the McGurk
effect," in Proceedings of AVSP 1998 (Terrigal, Australia), pp. 27-32.
Fleck, C., Wiig, E. H., and Corwin, M. (2015). "Stroop interference and AQT cognitive speed
may play complementary roles in differentiating dementias with frontal and posterior
lesions," Community Ment Health J 51, 315-320.
Fowler, C. A. (1986). "An event approach to the study of speech perception from a direct—
realist perspective," J Phon 14, 3-28.
Friston, K. (2009). "The free-energy principle: a rough guide to the brain?," Trends Cogn Sci
13, 293-301.
Füllgrabe, C., Moore, B. C. J., and Stone, M. A. (2015). "Age-group differences in speech
identification despite matched audiometrically normal hearing: Contributions from
auditory temporal processing and cognition," Frontiers in Aging Neuroscience 6.
Fuster-Duran, A. (1995). "Mcgurk effect in Spanish and German listeners: influences of
visual cues in the perception of Spanish and German conflicting audio-visual stimuli,"
in Fourth European Conference on Speech Communication and Technology,
EUROSPEECH (Madrid, Spain, ).
Ganesh, A. C., BERTHOMMIER, F., vilain, C., Sato, M., and Schwartz, J.-L. (2014). "A
Possible Neurophysiological Correlate of AudioVisual Binding and Unbinding in
Speech Perception," Front Psychol 5.
Gatehouse, S., and Akeroyd, M. (2006). "Two-eared listening in dynamic situations," Int J
Audiol 45 Suppl 1, S120-124.
Gatehouse, S., and Noble, W. (2004). "The Speech, Spatial and Qualities of Hearing Scale
(SSQ)," Int J Audiol 43, 85-99.
Ghazanfar, A. A., and Schroeder, C. E. (2006). "Is neocortex essentially multisensory?,"
Trends Cogn Sci 10, 278-285.
Grant, K. W. (2002). "Measures of auditory-visual integration for speech understanding: a
theoretical perspective," J Acoust Soc Am 112, 30-33.
Grant, K. W., and Braida, L. D. (1991). "Evaluating the articulation index for auditory-visual
input," J Acoust Soc Am 89, 2952-2960.
Grant, K. W., and Seitz, P. F. (1998). "Measures of auditory-visual integration in nonsense
syllables and sentences," J Acoust Soc Am 104, 2438-2450.
Grant, K. W., and Seitz, P. F. (2000). "The use of visible speech cues for improving auditory
detection of spoken sentences," J Acoust Soc Am 108, 1197-1208.
171
Grant, K. W., Walden, B. E., and Seitz, P. F. (1998). "Auditory-visual speech recognition by
hearing-impaired subjects: consonant recognition, sentence recognition, and auditory-
visual integration," J Acoust Soc Am 103, 2677-2690.
Green, K. P., Kuhl, P. K., Meltzoff, A. N., and Stevens, E. B. (1991). "Integrating speech
information across talkers, gender, and sensory modality: female faces and male
voices in the McGurk effect," Percept Psychophys 50, 524-536.
Hackett, T. A., Preuss, T. M., and Kaas, J. H. (2001). "Architectonic identification of the core
region in auditory cortex of macaques, chimpanzees, and humans," J Comp Neurol
441, 197-222.
Hall, D. A., Fussell, C., and Summerfield, A. Q. (2005). "Reading fluent speech from talking
faces: typical brain networks and individual differences," J Cogn Neurosci 17, 939-
953.
Hardison, D. M. (1996). "Bimodal Speech Perception by Native and Nonnative Speakers of
English: Factors Influencing the McGurk Effect," Language Learning 46, 3-73.
Hay-McCutcheon, M. J., Pisoni, D. B., and Kirk, K. I. (2005). "Audiovisual speech
perception in elderly cochlear implant recipients," Laryngoscope 115, 1887-1894.
Healey, M. K., Campbell, K. L., and Hasher, L. (2008). "Cognitive aging and increased
distractibility: costs and potential benefits," Prog Brain Res 169, 353-363.
Heckmann, M., Berthommier, F., and Kroschel, K. (2002). "Noise adaptive stream weighting
in audio-visual speech recognition," EURASIP J. Appl. Signal Process. 2002, 1260-
1273.
Homack, S., and Riccio, C. A. (2004). "A meta-analysis of the sensitivity and specificity of
the Stroop Color and Word Test with children," Arch Clin Neuropsychol 19, 725-743.
Hugenschmidt, C. E., Mozolic, J. L., and Laurienti, P. J. (2009). "Suppression of
multisensory integration by modality-specific attention in aging," Neuroreport 20,
349-353.
Hupé, J.-M., Joffo, L.-M., and Pressnitzer, D. (2008). "Bistability for audiovisual stimuli:
Perceptual decision is modality specific," J Vis 8, 1-1.
Hutchison, K. A., Balota, D. A., and Duchek, J. M. (2010). "The Utility of Stroop Task
Switching as a Marker for Early Stage Alzheimer’s Disease," Psychol Aging 25, 545-
559.
Huyse, A., Berthommier, F., and Leybaert, J. (2013). "Degradation of labial information
modifies audiovisual speech perception in cochlear-implanted children," Ear Hear 34,
110-121.
172
Hyde, M. (1997). "The N1 Response and Its Applications," Audiology and Neurotology 2,
281-307.
Irwin, J. R., Frost, S. J., Mencl, W. E., Chen, H., and Fowler, C. A. (2011). "Functional
activation for imitation of seen and heard speech," J Neurolinguist 24, 611-618.
Jiang, J., Alwan, A., Keating, P., Auer, E. J., and Bernstein, L. E. (2002). "On the
Relationship between Face Movements, Tongue Movements, and Speech Acoustics,"
Eurasip J Adv Sig Proc 11, 1174–1188.
Jones, J. A., and Callan, D. E. (2003). "Brain activity during audiovisual speech perception:
an fMRI study of the McGurk effect," Neuroreport 14, 1129-1133.
Keetels, M., Stekelenburg, J., and Vroomen, J. (2007). "Auditory grouping occurs prior to
intersensory pairing: evidence from temporal ventriloquism," Exp Brain Res 180,
449-456.
Keller, S. S., Crow, T., Foundas, A., Amunts, K., and Roberts, N. (2009). "Broca's area:
nomenclature, anatomy, typology and asymmetry," Brain Lang 109, 29-48.
Kim, J., and Davis, C. (2003). "Hearing foreign voices: does knowing what is said affect
visual-masked-speech detection?," Perception 32, 111-120.
Kim, J., and Davis, C. (2004). "Investigating the audio–visual speech detection advantage,"
Speech Comm 44, 19-30.
Kim, J., and Davis, C. (2011). "Audiovisual speech processing in visual speech noise," in
Proceedings of AVSP 2011 (Volterra, Italy), pp. 73-76.
Klucharev, V., Mottonen, R., and Sams, M. (2003). "Electrophysiological indicators of
phonetic and non-phonetic multisensory interactions during audiovisual speech
perception," Brain Res Cogn Brain Res 18, 65-75.
Knowland, V. C., Mercure, E., Karmiloff-Smith, A., Dick, F., and Thomas, M. S. (2014).
"Audio-visual speech perception: a developmental ERP investigation," Dev Sci 17,
110-124.
Koffka, K. (1935). Principles of Gestalt Psychology (Harcourt Brace, New York).
Koss, E., Ober, B. A., Delis, D. C., and Friedland, R. P. (1984). "The Stroop color-word test:
indicator of dementia severity," Int J Neurosci 24, 53-61.
Lachs, L., Pisoni, D. B., and Kirk, K. I. (2001). "Use of audiovisual information in speech
perception by prelingually deaf children with cochlear implants: a first report," Ear
Hear 22, 236-251.
173
Lallouache, M. T. (1990). "Un poste ‘visage-parole.’ Acquisition et traitement de contours
labiaux (A ‘face-speech’ workstation. Acquisition and processing of labial contours),"
in Proceedings XVIII Journées d’Etudes sur la Parole (Montréal), pp. 282–286.
Lamers, M. M., Roelofs, A., and Rabeling-Keus, I. (2010). "Selective attention and response
set in the Stroop task," Memory & Cognition 38, 893-904.
Lansbergen, M. M., Kenemans, J. L., and van Engeland, H. (2007). "Stroop interference and
attention-deficit/hyperactivity disorder: a review and meta-analysis,"
Neuropsychology 21, 251-262.
Laurienti, P. J., Burdette, J. H., Maldjian, J. A., and Wallace, M. T. (2006). "Enhanced
multisensory integration in older adults," Neurobiol Aging 27, 1155-1163.
Liberman, A. M., Cooper, F. S., Shankweiler, D. P., and Studdert-Kennedy, M. (1967).
"Perception of the speech code," Psychol Rev 74, 431-461.
Liberman, A. M., and Mattingly, I. G. (1985). "The motor theory of speech perception
revised," Cognition 21, 1-36.
Liegeois-Chauvel, C., de Graaf, J. B., Laguitton, V., and Chauvel, P. (1999). "Specialization
of left auditory cortex for speech perception in man depends on temporal coding,"
Cereb Cortex 9, 484-496.
Ludman, C. N., Summerfield, A. Q., Hall, D., Elliott, M., Foster, J., Hykin, J. L., Bowtell, R.,
and Morris, P. G. (2000). "Lip-reading ability and patterns of cortical activation
studied using fMRI," Br J Audiol 34, 225-230.
MacLeod, A., and Summerfield, Q. (1990). "A procedure for measuring auditory and audio-
visual speech-reception thresholds for sentences in noise: rationale, evaluation, and
recommendations for use," Br J Audiol 24, 29-43.
Maddox, R. K., Atilgan, H., Bizley, J. K., and Lee, A. K. (2015). "Auditory selective
attention is enhanced by a task-irrelevant temporally coherent visual stimulus in
human listeners," eLife 2015 4, e04995.
Marozeau, J., Innes-Brown, H., Grayden, D. B., Burkitt, A. N., and Blamey, P. J. (2010).
"The Effect of Visual Cues on Auditory Stream Segregation in Musicians and Non-
Musicians," PLoS One 5, e11297.
Massaro, D., and Hary, J. (1986). "Addressing issues in letter recognition," Psychol Res 48,
123-132.
Massaro, D. W. (1979). "Letter information and orthographic context in word perception," J
Exp Psychol Hum Percept Perform 5, 595-609.
174
Massaro, D. W. (1987). Speech Perception by Ear and Eye. (Lawrence Erlbaum Associates.,
Hillsdale, NJ).
Massaro, D. W. (1989). "Testing between the TRACE model and the fuzzy logical model of
speech perception," Cogn Psychol 21, 398-421.
Massaro, D. W. (1998). Perceiving Talking Faces (MIT Press., Cambridge).
Massaro, D. W., and Cohen, M. M. (1976). "The contribution of fundamental frequency and
voice onset time to the /zi/‐/si/ distinction," The Journal of the Acoustical Society of
America 60, 704-717.
Massaro, D. W., and Cohen, M. M. (1993). "Perceiving asynchronous bimodal speech in
consonant-vowel and vowel syllables," Speech Comm 13, 127-134.
Massaro, D. W., Thompson, L. A., Barron, B., and Laren, E. (1986). "Developmental
changes in visual and auditory contributions to speech perception," J Exp Child
Psychol 41, 93-113.
McGurk, H., and MacDonald, J. (1976). "Hearing lips and seeing voices," Nature 264, 746-
748.
Moore, B. (2004). An Introduction to the Psychology of Hearing (Elsevier, Oxford).
Moris Fernandez, L., Visser, M., Ventura-Campos, N., Avila, C., and Soto-Faraco, S. (2015).
"Top-down attention regulates the neural expression of audiovisual integration,"
NeuroImage 119, 272-285.
Mottonen, R., Krause, C. M., Tiippana, K., and Sams, M. (2002). "Processing of changes in
visual speech in the human auditory cortex," Brain Res Cogn Brain Res 13, 417-425.
Mottonen, R., Schurmann, M., and Sams, M. (2004). "Time course of multisensory
interactions during audiovisual speech perception in humans: a
magnetoencephalographic study," Neurosci Lett 363, 112-115.
Moulin, A., Pauzie, A., and Richard, C. (2015). "Validation of a French translation of the
speech, spatial, and qualities of hearing scale (SSQ) and comparison with other
language versions," International Journal of Audiology 54, 889-898.
Mozolic, J. L., Hugenschmidt, C. E., Peiffer, A. M., and Laurienti, P. J. (2012).
"Multisensory Integration and Aging," in The Neural Bases of Multisensory
Processes, edited by M. M. Murray, and M. T. Wallace (CRC Press/Taylor & Francis
Llc., Boca Raton (FL)).
Munhall, K., Kroos, C., and Vatikiotis‐Bateson, E. (2001). "Bandpass filtered faces and
audiovisual speech perception," J Acoust Soc Am 109, 2314-2314.
175
Munhall, K. G., Gribble, P., Sacco, L., and Ward, M. (1996). "Temporal constraints on the
McGurk effect," Percept Psychophys 58, 351-362.
Munhall, K. G., Jones, J. A., Callan, D. E., Kuratate, T., and Vatikiotis-Bateson, E. (2004).
"Visual prosody and speech intelligibility: head movement improves auditory speech
perception," Psychol Sci 15, 133-137.
Munhall, K. G., ten Hove, M. W., Brammer, M., and Paré, M. (2009). "Audiovisual
Integration of Speech in a Bistable Illusion," Current Biology 19, 735-739.
Naatanen, R., and Picton, T. (1987). "The N1 wave of the human electric and magnetic
response to sound: a review and an analysis of the component structure,"
Psychophysiology 24, 375-425.
Naatanen, R., and Winkler, I. (1999). "The concept of auditory stimulus representation in
cognitive neuroscience," Psychol Bull 125, 826-859.
Nahorna, O. (2013). "Analyse de scènes de parole multisensorielle : Mise en évidence et
caractérisation d’un processus de liage audiovisuel préalable à la fusion," (Doctoral
thesis, Université de Grenoble, Grenoble).
Nahorna, O., Berthommier, F., and Schwartz, J. L. (2012). "Binding and unbinding the
auditory and visual streams in the McGurk effect," J Acoust Soc Am 132, 1061-1077.
Nahorna, O., Berthommier, F., and Schwartz, J. L. (2015). "Audio-visual speech scene
analysis: characterization of the dynamics of unbinding and rebinding the McGurk
effect," J Acoust Soc Am 137, 362-377.
Nath, A. R., and Beauchamp, M. S. (2012). "A neural basis for interindividual differences in
the McGurk effect, a multisensory speech illusion," NeuroImage 59, 781-787.
Nath, A. R., Fava, E. E., and Beauchamp, M. S. (2011). "Neural correlates of interindividual
differences in children's audiovisual speech perception," J Neurosci 31, 13963-13971.
Navarra, J., Alsius, A., Soto-Faraco, S., and Spence, C. (2010). "Assessing the role of
attention in the audiovisual integration of speech," Information Fusion 11, 4-11.
Navarra, J., and Soto-Faraco, S. (2007). "Hearing lips in a second language: visual
articulatory information enables the perception of second language sounds," Psychol
Res 71, 4-12.
Nishitani, N., and Hari, R. (2002). "Viewing lip forms: cortical dynamics," Neuron 36, 1211-
1220.
Noesselt, T., Rieger, J. W., Schoenfeld, M. A., Kanowski, M., Hinrichs, H., Heinze, H.-J.,
and Driver, J. (2007). "Audio-visual temporal correspondence modulates multisensory
superior temporal sulcus plus primary sensory cortices," J Neurosci 27, 11431-11441.
176
Oden, G. C. (1979). "A fuzzy logical model of letter identification," J Exp Psychol Hum
Percept Perform 5, 336-352.
Oden, G. C., and Massaro, D. W. (1978). "Integration of featural information in speech
perception," Psychol Rev 85, 172-191.
Okada, K., Rong, F., Venezia, J., Matchin, W., Hsieh, I. H., Saberi, K., Serences, J. T., and
Hickok, G. (2010). "Hierarchical organization of human auditory cortex: evidence
from acoustic invariance in the response to intelligible speech," Cereb Cortex 20,
2486-2495.
Okada, K., Venezia, J. H., Matchin, W., Saberi, K., and Hickok, G. (2013). "An fMRI Study
of Audiovisual Speech Perception Reveals Multisensory Interactions in Auditory
Cortex," PLoS One 8, e68959.
Pichora-Fuller, M. K., and Singh, G. (2006). "Effects of age on auditory and cognitive
processing: implications for hearing aid fitting and audiologic rehabilitation," Trends
Amplif 10, 29-59.
Pilling, M. (2009). "Auditory Event-Related Potentials (ERPs) in Audiovisual Speech
Perception," J Speech Lang Hear Res 52, 1073-1081.
Pocklington, B., and Maybery, M. (2006). "Proportional Slowing or Disinhibition in ADHD?
A Brinley Plot Meta‐analysis of Stroop Color and Word Test Performance,"
International Journal of Disability, Development and Education 53, 67-91.
Poeppel, D., Guillemin, A., Thompson, J., Fritz, J., Bavelier, D., and Braun, A. R. (2004).
"Auditory lexical decision, categorical perception, and FM direction discrimination
differentially engage left and right auditory cortex," Neuropsychologia 42, 183-200.
Ponton, C. W., Don, M., Eggermont, J. J., Waring, M. D., and Masuda, A. (1996).
"Maturation of Human Cortical Auditory Function: Differences Between Normal-
Hearing Children and Children with Cochlear Implants," Ear Hear 17, 430-437.
Pressnitzer, D., and Hupé, J.-M. (2006). "Temporal Dynamics of Auditory and Visual
Bistability Reveal Common Principles of Perceptual Organization," Current Biology
16, 1351-1357.
Puce, A., Allison, T., Bentin, S., Gore, J. C., and McCarthy, G. (1998). "Temporal Cortex
Activation in Humans Viewing Eye and Mouth Movements," J Neurosci 18, 2188-
2199.
Rahne, T., Bockmann, M., von Specht, H., and Sussman, E. S. (2007). "Visual cues can
modulate integration and segregation of objects in auditory scene analysis," Brain Res
1144, 127-135.
177
Rao, R. P., and Ballard, D. H. (1999). "Predictive coding in the visual cortex: a functional
interpretation of some extra-classical receptive-field effects," Nat Neurosci 2, 79-87.
Reisberg, D., McLean, J., and Goldfield, A. (1987). "Easy to hear but hard to understand: a
lip-reading advantage with intact auditory stimuli," in Hearing by Eye: the
Psychology of Lip-reading, edited by B. Dodd, and R. Campbell (Lawrence Erlbaum
Associates, Hillsdale, NJ), pp. 97–113.
Rosenthal, D. F., and Okuno, H. G. (1998). Computational Auditory Scene Analysis (Erlbaum
Associates, NJ.: Lawrence ).
Ross, L. A., Saint-Amour, D., Leavitt, V. M., Javitt, D. C., and Foxe, J. J. (2007). "Do you
see what I am saying? Exploring visual enhancement of speech comprehension in
noisy environments," Cereb Cortex 17, 1147-1153.
Rouger, J., Fraysse, B., Deguine, O., and Barone, P. (2008). "McGurk effects in cochlear-
implanted deaf subjects," Brain Res 1188, 87-99.
Ruytjens, L., Albers, F., van Dijk, P., Wit, H., and Willemsen, A. (2006). "Neural responses
to silent lipreading in normal hearing male and female subjects," Eur J Neurosci 24,
1835-1844.
Sams, M., Aulanko, R., Hamalainen, M., Hari, R., Lounasmaa, O. V., Lu, S. T., and Simola,
J. (1991). "Seeing speech: visual information from lip movements modifies activity in
the human auditory cortex," Neurosci Lett 127, 141-145.
Sanabria, D., Soto-Faraco, S., Chan, J., and Spence, C. (2005). "Intramodal perceptual
grouping modulates multisensory integration: evidence from the crossmodal dynamic
capture task," Neurosci Lett 377, 59-64.
Scherg, M., and Von Cramon, D. (1986). "Evoked dipole source potentials of the human
auditory cortex," Electroencephalography and Clinical Neurophysiology/Evoked
Potentials Section 65, 344-360.
Schorr, E. A., Fox, N. A., van Wassenhove, V., and Knudsen, E. I. (2005). "Auditory-visual
fusion in speech perception in children with cochlear implants," Proc Natl Acad Sci U
S A 102, 18748-18750.
Schwartz, J. L. (2006). "The 0/0 problem in the fuzzy-logical model of perception," J Acoust
Soc Am 120, 1795-1798.
Schwartz, J. L. (2010). "A reanalysis of McGurk data suggests that audiovisual fusion in
speech perception is subject-dependent," J Acoust Soc Am 127, 1584-1594.
178
Schwartz, J. L., Basirat, A., Ménard, L., and Sato, M. (2012a). "The Perception-for-Action-
Control Theory (PACT): A perceptuo-motor theory of speech perception," J
Neurolinguist 25, 336-354.
Schwartz, J. L., Berthommier, F., and Savariaux, C. (2004). "Seeing to hear better: evidence
for early audio-visual interactions in speech identification," Cognition 93, B69-78.
Schwartz, J. L., Grimault, N., Hupe, J. M., Moore, B. C., and Pressnitzer, D. (2012b).
"Multistability in perception: binding sensory modalities, an overview," Philos Trans
R Soc Lond B Biol Sci 367, 896-905.
Schwartz, J. L., P. Teissier, and Escudier, P. (2009). "Multimodal speech: two or three senses
are better than one," in Spoken Language Processing, edited by J. J. Mariani (Wiley),
pp. 377-415.
Schwartz, J. L., Robert-Ribes, J., and Escudier, P. (1998). "Ten years after Summerfield. A
taxonomy of models for audiovisual fusion in speech perception," in Hearing by Eye
II. Perspectives and Directions in Research on Audiovisual Aspects of Language
Processing, edited by R. Campbell, B. Dodd, and D. Burnham ( Psychology Press,
Hove), pp. 85–108.
Scott, S. K., and Johnsrude, I. S. (2003). "The neuroanatomical and functional organization of
speech perception," Trends Neurosci 26, 100-107.
Sekiyama, K. (1994). "Differences in auditory-visual speech perception between Japanese
and Americans: McGurk effect as a function of incompatibility," Journal of the
Acoustical Society of Japan (E) 15, 143-158.
Sekiyama, K., and Burnham, D. (2008). "Impact of language on development of auditory-
visual speech perception," Dev Sci 11, 306-320.
Sekiyama, K., Kanno, I., Miura, S., and Sugita, Y. (2003). "Auditory-visual speech
perception examined by fMRI and PET," Neurosci Res 47, 277-287.
Sekiyama, K., Soshi, T., and Sakamoto, S. (2014). "Enhanced audiovisual integration with
aging in speech perception: a heightened McGurk effect in older adults," Front
Psychol 5, 323.
Sekiyama, K., and Tohkura, Y. (1991). "McGurk effect in non-English listeners: few visual
effects for Japanese subjects hearing Japanese syllables of high auditory
intelligibility," J Acoust Soc Am 90, 1797-1805.
Senkowski, D., Schneider, T. R., Foxe, J. J., and Engel, A. K. (2008). "Crossmodal binding
through neural coherence: implications for multisensory processing," Trends Neurosci
31, 401-409.
179
Setti, A., Burke, K. E., Kenny, R., and Newell, F. N. (2013). "Susceptibility to a multisensory
speech illusion in older persons is driven by perceptual processes," Front Psychol 4,
575.
Shamma, S. A., Elhilali, M., and Micheyl, C. (2011). "Temporal coherence and attention in
auditory scene analysis," Trends Neurosci 34, 114-123.
Shoop, C., and Binnie, C. A. (1979). "The Effects of Age Upon the Visual Perception of
Speech," Scand Audiol 8, 3-8.
Skipper, J. I., Nusbaum, H. C., and Small, S. L. (2005). "Listening to talking faces: motor
cortical activation during speech perception," NeuroImage 25, 76-89.
Skipper, J. I., van Wassenhove, V., Nusbaum, H. C., and Small, S. L. (2007). "Hearing Lips
and Seeing Voices: How Cortical Areas Supporting Speech Production Mediate
Audiovisual Speech Perception," Cereb Cortex 17, 2387-2399.
Snyder, J. S., Gregg, M. K., Weintraub, D. M., and Alain, C. (2012). "Attention, Awareness,
and the Perception of Auditory Scenes," Front Psychol 3, 15.
Sommers, M. S., Tye-Murray, N., and Spehar, B. (2005). "Auditory-visual speech perception
and auditory-visual enhancement in normal-hearing younger and older adults," Ear
Hear 26, 263-275.
Soto-Faraco, S., and Alsius, A. (2007). "Conscious access to the unisensory components of a
cross-modal illusion," Neuroreport 18, 347-350.
Soto-Faraco, S., and Alsius, A. (2009). "Deconstructing the McGurk-MacDonald illusion," J
Exp Psychol Hum Percept Perform 35, 580-587.
Soto-Faraco, S., Navarra, J., and Alsius, A. (2004). "Assessing automaticity in audiovisual
speech integration: evidence from the speeded classification task," Cognition 92, B13-
23.
Spieler, D. H., Balota, D. A., and Faust, M. E. (1996). "Stroop performance in healthy
younger and older adults and in individuals with dementia of the Alzheimer's type," J
Exp Psychol Hum Percept Perform 22, 461-479.
Stein, B. E., and Meredith, M. A. (1993). The Merging of the Senses (MIT Press, Cambridge,
MA).
Stekelenburg, J. J., and Vroomen, J. (2007). "Neural correlates of multisensory integration of
ecologically valid audiovisual events," J Cogn Neurosci 19, 1964-1973.
Stekelenburg, J. J., and Vroomen, J. (2012). "Electrophysiological correlates of predictive
coding of auditory location in the perception of natural audiovisual events," Front
Integr Neurosci 6, 26.
180
Stevens, K. N., and Blumstein, S. E. (1978). "Invariant cues for place of articulation in stop
consonants," J Acoust Soc Am 64, 1358-1368.
Strelnikov, K., Rouger, J., Barone, P., and Deguine, O. (2009). "Role of speechreading in
audiovisual interactions during the recovery of speech comprehension in deaf adults
with cochlear implants," Scand J Psychol 50, 437-444.
Stroop, J. R. (1935). "Studies of interference in serial verbal reactions," J Exp Psychol 18,
643-662.
Sumby, W. H., and Pollack, I. (1954). "Visual Contribution to Speech Intelligibility in
Noise," J Acoust Soc Am 26, 212-215.
Summerfield, Q. (1987). "Some preliminaries to a comprehensive account of audiovisual
speech perception," in Hearing by eye: The psychology of lipreading, edited by B.
Dodd, and R. Campbell (NJ: Lawrence Erlbaum Associates, Hillsdale), pp. 3-51.
Szycik, G. R., Stadler, J., Tempelmann, C., and Munte, T. F. (2012). "Examining the McGurk
illusion using high-field 7 Tesla functional MRI," Front Hum Neurosci 6, 95.
Talsma, D., Doty, T. J., and Woldorff, M. G. (2007). "Selective attention and audiovisual
integration: is attending to both modalities a prerequisite for early integration?,"
Cereb Cortex 17, 679-690.
Talsma, D., Senkowski, D., Soto-Faraco, S., and Woldorff, M. G. (2010). "The multifaceted
interplay between attention and multisensory integration," Trends Cogn Sci 14, 400-
410.
Talsma, D., and Woldorff, M. G. (2005). "Selective attention and multisensory integration:
multiple phases of effects on the evoked brain activity," J Cogn Neurosci 17, 1098-
1114.
Thompson, L. A. (1995). "Encoding and memory for visible speech and gestures: a
comparison between young and older adults," Psychol Aging 10, 215-228.
Tiippana, K., Andersen, T. S., and Sams, M. (2004). "Visual attention modulates audiovisual
speech perception," Eur J Cogn Psychol 16, 457-472.
Tiippana, K., Puharinen, H., Mottonen, R., and Sams, M. (2011). "Sound location can
influence audiovisual speech perception when spatial attention is manipulated,"
Seeing Perceiving 24, 67-90.
Treille, A., Vilain, C., and Sato, M. (2014a). "Haptic and visual information speed up the
neural processing of auditory speech in live dyadic interactions," Neuropsychologia
57, 71-77.
181
Treille, A., Vilain, C., and Sato, M. (2014b). "The sound of your lips: electrophysiological
cross-modal interactions during hand-to-face and face-to-face speech perception,"
Front Psychol 5, 420.
Tremblay, C., Champoux, F., Voss, P., Bacon, B. A., Lepore, F., and Théoret, H. (2007).
"Speech and Non-Speech Audio-Visual Illusions: A Developmental Study," PLoS
One 2, e742.
Tremblay, K., and Ross, B. (2007). "Effects of age and age-related hearing loss on the brain,"
J Commun Disord 40, 305-312.
Tye-Murray, N., Sommers, M. S., and Spehar, B. (2007). "Audiovisual integration and
lipreading abilities of older adults with normal and impaired hearing," Ear Hear 28,
656-668.
Van der Burg, E., Olivers, C. N., Bronkhorst, A. W., and Theeuwes, J. (2008). "Pip and pop:
nonspatial auditory signals improve spatial visual search," J Exp Psychol Hum
Percept Perform 34, 1053-1065.
Van der Burg, E., Olivers, C. N., Bronkhorst, A. W., and Theeuwes, J. (2009). "Poke and
pop: tactile-visual synchrony increases visual saliency," Neurosci Lett 450, 60-64.
van Mourik, R., Oosterlaan, J., and Sergeant, J. A. (2005). "The Stroop revisited: a meta-
analysis of interference control in AD/HD," J Child Psychol Psychiatry 46, 150-165.
Van Noorden, L. P. A. S. ( 1975). "Temporal coherence in the perception of tone sequences,"
(Doctoral dissertation, Eindhoven University of Technology, Eindhoven, The
Netherlands).
Van Wassenhove, V., Grant, K. W., and Poeppel, D. (2005). "Visual speech speeds up the
neural processing of auditory speech," Proc Natl Acad Sci U S A 102, 1181-1186.
Van Wassenhove, V., Grant, K. W., and Poeppel, D. (2007). "Temporal window of
integration in auditory-visual speech perception," Neuropsychologia 45, 598-607.
Vroomen, J., and Stekelenburg, J. J. (2010). "Visual anticipatory information modulates
multisensory interactions of artificial audiovisual stimuli," J Cogn Neurosci 22, 1583-
1596.
Walden, B. E., Busacco, D. A., and Montgomery, A. A. (1993). "Benefit from visual cues in
auditory-visual speech recognition by middle-aged and elderly persons," J Speech
Hear Res 36, 431-436.
Walden, B. E., Grant, K. W., and Cord, M. T. (2001). "Effects of amplification and
speechreading on consonant recognition by persons with impaired hearing," Ear Hear
22, 333-341.
182
Wang, D. L., and Brown, G. J. (2006). Computational auditory scene analysis: Principles,
algorithms and applications (IEEE Press/Wiley-Interscience, Hoboken, NJ.).
Wernicke, C. (1969). "The Symptom Complex of Aphasia," in Proceedings of the Boston
Colloquium for the Philosophy of Science 1966/1968, edited by R. Cohen, and M.
Wartofsky (Springer Netherlands), pp. 34-97.
Wu, J. (2009). "Speech perception and the McGurk effect : a cross cultural study using event-
related potentials," in Electronic Theses and Dissertations. Paper 1597.
Yang, L., and Hasher, L. (2007). "The enhanced effects of pictorial distraction in older
adults," J Gerontol B Psychol Sci Soc Sci 62, P230-233.
Yehia, H., Rubin, P., and Vatikiotis-Bateson, E. (1998). "Quantitative association of vocal-
tract and facial behavior," Speech Commun 26, 23-43.
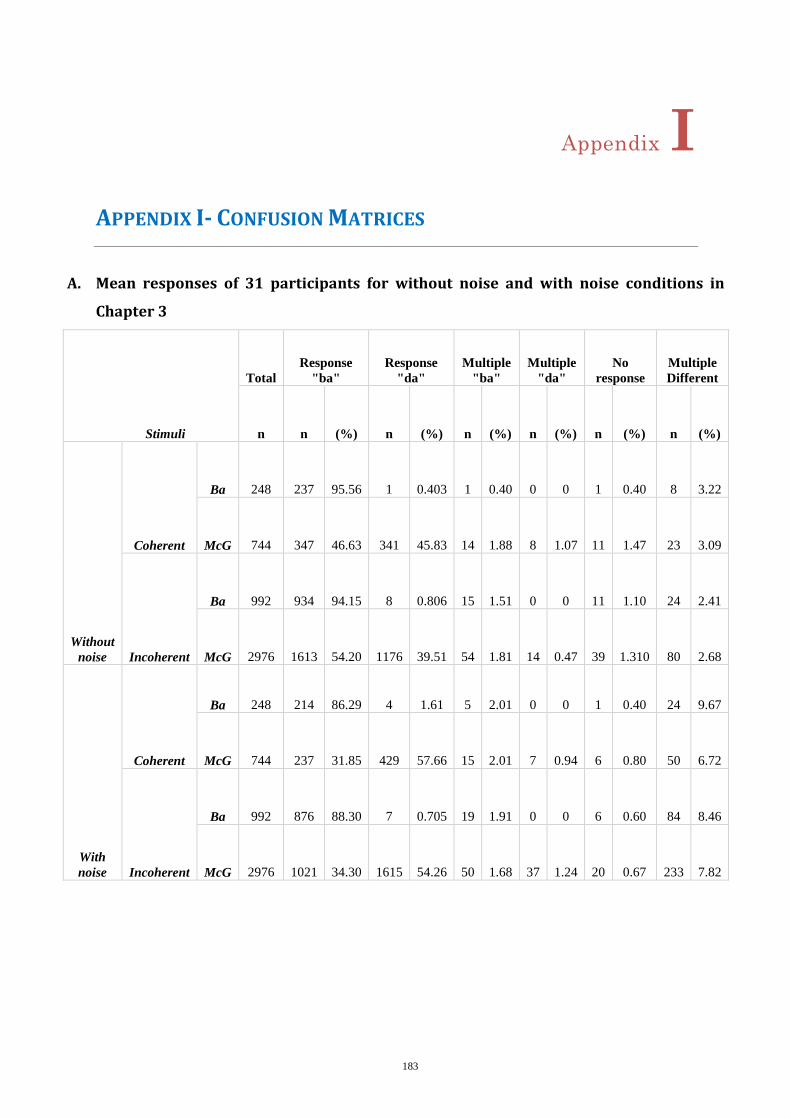
183
Appendix I
APPENDIX I- CONFUSION MATRICES
A. Mean responses of 31 participants for without noise and with noise conditions in
Chapter 3
Stimuli
Total
Response
"ba"
Response
"da"
Multiple
"ba"
Multiple
"da"
No
response
Multiple
Different
n n (%) n (%) n (%) n (%) n (%) n (%)
Without
noise
Coherent
Ba 248 237 95.56 1 0.403 1 0.40 0 0 1 0.40 8 3.22
McG 744 347 46.63 341 45.83 14 1.88 8 1.07 11 1.47 23 3.09
Incoherent
Ba 992 934 94.15 8 0.806 15 1.51 0 0 11 1.10 24 2.41
McG 2976 1613 54.20 1176 39.51 54 1.81 14 0.47 39 1.310 80 2.68
With
noise
Coherent
Ba 248 214 86.29 4 1.61 5 2.01 0 0 1 0.40 24 9.67
McG 744 237 31.85 429 57.66 15 2.01 7 0.94 6 0.80 50 6.72
Incoherent
Ba 992 876 88.30 7 0.705 19 1.91 0 0 6 0.60 84 8.46
McG 2976 1021 34.30 1615 54.26 50 1.68 37 1.24 20 0.67 233 7.82
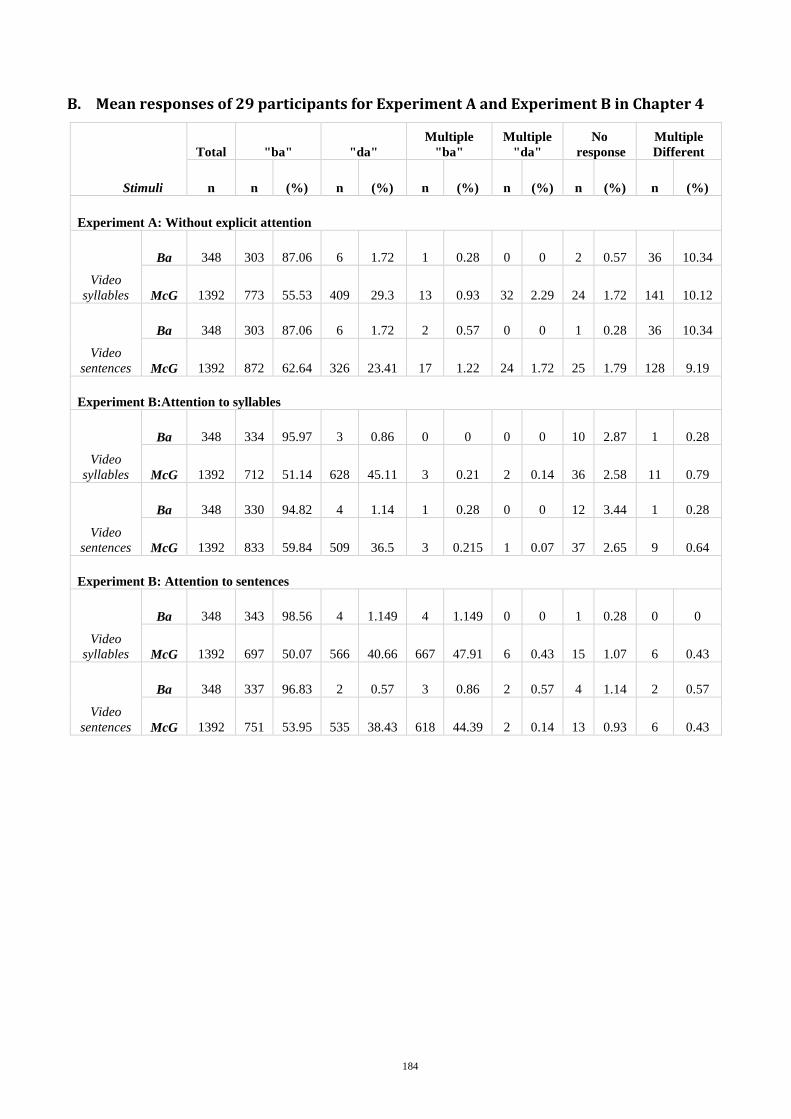
184
B. Mean responses of 29 participants for Experiment A and Experiment B in Chapter 4
Stimuli
Total "ba" "da"
Multiple
"ba"
Multiple
"da"
No
response
Multiple
Different
n n (%) n (%) n (%) n (%) n (%) n (%)
Experiment A: Without explicit attention
Video
syllables
Ba 348 303 87.06 6 1.72 1 0.28 0 0 2 0.57 36 10.34
McG 1392 773 55.53 409 29.3 13 0.93 32 2.29 24 1.72 141 10.12
Video
sentences
Ba 348 303 87.06 6 1.72 2 0.57 0 0 1 0.28 36 10.34
McG 1392 872 62.64 326 23.41 17 1.22 24 1.72 25 1.79 128 9.19
Experiment B:Attention to syllables
Video
syllables
Ba 348 334 95.97 3 0.86 0 0 0 0 10 2.87 1 0.28
McG 1392 712 51.14 628 45.11 3 0.21 2 0.14 36 2.58 11 0.79
Video
sentences
Ba 348 330 94.82 4 1.14 1 0.28 0 0 12 3.44 1 0.28
McG 1392 833 59.84 509 36.5 3 0.215 1 0.07 37 2.65 9 0.64
Experiment B: Attention to sentences
Video
syllables
Ba 348 343 98.56 4 1.149 4 1.149 0 0 1 0.28 0 0
McG 1392 697 50.07 566 40.66 667 47.91 6 0.43 15 1.07 6 0.43
Video
sentences
Ba 348 337 96.83 2 0.57 3 0.86 2 0.57 4 1.14 2 0.57
McG 1392 751 53.95 535 38.43 618 44.39 2 0.14 13 0.93 6 0.43
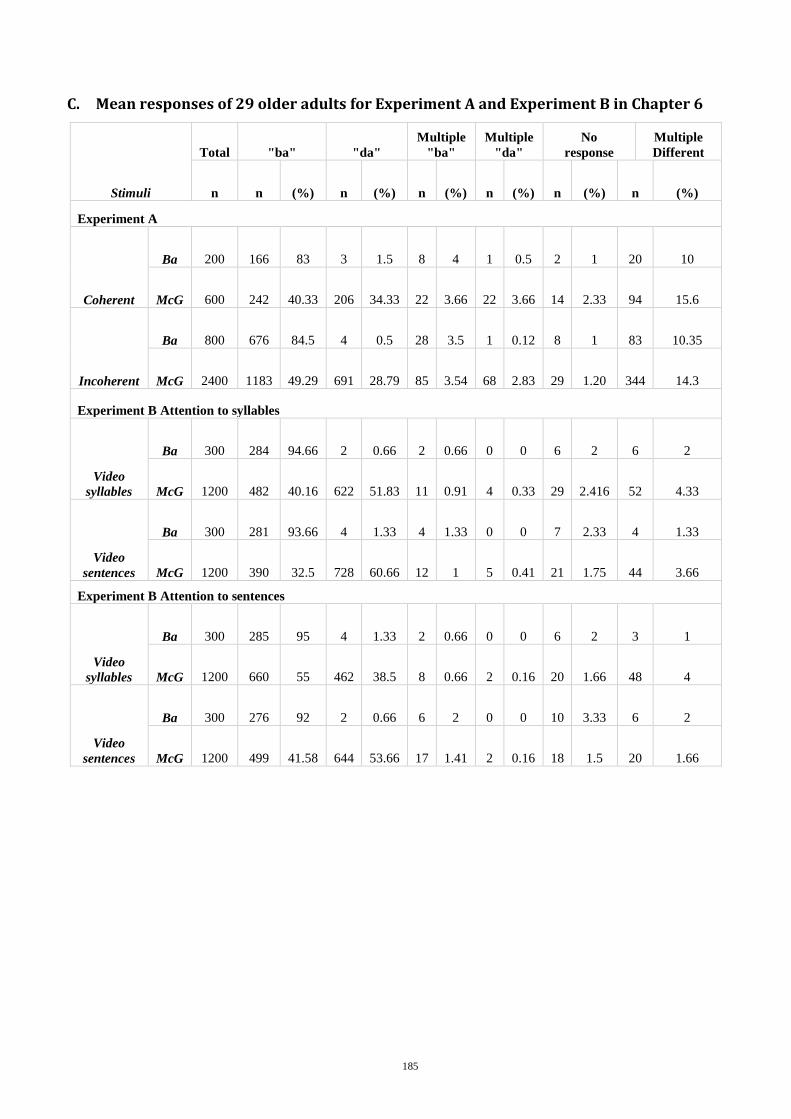
185
C. Mean responses of 29 older adults for Experiment A and Experiment B in Chapter 6
Stimuli
Total "ba" "da"
Multiple
"ba"
Multiple
"da"
No
response
Multiple
Different
n n (%) n (%) n (%) n (%) n (%) n (%)
Experiment A
Coherent
Ba 200 166 83 3 1.5 8 4 1 0.5 2 1 20 10
McG 600 242 40.33 206 34.33 22 3.66 22 3.66 14 2.33 94 15.6
Incoherent
Ba 800 676 84.5 4 0.5 28 3.5 1 0.12 8 1 83 10.35
McG 2400 1183 49.29 691 28.79 85 3.54 68 2.83 29 1.20 344 14.3
Experiment B Attention to syllables
Video
syllables
Ba 300 284 94.66 2 0.66 2 0.66 0 0 6 2 6 2
McG 1200 482 40.16 622 51.83 11 0.91 4 0.33 29 2.416 52 4.33
Video
sentences
Ba 300 281 93.66 4 1.33 4 1.33 0 0 7 2.33 4 1.33
McG 1200 390 32.5 728 60.66 12 1 5 0.41 21 1.75 44 3.66
Experiment B Attention to sentences
Video
syllables
Ba 300 285 95 4 1.33 2 0.66 0 0 6 2 3 1
McG 1200 660 55 462 38.5 8 0.66 2 0.16 20 1.66 48 4
Video
sentences
Ba 300 276 92 2 0.66 6 2 0 0 10 3.33 6 2
McG 1200 499 41.58 644 53.66 17 1.41 2 0.16 18 1.5 20 1.66
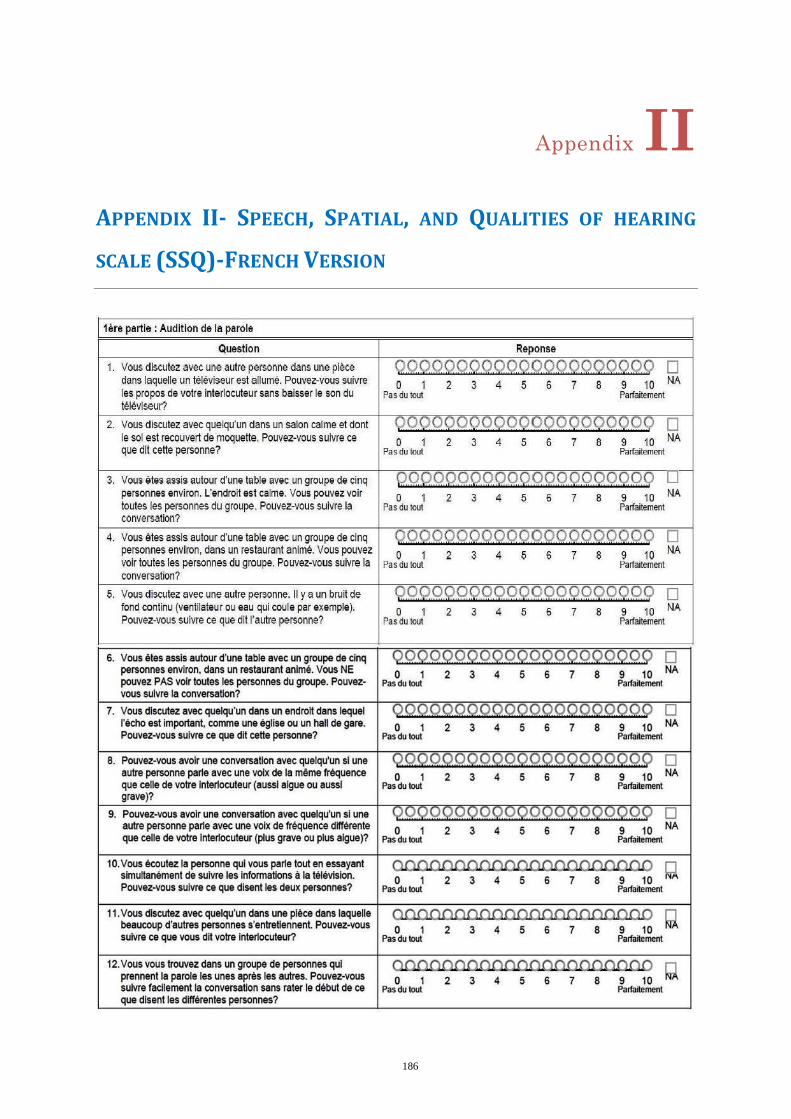
186
Appendix II
APPENDIX II- SPEECH, SPATIAL, AND QUALITIES OF HEARING
SCALE (SSQ)-FRENCH VERSION
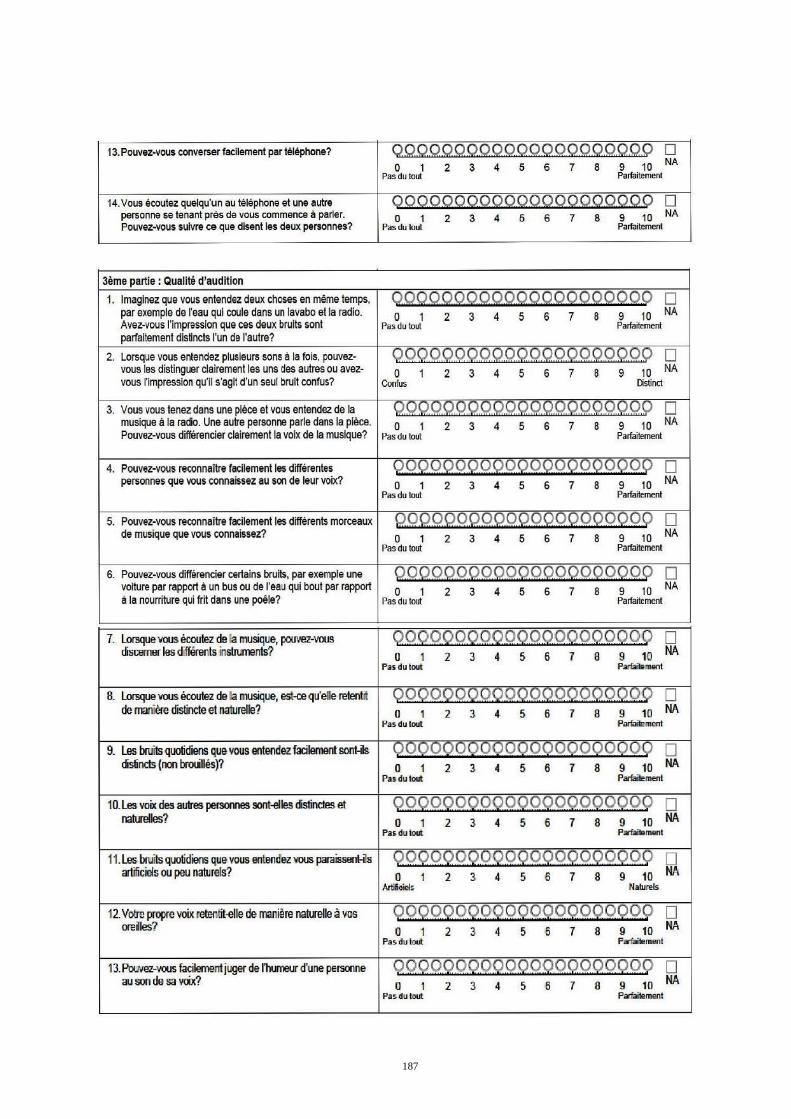
187
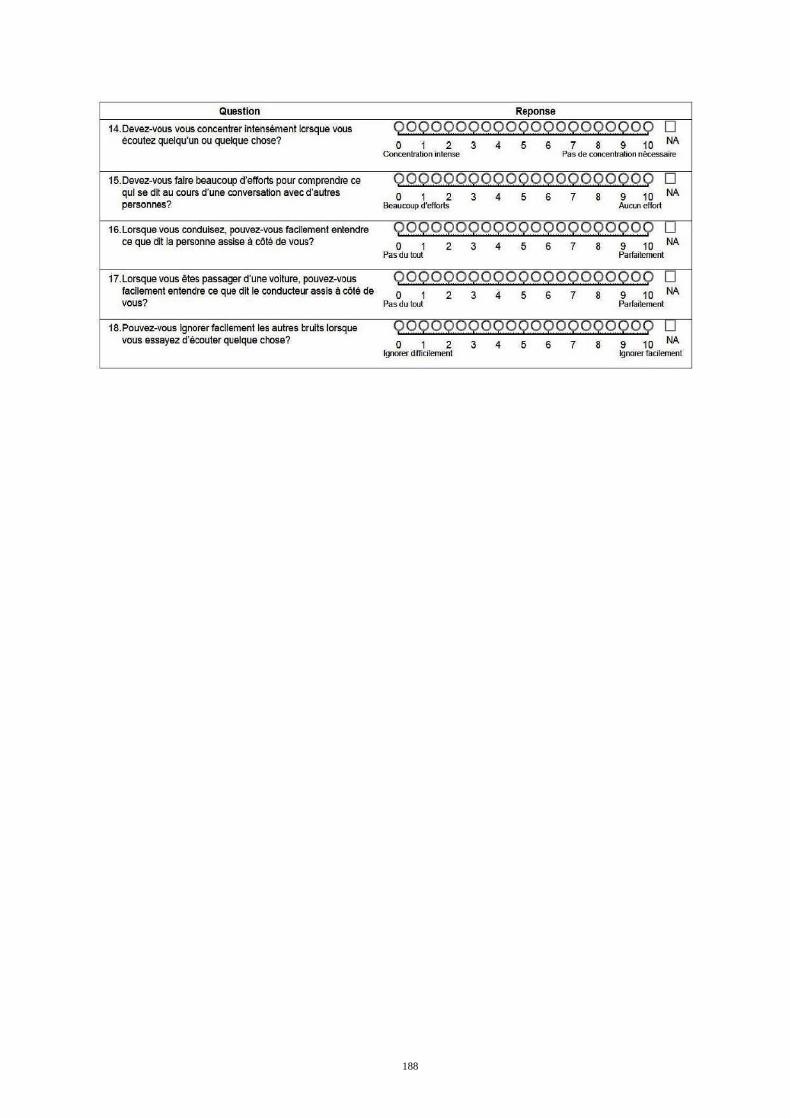
188