audiovisual attention boosts letter-speech sound integration
TRANSCRIPT
Audiovisual attention boosts letter-speech sound integration
MARIA MITTAG,a KIMMO ALHO,b,c RIKA TAKEGATA,a TOMMI MAKKONEN,a,d and TEIJA KUJALAa,e
aCognitive Brain Research Unit, Cognitive Science, Institute of Behavioural Sciences, University of Helsinki, Helsinki, FinlandbDivision of Cognitive Psychology and Neuropsychology, Institute of Behavioural Sciences, University of Helsinki, Helsinki, FinlandcHelsinki Collegium for Advanced Studies, University of Helsinki, Helsinki, FinlanddFinnish Centre of Excellence in Interdisciplinary Music Research, University of Jyväskylä, Jyväskylä, FinlandeCicero Learning Network, University of Helsinki, Helsinki, Finland
Abstract
We studied attention effects on the integration of written and spoken syllables in fluent adult readers by usingevent-related brain potentials. Auditory consonant-vowel syllables, including consonant and frequency changes, werepresented in synchrony with written syllables or their scrambled images. Participants responded to longer-durationauditory targets (auditory attention), longer-duration visual targets (visual attention), longer-duration auditory and visualtargets (audiovisual attention), or counted backwards mentally. We found larger negative responses for spoken consonantchanges when they were accompanied by written syllables than when they were accompanied by scrambled text. Thiseffect occurred at an early latency (~ 140 ms) during audiovisual attention and later (~ 200 ms) during visual attention.Thus, audiovisual attention boosts the integration of speech sounds and letters.
Descriptors: Attention, Mismatch negativity (MMN), Letter-speech sound integration, Audiovisual, P3
Learning to generate connections between the letters we see andthe spoken sounds we hear is crucial to becoming a fluent reader(Snowling, 1980). Recent studies indicate an automatic binding ofwritten print and spoken speech sounds, which occurs early inneural processes (Froyen, Van Atteveldt, Bonte, & Blomert, 2008;Mittag, Takegata, & Kujala, 2011). For instance, studies havefound that presenting synchronous task-irrelevant congruent letterson the screen improved the correct identification of spoken speechsounds (Blau, van Atteveldt, Formisano, Goebel, & Blomert,2008). Thus, even though the letters were unattended, they stronglyaffected the correct identification of the speech sounds. This studyexplored how the direction of attention influences the neural inte-gration of letters and speech sounds.
Attention is essential for the selection of relevant events from allinformation available, so that greater resources can be devoted totheir processing. Under certain circumstances, events from multi-ple senses tend to be integrated into a multisensory percept, andsuch integration processes are susceptible to the direction of ourattention (Degerman et al., 2007; Talsma, Doty, & Woldorff, 2007;Talsma, Senkowski, Soto-Faraco, & Woldorff, 2010). For instance,research has shown that participants attending to both auditory andvisual stimuli, rather than just one of those modalities, facilitated
the detection of audiovisual targets (Talsma et al., 2007). Facilita-tion effects were also observed with functional magnetic resonanceimaging (fMRI), revealing that attention to audiovisual featurecombinations engendered a stronger activation in superior temporalcortices than did attention to either the visual or auditory features(Degerman et al., 2007).
The neural mechanisms of audiovisual integration can be inves-tigated with the N2 response, a negative deflection of the event-related potential (ERP) during the early phases of auditory changedetection (Näätänen, Simpson, & Loveless, 1982; Novak, Ritter,Vaughan, & Wiznitzer, 1990). N2 response is a feasible tool forinvestigating how visual information affects auditory processing atthe cortical level (Lindström, Paavilainen, Kujala, & Tervaniemi,2012). N2 response to attended auditory stimulus changes consistsof two components: mismatch negativity (MMN) and N2b(Näätänen, 1992; Näätänen, Gaillard, & Mäntysalo, 1978;Näätänen et al., 1982; Novak et al., 1990). MMN is an ERP com-ponent elicited by occasional deviant sounds in a sequence ofrepetitive standard stimuli (Näätänen, 1992). MMN typically peaksfrontocentrally at 150–250 ms from deviance onset and is gener-ated mainly in the auditory cortex (Näätänen, 1992). MMN iselicited even when the participant is involved in an easy or difficulttask with other stimuli (Alho, Escera, Diaz, Yago, & Serra, 1997;Alho, Woods, Algazi, & Näätänen, 1992; Escera, Alho, Schröger,& Winkler, 2000; Escera, Alho, Winkler, & Näätänen, 1998), butattention can modulate the amplitude of MMN (Muller-Gass,Stelmack, & Campbell, 2006). The N2b component follows orpartially overlaps with MMN when the stimuli are attended to;thus, N2b is associated with a change detection mechanism on amore conscious level (Näätänen et al., 1982; Novak et al., 1990;Ritter et al., 1992; Sams, Paavilainen, Alho, & Näätänen, 1985).
The present study was supported by the National Doctoral Programmeof Psychology (University of Turku), the Academy of Finland (Grant128840), and the Research Funds of the University of Helsinki. We wish tothank Jari Lipsanen, Saila Seppänen, and Valtteri Wikström for their assist-ance during the various stages of this project, as well as the two anonymousreviewers for their valuable contributions.
Address correspondence to: Maria Mittag, Cognitive Brain ResearchUnit, PO Box 9, (Siltavuorenpenger 1B), 00014 University of Helsinki,Finland. E-mail: [email protected]
bs_b
s_ba
nner
Psychophysiology, •• (2013), ••–••. Wiley Periodicals, Inc. Printed in the USA.Copyright © 2013 Society for Psychophysiological ResearchDOI: 10.1111/psyp.12085
1
Recent studies found that sensory memory representationsstudied with MMN encode not only single features of bimodalevents, but also their conjunctions (Besle et al., 2007; Besle, Fort,& Giard, 2005). In the study of Besle et al. (2005), participantswere presented with a sequence of audiovisual standards (visualellipse + tone) interspersed with frequency changes in the tones ofthe audiovisual object (A′V), changes in the direction of the visualellipse (AV′), or changes in both parts (A′V′); the participants thenpressed a button in response to changes in a fixation cross presentedin the middle of the screen. Each unimodal deviant (A′V and AV′)elicited sensory-specific MMNs, and audiovisual deviants (A′V′)elicited responses at frontocentral sites (resembling the auditoryMMN) and at occipital sites (resembling the visual MMN). Thevisual MMN (AV′), however, differed from a genuine visual MMNresponse (V′), which was recorded with a visual-only experimentwherein ellipse changes were presented without the tones, suggest-ing that auditory and visual information interact before the MMNprocess. Thus, with MMN, the integration of different sensoryfeatures can be studied at the preperceptual level.
The audiovisual integration of letters and speech sounds wasfirst examined with ERPs by presenting an occasional vowelchange /o/ within a sequence of a repeated vowel sound /a/ and asynchronous letter “a” on a screen (Froyen et al., 2008). Largerresponses, which the authors called MMN, were observed in thiscondition than in an auditory-only condition with no visual letters,indicating that in the audiovisual condition, two processes underlieMMN: the processing of deviation from the auditory standard andthe processing of deviation from the letter on the screen. Mittaget al. (2011) extended these findings by investigating the perceptualintegration of written and spoken syllables with the auditorymultifeature paradigm (also called the Optimum-1 paradigm;Näätänen, Pakarinen, Rinne, & Takegata, 2004). They recordedMMNs to different types of changes in spoken syllables (changesin consonant, vowel identity, or vowel duration, or changes in theF0 frequency or intensity of the syllable) occurring together withsynchronized written syllables or scrambled letters. MMNs to con-sonant and frequency changes in syllables presented together withwritten syllables were larger than in syllables presented withscrambled text. The study showed that concurrent written syllablesin relation to concurrent meaningless images facilitated theprocessing of auditory changes.
Previous studies of letter-speech sound integration directedattention to visual modality, for example, participants were askedto press a button in response to colored pictures interspersed in asequence of letters on the screen in the audiovisual condition or towatch a silent video in the auditory-alone condition (Froyen et al.,2008), or attended to changes in the letters while ignoring thespeech sounds (Mittag et al., 2011). The current study explored theextent to which attention modulates audiovisual integration. Morespecifically, we determined how the direction of attention towardsthe visual, auditory, or both modalities or away from the stimulimodulates the spatiotemporal dynamics of audiovisual integration.In the current study, however, instead of the five auditory changes,we used only consonant and F0 frequency changes since thesechanges showed modulation by concurrent visual letters in thestudy of Mittag et al. (2011).
Thus, as in the study of Mittag et al. (2011), the participants inthe present study were presented with spoken syllables along withfrequency and consonant changes and synchronous written sylla-bles or scrambled images of the written syllables on the screen.There were four attentional conditions with duration changes astarget stimuli: participants were instructed to detect longer-duration
targets among (1) spoken syllables, (2) written syllables or theirscrambled versions, or (3) both spoken and written/scrambled syl-lables, or (4) to count backwards mentally and to ignore the spokenand written/scrambled syllables. All conditions involved similarsequences with an oddball paradigm that included frequency andconsonant changes. Either visual print or meaningless images werepresented concurrently with these sounds, the only differencebetween the conditions being the direction of the participant’sattention. We compared N2 responses elicited by the two types ofsyllable deviances in the four attention conditions and in the twovisual contexts.
We hypothesized that when participants are instructed to detectstimulus duration changes in the visual domain, as in the study ofMittag et al. (2011), the N2 responses to changes in spoken sylla-bles should be larger when accompanied by written syllables thanby scrambled images of written syllables. Since studies have shownattention to audiovisual feature combinations to elicit a strongeractivation in superior temporal cortices than does attention to thevisual or auditory features (Degerman et al., 2007), we furtherhypothesized that the effect of written syllables accompanyingspoken syllables on the N2 would be stronger during audiovisualattention than during auditory or visual attention. Finally, since theexisting literature showed that the responsiveness of the auditorycortex to task-irrelevant speech sounds is suppressed during mentalcounting tasks (Ghatan, Hsieh, Petersson, Stone-Elander, & Ingvar,1998), we expected the N2 responses to be the smallest when amental counting task directs attention away from the speech andletters.
Method
Participants
Altogether, 22 healthy, right-handed adult native Finnish speakersparticipated in the experiment. The participants provided theirwritten informed consent after hearing an explanation of the studyand received movie tickets as compensation for their participation.Four participants were excluded due to the low number of epochsper deviant (according to the outlier test by Grubbs, 1968) or due tohigh-amplitude alpha oscillations in their electroencephalogram(EEG), thereby preventing the reliable observation of ERPs. Oneparticipant recognized that the scrambled images were actuallyscrambled pictures of syllables, and was therefore excluded. Thus,17 participants were included in the analysis (Mage 27 years, range22–43 years, 6 males). The study was approved by the EthicsReview Board of the University of Helsinki in the Humanities andSocial and Behavioural Sciences.
Stimuli
Auditory stimuli. Auditory stimuli were semisyntheticconsonant-vowel syllables of the Finnish language. The standardsyllable was /ke:/ in half of the blocks and /pi:/ in the rest of them.The standard syllables had a fundamental frequency (F0) of 101 Hzand a duration of 170 ms. With the standard syllable /ke:/, thedeviant-consonant syllable was /pe:/ and the deviant-frequency/ke:/ syllables had an F0 of 93 or 109 Hz. With the standard syllable/pi:/, the deviant-consonant syllable was /ki:/ and the deviant-frequency /pi:/ syllables had an F0 of 93 or 109 Hz. Syllable soundswere generated with the semisynthetic speech generation method(Alku, Tiitinen, & Näätänen, 1999); for details, see Mittag et al.(2011). The auditory target syllables were generated by prolonging
2 M. Mittag et al.
the duration of the vowel in 10-ms steps. Target duration wasdetermined for each participant based on the individual discrimi-nation thresholds of the participants, with the resulting target dura-tion varying from 200 to 280 ms. The spoken syllables were alwaysbinaurally presented through headphones (Sony MDR-7506,Tokyo, Japan) at an intensity of 50 dB above the participants’hearing threshold.
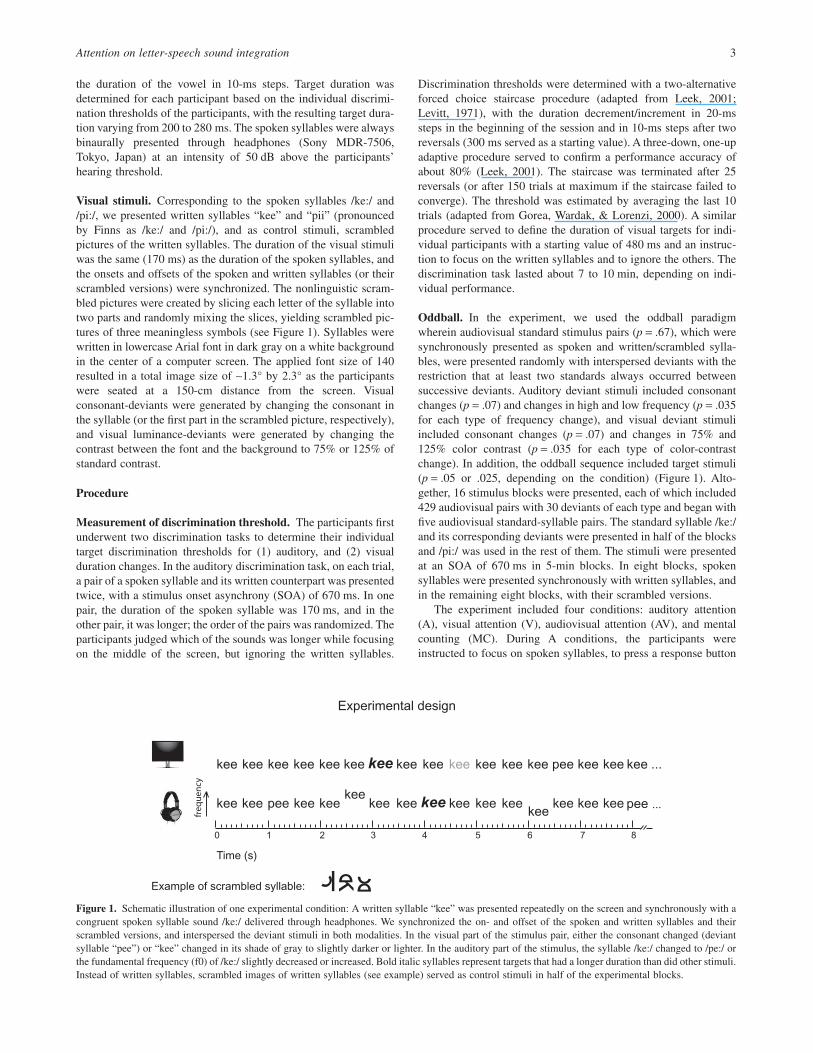
Visual stimuli. Corresponding to the spoken syllables /ke:/ and/pi:/, we presented written syllables “kee” and “pii” (pronouncedby Finns as /ke:/ and /pi:/), and as control stimuli, scrambledpictures of the written syllables. The duration of the visual stimuliwas the same (170 ms) as the duration of the spoken syllables, andthe onsets and offsets of the spoken and written syllables (or theirscrambled versions) were synchronized. The nonlinguistic scram-bled pictures were created by slicing each letter of the syllable intotwo parts and randomly mixing the slices, yielding scrambled pic-tures of three meaningless symbols (see Figure 1). Syllables werewritten in lowercase Arial font in dark gray on a white backgroundin the center of a computer screen. The applied font size of 140resulted in a total image size of ~1.3° by 2.3° as the participantswere seated at a 150-cm distance from the screen. Visualconsonant-deviants were generated by changing the consonant inthe syllable (or the first part in the scrambled picture, respectively),and visual luminance-deviants were generated by changing thecontrast between the font and the background to 75% or 125% ofstandard contrast.
Procedure
Measurement of discrimination threshold. The participants firstunderwent two discrimination tasks to determine their individualtarget discrimination thresholds for (1) auditory, and (2) visualduration changes. In the auditory discrimination task, on each trial,a pair of a spoken syllable and its written counterpart was presentedtwice, with a stimulus onset asynchrony (SOA) of 670 ms. In onepair, the duration of the spoken syllable was 170 ms, and in theother pair, it was longer; the order of the pairs was randomized. Theparticipants judged which of the sounds was longer while focusingon the middle of the screen, but ignoring the written syllables.
Discrimination thresholds were determined with a two-alternativeforced choice staircase procedure (adapted from Leek, 2001;Levitt, 1971), with the duration decrement/increment in 20-mssteps in the beginning of the session and in 10-ms steps after tworeversals (300 ms served as a starting value). A three-down, one-upadaptive procedure served to confirm a performance accuracy ofabout 80% (Leek, 2001). The staircase was terminated after 25reversals (or after 150 trials at maximum if the staircase failed toconverge). The threshold was estimated by averaging the last 10trials (adapted from Gorea, Wardak, & Lorenzi, 2000). A similarprocedure served to define the duration of visual targets for indi-vidual participants with a starting value of 480 ms and an instruc-tion to focus on the written syllables and to ignore the others. Thediscrimination task lasted about 7 to 10 min, depending on indi-vidual performance.
Oddball. In the experiment, we used the oddball paradigmwherein audiovisual standard stimulus pairs (p = .67), which weresynchronously presented as spoken and written/scrambled sylla-bles, were presented randomly with interspersed deviants with therestriction that at least two standards always occurred betweensuccessive deviants. Auditory deviant stimuli included consonantchanges (p = .07) and changes in high and low frequency (p = .035for each type of frequency change), and visual deviant stimuliincluded consonant changes (p = .07) and changes in 75% and125% color contrast (p = .035 for each type of color-contrastchange). In addition, the oddball sequence included target stimuli(p = .05 or .025, depending on the condition) (Figure 1). Alto-gether, 16 stimulus blocks were presented, each of which included429 audiovisual pairs with 30 deviants of each type and began withfive audiovisual standard-syllable pairs. The standard syllable /ke:/and its corresponding deviants were presented in half of the blocksand /pi:/ was used in the rest of them. The stimuli were presentedat an SOA of 670 ms in 5-min blocks. In eight blocks, spokensyllables were presented synchronously with written syllables, andin the remaining eight blocks, with their scrambled versions.
The experiment included four conditions: auditory attention(A), visual attention (V), audiovisual attention (AV), and mentalcounting (MC). During A conditions, the participants wereinstructed to focus on spoken syllables, to press a response button
Time (s)
kee
0 1 2 3 4 5 6 7 8
kee kee kee kee kee kee kee kee kee kee kee pee kee kee kee
kee keekee kee kee
...
...
kee
kee kee kee kee kee kee kee kee
freq
uen
cy
peekee
keepee
Example of scrambled syllable:
Experimental design
Figure 1. Schematic illustration of one experimental condition: A written syllable “kee” was presented repeatedly on the screen and synchronously with acongruent spoken syllable sound /ke:/ delivered through headphones. We synchronized the on- and offset of the spoken and written syllables and theirscrambled versions, and interspersed the deviant stimuli in both modalities. In the visual part of the stimulus pair, either the consonant changed (deviantsyllable “pee”) or “kee” changed in its shade of gray to slightly darker or lighter. In the auditory part of the stimulus, the syllable /ke:/ changed to /pe:/ orthe fundamental frequency (f0) of /ke:/ slightly decreased or increased. Bold italic syllables represent targets that had a longer duration than did other stimuli.Instead of written syllables, scrambled images of written syllables (see example) served as control stimuli in half of the experimental blocks.
Attention on letter-speech sound integration 3
with their right index finger whenever they detected a longerspoken syllable, and to fixate on the middle of the screen, but toignore the visual stimuli. During V conditions, the participantswere instructed to focus on the written/scrambled syllables on thescreen, to press the button whenever they perceived a longer dura-tion visual stimulus, and to ignore the spoken syllables. During AVconditions, the participants were instructed to attend to both thespoken syllables and the written/scrambled syllables and to pressthe button whenever they detected a longer-duration auditory orvisual stimulus. During MC conditions, the participants wereinstructed to count backwards mentally from 500 and to press thebutton whenever they reached full tens (490, 480, 470, etc.) whilefixating on the middle of the screen and ignoring the spoken andwritten/scrambled syllables. The target stimulus probability was.05 in the A, V, and MC conditions. During AV conditions, thetarget stimulus probability was set to .25 in each modality to keepthe overall target probability at .05. It is worth noting that theconsonant and frequency changes in the spoken syllables wereirrelevant to the task in all conditions.
Each condition had four stimulus blocks: two with written syl-lables (one with “kee” and its auditory counterpart /ke:/ as a stand-ard pair and another with “pii” and its counterpart /pi:/ as a standardpair) and two with their scrambled versions. The conditions anddifferent block types occurred in an order counterbalanced betweenthe participants.
Analysis of Behavioral Responses
Button presses occurring 100–1,500 ms after target onset wereclassified as hits, and reaction times (RTs) were calculated accord-ingly. All button presses outside this interval were classified as falsealarms (FAs). We conducted a three-way repeated measures analy-sis of variance (ANOVA) for the RT and hit rate measures sepa-rately with the factors of modality of target (2 levels: auditory,visual), attention (2 levels: unimodal [i.e., auditory or visual] atten-tion, bimodal attention), and visual context (2 levels: written syl-lables, scrambled syllables). We conducted a two-way repeatedmeasures ANOVA separately for FAs with the factors attention (3levels: A, V, AV) and visual context (2 levels) because FAs wereindependent of the modality of the target in the bimodal conditions.
EEG Recording and Analysis of Event-Related Potentials
EEG recording. Before the EEG recording, the participantsreceived training in the four conditions to ensure that they under-stood the task and felt confident in detecting the targets. The EEGwas recorded with a 64-active electrode cap (BioSemi, Amsterdam,The Netherlands) and with a band-pass 0.1–100 Hz (sampling rate512 Hz). Additional electrodes at the outer canthi of the eyes servedto register a horizontal electrooculogram (HEOG), and below andabove the right eye to register a vertical electrooculogram (VEOG).An electrode placed on the tip of the nose served as an offlinereference. The experiment was carried out in an electricallyshielded, sound-attenuated, video-monitored chamber. Data wererecorded at the same time of the day on two separate days.
Preprocessing of the data. The continuous EEG was downsam-pled to 256 Hz and offline filtered (band-pass of 1–45 Hz) by usingthe EEGLAB toolbox (Delorme & Makeig, 2004, http://sccn.ucsd.edu/eeglab). Epochs of 500 ms after each stimulus onset,including a 100-ms prestimulus period, were baseline correctedwith respect to the mean voltage of the prestimulus period. The
responses to the first five (standard) stimulus pairs of each blockwere omitted from averaging, as were two epochs occurring aftereach button press to control for possible contamination of sensoryERPs by motor responses (Luck, 2005). An independent compo-nent analysis (ICA) served to remove blink artifacts (one to twocomponents per participant). Thereafter, a 25-Hz low-pass filterwas applied, and any epochs with voltage changes of � 100 mV atany channel were automatically removed. Epochs with obviousartifacts were omitted manually by visual inspection, and responsesto broken channels were interpolated from neighboring channels(0–3 electrodes per participant, 1 on average).
Averaging. EEG epochs were averaged for standard and deviantstimulus pairs separately for each condition/visual context. Onaverage, 103 deviants (range: 83–114) were accepted for eachcondition/context. Responses to standard syllable pairs were aver-aged across the two types of auditory (and visual) standards /ke:/and /pi:/. Responses to the two different auditory consonantchanges from the respective conditions were averaged across thedeviant /pe:/ and deviant /ki:/, and responses to the F0 frequencychanges were averaged across the syllable types and across F0increases and decreases. ERPs to the standard syllables were sub-tracted from the ERPs to the deviant syllables to obtain ERPdifference waveforms to estimate the effects of auditory changeprocessing.
Analysis of N2. The deviant stimuli elicited negative deflections,which differed between the conditions (written syllable, scrambledimage) at latencies ranging from about 100 to 250 ms from stimu-lus onset.
This latency range included several peaks of which the last onepreceded the onset of P3a and was the easiest to identify andseparate from other N2 peaks at Oz. To investigate ERP differencesbetween the visual contexts (written syllables vs. scrambledimages), we first identified this peak and measured its amplitudefrom individual ERP difference waves as a mean amplitude over a30-ms time window centered on the peak latency of this peakdetermined at Oz separately for each experimental condition. Wethen measured amplitudes over two earlier consecutive 30-mslatency windows immediately preceding this latency window. Totest whether mean amplitudes differed significantly from zero, weconducted one-tailed t tests for these windows at the electrodeshowing the strongest signal (FCz for the first and second N2windows, and Pz for the third N2 window).
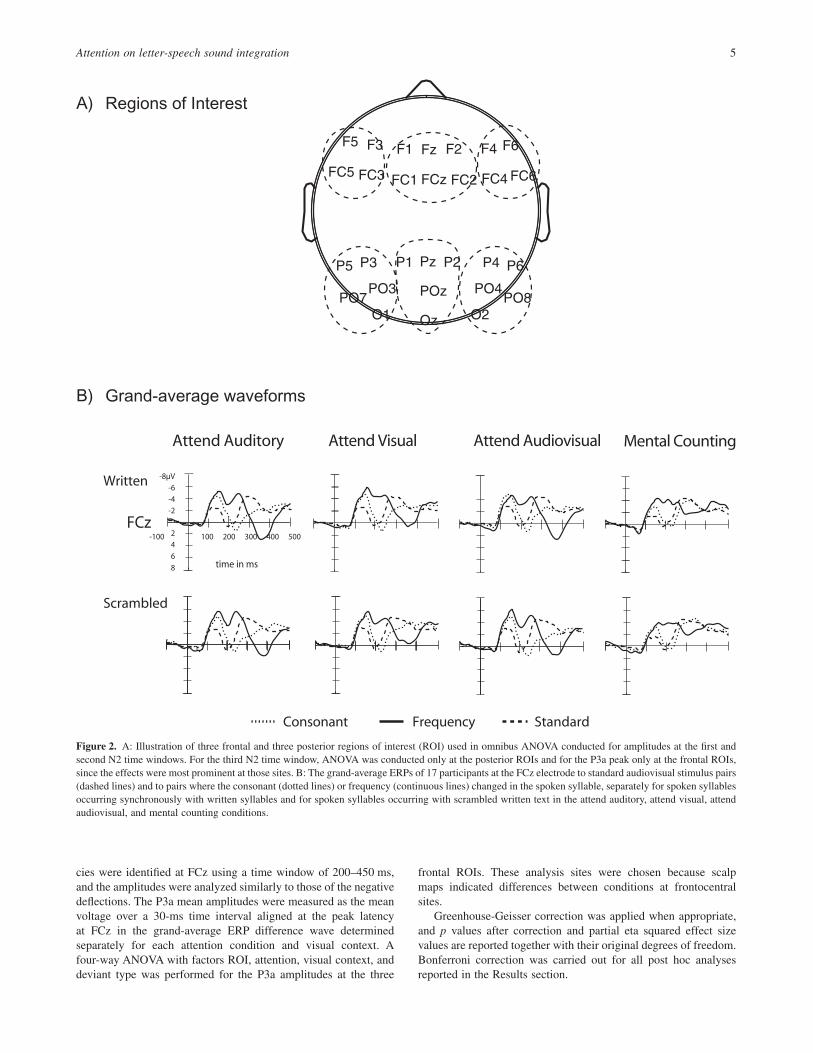
We conducted a four-way omnibus repeated measures ANOVAto test the effects of attention (4 levels), visual context (2 levels),and deviant type (2 levels) on the mean amplitudes at three frontaland three posterior regions of interest (ROIs) (6 levels: average ofelectrodes F5, F3, FC5, FC3 [left frontal ROI]; F1, Fz, F2, FC1,FCz, FC2 [mid-frontal ROI]; F4, F6, FC4, FC5 [right frontalROI)]; P5, P3, PO7, PO3, O1 [left posterior ROI]; P1, Pz, P2, POz,Oz [midposterior ROI]; P4, P6, PO4, PO8, O2 [right posteriorROI]; see Figure 2a), separately for the first and second N2windows. For the third N2 window, analysis was undertaken at theposterior ROI only (all factors for the ANOVA were the sameexcept for the ROI [3 levels]), since the effects were most promi-nent at those sites. Because the peaks were often difficult to reliablydetect in individual participants, we did not measure individualpeak latencies.
Analysis of P3a. The negative deflection to deviant spoken sylla-bles was followed by a positive P3a response. The P3a peak laten-
4 M. Mittag et al.
cies were identified at FCz using a time window of 200–450 ms,and the amplitudes were analyzed similarly to those of the negativedeflections. The P3a mean amplitudes were measured as the meanvoltage over a 30-ms time interval aligned at the peak latencyat FCz in the grand-average ERP difference wave determinedseparately for each attention condition and visual context. Afour-way ANOVA with factors ROI, attention, visual context, anddeviant type was performed for the P3a amplitudes at the three
frontal ROIs. These analysis sites were chosen because scalpmaps indicated differences between conditions at frontocentralsites.
Greenhouse-Geisser correction was applied when appropriate,and p values after correction and partial eta squared effect sizevalues are reported together with their original degrees of freedom.Bonferroni correction was carried out for all post hoc analysesreported in the Results section.
Written
Scrambled
Attend Auditory Attend Visual
Consonant Frequency Standard
Attend Audiovisual
FCz100 200 300 400 500
time in ms
-8µV
-4-2
2
4
6
-6
8
-100
Mental Counting
F1 F3 F5
FC5 FC3 FC1
P1 P3 P5
PO7PO3
O1 Oz
POz
Pz
Fz F2 F4 F6
FC6FC4FC2FCz
P2 P4 P6
PO8PO4
O2
A)
B)
Regions of Interest
Grand-average waveforms
Figure 2. A: Illustration of three frontal and three posterior regions of interest (ROI) used in omnibus ANOVA conducted for amplitudes at the first andsecond N2 time windows. For the third N2 time window, ANOVA was conducted only at the posterior ROIs and for the P3a peak only at the frontal ROIs,since the effects were most prominent at those sites. B: The grand-average ERPs of 17 participants at the FCz electrode to standard audiovisual stimulus pairs(dashed lines) and to pairs where the consonant (dotted lines) or frequency (continuous lines) changed in the spoken syllable, separately for spoken syllablesoccurring synchronously with written syllables and for spoken syllables occurring with scrambled written text in the attend auditory, attend visual, attendaudiovisual, and mental counting conditions.
Attention on letter-speech sound integration 5
Results
Behavioral Results
Table 1 shows mean RTs and hit rates. The RTs were shorter forvisual targets than for auditory targets (mean RTs: 688 ms and716 ms, respectively; main effect of modality: F(1,16) = 4.59,p < .05, ηp
2 223= . ). In addition, RTs were shorter during bimodal(audiovisual) attention than during unimodal (auditory or visual)attention (mean RTs: 665 ms and 739 ms, respectively; main effectof attention: F(1,16) = 87.89, p < .001, ηp
2 846= . ), and shorterwhen visual stimuli were scrambled text than when they weresyllables (mean RTs: 695 ms and 710 ms, respectively; main effectof visual context: F(1,16) = 4.79, p < .05, ηp
2 231= . ; RTs showedno significant interactions of visual context and modality orattention).
The modality of the target stimulus also affected hit rates (HRs):HRs were higher for auditory targets than for visual targets (meanHRs: 83.3% and 70.6%, respectively; main effect of modality:F(1,16) = 21.15, p < .001, ηp
2 569= . ).We found a significant interaction between attention and visual
context for false-alarm rates (FARs), F(2,32) = 5.82, p < .05,ηp
2 267= . : during the presentation of the written syllable, partici-pants had lower FARs in the AV condition (mean FAR 0.02%) thanin the A condition (mean FAR 0.15%; p < .05) or in the V condition(mean FAR 0.16%; p < .005).
N2 Response
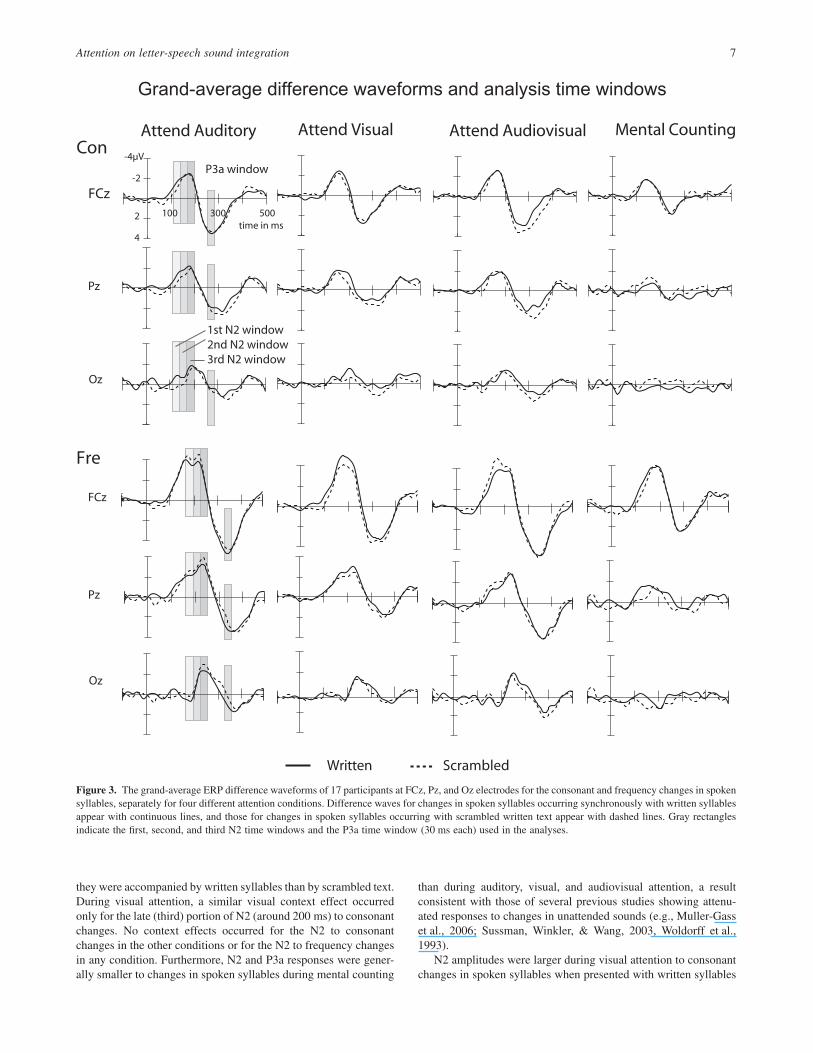
The first N2 time window. Figure 2 illustrates grand-mean ERPwaveforms at FCz for each condition, separately for the consonantand frequency deviants among spoken syllables. The correspond-ing grand-mean ERP difference waveforms at FCz, Pz, and Ozappear in Figure 3. Table 2 illustrates mean amplitudes and peaklatencies for the N2 and P3a responses. The mean amplitudes of thefirst N2 time window at FCz differed significantly from zero in allconditions for both spoken-consonant and frequency changes,t(17) = -11.5 to -4.0, p < .001 in all cases.
A four-way omnibus ANOVA revealed a significantAttention ¥ Visual Context ¥ Deviant Type interaction, F(3,48) =6.4, p < .05, ηp
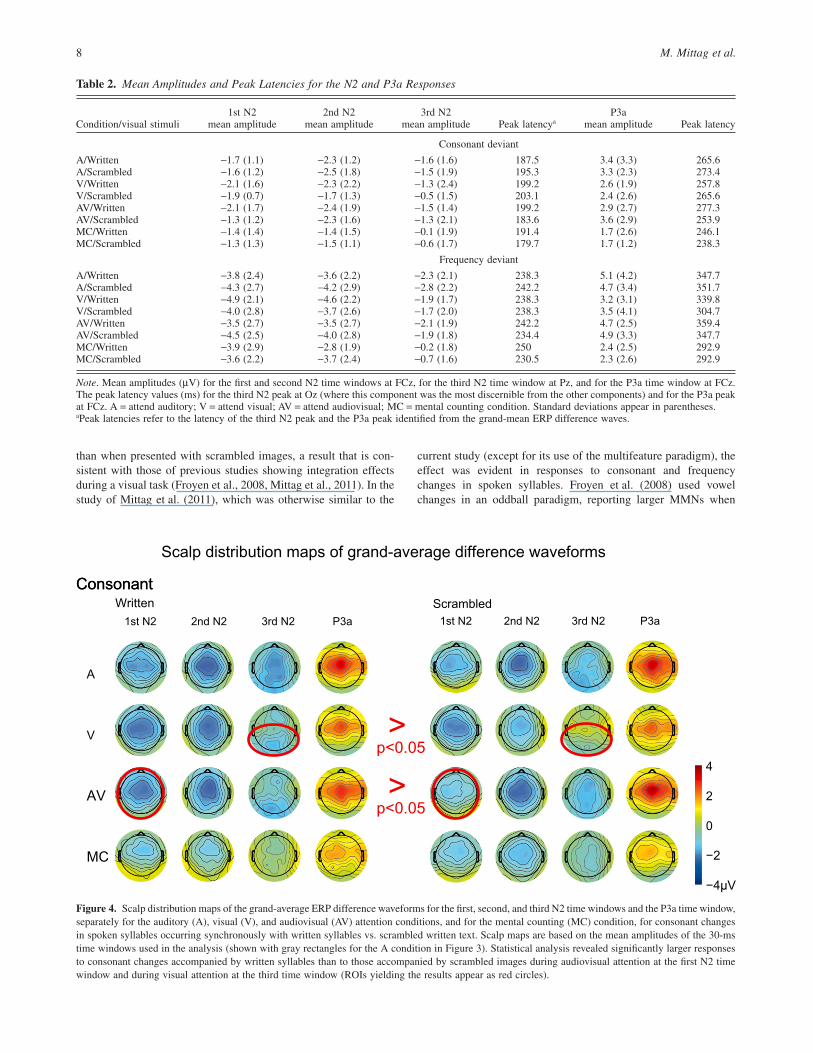
2 162= . . At the first measured time window, the N2to consonant changes in spoken syllables was larger when thespoken syllables were accompanied by written syllables than whenthey were accompanied by scrambled text in the AV condition(p < .05, see Figure 4). No such effect of the visual contextoccurred at the first time window for consonant changes in spokensyllables in the other conditions or for frequency changes in spokensyllables in any condition (see Figure 5).
The second N2 time window. The mean N2 amplitudes at thesecond time window differed significantly from zero at FCz in allconditions for both spoken-consonant and frequency changes,t(17) = -8.6 to -3.8, p < .001 in all cases. The four-way ANOVArevealed no significant effects of visual context on the amplitudeselicited by changes in spoken syllables. However, a significantAttention ¥ Deviant Type ¥ ROI interaction occurred, F(15,240) =3.92, p < .005, ηp
2 197= . . The responses to frequency changes inspoken syllables were smaller in the MC conditions than in the Aconditions (at the left frontal, p < .1, and at all posterior ROIs,p < .01, for all comparisons) and V conditions (at the left frontalROI, p < .1), and smaller in the V conditions than in the A condi-tions (at the right posterior ROI, p < .05).
The third N2 time window. Mean N2 amplitudes at the Pz elec-trode differed significantly from zero at the third time window in allconditions for spoken-consonant and frequency changes,t(17) = -5.9 to -2.5, p < .05 in all cases, except in the MC condi-tion for both consonant and frequency changes in spoken syllableswhen accompanied by written syllables. A four-way ANOVA atposterior sites revealed a significant Attention ¥ Visual Context ¥Deviant Type interaction, F(3,48) = 4.21, p < .05, ηp
2 208= . . In theV condition, the N2 amplitude at the third window to consonantchanges in spoken syllables was larger when the syllables wereaccompanied by written syllables than when they were accompa-nied by scrambled text (p < .05). No such effect of visual materialoccurred for spoken-consonant changes in the other conditions orfor frequency changes in any condition.
When the spoken syllables were accompanied by written sylla-bles, the N2 to frequency changes in spoken syllables at the thirdtime window was significantly smaller in the MC condition than inthe A (p < .001), V (p < .05), and AV conditions (p < .001). The N2to consonant changes in spoken syllables showed a similar pattern,being significantly smaller at the third window in the MC conditionthan in the A and AV conditions (p < .05 for both comparisons).Furthermore, during the presentation of scrambled images, the N2to frequency changes in spoken syllables at the third time windowwas smaller in the MC condition than in the A (p < .001) and AV(p < .005) conditions, and larger in the A than in the V conditions(p < .05).
The P3a Response
The mean amplitudes differed significantly from zero in all condi-tions at the FCz electrode, t(17) = -7.7 to -2.7, p < .05 in all cases.The P3a amplitudes at the three frontal ROIs showed a significantAttention ¥ ROI interaction, F(6,96) = 4.45, p < .05, ηp
2 217= . , theP3a being significantly smaller in the V than in the A condition(p < .05 at all ROIs) and significantly smaller in the A than in theAV condition (at left and mid-ROIs, p < .05). P3as were also sig-nificantly smaller in the MC condition than in the A condition (atthe midfrontal, p < .005, and right frontal ROIs, p < .05) and AVconditions (at the midfrontal, p < .005, and right frontal ROI,p < .01).
Discussion
The present study investigated the effects of attention on the inte-gration of speech sounds with different types of visual material.Our main results revealed novel effects around 140 ms after stimu-lus onset, with the negative responses being larger during audio-visual attention for consonant changes in spoken syllables when
Table 1. Mean (n = 17) Reaction Times (RTs) and Hit Rates
Modality of target Attention Visual context RT (ms) Hit %
Auditory Unimodal Written 724 (21) 84.8 (2.7)Scrambled 704 (17) 81.4 (3.2)
Bimodal Written 727 (16) 84.3 (3.2)Scrambled 709 (19) 82.8 (3.2)
Visual Unimodal Written 763 (16) 69.5 (3.9)Scrambled 766 (16) 67.0 (3.9)
Bimodal Written 624 (28) 75.2 (3.2)Scrambled 600 (16) 70.1 (3.3)
Note. Standard errors of the mean appear in parentheses.
6 M. Mittag et al.
they were accompanied by written syllables than by scrambled text.During visual attention, a similar visual context effect occurredonly for the late (third) portion of N2 (around 200 ms) to consonantchanges. No context effects occurred for the N2 to consonantchanges in the other conditions or for the N2 to frequency changesin any condition. Furthermore, N2 and P3a responses were gener-ally smaller to changes in spoken syllables during mental counting
than during auditory, visual, and audiovisual attention, a resultconsistent with those of several previous studies showing attenu-ated responses to changes in unattended sounds (e.g., Muller-Gasset al., 2006; Sussman, Winkler, & Wang, 2003, Woldorff et al.,1993).
N2 amplitudes were larger during visual attention to consonantchanges in spoken syllables when presented with written syllables
Attend Auditory Attend Visual
Pz
Fre
Mental CountingAttend Audiovisual
Written Scrambled
FCz
Pz
Oz
Oz
FCz
Con-4µV
time in ms
-2
2
4
100 500300
P3a window
1st N2 window2nd N2 window3rd N2 window
Grand-average difference waveforms and analysis time windows
Figure 3. The grand-average ERP difference waveforms of 17 participants at FCz, Pz, and Oz electrodes for the consonant and frequency changes in spokensyllables, separately for four different attention conditions. Difference waves for changes in spoken syllables occurring synchronously with written syllablesappear with continuous lines, and those for changes in spoken syllables occurring with scrambled written text appear with dashed lines. Gray rectanglesindicate the first, second, and third N2 time windows and the P3a time window (30 ms each) used in the analyses.
Attention on letter-speech sound integration 7
than when presented with scrambled images, a result that is con-sistent with those of previous studies showing integration effectsduring a visual task (Froyen et al., 2008, Mittag et al., 2011). In thestudy of Mittag et al. (2011), which was otherwise similar to the
current study (except for its use of the multifeature paradigm), theeffect was evident in responses to consonant and frequencychanges in spoken syllables. Froyen et al. (2008) used vowelchanges in an oddball paradigm, reporting larger MMNs when
Table 2. Mean Amplitudes and Peak Latencies for the N2 and P3a Responses
Condition/visual stimuli1st N2 2nd N2 3rd N2
Peak latencyaP3a
Peak latencymean amplitude mean amplitude mean amplitude mean amplitude
Consonant deviant
A/Written -1.7 (1.1) -2.3 (1.2) -1.6 (1.6) 187.5 3.4 (3.3) 265.6A/Scrambled -1.6 (1.2) -2.5 (1.8) -1.5 (1.9) 195.3 3.3 (2.3) 273.4V/Written -2.1 (1.6) -2.3 (2.2) -1.3 (2.4) 199.2 2.6 (1.9) 257.8V/Scrambled -1.9 (0.7) -1.7 (1.3) -0.5 (1.5) 203.1 2.4 (2.6) 265.6AV/Written -2.1 (1.7) -2.4 (1.9) -1.5 (1.4) 199.2 2.9 (2.7) 277.3AV/Scrambled -1.3 (1.2) -2.3 (1.6) -1.3 (2.1) 183.6 3.6 (2.9) 253.9MC/Written -1.4 (1.4) -1.4 (1.5) -0.1 (1.9) 191.4 1.7 (2.6) 246.1MC/Scrambled -1.3 (1.3) -1.5 (1.1) -0.6 (1.7) 179.7 1.7 (1.2) 238.3
Frequency deviant
A/Written -3.8 (2.4) -3.6 (2.2) -2.3 (2.1) 238.3 5.1 (4.2) 347.7A/Scrambled -4.3 (2.7) -4.2 (2.9) -2.8 (2.2) 242.2 4.7 (3.4) 351.7V/Written -4.9 (2.1) -4.6 (2.2) -1.9 (1.7) 238.3 3.2 (3.1) 339.8V/Scrambled -4.0 (2.8) -3.7 (2.6) -1.7 (2.0) 238.3 3.5 (4.1) 304.7AV/Written -3.5 (2.7) -3.5 (2.7) -2.1 (1.9) 242.2 4.7 (2.5) 359.4AV/Scrambled -4.5 (2.5) -4.0 (2.8) -1.9 (1.8) 234.4 4.9 (3.3) 347.7MC/Written -3.9 (2.9) -2.8 (1.9) -0.2 (1.8) 250 2.4 (2.5) 292.9MC/Scrambled -3.6 (2.2) -3.7 (2.4) -0.7 (1.6) 230.5 2.3 (2.6) 292.9
Note. Mean amplitudes (mV) for the first and second N2 time windows at FCz, for the third N2 time window at Pz, and for the P3a time window at FCz.The peak latency values (ms) for the third N2 peak at Oz (where this component was the most discernible from the other components) and for the P3a peakat FCz. A = attend auditory; V = attend visual; AV = attend audiovisual; MC = mental counting condition. Standard deviations appear in parentheses.aPeak latencies refer to the latency of the third N2 peak and the P3a peak identified from the grand-mean ERP difference waves.
Written Scrambled
ConsonantConsonant
A
AV
V
MC
2nd N2 3rd N2 P3a
−4µV
−2
0
2
4
1st N2 2nd N2 3rd N2 P3a1st N2
p < 0.05>
p < 0.05>
Scalp distribution maps of grand-average difference waveforms
Figure 4. Scalp distribution maps of the grand-average ERP difference waveforms for the first, second, and third N2 time windows and the P3a time window,separately for the auditory (A), visual (V), and audiovisual (AV) attention conditions, and for the mental counting (MC) condition, for consonant changesin spoken syllables occurring synchronously with written syllables vs. scrambled written text. Scalp maps are based on the mean amplitudes of the 30-mstime windows used in the analysis (shown with gray rectangles for the A condition in Figure 3). Statistical analysis revealed significantly larger responsesto consonant changes accompanied by written syllables than to those accompanied by scrambled images during audiovisual attention at the first N2 timewindow and during visual attention at the third time window (ROIs yielding the results appear as red circles).
8 M. Mittag et al.
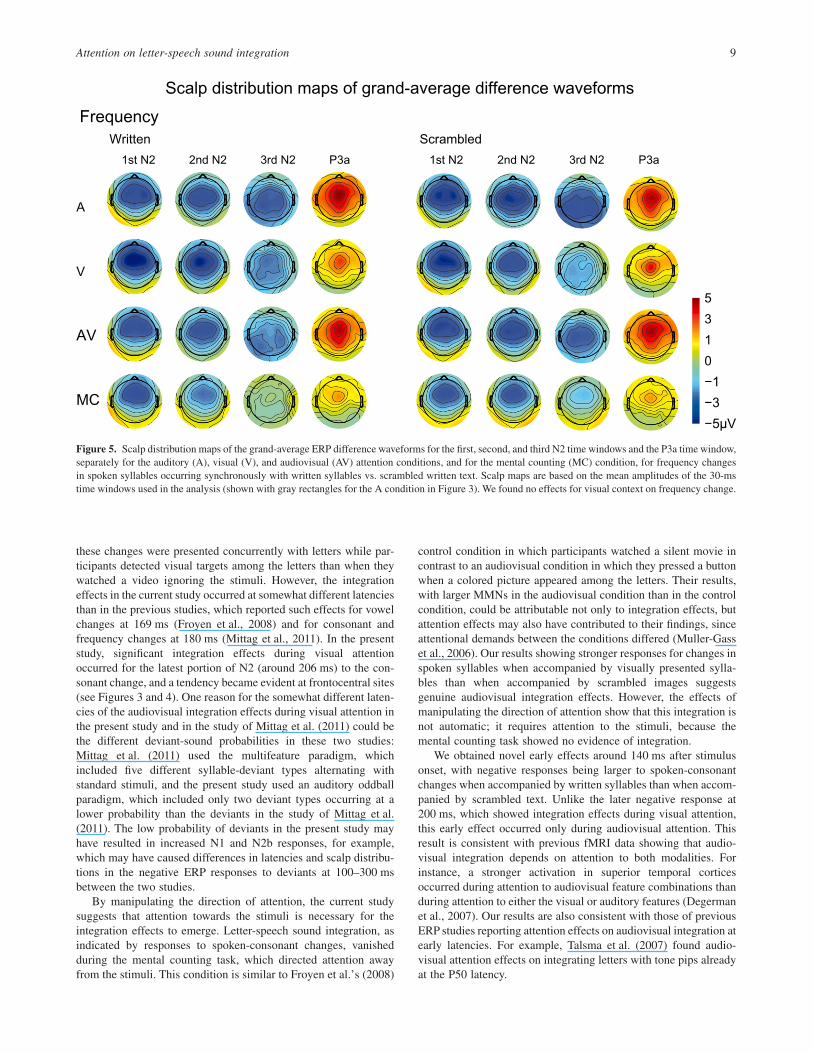
these changes were presented concurrently with letters while par-ticipants detected visual targets among the letters than when theywatched a video ignoring the stimuli. However, the integrationeffects in the current study occurred at somewhat different latenciesthan in the previous studies, which reported such effects for vowelchanges at 169 ms (Froyen et al., 2008) and for consonant andfrequency changes at 180 ms (Mittag et al., 2011). In the presentstudy, significant integration effects during visual attentionoccurred for the latest portion of N2 (around 206 ms) to the con-sonant change, and a tendency became evident at frontocentral sites(see Figures 3 and 4). One reason for the somewhat different laten-cies of the audiovisual integration effects during visual attention inthe present study and in the study of Mittag et al. (2011) could bethe different deviant-sound probabilities in these two studies:Mittag et al. (2011) used the multifeature paradigm, whichincluded five different syllable-deviant types alternating withstandard stimuli, and the present study used an auditory oddballparadigm, which included only two deviant types occurring at alower probability than the deviants in the study of Mittag et al.(2011). The low probability of deviants in the present study mayhave resulted in increased N1 and N2b responses, for example,which may have caused differences in latencies and scalp distribu-tions in the negative ERP responses to deviants at 100–300 msbetween the two studies.
By manipulating the direction of attention, the current studysuggests that attention towards the stimuli is necessary for theintegration effects to emerge. Letter-speech sound integration, asindicated by responses to spoken-consonant changes, vanishedduring the mental counting task, which directed attention awayfrom the stimuli. This condition is similar to Froyen et al.’s (2008)
control condition in which participants watched a silent movie incontrast to an audiovisual condition in which they pressed a buttonwhen a colored picture appeared among the letters. Their results,with larger MMNs in the audiovisual condition than in the controlcondition, could be attributable not only to integration effects, butattention effects may also have contributed to their findings, sinceattentional demands between the conditions differed (Muller-Gasset al., 2006). Our results showing stronger responses for changes inspoken syllables when accompanied by visually presented sylla-bles than when accompanied by scrambled images suggestsgenuine audiovisual integration effects. However, the effects ofmanipulating the direction of attention show that this integration isnot automatic; it requires attention to the stimuli, because themental counting task showed no evidence of integration.
We obtained novel early effects around 140 ms after stimulusonset, with negative responses being larger to spoken-consonantchanges when accompanied by written syllables than when accom-panied by scrambled text. Unlike the later negative response at200 ms, which showed integration effects during visual attention,this early effect occurred only during audiovisual attention. Thisresult is consistent with previous fMRI data showing that audio-visual integration depends on attention to both modalities. Forinstance, a stronger activation in superior temporal corticesoccurred during attention to audiovisual feature combinations thanduring attention to either the visual or auditory features (Degermanet al., 2007). Our results are also consistent with those of previousERP studies reporting attention effects on audiovisual integration atearly latencies. For example, Talsma et al. (2007) found audio-visual attention effects on integrating letters with tone pips alreadyat the P50 latency.
Written Scrambled
Frequency
P3a P3a
A
AV
V
MC
−5µV
−3
0
3
5
2nd N2 3rd N2 2nd N2 3rd N21st N2 1st N2
−1
1
Scalp distribution maps of grand-average difference waveforms
Figure 5. Scalp distribution maps of the grand-average ERP difference waveforms for the first, second, and third N2 time windows and the P3a time window,separately for the auditory (A), visual (V), and audiovisual (AV) attention conditions, and for the mental counting (MC) condition, for frequency changesin spoken syllables occurring synchronously with written syllables vs. scrambled written text. Scalp maps are based on the mean amplitudes of the 30-mstime windows used in the analysis (shown with gray rectangles for the A condition in Figure 3). We found no effects for visual context on frequency change.
Attention on letter-speech sound integration 9
Faster RTs to targets in the present conditions with scrambledimages than in conditions with visually presented text indicatedifferences in attention in the two visual contexts. One should note,however, that these RTs occurred for both auditory and visualtargets, as the ANOVA for RTs indicated no interactions betweenthe factor visual context and the other factors attention and modal-ity. Moreover, if longer RTs in the written-text context than in thescrambled-image context indicated less attention to the audiovisualstimulus pairs in the written-text condition, one would not expectthe early phase of N2, which showed the attention-dependent inte-gration effect to be larger in this context than in the scrambled-image context. Therefore, RTs to auditory and visual targets in thewritten-text context are likely longer than in the scrambled-imagecontext due to the participants’ inability to avoid automaticallyreading the visually presented letters. Thus, this RT effect may berelated to the Stroop effect (Stroop, 1935; MacLeod, 1991), whereconflicting semantic information distracts responses to font colorsin letters. For instance, correctly naming the font color (e.g., blueink) in letters is slowed down if the letters form a conflicting colorname (e.g., RED), because they are read automatically even whenattention should be directed selectively to the font color and awayfrom the semantic information.
To summarize, the present results show that letter-speechsound integration depends on attention. We found evidence for
letter-speech sound integration during both audiovisual (at anearly latency) and visual attention (at a later latency), whereas nointegration effects occurred when attention was directed solely tothe auditory modality or completely away from the audiovisualstimulation by a mental counting task. Furthermore, the earliereffects of letter-speech sound integration in response to spokenconsonant changes during audiovisual than during visual attentionsuggest that audiovisual attention boosts this integration. Ourresults may have implications for facilitating the generation ofletter-speech sound integration with specific training programs, asa deficit in the generation of correct letter-speech sound associa-tions is one of the major impairments in developmental dyslexia(Snowling, 1980). In addition, future studies should test theeffects of attention on the integration of written text and spokensounds in dyslexic readers, as they may employ different cogni-tive processing strategies in integrating audiovisual material thando normal-reading individuals (cf. Mittag, Thesleff, Laasonen, &Kujala, 2013). Furthermore, the effects of attention on linguisticversus nonlinguistic audiovisual material in dyslexic readersshould be identified, since integration deficits in dyslexia may notbe specific to letter-speech sound integration per se, but ratherstem from a general difficulty in audiovisual processing (Mittaget al., 2013; Widmann, Schröger, Tervaniemi, Pakarinen, &Kujala, 2012).
References
Alho, K., Escera, C., Diaz, R., Yago, E., & Serra, J. M. (1997). Effects ofinvoluntary auditory attention on visual task performance andbrain activity. NeuroReport, 8, 3233–3237. doi: 10.1097/00001756-199710200-00010
Alho, K., Woods, D. L., Algazi, A., & Näätänen, R. (1992). Intermodalselective attention. II. Effects of attentional load on processing of audi-tory and visual stimuli in central space. Electroencephalographyand Clinical Neurophysiology, 82, 356–368. doi: 10.1016/0013-4694(92)90005-3
Alku, P., Tiitinen, H., & Näätänen, R. (1999). A method for generatingnatural-sounding speech stimuli for cognitive brain research. ClinicalNeurophysiology, 110, 1329–1333. doi: 10.1016/S1388-2457(99)00088-7
Besle, J., Caclin, A., Mayet, R., Delpuech, C., Lecaignard, F., Giard, M. H.,& Morlet, D. (2007). Audiovisual events in sensory memory. Journal ofPsychophysiology, 21, 231–238. doi: 10.1027/0269-8803.21.34.231
Besle, J., Fort, A., & Giard, M. H. (2005). Is the auditory sensory memorysensitive to visual information? Experimental Brain Research, 166,337–344. doi: 10.1007/s00221-005-2375-x
Blau, V., van Atteveldt, N., Formisano, E., Goebel, R., & Blomert, L.(2008). Task-irrelevant visual letters interact with the processing ofspeech sounds in heteromodal and unimodal cortex. European Journalof Neuroscience, 28, 500–509. doi: 10.1111/j.1460-9568.2008.06350.x
Degerman, A., Rinne, T., Pekkola, J., Autti, T., Jaaskelainen, I. P., Sams,M., & Alho, K. (2007). Human brain activity associated with audio-visual perception and attention. NeuroImage, 34, 1683–1691. doi:10.1016/j.neuroimage.2006.11.019
Delorme, A., & Makeig, S. (2004). EEGLAB: An open source toolbox foranalysis of single-trial EEG dynamics including independent compo-nent analysis. Journal of Neuroscience Methods, 134, 9–21. doi:10.1016/j.jneumeth.2003.10.009
Escera, C., Alho, K., Schröger, E., & Winkler, I. (2000). Involuntary atten-tion and distractibility as evaluated with event-related brain potentials.Audiology and Neurootology, 5, 151–166. doi: 10.1159/000013877
Escera, C., Alho, K., Winkler, I., & Näätänen, R. (1998). Neural mecha-nisms of involuntary attention to acoustic novelty and change. Journalof Cognitive Neuroscience, 10, 590–604. doi: 10.1162/089892998562997
Froyen, D., Van Atteveldt, N., Bonte, M., & Blomert, L. (2008). Cross-modal enhancement of the MMN to speech-sounds indicates early andautomatic integration of letters and speech-sounds. NeuroscienceLetters, 430, 23–28. doi: 10.1016/j.neulet.2007.10.014
Ghatan, P. H., Hsieh, J. C., Petersson, K. M., Stone-Elander, S., & Ingvar,M. (1998). Coexistence of attention-based facilitation and inhibitionin the human cortex. NeuroImage, 7, 23–29. doi: 10.1006/nimg.1997.0307
Gorea, A., Wardak, C., & Lorenzi, C. (2000). Visual sensitivity to temporalmodulations of temporal noise. Vision Research, 40, 3817–3822. doi:10.1016/S0042-6989(00)00229-7
Grubbs, F. (1968). Procedures for detecting outlying observations insamples. Technometrics, 1–21. doi: 10.2307/1266761
Leek, M. R. (2001). Adaptive procedures in psychophysical research. Per-ception & Psychophysics, 63, 1279–1292. doi: 10.3758/BF03194543
Levitt, H. (1971). Transformed up-down methods in psychoacoustics [Sup-plement 2]. The Journal of the Acoustical Society, 49, 467–477. doi:10.1121/1.1912375
Lindström, R., Paavilainen, P., Kujala, T., & Tervaniemi, M. (2012).Processing of audiovisual associations in the human brain: Dependencyon expectations and rule complexity. Frontiers in Psychology, 159, 1–6.doi: 10.3389/fpsyg.2012.00159
Luck, S. J. (2005). An introduction to the event-related potential technique.Cambridge, MA: The MIT Press.
MacLeod, C. M. (1991). Half a century of research on the Stroop effect: Anintegrative review. Psychological Bulletin, 109, 163–203. doi: 10.1037/0033-2909.109.2.163
Mittag, M., Takegata, R., & Kujala, T. (2011). The effects of visual materialand temporal synchrony on the processing of letters and speech sounds.Experimental Brain Research, 211, 287–298. doi: 10.1007/s00221-011-2686-z
Mittag, M., Thesleff, P., Laasonen, M., & Kujala, T. (2013). The neuro-physiological basis of the integration of written and heard syllables indyslexic adults. Clinical Neurophysiology, 124, 315–326. doi: 10.1016/j.clinph.2012.08.003
Muller-Gass, A., Stelmack, R. M., & Campbell, K. B. (2006). The effect ofvisual task difficulty and attentional direction on the detection of acous-tic change as indexed by the mismatch negativity. Brain Research,1078, 112–130. doi: 10.1016/j.brainres.2005.12.125
Näätänen, R. (1992). Attention and brain function. Hillsdale, NJ: Erlbaum.Näätänen, R., Gaillard, A. W., & Mäntysalo, S. (1978). Early selective-
attention effect on evoked potential reinterpreted. Acta Psychologia(Amst), 42, 313–329. doi: 10.1016/0001-6918(78)90006-9
Näätänen, R., Pakarinen, S., Rinne, T., & Takegata, R. (2004). The mis-match negativity (MMN): Towards the optimal paradigm. ClinicalNeurophysiology, 115, 140–144. doi: 10.1016/j.clinph.2003.04.001
10 M. Mittag et al.
Näätänen, R., Simpson, M., & Loveless, N. E. (1982). Stimulus devianceand evoked potentials. Biological Psychology, 14, 53–98. doi: 10.1016/0301-0511(82)90017-5
Novak, G. P., Ritter, W., Vaughan, H. G., Jr., & Wiznitzer, M. L. (1990).Differentiation of negative event-related potentials in an auditory dis-crimination task. Electroencephalography and Clinical Neurophysiol-ogy, 75, 255–275. doi: 10.1016/0013-4694(90)90105-S
Ritter, W., Paavilainen, P., Lavikainen, J., Reinikainen, K., Alho, K., Sams,M., & Näätänen, R. (1992). Event-related potentials to repetition andchange of auditory stimuli. Electroencephalography and Clinical Neu-rophysiology, 83, 306–321. doi: 10.1016/0013-4694(92)90090-5
Sams, M., Paavilainen, P., Alho, K., & Näätänen, R. (1985). Auditoryfrequency discrimination and event-related potentials. Electroencepha-lography and Clinical Neurophysiology, 62, 437–448. doi: 10.1016/0168-5597(85)90054-1
Snowling, M. J. (1980). The development of grapheme-phoneme corre-spondence in normal and dyslexic readers. Journal of ExperimentalChild Psychology, 29, 294–305. doi: 10.1016/0022-0965(80)90021-1
Stroop, J. R. (1935). Studies of interference in serial verbal reactions.Journal of Experimental Psychology, 18, 643–661. doi: 10.1037/h0054651
Sussman, E., Winkler, I., & Wang, W. (2003). MMN and attention. Com-petition for deviance detection. Psychophysiology, 49, 430–435. doi:10.1111/1469-8986.00045
Talsma, D., Doty, T. J., & Woldorff, M. G. (2007). Selective attention andaudiovisual integration: Is attending to both modalities a prerequisite forearly integration? Cerebral Cortex, 17, 679–690. doi: 10.1093/cercor/bhk016
Talsma, D., Senkowski, D., Soto-Faraco, S., & Woldorff, M. G. (2010). Themultifaceted interplay between attention and multisensory integration.Trends in Cognitive Science, 14, 400–410. doi: 10.1016/j.tics.2010.06.008
Widmann, A., Schröger, E., Tervaniemi, M., Pakarinen, S., & Kujala, T.(2012). Mapping symbols to sounds: Electrophysiological correlates ofthe impaired reading process in dyslexia. Frontiers in Psychology, 3,1–12. doi: 10.3389/fpsyg.2012.00060
Woldorff, M. G., Gallen, C. C., Hampson, S. A., Hillyard, S. A., Pantev, C.,Sobel, D., & Bloom, F. E. (1993). Modulation of early sensory process-ing in human auditory cortex during auditory selective attention. Pro-ceedings of the National Academy of Sciences, 40, 8722–8726. doi:10.1073/pnas.90.18.8722
(Received July 27, 2012; Accepted May 15, 2013)
Attention on letter-speech sound integration 11