characterization and comparison of stream nutrients, land use, and loading patterns in maryland...
TRANSCRIPT

Characterization and Comparison of Stream Nutrients,Land Use, and Loading Patterns in MarylandCoastal Bay Watersheds
Kristen A. Beckert & Thomas R. Fisher &
Judith M. O’Neil & Roman V. Jesien
Received: 3 September 2010 /Accepted: 2 March 2011 /Published online: 26 March 2011# Springer Science+Business Media B.V. 2011
Abstract Land use and its relation to nutrient con-centrations and loading via streams is an importantissue in coastal lagoons and embayments worldwideincluding the Maryland coastal bays system, USA. Asin many coastal areas around the globe, decliningwater quality in the bays is the result of nutrientinputs from the surrounding watershed. In this study,the sources of the nutrient inputs were examined.Monthly concentrations of total nitrogen (TN), ammo-nium (NH4
+), nitrate (NO3-), phosphate (PO4
-3), andtotal phosphorus (TP) were measured in six streams inthe St. Martin River basin from July 2006 to January2008. Current land use information for the basins ofeach stream was also compiled. Several significantcorrelations between nutrients and land use type werefound. The most significant correlation was with theland area of feeding operations, which demonstrated asignificant positive relationship with mean baseflowTN concentrations. A similar relationship was alsofound with anthropogenic land area (cropland + urban +feeding operations), and wetland area was also posi-
tively associated with hydric soils. Using local wateryields from a US Geological Survey station, annualstream watershed export was calculated using theconcentration data, which indicated that the watershedwith the most crop agriculture had the highest N exportcoefficient (20.4 kg N ha-1 year-1), while the highest Pexport (0.47 kg P ha-1 year-1) was in a watershedcontaining a nonoperational chicken hatchery and asubsequently modified channel. This suggests thatagricultural development, especially animal feedingoperations, and landscape characteristics are importantfactors to understand nutrient loading in St. MartinRiver and Maryland coastal bays. The methods usedand the results determined in this study have implica-tions for determining nutrient loading in lagoons andembayments, in relation to land use in coastal regionsglobally.
Keywords Maryland . Lagoons . Coastal bays . Landuse . Poultry . Chickens . Agriculture .Water quality .
Stream . Nitrogen . Phosphorus
1 Introduction
Like other Atlantic seaboard estuaries, and manyothers around the globe, the watersheds of the coastalbays of Maryland have undergone large changes inland use and nutrient loading over the past 100 years.In this region, forest and wetlands have been convertedto intensively managed agricultural crop land, and more
Water Air Soil Pollut (2011) 221:255–273DOI 10.1007/s11270-011-0788-7
K. A. Beckert (*) : T. R. Fisher : J. M. O’NeilHorn Point Laboratory, Center for Environmental Science,University of Maryland,Cambridge, MD 21613, USAe-mail: [email protected]
R. V. JesienMaryland Coastal Bays Program,9919 Stephen Decatur Highway, Suite 4,Ocean City, MD 21842, USA

recently, these have been further converted into animalfeeding operations and urban development due topressures from increasing human population andchanges in the local economy (Benitez and Fisher2004; Benitez 2004; Lee et al. 2001). On top of thesechanges, the population of the coastal bay water-shed is expected to double between the years 2000and 2020, which will further increase land pressureson the ecosystem (Hager 1996). As developmentincreases along coastal environments, knowledge ofthe processes of nutrient sources, delivery, andinfluence upon coastal bays, in particular, can aidin the preservation of these terrestrial areas and theestuaries into which they drain.
Studies of water quality within the Marylandcoastal bays have indicated high concentrations oftotal nitrogen (TN), total phosphorus (TP), andelevated δ15N, which is a sensitive indicator ofprocessed nitrogen and wastewater inputs (Costanzoet al. 2001; Jones et al. 2004; Wazniak et al. 2004).Organic forms of both nitrogen (N) and phosphorus(P) are more abundant than the inorganic N and P,which tend to remain lower than 5 and 1 μM,respectively. Dissolved organic nitrogen (DON) mayrange between 10 and 30 μM, and TN may be greaterthan 30 μM (Glibert et al. 2007). Water surveys ofsub-bays of the Maryland coastal bays demonstrateddegradation in water quality parameters in both 2004and 2006, resulting in conditions inadequate forseagrasses, fisheries, and other aquatic life that hadbeen established by the Maryland Coastal BaysProgram and the Maryland Department of NaturalResources (Wazniak et al. 2004; Fertig et al. 2006).High turbidity and bottom oxygen concentrationslower than a threshold value of 3 mg l-1, asestablished by the Maryland Coastal Bays Program,were present in the upstream reaches of St. MartinRiver, one of the major tributaries of the Marylandcoastal bays (Jones et al. 2004; Fertig et al. 2006).Long-term recorded water quality monitoring haveindicated an increase in nutrients in most of thecoastal bays since 1991 (Wazniak et al. 2007).
Increases in nutrient loading to coastal waters mayoccur for many reasons including urban development(Peierls et al. 1991), crop agriculture (Lee et al. 2001),or the focusing of nutrient loads by a large ratio ofwatershed area to water area (Caddy 1993). EnhancedN and P inputs and subsequent water quality degrada-tion can be seen as the cumulative effects of the last
300 years of anthropogenic watershed development inthe USA including land clearing, fertilization, atmo-spheric deposition, and human sewage (Beaulac andReckhow 1982; Fisher and Oppenheimer 1991; Peierlset al. 1991). The greatest land use impact in the sub-watersheds of the Maryland coastal bays, however, hasresulted from crop and animal agricultural land use,which contributes one half to two thirds of totalnutrient inputs (Bohlen et al. 1997). Spatially explicitassessments of land use and loading patterns of sub-watersheds within this region can help to address thecauses of water quality patterns and potential system-wide changes.
Measurements of stream nutrients within a regioncan indicate if runoff, groundwater, or landscapemodification as a result of land use change is impactingthe ecosystem. Streams may be significantly impactedby agricultural and urban development, displayingpositive relationships between nitrogen (N) and phos-phorus (P) concentrations and percent of watersheddevelopment (Beaulac and Reckhow 1982; Jordan et al.1997a; Pionke et al. 2000). Low-order streams may beespecially important indicators of nutrient inputs andeffects of watershed land use (Lefebvre et al. 2007). In1999 and 2001, a synoptic survey of Maryland coastalbay streams in the Isle of Wight and St. Martin Riverbasins revealed that several streams had extremelyhigh concentrations of phosphate (PO4
-3) and nitrite(NO2
-) + nitrate (NO3-), hereafter represented as NO3
-,as NO2
-<5% NO3- (Novotny and Olem 1994).
Nutrient yield coefficients from land and loads to theestuary were correspondingly high (Primrose 2001).Wazniak et al. (2004) indicated high stream nutrientconcentrations and poor benthic indices throughout thecoastal bay watersheds, with especially high NO3
-
concentrations (>350 μM) in the upper tributaries ofthe St. Martin River. Extensive ditching of tributariesand streams in the region may allow for rapid, directentrance of groundwater into waterways, instead ofslow filtration through buffering wetlands.
The hypothesis of this study was that percentagesof crop agriculture and feeding operations in a givenwatershed would be directly related to N and Pconcentrations and net export in associated streamsand waterways in the watershed of St. Martin River, asub-watershed in the Maryland coastal bays. Suchrelationships have been found in both piedmont andcoastal plain settings in the Mid-Atlantic region (e.g.,Jordan et al. 1997b; Fisher et al. 2006) but have not
256 Water Air Soil Pollut (2011) 221:255–273

been described to date for the Maryland coastal bays.An extensive analysis of sources and trends ofnutrient concentrations and loading from streams hasnot been conducted for coastal bay watersheds, butsuch an analysis is especially important in under-standing impacts of residential growth, animal feedingoperations, and agriculture in this developing region.The present paper’s focus on examining the relation-ship between land use and nutrient export fromfreshwater streams may be especially helpful to landmanagers in this region, as well as other regions
globally, that can adapt the methods used for a givenregion’s particular land use and soil types.
2 Methods
2.1 Study Location
The Maryland coastal bays (Fig. 1) consist of a seriesof shallow (<3 m) lagoons between the east side ofthe Delmarva Peninsula on the East Coast of the USA
Fig. 1 Study watershed location of the St. Martin River basin in the Maryland coastal bays. Six sites (1, 2, 3, 4, 5, and 6) weremonitored biweekly in the St. Martin River watershed from July 2006 to January 2008 for nutrient concentrations
Water Air Soil Pollut (2011) 221:255–273 257

and its barrier islands. This study focused on the areaof the St. Martin River basin, which extends from theState of Maryland (MD) into the State of Delaware(DE) and encompasses the population centers ofSelbyville, DE and Ocean Pines, MD (Figs. 1, 2, 3).The river itself is one of the largest tributaries to thecoastal bays, which consists of two branches, one ofwhich is the Bishopville Prong that has a dam 1.3 kmbelow the Delaware State line, and the ShingleLanding Prong which stretches westward. Samplingfor this study was conducted biweekly at the six sites
in the St. Martin River basin, as indicated in Fig. 1and Table 1.
2.1.1 Land Use Composition and GIS Analysis
The US Geological Survey (USGS) provided 7.5 minmaps that gave georeferenced base maps and topog-raphy of the region. Topography and stream files wereused to manually delineate boundaries of the water-shed draining to each sampling location usingArcMap Geographic Information Services (GIS)
Fig. 2 Location and water-shed land use compositionof stream sites 1, 2, and 3 inthe St. Martin River region
258 Water Air Soil Pollut (2011) 221:255–273

v.9.2. Although the small range of topographic relief(0–15 m above sea level) and ditching complicatedthis process, drainage area for each basin boundarywas delineated visually within ArcMap. Land area(m2) per meter of stream was calculated by taking thewatershed area and dividing it by the total length ofall streams within the watershed, which wouldeventually drain to the sampling site. This estimateprovided a means of comparing land influences on thestreams in the watershed.
ArcMap was also used to assess 2002 land coverdata that was provided by Worcester County
Department of Planning and the State of DelawareDepartment of Natural Resources. These maps hada minimum mapping resolution of 4 ha (10 acres),depicting over 30 different types of digitized landcover categories (i.e., row crop, high-intensitydevelopment, etc.), which were simplified to fivebroad categories for this application (urban, forest,crop agriculture, wetland, and feeding operations)in a separate GIS shapefile. These five land usecategories were used so that a correlations andexport could be calculated, similar to the methodsin Fisher et al. (2006).
Fig. 3 Location and water-shed land use compositionof stream sites 4, 5, and 6 inthe St. Martin River region
Water Air Soil Pollut (2011) 221:255–273 259

The compiled 2002 land use/land cover file wasfurther modified for a more exact estimation of landcover. 2005 aerial photography was obtained from theMaryland Department of Natural Resources and usedto redraw many land use polygons, which wasespecially important for poultry houses, the primaryconcentrated animal feeding operation in the region.In addition, new polygons were drawn for someforested areas that were not delineated by the originalshapefile. Population data in block format was alsoobtained from the 2000 Census Bureau for informa-tion on regional populations in the UTM NAD 1983projected coordinate system. Watershed soil compo-sition was acquired from the Soil Data Mart bymerging data from Worcester, MD and Sussex, DEcounties and then clipping to the watersheds ofinterest. Shapefiles were in the NAD 1983 geographiccoordinate system.
2.2 Stream Analysis
The Maryland Coastal Bays Program collected streamnutrient data from July 2006 to January 2008 for sixsites in the St. Martin River basin (Figs. 1, 2, 3).These sites were numbered according to the percentof their watershed with feeding operations (Table 1),where site 1 had the lowest (0.14%) and site 6 had thehighest (1.6%). Five of the six sites (2–6) werelocated above the dam in the Bishopville Prong, whilethe remaining site (1) drains into the Shingle LandingProng. Biweekly samples of whole water (50 ml)were collected midstream just below the surface of thewater and filtered using 0.45 μm Gelman GF/Cfilters. This sampling procedure was conducted tominimize impacts from storms. In addition, anunfiltered sample was saved for TN and TP analysis.Samples were frozen on ice and taken to the HornPoint Laboratory Analytical Services for colorimetricdetermination of total and dissolved nutrients. MonthlyTN, NO3
-, ammonium (NH4+), TP, and PO4
-3 concen-trations and standard errors were computed by takingthe mean of all samples collected for each month(approximately two to three samples) during this 19-month period. Because the period of sampling did notextend over a full 2-year period, the only measure-ments for the months February through June occurred in2007. Therefore, mean concentrations for these monthswas calculated using monthly concentration data foronly 1 year of sampling.T
able
1Stream
site
locatio
n(decim
aldegrees,dd
),watershed
area
(ha),po
pulatio
ndensity
(#km
-2),land
usecompo
sitio
n(%
totalwatershed
area),hy
drolog
icsoilgrou
p,and
hydric
soilcompo
sitio
nof
watershedsof
sixstream
sandtheUSGSgaug
ingstationin
theSt.Martin
River
watershed
oftheMarylandcoastalbays
Site
Stream
Latitu
de(dd)
Lon
gitude
(dd)
Area
(ha)
Pop
.density
(peoplekm
-2)
Landarea
(m2)
perm
ofstream
%Cropland
%Urban
%Feeding
operations
%Forest
%Wetland
s%
Soilgrou
p%
Hyd
ric
AB
CD
1Chu
rchbranch
38.396
4−7
5.20
561,28
426
325
4013
0.14
470
214
2163
72
2Slabbranch
38.441
9−7
5.19
8513
114
522
849
160.46
340
1413
1262
72
3Carey
branch
38.446
0−7
5.2113
1,59
310
920
654
150.58
1912
631
954
91
4Dam
38.442
4−7
5.19
453,05
695
221
5118
0.82
1812
738
1242
88
5Bun
tings
branch
38.455
6−7
5.20
9390
718
225
146
221.3
1417
757
923
95
6Cem
eterybranch
38.449
4−7
5.19
8613
317
116
464
161.6
135
735
1238
87
USGS
Birch
branch
38.409
3−7
5.21
241,65
222
306
486
0.94
450
26
1577
85
260 Water Air Soil Pollut (2011) 221:255–273

Average daily discharge data was obtained from thecontinuous monitoring gauge of the US GeologicalSurvey (USGS 0148471320) for the same time periodas the chemistry (July 2006–January 2008). Meandischarge (m3 s-1) was calculated for each month,averaging all days in each month. The regionalmonthly water yield (WY, mmonth-1) was computed as:
WY ¼ Qd 86; 400 s day�1� �
=A ð1Þwhere Q=mean discharge (m3 s-1), d=number of daysin each month, and A=area of watershed (m2). Themonthly water yield for the Birch Branch USGS sitewas assumed to apply for the sampled watersheds inFig. 1 and was multiplied by the watershed areas (m2)of each of the six coastal bays program sites to obtainmonthly discharge volumes for each stream (m3 month-1).The water yield of this site could be applied to the otherwatersheds because of its proximity (<20 km) andsimilar soil composition (Table 1). Mean TN and TPconcentrations were calculated for each month overthe time period of 2006–2008 and then multiplied bytheir corresponding monthly water discharge volumeto estimate a monthly TN and TP export for eachcatchment. An annual export (kg year-1) was calcu-lated by the summing the months:
M ¼X12
i¼1
WYAwCm � 1; 000 ð2Þ
where M=annual export (kg N or P year-1), WY=monthly water yield (m month-1), Aw=watershedarea (m2), and Cm=mean N or P concentration formonth m (g m-3). The area-normalized export coefficientE (kg N or P ha-1 year-1) was computed as:
E ¼ 10; 000M=Aw ð3Þwhere 10,000 converts Aw from m2 to ha.
2.3 Statistics
Simple linear least-squares regressions were used toexamine land use effects on water quality parameters ofthe watersheds, as well as relationships between landuse, hydric soils, and predominant soil groups. Forest,wetland, urban, feeding operations, and crop agriculturepercentages were used as independent variables. Inaddition, a new category called “anthropogenic” landuse was formed by adding urban, feeding operations,and crop agriculture, while forest and wetland were
added to represent “natural” land cover. Statisticalsignificance was defined as p<0.05, and r2 values wereused to indicate the amount of variance explained byeach land use category.
3 Results
3.1 Land Use of Watersheds
The six watersheds were largely dominated by forest,wetlands, and crop agriculture, with small percentagesof feeding operations (Figs. 2 and 3). Site 1, ChurchBranch has the greatest proportion of forest of all thebasins (47%), while site 2, Slab Bridge, the smallestwatershed, has a similar percentage of cropland (49%,Fig. 2, Table 1). Site 6, Cemetery Branch is a smallwatershed that has the highest percentage of croplandand feeding operations (64%, 1.6%). The watershedof the USGS gauge on Birch Branch was alsopredominantly cropland (48%) with forest also beinga major component (45%).
The ratio of land area (m2) to total stream length(m) in the watersheds ranged between 164 and 325 m2
m-1 (Table 1). This is the amount of land that drainsinto each meter of stream length, indicating potentialrunoff reception. The gauged Birch Branch watershed,along with the watershed of site 1, had the largest landarea per meter of stream length (306 and 325,respectively).
Human populations were low (Table 1), rangingfrom a density of 22 people km2 in the Birch Branchwatershed to 182 people km2 in the Buntings Branchwatershed. Population density was significantly cor-related with % urban land use (r2=0.63, p<0.05).
Hydric (water-saturated) soils dominated all water-sheds, comprising between 72% (sites 1 and 2) and95% (site 5) of their areas (Table 1). Hydric soilsremain wet for long periods because water movesthrough them very slowly. The watersheds with thelowest percent of hydric soils were also those with thegreatest drainage area per stream length, althoughthere was no significant relationship between streamdensity and hydric soil % (p>0.05). B (moderatelywell-drained) and D (poorly drained) soils were theprimary hydrologic soil groups in the region (Table 1);D soils made up the highest percentage of the BirchBranch watershed (77%) and were less than 30% inonly one watershed (site 5), whereas site 5 had the
Water Air Soil Pollut (2011) 221:255–273 261

highest percentage of B soils (57%). A and B soilshave moderate to high infiltration rates even whenthoroughly wetted and typically consist of fine tomoderately coarse textures. C and D soils have slowinfiltration rates and consist of soils with moderatelyfine to fine textures. D soils, typically clays, have ahigh swelling potential and low infiltration rates.
Soil properties and hydrological drainage classesalso influenced watershed characteristics. Wetlandsare usually found in areas with hydric soils, and therelationship between % hydric soils and % wetlandwas positive above a threshold value of 85% hydric(r2=0.83, p<0.05, Fig. 4a). In addition, urban landcover showed a significant, positive relationship with% A + B soils, well-drained soils (Fig. 4b, r2=0.85),while forest had a significant, negative relationship(r2=0.82, Fig. 4c). Soil properties set limits on theland uses that humans can impose upon watersheds, dueto their ability to be drained or built upon, and forestsand wetlands tend to remain on poorly drained soils.
3.2 Stream Hydrology and Chemistry
During the study period, flow conditions at the USGScontinuous monitoring site, Birch Branch at Showell,were below the 8-year average (Fig. 5). Discharge
rates ranged from a low of 19 ls -1 in August to a peakof 708 ls -1 in November. The water yield for thestudy period was 38 cm year-1, while the 8-yearaverage for the gauged area was 43 cm year-1. Thesevalues are similar to other regional values reportedfor Delmarva (Fisher et al. 1998; Koskelo 2008).Discharge increased over the months of October andNovember and the high-flow months (December–March) showed less between-month variability withmean monthly discharges of 200–400 l s-1.
Mean monthly baseflow concentrations of Nshowed a tendency for seasonal peaks in the periodNovember–March and low peaks in June–October,while P showed less of this tendency (Fig. 6). Sites 2,4, 5, and 6 most clearly showed this pattern, and sites1 and 3 demonstrated less seasonal variation than theother sites, especially for TN, which ranged 100–600 μM over all sites and months. During the high-flow months of December–March, NO3
- was thedominant form of N in the streams, ranging fromnear zero at site 4 to 500 μM at site 6. In most cases,NO3
- comprised more than half of the TN. NH4+
concentrations remained much lower than NO3-
throughout the year in all six streams, althoughconcentrations up to 20 μM were observed. Sites 3,4, and 5 demonstrated trends of increased TN and
Fig. 4 Interaction between soils and land uses for the six studysites and the USGS watershed. Watersheds were first examinedusing ArcMap GIS for their % composition of hydric soils andhydrologic soil groups (A, B, C, and D drainage classes), whichwere then compared with different land uses (cropland, urban,
forest, wetland, and feeding operations). Hydric soils demon-strated a threshold relationship at the 85% hydric level (A).Significant regressions (p<0.05), denoted by *, were foundbetween A + B soils and urban and forest land covers (B and C)
262 Water Air Soil Pollut (2011) 221:255–273

NO3- in the wintertime and decreasing concentrations
toward the summer, while the smallest watersheds(2 and 6) had the greatest interannual variability inTN. Site 6 also displayed the highest monthly TNand NO3
- concentrations of all the sites, peaking inJanuary at ~600 μM (Fig. 6).
TP and PO4-3 concentrations in the streams did
not display the same seasonal patterns as TN andNO3
-. PO4-3 concentrations closely mirrored those of
TP, comprising an average of 50% of the TP poolthroughout the year and peaking in early spring(March–April) or fall (October–November) at 2–3 μM (Fig. 6). Similar peaks were observed at site 4,which had the highest observed TP concentration(2–5 μM), and at site 2 (2–6 μM), where both PO4
-3 andTP peaked in March and again in October. Concen-trations of TP at site 3 showed seasonal patternssimilar to those of 2, though PO4
-3 remained above1 μM for most of the year. Similar to sites 2–4, site 5displayed dual summer and fall peaks in August andOctober for both TP and PO4
-3, while TP concen-trations in sites 1 and 6 remained above 3 μM duringthe entire summer season, although they slightlyincreased in the fall.
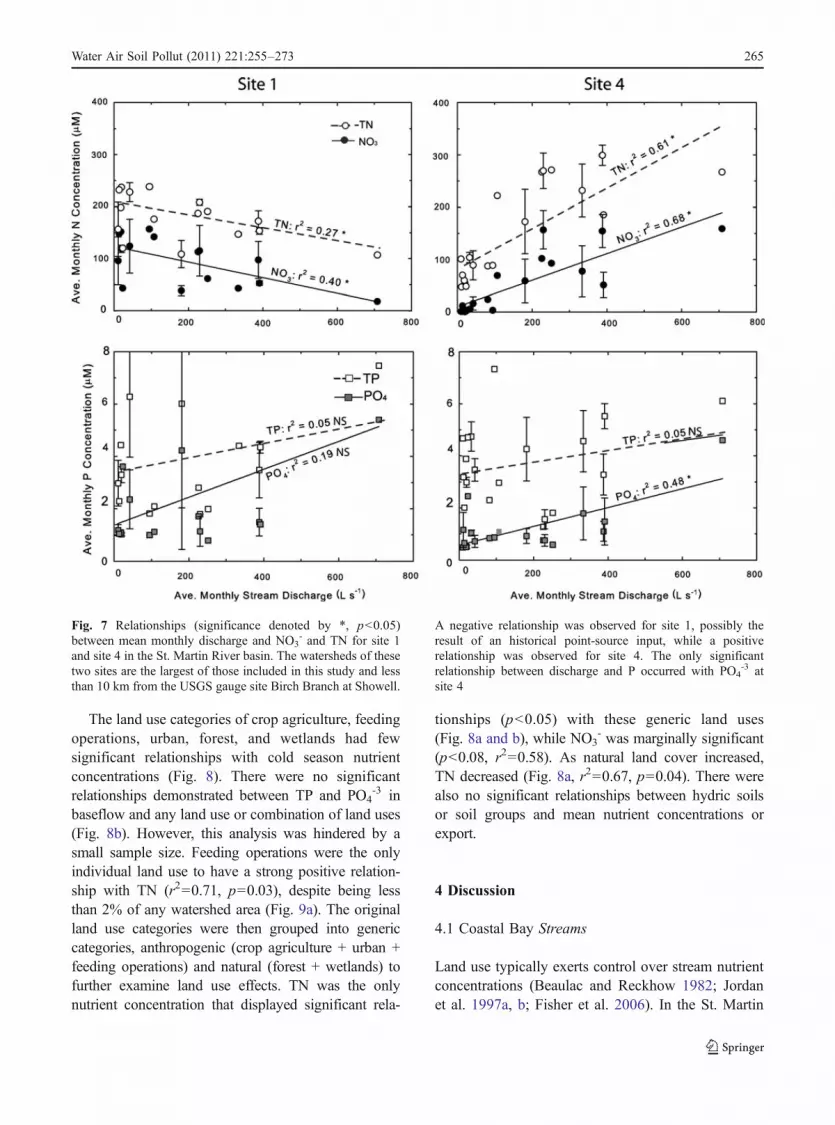
Mean monthly nutrient concentrations over theperiod July 2006–January 2008 also demonstratedsignificant responses to discharge (Fig. 7, Table 2).The mean monthly discharge measured at the USGSgauge was significantly correlated to TN and NO3
- atsites 1, 4, 5, and 6. This relationship was negative atsite 1 and positive at the other sites (Fig. 7). Thenegative relationship may be indicative of point-source dilution in the watershed of site 1. PO4 was
positively related to discharge at sites 3 and 4,although there were no significant relationshipsbetween discharge and TP or NH4
+.
3.3 Stream TN and TP Export
The time period December–March was used to computemean high-flow nutrient concentrations (TN, NO3
-,NH4
+, TP, and PO4-3) for each stream. This time
period showed less month-to-month variability, whilethe discharge in the period April–November showedmore variability, and concentrations decreased dramat-ically during the period May–October due to local,biological processing of low flows (e.g., algal slicksobserved during summer). All reported mean valueswere computed using data from the high flow seasononly, which were then used for annual land useregression analyses below. This time of year is theperiod of greatest nutrient concentrations in stream-flow, with minimal biological processing occurring inthe stream. The assumption made for these analyses isthat the local biological consumption during summerrepresents temporary storage, and that stored biologicalmaterial is flushed out during storms, which were notsampled in the research reported here.
Total export of TN and TP (kg N or P year-1) forthe six streams was the greatest in the largestwatersheds, but export coefficients (kg N or P ha-1
year-1) were more related to upstream land use(Table 1). Site 4 experiences the highest total N andP export, due to its large watershed area, but its Nexport coefficient was not the highest of the sixwatersheds. Site 6, which has the highest percentage
Fig. 5 Average monthly discharge at the USGS continuousmonitoring gauge on Birch Branch for 8 years (2006–2007) andfor the study period (July 2006–January 2008). This gaugingsite is located within the St. Martin River (see Fig. 1) and wasassumed to be representative of flow conditions experienced by
nearby sites. Mean monthly flows were calculated from datamade available by the USGS for the 8-year period December1999–September 2007. Error bars represent standard error ofthe years. Shaded areas represent the high-flow season used fornutrient vs. land use regression analyses below
Water Air Soil Pollut (2011) 221:255–273 263

of agriculture and feeding operations, had the highestN export coefficient and the lowest P export coeffi-cient. In contrast to site 6, site 1 had the highest Pexport coefficient and the lowest N export coefficient(Table 3).
Sites 2, 3, 5, and 6 indicate that roughly 22,531 kg Nyear-1 flows into the dam (site 4). However, it was
estimated that the export at the dam was 23,382 kg Nyear-1. Therefore, 851 kg N was lost in that location,most likely due to denitrification and storage insediments. On the contrary, P was exported from thedam; 753 kg P year-1 entered the pond, but 994 kg Pyear-1 was released from the dam. Therefore, the pondis releasing 241 kg P year-1 downstream.
Fig. 6 Monthly mean base-flow concentrations ofnitrogen and phosphorusspecies at sites 1–6. Datawas collected by monthlygrab samples July 2006–January 2008. Error barsrepresent the standard errorof each month over this timeperiod. Shaded areas repre-sent the high-flow seasonconcentrations used for Nand P vs. land use regres-sion analyses
264 Water Air Soil Pollut (2011) 221:255–273
The land use categories of crop agriculture, feedingoperations, urban, forest, and wetlands had fewsignificant relationships with cold season nutrientconcentrations (Fig. 8). There were no significantrelationships demonstrated between TP and PO4
-3 inbaseflow and any land use or combination of land uses(Fig. 8b). However, this analysis was hindered by asmall sample size. Feeding operations were the onlyindividual land use to have a strong positive relation-ship with TN (r2=0.71, p=0.03), despite being lessthan 2% of any watershed area (Fig. 9a). The originalland use categories were then grouped into genericcategories, anthropogenic (crop agriculture + urban +feeding operations) and natural (forest + wetlands) tofurther examine land use effects. TN was the onlynutrient concentration that displayed significant rela-
tionships (p<0.05) with these generic land uses(Fig. 8a and b), while NO3
- was marginally significant(p<0.08, r2=0.58). As natural land cover increased,TN decreased (Fig. 8a, r2=0.67, p=0.04). There werealso no significant relationships between hydric soilsor soil groups and mean nutrient concentrations orexport.
4 Discussion
4.1 Coastal Bay Streams
Land use typically exerts control over stream nutrientconcentrations (Beaulac and Reckhow 1982; Jordanet al. 1997a, b; Fisher et al. 2006). In the St. Martin
Fig. 7 Relationships (significance denoted by *, p<0.05)between mean monthly discharge and NO3
- and TN for site 1and site 4 in the St. Martin River basin. The watersheds of thesetwo sites are the largest of those included in this study and lessthan 10 km from the USGS gauge site Birch Branch at Showell.
A negative relationship was observed for site 1, possibly theresult of an historical point-source input, while a positiverelationship was observed for site 4. The only significantrelationship between discharge and P occurred with PO4
-3 atsite 4
Water Air Soil Pollut (2011) 221:255–273 265
River basin in theMaryland coastal bays, the percentageof anthropogenic land use (urban+agriculture) andfeeding operations appears to exert similar control on
N concentrations and export. Stream nutrient concen-trations in the St. Martin River watershed were high(Fig. 6), which most likely contributes to the highchlorophyll a and low dissolved oxygen that wereobserved by previous studies of tidal and nontidalstreams in the region (Wazniak et al. 2004; Primrose2001). Mean NO3
- concentrations during high flowperiods were all >70 μM (>1 mg N l-1), indicative ofhigh anthropogenic inputs (Roth et al. 2003). Thestream sites also displayed distinct seasonal patterns innitrogen concentrations and annual nutrient export,supporting the idea that land use, in conjunction withthe physical characteristics of an individual watershed,results in a characteristic nutrient signature (Fisheret al. 2006).
Site 1 was the only site that did not experience alarge decrease in NO3
- concentrations in the summer.There may be greater infiltration occurring in thisstream’s watershed, especially due to its high per-centage of forest cover (Jordan et al. 1997a). Sincesoils in this basin are similar to the other watersheds(Table 1), the land cover is most likely contributing tothese patterns.
Extremely low flows during the dry summerperiod, especially in streams draining small areas,impact nutrient concentrations by increasing theopportunity for local biological consumption. Wateroften ponds or stagnates in the streams during thistime, leading to higher rates of nutrient uptake,decreased NO3
-, and increased NH4+ concentrations.
NO3- is directly related to flow because it is highly
soluble within soils, while NH4+ displays the inverse
relationship because it is sorbed to cation exchangesites.
Variability in groundwater recharge and dischargerates between watersheds may also contribute to the
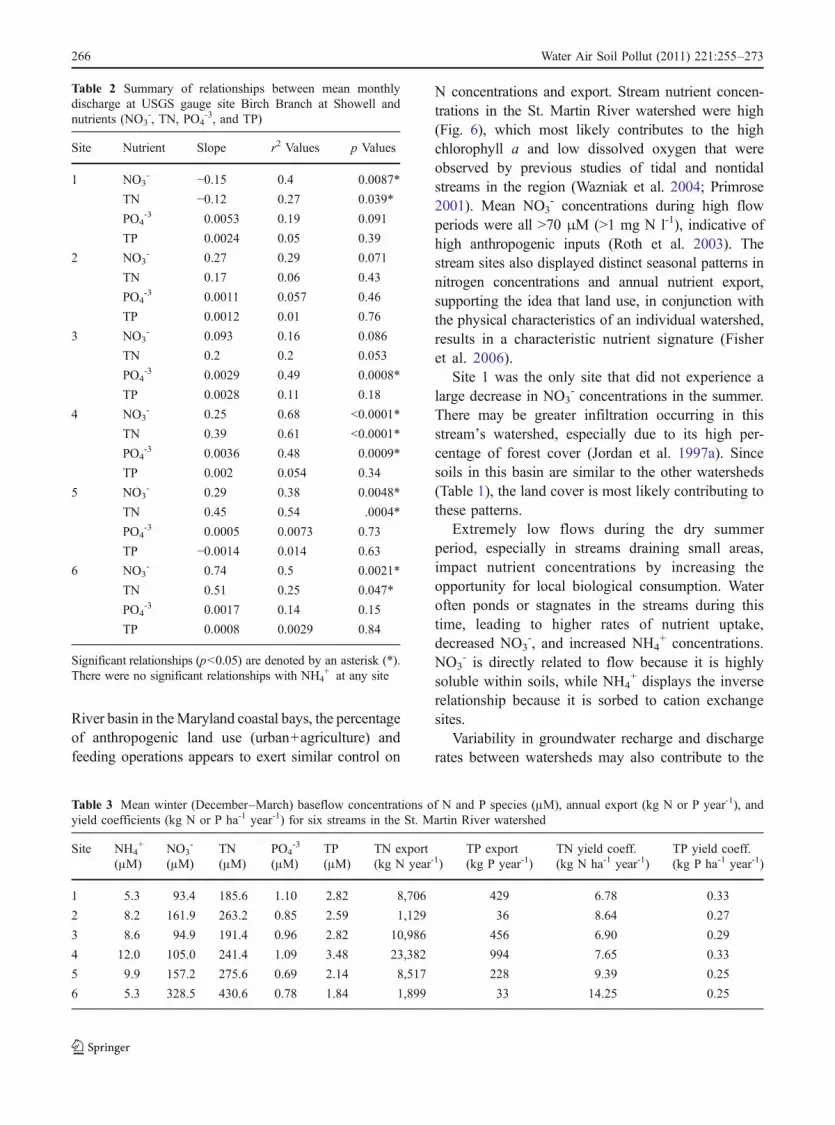
Table 2 Summary of relationships between mean monthlydischarge at USGS gauge site Birch Branch at Showell andnutrients (NO3
-, TN, PO4-3, and TP)
Site Nutrient Slope r2 Values p Values
1 NO3- −0.15 0.4 0.0087*
TN −0.12 0.27 0.039*
PO4-3 0.0053 0.19 0.091
TP 0.0024 0.05 0.39
2 NO3- 0.27 0.29 0.071
TN 0.17 0.06 0.43
PO4-3 0.0011 0.057 0.46
TP 0.0012 0.01 0.76
3 NO3- 0.093 0.16 0.086
TN 0.2 0.2 0.053
PO4-3 0.0029 0.49 0.0008*
TP 0.0028 0.11 0.18
4 NO3- 0.25 0.68 <0.0001*
TN 0.39 0.61 <0.0001*
PO4-3 0.0036 0.48 0.0009*
TP 0.002 0.054 0.34
5 NO3- 0.29 0.38 0.0048*
TN 0.45 0.54 .0004*
PO4-3 0.0005 0.0073 0.73
TP −0.0014 0.014 0.63
6 NO3- 0.74 0.5 0.0021*
TN 0.51 0.25 0.047*
PO4-3 0.0017 0.14 0.15
TP 0.0008 0.0029 0.84
Significant relationships (p<0.05) are denoted by an asterisk (*).There were no significant relationships with NH4
+ at any site
Table 3 Mean winter (December–March) baseflow concentrations of N and P species (μM), annual export (kg N or P year-1), andyield coefficients (kg N or P ha-1 year-1) for six streams in the St. Martin River watershed
Site NH4+
(μM)NO3
-
(μM)TN(μM)
PO4-3
(μM)TP(μM)
TN export(kg N year-1)
TP export(kg P year-1)
TN yield coeff.(kg N ha-1 year-1)
TP yield coeff.(kg P ha-1 year-1)
1 5.3 93.4 185.6 1.10 2.82 8,706 429 6.78 0.33
2 8.2 161.9 263.2 0.85 2.59 1,129 36 8.64 0.27
3 8.6 94.9 191.4 0.96 2.82 10,986 456 6.90 0.29
4 12.0 105.0 241.4 1.09 3.48 23,382 994 7.65 0.33
5 9.9 157.2 275.6 0.69 2.14 8,517 228 9.39 0.25
6 5.3 328.5 430.6 0.78 1.84 1,899 33 14.25 0.25
266 Water Air Soil Pollut (2011) 221:255–273

unpredictability of patterns in TN and NO3- (Dillow
and Greene 1999). Rates of groundwater recharge innearby watersheds are in the range of 20.3–40.6 cmyear-1 (Johnston 1973, 1977; Andreasen and Smith1997). High ratios of watershed area per meter ofstream length in these watersheds indicate a potentialfor high groundwater discharge (Table 1). In addition,extensive ditching of tributaries and creeks in the St.Martin River basin may alter runoff and infiltrationpatterns. In some places, augmented connectivity alongthe flow path may allow for rapid, direct transport ofnutrients from groundwater during high flow periods,but ditches may also enhance biological uptake anddenitrification during low flow (Abit 2005).
Phosphorus concentrations also revealed differingseasonal patterns among the streams (Fig. 6). Three of
the streams, sites 2, 3, and 4, demonstrated dual TPpeaks (5–6 μM) in the spring (March–April) and fall(October–November) as well as a decrease in PO4
-3 toapproximately 1 μM or lower in the summer months.These observations of high P are concurrent withhigh-flow conditions and potential leaching of poultrymanure to streams (0.5–1% of watershed area), whichcould be a significant source of P loads in theseagricultural watersheds (Foy and Withers 1995). Theremaining streams at sites 1, 5, and 6 also displayed apeak between September and November, but they didnot experience a summer PO4
-3 depression. In fact,TP and PO4
-3 increased between May and August atsites 5 and 6 (highest poultry, >1%), and site 1 had itsoverall TP peak in June. These variations in P peaksin the summer and depressions in the winter mayresult from seasonal variations in subsurface flowand, most importantly, from variations in stormflow(not sampled here). P has an affinity for soil particlesand accumulates in sediment (Scheffer et al. 1992;Gächter et al. 2004). Phosphorus accumulation insoils often results from the excess manure andfertilizers applied in areas in which agriculture andfeeding operations comprise a large percentage of thebasin, as exhibited in both sites 5 and 6 watersheds(Carpenter et al. 1998).
Land use, especially poultry feeding operations inthe region, is linked to N export. The strongestcorrelation of N concentration was with % feedingoperations (r2=0.71, Fig. 9a), representing <2% ofland use. This strongly points to poultry operationsas a significant source of N in coastal bay streams.The differences in N and P export coefficientsbetween watersheds, in addition to average high-flow (December–March) concentrations, demonstratedpatterns among the stream watersheds that wereconsistent with their land use compositions. All butone watershed displayed area yields between 6 and10 kg N ha-1 year-1, typical of mixed land usewatersheds (Fisher et al. 1998). The watershed of site6, displaying the highest percentage of cropland, thehighest amount of feeding operations, and the lowestnatural land cover, had the greatest high-flow TNconcentration and N export coefficient, but it had thelowest TP concentration and P export coefficient.
Cropland in the Delmarva region has been previ-ously reported as a primary source of nitrogen tostreams and rivers (Ritter and Harris 1984; Jordan etal. 1997a). Conversely, the watershed of site 1, which
Fig. 8 Regression analysis results of mean winter nitrogen (a)and phosphorus (b) species vs. percent of watershed consistingof natural (forest and wetlands) land use. Mean concentrationsof nutrient species were calculated for the high-flow periodDecember–March using data from December 2006 to January2008 for six stream sites. Watershed land use data was obtainedfrom Maryland Department of Planning 2002 and DelawareDepartment of Natural Resources land use/land cover files.Statistically significant (p<0.05) results are denoted by *, andnonsignificant results are denoted by NS
Water Air Soil Pollut (2011) 221:255–273 267

had the highest amount of natural land cover (47%)and lowest cropland and feeding operations (40% and0.14%, respectively) had the highest TP export perhectare per year. Historically, the Perdue Hatchery atShowell, MD was an additional point-source dis-charge to site 1 on Church Branch, which wascharacterized by highly incised channels that wereindicative of high flows (Maryland Department ofEnvironment 2000), but this plant was closed in 2006.In this case, channel erosion, often the most signifi-cant source of sediment to rivers and streams (Trimble1997), may also be a dominant source of P, as a resultof years of accumulation from both point-source andnonpoint discharge to the stream (Noe and Hupp 2005).Historical agricultural land use may result in consider-able storage of phosphorus in the landscape, regardlessof current land cover (Bennett et al. 1999, 2001).
Natural land cover and poultry feeding operationswere found to have significant relationships to N in
the St. Martin River, although in opposite directions(Figs. 8a and 9a). Feeding operations in bothWorcester County, MD and Sussex County, DE areprimarily broiler and other meat-type chickens, andthese counties ranked 23 and 1, respectively, in theUSA for their production levels in 2002 (USDA2002). Part of the reason this land use may be such astrong source of N is due to the imported grain forfeeding operations in addition to the production ofanimal waste, which is then spread over nearby cropfields as fertilizer. Because there were no significantrelationships between TN, NO3
-, and NH4+ with
individual cropland or urban land percentages, it ispossible that only the cumulative effect of land covermodification can be seen in these watersheds. Anegative relationship with their converse, natural landcover suggests that forest and wetlands reduce TNthrough their filtering capacity for runoff and/or lackof N sources (Wahl et al. 1997).
Fig. 9 Regression analysisresults of mean winternitrogen (a) and phosphorus(b) species vs. percent ofstream watershed areaconsisting of feeding oper-ations. Mean concentrationsof nutrient species werecalculated for the high-flowperiod December–Marchusing data from December2006 to January 2008 forsix stream sites. Watershedland use data was obtainedfrom Maryland Departmentof Planning 2002 andDelaware Department ofNatural Resources land use/land cover files, which werethen edited using 2005aerial photographyprovided by the MarylandDepartment of NaturalResources. Statisticallysignificant (p<0.05) resultsare denoted by *, and non-significant results aredenoted by NS
268 Water Air Soil Pollut (2011) 221:255–273

There were no significant relationships betweenland use and PO4
-3 or TP. However, negative relation-ships were suggested with all land uses, exceptnatural land cover, which exhibited a positive slope.It is possible that wetlands and forests adjacent tostreams act as a P source and that the poorly drained,hydric soils, on which forests and wetlands occur,enhance the leaching of P in this region (USDA2008). During baseflow, forests, especially in theriparian zone, may act as a source of both dissolvedorganic and inorganic P, especially under low redoxconditions, where P adsorbed to soil particles isreleased (Peterjohn and Correll 1984; Whigham et al.1988). These findings also concur with a study byRitter (1986) who showed a strong relationship betweenstream nutrient export and watershed hydrologic char-acteristics on the eastern Delmarva Peninsula. Thecorrelations between hydric soils, natural and urbanland covers, and nutrient concentrations support thehypothesis of this research described above.
4.2 Estimates of Export from the St. MartinRiver Basin
A total annual N and P load was calculated for thewhole St. Martin River basin using land use loadingcoefficients derived from the literature as well as theempirical data obtained from the streams in this study.Initially, nutrient loading was calculated using areayield coefficients for crop agriculture, urban, andforest land covers that had been determined in asynthesis of literature values of nutrient yields fromsmall watersheds (Beaulac and Reckhow 1982).
However, these estimated export coefficients repre-sented generalized, nationwide values that may not beapplicable to the specific region of interest. Therefore,a new set of land use export coefficients was derivedfrom literature that focused on the Delmarva Peninsulaand coastal bays region, as well as the empirical streamdata of this study, an approach that could be adapted forother regions globally, as well.
The watersheds and export coefficients presentedin the above sections, as well as localized literaturevalues, were used to estimate total nutrient inputs forthe St. Martin River basin (Table 4). Nutrient loadingto the river was estimated from both terrestrial andatmospheric sources. The St. Martin River as a wholeis characterized by a large percentage of cropagriculture (47%). These factors influence N and Ploading, as well as the effects on the estuary.
Stream nutrient mass loads (M, Eq. 2) obtainedfrom the empirical stream data, were used to calculateloading coefficients for feeding operations that couldbe applicable to the whole St. Martin River water-shed. For each stream catchment, Eq. 4 was solved forEfeed (export coefficient for feed lots, kg ha-1 year-1)using total N and P loads (kg year-1) from Eq. 2 as Mi:
Efeed ¼ Mi � EforAforð Þ � EcropAcrop
� �� EurbAurbð Þ� �=Afeed
ð4Þwhere M=mass loading (kg N or P year-1) incatchment i, A=area (ha), E=export coefficient (kg Nor P ha-1 year-1), for=forest, crop=crop agriculture,urb=urban and residential, and feed=animal feedingoperations. In this use of Eq. 2, there were no known
Table 4 Literature sources, locations, and export coefficients (kg N or P ha-1 year-1) of different types of land use, applicable to theMaryland coastal bays region
Land use kg N ha-1
year-1References kg P ha-1
year-1References Location
Crop agriculture 10 Fisher et al. 1998 0.23 Lee et al. 2001 Choptank River (Delmarva)
Urban 10 Beaulac and Reckhow 1982 0.35 Reckhow and Simpson 1980 N=nationwide
P=Higgins Lake (MI)
Feeding operations 280 This study 27.4 This study Coastal Bays (MD)
Forest 1 Lee et al. 2001; Fisheret al. 2007 (unpublished)
0.09 Lee et al. 2001; Fisheret al. 2007 (unpublished)
Choptank River (Delmarva)
Atmosphere 11.2 Volk et al. 2006 0.082 Volk et al. in prep. Rehoboth Bay (DE)
Empirical stream export results obtained in this study were used to compute export coefficients for feeding operations (poultry) in theSt. Martin River basin
Water Air Soil Pollut (2011) 221:255–273 269

point-source inputs within sites 1–6, and atmosphericdeposition was already included as a part of thereported land use export coefficients.
The six values of Efeed for N and P determined bythe stream loads were averaged to provide a region-ally applicable mean value of Efeed to be applied tothe whole St. Martin River basin. These values werequite high (Table 4, 280±110 kg N and 27±17 kg Pha-1 year-1). The feeding operation coefficients, alongwith the coefficients for crop agriculture, urban, andforest land covers, were used to calculate total N andP loads for the bay watersheds. Watershed nutrientexport was also normalized by catchment area inorder to compare with other normalized nutrientexport coefficients.
Total mass loading (Mi, kg N or P year-1) for thewhole St. Martin River basin, as well as individualcatchments, was calculated as:
Mi ¼ EforAforð Þ þ EcropAcrop
� �þ EurbAurbð Þþ EfeedAfeedð Þ þ EatmAwatð Þ þ PS ð5Þ
where i=the entire St. Martin River watershed or oneof the sampled catchments, A=area (ha), E=exportcoefficient (kg N or P ha-1 year-1), for=forest, crop=crop agriculture, urb=urban and residential, feed=animal feeding operations, atm=atmospheric deposi-tion, wat=water, and PS=point-source annual load.All crop agriculture was simplified to row-crop sincecorn and soybeans dominate agricultural crops inWorcester County (US Department of Agriculture2002). However, wetlands were not included in thecoefficient estimation study, and wetland land coverwas assigned a loading coefficient of 0, because manystudies have indicated that wetlands may even be asink for nutrients (Jordan et al. 1983). The loadingcoefficient for atmospheric input was multiplied onlyby water area because the coefficients for land usesalready included that factor in their calculations.Loading coefficients, their literature sources, and thelocations from which they were derived are describedin Table 4.
St. Martin River had estimated export of 9.9×10⁴
kg N year-1 and 3.7×10³ kg P year-1. Crop agriculturewas the dominant source of N (50.3%), while feedingoperations contributed the highest percentage of P(38.8%). The point-source input of Ocean Pinesresidential development was only 4.1% of N inputsand 3.9% of P. Forests occupied 29% of the land
cover, yet contributed only 3.8% of the N and P.Direct atmospheric deposition of N and P to the watersurface was less than 10% and 2% for N and P,respectively, due to the small water surface area.Land-derived inputs are the predominant source ofnutrients to this coastal bay and were the same orderof magnitude as those described in Primrose 2001.
Application of the export coefficient modelapproach should be validated with local data. Thereis considerable coefficient variability due to incon-sistent local conditions, topography, soils, and othervariables that affect nutrient loading (Jordan et al.1997a; Norton and Fisher 2000). Calibration of thesemodels by periodic measurements of concentrationand discharge in regional sub-watersheds can beused as an effective alternative, which allows for amore specific, local-based approach (Marchetti andVerna 1992). However, even model calibration throughthe use of yearly empirical data must be undertakenwith caution because aquatic nutrient fluxes areinfluenced by climate variability, allowing for a widerange of concentrations from year to year (Curran andRobertson 1991, Bachman and Phillips 1996).
Employing coefficients applicable to the hydro-logical regime and soil composition of the region(Lee et al. 2001; Fisher et al. 1998; Fisher,unpublished), as well as empirically derived poultryfeeding operations coefficients, may provide a moreaccurate assessment of annual N and P loads andrelative contributions of each land use to these loads.Yield coefficients for feeding operations for sites 1–6were 724, 387, 0, 71, 451, and 77 kg N ha-1 year-1
and with a 111, 16, 16, 4, 2, and 9 kg P ha-1 year-1,respectively. The variability of coefficient estimatesfor feeding operations among stream watershedssuggests that there are fine-scale differences betweenwatersheds that may include physical characteristics(Lee et al. 2001), manure management practices(Sharpley et al. 1997), and position in relation tonatural filters such as vegetation (Lowrance et al. 1984).In addition, the compounding of errors within thefeedlot calculations adds uncertainty to these results.
Due to the limited sample size and short (<2 years)time frame, further conclusions about specific effectsof land use cannot be made. Because stream exportcalculations were made using baseflow dischargefrom a neighboring watershed, export of nitrogenand phosphorus will be higher if stormflow wasalso included (Gächter et al. 2004; Koskelo 2008).
270 Water Air Soil Pollut (2011) 221:255–273

Phosphorus transport is highly dependent uponstormflows, especially in agricultural catchmentswhere fertilizers account for the majority of P in topsoil,and subsequently, in runoff (Stutter et al. 2008). Tofurther clarify these relationships, sampling over alonger time series and/or including more watershedswould be beneficial.
In order to understand the cumulative effect ofanthropogenic inputs on a watershed, sources ofnutrients, their relation to streams, physical character-istics of the land (soils, hydrology), and land usehistory must be considered. Feeding operations,although a small percentage of watershed area, maybe especially important in contributing to highnitrogen and phosphorus concentrations and loads inthe Maryland coastal bays region. Managementdecisions that target vulnerable watersheds may aidto reduce these loads. Use of empirically determinedexport coefficients to compare nutrient loading forstream watersheds is helpful to address relativenutrient contributions of different land uses andcompare their land use pressures. The ability ofmanagement efforts to improve water quality incoastal bays, globally, lies in addressing the keysources in each region of interest.
Acknowledgments We would like to thank Carol Cain foraccess to stream nutrient data, Greg Radcliffe and Ben Fertigfor their assistance with GIS, and Horn Point AnalyticalServices for analysis of water samples. This research wassupported by a Maryland Coastal Bays Program implementa-tion grant and a Horn Point Small Grant and StudentFellowship to K.A. Beckert UMCES contribution # 4500.
References
Abit, S. Jr. (2005). Evaluation of subsurface solutetransport and its contribution to nutrient load in thedrainage ditches prior to restoration of a Carolina bay(pp. 137) (M.S. thesis) North Carolina State University:Raleigh, NC.
Andreasen, D. C., & Smith, B. S. (1997). Hydrogeology andsimulation of ground-water flow in the Upper WicomicoRiver Basin and estimation of contributing areas of thecity of Salisbury well fields, Wicomico County, Maryland.Maryland Geological Survey Report of Investigations No.65, 87 pp.
Bachman, L. J., & Phillips, P. J. (1996). Hydrologiclandscapes on the Delmarva Peninsula Part 2: Esti-mates of base-flow nitrogen load to Chesapeake Bay.Journal of the American Water Resources Association,32, 779–791.
Beaulac, M. N., & Reckhow, K. H. (1982). An examination ofland use–nutrient export relationships. Water ResourcesBulletin, 18, 1013–1024.
Benitez, J. A. (2004). Land cover changes and impact on N andP export from the Choptank watershed (PhD thesis,University of Maryland).
Benitez, J. A., & Fisher, T. R. (2004). Historical land coverconversion (1665–1850) in the Choptank watershed,Eastern USA. Ecosystems, 7, 219–232.
Bennett, E. M., Reed-Andersen, T., Houser, J. N., Gabriel, J.R., & Carpenter, S. R. (1999). A phosphorus budget forthe Lake Mendota watershed. Ecosystems, 2, 69–75.
Bennett, E. M., Carpenter, S. R., & Caraco, N. F. (2001).Human impact on erodable phosphorus and eutrophica-tion: a global perspective. Bioscience, 51, 227–234.
Bohlen, C., Stokes, C., Goshorn, D., & Boynton, W. (1997).Today’s treasures for tomorrow: an environmental reporton Maryland’s coastal bays. Maryland Department ofNatural Resources, 36 pp.
Caddy, J. F. (1993). Toward a comparative evaluation ofhuman impacts on fishery ecosystems of enclosed andsemi-enclosed seas. Reviews in Fisheries Science, 1,57–95.
Carpenter, S. R., Caraco, N. F., Correll, D. L., Howarth, R. W.,Sharpley, A. N., & Smith, V. H. (1998). Nonpointpollution of surface waters with phosphorus and nitrogen.Ecological Applications, 8, 559–568.
Costanzo, S. D., O’Donohue, M. J., Dennison, W. C.,Loneragan, N. R., & Thomas, M. (2001). A newapproach for detecting and mapping sewage impacts.Marine Pollution Bulletin, 42, 149–156.
Curran, J. C., & Robertson, M. (1991). Water qualityimplications of an observed trend of rainfall and runoff.Water and Environment Journal, 5, 419–424.
Dillow, J. J. A., & Greene, E. A. (1999). Ground-waterdischarge and nitrate loadings to the coastal bays ofMaryland. US Geological Survey MD0DE-DC WaterScience Center, WRIR 99–4167.
Fertig, B., Carruthers, T., Wazniak, C., Sturgis, B., Hall, M.,Jones, A., & Dennison, W. (2006). Water quality in fourregions of the Maryland coastal bays: assessing nitrogensource in relation to rainfall and brown tide. Data report toMaryland Coastal Bays Program.
Fisher, D. C., & Oppenheimer, M. (1991). Atmosphericnitrogen deposition and the Chesapeake bay estuary.Ambio, 23, 102–208.
Fisher, T. R., Lee, K.-Y., Berndt, H., Benitez, J. A., & Norton,M. M. (1998). Hydrology and chemistry of the ChoptankRiver basin in the Chesapeake bay drainage. Water, Air,and Soil Pollution, 105, 387–397.
Fisher, T. R., Hagy, J. D., III, Boynton, W. R., & Williams, M.R. (2006). Cultural eutrophication in the Choptank andPatuxent estuaries of Chesapeake Bay. Limnology andOceanography, 51, 435–447.
Foy, R. H., & Withers, P. J. A. (1995). The contribution ofagricultural phosphorus to eutrophication. Proceedings ofthe Fertilizer Society, 365, 32.
Gächter, R., Steingruber, S. M., Reinhardt, M., & Wehrli, B.(2004). Nutrient transfer from soil to surface waters:differences between nitrate and phosphate. AquaticScience, 66, 117–122.
Water Air Soil Pollut (2011) 221:255–273 271

Glibert, P. M., Wazniak, C. E., Hall, M., & Sturgis, B. (2007).Seasonal and interannual trends in nitrogen in Marylan’scoastal bays and relationships with brown tide. EcologicalApplications, 17, S79–S87.
Hager, P. (1996). Worcester County, MD, pp. 20–24. In K.Beidler, P. Gant, M. Ramsay, & G. Schultz (Eds.),Proceedings Delmarva’s coastal bay watersheds: Not yetup the creek. EPA/600/R-95/052. U.S. EnvironmentalProtection Agency, National Health and EnvironmentalEffects Research Laboratory, Atlantic Ecology Division,Narragansett, RI, USA.
Johnston, R. H. (1973). Hydrology of the Columbia (Pleistocene)deposits of Delaware: an appraisal of a regional water-tableaquifer: Delaware Geological Survey Bulletin No. 14,78 pp.
Johnston, R. H. (1977). Digital model of the unconfinedaquifer in central and southeastern Delaware: DelawareGeological Survey Bulletin No. 15, 47 pp.
Jones, A. B., Carruthers, T. J., Pantus, F., Thomas, J., Saxby, T.A., & Dennison, W. (2004). A water quality assessment ofthe Maryland coastal bays including nitrogen sourceidentification using stable isotopes. Final report to theMaryland Coastal Bays Program.
Jordan, T. E., Correll, D. L., & Weller, D. E. (1997a). Relatingnutrient discharges from watersheds to land use andstreamflow variability. Water Resources Research, 33,2579–2590.
Jordan, T. E., Correll, D. L., & Weller, D. E. (1997b). Effects ofagriculture on discharges of nutrients from Coastal Plainwatersheds of Chesapeake Bay. Journal of EnvironmentalQuality, 26, 836–848.
Jordan, T. E., Correll, D. L., & Whigham, D. F. (1983).Nutrient flux in the Rhode River: Tidal exchange ofnutrients by brackish marshes. Estuarine Coastal andShelf Science, 17, 651–667.
Koskelo, A. (2008). Hydrologic and biogeochemical stormresponse in Choptank Basin headwaters (M.S. thesis,Marine-Estuarine-Environmental Sciences, University ofMaryland Center for Environmental Sciences).
Lee, K.-Y., Fisher, T. R., & Rochelle-Newall, E. (2001).Modeling the hydrochemistry of the Choptank River basinusing GWLF and Arc/Info 2: Model validation andapplication. Biogeochemistry, 56, 311–348.
Lefebvre, S., Clement, J. C., Pinay, G., Thenail, C., Durand, P.,& Marmonier, P. (2007). 15N-nitrate signature in low-orderstreams: effects of land cover and agricultural practices.Ecological Applications, 17, 2333–2346.
Lowrance, R. R., Fail, T. J., Hendrickson, O., Leonard, R., &Asmussen, L. (1984). Riparian forests as nutrient filters inagricultural watersheds. BioScience, 34, 374–377.
Marchetti, R., & Verna, N. (1992). Quantification of thephosphorus and nitrogen loads in the minor rivers ofthe Emilia-Romagna coast (Italy). A methodologicalstudy on the use of theoretical coefficients in calculat-ing the loads. Science of the Total Environment, 126(Supplement), 315–336.
Maryland Department of Environment. (2000). Total maximumdaily loads of nitrogen and phosphorus for five tidaltributaries in the northern coastal bays system, WorcesterCounty, MD. MDE Report II, October 2000.
Noe, G. B., & Hupp, C. R. (2005). Carbon, nitrogen, andphosphorus accumulation in floodplains of Atlanticcoastal plain rivers, USA. Ecological Applications, 15,1178–1190.
Norton, M. M., & Fisher, T. R. (2000). The effects of forest onstream water quality in two coastal plain watersheds of theChesapeake Bay. Ecological Engineering, 14, 337–362.
Novotny, V., & Olem, H. (1994). Water quality, prevention,identification, and management of diffuse pollution. NewYork: Van Nostrand Reinhold.
Peierls, B. L., Caraco, N. F., Pace, M. L., & Cole, J. J.(1991). Human influence on river nitrogen. Nature, 350,386–387.
Peterjohn, W. T., & Correll, D. L. (1984). Nutrient dynamics inan agricultural watershed: observations on the role of ariparian forest. Ecology, 65, 1466–1475.
Pionke, H. B., Gburek, W. J., & Sharpley, A. N. (2000). Criticalsource area controls on water quality in an agriculturalwatershed located in the Chesapeake Basin. EcologicalEngineering, 14, 325–335.
Primrose, N. L. (2001). Report on nutrient synopticsurveys in the Isle of Wight watershed, WorcesterCounty, Maryland, April 2001 as part of the water-shed restoration action strategy. Watershed EvaluationSection, Maryland Department of Natural Resources.
Reckhow, K. H., & Simpson, J. T. (1980). A procedure usingmodeling and error analysis for the prediction of lakephosphorus concentration from land use information.Canadian Journal of Fisheries and Aquatic Science, 37,1439–1448.
Ritter, W. F. (1986). Water quality of agricultural coastal plainwatersheds. Agricultural Wastes, 16, 201–216.
Ritter, W. F., & Harris, J. R. (1984). Nonpoint source nitrogenloads to Delaware lakes and streams. Agricultural Wastes,9, 35–50.
Roth, N. E., Southerland, M. T., Rogers, G. M., & Volstad, J. H.(2003). Maryland biological stream survey 2000–2004.Volume II: Ecological assessment of watersheds sampled in2001. Prepared by Versar, Columbia, MD with MarylandDepartment of Natural Resources,Monitoring andNon-TidalAssessment Division.
Scheffer, F., Schachtschabel, P., Blume, H. P., Brümmer, G.,Hartge, K. H., Schwertmann, U., et al. (1992). Book of soilscience (p. 491). Stuttgart: Enke.
Sharpley, A., Meisinger, J. J., Breeuwsma, A., Sims, J. T.,Daniel, T. C., & Shepers, J. S. (1997). Impacts of animalmanure management on ground and surface water quality.In J. L. Hatfield, & B. A. Stewart (Eds), Animal wasteutilization: effective use of manure as a soil resource(pp. 320). Boca Raton, FL: CRC Press.
Stutter, M. I., Langan, S. J., & Cooper, R. J. (2008). Spatialcontributions of diffuse inputs and within-channel processesto the form of stream water phosphorus over storm events.Journal of Hydology, 350, 203–214.
Trimble, S. W. (1997). Contribution of stream channel erosionto sediment yield from an urbanizing watershed. Science,21, 1442–1444.
US Department of Agriculture (2002). 2002 Census ofagriculture. Available at http:www.nass.usda.gov/Census/Create_Census_US_CNTY.jsp. Accessed 7 July 2008.
272 Water Air Soil Pollut (2011) 221:255–273

US Department of Agriculture, Natural Resources ConservationService. (2008). Web soil survey. Available at http://websoilsurvey.nrcs.usda.gov/app/WebSoilSurvey.aspx.Accessed 7 July 2008.
Volk, J. A., Savidge, K. B., Scudlark, J. R., Andres, A. S., &Ullman, W. J. (2006). Nitrogen loads through baseflow,stormflow, and underflow to Rehoboth Bay, Delaware.Journal of Environmental Quality, 35, 1742–1755.
Wahl, M. H., McKellar, H. N., & Williams, T. M. (1997).Patterns of nutrient loading in forested and urbanizedcoastal streams. Journal of Experimental Marine Biologyand Ecology, 213, 111–131.
Wazniak, C. E., Hall, M. R., Cain, C., Wilson, D., Jesien, R.,Thomas, J., Carruthers, T., & Dennison, W. C. (2004).State of the Maryland coastal bays report.
Wazniak, C. E., Hall, M. R., Carruthers, T. J. B., Sturgis, B.,Dennison, W. C., & Orth, R. J. (2007). Linking waterquality to living resources in a mid-Atlantic lagoonsystem, USA. Ecological Applications, 17(Supplement),S64–S78.
Whigham, D. F., Chitterling, C., & Palmer, B. (1988).Impacts of freshwater wetlands on water quality: alandscape perspective. Environmental Management, 12,663–671.
Water Air Soil Pollut (2011) 221:255–273 273