characterisation of the substrate of atrial fibrillation and flutter
TRANSCRIPT
Title Page
Characterisation of the Substrate of
Atrial Fibrillation and Flutter
Martin Kingsland Stiles
MB ChB, FRACP
Department of Cardiology
Royal Adelaide Hospital
and
Discipline of Medicine
University of Adelaide
A thesis submitted to the University of Adelaide in
fulfilment of the requirements for the degree of
Doctor of Philosophy
August 2008

II
Dedication
To my wife Christina and my children Isabelle and Liam

III
Table of Contents
Abstract .................................................................................. XIII
Declaration ..............................................................................XV
Acknowledgements ................................................................XVI
Publications and Communications to Learned Societies .........XVII
Prizes and Awards during Candidature....................................XXI
Abbreviations ........................................................................XXII
Chapter 1. Review of the Literature1
1.1 Introduction ................................................................................................... 1
1.1.1 History of Atrial Fibrillation................................................................................... 2
1.1.2 Epidemiology of Atrial Fibrillation ........................................................................ 3
1.1.3 History of Atrial Flutter ......................................................................................... 9
1.1.4 Epidemiology of Atrial Flutter............................................................................. 11
1.2 The Electrophysiological Basis of Atrial Fibrillation....................................... 13
1.2.1 The Multiple Heterotopous Centres Theory....................................................... 13
1.2.2 The Multiple Wavelet Hypothesis ...................................................................... 13
1.2.3 Localised Sources in the Initiation and Maintenance of Atrial Fibrillation ........ 15
1.2.4 The Venous Wave Hypothesis ............................................................................ 19
1.2.5 Rotors and Activation Gradients......................................................................... 21
IV
1.2.6 Summary ............................................................................................................. 22
1.3 Triggers and Substrate in Atrial Arrhythmia.................................................. 22
1.3.1 Focal Triggers ...................................................................................................... 23
1.3.2 Localised Reentry................................................................................................ 24
1.3.3 Anatomical Structures with Site‐specific Conduction Properties....................... 26
1.3.4 Complex Fractionated Atrial Electrograms......................................................... 29
1.3.5 Dominant Frequency .......................................................................................... 32
1.3.6 The Neural Basis of Atrial Fibrillation ................................................................. 34
1.3.7 Substrate Associated with Atrial Flutter............................................................. 36
1.3.8 Typical and Atypical Atrial Flutter....................................................................... 38
1.4 Inter‐relationships between Atrial Flutter and Atrial Fibrillation .................. 39
1.4.1 Atrial Flutter begets Atrial Fibrillation ................................................................ 40
1.4.2 Atrial Fibrillation begets Atrial Flutter ................................................................ 41
1.5 Rate‐related Remodelling............................................................................. 43
1.5.1 Electrical Remodelling ........................................................................................ 43
1.5.2 Structural Remodelling ....................................................................................... 45
1.6 Atrial Substrate in Conditions Associated with Atrial Arrhythmia ................. 47
1.6.1 Heart Failure ....................................................................................................... 47
1.6.2 Atrial Septal Defects ........................................................................................... 48
1.6.3 Hypertension....................................................................................................... 48
1.6.4 Valvular Heart Disease........................................................................................ 49
1.6.5 Sub‐clinical Atrial Disease in Lone Atrial Fibrillation .......................................... 51
1.7 Sinus Node Disease, Remodelling and Atrial Arrhythmias............................. 52
1.7.1 The Anatomical Sinus Node................................................................................ 52

V
1.7.2 The Functional Sinus Node Complex .................................................................. 53
1.7.3 Conventional Evaluation of Sinus Node Function .............................................. 56
1.7.4 High‐density Mapping of the Sinus Node ........................................................... 57
1.7.5 Sinus Node Disease............................................................................................. 58
1.7.6 Clinical Conditions Associated with Sinus Node Impairment............................. 59
Chapter 2. Right and left atrial electrical substrate of lone atrial fibrillation61
2.1 Introduction ................................................................................................. 61
2.2 Methods....................................................................................................... 62
2.2.1 Study Population................................................................................................. 62
2.2.2 Electrophysiological Study and Ablation ............................................................ 63
2.2.3 Electrophysiology Study Protocol ....................................................................... 64
2.2.4 Statistical Analysis............................................................................................... 66
2.3 Results.......................................................................................................... 67
2.3.1 Baseline Details................................................................................................... 67
2.3.2 Atrial Refractoriness ........................................................................................... 67
2.3.3 Atrial Conduction Time ....................................................................................... 68
2.3.4 Site‐Specific Conduction Abnormalities ............................................................. 68
2.3.5 Sinus Node Function ........................................................................................... 69
2.4 Discussion..................................................................................................... 69
2.4.1 Major findings ..................................................................................................... 69
2.4.2 Rate‐Related Electrical Remodelling................................................................... 70
2.4.3 Progression of Atrial Fibrillation ......................................................................... 71
2.4.4 Substrate Predisposing to the Development of Atrial Fibrillation ..................... 72

VI
2.4.5 Implications......................................................................................................... 74
2.4.6 Limitations .......................................................................................................... 74
2.5 Conclusion.................................................................................................... 75
Chapter 3. Right and left atrial electroanatomical substrate of lone atrial
fibrillation‐‐‐‐ ........................................................................... 82
3.1 Introduction ................................................................................................. 82
3.2 Methods....................................................................................................... 83
3.2.1 Study Population................................................................................................. 83
3.2.2 Electrophysiological Study and Ablation ............................................................ 84
3.2.3 Electroanatomical Study Protocol ...................................................................... 85
3.2.4 Statistical Analysis............................................................................................... 87
3.3 Results.......................................................................................................... 88
3.3.1 Baseline Details................................................................................................... 88
3.3.2 Structural and Voltage Abnormalities ................................................................ 88
3.3.3 Abnormalities in Conduction Velocity ................................................................ 89
3.3.4 Complex Electrograms ........................................................................................ 89
3.4 Discussion..................................................................................................... 90
3.4.1 Major findings ..................................................................................................... 90
3.4.2 Structural changes in Atrial Fibrillation .............................................................. 91
3.4.3 Electroanatomical Studies in Atrial Fibrillation and Related Conditions............ 91
3.4.4 Prior Studies Implicating Abnormalities in “Lone” Atrial Fibrillation ................. 93
3.4.5 Implications......................................................................................................... 93
VII
3.4.6 Limitations .......................................................................................................... 94
3.5 Conclusion.................................................................................................... 94
Chapter 4. Right atrial electrical substrate of atrial flutter ...................... 100
4.1 Introduction ................................................................................................100
4.2 Methods......................................................................................................101
4.2.1 Study Population............................................................................................... 101
4.2.2 Electrophysiological Study and Ablation .......................................................... 102
4.2.3 Electrophysiology Study Protocol ..................................................................... 102
4.2.4 Statistical Analysis............................................................................................. 104
4.3 Results.........................................................................................................105
4.3.1 Baseline Details................................................................................................. 105
4.3.2 Atrial Refractoriness ......................................................................................... 105
4.3.3 Atrial Conduction Time ..................................................................................... 106
4.3.4 Site‐Specific Conduction Abnormalities ........................................................... 106
4.3.5 Sinus Node Function ......................................................................................... 107
4.4 Discussion....................................................................................................107
4.4.1 Major Findings .................................................................................................. 107
4.4.2 The Inter‐relationship between Atrial Flutter and Atrial Fibrillation ............... 108
4.4.3 Substrate Predisposing to the Development of Atrial Flutter.......................... 109
4.4.4 Substrate in Conditions Predisposed to Atrial Arrhythmia .............................. 110
4.4.5 Implications....................................................................................................... 112
4.4.6 Limitations ........................................................................................................ 112
4.5 Conclusion...................................................................................................113

VIII
Chapter 5. Right atrial electroanatomical substrate of atrial flutter ........ 118
5.1 Introduction ................................................................................................118
5.2 Methods......................................................................................................119
5.2.1 Study Population............................................................................................... 119
5.2.2 Electrophysiological Study and Ablation .......................................................... 120
5.2.3 Electroanatomical Study Protocol .................................................................... 120
5.2.4 Statistical Analysis............................................................................................. 122
5.3 Results.........................................................................................................123
5.3.1 Baseline Details................................................................................................. 123
5.3.2 Structural and Voltage Abnormalities .............................................................. 123
5.3.3 Abnormalities in Conduction Velocity .............................................................. 124
5.3.4 Complex Electrograms ...................................................................................... 124
5.4 Discussion....................................................................................................125
5.4.1 Major Findings .................................................................................................. 125
5.4.2 Substrate in Clinical Conditions Associated with Atrial Arrhythmia................. 125
5.4.3 Substrate in Experimental Models of Atrial Flutter.......................................... 126
5.4.4 Substrate in Clinical Atrial Flutter ..................................................................... 127
5.4.5 Implications....................................................................................................... 128
5.4.6 Limitations ........................................................................................................ 128
5.5 Conclusion...................................................................................................129
IX
Chapter 6. High‐density mapping of the sinus node to characterise the
remodelling resulting from chronic atrial flutter .................... 134
6.1 Introduction ................................................................................................134
6.2 Methods......................................................................................................135
6.2.1 Study Population............................................................................................... 135
6.2.2 Electrophysiological Study and Ablation .......................................................... 136
6.2.3 Conventional Evaluation of Sinus Node Function ............................................ 137
6.2.4 High‐Density Simultaneous Unipolar Mapping of Sinus Node Function.......... 138
6.2.5 Statistical Analysis............................................................................................. 140
6.3 Results.........................................................................................................141
6.3.1 Baseline Details................................................................................................. 141
6.3.2 Sinus Node Dysfunction and Atrial Remodelling .............................................. 141
6.3.3 Extent and Shift of the Atrial Pacemaker Complex .......................................... 142
6.3.4 Preferential Pathway Conduction..................................................................... 143
6.3.5 Beat‐to‐beat Variation in Sinus Node Function................................................ 143
6.3.6 Crista Terminalis Conduction............................................................................ 144
6.3.7 Voltage Findings................................................................................................ 144
6.4 Discussion....................................................................................................145
6.4.1 Major Findings .................................................................................................. 145
6.4.2 The Sinus Node: Anatomical and Functional Considerations........................... 146
6.4.3 Atrial Remodelling and Sinus Node Function ................................................... 147
6.4.4 Preferential Pathways of Conduction............................................................... 149
6.4.5 Implications....................................................................................................... 151

X
6.4.6 Limitations ........................................................................................................ 151
6.5 Conclusion...................................................................................................152
Chapter 7. High‐density mapping of atrial fibrillation to determine the
optimal recording duration for dominant frequency and
automated detection of complex fractionated electrograms.. 166
7.1 Introduction ................................................................................................166
7.2 Methods......................................................................................................167
7.2.1 Study Population............................................................................................... 167
7.2.2 Electrophysiological Study ................................................................................ 168
7.2.3 High‐Density Bi‐atrial Mapping......................................................................... 168
7.2.4 Complex Fractionated Atrial Electrograms....................................................... 169
7.2.5 Dominant Frequency ........................................................................................ 170
7.2.6 Statistical Analysis............................................................................................. 171
7.3 Results.........................................................................................................171
7.3.1 Baseline details ................................................................................................. 171
7.3.2 CFE‐mean .......................................................................................................... 172
7.3.3 Dominant Frequency ........................................................................................ 173
7.4 Discussion....................................................................................................173
7.4.1 Major Findings .................................................................................................. 173
7.4.2 Time Domain Analysis....................................................................................... 175
7.4.3 Frequency Domain Analysis.............................................................................. 176
7.4.4 Differences in Effect of Electrogram Duration between CFE‐mean and DF..... 177

XI
7.4.5 Limitations ........................................................................................................ 178
7.5 Conclusion...................................................................................................178
Chapter 8. High‐density mapping of atrial fibrillation to determine the
relationship between activation frequency, complex
fractionated electrograms and the anatomical substrate....... 187
8.1 Introduction ................................................................................................187
8.2 Methods......................................................................................................188
8.2.1 Study Population............................................................................................... 188
8.2.2 Electrophysiological Study and Ablation .......................................................... 189
8.2.3 Study Protocol................................................................................................... 190
8.2.4 Complex Fractionated Atrial Electrograms....................................................... 191
8.2.5 Activation Frequency ........................................................................................ 192
8.2.6 Relationship between Activation Frequency and Fractionation ...................... 192
8.2.7 Statistical Analysis............................................................................................. 193
8.3 Results.........................................................................................................194
8.3.1 Baseline Details................................................................................................. 194
8.3.2 Complex Fractionated Atrial Electrograms....................................................... 194
8.3.3 Dominant Frequency ........................................................................................ 195
8.3.4 Relationship between CFE‐mean and Dominant Frequency............................ 196
8.4 Discussion....................................................................................................198
8.4.1 Major findings ................................................................................................... 198
8.4.2 Spatial Distribution of Complex Fractionated Atrial Electrograms .................. 199

XII
8.4.3 Spatial Distribution of Dominant Frequency .................................................... 199
8.4.4 Relationship between Activation Frequency and Fractionation ...................... 201
8.4.5 Clinical Implications .......................................................................................... 202
8.4.6 Limitations ........................................................................................................ 203
8.5 Conclusion...................................................................................................203
Chapter 9. Summary‐‐‐‐‐.......................................................................... 213
Chapter 10. Future Directions‐‐‐ ................................................................ 220
References ........................................................................... 223
XIII
Abstract
Atrial fibrillation and atrial flutter are the most common sustained arrhythmias,
however their underlying mechanisms are yet to be fully characterised. This thesis
evaluates the electrophysiological and electroanatomical substrate of the atria in
patients with these arrhythmias.
Experimental studies of atrial fibrillation have demonstrated effective refractory
period shortening and conduction slowing as a result of atrial fibrillation giving rise to
the concept that “atrial fibrillation begets atrial fibrillation”. However, cardioversion to
prevent electrical remodelling does not prevent progression of disease, suggesting a
“second factor” drives this process. Chapters 2 and 3 evaluate the atrial substrate in
patients with “lone” atrial fibrillation. These studies demonstrate such patients,
remote from an arrhythmic event, have prolongation of atrial refractoriness,
conduction slowing, impairment of sinus node function, site‐specific conduction delay,
lower voltage and a greater proportion of complex electrograms compared to
reference patients. These abnormalities constitute the “second factor” critical to the
development and progression of atrial fibrillation.
Atrial flutter has a close inter‐relationship with atrial fibrillation and these rhythms
frequently co‐exist. Atrial fibrillation often occurs in patients with heart disease known
to demonstrate abnormal atrial substrate; whether similar substrate exists in patients
with atrial flutter to account for the co‐existence of both arrhythmias is unknown.
Chapters 4 and 5 evaluate the atrial substrate in patients with atrial flutter, remote
from arrhythmia, demonstrating structural abnormalities characterised by loss of
myocardial voltage, conduction slowing and impaired sinus node function, without
XIV
reduction in atrial refractoriness. These findings implicate a common substrate as the
cause of the close inter‐relationship between these arrhythmias.
There is a frequent association between atrial arrhythmia and sinus node disease for
which several mechanisms have been postulated. In addition, there is a size
discrepancy between the anatomical sinus node and the much larger functional sinus
node complex. Little is known about normal sinus node function or the effects of
remodelling due to arrhythmia. Chapter 6 characterises sinus node activation to
determine the nature and extent of the functional sinus node complex in patients with
and without chronic atrial flutter. The functional sinus node complex demonstrates
dynamic shifts in activation with preferential pathways of conduction to atrial
myocardium. Patients with atrial flutter demonstrate lesser voltage, longer conduction
times along preferential pathways and a smaller functional sinus node complex. These
findings provide insights into the function of the human sinus node in health and
disease.
Sites of complex fractionated atrial electrograms and highest dominant frequency are
implicated in maintaining atrial fibrillation. Chapter 7 determines the minimum
recording duration that accurately characterises electrogram complexity and activation
frequency. An electrogram duration of ≥5 seconds is required to accurately identify
these sites. Chapter 8 evaluates the relationship between sites of fractionation and
high frequency activation during atrial fibrillation. Greater fractionation and higher
dominant frequency are seen in persistent atrial fibrillation and left atria. Preferential
areas of high dominant frequency are observed in paroxysmal but not persistent atrial
fibrillation. Areas of complex fractionated atrial electrograms are found adjacent to
sites of high dominant frequency.

XV
Declaration
This work contains no material which has been accepted for the award of any other
degree or diploma in any university or other tertiary institution to Martin Stiles and, to
the best of my knowledge and belief, contains no material previously published or
written by another person, except where due reference has been made in the text.
I give consent to this copy of my thesis when deposited in the University Library, being
made available for loan and photocopying, subject to the provisions of the Copyright
Act 1968.
The author acknowledges that copyright of published works contained within this
thesis (as listed below) resides with the copyright holder(s) of those works.
Martin Kingsland Stiles ___________________________________________ August 2008
Stiles MK, John B, Wong CX, Kuklik P, Brooks AG, Lau DH, Dimitri H, Roberts‐Thomson KC, Wilson L, De Sciscio P, Young GD, Sanders P. Paroxysmal lone atrial fibrillation is associated with abnormal atrial substrate: Characterising the “second factor”. J Am Coll Cardiol, in press
Stiles MK, Brooks AG, Kuklik P, John B, Dimitri H, Lau DH, Wilson L, Shashidhar, Roberts‐Thomson RL, Mackenzie L, Young GD, Sanders P. High‐density mapping of atrial fibrillation in humans: Relationship between high frequency activation and electrogram fractionation. J Cardiovasc Electrophysiol, 2008;19:1245‐1253
Stiles MK, Brooks AG, Sanders P. Putting CFAE on the map. J Cardiovasc Electrophysiol 2008;19:904‐906
Stiles MK, Brooks AG, John B, Shashidhar, Wilson L, Kuklik P, Dimitri H, Lau DH, Roberts‐Thomson RL, Mackenzie L, Willoughby S, Young GD, Sanders P. Effect of electrogram duration on the quantification of complex fractionated atrial electrograms and dominant frequency. J Cardiovasc Electrophysiol 2008;19:252‐258
Sanders P, Stiles MK, Young GD. Virtual Anatomy for Atrial Fibrillation Ablation. J Cardiovasc Electrophysiol 2006;17:349‐351

XVI
Acknowledgements
I would like to thank Professor Prashanthan Sanders and Dr Glenn Young as my supervisors and mentors. It has been a privilege and a pleasure to work with them and to learn from them and I admire their dedication to and knowledge of their chosen field. I am certain our collaboration and friendship will continue well into the future. I am grateful to the New Zealand Heart Foundation for the Overseas Training Fellowship which financially supported my first year of study, and the Royal Adelaide Hospital for the Dawes Scholarship which supported me subsequently. I am also indebted to the patients who, despite the anxieties associated with medical intervention, volunteered additional time during their procedure for me to gather the data on which this thesis is based. I am thankful to the Fellows who made the Electrophysiology Department a delight to work in, especially to Drs Bobby John, Dennis Lau, Hany Dimitri, Shashidhar, Han Lim, Muayad Alasady, Gautam Sharma and Narayanan Namboodiri. Special thanks goes to Mr Christopher Wong whose many hours of work performing data analysis kept my project on time, and to Dr Anthony Brooks whose hard work and good humour assisted me to produce this work. I am grateful to Dr Pawel Kuklik who developed the software critical to my data analysis and to the other members of the Cardiovascular Research Centre who provided the essential academic environment to nourish critical thought and independent analysis. Additional thanks to Mr Thomas Sullivan for statistical analysis. I am indebted to Professor Jonathan Kalman whose expertise in sinus node function he shared to significantly improve Chapter 6. My sincere appreciation goes to Dr Graydon Beatty for his help in understanding the complexities of the non‐contact mapping system and the mysteries of the unipolar electrogram. I acknowledge the encouragement of Associate Professor Warren Smith to follow an academic path in Adelaide. I would also like to thank the staff of the Cardiovascular Investigation Unit, Royal Adelaide Hospital without whom this research could not have taken place, in particular Ms Lauren Wilson for her encouragement and friendship. A special thanks to my parents Roger and Joan whose support, encouragement and love have always been there for me. It is because of them that our family has been empowered to seek their own course in life and, no matter where in the world this took us, the knowledge of their unqualified support was always there to sustain us. Most importantly, I wish to thank Christina, Isabelle and Liam whom I love dearly and to whom this thesis is dedicated. Christina has travelled with me, literally and figuratively, throughout my journey of learning whilst remaining understanding and supportive of the additional demands this has made on us all. I am sure we will look back fondly on our time in Adelaide and the friends we made here.

XVII
Publications and Communications to Learned Societies
Chapter 1
i) Manuscript: Stiles MK, Brooks AG, Sanders P. Putting CFAE on the map. J
Cardiovasc Electrophysiol 2008;19:904‐906
ii) Manuscript: Sanders P, Stiles MK, Young GD. Virtual Anatomy for Atrial
Fibrillation Ablation. J Cardiovasc Electrophysiol 2006;17:349‐351
iii) Presentation: Invited to present at the Cardiac Society of Australia and New
Zealand 56th Scientific Meeting August 2008, Adelaide, Australia on
Complex Electrograms and Dominant Frequency
Chapters 2 and 3
i) Manuscript: Stiles MK, John B, Wong CX, Kuklik P, Brooks AG, Lau DH,
Dimitri H, Roberts‐Thomson KC, Wilson L, De Sciscio P, Young GD, Sanders
P. Paroxysmal lone atrial fibrillation is associated with abnormal atrial
substrate: Characterising the “second factor”. J Am Coll Cardiol, in press
ii) Presentation: Presented at the Cardiac Society of Australia and New
Zealand 56th Scientific Meeting August 2008, Adelaide, Australia and
published in abstract form (Heart Lung Circ 2008;17:S120)
iii) Presentation: Presented at the Medical Grand Round, Royal Adelaide
Hospital, August 2008. Finalist for the 2008 Nimmo Prize for Full‐Time
Research

XVIII
Chapters 4 and 5
i) Manuscript: Stiles MK, Wong CX, John B, Kuklik P, Brooks AG, Lau DH,
Dimitri H, Wilson L, Young GD, Sanders P. Atrial flutter is associated with
diffuse atrial abnormalities: Implications for the development of atrial
fibrillation. Submitted for publication
ii) Presentation: Presented at the Cardiac Society of Australia and New
Zealand 56th Scientific Meeting August 2008, Adelaide, Australia and
published in abstract form (Heart Lung Circ 2008;17:S114)
Chapter 6
i) Manuscript: Stiles MK, Brooks AG, Roberts‐Thomson KC, Kuklik P, John B,
Young GD, Kalman JM, Sanders P. High‐density mapping of the sinus node
in humans: role of preferential pathways and the effect of remodelling.
Submitted for publication
ii) Presentation: Presented at the Heart Rhythm Society 28th Annual Scientific
Sessions, May 2008, San Francisco, United States of America and published
in abstract form (Heart Rhythm 2008;5:S278)
iii) Presentation: Presented at the Cardiac Society of Australia and New
Zealand 56th Scientific Meeting August 2008, Adelaide, Australia and
published in abstract form (Heart Lung Circ 2008;17:S121)
XIX
Chapter 7
i) Manuscript: Stiles MK, Brooks AG, John B, Shashidhar, Wilson L, Kuklik P,
Dimitri H, Lau DH, Roberts‐Thomson RL, Mackenzie L, Willoughby S, Young
GD, Sanders P. Effect of electrogram duration on the quantification of
complex fractionated atrial electrograms and dominant frequency. J
Cardiovasc Electrophysiol 2008;19:252‐258
ii) Presentation: Presented at the Heart Rhythm Society 28th Annual Scientific
Sessions, May 2007, Denver, United States of America and published in
abstract form (Heart Rhythm 2007;4:S348)
iii) Presentation: Presented at the Cardiac Society of Australia and New
Zealand 55th Scientific Meeting August 2007, Christchurch, New Zealand
and published in abstract form (Heart Lung Circ 2007;16:S109)
Chapter 8
i) Manuscript: Stiles MK, Brooks AG, Kuklik P, John B, Dimitri H, Lau DH,
Wilson L, Shashidhar, Roberts‐Thomson RL, Mackenzie L, Young GD,
Sanders P. High‐density mapping of atrial fibrillation in humans:
Relationship between high frequency activation and electrogram
fractionation. J Cardiovasc Electrophysiol 2008;19:1245‐1253
ii) Presentation: Presented at the American College of Cardiology 57th Annual
Scientific Sessions, March 2008, Chicago, United States of America and
published in abstract form (J Am Coll Cardiol 2008;51:A6)

XX
iii) Presentation: Presented at the Cardiac Society of Australia and New
Zealand 56th Scientific Meeting August 2008, Adelaide, Australia and
published in abstract form (Heart Lung Circ 2008;17:S120)
iv) Presentation: Presented at the Post‐graduate Research Expo, School of
Medicine, July 2008
XXI
Prizes and Awards during Candidature
i) New Zealand Heart Foundation Overseas Training Fellowship, 2005‐2006
ii) New Zealand Heart Foundation Travel Grant, Heart Rhythm 06, Boston,
United States of America, 2006
iii) Dawes Scholarship, Royal Adelaide Hospital, 2006‐2008
iv) Cardiac Society of Australia and New Zealand Annual Scientific Meeting
Travelling Scholarship, Canberra, 2006
v) St Jude Medical Australia Pacing and Electrophysiology Young Investigator
Award, 2006
vi) Cardiac Society of Australia and New Zealand Travelling Scholarship,
European Society of Cardiology Congress, Barcelona, Spain, 2006
vii) Best Moderated Poster in the Drugs/Ablation/Electrical Therapy of
Arrhythmias section, World Congress of Cardiology, Barcelona, Spain, 2006
viii) Australian Heart Foundation Travel Grant, Heart Rhythm 07, Denver, United
States of America, 2007
ix) University of Adelaide, Postgraduate Travelling Fellowship, 2008
x) Australian Heart Foundation Travel Grant, Heart Rhythm 08, San Francisco,
United States of America, 2008
xi) Finalist for the Nimmo Prize for Full‐Time Research, Adelaide, 2008

XXII
Abbreviations
CFAE Complex Fractionated Atrial Electrogram
CFE‐mean An automated measure of electrogram complexity
CI Confidence Interval
CSNRT Corrected Sinus Node Recovery Time
DF Dominant Frequency
EA Earliest Activation
ECG Electrocardiogram
ERP Effective Refractory Period
ICC Intra‐Class Correlation
IQR Inter‐Quartile Range
OR Odds Ratio
SACT Sino‐Atrial Conduction Time
SBO Sinus Break‐Out
Standard international NBG pacing codes are used (e.g. VVI, DDD)
Due to the common initials of atrial flutter and atrial fibrillation, these rhythms are
not abbreviated in the text. For some tables and figures, the abbreviation “AF” is
used for atrial fibrillation. Atrial flutter is abbreviated to “flutter” in some tables
and figures.

1
Chapter 1. Review of the Literature‐__
1.1 Introduction
Atrial fibrillation is a supraventricular tachyarrhythmia characterized by uncoordinated
atrial activation with consequent deterioration of atrial mechanical function. On the
electrocardiogram, atrial fibrillation is characterized by the replacement of consistent P
waves by rapid oscillations or fibrillatory waves that vary in amplitude, shape and
timing, associated with an irregular and often rapid ventricular response when
atrioventricular conduction is intact. The ventricular response to atrial fibrillation
depends on electrophysiological properties of the atrioventricular node and other
conducting tissues, the level of vagal and sympathetic tone, and the action of drugs.
ACC/AHA/ESC 2006 Guidelines for the Management of Patients with Atrial Fibrillation
(Fuster et al. 2006).
Atrial flutter is characterized by an organized atrial rhythm with a rate typically
between 250 and 350 bpm. Electrophysiological studies have shown that this simple
ECG definition includes tachycardias using a variety of reentry circuits. The reentry
circuits often occupy large areas of the atrium and are referred to as “macro‐
reentrant.” The classic type of atrial flutter (i.e. typical flutter) is dependent on the
cavotricuspid isthmus.
ACC/AHA/ESC 2003 Guidelines for the Management of Patients with Supraventricular
Arrhythmias (Blomstrom‐Lundqvist et al. 2003).
2
The typical form of atrial flutter is characterized by a sawtooth pattern of regular atrial
activation called flutter (ƒ) waves on the ECG, particularly visible in leads II, III, aVF, and
V1. If untreated, the atrial rate typically ranges from 240 to 320 beats per minute, with
ƒ waves inverted in leads II, III, and aVF and upright in lead V1. The direction of
activation in the right atrium may be reversed, resulting in upright ƒ waves in leads II,
III, and aVF and inversion in lead V1.
ACC/AHA/Physician Consortium 2008 Clinical Performance Measures for Adults with
Nonvalvular Atrial Fibrillation or Atrial Flutter (Estes et al. 2008).
1.1.1 History of Atrial Fibrillation
An irregular pulse, referred to as rebellious palpitations, delirium cordis and pulsus
irregularis perpetuus, was a cause of speculation by physicians since early times
(Silverman 1994). James Mackenzie (1907), a general practitioner in England, utilising
an ink‐writing polygraph to record and label jugular venous pulses, initially set about
deciphering normal and abnormal cardiac rhythms. His key observation that the
jugular "A wave" was lost in a patient who went from a normal to an irregular rhythm
provided the first insight into the mechanism of auricular fibrillation, as it was initially
called. The first electrocardiographic recordings of atrial fibrillation came shortly after
Einthoven invented the string galvanometer in 1901. He published a tracing from a
case of pulsus irregularis that showed QRS complexes with normal appearance; these
occurred irregularly but had too much background interference to permit the
identification of atrial activity (Einthoven 1906). Cushny and Edmunds (1907)
demonstrated a connection between irregularity of the pulse and atrial fibrillation.

3
Hering reporting on the electrocardiograms of patients in 1908, stated that one could
see no signs on the electrocardiogram of action of the auricles, and described “F
waves” in his recordings (Flegel 1995). These fine waves between ventricular beats
were considered to be responsible for the irregular rhythms whose pulse pressure
tracings had been published by MacKenzie. In 1909, Rothberger and Winterberg in
Vienna, and Lewis in England were the first to establish electrocardiographically that
auricular fibrillation was the cause of pulsus irregularis perpetuus (Silverman 1994).
Subsequently, Lewis (1910) noted from electrocardiographic studies that the R wave
was relatively normal in cases of irregular pulse and argued that ventricular contraction
must therefore originate from its usual starting point. He took the fine oscillations
between the R waves to be evidence of atrial activity throughout the cardiac cycle.
From detailed study of the chest leads, Lewis showed that these oscillations originated
from the atria rather than from the atrioventricular node as was thought by some
(Flegel 1995). Technical advances in ECG recording allowed signal amplification and
miniaturisation of the recording system (Ernestene and Levine 1928) which set the
stage for the subsequent path to understanding by way of electrophysiological
investigation of this frequently encountered clinical arrhythmia.
1.1.2 Epidemiology of Atrial Fibrillation
Atrial fibrillation is the most common chronic cardiac arrhythmia, estimated to affect
2.2 million people in the United States and 4.5 million people in the European Union
(Fuster et al. 2006). In Australia, it is a major health problem contributing to a
substantial proportion of the estimated 50,000 strokes a year (National Heart

4
Foundation of Australia 2004; Cadilhac et al. 2007). With ageing of the population and
improved survival after the occurrence of myocardial infarction and congestive heart
failure, Eugene Braunwald (1997) noted a doubling of admission rates for atrial
fibrillation between 1984 and 1994, and described atrial fibrillation as an emerging
epidemic. In Australia, the ICD‐10 principal diagnosis of “atrial fibrillation and flutter”
at discharge from public hospitals increased from 27,245 to 38,296 from 1999 to 2005
(Australian Institute of Health and Welfare 2008). Lifetime risks for development of
atrial fibrillation are 1 in 4 for men and women over the age of forty years and are still
high (1 in 6) even in the absence of antecedent congestive heart failure or myocardial
infarction (Lloyd‐Jones et al. 2004).
1.1.2.1 Incidence and Prevalence
The incidence and prevalence of atrial fibrillation varies between studies, most likely
related to study design and methods, but perhaps also to true regional variations.
Consistently across the studies, the incidence of atrial fibrillation increases with age
(Benjamin et al. 1994; Psaty et al. 1997; Miyasaka et al. 2006a). In the Cardiovascular
Health Study, the incidence of atrial fibrillation in the 65‐74 years age group was 18 per
1000 person‐years for men and 10 per 1000 person‐years for women. For the age
category 75‐84 years these numbers more than doubled to 43/1000 and 22/1000,
respectively (Psaty et al. 1997). The prevalence of atrial fibrillation is therefore highly
age‐related and although the age‐specific prevalence is higher in men (e.g. for ages 65‐
69 years: men 5.9%, women 2.8%), the gap narrows with women in the older age
categories. Furthermore, as women on average live longer than men, the absolute
number of women with atrial fibrillation actually exceeds that of men making this
5
disease of equal importance to both elderly men and women (Furberg et al. 1994). The
number of Australians with atrial fibrillation is estimated at 165,000, with numbers
expected to rise substantially due to ageing of the population together with the
increasing prevalence of atrial fibrillation with age (Eikelboom and Hankey 2004).
1.1.2.2 Associated Conditions
Key risk factors for the development of atrial fibrillation include increasing age,
hypertension, myocardial infarction, congestive heart failure and valvular heart disease
(Kannel et al. 1982a; Benjamin et al. 1994; Psaty et al. 1997). Data from the well known
Framingham cohort showed that, independent of other documented risk factors, each
decade of age increased the probability of developing atrial fibrillation by 2.1‐fold in
men and 2.2‐fold in women. In the same cohort, diabetes (men: 1.4‐fold; women 1.6‐
fold), underlying hypertension (men: 1.5‐fold; women: 1.4‐fold), past myocardial
infarction (1.4‐fold in men only), congestive heart failure (men: 4.5‐fold; women: 5.9‐
fold) and valvular disease usually affecting the mitral valve (men: 1.8‐fold; women: 3.4‐
fold) independently increased the likelihood of developing atrial fibrillation (Wolf et al.
1996). More recent data from the Framingham study reports that the development of
atrial fibrillation in patients with congestive heart failure is associated with an increase
in mortality of 2.7‐fold in men and 3.1‐fold in women (Wang et al. 2003). The Renfrew‐
Paisley study from the United Kingdom, found that middle‐aged men and women were
significantly more likely to develop atrial fibrillation during 25‐year follow‐up if they
had cardiomegaly (13‐fold increase), chronic bronchitis (2.2‐fold), left ventricular
hypertrophy (4.2‐fold), myocardial ischaemia (4.5‐fold), past history of stroke (3.9‐fold)
and glucose intolerance (3.1‐fold) (Stewart et al. 2001). Other reported causes include
6
pericarditis, alcohol, thyrotoxicosis, hypertrophic cardiomyopathy, myocarditis, severe
infection and disorders of the cardiac conduction system (Aberg 1968; Fuster et al.
2001; Stewart et al. 2001). Nevertheless, despite multiple risk factors for atrial
fibrillation, some of those with the condition are remarkable only for the absence of
overt cardiovascular disease or precipitating illness; so called “lone” atrial fibrillation
(Brand et al. 1985; Kopecky et al. 1987). Such patients younger that 65 years of age do
not have the increased risk of thromboembolism seen in atrial fibrillation overall
(Kopecky et al. 1987; Rostagno et al. 1995; Stewart et al. 2002). In fact, analysis of the
Framingham Study data of patients with lone atrial fibrillation revealed that after a
mean follow up of 25.2±9.5 years, cerebrovascular events had only occurred in
patients who had developed a least one risk factor for thromboembolism since
enrolment (Jahangir et al. 2007). Familial tendencies in lone atrial fibrillation have
been described and recently genetic linkage analysis studies have indicated
associations with specific chromosomal loci (Lai et al. 2003). Brugada et al. (1997)
reported the first monogenic cause for familial atrial fibrillation, implicating a gene on
chromosome 10. These studies, together with population studies of first degree
relatives (Ellinor et al. 2005), show there is growing evidence that genetic factors are
important in the pathogenesis of atrial fibrillation. Nevertheless, familial atrial
fibrillation has been shown to be genetically heterogeneous (Darbar et al. 2003;
Volders et al. 2007) and, unlike syndromes such as hypertrophic cardiomyopathy and
long QT syndrome, the role of genes in the vast majority of people who develop atrial
fibrillation probably comes second to the role of environmental factors and co‐morbid
disease.

7
1.1.2.3 Consequences of Atrial Fibrillation
Atrial fibrillation is a major cause of morbidity and mortality, increasing risk of death
(Benjamin et al. 1998; Vidaillet et al. 2002), congestive heart failure (Stewart et al.
2002), and embolic phenomena, including stroke (Wolf et al. 1991; Stewart et al.
2002). Approximately 15% of all strokes are attributable to atrial fibrillation (Wolf et al.
1987) and these are more debilitating than other types of strokes (Jorgensen et al.
1996). Independent of stroke, atrial fibrillation has been linked to cognitive
dysfunction although the mechanism by which this results is yet to be determined (Ott
et al. 1997; Miyasaka et al. 2007a). Congestive heart failure is not only a risk factor for
atrial fibrillation but can also be a consequence of atrial fibrillation. Therefore, whether
occurring in tandem or in succession these two conditions often co‐exist compounding
the adverse consequences of each in a “vicious cycle” (Cha et al. 2004). The incidence
of new congestive heart failure for a patient first diagnosed with atrial fibrillation has
been observed to be 44 per 1000 person‐years. Furthermore, the age‐ and sex‐
adjusted mortality risk for patients with atrial fibrillation following congestive heart
failure was estimated at 3.4 times that of those without heart failure (Miyasaka et al.
2006b). Atrial fibrillation confers an independent mortality risk, most recently shown in
a 21‐year community‐based study by the Framingham investigators. Patients with
newly diagnosed atrial fibrillation had a hazard ratio for dying of 2.08 over a mean of
5.3 years follow‐up, when compared with the general population of Minnesota.
Furthermore, this was markedly more dramatic (hazard ratio 9.62) in the first 4 months
from diagnosis, mainly from cardiovascular causes (Miyasaka et al. 2007b). In
Australians over the age of 60 years the relative mortality of patients with atrial
fibrillation (adjusted for confounding effects) is 1.92 for all causes and 3.78 for deaths
8
from stroke (Lake et al. 1989). Thus, atrial fibrillation is a disease that denotes
significant associated morbidity and mortality, with a large impact on both the
individual and the community as a whole. Importantly, these associated poor health
outcomes must be separated from the co‐morbid conditions frequently accompanying
atrial fibrillation. “Lone” atrial fibrillation has been defined as the absence of structural
heart disease or stroke based on history, physical examination, chest X‐ray, routine
blood chemistry, and trans‐thoracic as well as trans‐oesophageal echocardiography.
Additional exclusions to this group are coronary artery disease, significant pulmonary
disease, hypertension, hyperthyroidism and diabetes (Kopecky et al. 1987; Kumagai et
al. 1991; Jaïs et al. 2000). The survival for patients with “lone” atrial fibrillation has
been repeatedly shown to be comparable to the general population (Kopecky et al.
1987; Rostagno et al. 1995; Stewart et al. 2002). Although traditional teaching has
been that atrial fibrillation progresses from paroxysmal to persistent arrhythmia, a
recent Framingham study on the long‐term progression and outcomes of patients with
lone atrial fibrillation reported that of 71 patients with paroxysmal or persistent atrial
fibrillation, just 22 had progression to permanent atrial fibrillation over a mean follow‐
up of 25.2±9.5 years (Jahangir et al. 2007). Overall survival of the patients with lone
atrial fibrillation was similar to the survival of the age‐ and sex‐matched population.
Observed survival free of heart failure was slightly worse than expected but the risk for
cerebrovascular events was similar to that expected. Importantly, all patients who had
a cerebrovascular event had developed ≥1 risk factor for thromboembolism, thereby
were no longer strictly “lone” atrial fibrillation. While the association and
consequences of atrial fibrillation with all the factors described above may be clear,
the mechanisms by which these factors result in arrhythmia is not.

9
1.1.3 History of Atrial Flutter
The first published description of probable atrial flutter dates back to the nineteenth
century when McWilliam (1886) described regular, rapid excitations of the atrium in an
animal. Subsequently, Einthoven (1906) made an electrocardiographic recording of
atrial flutter. Distinction between atrial flutter and atrial fibrillation by characteristic
sawtooth waves in the inferior ECG leads followed (Jolly and Ritchie 1911). This
“common” type of atrial flutter was investigated by Lewis (1913) using a combination
of epicardial maps and ECG recordings from a canine model induced by rapid atrial
pacing. Continual activation of at least some part of the atrium resulted in flutter
waves seen in the surface ECG and the activation sequence was orderly, i.e. the wave‐
front circulated in either a cranio‐caudal or a caudo‐cranial direction in the right
atrium. From this pioneering experimental work it was concluded that atrial flutter was
due to intra‐atrial circus movement around the venae cavae (Lewis et al. 1921b).
Subsequent works that supported that atrial flutter was due to intra‐atrial reentry
included a crush injury model of this arrhythmia by creating a lesion between the
venae cavae (Rosenbleuth and Garcia‐Ramos 1947). Based on the epicardial maps, the
authors deduced that the reentry loop circled around the atrial crush lesion.
Interestingly, they also noted that when the crush lesion was extended from the
inferior vena cava to the atrioventricular groove, the arrhythmia disappeared and
could not be induced. This important finding suggested the true circuit may have
included the cavotricuspid isthmus. However, intra‐atrial macro‐reentry as the
mechanism of atrial flutter was not universally accepted. Goto et al. (1967) had shown
that aconitine caused abnormal automaticity at rapid rates in the rabbit atria. It was
thought that if the atrial site fired fast enough, either flutter (1:1 conduction) or

10
fibrillation (fibrillatory conduction because the atrial rate was too fast and 1:1
conduction could not be supported) occurred. Building on the work of Rosenbleuth
and Garcia‐Ramos, Frame et al. (1986) showed that the flutter reentry loop that
rotated around the tricuspid annulus could exist through creating a “Y” lesion in the
canine right atrium by extending the inter‐caval crush lesion to the right atrial free
wall. Subsequent experiments in various animal models and clinical studies have not
only confirmed that the mechanism of atrial flutter was due to intra‐atrial macro‐
reentry but also allowed the development of curative catheter ablation therapy. Of
particular importance are the studies which described techniques of manifest and
concealed entrainment, including identification of a site for catheter ablation (Waldo
et al. 1977; Inoue et al. 1981; Stevenson et al. 1995). Successful ablation of atrial
flutter by radiofrequency energy depended on the identification of a vulnerable,
critical zone in the reentrant circuit. Detailed analysis of intra‐operative mapping
studies of patients with persistent atrial flutter demonstrated that the narrowest part
of the circuit had relatively slow conduction and was localised to the low right atrium,
between the inferior vena cava and the tricuspid ring (Klein et al. 1986). Furthermore,
cryosurgical ablation of this critical region and its surrounding tissue prevented short‐
term recurrences of the arrhythmia. This was consistent with earlier work which noted
that when a crush lesion was extended from the inferior vena cava to the
atrioventricular ring, the arrhythmia could no longer be induced (Rosenbleuth and
Garcia‐Ramos 1947). Subsequent studies using direct current shocks to disrupt the
critical zone and eliminate the tachycardia supported the prospect that atrial flutter
could be permanently abolished by disruption of the isthmus (Saoudi et al. 1990).
However, one drawback of using direct current shock was that the shock itself could
11
convert atrial flutter. In the early 1990’s, two groups independently found that
disruption of the isthmus of the atrial flutter circuit could be carried out safely with
radiofrequency catheter ablation (Feld et al. 1992; Cosio et al. 1993). Subsequently,
using activation and entrainment mapping with guidance from intra‐cardiac
echocardiography, points in the right atrium that lay within or outside the circuit were
defined. The posterior barriers to conduction were identified as the crista terminalis
and the eustachian ridge (Olgin et al. 1995) and it was demonstrated that the tricuspid
annulus constitutes an anterior barrier constraining the reentrant wave front of human
anti‐clockwise atrial flutter (Kalman et al. 1996). Experiments in dogs show that the
atrial flutter circuit is critically dependent on a line of functional block extending to the
caval veins (Tomita et al. 2001). This has been confirmed in human studies showing the
crista terminalis as a line of functional block (Scaglione et al. 2000). Typical atrial flutter
therefore is a macro‐reentrant circuit in the right atrium with an anatomical barrier
anteriorly (the tricuspid valve) and a functional barrier posteriorly (the crista
terminalis).
1.1.4 Epidemiology of Atrial Flutter
Less data exists on the epidemiology of atrial flutter than atrial fibrillation, perhaps
because it is less common or because it is often included with atrial fibrillation in data
analysis, e.g. International Classification of Diseases, Tenth Revision. Certainly atrial
flutter shares many clinical risk factors with atrial fibrillation. Using the Marshfield
Epidemiological Study Area database of 58,820 residents, Granada et al. (2000)
ascertained all new cases of atrial flutter over a 4 year period from 1991. One‐hundred

12
and eighty‐one new cases of atrial flutter were diagnosed for an overall incidence of
88/100,000 person‐years. Incidence rates ranged from 0.005% in those 50 years old to
0.6% in subjects older than 80. Atrial flutter was 2.5 times more common in men, 3.5
times more common in subjects with heart failure and 1.9 times more likely for
subjects with chronic obstructive pulmonary disease. Among those with atrial flutter,
16% were attributable to heart failure and 12% to chronic obstructive lung disease.
Three subjects (1.7%) without identifiable predisposing risks were labelled as having
“lone atrial flutter”. When these figures are applied to the entire population of the
United States, an estimated 200,000 new cases of atrial flutter occur there annually.
With regard to mortality, atrial flutter appears more benign than atrial fibrillation, at
least initially. Vidaillet et al. (2002) found that for 6 months after diagnosis, mortality
was 2.5 times higher among those with atrial flutter (5%) than among controls (2%),
but 3.4 times lower than among patients who had atrial fibrillation with or without
atrial flutter (17%). After adjusting for baseline characteristics however, early mortality
was about seven times higher for patients with atrial fibrillation than for controls. With
longer follow‐up (mean 3.6 years), overall mortality was similar for patients in all
arrhythmia subgroups – 41% for atrial flutter, 45% for atrial fibrillation and 47% in
patients with both atrial flutter and atrial fibrillation – as compared with 22% in
controls. All three groups of patients with atrial fibrillation or atrial flutter had an
approximately two‐fold increased risk of mortality compared with controls in models
that adjusted for other risk factors. Mortality among patients with atrial fibrillation
trended somewhat higher (1.4‐fold) than among patients with atrial flutter alone.

13
1.2 The Electrophysiological Basis of Atrial Fibrillation
1.2.1 The Multiple Heterotopous Centres Theory
Initial theories of the mechanism of atrial fibrillation proposed that each heart fibre
becomes independently rhythmic and that each is a focus of its own impulse formation
as a result of increased excitability; the multiple heterotopous centres theory. Lewis
and Schleiter (1912) reasoned that activity from one or more heterogeneous centres
would account for single premature beats, for regular tachycardias and, ultimately, for
the completely incoordinate activity seen in auricular fibrillation. However, two unique
observations were made by Garrey (1914). Firstly, when a fibrillating chamber was cut
into four pieces, each fragment continued to fibrillate; this could not have happened if
the fragments were dependent on a single focus. Secondly, although portions of
isolated heart muscle were capable of fibrillating, a critical amount of muscle mass was
necessary. These observations made the multiple heterotopous centres theory
untenable and a competing theory of “circus movement” was proposed in which a
circuit of muscle could propagate a wave‐front round and round indefinitely, provided
the length of muscle exceeded the wave‐front length (Lewis et al. 1921b).
1.2.2 The Multiple Wavelet Hypothesis
The circus movement theory was developed further to explain the complexity of
experimental findings; these developments included the concept of a single "mother"
ring that propagated the arrhythmia and gave rise to "daughter" rings and, finally, to
multiple independent rings (Moe 1962). This theory of multiple circus movement, or
wavelets, dominated the thinking on the mechanism of atrial fibrillation for many
14
years. Moe hypothesised that a grossly irregular wave‐front becomes fractionated as it
divides around islets or strands of refractory tissue and each of the daughter wavelets
could then be considered independent offspring; the multiple wavelet hypothesis.
However, prior to this, Prinzmetal et al. (1950) had showed that premature systoles,
paroxysmal tachycardia, atrial flutter and atrial fibrillation of the left auricle
(investigated in over 200 dogs by high speed cinematography, cathode‐ray
oscillography and multiple‐channel electrocardiography) were of unitary origin and
suggested that all may occur from one ectopic focus. They categorically stated there is
no circus movement and claimed their conception of the auricular arrhythmias
simplified the understanding of the mechanism. Subsequent to Moe’s theory however,
Allessie et al. (1977) demonstrated reentrant circuits in isolated rabbit atria by using
precisely timed premature impulses to produce sustained tachycardia. Of particular
interest as an explanation of atrial fibrillation is the "leading circle” theory in which the
initiation of reentry takes place because of non‐uniform refractory periods in atrial
fibres in close proximity to one another. The initiating impulse conducts in fibres with
short refractory periods and is blocked in those with longer ones, forming the
conditions for reentry before the impulse has died out. Impulses circulate around a
central area that is kept refractory, and thereby blocked, by centripetal wavelets
arriving from all sides. The size of the circle is determined by the recovery time of the
tissue forming the circuit, because tissue on both sides is kept depolarised by the
leading circle. Further evidence to support this hypothesis came about when Cox et al.
(1991) demonstrated in an experimental dog model, with supplementary evidence
from intra‐operative clinical observations in humans, that macro‐reentrant circuits
within the atrial myocardium were responsible for the entire spectrum of atrial
15
arrhythmias. Both the experimental study and the clinical study demonstrated that
multiple wave fronts, non‐uniform conduction, bi‐directional block, and macro‐
reentrant circuits occur during atrial fibrillation. Subsequent work by Allessie’s group
on conscious dogs underscored the importance of slowed conduction and shortened
refractoriness — a short wavelength, the distance travelled by the depolarisation wave
during the refractory period — in determining the onset of atrial fibrillation during
rapid electrical stimulation (Rensma et al. 1988). Moe’s original theory of multiple
wavelets was lent considerable weight by the clinical observation that chronic atrial
fibrillation could be cured in some patients by the placement of multiple surgical
lesions (the maze procedure) to compartmentalise the atria into regions presumably
too small to sustain such wavelets (Cox et al. 1993). Intra‐operative mapping of human
atrial fibrillation found pivot points where the wavelets turn around at the end of lines
of functional block, illustrating the complexity of atrial activation (Konings et al. 1994).
1.2.3 Localised Sources in the Initiation and Maintenance of Atrial Fibrillation
At the time that surgical treatments of atrial fibrillation were being advanced, the first
direct evidence that the pattern of circulating wavelets during atrial fibrillation in
humans is not entirely random was published (Gerstenfeld et al. 1992). The hypothesis
that local atrial activation should be influenced by the constant anatomy and the
receding tail of refractoriness from the previous activation was proven by
demonstrating that a tendency for wave fronts to follow paths of previous excitation
(often termed "linking") was transiently present for the majority of patients with atrial
fibrillation. Further evidence that atrial fibrillation is not random comes from more

16
recent studies showing repetitive periodic activity demonstrating temporal and spatial
stability in the left atrium, particularly the pulmonary veins and posterior regions
(Skanes et al. 1998; Mansour et al. 2001). Analysis of the activation frequency at these
sites is highly suggestive of localised reentry or “rotors” which have been proposed as
drivers of the fibrillatory process (Jalife et al. 1998; 2002). Mansour (2001) reported
that wave‐fronts propagated from left to right in 80% of sheep atria and that right‐to‐
left propagation occurred in a significantly smaller percentage of cases. The cycle
length of left atrial sources determined the dominant peak in the frequency spectra in
atrial fibrillation and ablation of inter‐atrial connections reduces right atrial signal
frequency but not left. Human studies have also suggested localised reentry as a
driving mechanism of atrial fibrillation and are discussed further in Section 1.3.2. After
the leading circle wavelet theory had held sway for decades, Scherf (1947) revived the
focus theory by applying aconitine focally to the atrium, and in this way could induce
atrial fibrillation. More recently, research has similarly focussed on identifying local
triggers for atrial fibrillation. It has been observed that atrial fibrillation can ensue from
the degeneration of other atrial tachycardias such as atrial flutter or accessory
pathway mediated rhythms, and in fact ablation of such pathways can reduce the
incidence of atrial fibrillation (Haïssaguerre et al. 1992). Focal atrial tachycardia is
thought to arise from abnormal automaticity of cardiac cells and shows a predilection
for sites in close proximity to anatomical structures such as the crista terminalis (Chen
et al. 1994; Kalman et al. 1998), the atrial septum (Chen et al. 2000; Marrouche et al.
2002), the coronary sinus (Volkmer et al. 2002; Badhwar et al. 2005; Kistler et al.
2005), the atrioventricular annuli (Morton et al. 2001; Matsuoka et al. 2002; Kistler et
al. 2003b; Hachiya et al. 2005) and the pulmonary veins (Kistler et al. 2003a; Hachiya et

17
al. 2005). Cells around the tricuspid annulus with nodal characteristics have been
found (McGuire et al. 1996). Although histologically similar to atrial cells they
resembled nodal cells in their cellular electrophysiology, response to adenosine, and
connexin expression which suggests that nodal‐like cells capable of sustaining ectopic
activity exist in these structures where focal tachycardia has been found to originate.
Perhaps the most important source of ectopy for the initiation of atrial fibrillation is
that arising from the pulmonary veins (Haïssaguerre et al. 2000a). In a landmark study
94% of the 69 ectopic foci found to initiate atrial fibrillation in 45 patients with drug‐
refractory episodes were within the pulmonary veins (Haïssaguerre et al. 1998).
Furthermore, in the same study, radiofrequency ablation of these same foci kept 62%
of these subjects free of atrial fibrillation at a mean of eight months follow up. A
further study targeting the pulmonary veins by a slightly different technique of wide
circumferential ablation with good long term success lends further weight to the role
of the pulmonary veins in the genesis and maintenance of atrial fibrillation (Pappone
et al. 2000). Anatomical investigation of the pulmonary veins reveals sleeves of atrial
myocardium extending into the proximal veins a variable distance (Nathan and Eliakim
1966; Moubarak et al. 2000), the length of which is greatest in the superior veins (Saito
et al. 2000). Myocardial bundles can be seen to cover the complete pulmonary vein
circumference in 54% of veins examined 1cm from the ostium (Weiss et al. 2002).
Fibres of muscle in these ostial regions are variably arranged with one or more layers
of longitudinal, circular, oblique or spiral fibre orientation interwoven with non‐
conducting connective tissue, perhaps explaining the observation of the non‐uniform
breakthrough pattern of pulmonary vein activity into left atrial tissue (Haïssaguerre et
al. 2000b). Zones of activation delay have been observed in canine pulmonary veins
18
and correlated with abrupt changes in fascicle orientation, perhaps facilitating reentry
and arrhythmias (Hocini et al. 2002). Reports of pulmonary vein aneurysm being
implicated as a trigger for atrial fibrillation (Yamane et al. 2000) lend further weight to
the importance of vein structure in the electrical output to the left atrium. There is
also evidence to support the existence of important differences in membrane channel
distribution between the pulmonary veins and the left atrium (Melnyk et al. 2005) as
well as greater variation in myocyte size and fibrosis in the pulmonary veins of patients
with atrial fibrillation (Tagawa et al. 2001). The stage may then be set for reentry to
occur within or around the pulmonary veins when triggered by short‐coupled
“automatic” discharges (Shah et al. 2001). Study of human embryos with
immunohistochemical staining of the conduction system has shown specialised
conduction tissue at areas known to demonstrate abnormal automaticity in the adult
(Blom et al. 1999). Electron microscopy of autopsy specimens has suggested the
presence of P cells, transitional cells and Purkinje cells in the pulmonary veins (Perez‐
Lugones et al. 2003). Very recently, histological investigation of pulmonary vein sleeves
has identified “interstitial cells of Cajal”; cells known to act as pacemakers in the gut
which undoubtedly have the potential to act as a pacemaker through their expression
of ion channels with If properties (Morel et al. 2008). Clearly, these “triggers” found in
the pulmonary veins and other sites are important in the initiation of atrial fibrillation,
as backed up by evidence to show re‐initiation of atrial fibrillation following
cardioversion may be a result of local discharge from these areas (Lau et al. 1999;
Haïssaguerre et al. 2000c). Why these areas should be predisposed to initiating atrial
fibrillation and how their independent discharge should bring about wavelet reentry
has been the subject of intense investigation.
19
1.2.4 The Venous Wave Hypothesis
Building on work gone before, Haïssaguerre et al. (2004b) proposed the venous wave
hypothesis. This was an alternative hypothesis to the classical multiple wavelet
mechanism proposed by Moe that in at least some patients with paroxysmal atrial
fibrillation the pulmonary vein is the source of fibrillatory activity that maintains the
atria in fibrillation. Studies have shown that the pulmonary veins are capable of
automaticity and triggered activity under conditions of rapid atrial pacing or congestive
heart failure (Chen et al. 2001; Okuyama et al. 2003). The pulmonary veins of patients
with atrial fibrillation have been shown to have distinctive electrophysiological
properties when compared to those of patients without arrhythmia, and also to the
atria to which they are attached (Jaïs et al. 2002). The specific architecture of the
muscular sleeves within the pulmonary veins of dogs may facilitate reentry (Hocini et
al. 2002), and indeed reentry has been observed within human pulmonary veins at
multi‐electrode basket studies (Kumagai et al. 2004). Pulmonary veins identified as
initiators of arrhythmia demonstrate periods of short cycle length during ongoing atrial
fibrillation (O'Donnell et al. 2002). Isolation of such pulmonary veins renders the atria
less inducible to atrial fibrillation and therefore suggests a dynamic interplay occurring
between the atria and pulmonary veins (Oral et al. 2002). Chen et al. (1999) reported
longer refractory periods at the proximal portions of the pulmonary veins and this
distal‐to‐proximal gradient has been confirmed by others (Kumagai et al. 2004). This
may be somewhat protective against more distal rapid activation being conducted to
the atria, however this difference was attenuated with isoprenaline emphasising the
dynamic role of the autonomic system in the electrophysiology of the pulmonary veins
(Chen et al. 1999). Rapid pacing of isolated pulmonary veins following ablation can
20
induce local sustained reentry and features of decremental conduction within the
paced vein (Takahashi et al. 2003). Arora et al. (2003), performing optical mapping
studies of normal canine pulmonary veins, demonstrated that these structures possess
both anisotropic conduction and repolarisation heterogeneity. With extrastimulus
testing they observed regions of uni‐directional conduction block and slowed
conduction that initiated leading circle reentry which became sustained with
isoprenaline. Pulmonary vein isolation has been shown to produce a progressive
prolongation of the atrial fibrillation cycle length, varying in extent from vein to vein
and between individuals, culminating in arrhythmia termination in most patients after
a significant cumulative increase in the cycle length (Haïssaguerre et al. 2004a). The
distinctive electrophysiological properties of the pulmonary veins of patients with
atrial fibrillation have been shown to be emphasised by amiodarone therapy and may
be responsible for heterogeneous alteration of pulmonary vein electrophysiology
(Rostock et al. 2005). Recently, Rostock et al. (2008) have demonstrated differential
rate‐adaptation of the electrophysiological properties of the pulmonary veins in
patients without a history of atrial fibrillation. They observed that the effective
refractory period (ERP) of the pulmonary veins was higher than the ERP in the atria at
baseline, and that the shortening of ERP in response to 15 minutes of atrial fibrillation
was greater in the pulmonary veins than in the atria. This suggests that the changes
within the pulmonary veins promote the maintenance of atrial fibrillation to a greater
degree than the atria. Thus, there potentially exists within the pulmonary veins alone
the electrophysiological milieu necessary for both the initiation and maintenance of
atrial fibrillation. This hypothesis is further supported by evidence of continued
fibrillatory activity seen in disconnected pulmonary veins (Willems et al. 2003) and the

21
common observation of slow dissociated pulmonary vein activity. The venous wave
hypothesis therefore suggests that pulmonary veins have heterogeneous
electrophysiological properties capable of sustaining reentry and that these structures
are implicated not only as a trigger of atrial fibrillation in patients with the appropriate
substrate, but also as a source of “venous waves/drivers” that are capable of
maintaining the atria in fibrillation.
1.2.5 Rotors and Activation Gradients
Localised regions of high‐frequency activity demonstrating spatio‐temporal periodicity
have been suggested to act as drivers of atrial fibrillation (Skanes et al. 1998; Jalife et
al. 2002; Everett et al. 2006; Lin et al. 2006). Jalife et al. (1998) proposed the theory of
“mother rotors” as drivers of atrial fibrillation, with fibrillatory activity of nearby
myocardium unable to maintain 1:1 conduction with the rapid site. Evidence for
organisation of atrial fibrillation has come from animal optical mapping studies which
have used spectral analysis to demonstrate repetitive high frequency activity during
atrial fibrillation, consistent with the hypothesis of “driving” rotors (Kalifa et al. 2006).
Similar findings have also been reported in humans (Wu et al. 2002; Lazar et al. 2004;
Sahadevan et al. 2004; Sanders et al. 2005a; Haïssaguerre et al. 2006b). Gradients of
activation from the pulmonary veins to the remaining atrium of patients with
paroxysmal atrial fibrillation have been reported (Sanders et al. 2006). However, such
specific patterns of activation gradient are less conclusive in persistent atrial
fibrillation. Retrospective analysis of ablation of paroxysmal atrial fibrillation shows
that atrial fibrillation cycle length prolongation and eventual termination occurs at

22
sites of high frequency activation (Sanders et al. 2005a); this has not been shown for
persistent atrial fibrillation. Further discussion of the identification of high frequency
activation sites and their role in the atrial substrate is discussed in Section 1.3.5.
1.2.6 Summary
Since the first descriptions of atrial fibrillation, our understanding of the nature of this
rhythm has expanded and the explanations for its occurrence evolved. From the initial
Multiple Heterotopous Centres Theory, to the Multiple Wavelet Hypothesis, the more
recent Venous Wave Hypothesis, and the proposed concept of Rotors driving atrial
fibrillation, it is apparent that complex and varied mechanisms are at play in the
initiation and maintenance of this rhythm. It is probable that both focal activity and
reentry are responsible for the maintenance of atrial fibrillation. However, these
mechanisms may not have to be present in the same person at the same time (Wu et
al. 2004). Changes in electrophysiological characteristics of the myocardium could
convert multiple wavelet reentry atrial fibrillation into focal discharge atrial fibrillation
and vice‐versa. Alternatively, a partnership between focal discharge and reentrant
mechanisms might be necessary for maintenance of atrial fibrillation. Much is still to
be learnt about the electrophysiological basis of atrial fibrillation.
1.3 Triggers and Substrate in Atrial Arrhythmia
The concept of triggers, initiators and perpetuators advanced by Allessie et al. (2001)
requires that for atrial fibrillation to exist it must be initiated by some trigger and then
maintained by favourable electroanatomical properties, or substrate.

23
1.3.1 Focal Triggers
Abnormal impulse initiation may be divided into automaticity and triggered activity.
Automaticity is the property of cardiac cells to undergo spontaneous diastolic
depolarisation and initiate an electrical impulse in the absence of external electrical
stimulation (Peters et al. 2000). This is a known property of a variety of cardiac tissues
including the sinus node and subsidiary pacemaker sites and is thought to be due to
gradual inward net current (If) (Brown et al. 1979). Triggered activity is a term used to
describe impulse initiation dependent on after‐depolarisations. After‐depolarisations
are oscillations in membrane potential that follow the upstroke of an action potential
(Cranefield 1977). Delayed after‐depolarisations occur following the repolarisation of
an action potential. This can cause triggered activity if the after‐depolarisation reaches
threshold for a subsequent action potential. The most widely recognised cause of
delayed after‐depolarisation triggered activity is digitalis (Ferrier and Moe 1973). In
contrast, early after‐depolarisations occur prior to the repolarisation of an action
potential. These tend to delay the repolarisation phase and are important in the
mechanism of the congenital long QT syndromes. Mutated genes such as SCN5A,
KVLQT1 and HERG prolong action potential duration and allow early after‐
depolarisations (Roden et al. 1996). Evidence supporting focal sources in promoting
atrial fibrillation comes from studies characterising atrial tachycardia late after ablation
for atrial fibrillation. Haïssaguerre et al. (2005b) reported on 55 atrial tachycardias of
which 20 were characterised as focal in origin, 27 as macro‐reentrant and the
remaining 8 (localised to the atrial septum) displayed mixed mechanistic
characteristics. Gerstenfeld et al. (2005) reported a small series of 5 patients in whom
a focal atrial tachycardia was present following segmental pulmonary vein isolation.

24
Arentz et al. (2007) performed a sophisticated basket‐mapping study of the pulmonary
veins to characterise spontaneous activity initiating atrial fibrillation and found that
the first ectopic activity of all events was of focal origin. Nevertheless, some
tachycardias from the distal pulmonary veins of short cycle length demonstrated
continuous activity throughout a significant proportion of the tachycardia cycle length
favouring some reentrant mechanism occurring subsequently. Despite the highly
sophisticated mapping techniques employed there remains some methodological
problems in assessing the mechanism of tachycardia in pulmonary veins; entrainment
mapping is difficult at high rates, pacing manoeuvres may terminate tachycardia,
capture of the pulmonary vein without capture of adjacent structures is an issue, and
rapid pacing of itself induces fractionated electrograms (Willems and Rostock 2007).
Markowitz et al. (2007) have demonstrated that adenosine can assist in the
differentiation between focal and reentrant tachycardia, and furthermore micro‐
reentrant circuits can also be distinguished from automatic focal atrial tachycardia by
this means. This also suggests that some focal sources previously thought to be due to
automaticity or triggered activity may in fact be due to localised reentry.
1.3.2 Localised Reentry
The requirements for reentry are:
(i) uni‐directional conduction block,
(ii) a core of inexcitable tissue around which the wave‐front propagates, and
(iii) the maintenance of excitable tissue ahead of the propagating wave‐front
(the “excitable gap”) (Peters et al. 2000).

25
The excitable gap is facilitated by slowing of conduction and/or shortening of the
refractory period. The wavelength (in metres) is the product of the conduction velocity
(in metres/second) and the refractory period (in seconds). This is critical to the
development of atrial reentry; a shorter wavelength requires less atrial mass to sustain
reentry. Or to put it another way, a given atrial mass can sustain more reentrant
circuits if the wavelengths are shorter. It is important to realise that the above
requirements may be anatomical or functional. The core of inexcitable tissue may be
non‐myocardial tissue (such as a valve) or an area of functional block (such as the
crista terminalis) (Yamashita et al. 1992; Tai et al. 1998). The excitable gap will depend
on the refractory period of the circuit, itself highly influenced by drugs, hormonal and
autonomic factors. Sanders et al. (2005b) demonstrated local reentry by performing
endocardial mapping with a multi‐spline catheter during focal atrial tachycardia.
Features such as entrainment and a large proportion of cycle length observable within
the mapped area were able to be established. Haïssaguerre et al. (2005b) have
reported similar observations during atrial fibrillation organised by prior ablation.
Indeed, localised reentry can be mapped to sites where the greatest impact of ablation
on the atrial fibrillation cycle length has been shown to occur; the pulmonary veins,
the fossa ovalis, the coronary sinus and the base of the left atrial appendage. Although
these may be iatrogenic from the prior ablation procedure, the fact that they share
common sites with critical regions maintaining atrial fibrillation is evidence that these
areas of localised reentry are integral to the initiation and maintenance of arrhythmia.
This group subsequently were able to demonstrate features of small circuits consistent
with local reentry by simultaneous mapping with a multi‐spline catheter during the
26
latter stages of the initial ablation procedure for atrial fibrillation when periods of
relative organisation of electrograms can be seen (Haïssaguerre et al. 2006a).
1.3.3 Anatomical Structures with Site‐specific Conduction Properties
Integral to the theories of the electrophysiological basis of atrial fibrillation is the
concept of heterogeneous conduction properties. There are regions within the atria
where predictable alterations in these properties are seen.
1.3.3.1 Right Atrium
The crista terminalis has unique conduction properties; specifically the gap junctions
are located at the poles of muscle cells resulting in a higher degree of “end‐to‐end”
connections than other myocardial tissue (Saffitz et al. 1997). This confers a high
degree of anisotropy to this structure, resulting in conduction velocities 10 times
greater in the longitudinal than the transverse direction (Saffitz et al. 1994). This
feature of preferential conduction has been studied for some time (Spach et al. 1981)
and had led some investigators to conclude that specialised conduction exists within
the atria, despite no histological evidence of Purkinje‐equivalent fibres (Liebman
1985). Numerous studies have explored the functional conduction properties of the
crista terminalis (Olgin et al. 1995; 1996; Tai et al. 1998; 2004). In addition, site‐specific
conduction delays in the low right atrial myocardium and the presence of non‐uniform
anisotropic characteristics of the posterior triangle of Koch have been suggested as
critical substrate for induction of atrial fibrillation (Papageorgiou et al. 1996). This area
of the atrium has been shown to have complex electrophysiological properties and
27
multiple inputs to the atrioventricular node (McGuire et al. 1993) which may account
for its unique conduction characteristics.
1.3.3.2 Inter‐atrial Connections
The inter‐atrial connections are regions where the electrical wave‐front traverses from
right to left during sinus rhythm. The most important and well studied of these is
Bachmann’s bundle which is located superiorly on the anterior surface of the inter‐
atrial septum. This connection has been demonstrated in animal experiments to have
differing conduction properties than other atrial myocardium (velocity of conduction is
faster and ERP is higher), representing a potential substrate for reentry to occur
(Platonov 2007). In humans, left atrial mapping studies have demonstrated
Bachmann’s bundle as well as posterior and inferior connections in the vicinity of the
coronary sinus (De Ponti et al. 2002; Markides et al. 2003; Betts et al. 2004; Lemery et
al. 2007). Most of these studies have been conducted in patients with atrial fibrillation
during sinus rhythm and demonstrate Bachmann’s bundle as critical, however for atrial
ectopic beats occurring from the posterior left atrium it is easy to propose how the
inferior connections may contribute to initiation of arrhythmia. In addition, fibro‐fatty
degeneration of Bachmann’s bundle has been reported as common among patients
with a history of atrial fibrillation (Becker 2004). Recently, a study of 84 post‐mortem
hearts has confirmed inter‐atrial muscular connections present anteriorly at
Bachmann’s bundle, posteriorly between right pulmonary veins and inferiorly between
the coronary sinus and right inferior pulmonary vein (Platonov et al. 2008). Several
investigators have used the knowledge of the anatomy of inter‐atrial connections to
guide placement of an atrial pacemaker lead with the aim of shortening atrial
28
activation and thereby reducing atrial fibrillation (Bailin et al. 2001; Padeletti et al.
2001; Hermida et al. 2004; de Voogt et al. 2007). The results of these studies are
mixed, perhaps due to varying positions of the pacing lead and accompanying anti‐
arrhythmic pacing algorithms, as well as heterogeneity within the atrial fibrillation
population itself. Nevertheless, it remains a promising area of research for patients
with sick sinus syndrome, a group in whom atrial fibrillation is common.
1.3.3.3 Left Atrium
In the left atrium, several structures (besides the pulmonary veins; see Sections 1.2.3
and 1.2.4) have been investigated for their site‐specific properties. The left lateral
ridge (the infolding of myocardium between the left pulmonary vein antra and the
appendage) is an area of interest due to the close proximity of the vein of Marshall and
the ganglionic plexus epicardially (Cabrera et al. 2008). It is also a challenging area for
ablation, due to its narrow superior aspect making catheter stability difficult. The
septopulmonary bundle is of recent interest as a left atrial “crista‐equivalent”.
Markides et al. (2003) demonstrated by non‐contact mapping a vertical line of
functional block in the posterior left atrium corresponding to a region of abrupt change
in fibre orientation seen in 10 post‐mortem hearts. High‐resolution mapping in a sheep
model has demonstrated wave‐break occurring at the regions along the
septopulmonary bundle that showed sharp changes in fibre direction and abrupt
increases in myocardial thickness (Klos et al. 2008). Waves propagating from the
pulmonary veins into the posterior left atrium triggered reentry and atrial fibrillation
by breaking at boundaries along this bundle. Roberts‐Thomson et al. (2008) have
described a vertical line of functional conduction delay in a consistent anatomical
29
location in the posterior left atrium of patients with structural heart disease, most
markedly with atrial dilatation. This line facilitates circuitous wave‐front propagation,
suggesting a potential role in arrhythmogenesis.
1.3.4 Complex Fractionated Atrial Electrograms
One of the characteristic features of the underlying substrate of atrial fibrillation is the
presence of complex fractionated atrial electrograms (CFAE). CFAE observed during
intra‐operative mapping of human atrial fibrillation are found mostly in areas of slow
conduction and/or at pivot points where the wavelets turn around at the end of arcs of
functional block (Konings et al. 1994). Results from this pivotal publication by the
laboratory of Allessie and colleagues were confirmed by later studies in which the
morphology of electrograms during atrial fibrillation reflected the occurrence of
various specific patterns of conduction (Konings et al. 1997). The authors postulated
that electrogram morphology might be used to identify regions with structural
conduction disturbances involved in the perpetuation of atrial fibrillation. Prior to this,
Cosio et al. (1986) had identified complex electrograms as important in the
determination of abnormal conduction in atrial flutter. Jaïs et al. (1996) initially
described regional bi‐atrial disparities in endocardial fractionation in paroxysmal atrial
fibrillation and found that complex electrical activity was more frequently found in the
septal and posterior regions of both atria, with more regular activity seen in the
trabeculated atria. These findings led Nademanee et al. (2004) to hypothesise that if
CFAE were to be selectively eliminated by catheter ablation, wavelet reentry should
stop, thereby preventing atrial fibrillation perpetuation. The earlier observations that
30
led to the multiple wavelet theory as the underlying mechanism for atrial fibrillation
(random reentry with meandering wavelets) is at odds with the observation of site‐
specific reentry. Possible explanations include the linking phenomenon (Gerstenfeld et
al. 1992), which may explain maintenance of the direction of wavelet propagation
during atrial fibrillation, and the existence of adverse electrical remodelling with
repeated episodes of atrial fibrillation (Wijffels et al. 1995). By targeting sites of CFAE
for ablation, Nademanee et al. (2004) reported 70% of a balanced paroxysmal and
persistent cohort were arrhythmia‐free off medication one year following a single
ablation procedure. Furthermore, with a mean of 1.24 ablation procedures and a small
minority still on anti‐arrhythmic drugs, 91% were free of atrial fibrillation. The inter‐
atrial septum was the most common site for CFAE in this study; other common sites
were the pulmonary veins, left atrial roof and proximal coronary sinus. It is important
to note that while many previous studies have used an epicardial approach where
areas such as the septum, pulmonary veins and coronary sinus os are not accessible
(Cox et al. 1991; Gerstenfeld et al. 1992), these were precisely the sites found to
contain CFAE at endocardial mapping. CFAE may be seen more frequently at sites of
known site‐specific conduction abnormalities (Roberts‐Thomson et al. 2008). In
addition, an association between CFAE and atrial fibrillation cycle length was
demonstrated by Rostock et al. (2006) who observed a shortening in cycle length
preceding the development of maximum fractionation at 91% of mapped sites,
suggesting a functional nature to these electrograms. More recently, Nademanee et al.
(2008) have published long‐term outcomes for high‐risk patients ablated by this
technique. For a mean of 1.68 procedures per patient, 81% of these challenging cases
were in sinus rhythm at an average of 2.3 years follow up. Just 13% of those free of

31
atrial fibrillation required anti‐arrhythmic agents to maintain sinus rhythm. However,
these results have not been reproduced by operators seeking to emulate this success.
Although most investigators have incorporated CFAE‐targeted ablation into a multi‐
faceted ablation approach (Takahashi et al. 2007; Porter et al. 2008; Verma et al.
2008), Oral et al. performed solely CFAE‐targeted ablation in 100 patients with chronic
atrial fibrillation and reported modest success of 33% maintenance of sinus rhythm
without drugs at 14 months mean follow‐up. Perhaps one reason for the lack of
reproducible outcomes by this method is that operators have been reliant on
subjective analysis of CFAE classification as guided by the published definitions.
Definitions for CFAE are plentiful and varied, and include:
(i) electrograms with an FF interval <100ms or continuous activity (Jaïs et al.
1996),
(ii) fractionated electrograms composed of ≥2 deflections, perturbation of the
baseline with continuous deflection of a prolonged activation complex, or atrial
electrograms with a cycle length ≤120ms (Nademanee et al. 2004),
(iii) fractionated potentials with ≥3 deflections from the isoelectric line or
continuous activity as their criteria for CFAE (Rostock et al. 2006), and
(iv) electrograms with a cycle length ≤120ms or shorter than the coronary sinus, or
those that were fractionated or displayed continuous electrical activity (Oral et
al. 2007).
It is perhaps the variability of these descriptions that accounts for some of the
inconsistent results reported across different centres using CFAE‐targeted ablation.
Takahashi et al. (2008) attempted to define the characteristics of electrograms which
32
identified successful ablation by measuring the effect of ablation on change in atrial
fibrillation cycle length. They found that electrograms with a temporal activation
gradient of >70ms or continuous activity indicated favourable sites for effective
ablation. Algorithms for quantification of electrogram fractionation have become
commercially available and the use of such algorithms to complement established
ablation strategies should aim to target critical sites maintaining fibrillation, while
sparing bystander atrium. The first publication using an automated fractionation
detection tool to describe ablation outcomes has taken advantage of the reproducible
nature of automated algorithms allowing it to guide ablation in a consistent fashion
across three centres to demonstrate an incremental success rate over historical
controls (Verma et al. 2008). While there is mounting evidence to suggest that
mapping CFAE by automatic techniques identifies critical ablation sites, the
effectiveness of CFAE‐targeted ablation is yet to be widely demonstrated.
Nevertheless, a consistent approach to characterise fractionation is the first step
towards establishing a reproducible method on which trials designed to address the
efficacy of CFAE‐guided ablation may rely.
1.3.5 Dominant Frequency
Analysis of electrograms within the time domain has led to identification of features
such as automatic activity and complex fractionation, however due to the apparently
chaotic nature of electrical activity during atrial fibrillation it is difficult to see
underlying patterns of depolarisation that may be important in the substrate
maintaining atrial fibrillation. This has led to the analysis of electrograms in the

33
frequency domain by fast fourier transform. Using this technique, information about
local activation may be distilled from an electrogram otherwise too complex or noisy
to be appreciated in the time domain. The atrial electrograms obtained during
fibrillation are often such electrograms and hence fast fourier transform “unlocks” that
information for analysis. The fast fourier transform attempts to reduce a complex
electrogram to its constituent sine wave components and plots the frequency of these
waves against the amplitude of the wave power to represent the electrogram in the
frequency domain. The frequency value demonstrating peak power in this spectrum is
termed the dominant frequency (DF). A strong correlation has been shown
experimentally between DF and atrial rotor frequency observed by optical mapping
(Sarmast et al. 2003). Sites demonstrating high DF have been proposed as “drivers” of
atrial fibrillation (Jalife et al. 1998; Berenfeld et al. 2000; Sanders et al. 2005a).
Evidence for organisation of atrial fibrillation from optical mapping in animal studies
has used spectral analysis to demonstrate repetitive high frequency activity with
temporal and spatial periodicity during atrial fibrillation (Skanes et al. 1998; Kalifa et al.
2006). Similar findings by alternative, lower‐resolution techniques have been reported
in humans (Wu et al. 2002; Lazar et al. 2004; Sahadevan et al. 2004; Sanders et al.
2005a). Higher DF has been reported in the left atrium of patients with paroxysmal
atrial fibrillation (Lazar et al. 2004; Lin et al. 2006). Furthermore, the maximal DF has
been reported in the pulmonary veins in patients with paroxysmal but not persistent
atrial fibrillation (Sanders et al. 2006). Persistent atrial fibrillation has a less conclusive
pattern of DF distribution. Although some publications have shown a higher mean DF
in the left atria, particularly around the pulmonary veins (Wu et al. 2002), others have
shown that this distinction disappears for longstanding atrial fibrillation where other
34
sites are observed to predominate (Lazar et al. 2004; Atienza et al. 2006; Sanders et al.
2006; Stiles et al. online early). Isolation of the pulmonary veins abolishes this left‐to‐
right gradient in paroxysmal atrial fibrillation and, for the subset of patients with
persistent atrial fibrillation in whom a left‐to‐right gradient exists, success of
pulmonary vein isolation alone exceeds that of persistent atrial fibrillation without
such gradient (Lazar et al. 2006). Retrospective analysis of ablation of paroxysmal atrial
fibrillation shows that atrial fibrillation cycle length prolongation and eventual
termination occurs at sites of high DF (Sanders et al. 2005a). This has not been shown
for persistent atrial fibrillation where DF is distributed more evenly throughout atrial
regions, prompting a more aggressive multi‐region approach to be advocated when
ablating longstanding persistent atrial fibrillation (Haïssaguerre et al. 2005a). The
precise role of DF analysis to guide ablation clinically, like that of CFAE and
ganglionated plexi, is yet to be established.
1.3.6 The Neural Basis of Atrial Fibrillation
An additional dimension to the substrate of atrial fibrillation is that of the influence of
the autonomic nervous system. It has long been observed that electrical stimulation of
the autonomic nerves to the heart could induce atrial fibrillation (Lewis et al. 1921a;
Hoff and Geddes 1955). Atrial fibrillation has been proposed to be a consequence of
disordered autonomic tone (Coumel 1994). Neural influences on the atria mediated via
the autonomic ganglia found in the epicardial fat pads have been hypothesised to play
an important role in converting ectopic activity into atrial fibrillation (Scherlag et al.
2005a). This is based on the findings that during stimulation of canine atrial ganglia
35
fewer ectopic beats were required to initiate atrial fibrillation and, conversely, that
blockade of neural elements by lignocaine inhibits inducibility to atrial fibrillation by
ectopic beats. Applying this knowledge clinically, Scherlag et al. (2005b) added ablation
of the left atrial ganglionated plexi to the usual strategy of pulmonary vein antrum
isolation in 33 of 60 patients with paroxysmal or persistent atrial fibrillation. Those
receiving atrial denervation had less recurrence of atrial fibrillation at short‐term
follow up (median 5 months). Techniques by which to identify ganglionated plexi for
subsequent ablation have since been published. Using high‐frequency electrical
stimulation, an autonomic ganglion is identified by profound ventricular rate slowing
and subsequent ablation of the same area renders the stimulation response negative
on re‐testing (Lemery et al. 2006). Pappone et al. (2004) have published a 99% success
rate at 12 months follow up for patients who demonstrated complete vagal
denervation at their ablation procedure. Additionally, failure to achieve vagal
denervation was predictive for recurrence of atrial fibrillation. Takahashi et al. (2006)
characterised the change in atrial fibrillation cycle length occurring with vagally‐
mediated atrioventricular block during pulmonary vein isolation and found a greater
decrease in the cycle length of pulmonary vein activity than in the coronary sinus,
suggesting that vagal excitation enhances the driving role of pulmonary veins.
Recently, animal data linking the action of ganglionated plexi to complex fractionated
electrograms (Lin et al. 2007) and frequency gradient (Lu et al. 2008) have been
published. Convincing outcome data on the use of this technique to assist ablation is
yet to be published, but this remains a promising area of research.

36
1.3.7 Substrate Associated with Atrial Flutter
Experimental models of atrial flutter have shown abnormal electrical substrate to be
present. Morton et al. (2002) demonstrated in a sheep model that prolonged atrial
flutter resulted in abrupt‐onset reduction in refractoriness and slower‐onset reduction
in conduction velocity. Much work on atrial flutter has been performed in the sterile
pericarditis dog model which has been shown to dependably produce atrial flutter in a
time course similar to the post‐bypass arrhythmias seen clinically. The inducibility of
atrial flutter in this model is independent of differences in ERP, conduction time or
threshold (Page et al. 1986). More recently, the role of inflammation in atrial flutter
has been highlighted in a study in which the usually reliable induction of atrial flutter in
this model was abolished by pre‐treatment with prednisone (Goldstein et al. 2008).
Interestingly, this observation of no atrial flutter with steroid was accompanied by
lower ERP compared to the 11 untreated pericarditis dogs, strongly suggesting that
this aspect of electrical remodelling is neither integral to the initiation nor
maintenance of atrial flutter. Histological and gross inspection of the atria revealed
marked structural changes of inflammation in the untreated group, all of whom (bar
one with atrial fibrillation) developed atrial flutter. Therefore, suppression of
inflammation by corticosteroid is able to prevent subsequent arrhythmia in dogs given
sterile pericarditis which has intriguing implications for patients following cardiac
surgery. Patients with chronic atrial flutter have been observed to have electrical
remodelling by way of shortened monophasic action potential durations with impaired
rate adaptation compared to control patients (Franz et al. 1997). Sparks et al. (2000)
studied patients with paroxysmal atrial flutter and observed a reduction in ERP
immediately after 5‐10 minutes of induced atrial flutter, followed by a return to
37
baseline ERP over a period of minutes. In patients with chronic atrial flutter however,
ERP remained low out to 30 minutes and was seen to recover only when re‐tested at 3
weeks. These patients also demonstrated an improvement in corrected sinus node
recovery time (CSNRT) over the 3 week period suggesting sinus node dysfunction as a
direct result of chronic atrial flutter. Further evidence for remodelling of sinus node
function with atrial flutter is reported by Daoud et al. (2002) who studied patients with
chronic atrial flutter following ablation and observed impaired sinus node function
which recovered over a 3 month period. Differences in the underlying substrate seen
in atrial flutter between young and old have been published, with younger patients
tending toward slowest conduction in the lateral isthmus while older patients
demonstrate a low voltage zone and slowest conduction in the medial isthmus (Huang
et al. 2008). The substrate predisposing to atrial flutter may differ from that seen in
atrial fibrillation alone. Patients with typical atrial flutter in addition to paroxysmal
atrial fibrillation have been shown to have more frequent recurrence of arrhythmia
following pulmonary vein cryoisolation with accompanying isthmus line (Moreira et al.
2007). This suggests non‐pulmonary vein sites are more important to the maintenance
of atrial fibrillation in patients with co‐existent atrial flutter. This may reflect the
observation that an increase in the dispersion of refractoriness predicts the inducibility
of atrial fibrillation in patients undergoing ablation for atrial flutter (Ramanna et al.
2005).

38
1.3.8 Typical and Atypical Atrial Flutter
Electrophysiological studies have shown that the simple ECG definition of an organised
atrial rhythm with a rate typically between 250 and 350 beats per minute includes
many atrial tachycardias using a variety of reentry circuits. The reentry circuits often
occupy large areas of the atrium and are referred to as “macro‐reentrant” (Blomstrom‐
Lundqvist et al. 2003). Most early work on atrial flutter focussed on the more common
typical anti‐clockwise flutter; i.e. atrial flutter characterised by negative flutter waves
in the inferior ECG leads and a circuit moving in an anti‐clockwise direction when
viewed from the left anterior oblique radiographic view. This classic type of atrial
flutter is dependent on the cavotricuspid isthmus. Other forms of atrial flutter have
been described, including clockwise flutter and true atypical flutter. Clockwise atrial
flutter uses the same circuit with the same endocardial barriers as its anti‐clockwise
counterpart and is best considered a form of typical atrial flutter (Kalman et al. 1997).
It is amenable to the same ablation treatment as anti‐clockwise atrial flutter; i.e.
cavotricuspid isthmus ablation. Clockwise isthmus‐dependent atrial flutter shows the
opposite ECG pattern to the anti‐clockwise form – positive flutter waves in the inferior
leads and wide, negative flutter waves in lead V1, transitioning to positive waves in
lead V6. Olgin et al. (1997) showed that even in patients with clinical anti‐clockwise
atrial flutter, clockwise atrial flutter is frequently induced before ablation and is
dependent on the site of induction; pacing from the smooth right atrium induces anti‐
clockwise atrial flutter, whereas pacing from the trabeculated right atrium induces
clockwise atrial flutter. Atrial flutter caused by macro‐reentry circuits that do not use
the cavotricuspid isthmus are less common. Most are related to an atrial scar that
creates conduction block and a central obstacle for reentry (Blomstrom‐Lundqvist et
39
al. 2003). Prior cardiac surgery involving the atrium (such as repair of congenital heart
disease, mitral valve surgery or the atrial maze procedure) is a common cause
(Nakagawa et al. 2001; Triedman et al. 2001), as is (more latterly) ablation for atrial
fibrillation. True atypical atrial flutters usually show heterogeneous ECG morphologies,
shorter cycle lengths than typical atrial flutter, and frequent transitions from and to
atrial fibrillation (Kalman et al. 1997). Ablation of these macro‐reentrant loops is
particularly challenging as each circuit is unique to each patient. Furthermore, patients
with substantial atrial scarring may not demonstrate the ECG features of typical flutter
when cavotricuspid isthmus‐dependent flutter is indeed present, and conversely an
atypical flutter circuit may manifest on the surface ECG as common‐type atrial flutter
(Chugh et al. 2006).
1.4 Inter‐relationships between Atrial Flutter and Atrial Fibrillation
Atrial flutter has a close inter‐relationship with atrial fibrillation; the two rhythms
frequently co‐exist (Halligan et al. 2004) and share many of the same aetiological
factors (Vidaillet et al. 2002). The inter‐relationship is further distorted, in that for
some epidemiological reports the two conditions are reported together (Australian
Institute of Health and Welfare 2008). The substrate of atrial fibrillation however has
been more extensively investigated than that of atrial flutter and whether these two
arrhythmias share this substrate is unknown.

40
1.4.1 Atrial Flutter begets Atrial Fibrillation
The incidence of atrial fibrillation episodes prior to atrial flutter ablation is, perhaps
not surprisingly, a strong predictor for the occurrence of atrial fibrillation after the
procedure (Da Costa et al. 2002; Hsieh et al. 2002; Ramanna et al. 2005). However,
ablation of atrial flutter has been observed to significantly reduce the occurrence of
atrial fibrillation at 496±335 days post‐ablation from 55% to 33% (Schmieder et al.
2003). Despite this reduction a significant proportion, perhaps even the majority with
long‐term follow‐up, eventually develop atrial fibrillation (Chinitz et al. 2007; Meissner
et al. 2007; Moreira et al. 2008). Paydak et al. (1998) reported that 20±9 months after
atrial flutter ablation, 25% of patients have atrial fibrillation; Hsieh et al. (2002)
published a series of 333 patients in which 31% of patients had occurrence of atrial
fibrillation at 29±17 months follow up; and Ellis et al. (2007) described new atrial
fibrillation in 82% at 39±11 months follow up. Independent factors predictive of atrial
fibrillation within 6 months following ablation for atrial flutter are left ventricular
ejection fraction and, for those without prior atrial fibrillation, degree of mitral
regurgitation (Paydak et al. 1998; Da Costa et al. 2002). Yang et al. (2003) reported
mechanisms of transition from flutter to fibrillation observed in the laboratory during
atrial flutter ablation procedures as lower or upper loop reentry, and focal ectopic
activity (including pulmonary vein discharge). After 4 weeks of experimental atrial
flutter, conversion to atrial fibrillation has been demonstrated to be dependent on
critically timed extra‐stimuli, as demonstrated by Morton et al. (2002) in a sheep
model. It is being increasingly recognised that macro‐reentry may be a significant
contributor to the maintenance of long‐standing persistent atrial fibrillation
(Haïssaguerre et al. 2005b). Indeed, ablation of conduction gaps in the crista terminalis
41
can result in atrial fibrillation organising to atrial flutter (Liu et al. 2002). In the
subgroup of patients with atrial fibrillation in whom the administration of a class 1C
anti‐arrhythmic agent converts them to atrial flutter, it has been shown that atrial
flutter ablation, together with continuation of the drug, results in satisfactory control
of both arrhythmias (Schumacher et al. 1999).
1.4.2 Atrial Fibrillation begets Atrial Flutter
Key to the understanding of the close inter‐relationship of atrial flutter and atrial
fibrillation is the recognition that typical atrial flutter almost always develops from
antecedent atrial fibrillation of variable duration. The classic model of reentry seen in
clinical practice is that of atrioventricular reentry tachycardia. In this reentry circuit, a
critically timed extra‐stimulus encounters block in one limb of the circuit which is then
able to subsequently conduct in the opposite direction, thereby setting up a circuit. In
atrial flutter this pre‐existing circuit may not exist, therefore more than a simple
ectopic is required for its initiation. The line of functional inter‐caval block needs to be
created by a burst of rapid atrial rhythm for stable atrial flutter to ensue (Shimizu et al.
1991). Some patients have a fixed inter‐caval line of block and others have been shown
to have at least some degree of functional block (Olgin et al. 1995), therefore atrial
flutter may develop without preceding atrial fibrillation only in those with fixed block.
Waldo and Cooper (1996) observed triggers in post‐bypass patients that led to
transitional atrial fibrillation and then atrial flutter. Roithinger et al. (1997) observed
regular right atrial activation during atrial fibrillation which slowed and organised into
atrial flutter. If the pre‐requisite inter‐caval functional block is not achieved however,

42
either the atrial fibrillation will spontaneously revert to sinus rhythm or it will persist as
fibrillation rather than become atrial flutter. In short, there is no atrial flutter if the line
of functional block between the venae cavae does not form. It would therefore seem
that atrial fibrillation of variable duration (very brief to prolonged episodes) precedes
the onset of atrial flutter. The best evidence of this association is perhaps the study by
Ortiz et al. (1994) in the sterile pericarditis model on the association between the
length of inter‐caval block and atrial rhythm. During all episodes of stable pacing‐
induced atrial flutter, a line of functional block with a mean length of 24mm was
localised on the right atrial free wall. When the previously stable line of functional
block decreased to a mean of 16mm the line of functional block was not long enough
to maintain stable atrial flutter and conversion to atrial fibrillation resulted. When
sustained atrial fibrillation evolved to stable atrial flutter, there was reformation of a
long line of functional block, long enough (≥ prior length) to create a stable reentrant
circuit. Thus, the atrial rhythm was shown to depend directly on the length of
functional block between the inferior and superior venae cavae. Testing the hypothesis
that atrial fibrillation facilitates development of the line of functional conduction block
along the crista terminalis required to sustain atrial flutter, the effect of trigger
elimination by performing pulmonary vein isolation without cavotricuspid isthmus
ablation was studied by Wazni et al. (2003). In 59 patients with both atrial fibrillation
and atrial flutter, 32 of these patients developed episodes of atrial flutter acutely.
However, only 3 had sustained atrial flutter after 8 weeks suggesting that, without the
antecedent atrial fibrillation, atrial flutter was unable to be initiated. This concept of
treating fibrillation to cure flutter still requires further evaluation before becoming
mainstream therapy. Thus, it can be seen that atrial flutter and atrial fibrillation are
43
closely inter‐related and that the features previously shown in the underlying atrial
substrate of atrial fibrillation are likely to be also present in atrial flutter, even in those
in whom no clinical history of atrial fibrillation is noted. Critical to our management of
patients with both atrial flutter and atrial fibrillation is an understanding of the
interactions and shared characteristics of these rhythms.
1.5 Rate‐related Remodelling
1.5.1 Electrical Remodelling
Wijffels et al. (1995) observed that in normal goats, induction of atrial fibrillation was
relatively difficult and lasted for just a few seconds. With repetitive induction of
arrhythmia however, the cycle length of the atrial fibrillation shortened and episodes
became sustained. This led to the notion that “atrial fibrillation begets atrial
fibrillation” by means of shortening in atrial ERP after periods of atrial fibrillation.
Further experimental studies have confirmed this finding in dogs (Morillo et al. 1995;
Elvan et al. 1996; Goette et al. 1996) with the additional observations that atrial
fibrillation caused an increase in the heterogeneity of refractoriness (Fareh et al. 1998)
and maladaption of refractoriness to rate (Lee et al. 1999). While initial studies did not
observe conduction abnormalities, subsequent canine studies by Gaspo et al. (1997)
demonstrated that progressively longer episodes of atrial fibrillation also resulted in
conduction slowing. Attenuation of conduction velocity was maximal at 6 weeks, and
lagged behind that of maximum reduction in ERP at 7 days, suggesting that these
abnormalities are mediated by different mechanisms. Morton et al. (2002)
demonstrated a reduction in atrial refractoriness in a sheep model with sustained
44
atrial flutter. Again a reduction in conduction velocity was seen to develop over a
slower time course. Thus, the mechanism by which electrical remodelling of the atria
lends toward the perpetuation of arrhythmia in response to atrial fibrillation is by a
shortening of the reentrant “wavelength”. Human studies of patients with recent atrial
arrhythmia have also been shown to have shorter ERP than control groups, as well as
conduction delay and sinus node dysfunction (Cosio et al. 1983; Kumagai et al. 1991).
Yu et al. (1999) demonstrated shorter ERP with impaired rate adaptation and
depressed conduction following cardioversion for longstanding atrial fibrillation, with
the ERP gradually increasing after 4 days of sinus rhythm. Garratt et al. (1999)
evaluated the effect of repeated episodes of atrial fibrillation on atrial electrical
remodelling. While marked remodelling was observed with five days of atrial
fibrillation, two days of sinus rhythm was adequate to reverse all abnormalities.
Despite repetitive episodes of atrial fibrillation, there were no additive changes
observed in atrial electrical remodelling. Sparks et al. (2000) documented the changes
in atrial ERP following ablation for chronic atrial flutter and observed a recovery in ERP
over a 3 week period. In the same study, 10 minutes of induced atrial flutter in a group
of patients presenting in sinus rhythm for their flutter ablation reduced ERP but this
recovered within 15 minutes. To investigate the possibility that early and repeated
cardioversion of atrial fibrillation could avoid the cycle of adverse electrical
remodelling, Fynn et al. (2002) evaluated this strategy in the clinical setting. Despite an
aggressive protocol to achieve and maintain sinus rhythm, frequent cardioversion
failed to prevent the progression to more atrial fibrillation. This occurred despite a well
documented increase in atrial ERP at successive cardioversions indicating that reversal
of electrical remodelling was in fact taking place. Indeed, their findings suggest that in
45
patients with a history of atrial fibrillation, sinus rhythm does not beget sinus rhythm.
In addition to the effects on ERP and conduction, several investigators have observed
remodelling of the sinus node that develops soon after the initiation of arrhythmia and
reverses after restoration of sinus rhythm. Kumagai et al. (1991) reported significantly
longer sino‐atrial conduction time (SACT) and CSNRT in patients recently cardioverted
from chronic lone atrial fibrillation compared to controls. Elvan et al. (1996)
demonstrated in dogs that atrial fibrillation was responsible for impaired sinus node
function which partially reversed when sinus rhythm was restored. Other investigators
have confirmed the prolongation of CSNRT in patients following cardioversion for atrial
fibrillation compared to control patients (Tse et al. 1999) and furthermore this finding
may be associated with a trend to recurrence of atrial fibrillation (Manios et al. 2001).
This phenomenon of sinus node remodelling does not appear unique to atrial
fibrillation but has also been demonstrated with atrial flutter (Sparks et al. 2000;
Daoud et al. 2002). Hocini et al. (2003) demonstrated in 20 patients with a
documented >3 second pause post‐termination of atrial fibrillation that isolation of the
pulmonary veins and linear atrial ablation improved sinus node function as measured
by ambulatory heart rate parameters and CSNRT at 2 years. 19 of these patients
avoided the implantation of a pacemaker, including 1 with ongoing infrequent
episodes of atrial fibrillation.
1.5.2 Structural Remodelling
While the above electrical changes observed due to atrial arrhythmia are a relatively
recent finding, Davies and Pomerance (1972) were the first to suggest structural

46
change due to atrial fibrillation itself. After post‐mortem examination of 100 patients
with atrial fibrillation, they described loss of atrial myocardium in the region of the
sinus node and nodal artery stenosis in patients with long‐term atrial fibrillation, as
compared to the lack of such features in patients in whom arrhythmia had only been
present within the last 2 weeks of their life. Additional data from tissue of patients
taken at cardiac bypass operations reported degenerative changes in the atria of
patients with arrhythmias (Mary‐Rabine et al. 1983). Further characterisation of atrial
tissue from patients undergoing cardiac surgery has revealed apoptotic death of
myocytes in those with atrial fibrillation, suggesting some degree of irreversible
remodelling (Aimé‐Sempé et al. 1999). Other changes at the cellular level have been
observed in the distribution of connexin sub‐types in patients with atrial fibrillation
(Kostin et al. 2002). In patients with sinus rhythm, gap junction proteins are localised
to the intercalated discs, whereas in patients with atrial fibrillation there is
lateralisation of these proteins and a preferential expression of connexin 40 over
connexin 43. Ausma et al. (2003) have observed that ultrastructural changes evolve
over a much longer time frame than the electrical remodelling of the atria in response
to rate, and alterations in ultrastructure are not completely resolved as late as four
months after return to sinus rhythm from prolonged atrial fibrillation. These slowly
resolving alterations have been characterised as an increase in myolysis and the
fraction of extracellular matrix per myocyte, as well as changes in the expression of
structural proteins. It is these structural changes associated with atrial fibrillation
occurring over a slower time‐course than that of electrical remodelling which have
been proposed as the critical factors in the “domestication” of atrial fibrillation
(Allessie et al. 2002).
47
1.6 Atrial Substrate in Conditions Associated with Atrial Arrhythmia
As discussed in Sections 1.1.2 and 1.1.4, several clinical conditions have been shown to
have an association with atrial fibrillation and atrial flutter. Study of the atrial substrate
in conditions predisposing to atrial arrhythmia may give insights into the factors
promoting rhythm disturbance.
1.6.1 Heart Failure
In patients with symptomatic heart failure, the prevalence of atrial fibrillation ranges
from 10 to 30 percent, with the highest incidence among those with the most severe
heart failure (Stevenson and Stevenson 1999). The electrophysiological substrate of
the atria present in heart failure has been studied extensively. Boyden et al. (1984)
demonstrated large amounts of interstitial fibrosis, cellular hypertrophy and
degeneration, and thickened basement membranes in the atria of a feline model of
cardiomyopathy. Power et al. (1998) showed in a ventricular pacing‐induced sheep
model of heart failure, that larger left atria were increasingly susceptible to atrial
fibrillation. Li et al. (1999) published findings from a canine model of heart failure that
showed an increase in the heterogeneity of conduction associated with histological
changes of marked interstitial fibrosis, and furthermore that these changes are
mediated via significant alterations in cellular electrophysiology (Li et al. 2000). Clinical
studies of heart failure have demonstrated that electrophysiological and structural
remodelling is present even in a cohort without known atrial fibrillation (Sanders et al.
2003). Studies of the right atrium showed that voltage reduction and areas of electrical
silence were more apparent in the heart failure group when compared to a control

48
group, and that atrial refractoriness was increased in the diseased atria. Conduction
delay was recorded not only in global measures and regional analysis, but also
specifically at the crista terminalis in the heart failure group who were more
susceptible to atrial fibrillation.
1.6.2 Atrial Septal Defects
Patients with haemodynamically‐significant atrial septal defects are characterised by
chronic right atrial volume overload and are at increased risk of atrial arrhythmia;
furthermore this risk persists despite correction of the underlying anatomical defect
(Murphy et al. 1990). Morton et al. (2003), in studying 13 patients with atrial septal
defects, demonstrated an increase in right atrial refractoriness, conduction delay at
the crista terminalis and sinus node dysfunction compared to a control group.
Importantly, re‐study in 4 of these patients at >6 months following correction of the
defect showed that site‐specific conduction delay persisted while there was no
significant change in the electrical parameters, perhaps explaining why risk of
arrhythmia has been shown to persist.
1.6.3 Hypertension
Hypertension is the most common contributor to the burden of atrial fibrillation in the
developed world, simply due to its high prevalence in Western society (Kannel et al.
1982a). Increases in left atrial dimension and left ventricular mass as well as
prolongation of the maximum duration and dispersion of the P wave, and reduced A‐
wave velocity are predictors for the onset of atrial fibrillation in the hypertensive

49
population (Ciaroni et al. 2000). Kistler et al. (2006) demonstrated in an ovine model of
hypertension that widespread conduction abnormalities and shortening of atrial
wavelength were present when compared to controls. The increase in atrial fibrillation
that they observed occurred despite no significant change in refractoriness. Atrial
myocyte hypertrophy and myolysis were seen in all hypertensive sheep and focal
scarring in many. Mitochondrial and nuclear enlargement was seen under electron
microscopy in hypertensive sheep but not in any controls.
1.6.4 Valvular Heart Disease
Mitral regurgitation is associated both with atrial fibrillation and congestive heart
failure; furthermore onset of arrhythmia often heralds haemodynamic
decompensation (Grigioni et al. 2002). Animal models of mitral incompetence have
shown that while conduction is unchanged after chronic atrial volume overload, a
uniform increase in atrial refractoriness is observed suggesting that electrical
remodelling is not the means by which atrial fibrillation is inclined to develop in this
disease (Verheule et al. 2003). Similarly, mitral stenosis predisposes to atrial
fibrillation. Boyden et al. (1982) studied 23 dogs with spontaneous mitral valve fibrosis
and left atrial enlargement. Although these animals demonstrated no difference in
action potential duration it was noted that there were reduced numbers of muscle cell
layers and an unusually large amount of connective tissue between greatly
hypertrophied cells. Atrial fibrillation is a disease with which rheumatic mitral stenosis
is not only frequently associated, but is in fact a potentially disastrous complication of,
leading to a 17‐fold increase in the risk of thromboembolism (Wolf et al. 1978). Fan et

50
al. (2002) performed electrophysiological evaluation of the right atrium in 31 patients
at the time of mitral commissurotomy for rheumatic mitral stenosis. Following
cardioversion of atrial fibrillation, these patients demonstrated shorter ERP, sinus node
dysfunction and no difference in atrial conduction compared to those patients who
presented for the procedure in sinus rhythm. Soylu et al. (2004) evaluated right atrial
ERP before and after mitral commissurotomy in 25 patients with mitral stenosis in
sinus rhythm. This study observed an acute increase in ERP immediately after relief of
mitral stenosis. However, neither of these studies included a normal control group to
determine the effects of mitral stenosis independent of the effects of the arrhythmia
itself or provided left atrial data. Recently, John et al. (online early) have described in
detail the electrophysiological substrate of both the right and left atria of a group with
severe mitral stenosis undergoing mitral valvuloplasty. This study demonstrated
widespread and severe atrial remodelling when compared to a control group with left
sided accessory pathways, despite not having previously had atrial fibrillation. This
suggests that it was the structural remodelling, in this case characterised by voltage
reduction, conduction slowing and sinus node dysfunction, which predisposed this
group to their increased susceptibility to atrial fibrillation during ERP testing. Indeed,
the ERP testing revealed an increase in atrial refractoriness which runs counter to the
electrical remodelling seen following episodes of atrial fibrillation (Wijffels et al. 1995)
and is more in keeping with the “atrial remodelling of a different sort” first reported by
Li et al. (1999) in another condition predisposed to atrial fibrillation.

51
1.6.5 Sub‐clinical Atrial Disease in Lone Atrial Fibrillation
Frustaci et al. (1997) reported abnormal atrial histology including inflammatory
infiltrates and patchy fibrosis in all of 12 patients studied with paroxysmal lone atrial
fibrillation, and in none of 11 control patients. Excess fibrosis has been characterised
as an increased concentration of collagen type I in patients with lone atrial fibrillation
compared to controls and this increase has been observed to be attenuated in those
patients receiving angiotensin converting enzyme inhibitors (Boldt et al. 2006). Further
evidence that inflammation plays a role in atrial fibrillation comes from the
observation that C‐reactive protein is elevated in patients with lone atrial fibrillation
(Chung et al. 2001). Diastolic dysfunction diagnosed by transeptal haemodynamic
evaluation of left atria has been demonstrated to be present in patients with lone
atrial fibrillation (Jaïs et al. 2000). In addition, there is some evidence to suggest that
patients with lone atrial fibrillation have microvascular dysfunction in the coronary
circulation (Skalidis et al. 2008). Thus, it is feasible that patients without overt
structural heart disease may have fibrosis, inflammation, structural change and
vascular dysfunction that contribute to the underlying atrial substrate. In addition,
when considering the atrial substrate encountered in diseases known to be associated
with the subsequent development of atrial arrhythmia some unifying features can be
seen to emerge. Atrial refractoriness is either unchanged or increased, while structural
abnormalities, conduction delay and sinus node dysfunction become increasingly
apparent. Cellular and ultrastructural alteration underpins these gross and functional
changes and the end result of such abnormal substrate is an increase in the likelihood
of initiation and maintenance of atrial arrhythmia.
52
1.7 Sinus Node Disease, Remodelling and Atrial Arrhythmias
“The sinus node is the essence of life” – Bruno Kisch, co‐founder and president of the
American College of Cardiology, 1951‐1953.
Remodelling of the sinus node is known to develop soon after the initiation of
arrhythmia and reverse after restoration of sinus rhythm (see Section 1.5.1).
Irrespective of the mechanism by which sinus node remodelling occurs due to rapid
atrial rates, an increase in the time window due to sinus bradycardia can facilitate the
development of atrial fibrillation by increasing atrial ectopy and the dispersion of
refractoriness (Luck and Engel 1979). Therefore, the frequent co‐existence of atrial
arrhythmia and sinus node disease may be due to a slow sinus rate increasing
vulnerability to atrial fibrillation, a common disease substrate, and/or arrhythmia
directly impairing sinus node function; all 3 possibilities have evidence to support them
(Rubenstein et al. 1972; Moss and Davis 1974; Gomes et al. 1981).
1.7.1 The Anatomical Sinus Node
The anatomical sinus node is located at the junction of the superior vena cava with the
right atrium (James 1977; Anderson et al. 1979). The sinus node consists of specialised
nodal cells lying immediately sub‐epicardially at the superior pole of the sulcus
terminalis of the right atrium which, under autonomic influence, spontaneously
depolarise at a variable rate to match heart rate to physiological demand. The
endocardial aspect of the sulcus terminalis is marked by the crista terminalis; the
structure demarcating the embryonic junction of the anterior trabeculated appendage
and the posterior smooth‐walled venous component. In a study of 47 adult hearts, the
53
histological sinus node has been shown to be crescent‐shaped with the long axis
parallel to the crista terminalis and has a mean length of 13.5mm (range 8‐21.5mm)
(Sanchez‐Quintana et al. 2005). Histological sectioning of the atria by a range of
investigators has failed to identify islands of nodal cells separate from the sinus node
itself. Indeed, all such studies have demonstrated that the sinus node has a defined
and consistent anatomical location (James 1977; Anderson et al. 1979; Boineau et al.
1980; Sanchez‐Quintana et al. 2005). No insulating tract is seen and nodal tissue
radiates for short distances into the surrounding working myocardium. In comparison
to contractile cardiac myocytes, nodal cells are smaller cells that are packed within a
dense matrix of connective tissue. The lack of intercalated discs and poorly developed
sarcoplasmic reticulum are proposed reasons for slow intra‐nodal conduction (James
et al. 1966). Recent immunohistochemical studies on the sinus node have revealed
regional differences in connexin expression. Kwong et al. (1998) showed that the
canine sinus node was composed of mainly connexin 43‐negative cells, with the
majority expressing connexin 40. The one‐third of cells expressing connexin 43
however, abutted working atrial myocardium and it is hypothesised that these cells
form bridges for the propagation of the action potential from the centre of the sinus
node to the atrial muscle.
1.7.2 The Functional Sinus Node Complex
Shifts in the origin of the sinus node impulse along the sulcus terminalis under
autonomic influences were first observed by Lewis et al. (1910) and by Meek and
Eyster (1914) early last century. The advent of medium‐density epicardial mapping

54
using multi‐polar epicardial plaques confirmed the initial observations, with the
functional sinus node demonstrating complex activity under autonomic control
(Bouman et al. 1968; Geesbreght and Randall 1971; Goldberg 1975; Goldberg et al.
1981). Boineau and colleagues (1978; 1980) performed medium‐density mapping of
the right atrial epicardium with simultaneous endocardial mapping in a subset,
together with some histological analysis, under conditions of sympathetic and
parasympathetic stimulation and following overdrive pacing. They observed that the
sinus P wave may arise from a ‘pacemaker complex’, distributed over an extensive
extra‐nodal area spanning the superior vena cava ‐ right atrial junction to the inferior
vena cava. These studies of the canine functional sinus node complex have identified
that the area of the origin of cardiac depolarisation exceeds that of the anatomical
sinus node area by 3 to 4‐fold. A strong correlation between heart rate and functional
sinus origin was observed with vagal stimulation and isoprenaline infusion resulting in
inferior and supero‐anterior shifts, respectively. This study reported several seminal
observations; (i) at least three anatomically fixed (in contrast to diffusely wandering)
areas of sinus node origin were present, each of which became dominant within a
specific range of heart rates, (ii) after intramural disconnection of the origins they
maintained their normal function in their respective heart rate ranges, and (iii) origin
points were mapped to the same anatomical location using both epicardial and
endocardial mapping, which suggested a lack of intramural preferential conduction.
However, in conflict with their proposition was the histological absence of specialised
nodal cells at the extra‐nodal sinus origins. On the weight of evidence, Boineau et al.
(1980) concluded that the multi‐centric nature of functional sinus origin was mediated
through a complex system of separate atrial pacemakers with differential sensitivities

55
to autonomic control. Boineau et al. (1988) extended their studies to humans to
elegantly describe the functional sinus node origin(s) using 156 bipole epicardial
plaques in 14 patients undergoing open‐heart surgery for the ablation of accessory
pathways. They reported uni‐focal nodal and extra‐nodal sinus origins in addition to
multi‐centric origins over two to four widely distributed pacemaker sites. The similarity
in anatomical origin of escape beats after overdrive pacing compared to that in sinus
rhythm supported the role of extra‐nodal sites in healthy sinus function. The functional
sinus pacemaker complex in humans was estimated to exist over a zone centred about
the long axis of the sulcus terminalis encompassing a 7.5 by 1.5cm area, with a cranial
and caudal border consisting of the superior and inferior venae cavae, respectively.
Alternative hypotheses for extra‐nodal sinus origins proposed by Boineau et al. (1988)
include; (i) the existence of specialised conduction tracts from the anatomically fixed
nodal source to remote exit sites, and (ii) a coordinated exchange of dominance
amongst competing pacemakers via autonomic modulation. For the former
explanation, the presence of nodal radiations into adjacent atrial myocardium through
electrically isolating connective tissue supports this theory, however no insulated
rapidly conducting tissue analogous to that found in the ventricles has been
conclusively demonstrated (Anderson et al. 1981a). Supporting the latter hypothesis,
autonomically mediated shifts in activation sites appear linked to changes in heart
rate, however the mechanism by which a stable rate is maintained without faster
pacemakers dominating is yet to be shown. These considerations led to a hybrid model
being proposed where neural and hormonal factors influence both the site of
pacemaker activation and the point of exit from the sinus node (Schuessler et al.
1996). Additional canine right atrial studies have shown that transmembrane
56
potentials from sinus node pacemaker cells do not show a temporal or spatial
relationship with atrial extracellular potentials (Bromberg et al. 1995). This suggests
relative electrical isolation of the sinus node from surrounding working atrial
myocardium with the earliest extracellular potentials representing the exit points from
the node. Further evidence of a multi‐centric and widely distributed functional
pacemaker complex comes from clinical studies that have aimed to modify sinus
activity in patients with inappropriate sinus tachycardia. Inappropriate sinus
tachycardia is a non‐paroxysmal tachyarrhythmia characterised by an increased resting
heart rate and/or an exaggerated heart rate response to minimal exertion or a change
in body posture (Still et al. 2005). In contrast to a single uni‐focal lesion, procedures for
the treatment of inappropriate sinus tachycardia require extensive ablation along the
entire length of the crista terminalis to achieve functional inhibition of the sinus node
(Kalman et al. 1995; Lee et al. 1995).
1.7.3 Conventional Evaluation of Sinus Node Function
Conventional tests of sinus node automaticity and sino‐atrial coupling are based on
indirect surrogate measures and as such, are thought to contain limited clinical value
(Tonkin and Heddle 1984). Sinus node automaticity has traditionally been assessed by
the duration of the first return cycle after cessation of sinus overdrive pacing (Mandel
et al. 1971; Narula et al. 1972). The CSNRT adjusts for the preceding sinus cycle length
before overdrive pacing, however neither the raw measure nor CSNRT provide a pure
assessment of sinus node automaticity and both are confounded by extrinsic
influences. Consequently, there is poor inter‐laboratory agreement for ‘normal’ ranges

57
of CSNRT (Kulbertus et al. 1975; Breithardt et al. 1977; Alboni et al. 1982) and the
positive predictive accuracy in patients with suspected sinus node dysfunction is as low
as 30% (Yee and Strauss 1987). Methods to evaluate sino‐atrial conduction have
included indirect measures (Strauss et al. 1973; Narula et al. 1978) and the direct
method by the recording of a sinus node electrogram (Hariman et al. 1980). However,
as with measures of automaticity, the positive predictive value of these tests for
identification of clinical sinus node disease has been too low to warrant routine clinical
use. Nevertheless, due to their widespread use within the body of literature on sinus
node disease, these measures retain a degree of utility for research on the mechanism
of sinus node dysfunction.
1.7.4 High‐density Mapping of the Sinus Node
Initial mapping studies of the functional sinus node complex utilised multi‐electrode
plaques placed epicardially or endocardially at surgery (Boineau et al. 1978). The
subsequent development of 3‐dimensional endocardial mapping systems has allowed
less invasive assessment of sinus node activity, although high‐density has been
achieved using analysis of many sequential beats rather than single‐beat mapping
(Sanders et al. 2004b). The advent of non‐contact mapping has facilitated high‐density
simultaneous endocardial mapping of cardiac depolarisation. The morphology of
unipolar electrograms provides measurable information of the depolarisation wave‐
front direction, speed and width of the approaching or retreating wave. In an animal
model, virtual unipolar electrograms from non‐contact mapping were able to
differentiate between endocardial and sub‐endocardial pacing origins thus providing

58
information on the intramural depth of impulse origin (Kroll et al. 2003). The
morphology characteristics of virtual electrograms have been shown to match with
high reliability those of conventional contact unipolar electrograms (Schilling et al.
1998; Kadish et al. 1999; Schilling et al. 2000; Thiagalingam et al. 2004a; Earley et al.
2006). Higa et al. (2004) have shown insights into the additional information provided
via the utilisation of high density unipolar mapping during atrial tachycardia. Non‐
contact mapping showed that in many cases the traditionally mapped origin – the site
from which centrifugal activation occurs to spread activation to the remaining atria –
was indeed a break‐out point. Detailed inspection of the unipolar electrograms
demonstrated an earlier site of origin (“QS” morphology) with a preferential pathway
of conduction to the break‐out point. These investigators were able to confirm the
existence of an alternate origin with a preferential conduction pathway by curative
ablation of the tachycardia at both the origin and also along the preferential pathway.
Whether similar pathways exist in the non‐diseased atrium, including within the sinus
node, is yet to be reported.
1.7.5 Sinus Node Disease
Sinus node disease is thought to result from disordered impulse generation within the
sinus node or impaired conduction of the impulse to the surrounding atrial tissue
(Ferrer 1968). While differentiation between these two potential aetiologies has been
difficult owing to the absence of an appropriate experimental model, Sanders et al.
(2004a) have performed point‐by‐point atrial mapping studies in patients with sinus
node disease and found evidence of a diffuse atrial myopathy. Compared to age‐

59
matched controls, patients with sinus node disease demonstrated an increase in atrial
refractoriness, atrial conduction time and P wave duration. Interestingly, the sinus
node complex in disease was more often uni‐centric and localised to the low crista
terminalis with evidence of regional conduction slowing and scar. These data suggest
that impulse conduction rather than impulse generation are responsible for the
manifestations of sinus node disease.
1.7.6 Clinical Conditions Associated with Sinus Node Impairment
An association with sinus node dysfunction is seen for many disease states. This not
only includes the direct relationship between atrial arrhythmia and sinus node
remodelling, but also conditions (e.g. heart failure) that demonstrate an association
with both atrial arrhythmia and impairment of sinus node function. Elvan et al. (1996)
demonstrated significant prolongation of CSNRT and the intrinsic sinus cycle length
after two to six weeks of atrial fibrillation in dogs. In humans, short durations of rapid
atrial pacing resulted in similar sinus node inhibition (Hadian et al. 2002) and CSNRT
was significantly longer in patients cardioverted from chronic lone atrial fibrillation
compared to controls (Kumagai et al. 1991; Tse et al. 1999; Manios et al. 2001).
Manios et al. (2001) also reported that sinus node inhibition improved within 24 hours
after cardioversion. Sinus node dysfunction as measured by traditional parameters has
been reported after reversion to sinus rhythm from atrial flutter (Sparks et al. 2000;
Daoud et al. 2002). A decrement in sinus node function has been reported during
clinically induced atrial stretch. In a prospective randomised comparison, Sparks et al.
(1999) reported that long‐term (3 months) VVI pacing resulted in increased atrial
60
refractoriness, a prolongation of P wave duration and longer CSNRT in comparison to
DDD pacing. They further highlighted that the changes observed in the VVI pacing
group were reversed with three months of DDD pacing. Similar increases in P wave
duration and CSNRT have been reported in patients with atrial stretch due to
significant atrial septal defects (Morton et al. 2003) and congestive heart failure
(Sanders et al. 2004b). For the latter, Sanders et al. reported a more caudal localisation
of sinus origin and greater structural remodelling of the crista terminalis in heart
failure patients when compared to age‐matched controls. Structural remodelling was
represented by a loss of voltage, demonstration of conduction delay at the crista
terminalis and circuitous propagation of the sinus impulse. These findings raise the
possibility that dysfunction of the sinus node may have been a consequence of
structural change associated with atrial stretch.

61
Chapter 2. Right and left atrial electrical substrate of lone atrial fibrillation
2.1 Introduction
Atrial fibrillation arises as a result of a complex interaction of triggers, perpetuators
and substrate (Allessie et al. 2001). Experimental studies of atrial fibrillation have
demonstrated shortening of the ERP and slowing of conduction as a result of atrial
fibrillation and have suggested that these factors combine to promote continuing atrial
fibrillation, giving rise to the concept that “atrial fibrillation begets atrial fibrillation”
(Morillo et al. 1995; Wijffels et al. 1995; Goette et al. 1996; Gaspo et al. 1997; Fareh et
al. 1998). Clinical studies have shown reversal of electrical remodelling over time after
termination of arrhythmia (Yu et al. 1999; Hobbs et al. 2000). However, strategies of
prompt termination of atrial fibrillation to avoid this cycle of adverse remodelling have
failed to show benefit (Fynn et al. 2002). In fact, the natural history of paroxysmal
atrial fibrillation is one of increasing frequency and duration of episodes (Kopecky et al.
1987). These observations have led to the search for a “second factor” integral to the
development and progression of atrial fibrillation (Garratt et al. 1999).
We hypothesised that patients with paroxysmal “lone” atrial fibrillation have an
abnormal atrial substrate that determines disease progression. In order to evaluate
the substrate predisposing to atrial fibrillation, free of the electrical remodelling effects
of the arrhythmia itself, we evaluated the electrophysiological characteristics of atria
in patients with paroxysmal “lone” atrial fibrillation, remote in time from the
arrhythmia.
62
2.2 Methods
2.2.1 Study Population
This study comprised 13 patients undergoing first‐time ablation for paroxysmal atrial
fibrillation and a reference group of 13 patients with structurally normal hearts
undergoing radiofrequency ablation for atrioventricular reentry tachycardia with left‐
sided accessory pathways and no history of atrial fibrillation. Patients for the study
group were excluded if they had atrial fibrillation during the week prior to ablation
(established by continuous monitoring) or any of the criteria that would prohibit the
diagnosis of “lone” atrial fibrillation, previously defined as the absence of structural
heart disease or stroke based on history, physical examination, chest X‐ray, routine
blood chemistry, and trans‐thoracic as well as trans‐oesophageal echocardiography
(Kopecky et al. 1987; Kumagai et al. 1991; Jaïs et al. 2000). Coronary artery disease was
excluded by clinical, ECG or stress test criteria. Pulmonary disease, hypertension,
hyperthyroidism and diabetes were eliminated by appropriate tests. Paroxysmal atrial
fibrillation was defined according to the Expert Consensus Statement as recurrent
atrial fibrillation that terminates spontaneously within 7 days (Calkins et al. 2007).
Thus, of 109 patients with highly symptomatic atrial fibrillation presenting for ablation
screened, 13 patients were suitable to be included in this study.
All anti‐arrhythmic medication was ceased ≥5 half‐lives prior to the study. No patient
had received amiodarone. All patients provided written informed consent to the study
protocol which was approved by the Human Research Ethics Committee of the Royal
Adelaide Hospital.
63
2.2.2 Electrophysiological Study and Ablation
Electrophysiological study was performed in the post‐absorptive state with sedation
utilising midazolam and fentanyl. In patients with atrial fibrillation the study protocol
was performed before ablation, while in the reference group this was done after
accessory pathway ablation. The left atrium was accessed using a single transeptal
puncture following which repeated bolus unfractionated heparin was utilised to
maintain the activated clotting time between 300‐350 seconds.
Following the study protocol, patients with atrial fibrillation underwent circumferential
pulmonary vein ablation with an end‐point of isolation confirmed by circumferential
mapping (Lasso, Biosense‐Webster) with either elimination or dissociation of
pulmonary venous potentials. Ablation of the pulmonary veins was performed using a
delivered power of 30W with irrigation rates of 30mL/min (Thermocool, Biosense
Webster). Additional substrate modification was performed in patients with an
episode of atrial fibrillation ≥48 hours or with a left atrial size ≥57mm (longest
diameter). This took the form of linear ablation along the left atrial roof with an end‐
point of linear double potentials and conduction block demonstrated by an activation
detour during pacing of the left atrial appendage. Cavotricuspid isthmus ablation with
an endpoint of bi‐directional isthmus block was performed only in patients with a
history of typical flutter or if mapping confirmed typical flutter during the procedure.
Linear ablation was performed with a delivered power of 30‐35W with irrigation rates
of 30‐60mL/min.

64
2.2.3 Electrophysiology Study Protocol
The following catheters were positioned for the study protocol: (i) a 10‐pole catheter
(2‐5‐2mm inter‐electrode spacing, Daig Electrophysiology) within the coronary sinus
with the proximal bipole at the coronary sinus ostium as determined in the best septal
left anterior oblique position; (ii) a 20‐pole “crista” catheter (1‐3‐1mm inter‐electrode
spacing, Biosense‐Webster) placed along the crista terminalis with the distal tip
superiorly such that the second bipole lay at the junction of the superior vena cava and
right atrium, stabilised by a long sheath (CSTA, Daig Electrophysiology) to ensure close
apposition to this structure; (iii) a 20‐pole catheter (2‐5‐2mm inter‐electrode spacing,
Daig Electrophysiology) placed along the lateral right atrium; and (iv) a roving 10‐pole
catheter (2‐5‐2mm inter‐electrode spacing, Biosense‐Webster) was positioned within
the left atrium via trans‐septal puncture (Figure 2‐1). This catheter was stabilised with
the use of a long sheath (Preface, Biosense‐Webster or SL0, Daig Electrophysiology)
and sequentially positioned as follows at the: (i) left atrial roof; (ii) inferior left atrium;
(iii) mid‐posterior left atrium; (iv) left atrial appendage and (v) high right atrial septum,
as previously described (John et al. online early). Electrophysiological evaluation was
performed as detailed below.
2.2.3.1 Effective Refractoriness
Atrial ERP was evaluated at twice diastolic threshold at cycle lengths of 600 and 450ms
using an 8‐beat drive followed by an extra‐stimulus, starting with a coupling interval of
150ms increasing in 10ms increments. ERP was defined as the longest coupling interval
failing to propagate to the atrium. At each site the ERP was measured 3 times at each
cycle length and averaged. If ERP varied by >10ms an additional 2 measurements were
65
made and the total number averaged. ERP was measured from the following sites: (i)
distal coronary sinus; (ii) proximal coronary sinus; (iii) low‐lateral right atrium; (iv) high‐
lateral right atrium; (v) high‐septal right atrium; (vi) left atrial appendage; (vii) mid‐
posterior left atrium; (viii) inferior left atrium; (ix) junction of the left superior
pulmonary vein with the left atrial roof; and (x) junction of the right superior
pulmonary vein with the left atrial roof. Atrial fibrillation induced by ERP testing lasting
>5 minutes was considered sustained; when this occurred, no further data was
acquired.
2.2.3.2 Atrial Conduction
Atrial conduction time was assessed along linearly placed catheters by pacing the distal
bipole (1,2) and determining the conduction time to a proximal bipole (9,10) at the left
atrial roof, inferior left atrium, coronary sinus and lateral right atrium. Conduction time
at each site was averaged over 10 beats during stable capture at 600 and 450ms cycle
lengths.
P wave duration was determined as a marker of global conduction by the average of
10 beats on ECG lead II.
2.2.3.3 Site‐specific Conduction Abnormalities at the Crista Terminalis
The number of bipoles on the crista terminalis catheter with discrete double potentials
separated by an isoelectric interval or complex fractionated activity of ≥50ms duration,
and the maximum electrogram duration were determined during sinus rhythm,
constant pacing and for the shortest‐coupled captured extra‐stimulus from the
66
proximal coronary sinus, low‐lateral right atrium, inferior left atrium and left atrial
appendage.
2.2.3.4 Sinus Node Function
Sinus node function was evaluated as follows: (i) Baseline sinus cycle length was
determined over 10 consecutive sinus cycles; (ii) SACT was determined after an 8‐beat
pacing train [using the formula SACT = (return ‐ basic cycle length)/2] (Narula et al.
1978) 3 times and averaged; and (iii) CSNRT was determined after a 30‐second drive
train at cycle lengths of 600 and 450ms, correcting for the baseline cycle length. At
each cycle length, CSNRT was determined 3 times and averaged.
2.2.4 Statistical Analysis
Continuous variables are reported as mean ± standard deviation or median and inter‐
quartile range as appropriate. Categorical variables are reported as number and
percentage. Proportions were compared using Fisher’s Exact test. Comparisons
between means were analysed using paired or unpaired t tests as appropriate.
Comparisons with adjustment for multiple sampling within patients were performed
using a Mixed Linear Model for continuous data or a logistic Generalised Estimating
Equation for categorical data. Statistical tests were performed using SPSS 15 (SPSS Inc)
and statistical significance was set at p<0.05.

67
2.3 Results
2.3.1 Baseline Details
Baseline patient characteristics are summarised in Table 2.1. Patients with atrial
fibrillation had a median arrhythmia history of 72 months and a mean longest episode
of 2.8±1.9 days. Groups were well matched for age, gender, left ventricular wall
thickness and function. However, patients with atrial fibrillation had significantly larger
left atria (p=0.004). None of the patients with atrial fibrillation had atrial arrhythmias
(>30 seconds) by continuous monitoring in the 7 days prior to the procedure.
2.3.2 Atrial Refractoriness
For patients with atrial fibrillation, the mean ERP across all sites was greater than that
of reference patients (at 600ms: 255±25 versus 222±16ms, p<0.001; at 450ms: 234±20
versus 212±14ms, p=0.004). Figure 2‐2 demonstrates the ERP at the ten sites tested
following 600 and 450ms drive trains in patients with atrial fibrillation versus reference
patients, and indicates those areas where significant differences were seen. The
differences in ERP between patients with atrial fibrillation and reference patients were
not uniform across all sites (p=0.02). At each site, patients with atrial fibrillation
demonstrated either an increase or no significant change in ERP when compared to
the reference group. The ERP was higher following a 600ms drive train than after a
450ms drive train for both patients with atrial fibrillation (p<0.001) and reference
patients (p=0.02); that is, there was preservation of physiological rate‐adaptation of
ERP in both groups (p=0.1).
68
2.3.3 Atrial Conduction Time
The conduction time along the catheters at the left atrial roof, inferior left atrium,
coronary sinus and lateral right atrium was significantly longer in patients with atrial
fibrillation compared to the reference group (57±18 versus 47±10ms, p=0.01).
However, there was no significant interaction between patient group and site of
conduction measurement (p=0.3), suggesting a homogenous slowing of conduction in
patients with atrial fibrillation.
The P wave duration was significantly prolonged in patients with atrial fibrillation
compared to reference patients (128±8 versus 95±10ms, p<0.001).
2.3.4 Site‐Specific Conduction Abnormalities
Site‐specific conduction abnormalities at the crista terminalis during sinus rhythm
were more apparent in patients with atrial fibrillation than reference patients. During
sinus rhythm, patients with atrial fibrillation had a greater number of bipoles
demonstrating double potentials or fractionated signals on the crista terminalis
catheter than reference patients (4.9±1.8 versus 0.7±0.8, p<0.001) of which the
maximum electrogram duration was longer (84±15 versus 52±11ms, p<0.001). These
differences were even more marked during pacing and increased further with extra‐
stimulus (Figures 2‐3 and 2‐4). These data highlight the functional nature of the
conduction delay at the crista terminalis, as evidenced by variation in the extent of
conduction abnormalities depending on the rate and site of stimulation.

69
2.3.5 Sinus Node Function
Patients with atrial fibrillation had a longer baseline sinus cycle length (975±131 versus
762±129ms, p<0.001), SACT (154±58 versus 83±31ms, p<0.001) and CSNRT at 600ms
(265±57 versus 185±60ms, p=0.002) but not 450ms (261±96 versus 241±76ms, p=0.6)
compared to reference patients.
2.4 Discussion
2.4.1 Major findings
This study utilised electrophysiological mapping to demonstrate new information on
the nature of abnormalities within the atria of patients with paroxysmal “lone” atrial
fibrillation, remote from an arrhythmic event.
The major findings are as follows:
(i) Conduction abnormalities characterised by prolongation of conduction
times along linearly placed catheters, longer P wave duration and site‐
specific conduction delay.
(ii) Impaired sinus node function indicated by prolonged SACT and CSNRT.
(iii) An increase in ERP, which is consistent with prior studies evaluating clinical
substrates for atrial fibrillation but is in contrast to the remodelling
attributed to atrial fibrillation itself.
Thus, this suggests that patients with paroxysmal lone atrial fibrillation have an
abnormal atrial electrophysiological substrate. We posit that these abnormalities
70
contribute to the “second factor” that promotes progression of atrial fibrillation and
why sinus rhythm does not beget sinus rhythm.
2.4.2 Rate‐Related Electrical Remodelling
The seminal observations by Wijffels et al. (1995) that “atrial fibrillation begets atrial
fibrillation” has as its central tenet the observation of reduction in atrial ERP by
repeated induction of atrial fibrillation thereby allowing atrial fibrillation to sustain
itself. Many experimental studies have confirmed this finding (Morillo et al. 1995;
Elvan et al. 1996; Goette et al. 1996; Fareh et al. 1998; Lee et al. 1999). While these
initial studies fail to observe any conduction abnormalities, subsequent studies by
Gaspo et al. (1997) demonstrated that progressively longer episodes of atrial
fibrillation also resulted in conduction slowing. Thus, the electrical remodelling of the
atria in response to atrial fibrillation lends toward the perpetuation of arrhythmia by a
shortening of the reentrant “wavelength”. In addition, several investigators have also
observed remodelling of the sinus node that develops soon after the initiation of
arrhythmia and reverses after restoration of sinus rhythm (Kumagai et al. 1991; Elvan
et al. 1996; Hocini et al. 2003).
Clinical studies have also observed similar effects of rate on the atria. Patients with
recent atrial fibrillation have been shown to have shorter ERP than control groups, as
well as sinus node dysfunction and conduction delay (Cosio et al. 1983; Kumagai et al.
1991). Yu et al. (1999) demonstrated shorter ERP with impaired rate adaptation and
depressed conduction following cardioversion for longstanding atrial fibrillation, with
the ERP gradually increasing after 4 days of sinus rhythm. Kojodjojo et al. (2007)
71
studied patients with paroxysmal and persistent atrial fibrillation at their ablation
procedure and demonstrated a reduction in ERP at 3 sites compared to patients with
no atrial fibrillation. In this study, patients with persistent atrial fibrillation had just 10
minutes of sinus rhythm prior to study and those with paroxysmal atrial fibrillation had
a mean atrial fibrillation burden of 3.2±3.7 hours in the preceding 72 hours. However,
with the known experimental evidence of rate‐related remodelling, it is unclear if the
abnormalities observed in such patients with atrial fibrillation form the underlying
substrate for or are a consequence of atrial fibrillation.
2.4.3 Progression of Atrial Fibrillation
Garratt et al. (1999) evaluated the effect of repeated episodes of atrial fibrillation on
atrial electrical remodelling. While marked remodelling was observed with five days of
atrial fibrillation, two days of sinus rhythm was adequate to reverse all abnormalities.
Despite repetitive episodes of atrial fibrillation, there were no additive changes
observed in atrial electrical remodelling. Fynn et al. (2002) evaluated the strategy of
repeated cardioversion of atrial fibrillation in the clinical setting. Early and repeated
cardioversion was performed to maintain sinus rhythm but failed to prevent the
progression to more atrial fibrillation. Indeed, their findings suggest that sinus rhythm
does not beget sinus rhythm in patients with a history of atrial fibrillation.
These findings have led Allessie and co‐workers to propose the existence of a “second
factor” for the initial substrate and subsequent progression of atrial fibrillation (Garratt
et al. 1999). To identify this factor we studied patients with paroxysmal lone atrial
fibrillation who were remote from an episode of atrial fibrillation (thereby removing

72
the effects of acute rate‐related remodelling). When studied distant from an
arrhythmic event, patients with lone atrial fibrillation demonstrate an increase in atrial
refractoriness, widespread and site‐specific conduction abnormalities, and evidence of
sinus node remodelling. We put forward that these changes in conduction seen in lone
paroxysmal atrial fibrillation, when studied remote from arrhythmia, contribute to the
“second factor” which plays an important role in the development and progression of
atrial fibrillation.
2.4.4 Substrate Predisposing to the Development of Atrial Fibrillation
Although the abnormalities that have been observed to result from atrial fibrillation
itself have been proposed as the mechanisms by which atrial fibrillation begets atrial
fibrillation, it is not likely that rate‐related remodelling forms the substrate
predisposing to the development of atrial fibrillation in the first place. This has led
several investigators to evaluate the atrial abnormalities in conditions predisposed to
the development of atrial fibrillation.
Li et al. (1999) developed a canine model of congestive heart failure to evaluate effects
on atrial remodelling and demonstrated "atrial remodelling of a different sort" to that
seen due to atrial fibrillation alone. A significant increase in ERP at short cycle lengths
associated with an increase in the heterogeneity of conduction and marked interstitial
fibrosis was seen. Despite the increase in ERP, these abnormalities resulted in a
significant increase in the duration of atrial fibrillation. Verheule et al. (2003) observed
a propensity for atrial fibrillation despite an increase in ERP in a canine model of mitral
73
regurgitation, again due to abnormalities in conduction and profound structural
remodelling.
Clinical studies of the atrial substrate in patients known to be predisposed to atrial
fibrillation but without antecedent arrhythmia have demonstrated similar
observations. Morton et al. (2003) studied the right atrial substrate in patients with
atrial septal defects and observed prolonged ERP and delayed conduction across the
crista terminalis compared to reference patients. Sanders et al. showed similar findings
of prolonged ERP with widespread and site‐specific conduction abnormalities in
patients with congestive heart failure (2003) and sinus node disease (2004a). Kistler et
al. (2004) demonstrated such changes in a progressive manner with increasing age.
While these findings have been restricted to right atria, comparable results have
recently been observed in the left atria of patients with mitral stenosis (John et al.
online early).
In patients with atrial fibrillation there is a paucity of clinical electrophysiological
studies performed outside the context of recent arrhythmia. In order to minimise the
confounding effects of electrical remodelling, we have undertaken meticulous
screening to identify patients who were in sinus rhythm for a minimum of 7 days prior
to their ablation procedure. Using such stringent enrolment criteria, the observations
of the current study are remarkably consistent with the findings observed in the above
conditions on the substrate predisposing to atrial fibrillation. Taken together, these
studies provide compelling evidence that the significant contributors giving rise to the
substrate underlying atrial fibrillation are not the changes in refractoriness, but rather
the conduction abnormalities discussed above.
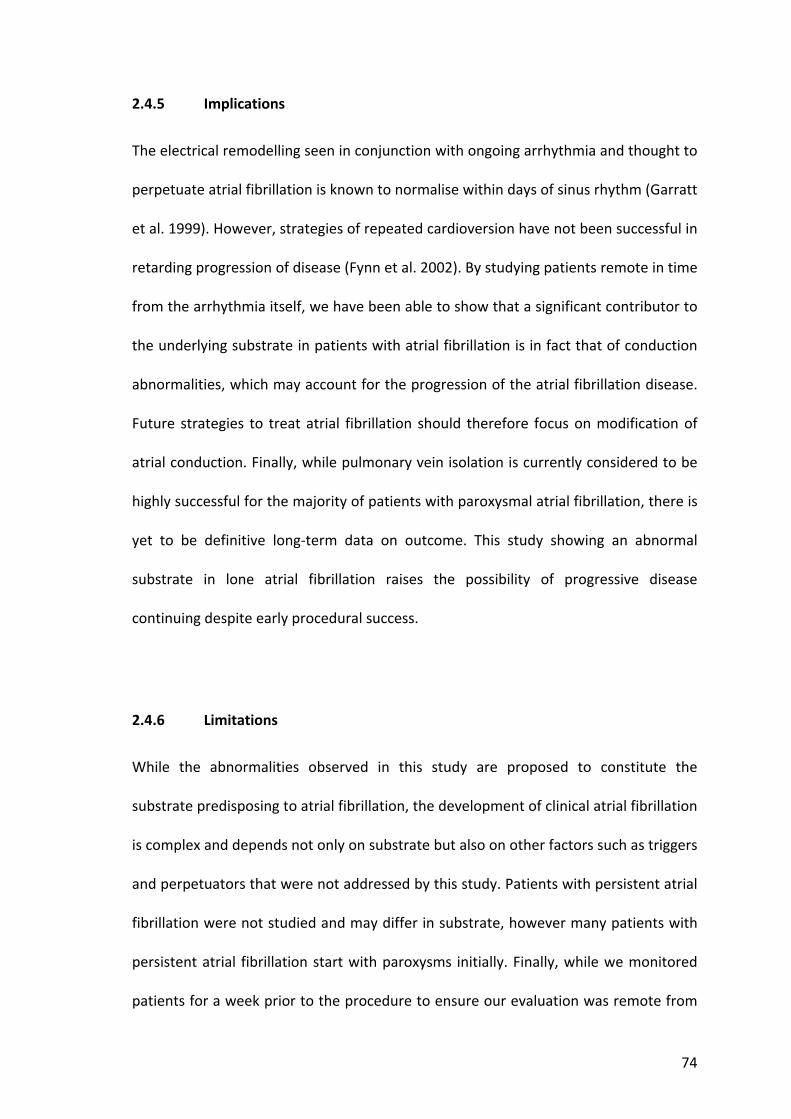
74
2.4.5 Implications
The electrical remodelling seen in conjunction with ongoing arrhythmia and thought to
perpetuate atrial fibrillation is known to normalise within days of sinus rhythm (Garratt
et al. 1999). However, strategies of repeated cardioversion have not been successful in
retarding progression of disease (Fynn et al. 2002). By studying patients remote in time
from the arrhythmia itself, we have been able to show that a significant contributor to
the underlying substrate in patients with atrial fibrillation is in fact that of conduction
abnormalities, which may account for the progression of the atrial fibrillation disease.
Future strategies to treat atrial fibrillation should therefore focus on modification of
atrial conduction. Finally, while pulmonary vein isolation is currently considered to be
highly successful for the majority of patients with paroxysmal atrial fibrillation, there is
yet to be definitive long‐term data on outcome. This study showing an abnormal
substrate in lone atrial fibrillation raises the possibility of progressive disease
continuing despite early procedural success.
2.4.6 Limitations
While the abnormalities observed in this study are proposed to constitute the
substrate predisposing to atrial fibrillation, the development of clinical atrial fibrillation
is complex and depends not only on substrate but also on other factors such as triggers
and perpetuators that were not addressed by this study. Patients with persistent atrial
fibrillation were not studied and may differ in substrate, however many patients with
persistent atrial fibrillation start with paroxysms initially. Finally, while we monitored
patients for a week prior to the procedure to ensure our evaluation was remote from

75
an episode of atrial fibrillation, we cannot exclude an effect of rate‐related remodelling
from previous episodes. However, prior studies have demonstrated no additive effects
of episodic atrial fibrillation and resolution of remodelling within days (Garratt et al.
1999).
2.5 Conclusion
Patients with paroxysmal lone atrial fibrillation, remote from an arrhythmic episode,
demonstrate electrophysiological abnormalities characterised by widespread and site‐
specific conduction abnormalities, altered sinus node function and prolonged atrial
refractoriness. These abnormalities contribute to the “second factor” critical to the
development and progression of atrial fibrillation.

76
Table 2.1
Patient characteristics
AF (n=13)
Reference (n=13)
p value
Age (years) 54±11 53±8 0.7
Male gender (%) 69 46 0.4
Median AF history (months) 72 0 n/a
Longest AF duration (days) 2.8±1.9 0 n/a
Left atrial parasternal size (mm) 42±7 34±5 0.004
Interventricular septum (mm) 11±2 11±1 0.7
Left Ventricular ejection fraction (%) 54±9 58±8 0.7

77
Figure 2‐1
Catheter positions on fluoroscopy
Left anterior oblique views of a decapolar catheter in the coronary sinus, a
duodecapolar catheter along the crista terminalis with its stabilising sheath, a
duodecapolar catheter along the lateral right atrium and a decapolar catheter with its
stabilising sheath in the left atrium. The left atrial catheter was sequentially positioned
by looping the catheter to record along the left atrial roof (left) and then withdrawn to
record the inferior left atrium (right). Subsequently, the decapolar catheter was
positioned at the left atrial appendage, posterior left atrial wall and the high‐septal
right atrium (not shown).

78
Figure 2‐2
Regional effective refractoriness
Figure legend overleaf.
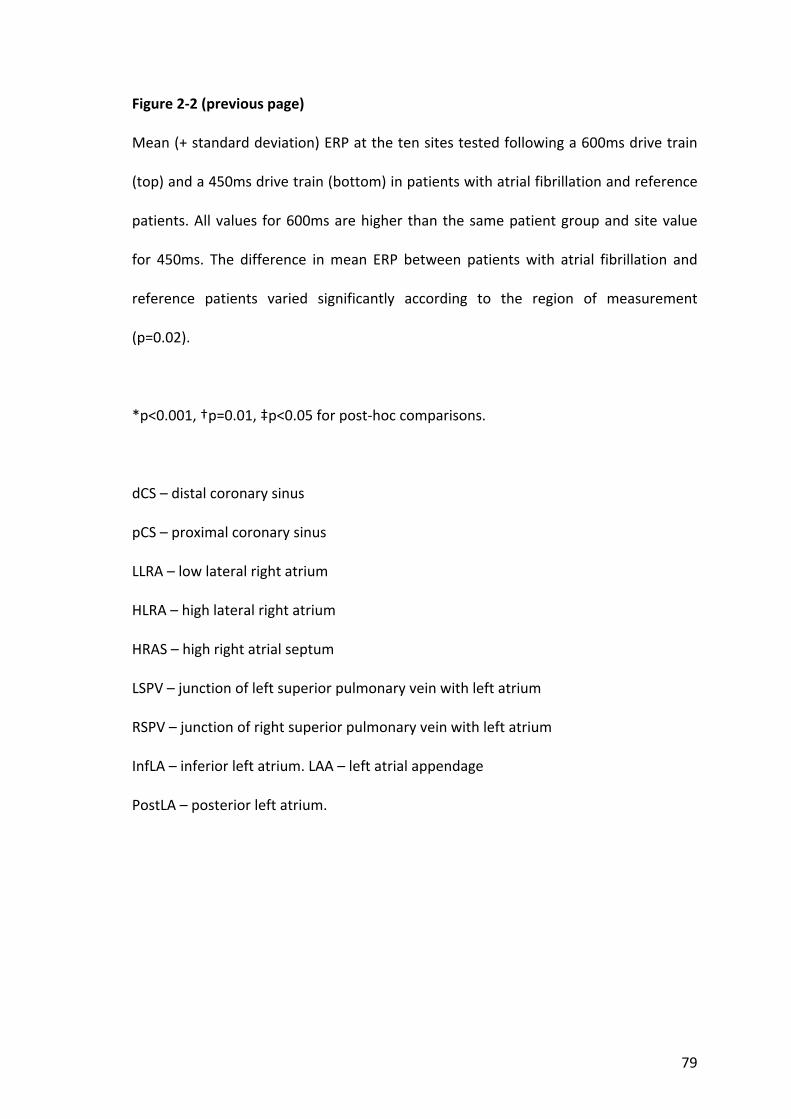
79
Figure 2‐2 (previous page)
Mean (+ standard deviation) ERP at the ten sites tested following a 600ms drive train
(top) and a 450ms drive train (bottom) in patients with atrial fibrillation and reference
patients. All values for 600ms are higher than the same patient group and site value
for 450ms. The difference in mean ERP between patients with atrial fibrillation and
reference patients varied significantly according to the region of measurement
(p=0.02).
*p<0.001, †p=0.01, ‡p<0.05 for post‐hoc comparisons.
dCS – distal coronary sinus
pCS – proximal coronary sinus
LLRA – low lateral right atrium
HLRA – high lateral right atrium
HRAS – high right atrial septum
LSPV – junction of left superior pulmonary vein with left atrium
RSPV – junction of right superior pulmonary vein with left atrium
InfLA – inferior left atrium. LAA – left atrial appendage
PostLA – posterior left atrium.
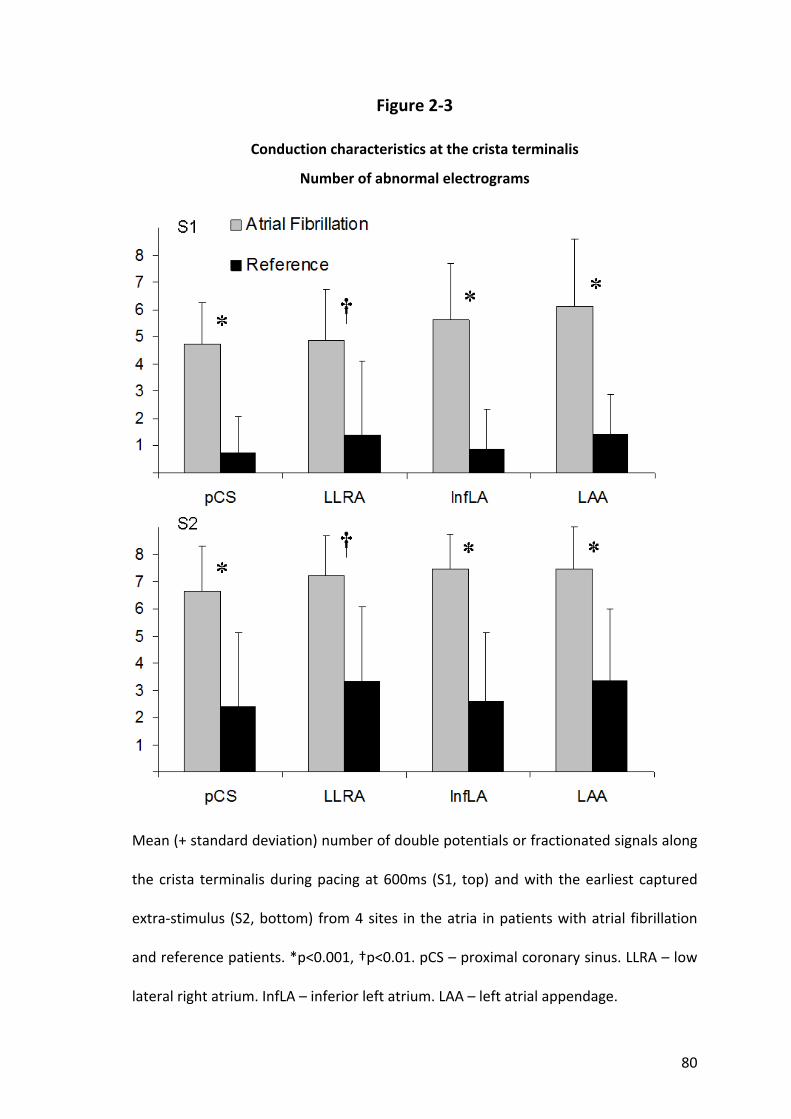
80
Figure 2‐3
Conduction characteristics at the crista terminalis
Number of abnormal electrograms
Mean (+ standard deviation) number of double potentials or fractionated signals along
the crista terminalis during pacing at 600ms (S1, top) and with the earliest captured
extra‐stimulus (S2, bottom) from 4 sites in the atria in patients with atrial fibrillation
and reference patients. *p<0.001, †p<0.01. pCS – proximal coronary sinus. LLRA – low
lateral right atrium. InfLA – inferior left atrium. LAA – left atrial appendage.

81
Figure 2‐4
Conduction characteristics at the crista terminalis
Maximum duration of abnormal electrograms
Mean (+ standard deviation) of the maximum duration of double potentials or
fractionated signals along the crista terminalis during pacing at 600ms (S1) and with
the earliest captured extra‐stimulus (S2) from 4 sites in the atria in patients with atrial
fibrillation and reference patients. *p<0.001, †p<0.01. pCS – proximal coronary sinus.
LLRA – low lateral right atrium. InfLA – inferior left atrium. LAA – left atrial appendage.
82
Chapter 3. Right and left atrial electroanatomical substrate of lone atrial
fibrillation‐‐‐‐
3.1 Introduction
The initiation and maintenance of atrial fibrillation is brought about by intricate
interactions between triggers and perpetuators within the atrial substrate (Allessie et
al. 2001). The perpetuation of atrial fibrillation is aided by the electrical remodelling
undergone by the atria and demonstrated repeatedly in the experimental setting
(Morillo et al. 1995; Wijffels et al. 1995; Goette et al. 1996; Gaspo et al. 1997; Fareh et
al. 1998). However, while this electrical remodelling is seen clinically, the effects are
reversible once sinus rhythm is restored (Yu et al. 1999; Hobbs et al. 2000).
Nevertheless, policies of early and repeated cardioversion to avoid self‐sustaining
arrhythmia have not halted the progression of disease (Fynn et al. 2002). This
observation has prompted the hunt for a “second factor” promoting the evolution and
advancement of atrial fibrillation.
The structural and electrical changes associated with atrial fibrillation are difficult to
differentiate from that due to the affiliated conditions that may be giving rise to the
arrhythmia; conditions such as heart failure and hypertension. Patients with “lone”
atrial fibrillation however, are defined as a group without overt concomitant
conditions (Kopecky et al. 1987; Kumagai et al. 1991; Jaïs et al. 2000) and study of
these individuals may provide insight into the underlying substrate of the arrhythmia
itself. Furthermore, the arrhythmia alone can lead to alterations in the atrial structure
which may tend to perpetuate atrial fibrillation (Ausma et al. 2003). Studying patients
with lone atrial fibrillation, after allowing sufficient time for electrical remodelling to

83
reverse, would allow conclusions to be drawn about the structural and electrical
changes seen in the atrial substrate predisposing to atrial fibrillation, without the
effects of associated heart disease and rate‐related remodelling.
We hypothesised that the disease progression of patients with paroxysmal “lone”
atrial fibrillation is determined by abnormal atrial substrate. In order to evaluate the
substrate predisposing to atrial fibrillation, we evaluated the electroanatomical
characteristics of atria in patients with paroxysmal “lone” atrial fibrillation, remote in
time from the arrhythmia.
3.2 Methods
3.2.1 Study Population
This study comprised 12 patients undergoing first‐time ablation for paroxysmal atrial
fibrillation and a reference group of 12 patients with structurally normal hearts
undergoing radiofrequency ablation for atrioventricular reentry tachycardia with left‐
sided accessory pathways and no history of atrial fibrillation. Patients in the study
group were excluded if they had atrial fibrillation during the week prior to ablation
(established by continuous monitoring) or any of the criteria that would prohibit the
diagnosis of “lone” atrial fibrillation, previously defined as the absence of structural
heart disease or stroke based on history, physical examination, chest X‐ray, routine
blood chemistry, and trans‐thoracic as well as trans‐oesophageal echocardiography
(Kopecky et al. 1987; Kumagai et al. 1991; Jaïs et al. 2000). Coronary artery disease was
excluded by clinical, ECG or stress test criteria. Pulmonary disease, hypertension,

84
hyperthyroidism and diabetes were eliminated by appropriate tests. Paroxysmal atrial
fibrillation was defined according to the Expert Consensus Statement as recurrent
atrial fibrillation that terminates spontaneously within 7 days (Calkins et al. 2007).
Thus, of 106 patients with highly symptomatic atrial fibrillation presenting for ablation
screened, 12 patients were suitable to be included in this study.
All anti‐arrhythmic medication was ceased ≥5 half‐lives prior to the study. No patient
had received amiodarone. All patients provided written informed consent to the study
protocol which was approved by the Human Research Ethics Committee of the Royal
Adelaide Hospital.
3.2.2 Electrophysiological Study and Ablation
Electrophysiological study was performed in the post‐absorptive state with sedation
utilising midazolam and fentanyl. In patients with atrial fibrillation the study protocol
was performed before ablation, while in the reference group this was done after
accessory pathway ablation. The left atrium was accessed using a single transeptal
puncture following which repeated bolus unfractionated heparin was utilised to
maintain the activated clotting time between 300‐350 seconds.
Following the study protocol, patients with atrial fibrillation underwent circumferential
pulmonary vein ablation with an end‐point of isolation confirmed by circumferential
mapping (Lasso, Biosense‐Webster) with either elimination or dissociation of
pulmonary venous potentials. Ablation of the pulmonary veins was performed using a
delivered power of 30W with irrigation rates of 30mL/min (Thermocool, Biosense
Webster). Additional substrate modification was performed in patients with an
85
episode of atrial fibrillation ≥48 hours or with a left atrial size ≥57mm (longest
diameter). This took the form of linear ablation along the left atrial roof with an end‐
point of linear double potentials and conduction block demonstrated by an activation
detour during pacing of the left atrial appendage. Cavotricuspid isthmus ablation with
an endpoint of bi‐directional isthmus block was performed only in patients with a
history of typical flutter or if mapping confirmed typical flutter during the procedure.
Linear ablation was performed with a delivered power of 30‐35W with irrigation rates
of 30‐60mL/min.
3.2.3 Electroanatomical Study Protocol
Electroanatomical maps were created of both atria during sinus rhythm using the
CARTO mapping system (Biosense‐Webster). The electroanatomical mapping system
has been previously described in detail; the accuracy of the sensor position has been
previously validated and is 0.8mm and 5 degrees (Gepstein et al. 1997). In brief, the
system records the surface ECG and bipolar electrograms filtered at 30‐400Hz from the
mapping and reference catheters. Endocardial contact during point acquisition was
facilitated by electrogram stability, fluoroscopy and the catheter icon on the CARTO
system. Points were acquired in the auto‐freeze mode if the stability criteria in space
(≤6mm) and local activation time (≤5ms) were met. Mapping was performed with an
equal distribution of points using a fill‐threshold of 15mm. Editing of points was
performed off‐line. Local activation time was manually annotated to the peak of the
largest amplitude deflection on bipolar electrograms; in the presence of double
potentials this was annotated at the largest potential. If the bipolar electrogram

86
displayed equivalent maximum positive and negative deflections, the maximum
negative deflection on the simultaneously acquired unipolar electrogram was used to
annotate the local activation time. Points not conforming to the surface ECG P wave
morphology or <75% of the maximum voltage of the preceding electrogram were
excluded. Regional atrial bipolar voltage and conduction velocity were analysed as
previously described and are detailed below (Sanders et al. 2003; Kistler et al. 2004;
Sanders et al. 2004a; John et al. online early).
3.2.3.1 Voltage Analysis
For the purposes of evaluating regional voltage differences, each atrium was
segmented using previously validated offline software (Kuklik et al. 2004). The right
atrium was segmented as the high‐ and low‐lateral right atrium, high‐ and low‐
posterior right atrium, high‐ and low‐septal right atrium, and anterior right atrium. The
left atrium was segmented as posterior left atrium, anterior left atrium, septal left
atrium, inferior left atrium, lateral left atrium and left atrial roof. The voltage of points
identified by region was then exported for analysis. Low voltage points were defined as
point with a bipolar voltage ≤0.5mV and electrically silent points as the absence of
recordable activity or a bipolar voltage amplitude ≤0.05mV (the noise level of the
system).
3.2.3.2 Conduction Velocity Analysis
Isochronal activation maps (5ms intervals) of the atria were created and regional
conduction velocity determined in the direction of the wave‐front propagation (least
isochronal crowding). An approximation of conduction velocity was determined by
expressing the distance between two points as a function of the difference in local

87
activation time. Mean conduction velocity for each region was determined by
averaging the conduction velocity between 5 pairs of points, as previously described
(Sanders et al. 2003; Kistler et al. 2004; Sanders et al. 2004a; John et al. online early).
For the purposes of evaluating regional conduction differences, each atrium was
segmented as above.
3.2.3.3 Complex Electrograms
The proportion of points demonstrating complex electrograms was determined using
the following definitions: (i) Fractionated signals – complex activity of ≥50ms duration;
and (ii) Double potentials – potentials separated by an isoelectric interval where total
electrogram duration was ≥50ms.
3.2.4 Statistical Analysis
Continuous variables are reported as mean ± standard deviation or median and inter‐
quartile range as appropriate. Categorical variables are reported as number and
percentage. Proportions were compared using Fisher’s Exact test. Comparisons
between means were analysed using paired or unpaired t tests as appropriate.
Comparisons with adjustment for multiple sampling within patients were performed
using a Mixed Linear Model for continuous data or a logistic Generalised Estimating
Equation for categorical data. Statistical tests were performed using SPSS 15 (SPSS Inc)
and statistical significance was set at p<0.05.

88
3.3 Results
3.3.1 Baseline Details
Baseline patient characteristics are summarised in Table 3.1. Patients with atrial
fibrillation had a median arrhythmia history of 60 months and a mean longest episode
of 3.2±2.6 days. Groups were well matched for age, gender, left ventricular wall
thickness and function. However, patients with atrial fibrillation had significantly larger
left atria (p=0.01). None of the patients with atrial fibrillation had atrial arrhythmias
(>30 seconds) by continuous monitoring in the 7 days prior to the procedure.
A total of 193±62 points per patient were analysed in the left atrium and right atrium
using electroanatomical mapping.
3.3.2 Structural and Voltage Abnormalities
Both right and left atrial volumes by electroanatomical mapping were significantly
greater in patients with atrial fibrillation compared to reference patients; right atrium:
94±18 versus 69±9mL, p=0.003 and left atrium: 99±19 versus 77±17mL, p=0.006.
The mean bipolar voltage was reduced in patients with atrial fibrillation compared to
reference patients (right atrium: 1.7±0.4 versus 2.9±0.4mV; left atrium: 1.7±0.7 versus
3.3±0.7mV, p<0.001). The difference in mean log bipolar voltage between patients
with atrial fibrillation and reference patients varied significantly by Mixed Linear model
according to the region of measurement (right atrium: p=0.002; left atrium: p=0.03).
Regional differences in bipolar voltage with significant differences indicated are
illustrated in Figure 3‐1. Additionally, points in patients with atrial fibrillation at the

89
high‐lateral right atrium, posterior left atrium and the left atrial roof were more likely
to be low voltage (≤0.5mV) (OR 2.9, 95% CI 1.4‐6.3; OR 1.7, 95% CI 1.1‐2.6; OR 3.3, 95%
CI 1.8‐6.3, respectively). No significant areas of electrical silence (≤0.05mV) were
observed in this cohort of patients. Representative examples of electroanatomical
maps in representative patients are shown in Figure 3‐2.
3.3.3 Abnormalities in Conduction Velocity
Patients with atrial fibrillation had a significantly slower mean conduction velocity
during sinus rhythm compared to reference patients (right atrium: 1.3±0.3 versus
2.1±0.5mm/ms; left atrium: 1.2±0.2 versus 2.2±0.4mm/ms, p<0.001). Regional
differences in conduction velocity with significant differences indicated are illustrated
in Figure 3‐3. The total atrial activation time was significantly prolonged in patients
with atrial fibrillation compared to reference patients (128±17 versus 89±10ms,
p<0.001).
3.3.4 Complex Electrograms
Patients with atrial fibrillation demonstrated a significantly greater number of points
with double potentials or fractionated signals than reference patients (27±8 versus
8±5%, p<0.001). Patients with atrial fibrillation were more likely to have a point with a
double potential or fractionated signal in any region than reference patients (p<0.02).
These points were distributed throughout both atria with a clustering at the high‐
90
posterior and high‐septal regions of the right atrium, and the left atrial septum and
roof (Figure 3‐2).
3.4 Discussion
3.4.1 Major findings
This study utilised electroanatomical mapping to demonstrate new information on the
nature of abnormalities within the atria of patients with paroxysmal “lone” atrial
fibrillation, remote from an arrhythmic event.
The major findings are as follows:
(i) Structural abnormalities characterised by atrial dilatation and lower mean
atrial voltage suggesting the loss of atrial myocardium.
(ii) Slower conduction velocities.
(iii) An increase in the proportion of electrograms characterised as double
potentials or fractionated signals.
Thus, these findings suggest that patients with paroxysmal lone atrial fibrillation have
an abnormal electroanatomical atrial substrate. We posit that these abnormalities,
contribute to the “second factor” that promotes progression of atrial fibrillation and
why sinus rhythm does not beget sinus rhythm.
91
3.4.2 Structural changes in Atrial Fibrillation
Despite the early occurrence and reversibility of electrical remodelling of the atria in
response to rate, Ausma et al. (2003) have observed that ultrastructural changes
evolve over a much longer time frame and are not completely resolved as late as four
months after return to sinus rhythm from prolonged atrial fibrillation. These slowly
resolving alterations have been characterised as an increase in myolysis and the
fraction of extracellular matrix per myocyte, as well as changes in the expression of
structural proteins. These observations were associated with longer episodes of
induced atrial fibrillation when compared to baseline inductions.
Recent studies in patients with atrial fibrillation undergoing ablation have
demonstrated the presence of areas of low voltage and electrical silence (Lo et al.
2007; Marcus et al. 2007), and have implicated this substrate as a marker of a worse
outcome following an ablation procedure (Verma et al. 2005). However, these studies
have included patients with structural heart disease and recent arrhythmia, and
therefore may reflect the effects of the associated heart disease and/or remodelling
due to atrial fibrillation itself.
3.4.3 Electroanatomical Studies in Atrial Fibrillation and Related Conditions
In patients with atrial fibrillation there has been little clinical mapping performed
outside the context of recent arrhythmia. For example, Kojodjojo et al. (2007) studied
the electroanatomical maps of patients with paroxysmal and persistent atrial
fibrillation created at their ablation procedure and demonstrated slowing of wave‐
front propagation velocity compared to patients with no atrial fibrillation. In this study,
92
patients with persistent atrial fibrillation had just 10 minutes of sinus rhythm prior to
study and those with paroxysmal atrial fibrillation had a mean arrhythmia burden of
3.2±3.7 hours in the preceding 72 hours. It is therefore uncertain how much of this
observed change is due to electrical remodelling from recent arrhythmia and how
much it is reflecting the actual underlying substrate.
One of the mechanisms by which atrial fibrillation begets atrial fibrillation has been
suggested to be rate‐related remodelling. However, it is unlikely that the abnormalities
that have been observed to result from atrial fibrillation itself form the substrate
predisposing to the development of atrial fibrillation in the first instance. Insights into
the underlying substrate can be gained from looking at the atrial abnormalities
reported in conditions known to be predisposed to atrial fibrillation. Many of these
studies have used electroanatomical maps to illustrate such characteristics in patients
with conditions associated with atrial fibrillation, but without atrial fibrillation
themselves. Sanders et al. studied the right atrial substrate of patients with congestive
heart failure (2003) and sinus node disease (2004a) and reported areas of low voltage
and electrical silence in association with conduction abnormalities. Kistler et al. (2004)
demonstrated progressive changes in older patients without significant heart disease,
when compared to younger cohorts of patients. While these findings have been
restricted to the right atrium, recently similar characteristics have been observed via
electroanatomical mapping in the left atria of patients with mitral stenosis (John et al.
online early).
93
3.4.4 Prior Studies Implicating Abnormalities in “Lone” Atrial Fibrillation
Although patients with “lone” atrial fibrillation are defined as a group with no
structural heart disease, there is accumulating evidence of occult abnormalities.
Frustaci et al. (1997) found abnormal atrial histology including patchy fibrosis and
inflammatory infiltrates in all of 12 patients with paroxysmal lone atrial fibrillation, and
in none of 11 control patients. The fibrosis has been characterised as an increased
concentration of collagen type I in patients with lone atrial fibrillation compared to
controls and this increase has been observed to be attenuated in those patients
receiving angiotensin converting enzyme inhibitors (Boldt et al. 2006). There is further
evidence that inflammation plays a role in atrial fibrillation, with the observation that
C‐reactive protein is elevated in patients with lone atrial fibrillation (Chung et al. 2001).
Jaïs et al. (2000) have demonstrated by transeptal haemodynamic evaluation that
diastolic dysfunction is present in patients with lone atrial fibrillation. Finally, there is
some evidence to suggest that patients with lone atrial fibrillation have microvascular
dysfunction in the coronary circulation (Skalidis et al. 2008). Thus, it is feasible that
patients without overt structural heart disease may have fibrosis, inflammation,
structural change and vascular dysfunction; all features that are consistent with and
contribute to our observations of an abnormal substrate in “lone” atrial fibrillation.
3.4.5 Implications
Our understanding of the atrial substrate predisposing to atrial fibrillation is extended
by this study. We have been able to show that the predominant underlying substrate
in patients with atrial fibrillation is slowing in regional conduction, together with
94
structural change reflected by lower voltage and larger atria. Importantly, this data is
from patients without overt structural heart disease and remote in time from the
remodelling effect of recent arrhythmia in order to minimise the effects of associated
heart conditions and the arrhythmia itself. Future strategies to treat atrial fibrillation
should therefore focus on atrial myocardial structure and conduction. While there is
yet to be definitive long‐term data on the outcome of ablation treatments for patients
with paroxysmal atrial fibrillation, this study raises the possibility of progressive
disease continuing despite apparent procedural success due to the continuing
evolution of abnormal substrate in lone atrial fibrillation.
3.4.6 Limitations
Patients with persistent atrial fibrillation were not studied and may differ in substrate,
however many patients with persistent atrial fibrillation have progressed from
paroxysms initially. While the abnormalities observed in this study are proposed to
constitute the substrate predisposing to atrial fibrillation, the development of clinical
atrial fibrillation is complex and depends not only on substrate but also on other
factors such as triggers and perpetuators that were not addressed by this study.
3.5 Conclusion
Patients with paroxysmal lone atrial fibrillation demonstrate structural abnormalities
characterised by loss of myocardial voltage, conduction slowing and an increase in the

95
proportion of complex electrograms. These abnormalities contribute to the “second
factor” critical to the development and progression of atrial fibrillation.
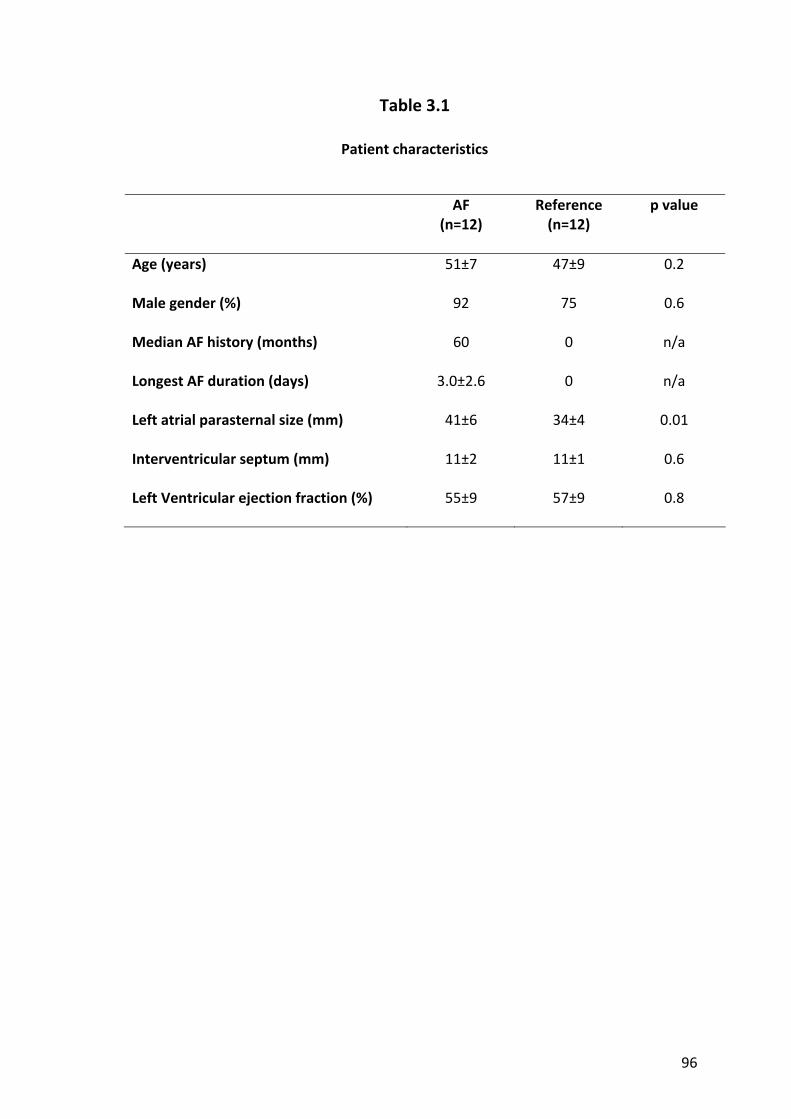
96
Table 3.1
Patient characteristics
AF (n=12)
Reference (n=12)
p value
Age (years) 51±7 47±9 0.2
Male gender (%) 92 75 0.6
Median AF history (months) 60 0 n/a
Longest AF duration (days) 3.0±2.6 0 n/a
Left atrial parasternal size (mm) 41±6 34±4 0.01
Interventricular septum (mm) 11±2 11±1 0.6
Left Ventricular ejection fraction (%) 55±9 57±9 0.8

97
Figure 3‐1
Regional bipolar voltage
Mean (+ standard deviation) bipolar voltage of the 7 right and 6 left atrial regions from
the electroanatomical map.
*p<0.001, †p<0.01, ‡p<0.05. RA – right atrium. LA – left atrium. H – high. L – low.

98
Figure 3‐2
Example electroanatomical bipolar voltage maps
Representative CARTO maps of a patient with atrial fibrillation (bottom) and a
reference patient (top). Both atria are oriented in the posterior‐anterior projection and
are of the same scale. The colour scale is identical in both images with red
representing voltage ≤0.5mV and purple being voltage ≥5mV. In addition to having
greater regions of low voltage (red), the patient with atrial fibrillation has more
evidence of conduction abnormalities in the form of fractionated signals (pink tags)
and double potentials (blue tags).
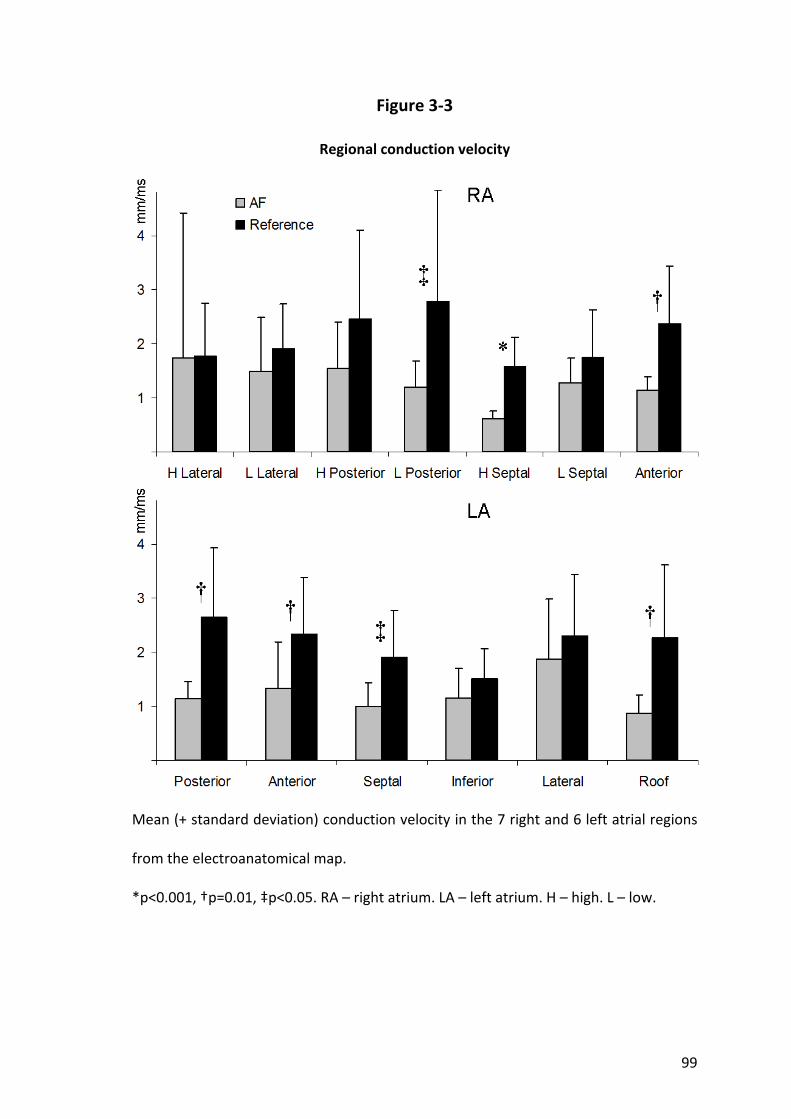
99
Figure 3‐3
Regional conduction velocity
Mean (+ standard deviation) conduction velocity in the 7 right and 6 left atrial regions
from the electroanatomical map.
*p<0.001, †p=0.01, ‡p<0.05. RA – right atrium. LA – left atrium. H – high. L – low.
100
Chapter 4. Right atrial electrical substrate of atrial flutter
4.1 Introduction
The circuit of typical atrial flutter has been well characterised with the crista terminalis
and the tricuspid annulus defined as the posterior and anterior conduction barriers,
respectively (Cosio et al. 1988; Olgin et al. 1995; Kalman et al. 1996; Nakagawa et al.
1996). Ablation of the cavotricuspid isthmus is a highly successful treatment for atrial
flutter, however a significant proportion subsequently develop atrial fibrillation
(Paydak et al. 1998; Chinitz et al. 2007; Ellis et al. 2007). Indeed, atrial flutter has a
close inter‐relationship with atrial fibrillation and the two rhythms frequently co‐exist
(Halligan et al. 2004). Key to the understanding of this relationship are the seminal
observations by Waldo and colleagues that typical atrial flutter almost always develops
from antecedent atrial fibrillation of variable duration (Shimizu et al. 1991; Waldo and
Cooper 1996). One of the postulates for this observation has been that a period of
atrial fibrillation facilitates the development of the functional conduction block along
the crista terminalis required for atrial flutter to sustain.
It is well recognised that atrial fibrillation occurs in patients with structural heart
disease and an abnormal atrial substrate (Kannel et al. 1982b). The atrial substrate has
been extensively characterised in conditions predisposed to the development of atrial
fibrillation such as heart failure, hypertension, valvular heart disease, congenital heart
disease, sinus node disease and ageing (Li et al. 1999; Morton et al. 2003; Sanders et
al. 2003; Verheule et al. 2003; Kistler et al. 2004; Sanders et al. 2004a; Kistler et al.
2006; John et al. online early). Whether similar such abnormal atrial substrate exists in
101
patients with atrial flutter to account for the frequent co‐existence of both
arrhythmias is not known.
We hypothesised that patients with atrial flutter would demonstrate an abnormal
atrial substrate to account for the frequent development of atrial fibrillation. In order
to evaluate the substrate without the electrical remodelling effects of the arrhythmia
itself, we performed electrophysiological mapping of right atrium remote in time from
the arrhythmia.
4.2 Methods
4.2.1 Study Population
This study comprised 8 patients without antecedent atrial fibrillation undergoing
ablation for typical atrial flutter and a reference group of 12 patients undergoing
radiofrequency ablation for atrioventricular reentry tachycardia or atrioventricular
nodal reentry tachycardia. Patients with atrial flutter were selected on the basis of
having ≥2 previous episodes of typical atrial flutter confirmed on a 12‐lead
electrocardiogram. These patients were documented to be in sinus rhythm and
described no symptoms attributable to atrial flutter for at least 1 month prior to
ablation. In addition, all patients underwent continuous monitoring for 7 days prior to
the study and were excluded if they had evidence of any atrial arrhythmia >30
seconds.
All anti‐arrhythmic medication was ceased ≥5 half‐lives prior to the study. No patient
had received amiodarone. All patients provided written informed consent to the study
102
protocol which was approved by the Human Research Ethics Committee of the Royal
Adelaide Hospital.
4.2.2 Electrophysiological Study and Ablation
Electrophysiological study was performed in the post‐absorptive state with sedation
utilising midazolam and fentanyl. In patients with atrial flutter the study protocol was
performed before ablation, while in the reference group this was done after ablation.
Following the study protocol, patients with atrial flutter underwent cavotricuspid
isthmus ablation with a delivered power of 35W with irrigation rates of 30‐60mL/min
and an endpoint of bi‐directional isthmus block.
4.2.3 Electrophysiology Study Protocol
The following catheters were positioned for the study protocol: (i) a 10‐pole catheter
(2‐5‐2mm inter‐electrode spacing, Daig Electrophysiology) within the coronary sinus
with the proximal bipole at the coronary sinus ostium as determined in the best septal
left anterior oblique position; (ii) a 20‐pole “crista” catheter (1‐3‐1mm inter‐electrode
spacing, Biosense‐Webster) placed along the crista terminalis with the distal tip
superiorly such that the second bipole lay at the junction of the superior vena cava and
right atrium, stabilised by a long sheath (CSTA, Daig Electrophysiology) to ensure close
apposition to the postero‐lateral right atrium; and (iii) a 20‐pole catheter (2‐5‐2mm
inter‐electrode spacing, Daig Electrophysiology) placed initially along the lateral right

103
atrium and then moved to the high right atrial septum (Figure 4‐1). The following
parameters were determined:
4.2.3.1 Effective Refractoriness
Atrial ERP was evaluated at twice diastolic threshold at cycle lengths of 600 and 450ms
using an 8‐beat drive followed by an extra‐stimulus, starting with a coupling interval of
150ms increasing in 10ms increments. ERP was defined as the longest coupling interval
failing to propagate to the atrium. At each site the ERP was measured 3 times at each
cycle length and averaged. If ERP varied by >10ms an additional 2 measurements were
made and the total number averaged. ERP was measured from the following sites: (i)
distal coronary sinus; (ii) proximal coronary sinus; (iii) low‐lateral right atrium; (iv) high‐
lateral right atrium; and (v) high‐septal right atrium. Atrial fibrillation induced by ERP
testing lasting >5 minutes was considered sustained; when this occurred, no further
data was acquired.
4.2.3.2 Atrial Conduction
Atrial conduction time was assessed along linearly placed catheters by pacing
the distal bipole (1,2) and determining the conduction time to a proximal bipole (9,10)
at the coronary sinus and lateral right atrium. Conduction time at each site was
averaged over 10 beats during stable capture at 600 and 450ms cycle lengths.
P wave duration was determined as a marker of global conduction by the
average of 10 beats on ECG lead II.

104
4.2.3.3 Site‐specific Conduction Abnormalities at the Crista Terminalis
The number of bipoles on the crista terminalis catheter with discrete double potentials
separated by an isoelectric interval or complex fractionated activity of ≥50ms duration,
and the maximum electrogram duration were determined during sinus rhythm,
constant pacing and for the shortest‐coupled captured extra‐stimulus from the
proximal coronary sinus and low‐lateral right atrium.
4.2.3.4 Sinus Node Function
Sinus node function was evaluated as follows: (i) Baseline sinus cycle length was
determined over 10 consecutive sinus cycles; (ii) SACT was determined after an 8‐beat
pacing train using the formula [SACT = (return ‐ basic cycle length)/2] 3 times and
averaged; and (iii) CSNRT was determined after a 30‐second drive train at cycle lengths
of 600 and 450ms, correcting for the baseline cycle length. At each cycle length, CSNRT
was determined 3 times and averaged.
4.2.4 Statistical Analysis
Continuous variables are reported as mean ± standard deviation or median and inter‐
quartile range as appropriate. Categorical variables are reported as number and
percentage. Proportions were compared using Fisher’s Exact test. Comparisons
between means were analysed using analysis of variance and paired or unpaired t tests
as appropriate. Comparisons with adjustment for multiple sampling within patients
were performed using a Mixed Linear Model for continuous data or a logistic
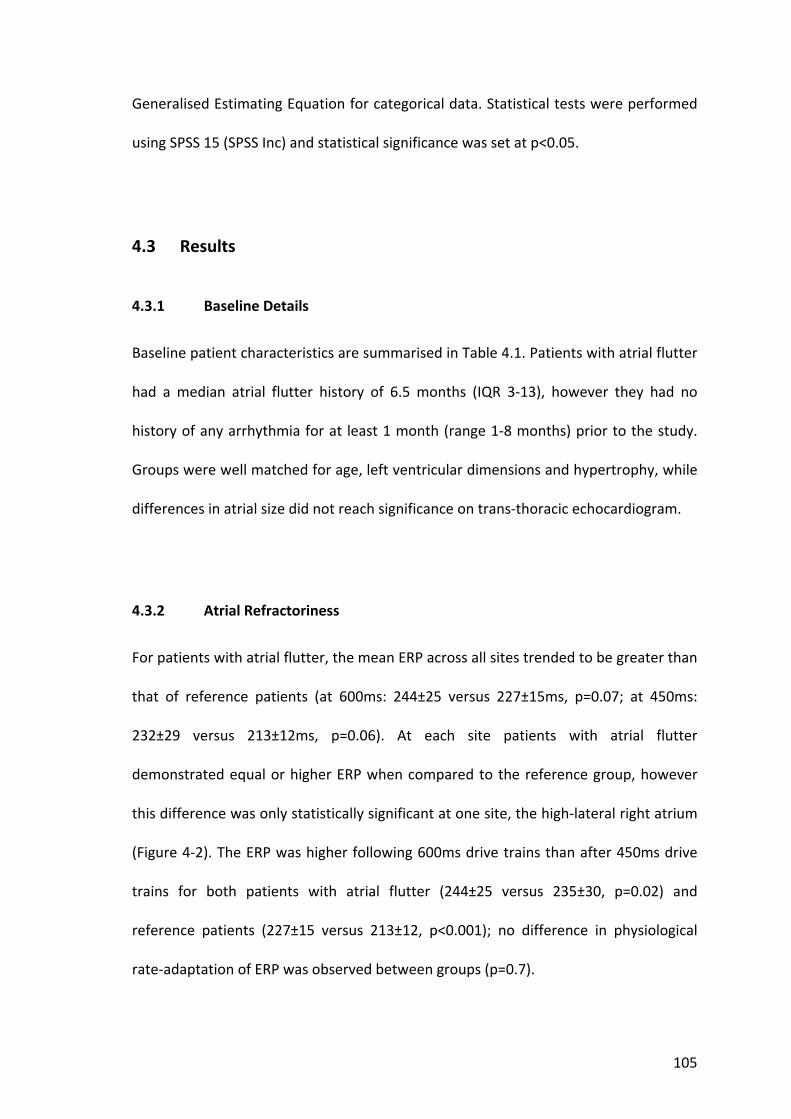
105
Generalised Estimating Equation for categorical data. Statistical tests were performed
using SPSS 15 (SPSS Inc) and statistical significance was set at p<0.05.
4.3 Results
4.3.1 Baseline Details
Baseline patient characteristics are summarised in Table 4.1. Patients with atrial flutter
had a median atrial flutter history of 6.5 months (IQR 3‐13), however they had no
history of any arrhythmia for at least 1 month (range 1‐8 months) prior to the study.
Groups were well matched for age, left ventricular dimensions and hypertrophy, while
differences in atrial size did not reach significance on trans‐thoracic echocardiogram.
4.3.2 Atrial Refractoriness
For patients with atrial flutter, the mean ERP across all sites trended to be greater than
that of reference patients (at 600ms: 244±25 versus 227±15ms, p=0.07; at 450ms:
232±29 versus 213±12ms, p=0.06). At each site patients with atrial flutter
demonstrated equal or higher ERP when compared to the reference group, however
this difference was only statistically significant at one site, the high‐lateral right atrium
(Figure 4‐2). The ERP was higher following 600ms drive trains than after 450ms drive
trains for both patients with atrial flutter (244±25 versus 235±30, p=0.02) and
reference patients (227±15 versus 213±12, p<0.001); no difference in physiological
rate‐adaptation of ERP was observed between groups (p=0.7).

106
4.3.3 Atrial Conduction Time
The conduction time along linear catheters at the lateral right atrium and the coronary
sinus was significantly longer in patients with atrial flutter when compared with
reference patients (p=0.04) and this difference depended on the site of measurement
(p<0.001 for interaction). Post hoc tests performed within the statistical model
revealed slower conduction observed along the lateral right atrium in patients with
atrial flutter than the reference group (67±4 versus 47±3ms, p<0.001) and no
difference in conduction time at the coronary sinus (45±4 versus 46±3ms, p=0.8).
The P wave duration was significantly prolonged in patients with atrial flutter
compared to reference patients (122±18 versus 102±11ms, p=0.007).
4.3.4 Site‐Specific Conduction Abnormalities
Site‐specific conduction abnormalities at the crista terminalis during sinus rhythm
were more apparent in patients with atrial flutter than in reference patients. During
sinus rhythm, patients with atrial flutter had a greater number of bipoles
demonstrating double potentials or fractionated signals on the crista terminalis
catheter than reference patients (4.1±2.6 versus 1.0±1.1 respectively, p=0.001) of
which the maximum electrogram duration was longer (80±26 versus 53±7ms
respectively, p=0.004). These differences were even more marked during pacing and
increased further with extra‐stimulus (Figure 4‐3). These data highlight the functional
nature of the conduction delay at the crista terminalis, as evidenced by variation in the
extent of conduction abnormalities depending on the rate and site of stimulation.
107
4.3.5 Sinus Node Function
Patients with atrial flutter had a longer baseline sinus cycle length than reference
patients (1019±184 versus 777±137ms, p=0.003) and longer CSNRT at 450ms (318±71
versus 203±94ms, p=0.02). Differences in SACT (107±53 versus 82±35ms, p=0.2) and
CSNRT at 600ms (266±113 versus 194±74ms, p=0.1) did not reach significance.
4.4 Discussion
4.4.1 Major Findings
This study utilised electrophysiological mapping to demonstrate new information on
the nature of atrial abnormalities in patients with typical atrial flutter, remote from an
arrhythmic event. The major findings are as follows:
(i) Conduction abnormalities characterised by prolongation of lateral right
atrial conduction time, longer P wave duration and site‐specific conduction
delay.
(ii) Impairment of sinus node function.
(iii) An increase or no change in ERP, consistent with prior studies evaluating
clinical substrates for atrial arrhythmia but in contrast to the remodelling
attributed to atrial arrhythmia itself.
Thus, the present study suggests that patients with atrial flutter, studied remote from
an arrhythmic event, have widespread and persistent abnormal atrial substrate. We
108
posit that these diffuse atrial abnormalities are partly responsible for the frequent
development of atrial fibrillation in patients with atrial flutter.
4.4.2 The Inter‐relationship between Atrial Flutter and Atrial Fibrillation
Ablation of atrial flutter has been observed to significantly reduce the occurrence of
atrial fibrillation at 496±335 days post‐ablation from 55% to 33% (Schmieder et al.
2003). Despite this reduction, reports from patient cohorts followed up after ablation
for atrial flutter describe subsequent atrial fibrillation rates ranging from 25% after
20±9 months surveillance (Paydak et al. 1998) to 82% at 39±11 months follow up (Ellis
et al. 2007). Thus, it is clear that although atrial flutter may be the only clinical
arrhythmia initially apparent, progression to atrial fibrillation is not uncommon.
The atrial arrhythmias of atrial flutter and atrial fibrillation share many of the same
aetiological factors and often co‐exist in the same patient (Vidaillet et al. 2002). Liu et
al. (2002) observed that ablation of conduction gaps in the crista terminalis can result
in the organisation of atrial fibrillation to atrial flutter. Shimizu et al. (1991)
demonstrated in dogs that the onset of atrial flutter in the sterile pericarditis model is
preceded by atrial fibrillation. Ortiz et al. (1994) provided insights into the mechanism
of atrial flutter by demonstrating that maintenance of stable atrial flutter was directly
dependent on sufficient length of functional block being present in the right atrial free
wall. The further observation that triggers in post‐bypass patients led to transitional
atrial fibrillation and then atrial flutter supported the notion that atrial fibrillation,
however short‐lived, was integral to the development of the necessary functional
block (Waldo and Cooper 1996). Roithinger et al. (1997) subsequently observed regular

109
right atrial activation during atrial fibrillation which slowed and organised into atrial
flutter, thereby implicating atrial fibrillation in the generation of atrial flutter.
Testing the hypothesis that atrial fibrillation was indeed necessary for subsequent
atrial flutter, Wazni et al. (2003) studied the effect of trigger elimination by performing
pulmonary vein isolation without cavotricuspid isthmus ablation in 59 patients with
both atrial fibrillation and atrial flutter and found that although 32 of these patients
developed episodes of atrial flutter acutely, only 3 had sustained atrial flutter after 8
weeks. Indeed, patients undergoing ablation for atrial fibrillation in whom atrial flutter
has not been documented clinically or at electrophysiology study have no difference in
outcome with or without cavotricuspid isthmus line (Shah et al. 2007). Patients with
typical atrial flutter in addition to paroxysmal atrial fibrillation have been shown to
have more frequent recurrence of arrhythmia following pulmonary vein cryoisolation
with accompanying isthmus line than patients with atrial fibrillation alone, suggesting
that the substrate of patients with atrial flutter harbours important non‐pulmonary
vein sites of arrhythmogenesis (Moreira et al. 2007).
4.4.3 Substrate Predisposing to the Development of Atrial Flutter
Experimental models have shown the development of an abnormal electrical substrate
with atrial flutter. Morton et al. (2002) demonstrated that prolonged atrial flutter
resulted in an abrupt reduction in refractoriness and a slower reduction in conduction
velocity. Additionally, this study underlined the importance of critically‐timed triggers
in the conversion of atrial flutter to atrial fibrillation after the necessary substrate was
allowed to develop after 4 weeks of atrial flutter.

110
Patients with chronic atrial flutter have been observed to have electrical remodelling
by way of shortened monophasic action potential durations with impaired rate
adaptation compared to control patients (Franz et al. 1997). Ramanna et al. (2005)
have shown that an increase in the dispersion of refractoriness predicts the inducibility
of atrial fibrillation in patients undergoing ablation for atrial flutter. Sparks et al. (2000)
studied patients with paroxysmal atrial flutter and observed a reduction in ERP
immediately following 5‐10 minutes of induced atrial flutter with a return to baseline
ERP over a period of minutes. In patients with chronic atrial flutter however, ERP
remained low out to 30 minutes but was seen to recover (in addition to sinus node
function) when retested at 3 weeks. Further evidence for remodelling of the sinus
node with atrial flutter is reported by Daoud et al. (2002) who studied patients with
chronic atrial flutter following ablation and observed impaired sinus node function
which recovered over a 3 month period.
These reports of electrical remodelling as a result of atrial flutter characterised by ERP
shortening and impairment of sinus node function have underlined the importance of
recent arrhythmia in generating these features. Whether such features persist when
tested remote from an episode of atrial flutter is critical when elucidating the features
of the underlying atrial substrate (rather than the effects of rate related remodelling)
that may aid the progression of arrhythmia to atrial fibrillation.
4.4.4 Substrate in Conditions Predisposed to Atrial Arrhythmia
While studies have implicated the role of shortened ERP resulting from arrhythmia
itself in the development and maintenance of atrial arrhythmia (Morillo et al. 1995;

111
Wijffels et al. 1995), evaluation of conditions predisposed to atrial flutter and atrial
fibrillation (but without arrhythmia) have provided evidence to the contrary. Li et al.
(1999) developed a canine model of congestive heart failure and demonstrated "atrial
remodelling of a different sort" to that seen due to atrial fibrillation alone. An increase
in ERP at short cycle lengths associated with an increase in the heterogeneity of
conduction resulted in longer durations of atrial fibrillation despite the increase in
refractoriness. Verheule et al. (2003) observed an increase in ERP but a propensity for
atrial fibrillation in a canine model of mitral regurgitation, presumed to be due to
abnormalities in conduction and structural remodelling. In humans, patients with atrial
septal defects have demonstrated prolonged ERP and delayed conduction across the
crista terminalis compared to reference patients (Morton et al. 2003). Patients with
congestive heart failure similarly have significant conduction abnormalities and sinus
node dysfunction in association with prolonged ERP (Sanders et al. 2003). Kistler et al.
(2004) have demonstrated widespread and site‐specific conduction abnormalities in a
progressive manner with increasing age. Similar changes have been documented by
Sanders et al. (2004a) and John et al. (online early) in patients with sinus node disease
and rheumatic mitral stenosis, respectively.
These experimental and clinical studies provide compelling evidence that the
predominant electrophysiological features of the substrate for atrial arrhythmias,
excluding the effect of arrhythmia itself, are related to conduction abnormalities
rather than changes in refractoriness. In the current study we have shown that
patients with atrial flutter, studied remote from arrhythmia, have right atrial
conduction abnormalities and sinus node dysfunction, without obvious reduction in

112
refractoriness. These findings are consistent with the studies to have evaluated the
substrate predisposing to atrial fibrillation.
4.4.5 Implications
This study has confirmed the existence of significant widespread remodelling of the
atria in patients with atrial flutter remote from an arrhythmic event characterised by
increased linear conduction times, sinus node dysfunction and site‐specific conduction
abnormalities. Patients were studied remote in time from the arrhythmia itself to
evaluate the underlying substrate without the known confounding effects of
arrhythmia itself, which may well further perpetuate atrial arrhythmia. These findings
strongly argue that patients with atrial flutter have a pre‐existing diffuse substrate
which may contribute to both the frequent co‐existence of atrial fibrillation and the
development of atrial fibrillation after ablation for atrial flutter.
4.4.6 Limitations
While the abnormalities observed in this study may constitute the substrate
predisposing to atrial fibrillation, the development of clinical atrial fibrillation is
complex and depends not only on substrate but also on other factors such as triggers
and perpetuators that were not addressed by this study (Allessie et al. 2001). Access to
the left atrium was not mandated by the clinical procedure therefore no left atrial data
could be collected. Finally, although no patient had symptoms for a month and
patients were monitored for a week prior to the procedure to ensure our evaluation

113
was remote from an episode of atrial flutter, we cannot exclude an additive effect of
rate‐related remodelling, although there is a substantial amount of evidence that
electrical remodelling reverses within a short time after restoration of atrial flutter to
sinus rhythm (Sparks et al. 2000).
4.5 Conclusion
Patients with atrial flutter, remote from an arrhythmic episode, demonstrate
conduction abnormalities and altered sinus node function, without reduction in atrial
refractoriness. These findings suggest that the cause of the observed close inter‐
relationship of atrial flutter and atrial fibrillation may be reflected in this atrial
substrate.

114
Table 4.1
Patient characteristics
Atrial Flutter
(n=8)
Reference
(n=12)
p value
Age (years) 66±8 59±12 0.2
Structural heart disease, n (%) 2 (25) 1 (8) 0.5
Left atrial parasternal size (mm) 41±8 38±7 0.5
Left atrial area (cm2) 22±5 19±4 0.3
Right atrial area (cm2) 19±3 13±6 0.1
LV end‐diastolic dimension (mm) 49±4 46±6 0.3
LV end‐systolic dimension (mm) 30±7 30±5 0.9
Interventricular septum (mm) 10±2 11±1 0.2
LV = left ventricular.
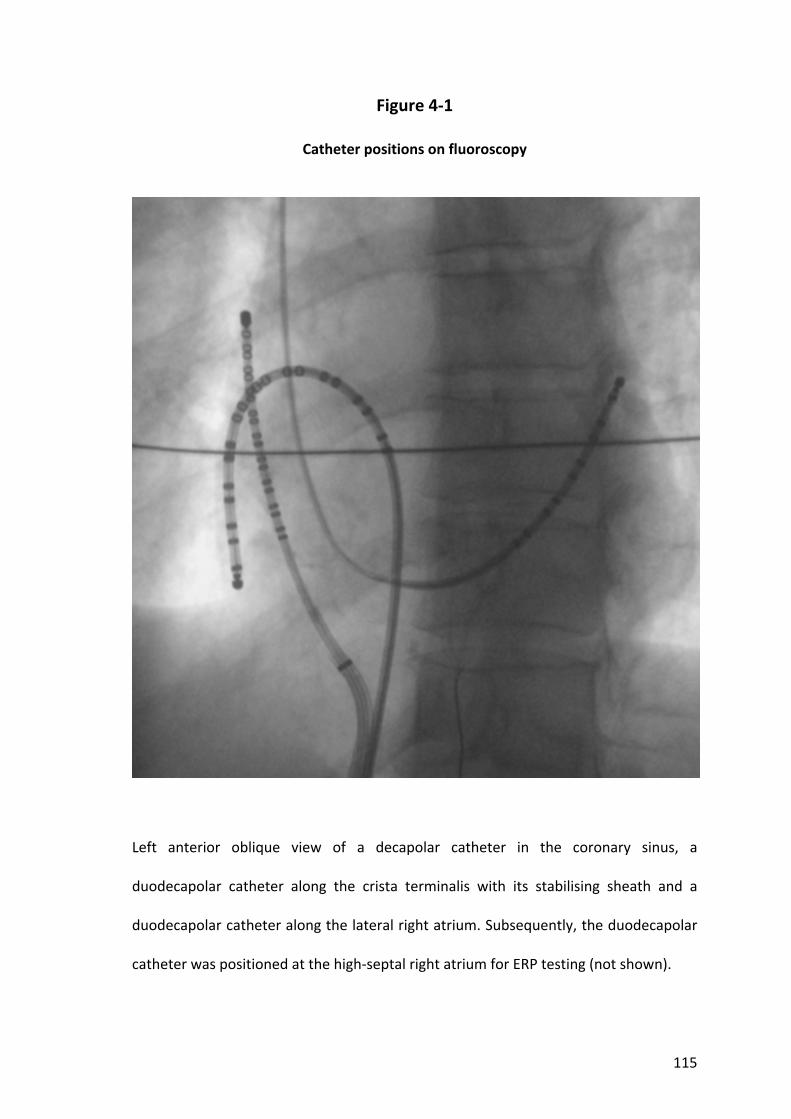
115
Figure 4‐1
Catheter positions on fluoroscopy
Left anterior oblique view of a decapolar catheter in the coronary sinus, a
duodecapolar catheter along the crista terminalis with its stabilising sheath and a
duodecapolar catheter along the lateral right atrium. Subsequently, the duodecapolar
catheter was positioned at the high‐septal right atrium for ERP testing (not shown).

116
Figure 4‐2
Regional effective refractoriness
Mean (+ standard deviation) effective refractory period at the five sites tested
following a 600ms drive train (top) and a 450ms drive train (bottom) in patients with
atrial flutter and reference patients. All values for 600ms are higher than the same
patient group and site value for 450ms.
*p<0.05. dCS – distal coronary sinus. pCS – proximal coronary sinus. LLRA – low lateral
right atrium. HLRA – high lateral right atrium. HRAS – high right atrial septum.
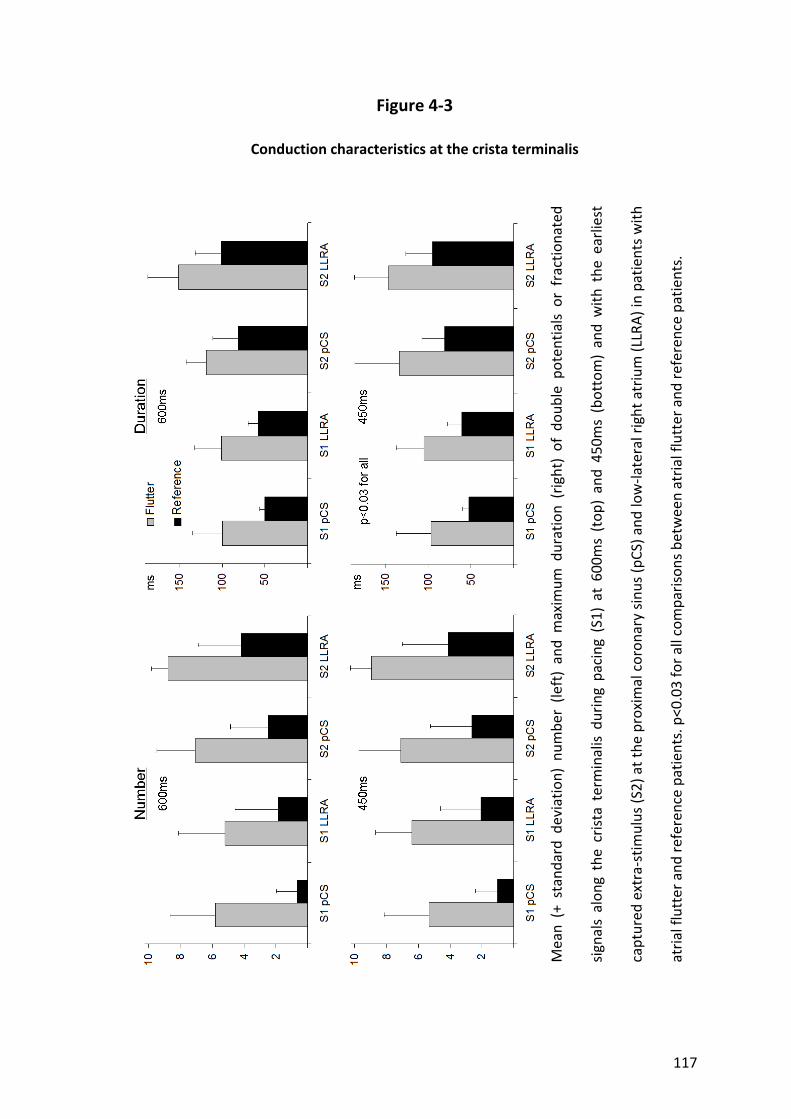
117
Figure 4‐3
Conduction characteristics at the crista terminalis
Mean (+ stand
ard de
viation) num
ber (le
ft) and maxim
um duration (right) of dou
ble po
tentials or fractio
nated
signals alon
g the crista terminalis during pacing
(S1) at 600ms (top
) and 450m
s (bottom) and with
the
earliest
captured
extra‐stim
ulus (S2) at the proxim
al coron
ary sinu
s (pCS) a
nd low‐la
teral right atrium (LLRA) in patie
nts with
atrial flutter a
nd referen
ce patients. p<0.03 for all com
parisons between atrial flutter a
nd referen
ce patients.

118
Chapter 5. Right atrial electroanatomical substrate of atrial flutter
5.1 Introduction
The underlying substrate of typical atrial flutter is not fully understood. Atrial flutter
has a close inter‐relationship with atrial fibrillation and the two rhythms frequently co‐
exist (Halligan et al. 2004). Ablation of atrial flutter has been observed to significantly
reduce the occurrence of atrial fibrillation in the short term (Schmieder et al. 2003).
Despite this reduction a significant proportion, perhaps even the majority with long‐
term follow‐up, eventually develop atrial fibrillation (Paydak et al. 1998; Chinitz et al.
2007; Ellis et al. 2007; Meissner et al. 2007; Moreira et al. 2008). Key to the
understanding of the close inter‐relationship for atrial flutter and atrial fibrillation is
the recognition that typical flutter almost always develops from antecedent atrial
fibrillation of variable duration (Shimizu et al. 1991; Waldo and Cooper 1996;
Roithinger et al. 1997). Emerging evidence implicates abnormal atrial structural
remodelling and its resultant electrophysiological milieu in clinical conditions known to
be predisposed to atrial fibrillation (Li et al. 1999; Morton et al. 2003; Sanders et al.
2003; Verheule et al. 2003; Kistler et al. 2004; Sanders et al. 2004a; Kistler et al. 2006;
John et al. online early). Whether patients with atrial flutter also demonstrate
abnormal substrate outside of the well characterised circuit of typical flutter is not
known.
Critical to our management of patients with both atrial flutter and atrial fibrillation is
an understanding of the interactions and shared characteristics of these rhythms.
Importantly, electrical characteristics of patients with atrial arrhythmia are known to
119
be affected by recent arrhythmia (Wijffels et al. 1995). We hypothesised that patients
with atrial flutter would demonstrate an abnormal atrial substrate to account for the
frequent development of atrial fibrillation. In order to evaluate this we performed
high‐density electroanatomical mapping of the right atrium to assess voltage and
conduction characteristics of the atrial flutter substrate, remote from recent
arrhythmia.
5.2 Methods
5.2.1 Study Population
This study comprised 12 patients without antecedent atrial fibrillation undergoing
ablation for typical atrial flutter and a reference group of 9 patients undergoing
radiofrequency ablation for atrioventricular reentry tachycardia or atrioventricular
nodal reentry tachycardia. Patients with atrial flutter were selected on the basis of
having ≥2 previous episodes of typical atrial flutter confirmed on a 12‐lead
electrocardiogram. These patients were documented to be in sinus rhythm and
described no symptoms attributable to atrial flutter for at least 1 month prior to
ablation. In addition, all patients underwent continuous monitoring for 7 days prior to
the study and were excluded if they had evidence of any atrial arrhythmia >30
seconds.
All anti‐arrhythmic medication was ceased ≥5 half‐lives prior to the study. No patient
had received amiodarone. All patients provided written informed consent to the study

120
protocol which was approved by the Human Research Ethics Committee of the Royal
Adelaide Hospital.
5.2.2 Electrophysiological Study and Ablation
Electrophysiological study was performed in the post‐absorptive state with sedation
utilising midazolam and fentanyl. In patients with atrial flutter the study protocol was
performed before ablation, while in the reference group this was done after ablation.
Following the study protocol, patients with atrial flutter underwent cavotricuspid
isthmus ablation with a delivered power of 35W with irrigation rates of 30‐60mL/min
and an endpoint of bi‐directional isthmus block.
5.2.3 Electroanatomical Study Protocol
Electroanatomical maps were created of the right atrium during sinus rhythm using the
CARTO mapping system (Biosense‐Webster). The electroanatomical mapping system
has been previously described in detail; the accuracy of the sensor position has been
previously validated and is 0.8mm and 5 degrees (Gepstein et al. 1997). In brief, the
system records the surface ECG and bipolar electrograms filtered at 30‐400Hz from the
mapping and reference catheters. Endocardial contact during point acquisition was
facilitated by electrogram stability, fluoroscopy and the catheter icon on the CARTO
system. Points were acquired in the auto‐freeze mode if the stability criteria in space
(≤6mm) and local activation time (≤5ms) were met. Mapping was performed with an
equal distribution of points using a fill‐threshold of 15mm. Editing of points was
121
performed off‐line. Local activation time was manually annotated to the peak of the
largest amplitude deflection on bipolar electrograms; in the presence of double
potentials this was annotated at the largest potential. If the bipolar electrogram
displayed equivalent maximum positive and negative deflections, the maximum
negative deflection on the simultaneously acquired unipolar electrogram was used to
annotate the local activation time. Points not conforming to the surface ECG P wave
morphology or <75% of the maximum voltage of the preceding electrogram were
excluded. Regional atrial bipolar voltage and conduction velocity were analysed as
previously described and are detailed below (Sanders et al. 2003; Kistler et al. 2004;
Sanders et al. 2004a; John et al. online early).
5.2.3.1 Voltage Analysis
For the purposes of evaluating regional voltage differences, each atrium was
segmented using previously validated offline software (Kuklik et al. 2004). The right
atrium was segmented as the high‐ and low‐lateral right atrium, high‐ and low‐
posterior right atrium, high‐ and low‐septal right atrium, and anterior right atrium. At
each of these regions an average voltage of 10 points was determined. The voltage of
points identified by region was exported for analysis. Low voltage points were defined
as points with a bipolar voltage ≤0.5mV and electrically silent points as the absence of
recordable activity or a bipolar voltage amplitude ≤0.05mV (the noise level of the
system).
5.2.3.2 Conduction Velocity Analysis
Isochronal activation maps (5ms intervals) of the atria were created and regional
conduction velocity determined in the direction of the wave‐front propagation (least
122
isochronal crowding). An approximation of conduction velocity was determined by
expressing the distance between two points as a function of the difference in local
activation time. Mean conduction velocity for each region was determined by
averaging the conduction velocity between 5 pairs of points, as previously described
(Sanders et al. 2003; Kistler et al. 2004; Sanders et al. 2004a; John et al. online early).
For the purposes of evaluating regional conduction differences, each atrium was
segmented as above.
5.2.3.3 Complex Electrograms
The proportion of points demonstrating complex electrograms was determined using
the following definitions: (i) Fractionated signals – complex activity of ≥50ms duration;
and (ii) Double potentials – potentials separated by an isoelectric interval where total
electrogram duration was ≥50ms.
5.2.4 Statistical Analysis
Continuous variables are reported as mean ± standard deviation or median and inter‐
quartile range as appropriate. Categorical variables are reported as number and
percentage. Proportions were compared using Fisher’s Exact test. Comparisons
between means were analysed using analysis of variance and paired or unpaired t tests
as appropriate. Comparisons with adjustment for multiple sampling within patients
were performed using a Mixed Linear Model for continuous data or a logistic
Generalised Estimating Equation for categorical data. Statistical tests were performed
using SPSS 15 (SPSS Inc) and statistical significance was set at p<0.05.

123
5.3 Results
5.3.1 Baseline Details
Baseline patient characteristics are summarised in Table 5.1. Patients with atrial flutter
had a median atrial flutter history of 16 months (IQR 8‐22), however they had no
history of any arrhythmia for at least 1 month (range 1‐7 months) prior to the study.
Groups were well matched for age, left ventricular dimensions and hypertrophy,
however patients with atrial flutter had significantly larger left atria on trans‐thoracic
echocardiogram.
A total of 97±19 points per patient were analysed in the right atrium using
electroanatomical mapping.
5.3.2 Structural and Voltage Abnormalities
Mean right atrial volume by electroanatomical map was significantly greater in
patients with atrial flutter compared to reference patients (121±30 versus 83±24mL,
p=0.005). The mean right atrial bipolar voltage was reduced in patients with atrial
flutter compared to reference patients (2.1±0.5 versus 3.0±0.5mV, p<0.001). Regional
differences in bipolar voltage are illustrated in Figure 5‐1; significant differences
between patients with atrial flutter and reference patients were seen in high‐lateral,
high‐posterior and anterior regions. Additionally, points at the high‐posterior region
were more likely to be low voltage (≤0.5mV) in patients with atrial flutter (odds ratio
3.7, 95% CI 2.1‐6.7). No significant areas of electrical silence (≤0.05mV) were observed.

124
Illustrative examples of electroanatomical maps in representative patients are shown
in Figure 5‐2.
5.3.3 Abnormalities in Conduction Velocity
Patients with atrial flutter had slower mean conduction velocity during sinus rhythm
compared to reference patients (1.2±0.2 versus 2.1±0.6mm/ms, p<0.001). Figure 5‐3
illustrates regional conduction velocities, which were significantly slower in patients
with atrial flutter compared to reference patients at the high‐lateral, low‐posterior,
low‐septal and anterior right atrium.
The right atrial activation time was significantly prolonged in patients with atrial flutter
compared to reference patients (107±23 versus 85±14ms, p=0.02).
5.3.4 Complex Electrograms
Patients with atrial flutter demonstrated a significantly greater number of points with
double potentials or fractionated signals than reference patients (16±4 versus 10±6%,
p=0.006). These points were distributed throughout both atria with a clustering at the
high‐posterior, high‐lateral and high‐septal regions of the right atrium (Figure 5‐2).
125
5.4 Discussion
5.4.1 Major Findings
This study utilised electroanatomical mapping to demonstrate new information on the
nature of atrial abnormalities in patients with typical atrial flutter, remote from an
arrhythmic event. The major findings are as follows:
(i) Structural abnormalities characterised by atrial dilatation and lower mean
right atrial voltage suggesting the loss of atrial myocardium.
(ii) Slower conduction velocities.
(iii) An increase in the proportion of electrograms characterised as double
potentials or fractionated signals.
Thus, the present study suggests that patients with atrial flutter, studied remote from
an arrhythmic event, have widespread and persistent abnormal atrial substrate. We
posit that these diffuse atrial abnormalities are partly responsible for the frequent
development of atrial fibrillation in patients with atrial flutter.
5.4.2 Substrate in Clinical Conditions Associated with Atrial Arrhythmia
Sanders et al. have demonstrated significant electroanatomical remodelling with areas
of low voltage and electrical scar with associated widespread conduction abnormalities
in patients with congestive heart failure (2003) and sinus node disease (2004a)
compared to control groups. Kistler et al. (2004) have demonstrated by
electroanatomical mapping studies that ageing is associated with progressive regional

126
conduction slowing and structural changes that include areas of low voltage. Perhaps
the most marked changes have been shown in patients with rheumatic mitral stenosis
in whom striking differences in voltage, conduction velocity and the proportion of
complex electrograms are seen when compared to controls (John et al. online early). In
addition to the clinical studies, animal models of such diseases have revealed similar
features in the abnormal substrate contributing to the potential for arrhythmia (Li et
al. 1999; Verheule et al. 2003; Kistler et al. 2006).
These studies provide compelling evidence that the predominant contributors to the
substrate for atrial arrhythmias are diffuse structural and conduction abnormalities. In
the current study we have shown that patients with atrial flutter, studied remote from
arrhythmia, have right atrial structural remodelling with associated conduction
abnormalities. These findings are thus consistent with the studies to have evaluated
the clinical substrate predisposing to atrial fibrillation.
5.4.3 Substrate in Experimental Models of Atrial Flutter
Early work to create atrial flutter in animals included a crush injury model by creating a
lesion between the venae cavae (Rosenbleuth and Garcia‐Ramos 1947). Based on the
epicardial maps, the authors deduced that the reentry loop circled around the atrial
crush lesion. Much work on atrial flutter has been performed in the sterile pericarditis
dog model which has been shown to dependably produce this arrhythmia to allow
characterisation of the circuit (Page et al. 1986). One of the critical features
demonstrated by this model is that a sufficient length of functional block is critical to
the maintenance of atrial flutter (Ortiz et al. 1994). Interestingly, the time course of
127
atrial flutter developing is similar to that of the post‐bypass arrhythmias seen clinically
(Waldo and Cooper 1996); this underscores the role of pericardial inflammation in the
genesis of arrhythmia in cardiac surgery patients. More recently, the role of
inflammation in atrial flutter has been highlighted in a study in which the usually
reliable induction of atrial flutter in the sterile pericarditis model was abolished by pre‐
treatment with prednisone (Goldstein et al. 2008). Histological and gross inspection of
the atria revealed marked structural changes of inflammation only in the untreated
group, all of whom (bar one with atrial fibrillation) developed atrial flutter as expected.
A sheep model of atrial flutter demonstrated that sustained atrial flutter for 4 weeks
allows the development of atrial substrate such that conversion to atrial fibrillation is
achieved by extra‐stimuli and that this new rhythm is able to be maintained (Morton
et al. 2002).
5.4.4 Substrate in Clinical Atrial Flutter
Studies of human atrial flutter have been mainly concerned with elucidating the typical
flutter circuit within the right atrium. This has now been well characterised with the
posterior and anterior barriers to the circuit defined as the crista terminalis and the
tricuspid valve, respectively (Olgin et al. 1995; Kalman et al. 1996). Differences in the
atrial flutter circuit between young and old have been published, with younger
patients tending toward slowest conduction in the lateral isthmus while older patients
demonstrate a low voltage zone and slowest conduction in the medial isthmus (Huang
et al. 2008). The substrate of patients with both atrial fibrillation and atrial flutter may
differ from that seen in atrial fibrillation alone. Patients with typical atrial flutter in

128
addition to paroxysmal atrial fibrillation have been shown to have more frequent
recurrence of arrhythmia following pulmonary vein isolation with accompanying
isthmus line (Moreira et al. 2007). This suggests that non‐pulmonary vein sites are
more important to the maintenance of atrial fibrillation in patients with co‐existent
atrial flutter and supports the view that the atrial substrate in atrial flutter is indeed
diffuse throughout the atria.
5.4.5 Implications
This study has confirmed the existence of significant diffuse remodelling of the atria in
patients with atrial flutter remote from an arrhythmic event characterised by regional
slowing in conduction and structural change reflected in lower voltage, larger atria and
widespread conduction abnormalities. Patients were studied remote in time from the
arrhythmia itself to evaluate the underlying substrate without the known confounding
effects of arrhythmia itself, which may well further perpetuate atrial arrhythmia. These
findings strongly argue that patients with atrial flutter have a pre‐existing diffuse
substrate which may contribute to both the frequent co‐existence of atrial fibrillation
and the development of atrial fibrillation after ablation for atrial flutter.
5.4.6 Limitations
Access to the left atrium was not mandated by the clinical procedure therefore no left
atrial data could be collected. While the abnormalities observed in this study may
constitute the substrate predisposing to atrial fibrillation, the development of clinical
129
atrial fibrillation is complex and depends not only on substrate but also on other
factors such as triggers and perpetuators that were not addressed by this study
(Allessie et al. 2001).
5.5 Conclusion
Patients with atrial flutter, remote from an arrhythmic episode, demonstrate structural
abnormalities characterised by loss of myocardial voltage, conduction slowing and an
increase in the proportion of abnormal electrograms. These findings suggest that the
cause of the observed close inter‐relationship of atrial flutter and atrial fibrillation may
be reflected in this atrial substrate.

130
Table 5.1
Patient characteristics
Atrial Flutter
(n=12)
Reference
(n=9)
p value
Age (years) 55±10 59±15 0.5
Structural heart disease, n (%) 2 (17) 1 (11) 1.0
Left atrial parasternal size (mm) 41±4 34±4 0.001
Left atrial area (cm2) 24±6 17±1 0.047
Right atrial area (cm2) 19±4 17±4 0.5
LV end‐diastolic dimension (mm) 52±4 50±6 0.5
LV end‐systolic dimension (mm) 30±6 34±5 0.2
Interventricular septum (mm) 12±5 10±2 0.5
LV = left ventricular.
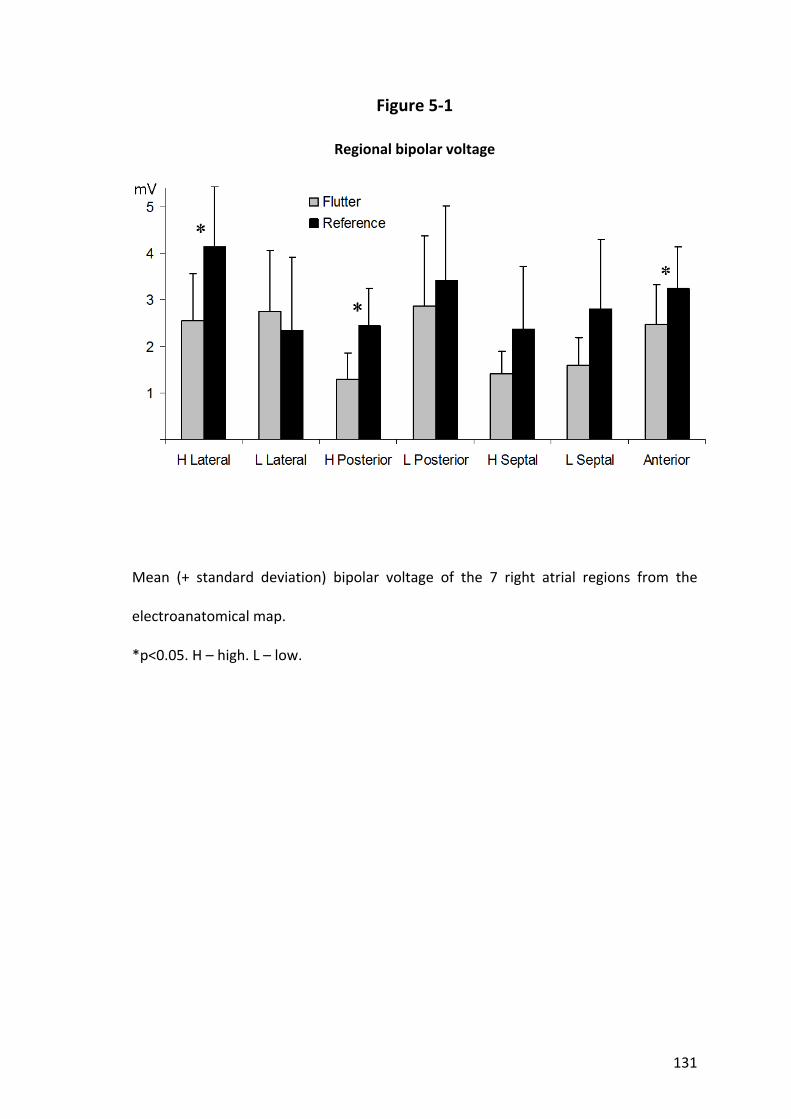
131
Figure 5‐1
Regional bipolar voltage
Mean (+ standard deviation) bipolar voltage of the 7 right atrial regions from the
electroanatomical map.
*p<0.05. H – high. L – low.

132
Figure 5‐2
Example electroanatomical bipolar voltage maps
Representative CARTO maps of a patient with atrial flutter (right) and a reference
patient (left). Both are oriented in the posterior‐anterior projection and are of the
same scale. The colour scale is identical in both images with red representing voltage
≤0.5mV and purple being voltage ≥5mV. In addition to having greater regions of low
voltage (red), the patient with atrial flutter has evidence of conduction abnormalities
in the form of fractionated signals (pink tags) and double potentials (blue tags).

133
Figure 5‐3
Regional conduction velocity
Mean (+ standard deviation) conduction velocity in the 7 right atrial regions from the
electroanatomical map.
*p<0.05. H – high. L – low.
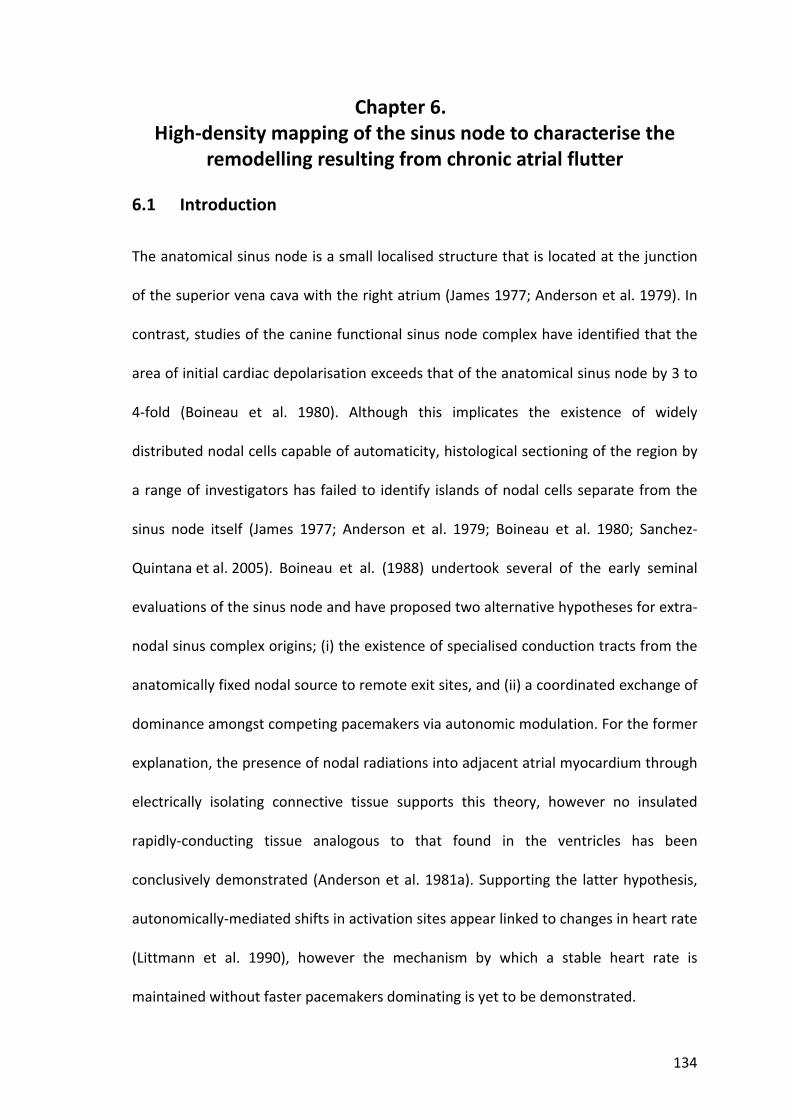
134
Chapter 6. High‐density mapping of the sinus node to characterise the
remodelling resulting from chronic atrial flutter
6.1 Introduction
The anatomical sinus node is a small localised structure that is located at the junction
of the superior vena cava with the right atrium (James 1977; Anderson et al. 1979). In
contrast, studies of the canine functional sinus node complex have identified that the
area of initial cardiac depolarisation exceeds that of the anatomical sinus node by 3 to
4‐fold (Boineau et al. 1980). Although this implicates the existence of widely
distributed nodal cells capable of automaticity, histological sectioning of the region by
a range of investigators has failed to identify islands of nodal cells separate from the
sinus node itself (James 1977; Anderson et al. 1979; Boineau et al. 1980; Sanchez‐
Quintana et al. 2005). Boineau et al. (1988) undertook several of the early seminal
evaluations of the sinus node and have proposed two alternative hypotheses for extra‐
nodal sinus complex origins; (i) the existence of specialised conduction tracts from the
anatomically fixed nodal source to remote exit sites, and (ii) a coordinated exchange of
dominance amongst competing pacemakers via autonomic modulation. For the former
explanation, the presence of nodal radiations into adjacent atrial myocardium through
electrically isolating connective tissue supports this theory, however no insulated
rapidly‐conducting tissue analogous to that found in the ventricles has been
conclusively demonstrated (Anderson et al. 1981a). Supporting the latter hypothesis,
autonomically‐mediated shifts in activation sites appear linked to changes in heart rate
(Littmann et al. 1990), however the mechanism by which a stable heart rate is
maintained without faster pacemakers dominating is yet to be demonstrated.

135
The observations above were based on conventional mapping techniques. However,
newer mapping technology has provided novel insights into arrhythmia mechanisms
not previously afforded using conventional techniques. Higa et al. (2004) used non‐
contact mapping, and demonstrated “preferential pathways” from earliest activation
to the site where break‐out occurs to the remaining atria in ectopic atrial tachycardia.
Whether similar pathways exist to account for the discrepancy between the
anatomical and functional sinus node complex is not known.
This study aimed to characterise the electrical properties of the functional sinus node
complex in the normal heart. To further explore the sinus node complex activity, the
same characterisation was performed in a group known to have impaired sinus node
function (Sparks et al. 2000; Daoud et al. 2002) to establish how sinus node activity is
affected by atrial remodelling. The anatomical and electrical resolution provided by the
three‐dimensional, simultaneous, high‐density EnSite Array mapping system (St Jude
Medical) provides the ability to examine the extent and variability of endocardial sinus
activation with detail not previously available.
6.2 Methods
6.2.1 Study Population
Fifteen patients with structurally normal hearts undergoing radiofrequency ablation
for atrioventricular nodal reentry tachycardia were studied as a reference group. To
evaluate the effects of remodelling, a further 16 patients undergoing ablation for
chronic typical atrial flutter (median 8 months, IQR 6‐23) were studied. The latter
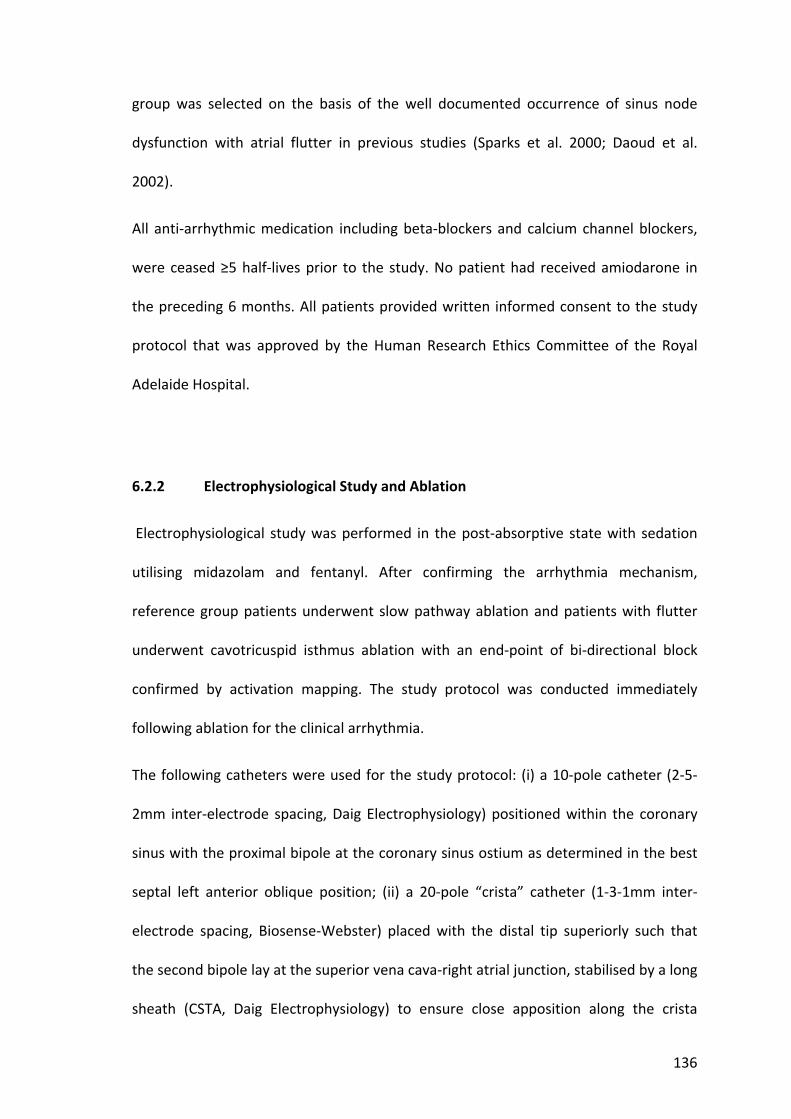
136
group was selected on the basis of the well documented occurrence of sinus node
dysfunction with atrial flutter in previous studies (Sparks et al. 2000; Daoud et al.
2002).
All anti‐arrhythmic medication including beta‐blockers and calcium channel blockers,
were ceased ≥5 half‐lives prior to the study. No patient had received amiodarone in
the preceding 6 months. All patients provided written informed consent to the study
protocol that was approved by the Human Research Ethics Committee of the Royal
Adelaide Hospital.
6.2.2 Electrophysiological Study and Ablation
Electrophysiological study was performed in the post‐absorptive state with sedation
utilising midazolam and fentanyl. After confirming the arrhythmia mechanism,
reference group patients underwent slow pathway ablation and patients with flutter
underwent cavotricuspid isthmus ablation with an end‐point of bi‐directional block
confirmed by activation mapping. The study protocol was conducted immediately
following ablation for the clinical arrhythmia.
The following catheters were used for the study protocol: (i) a 10‐pole catheter (2‐5‐
2mm inter‐electrode spacing, Daig Electrophysiology) positioned within the coronary
sinus with the proximal bipole at the coronary sinus ostium as determined in the best
septal left anterior oblique position; (ii) a 20‐pole “crista” catheter (1‐3‐1mm inter‐
electrode spacing, Biosense‐Webster) placed with the distal tip superiorly such that
the second bipole lay at the superior vena cava‐right atrial junction, stabilised by a long
sheath (CSTA, Daig Electrophysiology) to ensure close apposition along the crista
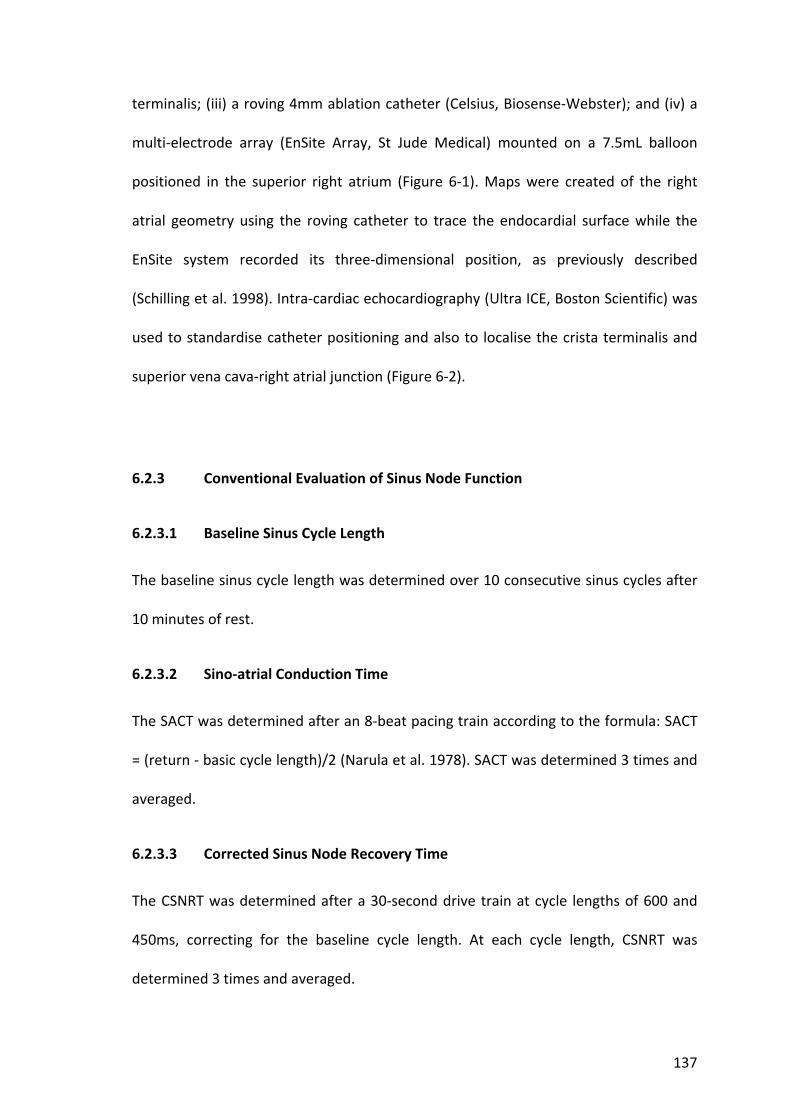
137
terminalis; (iii) a roving 4mm ablation catheter (Celsius, Biosense‐Webster); and (iv) a
multi‐electrode array (EnSite Array, St Jude Medical) mounted on a 7.5mL balloon
positioned in the superior right atrium (Figure 6‐1). Maps were created of the right
atrial geometry using the roving catheter to trace the endocardial surface while the
EnSite system recorded its three‐dimensional position, as previously described
(Schilling et al. 1998). Intra‐cardiac echocardiography (Ultra ICE, Boston Scientific) was
used to standardise catheter positioning and also to localise the crista terminalis and
superior vena cava‐right atrial junction (Figure 6‐2).
6.2.3 Conventional Evaluation of Sinus Node Function
6.2.3.1 Baseline Sinus Cycle Length
The baseline sinus cycle length was determined over 10 consecutive sinus cycles after
10 minutes of rest.
6.2.3.2 Sino‐atrial Conduction Time
The SACT was determined after an 8‐beat pacing train according to the formula: SACT
= (return ‐ basic cycle length)/2 (Narula et al. 1978). SACT was determined 3 times and
averaged.
6.2.3.3 Corrected Sinus Node Recovery Time
The CSNRT was determined after a 30‐second drive train at cycle lengths of 600 and
450ms, correcting for the baseline cycle length. At each cycle length, CSNRT was
determined 3 times and averaged.

138
6.2.3.4 Conduction Properties at the Crista Terminalis
Site‐specific conduction properties at the crista terminalis were quantified by
recording the presence of electrograms with discrete double potentials separated by
an isoelectric interval or complex fractionated activity of ≥50ms duration on each
recording bipole of the crista terminalis catheter. Both the number of bipoles
demonstrating these conduction characteristics and the maximum electrogram
duration were determined over ten beats in sinus rhythm and one beat immediately
after the cessation of each pacing train.
6.2.4 High‐Density Simultaneous Unipolar Mapping of Sinus Node Function
Mapping of the sinus node complex was performed during baseline sinus rhythm and
also after pace suppression of sinus pacemaker activity following 30‐second drive
trains at 600 and 450ms. Sinus node activation was characterised by determining the
positions of earliest activation (EA) and sinus break‐out (SBO). EA was defined as the
earliest unipolar electrogram displaying a “QS” pattern and SBO as the earliest
unipolar electrogram displaying an “RS” pattern and a sudden increase in dV/dt
indicating rapid depolarisation of surrounding myocardium, as previously described
(Higa et al. 2004). For review of the recorded data the high‐pass filter was set to 1Hz to
allow for slow conduction of the activation wave‐front. The position of the virtual
electrodes in the region of interest was repeatedly adjusted to find the points of
interest. The following parameters were evaluated from simultaneous unipolar
recordings of right atrial activation from the balloon array.
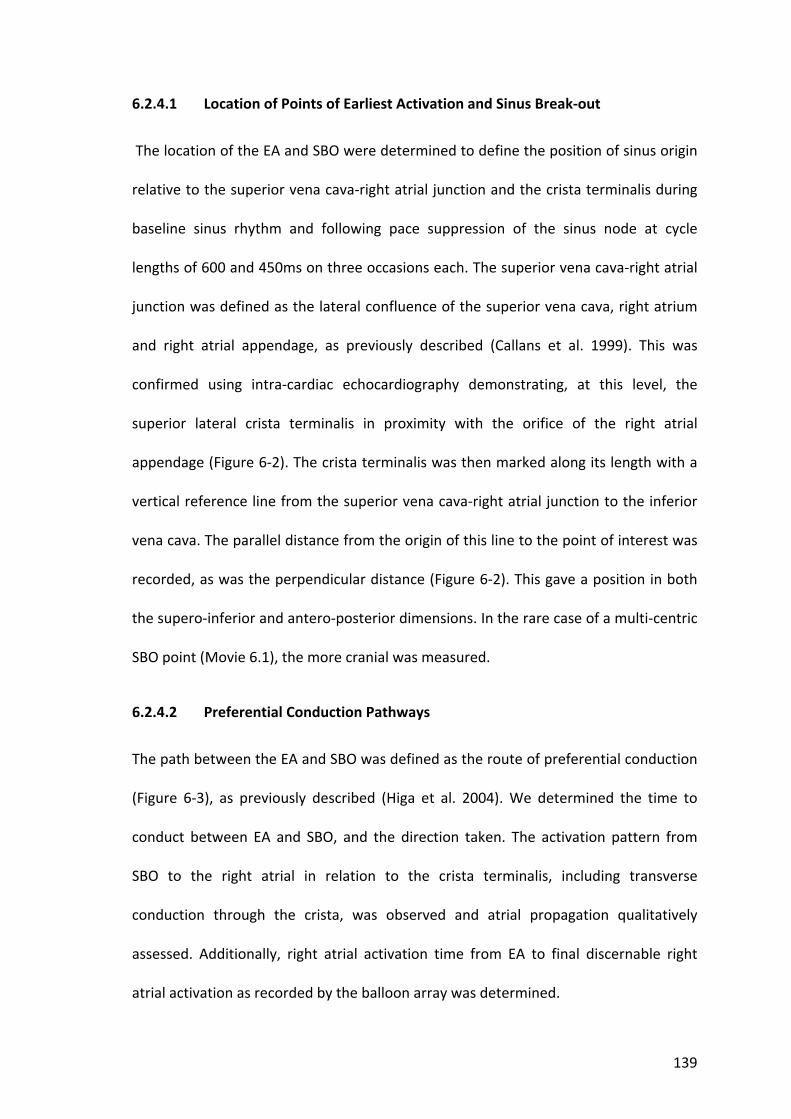
139
6.2.4.1 Location of Points of Earliest Activation and Sinus Break‐out
The location of the EA and SBO were determined to define the position of sinus origin
relative to the superior vena cava‐right atrial junction and the crista terminalis during
baseline sinus rhythm and following pace suppression of the sinus node at cycle
lengths of 600 and 450ms on three occasions each. The superior vena cava‐right atrial
junction was defined as the lateral confluence of the superior vena cava, right atrium
and right atrial appendage, as previously described (Callans et al. 1999). This was
confirmed using intra‐cardiac echocardiography demonstrating, at this level, the
superior lateral crista terminalis in proximity with the orifice of the right atrial
appendage (Figure 6‐2). The crista terminalis was then marked along its length with a
vertical reference line from the superior vena cava‐right atrial junction to the inferior
vena cava. The parallel distance from the origin of this line to the point of interest was
recorded, as was the perpendicular distance (Figure 6‐2). This gave a position in both
the supero‐inferior and antero‐posterior dimensions. In the rare case of a multi‐centric
SBO point (Movie 6.1), the more cranial was measured.
6.2.4.2 Preferential Conduction Pathways
The path between the EA and SBO was defined as the route of preferential conduction
(Figure 6‐3), as previously described (Higa et al. 2004). We determined the time to
conduct between EA and SBO, and the direction taken. The activation pattern from
SBO to the right atrial in relation to the crista terminalis, including transverse
conduction through the crista, was observed and atrial propagation qualitatively
assessed. Additionally, right atrial activation time from EA to final discernable right
atrial activation as recorded by the balloon array was determined.
140
6.2.4.3 Voltage in the Right Atrium and Crista Terminalis
Unipolar voltage at the points of EA and SBO was recorded. Electrograms for 100ms
following EA were exported from the EnSite Array for further analysis. This included
256 evenly distributed electrograms throughout the right atrium and 10 evenly spaced
electrograms along the length of the crista terminalis. From these exports, peak
negative unipolar voltage of the entire right atrium and along the crista terminalis was
determined. Additionally, right atrial surface area and distance to the array was able to
be determined from the exported geometry.
6.2.5 Statistical Analysis
Continuous variables are reported as mean ± standard deviation or median and inter‐
quartile range as appropriate to its distribution. Categorical variables are reported as
number and percentage. Comparisons between groups were performed using
unpaired t tests or Mann‐Whitney U tests. Proportions were compared using Fisher’s
Exact test. Comparisons with adjustment for multiple sampling within patients were
performed using a Mixed Linear Model for continuous data or a logistic Generalised
Estimating Equation for categorical data. Statistical tests were performed using SPSS
15 (SPSS Inc) and statistical significance was set at p<0.05.
141
6.3 Results
6.3.1 Baseline Details
Baseline patient characteristics are summarised in Table 6.1. Mean distance from the
array to the right atrial geometry was 30±3mm and the crista terminalis was 23±3mm,
well within the reported limits of accuracy (Thiagalingam et al. 2004b). Baseline sinus
cycle length did not differ significantly between reference patients and those recently
ceasing chronic flutter (775±104ms versus 784±193ms, p=0.9). Differences were seen
between the reference group and patients with flutter in right atrial surface area
(132±12 versus 163±34cm2, p=0.003), P wave duration (109±13 versus 147±13ms,
p<0.001), inter‐caval distance (70±7 versus 87±8mm, p<0.001), and right atrial
activation time (92±12 versus 120±15ms, p<0.001).
6.3.2 Sinus Node Dysfunction and Atrial Remodelling
Reference patients had normal measures of sinus node function, including SACT
(83±33ms) and CSNRT (at 600ms: 245±88ms; at 450ms: 253±96ms). Patients with
flutter demonstrated longer SACT (150±100ms, p=0.03) and longer CSNRT (at 600ms:
339±151ms, p=0.04; at 450ms: 498±409ms, p=0.03). Site‐specific conduction
abnormalities at the crista terminalis during sinus rhythm were significantly less in the
reference group than in patients with flutter (Figure 6‐4): the number of double
potentials or fractionated electrograms was 2.1±1.8 versus 5.4±2.9, p=0.002; the
maximum duration of such signals was 60±15 versus 72±14ms, p=0.04. These

142
differences were even more marked during and immediately following 30‐second
pacing trains (Table 6.2).
6.3.3 Extent and Shift of the Atrial Pacemaker Complex
As determined by the multi‐polar array, the mean distance from the superior vena
cava‐right atrial junction to the point of EA was 4±4mm and SBO 9±6mm in reference
patients. The mean distance from the crista terminalis in an anterior direction was
8±11mm for EA and 14±8mm for SBO. For patients with flutter, the distance inferiorly
from the superior vena cava‐right atrial junction was greater (EA: 15±12mm, p=0.003;
SBO: 23±11mm, p<0.001). The distance from the crista terminalis anteriorly to the EA
(5±14mm, p=0.5) or SBO (16±7mm, p=0.5) did not differ for patients with flutter.
Normalised to mean inter‐caval distance for this group with larger right atria, the
distance inferiorly to EA (p=0.007) and SBO (p=0.003) remained significantly different
from the reference group.
Following 30‐second pacing trains the mean distance from the superior vena cava‐right
atrial junction to EA and SBO points changed significantly for reference patients (EA
4±4 to 13±8mm, p=0.006; SBO 9±6 to 16±10mm, p=0.02); representing a mean caudal
shift for EA of 10±9mm and for SBO of 7±8mm. For patients with flutter the mean
distance from the superior vena cava‐right atrial junction to EA and SBO points also
changed significantly (EA 15±12 to 19±12mm, p=0.045; SBO 23±11 to 28±9mm,
p=0.02). However, caudal shift was markedly diminished in patients with flutter
compared to the reference group; EA was 4±7mm and SBO 4±6mm. The change in
distance from the crista terminalis anteriorly to the EA or SBO following pacing did not
143
significantly differ for either patient group. Figure 6‐5 demonstrates the mean location
and caudal shift of the physiological pacemaker complex and a representative example
is shown in Figure 6‐6. The median number of beats for activation to resume baseline
position was 2 (IQR 1 to 4, range 1 to 28 beats) and did not significantly differ between
patient groups.
6.3.4 Preferential Pathway Conduction
The mean time to conduct along the preferential pathway from EA to SBO was 15±5ms
for the reference group. Patients with flutter took significantly longer (23±8ms,
p=0.005) to conduct between the two points. While the SBO was located at or anterior
to the crista terminalis in all patients, the preferential pathway between the EA to the
SBO was directed inferiorly in 63%, anteriorly in 22%, posteriorly in 10% and superiorly
in 5% of beats analysed; no difference was seen between patient groups.
6.3.5 Beat‐to‐beat Variation in Sinus Node Function
The beat‐to‐beat site of EA ranged within an individual from 0 to 41mm (median 19,
IQR 7‐31) from the superior vena cava‐right atrial junction suggesting the capacity for
multi‐centric activation. We did not observe simultaneously occurring multi‐centric EA
points. Beat‐to‐beat variation of SBO ranged within an individual from 0 to 33mm
(median 12, IQR 8‐23). In contrast to EA, there were 3 controls who demonstrated dual
near‐simultaneous SBO points during a single beat (Movie 6.1). In all 3 instances, one
of the SBO points was on the crista terminalis.

144
6.3.6 Crista Terminalis Conduction
More frequent transverse conduction through the crista terminalis was seen during
sinus rhythm beats in the reference group than in the patients with flutter (38% versus
4%, p=0.003), almost invariably through the superior third of the crista near the level
of the SBO point. For those beats analysed in which there was no conduction through
the crista terminalis, the delay between anterior and posterior activation of the crista
was 17±6ms for reference patients and 24±7ms for patients with flutter (p=0.02). The
circuitous activation pattern subsequent to SBO in such patients was in 2 directions:
inferiorly down the anterior border of the crista terminalis to the anterior right atrium,
and supero‐posteriorly over the basal appendage and then inferiorly down the
posterior right atrium (Figure 6‐7).
6.3.7 Voltage Findings
For reference patients, mean unipolar voltage was 1.8±0.6mV for the right atrium,
1.9±0.6mV along the crista terminalis, 0.12±0.10mV at the point of EA and 3.2±1.5mV
at the point of SBO. The average maximum unipolar voltage recorded was 5.0±1.8mV
for the right atrium and 3.5±1.4mV along the crista terminalis. Patients with flutter
trended to lower mean right atrial voltage (1.4±0.6mV, p=0.1), while mean voltage at
the crista (1.3±0.6mV, p=0.009) and point of SBO (1.5±1.4mV, p=0.005) was
significantly lower compared to reference patients. Voltage at the point of EA did not
differ (0.12±0.13mV, p=0.9). As with mean voltage, maximum voltage for the right
atrium trended to lower for patients with flutter (3.9+2.1mV, p=0.2) and was

145
significantly less at the crista terminalis (2.2±1.2mV, p=0.01). Differences in voltage
parameters are shown in Table 6.3.
6.4 Discussion
6.4.1 Major Findings
This study utilised high‐density simultaneous endocardial unipolar mapping of sinus
rhythm to describe the characteristics of the functional sinus node complex and the
effects of remodelling due to chronic atrial flutter. The major findings are as follows:
(i) The sinus node complex in normal hearts displays a dynamic range of activation
sites along the postero‐lateral right atrium.
(ii) Preferential pathways of conduction exist between the sinus node and the exit
of sinus activity to the atria.
(iii) There were multiple origins of sinus activation (EA) and exit sites to the atria
(SBO), providing evidence of multi‐centricity of the sinus node complex.
(iv) Remodelled atria demonstrate structural change reflected by loss of voltage
that was associated with more caudal activation, slower conduction time along
preferential pathways, only modest shifts of the functional pacemaker complex
and more frequent conduction block across the crista terminalis with resultant
circuitous conduction of the sinus impulse.

146
These findings extend our knowledge of the function of the highly complex human
sinus node by demonstrating the presence of preferential pathways of conduction
within the functional sinus node complex.
6.4.2 The Sinus Node: Anatomical and Functional Considerations
The sinus node consists of specialised nodal cells lying immediately sub‐epicardially at
the superior pole of the sulcus terminalis of the right atrium and has a mean length of
13.5mm (range 8‐21.5mm) (Sanchez‐Quintana et al. 2005). The variability of the
functional sinus node position exceeds that of the histologically defined sinus node by
a factor of three to four (Boineau et al. 1980). Shifts in the origin of the sinus node
impulse along the sulcus terminalis under autonomic influences have been observed
by several investigators since early last century (Lewis et al. 1910; Geesbreght and
Randall 1971).
Further evidence of a widely distributed functional pacemaker complex comes from
clinical studies that have aimed to modify sinus activity in patients with inappropriate
sinus tachycardia. In contrast to the single lesions effective for ectopic atrial
tachycardia treatment, these procedures require extensive ablation along the length of
the crista terminalis to achieve functional inhibition of the sinus node (Lee et al. 1995).
Boineau et al. (1978; 1980; 1984) performed detailed epicardial mapping of animal
hearts and observed that the sinus P wave may arise from a “pacemaker complex”,
distributed over an extensive extra‐nodal area spanning the superior vena cava‐right
atrial junction to the inferior vena cava. A strong correlation between heart rate and
functional sinus origin was observed with vagal stimulation and isoprenaline infusion
147
resulting in inferior and supero‐anterior shifts, respectively. The authors concluded
that the multi‐centric nature of functional sinus origin was mediated through a
complex system of separate atrial pacemakers with differential sensitivities to
autonomic control (Boineau et al. 1980). However, while dismissing the presence of
specialised conduction tissue, they acknowledged the potential role of preferential
pathways for the rapid dispersion of the sinus impulse. In humans, Boineau et al.
(1988) reported uni‐focal nodal and extra‐nodal sinus origins in addition to multi‐
centric origins over two to four widely distributed pacemaker sites. The functional
sinus pacemaker complex in humans was estimated to exist over a zone centred about
the long axis of the sulcus terminalis encompassing a 75 by 15mm area, with a cranial
and caudal border of the superior and inferior vena cava, respectively. They suggested
a model where neural and hormonal factors influence both the site of pacemaker
activation and the point of exit from the sinus node, a hypothesis further supported by
studies suggesting relative electrical isolation of the sinus node from surrounding atrial
myocardium with distinct exit points from the node (Bromberg et al. 1995). Consistent
with these observations, in the current study we observed dynamic variation in the
position of atrial activation in the reference group in response to pacing, with early
activation and break‐out points to surrounding myocardium noticeably more caudal
following pacing.
6.4.3 Atrial Remodelling and Sinus Node Function
Sinus node disease is thought to result from disordered impulse generation within the
sinus node or impaired conduction of the impulse to the surrounding atrial tissue

148
(Ferrer 1968). While differentiation between these two potential aetiologies has been
difficult owing to the absence of an appropriate experimental model, Sanders et al.
(2004a) have performed atrial mapping studies in patients with sinus node disease and
found evidence of a diffuse atrial myopathy as evidenced by low atrial voltage, slowed
atrial conduction and prolonged P wave duration. Interestingly, the sinus node
complex was more often uni‐centric and localised to the low crista terminalis with
evidence of regional conduction slowing and scar. While this study showed that
patients with advanced sinus node dysfunction have evidence of structural atrial
remodelling, other studies have shown that sinus node remodelling may occur in
response to short duration atrial pacing or atrial arrhythmias and under these
circumstances may be reversible. Elvan et al. (1996) demonstrated significant
prolongation of CSNRT and the sinus cycle length after two to six weeks of atrial
fibrillation in dogs. In humans, short durations of rapid atrial pacing resulted in similar
sinus node inhibition (Hadian et al. 2002) and CSNRT was significantly longer in
patients cardioverted from chronic lone atrial fibrillation compared to controls
(Kumagai et al. 1991). Manios et al. (2001) also reported that sinus node inhibition did
not revert within 24 hours after cardioversion. However, Hocini et al. (2003)
demonstrated reversibility of sinus impairment in patients in whom atrial fibrillation
was cured by pulmonary vein isolation when follow‐up was continued out to 6 months.
Remodelling of the sinus node has also been reported in clinical conditions such as
asynchronous ventricular pacing (Sparks et al. 1999), atrial septal defects (Morton et
al. 2003) or congestive heart failure (Sanders et al. 2004b). For the latter, Sanders et al.
reported a more caudal localisation of sinus node complex and greater structural
remodelling at the crista terminalis in heart failure patients when compared to

149
controls, raising the possibility that the sinus node remodelling may be a consequence
of these changes via disruption of preferential pathways or loss of tissue capable of
automaticity.
In the current study we have observed significant impairment of sinus node function
following a median 8 months of continuous atrial flutter, consistent with previous
reports. The findings were of similar type, with impairment of sinus node function
associated with structural change, slowed conduction and caudal displacement of the
sinus node complex, albeit to a lesser extent than that described in sinus node disease
(Sanders et al. 2004a). In addition, these findings extend previous observations by
demonstrating caudal shift of both sites of EA and SBO with longer conduction time
within regions of preferential conduction in patients with atrial remodelling due to
persistent arrhythmia.
6.4.4 Preferential Pathways of Conduction
Preferential conduction exists in the atria due to rapid conduction parallel to the
orientation of non‐specialised myocardial cell fibre bundles (Anderson et al. 1981b;
Spach and Dolber 1986; Saffitz et al. 1994). Higa et al. (2004) used the EnSite array to
demonstrate that in some patients with atrial tachycardia the traditionally mapped
origin – the site from which centrifugal activation occurs to the remaining atria – was
indeed the break‐out point. Detailed inspection of the unipolar electrograms
demonstrated a site of earliest activation (“QS” morphology) with a preferential
pathway of conduction to the break‐out point. These investigators were able to
confirm the existence of the origin with a preferential pathway by curative ablation of
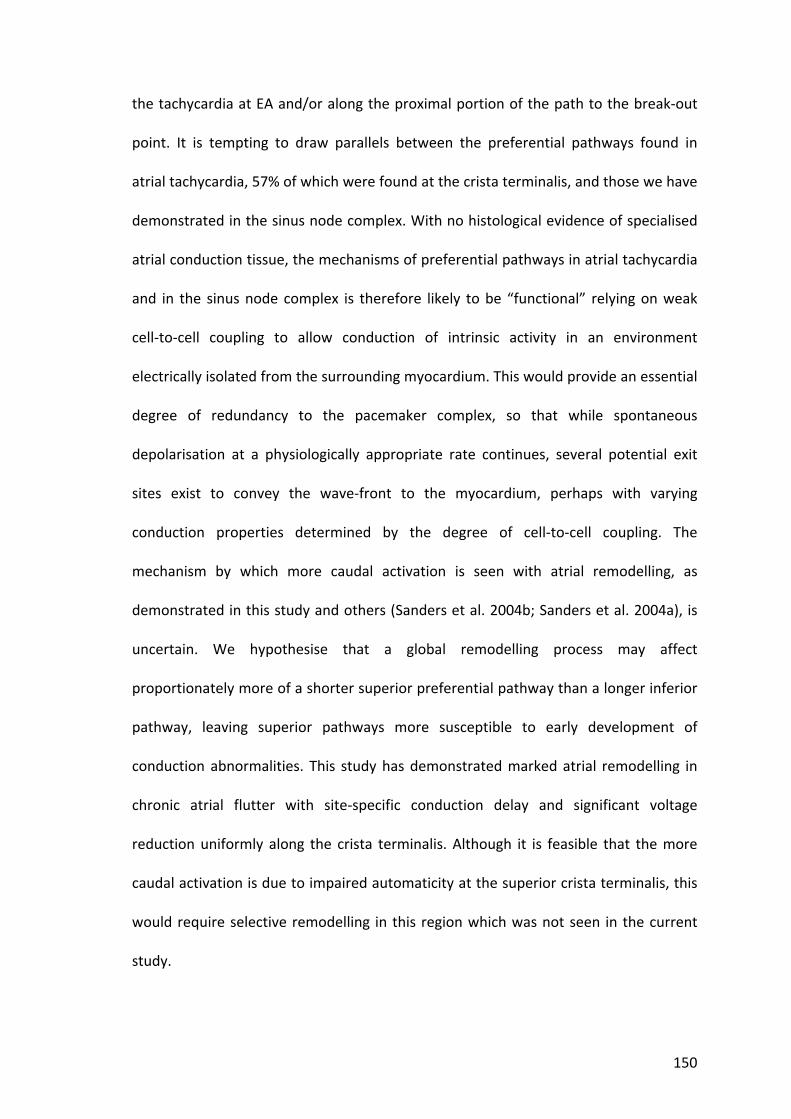
150
the tachycardia at EA and/or along the proximal portion of the path to the break‐out
point. It is tempting to draw parallels between the preferential pathways found in
atrial tachycardia, 57% of which were found at the crista terminalis, and those we have
demonstrated in the sinus node complex. With no histological evidence of specialised
atrial conduction tissue, the mechanisms of preferential pathways in atrial tachycardia
and in the sinus node complex is therefore likely to be “functional” relying on weak
cell‐to‐cell coupling to allow conduction of intrinsic activity in an environment
electrically isolated from the surrounding myocardium. This would provide an essential
degree of redundancy to the pacemaker complex, so that while spontaneous
depolarisation at a physiologically appropriate rate continues, several potential exit
sites exist to convey the wave‐front to the myocardium, perhaps with varying
conduction properties determined by the degree of cell‐to‐cell coupling. The
mechanism by which more caudal activation is seen with atrial remodelling, as
demonstrated in this study and others (Sanders et al. 2004b; Sanders et al. 2004a), is
uncertain. We hypothesise that a global remodelling process may affect
proportionately more of a shorter superior preferential pathway than a longer inferior
pathway, leaving superior pathways more susceptible to early development of
conduction abnormalities. This study has demonstrated marked atrial remodelling in
chronic atrial flutter with site‐specific conduction delay and significant voltage
reduction uniformly along the crista terminalis. Although it is feasible that the more
caudal activation is due to impaired automaticity at the superior crista terminalis, this
would require selective remodelling in this region which was not seen in the current
study.
151
6.4.5 Implications
This study demonstrates that the functional sinus node complex is a dynamic and
intricate entity. This complexity is required to balance the need for relative electrical
isolation in order to generate an intrinsic heart beat without the influence of
surrounding myocardium, against the need to conduct such activity to the atrium in a
reliable and consistent fashion. The hypothesis of Boineau et al. (1988) whereby neural
and hormonal factors influence both the site of pacemaker activation and the point of
exit from the sinus node is further supported by our observation of shifting points of
initial activity and exit sites in response to pacing. This study extends the
understanding of the sinus node complex by demonstrating the existence of
preferential pathways of conduction contributing to the diffuse sinus node complex. In
addition, it demonstrates that patients known to have impaired sinus node function
(Sparks et al. 2000; Daoud et al. 2002) have structural remodelling which diminishes
sinus node variability, slows conduction time along preferential pathways, inhibits
conduction across the crista terminalis and results in circuitous conduction of the sinus
impulse.
6.4.6 Limitations
Several studies have now validated the morphology characteristics of virtual
electrograms determined from the EnSite mapping system demonstrating them to
match with high reliability those of conventional contact unipolar electrograms
(Schilling et al. 1998; Thiagalingam et al. 2004b). The technology employed has specific

152
limitations addressed by previous studies and this study has endeavoured to minimise
any inaccuracy by staying within reported limits of accuracy.
6.5 Conclusion
The functional sinus node complex displays a dynamic range of activation along the
postero‐lateral right atrium. Preferential pathways between the site of earliest
activation and conduction to atrial myocardium exist. Remodelled atria demonstrate
more caudal activity, longer conduction time along preferential pathways, diminished
shifts in activation along a constrained functional sinus node complex, lower voltage,
transverse conduction block along the crista terminalis and resultant circuitous wave‐
front propagation. These findings provide additional insight into the function of the
highly complex human sinus node in both health and disease.
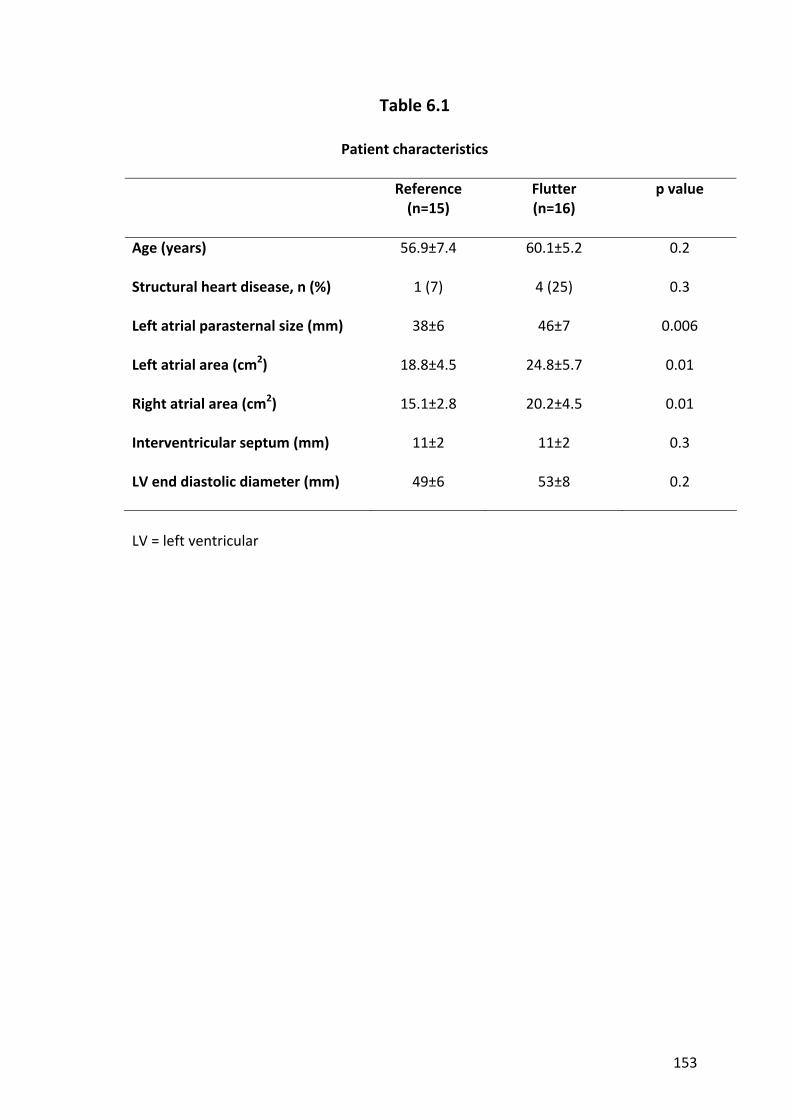
153
Table 6.1
Patient characteristics
Reference (n=15)
Flutter (n=16)
p value
Age (years) 56.9±7.4 60.1±5.2 0.2
Structural heart disease, n (%) 1 (7) 4 (25) 0.3
Left atrial parasternal size (mm) 38±6 46±7 0.006
Left atrial area (cm2) 18.8±4.5 24.8±5.7 0.01
Right atrial area (cm2) 15.1±2.8 20.2±4.5 0.01
Interventricular septum (mm) 11±2 11±2 0.3
LV end diastolic diameter (mm) 49±6 53±8 0.2
LV = left ventricular

154
Table 6.2
Electrogram characteristics at the crista terminalis catheter under various conditions
Type of beat Reference (n=15)
Flutter (n=16)
p value
Sinus rhythm
2.1±1.8 5.4±2.9 0.002
Pacing at 600ms
1.8±1.5 6.4±3.0 <0.001
Pacing at 450ms
2.1±1.8 6.7±3.1 <0.001
Immediately following 600ms drive train
1.9±1.5 6.1±3.0 <0.001
Immediately following 450ms drive train
1.8±1.6 6.4±3.2 <0.001
Number of bipoles demonstrating double potentials or fractionated electrograms on the crista terminalis catheter
With shortest captured extra‐stimulus
4.0±2.6 6.7±3.4 0.03
Sinus rhythm
60.3±14.7 72.4±14.3 0.04
Pacing at 600ms
55.5±10.2 97.2±31.3 <0.001
Pacing at 450ms
58.9±11.4 96.5±30.7 0.001
Immediately following 600ms drive train
59.2±13.3 76.2±13.3 0.002
Immediately following 450ms drive train
59.7±15.0 80.1±18.5 0.004
Maximum duration of the longest electrogram on the crista terminalis catheter (ms)
With shortest captured extra‐stimulus
91.2±61.7 104±30.8 0.5

155
Table 6.3
Unipolar voltage recorded by the multi‐polar balloon array
Reference (n=15)
Flutter (n=16)
p value
Mean right atrial voltage (mV) 1.78±0.63 1.36±0.63 0.1
Maximum right atrial voltage (mV) 4.96±1.84 3.88±2.07 0.2
Mean voltage at crista (mV) 1.94±0.62 1.28±0.61 0.009
Maximum voltage at crista (mV) 3.50±1.39 2.16±1.20 0.01
Mean voltage at point of EA (mV) 0.12±0.10 0.12±0.13 0.9
Mean voltage at point of SBO (mV) 3.20±1.52 1.54±1.37 0.005
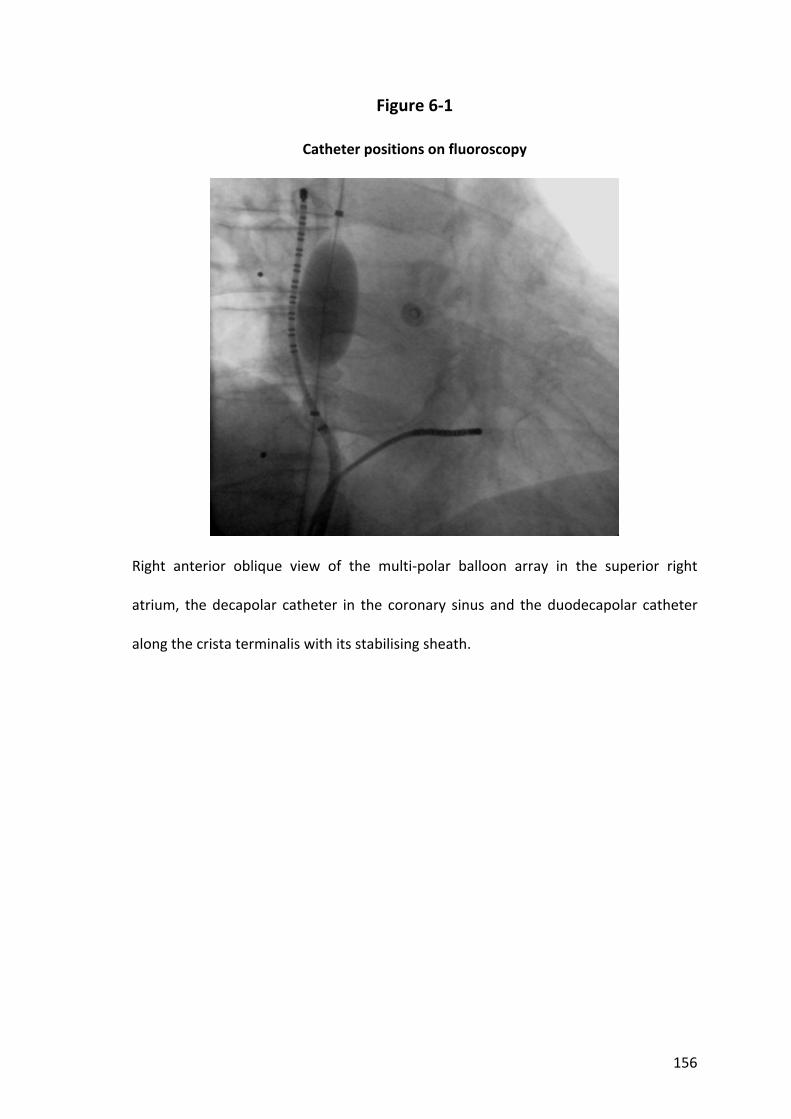
156
Figure 6‐1
Catheter positions on fluoroscopy
Right anterior oblique view of the multi‐polar balloon array in the superior right
atrium, the decapolar catheter in the coronary sinus and the duodecapolar catheter
along the crista terminalis with its stabilising sheath.

157
Figure 6‐2
Method of measuring the position of Earliest Activation and Sinus Break‐Out
Figure legend overleaf.

158
Figure 6‐2 (previous page)
A right anterior oblique view showing 3 cross‐sectional intra‐cardiac ultrasound views
at the indicated levels of the right atrium. The superior vena cava‐right atrial junction
was defined using ultrasound at the level where the superior lateral crista terminalis is
in proximity to the orifice of the right atrial appendage (middle panel). The crista
terminalis was then marked along its length with vertical line. Vertical measurement
from the superior end of the crista terminalis parallel to this line gives the distance
from the superior vena cava‐right atrial junction. Horizontal measurement
perpendicular to this line gives the anterior distance.
CT – crista terminalis, FO – fossa ovalis, LA – left atrium, RAA – right atrial appendage,
RA – right atrium, SVC – superior vena cava.

159
Figure 6‐3
Example preferential pathway of conduction
Composite map of wave‐front activation from earliest activation (1) via a preferential
pathway (2,3) to sinus break‐out (4) then diverging to the remaining atrium in a patient
with flutter. Electrograms demonstrate a QS pattern at (1) and an RS pattern at (4).
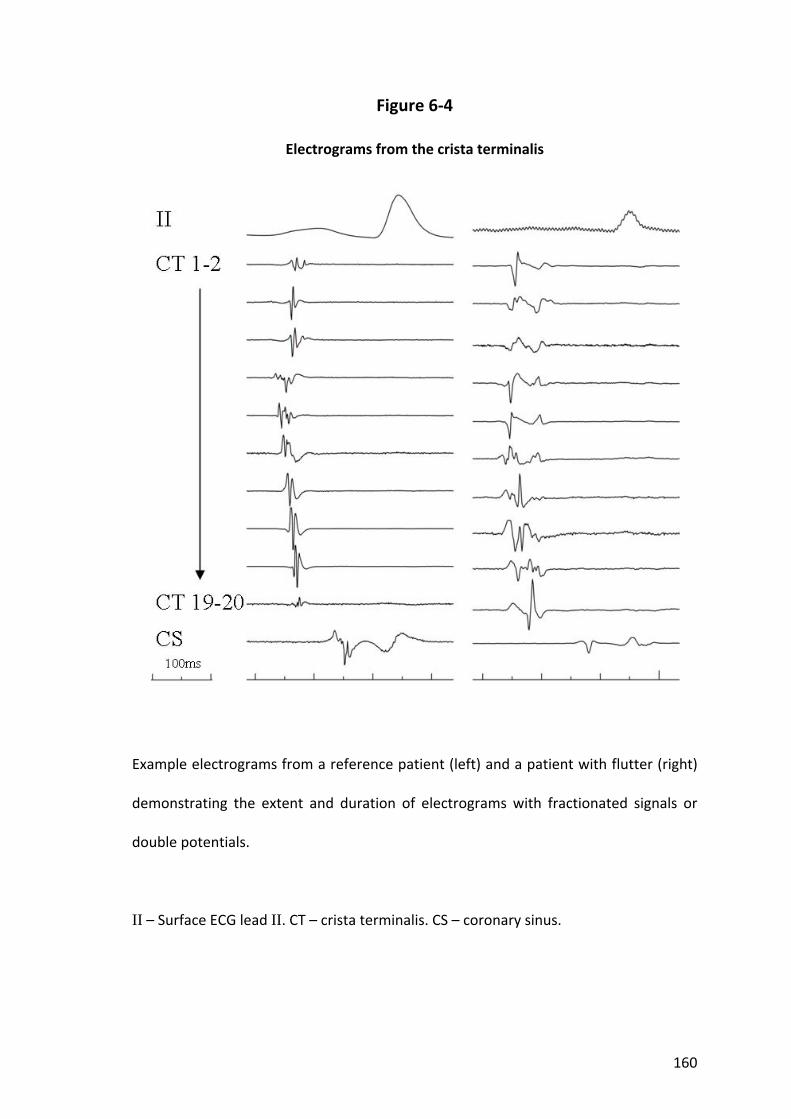
160
Figure 6‐4
Electrograms from the crista terminalis
Example electrograms from a reference patient (left) and a patient with flutter (right)
demonstrating the extent and duration of electrograms with fractionated signals or
double potentials.
II – Surface ECG lead II. CT – crista terminalis. CS – coronary sinus.
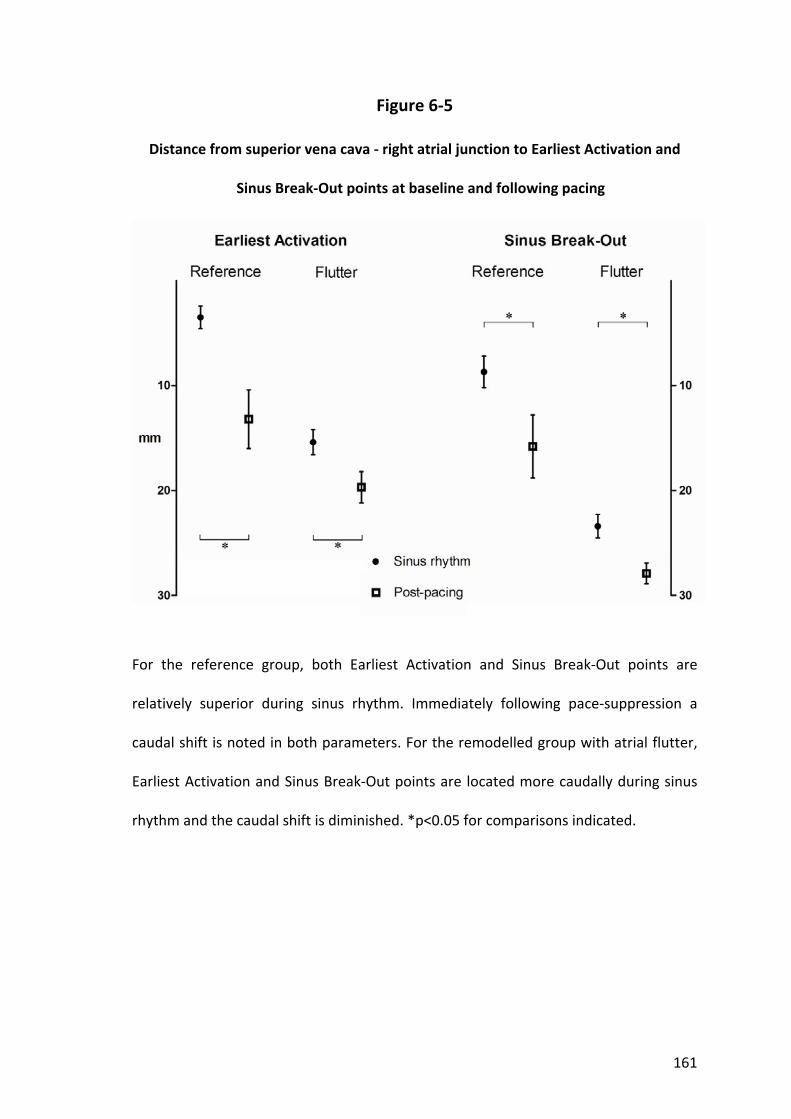
161
Figure 6‐5
Distance from superior vena cava ‐ right atrial junction to Earliest Activation and
Sinus Break‐Out points at baseline and following pacing
For the reference group, both Earliest Activation and Sinus Break‐Out points are
relatively superior during sinus rhythm. Immediately following pace‐suppression a
caudal shift is noted in both parameters. For the remodelled group with atrial flutter,
Earliest Activation and Sinus Break‐Out points are located more caudally during sinus
rhythm and the caudal shift is diminished. *p<0.05 for comparisons indicated.
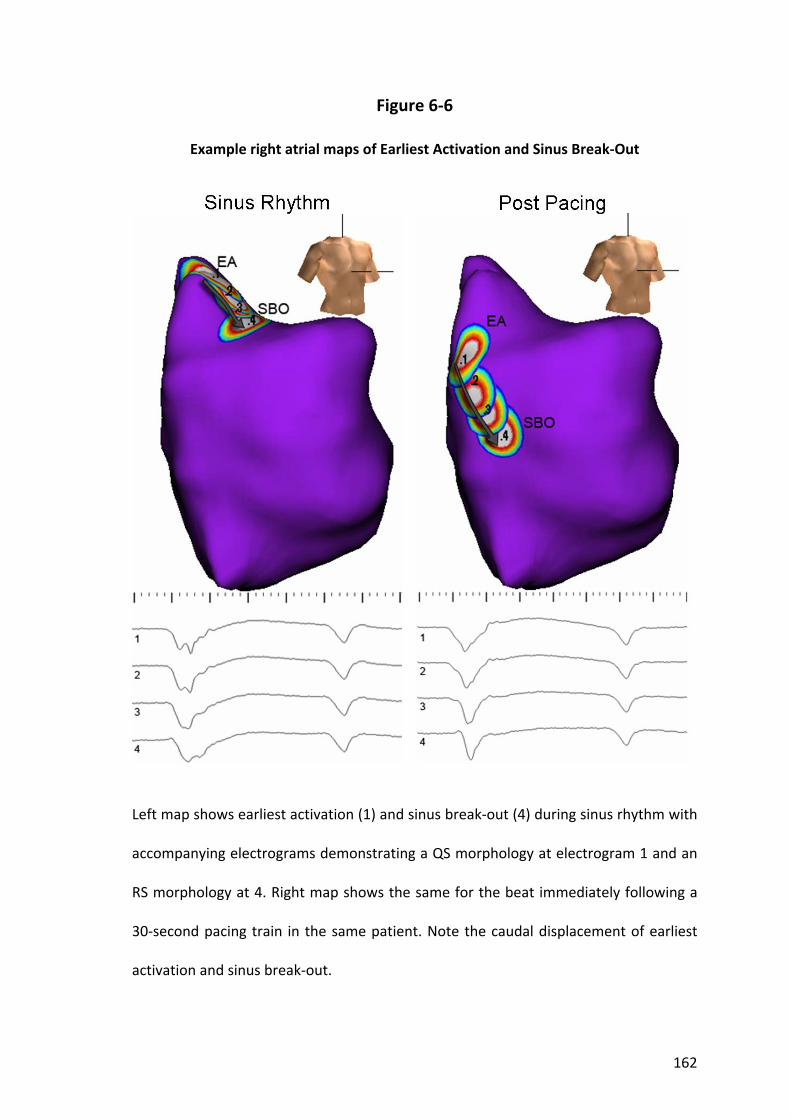
162
Figure 6‐6
Example right atrial maps of Earliest Activation and Sinus Break‐Out
Left map shows earliest activation (1) and sinus break‐out (4) during sinus rhythm with
accompanying electrograms demonstrating a QS morphology at electrogram 1 and an
RS morphology at 4. Right map shows the same for the beat immediately following a
30‐second pacing train in the same patient. Note the caudal displacement of earliest
activation and sinus break‐out.
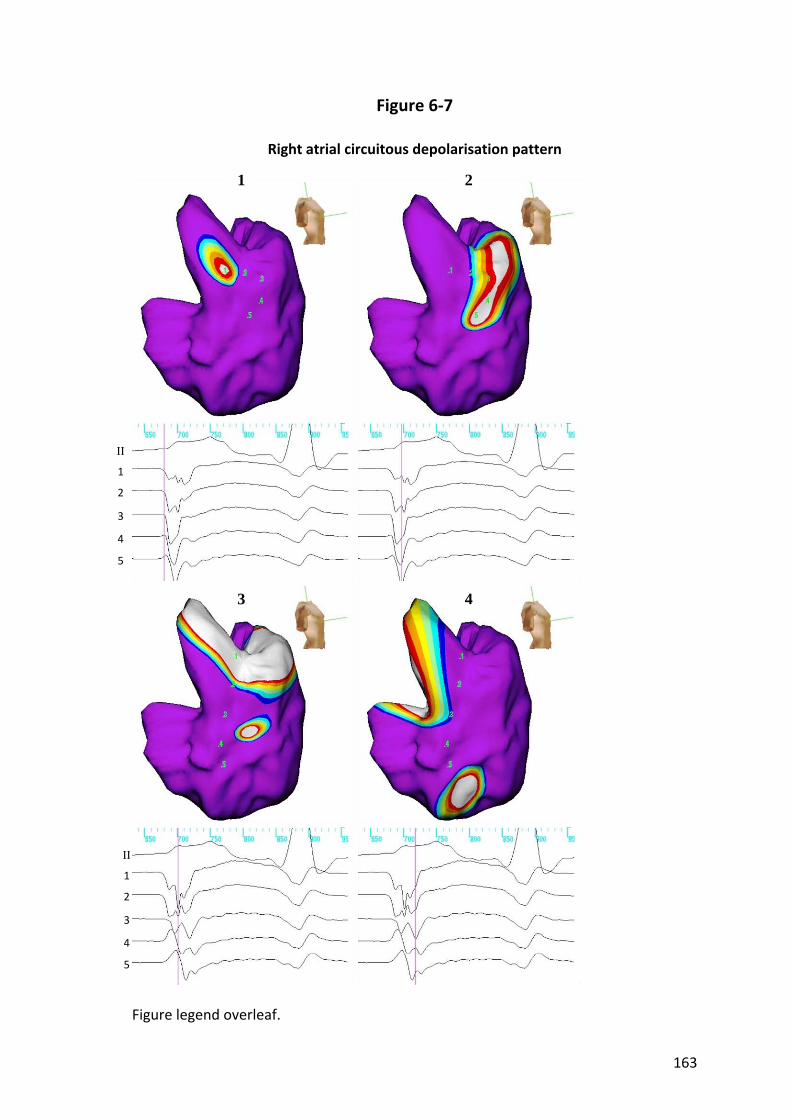
163
Figure 6‐7
Right atrial circuitous depolarisation pattern
Figure legend overleaf.
II
1
2
3
4
5
II
1
2
3
4
5
1 2
3 4
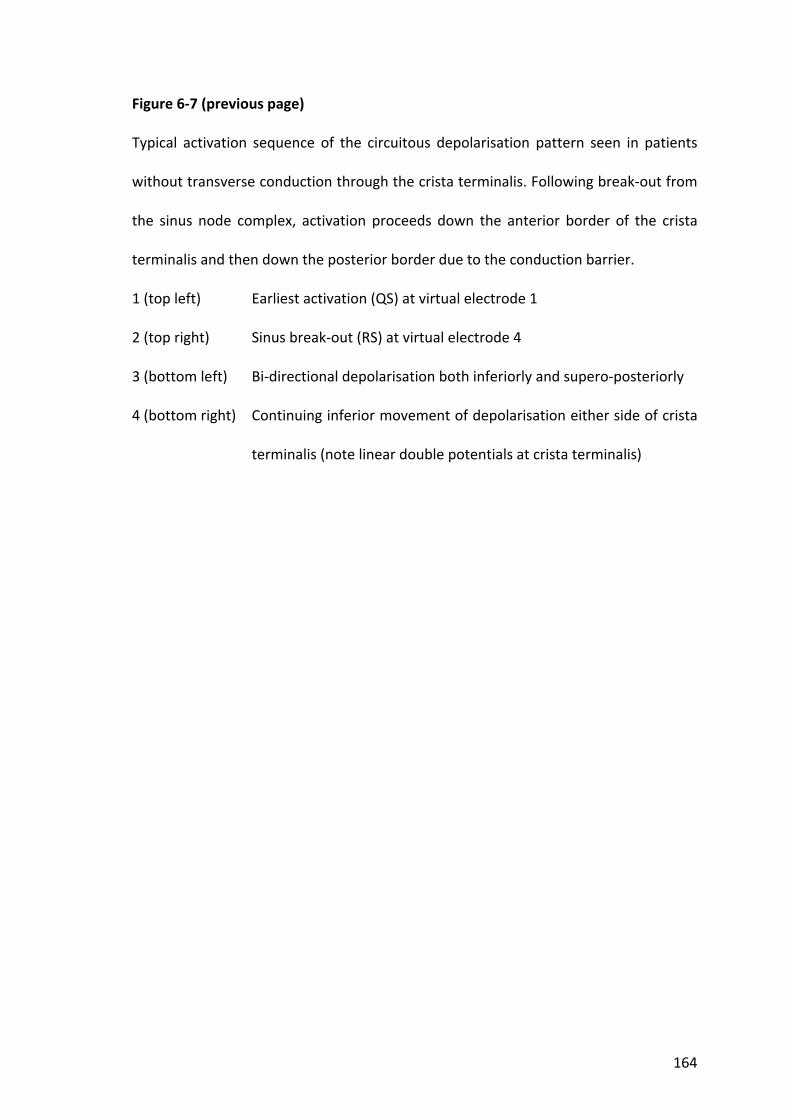
164
Figure 6‐7 (previous page)
Typical activation sequence of the circuitous depolarisation pattern seen in patients
without transverse conduction through the crista terminalis. Following break‐out from
the sinus node complex, activation proceeds down the anterior border of the crista
terminalis and then down the posterior border due to the conduction barrier.
1 (top left) Earliest activation (QS) at virtual electrode 1
2 (top right) Sinus break‐out (RS) at virtual electrode 4
3 (bottom left) Bi‐directional depolarisation both inferiorly and supero‐posteriorly
4 (bottom right) Continuing inferior movement of depolarisation either side of crista
terminalis (note linear double potentials at crista terminalis)

165
Movie 6.1
Example of near‐simultaneous dual Sinus Break‐Out points
Please see files on CD supplied entitled Movie 6.1. This movie has been provided in
.mpg, .avi and .wmv formats. The latter is the original version and plays with highest
quality.
The initiation of 3 consecutive beats is shown. Virtual electrograms 1 to 4 placed along
the preferential pathway from EA are displayed below the geometry. The “tracking
virtual” feature of the EnSite tracks the instantaneous peak negative potential along
this path for illustrative purposes. Break‐out to the atrial myocardium is seen at
position 4 and, within 5ms, at position 1 on the crista terminalis near‐simultaneously.

166
Chapter 7. High‐density mapping of atrial fibrillation to determine the optimal recording duration for dominant frequency and
automated detection of complex fractionated electrograms
7.1 Introduction
The understanding of the pathophysiology of atrial fibrillation has evolved such that
ablation targeting the pulmonary veins is highly effective in treating many patients
with paroxysmal atrial fibrillation. However, some patients with paroxysmal and most
patients with persistent atrial fibrillation still require considerable additional substrate
modification to improve ablation outcomes. Areas of CFAE and high DF have been
proposed as critical regions maintaining atrial fibrillation (Berenfeld et al. 2000;
Nademanee et al. 2004; Sanders et al. 2005a; Lin et al. 2006). CFAE have been
implicated as identifying areas acting as pivot points, slowed conduction or anisotropy
all capable of sustaining reentry (Cosio et al. 1986; Spach and Dolber 1986; Konings et
al. 1994). Similarly, localised regions of high frequency activity demonstrating spatio‐
temporal periodicity have been suggested to act as drivers of atrial fibrillation
(Karagueuzian et al. 1998; Skanes et al. 1998; Jalife et al. 2002; Everett et al. 2006).
Thus, identifying such electrograms may allow more targeted ablation to improve
outcomes. To date the evaluation of CFAE has been subjective and development of
automated analysis is paramount for reproducible and objective assessment.
Algorithms for quantification of electrogram fractionation and real‐time DF calculation
have become available and it is desirable that these process a sufficient density of
points without unduly delaying the ablation procedure. The ideal duration of
electrograms required to reproducibly identify sites of CFAE or highest DF is not

167
known. Prior studies have used lengths of electrogram recordings between 2 and 10
seconds to determine these measures (Mansour et al. 2001; Wu et al. 2002; Lazar et al.
2004; Sahadevan et al. 2004; Ravelli et al. 2005; Sanders et al. 2005a; Lin et al. 2006;
Narayan et al. 2006; Ng et al. 2006; Rostock et al. 2006; Ryu et al. 2006; Sanders et al.
2006; Schuessler et al. 2006; Scherr et al. 2007). While longer electrogram recordings
extend the data collection process unnecessarily, shorter durations may provide an
inaccurate representation of the true degree of fractionation or frequency. This study
aimed to determine the minimum duration of electrogram recording that provides
accurate data without unduly lengthening the data collection process, by exploring the
degree of correlation between progressively shorter electrogram recordings with the
longest exportable data sample length.
7.2 Methods
7.2.1 Study Population
The study comprised 14 patients with symptomatic drug‐refractory atrial fibrillation
undergoing catheter ablation. All anti‐arrhythmic drugs, with the exception of
amiodarone, were ceased ≥5 half‐lives before the study. Prior to the procedure all
patients received anticoagulation with warfarin (International Normalised Ratio 2‐4)
for ≥6 weeks and underwent trans‐oesophageal echocardiography to exclude left atrial
thrombus. The study protocol was approved by the institutional Clinical Research and
Ethics Committee and all patients provided written informed consent for the
procedure.
168
7.2.2 Electrophysiological Study
Electrophysiological study was performed in the post‐absorptive state with sedation
utilising midazolam and fentanyl. The following catheters were utilised for mapping: (i)
10 pole catheter (2‐5‐2mm inter‐electrode spacing, Daig Electrophysiology) positioned
within the coronary sinus with the proximal bipole at the coronary sinus ostium as
determined in the best septal left anterior oblique position; (ii) 5‐spline, 20 pole
catheter (1mm electrodes separated by 4‐4‐4 inter‐electrode spacing; PentaRay;
Biosense‐Webster). The PentaRay catheter was stabilised using a long vascular sheath
(Preface, Biosense‐Webster or SL0 Braided, St Jude Medical); and (iii) 3.5mm tip
externally irrigated ablation catheter (Celsius Thermocool; Biosense‐Webster). The left
atrium was accessed using a single transeptal puncture. Following transeptal access
bolus unfractionated heparin was utilised to maintain the activated clotting time
between 250‐350 seconds. Following the mapping, patients underwent tailored, step‐
wise ablation comprising pulmonary vein isolation ± linear ablation lines ± CFAE site
ablation.
7.2.3 High‐Density Bi‐atrial Mapping
Mapping was performed during spontaneous (n=8) or induced (n=6) atrial fibrillation
of ≥10 minutes duration. Three‐dimensional reconstructions of the right and left atria
were made using the NavX (Version 6.0R, St Jude Medical) navigation system. High
density mapping of both atria was performed using the PentaRay catheter by
sequentially acquiring 15 simultaneous bipolar electrograms. After ensuring adequate
endocardial contact by fluoroscopy the catheter was held stationary for 8 seconds; this

169
duration for comparator electrogram was chosen as this is the maximum duration
electrogram exportable from the system used and is towards the high end of the range
used in previous studies. These 8 second electrograms were sampled at 1200Hz, band
pass filtered between 30‐500Hz and their location on the 3‐dimensional map
annotated using the Diagnostic Landmark Mapping feature of the system. This ensured
all areas of the atria, venae cavae and pulmonary veins were visited at least once and
the spread of points was equal throughout both chambers. All electrograms were
manually reviewed offline with those demonstrating an unacceptable signal to noise
ratio excluded.
7.2.4 Complex Fractionated Atrial Electrograms
CFAE were defined as fractionated potentials exhibiting multiple deflections from the
isoelectric line and were characterised using the NavX "CFE‐mean" contact mapping
tool. CFE‐mean is defined as the average time duration between consecutive
deflections during a specific time period set by the user and recorded at each site.
Deflections are identified by a detection algorithm and annotated on the electrogram
with yellow "tick‐marks" (Figure 7‐1). Detection is based on three criteria, set by the
user, in which the deflection must: 1) exceed an adaptive "Peak‐to‐Peak Sensitivity"
threshold that is set at a reference‐amplitude slightly greater than the magnitude of
baseline noise; 2) possess a "downstroke" morphology in which the leading local‐
maximum and the trailing local‐minimum amplitude occurs within a time "Duration"
that is set to avoid detection of broad, far‐field events; and 3) exceed a "Refractory"
period from the previous detection that is set to avoid multiple detections on a single
170
deflection. When all three of these criteria are met, a yellow tick‐mark is placed on the
electrogram at the instant of maximum‐negative slope on the downstroke (Figure 7‐1).
In our study, CFE‐mean values were calculated from the maximum possible recording
duration of 8 seconds and exported for analysis by an external computer program.
Also, 7, 6, 5, 4, 3, 2 and 1 second recordings were sub‐sampled and exported for
comparison with the original 8 second recordings. Our user settings included a
Refractory Period of 30ms, a Peak‐to‐Peak Sensitivity typically between 0.05 and 0.1
mV and a Duration of 10ms. Sites with a CFE‐mean value within the range of 40 and
250ms were included for analysis. This wide range was selected to determine
comparative accuracy across the entire spectrum of potentially physiologically relevant
values at differing electrogram durations.
7.2.5 Dominant Frequency
All electrograms were exported at 1200Hz to perform spectral analysis using offline
custom designed software. The electrograms were initially rectified, filtered using
Butterworth filters (Low pass 20Hz, High pass 1Hz) and edge‐tapered with a Hanning
window. Frequency spectra were calculated by Fast Fourier Transform and zero‐
padded for shorter electrogram durations, giving a consistent spectral resolution of
0.07Hz. DF was defined as the frequency containing maximum power within the
frequency domain 3‐15Hz (Figure 7‐2). Points with a Regularity Index (defined as the
ratio of the power within a 0.75Hz band at the DF to total power over 3‐15Hz) of less
than 0.2 calculated from 8 second electrograms were excluded from analysis (Sanders
171
et al. 2005a). DF values were calculated from the entire 8 second sample and from 7,
6, 5, 4, 3, 2 and 1 second sub‐samples for comparison.
7.2.6 Statistical Analysis
Variables are reported as mean ± standard deviation. Left and right atrial CFE‐mean
data were compared using an independent samples t test. Comparison of CFE‐mean
data from 7, 6, 5, 4, 3, 2, and 1 second electrograms with CFE‐mean data from the
index 8 second electrograms from the same points were compared using analysis of
variance with Scheffe’s post hoc comparison. Correlation of CFE‐mean values from 7,
6, 5, 4, 3, 2 and 1 second electrograms with the CFE‐mean values of the index 8 second
electrograms from the same points were quantified using Intraclass Correlation
Coefficients (ICC). Left and right atrial DF comparisons and correlation of sub‐sampled
values with index electrogram values were compared in the same fashion. Statistical
tests were performed using SPSS 13.0 (SPSS Inc).
7.3 Results
7.3.1 Baseline details
Baseline patient characteristics, echocardiographic data and medications are
summarised in Table 7.1. Electrograms from a total of 6967 points (498±174
points/patient) were analysed; 228±102 points/patient in the right and 270±86
points/patient in the left atria. Bi‐atrial mapping took 37±13 minutes to complete.

172
7.3.2 CFE‐mean
For the index 8 second samples CFE‐mean was 114±20ms for the right atria and
102±17ms for the left atria (p=0.01). Bi‐atrial mean values for all electrogram durations
are shown in Figure 7‐3A. A trend to decrease with shorter electrograms is seen but
these are not significantly different to the index mean for all points of 109ms (p=0.2).
However, it is point‐by‐point accuracy that is more important for CFE‐mean and under‐
estimations tend to cancel out over‐estimations in mean values. The mean absolute
differences between 8 second electrogram index CFE‐mean and the 7, 6, 5, 4, 3, 2 and
1 second CFE‐mean are therefore shown in Figure 7‐3B. The increase in the magnitude
of absolute difference as electrogram duration decreases reflects the poorer
correlation of each shorter sub‐sampled electrogram value with its index 8 second
value. The percentage of sub‐sampled electrograms where CFE‐mean deviated from
the 8 second index CFE‐mean by more than 10% is shown in Figure 7‐4. Progressively
more points demonstrate >10% difference from the index value as electrogram
duration shortens. Scatter plots of CFE‐mean for the index 8 second value (y axis)
versus the CFE‐mean for the same point derived from the 7, 6, 5, 4, 3, 2 and 1 second
sub‐samples (x axes) are shown in Figure 7‐5A. Intraclass Correlation Coefficients of
sub‐sampled electrogram CFE‐mean as compared to the index 8 second electrogram
CFE‐mean quantify this weakening relationship as the electrogram duration becomes
shorter.
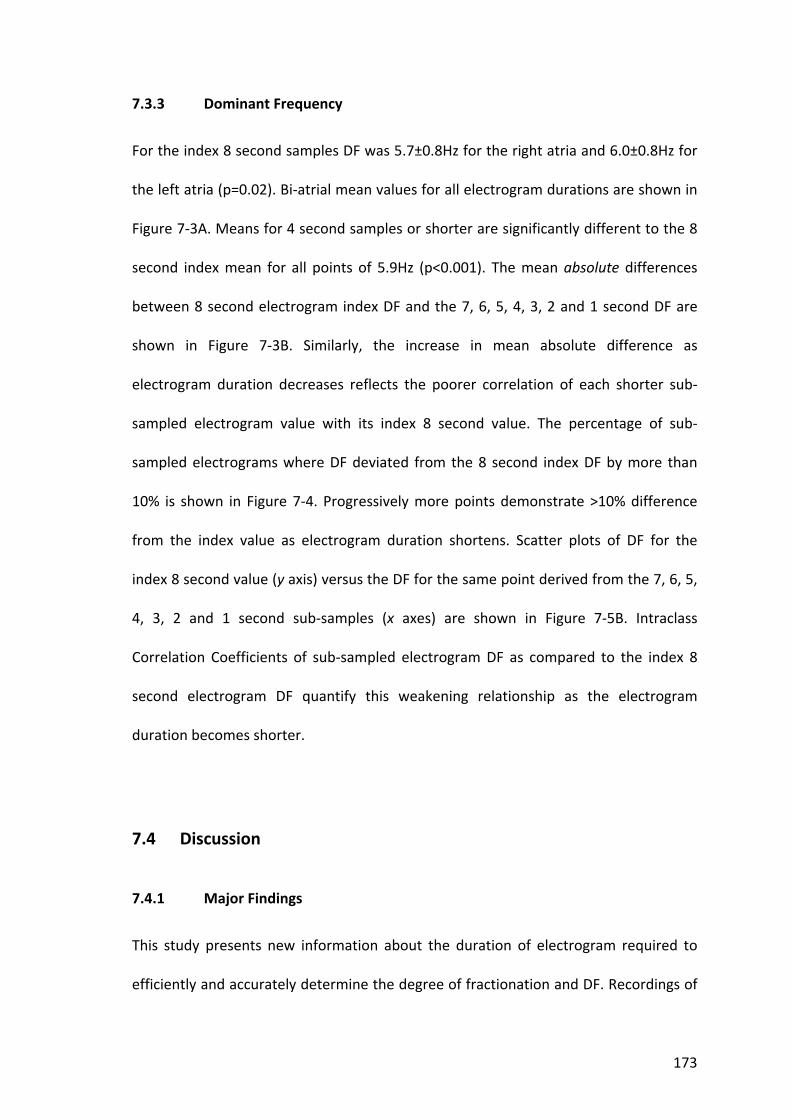
173
7.3.3 Dominant Frequency
For the index 8 second samples DF was 5.7±0.8Hz for the right atria and 6.0±0.8Hz for
the left atria (p=0.02). Bi‐atrial mean values for all electrogram durations are shown in
Figure 7‐3A. Means for 4 second samples or shorter are significantly different to the 8
second index mean for all points of 5.9Hz (p<0.001). The mean absolute differences
between 8 second electrogram index DF and the 7, 6, 5, 4, 3, 2 and 1 second DF are
shown in Figure 7‐3B. Similarly, the increase in mean absolute difference as
electrogram duration decreases reflects the poorer correlation of each shorter sub‐
sampled electrogram value with its index 8 second value. The percentage of sub‐
sampled electrograms where DF deviated from the 8 second index DF by more than
10% is shown in Figure 7‐4. Progressively more points demonstrate >10% difference
from the index value as electrogram duration shortens. Scatter plots of DF for the
index 8 second value (y axis) versus the DF for the same point derived from the 7, 6, 5,
4, 3, 2 and 1 second sub‐samples (x axes) are shown in Figure 7‐5B. Intraclass
Correlation Coefficients of sub‐sampled electrogram DF as compared to the index 8
second electrogram DF quantify this weakening relationship as the electrogram
duration becomes shorter.
7.4 Discussion
7.4.1 Major Findings
This study presents new information about the duration of electrogram required to
efficiently and accurately determine the degree of fractionation and DF. Recordings of
174
shorter durations were compared to the maximum duration recordable by the system
using the following criteria: i) mean values, ii) mean absolute differences of >10ms or
0.5Hz, iii) proportion of points deviating >10% from the index value, and iv) ICC. CFE‐
mean values derived from electrogram durations of 3 seconds or less have a mean
absolute error of more than 10ms (Fig 3B) and for electrogram durations of 4 seconds
or less, at least 1 in 5 points deviate more than 10% from the index value (Fig 4).
Intraclass Correlation Coefficients for CFE‐mean demonstrate “substantial agreement”
(ICC>0.8) for all sub‐samples except 1 second electrograms. Visual inspection of CFE‐
mean scatter plots suggests electrograms of more than 4 seconds approximate the
index 8 second electrogram value (Fig 5A). Mean DF derived from electrograms of 4
seconds or less differ significantly from the index 8 second mean (Fig 3A) and DF values
from electrogram durations of 4 seconds or less have a mean absolute error of more
than 0.5Hz (Fig 3B). With electrogram durations of 3 seconds or less, for at least 1 in 5
points DF deviates more than 10% from the index value (Fig 4). Intraclass Correlation
Coefficients for DF demonstrate “substantial agreement” for 7 second sub‐samples,
“moderate agreement” (ICC 0.6‐0.8) for 6 and 5 second sub‐samples, and only fair or
poor agreement for shorter electrograms. Visual inspection of DF scatter plots
suggests electrograms of more than 4 seconds approximate the index 8 second
electrogram value (Fig 5B).
These observations, based on the above criteria, suggest a minimum of 5 seconds is
required to achieve accuracy comparable to the maximum recordable sample of 8
seconds.

175
7.4.2 Time Domain Analysis
The postulated mechanisms that bring about CFAE include anisotropic propagation
(Spach and Dolber 1986), areas of slowed conduction (Cosio et al. 1983) and multiple
wavelets leading to random or leading circle reentry. CFAE are observed at pivot points
where wavelets rotate at zones of functional block (Konings et al. 1994). Selective
elimination of CFAE by catheter ablation has been proposed to halt wavelet reentry,
thereby preventing perpetuation of atrial fibrillation (Nademanee et al. 2004; Oral et
al. 2007). Previous reports of CFAE mapping have used descriptive terms to
subjectively determine which electrograms fit these criteria. Nademanee et al. (2004)
defined CFAE as fractionated electrograms composed of ≥2 deflections, perturbation
of the baseline with continuous deflection of a prolonged activation complex, or atrial
electrograms with a cycle length ≤120ms. Rostock et al. (2006) used fractionated
potentials with ≥3 deflections from the isoelectric line or continuous activity as their
criteria for CFAE. Oral et al. (2007) targeted electrograms with a cycle length ≤120ms or
shorter than the coronary sinus; or those that were fractionated or displayed
continuous electrical activity. Few studies have tried to automate this procedure and
the minimum electrogram duration required to accurately determine electrogram
complexity is unknown. Ravelli et al. (2005) studied fibrillatory wave complexity using
an automated wave similarity algorithm calculated over 5 second windows. Narayan et
al. (2006) used a “gold‐standard” of manually measured atrial fibrillation cycle length
to validate an autocorrelation method of determining local cycle length. Atrial
fibrillation cycle length estimates were more stable performed over 10 seconds rather
than 2 seconds due to short term cycle length fluctuations. Scherr et al. (2007) have
recently used another automated algorithm of 2.5 second recordings to classify 86% of

176
1904 left atrial sites from 19 patients as exhibiting CFAE, one third of which were
deemed “highly repetitive”. No comparison between different electrogram durations
was made.
7.4.3 Frequency Domain Analysis
Regions of high frequency activations demonstrating spatio‐temporal periodicity have
been suggested as local drivers of atrial fibrillation. Such “rotors” or “focal sources”
would be identifiable by fast activity and may be constantly present. These drivers
have been suggested to be present where structural remodelling of the atria has
occurred, and absent where atrial fibrillation is due to electrical remodelling alone
where multiple wavelets predominate (Everett et al. 2006). Further evidence for atrial
fibrillation spatial organisation comes from optical mapping in animals using DF to
demonstrate areas of periodic high frequency (Skanes et al. 1998; Kalifa et al. 2006).
Retrospective analysis of ablation of paroxysmal atrial fibrillation shows that cycle
length prolongation and eventual termination occurs at sites of high DF (Sanders et al.
2005a). Prior studies to localise DF sites have used electrogram sample lengths of
between 2 to 10 seconds (Mansour et al. 2001; Wu et al. 2002; Lazar et al. 2004;
Sanders et al. 2005a; Lin et al. 2006; Narayan et al. 2006; Ng et al. 2006; Ryu et al.
2006; Sanders et al. 2006; Schuessler et al. 2006). Ng et al. (2007) reported good
correlation for DF calculated from 2 second sub‐samples with atrial activation rates
calculated in the time domain from 4 second recordings. Correlation between 1 and 4
second samples was less satisfactory, therefore a 2 second minimum electrogram was
recommended. Additionally, the mean DF of 4 sequential 4 second electrograms
177
showed improved correlation with activation rates compared to the DF of a single 4
second electrogram, both for simulated and clinical electrograms (Ng et al. 2006).
Harmonics in the frequency spectrum are a source of error in the estimation of true
atrial activation rate in the highly fractionated signal (Ng et al. 2006; Ryu et al. 2006).
The use of indices such as the Regularity Index used here has sought to eliminate such
conflicting information from analysis (Sanders et al. 2005a).
7.4.4 Differences in Effect of Electrogram Duration between CFE‐mean and DF
For DF, shorter electrogram durations tend to over‐estimate the value, predominantly
due to more prominent harmonics in the frequency spectra. This can be seen in Figure
7‐5B where an additional “line” at half the slope to the right of the regression line
becomes more prominent as electrograms shorten. This explains the poorer ICC values
for DF than CFE‐mean; a significant number of points have twice the index value,
whereas CFE‐mean errors are more homogenously distributed around the regression
line (Figure 7‐5A). The harmonics also explain why shorter electrograms provide a
significantly higher mean DF, whereas the average CFE‐mean does not significantly
change with shorter electrogram durations. Despite better ICC, CFE‐mean has more
points deviating >10% from the index value for electrograms of 5 seconds or less,
compared with DF (Figure 7‐4). This suggests that although errors in DF are less
common from shorter electrograms, they are likely to be greater in magnitude.

178
7.4.5 Limitations
The results of this study pertain to the specific algorithms and pre‐processing methods
employed. CFAE‐guided ablation has been established as an effective treatment for
atrial fibrillation, but the definitions of targets differ. The CARTO system (Biosense‐
Webster) has recently added an automated fractionation detection algorithm to allow
real‐time annotation of fractionated sites (CFAE Software Module) using a fixed 2.5
second interval (Scherr et al. 2007). This algorithm differs to that employed in this
study, in that it includes both low and high voltage thresholds (default 0.05 and
0.15mV), alternative interval thresholds (default 70 to 120ms), and indicates the
degree of fractionation by Interval Confidence Level (intervals detected per 2.5
seconds). Given the differences between this algorithm and the one employed in this
study, extrapolation of this study’s results regarding minimum electrogram duration to
other CFAE detection algorithms may not be accurate. Finally, while this study aimed
to determine the ideal recording duration for CFAE and DF analysis, it was not
designed to evaluate the clinical efficacy of these parameters (or software) to guide
ablation.
7.5 Conclusion
The minimum electrogram duration for accurate analysis of CFAE and DF by the
methods described is 5 seconds. This is based on the comparison of values derived
from electrograms of 1 to 7 seconds and their comparison with 8 second electrogram
values. Electrograms of 4 seconds or less have unacceptable rates of error by the

179
methods used and may be misleading in the ablation of atrial fibrillation guided by
these parameters.

180
Table 7.1
Patient characteristics
Number of Patients 14
Age (years) 57±11
History of atrial fibrillation (months) 68±50
Type of atrial fibrillation: Paroxysmal/Persistent 5/9
Structural heart disease
Ischaemic heart disease 1
Hypertrophic cardiomyopathy 1
Hypertension 3
Left atrial dimension (mm) 48±6
Left atrial area (cm2) 29±6
Right atrial area (cm2) 24±7
Inter‐ventricular septal thickness (mm) 11±2
Left ventricular end diastolic dimension (mm) 52±5
Left ventricular ejection fraction (%) 57±9
Anti‐arrhythmic preceding electrophysiology study
Amiodarone 4
Sotalol 5
Flecainide 2
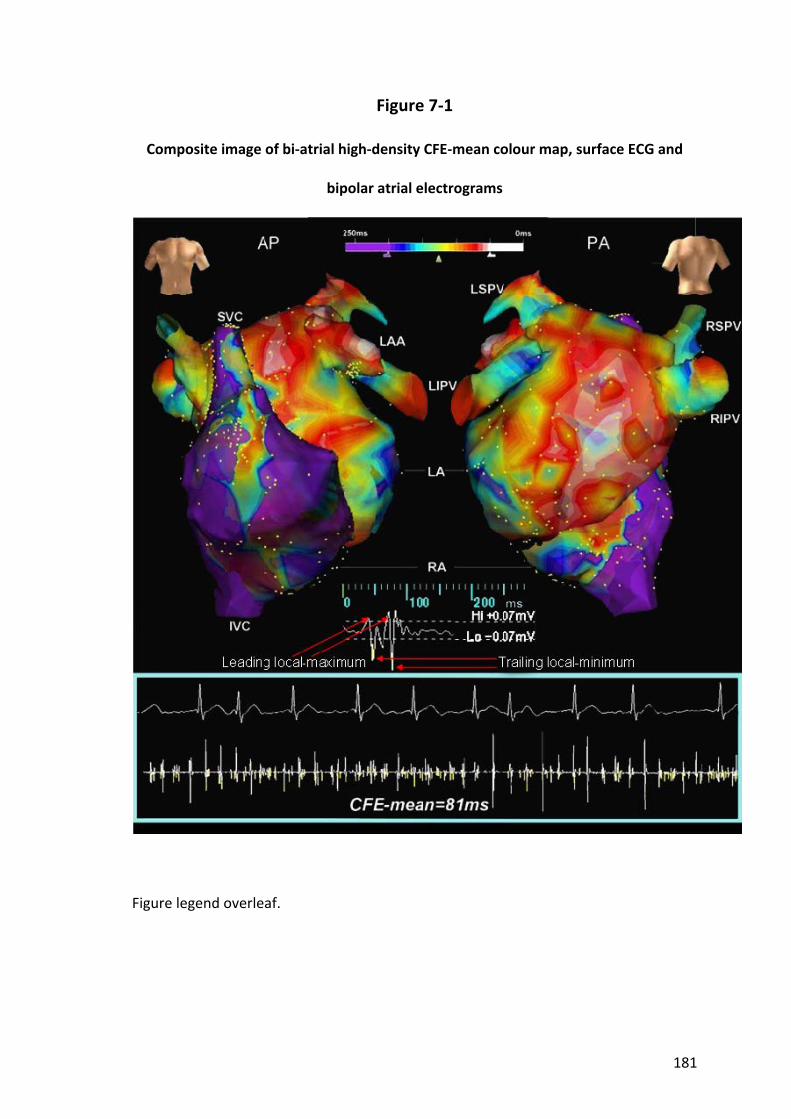
181
Figure 7‐1
Composite image of bi‐atrial high‐density CFE‐mean colour map, surface ECG and
bipolar atrial electrograms
Figure legend overleaf.
182
Figure 7‐1 (previous page)
A short example electrogram (centre) is given demonstrating 2 yellow tick‐marks on
downstrokes between leading local‐maximum and trailing local‐minimum points. Tick‐
marks along a full 8 second electrogram (bottom) indicate annotations of deflection
events in the electrogram according to the Refractory, P‐P sensitivity and Duration
criteria defined in the text. CFE‐mean is the average time duration between
annotations and the value for each point is displayed along a colour spectrum on the 3‐
dimensional geometry (top).
AP – antero‐posterior, PA – postero‐anterior, SVC – superior vena cava, LSPV – left
superior pulmonary vain, RSPV – right superior pulmonary vein, LAA – left atrial
appendage, LIPV – left inferior pulmonary vein, RIPV – right inferior pulmonary vein,
IVC – inferior vena cava, LA – left atrium, RA – right atrium.

183
Figure 7‐2
Example electrogram with accompanying frequency spectra
Frequency spectra from 3 to 15Hz derived by Fast Fourier Transform analysis from 8, 7,
6, 5, 4, 3, 2 and 1 second samples of the 8 second bipolar electrogram shown at top.
Dominant frequency is the frequency with the highest power (y axis).
DF – dominant frequency, RI – regularity index.
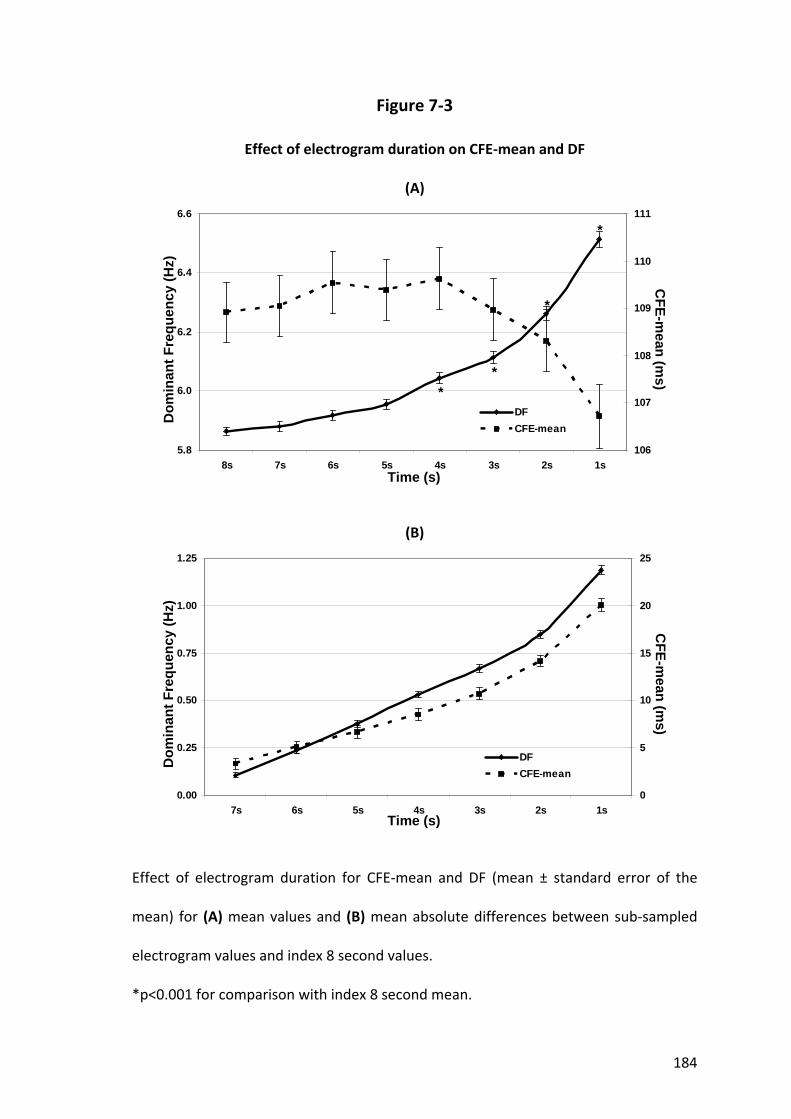
184
Figure 7‐3
Effect of electrogram duration on CFE‐mean and DF
(A)
5.8
6.0
6.2
6.4
6.6
8s 7s 6s 5s 4s 3s 2s 1s106
107
108
109
110
111
DFCFE-mean
Dom
inan
t Fre
quen
cy (H
z)
Time (s)
CFE-m
ean (ms)
**
*
*
(B)
0.00
0.25
0.50
0.75
1.00
1.25
7s 6s 5s 4s 3s 2s 1s0
5
10
15
20
25
DFCFE-mean
Dom
inan
t Fre
quen
cy (H
z)
Time (s)
CFE-m
ean (ms)
Effect of electrogram duration for CFE‐mean and DF (mean ± standard error of the
mean) for (A) mean values and (B) mean absolute differences between sub‐sampled
electrogram values and index 8 second values.
*p<0.001 for comparison with index 8 second mean.

185
Figure 7‐4
Effect of electrogram duration on accuracy
0
10
20
30
40
50
60
7s 6s 5s 4s 3s 2s 1s
CFE-mean Dominant Frequency
%
Time (s)
Percentage of electrograms deviating by more than 10% from the index 8 second value
for CFE‐mean and DF. Both parameters show a greater proportion of inaccurate values
as electrogram duration shortens.

186
Figure 7‐5
Scatter plots of CFE‐mean and DF
(A) (B)
Scatter plots of Inde
x 8 second
value
s (y axis) versus the values fo
r the same po
int d
erived
from
the 7, 6, 5, 4, 3, 2
and
1 second
sub
‐sam
ples (x axes) for (A) CFE‐mean and (B) DF. Note the de
creasing
Intraclass Correlatio
n Co
efficients
(ICC) with
sho
rter electrogram
durations. A
value
of 1
indicates pe
rfect a
greemen
t and
0 indicates no
agreemen
t.

187
Chapter 8. High‐density mapping of atrial fibrillation to determine the
relationship between activation frequency, complex fractionated electrograms and the anatomical substrate
8.1 Introduction
There have been significant advances in our understanding of the pathophysiology of
atrial fibrillation over the last decade. These have led to ablation targeting the
pulmonary veins being able to abolish atrial fibrillation in a significant proportion of
patients with paroxysmal atrial fibrillation. However, some patients with paroxysmal
and most patients with persistent atrial fibrillation still require considerable additional
substrate modification to improve outcomes. Areas of CFAE and high DF have been
proposed as critical regions maintaining atrial fibrillation (Berenfeld et al. 2000;
Nademanee et al. 2004; Sanders et al. 2005a). The postulated mechanisms that bring
about CFAE include anisotropic propagation, areas of slowed conduction, multiple
wavelets leading to random or leading circle reentry, pivot points where wavelets
rotate about sites of functional block and out of phase activation (Cosio et al. 1983;
Spach and Dolber 1986; Konings et al. 1994). Selective elimination of CFAE by catheter
ablation has been proposed to halt wavelet reentry, thereby preventing the
perpetuation of atrial fibrillation (Nademanee et al. 2004; Oral et al. 2007; Schmitt et
al. 2007; Nademanee et al. 2008). Similarly, localised regions of high frequency activity
demonstrating spatio‐temporal periodicity have been suggested to act as drivers of
atrial fibrillation (Skanes et al. 1998; Jalife et al. 2002; Everett et al. 2006; Lin et al.
2006). Thus, identifying electrograms with these features may allow targeted ablation
to improve success rates. However, there is a paucity of data on the relationship
188
between CFAE and DF. In particular it is not known whether they are markers of the
same or provide complementary information on the pathogenesis of atrial fibrillation.
Understanding the relationship between these targets may be useful in guiding
radiofrequency ablation. In this clinical study we aimed to examine the relationship
between sites of high frequency activation and fractionation during atrial fibrillation.
8.2 Methods
8.2.1 Study Population
The study comprised 20 patients with symptomatic drug‐refractory atrial fibrillation
undergoing catheter ablation. All anti‐arrhythmic drugs, with the exception of
amiodarone, were ceased ≥5 half‐lives before the study. Prior to the procedure, all
patients received anticoagulation with warfarin (International Normalised Ratio 2‐4)
for ≥6 weeks and underwent trans‐oesophageal echocardiography to exclude left atrial
thrombus. The study protocol was approved by the institutional Clinical Research and
Ethics Committee and all patients provided written informed consent for the
procedure.
For the purposes of the study atrial fibrillation was defined in accordance with the HRS
Expert Consensus Statement (Calkins et al. 2007); paroxysmal atrial fibrillation was
defined as atrial fibrillation episodes that terminate spontaneously within 7 days and
persistent as having greater than 7 days of atrial fibrillation. Indeed, all patients with
persistent atrial fibrillation in this study had a minimum of 6 months continuous atrial
fibrillation at some point prior to their study.
189
8.2.2 Electrophysiological Study and Ablation
Electrophysiological study was performed in the post‐absorptive state with sedation
utilising midazolam and fentanyl. The following catheters were utilised for mapping: (i)
10 pole catheter (2‐5‐2mm inter‐electrode spacing, Daig Electrophysiology) positioned
within the coronary sinus with the proximal bipole at the coronary sinus ostium as
determined in the best septal left anterior oblique position; (ii) 5‐spline, 20 pole
catheter (1mm electrodes separated by 4‐4‐4mm inter‐electrode spacing; PentaRay;
Biosense‐Webster). The PentaRay catheter was stabilised using a long vascular sheath
(Preface, Biosense‐Webster or SL0 Braided, St Jude Medical); and (iii) 3.5mm tip
externally irrigated ablation catheter (Celsius Thermocool, Biosense Webster). The left
atrium was accessed using a single transeptal puncture. Following transeptal access,
bolus unfractionated heparin was utilised to maintain the activated clotting time
between 250‐350 seconds.
After mapping, patients underwent circumferential pulmonary vein ablation with an
end‐point of isolation confirmed by circumferential mapping (Lasso, Biosense‐
Webster) with either elimination or dissociation of pulmonary venous potentials.
Ablation of the pulmonary veins was performed using a delivered power of 30 W with
irrigation rates of 30mL/min. Additional substrate modification by linear ablation (roof‐
line or mitral isthmus ablation) or targeting regions of CFAE was performed in patients
with atrial fibrillation episodes persisting for > 48 hours, structural heart disease or
with marked left atrial dilatation (longest diameter >57mm). Cavotricuspid isthmus
ablation with an endpoint of bi‐directional isthmus block was performed only in
patients with a history of typical atrial flutter or if mapping confirmed typical atrial

190
flutter during the procedure. The endpoint of substrate modification was either
electrophysiologically confirmed linear conduction block established via pacing
manoeuvres or the elimination of local fractionation. Substrate modification was
performed using a delivered power of 30‐35 W with irrigation rates of 30‐60mL/min.
Detailed DF or CFE‐mean analyses were not available to guide the procedure.
8.2.3 Study Protocol
Mapping was performed during spontaneous or induced (n=9) sustained atrial
fibrillation of >10 minutes duration. Three‐dimensional reconstructions of the right
and left atria were made using the NavX navigation system (Version 6.0R or 7.0, St
Jude Medical). High‐density mapping of both atria was performed using the PentaRay
catheter by sequentially acquiring 15 simultaneous bipolar electrograms. After
ensuring adequate endocardial contact by fluoroscopy the catheter was held
stationary for 8 seconds. These 8 second electrograms were sampled at 1200Hz, band
pass filtered between 30‐500Hz and their location on the 3‐dimensional map
annotated using the Diagnostic Landmark Mapping feature of the system. This ensured
all areas of the atria, venae cavae and pulmonary veins were visited at least once and
aimed to have the spread of points equal throughout both chambers. All electrograms
were manually reviewed offline with those demonstrating an unacceptable signal to
noise ratio excluded from analysis. For the purpose of regional evaluation, points were
designated as belonging to one of 4 right atrial areas (anterior, septal, posterior or
lateral) or 8 left atrial areas (roof, anterior, septum, lateral, posterior, inferior,
pulmonary veins or appendage) using previously validated software (Coperniqs,

191
Medicalgorithmics) (Kuklik et al. 2004). Points designated at pulmonary veins were
well within the veins, not at the ostia or antra which were considered part of a left
atrial area.
The baseline atrial fibrillation cycle length within the coronary sinus was determined as
previously described by averaging intervals over 1 minute using automated cycle
length monitoring software (Bard Electrophysiology). Inter‐electrogram intervals of
<100ms and continuous electrical activity were counted as a single interval. At each
time point, the automated annotation was manually verified and corrected with online
calipers at a paper speed of 100mm/s (Sanders et al. 2005a).
8.2.4 Complex Fractionated Atrial Electrograms
CFAE were defined as fractionated potentials exhibiting multiple deflections from the
isoelectric line. For the purposes of the study, CFAE were quantified using the
automated NavX "CFE‐mean" contact mapping tool, recently shown to effectively
guide CFAE‐targeted ablation (Verma et al. 2008), which provided a measure of
electrogram fractionation as the average time duration between consecutive
deflections during the 8 second electrogram. Deflections were identified by a
detection algorithm and annotated on the electrogram with yellow "tick‐marks".
Detection is based on three user‐defined criteria in which the deflection must: 1)
exceed an adaptive "Peak‐to‐Peak Sensitivity" threshold set at a reference‐amplitude
slightly greater than baseline noise; 2) possess a "downstroke" morphology in which
the leading local‐maximum and the trailing local‐minimum amplitude occurs within a
time "Duration" that is set to avoid detection of broad, far‐field events; and 3) exceed

192
a "Refractory" period from the previous detection that is set to avoid multiple
detections on a single deflection. When all three of these criteria are met, a yellow
tick‐mark is placed on the electrogram at the instant of maximum‐negative slope on
the downstroke (Figure 8‐1). Our user settings were a Refractory Period of 30ms, a
Peak‐to‐Peak Sensitivity of 0.1mV and a Duration of 10ms. Points with a CFE‐mean
value from the minimum of 40ms (Refractory + Duration) up to 250ms were included
for analysis to ensure inclusion of all potentially relevant data.
8.2.5 Activation Frequency
All electrograms were exported at 1200Hz to perform spectral analysis using offline
software (Coperniqs). The electrograms were initially rectified, filtered using
Butterworth filters (Low pass 20Hz, High pass 1Hz) and edge‐tapered with a Hanning
window. Frequency spectra were calculated by Fast Fourier Transform with a spectral
resolution of 0.07Hz. DF was defined as the frequency containing maximum power
within the frequency domain 3‐15Hz. Points with a Regularity Index (defined as the
ratio of the power within a 0.75Hz band at the DF to total power over 3‐15Hz) of less
than 0.2 were excluded from analysis (Sanders et al. 2005a).
8.2.6 Relationship between Activation Frequency and Fractionation
The relationship between CFAE and DF were evaluated as follows: (i) Point‐by‐point, to
explore correlation at each sample location in every patient; (ii) Patient‐by‐patient, to
explore correlation between medians of CFE‐mean and DF for a bi‐atrial map; and (iii)

193
Spatial distribution, to examine the relative positions of fractionation to high DF points.
The latter was determined by displaying the 20 highest DF points for each patient and
grouping them in clusters (for points <5mm apart) showing a frequency gradient to the
surrounding atria as previously described (Sanders et al. 2005a). The distance from
these clusters to areas of low CFE‐mean (multiple contiguous points within 5mm
demonstrating CFE‐mean<80ms) was measured on the 3‐dimensional maps. In
addition, activation mapping was performed on the 15 simultaneously acquired
PentaRay bipolar electrograms at sites of high DF. Activation mapping was only
performed during periods of organised atrial fibrillation as previously described
(Haïssaguerre et al. 2006b). Local activation was manually annotated to the peak or
trough of the largest amplitude deflection on the bipolar contact electrogram.
8.2.7 Statistical Analysis
Continuous variables are reported as mean ± standard deviation or median and inter‐
quartile range as appropriate. Categorical variables are reported as number and
percentage. Proportions were compared using Fisher’s Exact test. Comparisons were
analysed using paired or unpaired t tests, or the Mann‐Whitney U test as appropriate.
To analyse differences in CFE‐mean or DF according to atrial fibrillation type and
region, a linear mixed effects model was fitted to the data. In the model, atrial
fibrillation type, region, and the interaction between atrial fibrillation type and region
were fitted as fixed effects. Random effects were included in the model to account for
the dependence in observations both within a patient and within a given region of a
patient, following which post‐hoc pair‐wise comparisons were performed within the
194
model. Correlation between variables was measured by Pearson’s r statistic. Statistical
significance was set at p<0.05.
8.3 Results
8.3.1 Baseline Details
There were 10 patients with paroxysmal and 10 with persistent atrial fibrillation.
Baseline patient characteristics are summarised in Table 8.1. Structural heart disease
was present in 2 patients, 1 with ischaemic and the other with hypertrophic
cardiomyopathy. In addition, 5 patients had hypertension, 2 had prior transient
cerebrovascular events and 1 had obstructive sleep apnoea. Left atrial size and left
ventricular hypertrophy were greater in the persistent compared to paroxysmal atrial
fibrillation group.
Electrograms from a total of 10,133 points were analysed (507±150 points/patient);
238±79 points/patient in the right and 268±102 points/patient in the left atria. Atrial
fibrillation cycle length as measured in the coronary sinus at the commencement of
the study was 174±20ms (184±20ms for paroxysmal atrial fibrillation, 163±14ms for
persistent atrial fibrillation, p=0.02).
8.3.2 Complex Fractionated Atrial Electrograms
Median CFE‐mean was 103ms (IQR 76‐143ms) for right atrial points and 98ms (IQR 72‐
139ms) for left atrial points (p<0.001). Median CFE‐mean was 117ms (IQR 85‐161ms) in

195
paroxysmal atrial fibrillation and 92ms (IQR 70‐127ms) in persistent atrial fibrillation
(p<0.001). Figure 8‐2A demonstrates the regional variation in CFE‐mean, with high
CFE‐mean values indicating less fractionation. CFE‐mean was significantly lower in
persistent atrial fibrillation compared to those with paroxysmal atrial fibrillation for all
12 regions (p=0.009). The difference between regions was not dependent on type of
atrial fibrillation by the statistical model employed (p=0.7), hence the comparisons
presented between areas for CFE‐mean are across all patients, regardless of atrial
fibrillation type. The areas of greatest fractionation within the left atrium were the
roof, septum, posterior, anterior and inferior walls. All right atrial regions
demonstrated a higher CFE‐mean than these areas (p<0.05, Figure 8‐2A).
Areas containing multiple points with low (<80ms; lowest quartile) CFE‐mean were
located on the 3‐dimensional maps (Off et al. 2008). The mean number of such areas
per patient was 10.3±4.2 and these areas were compared in location to clusters of high
DF points (see below). More areas of low CFE‐mean per patient were seen in persistent
compared to paroxysmal atrial fibrillation (13±3.5 versus 7.5±3.5; p=0.002).
Median CFE‐mean correlated moderately with atrial fibrillation cycle length (r=0.47,
p=0.04) and there was an inverse correlation (r=‐0.45, p<0.05) between mean atrial
fibrillation cycle length and the number of areas of low CFE‐mean.
8.3.3 Dominant Frequency
Median DF was 5.49Hz (IQR 4.91‐6.15) for right atrial points and 5.57Hz (IQR 4.91‐6.23)
for left atrial points (p=0.02). Median DF was 5.27Hz (IQR 4.69‐5.71) in paroxysmal
atrial fibrillation patients and 5.93Hz (IQR 5.35‐6.67) in persistent atrial fibrillation
196
patients (p<0.001). Regional differences in DF are illustrated in Figure 8‐2B. DF was
higher in persistent atrial fibrillation for all regions compared to paroxysmal atrial
fibrillation (Figure 8‐2B). The differences between regions across type of atrial
fibrillation were not uniform (p=0.01), hence the comparisons presented between
regions are made only within paroxysmal or within persistent atrial fibrillation groups.
For paroxysmal atrial fibrillation the DF of pulmonary veins, left atrial appendage and
roof was significantly higher than in the inferior and lateral left atrial regions (p<0.05,
Figure 8‐2B). For persistent atrial fibrillation no significant differences were seen
between left atrial areas, except that the inferior left atrium had lower DF than the 3
highest areas; lateral and posterior left atrium, and left atrial appendage (p<0.05,
Figure 8‐2B).
The 20 highest DF points for each patient were located on the 3‐dimensional maps.
These 20 highest DF points were clustered such that the mean number of high DF
clusters was 5.2±1.7 per patient. These clusters were compared in location to areas of
low CFE‐mean. Of 104 clusters, 68 (65%) were within the left atria, of which 24 were
located in the pulmonary veins.
Median DF correlated well with atrial fibrillation cycle length (r=‐0.67, p=0.001);
however, there was no significant correlation between atrial fibrillation cycle length
and the number of high DF clusters (p=0.3).
8.3.4 Relationship between CFE‐mean and Dominant Frequency
Correlation of CFE‐mean and DF on a patient‐by‐patient basis shows a moderate
inverse correlation (r=‐0.50, p=0.03; Figure 8‐3), suggesting that for a given patient the
197
degree of fractionation (as indicated by low CFE‐mean) increases with the DF.
However, point‐by‐point correlation between CFE‐mean and DF reveals a poorer
correlation (r=‐0.17, p<0.001; Figure 8‐3), suggesting that these two parameters, while
not the same, may co‐exist within a common area. To further explore the relationship
between these measures, the spatial relationship of the 104 clusters of high DF to
CFAE areas were evaluated. The median distance between DF clusters and CFAE areas
was 5mm (IQR 2‐10). Eighty percent of DF clusters were at or less than 10mm from
fractionation and in a further 10% they were found between 10‐20mm. Figure 8‐4
shows a representative example of the spatial relationship of fractionation to a high DF
site. It shows the electrograms and their frequency spectra from high DF points,
together with the electrograms from nearby low CFE‐mean areas. The high DF site
demonstrates a frequency gradient to the surrounding tissue with adjacent
electrograms demonstrating more fractionation. In this example, the distance from the
high DF site to the most fractionated electrogram shown was 7mm.
To further determine the relationship between sites of high DF and CFAE we
performed activation mapping where possible using simultaneous electrograms from
the PentaRay catheter at sites of high DF. Figure 8‐5 demonstrates activation mapping
at high DF cluster sites and reveals that during organised activity, varying patterns of
wave‐front activation and isochronal crowding are seen adjacent to the high DF site.
Electrogram fractionation is observed to occur in close proximity to high DF sites in
these examples.

198
8.4 Discussion
8.4.1 Major findings
This study utilised high‐density endocardial mapping of atrial fibrillation to describe
the relationship of activation frequency and electrogram fractionation within the atria.
The major findings are as follows:
(i) The left atrium is more highly fractionated than the right atrium and patients
with persistent atrial fibrillation demonstrate a higher degree of fractionation
than those with paroxysmal atrial fibrillation.
(ii) Activation frequency is higher in the left atrium than the right atrium and
higher in persistent atrial fibrillation than paroxysmal atrial fibrillation. In
paroxysmal atrial fibrillation regional analysis demonstrated significant
variation in frequency, but these regional differences were less apparent in
persistent atrial fibrillation.
(iii) Fractionation and activation frequency correlate with atrial fibrillation cycle
length. While these variables do not demonstrate a relationship on a point‐by‐
point basis, within an individual a moderate relationship is observed between
them.
(iv) Exploration of their spatial relationship suggests that electrogram fractionation
is observed in close proximity to sites of high frequency activation and is
further supported by high‐density simultaneous activation mapping at these
sites.
199
8.4.2 Spatial Distribution of Complex Fractionated Atrial Electrograms
The finding of a higher degree of fractionation in the left atrium than the right is
consistent with previous reports. Jaïs et al. (1996) initially described regional bi‐atrial
disparities in endocardial fractionation in paroxysmal atrial fibrillation, at a time when
much of the data were from epicardial studies. They found that complex electrical
activity was more frequently found in the septal and posterior regions of both atria,
with more regular activity seen in the trabeculated atria. This group has further gone
on to describe the characteristics of CFAE predictive of favourable ablation targets
(Takahashi et al. 2008). Proponents of CFAE‐targeted ablation have found fractionation
predominantly in left atrial sites: the pulmonary vein ostia; inter‐atrial septum; mitral
annulus; basal left atrial appendage; left atrial roof; and the posterior left atrium
(Nademanee et al. 2004; Oral et al. 2007; Schmitt et al. 2007; Porter et al. 2008). They
reported that such sites were found more widely spread amongst those with longer
duration atrial fibrillation, consistent with the greater number of electrogram
fractionation areas found in the patients with persistent atrial fibrillation in the current
study.
8.4.3 Spatial Distribution of Dominant Frequency
The initial evidence for organisation of atrial fibrillation came from optical mapping in
animal studies which used spectral analysis to demonstrate repetitive high frequency
activity with temporal and spatial periodicity during atrial fibrillation, consistent with
the hypothesis of “driving” rotors (Skanes et al. 1998; Kalifa et al. 2006). More
recently, similar findings have been reported in humans (Wu et al. 2002; Lazar et al.
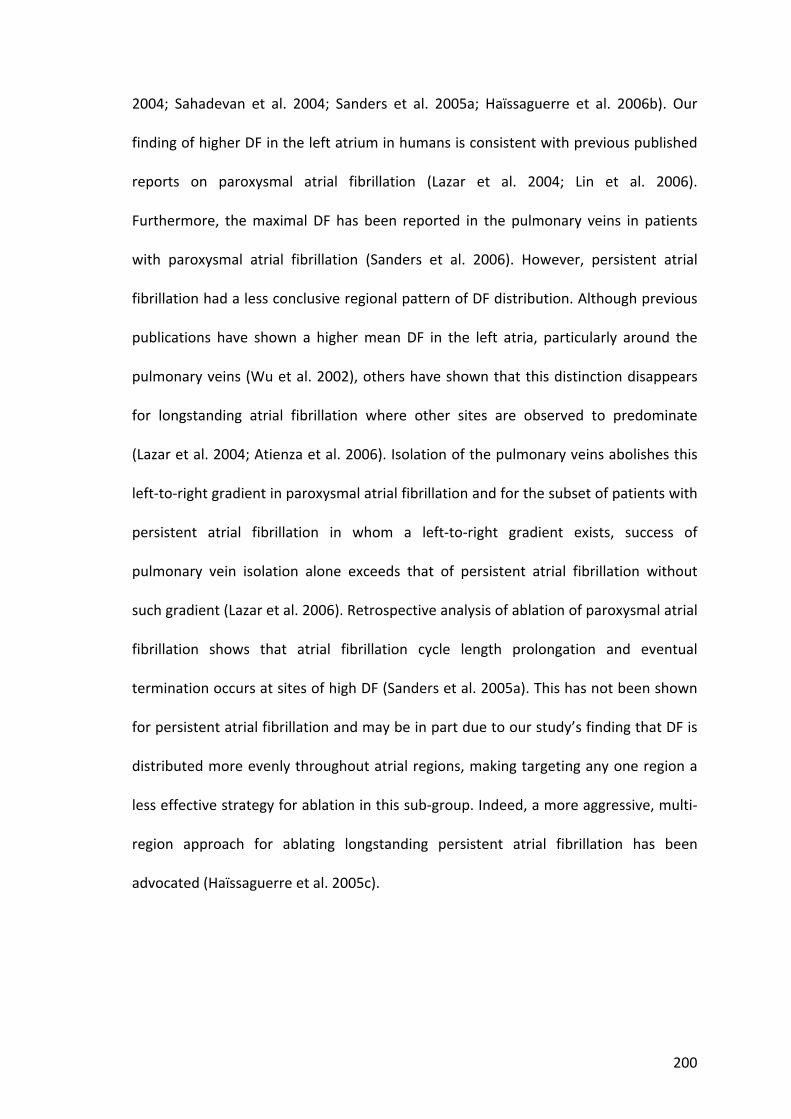
200
2004; Sahadevan et al. 2004; Sanders et al. 2005a; Haïssaguerre et al. 2006b). Our
finding of higher DF in the left atrium in humans is consistent with previous published
reports on paroxysmal atrial fibrillation (Lazar et al. 2004; Lin et al. 2006).
Furthermore, the maximal DF has been reported in the pulmonary veins in patients
with paroxysmal atrial fibrillation (Sanders et al. 2006). However, persistent atrial
fibrillation had a less conclusive regional pattern of DF distribution. Although previous
publications have shown a higher mean DF in the left atria, particularly around the
pulmonary veins (Wu et al. 2002), others have shown that this distinction disappears
for longstanding atrial fibrillation where other sites are observed to predominate
(Lazar et al. 2004; Atienza et al. 2006). Isolation of the pulmonary veins abolishes this
left‐to‐right gradient in paroxysmal atrial fibrillation and for the subset of patients with
persistent atrial fibrillation in whom a left‐to‐right gradient exists, success of
pulmonary vein isolation alone exceeds that of persistent atrial fibrillation without
such gradient (Lazar et al. 2006). Retrospective analysis of ablation of paroxysmal atrial
fibrillation shows that atrial fibrillation cycle length prolongation and eventual
termination occurs at sites of high DF (Sanders et al. 2005a). This has not been shown
for persistent atrial fibrillation and may be in part due to our study’s finding that DF is
distributed more evenly throughout atrial regions, making targeting any one region a
less effective strategy for ablation in this sub‐group. Indeed, a more aggressive, multi‐
region approach for ablating longstanding persistent atrial fibrillation has been
advocated (Haïssaguerre et al. 2005c).

201
8.4.4 Relationship between Activation Frequency and Fractionation
Few studies have examined the relationship between CFAE and DF. Lemola et al.
(2006) examined the DF before and after atrial fibrillation ablation by 2 techniques;
circumferential‐pulmonary‐vein and electrogram‐guided ablation. Using CFAE to guide
ablation, the mean left atrial DF was seen to reduce by 17% and this decrease was
associated with less recurrent atrial fibrillation for patients with persistent atrial
fibrillation. No such prognostic advantage of DF reduction was seen for the pulmonary
vein encircled group, suggesting that differing mechanisms are eliminated by the 2
ablation strategies. Rostock et al. (2006) have shown that dynamic changes in CFAE are
dependent on regional atrial fibrillation cycle length, in that shortening of local cycle
length preceded development of CFAE. Our finding of significant correlation between
atrial fibrillation cycle length and number of areas of low CFE‐mean, and the proximity
of DF clusters to CFAE areas, is consistent with this observation. A recent study
evaluating the potential role of ganglionated plexi in atrial fibrillation has
demonstrated that following local administration of acetyl choline there was a
significant gradient of decreasing DF and incidence of CFAE from ganglionated plexi
toward distant sites (Lu et al. 2008). While we did not evaluate the role of
ganglionated plexi, this inter‐relationship of CFAE and DF is supported by our study.
Kalifa et al. (2006) have investigated the relationship between focal drivers and sites of
fractionation using optical mapping in the experimental setting. In 8 isolated sheep
hearts they were able to show maximal DF regions in which fractionation was lowest
and an increased band of fractionation observed at border‐zones with areas of lower
DF in the posterior left atria. They therefore conclude that alongside areas of fast,

202
regular atrial activation, there are zones where propagation pattern variability and
fractionated activity occur most frequently. In the current study, high‐density mapping
in human atrial fibrillation identified clusters of high DF points, predominantly within
the left atrium, with fractionation observed at or adjacent to these sites. These
findings are consistent with data from the findings of Kalifa et al. (2006). These
investigators suggested that the success of the CFAE‐targeted ablation is due to
anatomical barriers being created to isolate the influence of high frequency “driver”
sites on the rest of the atria. The current clinical study suggests that such ablation in
the beating heart could additionally involve the closely positioned sites of high
activation frequency.
8.4.5 Clinical Implications
Activation mapping during atrial fibrillation has been notoriously difficult to perform in
the clinical setting. In addition, for longer duration atrial fibrillation, CFAE are observed
in many regions of the atria making identification of critical CFAE sites difficult. In this
setting, mapping activation frequency with DF may be of particular value in guiding
ablation in patients with more complex substrate such as in longstanding persistent
atrial fibrillation. A combined approach using both CFAE and DF mapping may allow a
more expeditious and targeted approach to ablation of the critical atrial substrate,
which further studies should address.

203
8.4.6 Limitations
Although this clinical study has provided high‐density contact mapping to evaluate the
relationship of CFAE and DF, its relative density does not approach that achieved by
optical mapping in the experimental setting. Higher density mapping may have allowed
identification of mechanisms leading to these phenomena. Nevertheless, our findings
on the relationship between CFAE and DF are similar to that achieved in such studies.
This study was unable to determine the effects of ablation on these sites due to the
off‐line nature of the analysis. In addition, the coronary sinus was not studied. Finally,
the questions of optimal sample length and the temporal stability of DF and CFE‐mean
over periods of minutes or more was not addressed by this study, but have been
studied elsewhere (Lazar et al. 2004; Sanders et al. 2005a; Lin et al. 2008; Stiles et al.
2008).
8.5 Conclusion
Greater fractionation and higher activation frequency are seen in persistent atrial
fibrillation and in the left atria. Significant regional variation in activation frequency is
observed in paroxysmal atrial fibrillation and this distinction diminishes in persistent
atrial fibrillation. CFAE and DF demonstrate no relationship on a point‐by‐point basis.
However, there is a relationship between CFAE and DF at an individual level. High‐
density exploration of their spatial relationship confirms the occurrence of CFAE
adjacent to areas of high frequency activation.

204
Table 8.1
Patient characteristics
Paroxysmal (n=10)
Persistent (n=10)
p value
Age (years) 61.5 55.0 0.1
Male, n (%) 6 (60) 10 (100) 0.09
Longest AF episode 3±2 days 15±7 months <0.0001
Time since first AF episode 51±37 months 59±53 months 0.7
Structural heart disease, n (%) 0 2 (20) 0.5
Amiodarone use, n (%) 1 (10) 5 (50) 0.1
Left atrial parasternal size (mm) 43±5 49±7 0.045
Left atrial area (cm2) 25±5 31±7 0.04
Right atrial area (cm2) 20±5 25±8 0.2
Interventricular septum (mm) 10±1 12±2 0.009
LV end diastolic diameter (mm) 49±5 53±5 0.09
LV end systolic diameter (mm) 32±7 36±8 0.2
LV ejection fraction (%) 60±4 56±10 0.3
AF = atrial fibrillation, LV = left ventricular

205
Figure 8‐1 Integrated bi‐atrial high‐density CFE‐mean colour maps with example bipolar atrial
electrogram
Figure legend overleaf.

206
Figure 8‐1 (previous page)
The electrogram demonstrates yellow tick‐marks at the instant of maximum‐negative
slope on downstrokes between leading local‐maximum and trailing local‐minimum
points. Tick‐marks indicate annotations of deflection events in the electrogram
according to the Refractory, Peak‐to‐Peak Sensitivity and Duration criteria defined in
the text. CFE‐mean is the average time duration between annotations and the value
for each point is displayed along a colour spectrum on the 3‐dimensional geometry.
IVC – inferior vena cava , LAA – left atrial appendage, LIPV – left inferior pulmonary
vein, LSPV – left superior pulmonary vein, MA – mitral annulus, RAA – right atrial
appendage, RIPV – right inferior pulmonary vein, RSPV – right superior pulmonary vein,
SVC – superior vena cava, TA – tricuspid annulus.
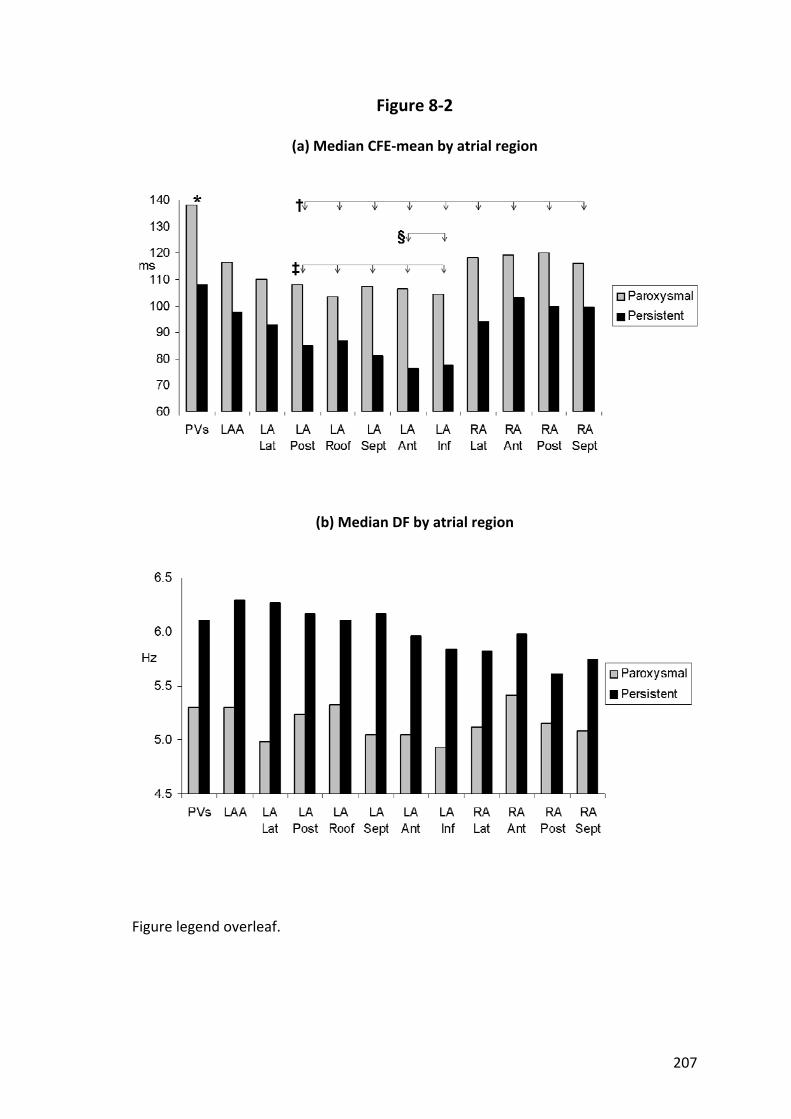
207
Figure 8‐2
(a) Median CFE‐mean by atrial region
(b) Median DF by atrial region
Figure legend overleaf.
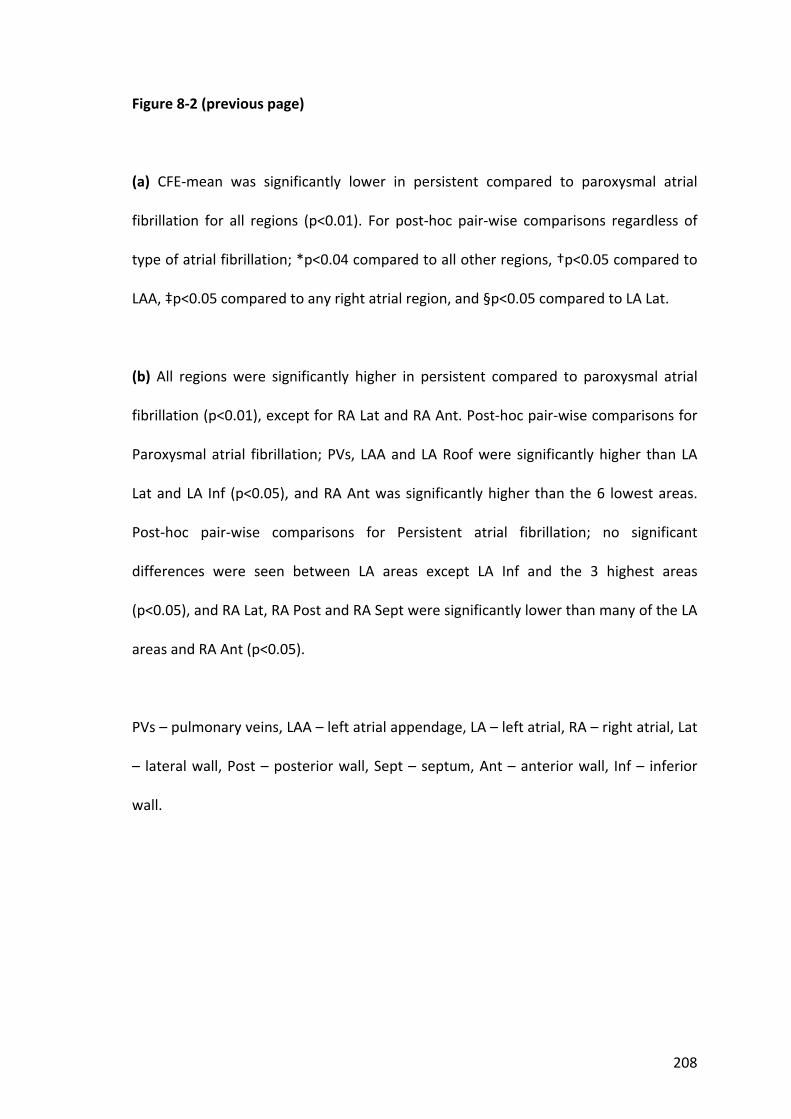
208
Figure 8‐2 (previous page)
(a) CFE‐mean was significantly lower in persistent compared to paroxysmal atrial
fibrillation for all regions (p<0.01). For post‐hoc pair‐wise comparisons regardless of
type of atrial fibrillation; *p<0.04 compared to all other regions, †p<0.05 compared to
LAA, ‡p<0.05 compared to any right atrial region, and §p<0.05 compared to LA Lat.
(b) All regions were significantly higher in persistent compared to paroxysmal atrial
fibrillation (p<0.01), except for RA Lat and RA Ant. Post‐hoc pair‐wise comparisons for
Paroxysmal atrial fibrillation; PVs, LAA and LA Roof were significantly higher than LA
Lat and LA Inf (p<0.05), and RA Ant was significantly higher than the 6 lowest areas.
Post‐hoc pair‐wise comparisons for Persistent atrial fibrillation; no significant
differences were seen between LA areas except LA Inf and the 3 highest areas
(p<0.05), and RA Lat, RA Post and RA Sept were significantly lower than many of the LA
areas and RA Ant (p<0.05).
PVs – pulmonary veins, LAA – left atrial appendage, LA – left atrial, RA – right atrial, Lat
– lateral wall, Post – posterior wall, Sept – septum, Ant – anterior wall, Inf – inferior
wall.

Figure 8‐3
Scatter plots of DF and CFE‐mean with “line of best fit”
Left pan
el: P
oint‐by‐po
int correlatio
n for every sample locatio
n in every patient.
Right p
anel: P
atient‐by‐patie
nt correlatio
n be
tween med
ians of C
FE‐m
ean and DF
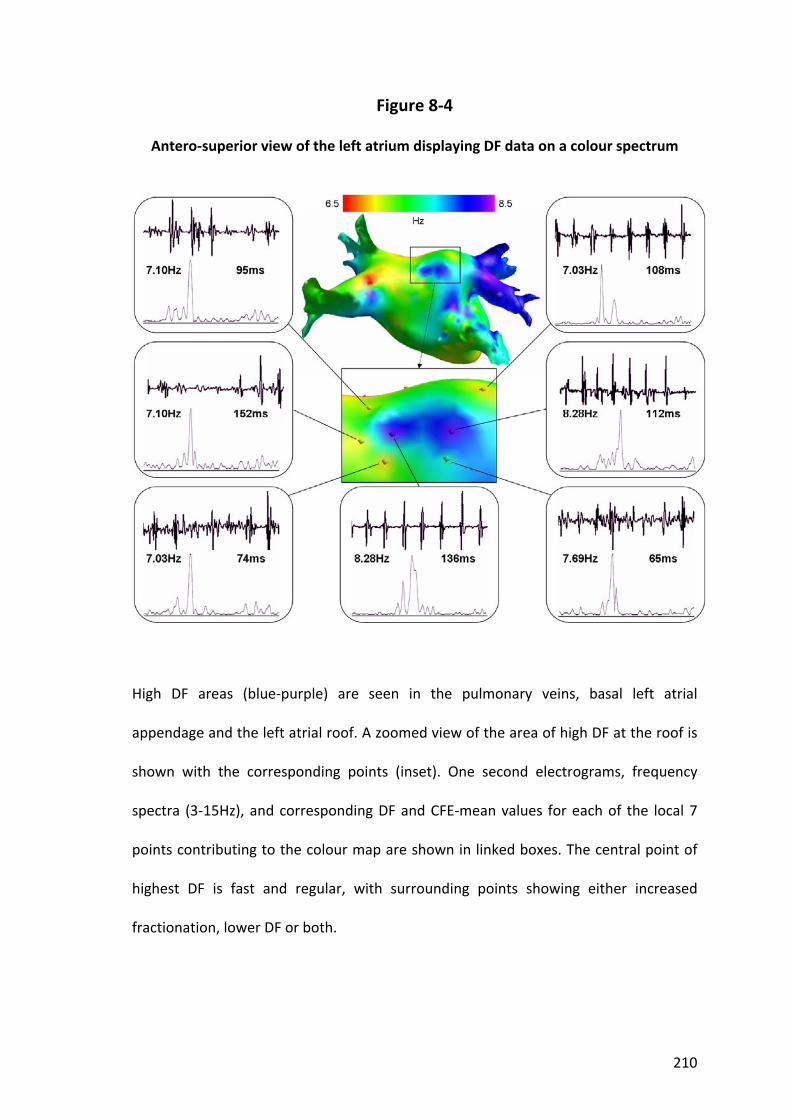
210
Figure 8‐4
Antero‐superior view of the left atrium displaying DF data on a colour spectrum
High DF areas (blue‐purple) are seen in the pulmonary veins, basal left atrial
appendage and the left atrial roof. A zoomed view of the area of high DF at the roof is
shown with the corresponding points (inset). One second electrograms, frequency
spectra (3‐15Hz), and corresponding DF and CFE‐mean values for each of the local 7
points contributing to the colour map are shown in linked boxes. The central point of
highest DF is fast and regular, with surrounding points showing either increased
fractionation, lower DF or both.
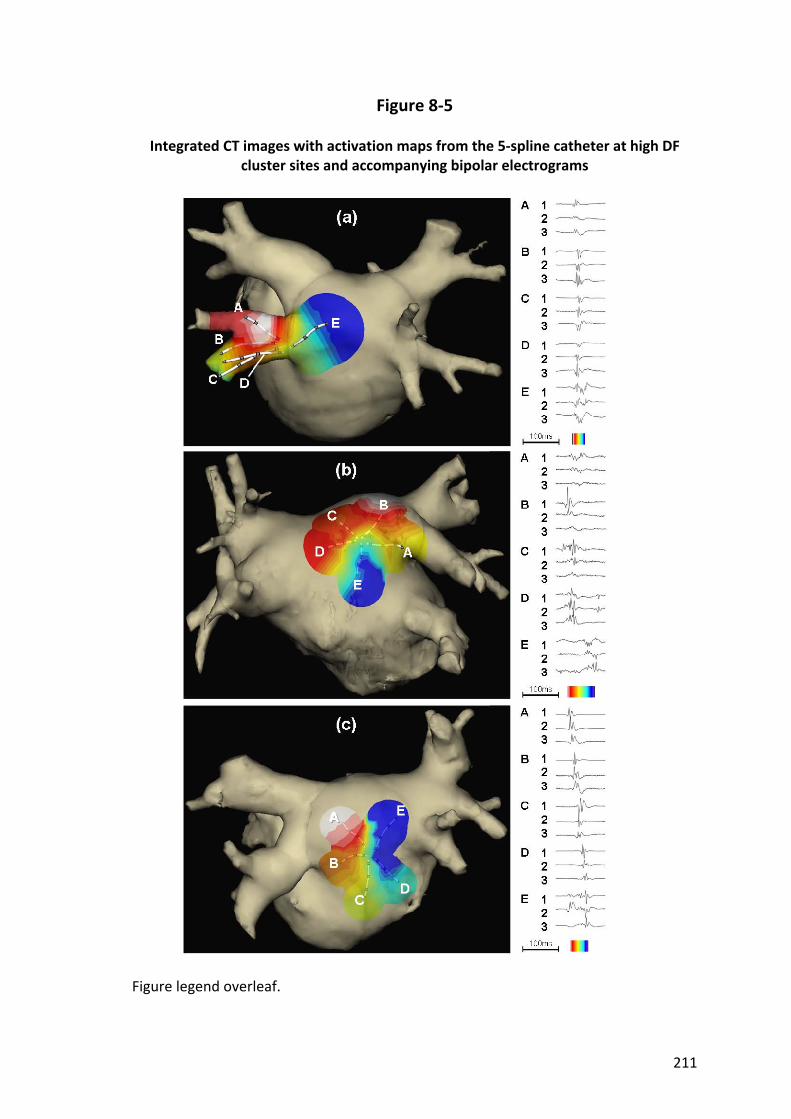
211
Figure 8‐5
Integrated CT images with activation maps from the 5‐spline catheter at high DF cluster sites and accompanying bipolar electrograms
Figure legend overleaf.

212
Figure 8‐5 (previous page)
(a) Activation map at the left inferior pulmonary vein of a patient with paroxysmal
atrial fibrillation. Dominant frequency at this site was 7.5Hz (median DF 5.4Hz for this
left atrium). In this example, activation seems to radiate out from a distinctly early site
(A2). Note the increase in fractionation in Spline E with delayed conduction.
(b) Activation map at the left atrial roof of a patient with persistent atrial fibrillation.
Dominant frequency at this site was 8.4Hz (median DF 7.2Hz for this left atrium).
Earliest activation is seen in distal Spline B with Splines C and D activated soon after.
Delayed conduction is seen in the direction of Splines A and E with isochronal crowding
and fractionation.
(c) Activation map at the posterior left atrial wall of a patient with paroxysmal atrial
fibrillation. Dominant frequency at this site was 6.4Hz (median DF 5.8Hz for this left
atrium). Activation can be seen to move in an anti‐clockwise direction around the
splines with block between Splines A and E, evidenced by double potentials in Spline E.
213
Chapter 9. Summary‐‐‐‐‐
This thesis has examined aspects of the underlying substrate present in atrial
fibrillation and atrial flutter. The insights gained into the characteristics of the atrial
myocardium that initiate and sustain atrial arrhythmia have advanced our
understanding of the mechanisms responsible for this disease. This knowledge may
contribute to strategies aimed at prevention and treatment of atrial arrhythmia.
Studies of patients with recent atrial arrhythmia have demonstrated electrical and
structural remodelling within the atria. However, it is not known if this remodelling
precedes, occurs in association with, or results from the atrial arrhythmia. These
studies have suggested an important role for a decrease in atrial refractoriness and are
central to the observation that "atrial fibrillation begets atrial fibrillation". Clinical
studies have shown reversal of electrical remodelling over time after termination of
arrhythmia, however strategies of prompt termination of atrial fibrillation to avoid this
cycle of adverse remodelling have failed to show benefit. These observations have led
to the search for a “second factor” integral to the development and progression of
atrial fibrillation. Characterisation of the atrial substrate distant in time from episodes
of atrial fibrillation removes the effect that recent arrhythmia is known to have on
atrial electrophysiology. Chapter 2 has characterised the electrical substrate of the
right and left atria of patients with paroxysmal lone atrial fibrillation, remote from
recent arrhythmia, and demonstrated conduction abnormalities characterised by
prolongation of conduction times along linearly placed catheters, longer P wave
duration and site‐specific conduction delay; impaired sinus node function indicated by
prolonged SACT and CSNRT; and an increase in ERP, which is consistent with prior

214
studies evaluating clinical substrates for atrial fibrillation but is in contrast to the
remodelling attributed to atrial fibrillation itself. This suggests that patients with
paroxysmal lone atrial fibrillation have an abnormal atrial electrophysiological
substrate and that these abnormalities contribute to the “second factor” that
promotes progression of atrial fibrillation. Chapter 3 has characterised the
electroanatomical substrate present in lone atrial fibrillation. Several animal models
and clinical conditions known to be associated with atrial fibrillation have
demonstrated structural remodelling and conduction abnormalities without reduction
in refractoriness, but the changes observed may be influenced by the underlying
disease itself. Patients with “lone” atrial fibrillation do not have overt cardiovascular
disease to influence the underlying substrate. Therefore, electroanatomical
characterisation of the atria of patients with lone atrial fibrillation has aimed to
minimise the effects of associated disease and look at the substrate related to the
arrhythmia itself. In addition, this characterisation was performed remote from recent
episodes of arrhythmia to diminish the transient effects of rate‐related remodelling.
This study demonstrated bi‐atrial structural abnormalities characterised by atrial
dilatation and lower mean atrial voltage suggesting the loss of atrial myocardium;
slower conduction velocities; and an increase in the proportion of electrograms
characterised as double potentials or fractionated signals. These findings suggest that
patients with paroxysmal lone atrial fibrillation have an abnormal electroanatomical
atrial substrate and that these abnormalities also contribute to the “second factor”
that promotes atrial fibrillation.
The course of the typical atrial flutter circuit has been well characterised and ablation
of the cavotricuspid isthmus is a highly successful treatment. However, despite this

215
therapy a significant proportion subsequently develop atrial fibrillation. Indeed, atrial
flutter has a close inter‐relationship with atrial fibrillation and the two rhythms
frequently co‐exist. Chapter 4 postulates that causes for the propensity for future
atrial fibrillation in this population may be found by investigation of the underlying
electrical substrate of the right atrium in atrial flutter. Major findings from this study
include conduction abnormalities characterised by prolongation of lateral right atrial
conduction time, longer P wave duration and site‐specific conduction delay;
impairment of sinus node function; and an increase or no change in ERP. Thus, the
abnormal electrical substrate of atrial flutter is found to be present diffusely
throughout the right atrium and not confined to the barriers of the known typical
flutter circuit. Chapter 5 has characterised the electroanatomical substrate of atrial
flutter to further define abnormalities throughout the right atrium. Findings include
structural abnormalities reflected in atrial dilatation and lower mean right atrial
voltage suggesting the loss of atrial myocardium; conduction abnormalities in the form
of slower mean conduction velocity; and an increase in the proportion of complex
electrograms. Together with the electrical substrate determined in the prior chapter,
these changes reflect a diffusely abnormal right atrial substrate characteristic of the
changes seen in atrial fibrillation with prior studies and indeed earlier in this thesis.
Perhaps it is these abnormalities that predispose many patients with atrial flutter to
progress to atrial fibrillation.
Several investigators have observed remodelling of the sinus node that develops soon
after the initiation of arrhythmia and reverses after restoration of sinus rhythm. In
addition, it is known that several conditions predisposed to the development of atrial
arrhythmias demonstrate sinus node remodelling. Furthermore, atrial fibrillation not
216
uncommonly complicates sinus node disease. This frequent co‐existence of atrial
arrhythmia and sinus node disease may be due to a slow sinus rate increasing
vulnerability to atrial fibrillation, a common disease substrate and/or arrhythmia
directly impairing sinus node function. The anatomical sinus node is a small localised
structure located at the junction of the superior vena cava with the right atrium. In
contrast, the functional sinus node complex has been demonstrated to extend the
length of the crista terminalis and indeed beyond. This discrepancy is difficult to
reconcile and various hypotheses have been proposed. Newer mapping technology has
provided novel insights into arrhythmia mechanisms not previously afforded using
conventional techniques, demonstrating “preferential pathways” from earliest
activation to the site where break‐out occurs to the remaining atria in ectopic atrial
tachycardia. Whether similar pathways exist to account for the discrepancy between
the anatomical and functional sinus node complex is not known. Chapter 6 aimed to
characterise the electrical properties of the functional sinus node complex in the
normal heart with the anatomical and electrical resolution provided by a 3‐
dimensional non‐contact mapping system. To further explore the sinus node complex
activity, the same characterisation was performed in patients with chronic atrial flutter
(a group known to have impaired sinus node function) to establish how sinus node
activity is affected by atrial remodelling. This chapter found that the sinus node
complex in normal hearts displays a dynamic range of activation sites along the
postero‐lateral right atrium and preferential pathways of conduction do indeed exist
between the sinus node and the exit of sinus activity to the atria. There were multiple
origins of sinus activation and exit sites to the atria, providing evidence of multi‐
centricity of the sinus node complex. Lastly, remodelled atria demonstrate structural

217
change reflected by loss of voltage that was associated with more caudal activation,
slower conduction time along preferential pathways, only modest shifts of the
functional pacemaker complex and more frequent conduction block across the crista
terminalis with resultant circuitous conduction of the sinus impulse. These findings
extend our knowledge of the function of the highly complex human sinus node by
demonstrating the presence of preferential pathways of conduction within the
functional sinus node complex. The abnormalities in the sinus node complex shown for
the patients with atrial flutter underscore the important association between impaired
sinus node function and atrial arrhythmia.
As ablation techniques are used to treat patients with atrial fibrillation, it has become
apparent that many patients require not just trigger elimination but also substrate
modification. There is much work being done on identifying the appropriate atrial
substrate to be modified. Areas of CFAE and DF have been suggested as critical regions
maintaining atrial fibrillation. Techniques to modify the underlying atrial substrate by
ablation of these targets in order to treat atrial fibrillation have been proposed. CFAE‐
targeted ablation is one such technique and has been reported as highly successful,
although attempts to emulate the outcomes initially reported have shown more
modest improvements. Perhaps one reason for this non‐reproducibility is that the
evaluation of CFAE has been based on the operator’s subjective analysis. Mapping to
identify sites of high DF may identify the position of “drivers” of atrial fibrillation and
targeting these electrograms is a promising area of research. The development of
automated algorithms for both quantification of electrogram fractionation and real‐
time DF calculation aims to deliver a reproducible and objective assessment of
electrogram characteristics and thereby standardise the approach to substrate

218
modification. The ideal duration of electrograms required to reproducibly identify sites
of CFAE or highest DF is not known. While longer electrogram recordings extend the
data collection process unnecessarily, shorter durations may provide an inaccurate
representation of the true degree of fractionation or frequency. Chapter 7 aimed to
determine the minimum duration of electrogram recording that provides accurate
data without unduly lengthening the data collection process, by exploring the degree
of correlation between progressively shorter electrogram recordings with the longest
exportable data sample length. Recordings of shorter durations were compared to the
maximum duration recordable by the system using several criteria including mean
values, mean absolute differences, the proportion of points deviating >10% from the
index value and intra‐class correlation coefficients. Using these criteria, a recording
duration of less then 5 seconds was shown to disclose inaccurate data about the
fractionation and activation frequency of the electrograms reflecting underlying
substrate of atrial fibrillation. An electrogram duration of 5 seconds is therefore
recommended with these techniques of automated analysis.
The relationship between CFAE and sites of high DF has not been previously
demonstrated in humans. In particular, it is not known whether they are markers of
the same or provide complementary information on the pathogenesis of atrial
fibrillation. Understanding the relationship between these targets may be useful in
guiding radiofrequency ablation. In Chapter 8, the relationship between sites of high
frequency activation and fractionation during atrial fibrillation was examined by the
creation of high‐density bi‐atrial maps. This study found that the left atrium is more
highly fractionated than the right atrium and that patients with persistent atrial
fibrillation demonstrate a higher degree of fractionation than those with paroxysmal

219
atrial fibrillation. Similarly, activation frequency is higher in the left atrium than the
right atrium and higher in persistent atrial fibrillation than paroxysmal atrial
fibrillation. In paroxysmal atrial fibrillation regional analysis demonstrated significant
variation in frequency, but these regional differences were less apparent in persistent
atrial fibrillation. Correlation between fractionation and activation frequency exists but
is much stronger on a patient‐by‐patient rather than a point‐by‐point basis, prompting
the exploration of the spatial relationship between points of high DF and fractionation.
Detailed inspection of 3‐dimensional high‐density maps created during atrial
fibrillation reveals that electrogram fractionation is observed in close proximity to sites
of high frequency activation. This data is further supported by high‐density
simultaneous activation mapping at sites of high DF. The clinical implications of this
relationship are that mapping activation frequency with DF may be of particular value
in guiding ablation in patients with more complex substrate such as in longstanding
persistent atrial fibrillation. A combined approach using both CFAE and DF mapping
may allow a more expeditious and targeted approach to ablation of the critical atrial
substrate, which further studies should address.
220
Chapter 10. Future Directions‐‐‐
The characterisation of the underlying atrial substrate of atrial fibrillation and atrial
flutter performed for the purpose of this thesis has provided important insights into
the mechanism of the disease process associated with atrial arrhythmia. However,
many questions remain unanswered, some of which are discussed below.
This thesis provides documentation of the substrate of atrial fibrillation and of atrial
flutter under specific conditions. By design, the electrophysiological and
electroanatomical studies were performed remote from recent arrhythmia to minimise
the known transient effects of rate‐related remodelling. As such, the conclusions
drawn relate to the substrate present without the effects of recent arrhythmia which
of course may not reflect the clinical situation of many patients with atrial arrhythmia.
The complex interaction between the electrical and structural remodelling
demonstrated here and the rate‐related remodelling observed during and shortly after
arrhythmia requires further study.
Additionally, the similarly complex interaction between substrate for atrial fibrillation
and associated cardiovascular disease is an area for future investigation. The bi‐atrial
substrate identified for lone atrial fibrillation here necessarily excluded underlying
heart disease and most patients with atrial fibrillation do indeed have related disorders
which would variably impact on the atrial substrate.
The cause of atrial arrhythmia is widely recognised to be due to the presence of both
triggers and substrate to initiate and maintain the abnormal rhythm. This thesis has
concentrated on characterising the substrate underlying atrial arrhythmia. Although

221
extrapolation of data regarding sites of high DF as potential triggers sites could be
made, this was not the primary aim of the study. Therefore, detailed examination of
the electrophysiological characteristics of triggers of atrial arrhythmia is a potential
area for future research that would complement the work on atrial substrate.
Clinical studies such as those performed in this thesis make some assumptions about
disease process and observed findings – e.g. reduction in observed voltage is likely to
reflect loss of atrial myocardium. Insights into the precise mechanisms contributing to
the changes observed may come from animal studies where the methods by which
abnormalities manifest are more readily established.
A substantial body of work exists on the effect of the autonomic nervous system on
atrial fibrillation. This thesis did not set out to characterise the effect of the ganglionic
plexi on the atrial substrate and future work on the contribution of vagal influence on
the triggers and maintenance of atrial fibrillation is expected to increase our
knowledge in this important area.
Sinus node disease is a significant cause of morbidity and a leading indication for
permanent pacemaker implantation. The findings in this thesis of preferential
pathways being integral to the function of the sinus node complex, and the
observations of sinus node remodelling associated with atrial flutter being mediated
via these pathways, has implications for the understanding and perhaps eventual
management of this common condition.
Translating the findings regarding atrial substrate to a useful clinical intervention
would be a worthy aim. The studies of CFAE and DF have a potential role in the
effective guidance of ablation strategies aiming to modify the substrate of atrial

222
arrhythmia. Although the strategy of CFAE‐targeted ablation is well accepted, that of
targeting sites of high DF is not yet established. DF‐guided ablation is a potential direct
application of the data presented in Chapter 8 and future studies comparing standard
ablation techniques with or without additional targeting of sites of high DF may show a
difference in ablation efficacy. Furthermore, a combined approach (identifying both
CFAE and sites of high DF) of electrogram‐targeted ablation may utilise the
complementary information obtained from each technique to increase effective
ablation while decreasing unnecessary ablation of “bystander” myocardium not
actively involved in the substrate maintaining atrial fibrillation. As the indications for
atrial fibrillation ablation expand and the additional ablation required to maintain
outcomes in the more complex patient increases, a method that could reduce ablation
time and increase safety yet maintain efficacy would be welcome.

223
References
Aberg H. Atrial fibrillation. A review of 463 cases from Philadelphia General Hospital
from 1955 to 1965. Acta Med Scand 1968;184:425‐431.
Aimé‐Sempé C, Folliguet T, Rucker‐Martin C, Krajewska M, Krajewska S, Heimburger M,
Aubier M, Mercadier JJ, Reed JC and Hatem SN. Myocardial cell death in
fibrillating and dilated human right atria. J Am Coll Cardiol 1999;34:1577‐1586.
Alboni P, Malcarne C, Pedroni P, Masoni A and Narula OS. Electrophysiology of normal
sinus node with and without autonomic blockade. Circulation 1982;65:1236‐
1242.
Allessie M, Ausma J and Schotten U. Electrical, contractile and structural remodeling
during atrial fibrillation. Cardiovasc Res 2002;54:230‐246.
Allessie MA, Bonke FI and Schopman FJ. Circus movement in rabbit atrial muscle as a
mechanism of tachycardia. III. The "leading circle" concept: a new model of
circus movement in cardiac tissue without the involvement of an anatomical
obstacle. Circ Res 1977;41:9‐18.
Allessie MA, Boyden PA, Camm AJ, Kleber AG, Lab MJ, Legato MJ, Rosen MR, Schwartz
PJ, Spooner PM, Van Wagoner DR and Waldo AL. Pathophysiology and
prevention of atrial fibrillation. Circulation 2001;103:769‐777.
Anderson KR, Ho SY and Anderson RH. Location and vascular supply of sinus node in
human heart. Br Heart J 1979;41:28‐32.
Anderson RH, Ho SY, Smith A and Becker AE. The internodal atrial myocardium. Anat
Rec 1981a;201:75‐82.
224
Anderson RH, Becker AE, Tranum‐Jensen J and Janse MJ. Anatomico‐
electrophysiological correlations in the conduction system‐‐a review. Br Heart J
1981b;45:67‐82.
Arentz T, Haegeli L, Sanders P, Weber R, Neumann FJ, Kalusche D and Haïssaguerre M.
High‐density mapping of spontaneous pulmonary vein activity initiating atrial
fibrillation in humans. J Cardiovasc Electrophysiol 2007;18:31‐38.
Arora R, Verheule S, Scott L, Navarrete A, Katari V, Wilson E, Vaz D and Olgin JE.
Arrhythmogenic substrate of the pulmonary veins assessed by high‐resolution
optical mapping. Circulation 2003;107:1816‐1821.
Atienza F, Almendral J, Moreno J, Vaidyanathan R, Talkachou A, Kalifa J, Arenal A,
Villacastin JP, Torrecilla EG, Sanchez A, Ploutz‐Snyder R, Jalife J and Berenfeld
O. Activation of inward rectifier potassium channels accelerates atrial
fibrillation in humans: evidence for a reentrant mechanism. Circulation
2006;114:2434‐2442.
Ausma J, van der Velden HM, Lenders MH, van Ankeren EP, Jongsma HJ, Ramaekers FC,
Borgers M and Allessie MA. Reverse structural and gap‐junctional remodeling
after prolonged atrial fibrillation in the goat. Circulation 2003;107:2051‐2058.
Australian Institute of Health and Welfare, National Hospital Morbidity Database,
Separation statistics by principal diagnosis in ICD‐10‐AM, Australia, 1998‐99 to
2004‐2005. Retrieved 21 April 2008 from www.aihw.gov.au/cognos/cgi‐
bin/ppdscgi?DC=Q&E=/ahs/principaldiagnosis9899‐0405.
Badhwar N, Kalman JM, Sparks PB, Kistler PM, Attari M, Berger M, Lee RJ, Sra J and
Scheinman MM. Atrial tachycardia arising from the coronary sinus musculature:

225
electrophysiological characteristics and long‐term outcomes of radiofrequency
ablation. J Am Coll Cardiol 2005;46:1921‐1930.
Bailin SJ, Adler S and Giudici M. Prevention of chronic atrial fibrillation by pacing in the
region of Bachmann's bundle: results of a multicenter randomized trial. J
Cardiovasc Electrophysiol 2001;12:912‐917.
Becker AE. How structurally normal are human atria in patients with atrial fibrillation?
Heart Rhythm 2004;1:627‐631.
Benjamin EJ, Levy D, Vaziri SM, D'Agostino RB, Belanger AJ and Wolf PA. Independent
risk factors for atrial fibrillation in a population‐based cohort. The Framingham
Heart Study. JAMA 1994;271:840‐844.
Benjamin EJ, Wolf PA, D'Agostino RB, Silbershatz H, Kannel WB and Levy D. Impact of
atrial fibrillation on the risk of death: the Framingham Heart Study. Circulation
1998;98:946‐952.
Berenfeld O, Mandapati R, Dixit S, Skanes AC, Chen J, Mansour M and Jalife J. Spatially
distributed dominant excitation frequencies reveal hidden organization in atrial
fibrillation in the Langendorff‐perfused sheep heart. J Cardiovasc Electrophysiol
2000;11:869‐879.
Betts TR, Roberts PR and Morgan JM. High‐density mapping of left atrial endocardial
activation during sinus rhythm and coronary sinus pacing in patients with
paroxysmal atrial fibrillation. J Cardiovasc Electrophysiol 2004;15:1111‐1117.
Blom NA, Gittenberger‐de Groot AC, DeRuiter MC, Poelmann RE, Mentink MM and
Ottenkamp J. Development of the cardiac conduction tissue in human embryos
using HNK‐1 antigen expression: possible relevance for understanding of
abnormal atrial automaticity. Circulation 1999;99:800‐806.
226
Blomstrom‐Lundqvist C, Scheinman MM, Aliot EM, Alpert JS, Calkins H, Camm AJ,
Campbell WB, Haines DE, Kuck KH, Lerman BB, Miller DD, Shaeffer CW,
Stevenson WG, Tomaselli GF, Antman EM, Smith SC, Jr., Alpert JS, Faxon DP,
Fuster V, Gibbons RJ, Gregoratos G, Hiratzka LF, Hunt SA, Jacobs AK, Russell RO,
Jr., Priori SG, Blanc JJ, Budaj A, Burgos EF, Cowie M, Deckers JW, Garcia MA,
Klein WW, Lekakis J, Lindahl B, Mazzotta G, Morais JC, Oto A, Smiseth O and
Trappe HJ. ACC/AHA/ESC guidelines for the management of patients with
supraventricular arrhythmias ‐ executive summary. A report of the American
College of Cardiology/American Heart Association task force on practice
guidelines and the European Society of Cardiology committee for practice
guidelines. J Am Coll Cardiol 2003;42:1493‐1531.
Boineau JP, Schuessler RB, Mooney CR, Wylds AC, Miller CB, Hudson RD, Borremans JM
and Brockus CW. Multicentric origin of the atrial depolarization wave: the
pacemaker complex. Relation to dynamics of atrial conduction, P‐wave changes
and heart rate control. Circulation 1978;58:1036‐1048.
Boineau JP, Schuessler RB, Hackel DB, Miller CB, Brockus CW and Wylds AC.
Widespread distribution and rate differentiation of the atrial pacemaker
complex. Am J Physiol 1980;239:H406‐415.
Boineau JP, Miller CB, Schuessler RB, Roeske WR, Autry LJ, Wylds AC and Hill DA.
Activation sequence and potential distribution maps demonstrating
multicentric atrial impulse origin in dogs. Circ Res 1984;54:332‐347.
Boineau JP, Canavan TE, Schuessler RB, Cain ME, Corr PB and Cox JL. Demonstration of
a widely distributed atrial pacemaker complex in the human heart. Circulation
1988;77:1221‐1237.
227
Boldt A, Scholl A, Garbade J, Resetar ME, Mohr FW, Gummert JF and Dhein S. ACE‐
inhibitor treatment attenuates atrial structural remodeling in patients with lone
chronic atrial fibrillation. Basic Res Cardiol 2006;101:261‐267.
Bouman LN, Gerlings ED, Biersteker PA and Bonke FI. Pacemaker shift in the sino‐atrial
node during vagal stimulation. Pflugers Arch 1968;302:255‐267.
Boyden PA, Tilley LP, Pham TD, Liu SK, Fenoglic JJ, Jr. and Wit AL. Effects of left atrial
enlargement on atrial transmembrane potentials and structure in dogs with
mitral valve fibrosis. Am J Cardiol 1982;49:1896‐1908.
Boyden PA, Tilley LP, Albala A, Liu SK, Fenoglio JJ, Jr. and Wit AL. Mechanisms for atrial
arrhythmias associated with cardiomyopathy: a study of feline hearts with
primary myocardial disease. Circulation 1984;69:1036‐1047.
Brand FN, Abbott RD, Kannel WB and Wolf PA. Characteristics and prognosis of lone
atrial fibrillation. 30‐year follow‐up in the Framingham Study. JAMA
1985;254:3449‐3453.
Braunwald E. Shattuck lecture‐‐cardiovascular medicine at the turn of the millennium:
triumphs, concerns, and opportunities. N Engl J Med 1997;337:1360‐1369.
Breithardt G, Seipel L and Loogen F. Sinus node recovery time and calculated sinoatrial
conduction time in normal subjects and patients with sinus node dysfunction.
Circulation 1977;56:43‐50.
Bromberg BI, Hand DE, Schuessler RB and Boineau JP. Primary negativity does not
predict dominant pacemaker location: implications for sinoatrial conduction.
Am J Physiol 1995;269:H877‐887.
Brown HF, DiFrancesco D and Noble SJ. How does adrenaline accelerate the heart?
Nature 1979;280:235‐236.
228
Brugada R, Tapscott T, Czernuszewicz GZ, Marian AJ, Iglesias A, Mont L, Brugada J,
Girona J, Domingo A, Bachinski LL and Roberts R. Identification of a genetic
locus for familial atrial fibrillation. N Engl J Med 1997;336:905‐911.
Cabrera JA, Ho SY, Climent V and Sanchez‐Quintana D. The architecture of the left
lateral atrial wall: a particular anatomic region with implications for ablation of
atrial fibrillation. Eur Heart J 2008;29:356‐362.
Cadilhac DA, Carter RC, Thrift AG and Dewey HM. Why invest in a national public
health program for stroke? An example using Australian data to estimate the
potential benefits and cost implications. Health Policy 2007;83:287‐294.
Calkins H, Brugada J, Packer DL, Cappato R, Chen SA, Crijns HJ, Damiano RJ, Jr., Davies
DW, Haines DE, Haïssaguerre M, Iesaka Y, Jackman W, Jaïs P, Kottkamp H, Kuck
KH, Lindsay BD, Marchlinski FE, McCarthy PM, Mont JL, Morady F, Nademanee
K, Natale A, Pappone C, Prystowsky E, Raviele A, Ruskin JN and Shemin RJ.
HRS/EHRA/ECAS expert Consensus Statement on catheter and surgical ablation
of atrial fibrillation: recommendations for personnel, policy, procedures and
follow‐up. A report of the Heart Rhythm Society (HRS) Task Force on catheter
and surgical ablation of atrial fibrillation. Heart Rhythm 2007;4:816‐861.
Callans DJ, Ren JF, Schwartzman D, Gottlieb CD, Chaudhry FA and Marchlinski FE.
Narrowing of the superior vena cava‐right atrium junction during
radiofrequency catheter ablation for inappropriate sinus tachycardia: analysis
with intracardiac echocardiography. J Am Coll Cardiol 1999;33:1667‐1670.
Cha YM, Redfield MM, Shen WK and Gersh BJ. Atrial fibrillation and ventricular
dysfunction: a vicious electromechanical cycle. Circulation 2004;109:2839‐
2843.
229
Chen CC, Tai CT, Chiang CE, Yu WC, Lee SH, Chen YJ, Hsieh MH, Tsai CF, Lee KW, Ding
YA, Chang MS and Chen SA. Atrial tachycardias originating from the atrial
septum: electrophysiologic characteristics and radiofrequency ablation. J
Cardiovasc Electrophysiol 2000;11:744‐749.
Chen SA, Chiang CE, Yang CJ, Cheng CC, Wu TJ, Wang SP, Chiang BN and Chang MS.
Sustained atrial tachycardia in adult patients. Electrophysiological
characteristics, pharmacological response, possible mechanisms, and effects of
radiofrequency ablation. Circulation 1994;90:1262‐1278.
Chen SA, Hsieh MH, Tai CT, Tsai CF, Prakash VS, Yu WC, Hsu TL, Ding YA and Chang MS.
Initiation of atrial fibrillation by ectopic beats originating from the pulmonary
veins: electrophysiological characteristics, pharmacological responses, and
effects of radiofrequency ablation. Circulation 1999;100:1879‐1886.
Chen YJ, Chen SA, Chen YC, Yeh HI, Chan P, Chang MS and Lin CI. Effects of rapid atrial
pacing on the arrhythmogenic activity of single cardiomyocytes from
pulmonary veins: implication in initiation of atrial fibrillation. Circulation
2001;104:2849‐2854.
Chinitz JS, Gerstenfeld EP, Marchlinski FE and Callans DJ. Atrial fibrillation is common
after ablation of isolated atrial flutter during long‐term follow‐up. Heart
Rhythm 2007;4:1029‐1033.
Chugh A, Latchamsetty R, Oral H, Elmouchi D, Tschopp D, Reich S, Igic P, Lemerand T,
Good E, Bogun F, Pelosi F, Jr. and Morady F. Characteristics of cavotricuspid
isthmus‐dependent atrial flutter after left atrial ablation of atrial fibrillation.
Circulation 2006;113:609‐615.
230
Chung MK, Martin DO, Sprecher D, Wazni O, Kanderian A, Carnes CA, Bauer JA, Tchou
PJ, Niebauer MJ, Natale A and Van Wagoner DR. C‐reactive protein elevation in
patients with atrial arrhythmias: inflammatory mechanisms and persistence of
atrial fibrillation. Circulation 2001;104:2886‐2891.
Ciaroni S, Cuenoud L and Bloch A. Clinical study to investigate the predictive
parameters for the onset of atrial fibrillation in patients with essential
hypertension. Am Heart J 2000;139:814‐819.
Cosio FG, Palacios J, Vidal JM, Cocina EG, Gomez‐Sanchez MA and Tamargo L.
Electrophysiologic studies in atrial fibrillation. Slow conduction of premature
impulses: a possible manifestation of the background for reentry. Am J Cardiol
1983;51:122‐130.
Cosio FG, Arribas F, Palacios J, Tascon J and Lopez‐Gil M. Fragmented electrograms and
continuous electrical activity in atrial flutter. Am J Cardiol 1986;57:1309‐1314.
Cosio FG, Arribas F, Barbero JM, Kallmeyer C and Goicolea A. Validation of double‐
spike electrograms as markers of conduction delay or block in atrial flutter. Am
J Cardiol 1988;61:775‐780.
Cosio FG, Lopez‐Gil M, Goicolea A, Arribas F and Barroso JL. Radiofrequency ablation of
the inferior vena cava‐tricuspid valve isthmus in common atrial flutter. Am J
Cardiol 1993;71:705‐709.
Coumel P. Paroxysmal atrial fibrillation: a disorder of autonomic tone? Eur Heart J
1994;15 Suppl A:9‐16.
Cox JL, Canavan TE, Schuessler RB, Cain ME, Lindsay BD, Stone C, Smith PK, Corr PB and
Boineau JP. The surgical treatment of atrial fibrillation. II. Intraoperative
231
electrophysiologic mapping and description of the electrophysiologic basis of
atrial flutter and atrial fibrillation. J Thorac Cardiovasc Surg 1991;101:406‐426.
Cox JL, Boineau JP, Schuessler RB, Kater KM and Lappas DG. Five‐year experience with
the maze procedure for atrial fibrillation. Ann Thorac Surg 1993;56:814‐823.
Cranefield PF. Action potentials, afterpotentials, and arrhythmias. Circulation Res
1977;41:415‐423.
Cushny AR and Edmunds CW. Paroxysmal irregularity of the heart and auricular
fibrillation. Am J Med Sci 1907;133.
Da Costa A, Romeyer C, Mourot S, Messier M, Cerisier A, Faure E and Isaaz K. Factors
associated with early atrial fibrillation after ablation of common atrial flutter. A
single centre prospective study. Eur Heart J 2002;23:498‐506.
Daoud EG, Weiss R, Augostini RS, Kalbfleisch SJ, Schroeder J, Polsinelli G and Hummel
JD. Remodeling of sinus node function after catheter ablation of right atrial
flutter. J Cardiovasc Electrophysiol 2002;13:20‐24.
Darbar D, Herron KJ, Ballew JD, Jahangir A, Gersh BJ, Shen WK, Hammill SC, Packer DL
and Olson TM. Familial atrial fibrillation is a genetically heterogeneous disorder.
J Am Coll Cardiol 2003;41:2185‐2192.
Davies MJ and Pomerance A. Pathology of atrial fibrillation in man. Br Heart J
1972;34:520‐525.
De Ponti R, Ho SY, Salerno‐Uriarte JA, Tritto M and Spadacini G. Electroanatomic
analysis of sinus impulse propagation in normal human atria. J Cardiovasc
Electrophysiol 2002;13:1‐10.
de Voogt W, van Hemel N, de Vusser P, Mairesse GH, van Mechelen R, Koistinen J, van
den Bos A, Roose I, Voitk J, Yli‐Mayry S, Stockman D, El Allaf D, Tse HF and Lau

232
CP. No evidence of automatic atrial overdrive pacing efficacy on reduction of
paroxysmal atrial fibrillation. Europace 2007;9:798‐804.
Earley MJ, Abrams DJ, Sporton SC and Schilling RJ. Validation of the noncontact
mapping system in the left atrium during permanent atrial fibrillation and sinus
rhythm. J Am Coll Cardiol 2006;48:485‐491.
Eikelboom JW and Hankey GJ. The beginning of the end of warfarin? Med J Aust
2004;180:549‐551.
Einthoven W. Le telecardiogramme. Arch Int Physiol 1906;4:132‐164.
Ellinor PT, Yoerger DM, Ruskin JN and Macrae CA. Familial aggregation in lone atrial
fibrillation. Hum Genet 2005;118:179‐184.
Ellis K, Wazni O, Marrouche N, Martin D, Gillinov M, McCarthy P, Saad EB, Bhargava M,
Schweikert R, Saliba W, Bash D, Rossillo A, Erciyes D, Tchou P and Natale A.
Incidence of atrial fibrillation post‐cavotricuspid isthmus ablation in patients
with typical atrial flutter: left‐atrial size as an independent predictor of atrial
fibrillation recurrence. J Cardiovasc Electrophysiol 2007;18:799‐802.
Elvan A, Wylie K and Zipes DP. Pacing‐induced chronic atrial fibrillation impairs sinus
node function in dogs. Electrophysiological remodeling. Circulation
1996;94:2953‐2960.
Ernestene AC and Levine SA. A comparison of records taken with the Einthoven string
galvanometer and the amplifier type electrocardiograph. Am Heart J
1928;4:725‐731.
Estes NA, 3rd, Halperin JL, Calkins H, Ezekowitz MD, Gitman P, Go AS, McNamara RL,
Messer JV, Ritchie JL, Romeo SJ, Waldo AL, Wyse DG, Bonow RO, DeLong E,
Goff DC, Jr., Grady K, Green LA, Hiniker A, Linderbaum JA, Masoudi FA, Pina IL,
233
Pressler S, Radford MJ and Rumsfeld JS. ACC/AHA/Physician Consortium 2008
Clinical performance measures for adults with nonvalvular atrial fibrillation or
atrial flutter: A report of the American College of Cardiology/American Heart
Association task force on performance measures and the physician consortium
for performance improvement. J Am Coll Cardiol 2008;51:865‐884.
Everett TH, Wilson EE, Verheule S, Guerra JM, Foreman S and Olgin JE. Structural atrial
remodeling alters the substrate and spatiotemporal organization of atrial
fibrillation: a comparison in canine models of structural and electrical atrial
remodeling. Am J Physiol Heart Circ Physiol 2006;291:H2911‐H2923.
Fan K, Lee KL, Chow WH, Chau E and Lau CP. Internal cardioversion of chronic atrial
fibrillation during percutaneous mitral commissurotomy: insight into reversal of
chronic stretch‐induced atrial remodeling. Circulation 2002;105:2746‐2752.
Fareh S, Villemaire C and Nattel S. Importance of refractoriness heterogeneity in the
enhanced vulnerability to atrial fibrillation induction caused by tachycardia‐
induced atrial electrical remodeling. Circulation 1998;98:2202‐2209.
Feld GK, Fleck RP, Chen PS, Boyce K, Bahnson TD, Stein JB, Calisi CM and Ibarra M.
Radiofrequency catheter ablation for the treatment of human type 1 atrial
flutter. Identification of a critical zone in the reentrant circuit by endocardial
mapping techniques. Circulation 1992;86:1233‐1240.
Ferrer MI. The sick sinus syndrome in atrial disease. JAMA 1968;206:645‐646.
Ferrier GR and Moe GK. Effect of calcium on acetylstrophanthidin‐induced transient
depolarizations in canine Purkinje tissue. Circulation Res 1973;33:508‐515.
Flegel KM. From Delirium Cordis to Atrial Fibrillation: Historical Development of a
Disease Concept. Ann Intern Med 1995;122:867‐873.

234
Frame LH, Page RL and Hoffman BF. Atrial reentry around an anatomic barrier with a
partially refractory excitable gap. A canine model of atrial flutter. Circulation
Res 1986;58:495‐511.
Franz MR, Karasik PL, Li C, Moubarak J and Chavez M. Electrical remodeling of the
human atrium: similar effects in patients with chronic atrial fibrillation and
atrial flutter. J Am Coll Cardiol 1997;30:1785‐1792.
Frustaci A, Chimenti C, Bellocci F, Morgante E, Russo MA and Maseri A. Histological
substrate of atrial biopsies in patients with lone atrial fibrillation. Circulation
1997;96:1180‐1184.
Furberg CD, Psaty BM, Manolio TA, Gardin JM, Smith VE and Rautaharju PM.
Prevalence of atrial fibrillation in elderly subjects (the Cardiovascular Health
Study). Am J Cardiol 1994;74:236‐241.
Fuster V, Ryden LE, Asinger RW, Cannom DS, Crijns HJ, Frye RL, Halperin JL, Kay GN,
Klein WW, Levy S, McNamara RL, Prystowsky EN, Wann LS and Wyse DG.
ACC/AHA/ESC guidelines for the management of patients with atrial fibrillation.
A report of the American College of Cardiology/American Heart Association
Task Force on Practice Guidelines and the European Society of Cardiology
Committee for Practice Guidelines and Policy Conferences. Eur Heart J
2001;22:1852‐1923.
Fuster V, Ryden LE, Cannom DS, Crijns HJ, Curtis AB, Ellenbogen KA, Halperin JL, Le
Heuzey JY, Kay GN, Lowe JE, Olsson SB, Prystowsky EN, Tamargo JL, Wann S,
Smith SC, Jr., Jacobs AK, Adams CD, Anderson JL, Antman EM, Halperin JL, Hunt
SA, Nishimura R, Ornato JP, Page RL, Riegel B, Priori SG, Blanc JJ, Budaj A, Camm
AJ, Dean V, Deckers JW, Despres C, Dickstein K, Lekakis J, McGregor K, Metra
235
M, Morais J, Osterspey A, Tamargo JL and Zamorano JL. ACC/AHA/ESC 2006
Guidelines for the Management of Patients with Atrial Fibrillation: a report of
the American College of Cardiology/American Heart Association Task Force on
Practice Guidelines and the European Society of Cardiology Committee for
Practice Guidelines. Circulation 2006;114:e257‐354.
Fynn SP, Todd DM, Hobbs WJ, Armstrong KL, Fitzpatrick AP and Garratt CJ. Clinical
evaluation of a policy of early repeated internal cardioversion for recurrence of
atrial fibrillation. J Cardiovasc Electrophysiol 2002;13:135‐141.
Garratt CJ, Duytschaever M, Killian M, Dorland R, Mast F and Allessie MA. Repetitive
electrical remodeling by paroxysms of atrial fibrillation in the goat: no
cumulative effect on inducibility or stability of atrial fibrillation. J Cardiovasc
Electrophysiol 1999;10:1101‐1108.
Garrey WE. The nature of fibrillary contraction of the heart: its relation to tissue mass
and form. Am J Physiol 1914;33:397‐414.
Gaspo R, Bosch RF, Talajic M and Nattel S. Functional mechanisms underlying
tachycardia‐induced sustained atrial fibrillation in a chronic dog model.
Circulation 1997;96:4027‐4035.
Geesbreght JM and Randall WC. Area localization of shifting cardiac pacemakers during
sympathetic stimulation. Am J Physiol 1971;220:1522‐1527.
Gepstein L, Hayam G and Ben‐Haim SA. A novel method for nonfluoroscopic catheter‐
based electroanatomical mapping of the heart. In vitro and in vivo accuracy
results. Circulation 1997;95:1611‐1622.
Gerstenfeld EP, Sahakian AV and Swiryn S. Evidence for transient linking of atrial
excitation during atrial fibrillation in humans. Circulation 1992;86:375‐382.

236
Gerstenfeld EP, Callans DJ, Sauer W, Jacobson J and Marchlinski FE. Reentrant and
nonreentrant focal left atrial tachycardias occur after pulmonary vein isolation.
Heart Rhythm 2005;2:1195‐1202.
Goette A, Honeycutt C and Langberg JJ. Electrical remodeling in atrial fibrillation. Time
course and mechanisms. Circulation 1996;94:2968‐2974.
Goldberg JM. Intra‐SA‐nodal pacemaker shifts induced by autonomic nerve stimulation
in the dog. Am J Physiol 1975;229:1116‐1123.
Goldberg JM, Lynn‐Johnson MH and Neely B. Use of P wave morphology for inferring
pacemaker localization along the sulcus terminalis in the dog. J Electrocardiol
1981;14:115‐124.
Goldstein RN, Ryu K, Khrestian C, van Wagoner DR and Waldo AL. Prednisone prevents
inducible atrial flutter in the canine sterile pericarditis model. J Cardiovasc
Electrophysiol 2008;19:74‐81.
Gomes JA, Kang PS, Matheson M, Gough WB, Jr. and El‐Sherif N. Coexistence of sick
sinus rhythm and atrial flutter‐fibrillation. Circulation 1981;63:80‐86.
Goto M, Sakamoto Y and Imanaga I (1967). Aconitine‐induced fibrillation of the
different muscle tissues of the heart and the action of acetylcholine.
Electrophysiology and Ultrastructure of the Heart. T Sano, K Matsuda and B
Mizuhira. New York, Grune & Stratton: 199‐201.
Granada J, Uribe W, Chyou PH, Maassen K, Vierkant R, Smith PN, Hayes J, Eaker E and
Vidaillet H. Incidence and predictors of atrial flutter in the general population. J
Am Coll Cardiol 2000;36:2242‐2246.
Grigioni F, Avierinos JF, Ling LH, Scott CG, Bailey KR, Tajik AJ, Frye RL and Enriquez‐
Sarano M. Atrial fibrillation complicating the course of degenerative mitral

237
regurgitation: determinants and long‐term outcome. J Am Coll Cardiol
2002;40:84‐92.
Hachiya H, Ernst S, Ouyang F, Mavrakis H, Chun J, Bansch D, Antz M and Kuck KH.
Topographic distribution of focal left atrial tachycardias defined by
electrocardiographic and electrophysiological data. Circ J 2005;69:205‐210.
Hadian D, Zipes DP, Olgin JE and Miller JM. Short‐term rapid atrial pacing produces
electrical remodeling of sinus node function in humans. J Cardiovasc
Electrophysiol 2002;13:584‐586.
Haïssaguerre M, Fischer B, Labbe T, Lemetayer P, Montserrat P, d'Ivernois C, Dartigues
JF and Warin JF. Frequency of recurrent atrial fibrillation after catheter ablation
of overt accessory pathways. Am J Cardiol 1992;69:493‐497.
Haïssaguerre M, Jaïs P, Shah DC, Takahashi A, Hocini M, Quiniou G, Garrigue S, Le MA,
Le MP and Clementy J. Spontaneous initiation of atrial fibrillation by ectopic
beats originating in the pulmonary veins. N Engl J Med 1998;339:659‐666.
Haïssaguerre M, Shah DC, Jaïs P, Hocini M, Yamane T, Deisenhofer I, Garrigue S and
Clementy J. Mapping‐guided ablation of pulmonary veins to cure atrial
fibrillation. Am J Cardiol 2000a;86:9K‐19K.
Haïssaguerre M, Shah DC, Jaïs P, Hocini M, Yamane T, Deisenhofer I, Chauvin M,
Garrigue S and Clementy J. Electrophysiological breakthroughs from the left
atrium to the pulmonary veins. Circulation 2000b;102:2463‐2465.
Haïssaguerre M, Jaïs P, Shah DC, Arentz T, Kalusche D, Takahashi A, Garrigue S, Hocini
M, Peng JT and Clementy J. Catheter ablation of chronic atrial fibrillation
targeting the reinitiating triggers. J Cardiovasc Electrophysiol 2000c;11:2‐10.

238
Haïssaguerre M, Sanders P, Hocini M, Hsu LF, Shah DC, Scavee C, Takahashi Y, Rotter
M, Pasquie JL, Garrigue S, Clementy J and Jaïs P. Changes in atrial fibrillation
cycle length and inducibility during catheter ablation and their relation to
outcome. Circulation 2004a;109:3007‐3013.
Haïssaguerre M, Sanders P, Hocini M, Jaïs P and Clementy J. Pulmonary veins in the
substrate for atrial fibrillation: the "venous wave" hypothesis. J Am Coll Cardiol
2004b;43:2290‐2292.
Haïssaguerre M, Sanders P, Hocini M, Takahashi Y, Rotter M, Sacher F, Rostock T, Hsu
LF, Bordachar P, Reuter S, Roudaut R, Clementy J and Jaïs P. Catheter ablation
of long‐lasting persistent atrial fibrillation: critical structures for termination. J
Cardiovasc Electrophysiol 2005a;16:1125‐1137.
Haïssaguerre M, Hocini M, Sanders P, Sacher F, Rotter M, Takahashi Y, Rostock T, Hsu
LF, Bordachar P, Reuter S, Roudaut R, Clementy J and Jaïs P. Catheter ablation
of long‐lasting persistent atrial fibrillation: clinical outcome and mechanisms of
subsequent arrhythmias. J Cardiovasc Electrophysiol 2005b;16:1138‐1147.
Haïssaguerre M, Sanders P, Hocini M, Takahashi Y, Rotter M, Sacher F, Rostock T, Hsu
LF, Bordachar P, Reuter S, Roudaut R, Clementy J and Jaïs P. Catheter ablation
of long‐lasting persistent atrial fibrillation: critical structures for termination. J
Cardiovasc Electrophysiol 2005c;16:1125‐1137.
Haïssaguerre M, Hocini M, Sanders P, Takahashi Y, Rotter M, Sacher F, Rostock T, Hsu
LF, Jonsson A, O'Neill MD, Bordachar P, Reuter S, Roudaut R, Clementy J and
Jaïs P. Localized sources maintaining atrial fibrillation organized by prior
ablation. Circulation 2006a;113:616‐625.

239
Haïssaguerre M, Hocini M, Sanders P, Takahashi Y, Rotter M, Sacher F, Rostock T, Hsu
LF, Jonsson A, O'Neill MD, Bordachar P, Reuter S, Roudaut R, Clementy J and
Jaïs P. Localized sources maintaining atrial fibrillation organized by prior
ablation. Circulation 2006b;113:616‐625.
Halligan SC, Gersh BJ, Brown RD, Jr., Rosales AG, Munger TM, Shen WK, Hammill SC
and Friedman PA. The natural history of lone atrial flutter. Ann Intern Med
2004;140:265‐268.
Hariman RJ, Hoffman BF and Naylor RE. Electrical activity from the sinus node region in
conscious dogs. Circ Res 1980;47:775‐791.
Hermida JS, Kubala M, Lescure FX, Delonca J, Clerc J, Otmani A, Jarry G and Rey JL.
Atrial septal pacing to prevent atrial fibrillation in patients with sinus node
dysfunction: results of a randomized controlled study. Am Heart J
2004;148:312‐317.
Higa S, Tai CT, Lin YJ, Liu TY, Lee PC, Huang JL, Hsieh MH, Yuniadi Y, Huang BH, Lee SH,
Ueng KC, Ding YA and Chen SA. Focal atrial tachycardia: new insight from
noncontact mapping and catheter ablation. Circulation 2004;109:84‐91.
Hobbs WJ, Fynn S, Todd DM, Wolfson P, Galloway M and Garratt CJ. Reversal of atrial
electrical remodeling after cardioversion of persistent atrial fibrillation in
humans. Circulation 2000;101:1145‐1151.
Hocini M, Ho SY, Kawara T, Linnenbank AC, Potse M, Shah D, Jaïs P, Janse MJ,
Haïssaguerre M and De Bakker JM. Electrical conduction in canine pulmonary
veins: electrophysiological and anatomic correlation. Circulation
2002;105:2442‐2448.
240
Hocini M, Sanders P, Deisenhofer I, Jaïs P, Hsu LF, Scavee C, Weerasoriya R, Raybaud F,
Macle L, Shah DC, Garrigue S, Le MP, Clementy J and Haïssaguerre M. Reverse
remodeling of sinus node function after catheter ablation of atrial fibrillation in
patients with prolonged sinus pauses. Circulation 2003;108:1172‐1175.
Hoff HE and Geddes LA. Cholinergic factor in auricular fibrillation. J Appl Physiol
1955;8:177‐192.
Hsieh MH, Tai CT, Chiang CE, Tsai CF, Yu WC, Chen YJ, Ding YA and Chen SA. Recurrent
atrial flutter and atrial fibrillation after catheter ablation of the cavotricuspid
isthmus: a very long‐term follow‐up of 333 patients. J Interv Card Electrophysiol
2002;7:225‐231.
Huang JL, Tai CT, Lin YJ, Ueng KC, Huang BH, Lee KT, Higa S, Yuniadi Y, Chang SL, Lo LW,
Wongcharoen W, Hu YF, Lee PC, Tuan TC, Ting CT and Chen SA. Right atrial
substrate properties associated with age in patients with typical atrial flutter.
Heart Rhythm 2008;5:1144‐1151.
Inoue H, Matsuo H, Takayanagi K and Murao S. Clinical and experimental studies of the
effects of extrastimulation and rapid pacing on atrial flutter: evidence of
macroreentry with an excitable gap. Am J Cardiol 1981;48:623‐631.
Jahangir A, Lee V, Friedman PA, Trusty JM, Hodge DO, Kopecky SL, Packer DL, Hammill
SC, Shen WK and Gersh BJ. Long‐term progression and outcomes with aging in
patients with lone atrial fibrillation: a 30‐year follow‐up study. Circulation
2007;115:3050‐3056.
Jaïs P, Haïssaguerre M, Shah DC, Chouairi S and Clementy J. Regional disparities of
endocardial atrial activation in paroxysmal atrial fibrillation. Pacing Clin
Electrophysiol 1996;19:1998‐2003.

241
Jaïs P, Peng JT, Shah DC, Garrigue S, Hocini M, Yamane T, Haïssaguerre M, Barold SS,
Roudaut R and Clementy J. Left ventricular diastolic dysfunction in patients with
so‐called lone atrial fibrillation. J Cardiovasc Electrophysiol 2000;11:623‐625.
Jaïs P, Hocini M, Macle L, Choi KJ, Deisenhofer I, Weerasooriya R, Shah DC, Garrigue S,
Raybaud F, Scavee C, le MP, Clementy J and Haïssaguerre M. Distinctive
electrophysiological properties of pulmonary veins in patients with atrial
fibrillation. Circulation 2002;106:2479‐2485.
Jalife J, Berenfeld O, Skanes A and Mandapati R. Mechanisms of atrial fibrillation:
mother rotors or multiple daughter wavelets, or both? J Cardiovasc
Electrophysiol 1998;9:S2‐12.
Jalife J, Berenfeld O and Mansour M. Mother rotors and fibrillatory conduction: a
mechanism of atrial fibrillation. Cardiovasc Res 2002;54:204‐216.
James TN, Sherf L, Fine G and Morales AR. Comparative ultrastructure of the sinus
node in man and dog. Circulation 1966;34:139‐163.
James TN. The sinus node. Am J Cardiol 1977;40:965‐986.
John B, Stiles MK, Kuklik P, Chandy ST, Young GD, Mackenzie L, Szumowski L, Joseph G,
Worthley SG, Kalman JM and Sanders P. Electrical remodeling of the left and
right atria due to rheumatic mitral stenosis. Eur Heart J online
early;doi:10.1093/eurheartj/ehn1329.
Jolly WA and Ritchie TW. Auricular flutter and fibrillation. Heart 1911;3:177‐221.
Jorgensen HS, Nakayama H, Reith J, Raaschou HO and Olsen TS. Acute stroke with
atrial fibrillation. The Copenhagen Stroke Study. Stroke 1996;27:1765‐1769.

242
Kadish A, Hauck J, Pederson B, Beatty G and Gornick C. Mapping of atrial activation
with a noncontact, multielectrode catheter in dogs. Circulation 1999;99:1906‐
1913.
Kalifa J, Tanaka K, Zaitsev AV, Warren M, Vaidyanathan R, Auerbach D, Pandit S,
Vikstrom KL, Ploutz‐Snyder R, Talkachou A, Atienza F, Guiraudon G, Jalife J and
Berenfeld O. Mechanisms of wave fractionation at boundaries of high‐
frequency excitation in the posterior left atrium of the isolated sheep heart
during atrial fibrillation. Circulation 2006;113:626‐633.
Kalman JM, Lee RJ, Fisher WG, Chin MC, Ursell P, Stillson CA, Lesh MD and Scheinman
MM. Radiofrequency catheter modification of sinus pacemaker function guided
by intracardiac echocardiography. Circulation 1995;92:3070‐3081.
Kalman JM, Olgin JE, Saxon LA, Fisher WG, Lee RJ and Lesh MD. Activation and
entrainment mapping defines the tricuspid annulus as the anterior barrier in
typical atrial flutter. Circulation 1996;94:398‐406.
Kalman JM, Olgin JE, Saxon LA, Lee RJ, Scheinman MM and Lesh MD.
Electrocardiographic and electrophysiologic characterization of atypical atrial
flutter in man: use of activation and entrainment mapping and implications for
catheter ablation. J Cardiovasc Electrophysiol 1997;8:121‐144.
Kalman JM, Olgin JE, Karch MR, Hamdan M, Lee RJ and Lesh MD. "Cristal tachycardias":
origin of right atrial tachycardias from the crista terminalis identified by
intracardiac echocardiography. J Am Coll Cardiol 1998;31:451‐459.
Kannel WB, Abbott RD, Savage DD and McNamara PM. Epidemiologic features of
chronic atrial fibrillation: the Framingham study. N Engl J Med 1982a;306:1018‐
1022.

243
Kannel WB, Abbott RD, Savage DD and McNamara PM. Epidemiologic features of
chronic atrial fibrillation: the Framingham study. N Engl J Med 1982b;306:1018‐
1022.
Karagueuzian HS, Athill CA, Yashima M, Ikeda T, Wu TJ, Mandel WJ and Chen PS.
Transmembrane potential properties of atrial cells at different sites of a spiral
wave reentry: cellular evidence for an excitable but nonexcited core. Pacing
Clin Electrophysiol 1998;21:2360‐2365.
Kistler PM, Sanders P, Fynn SP, Stevenson IH, Hussin A, Vohra JK, Sparks PB and Kalman
JM. Electrophysiological and electrocardiographic characteristics of focal atrial
tachycardia originating from the pulmonary veins: acute and long‐term
outcomes of radiofrequency ablation. Circulation 2003a;108:1968‐1975.
Kistler PM, Sanders P, Hussin A, Morton JB, Vohra JK, Sparks PB and Kalman JM. Focal
atrial tachycardia arising from the mitral annulus: electrocardiographic and
electrophysiologic characterization. J Am Coll Cardiol 2003b;41:2212‐2219.
Kistler PM, Sanders P, Fynn SP, Stevenson IH, Spence SJ, Vohra JK, Sparks PB and
Kalman JM. Electrophysiologic and electroanatomic changes in the human
atrium associated with age. J Am Coll Cardiol 2004;44:109‐116.
Kistler PM, Fynn SP, Haqqani H, Stevenson IH, Vohra JK, Morton JB, Sparks PB and
Kalman JM. Focal atrial tachycardia from the ostium of the coronary sinus:
electrocardiographic and electrophysiological characterization and
radiofrequency ablation. J Am Coll Cardiol 2005;45:1488‐1493.
Kistler PM, Sanders P, Dodic M, Spence SJ, Samuel CS, Zhao C, Charles JA, Edwards GA
and Kalman JM. Atrial electrical and structural abnormalities in an ovine model
of chronic blood pressure elevation after prenatal corticosteroid exposure:
244
implications for development of atrial fibrillation. Eur Heart J 2006;27:3045‐
3056.
Klein GJ, Guiraudon GM, Sharma AD and Milstein S. Demonstration of macroreentry
and feasibility of operative therapy in the common type of atrial flutter. Am J
Cardiol 1986;57:587‐591.
Klos M, Calvo D, Yamazaki M, Zlochiver S, Mironov S, Cabrera J‐A, Sanchez‐Quintana D,
Jalife J, Berenfeld O and Kalifa J. The atrial septopulmonary bundle of the
posterior left atrium provides a substrate for AF initiation in a model of vagally
mediated pulmonary vein tachycardia of the structurally normal heart. Circ
Arrhythmia Electrophysiol 2008;1:175‐183.
Kojodjojo P, Peters NS, Davies DW and Kanagaratnam P. Characterization of the
electroanatomical substrate in human atrial fibrillation: the relationship
between changes in atrial volume, refractoriness, wavefront propagation
velocities, and AF burden. J Cardiovasc Electrophysiol 2007;18:269‐275.
Konings KT, Kirchhof CJ, Smeets JR, Wellens HJ, Penn OC and Allessie MA. High‐density
mapping of electrically induced atrial fibrillation in humans. Circulation
1994;89:1665‐1680.
Konings KT, Smeets JL, Penn OC, Wellens HJ and Allessie MA. Configuration of unipolar
atrial electrograms during electrically induced atrial fibrillation in humans.
Circulation 1997;95:1231‐1241.
Kopecky SL, Gersh BJ, McGoon MD, Whisnant JP, Holmes DR, Jr., Ilstrup DM and Frye
RL. The natural history of lone atrial fibrillation. A population‐based study over
three decades. N Engl J Med 1987;317:669‐674.
245
Kostin S, Klein G, Szalay Z, Hein S, Bauer EP and Schaper J. Structural correlate of atrial
fibrillation in human patients. Cardiovasc Res 2002;54:361‐379.
Kroll M, Kriebel T, Windhagen‐Mahnert B, Franzbach B, Jux C, Zutz M, Tebbenjohanns J
and Paul T. Origin of electrical activation within the right atrial and left
ventricular walls: differentiation by electrogram characteristics using the
noncontact mapping system. Pacing Clin Electrophysiol 2003;26:1970‐1978.
Kuklik P, Szumowski L, Zebrowski JJ and Walczak F. The reconstruction, from a set of
points, and analysis of the interior surface of the heart chamber. Physiol Meas
2004;25:617‐627.
Kulbertus HE, Leval‐Rutten F, Mary L and Casters P. Sinus node recovery time in the
elderly. Br Heart J 1975;37:420‐425.
Kumagai K, Akimitsu S, Kawahira K, Kawanami F, Yamanouchi Y, Hiroki T and Arakawa
K. Electrophysiological properties in chronic lone atrial fibrillation. Circulation
1991;84:1662‐1668.
Kumagai K, Ogawa M, Noguchi H, Yasuda T, Nakashima H and Saku K.
Electrophysiologic properties of pulmonary veins assessed using a
multielectrode basket catheter. J Am Coll Cardiol 2004;43:2281‐2289.
Kwong KF, Schuessler RB, Green KG, Laing JG, Beyer EC, Boineau JP and Saffitz JE.
Differential expression of gap junction proteins in the canine sinus node.
Circulation Res 1998;82:604‐612.
Lai LP, Lin JL and Huang SK. Molecular genetic studies in atrial fibrillation. Cardiology
2003;100:109‐113.
Lake FR, Cullen KJ, de Klerk NH, McCall MG and Rosman DL. Atrial fibrillation and
mortality in an elderly population. Aust N Z J Med 1989;19:321‐326.
246
Lau CP, Tse HF and Ayers GM. Defibrillation‐guided radiofrequency ablation of atrial
fibrillation secondary to an atrial focus. J Am Coll Cardiol 1999;33:1217‐1226.
Lazar S, Dixit S, Marchlinski FE, Callans DJ and Gerstenfeld EP. Presence of left‐to‐right
atrial frequency gradient in paroxysmal but not persistent atrial fibrillation in
humans. Circulation 2004;110:3181‐3186.
Lazar S, Dixit S, Callans DJ, Lin D, Marchlinski FE and Gerstenfeld EP. Effect of
pulmonary vein isolation on the left‐to‐right atrial dominant frequency gradient
in human atrial fibrillation. Heart Rhythm 2006;3:889‐895.
Lee RJ, Kalman JM, Fitzpatrick AP, Epstein LM, Fisher WG, Olgin JE, Lesh MD and
Scheinman MM. Radiofrequency catheter modification of the sinus node for
"inappropriate" sinus tachycardia. Circulation 1995;92:2919‐2928.
Lee SH, Lin FY, Yu WC, Cheng JJ, Kuan P, Hung CR, Chang MS and Chen SA. Regional
differences in the recovery course of tachycardia‐induced changes of atrial
electrophysiological properties. Circulation 1999;99:1255‐1264.
Lemery R, Birnie D, Tang AS, Green M and Gollob M. Feasibility study of endocardial
mapping of ganglionated plexuses during catheter ablation of atrial fibrillation.
Heart Rhythm 2006;3:387‐396.
Lemery R, Birnie D, Tang AS, Green M, Gollob M, Hendry M and Lau E. Normal atrial
activation and voltage during sinus rhythm in the human heart: an endocardial
and epicardial mapping study in patients with a history of atrial fibrillation. J
Cardiovasc Electrophysiol 2007;18:402‐408.
Lemola K, Ting M, Gupta P, Anker JN, Chugh A, Good E, Reich S, Tschopp D, Igic P,
Elmouchi D, Jongnarangsin K, Bogun F, Pelosi F, Jr., Morady F and Oral H.

247
Effects of two different catheter ablation techniques on spectral characteristics
of atrial fibrillation. J Am Coll Cardiol 2006;48:340‐348.
Lewis T. Auricular fibrillation and its relationship to clinical irregularity of the heart.
1910;1:306‐372.
Lewis T, Oppenheimer BS and Oppenheimer A. The site of origin of the mammalian
heart beat: The pacemaker in the dog. Heart 1910;2:147‐169.
Lewis T and Schleiter HG. The relation of regular tachycardias of auricular origin to
auricular fibrillation. Heart 1912;3:173‐193.
Lewis T. Observations upon a curious, not uncommon form of extreme acceleration of
the auricle; atrial flutter. Heart 1913;4.
Lewis T, Drury AN and Bulger HA. Observations upon atrial flutter and fibrillation VI.
Heart 1921a;8:84‐134.
Lewis T, Drury AN and Iliescu CC. A demonstration of circus movement in clinical
fibrillation of the auricles. Heart 1921b;8:361‐369.
Li D, Fareh S, Leung TK and Nattel S. Promotion of atrial fibrillation by heart failure in
dogs: atrial remodeling of a different sort. Circulation 1999;100:87‐95.
Li D, Melnyk P, Feng J, Wang Z, Petrecca K, Shrier A and Nattel S. Effects of
experimental heart failure on atrial cellular and ionic electrophysiology.
Circulation 2000;101:2631‐2638.
Liebman J. Are there internodal tracts? Yes. Int J Cardiol 1985;7:175‐185.
Lin J, Scherlag BJ, Zhou J, Lu Z, Patterson E, Jackman WM, Lazzara R and Po SS.
Autonomic mechanism to explain complex fractionated atrial electrograms
(CFAE). J Cardiovasc Electrophysiol 2007;18:1197‐1205.

248
Lin YJ, Tai CT, Kao T, Tso HW, Higa S, Tsao HM, Chang SL, Hsieh MH and Chen SA.
Frequency analysis in different types of paroxysmal atrial fibrillation. J Am Coll
Cardiol 2006;47:1401‐1407.
Lin YJ, Tai CT, Kao T, Chang SL, Wongcharoen W, Lo LW, Tuan TC, Udyavar AR, Chen YJ,
Higa S, Ueng KC and Chen SA. Consistency of complex fractionated atrial
electrograms during atrial fibrillation. Heart Rhythm 2008;5:406‐412.
Littmann L, Svenson RH, Gallagher JJ, Bharati S, Lev M, Linder KD, Tatsis GP and
Nichelson C. Modification of sinus node function by epicardial laser irradiation
in dogs. Circulation 1990;81:350‐359.
Liu TY, Tai CT and Chen SA. Treatment of atrial fibrillation by catheter ablation of
conduction gaps in the crista terminalis and cavotricuspid isthmus of the right
atrium. J Cardiovasc Electrophysiol 2002;13:1044‐1046.
Lloyd‐Jones DM, Wang TJ, Leip EP, Larson MG, Levy D, Vasan RS, D'Agostino RB,
Massaro JM, Beiser A, Wolf PA and Benjamin EJ. Lifetime risk for development
of atrial fibrillation: the Framingham Heart Study. Circulation 2004;110:1042‐
1046.
Lo LW, Tai CT, Lin YJ, Chang SL, Wongcharoen W, Chang SH, Hsieh MH, Tuan TC,
Udyavar AR, Chen YJ, Tsao HM and Chen SA. Progressive remodeling of the
atrial substrate‐‐a novel finding from consecutive voltage mapping in patients
with recurrence of atrial fibrillation after catheter ablation. J Cardiovasc
Electrophysiol 2007;18:258‐265.
Lu Z, Scherlag BJ, Lin J, Niu G, Ghias M, Jackman WM, Lazzara R, Jiang H and Po SS.
Autonomic mechanism for complex fractionated atrial electrograms: Evidence
by fast fourier transform analysis. J Cardiovasc Electrophysiol 2008;19:835‐842.
249
Luck JC and Engel TR. Dispersion of atrial refractoriness in patients with sinus node
dysfunction. Circulation 1979;60:404‐412.
Mackenzie J. The interpretation of the pulsations in the jugular veins. Am J Med Sci
1907;134:12.
Mandel W, Hayakawa H, Danzig R and Marcus HS. Evaluation of sino‐atrial node
function in man by overdrive suppression. Circulation 1971;44:59‐66.
Manios EG, Kanoupakis EM, Mavrakis HE, Kallergis EM, Dermitzaki DN and Vardas PE.
Sinus pacemaker function after cardioversion of chronic atrial fibrillation: is
sinus node remodeling related with recurrence? J Cardiovasc Electrophysiol
2001;12:800‐806.
Mansour M, Mandapati R, Berenfeld O, Chen J, Samie FH and Jalife J. Left‐to‐right
gradient of atrial frequencies during acute atrial fibrillation in the isolated
sheep heart. Circulation 2001;103:2631‐2636.
Marcus GM, Yang Y, Varosy PD, Ordovas K, Tseng ZH, Badhwar N, Lee BK, Lee RJ,
Scheinman MM and Olgin JE. Regional left atrial voltage in patients with atrial
fibrillation. Heart Rhythm 2007;4:138‐144.
Markides V, Schilling RJ, Ho SY, Chow AW, Davies DW and Peters NS. Characterization
of left atrial activation in the intact human heart. Circulation 2003;107:733‐739.
Markowitz SM, Nemirovksy D, Stein KM, Mittal S, Iwai S, Shah BK, Dobesh DP and
Lerman BB. Adenosine‐insensitive focal atrial tachycardia: evidence for de novo
micro‐re‐entry in the human atrium. J Am Coll Cardiol 2007;49:1324‐1333.
Marrouche NF, SippensGroenewegen A, Yang Y, Dibs S and Scheinman MM. Clinical
and electrophysiologic characteristics of left septal atrial tachycardia. J Am Coll
Cardiol 2002;40:1133‐1139.

250
Mary‐Rabine L, Albert A, Pham TD, Hordof A, Fenoglio JJ, Jr., Malm JR and Rosen MR.
The relationship of human atrial cellular electrophysiology to clinical function
and ultrastructure. Circ Res 1983;52:188‐199.
Matsuoka K, Kasai A, Fujii E, Omichi C, Okubo S, Teramura S, Uchida F and Nakano T.
Electrophysiological features of atrial tachycardia arising from the
atrioventricular annulus. Pacing Clin Electrophysiol 2002;25:440‐445.
McGuire MA, Bourke JP, Robotin MC, Johnson DC, Meldrum‐Hanna W, Nunn GR, Uther
JB and Ross DL. High resolution mapping of Koch's triangle using sixty
electrodes in humans with atrioventricular junctional (AV nodal) reentrant
tachycardia. Circulation 1993;88:2315‐2328.
McGuire MA, de Bakker JM, Vermeulen JT, Moorman AF, Loh P, Thibault B, Vermeulen
JL, Becker AE and Janse MJ. Atrioventricular junctional tissue. Discrepancy
between histological and electrophysiological characteristics. Circulation
1996;94:571‐577.
McWilliam JA. Fibrillar contraction of the heart. J Physiol 1886;8:296.
Meek WJ and Eyster JAE. Experiments on the origin and propagation of the impulse in
the heart. Heart 1914;5:227–244.
Meissner A, Christ M, Maagh P, Borchard R, van Bracht M, Wickenbrock I, Trappe HJ
and Plehn G. Quality of life and occurrence of atrial fibrillation in long‐term
follow‐up of common type atrial flutter ablation: ablation with irrigated 5 mm
tip and conventional 8 mm tip electrodes. Clin Res Cardiol 2007;96:794‐802.
Melnyk P, Ehrlich JR, Pourrier M, Villeneuve L, Cha TJ and Nattel S. Comparison of ion
channel distribution and expression in cardiomyocytes of canine pulmonary
veins versus left atrium. Cardiovasc Res 2005;65:104‐116.

251
Miyasaka Y, Barnes ME, Gersh BJ, Cha SS, Bailey KR, Abhayaratna WP, Seward JB and
Tsang TS. Secular Trends in Incidence of Atrial Fibrillation in Olmsted County,
Minnesota, 1980 to 2000, and Implications on the Projections for Future
Prevalence. Circulation 2006a.
Miyasaka Y, Barnes ME, Gersh BJ, Cha SS, Bailey KR, Abhayaratna W, Seward JB,
Iwasaka T and Tsang TS. Incidence and mortality risk of congestive heart failure
in atrial fibrillation patients: a community‐based study over two decades. Eur
Heart J 2006b;27:936‐941.
Miyasaka Y, Barnes ME, Petersen RC, Cha SS, Bailey KR, Gersh BJ, Casaclang‐Verzosa G,
Abhayaratna WP, Seward JB, Iwasaka T and Tsang TS. Risk of dementia in
stroke‐free patients diagnosed with atrial fibrillation: data from a community‐
based cohort. Eur Heart J 2007a;28:1962‐1967.
Miyasaka Y, Barnes ME, Bailey KR, Cha SS, Gersh BJ, Seward JB and Tsang TS. Mortality
trends in patients diagnosed with first atrial fibrillation: a 21‐year community‐
based study. J Am Coll Cardiol 2007b;49:986‐992.
Moe GK. On the multiple wavelet hypothesis of atrial fibrillation. Arch Int
Pharmacodyn Ther 1962;140:183‐188.
Moreira W, Timmermans C, Wellens HJ, Mizusawa Y, Philippens S, Perez D and
Rodriguez LM. Can common‐type atrial flutter be a sign of an arrhythmogenic
substrate in paroxysmal atrial fibrillation? Clinical and ablative consequences in
patients with coexistent paroxysmal atrial fibrillation/atrial flutter. Circulation
2007;116:2786‐2792.
Moreira W, Timmermans C, Wellens HJ, Mizusawa Y, Perez D, Philippens S and
Rodriguez LM. Long term outcome of cavotricuspid isthmus cryoablation for

252
the treatment of common atrial flutter in 180 patients: a single center
experience. J Interv Card Electrophysiol 2008;21:235‐240.
Morel E, Meyronet D, Thivolet‐Bejuy F and Chevalier P. Identification and distribution
of interstitial Cajal cells in human pulmonary veins. Heart Rhythm 2008;5:1063‐
1067.
Morillo CA, Klein GJ, Jones DL and Guiraudon CM. Chronic rapid atrial pacing.
Structural, functional, and electrophysiological characteristics of a new model
of sustained atrial fibrillation. Circulation 1995;91:1588‐1595.
Morton JB, Sanders P, Das A, Vohra JK, Sparks PB and Kalman JM. Focal atrial
tachycardia arising from the tricuspid annulus: electrophysiologic and
electrocardiographic characteristics. J Cardiovasc Electrophysiol 2001;12:653‐
659.
Morton JB, Byrne MJ, Power JM, Raman J and Kalman JM. Electrical remodeling of the
atrium in an anatomic model of atrial flutter: relationship between substrate
and triggers for conversion to atrial fibrillation. Circulation 2002;105:258‐264.
Morton JB, Sanders P, Vohra JK, Sparks PB, Morgan JG, Spence SJ, Grigg LE and Kalman
JM. Effect of chronic right atrial stretch on atrial electrical remodeling in
patients with an atrial septal defect. Circulation 2003;107:1775‐1782.
Moss AJ and Davis RJ. Brady‐Tachy syndrome. Prog Cardiovasc Dis 1974;16:439‐454.
Moubarak JB, Rozwadowski JV, Strzalka CT, Buck WR, Tan WS, Kish GF, Kisiel T, Fronc
HC and Maloney JD. Pulmonary veins‐left atrial junction: anatomic and
histological study. Pacing Clin Electrophysiol 2000;23:1836‐1838.
Murphy JG, Gersh BJ, McGoon MD, Mair DD, Porter CJ, Ilstrup DM, McGoon DC, Puga
FJ, Kirklin JW and Danielson GK. Long‐term outcome after surgical repair of

253
isolated atrial septal defect. Follow‐up at 27 to 32 years. N Engl J Med
1990;323:1645‐1650.
Nademanee K, McKenzie J, Kosar E, Schwab M, Sunsaneewitayakul B, Vasavakul T,
Khunnawat C and Ngarmukos T. A new approach for catheter ablation of atrial
fibrillation: mapping of the electrophysiologic substrate. J Am Coll Cardiol
2004;43:2044‐2053.
Nademanee K, Schwab MC, Kosar EM, Karwecki M, Moran MD, Visessook N, Michael
AD and Ngarmukos T. Clinical outcomes of catheter substrate ablation for high‐
risk patients with atrial fibrillation. J Am Coll Cardiol 2008;51:843‐849.
Nakagawa H, Lazzara R, Khastgir T, Beckman KJ, McClelland JH, Imai S, Pitha JV, Becker
AE, Arruda M, Gonzalez MD, Widman LE, Rome M, Neuhauser J, Wang X,
Calame JD, Goudeau MD and Jackman WM. Role of the tricuspid annulus and
the eustachian valve/ridge on atrial flutter. Relevance to catheter ablation of
the septal isthmus and a new technique for rapid identification of ablation
success. Circulation 1996;94:407‐424.
Nakagawa H, Shah N, Matsudaira K, Overholt E, Chandrasekaran K, Beckman KJ,
Spector P, Calame JD, Rao A, Hasdemir C, Otomo K, Wang Z, Lazzara R and
Jackman WM. Characterization of reentrant circuit in macroreentrant right
atrial tachycardia after surgical repair of congenital heart disease: isolated
channels between scars allow "focal" ablation. Circulation 2001;103:699‐709.
Narayan SM, Krummen DE, Kahn AM, Karasik PL and Franz MR. Evaluating fluctuations
in human atrial fibrillatory cycle length using monophasic action potentials.
Pacing Clin Electrophysiol 2006;29:1209‐1218.
254
Narula OS, Samet P and Javier RP. Significance of the sinus‐node recovery time.
Circulation 1972;45:140‐158.
Narula OS, Shantha N, Vasquez M, Towne WD and Linhart JW. A new method for
measurement of sinoatrial conduction time. Circulation 1978;58:706‐714.
Nathan H and Eliakim M. The junction between the left atrium and the pulmonary
veins. An anatomic study of human hearts. Circulation 1966;34:412‐422.
National Heart Foundation of Australia. Atrial Fibrillation. Information Sheet 305
(2004).
Ng J, Kadish AH and Goldberger JJ. Effect of electrogram characteristics on the
relationship of dominant frequency to atrial activation rate in atrial fibrillation.
Heart Rhythm 2006;3:1295‐1305.
Ng J, Kadish AH and Goldberger JJ. Technical considerations for dominant frequency
analysis. J Cardiovasc Electrophysiol 2007;18:757‐764.
O'Donnell D, Furniss SS and Bourke JP. Paroxysmal cycle length shortening in the
pulmonary veins during atrial fibrillation correlates with arrhythmogenic
triggering foci in sinus rhythm. J Cardiovasc Electrophysiol 2002;13:124‐128.
Off MK, Solheim E, Schuster P, Hoff PI, Ohm O‐J and Chen J. Detection of complex
fractionated electrograms by an automated algorithm (abstract). Heart Rhythm
2008;5:S171.
Okuyama Y, Miyauchi Y, Park AM, Hamabe A, Zhou S, Hayashi H, Miyauchi M, Omichi C,
Pak HN, Brodsky LA, Mandel WJ, Fishbein MC, Karagueuzian HS and Chen PS.
High resolution mapping of the pulmonary vein and the vein of Marshall during
induced atrial fibrillation and atrial tachycardia in a canine model of pacing‐
induced congestive heart failure. J Am Coll Cardiol 2003;42:348‐360.

255
Olgin JE, Kalman JM, Fitzpatrick AP and Lesh MD. Role of right atrial endocardial
structures as barriers to conduction during human type I atrial flutter.
Activation and entrainment mapping guided by intracardiac echocardiography.
Circulation 1995;92:1839‐1848.
Olgin JE, Kalman JM and Lesh MD. Conduction barriers in human atrial flutter:
correlation of electrophysiology and anatomy. J Cardiovasc Electrophysiol
1996;7:1112‐1126.
Olgin JE, Kalman JM, Saxon LA, Lee RJ and Lesh MD. Mechanism of initiation of atrial
flutter in humans: site of unidirectional block and direction of rotation. J Am
Coll Cardiol 1997;29:376‐384.
Oral H, Ozaydin M, Tada H, Chugh A, Scharf C, Hassan S, Lai S, Greenstein R, Pelosi F,
Jr., Knight BP, Strickberger SA and Morady F. Mechanistic significance of
intermittent pulmonary vein tachycardia in patients with atrial fibrillation. J
Cardiovasc Electrophysiol 2002;13:645‐650.
Oral H, Chugh A, Good E, Wimmer A, Dey S, Gadeela N, Sankaran S, Crawford T,
Sarrazin JF, Kuhne M, Chalfoun N, Wells D, Frederick M, Fortino J, loucif‐Moore
S, Jongnarangsin K, Pelosi F, Jr., Bogun F and Morady F. Radiofrequency
catheter ablation of chronic atrial fibrillation guided by complex electrograms.
Circulation 2007;115:2606‐2612.
Ortiz J, Niwano S, Abe H, Rudy Y, Johnson NJ and Waldo AL. Mapping the conversion of
atrial flutter to atrial fibrillation and atrial fibrillation to atrial flutter. Insights
into mechanisms. Circulation Res 1994;74:882‐894.

256
Ott A, Breteler MM, de Bruyne MC, van Harskamp F, Grobbee DE and Hofman A. Atrial
fibrillation and dementia in a population‐based study. The Rotterdam Study.
Stroke 1997;28:316‐321.
Padeletti L, Pieragnoli P, Ciapetti C, Colella A, Musilli N, Porciani MC, Ricci R, Pignalberi
C, Santini M, Puglisi A, Azzolini P, Spampinato A, Martelli M, Capucci A, Boriani
G, Botto G and Proclemer A. Randomized crossover comparison of right atrial
appendage pacing versus interatrial septum pacing for prevention of
paroxysmal atrial fibrillation in patients with sinus bradycardia. Am Heart J
2001;142:1047‐1055.
Page PL, Plumb VJ, Okumura K and Waldo AL. A new animal model of atrial flutter. J
Am Coll Cardiol 1986;8:872‐879.
Papageorgiou P, Monahan K, Boyle NG, Seifert MJ, Beswick P, Zebede J, Epstein LM
and Josephson ME. Site‐dependent intra‐atrial conduction delay. Relationship
to initiation of atrial fibrillation. Circulation 1996;94:384‐389.
Pappone C, Rosanio S, Oreto G, Tocchi M, Gugliotta F, Vicedomini G, Salvati A, Dicandia
C, Mazzone P, Santinelli V, Gulletta S and Chierchia S. Circumferential
radiofrequency ablation of pulmonary vein ostia: A new anatomic approach for
curing atrial fibrillation. Circulation 2000;102:2619‐2628.
Pappone C, Santinelli V, Manguso F, Vicedomini G, Gugliotta F, Augello G, Mazzone P,
Tortoriello V, Landoni G, Zangrillo A, Lang C, Tomita T, Mesas C, Mastella E and
Alfieri O. Pulmonary vein denervation enhances long‐term benefit after
circumferential ablation for paroxysmal atrial fibrillation. Circulation
2004;109:327‐334.

257
Paydak H, Kall JG, Burke MC, Rubenstein D, Kopp DE, Verdino RJ and Wilber DJ. Atrial
fibrillation after radiofrequency ablation of type I atrial flutter: time to onset,
determinants, and clinical course. Circulation 1998;98:315‐322.
Perez‐Lugones A, McMahon JT, Ratliff NB, Saliba WI, Schweikert RA, Marrouche NF,
Saad EB, Navia JL, McCarthy PM, Tchou P, Gillinov AM and Natale A. Evidence
of specialized conduction cells in human pulmonary veins of patients with atrial
fibrillation. J Cardiovasc Electrophysiol 2003;14:803‐809.
Peters NS, Cabo C and Wit AL (2000). Arrhythmogenic mechanisms: Automaticity,
Triggered Activity and Reentry. In: Zipes DP, Jalife J, editors. Cardiac
Electrophysiology: from Cell to Bedside: 345‐356.
Platonov PG. Interatrial conduction in the mechanisms of atrial fibrillation: from
anatomy to cardiac signals and new treatment modalities. Europace 2007;9
Suppl 6:vi10‐16.
Platonov PG, Mitrofanova L, Ivanov V and Ho SY. Substrates for intra‐atrial and
interatrial conduction in the atrial septum: anatomical study on 84 human
hearts. Heart Rhythm 2008;5:1189‐1195.
Porter M, Spear W, Akar JG, Helms R, Brysiewicz N, Santucci P and Wilber DJ.
Prospective study of atrial fibrillation termination during ablation guided by
automated detection of fractionated electrograms. J Cardiovasc Electrophysiol
2008;19:613‐620.
Power JM, Beacom GA, Alferness CA, Raman J, Wijffels M, Farish SJ, Burrell LM and
Tonkin AM. Susceptibility to atrial fibrillation: a study in an ovine model of
pacing‐induced early heart failure. J Cardiovasc Electrophysiol 1998;9:423‐435.
258
Prinzmetal MYRO, Corday ELIO, Brill IC, Sellers AL, Oblath RW, Flieg WA and Kruger HE.
Mechanism of the auricular arrhythmias. Circulation 1950;1:241‐245.
Psaty BM, Manolio TA, Kuller LH, Kronmal RA, Cushman M, Fried LP, White R, Furberg
CD and Rautaharju PM. Incidence of and risk factors for atrial fibrillation in
older adults. Circulation 1997;96:2455‐2461.
Ramanna H, de Bakker JM and Hauer RN. Mechanism of propensity to atrial fibrillation
in patients undergoing isthmus ablation for typical atrial flutter. J Cardiovasc
Electrophysiol 2005;16:167‐172.
Ravelli F, Faes L, Sandrini L, Gaita F, Antolini R, Scaglione M and Nollo G. Wave
similarity mapping shows the spatiotemporal distribution of fibrillatory wave
complexity in the human right atrium during paroxysmal and chronic atrial
fibrillation. J Cardiovasc Electrophysiol 2005;16:1071‐1076.
Rensma PL, Allessie MA, Lammers WJ, Bonke FI and Schalij MJ. Length of excitation
wave and susceptibility to reentrant atrial arrhythmias in normal conscious
dogs. Circulation Res 1988;62:395‐410.
Roberts‐Thomson KC, Stevenson IH, Kistler PM, Haqqani HM, Goldblatt JC, Sanders P
and Kalman JM. Anatomically determined functional conduction delay in the
posterior left atrium relationship to structural heart disease. J Am Coll Cardiol
2008;51:856‐862.
Roden DM, Lazzara R, Rosen M, Schwartz PJ, Towbin J and Vincent GM. Multiple
mechanisms in the long‐QT syndrome. Current knowledge, gaps, and future
directions. The SADS Foundation Task Force on LQTS. Circulation 1996;94:1996‐
2012.
259
Roithinger FX, Karch MR, Steiner PR, SippensGroenewegen A and Lesh MD.
Relationship between atrial fibrillation and typical atrial flutter in humans:
activation sequence changes during spontaneous conversion. Circulation
1997;96:3484‐3491.
Rosenbleuth A and Garcia‐Ramos J. Studies on flutter and fibrillation II. The influence
of artificial obstacles on experimental auricular flutter. Am Heart J 1947;33:677‐
684.
Rostagno C, Bacci F, Martelli M, Naldoni A, Bertini G and Gensini G. Clinical course of
lone atrial fibrillation since first symptomatic arrhythmic episode. Am J Cardiol
1995;76:837‐839.
Rostock T, Servatius H, Risius T, Ventura R, Weiss C, Meinertz T and Willems S. Impact
of amiodarone on electrophysiologic properties of pulmonary veins in patients
with paroxysmal atrial fibrillation. J Cardiovasc Electrophysiol 2005;16:39‐44.
Rostock T, Rotter M, Sanders P, Takahashi Y, Jaïs P, Hocini M, Hsu LF, Sacher F,
Clementy J and Haïssaguerre M. High‐density activation mapping of
fractionated electrograms in the atria of patients with paroxysmal atrial
fibrillation. Heart Rhythm 2006;3:27‐34.
Rostock T, Steven D, Lutomsky B, Servatius H, Drewitz I, Klemm H, Mullerleile K,
Ventura R, Meinertz T and Willems S. Atrial fibrillation begets atrial fibrillation
in the pulmonary veins on the impact of atrial fibrillation on the
electrophysiological properties of the pulmonary veins in humans. J Am Coll
Cardiol 2008;51:2153‐2160.
Rubenstein JJ, Schulman CL, Yurchak PM and DeSanctis RW. Clinical spectrum of the
sick sinus syndrome. Circulation 1972;46:5‐13.

260
Ryu K, Sahadevan J, Khrestian CM, Stambler BS and Waldo AL. Use of fast fourier
transform analysis of atrial electrograms for rapid characterization of atrial
activation‐implications for delineating possible mechanisms of atrial
tachyarrhythmias. J Cardiovasc Electrophysiol 2006;17:198‐206.
Saffitz JE, Kanter HL, Green KG, Tolley TK and Beyer EC. Tissue‐specific determinants of
anisotropic conduction velocity in canine atrial and ventricular myocardium.
Circ Res 1994;74:1065‐1070.
Saffitz JE, Green KG and Schuessler RB. Structural determinants of slow conduction in
the canine sinus node. J Cardiovasc Electrophysiol 1997;8:738‐744.
Sahadevan J, Ryu K, Peltz L, Khrestian CM, Stewart RW, Markowitz AH and Waldo AL.
Epicardial mapping of chronic atrial fibrillation in patients: preliminary
observations. Circulation 2004;110:3293‐3299.
Saito T, Waki K and Becker AE. Left atrial myocardial extension onto pulmonary veins in
humans: anatomic observations relevant for atrial arrhythmias. J Cardiovasc
Electrophysiol 2000;11:888‐894.
Sanchez‐Quintana D, Cabrera JA, Farre J, Climent V, Anderson RH and Ho SY. Sinus
node revisited in the era of electroanatomical mapping and catheter ablation.
Heart 2005;91:189‐194.
Sanders P, Morton JB, Davidson NC, Spence SJ, Vohra JK, Sparks PB and Kalman JM.
Electrical remodeling of the atria in congestive heart failure:
electrophysiological and electroanatomic mapping in humans. Circulation
2003;108:1461‐1468.
Sanders P, Morton JB, Kistler PM, Spence SJ, Davidson NC, Hussin A, Vohra JK, Sparks
PB and Kalman JM. Electrophysiological and electroanatomic characterization
261
of the atria in sinus node disease: evidence of diffuse atrial remodeling.
Circulation 2004a;109:1514‐1522.
Sanders P, Kistler PM, Morton JB, Spence SJ and Kalman JM. Remodeling of sinus node
function in patients with congestive heart failure: reduction in sinus node
reserve. Circulation 2004b;110:897‐903.
Sanders P, Berenfeld O, Hocini M, Jaïs P, Vaidyanathan R, Hsu LF, Garrigue S, Takahashi
Y, Rotter M, Sacher F, Scavee C, Ploutz‐Snyder R, Jalife J and Haïssaguerre M.
Spectral analysis identifies sites of high‐frequency activity maintaining atrial
fibrillation in humans. Circulation 2005a;112:789‐797.
Sanders P, Hocini M, Jaïs P, Hsu LF, Takahashi Y, Rotter M, Scavee C, Pasquie JL, Sacher
F, Rostock T, Nalliah CJ, Clementy J and Haïssaguerre M. Characterization of
focal atrial tachycardia using high‐density mapping. J Am CollCardiol
2005b;46:2088‐2099.
Sanders P, Nalliah CJ, Dubois R, Takahashi Y, Hocini M, Rotter M, Rostock T, Sacher F,
Hsu LF, Jonsson A, O'Neill MD, Jaïs P and Haïssaguerre M. Frequency mapping
of the pulmonary veins in paroxysmal versus permanent atrial fibrillation. J
Cardiovasc Electrophysiol 2006;17:965‐972.
Saoudi N, Atallah G, Kirkorian G and Touboul P. Catheter ablation of the atrial
myocardium in human type I atrial flutter. Circulation 1990;81:762‐771.
Sarmast F, Kolli A, Zaitsev A, Parisian K, Dhamoon AS, Guha PK, Warren M, Anumonwo
JM, Taffet SM, Berenfeld O and Jalife J. Cholinergic atrial fibrillation: I(K,ACh)
gradients determine unequal left/right atrial frequencies and rotor dynamics.
Cardiovasc Res 2003;59:863‐873.

262
Scaglione M, Riccardi R, Calo L, Di DP, Lamberti F, Caponi D, Coda L and Gaita F. Typical
atrial flutter ablation: conduction across the posterior region of the inferior
vena cava orifice may mimic unidirectional isthmus block. J Cardiovasc
Electrophysiol 2000;11:387‐395.
Scherf D. Studies on auricular tachycardia caused by aconitine administration. Proc Soc
Exp Biol Med 1947;64:233‐239.
Scherlag BJ, Yamanashi W, Patel U, Lazzara R and Jackman WM. Autonomically induced
conversion of pulmonary vein focal firing into atrial fibrillation. J Am Coll Cardiol
2005a;45:1878‐1886.
Scherlag BJ, Nakagawa H, Jackman WM, Yamanashi WS, Patterson E, Po S and Lazzara
R. Electrical stimulation to identify neural elements on the heart: their role in
atrial fibrillation. J IntervCard Electrophysiol 2005b;13 Suppl 1:37‐42.
Scherr D, Dalal D, Cheema A, Cheng A, Henrikson CA, Spragg D, Marine JE, Berger RD,
Calkins H and Dong J. Automated detection and characterization of complex
fractionated atrial electrograms in human left atrium during atrial fibrillation.
Heart Rhythm 2007;4:1013‐1020.
Schilling RJ, Peters NS and Davies DW. Simultaneous endocardial mapping in the
human left ventricle using a noncontact catheter: comparison of contact and
reconstructed electrograms during sinus rhythm. Circulation 1998;98:887‐898.
Schilling RJ, Kadish AH, Peters NS, Goldberger J and Davies DW. Endocardial mapping
of atrial fibrillation in the human right atrium using a non‐contact catheter. Eur
Heart J 2000;21:550‐564.
Schmieder S, Ndrepepa G, Dong J, Zrenner B, Schreieck J, Schneider MA, Karch MR and
Schmitt C. Acute and long‐term results of radiofrequency ablation of common
263
atrial flutter and the influence of the right atrial isthmus ablation on the
occurrence of atrial fibrillation. Eur Heart J 2003;24:956‐962.
Schmitt C, Estner H, Hecher B, Luik A, Kolb C, Karch M, Ndrepepa G, Zrenner B, Hessling
G and Deisenhofer I. Radiofrequency ablation of complex fractionated atrial
electrograms (CFAE): preferential sites of acute termination and regularization
in paroxysmal and persistent atrial fibrillation. J Cardiovasc Electrophysiol
2007;18:1039‐1046.
Schuessler RB, Boineau JP and Bromberg BI. Origin of the sinus impulse. J Cardiovasc
Electrophysiol 1996;7:263‐274.
Schuessler RB, Kay MW, Melby SJ, Branham BH, Boineau JP and Damiano RJ, Jr. Spatial
and temporal stability of the dominant frequency of activation in human atrial
fibrillation. J Electrocardiol 2006;39:S7‐12.
Schumacher B, Jung W, Lewalter T, Vahlhaus C, Wolpert C and Luderitz B.
Radiofrequency ablation of atrial flutter due to administration of class IC
antiarrhythmic drugs for atrial fibrillation. Am J Cardiol 1999;83:710‐713.
Shah DC, Haïssaguerre M and Jaïs P. Toward a mechanism‐based understanding of
atrial fibrillation. J Cardiovasc Electrophysiol 2001;12:600‐601.
Shah DC, Sunthorn H, Burri H and Gentil‐Baron P. Evaluation of an individualized
strategy of cavotricuspid isthmus ablation as an adjunct to atrial fibrillation
ablation. J Cardiovasc Electrophysiol 2007;18:926‐930.
Shimizu A, Nozaki A, Rudy Y and Waldo AL. Onset of induced atrial flutter in the canine
pericarditis model. J Am Coll Cardiol 1991;17:1223‐1234.

264
Silverman ME. From rebellious palpitations to the discovery of auricular fibrillation:
contributions of Mackenzie, Lewis and Einthoven. Am J Cardiol 1994;73:384‐
389.
Skalidis EI, Hamilos MI, Karalis IK, Chlouverakis G, Kochiadakis GE and Vardas PE.
Isolated atrial microvascular dysfunction in patients with lone recurrent atrial
fibrillation. J Am Coll Cardiol 2008;51:2053‐2057.
Skanes AC, Mandapati R, Berenfeld O, Davidenko JM and Jalife J. Spatiotemporal
periodicity during atrial fibrillation in the isolated sheep heart. Circulation
1998;98:1236‐1248.
Soylu M, Demir AD, Ozdemir O, Topaloglu S, Aras D, Duru E, Sasmaz A and Korkmaz S.
Evaluation of atrial refractoriness immediately after percutaneous mitral
balloon commissurotomy in patients with mitral stenosis and sinus rhythm. Am
Heart J 2004;147:741‐745.
Spach MS, Miller WT, 3rd, Geselowitz DB, Barr RC, Kootsey JM and Johnson EA. The
discontinuous nature of propagation in normal canine cardiac muscle. Evidence
for recurrent discontinuities of intracellular resistance that affect the
membrane currents. Circ Res 1981;48:39‐54.
Spach MS and Dolber PC. Relating extracellular potentials and their derivatives to
anisotropic propagation at a microscopic level in human cardiac muscle.
Evidence for electrical uncoupling of side‐to‐side fiber connections with
increasing age. Circulation Res 1986;58:356‐371.
Sparks PB, Mond HG, Vohra JK, Jayaprakash S and Kalman JM. Electrical remodeling of
the atria following loss of atrioventricular synchrony: a long‐term study in
humans. Circulation 1999;100:1894‐1900.

265
Sparks PB, Jayaprakash S, Vohra JK and Kalman JM. Electrical remodeling of the atria
associated with paroxysmal and chronic atrial flutter. Circulation
2000;102:1807‐1813.
Stevenson WG, Sager PT and Friedman PL. Entrainment techniques for mapping atrial
and ventricular tachycardias. J Cardiovasc Electrophysiol 1995;6:201‐216.
Stevenson WG and Stevenson LW. Atrial fibrillation in heart failure. N Engl J Med
1999;341:910‐911.
Stewart S, Hart CL, Hole DJ and McMurray JJ. Population prevalence, incidence, and
predictors of atrial fibrillation in the Renfrew/Paisley study. Heart 2001;86:516‐
521.
Stewart S, Hart CL, Hole DJ and McMurray JJ. A population‐based study of the long‐
term risks associated with atrial fibrillation: 20‐year follow‐up of the
Renfrew/Paisley study. Am J Med 2002;113:359‐364.
Stiles MK, Brooks AG, John B, Shashidhar, Wilson L, Kuklik P, Dimitri H, Lau DH,
Roberts‐Thomson RL, Mackenzie L, Willoughby S, Young GD and Sanders P. The
effect of electrogram duration on quantification of complex fractionated atrial
electrograms and dominant frequency. J Cardiovasc Electrophysiol
2008;19:252‐258.
Stiles MK, Brooks AG, Kuklik P, John B, Dimitri H, Lau DH, Wilson L, Shashidhar,
Roberts‐Thomson RL, Mackenzie L, Young GD and Sanders P. High‐density
mapping of atrial fibrillation in humans: relationship between high‐frequency
activation and electrogram fractionation. J Cardiovasc Electrophysiol online
early;doi:10.1111/j.1540‐8167.2008.01253.x.
266
Still AM, Raatikainen P, Ylitalo A, Kauma H, Ikaheimo M, Antero Kesaniemi Y and
Huikuri HV. Prevalence, characteristics and natural course of inappropriate
sinus tachycardia. Europace 2005;7:104‐112.
Strauss HC, Saroff AL, Bigger JT, Jr. and Giardina EG. Premature atrial stimulation as a
key to the understanding of sinoatrial conduction in man: presentation of data
and critical review of the literature. Circulation 1973;47:86‐93.
Tagawa M, Higuchi K, Chinushi M, Washizuka T, Ushiki T, Ishihara N and Aizawa Y.
Myocardium extending from the left atrium onto the pulmonary veins: a
comparison between subjects with and without atrial fibrillation. Pacing Clin
Electrophysiol 2001;24:1459‐1463.
Tai CT, Chen SA, Chen YJ, Yu WC, Hsieh MH, Tsai CF, Chen CC, Ding YA and Chang MS.
Conduction properties of the crista terminalis in patients with typical atrial
flutter: basis for a line of block in the reentrant circuit. J Cardiovasc
Electrophysiol 1998;9:811‐819.
Tai CT, Huang JL, Lee PC, Ding YA, Chang MS and Chen SA. High‐resolution mapping
around the crista terminalis during typical atrial flutter: new insights into
mechanisms. J Cardiovasc Electrophysiol 2004;15:406‐414.
Takahashi Y, Iesaka Y, Takahashi A, Goya M, Kobayashi K, Fujiwara H and Hiraoka M.
Reentrant tachycardia in pulmonary veins of patients with paroxysmal atrial
fibrillation. J Cardiovasc Electrophysiol 2003;14:927‐932.
Takahashi Y, Jaïs P, Hocini M, Sanders P, Rotter M, Rostock T, Hsu LF, Sacher F,
Clementy J and Haïssaguerre M. Shortening of fibrillatory cycle length in the
pulmonary vein during vagal excitation. J Am CollCardiol 2006;47:774‐780.
267
Takahashi Y, O'Neill MD, Hocini M, Reant P, Jonsson A, Jaïs P, Sanders P, Rostock T,
Rotter M, Sacher F, Laffite S, Roudaut R, Clementy J and Haïssaguerre M.
Effects of stepwise ablation of chronic atrial fibrillation on atrial electrical and
mechanical properties. J Am Coll Cardiol 2007;49:1306‐1314.
Takahashi Y, O'Neill MD, Hocini M, Dubois R, Matsuo S, Knecht S, Mahapatra S, Lim KT,
Jaïs P, Jonsson A, Sacher F, Sanders P, Rostock T, Bordachar P, Clementy J, Klein
GJ and Haïssaguerre M. Characterization of electrograms associated with
termination of chronic atrial fibrillation by catheter ablation. J Am Coll Cardiol
2008;51:1003‐1010.
Thiagalingam A, Wallace EM, Boyd AC, Eipper VE, Campbell CR, Byth K, Ross DL and
Kovoor P. Noncontact mapping of the left ventricle: insights from validation
with transmural contact mapping. Pacing Clin Electrophysiol 2004a;27:570‐578.
Thiagalingam A, Wallace EM, Boyd AC, Eipper VE, Campbell CR, Byth K, Ross DL and
Kovoor P. Noncontact mapping of the left ventricle: insights from validation
with transmural contact mapping. Pacing Clin Electrophysiol 2004b;27:570‐578.
Tomita Y, Matsuo K, Sahadevan J, Khrestian CM and Waldo AL. Role of functional block
extension in lesion‐related atrial flutter. Circulation 2001;103:1025‐1030.
Tonkin AM and Heddle WF. Electrophysiological testing of sinus node function. Pacing
Clin Electrophysiol 1984;7:735‐748.
Triedman JK, Alexander ME, Berul CI, Bevilacqua LM and Walsh EP. Electroanatomic
mapping of entrained and exit zones in patients with repaired congenital heart
disease and intra‐atrial reentrant tachycardia. Circulation 2001;103:2060‐2065.
268
Tse HF, Lau CP and Ayers GM. Heterogeneous changes in electrophysiologic properties
in the paroxysmal and chronically fibrillating human atrium. J Cardiovasc
Electrophysiol 1999;10:125‐135.
Verheule S, Wilson E, Everett T, Shanbhag S, Golden C and Olgin J. Alterations in atrial
electrophysiology and tissue structure in a canine model of chronic atrial
dilatation due to mitral regurgitation. Circulation 2003;107:2615‐2622.
Verma A, Wazni OM, Marrouche NF, Martin DO, Kilicaslan F, Minor S, Schweikert RA,
Saliba W, Cummings J, Burkhardt JD, Bhargava M, Belden WA, Abdul‐Karim A
and Natale A. Pre‐existent left atrial scarring in patients undergoing pulmonary
vein antrum isolation: an independent predictor of procedural failure. J Am Coll
Cardiol 2005;45:285‐292.
Verma A, Novak P, Macle L, Whaley B, Beardsall M, Wulffhart Z and Khaykin Y. A
prospective, multicenter evaluation of ablating complex fractionated
electrograms (CFEs) during atrial fibrillation (AF) identified by an automated
mapping algorithm: Acute effects on AF and efficacy as an adjuvant strategy.
Heart Rhythm 2008;5:198‐205.
Vidaillet H, Granada JF, Chyou PH, Maassen K, Ortiz M, Pulido JN, Sharma P, Smith PN
and Hayes J. A population‐based study of mortality among patients with atrial
fibrillation or flutter. Am J Med 2002;113:365‐370.
Volders PG, Zhu Q, Timmermans C, Eurlings PM, Su X, Arens YH, Li L, Jongbloed RJ, Xia
M, Rodriguez LM and Chen YH. Mapping a novel locus for familial atrial
fibrillation on chromosome 10p11‐q21. Heart Rhythm 2007;4:469‐475.
Volkmer M, Antz M, Hebe J and Kuck KH. Focal atrial tachycardia originating from the
musculature of the coronary sinus. J Cardiovasc Electrophysiol 2002;13:68‐71.

269
Waldo AI and Cooper TB. Spontaneous onset of type I atrial flutter in patients. J Am
Coll Cardiol 1996;28:707‐712.
Waldo AL, MacLean WA, Karp RB, Kouchoukos NT and James TN. Entrainment and
interruption of atrial flutter with atrial pacing: studies in man following open
heart surgery. Circulation 1977;56:737‐745.
Wang TJ, Larson MG, Levy D, Vasan RS, Leip EP, Wolf PA, D'Agostino RB, Murabito JM,
Kannel WB and Benjamin EJ. Temporal relations of atrial fibrillation and
congestive heart failure and their joint influence on mortality: the Framingham
Heart Study. Circulation 2003;107:2920‐2925.
Wazni O, Marrouche NF, Martin DO, Gillinov AM, Saliba W, Saad E, Klein A, Bhargava
M, Bash D, Schweikert R, Erciyes D, Abdul‐Karim A, Brachman J, Gunther J,
Pisano E, Potenza D, Fanelli R and Natale A. Randomized study comparing
combined pulmonary vein‐left atrial junction disconnection and cavotricuspid
isthmus ablation versus pulmonary vein‐left atrial junction disconnection alone
in patients presenting with typical atrial flutter and atrial fibrillation. Circulation
2003;108:2479‐2483.
Weiss C, Gocht A, Willems S, Hoffmann M, Risius T and Meinertz T. Impact of the
distribution and structure of myocardium in the pulmonary veins for
radiofrequency ablation of atrial fibrillation. Pacing Clin Electrophysiol
2002;25:1352‐1356.
Wijffels MC, Kirchhof CJ, Dorland R and Allessie MA. Atrial fibrillation begets atrial
fibrillation. A study in awake chronically instrumented goats. Circulation
1995;92:1954‐1968.

270
Willems S, Weiss C, Risius T, Rostock T, Hoffmann M, Ventura R and Meinertz T.
Dissociated activity and pulmonary vein fibrillation following functional
disconnection: impact for the arrhythmogenesis of focal atrial fibrillation.
Pacing Clin Electrophysiol 2003;26:1363‐1370.
Willems S and Rostock T. A basket full of mechanistic insights into pulmonary vein
arrhythmogenicity: reentry, focal activity, or fibrillatory conduction? J
Cardiovasc Electrophysiol 2007;18:39‐40.
Wolf PA, Dawber TR, Thomas HE, Jr. and Kannel WB. Epidemiologic assessment of
chronic atrial fibrillation and risk of stroke: the Framingham study. Neurology
1978;28:973‐977.
Wolf PA, Abbott RD and Kannel WB. Atrial fibrillation: a major contributor to stroke in
the elderly. The Framingham Study. Arch Intern Med 1987;147:1561‐1564.
Wolf PA, Abbott RD and Kannel WB. Atrial fibrillation as an independent risk factor for
stroke: the Framingham Study. Stroke 1991;22:983‐988.
Wolf PA, Benjamin EJ, Belanger AJ, Kannel WB, Levy D and D'Agostino RB. Secular
trends in the prevalence of atrial fibrillation: The Framingham Study. Am Heart
J 1996;131:790‐795.
Wu TJ, Doshi RN, Huang HL, Blanche C, Kass RM, Trento A, Cheng W, Karagueuzian HS,
Peter CT and Chen PS. Simultaneous biatrial computerized mapping during
permanent atrial fibrillation in patients with organic heart disease. J Cardiovasc
Electrophysiol 2002;13:571‐577.
Wu TJ, Kerwin WF, Hwang C, Peter CT and Chen PS. Atrial fibrillation: focal activity, re‐
entry, or both? Heart Rhythm 2004;1:117‐120.
271
Yamane T, Shah DC, Hocini M, Jaïs P, Peng JT, Garrigue S, Clementy J and Haïssaguerre
M. Pulmonary vein aneurysm in association with arrhythmogenic foci in a
patient with focally initiated atrial fibrillation. J Cardiovasc Electrophysiol
2000;11:715.
Yamashita T, Inoue H, Nozaki A and Sugimoto T. Role of anatomic architecture in
sustained atrial reentry and double potentials. Am Heart J 1992;124:938‐946.
Yang Y, Mangat I, Glatter KA, Cheng J and Scheinman MM. Mechanism of conversion of
atypical right atrial flutter to atrial fibrillation. Am J Cardiol 2003;91:46‐52.
Yee R and Strauss HC. Electrophysiologic mechanisms: sinus node dysfunction.
Circulation 1987;75:III12‐18.
Yu WC, Lee SH, Tai CT, Tsai CF, Hsieh MH, Chen CC, Ding YA, Chang MS and Chen SA.
Reversal of atrial electrical remodeling following cardioversion of long‐standing
atrial fibrillation in man. Cardiovasc Res 1999;42:470‐476.

DVD ‘Movie 6.1’ is available in the University of Adelaide Library.