atrial fibrillation: part 1
TRANSCRIPT
may 28/vol17/no37/2003 nursing standard 45
C O N T I N U I N G P R O F E S S I O N A L D E V E LO P M E N T
Cardiology
By reading this article and writing a practice profile, you can gain
ten continuing education points (CEPs). You have up to a year to
send in your practice profile. Guidelines on how to write and
submit a profile are featured at the end of this article.
Atrial fibrillation: part 1
The aim of this article is to describe the normalanatomy and physiology of the heart and examinethe mechanical and electrical events that can occuras a consequence of atrial fibrillation (AF). A goodunderstanding of the anatomy and physiology ofthe heart is vital for nurses to appreciate the mech-anisms that contribute to the signs and symptomsof this arrhythmia and to provide optimum carefor patients. Although AF is a common rhythmabnormality, the complexities of the condition arenot always fully appreciated. After reading this arti-cle you should be able to: ■ Describe what constitutes normal heart function.■ Explain the signs and symptoms patients experi-
ence when normal heart function is compromised.■ Describe the link between mechanical, electri-
cal and chemical events in the heart.■ Explain how electrolyte imbalance can influence
cardiac function.■ State the normal parameters of the cardiac con-
duction cycle.■ Describe the techniques used to produce a good
quality electrocardiogram (ECG) trace.■ Interpret a rhythm strip using basic principles.■ Describe the physiological mechanisms that can
occur in AF.
Atrial fibrillation (AF) has been a recognised prob-lem for many decades. The overall prevalence ofAF is between 1 and 1.5 per cent in the generalpopulation, making it the most common sustainedarrhythmia (Goodacre and Irons 2002). In thoseaged over 70 years, the prevalence increases toabout 10 per cent (Goodacre and Irons 2002). The
enormity of the problem and the fact that AF eithercomplicates or causes many other medical conditions,such as stroke and heart failure, create a significantdrain on healthcare resources. AF causes substantialincreases in mortality and morbidity (Peters 1998);the mortality rate is double that of patients in sinusrhythm (Task Force Report 2001). It is also thoughtto account for up to one third of hospital admissionsfor cardiac rhythm problems (Task Force Report 2001).
Higher levels of mortality and morbidity have beenattributable to the increased risk of arterial thrombo-embolism and ischaemic stroke in patients with AF(Lip et al 2002). In the Framingham study (Wolf et al1987) risk of stroke increased with age from 1.5 percent in the 50-59 year group to almost 25 per centin the 80-89 year group (Task Force Report 2001). Inthe presence of other cardiovascular disease, the riskof stroke is estimated to be as high as 75 per centin patients with AF (Cabin et al 1990). With the pro-portion of older people in the UK increasing, AF andthe associated risks will demand even more health-care resources (Lip et al 1996).
Most nurses will be familiar with AF, and havecome into contact with patients with AF at somepoint in their career. Although a common cardiaccondition, AF can be a complex and often harmfularrhythmia. Therefore, it is important to understandthe normal mechanical and electrical function ofthe heart to improve knowledge about the char-acteristics and mechanisms of AF.Introduction
Aim and intended learning outcomes
NS193 Navas S (2003) Atrial fibrillation: part 1. Nursing Standard. 17, 37, 45-54.Date of acceptance: April 23 2003.
AuthorSandra Navas RGN,BSc(Hons), PGCM, is ClinicalNurse Manager Cardiology,Cardiology Department,University Hospitals Coventryand Warwickshire NHS Trust,Walsgrave Hospital, Coventry.Email: [email protected]
SummaryPart 1 of this two-part articleon atrial fibrillation – acommon cardiac rhythmabnormality – covers themechanical and electricalfunctions of the heart. It alsolooks at cardiac monitoringand rhythm interpretation.Part two, published in nextweek’s Nursing Standard, willdiscuss the predisposingfactors, investigations andmethods of treatment.
Key words■ Cardiovascular system
and disorders■ Heart disorders■ Nursing
These key words are basedon subject headings from theBritish Nursing Index. Thisarticle has been subject todouble-blind review.
In brief
Atrial fibrillation: part 1pages 45-54
Multiple-choice questionsand submission instructionspage 55
Practice profile assessment guidepage 56
A reader’s practice profilepage 26
For related articles visit ouronline archive at:www.nursing-standard.co.ukand search using the keywords above.
Online archiveUsing an anatomy and physiologybook of your choice, review thenormal functioning of the heartand the cardiac cycle. Suggestedtextbooks include Scanlon and Sanders(2003), Tortora and Grabowski (2000).
TIME OUT 1
46 nursing standard may 28/vol17/no37/2003
C O N T I N U I N G P R O F E S S I O N A L D E V E LO P M E N T
Cardiology
The heart is a muscular pump about the size of theowner’s fist. Positioned in the thoracic cavity betweenthe lungs and immediately above the diaphragm(Marieb 1997), the heart acts as a double pumpthat serves two circulations: the pulmonary andthe systemic. These circulations provide transportof oxygen and nutrients to the cells via the bloodand blood vessels and remove metabolic wasteproducts from the cells (Jowett and Thompson2003). The pulmonary circulation is a low-pressurevenous system that transports de-oxygenated bloodto the lungs. The systemic circulation is a high-pres-sure arterial system, which transports oxygenatedblood between the heart and the rest of the body.At rest, the heart beats an average of 70 to 80times per minute (an average of 100,000 times perday), and pumps five litres of blood per minute(approximately 7,000 litres per day) (Scanlon andSanders 2003).
The heart is composed of four chambers. Theupper chambers of the heart are the left and rightatria, the lower chambers the left and right ventri-cles. The atria are smaller and have thinner wallsthan the ventricles and act as low-pressure reservoirsor storage chambers, whereas the ventricles are high-pressure pumping chambers. A common wall ofmyocardium, known as the interatrial septum, sep-arates the atria. The left and right ventricles havethicker walls as they have to pump blood againstresistance in the pulmonary and systemic systems(Jowett and Thompson 2003). The ventricles areseparated by the interventricular septum.
The cardiac cycle is a sequence of events that takeplace during one heartbeat. The heart contracts (sys-tole) and then relaxes (diastole) in a sequence of vol-ume and pressure changes to complete the cycle.The duration of the cycle is about 0.8 seconds andit occurs at an average heart rate of 75 beats perminute (bpm) (Vickers 1999a). Timings for systoleand diastole are comparable at 0.4 seconds, but asheart rate increases the diastolic period decreases.As coronary perfusion occurs during diastole, rapidheart rates may severely impair blood supply to themyocardium (Jowett and Thompson 2003). The vol-ume of blood pumped by the ventricles during eachcontraction is known as the stroke volume. Theamount of blood ejected from the heart per minuteis the cardiac output, which is calculated by multi-plying the heart rate (bpm) by the stroke volume(ml/beat) (Vickers 1999a).
The action of the four heart valves is importantto prevent backflow of blood and ensure that bloodflows through the heart in one direction (Linden2000). Malfunction of the heart valves can occurbecause of stenosis (narrowing of the valve, which
restricts blood flow) or regurgitation (an incompletelyclosed valve) causing blood to flow backwards. Thevalves most often affected in the heart are the mitraland aortic. Valvular malfunction can add to theworkload of the heart and make it less efficient.Without treatment this extra work can cause car-diac failure (Linden 2000).
The heart wall is another important componentin heart function. It consists of three separate layers:the endocardium (inner layer), myocardium (middlelayer), and outer epicardium, which is formed fromthe inner/visceral layer of serous pericardium.
The endocardium, made up of endothelium, linesthe chambers and vessels of the heart and alsoextends to cover the valves (Scanlon and Sanders2003). This smooth tissue promotes free flow ofblood, preventing turbulence, blood clot forma-tion and damage to the vessel wall. The myocardiumforms the main bulk of the heart wall and consistsof strong muscular tissue. There are two types ofcardiac muscle cells: cells that respond to electri-cal impulses by contracting; and specialised mus-cle cells that generate and then conduct electricalimpulses through the heart muscle (Levick 1995).
The myocardium has the ability to depolarise (becomeelectrically charged) and contract without stimula-tion from the nerves. This intrinsic ability of theheart muscle to generate an impulse spontaneouslyis known as automaticity or autorhythmicity (Vickers1999b). The rate of contraction in cardiac muscleis determined by pacemaker cells in the conduc-tion system of the heart. The sinoatrial (SA) nodeis known as the primary pacemaker as it is fasterand more localised and therefore sets the pace forthe heart. The autonomic nerves supplying theheart have the capability to alter rate and force ofcontraction and affect the cells’ excitability andspeed of conduction (Vickers 1999b).
Parasympathetic fibres (vagus nerve) slow theheart, whereas sympathetic fibres (the flight or fightresponse mechanism) speed up the heart. Imbalancesin blood chemistry – in particular potassium, mag-nesium, and calcium – can under or over-stimulatecardiac cells, which encourages abnormal heartrhythms or causes the heart to speed up or slowdown. Cells in the myocardium are not only con-nected electrically and mechanically but also chem-ically (Vickers 1999c). This fusion means that animpulse cannot remain in one place and, therefore,
Anatomy and physiology
Following your review of theheart, describe the generationand conduction of impulses in theheart tissues. Try to identify how thisdiffers from normal muscular tissue.
TIME OUT 2
may 28/vol17/no37/2003 nursing standard 47
C O N T I N U I N G P R O F E S S I O N A L D E V E LO P M E N T
Cardiology
disseminates throughout the network of cardiac cells. The myocardium relies on adequate blood supply
to fulfil its energy requirements. Without sufficientoxygen, myocardial performance can be severelyimpaired. The myocardium is thicker in the ventri-cles, especially the left ventricle, which enables it tocontract more forcibly. Ventricular function is depend-ent on a number of factors to ensure delivery ofsufficient output into the systemic circulation. Themain determinant of ventricular function is cardiacoutput, which, as previously mentioned, is the prod-uct of heart rate and stroke volume. The autonomicnerves exert control on heart rate through the bal-ance of sympathetic and parasympathetic influenceon the sinoatrial node. Stroke volume is determinedby the interaction of preload (filling of the heartduring diastole), afterload (resistance against whichthe heart must pump), and contractility of the heartmuscle (Timmis et al 1997).
As the ventricles fill with blood, the cardiac musclefibres are stretched and the next contraction occurs.According to Starling’s law, an increase in bloodvolume and subsequent myocardial stretching cre-ates a more forceful contraction, thereby increas-ing the volume of blood ejected (Starling 1918).However, if the volume of blood increases beyondphysiological limits, as in heart failure, the poorlyfunctioning ventricle is unable to stretch further orcontract sufficiently to increase the stroke volume.As heart failure progresses, compensatory mecha-nisms attempt to maintain adequate circulation.These compensatory mechanisms are often inap-propriate and cause dilatation of the heart (inresponse to volume load), impaired myocardial con-tractility and reduced cardiac output, which embar-rass the circulation further (Timmis et al 1997). Inaddition to ventricular dilatation and enlargement,neurohormonal activation is a major compensatorymechanism. Sympathetic nerve stimulation is oneof the mechanisms that occur as a result of neuro-hormonal changes. This leads to increases in heartrate, myocardial contractility and vasoconstrictionof blood vessels, which in turn increases preload,afterload and the oxygen requirements of the heart(Julian et al 2000).
The pericardium is a tough, protective fibrous sac,which encloses the heart. It has a tough fibrous outerlayer that holds the heart in a fixed position and lim-its its movements in the thorax (Vickers 1999c). Theinner serous layer consists of a parietal layer (liningthe fibrous pericardium) and a visceral layer (alsocalled the epicardium). The pericardial cavity is situ-ated between the parietal and visceral pericardialmembranes and contains 20-30ml of serous fluid.This fluid acts as a lubricant to allow friction-freemovement as the heart contracts and relaxes (Vickers1999c). The heart requires adequate blood supply
to function effectively. The purpose of the coronarycirculation is to supply blood directly to the myocardium,as oxygen is essential to support the metabolicdemands of the heart. Oxygen is provided by theright and left coronary arteries, which are the firstbranches of the ascending aorta. Approximately 5per cent (275ml/min) of cardiac output is pumpedinto the coronary arteries, which fill during diastole(Vickers 1999a). During systole the coronary arter-ies are compressed causing resistance to blood flow.
The left coronary artery arises from the left pos-terior sinus of the aorta. The artery divides into twobranches: the left anterior descending artery andthe circumflex artery. The left anterior descendingartery supplies blood to parts of the left and rightventricles, the interventricular septum and apex ofthe heart. The circumflex artery runs in the atrio-ventricular groove, supplying blood to the left atriumand lateral wall of the left ventricle (Jowett andThompson 2003). The right coronary artery arisesfrom the right coronary sinus of the aorta. A smallbranch off the right coronary artery supplies theSA node. Further branches of this artery supply theconducting tissue, the right ventricle and the inferiorsurface of the left ventricular wall. The majority ofblood reaches the myocardium during diastole. Asthe heart rate increases, both diastolic and systolictimes shorten. Therefore, during increased heartrates the diastolic filling time of the coronary arter-ies and ventricles is decreased, which can seriouslyimpair the performance of the heart in patients withunderlying heart disease (Vickers 1999a). Venousdrainage of the heart occurs via the coronary veinsforming the coronary sinus, which opens directlyinto the right atrium.
Atrial and ventricular systole and diastole are co-ordinated by electrical events in the cardiac cycle.The conduction system is made up of specialisedmuscle cells that initiate and conduct electricalimpulses in the heart to produce myocardial con-traction (Vickers 1999b). The conduction systemof the heart is reliant on an active, energy con-suming ‘sodium pump’. This metabolic pump reg-ulates the movement of positively charged sodium(Na+), calcium (Ca2+) and potassium (K+) ions (elec-trolytes) in and out of the cells. As ions move inand out between the interior of the cell and the
Cardiac conduction
Using a physiology textbook,review the electrolytes that areimportant in cardiac function andtheir effects on the cardiac cycle.Describe an action potential.
TIME OUT 3
48 nursing standard may 28/vol17/no37/2003
C O N T I N U I N G P R O F E S S I O N A L D E V E LO P M E N T
Cardiology
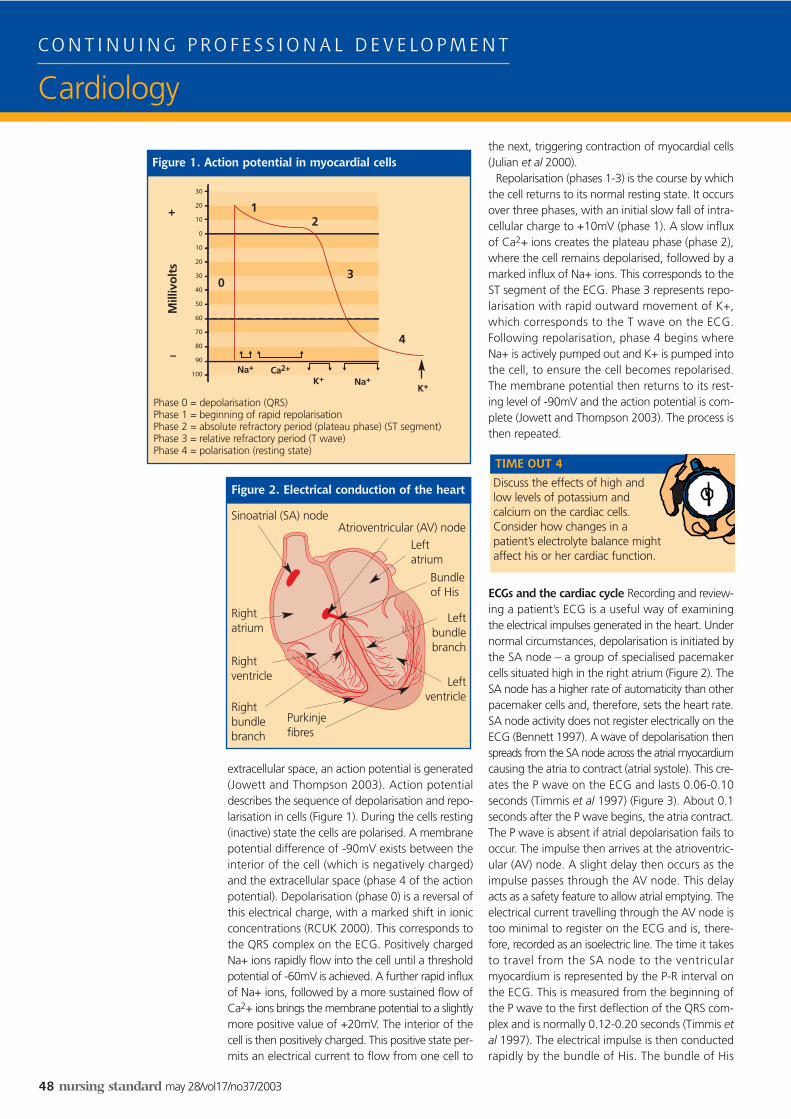
extracellular space, an action potential is generated(Jowett and Thompson 2003). Action potentialdescribes the sequence of depolarisation and repo-larisation in cells (Figure 1). During the cells resting(inactive) state the cells are polarised. A membranepotential difference of -90mV exists between theinterior of the cell (which is negatively charged)and the extracellular space (phase 4 of the actionpotential). Depolarisation (phase 0) is a reversal ofthis electrical charge, with a marked shift in ionicconcentrations (RCUK 2000). This corresponds tothe QRS complex on the ECG. Positively chargedNa+ ions rapidly flow into the cell until a thresholdpotential of -60mV is achieved. A further rapid influxof Na+ ions, followed by a more sustained flow ofCa2+ ions brings the membrane potential to a slightlymore positive value of +20mV. The interior of thecell is then positively charged. This positive state per-mits an electrical current to flow from one cell to
the next, triggering contraction of myocardial cells(Julian et al 2000).
Repolarisation (phases 1-3) is the course by whichthe cell returns to its normal resting state. It occursover three phases, with an initial slow fall of intra-cellular charge to +10mV (phase 1). A slow influxof Ca2+ ions creates the plateau phase (phase 2),where the cell remains depolarised, followed by amarked influx of Na+ ions. This corresponds to theST segment of the ECG. Phase 3 represents repo-larisation with rapid outward movement of K+,which corresponds to the T wave on the ECG.Following repolarisation, phase 4 begins whereNa+ is actively pumped out and K+ is pumped intothe cell, to ensure the cell becomes repolarised.The membrane potential then returns to its rest-ing level of -90mV and the action potential is com-plete (Jowett and Thompson 2003). The process isthen repeated.
ECGs and the cardiac cycle Recording and review-ing a patient’s ECG is a useful way of examiningthe electrical impulses generated in the heart. Undernormal circumstances, depolarisation is initiated bythe SA node – a group of specialised pacemakercells situated high in the right atrium (Figure 2). TheSA node has a higher rate of automaticity than otherpacemaker cells and, therefore, sets the heart rate.SA node activity does not register electrically on theECG (Bennett 1997). A wave of depolarisation thenspreads from the SA node across the atrial myocardiumcausing the atria to contract (atrial systole). This cre-ates the P wave on the ECG and lasts 0.06-0.10seconds (Timmis et al 1997) (Figure 3). About 0.1seconds after the P wave begins, the atria contract.The P wave is absent if atrial depolarisation fails tooccur. The impulse then arrives at the atrioventric-ular (AV) node. A slight delay then occurs as theimpulse passes through the AV node. This delayacts as a safety feature to allow atrial emptying. Theelectrical current travelling through the AV node istoo minimal to register on the ECG and is, there-fore, recorded as an isoelectric line. The time it takesto travel from the SA node to the ventricularmyocardium is represented by the P-R interval onthe ECG. This is measured from the beginning ofthe P wave to the first deflection of the QRS com-plex and is normally 0.12-0.20 seconds (Timmis etal 1997). The electrical impulse is then conductedrapidly by the bundle of His. The bundle of His
Discuss the effects of high andlow levels of potassium andcalcium on the cardiac cells.Consider how changes in apatient’s electrolyte balance mightaffect his or her cardiac function.
TIME OUT 4
Figure 1. Action potential in myocardial cells
Figure 2. Electrical conduction of the heart
Sinoatrial (SA) node
Phase 0 = depolarisation (QRS)Phase 1 = beginning of rapid repolarisationPhase 2 = absolute refractory period (plateau phase) (ST segment)Phase 3 = relative refractory period (T wave)Phase 4 = polarisation (resting state)
Mill
ivo
lts
Na+
Na+Ca2+
K+K+
–
+ 1
0
2
3
4
Atrioventricular (AV) node
Bundleof His
Leftbundlebranch
Rightbundlebranch
Purkinjefibres
Rightatrium
Rightventricle
Leftatrium
Leftventricle
may 28/vol17/no37/2003 nursing standard 49
C O N T I N U I N G P R O F E S S I O N A L D E V E LO P M E N T
Cardiology
divides into left and right bundle branches and endsin the Purkinje fibres, which are firmly buried in theventricular myocardium.
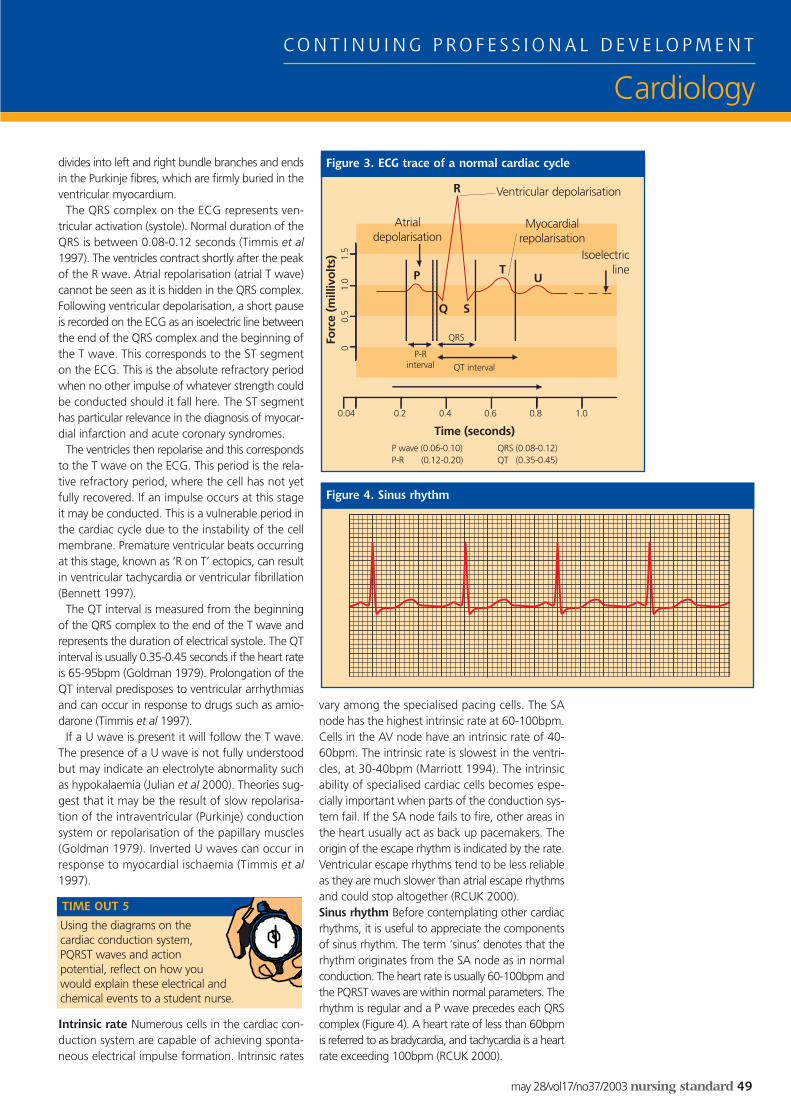
The QRS complex on the ECG represents ven-tricular activation (systole). Normal duration of theQRS is between 0.08-0.12 seconds (Timmis et al1997). The ventricles contract shortly after the peakof the R wave. Atrial repolarisation (atrial T wave)cannot be seen as it is hidden in the QRS complex.Following ventricular depolarisation, a short pauseis recorded on the ECG as an isoelectric line betweenthe end of the QRS complex and the beginning ofthe T wave. This corresponds to the ST segmenton the ECG. This is the absolute refractory periodwhen no other impulse of whatever strength couldbe conducted should it fall here. The ST segmenthas particular relevance in the diagnosis of myocar-dial infarction and acute coronary syndromes.
The ventricles then repolarise and this correspondsto the T wave on the ECG. This period is the rela-tive refractory period, where the cell has not yetfully recovered. If an impulse occurs at this stageit may be conducted. This is a vulnerable period inthe cardiac cycle due to the instability of the cellmembrane. Premature ventricular beats occurringat this stage, known as ‘R on T’ ectopics, can resultin ventricular tachycardia or ventricular fibrillation(Bennett 1997).
The QT interval is measured from the beginningof the QRS complex to the end of the T wave andrepresents the duration of electrical systole. The QTinterval is usually 0.35-0.45 seconds if the heart rateis 65-95bpm (Goldman 1979). Prolongation of theQT interval predisposes to ventricular arrhythmiasand can occur in response to drugs such as amio-darone (Timmis et al 1997).
If a U wave is present it will follow the T wave.The presence of a U wave is not fully understoodbut may indicate an electrolyte abnormality suchas hypokalaemia (Julian et al 2000). Theories sug-gest that it may be the result of slow repolarisa-tion of the intraventricular (Purkinje) conductionsystem or repolarisation of the papillary muscles(Goldman 1979). Inverted U waves can occur inresponse to myocardial ischaemia (Timmis et al1997).
Intrinsic rate Numerous cells in the cardiac con-duction system are capable of achieving sponta-neous electrical impulse formation. Intrinsic rates
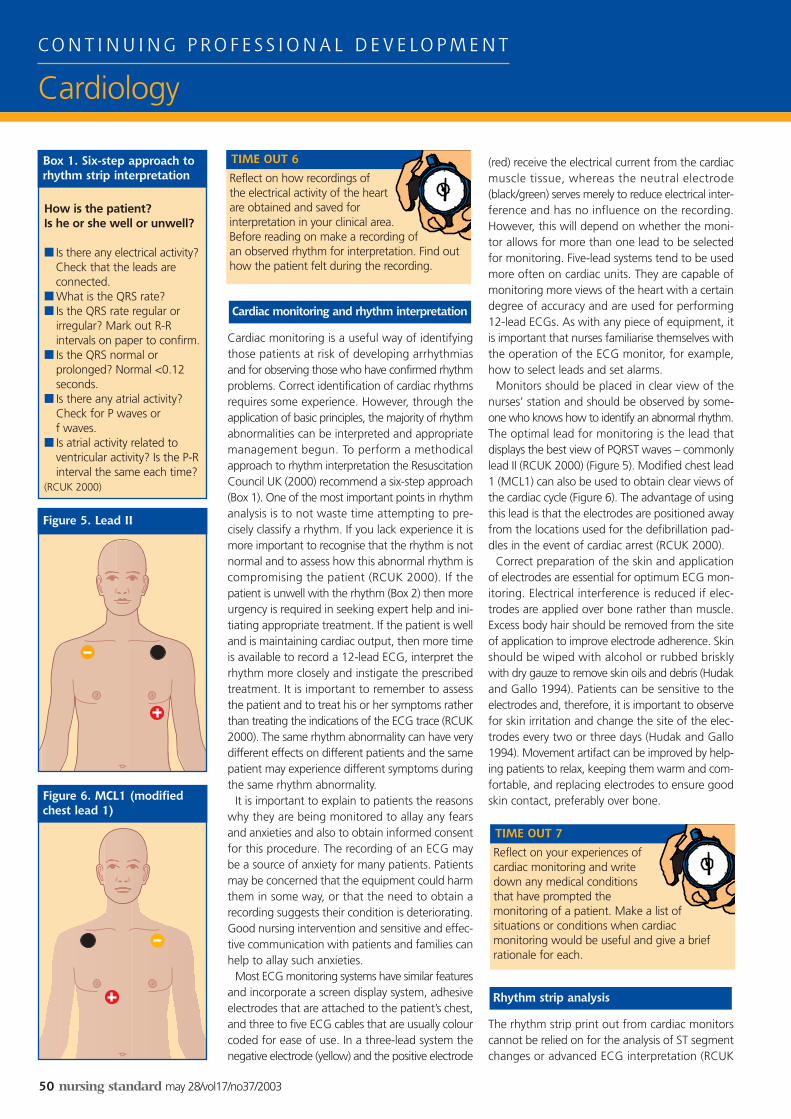
vary among the specialised pacing cells. The SAnode has the highest intrinsic rate at 60-100bpm.Cells in the AV node have an intrinsic rate of 40-60bpm. The intrinsic rate is slowest in the ventri-cles, at 30-40bpm (Marriott 1994). The intrinsicability of specialised cardiac cells becomes espe-cially important when parts of the conduction sys-tem fail. If the SA node fails to fire, other areas inthe heart usually act as back up pacemakers. Theorigin of the escape rhythm is indicated by the rate.Ventricular escape rhythms tend to be less reliableas they are much slower than atrial escape rhythmsand could stop altogether (RCUK 2000).Sinus rhythm Before contemplating other cardiacrhythms, it is useful to appreciate the componentsof sinus rhythm. The term ‘sinus’ denotes that therhythm originates from the SA node as in normalconduction. The heart rate is usually 60-100bpm andthe PQRST waves are within normal parameters. Therhythm is regular and a P wave precedes each QRScomplex (Figure 4). A heart rate of less than 60bpmis referred to as bradycardia, and tachycardia is a heartrate exceeding 100bpm (RCUK 2000).
Using the diagrams on thecardiac conduction system,PQRST waves and actionpotential, reflect on how youwould explain these electrical andchemical events to a student nurse.
TIME OUT 5
Figure 3. ECG trace of a normal cardiac cycle
Figure 4. Sinus rhythm
R
P
Q S
TU
Ventricular depolarisation
Isoelectricline
Myocardialrepolarisation
Atrialdepolarisation
P-Rinterval
QRS
QT interval
0.04 0.2 0.4 0.6 0.8 1.0
P wave (0.06-0.10)P-R (0.12-0.20)
QRS (0.08-0.12)QT (0.35-0.45)
00.
51.
01.
5
Time (seconds)
Forc
e (m
illiv
olt
s)
50 nursing standard may 28/vol17/no37/2003
C O N T I N U I N G P R O F E S S I O N A L D E V E LO P M E N T
Cardiology
Cardiac monitoring is a useful way of identifyingthose patients at risk of developing arrhythmiasand for observing those who have confirmed rhythmproblems. Correct identification of cardiac rhythmsrequires some experience. However, through theapplication of basic principles, the majority of rhythmabnormalities can be interpreted and appropriatemanagement begun. To perform a methodicalapproach to rhythm interpretation the ResuscitationCouncil UK (2000) recommend a six-step approach(Box 1). One of the most important points in rhythmanalysis is to not waste time attempting to pre-cisely classify a rhythm. If you lack experience it ismore important to recognise that the rhythm is notnormal and to assess how this abnormal rhythm iscompromising the patient (RCUK 2000). If thepatient is unwell with the rhythm (Box 2) then moreurgency is required in seeking expert help and ini-tiating appropriate treatment. If the patient is welland is maintaining cardiac output, then more timeis available to record a 12-lead ECG, interpret therhythm more closely and instigate the prescribedtreatment. It is important to remember to assessthe patient and to treat his or her symptoms ratherthan treating the indications of the ECG trace (RCUK2000). The same rhythm abnormality can have verydifferent effects on different patients and the samepatient may experience different symptoms duringthe same rhythm abnormality.
It is important to explain to patients the reasonswhy they are being monitored to allay any fearsand anxieties and also to obtain informed consentfor this procedure. The recording of an ECG maybe a source of anxiety for many patients. Patientsmay be concerned that the equipment could harmthem in some way, or that the need to obtain arecording suggests their condition is deteriorating.Good nursing intervention and sensitive and effec-tive communication with patients and families canhelp to allay such anxieties.
Most ECG monitoring systems have similar featuresand incorporate a screen display system, adhesiveelectrodes that are attached to the patient’s chest,and three to five ECG cables that are usually colourcoded for ease of use. In a three-lead system thenegative electrode (yellow) and the positive electrode
(red) receive the electrical current from the cardiacmuscle tissue, whereas the neutral electrode(black/green) serves merely to reduce electrical inter-ference and has no influence on the recording.However, this will depend on whether the moni-tor allows for more than one lead to be selectedfor monitoring. Five-lead systems tend to be usedmore often on cardiac units. They are capable ofmonitoring more views of the heart with a certaindegree of accuracy and are used for performing12-lead ECGs. As with any piece of equipment, itis important that nurses familiarise themselves withthe operation of the ECG monitor, for example,how to select leads and set alarms.
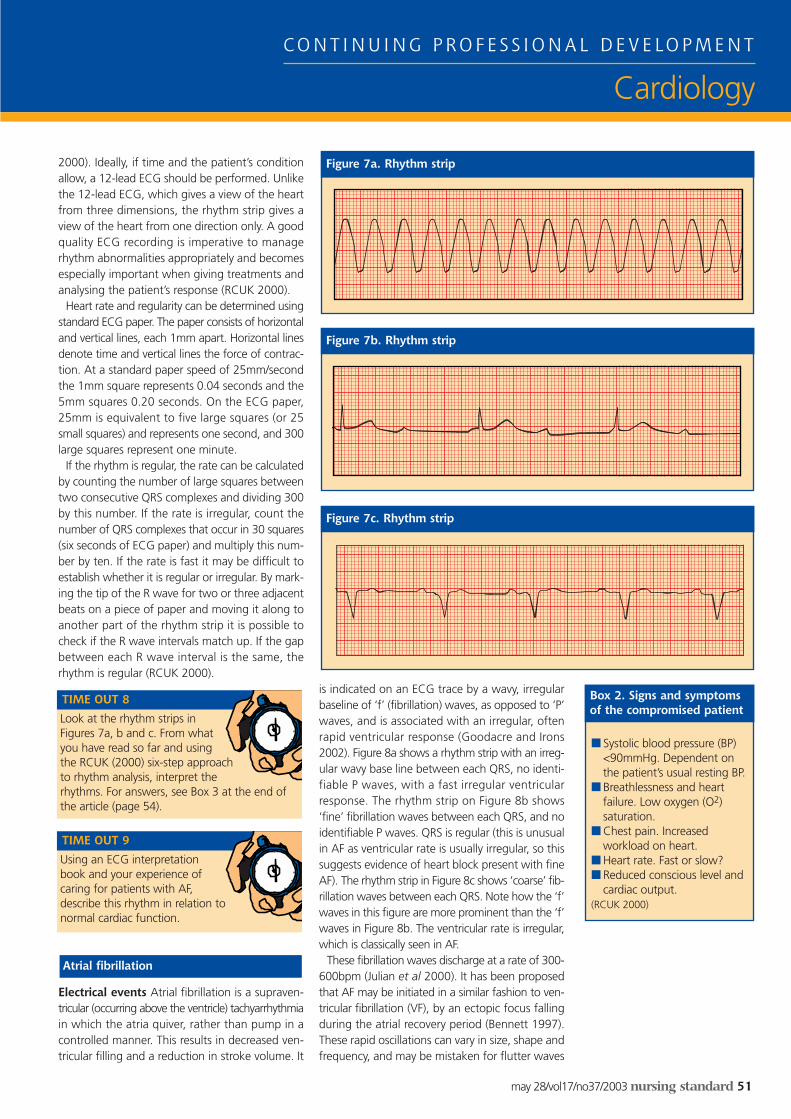
Monitors should be placed in clear view of thenurses’ station and should be observed by some-one who knows how to identify an abnormal rhythm.The optimal lead for monitoring is the lead thatdisplays the best view of PQRST waves – commonlylead II (RCUK 2000) (Figure 5). Modified chest lead1 (MCL1) can also be used to obtain clear views ofthe cardiac cycle (Figure 6). The advantage of usingthis lead is that the electrodes are positioned awayfrom the locations used for the defibrillation pad-dles in the event of cardiac arrest (RCUK 2000).
Correct preparation of the skin and applicationof electrodes are essential for optimum ECG mon-itoring. Electrical interference is reduced if elec-trodes are applied over bone rather than muscle.Excess body hair should be removed from the siteof application to improve electrode adherence. Skinshould be wiped with alcohol or rubbed brisklywith dry gauze to remove skin oils and debris (Hudakand Gallo 1994). Patients can be sensitive to theelectrodes and, therefore, it is important to observefor skin irritation and change the site of the elec-trodes every two or three days (Hudak and Gallo1994). Movement artifact can be improved by help-ing patients to relax, keeping them warm and com-fortable, and replacing electrodes to ensure goodskin contact, preferably over bone.
The rhythm strip print out from cardiac monitorscannot be relied on for the analysis of ST segmentchanges or advanced ECG interpretation (RCUK
Rhythm strip analysis
Cardiac monitoring and rhythm interpretation
Reflect on how recordings ofthe electrical activity of the heartare obtained and saved forinterpretation in your clinical area.Before reading on make a recording ofan observed rhythm for interpretation. Find outhow the patient felt during the recording.
TIME OUT 6
How is the patient? Is he or she well or unwell?
■ Is there any electrical activity?Check that the leads areconnected.
■ What is the QRS rate?■ Is the QRS rate regular or
irregular? Mark out R-Rintervals on paper to confirm.
■ Is the QRS normal orprolonged? Normal <0.12seconds.
■ Is there any atrial activity?Check for P waves or f waves.
■ Is atrial activity related toventricular activity? Is the P-Rinterval the same each time?
(RCUK 2000)
Box 1. Six-step approach torhythm strip interpretation
Figure 5. Lead II
Figure 6. MCL1 (modifiedchest lead 1)
Reflect on your experiences ofcardiac monitoring and writedown any medical conditionsthat have prompted themonitoring of a patient. Make a list ofsituations or conditions when cardiacmonitoring would be useful and give a briefrationale for each.
TIME OUT 7
may 28/vol17/no37/2003 nursing standard 51
C O N T I N U I N G P R O F E S S I O N A L D E V E LO P M E N T
Cardiology
2000). Ideally, if time and the patient’s conditionallow, a 12-lead ECG should be performed. Unlikethe 12-lead ECG, which gives a view of the heartfrom three dimensions, the rhythm strip gives aview of the heart from one direction only. A goodquality ECG recording is imperative to managerhythm abnormalities appropriately and becomesespecially important when giving treatments andanalysing the patient’s response (RCUK 2000).
Heart rate and regularity can be determined usingstandard ECG paper. The paper consists of horizontaland vertical lines, each 1mm apart. Horizontal linesdenote time and vertical lines the force of contrac-tion. At a standard paper speed of 25mm/secondthe 1mm square represents 0.04 seconds and the5mm squares 0.20 seconds. On the ECG paper,25mm is equivalent to five large squares (or 25small squares) and represents one second, and 300large squares represent one minute.
If the rhythm is regular, the rate can be calculatedby counting the number of large squares betweentwo consecutive QRS complexes and dividing 300by this number. If the rate is irregular, count thenumber of QRS complexes that occur in 30 squares(six seconds of ECG paper) and multiply this num-ber by ten. If the rate is fast it may be difficult toestablish whether it is regular or irregular. By mark-ing the tip of the R wave for two or three adjacentbeats on a piece of paper and moving it along toanother part of the rhythm strip it is possible tocheck if the R wave intervals match up. If the gapbetween each R wave interval is the same, therhythm is regular (RCUK 2000).
Electrical events Atrial fibrillation is a supraven-tricular (occurring above the ventricle) tachyarrhythmiain which the atria quiver, rather than pump in acontrolled manner. This results in decreased ven-tricular filling and a reduction in stroke volume. It
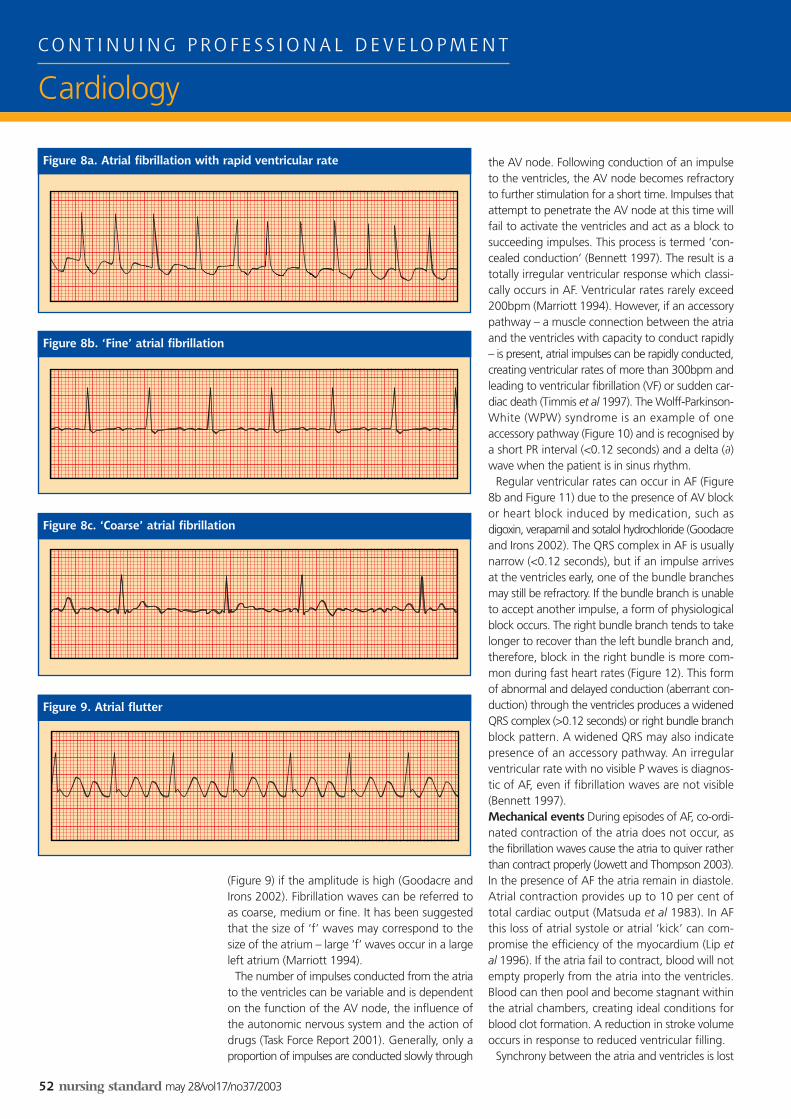
is indicated on an ECG trace by a wavy, irregularbaseline of ‘f’ (fibrillation) waves, as opposed to ‘P’waves, and is associated with an irregular, oftenrapid ventricular response (Goodacre and Irons2002). Figure 8a shows a rhythm strip with an irreg-ular wavy base line between each QRS, no identi-fiable P waves, with a fast irregular ventricularresponse. The rhythm strip on Figure 8b shows‘fine’ fibrillation waves between each QRS, and noidentifiable P waves. QRS is regular (this is unusualin AF as ventricular rate is usually irregular, so thissuggests evidence of heart block present with fineAF). The rhythm strip in Figure 8c shows ‘coarse’ fib-rillation waves between each QRS. Note how the ‘f’waves in this figure are more prominent than the ‘f’waves in Figure 8b. The ventricular rate is irregular,which is classically seen in AF.
These fibrillation waves discharge at a rate of 300-600bpm (Julian et al 2000). It has been proposedthat AF may be initiated in a similar fashion to ven-tricular fibrillation (VF), by an ectopic focus fallingduring the atrial recovery period (Bennett 1997).These rapid oscillations can vary in size, shape andfrequency, and may be mistaken for flutter waves
Atrial fibrillation
Look at the rhythm strips inFigures 7a, b and c. From whatyou have read so far and usingthe RCUK (2000) six-step approachto rhythm analysis, interpret therhythms. For answers, see Box 3 at the end ofthe article (page 54).
TIME OUT 8
Using an ECG interpretationbook and your experience ofcaring for patients with AF,describe this rhythm in relation tonormal cardiac function.
TIME OUT 9
■ Systolic blood pressure (BP)<90mmHg. Dependent onthe patient’s usual resting BP.
■ Breathlessness and heartfailure. Low oxygen (O2)saturation.
■ Chest pain. Increasedworkload on heart.
■ Heart rate. Fast or slow?■ Reduced conscious level and
cardiac output.(RCUK 2000)
Box 2. Signs and symptomsof the compromised patient
Figure 7b. Rhythm strip
Figure 7c. Rhythm strip
Figure 7a. Rhythm strip
52 nursing standard may 28/vol17/no37/2003
C O N T I N U I N G P R O F E S S I O N A L D E V E LO P M E N T
Cardiology
(Figure 9) if the amplitude is high (Goodacre andIrons 2002). Fibrillation waves can be referred toas coarse, medium or fine. It has been suggestedthat the size of ‘f’ waves may correspond to thesize of the atrium – large ‘f’ waves occur in a largeleft atrium (Marriott 1994).
The number of impulses conducted from the atriato the ventricles can be variable and is dependenton the function of the AV node, the influence ofthe autonomic nervous system and the action ofdrugs (Task Force Report 2001). Generally, only aproportion of impulses are conducted slowly through
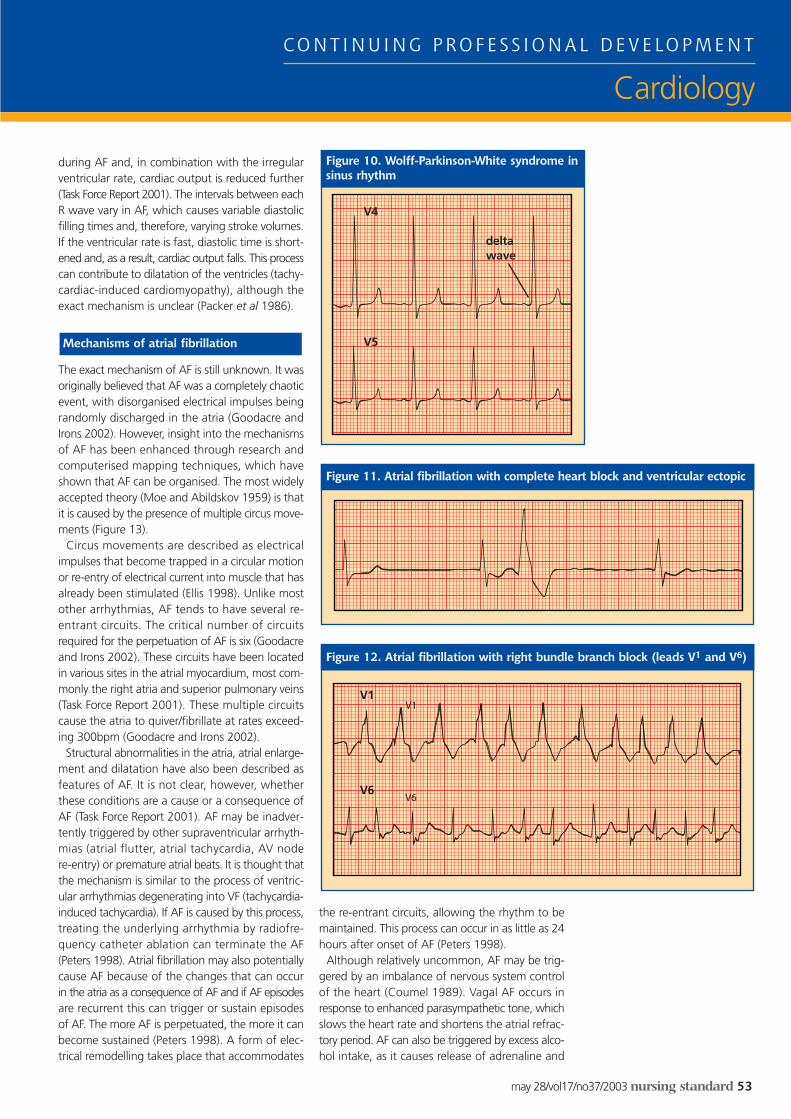
the AV node. Following conduction of an impulseto the ventricles, the AV node becomes refractoryto further stimulation for a short time. Impulses thatattempt to penetrate the AV node at this time willfail to activate the ventricles and act as a block tosucceeding impulses. This process is termed ‘con-cealed conduction’ (Bennett 1997). The result is atotally irregular ventricular response which classi-cally occurs in AF. Ventricular rates rarely exceed200bpm (Marriott 1994). However, if an accessorypathway – a muscle connection between the atriaand the ventricles with capacity to conduct rapidly– is present, atrial impulses can be rapidly conducted,creating ventricular rates of more than 300bpm andleading to ventricular fibrillation (VF) or sudden car-diac death (Timmis et al 1997). The Wolff-Parkinson-White (WPW) syndrome is an example of oneaccessory pathway (Figure 10) and is recognised bya short PR interval (<0.12 seconds) and a delta (∂)wave when the patient is in sinus rhythm.
Regular ventricular rates can occur in AF (Figure8b and Figure 11) due to the presence of AV blockor heart block induced by medication, such asdigoxin, verapamil and sotalol hydrochloride (Goodacreand Irons 2002). The QRS complex in AF is usuallynarrow (<0.12 seconds), but if an impulse arrivesat the ventricles early, one of the bundle branchesmay still be refractory. If the bundle branch is unableto accept another impulse, a form of physiologicalblock occurs. The right bundle branch tends to takelonger to recover than the left bundle branch and,therefore, block in the right bundle is more com-mon during fast heart rates (Figure 12). This formof abnormal and delayed conduction (aberrant con-duction) through the ventricles produces a widenedQRS complex (>0.12 seconds) or right bundle branchblock pattern. A widened QRS may also indicatepresence of an accessory pathway. An irregularventricular rate with no visible P waves is diagnos-tic of AF, even if fibrillation waves are not visible(Bennett 1997).Mechanical events During episodes of AF, co-ordi-nated contraction of the atria does not occur, asthe fibrillation waves cause the atria to quiver ratherthan contract properly (Jowett and Thompson 2003).In the presence of AF the atria remain in diastole.Atrial contraction provides up to 10 per cent oftotal cardiac output (Matsuda et al 1983). In AFthis loss of atrial systole or atrial ‘kick’ can com-promise the efficiency of the myocardium (Lip etal 1996). If the atria fail to contract, blood will notempty properly from the atria into the ventricles.Blood can then pool and become stagnant withinthe atrial chambers, creating ideal conditions forblood clot formation. A reduction in stroke volumeoccurs in response to reduced ventricular filling.
Synchrony between the atria and ventricles is lost
Figure 9. Atrial flutter
Figure 8c. ‘Coarse’ atrial fibrillation
Figure 8a. Atrial fibrillation with rapid ventricular rate
Figure 8b. ‘Fine’ atrial fibrillation
may 28/vol17/no37/2003 nursing standard 53
C O N T I N U I N G P R O F E S S I O N A L D E V E LO P M E N T
Cardiology
during AF and, in combination with the irregularventricular rate, cardiac output is reduced further(Task Force Report 2001). The intervals between eachR wave vary in AF, which causes variable diastolicfilling times and, therefore, varying stroke volumes.If the ventricular rate is fast, diastolic time is short-ened and, as a result, cardiac output falls. This processcan contribute to dilatation of the ventricles (tachy-cardiac-induced cardiomyopathy), although theexact mechanism is unclear (Packer et al 1986).
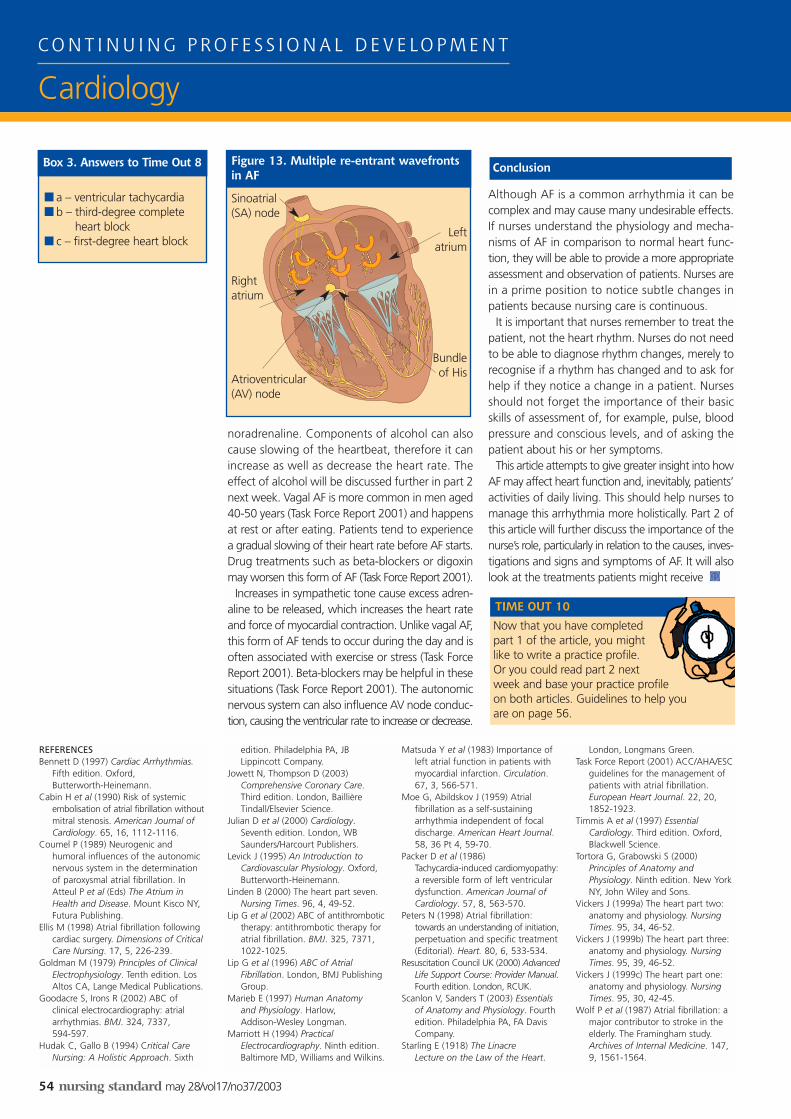
The exact mechanism of AF is still unknown. It wasoriginally believed that AF was a completely chaoticevent, with disorganised electrical impulses beingrandomly discharged in the atria (Goodacre andIrons 2002). However, insight into the mechanismsof AF has been enhanced through research andcomputerised mapping techniques, which haveshown that AF can be organised. The most widelyaccepted theory (Moe and Abildskov 1959) is thatit is caused by the presence of multiple circus move-ments (Figure 13).
Circus movements are described as electricalimpulses that become trapped in a circular motionor re-entry of electrical current into muscle that hasalready been stimulated (Ellis 1998). Unlike mostother arrhythmias, AF tends to have several re-entrant circuits. The critical number of circuitsrequired for the perpetuation of AF is six (Goodacreand Irons 2002). These circuits have been locatedin various sites in the atrial myocardium, most com-monly the right atria and superior pulmonary veins(Task Force Report 2001). These multiple circuitscause the atria to quiver/fibrillate at rates exceed-ing 300bpm (Goodacre and Irons 2002).
Structural abnormalities in the atria, atrial enlarge-ment and dilatation have also been described asfeatures of AF. It is not clear, however, whetherthese conditions are a cause or a consequence ofAF (Task Force Report 2001). AF may be inadver-tently triggered by other supraventricular arrhyth-mias (atrial flutter, atrial tachycardia, AV nodere-entry) or premature atrial beats. It is thought thatthe mechanism is similar to the process of ventric-ular arrhythmias degenerating into VF (tachycardia-induced tachycardia). If AF is caused by this process,treating the underlying arrhythmia by radiofre-quency catheter ablation can terminate the AF(Peters 1998). Atrial fibrillation may also potentiallycause AF because of the changes that can occurin the atria as a consequence of AF and if AF episodesare recurrent this can trigger or sustain episodesof AF. The more AF is perpetuated, the more it canbecome sustained (Peters 1998). A form of elec-trical remodelling takes place that accommodates
the re-entrant circuits, allowing the rhythm to bemaintained. This process can occur in as little as 24hours after onset of AF (Peters 1998).
Although relatively uncommon, AF may be trig-gered by an imbalance of nervous system controlof the heart (Coumel 1989). Vagal AF occurs inresponse to enhanced parasympathetic tone, whichslows the heart rate and shortens the atrial refrac-tory period. AF can also be triggered by excess alco-hol intake, as it causes release of adrenaline and
Mechanisms of atrial fibrillation
Figure 12. Atrial fibrillation with right bundle branch block (leads V1 and V6)
Figure 11. Atrial fibrillation with complete heart block and ventricular ectopic
Figure 10. Wolff-Parkinson-White syndrome insinus rhythm
deltawave
V4
V5
V1
V6
REFERENCESBennett D (1997) Cardiac Arrhythmias.
Fifth edition. Oxford, Butterworth-Heinemann.
Cabin H et al (1990) Risk of systemicembolisation of atrial fibrillation withoutmitral stenosis. American Journal ofCardiology. 65, 16, 1112-1116.
Coumel P (1989) Neurogenic andhumoral influences of the autonomicnervous system in the determinationof paroxysmal atrial fibrillation. InAtteul P et al (Eds) The Atrium inHealth and Disease. Mount Kisco NY,Futura Publishing.
Ellis M (1998) Atrial fibrillation followingcardiac surgery. Dimensions of CriticalCare Nursing. 17, 5, 226-239.
Goldman M (1979) Principles of ClinicalElectrophysiology. Tenth edition. LosAltos CA, Lange Medical Publications.
Goodacre S, Irons R (2002) ABC of clinical electrocardiography: atrialarrhythmias. BMJ. 324, 7337, 594-597.
Hudak C, Gallo B (1994) Critical CareNursing: A Holistic Approach. Sixth
noradrenaline. Components of alcohol can alsocause slowing of the heartbeat, therefore it canincrease as well as decrease the heart rate. Theeffect of alcohol will be discussed further in part 2next week. Vagal AF is more common in men aged40-50 years (Task Force Report 2001) and happensat rest or after eating. Patients tend to experiencea gradual slowing of their heart rate before AF starts.Drug treatments such as beta-blockers or digoxinmay worsen this form of AF (Task Force Report 2001).
Increases in sympathetic tone cause excess adren-aline to be released, which increases the heart rateand force of myocardial contraction. Unlike vagal AF,this form of AF tends to occur during the day and isoften associated with exercise or stress (Task ForceReport 2001). Beta-blockers may be helpful in thesesituations (Task Force Report 2001). The autonomicnervous system can also influence AV node conduc-tion, causing the ventricular rate to increase or decrease.
Although AF is a common arrhythmia it can becomplex and may cause many undesirable effects.If nurses understand the physiology and mecha-nisms of AF in comparison to normal heart func-tion, they will be able to provide a more appropriateassessment and observation of patients. Nurses arein a prime position to notice subtle changes inpatients because nursing care is continuous.
It is important that nurses remember to treat thepatient, not the heart rhythm. Nurses do not needto be able to diagnose rhythm changes, merely torecognise if a rhythm has changed and to ask forhelp if they notice a change in a patient. Nursesshould not forget the importance of their basicskills of assessment of, for example, pulse, bloodpressure and conscious levels, and of asking thepatient about his or her symptoms.
This article attempts to give greater insight into howAF may affect heart function and, inevitably, patients’activities of daily living. This should help nurses tomanage this arrhythmia more holistically. Part 2 ofthis article will further discuss the importance of thenurse’s role, particularly in relation to the causes, inves-tigations and signs and symptoms of AF. It will alsolook at the treatments patients might receive
Conclusion
■ a – ventricular tachycardia■ b – third-degree complete
heart block■ c – first-degree heart block
Box 3. Answers to Time Out 8
54 nursing standard may 28/vol17/no37/2003
C O N T I N U I N G P R O F E S S I O N A L D E V E LO P M E N T
Cardiology
Now that you have completedpart 1 of the article, you mightlike to write a practice profile.Or you could read part 2 nextweek and base your practice profileon both articles. Guidelines to help you are on page 56.
TIME OUT 10
Figure 13. Multiple re-entrant wavefrontsin AF
Sinoatrial(SA) node
edition. Philadelphia PA, JBLippincott Company.
Jowett N, Thompson D (2003)Comprehensive Coronary Care.Third edition. London, BaillièreTindall/Elsevier Science.
Julian D et al (2000) Cardiology.Seventh edition. London, WBSaunders/Harcourt Publishers.
Levick J (1995) An Introduction toCardiovascular Physiology. Oxford,Butterworth-Heinemann.
Linden B (2000) The heart part seven.Nursing Times. 96, 4, 49-52.
Lip G et al (2002) ABC of antithrombotictherapy: antithrombotic therapy foratrial fibrillation. BMJ. 325, 7371,1022-1025.
Lip G et al (1996) ABC of AtrialFibrillation. London, BMJ PublishingGroup.
Marieb E (1997) Human Anatomy and Physiology. Harlow, Addison-Wesley Longman.
Marriott H (1994) PracticalElectrocardiography. Ninth edition.Baltimore MD, Williams and Wilkins.
Matsuda Y et al (1983) Importance ofleft atrial function in patients withmyocardial infarction. Circulation.67, 3, 566-571.
Moe G, Abildskov J (1959) Atrial fibrillation as a self-sustainingarrhythmia independent of focaldischarge. American Heart Journal.58, 36 Pt 4, 59-70.
Packer D et al (1986) Tachycardia-induced cardiomyopathy:a reversible form of left ventriculardysfunction. American Journal ofCardiology. 57, 8, 563-570.
Peters N (1998) Atrial fibrillation:towards an understanding of initiation,perpetuation and specific treatment(Editorial). Heart. 80, 6, 533-534.
Resuscitation Council UK (2000) AdvancedLife Support Course: Provider Manual.Fourth edition. London, RCUK.
Scanlon V, Sanders T (2003) Essentialsof Anatomy and Physiology. Fourthedition. Philadelphia PA, FA DavisCompany.
Starling E (1918) The Linacre Lecture on the Law of the Heart.
London, Longmans Green.Task Force Report (2001) ACC/AHA/ESC
guidelines for the management ofpatients with atrial fibrillation.European Heart Journal. 22, 20,1852-1923.
Timmis A et al (1997) EssentialCardiology. Third edition. Oxford,Blackwell Science.
Tortora G, Grabowski S (2000)Principles of Anatomy andPhysiology. Ninth edition. New YorkNY, John Wiley and Sons.
Vickers J (1999a) The heart part two:anatomy and physiology. NursingTimes. 95, 34, 46-52.
Vickers J (1999b) The heart part three:anatomy and physiology. NursingTimes. 95, 39, 46-52.
Vickers J (1999c) The heart part one:anatomy and physiology. NursingTimes. 95, 30, 42-45.
Wolf P et al (1987) Atrial fibrillation: amajor contributor to stroke in theelderly. The Framingham study.Archives of Internal Medicine. 147,9, 1561-1564.
Atrioventricular(AV) node
Rightatrium
Bundleof His
Leftatrium