characterisation of left ventricular relaxation in the isolated guinea pig heart
TRANSCRIPT
Res Exp Mad (1996) 195:261-273 Research in
Experimental Medicine �9 Springer-Veflag 1996
Original papers
Characterisation of left ventricular relaxation in the isolated guinea pig heart
Stefan SchMer 1, Wolfgang Schlack 2, Malta Kelm 1, Andreas Deussen 3, Bodo E. Strauer ~
1 Medizinische Klinik B, Abteilung Kardiologie, Pneumologie und Angiologie, Heinrich-Heine-Universit~it, Dtisseldorf, Germany 2 Institut ftir Klinische Anaesthesiologie, Heinrich-Heine-Universit~it, Dtisseldorf, Germany 3 Physiologisches Institut, Abt. Herz- und Kreislaufphysiologie, Heinrich-Heine-Universit~it, Dtisseldorf, Germany
Received: 25 March 1996 ! Accepted: 15 July 1996
Abstract. The time constant of left ventricular pressure fall, "c, has frequently been used as a measure of myocardial relaxation in the blood-perfused, ejecting heart. The aim of the present study was to characterise x in relation to ]3-adrenergic acti- vation, coronary perfusion pressure and flow as well as cardiac oxygen supply and demand in the isolated, isovolumically beating heart. Therefore, "~ was analysed from digitised left ventricular pressure data in a total of 23 guinea pig hearts per- fused with saline at constant pressure (60 cmH20 ). The coronary venous adeno- sine concentration ([ADO]) served as an index of myocardial oxygenation. Iso- prenaline (0.4-3.2 nmol 1-1) decreased and propranolol (3-9 pmol 1-1) increased "~ dose-dependently (linear regression ~ vs lg([isoprenaline]), r = 0.74; "c vs. lg([pro- pranolol]), r -- 0.66, both P<0.05). During graded reductions in cardiac oxygen supply from 96.1-+12.6(SEM) to 44.4+4.4 ~tl min -1 g-l, ,~ was prolonged from 61.5_+12.7 to 109.9_+22.6 ms while left ventricular developed pressure (LVDP) de- creased from 90.7_+7.2 to 40.7_+5.1 mmHg. In parallel, [ADO] increased from 23.7_+9.1 to 58.0_+19.1pmolm1-1 (P<0.05). Increasing oxygen supply to 165.4_+32.4 ~l rain -1 g-~ augmented LVDP to 102.7+7.3 mmHg but did not change "~ or [ADO]. There was a dual response of "~ to changes in cardiac oxygen supply or demand. As long as oxygen supply and demand matched, "c remained constant. However, when the oxygen supply was less than 100 ~1 rain -1 g-a, left ventricular relaxation was prolonged in parallel to the reduction in oxygen supply. In addition, a close relationship was observed between [ADO] as an indicator of myocardial oxygenation and "c (Spearman correlation, r = 0.99, P<0.005). We conclude that the time constant of left ventricular pressure fall, "c, sensitively reflects myocardial relaxation in the isolated, isovolumically beating guinea pig heart. Moreover, in
Correspondence to: S. Sch~ifer, Medizinische Klinik B, Abteilung Kardiologie, Pneumologie und Angiologie, Heinrich-Heine-Universit~it, P.O. Box 10 10 07, D-40001 Dtisseldorf, Germany
262
this model left ventricular relaxation is not influenced by alterations in coronary perfusion pressure or flow as long as cardiac oxygen demand is matched by an ad- equate supply. Rather, relaxation is strictly coupled to myocardial oxygenation as reflected by coronary venous adenosine concentrations.
Key words: Guinea pig - Relaxation - Diastolic function - Adenosine - Myocar- dial oxygenation
Introduct ion
Left ventricular relaxation is an important determinant of overall cardiac perfor- mance. Prolonged relaxation can impair subsequent ventricular filling, contribute to increased filling pressures and promote cardiac failure [25]. By analysing relax- ation in the ejecting dog heart, Weiss et al. [26] and Karliner et al. [14] found that isovolumic left ventricular pressure fall after aortic valve closure very closely fits an exponential curve and, consequently, left ventricular relaxation can be charac- terised by the time constant of the exponential model, "c. Since then, "c has been proven to be a sensitive indicator of left ventricular relaxation under a variety of conditions such as ischaemia, changing pre- and afterload, or asynchrony (for re- view see [5]). Until now, however, experimental use of "t has almost exclusively been restricted to the blood-perfused, ejecting heart, requiring large animal mod- els which are costly and of limited availability due to governmental restrictions. In contrast, the isolated, isovolumically beating rodent heart perfused according to the Langendorff technique is a widely used, well-established and less costly model suitable for analysis of cardiac dynamics, coronary flow, and myocardial metabolism. The increasingly recognised importance of diastolic function makes the additional analysis of left ventricular relaxation in this model highly desirable.
The aim of the present study was, therefore, to characterise the time constant z as a measure of myocardial relaxation systematically and to analyse its dependency on haemodynamic and metabolic variables in the isolated, isovolumically beating, buffer perfused guinea pig heart. More specifically, in a first step we analysed z during variations of ~-adrenergic activation in order to validate "c in this model. In a second step, in order to analyse the effect of haemodynamics on left ventricular relaxation, coronary perfusion pressure and coronary arterial pO 2 were varied systematically over a wide range. Thirdly, cardiac oxygen supply and demand were determined in order to assess the influence of oxidative metabolism on myocar- dial relaxation. In this set of experiments, the coronary venous adenosine concen- tration served as an index of the myocardial oxygenation.
Materia ls and methods
Methodological experiments
The accuracy of the fluid-filled pressure recording system, i.e. its ability to describe left ventric- ular pressure fall without significant damping, was assessed with the balloon outside the left ven- tricle as follows: an abrupt fall of pressure in the system was produced by rapidly releasing the balloon, which had been clamped manually to 100 mmHg. Assuming a rectangular pressure fall from 100 mmHg to 0 mmHg, any damping will result in an exponential signal on the recorder. The time constant "c* of this exponential pressure fall characterises the extent of damping intrin- sic to the system.

263
In addition to these technical measurements, a biological approach was used to validate "c in the isolated isovolumically beating heart. Variations in ~-adrenergic activation known to mod- ulate myocardial relaxation in various experimental models [3, 14, 26] were produced and their effects on the numerical value of "c determined. Simultaneously, the goodness of fit of the record- ed pressure data to the mathematical exponential model (see below) was assessed.
Experimental preparation
The present study conforms to the Principles of Laboratory Animal Care, as published by the National Institutes of Health, USA (NIH publication no. 85-23, revised 1985) as well as to the current version of the German Law on the Protection of Animals.
Hearts from a total of 23 guinea pigs (body mass 350-700 g) were quickly excised and per- fused at 37~ at constant pressure according to the Langendorff technique. The perfusion medi-
1 um consisted of a modified Krebs-Henseleit buffer containing (in mmol 1- ): NaC1 116, KC14.7, MgSO 4 1.1, KHzPO 4 1.17, NaHCO 3 24.9, CaCI2 2.52, glucose 8.3 and pyruvate 2.0. Except where indicated, the perfusion medium was equilibrated with a gas mixture composed of 02: CO2 (0.95: 0.05, v: v). After ligating both venae cavae, the right ventricle was vented via the pulmonary artery with a polyethylene catheter (1.2 mm outer diameter, 7 cm length). The tip of the catheter was placed approximately 2 cm below the apex of the heart to permit optimal drain- age of the right ventricle. The mitral valve was cut to prevent fluid accumulation in the left ven- tricle. After completion of the experimental preparation, the heart was placed in a water-jacket- ed chamber at 37~ and allowed to equilibrate for 30 rain.
Experimental protocols
Effect of ~-adrenergic activation. In two preliminary sets of experiments (each n = 5), isopren- aline (0.4, 0.8, 1.6 and 3.2 nmol V t) and propranolol (3, 6 and 9 ~mol 1 - l) were infused at in- creasing doses into the perfusion line at a constant coronary perfusion pressure of 90 cmH20. At this perfusion pressure, inotropic stimulation of the isolated perfused guinea pig heart does not result in an imbalance between myocardial oxygen supply and demand, whereas at 60 cmH20 inotropic stimulation may result in critical myocardial oxygenation as indicated by increased coronary venous adenosine release [7].
Effect of coronary perfusion pressure and oxygen supply. In the presence of a high perfusate pO 2 (>550 mmHg), coronary perfusion pressure was varied in eight hearts between 30 and 110 cmH20. Measurements were made at 30, 38, 45, 60, 75, 90 and 110 cmH20. Starting from a control value of 60 cmHzO, the different perfusion pressures were subsequently generated in random order. Left ventricular dynamic and metabolic measurements were made when a steady state was reached during each intervention, i.e. after 2 -4 min. In five hearts, the adenosine con- centration was measured in the coronary venous effluent perfusate at selected coronary perfu- sion pressures of 30, 45, 60 and 90 cmH20.
In order to analyse the effect of myocardial oxygen supply on left ventricular function, pO2 of the arterial perfusate was lowered stepwise from control (pO 2 = 550 mmHg) in five addition- al hearts at a constant coronary perfusion pressure (60 cmH20) by equilibrating the perfusate with different gas mixtures of 95% 02/5% CO z and 95% N2/5% CO 2 in order to achieve mild (pO2 = 350 mmHg), moderate (PO2 = 250 mmHg), and severe (pO z = 150 mmHg) reduction of oxygen supply. After the moderate reduction in oxygen supply, 5-10 rain were allowed for re- covery at pOo -~ 550 mmHg before severe hypoxic perfusion was produced.
Because electrical pacing of the ventricle produces myocardial asynchrony which, in turn, affects left ventricular relaxation [4], all experiments were performed at the spontaneous sinus heart rate. After each experiment, the hearts were weighed after blotting the endo- and epicar- dial surface with a paper towel. Coronary flow and myocardial oxygen supply and demand were expressed per gram tissue.
264
Assessment o f cardiac dynamics
Coronary flow was measured either using an electromagnetic flow probe (SP2202, Statham, Ox- nard, CA, USA) or by sampling (1 min) and subsequent weighing of the coronary effluent per- fusate assuming a specific weight of 1.0 g m1-1. For measurement of left ventricular dynamics, a latex balloon (size 4, Hugo Sachs Elektronik KG, March, Germany) was introduced into the left ventricle via the cut mitral valve. The balloon was fixed directly onto a stainless steel can- nula (internal diameter 1.5 ram, length 8.5 cm) connected to a pressure transducer (Gould P23, Cleveland, OH, USA). This set-up permitted a high-fidelity recording of the intra-balloon pres- sure changes (see below). Left ventricular pressure and (by electronic differentiation) dP/dt were continuously monitored on an ink recorder (Gould, Brush 480, Cleveland, OH, USA). At the be- ginning of each experiment, the latex balloon was filled with normal saline solution without air bubbles to achieve an end-diastolic left ventricular pressure of approximately 5+_3 mmHg. This volume was then held constant for the remainder of the experiment. Close contact of the left ven- tricular walls with the balloon was verified at the end of each experiment by visual inspection after longitudinal dissection of the ventricle. The left ventricular pressure signal and its first de- rivative dP/dt were digitised at a sampling rate of 2000 Hz using an AD/DA converter (Data Translation 2801, Marlboro, MA, USA) and then further processed on a personal computer system. Left ventricular end-diastole was determined as the point when left ventricular dP/dt started its rapid upstroke after crossing the zero line. Left ventricular end-systole was defined as the point of minimum dP/dt. Left ventricular peak systolic and end-diastolic pressure, maximum and minimum dP/dt [(+)dP/dt and (-)dP/dt, respectively], and heart rate were obtained from the digitised signals. As a measure of myocardial relaxation, the rate of left ventricular pressure fall (x) from end-systole to the time point when left ventricular pressure had declined to 5 mmHg above the next end-diastolic pressure was calculated according to the following equation:
P(t) = Po • exp (-t/x) + PB
where P0 is left ventricular pressure at the time of (-)dP/dt; x, time constant of left ventricular pressure fall; and Pn, asymptote to which left ventricular pressure would fall if decay continued indefinitely. The time constant was obtained by the semilogarithmic (xln) and the exponential (%0 method. The former method assumes a fixed asymptote of PB = 0 rnmHg and, thus, "~ln was determined as the negative inverse slope of the linear lnP versus x relation (method of least squares) [26]. In particular in situ and when left ventricular pre- or afterload are acutely changed, x may be assessed more accurately assuming that PB is variable [16, 24]. %x is then calculated accounting for a potentially variable PB using a non-linear least square fit using the Marquardt gradient expansion algorithm.
Metabolic measurements
For determination of myocardial oxygen supply and demand, aliquots from the perfusion medi- um and from the coronary venous effluent were sampled anaerobically and subsequently ana- lysed for pO e (ABL 300, Radiometer, Copenhagen, Denmark). Oxygen supply was calculated with the use of Bunsen's absorption coefficient ~x = 0.0316 lal mmHg i ml- ,H2 O at 37~ as
I)O 2 (lal min q g 1) = PO2a ogCF,
where pO2a is arterial pO2 (in mmHg) and CF coronary flow (in ml min i g-l). Likewise, car- diac oxygen demand was calculated as:
"4'O2 (~tl min -~ gq ) = (pO2a - pO2v) ~ ' CF,
where pO2v is coronary venous pO2 (in mmHg). The cardiac supply/demand ratio for oxygen was calculated as DoJx)O2.
For determination of coronary venous adenosine concentration, the sample preparation was similar to that described earlier in detail [6]. Briefly, coronary venous effluent was collected for 1-2 min and passed over C~8-SEPAK columns (Waters, Eschborn, Germany) for desalination. Adsorbed purines were eluted with 2 ml methanol/H20 (2:1 v:v). After evaporation to dryness (Vortex evaporator, Buchler, Lenexa, KS, USA), samples were redissolved in 200 lal H20 of which 20 ~tl were used for high performance liquid chromatography. The chromatography system

265
used (Sykam $1100 and $8110, Sykam, Gilching, Germany, and Axxiom 727 software package, Axxiom Inc., Moorpark, CA, USA) was programmed for gradient elution of samples injected onto a Cls-reversed phase column (150 x 3.9 mm, particle size 10 gin, Waters, Eschborn, Ger- many). A linear gradient at a flow of 1 ml min -I was used starting at 95 % buffer A (ammoni- um acetate, 0.026 mol 1-1, pH 5.0) and 5 % buffer B (70:30 v:v methanol:water) reaching 75 % buffer A/25 % buffer B after 8 min. Absorbance of column eluate was continuously recorded at
= 254 nm (Linear Instruments UVis 200, Reno, NV, USA), and peaks were identified by com- parison with retention time of external standards. Quantification was achieved by measuring peak area and comparing it to known standards:
Statistics
Results are expressed as means+SEM, Statistical significance between means was tested using one-way analysis of variance, followed by Duncan's post-hoc test where appropriate. A P<0.05 was considered significant. Linear and non-linear regressions were calculated using the method of least squares. In order to determine the relationship between coronary venous adenosine con- centration and % a Spearman correlation analysis was performed because a linear relationship cannot necessarily be assumed.
Results
Methodological experiments
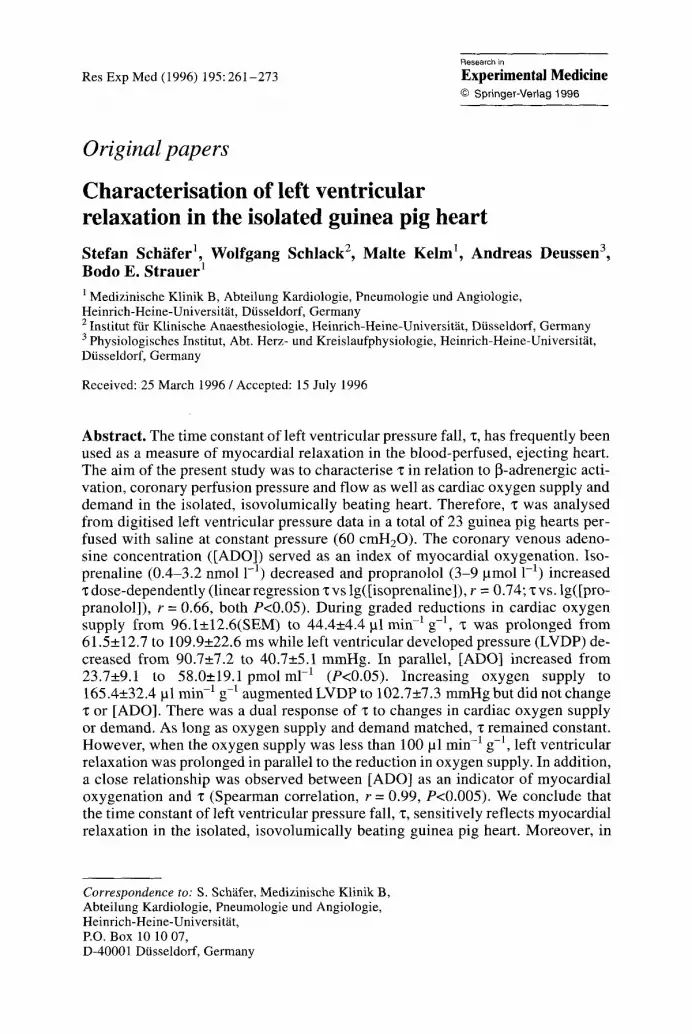
The time constant of pressure fall after abruptly release o f the c lamped balloon outside the left ventricle f rom i00 m m H g to 0 m m H g was z* = 3.2_+0.3 ms f rom n = 4 determinations. Figure 1 illustrates the goodness o f fit o f ~ln to characterise left ventricular pressure decay during control condit ions and infusion of isopren- aline and propranolol in the isolated perfused guinea pig heart. Using the natural logari thm of the instantaneous pressure signal, excellent linear correlations were found fitting the measured data points to the mathematical model (mean f rom 124 interventions in 23 hearts: r = 0.993 --. 0.006; for details see legend to Fig. 1). In general, similar changes in the time constant were observed regardless o f whether "qn or Xex was calculated. Accordingly, there was a significant overall correlation between Xln and %x ('Cex = 1"22"qn + 25.2, r = 0.60, P<0.05, n = 124). In the fol- lowing, "Cex is used to describe left ventricular relaxation unless otherwise stated.
The effects o f isoprenaline (0.4-3.2 nmol 1-1) and propranolol (3-9 lamol 1-1) on left ventricular dynamics and oxygen demand are summarised in Tables 1 and 2. Isoprenaline dose-dependent ly increased heart rate, left ventricular developed pressure, (+)dP/dt, (-)alP/tit, coronary flow and myocardia l oxygen demand. In parallel, both "qn and "Cex were shortened, indicating accelerated left ventricular re- laxation. Lef t ventricular end-diastolic pressure and the calculated asymptote o f left ventricular pressure fall (Pn) were unchanged. There was a linear correlat ion between lg([isoprenaline]) and ~, reflecting the dose-dependent acceleration o f left ventricular relaxation by isoprenaline (Xex = 20.3 lg([isoprenaline])-147, r = 0.74, n = 20, P<0.05). Propranolol had effects opposi te to isoprenaline (Table 2): left ventricular developed pressure, (+)dP/dt and (-)dP/dt decreased with increasing doses of propranolol . Coronary flow remained unchanged but myocardial oxygen demand was diminished. In parallel to the decreased contractility, both "q~ and "c~x were markedly increased, indicating prolonged myocardia l relaxation, whereas PB showed no significant alteration. There was an inverse linear correlation

266
7O ~~ ~ , ' ~
50 '*%~- %** * control
~!~. ,a i soprena lme 40 Fo~.._ ~*~*~** o propranolol
20
10
0 0 10 20 30 40 50
B 4
0 10 20 30 40 50 60
t ime (ms)
Fig. 1 A, B. Accuracy of deter- mination of the time constant of left ventricular pressure (LVP) fall, "c. Plot of digitised data from three representative beats [con- trol at 90 cmH20, isoprenaline (1.6 nmol 1-1) and propranolol (6 ~tmol 1-1)] showing left ven- tricular pressure on a linear (A) and a logarithmic (B) scale be- ginning at end-systole. Data sampling rate was 2000 Hz. Sym- bols represent measured data (for clarity, only every second data point is shown), solid l#zes rep- resent the calculated linear re- gressions, Control: Ig[LVP] = -0.016 x + 4.10, r = 0.999; isoprenaline: lg[LVP] = -0.022 z + 4.21, r = 0.999; propranolol: Ig[LVP] = -0.006 "t + 3.57, r = 0.996)
between lg([propranolol]) and x (%• = - 9 3 lg([propranolol]) +565, r = 0.66, n = 14, P<0.05).
Effect of coronary perfusion pressure and oxygen supply
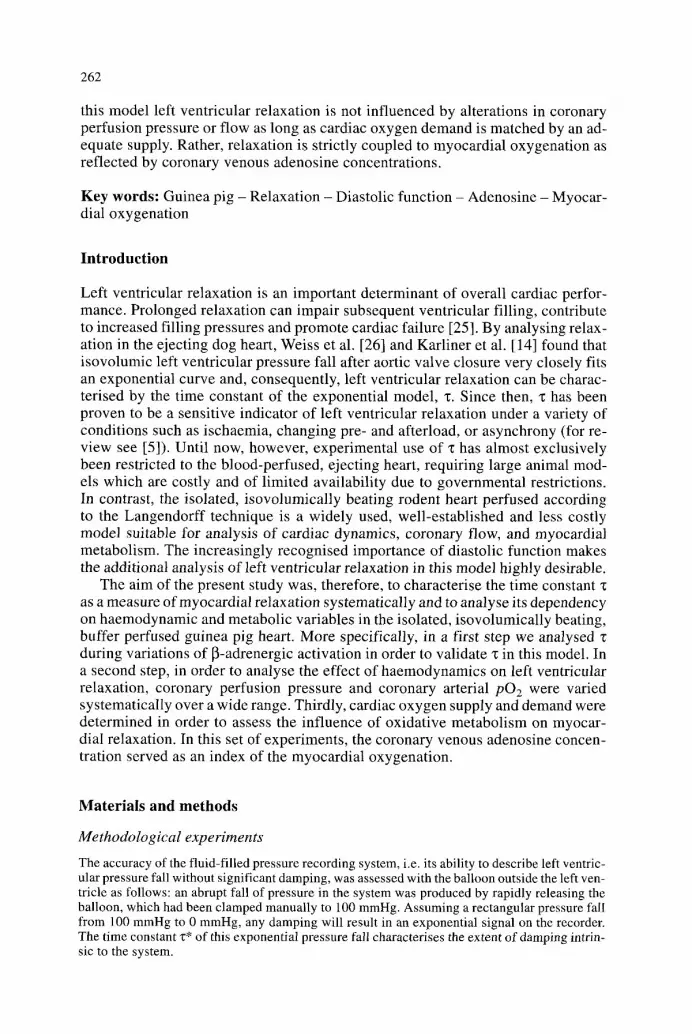
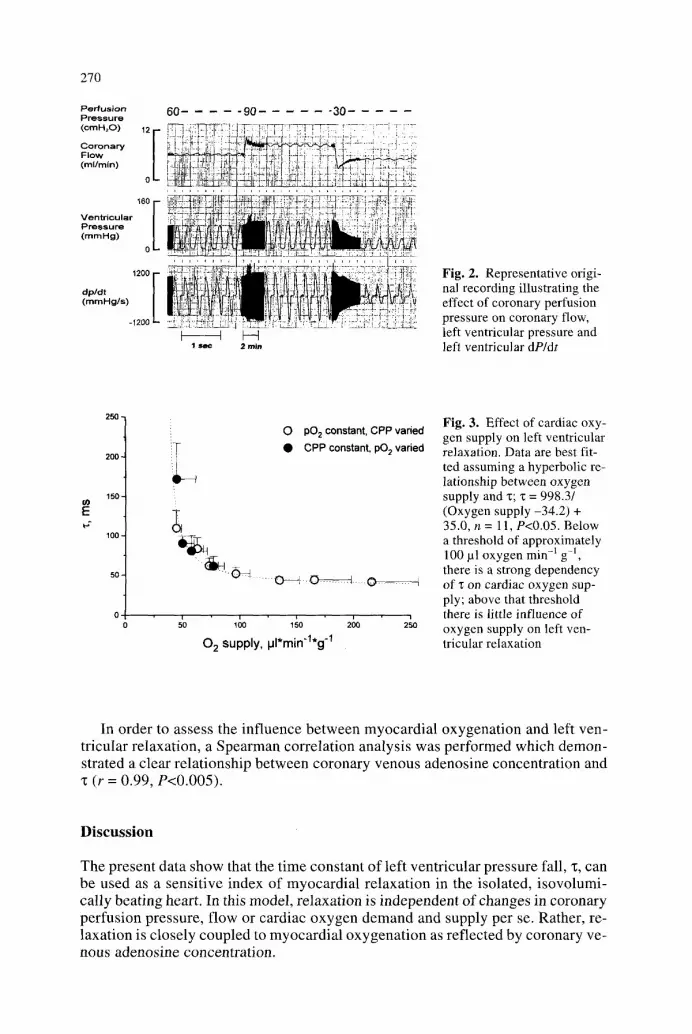
Figure 2 shows a representative original recording illustrating the impact o f coro- nary perfusion pressure at pO 2 = 600 m m H g on coronary f low and left ventricular pressure and dP/dt. Increasing coronary perfusion pressure from a baseline value o f 60 to 90 c m H 2 0 increased coronary f low and left ventricular function; subse- quent reduction of coronary perfusion pressure to 30 c m H 2 0 decreased coronary flow and left ventricular contractility, measured as left ventricular developed pres- sure or (+)dP/dt. The preparation shows a moderate degree of autoregulation, as reflected by the overshoot ing flow response to abrupt changes in coronary perfu- sion pressure with subsequent stabilisation of coronary f low on a different level.
As summarised in Table 3, coronary f low increased at increasing perfusion pres- sures, resulting in greater oxygen supply and a markedly increased oxygen sup- p ly /demand ratio at higher perfusion pressures. In parallel, left ventricular devel- oped pressure, (+)dP/dt and (-)dP/dt increased at higher perfusion pressures over the whole range studied. In contrast, there was a dual response of "c to alterations in perfusion pressure: be low 60 cmH20, any reduction o f coronary perfusion pres- sure and, hence, cardiac oxygen supply was parallelled by an appropriate increase in "~. However , when perfusion pressure was raised above control level (i.e.
267
II
+1
0
0
m
?1
I
I
T
+1 ~ + 1 0 ~ +1 , ~ +1 ~ +1
+1 c~l +1 I +1 I + l I +1
+1 "~" +1 +1 cg +1 +1
+l ~ +l ~ +l ~ +l ~ +l
0 u~
+1 +1 ~-~ +1 ~ +1 .-~ +1
' ,~ +I ~ § ~ +1 ~ +1 ~ +I
r~
>
0
E ~
' ~ 0
V
H
+1
~D
'6
o
� 9 I
,.-.,
T
I
I
~', ~ on cN
~?+,T+I , +r +,
cN - H c m +1 +1 +1
+1 ~ +1 ~ +1 ~ +1
~ , -I-I ~ , -H ~ +1 ~-~ -H
L - ~ ~ ~-~ ~ cN -H cN +1 ,-~ "H ,-~ -1-1
7.
V
::L
V
O
o. O V

268
Table 3. Effect of coronary perfusion pressure (mean + SEM; n = 8)
on cardiac dynamic and metabolic parameters
CPP Coronary flow 1302 l VO2 DOzffr Heart rate LVEDP LVDP (cmHzO) (ml rain -t g 1) (pl rain- g-l) (pl min -I g-l) (beats min -~) (mmHg) (mmHg)
30 2.3 *1'.2'.3 44.4 .1'.2'.3 30.9 1.52 *1'.2'.3'.4 180 .1'.2'.3 1.5 36.5 * 1'.2'.3'.4'.5
_+0.2 _+4.4 • _+0.13 + 4 • -+3.9
38 3.1 *1'.2'.3 62.6 *1'.2'.3 39.1 1.68 .1'.2'.3 186 .1 1.6 56.1.1'.2'.3'.4 -+0.3 -+5.1 • -+0.20 -+3 -+1.2 -+5.6
45 3.8 .1".2 76.2 *1'.2 43.2 1.90 .1 188 .1 1.3 72.3 .1'.2'.3 -+ 0.4 -+ 7.6 -+ 8.4 -+ 0.33 _+ 3 -+ 1.0 -+ 7.5
60 4.6* I,.2 96.1 * 1 ,*~ 49.7 2.05 191 * l 2.1 88.9 *j -+0.6 -+12.6 -+11.8 -+0.31 -+5 -+1.1 -+9.0
75 6.4 134.6 57.8 2.57 197 1.3 102.1 �9 +0.8 -2_ 17.5 -+ 14.1 -+0.50 -+4 +_0.9 • 10.0
90 7.5 165.4 68.5 2.48 199 1.8 102.7 -+1.5 -+32,4 -+25.9 +0.51 + 6 +0.9 -+7.3
110 9.5 215.7 69.8 3.44 205 3.1 114.8 -+ 1,4 -+ 40.6 -+ 21.1 _+0.62 _+4 _+ 1.3 _+ 10.7
[ADO], adenosine concentration in the coronary venous effluent perfusate (n = 5); * 1 "2 *3 P < 0.05 vs CPP 110 c m H 2 0 ; P < 0.05 vs CPP 90 cmH20 ; P < 0.05 vs CPP 75 cmH20 ; *4 p < 0.05 vs CPP 60 c m H 2 0 ; *5 p < 0.05 vs CPP 45 c m H 2 0 ; *6 p < 0.05 vs CPP38 cmH20 ;
n.d., not determined
Table 4. Effect of graded reduction in arterial pO 2 and reoxygenation on cardiac dynamic and metabolic parameters (mean +_ SEM; n = 5)
Coronary flow 13 0 2 ~/O 2 D Oz/VO 2 Heart rate LVEDP LVDP (ml rain -I g 1) (,ul rain -1 g-t) (pl rain -1 g-l) (beats rain -t) (mmHg) (mmHg)
Control 4.2 76.5 57.6 1.34 212 4.3 90.7 (pO2=550) -+0.5 -+9.5 -+-.8.0 -+0.03 -+15 -+0.9 -+7.2 mmHg)
pO2=350 5.9 57.6 38.7 .1 1.49 201 6.2 62.7 .1 mmHg -+ 0.8 -+ 13.4 -+ 7.5 -+ 0.12 -+ 23 -+ 2.2 -+ 4.8
pO2=250 7.1.1 49.9 .1 35.2 *l 1.44 207 7.9 49.2 .1 mmHg -+ 1.1 -+ 10.0 --+ 9.5 -+ 0.06 -+ 22 • 2.6 -+ 2.8
pO2= 150 7.1 *l 44.7 .1 30.9 *t 1.56 202 12.6 *1'.2 40.7 .1'.2 mmHg -+0.6 -+ 16.8 -+7.8 -+0.13 -+21 +2,1 -+5.1
Reoxy- 3.4 .2'.3'.4 64.2 47.0 1.38 174 6.9 68,1 *1'.3'.4 genation -+ 0.2 • 8.6 -+ 4.1 -+ 0.06 -+ 13 +- 1.3 -+ 8.4
* 1 p < 0.05 vs control, *2 p < 0.05 vs pO 2 = 350, *3 p < 0.05 vs pO 2- 250, *4 p < 0.05 vs pO2 = 150
60 cmH20), no change in left ventricular relaxation was observed despite massive increases in cardiac oxygen supply.
As shown in Table 4, graded reductions in arterial pO 2 progressively decreased left ventricular developed pressure and (+)dP/dt. Although coronary flow in- creased, it could not completely compensate for the reduction in arterial pO 2 since cardiac oxygen supply progressively decreased. Left ventricular end diastolic pres- sure increased, indicating increased diastolic chamber stiffness. In the absence of heart rate alterations, (-)dP/dt decreased and z increased, reflecting progressive prolongation of myocardial relaxation, while the pressure asymptote PB was unaf- fected. Reoxygenation allowed partial recovery of left ventricular (+)dP/dt, devel- oped pressure, ~ and myocardial oxygen demand within 5 -10 min (Table 4).

269
(+)dP/dt ( - )dP /d t Duration of "qn "~ex Pn [ADO] (namHg s 1) ( m m H g s - l ) systole (ms) (ms) (ms) ( mmHg) (lamol 1 -~)
5 8 8 * 1 ' . 2 ' . 3 ' . 4 ' . 5 347 *1'.2' .3 ' .4 ' .s 209 43 .2 *1'.2' .3' .4' .5' .6 109.9 * 1'.2'.3' .4' .5 - 1 7 . 3 5 8 . 0 .1 ' . 2
�9 + 6 7 -+56 4- 15 -+7.0 -*22.6 -+5.9 -+ 19.1
729 .1 ' .2 ' .3 554 *1'.2'.3' .4' .5 212 29 .9 83.5 *1'.2'.3 - 2 1 , 2 u,d.
_+52 -+54 * 13 -+3.9 -+ 13,9 -+4.4
9 l 5* 1,.2 828* ],.2,.3 2 l 1 23 .9 60 .9 - 2 0 . 4 45.5* 1 ,.2 -+ 72 -+ 96 -+ 9 -+ 3.0 -+ 9 .6 -+ 4.4 -+ 17.7
9 8 0 .1 ' .2 905 .1'*a'.3 210 23 .6 52 .0 - 1 9 . 6 23 .7 _+ 82 -+ 81 -+ 12 -+ 2.7 -+ 7.9 -+ 4.9 _. 9.1
1144 .1 1168 207 21.1 43 .8 - 1 7 . 3 n.d. -+96 -+84 -+ 11 _+2.1 -+4.3 + 2 . 3
1286 1236 209 21 .2 44 .4 - 1 9 . 4 23 .0 -+ 94 __. 83 -+ 12 -+ 1.7 -+ 5,0 +- 3.4 -+ 8.4
1441 1329 206 22 .2 42 ,0 - 1 7 . 5 n.d. -+ 163 -+ 135 ~ 12 +- 1.7 -+ 2.8 -+ 2.2
(+)dP/dt ( - )dP /d t Duration "l~ln "r PB of systole (ms) (ms) (ms) (nag)
1235 988 207 28 .4 61.5 - 1 6 , 9 _+ 135 - 110 + 11 -+3.0 -+ 12.7 -+5.6
972 624 .1 202 44 .8 80.7 - 1 3 . 6 -+ 137 + 117 + 10 +_ 6.9 -+ 19.5 + 6.9
831 *l 509 ~1 208 53 ,4 90.5 - 1 5 , 0 . �9 +_ 108 +- 80 -- 9 -+ 7.9 -+ 9.3 -+ 3.5
826 .1 4 7 9 q 203 90.3 .1,.2' .3 172,5 .1 ' .2 ' .3 - 1 7 . 7
+ 6 8 + 101 + 7 _+ 13.9 + 4 5 . 5 -+ 10.6
856 .1 658 .1 205 46 ,8 *4 84 .2 ~17 .0 _+ 41 + 76 -+ 8 -+ 5.2 _+ 14.4 -+ 9.0
Relation between cardiac metabolism and left ventricular relaxation
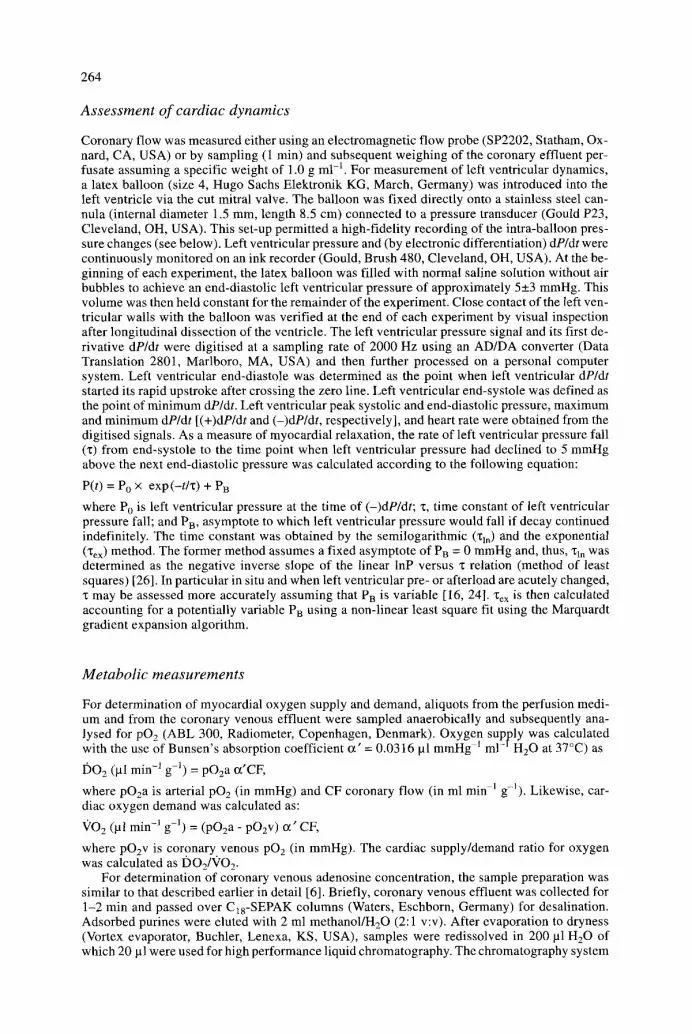
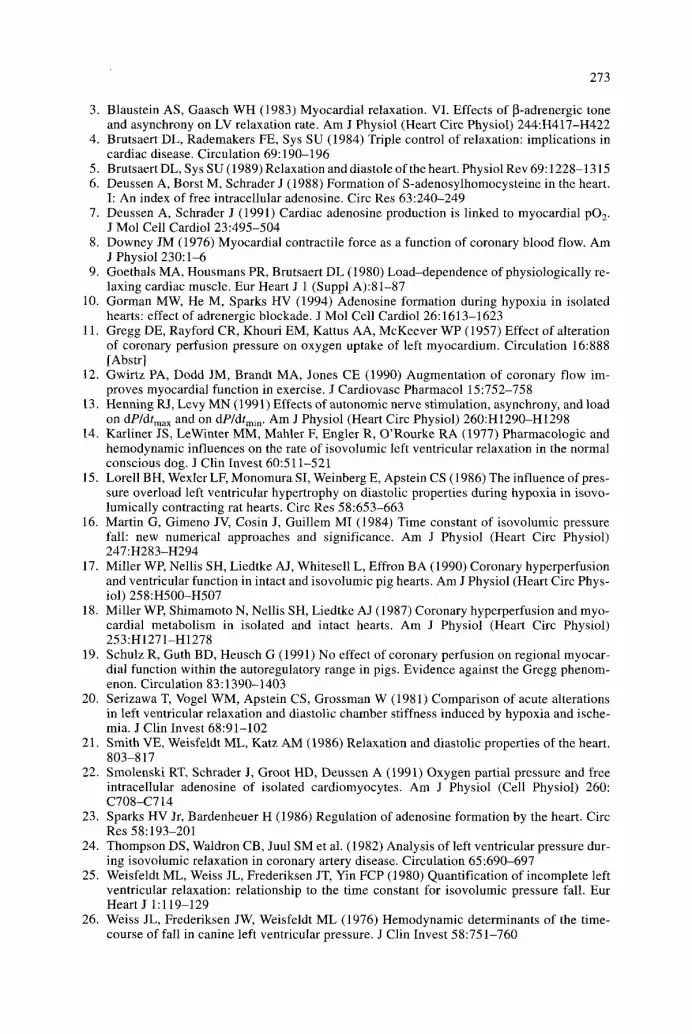
The relationship between cardiac oxygen supply and left ventricular relaxation is illustrated for all experimental conditions in Fig. 3. There was a differential re- sponse of left ventricular relaxation to changes in myocardial oxygen delivery. Only when myocardial oxygen supply was reduced to less than approximately 100 lal min -1 g-i did "r increase with decreases in oxygen delivery; above that threshold even marked alterations in oxygen supply had only minimal effects on left ventricular relaxation. These effects of cardiac oxygen supply on "c were par- allelled by the changes in coronary venous adenosine concentration. Only at per- fusion pressures below 60 cmH20 did the coronary venous adenosine concentra- tion increase considerably (Table 4).
270
Pe,+us+on 60 . . . . . 90 . . . . . . 30 P i e , s u r e
. . . . ~ . . . . . + T ; ]; ; I ~ : ~ - r2:- :: 7T ! T ! T Coronary i' I iu ~..P D![ :-+- F l o w / l-~;+p-~ ' J , : i ! i ]
o i : ~ 1 T ~ + 1- ~i :' ~ .... ~% !-
[ , . . . . . . . . . . : . . . . , . . . , , ] , , . . . + . , , . . . . .
Ventr icular !i'! i-i+~?, i,! d :-h;~" ""'-;-.::;i " 4:]:- : +:.,: -~ - - ; ', +[i~ I+:ii: : (mrnHg) P . . . . . . . ~ : ! ~! ~ l!~ :, ; ' ~ ~ !! (=: ;~ ', ~' 1':2" rj:~:~iii't.':t;i!ii~ :~ I
o ~ ~
E I [ ' I P'' :li }:? +'.i alp/tit d ,~ '-: !i ]- +=! ~ j i ] _J i.: 21 ...... :i 2-! !i:;= ! i ' - ; !IQ '2r̀ "
(mmHg /s ) = ' s : i-h �9 = .-i--~,,!: ~-r~
- 1 2 0 0 ~ : ; ~ " : 7 : i " �9 '.'= " ' , ! ) ~
I ~ H 1 s ~ 2 rain
Fig. 2. Representative origi- nal recording illustrating the effect of coronary perfusion pressure on coronary flow, left ventricular pressure and left ventricular dP/dt
I O
E
2 5 0 -
2 0 0 -
1 5 0 -
100 -
50-
O pO 2 constant, CPP varied �9 CPP constant, pO 2 varied
10 i + 100 150 240 250
0 2 supply, iJl*min' l*g -1
Fig. 3. Effect of cardiac oxy- gen supply on left ventricular relaxation. Data are best fit- ted assuming a hyperbolic re- lationship between oxygen supply and z; ": = 998.3/ (Oxygen supply -34.2) + 35.0, n = 11, P<0.05. Below a threshold of approximately 100 pl oxygen min q gq, there is a strong dependency of z on cardiac oxygen sup- ply; above that threshold there is little influence of oxygen supply on left ven- tricular relaxation
In order to assess the inf luence be tween myocardia l oxygenat ion and left ven- tricular relaxation, a Spearman correlat ion analysis was performed which demon- strated a clear relat ionship between coronary venous adenosine concentrat ion and "t (r = 0.99, P<0.005).
D i s c u s s i o n
The present data show that the t ime constant of left ventr icular pressure fall, "~, can be used as a sensi t ive index of myocardia l relaxat ion in the isolated, i sovolumi- cally beat ing heart. In this model, relaxat ion is independent of changes in coronary perfusion pressure, flow or cardiac oxygen demand and supply per se. Rather, re- laxat ion is closely coupled to myocardia l oxygenat ion as reflected by coronary ve- nous adenosine concentrat ion.

271
Methodological considerations
In general, any index thought to be a measure of any biological property has to be characterised with regard to its sensitivity and reliability to detect changes in that biological property. Therefore, as a first step, the sensitivity of the fluid-filled pres- sure recording system itself was assessed. We found an intrinsic "c* of the pressure recording system of 3-4 ms, which is more than 10 times below the changes in "c found in the present study. Thus, the technical prerequisites for sensitive measure- ment of left ventricular relaxation were in place. In addition, there were excellent fits of the measured pressure data to the mathematical model (with and without variable asymptote) under various conditions (see Fig. 1), confirming the notion that left ventricular pressure fall also follows an exponential time course in the iso- volumically beating heart. Moreover, the known effects of ~-adrenergic receptor activation on myocardial relaxation were sensitively reflected by the significant correlations of lg([isoprenaline]) and lg([propranolol]), respectively, with "c, in our preparation. Therefore, we conclude that the time constant can be used as an ap- propriate index to characterise left ventricular relaxation in the isolated, isovolum- ically beating guinea pig heart.
Different methods have been used to calculate "c in various experimental mod- els. Some methods include a variable asymptote whereas others do not [16, 24]. In the present study, there was a significant correlation between ~ln (i.e. assuming a fixed asymptote PB = 0 mmHg) and "Cex (i.e. assuming a variable asymptote), re- flecting the similar directional changes of these two indices during each interven- tion. Therefore, the conclusions drawn do not depend on the mathematical model chosen to characterise left ventricular pressure decay. While ~ln is easier to calcu- late and avoids determination of a pressure asymptote with an unclear physiolog- ical meaning [ 16], %x may be advantageous because absolute and relative changes are greater in response to a variety of interventions.
Apart from "~, two other parameters potentially reflecting myocardial relaxation properties have been proposed, namely the maximum rate of pressure fall [(-)dP/dt] and the timing of the onset of relaxation, measured as the duration of systole [5]. As (-)dP/dt is highly sensitive to changes in afterload [13], however, it cannot be used as a reliable measure of relaxation under conditions when afterload changes simultaneously. This is reflected by the stepwise increase in (-)dP/dt even above a perfusion pressure of 60 cmH20, i.e. in the range where "c remains constant (Ta- ble 3). With regard to the timing of relaxation, no significant effect was seen over the entire range of oxygen supply studied. As there were only minor changes in heart rate, the duration of diastole also remained virtually constant at about 120 ms. Thus, in the experimental model used, the timing parameter appears to have mi- nor sensitivity as a measure of left ventricular relaxation.
Effect of coronary perfusion pressure and oxygen supply
As illustrated in Fig. 3, there is no linear relationship between cardiac oxygen sup- ply and "c. Only when oxygen supply was reduced to below a certain threshold (ap-
1 1 proximately 100 ~1 min- g- ) was relaxation impaired in parallel to the reduction in oxygen delivery. Thus, our results extend previous data demonstrating a pro- longed relaxation after hypoxia in isolated rat or rabbit hearts [15, 20]. Moreover, it seems of particular importance that above 100 ~1 rain -1 g 1 oxygen supply even

272
marked increases in coronary perfusion pressure and, consequently, oxygen sup- ply did not improve myocardial relaxation (Table 3, Fig. 3). Likewise, the signif- icant increases in cardiac oxygen demand at higher coronary perfusion pressures did not impair relaxation. Thus, neither coronary perfusion pressure and flow nor cardiac oxygen supply or demand per se affect myocardial relaxation as long as oxygen demand is matched by an adequate oxygen supply to the myocardium. This is in accordance with the view that myocardial relaxation is an active, energy-re- quiting process [21 ].
Relation between cardiac energetics and left ventricular relaxation
Increased adenosine production in cardiac tissue is best explained by a critical level of myocardial oxygenation [7, 22] and a resultant fall in the phosphorylation po- tential [10]. Accordingly, we determined the coronary venous adenosine concen- tration as a marker of the myocardial supply/demand ratio for oxygen [2, 23]. While the cardiac supply/demand ratio for oxygen serves as a more global index, the cor- onary venous adenosine concentration may reflect myocardial oxygenation (i.e. the myocardial supply/demand ratio for oxygen) on the cellular level. In the present study, both indices revealed that relaxation is closely coupled to myocardial oxy- genation.
In both the present study and in previous investigations, acute elevations in cor- onary perfusion pressure and/or flow have been demonstrated to increase contrac- tile function and oxygen demand of the left ventricle (Gregg or garden hose effect) [1, 11, 12]. However, this effect has not been observed by other groups, in partic- ular when isovolumic conditions were absent [17, 19]. Therefore, it has been argued that improved contractility at higher perfusion pressures occurs only in hypoxic hearts relieved of myocardial underperfusion [8, 18]. Although the present study was not specifically designed to address this question, the identical coronary ve- nous adenosine concentrations at 60 and 90 cmH20 (Table 4) suggest that the myo- cardium is adequately oxygenated at 60 cmH20 and a pO 2 greater than 550 mmHg.
In conclusion, the present data show that the time constant of left ventricular pressure fall, "c, serves as a sensitive marker of myocardial relaxation in the iso- lated, isovolumically beating guinea pig heart. At a given level of [~-adrenoceptor activation, "t remains constant as long as myocardial oxygenation is adequate. This renders this index less vulnerable to the variations in coronary dynamics that of- ten occur simultaneously with the physiological or pharmacological interventions under investigation.
Acknowledgements. This study was supported by a grant from the Deutsche Forschungsgemein- schaft, SFB 242. Dr. A. Deussen is a Heisenberg Fellow of the Deutsche Forsehungsgemein- schaft. The authors wish to thank Ms S. Ugurel for helpful assistance.
References
1. Arnold G, Kosche F, Miessner E, Neitzert A, Lochner W (1968) The importance of the per- fusion pressure in the coronary arteries for the contractility and the oxygen consumption of the heart. Pfliigers Arch 299:339-356
2. Bardenheuer H, Schrader J (1986) Supply-to-demand ratio for oxygen determines forma- tion of adenosine by the heart. Am J Physiol (Heart Circ Physiol) 250:H173-H180
273
3. Blaustein AS, Gaasch WH (1983) Myocardial relaxation. VI. Effects of I]-adrenergic tone and asynchrony on LV relaxation rate. Am J Physiol (Heart Circ Physiol) 244:H417-H422
4. Brutsaert DL, Rademakers FE, Sys SU (1984) Triple control of relaxation: implications in cardiac disease. Circulation 69:190-196
5. Brutsaert DL, Sys SU (1989) Relaxation and diastole of the heart. Physiol Rev 69:1228-1315 6. Deussen A, Borst M, Schrader J (1988) Formation of S-adenosylhomocysteine in the heart.
I: An index of free intracellular adenosine. Circ Res 63:240-249 7. Deussen A, Schrader J (199l) Cardiac adenosine production is linked to myocardial pO z.
J Mol Cell Cardiol 23:495-504 8. Downey JM (1976) Myocardial contractile force as a function of coronary blood flow. Am
J Physiol 230:1-6 9. Goethals MA, Housmans PR, Brutsaert DL (1980) Load-dependence of physiologically re-
laxing cardiac muscle. Eur Heart J 1 (Suppl A):81-87 10. Gorman MW, He M, Sparks HV (1994) Adenosine formation during hypoxia in isolated
hearts: effect of adrenergic blockade. J Mol Cell Cardiol 26:1613-1623 11. Gregg DE, Rayford CR, Khouri EM, Kattus AA, McKeever WP (1957) Effect of alteration
of coronary perfusion pressure on oxygen uptake of left myocardium. Circulation 16:888 [Abstr]
12. Gwirtz PA, Dodd JM, Brandt MA, Jones CE (1990) Augmentation of coronary flow im- proves myocardial function in exercise. J Cardiovasc Pharmacol 15:752-758
13. Henning RJ, Levy MN (1991) Effects of autonomic nerve stimulation, asynchrony, and load on dP/dtinax and on dP]dtmi n. Am J Physiol (Heart Circ Physiol) 260:H1290-H1298
14. Karliner JS, LeWinter MM, Mahler F, Engler R, O'Rourke RA (1977) Pharmacologic and hemodynamic influences on the rate of isovolumic left ventricular relaxation in the normal conscious dog. J Clin Invest 60:511-521
15. Lorell BH, Wexler LF, Monomura SI, Weinberg E, Apstein CS (1986) The influence of pres- sure overload left ventricular hypertrophy on diastolic properties during hypoxia in isovo- lumically contracting rat hearts. Circ Res 58:653-663
16. Martin G, Gimeno JV, Cosin J, Guillem MI (1984) Time constant of isovolumic pressure fall: new numerical approaches and significance. Am J Physiol (Heart Circ Physiol) 247:H283-H294
17. Miller WE Nellis SH, Liedtke AJ, Whitesell L, Effron BA (1990) Coronary hyperperfusion and ventricular function in intact and isovolumic pig hearts. Am J Physiol (Heart Circ Phys- iol) 258:H500-H507
18. Miller WE Shimamoto N, Nellis SH, Liedtke AJ (1987) Coronary hyperperfusion and myo- cardial metabolism in isolated and intact hearts. Am J Physiol (Heart Circ Physiol) 253:H1271-H1278
19. Schulz R, Guth BD, Hensch G (1991) No effect of coronary perfusion on regional myocar- dial function within the autoregulatory range in pigs. Evidence against the Gregg phenom- enon. Circulation 83:1390-1403
20. Serizawa T, Vogel WM, Apstein CS, Grossman W (1981) Comparison of acute alterations in left ventricular relaxation and diastolic chamber stiffness induced by hypoxia and ische- mia. J Clin Invest 68:91-102
21. Smith VE, Weisfeldt ML, Katz AM (1986) Relaxation and diastolic properties of the heart. 803-817
22. Smolenski RT, Schrader J, Groot HD, Deussen A (1991) Oxygen partial pressure and free intracellular adenosine of isolated cardiomyocytes. Am J Physiol (Cell Physiol) 260: C708-C714
23. Sparks HV Jr, Bardenheuer H (1986) Regulation of adenosine formation by the heart. Circ Res 58:193-201
24. Thompson DS, Waldron CB, Juul SM et al. (1982) Analysis of left ventricular pressure dur- ing isovolumic relaxation in coronary artery disease. Circulation 65:690-697
25. Weisfeldt ML, Weiss JL, Frederiksen JT, Yin FCP (1980) Quantification of incomplete left ventricular relaxation: relationship to the time constant for isovolumic pressure fall. Eur Heart J 1:119-129
26. Weiss JL, Frederiksen JW, Weisfeldt ML (1976) Hemodynamic determinants of the time- course of fall in canine left ventricular pressure. J Clin Invest 58:751-760