cardiovascular safety beyond herg: in silico modelling of a guinea pig right atrium assay
TRANSCRIPT
Cardio-vascular safety beyond hERG: in silico modellingof a guinea pig right atrium assay
Luca A. Fenu • Ard Teisman • Stefan S. De Buck •
Vikash K. Sinha • Ron A. H. J. Gilissen • Marjoleen J. M. A. Nijsen •
Claire E. Mackie • Wendy E. Sanderson
Received: 3 August 2009 / Accepted: 17 October 2009 / Published online: 5 November 2009
� Springer Science+Business Media B.V. 2009
Abstract As chemists can easily produce large numbers
of new potential drug candidates, there is growing demand
for high capacity models that can help in driving the
chemistry towards efficacious and safe candidates before
progressing towards more complex models. Traditionally,
the cardiovascular (CV) safety domain plays an important
role in this process, as many preclinical CV biomarkers
seem to have high prognostic value for the clinical out-
come. Throughout the industry, traditional ion channel
binding data are generated to drive the early selection
process. Although this assay can generate data at high
capacity, it has the disadvantage of producing high num-
bers of false negatives. Therefore, our company applies the
isolated guinea pig right atrium (GPRA) assay early-on in
discovery. This functional multi-channel/multi-receptor
model seems much more predictive in identifying potential
CV liabilities. Unfortunately however, its capacity is lim-
ited, and there is no room for full automation. We assessed
the correlation between ion channel binding and the
GPRA’s Rate of Contraction (RC), Contractile Force (CF),
and effective refractory frequency (ERF) measures assay
using over six thousand different data points. Furthermore,
the existing experimental knowledge base was used to
develop a set of in silico classification models attempting to
mimic the GPRA inhibitory activity. The Naıve Bayesian
classifier was used to built several models, using the ion
channel binding data or in silico computed properties and
structural fingerprints as descriptors. The models were
validated on an independent and diverse test set of 200
reference compounds. Performances were assessed on the
bases of their overall accuracy, sensitivity and specificity in
detecting both active and inactive molecules. Our data
show that all in silico models are highly predictive of
actual GPRA data, at a level equivalent or superior to the
ion channel binding assays. Furthermore, the models were
interpreted in terms of the descriptors used to highlight the
undesirable areas in the explored chemical space, specifi-
cally regions of low polarity, high lipophilicity and high
molecular weight. In conclusion, we developed a predictive
in silico model of a complex physiological assay based on a
large and high quality set of experimental data. This model
allows high throughput in silico safety screening based on
chemical structure within a given chemical space.
Keywords In silico � In vitro � Computational �hERG � Cardio vascular safety
Introduction
Developing new drugs is an intrinsically risky business.
Both in the regulatory guidelines, e.g., ICH S7B, as well as
the scientific literature, a considerable amount of attention
has been devoted to the rapid component of the delayed
rectifier potassium current, IKr, mediated by the channel
whose a subunit is encoded by the human Ether-a-go-go
Electronic supplementary material The online version of thisarticle (doi:10.1007/s10822-009-9306-z) contains supplementarymaterial, which is available to authorized users.
L. A. Fenu (&) � A. Teisman � V. K. Sinha �R. A. H. J. Gilissen � C. E. Mackie � W. E. Sanderson
RED/EU, Johnson & Johnson Pharmaceutical Research
and Development, Turnhoutseweg 30, Beerse, Belgium
e-mail: [email protected]
S. S. De Buck
Novartis Pharma AG, Basel, Switzerland
M. J. M. A. Nijsen
Abbot Laboratories, Ludwigshafen, Germany
123
J Comput Aided Mol Des (2009) 23:883–895
DOI 10.1007/s10822-009-9306-z
Related Gene (hERG) [1]. Inhibition of the IKr current has
been shown to potentially lead to prolongation of the
interval between the Q and T waves in electrocardiograms
[1], which has generally been described as an early bio-
marker for potential development of Torsades des Pointes
(TdP) [2] that eventually can lead to fatal cardiac
arrhythmia. A large number of drugs, covering different
chemical and pharmacological classes, suffer from this
problem of inducing QT-prolongation, mostly as a result of
IKr inhibition. In the past, this has lead to withdrawal from
the market or extensive labelling of such drugs [3].
It has been suggested by Cavero et al. [4] that com-
pounds with [30-fold margin between hERG IC50 and
efficacious ED50 can be considered relatively safe. In
addition Redfern et al. [5] claim from their analysis on
marketed compounds that drugs associated with TdP in
humans are also associated with hERG channel blockade,
and that a[30-fold margin between free efficacious plasma
exposure and hERG IC50 may suffice for drugs to undergo
clinical evaluation. This suggests that in vitro assays can be
used to drive the chemistry and select safe compounds. It is
attractive to assess potential cardiovascular (CV) liabilities
in vitro and in vivo as early as possible in the drug dis-
covery process in order to reduce the drug development
time and cost.
As a consequence, many drug discovery flowcharts
include assays that allow de-selection of compounds with
such liabilities. Some of the assays that can be performed at
relatively high throughput are receptor/channel binding
assays. Although very useful in early selection processes, a
major limitation of these assays is that the data only present
affinity to the one particular site of the channel and
therefore it can only give limited answers on the binding
liability of a compound. In addition, a static binding assay
does not truly represent the dynamics of a channel which
exposes different binding sites at different polarisation
states. Finally, even with proper prediction, it is not sure if
blockade of the channel in vitro would lead to QT-pro-
longation in vivo, as the latter is the net result of activity of
multiple ion channels in parallel.
One of the most detailed ways to study the contribution
of the different currents is by monitoring the action
potential duration (APD) in myocardial cells. Unfortu-
nately, such studies are very labour intensive and unsus-
tainable at the high throughput required in early discovery
settings. Therefore, they cannot be used to drive compound
selection processes. In our experience, this assay well
correlates with the hERG binding assay, although the latter
will fail to identify compounds which binds hERG at a
different site than the radio-labelled inhibitor (in our case,
Astemizole is used).
As an alternative to a detailed APD-assay, compounds
can be evaluated in slightly less detailed but higher
throughput assays such as the spontaneously beating iso-
lated right atrium that has a long history in CV safety
screening [6, 7]. Within J&J-PRD, this assay is used to
provide early multi ion channel readout. In this model we
monitor the rate of the contraction (RC), the contractile
force (CF) and the effective refractory frequency (ERF).
The latter is defined as the minimal stimulation frequency
not followed by cardiac muscle contraction. The assay is
sensitive to molecules inhibiting any of the ion channels,
enzymes (such as adenylate or guanylate cyclases, phos-
phodiesterases) or receptors expressed in myocardial or
pacemaker cells [8–10]. It has been performed internally
for many years following a standardised screening proto-
col, on roughly 500 compounds per year. This has resulted
in a large, consistently high quality dataset of both internal
and external compounds.
The recurring bottleneck with all of these early assays in
drug discovery flowcharts is their capacity and data turn-
around time. As an alternative, with the increasing com-
puter capacity, the option of developing more complex and
more predictive in silico models that can deal with large
numbers of chemical structures becomes more and more
attractive. Until recently, the in silico modelling in the
cardiovascular safety domain mainly has concentrated on
hERG inhibition per se, with several models being pub-
lished [11–18]. A number of good reviews summarises the
efforts in this field [19–22]. However, CV safety experts
extensively realise that hERG inhibition by itself is not the
one and only driver of QT-prolongation and development
of TdP. Therefore, it does not seem appropriate to deselect
compounds based on this criterion alone. As there is higher
faith in predictivity from readouts of multi-channel assays,
this should also be the focus of in silico modelling.
To our knowledge, no in silico model aimed at pre-
dicting an effect on cardiac parameters directly from
chemical structure of a compound has been published. The
primary goal of this exercise was to build such an in silico
model with high predictive value for detection of CV-lia-
bilities within the J&J-PRD chemistry. We first identified
the predictivity of the readouts from the guinea pig right
atrium (GPRA) assay by focusing on the correlation
between ion channel binding assays and the different
GPRA parameters. Unfortunately, the limited amount of
data available for other receptors screening assays did not
allow us to build models including other experimental data.
Therefore, only the ion channel binding assays were con-
sidered. The second step was to build several different in
silico classification models of the in vitro GPRA assay
using a modelling technique known as Naıve Bayesian
classifier. Different models were built starting from ion
channel binding data or in silico descriptors. Their pre-
dictive performances were validated on an internally tested
set of reference compounds, whose structures and activities
884 J Comput Aided Mol Des (2009) 23:883–895
123
in the aforementioned assays are disclosed in the supple-
mentary information.
In conclusion, the present data show that predicting
complex physiological read-outs directly from chemical
structure is possible with a good degree of accuracy. Per-
formance of these in silico models are similar or better than
when ion channel binding assay data is used. In particular,
recovery of active compounds is higher with in silico
models than using in vitro data. This makes these in silico
models ideal as a tool for pre-synthesis screening and to
prioritise compounds to be sent for GPRA testing.
Methods
Dataset selection
Out of our corporate database, all compounds with avail-
able GPRA data (measured at 10-5 M) were retrieved,
resulting in a total dataset of 6,674 compounds.
In the GPRA assay, a compound can either decrease or
increase RC and/or CF, whereas ERF can only be
decreased. A compound was considered ‘‘RC-active’’ if the
rate of contraction was stimulated to levels C105% of
baseline (inducing) or B90% of the baseline (inhibiting).
Similarly, ‘‘CF-active’’ was defined by its reduction of
contractile force to levels below 65% or above 105% of
controls. An ‘‘ERF-active’’ compound lowers the ERF
below 10 Hz—that is, it stops the heart from beating faster
than 600 beats per minute.
The number of inhibitors in both the RC and CF mea-
sures greatly outnumbers that of the inducers, in a ratio of
approximately ten to one (see Tables 1, 2 for details). Since
the inhibitory and inducing action go through distinct
pathways, it is better to keep the modelling of these two
classes separate. Preliminary studies (data not shown)
suggested that the amount of inducers was too low to
generate a reliable model. Therefore, compounds inducing
a change in a given GPRA measure were excised from that
measure’s training set, leaving only inhibiting and inactive
compounds.
Data on binding assays of the Na? (isolated from Wistar
rat cortex), Ca2? (also from Wistar rat cortex), and hERG
channels were also retrieved for all compounds. A com-
pound was considered active in a given binding assay when
it showed a pIC50 C 6. The reference ligands to be dis-
placed were nitrendipine for the Ca2? channel, batraco-
toxin for the Na? channel and astemizole for hERG.
The whole dataset contained 628 reference compounds
of which only 345 of these had a complete experimental
record, i.e., all three ion channels and all three GPRA
parameters. Based on their structural diversity and GPRA
activity spectrum, 200 compounds were selected as a test
set on which to compare predictive performances of in
vitro ion channel binding and in silico GPRA models. This
selection process was performed using a maximum dis-
similarity method with path-4 Extended Connectivity Fin-
gerprints [23].
An overview of the number of training and test com-
pounds subdivided per effect in the GPRA and the binding
assays is given in Tables 1 and 2. The structures of the
compounds in the test set and their experimental outcomes
can be found in the supporting information.
Descriptor sets
Different descriptor sets were used for generation of
the models. The ‘IonCh’ set is composed of the activity
flags from the three ion channel binding assays. The
‘PP’ descriptor set contains a selection of calculated
Table 1 Number of compounds in the training and test set with data for each of the GPRA read-outs (RC, CF and ERF, respectively rate of
contraction, force of contraction and effective refractory frequency) and the ion channel experiments
Training set (total = 6,468)
GPRA Untested Tested of which
Inactives Inhibitors Inducers
RC 36 (0.5%) 6,432 (99.5%) 2,046 (31%) 3,973 (61%) 413 (6%)
CF 38 (0.6%) 6,430 (99.4%) 3,355 (51%) 2,820 (43%) 255 (3%)
ERF 858 (13%) 5,610 (86%) 3,830 (59%) 1,780 (27%) 0 (0%)
ION Untested Tested Inactives Actives
Na? 2,239 (35%) 4,229 (65%) 3,599 (55%) 630 (9%)
Ca2? 1,739 (27%) 4,728 (73%) 4,472 (69%) 256 (4%)
hERG 2,752 (43%) 3,716 (57%) 2,492 (39%) 1,224 (18%)
Classification of inactive/active, inhibitors/inducers is based on the compound’s performance at 10 lM using the criteria presented in the
‘‘Methods’’ section. The percentages are given relative to the total of the set, and not the portion tested on a assay under exam
J Comput Aided Mol Des (2009) 23:883–895 885
123
physicochemical properties. Rather than generating com-
plex, exoteric descriptors, we limited ourselves to a small
set of simple ones, in the hope that the correlations high-
lighted would bear an intuitive chemical meaning. Pipeline
Pilot (by Scitegic/Accelrys) was used to compute 16 simple
descriptors such as the number of acceptor and donor
atoms, predicted physical properties like AlogP [24], LogD
[25] and molecular solubility [26], atom and ring counts,
molecular volumes and surfaces. The full list of PP
descriptors is provided in the supplementary material.
Finally, the ‘ECFP_X’ descriptor sets refer to Extended
Connectivity Fingerprints [23] with path-lengths of 4, 8, or
12 (X = 4, 8, 12) generated with Pipeline Pilot.
Model building
For generating the models we used the Naıve Bayesian
classifier as implemented in Scitegic/Accelrys Pipeline Pilot.
The Naıve Bayesian classifier uses the Bayes’ theorem to
assess the probability that each fingerprint feature or pre-
dicted property in the training set is associated with the
modelled activity. Molecules only contain a subset of all
features and/or descriptors in the training set, and the
probabilities of this subset are added up to get an estima-
tion of the overall probability that a compound is active.
Continuous descriptors such as ALogP are binned, and
each bin is associated with a contribution to the activity.
Categorical measures such as the in vitro activity flags and
presence of a fingerprint feature are instead directly asso-
ciated with this contribution. Fingerprints and predicted
properties were not used together, as the sheer number of
fingerprints would swamp the relative importance of the
relatively few continuous descriptors in the model. All
models built were cross-validated internally with a leave-
N-Out method. For construction of the models only built-in
and automated optimisation techniques from Pipeline Pilot
were used. This will allow for automatic updates of the
models once new experimental data become available.
Unfortunately it is currently not possible to obtain a
‘distance from the model’ measure for the Naıve Bayesian
classifier. However, we took all precautions to make sure
that our test set, albeit diverse, was within the training set
descriptors’ space, and therefore within the models’
applicability domain [27].
Performance measures
Our endpoint is the prediction of the experimental GPRA
activity flags (active/inactive). When an in silico model or
a binding assay flags a compound as active, and the com-
pound classification matches the GPRA-assay result, then
one talks of that compound as a ‘‘True Positive’’ (TP). If a
negative GPRA readout contradicts the prediction, we are
in presence of a ‘‘False Positive’’ (FP). A ‘‘True Negative’’
(TN) is a compound predicted inactive by the binding assay
or in silico model which also does not report any activity in
the GPRA assay. However, if the GPRA reports activity,
then the compound is a ‘‘False Negative’’ (FN). In short,
the positive/negative value is attributed by the assay (or the
in silico model) making the prediction; the true/false comes
from the comparison with the value observed during the
GPRA assay.
After the in silico models had been trained, they were
run on the test set. In order to measure the quality of the
predictions by the models and binding assays beyond the
simple count of TP, FP, FN and TN, five derived param-
eters were used.
First, the model Accuracy, defined as (TP ? TN)/
(TP ? FP ? TN ? FN), was used to assess the percentage
of compounds correctly classified either as active or
Table 2 Number of compounds in the training and test set with data for each of the GPRA read-outs (RC, CF and ERF, respectively rate of
contraction, force of contraction and effective refractory frequency) and the ion channel experiments
Test set (total = 200)
GPRA Untested Tested of which
Inactives Inhibitors Inducers
RC 0 (0%) 200 (100%) 72 (36%) 128 (64%) 0 (0%)
CF 0 (0%) 200 (100%) 106 (53%) 94 (47%) 0 (0%)
ERF 0 (0%) 200 (100%) 149 (75%) 51 (25%) 0 (0%)
ION Untested Tested Inactives Actives
Na? 0 (0%) 200 (100%) 169 (85%) 31 (15%)
Ca2? 0 (0%) 200 (100%) 185 (93%) 15 (7%)
hERG 0 (0%) 200 (100%) 148 (74%) 52 (26%)
Classification of inactive/active, inhibitors/inducers is based on the compound’s performance at 10 lM using the criteria presented in the
‘‘Methods’’ section. The percentages are given relative to the total of the set, and not the portion tested on a assay under exam
886 J Comput Aided Mol Des (2009) 23:883–895
123
inactive by an in silico model or in vitro assay. This
measure equals 100% for a perfect classifier whereas the
value expected for a random classifier is 50%. It should be
noted however that, as this percentage is influenced by the
ratio of active to inactive compounds, accuracy may be
close to 100% even if none of the actives is correctly
identified (specifically, in case of a very low number of
actives). To account for this, four more measures are used:
1. Positive Predictive Value, or Precision = TP/(TP ?
FP)
2. True Positive Recall, or Recovery = TP(TP ? FN)
3. Negative Predictive Value, or Specificity = TN/(TN ?
FN)
4. Sensitivity = TN/(TN ? FP)
The precision expresses how often the prediction of a
compound as positive is correct; it is therefore, the speci-
ficity of the assay for positives. The recovery is instead
defined as a measure of the share of experimentally active
compounds properly classified as positives. In our defini-
tion of specificity and sensitivity, we follow Baldi et al.
[28]. The specificity expresses how often the prediction of
a compound as negative is correct; the sensitivity evaluates
the share of experimentally inactive compounds properly
classified as negatives by the models or assays. The higher
these four performance measures, with a theoretical limit
of 100%, the better the model. A pure random classifier,
that is one which indiscriminately categorise half of the set
in the positives and the other half as negatives, will have
recovery and sensitivity close to 50%, whereas precision
and specificity will depend on the actual actives/inactives
ratio in the set (being respectively P/A, and N/A, where P
are the positives, N the negatives and A = P ? N). If the
random classifier is biased to reproduce the actual actives/
inactives ratio, then recovery and sensitivity tend to 50%,
whereas precision and specificity are expected to near P/A
and N/A.
Four more measures of performance can be easily
derived, for example False Discovery Rate (FDR = FP/
(FP ? TP)) or False Prediction Rate (FPR = FP/(FP ?
TN)). However, FPR is nothing but 1-SPC, whereas FDR
can be expressed as 1-PPV. The same holds for analogous
measures focusing on the FN. Because these measures do
not really add any information, they were excluded from
the analysis.
Two more measures were used during the study, one to
express the amount of correlation between observed and
predicted activities. The Correlation Coefficient [28],
expressed as
CC ¼�TN� TP� FP� FN
�=SQRT
��TN� FP
�
þ�TN� FN
�þ�TP� FP
�þ�TP� FN
��
is 0 for a random classifier (pure, and biased) and 1 for a
perfect model. The correlation coefficients are plotted on
the side of the performance measures to provide additional
insight on the overall correlation between predicted and
observed changes in RC, CF, or ERF.
The v2 test is instead used to make sure that the agree-
ment between predicted and obtained values is statistically
discernible from a random classifier (type one, pure,
unbiased). The test returns a p-value, showing the likeli-
hood that the numbers of TP, TN, FP and FN obtained were
obtained even if the underlying distribution is nothing but
random. A p-value lower than 0.05 is usually accepted as a
significance test [29]. The v2 values were computed using
the chitest function within Microsoft Excel, using the
expected outcome (in terms of TP, TN, FP, FN) of a ran-
dom classifier as first argument, and the observed classifi-
cation as second. These p-values were not reported in the
plots for reasons of clarity, as their scale differs too much
from the other measures. These p-value, when relevant, are
discussed within the results’ presentation.
Diversity analysis
In order to make sure that the compound collection
chosen is a diverse, yet representative subset of the
company chemistry, the diversity of the training and
test set was assessed via hierarchical clustering using
the BCI software [30]. When the corporate collection is
partitioned into 400 clusters [31], a 4,000-strong ran-
dom sampling of it will be fairly evenly distributed
among them (395 out of 400 clusters represented,
average population per cluster 10, standard deviation
6.1). The training set did however show a greater
concentration around particular clusters (303 clusters
are represented, average population per cluster 21,
standard deviation 52) reflecting an inherent bias of the
current chemistry. However, the compounds were
spread evenly in different sub-clusters, and the Maximal
Common Substructures of these sub-clusters were small,
e.g., a piperidine. Most importantly, these clusters had
an active/inactive ratio similar to the full training set,
so that they would not steer the models to describe an
anomalous (very high or very low activity) region of
the chemical space.
Since the test set is composed of reference compounds, a
perfect coverage of the chemical space cannot be expected.
Only 117 clusters are covered, as opposed to 143 for a
random selection of similar size. Only 3 test compounds
fall in clusters that are not covered by the training set. At
the 800-clusters level, 10 test set compounds are in clusters
not occupied by any training set compound. At finer clus-
tering levels, the number of test set compounds out of the
J Comput Aided Mol Des (2009) 23:883–895 887
123
training set increases, but not dramatically. This reasonable
coverage of chemical space is also observed when looking
at the Tanimoto similarity between the test set compounds
and the nearest training set compound. Identical com-
pounds have a Tanimoto similarity of 1 while for com-
pletely dissimilar compounds it is 0. The average Tanimoto
similarity over all test set compounds is 0.73, with a
standard deviation of 0.22. Only 44 compounds have a
Tanimoto similarity to the closest training compound lower
than 0.5, and the lowest value observed is 0.23. Overall, we
believe that the test set is sufficiently covered by the
training set, so the same should hold for the models’
applicability domains [27, 32].
Results and discussion
The first question to answer was whether the ion channel
binding assays were good and reliable predictors of
activity in the GPRA assay. Based on the physiological
connection between ion channel currents and action
potential, a good correlation is anticipated. The predic-
tive performances of the in vitro assays will be discussed
separately for any given GPRA measure (RC, CF, ERF).
Next will come the presentation and discussion of the
model built using the data from the three in vitro ion
channel binding assays. Finally, the performances of the
models based solely on in silico descriptors are dis-
cussed, and interpreted in terms of possible suggestions
for the medicinal chemist. This layout will be repeated
for each of the GPRA measures.
Although the in vitro assays performances could be
based on the full data set, the vast majority of these data
have been used as training set for the in silico models. The
only true validation can come from application to an
independent set. Therefore, all comparisons between
models and assays will be made on the basis of their per-
formance on the 200-strong test set.
We have observed that the models based on extended
connectivity fingerprints of different paths perform very
similarly on the test set, although the fitting to the training
set increases with the path length. This raises the question
of whether the higher-path fingerprints models may be
over-fitting the training set. However, with an internal
cross-validation having been performed during the training,
this does not seem to be the case. Therefore, only the
results of the ECFP_12-based models will be discussed, as
this includes contributions from lower-length fingerprints
as well. Other fingerprint-based models will be cited only
when they perform better. The predictions made by all
different models on the test set can however be found in the
supporting information.
Prediction of changes in the rate of contraction:
performance of binding assays
The predictive performances of all in vitro binding assays
towards an effect on the rate of contraction in the GPRA
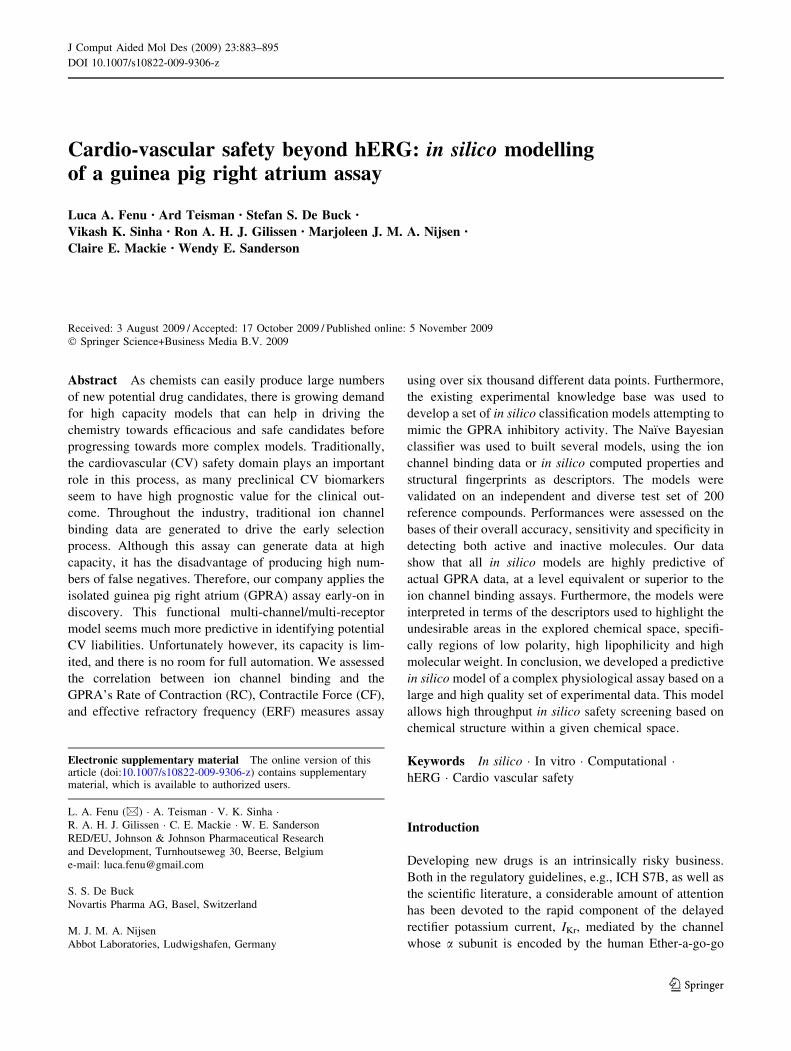
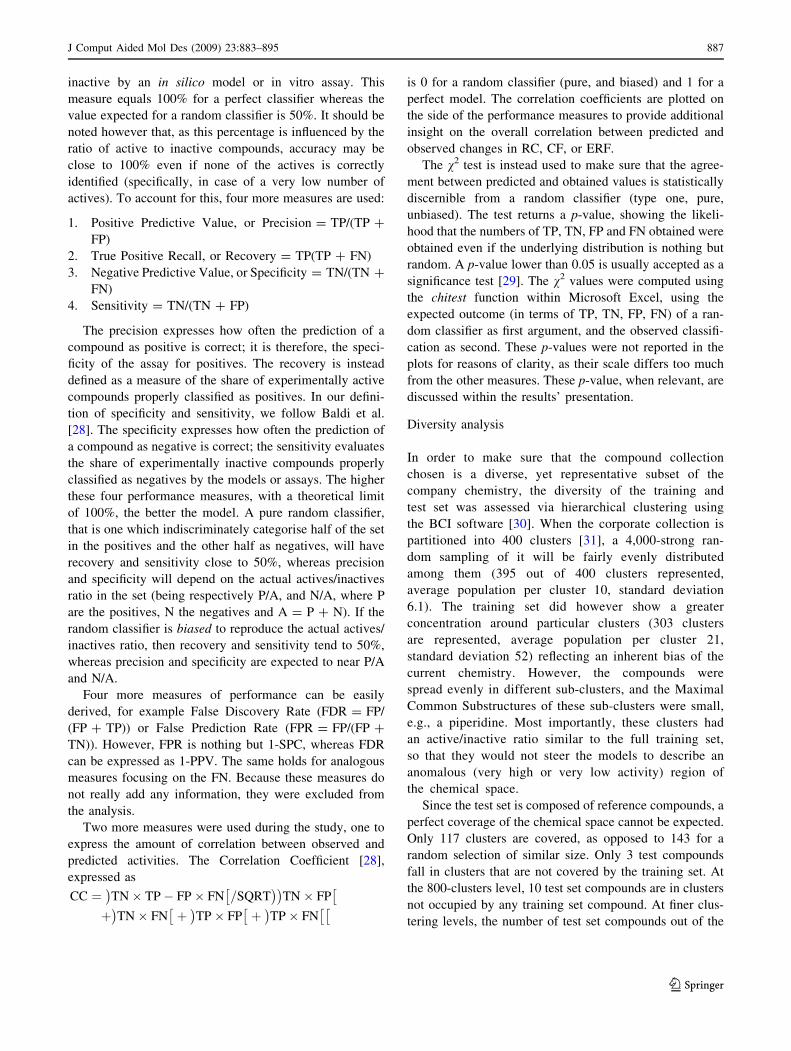
assay are summarised in Fig. 1 for the test set compounds.
Accuracy, shown by the green bar in Fig. 1, is low for
all three binding assays, ranging from a very low 42% of
the Ca2? channel to the hERG at 53%. However, it is
important to note that actives and inactives are not evenly
distributed. For example, 64% of the compounds inhibit
RC, on the other hand only 15% of the compounds bind to
the Na? channel. This uneven distribution is the main
reason for the low accuracy and therefore it is more rele-
vant to look at the other performance measures. Notwith-
standing the low accuracy, precision (blue bar in Fig. 1) is
relatively high. This implies that there definitely is a con-
nection between ion channel binding and RC-activity.
Overall, 83–90% of the channel binders show an inhibitory
effect on RC. On the other hand, the recovery (pink bar) is
low for all assays, ranging from 10% for Ca2? to 34% for
hERG. This means that in general the assays are catching
inhibitors working their effect through ion channel inhibi-
tion, but also that inhibitors with other modes of actions are
going undetected. An assay can not recover more RC-
inhibitors than its own actives share, and that is bound to
include some false positives. Specificity is mediocre (38–
43%, clear bars) for the three binding assays, but sensitivity
to negatives (purple bars) is around 90% for all of them. To
conclude, the low accuracy observed is explained by too
high a number of false negatives, which causes both recall
and specificity to drop.
Although the correlation coefficients for the three assays
towards the RC readout are not much above zero (0.13 for
Ca2?, 0.23 for the two others), the values of the v2 test
seem to reassure us that performances observed are sta-
tistically discernible from those of a random classifier.
Test Set - Prediction of GPRA - RC from:
0.00
0.20
0.40
0.60
0.80
1.00
Rando
m Na Ca
hERG
Bayes
_Ion
Ch
Bayes
_PP
Bay
es_E
CFP_12
Perfe
ct
Binding Assay or In Silico Model
Accuracy Precision
Recovery Specificity
Sensitivity Corr. Coeff.
Fig. 1 Accuracy, precision, recovery, specificity, sensitivity and
correlation coefficient of the in silico models in predicting the
outcome of GPRA/RC, compared to the ion channel binding assays
888 J Comput Aided Mol Des (2009) 23:883–895
123
It has been reported [33] that compounds simultaneously
inhibiting hERG and Na? ion channels may have opposite,
compensating effects on the physiological read outs. Flag-
ging these compounds as active may result in an overesti-
mation of false positives. However, in the training set only
43 out of 445 compounds that showed activity on both
hERG and Na? channel showed no effect on RC. In the test
set, we observe 2 out of 23. This puts a rather low limit
(10% or so) on the likelihood of such compensating effects.
Prediction of changes in the rate of contraction:
performance and interpretation of Bayesian models
The performances of the in vitro-based Bayesian classifier
are the baseline against which to measure those of our
purely in silico models, also shown in Fig. 1. The Bayesian
classifier was trained on different sets of descriptors, the in
vitro ion channel binding assays (IonCh), the PP descriptor
set, and the ECFP fingerprints of various paths.
The overall performance of the IonCH model is very
similar to that of the independent ion channel assays on
which it is built, particularly the hERG binding assay. The
reason for this lies in the way the Bayesian classifier works.
At least at first glance, the Na? channel has a major
importance than the hERG, since a compound binding to
the Na? channel has a higher probability of affecting RC
(0.23) than a compound binding to the hERG channel
(0.18). However, the model can not attach a probability of
RC-inactivity to the observation that a compound is not a
Na? channel binder, whereas such probability is defined
for the hERG channel (0.05). Therefore, a negative results
in the hERG assay, unless overridden by a positive results
in the Na? or Ca2? assays, cause the compounds to be
classified as RC-inactive. In short, a compound which does
not show binding to Na? can not be said RC-safe. Other
things being equal, the same compound not binding to
hERG is RC-safe. Unless, of course, it binds to the Na? or
Ca2? channel. This causes the Bayes_IonCh model to
resemble more closely the hERG channel assay.
The fingerprint-based classifiers show profiles charac-
terised by relatively high precision and sensitivity, but low
recovery and specificity—once again, an indication of too
many false negatives. The PP-based classifier has instead a
different profile, with high precision and recovery (86 and
70%), and lower yet reasonable values for specificity and
sensitivity (59, and 79%). This enables the PP-based model
to score the highest in terms of accuracy, including a
correlation coefficient value around 0.47.
An important observation one can make at this stage is
that our attempts to build models based on in vitro ion
channel binding assays do not seem to provide a better
alternative than using in silico descriptors only. Overall,
precision and recovery are more balanced in the purely
in silico models. In vitro binding assays are instead more
specific, although this comes to the price of a lower sen-
sitivity. This suggests that in vitro binding assays are only
able to capture limited aspects of such a complex phe-
nomenon and, to improve performances, complementary
data on other kinds of off-target interactions are needed,
e.g., enzymes, signalling receptors or other ion channels.
Performances are important, but in silico models should
also be able to offer insight into the relationship between
structure and activity observed. In order to do so, they
should be easily interpretable and offer guidelines and
optimisation routes on the basis of the descriptors used.
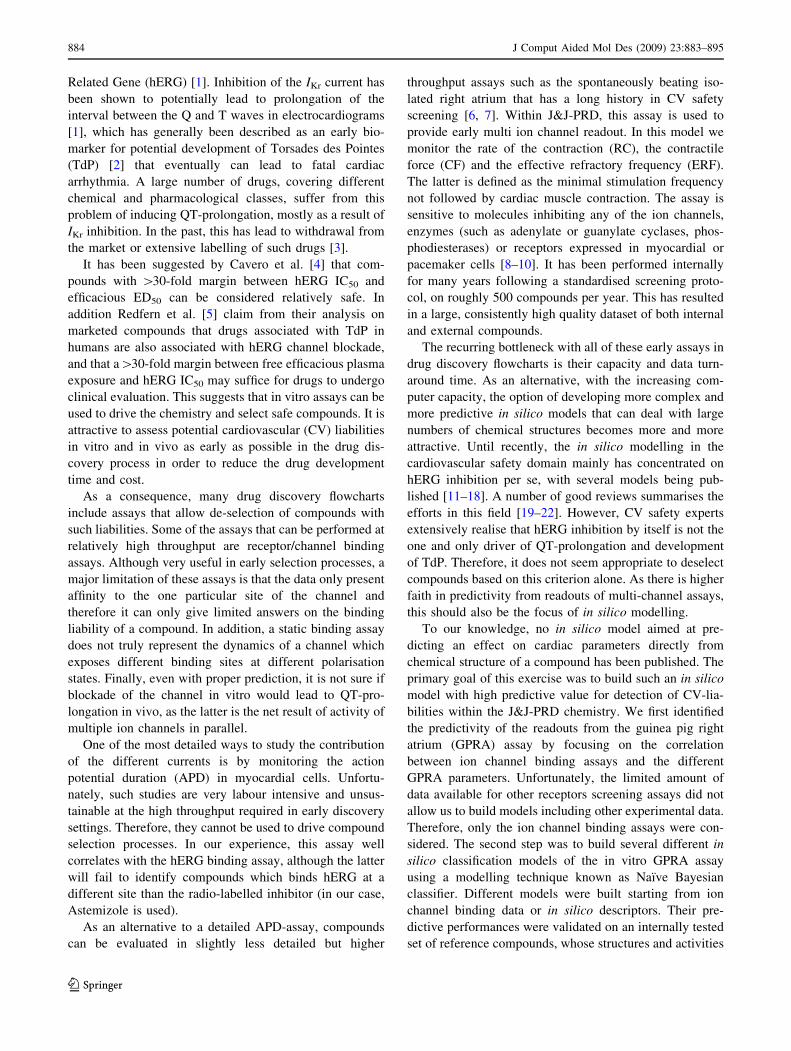
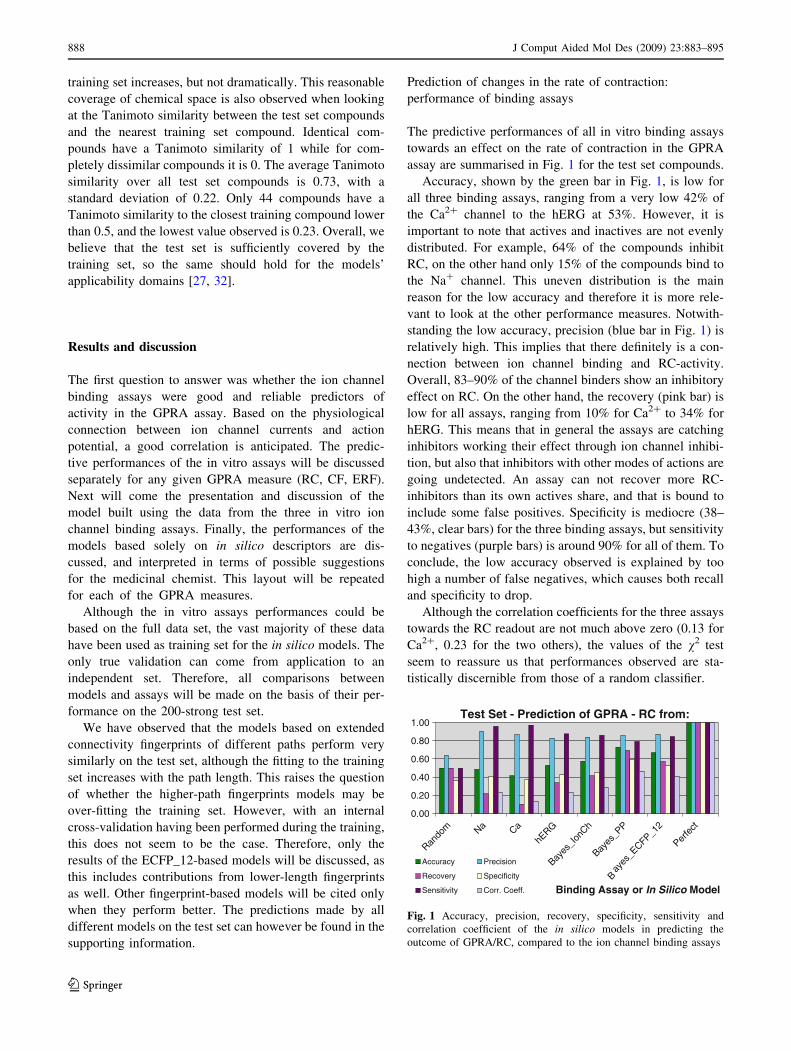
One of the Bayesian models was built on ECFP_12
chemical fingerprints, capturing various structural features
present in each molecule. Some molecular features are asso-
ciated with a high likelihood of observing RC-activity, others
are not. The interplay of these features ultimately determines
the RC-activity, or lack thereof. Small modifications in the
molecule could disrupt some of the features detected, and have
a major influence on cardiovascular effects.
There is one important caveat, though. Whereas it is
commendable to weed out structural features which nearly
always cause activity, the opposite is not true. Features that
never correlate with activity are not a guarantee of safety if
inserted in a compound. That is, it is unlikely that we can
counteract a bad feature in a molecule (e.g., needed to
optimise primary activity) by engineering in a ‘safe’ fea-
ture. In short, the fingerprint-based models can tell us what
should NOT be there, but can not provide us with sug-
gestions, except perhaps in the limited cases where one
‘bad’ group can be substituted by a ‘good’ isostere.
Moreover, since the features detected even with modest
path-lengths are often large, the use of fingerprints seems
more apt to screen out chemotypes with high likelihood of
activity, rather than an intra-series prioritisation. Some
structural features highly correlated to RC-activity are
shown in Fig. 2.
On the other hand, the Bayesian classifier based on the
PP descriptor set is easier to interpret. The five most
important descriptors to RC-activity can be seen at a
glance in Table 3, together with their cut-offs. The model
shows the Molecular_FractionalPolarSASA as the most
important descriptor, where values lower than 0.17 are
associated with high likelihood of RC-activity. Molecules
below this cut-off have an overall likelihood of 77% of
being RC-Active, whereas molecules above only have a
50% chance. Both above and below the cut-off, the
training method has generated bins with associated like-
lihood. The exact score assigned by the Bayesian classi-
fier depends on the bin within which the compounds fall.
In this model all bins above the cut-off show a larger
portion of actives. A predicted measure of lipophilicity,
the ALogP, is the second most important descriptors in
J Comput Aided Mol Des (2009) 23:883–895 889
123
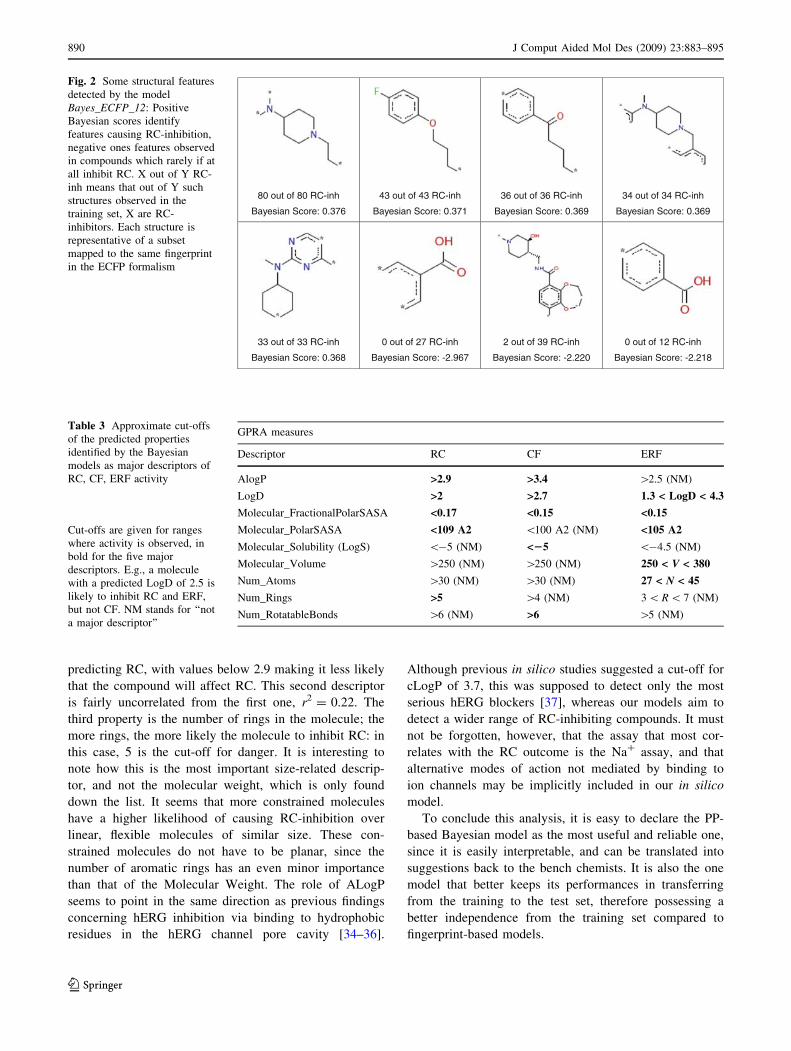
predicting RC, with values below 2.9 making it less likely
that the compound will affect RC. This second descriptor
is fairly uncorrelated from the first one, r2 = 0.22. The
third property is the number of rings in the molecule; the
more rings, the more likely the molecule to inhibit RC: in
this case, 5 is the cut-off for danger. It is interesting to
note how this is the most important size-related descrip-
tor, and not the molecular weight, which is only found
down the list. It seems that more constrained molecules
have a higher likelihood of causing RC-inhibition over
linear, flexible molecules of similar size. These con-
strained molecules do not have to be planar, since the
number of aromatic rings has an even minor importance
than that of the Molecular Weight. The role of ALogP
seems to point in the same direction as previous findings
concerning hERG inhibition via binding to hydrophobic
residues in the hERG channel pore cavity [34–36].
Although previous in silico studies suggested a cut-off for
cLogP of 3.7, this was supposed to detect only the most
serious hERG blockers [37], whereas our models aim to
detect a wider range of RC-inhibiting compounds. It must
not be forgotten, however, that the assay that most cor-
relates with the RC outcome is the Na? assay, and that
alternative modes of action not mediated by binding to
ion channels may be implicitly included in our in silico
model.
To conclude this analysis, it is easy to declare the PP-
based Bayesian model as the most useful and reliable one,
since it is easily interpretable, and can be translated into
suggestions back to the bench chemists. It is also the one
model that better keeps its performances in transferring
from the training to the test set, therefore possessing a
better independence from the training set compared to
fingerprint-based models.
80 out of 80 RC-inh
Bayesian Score: 0.376
43 out of 43 RC-inh
Bayesian Score: 0.371
36 out of 36 RC-inh
Bayesian Score: 0.369
34 out of 34 RC-inh
Bayesian Score: 0.369
33 out of 33 RC-inh
Bayesian Score: 0.368
0 out of 27 RC-inh
Bayesian Score: -2.967
2 out of 39 RC-inh
Bayesian Score: -2.220
0 out of 12 RC-inh
Bayesian Score: -2.218
Fig. 2 Some structural features
detected by the model
Bayes_ECFP_12: Positive
Bayesian scores identify
features causing RC-inhibition,
negative ones features observed
in compounds which rarely if at
all inhibit RC. X out of Y RC-
inh means that out of Y such
structures observed in the
training set, X are RC-
inhibitors. Each structure is
representative of a subset
mapped to the same fingerprint
in the ECFP formalism
Table 3 Approximate cut-offs
of the predicted properties
identified by the Bayesian
models as major descriptors of
RC, CF, ERF activity
Cut-offs are given for ranges
where activity is observed, in
bold for the five major
descriptors. E.g., a molecule
with a predicted LogD of 2.5 is
likely to inhibit RC and ERF,
but not CF. NM stands for ‘‘not
a major descriptor’’
GPRA measures
Descriptor RC CF ERF
AlogP >2.9 >3.4 [2.5 (NM)
LogD >2 >2.7 1.3 < LogD < 4.3
Molecular_FractionalPolarSASA <0.17 <0.15 <0.15
Molecular_PolarSASA <109 A2 \100 A2 (NM) <105 A2
Molecular_Solubility (LogS) \-5 (NM) <25 \-4.5 (NM)
Molecular_Volume [250 (NM) [250 (NM) 250 < V < 380
Num_Atoms [30 (NM) [30 (NM) 27 < N < 45
Num_Rings >5 [4 (NM) 3 \ R \ 7 (NM)
Num_RotatableBonds [6 (NM) >6 [5 (NM)
890 J Comput Aided Mol Des (2009) 23:883–895
123
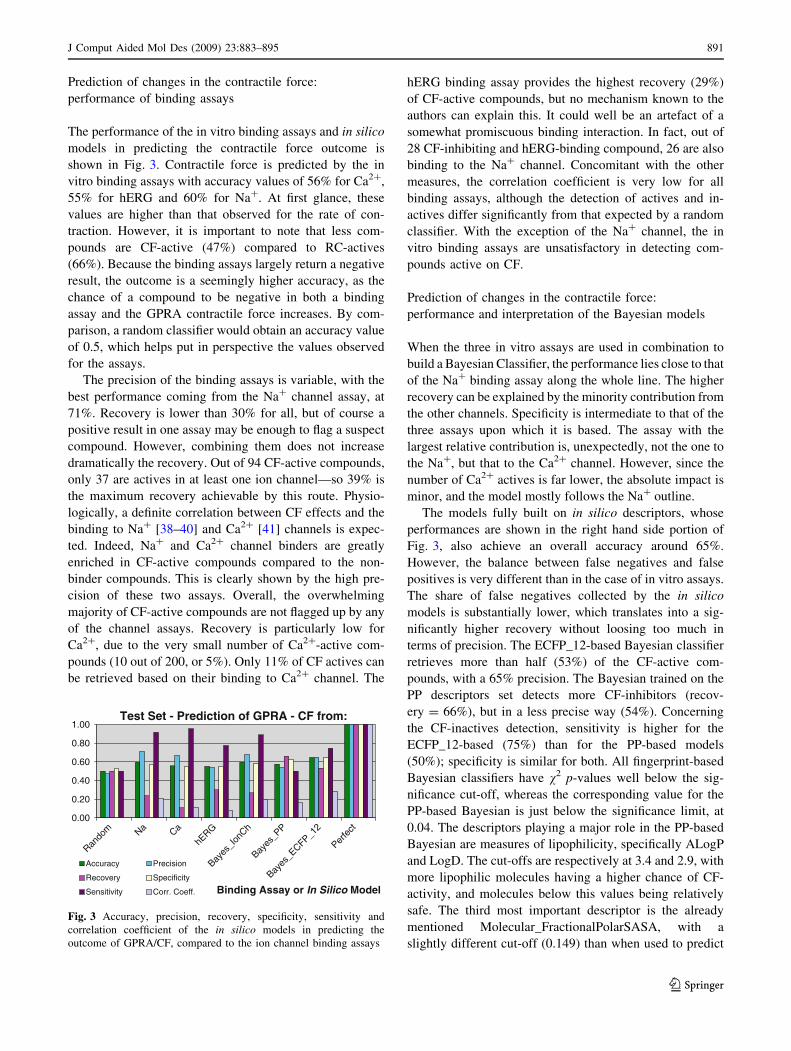
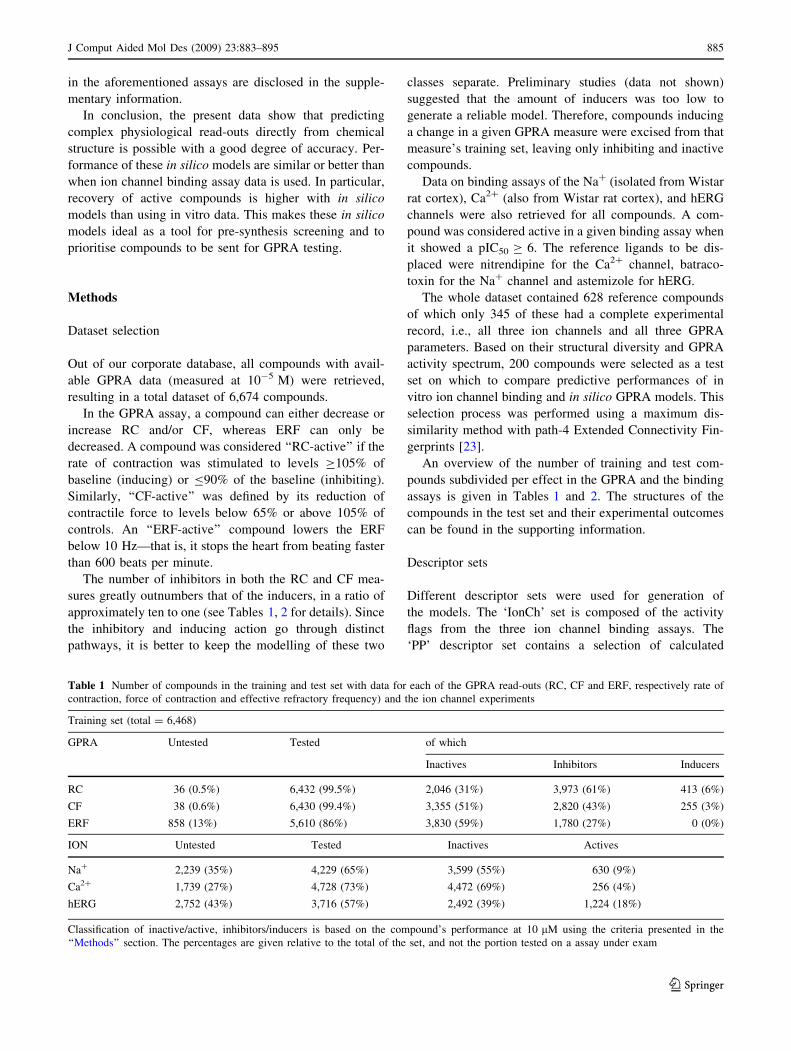
Prediction of changes in the contractile force:
performance of binding assays
The performance of the in vitro binding assays and in silico
models in predicting the contractile force outcome is
shown in Fig. 3. Contractile force is predicted by the in
vitro binding assays with accuracy values of 56% for Ca2?,
55% for hERG and 60% for Na?. At first glance, these
values are higher than that observed for the rate of con-
traction. However, it is important to note that less com-
pounds are CF-active (47%) compared to RC-actives
(66%). Because the binding assays largely return a negative
result, the outcome is a seemingly higher accuracy, as the
chance of a compound to be negative in both a binding
assay and the GPRA contractile force increases. By com-
parison, a random classifier would obtain an accuracy value
of 0.5, which helps put in perspective the values observed
for the assays.
The precision of the binding assays is variable, with the
best performance coming from the Na? channel assay, at
71%. Recovery is lower than 30% for all, but of course a
positive result in one assay may be enough to flag a suspect
compound. However, combining them does not increase
dramatically the recovery. Out of 94 CF-active compounds,
only 37 are actives in at least one ion channel—so 39% is
the maximum recovery achievable by this route. Physio-
logically, a definite correlation between CF effects and the
binding to Na? [38–40] and Ca2? [41] channels is expec-
ted. Indeed, Na? and Ca2? channel binders are greatly
enriched in CF-active compounds compared to the non-
binder compounds. This is clearly shown by the high pre-
cision of these two assays. Overall, the overwhelming
majority of CF-active compounds are not flagged up by any
of the channel assays. Recovery is particularly low for
Ca2?, due to the very small number of Ca2?-active com-
pounds (10 out of 200, or 5%). Only 11% of CF actives can
be retrieved based on their binding to Ca2? channel. The
hERG binding assay provides the highest recovery (29%)
of CF-active compounds, but no mechanism known to the
authors can explain this. It could well be an artefact of a
somewhat promiscuous binding interaction. In fact, out of
28 CF-inhibiting and hERG-binding compound, 26 are also
binding to the Na? channel. Concomitant with the other
measures, the correlation coefficient is very low for all
binding assays, although the detection of actives and in-
actives differ significantly from that expected by a random
classifier. With the exception of the Na? channel, the in
vitro binding assays are unsatisfactory in detecting com-
pounds active on CF.
Prediction of changes in the contractile force:
performance and interpretation of the Bayesian models
When the three in vitro assays are used in combination to
build a Bayesian Classifier, the performance lies close to that
of the Na? binding assay along the whole line. The higher
recovery can be explained by the minority contribution from
the other channels. Specificity is intermediate to that of the
three assays upon which it is based. The assay with the
largest relative contribution is, unexpectedly, not the one to
the Na?, but that to the Ca2? channel. However, since the
number of Ca2? actives is far lower, the absolute impact is
minor, and the model mostly follows the Na? outline.
The models fully built on in silico descriptors, whose
performances are shown in the right hand side portion of
Fig. 3, also achieve an overall accuracy around 65%.
However, the balance between false negatives and false
positives is very different than in the case of in vitro assays.
The share of false negatives collected by the in silico
models is substantially lower, which translates into a sig-
nificantly higher recovery without loosing too much in
terms of precision. The ECFP_12-based Bayesian classifier
retrieves more than half (53%) of the CF-active com-
pounds, with a 65% precision. The Bayesian trained on the
PP descriptors set detects more CF-inhibitors (recov-
ery = 66%), but in a less precise way (54%). Concerning
the CF-inactives detection, sensitivity is higher for the
ECFP_12-based (75%) than for the PP-based models
(50%); specificity is similar for both. All fingerprint-based
Bayesian classifiers have v2 p-values well below the sig-
nificance cut-off, whereas the corresponding value for the
PP-based Bayesian is just below the significance limit, at
0.04. The descriptors playing a major role in the PP-based
Bayesian are measures of lipophilicity, specifically ALogP
and LogD. The cut-offs are respectively at 3.4 and 2.9, with
more lipophilic molecules having a higher chance of CF-
activity, and molecules below this values being relatively
safe. The third most important descriptor is the already
mentioned Molecular_FractionalPolarSASA, with a
slightly different cut-off (0.149) than when used to predict
Test Set - Prediction of GPRA - CF from:
0.00
0.20
0.40
0.60
0.80
1.00
Rando
m Na Ca
hERG
Bayes
_Ion
Ch
Bayes
_PP
Bayes
_ECFP_1
2
Perfe
ct
Binding Assay or In Silico Model
Accuracy Precision
Recovery Specificity
Sensitivity Corr. Coeff.
Fig. 3 Accuracy, precision, recovery, specificity, sensitivity and
correlation coefficient of the in silico models in predicting the
outcome of GPRA/CF, compared to the ion channel binding assays
J Comput Aided Mol Des (2009) 23:883–895 891
123
the RC inhibition. This similarity of descriptors brought us
to enquire how often RC and CF inhibition happen toge-
ther, and whether our models are able to detect this. In fact,
96% of CF-actives are also RC-actives. It is however true
that 25% of the RC-active compounds in the test set turns
out to be CF-inactive. So CF-actives are mostly a subset of
RC-actives. Figures for the training set are very similar.
Referring again to Table 3, one can see how the for all
three major descriptors shared by RC and CF (ALogP,
LogD, Molecular_FractionalPolarSASA) the cut-offs for
CF actually define a subset of the RC-actives. That 8% of
CF-active, RC-inactive compounds comes from contribu-
tion from minor descriptors, since also the cut-offs for CF
and RC activity are matched for Molecular_Solubility and
Num_RotatableBonds—even if these two descriptors are
not major for the RC predictions.
Overall, the performance of the in silico models was
lower than hoped, yet more equilibrated than the in vitro
ion channel binding assays, with a major focus on inhibi-
tors’ detection, and therefore a higher recovery. The model
with the best balance in terms of precision and accuracy is
the Bayesian classifier with ECFP_12. Its superior overall
accuracy is a strong argument for this choice. However, the
lack of ability to suggest to the chemists desirable areas,
rather than just forbidding dangerous ones, is a serious
handicap. We believe that the simultaneous use of the PP-
based with a fingerprint-based model could compensate for
the low overall accuracy, at the same time enabling us to
provide direct suggestions to the chemists.
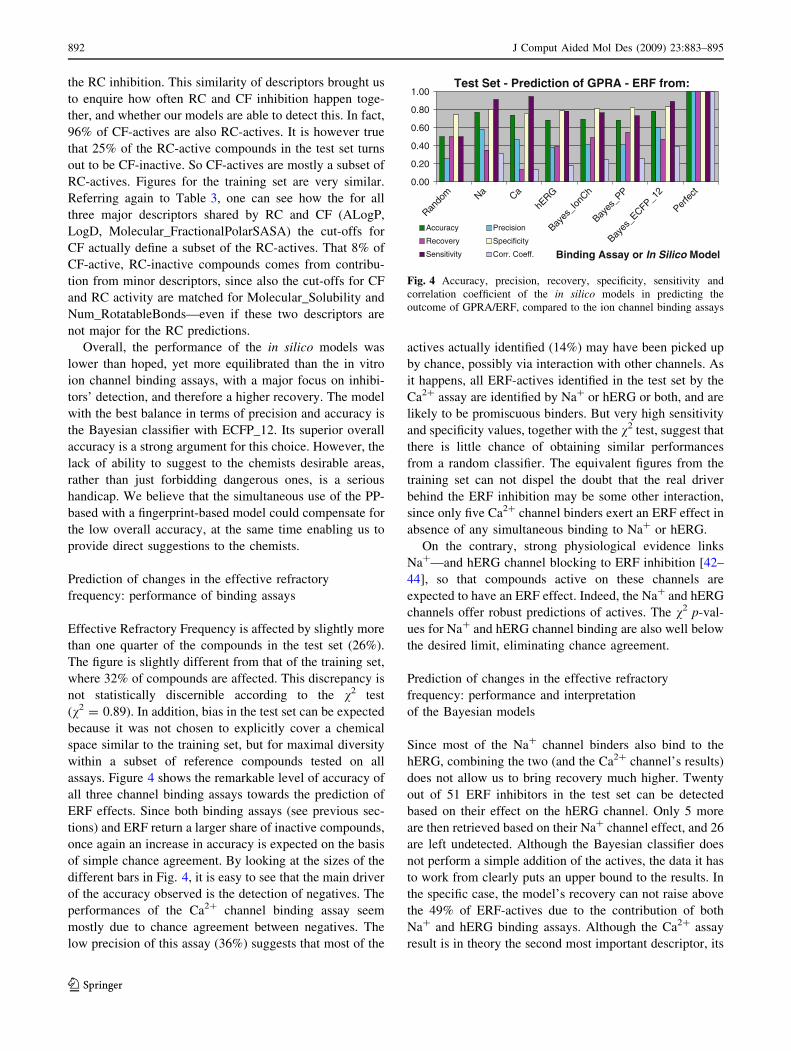
Prediction of changes in the effective refractory
frequency: performance of binding assays
Effective Refractory Frequency is affected by slightly more
than one quarter of the compounds in the test set (26%).
The figure is slightly different from that of the training set,
where 32% of compounds are affected. This discrepancy is
not statistically discernible according to the v2 test
(v2 = 0.89). In addition, bias in the test set can be expected
because it was not chosen to explicitly cover a chemical
space similar to the training set, but for maximal diversity
within a subset of reference compounds tested on all
assays. Figure 4 shows the remarkable level of accuracy of
all three channel binding assays towards the prediction of
ERF effects. Since both binding assays (see previous sec-
tions) and ERF return a larger share of inactive compounds,
once again an increase in accuracy is expected on the basis
of simple chance agreement. By looking at the sizes of the
different bars in Fig. 4, it is easy to see that the main driver
of the accuracy observed is the detection of negatives. The
performances of the Ca2? channel binding assay seem
mostly due to chance agreement between negatives. The
low precision of this assay (36%) suggests that most of the
actives actually identified (14%) may have been picked up
by chance, possibly via interaction with other channels. As
it happens, all ERF-actives identified in the test set by the
Ca2? assay are identified by Na? or hERG or both, and are
likely to be promiscuous binders. But very high sensitivity
and specificity values, together with the v2 test, suggest that
there is little chance of obtaining similar performances
from a random classifier. The equivalent figures from the
training set can not dispel the doubt that the real driver
behind the ERF inhibition may be some other interaction,
since only five Ca2? channel binders exert an ERF effect in
absence of any simultaneous binding to Na? or hERG.
On the contrary, strong physiological evidence links
Na?—and hERG channel blocking to ERF inhibition [42–
44], so that compounds active on these channels are
expected to have an ERF effect. Indeed, the Na? and hERG
channels offer robust predictions of actives. The v2 p-val-
ues for Na? and hERG channel binding are also well below
the desired limit, eliminating chance agreement.
Prediction of changes in the effective refractory
frequency: performance and interpretation
of the Bayesian models
Since most of the Na? channel binders also bind to the
hERG, combining the two (and the Ca2? channel’s results)
does not allow us to bring recovery much higher. Twenty
out of 51 ERF inhibitors in the test set can be detected
based on their effect on the hERG channel. Only 5 more
are then retrieved based on their Na? channel effect, and 26
are left undetected. Although the Bayesian classifier does
not perform a simple addition of the actives, the data it has
to work from clearly puts an upper bound to the results. In
the specific case, the model’s recovery can not raise above
the 49% of ERF-actives due to the contribution of both
Na? and hERG binding assays. Although the Ca2? assay
result is in theory the second most important descriptor, its
Test Set - Prediction of GPRA - ERF from:
0.00
0.20
0.40
0.60
0.80
1.00
Rando
m Na Ca
hERG
Bayes
_Ion
Ch
Bayes
_PP
Bayes
_ECFP_1
2
Perfe
ct
Binding Assay or In Silico Model
Accuracy Precision
Recovery Specificity
Sensitivity Corr. Coeff.
Fig. 4 Accuracy, precision, recovery, specificity, sensitivity and
correlation coefficient of the in silico models in predicting the
outcome of GPRA/ERF, compared to the ion channel binding assays
892 J Comput Aided Mol Des (2009) 23:883–895
123
low return in terms of actives means that the overall
decisions are based on the Na?, and hERG when this is not
conclusive.
The performances of the in silico models for prediction
of ERF can also be seen in Fig. 4. Accuracy is around
70–80% depending on the descriptors used, with the fin-
gerprint faring better than the PP-based method. Precision
values range from 40 to 60%, with the fingerprint-based
methods coming out on top again. In the recovery field
PP-based and ECFP_4 are on a par whereas the path 12
fingerprints are at a disadvantage. In general, with longer
fingerprints comes higher precision, but also a simulta-
neous decrement in recovery. The larger fingerprints
associated with ERF-inhibition allows it to describe more
specific structures correlated with activity. But they also tie
the model too narrowly to the training space, because even
if shorter paths fingerprints are still present, they have a
diminished importance. This phenomenon is obviously
only partially compensated by a pruning of features per-
formed by the cross-validation procedure put in place to
minimise over-training. Both sensitivity and specificity are
at very satisfactory levels for all in silico models built.
These two make up for an important part of the overall
accuracy, when ERF-inactives compose over two-thirds of
the training (and test) set. When the v2 test is performed on
the results from the test set, all models are well within the
requested cut-off for significance.
The ECFP_12-based Bayesian has the best overall per-
formances, with accuracy and precision to match the ion
channels assays, and recovery and specificity slightly supe-
rior to the IonCh-based Bayesian’s. This values are also well
conserved from the training to the test set, although extension
to sets composed of radically different scaffolds is likely to
quickly degrade the performances. Its interpretation in terms
of suggestions for the synthesis is, once again, not immedi-
ate. A plethora of hetero-aromatic cycles are deemed safe,
but we already pointed out that only structural features cor-
related with activity can be reliably used.
The Bayesian points in the direction of polar surface
measures as descriptors of ERF-inhibitory activity; an
absolute value of less than 120A2 (or polar surface less than
15% of total surface, as indicated by the second descriptor
in order of importance, Molecular_FractionalPolarSASA) is
a good indicator of ERF activity. However, the region
around 120 ± 15 (or 15 ± 2%) is a grey area. That is, the
trend is not monotonic but briefly inverts around that value.
This is likely to be just a statistical fluke coming from the
training set’s make up, and does not significantly alter the
main trend. The third most important is instead size-related,
the ‘‘Number of Atoms’’ count. For this descriptor, another
non-monotonic trend is observed, with molecules between
31 and 44 atoms significantly more likely to cause ERF-
inhibition. The reason this may be is unclear to the authors.
Concluding, as in the case of Contractile Force, the best
and most robust model seems to be the ECFP_12-based
Bayesian model. The PP-based model may be used in
combination with it, but essentially its main indication is to
keep the molecule as small and polar as possible, which
can of course be a challenge depending on the targets of
interest.
Conclusions
In this paper, we show how in vitro binding assays posi-
tively correlate with physiological read outs from the
spontaneously beating isolated guinea pig right atrium
assay. Results from the Na? channel and hERG binding
assays are particularly well suited to identify actives in
various measures. However, a sizeable percentage of false
negatives is still observed, due either to sensitivity differ-
ences between the ex vivo and the in vitro assays, or pos-
sibly because of mechanisms different from those
investigated by the binding tests. The Ca2? channel assay
returns a low share of active results, and as such has a
limited impact in absolute terms, but reliably identifies the
relatively few molecules influencing the cardiac readouts
via this route. The Na? channel assay is both more precise
and higher recovery, on all three cardiac measure exam-
ined. On the other hand, the hERG channel seems much
more promiscuous, and this causes a wealth of false posi-
tives, molecules binding to the channel for which no sig-
nificant cardiac inhibition is observed. Statistical methods
can significantly improve the results by adequately
weighing these three in vitro results. A Bayesian classifier
built on the ion channel binding assays seems to perform
particularly well, increasing recovery and not loosing much
in terms of precision and specificity, the real advantages of
in vitro binding assays. The limit to higher recovery is set
not only by the share of molecules which simultaneously
bind to more than one channel, but more importantly by
modes of actions other than ion channels binding by which
a molecule may affect the modelled measures. An obvious
step to improve predictivity is to include binding data from
in vitro assays on other receptors. However, Bayesian
classifiers built correlating in silico structural fingerprints
or other predicted molecular descriptors offer an alternative
path to improve performances. The nicely balanced equi-
librium obtained between the contrasting trends of mini-
mising the number of false positives (optimising precision
and specificity) or that of false negatives (boosting recov-
ery and sensitivity) offers accuracies similar to, and a
recovery significantly higher than the models using
experimental binding results as descriptors. Moreover,
structures can be assessed pre-synthesis, as long as they are
within the descriptors’ space covered by the training set.
J Comput Aided Mol Des (2009) 23:883–895 893
123
One important conclusion is that, if a large enough
number of high quality data is available, even a very
complex physiological phenomenon can be successfully
modelled directly from the compounds structures with in
silico techniques. These empirical, statistics-based methods
cannot provide the understanding that is possible from a
mechanistic method, but can at least point us in the right
direction, especially if the input from models based on
structural fingerprints and predicted properties are used
together. Although a given descriptor will play a different
role in determining a given change in RC, CF or ERF, the
cut-offs suggested to keep a molecule ‘safe’ well align, as
shown in (Table 3). This allows for a concerted optimisa-
tion strategy prior synthesis.
We have therefore shown how an in silico predictive
GPRA model can provide reasonably accurate forecasts
pre-synthesis, identifying structural features likely to cause
unwanted activity or dangerous areas in the physico-
chemical space. The accuracy levels of these forecasts are
equal or superior to the predictivity afforded by the use of
in vitro assays, and recovery of active compounds is greatly
improved. We believe these models to be a useful add-on
in the first stages of drug discovery.
Such consistently strong performance from the in silico
models shows that the critical step is most likely the data
generation. Preliminary data on alternative models show
that good results are obtained regardless of the technique
chosen, so that one can be selected to best fit the personal
inclination or already existing infrastructures.
This work opens up the possibilities to an inexpensive,
broad and coarse pre-screening of the chemical space by
using the models to flag unsafe areas of chemical space. It
also puts a strict limit to the usefulness of such an approach
when prioritising between very similar compounds based
on the risk perceived by the model. Even though a sig-
nificant number of very similar molecules will share the
same activity, errors are likely to occur. This is however,
not a major drawback: our in silico model is designed to
provide a binary alert flag, not very precise measurements
of the effect. Alternatively, once enough experimental data
have been accumulated, a local in silico model can provide
reliable ranking of a congeneric series and adequate
prioritisation.
Supporting information
Attached, the list of the 200 compounds used as a test set,
with structures in SMILES format and generic name when
available, active/inactive flags for the three GPRA mea-
sures, the three ion channel binding assays, and the activity
predictions output by the various models. The PP-based
models are available from the authors upon request.
Acknowledgments This work was a collaborative effort of the
ADME-Tox, Molecular Informatics, Enabling Technologies (HTS)
departments and the Centre of Excellence for Cardiovascular Safety
Research at J&J-PRD, Beerse. Our thanks go to all members of the
departments involved and in particular to Danny Geyskens for the
generation of the large high quality GPRA-assay dataset and Luc Gys
for generation of the receptor binding data.
References
1. Sanguinetti MC, Jiang C, Curran ME, Keating MT (1995) Cell
81:299
2. Jackman WM, Clark M, Friday KJ, Aliot EM, Anderson J,
Lazzara R (1984) Med Clin North Am 68:1079
3. Roden DM (2004) N Engl J Med 350:1013
4. Cavero I, Mestre M, Guillon JM, Crumb W (2000) Expert Opin
Pharmacother 1:947
5. Redfern WS, Carlsson L, Davis AS, Lynch WG, MacKenzie I,
Palethorpe S, Siegl PK, Strang I, Sullivan AT, Wallis R, Camm
AJ, Hammond TG (2003) Cardiovasc Res 58:32
6. Miyahara JT, Akau CK, Yasumoto T (1979) Res Commun Chem
Pathol Pharmacol 25:177
7. Palaoglu O, Soydan S, Bokesoy TA (1982) Pharmacology 25:183
8. Studenik C, Lemmens-Gruber R, Heistracher P (1999) Pharmazie
54:330
9. Kobayashi Y, Hoshikuma K, Nakano Y, Yokoo Y, Kamiya T
(2001) Planta Med 67:244
10. Vasconcelos CM, Araujo MS, Silva BA, Conde-Garcia EA
(2005) Braz J Med Biol Res 38:1113
11. Aronov AM (2006) J Med Chem 49:6917
12. Aronov AM, Goldman BB (2004) Bioorg Med Chem 12:2307
13. Dubus E, Ijjaali I, Petitet F, Michel A (2006) ChemMedChem
1:622
14. Farid R, Day T, Friesner RA, Pearlstein RA (2006) Bioorg Med
Chem 14:3160
15. O’Brien SE, de Groot MJ (2005) J Med Chem 48:1287
16. Pearlstein RA, Vaz RJ, Kang J, Chen XL, Preobrazhenskaya M,
Shchekotikhin AE, Korolev AM, Lysenkova LN, Miroshnikova
OV, Hendrix J, Rampe D (2003) Bioorg Med Chem Lett 13:1829
17. Rajamani R, Tounge BA, Li J, Reynolds CH (2005) Bioorg Med
Chem Lett 15:1737
18. Roche O, Trube G, Zuegge J, Pflimlin P, Alanine A, Schneider G
(2002) Chembiochem 3:455
19. Sanguinetti MC, Mitcheson JS (2005) Trends Pharmacol Sci
26:119
20. Pearlstein R, Vaz R, Rampe D (2003) J Med Chem 46:2017
21. Ekins S (2004) Drug Discov Today 9:276
22. Aronov AM (2005) Drug Discov Today 10:149
23. Rogers D, Brown RD, Hahn M (2005) J Biomol Screen 10:682
24. Ghose AK, Viswanadhan VN, Wendoloski JJ (1998) J Phys
Chem A 102:3762
25. Csizmadia F, Tsantili-Kakoulidou A, Panderi I, Darvas F (1997) J
Pharm Sci 86:865
26. Tetko IV, Tanchuk VY, Kasheva TN, Villa AE (2001) J Chem
Inf Comput Sci 41:1488
27. Tetko IV, Bruneau P, Mewes HW, Rohrer DC, Poda GI (2006)
Drug Discov Today 11:700
28. Baldi P, Brunak S, Chauvin Y, Andersen CA, Nielsen H (2000)
Bioinformatics 16:412
29. Mehta CR, Patel NR, Tsiatis AA (1984) Biometrics 40:819
30. Barnard JM, Downs GM (1992) J Chem Inf Comput Sci 32:644
31. Engels MF, Thielemans T, Verbinnen D, Tollenaere JP, Verbeeck
R (2000) J Chem Inf Comput Sci 40:241
894 J Comput Aided Mol Des (2009) 23:883–895
123
32. Tetko IV, Sushko I, Pandey AK, Zhu H, Tropsha A, Papa E,
Oberg T, Todeschini R, Fourches D, Varnek A (2008) J Chem Inf
Model 48:1733
33. Hoffmann P, Warner B (2006) J Pharmacol Toxicol Methods 53:
87
34. Scholz EP, Zitron E, Kiesecker C, Lueck S, Kathofer S, Thomas
D, Weretka S, Peth S, Kreye VA, Schoels W, Katus HA, Kiehn J,
Karle CA (2003) Naunyn Schmiedebergs Arch Pharmacol 368:
404
35. Sanchez-Chapula JA, Ferrer T, Navarro-Polanco RA, Sanguinetti
MC (2003) Mol Pharmacol 63:1051
36. Mitcheson JS, Chen J, Lin M, Culberson C, Sanguinetti MC
(2000) Proc Natl Acad Sci USA 97:12329
37. Buyck C, Tollenaere J, Engels M, De Clerck F (2002) Designing
drugs and crop protectants: processes, problems and solutions.
EuroQSAR 2002
38. Muller-Ehmsen J, Nabauer M, Schwinger RHG (1999) Naunyn
Schmiedebergs Arch Pharmacol 359:60
39. Schiffmann H, Rizouli V, Luers F, Hackmann F, Hoebel D,
Pfahlberg A, Hellige G (2003) Pediatr Res 54:875
40. Hoey A, Amos GJ, Wettwer E, Ravens U (1994) J Cardiovasc
Pharmacol 23:907
41. Budriesi R, Cosimelli B, Ioan P, Lanza CZ, Spinelli D, Chiarini A
(2002) J Med Chem 45:3475
42. Hansen RS, Diness TG, Christ T, Demnitz J, Ravens U, Olesen
SP, Grunnet M (2006) Mol Pharmacol 69:266
43. Wang L, Chiamvimonvat N, Duff HJ (1993) J Pharmacol Exp
Ther 264:1056
44. Shirayama T, Inoue D, Inoue M, Tatsumi T, Yamahara Y,
Asayama J, Katsume H, Nakagawa M (1991) J Pharmacol Exp
Ther 259:884
J Comput Aided Mol Des (2009) 23:883–895 895
123