chapter one population and vital statistics
TRANSCRIPT

1975-20052005
199320002005
5
20062010
2011
Chapter one
Population and Vital Statistics
This chapter contains data about the population size of the Emirate according to the population
censuses conducted during the period along with population estimates for the period
after 2005. Moreover, it includes data on the age and household type structure of the population
besides the demographic, educational, marital and employment characteristics during the censuses
conducted in (1993, 2000 and 2005) and its associated estimates. Additionally, it also contains the
At the same time, births and mortality data are two of the main three essential factors, besides
immigration, that directly affect population growth rate and demographic changes in the society.
Therefore, a special section was devoted under this chapter to cover vital statistics which includes
births and mortality statistics according to the different characteristics such as gender, age,
nationality, marriage contracts and registered divorce cases.
The study of population developments is significantly important because it is the basis upon which
development plans, in several fields such as education, health, labor market, and others, are built.
Understanding population structure of any society in terms of gender, age, occupation, education and
marital status...etc, provides planners, policy and decision makers with needed data and information
for formulating appropriate and adequate plans for all society segments.
Finally, demographic data is compiled through the general population censuses which were regularly
conducted (every 5 years) by Dubai Statistics Center. Currently, the Centre prepares the population
estimates for the periods between two consecutive censuses using the exponential growth rate for
the period from 2006 till 2010, and from 2011 till now the center uses the compound methodology
model In addition, vital statistics for births and deaths are available on a regular basis (quarterly)
from Dubai Health Authority registries and marriages and divorces statistics (monthly) from Dubai
Courts.

0101Table
YearsMalesFemalesTotal
1975128,82154,366183,187
1980187,71488,587276,301
1985247,179123,609370,788
1993406,128204,798610,926
1995478,209211,211689,420
2000611,799250,588862,387
2005989,305332,1481,321,453
2006*1,073,485348,3271,421,812
2007*1,164,576365,2161,529,792
2008*1,263,130382,8431,645,973
2009*1,369,740401,2381,770,978
2010*1,485,046420,4301,905,476
2011*1,515,770487,4002,003,170
2012*1,547,135558,7402,105,875
2013*1,579,145634,7002,213,845
2014*1,613,175714,1752,327,350
2015*1,703,355743,3202,446,675
2016*1,888,520810,0802,698,600
2017*2,088,870887,5852,976,455
2018*2,233,390958,8853,192,275
2019*2,331,8001,024,1003,355,900
* Estimated data for the number of population at the end of the year
19932000200520162018Source: Dubai Statistics Center, Censuses of 1993 , 2000 , 2005 , Dubai Population Statistics 2016-2018
19681975198019851995 Ministry of Economy (Planning Previously) the Censuses of 1968 , 1975 , 1980 , 1985 , 1995
Population by Gender - Emirate of Dubai
0201Table
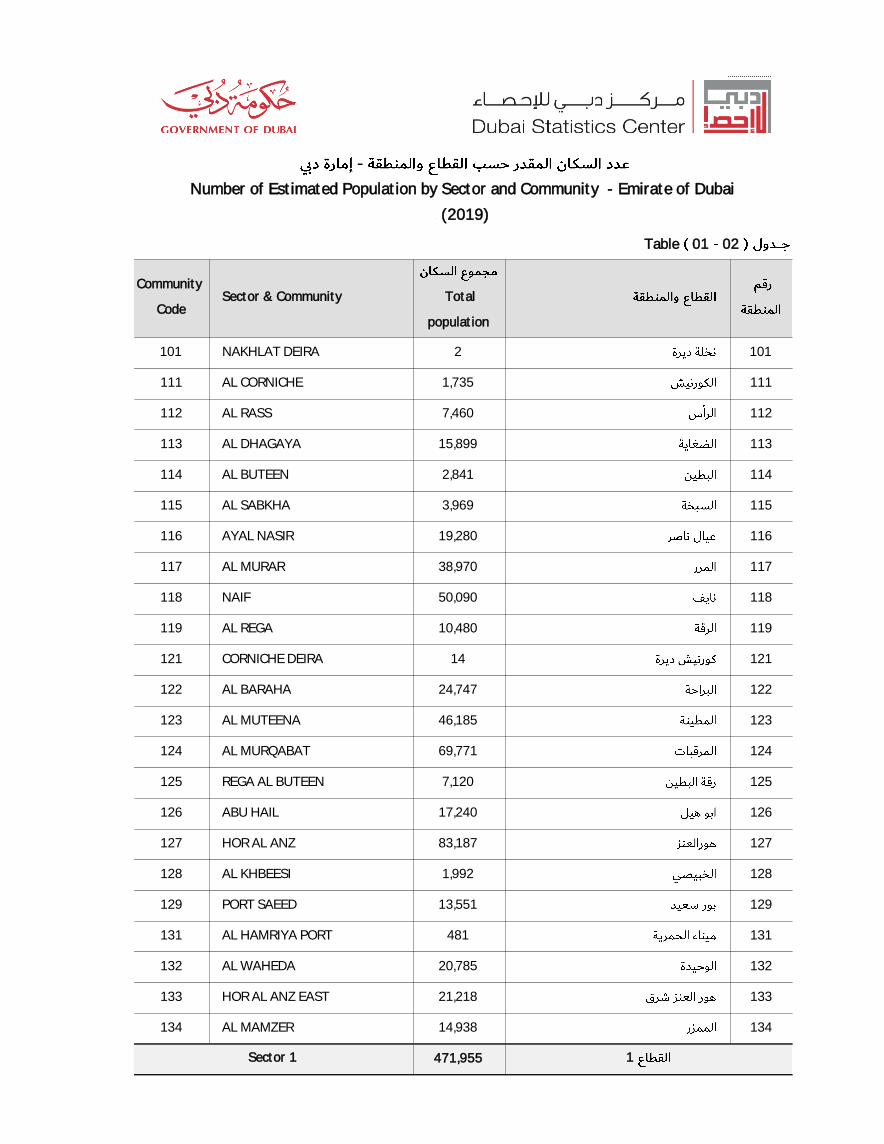
1012NAKHLAT DEIRA101
1111,735AL CORNICHE111
1127,460AL RASS112
11315,899AL DHAGAYA113
1142,841AL BUTEEN114
1153,969AL SABKHA115
11619,280AYAL NASIR116
11738,970AL MURAR117
11850,090NAIF118
11910,480AL REGA119
12114CORNICHE DEIRA121
12224,747AL BARAHA122
12346,185AL MUTEENA123
12469,771AL MURQABAT124
1257,120REGA AL BUTEEN125
12617,240ABU HAIL126
12783,187HOR AL ANZ127
1281,992AL KHBEESI128
12913,551PORT SAEED129
131481AL HAMRIYA PORT131
13220,785AL WAHEDA132
13321,218HOR AL ANZ EAST133
13414,938AL MAMZER134
471,955 1Sector 1
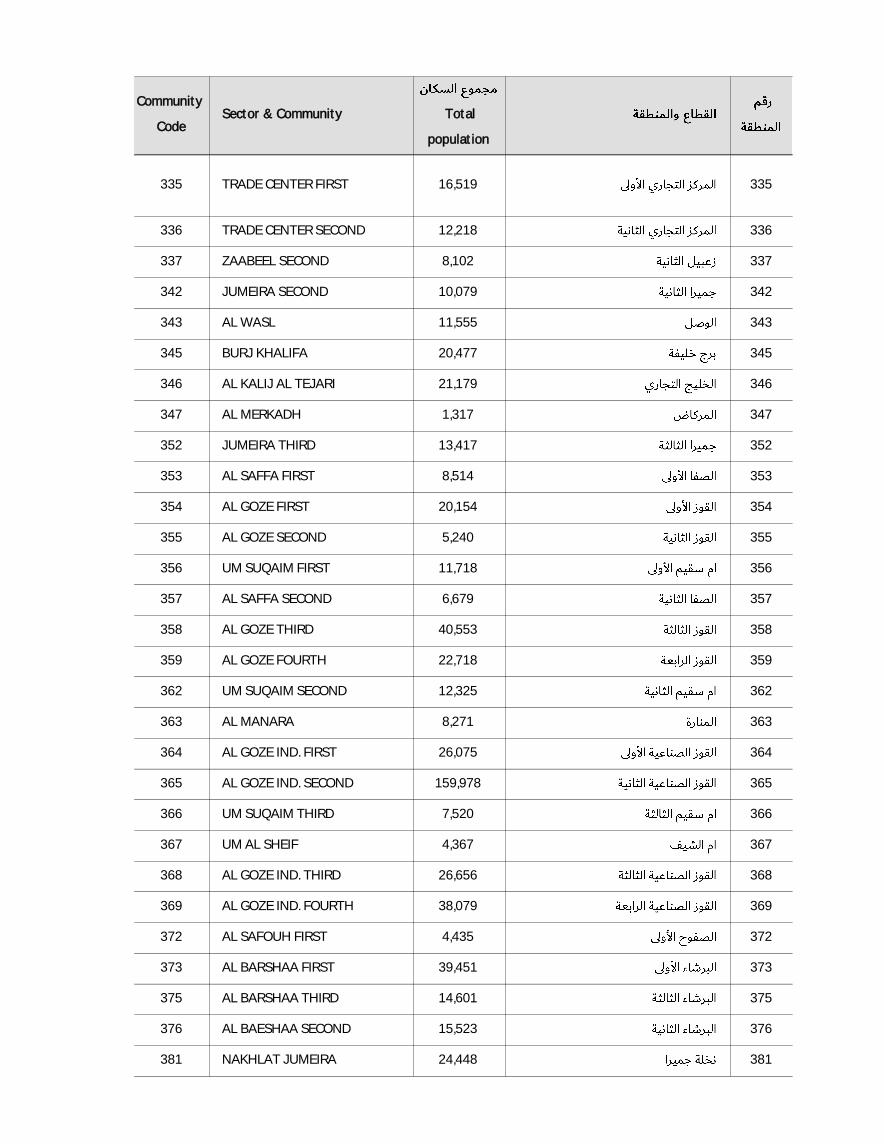
Number of Estimated Population by Sector and Community - Emirate of Dubai
` (2019)
Total
population
Sector & Community Community
Code
Total
population
Sector & Community Community
Code
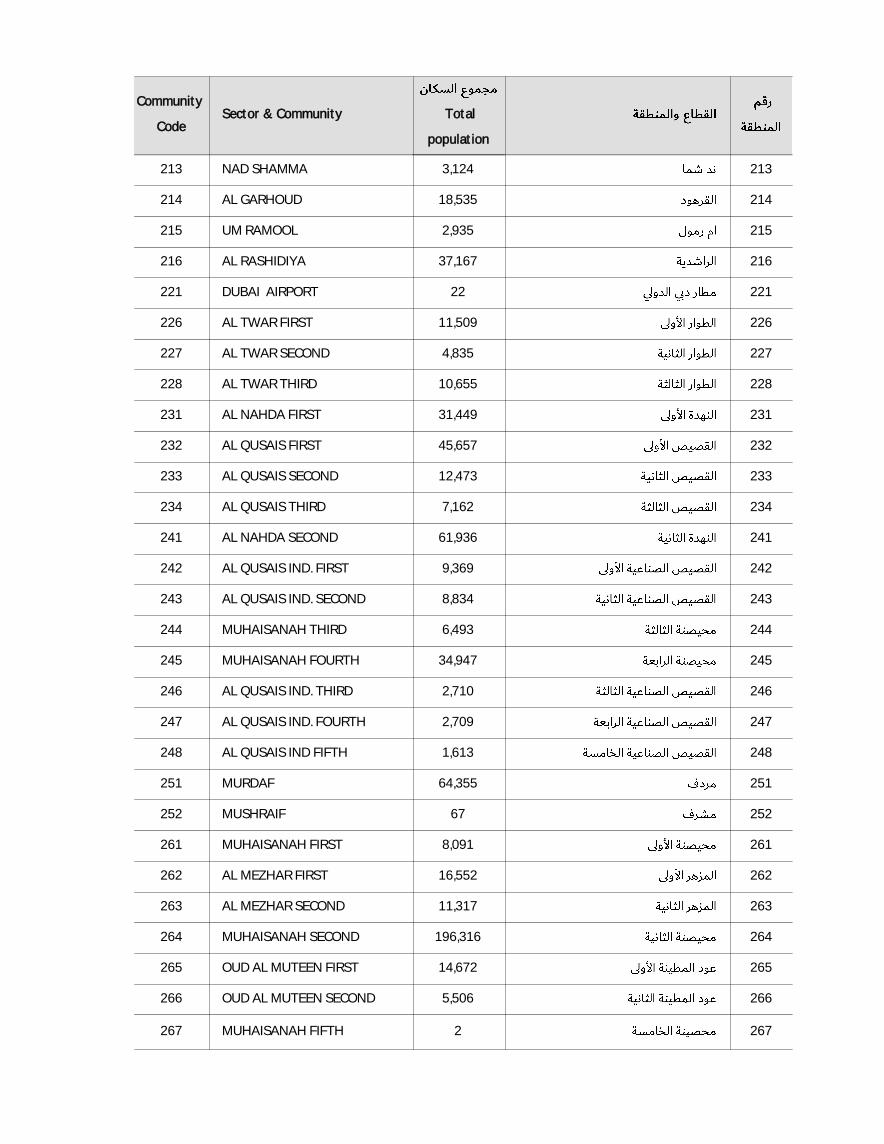
2133,124NAD SHAMMA213
21418,535AL GARHOUD214
2152,935UM RAMOOL215
21637,167AL RASHIDIYA216
22122DUBAI AIRPORT221
22611,509AL TWAR FIRST226
2274,835AL TWAR SECOND227
22810,655AL TWAR THIRD228
23131,449AL NAHDA FIRST231
23245,657AL QUSAIS FIRST232
23312,473AL QUSAIS SECOND233
2347,162AL QUSAIS THIRD234
24161,936AL NAHDA SECOND241
2429,369AL QUSAIS IND. FIRST242
2438,834AL QUSAIS IND. SECOND243
2446,493MUHAISANAH THIRD244
24534,947MUHAISANAH FOURTH245
2462,710AL QUSAIS IND. THIRD246
2472,709AL QUSAIS IND. FOURTH247
2481,613AL QUSAIS IND FIFTH248
25164,355MURDAF251
25267MUSHRAIF252
2618,091MUHAISANAH FIRST261
26216,552AL MEZHAR FIRST262
26311,317AL MEZHAR SECOND263
264196,316MUHAISANAH SECOND 264
26514,672OUD AL MUTEEN FIRST265
2665,506OUD AL MUTEEN SECOND 266
2672MUHAISANAH FIFTH267
Total
population
Sector & Community Community
Code
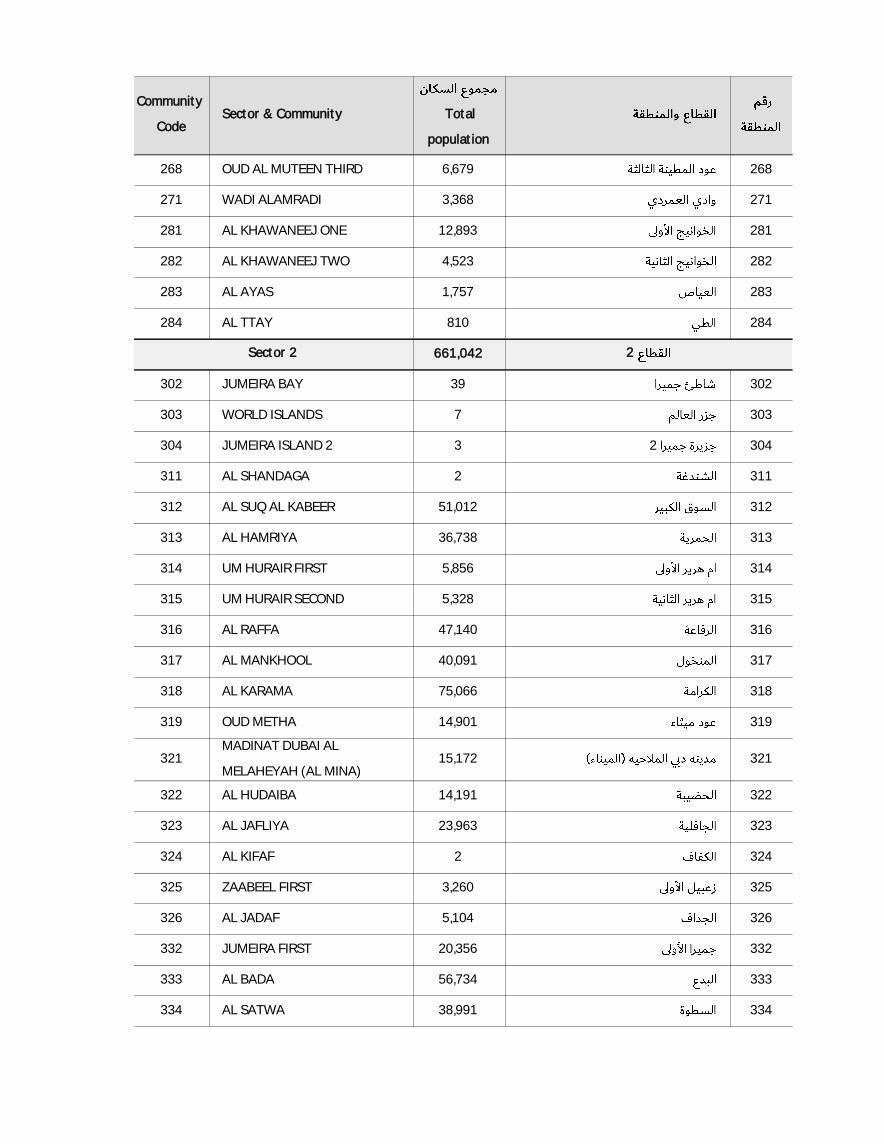
2686,679OUD AL MUTEEN THIRD 268
2713,368WADI ALAMRADI271
28112,893AL KHAWANEEJ ONE281
2824,523AL KHAWANEEJ TWO282
2831,757AL AYAS283
284810AL TTAY284
661,042
30239JUMEIRA BAY302
3037WORLD ISLANDS303
30423JUMEIRA ISLAND 2304
3112AL SHANDAGA311
31251,012AL SUQ AL KABEER312
31336,738AL HAMRIYA313
3145,856UM HURAIR FIRST314
3155,328UM HURAIR SECOND315
31647,140AL RAFFA316
31740,091AL MANKHOOL317
31875,066AL KARAMA318
31914,901OUD METHA319
32115,172MADINAT DUBAI AL
MELAHEYAH (AL MINA)321
32214,191AL HUDAIBA322
32323,963AL JAFLIYA323
3242AL KIFAF324
3253,260ZAABEEL FIRST325
3265,104AL JADAF326
33220,356JUMEIRA FIRST332
33356,734AL BADA333
33438,991AL SATWA334
2Sector 2
Total
population
Sector & Community Community
Code
33516,519TRADE CENTER FIRST335
33612,218TRADE CENTER SECOND336
3378,102ZAABEEL SECOND337
34210,079JUMEIRA SECOND342
34311,555AL WASL343
34520,477BURJ KHALIFA345
34621,179AL KALIJ AL TEJARI346
3471,317AL MERKADH347
35213,417JUMEIRA THIRD352
3538,514AL SAFFA FIRST353
35420,154AL GOZE FIRST354
3555,240AL GOZE SECOND355
35611,718UM SUQAIM FIRST356
3576,679AL SAFFA SECOND357
35840,553AL GOZE THIRD358
35922,718AL GOZE FOURTH359
36212,325UM SUQAIM SECOND362
3638,271AL MANARA363
36426,075AL GOZE IND. FIRST 364
365159,978AL GOZE IND. SECOND 365
3667,520UM SUQAIM THIRD366
3674,367UM AL SHEIF367
36826,656AL GOZE IND. THIRD 368
36938,079AL GOZE IND. FOURTH 369
3724,435AL SAFOUH FIRST372
37339,451AL BARSHAA FIRST373
37514,601AL BARSHAA THIRD375
37615,523AL BAESHAA SECOND376
38124,448NAKHLAT JUMEIRA 381

Total
population
Sector & Community Community
Code
3826,126AL SOFOUH SECOND382
38324,834AL THANYAH FIRST (V. RABIE
SAHRA'A)383
384115AL THANYAH SECOND (JEBEL ALI
HORSE RACING)384
38821,442AL THANYAH THIRD (EMIRATE
HILLS SECOND)388
39261,047MARSA DUBAI (AL MINA AL
SEYAHI) 392
39340,586AL THANYAH FIFTH (EMIRATE
HILLS FIRST) 393
39427,728AL THANYAH FOURTH (EMIRATE
HILLS THIRD) 394
1,248,002
4124,982AL KHEERAN412
4132RAS AL KHOR413
415587AL KHAIRAN FIRST415
41614,216NAD AL HAMAR416
42124,679AL WARQAA FIRST421
42210,689AL WARQAA SECOND422
42314,728AL WARQAA THIRD423
42413,452AL WARQAA FOURTH 424
42560AL WARQAA FIFTH 425
43155WADI ALSHABAK 431
83,450
5015NAKHLAT JABAL ALI501
5024AL WAJEHAH AL BHARIYAH502
5113,492HESSYAN FIRST511
51245HESSYAN SECOND512
51319SAIH SHUAIB 1513
5162,462JABAL ALI INDUSTRIAL THIRD516
51823,000JABAL ALI INDUSTRIAL
SECOND518
4Sector 4
3Sector 3
Total
population
Sector & Community Community
Code
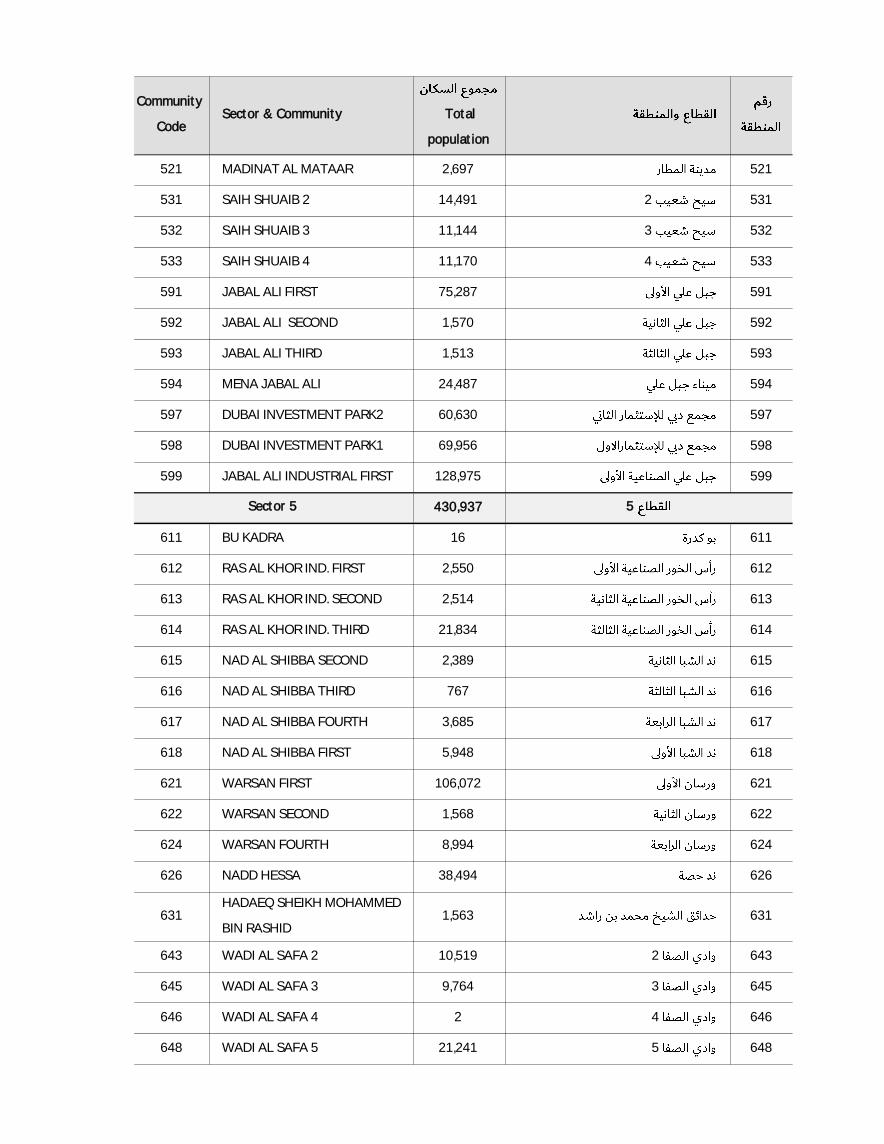
5212,697MADINAT AL MATAAR521
531214,491SAIH SHUAIB 2531
532311,144SAIH SHUAIB 3532
533411,170SAIH SHUAIB 4533
59175,287JABAL ALI FIRST591
5921,570JABAL ALI SECOND592
5931,513JABAL ALI THIRD593
59424,487MENA JABAL ALI594
59760,630DUBAI INVESTMENT PARK2597
59869,956DUBAI INVESTMENT PARK1598
599128,975JABAL ALI INDUSTRIAL FIRST599
430,937
61116BU KADRA611
6122,550RAS AL KHOR IND. FIRST612
6132,514RAS AL KHOR IND. SECOND613
61421,834RAS AL KHOR IND. THIRD614
6152,389NAD AL SHIBBA SECOND615
616767NAD AL SHIBBA THIRD616
6173,685NAD AL SHIBBA FOURTH617
6185,948NAD AL SHIBBA FIRST618
621106,072WARSAN FIRST621
6221,568WARSAN SECOND622
6248,994WARSAN FOURTH624
62638,494NADD HESSA626
6311,563HADAEQ SHEIKH MOHAMMED
BIN RASHID631
643210,519WADI AL SAFA 2643
64539,764WADI AL SAFA 3645
64642WADI AL SAFA 4646
648521,241WADI AL SAFA 5648
5Sector 5
Total
population
Sector & Community Community
Code
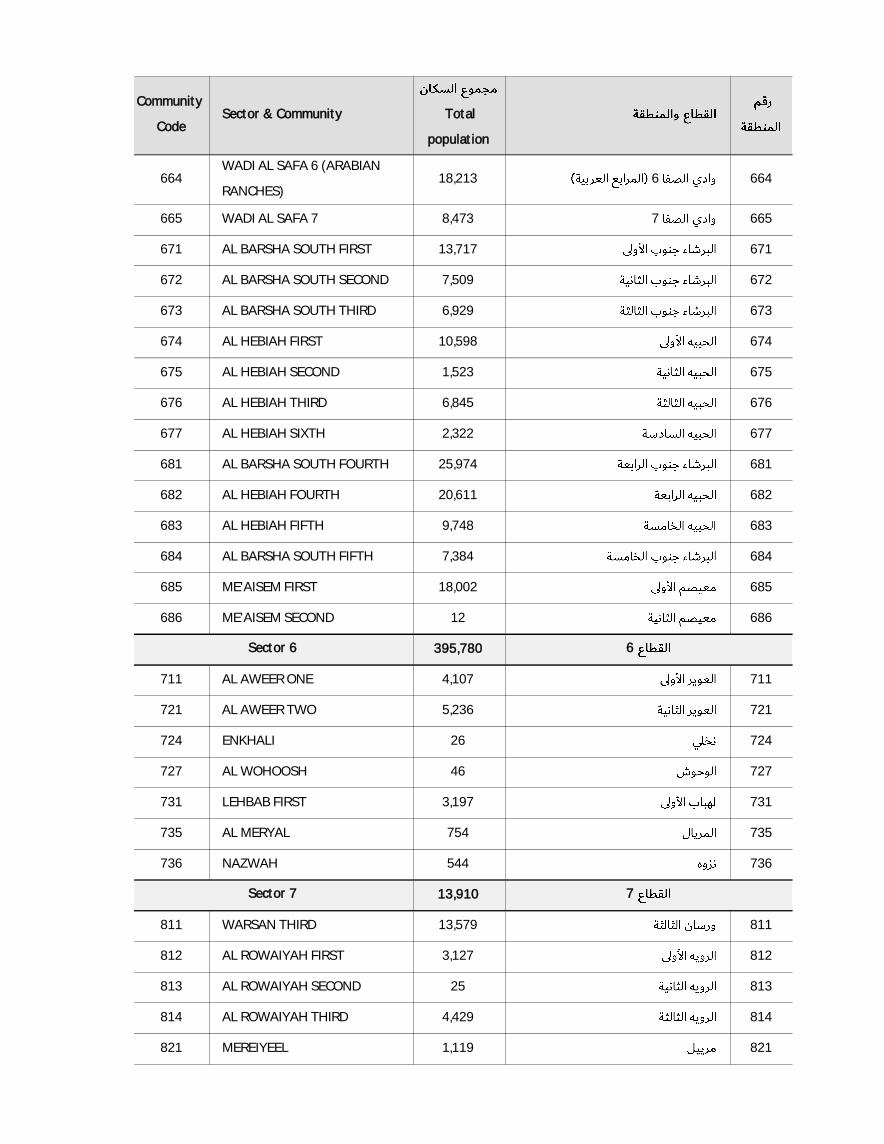
664618,213WADI AL SAFA 6 (ARABIAN
RANCHES)664
66578,473WADI AL SAFA 7665
67113,717AL BARSHA SOUTH FIRST671
6727,509AL BARSHA SOUTH SECOND672
6736,929AL BARSHA SOUTH THIRD673
67410,598AL HEBIAH FIRST674
6751,523AL HEBIAH SECOND675
6766,845AL HEBIAH THIRD676
6772,322AL HEBIAH SIXTH677
68125,974AL BARSHA SOUTH FOURTH681
68220,611AL HEBIAH FOURTH682
6839,748AL HEBIAH FIFTH683
6847,384AL BARSHA SOUTH FIFTH684
68518,002ME'AISEM FIRST685
68612ME'AISEM SECOND686
395,780
7114,107AL AWEER ONE711
7215,236AL AWEER TWO721
72426ENKHALI724
72746AL WOHOOSH727
7313,197LEHBAB FIRST731
735754AL MERYAL735
736544NAZWAH736
13,910
81113,579WARSAN THIRD811
8123,127AL ROWAIYAH FIRST812
81325AL ROWAIYAH SECOND813
8144,429AL ROWAIYAH THIRD814
8211,119MEREIYEEL821
7Sector 7
6Sector 6
Total
population
Sector & Community Community
Code
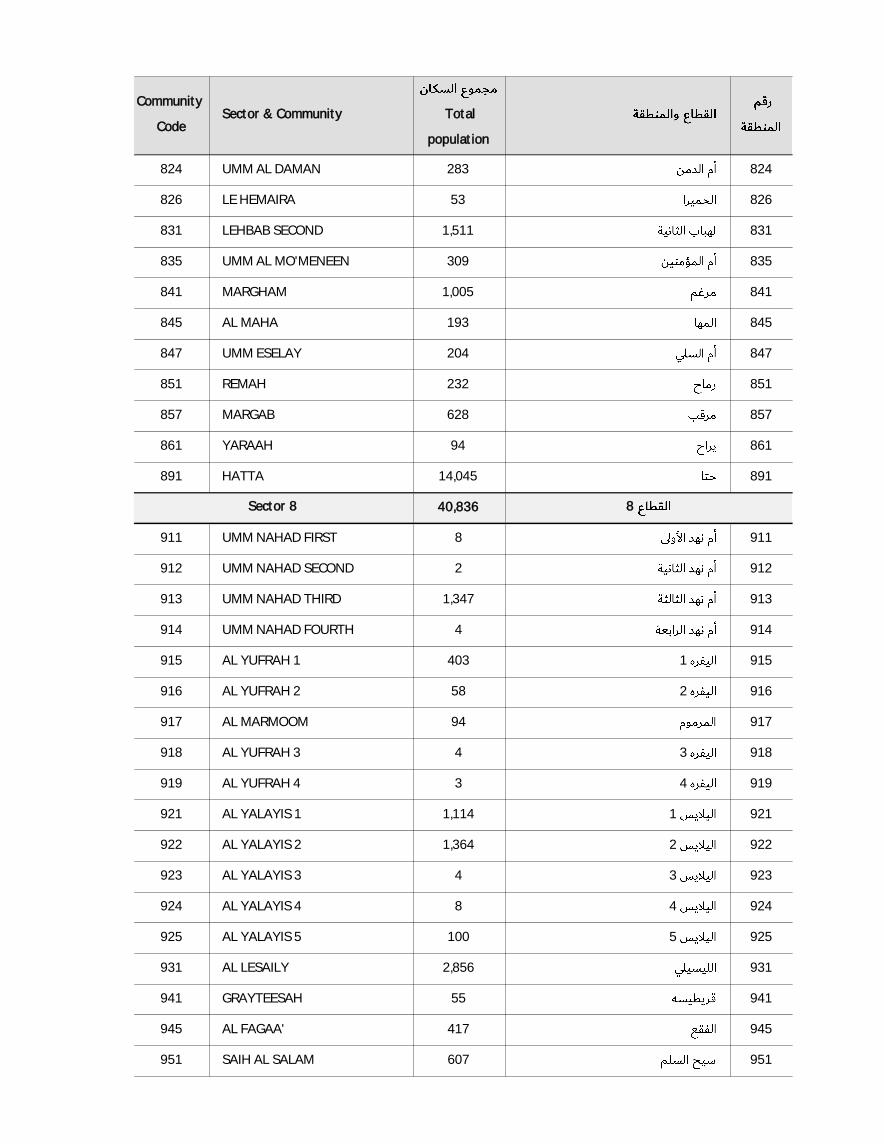
824283UMM AL DAMAN824
82653LE HEMAIRA826
8311,511LEHBAB SECOND831
835309UMM AL MO'MENEEN835
8411,005MARGHAM841
845193AL MAHA845
847204UMM ESELAY847
851232REMAH851
857628MARGAB857
86194YARAAH861
89114,045HATTA891
40,836
9118UMM NAHAD FIRST911
9122UMM NAHAD SECOND912
9131,347UMM NAHAD THIRD913
9144UMM NAHAD FOURTH914
9151403AL YUFRAH 1915
916258AL YUFRAH 2916
91794AL MARMOOM917
91834AL YUFRAH 3918
91943AL YUFRAH 4919
92111,114AL YALAYIS 1921
92221,364AL YALAYIS 2922
92334AL YALAYIS 3923
92448AL YALAYIS 4924
9255100AL YALAYIS 5925
9312,856AL LESAILY931
94155GRAYTEESAH941
945417AL FAGAA'945
951607SAIH AL SALAM951
8Sector 8

Total
population
Sector & Community Community
Code
95635AL HATHMAH956
961665AL SELAL961
9677GHADEER BARASHY967
97116SAIH AL DAHAL971
9750AL O'SHOOSH975
9783SAIH SHUA'ALAH978
981804MUGATRAH981
987110AL LAYAN 1987
98820AL LAYAN 2988
9910HEFAIR991
9,988
3,355,900
Source: Dubai Statistics Center
Yearly Population Estimates
Note: It should be noted that population estimates and
forecasts give an estimated picture of the size of the
population who are permenant residents in the emirate
during a given period of time, which is not fixed,
excluding individuals with Dubai visas and living
outside the emirate. Emiratis include those who have
other emirates' passports and living as perminant
residents in Dubai.
Total
*Preliminary Estimations
9Sector 9
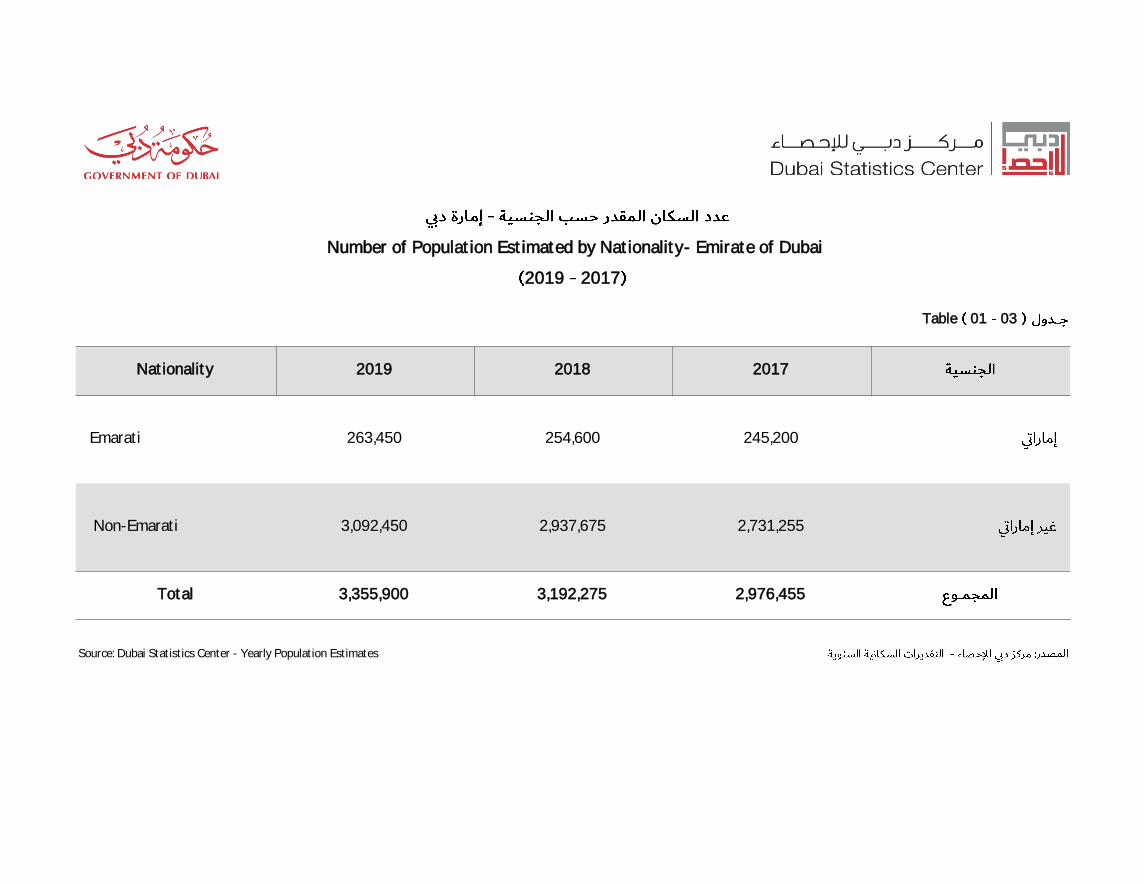
0301Table
201720182019Nationality
245,200254,600263,450Emarati
2,731,2552,937,6753,092,450 Non-Emarati
2,976,4553,192,2753,355,900Total
Source: Dubai Statistics Center - Yearly Population Estimates
Number of Population Estimated by Nationality- Emirate of Dubai
20172019
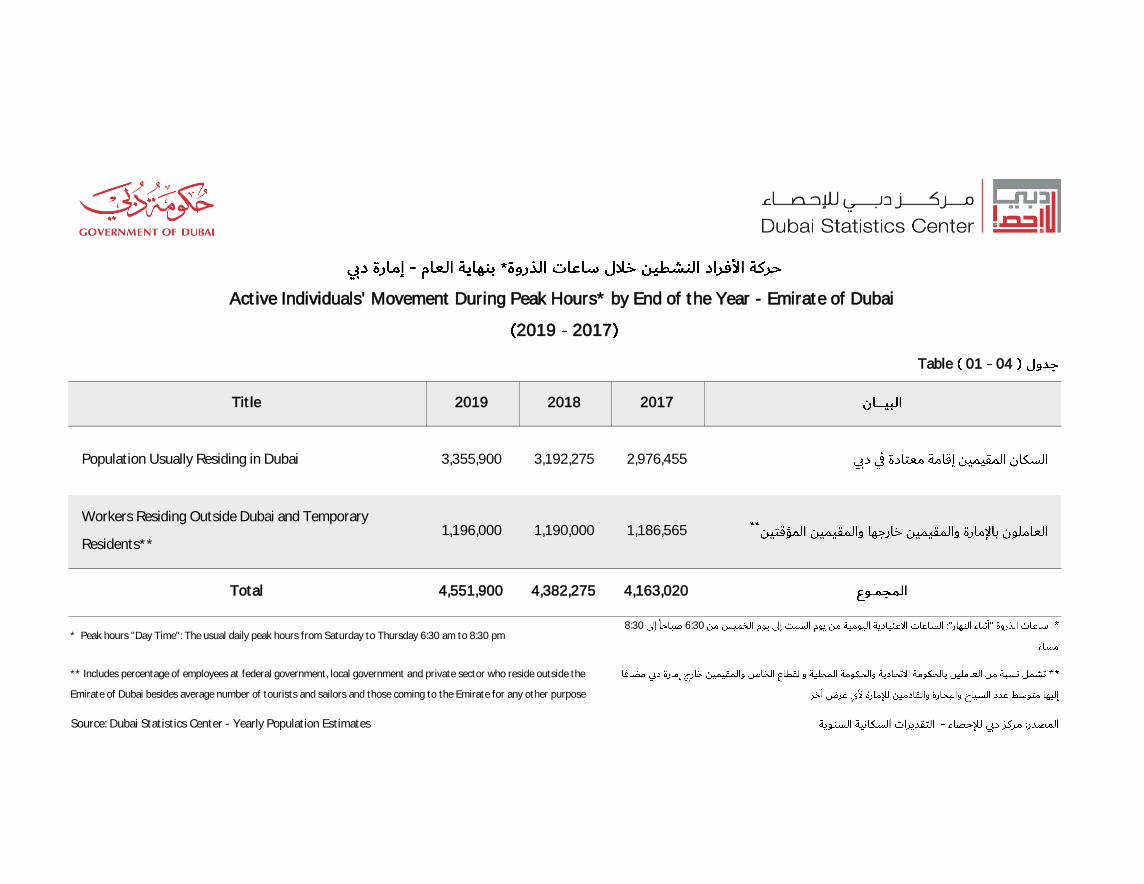
0401Table
201720182019Title
2,976,4553,192,2753,355,900Population Usually Residing in Dubai
1,186,5651,190,0001,196,000Workers Residing Outside Dubai and Temporary
Residents**
4,163,0204,382,2754,551,900Total
Source: Dubai Statistics Center - Yearly Population Estimates
* Peak hours "Day Time": The usual daily peak hours from Saturday to Thursday 6:30 am to 8:30 pm
** Includes percentage of employees at federal government, local government and private sector who reside outside the
Emirate of Dubai besides average number of tourists and sailors and those coming to the Emirate for any other purpose
6:308:30
Active Individuals' Movement During Peak Hours* by End of the Year - Emirate of Dubai
20172019
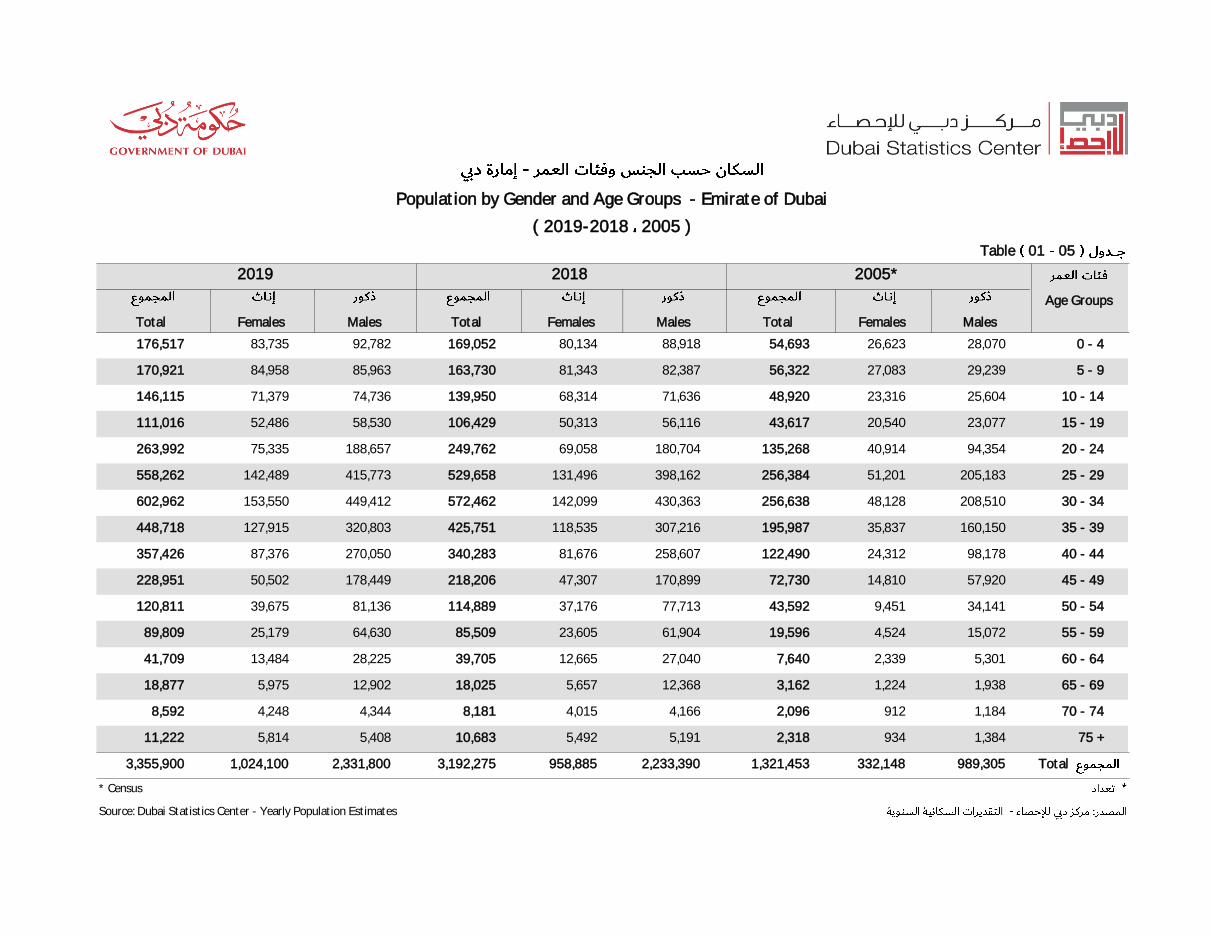
0501Table
Age Groups
MalesFemalesTotalMalesFemalesTotalMalesFemalesTotal
0 - 428,07026,62354,69388,91880,134169,05292,78283,735176,517
5 - 929,23927,08356,32282,38781,343163,73085,96384,958170,921
10 - 1425,60423,31648,92071,63668,314139,95074,73671,379146,115
15 - 1923,07720,54043,61756,11650,313106,42958,53052,486111,016
20 - 2494,35440,914135,268180,70469,058249,762188,65775,335263,992
25 - 29205,18351,201256,384398,162131,496529,658415,773142,489558,262
30 - 34208,51048,128256,638430,363142,099572,462449,412153,550602,962
35 - 39160,15035,837195,987307,216118,535425,751320,803127,915448,718
40 - 4498,17824,312122,490258,60781,676340,283270,05087,376357,426
45 - 4957,92014,81072,730170,89947,307218,206178,44950,502228,951
50 - 5434,1419,45143,59277,71337,176114,88981,13639,675120,811
55 - 5915,0724,52419,59661,90423,60585,50964,63025,17989,809
60 - 645,3012,3397,64027,04012,66539,70528,22513,48441,709
65 - 691,9381,2243,16212,3685,65718,02512,9025,97518,877
70 - 741,1849122,0964,1664,0158,1814,3444,2488,592
75 +1,3849342,3185,1915,49210,6835,4085,81411,222
Total989,305332,1481,321,4532,233,390958,8853,192,2752,331,8001,024,1003,355,900
* Census
Source: Dubai Statistics Center - Yearly Population Estimates
Population by Gender and Age Groups - Emirate of Dubai
( 2019-2018 2005 )
2005*20182019
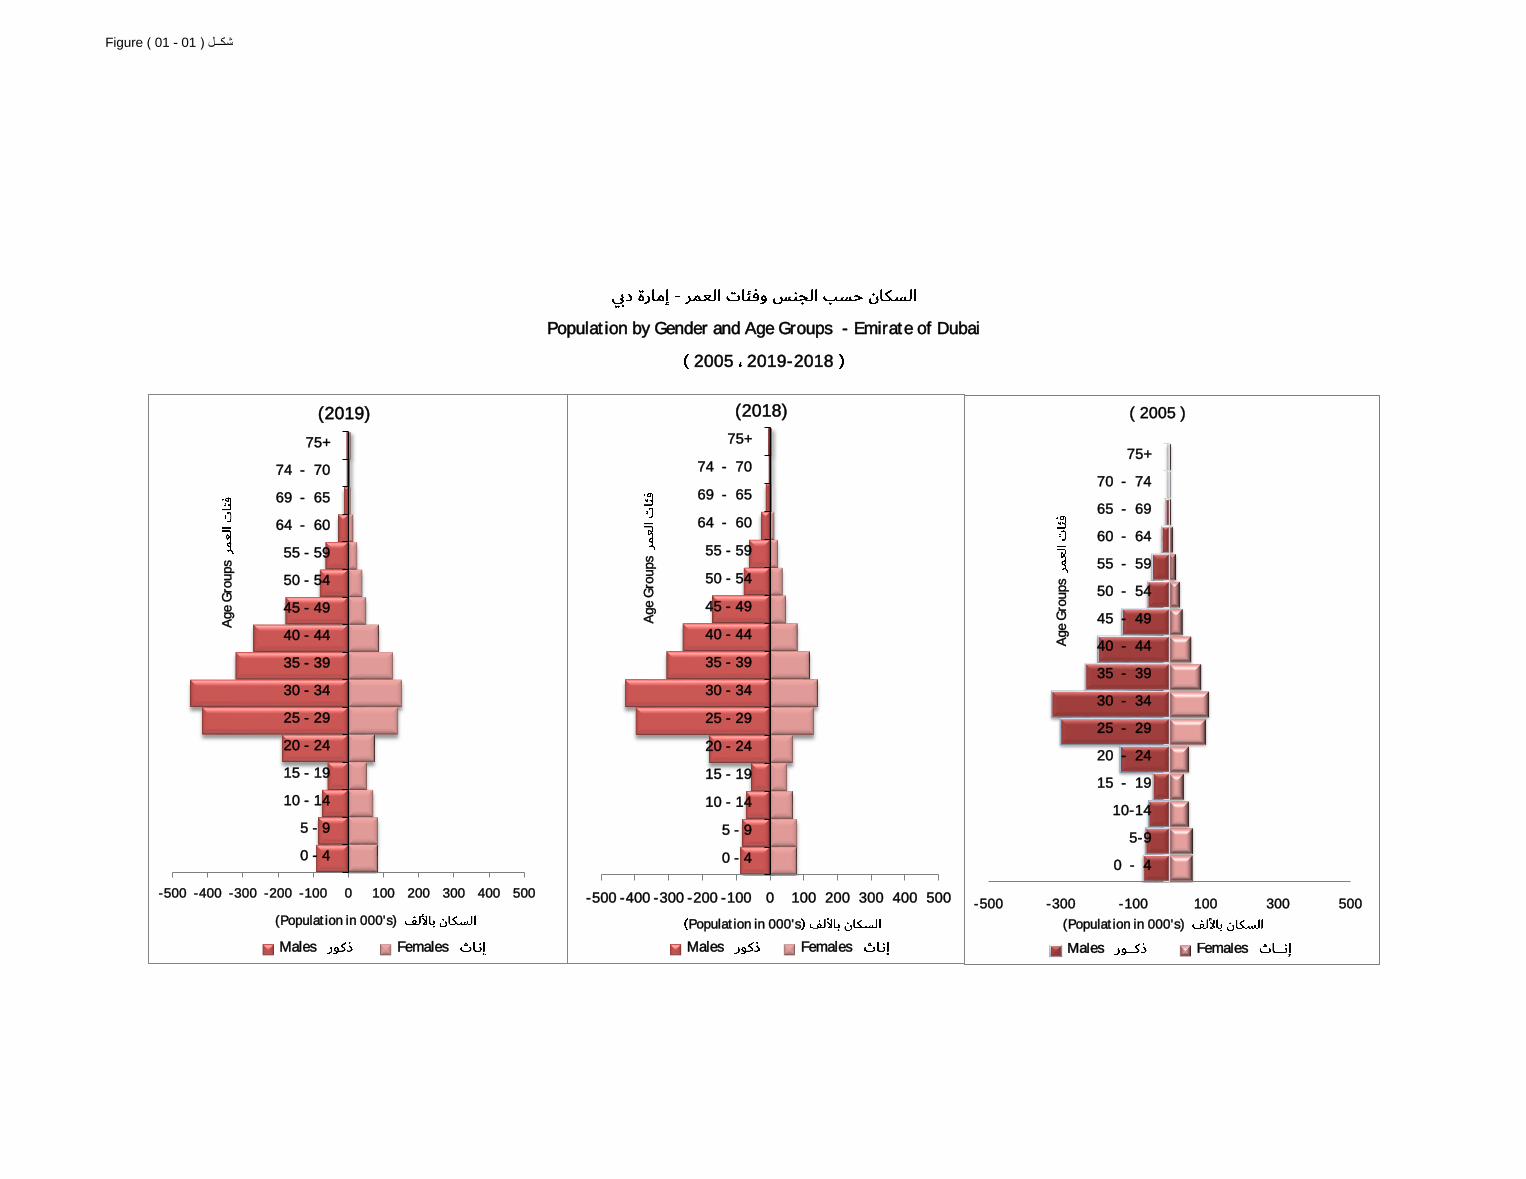
Figure ( 01 - 01 )شكــل
Population by Gender and Age Groups - Emirate of Dubai
2019-20182005
-500 -300 -100 100 300 500
0 - 4
5-9
10-14
15 - 19
20 - 24
25 - 29
30 - 34
35 - 39
40 - 44
45 - 49
50 - 54
55 - 59
60 - 64
65 - 69
70 - 74
75+
Males Females
Ag
e G
rou
ps
( 2005 )
(Population in 000's)
-500 -400 -300 -200 -100 0 100 200 300 400 500
0 - 4
5 - 9
10 - 14
15 - 19
20 - 24
25 - 29
30 - 34
35 - 39
40 - 44
45 - 49
50 - 54
55 - 59
64 - 60
69 - 65
74 - 70
75+
(2018)
Males Females
Population in 000's
Ag
e G
rou
ps
-500 -400 -300 -200 -100 0 100 200 300 400 500
0 - 4
5 - 9
10 - 14
15 - 19
20 - 24
25 - 29
30 - 34
35 - 39
40 - 44
45 - 49
50 - 54
55 - 59
64 - 60
69 - 65
74 - 70
75+
(2019)
Males Females
(Population in 000's)
Ag
e G
rou
ps
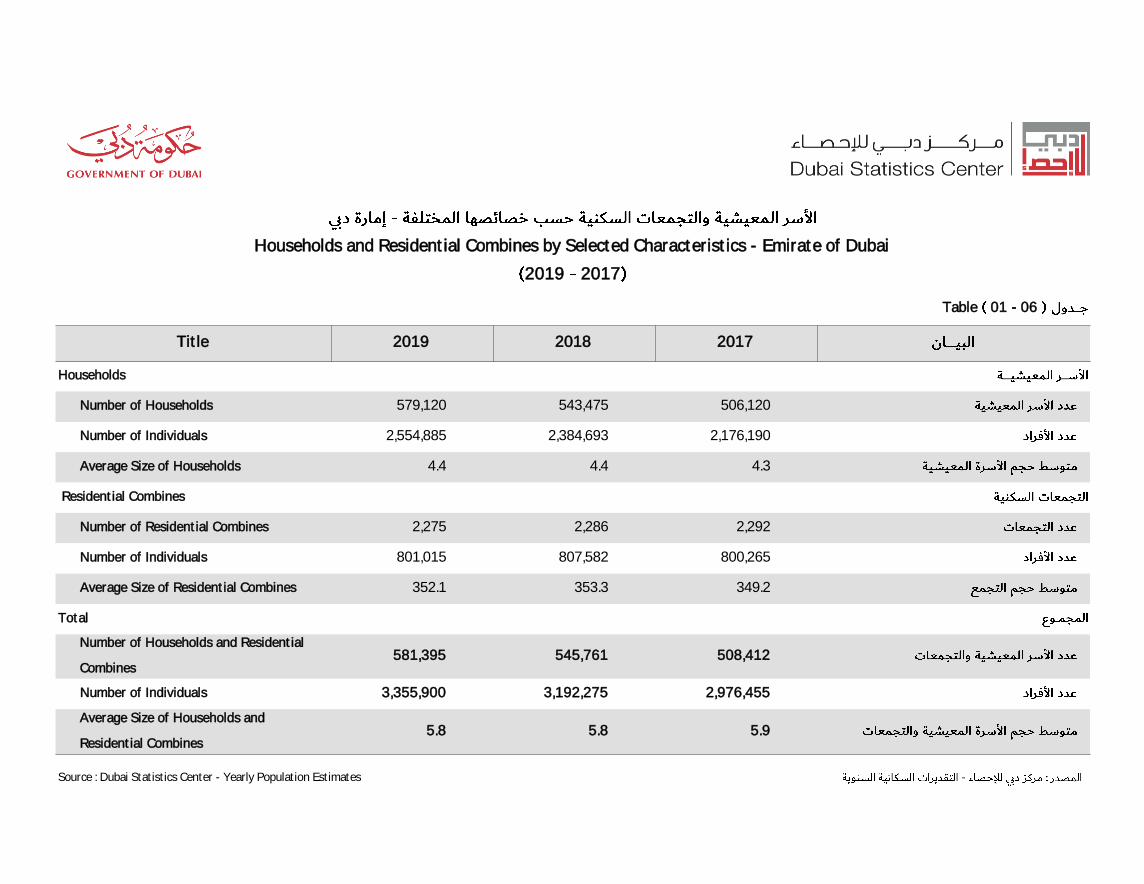
0601Table
201720182019Title
Households
506,120543,475579,120Number of Households
2,176,1902,384,6932,554,885Number of Individuals
4.34.44.4Average Size of Households
Residential Combines
2,2922,2862,275Number of Residential Combines
800,265807,582801,015Number of Individuals
349.2353.3352.1Average Size of Residential Combines
Total
508,412545,761581,395Number of Households and Residential
Combines
2,976,4553,192,2753,355,900Number of Individuals
5.95.85.8Average Size of Households and
Residential Combines
Source : Dubai Statistics Center - Yearly Population Estimates
Households and Residential Combines by Selected Characteristics - Emirate of Dubai
20172019
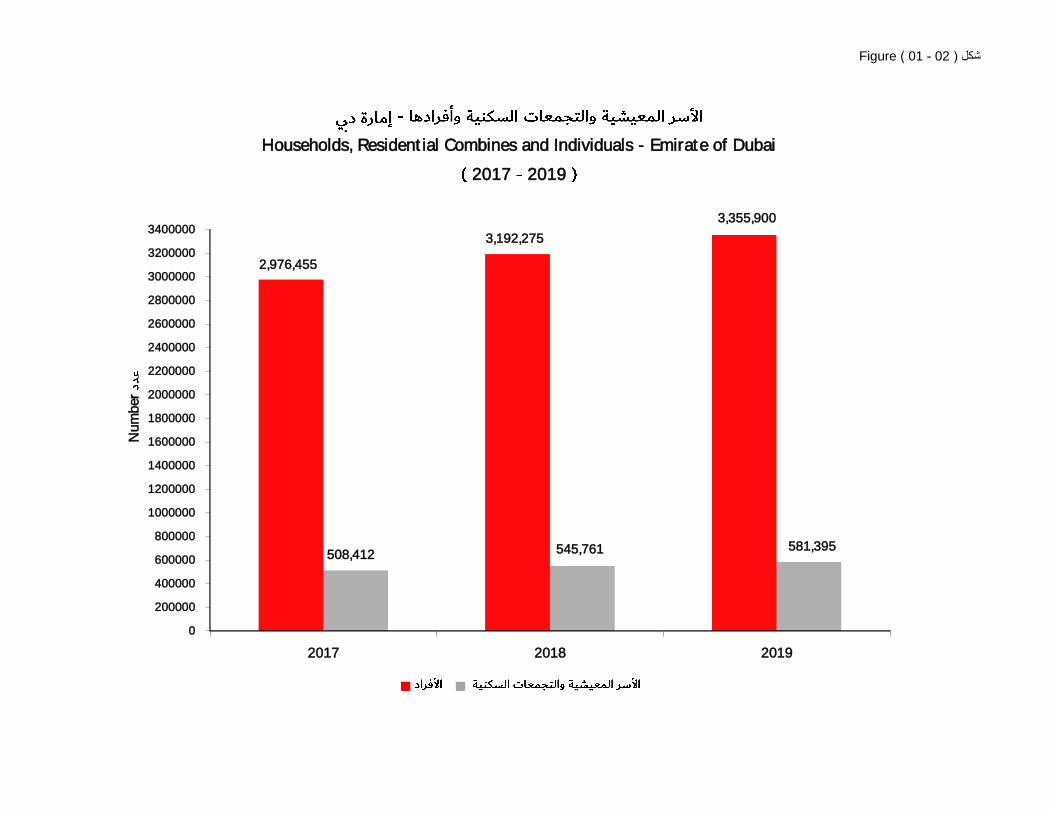
Figure ( 01 - 02 )شكل
0
200000
400000
600000
800000
1000000
1200000
1400000
1600000
1800000
2000000
2200000
2400000
2600000
2800000
3000000
3200000
3400000
2017 2018 2019
2,976,455
3,192,275
3,355,900
508,412 545,761 581,395
Households, Residential Combines and Individuals - Emirate of Dubai
20192017
Nu
mb
er
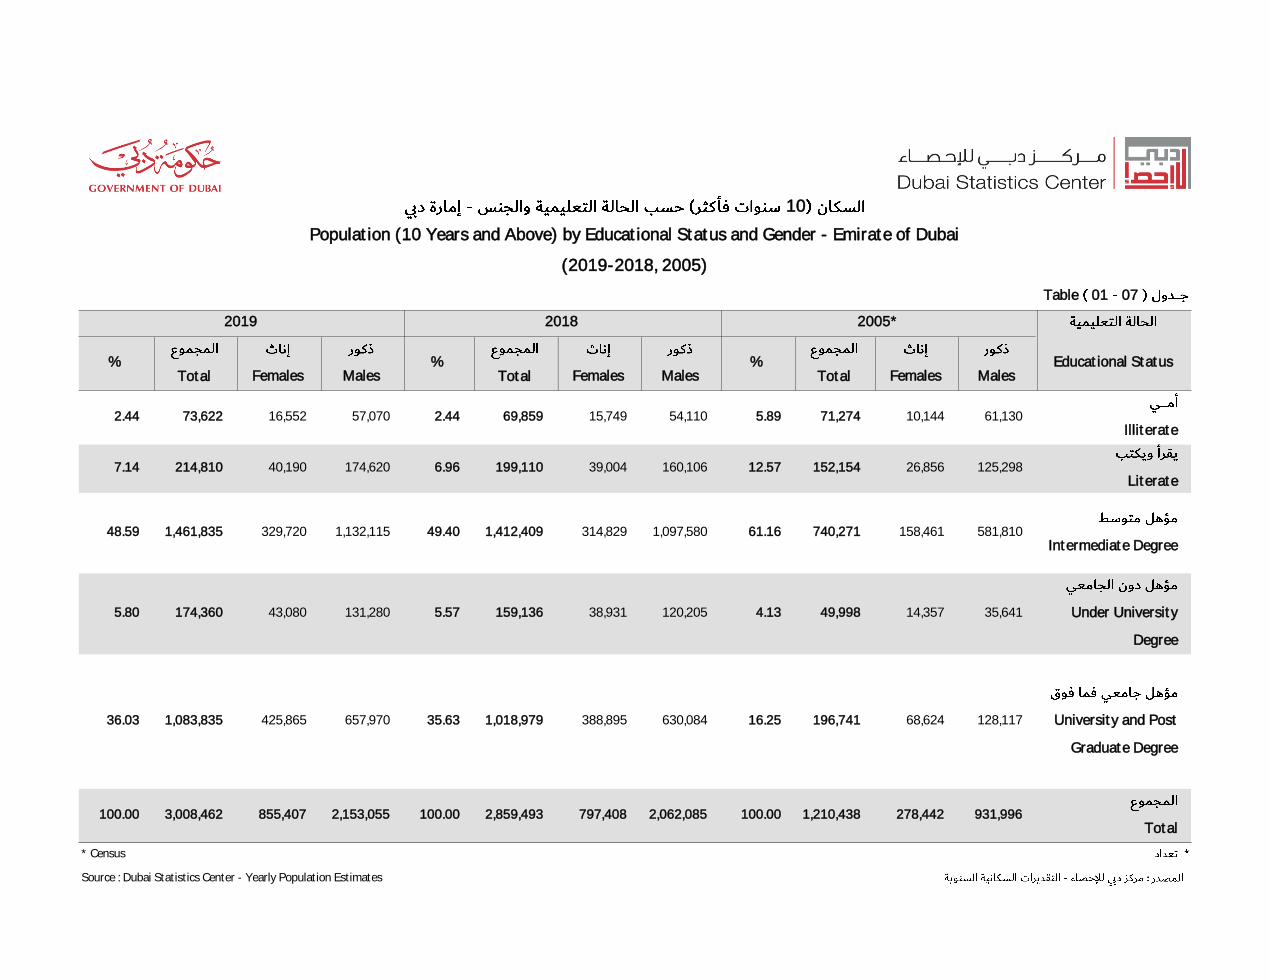
0701Table
MalesFemalesTotalMalesFemalesTotalMalesFemalesTotal
Illiterate61,13010,14471,2745.8954,11015,74969,8592.4457,07016,55273,6222.44
Literate125,29826,856152,15412.57160,10639,004199,1106.96174,62040,190214,8107.14
Intermediate Degree581,810158,461740,27161.161,097,580314,8291,412,40949.401,132,115329,7201,461,83548.59
Under University
Degree
35,64114,35749,9984.13120,20538,931159,1365.57131,28043,080174,3605.80
University and Post
Graduate Degree
128,11768,624196,74116.25630,084388,8951,018,97935.63657,970425,8651,083,83536.03
Total931,996278,4421,210,438100.002,062,085797,4082,859,493100.002,153,055855,4073,008,462100.00
* Census
Source : Dubai Statistics Center - Yearly Population Estimates
Educational Status%%%
10
Population (10 Years and Above) by Educational Status and Gender - Emirate of Dubai
(2019-2018, 2005)
2005*20182019
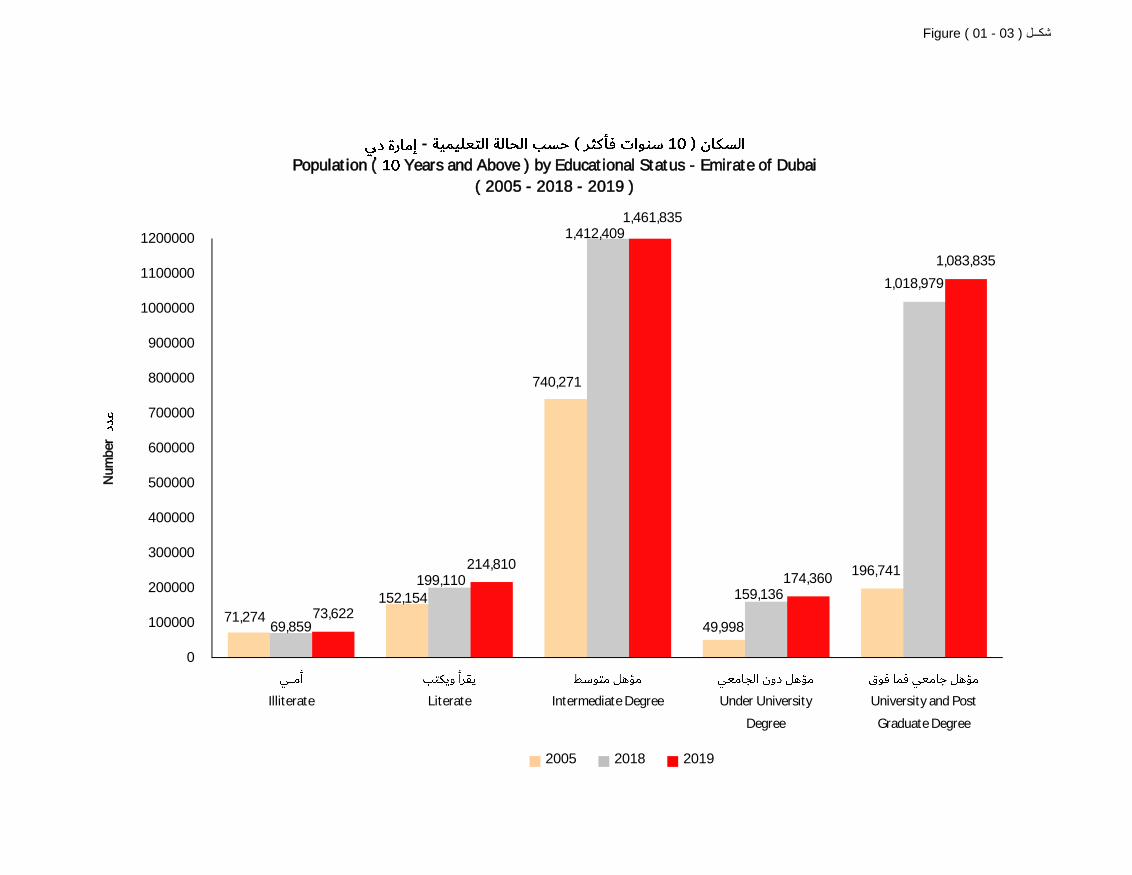
Figure ( 01 - 03 ) شكــل
0
100000
200000
300000
400000
500000
600000
700000
800000
900000
1000000
1100000
1200000
Illiterate Literate Intermediate Degree Under University
Degree
University and Post
Graduate Degree
71,274
152,154
740,271
49,998
196,741
69,859
199,110
1,412,409
159,136
1,018,979
73,622
214,810
1,461,835
174,360
1,083,835
2005 2018 2019
-
Population ( Years and Above ) by Educational Status - Emirate of Dubai
( 2005 - 2018 - 2019 )
Nu
mb
er
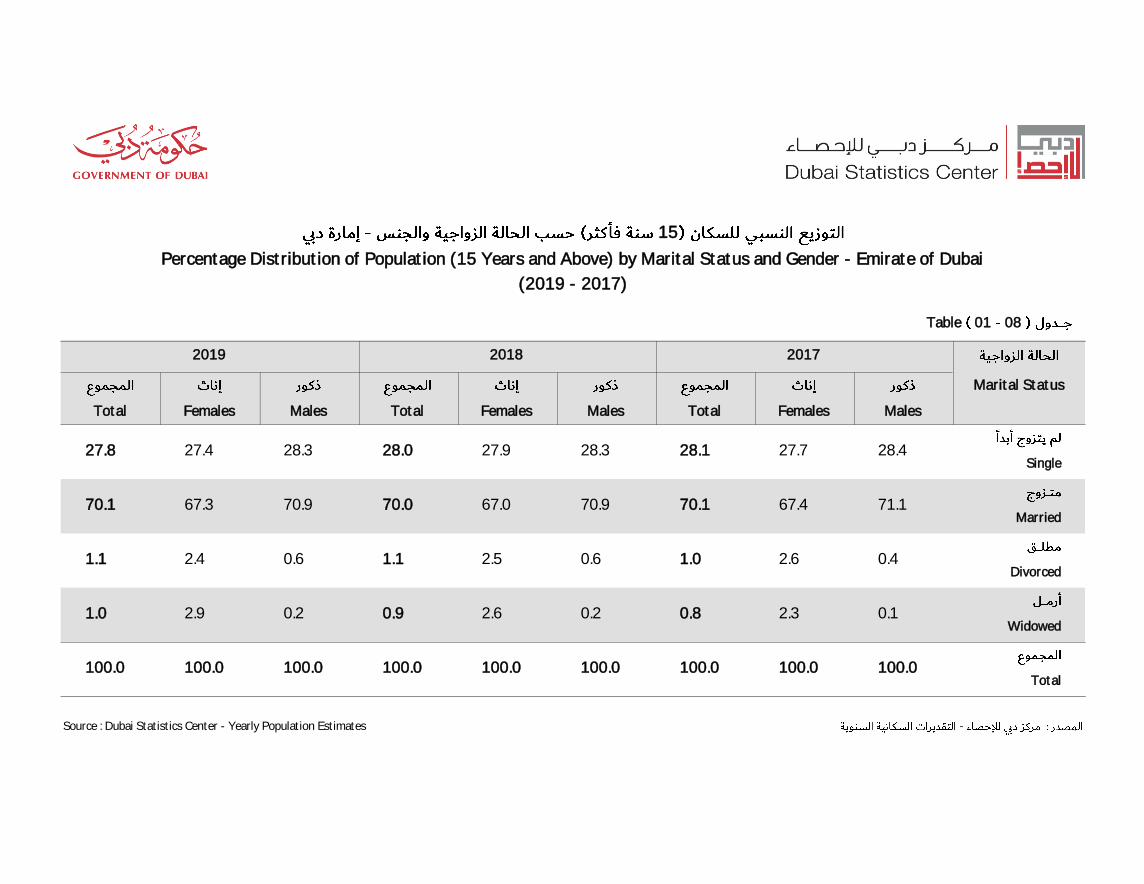
MalesFemalesTotalMalesFemalesTotalMalesFemalesTotal
Single28.427.728.128.327.928.028.327.427.8
Married71.167.470.170.967.070.070.967.370.1
Divorced0.42.61.00.62.51.10.62.41.1
Widowed0.12.30.80.22.60.90.22.91.0
Total100.0100.0100.0100.0100.0100.0100.0100.0100.0
20182019
Source : Dubai Statistics Center - Yearly Population Estimates
2017
Percentage Distribution of Population (15 Years and Above) by Marital Status and Gender - Emirate of Dubai
15
(2019 - 2017)
Marital Status
0801Table
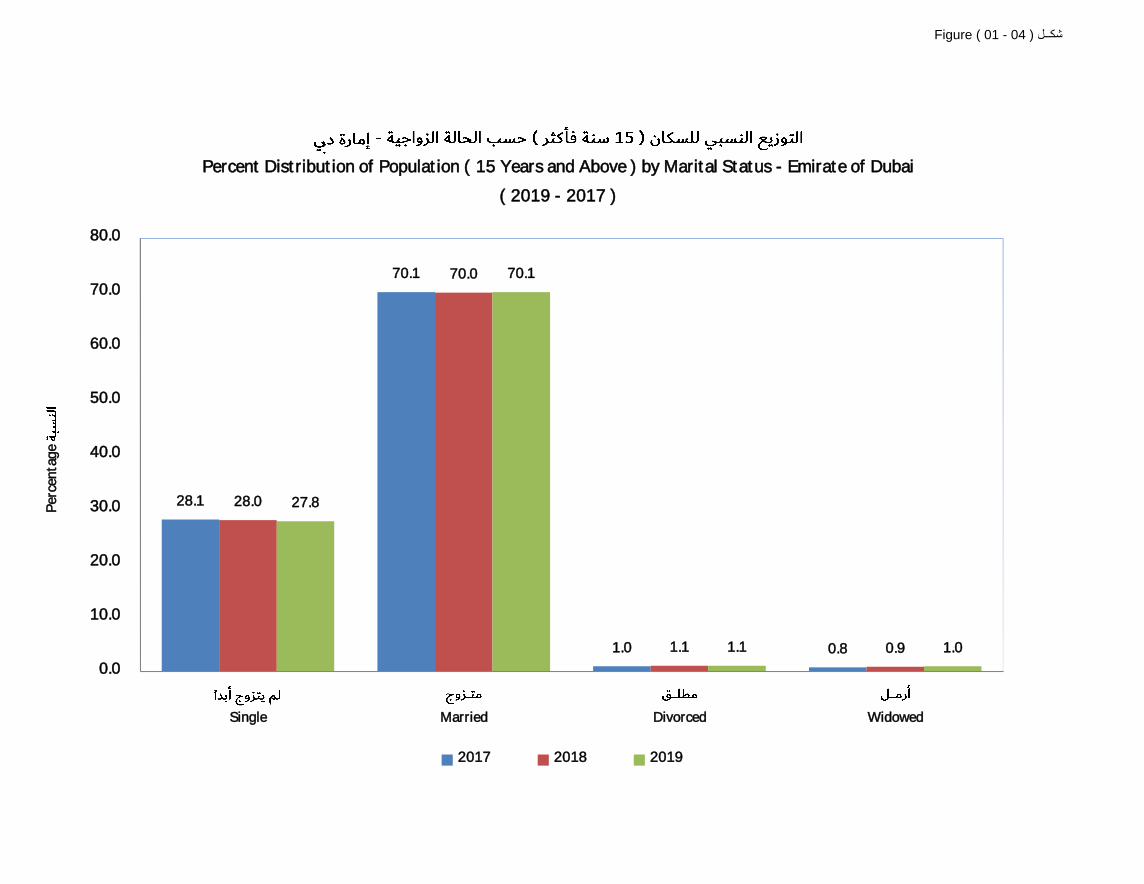
Figure ( 01 - 04 ) شكــل
Percent Distribution of Population ( 15 Years and Above ) by Marital Status - Emirate of Dubai
( 2019 - 2017 )
28.1
70.1
1.0 0.8
28.0
70.0
1.1 0.9
27.8
70.1
1.1 1.0
0.0
10.0
20.0
30.0
40.0
50.0
60.0
70.0
80.0
Single Married Divorced Widowed
2017 2018 2019
Per
cen
tag
e

0901Table
Years
MalesFemalesTotalMalesFemalesTotalMalesFemalesTotal Economic Status
Labour Force (Active Population)
94.352.882.795.153.082.894.753.182.4Employed Persons
0.30.80.40.20.80.40.20.70.4Unemployed Persons
94.653.683.195.353.883.294.953.882.8Total
Out of Labour Force (Inactive
Population)
-33.09.3-34.310.0-34.310.1House Wives
3.37.34.43.28.24.63.48.95.0Students
0.62.11.00.31.40.60.51.50.8Disabled and Over Age
1.54.02.21.22.31.61.21.51.3Unwilling to Work and Others
5.446.416.94.746.216.85.146.217.2Total
100.0100.0100.0100.0100.0100.0100.0100.0100.0Grand Total
20172019 2018
Source : Dubai Statistics Center - Labor Force Survey
15
Percentage Distribution of Population (15 Years and Above) by Economic Status and Gender - Emirate of Dubai
(2019 - 2017)
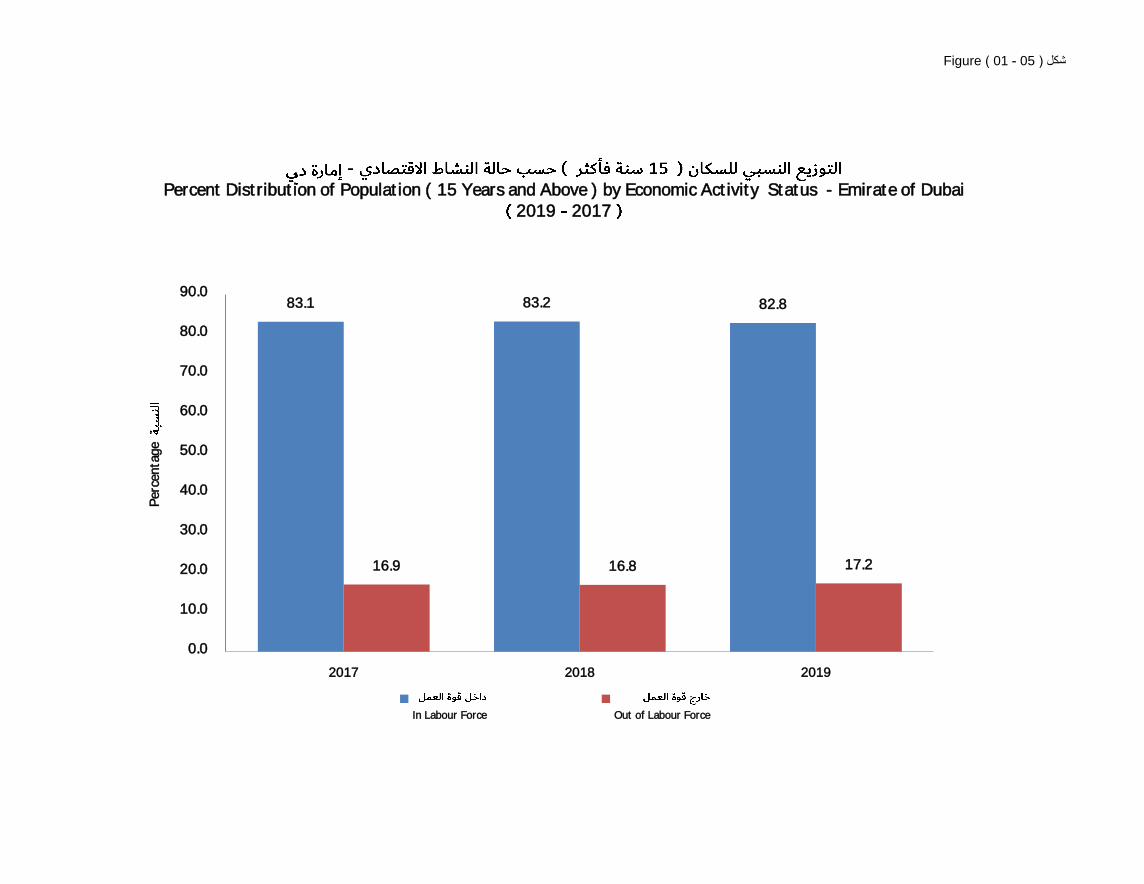
Figure ( 01 - 05 )شكل
83.1 83.2 82.8
16.9 16.8 17.2
0.0
10.0
20.0
30.0
40.0
50.0
60.0
70.0
80.0
90.0
2017 2018 2019
In Labour Force Out of Labour Force
Percent Distribution of Population ( 15 Years and Above ) by Economic Activity Status - Emirate of Dubai20172019
Per
cen
tag
e
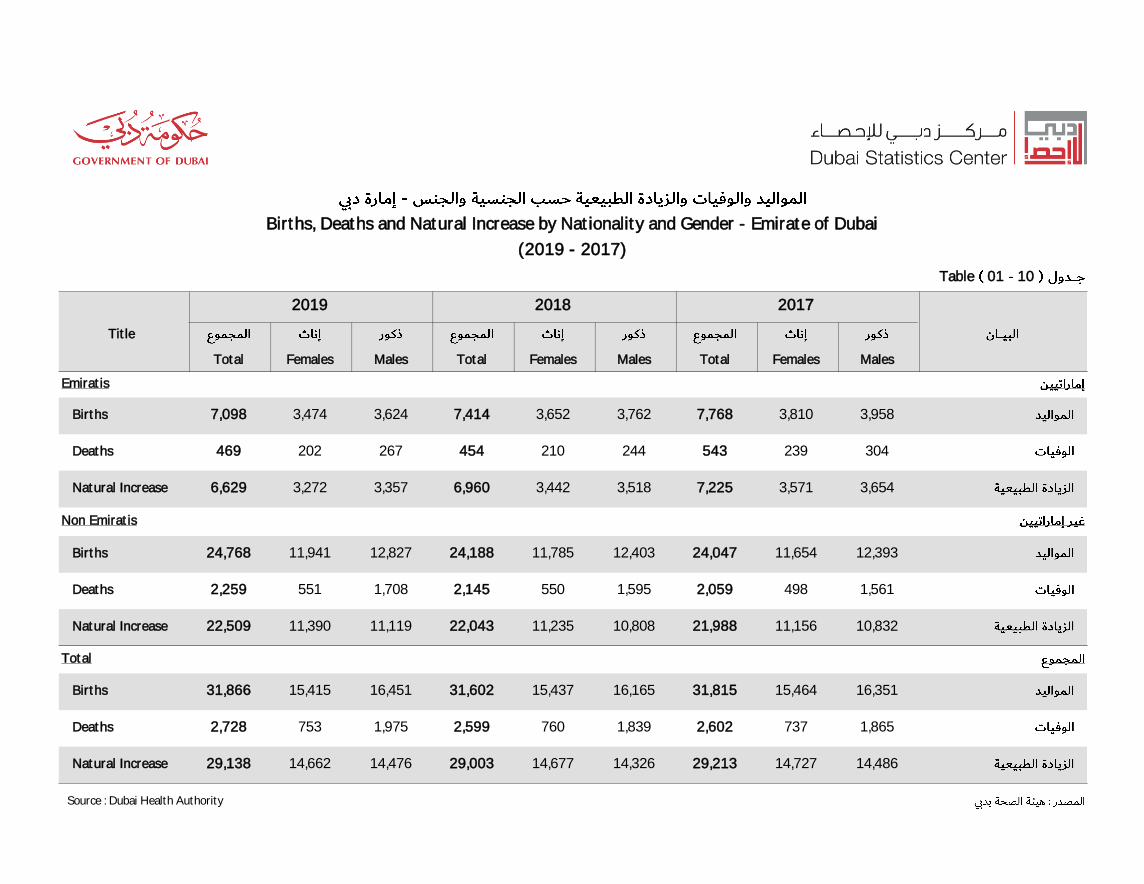
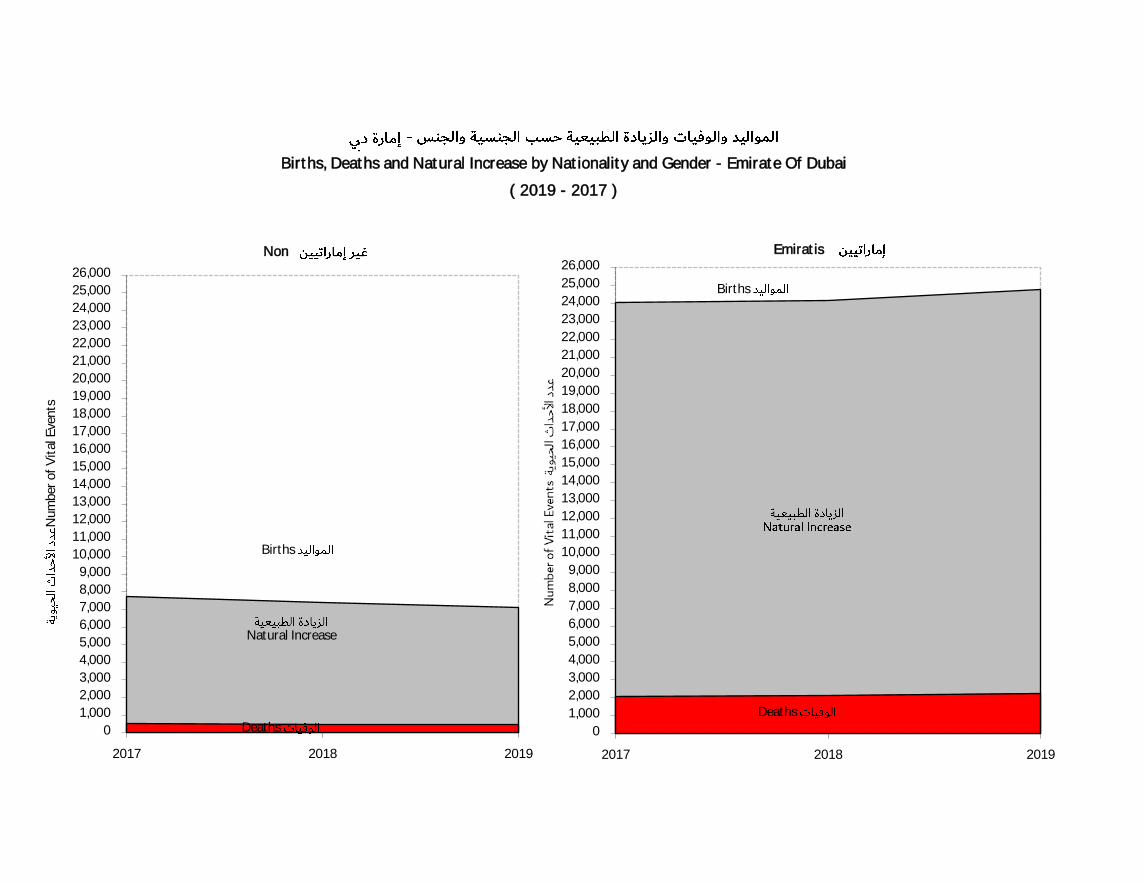
Births, Deaths and Natural Increase by Nationality and Gender - Emirate of Dubai
(2019 - 2017)
1001Table
Title
MalesFemalesTotalMalesFemalesTotalMalesFemalesTotal
Emiratis
3,9583,8107,7683,7623,6527,4143,6243,4747,098Births
304239543244210454267202469Deaths
3,6543,5717,2253,5183,4426,9603,3573,2726,629Natural Increase
Non Emiratis
12,39311,65424,04712,40311,78524,18812,82711,94124,768Births
1,5614982,0591,5955502,1451,7085512,259Deaths
10,83211,15621,98810,80811,23522,04311,11911,39022,509Natural Increase
Total
16,35115,46431,81516,16515,43731,60216,45115,41531,866Births
1,8657372,6021,8397602,5991,9757532,728Deaths
14,48614,72729,21314,32614,67729,00314,47614,66229,138Natural Increase
Source : Dubai Health Authority
201720182019
0
1,000
2,000
3,000
4,000
5,000
6,000
7,000
8,000
9,000
10,000
11,000
12,000
13,000
14,000
15,000
16,000
17,000
18,000
19,000
20,000
21,000
22,000
23,000
24,000
25,000
26,000
2017 2018 2019
Nu
mb
er o
f V
ital
Eve
nts
0
1,000
2,000
3,000
4,000
5,000
6,000
7,000
8,000
9,000
10,000
11,000
12,000
13,000
14,000
15,000
16,000
17,000
18,000
19,000
20,000
21,000
22,000
23,000
24,000
25,000
26,000
2017 2018 2019
Nu
mb
er o
f V
ital
Eve
nts
Natural Increase
Births
Deaths
Births, Deaths and Natural Increase by Nationality and Gender - Emirate Of Dubai
( 2019 - 2017 )
Deaths الوفيات
Births
Deaths
Emiratis Non
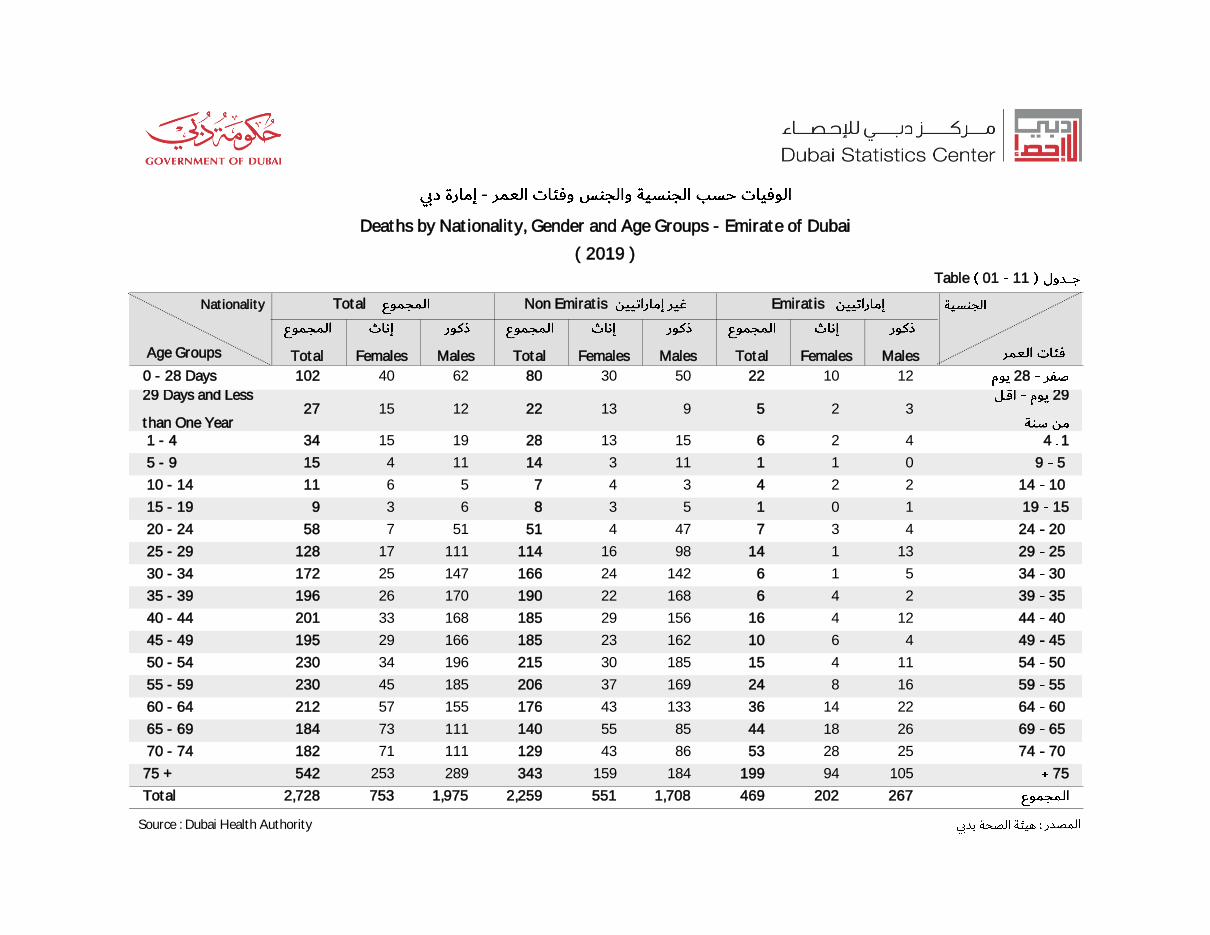
( 2019 )
1101Table
Nationality
MalesFemalesTotalMalesFemalesTotalMalesFemalesTotal Age Groups
2812102250308062401020 - 28 Days
2932591322121527
29 Days and Less
than One Year 14426151328191534 1 - 4
590111131411415 5 - 9
10142243475611 10 - 14
1519101538639 15 - 19
20244374745151758 20 - 24
252913114981611411117128 25 - 29
30345161422416614725172 30 - 34
35392461682219017026196 35 - 39
4044124161562918516833201 40 - 44
454946101622318516629195 45 - 49
5054114151853021519634230 50 - 54
5559168241693720618545230 55 - 59
60642214361334317615557212 60 - 64
6569261844855514011173184 65 - 69
7074252853864312911171182 70 - 74
751059419918415934328925354275 +
2672024691,7085512,2591,9757532,728Total
Source : Dubai Health Authority
Deaths by Nationality, Gender and Age Groups - Emirate of Dubai
EmiratisNon EmiratisTotal
(2019 - 2017)
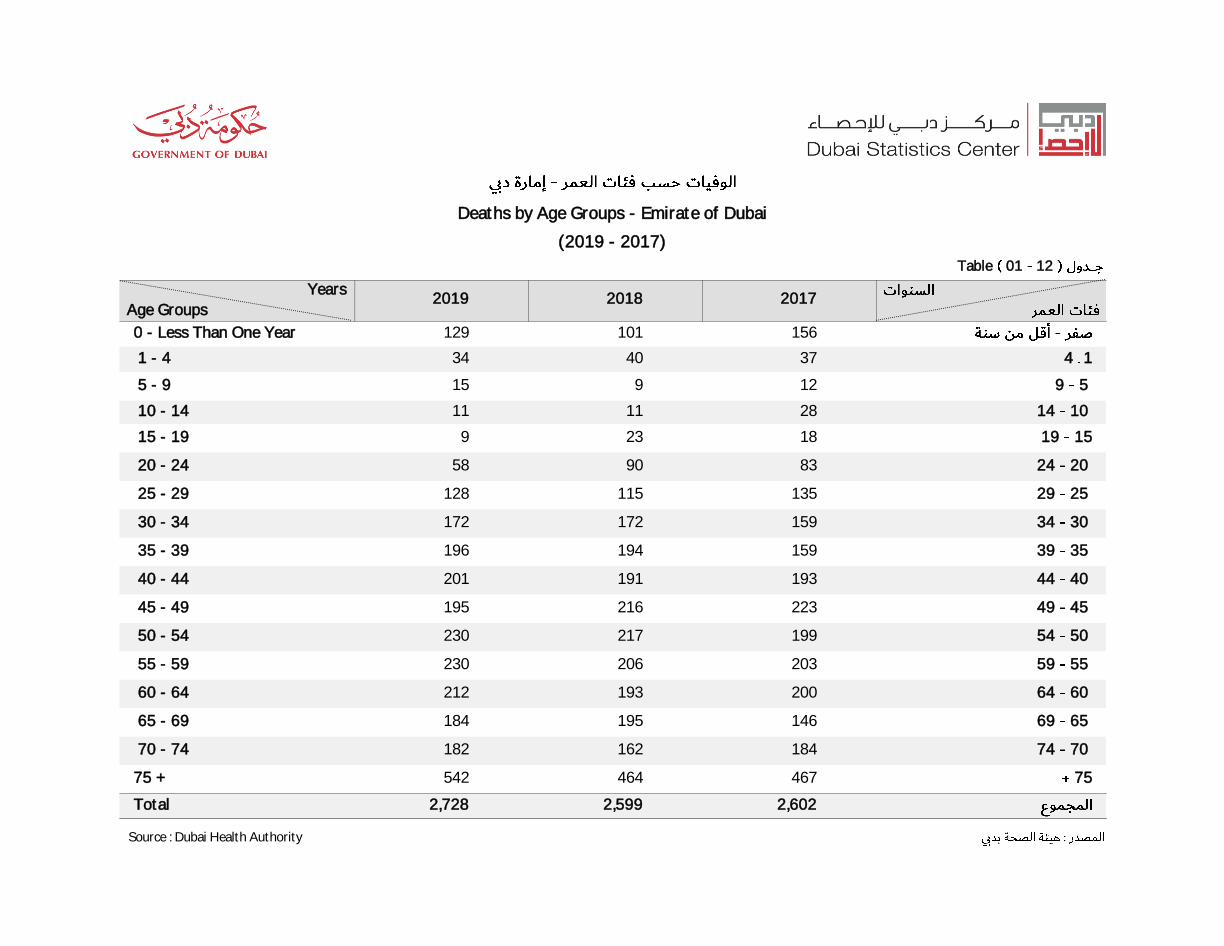
1201Table
Years
Age Groups
1561011290 - Less Than One Year
14374034 1 - 4
5912915 5 - 9
1014281111 10 - 14
151918239 15 - 19
2024839058 20 - 24
2529135115128 25 - 29
3034159172172 30 - 34
3539159194196 35 - 39
4044193191201 40 - 44
4549223216195 45 - 49
5054199217230 50 - 54
5559203206230 55 - 59
6064200193212 60 - 64
6569146195184 65 - 69
7074184162182 70 - 74
7546746454275 +
2,6022,5992,728Total
Source : Dubai Health Authority
Deaths by Age Groups - Emirate of Dubai
201720182019
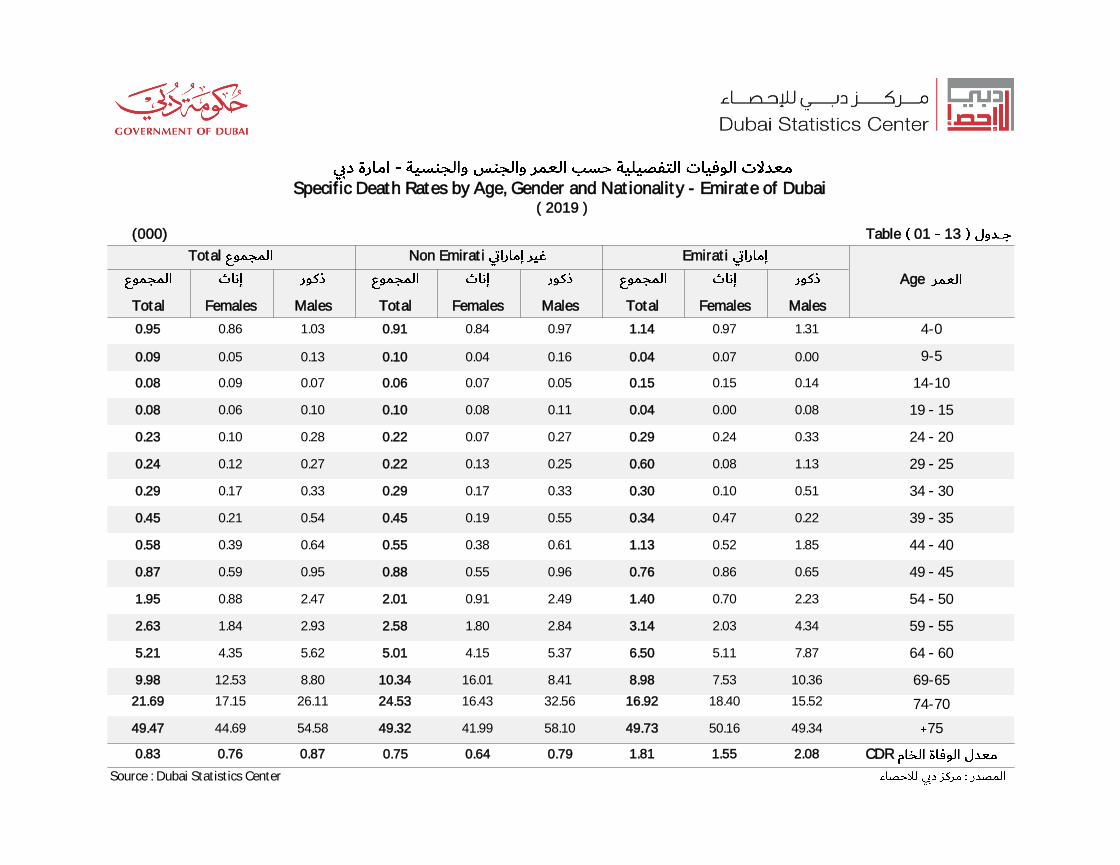
Specific Death Rates by Age, Gender and Nationality - Emirate of Dubai
1301Table (000)
MalesFemalesTotalMalesFemalesTotalMalesFemalesTotal
4-01.310.971.140.970.840.911.030.860.95
9-50.000.070.040.160.040.100.130.050.09
14-100.140.150.150.050.070.060.070.090.08
15190.080.000.040.110.080.100.100.060.08
20240.330.240.290.270.070.220.280.100.23
25291.130.080.600.250.130.220.270.120.24
30340.510.100.300.330.170.290.330.170.29
35390.220.470.340.550.190.450.540.210.45
40441.850.521.130.610.380.550.640.390.58
45490.650.860.760.960.550.880.950.590.87
50542.230.701.402.490.912.012.470.881.95
55594.342.033.142.841.802.582.931.842.63
60647.875.116.505.374.155.015.624.355.21
69-6510.367.538.988.4116.0110.348.8012.539.98
74-7015.5218.4016.9232.5616.4324.5326.1117.1521.69
7549.3450.1649.7358.1041.9949.3254.5844.6949.47
CDR2.081.551.810.790.640.750.870.760.83
Source : Dubai Statistics Center
( 2019 )
Age
EmiratiNon EmiratiTotal

1401Table
MalesFemalesTotal
1 - 082.483.282.7
4 - 1 81.882.582.1
9 - 577.978.678.2
14 - 1072.973.673.2
19 - 1568.068.668.2
24 - 2063.063.663.3
29 - 2558.158.758.3
34 - 3053.253.753.4
39 - 3548.248.748.5
44 - 4043.443.843.6
49 - 4538.538.938.7
54 - 5033.734.033.9
59 - 5529.129.129.2
64 - 6024.424.424.5
69 - 6520.119.820.1
74 - 7015.916.016.0
79 - 7512.712.212.5
8010.79.310.0
Source : Dubai Statistics Center
Life Expectancy ( Year ) by Age and Gender - Emirate of Dubai
( 2019 )
Ageex
Note : The Direct Technique was Used Depending on Vital Registration of Deaths at Dubai Health
Authority 2016
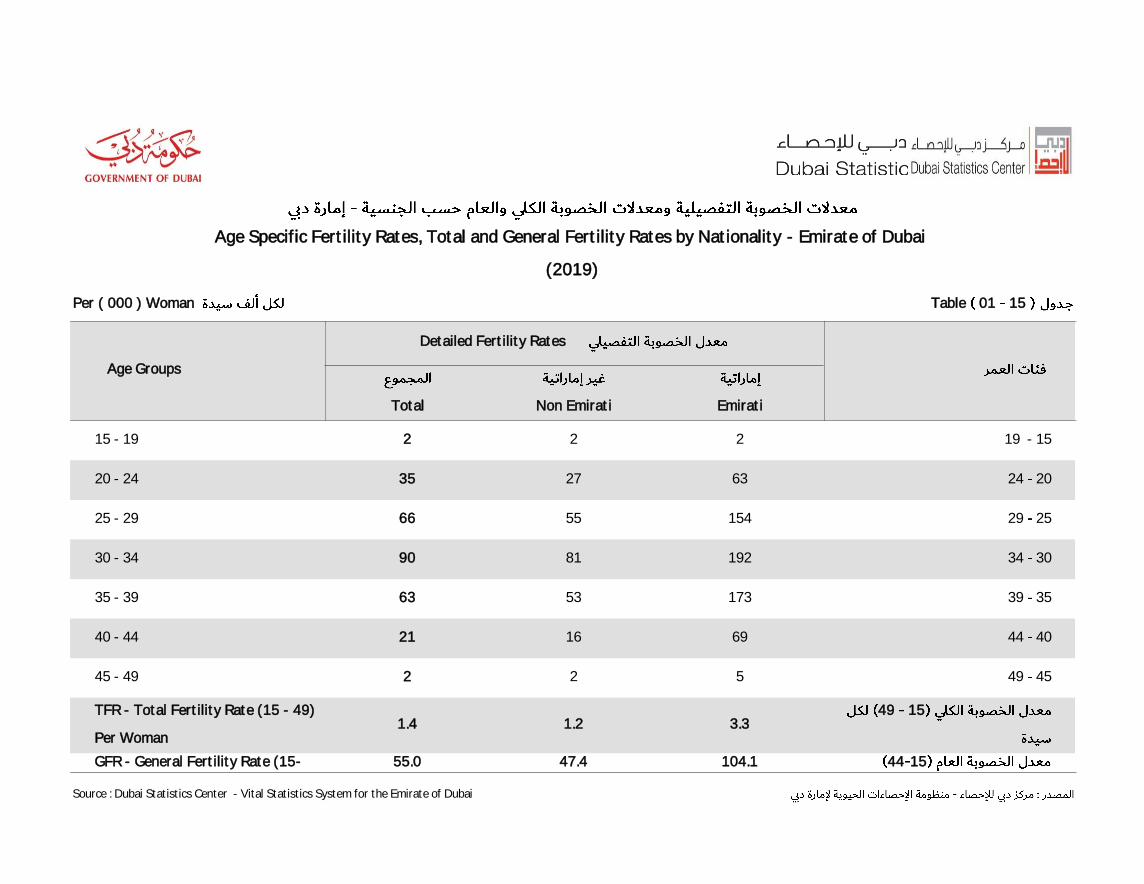
1501TablePer ( 000 ) Woman
EmiratiNon EmiratiTotal
19 - 1522215 - 19
202463273520 - 24
2529154556625 - 29
3034192819030 - 34
3539173536335 - 39
404469162140 - 44
454952245 - 49
15493.31.21.4
TFR - Total Fertility Rate (15 - 49)
Per Woman
1544104.147.455.0GFR - General Fertility Rate (15-
Source : Dubai Statistics Center - Vital Statistics System for the Emirate of Dubai
Age Specific Fertility Rates, Total and General Fertility Rates by Nationality - Emirate of Dubai
(2019) `
Detailed Fertility Rates
Age Groups

1601Table
201720182019Title
Marriage Contracts
1,051965956Emirati Husband - Emirati Wife
694701699Emirati Husband - Non Emirati Wife*
2,6512,7782,942Non-Emirati Husband - Non Emirati Wife
4,3964,4444,597Total
Divorce Facts*
541413397Emirati Husband - Emirati Wife
340254236Emirati Husband - Non Emirati Wife**
1,2791,3621,096Non Emirati Husband - Non Emirati Wife
2,1602,0291,729Total
* Divorce data has been modified to include divorce cases by Legal Judgment
** Includes cases of Emirati with non Emirati for both male and female
Source : Dubai Courts Department
Marriage Contracts and Divorce Facts by Nationality - Emirate of Dubai
(2019 - 2017)

(2019 - 2017)
1701Table
201720182019Indicator
11.210.89.7Crude Birth Rate ( 000 )*
8.37.97.2 Males
18.017.515.5 Females
0.90.80.8Crude Death Rate ( 000 )*
1.00.90.9 Males
0.90.80.8 Females
1.01.00.9Natural Increase Rate ( % )
4.93.84.0Infant Mortality Rate ( 000 )
3.33.23.2Neonatal Mortality Rate ( 000 )
1.61.41.4Crude Marriage Rate ( 000 )*
0.80.70.5Crude Divorce Rate ( 000 )*
* Calculated depending on estimated population at mid - year
Source : Dubai Statistics Center
Basic Vital Statistics Indicators - Emirate of Dubai