1977 indonesian sample vital registra - open
TRANSCRIPT
M.A. DEMOGRAPHY PROGRAM
, T K E P A I T E R N A N D L E V E L S OFM O R T A L I T Y F OR T H E 1975' - 1977 I N D O N E S I A N
SAMPLE V I T AL REGI ST RAT I ON
P R O J E C T . AREA
BY
PON1MAN SUHARTÖNQ
A THESIS SUBMITTED IN PARTIAL FULFILMENT
FOR THE DEGREE OF MASTER OF ARTS IN DEMOGRAPHY.
DEPARTMENT OF DEMOGRAPHY RESEARCH SCHOOL OF SOCIAL SCIENCES
AUSTRALIAN NATIONAL UNIVERSITY
APRIL 1980
D E C L A R A T I O N
EXCEPT WHERE OTHERWISE INDICATED,
THIS THESIS IS MY OWN WORK.
APRIL , 1980 PON I MAN SUHARTONO
M . A . DEMOGRAPHY PROGRAM DO NOT REMOVE

DEDICATED TO
E. Harliani, P. Harianto and T . Harlianti
' Vv i u i i V tjS^y/

ACKNOWLEDGEMENTS
I express my sincere appreciation to my supervisor Dr. S.K. Jain for his easy accessibility, constructive comments and guidance which contributed greatly to this work.Special thanks go to Dr Peter F. McDonald and Dr. Terence H. Hull for their useful suggestions, comments and encouragement throughout the different stages of this thesis. I am thankful to Mr. Peter Gardiner and Jenny WiddosSsson in helping the data processing. I sincerely appreciate of Mrs. Brigid Ballard and Mrs. Barbara McDonald for their encouragement and guidance through the draft for correcting the grammar and the style of my English writing. I am also grateful to Dr. D.W. Lucas, Ms. Tania Sherlaimoff and fellow students of the M.A. Program in Demography for their encouragement.
Special thanks also go to Mrs. Pat Ashman for her excellent secretarial assistance during my course. I wish to thank Mrs P.H. Quiggin, and the staff of the Menzies Library for their assistance in finding some references which I needed for this study.
I would like to thank the AustraliaftGovemment who offered me a fellowship to participate in the Australian National University, and the Indonesian Central Bureau of Statistics for permission to study in Australia To A.D.A.B. officers, especially to Mr. Jeff Chandler and Ms. Dqwn Beresford Wylie, I wish to express my appreciation for their assistance during my stay in Australia.
Mr. Abdulmadjid and Mr. Sugito from the Indonesian Central Bureau of Statistics, were always sources of encouragement through their letters, my thanks also go to them.
Finally, my sincere gratitude goes to my wife, Suryani, for her assistance in typing the draft, and also continuous for her support and patience during the preparation and completion of this thesis.
Canberra, April, 1?80./ / /7vPpniman Suhartono.
ABSTRACT
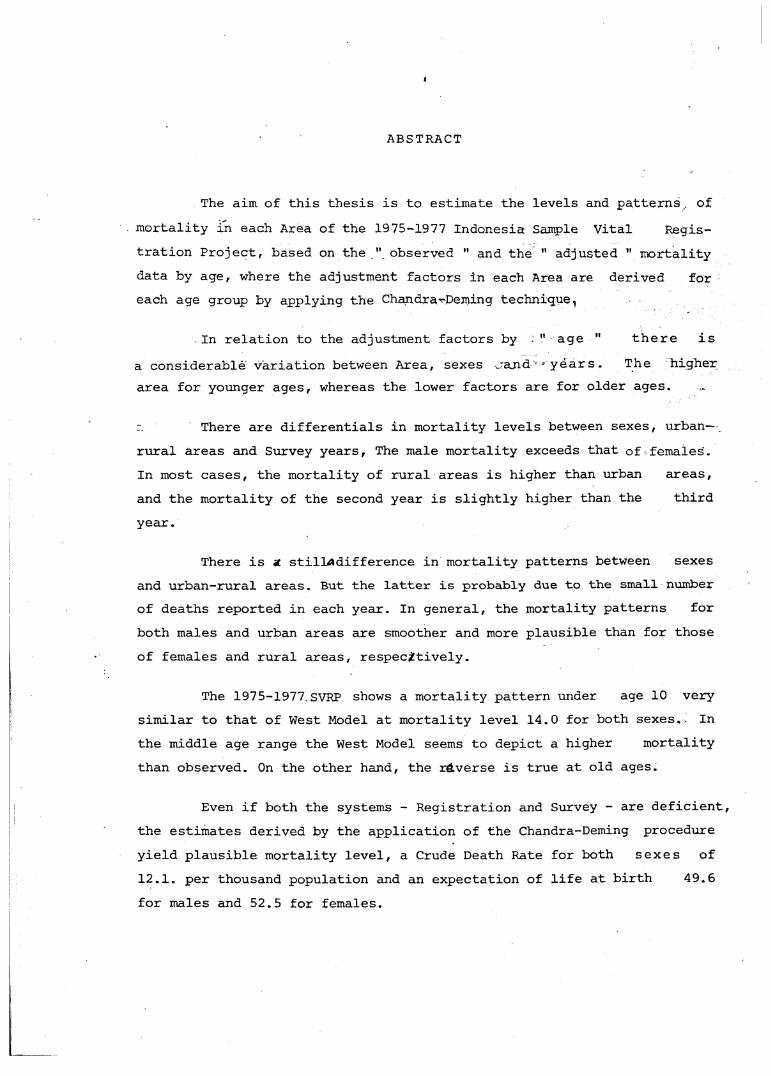
The aim of this thesis is to estimate the levels and patterns of mortality in each Area of the 1975-1977 Indonesia Sample Vital Registration Project, based on the " observed " and the " adjusted " mortality data by age, where the adjustment factors in each Area are derived for each age group by applying the Chandra-Deming technique,
In relation to the adjustment factors by " age " there isa considerable variation between Area, sexes ~a.nd ’years. The higher area for younger ages, whereas the lower factors are for older ages.
There are differentials in mortality levels between sexes, urban- rural areas and Survey years, The male mortality exceeds that of females.In most cases, the mortality of rural areas is higher than urban areas,and the mortality of the second year is slightly higher than the third year.
There is 2 stilladifference in mortality patterns between sexes and urban-rural areas. But the latter is probably due to the small number of deaths reported in each year. In general, the mortality patterns for both males and urban areas are smoother and more plausible than for those of females and rural areas, respectively.
The 1975-1977 SVRP shows a mortality pattern under age 10 very similar to that of West Model at mortality level 14.0 for both sexes. In the middle age range the West Model seems to depict a higher mortality than observed. On the other hand, the reverse is true at old ages.
Even if both the systems - Registration and Survey - are deficient, the estimates derived by the application of the Chandra-Deming procedure yield plausible mortality level, a Crude Death Rate for both sexes of 12.1. per thousand population and an expectation of life at birth 49.6 for males and 52.5 for females.
Contents
Chapter . 1 . Introduction1.1. General
f > 11.2.
ofS! ^ iCah baCkgrOUnd of the Previous studies of the estimation levels and patterns of mortality in Indonesia. f
2 - 3
1.3. The background of the Indonesian Sample Vital Registration Project (SVRP), 1974 - 1977. 3 - 7
1.4. The objective of the Study.7 - 8
1.5. Methodology of the Study.
CO 1 h-1 f—1
1.6. Organization of the Study. 12
Chapter I I . Observed levels and nafteiS and patterns of mortality.2 ' 1 ' Data on age at death.
Data on Base Population.2‘3’ Crude Death Rate.
-•4* Age Specific Death Rates.' * * Discussion.
Chapter III. Adjusted levels and patterns of mortality.3.1.
. 3.2.
3.3.
3.4.
3.5.
3.5.1
3.5.2
Matching procedure.
Results of matching.
Adjusted factors.
Analysis of adjustment factors. Adjusted Life Tables.
Probability of dying,n*^x
Expectation of life °ex K
Discussion.
13 - 41
13 - 20
20 - 28
28 - 31
3 1 - 3 6 *
36f- 41
42 - 82
42 - 46
46 - 60
61
61--64
64 - 66
66 - 71
72 - 773.6.
77 - 82
ii//
Contents
Chapter IV. A Comparison - of the various mortality estimates derived elsewhere and the present study.
4.1. A Comparison of the probability of dying,nqx
4.2. A Comparison of the expectation of life, °ex
4.3. A Comparison of the Crude Death Rate
Chapter V. Conclusion
References
Pages
83 - 96
83 - 91
92 - 94
95 - 96
97 - 99
100 - 104
iiif i f
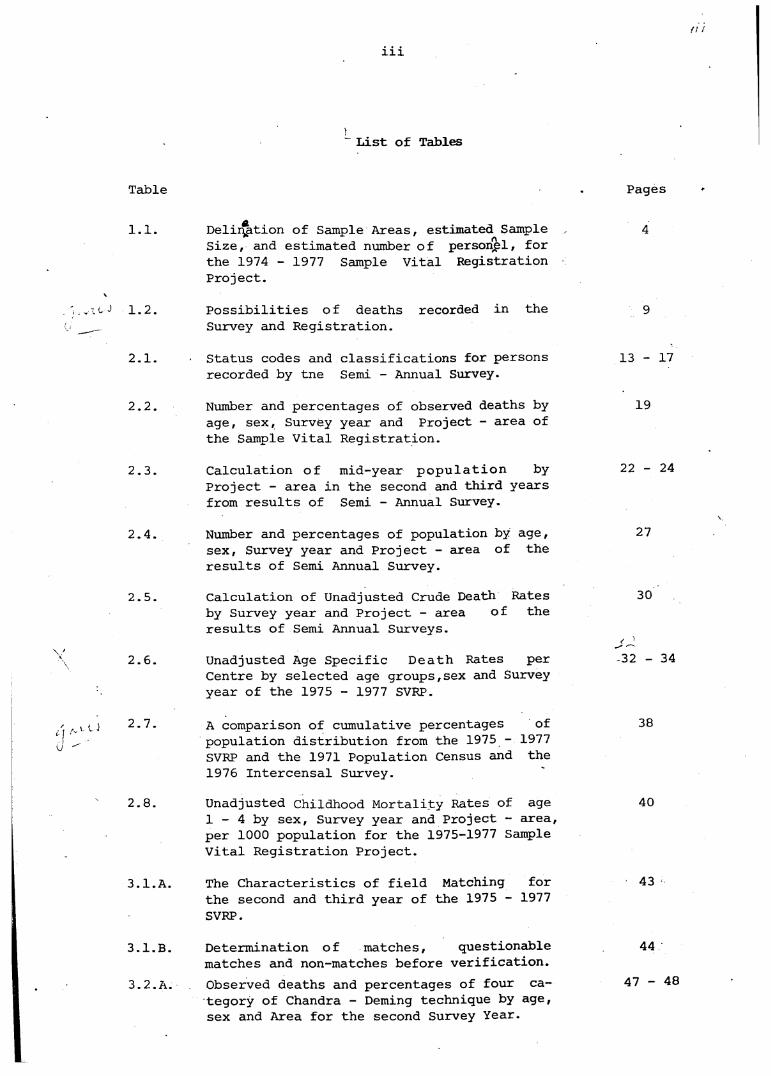
List of Tables
Table . Pages
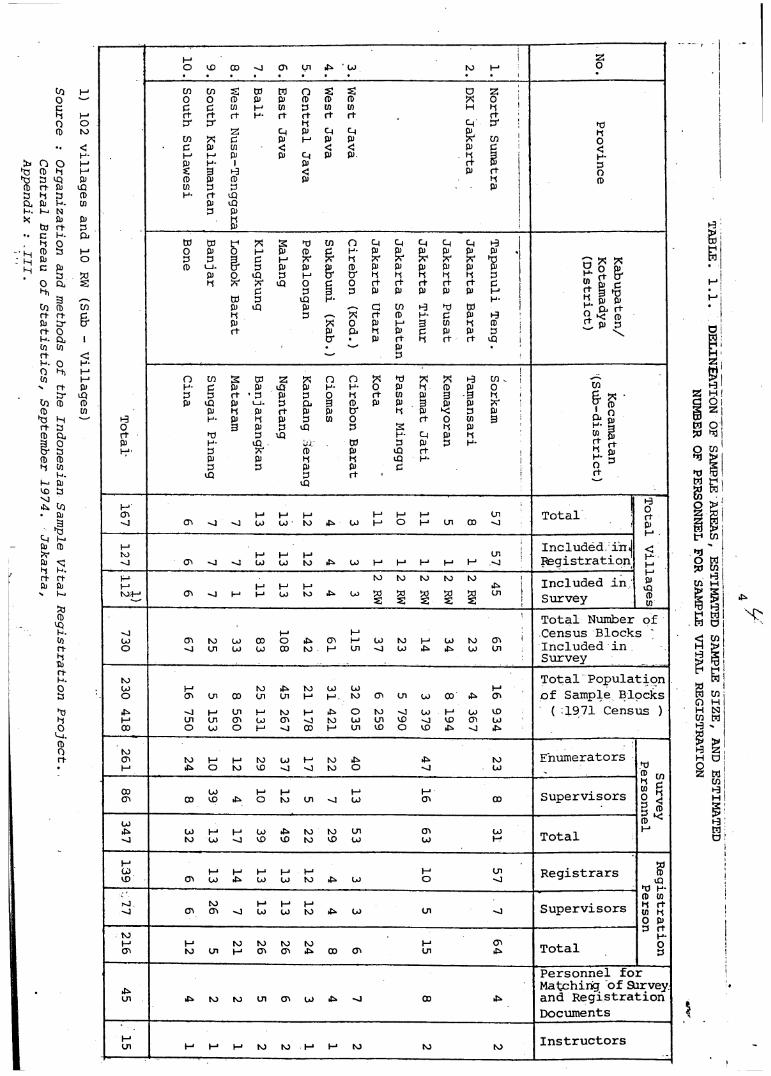
1.1. Delir^tion of Sample Areas, estimated Sample 4Size, and estimated number of personel, for the 1974 - 1977 Sample Vital Registration Project.
. ; ■- J 1.2. Possibilities of deaths recorded in the 9Survey and Registration.
2.1. Status codes and classifications for persons 13 - 17recorded by tne Semi - Annual Survey.
2.2. Number and percentages of observed deaths by 19age, sex, Survey year and Project - area of the Sample Vital Registration.
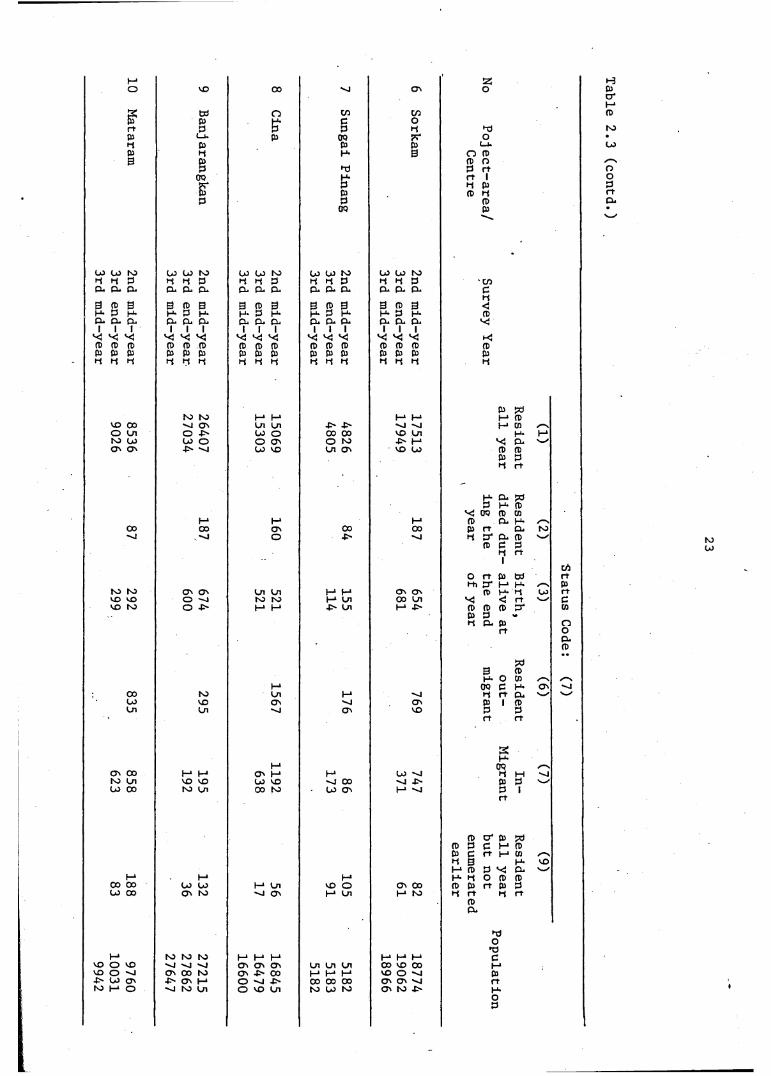
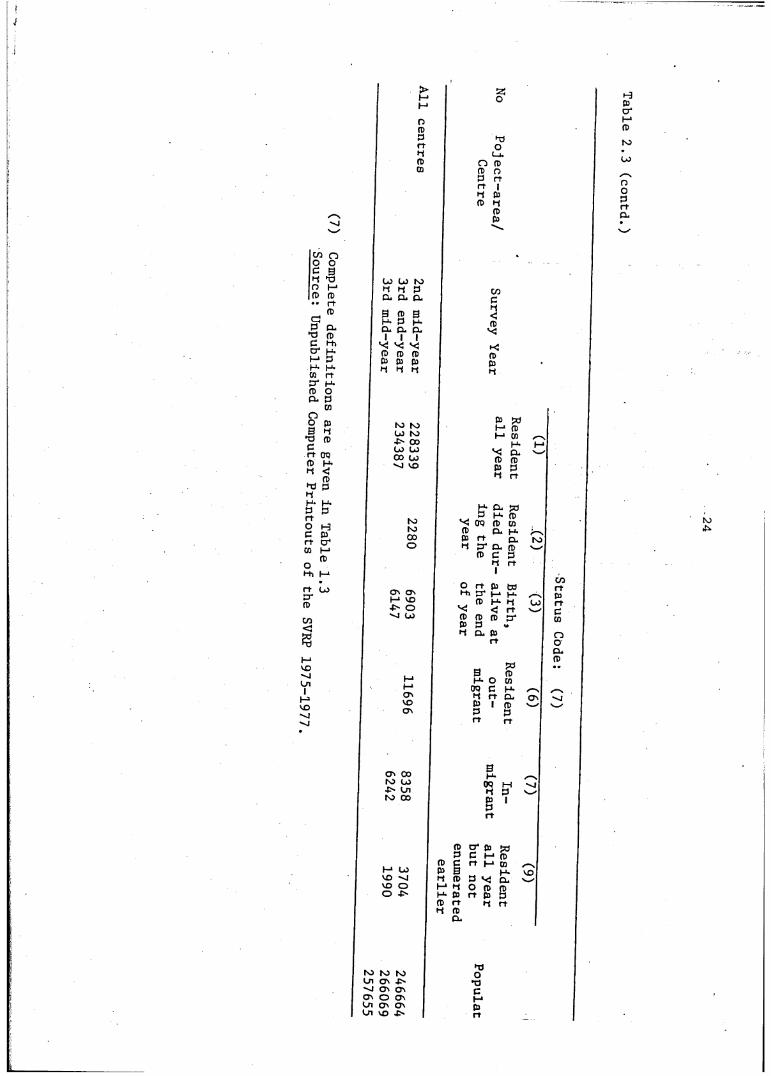
2.3. Calculation of mid-year p o p u l a t i o n by 22 - 24Project - area in the second and third years from results of Semi - Annual Survey.
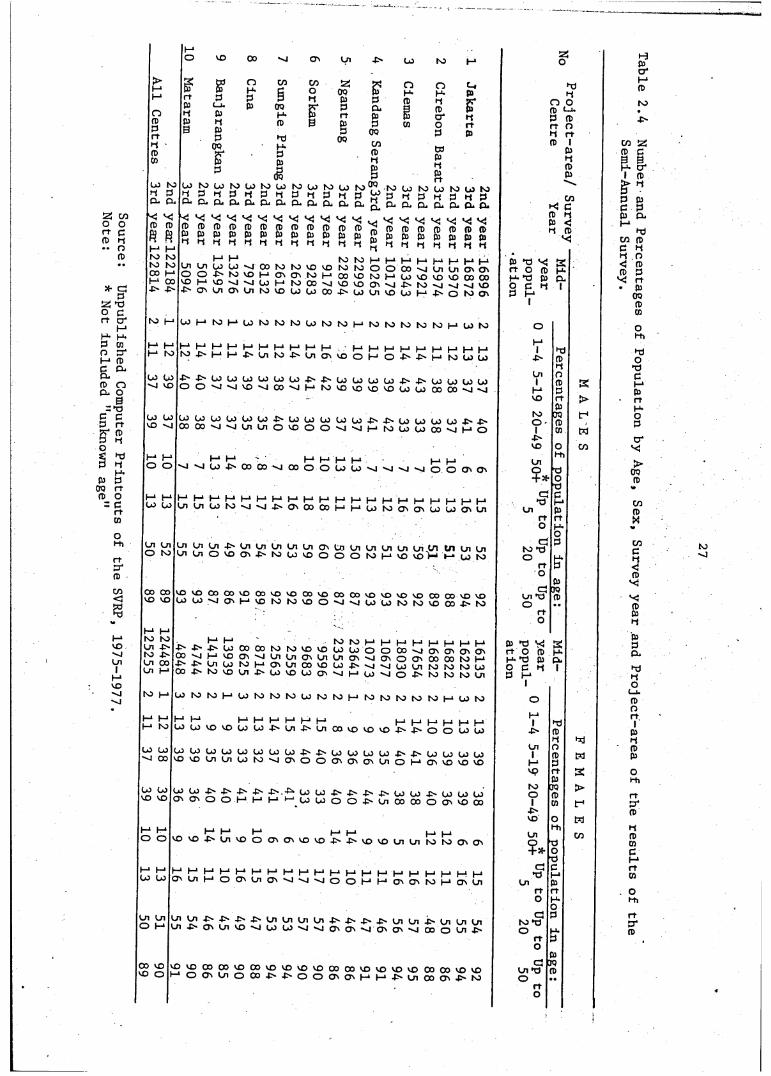
2.4. Number and percentages of population by age, 27sex, Survey year and Project - area of the results of Semi Annual Survey.
2.5. Calculation of Unadjusted Crude Death Rates 30by Survey year and Project - area of theresults of Semi Annual Surveys.
2.6. Unadjusted Age Specific D e a t h Rates per 32 - 34Centre by selected age groups,sex and Survey year of the 1975 - 1977 SVRP.
. 2.7.t j a -' Jo ^
A comparison of cumulative percentages of 38population distribution from the 1975 - 1977SVRP and the 1971 Population Census and the 1976 Intercensal Survey.
2.8. Unadjusted Childhood Mortality Rates of age 401 - 4 by sex, Survey year and Project - area, per 1000 population for the 1975-1977 Sample Vital Registration Project.
3.1.A. The Characteristics of field Matching for 43the second and third year of the 1975 - 1977SVRP.
3.I.B. Determination of matches, questionable 44matches and non-matches before verification.
3.2.A. Observed deaths and percentages of four ca- 47 - 48tegory of Chandra - Deming technique by age, sex and Area for the second Survey Year.
iv
Table
3.2. B.
3.2. C.
3.2. D.
3.2. E.
3.2. F.
3.2. G.
3.3.
3.4.
3.5. A.
3.5. B.
/ > ’
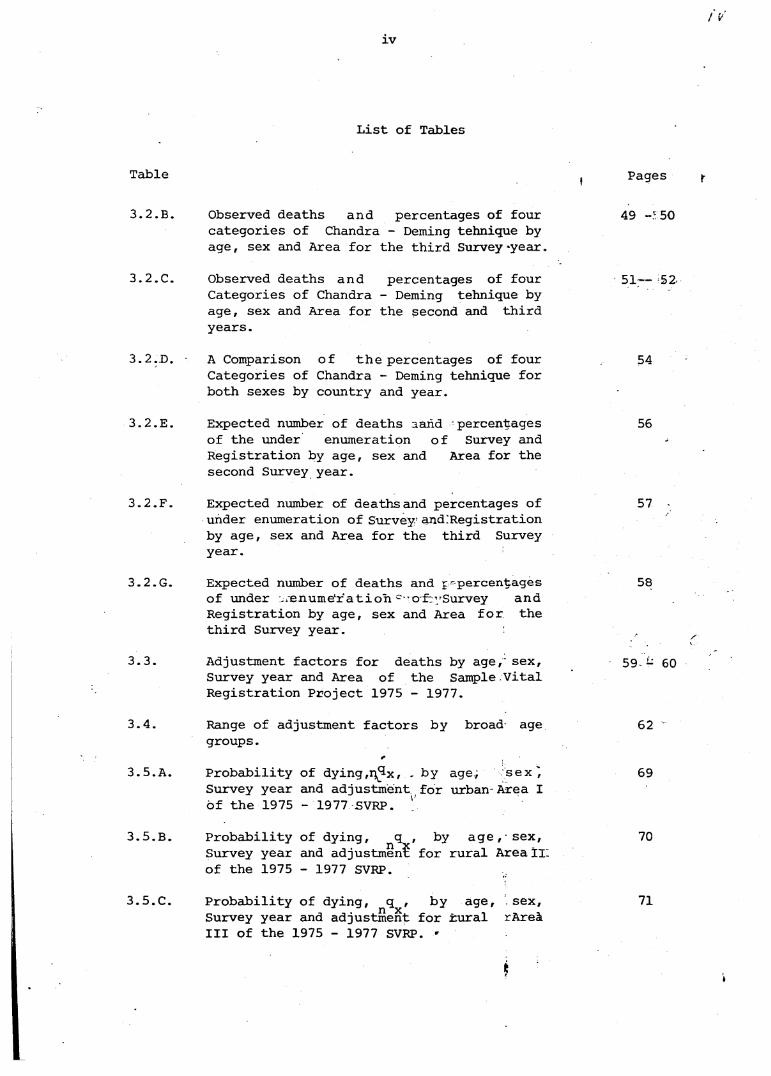
List of Tables
Observed deaths and percentages of four categories of Chandra - Deming tehnique by age, sex and Area for the third Survey-year.
Observed deaths and percentages of four Categories of Chandra - Deming tehnique by age, sex and Area for the second and third years.
A Comparison of the percentages of four Categories of Chandra - Deming tehnique for both sexes by country and year.
Expected number of deaths land percentages of the under enumeration of Survey and Registration by age, sex and Area for the second Survey year.
Expected number of deaths and percentages of under enumeration of Survey and Registration by age, sex and Area for the third Survey year.
Expected number of deaths and j'percentages of under enumeration c- of "/Survey andRegistration by age, sex and Area for the third Survey year.
Adjustment factors for deaths by age,' sex, Survey year and Area of the Sample Vital Registration Project 1975 - 1977.
Range of adjustment factors by broad age groups.
+
Probability of dying,n^x, . by age, sex', Survey year and adjustment for urban Area I of the 1975 - 1977 SVRP.
Probability of dying, q , by age , sex, Survey year and adjustment for rural Area II. of the 1975 - 1977 SVRP.
Probability of dying, q , by age, sex, Survey year and adjustment for rural rAreä III of the 1975 - 1977 SVRP. *
Pages »■
49 50
51— 52
54
56
57
58
59 - 60
62
69
70
3.5.C. 71
VI
List of Tables
Table
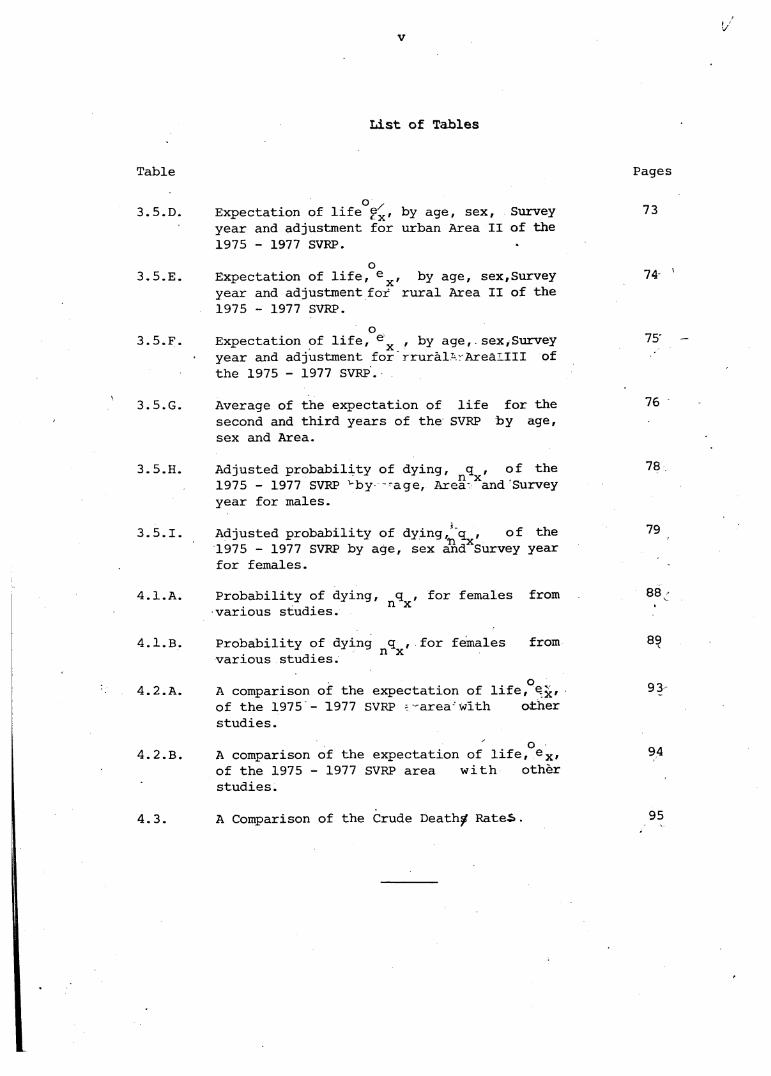
3.5. D.
3.5. E.
3.5. F.
3.5. G.
3.5. H.
3.5.1.
4.1. A.
4.1. B.
4.2. A.
4.2. B.
4.3.
Expectation of life by age, sex, Surveyyear and adjustment for urban Area II of the 1975 - 1977 SVRP.
oExpectation of life, ex , by age, sex,Survey year and adjustment for rural Area II of the 1975 - 1977 SVRP.
oExpectation of life, ex , by age, sex,Survey year and adjustment for rruräl- Areallll of the 1975 - 1977 SVRP.
Average of the expectation of life for the second and third years of the SVRP by age, sex and Area.
Adjusted probability of dying, q , of the 1975 - 1977 SVRP by age, Area Xand Survey year for males.
Adjusted probability of dying, 'q , of the 1975 - 1977 SVRP by age, sex and Survey year for females.Probability of dying, q , for females from various studies.
Probability of dying q , for females from various studies.
oA comparison of the expectation of life, of the 1975 - 1977 SVRP area with other studies.
oA comparison of the expectation of life, e x , of the 1975 - 1977 SVRP area with other studies.
A Comparison of the Crude Death^ Rate-5>.
Pages
73
74
75'
76
78
79
88
89
93
94
95
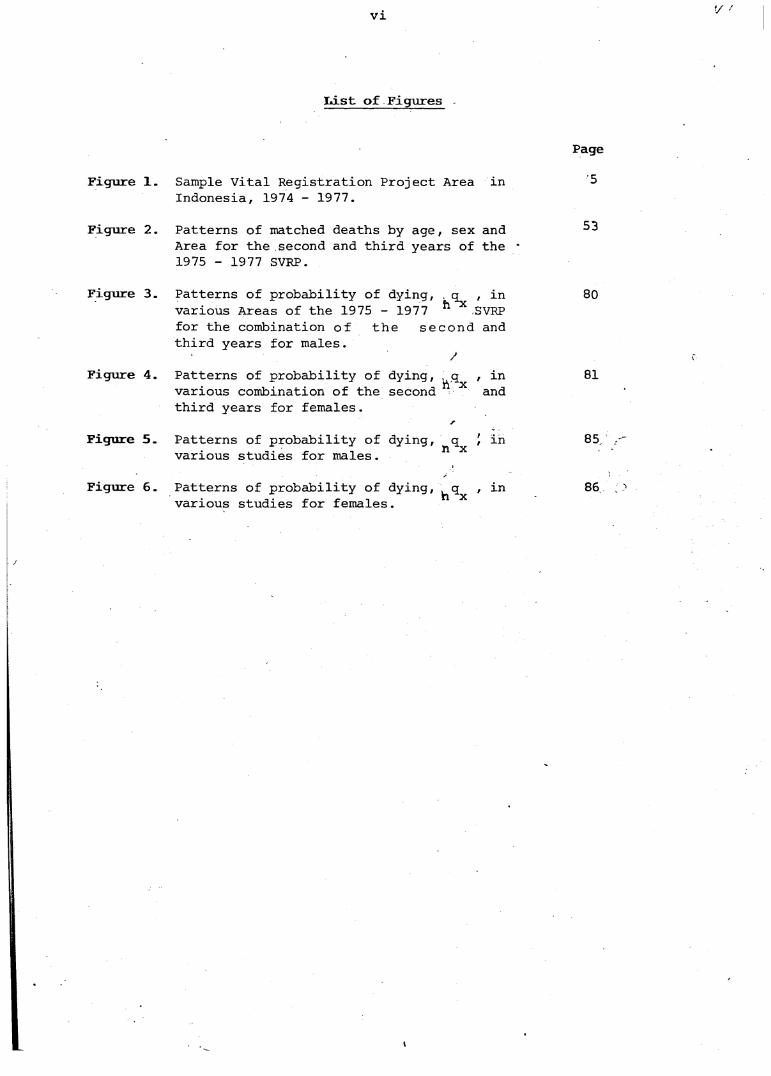
Figure 1
Figure 2
Figure 3
Figure 4
Figure 5
Figure 6
vi V
List of Figures
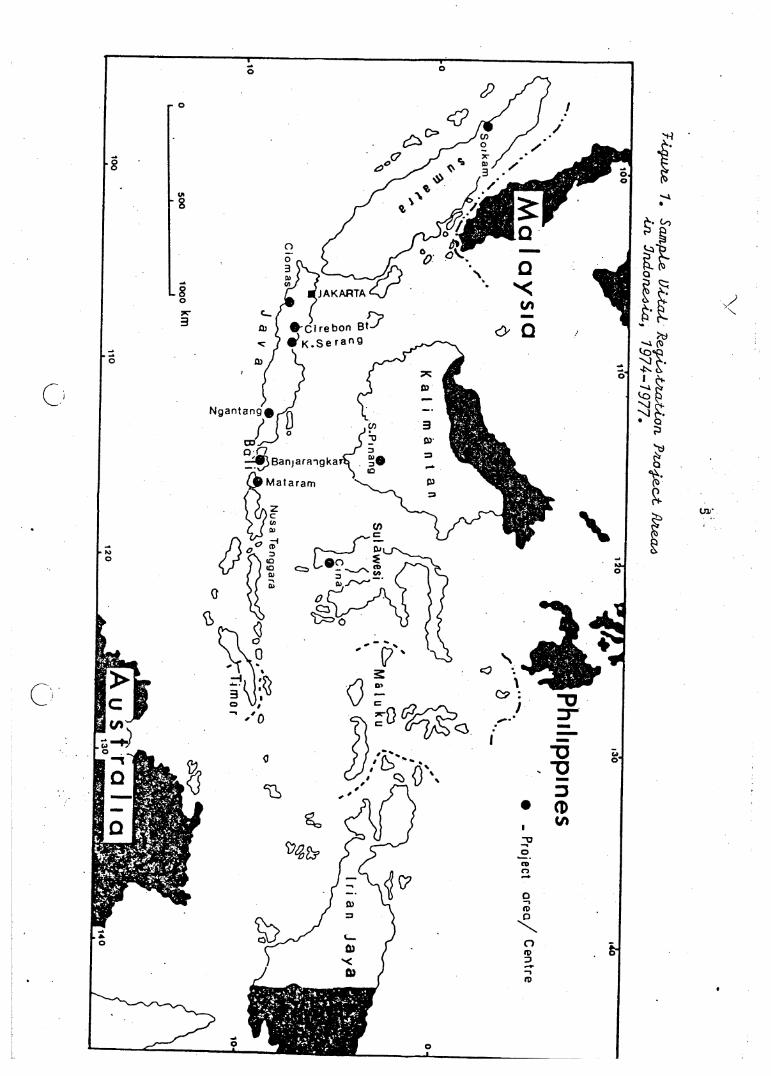
Sample Vital Registration Project Area in Indonesia, 1974 - 1977.
Patterns of matched deaths by age, sex and Area for the second and third years of the * 1975 - 1977 SVRP.
Patterns of probability of dying, . q , in various Areas of the 1975 - 1977 ^ X SVRP for the combination of the second and third years for males.
Patterns of probability of dying, q , in various combination of the second and third years for females.
Patterns of probability of dying, q \ in various studies for males.
Patterns of probability of dying, ^q^ , in various studies for females.
Page5
53
80
81
85
86
1
vii <//
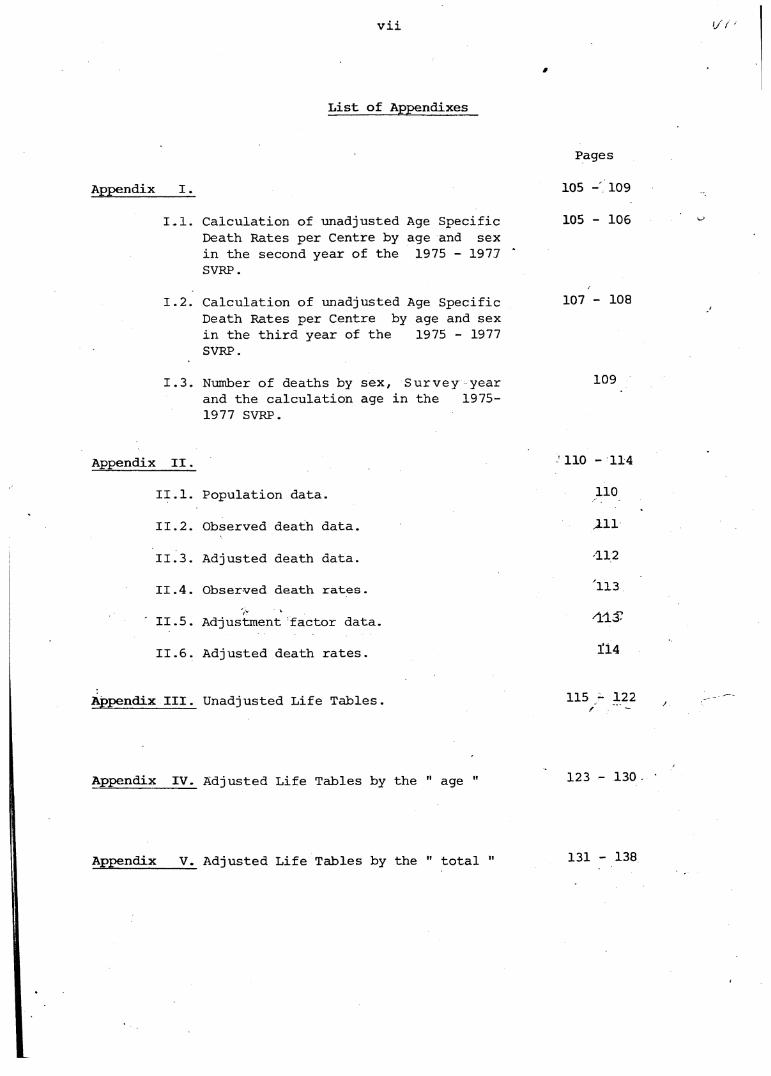
List of Appendixes
Pages
Appendix I . 105 - 109
1.1. Calculation of unadjusted Age Specific Death Rates per Centre by age and sex in the second year of the 1975 - 1977 SVRP.
105 - 106
1.2. Calculation of unadjusted Age Specific Death Rates per Centre by age and sex in the third year of the 1975 - 1977 SVRP.
107 - 108
1.3. Number of deaths by sex, Survey year and the calculation age in the 1975- 1977 SVRP.
109
Appendix II. 110 - 114
II.1. Population data. 110
CNHH Observed death data. 111
II.3. Adjusted death data. 112
II .4 . Observed death rates. 113
II.5. >Adjustment factor data. 113-
HH Adjusted death rates. 114
Appendix III. Unadjusted Life Tables. 115 - 122/ *' -
Appendix IV. Adjusted Life Tables by the " age " 123 - 130
Appendix V. Adjusted Life Tables by the " total 131 - 138
1
CHAPTER I ,
I N T R O D U C T I O N
1.1. General
The acquisition of statistical data is often an arduous and
expensive task but the establishment of a good national development
programme may prove to be even more difficult and expensive without such
data. A special programme can only be achieved successfully . »4 it is both
perfectly planned and supported with quantitative and quanlitative data.
As the function of statistics is to assist the other sciences such as the
social sciences, economics, politics, physics etc, the reliability of the
statistical data is (absolutely essential. Up-to-date and reliable
demographic data is thus necessary to support policy and decision-makers
in their planning.
Attempts to study recent mortality in Indonesia have been hampered
by the lack of accurate and reliable data on mortality because the Vital
Registration has not been properly carried out in most parts of the
country. One effort to improve the collection of Vital Registration data
was piloted in 1974-1977 ( Central Bureau of Statistics : '1974, 1976,2 \1976/1977 and 1978 ), but it will be some time before Indonesia has
reasonably accurate and reliable data from Vital Registration.
As the Government has been recently planning the third : five-year
National Development Programme ( 1979-1983 ), an accurate and up-to-date
estimation of the current and future vital statistics such as ^current
patterns and levels of mortality and fertility is ’essential in the
formulation of a sound national development plan.
2
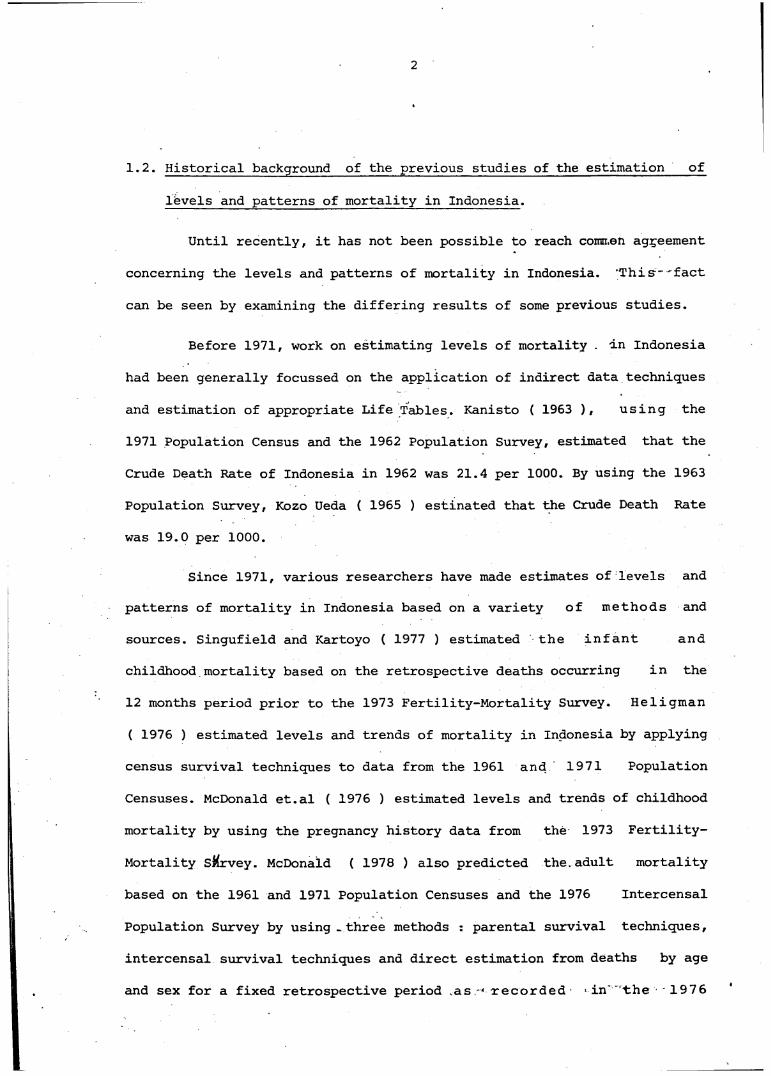
1.2. Historical background of the previous studies of the estimation of
levels and patterns of mortality in Indonesia.
Until recently, it has not been possible to reach common agreement
concerning the levels and patterns of mortality in Indonesia. 'This- fact
can be seen by examining the differing results of some previous studies.
Before 1971, work on estimating levels of mortality . in Indonesia
had been generally focussed on the application of indirect data techniques
and estimation of appropriate Life Tables. Kanisto ( 1963 ), using the
1971 Population Census and the 1962 Population Survey, estimated that the
Crude Death Rate of Indonesia in 1962 was 21.4 per 1000. By using the 1963
Population Survey, Kozo Ueda ( 1965 ) estinated that the Crude Death Rate
was 19.0 per 1000.
Since 1971, various researchers have made estimates of levels and
patterns of mortality in Indonesia based on a variety of methods and
sources. Singufield and Kartoyo ( 1977 ) estimated the infant and
childhood mortality based on the retrospective deaths occurring in the
12 months period prior to the 1973 Fertility-Mortality Survey. Heligman
( 1976 ) estimated levels and trends of mortality in Indonesia by applying
census survival techniques to data from the 1961 and 1971 Population
Censuses. McDonald et.al ( 1976 ) estimated levels and trends of childhood
mortality by using the pregnancy history data from the 1973 Fertility-
Mortality Survey. McDonald ( 1978 ) also predicted the.adult mortality
based on the 1961 and 1971 Population Censuses and the 1976 Intercensal
Population Survey by using _three methods : parental survival techniques,
intercensal survival techniques and direct estimation from deaths by age
and sex for a fixed retrospective period .as - recorded in the 197 6
3
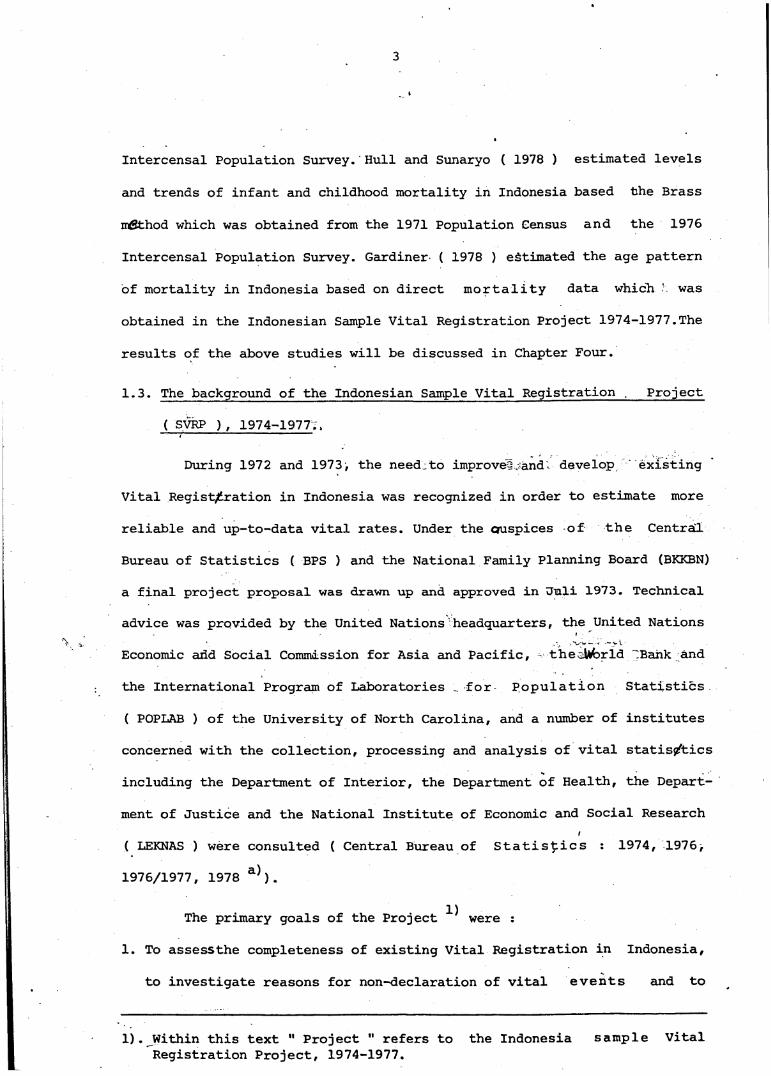
Intercensal Population Survey. Hull and Sunaryo ( 1978 ) estimated levels
and trends of infant and childhood mortality in Indonesia based the Brass
mßthod which was obtained from the 1971 Population Census and the 1976
Intercensal Population Survey. Gardiner ( 1978 ) estimated the age pattern
of mortality in Indonesia based on direct mortality data which was
obtained in the Indonesian Sample Vital Registration Project 1974-1977.The
results of the above studies will be discussed in Chapter Four.
1.3. The background of the Indonesian Sample Vital Registration . Project
( SVRP ), 1974-1977.,
During 1972 and 1973, the need to improved , and develop existing
Vital Regist/£ration in Indonesia was recognized in order to estimate more
reliable and up-to-data vital rates. Under the ouspices of the Central
Bureau of Statistics ( BPS ) and the National Family Planning Board (BKKBN)
a final project proposal was drawn up and approved in Juli 1973. Technical
advice was provided by the United Nations headquarters, the United Nations
Economic arid Social Commission for Asia and Pacific, the iAforld Bank and
the International Program of Laboratories . for Population Statistics
( POPLAB ) of the University of North Carolina, and a number of institutes
concerned with the collection, processing and analysis of vital statistics
including the Department of Interior, the Department of Health, the Depart
ment of Justice and the National Institute of Economic and Social Research
( LEKNAS ) were consulted ( Central Bureau of Statistics : 1974, 1976,
1976/1977, 1978 a)).
The primary goals of the Project ^ were :
1. To assessthe completeness of existing Vital Registration in Indonesia,
to investigate reasons for non-declaration of vital events and to
1). Within this text " Project " refers to the Indonesia sample Vital Registration Project, 1974-1977.
of S
tatis
tics
, S
eptember 1974.
VsV0)Üai-*.x
o0)arthpp
tocha>Pc
Ptvft)h
•ox ID 00 •o cr on 4* 00 to p
fa P ia w s3 CO m O s: S D z0 --- o O fb p p lb p fD Z Üc b c in P1 in b U) P H bh P rt rt r+ p rt rt rt rt rt0 O cr or M C-l crft) to Z G P Q C-l P
fa * b P P P P z cn• • < b P in < < < p b
P p t—1 P P C| P P b §o 1—1 P p i P rt Ph P £ 3 t-3 < P rtua P o P (D P bp ua in b b PS fb P rt Gp . in P 03M b PP P brt b PP Oj0 CO CO V z K) cn O C-l C-l G C-l C-l i-3Ü P 0 P O p* P P b p P p P p P P
o b b 3 b p W n Z Z Z z Z VSP fb 1_1. b P p p P P P p P Pb z P O ua b p & cr b b b b b ba s b Z z cQ 0 b 0 rt rt rt rt rt b
b b 3 b P P P P P p5 CO b ua H- pfD fa p ua p G in id Z Cdrt b b b z rt P H- b P HCr & p Z o P p 3 cn b P0 rt P a b P b P P ba 1 tr • P rt b rt rt uain • —" P •
< — bP1—1 o ia CO Z z o o Z Z Z Z t-3 fa
rt P H- b P p ua p H- H- 0 P b P P 0Cr ua b b rt ■ b p b 0 rf rt in P 3 3 bft) o P cD) P l-J. b a 3 P P P 3 P P zin p b p rt p P cr b P K b pH --- t-3 p P b P b p 0 rt 0 cn 3Ü 0 3 p b yQ b Z b Po, rt Z b vQ H- C-l P b0 P P- ua wi. Cd b P b H*b P b z P P ua rtft) P p b ua Pm b b P P bp. ua b rt *p uabfa Pp CT p P p P p P on3 O er» -o oo oo to 4 oo P o p On 00 ■OVspjft) Pto p P p onv; -J cr 'J -0 00 00 to 4 00 P p p P p 'Jrt P to to to to toP P p p p 4P to I-1 CT -j P p CO to 4 oo Z z Z Z 2 on— s S £ S3 2fbuaK*. p pin to CT to OO 00 o 4 CT» p 00 to p 00 to crrt o on 00 oo 00 to P on 00 4 4 00 onhUjr+P. to0 oo 1—1 to 4 to 00 oo Pb o cr> on 00 on on p P to cr on 00 00 4 cr
Vs ►P -o p on p to p O to 00 P 00 CDh p on on cr 00 cn •o to 00 on CD -J CD cr 000 00 o oo o p -o 00 P on CD O CD 4 -j 4pj.fb tort CT to P P to 00 p to 4 to• P 4 O to OD -o to O •~J 00
00 00 P p P PCT 00 »40 4 O to on 00 cr» 00
004 00 P PJ 00 4 to to on cr OO-J to oo -o CD ID to ID 00 OO p
P00 P P P P p p onID cr OO 4 OO 00 to 4 oo o -Jto p P p'J cr cr -o 00 00 to 4 00 on -j
to1—1 p to to to to p crcr to on p cr cr> 4 00 cr> on
4on 4 to to on CT» 00 4 -u CO 4
Pon P P p to to p P to to to
vsbo<PbO0)
n Z *f S&n. p pn a rt9 . k : a> Z p 3
tn
&IaPU)rtbPOr+
Total
I n c lu d e d in.j R e g is t r a t io n
I n c lu d e d in S u rv ey
i-30rtPP< P P t—1 ß) ua o in
T o t a l Number o f C en su s B lo c k s I n c lu d e d in S u rv ey
T o t a l P o p u la t io n o f Sam ple B lo c k s
( 1971 C en su s )
Enumerators
S u p e r v is o r s
T o t a l
R e g i s t r a r s
S u p e r v is o r s
T o t a l
s?uaPinrtbPrtPO
P e r s o n n e l f o r M atching o f Survey and R e g i s t r a t i o nD ocum ents
I n s t r u c t o r s
TA
BL
E.
1.1
. D
EL
INE
AT
ION
O
F SA
MPLE
AR
EA
S, ESTIM
ATED
SA
MPLE
SIZ
E,
AN
D
ESTIMA
TED
NUMBER
OF
PERSO
NN
EL FO
R SA
MPLE
VIT
AL
R
EG
ISTR
AT
ION
" -A
P>§

6
develop improved methods of Vital Registration, and
2. To the extent that the sample allowed, to obtain reliable estimates of
fertility, mortality and population growth ( Central Bureau of Statis
tics : 1974, p : 8 ). '
The Project commenced in July of 1974 and was conducted in ten
widely dispersed Project-areas or " Centres " in Indonesia. These
Centres except for Jakarta, (where the Centres were all Sub-District or
Kecamatan ) were intentionally selected as being representative of diverse
social, cultural and socio-economic conditions. Five of these Centres
were in Java ( one urban area and four rural areas ) and five were out
side Java ( one urban area and four rural areas ) in the Province of North
Sumatra, South Kalimantan, South Sulawesi, Bali and .. West Nusa Tenggara
( See Table 1.1 and Figure 1 )
The basic approach of the Project was the - combination of
continuous Vital Registration with an independent Semi-annual; Survey.
Subsequent to the Base-line Survey which was carried out in July 1974, 2)Surveys were conducted every six months over a two week period. The
Survey recorded any changes in composition of the household member, for
example,birth, death or migration through the previous six months. During
the Project period, 1st July of 1974 to 30th June of 1977 , Vital
Registration was also maintained continuously, particularly in the
registration of births, deaths, still births and migration which occurred
2). " Survey " refers to the Semi-annual Survey which was conducted regularly every six months to record any changes in composition of household members over the previous six months.
7
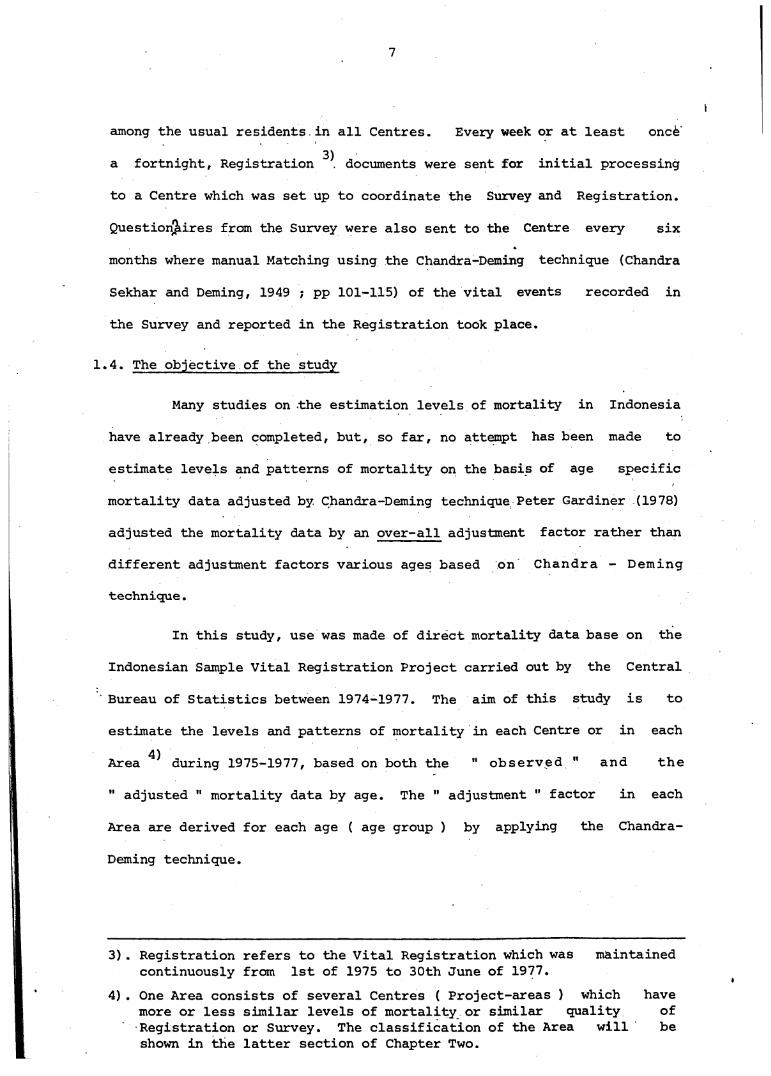
among the usual residents in all Centres. Every week or at least onc63)a fortnight, Registration documents were sent for initial processing
to a Centre which was set up to coordinate the Survey and Registration.
Questionnaires from the Survey were also sent to the Centre every six
months where manual Matching using the Chandra-Deming technique (Chandra
Sekhar and Deming, 1949 ; pp 101-115) of the vital events recorded in
the Survey and reported in the Registration took place.
1.4. The objective of the study
Many studies on the estimation levels of mortality in Indonesia
have already been completed, but, so far, no attempt has been made to
estimate levels and patterns of mortality on the basis of age specific
mortality data adjusted by Chandra-Deming technique Peter Gardiner (1978)
adjusted the mortality data by an over-all adjustment factor rather than
different adjustment factors various ages based on Chandra - Deming
technique.
In this study, use was made of direct mortality data base on the
Indonesian Sample Vital Registration Project carried out by the Central
Bureau of Statistics between 1974-1977. The aim of this study is to
estimate the levels and patterns of mortality in each Centre or in each 4)Area during 1975-1977, based on both the " observed " and the
" adjusted " mortality data by age. The " adjustment " factor in each
Area are derived for each age ( age group ) by applying the Chandra-
Deming technique.
3) . Registration refers to the Vital Registration which was maintainedcontinuously from 1st of 1975 to 30th June of 1977.
4) . One Area consists of several Centres ( Project-areas ) which havemore or less similar levels of mortality or similar quality ofRegistration or Survey. The classification of the Area will be shown in the latter section of Chapter Two.
8
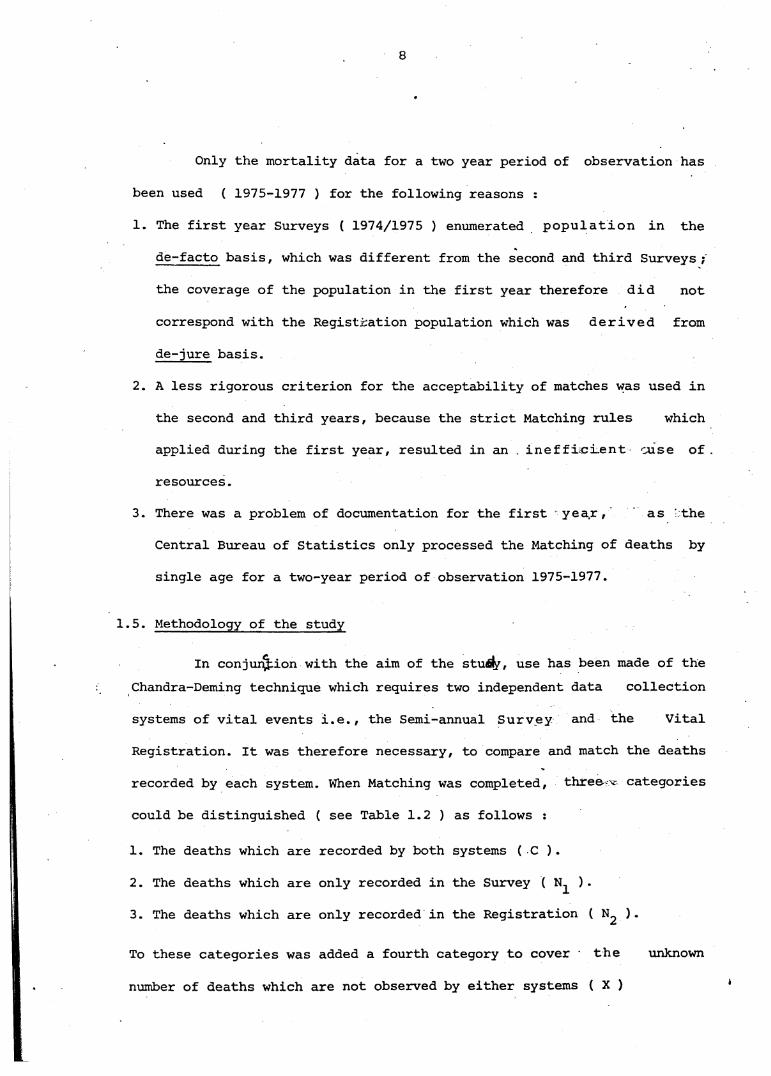
Only the mortality data for a two year period of observation has
been used ( 1975-1977 ) for the following reasons :
1. The first year Surveys ( 1974/1975 ) enumerated population in the
de-facto basis, which was different from the second and third Surveys;
the coverage of the population in the first year therefore did not
correspond with the Registration population which was derived from
de-jure basis.
2. A less rigorous criterion for the acceptability of matches was used in
the second and third years, because the strict Matching rules which
applied during the first year, resulted in an inefficient :.use of
resources.
3. There was a problem of documentation for the first year, as 'the
Central Bureau of Statistics only processed the Matching of deaths by
single age for a two-year period of observation 1975-1977.
1.5. Methodology of the study
In conjuration with the aim of the stuily, use has been made of the Chandra-Deming technique which requires two independent data collection
systems of vital events i.e., the Semi-annual Survey and the Vital
Registration. It was therefore necessary, to compare and match the deaths
recorded by each system. When Matching was completed, three categories
could be distinguished ( see Table 1.2 ) as follows :
1. The deaths which are recorded by both systems ( C ).
2. The deaths which are only recorded in the Survey ( ).
3. The deaths which are only recorded in the Registration ( ).
To these categories was added a fourth category to cover the unknown
number of deaths which are not observed by either systems ( X )
9
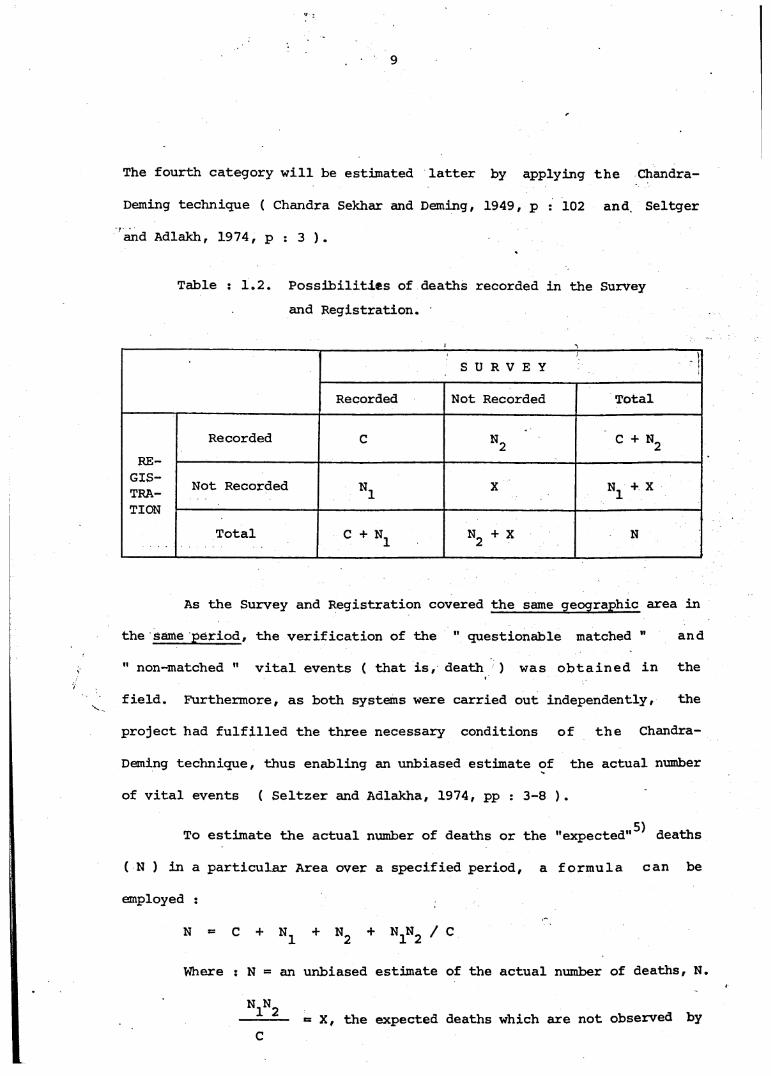
The fourth category will be estimated latter by applying the Chandra-
Deming technique ( Chandra Sekhar and Deming, 1949, p : 102 and. Seltger
and Adlakh, 1974, p : 3 ).
Table : 1.2. Possibilities of deaths recorded in the Survey and Registration.
\S U R V E Y
Recorded Not Recorded Total
RE-GIS-TRA-TION
Recorded C N2 c + n2
Not Recorded Ni X N + X
Total C + N n 2 + X N
As the Survey and Registration covered the same geographic area in
the same period, the verification of the " questionable matched " and
" non-matched " vital events ( that is, death ) was obtained in the
field. Furthermore, as both systems were carried out independently, the
project had fulfilled the three necessary conditions of the Chandra-
Deming technique, thus enabling an unbiased estimate of the actual number
of vital events ( Seltzer and Adlakha, 1974, pp : 3-8 ).5)To estimate the actual number of deaths or the "expected" deaths
( N ) in a particular Area over a specified period, a formula can be
employed :
N = C + N_ + N„ + N N / C 1 2 1 2
Where : N = an unbiased estimate of the actual number of deaths, N.
N N------ - X, the expected deaths which are not observed by
C
10
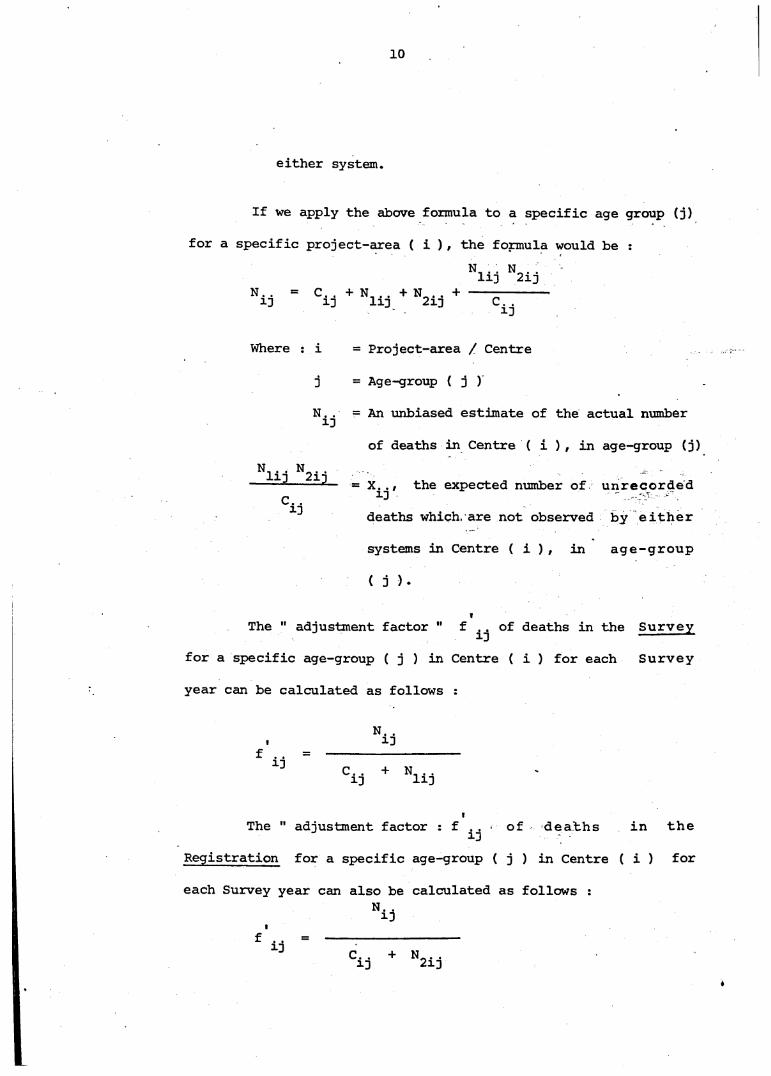
either system.
If we apply the above formula to a specific age group (j)
for a specific project-area ( i ) , the formula would be :
N. . = C . . + N . + N . + il il 111 2id
N, . . N . . Ill 21D
Where
ij
N. . . N . . Ill 21J
Project-area / Centre
Age-group ( j )
An unbiased estimate of the actual number
of deaths in Centre ( i ), in age-group (j)
X _. / the expected number of u n r e c o r d e d
deaths which, are not observed by e i t h e r
systems in Centre ( i ) , in a g e - g r o u p
( j )•
The " adjustment factor " f „ of deaths in the S u r v e y
for a specific age-group ( j ) in Centre ( i ) for each S u r v e y
year can be calculated as follows :
N ijij C. . + N n . .11 111
The " adjustment factor : f _ of d e a t h s
Registration for a specific age-group ( j ) in Centre ( i )
each Survey year can also be calculated as follows :N
in the
i ) for
ij
ij
C . . + N 0 ..il 2ij
11
The " adjustment " f of the "observed" deaths ( that
is, for both Survey and Registration ) for a specific age-group
( j ) in Centre ( i ) for each Survey . year would then be
calculated as follows :
fi3 C. . + N . . + N...ID liD 2id
The under enumeration of deaths in the Survey for a
specific age-group ( j ) in Centre ( i ) for each Survey year can
be obtained as.1
Similarly, the under enumeration of deaths in the Registration
for a specific age-group ( j ) in Centre ( i ) for each Survey
year is equal to :1
1 - ----n-------f . .13
The under enumeration of " observed " deaths for a specific age-
group ( j ) in Centre ( i ) for each Survey year will be :
11
t
6). In this text, the " observed " deaths = C + + N^.
12
1 .6 . O rg a n iz a tio n o f th e s tu d y
Having g iv e n th e o b j e c t iv e s and c o n d it io n s assum ed, we g iv e h e re
an o u t l i n e o f th e s tu d y . In C h a p te r Two, we p r e s e n t th e o b se rv e d l e v e l s
and p a t t e r n s o f m o r t a l i t y f o r th e 1975-1977 SVRP, w ith a v iew t h a t t h i s
would a id th e u n d e rs ta n d in g o f th e outcom e . o f t h e n u m e r i c a l
i l l u s t r a t i o n s in th e s tu d y . Then th e m ain r e s u l t s o f th e s tu d y a r e
p r e s e n te d in C h ap te r T h re e .
An e x a m in a tio n o f th e a d ju s te d l e v e l s and p a t t e r n s o f m o r t a l i ty
w i th in t h e 1975-1977 SVRP a r e a u s in g th e Chandra-Dem ing te c h n iq u e i s
p ro v id e d in C h a p te r T h re e , w hich c o n s i s t s o f th e d e sc r ip tio n o f M atching
p r o c e d u r e s , r e s u l t s o f M a tc h in g , a d ju s tm e n t f a c t o r s , a n a l y s i s o f
a d ju s tm e n t f a c t o r s b o th by th e " age " and th e " t o t a l " a n d
a d ju s te d L i f e T a b le s .
C h a p te r F o u r i s c o n c e rn e d w ith th e com parison o f th e l e v e l s and
p a t t e r n s o f m o r t a l i t y f o r t h i s s tu d y w ith v a r io u s m o r t a l i ty e s t im a te s
d e r iv e d e ls e w h e re such a s th e 1971 and 1973 In d o n e s ia f i g u r e s , th e 1974-
1977 SVRP a d ju s te d by th e " t o t a l " and th e w est Model a t m o r t a l i t y
l e v e l 1 4 .0 T h is co m p ariso n i s e s p e c i a l l y done f o r th e a n a ly s i s o f th e
v a lu e s o f p r o b a b i l i t y o f d y in g ( ) , e x p e c ta t io n o f l i f e ( ^e ) and
Crude D ea th R a te .
F i n a l l y , th e c o n c lu s io n o f t h i s s tu d y i s p r e s e n te d in C h a p te r F iv e ,
w hich in c lu d e s th e summary o f th e m o r t a l i t y l e v e l s and p a t t e r n s w i th in
in d iv id u a l a r e a s and th e w hole a r e a o f th e 1975-1977 SVRP.
t
Vi i;
CHAPTER II
OBSERVED LEVELS AND PATTERNS OF MORTALITY
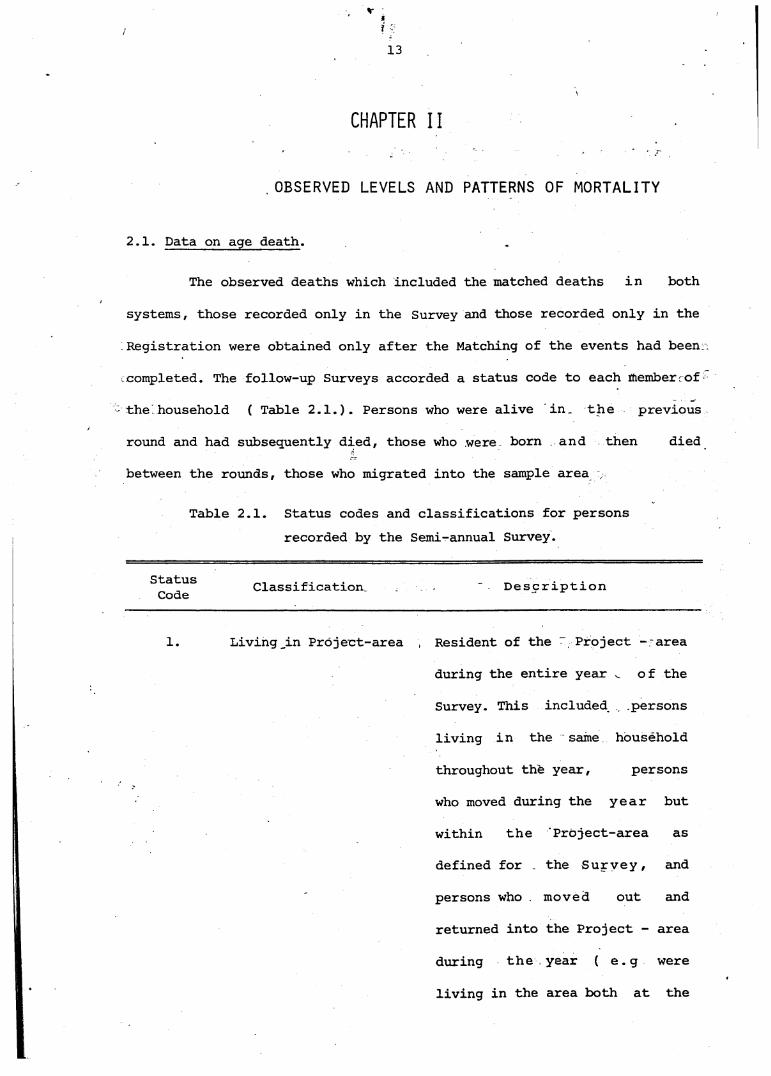
2.1. Data on age death.
The observed deaths which included the matched deaths in both
systems, those recorded only in the Survey and those recorded only in the
Registration were obtained only after the Matching of the events had been
completed. The follow-up Surveys accorded a status code to each member of
the household ( Table 2.1.). Persons who were alive in. the previous
round and had subsequently died, those who were born and then died
between the rounds, those who migrated into the sample area
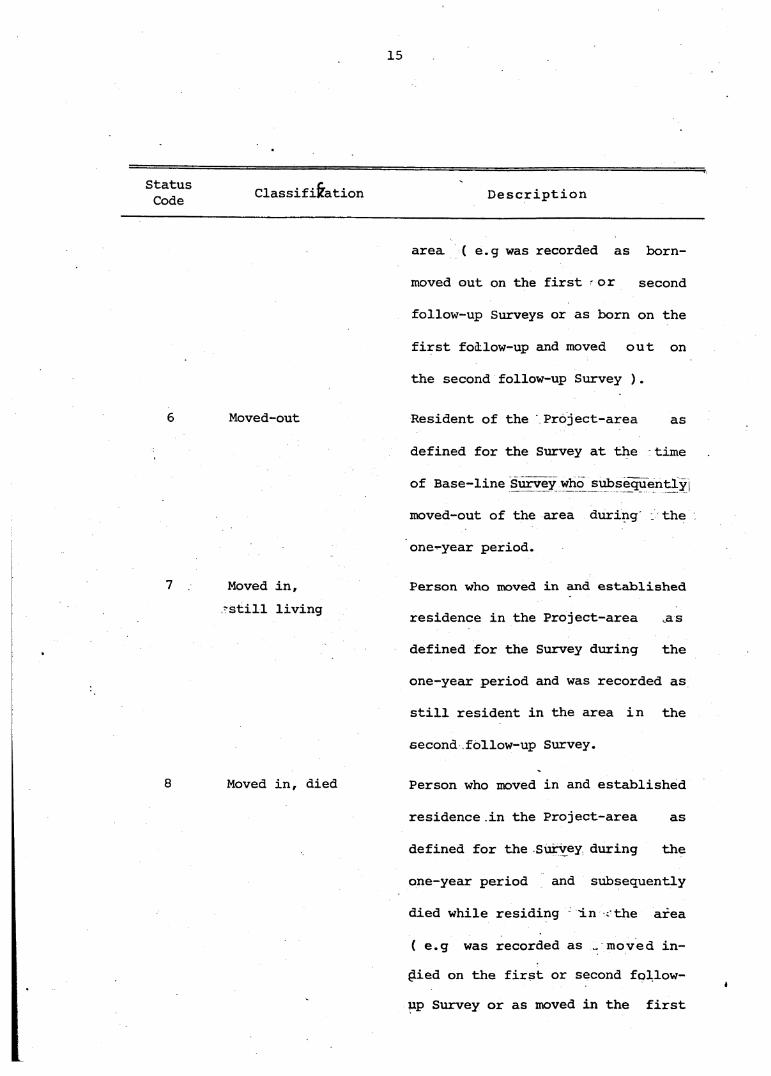
Table 2.1. Status codes and classifications for persons recorded by the Semi-annual Survey.
Status Classification DescriptionCode
1. Living_in Project-area , Resident of the " Project - area
during the entire year v. of the
Survey. This included persons
living in the same household
throughout the year, persons
who moved during the year but
within the 'Project-area as
defined for . the Survey, and
persons who moved out and
returned into the Project - area
during the year ( e.g were
living in the area both at the
13
14
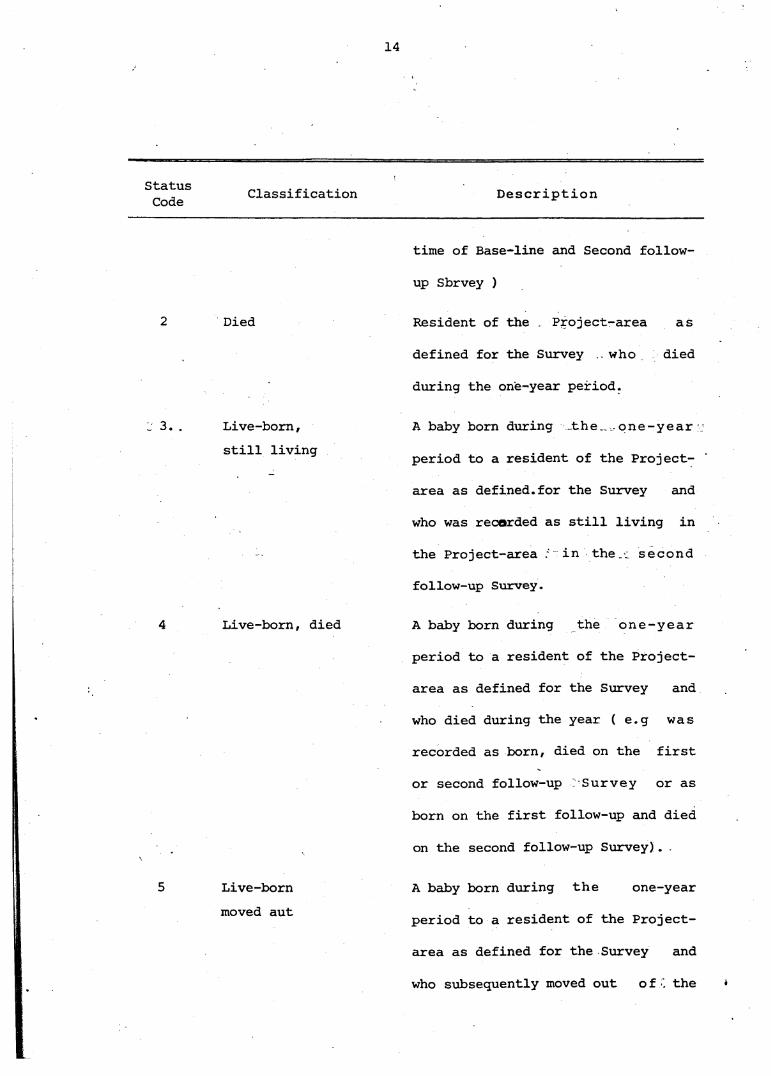
Status ClassificationCode Description
2 Died
time of Base-line and Second followup Sbrvey )
Resident of the Project-area as defined for the Survey who died during the one-year period.
_ 3.. Live-born, A baby born during the one-yearstill living period to a resident of the Project-
area as defined.for the Survey and who was recorded as still living in the Project-area . in the._ second follow-up Survey.
4 Live-born, died A baby born during the one-year period to a resident of the Project- area as defined for the Survey and who died during the year ( e.g was recorded as born, died on the first or second follow-up Survey or as
born on the first follow-up and died on the second follow-up Survey).
5 Live-born A baby born during the one-yearmoved aut period to a resident of the Project-
area as defined for the Survey and
who subsequently moved out o f . the
15
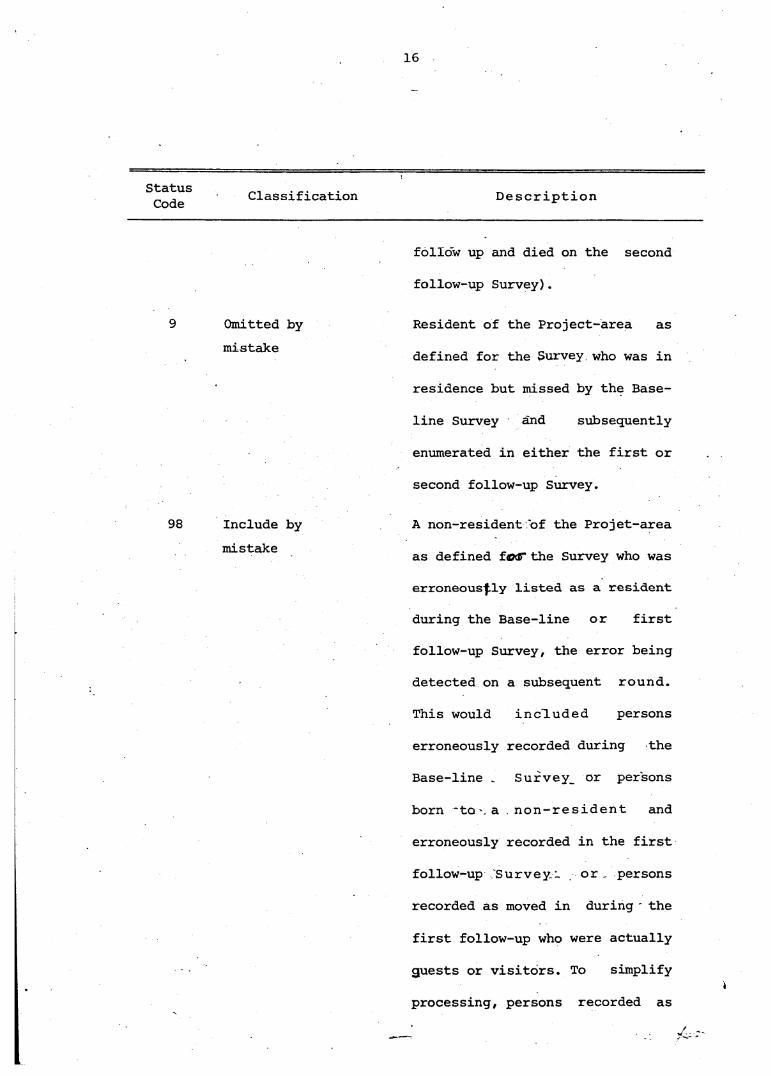
StatusCode
6
7
Classification Description
Moved-out
Moved in, 'still living
Moved in, died
area ( e.g was recorded as born-
moved out on the first or second
follow-up Surveys or as born on the
first follow-up and moved out on
the second follow-up Survey ).
Resident of the Project-area as
defined for the Survey at the time
of Base-line Survey who subsequently
moved-out of the area during . the
one-year period.
Person who moved in and established
residence in the Project-area .as
defined for the Survey during the
one-year period and was recorded as
still resident in the area in the
second follow-up Survey.
Person who moved in and established
residence in the Project-area as
defined for the Survey during the
one-year period and subsequently
died while residing in . the area
( e.g was recorded as .. moved in- {lied on the first or second followup Survey or as moved in the first
16
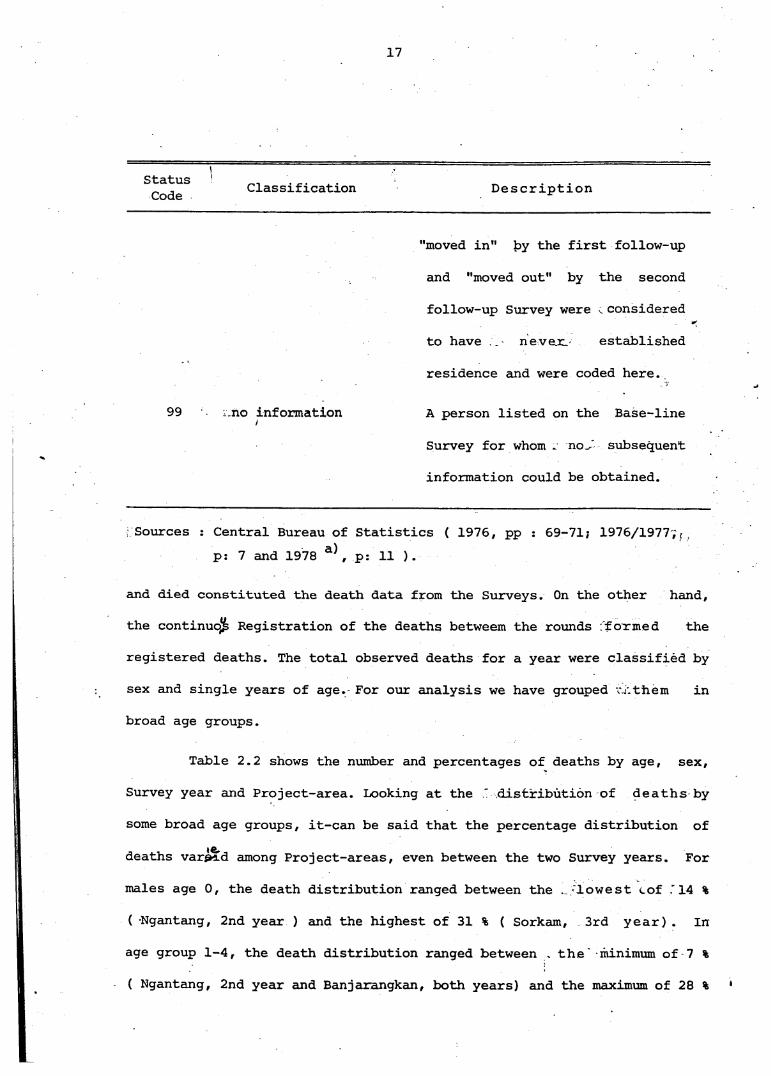
StatusCode Classification Description
9 Omitted bymistake
98 Include bymistake
follow up and died on the second
follow-up Survey).
Resident of the Project-area as
defined for the Survey who was in
residence but missed by the Base
line Survey and subsequently
enumerated in either the first or
second follow-up Survey.
A non-resident of the Projet-area
as defined fsxT the Survey who was
erroneously listed as a resident
during the Base-line or first
follow-up Survey, the error being
detected on a subsequent round.
This would included persons
erroneously recorded during the
Base-line . Survey^ or persons
born 'to-.a non-resident and
erroneously recorded in the first
follow-up Survey i or persons
recorded as moved in during the
first follow-up who were actually
guests or visitors. To simplify
v _
processing, persons recorded as
17
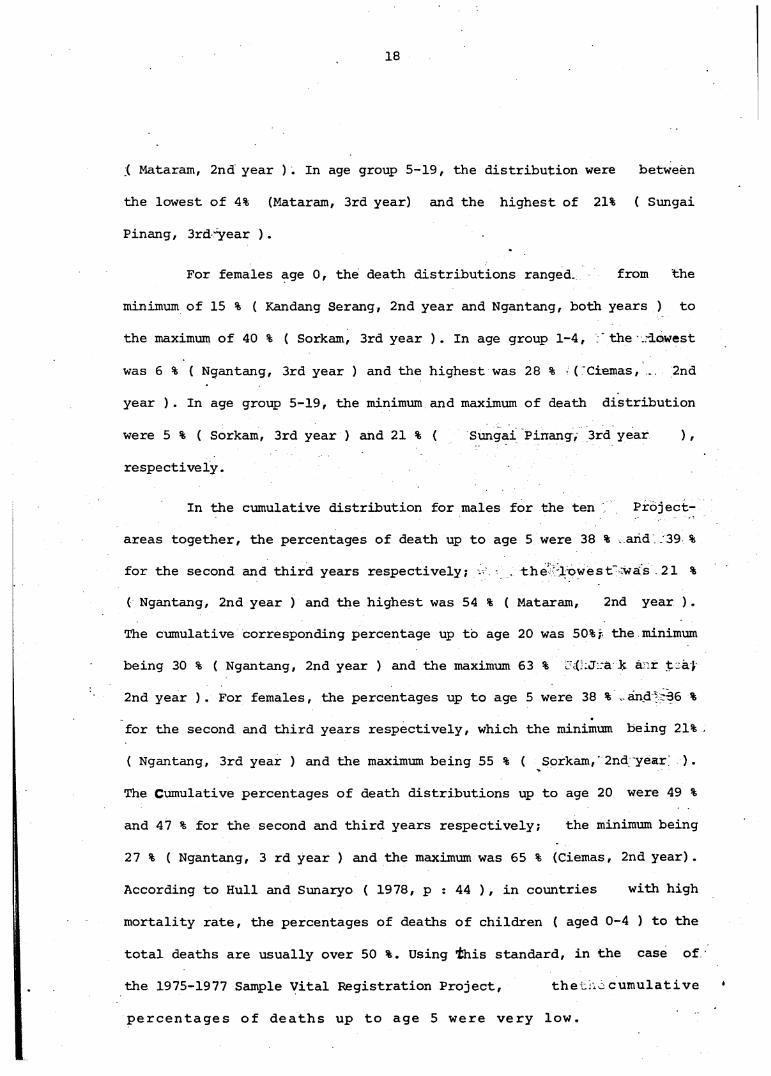
StatusCode Classification Description
"moved in" by the first follow-up
and "moved out" by the second
follow-up Survey were ; considered
to have never. established
residence and were coded here.
99 ,.no information/ A person listed on the Base-line
Survey for whom . no/ subsequent
information could be obtained.
Sources : Central Bureau of Statistics ( 1976, pp : 69-71; 1976/1977, < p: 7 and 1978 a), p: 11 ).
and died constituted the death data from the Surveys. On the other hand,
the continuo^ Registration of the deaths betweem the rounds formed the
registered deaths. The total observed deaths for a year were classified by
sex and single years of age. For our analysis we have grouped w. them in
broad age groups.
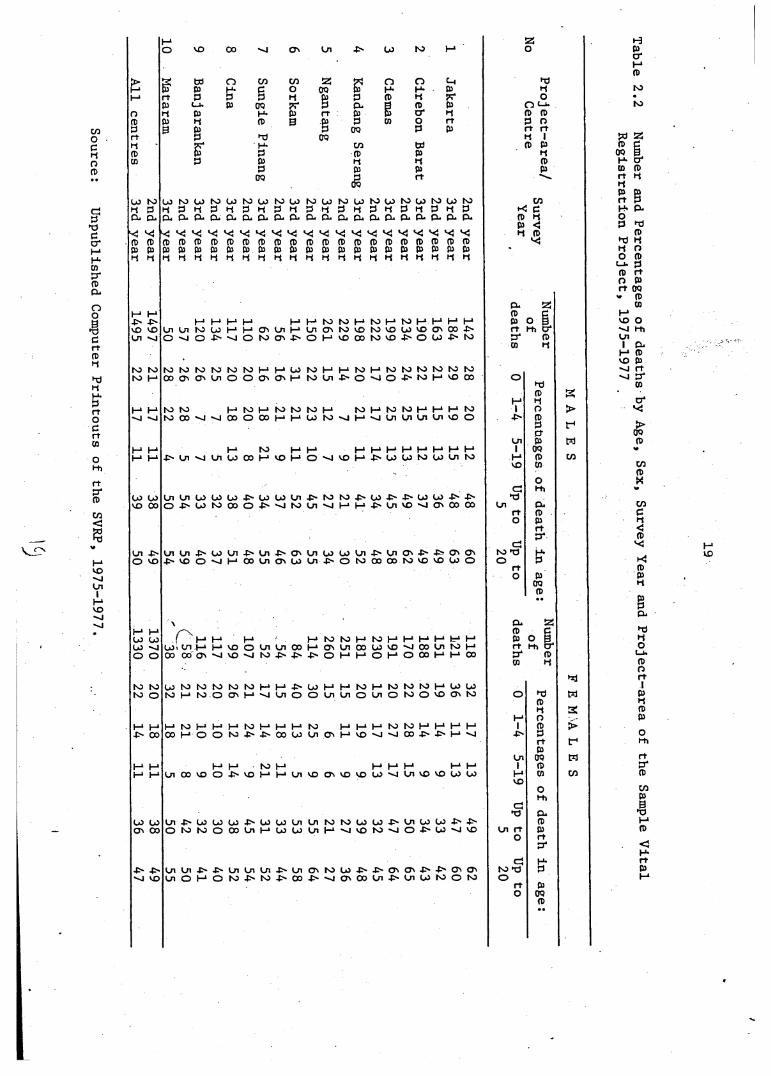
Table 2.2 shows the number and percentages of deaths by age, sex,
Survey year and Project-area. Looking at the ' distribution of deaths by
some broad age groups, it-can be said that the percentage distribution of
deaths var^id among Project-areas, even between the two Survey years. For
males age 0, the death distribution ranged between the . lowest «.of .'14 %
( -Ngantang, 2nd year ) and the highest of 31 % ( Sorkam, 3rd year) . In
age group 1-4, the death distribution ranged between „ the" minimum of 7 %
( Ngantang, 2nd year and Banjarangkan, both years) and the maximum of 28 % *
18
( Mataram, 2nd year ). In age group 5-19, the distribution were between
the lowest of 4% (Mataram, 3rd year) and the highest of 21% ( Sungai
Pinang, 3rd year ).
For females age 0, the death distributions ranged. from the
minimum of 15 % ( Kandang Serang, 2nd year and Ngantang, both years ) to
the maximum of 40 % ( Sorkam, 3rd year ) . In age group 1-4, ' the . lowest
was 6 % ( Ngantang, 3rd year ) and the highest was 28 % (Ciemas, .. 2nd
year ) . In age group 5-19, the minimum and maximum of death distribution
were 5 % ( Sorkam, 3rd year ) and 21 % ( Sungai Pinang, 3rd year ) ,
respectively.
In the cumulative distribution for males for the ten Project-
areas together, the percentages of death up to age 5 were 38 % .and 39 %
for the second and third years respectively; . . the lowest was 21 %
( Ngantang, 2nd year ) and the highest was 54 % ( Mataram, 2nd year ) .
The cumulative corresponding percentage up to age 20 was 50%;- the minimum
being 30 % ( Ngantang, 2nd year ) and the maximum 63 % J a k a r t a)
2nd year ). For females, the percentages up to age 5 were 38 % . and rS6 %
for the second and third years respectively, which the minimum being 21%
( Ngantang, 3rd year ) and the maximum being 55 % ( Sorkam, 2nd year ).
The Cumulative percentages of death distributions up to age 20 were 49 %
and 47 % for the second and third years respectively; the minimum being
27 % ( Ngantang, 3 rd year ) and the maximum was 65 % (Ciemas, 2nd year).
According to Hull and Sunaryo ( 1978, p : 44 ), in countries with high
mortality rate, the percentages of deaths of children ( aged 0-4 ) to the
total deaths are usually over 50 %. Using ’this standard, in the case of
the 1975-1977 Sample Vital Registration Project, the ....~ cumulative *
percentages of deaths up to age 5 were very low.
Un
pu
blis
he
d
Co
mp
ute
r P
rin
tou
ts
of
th
e
SV
RP
, 1
97
5-1
97
7
coocdo3
M 25O VO 00 •o Ov Ul -tv U) to M O
> s Cd o CO CO 2! F n o M dj3 3 M 3 o 00 3 M M 3 d
-* r t 3 3 3 d 3 3 3 d o3 (_i. 3 00 3 D. 3 3 3 n c_u
o d 3 M 3 r t 3 3 a 4 d 3 33 3 d 3 3 3 3 cn o r t 3 O3 3 3 3 00 3 3 r t r tr t 3 dJ 00 d ld F 4 M CO Cd 3 33 3 3 3 3 dcn 3 3 d d 3
3 3 3 300 5 rt
U5 N)d 3 cc cl
‘C Vi 3 3(13 (13d d
I-1 M 4V -t> vO VO Ul
t o to ho i-*
M M • i ' -j
i -1 i -1 m M
u> coVO 00
Ln -t>~ O VO
I-* I-1 CO U) COO O
N3 tO t o O
M I—1 -O' 00
M M M I-1
W N W t O U M W M W N W t O W h J W N l U l v J W f O 3 d 3 d 3 d 3 d 3 d 3 d 3 d 3 d 3 d 3
p. Qj (IL ^ ■ pi. pi. Qu Pi ■ Pi. Qj pi. pi. pi i pi» pi« pi» pi ■ pi ■ pi •
^ViViVJVi'<JViV<<<i«<(v<J ^ y v i V i V ((V(JViV('C3 3 3 3 3 3 3 3 3 3 3 3 3 3 3 3 3 3 3 3C ) ) f U C D C ü f l ) 3 3 C ü 3 p ( D ( l ) ( Ü 3 3 3 3 3 3 3d d d d d d d d d d d d d d d d d d d d
t—* 1—‘ I—* I—* H H M M H t O H W H H H HU i U M W H H O U i H U i O i t O v O t O v O W V O O O O O O v l O J V M O I v 3 0 N j v O h l v D O O Mv O ^ O U - > N )
t O t O I O t O f O t O H 1 M1 W t o H ' H t O H M t O t O N f O t O O O O ' O U n O O O ' O ' H M U i ^ O V O - P ' ^ H v O O O
to to t—* to I—* to to to m r o H t o t o H H H Mt O O O v J v J O O O O O H H W I O s J p s J Ü l U U l Ü l V O O
-o- ->~o VO
- > Ln -OM t o M M
L n W O O H v O H O OH-‘ I—‘ I—*1—*1—*»—•»—‘ I—1k D H 4 M J U l t O Wm t O
L n L n U 3 W U J 4 v WWV n 4 v t 0 t 0 4 v u £ ' 4 v w W4 v i v O J V U t O O O O ^ v J f O U i —I p H ■> Ui VO —I O' (X) CO
UiU i^> U )U l - t> U i . t v O 'U iW U U i . t s UiO'-C'4>, (J'OV O v l H O O U i O ' W U i J V O I O O O O O t O V O ' O W O-O' VO
M M j_iU) Cn M M vo O 00 0 0 ov O vo O
MUl Ui 00 M M 4v Jv ^
t O t O M t O M M M M M MOMn o o Wi OVOOUi t OMO M M O M O O O M M O O
(O M U WW t O I O I O W t O M M ^ U M M t O M I O t O t O M t O O O v M ' O L n O O ' - n U i O L n O N J O v O O v t O
M t O M M M t O M M M t O M M M N 5 N 3 M M M M C O MO O f O t ' J v O O WI n O N Mv O v I v J O O J Mv Mv l
M M t o M M M M M ML n O O V O O - C ' V O M M V - n v D O v v D V O C O —I Ui VO vO W W
Ln4>C0L0L0-t>'L0L0LnUitorOL0L04>VnU5(-0-O-P'O M t O O O O U M U U O U l M v J v O t O s l O ^ W M v O
VnVn^'^lnLnLn4virCT'IOUi-JV-P'Ov(J' -C'-C'0'CT'O l O M O M - I V t O J v O O ^ M O N O O U l J M J l U t O O l O
COH< C ft) d(13 <d a>
vj
a . 23(D cn o p rt t-h cr* O4 ft)cn d
*10
cto TOo
r tO
d jft)doft)3Ö(i)ooft)cn
oHi
Ouft)3r tP 4
M3
300ft)
Cu 25 ft) 33 ° B r t hi cr*0 4 ft) cn d
<=!*r)Ui r t
O
at o 13 O
r tO
T)ft)doft)3r t300ft)cn
OHi
D.ft)3r tP 4
M3
3003
£>t -1
WCO
w
2
>r 1
w
CO
Tab
le 2
.2
Num
ber and
Percen
tages
of
death
s by
Age,
Sex,
Survey Y
ear and
Pro
jec
t area
of th
e S
ample
Vita
l R
eg
istratio
n
Pro
jec
t, 1
97
5-1
97
7
.
20
In most Project-areas, between the Survey years for both sexes,
the variation rn the cumulative percentages of deaths .between the ten
Project-areas decreased as the age increased ( see Table 2.2 ,. Memoryand perhaps unwillingness to report on the part of the respondents could
possibly account for such mis-reporting on age at death _ and under
enumeration of deaths. In Table 2.2, it is clear that under enumeration of
deaths under age 5 for both sexes occurred more fre?ue?(ntly in Cirebon Ba-
rat, Kandang Serang, Ngantang Sungai Pinang, Cina and Banjarangkan. It is
argued that some of the 25 % of deaths which occurred outside the village
of residence were not reported by the respondents. , Central Bureau of Statistics, 1976/1977, p: 113 and 1978 *>, p: 140 ), It Bas - perMps
confusing for respondents to take into account the concept of the , " d e -
l iure " residence which was used for the enumeration in the survey and
Registration. In particular, there was probably an incorrect statement on
age at death of children age 4 which were more often reported as deaths at
5 years of age ( CBS, 1977, unpublished reporl). The variation in the
cumulative percentages of deaths between the ten Project-areas was also
due to the small number of deaths and broad variation of the age structure Of the population in each Project-area.
2*2* Data on Base Population
In order to obtain the appropriate denominator for. the
calculation of vital rates, we should obtain a total . number of person-
years lived during the year residents of the Project-area. In practice,
this is never done even in the most sophisticated national vital statist
tics systems since the error introduced by the population in la£er groupsdoes not much effect thfirpgnifc / _ , ,• ( Central Bureau of Statistics, 1976 ).in this study, the terminology of "base pojmajtion" means the number o f
21
people in a given Project-area to which specific vital rates apply-for
example, the denominator of the Crude.Death'Rate .or Crude'Birth Rate
( Marks & Seltzer, 1974 : 432 ) . For this reason, the base population is
computed as the mid-year population which is assumed to be approximately
the same as the total number of person-years lived.
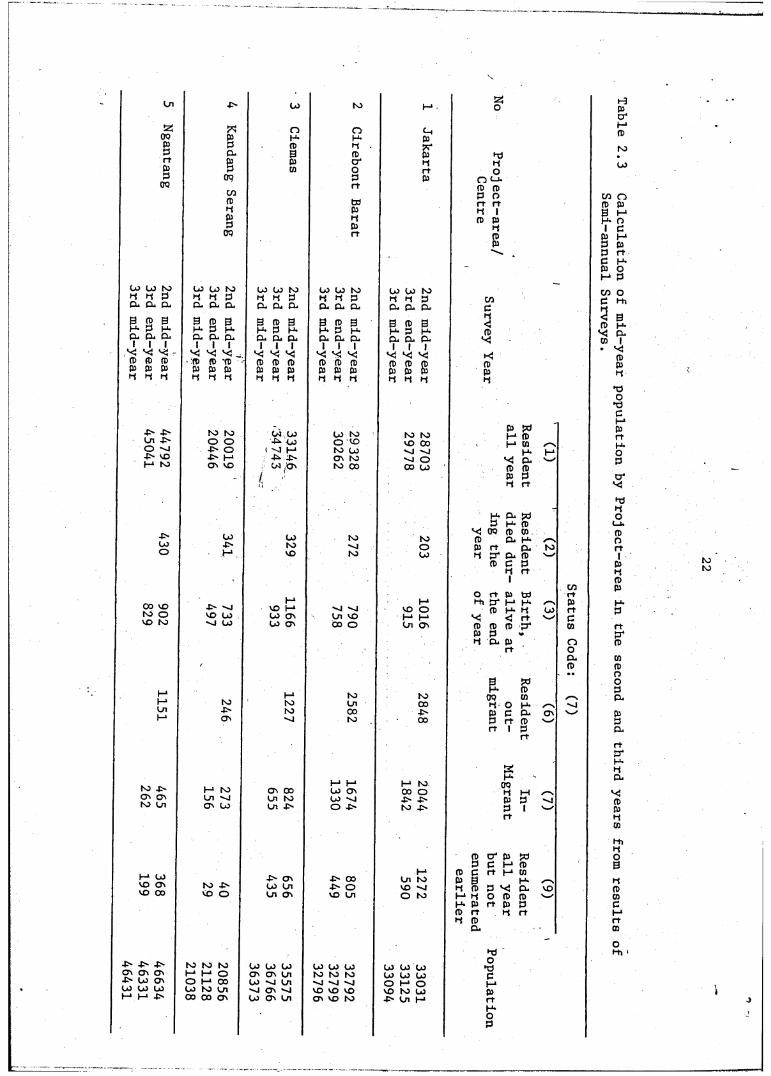
The 1975-1977 SVRPwas conducted from 1-7-1974 to 30-6-1977. The
computation of mid-year population for the second Survey year is as
follows. The figures in brackets for the Jakarta Project-area illustrate
the calculations ( See Table 2.3 ) :
Population at the beginning of the Survey year =
Residents living at the end of Survey year as code 1 ( 28,703 )
+'■ Residents who died during the Survey year as code 2 ( 203 )
+ Residents who left the Project-area during the Survey-year as
code 6 ( 2,848 )
+ Residents living for the whole of Survey year mistakenly not
enumerated at the beginning of the Survey year and found of the
end of Survey year as code 9 ( 1,272 ) = 33,026.
Population at the end of Survey year =
Residents living at the end of Survey year who were also present
at start of year as code 1 ( 28,703 )
+ Children born during the Survey year and still alive at the end
of Survey year as code 3 ( 1,016 )
+ Immigrants during the Survey year as code 7 ( 2,044 )
+ Residents living for the whole of Survey year but mistakenly
excluded at the beginning of Survey year and found at the- end
of Survey year as code 9 ( 1,272 ) = 33,035.
Cn 4^ co hO P
No
n O P00 P P P PP P p M ? rP P 0 P p pjM P c r p pP P CO o M oP OQ p P O t_LOQ
COM p p
P oP to M MM p P 1P M P PP p pOQ r t P
-
P^
CO CO ho CO CO hO CO CO ho co co ho CO CO hOM M P M M P M P P P P P p p p cnQ-» CL CL Q-» Q-t CL CL CL CL CL CL CL p p p c0 P 0 0 P 0 0 P 0 0 P 0 0 P 0
p<P P P P P P P P P P P P P P P pCl CP
1 1 1P i CL CL1 1 1 P P P
1 i i P P P 1 1 1 P P P vsvs vs ^s - vs vs VJ _
1 1 1VJ VS v< 1 1 1VS vs cs
1 1 1vs vs VJ hSP P P P P 'P P P P P P P P P p PP P P P P p P P P P P P P P P PP P P P P P H H H P P M P P P P
4> ■C' ho hO Co co Co ho ho ho P Jd P PCn 4> o o 4L Vo o CO VO 00 p cnO 'O 4v O 1 -0 p ho co ^4 ~vj P f—l4> VO -l> P 4L JS P ho ' 'J o VS CL V-/I—1 ho O ' VO Co p ho CO 00 CO P P
( ’ P P P M
P CL JX) P P P
-
VS 00 P CD■C*- co CO ho ho P CL pCO 4> hO ^4 o P M CL hoO P VO ho CO p cr cl p V-/p p p
P M 1
mO r t CL CO MH1 P Mi tr p p p00 VO -P' "4 VO P ^4 ^4 vo O p p p LO Mho O VO Co CO O' Cn vo P P v< <S M s-/ cVO ho ^4 CO CO P Co o Cn O ' p p p c r p p
cn
P CL p OM O
CLP
0 ?C1p P hO hO
P P00 CDH 1 hO ho Cn 00 P O PCn ho 00 4> P C CL as v-/
I—1 p ^4 ho CO P M P M 1 p
s-/
M
spP P P ho 00ho P hO P 00 CO p oo o P wO ' O ' Cn ^4 Cn ho CO "4 4v 4V p pho Ln P Co Cn -C- O 4v hO 4> p 1M
p c r p pa p p p p
P P C m i—1 cnP CO 4> CT> 4> 00 Cn hO P 0 P /-NVO O ' hO 4>- CO Cn 4> O vo ^4 P P p VJ CL VOVO CO VO O Cn p VO Cn O ho P P O P P v-/P p r t p pP M P MP p
CL
PJJh Jh hO hO ho Co co Co CO CO CO co co co
o*0O ' O ' O' P P O P P Cn hO hO hO co co co c^ D O ' O P 00 Co »-j cn ^4 O P o pco co co CO hO Cn P '-4 VO VO vo vo ho co pP P 4> CO 00 P CO p Cn P vo ho 4> Cn P MPOP
H P c rP(Dho
co
cn o P P B P P O I C
PPr tPO
P P
cn oC MiP<p
v jCO
0PCLI
viPPP
X)OP)cP P rt f—Lopcr*vs
PSP0
(_upOrt1
PPPPPPr tP*p
cnpooPCl
PPCL
rtc rppCL
VJPPPcnMiMO0MPCOpM*rtCO
OMi *
fOto
J
L_
10 Mataram
2nd mid-year 8536
87 292
835 858
188 9760
3rd end-year 9026
299 623
83 10031
3rd mid-year 9942
ZVO oo -O ON o
td n CO CO0) H* C oP P P p PJ<_i. 02 00 o02 p p <_uP H* 3 O P02 P oP pj P rr00 H* rr 1F
P P PP P Pp P P00
u> U2 ro LO LO ho Co LO to LO LO to•
p P P P P P P *-t p p p p • COP-. a Cb Cb Cb Cb Cb Cb Cb Cb Cb Cb pp3 P 3 3 fD 3 3 fD 3 3 P 3 <H- P H- H- P H* H- P H* H- P H* pCl. CL. CbI CbI Cb1 CbI CbI Cb■ Cb Cb Cb Cbv;
i 1 1 1 1V3
1•c
iv: L- V< V-
(D P (0 fD fD fD fD P p P P P PP P 02 P 02 02 P P p P P P Pp p p P P p P P p P P P P
P pdho ho M 1-* I-1 I-1 M P•ol ON Ln Ln 4> -> •o h-> cno 4^ U> O 00 oo VO Ln H- MLO O O ON O ro 4^ I-1 v< cb V-/-P' ■O U) vo Ln ON VO LO P P P P P rt
H* Cb pöP H- Pv: oo p »
t-> (-* (— 1 P Cb P- /-Soo ON 00 00 p rr Cb ro-o O ■p- '-J p cr Cb pP C PP rr 1
COO rr p td rrP P H H- PON ON Ln Ln I-1t—* ON ON P H- P LO rro ~0 hO ro t—* Ln 00 Ln ^ < rr v—' Co 4 t—1 M -O' Ln I-* P P P CT*P P
cnP Cb p nrr oCbp
po3 pl-L o cn ✓~N /-vI-1 00 C H- -o
tO Ln I-1 -o P rr Cb Vw ovo ON ■o O' P 1 PLn -O ON VO P Prr rr
SH*M OO / Sh-1 l-1 ON I-1 I-1 LO OJ P MVO vo U> vo 00 'O 4> P P V-/ho Ln 00 to LO ON I-1 -o P 1rr
P cT p pdP P C H* P P p rr (-* CßP 3 H- VOM p 3 L- cb
h-1 I-1 h - p o p pLo LO 1-* Ln VO o ON 00 p p rr p pON to ON M Ln M to P rr p rr
PCb
PIOT3
tO ho ro (-* I-1 I-1 I-1 H* I-1 C^4 '-J ■O ON O' ON Ln Ln Ln 00 VO oo t-1O' oo N2 ON -> 00 M H* I-1 vo O P4> ON I-1 o 'O -P' 00 OO 00 ON ON -o rr
ho Ln o VO Ln to LO ro on ro H*OP
Table 2.3 (contd.)
J
GP
*3cc r(-*H-COP 4PCL
nO CD 0 h
T3 ft)CH OQ
OO9
t3I-*CDr tft)
Clft)t-hH-PH*r tH*OPCO
ft)rf
hdHH-Pr tOCr tCO
OHi
H-<ft)P
H*P
HPO4M0)
r t oop 4ft)
CO<S3h->VO
OnIM*
VO"■vj■'vj
> |(—1 M
Oft)
O
P •■dr t oH Oj .ft) n pCO p o
P r t r t 1 H P P H
P P^
U U foH U P CO1 Qj CL CL cg p g H
<H- P H- PI P . Pi P jI I I
o-\ * < V- VJ ►<
P P P P IP P p PH H l-f H
fO N5 P pcf I - 1 POO N5 H CD \4> 00 H* H00 00 v ! a n. /
0 0 (jO p pvo p pH r t
H* CO fP P H- Pto ^ 00 P 0) I
to P O. H-oo P H Cl NOo H p 4 CO (D n—
P C P H r t1
coo H p CÖ r tON ON H) P H H- ^ ft)l—i VO P H* H OO r tO ^ < H 'w^ cuo P P P 3* P P toH CL p O
H OCLCD
a ^g p ••1—* K O 0 ) IM OO C H- ^ n NON H H C l o nVO P I n> W ION P P
H rt
gON 0 0 H- i—N Iro oo 0 0 H s i I■C" On H 3 v--' INO 0 0
(
Res
ant
all
bu
t enu e
H* oo p g h * vo 1VO H P P V i C l w IVO O H* H o fD fDO - t s H- P H p 3
P H H hH ft)
CL
t JNO to to o 1In on N t oN j O ) O n c I
I O n O O n t—1O n o n O n pO n vO - t ' | H 1
NO.N
Tab
le 2
.3
(con
td.)
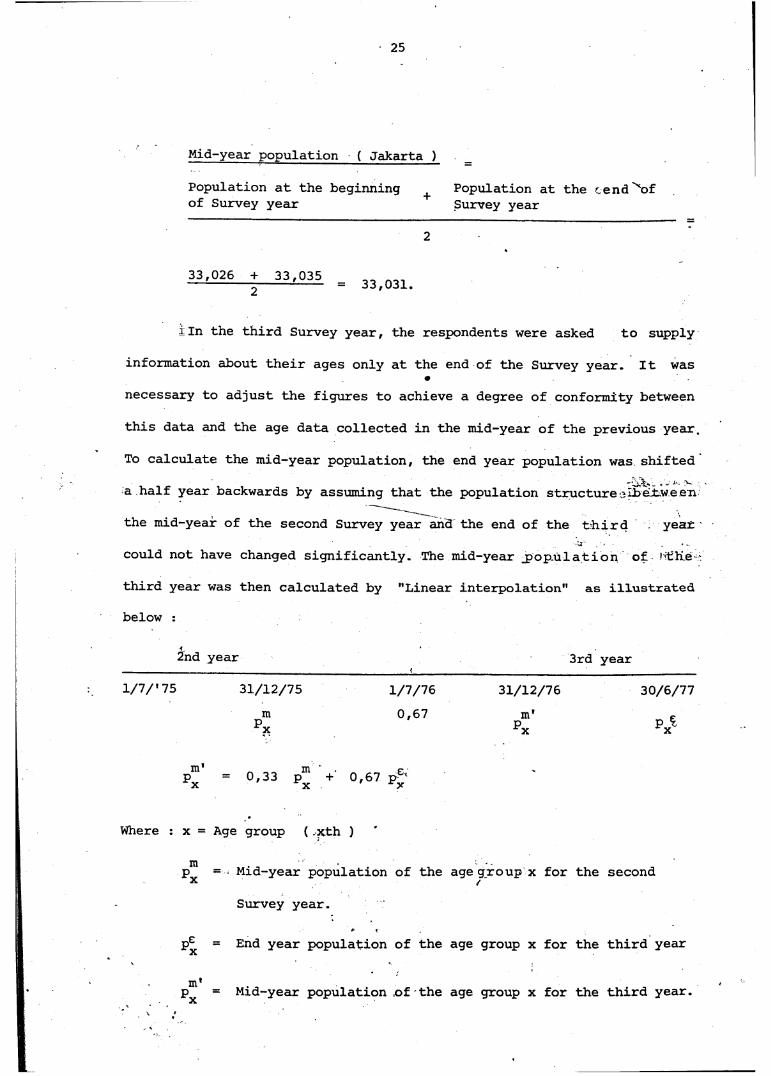
25
Mid-year population ( Jakarta )
Population at the beginning Population at the -end^ofof Survey year Survey year
33,026 + 33,0352 33,031.
iIn the third Survey year, the respondents were asked to supply
information about their ages only at the end of the Survey year. It was
necessary to adjust the figures to achieve a degree of conformity between
this data and the age data collected in the mid-year of the previous year.
To calculate the mid-year population, the end year population was shifted
a half year backwards by assuming that the population structure between
the mid-year of the second Survey year and the end of the third year-a- .
could not have changed significantly. The mid-year p o p u l a t i o n of 'file
third year was then calculated by "Linear interpolation" as illustrated
below :
2nd year 3rd year
1/1/'75 31/12/75m
1/7/760,67
31/12/76 30/6/77
P $ x
p = 0,33 p + 0,67 p e'X X
Where : x = Age group (.xth )
Mid-year population of the age group x for the second
Survey year.
End year population of the age group x for the third year
Mid-year population of the age group x for the third year.
26 •
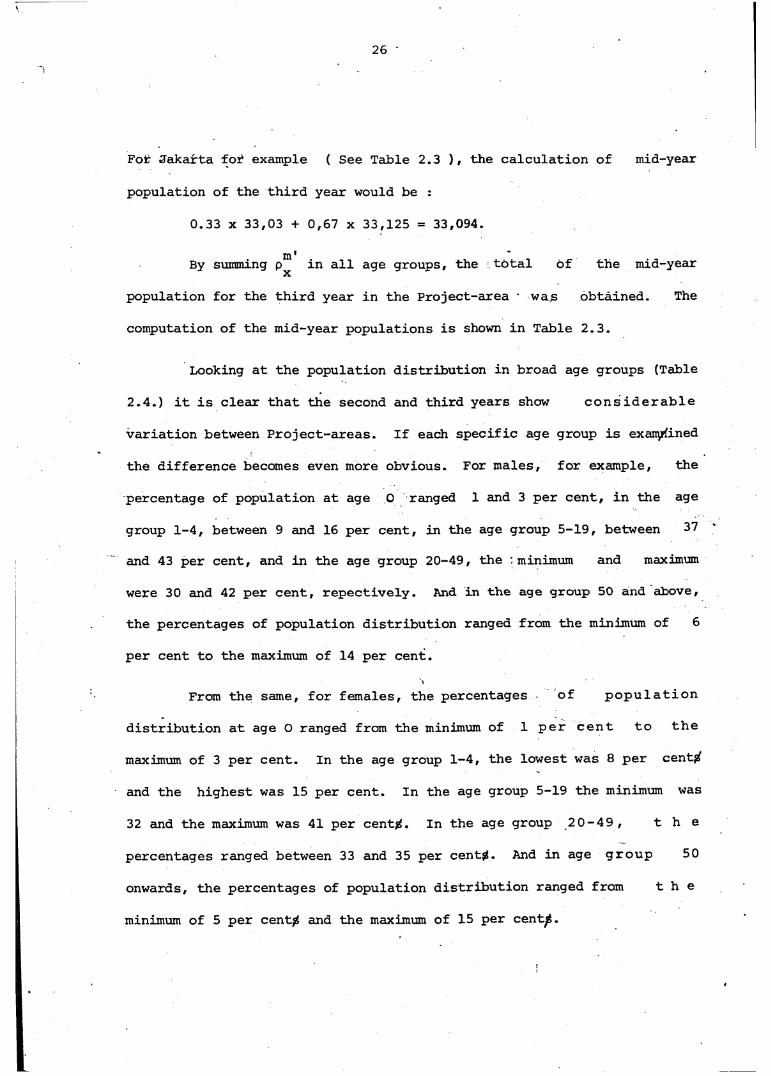
For Jakarta for example ( See Table 2.3 ), the calculation of mid-year
population of the third year would be :
0.33 x 33,03 + 0,67 x 33,125 = 33,094.m I •
By summing in all age groups, the total of the mid-year
population for the third year in the Project-area * was obtained. The
computation of the mid-year populations is shown in Table 2.3.
Looking at the population distribution in broad age groups (Table
2.4.) it is clear that the second and third years show considerable
variation between Project-areas. If each specific age group is examined
the difference becomes even more obvious. For males, for example, the
percentage of population at age 0 ranged 1 and 3 per cent, in the age
group 1-4, between 9 and 16 per cent, in the age group 5-19, between 37
and 43 per cent, and in the age group 20-49, the minimum and maximum
were 30 and 42 per cent, repectively. And in the age group 50 and above,
the percentages of population distribution ranged from the minimum of 6
per cent to the maximum of 14 per cent.
From the same, for females, the percentages of population
distribution at age 0 ranged from the minimum of 1 per cent to the
maximum of 3 per cent. In the age group 1-4, the lowest was 8 per cent^
and the highest was 15 per cent. In the age group 5-19 the minimum was
32 and the maximum was 41 per centg. In the age group 2 0-49, t h e
percentages ranged between 33 and 35 per cent#. And in age group 50
onwards, the percentages of population distribution ranged from t h e
minimum of 5 per cent# and the maximum of 15 per cent^.
So
urce:
Un
pu
blish
ed
Com
pu
ter P
rin
tou
ts o
f th
e SV
RP
, 1
97
5-1
97
7.
No
te: *
Not
inclu
ded
"
un
kn
own
age"
>mM
Oft)3rt3ft)cn
MO
Ire3333
V1
rt) re 8 8
ho3c l
<cft)33
£3
(_u3333
OQF3
Co3Cl
<C333
I—1CJ
vOCn
OH33
ho3Cl
VC333
MU )ho
Ov
OQM3
3)M33
(Bho u) 3 3CL CL
COo3
F3
22OQ33rt33
OQ
P3CL33
OQCO3333
po™3CL 2
nM3
OM33wO3
W3333U)3CL
C-,3
F333
hO CO ho3 3 3CL CL CL
^ VJ v<j vj y y3 3 3 3 3 3P) 3 &) P) (D ß)3 3 3 3 3 3
^ ^ ^ v-V<3 C^3 3 ^ 3 3 3 3 3 3 3 3 3 ^ 3 3 3 3 3 3 3 3 3 3 3 3 3 3 3 3 3
( O h J H H H H H H H H W f O O O O l N l l n U i O ' O ' 00 CO hO I—1 Co vo vo CD 00 00 VOVOOVvJf>hOvJ>sjNjVO - h U l n v D D H ^ O W C n
hO M CO H h O H D h O h O h O U h O h O H h O h O h O r o M H W t O
f—1 M M M‘ M M M M M M M M (—“ M M M M M M M h - 1M fO hO P ' M M - h O U O - h O i O v v o O M O f ' - h H h O D W
' ' J V O I O O I s i VD s i CO s i M hO SO VO VO vO CO CO CO f f l s i s i
UJ C olco 3 U C O W 3 4 h C O C O U U U ) P ' f ' ( JJ C O C O C O ^ ' J S VO M lOO C O s J s l U U l O V O O O s l s l H M O U O O s J M O
M Ml M M - I—* I—» I—• I—»O 0 | s j s i Co -C~ 0 0 0 0 s i 0 0 O O Co CO s i s j
M M—I M O O Ov Os
M M l M M M M M M M M M M M M M M M M M M M MCO Colon O i U t O s i s j j s o v O D O O H H U h O O O U J W O v O i
J=" '?A?' J- nWj -^CnCnCnCnCnovCnCnCnCncnCnl n Cn Cn CnO ho |Cn I n O v O O - h h O t o v O O O O h O H ' ß v O H l - ' c o h O
V ^ C O O O S O O O S O S O O O S O O O O O S O V O S D V O O O O O V O S OVO volco U S J O M —1 VO N) ho VO o Sj —ICOCOhOhOvOOO-t>hO
MPs)| M M hOhO|—‘ M M M M M
MT ^ f v W K O O h O h O V O v O W U O O O O s l O v O ) X" 9P ' V M v O O v s i U l U i t M n L n O s i O N O O ' O O O O 00 Un - C' CncohOl —‘ Ov C n CO v OC o j S s i —ICoCnhOhO M 100 J S h O v o U i J N U v O U O v s l H U s l O - h M h J
M M Ch Ov ho M ho co ho cn
M W ho ho M Co ho ho ho c o ho ho i—1 ho ho ho ho ho I—1 c o ho
M M M M I—1 I—1 I—1 M I—> I—» I—i i _> I_> ■__i ^_i I__iM ho CO O V D v O C O O P ' O i P ' C n C O v O v O v D t S h - O O W C O
^ r i ^ ^ ^ W ^ ^ W f s t s W D D U - h J S L J C O W W00 SO v o C n C n C O h O s l O v O O G s a v o s C n O M O s v O v o v O
VO VO I Os Ov O O I l M M l—l C O C o o O - C ' C n O O O O O O ' ' V O O O
M MI M M MO O I vo v D- t ' Cn v O OOs O' v v o v O
M M M M■ h - h v o v o c n u w r o o o
M M l M M M M M M M M M M M M M M M M M M M M CO C o la s C n M O O v C n o v —i s i s l O O M M O O h O H O C n
! ^ ^ l , L2VC£r,4>' ' ^ ‘t ' UlLnL/lLn-p' - t' - t' - I>l-n Cn4^CnCnCnV— MICn P ' O v U i v O s i c o L ) s j s J O ) O v s J O \ 0 ' s J O O O C n P '
vo vo 00M O Ov
00 voCn O O O V O V O V O V O O O O O V O V O V D V O
O O h h O O C n o v H H - h C n 00 VO VO O) M O
22o
hd3
O O3 <-i.3 3 r t O 3 r t 3 I
3 3 3 3
CO►C C 3 3 3 <2 3 3
v<i
X) *c SO 3 M
i. io co CL3 3 1M1
O
M1 3)
M 33
Cn O1 3
M 3VO r t
3ho OQO - 31 cn
VO Oi-h
CnO X)+ * o
ndC 3
X3 MCn 3
r t r tO M
O3
ho ndO M
r t 3O
3a OQ
cn no 3O • •
r tO
X) VC KO 3 M
no 3 CL3 3 1M1
oM1 hd
M 33
Cn O1 3
M 3VO r t
3ho OQO 31 cn
VO oHi
CnO nd+ * o
ndc : 3
nd MCn 3
r t r tO M
OC 3
ho ndO M
r t 3O
aCn nd o
r tO
K
Ta
ble
2.4
N
umber
and
P
er
ce
nta
ge
s o
f P
op
ula
tion
b
y A
ge,
Sex
, S
urv
ey
yea
r an
d
Pr
oje
ct-a
re
a
of
the
r
esu
lts o
f th
e
Sem
i-An
nu
al
Su
rvey
.
28
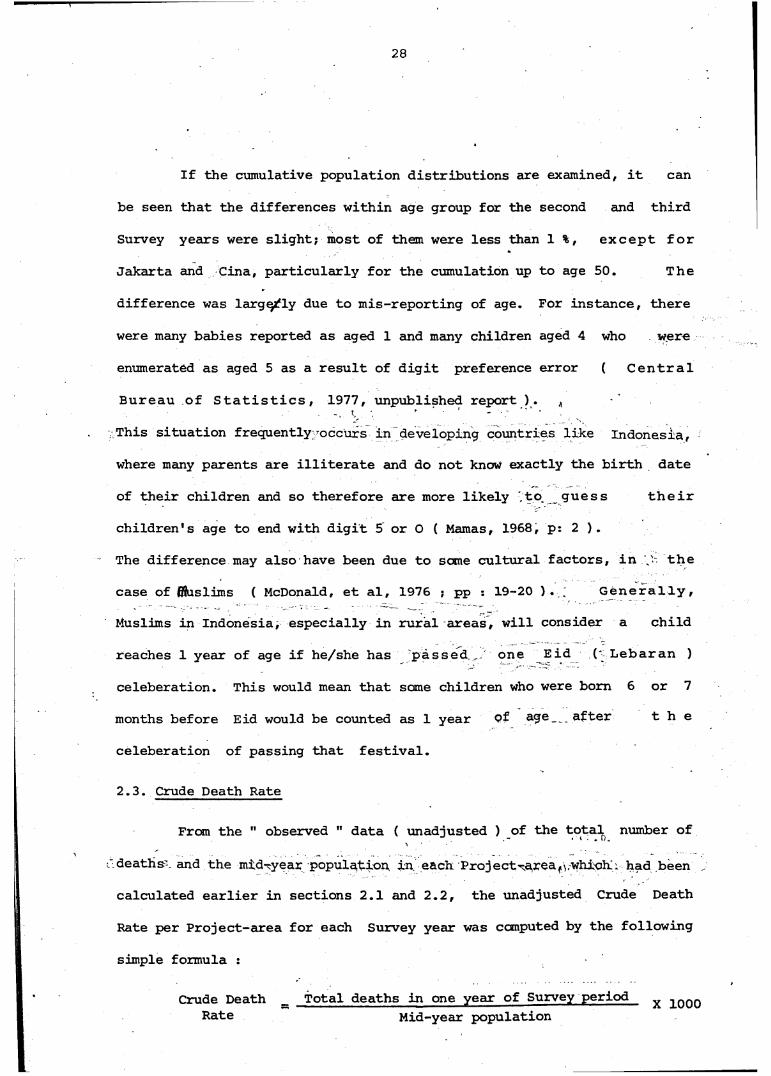
If the cumulative population distributions are examined, it can
be seen that the differences within age group for the second and third
Survey years were slight; most of them were less than 1 %, except for
Jakarta and Cina, particularly for the cumulation up to age 50. The
difference was largely due to mis-reporting of age. For instance, there
were many babies reported as aged 1 and many children aged 4 who were
enumerated as aged 5 as a result of digit preference error ( Ce n t r a l
Bureau of Statistics, 1977, unpublished report ). *
This situation frequently occurs in developing countries like Indonesia,
where many parents are illiterate and do not know exactly the birth date
of their children and so therefore are more likely to, guess their
children's age to end with digit 5 or 0 ( Mamas, 1968, p: 2 ).
The difference may also have been due to some cultural factors, in the
case of ffluslims ( McDonald, et al, 1976 ; pp : 19-20 ). Generally,
Muslims in Indonesia, especially in rural areas, will consider a child
reaches 1 year of age if he/she has passed . one Eid ( Lebaran )
celeberation. This would mean that some children who were b o m 6 or 7
months before Eid would be counted as 1 year Qf age_ after t h e
celeberation of passing that festival.
2.3. Crude Death Rate
From the " observed " data ( unadjusted ) of the total number of
deaths-’, and the mid-year population in each Projectrareaf • which.. had been
calculated earlier in sections 2.1 and 2.2, the unadjusted Crude Death
Rate per Project-area for each Survey year was computed by the following
simple formula :
Total deaths in one year of Survey period Mid-year population
Crude Death Rate X 1000

29
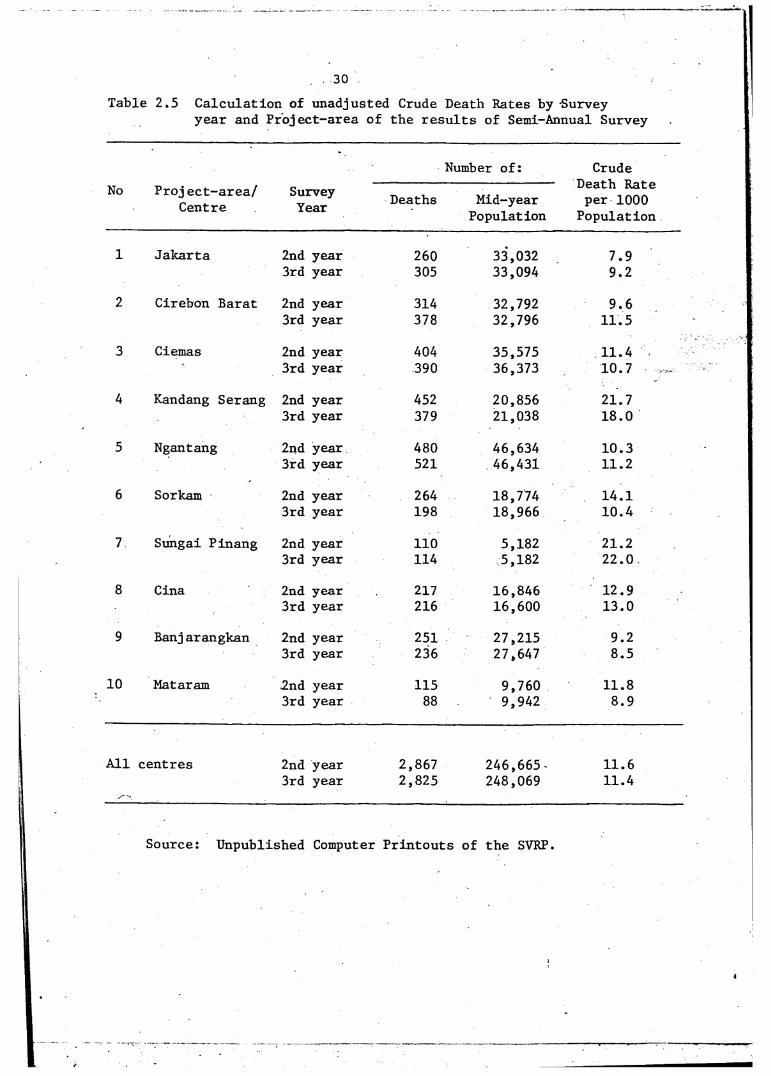
The summary of the calculation of the Crude Death Rate for each Project-
area in the second and third years of Survey is presented in Table 2.5.
Estimation of unadjusted Crude Death Rate from the Surveys in the
second and third years in Table 2.5. showed similar and considerable
variation between Project-areas. The highest estimates were found in
Kandang Serang ( 21.7 per 1000 population for the second Survey year and
18.0 per 1000 population for the third year ) , and Sungai Pinang ( 21.2
per 1000 population for the second year and 22.0 per 1000 population
for the third year ) . These areas are isolated rural areas in Central
Java and South Kalimantan, where medical care and health facilities are
very poor.
There are the additional factors of difficulties of communication and
transportation plus the problem of low education of the villagers
(Suhartono, 1979 : 16-17). Estimates of Crude Death Rate around 11 - 14
per 1000 population were found in other rural areas such as Ciemas Sorkam
and Cina. Estimates of 8 to 12 per 1000 population were obtained in
urban areas such as Jakarta, Cirebon Barat and Mataram, where the social
conditions and health, together with medical facilities were superior,
and many of the infectious, parasitic and respiratory diseases were more
likely to be effectively controlled. These conditions were also believed
to apply to Ngantang and Banjarangkan where Crude Death Rates were around
9-11 per 1000 population.
The low Crude Death Rate in most of the Project-areas, except for
Kandang Serang and Sungai Pinang, seemed to be unreasonably low compared
with other estimates obtained from other sources ( more detailed
examination of this aspect is to be found in section 2.5 and Chapter
30Table 2.5 Calculation of unadjusted Crude Death Rates by -Survey
year and Project-area of the results of Semi-Annual Survey
No Proj ect-area/ Centre
* .Number of: Crude
Death Rate per 1000 Population
SurveyYear Deaths Mid-year
Population
1 Jakarta 2nd year 260 33,032 7.93rd year 305 33,094 9.2
2 Cirebon Barat 2nd year 314 32,792 9.63rd year 378 32,796 11.5
3 Ciemas 2nd year 404 35,575 11.43rd year 390 36,373 10.7
4 Kandang Serang 2nd year 452 20,856 21.73rd year 379 21,038 18.0
5 Ngantang 2nd year 480 46,634 10.33rd year 521 46,431 11.2
6 Sorkam 2nd year 264 18,774 14.13rd year 198 18,966 10.4
7 Sungai Pinang 2nd year 110 5,182 21.23rd year 114 5,182 22.0
8 Cina 2nd year 217 16,846 12.93rd year 216 16,600 13.0
9 Banj arangkan 2nd year 251 27,215 9.23rd year 236 27,647 8.5
10 Mataram 2nd year 115 9,760 11.83rd year 88 9,942 8.9
All centres 2nd year 2,867 246,665 • 11.63rd year 2,825 248,069 11.4
Source: Unpublished Computer Printouts of the SVRP
31
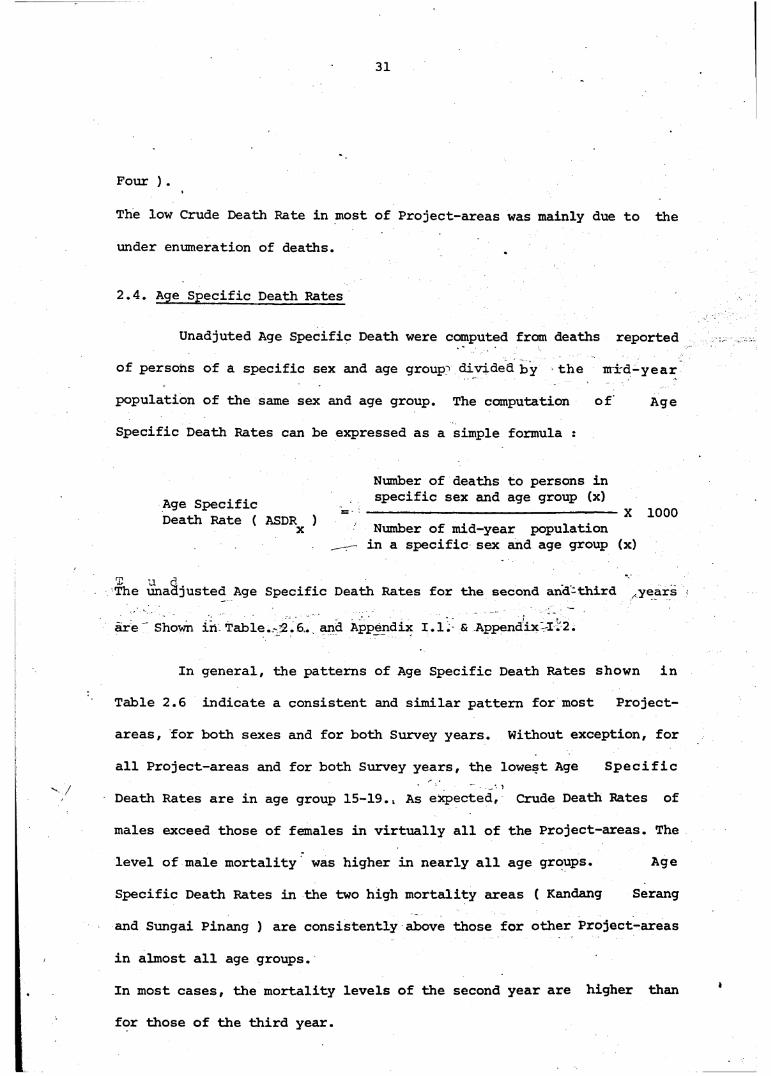
Four ).
The low Crude Death Rate in most of Project-areas was mainly due to the
under enumeration of deaths.
2.4. Age Specific Death Rates
Unadjuted Age Specific Death were computed from deaths reported
of persons of a specific sex and age group divided by the mid-year
population of the same sex and age group. The computation of Age
Specific Death Rates can be expressed as a simple formula :
Age SpecificDeath Rate ( ASDR ) x
Number of deaths to persons in specific sex and age group (x)
--------------------------------- X 1000Number of mid-year population in a specific sex and age group (x)
The unadjusted Age Specific Death Rates for the second and third years
are Shown in Table. =2.6. and Appendix 1.1. & Appendix 1.2.
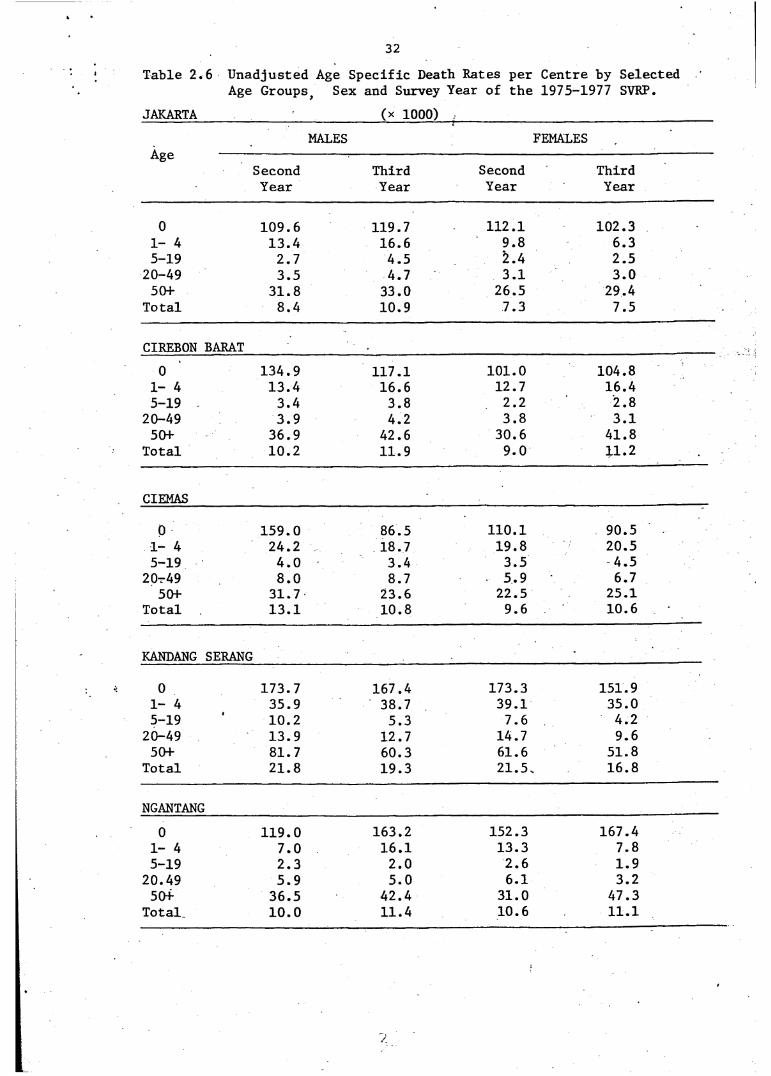
In general, the patterns of Age Specific Death Rates shown in
Table 2.6 indicate a consistent and similar pattern for most Project-
areas, for both sexes and for both Survey years. Without exception, for
all Project-areas and for both Survey years, the lowest Age Specific
Death Rates are in age group 15-19.4 As expected, Crude Death Rates of
males exceed those of females in virtually all of the Project-areas. The
level of male mortality was higher in nearly all age groups. Age
Specific Death Rates in the two high mortality areas ( Kandang Serang
and Sungai Pinang ) are consistently above those for other Project-areas
in almost all age groups.
In most cases, the mortality levels of the second year are higher than
for those of the third year.
32
T a b l e 2 . 6 U n a d j u s t e d A g e S p e c i f i c D e a t h R a t e s p e r C e n t r e b y S e l e c t e dA g e G r o u p s ^ S e x a n d S u r v e y Y e a r o f t h e 1 9 7 5 - 1 9 7 7 SVRP.
JAKARTA ( x 1 0 0 0 )
MALES FEMALESAge
S e c o n d T h i r d S e c o n d T h i r dY e a r Y e a r Y e a r Y e a r
0 1 0 9 . 6 1 1 9 . 7 1 1 2 . 1 1 0 2 . 31 - 4 1 3 . 4 1 6 . 6 9 . 8 6 . 35 - 1 9 2 . 7 4 . 5 2 . 4 2 . 5
2 0 - 4 9 3 . 5 4 . 7 3 . 1 3 . 05 0 + 3 1 . 8 3 3 . 0 2 6 . 5 2 9 . 4
T o t a l 8 . 4 1 0 . 9 7 . 3 7 . 5
CIREBON BARAT
0 1 3 4 . 9 1 1 7 . 1 1 0 1 . 0 1 0 4 . 81 - 4 1 3 . 4 1 6 . 6 1 2 . 7 1 6 . 45 - 1 9 3 . 4 3 . 8 2 . 2 2 . 8
2 0 - 4 9 3 . 9 4 . 2 3 . 8 3 . 15 0 + 3 6 . 9 4 2 . 6 3 0 . 6 4 1 . 8
T o t a l 1 0 . 2 1 1 . 9 9 . 0 1 1 . 2
CIEMAS
0 1 5 9 . 0 8 6 . 5 1 1 0 . 1 9 0 . 51 - 4 2 4 . 2 1 8 . 7 1 9 . 8 2 0 . 55 - 1 9 4 . 0 3 . 4 3 . 5 4 . 5
2 0 - 4 9 8 . 0 8 . 7 5 . 9 6 . 75 0 + 3 1 . 7 2 3 . 6 2 2 . 5 2 5 . 1
T o t a l 1 3 . 1 1 0 . 8 9 . 6 1 0 . 6
KANDANG SERANG
0 1 7 3 . 7 1 6 7 . 4 1 7 3 . 3 1 5 1 . 91 - 4 3 5 . 9 3 8 . 7 3 9 . 1 3 5 . 05 - 1 9 1 0 . 2 5 . 3 7 . 6 4 . 2
2 0 - 4 9 1 3 . 9 1 2 . 7 1 4 . 7 9 . 65 0 + 8 1 . 7 6 0 . 3 6 1 . 6 5 1 . 8
T o t a l 2 1 . 8 1 9 . 3 2 1 . 5 . 1 6 . 8
NGANTANG
0 1 1 9 . 0 1 6 3 . 2 1 5 2 . 3 1 6 7 . 41 - 4 7 . 0 1 6 . 1 1 3 . 3 7 . 85 - 1 9 2 . 3 2 . 0 2 . 6 1 . 9
2 0 . 4 9 5 . 9 5 . 0 6 . 1 3 . 25 0 + 3 6 . 5 4 2 . 4 3 1 . 0 4 7 . 3
T o t a l 1 0 . 0 1 1 . 4 1 0 . 6 1 1 . 1
33
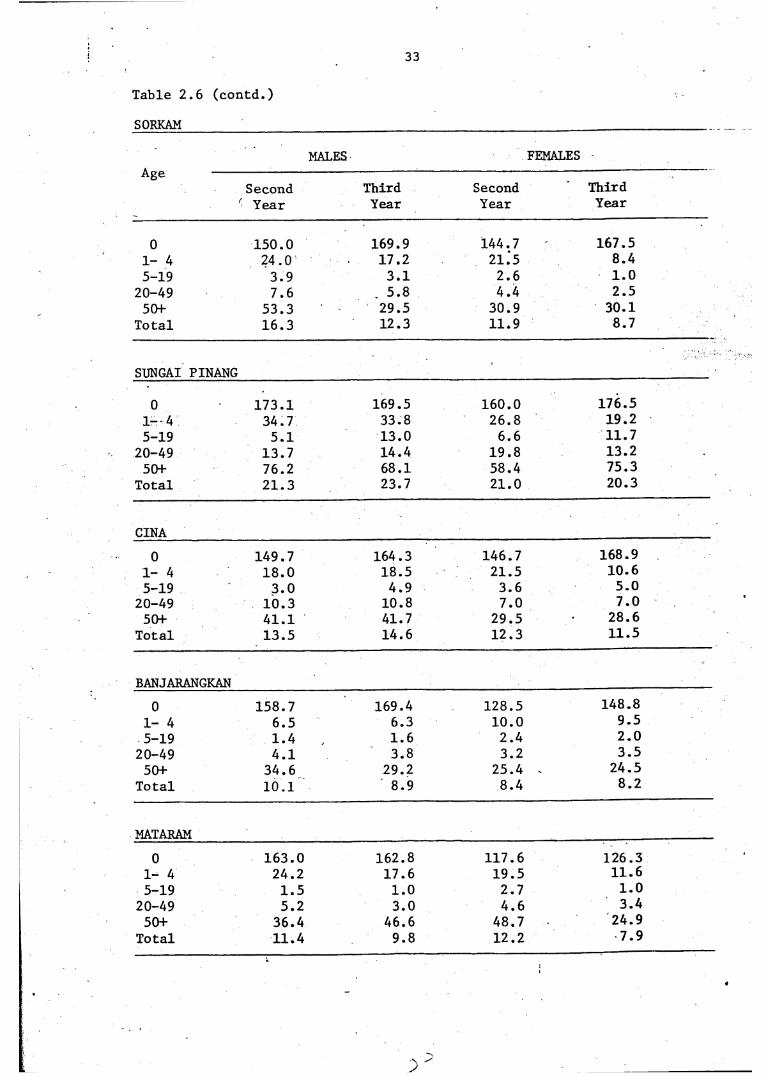
Table 2.6 (contd.)SORKAM
AgeMALES FEMALES
Second Third Second Third' Year Year Year Year
0 150.0 169.9 144.7 167.51- 4 24.0 17.2 21.5 8.45-19 3.9 3.1 2.6 1.0
20-49 7.6 5.8 4.4 2.550+ 53.3 29.5 30.9 30.1
Total 16.3 12.3 11.9 8.7
SUNGAI PINANG
0 173.1 169.5 160.0 176.51- 4 34.7 33.8 26.8 19.25-19 5.1 13.0 6.6 11.7
20-49 13.7 14.4 19.8 13.250+ 76.2 68.1 58.4 75.3
Total 21.3 23.7 21.0 20.3
CINA0 149.7 164.3 146.7 168.9
1- 4 18.0 18.5 21.5 10.65-19 3.0 4.9 3.6 5.020-49 10.3 10.8 7.0 7.050+ 41.1 41.7 29.5 28.6
Total 13.5 14.6 12.3 11.5
BANJARANGKAN0 158.7 169.4 128.5 148.81- 4 6.5 6.3 10.0 9.55-19 1.4 1.6 2.4 2.020-49 4.1 3.8 3.2 3.550+ 34.6 29.2 25.4 . 24.5
Total 10.1 8.9 8.4 8.2
MATARAM0 163.0 162.8 117.6 126.31- 4 24.2 17.6 19.5 11.65-19 1.5 1.0 2.7 1.0
20-49 5.2 3.0 4.6 3.450+ 36.4 46.6 48.7 24.9
Total 11.4 9.8 12.2 7.9
34
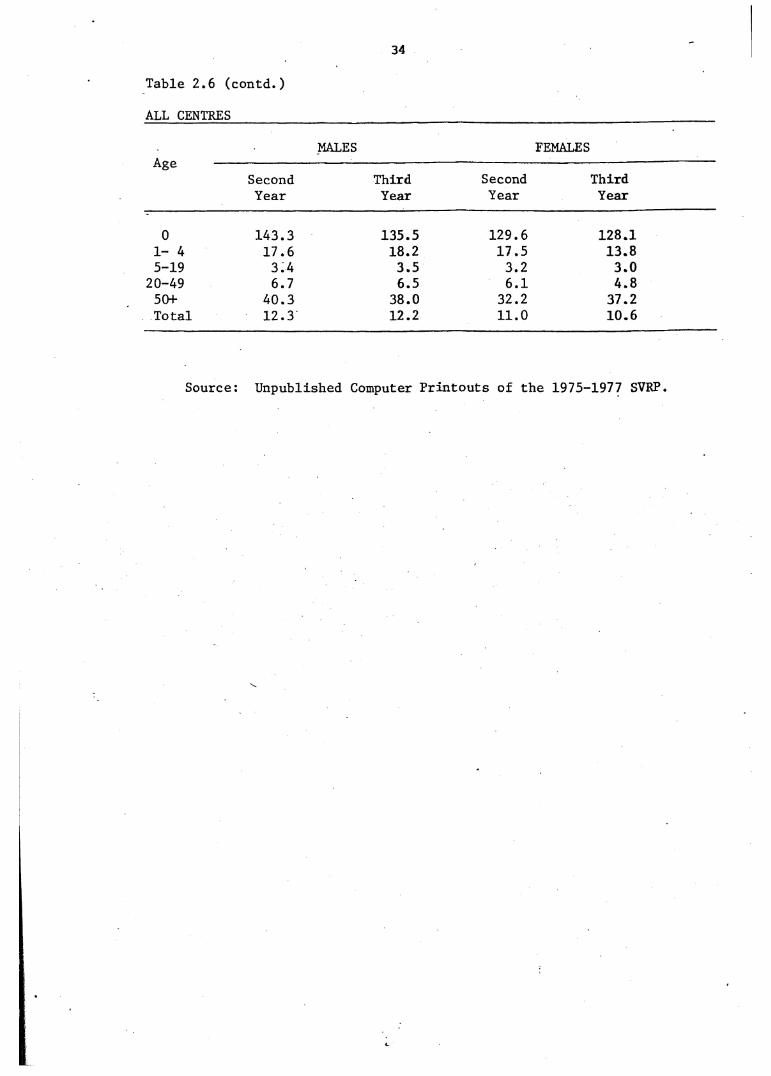
Table 2.6 (contd.)
ALL CENTRES
MALES FEMALESAge
SecondYear
ThirdYear
SecondYear
ThirdYear
0 143.3 135.5 129.6 128.11- 4 17.6 18.2 17.5 13.85-19 3.4 3.5 3.2 3.0
20-49 6.7 6.5 6.1 4.850+ 40.3 38.0 32.2 37.2Total 12.3 12.2 11.0 10.6
Source: Unpublished Computer Printouts of the 1975-1977 SVRP
35
It would seem that most . Age Specific Death Rates are
questionable especially for ages 0 and 1-4. In the majority of cases,
the Age Specific Death Rates at age 0 are higher, and at age 1-4 are
lower than the expected rates. The high Age Specific Death Rates at age
0 in some Project-areas are probably due . to mis-reporting of
population at age 0 as mentioned earlier; that is, some babies were
perhaps as being one year olds. The low Age Specific Death Rates at age
1-4 are also due to the under enumeration of deaths at this age.-
Furthermore, the reporting of age at death may have also been effected by
age mis-statement. Those above problems will be later discussed in
Chapter Three. Meanwhile, some areas have a high death rate at age 0
while other areas have a low death rate at age 1-4. Unfortunately,
without adjustment it is difficult to evaluate the accuracy of Infant
and Childhood Mortality Rates for each Project-area.
It should be noted that for the purpose of this analysis, the
age-unknown for the population data is not distributed on a pro-rata
basis and is excluded from the calculation of Age Specific Death1, Rates,S
because fthe proportion is small (about 1 per cent) , it will not have/ /
much effect on the calculation of Age Specific Death Rates ( Central
Bureau of Statistics, 1976/1977 ; 138 and 1978 ; 156 ).
As known that the enumerated population by age may have some
errors such as, mis-statement of age and under enumeration of population,
it was a problem throughout the project to adjust * the population data
because in all the Survey ’years, age was assigned.in different period. For
instance, in the first year, age was assigned as recorded by the baseline
Survey at the beginning of the first year. In the second year, age was
assigned as recorded by the Survey in the middle of the second year. Forr
the third year, age was assigned as recorded by the Survey at the end of
the third Survey. However, in the 1975-1977 SVRP, there were six rounds of
Surveys where in conducting every Survey f there was. an iintensive
training for the permanent interviewers to improve their ability and I t <<
accuracy, especially to guide them,how to correct the age by using the
"calendar events" well known by the local people. So in this study, the
population has not been adjusted directly, but,, in order to obtain the
appropriate denominators for calculating Age Specific Death Rates,the mid
year population in the second and third years:.were calculated by weight
ing and interpolating the ©ver enumerated population, as explained in
Section 2.2.\
2.5. Discussion
Infant deaths and child deaths usually stand , out * as the major
contributors in countries with high mortality levels, '.where: more than 50
per cent of deaths occur to persons aged less than 5 ( See page 18 ). The
percentages of infant deaths and child deaths from ■. the 1975-1977 SVRP
therefore, are significantly low ( See Table 2.2 ).The low percentages of
deaths for children under 5 years old were primarily due to . the under
enumeration and mis-statement or mis-reporting of age at death cf the
Survey arid Registration,( This evidence will be discussed in Chapter Three^
37
Without reliable statistics of causes of deaths, it can only be
assumed that environmental and infectious causes contribute significantly-> ■uto a higher proportion^-of infant deaths, especially neonatal deaths. This
assumption was also applied to the data of the Indonesian Socio and
Economic Survey where it was estimated that about 35 and 50 per cent of
neonatal deaths in urban and rural areas respectively were mis-eruimerated
( Ruzicka, 1972, pp : 5-6 ). Perhaps this argument could be supported by
the statistics on attendance at births and deaths from the 'data of the
1975-1977'SVRP. The Project revealed that quite a number of births,that is
about 70 per cent and more than 80 per cent of total deaths occurred
outside of hospital. Almost 70 per cent of deaths were hot attended either
by doctors, nurses or other health officials ( Central Bureau of .Statis
tics, 1976/1977, pp: 113-115 and 1978a), pp: 140-142 ).
With respect to mis-statement of age at death, in a population
such as Indonesia many illiterate parents usually do not . knowc; - their
children’s exact birth dates. They prefer to guess their children's ages,
ending with digits 0 and 5. In this case, it seeemed that many deaths in
age 4 were reported as age 5, resulting in the number of deaths under age
5 becoming less than the expected number,( This evidence will be discussed<in Chapter Three.. See also pages. 20^and^.26 ). This phenomenon c common in
some developing countries in Asia and Pacific, and is also , known as age
"heaping" or digital preference. The extent of age "heaping" is closely
related to the low levels of educational status of the villagers ( Ueda,
1976, p: 4 ).
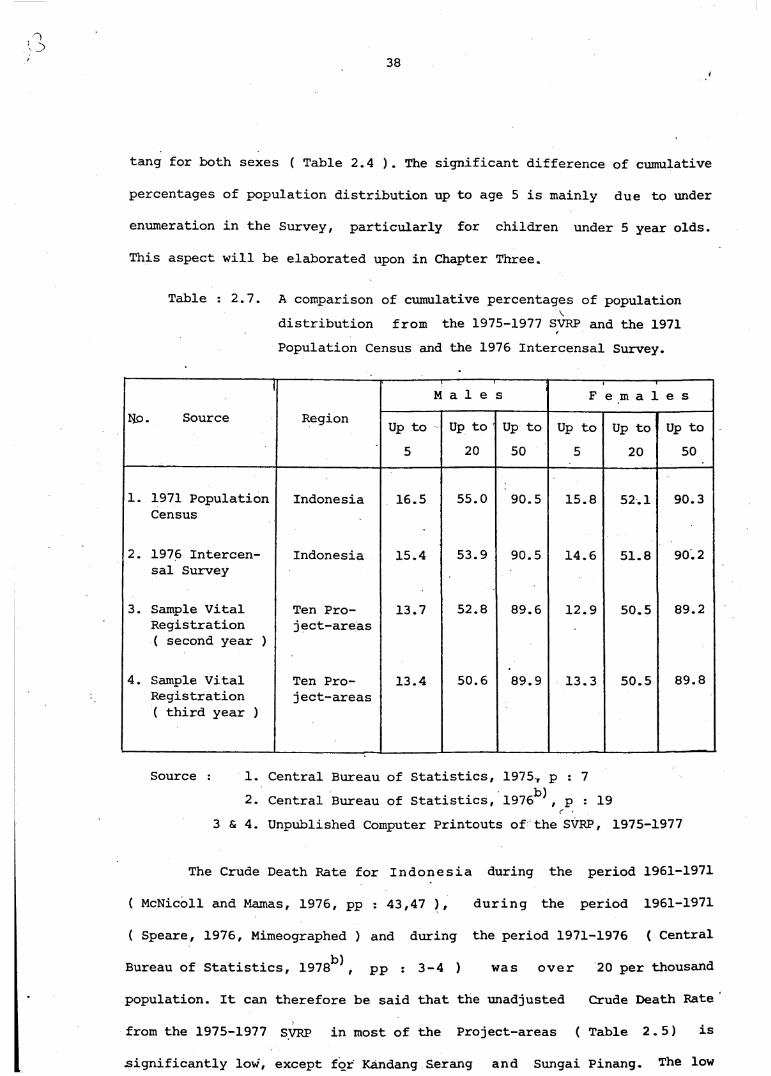
Taken at face value, the results for ..«-the ten ' Project — areas
obtained from the observed figures of the 1975-1977 SVRP show cumulative
percentages of population distribution up to age 5 rather lower than those
calculated from the 1971 Population Census and the 1976 Intercensal Survey
( See Table 2.7 ). The lowest percentages are in the Project-area of Ngan-
38O
l, 3
tang for both sexes ( Table 2.4 ). The significant difference of cumulative
percentages of population distribution up to age 5 is mainly due to under
enumeration in the Survey, particularly for children under 5 year olds.
This aspect will be elaborated upon in Chapter Three.
Table : 2.7. A comparison of cumulative percentages of population distribution from the 1975-1977 SVRP and the 1971 Population Census and the 1976 Intercensal Survey.
1 M a l e s F e m a 1 e sNo. Source Region Up to Up to Up to Up to Up to Up to
5 20 50 5 20 50
1. 1971 Population Census
Indonesia 16.5 55.0 90.5 15.8 52.1 90.3
2. 1976 Intercensal Survey
Indonesia 15.4 53.9 90.5 14.6 51.8 90.2
3. Sample Vital Registration ( second year )
Ten Project-areas
13.7 52.8 89.6 12.9 50.5 89.2
4. Sample Vital Registration ( third year )
Ten Project-areas
13.4 50.6 89.9 13.3 50.5 89.8
Source : 1. Central Bureau of Statistics, 1975, p : 72. Central Bureau of Statistics, 1976^, p : 19
3 & 4. Unpublished Computer Printouts of the SVRP, 1975-1977
The Crude Death Rate for Indonesia during the period 1961-1971
( McNicoll and Mamas, 1976, pp : 43,47 ), during the period 1961-1971
( Speare, 1976, Mimeographed ) and during the period 1971-1976 ( Central
Bureau of Statistics, 1978*^ f pp : 3-4 ) was over 20 per thousand
population. It can therefore be said that the unadjusted Crude Death Rate
from the 1975-1977 SVRP in most of the Project-areas ( Table 2.5) is
.significantly low, except for Kandang Serang and Sungai Pinang. The low
39
Crude Death Rates in eight out of the ten Project-areas were mainly due to
the under enumeration of deaths for both the Registration and Survey,
particularly the infant and child deaths at ages 1-4. ( Again, this
evidence will be discussed in Chapter Three ) . Deaths of infants and young
children may be " selectively forgotten " or the people may feel that
there is no necessity to report these events because in reporting these
events they would be reminded of their bereavement ( Suhartono, 1979, p:16)
An investigation of the childhood mortality rates in the age group
1-4 ( Table 2.8 ) , shows considerable variation between these rates in the
various project-areas, for both sexes and for both years. For males, the
rates range from the minimum of 6s 3 per 1000 ( Banjarangkan for the third
year ) to the maximum of 38.7 per 1000 ( Kandang Serang for the second
year), and in the case of females, the rates range from the lowest off 6.3
per 1000 ( Jakarta for the third year ) to the highest of 39.1 per' 1000
( Kandang Serang for the second year ). Furthermore, considering all Pro
ject-areas together the childhood mortality for males between the two
Survey yeaEfc ranges from 17.6 to 18.2 per 1000, whereas for females it
ranges from 13.8 to 17.5 per 1000.In conjunction with the childhood mortality level in the previous
decade for Indonesia as a whole, where the rate for males was 27.5 per
1000 and for females 23.5 per 1000 ( Mamas, 1968, pp : 14-15 and for rural
Java-Madura, the rate for males 3111. per 1000 and for females was 27.3
per 1000 ( Suhartono and Suardi, 1970, pp : 8-9 ), it is apparent that the
childhood mortality rate for the ten Project-areas is lower than the above
data. The primary reasons are due to similar factors which have affected
the low Infant Mortality Rate such as, the under enumeration of deaths in
the Registration and Survey, and mis-reporting and mis-statement of age,
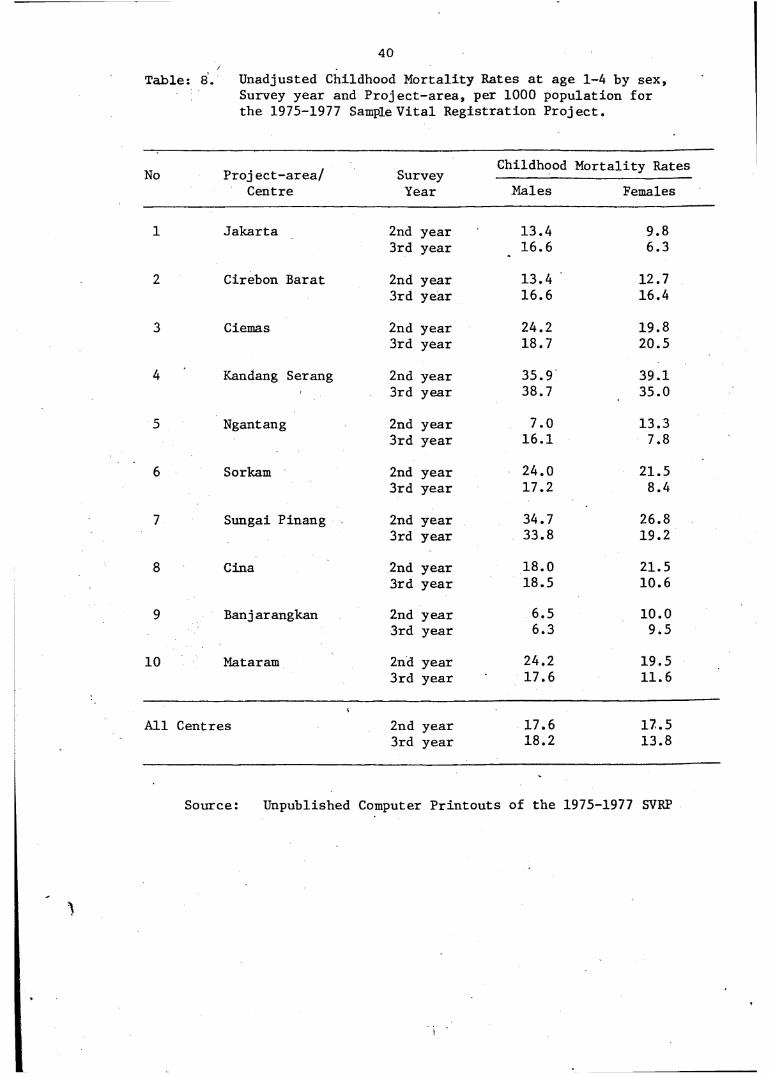
40Table: 8. Unadjusted Childhood Mortality Rates at age 1-4 by sex,
Survey year and Project-area, per 1000 population for the 1975-1977 Sample Vital Registration Project.
No Proj ect-area/ Centre
SurveyYear
Childhood Mortality RatesMales Females
1 Jakarta 2nd year 13.4 9.83rd year 16.6 6.3
2 Cirebon Barat 2nd year 13.4 12.73rd year 16.6 16.4
3 Ciemas 2nd year 24.2 19.83rd year 18.7 20.5
4 Kandang Serang 2nd year 35.9 39.13rd year 38.7 35.0
5 Ngantang 2nd year 7.0 13.33rd year 16.1 7.8
6 Sorkam 2nd year 24.0 21.53rd year 17.2 8.4
7 Sungai Pinang 2nd year 34.7 26.83rd year 33.8 19.2
8 Cina 2nd year 18.0 21.53rd year 18.5 10.6
9 Banjarangkan 2nd year 6.5 10.03rd year 6.3 9.5
10 Mataram 2nd year 24.2 19.53rd year 17.6 11.6
All Centres 2nd year 17.6 17.53rd year 18.2 13.8
Source: Unpublished Computer Printouts of the 1975-1977 SVRP
41
either for deaths or population data. The last two aspects were also
applied to the data on the 1973 Fertility - Mortality Survey ( McDonald,
et*al, 1976, pp : 19-21 and 60-62 ). These problems will be discussed in
Chapter Three.
Because of the small numbers and the fluctuation of the rates
from one area to another and on the basis of the evaluation of the
quality of the Registration ( Central Bureau of Statistics, 1976/1977, p:
76 and 1978 , p : 174 ), it was considered appropriate to group the ten
Project-areas into three categories. The first Area is the urban areas
which have a low quality of Registration such as, Jakarta, Cirebon Barat
and Mataram.
The second Area is the rural areas which . have a good quality of
Registration and have a low level of mortality such as Ngantang, Sorkam,
Cina and Banjarangkan. The third Area included the rural areas which
have a high level of mortality and in most cases, have rather low quality
of Registration such as, Ciemas, Kandang Serang and Sungai Pinang. To be
assessed in greater detail, in this study two more Areas were added, i.e.
the fourth Area is the combination of the rural areas of low and high
levels of mortality, and the fifth Area included all the areas of the
1975-1977 Sample Vital Registration Project. The following are the
abbreviations for those five Areas, which are used in the following
Chapters :
Area I is the urban areas.
Area II is the rural areas with a low level of mortality.
Area III is the rural areas with a high level of mortality.
Area IV is the whole rural areas which consists of Areas II and III.
Area V is the whole areas of the 1975-1977 SVRP, which consists of
Areas I, II and III, or Areas I and IV.
42
C HA P TER I I I
ADJU STED LEVELS AND PATTERNS OF MORTALITY,
3 .1 . M a tch in g p ro c e d u re
The f i r s t s t e p o f th e M a tc h in g was c a r r i e d o u t a t t h e " C e n t r e "
o f f i c e w here th e S u rv e y d e a th s w ere m atch ed a g a i n s t th o s e r e c o r d e d in th e
R e g i s t r a t i o n . In t h i s s t e p , a l l d e a th s w ere c l a s s i f i e d a s :
1 . M atched d e a th s ,
2 . N o n -m atch ed d e a th s , r e c o r d e d by S u rv ey o n ly ,
3 . N o n -m atch ed d e a t h s , r e c o r d e d by R e g i s t r a t i o n o n ly , and
4 . Q u e s t io n a b le m a tc h e d d e a t h s .
The f i n a l m atch s t a t u s o f q u e s t i o n a b l e m a tch ed an d n o n -m a tc h e d d e a th s b o th
by S u rv e y an d R e g i s t r a t i o n was d e te r m in e d by f i e l d v e r i f i c a t i o n . In th e
f i r s t y e a r o f o b s e r v a t io n ( 1 9 7 4 /1 9 7 5 ) , t h e v e r i f i c a t i o n was r e s t r i c t e d
t o q u e s t i o n a b l e m a tc h e d an d n o n -m a tc h e d d e a th s w h ich w ere r e c o r d e d b y
R e g i s t r a t i o n o n ly . In t h e s e c o n d y e a r ( 1 9 7 5 /1 9 7 6 ) and t h i r d y e a r ( 1 9 7 6 /
1977 ) , a l l u n m atch ed d e a th s w ere f o l lo w e d - u p .
The c h a r a c t e r i s t i c s w h ic h w e re u s e d t o com pare th e r e s u l t s o f
S u rv e y an d R e g i s t r a t i o n a r e a s f o l lo w s :
1 . Name o f d e c e a s e d an d h e a d o f h o u s e h o ld ,
2 . Sex o f d e c e a s e d ,
3 . D a te o f d e a th s , an d
4 . A d d re s s o r p l a c e o f u s u a l r e s i d e n c e o f d e c e a s e d .
A d e t a i l e d d e s c r i p t i o n o f t h e i n f o r m a t i o n r e q u e s te d i s s e t o u t i n T a b le
3 .1 A .
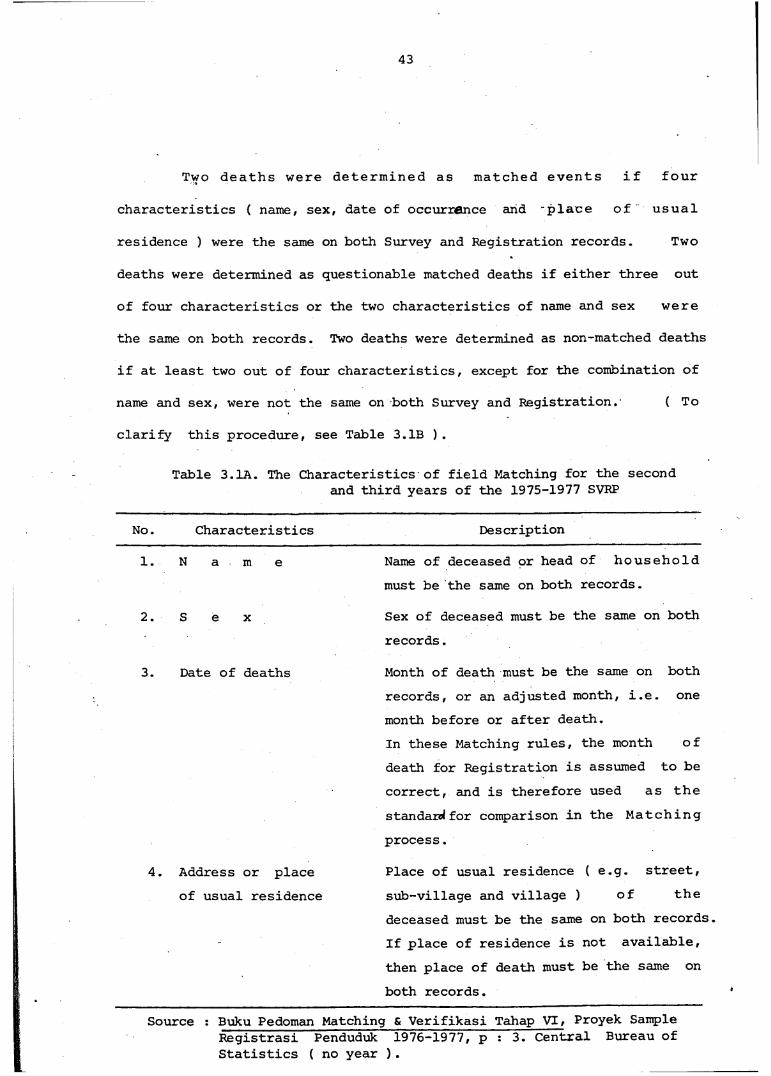
43
Two deaths were determined as matched events if four
characteristics ( name, sex, date of occurrence and place of usual
residence ) were the same on both Survey and Registration records. Two
deaths were determined as questionable matched deaths if either three out
of four characteristics or the two characteristics of name and sex were
the same on both records. Two deaths were determined as non-matched deaths
if at least two out of four characteristics, except for the combination of
name and sex, were not the same on both Survey and Registration. ( To
clarify this procedure, see Table 3.IB ).
Table 3.1A. The Characteristics of field Matching for the secondand third years of the 1975-1977 SVRP
No. Characteristics Description
1. N a m e
2. S e x
Name of deceased or head of household must be the same on both records.
Sex of deceased must be the same on both records.
3. Date of deaths Month of death must be the same on bothrecords, or an adjusted month, i.e. one month before or after death.In these Matching rules, the month of death for Registration is assumed to be correct, and is therefore used as the standard for comparison in the Matching process.
4. Address or place Place of usual residence ( e.g. street,of usual residence sub-village and village ) of the
deceased must be the same on both records. If place of residence is not available, then place of death must be the same on both records.
Source : Buku Pedoman Matching & Verifikasi Tahap VI, Proyek Sample Registrasi Penduduk 1976-1977, p : 3. Central Bureau of Statistics ( no year ).
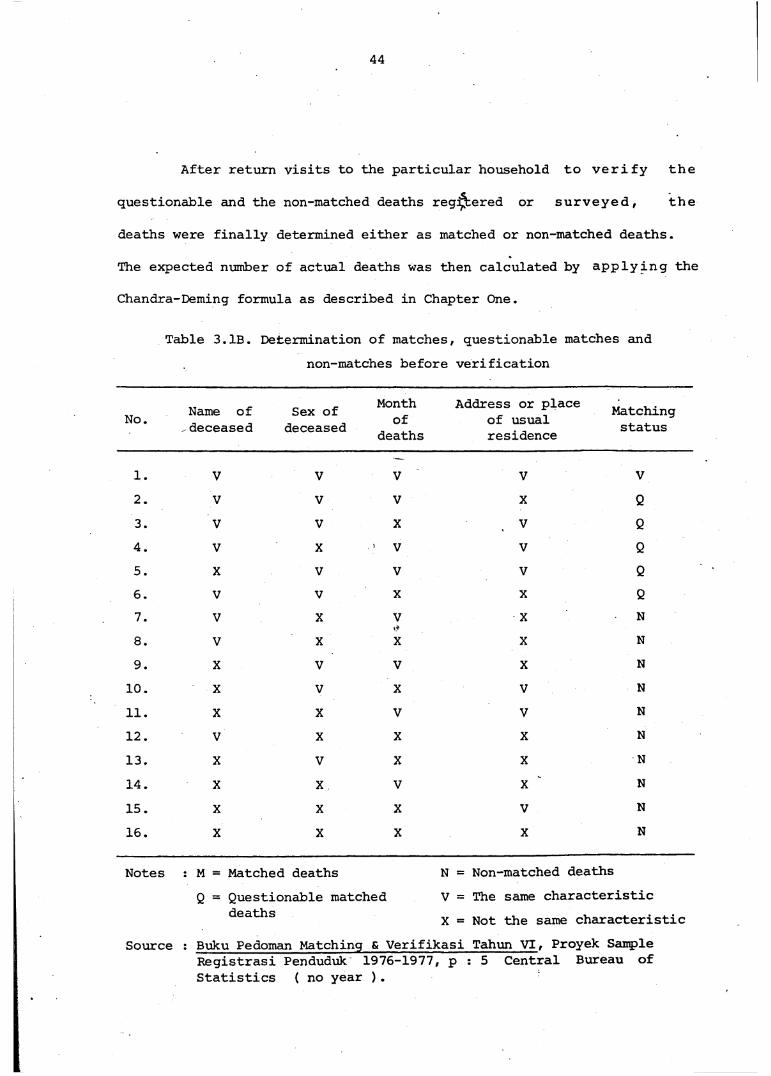
44
After return visits to the particular household to verify the
questionable and the non-matched deaths registered or surveyed, the
deaths were finally determined either as matched or non-matched deaths.
The expected number of actual deaths was then calculated by applying the
Chandra-Deming formula as described in Chapter One.
Table 3.1B. Determination of matches, questionable matches and non-matches before verification
No. Name of deceased
Sex of deceased
Monthof
deaths
Address or place .. , , ._ , Matchingof usual .. , statusresidence
1. V V V V V2. V V V X Q3. V V X V Q4. V X ' V V Q5. X V V V Q6. V V X X Q
7. V X V X N8. V X X X N9. X V V X N
10. X V X V N11. X X V V N12. V X X X N13. X V X X N14. X X V X N15. X X X V N16. X X X X N
Notes : M = Matched deaths N = Non-matched deathsQ = Questionable matched V = The same characteristic
deaths X = Not the same characteristicSource : Buku Pedoman Matching & Verifikasi Tahun VI, Proyek Sample
Registrasi Penduduk 1976-1977 / P : 5 Central Bureau ofStatistics ( no year ) .
45
\
When a matcher visited a particular household to verify the
questionable matched and non-matched deaths registered or surveyed, the
matcher had to reinterView the household head, questioning directly and
carefully all members who had been living in that'household during the
year of the Survey. The matcher could then immediately check the vital
event ( in this case, death-) which was classified as questionable matched
or non-matched death. In the case of the questionable matched deaths, the
matcher would check whether the deaths which were recorded either in the
Survey or in the Registration were matched or non-matched. If the death
was considered as a matched de^ihs, then the matcher would change the
wrong information which existed either in the Survey questionnaire or in
the Registration questionnaire. In the case of incorrect completion of the
Registration questionnaire, the matcher was to ask the village headman to
correS it. However, if the death was considered as a non- matched'death,
the matcher would distinguish that one death into two deaths, one as
a death which was recorded only in the Survey, and the other as a death
which was recorded only in the Registration. In the case of a death which
was previously recorded only in the Survey, if, after visiting .. theKoMhouselhod, the household could produce the death certificate to the
matcher, then the matcher would classify this deaths as a matched death.
Sometimes, it also happened that a non-matched deaths which was previously
only registered in the R^istration, was often mistakenly copied in the
Survey questionnaire. In that case, the matcher would alter the wrong
information in the Survey questionnaire and classify -this death as
a matched death. On the other hand, if, the matcher could not find any
more information than the existing information in the Registration
questionnaire, then the matcher would still classify this death as a non-
46
\
matched death.
Before the field verication, the questionnaire deaths were about
24 per cent of the total deaths. After the field verification, more than
90 per cen+of the questionable deaths were changed to become " matched "
deaths. The questionj^able deaths were mainly due to differences in month
of death ( 51 per cent ) and the difference in the names of deceased ( 36cl)per cent ). ( Central Bureau of Statistics, 1976/1977 and 1978 ).
3.2. Results of Matching
Tables 3.2A to 3.2C give the percentages of deaths dn four
categories of the Chandra-Deming technique. Looking at these Tables, it
seems that the percentages. of the four categories r of ~£he Chandra-Deming
technique vary between age groups, Areas ain Survey years for both sexes.
The highest percentage of matched deaths was found in rural Area II which
has a low level of mortality where-the. Registration and Survey were better
implemented than other Areas. The lowest percentage of missed deaths
obtained in the rural Area II was also related to this situation.
By plotting the data of Tables 3.2A to 3.2C into Figure 2, it was
easier to compare the patterns of the percentages of matched deaths by sex
and Area for both years. It is apparent that the patterns by, age .of the
matched deaths for males and females in both years were more or less
similar for both rural II and III. However, Hooking at ithe patterns of
matched deaths for urban Area I for’both sexes in both years, the pattern
is not the same due to the random fluctuations of the observed deaths,
particularly at age 0 and ages 1 to 4. After age 5, the pattern appears to
be similar for both sexes.
On the basis of the data in Tables 3.2A to 3.2C, it can be seen
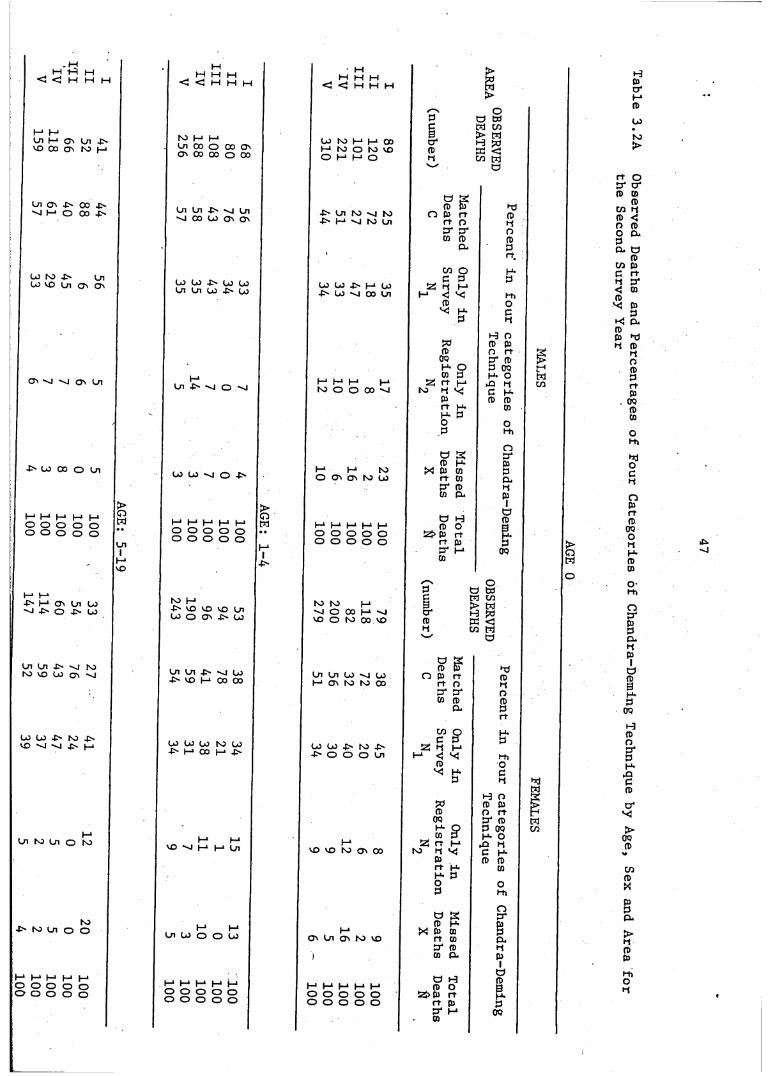
AGE: 5-19
. MM t—I I—I < < M M M
(-■ t—1Ln (-* O ' Ln «3 00 O' N H
L n 0 4> 00 4S — I H O OO ^
Lo ho .fs Lyi ^ ^ Ln on O '
O' si M O' Ln
■MJ O0 O Ln
H* (-*■Ih p O' Ln W 'J JhO U
Ln In Jh si to to no U) O' si
W U) Jh M js VO 's! —I js p
I—1U i N ) U i O M
hoho U i o o
M M M M I—1 O O O O O O O O O O
MM M M < < M M HMW M M
< < M M M>§>
rv o3 ö tö3 W coN) H H. Ln 00 O 00 O' O' 00 CD O 00
U) to 1—1 H* 00H hO O tv) VCO H* H* O
9cr1ft)H> W H 50 PC <5CO Ms- Ö
Ö SOi Oi js si In 4s Cn IQ si N) ft) 3 O 3 rt hp3Sj 00 U) O' O' 4s H si to Ln rt O Hcr cr O3 3 3. CL. 3rt.
CO o H-U) U) Js U) U) LO OJ js H W 2 ti H 3Ui Ln U) 4s Lo 4S W sj OO Ln M < X Hi3 OX H* 33 H
H nSO 3 33 O H 21 OQ cr 3 f>* H* O 3 OQ fMLn 4S si O sj H * 1—1 t—1 1—1ho O O 00 "-J3 3 Z H H* hQ H X
H- O ►Q l-j 3 H-MCO
3 3 3rt H- H* 3 3O O3 Hi
nÜ s crI 3 H* 3U) U si o js H* M Isi
O O' O' to U X 3 3 rt Cfi 3CL.cr 3 H3 CL. 3!_, 1— ,
AGE H* M I-1 H I-1 Ö H 3 O1Ö3aO O O O O O O O O O O O O O O O O O O O Z> 3 H H 3pH-3 hf—1 cr m OQ rc1 3 t
cI /S O3 ö WN) H-C" VO VO VO Ln W O O' 4Mi)
N) to h-1O 00 M — iVO O ho 00 vo
3 fj CO3 > Mcr h 33 pc <H cn MaÖ s
Ln Ln sl Lo ^ VO H oo oo Ln Ln U) si U) H O' tv) M 003 3 O 3 rt rt o
►V3Hcr pr O1 3 3 31 a 3rt“ 9 H-
U> U> OJ hO U) U O J J S t O J v Z H I-1 3H 00 H -C' O O O Ln H* <J X Hi3 OX H* 31 3 H HjMj 1 H O 2
* 3 3 3 j>1 1 3 O H pOQ cr 3 W1 1 H- 9 3 OQ CO
H* t—*vO "J (—1 |—1 Ln I—1vO vo ho O' 003 3 Z rt i—1 ho H LJ
H* O ►Q H 3 H-3 3 3rt H- H* 3 31 O O3 Hi
na s crt—* H*Ln LO O O U) h-1O' Ln O' to VO
3 H- X 3 3 rt cn 8CL.cr 3 Hj j cn cl. 3I1a
1—1 1—* 1—* 1—1 |—1 1—1 t—1 H* H* t—1 Ö H 3 O 33p.o o o o o O O O O O Z> 3 rto o o o o O O O O O rt 3 31 cr H13 OQ
HOrt03
OQ33oHiH3 OcHO3rtft)
OQOHH*ft)COOHi0 pr 3 3 Cl. H 31Öft)3H-3
OQ
i-3(DOcr3H*
►n3(DcTX>
OQfD
COft)X
CL.>H(D3HiOH
.3-o
Table 3.2A Observed Deaths and Pe the Second Survey Year
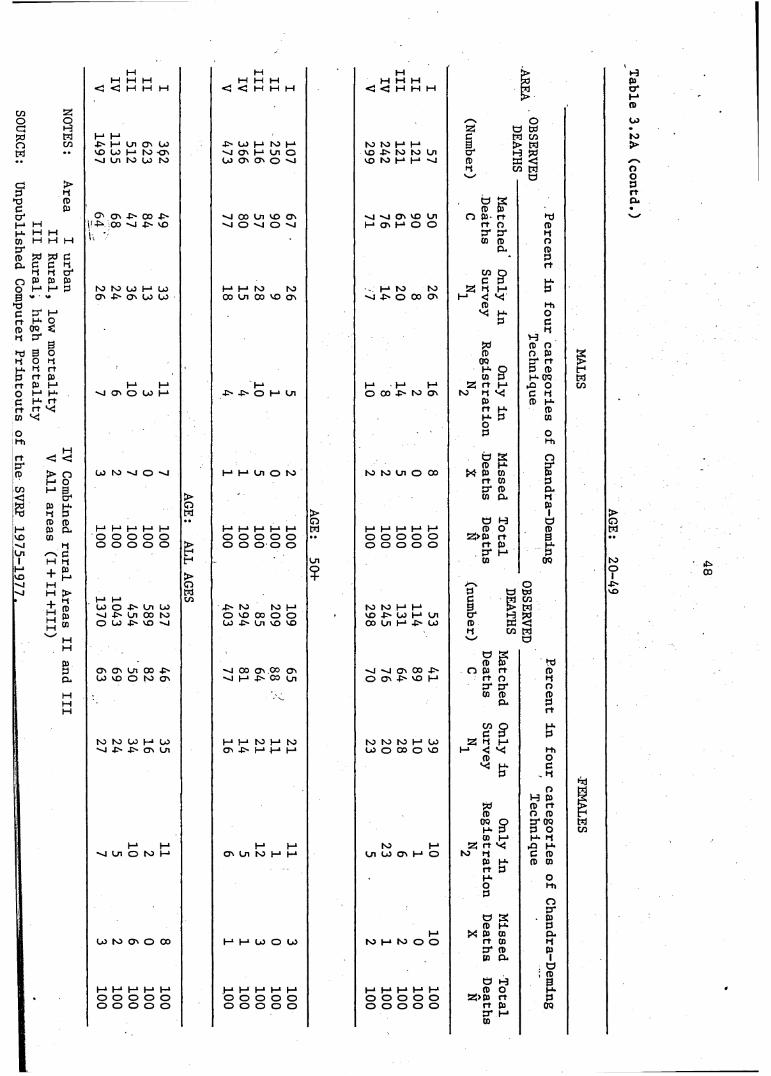
NOTES: Area
I urban IV Combined rural Areas II and III
II Rural, low mortality V All areas (I + II+III)
III Rural, high mortalitySOURCE:
Unpublished Computer Printouts of the SVRP 1975-1977^_____
-
MM M M < < M M M
MM M M
< < M M 3
3 I-14S H in O' 3 3 H to HVD W H to -O' S O' H In Osi in to W to 3 O' O' O si
O' O' N CO N •—1 OO 3 VO O'i -3 00 's! 4>> SOl '
SJ o sj o SI
to to w H wO' .N O' U U
1—1 3 tO NO00 Ln 00 SO O'
3 3si O' O 3 H 3-P' O 3 Ln
3 to si O sj 3 H 3 O to
1—1 1—1 1—• 1—1 1—•
AGE:
3 3 3 3 3o o o o o O O O O Oo o o o o O O O O O
3 33 O N 3 3 si N 3 3 to
3>OwCO
•> tsi NO 3O ID 00 O OO 3 vo si 3 -P" Ln SO SO
O' O' Ln 00 JN si 00 O' 00 O'3 VO O to O' si 3 ■> 3 in
to to 3 H 3 1—1 1—1 to 3 to-O -P' 4> O' Ln O' -P' 3 3 3
3 3si in O 3 H 3 3O' Ln to 3 3
3 to O' O W 3 3 U> O U>
1—1 1—* 1—* t—» 1—• 3 3 3 3 3o o o o o O O O O Oo o o o o O O O O O
Hw H H
< < 3 M W
S3 IO H H VD ^ t o t o Ln VO IO H H s i
s j s i O ' v o i n I—1 Os I—1 O O
3 tO N3 s j J S O OO O'
I-1 I-*O 00
3
fO os
t o t o i n O 0 3
3 3 3 3 3 O O O O O O O O O O
IO IO H H V O M O H OO ln H
s l s I O ' O O f ' O O ' VO H
NO fO tO I—1 LO U O 03 O VO
tO I—*l n W O ' H O
acCT1(D
oWcow§wÖ
ÜCD03.rtD*CO
COc3 <
CDX
o3I-1X33
&CD0Q» S’rt t—* t-i X 3rt 3 3 3 O 3aCDX 3 rt bT CO
O H 3 O 25>$D rt rt fü 3* I-* CO
339o"3i-C
o33rtbrco
coc25 nI-1 <3
X
t—1
5Ö3H. S’CO 3 25 rt v-
NO 3 3 rt p 3 O 3
H3O33►QC3
OtdCOW§WÖ
H3O&33►Q33
3to H to O O X
Ö33rt33
£3cn33D.
I—1 I—1 I—1 I—* I—1o o o o o o o o o oO H 3 O
25>3 rt rt 3 3 3 3
\ H 3 3 t—1 3U>NO>OO3rt&•Percent in four categories of Chandra-Deming
Percent in four categories of Chandra-Deming
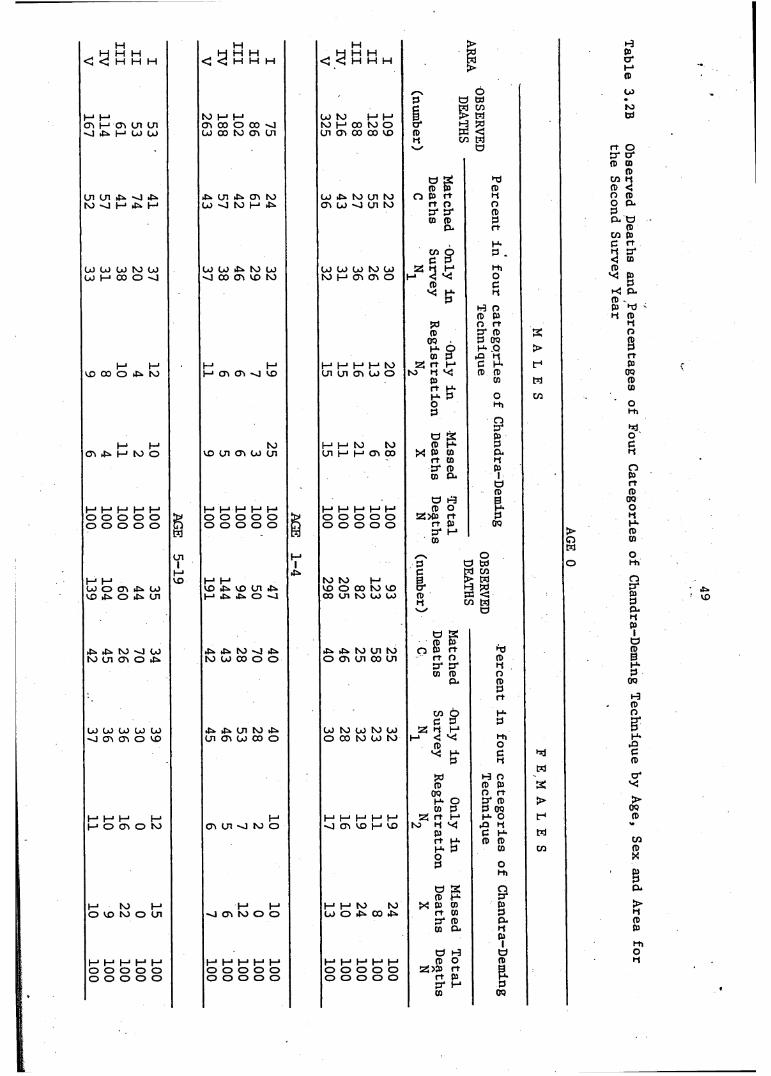
5-19
H. H H H < < H M M
M h-1On I—1 On U1 U1 s J . M - ' U U )
U l U l v ) 4^fo —] I—■ 4 1—1
U l U ) U ) M U ) U H CO O v j
I—1 h-1VO CO O ^ K )
I—1 h-1OV H to O
I—1 I—1 I—* I—* I—1 o o o o o o o o o o 8M
w o m 4 ioVO 4 ^ O 4 ^ U1
^ NO U )to (J1 OV o
W U) W U) (jJ v j OV OV O VO
H H H I-1 I—1 o ov o to
I—1 NO I—1 o vo to o in
t—1 I—1 M I—1 M o o o o o o o o o o
H H 1>H H H ^ H H H 13d
A A I I I < < H H H 1t l>
Op Ö t oc p i CO
to H H CO NO H H 3 S Mcn co o oo >o N) H 00 NJ O O* HU) 03 to ov in in ov oo oo vo (D PC <3
p CO WÖ
ö 3 T3P 03 P
4^ in ov to w 4^ to in to n m n PU) v j to I—1 tP o m o v j m to r t O O
PT PT P03 0) P
Cl* r t
H»C/3 Q P .C P
U) 0J iN tO U) CO CO CO NO CO 3 P H1 l-tnN j 00 o> VO to to h ov cn o H < 3 O
ft) CX p . P
PH O P P
Pö O r tfD PT p
OQ P OQH* O H* .003 P ►Q P
1—1 M 1—1 1—1 H—* 1—1 N) 2 5 r t 1—' C P*I—1 crv cr> v j vo cn in an co o N3 P X p p
Pr t h *
03
H* P OO f hP
O
a 3p rp
NO 1—1 h-1 NJ NJ fD H* Pvo in cjv io u i in H H on oo X P 03 p
r t 03 pp r p p03 p i
öp
O K3 3h-1 H 1 1—1 M 1—1 l—1 1—* 1—1 l—* l—1 P O H*O O O O O o o o o o 3 > P r t Po o o o o
H
o o o o o r t p P* H1 cn
OQ
M o1 p Ö w
C w C/3h-1 I—1 NJ NJ h-1 g > wvo 4^ vo in VO O 00 NJ VO <3 h Wh-1 *N O oo cn to co co P PC <
t-i cn w__f Ö
O 3
4^ 4 i to cn top P
O p r t *nto CO CO o o o on cn co cn r t O
*-r* fr*p
i—* *-*03 P O
P PPr t
C/3 Q H-P P P
4^ i M n M 45> CO NJ CO NJ co 2 P H*in o m o oo o O CO NJ CO NJ t—1 C 3 i-h
P OX H> C
P P
PJ H OP P P
0Q O r tH* O p r pm P P OQ
1—' 1—1 I—’ 1—1 1—1 1—* Z r t H H- oo v i n s i t o o v i c n v o H v o to P X ►n p
P C H-r t p . P PP- P O
cn
P ol-h
ö 3 oP H- cr
H 1—1 1—1 1—1 NJ NJ X P 03 Ps i t n t o o o CJ O 4^ CD 4^ r t 0) P
O' P p03 P p
P1Ü H Ö
l—1 l—1 l—1 l—1 I—• H H H H H P O po o o o o o o o o o 25 >P r t 3o o o o o o o o o o r t p
PT I-1H*P
cn 0Q
3>fwco
M3►fwco
Tab
le 3.2B
O
bserved D
eaths and P
ercentages
of F
our C
ategories of
Chandra-D
eming T
echnique by Age,
Sex and Area
for th
e Second
Survey Year
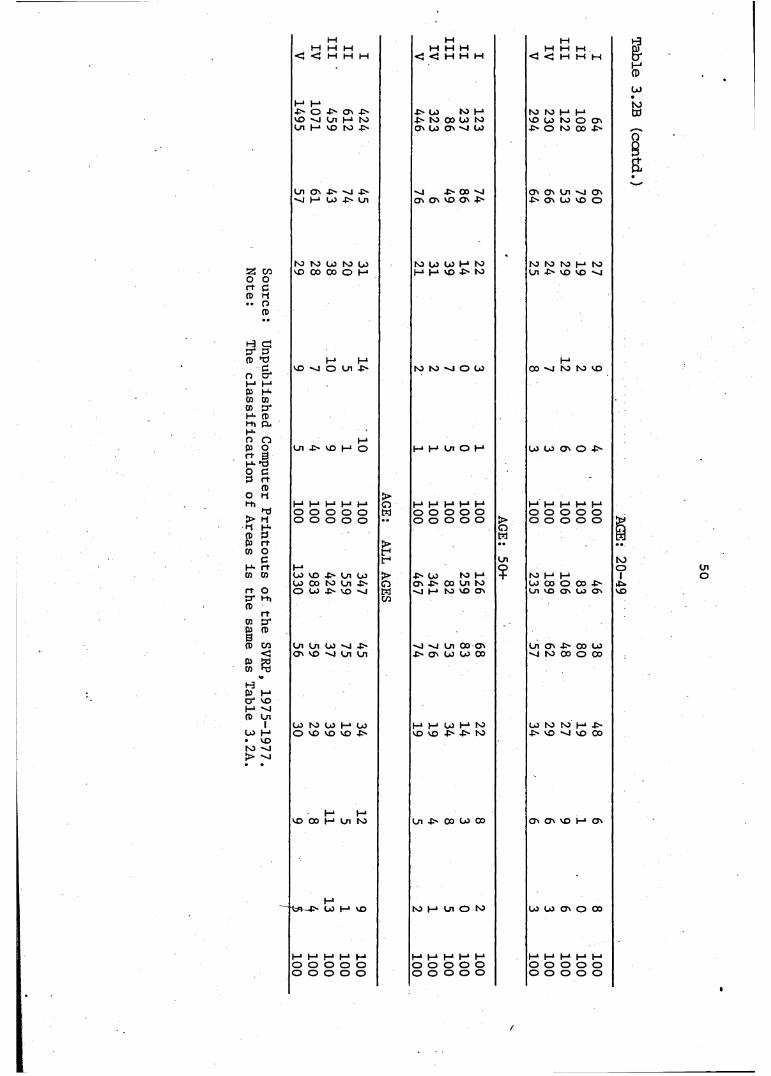
a zn> o o n- c a> P• • o
CD
§
&PPCDcrCD(XOO3
P T3
2 CP r t(0ppjpP3rtOCrtCD
rt OO' t-hrt3*(D
c/3<
HP Mcr* vo I-1 "J CD L/iIU> P • VO N3 -vj > "J
PM M M< < M M P
P P-> O -> Ov ->vO Ui H K)U i H vo hJ j s
UiOv4NvJ4S v l H U JN Ui
N3 NJ W M U VO OD 03 O H
I -1 P VO v j o Ln ->
I—*Üi 4> vo H O
I—* I—1 t—1 i—* I—1o o o o o o o o o o
I—1LP VO -P> Ln LO W 00 t o Ol j s O U - M O M
Ln In CO —I 4s Ov vO vl Ui Ui
LO to U) I—1 LO O vO vo vO -F"
P I -1VO 03 P In to
t—1Ln F- CO P 1 VO
I—‘ I—‘ I—1 t—1 (—1o o o o o o o o o o
>oM
MP P PH
< < H H H
PHP P P
< < P M M
4> U> M l - 1F - to CO LO to
to to p p VOLO t O O O'
O' LO O —1 LO -> o to oo ->
—1 -> 00 v lO' O' vo O' ■t'
O' O' Ln v l O' J S O ' U V O O
to LO LO P to•
to N) t o p toP p CD -F to Ln ■> VO VO v j
tO to v l O LOP-*
CD v l tO tO VO
P P Ln O H LO U) O' O N
P H H H P P P P P PO O O O O O O O O OO O O O O > O O O O O
- > 0 0 NO I-1O' -> O0 Ln NO
GE:
50+
t o p p CO 03 O 03 •>
v l P 1 to vo O' Ln vo O' U O'
—1 v l Ln 00 O' Ln O' -N 00 LON O' LO W CD v l tO 03 O 03
P P LO P tO U tO tO p NVO VO -> -> NO N VO v l vo 03
Ln N 03 W 03 O' O' VO P O'
NO P Ln O N) LO LO O' O 03
P P P P P P* P P P Po o o o o O O O O Oo o o o o o o o o o
LnO
Tab
le 3.2B
(can
td.)
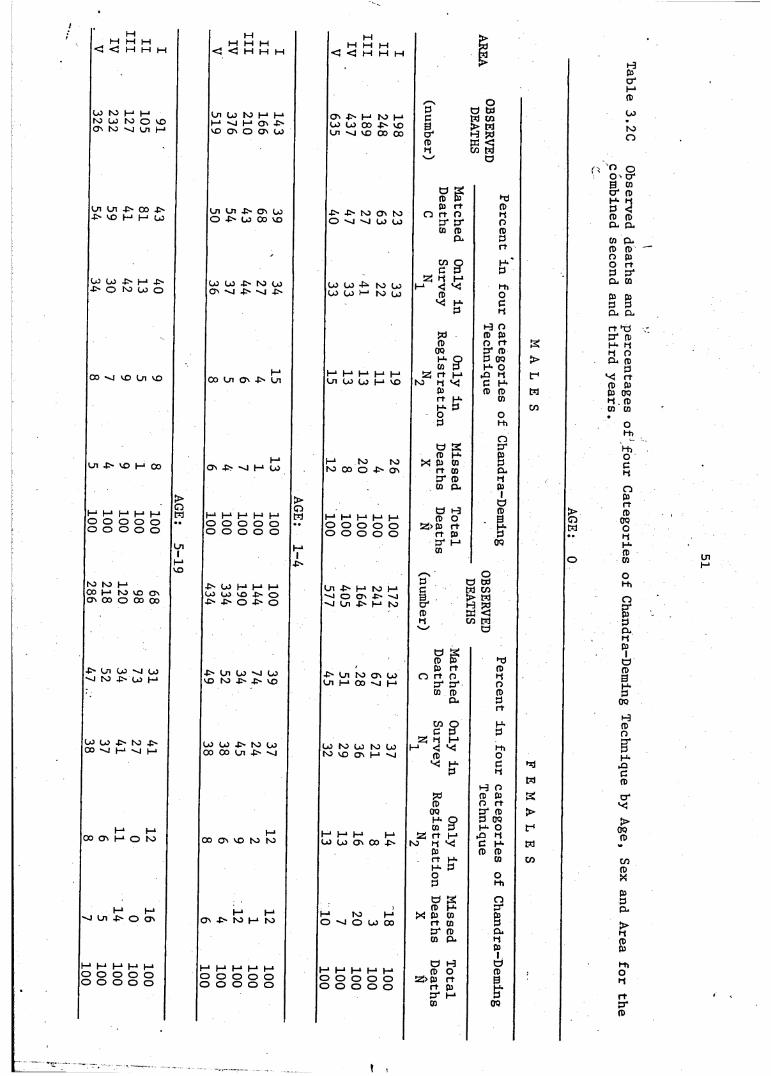
AGE: 5-19
M M M< < M M M
U) N) H H W W to O \D O' to s | ^ H
On I n 4 0 OO -> H H U
U> Lo -> P-* 4^ 4- O to W o
OO s j vD Ln VO
On 4> oo t—1 OO
to to HCO H to vd O O' 00 O 00 00
4MJ1 W OJ woj to 40 (jO H
W W 40 IO 4S03 Vi p —I |_i
CO O' P o to
M Ln t > O O '
o o o oo o o o
HH H H< < M M M
ln p to H P I—1 -~J I—1 oo 4>~ 4) O' O O' W
In Ln 4 0 O' p O 40 p OO vo
P P 40 to p O' ol 40 s i 4 0
I—100 Oi O' 40 In
I—1O' 4 0 s i p p
I—* I—* I—* I—1 I—»o o o o oo o o o o
4o P p p pP P VO 40 o40 4 0 O 40 O
40 p p s i p vO to 4 0 4s
I P P 4 0 to p 00 00 Ln 4 0 si
P-1O' VO N) Is)
M P-* Jts ts) |—1 Is)
P P P Po o o o o o o o
PHPH M PH
< < H P H
40 p to p P 00 40 VD sj VD 00 00
40 40 p O' to O s i s i p p
OJ -43». U> P-1
N) U> ts> pj
P-1 P-1 P-1 p-* p-< Ul P p p VD
I—1 tS) Is) to P o 40 O'
P-1 P-1 P-* P-* Po o o o oo o o o o
oi P-1 to pSI O O' 40 sis i p 40 p to
40 p to O' P P P 00 si P
P to p to p fs) V40 O' I—1
Pc0crfDip
owm
w
3MÖ
m
C2J H M C fD
P-*
P-* P-1 P->P O' 00 4 0
Iso p-> OJ O P CO
p-1 P-* p-1 P-*o o o o o o o o
fDOQM §
rt P-* H VJ Pr t H* pu P O P
Ö 3 fD pu CD CO rt cd cr a)CD pu
ö H fD O
3 > P r t rt CD CT P-* CD
Pci*fDi-j
Pd(DPiOfDPr t
pu*PPhOCp{
H O fD CD O r t CT fD P OO pu O
►a p{(C pp fD fD
CD
OPh
0 d r CD P a.p{CD1ÜfD. gp
OQ
S’?CD r t r t oor drCD fD
CD
COc21 Pi
P-1 <fD
OPP-1
puP
fö(D
OQH- QCD P rt p-> Pi ^ Prt pu pu P O P
ÖfD
Z > PrtcrCD
3PUCDCDfDCD
fDPiOfDPr t
P -PPhOCp<
H) O fD P O r tcr pP OQ pu O►40 p(C pu fD (D
CO
OPh
ncr
CDP{PIa
(Dg
3>r 1w
cn
pdW
3>
r 1w
m
>oM
O
Table 3.2C Observed deaths and percentages of four Categories of Chandra-Deming Technique by Age, Sex and Area for the combined second and third years.
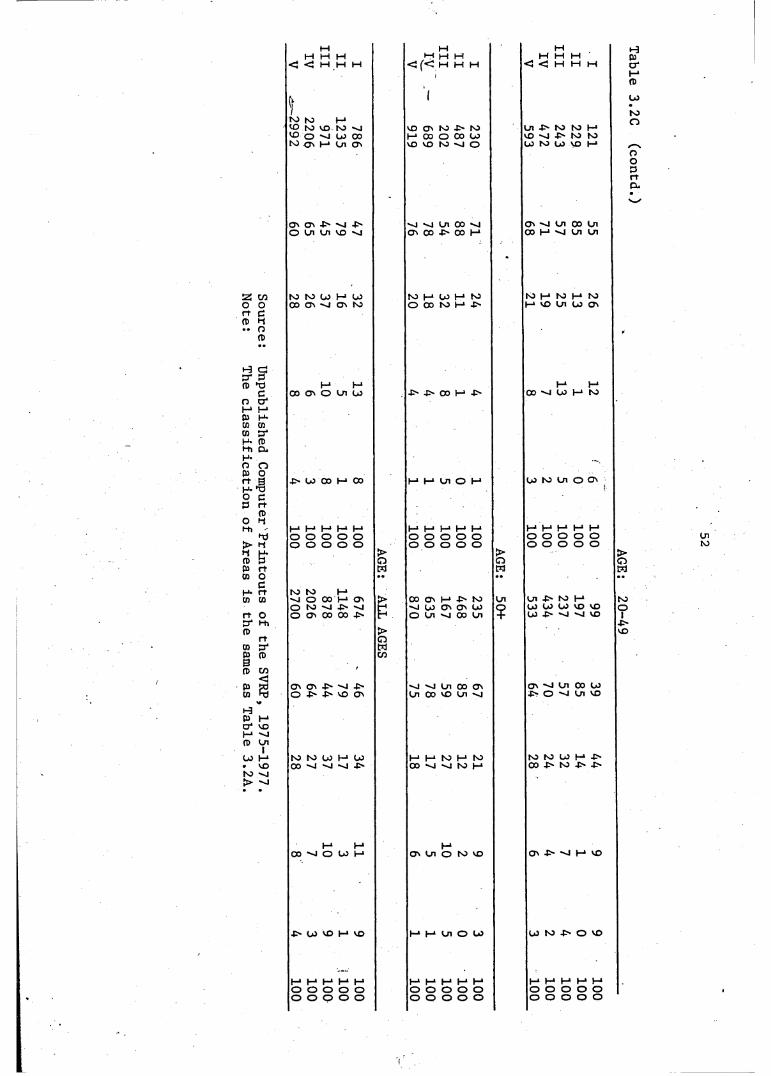
MH M P
< < P M P
ftK) N3 P
N ) VD (O s j' ß O v J W 00 Is3 Os H 1 Cn O '
0 \ O ' S I 4> O U i o n e s i
Z COo o ft cCD n• • o
CD
N ) fO W H U)OO CJN S j O ' S3
h a pr P CD ^
CoP P W CO P l-h P O P r t P ȆO C
CT1PPCOsc*CDcc
nog
r tCDP
hdP
S*r tOCr tCO
r t Opr hiCD
r tej*(D
CO<«8
I-* I-*03 O ' O l n W
M 3 0 3 H 03
P P P P P O O O O O O O O O O
S3 S3 Ps i O OO H O 'o S3 S l ^ s iO O ' 0 3 OO 4 S
O ' O ' 4 ^ s | 4SO - S - S 'D O '
HC33 Pc r s o P --J CD Cn
ICo P • s oSO s j> "-J
S3 S3 W P CO 03 s i s j s j 4 s
P P OO s i O U H
4 S U VO H \D
P P P P PO O O O Oo o o o o
pt—l P H
< ( < P H M
SD O ' S3 -C- NOP 03 O 0 3 CJSO SO S3 —I O
S J s j c n 0 3 s j O ' 0 3 - ts 03 P
K3 P LO P N3 O 00 S3 P j s
4s 4s 03 H -is
P P Cn O P
P P P P P O O O O O O O O O O
OO O ' P 4 s S3 s i U3 O ' O ' W O C i s i 00 Cn
s j s i Cn OO O ' Cn 00 s o Cn —I
I—1 P S3 I—1 N3 00 s i s j S3 P
PO ' Cn O S3 s o
P P Cn O OJ
P P P P P O O O O O O O O O O
M P P
U l 4S S3 S3 PVO s i 4S S3 S3CO N) CO s o P
O ' s j on 0 3 Cn03 P s i Cn Cn
S3 P N) P S3P SO Cn C J O '
0 3 s i C3 P S3
CJ S3 Cn O O '
o o o o o
Cn 4 s S 3 PCJ CO LO SO SOC3 4> s j s i SO
O ' s i Ln oo CJ4 s O s i I n VO
N3 S3 CJ P 4S
CJ S3 4> O VO
o o o o oo o o o o
>ow
K301
-p*so
CnSJ
Table
3.2C
(contd
.)
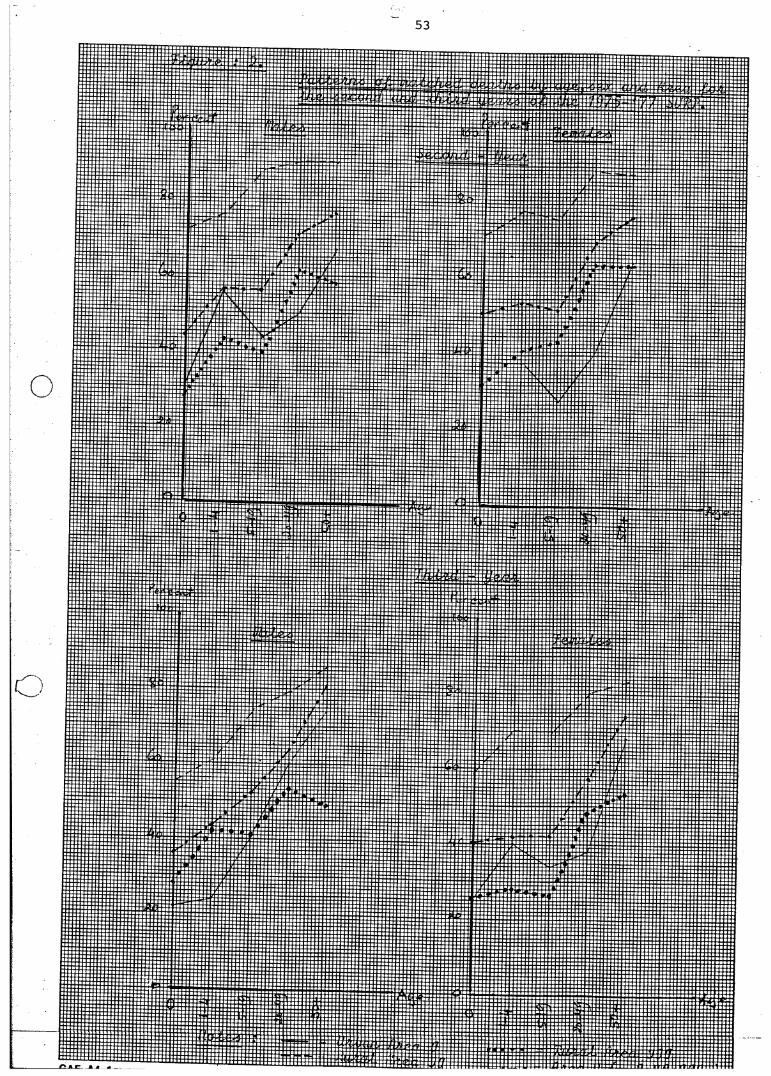
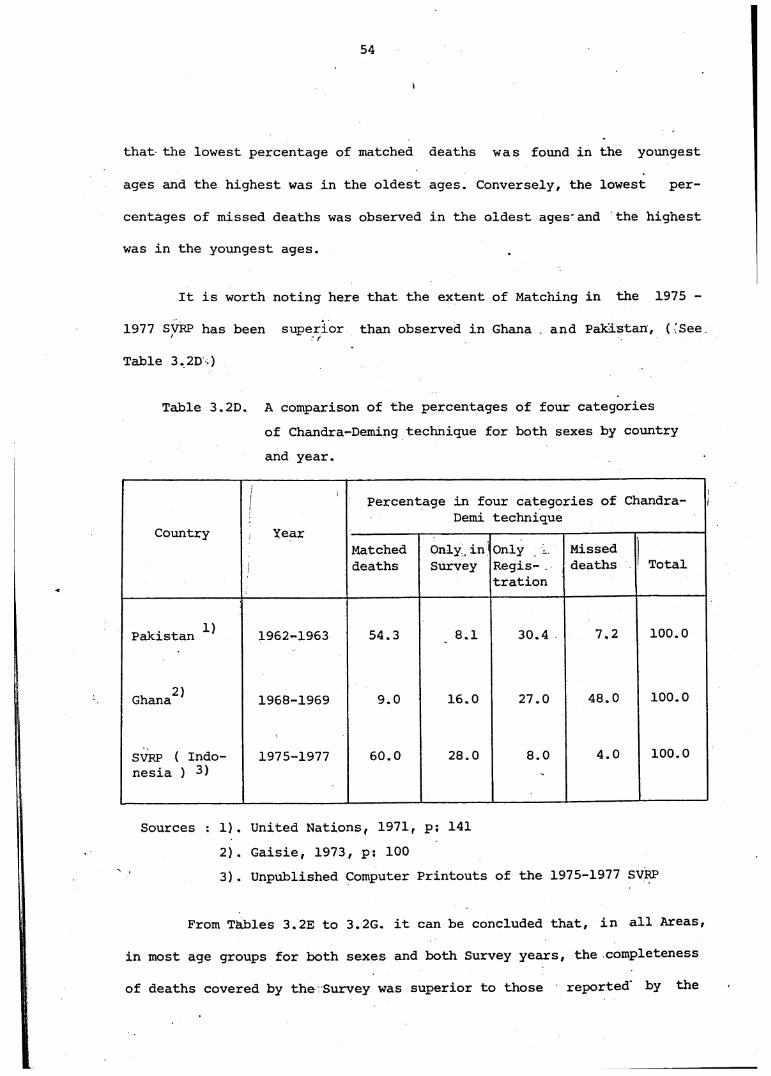
54
that the lowest percentage of matched deaths was found in the youngest
ages and the highest was in the oldest ages. Conversely, the lowest per
centages of missed deaths was observed in the oldest ages'and the highest
was in the youngest ages.
It is worth noting here that the extent of Matching in the 1975 -
1977 SVRP has been superior than observed in Ghana and Pakistan, ( 'See
Table 3.2D )
Table 3.2D. A comparison of the percentages of four categoriesof Chandra-Deming technique for both sexes by country and year.
Country
J
Year
Percentage in four categories of Chandra- Demi technique
Matcheddeaths
Only in 1 Survey
OnlyRegistration
Misseddeaths Total
Pakistan ^ 1962-1963 54.3 8. i 30.4 7.2 100.0
, 2) Ghana 1968-1969 9.0 16.0 27.0 48.0 100.0
SVRP ( Indo- 1975-1977 60.0 28.0 8.0 4.0 100.0nesia ) 2) **
Sources : 1). United Nations, 1971, p; 1412) . Gaisie, 1973, p: 1003) . Unpublished Computer Printouts of the 1975-1977 SVRP
From Tables 3.2E to 3.2G. it can be concluded that, in all Areas,
in most age groups for both sexes and both Survey years, the completeness
of deaths covered by the Survey was superior to those reported by the

55
Registration. The reasons are mainly due to factors such as :
1. There is no national law to regulate and enforce the execution of' Vital
Registration in Indonesia. Although some provinces have local
regulations which are neither uniform nor compulsory.
2. People do not appreciate the significance of Vital Registration data
either for the Government or for themselves. This is primarily because
there is insufficient comprehension of the aims of Registration due to
a lack of information about Registration.
3. Most of the Government Departments or Institutions require collection
of statistical information at the village level, and as a consequence,
the Registrar's work load is too heavy.
4. A lack of adequately trained registrars who can inform and quide people
in conducting Registration.
5. The low educational level of people often impedes . the collection of
accurate data on vital events. In some areas, traditional beliefs may
cause difficulties in relation to the reporting of . a death in the
family, because by reporting that death, they will be reminded of their
bereavement.6. 'The passive system of colllecting information on vital events is
inadequate in areas which have a problem .. of communication and
transportation, in poor areas and in areas with a low level öf
education.
8). For more details, see " Population and Vital Registration in Indonesia ", by Suhartono, 1979, and " Attitudes and Conditions Underlying Vital Registration in Sample Registration Project Areas in Indonesia ", by Gardiner, and Sugito, 1977
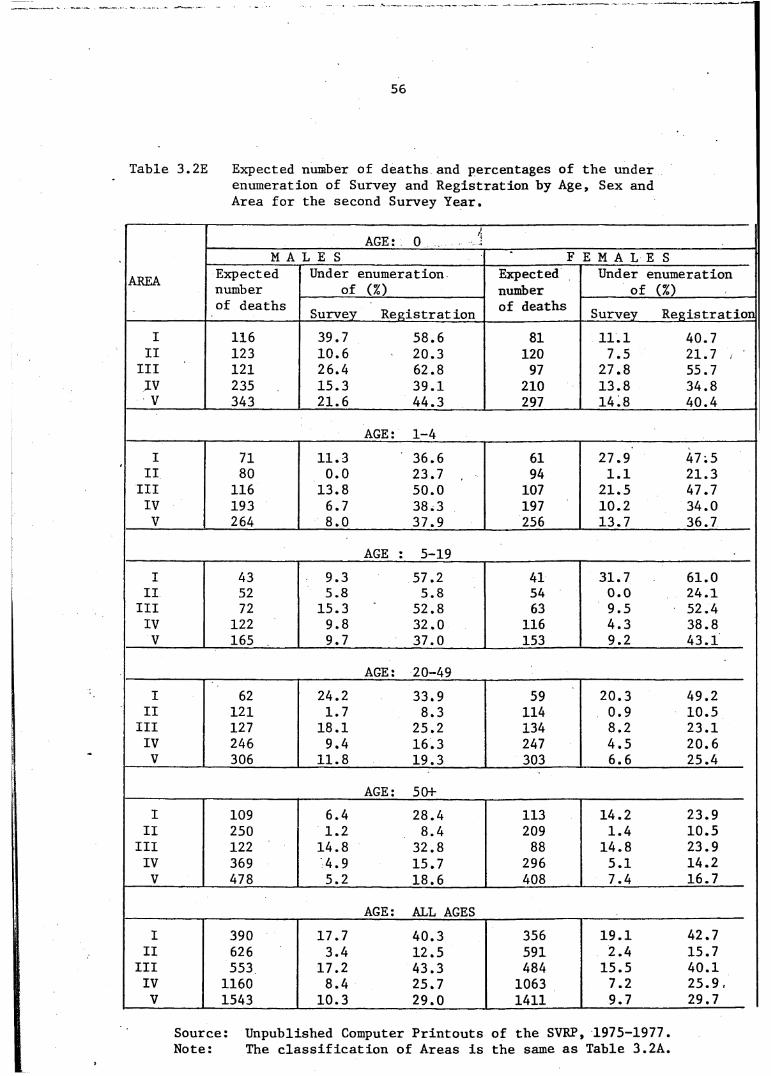
Table 3.21
56
] Expected number of deaths and percentages of the underenumeration of Survey and Registration by Age, Sex and Area for the second Survey Year.
AGE: 0M A L E S F E M A L E S
A R F A Expected Under enumeration Expected Under enumerationnumber of o o number of (%)of deaths of dpathsSurvey Registration Survey Registration
I 116 39.7 58.6 81 11.1 40.7II 123 10.6 20.3 120 7.5 21.7III 121 26.4 62.8 97 27.8 55.7IV 235 15.3 39.1 210 13.8 34.8V 343 21.6 44.3 297 14.8 40.4
AGE: 1-4I 71 11.3 36.6 61 27.9 47.5II 80 0.0 23.7 94 1.1 21.3III 116 13.8 50.0 107 21.5 47.7IV 193 6.7 38.3 197 10.2 34.0V 264 8.0 37.9 256 13.7 36.7
AGE : 5-19I 43 9.3 57.2 41 31.7 61.0
II 52 5.8 5.8 54 0.0 24.1III 72 15.3 52.8 63 9.5 52.4IV 122 9.8 32.0 116 4.3 38.8V 165 9.7 37.0 153 9.2 43.1
AGE: 20-49I 62 24.2 33.9 59 20.3 49.2II 121 1.7 8.3 114 0.9 10.5III 127 18.1 25.2 134 8.2 23.1IV 246 9.4 16.3 247 4.5 20.6V 306 11.8 19.3 303 6.6 25.4
AGE: 50+I 109 6.4 28.4 113 14.2 23.9
II 250 1.2 8.4 209 1.4 10.5III 122 14.8 32.8 88 14.8 23.9IV 369 4.9 15.7 296 5.1 14.2V 478 5.2 18.6 408 7.4 16.7
AGE: ALL AGESI 390 17.7 40.3 356 19.1 42.7II 626 3.4 12.5 591 2.4 15.7
III 553 17.2 43.3 484 15.5 40.1IV 1160 8.4 25.7 1063 7.2 25.9,V 1543 10.3 29.0 1411 9.7 29.7
Source: Unpublished Computer Printouts of the SVRP, 1975-1977Note: The classification of Areas is the same as Table 3.2A
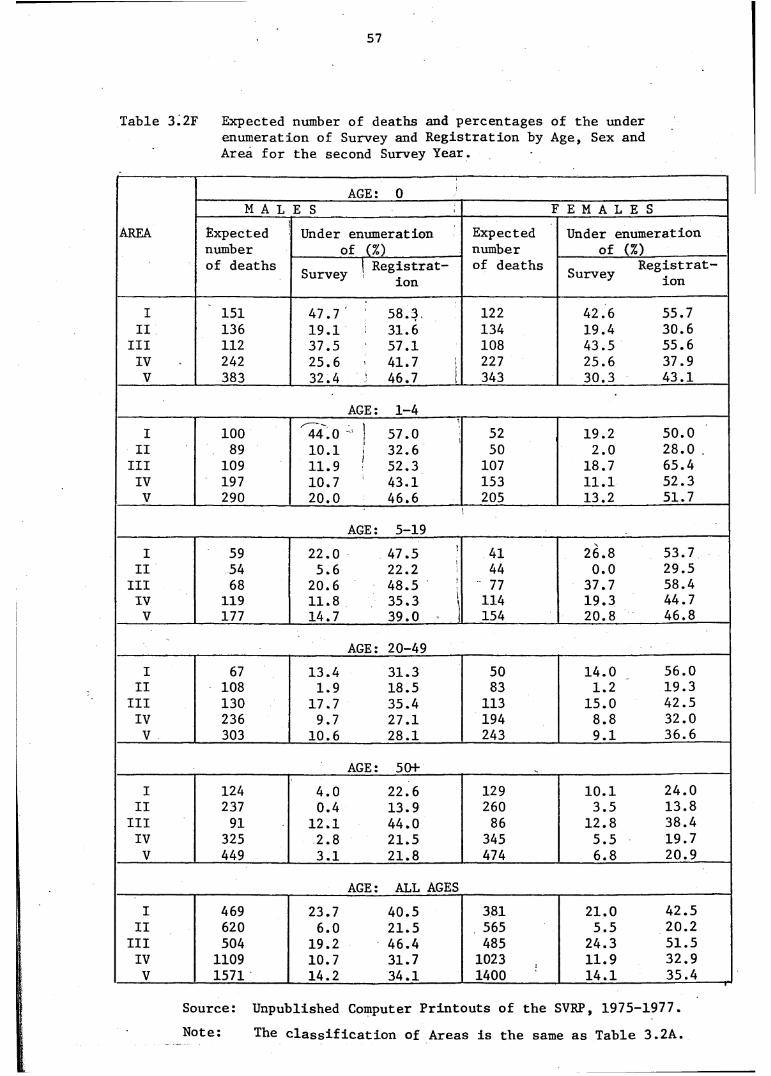
57
Table 3.2F Expected number of deaths and percentages of the under enumeration of Survey and Registration by Age, Sex and Area for the second Survey Year.
AREA
AGE: 0M A L E S F E M A L E S
Expected number of deaths
Under enumeration of (%)
Expected number of deaths
Under enumeration of (%)
_ ' Registrat-Survey ion_ Registrat-SurveyJ ion
I 151 47.7 58.3 122 42.6 55.7II 136 19.1 31.6 134 19.4 30.6
III 112 37.5 57.1 108 43.5 55.6IV 242 25.6 41.7 227 25.6 37.9V 383 32.4 46.7 343 30.3 43.1
AGE: 1-4I 100 44.0 ' 57.0 52 19.2 50.0
II 89 10.1 ; 32.6 50 2.0 28.0 .III 109 11.9 52.3 107 18.7 65.4IV 197 10.7 43.1 153 11.1 52.3V 290 20.0 46.6 205 13.2 51.7
AGE: 5-19I 59 22.0 47.5 41 26.8 53.7
II 54 5.6 22.2 44 0.0 29.5III 68 20.6 48.5 77 37.7 58.4IV 119 11.8 35.3 1 114 19.3 44.7V 177 14.7 39.0 154 20.8 46.8
AGE: 20-49I 67 13.4 31.3 50 14.0 56.0
II 108 1.9 18.5 83 1.2 19.3III 130 17.7 35.4 113 15.0 42.5IV 236 9.7 27.1 194 8.8 32.0V 303 10.6 28.1 243 9.1 36.6
AGE: 50+I 124 4.0 22.6 129 10.1 24.0
II 237 0.4 13.9 260 3.5 13.8III 91 12.1 44.0 86 12.8 38.4IV 325 2.8 21.5 345 5.5 19.7V 449 3.1 21.8 474 6.8 20.9
AGE: ALL AGESI 469 23.7 40.5 381 21.0 42.5II 620 6.0 21.5 565 5.5 20.2
III 504 19.2 46.4 485 24.3 51.5IV 1109 10.7 31.7 1023 11.9 32.9V 1571 14.2 34.1 1400 14.1 35.4
Source: Unpublished Computer Printouts of the SVRP, 1975-1977.Note: The classification of Areas is the same as Table 3.2A.
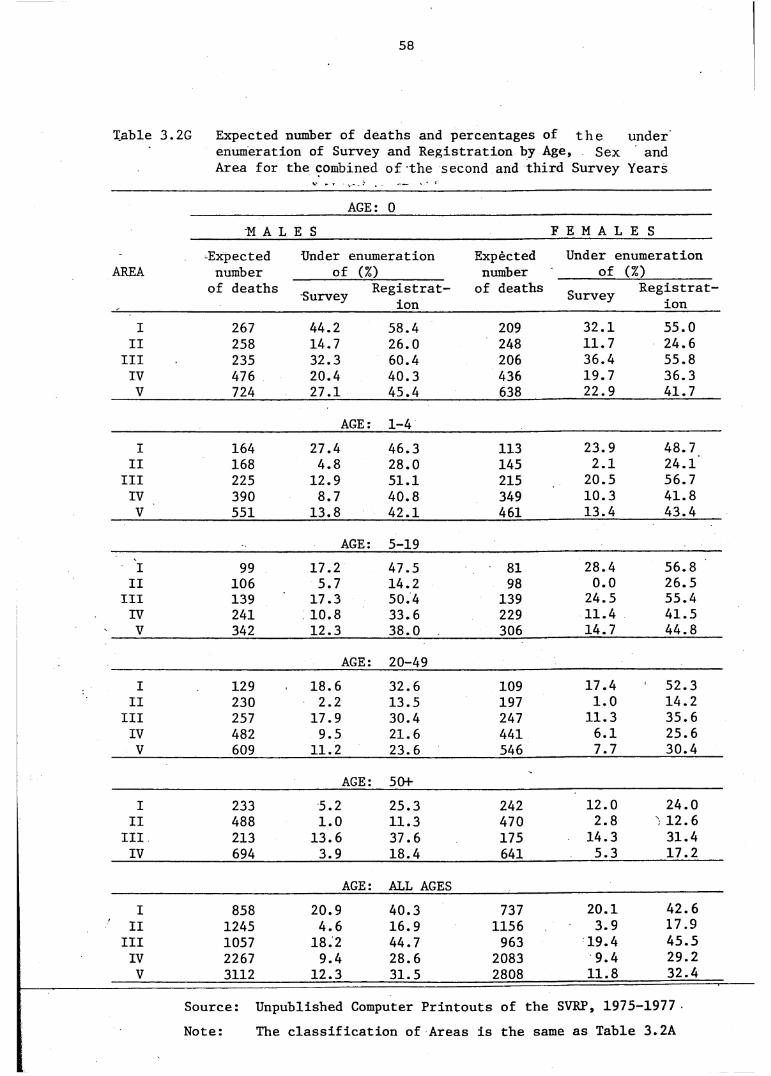
58
Table 3.2G Expected number of deaths and percentages of the underenumeration of Survey and Registration by Age, Sex and Area for the combined of the second and third Survey Years
AGE: 0
AREA
M A L E S F E M A L E SExpected number of deaths
Under enumeration of (%)
Expected number of deaths
Under enumeration of (%)
_ Registrat-Survey °.ion Survey Registration
I 267 44.2 58.4 209 32.1 55.0II 258 14.7 26.0 248 11.7 24.6III 235 32.3 60.4 206 36.4 55.8IV 476 20.4 40.3 436 19.7 36.3V 724 27.1 45.4 638 22.9 41.7
AGE: 1-4I 164 27.4 46.3 113 23.9 48.7II 168 4.8 28.0 145 2.1 24.1III 225 12.9 51.1 215 20.5 56.7IV 390 8.7 40.8 349 10.3 41.8V 551 13.8 42.1 461 13.4 43.4
AGE: 5-19I 99 17.2 47.5 81 28.4 56.8II 106 5.7 14.2 98 0.0 26.5III 139 17.3 50.4 139 24.5 55.4IV 241 10.8 33.6 229 11.4 41.5V 342 12.3 38.0 306 14.7 44.8
AGE: 20-49I 129 18.6 32.6 109 17.4 52.3II 230 2.2 13.5 197 1.0 14.2III 257 17.9 30.4 247 11.3 35.6IV 482 9.5 21.6 441 6.1 25.6V 609 11.2 23.6 546 7.7 30.4
AGE: 50+ -
I 233 5.2 25.3 242 12.0 24.0II 488 1.0 11.3 470 2.8 12.6III 213 13.6 37.6 175 14.3 31.4IV 694 3.9 18.4 641 5.3 17.2
AGE: ALL AGESI 858 20.9 40.3 737 20.1 42.6II 1245 4.6 16.9 1156 3.9 17.9III 1057 18.2 44.7 963 19.4 45.5IV 2267 9.4 28.6 2083 9.4 29.2V 3112 12.3 31.5 2808 11.8 32.4
Source: Unpublished Computer Printouts of the SVRP, 1975-1977Note: The classification of Areas is the same as Table 3.2A
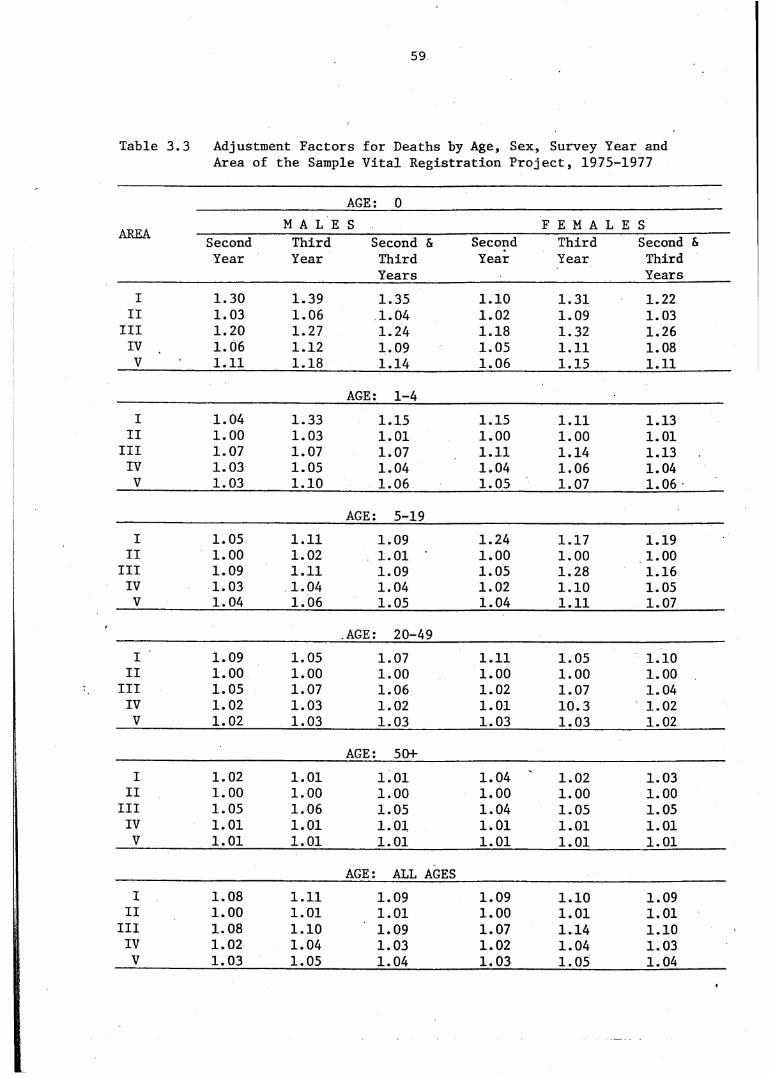
59
Table 3.3 Adjustment Factors for Deaths by Age, Sex, Survey Year and Area of the Sample Vital Registration Project, 1975-1977
AGE: 0AREA M A L E S F E M A L E S
Second Third Second & Second Third Second &Year Year Third Year Year Third
Years YearsI 1.30 1.39 1.35 1.10 1.31 1.22II 1.03 1.06 1.04 1.02 1.09 1.03
III 1.20 1.27 1.24 1.18 1.32 1.26IV 1.06 1.12 1.09 1.05 1.11 1.08V 1.11 1.18 1.14 1.06 1.15 1.11
AGE: 1-4I 1.04 1.33 1.15 1.15 1.11 1.13II 1.00 1.03 1.01 1.00 1.00 1.01
III 1.07 1.07 1.07 1.11 1.14 1.13IV 1.03 1.05 1.04 1.04 1.06 1.04V 1.03 1.10 1.06 1.05 1.07 1.06
AGE: 5-19I 1.05 1.11 1.09 1.24 1.17 1.19II 1.00 1.02 1.01 1.00 1.00 1.00
III 1.09 1.11 1.09 1.05 1.28 1.16IV 1.03 1.04 1.04 1.02 1.10 1.05V 1.04 1.06 1.05 1.04 1.11 1.07
AGE: 20-49I 1.09 1.05 1.07 1.11 1.05 1.10II 1.00 1.00 1.00 1.00 1.00 1.00III 1.05 1.07 1.06 1.02 1.07 1.04IV 1.02 1.03 1.02 1.01 10.3 1.02V 1.02 1.03 1.03 1.03 1.03 1.02
AGE: 50+I 1.02 1.01 1.01 1.04 1.02 1.03II 1.00 1.00 1.00 1.00 1.00 1.00III 1.05 1.06 1.05 1.04 1.05 1.05IV 1.01 1.01 1.01 1.01 1.01 1.01V 1.01 1.01 1.01 1.01 1.01 1.01
AGE: ALL AGESI 1.08 1.11 1.09 1.09 1.10 1.09II 1.00 1.01 1.01 1.00 1.01 1.01III 1.08 1.10 1.09 1.07 1.14 1.10IV 1.02 1.04 1.03 1.02 1.04 1.03V 1.03 1.05 1.04 1.03 1.05 1.04
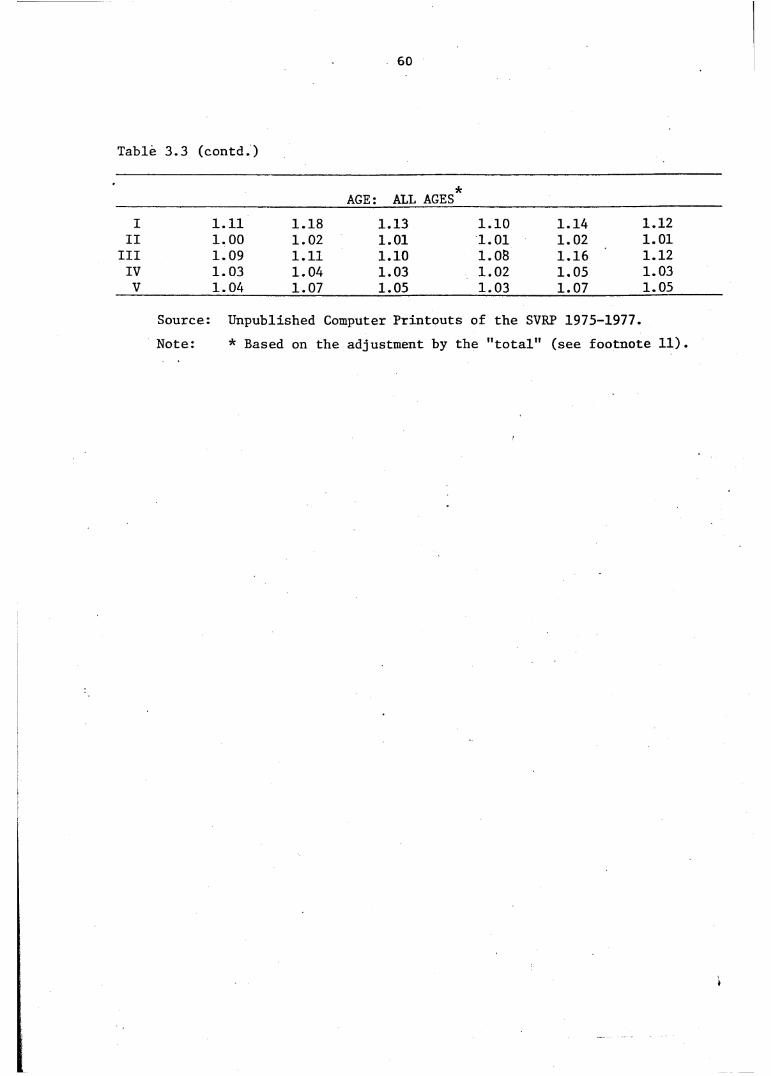
60
Table 3.3 (contd.)
AGE: ALL AGES*I 1.11 1.18 1.13 1.10 1.14 1.12II 1.00 1.02 1.01 1.01 1.02 1.01III 1.09 1.11 1.10 1.08 1.16 1.12IV 1.03 1.04 1.03 1.02 1.05 1.03V 1.04 1.07 1.05 1.03 1.07 1.05
Source: Unpublished Computer Printouts of the SVRP 1975-1977.Note: * Based on the adjustment by the "total" (see footnote 11).
61
3.3. Adjustment factors
As mentioned in Chapter One, the calculation of the adjustment
factors for deaths by the Chandra-Deming technique can be classified into
three categories : the adjustment factor, taefcor for the Survey only, the
factor for the Registration only and the adjustment fcator for the whole
observation for both Survey and Registration. In . this Chapter, the
discussion is limited to the case of the adjustment factors to the
" observed " deaths, based on both Survey and Registration, rhther than
by the Survey or Registration only.
The explanation of the calculation of the adjustment factors will
not be repeated here, because it has been mentioned in Chapter One,
Section 1.5.
The adjustment factors in this study were obtained for all Areas, both
years for selected age groups for both sexes ( See Table 3.3. )
To eliminate, the substantial ratio errors as consequence of
small member of deaths in five-year age group for some Project-areas, in
applying the Chandra-Deming technique, it is better to stratify *age at
death into five broad age-groups, as shown in Table 3.3 and some Tables
earlier ( Marks et.al, 1974 )
3.4. Analysis of adjustment factors
The range of adjustment factors for various - age groups is as
follows :
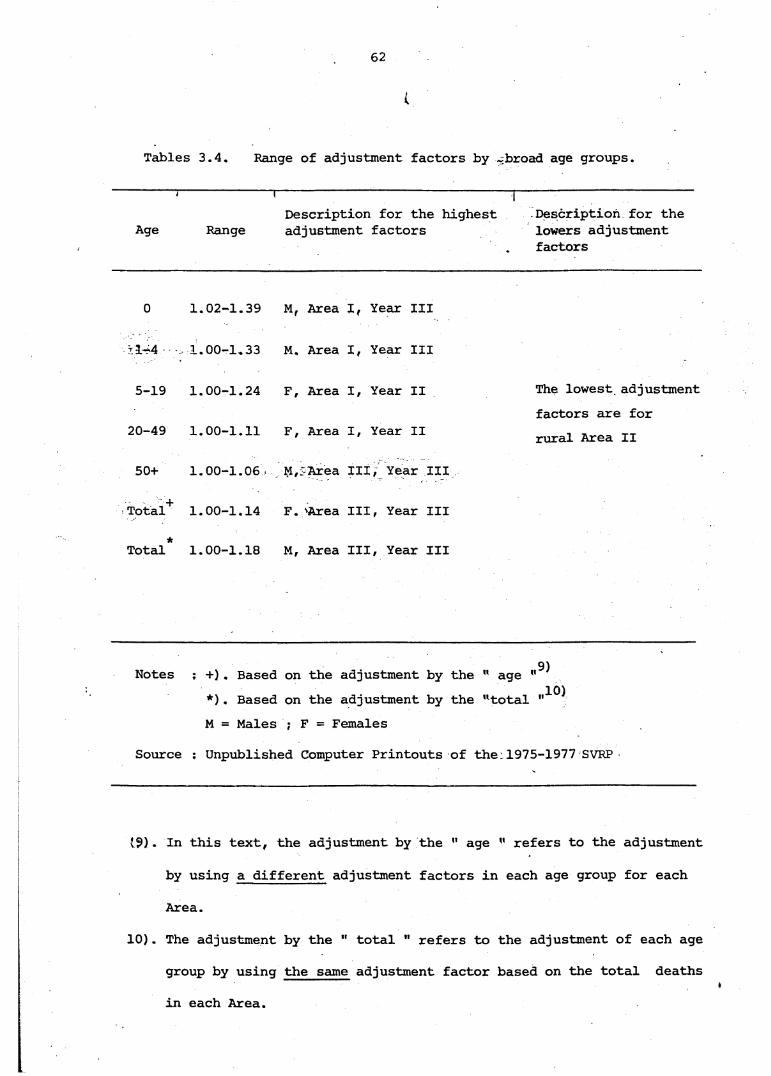
62
Tables 3.4. Range of adjustment factors by abroad age groups.
7
Age
r
Range
~ r ~
Description for the highest adjustment factors
Description for the lowers adjustment factors
0 1.02-1.39 M, Area I, Year III
>1-4 1.00-1.33 M. Area I, Year III
5-19 1.00-1.24 F, Area I, Year II The lowest adjustmentfactors are for
20-49 1.00-1.11 F, Area I, Year II rural Area II
50+ 1.00-1.06 M,JArea III, Year III
Total+ 1.00-1.14 F. ■'Area III, Year III*Total 1.00-1.18 M, Area III, Year III
Notes ; +). Based on the adjustment by the " age*). Based on the adjustment by the "total „1°)M = Males ; F = Females
Source : Unpublished Computer Printouts of the 1975-1977 SVRP
(9). In this text, the adjustment by the " age " refers to the adjustment
by using a different adjustment factors in each age group for each
Area.
10). The adjustment by the " total " refers to the adjustment of each age
group by using the same adjustment factor based on the total deaths
in each Area.

63
Except for rural Area II at ages 1 and over for males in year II
and for females in both years, it is clear from Table 3.3 that three is
a considerable variation in the adjustment factors between Areas, ages,
sexes and years. However, the lowest factors are for higher ages for rural
Area II and for year II, whereas the highest factors are for younger
ages, for urban Area I and for year III.
At age 0, the adjustment factor ranges from 1.02 to 1.39 ( TableA'QM&UtiA,y ■
3.4 ), indicating up to 39 per cent of deficiency in the observed deaths.
The urban Area I in the case of males, shows a higher adjustment factor
than rural Area III, but the reverse is true for females. The rural Area II
requires only between 3 and 6 per cent of adjustment in the case of males
and between 2 and 9 per cent for females for the second and third years
respectively.
The adjustment required at ages 1-4 is much lower than for age 0
( uo to 15 per cent ), except for males in urban Area I for year III which
still requires a higher adjustment factor. A higher factor for males in
this area is mainly due to very high under enumeration - -of deaths',
especially for the Registration where the under counting in that age group
is close to 60 per cent ( Table 3.2F ). Similar to age 0, .the adjustment
factor in age group 1-4 in rural Area II is still minimal ( up to 3 2 per
cent only )
For ages beyons 5 year, the adjustment factors are smaller; the
urban Area I and rural Area III require more or less identical adjustments,
while rural Area II sems to require practically no adjustment.
The lowest and more homogenous adjustment factors found in rural
Area II seem plausible when compared with the other Areas.
64
Rural Area II had both better Registration and Survey, therefore it has
a low percentage of missed deaths as a consequence of a low percentage of
under-enumdration.
The adjustment factors for all ages combined are identical for
urban Area I and rural Area III requiring up to 10 per cent adjustment,
whereas rural Area II required only up to 1 per cent adjustment. Thus, the
analysis of the adjustment factors strongly suggest that while using the?
Chandra-Deming technique, the adjusted ideaths in various age group, based
on a single adjustment factor derived from the adjustment by the "total"
would under estimate deaths at the younger ages and over estimate at the .
older ages. However, if the per cent of over all adjustment is very small
( that is, rural Area II ), the adjustment by the " total " may or may not
produce the above effect.
3.5.Adjusted Life Tables.
Construction of the adjusted Life Tables was carried -'out as
follows :
First
Second
: Computer computation of the adjusted deaths in broad age-
groups was carried out by multiplying the " observed " deaths
by the " adjustment factors " in the same age-group. These
adjusted deaths would be equal to the number of deaths for
the four categories of the Chandra-Deming Method as as shown in Tables 3.2A to 3.2C.
: The adjusted deaths in five-year age group were calculated by
splitting the above deaths ( that is, those in broad age
groups ) into five-year age groups by using the proportions
of the " observed " deaths within each broad age group of the* ^ « . x s • ~ 1 v __
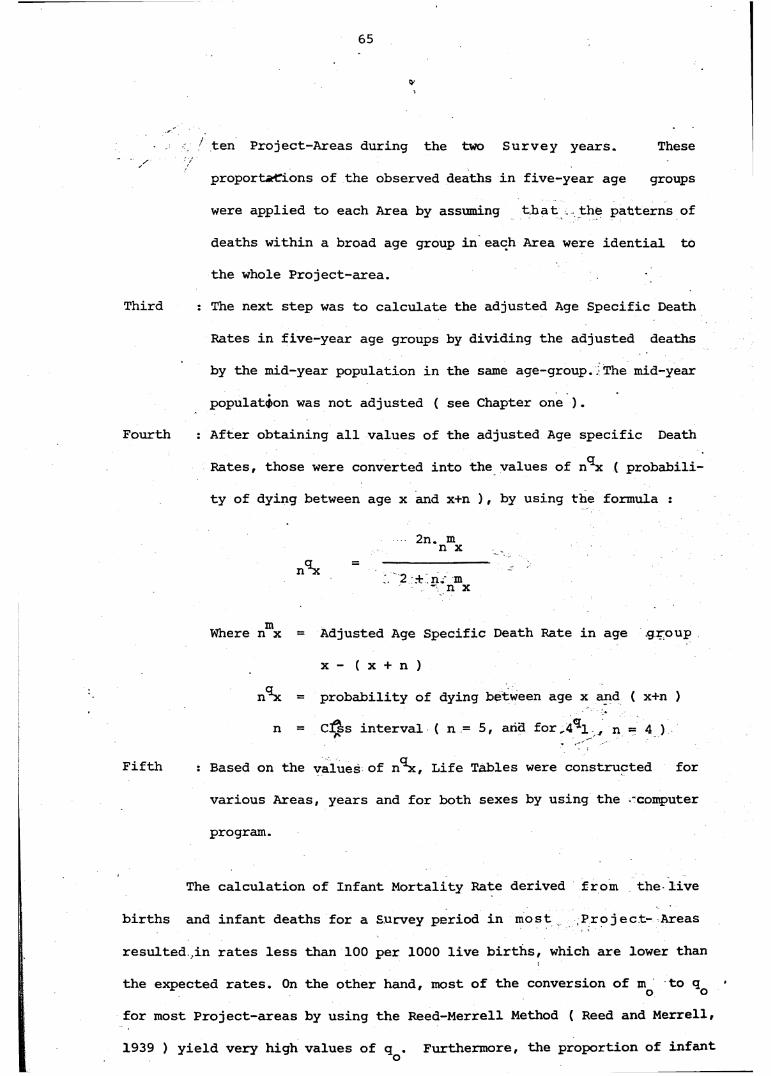
65
*
/
ten Project-Areas during the two Survey years. These
proport*rtTions of the observed deaths in five-year age groups
were applied to each Area by assuming t.hat . the patterns of
deaths within a broad age group in each Area were idential to
the whole Project-area.
Third : The next step was to calculate the adjusted Age Specific Death
Rates in five-year age groups by dividing the adjusted deaths
by the mid-year population in the same age-group..The mid-year
population was not adjusted ( see Chapter one ).
Fourth : After obtaining all values of the adjusted Age specific DeathqRates, those were converted into the values of n x ( probabili
ty of dying between age x and x+n ), by using the formula :
2n. m n xnSc 2 .+ n. m - n x
Fifth
Where n x = Adjusted Age Specific Death Rate in age .giroup
x - ( x + n )
n^x = probability of dying between age x and ( x+n )
n = cfss interval ( n = 5, and for„4^1 , n = 4 )
: Based on the values of nSc, Life Tables were constructed for
various Areas, years and for both sexes by using the -'computer
program.
The calculation of Infant Mortality Rate derived from the live
births and infant deaths for a Survey period in most Project- Areas
resulted in rates less than 100 per 1000 live births, which are lower than
the expected rates. On the other hand, most of the conversion of m to qo ofor most Project-areas by using the Reed-Merrell Method ( Reed and Merrell,
1939 ) yield very high values of q . Furthermore, the proportion of infant
66
v
deaths in a calendar year to births in previous Survey year (f) in the
Project-areas fluctuated between 0.13 and 0.27, which is rather lower than
the expected in developing countries, .as a consequence of* under
enumeration of infant deaths. By considering these problems as mentioned
above, it was decided to use a value (f) of 0.30 instead. This value has
been auggested by Coale and Deming ( 1966 : 20 ) for countries where the
level of the Infant Mortality Rate is over 100 per 1000 live births.
The calculation of Infant Mortality Rate (q ) was done as factors:o
1 + (1-f) m
where : = probability of dying between age 0 and 1.
m ' = adjusted Age-Specific Death Rate at age o of = the proportion of infant deaths in a ca
lendar year to births in the previous *Survey years.
The L is calculated by multipying the value of 1__ (sur- co 80 80♦
vivoyfrs at exact age 80 ) with the logarithm value of lg^ In a simple
formula t*Lgo is derived as follows : (United Nations, 1956 ; p: 23 )
L =-•w 80 1 1_- log 180 y 80
3.5.1. Probability of dying, nSc
Tables 3.5A to a.5C show the unadjusted and adjusted values of
probability of dying, nSc, based both on " age " and the" total "
adjustment factors. The unadjusted and adjusted values of nSc for both
adjustment seems to vary considerably amongst Survey years,Areas and age groups for both sexes. In all Areas, for both year and for both sexes,the
adjusted values of n^x by the " age " and the " total " in almost all
age groups are greater than those of the unadjusted values. This i-a
67
. \
because most of the adjustment factors for both adjustment are greater-
than unity, as a result of the under enumeration of deaths in almost all age groups.
Looking at the value of the nqx in Tables 3.5A to 3.5C, .it can
be said that the adjusted values of nqx by the " age " at the younger
ages less than 20 years are greater than those based on the adjustment by
the " total Conversely, at ages 50 onwards, the n^x value adjusted
for the " age " are smaller than those adjusted for the " total ". At
adult ages between 20 and 49, the n^x values for both adjustment are
more or less equal. The above situations, are mainly due to underL<-estimation of deaths at the younger ages and over Estimation of deaths at the
older ages for the adjustment by the " total " as mentioned earlier in
the analysis of the adjustment factors in point 3.4.
Considering Infant and Childhood Mortality together with mortality
rates at other ages as shown in Tables 3.5A to 3.5C, it is obvious that
the highest mortality level in all age groups, for all Areas, for both years
and both sexes is obtained in rural Area III. The lowest mortality is for*
rural Area II, while the mortality for urban Area I at the youngerygcages
less than 20 years and at the older ages from 55 and over lies_i between
rural Areas II and III, tending to be closer to rural Area II., -• The
exception is in the adult ages between 20 and 54, where mortality is lower
in urban Area I than in rural Area II. This is possibly due to good access
to modern facilities in urban areas, especially in most parts of . Java
with the result that many of the infective ■ and the ’parasitic. * and
respiratory diseases can be effectively controlled for persons in those
adult age groups ( Indonesia Panel, Committee on Population and Demography, 1979, p: 29 ). However, this particular benefit does not have a significant
effect on the reduction of Infant and Childhood Mortality. The selected
urban Areas ( Jakarta, Cirebon Barat and Mataram ) are adjacent to rural
68
areas, and their living conditions and life styles which affect the
mortality at the very young ages are similar in characteristics to those-
of the rural population, particularly, their attitudes towards health
conditions.
Looking at the mortality differentials for both years, Tables 3.5A
to 3.5C show that the mortality levels of the second year are slightly
higher than those of the third year. In most cases, the mortality levels
of males exceed those for females in both the years.
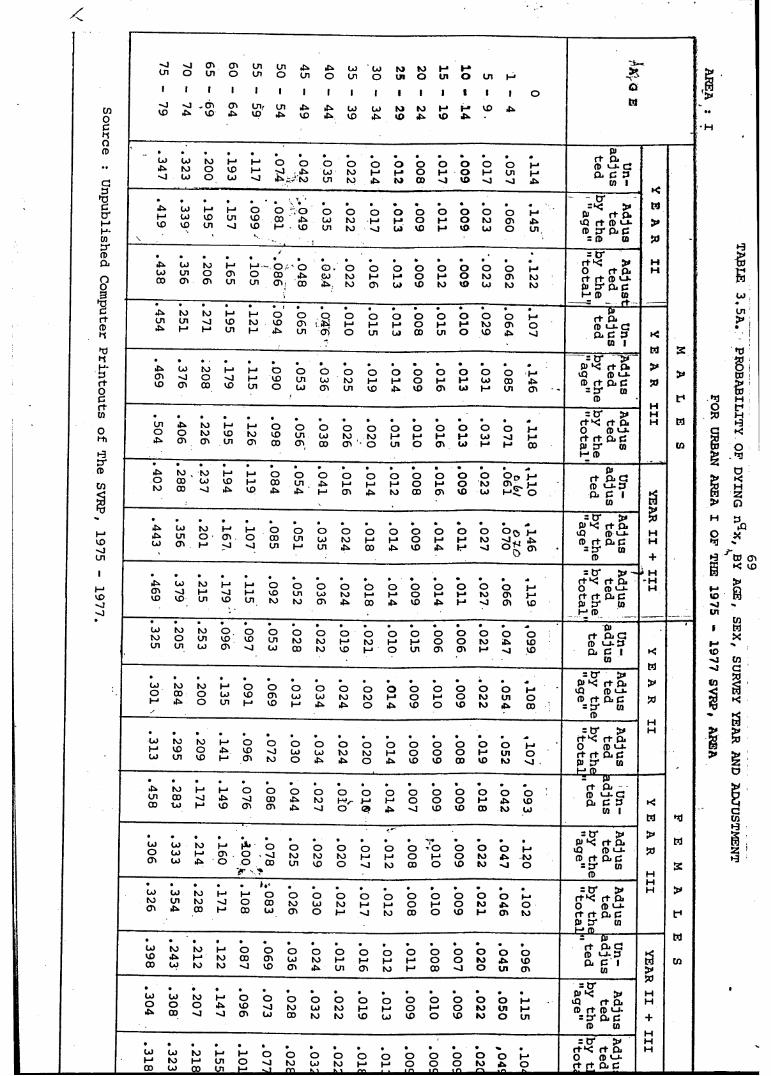
Source : Unpublished Computer Printouts of The SVRP, 1975 - 1977.
in O
o oM O
o . oH* O
f t p .r t r t n> <-»-
CTi ' ifel M a d 3
ju rt O*CD «-»-
(D f t Öj C
r t aaCD c j - 3P i C I
ftao o o j—* CD u -(P r t a d
CD <-»-r t r t a d
P i C I
p> f t P io oCD r t P i C
CD <-«-r t r t P i Cpj &
CD <-i-
CD <-»•f t r t P i C
= cr >CD «-J-
oJOa§I
Ho
sHVOinIMVO'Ji§>
TABLE 3.5A. PROBABILITY OF DYING nqx, BY AGE, SEX, SURVEY YEAR AND ADJUSTMENT
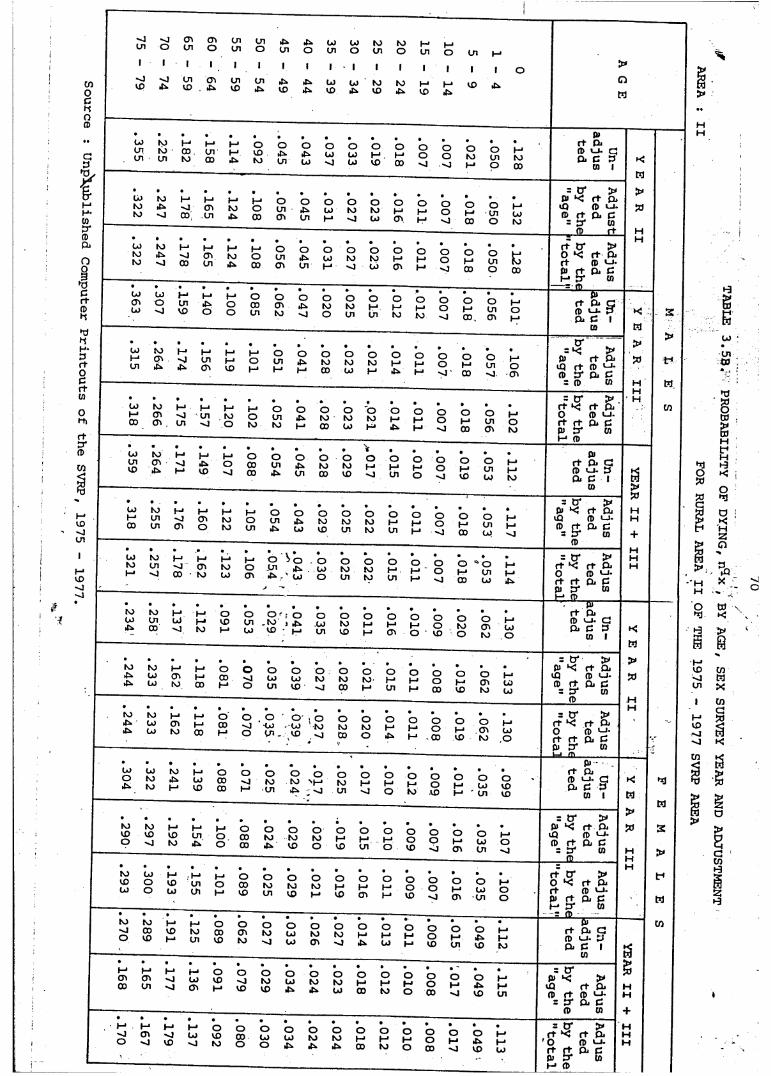
So
ur
ce
:
Un
plp
blis
he
d
Co
mp
ute
r
Pr
in
to
ut
s
of
th
e
SV
RP
, 1
97
5
-
19
77
.
Ul
CO
-0o
4»
cnu i
UlCD
cno
Ol4»
UlUl
UlCD
Ulo
Ul4»
4»Ul
4»CD
4»O
4^
U)Ul
LJCD
LJO
LJ4»
k jUl
KJCD
KJO
KJ4^
t—1 Ul
t—1 CD
f—4 O
(—1 4»
Ul t—>
I I
CD 4»
LJUlUl
KJKJUl
I—100KJ
f - 4Ul00
h->4»
oCDKJ
o4»Ul
o4»LJ
O O LJ LJ
LJ
O (—1 CD
O t—100
o o o o•vj - J
o oKJ Ui M O
I—1 KJ 00
LJ KJ KJ 4» KJ « J
1—1 -0 00
McnUl
I—1 KJ 4»
H*O00
oUlcn
o o o o4» LJ KJ KJu i (-> ' J LJ
OI - 4cn
o oM O M ^0
o1—*00
oUlo
I—1LJKJ
LJ KJ KJ 4» KJ
f—* 00
McnUl
t—1 KJ 4*
(—4 O 00
oUlcn
o o o o4» LJ KJ KJUl M 'U LJ
0 t—101
o o l - 4 O •—1 <1
o(->00
oUlo
LJ LJ j- jcn o uiLJ CD
I—1 4^ O
(—1 OO 00 O Ul
ocnKJ
O O 4» KJ - J O
oKJUl
oMUl
oMKJ
OI-4KJ
oo oM00
o (—'Ul o cn h-■
LJMUl
KJ I—>cn4*. 4»
f—4 Ul Ol
I—1 (—1 CD
M O O Ul I—1 h-1
o o4» KJ M 00
O O KJ KJ LJ I—*
OH 44»
O O M O I—1 'J
OM00
OUI
I—*ocn
LJM00
KJcncnM' jUl
MUl- j
i—• KJ O
I—1oKJ
OUlKJ
O4»M
OKJ00
oKJLJ
O KJ f—4
O I—1 4»
O I—* t—1
Oov j
oM00
OUlcn
MoKJ
LJ KJ I—*Ul d —1CD 4» H 1
I—1 4» CD
I—1 O
o0000
oUl4»
O4».Ul
OKJ00
oKJCD
'*OM
O I—1 Ul
ot—1o
oo'•J
oI - 1CD
OUlLJ
h-41-*KJ
LJh-400
KJUlUl
I—1
cnf—1cno
i—1 KJ KJ
h->OUl
oUl4*
o4»LJ
OKJCD
OKJUl
OKJKJ
O I—1 Ul
oI—1 M
OO- J
O I—100
o I—1U l 1-1 LJ
LJ KJ KJ Ul
00cnKJ
MKJLJ
MOcn
o V o o.Ul i t LJ4> . ' U> O
OKJUl
OKJKJ
OH 1 Ul
O O M O
O
00
OUlLJ
I-*M4»
KJ KJ MLJ UI LJ4c 00 s]
MH*KJ
OCDM
O O ' ; O OUl .K J j ^ o jLJ CD i—i cn
O O KJ l—i CO |->
oMcn
oi—■o
ooCD
OKJO
ocnKJ
LJo
KJ KJ 4* LJ 4c. LJ
I—1cnKJ
I—1 M00
O00I—4
oo
oLJUl
o oLJ KJ CD
O O KJ KJ 00 1—1
OMUl
O O M O H* 00
OMCD
OcnKJ
t—1 LJ LJ
KJ4c.4c.
KJLJLJ
McnKJ
I—1 I—100
o00
O
oo o oLJ LJ KJUl - CD
OKJ00
oKJO
O I—1 4c
O O t—1 oM 00
O I—1 CD
OcnKJ
I—1 LJo
>CD
M
0>r t DiO u. G D. P D
CD
= e r >P) K f t Ol
cQ (D u . in rt ft C
= tr CD
r t CTor t0> r t M e r
> r t Di (0 Di C
co
Di C CD
£ 9
er= ^ >
pi r t Di cQ r t (I) u (I) O ' D i C
= 0) W
= err t c< 0r t r toj e rt—1 (D
> r t DifO LJ.Di C
CO
0)r t Oj a fD LJ. 3 Di C I
CD
= eroj ^
cQD r t= er
CD
> r t a CD c_i.Di c
CO
= err t l<or t r toj erM CD
> r t Di CD LJ- Di C
Co
0)r t Di CD L j. G D i C 3
CO I
er oj
cQCD r ter
CD
> r t Di CD L j.Di C
co
LJ LJ O KJ 4^. KJ
KJ l—i 41» LJ J—1 CD
O O O00 v j (OCO H U l
oKJ4»
O O 'M KJ
' J Ui
O t—1 •U
o (—1 o
oMKJ
O O O M CD I—i
OLJUl
OCOCD
KJ KJ CD CD O
f—1 CD KJ
I—1 Ul 4»
M O OO 00 KJO 00 4»
OKJCD
O O KJ M O CD
OMUl
o(-*o
o o o oCD
O I—*cn
O M LJ o U l - J
KJ LJ CD O LJ O
MCDLJ
J—1 I—• Oui o ooUl 1-1 CD
OKJUl
OKJCD
OKJM
O
CD
O I—1cn
ot—■ t—*
o o o oCO
O I—1cn
oLJUl
t—1oo
KJ KJ •O 00 O CD
M t—*CD KJ I—1 Ul
o00CD
O Ocn coKJ
OLJLJ
0 O KJ KJ01 -O
OM4^
OMLJ
O O M O t—1 CD
OMUl
O4»CD
I—1 M KJ
Mcn00
McnUl
t—1 i—• oLJ CD
'J cn MoCD
oKJCD
OLJ4»
OKJ4»
OKJLJ
OM00
OMKJ
O H1 O
O O O 1—•00
o4»CD
t—1 M Ul
H 4•^JO
t—*cn- j
M
CD
(-•LJ«u
oCDKJ
O00o
oLJO
OLJ4»
OKJ4»
OKJ4»
O I—* 00
oH4KJ
O l—1oo o oo 1-1 4»00 'O CD
►—4 MLJ
er >r t r t Qi 0 0) LJ-r t r t & ßoj er w
pjr t Dla> L j . a Oi ß e cn i
= er o> K
cQa> r t= er
>
r t Dift> LJ. Di Ccn
r t CT 0 r t0) r ti- er
= fD
> r t Du fD LJ.Di Ccn
r t fD L J . Di C
cn
OjD i G
= erpj
cQfD r t= er
fD
> r t DlfD LJ.Di C cn
= err t ^ Or t r toj erI- 4 fD
rt afD LJ.Dl ccn
I-
S
>
G
M
^3
td
S
>
G
n
TA
BL
E
3.5
b.
PR
OB
AB
ILIT
Y
OF
DY
ING
, n
^x
BY
A
GE
, SE
X
SUR
VE
Y
YE
AR
A
ND
A
DJU
STM
EN
T
FOR
R
UR
AL
A
RE
A
II O
F T
HE
1
97
5
- 1
97
7
SVR
P
AR
EA
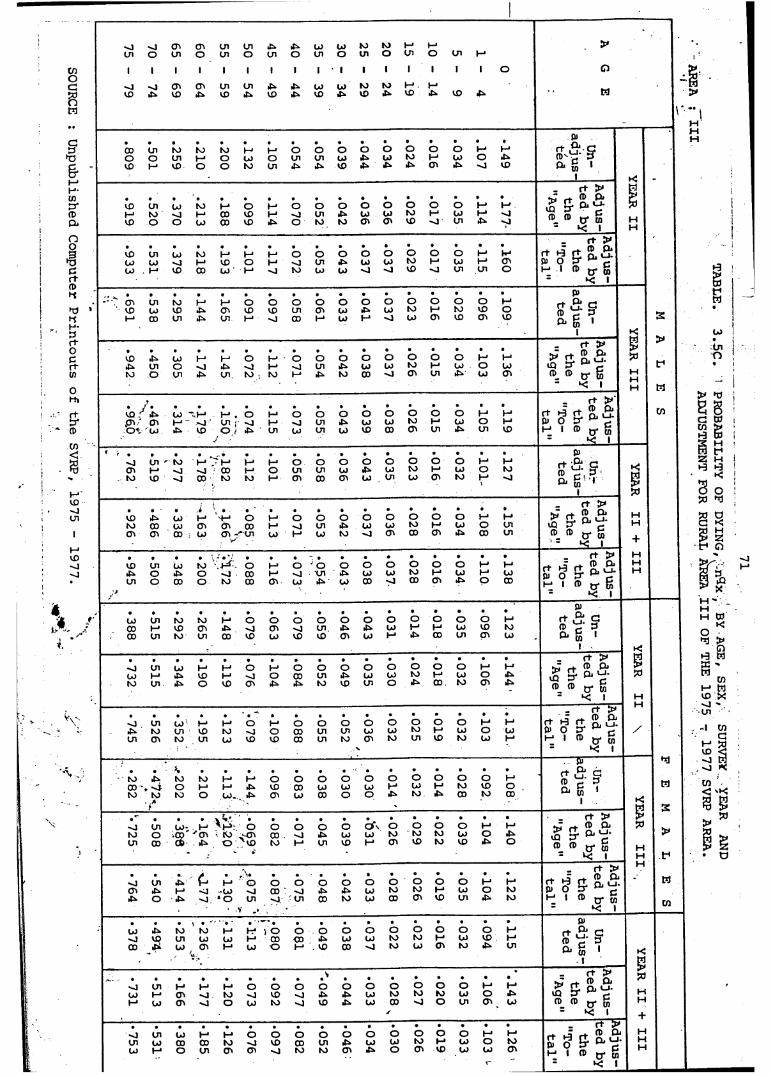
SOURCE : Unpublished Computer Printouts of the SVRP, 1975 - 1977.
4i •'
v - VY
A
•o cn cn on on 4 4 oo CO to to 1—* I-* >On1
o on 01
on 01
on O1
on1
01
on1
01
on1
01
on t—1 1 o O
>o cn cn on on 4 4 00 oo to to h-1 t->4 vo 4 VD 4 VD 4 VD 4. VD 4* VD 4» VD 4» td\ ‘
00 on to to to 4 1—* O O O O o o o O t—1 t—1»1
f+ Ä Go o on t—1 O 00 o on on 00 4> oo to t—1 00 O 4 ; c ^vd t—1 vo o O to on 4 4 VD 4» 4» 4> cn 4- -o VD o* m 11 t< _
rt > EVD on 00 to 4 O 4 O O O b o o o o t—1 H rt (D P-
S J 01t—1 to 'O M 00 VD 4 -o On 4 oo 00 to (—1 00 I—1 'OVD O o OO 00 VD 4 O to to cn cn VD on lu_ O' inK 1 HHrt >
VD on 00 to t—1 4 4 O o O o o o o O H1 W rt % rt ® £OJ 00 -o H VD O 4 -o on 4 00 00 to I-1 00 t—1 cn P) 0 ^00 t—1 VO 00 00 1—1 •o to oo 00 'J VD 'O on on o H 1 ^ tr m= K Ip>* *> <n Ui to M t—1 o o o O O o o o o O o M rt P1 r;vd 00 vo 4 cn VD VD on <n 00 4* 00 to t—1 to VD o CD ‘d-h-> 00 on 4 on I-1 ■O CD i—* 00 M -o oo cn VD cn VD Dj K 1 21r+ >
VO 4 00 M t—1 O 4 O o o o o o o O i—1 M (t) CL(T Qi U . 5X34 on O 'O 4 «O 4 -J on 4 oo 00 to i-1 00 o 00 »Q sf t-1to O on 4 on to to 4 4 to CD -o cn on 4» 00 cn ®. ® cr w M
*< i H M, rt >
vo r'4 00 * 1—1 t—1 b I—1 O O O O o o O O M M ^ o It Prt ^ Cl Qj oo. cn.cn cn t—> -O vn •o I-1 ■O on 4 00 oo to 1—1 00 O t—* 0) 0 V ^ ro\ 00 4 VD O 4 on 00 on OO VD CD cn On 4 on VD hi 1 ^ tr w0 i
p>'O on - to 1—1 4 H 4 o O O O o o O O h-icn t—1 'vl •o 00 4 o on on 00 4- oo to t—1 O0 O to [J LJ. b 4to VO -o 00 to to i—1 cn 00 cn 00 on 00 cn to l-J -O Di S '* S5Ö
r+ >vo 4 00 H* t—1 O 4 o o o O o o o O M M " n, LJ- Mto 00 00 cn cn 00 4 on 4> OO oo to M OO O on iQ ? ^ r HOv cn 00 00 cn --“on 00 i—* 00 to cn CD cn 4> CD on ® cr m +
rt > HVO on 00 to o 4 o • O O o o o o O t-> t—1 r+ ^ r+ 2 m M4 o 4 o ~o 00 4 -o on 4 oo 00 to m 00 t—1 00 £ o S* hion o 00 o to 00 cn 00 4 OO CD -o CD cn O CD “ ° ® o- 6
i* = k; iB)
u> on to to I-1 o o o O O O o o o o o t-> r+ Ä G00 t—1 VO cn 4 '•J cn -o on 4. 4» 00 1—* t—1 oo VD to 5 c 300 on to on 00 VD oo VD vo cn 00 1—* CD on cn 00 ^ m 1Kjr+ 3* Eon 00 t—1 I-1 O 4 O O o O o o O O t—1 1—1 > rt X ,0*to t—1 4 VD t—1 o 00 on 4 00 oo to t—1 00 o 4- vn ? ^ 5X3
to on 4 O VD cn 4* 4 to VD on o CD to cn ® cr wi Hrt >
-o on oo M t—1 o 4 O O O o o o O O t—* M rt J rt- P> Cbct y “ Q, oj.4 to on VD to O 00 on on oo oo to t—1 00 o OO P) 0 V ^ r- /on cn to on 00 VD VD 00 on to cn to on VD to 00 M H 1 ® tr w' *< iJS *1
to 4 to to I-1 4 O o O O o o o O o o M rt ß* G (D ~! D00 -o O t—1 4 4 VD oo oo 00 00 1—1 oo t—1 to VD O n, S 1 wto roA to o 00. 4 cn oo 00 O o 4> to CD to CD 1 M S
>4rt > >
-o on 00- t—1 O o o o O o \ o o o o I-* M > rt ® & 5x3to O ■00 ""cn to <cnaVD 00 •o 4 00 oo to to to 00 o vfl 5 1 °*On 00 cb 4 o to 4 on VD t—* cn VD to VD O
® o cr 5 H- *< i H f
'O on 4 t—1 o o o O O o o o o O 1—*rt >
rt p rt m piCl y ~ CL OJ. Mcn 4 t—■ -o -00 -o 00 •o 4 4i 00 to to t—1 00 o to pi 0 ? ^ r4 O 4 •o * o on
v .*-o on 00 to OO CD cn VD on 4 to h: 1 ° cr cnt< i cn
pi(jO 4 to to 4 4 *. o o O o o o o o o O 1—* rt c;-o VO on oo 00 t— 1 00 00 4 00 00 to to I-1 00 VD t— 1 CD00 4 00 cn
u4 00 o 1-’ VD CD -0 to 00 cn to on
^ W 1 1
K
- g
'O on M m t— 1 o o oV
b o o o o o o M t— 1rt >
sj rt 05 ^^ Q j LJ-30
U) t— ■ cn •o to -o VD -o 4 4> oo to to to 00 O VQ r* HM 00 cn -o o oo to -o VD 4^ oo CD -o o on cn 00 cr w H
y »< 1 _ +rt ip-on 00 t— * 4 o o o O O o o o o O t— * t— 1 r+ H ft !? i j H
On CO cn 00 to VD 00 on 4» oo oo to H* 00 o to Si o S* ^ n00 t— 1 o on cn cn -o to to cn 4> o cn VD oo 00 cn t- 1 cr cn\- V< 1
onO
st—1
72
3*5*2* Expectation of life. °e ~ ' x
The effect of the adjustments both by the "age" and the "total- can also be seen on the expectation of life, °e. .
Compared to the unadjusted values, both adjusted values of °ex are
smaller, (Tables 3.5D to 3.5F), for the same reason as the adjusted va
lues of nqx , that is most of the adjustment factors are greater than
one as a consequence of the under enumeration of deaths in almost all
age groups. Without exeption, the reduction in expectation of life at
birth, ex . from the unadjusted values in all areas, for both years
and both sexes adjusted by the " age " is greater than those adjusted by
the - total ". For instance, the reduction of the expectation of life
at birth, ex - for males for urban area I in the third year, because
of the adjustment by the " age ", is about 7 per cent, that is about
3.5 years compared to the unadjusted V The reduction by the
" tDtal " iS aPPro*“ ately half of the adjustment by the " age " (Table 3.5. D) .
On the contrary-, in general, the reduction in expectation of life,°ex ,
at ages 1 onwards adjusted by the " total - is greater than that by the
" age ", except for rural Area II for the second year for both sexes,
where both adjustments produce equal effect on the reduction in the expectation of life at ages 1 and above.
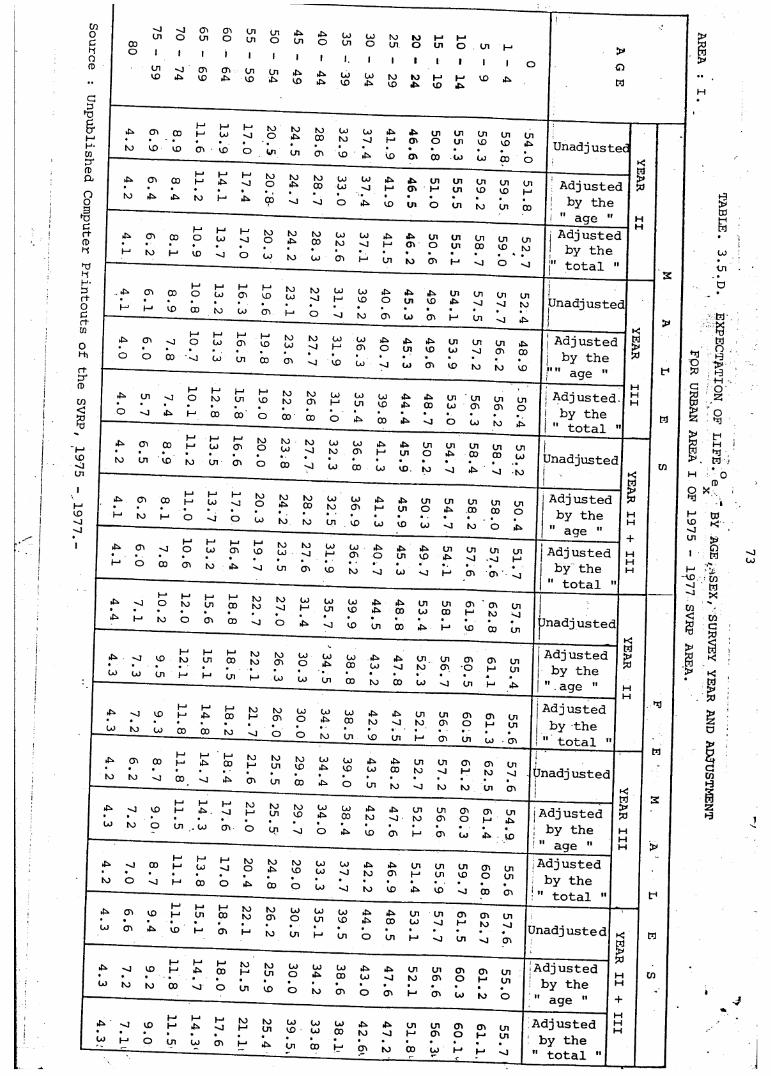
Computer Printouts of the SV
RP, 1975
SURV
EY
YEA
R AND A
DJU
STMEN
T
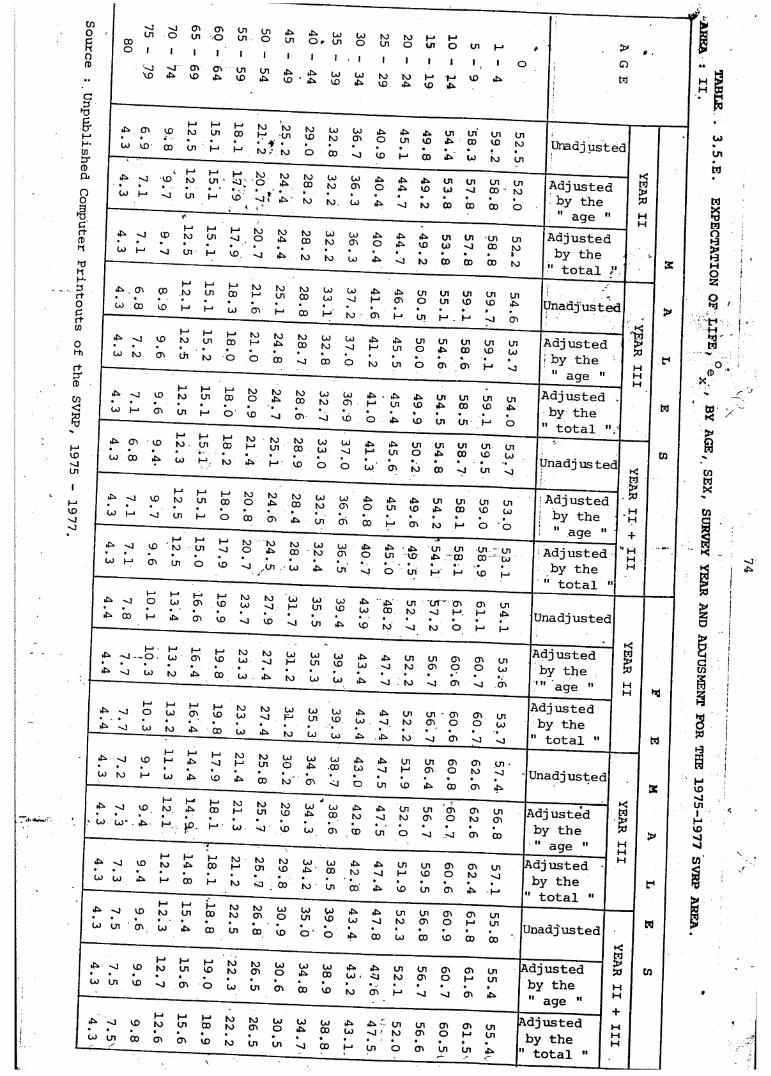
I I
•£. CTi 00 (->Urad j u s t e d
A d ju stedby th e
UJ |-> by th et o t a l
U n ad justedM Ui
A d ju stedby th e
A d ju stedby th e
t o t a l•fc. cr*
A d ju stedto (—1 by th e
A d ju stedu> Mby th e
t o t a lt-n err -
U n ad justed
Adj u s te dby th e
A d ju stedby th e
t o t a l
U n ad ju sted
A d ju stedp . I— OJ by th e
d ju s te du> by th eoo ^
t o t a l
U n ad justed
A d ju stedby th e
A d ju stedby th eu> <_n
t o t a l
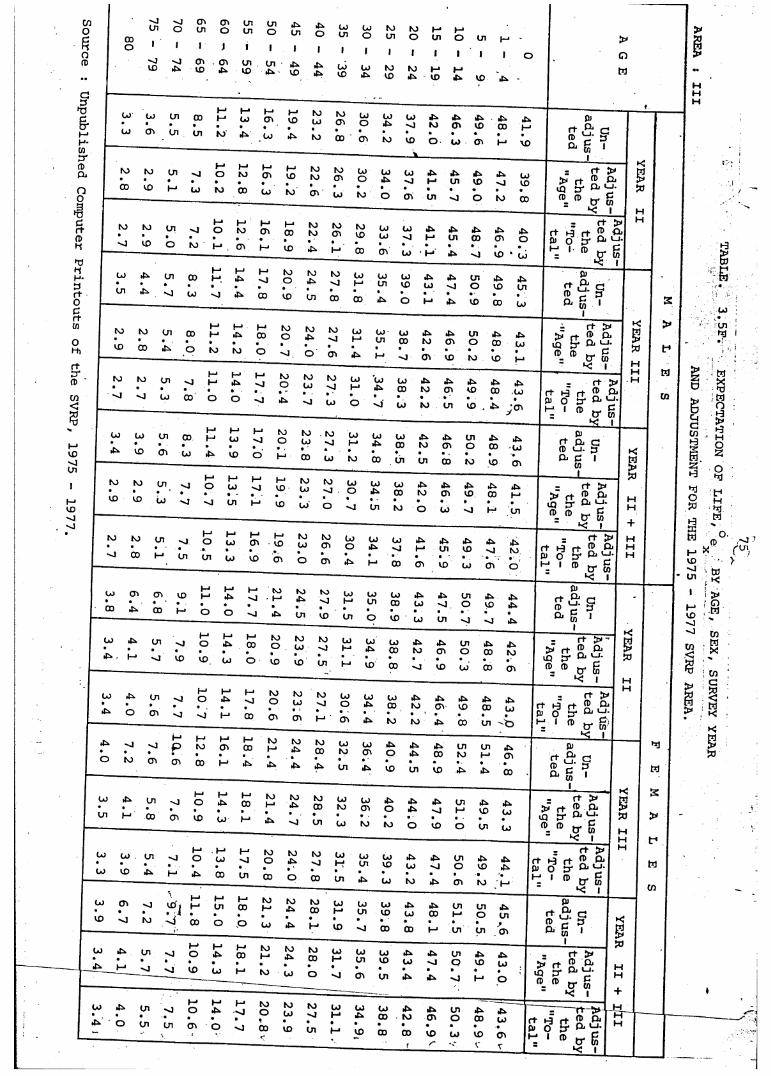
Source : Unpublished Computer Printouts of the SVRP, 1975 _ 1977
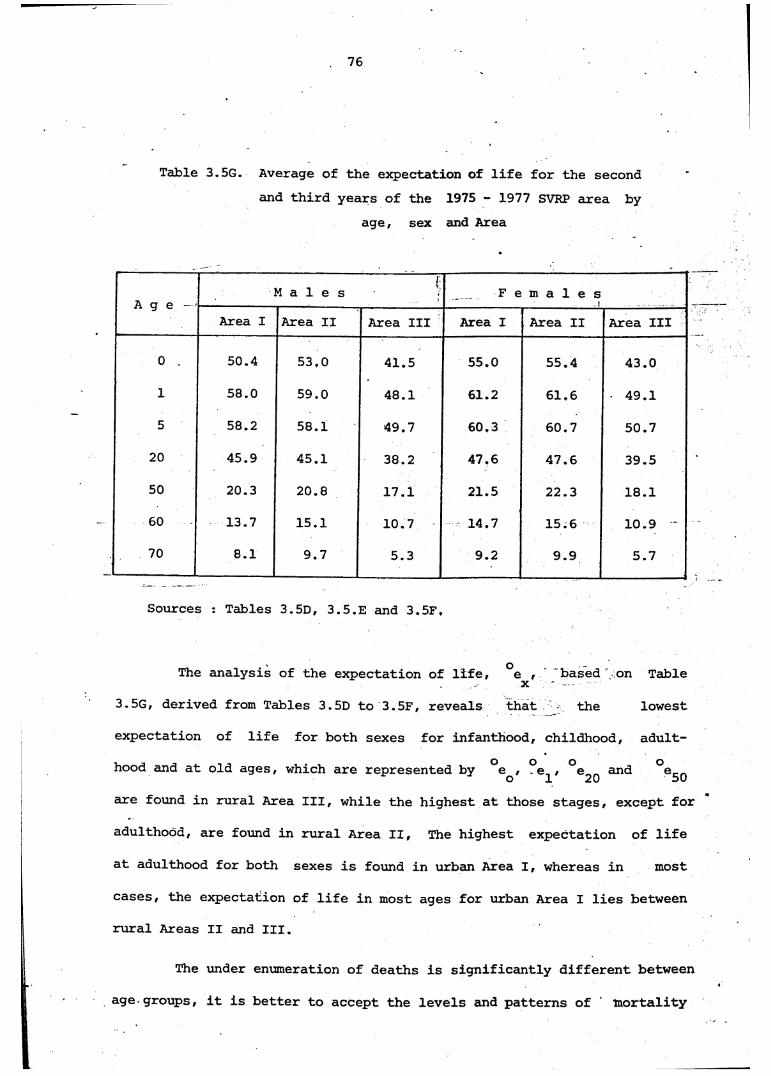
76
Table 3.5G. Average of the expectation of life for the second and third years of the 1975 - 1977 SVRP area by
age, sex and Area
A g e - a 1 e s1V» F e m a l e s
t
Area I Area II Area III Area I Area II Area III
0 . 50.4 53.0 41.5 55.0 55.4 43.01 58.0 59.0 48.1 61.2 61.6 • 49.15 58.2 58.1 49.7 60.3 60.7 50.7
20 45.9 45.1 38.2 47.6 47.6 39.550 20.3 20.8 17.1 21.5 22.3 18.160 13.7 15.1 10.7 14.7 15.6 10.970 8.1 9.7 5.3 9.2 9.9 5.7
Sources : Tables 3.5D, 3.5.E and 3.5F.
The analysis of the expectation of life, °e , based on Tablex3.5G, derived from Tables 3.5D to 3.5F, reveals that the lowest
expectation of life for both sexes for infanthood, childhood, adult
hood and at old ages, which are represented by °e0' °e^/ °e2o °e50
are found in rural Area III, while the highest at those stages, except fo3
adulthood, are found in rural Area II, The highest expectation of life
at adulthood for both sexes is found in urban Area I, whereas in most
cases, the expectation of life in most ages for urban Area I lies between
rural Areas II and III.
The under enumeration of deaths is significantly different between
age-groups, it is better to accept the levels and patterns of mortality
77
produced by the life Tables adjusted by the " age " rather than the
" total
3.6. Discussion.
A comparison of the mortality levels for both sexes of urban Area
I with all the rural areas represented by Area IV ( Tables 3.5H and 3.51 )
shows that, in most age groups, the mortality levels of rural Area IV are
higher than for urban Area I.
The exceptions are infant mortality for males in both -..years and for
females in the third year, and in most of the older ages above 60 for both
sexes.
In order to examine the levels and patterns of mortality within
the 197-5-1977 SVRP area for both sexes, the best way of avoiding the
fluctuative differences of mortality levels in some age groups between two
years, is to draw and compare the graphs of the probability of dying, n^x*
adjusting by the " age " for the combination of the second and thirdqyears, with age on the abscissa and the value of n x on the ordinate.
For both sexes (_ Figures. 3. and 4 .), the mortality.-declines-sharply
from the youngest age 0 to the minimum age around 10-14. Between ages 15
and 49, the rates begin to increase gradually, and after age 50 there is a
continuous increase in the rates.
Looking at Tables 3.5H and 3.51 and Figures 3 and 4,it can he said
that the mortality pattern for each sex in each Area for both year is
similar. By comparing the mortality patterns between males and females in
each Area, the results are slightly different. Even though there are still
some fluctuations in the mortality levels in some age groups, particularly
for urban Area I and rural Area III, it seems that the mortality pattern
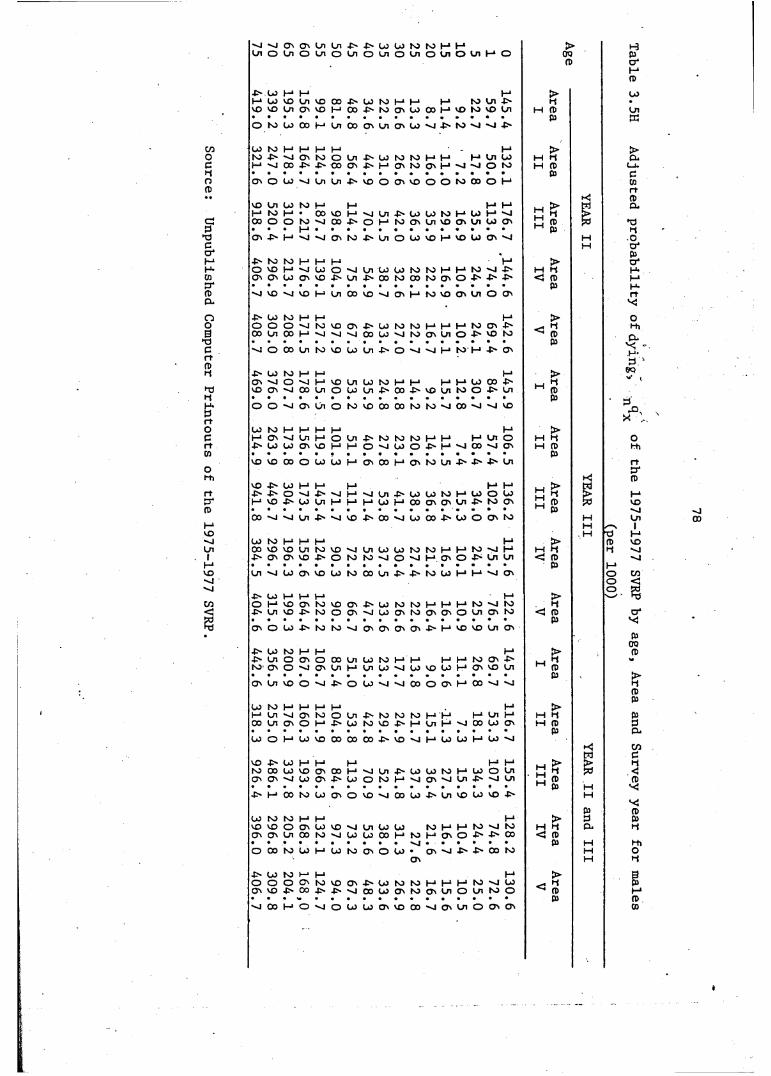
^ 4 ON ON Ln Ln 4^ 4 N L0 L0 hO ho t—1 t—1 >Ln O Ln O Ln O Ln O Ln O Ln o Ln O Ln
0l
00ft)
4>-l_i
U>Uo
I - 1vo
h-1l n m rs. K 1
H* V/l fv
>HVO VO Ln ON VO
OJi-*
4 -CO
V/J4N
rvro
I—1O '
h~1 LJ 00
)—1 H* VO hO vO Ln l- l
r »(DOx
O ro LO 00 M Ln 00 ON Ln ON LJ ^ 4 4 J> ho 'O 'OP/
ono
LJho
ho.p». M M M H*
f—N 1 r-i i . » k X K «V 1 1 -L_l
(-• Vji h *'
>
CH
M V 00 -P'[V4>-
LO00
VOiON
4 -^4>>
V/Jh-*
|VJON
IVho
P^O '
I- *I - 1 '-J O ho
1—1 M
■lft)Axn
OP
ON o L0 V Ln Ln 4 N VO o ON VO o O ho 00 O I - 1
VOi__i
Lnho
L 0i_i
hO I - 1PO v c\
1—1 H* M M >
c>3
r—00 o
iO ho
)__i
OJ' - j
VÜ00
I—14 N o
Lnh-*
■PhO
LOO '
LJLn
hoVO
I- *O '
OJLn LJ O ' M
M fDnx►or*
On -p" M V ON ho 4^ Ln o LJ VO h-1 VO LO O ' ^ 4Ucr* .M ho ho I - 1 M 1-* I - 1 >H-m O VO I - 1
l »X^ 4 LO
V O orv Ln LO LJ hO ho 1—1 I-* roJV.
^ 4 4 N -P' -P
MUJCT
U ' U ' w ON• •
4 - Ln 00 ho 00 ho O ' O 4 -•
fDP
iuCL
"—I VO h™4 Ln 00 VO *~J O ' I—1 ho VO O ' Ln O O '
o 4>- LJ hO 1—1 M I - 1 >oÖ
O00
01 n o00
V hO VO ON - > L 0 hO hok N M H*1 n 1-* ro O ' -P*
vD hO < rr»T )r-
V 1
/'—x Or» • •00 LO
•rv/ O ' V-/1 o 4-
rv
1 up
Pr t
V—/ LaJ Ln ro vO L 0 Ln ■P~ o ^ 4 H 4 ho P^ 4 - U»
fDr i -P*- l j hO
/■—x (-* M H 1 >
►tjO 'VO O '
V_/v 00
I—1Ln
VOo
LnL0
L0Ln
hO4>
I—100
M-P- VO
H 4Ln
I—1 ho
LOo 4> Ln M 0)fix
H*p
O O v ON Ln o ho VO 00 00 hO hO 00 V VOp
pr tOr *
LO1—1
hO m I - 11 n MI » I - 1 I n k *N K ■» 1 I H-* Ln O » I >
Hr tm
4N LJ L0v lON
P^VO
oI - 1
L/ii - 1
4-o
rvj•^j
IVLO o
1—*4 S
h“*H 4 -vj
p^00 V O '
P^M
r ifDfixSJJ
QvO VO 00 o L0 L0 M O ' 00 1-* O ' hO Ln 4h~ 4 > 4 >* Ln
P
H i
f 4 VO -P'_p LOf—X M M H* k X ■ i 1 .X M I - 1
f—X 1 J M >HI Is rfix
4-1-* VO
V—/- > L0
-4-Ln M
h-* M
JH*
LnLO
-P^H
L000
L 0O '
IVON
(—■Ln
V/J4 ^
L J V//r o o n M
M•>p
11/1 i
00 V — 1 Ln ^ 4 VO 4 N 00 'O LJ 00 LJ O o n r or—VO
/ .X K 1 1 i 1 « ■ i L__lLn 00
rv
IVVO
P^VO/•“Tx
P^LnV o
hors* VO K *V Lnk LO LJ hO ho M I—1 hO -vl M
I n I nW«--i flX
M4-
1 n
vJ' _|
VJ '•( .x
vL/ 4-•i f~s
0
1 .
ro
K ■»
IV
P»
O "^4 I-1 ON 0•1 i
4- V/ 1 V 1 IÜP
-vlW 1 O ' LO |NJ UO Ln -P' -P ho LO P^
-F-/—X
LO1 i »-* H 4 H-* v O i i 1 » KX
i - 1^ 4 jsj >*-/
<I-tHV—/t >
l—*Ln VO
CTn- > hO
VL/o
ONON
4-^*^J
LOLO
hoO '
hoho O '
P^ON
P^o
rv/Ln O ' ho <
•»pfix
ON O LO hO ho 'O ON O ' O ' 4 > M VO VO Ln o nP
4>-rv»
00 1 n
hO M M h-1 >hV4 -—ho
v/1O '
uo
O n
->JOON
00Ln
LnI - 1
LOLn
hoL 0
H-* (—*LJ VO
H 4LO
(—1 I -* ON VO Ln M n
fDfixO ' Ln VO o 4 ^ O LO ''J 00 O ON H-1 00 V V
p
LJL—1
ho0/1
m h-*r r \
h-1K 1 H*1 n k *1 K i i i » L_1
I - 1 Ln |—1 i—i >
00 Ln ONO 'o
1VI - 1
V—)-P'
v_nLO hO
rs/VO
rv/I-*
r—1 Ln H —1 00 LO ON M (Dfix
00 O ( - * L0 VO 00 00 00 4^ VO ^ 4 I - 1 LO LJ M LJ Vp
VOho o o
LO ( - * I - 1r v i
H *i i [V k X 1 -»M 1—1f—^ M >
O ' ON ^ 4 LOONON 4 N
iL0 o
LnhO
4-^t - 1
v/J^ 4
LJON
rv / P ^Ln
v /- > v Ln • M
M CDfix-P* M 00 hO LO ON O VO 00 LJ -P - Ln VO LO vo 4>-
p
LJ hOVO
hO(—s
t—1 H *V P» I . X K ^ r o
M ^ 4 hO
>H
o nv uON
v_*Ln
ON00
U JhO
VL/' - j L0
LnLO 00
LOI - 1 hO
r s jH *
h~*ON O 4 ^ 4> 00
P<
n(Dfix
o 00 ho LO M L 0 hO Ov o LJ■^4
ON — 1 4^ 4> 0O hOp
O '
-CNt—i
LJr—■v
hoo
(—1 O n
I—1V P*» k *N i i i » r o
H *LJ
>V_4ON
v—-VO
v—*4 > 0 0 4 ^
VL/4 ^
ON 4-^*00
V/VL 0
rvjO '
r v /hO
1—1 ON
1—1 Ln O Ln ho o < ft)
" 4 00 I- 1 O O L 0 LO O ' VO 00 ^ 4 ON Ln o ON ONP
Table 3.5H Adjusted probability of dying-,
nQx of the 1975-1977 SVRP by age, Area and Survey year for males
_____________________________________________;_______________(per 1000)_______________________________________
YEAR II YEAR III
YEAR II and III
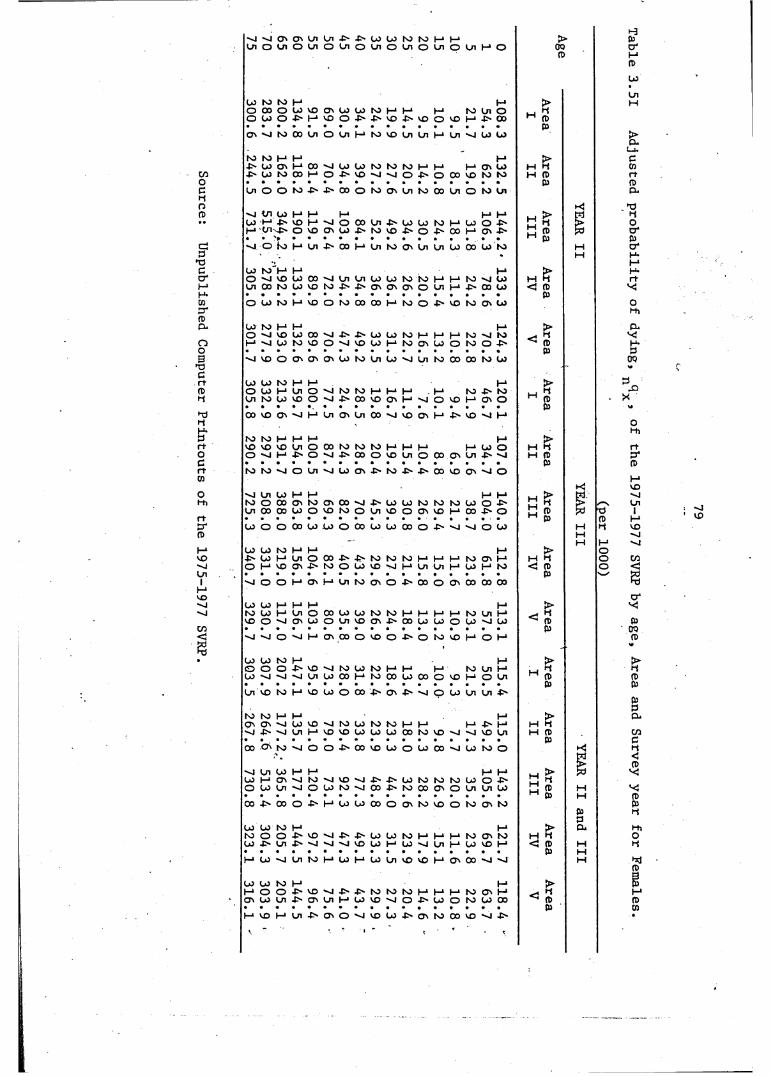
n j n i o ' O ' Ln i n O U> O Ln
Ln -f> LJ U ) M NJ I—1 O C n o C n O C n O C n
H*O Ln H O
>00n>
co to to H* H* >o 00 o CO vO O ' co CO to I -1 I - 1 H* to Cn O rfo CO o -E> I-* vo o -IN JN VO -IN vo O VO h-1 JN 00 HH fD• • • • . • • . . • . . • . . . « fDO ' ^0 to 00 Cn o Cn M to vo Cn Cn H* Cn n J CO CO
tO to I-1 H-1 I-* P>JN co Ov t - 1 00 CO Co to to to M t—* I - 1 cr> co M HCO JN CO to 00 h-1 o JN VO Nj n J O JN O 00 VO to to M fDo . • • • • • . . . • . . . • • • • fDcl-t
Cn o o to JN 00 o to O ' Cn to 00 Cn o to Cn
ofD ^1 cn co 1—* I- 1 M M H* >. . CO )-* JN VO 'O O 00 Cn -IN CO CO to 1—1 CO O -IN H l-f
cn JN O vo ON CO -IN to vo JN o JN 00 1—* O ' -IN HH fD. . • • • • • • • . » • • . « • • fD
a '-J o to (—1 Cn JN 00 t—* Cn to O ' Cn Cn CO 00 CO top .
T3P CO t o ' H* I-1 M >a 4 o " J vo CO 00 '-J Cn Cn C O co to to I - 1 h-* to Nj co Mi - 1 Cn 00 to C O VO to JN -IN On On On O Cn M JN oo CO < fDH- • • • • • • • . • • • • . * • . • fDcn O CO to M VO o to 00 00 I—1 to o -IN vo to On COp 4fDCc CO to M M f—* >o 'O vo CO 00 'O - O ' JN co CO to M M to ' O ton 1— 1 ' - j CO to VO o VO CO 1— 1 to On CO O to O 4N fDo . • . • • . . . . . . • . • • . • fD
3 ' v j VO O On on On CO to Cn CO N j Cn to 00 00 to co*0cr tfD»-!
Tlrf
LO U) W H H I-*O W H L n O ^ J K J N J H H H (-* t o JN to L n N W ' O O N l J S C ß ' O O ' H M O ' O H O ' O• • • • • • • • • • • • • • • • aO O L O O ' v l H U i O M j i O O s i ' O O ' H J S L O v l H
>HfD03
►<w>pö
MM
H-Pr tOCr tcn0 i - h
r tP 4ft)
vo' ■ jCn1
f->vo
CO<[S
to to I-* I - 1 I-* I-* >VO vo VO Cn O 00 to to to I -1 h-> co o M nO M -IN O 'O JN 00 o vo Cn o 00 ON Cn JN '-J M fD. • • • • • • . . • . • . • . . • fDto to —1 O Cn 'O Co O ' JN to JN JN 00 vo O ' o
•-<NJ Cn co I-1 M h-1 I -1 L 1 >to O 00 ON to ON 00 ' 'J JN co CO to to to CO o JN 1 1 n >Cn 00 00 co O VO to o Cn VO o ON VO h-1 00 JN o r-i fD & T3• . • • • • • • . • • • • . . • • fD fDCO o o 00 co CO O 00 C0 CO 00 o JN o CO H M
M“ M f—1
CO co to M M > O-IN CO (-* Cn O 00 4N JN to to to I -1 I - 1 M to ON (—1 M •1 Oo H-* vo ON -IN to O CO VO H-* Cn Cn CO I-1 to < fD o• • • • • • • • • . • • . • • . . fD ■wNJ o o I -1 ON (-> Cn to O ' o JN 00 o ON 00 00 00
CO CO I-1 H-* M H >to co H* Cn O 00 CO CO to to 1—1 M 1—1 I- 1 to Cn h-* rfvo o —J ON CO o Cn VO ON JN 00 CO co o co '■J co fD. . • . • • • . • • • • • • • . • fD'O 'O O '-J f—1 O ' 00 o VO o JN o to VO h-* O l-*
CO CO to M I-1 >o o o JN VO '■J to co to I—1 M I-1 to Cn I—1 1 I r<CO NJ NJ Cn CO oo M to 00 co 00 o VO I-1 O Cn (D• . • • • • • . • • • • • . • • • fDCn VO to t—1 vo CO o 00 JN O ' JN •'O o CO Cn Cn JN
to to H* I-1 M >O ' on —1 co vo 'O to co to to M h—1 1-* JN I-1 H'-J -IN nj Cn H * VO vo co CO CO 00 to vo '-J 'O VO Cn H fD• » • . • • • • « . • • • • • • • fD00 .ON to '-J O o 4N 00 vo CO o CO 00 "O co to O ><
Nj Cn CO I-1 M M I-1 L__J >CO H* ON '-J to '-J VO 'O JN JN CO to to to CO O JN r l \ i r{o co Cn 'O o CO to '-J 00 JN to 00 O ' o Cn Cn CO i i fD M• . * • • • • . • • . • . . . » . M fD M00 JN 00 O JN I - 1 CO co 00 o ON to VO o to ON to
fD
CO CO to I-* (-* >Pa .
ro O o JN VO '-J 4N JN co CO to I - 1 M I- 1 to ON to Mco -IN Cn JN —1 -o vo CO I- 1 CO '-J Cn I - 1 CO vo I-* < (D M• • • . • • • • • • • • » • • « • fD MM CO '-J Cn to 1-* co I-1 co Cn vo VO 1—1 ON 00 "O ''J M
CO co to H-* M >(- 1 o o JN VO —1 JN JN to to to I—1 1-* I - 1 to ON I-* •IOv CO Cn -IN O ' Cn co vo o JN co O to co 00 (D• . • • • . • • • . • • • . • . • fDI - 1 vo I - 1 Cn JN ON O 'O vo co JN ON to OO vo JN
Table 3.51 Adjusted probability of dying,
q , of the 1975-1977 SVRP by age, Area and Survey year for Females.
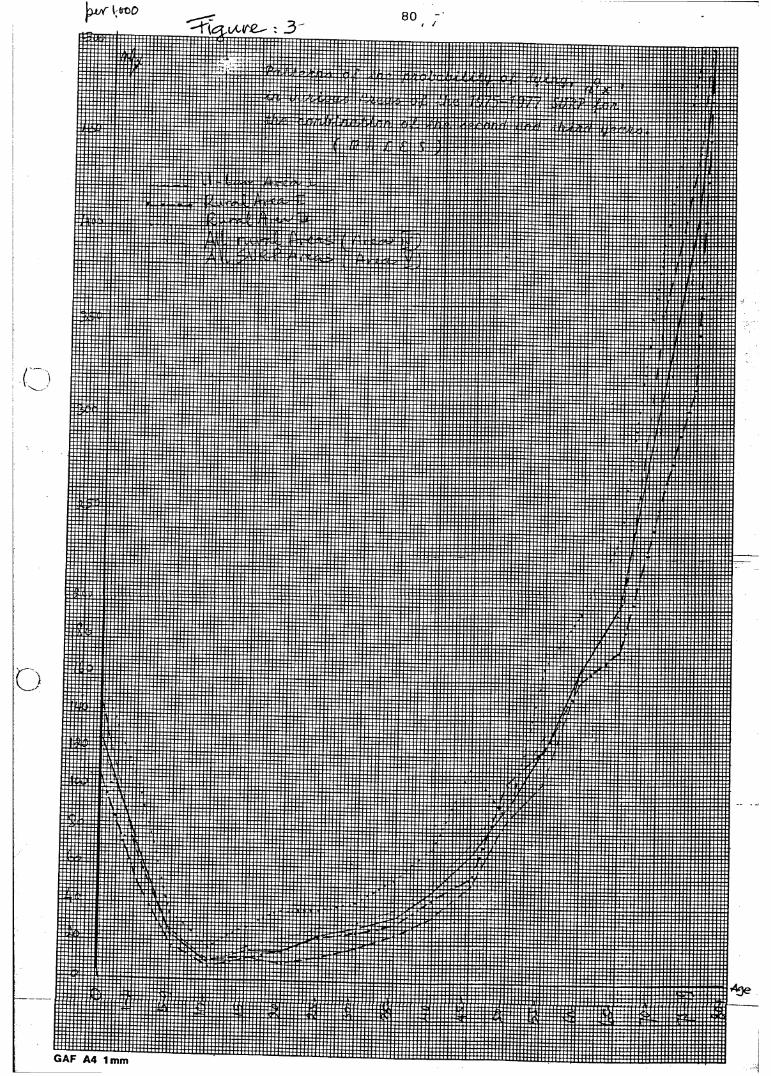
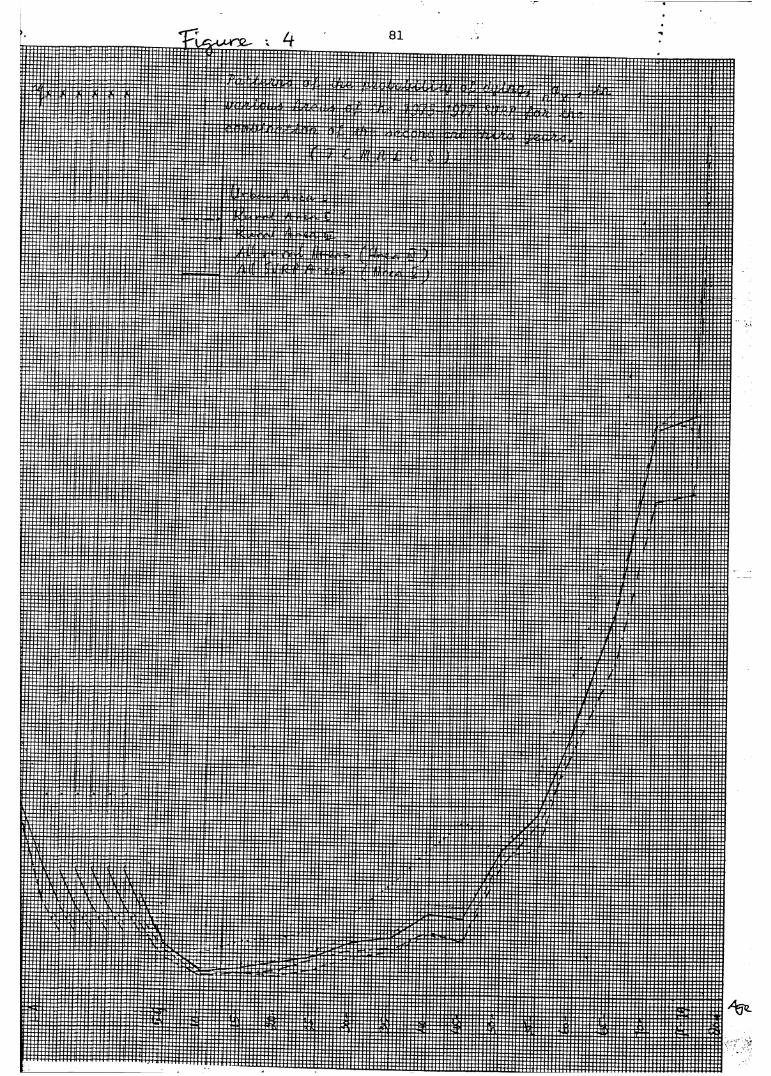
82
for males is smoother than for females.
From the above discussion, it can be concluded that there are
differentials in motality levels between sexes, urban-rural areas and
Survey years. In most cases, the mortality levels of males exceed those
of females, the rural levels are higher than the urban areas, and for
the Survey years, the levels of the second year are slightly higher than
those of third year. However, regarding mortality patterns, there is
still a difference between sexes and urban-rural areas, but not between
Survey years. The mortality patterns for both the males and the urban
areas are smoother than those of the females and the rural areas ,
respectively. To be more specific, it is clear that the mortality pattern
of the whole area of the 1975-1977 SVRP is best represented by Area V for
the combination of both Survey years, which is smoother and more
plausible than the others. The following discussion of the comparison
of mortality patterns and levels with other studies is limited to the
whole area of the 1975-1977 SVRP, that is Area V for the combination of
both the Survey years, for besides the fact that it best represents the
whole area of the 1975-1977 SVRP, there also no available separate
Indonesia Life Tables for urban and rural areas.
83
CHAPTER IVt ,
A COMPARISON OF THE VARIOUS MORTALITY ESTIMATES DERIVED ELSEWHERE AND IN THE PRESENT STUDY,
4.1. A comparison of the probability of dying, q
Although Area V for both years combined can represent the whole of.
the 1975-1977 SVRP area, it does not, however, represent the whole
country in general, because of the non probability selection of the 1975
-1977 SVRP areas. The size of the study population had also been too
small for a representative study of age specific mortality rates in a
country. Yet it can be argued that a comparison of mortality levels and
patterns with other previous studies and a specific model is both
necessary and relevant in this analysis. Due to a lack of mortality
studies available in Indonesia, in this section comparison will only be
made with certain important studies such as, the 1971 figures based on
the Census Survival Method ( Heligman, 1976 ), the 1973 Indonesia data
( McDonald, 1978 ) based on three methods, i.e. : 1) Parental Survival
Technique, 2) Intercensal Survival Technique, and 3) Direct estimation
from deaths by age and sex for a fixed, retrospective period as recorded
in the 1976 Intercensal Population Survey, and the 1974-1977 SVRP data
based on the Chandra-Deming technique adjustment by the " total "
( Gardiner, 1978 ). Furthermore comparisons were also made with the West
Model as suggested by some earlier writers (Central Bureau of Statistics
84
, 1973, 1978b) ; McNicoll and Mamas, 1976; Cho et al, Hull and Sunaryo,
1978; Gardiner 1978 and McDonald, 1978 ).
In relation to the above suggestions, the West mortality level for both
sexes was computed to be about 14.0, based on the. expectation of live at
birth, °e0, whicht-was observed from the 1975-rl977 “Indonesian Sairple Vital Registration Project.
In most cases, the mortality pattern of this study*, for both sexes
differs slightly from the pattern obtained from other studies such as the
1971 and 1973 Indonesia figures, 1974-1975 SVRP adjusted by the " total "
and even the West Model. The 1975-1977 SVRP shows a male pattern under age
10 and 65 onwards very similar to that the West Model; and in the case of
females, it also tends to display quite a similar pattern to that of West
Model, particularly under age 10 and between ages 55 and 74. Compared with
other studies, the male mortality pattern between ages 35 and 49 and 65
onwards is similar to those of the 1971 and 1973 national figures and the
1974-1977 SVRP adjusted by the " total ". The male pattern under age 5 is
also similar to the 1973 national data and the 1974-1977 figures.
Meanwhile, the female mortality pattern under age 5 and between age 55 to
74 shows a similar pattern to those of the 1973 Indonesia figures, and the
1974-1977 SVRP data. However, in age groups other- _than 'those*■ mentionedabove' Patte m for both sexes of this study is significantly differentT-U'- --»a «— ^ . a \.(Figures 5 and 6) .II). Based on the Panel Discussion of Population Projection held in the
Hotel Indonesia, on 6-7 January 1978, which was attended by many institutions including the Central Bureau of Statistics, Demography Institute UI, LEKNAS - LIPI, the National Family Planning Board ( BKKBN ), Population Institute - GAMA and World Bank (IBRD),the West mortality level for Indonesia in the period 1971-1976. was considered to be around 12.0.
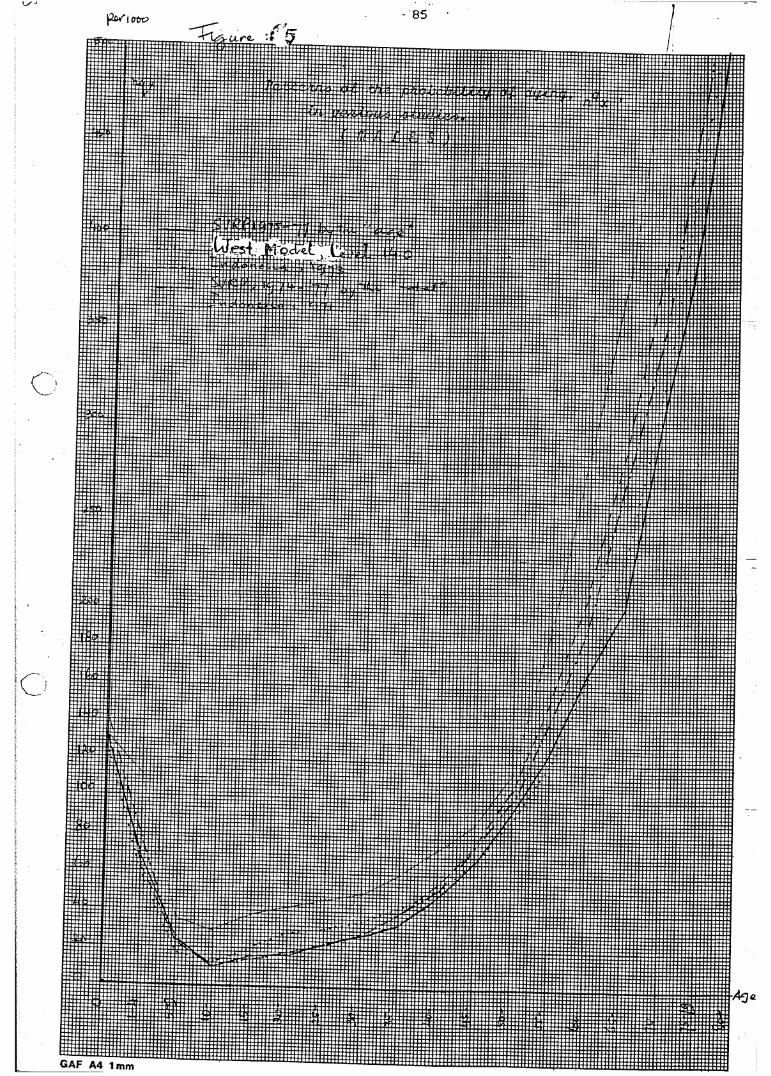
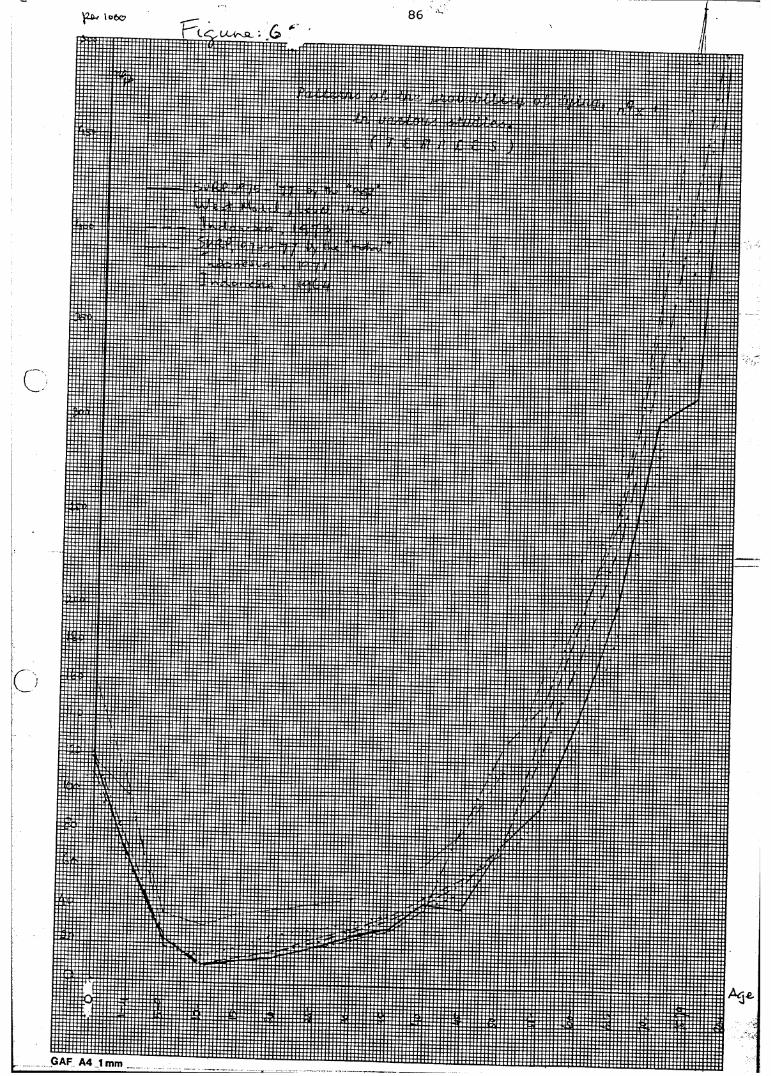
(
87
Compared with the mortality level which corresponds to West level
14.0, the 1975-1977 SVRP mortality is higher among males at ages less than
10 years and lower at ages 10 to 44 and 65 onwards ( Table 4.1A ). In the
case of females, the 1975-1977 SVRP mortality shows a tendency towards a
higher female mortality at ages less than 10 years and at old ages 50
onwards, and a lower at ages 10 to 49 ( Table 4.IB ).
By looking at the infant mortality and childhood mortality between
ages 1 and 4 for the whole area of the 1975-1977 SVRP,which is represented
by Area V, it can be inferred that the rates are close to the estimated12)1973 Indonesia figures . Compared to the infant mortality of Indonesia
from the 1971 Census figures, that is 152.2 and 128.9 per 1.000 for males
and females, respectively (Cho, et al, 1976, p : 62), the infant mortality
obtained from the 1971 Indonesia data appears to be very high. This is
primarily due to the difference in time period of the different estimates
of infant mortality and the substantial under counting of number of
children ever born and still living because a large proportion of women
without stated responses were assumed to have no children. ( H u l l and
S u n a r y o, 1978, pp : 15-18 ).
12) . Infant mortality in 1973 in Indonesia for males and females were
estimated to be 130.0 and 110.0 per 1.000 respectively, and the
childhood mortality for males and females were 63.2 and 65,2 per 1000
respectively. ( Indonesia Panel, Committee Population and
Demography, p : 13 ).
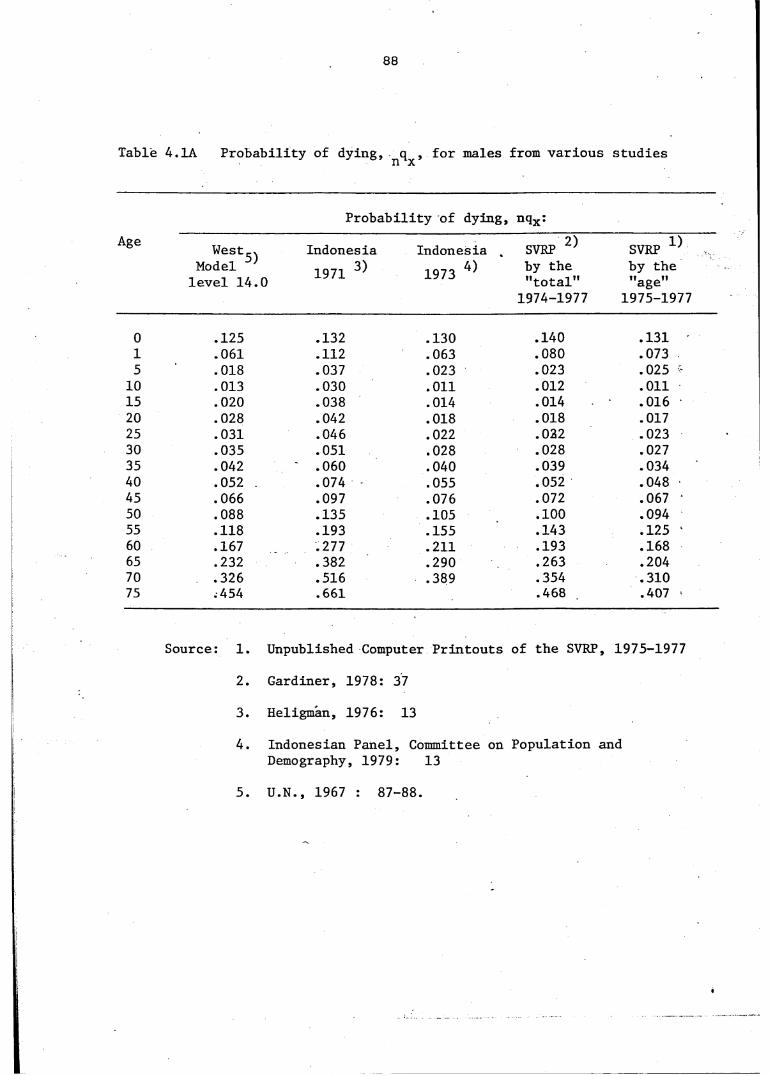
88
Table 4..1A Probability of dying, q , for males n n x from v a r i o u s studies
Probability of dying, n q x ;Age West ,-x
M o d e l level 14.0
Indonesia Indonesia SVRP SVRP ^
1971 3) 4)1973 ' by the "total"
1974-1977
b y the "age"
1975-1977
0 .125 .132 .130 .140 .1311 .061 .112 .063 .080 .0735 .018 .037 .023 .023 .025
10 .013 .030 .011 .012 .01115 .020 .038 .014 .014 .01620 .028 .042 .018 .018 .01725 .031 .046 .022 .022 .02330 .035 .051 .028 .028 .02735 .042 .060 .040 .039 .03440 .052 .074 .055 .052 .04845 .066 .097 .076 .072 .06750 .088 .135 .105 .100 .09455 .118 .193 .155 .143 .12560 .167 .277 .211 .193 .16865 .232 .382 .290 .263 .20470 .326 .516 .389 .354 .31075 .454 .661 .468 .407
Source: 1. U n published Computer Printouts of the SVRP, 1975- 1 9 7 7
2. Gardiner, 1978: 37
3. Heligman, 1976: 13
4. Indonesian Panel, C ommittee on Demography, 1979: 13
Popu l a t i o n and
5. U.N., 1967 : 87-88.
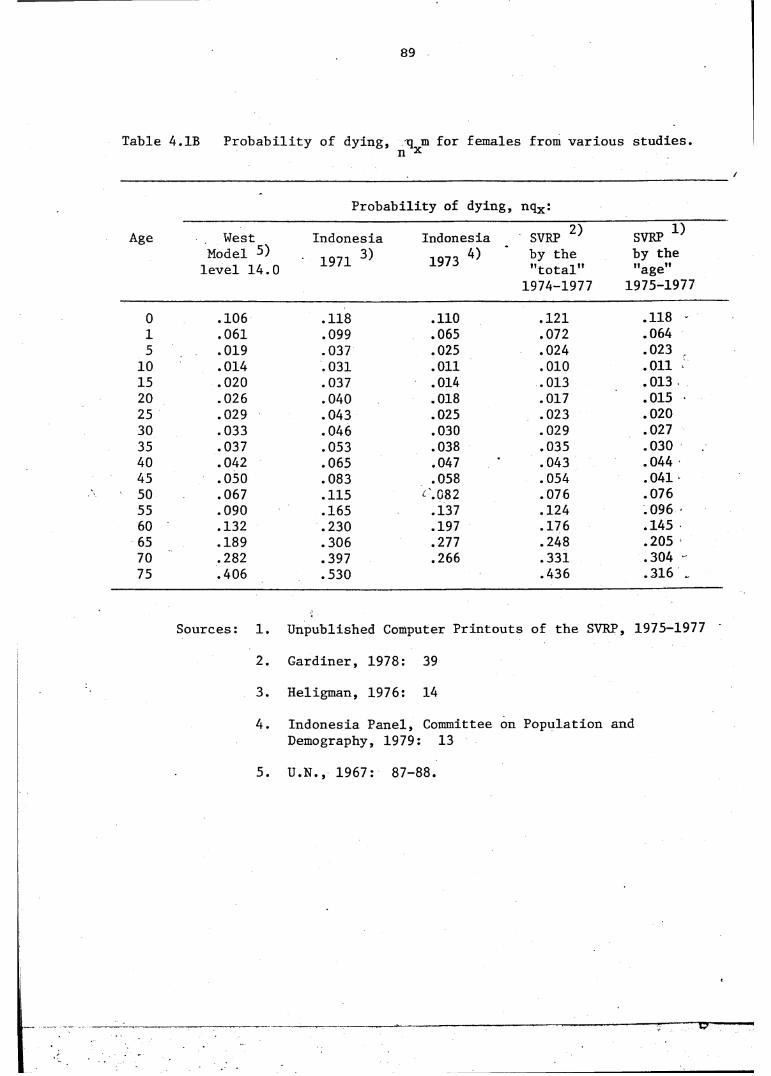
89
Table 4.IB Probability of dying, q m for females n x from various studies.
-Probability of dying, nqx:
Age West Indonesia Indonesia SVRP 2') SVRP ^Model 5) level 14.0 1971 3) 1973 4) by the
"total" 1974-1977
by the "age"
1975-1977
0 .106 .118 .110 .121 .118 -1 .061 .099 .065 .072 .0645 .019 .037 .025 .024 .02310 .014 .031 .011 .010 .011 -
15 .020 .037 .014 .013 .01320 .026 .040 .018 .017 .01525 .029 .043 .025 .023 .02030 .033 .046 .030 .029 .02735 .037 .053 .038 .035 .03040 .042 .065 .047 .043 .04445 .050 .083 .058 .054 .04150 .067 .115 - .082 .076 .07655 .090 .165 .137 .124 .09660 .132 .230 .197 .176 .14565 .189 .306 .277 .248 .20570 .282 .397 .266 .331 .30475 .406 .530 .436 .316 „
Sources: 1.
2.3.
4.
5.
Unpublished Computer Printouts of the SVRP, 1975—1977
Gardiner, 1978: 39
Heligman, 1976: 14
Indonesia Panel, Committee on Population and Demography, 1979: 13
U.N., 1967: 87-88.
T7~
90
Compared with 1973 Indonesia figures and the 1974-1977 SVRP
adjusted by the " total , Tables 4.1A and 4.IB, show the mortality level
of the 1975-1977 SVRP adjusted by the "age" under age 40 for both sexes,
is close to both studies, whereas after age 40 the gap between this study
and both the other studies becomes more significant. In . most cases the
mortality level for both sexes is lower from adolescence, age 20 onwards,
and it is quite close for under age 20 compared with the 1973 Indonesia
data. Compared with the 1974-1977 SVRP data, in general,the mortality for
both sexes obtained from this study is lower. This is mainly due to the
effect of the data of 1974 which has a higher mortality level compared tob)the 1975-1977 data. ( Central Bureau of Statistics, 1976 , p : 141 and
1979, p : 18 )./ I , '
The lower mortality level for the 1975-1977.SVRP compared with the
1973 national figures possibly relates to the actual situation in which,
after three to four years, there was a slight decline in the mortality
level. This situation can probably be supported by other research which
suggests that since 1968 Indonesian mortality may have started to decline
as a result of modern facilities, better nutrition, an increases in food
production, especially rice, and more effective control of many diseases.
( Departemen Penerangan, 1969, p : 50; United Nations, 1970, p : 57 and
Heligman, 1976, p : 11 ). Another probable reason is the non probability
selection of the 1975-1977 SVRP areas.
A slightly lower mortality level, particularly in adult ages, for
the 1975-1977 SVRP compared to the accumulated three years of the 1974-
1977 SVRP is mainly due to the adjustment by " age " which, in fact,
strongly suggests the idea of the difference in under enumeration of
91
deaths in every age group.This further increases, the observed probability
of dying, q , particularly, in the youngest ages than in the adult and 13)oldest ages -
Compared to the Indonesia data, it is obvious that j the mortality
levels of the 1975-1977 SVRP are lower and more accurate for both sexes,
as the 1971 data throws little or no light on mortality levels and
pattern due to the heavy under counting and under statement as - -mentioned
earlier in section 3.6.
13). Probably the picture for the youngest ages is not clear here.
The comparison does not consider the same period, whereas the data
for this study covers only a two year period ( 1975 - 1977 ) rather
than three years for the 1974-1977 SVRP adjusted by the " total ".
92
4.2. A comparison of the expectation of life,
0From the comparison of the expectation of life, e^ , in Tables
4.2A and 4.2B, it is apparent that in all ages the expectation of life for
the 1975-1977 SVRP is higher than figures obtained from other studies. In
general, the ratio of the ^e of the other studies to the 1975-1977 SVRP / xdecreases with age. This means that the relative variation of the
expectation of life between this study and others become greater in the
older ages than in the younger ages ( except the West model ) . . In most
cases, the °e ratio for the 1973 Indonesia data and thC.1974 - 1977 SVRP xfigures to the 1975-1977 SVRP is greater for males than for females. The-
opposite situation however occurs for the ^e ratio of the 1971 nationalxfigures, perhaps as a consequence of greater age mis-statement of females
than for males for the 1971 data. This reasoning is reinforced by the
computation of the Age Score Index and Myers' index of the 1971 data which
indicates better age reporting for males than for females. The Age Score
Indices for males and females are 45.3 and 51.0, and the Myers' ‘Indices
for males and females are 19.2 and 23.7, respectively ( Central Bureau of
Statistics, 1973, pp : 14-18 and ii ) .
By comparing the ratio of the °e in all ages, in general thexexpectation of life for the 1975 - 1977 SVRP area is closer to the West
model rather than to other studies. A more detailed examination of the ^e^
and °e which represent the key stages of infancy and adulthood^ Arespectively, shows that the highest expectation of life at those stages
is obtained in the 1975 - 1977 SVRP area, or, in other words, the lowest
mortality level particularly at adulthood and beyond is found in the
1975 - 1977 SVRP areas.
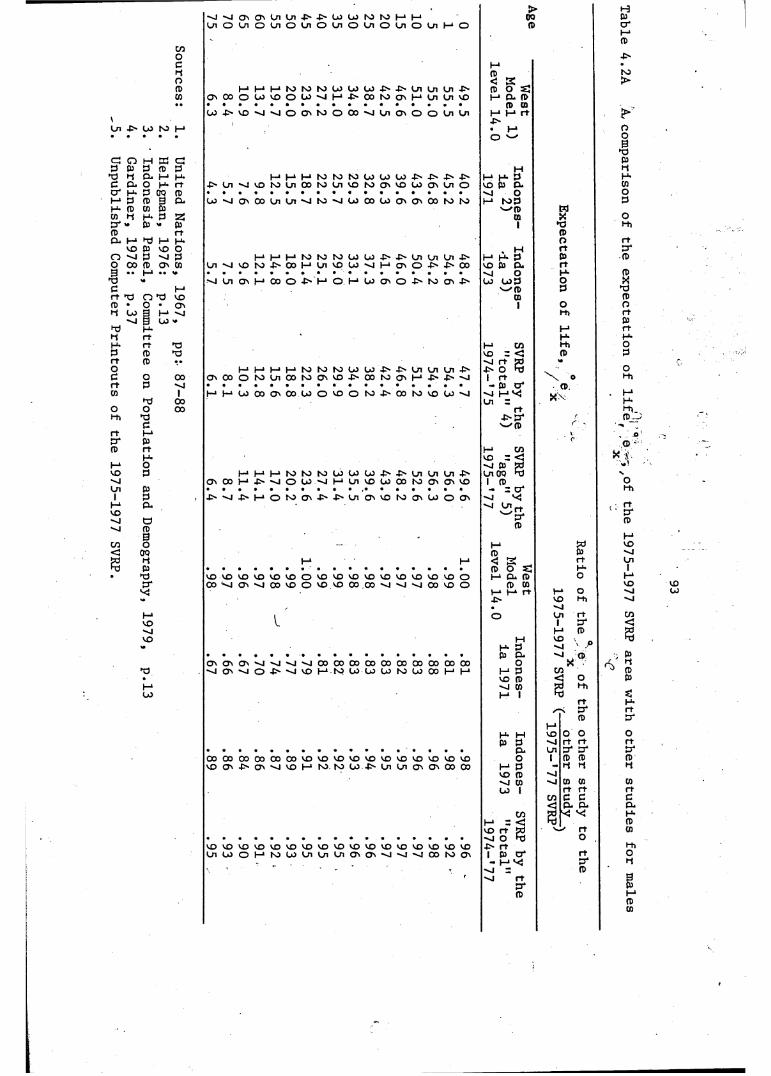
5= H- o O n ON Ln Ln 4 ^ -P ' CO LO t o t o t—1 Oc dCn O Ln o Ln O Ln O Ln O Ln o Cn o Ln t—* o fD o "
MfD
COO -P 'c (-• •H (D t oO <J 2 >CD M h—* H* t o t o t o CO L0 CO - > -IS Ln Ln Ln -P- (C O S3Cß O n 0 0 O CO VO o CO H* -D- o o t o ON i-* Ln Ln v o H* CL (D• • • • • • • • • • • • • • • • • • • (D Cß
\CO 4 > VO - o o ON t o O 0 0 Ln ON o O Ln Ln H H r t
4 >>
Ln 4 > CO t o (—1 • t - 1 OO w o
3nd
C O M ffi c d dd CL d CD d M H
nd H CL H* H- 1—1 (-• I - 1 t o t o t o c o c o c o 4 > 4N 4N 4>- h -1 H - d H*C Cd o H- r t 4 > Ln VO t o Ln CD t o Ln v o t o ON VO CO ON Cn O v o fD CL CDcr H- d OO CD • • • • • • • • • • • • • • • • • O Oi - 1 d CD 3 CL 0 0 - o O n o o Ln Ln t o 'O c o 0 0 CO ON ON 0 0 t o t o M t o d dH- fD Cß CL v_x(D 7iCD H H* d C2J CO X od 4 CL V« CL 1 »10 H i(D r t DCL 1—1 T l I - 1 H* D r t
VO d VO O . H r t dTO "O d d (-• M I - 1 t o t o t o CO CO - o 4 ^ Ln Ln Ln 4N i—1 h * d D fDO 0 0 rc ON Cß Ln VO t o 0 0 I - 1 Ln v o CO - o t—1 O n O 4 > 4N 0 0 VO d CL - t3 • • H* • • y* • • • • • • • • • • • • • • • • • o -L fD
nd * • o Ln ON M 0 0 O 4N I - 1 o I—1 L0 ON O t o ON -P ' c o c o d o Xc h-> N-^fD 3 ndr t nd o nd VO cn fDfD • o • O n 1 O oH CO 9 M H , r t
§ U ) V# dhd H- -* HH r t -*> H*H- r t nd t—1 CD H i O3 CD nd VO d < D dr t CD • • M d Wo H* H* H* I - 1 t o t o t o CO CO 4N Ln Ln Ln 4N J S O ^
Xo
c O 0 0 O n 0 0 O t o Ln 0 0 t o ON v o .O ' 0 0 t o ON 1-* 4 > 4 ^ -O 1 r t 0 H ir t d 'O • • • • • • • • • • • • • • • • • - d o 1 CDCß 1 M H* Co o o on o o CO o v o o t o -P ' o o t o VO L0 •-J N j x \ . M
T J 0 0 Cn z H-o o 0 0 r t H iH i nd - P ' d ' fD _ J
d w ( Dr t i - 1 \ oc r CL CDCD r t M CD
H - v o z <M O s i d WVO d I - 1 t - 1 t—1 t o t o t o CO c o CO -P ' 4 > Ln Ln Ln 4 ^ Ln 0 0 nd•O on 0 0 t—1 4 ^ o CO '- J (-* Ln VO CO 0 0 t o ON ON VO 1 fD
- : c fo
Cn CL • • • • • • • • • • • • • • • • • f-h1 d - > - o 4 ^ M o t o ON 4 > 4 > Ln ON v o t o ON c o O ON "-J LJ
H* CL ■O Ln rt. r tVO c r'- J a fD
rt)H*
cd o t—* po v o< 00 fD ds H t—1 M < g r t Cnhd CL (D O S3 H- 1• nd VO VO VO VO VO VO o v o v o VO VO v o v o VO v o v o O I - 1 CL fD O t—*
c r o o ^ 4 O n - o o o VO o VO VO o o o o " J 'O 0 0 v o O fD cn VOLd 1—1 t—1 H t— O - o
4 ^ VO H i•
h -1 . O Ln r t CDVO 1 c r <"O 1—* fD sVO M vO h3
># H- d " Jd c l - o CD d
O n on on •^J 'O 'O 0 0 o o o o o o 0 0 o o o o o o 0 0 0 0 o ^ 2T ) • o ON ' - j O 4 > - o VO I—1 t o CO c o CO t o CO o o H> I - 1 t—* d CD• v o fD < O dM 'O CD 2 3 H iCO M 1 h 3 S3
r t H*c r HfD z r
t—1H* W v o O O od d - o H r t r t
CL Ln z r c r d 40 0 OO 0 0 0 0 0 0 0 0 VO VO VO VO VO v o VO v o v o VO v o o 1 fD fD fDVO O n - o on - o VO M t o t o c o 4 > Ln c n ON ON o o 0 0 H* d H H H
v o fD - o'O CD CD CD CDCO 1 H H H
CD C C c< CL CL CL
CD s L3 H*H 1 = < l-d fDv o r t W r t CD■o o hi O
VO VO VO v o VO VO VO VO v o v o VO VO v o v o v o VO v o 4 > r t HiLn CO o M to CO Ln Ln Ln ON ON o o to ON 1 d c r r t O
- t—1 v< XT HT f tII77 fD
3d
fD t—1fDCD
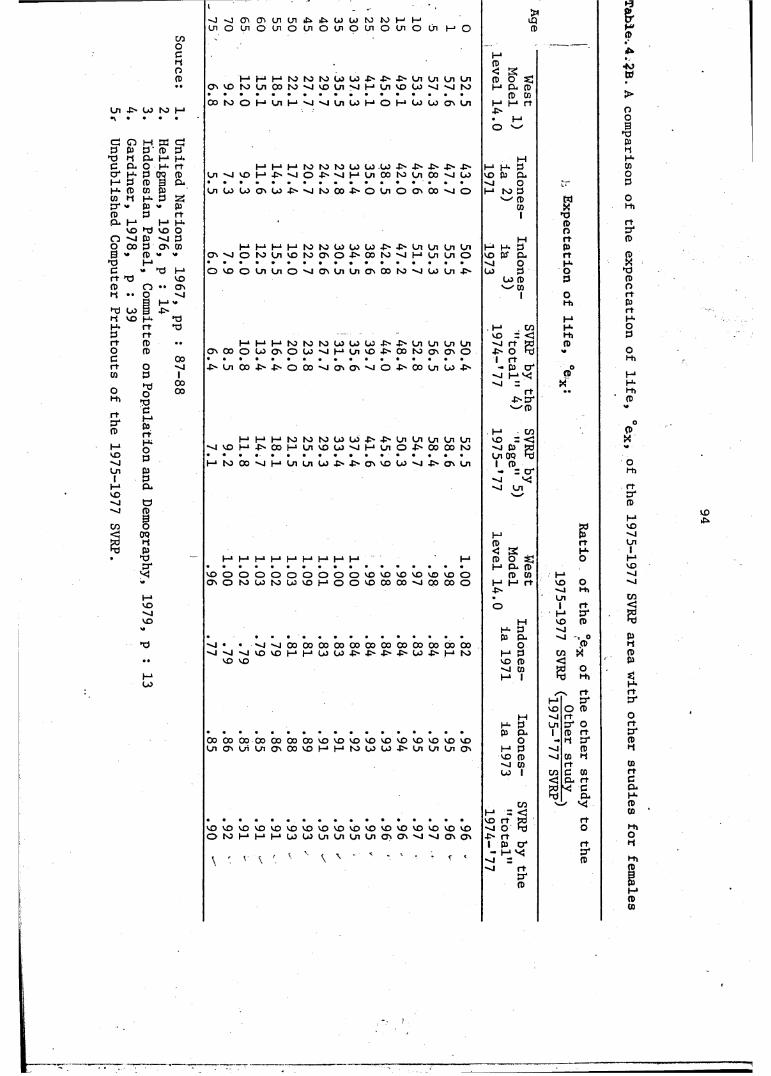
Co
mm
ittee on P
op
ula
tion
and D
emography,
1979,
inocnoP
Cn JN U) fo I—1
aPT)Co4h-1H-pp 4 V.pCb
no3T3Crt
M ffi P 0)Cb M O H- P 00 fD 3 p pH* P(Ü V»p
apH*r tfDCb
25PrtH*OPCD
i-d cc p *- P a(t) <• >»H-1- X) MCO• • ao
M <* to
001
0000
^ l - J C T i O i n L n | i i b U i W t O K ) H Pc n o u i o c n o c n o c n o m o c n o c n I-1 O
H H H N ) t O N J U W ^ . > - > C n ü i L n U i p v O N J U i K N J s l ^ i C n s l H C n v D P v j s i r o • • • • • • • • • • • • • • • • •OO N) O H U i I—1 —I s i Cn LO I— 1 O I— 1 U U / O ' In
U n I V D H J N v J O - P ' M P U i P M U i P ' J P • • ■ • • • » • • • • • • • • • •C n U P P P J c v j t o p J s o C n O O ' W s i O
H H H H M f O U W W J c f ' l n U i L n U it ^ M O M C n v O M ^ O - t ' O O N J ' J H U i U i O• • • • • • • • • • • • • • • a *O v O O C n U i O c J O c C n U i O ' W P c J U C n i '
H H H P N > h O U U W - t ' - > U i C n C n C nC ^ O O O b / O O W s l H U i v D ^ O O t O C h O O
- P ' L n P ^ ^ ' O 0 0 N i a i C T ' ' ^ O - P ' K l n W - P '
H H H M K J M O J U J c J c U i C n L n C n C n' J d H ^ P h M j i ' D P s l H C n O - P ' P a N )• • • • • • • • • • • • • • • • aH P P v J H C n L n U ^ f ' P d W ' s i - t ' P C n
I-1fD<fDI—*I- 14N
>cQP
M H- P P Cb
0NO Pw fD
p1
H -*• P tf Cb
0p
0 0 P ' p
1
H-* m co - < vj r w 4^ o d I r t - P a 4
CjZ
r t4Np-v_^P
I—* in co = <3 VJ P 5 ) On OO h j I P - = a 4-vj v;
On
WX'apor tPr tH*OP
oHi
HH-HiP
P°
&H'P
►3
•roto
oo3*apHH>pop
oHi
r tP4P
PXndPor tPr tH-OPOHi
I-1H-HiP
OHi
r tP4P
X)
I-*U>
t—*H-*I—‘ t—»t—‘ I—‘ I—‘ H-»!—• I-1C O O O O O O O O O O C D C O C Oa c o r o o o r o o o c o M O O c o o o o o
CD CO c o O M OO CO O
'• J • • ^ J ^ O O O O O O O O O O O O O O O O O O O O O O O O—I ' ^ J —I C O C O H H U W - N - N - N - N W - N H N )
co co
H1 PcpMh-1
O
o s :Cb p P pI - 1 r t
H*PH*co'-JI-1
MPCbOPPCDI
Pr tH*O
t—1CO oHi
OnI r t
t—1 P 4co P'■J■'■J , opin X
O O O O O O O O O O O O O O C O C O C O C O C O C O C O C D C D C O O n a c O r i O n o c O O c o H 1 H ‘ P W W - N ü i O n O n p
MPCb0 p p p1
C D C O C O C O C D C O C O C DO M H H H U U U i
\ ' ' * < * ' '
C D C O C O C D C O C O C D C O C OU i O n O n O ' O ' ^ M C T ' O i
\ r <
m= <
r t 5do (ar tP a 4H*
z•»J rt
P 4P
\ rt P 4
O PrtP 4 O P rt a p 4
pP H rtC P CP rt
^ CCb
rtOrtP*P
I—1co—IOnII-1co
"J
in<a
pHPP
£H*rtP 4
OrtP 4PHPrtCCbH-PP
HioHH i
I-*PP
CO.P
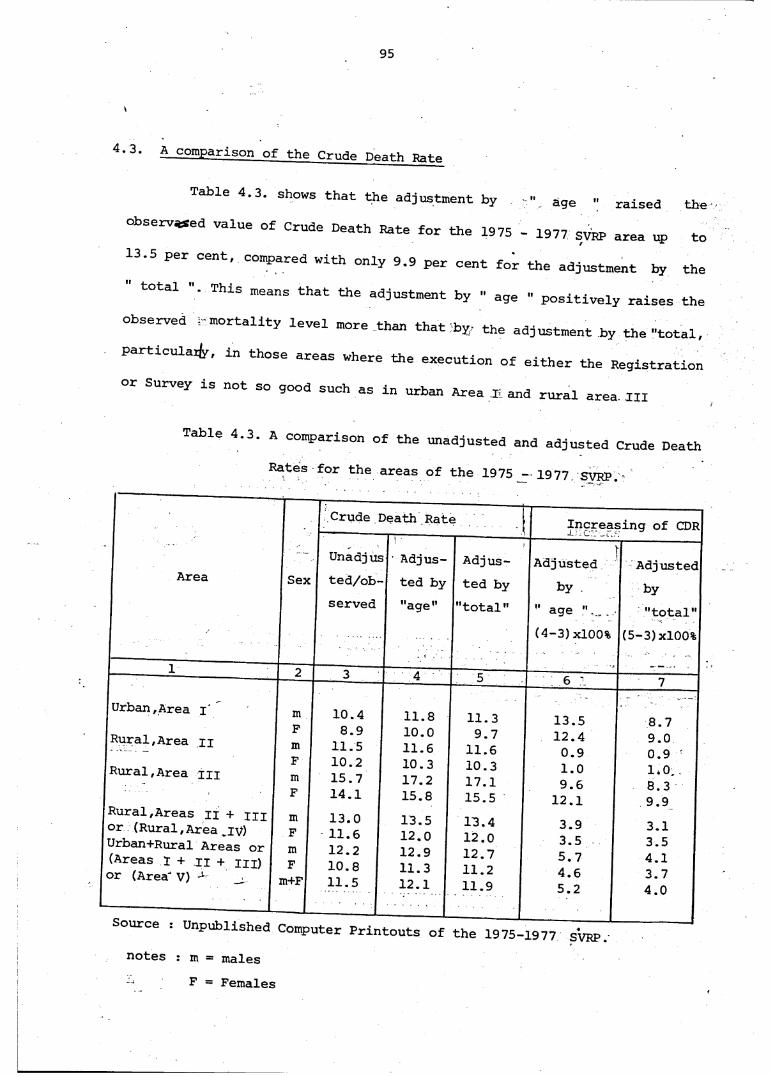
95
4‘3* -A comparison of the Crude Death Rate
Table 4.3. shows that the adjustment by * age ■' raised the
observed value of Crude Death Rate for the 1975 - 1977 SVRP area up to
13.5 per cent, compared with only 9.9 per cent for the adjustment by the
" t0tal "• ThiS means that “ >« Adjustment by " age •• positively raises the Observed -mortality level more than that by the adjustment by the ■■total,
particular^, in those areas where the execution of either the Registration
or Survey is not so good such as in urban Area and rural area. Ill
Table 4.3. A comparison of the unadjusted and adjusted Crude Death
Rates for the areas of the 1975 - 1977 SVRP.
F = Females
96
The adjusted Crude Death Rate for both sexes from the whole area
of this study, that is, 12.1 per 1000, seems to be lower than the lastr
1973 Indonesia estimate made by the Indonesia Panel of the Committee on
Population and Demography ( 1979 : 12 ) where the -Crude Death Rate for
both sexes at the end of 1973 was 15.0 per 1000. This lower mortality
level of the 1975 - 1977 SVRP area compared to the 1973 national figures,
is due the actual situation of a slight decline in the mortality level and
perhaps also due to the small non-probability selection of the sample
areas of the 1975 - 1977 SVRP, as explained earlier in this Chapter.
The results of the comparison of the probability of dying, ,
and the expectation of life, ^e^ , at all age groups between this study
and other studies elsewhere, would appear to indicate that the 1975-1977\ f
SVRP life Tables adjusted by " age " produced here are more likely to
provide a good current indication of the mortality pattens and level in
some areas of Indonesia. This conclusion is similar to the suggestion of
the Indonesia Panel, Committee on Population and Demography ( 1979 : 9 )
Although the 1975-1977 SVRP area cannot necessarily be taken as
representative of Indonesia as a whole, it probably provides the
current indication of the age pattern of morality in Indonesia.
best
97
CHAPTER V.CONCLUSION
In developing countries such as most Asian and African countries,
certain difficulties can hamper and retard the effectiveness öf the
execution of either the Registration or the Survey- These problems may have
a direct effect on the under counting of vital ' > events especiallyX
Registration.
In general, the findings of this study of the 1975 - 1977 SVRP
suggest that the application of a certain adjustment such as the Chandra-
Deming technique to all specific age groups makes it possible to estimate
the under enumeration of deaths relatively easf^*
The findings reveal that, in all Areas, in most age groups and for both
sexes, the completeness of reported deaths covered by the Survey is
superior to that of the Registration. Furthermore, there is a negative
relationship between the completness of matched deaths and missed deaths ,
as the percentage of matched deaths increases as age at death increases; on
the other hand, the percentage of missed death decreases as age increases.
In relation to the adjustment factors by " age ", there is
a considerable variation between Areas, sexes and years. Furthermore, the
higher adjustment factors are for younger ages, whereas the lower factors
are for older ages. There is some argument for applying the adjustment by
" age " rather than by the " total " in that under enumeration of deaths
is significantly different between age groups, thus producing a different
effect on the increasing mortality levels, particulary in the younger andA
older ages.
The mortality levels and patterns within the 1975 - 1977 SVRP area
can be summarized as follows :
98
1. There are differentials in mortality levels between sexes, urban-rural
areas and Survey years. The male mortality exceeds that of females. In
most cases, the mortality of rural areas is higher than for the urban
areas, and the mortality of the second year is slightly higher than the
third year.
2. There is still a different in mortality patterns between sexes and
urban-rural areas, but not between Survey years.
By applying the adjustment by " age " , the broad mortality
pattern of the 1975 - 1977 SVRP changed significantly, especially in
the younger ages under 25. This has been observed particularly in Areas
which have a higher under counting of deaths either in the Registration or
the Survey. This argument is somewhat different to the pattern described
by Gardiner ( 1978 ), where his preliminary analysis indicates that the
broad mortality pattern will remain unchanged when applying the adjustment
by " age ".
The mortality pattern of the whole area of the 1975 - 1977 SVRP
for both sexes, differs slightly from the patterns obtained from other
studies such as the 1971 and 1973 Indonesia data and the 1974 - 1977 SVRP
adjusted by the "total" and even the West pattern. In one specific case,
the 1975 - 1977 SVRP shows a mortality pattern under age 10 very similar
to that of West for both sexes. Furthermore, the pattern of this study at
old ages is also rather close to the West pattern, particular^ in the case
of males. Meanwhile, the mortality pattern under age 5 for both sexes of
this study is also very similar to the 1973 national data and the 1974
1977 SVRP figures adjusted by the " total ".
99
Considering the mortality level which corresponds to the West
level 14.0, the 1975 - 1977 SVRP shows a higher mortality at younger ages
under 10 aad older ages 50 onwards, and a lower level at ages 10 to 44.
From the present analysis, it may be possible to conclude that the level
at older ages in this study area seemed rather high in relation to
chlidhood mortality, compared with .West life Tables. However, this high
level is confirmed in certain previous studies such as Bakir ( 1974 ) ,
Heligman ( 19 76 ) and Me Donald and Sontosudarmo ( 1976 ) . The lower
mortality level between ages 10 and 44 is also confirmed in the
independent analysis of the data from the 19 73 national figures and the
1974 - 1977 SVRP adjusted by the " total ", which may be a justification
of the claim that the mortality pattern and level obtained in this study
seem to be a good indication of mortality patterns and levels in most
areas in Indonesia.
The final conclusion related to the mortality level of the whole
area of the 1975 - 1977 SVRP in general, even if both systems of
Registration and Survey are deficient to some degree, is that this
deficiency can be estimated by the application of the dual - system
estimation procedure ( that is the Chandra - Deming technique ), which
yields plausible mortality level, a crude Death Rate of 12.1 per thousand
population for both sexes and an expectation of life at birth 49.6 for
I
V
males and 52.5 for females.
100
V
References
ALDEN SPEARE, 1976.
Quasi Stable Population Method for Adjusting Age Distribution in Indonesia. LEKNAS, LIPI, Jakarta. (Mimeographed )
BAKIR, Siti Zainab, 1974.Perkiraan Tingkat Kelahiran dan Kematian Penduduk Sumatera
Selatan ", Majaiah Demografi Indonesia, Year 2, No. 4, Jakarta, pp : 63-90.
CENTRAL BUREAU OF STATISTICS, 1973.Proyeksi Penduduk Indonesia 1971-1981. Serie K, No. 1, Jakarta. __________________ , 1974.Organization and Method of the Indonesian Sample Vital____Registration Projects. Technical Report Series, Monograph No. 1 Jakarta.
__________________ , 1976.Analysis and Evaluation of the first year results of the Sample Vital Registration Projects. Technical Report Series, Monograph No. 2, Jakarta.
__________________ , 1976-1977.Buku Pedoman Matching & Verifikasi. Tim Teknis Sample Registrasi Penduduk, Jakarta.
_____________ , 1976/1977Analysis and Evaluation of the third year results of the Sample Vital Registration Projects. Technical Report Series, Monograph No. 4, Jakarta.
__________________ , 1977.Laporan para Instruktur Pusat dan Daerah mengenai pelaksanaan Proyek Sample Registrasi Penduduk, 1974-1977. Biro Pusat Statistik, Jakarta. ( Unpublished report ).
___________________ , 1978 a)Analysis and Evaluation of the second year results of the Sample Registration Project. Technical Report Series, MonographNo. 3, Jakarta.
101
, 1978Proyeksi Penduduk Indonesia 1976-2001, Serie K, No, 2, Jakarta.
, 1979.Analisa dan Sample Registrasi Penduduk 1974-1977.Tim Teknis Sample Registrasi Penduduk, Seri Laporan Teknis No.6, Jakarta,
CHANDRA SEKHAR, C and W, EDWARDS DEMING, 1949." On a Method of Evaluating Birth and Death and the Extent of Registration", Journal of the American Statistical Association, Vol 44, 1949, pp : 101-115,
CHO, Lee-Jay, SAM SUHARTO, McNICOLL, G and MAMAS, SGM, 1976.Estimates of Fertility and Mortality in Indonesia Based on the 1971 Census, 1971 Census Publication, SP 76-L02, Central Bureau of Statistics, Jakarta,
COALE, Ansley and DEMENY, P, 1968.Regional Model Life Tables and Stable Population, Princeton University Press. Princeton.
•
DEPARTEMEN PENERANGAN, 1969Rencana Pembangunan Lima Tahun Pertama, 1969/1970 - 1973/1974 Jilid 20. Jakarta.
GARDINER, Peter, 1978" Age Pattern of Mortality in Indonesia ; An Analysis of results of the Indonesian Sample Vital Registration Project 1974-1977 ", Woring Paper prepared for the Indonesia Panel of the Committee on Population and Demography, National Research Council, Washington, DC.
GARDINER, P and SUGITO, 1977" Attitudes and Conditions Underlying Vital Registration in Sample Registration Project Areas in Indonesia ".Working paper prepared for Conference on Vital Statistics Practices in Asia, Manila, Philippines, May 9-13, 1977.
102
GAISIE, S.K., 1973" Determination of Population Growth in Ghana ". A thesisprepared for the Degree of Doctor of Philosophy at the Australian National University. Canberra.
HELIGMAN, Larry, 1976.Mortality in Indonesia 1961-1971. Population Institute, GAMA, Yogyakarta. This is a translation from : " Levels and Trends of Mortality in Indonesia 1961-1971 ", published by International Programs Center, U.S. Bureau Of Census, Washington, DC, 1974.
HULL, T.H. and SUNARYO, 1978" Levels and Trends of Infant and Childhood Mortality in Indo-
Mnesia. Working paper prepared for the Indonesia Panel of the . Committee on Population and Demography, National Research Council, Washington, DC.
INDONESIA PANEL OF THE COMMITTEE ON POPULATION AND DEMOGRAPHY, 1979." Draft Report Fertility and Mortality Trends in Indonesia ", National Research Council, Wshington, DC.
KANNISTO, Vaino, 1963" Population Increase in Indonesia, 1962 ". Central Bureau of Statistics. Jakarta.
KOZO.UEDA, 1964" Population Increase in Indonesia, 1963 ". Statistical Research and Development Center, Central Bureau of Statistics, Jakarta.
KOZO UEDA, 1976" Accuracy of Census Sex-Age Data in Asia and the Pafi-ific Countries " Institute of Developing Economics, Tokyo.
MAMAS, S.G.M., 1968" Angka2 Kelahiran dan Kematian Indonesia Hasil SUSENAS 1964/
•i
1965."Pusat Penelitian dan Perkembangan Statistik, CBS, Jakarta'.'
MARKS, E.S. and SELTZER, W, and KROTKI, KJ. 1974.Population Growth Estimation : A hand book of Vital Statistics Measurement. The Population Council, New York.
103
MCDONALD, Peter, 1978." Adult Mortality in Indonesia : An Examination of Evidence from the 1961 and 1971 Censuses and the 1976 Intercensal Survey Paper prepared for the Indonesia Panel of the Committee on Population and Demography, National Research Council,Washington, DC.
MCDONALD, Peter, MOHAMMAD YASIN and JONES, GW, 1976Levels and Trends in Fertility and Child); >od Mortality in Indonesia. Demographic Institute, University of Indonesia, Jakarta.
MCDONALD, Peter and ALIP SONTOSUDARMO, 1976Response to Population Pressure : The Case of the Special Region of Yogyakarta. Gadjah Mada University Press, Yogyakarta.
REED, LJ and MERRELL, M (1939)" A Short Method for Constructing an Abridged Life Table ".The American Journal of Hygiene, Vol 30, No 2, pp 33 - 62, September 1939.
RUZICKA, L.T. 1972" Infant and Childhood Mortality in the Countries of South Asia: A Review The Australian National University, Canberra.
SELIZER, W and ADLAKHA, A, 1974On the Effect of Errors in the Application of the Chandrasekar- Deming Technique. Laboratories for Population Statistics,Reprint Series No 14, The University Of North Carolina at Chapel Hill, Chapel Hill.
SINGUEFIELD, Jeanne C and AZWINI KARTOYO, 1977" Using Retrospective Mortality Data to test the Application of Model Life Tables for Indonesia ", Majaiah Demografi Indonesia, Year 4, No 7, Jakarta, pp : 25-41
SUHARTONO, Poniman, 1979" Population and Vital Registration in Indonesia : An analyisbased on the Indonesia Sample Vital Registration Project 1974- 1977.
104
Paper submitted as part of the coursework for the Degree of Master of Arts in Demography, The A&utralian National University, Canberra.
SUHARTONO, Poniman and SUARDI, Hadma Ali, 1970, *" Estimation of Mortality of the Rural Population of Java-Madura 1964 ", The Demographic Training and Research Centre, Bombay.
UNITED NATIONS, 1956Manual III. Methods for Population Projections by Sex and Age Population Studies, No 25, ST/SO/Series A, NEW York,
__________ , 1967Manual IV. Methods of Estimating Basic Demographic Measures from Incomplete Data, ST/SOA/Series A/42, New York.
_________________ , 1970Economic Bulletin for Asia and the Far East, Vol 21, No 3, Bangkok.
________________________ , 1971Methodology of Demographic Sample Surveys. Statistical Papers, Series M, No 51, New York.
____________________________ , 1978Population and Vital Statistics Report. Statistical Papers, Series D, Vol XXIX, No 4, New York.
A p p e n d i x i
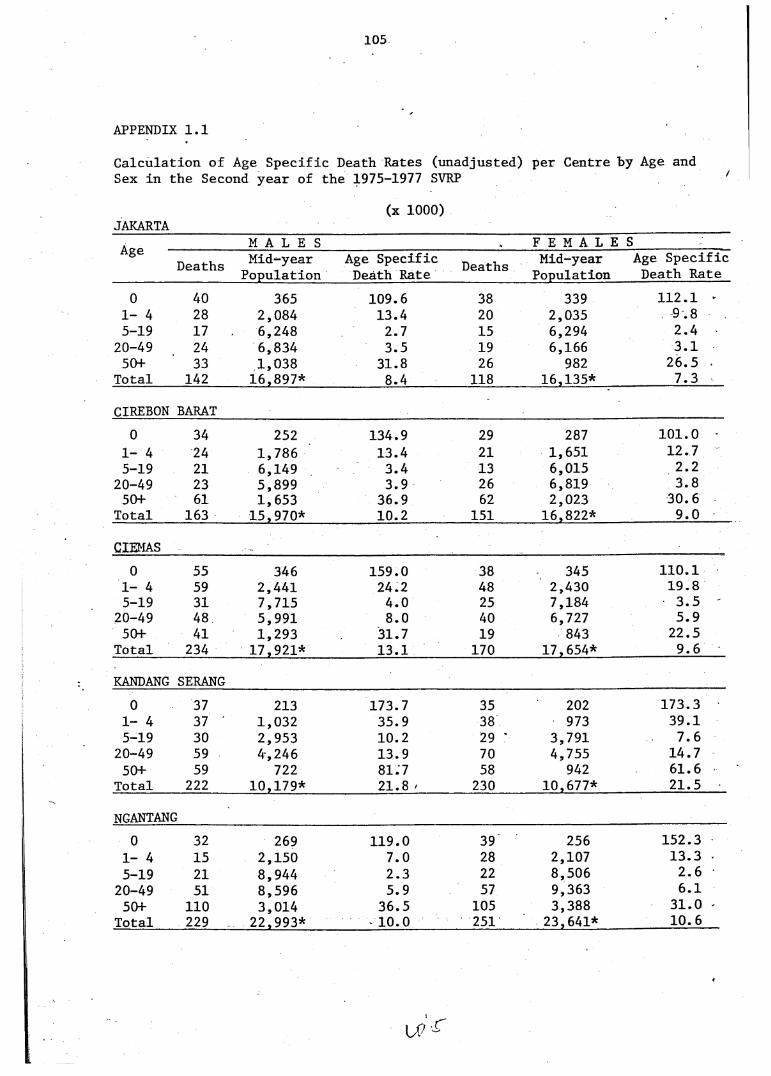
105
APPENDIX 1.1
Calculation of Age Specific Death Rates (unadjusted) per Centre by Age and Sex in the Second year of the 1975-1977 SVRP
(x 1000)JAKARTA
M A L E S * F E M A L E SAgeDeaths Mid-year Age Specific Deaths Mid-year Age Specific
Population Death Rate Population Death Rate0 40 365 109.6 38 339 112.1 ►1- 4 28 2,084 13.4 20 2,035 9.85-19 17 6,248 2.7 15 6,294 2.4
20-49 24 6,834 3.5 19 6,166 3.150+ 33 1,038 31.8 26 982 26.5
Total 142 16,897* 8.4 118 16,135* 7.3
CIREBON BARAT0 34 252 134.9 29 287 101.0
1- 4 24 1,786 13.4 21 1,651 12.75-19 21 6,149 3.4 13 6,015 2.2
20-49 23 5,899 3.9 26 6,819 3.850+ 61 1,653 36.9 62 2,023 30.6
Total 163 15,970* 10.2 151 16,822* 9.0
CIEMAS0 55 346 159.0 38 345 110.1
1- 4 59 2,441 24.2 48 2,430 19.85-19 31 7,715 4.0 25 7,184 3.5
20-49 48 5,991 8.0 40 6,727 5.950+ 41 1,293 31.7 19 843 22.5
Total 234 17,921* 13.1 170 17,654* 9.6
KANDANG SERANG0 37 213 173.7 35 202 173.31- 4 37 1,032 35.9 38 973 39.15-19 30 2,953 10.2 29 ' 3,791 7.6
20-49 59 4,246 13.9 70 4,755 14.750+ 59 722 81.7 58 942 61.6
Total 222 10,179* 21.8 ' 230 10,677* 21.5
NGANTANG0 32 269 119.0 39 256 152.3
1- 4 15 2,150 7.0 28 2,107 13.35-19 21 8,944 2.3 22 8,506 2.620-49 51 8,596 5.9 57 9,363 6.150+ 110 3,014 36.5 105 3,388 31.0
Total 229 22,993* 10.0 251 23,641* 10.6
U ' r
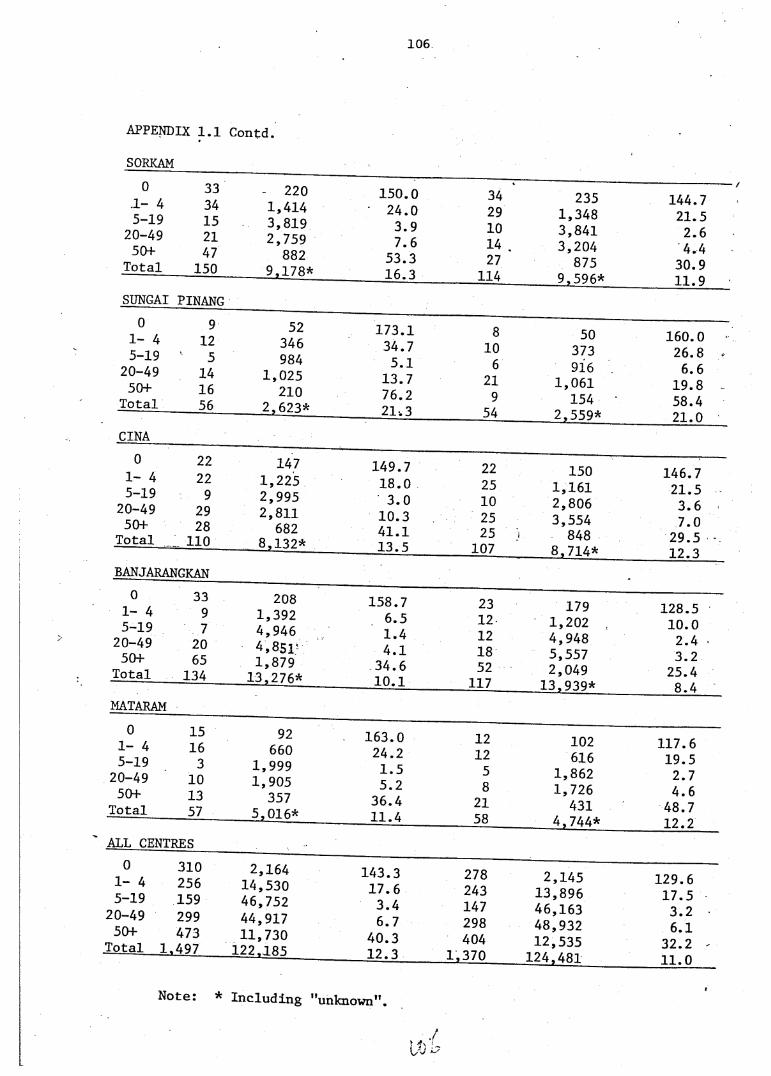
106
APPENDIX 1.1 Contd.
SORKAM0
.1- 4 5-19
20-49 50+
Total
3334 15 21 47
150
- 220 1,414 3,819 2,759
8829,178*
150.024.03.97.6
53.316.3
34 29 10 14 . 27
114
2351,3483,8413,204
8759,596*
144.7 21.5 2.6 4.4
30.9 n 9
SUNGAI PINANG0
1- 4 5-19
20-49 50+
Total
9125
141656
52346984
1,025210
2,623*
173.134.7 5.1
13.776.221.3
8106
219
54
50 373 916
1,061 154 •
2 S S Q *
160.0 26.8 . 6.6
19.8 58.4on n
CINA0
1- 4 5-19
20-49 50+
Total
22229
2928
110
1471,2252,9952,811
6828,132*
149.718.03.0
10.341.113.5
2225102525
107
1501,1612,8063,554
8488.714*
146.721.5 3.6 7.0
29.519 0
BANJARANGKAN0
1- 4 5-19
20-49 50+
Total
3397
2065
134
2081,3924,9464,851-1,879
13,276*
158.76.51.44.1
34.610.1
2312121852
117
1791,2024,9485,5572,049
1 3 . Q 3 Q *
128.510.02.43.2
25.4D /.
MATARAM0
1- 4 5-19
20-49 50+
Total
1516 3
101357
92660
1,9991,905
3575,016*
163.024.21.55.2
36.411.4
121258
2158
102616
1,8621,726
4314.ILL*
117.619.52.74.6
48.719 0
ALL CENTRES0
1- 4 5-19
20-49 50+
Total 1,
310256159299473497
2,16414,53046,75244,91711,730
122,185
143.317.63.46.7
40.312.3
278243147298404
1,370
2,14513,89646,16348,93212,535
124,481
129.617.53.26.1
32.211.0
Note: * Including "unknown".
./Ib y
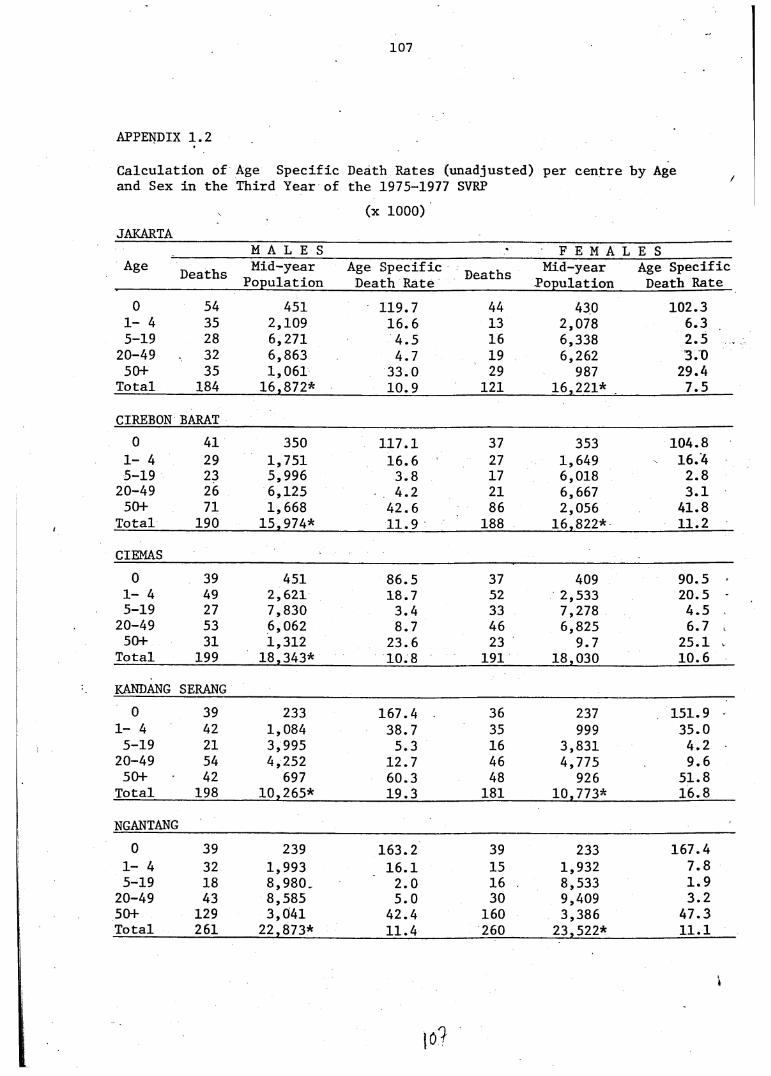
107
APPENDIX 1.2
Calculation of Age Specific Death Rates (unadjusted) per centre by Age and Sex in the Third Year of the 1975-1977 SVRP
(x 1000)JAKARTA
M A L E S ♦ F E M A L E SAge Deaths Mid-year Age Specific Deaths Mid-year Age Specific
Population Death Rate Population Death Rate0 54 451 119.7 44 430 102.3
1- 4 35 2,109 16.6 13 2,078 6.35-19 28 6,271 4.5 16 6,338 2.5
20-49 . 32 6,863 4.7 19 6,262 3.050+ 35 1,061 33.0 29 987 29.4
Total 184 16,872* 10.9 121 16,221* 7.5
CIREBON BARAT0 41 350 117.1 37 353 104.8
1- 4 29 1,751 16.6 27 1,649 16.45-19 23 5,996 3.8 17 6,018 2.8
20-49 26 6,125 4.2 21 6,667 3.150+ 71 1,668 42.6 86 2,056 41.8
Total 190 15,974* 11.9 188 16,822* 11.2CIEMAS
0 39 451 86.5 37 409 90.5 •1- 4 49 2,621 18.7 52 2,533 20.5 -5-19 27 7,830 3.4 33 7,278 4.520-49 53 6,062 8.7 46 6,825 6.750+ 31 1,312 23.6 23 9.7 25.1 v
Total 199 18,343* 10.8 191 18,030 10.6KANDANG SERANG
0 39 233 167.4 36 237 151.9 -1- 4 42 1,084 38.7 35 999 35.05-19 21 3,995 5.3 16 3,831 4.220-49 54 4,252 12.7 46 4,775 9.650+ 42 697 60.3 48 926 51.8
Total 198 10,265* 19.3 181 10,773* 16.8NGANTANG
0 39 239 163.2 39 233 167.41- 4 32 1,993 16.1 15 1,932 7.85-19 18 8,980. 2.0 16 8,533 1.920-49 43 8,585 5.0 30 9,409 3.250+ 129 3,041 42.4 160 3,386 47.3Total 261 22,873* 11.4 260 23,522* 11.1
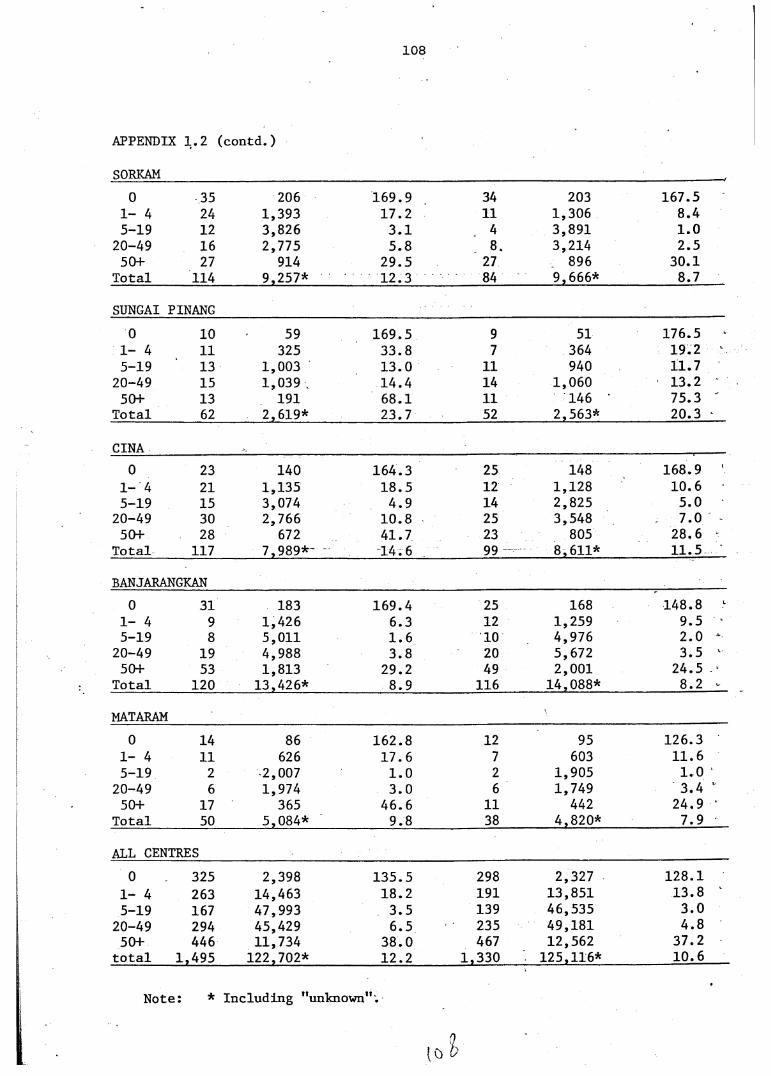
108
APPENDIX 1.2 (contd.)
SORKAM0 35 206 169.9 34 203 167.5
1- 4 24 1,393 17.2 11 1,306 8.45-19 12 3,826 3.1 4 3,891 1.0
20-49 16 2,775 5.8 8. 3,214 2.550+ 27 914 29.5 27 896 30.1
Total 114 9,257* 12.3 84 9,666* 8.7
SUNGAI PINANG0 10 59 169.5 9 51 176.5
1- 4 11 325 33.8 7 364 19.2 ‘5-19 13 1,003 13.0 11 940 11.7
20-49 15 1,039 14.4 14 1,060 13.250+ 13 191 68.1 11 146 ' 75.3
Total 62 2,619* 23.7 52 2,563* 20.3 ‘
CINA0 23 140 164.3 25 148 168.9 1
1- 4 21 1,135 18.5 12 1,128 10.65-19 15 3,074 4.9 14 2,825 5.0
20-49 30 2,766 10.8 25 3,548 7.050+ 28 672 41.7 23 805 28.6
Total 117 7,989* 14.6 99 8,611* 11.5
BANJARANGKAN0 31 183 169.4 25 168 148.8 L
1- 4 9 1,426 6.3 12 1,259 9.55-19 8 5,011 1.6 10 4,976 2.0 -20-49 19 4,988 3.8 20 5,672 3.5 '50+ 53 1,813 29.2 49 2,001 24.5
Total 120 13,426* 8.9 116 14,088* 8.2 w
MATARAM0 14 86 162.8 12 95 126.3
1- 4 11 626 17.6 7 603 11.65-19 2 2,007 1.0 2 1,905 1.020-49 6 1,974 3.0 6 1,749 3.4 '50+ 17 365 46.6 11 442 24.9
Total 50 5,084* 9.8 38 4,820* 7.9
ALL CENTRES0 325 2,398 135.5 298 2,327 128.1
1- 4 263 14,463 18.2 191 13,851 13.8 15-19 167 47,993 3.5 139 46,535 3.0
20-49 294 45,429 6.5 235 49,181 4.850+ 446 11,734 38.0 467 12,562 37.2
total 1,495 122,702* 12.2 1,330 125,116* 10.6
Note: * Including "unknown";
n(ö 0
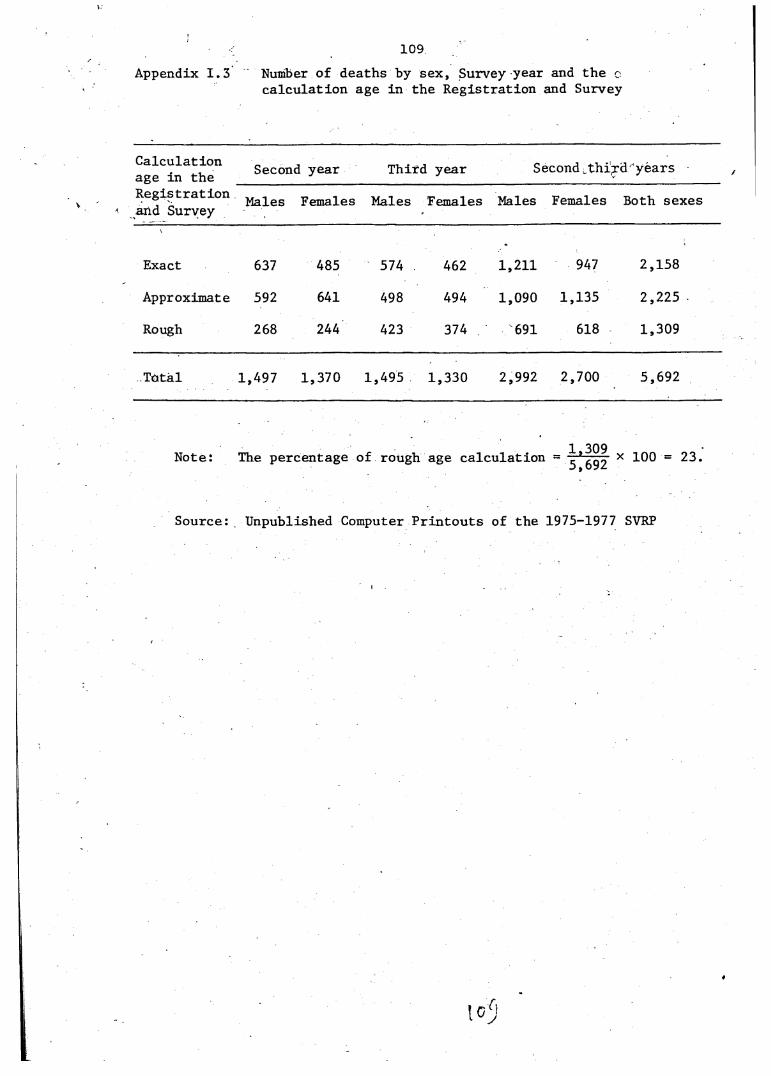
109Appendix 1.3 Number of deaths by sex, Survey year and the e
calculation age in the Registration and Survey
Calculation age in the Secondi year Third year Second.third yearsRegistration and Survey Males Females Males Females Males Females Both sexes
Exact 637 485 574 462 1,211 947 2,158
Approximate 592 641 498 494 1,090 1,135 2,225
Rough 268 244 423 374 691 618 1,309
Total 1,497 1,370 1,495 1,330 2,992 2,700 5,692
Note: The percentage of rough age calculation 1,3095,692 x 100 23.
Source: Unpublished Computer Printouts of the 1975-1977 SVRP
A P P E N D I X II
Note :I
Year 1 refers to the second year of Survey or the observation from July 1975 to June 1976.
Year 2 refers to the third year of Survey or the observation from July 1976 to June 1977.
3 refers to the combination of the second and third years or the observation from July 1975 to June 1977.
Year
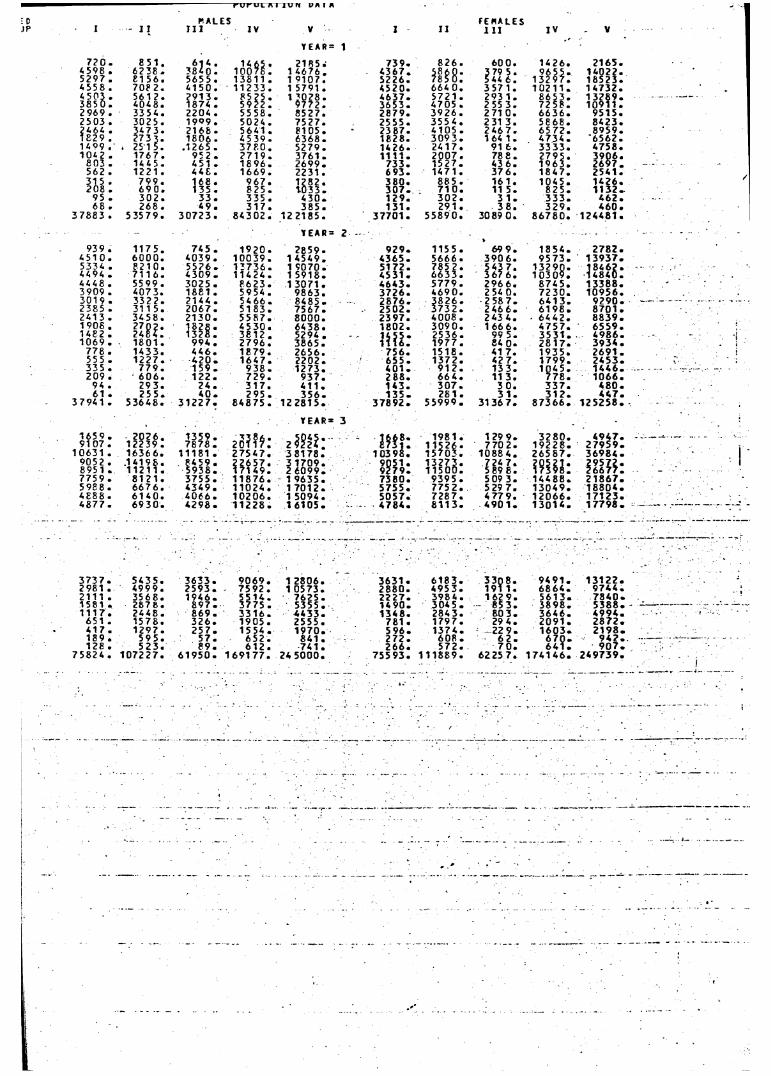
r u r u i a J V U V A I A
•0 P A L E S F E P A L E SI I I I l l I V V I I I I 11 I V V
Y E A R = 1
7 ? 0 • 8 5 1 . 6 1 4 .i o o ^ l !
2 1 8 5 . 7 3 9 . 8 2 6 . 60 0 . 14 2 6 . 2 1 6 5 .4 ,598 . 62 38 . 3 8 4 0 . 1 4 6 7 6 . 4 3 6 7 . 3 79 5 . 9 6 5 5 .
1 3 2 9 7 .1 4 0 2 2 .
5 2 9 7 . 8 1 5 6 . 5 65 5 . 1 3 6 1 1 . 1 0 1 0 7 . 5 2 2 6 . 5 44 6 . 1 6 5 2 3 .4,55 8 . 7 08 2 . 4 1 5 0 . 1 1 2 3 3 . 1 5 7 9 1 . 4 5 2 0 . 6 64 0 . 3 57 1 . 1 0 2 1 1 . 1 4 7 3 2 .4 5 0 } . 5 6 1 2 . 2 9 1 3 . 85 25 . 1 7 0 2 6 . 4 6 3 7 . 5 7 2 1 . 2 9 3 1 . 8 6 5 3 .
I o « ? ? :3 8 5 0 . 4 0 4 8 . 1 8 7 4 . 5 9 22 . 9 7 7 2 . 3 6 5 3 . 4 7 0 5 . 2 55 3 . 7 2 5 8 .2 9 6 9 . 33 54 . 2 2 0 4 . 55 58 . 8 5 2 7 . 2 8 7 9 . 3 9 2 6 . 2 71 0 . 6 6 3 6 . 9 5 1 5 .2 5 0 3 . 3 0 2 5 . 1 9 9 9 . 5 0 2 4 . 7 5 2 7 . 25 55 . 3 5 5 4 . 2 31 3 . 5 8 6 8 . 8 4 2 3 .2 4, 6 4, . 3 47 3 . 2 1 6 8 . 5 6 4 1 . 8 1 0 5 . 2 3 8 7 . 4 1 0 5 . 2 4 6 7 . 6 5 7 2 . 8 9 5 9 .1 8 2 9 . 2 73 3 . 1 6 0 6 . 4 5 39 . 6 3 6 8 . 1 8 2 8 . 3 0 9 3 . 1 64 1 . 4 7 3 4 . 6 5 6 2 .1 4 0 9 . . 25 1 5 . . 1 2 6 5 . 3 7 8 0 . 52 79 . 14 2 6 . 2 4 1 7 . 91 6 . 3 3 3 3 . 4 7 5 8 .1 04 2 . 1 7 6 7 . 9 5 2 . 2 7 1 9 . 3 76 1 . 1 1 1 1 . 2 0 0 7 . 78 8 . 2 7 9 5 .
? W :£ 0 3 . 14 4 5 . 4 5 1 . 1 8 9 6 . 2 6 9 9 . 7 3 3 . 1 5 2 7 . 43 6 . 1 9 6 3 .5 6 2 . 1 2 2 1 . 4 4 8 . 1 6 6 9 . 2 2 3 1 . 6 9 3 . 1 4 7 1 . 3 7 6 . 1 8 4 7 . 2 5 4 1 .3 1 5 . 7 9 9 . 1 6 8 . 9 6 7 . 1 2 8 2 . 3 8 0 . 8 8 5 . 16 1 . 1 04 5 . 1 4 2 6 .2 0 8 . 6 9 0 . 1 3 5 . 8 2 5 . 1 0 3 3 . 3 0 7 . 7 1 0 . 11 5 . 8 25 . 1 1 3 2 .
9 5 . 3 0 2 . 3 3 . 3 3 5 . 4 3 0 . 1 2 9 . 3 0 2 . 3 1 . 3 3 3 . 4 6 2 .6 8 . 2 6 8 . 4 9 . 3 1 7 . 3 8 5 . 1 3 1 . 2 91 . 3 8 . 3 2 9 . 4 6 0 .
3 7 8 8 3 . 5 35 7 9 . 3 0 7 2 3 . 8 4 3 0 2 . 12 2 1 8 5 . 3 7 7 0 1 . 5 5 8 9 0 . 3 0 8 9 0 . 8 6 7 8 0 . 1 2 4 4 8 1 .
Y E A R = 2 . . • - • - • •
9 3 9 . 1 1 7 5 . 7 4 5 . 1 9 2 0 . 2 8 5 9 . 9 2 9 . 1 1 5 5 . 69 9 . 1 8 5 4 . 2 7 8 2 .4 5 1 0 . 6 0 0 0 . 4 0 3 9 . 1 0 0 3 9 . 1 4 5 4 9 . 4 3 6 5 . 5 6 6 6 . 3 9 0 6 . 9 5 7 3 . 1 3 9 3 7 .5 3 3 4 . 8 2 1 0 . 5 5 2 6 . 1 7 7 3 6 . 1 9 0 7 0 . 5 1 7 2 . 7 85 2 . HU: 1 3 2 9 0 . 1 8 4 6 2 .4 4 9 4 . 7 1 1 6 . 4 3 0 9 . 1 1 4 2 4 . 1 5 9 1 8 . 45 31 . 6 6 3 3 . 1 0 3 0 9 . 1 4 8 4 0 .4 4 4 8 . 5 5 9 9 . 3 0 2 5 . 8 6 2 3 . 1 3 07 1 . 4 6 4 3 . 5 7 7 9 . 2 9 6 6 . 8 7 4 5 . 1 3 3 8 8 .3 9 0 9 . 4 0 7 3 . 1 8 8 1 . 5 9 5 4 . 9 8 6 3 . 3 7 2 6 .
2 8 7 6 .4 6 9 0 . 2 54 0 . 7 2 3 0 . 1 0 9 5 6 .
3 0 1 9 . 33 2 2 . 2 1 4 4 . 5 4 6 6 . 8 4 8 5 . 3 8 2 6 . 2 58 7 . 6 4 1 3 . 9 2 9 0 . - - - - - ....................2 3 85 . 3 1 1 5 . 2 0 6 7 . 5 1 8 3 . 7 5 6 7 . 2 5 0 2 . 3 7 3 2 . 2 4 6 6 . 6 1 9 8 . 8 7 0 1 .2 4 1 3 . 34 5 8 . 2 1 3 0 . 5 5 8 7 . 8 0 0 0 . 2 3 9 7 . 4 0 0 8 . 2 4 3 4 . - 6 4 4 2 . 8 8 3 9 .1 9 0 8 . l l l l : 1 8 2 8 . 4 5 3 0 . 6 4 3 8 . 1 8 0 2 . 3 0 9 0 . 1 66 6 . 4 7 5 7 . 6 5 5 9 .1 4 8 2 . 1 3 2 8 . 3 8 1 2 . 5 2 9 4 .
? ? ! ! :2 5 3 6 . 99 5 . 35 3 1 . 4 9 8 6 .
1 0 6 9 . 1 8 0 1 . 9 9 4 . 2 7 9 6 . 3 8 6 5 . 1 9 7 7 . 84 0 . 2 8 1 7 . 3 9 3 4 .7 7 8 . 1 4 3 3 . 4 4 6 . 18 79 . 2 6 5 6 . 7 5 6 . 1 5 1 8 . 41 7 .
42 7 .1 9 3 5 . 2 6 9 1 .
55 5 . 1 2 2 7 . 4 2 0 . 1 6 4 7 . 2 2 0 2 . 65 5 . 1 3 7 2 . 1 7 9 9 . 2 4 5 3 .3 3 5 . 7 7 9 . 1 5 9 . 9 3 5 . 1 2 7 3 . 4 0 1 . 9 1 2 . 13 3 . 1 0 4 5 . 1 4 A 6 *2 0 9 . 6 0 6 . 1 2 2 . 7 2 9 . 9 3 7 . 2 8 6 . 6 6 4 . 11 3 . 7 7 8 . 1 0 6 6 .
94 . 29 3 . 2 4 . 3 1 7 . 4 1 1 . 1 4 3 . 3 0 7 . 3 0 . 3 3 7 . 4 8 0 .61 . 2 5 5 . 4 0 . 2 9 5 . 3 5 6 . 1 3 5 . 2 8 1 . 3 1 . 3 1 2 . 4 4 7 .
3 7 9 4 1 . 5 3 6 4 8 . 3 1 2 2 7 . 8 4 8 7 5 . 12 281 5 . 3 7 8 9 2 . 5 5 9 9 9 . 31 3 6 7 . 8 7 3 6 6 . 1 2 5 2 5 8 .
Y E A R = 3
1 65 9 . 91 0 7 .
2 0 2 6 . 1 2 2 3 9 .
1 3 5 9 . 7 8 7 8 . I M J :
1 9 8 1 . 1 1 5 2 6 - 1 5 7 0 3 .
1 29 9 . 7 7 0 2 .
3 2 8 0 .1 9 2 2 8 .
4 9 4 7 .2 7 9 5 9 .
1 0 6 3 1 . 1 6 3 6 6 . 1 1 1 8 1 . 2 7 5 4 7 . 3 8 1 7 8 . 1 0 3 9 8 . 1 0 8 8 4 . 2 6 5 6 7 . 3 6 9 8 4 .9 0 5 2 . 8 95 1 .
. 1 4 1 9 8 . 1 1 2 1 1 .
8 4 5 9 . 5 9 3 8 .
2 2 6 5 7 . 1 7 1 4 9 .
3 1 7 0 9 . 2 6 0 9 9 .
9 0 5 1 . 9 2 7 9 .
1 3 2 7 3 .1 1 5 0 0 .
7 2 4 7 . 5 8 9 8 . ?9!S2: -
7 7 5 9 . 8 1 2 1 . 3 7 5 5 . 1 1 8 7 6 . 1 9 6 3 5 . 7 3 8 0 . 9 3 9 5 . 5 09 3 . 1 4 4 8 8 . 2 1 8 6 7 .5 9 8 8 . 6 6 7 6 . 4 3 4 9 . 1 1 0 2 4 . 1 7 0 1 2 . 5 7 5 5 . 7 75 2 . 5 2 9 7 . 1 3 0 4 9 . 1 8 8 0 4 .4 8 8 8 . 6 1 4 0 . 4 0 6 6 . 1 0 2 0 6 . 1 5 0 9 4 . 5 0 5 7 . 7 2 8 7 . 4 77 9 . 1 2 0 6 6 . 1 7 1 2 3 .4 8 7 7 . 6 9 3 0 . 4 2 9 8 . 1 1 2 2 8 . 1 6 1 0 5 . 4 7 8 4 . 8 1 1 3 . 4 9 0 1 . 1 3 0 1 4 . 1 7 7 9 8 . ---------- -----------------
3 7 3 7 . 5 4 3 5 . 3 6 3 3 . 9 0 6 9 . 1 2 8 0 6 . 3 6 3 1 . 6 1 8 3 . 3 3 0 8 . 9 4 9 1 . 1 3 1 2 2 .2 9 8 1 . 4 9 9 9 . 2 5 9 3 . 7 5 9 2 . 1 0 5 7 3 . 2 8 8 0 . 4 9 5 3 . 1 9 1 1 . 6 8 6 4 . 9 7 4 4 .2 1 1 1 . 3 5 6 8 . 1 9 4 6 . 55 1 4 . 7 6 2 5 . 2 2 2 7 . 3 9 8 4 . 1 6 2 9 . 5 6 1 3 . 7 8 4 0 .15 81 . 2 67 8 . 8 9 7 . 3 7 7 5 . 5 3 5 5 . 1 4 9 0 . 3 0 4 5 . 85 3 . 3 8 9 8 . 5 3 8 8 . .......-1 1 1 7 . 2 4 4 8 . 8 6 9 . 3 3 1 6 . 4 4 3 3 . 1 34 8 . 2 8 4 3 . 80 3 . 3 6 4 6 . 4 9 9 4 .
6 51 . 1 5 7 8 . 3 2 6 . 1 9 0 5 . 2 5 5 5 . 7 81 . 1 7 9 7 . 29 4 . 2 0 9 1 . 2 8 7 2 .4 1 7 . 1 2 9 7 . 2 5 7 . 1 5 54 . 1 9 7 0 . 5 9 6 . 1 3 7 4 . 22 9 . 1 6 0 3 . 2 1 9 8 .1 8 9 . 5 9 5 . 5 7 . 6 5 2 . 8 41 . 2 7 2 . 6 0 8 . 6 2 . 6 7 0 . 9 4 2 . - -1 28 . 5 2 3 . 8 9 . 6 1 2 . 7 41 . 2 6 6 . 5 7 2 . 7 0 . 6 4 1 . 9 0 7 .
7 5 8 2 4 . 1 0 7 2 2 7 . 6 1 9 5 0 . 1 6 9 1 7 7 . 24 5 0 0 0 . 7 5 5 9 3 . 1 1 1 8 8 9 . 6 2 2 5 7 . 1 7 4 1 4 6 . 2 4 9 7 3 9 .1
• ;•
I
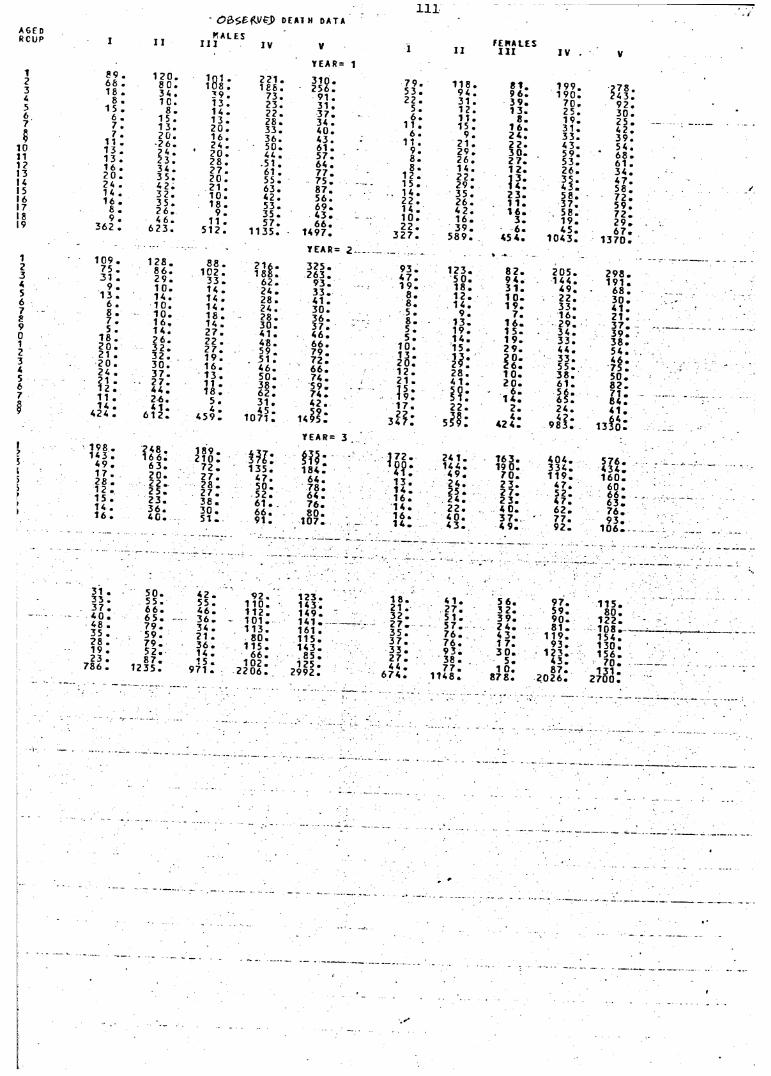
4567$
10111 ?131 4151617IS19
12345678901234567
I?5l5>f
I
111DEATH DATA
PALESI I I
896618
815 ,
6 , 7 ,7 .
11 . 13 . 13 .16 . 2 0 . 24 . 1 4 . 16 .
8 . 9 .
362 .
109 . 75 . 31 .
9 . 13 .
6 . 8 . 7 . 5 .
18 . 2 0 . 21 . 20 . 24 . 21 • 12 . 11 .
1 2 0 . 8 0 . 34 . 1C.
8 . 1 5 . 1 3 . 2 0 . 2 6 .IS:34 .3 5 .4 2 .3 2 .3 5 .2 6 .4 6 .
6 2 3 .
1 2 8 .8 6 .2 9 . 1 0 . 1 4 . 1 0 . 10. 1 6 . 1 4 . 2 6 . 3 2 . 3 2 .3 0 . 3 7 . 2 7 . 4 4 .
? 83 .39, 13, 14 , 13. 2 0 . 16 . 24 . 2 0 . 2 8 . 2 7 . 2 0 . 21 . 1 0 . 18 .
9 . 11 .
5 1 2 .
88 .1 0 2 .
3 3 . 14 . 14 . 14 . 1 8 . 14 . 2 7 . 22 . 2 7 . 1 9 . 1 6 . 1 3 . 11 . 1 8 .
221.1 8 6 .
73.23.2 2 .2 8 .33.36.50. 44 .5 1. 61 . 55 . 63. 42. 53 . 3 5 . 57.
1 1 3 5.
2 1 6 . 1 8 8 .
6 2 . 2 4 . 28 . 24 . 2 8 . 3 0 . 41 . 4 8 . 5 9 . 51 . 4 6 . 5 0 . 3 8 . 6 2 .
Y E A R = 1
3 1 0 .2 5 6 .
91 .31 .3 7 .34 .4 0 .43.6 1 .5 7 .6 4 .7 7 .7 5 .8 7.5 6.6 9 .4 3 .6 6 .
1497.
YEAR = 2
3 2 5 .263 .
9 3 .3 3 .41 .3 0 .3 6 .3 7 .4 6 .6 6 .7 9 .7 2 .6 6.7 4 .5 9 .7 4 .
7 9 .5 3 .2 2 .
5 .6 .
1 1 .6 .
11 .9 . 8 . 8 .
1 2 . 15 . 1 4 . 2 2 . 1 4 . 1 0 . 2 2 .
3 2 7 .
9 3 .4 7 .1 9 .
8.8.5 .8.5 .5 .
1 0 .1 3 .2 0 . 1 2. 21 .V -9 .
14 . 424 . 4 1 1
6 1 2 .3 .4 .
4 5 9 .31 .
1071 r4 2 .5 9 .
1495.1 7 .
zU:Y E A R = 3 .
198 . 143 .
49 . 17 . 28 . 12 .15 . 14 .16 .
248 . 16 6 .
6 3 . 2 0 . 2 2 . 2 5 . 2 3 . 3 6 . 4 C .
1 8 9 . 2 1 0 .
7 2 . 2 7 . 28 . 2 7 . 3 8 . 3 0 . 5 1 .
W:1 3 5 .
4 7.5 0 .5 2 .6 1 .6 6 .9 1 .
1 8 4 .6 4 .7 8 .6 4 .76 .8 0 .
1 0 7 .
1 7 2 .
' i t :1 3 .1 4 . 1 6 . 1 4 . 1 6 . 1 4 .
1 1 8 . 9 4 . 31 . 1 2 . 11. 15 .
9 . 2 1 . 2 9 . 2 6 . 1 4 . 2 2 . 2 9 . 3 5 . 2 6 . 4 2 . 1 6 . 3 9 .
5 8 9 .
1 2 3 .5 0 .1 8 .1 2 .1 4 .
9 .1 3 . 1 9 .1 4 .1 5 .
II:2 8 .4 1.It:22.siJ:
2 4 1 . 1 4 4 . 4 9 . 2 4 . 25 . 2 4 . 2 2 . 4 0 . 4 3 .
EE WA LE S I I I
8 1 .9 6 .3 9 .1 3.
8.1 6 . 2 4 . 2 2 . 3 0 .2 7. 1 2.
) < :2 3 .1 1 .1 6 .
3 .6 .
4 5 4 .
8 2 . 9 4 . 3 1 . 1 0 . 1 9 .
7 . 1 6 . 1 5 . 1 9 . 2 9 . 2 0. 2 6 . 1 0 . 2 0.
6. 1 4 .
2 . 4 .
42 4 .
1 6 3 .1 9 0 .
7 0 .2 3 .2 7 .2 3 .4 0 .3 7 .4 9 .
1 9 9 . 1 9 0 .
7 0 .25 . 19 . 3 1 . 3 3 . 4 3 . 5 9 . 5 3 .2 6.
I5 8 .3 7 .5 8 .1 9 .4 5 .
1 0 4 3 .
2 0 5 .1 4 4 .
4 9 .2 2 .3 3 . 1 6. 2 9 .3 4 . 3 3 . 4 4 . 3 3 . 5 5 . 3 8 . 6 1 .
It2 4 .
9 8 ? r
4 0 4 .3 3 4 .1 1 9 .
4 7 .5 2 .4 7 .6 2 .7 7 .9 2 .
778243
923025423954
* 68 61 34 4758 7259 72 29 67
1370
298191
683 0 .4 1 .2 1 .3 7 . 3 9 .3 8 . 5 4 . 4 6 . 7 5 . 5 0 . 8 2 . 7 1 . 8 4 . 4 1 .
4 .0 .1 3 !
5 76. 434. 160.
60. 6 6 . 6 3. 76. 9 3 .
1 0 6 .
31 33 37 40 48 , 35 , 28 . 19 , 23 .
786 .
50.55.6 6 .6 5.7 9.59.7 9 .5 2.
. 8 7 * 1 2 3 5.
42 . 55 . 4 6 . 3 6 . 34 . 21 . 3 6 .14 .15 .
971 .
92. 1 1 0 . 1 1 2 . 1 0 1 . 113.
80. 1 15 .
6 6 . 1 0 2 .
2 2 0 6 .
123. 143, 149, 141 . 161 . 115. 143.
85.125 .
2992.
1 8 . 21 .3 2 . 2 7 . 3 5 . 3 7 .3 3 . 2 7 . 44 .
6 7 4 .
4 1 .2 7 . 5 1 . 5 7 . 7 6 .7 6 . 9 3 . 38 .7 7 .
1 1 48.
5 6 . 3 2 . 3 9 . 2 4 . 4 3 . 1 7. 3 0 .
5 . 1 0 .
8 7 8 .
9 7 .5 9.9 0 .8 1 .
1 1 9 .9 3 .
1 2 3 .4 3 .8 7 .
2 0 2 6 .
1 1 5.8 0 .122.
1 0 8.1 5 4.1 3 0. 1 5 6.
7 0.1 3 1.
2 7 0 0.
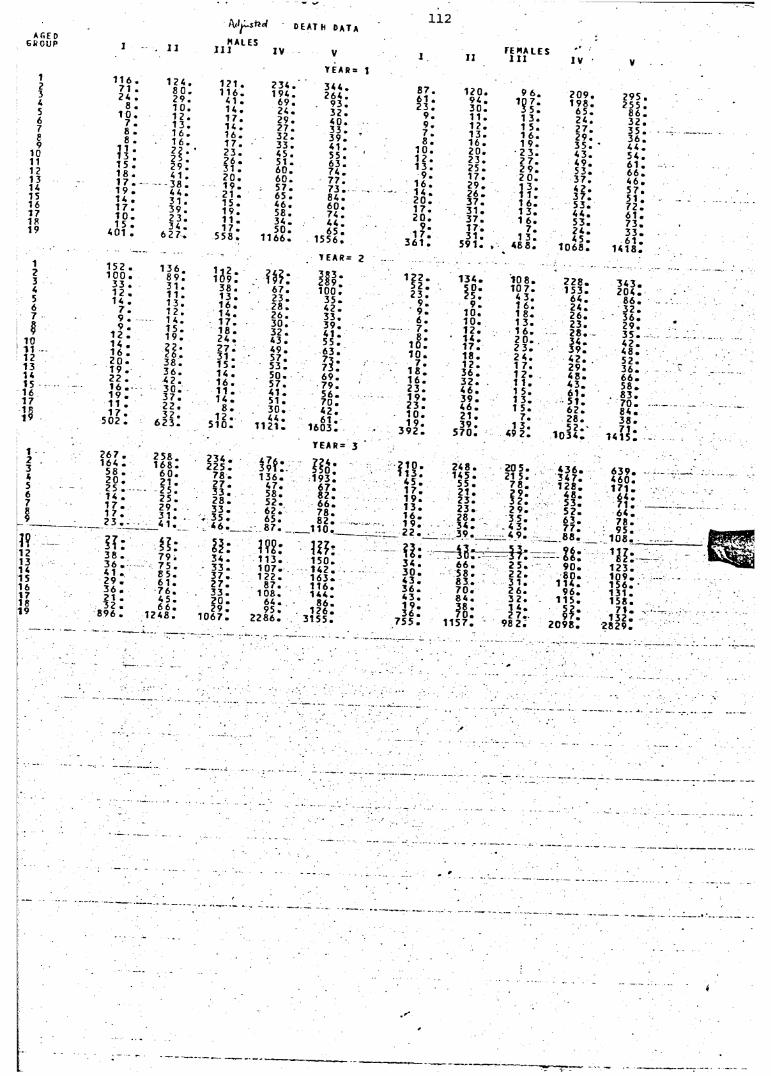
AGE 0 G k OUP
12345678 9
10 11 1 2131415161718 19
123456 7I
TOI I 1213141516 17
/V^-snWmales
116 . 71 . 24 .
8 . 1 0 .
7 .8 . 8 .
11 .13 . 15 . 18 . 17 . 1 9 .14 . 1 7 . 1 0 .1 5 .
401 .
152 1 0 0 ,
33 , 12 ,14 .
7 . 9 . 9 .
12 . 14 . 16 . 2 0. 1 9 . 22 . 16 . 19 . 11 .
1 1 111 IV
1 2 4 . 1 2 1 . 234 .8 0 . 1 1 6 . 1 94 .2 9 .1 0 .1 2 .1 3 .1 6 .
41 . 14 . 1 7 . 14 .1 6 .
6 9 . 2 4. 2 9. 2 7 . 32 .1 6 . 1 7 . 3 3 .
l l ' ' 2 3 . 4 5.2 5 . 2 6 . 51 .29 . 31 . 6 0 .4 1 . 2 0 . 6 0 .3 8 .4 4 .
1 9 . 21 .
57. 65 .3 1 . 1 5 . 4 6 .39 .
2 3 . 3 4 .
1 9 .1 1 .1 7 .
5 8.3 4 .50.6 2 7« 558 . 1 1 6 6 .
1 3 6 .8 9 .3 1 .11.1 3 .1 2 .1 4 .1 5 . 1 9 .
f i :3 8 .3 6 . 4 2 . 3 0 .3 7 .2 2 .
d e a t h d a t a
t e a r = i
344 .264 .
9 3 .3 2 .4 0 .3 3 . . 3 9 .4 1 .5 5.6 3 .7 4 .77 .7 3 .8 4 .6 0 .7 4 .4 4 .6 5 .
1556.
T E A R = 2
I I I :3 8 .1 3 . 1 6 .1 4 .1 7 .1 8 . 2 4 . 2 7 . 3 1 .1 5 . 1 4 .1 6 . 11 . 1 4 .
8 .
67 .2 3 .2 8 .2 6 .30.3 2 .4 3 .4 9 . 57. 5 3 .50. 5 7. 4 1 . 51 . 3 0 .
183 . 9 .
1 0 0.3 5 .4 2 .33.3 9 .4 1 .5 5 . 6 3 .
?1 :6 9 . 7 9 .5 6 .7 0 .
8 7 . 61 . 2 3 .
9 .9 .7 .8 .
1 0 . 1 2 .1 3 .
9 .1 6 .1 4 . 2 0 . 1 7 . 2 0 .
9 . 1 7 .
361 .
122.5 2 .2 3 .
9 .9 .6 .7 .8 .
1 0. 1 0 .
7 .1 8 .1 6 .2 3 .1 9 .2 3 .
FEMALES11 I I I I V
120. 9 6 . 2 0 9 .94 . 3 0 . 1 1 . 1 2 . 1 3 . 1 6 . 2 0 . 2 3 .
1 3 .1 5. 1 6 . 1 9 .2 3 .2 7.
1 9 8 .6 5 .24.2 7 .2 9 .3 5 .4 3 .4 9 .25 •
17. 2 9 .
2 9 .2 0 .1 3 .
5 3 .3 7 .4 2 .2 6 . 1 1 . 3 7 .3 7 .
3 1 .3 7 .1 7 .3 1 .
1 6 . 1 3 . 1 6 .
1 3 l
5 3. 4 4 . 5 3 . 2 4 . 4 5 .5 9 1 . , 4 8 8 . 1 0 6 8 .
1?:1 0 r 1 0 . 1 2 . 1 4 .17 .1 8. 1 2 . 3 6 . 3 2 . 4 6 . 3 9 . 4 6 .
1 0 8 . 1 0 7 . 4 3. 1 6. 1 8. 1 3 . 1 6 . 2 0 .2 3 .2 4 . 1 7. 1 2 . 1 1 .1 5.1 3 .1 5 .
2 2 8 .1 5 3 .
6 4 .2 4 .2 6 .2 3 .2 8 .3 4 .3 9 .4 2 . 2 9 . 4 8 .4 3 . 6 1 . 5 1 . 6 2 .
295 . 255 .
8 6.3 2 .3 5 .3 6 . 4 4 . 5 4 . 6 1 . 6 6. 4 6 . 5 7 . 5 1 .7 2 . 6 1 .7 3 .3 3 . 6 1 .
1 4 18.
3 4 3 .2 0 4 .
8 6 .3 2 .3 6 .29 .3 5 . 4 2 . 4 8 . 5 2 .3 6 . 6 6 . 5 8 . 8 3 . 7 0 .
19 502 . S2 .6 2 3 . 1 2 .
5 1 0 .4 4.
1 1 2 1 .6 1 .
160 3.1 u .
3 92 121 . 3 9 .
5 7 0 .
7 .1 3.
49 2 .2 8 .
. 57.'1 0 3 4 .3 8 .7 1 .
1 4 1 5 .TEAR= 3
53456 7
J
267 . 164 .
58 . 2 0 . 25 . 14 . 1 7 . 17 . 23 . -
2 5 8 . 1 6 8 .
6 0 . 2 1 .
• 2 5 .2 5 . 2 9 . 3 1 . 4 1 .
234 . 225 .
7 8 .2 7 . 3 3 .2 8 . 3 3 .
. 3 5 .
!»:.1 3 6 .
4 7.58.5 2.6 2 .65.
IIS;1 9 3 .
6 7 .8 2 .6 6 .7 8 .8 2 . . . . . .
4 5 .1 7 .1 9 .1 3 .1 6 .1 9 .
24 8 . 1 4 5 . 5 5 . 2 1 . 2 3 . 2 3 . 2 8 . j 4
20 5.21 5.
7 8 .
II:2 9 .3 5 .
4 3 6 .3 4 7 .1 2 8 .
4 8 .5 3 .5 2 .6 3 .
6 3 9 . 4 6 0 . 1 7 1 .
6 4 . 7 1 . _ 6 4 . 7 8 .
I? If: i i i :
87 •
1??:1 13 .1 0 7 .1 2 2 .
8 7. 1 0 8.
6 4 . 9 5 .
2 2 8 6 .
__ 110 . ______ - • 22 1
2 3 .3 9 .
Mr.6 6 .5 8 .8 3 . 7 0 .8 4 .
H:1 1 5 7.
•» 5 m4 9 .
-H :2 5. 2 2 .3 1 . 2 6 . 3 2 . 1 4 . 2 7 .
98 2.
77.8 8 .9 6 .
9 5 .1 0 8 . -
'21: - 1 2 3 . 1 0 9 . 1 5 6 . •1 3 1 . 1 5 8 .
7 1 . ,1 3 2 .
2 8 2 9 .
1 Cu1516
1819
3 8* 36 . 41 . 29 . 36 . 21 . 32 .
896 .
7 9 .7 5 . 8 5. 6 1 .7 6 . 4 5 . 6 6 .
1248 .
3 4 .3 3 .3 7 .2 7 .3 3 .2 0 .2 9 .
1 0 6 7 .
15 0.1 4 2 .1 6 3 .1 1 6 .1 4 4 .
8 6 .1 2 6 .
315 5.
1 6 .3 4 .3 0 .4 3 .3 6 .4 3 .1 9 .3 6 .
7 5 5 .
0 6 .9 0 .8 0 .
1 1 4 . 9 6 .
1 1 5 .
If:2 0 9 8 .
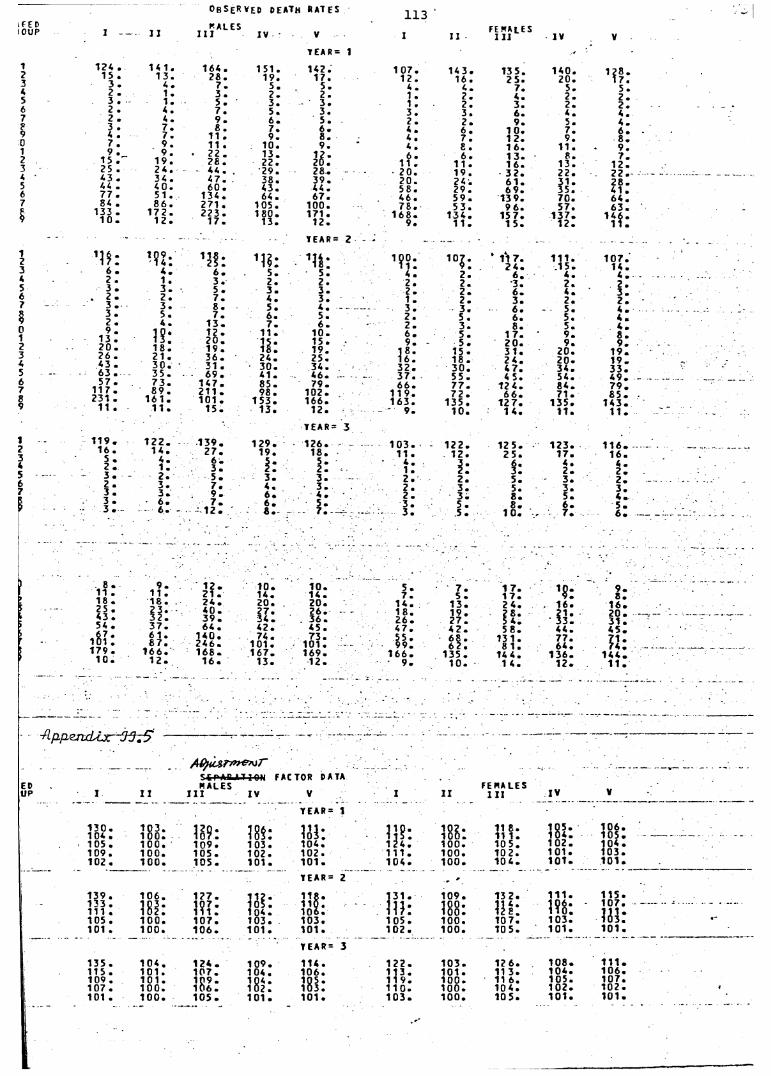
Ob S ERVEO DEATH RAT ES
t f t D (OUP 1 1 1
PALESI I I IV V 1 11
FEPAl ES 1 11 IV V
YEAR = 1 ' '1 124 . 14 1. 164 . 1 51. 142. 1 0 7 . 14 3 . 13 5. 1 4 0 . 1 2 8 .23
1 5 .3 .
1 3 . 4 .
28 .7 .
19.5 .
17.5 .
1 2 . 4 .
1 6.4 .
2 5 .7.
20 .5.
1 7 .5 .4
52 • 3 .
1 . 1 .
3 . 5 .
2 .3 .
2 .3 .
1 . 1 .
2 .2 .
4.3 .
2 .2 .
2 .2 .6 2 • 4 • 7 . 5 . 3 . 3 . 3 . 6 . 4 . 4 .7 2 • 4 . 9 . 6 . 5 . 2 . 2 . 9 . 5. 4 .P 3 • 7 . 8 « 7 . 6 . 4 . 6 . 1 0 . 7 . 6 .9 4 • 7 . 11 . 9 . 8 . 4 . 7 . 1 2. 9 . 8 .0 7 • 9 . 11 . 10. 9 . 4 . 8 . 1 6. 11 . 9 .1
29 •
15 . ~9 .
1 9 .• 22 .
2 6 .1 3 .22. U : 6 .
11 .6 .
1 1 .1 3 . 1 6 .
8.13.
7 .1 2 .3 2 5« 2 4 . 44 . . 2 9. 2 8 . 2 0 . 1 9 . 3 2 . 2 2 . 2 2 .4 43 • 3 4« 4 7 . 3 8 . 3 9 . 2 0 . 2 4 . 6 1 . 3 1 . 28 .5 4 4« 4 0 . 60 ■ 43 . 4 4 . 5 8 . 2 9 . 6 9 . 35. 41 .6 77 • 5 1 . 134 . 64 . 6 7 . 4 6 . 5 9 . 13 9. 7 0. 6 4 .7 8 4 . 8 6 . 271 . 1 05 . 100. 7 8 . 5 3 . 9 6. 57. 6 3 .
§ 13 3« 17 2« 223 . 1 8 0 . 171 . 1 6 8 . 1 3 4 . 15 7 . 1 3 7 . 1 4 6 .y 10« 12« 1 7 . 13. 1 2. 9 . 1 1 . 1 5 . 1 2 . 1 1 .— - . . T E A R = 2 - • - _
123
’ I f :6 .
' S I :4 . 6 .
1 U :5. 5 ! 4 . 2 .
* 1 17 . 2 4 .
6 .
1 1 1 .1 5 .
4 .
1 0 7 . 1 4 .
4 .4 2 . 1 . 3 . 2 . 2 . 2 . 2 . •3. 2 . 2 .5 3 • 3 . 5 • 3 . 3 . 2 . 2 . 6 . 4 . 3 .6 . 2 . 2 . 7 • 4 . 3 . 1 . 2 . 3 . 2 . 2 .7 3 . 3 . 8 . 5 . 4 . 3 . 3 . 6 . 5 . 4 .s 3 ■ 5 « 7 a 6 . 5 . 2 . 5 . 6 . 5. 4 .y012
2 . 9 .
13 . 2 0 .
4 •
I S :1 8 .
1 3 .
J 8 :1 9 .
7 .11 .
H :
6 .1 0 .1 5 .19.
2 .6 .9 .
1 8 .
3 . 5 . 5 .
15 .
8 .1 7 . •2 0 . 3 1 .
5 .9 .9 .
2 0 .
4 .8 .9 .
1 9 .j 2 6 . 2 1 . 36 • 2 4 . 25 . 1 6 . 18 . 2 4 . 2 0 . 1 9 .4 43 • 3 0 . 31 . 3 0 . 3 4 . 3 2 . 3 0 . 4 7 . 3 4 . 3 3 .5 63 . 3 5 . 69 . 41 . 4 6 . 3 7 . 5 5 . 4 5. 54. 4 9 .6 5 7 . 7 3 . 1 4 7 . 8 5 . 7 9 . 6 6 . 7 7 . 1 2 4 . 8 4 . 7 9 .78
1 1 7 . 231 .
89 .1 6 1 .
211 . 101 .
9 8 .1 5 3 .
1 0 2 .1 66 .
1 1 9 . 1 6 3 .
7 2 .1 3 5 .
6 6 .1 2 7 .
7 1 .1 3 5 .
8 5 .1 4 3 .9 11« 1 1 . 1 5 . 13. 12. 9 . 1 0 . 1 4. 11. 11 .
TEAR= 31*5 1 1 9 . 1 2 2 . 1 3 9 . 1 2 9 . 1 2 6 . 1 0 3 . 1 2 2 . 12 5 . 1 2 3 . 1 1 6 .*345
16«5 . 2 . 3 .
1 4 .4 .1 .2 .
27«6 .3 .5 .
19 .
i :3 .
18 .5 .2 .3 .
11 . 4 . 1 . 2 .
1 2 .
I:2 .
2 5 .
S:5 .
17.4 .2 .3 .
1 6 . 4 . 2 . 2 .6
72 . 3 .
3 . 3 .
7 .9 .
4 .6 .
3 .4 .
2 .2 .
3 .3 .
5.8 .
3 .5 .
3 .4 .
53 . 3 .
6 «■ - 6 . -
7 . 1 2 .
6 . £ .
5 .-- 7 . - ~ ..
3 .3 .
5 .5 .
8 .1 0 .
6 . 5 .6 .
EDUP
5 i P--AJ.1T I OH FACTOR DATAWALES FEMALES
I 11 111 IV V I I I 1 11 I V V
T E A R = 1
1 3 0 . 104 .
1 0 3 .1 0 0 . 189: 181: 131: l? ? : 1 0 2 .
1 0 0 .11 8 . 11 1 .
1 0 5 .1 0 4 . lo t
105 . 1 0 0 . 1 0 9 . 1 0 3 . 10 4. 1 2 4 . 1 0 0 . 1 0 5 . 1 0 2 . 1041 0 9 . 1 0 0 . 105 . 1 0 2 . 10 2. 1 1 1 . 1 0 0 . 1 0 2 . 1 0 1 . 103102 . 1 0 0 . 1 0 5 . 101 . 1 0 1 . 1 0 4 . 1 0 0 . 1 0 4 . 1 0 1 . 101
Y E A R = 2
139 . 1 0 6 . 1 7 7 . 135:1 04 .
1 1 8 . ill; 1 0 9 . 13 2. 1 1 1 . 115133 . 111 . 181: 1 0 7 .
111 .1 10 .1 0 6 .
1 0 0 .l o o . I l l : m: 107
!33105 . 1 0 0 . 1 0 7 . 1 03 . 1 0 3 . 1 0 5 . 1 0 0 . 1 0 7 . 1 0 3 .101 . 1 0 0 . 1 0 6 . 101 . 1 0 1 . 1 0 2 . 1 0 0 . 1 0 5 . 1 0 1 . 101
YEAR= 3
135 . 1 0 4 . 124 . 1 0 9 . 1 1 4 . 1 2 2 . 1 0 3 . 12 6 . 1 0 8 . 111115 . 1 0 1 . 1 0 7 . 1 0 4 . 1 0 6 . 1 1 3 . 101 . 11 3 . 1 0 4 . 106109 . 10 1. 1 0 9 . 1 04 . 1 0 5 . 1 1 9 . 1 0 0 . 11 6 . 1 0 5 . 107107 . 1 0 0 . 1 0 6 . 1 0 2 . 1 0 3 . 1 1 0 . 1 0 0 . 10 4 . 1 0 2 . 102101 . 1 0 0 . 1 0 5 . 101 . 101 . 1 0 3 . 1 0 0 . 1 0 5 . 1 0 1 . 101
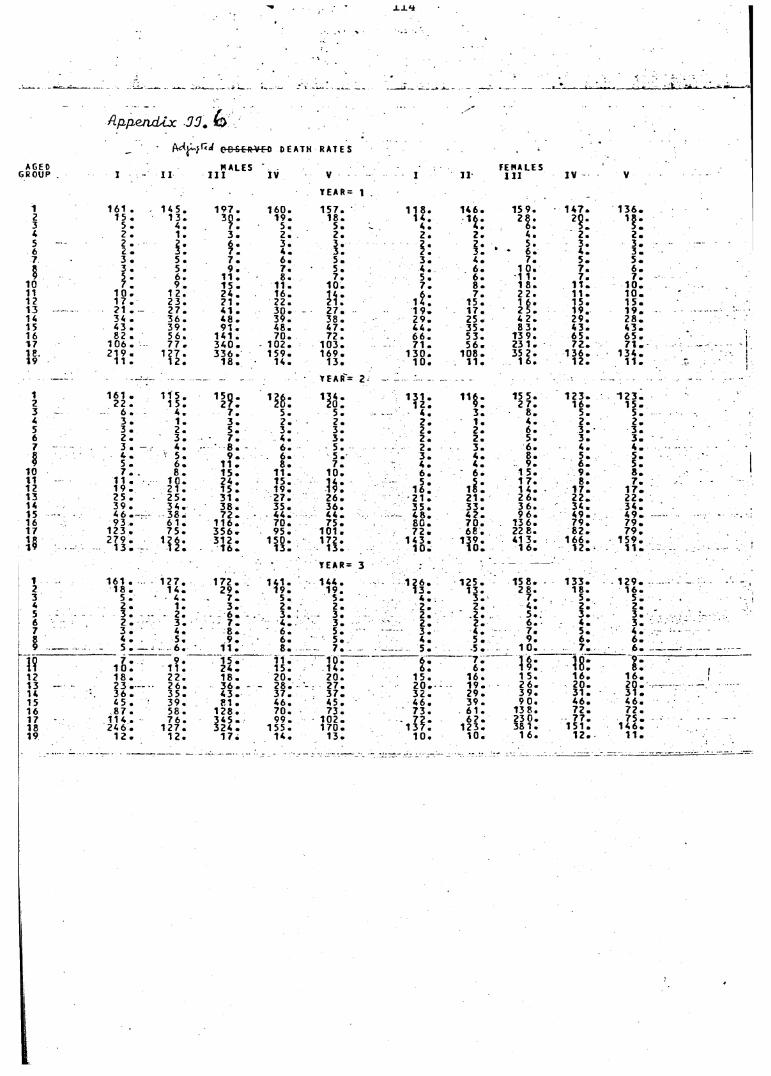
X X f t
_fc-..
Aßßem U x 30. £>
• f r A ^ r < J o-B-S-E-R-V-M) DEATH RATES
AGED WALES ' FEMALESGROUP I 1 1 I I I I V V I 11 I 11 I V V
T E A R = 1
1 1 61 . 1 4 5 . 1 9 7 . 1 6 0 . 1 5 7 . 1 1 8 . 1 4 6 . 1 5 9 . 1 4 7 . 1 3 6 .| 15 . 1 3 . 3 0 . 1 9 . 1 8 . 1 4 .
M :2 8 . 2 0 . 1 8 .
3 5 . 4 . 7 . 5 . 5 . 4 . 6 . 5 . 5 .4 2 . 1 . 3 . 2 . 2 . 2 . 2 . 4 . 2 . 2 .5 2 . 2 . 6 . 3 . 3 . 2 . 2 . 5 . 3 . 3 .6 2 - 3 . 7 . 4 . 3 . 2 . 3 . * * 6 . 4 . 3 .7 3 . 5 . 7 . 6 . 5 . 3 . 4 . 7 . 5 .
7 .5 .
8 3 . 5 . 9 . 7 . 5 . 4 . 6 . 1 0 . 6 .9 5 . 6 . 11 . 8 . 7 . 5 . 6 . 1 1 . 7 . 7 .
10 7 . 9 . 15 . 1 1 . 1 0 . 7 . 8 • 1 8 . 1 1 . 1 0 .11 1 0 . 1 2 . 2 4 . 1 6 . 1 4 . 6 . 7 . 2 2 . 1 1 . 1 0 .1? 1 7 . 2 3 . 21 . 2 2 . 2 1 . 14 . 1 5 . 1 6 . 1 5 . 1 5 .13 ------- 21 . - 2 7 . 41 . 3 0 . 2 7 . 1 9 . 1 7 . 2 5 . 1 9 . 1 9 .14 3 4 . 3 6 . 4 8 . 3 9 . 3 8 . 2 9 . 2 5 . 4 2 . 2 9 . 2 8 .15 4 3 . 3 9 . 91 . 4 8 . 4 7 . 4 4 . 3 5 . 8 3 . 4 3 . 4 3 .16 8 2 . 5 6 . 1 41 . 7 0 . 7 2 . 6 6 . 5 3 . 13 9 . 6 5 . 6 5 .17 1 0 6 . 7 7 . 3 4 0 . 1 0 2 . 1 0 3 . 71 . 5 6 . 23 1 . 7 2 . 7 1 .18 2 1 9 . 1 2 7 . 3 3 6 . 1 5 9 . 1 6 9 . 1 3 0 . 1 0 8 . 35 2 . 1 3 6 . 1 3 4 .19 11 . 1 2 . 1 8 . 1 4 . 1 3 . 1 0 . 1 1 . 1 6 . 1 2 . 1 1 .
— ; '■ - - - - - — - - Y E A R = 2 - ~ ~ : ...............
51 6 1 .
2 2 .1 1 5 .
1 5 . 1 ! 9 : M S : 1 3 4 .2 0 .
1 3 1 . 1 2 .
15 5 .2 7 .
1 2 3 .1 6 .
1 2 3 .1 5 .
3 - 6 . 4 . 7 . 5 . 5 . 4 . 3 . 8 . 5 . 5 .4 3 . 1 . 3 . 2 . 2 . 2 . 1 . 4 . 2 . 2 .5 3 . 2 . 5 . 3 . 3 . 2 . 2 . 6 . 3 . 3 .6 2 . 3 . 7 . 4 . 3 . 2 . 2 . 5 . 3 . 3 .7 3 . 4 . 8 . 6 . 5 . 2 . 3 . 6 . 4 . 4 .5 4 . 5 . 9 . 6 . 5 . 3 . 4 . 8 . 5 . 5 .9 5 . 6 . 11 . 8 . 7 . 4 . 4 . 9 . 6 . 5 .
10 7 . . 8 . 1 5 . 11 . 1 0 . 6 . 6 . 1 5 . 9 . 8 .11 11 . 1 C . 2 4 . 1 5 .
U :5 . 5 . 1 7 .
1 7 l12 1 9 . 21 . 15 . 1 9 . 1 6 . 18 . 1 4 . 1 7 .13 2 5 . 2 5 . 31 . 2 7 . 2 6 . 21 . 21 . 2 6 . 2 2 . 2 2 .14 3 9 . 3 4 . 3 8 . 3 5 . 3 6 . 3 5 . 3 3 . 3 6 . 3 4 . 3 4 .15 - 4 6 « - r * 3 8 . 7 2 . 4 4 . 4 4 . -• 4 8 . 4 2 . 9 6 . 4 9 . 4 9 . -16 9 3 . 6 1 . 1 1 6 . 7 0 . 7 5 . 8 0 . 7 0 . 13 6 . 7 9 . 7 9 .17 1 2 3 . 7 5 . 3 5 6 . 9 5 . 101 . 7 2 . 6 8 . 22 8 . 8 2 . 7 9 .
V 2 7 9 . M S : 3 1 2 . 1 5 0 . 1 7 2 . 1 4 3 . 1 3 9 . 41 3 . 1 6 6 . 1 5 9 .1 3 . 1 6 . 1 3 . 1 3 . 1 0 . 1 0 . 1 6 . 1 2 . 1 1 .
Y E A R = 3 • -------- -------'
1 1 6 1 . 1 2 7 . 1 7 2 . 1 4 1 .1 9 .
1 4 4 . 1 2 6 . 1 2 5 . 1 5 8 . 1 3 3 . 1 2 9 .1 6 .2 18 . 1 4 . 2 9 . 1 9 . 1 3 . 1 3 . 2 8 . 1 8 .
3 5 . 4 . 7 . 5 . 5 . 4 . 3 . 7 . 5 . 5 .4 2 . 1 . 3 . 2 . 2 . 2 . 2 . 4 . 2 . 2 .5 3 . 2 . 6 . 3 . 3 . 2 . 2 . 5 . 3 . 3 .6 2 . 3 . 7 . 4 . 3 . 2 . 2 . 6 . 4 . 3 .7 3 . 4 . 8 . 6 . 5 . 3 . 4 . 5 . 4 .8 4 . 5 . 9 . 6 . 5 . 4 . 5 . 9 . 6 . 6 .9 ____ 5 • — - 6 . 11 . 8 . 7 . 5 . 5 . 1 0 . 7 . 6 . -
1? 7 . 9 . 1 5 . 11 . 1 0 . 6 . 7 . 1 6 . 1 8 : 9 .1 0 . 1 1 . 2 4 . 1 5 . 1 4 . 6 . 6 . 1 9 . 8 .
12 1 8 . 2 2 . 1 8 . 2 0 . 2 0 . 1 5 . 1 6 . 1 5 . 1 6 . 1 6 .13 - - 2 3 . - 2 6 . 3 6 . - - 2 8 . 2 7 . 2 0 . 1 9 . 2 6 . 2 0 . 2 0 .14 3 6 . 3 5 . 4 3 . 3 7 . 3 7 . 3 2 . 2 9 . 3 9 . 3 1 . 31 .15 4 5 . 3 9 . 81 . 4 6 . 4 5 . 4 6 . 3 9 . 9 0 . 4 6 . 4 6 .16 8 7 . 5 8 . 1 2 8 . 7 0 . 7 3 . 7 3 . 61 . 13 8 . 7 2 . 7 2 .17 1 1 4 . 7 6 . 34 5 . 9 9 . 1 0 2 . 7 2 . 6 2 . 23 0 . 7 7 . 7 5 .18 2 4 6 . 1 2 7 . 3 2 4 . 1 5 5 . 1 7 0 . 1 3 7 . 1 2 3 . 38 1 . 1 5 1 . 1 4 6 *19 1 2 . 1 2 . 1 7 . 1 4 . 1 3 . 1 0 . 1 0 . 1 6« 1 2 . i i .
i
A P P E N D I X I I I
U N A D J U S T E D L I F E T A B L E S
N o t e : S e e A p p e n d i x I I
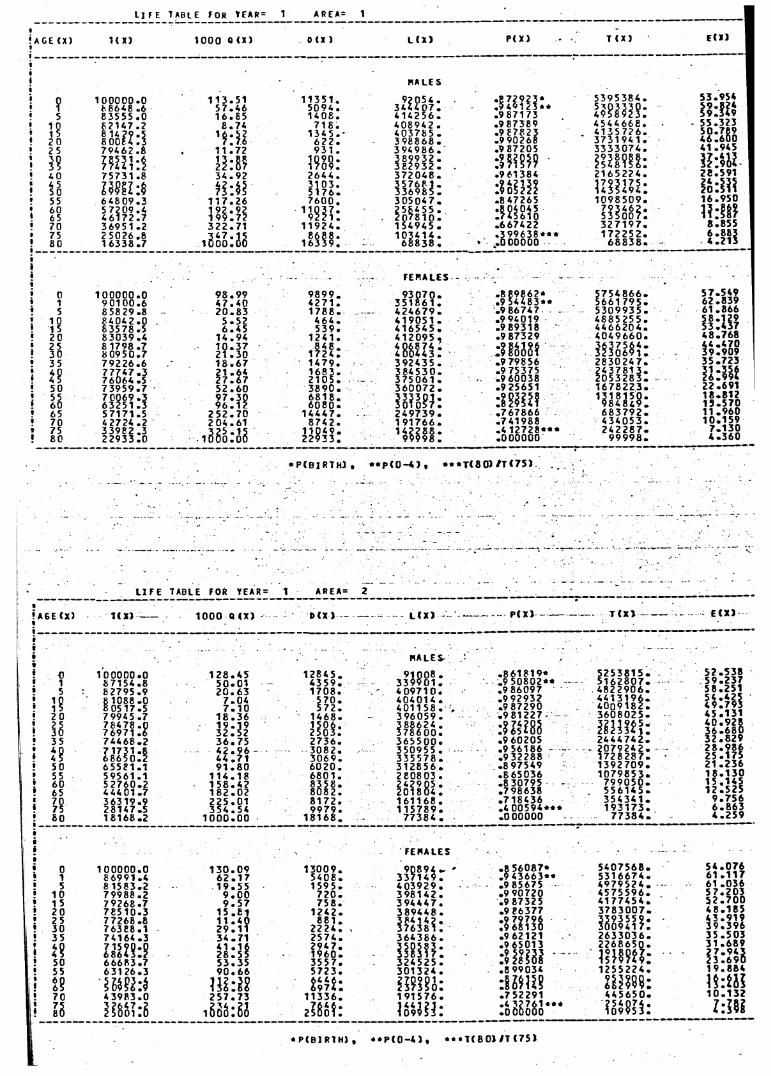
L l F E t a b l e f o r t e a r = 1 A R E A = 1
• a g e ( x ) 1 ( X) i o o o o ( x ) 0 ( X ) L ( X )
| M A L E S
; ? l O O O C O . O 8 8 6 * 8 . 6
1 1 3 . 5 1 5 7 . * 6
1 1 3 5 1 .5 0 9 * .
• 5 8 3 5 5 5 . 0 1 6 . 8 5 1 * 0 8 . * 1 * 2 5 6 .
■ 1 Q 6 2 1 * 7 . 2 8 . 7 * 7 1 8 . * 0 8 9 * 2 .! 1 3 6 1 * 2 9 . 5 ’?:$] 1 3 * 5 . - * 0 3 7 6 5 .‘ 2 0 8 0 0 6 * . 3 6 2 2 . 3 9 8 8 6 8 .! 2 5 7 9 * 6 2 . 8 1 1 . 7 2 9 3 1 . 3 9 * 9 8 6 .
! wm WS: 3 8 9 9 3 2 . 3 8 2 9 3 2 .
• * 0 7 5 7 3 1 . 8 3 * . 9 2 2 6 * * . 3 7 2 0 * 8 .
! n i m i ’j H:i! 3 1 0 3 .5 1 7 6 .
3 5 7 6 8 1 . 3 3 6 9 8 5 .
! 5 5 6 * 8 0 9 . 3 1 1 7 . 2 6 7 6 0 0 . 3 0 5 0 * 7 .• 6 0 ‘ 6 5
5 7 2 0 9 . * * 6 1 7 2 . 7
1 9 2 . 9 21 9 9 . 7 2 ’IS??: 2 5 6 * 5 5 .
2 0 7 8 1 0 .• 7 0 3 6 9 5 1 . 2 3 2 2 . 7 1 1 1 9 2 * . 1 5 * 9 * 5 .» 7 5 2 5 0 2 6 . 8
i S o o I ^1 0 3 * 1 * .
! 8 0 1 6 3 3 8 . 7 6 8 8 3 8 .
FEMALES
0 1 0 0 0 0 0 . 0 9 8 . 9 9 9 8 9 9 . 9 3 0 703 51 86 11 9 0 1 0 0 . 6
858 29 .8* 7 . 4 0 * 2 7 1 .
5 2 0 . 8 3 1 7 8 8 . 4 2 * 6 7 91 0 8 4 0 * 2 . 0 5 . 5 2 * 6 * . 4190511 5 83578 .5
8 3 0 3 9 . *6 . 4 5 5 3 9 . 4 1 6 5 * 5
20 1 4 . 9 * 1 2* 1 . 4 12 09 525 6 1798 .7 1 0 . 3 7 848 . 4 068 7*30 8 0 9 5 0 . 7 2 1 . 3 0 1 7 2 * . 4 0 0 * 4 33 5 7 9 2 2 6 . 6
7 7 7 * 7 . 3 7 6 0 6* .5
1 8 . 6 7 1 * 7 9 . 3 9 2 * 3 5
IS 2 1 . 6 *2 7 . 6 7
1 6 8 3 .2 1 0 5 .
3 8 * 5 3 03 75 06 1
50 7 3 9 5 9 . 7 5 2 . 6 0 3 8 9 0 . 3 60 07 255 7 0 0 6 9 . 3 9 7 . 3 0 6 8 1 8 . li?iSSI60 63251 .3 9 6 . 1 2 6 0 8 0 .65 5 7 1 7 1 . 5 2 5 2 . 7 0 1 * * * 7 . 2 * 9 7 3 970 * 272* .2
33982 .3 2 2 9 3 3 . 0
2 0 4 . 6 1 8 7 * 2 . 1 91 76 67580 i3SoioS 1 1 0 * 9 .
2 2 9 3 3 .1 42 28 8
99998
* P ( BI R T H) « * * P < 0 - 0 ,
P( X)
.8 7 2 9 23 *
. 5 * 0 1 2 3 « *
. 9871 73
. 9 8 73 8 9
.9 8 782 3
. 9 902 68
.9 87205
:J?W9. 9 6 1 3 8 *
:J4 m.8 *7265
. 6 6 7 * 2 2
. 3 9 9 6 3 8 * * * ..0 00000
. 8 8 9 8 6 2 *
.9 5 * 4 8 3 * *
.9 8 67*7
. 9 9 * 0 1 9
.9 89318
.9 87329
;?i$889.9 79856 .9 75375 .9 60038 .9 25651
: ? ? ! ? ! ? . 7 6 78 6 6 . 7 * 1 9 8 8 .4 1 2 7 2 8 * * * .0 0 00 0 0
T ( X)
5 3 9 5 3 8 * .
«SHIS:* 5 * * 6 6 8 .* 1 3 5 7 2 6 .3 7 3 1 9 * 1 .3 3 3 3 0 7 * .1121911:2 1 6 5 2 2 * .
USIH2:1 0 9 8 5 0 9 .
BI8H:3 2 7 1 9 7 .1 7 2 2 5 2 .
6 8 8 3 8 .
5 7 5 * 8 6 6 . 5 6 6 1 7 9 5 . 5 3 0 9 9 3 5 . * 8 8 5 2 5 5 . * * 6 6 2 0 * . * 0 * 9 6 6 0 .
ItiiiM:2 8 3 0 2 * 7 ,2 * 3 7 8 1 3 .2 0 5 3 2 8 3 .1 6 7 8 2 2 3 .
’JHHS:6 8 3 7 9 2 .* 3 * 0 5 3 .2 * 2 2 8 7 .
9 9 9 9 8 .
E ( X )
5 3 . 9 5 *
IMli55. 323 50. 789 * 6 . 6 0 0 * 1 . 9 * 5UM28. 591am1 6. 95 0
H : ! »8. 8556 . 8 83* . 2 1 3
5 7 . 5 * 9 6 2. 83 9 6 1. 86 6 5 8. 12 9 5 3 . * 3 7 * 8 . 7 6 8 * * . * 7 0 3 9 . 90 9 3 5 . 7 2 3n-M22 .69 11 8. 81 21 3 . 5 7 01 1 . 9 6 01 0 . 15 9
7 . 1 3 0* . 3 6 0
--- -------- 7* ............ ....... ----- ' ’ “ - • - — - • • •
- ----- - _ . -
L I FE t a b l e FOR YEAR= 1 A R E A = 2•! A 6 E (X)• 1 ( X ) ------ 1 0 0 0 Q ( X) D ( X ) - ....... L ( X )
§«• m a l e s
i 0 10C0C0.0 1 2 8 . 4 5 1 2 8 * 5 .3 3 ? 5 o i :• 1 8 7 1 5 4 . 8 5 0 . 0 1 * 3 5 9 .
« 5 8 2 7 9 5 . 9 2 0 . 6 3 1 7 0 8 . 4 0 9 7 1 0 .t 10 8 1 0 8 8 . 0 7 . 0 * 5 7 0 . 4 0 *0 1 * .t 1 5 8 05 17. 5
7 99 *5 .77 . 1 0 5 7 2 . * 0 1 1 5 8 .
i 2 0 1 8 . 3 6 1 4 6 8 . 396 05 9 .«* U
7 8 * 7 8 . 0 76971 .6 l l : ? ? HiIS: H S I S t :
! 35 7 * 4 6 8 . 2 3 6 . 7 5 2 7 3 6 . 3 6 5 5 0 0 .• * 0 7 1731 .8 * 2 . 9 6 3 0 8 2 . 350 95 5 .f 4 5 6 8 6 5 0 . 2 * 4 .7 1 3 0 6 9 . 3 3 5 5 7 8 .V 50 6 5 5 8 1 . 1 9 1 . 8 0 6 0 2 0 . 31 28 56 .9 55 5 9 5 6 1 . 1
5 2 7 6 0 . 21 1 4 . 1 8 6 8 0 1 . 2 80 80 3 .«
*60 1 5 8 . 4 2 8 3 5 8 . 2429 05 .65 * 4 * 0 1 .7 1 8 2 . 0 2 8 0 8 2 . 2 01 80 4 .
fi 70 3 6 3 1 9 . 9 2 2 5 . 0 1 8 1 7 2 . 1 6 1 1 6 8 .
75 2 8 1 * 7 . 5 3 5 4 . 5 * 9 9 7 9 . 1 1 5 7 8 9 .9 60 1 8 1 6 8 . 2 1 0 0 0 . 0 0 1 8 1 6 8 . 7 7 3 8 * .
M X )
015
1 01 5 202 5 30 35
iS5055
6 ?70
»'S
1 0 0 0 0 0 . 0 8 6 9 9 1 . * 8 1 583. 27 9 9 8 8 . 27 9 2 6 8 . 77 8 5 1 0 . 3 77268 .8 7 6 3 88 . 1 7 * 1 6 * . 3uim6 6 6 8 3 . 7 631 26 .3IMhi* 3983 . 0
3Si»:i
1 3 0 . 0 96 2 . 1 71 9 . 5 5
9 . 0 0 9 . 5 7
1 5 . 8 1 11 . * 6 2 9 . 1 1 3 * . 7 1 * 1 . 1 62 8 . 5 5 5 3 . 3 5 9 0 . 6 6
131:182 5 7 . 7 3
i S ö Ö l S i
1 3 0 0 9 . 5 * 0 8 . 1 59 5 .
7 2 0 . 7 5 8 .
1 2* 2 . 8 8 1 .
2 2 2*. 2 5 7 * . 2 9 * 7 . 1 9 6 0 . 355 7 . 5 7 2 3 .
K it:1 1 3 3 6 .
2 ? 8 o t r
FEMALES
9 08 9* ► ' 3 3 7 1 * 9 . * 0 3 9 2 9 . 3 9 8 1 * 2 .3 9* * * 7 . 3 8 9 * * 8 .
HHH:3 6 * 3 8 6 .
3 2 * 5 2 5 . 3 0 1 3 2 * .
nmi:1 9 1 5 7 6 .
Mil l :
. 8 6 1 8 1 9 *
.9 5 0 8 0 2 * *
.9 86097
. 9 9 2 9 3 2
.9 87290
. 9 8 1 2 2 7sum
. 9 6 0 2 0 5
.9 56186 - -
.9 32288
.8 9 75 *9
. 8 6 50 3 6
.8 30795
. 79 86 3 8
. 7 1 8 * 3 6
. * 0 0 5 9 * * * *
.0 0 0 0 0 0
. 8 5 6 0 8 7 *
.9 * 3 6 6 3 * *
.9 85675
.9 90720
.9 87325
.9 86377
aim.9 62121 .9 6501 3
: imil.8 9903*
:I im.7 52291 . * 7? 7 6 1 «•■ .000000
T ( X ) --------
5 2 5 3 8 1 5 .5 1 6 2 8 0 7 ,* 8 2 2 9 0 6 .* * 1 3 1 9 6 .* 0 0 9 1 8 2 .3 6 0 8 0 2 5 .mmi2* * * 7* 2. 2 0 7 9 2 * 2 . 1 7 28 2 8 7 . 1 3 92 7 0 9 . 1 0 79 8 5 3 .
7 9 9 0 5 0 . 5 5 6 1 * 5 . 3 5 * 3 * 1 . 1 9 3 17 3 .
7 7 3 8 * .
5 * 0 7 5 6 8 .5 3 1 6 6 7 * .* 9 7 9 5 2 * .* 5 7 5 5 9 6 .* 1 7 7 * 5 * .3 7 8 3 0 0 7 .lllllW:2 6 3 3 0 3 6 .2 2 6 8 6 5 0 .mm?:1 2 5 5 2 2 * .ItiW:
* * 5 6 5 0 .
iKK i:
E ( X )
5 2 . 5 3 8 5 9 . 2 3 7 5 8 . 2 5 1 5 * . * 2 5 * 9 . 7 9 3 * 5 . 1 3 1 * 0 . 9 2 8 3 6 . 6 8 0 3 2 . 8 2 9 2 8 . 9 8 6 2 5 . 1 7 5 21 . 2 3 6 1 8 . 1 3 0 1 5 . 1 * 5 1 2 . 5 2 5
9 . 7 5 6 6 . 8 6 3 * . 2 5 9
5 * . 0 7 6 61 . 1 1 7 6 1 . 0 3 6 5 7 . 2 0 3 5 2 . 7 0 0 * 8 . 1 8 5 * 3 . 9 1 9 3 9 . 3 9 6 3 5 . 5 0 33 1 . 6 8 9 2 7 . 9 * 32 3 . 6 9 0 1 9 . 8 8 *
1 0 . 1 3 2
I M• P ( B I R T H ) , * * P ( 0 - * ) * * * * 1 ( 8 0 ) /T ( 7 5 )
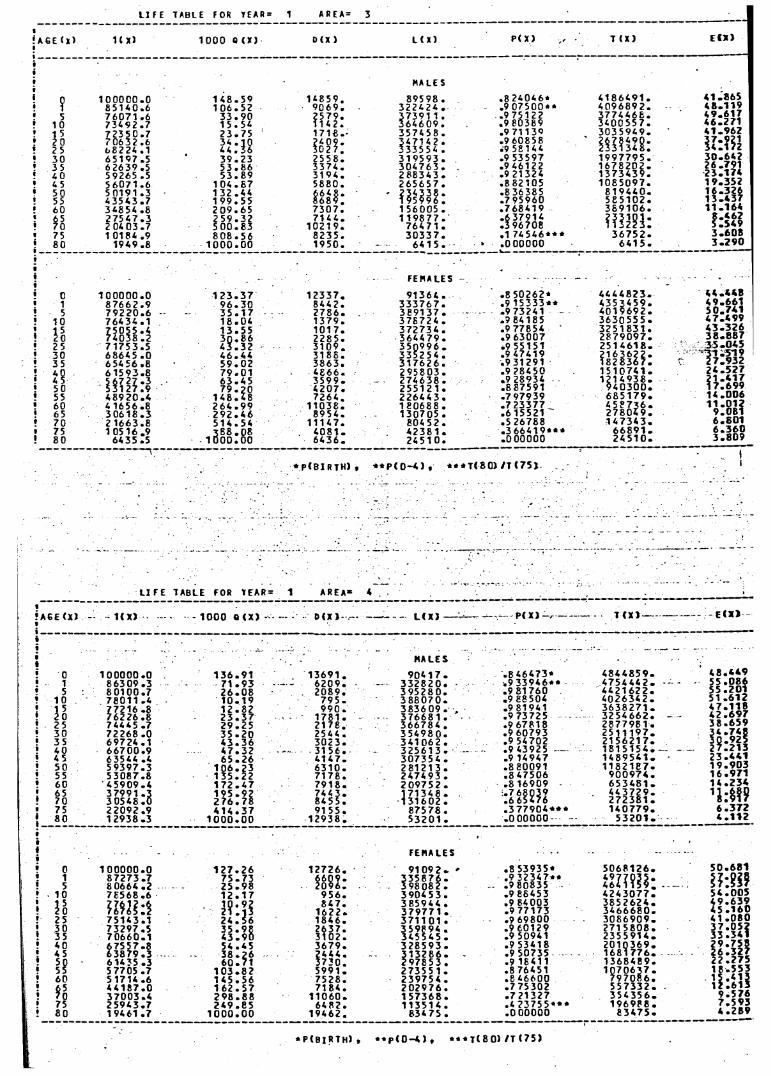
i A GE (X)
1 0n2 5 30 35 40 4 5 50 55 6 0
n7580
LI FE TABLE FOR T E A R =
1( X) 1 0 0 0 0 (X)
1 A R E A = 3
0 (X ) L ( X ) P( X ) T ( X ) E l l )
1 0 0 0 0 0 . 08 5 1 4 0 . 67 6 0 7 1 . 67 3 4 9 2 . 77 2 3 5 0 . 7 / 0632 .6 6 8 2 2 4 . 16 5 1 9 7 . 5 6 2639 .5 59265 .55 6 0 7 1 . 6 50191 .34 3 5 4 3 . 7 34854 .8 2 7 5 4 7 . 3 2 0403 .7 10184 .9
1949 .8
1 4 8 . 5 91 0 6 . 5 2
3 3 . 9 01 5 . 5 42 3 . 7 5
3 9 . 2 3 5 3 . 8 6 5 3 . 8 9
1 0 4 . 6 7 1 3 2 . 4 41 9 9 . 5 5 2 0 9 . 6 5 2 5 9 . 3 ? 5 0 0 . 8 38 0 8 . 5 6
1 0 0 0 . 0 0
1 4 8 5 9 .9 0 6 9 .2 5 7 9 .1 1 4 2.1 7 1 8 .-
iSSf:2 5 5 8 .3 3 7 4 .3 1 9 4 .5 8 8 0 .
7 3 0 7 .7 1 4 4 .
1 0 2 1 9 .8 2 3 5 .1 9 5 0 .
HALES
89598 . 3 22 42 4 . 37391 1 . 3 6 4 6 0 9 . 3 5 7 4 5 8 . 3471 4 2 . 3335 54 . 3 19 59 3 . 3 0 4 76 3 . 2 6 8 3 4 3 . 2 6 5 65 7 .
fit?«:1 56005 . 1 1 9 8 7 7 .
76471 . 3 0 3 3 7 .
6 4 1 5 .
.8 2 40 46 *
.9 0 7 5 0 0 * *
.9 751 22
.9 80389
.9 71139
.9 60858
.9 58 1 44
.9 53597
.9 461 22
.9 21 324
. 8 8 21 0 5
.8 36385
. 7 9 5 9 6 0
. 7 6 8 4 1 9
.6 37914
.3 96708
.1 7 4 5 4 6 * * *
. 0 0 0 0 0 0
4 1 8 6 4 9 1 . 4 0 9 6 8 9 2 . 3 7 7 4 4 6 6 . 3 4 0 0 5 5 7 . 3 0 3 5 9 4 9 .
m m - .1 9 9 7 7 9 5 .1 6 7 8 2 0 2 .1 3 7 3 4 3 9 .1 0 8 5 0 9 7 .
8 1 9 4 4 0 .5 8 5 1 0 2 .3 6 9 1 0 6 .
fHISS:3 6 7 5 2 .
6 4 15.
FEMALES
0 1 0 0 0 0 0 . 0 1 2 3 . 3 7 1 2 3 3 7 . 913641 8 7 6 6 2 . 9 9 6 . 3 0 844 2. 3 3 3 7 6 75 7 9 2 2 0 . 6 3 5 . 1 7 2 7 8 6 . 3891 37
1 0 7 6 4 3 4 . 1 1 8 . 0 4 1 3 7 9 . 3 7672415
^ 4 0 ^ 8 1 2 7 175 3 .5
1 3 . 5 5 1 0 1 7 . 3 72 73 42c 3 n . 86 2 2 8 5 . 3 64 47 925 4 3 . 3 ? 3 1 0 9 . 3 50 99 630 68645 .0
65456 .84 6 . 4 4 3 1 8 6 . 3 35 25 4
35 5 9 . 0 2 3 8 6 3 . 3 17 62 640 6 1 5 9 3 . 8 7 9 . 0 1 4 6 6 6 . 2 95 80 34 5
1 1 1 f ?6 3 . 4 5 3599 . 2 74 63 8
50 7 9 . 2 01 4 8 . 4 8
4207 . 2 5512155 4 8 9 2 0 . 4 7 2 6 4 . 2 26 44 360 4 1656 .8 2 6 4 . 9 9 1 1 0 3 8 . 1 80 68 865 3 0 6 1 8 . 3
2 1 66 3. 82 9 2 . 4 6 8 9 5 4 . 130705
70 5 1 4 . 5 4 1 1 1 4 7 . 804 5275 1 0 5 1 6 . 9 3 8 8 . 0 8
1 0 0 0 . 0 04 0 8 1 . 4238 1
80 6435 .5 6 4 3 6 . 245 1 0
* p (B I RTH) , * * P ( 0 —4 ) ,
.8 5 0262* 4 4 4 4 8 2 3 .
.9 1 5 3 3 3 * * 4 3 5 3 4 5 9 .
.9 73241 - 4 0 1 9 6 9 2 .
. 9 8 4 1 8 5 3 6 3 0 5 5 5 .
.9 77854 3 2 5 1 8 3 1 .
.9 63007 2 8 7 9 0 9 7 .
.9 55 1 51 2 5 1 4 6 1 8 .
.9 47419 2 1 6 3 6 2 2 .
.9 31 291 1 8 2 8 3 6 7 .
.9 28450 1 5 1 0 7 4 1 .
.9 28934 1 2 1 4 9 3 8 .
. 88 75 9 1 9 4 0 3 0 0 .
. 7 9 7 9 3 9 6 8 5 1 7 9 .
. 7 2 3 3 7 7
.6 155214 5 8 7 3 6 .2 7 8 0 4 9 .
.5 26788 1 4 7 3 4 3 .
. 3 6 6 4 1 9 * * * 6 6 8 9 1 .
.0 00000 2 4 5 1 0 .
4 1 . 8 6 5 4 8 . 1 1 9 4 9 . 6 1 7 4 6. 27 1 4 1 . 9 6 2
3 0 -6 422 6. 79 12 3 . 1 7 41 9 . 35 21 6 -3 2 61 3 . 4 3 71 1 . 1 6 4
!:t83 . 6 0 83 . 2 9 0
4 4 . 4 4 84 9 . 6 6 15 0 . 7 4 14 7 . 4 9 94 3 . 3 2 63 8 - 8 8 73 5 - 0 4 53 1 - 5 1 92 7 . 9 3 22 4 . 5 2 7
ifc»1 4 . 0 0 6
15 :8 b?6 . 8 016 . 3 6 03 . 8 0 9
LI F E t a b l e FOR y e a r = 1 AREA* 4
• .......- .........
E (X) i d ) 1 0 0 0 O C X ) - - ... . OCX) - ------------ L C X ) ---- 4-------- ------ PCX) —r ------------ T CX) — - —
. .
MALES‘ . --------- — • • —
0 1 0 0 0 0 0 . 0 1 3 6 . 9 1 13691 . 9 0 4 1 7 . .8 4 6 473 * 4 8 4 4 8 5 9 .1 86309 .3 7 1 . 9 3 6 2 0 9 . 3 3 2 8 2 0 . .9 3 3 9 4 6 * * 4 75 44 4 2 . --5 8 0 1 0 0 . 7 2 6 . 0 8 2 0 8 9 . 3 9 5 2 8 0 . 81760 * 4 2 1 6 2 2 .
10 7 8 0 1 1 . 4 1 0 . 1 9 7 9 5 . 3 8 8 0 7 0 . .9 88504 4 0 2 6 3 4 2 .1 5 77216 .8 1 2 . 8 2 9 9 0 . 3 8 3 6 0 9 . , .9 81 9412 0 76226 .8 2 3 . 3 7 1781 . 3 7 6 6 8 1 . .9 73725 32 5 4 c6 2 .25 74445 .7 2 9 . 2 5 2 1 7 8 . 3 6 6 7 8 4 . . 9 6 7 8 1 8 2 8 7 7 9 8 1 .30 72268 .0 3 5 . 2 0 25 4 4 . 3 5 4 9 8 0 . .9 60793 2 5 1 1 1 9 7 .3 5 6 9 7 2 4 . 1 4 3 . 3 6 3 0 2 3 . 3 4 1 0 6 2 . .9 5470240 6 6 7 0 0 . 9 4 7 . 3 2 3 1 5 6 . 3 2 5 6 1 3 . - - .9 43925 181515 4 . —4 5 6 3544 .4 6 5 . 2 6 4 1 4 7 . 3 07 35 4 . .9 14947 1 4 8 9 5 4 1 .50 5 9 3 9 7 . 3 1 0 6 . 2 3 6 3 1 0 . 2 8 1 2 1 3 . .8 80091 1 1 8 2 1 8 7 .55 5 3 0 8 7 . 8 1 3 5 . 2 2 7 1 7 8 . 2474 93 . .8 47506 9 0 0 9 7 4 .60 45909 .4 1 7 2 . 4 7 7 9 1 8 . 2 0 9 7 5 2 . .8 16909 6 5 3 4 8 1 .65 37991 .3 1 9 5 . 9 2 74 4 3 . 1 71 348 . . 7 6 8 0 3 9 4 4 3 7 2 9 .70 30548 . 0 2 7 6 . 7 8 8455 . 1 3 1 6 0 2 . .6 65 4 76 2 7 2 3 8 1 .75 22092 .9 4 1 4 . 3 7 9 1 5 5 . 87578 . .3 7 7 9 0 4 * * * 1 4 0 7 7 9 .80 1 2 9 3 8 . 3 1 0 0 0 . 0 0 1 2 9 3 8 . 5 3 2 0 1 . . 0 0 0 0 0 0 5 3 2 0 1 .
E ( X )
4 8 . 4 4 9
!i:?8i 51 . 6 1 2 4 7 . 1 1 8 4 2 . 6 9 7 3 8 . 6 5 9
m2 7 . 2 1 32 3 . 4 4 11 9 . 9 0 31 6 . 9 7 11 4 . 2 3 4
1B!96 . 3 7 24 . 1 1 2
f e m a l e s
• 0 1 0 0 0 0 0 . 0 1 2 7 . 2 6 1 2 7 2 6 . 9109 2 . ' .8 53935* .9 3 2 3 4 7 * * .9 80835
5 0 681 26 ,«!
15
8 7 2 7 3 . 7 80664 .2
7 5 . 7 32 5 . 9 8 I J M :
3 3 5 8 7 6 . 3 9 8 0 8 2 .
9 10 78568 .6 1 2 . 1 7 9 5 6 . 3 9 0 4 5 3 . .9 86453 4 24 30 7 7,ift n W i l l i H : «
8 4 7 .1 6 2 2 .
3 8 5 94 4 . 3 7 9 7 7 1 .
.9 84003
.9 771733 8 526 24 ,3 4 6 66 8 0
V 25 7 5 1 4 3 . 17 3 2 9 7 . 5
2 4 . 5 6 1 8 4 6 . 3 7 1 1 0 1 . .9 69800 306 69 09 ,• 30 3 5 . 9 8 2 6 3 7 .
3 1 0 2 .3 5 9 8 9 4 . .9 60129
.9 509412 7 158 08t 35 7 0 6 6 0 . 1 4 3 . 9 0 3 4 5 5 4 5 . 235 59 14 ,
9 40 6 7 5 5 7 . 86 3 8 7 9 . 3
5 4 . 4 5 3 6 7 9 . 3 2 6 5 9 3 . .9 534 1 8 2 0 103 6999
4 5 3 8 . 2 6 2 4 4 4 . 3 1 3 2 6 6 . - .9 50735 1681 776,50 6 1435 .3
5 7705 .76 0 . 7 1 3 7 3 0 . 2 9 7 8 5 3 . .9 18411 1 3 684 89
! 55 1 0 3 . 8 ? 5991 . 2 7 3 5 5 1 . .8 76451 1 0 706 377 97 08 65 57 33 2
I 60 5 1714 .6 4 4 1 8 7 . 0
1 4 5 . 5 6 7 5 2 8 . 2 39 75 4 . . 8 4 6 6 0 0• 6 5 1 6 2 . 5 7 71 8 4 . 2 0 2 9 7 6 . .7 75302 .7 21 3279 70 3 7 0 0 3 . 4
2 5 9 4 3 . 72 9 8 . 8 8 1 1 0 6 0 . 1 5 7368 . 3 5 4 3 5 6
• 75 2 4 9 . 8 5 6482 . 1 1 3 5 1 4 . .4 2375 5 * * * . 0 0 0 0 0 0
1969889 80 1 9461 .7 1 0 0 0 . 0 0 1 9 4 6 2 . 83475 . £ 3475
5 0 . 6 8 1
u m5 4 . 0 0 5 4 9 . 6 3 9 45 . 1 6 0 4 1 . 0 8 0
iJriii2 2 . 2 7 51 8 . 5 5 3
9 . 5 7 67 . 5 9 34 . 2 8 9
* P(BIR T H) • * p C 0 -4 ) • * « « T ( 8 0 ) /T <75)
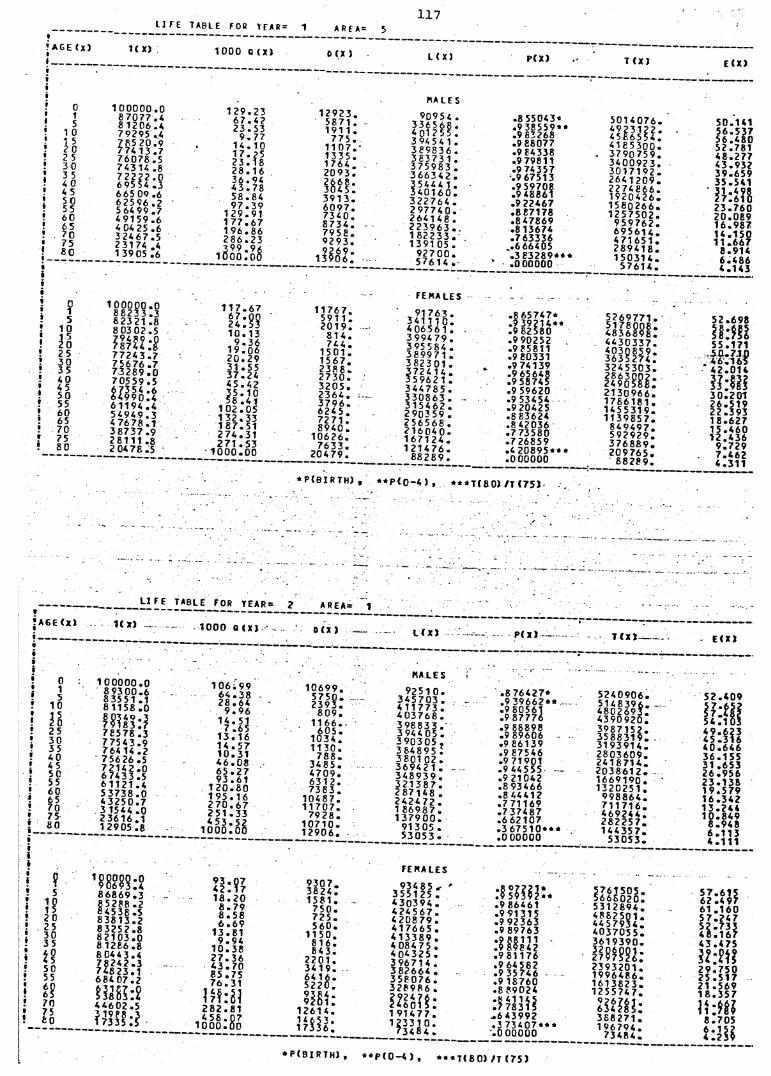
117’ AGE (X)ti_________
L I F E TABLE FOR YEAR:
1< x > 100 0 a ( x )
1 A R £ A = 5
0 (X ) L ( X) P ( X )
!
»tI
L|
»»i
015
1 0
Jo2 53 03 54 04 55 0 55 60 65 ?0 75 80
1 0 0 0 0 0 . 0 8 7 0 7 7 . 4 8 1206 .4 79295 .4
H H S :*7 6 0 7 8 . 5 74314 .8 7 2 2 2 2 . 0 695 54 .3 665 09 .6 6 2596 .2 5 64 99 .7 4 91 59 .6 4 04 25 .63 2 4 6 7 . 5 23174 .4 1 3905 .6
1 2 9 . 2 3 6 7 . 4 2 2 3 . 5 3
9 . 7 71 4 . 1 01 7 . 2 52 3 . 1 82 8 . 1 63 6 . 9 44 3 . 7 85 8 . 8 49 7 . 3 9
1 2 9 . 9 11 7 7 . 6 71 9 6 . 8 62 8 6 . 2 3
■3SS:SS
1 2 9 2 3 . 5871 . 1 9 1 1 .
775 . 1 1 0 7 . - 1335 .1 764 . 2 0 9 3 .
m :3 9 1 3 .6 0 9 7 .7 3 4 0 .8 7 3 4 .7 9 5 8 .9 2 9 3 .9 2 6 9 .
1 3 9 0 6 .
015
1 0
2 5253035404550556 065707580
1 0 0 0 0 0 . 08 8 2 3 3 . 3 82321 .8 8 0 3 0 2 . 5
7 7 2 4 3 . 7 75676 .7 7 3 2 6 9 . 0 70559 .5ttt IS:*6 1 1 9 4 . 45 4 9 4 9 . 3 4 7 6 7 8 . 1 3 8 7 37 .9 28111 .8 2 04 7 8 . 5
1 1 7 . 6 7
2*:?S1 0 . 1 3
9 . 3 61 9 . 0 62 0 . 2 93 1 . 5 53 7 . 2 44 5 . 4 23 5 . 1 05 8 . 4 1
1 0 2 . 0 51 3 2 . 3 31 8 7 . 5 12 7 4 . 3 12 7 1 . 5 3
1 0 0 0 . 0 0
1 1 7 6 7 . 5 9 1 1 . 2 0 1 9 .
8 1 4 . 7 4 4 .
1 5 0 1 . 1 5 6 7 . 2 3 8 8 . 2 7 3 0 . 3 2 0 5 . 2 3 6 4 . 3 7 9 6 . 624 5 . 7271 . 8 9 4 0 .
1 0 6 2 6 .7 6 3 3 .
2 0 4 7 9 .
MALES
90954 . 3 3 6 5 6 8 . 4 01 2 5 5 . 3 945 4 1 . 3 8 9 8 3 6 . 3 83 73 1 . 3 7 5983 . 3663 4 2 . 3 544 4 1 . 3 4 0 1 6 0 . 3 2 2 7 6 4 . 2 9 7 7 4 0 . 2 6 4 1 4 8 . 2 2 3 9 6 3 . . 1 8 2 2 3 3 .1 391 05 .
9 2 7 0 0 . 57614 .
f e m a l e s
4 0 6 5 6 1 . 3 9 9 4 7 9 . 395 584 . 3 8 9 9 7 1 . 3 8 2 3 0 1 . 3 7 2 4 1 4 . 3 59 62 1 . 3 4 4 7 8 5 . 3 3 0 8 6 3 . 3 1 5 4 6 2 . 2 9 0 3 5 9 . 2 5 6 5 6 8 . 2 1 6 0 4 0 . 1 6 7 1 2 4 . 1 2 1 4 7 6 .
8 8 2 8 9 .
.8 55043*
.9 3 8 5 59 * *
.9 E3268
.9 £8077
.9 £4338
. 979811
.9 74357
.9 67513
.9 59708
.9 48861
. 9 224 67
.8 87178
. 847869
.8 13674
.763336 . . 666405 .3 8 3 2 8 9 * * * .000000
. 8 6 5 7 4 7 *
.9 3 92 14 * *
.9 82580
.9 90252
.9 85811
.9 80331
. 974139
.9 65648
.9 58745
.9 59620
.9 53454
.9 20425
.8 83624
.8 42036
. 7 7 35 8 0
.7 26859
.4 2 0 8 9 5 * * *
.000000
T ( X J
5 0 1 4 0 7 6 .4 ? ? 3 1 ? 2 .4 5 8 6 5 5 4 .4 1 8 5 3 0 0 .3 7 9 0 7 5 9 .3 4 0 0 9 2 3 .3 0 1 7 1 0 2 .2 6 4 1 2 0 9 .2 2 7 4 8 6 6 .1 9 2 0 4 2 6 .1 5 8 0 2 6 6 .1 2 5 7 5 0 2 .
9 5 9 7 6 2 .6 9 5 6 1 4 .4 7 1 6 5 1 .2 8 9 4 1 8 .1 5 0 3 1 4 .
5 7 6 1 4 .
5 2 6 9 7 7 1 .
4 8 3 6 § § f r4 4 3 0 3 3 7 .4 0 3 0 8 5 9 .3 6 3 5 2 7 4 !3 2 4 5 3 0 3 .
l 4 9 o ? ? I :2 1 3 0 9 6 6 . 1786181 . 1 4 5 5 3 1 9 . 1 1 3 9 8 5 7 .
8 4 9 4 9 7 . 5 9 2 9 2 9 . 3 7 6 8 8 9 . 2 0 9 7 6 5 .
8 8 2 8 9 .
E ( X )
50. 1415 6 . 5 3 75 6 . 4 8 052.7814 8 . 27 74 3. 93 23 9 . 65 93 5. 541
j w n2 3 . 7 6 02 0 . 08 91 6 . 9 8 71 4 . 1 5 01 1 . 6 6 7
8. 9146 . 4 8 64 . 1 43
5 2 . 69 8
5 5. 171 5 0 . 7 1 0
. 4 6 . 1 6 5 4 2 . 0 1 4mu3 0 . 20 12 6 . 5 1 92 2 . 3 9 31 8 . 62 71 5 . 4 6 01 2 . 4 3 6
9 . 7 297 . 4624 . 311
* P ( B I R T H ) , * * P ( 0 - 4 ) , * * * TC 8 01 /T C 75 J
A 6 E <X)
___ life T1£LE F0R iear=K x) - i ooo a <xi
2 A R E A= 1
0 ( X ) ----- L ( X ) P( X) T t x r E ( X )
015
10
3 S25 30 35 4 0 4 5 50 55 60 65 70 7 5 80
1 0 0 0 0 0 . 0 8 9 3 0 0 . 6 83551 .1 81158 .0
i. 18 3 78578 __ 7 7 5 4 3 . 9 764 14 .2 75626 .5
im m6 1 1 2 1 . 4 53738 . 0 4 3 2 5 0 . 7 3 1544 .0 2 3 6 1 6 . 1 1 2905 .8
1 0 6 . 9 9 6 4 . 3 8 2 8 . 6 4
9 . 9 6 1 4 . 5 1
7 .65 1 3 . 1 6 1 4 . 5 7 1 0 . 3 1 4 6 . 0 8 6 5 . 2 7 9 3 . 6 1
1 2 0 . 8 0 1 9 5 . 1 6 2 7 0 . 6 7 2 5 1 . 3 3 4 5 3 . 5 2
1 0 0 0 . 0 0
1 0 6 9 9 .5 7 5 0 .2 3 9 3 .
8 0 9 .1 1 6 6 .
6 0 5 .1 0 3 4 .1 1 3 0 .
7 8 8 .3 4 8 5 .4 7 0 9 .6 3 1 2 .7 3 8 3 .
1 0 4 8 7 .1 1 7 0 7 .
7 9 2 8 .1 0 7 1 0 .1 2 9 0 6 .
MALES
9 2 5 1 0 . 3 4 5 7 0 3 . 4 1 1 7 7 3 . 4 0 3 7 6 8 . 3 9 8 8 3 3 . 3 944 05 . 3 9 0 3 0 5 . 3 8 4 8 9 5 i 3 8 0 1 0 2 . 3 69 42 1 . 3 4 8 9 3 9 . 3 2 1 3 8 7 . 2 8 7 1 4 8 . 2 4 2 4 7 2 .1 8 6 9 8 7 . 1 3 7 9 0 0 .
91 305 . 5 3 0 5 3 .
. 8 7 6 4 2 7 *
.9 3 9 6 6 2 * *
.9 80561
.9 87776
.9 88898
.9 89606
.9 £6139
.9 87546
.9 71901 .9 44555 -.9 21042 . 8 9 3 4 6 6 .8 44412 . 7 7 1 1 6 9 .7 37487 .6 62107 .3 6 7 5 1 0 * * * . 0 0 0 0 0 0
5 2 4 0 9 0 6 . 5 1 4 8 3 9 6 . 4 8 0 2 6 9 3 . 4 3 9 0 9 2 0 . 3 9 8 7 1 5 2 . 3 5 8 8 3 1 9 . 3 1 9 3 9 1 4 . 2 8 0 3 6 0 9 . 2 4 1 8 7 1 4 . 2 0 3 8 6 1 2 . 1669190 . 1 3 2 0 2 5 1 .
9 9 8 8 6 4 . 7 1 1 7 1 6 . 4 6 9 2 4 4 . 2 8 2 2 5 7 . 1 4 4 3 5 7 .
5 3 0 5 3 .
5 2 . 4 0 9
4 9 . 6 2 3 4 5 . 3 1 6 4 0 . 6 4 6 3 6 . 1 5 5 31 .653 2 6 . 9 5 6 2 3 . 1 3 8 1 9 . 5 7 9 1 6 . 3 4 2 1 3 . 2 4 4 1 0 . 8 4 9
8 . 9 4 8 6 . 1 1 3 4 . 1 1 1
5101 52 0 25 30 35
2 ? 5 C 55
2!7075to
8 6 8 6 9 . 3 § 5288 .28 4 5 3 8 . 58 3 8 1 3 . 2 8 3 2 5 2 . 88 2 1 0 3 . 0 8 1286 .8 8 044 3 . 47 8 2 4 2 . 37 4 8 2 3 . 16 8 4 0 7 . 2mu4 4 6 0 2 . 5
9 3 . 0 74 2 . 1 71 8 . 2 0
8 . 7 98 . 5 86 . 6 9
1 3 . 8 19 . 9 4
1 0 . 3 82 7 . 3 64 3 . 7 08 5 . 7 57 6 . 3 1
W :J12 8 2 . 8 14 5 8 . 0 7
1 0 0 0 . 0 0
9 3 0 7 . 3 8 2 4 . 1 5 8 1 .
7 5 0 . 7 2 5 . 5 6 0 .
1 1 5 0 . 8 1 6. 8 4 3 .
2201 . 3 4 1 9 . 64 1 6 . 5 2 2 0 .
? 1 £ 1 :1 2 6 1 4 .
■•til:
f e m a l e s
9 34 85 «- ‘ 3551 25 . 4 3 0 3 9 4 . 4 2 4 5 6 7 . 4 2 0 8 7 9 . 4 1 7 6 6 5 . 4 1 3 3 8 9 .4 084 75 . 4 0 4 3 2 5 .3 9671 4 . 3 8 2 6 6 4 . 3 5 8 0 7 6 . 3 2 8 9 8 6 .
I 8 i « :1 9 1 4 7 7 .1 2 3 3 1 0 .
34 8 4 .
.9 86461
. 9 9 1 3 1 5
.9 92363
.9 89763
. 9 8 1 1 7 6
.9 64582
.9 35746
. 9 1 8 7 6 0
. 8 8 9 0 2 4
.8 41145
.7 7831 5 -.6 43992 .3 7 3 4 0 7 * * * ' .0 00000
5 3 1 2 8 9 4 .4 8 8 2 5 0 1 .4 4 5 7 9 3 4 .4 0 3 7 0 5 5 .3 6 1 9 3 9 0 .
2 3 9 3 2 0 1 .1 9 9 6 4 8 6 .1 6 1 3 8 2 3 .1 2 5 5 7 4 7 .
m m - .3 8 8 2 7 1 .1 9 6 7 9 4 .
7 3 4 8 4 .
5 7 . 6 1 5 62 . 4 97 61 . 1 6 0 5 7 . 2 4 7 5 2 . 7 3 3 4 8 . 1 6 7 4 3 . 4 7 5
H : M2 9 . 7 5 02 5 . 5 1 72 1 . 5 6 91 8 . 3 5 7
It:»«8 . 7 0 5
* P(BIRTHJ * * P ( 0 -4 ) • * T( 8 0) 7T ( 7 5 )
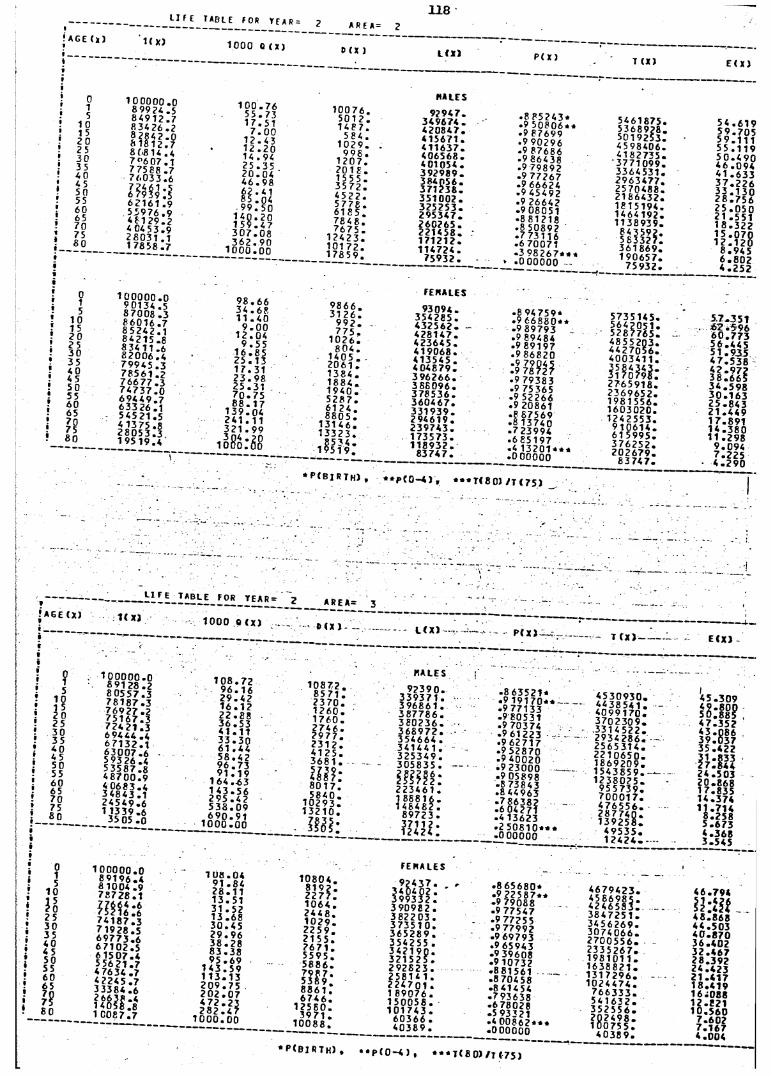
118AGE <X) 1(X)
Lift TABLE FOR TEAR= 2
1000 0 (X)A R E A = 2
0 (X ) L ( X ) P( X) T ( X ) E ( X )
015
1 01 5202 5303 5 404 5 50 55 60 65 70 75 80
1 ooooo.o89924 .5 8 4 9 7 2 . 78 3 4 2 6 . 2iff}!:?8 08 14 . 4 7 f,6 0 7. 7 77588 .77 6 0 3 3 . 6
6 ^9 ^ 9 1 ?6 2 7 6 7 . 95 5 9 7 6 . 94 8 7 2 9 . 2 4 0 4 5 3 . 97 8 0 3 7 . 7 1 7858 .7
1 0 0 . 7 6 5 5 . 7 3 1 7 . 5 1
7 . 0 0 1 2 . 4 3 1 2 . 2 0 1 4 . 9 4 2 5 . 3 52 0 . 0 4 ' 4 6 . 9 8 6 2 . 4 18 5 . 0 4 9 9 . 5 0
1 4 0 . 2 01 5 9 . 4 73 0 7 . 0 83 6 2 . 9 0
1 0 0 0 . 0 0
1 0 0 7 6 . 5 0 1 2 . 1 4 8 7 .
5 84 . 1 0 2 9 .
9 9 6 . 1 2 0 7 . 2 0 1 8 . 1 5 5 5 . 3 5 7 2 . 45 2 2 .5 778 . 6 1 8 5 . 7 8 4 8 .7 6 7 5 .
1 2 4 2 3 .1 0 1 7 2 .1 7 8 5 9 .
h a l e s
92 947 . 3 4 9 6 7 4 . 4 2 0 8 47 . 415671 . 4 1 1 6 3 7 . 4 0 6 56 8 . 401054 . 3 9 2 9 8 9 .
3 5 1 0 0 2 . 3 2 5 2 5 3 . 2 9 5 3 4 7 . 2 6 0 7 6 5 . 2 2 1 4 58 . 1 7 1 2 12 . 1 1 4 7 2 4 .
7 5 9 3 2 .
.8 P 5 2 4 3 *• 9 5 08 06 * *• 9 87699 .9 90296• 9 8 7 6 8 6• 9 86438• 9 79892 •9 77267• 9 66624• 9 45492 .9 26642 .9 08051 •8 81218• 8 50892• 7 731 16• 6 70071• 3 9 8 2 6 7 * * «• 0 00000
5 4 618 75 .5 3 689 28 .50 192 53 .4 5 9 84 0 6.4 18 27 3 5.3 7 7 10 9 9.3 36 45 3 1.2 9 6 3 4 7 7 .2 5 7 0 4 8 8 .2 18 64 3 2.1 81 51 9 4.1 4 641 92 .1 138939.8 4 3 5 9 2 .5 8 3 3 2 7 .3 6 1 8 6 9 .1 90 65 7 .
7 59 32 .
5 4 . 6 1 95 9 . 7 0 55 9 . 1 1 15 5 . 1 1 9 5 0 . 4 9 0 4 6 . 0 9 4 4 1 . 6 3 3 3 7 . 2 2 6 3 3 . 1 3 0 2 8 . 7 5 6 7 5 . 0 5 0? ! * 5511 8 . 3 2 21 5 . 0 7 01 7 . 1 2 0
8 . 9 4 5 6 . 8 0 2 4 . 2 5 2
015
1 01 5202 5 30 35 40 45 50 55 60 65
7580
1 0 0 0 0 0 . 0 90134 .5 87008 .3 8 6 0 1 6 . 7 8 5 2 4 2 . 1 84215 .8 834 11 .68 2 0 0 6 . 47 9 9 4 5 . 3 78561 .27 6 6 7 7 . 37 4 7 3 7 . 0 6 9 4 4 9 . 76 3 3 2 6 . 15 4 5 2 1 . 5
1 9 5 1 9 . 4
9 8 . 6 63 4 . 6 81 1 . 4 0
9 . 0 01 2 . 0 4
9 . 5 51 6 . 8 52 5 . 1 31 7 . 3 1 2 3 . 9 82 5 . 3 1 7 0 . 7 5 8 8 . 1 7
1 3 9 . 0 4 7 4 1 . 1 1 3 2 1 . 9 9
i o 8o .’ 6 o
9 8 6 6 . 3 1 2 6 .
99 2 . 775 .
1 0 2 6 .8 0 4 .
1405 . 2 0 6 1 . 1 3 8 4 . 1 8 8 4 . 1 9 4 0 . 5 2 8 7 . 6 1 2 4 . 8 8 0 5 .
1 3 1 4 6 . 1 3 3 2 3 .
1 $ 5 ?9 r
FEHALES
9 30 94 . 3 5 4 2 8 5 . 4 3 2 5 6 2 . 4 2 8 1 4 7 . 4 2 3 6 4 5 . 4 1 9 0 6 8 . 413545 . 4 0 4 8 7 9 . 3 9 6 2 6 6 .3 88 0 9 6 . 3 7 8 5 3 6 . 3 6 0 4 6 7 . 3 3 1 9 3 9 . 2 9 4 6 1 9 . 2 3 9 7 4 3 . 1 7 3 5 7 3 . 1 1 8 9 3 2 .
8 3 7 4 7 .
.8 94 7 5 9 *• 9 6 6 8 8 0 * *• 9 89793 .9 89484 .9 89197• 9 86820
:V,m• 9 79383 •9 75365• 9 52266• 9 20861 .8 87569• 8 13740• 723994• 6 85 19 7• 4 1 32 01 * * *• 0 00000
5 73 51 4 5.
4 8 5 5 2 0 3 .4 4 2 7 0 5 6 .4 0 0 3 4 1 1 .
m i n i :7 7 6 5 9 1 8 . 2 3 6 9 6 5 2 . 1 9 8 1 5 5 6 . 1 6 0 3 0 2 0 . 1 2 4 2 5 5 3 .
9 1 0 6 1 4 . 6 1 5 9 9 5 . 3 7 6 2 5 2 . 2 0 2 6 7 9 .
8 3 7 4 7 .
* P ( B j R T h ) ( * * p ( 0 - 4 ) t * * * 7 ( 8 0 1 / 7 ( 7 5 )
5 7 . 3 5 1 £ 2 . 5 9 6 6 0 . 7 7 3 5 6 . 4 4 5 5 1 . 9 3 5 4 7 . 5 3 8
Skill3 4 . 5 9 8 3 0 . 1 6 3 2 5 . 8 4 3 2 1 . 4 4 9 1 7 . 89 1it.il?
9 . 0 9 47 . 2 2 54 . 2 9 0
-------------- --------------- ! ; I : e _ 7 A B L E _ F 0 R _ Y E A R : _ ^ ______ AREA= 3
( X ) 1 < X J 1 0 0 0 0 < X I - • 6 ( x ) . L ( X 1 — »• p X ) - ;T ( X l - E (X 1
1 0 0 0 0 0 . 089128 .28 0 5 5 7 . 37 8 1 8 7 . 37 6 9 2 7 . 27 5 1 6 7 . 3 72421 .3 69444 .4 6 7 1 3 2 . 16 3 0 0 7 . 6 5 93 26 .45 3 5 8 7 . 84 8 7 0 0 . 9 4 0 6 8 3 . 4 34843 .12 4 5 4 9 . 6 1 13 39 .6
3505 . 0
1 0 8 . 7 29 6 . 1 62 9 . 4 2 1 6 . 1 2 2 2 . 8 8 3 6 . 5 3 4 1 . 1 1 3 3 . 3 0 6 1 . 4 45 8 . 4 2 9 6 . 7 3 9 1 . 1 9
1 6 4 . «3 1 4 3 . 5 6 2 9 5 . 4 2 5 3 8 . 0 9 6 9 0 . 9 1
1 0 0 0 . 0 0
1 0 8 7 2 . 85 71 . 2 3 7 0 . 1 2 6 0 . 1 7 6 0 .
U H :2 3 1 2 .4 1 2 5 .3 6 8 1 .
l i l t :8 0 1 7 . 5840 .
1 0 2 9 3 . 1 3 2 1 0 .Ifo3?:
HALES
9 2 3 9 0 . 3 3 9 3 7 1 . 396861 . 3 8 7 7 8 6 . 3 8 0 2 3 6 . 3 6 8 9 7 2 . 354664 . 3 4 1 4 4 1 . 3 2 5 3 4 9 . 3 0 5 8 3 5 .
i m t :2 2 3 4 6 1 .1 888 16 . 1 4 6 4 8 2 .
8 9 7 2 3 .
VAU.
• 8 6 3 5 2 1 «• 9 1 9 1 7 0 «* - • 9 77 13 3• 9 80531• 9 70374• 9 61223 -• 9 62717• 9 52870• 9 40020• 9 23000 --9 05898-8 73843 .8 44963
■ ja m• 4 13623.2 5081 0 * * *.0 00000
4 5 3 0 9 3 0 .4 4 3 8 5 4 1 .4 0 9 9 1 7 0 .3 7 0 2 3 0 9 .3 3 1 4 5 2 2 .2 9 3 4 2 8 6 .2 5 6 5 3 1 4 .2 2 1 0 6 5 0 .1 8 6 9 2 0 9 .1 5 4 3 8 5 9 .1 2 3 8 0 2 5 .
9 5 5 7 3 9 .7 0 0 0 1 7 .4 7 6 5 5 6 .2 8 7 7 4 0 .1 3 9 2 5 8 .
4 9 5 3 5 .1 2 4 2 4 .
4 5 . 3 0 9
1 2:!??4 7 . 3 5 24 3 . 0 8 6
l l : kM U2 4 . 5 0 3 2 0. 86 8 17 .83 5 1 4. 37 4 1 1 . 71 4
8 . 258 5 . 6 73 4 . 3 68 3 . 545
1 0 0 0 0 0 . 08 9 1 9 6 . 4 61004 .9 7 8 7 2 8 . 1
IJIti:?7 4 1 8 7 . 37 1 9 2 8 . 56 9 7 7 3 . 6 6 7 1 0 2 . 56 1 5 0 7 . 4 5 5 6 2 1 . 7 47634 .74 2 2 4 5 . 7 3 3384 .62 6 6 3 8 . 4 1 4 0 5 8. 8 1 COE 7 .7
1 U 8 . 0 4 9 1 . 8 4 2 8 . 1 11 3 . 5 13 1 . 5 21 3 . 6 8 3 0 . 4 5 2 9 . 9 6 3 8 . 2 8 8 3 . 3 89 5 . 6 9
1 4 3 . 5 9 1 1 3 . 1 3 2 0 9 . 7 5 2 0 2 . 0 7 4 7 2 . 2 3 2 8 2 . 4 7
1 0 0 0 . 0 0
1 0 8 0 4 . 8 1 9 ? . 2 2 7 ?. 1 0 6 4 . 2 4 4 8 . 1 0 2 9 . 2 2 5 9 . 2 1 5 5 . 2 6 7 1 . 55 95 . 5 8 8 6 .
BK: 8861 . 6 7 4 6 .
1 2 5 S O .3971 .
1 0 0 8 8 .
FEHALES
340402 1 ’ 3 9 9 3 3 2 . 3 90 98 2 . 3 8 2 2 0 3 . 3 7 3 5 1 0 . 3 65 28 9 . 3542 55 . 3 4 2 1 9 0 . 321 5 2 5 . 2 9 2 8 2 3 . 2 5 8 1 4 1 . 2 24 70 1 .1 89076 . 1 5 0 0 5 8 . 1 0 1 7 4 3 .
60366 . 40389 .
• 8 6 5 6 8 0 * • 9 2 2 5 8 7 * * .9 79088.9 77547 .9 77255• 9 77992• 9 69793 . 96 59 4 3 •9 39608 .9 10732 «881 561 .8 70458 .8 41454 . 7 936 38• 6 78028 .5 93321.4 00 8 6 2 * * *.0 0 00 0 0
4 6 7 9 4 2 3 . 4 5 6 6 9 8 5 . 4 2 4 6 5 8 3 . 3 8 4 7 2 5 1 . 3 4 5 6 2 6 9 . 3 0 7 4 0 6 6 . 2 7 0 0 5 5 6 . 2 3 3 5 2 6 7 . 198101 1 . 1 6 3 8 8 2 1 . 1 3 1 7 2 9 6 . 1 0 2 4 4 7 4 .
7 6 6 3 3 3 . 5 4 1 6 3 2 . 3 5 2 5 5 6 . 2 0 2 4 9 8 . 1 0 0 7 5 5 .
4 0 3 8 9 .
4 6 . 79 *
i« i*4 8. 86 84 4 . 50 34 0 . 8 7 036 .40 23 2 . 4 6 72 8 . 39 22 4. 42 3
1 8. 41 91 6. 088Vo-Aih
7. 6027 . 1674. 004
• P ( B I R T H ) , * • p ( 0 - 4 ) , * * « 7 ( 8 0) / T ( 7 5 )
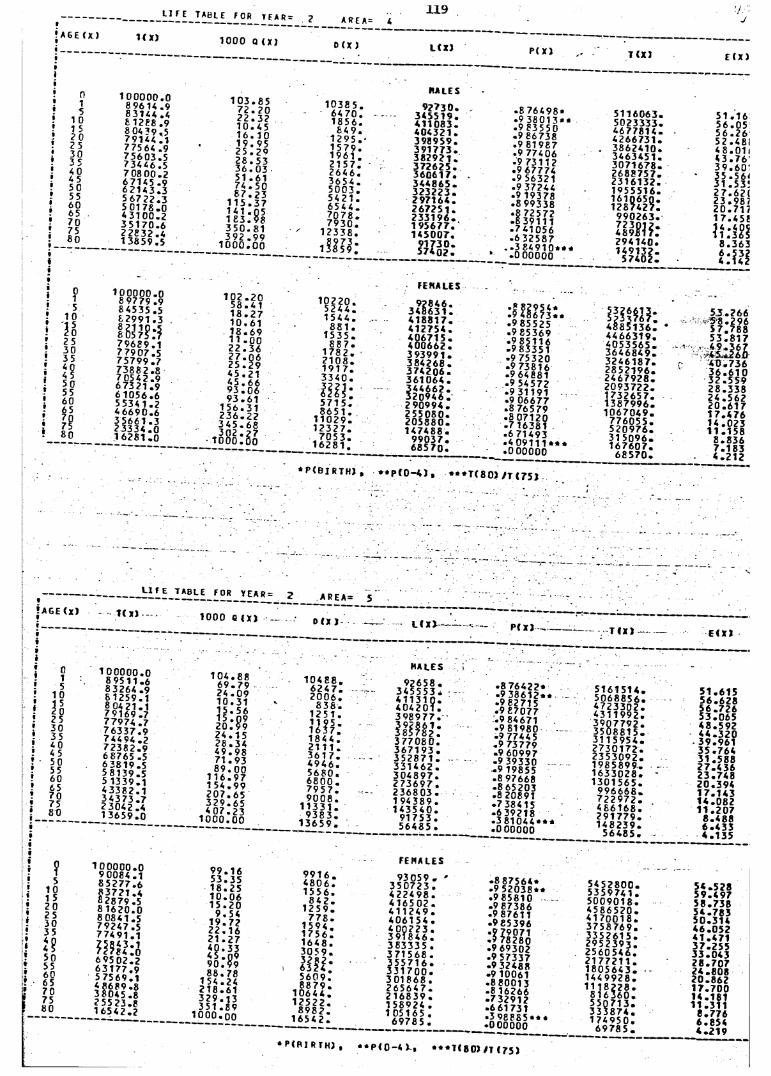
t
AGE (X )
_______ I Ü E _ T A B L _ £ f O R _ T F A R = ? A R E A ;
1<X) 1000 Q (X)
ni5
1 0 1 s2025303 54 0 4 5 50 55 60 65 70 75 60
015
10
132 5 30 35 40 4 5 50 55 60 65 70 75 80
1 0 0 0 0 0 . 0 89614 .9 83144 .4 61288 .9 8 04 ?9 .5
7 75 64 :<?7 5 6 0 3 . 5 73446 .57 0 8 0 0 . 2 67145 .96 2 1 4 3 . 3 5 6 7 2 2 . 3 5 0 1 7 8 . 0 4 3 1 0 0 . 23 5 1 7 0 . 6 22832 .4 1 3 6 5 9 . 5
1 0 0 0 0 0 . 0 89775 .9 64535 .5 8 2 9 9 1 . 3
I S ???:?7 9 6 8 9 . 17 7 9 0 7 . 5 75799 .7 7 3 8 6 2 . 8 7 0 54 2 . 9 67321 .9 6 1056 .65 5 3 4 1 . 24 6 6 9 0 . 63 5 6 6 1 . 32 3 3 3 4 . 01 6 2 8 1 . 0
1 0 3 . 8 5 7 2 . 2 0 2 2 . 3 2 1 0 . 4 5 1 6 . 1 0 1 9 . 9 5 2 5 . 2 *7 2 8 . 5 3 3 6 . 0 3 5 1 . 6 1 £ 4 . 5 0 6 7 . 2 3
1 1 5 . 3 7 1 4 1 . Q5 1 £ 3 . 9 8 3 5 0 . 8 1 3 9 2 . 9 9
1 0 0 0 . 0 0
0 (X )
1 0 3 8 5 .6 4 7 0 .1 8 5 6 .
£ 4 9 . 1295 . 1 5 7 9 . 1961 . 2 1 5 7 . 2 6 4 6 . 3654 . 5 0 0 3 . 5421 . 654 4 . 7 0 7 8 . 7 9 3 0 .
1 2 3 3 8 .
i f ? ? ? 5:
102.205 8 . 4 11 8 . 2 71 0 . 6 11 8 . 6 91 1 . 0 02 2 . 3 62 7 . 0 6 2 5 . 2 9 4 5 . 2 1 4 5 . 6 69 3 . 0 6 9 3 . 6 1
1 5 6 . 3 1 2 3 6 . 2 2 3 4 5 . 6 8 3 0 2 . 2 7
1 0 0 0 . 0 0
1Q220. 5 2 4 4 . 1 5 4 4 .
8 8 1 . 1 5 3 5 .
8 8 7 . 1 7 8 2 . 2 1 0 8 . 1 9 1 7 . 3 3 4 0 .
l i l l :5 7 1 5 .8 6 5 1 .
1 1 0 2 9 .1 2 3 2 7 .
7 0 5 3 .1 6 2 8 1 .
119
L ( X )
RALES
92 730 .3 4 5 5 1 9 .4 1 1 08 3 .4 0 4 3 2 1 .3 98 95 9 .3 9 1 77 3 .3 8 2 9 2 1 .3 7 2 6 2 5 .3 6 0 61 7 .3 4 4 8 6 5 .3 2 3 2 2 3 .2 9 7 16 4 .2 6 7 2 5 1 .2 3 3 1 9 6 .1 95 67 7 . 1 45 00 7.
P( X)
.8 76 4 98*
.9 3 8 0 1 3 * *• 9 835 50 . 9 8 67 3 8 .9 81987 .9 77406 .9 731 12 .9 67774• 9 56321 .9 37244 •9 19 37 8• 8 99338• 8 72572 .6 3911 1• 741056• 6 32587
- . 3 8 4 9 1 0 * * *.0 00000
FEMALES
9 7846. 348631 . 4 1 8 8 1 7 . 4 1 2 7 5 4 . 4 0 6 7 1 5 . 4 0 0 6 6 2 . 3 9 3 9 9 1 . 3 8 4 2 6 8 . 3 7 4 2 0 6 . 3 6 1 0 6 4 . 3 4 4 6 6 2 . 3 2 0 9 4 6 . 2 9 0 9 9 4 . 2 5 5 0 8 0 . 2 0 5 8 8 0 . 1 4 7 4 8 8 .
9 9 0 3 7 . 6 8 5 7 0 .
.8 82954*• 9 4 8 6 7 3 * * .9 85525• 9 85369 .9 85116 . 98 33 51 .9 75320 .9 73816 .9 64881 .9 54572 .9 31191 .9 06677 .8 76579 .8 07120 .7 16381 .6 71493• 4 0 9 1 1 1 * * *• 0 00000
T (X )
5 116063.502 33 33 .4 6 7 78 1 4.4 26 67 3 1.386 24 10 .346 34 51 .3 0 7 16 7 8 .2 6 8 87 5 7.231 61 32 .1 055516.161Q65Q.128 74 27 .
9 9 0 26 3 .
HIM:2 94 14 0.1 4 9 1 3 2 .
5 7 4 0 2 .
4 8 8 5 1 3 6 .4 4 6 6 3 1 9 .4 0 5 3 5 6 5 .3 6 4 6 8 4 9 .3 2 4 6 1 8 7 .2 8 5 21 9 6 .2 4 6 7 9 2 8 .2 0 93 7 2 2 .1 7 3 26 5 7.1 3 8 7 9 9 6 .1 0 6 7 0 4 9 .
7 7 6 0 5 5 .5 2 0 9 7 6 .3 1 5 0 9 6 .1 6 7 6 0 7 .
6 8 5 7 0 .
E < X )
5 1 . 1 6 5 6 . 0 5 5 6 . 2 6 52.481 4 8 . 01 ( 4 3 . 7 6 ' 3 9 . 6 0 ' 3 5 . 5 6 * 31 . 5 3 ! 2 7. 621 2 3 . 98 7 2 0 . 71 7 1 7 . 4 5 ! 1 4 . 40 9 1 1 . 3 6 5
8 . 3 6 3
4 . * u f
5 3 . 2 6 65 8 . 2 9 65 7 . 7 8 85 3 . 8 1 7
i f c l t t4 0 . 7 3 6 3 6 . 6 1 0 3 2 . 5 5 9 2 8 . 3 3 8 2 4 . 5 6 2 2 0 . 6 1 7 1 7 . 4 7 6 1 4 . 0 2 3 11 . 158
8 . 8 3 6 7 . 1 8 3 4 . 2 1 2
* P < B I R T H ) , * * P ( 0 —4 ) , * * * T ( 8 0 ) / T { 75 }
!A6E (X)i_________i»»i
_______f0R YEAR:1{ x) 1000 Q ( X )
2 ___ AREA =
D ( X ) L ( X ) P ( X ) T EX J
f 0! ii 5V 1 0i 15! 20
259 30• 35i9 40
4 5l 509 559 609 65t 70
759t __ 80
510 1 5 20 25 30 35
«50556 065707580
1 0 0 0 0 0 . 0 8 9 51 1 . 6 83264 .96 1 2 59 . 1
JWM77974 .77 6 3 3 7 . 97 4 4 9 4 . 27 2 3 8 2 . 9 68765 .5 6 3 8 1 9 . 5 5 8 13 9 . 5 5 1339.1 4 3 3 8 2 . 1 3 4 3 7 3 . 7 23042 .4 1 3 6 5 9 . 0
100000.09 0 0 84 . 1 8 5 2 7 7 . 68 3 7 2 1 . 4 82879 .5 8 1 62 0 . 08 0 8 4 1 . 57 9 2 47 . 57 7 4 91 . 1
W t f : ! ,6 9 5 0 2 . 2 6 3 1 7 7 . 9 5 7 569. 1 4 8689 .8 3 8 0 4 5 . 8 255 23.81 6 5 42 . 2
1 0 4 . 8 8 6 9 . 7 9 24 ‘ 10 15,152 0 ,24,28.49,71,89,
116, 154, 207, 329 , 407,
1 0 0 0 ,
.09. 31. 5 6
,15 . 3 4 . 9 8 . 93 . 00 . 97 . 9 9 .65 .65 .23 . 00
9 9 . 1 6 5 3 . 3 5 1 8 . 2 5 1 0 . 0 6 1 5 . 2 0
9 . 5 41 9 . 7 22 2 . 1 6 2 1 . 2 7 4 0 . 3 3 4 5 . 0 9 9 0 . 9 9 8 8 . 7 8
1 5 4 . 2 42 1 8 . 6 13 2 9 . 1 33 5 1 . 8 9
1 0 0 0 . 0 0
1 0 4 8 8 .6 2 4 7 .2 0 0 6 .
8 3 6 .1 2 5 1 .
« ! ? : 184 4 . 2 1 1 1 . 3 6 1 7 . 4 9 4 6 . 5 6 8 0 . 6 8 0 0 . 7 9 5 7 . 9 0 0 8 .
1 1 3 3 1 . 9 3 8 3 .
1 3 6 5 9 .
9 9 1 6 .4 8 0 6 .1 5 5 6 .
84 2 . 1 2 5 9 .
7 7 8 . 1 5 9 4 . 1 75 6 r 1 6 4 8 . 3 0 5 9 .
I W :5 6 0 9 .8 8 7 9 .
1 0 6 4 4 .1 2 5 2 2 .
8 9 8 2 .1 6 5 4 2 .
m a l e s
92658 . 3 4 5 5 5 3 . 4 1 1 3 1 0 . 4 0 4 2 0 1 . 3 9 8 9 7 7 .
n m k3 7 7 0 8 0 . 3 6 7 1 9 3 . 3 5 2 8 7 1 . 3 31462 . 3 0 4 8 9 7 . 2 7 3 6 9 7 . 2 3 6 8 0 3 .1 9 4 3 8 9 . 1 4 3 5 4 0 .
9 1 7 5 3 . 56485 .
FEMALES
93059 „ ' 3 5 0 7 2 3 . 4 2 2 4 9 8 . 4 1 6 5 0 2 . 4 1 1 2 4 9 . 4 0 6 1 5 4 . 4 0 0 2 2 3 . 391 8 4 6 . 3 83 33 5 . 371 568 . 3 5 5 7 1 6 . 3 3 1 7 0 0 . 3 0 1 8 68 . 2 6 5 6 4 7 . 2 1 6 8 3 9 .1 56924 .1 051 65 .
6 9785 .
.8 76422*
.9 3 8 6 1 2 * *• 9 82715 .9 87077• 9 84671 .9 81980 .9 77445 .9 73779 .9 60997• 9 39330 .9 19855 .8 97668 .8 65203 .8 20891 .7 384 15 • 639218.3 8 1 0 4 4 * * *.0 0 00 0 0
.8 87 5 64*
.9 5 2 0 38 * *
. 9 8 58 1 0
.9 87386
.9 87611• 985396• 9 79071 .9 78280 .9 69302 •9 57337 •9 32488 .9 10061 . 88 00 1 3 .8 16 266 . 7 329 12 . 661731«3 9 8 8 8 5 . * , •0 00 00 0
5 1 6 1 5 1 4 .5 0 6 8 8 5 6 .4 7 2 3 3 0 2 .4 3 1 1 9 9 2 .3 9 Q7 79 2 .3 5 0 8 8 1 5 .3 1 1 5 9 5 4 .2 7 3 0 1 7 2 .2 3 5 3 0 9 2 .1 9 8 5 8 9 9 .1 6 3 3 0 2 8 .1 3 0 1 5 6 5 .
9 9 6 6 6 8 .7 2 2 9 7 2 .4 6 6 1 6 8 .2 9 1 7 7 9 .1 4 8 2 3 9 .
5 6 4 8 5 .
5 4 5 2 8 0 0 .5 3 5 9 7 4 1 .5 0 0 9 0 1 8 .4 5 8 6 5 2 0 .4 1 7 0 0 1 8 .3 7 5 8 7 6 9 .3 3 5 2 6 1 5 .2 9 5 2 3 9 3 .2 5 6 0 5 4 6 .2 1 7 7 2 1 1 .1 8 0 5 6 4 3 .1 4 4 9 9 2 8 .
1! , 85i §:8 1 6 ] 5 5 0 7 1 3 . 3 3 3 8 7 4 . 1 7 4 9 5 0 .
6 9 7 8 5 .
E ( X )
5 1 . 6 1 5 5 6 . 6 2 8 5 6 . 7 2 6 5 3 . 0 6 5 4 8 . 5 9 2 4 4 . 3 2 0
• 39 .9 61 3 5 . 7 6 4 3 1 . 5 8 8 2 7 . 4 3 6 2 3 . 7 4 8 2 0 . 3 9 4 1 7 . 1 4 3 1 4 . 08 2 1 1 . 2 0 7
8 . 4 8 8 6 . 4 3 3 4 . 1 3 5
5 4 . 5 2 85 9 . 4 9 75 8 . 73 85 4. 78 35 0. 31 44 6 . 0 5 241 .47 13 7 . 25 53 3 . 0 4 32 8 . 7 0 72 4 . 80 82 0 . 86 21 7 . 7 0 014. 18111. 311
8 . 7 766 . 8 544 . 2 1 9
• P C P I R T H ) * • P ( 0 -4 X * * * 1 ( 8 0 ) / I ( 7 5 )
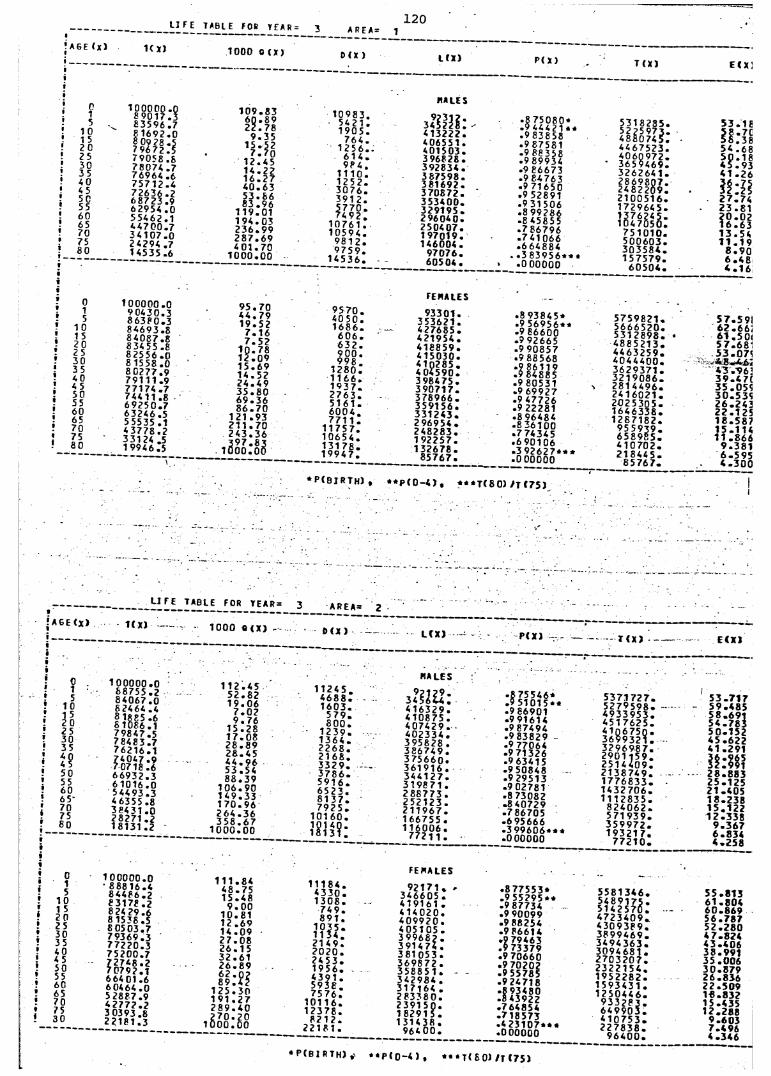
120
AGE <x)
015
1 01 52 C 25 30 35 40 45 5 C 55 60 65 70 75 80
015
1 0 1 5 20 25 30 35 40 4 5 50 55 60 65 70 75 80
__LI FE ta b l e FOB TEAR:
1< 1000 0 (X)
3_ A R E A= 1
0 ( X ) L m
1 0 0 00 0 -08 9 0 1 7 . 3 8 3 5 9 6 . 7 8 16 92. 0
Wil:i7 9 0 58 . 6 78074 .7 76964 .67 5 7 1 2 . 4 72636 .2 68723 .9 62954 .0 5 54 62 . 14 4 7 0 0 . 7 3 4 1 0 7 . 0 2 4294 .7 1 4535 .6
10 0 00 0 .09 0 4 3 0 . 38 6 3 8 0 . 38 4 6 93 . 88 4 0 87 . 8 8 34 55 .8 82556 .0 £ 15 58 .08 0 2 77 . 97 9 1 11 . 9 77174 .7 7 4 4 11 . 8 6 9 2 5 0 . 7 63246 .5 5 5535 .1 4 3 7 7 8 . 2 331 24 .5 1 9946. 5
1 0 9 . 8 3 6Q. 89 2 2 . 7 8
9 . 3 5 1 5 . 5 2
7 . ?0 1 2 . 4 5 1 4 . 2 2 1 6 . 2 7 4 0 . 6 3 5 3 . 6 6 8 3 . 9 6
1 19 .0 1 1 9 4 . 0 3 2 3 6 . 9 92 8 7 . 6 94 0 1 . 7 0
1 0 0 0 . 0 0
9 5 . 7 04 4 . 7 91 9 . 5 2
7 . 1 6 7 . 5 2
1 0 . 7 81 2 . 0 91 5 . 6 91 4 . 5 2 2 4 . 4 93 5 . 8 0 6 9 . 3 68 6 . 7 0
1 2 1 . 9 3 2 1 1 . 7 0 2 4 3 . 3 6
i2SZ:H
1 0 9 8 3 . 54 2 1 . 1 9 0 5 .
7 6 4 .1 25 6 . .
6 1 4 . 9 8 4 .
1 1 1 0 .1 25 2 . 3 0 7 6 . 3 9 1 2 . 5 7 7 0 . 7 4 9 2 .
1 0 7 6 1 . 1 0 5 9 4 .
9 8 1 2 . 9 7 5 9 .
1 4 5 3 6 .
9 5 7 0 . 40 5 0 . 1 6 8 6 .
6 0 6 . 6 3 2 . 9 0 0 . 9 9 8 .
1 2 8 0 . 1 1 6 6 . 1 9 3 7 . 2 7 6 3 . 5 1 6 1 . 6 0 0 4 . 7 7 1 1 .
1 1 7 5 7 . 1 0 6 5 4 . 1 3 1 7 8 . 1 9 9 4 7 .
hales
413222. 40655 1. 4 01 50 3. 3 96 82 8. 3 92834 . 3 87 59 8 . 3 81 69 2 . 3 70 87 2. 3 53 40 0 . 3 2 9 19 5 . 2 9 6040. 2 50 40 7 .1 97 01 9. 14600 4.
97076. 60 504 .
females
93301.3 5 3 62 1 .4 2 7 68 5 .4 2 1 95 4 .4 1 8 8 5 9 .4 15 03 0 .4 1 0 2 8 5 .4 0 4 5 9 0 .3 9 8 4 7 5 .3 9 0 7 1 7 .3 7 6 9 6 6 .3 5 9 15 6 .3 3 1 2 4 3 .2 9 6 9 5 4 .2 4 8 2 8 3 .1 92 257 . 1 3 2 6 7 8 .
8 5 7 67 .
P C X )
.8 7 5080*
.9 44421 * *
.9 83858
.9 87581
.9 88358
.9 89934
.9 86673
.9 84763
.9 71650
.9 52891
.9 31 506
. 8 9 9 2 8 6 • 8 458 5 5 . 7 8 6 7 9 6 . 7 4 10 6 6 .6 64884 .3 8 3 9 5 6 * * * . 0 0 0 0 0 0
.8 9 38 45 *• 9 5 6 9 5 6 * * .9 86600 .9 92665.9 90857 .9 88568• 9 86119 .9 84885 .9 80531 .9 69927 .9 47726 .9 22281 .8 96484 .8 36100• 774345 . 6 9 01 0 6.3 9 2 6 2 7 * * *.0 00000
T ( X )
5 3 1 82 8 5 . 5 2 2 5 9 7 3 . 4 8 8 0 7 4 5 . 4 4 67 5 2 3 . 4 0 6 0 9 7 2 . 3 6 5 9 4 6 9 . 3 2 6 2 6 4 1 . 2 8 6 9 8 0 7 . 2 4 8 2 2 0 9 . 2 1 0 0 5 1 6 . 1 7 29 6 4 5 . 1 3 7 6 2 4 5 . 1 0 4 70 5 0 .
7 5 1 0 1 0 . 5 0 0 6 0 3 . 3 0 3 5 8 4 . 1 5 7 5 7 9 .
6 0 5 0 4 .
• P C B I R T h ) , * * p C 0 -4 ) t * * * T ( 8 0) / f f 75 )
5 7 5 9 8 2 1 . 5 6 6 6 5 2 0 . 5 3 1 2 8 9 8 . • 4 8 8 5 2 1 3 . 4 4 6 3 2 5 9 . 4 0 4 4 4 0 0 . 3 6 2 9 3 7 1 . 3 2 1 9 0 8 6 .
n 2 8 1 4 4 9 6 . 2 4 1 6 0 2 1 . 2 0 2 5 3 0 5 . 1 6 4 6 3 3 8 . 1 2 8 7 1 8 2 .
9 5 5 9 3 9 . 6 5 8 9 8 5 . 4 1 0 7 0 2 . 2 1 8 4 4 5 .
8 5 7 6 7 .
5 3 . 1 8
1 1 :1 15 4 . 6 85 0 . 1 8 4 5 . 9 3 41 . 2 6
ItJl2 7 . 7 42 3 . 8 12 0 . 0 21 6 . 6 31 3 . 5 41 1 . 1 9
8 . 9 0 6 . 4 8 4 . 1 6
5 7 . 5 9 ! 6 2 . 6 6 ! 6 1 . 5 0( 5 7. 68 1 53 .07 ? 4 8 6 1
4 3 . 9 6 ! 3 9 . 4 7( 3 5 . 0 5 ? 3 0 . 5 3 ? 2 6 . 2 4 3 2 2 . 1 2 5 1 8 . 5 8 7
11.*8669 . 3 8 16 . 5 9 54 . 3 0 0
A 6 E < X )
______ L 1 f E T * B L E E 0 R Y E A R = 3 A R E A * 2
1 ( X ) -------- 1 0 0 0 Q ( X) - - D ( X ) L C X ) PCX) T < X ) E < X )
015
101 52 0 25 30 35
i?50556065'707580
1 0 00 0 0 . 08 8 7 5 5 . 28 4 0 6 7 . 0 8 2464 .4
79847 .5 78483 .776216 .1
F .« > i l : l6 6 9 32 . 3 6 1016. 05 4 4 93 . 3 4 6355 .8 38431 .02 8 2 71 . 21 81 31 .2
1 1 2 . 4 55 2 . 8 21 9 . 0 6
7 . 0 29 . 7 6
1 5 . 2 81 7 . 0 82 8 . 8 92 8 . 4 54 4 . 9 65 3 . 5 48 8 . 3 9
1 0 6 . 9 01 4 9 . 3 31 7 0 . 9 62 6 4 . 3 63 5 8 . 6 7
1 0 0 0 . 0 0
1 1 2 4 5 . 4 6 8 8 . 1 6 0 3 .
5 7 9 . 8 0 0 .
1 2 3 9 . 1 3 6 4 . 2 2 6 8 . 2 1 6 8 . 3 3 2 9 . 3 7 8 6 . 5 9 1 6 . 6 5 2 3 . 8 1 3 7 . 7 9 2 5 .
1 0 1 6 0 . 1014 1813 ?:
HALES
3 Zlltt:4 1 6 3 2 9 . 4 1 0 8 7 5 . 4 0 7 4 2 9 . 4 0 2 3 3 4 . 395828 . 3 8 6 7 4 9 . 3 7 5 6 6 0 . 3 6 1 9 1 6 . 3 4 4 1 2 7 . 3 1 9 8 7 1 . 2 8 8 7 7 3 . 2 5 2 1 2 3 . 2 1 1 9 6 7 . 1 6 6 7 5 5 . 1 1 6 0 0 6 .
7 7 2 1 1 .
• 8 75 546*.9 5 1 0 15 * * .9 86901.9 91614 .9 87494 .9 83829 - .9 77064 .9 71326• 9 63415 .9 50848• 9 29513 .9 02781 .8 73082 . 84 07 2 9 .786705 . 6 956 66.3 9 9 6 0 6 * * *.0 00000
5 3 7 1 7 2 7 . 5 2 7 9 5 9 8 . 4 9 3 3 9 5 3 . 4 5 1 7 6 2 5 . 41Q675Q. 3 6 9 9 3 2 1 . 3 2 9 6 9 8 7 . 2 9 0 1 1 5 9 . 2 5 1 4 4 0 9 . 2 1 3 8 7 4 9 . 1 7 7 6 8 3 3 . 1 4 3 2 7 0 6 . 1 1 1 2 8 3 5 .
8 2 4 0 6 2 . 5 7 1 9 3 9 . 3 5 9 9 7 2 . 1 9 3 2 1 7 .
7 7 2 1 0 .
5 3 . 7 1 7 5 9 . 4 8 5 5 8 . 6 9 1 5 4 . 7 8 3 5 0 . 1 5 2 4 5 . 6 2 2 4 1 . 2 9 1
»:»?2 8 . 8 8 32 5 . 1 2 52 1 . 4 0 51 8 . 2 3 81 5 . 1 2 21 2 . 3 3 8
9 . 3 6 76 . 8 3 44 . 2 5 8
015
10 1 5 20 25 30 35 40 45 50 55 60 65 70 75 30
1 0 0 00 0 . 08 8 8 1 6 . 48 4 4 86 . 28 3 1 7 8 . 2 8 24 29 .6 8 1538 .58 0 5 03 . 77 93 69 .37 72 20 .37 52 00 .7 7 2 7 48 . 27 0792. 1 66401 .6 60464 .0 5 28 87 .94 2 7 77 . 2 3 0393 .82 21 81 . 3
1 1 1 . 8 44 8 . 7 51 5 . 4 8
9 . 0 01 0 .811 2 . 6 91 4 . 0 92 7 . 0 82 6 . 1 53 2 . 6 12 6 . 8 96 2 . 0 78 9 . 4 2
1 2 5 . 3 01 9 1 . 2 72 8 9 . 4 07 7 0 . 2 0
1 0 0 0 . 0 0
1 1 1 8 4 .4 3 3 0 .1 3 0 8 .
7 4 9 .8 9 1 .
1 0 3 5 .1 1 3 4 .2 1 4 9 .7 0 2 0 . 24 5 3 . 1 9 5 6 . 4391 . 5 9 3 8 . 7 5 7 6 .
1 0 1 1 6 . 1 2 3 7 8 .
82 1 2 . 2 2 1 8 1 .
FEMALES
9 2 1 7 1 , ' 3 4 6 6 0 5 . 4 1 9 1 6 1 . 4 1 4 0 2 0 . 4 0 9 9 2 0 . 4 0 5 1 0 5 . 3 9 9 6 8 7 . 391 47 4 . 3 8 1 0 5 3 . 3 6 9 8 7 2 . 3 5 8 8 5 1 . 342984 . 317164 . 2 8 3 3 8 0 . 2 3 9 1 5 0 . 1 8 2 9 1 5 . 1 3 1 4 3 8 .
964 0 0 .
. 8 7 7 5 5 3 *
.9 5 5 2 95 * *
. 987734
.9 90099
.9 88254
. 98 66 14
.9 79463
. 97 33 7 9
.9 70660
.9 70202
.9 55785
.9 24718
.8 93480
.8 43922
.764854
. 71 85 73
.4 2 3 1 0 7 * * *
.000000
5 5 8 1 3 4 6 .
3 1 4 2 5?Jr4 7 2 3 4 0 9 . 4 3 0 9 3 8 9 . 3 8 9 9 4 6 9 . 3 4 9 4 3 6 3 . 3 0 9 4 6 8 1 . 2 7 0 3 2 0 7 . 2 3 2 2 1 5 4 . 1 9 5 2 2 8 2 . 1 5 9 3 4 3 1 . 1 2 5 0 4 4 6 .
9 3 3 2 8 3 - 6 4 9 9 0 3 . 4 1 0 7 5 3 . 2 2 7 8 3 8 .
9 6 4 0 0 .
5 5 . 8 1 3 6 1 . 8 0 4 6 0 . 8 6 9 5 6 . 7 8 7 5 2 . 2 8 0 4 7 . 8 2 4 4 3 . 4 0 6 3 8 . 99 1 3 5 . 0 0 6 3 0 . 8 7 9 2 6 . 8 3 6 2 2 . 5 0 9 1 8 . 83 2 1 5. 43 5 1 2 . 28 8
9 . 6 0 3 7 . 496 4 . 3 4 6
* P(BI RTH) , * * P C 0 -4 ) , • • * T( 8 0) /T €75)
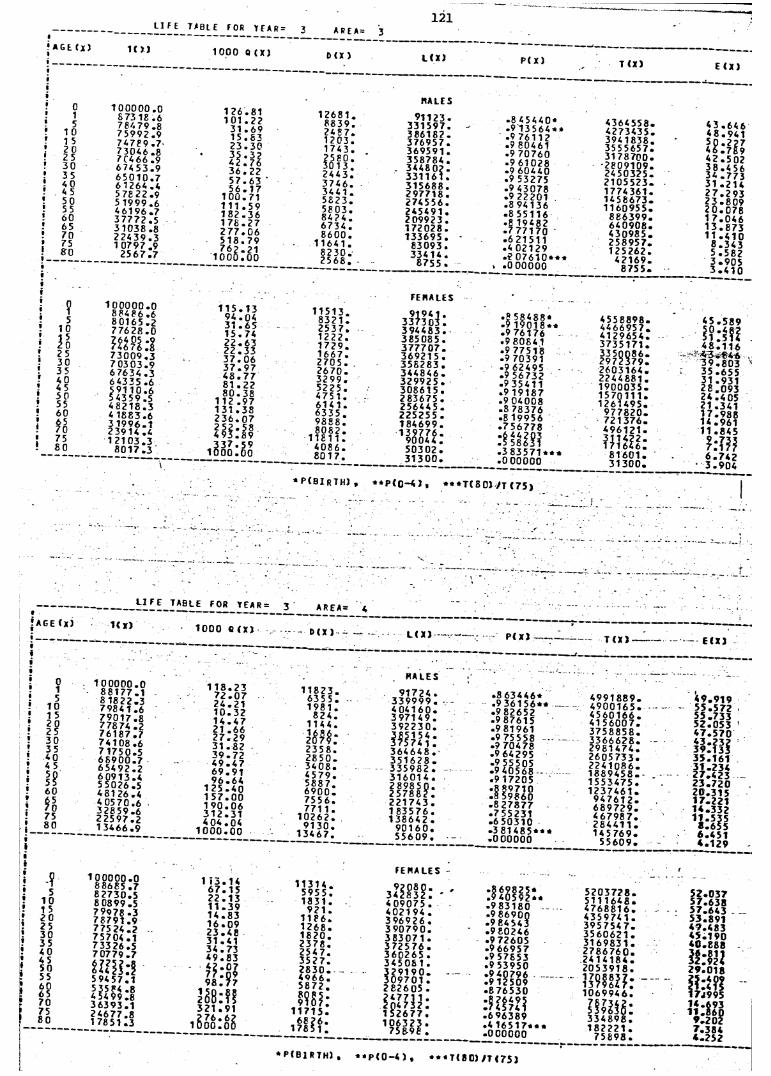
121AGE (X)
_____ LIFE TABLE FOR Y F A R :
1( , J 1 00 0 0 (X)
3 AREA:
OCX) L ( X ) PCX) T (X) E (X)
015
1 01 52 C 25 30 35 AO A 5 50 55 60 65 70 75 80
1 0 0 0 0 0 . 05 73 18 .6 7 84 79 .8 7 5 9 9 2 . 97 4 7 8 9 . 7 73046 .8 7 CA 66 .96 7 A 5 3 .96 5 0 1 0 . 76 126A .A5 78 2 2 . 9 5 1999 .6 A 6 1 9 6 . 7 3 7 7 7 2 . 5 3 10 38 .8 2 2 A3 9 . 3 1 0797 .9
2 5 6 7 . 7
1 2 6 . 8 11 0 1 . 2 2
3 1 . 6 91 5 . 8 32 3 . 3 011:11 3 6 . 2 2 5 7 . 6 3 5 6 . 1 7
1 0 0 . 7 1 1 1 1 . 5 9 1 8 2 . 3 6 1 7 8 . 2 7 2 7 7 . 0 6 5 1 8 . 7 9
i o o SToo
1 2 6 8 1 .8 8 3 9 .2A87.1 2 0 3 .1 7 A 3 .?5 fS:2 A A 3 .3 7 A 6 . 3 A A 1 . 5 8 2 3 . 5 P 0 3 . 8 A ? A . 6 7 3 A . 8 6 0 0 .
1 16A1. 8 2 3 0 . 2 5 6 8 .
«ALES
9 1 1 2 3 . 3 3 1 5 9 7 . 3 8 6 1 8 2 . 3 7 6 9 5 7 . 3 6 9 5 9 1 . 3 5878 A . 3 AA8 02 . 3 3 1 1 6 1 . 3 1 5 6 8 8 . 297718 . 27A556. 2 A 5 A 9 1 . 2 0 9 9 2 3 . 1 7 2 0 2 8 . 1 3 3 6 9 5 .
£ 3 0 9 3 . 3 3 A 1A .
8755 .
• 8 A 5 A A 0 *• 9 1 3 5 6 4 * * .9 761 12.9 80 A 61 .9 70760 .9 61028 .9 60AAO .9 53275 .9 A3078 .9 22201 .8 9A136• 8 55 1 1 6• 8 19 A 8 2 . 7 7 7 1 7 0 . 6 2 1 5 1 1• A 021 29.2 0 7 61 0* **.0 00000
A36A558. A273A35. 39A 18 38 . 3 5 5 5 6 5 7 . 3 1 7 8 7 0 0 .
• 2 809109 . 2A50325. 2 1 0 5 5 2 3 . 177A361. 1A 5 8 6 7 3 . 1 1 6 0 9 5 5 .
8 8 6 3 9 9 . 6A0908 . A3 0985 . 2 5 8 9 5 7 . 1 2 5 2 6 2 .
A2169. 8 7 5 5 .
A3 .6A 6 A 8 . 9A1
12:111 A 2 . 5 0 2 3 8 . A 5 6 3A . 7 7 3 31 . 2 U 2 7 . 2 9 3 2 3 . 8 0 9 2 0 . 0 7 8 1 7 .0 A6 1 3 . 8 7 3 11 .A10
8 . 3 A 3 5 . 5 8 2 3 . 9 0 5 3 .A 1 0
510
3 125 30 35 AO A 5 50 55 60 65 70 75 80
1 0 0 0 0 0 . 088A86 .68 0 1 6 5 . 2 7 7 6 2 8 . 0
7 3 0 0 9 . 3 7 0 3 0 3 . 9 6 76 3 A .3 6A335 .6
i!W:iA 8 2 1 3 . 3 A 1 8 8 3 . 6 3 1 9 9 6 . 1 239 1A .A1 2 1 0 3 . 3
8 0 1 7 . 3
1 1 5 . 1 3 9A .OA 3 1 . 6 5 1 5 . 7A 2 2 . 6 3 2 2 . 3 3 3 7 . 0 6 3 7 . 9 7 A 8 . 77 8 1 . 2 2 8 0 . 3 8
112 . 9 7 1 3 1 . 3 8 2 3 6 . 0 72 5 2 . 5 8 A 9 3 . 8 93 3 7 . 5 9
1 0 0 0 . 0 0
1 1 5 1 3 .8321 . 2 5 3 7 . 1 2 2 2 . 1 7 2 9 . 1 6 6 7 . 2 7 0 5 . 2 6 7 0 . 3 2 9 9 . 5 2 2 5 . A 7 5 1 . 61 A1. 6 3 3 5 . 9 8 8 8 . 8 0 8 2 .
1 1 8 1 1 . AO 8 6 . 8 0 1 7 .
FEMALES
s J H H :3 9 4 4 8 3 . 3 8 5 0 8 5 . 3 7 7 7 0 7 . 3 6 9 2 1 5 . 358 2 83 .3 A A 8 A 6 • 3 2 9 9 2 5 . 3 0 8 6 1 5 . 2 8 3 6 7 5 .2 56A A 5 . 225 255 . 1 8A699 . 1 3 9 7 7 6 .
900AA . 5 0 3 0 2 . 3 1 3 0 0 .
• 8 58A88*.9 190 18** .9 76176 .9 808 A 1 .9 77518 .9 70391 *9 62 A95 .9 56732 .9 35 A 11 .9 191 8 7 .9 OA008 .8 78376 • 8 19956 . 7 5 6 7 7 8rlfllSf. 3 8 3 5 7 1 * * *. 0 0 0 0 0 0
A55 8898 . AA 6695 7 . A12965A. 3 7 3 5 1 7 1 . 3 3 5 0 0 8 6 . 2 9 7 2 3 7 9 . 260 316A. 22 A A 8 8 1 . 1 9 0 0 0 3 5 . 1 5 7 0 1 1 1 . 1 2 6 1 A95.
9 7 7 8 2 0 . 7 2 1 3 7 6 . A9 6121 .?H8i:
8 1 6 0 1 .3 1 3 0 0 .
A5. 5 8 9i¥;if!A 8 . 1 1 6< 3 . 8 4 ^3 9 . 8 0 33 5 . 6 5 53 1 . 9 3 1
:?S!21 .3A-I
i 4 : § 6 ?11 . 8 45
km6 . 7A23 .9 0A
• P C B I r TH) , **P(0~A ) t * * * T ( 8 0 ) / T ( 7 5 )
! ■
X
AGE (X)
_____ LIFE TABLE FOR TEAR
1<I) 1 0 0 0 6 ( X)
3___A R E A= A
- D ( X ) - — - L (X) PCX) T (X) E ( X )
0 1 5
10 1 5 2 0 25 30 35 AO A 5
IS6 0
«75
, 80•I
1 0 0 0 0 0 . 0 8 8 1 7 7 . 1 8 1 8 2 2 . 3 798 A 1 .6 7 9 0 1 7 . 8 7787A .27 6 1 8 7 . 7 7 A 1 08 .6 7 1 7 5 0 . 56 6 9 0 0 . 7 6 5 A9 2 . 2 6 0 9 1 3 . A 5 5 0 2 6 . 5 A8126.A A 05 70 .6 32 85 9 .6 2 2 5 9 7 . 2 1 3A66. 9
1 1 8 . 2 3 7 2 . 0 7 2 A . 21 1 0 . 3 2 1 A . A 7 21 . 6 6 2 7 . 2 9 3 1 . 8 2 3 9 . 7 2 A 9 . A 7 6 9 . 9 1 9 6 . 6A
1 2 5 . AO 1 5 7 . 0 0 1 9 0 . 0 6 3 1 2 . 3 1 AOA.OA
1 0 0 0 . 0 0
1 1 8 2 3 . 635 5 . 1 9 8 1 .
8 2 A .11 AA.m i :2 3 5 8 . 2 8 5 0 . 3 A 08 • A 5 79 . 5 8 8 7 . 6 9 0 0 . 7 5 5 6 . 7 7 1 1 .
1 0 2 6 2 .9 1 3 0 .
13 A67 .
«ALES
9172A . 3 3 9 9 9 9 . A0A1 6 0 . 3971 A9. 3 9 2 2 3 0 .m m :36A6 A8 . 3 5 1 6 2 8 . 3 3 5 9 8 2 . 31601 A . 2 8 9 8 5 0 . 2 5 7 8 8 2 . 2 217 A 3 .1 8 3 5 7 6 .1386 A 2 .
9 0 1 6 0 . 5 5 6 0 9 .
.8 63 A A 6 *
.9 3 61 56 * *
.9 82652
.9 87615
.9 81961
.9 75558 •
.9 70 A 78
.9 6A295 •9 5 5 505 • 9 AO568 - .9 17205• 8 8 9 7 1 0 . 8 $ 9 8 6 0 .8 27877 .7 55231 .6 50310 .3 81 A85*** . 0 0 0 0 0 0
A 9 9 1 8 8 9 . A 9 0 0 1 6 5 . A 5 601 6 6 . A15 6 0 0 7 . 3 7 5 8 8 5 8 . 3 3 6 6 6 2 8 . 2 9 8 1 A7A. 2 6 0 5 7 3 3 . 2 2 A 1 08 6 . 1 8 8 9 A 5 8 . 1 5 53 A7 5 . 1 23 7 A 6 1 .
9 A 7 6 1 2 • 6 8 9 7 2 9 . A 67 9 8 7 . 2 8 A A11 . 1 A 5 76 9 •
5 5 6 0 9 .
4 9 .9 1 95 5 .5 7 2
1 1 :5 1 1A 7.570
8:?H3 5 .1 6 13 1 .2 3 42 7 .4 2 32 3 .7 2 02 0 .3 1 51 7 .2 2 11 4 .3 3 21 1 .5 3 5
8 .6 5 56 .4 5 14 .1 2 9
?5
101 5 2 0 25 30 35 AO 45 50 55 60 65 70 75 80
1 0 0 0 0 0 . 06 8 6 8 5 . 78 2 7 3 0 . 58 0 8 9 9 . 5 79978 . 3 7 8 7 9 1 . 9 775 24 . 2 75704 .17 3 3 2 6 . 57 0 7 7 9 . 7
Hlii.15 9 4 5 7 . 1 5 35 84 .8 A 5499 .83 6 3 9 3 . 12 4 6 7 7 . 8 1 7851 .3
1 1 3 . 1 4 6 7 . 1 5 2 2 . 1 3 1 1 . 3 91 4 . 8 3 1 6 . 0 9 2 3 . 4 8 3 1 . 4 1 3 4 . 7 34 9 . 8 3fkSi9 8 . 7 7
218:??3 2 1 . 9 12 7 6 . 6 ?
1 0 0 0 . 0 0
1131 A . 5 9 5 5 . 1 8 3 1 .
9 2 1 .1 1 8 6 .1 2 6 8 .1 8 2 0 .2 3 7 8 .2 5 4 7 .3 5 2 7 .2 8 3 0 .4 0 6 6 .5 8 7 2 .
1 1 7 1 5 .
FEMALES
-4 0 9 0 7 5 . 4021 94 . 3 9 6 9 2 6 . 3 9 0 7 9 0 . 3 8 3 0 7 1 . 3 7 2 5 7 6 . 3 6 0 2 6 5 . 3 4 5 0 6 1 . 3 2 9 1 9 0 . 3 0 9 7 0 1 .2 826 05 .
iSHU:1 5 2 6 7 7 . 1 0 6 3 2 3 .
758 9 8 .
• 8 69 8 2 5 *.9 4059 2** .9 83180 .9 £6900 • 9 84543 . 9 8 0 2 4 6 .9 72605 .9 669 5 7 .9 57653 .9 53950 .9 40796 .9 12509 .8 765 30
.•»»a ?
. 6 9 6 3 8 9
.4 1 6517* **
. 0 0 0 0 0 0
5 2 0 3 7 2 8 .5 1 1 1 6 4 8 .4 7 6 8 8 1 6 .4 3 5 9 7 4 1 .3 9 5 7 5 4 7 .3 5 6 0 6 2 1 .3 1 6 9 8 3 1 .2 7 8 6 7 6 0 .2 4 1 4 1 8 4 .2 0 5 3 9 1 8 .
1 0 6 9 9 4 6 .
3 3 4 8 9 8 . 1 8 2 2 2 1 .
7 5 8 9 8 .
| | : 2 I b5 7 .6 4 35 3 .8 9 14 9 .4 8 34 5 .1 9 04 0 .8 8 8
»:«!2 9 .0 1 8
m'i:i
7 .3 8 44 .2 5 2
* PCB)RTH) * * P C 0 -4 ) * * « TC 8 0) /T (75 )
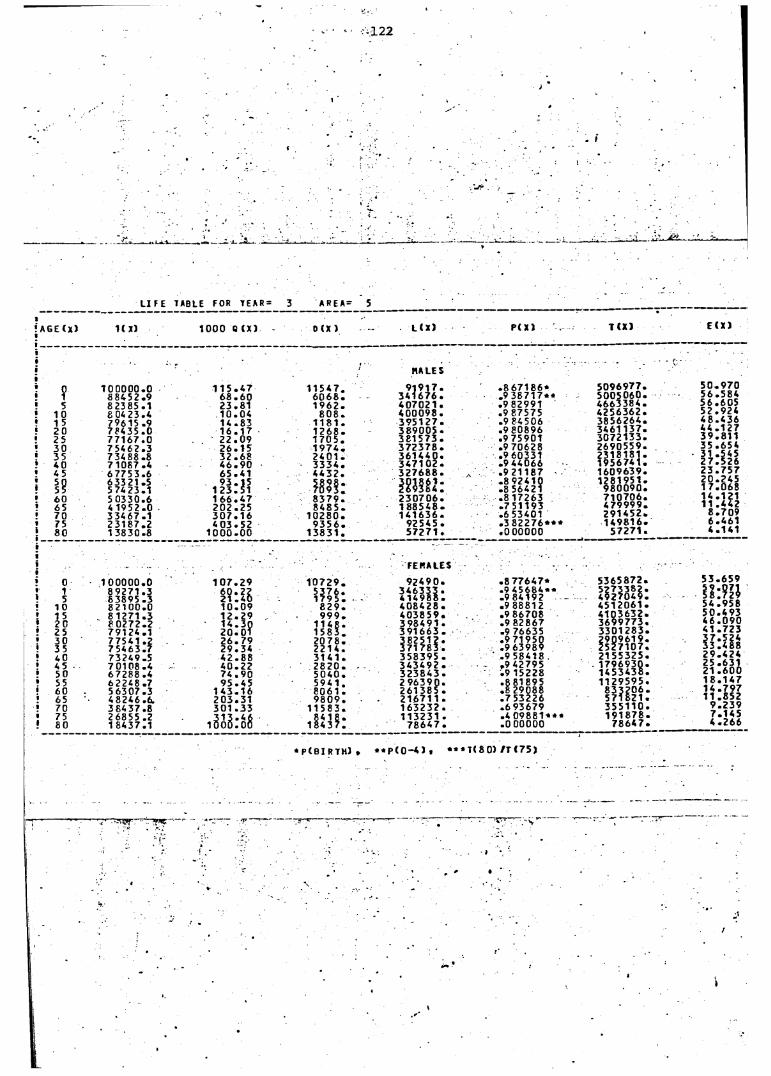
• • ' 122
LI FE TABLE FOR YEAR= 3i' AGE <x) 1( X) 1000 0 (X)
0 1 0 0 0 0 0 . 0 1 1 5 . 4 71 8 8 4 5 2 . 9 6 8 . 6 05 8 2 385. 1 2 3 . 8 1
1 0 1 5
8 0 4 2 3 . 4 79615 .9
1 0 . 0 41 4 . 8 3
20 78435 . 0 1 6 . 1 725 7 7 1 6 7 . 0 2 2 . 0 93035
7 5 4 6 2 . 3 73488 .8
2 6 . 1 53 2 . 6 8
40 71087 .4 4 6 . 9 04 5 6 7 7 5 3 . 6 6 5 . 4 150 63321 .5 9 3 . 1 5
1 2 3 . 5 155 5 7423. 160 5 0 33 0 . 6
4 19 52. 01 6 6 . 4 7
65 2 0 2 . 2 570 3 3 4 6 7 . 1 3 0 7 . 1 675 2 3 1 8 7 . 2 4 0 3 . 5 280 1 3 83 0 . 8 1 0 0 0 . 0 0
0 1 0 0 0 0 0 . 0 1 0 7 . 2 915
89271 .3 6 3 8 9 5 . 3
6 0 . 2 22 1 . 4 0
1 0 8 2 1 0 0 . 0 1 0 . 0 91 5 8 1 2 7 1 . 3 1 2 . 2 920 8 0 2 7 2. 2 1 4 . 3 025 7 9 1 24 . 1 2 0 . 0130 7 7 5 4 1 . 2 2 6 . 7 93 5 7 5 4 6 3 . 7 2 9 . 3 440 7 3 2 49 . 5 4 2 . 8 84550
7 0 1 0 8 . 4 67288 .4
4 0 . 2 27 4 . 9 0
55 62248 .7 9 5 . 4 560 5 6 3 0 7 . 3 1 4 3 . 1 665 48246 .6. 2 0 3 . 3 170 3 8 4 3 7 . 8 3 0 1 . 3 37580
26855 .2 1 8 4 37 . 1 1$0(Slo8
AREA- 5
o c x ) i m p m
MALES
1 1 5 4 7 .6 0 6 8 .
9 1 9 1 7 .3 4 1 6 7 6 .
. 8 6 7 1 8 6 *
.9 3 8 7 1 7 * *1 9 6 2 . 4 0 7 0 2 1 . .9 82991
8 0 8 . 4 0 0 0 9 8 . .9 875751 1 8 1 . 3 9 5 1 2 7 . .9 84 5061 2 6 8 . 3 8 9 0 0 5 . .9 808961 7 0 5 . 381573 . .9 759011 9 7 4 . 3 7 2 3 7 8 . .9 706282401 . 3 6 1 4 4 0 . .9 603313 3 3 4 . 3 4 7 1 0 2 . . 9 4 4 0 6 64 4 3 2 . 3 2 7 6 8 8 . .9 21187
H«: 8HU: .8 92410 .8 56421
8 3 7 9 . 2 3 0 7 0 6 . . 8 1 7 2 6 38 4 8 5 . 1 88548 . . 7 5 1 1 9 3
1 0 2 8 0 . 1 4 1 6 3 6 . .6 534019 3 5 6 . 9254 5 . .3 8 2 2 7 6 * * *
1 3 8 3 1 . 57271 . . 0 0 0 0 0 0
FEMALES
1 0 7 2 9 . 9 2 4 9 0 . . 8 7 7 6 4 7 *5 3 7 6 .1 7 9 5 .
346333 • 4 1 4 9 8 8 .
.9 4 5 6 8 4 * *
.9 841928 2 9 . 4 0 8 4 2 8 . .9 8881 29 9 9 . 4 0 3 8 5 9 . .9 86708
1 1 4 8 . 398491 . .9 828671 5 8 3 . 3 91 66 3 . .9 766352 0 7 8 . 3 8 2 5 1 2 . .9 719502 2 1 4 . 3 71783 . .9 639893 1 4 1 . 358395 . ’ .9 584182 8 2 0 . 3 4 3 4 9 2 . .9 427955 0 4 0 . 3 2 3 8 4 3 . .9 15228594 1 . 2 9 6 3 9 0 . . 8 8 18 9 58061 . 9 8 0 9 .
261385 . 2 1 6 7 1 1 .
.8 29088
. 7 532261 1 5 8 3 . 1 6 3 2 3 2 . . 6 9 3 6 7 9
8 4 1 8 . 113231 . .4 0 9 8 8 1 * * *1 8 4 3 7 . 7 8647 . .0 00000
P( BI RT Hl , * * P < 0 - 4 J t * * * T( 8 0) / T < 7 5 )
T (X J
509 69 77 . 5 0 0 50 6 0. 4663 38 4 . 4 25 63 6 2 . 3 85 62 6 4. 3 4 6 11 3 7. 3 07 21 3 3. 2 6 9 05 5 9. 2 31 81 8 1. 1 9 5 67 4 1. 1 6 096 39 . 1 28 19 5 1.
9 8 0 0 9 0 . 7 1 0 7 0 6 . 4 7 9 9 9 9 . 2 9 1 4 5 2 . 1 4 9 8 1 6 .
5 7 2 71 .
5 3 65 8 7 2 .
m i l l :4 5 1 2 0 6 1 . 4 1 0 3 6 3 2 . 3 6 99 7 7 3 . 3 3 0 1 2 8 3 . 2 9 0 9 6 1 9 . 2 5 2 7 1 0 7 . 2 1 5 53 2 5 . 179693Q. 1 4 53 4 3 8 . 1 1 29 5 9 5 .
8 3 3 2 0 6 . 5 7 1 8 2 1 . 3 5 5 1 1 0 . 1 9 1 8 7 8 .
7 8 6 4 7 .
E ( X )
5 0 . 9 7 0 5 6 . 5 8 4 5 6 . 6 0 5 5 2 . 9 2 4 4 8 . 4 3 6 4 4 . 1 2 7 3 9 . 8 1 1 3 5 . 6 5 4 31 .545 2 7 . 5 2 6 2 3 . 7 5 7 2 0 . 2 4 5 1 7 . 0 6 8 14 .121 1 1 . 4 4 2
8 . 7 0 9 6 . 4 61 4 . 1 4 1
5 3 . 6 5 911:95»5 4 . 9 5 85 0 . 4 9 34 6 . 0 9 04 1 . 7 2 3
ll:Ui2 9 . 4 2 4 2 5 . 6 3 1 21 . 6 0 0 1 8 . 1 4 7 1 4 . 7 9 7 1 1 . 8 5 2
9 . 2 3 9 7 . 1 4 5 4 . 26 6
A P P E N D I X I V
A D J U S T E D L I F E T A B L E S B Y " A G E "
N o t e : S e e A p p e n d i x I I
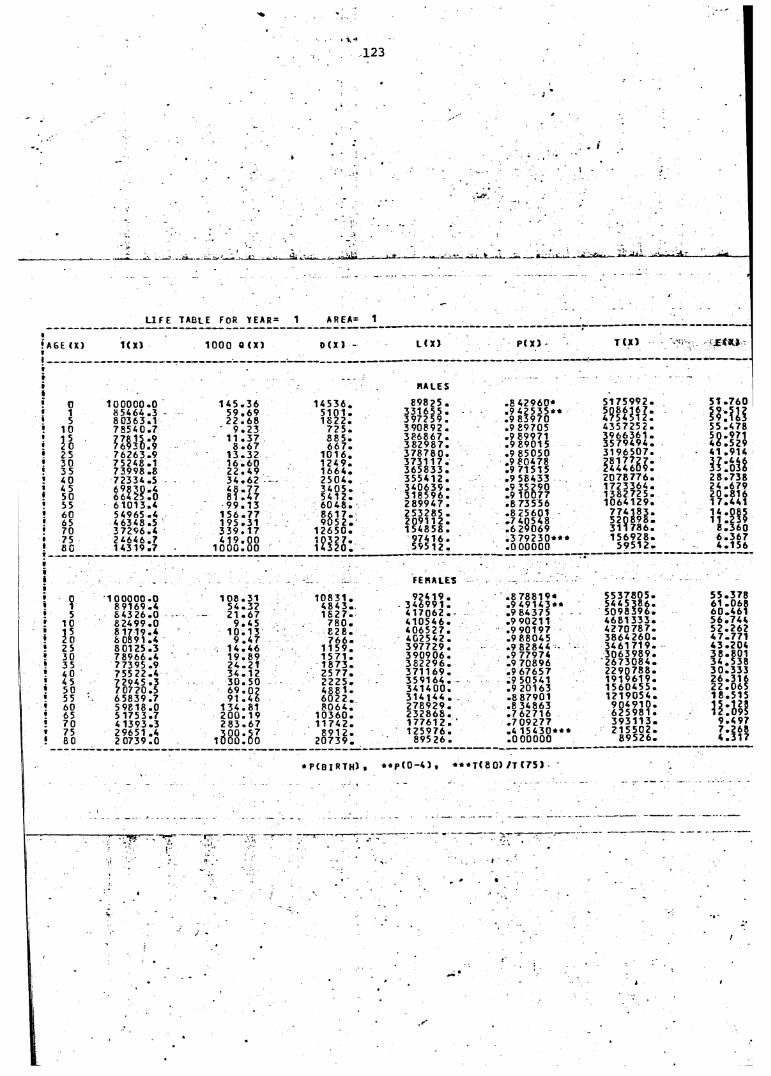
. ^ t i u . . . l l V ' A .,» .
• A 6 E (X)«
L IFE TABLE FOR YEAR-
1(X) 1 0 0 0 Q ( X)
1 A R E A= 1
D ( X ) - L ( X ) P<X> T (X) E (X )
015
10
3&a35 AO A 5 50 55 60 65 70 75 8G
015
1 0n25 30 35 AO A 5 50 55 6 0 65 70 75 80
1 0 0 0 0 0 . 0 85A6A .3 8 03 63 . 1 7 85 A 0 .7
7 6 2 63 . 9 752A8. 1 73998 .8 7 2 3 3 A .5 6 9 8 3 0 . A 664 25 . 0 6 1 0 1 3 . A 5A965 .A A 63 A 8 .5 3 7 2 9 6 . A 2 ^ 6 4 6 . 7 1 A319. 7
1 0 0 0 0 0 . 0 8 9 1 6 9 .A 8 A3 26 .0 82A99 . 0 8 1 7 1 9 . A 8 0891 .A 80125 .3 78966 .A 77395 .9 755 2 2 . A 7 2 9 4 5 . 37 07 70 . 5 6 5839 .7 5 9818 .0 5 175 3 .7 A 1 393. 3 29651 .A 2 0 73 9. 0
1 A 5 . 3 6 1A 5 36 .5 9 . 6 9 5 1 0 1 .2 2 . 6 8 1 8 2 2 .
9 . 2 3 7 2 5 .1 1 . 3 7
8 . 6 78 8 5 .6 6 7 .
1 3 . 3 2 1 0 1 6 .1 6 . 6 0 1 2 4 9 .2 2 . A9 1 6 6 4 .3 4 . 6 2 2 5 0 4 .4 8 . 7 7 3 4 0 5 .81 . 4 7 5 4 1 2 .9 9 . 1 3 6 0 4 8 .
1 5 6 . 7 7 8 6 1 7 .1 9 5 . 3 1 9 0 5 2 .3 3 9 . 1 7 1 2 6 5 0 .4 1 9 . 0 0 1 0 3 2 7 .
1 0 0 0 . 0 0 1 4 3 2 0 .
1 0 8 . 3 1 1 0 8 3 1 .5 4 . 3 2 48 4 3 .2 1 . 6 7 1 6 2 7 .
9 . 4 5 7 8 0 .1 0 . 1 3 £ 2 8 .
9 . 4 7 7 6 6 -1 4 . 4 6 1 1 5 9 .1 9 . 8 9 1 5 7 1 .2 4 . 2 1 1 8 7 3 .3 4 . 1 2 2 5 7 7 .3 0 . 5 0 2 2 2 5 .6 9 . 0 2 4 8 8 1 .91 . 4 6 6 0 2 2 .
1 3 4 . 8 1 8 0 6 4 .2 0 0 . 1 9 1 0 3 6 0 .2 8 3 . 6 7 1 1 7 4 2 .
i ^ o o l c l o8 9 1 2 .
2 0 7 3 9 .
«ALES
898?5 . 331655 . 3 9 7 2 5 9 . 390892 . 3 8 6 8 6 7 . 3 8 2 9 8 7 . 3 7 8 7 8 0 . 3 7 3 1 1 7 . 3 6 5 8 3 3 . 3 5 5 A 12 . 3 A 0 6 3 9 . 3 1 8 5 9 6 . 2 8 9 9 A 7 . 253285 . 2 0 9 1 1 2 . 1 5 A 8 5 8 .
97 A 1 6 • 5 9 5 1 2 .
FEMALES
92 A 19 . 346991 .A 17062 .A105 A6 . A 0 6 5 2 7 . AG25A2. 3 9 7 7 2 9 . 3 9 0 9 0 6 . 3 8 2 2 9 6 . 3 7 1 1 6 9 . 3 5 9 1 6 A . - 3 A1A 00 .3 1 A 1 A A . 2 7 8 9 2 9 . 2 3 2 8 6 8 . 1 7 7 6 1 2 . 1 2 5 9 7 6 .
895 26 .
.8 4 29 60 *• 9 4 2 5 3 5 * * .9 83970 .9 89705 .9 89971 .9 89015 .9 85050 .9 80A78 .9 71515 .9 58A33 .9 35290 .9 10077 .8 73556 .8 25601 . 7 AQ5A8 .6 29069 .3 7 9 2 3 0 * * * .0 00000
.8 7 8 8 19 *
.9 4 9 1 4 3 * *
.9 8A375
.9 90211
.9 90197
.9 8 8 0 A 5
.9 82844
.9 7 7 9 7 A
.9 70896
.9 67657
.9 50541
.9 20163
.8 87901
.8 34863
.7 62716
. 7 0 9 2 7 7
.A 1 5 4 3 0 * * *
. 0 0 0 0 0 0
5 1 7 5 9 9 2 .mm:4357252■ 3 9 6 6 3 6 1 . 3 5 7 9 4 9 4 , 3 1 9 6 5 0 7 .
i l l l l i i :2 0 7 8 7 7 6 .1 7 2 3 3 6 4 .1 3 8 2 7 2 5 .1 0 6 4 1 2 9 .
7 7 4 1 8 3 .5 2 0 8 9 8 .3 1 1 7 8 6 .1 5 6 9 2 8 .
5 9 5 1 2 -
5 5 3 7 8 0 5 . 5 4 4 5 3 8 6 . 5 0 9 8 3 9 6 . 4 6 8 1 3 3 3 . 4 2 7 0 7 8 7 . 3 8 64 2 6 0 . 3461 719. 3 0 63 9 8 9 . 2 6 73 0 8 4 . 2 2 9 07 8 8. 1 9 1 96 1 9. 1 56 04 55 . 121 90 54 .
9 0 4 91 0 . 6 2 5 9 8 1 . 3 9 3 11 3 . 2 1 5 50 2 .
8 9526.
51 . 76 0
SWH55 .478 5 0 . 97 1 4 6 . 5 2 9 41 .914
U-Mt2 8 . 7 3 8 24 .679 2 0 . 8 1 6 1 7. 44 1
8 . 3 6 06 . 3 6 74 . 1 5 6
5 5 . 3 7 8 6 1 . 0 6 8 6 0 . 46 1 5 6 . 7 4 4 5 2 . 2 6 2 4 7 . 7 7 1 4 3 . 2 0 4 3 8 . 8 0 1 3 4 . 5 3 8 3 0 . 3 3 3 2 6 . 3 1 6 2 2 . 0 6 5 1 8 . 5 1 5
13:11!9 . 4 9 77 . 2684 . 3 1 7
* P ( B I R T H ) , * * p ( 0 - 4 ) , * * * T ( 8 0 ) / T ( 7 5 )
"■1*' ■ '”TT ’ ‘ -5“!;
v-
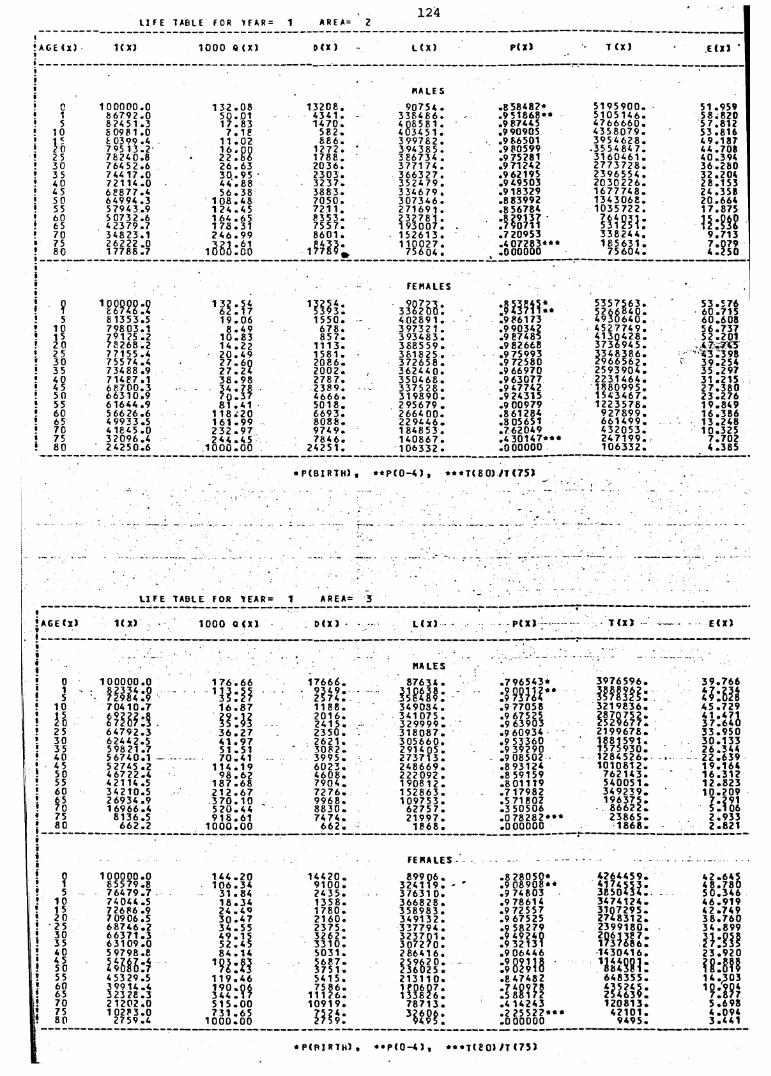
124 'LIFE TABLE FOR T F A R = 1 A R E A = 2
AGE <X) 1( X) 1 0 0 0 0 (X) D ( X ) L (X) P(X) T ( X ) E(X> •
RALE S0 1 0 0 0 0 0 . 0 1 3 2 . 0 8 1 3 2 0 8 . 90754 . .8 58482* 5 1 9 5 9 0 0 . 51 .9591 8 6 7 9 2 . 0 5 0 . 0 1 4 3 4 1 . - 3 3 8 4 8 6 . . 9 5 1 8 6 8 * * 5 1 0 5 1 4 6 . 5 8. 82 05 6 74 5 1 .3
8 098 1 .01 7 . 8 3 1 4 7 0 . 4 0 8 5 8 1 . .9 87445 4 7 6 6 6 6 0 . 5 7. 8121 0 7 . 1 8 582 . 4 0 3 4 5 1 . .990905 4 3 5 8 0 7 9 . 5 3. 81 6
To E 0399 .4 795 13.2 7624C.8
1 1 . 0 2 6 8 6 . 3 9 9 7 8 2 . .9 86501 3 9 5 4 6 2 8 . 4 9. 18 7
. if:H 1 2 7 2 . ' 3 94 3 8 5 . .980599 .35 54 84 7. 4 4. 7082 5 1 788 . 386734 . .9 75281 31 60461 . 40 .39430 764 5 2 .6 2 6 . 6 3 2 0 3 6. 3 7 7 1 7 4 . .9 71242 2 7 7 3 7 2 8 . 3 6 . 26 03 5 744 17 .0
7 2 1 1 4 . 03 0 . 9 5 • 2 3 0 3 . 366 32 7 .
3 5 2 4 7 9 .. 962195 2 3 9 6 5 5 4 . 3 2. 204
40 4 4 . 8 8 3 2 3 7 . .9 49503 2 0 3 0 2 2 6 . 2 8. 15 345 6 8 8 7 7 . 4 5 6 . 3 8 3 8 8 3 . 3 34679 . .9 18329 1 6 7 7 7 4 8 . 2 4. 35 850 64994 .3
5 7 9 4 3 . 91 0 8 . 4 8 7 0 5 0 . 307 34 6 . .883992 1 3 4 3 0 6 8 . 2 0. 664
55 1 2 4 . 4 5 7 2 1 1 . 271 69 1 . .8 56784 1 0 3 5 7 2 2 . 1 7. 8756065
5 0732 .6 4 2 37 9 . 7
1 6 4 . 6 5 1 7 3 . 3 1
8 3 5 3 . 75 5 7 .
2 3278 1 .1 9 3 0 0 7 . .
. 720953mm:
70 3 4 8 23 . 1 2 4 6 . 9 9 8601 . 1 5 2 6 1 3 . 3 3 8 2 4 4 . 9 . 71375 26222 .0
1 5 ^ 3 r oo 1 7 7 ^ *1 1 0 0 2 7 .
75604 .. 4 0 7 2 8 3 * * * 1 8 5 6 3 1 . 7 . 079
80 1 7 78 6 . 7 .000000 7 5 6 0 4 . 4 . 2 5 0
FEMALES? ’ W K : ?
1 3 2 . 5 46 2 . 1 7 'UU: 3 3 8 2 ^
5 3 5 7 5 6 3 .5 2 6 6 8 4 0 .4 9 3 0 6 4 0 .
5 3 . 57 6 60 .715
5 8 1353 .5 1 9 . 0 6 1 550 . 40289 1 . .9 86173 6 0 . 60 81 0 7 9 8 03 . 1 8 . 4 9 6 7 8 . 3 9732 1 . .990342 4 5 2 7 7 4 9 . 5 6 . 73 71520
791 25 .2 78268 .2
1 0 . 8 31 4 . 2 2
8 5 7 .1 1 1 3 .
3 9 3 4 8 3 . 3 8 8 5 5 9 .
.9 87485
.9 826684 1 3 0 4 2 8 .3 7 3 6 9 4 5 .
52 .20 1 4 7 . 745
25 7 7 1 5 5 . 4 2 0 . 4 9 1581 . 3 8 1 8 2 5 . . 975993 3 3 4 8 3 8 6 . 4 3 . 3 9 830 7 55 74 .4
73488 .92 7 . 6 0 2 0 8 6 . 372658 . .9 72580 2 9 6 6 5 6 2 . 3 9 . 25 4
35 2 7 . 2 4 2 0 0 2 . 3 6 2 4 4 0 . .9 66970 2 5 9 3 9 0 4 . 35 .29740 7 1467 .1 3 8 . 9 8 278 7. 3 5 0 4 6 8 . . 96 30 77 2 2 3 1 4 6 4 . 31 .2154 5 6 6 7 0 0 . 3
6 6 3 1 0 . 93 4 . 7 87 0 . 3 7
2 3 8 9 . 337528 . .9 47742 1 8 8 0 9 9 5 . 2 7 . 3 8 050 4 6 6 6 . 3 1 9 8 9 0 . .9 24315 1 5 4 3 4 6 7 . 2 3 . 2 7 655 6 1644 .9 8 1 . 4 1 5 0 1 8 . 2 95679 . .9 00979 1 2 2 3 5 7 8 . 1 9 . 8 4 960 5 6 6 2 6 . 6
4 9 9 3 3 . 51 1 8 . 2 0 6 6 9 3 . 2 6 6 4 0 0 . .8 61 284 9 2 7 8 9 9 . 1 6 . 3 8 6
65 1 6 1 . 9 9 8 0 8 8 . 2 2 9 4 4 6 . .8 05651 6 6 1 4 9 9 . 1 3 . 2 4 870 4 1845 .0
32096 .42 3 2 . 9 7 9 7 4 9 . 1 8 4 8 5 3 . . 7620 49 4 3 2 0 5 3 . 10 .32 5
75 2 4 4 . 4 5 7 8 4 6 . 1 4 0 8 6 7 . .4 3 0 1 4 7 * * * 2 4 7 1 9 9 . 7 . 70280 2 4 2 5 0 . 6 1 0 0 0 . 0 0 2 4 2 5 1 . 106332 . . 0000 00 1 0 6 3 3 2 . 4 .385
* P ( 8 I R T H ) ■ * * P ( 0 - 4 ) , * * * T( 8 0) / T C75)
LI F ETABLE FOR TEAR = 1 A R E A = 3AGE (X) 1( X) 1000 Q <X) D ( X ) L ( X ) T (x } E ( X )
.MALES
. . . . : - — '
0 1 0 0 0 0 0 . 0 1 7 6 . 6 6 1 7 6 6 6 . 87634 . . 7 9 6 5 4 3 * 3 9 7 6 5 9 6 . 3 9 . 7 6 615
8 2 3 3 4 . 0 72984 .9 'u rn 9 3 4 9 .
2 5 7 4 . HHM: ■.mu- »Hifi: H:SH4 5 . 7 2 91 0 7 0 4 1 0 . 7 1 6 . 8 7 1 1 8 8 . 3 4 9 0 8 4 . .9 77058 3 2 1 9 8 3 6 .
11 i?:ii 2 0 1 6 .2 4 1 5 .
3 4 1 0 7 5 . 3 2 9 9 9 9 .
.9 67525
.9 63903 isaiH: 4 1 . 4 7 13 7 . 6 4 03 3 . 9 5 025 6 4 7 9 2 . 3 3 6 . 2 7 2 3 5 0 . . 3 1 8 0 8 7 . .9 60934 2 1 9 9 6 7 8 .
30 6 2 4 4 2 . 5 598 21 .7
4 1 . 9 7 262 1 . 3 0 5 6 6 0 . .9 53360 1881591 . 3 0 . 1 3 335 5 1 . 5 1 3 0 8 2 . 2914 05 . .9 39290 1 5 75 9 3 0 . 2 6 . 3 4 4
2 2 . 6 3 940 5 6 7 4 0 . 1 - 7 0 . 4 1 3995 . 2 7 3 7 1 3 . .9 08502 1 2 8 4 5 2 6 .45 52745 .2
4 6 7 2 2 . 41 1 4 . 1 9 6 0 2 3 . 248669 . .8 93124 1 0 10 8 1 2 . 1 9 . 1 6 4
50 9 8 . 6 2 4 6 0 8 . 222092 . .8 591 59 7 6 2 1 4 3 . 1 6 . 3 1 255 42114 .5 1 8 7 . 6 8 7 9 0 4 . 1 908 12 . . 8 0 11 1 9 5 4 0 0 5 1 . 1 2 . 8 2 360 3 4 2 1 0 . 5
26934 .92 1 2 . 6 7 7 2 7 6 . 1 5 2 8 6 3 . . 7 1 7 9 8 2 3 4 9 2 3 9 . 1 0 . 2 0 9
65 3 7 0 . 1 0 9 9 6 8 . 1 0 9 7 5 3 . .5 71802 1 9 6 3 7 5 . 7 . 29170 1 6966 .4
8 1 3 6. 55 2 0 . 4 4 8 8 3 0 . 6 2 7 5 7 . .3 50506 8 6 6 2 2 . 5 . 1 0 6
75 9 1 8 . 6 1 7 4 7 4 . 2 1 9 9 7 . .0 7 8 2 8 2 * * * 2 3 8 6 5 . 2 . 9 3 380 6 6 2 . 2 1 0 0 0 . 0 0 6 6 2 . 1868 . .0 00000 1 8 6 8 . 2 . 821
FEMALES
0 1 0 0 0 0 0 . 0 1 4 4 . 2 0 1 4 4 2 0 . 899 061 6 5 5 7 9 . 8 1 0 6 . 3 4 9 1 0 0 . 3241195 7 6 4 7 9 . 7 3 1 . 8 4 24 3 5 . 3 76 31 0
1 0 74044 .5 1 8 . 3 4 1 3 5 8 . 3668281 5 72686 .9 2 4 . 4 0 1 7 8 0 . 3589832 0 7 09 C 6 . 5 3 0 . 4 7 2 1 6 0 . 34913225 68746 .2 3 4 . 5 5 2 3 7 5 . 33779430 6 6 3 7 1 . 3 4 9 . 1 5 3 2 6 2 . 32370135 6 3 1 0 9 . 0 5 2 . 4 5 3 3 1 0 . 30727040 59798 .8 8 4 . 1 4 5031 . 2864164 5 50 m i: f 'n-M 5 6 8 7 .
375 1 . ilitil55 4 53 29 .5 1 1 9 . 4 6 5 4 1 5 . 2 1 3 11 06065
39914 .4 3 2 3 2 8 . 3
7 5 8 6 .1 1 1 2 6 .
1 806 07 133826
70 2 1 20 2 . 0 5 1 5 . 0 0 1 0 9 1 9 . 787137580
1 0 2 8 3 . 0 2 7 5 9. 4
731 . 6 51 0 0 0 . 0 0
.8 2 8050*
.9 P 8 90 8 • *
. 9 7 4 8 0 3
.9 78614
.9 72557
.9 67525 .9 58279 .9 49240 .9 32131 .9 06446
:S 8 ? 5 I8.8 47482
.4 14243
.2 2 5 5 2 2 * * *
.0 00000
4 26 4459.4 17 4553.3 85 0434.3 47 4124.3 10 7295.2748312.2399180.2061387,1737686.1430416,
’MiWi:6 48355.4 35245.2 54639.120813.
42101.9495.
4 2 . 6 4 54 8 . 7 8 05 0 . 3 4 64 6 . 9 1 9 4 2 . 7 4 9 3 8 . 7 6 0 3 4 . 8 9 9
!Mi!2 3 . 9 2 0
1 4 . 3 0 3m.m5 . 6 9 84 . 0 9 43 . 4 41
* P ( R I R1H) * • P ( 0 -4 1 * * * T ( 8 0 ) / T 1 7 5 )
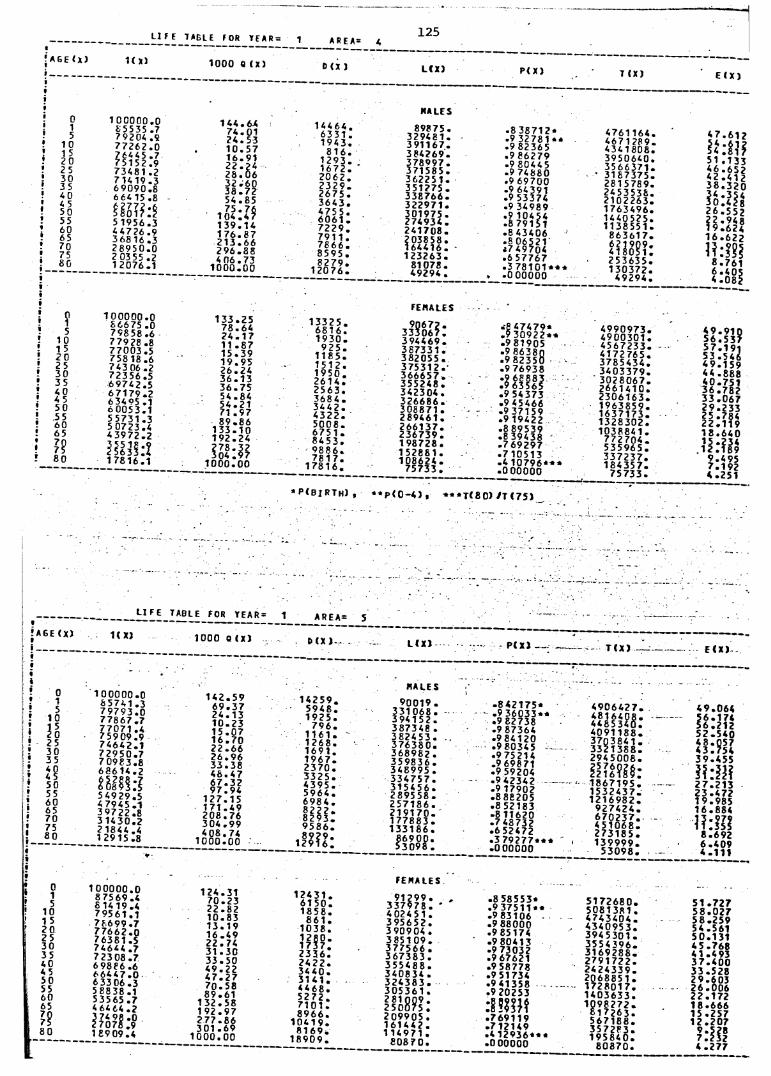
AGE <X)
015
1 01 52 0 2 5 30 35 40 4 5 50 55 60 65 70 75 80
_ L I F E TABLE f OR YEAR = 1 AREA =
1(X) 1000 Q ( X )
“ I
015
1 0 1 5 20 25 30 35 40 4 5 50 55 6 0 65
??80
1 CC000.0 8 5535 .7 79204 .97 7 2 6 2 . 0
73481 .2 7 14 19 . 3 6 9 0 9 0 . 8 664 15 .8
5 1956 .3 4 4726 .9 368 16 .32 8 9 5 0 . 0 2 0355 .2 1 20 76. 1
1 0 0 0 0 0 . 0 £ 6 6 7 5 . 0 79858 .6 77928 .87 7 0 0 3 . 5 758 18 .6 74306 .27 2 3 5 6 . 56 9 7 4 2 . 56 7 1 7 9 . 263405 .16 0 0 5 3 . 15 5 7 3 1 . 3 5 07 23. 44 3 9 7 2 . 2
3JHI:!1 7 8 16 . 1
D (X )
1 4 4 . 6 47 4 . 012 4 . 5 31 0 . 5 71 6 . 912 2 . 2 42 8 . 0 63 2 . 6 03 8 . 7 25 4 . 8 5
io745 : I *1 3 9 . 1 41 7 6 . 8 72 1 3 . 6 62 9 6 . 8 84 0 6 . 7 3
1 0 0 0 . 0 0
1 3 3 . 2 5 7 8 . 6 4 2 4 . 1 7 1 1 . 8 7 1 5 . 3 9 1 9 . 9 5 2 6 . 2 4 3 6 . 1 3 3 6 . 7 5 5 4 . 8 4 5 4 . 2 1 7 1 . 9 789
133 192
l l t t t1 0 0 0 . 0 0
861024
1 4 4 6 4 . 6331 . 194 3.
8 1 6 . 1 2 9 3 . 1 6 7 2 . 2 0 6 2 . 2 3 2 9 . 2 6 7 5 . 3 6 4 3 . 475 5 . 6061 . 7 2 2 9 . 7 9 1 1 . 7 8 6 6 . 8595 . 8 2 7 9 .
1 2 0 7 6 .
L ( X )
«ALES
89875 . 3 2 9 48 1 . 3 91 16 7 . 3 8 4 26 9 . 3 7 8 0 9 7 . 3 7 1 58 5 . 3 6 2 2 5 1 . 3 5 1 2 7 5 . 3 3 8 7 6 6 . 3 2 2 9 7 1 . 3 0 1 97 5 . 2 7 4 9 3 4 . 2 4 1 7 0 8 . 2 0 3 85 8 . 1 6 4 41 6 . 1 2 3 2 6 3 .
8 1078. 4 9 2 9 4 .
P( X)
.8 38 712*• 9 32781 »* .9 82365.9 86279 .9 80445 .9 74880 .9 69700 .9 64391 .9 53374 .9 34989 .9 10454 .8 79151 .8 43406 .8 06521• 7 49704 .6 57767.3 7 8 1 0 1 * * *.0 00000
1 3 3 2 5 . 6 8 1 6 . 1 9 3 0 .
9 2 5 . 1 1 8 5 . 1 5 1 2 . 1950 . 2 6 1 4 . 2 5 6 3 . 3 6 8 4 . 3442 . 4 3 2 2 . 5 0 0 8 . 675 1 . 8 4 5 3 . 9 8 8 6 . 7 8 1 7 .
1 7 8 1 6 .
f e u a l e s
3? ® : 3 9 4 4 6 9 . 3 8 7 3 3 1 . 3 8 2 0 5 5 . 3 7 5 3 1 2 . 3 6 6 6 5 7 . 355248 . 3 4 2 3 0 4 . 3 2 6 6 8 6 . 308871 . 289461 . 2 6 6 1 3 7 . 2 3 6 7 3 9 . 1 9 8 7 2 8 .1 5288 1 . 108624 .
7 5 7 3 3 .
.8 4 7 479 *
. 9 3 0 9 2 2 * *
.9 81905
.9 86380 • 9 82350 .9 76938 •9 68883 •9 6 35 65 .9 54373 .9 4 5 4 66 .9 371 59 .9 19422 .8 89539 .8 39438 . 7 6 9 2 9 7 . 7 10513 . 4 1 0 7 9 6 * * * .0 00000
T ( X )
4761164, 467 1 289, 4 34 1808, 3 95 0640. 3 56 6371. 3 18 7375. 281 57 89 . 24 5 3 5 3£ • 2 1 0 22 6 3. 1 7 634 96 . 1 4 405 25 . 1 1 3 85 5 1 .
8 6 3 6 1 7 . 6 2 1 9 0 9 . 4 1 8 0 5 1 . 2 5 3 6 3 5 . 1 3 0 3 7 2 .
4 9 2 9 4 .
E ( X )
4 7 . 6 1 2
5 1 . 1 3 3 4 6 . 6 5 2 4 2 . 4 1 2 3 8 . 3 2 0 34 .3 54 3 0 . 4 2 8 2 6 . 5 5 2
ii:IH1 6 . 6 2 2
H:?H8 . 7 6 16 . 4 0 54 . 0 8 ?
4 9 9 0 9 7 3 . 4 9 0 0 3 0 1 . 4 5 6 7 2 3 3 . 4 1 7 2 7 6 5 . 3 7 8 5 4 3 4 . 3 4 0 3 3 7 9 . 3 0 2 8 0 6 7 . 2 6 6 1 4 1 0 . 2 3 0 6 1 6 3 . 1 9 6 3 8 5 9 . 1 6 3 7 1 7 3 . 1 3 2 8 3 0 2 . 1 0 3 8 8 4 1 .
7 7 2 7 0 4 . 5 3 5 9 6 5 . 3 3 7 2 3 7 . 1 8 4 3 5 7 .
7 5 7 3 3 .
4 9 . 9 1 05 6 . 5 3 757 . 19 15 3 . 5 4 64 9 . 1 5 94 4 . 8 8 8
m .-h s3 3 . 0 6 7 2 9 . 2 3 3 25 .784 2 2 . 1 1 9 1 8 . 6 4 0
?:$?!4 .251
* P ( B i RTh) , * * p ( 0 - 4 ) t * * * T < 8 0 ) / T E 7 5 )
*
' A 6 E ( X )ti _______
i«i
LI^FE t a b l e FOR YEAR:
1< X) 1000 0 (X)
1 AREA- 5
0 ( X ) -. . LEX)
0 1 5
1 0
3S25 30 35
IS50 55 60 65 70 75
ii•
015
10 1 5 20 25 303 5 404 5 50 55 6 0 65
?S80
1 0 0 0 0 0 . 08 5 7 4 1 . 37 9 7 9 3 . 0 77867 .77 7 0 7 1 . 4 7 5 9 0 9 . 97 4 6 4 2 . 17 2 9 5 0 . 77 0 9 8 3 . 86 8 6 1 4 . 2mm5 4 9 2 9 . 5 4 7945 .13 9 7 2 2 . 8 3 14 30 .2 2 1844 .41 2 9 1 5 . 8
1 0 0 0 0 0 . 0 8 7 5 6 9 . 4 £ 14 19 .4 7 9 5 6 1 . 17 8 6 9 9 . 77 7 6 6 2 . 0 76381 .5 74644 .77 2 3 0 8 . 7 6 988 6 .66 6 4 4 7 . 0 6 3 3 0 6 . 3 5 88 38.15 3 5 6 5 . 7 4 64 6 4 . 22 70; „1 £9 09,
1 4 2 . 5 96 9 . 3 7 2 4 . 1 3 1 0 . 2 3 1 5 . 0 7 1 6 . 7 0 2 2 . 6 6 2 6 . 9 63 3 . 3 8 4 8 . 4 7 6 7 . 3 2 9 7 . 9 4
1 2 7 . 1 51 7 1 . 4 92 0 8 . 7 63 0 4 . 9 94 0 8 . 7 4
1 0 0 0 . 0 0
1 2 4 .3 17 0 . 2 32 2 . 8 21 0 . 8 31 3 . 1 91 6 . 4 9 2 2 . 7 4 3 1 . 3 03 3 . 5 0 4 9 . 2 2 4 7 . 2 7 7 0 . 5 8 8 9 . 6 1
1 3 2 . 5 8 1 9 2 . 9 7 2 7 7 . 8 6 3 0 1 . 6 9
1 0 0 0 . 0 0
1 4 2 5 9 .5 9 4 8 .1 9 2 5 .
7 9 6 .1 1 6 1 .1 2 6 8 .1 6 9 1 .1 9 6 7 .2 3 7 0 .3 3 2 5 .4 3 9 5 .5 9 6 4 .6 9 8 4 .8 2 2 2 .8 2 9 3 .9 5 8 6 .
.SKI:
1 2 4 3 1 .6 1 5 0 . 1 8 5 8 .
8 6 1 . 1 0 3 8 . 1 2 8 0 . 1 7 3 7 . 2 3 3 6 . 2 4 2 2 . 3 4 4 0 . 3 1 4 1 . 4 4 6 8 . 5272 . 7 1 0 1 . 8 9 6 6 .
1 0 4 1 9 .8 1 6 9 .
1 8 9 0 9 .
HALES
9 0 0 1 9 . 3 3 1 0 6 8 . 3 9 4 1 5 2 . 387348 . 3824 53 . 3 7 6 3 8 0 . 368982 . 3 5 9 8 3 6 . 348995 . 3 3 4 7 5 7 . 3 1 5 4 5 6 . 2 895 58 . 2 5 7 1 8 6 . 2 1 9 1 7 0 . 1 7 7 8 8 3 . 1 3 3 1 8 6 .
8 6 9 0 0 . 53098 .
FEHALES
91299 . 3 37 97 8 . ' 4 024 5 1 . 3 9 5 6 5 2 . 3 90 90 4 . 3851 0 9 . 3 7 7 5 6 6 . 3 67 38 3 . 3 5 5 4 8 8 . 340 83 4 . 3 2 4 3 8 3 . 3 0 5 3 6 1 .2 81 Q09 . 2 50075 . 2 09 90 5 . 1 6 1 4 4 2 . 1 1 4 9 7 1 .
8 0 8 7 0 .
PEX)
. 8 4 2 1 7 5 *
.9 3 6 0 3 3 * *
.9 82738
.9 87364
.9 84 120
. 9 8 03 4 5 -
.9 75214
.9 69871
.9 59204
.9 42342
.9 17902
. 8 8 82 0 5
.8 52183
.8 11 620
.7 48732
.6 52472
.3 7 9 2 7 7 * * *
.0 00000
.8 58553*
.9 3 7 5 1 1 * *
.9 83106
.9 88000
.9 85 174
.9 80413
.9 73032
.9 67621
.9 58778
.9 51734
.9 41358
.9 20253
:S!Wt. 7 6 91 1 9 .7 12149 . 4 1 2 9 3 6 « * *.0 00000
T (X )
4 9 0 6 4 2 7 .4 8 1 6 4 0 8 .4 4 8 5 3 4 0 .4 0 9 1 1 8 8 .3 7 Q 38 4 1.3 3 2 1 3 8 8 .2 9 4 5 0 0 8 .
IIHSH:1 8 6 7 1 9 5 .1 5 3 2 4 3 7 .1 2 1 6 9 8 2 .
9 2 7 4 2 4 .6 7 0 2 3 7 .4 5 1 0 6 8 .2 7 3 1 8 5 .1 3 9 9 9 9 .
5 3 0 9 8 .
5 1 7 2 6 8 0 . 5 0 8 1 3 8 1 . 4 7 4 3 4 0 4 . 4 3 4 0 9 5 3 . 3 9 4 5 3 0 1 . 3 5 5 4 3 0 6 . 3 1 6 9 2 8 8 . 2 7 9 1 7 2 2 . 2 4 2 4 3 3 9 . 2 0 6 8 8 5 1 . 1 7 2 8 0 1 7 . 1 4 0 3 6 3 3 .
' W i l l :5 6 7 1 8 8 .3 5 7 2 P 3 .1 9 5 8 4 0 .
8 0 8 7 0 .
E EX)
4 9 . 0 6 45 6 . 1 7 45 6 . 2 1 2 5 2 . 5 4 0mu3 9 . 4 5 5
lf:*H2 7 . 2 1 3 2 3 . 4 7 2 1 9 . 9 8 5 1 6 . 8 8 4
]?:???8 . 6 9 26 . 4 0 94 . 1 1 1
5 1 . 7 2 7 5 8 . 0 2 7 5 8 . 2 5 9 54 .561 5 0 . 1 3 1 4 5 . 7 6 8 4 1 . 4 9 3 3 7 . 4 0 0 3 3 . 5 2 8 2 9 . 6 0 3 2 6 . 0 0 6 2 2 . 1 7 2 18 . 666 1 5 . 2 5 7 1 2 . 2 0 7
?:?if4 .277
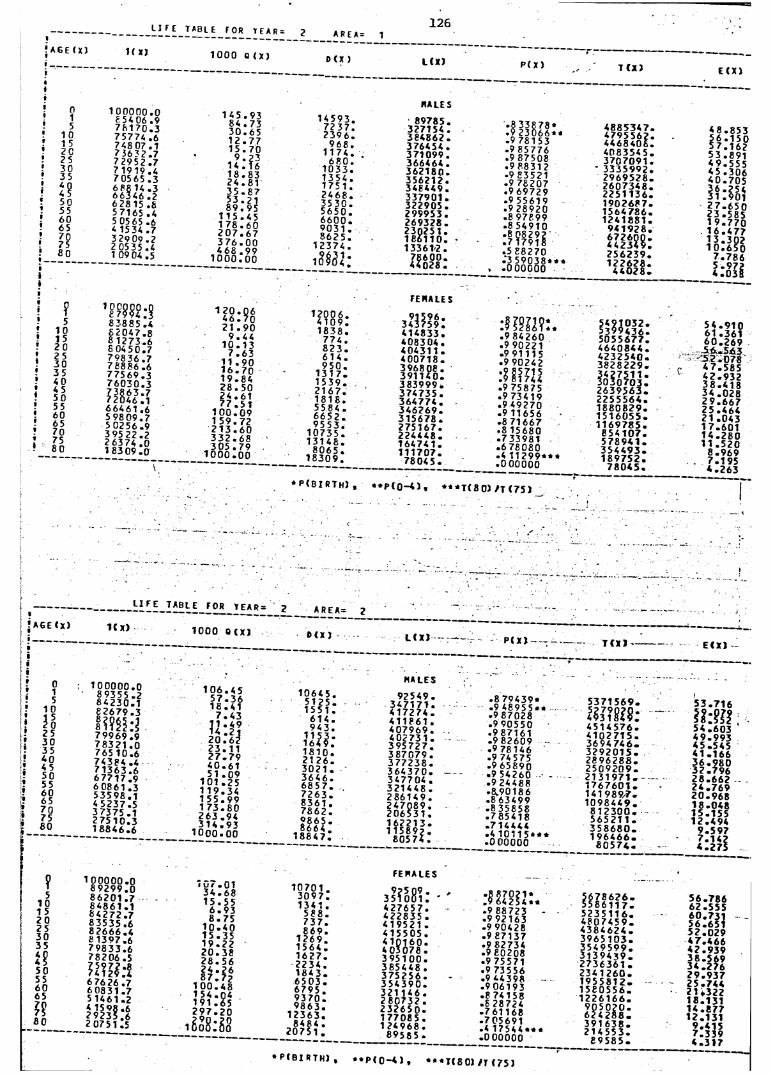
A 6 E ( X )
___ !:![£_ta8le_eor_>far = _ ?___ area» i
1( x) 1 00 0 o ( x )
126
015
1 0 1 52 C253035
{ ?50556 0657075£0
51 0 1520 2 5 30 35 40 4 5 50 55 60 65 70 75 80
1 0 0 0 0 0 . 08 54 06 .97 6 1 7 0 . 3 75774 .6 748 07. 1 7 J6 3 2 .7 7 2 9 5 2 . 77 1 9 1 9 . 4 70565 .3 688 14 .3 66346 .2 628 15 .6 5 7165 .4 5 05 65 .6 4 1534 .7 3 2 9 0 9 . 2 2 0535 .4 1 09 04 .5
1 4 5 . 9 3 8 4 . 7 3 3 0 . 6 5 1 2 . 7 7 1 5 . 7 0
9 •1 4 . T6 1 8 . 8 3 2 4 . 8 1 3 5 . 8 7 5 3 . 2 1 8 9 . 9 5
1 1 5 . 4 5 1 7 8 . 6 0 2 0 7 . 6 7 3 7 6 . 0 0 4 6 8 . 9 9
1 0 0 0 . 0 0
D (X )
1 4 5 9 3 . 72 3 7 . 2 3 9 6 .
9 6 8 . 1 1 7 4 .
6 8 0 . 1 0 3 3 . 13 54 . 1 7 5 1 . 2 4 6 8 . 35 3 0 . 5 6 5 0 . 6 6 0 0 . <?0 3 1 . 8 6 2 5 .
1 2 3 7 4 .
1 2 0 . 0 64 6 . 7 02 1 . 9 083885 .4
8 2 0 4 7 . 88 1273. 6 £ 0 450. 7 1 0 . 1 37 A7 9 8 3 6 . 7 78886 .67 7 5 6 9 . 37 6 0 3 0 . 3m il :]
1 1 . 9 01 6 . 7 01 9 . 8 42 8 . 5 02 4 . 6 177 «; *
66461 .6 5 9 8 0 9 . 7 5 0256 .9! II#l:g1 8 3 0 9 . 0
1 0 0 . 0 9 1 5 9 . 7 2 2 1 3 . 6 0 3 3 2 . 6 8 3 0 5 . 7 9
1 0 0 0 . 0 0
1 2 0 0 6 . 4 1 0 9 . 1 8 3 8 .
7 7 4 . 8 2 3 . 6 1 4 . 9 5 0 .
1 3 1 7 . 1 5 3 9 . 2 1 6 7 . 1 8 1 8 . 5 5 84 . 6 6 5 2 . 95 5 3 .
1 0 7 3 5 . 1 3 1 4 8 .
8 0 6 5 .1 8 3 0 9 .
L ( X )
KALES
8 97 85 . 327154 . 3 8 4 8 6 2 . 3 7 6 4 5 4 . 3 7 1 0 9 9 . 3 6 6 4 6 4 . 3 6 2 1 8 0 . 3 5 6 2 1 2 . 34F449 . 3 3 7 9 0 1 . 3 2 2 9 0 5 . 2 9 9 9 5 3 . 2 6 9 3 2 8 . 2 3 0 2 5 1 . 1 8 6 1 1 0 . 1 3 3 6 1 2 .
7 8 6 0 0 . 4 4 0 2 8 .
FEKALES
9 1 5 96 . 3 4 3 7 5 9 . 4 1 4 8 3 3 . 4 0 8 3 0 4 . 4 0 4 3 1 1 . 4 0 0 7 1 8 . 396808 . 3 9 1 1 4 0 . 3 8 3 9 9 9 . 3 7 4 7 3 5 . 3 6 4 7 7 4 . 3 4 6 2 6 9 . 3 1 5 6 7 8 . 2 7 5 1 6 7 . 2 2 4 4 4 8 . 1 6 4 7 4 1 . 1 1 1 7 0 7 .
7 8 0 4 5 .
P < X)
.8 3 3 8 7 8 *• 9 2 3 0 6 6 **
.9 781 53
.9 85776
.9 87508
.9 8831 2• 9 83521 .9 78207 .9 69729 .9 5561 9 .9 28920 .8 97899 .8 54910
.5 88270 •‘ 3 5 9 0 3 8*** .0 0 0 0 0 0
■Mmr...9 84260 .9 90221 .9 91115 .9 90242 • 2 85 71 5 .9 81744 .9 75875 .9 73419 .9 49270 . 9 1 1 6 5 6 .8 71667 .8 15680 . 73 39 8 1 .6 78080 .4 1 12 99*** . 0 0 0 0 0 0
T <X)
4 8 8 5 3 4 7 . 4 7 9 5 5 6 2 . 4 4 6 8 4 0 8 . 4 0 8 3 5 4 5 . 3 7 0 7 0 9 1 .
' 3 3 3 5 9 9 2 . 2 9 6 9 5 2 8 . 2 6 0 7 3 4 8 . 2 2 5 1 1 3 6 . 1 9 0 2 6 8 7 . 1 5 6 4 7 8 6 . 1 2 4 1 8 8 1 .
9 4 1 9 2 8 . 6 7 2 6 0 0 . 4 4 2 3 4 9 . 2 5 6 2 3 9 . 1 2 2 6 2 8 .
4 4 0 2 8 .
n w i l :5 0 5 5 6 7 7 .4 6 4 0 8 4 4 .4 2 3 2 5 4 0 .3 8 2 8 2 2 9 .3 4 2 7 5 1 1 .3 0 3 0 7 0 3 .2 6 3 9 5 6 3 .2 2 5 5 5 6 4 .1 8 8 0 8 2 9 .1 5 1 6 0 5 5 .1 1 6 9 7 8 5 .
8 5 4 1 0 7 .5 7 8 9 4 1 .3 5 4 4 9 3 .1 8 9 7 5 2 .
7 8 0 4 5 .
E ( X )
4 8 . 8 5 35 6 . 1 5 05 7 . 1 6 25 3 . 8 9 14 9 . 5 5 54 5 . 3 0 64 0 . 7 0 53 6 . 2 5 43 1 . 9 0 12 7 . 6 5 0 2 3 . 5 8 5 1 9 . 7 7 0 1 6 . 4 7 7 1 3 . 3 0 21 0 . 6 5 0
7 . 7 8 6
5 4 . 9 1 0 6 1 . 3 6 1 6 0 . 2 6 9 5 6 . 5 6 3
Vr-Ml34 .028 2 9 . 6 6 7 2 5 . 4 6 4 2 1 . 0 4 3 1 7 . 6 0 1
i 1.1188 . 9 6 97 . 1954 . 2 6 3
‘^(BIRTh), **p (0~4) « ***T( 8 0) /T (75 )
---------------------- ---------------£ £ £ £ _ £ ABL E FOR YEAR:
AGE(X) 1 000 0 ( X)
015
1 0n25 30 35 40 4 5 50 55 60 65 70 75 60
1 0 0 0 0 0 . 08 9355 .28 4 2 3 0 . 18 2 6 7 9 . 3
m il :J79969 .9 78321 .0 765 10.6 74384 .4 7 1 3 6 3 . 6 6 7 7 1 7 . 9 6 0861 .35 3 5 9 8 . 1 4 5 23 7. 53 7 3 7 5 . 12 7 5 1 0 . 3 18846 .6
1 0 6 . 4 55 7 . 3 01 8 . 4 1
7 . 4 3
« 20 23 27 40 51
101 1 19 155 1 73 263 3 1 4 ,
1 0 0 0 .
49
. 11
. 7 9
.61
. 09
.25
.34 , 99 .80 .94 93 00
2_ _A R E A= 2
0 ( X )
1 0 6 4 5 . 5 1 2 5 . 1 5 5 1 .
6 1 4 . 94 3 .
« 2 1 : 1 8 1 0 . 21 2 6 . 3 0 2 1 . 3 6 4 6 . 6 8 5 7 . 7 2 6 3 . 8361 . 7 8 6 2 . 0 8 6 5 . 8 6 6 4 .
1 8 8 4 7 .
L ( X )
KALES92549 .
3 4 7 1 7 1 . 4 1 7 2 7 4 . 411861 . 4 0 7 9 6 9 . 4 0 2 7 3 1 . 3 9 5 7 2 7 . 387079 . 3 7 7 2 3 8 . 3 6 4 3 7 0 . 3 4 7 7 0 4 . 321 44 8 . 2 8 6 1 4 9 . 2 4 7 0 8 9 . 2 0 6 5 3 1 . 1 6 2 2 1 3 .1 1 5 8 9? .
80574 .
P ( X )
.8 7 9 4 39*
.9 4 8 9 5 5** .9 87028 .9 90550 .9 87161 .9 82609 .9 78146 .9 74 575 .9 65890 .9 54260 .9 24488 . 8.90186 .8 63499 .8 35858 .7 85418 . 7 1 44 4 4 .4 1 01 15*** . 0 0 0 0 0 0
T ( X J
5 3 7 1 5 6 9 .m m :4 5 1 4 5 7 6 . 4 1 0 2 7 1 5 . 3 6 9 4 7 4 6 . 3 2 9 2 0 1 5 . 2 8 9 6 2 8 8 . 2 5 0 9 2 0 9 . 2 1 3 1 9 7 1 . 1 7 6 7 6 0 1 . 141 98 9-7 . 1 0 9 8 4 4 9 .
8 1 2 3 0 0 . 5 6 5 2 1 1 . 3 5 8 6 8 0 .1 9 6 4 6 6 .
8 0 5 7 4 .
E ( X )
5 3 . 7 1 6If:???5 4 . 6 0 34 9 . 9 9 34 5 . 5 4 54 1 . 1 6 6
!? :??“ 2 8 . 6 6 2 2 4 . 7 6 9 2 0 . 9 6 8 1 8 . 0 4 8 15.-155 1 2 . 4 9 4
9 . 5 9 7 7 . 1 42 4 . 2 7 5
5101 5 20 25 30 35
i ?50556065
H80
1 0 0 0 0 0 . 08 9 2 9 9 . 0 86201 .78 4 8 6 1 . 1 6 4 2 7 2 . 78 3 5 3 5 . 6 8 2 6 6 6 . 4 8 1 397. 67 9 8 3 3 . 6 78206 .5a m i67626 .7 60831 .7 5 1 461. 2
HHf.12 0751 .5
1 G7 . 0 13 4 . 6 81 5 . 5 5
6 . 9 3 8 . 7 5
1 0 . 4 01 5 . 3 51 9 . 2 22 0 . 3 82 8 . 5 6 2 4 . 2 6
FEKALES
87 100 1 54 191 2 9 7 _
i 2S8 :S
48
S t20
00
1 0 7 0 1 . 3 0 9 7 : 1 3 4 1 .
5 8 8 . 7 3 7 . 8 6 9 .
1 2 6 9 . 1 5 6 4 . 1 6 2 7 . 2234 . 184 3 . 65 0 3 . 6795 . 9 3 7 0 . 9 8 6 3 .
1 2 3 6 3 .8484 .
207 St:
9?5 09 . 351001 . 4 2 7 6 5 7 . 422835 . 4 1 952 1 . 4 1 5 5 0 5 . 4 1 0 1 6 0 . 403 07 8 . 3 9 5 1 0 0 . 3 6 5 4 4 8 . 3 7 5 2 5 6 . 3 5 4 3 9 0 . 3 2 1 1 4 6 . 2 8 0 7 3 2 . 2 3 2 6 5 0 . 1 7 7 0 8 5 .1 2 4 9 6 8 .
89585 .
•8 8 7 0 2 1 *. 9 6 4 2 5 4 ** .9 88723 -.9 92163 .9 90428 .9 87137 .9 82734 .9 80208 .9 75571 .9 73556 . 9 4 43 9 8 .9 06193 . 8 74158 .8 28724 . 761 168 . 7 056 91 .4 1754 4 *** .0 00000
Slit???:5 2 3 5 1 1 6 .4 8 0 7 4 5 9 .4 3 8 4 6 2 4 .3 9 6 5 1 0 3 .3 5 4 9 5 9 9 .3 1 3 9 4 3 9 .2 7 3 6 3 6 1 .2 3 4 1 2 6 0 .1 9 5 5 8 1 2 .1 5 8 0 5 5 6 .1 2 2 6 1 6 6 .
9 0 5 0 2 0 .6 2 4 2 8 8 .3 9 1 6 3 8 .2 1 4 5 5 3 .
8 9 5 8 5 -
5 6 . 7 8 6 6 2 . 55 5 6 0. 73 1 5 6 . 65 1 5 2 . 0 2 9 4 7 . 4 66 4 2 . 9 3 9 3 6 . 5 6 9 3 4 . 2 7 6 2 9 . 9 3 7 2 5 . 7 4 4 2 1 . 3 2 21 8. 131 1 4 . 8 7 71 2. 131
9 . 415 7 . 3 39 4 . 3 1 7
* P ( B 1 R T H ) * * P ( 0 —4 ) * * * T( 8 0) n (75)
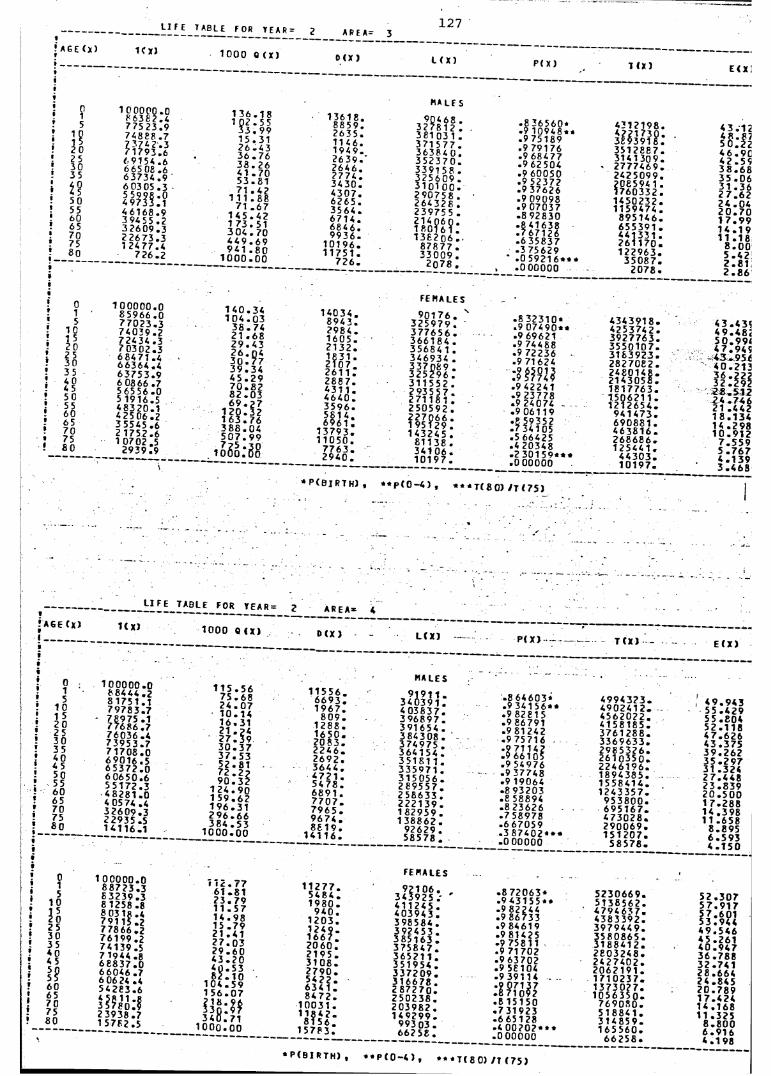
AGE (X)
_____ OR_YEAR= _ l _ A P E A= 3
1<X) 1 0 0 0 0 (X) 0 (X )
127
L ( X ) P< X ) 7 (X )
s§202 5 30 35
*?50556 065707580
1 0 0 0 0 0 . 0 8 6 3 82 . 4 775 23.9 74888 .7
HB? :.369154 .6 6 65 08 .6 6 3 7 3 4 . 96 0 3 0 5 . 3im w4 6168 .9 394 55 .23 2 6 0 9 . 32 2 6 7 3 . 31 2 4 77 . 4
7 2 6 .2
1 3 6 . 1 8 1 0 2 . 5 5
3 3 . 9 9 1 5 . 3 1 2 6 . 4 3 3 6 . 7 6 3 3 . 2 6 4 1 . 7 0 5 3 . 8 1 7 1 . 4 2
1 1 1 . 8 8 71 . 6 7
1 4 5 . 4 2 1 7 3 . 5 1 3 0 4 . 7 0 4 4 9 . 6 9 9 4 1 . 8 0
1 0 0 0 . 0 0
1 36 18 .8 8 5 9.2 6 3 5.1 1 46.1 9 4 9 . 2 6 3 9 . ' 26 4 6 . 2 7 7 4 . 3 4 3 0 . 4 3 0 7 . 6265 . 35 64 . 6 7 1 4 . 6 8 4 6 . 9 9 3 6 .
1 0 1 9 6 . 1 1 7 5 1 .
7 2 6 .
MALES
j’ PbiI :381 03 1 . 3 7 1 5 7 7 . 3 6 3 8 4 0 . 3 5 2 3 7 0 . 3391 58. . 3 25 60 9 . 3 1 0 1 0 0 . 2 9 0 7 5 8 . 264 32 8 . 23975 5 . 2 1 4 0 6 0 . 18,0161 . 1 3 8 2 0 6 .
87877 . 3 3 0 0 9 .
2078 .
• 8 36560*.9 1 09 48 * * .9 75189 .9 791 76.9 68477• 9 62504 .9 60050• 9 52372 .9 37626 .9 09098 .9 07037 .8 92830 .8 41 638 .7 671 26 .6 35837 .3 75629• 0 5 9 2 1 6 * * *. 0 0 00 0 0
4 31 21 9 8.
3 5 1 28 8 7 . 3141 3 0 9 . 2 7 77 4 6 9 . 2 42 50 9 9. 208594 1 . 1 76 03 3 2 . 1 45 02 3 2. 1 1 594 74 .
8 9 5 1 4 6 . 655391 . 4 4 1 3 3 1 . 2 6 1 1 7 0 . 1 2 2 96 3 .
3 5 0 8 7 . 2 0 7 8 .
4 3 . 1 2
tt:!l4 6 . 9C 4 2 . 5 9 3 8 . 6 6 3 5 . 0 6 3 1 . 3 6 2 7 . 6 2 2 4 . 0 4 2 0 . 7 0 1 7 . 9 9 1 4 . 1 9 1 1 . 1 8
8 . 0 0 5 . 4 2 2 . 8 1 2 . 8 6
015
10 1 5 20 25 303 5 404 5 50 55 60 65 70 75 80
1 0 0 0 0 0 . 08 5 9 6 6 . 0 7 7 0 2 3 . 37 4 0 3 9 . 2 72434 .37 0 3 02 . 3 68471 .46 6 3 6 4 . 4 6 3 7 5 3 . 9 6 0866 .7 565 56 .0 5 1916.54 8 3 20 . 1 42506 .2 3 5545 .6 2 1752. 6 1 0702 .5
2 93 9. 9
1 4 0 . 3 4 1 0 4 . 0 3
3 6 . 7 4 2 1 . 6 8 2 9 . 4 3 2 6 . 0 4 3 0 . 7 7 3 9 . 3 4 4 5 . 2 9 7 0 . 8 2 8 2 . 0 3 6 9 . 2 7
1 2 0 . 3 2 1 6 3 . 7 6 3 8 8 . 0 4 5 0 7 . 9 9
1 0 6 0 *:3o°
1 4 0 3 4 . 894 3. 2984 . 1 6 0 5 . 2 1 3 2 . 1 8 3 1 . 2 1 0 7 . 2 6 1 1 . 288 7. 4 3 1 1 . 4 6 4 0 . 3 5 9 6 . 5 6 1 4 . 696 1 :
1 3 7 9 3 . 1 1 0 50 .
7 7 6 3 . 2 9 4 0 .
FEMALES
9 0 1 7 6 . s 3 2 5 9 7 9 . 3 7 7 6 5 6 . 3661 84 . 35684 1 . 346934 .
IIIFII:3 1 1 5 5 2 . 2935 57 . 2 71181 . 2 5 0 5 9 2 .
195 ?2 9 :1 4324 5 .
£1138 . 341 06 . 1 0 1 9 7 .
.8 32310*
.9 0 7 4 9 0 * *• 9 69621 .9 74468 .9 72236 .9 71624
.9 42241
.9 23778
.9 24074
.9 061 19 • 8 59 35 2 .7 34105 .5 66425 .4 20348 .2 301 5 9 « * * .0 0 00 0 0
4 3 4 3 9 1 8 . 4 2 5 37 4 2. 3 9 2 7 7 6 3 . 3 5 5 0 1 0 7 . 31 £ 3 9 2 3 . 2 8 2 70 8 2 . 2 4 8 0 1 4 8 . 2 1 4 3 0 5 8 . 1 5 1 77 6 3. 1 5 0 6 2 1 1 . 1 2 1 26 5 4.
9 4 1 4 7 3 . 690881 . 463816 . 2 6 8 6 8 6 . 1 2 5 44 1 .
4 4 3 0 3 . 1 0 1 9 7 .
43 .4354 9 . 48« 5 0 . 99 < 4 7 . 9 4 5 4 3 . 9 5 6 4 0 . 2 1 3
l lr l i l2 8 . 5 1 2 2 4 . 7 4 6 21 . 44 2 1 8 . 1 3 4 14 .2 9 8 1 0 . 9 1 2
7 . 5 5 95 . 7 6 7 4 . 1 3 9 3 . 4 6 8
* P ( B I R 7 h ) , * * p ( 0 - 4 ) , * * * T ( 8 0 ) / T ( 7 5 )
AGE (X)
_____ LIFE TABLE FOR YEAR:
U x ) 1000 Q ( X )
2_ ARE A= 4
D ( X) L ( X ) P( X) T (X ) E ( X )
015
10 1 5 20 25 30 35 40 4 5 50 55 60 65 70 75 80
1 0 0 0 0 0 . 0 88444 .2 8 1 7 51 . 17 9 7 8 3 . 7 78975 .17 76 86 . 77 6 0 36 . 47 3 9 5 3 . 77 1 7 0 8 . 06 9 0 1 6 . 56 5 3 7 2 . 0 6 0 650. 65 5 1 7 2 . 3
• 4 8 2 8 1 . 0 4 0574 .43 2 6 0 9 . 3 22935 .51 41 16 . 1
1 1 5 . 5 67 5 . 6 82 4 . 0 71 0 . 1 41 6 . 3 1 2 1 . 2 4 2 7 . 3 9 3 0 . 3 7 3 7 . 5 3 5 2 . 8 1 7 2 . 2 ?9 0 . 3 2
1 2 4 . 9 0 1 5 9 . 6 2 1 9 6 . 3 1 2 9 6 . 6 6 3 8 4 . 5 3
1 0 0 0 . 0 0
1 1 5 5 6 .6 6 9 3 .1 9 6 7 .
8 0 9 . 1 2 8 8 . 1 6 5 0 . 2 0 8 3 . 2 2 4 6 . 2 6 9 2 . 3 6 4 4 . 4 7 2 1 . 5 4 7 8 . 6891 . 7 7 0 7 . 7 9 6 5 . 9 6 7 4 . 88 1 9 .
1 4 1 1 6 .
MALES
4 03 8 3 7 . 3 9 6 8 9 7 . 3 9 1 6 5 4 . 384308 . 3 7 4 9 7 5 . 3 6 4 1 5 4 . 3 5 1 8 1 1 . 3 3 5 0 7 1 . 3 1 5 0 5 6 . 2 8 9 5 5 7 . 2 5 8 6 3 3 . 2 2 2 1 3 9 .1 82959 .1 38862 .
92629 . 58578 .
.8 64603*
.9 34 1 5 6 * *
.9 8281 5
.9 86791
.9 81 242
.9 75716
.9 71142
.$ 66105
.9 54976
.9 37748
.9 19064
.8 93203
.8 58894
.8 23626
.7 58978
. 6 6 70 5 9
.3 8 7 4 0 2 * * *
.0 0 0 0 0 0
4 9 9 4 3 2 3 . 4 9 0 2 4 1 2 . 4 5 6 2 0 2 2 . 4 1 5 8 1 8 5 . 3 7 6 1 2 8 8 . 3 3 6 9 6 3 3 . 2 9 8 5 3 2 6 . 2 6 1 0 3 5 0 . 2 2 4 6 1 9 6 . 1 8 9 43 8 5. 1 5 5 8 4 1 4 . 1 2 4 3 3 5 7 .
9 5 3 8 0 0 . 6 9 5 1 6 7 . 4 7 3 0 2 8 . 2 9 0 0 6 9 . 1 5 1 2 0 7 .
5 8 5 7 6 .
4 9 . 9 4 3 55 . 4 2 9 5 5 . 8 0 4 5 2 . 1 1 8 4 7 . 6 2 6 4 3 . 3 7 5 3 9 . 2 6 2 3 5 . 2 9 7 31 . 324 2 7 . 4 4 8 2 3 . 8 3 9 2 0 . 5 0 0 1 7 . 2 8 8 1 4 . 3 9 8 1 1 . 6 5 8
8 . 8 9 5 6 . 5 9 3 4 . 1 5 0
015
1 0
25253035404 5
if6065707580
1 0 0 0 0 0 . 0 £ 8 7 2 3 . 3 1 1 2 . 7 7
6 1 x 16 3 2 3 9 . 3 O I . O I
2 3 . 7 98 1 2 5 8 . 8 1 1 * 5 71 4 . 9 8
7 7 8 6 6 . 276199 .274139 .5
l j • ( V 2 1 . 4 1 2 7 . 0 3 2 9 . 6 07 1 9 4 4 . 8
68837 .0 6 6 0 4 6 . 7 6 06 24 .4 5 42 83 . 6
4 3 l 2 04 0 . 5 38 2 . 1 0
1 0 4 . 5 91 5 6 . 0 7
2 3938 .72 1 8 . 9 6 * 3 0 . 9 7 3 4 0 7 1
1 57 82 .5 -7 *• U • f I
1 0 0 0 . 0 0
1 1 2 7 7 .5 4 8 4 .1 9 8 0 .
9 4 0 . 1 2 0 3 . 1 2 4 9 . 1 6 6 7 . 2 0 6 0 . 2 1 9 5 . 3 1 0 8 . 2 7 9 0 . 5 4 2 2 . 634 1 . 8 4 7 2 .
1 0 0 3 1 .
"Ml:1 5 7 8 3 .
f e m a l e s
9 2 1 0 6 . 343925 .' 4 1 1 2 4 5 . 4 0 3 9 4 3 . 3 9 8 5 8 4 . 39245 3 . 3 8 5 1 6 3 . 3 7 5 8 4 7 . 3 6 5 2 1 1 . 3 5 1 9 5 4 . 3 3 7 2 0 9 . 3 16678 . 2 8 7 2 7 0 . 2 5 0 2 3 8 . 2 0 3 9 8 2 . 1 4 9 2 9 9 .
99303 . 662 56 .
.8 7 2063*
.9 43 1 5 5 * *
.9 82244
.9 86733
.9 84619
.9 81425
.9 7581 1
.9 71 702
.9 63702
.9 56 104
.9 391 14 • 9 071T7 .8 71092 • E 15150 .7 31923 .6 651 28 .4 0 0 2 0 2 * » * .0 00000
5 2 3 0 6 6 9 . 5 1 3 8 5 6 2 . 4 7 9 4 6 3 7 . 4 3 8 3 3 9 2 . 3 9 7 9 4 4 9 . 3 5 8 0 8 6 5 . 3 1 8 8 4 1 2 . 2 8 0 3 2 4 8 . 2 4 2 7 4 0 2 . 2 0 6 2 1 9 1 . 1 7 1 0 2 3 7 . 1 3 7 3 0 2 7 . 1 0 5 6 3 5 0 -
7 6 9 0 8 0 . 5 1 8 8 4 1 . 3 1 4 8 5 9 . 1 6 5 5 6 0 .
6 6 2 5 8 .
5 2 . 3 0 7 5 7 . 9 1 7 5 7 . 6 0 1 5 3 . 9 4 4 4 9 . 5 4 6 4 5 . 2 6 1 4 0 . 9 4 7 36 .788 3 2 . 7 4 1 2 8 . 6 6 4 2 4 . 8 4 5 2 0 . 7 8 9 1 7 . 4 2 4 1 4 . 1 6 8 11 .325
8 . 8 0 0 6 . 9 1 6 4 .1 98
P ( B I R T H ) , • • P C 0 - 4 ) * * * T ( 8 0) /T ( 7 5 )
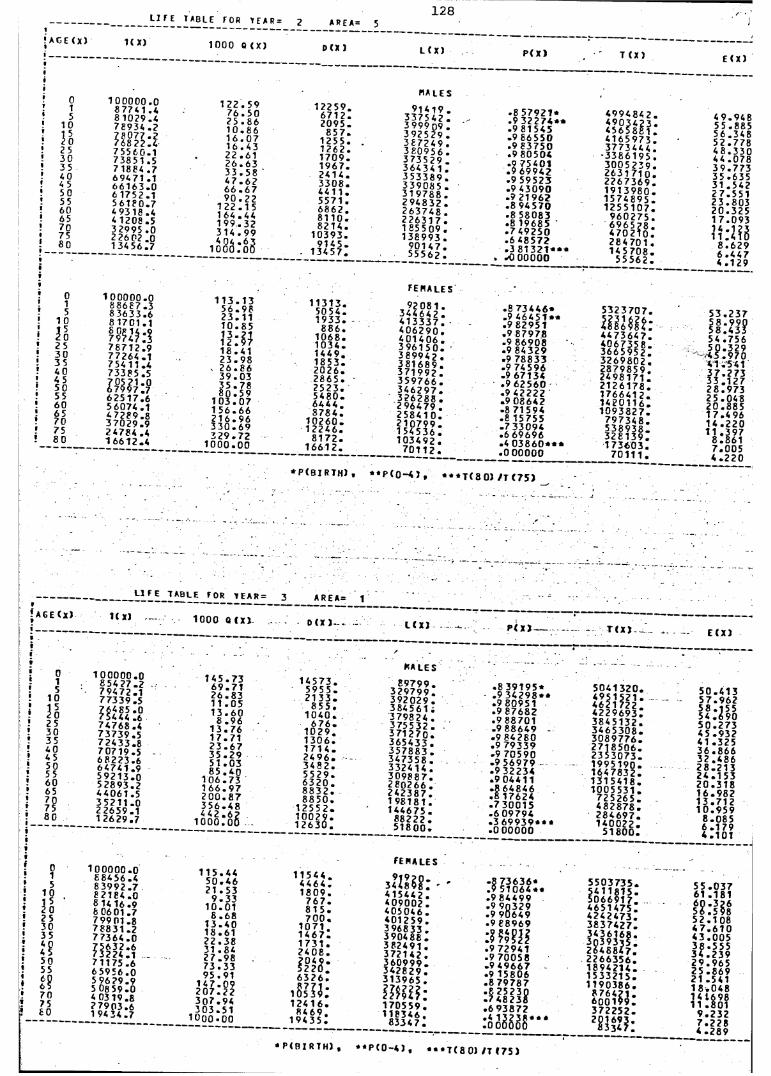
AGE (X)
L I FE TABLE FOR TFAR:
1( x) 1000 0 (X)
2 A P E A = 5
D (X )
128
L ( X ) P ( X ) T (X ) E ( X 3
10
2S2 5 303 5 404 5 50 55 60 65 70 75 80
1 0 0 0 0 0 . 0 87741 .4 8 1029.4 78934 . 2 7 8 0 7 7 . 27 6 8 22 . 4 7 55 60 .1 73851 .5 7 1884 .7 69471 .1 6 6 1 6 3 . 0 6 1752.1 5 6 1 80 . 7 4 93 18 .44 1 2 08 . 5 32995 .0 22602 .0 1 3 45 6 . 7
1 2 2 . 5 97 6 . 5 02 5 . 8 61 0 . 8 6 1 6 . 0 7 1 6 . 4 3 2 2 . 6 1 2 6 . 6 3 3 3 . 5 8 4 7 . 6 2 6 6 . 6 7 9 0 . 2 2
1 2 2 . 1 51 6 4 . 4 41 9 9 . 3 23 1 4 . 9 9
i o o c i ! o 3
1 2 2 59 .6 7 1 2 .2 0 9 5 .
8 5 7 . 1 2 5 5. 1 2 62. 1 7 0 9 . 1 9 6 7. 2 4 1 4. 3 3 0 8 . 4 4 1 1 . 5571 . 6 8 6 2 . 8 1 1 0 . 8 2 1 4 .
1 03 93 .9 1 4 5 .
1 3 4 5 7 .
«ALES
91419 . 337542 . 3 999 09 . 3925 29 . 3 8 7 2 4 9 . 3 8 0 9 5 6 . 3 7 3 5 2 9 . 36434 1 . 3 5 3 3 8 9 . 33908 5 . 31 9788 . 2 9 4 8 3 2 . 2 63 74 8 . 2 2 6 3 1 7 .1 855 09 .1 38993 .
9 0 1 4 7 . 5 5 5 6 2 .
• 8 57921*.9 3 2 2 7 4 * * .9 81 545 .9 £6 550 .9 83750 .9 80504 .? 75 401 .9 69942 .9 59523 .9 43090 .9 2196?.8 94570 .8 58083 .8 19685 ’.7 49250 .6 48572 .3 8 1 3 2 1 * * *
» .-0 00000
4 9 9 4 8 4 2 . 4 9 0 J 4 2 3 . 4 5 6 5 8 8 1 . 4 1 6 5 9 7 3 . 3 7 7 3 4 4 4 .
• 3 3 8 6 1 9 5 . 3 0 0 5 2 3 9 . 2631 71 0 . 2 2 6 7 3 6 9 . 1 9 1 3 9 8 0 . 1 5 7 4 8 9 5 . 1 2 5 5 1 0 7 .
9 6 0 2 7 5 . 6 9 6 5 2 8 . 4 7 0 2 1 0 . 2 8 4 7 0 1 . 1 4 5 7 0 8 .
5 5 5 6 2 .
4 9 . 9 4 8 5 5 . 8 8 5 5 6 . 3 4 8 5 2 . 7 7 8 4 8 . 3 3 0 44 .078 3 9 . 7 7 3 3 5 . 6 3 5 3 1 . 5 4 2 2 7 . 5 5 1 2 3 . 8 0 3 2 0 . 3 2 5 1 7 . 0 9 3
8 . 6 2 96 . 4 4 74 . 1 2 9
015
1 0n2 5 30 35 40 4 5 50 55 60 65 70 75 80
1 0 0 0 0 0 . 0 8 8 6 8 7 . 38 3 6 33 . 68 17 01 .1
79?41) . i7 87 12 . 97 72 64 . 1 754 11 .4 73385 .5
6 2 5 1 7 . 656074 .14 7 2 89 . 83 7 0 29 . 9 24784 .4 1 6 6 1 2 . 4
1 1 3 . 1 35 6 . 9 8 2 3 . 1 11 0 . 8 5
1 8 . 4 12 3 . 9 82 6 . 8 6 3 9 . 0 3 3 5 . 7 8 8 0 . 5 9
1 0 3 . 0 7 1 5 6 . 6 6 2 1 6 . 9 6 3 3 0 . 6 9 3 2 9 . 7 2
1 0 0 0 . 0 0
1 1 3 13 . 50 5 4. 1 9 3 3 .
8 8 6 . 1 0 6 8. 1 0 3 4 . 1 4 4 9. 1 8 5 3 . 2 0 2 6 . 2 8 6 5 . - 2 5 2 3 . 5 4 8 0 . 6 4 4 4 . 8 7 8 4 .
1 0 2 6 0 . 1 2 2 4 6 .
8 1 7 2 .1 6 6 1 2 .
f e ma l e s
92081 . 344642 . 4 1 3 3 3 7 . 406 29 0 . 4 01 40 6 . 3 9 6 1 5 0 . 3 8 9 9 4 2 . 3 8 1 6 8 9 . 3 7 1 9 9 2 . 3 5 9 7 6 6 . 3 4 6 2 9 7 . 326288 . 296479 . 2 5 8 4 1 0 . 2 1 0 7 9 9 .1 54536 . 103492 .
7 0 1 1 2 .
.8 7 34 4 6 *
.9 4 6 4 5 1 * *
.9 82951
.9 87978
.9 86908
.9 84329
.9 78833
.9 74596 .9 67134 .9 62560 .9 42222 .9 08642 .8 71594 .8 15755 .7 33094 .6 69696 • 4 0 3 8 6 0 * * * . 0 0 0 0 0 0
5 3 2 3 7 0 7 .
• ^Ü6 $8 4 r 4 4 7 3 6 4 7 . 4 0 6 7 3 5 8 . 3 6 6 5 9 5 2 . 3 2 6 9 8 0 2 . 2 8 7 9 8 5 9 . 2 4 9 8 1 7 1 . 2 1 2 6 1 7 8 . 1 7 6 6 4 1 2 . 1 4 2 0 1 1 6 . 1 0 9 3 8 2 7 .
7 9 7 3 4 8 . 5 3 8 9 3 8 . 3 2 8 1 3 9 . 1 7 3 6 0 3 .
7 0 1 1 1 .
5 3 . 2 3 7
5 8 14 3? 54 .756 5 0 . 3 2 9 4 5 . 9 7 0 4 1 . 5 4 1 3 7 . 2 7 3 33 . 12 7 2 8 . 9 7 3 2 5 . 0 4 8 2 0 . 8 8 5 1 7 .4 96 1 4 . 2 2 0 11 . 39 7
8 . 861 7 . 0 0 5 4 . 2 2 0
* P ( BI R TH) t * * P (0 -4 ) , * * * T ( 8 0 ) / T ( 7 5 )
AGE ( X )
_____L 1 /E 7ABLE FOR T E A R :
1( x) — 1000 Q ( X )
3 ARE A= 1
0(X )- . . L ( X ) P ( X ) T J X ) E ( X )
015
10
V25 30 35 40 4 5 50 55 60 65 70 75 80
1 0 0 0 0 0 . 0854 27.27 94 72 . 177339 .5 76485 .0 75444 .6 74768 .47 3 7 39 . 5 7 2 4 33 . 8 70719 .56 8 2 23 . 6 64741 .9 5 9 2 1 3 . 05 2 8 93 . 2 44061 .5 3 5211 .0 22659 .11 2 6 29 . 7
1 4 5 . 7 36 9 . 7 1 2 6 . 8 3 1 1 . 0 5 1 3 . 6 0
8 . 9 61 3 . 7 61 7 . 7 1 2 3 . 6 7 3 5 . 2 9 5 1 . 0 3 8 5 . 4 0
1 0 6 . 7 3 1 6 6 . 9 7 2 0 0 . 8 7 3 5 6 . .. 4 4 2 . 6 .
1 0 0 0 . o(
.48
14573, 595 5. 2 1 33.
8 5 5 .1 0 40.
6 7 6 . 1 0 2 9 . 1 3 0 6 . 1 7 1 4 . 2 4 9 6 . 34 8 2 . 55 2 9 . 6 3 2 0 . 8 8 3 2 . 8 8 5 0 .
1 2 5 5 2 . 1 0 0 2 9 . 1 2 6 3 0 .
MALES8 9 7 9 9 .
329799 . 3 9 2 0 2 9 . 3 84 5 61 . 379824 . 375532 . 3 7 1 2 7 0 . 3 6 5 4 3 3 . 357883 . 3 4 7 3 5 8 . 3324 1 4 . 3 0 9 8 8 7 . 2 8 0 2 6 6 . 2 4 2 3 8 7 .19818 1 . 144675 .
8 8 2 2 2 . 5 1 8 0 0 .
.8 3 91 95 *
.9 3 4 2 9 8 * *
.9 80951
.9 87682
.9 88701
.9 88649 .9 84280 .9 79339 .9 70590 .9 56979 .9 32234 .9 04411 .8 64846 .8 17624 . 7 3 0 0 1 5 .6 09794 .3 6 9 9 3 9 * * * . 0 0 0 0 0 0
5 0 4 13 2 0 .4 9 5 1 5 2 1 .4621 722 . 4 2 2 9 6 9 3 ! 3 8 4 5 1 3 2 . 3 4 6 5 3 0 8 . 3 0 8 9 7 7 6 . 2 7 1 8 5 0 6 . 2 3 5 3 0 7 3 . 1 9 9 5 1 9 0 . 1 6 47 8 3 2 . 1 3 1 5 4 1 8 . 1 0 0 5 5 3 1 .
7 2 5 2 6 5 . 4 8 2 8 7 8 . 2 8 4 6 9 7 . 1 4 0 0 2 2 .
5 1 8 00 .
5 0 . 4 1 3 5 7 . 9 6 2 5 8 . 1 5 5 5 4 . 6 9 0 5 0 . 2 7 3 4 5 . 9 3 2 4 1 . 3 2 5 3 6 . 8 6 6 3 2 . 4 8 6 2 8 . 2 1 3 2 4 . 1 5 3 2 0 . 3 1 8 1 6 . 9 8 2 1 3 . 7 1 2 1 0 . 9 5 9
8 . 0 8 5 6 . 17 9 4 . 1 0 1
015
1 0
2 5 303 5 404 5 50 55
IS7075£0
1 0 0 0 00 .0£ 8 4 56 . 48 3 9 9 2 . 7 8 2184 .0 8 14 16 .9 8 0601 .77 99 01 . 8 7 8 8 3 1 . 27 7 3 6 4 . 0
7 11 75 . 66 5 9 5 6 . 05 9 6 29 . 9 5 08 59 .0 4 03 19.8
VoiV'J
1155021
910
8 13 18, 22 , 31 , 27, 73. 95 .
147. 2 0 7 . 3 0 7 . 3 0 3 .
10 oo •
. 44
. 4 6
. 53
.33
.01
. 68
.40
.61,38,84.9833910922945100
1 1 5 4 4 .4 4 6 4 .1 8 0 9 .
7 6 7 .8 1 5 .7 0 0 .
1 0 7 1 .1 46711 7 3 1 .2 4 0 8 .
f?M:6 3 2 6 .
1 S I 3 9 r 1 2 4 1 6 .
8 4 6 9 .1 9 4 3 5 .
femal es
zW W : -4 0 9 0 0 2 ! 4 0 5 0 4 6 . 4 0 1 2 5 9 . 396833 . 390488 .3 82491 . 3 7 2 1 4 2 . 3 6 0 9 9 9 . 3 4 2 8 2 9 . 313965 .
i ltti i:1 7 0 5 5 9 . 1 1 8 34 6 .
£3347 .
-8 7 3 6 36 *.9 5 1 0 6 4 * * .9 84499 .9 9n329 .9 90649 .9 88969
: i m i.9 72941 .9 70058 -9 4 9667 .9 15806 .8 79787 . 8 2 5 2 3 0 .7 48238 .6 93872
! o o $ o o § * # *
5503735. 5411815. 506691 7. 46 514 75 ! 4 2 424 73 . 38 374 27 . 34 361 68 . 3 n 3 9 3 3 5 . 2 6 4 66 4 7 . 2 2 6 63 5 6. 1 89 42 1 4. 1 53 32 1 5. 1 1 9 03 8 6.
8 7 6 4 2 1 . 6 0 0 1 9 9 . 3 7 2 2 5 2 . 20169
8334 ?!
5 5 . 0 3 7 61 .181 6 0 . 3 2 65 6 . 5 98 5 2 . 1 0 8 4 7 . 6 1 04 3 . 0 0 5 3 8 . 5 5 5 3 4 . 2 3 9 2 9 . 9 6 5 2 5 . 8 6 9 2 1 . 5 4 1 1 8 . 0 4 8 14 1698 1 1 . 8 0 1
9 . 2 3 2 7 . 2 2 8 4 .2 89
* P( PI RTH) * * P { 0 - 4 ) • * ♦ T ( 8 0) /T ( 7 5 )
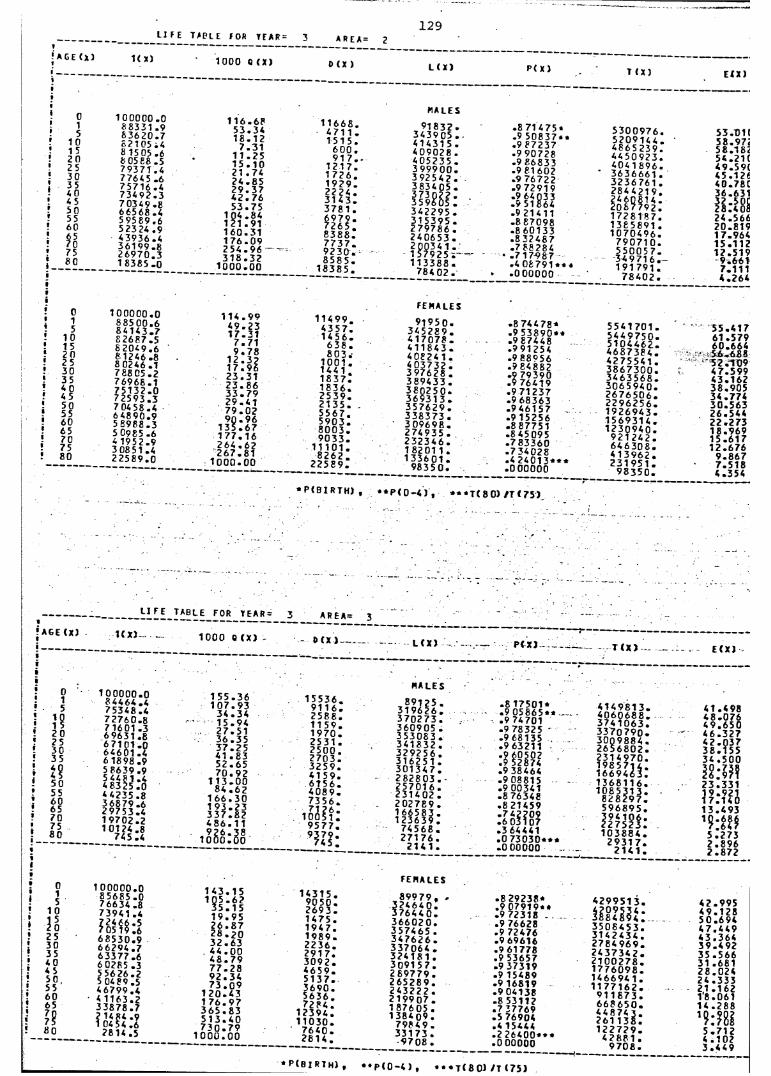
A G E ( X )
l i f e t a p e e f o r t e a r -
1 ( x ) 1 0 0 0 o ( x )
1293 A R E A :
D ( X ) L ( X ) P < X ) T ( X ) E X X )
01
1 0 0 0 0 0 . 0 1 1 6 . 6 88 8 3 3 1 . 9 3 3 , 3 45 8 3 6 2 0 . 7 1 8 . 1 21 0 8 2 1 0 5 . 4 7 . 311 5 8 15 05 .6 1 1 . 2 *>2 0 8 0588 .5 i «5. i n2 5 7 93 71 . 4 ? 1 . 7 ^30 77645 .6 24.8«;3 5 75716 .4 2 9 . 3 7A 0 7 3 4 9 2 . 3 4 2 . 7 64 5 50
70349 .8 66568 .4 5 3 . 7 5
1 0 4 . 8 41 2 1 . 9 11 6 0 . ^ 1
5 5 5 9 5 89 . 660 523 24 .9n7580
4 3 9 3 6 . 4 3 6 1 99 . 8 2 6 9 7 0 . 3 1 8 3 8 5 . 0
1 7 6 . 0 92 5 4 . 9 63 1 8 . 3 2
1 0 0 0 . 0 0
1 1 6 6 8 .4 7 1 1 .1 5 1 5 .
6 0 0 .9 1 7 . -
1 2 1 7 .1 7 2 6 . 1 9 2 9 . 22 2 4 . 3 1 4 3 .3 781 . 6 9 7 9 . 7 2 6 5 . 8 3 8 8 . 7 7 3 7 . 9 2 3 0 . 8 5 8 5 .
1 8 3 8 5 .
p a l e s
91832 . 343 90 5 . 4 1 4 3 1 5 . 4 0 9 0 2 8 . 4 0 5 2 3 5 . 3 9 9 9 0 0 . 3 9 2 5 4 2 . 3 8 3 4 0 5 .
mm-.3 42295 . 3 1 5 3 9 5 . 2 7 9 7 8 6 . 2 4 0 6 5 3 . 20034 1 .1 57925 . 1 1 3 3 8 8 .
7 8 X 0 2 .
.8 71 4 75 *
.9 5 0 8 3 7 * * .9 87237 .9 90728 .9 86833 .9 81 602 .9 76722 .9 72919
.9 21 X 11
.8 87098
.8 60133
.8 32467
. 7 8 82 8 4
.7 17987
. 4 0 8 7 9 1 * * «
. 0 0 0 0 0 0
5 3 0 0 9 7 6 .5 2 0 9 1 X 4 . 4 8 6 5 2 3 9 . 4 4 5 0 9 2 3 . 4 0 4 1 8 9 6 . 3636661 . 3236761 . 284 4 2 1 9 . 246081 4 . 2 0 6 7 7 9 2 . 1 7 2 8 1 8 7 . 1 365891 . 1 0 7 0 4 9 6 .
7 9 0 7 1 0 . 5 5 0 0 5 7 . 3 4 9 7 1 6 . 1 9 1 7 9 1 .
7 8 4 0 2 .
53. 01( 5 8 . 9 7 J 5 8 . 1 8< 5 4 . 2 1 C 4 9 . 5 9 C 45.12« 4 0 . 7 8 C 36.631H . - I8 S24 .566 20. 819 17. 964 15. 112 1 2. 519
9 .661 7.111 4 . 264
015
1 0 1 520 25 30 35 4 0 45 50 55 60 65 70 75 80
1 0 0 0 0 0 . 08 8 5 0 0 . 68 4 1 4 3 . 7 £ 26 87 . 5 6 2 0 4 9 . 68 12 46 . 8 8 0246 .17 8 8 05 . 2 7 69 66 . 17 5 1 3 2 . 07 25 93 . 3 7 04 58 .46 4 8 9 0 . 9 5 £988 . 3 5 0985 .6 4 1952 .9 3 0851 .42 2 5 8 9 . 0
1 1 4 . 9 94 9 . 2 31 7 . 3 1
7 . 7 1 9 . 7 8
1 2 . 3 ?1 7 . 9 62 3 . 3 1 2 3 . 8 6 3 3 . 7 9 2 9 . 4 1 7 9 . 0 2 9 f | . 9 6
1 3 5 . 6 71 7 7 . 1 62 6 4 . 6 22 6 7 . 8 1
1 0 0 0 . 0 0
1 1 4 9 9 . 4 3 5 7 . 14 5 6 .
6 3 8 . 8 0 3.-
1 0 0 1 . 144 1 . 1 8 3 7 . 1 8 3 6 . 25 3 9 . 2 1 3 5 . 5 5 6 7 . 5 9 0 3 . 8 0 0 3 . 9 0 3 3 .
1 1 1 0 1 . 8 2 6 2 .
2 2 5 8 9 .
f e h a l e s
9 1 9 5 0 . 3 4 5 2 8 9 . 417 07 8 . 4 1 1 8 4 3 . 40824 1 . 4 0 3 7 3 2 . 3 9 7 6 2 8 . 389 43 3 . 3 8 0 2 5 0 . 3 6 9 3 1 3 . 3 5 7 6 2 9 . 3 3 8 3 7 3 . 3 0 9 6 9 8 . 274935 . 2 3 2 3 4 6 .1 8201 1 .1 33601 .
9 8 3 5 0 .
.8 7 44 78 *
.9 5 3 8 9 0 * *
.9 87448
. 9 9 12 5 4
.9 88056
.9 84882
.9 79390
.9 76419
.9 71237
.9 68363
. 9 4 6 1 5 7
.9 1 5256
.8 87751
. 8 450 95
. 7 8 3 3 6 0
. 7 3 40 2 8
.4 2 4 0 1 3 * * *
.0 0 00 0 0
* P ( B I R T H ) , * * P ( 0 - 4 ) , * * * T ( 8 0 ) / T X 75 )
5 5 4 1 7 0 1 .5 4 4 9 7 5 0 .5 1 0 4 4 6 2 .4 6 8 7 3 8 4 .4 2 7 5 5 4 1 .3 8 6 7 3 0 0 .3 4 6 3 5 6 8 .3 0 6 5 9 4 0 .2 6 7 6 5 0 6 .2 2 9 6 2 5 6 .1 9 2 6 9 4 3 .1 5 6 9 3 1 4 .1 2 3 0 9 4 0 .
9 2 1 2 4 2 .6 4 6 3 0 8 .4 1 3 9 6 2 .2 3 1 9 5 1 .
9 8 3 5 0 .
5 5. 41 761 .57 96 0. 6645 6. 68 85 2. 10 94 7 . 59 94 3. 16 23 8. 90 534 .77 43 0. 56 32 6. 5442 2 . 27 31 8. 96 91 5 . 61 71 2. 67 6
9 . 8 6 77 . 5 1 B4. 354
A GE ( X )
_____L I F E T A B L E FOR Y E A R :
U x ) — 1000 Q X X ) -
3 __ A R E A= 3
0 (X ) ........ L X X ) P X X ) T X X ) E X X )
015
10 1 5 20 25 30 35 40 4 5 50 55 60 65 70 75 80
1 0 0 0 0 0 . 08 4 4 6 4 . 47 5 3 48 . 47 27 60 . 8 7 1601. 3 69631 .8 6 7 10 1 . 0 64601 .4 6 1898. 9 5 8639 .95 4 4 8 1 . 4 4 83 25 .04 4 2 3 5 . 8 3 6 8 79 . 6 29753 .4 1 9 7 02 . 2 10124 .8
745 .4
1 5 5 . 3 61 0 7 . 9 3
3 4 . 3 4 1 5 . 9 4 2 7 . 5 13 6 . 3 5 3 7 . 2 5 4 1 . 8 3 5 2 . 6 5 7 0 . 9 2
1 1 3 . 0 0 8 4 . 6 2
1 6 6 . 3 0 1 9 3 . 2 3 3 3 7 . 8 2 4 8 6 . 1 1 9 ? 6 . 3 8
1 0 0 0. 0 0
1 5 5 3 6 . 9 1 1 6 . 2 5 8 8 . 1 1 5 9 . 1 9 7 0 . 25 31 . 2 5 0 0 . 2 7 0 3 . 3 2 5 9 . 4 1 5 9 . 6 1 5 6 . 4 0 8 9 . 7 3 5 6 .
100 f 1 19 5 7 7 . 9 3 7 9 .
745 .
P A L E S
, 8 9 1 2 5 . 3 1 9 6 2 6 . 3 7 0 2 7 3 . 360905 . 3 5 3 0 8 3 . 3 4 1 8 3 2 . 3 2 9 2 5 6 . 3 1 6 2 5 1 . 3 0 1 3 4 7 . 2 82 80 3 . 2 5 7 0 1 6 . 2 3 1 4 0 2 . 2 02 78 9 . 1 6 6 5 8 3 .1 2 3639 .
7 4 5 6 8 . 2 7 1 7 6 .
2 1 4 1 .
. 8 1 7 5 0 1 *
.9 0 5 6 65 * * .
.9 74701
.9 78325 '
.9 68135
.9 63211
.9 38464
.9 0881 5
.9 00341
.8 76348
.8 21459
.3 64441
.0 7 3 0 3 0 * * *
.0 00000
4 1 4 9 8 1 3 .4 0 6 0 6 8 8 .3 7 4 1 0 6 3 .3 3 7 0 7 9 0 .30 Q 9 8 8 4 .2 6 5 6 8 0 2 .2 3 1 4 9 7 0 .1 9 8 5 7 1 4 .1 6 6 9 4 6 3 .1 3 6 8 1 1 6 .1 0 8 5 3 1 3 .
8 2 8 2 9 7 .5 9 6 8 9 5 .
?!*!?!:1 0 3 8 8 4 .
2 9 3 1 7 .2 1 4 1 .
4 1 . 4 9 8 4 8 . 0 7 6 4 9 . 6 5 0 4 6 . 3 2 7 4 2 . 0 3 7 3 8 . 1 5 5 34 . 50 0
12:1??2 3 . 33 1
}?:?!!1 3 . 4 9 3
5 . 273 2 . 8 9 6 2 . 8 7 2
015
10
2525 30 35 40 4 5 50 55 60 65
?!«0
1 0 00 0 0 . 0 8 5685 . 0 76634 .8 73941 .4
6 8 5 30 . 9 66294 .76 3 3 77 . 6 60285 .3 5 56 26 .2 5 0489 .5 4 6 7 99 . 4 4 1 1 63 . 23 3 8 7 8 . 7
n m - . i2814 .5
1 4 3 . 1 5 1 0 5 . 6 2
3 5 . 1 5 1 9 . 9 5 2 6 . 8 7 2 8 . 2 0 3 2 . 6 3 4 4 . 0 0 4 8 . 7 9 7 7 . 2 8 9 2 . 3 4 7 3 . 0 9
1 2 0 . 4 3 1 7 6 . 9 7 3 6 5 . 8 3 5 1 3 . 4 0 7 3 0 . 7 9
1 0 0 0 . 0 0
1 4 3 1 5 . 9 0 5 0 . 2 6 9 3 . 1 4 7 5 . 1 9 4 7 . 1 9 8 9 . 2 2 3 6 . 2 9 1 7 . 3 0 9 2 . 4 6 5 9 . 5 1 3 7 . 3 6 9 0 . 5636 . 7 2 8 4 .
1 2 3 9 4 . 1 1 0 3 0 .
7 6 4 0 . 2 8 1 4 .
FEPALES
8 9 9 7 9 , . 3 2 4 6 4 0 . 3 7 6 4 4 0 . 3 6 6 0 2 0 . 3 5 7 4 6 5 . 3 4 7 62 6 . 3 37064 . 3 2 4 1 8 1 . 3091 5 7 . 2 8 9 7 7 9 . 2 6 5 2 8 9 . 243 22 2 . 2 19 90 7 .1 87605 .1 38409 .
79849 . 331 73 . •9708 .
.8 29238«
.9 0 79 19 * *
.9 72318
.9 76628
.9 72476
.9 69616
.9 61778
.9 53657
.9 37319
.9 15489
.9 16819
.9 04138
.8 5311?
.7 37769
.5 76904
.415444
.2 2 6 4 0 0 * * *
.0 00000
4 2 9 9 5 1 3 .
H 8 Z I I S :3 5 0 8 4 5 3 . 3 1 4 2 4 3 4 . 2 7 8 4 9 6 9 . 2 4 3 7 3 4 2 . 2 1 0 0 2 7 8 . 1 7 7 6 0 9 8 . 1 4 6 6 9 4 1 . 1 1 7 7 1 6 2 .
« 1 1 8 7 3 . 6 6 8 6 5 0 . 4 4 8 7 4 3 . 2 6 1 1 3 8 . 1 2 2 7 2 9 .
4 2 8 8 1 . 9 7 0 8 .
4 2 . 9 9 5 4 9 . 1 2 8 5 0 . 6 9 4 4 7 . 4 4 9 4 3 . 3 6 4 3 9 . 4 9 2 3 5 . 5 6 6 31 .681 2 8 . 0 2 4 2 4 . 3 3 3 21 .162 1 8 . 0 6 1 1 4 . 2 8 8
’ 9 :?8 i5 . 7 1 24 . 1 0 23 . 4 4 9
« P ( B I R T h ) * * P (0 -4 ) • * T ( 8 C ) / T ( 7 5 )
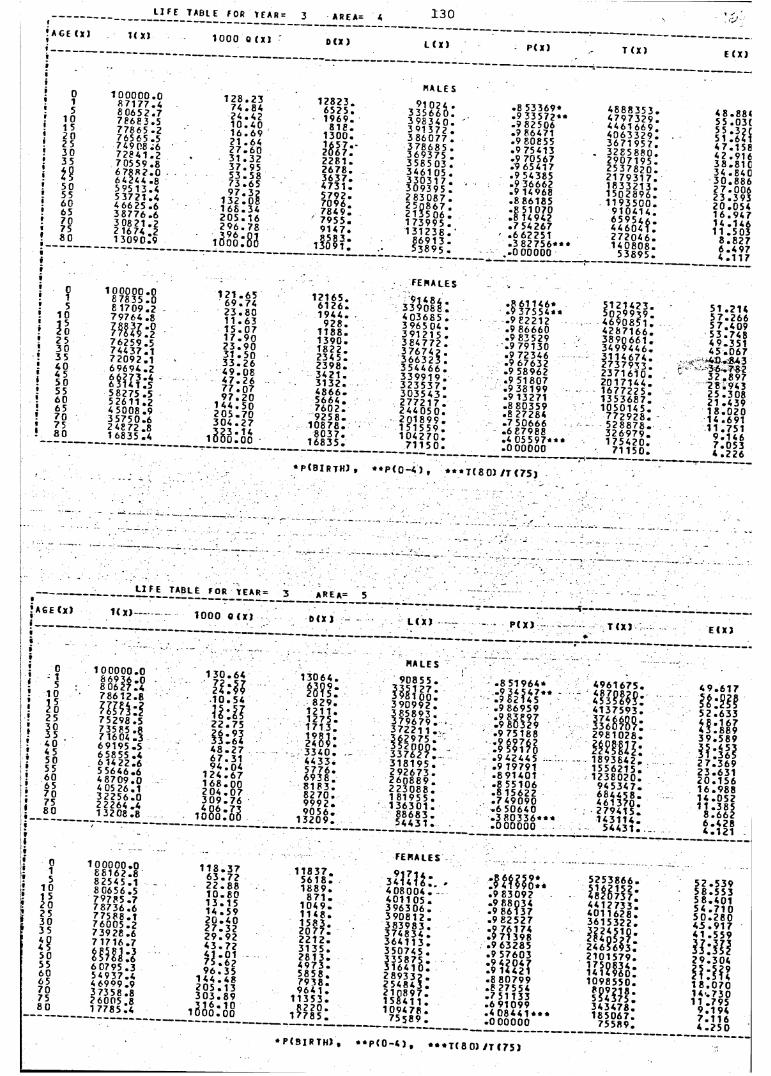
AGE < X )
015
10 1 5 20 25 30 35
H50556065707580
______TABLE f OR > E A R = 3 AREA= A 1 3 0
1( x} i o o o o ( x ) D ( X ) L ( X ) P( X ) T ( X ) E ( X )
1 0 0 0 0 0 . 08 7 1 7 7 . 4 8 0 6 5 2 . 77 8 6 83 . 5 77865 .2 765 65 .5 74908 .6 7 2 8 4 1 . 2 70559 .8 6 7 8 8 2 . 0 64244 .85 9 5 1 3 . 45 3 7 2 1 . 4 4 6625 .63 8 7 7 6 . 6 3 08 2 1 .2 2 1674 .2 1 3 0 9 0 . 9
1 2 8 . 2 3 7 4 . 8 4 2 4 . 4 2 1 0 . 4 0 1 6 . 6 92 1 . 6 4 2 7 . 6 0 3 1 . 3 2 3 7 . 9 5 5 3 . 5 87 3 . 6 5 9 7 . 3 ?
1 3 2 . 0 8 1 6 8 . 3 4 2 0 5 . 1 6 2 9 6 . 7 8
I oo r 83
1 2 8 23 .6 5 2 5 .1 9 69.
8 1 8 .130 0.1 6 57 . -2 0 6 7 .2 2 8 1 .2 6 7 8 .3 6 3 7 .4 7 3 1 .5 7 9 2.7 0 9 6.7 8 4 9 .7 9 5 5 .9 1 4 7 .8 5 8 3 .
1 3 0 9 1 .
MALES
91 024 . 3 3 5 6 6 0 . 3 9 8 3 4 0 . 3^1 372 . 3 8 6 0 7 7 . 3 7 8 6 8 5 . 3 69 37 5 . 3585 03 . 3461 05 . 3 3 0 3 1 7 . 3 09 39 5 . 2 8 3 0 8 7 . 2 5 0 8 6 7 . 21 35 06 .1 7 3 9 9 5 . 1 3 1 2 3 8 . '
8691 3 . 53895 .
01 1 0 0 0 0 0 . 0
87835 . 0 1 2 1 . 6 56 9 . 7 4510 6 17 09. 2
79764 .8 2 3 . 8 01 1 . 6 3
2o2 5 30 35 40 4 5 50
??i4357 : ?7 6 2 5 9 . 57 4 4 3 7 . 17 2 0 92 . 16 9 6 9 4 . 26 6 2 7 3 . 46 3 1 4 1 . 5
1 5 . 0 71 7 . 9 02 3 . 9 0 3 1 . 5 03 3 . 2 64 9 . 0 84 7 . 2 677 n 755
6065707580
58275 .5 5 2611 .2 45008 .9 3 5 7 5 0 . 6 2 4872 .8 1 6 8 3 5 . 4
f f m {j f9 7 . 2 0
1 4 4 . 5 02 0 5 . 7 03 0 4 . 2 7
12 165 .6 1 2 6 .1 9 4 4 .
9 2 8 . 1 1 8 8. 1 3 9 0 . 1 8 2 2 . 234 5 . 2 3 9 8 . 3 4 2 1 . 3 1 3 2. 4 8 6 6 . 5 6 6 4 . 7 6 0 2 . 9 2 5 8 .
1 0 8 7 8 .8 0 3 7 .
1 6 8 3 5 .
FEMALES
slttit:4 0 3 6 8 5 . 3965 04 . 3 9 1 2 15 . 3 84 77 2 . 3 7 6 7 4 ? . 3 6 6 3 2 3 . 3 5 4 46 6 . 3 3 9 9 1 9 . 3 2 3 5 3 7 . 3 0 3 5 4 3 .
2 4405 0 T
? ¥ ? ! $ ! :1 0 4 2 7 0 .
7 1 1 5 0 .
.8 53369«
.9 33572««
.9 82506
.9 86471
.9 80855
.9 75413
.9 70567
.9 65417
.9 54385
.9 36662
.9 14968
. 8 8 61 8 5
.8 51070 .8 14942 . 7 5 4 2 6 7 . 66 22 51 .3 82756«»*
. . 0 00000
.8 61 146«
.9 375 54*«
.9 £2212
.9 86660
.9 83529
.9 79130
.9 72346
.9 67632
.9 58962
.9 51807
.9 38199
.9 13271
.8 80359
.8 27264
.7 50666
.6 87988
.4 0 5 5 9 7 * « *
.0 00000
4 8 8 8 3 5 3 .4 7 9 7 3 2 9 .4 4 6 1 6 6 9 .4 0 6 3 3 2 9 .3 6 7 1 9 5 7 .3 2 8 5 8 8 0 .2 9 0 7 1 9 5 .2 5 3 7 8 2 0 .2 1 7 9 3 1 7 .1 8 3 3 2 1 3 .1 5 0 2 8 9 6 .1 1 9 3 5 0 0 .
9 1 0 4 1 4 .
4 4 6 0 4 f r2 7 2 0 4 6 .1 4 0 8 0 8 .
5 3 8 9 5 .
5 1 2 1 4 2 3 . 5 0 2 9 9 3 9 . 4 6 9 0 8 5 1 . 4 2 8 7 1 6 6 . 3 8 9 0 6 6 1 . 3 4 9 9 4 4 6 . 3 1 1 4 6 7 4 . 2 7 3 7 9 3 3 . 2 3 7 1 6 1 0 . 2 0 1 7 1 4 4 . 1 6 7 7 2 2 5 . 1 3 5 3 6 8 7 . 1 0 5 0 1 4 5 .
7 7 2 9 2 8 . 5 2 8 8 7 8 . 3 2 6 9 7 9 . 1 7 5 4 2 0 .
7 1 1 5 0 .
4 8.88< 55 .03C 55 . 3 ? f 51 .641 4 7 . 1 5 8 4 2 . 9 1 6 3 8 . 8 1 0 3 4 . 8 4 0 3 0 . 8 8 6 2 7 . 0 0 6 2 3 . 3 9 3 2 0 . 0 5 4 1 6 . 9 4 7 1 4 . 1 4 6 11 .503
8 . 8 2 7 6 . 4 9 7 4 . 1 1 7
5 1 . 2 1 4 5 7 . 2 6 6 5 7 . 4 0 9 5 3 . 7 4 8 4 9 . 3 5 1 4 5 . 0 6 7
-40.8-4 3 3 6 . 7 8 2 3 2 . 8 9 7 2 8 . 9 4 3 2 5 . 3 0 8 2 1 . 4 3 9 1 8 . 0 2 0 1 4 . 6 9 1 1 1 . 75 1
9 . 1 4 6 7 . 0 5 3 4 . 22 6
* PCBI RTHJ , * * p ( o - 4 ) f * * « T( 8 0 ) / T ( 7 5 j
I| a g e ( X )I
i99
! 0
f 5 * 1 0
; n* 25I 30
35 40 ' 45 50 55 60 65 70 75 80
___________T A8L E FOR Y£AR =
K x > — 1 000 0 ( x )
1 0 0 0 0 0 . 0
s o ? ! ? : "7 8 6 1 2 . 8nm-A75298 .5 73585 .8 7 1604 . 3 69195 .5 6 5855 .4 6 1 4 2 2 . 6 5 56 46 .64 8 7 0 9 . 0 4 05 26.13 2 2 5 6 . 0 22264 .4 1 32 08 . 8
1 3 0 . 6 4 7 2 . 5 7 2 4 . 9 9
• 1 0 . 5 4u-j2 2 . 7 52 6 . 9 33 3 . 6 44 8 . 2 76 7 . 3 19 4 . 0 4
1 2 4 . 6 71 6 8 . 0 02 0 4 . 0 73 0 9 . 7 6
i o o o . ‘ o3
015
1 0 1 5 20 25 30 35
2 !50556 065707580
1 0 0 0 0 0 . 0£ 8 1 6 2 . 88 2 5 4 5 . 1 8 0656 .5 7 9 7 8 5 . 7 78736 .67 7 5 88 . 17 6 0 0 5 . 2 73928 .6 7 1716. 7
m i : i6 0795 .3 5 4 9 3 7 . 4 4 6909 .9 3 7358 .8 26005 .8 1 7785 .4
118 63 22 10 1 3, 14 , 2 0 , 27. 29. 43.
H :9 6 .
1 4 4 .205 . 3 0 3 . 31 6
1000,
37 72 . 88
. 8 0
. 1 5
. 5 9
. 4 0
. 32
. 92
. 72
.01
.62 35
,48 ,13 89 10 00
3_ AREA= 5
D (X )
1 3 0 6 4 .
f f l l :8 2 9 .
1 2 1 1 .1 2 7 5 .1 7 1 3 .mi:3 3 4 0 .4 4 3 3 .5 7 7 6 .6 9 3 8 .8 1 8 3 .8 2 7 0 .9 9 9 2 .9 0 5 6 .
1 3 2 0 9 .
1 1 8 3 7 .5 6 1 8 .1 8 8 9 .
8 7 1 . 1 0 4 9 . 1 1 4 8 . 1 5 8 3 . 2 0 7 7 . 2 2 1 2 . 3 1 3 5 . 2 8 1 3 . 4 9 7 3 . 5 8 5 8 . 7 9 3 8 . 964 1 .
1 1 3 5 3 . 8 2 2 0 .
1 7 7 8 5 .
L ( X )
MALES
90855 .
1 1 1 ! go7:3 9 0 9 9 2 . 3 8 5 8 9 3 . 3 7 9 6 7 9 . 37221 1 .
3 18195 . 2 9 2 6 7 3 . 2 6 0 8 8 9 . 2 2 3 0 8 8 .1 81 95 5 . 136301 .
88683 . 54431 .
- - P ( X ) - T (X )
.8 51964»
.9 34 S4 7* *
.9 82145
.9 86959
.9 83897
.9 80329
.9 75 188
.9 42445
.9 19791
. 8 9 1 4 0 1
.8 55106
.8 15622
. 7 4 9 0 9 0
. 6 50640
.3 8 0 3 3 6 * * «
. 0 0 0 0 0 0
4 9 6 1 6 7 5 .
4 1 3 7 5 9 3 .
l l itffl:2 9 8 1 0 2 6 .mm -.
- 1 8 9 3 6 4 2 . 1 5 5 62 1 5. 1 23 80 2 0.
9 4 5 3 4 7 . 6 6 4 4 5 8 . 4 6 1 3 7 0 . 2 7 9 4 1 5 . 1 4 3 1 1 4 .
5 4 4 3 1 .
f e m a l e s
4 0 8 0 0 4 . 4 0 1 1 0 5 . 396 30 6 . 3 9 0 8 1 2 . 3 8 3 9 8 3 . 3 74834 . 3 6 4 1 1 3 . 350745 . 3 3 5 8 7 5 . 3 1 6 4 1 0 .2 8933? . 2 5 4 8 4 3 . 2 1 0 8 9 7 . 1 5 8 4 1 1 .1 09478 .
75589 .
.9 £3092
.9 88Q34
.9 86137
.9 82527
.9 76174
.9 71 398
.9 63285
.9 57603
:J« K¥.8 80799 .8 27554 .7 51133 .6 91099 .4 0844 1 * * * .0 00000
5 2 5 3 8 6 6 .limit:4 4 1 2 7 3 3 .4 0 1 1 6 2 8 .3 6 1 5 3 2 2 .
IliilJ»:2 4 6 56 9 3.2 1 0 15 7 9.
UHHJ:109 85 50 .
£ 0 9 ?1 8 .5 5 4 37 5 .3 4 3 47 8 .1 65 06 7.
7 55 89 .
E ( X J
4 9 . 6 1 7
i t m5 2 . 6 3 34 8 . 1 6 74 3 . 8 8 93 9 . 5 8 9
1 5 : 1 1 12 7 . 3 6 9 2 3 . 6 3 1 2 0 . 1 5 6 1 6 . 9 8 8 14 . 05 2 11 . 385
8 . 6 6 2 6 . 4 2 8 4 . 1 2 1
5 2 . 5 3 95 8 . 5 5 35 8 . 4 0 15 4 . 7 1 05 0 . 2 8 04 5 . 9 1 74 1 . 5 5 9
11:1112 9 . 3 0 4
H:lfi1 8 . 0 7 0 1 4 . 7 3 0 1 1 . 7 9 5
9 . 1 9 4 7 . 1 1 6 4 . 2 5 0
• P ( 9 I R T H ) , * * p ( 0 - 4 ) # * « « TC 8 0) 7T ( 75 )
A P P E N D I X V
A D J U S T E D L I F E T A B L E S B Y " T O T A L "
N ote : See A p p en d ix I I
\
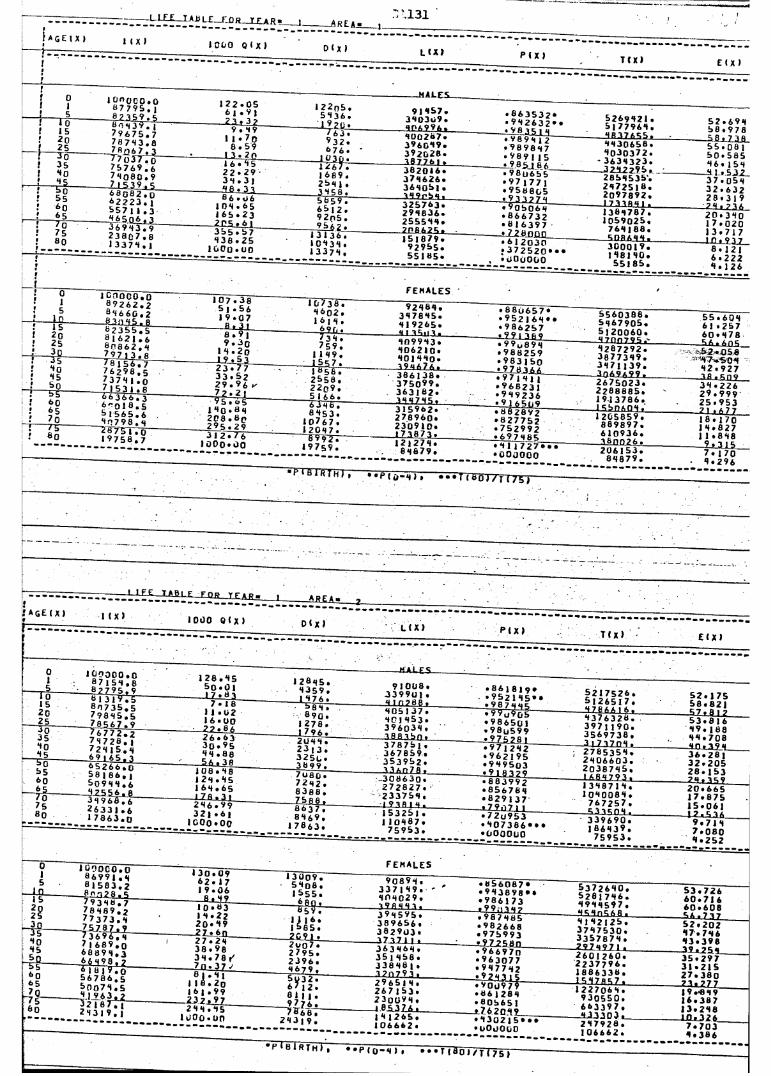
:: M 3 1
! T o f J s ! 2 0
25: 3 o .* 35 ! « 0 » 4 C! T o! 55! 6 q
<>5T o75
j __ f 2 _ . 1 3 3 7 4 ! i
1<J°0C0.0 87 795. j 8.23 59.5a 4 p r . l
122.056| .9 124.37122p5. 5436.I 9 .
- MALES_91457. 340309. • 863532» •942632»«
79675.778743.8 7 «06 7. 3 77 o3 7•0
9.491 1 • 7o8.59 ----13 • 20
7 637-----932.676 . •-____1^30.
400287.396049.392028.------- i-98_35_L4
•989412 • 9 8 98 4 7.989115
75769.6 74080.9 _ 715 3 9,5 6 8 o 8 ? , n
16*45 22*29 34.31 4 8.41lZ67~.------1689.254 |.3 4 5 8.
382016. 374626. 364051.—-----!_985166•98o6b5 •97J771 • 958805
»2223.i 557 1 1.3 «6506,3 36943.9 '
8 6.06 104.65165.23
■ 2üJ5j-6j
5F5T~.------65 i 2 . 92n5.9562 .
325763. 294836. 255544.------ i p i 2-ZJ__• 905064• 866732• 8 1 6397
23807.8 1 3374.1355.57 438.25 IoCq. uo
13136. » 0434 .13374.
151879.9295S.55185.------ •-Z-2-800D• 612030
.*372520»»
5 2 6 9 4 2 1 . & 1 77 9 6 4 .
4 4 3 0 6 5 6 “!4 0 3 0 3 7 2 .3 6 3 4 3 2 3 .
-J2*L22?S>.2 8 5 4 5 3 5 ' .2 4 7 2 5 1 » .2 0 9 7 8 9 2 .I 7 v t f t q 1 ■
E ( X )
5 2 . 6 9 85 8 . 9 7 8
5 5 . 0 8 1 5 0 . 5 8 5 4 6 . 1 5 4 -4 1 . 532_ 3 7 . 0 5 4 3 2 . 6 3 2 2 8 . 3 1 9 2 4 . 7 U
;!!:;
0 l 5
1 n 1 5
I C OO C O . O« 9 2 6 2 . 28 4 6 6 0 . 2
6 7 4 5 5 / 5
1 0 7 . 3 8 5 l . 5 6 1 9 . 0 7
ft . 4 1
3 8 . 4 6 0 2 .16 1 4 .
6 9 f , .
FEMALES
9 2 4 8 4 .3 4 7 8 4 5 .4 1 9 2 6 5 .
• 8 8 u 6 5 7 • • 9 5 2 1 6 4 » * • 9 8 6 2 5 7
?!!!
2 0 25 3c
8 1 6 2 1 . 6 8 0 8 6 2 , 4 7 9 7 j 3 • 87 8 1 5 6 , 7
8 » 9 j9 . 3 q
1 4 . 2 0 l T j S j .
^ 3 4 .7 5 9 .
1 1 4 9 .1 5 5 7 .
4 0 9 9 4 3 .4 0 6 2 1 0 .4 0 1 4 4 0 .
--------------. 9 9 13 fi 9• 9 9 u 8 9 4 • 9 8 8 2 5 9 • 9 8 3 1 5 0
!
!!
«0 45 5 0bb
7 6 2 9 8 . 57 3 7 4 1 . 07 l 5 3 l . f i6 6 3 6 6 . 3
2 3 • 7 73 3 . 5 2 2 9 . 9 6 r
______ Z 2 . 2 1
1 8 5 6 . 2 5 5 8 . 2 2 p 9 •
3 8 6 1 3 8 .3 7 5 0 9 9 .3 6 3 1 8 2 .
------------- 1-9 7-83 6 6• 9 7 1 4 1 1 • 9 6 8 2 3 1 • 9 4 9 2 3 6
I
V
60 65 7 0
~rs
6 ^ 0 1 8 . 5 5 1 5 6 5 . 6 4 0 7 9 8 , 4
"2 8 7 5TTÖ ---------------
9 5 . 0 5 1 4 q . 8 42 0 8 . 8 p2 9 5 . 2 9
6 3 4 b .8 4 5 3 .
1 0 7 6 7 .1 2 0 4 7 .
3 1 5 9 6 2 .2 7 8 9 6 0 .2 3 0 9 1 0 .
• 9 1 6 5 1 , 9• bb 2 8 9 2 • 8 2 7 7 5 2• 7 5 2 9 9 2
: « 0 1 9 7 5 8 . 7 3 1 2 « / 6 1 0 0 0 * 0 0
‘ 8 9 9 2 . 1 9 7 5 9 . 1 2 1 2 7 4 .
• 6 9 7 4 fa 5 • 4 1 1 7 2 7 » * *
5 5 6 0 3 8 8 .5 4 6 7 9 0 5 .5 1 2 0 0 6 0 .
. 4 7 n n 7 9 S - -
5 5 . 6 0 4 61 . 2 5 7 6 0 . 4 7 8
4 2 8 7 2 9 2 . 3 8 7 7 3 4 9 . 3 4 7 1 1 3 9 .
-3-06 9 6 9 9 . 2 6 7 5 0 2 3
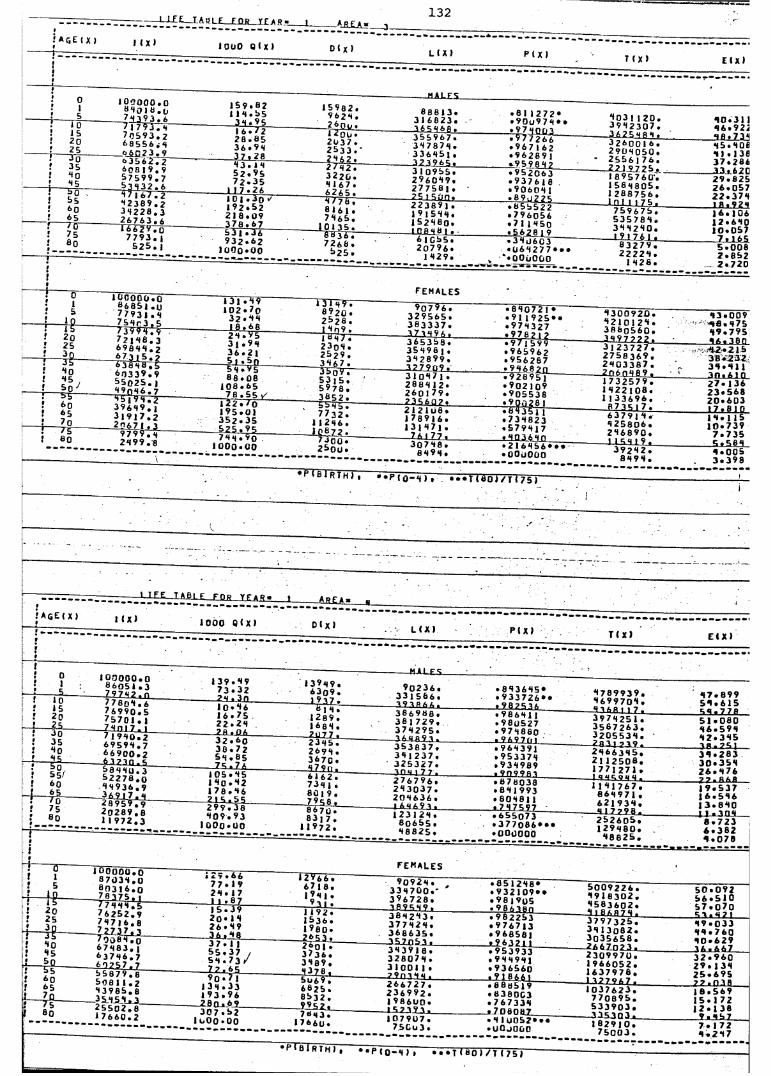
--LE £_J A p L £_EJ1R_ JT £ A R
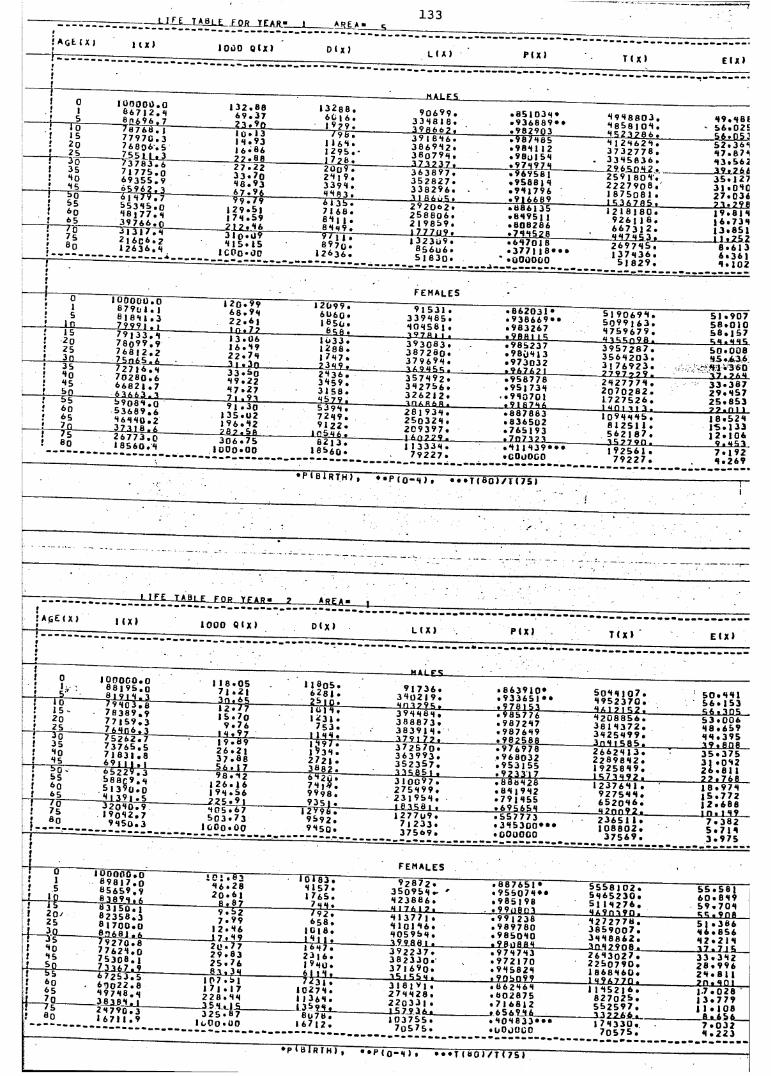
----------- r . ......................... T a b l £_ t Qi L j r E a r - 1 -------a r e *1 3 3
■ s
I a g l i x ) I t * ) 1 0 0 0 OCX! 0 1 X ) L 1 X ) P 1 X) T ( X > E 1 X )
if ..............^ ......................
i oi
--------- i r i b
11) 0 0 0 0 . 0 6 6 7 1 2 . 8 S H A 9 6 . 7 7 8 76b . J
1 3 2 . 8 86 9 . 3 7
------------------------ 2 3 . 9 Q ___
» 3 2 8 8 . 6 0 , 6 . 1 9 ? 9 .
* -■ f tAL £ S
9 0 6 9 9 . 3 3 8 8 1 8 .1 9 8 6 6 7 -
. 8 5 1 0 3 8 *
. 9 3 6 8 8 9 * * 8 9 8 8 8 0 3 .8 8 5 8 1 0 8 .
8 9 , 8 6 6 - 5 6 . 0 2 E
1 1 5; 2 o
_____ f 251 3o
7 7 9 7 0 . 37 6 8 0 6 . 5
---------- 7 5 5 ) L . 37 3 7 8 3 . 6
1 u • 1 3 1 8 . 9 3 1 6 * 8 6 7 2 . 8 8
/ 9 fa .1 1 6 8 .1 2 9 5 . -
------------
3 9 1 8 8 6 . 3 8 6 9 8 2 . 3 8 0 7 9 8 . 1 7 3 7 3 7 .
. 9 8 7 8 8 5
. 9 8 8 1 1 2 • 9 B J 1 5 8
45_2JL2_86 • 8 1 2 8 6 2 8 . 3 7 3 2 7 7 8 .
. 3 3 8 5 8 3 6 .
5 6 . 0 5 ;5 2 . 3 6 68 7 . 8 7 68 3 . 5 6 2
! 35! 4o
______;___1 So
7 1 7 7 5 . 0 6 9 3 5 5 . 9 6 5 9 6 ?. i oT 4 T 7 . 7
2 7 . 2 2 3 3 * 7 0 8 8 . 9 3 6 7 . 9 6
2 0 02 4 , 9 .3 3 9 4 .4 4 8 3 .
3 6 3 8 97 . 3 5 2 8 2 7 . 3 3 8 2 9 6 . 1 , 8 6 1 . 5 .
. 9 6 9 5 8 1 • V 5 8 B ) 8 . 9 8 1 7 9 6
------------- 2 9 6 .508 2 .25 9 , 8 0 8 -. 2 2 2 7 9 0 8 . 1 8 7 5 0 8 1 .
3 9j _Z 6 1 3 5 . 1 2 7 31 . 0 8 0 2 7 . 0 3 6
! 5 5 ! 6 0 ! 6 5! 7 o
5 5 3 4 5 . 0 4 8 , 7 7 .**3 9 7 6 6 . 0 3 1 3 1 7 . * *
1 2 9 . 5 1 1 7 8 . 5 9
-------------------_ 2 1 Z a 46
6 1 3 5 .7 1 6 8 . S 4 1 1 »8 8 ** 9 .
2 9 2 0 6 2 . 2 5 8 8 0 6 . 2 1 9 8 5 9 . I 7 7 7 i t9 .
• 6 8 6 1 3 5 • 8 8 9 5 J 1 • 8 0 8 2 6 6
— ----- 1 ^ 3 ^ 7 8 5 »1 2 1 8 ) 8 0 .
9 2 6 , 1 6 . 6 6 7 3 1 2 .
7 1 . 7 9 61 9 . 8 1 81 6 . 7 3 81 3 . 6 5 1
! 7s j Ö0
i
2 1 6c 6 . 2 1 2 6 3 6 .**
3 1 0 • 0 9 4 1 5 * 1 5
1C P o * 0 0
^ 7 T T T -8 9 7 o .
» 2 6 3 6 .| 3 2 3 u 9 .
8 5 6 u 6 .. 6 8 7 0 1 8 * 3 7 7 1 1 8 * * *
4.17 8 5 3 . 2 6 9 7 8 5 . 1 3 7 8 3 6 .
___________ 1 L i 2 5 28 . 6 13 6 . 3 6 1 8 . 1 0 2
-------- 1----------------------- ------------ f e m a l e s
1r s
i n 1 5
S 7 9 0 1 . 1 Si 8 **1 . 3 7 9 9 9 i t | 7 9 j 3 3 . **
16 8 . 9 82 2 * 6 1
---------------------- 1 0 * 7 7 _______
1 2 0 9 9 . 6 0 6 0 . 1 S5*j ,
8 5 8 .
9 1 5 3 1 . 3 3 9 8 8 5 . 8 0 8 5 6 , .19 7 8 1 , -
. 8 6 2 0 3 1 •• 9 3 8 6 6 9 * *. 9 8 3 2 6 7
5 1 9 0 6 9 8 . 5 0 9 9 J 6 3 . 8 7 5 9 6 7 9 .
5 1 . 9 0 7 5 8 . 0 1 0 5 8 . 1 5 7
! 2 of 25
____ !___ 3 q___35
7 8 0 9 V . 9 7 6 8 1 2 . 2
_____ 7 5 / 1 6 5 . 6
1 3 * 0 6 1 6 . 8 9 2 2 * 7 8
—------ ----------- 3 1 « 3n
1 0 3 3 . 1 2 8 6 . 1 7 8 7 . 2 3 8 9 .
3 9 3 0 8 3 . 3 8 7 2 S O . 3 7 9 6 9 8 .
. 9 8 5 2 3 7
. 9 8 0 8 1 3
. 9 7 3 0 3 2
<4 1 5 5 0 9 8 . 3 9 5 7 2 8 7 . 3 5 6 8 2 0 3 . 3 1 7 6 9 2 3 .
5*1 . «4655 0 . 0 0 88 5 . 6 3 6* 1 1 .3 6 0
! 4 0 ! 45 f 5n; 5 5
7 0 2 8 0 . 66 6 8 2 1 . 7 6 1 6 6 .1 .1
3 3 * Sq 8 9 . 2 2 8 7 * 2 7
—__________ 7 1 . 91
2 8 3 6 . 3 4 5 9 . 3 1 5 8 . 4 5 7 9 .
3 5 7 8 9 2 . 3 8 2 7 5 6 . 3 2 6 2 1 2 .
. 9 5 8 7 7 8
. 9 5 1 7 3 8
. 9 8 0 7 0 1
----------- 2 1 5 7 2 ? 9 .2 8 2 7 7 7 8 . 2 0 7 0 2 8 2 . 1 7 2 7 5 2 6 .
------------------3-7 j-2-6-83 3 . 3 8 72 9 . 8 5 72 5 . 8 5 3
! 6 0 f 6 S f 7n I 7 5
5 3 6 8 9 . 6 4 6 ** ** 0 . 23 7 1 . 8 . 6
9 1 * 3 o 1 3 5 . 0 2 1 9 6 . 8 2
------------------26.2., 5fi________
5 3 9 8 . 7 2 8 9 . 9 1 2 2 .
1 n 5**6 .
2 8 1 9 3 8 . 2 5 0 3 2 8 . 2 C 9 3 9 7 .
. 8 8 7 8 6 3
. 8 3 6 5 0 2
. 7 6 5 1 9 3
1 « n 1 1 1 1 . 1 0 9 8 8 8 5 .
8 1 2 5 1 1 . 5 6 2 1 8 7 .
7 ? . n 11 1 8 . 5 2 8 I S . 133 1 2 . 1 0 6
! S 0 1 8 5 6 0 . 8 3 0 6 • 7 5 1 0 0 0 * 0 0
8 2 1 3 .1 8 5 6 0 « 1 1 3 3 3 8 . . 8 1 1 8 3 9 * * *
. i 5 ? 7 o n . 1 9 2 5 6 1 .
9 . <451 7 . 1 9 2 8 . 2 6 9
• P 1 B 1 R T H ) 1 • - P 1 0 - 8 ) . i T T T » 8 0 ) / T ( 7 S 1i
■ '
; .........................~ - - - - - • • -• • ' - - . . . — ---------------------- ------- ' - - --------------------- ; : - - ------- ________ ________ __
-------------------- L IF E - l* S L iL _ tO R Y EAR- 7 a r e a - -J«f A G E ( X ) ; 1 ( X ) 1 0 0 0 O l X ) d 1 x 1 L ( X ) P 1 X ) T 1 X 1 E (X 1
;«!
....................- ...............
1 0
1 5 ': i o
1 0 0 0 0 0 . 0 Ö 8 1 9 5 . 08 1 9 1 8 . 1 / v 8 r 3 . p
1 1 8 . 0 57 1 . 2 1
------------------3 0 . 6 5
1 1 6 q 5 . 6 2 8 1 .
_ 2 8 , 0 .9 1 7 3 6 .
3 8 0 2 1 9 .. 8 6 3 9 1 0 *. 9 3 3 6 5 1 * » 5 0 8 8 1 0 7 .
8 9 5 2 3 7 0 .5 0 . 8 8 15 6 . 1 5 3
f 1 5 - f 20r___ 25i 3 o
7 8 3 8 9 . 97 7 1 5 9 . 37iLi06_,J}___7 5 2 6 2 . 7
1 2 • 7 7 1 5 . 7o
9 . 7 6 1 ** . 97
1 u j 8 . U 3 1 .
2 5 3 .1 1 8 8 .
3 9 8 8 8 8 . 3 8 8 8 7 3 . 3 8 3 9 1 8 . 1 7 9 1 7 7 .
• 9 8 5 7 7 6. 9 8 7 2 8 7. 9 8 7 6 8 9. 9 8 2 5 « «
8 A 1 7 1 5 2 . 8 2 0 8 8 5 6 . 3 8 1 8 3 7 2 . 3 8 2 5 8 9 9 .
5 6 . 1 0 55 3 . 0 0 68 8 . 6 5 98 8 . 3 9 5
! 3 5! 4 0f 45i 5 o -
7 3 7 6 5 . 5 7 1 8 3 1 . 8 6.91 1 1 . 16 5 2 2 9 . 3 ---------
2 6 . 2 1 3 7 . 8 8 5 6 . 1 7
1 4 9 7 . 1 '934 . 2 7 2 1 . 3 8 8 2 .
3 7 2 5 7 0 .3 6 3 9 9 3 . 3 5 2 3 5 7 .1 1 5 8 5 , ,
. 9 7 6 9 7 8 • 9 6 8 0 3 2 . 9 5 3 1 5 5
3n 8 1 5 8 5 . 2 6 6 2 8 1 3 . 2 2 8 9 8 8 2 . 1 9 2 5 8 8 9 .
1 9 . Bne 3 5 . 3 7 5 31 . 0 8 2 2 6 . 8 1 1
J 5 5 ! 6 0 f 6 5 1 7 o
5 e a r 9 . * * 5 1 3 9 0 . 0 ^ J 3 9_J . 5 3 2 0 8 0 . 9
9 8 . 82" 1 2 6 * 1 6 1 9 *t . S 6 2 2 5 . 9 ,
6 4 2 0 • 7 4 1 •$ . 9 9 9 8 . 9 3 5 1 .
3 1 0 0 9 7 . 2 7 5 8 9 9 . 2 3 1 9 5 8 . 1 8 3 5 8 1 .
* ' 4 J J 1 / . 8 8 8 8 2 8 . 8 8 1 9 8 2• 79 j 8 55
1 5 7 1 8 9 2 . 1 2 3 7 6 8 1 .
9 2 7 5 8 8 . 6 5 2 0 8 6 .
7 7 . 7 6 81 8 . 9 7 81 5 . 7 7 21 2 . 6 8 8
! 7 b j So
J
1 9 0 8 2 . 79 8 5 0 . 3
8 0 5 * 6 75 0 3 . 7 3
i c o o . o o
1 2 ? 9 6 7 9 5 9 2 . 9 4 5 0 .
1 2 7 7 u 9 . 7 1 2 3 3 .
. 5 5 7 7 7 3
. 3 8 5 3 0 0 * * *
______8 2 n n 9 2 .2 3 6 5 1 1 . 1 0 8 8 0 2 .
-------------- i n . 1 8J?7 . 3 8 25 . 7 1 83 . 9 7 5
!
4 — 0— J u n 0 0 0 ■ 0f e m a l e s
1! 5! i n:— f t ----------
6 9 8 "l 7 J 06 5 6 5 9 . 9 « 3 8 9 * * . 6 S3 1 5 0 . 1
1 0 1 . S 3 8 6 . 2 8 2 0 . 6 1
8 . 8 7
1 0 1 8 3 . 4 1 5 7 . 1 2 6 5 .
2 8 8 .
9 2 8 7 2 . 3 5 0 9 5 8 - ' 8 2 3 8 8 6 .
. 8 8 7 6 5 1 •
. 9 5 5 0 7 8 * *
. 9 8 5 1 9 85 5 5 8 1 0 2 . 5 8 6 5 2 3 0 . Si 1 8 2 7 6 .
5 5 . 5 8 16 0 . 8 8 95 9 . 7 0 8
! 2 0 / f 25
+ - » -----------
6 2 3 5 8 ^ 3 8 1 7 0 0 . 0 8 2 6 SJ . 6 7 9 2 7 0 . 8
9 . 5 2 7 . 9 9
1 2 . 8 6 _________1 7 • 4 5
7 92 . 6 5 8 .
1 G 1 6 .1 4 H .
8 1 37 7 1 . 8 1 0 1 8 6 . 8 0 5 9 5 8 .
______ 3 9 9 8 Ü I , ___
. 9 9 1 2 3 8
. 9 8 9 7 8 0
. 9 8 5 0 8 0
8 a 9 n 1 9 n . 4 2 7 2 7 7 8 . 3 8 5 9 0 0 7 . 3 8 4 8 8 6 2 .
5 5 . 9 0 « 51 . 3 8 6 8 6 . 8 5 6 8 2 . 2 1 8
! 4 o 1 45 ? 5n f 55
7 7 6 2 8 . 07 5 3 0 8 . 1 7 3 3 6 7 . 9 6 7 ?5 3V5
2 9 . 8 3 2 5 . 7 6 P .1 .3 8
1 6 ** 7 ,2 3 1 6 .1 9* * u.
— —
3 9 2 2 3 7 . 3 8 2 3 3 0 .3 7 , 6 9 0 .1 5 1 5 ^ 8 1
. 9 7 8 7 8 3 • 9 7 2 1 7 0 . 9 8 5 8 2 8
------3 •2 6 4 3 0 2 7 . 2 2 5 0 7 9 0 . 1 8 6 8 8 6 0 .
1 7 . 7 1 53 3 . 3 8 22 8 . 9 9 62 8 . 8 1 1
f 6 o f 6 5
i 7 5 J e 0
6 0 0 2 2 . 8« 9 7 8 8 . * *3 8 3 8 8 . 12 4 7 9 0 . 3
1 0 7 . 6 1l 7 | . 1 72 2 8 . 8 83 5 8 , 1 5
?231 . 1 0 2 7 8 . 1 ) 3 6 8 . 1 3 8 9 8 ,
3 1 8 1 9 1 . 2 7 8 8 2 8 . 2 2 0 3 3 1 .
______ I S 7 9 3 6j ___
. 8 6 2 8 6 8 • 6 0 2 8 7 5 . 7 1 6 8 1 2
1 8 9 6 7 7 0 . 1 1 8 5 2 1 6 .
8 2 7 0 2 5 . 5 5 2 5 9 7 ,
7 0 . 4 0 11 7 . 0 2 81 3 . 7 7 91 1 * 1 0 8
1 6 7 1 1 . 9 1t G o * 0 08 u 7 b .
» 6 7 1 2 . 1 0 3 7 5 5 . . 8 0 8 8 3 3 * * *-------- 13 2- 2 6 6 * _
1 7 8 3 3 0 ,8 . 6 5 6 ___
» • • p C 0 -*4 » • * * * T ( t»0 1 / T 1 75 1P ( B I R T H )
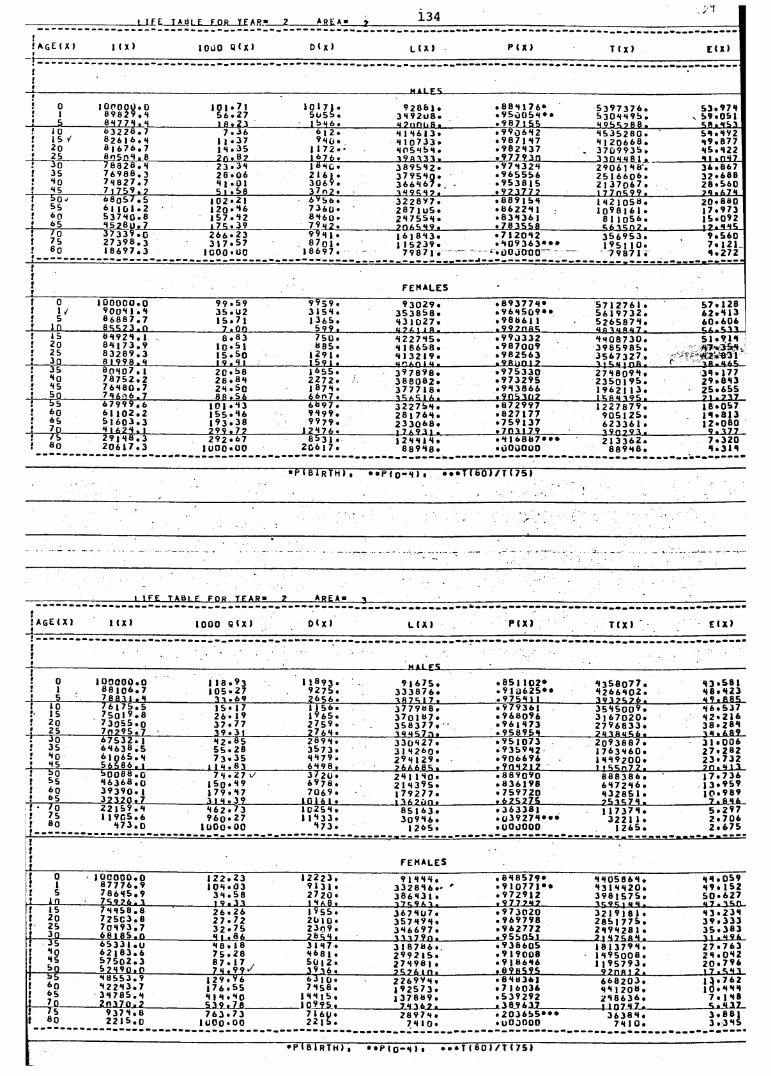
______L l f E 1AP L E F_QiL_JLE A R - ___Z______ * S t * *____2
f A g C ( X )j
t ( X ) l Ou O Q < X ) D ( X > L » X 1 P 1 X ) T ( X ) E ( X >
i1» M 1 L F 5
1 0! 1! 5
i o p o o g . o8 9 8 2 9 . 4 0 4 7 7 4 . 4
1 0 1 * 7 15 6 . 2 7
___ 1 8 . 2 3
» 0 » 7 1 .5 u 5 5 . 1 5 4 6 .
9 2 8 8 » . 34 9 2 U 8 . 4 7 n n i i B •
. 8 8 4 1 7 6 *
. 9 5 0 0 5 4 * *
. 9 8 7 1 5 5
5 3 9 7 3 7 6 .5 3 0 4 4 9 5 .4 9 5 5 2 8 8 .
5 3 . 9 7 4 . 5 9 . 0 5 1
5 8 . 4 5 3f 1 0f i 5 v1! 2 oI___ 2 6
0 3 2 2 8 . 7 0 2 6 ) 6 . 4 8 | 6 7 6 . 7 8 0 5 n H . 8
7 . 3 6 » 1 . 3 7 1 8 . 3 5 2 r. . 8 2
0 1 2 .9 4 u •
1 1 7 2 . * 1 0 7 6 .
4 1 4 6 1 3 . 4 » 0 7 3 3 . 4 P 5 4 5 4 • 3 9 R 3 3 3 .
. 9 9 0 6 4 2
. 9 8 7 1 4 7
. 9 8 2 4 3 7
. 9 7 7 9 3 0
4 5 3 5 2 8 0 . 0 1 2 0 6 6 8 .
. 3 7 0 9 9 3 5 .3 3 0 4 4 8 1 .
5 4 . 4 9 2 4 9 . 8 7 7 4 5 . 4 2 2
___i l . p 4 7! 3o 1 35 !! 45
7 8 8 2 8 . 4 7 6 9 8 8 . 3 7 4 8 2 7 . 7 7 1 7 5 9 . ?
23 • 34 2 8 . 0 64 1 . 0 15 1 . 5 8
1 8 4 0 . 2 1 6 1 . 3 0 6 9 . 3 7 n 2 •
3 8 9 5 4 2 . 3 7 9 5 4 0 . 3 6 6 4 6 7 . •3 4 9 8 4 2 .
. 9 7 4 3 2 4
. 9 6 5 5 5 6
. 9 5 3 8 1 5
. 9 2 3 7 7 ?
2 9 0 6 1 46 ' . 2 5 1 6 6 0 0 « 2 1 3 7 0 6 7 . 1 7 7 0 5 9 9 .
3 6 . 8 6 7 3 2 • 68B 2 8 . 5 6 0 2 4 . 6 7 4
» i »0-! &5f <>0 f 05
0 8 0 5 7 . 6 6 1 1 0 1 . 2 5 3 7 4 0 . 88 5 2 8 0 . 7
» 0 2 * 2 1 1 2 0 • H 6 1 5 7 . 8 2
__ l l 5 . 3 9
6 ^ b 6 •7 3 6 u •8 i 6l ) • 7 9 h 2 .
3 2 2 8 9 7 . 2 8 7 1u 5 . 2 8 7 5 5 4 .7 0 6 5 4 9 .
. 0 8 9 ( 5 4
. 8 6 2 2 4 1 • 8 3 4 3 6 1 . 7 8 3 5_5 8___
1 4 2 1 0 5 8 . 1 0 9 8 1 6 1 .
8 1 1 0 5 6 . 5 6 3 5 0 7 .
2 0 . 8 0 0 1 7 . 9 7 3 1 5 . 0 9 2 1 2 . 4 4 5
1 7 o ! 75 ! «0
3 7 3 3 9 . 02 7 3 9 8 . 3» 8 6 9 7 . 3
2 6 6 * 2 33 1 7 . 5 7
i c o o . o c
9“94 1 . 8 7 o j .
» 8 6 9 7 . . _ .
» 6 1 8 4 3 . 1 » 5 2 3 9 .
7 9 8 7 1 .
. 7 I 2 0 4 2
. 4 0 9 3 6 3 * * * • » □ O j OOO
3 5 6 9 5 3 .1 9 5 1 1 0 .
7 9 8 7 1 .
9 . 5 6 07 . 1 2 14 . 2 7 2
»!!; f e m a l e s
i oJ i /! 5• l n
» □ 0 0 0 0 . 0 9 0 0 8 1 . 8 0 6 8 8 7 . 7 8 8 8 2 3 . 0
9 9 . 5 93 5 . 0 21 5 . 7 i
7 . o n
9 9 5 9 . 3 » 54 . 1 3 6 5 .
5 9 9 .
9 3 0 2 9 . 3 5 3 8 5 8 . 4 3 1 0 2 7 . u 2 6 ] i n .
. 8 9 3 7 7 4 *
. 9 6 4 5 0 9 * *
. 9 8 8 6 1 1
. 9 9 7 P R 5
5 7 1 2 7 6 1 . 5 6 1 9 7 3 2 . 5 2 6 5 8 7 4 .4 n 3 « R 4 7 .
5 7 . 1 2 86 2 . 4 1 36 0 . 6 0 64 6 . 5 3 3
J 5! 2o ; 2 5! 3 Q
8 8 9 2 8 . 18 8 1 7 3 . 96 3 2 8 9 . 38 1 9 9 8 . 4
8 . 8 3» 0 * 5 11 5 . 5 0
___1 9 . 8 1 ___
7 5 ü • 8 8 5 .
1 29 1 . 1 5 9 1 .
4 2 2 7 4 5 . 4 1 8 6 5 8 . 4 1 3 2 1 9 . u r a n * <4 .
. V 9 J 3 3 2
. 9 8 7 0 0 9
. 9 8 2 5 6 3 ■ 9 8 ; i n 1 2
4 4 0 8 7 3 0 . 3 9 8 5 9 8 5 . 3 5 6 7 3 2 7 ,
5 1 . 9 1 4 4 7 . 3 5 4 4 2 . 8 3 1 7 « . « 6 5
! 35 I H 0 ! 4 5 • 5 n
8 f ! 4 0 7 , 17 8 7 5 2 . 2 7 6 8 8 0 . 7 7 4 6 P 6 . 7
2 0 * 5 82 8 . 8 42 4 . 5 08 8 . 5 6
» 0 5 5 . 2 2 7 2 . 1 8 7 4 .6 6n 7 .
3 ? 7 8 9 8 .3 8 8 0 8 2 .3 7 7 7 1 8 .7 5 6 5 1 6 .
. 9 7 5 3 3 0
. 9 7 3 2 9 5
. 9 4 3 8 6 6
. 9 0 5 3 0 2
2 7 4 8 0 9 4 . 2 3 5 0 1 9 5 . » 9 6 2 1 1 3 . 1 t; 8 4 3 9 5 .
3 4 . 1 7 7 2 9 . 8 4 3 2 5 . 6 5 5 7 1 . 2 3 7
! 55 ! o o ! 05 J 7 o
6 7 9 9 9 . 66 1 1 0 2 . 25 1 6 0 3 . 38 l 6 2 8 . 1
1 0 1 . 8 3» 5 5 . 8 6» 9 3 . 3 82 9 9 . 7 7
6 8 9 7 . 9 4 9 9 . 9 9 7 9 .
1 2 4 7 6 .
3 2 2 7 5 4 . 2 8 1 7 6 4 . 2 3 3 0 6 8 . l 7 6 9 3 | .___
• 8 7 2 9 V 7 . 8 2 7 1 7 7 . 7 5 9 1 3 7 . 7 0 3 1 7 9
1 2 2 7 8 7 9 .9 0 5 1 2 5 .6 2 3 3 6 1 .3 9 0 7 9 3 .
1 8 . 0 5 71 4 . 8 1 31 2 . 0 8 0
9 . 3 7 7* ! 5! 8 0
2 9 1 8 8 . 32 0 6 1 7 . 3
2 9 2 . 6 7 1UOO * 0 0
8 5 3 1 . 2 0 6 1 7 .
1 2 4 4 1 4 .8 8 9 4 8 .
. 4 1 6 8 b 7 * * *
. 0 0 0 0 0 02 1 3 3 6 2 .
8 8 9 4 8 .7 . 3 2 04 . 3 1 4
• P I B I r TH) , • • P ( o - H ) » * * * T ( b o J / T ( 7 5 )
1- 1 FE t a b l e F O R TEAR» 2 » RE A « 3
• A G E ( X I 1___
1 ( X » 1 0 0 0 Q ( X ) D ( X » L ( X 1 PCX» T C X > E » X »
i!_________________________________ « i t r<;
i 01
! 5
1 0 0 0 0 0 . 08 8 1 0 0 . 77 8 8 3 1 . 4
1 1 8 . 9 3 1 0 5 . 2 7
3 3 . 6 9
1 I 8 9 3 .9 2 7 5 . 2 6 5 6 .
9 1 6 7 5 .3 3 3 8 7 6 .3 8 7 4 1 7 .
. 8 5 » 1 0 2 *
. 9 1 J 6 2 S * •
. 9 7 5 4 1 1
4 3 5 8 0 7 7 . 4 2 6 6 4 0 2 . 3 9 3 7 8 7 6 .
4 3 . 5 8 14 8 . 4 2 3« 9 . 8 8 5
10 !- 15f 20 ;___ 2 5 _____
7 6 1 7 5 . 5 7 5 0 1 9 . 8 7 3 0 5 5 . 0 7 o ? 9 5 • 7
1 5 . 1 72 6 * 1 93 7 . 7 73 9 . 3 1
1 1 5 6 . 1 9 6 5 . 2 7 5 9 .
___2 7 6 4 .
3 7 7 9 8 8 . 3 7 0 1 8 7 . 3 5 8 3 7 7 . 3 4 4 5 7 O •
. 9 7 9 3 6 1
. 9 6 8 0 9 6
. 9 6 1 4 7 3
. 9 5 8 9 5 4
3 5 4 5 0 0 ’ . 3 1 6 7 0 2 0 . 2 7 9 6 8 3 3 . 7 « 3 R « 4 6 .
4 6 . 5 3 74 2 . 2 1 63 8 . 2 8 43 4 . 6 8 9
! 3 0 .» 35 f 4 0 • 45
6 7 5 3 2 . 1 6 4 6 3 8 . 5 6 ] 0 6 5 * 45 6 5 8 6 . 1
4 2 * 0 5 5 5 . 2 8 7 3 . 3 5
1 1 4 . 8 3
2 0 9 4 . 3 5 7 3 . 4 4 7 9 . 6 4 9 8 .
3 3 0 4 2 7 . 3 I 4 2 6 0 . 2 9 4 1 2 9 . 7 6 6 6 8 4 .
. 9 5 1 0 7 3
. 9 3 5 9 4 2
. 9 0 6 6 9 6
. 9 0 4 2 1 2
2 o ’ 3 8 8 7 . 1 7 6 3 4 6 0 . 1 4 4 9 2 0 0 . 1 » 8 8 n 7 2 .
3 1 . 0 0 6 2 7 . 2 8 2 2 3 . 7 3 2 ? n . « 13
! i»0f 85 1 6 0 ! 05
5 0 0 8 8 . 04 6 3 6 8 . 03 9 3 9 0 . 1 3 2 3 2 0 . 7
7 4 . 2 7 t / » 5 Q . 4 9 » 7 9 . 4 7
___3 1 4 . 3 ?___
3 l 2 o *6 9 7 8 . 7 0 6 9 .
LO 1_6 1 .
2 4 J 1 4 0 . 2 1 4 3 9 5 . 1 7 9 2 7 7 . 1 3 6 ?. 1 n .
. 8 8 9 0 9 0
. 8 3 6 1 9 8
. 7 5 9 7 2 0 ___. 6 2 5 2 Z 5___
8 8 8 3 8 6 . 6 4 7 2 4 6 . 4 3 2 8 5 1 . 7 5 3 8 7 4 .
1 7 . 7 3 61 3 . 9 5 91 0 . 9 8 9
7 . 8 4 6! ■ 7 0 J 7 5 l «0
2 2 1 5 9 . 4 » 1 9 0 5 . 6
4 7 3 . 0
4 6 2 . 7 39 6 0 . 2 7
1 UOO * 0 0
1 C 2 5 4 • » » 4 3 3 .
4 7 3 .
8 5 » 6 3 . 3 0 9 4 6 .
1 2 6 5 .
. 3 6 3 3 8 1 • 0 3 9 2 7 4 * * * , 0 0 0 0 0 0
1 1 7 3 7 4 . 3 2 2 1 1 .
1 2 6 5 .
5 . 2 9 72 . 7 0 62 . 6 7 5
1}11 f e m a l e s
? 0? 1I 5• 1 n
» 0 0 0 0 0 . 0 « 7 7 7 6 . 9 7 8 6 4 5 . 9 7 5 9 2 6 . 3
1 2 2 . 2 31 0 4 . 0 3
3 4 . 5 81 9 . 3 3
» 2 2 2 3 . 9 1 3 » . 2 7 2 0 . 1 4 a 8 .
9 1 4 4 4 , 3 3 2 8 4 6 . ' ' 3 8 6 4 3 1 .
. 8 4 8 5 7 9 *. 9 1 0 7 7 1 • • . 9 7 2 9 1 2. 9 7 7 7 4 7
4 4 0 5 8 6 4 .4 3 1 4 4 2 0 .3 9 8 ) 5 7 5 .
4 4 . 0 5 9 4 9 . 1 5 2 5 0 * 6 2 74 7 . 3 8 0
f »5l 2 0 1 25
-j___ ________
7 4 4 5 8 . 87 2 5C 3 . 8 7 0 4 9 3 . 78 8_i 8 8 j 0
2 6 . 2 6 2 7 . 7 2 3 2 . 7 5 4 1 . 8 6
1 9 5 5 . 2 0 ) 0 «2 3 n 9 •2 8 4 4 .___
3 6 7 4 U 7 « 3 5 7 4 9 4 . 3 4 6 6 9 7 . 3 3 3 7 9 n .
. 9 7 3 0 2 0
. 9 6 9 7 9 8
. 9 6 2 7 7 2
. 9 S 5 0 5 1
3 2 1 9 1 8 » . 2 8 5 1 7 7 5 . 2 4 9 4 2 8 1 . 2 1 4 7 8 8 4 .
4 3 . 2 3 4 3 9 . 3 3 3 3 5 . 3 8 3
___3 1 . 4 9 6• 3 S! 4 01 45
J__ ______
6 5 3 3 1 . u 6 2 ( 8 3 . 6 5 7 5 0 2 . 3 5 2 4 9 0 . n
4 8 . 1 8 7 5 . 2 8 87 . » 7 7 4 . 9 9 ^
3 1 4 7 . 4 6 8 1 . SU| 2 . 39 >6 .
3 I 8 7 8 6 . 2 9 9 2 1 5 . 2 7 4 9 8 J . 7 5 2 6 1 n .
. 9 3 6 6 0 5
. 9 1 9 0 0 8
. 9 1 b 6 4 6
. 6 9 8 5 9 5
1 8 1 3 7 9 4 . 1 4 9 5 0 0 8 . 1 1 9 5 7 9 3 .
9 7 n n 1 2 .
2 7 . 7 6 32 4 . 0 4 22 0 * 7 9 61 7 . 8 4 3
1 55 1 00 1 85
-1_____
4 8 5 5 3 . 94 2 2 4 3 . 73 4 7 8 5 . 4
. 2 0 3 7 0 . 2
» 2 9 . 9 61 7 6 . 5 54 1 4 . 4 05 3 9 . 7 8
63 1 0* 7 4 5 8 .
144 j 5 . » 0 9 9 5 .
2 2 6 9 9 4 . 1 9 2 5 7 3 . 1 3 7 8 8 9 .
7 4 3 6 7 .
. 8 4 8 3 6 1 • 7 1 6 0 3 6 . 5 3 9 2 9 2
___, 3 8 9 6 3 2 _____
6 6 8 2 0 3 . 44 j 2 0 Ö . 2 4 8 6 3 6 . 1 | 0 7 « 7 .
1 3 . 7 6 2 » 0 . 4 4 4
7 . 1 4 8 ___5 , 4 37
! 7 5 ! 8 0
9 3 7 4 . 82 2 1 5 . 0
7 6 3 . 7 3 1 l i Oo > 0 0
7 1 6 0 » 2 2 1 5 .
2 8 9 7 4 . 7 4 1 0 .
. 2 0 3 6 5 5 * * *
. UOJOOO3 6 3 8 4 .
74 1 0 .3 . 8 8 13 . 3 4 5
• P l B l R T H ) , • • P ( Q “ 4 ) t • • * T ( 8 0 » / T ( 7 5 )
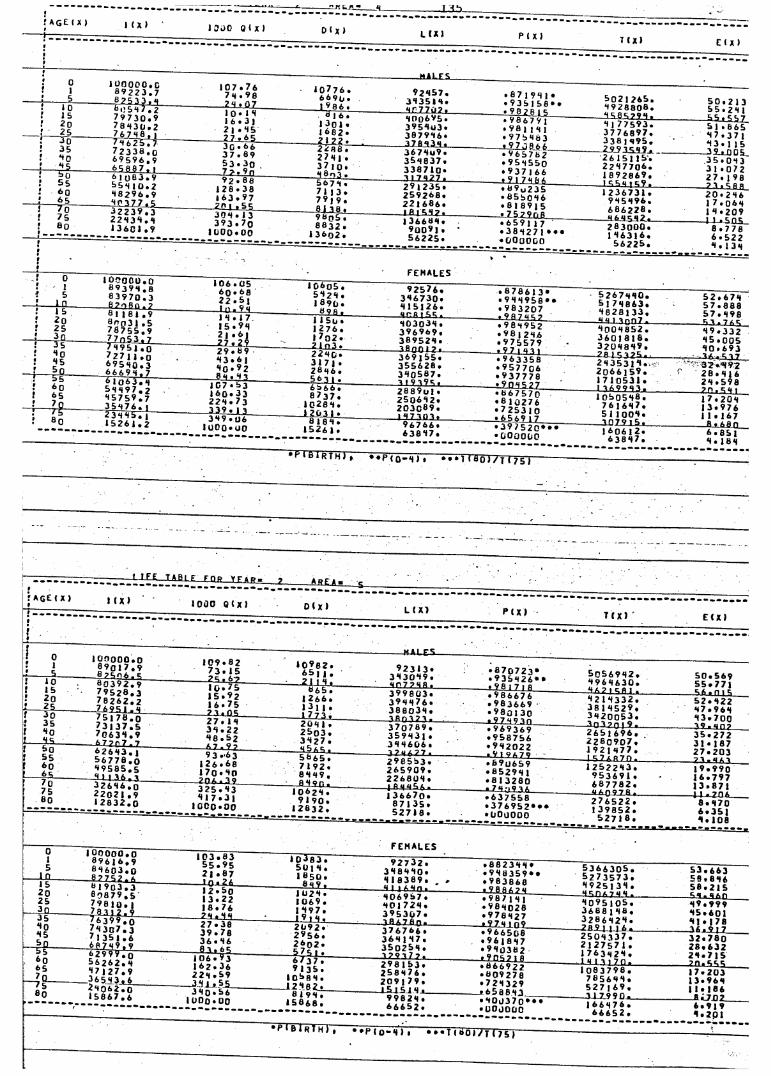
f A G E ( x > I ( X ) J O o O 0 l X ) o ( X >
- L J - b . .
L U I P l X ) T ( X ) E ( X )
1 0 0 0 0 0 . C 0 9 2 2 3 . 7 0 ? 5 3 .
-HALLS.1 0 7 . 7 6
7 I* . 9e 1 0 7 7 6 . 6 6 9 0 . 9 2 0 5 7 . 0 7 I 9H 1 •
0 0 5 8 / . 2 7 9 7 3 0 . 9 7 8 8 3 0 . 2 7 6 7 1 a f J 7 8 6 2 5 . 7
1 0 * 1 1 1 6 . 3 ) 2 | . 1 5 2 7 . 6 5
1 T Ö 6 • 0 1 6 .
1 ^ 0 1 . 1 6 8 2 .2 1 ?;> .
8 r 7 7 iJ 7 . 8 0 0 6 9 5 .3 9 5 0 U 3 .3 0 7 9 8 6 .3 7 6 0 3 f t .
• 9 8 7 R | t,• V 8 6 7 9 1• 9 8 n 8 1• 9 7 5 8 6 3
7 2 3 3 8 . 0 6 9 5 9 6 . 96 5 8 8 7 . 1 6 | y ß 3 t 9
3 G • 6 6 3 7 . 0 9 5 3 . 3 o
-__________ 7 ?■. 9 n
2 * 8 8 . 2 7 8 1 . 3 7 1 o .8 0 n j .
3 6 7 8 u 9 • 3 5 8 8 3 7 . 3 3 8 7 1 0 .
— —— 6. 9 6 5 7 6 2 * 9 5 8 5 5 0 . 9 3 7 1 6 6
5 5 8 1 0 . 2 1 8 2 9 6 . 9
- I P 1 2 7 , 5
9 2 . 0 6 1 2 8 * 3 8 1 6 3 . 9 7
--------------- Z P -L *J ? 5
5 6 7 8 . 7 1 1 3 .7 9 j 9 .8 | 3 8 •
2 ’ 1 2 3 5 . 2 5 9 2 6 8 . 2 2 1 6 8 6 .
----------- . 9 1 7 8 6 6« 0 9 o 2 3 5 • 8 5 5 0 8 6 . 8 I 8 9 J 5
2 2 0 3 1 . 8 1 3 6 C I . 9
3 0 8 . 1 3 3 9 3 . 7 0
1 0 0 0 * 0 0
9 0 0 5 . 8 0 3 2 .
1 3 6 0 2 .
------------ 1-fl 1 5 8 2 «_______1 3 6 6 8 8 .
9 u 0 9 | . *5 6 2 2 5 .
------------* -Z 5 -2 S G l6« 6 5 9 1 1 7 * 3 8 8 2 7 1 • • •
5 0 2 I 2 6 5 . * < 9 2 8 8 0 8 .0 f t 8 f t 7 9 9 .9 1 7 7 5 9 3 . 3 7 7 6 8 9 7 . 3 3 8 1 9 9 5 .
-25_?3S-9?jl 2 6 1 5 1 1 8 . 2 2 *1 7 7 0 8 . 1 8 9 2 8 6 9 ,1 ftftft j f t 9 .
5 0 . 2 1 3 5 5 . 2 8 1
_££ . S5 7
1 2 3 6 7 3 1 . 9 8 5 8 9 6 . 6 8 6 2 2 8 . 8 6.0 S 0 2 .. 2 0 3 0 0 0 . 1 8 6 3 1 6 .
5 6 2 2 5 .
5 1 . 8 6 5 1 7 . 3 7 1 8 3 . 1 1 5
- J 9 l OG5_ 3 5 . 0 8 3 3 1 . 0 7 2 2 7 . 1 9B
- 2 3 . 5 8 8
1 O 0 0 G U . 08 9 3 9 8 . 80 3 9 7 0 . 36 7 •-> 8 a . 20 1 1 8 1 . 9 8 n P 3 l . 57 8 7 5 5 . 9
7 8 9 5 1 . 07 2 7 1 1 . 08 9 5 8 0 . 38 6 6 9 8 . 76 1 0 6 3 . 8 5 8 8 9 7 . 2 1 5 7 5 9 . 73 5 8 7 6 . 12T 8 *T5T i1 5 2 6 1 . 2
1 8 . 1 71 5 . 9 82 J . 6 1
________ 2 J , 2 92 9 * 0 9
8 9 f t .1 1 5 o . 1 2 7 6 .1 7 o 2 •2 1 f>3 •
X r s I 5 ft . 8 0 3 0 3 8 . 3 9 6 9 6 9 . 3 8 9 5 2 8 .
--------------3-8-00 1 7 .
• ▼o J /_______ * 9fi7<4C>?
. 9 8 8 9 5 2• V 8 j 2 8 6 » 9 7 5 5 7 9
8 8 2 8 1 3 3 .--------181 3 p n 7 .
0 0 0 8 8 5 2 . 3 6 0 1 8 1 0 . 3 2 0 8 8 0 9 .
5 7 . 8 9 8ft 3 . 7 Af t8 9 . 3 3 28 5 . 0 0 58 0 . 6 9 3
1 3 . 6 10 0 * 9 28 * . 8 3
| 0 7 • b3
2 2 8 g . 3 1 7 | . 2 0 8 6 . 56 3 | .
3 6 9 1 5 5 .3 5 5 6 2 8 .3 8 0 5 8 7 .3 1 9 3 9 f t .
« 9 6 3 3 5 8 • 9 5 7 7 0 6 » 9 3 7 7 7 8 • 9 r i8 f t 7 7
------- 28-15 32S j ____2 8 3 5 3 1 1 .2 0 6 6 1 5 9 .1 7 1 0 5 3 1 .
------------36-._£lX L _3 2 . 0 9 22 8 . 0 1 62 0 . 5 9 8
1 6 0 * 3 3 2 2 8 . 7 3
______ 3 39 . ( 3___3 8 9 . 0 6
6 b 6 6 •0 7 3 7 .
1 0 2 8 8 . 1 2 0 3 1 .
2 0 8 9 U | . 2 5 0 6 8 2 . 2 0 3 0 0 9 . 1 8 7 3 0 3 .
• " 6 6 7 5 7 0• 8 1 0 2 7 6• 7 2 5 3 1 0• 6 5 6 9 j 7
1 0 5 0 5 0 0 . 7 6 1 6 0 7 . 5 1 1 0 0 1 .
_______ 2 0 . 5 8 11 7 . 2 0 81 3 . 9 7 61 1 . 1 6 7
1 0 0 0 * 0 00 18 8 .
1 5 2 6 1 . 9 6 7 6 6 . • 3 9 / 5 2 0 » * »3 n 7 9 1 5 . Bj 6 8 0
• r i B I R T H ) , • «P ( o - 8 ) » « ö O ) / ’ t ( 7 5 )
--- I 1 F E TAB_L f-_£l i a _X iL A jt^ ? A p F i . -AGE 1 X 1 1 ( X 1 1 0 0 0 Q (X ) D < X > L ( X I
T I X ) E ( X 1
750 0
6 2 9 9 V7 Ö5 6 2 6 2 . 81 7 1 2 7 . 9
_____3 6 5 8 3 jl62 1 0 6 2 . 01 5 6 6 7 . 6
1 0 6 . T 3 1 6 2 . 3 6 2 2 8 . 5 9 - 3 0 1 * S£ 3 0 0 * 5 6
1 0 0 0 * 0 0
6 7 3 7 ,9 1 3 5 .
1 0 5 8 8 . J 2 1 8 2_!_
0 1 9 8 . 1 5 0 6 8 .
2 9 8 1 5 3 . 2 5 8 8 7 6 . 2 0 9 j 7 9 .l 5 l S 1 8 *_
9 9 8 2 8 .
• 0 6 6 9 2 2 • 0 0 9 2 7 8 • 7 2 8 3 2 9
- » 65 ( 1 8 8 3 • 1 0 0 3 7 0 » •UO0 OG0
* P ‘ B T p T hT I • * P ( 0 - 1 ) I • • • T ( o Ö * / T r j T )
5 3 6 6 3 0 5 . 5 3 . 6 6 35 2 7 3 5 7 3 . £ 8 . 0 9 60 9 2 5 1 3 8 . 5 8 . 2 1 58 ft n a 7 ft 8 . _______ ft ft . ft A g__0 0 9 5 1 0 5 . 9 9 . 9 9 93 6 8 8 1 0 0 . 9 5 . 6 0 13 2 0 6 0 2 1 . 0 1 * 1 7 8
- 2 8 9 J U 6 . 3 6 . 9 1 72 5 0 0 3 3 7 . 3 2 . 7 8 02 1 2 7 5 7 1 . 2 6 . 6 3 21 7 6 3 f t 2 0 . 2 0 . 7 1 5
- 10 13 1 7 0 . 7 0 . ft ftf t1 0 0 3 7 9 0 . 1 7 . 2 0 3
7 8 5 6 0 0 . 1 3 . 9 6 05 2 7 1 6 9 . 1 1 . 1 8 6
— U 7 9 9 0 . 6 , 7 0 ?1 6 6 0 7 6 . 6 . 9 1 9
0 . 2 0 1
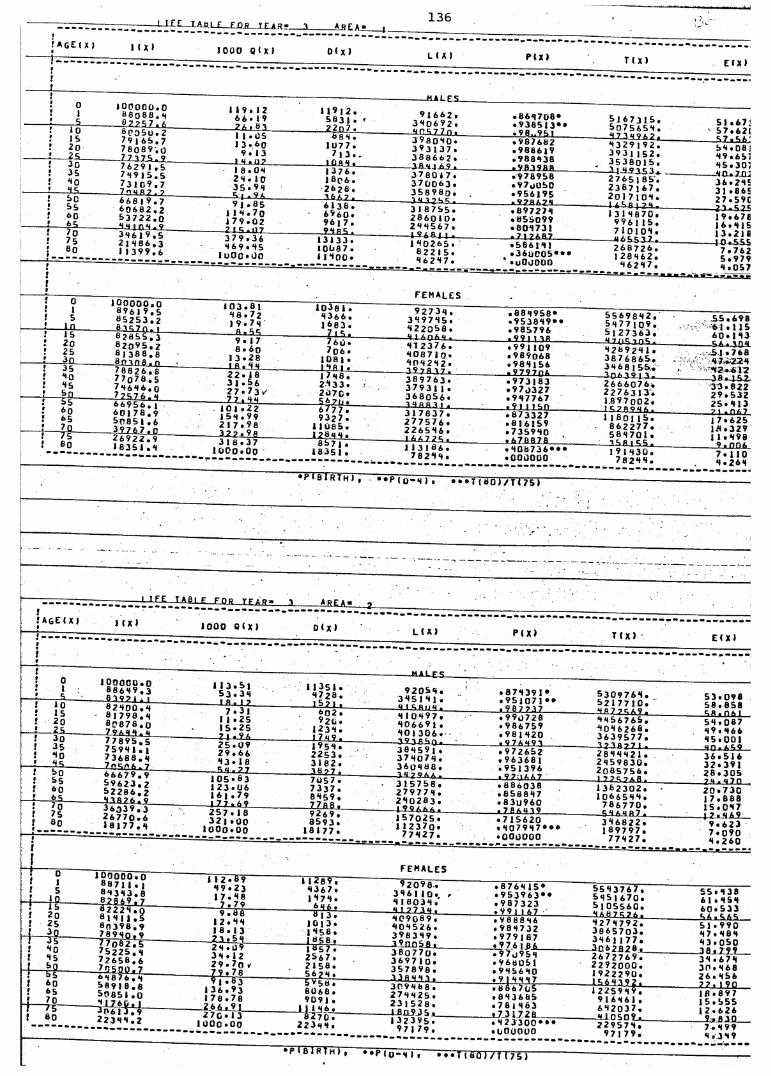
1361 A 0 L £ — E jQ fi—I £ A R - 3 A p £ A."
9
! A 6 E ( X )0->__________
1 ( X ) 1 0 0 0 Q ( X 1 OCX) L ( X ) PI X) T ( X ) E C X »9
i99
.......................... ...
; oi
f s »0
1ÜOOOO. O 8 8 0 8 8 . 8 0 ? ? 5 7 . A
1 1 9 . 1 26 6 . 1 92 6 . 8 l
» 1 9 I 2 . 5 8 3 1 , < 2 2 n 7 •
9 1 6 6 2 . 3 S 0 6 9 2 , S n 5 7 7 n .
• 8 6 8 7 0 8 *• 9 3 6 5 1 3 * »
b 1 6 7 3 1 5 . b o 7 5 6 5 S ,
5 1 . 6 7 ;5 7 . 6 2 1
1 5r 2 o
. . ! 25_____30
7 9 1 6 5 . 7 7 8 0 8 9 . 0
-?-7 3 7 5 ^ 9
1 i . 051 3 . 6 0
9 . 1 31 4 . i l 7
6 8 S • 1 0 7 7 .
7 1 3 . .I ÜR4 .
3 9 e 0 s 0 . 3 9 3 1 3 7 . 3 8 8 6 6 2 .
. 9 8 7 6 8 2
. 9 8 6 6 1 9 • 9 8 8 S3 8
S7 1 4 9 6 ? . S 3 2 9 J 9 2 . 3 9 3 1 1 5 2 . 3 5 3 8 0 1 b .
5 7 . 5 6 ' SS . 0 8 1 8 9 . 6 5 / S S . 3 0 ;
! 3 5; s 0• Sc,! be
7 8 9 1 5 . 57 3 1 0 9 . 77 O 4 ft ? , f
1 8 . OS2 S • 1 0 3 5 . 9 sC. j . V A
1 3 7 6 . 1 6 p 6 . 2 6 2 8 . U A 5 .
3 7 8 0 4 7 . 3 7 0 0 6 3 . 3 5 8 9 8 0 .
------
. 9 7 6 9 5 8 • 97o l ) 5C . 9 5 6 1 9 5
-------— 3^1- 85353^ .2 7 6 5 185 ' . 2 3 6 7 1 6 7 . 2 0 1 7 1 O S .
----------s o . 7 a ;3 6 . 2 8 «3 1 . 8 6 52 7 . 5 9 C
; s s ! 6 0 * 6 c,
2 o
8 0 6 8 2 . 2 b 3 7 2 2 . 0
-----SJU-G-5..J______ _
9 j . 85 1 1 s . 7 q 1 7 9 . 0 2
------24 5 »-U7___ _
6 1 3 8 . 6 9 6 0 . 9 6 j 7 . 9 SR5 .
3 1 8 7 5 5 . 2 8 6 0 1 0 . 2 S S 5 6 7 .
. 8 9 7 2 7 S
. 6 5 5 0 9 9 • 60S 7 31
-----------1-6-58 14-5^______l 3 1 S 8 7 0 .
9 9 6 ] 1 5 .7 1 0 1 0 S .
--------- 2-3.52-51 9 . 6 7 aI 6 . S 1 5
75{ 80
f
2 1 8 8 6 , 3 1 1 3 9 9 . 6
3 7 9 . 3 6 S 6 9 • S 5
1 u O o * JO
1 3 1 3 3 . < 0 0 8 7 . 1 1 HOC •
---------4 ^ 6 B-4-4—•—1 9 0 2 6 5 .
8 2 2 1 5 .
— —----------. 7 1 2 6 6 7 ______• 5 8 6 1 S ! • 3 6 u C 0 5 * * *
-------------S 6 5 S32_._______2 6 8 7 2 6 .1 2 8 S 6 2 .
--------- 1 0 .5 5 57 . 7 6 25 . 9 7 9
fli
f e m a l e s
! 1 ! 5 ! 1 n
15
1 0 0 0 0 0 . 0 8 9 6 1 9 . 58 5 2 5 3 . 28 . I8 7 8 5 5 , 3
1 0 3 . 8 1 S 6 . 7 2 1 9 . 7 s
tt . 55
1 0 3 8 1 . S 3 6 6 . 1 6 8 3 .
_________ 7 1 5 .
9 2 7 3 s . 3 S 9 7 S 5 . S 2 2 0 b 8 •
. 8 8 S 9 5 8 *• 9 5 3 8 S 9 » ». 9 8 5 7 9 6
5 5 6 9 8 8 2 . 5 S 7 7 1 0 9 . 5 l 2 7 3 6 3 .
5 5 . 6 9 86 1 . 1 1 56 0 . 1 8 3
: 2o r 25f 3n J 3S
6 2 0 9 5 . 2 8 1 3 8 8 . 8 8 f M n 8 . n
9 . 1 7 8 . 6 o
1 3 . 2 81 ft . 84
7 6 0» 7 0 6 .
1 08 1 . 1 Sft i .
S I 2 3 7 6 . S 0 8 7 1 0 • S P S 2 S 2 •
. 9 9 1 1 0 9 . 9 8 9 0 6 8 • 9 8 S 156
----------80-05 3 0 5 . _______8 2 6 9 2 8 1 . 3 8 7 6 8 6 5 .3 S 6 8 1 5 5 .
-------- 5 6 . 3 OS.5 1 . 7 6 88 7 . 2 2 88 2 . 6 1 2
! H0; s sf bn 5 5S
7 7 0 7 8 ^ 5 7 8 6 8 6 , q
. 7 2 5 7 6 . *f
2 2 . 1 8 3 1 . 5 6 2 7 . 7 3 / 7 7 . S S
1 7*48. 2 9 3 3 . 2 0 7 0 »56 2 1 ,.
3 8 9 7 6 3 . 3 7 9 3 1 1 . 3 6 8 0 5 6 .
. 9 7 3 1 6 3
. 9 7 j 3 27 • 9 S 7 7 6 7
--------- 3-06 -3 2 4 4 - _______2 6 6 6 0 7 6 .2 2 7 6 3 1 3 .1 8 9 7 0 0 2 .
3-B. 1 52 3 3 . 8 2 2 2 9 . 5 3 27 5 . 4 1 3
: 8 0 ; 65 f 7 Q J 75
8 0 1 7 8 . ? br>8 5 1 . 6 3 9 7 6 7 . n 2 6 9 2 2 . 9
1 0 1 . 2 2 1 5 s . 9? 2 1 7 . 9 8
- 3 2 ^ . 9 g___
6 / 7 7 . 9 3 2 7 .
1 1 U 8 5 . 1 2 8 4 S .
3 1 7 8 3 7 . 2 7 7 5 7 6 . 2 2 6 5 S 6 .1 6 A 7 7 5 .
. 8 7 3 3 2 7
. 8 1 6 1 5 9 » 7 3 5 9 S 0
_____ K ? a o 4 A .1 1 8 0 1 1 5 .
8 6 2 2 7 7 . 5 8 S 7 0 1 .
--------2 1 « 06 7..1 7 . 6 2 5I. 8 . 3 2 9I I . 8 98
8 o 1 8 3 5 1 . 83 1 8 * 3 7
1U O O • Qo8 5 7 1 .
1 8 3 5 1 . 1 1 3 1 6 6 . . S Q 6 7 3 6 * * * 19 1 S 3 0 .9 . n n * 7 . 1 1 0 8 . 2 6 8
» H B l R T H ) , • • P ( 0 - S 1 . • • • T < e o i / T ( 7 5 )
- - ............ - ...
- -— ----------- ----------- ------ ----------------
— — ------------------ L.1FE - I A 8 I £ FOR T F I S i 3 A r e a * 5
j A G E 1 X )
--------------1 ( X 1 1 0 0 0 OCX) D C x ) L ( X 1 PCX) T ( X > E < X )
;!•!
--------- ----------------------------
• ? • 5J 10
I OOOOU. O8 8 6 8 9 . 38 3 9 ? i . i
1 1 3 . S i 5 3 . 3 8
—________ 1 8 . 1 7
1 1 3 5 1 .8 7 2 8 .< 5 7 1 .
9 2 0 5 8 . 3 8 5 1 8 1 .
. 8 7 8 3 9 1 *
. 9 5 1 0 7 1 • •5 3 0 9 7 6 8 .5 2 1 7 7 1 0 .
5 3 . 0 9 85 8 . 8 5 8
15 f 2 0! 2 5; 3 o
8 ) 7 9 8 . 8 8 0 8 7 8 . 0 7 9 6 8 S . 8
7 • 3 11 1 . 2 51 5 . 2 5
----------------- 2 4 - . £ 6 _____
«>02 . ? 2 (j •
1 2 3 8 .1 7 4 9 .
8 1 0 8 9 7 . 8 0 6 6 9 1 . 8 0 1 3 0 6 .
• 9 9 J 7 2 8 . 9 8 6 7 5 9 . 9 8 1 8 2 0
S ft 7 ?C A 9 . 8 8 5 6 7 6 5 . 8 0 8 6 2 6 8 . 3 6 3 9 5 7 7 .
c, ft . n a 1 5 8 . 0 8 7 8 9 . 8 6 6 8 5 . 0 0 1
f 3 5 ! 8 0 * 85! bo
7 5 9 8 1 l 1 7 3 6 8 8 . 8 7 P 5 6 . 7
2 5 . 0 9 2 9 . 6 6 8 3 * 1 8
-----------------5 4 . 7 7
1 9 5 8 .2 2 5 3 .3 1 8 2 .3 8 7 7 .
3 8 8 5 9 1 .3 7 8 0 7 8 . 3 6 0 8 8 8 .
. 9 7 2 6 5 2
. 9 6 3 6 8 1
. 9 5 1 3 9 6
------------1 2 4 8 2 7 -U -2 8 8 8 8 2 1 .2 8 5 9 8 3 0 .2 0 6 5 7 5 6 .
------------------- 8 0 . 6 5 93 6 . 5 1 63 2 . 3 9 12 8 . 3 0 5
! b 5 ! 6 0 f 65! 7 0
b 9 6 2 3 . 2 b 2 2 8 6 , 2S 3 8 7 6 . 9
1 0 5 . 8 31 2 3 . 0 61 6 1 . 7 9
--------------L2_2ju6_9
7 u S 7 . 7 3 3 7 . 8 8 5 9 . 7 7 8 8 .
3 1 5 7 5 8 . 2 7 9 7 7 8 . 2 8 0 2 8 3 .
. 8 8 6 0 3 8
. 8 5 0 8 8 7
. 8 3 U 9 6 0
----------- J -2 2 5 4 A Ä -.1 3 6 2 3 0 2 .1 0 6 6 5 8 8 .
7 8 6 7 7 0 .
-------------------- 2 - 8 . 8 70 .2 0 . 7 3 01 7 . 8 B 81 5 . 0 8 7
f 75 f 8 0
!
2 6 7 7 0 . 61 8 1 7 7 . 8
2 5 7 . 1 8 3 2 | . 0 0
1 OO O• 0 0
9 2 6 9 . 8 5 9 3 .
1 8 1 7 7 .1 5 7 0 2 5 . 1 1 2 3 7 0 .
• 7 1 5 6 2 0 . 8 0 7 9 8 7 * * *
--------------5-8-6 8 fi2-»_3 8 6 8 2 2 .1 8 9 7 9 7 .
------------------- 1 2 .-8 6 9 _9 . 6 2 3
1
- K - f e m a l e s
! 1 ! 5____I Q
J 1 5
8 8 7 1 1 • 1 8 8 3 8 3 . 8 8 2 8 6 9 . 78 2 2 2 S . 0
1 1 2 . 8 ? 8 9 . 2 3 1 7 . 8 8
_________ 7 . 7 9
T T Z bT T8 3 6 7 . 1 H 7 8 •
6 8 6 .
9 2 0 9 8 - . 3 8 6 1 1 0 , ,8 18 0 3 8 . '4 1 7 7 3 4 t
. 8 7 6 8 I S *« 9 5 3 9 6 3 * *. 9 8 7 3 2 3
5 5 8 3 7 6 7 . 5 S S 1 6 7 0 . 5 1 0 5 5 6 0 .
S S . 8 3 86 1 . 8 5 86 0 . 5 3 3
! 2 01 25
J__3 Q____! J 5
e ! 8 | 1 8 0 3 9 8 , 9 7 8 9 8 0 . 9 7 7 n 8 2 , 5
9 . 8 fi1 2 . 8 81 8 . 1 32 3 * 5 8
8 1 3 . 1 0 1 3 . 1 8 5 8 . 1 8 5 8 ,
8 0 9 Q 8 9 . 8 0 8 5 2 6 . 3 9 8 3 8 9 .
t V 8 8 8 8 6. 9 8 S 7 3 2 . 9 7 9 1 8 7
S A H 7 c ,
S 2 7 S 7 9 2 . 3 8 6 5 7 0 3 . 3 8 6 ] J 7 7 .
5 1 . 9 9 08 7 . 8 8 88 3 . 0 5 0
f 8 o 8 5
1 bo ! bb
7 b 2 2 b . 87 2 6 5 8 . 67 0 5 0 0 . 78 8 8 7 6 . 8 "
2 8 . 0 9 3 8 . 1 2 2 9 . 7 0 >f 7 9 . 7 8
l S 5 7 . 2b 6 7 . 2 1 5 8 . 5 6 ? 8 .
3 8 0 7 7 0 . 3 6 9 7 1 0 . 3 5 7 8 9 8 .3 .3 fi 4 8 3 .
• 9 7 j 9 5 8 . 9 6 8 0 5 1 . 9 8 5 6 8 0 . 9 1 8 8 8 7
----------3 0 6 2 8 2 8 . »_2 6 7 2 7 6 9 .2 2 9 2 0 0 0 .1 9 2 2 2 9 0 .
3 8^,25.9___3 8 . 6 7 83 0 . 8 6 82 6 . 8 5 6
: 6 0f 6 5___ 70
4 75
b 8 9 | 8 . f ib 0 8 5 1 . 0
------7 1 - 7 6 ü jl J3 0 6 1 3 . ?
9 1 * 8 3 1 3 6 . 9 31 7 8 . 7 8
________2 6 6 , 9 ] ___
5 9 5 0 , 8 0 6 8 . 9 0 9 1 .
—
3 r 9 8 8 8 . 2 7 8 8 2 5 . 2 3 1 5 2 8 .
---------------Lf iO 9 3 5 «
. 8 8 6 7 0 5
. 8 8 3 6 8 5
. 7 8 1 8 8 3 t 7 3 1 7 2 fl
1 2 2 5 9 S t , 9 1 6 8 6 1 . 6 S 2 0 3 7 .
2 2 . 1 9 0 1 8 . 8 V 7 1 5 . 5 5 5 1 2 . 6 2 6
! 8 q 2 2 3 8 8 . 2* / U • 1 J
1 0 0 0 * 0 0“ * 7 (j •
2 2 3 8 8 . 1 3 2 3 9 5 .9 7 1 7 9 .
. 8 2 3 3 0 0 * * *---------- — 8 J 0 5 0 9 ,
2 2 9 5 7 8 .9-t B 3 Q___7 . 8 9 98 , 3 8 9
* P < B 1 R T H 1 1 • * P ( U - 8 ) f • • • T ( « 0 J / T ( 7 5 1
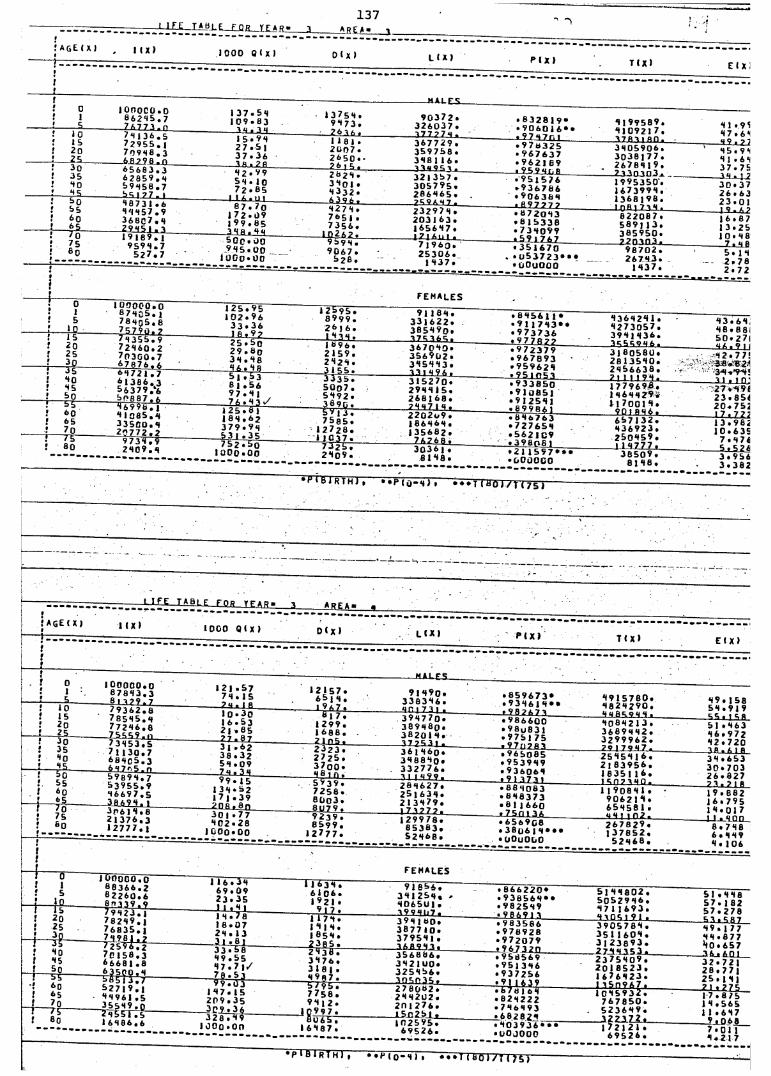
137—T L ^ _ L Q K— T £ A R» 3 _____ ar e a « 3
! 0 ! 1•. 5; 10
I O n o c o . 08 6 2 9 5 . 77 A 7 7 1 _ n
1 3 7 . 5 9 1 0 9 . 8 3
----------------- - 3 R . 3 R
1 3 7 5 R ,99 73 .2 6 1 A .
-------------------B A L t i ___
9 0 3 7 2 . 3 2 6 0 3 7 .
» 8 3 2 8 1 9 «« 9 0 6 0 1 6 • •
9 1 9 9 5 8 9 . 9 1 0 9 2 1 7 .
91 .?<> 9 7 . 6 1
1 5! 2 0! 2 5! 3 0
7 2 9 5 5 . j 7 0 9 9 8 . 3
- 6£L29 Ö. Q_
1 5 * 9R 2 7 . 5 J 3 7 . 3 6 1 « . 7 o
1 1 8 1 .2 0 0 7 . 2 6 5 0 . -
------------ 26 1 5 .
3 6 7 7 2 9 . 3 5 9 7 5 8 . 3 9 8 1 1 6 .1 1u b 5 1 .
---------------- « 9 7 R 7 n i* 9 7 b 3 2 5* 9 6 7 6 3 7* 9 6 2 • 6 9
1 7 811 a n . 3 9 0 5 9 0 6 . 3 0 3 8 1 7 7 . 2 6 7 8 9 1 9 ,
R 9 . 7 1' 9 5 . 9 9
* 11 . 69 3 7 . 7 5
f 35! *<0
______f 9 5•’ *>0
6 2 8 5 9 . Rb 9 9 5 8 • 7
9 2 . 9 95 9 . 1 07 2 . 8 5
2 b 2 9 .3*«0I * 9 3 3 2 .
3 2 1 3 5 7 .3 0 5 7 9 5 .2 8 6 9 6 5 .
—-------------- 1_£53 HOD• 9 5 1 5 7 6 * 9 3 6 7 0 6 • 9 0 6 3 b 9
_ — 2 3 3 0 3 03 . » . 1 9 9 5 3 5 0 .1 6 7 3 9 9 9 . 1 3 6 8 1 9 8 .
-------1 9 . 4 - 23 0 . 3 72 6 . 6 32 3 . 0 1
! b£, f 6 0 f 65
' 0
9 9 9 5 7 . 9 3 6 8C 7 . R m s i L j
8 7 . 7 01 7 2 . 0 91 9 9 . 8 5I R r , RA)
9 2 7 9 . 7 6 5 1 .7 3 S 6 •
------------- 1 0 £ 6 2 jl____
2 32 9 7 9 • 2 0 3 1 6 3 . 1 6 5 6 9 7 . 1 7 1 A || 1 .
* 8 7 2 0 9 3 "» 8 1 5 3 3 8 • 7 3 9 0 9 9
8 2 2 0 8 7 .5 8 9 1 1 3 .3 8 5 9 5 0 .
1 6 . 8 71 3 . 2 51 0 * 9 8
! 7 s ; b q
9
9 59 R . 7 5 2 7 . 7
SOc * 0 0 9 R 5 • 0 0
1O O o • UO
9 5 9 R . 9 0 6 7 .
5 2 8 .
7 1 9 6 3 .2 5 3 0 6 .
■----------------«-5l9 17 6 7» 3 5 1 6 7 0
. • 0 5 3 7 2 3 * • •
---------- 2 20 3 0 3 .1 _______9 8 7 0 2 .2 6 7 9 3 .
---------7_._9B5 . 1 92 . 7 82 . 7 2
f e m a l e s
1r 5 f 1 n} J 5
8 7 R C 5 . 1 7 8 r q S . 8
____ Z 5 7 9 Ü . 77 H15b . 9
1 2 5 . 9 51 0 2 . 9 6
3 3 * 3 6 1 8 . 9 7
1 2 5 9 5 .8 9 9 9 .2 6 1 6 . 1 9 i r .
9 1 1 8 9 .3 3 1 6 2 2 .3 8 5 9 9 o .1 7 5 1 6 5 .
* 8 9 5 6 J 1 •• 9 1 1 7 9 3 * • • 9 7 3 7 3 6
9 3 6 9 2 * 1 1 . * 12 7 3 05 7 . 3 9 9 1 9 3 6 .
9 3 . 6 9 ,9 8 . 8 8 15 0 . 2 7 1
! 2 0 ! 25 ? 30 1 35
7 2 9 6Q . 27 0 3 0 0 . 7 6 7 8 7 8 . a6 8 7 2 1 . 7
2 5 . 5 o 2 9 . 8 0 3 R • 9 89 a . 9 n
1 6 9 6 . 2 1 5 9 .2 9 2 R • 3 1 5 5 .
3 6 7 0 * 1 0 *3 5 6 9 0 2 *3 9 5 9 9 3 .1 3 1 9 9 6 .
• 9 7 2 3 7 9• 9 6 7 8 9 3• 9 5 9 6 2 9
3 a 5 5 b r 6 . 3 1 8 0 5 8 0 . 28 1 3 5 9 0 . 2 9 5 6 6 3 8 .
— y . ? u 9 2 . 7 7! 3 8 . 8 2* 3 9 . 9 9 «
f **0r 95f Bo ! s b
6 1 3 8 6 . 3 B 6 3 7 9 . 8 5 0 8 8 7 . A 8 6 9 9 b . j
5 1 . 5 3 8 1 . 5 6 9 7 . 9 |7 6 . 9 1 i /
3 ^ 3 5 . 5 0 0 7 . 5 9 9 2 .
-----------------3 8 9 0 .
3 1 5 2 7 0 . 2 9 9 9 1 5 . 2 6 8 1 6 8 . 7 9 R 7 1 R •
• 9 3 3 8 5 0* 9 1 0 8 5 1 • 9 1 2 5 9 1
------ 2X1 X L 2 JL ,1 7 7 9 6 9 8 . 1 9 6 9 9 2 9 *H 7 0 0 1 1 *
1 1 . 1 0 ' 2 7 « 9 9 1 2 3 . 8 5 4 2 0 . 7 5 2
f * 0 ; 65! 7 0i T5---------
9 1 3 8 5 . 9 3 3 SCO. 9 2 " 7 7 2 . 7 “9 7 3 8 7 9
1 2 5 * 8 1 1 8 9 . 6 2 3 7 9 . 9 r 5 3 1 . 3 5
1 3 . 7 5 8 5 .
1 2 7 2 8 . 1 1 C 3 7 .
2 2 0 2 o 9 .18 6 R 6 R .1 3 5 6 8 2 .
7 6 7 6 8 .
• Ö 9 & 7 6 3 » 7 2 7 6 5 9• 5 6 2 1 C9
901 P R 6 . 6 5 7 1 3 2 . 9 3 6 9 2 3 . 2 5 0 * 1 5 9 .
___L7 t 7 2 21 3 . 9 8 21 0 . 6 3 5
7 . 9 7 62 9 0 9 . 9 1 a o o . o o
7 3 2 b • 2H 0 9 .
3 0 3 6 1 . 8 1 9 8 .
» 2 1 1 5 9 7 * * « 3 8 5 o t t ---------------------- f c f f i8 1 9 8 . 3 . 3 8 2
• F I B J R T H J ,— • • P C 0 ” 9 J » • • • 1 i B o j / T ( 7 5 1
•
«— - — - - - ------------ - • .........-------------------------------------- — ------------------------------- ------------------------------------ ---------- ■ - ................... — _____
1 I F F J A B L E f o r t f a r . - 3 A r e a » «!! A g E < X )
- j ..........................-1 ( X ) 1 0 0 0 0 C X 1 0 1 X 1 L C X ) P C X ) T C X » ECX)
!
[
r. ! 0
J• 5! 10
1o o o c o . o8 7 8 9 3 . 38 1 1 7 9 . 7
1 2 1 . 5 77 9 . 1 5
------------------------2 R . 1 f i
1 2 1 5 7 . 6 5 1 9 .I 9 A 7 •
9 1 9 9 0 .3 3 8 3 9 6 . » 8 5 9 6 7 3 *
• 9 3 9 6 1 9 * *9 9 1 5 7 8 0 . 9 8 2 9 2 9 0 .
9 9 . 1 5 85 9 . 9 1 9
: 15 2 0
f 25 f 3 0
7 8 5 8 5 . R 7 7 2 R 6 . 8 7_5 5 5 9 . n
1 0 • 3o1 6 . 5 3 2 J . 8 5
_____________ 2 7 . 8 7
8 ) 7 , 1 2 9 9 . 1 6 8 8 . 7 1 n 5 t
3 9 9 7 7 0 .3 8 9 9 8 0 .3 8 2 0 1 9 .1 7 7 5 1 J ,
----------------» 9 8 2 6 7 1_____________• 9 8 6 6 0 0• 9 8 u 8 3 1 » 9 7 5 1 75
R q f t a b R R . *10892 1 3 . 3 6 8 9 9 9 2 . 3 2 9 9 9 6 2 .
9 9 . 1 9 » 5 1 . 9 6 3 9 6 . 9 7 2 9 2 . 7 2 0
! 35 ! 9 0 ! 95 ! Bo
7 1 1 3 0 . 7 6 8 R c 5 . 3 6 R 7 r. 5 . n
3 | . 6 2 3 8 . 3 2 5 R . 0 9 7 u . 3 R
2 3 2 3 . 2 7 2 5 . 3 7 0 0 *9 6 t n .
3 6 1 9 6 0 .3 9 8 8 9 Q .3 3 2 7 7 6 .11 1 R 9 b ,
---------------jl3LZd 2 B 3• 9 6 5 0 8 5• 9 5 3 9 9 9• 9 3 6 0 6 9
7 b 1 7 b R 7 . 25*159 1 6 . 2 1 8 3 9 5 6 . 1 6 3 5 1 1 6 .
- 1 8 . X 1B_ 3 9 . 6 5 3 3 0 . 7 0 3 2 6 . 8 2 7
! b 5 ! 60
— j $ 5 ______f 70
5 3 9 5 5 . 99 6 6 9 7 . 53 8 .699^1___3 0 6 1 9 , 8
9 9 . 1 5 1 3 R . 5 2 1 7 j . 39 2D 8 « 8 n
5 9 3 9 . 7 2 5 8 . 8 0 0 3 . 8 U 7 9 •
2 6 R 6 2 7 • 2 5 1 6 3 9 . 2 1 3 9 7 9 . 1 7 1 7 7 7 .
» 8 8 9 0 6 3» 8 9 8 3 7 3« 8 1 1 6 6 0
K n n w n . 1 1 9 0 8 9 1 . •
9 0 6 2 1 *1. 6 5 9 5 8 1 .
7 3 . 7 1 f l
1 9 . 8 8 2 1 6 . 7 9 5 1 * 1 . 0 1 7
! 7 s ! 60
if
2 1 3 7 6 . 3• 2 7 7 7 . 1
3 0 1 * 7 7 9 0 2 . 2 8
1 0 0 0 * 0 0
9 2 3 9 .8 5 9 9 .
1 2 7 7 7 .
1 2 9 9 7 8 .8 5 3 8 3 .
» 6 5 6 9 0 8 »3 8 o 6 j 9 • • •
R 9 X 1 0 2 ■_______2 6 7 8 2 9 .1 3 7 8 5 2 .
-X 1 j _HQÜ—8 . 7 9 86 . 9 9 9* 1 . 1 0 6
l
I 0 l 1 f 5___ 10
I i b
1 u n o o o . o 8 8 3 6 6 . 2 8 2 2 6 0 . 6 8 n 3 3 9 . 9 7 9 9 2 3 . 1
1 1 6 . 3 9 6 9 . 0 9 2 3 . 3 5
_________ l l . 9 |
1 1 6 3 9 . 6 1 0 6 . 1 ’ 21 .
9 1 7 .
9 1 8 5 6 . 3 9 1 2 5 9 , » 9 0 6 5 0 1 •
______ 3 9 9 RI 17 .
. 8 6 6 2 2 0 ** 9 3 6 5 6 9 * * • 9 8 2 5 9 9
5 1 9 9 8 0 2 . S 0 5 2 9 9 6 . 97 1 1 6 9 3 .
51 . 9 9 8 S 7 . 182 5 7 . 2 7 8
! 2 0: 2 5
- M S —
7 8 2 9 9 . 17 6 8 3 5 . 1
1 9 • 7 8 1 8 . 0 7 2 9 . 1 3 3 1 . 8 1
1 1 7 9 .1 9 j 9 . 1 8 5 9 . 2 3 0 5 .
3 9 9 1 6 0 . 3 8 7 7 1 0 . 3 7 9 5 9 1 . 3 6 8 9 9 3 .
• 9 8 3 5 6 6 . 9 7 8 9 2 8 » 9 7 2 0 7 9
9 1 0 5 1 9 1 . 3 9 0 5 7 8 9 . 3 5 1 1 6 0 9 . 3 1 2 3 8 9 3 .
---------- 5Xi_S8_Z_9 9 . 1 7 79 9 . 8 7 79 0 . 6 5 7
J *10 l 95 I 5 °1 5 3 ------------
7 0 1 5 8 . 36 6 6 8 1 . 8
- H O W —
3 3 * 5 8 9 9 . 5 5 9 7 . 7 | / 7 fl . 5 1 9 9 * 0 3
2 ^ 3 8 .3 9 7 6 . 3 1 8 1 . 9 9 a 7 .
3 5 6 6 0 6 . 3 9 2 1 UO* 3 2 5 9 5 6 . 3 0 5 0 3 5 .
. 9 5 6 5 6 9 » 9 5 1 3 9 6 » 9 3 7 2 5 6 »91 I 6 } ?
2 7 9 9 3 5 3 . 2 3 7 5 9 0 9 . 2 0 1 8 5 2 3 . 1 6 7 6 9 2 3 .
---------- 3 6 j 6QJ__3 2 . 7 2 1 2 8 . 7 7 1 2 5 . 1 9 1
•f 6 0 ! 65i 7p______1 ^ 5
5 2 7 1 9 . 1 *1*1961.5 3 5 5 9 9 . 02 R b s r . b
1 9 7 . 1 52 0 9 . 3 53 0 9 . 3 6
5 7 9 5 , 7 7 5 8 . 9 9 1 2 .
1 0 9 9 7 .
2 7 8 0 8 2 .2 9 9 2 0 2 .2 0 1 2 7 6 .
______ 1.5C25 l j ___
» 8 7 6 1 6 9 • 8 2 9 2 2 2 • 7 9 6 H 9 3
1 0 9 5 9 3 2 . 7 6 7 8 5 0 .
. 5 2 3 6 9 9 .
? 1 « 7 7 5 1 7 . 8 7 5 1 9 . 5 6 5 1 1 . 6 9 7
! 8 0 1 6 9 6 6 . 6 1o o o • o nÖ 0 6 T ;
1 6 9 8 7 .1 0 2 5 9 5 . • 9 0 3 9 3 6 • • •
3 2 2 3 7 2 t 1 7 2 1 2 1 .
? i0 6 8
1 ••f>(o—**» •• > 1 B I R T H 1 • • • I ( b o i / I ( 7 S )
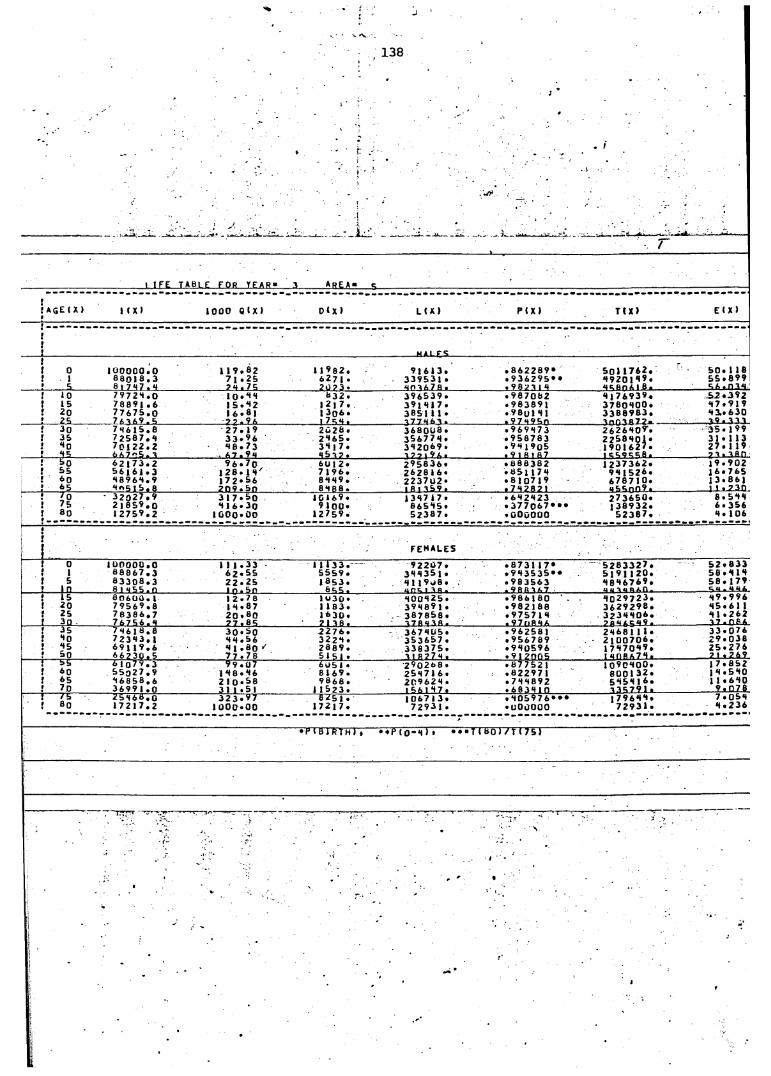
138
l I F £ T A b L E FOR Y E A R « 3 A r e a - c.
!V9
A G E ( X ) 1 ( X > 1 0 0 0 Q ( X ) D 1 X 1 L ( X ) P C X ) T ( X ) E ( X )
1
ijf MAI E»%1f 0 1 0 0 0 0 0 . 0 1 1 9 . 8 2 1 1 9 6 2 . 9 1 6 1 3 . . 8 6 2 2 8 9 * 5 0 1 1 7 6 2 .
-5 0 . 1 1 8
• 1 B 8 0 I 8 . 3 7 1 . 2 5 6 2 7 1 . 3 3 9 5 3 1 . . 9 3 6 2 9 5 * * 9 9 2 0 1 9 9 . 5 5 . 8 9 91 5 6 i 7 9 7 . 9 2 9 . 7 5 2 0 7 3 . 9 0 3 6 7 8 . . 9 8 7 3 1 9 *4 5 ft O A 1 6 . 5 A . n 3*4• 1 0 7 V 7 2 1 . 0 1 0 . 8 3 2 . 3 9 6 5 3 9 . . 9 8 7 0 8 2 9 1 7 6 9 3 9 . 5 2 . 3 9 2f 1 5 7 8 8 9 1 . 6 1 5 . * 1 2 1 2 i 7 , 3 9 1 9 1 7 . . 9 8 3 8 9 1 3 7 6 0 9 0 0 . 9 7 . 9 1 99 2C 7 7 6 7 S • o 1 6 . 8 j 1 3 o 6 . 3 8 5 1 l 1 . • 9 8 0 1 9 1 3 3 8 8 9 8 3 . 93 . . 6 3 0« 2 5 7 A 3 A V . 5 7 7 . 9 6 1 7 5 9 . 3 7 7 9 6 3 . ___. 9 7 9 9 5 0 *\ n p Ä 7 2 a. 3 9 . 3 . 3 3 -9 3 0 7 9 6 1 5 . 6 2 7 . 1 9 2 u 2 b • 3 6 8 0 0 8 . . 9 6 9 9 7 3 2 6 2 6 9 0 ? ' . 3 5 . 1 9 9
3 5 7 2 5 8 7 . S 3 3 » ’ 6 2 9 6 5 . 3 5 6 7 7 9 . . 9 5 6 7 6 3 2 2 6 8 9 0 1 *1 9 0 1 6 2 / .
3 1 . 1 1 39 *1 0 7 0 1 2 2 . 2 9 8 . 7 3 3 9 i 7 . 3 9 2 0 6 9 . . 9 9 1 9 0 5 2 7 . 1 1 9
9 5 6 6 7 « 5 . 1 6 7 . 9 9 9 5 7 7 . 3 7 7 1 9 6 • . 9 1 8 1 8 7 j S 5 9 5 5 8 . ? 3 . 3 8 nV i>0 6 2 1 7 3 . 2 9 6 • 7 o 6 0 1 2 * 2 9 5 8 3 6 * . 8 8 6 3 6 2 1 2 3 7 3 6 2 . 1 9 . 9 0 2
5 5 5 6 | 6 1 . 3 1 2 8 . 1 9 ' 7 1 9 6 . 2 6 2 8 1 6 . . 6 5 1 1 7 9 9 9 1 5 2 6 . 1 6 . 7 6 56 0 9 8 9 6 9 . 9 1 7 2« S6 8 9 9 9 . 2 2 3 7 0 2 * . 8 I 0 7 J 9 6 7 8 7 1 0 . 1 3 . 8 6 1
9 <>5 8 »>5 1 5 . 8 2 0 9 . 5 n 8 9 0 8 . 1 8 1 3 5 9 . . 7 9 2 8 7 1 « 5 5 n n 9 . ____l-l_t-2-3-Q_9 ' 0 ' 3 2 0 2 7 . 9 3 1 7 . & 0 1 0 1 6 9 . 1 3 9 7 1 7 . . 6 9 2 9 2 3 2 7 3 6 5 0 . 8 . 5 9 9
7 5 2 1 8 5 9 . 0 9 1 6 . 3 0 9 1 0 0 * 8 6 5 9 5 . . 3 7 7 0 6 7 * * * 1 3 8 9 3 2 . 6 . 3 5 699
So 1 2 7 5 9 . 2 1 0 0 0 * 0 0 1 2 7 5 9 . 5 2 3 8 7 . . 0 0 0 0 0 0 5 2 3 8 7 . 9 . 1 0 6
99
ij
F E M A L E S
! 0 1 0 0 0 0 0 . 0 1 1 1 . 3 3 1 1 1 3 3 . 9 2 2 0 7 . . 8 7 3 1 1 7 * 5 2 8 3 3 2 7 . 5 2 . 8 3 31 6 8 8 6 7 . 3 6 2 . 8 8 5 5 5 9 . 3 9 9 3 5 1 . . 9 9 3 5 3 5 * * 5 1 9 1 1 2 0 . 5 8 . 9 1 9
J 5 8 3 3 0 6 . 3 2 2 . 2 5 1 8 5 3 . 9 1 1 9 j 8 . . 9 8 3 5 6 3 9 8 9 6 7 6 9 , 5 8 . 1 7 9l n 8 1 *4 5 5 . n b 5 5 • u o t 1 3 8 . . 9 R R 3 A 7 u u C. U - M U k15 8 0 6 0 0 . 1 1 2 . 7 8 1 0 3 0 * 9 0 0 9 2 5 . . 9 8 6 1 6 0 ' . 9 0 2 9 7 2 3 . 9 9 . 9 9 62 0 7 9 5 6 9 . 8 1 9 * 8 7 1 1 8 3 . 3 9 9 8 9 1 . . 9 8 2 1 6 8 3 6 2 9 2 9 8 . 9 5 . 6 1 12 5 7 8 3 8 6 . 7 2 0 » ö 0 1 6 3 0 * 3 8 7 8 8 8 . . 9 7 5 7 1 9 3 2 3 9 9 0 6 . 9 1 . 2 6 23 n 7 6 7 5 6 . 8 7 7 . 6 5 ___ 2 1 3 8 . 3 7 8 9 3 8 . . 9 7 n R 9 A ? a *4 A 5 9 i_ .___ ____37.» P E A .3 5 7 9 6 1 8 . 8 3 0 * 8 0 2 2 7 6 . 3 6 7 9 0 5 . . 9 6 2 5 8 1 2 9 6 8 1 1 1 . 3 3 . 0 7 6*10 7 2 3 9 3 . 1 9 9 . 8 6 3 2 2 9 . 3 5 3 6 5 7 . . 9 5 6 7 6 9 2 1 0 0 7 0 6 . 2 9 . 0 3 89 5 6 9 1 1 9 . 6 9 l . 8 o * * 2 8 8 9 . 3 3 6 3 7 5 . . 9 9 0 5 9 6 1 7 9 7 0 9 9 . 2 5 . 2 7 65 0 6 6 2 3 0 . 5 7 7 * 7 8 5 1 5 1 * 3 1 8 7 7 9 . . 9 1 2 0 0 5 i * 4 n ft a 7 9 . 7 1 . 2 6 98 5 6 1 0 7 9 . 3 9 9 . 0 7 6 0 5 1» 2 9 0 2 8 8 . . 6 7 7 5 2 1 1 0 ? 0 9 0 0 . 1 7 . 8 5 2* 0 5 5 o 2 7 . 9 1 9 8 . 9 6 8 1 6 9 . 2 5 9 7 1 6 . . 8 2 2 9 7 1 8 0 0 1 3 2 . 1 9 . 5 9 06 5 * 1 6 8 5 8 . 6 2 1 0 * 8 8 9 8 6 8 . 2 0 9 6 2 9 . . 7 9 9 8 9 2 5 9 5 9 1 6 . 1 1 . 6 9 07 0 3 6 9 9 1 . 0 3 1 1 . 8 1 1 1 5 2 3 . 1 5 6 1 9 7 . . 6 8 3 9 1_Q___ 1 3 5 7 9 1 . 9 . 0 7 8/ 5 2 5 9 6 8 . Q 3 2 3 ^ 7 ^ Z 5 ~ i . 1 0 6 7 1 3 . . 9 0 5 9 7 6 * * * 1 7 9 6 9 9 . 7 . 0 5 9B O 1 7 2 1 7 . 2 1 0 0 0 * 0 0 1 7 2 1 7 . 7 2 9 3 1 . • U O O O O O 7 2 9 3 1 . 9 . 2 3 6
• P l B 1 RT H ) , « « P ( 0 ~ 9 > f • » • T < 8 0 J / T ( 7 5 )
* i