chapter: 1 introduction
TRANSCRIPT
1
Chapter: 1
Introduction
1.1 Introduction
The rupee is posing a unique set of challenges for the Indian economy. The impact would
not be limited to macro economy alone but it will also affect down to the level of firms
under various sections of economy. This is conceptual study based on Rupee Dollar
relationship in terms of Rupee appreciation that is Dollar depreciation and Rupee
depreciation that is Dollar appreciation. It provides valuable insights into impact of
changes in currency relations on various sectors of economy keeping in focus economy in
general and Indian economy in particular. Pros and Cons of currency appreciation and
depreciation are studied as boon and bane for the economic growth. It also provides
suggestions or steps needed to control as well as to overcome ill-effects of excessive
fluctuations between rupee and dollar keeping in view current trends.
Global economy is much more interlinked than it was earlier due to lot of trade taking
place between different countries. It goes without saying that U.S. is major trading
partner for many nations and biggest trading importer of goods and services from across
the world. Change in any direction in U.S. economy is directly going to affect economy
of all related countries.
Democratic principle and human capital has given India unique position among world
community. Indian economic policies are flexible enough to get adjusted to the other
nations. India has always been major country when it comes to being trading partner of
U.S., which has always given economic and strategic support to country like India
occupying strategic importance among world community.
2
1.2 Importance of the study
The following are the importance of the study.
Ø To examine the reasons for the rapid variation in the home currency
Ø To analyze the impact of rupee variation on the economy.
Ø To critically analyze the role of the central bank in the foreign exchange market.
Ø To assess the possible future movement of the rupee vis-à-vis the US dollar.
Ø To understand the importance of exchange rate management.
1.3 Need for the Study
This study assesses the impact Indian Rupee Depreciation has on different sectors of the
Indian Economy. It mainly takes into account the imported goods as the main areas,
which have been impacted by the fall in the Indian Rupee against the US Dollar.
Indian Rupee Crisis mainly during the last quarter of 2013 & the impact it had on the
Indian Economy then & now. The study first summarizes the outlook of the Indian
Economy, its economical & financial history. It shows how the trend of the Indian rupee
has been from 1991 to 2013 & the main reasons behind the fluctuations in the Indian
Rupee.
1.4 Scope of the Study
The study is restricted to only momentum of Dollar V/s Rupee in particular. In other
words, this study has focused attention on How the Rupee movement affects different
stakeholders, actions initiated/taken by the Central Bank for controlling the variations,
external factors responsible for the Rupee movement.
This project tries to study the reasons for devaluation of pre liberalization era and post
liberalization that is of the year 2013. It also attempts to study the real implications of the
3
depreciation of the rupee on the Indian economy and shows that in the long run, the
Indian economy has more to lose and less to gain with weaker rupee.
This study gives its findings, suggestions/recommendations only on the basis of study
conducted on the available data/facts etc.
1.5 Objective
The following are the objectives of the study.
Ø This is conceptual study to understand Rupee Dollar relationship in terms of Rupee
appreciation and depreciation.
Ø To evaluate the relationship between various economic variables and value of Rupee.
Ø To explore the Pros and Cons of currency appreciation and depreciation as a boon and
bane for economic growth.
Ø To study the steps needed to control as well as to overcome ill-effects of excessive
fluctuations between rupee and dollar keeping in view current trends.
1.6 Methodology of the Study
1.6.1 Research Design
The research design is a Descriptive research which answers to a research question that
which is the thesis statement.
Research design can be defined as the plan and structure of inquiry, formulated in order
to obtain answer to research question on business aspects. It constitutes the overall
program of the business research process. Research design used in this research work is
both exploratory and causal research.
4
1.6.2 Sources of Data
For the accomplishment of this study the researcher has retrieved data from secondary
sources.
Secondary Data
The researcher has also extracted secondary data from sources such as textbooks,
reference books, journals, publications, magazines and websites.
1.6.4 Data Analysis and Interpretation
The following tools are used for statistical representation
Trend analysis or trend percentage
Comparison of past over a period of time with base year is known as trend analysis. So,
trend percentage or trend ratio analysis is a method of analysis under which the
percentage relationship that each financial statement item of each year bears to same item
in the base year is calculated. After the trend percentage of different items for various
years are calculated, the trend percentages or trend ratio are shown in comparative
financial statements.
Correlation
Degree and type of relationship between any two or more quantities (variables) in which
they vary together over a period; A positive correlation exists where the high values of
one variable are associated with the high values of the other variable(s). A 'negative
correlation' means association of high values of one with the low values of the other(s).
Correlation can vary from +1 to -1. Values close to +1 indicate a high-degree of positive
correlation, and values close to -1 indicate a high degree of negative correlation. Values
close to zero indicate poor correlation of either kind, and 0 indicates no correlation at all.
5
After the analysis, inferences were drawn and explained theoretically with the help of
exhibits
1.7 Limitations of the Study
The following are the limitations of the study
• The study is purely based on the facts and figures collected from the Central Bank,
SEBI or its other sources.
• The study is an academic effort; thus the findings cannot not be finalized.
• The study is mainly restricted to only momentum of Dollar V/s Rupee in particular
and other Currency variations are not studied
• Policies of Govt. of India and RBI might also contract the steps suggested in this
study.
• This research is subject to limitations of availability of data.
• Time constraints due to which limited data were included upon which conclusion can
be drawn
1.8 Concepts Used
1. RBI (Reserve Bank of India)
This organization is India's central banking institution, which controls the monetary
policy of the Indian rupee. It was established on 1 April 1935 during the British Raj in
accordance with the provisions of the Reserve Bank of India Act, 1934. The RBI plays an
important part in the development strategy of the Government of India.
2. GDP (Gross Domestic Product)
The monetary value of all the finished goods and services produced within a country's
borders in a specific time period, though GDP is usually calculated on an annual basis. It
includes all of private and public consumption, government outlays, investments and
exports less imports that occur within a defined territory.
6
3. FII (Foreign Institutional Investor)
Organizations that pool large sums of money and invest those sums in securities, real
property and other investment assets. The term is used most commonly in India to refer to
outside companies investing in the financial markets of India.
4. SEBI (Securities and Exchange Board of India)
The Securities and Exchange Board of India is the regulator for the securities market in
India. It was established in the year 1988 and given statutory powers on 12 April 1992
through the SEBI Act, 1992.
5. Secondary Data
Secondary data is the data that already exists which has been collected by some other
persons. Sources of secondary data include websites, trade association journals
6. Current Account Deficit
Occurs when a country's total imports of goods, services and transfers are greater than the
country's total export of goods, services and transfers. This situation makes a country a
net debtor to the rest of the world.
7. Fiscal Deficit
When a government's total expenditures exceed the revenue that it generates (excluding
money from borrowings). Deficit differs from debt, which is an accumulation of yearly
deficits.
7
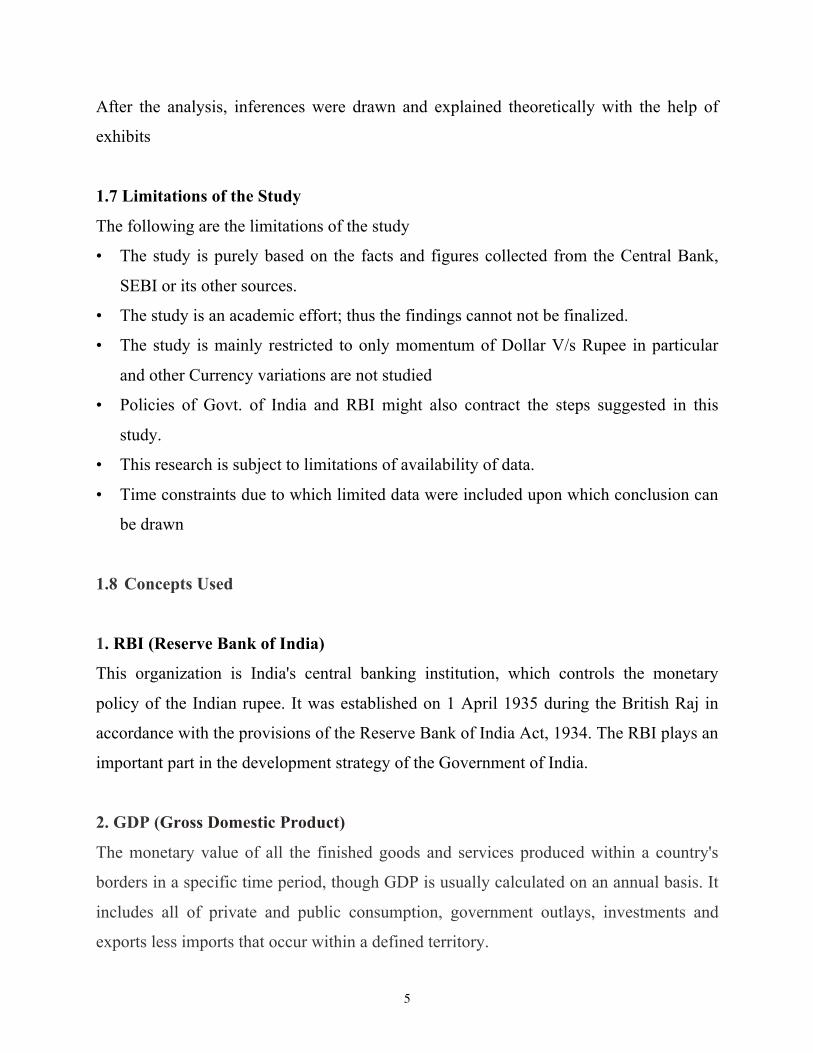
1.9 Conceptual Framework
Exhibit 1.1
8
1.10 List of Abbreviations BSE Bombay Stock Exchange Limited CAIIB Certified Associates by Indian Institute of Bankers ESOP Employee stock ownership plan ECB European Central Bank F&O Futures and Options. FCCB Foreign Currency Convertible Bond FFSIL Fortune Financial Services (India) Ltd FII Foreign Institutional Investor GDP Gross Domestic Product GDR Global depository receipt HPCL Hindustan Petroleum Corporation Limited IAS Indian Administrative Service IIT Indian Institutes of Technology INR Indian rupee IOC Indian Oil Corporation Ltd IPO Initial public offering IT Information technology IT Information technology MCX Multi Commodity Exchange MOSL Motilal Oswal Securities Ltd. NBFC Non-Banking Financial Company NCDEX National Commodity and Derivative Exchange NSE National Stock Exchange PMS Portfolio Management Services RBI Reserve Bank of India SBI State Bank of India
SEBI Securities and Exchange Board of India SWOT Strengths, Weaknesses, Opportunities, and Threats U.S United States USD United States dollar V/s, vs. Versus WTO World Trade Organization

9
1.11 Chapter Scheme
The following is the scheme of chapterisation found suitable for this study:
I Introduction
1.1 Introduction to the study
1.2 Importance of the study
1.3 Need for the Study
1.4 Scope of the Study
1.5 Objectives
1.6 Methodology of the study
1.7 Limitations of the Study
1.8 Concepts and Conventions
1.9 Chapter Scheme
II Review of Literature
2.1 Introduction
2.2 Review
2.3 Conclusion
III Profile of the Economy
3.1 Introduction
3.2 Effect of Depreciation
3.3 Reason for Depreciation
IV Profile of the Organization
3.1 Background and Inception
3.2 Subsidiaries of Fortune Financial services India Ltd
3.3 Nature of Business
10
3.4 Vision & Mission
3.5 Services of Fortune Financial services India Ltd
3.6 Areas of Operation
3.7 Shareholding Pattern
3.8 Board of Directors
3.9 Competitors of Fortune Financial Services India Ltd
3.10 Infrastructure Facilities
3.11 Work Flow Model
3.12 Future Plans and Prospects
3.13 Mckinsey’s 7S frame work
3.14 SWOT Analysis
V Data Analysis & Interpretation
VI Summary of Findings, Suggestions and Conclusion
Bibliography
Annexure(s)
11
Chapter: 2
Review of Literature
2.1. Introduction
It is essential for a researcher to review the literature related to the present study to have a
deep knowledge on the subject. It is only through this literature that the researcher takes
the initial step of fixing the problem of study. A thorough review of literature will
expose the researcher to the previous researchers conducted and their area of study etc.
A review of previous studies will also help the researcher to know about the limitations
of the study. The present chapter gives the reader, a broader outlook on the back ground
and situations under which the study has been undertaken. Following are a few of the
definitions and extracts from experts. A review of these studies enabled the researcher to
formulate the research problem.
2.2. Review
The following are some of the secondary data reviewed by the researcher.
Ø Singhal, Shelly (2011), “AN ANALYTICAL STUDY ON INDIAN CURRENCY
RUPEE DEPRECIATION AGAINST THE US DOLLAR AND ITS
ECONOMIC IMPACT”, Arth Prabhand: A Journal of Economics and Management,
Vol.1 Issue 1, April 2012, Pp. 73-83.
This paper mainly takes into account the Indian Rupee Crisis mainly during the last
quarter of 2012 & the impact it had on the Indian Economy then & now. The paper
first summarizes the outlook of the Indian Economy, its economical & financial
history. It shows how the trend of the Indian rupee has been from 1991 to 2011 & the
main reasons behind the fluctuations in the Indian Rupee.
12
After determining the reasons behind the fluctuations it talks about the depreciation in
the Rupee against the Dollar over the last financial year (2011-12). Basic reasons
identified in the paper are:
ü Persistent Inflation
ü Persistent Fiscal Deficits
ü Lack of Reforms
ü Global Economic Scenario
Ø Rupee Exchange Depreciation1
It mainly takes into account the imported goods as the main areas which have been
impacted by the fall in the Indian Rupee against the US Dollar. India is poor in oil
resources and is heavily dependent on coal and foreign oil imports for its energy
needs. Thus, oil imports & other imports form a major source for India when it comes
to its energy requirements. Other imported products are: machinery, gems, fertilizers
and chemicals. Main import partners are European Union, Saudi Arabia and United
States.
India being a major importer has various firms, which have huge imports on account
of the raw materials. With the depreciation in Indian rupee these firms have incurred
huge forex losses. Thus, in order to control their losses these firms are increasing
prices of the goods they sell which in turn has led to rise in inflation. Moreover, the
economic growth in India has slowed down with these factors playing a major role in
it. Thus, Indian Rupee depreciation has led to the slowing down of the economy as
whole.
1http://www.assocham.org/arb/general/Rupee_Exchange_Depreciation_Impact_Analysis- 2012.pdf
13
Ø Exchange Rate Slide2 –
This study also accounts for the impact that the Indian Rupee has had on the Indian
Economy. It has shown the fluctuations of the Indian Rupee with respect to various
major currencies like the USD, Pound Sterling, Japanese Yen & the Euro. The impact
of depreciation on the imports has also been considered in the paper. Moreover,
impact on the debt in the corporate sector has also been considered.
Falling Rupee: Understanding India’s financial statements like a company’s3
Ø International Monetary Fund (1998) "EXCHANGE RATE ARRANGEMENTS
AND ECONOMIC PERFORMANCE IN DEVELOPING COUNTRIES," by
Francesco Caramazza and Jahangir Aziz.
Ø Fixed or Flexible?
Getting the Exchange Rate Right in the 1990s4
Analysts agree that "getting the exchange rate right" is essential for economic stability
and growth in developing countries. Over the past two decades, many developing
countries have shifted away from fixed exchange rates and moved toward more
flexible exchange rates. During a period of rapid economic growth, driven by the twin
forces of globalization and liberalization of markets and trade, this shift seems to have
served a number of countries well. But as the currency market turmoil in Southeast
Asia has dramatically demonstrated, globalization can amplify the costs of
2 http://www.assocham.org/arb/general/Exchange_Rate_Study.pdf
3 http://sbr.sunstone.in/falling-rupee-understanding-indias-financial-statements-like-a-companys/ Published on August 19, 2013 By Aniket Khera
3 http://www.imf.org/external/pubs/ft/issues13/issue13.pdf Published on April, 1998
14
inappropriate policies. Moreover, the challenges facing countries may change over
time, suggesting a need to adapt exchange rate policy to changing circumstances.
This paper examines the recent evolution of exchange rate policies in the developing
world. It looks at why so many countries have made a transition from fixed or
"pegged" exchange rates to "managed floating" or "independently floating"
currencies. It discusses how economies perform under different exchange rate
arrangements, issues in the choice of regime, and the challenges posed by a world of
increasing capital mobility, especially when banking sectors are inadequately
regulated or supervised.
Ø Adjusting to Capital Inflows 5
In many fast-growing emerging market economies, upward pressure on the exchange
rate in recent years has stemmed largely from vastly increased private capital inflows.
When capital inflows accelerate, if the exchange rate is prevented from rising,
inflationary pressures build up and the real exchange rate will appreciate through
higher domestic inflation. To avoid such consequences, central banks have usually
attempted to "sterilize" the inflows–by using offsetting open market operations to try
and "mop up" the inflowing liquidity.
Ø Capital Account Convertibility6
In recent years, many emerging economies have gradually relaxed or removed
capitals controls and are now proceeding toward full capital account convertibility.
Remaining restrictions are nevertheless significant, and are mostly asymmetric–
5 http://www.imf.org/external/pubs/ft/issues13/issue13.pdf Published on April, 1998 6 http://www.imf.org/external/pubs/ft/issues13/issue13.pdf Published on April, 1998
15
placing more restrictions on capital flowing out than on capital flowing in. More
liberal rules in both directions would have the advantage of increasing economic
efficiency (allowing more capital to flow to where it gets the best returns).
Liberalization would also provide domestic investors with more opportunities to
diversify their portfolios and reduce the concentration of exposure to domestic market
risks.
2.3 Conclusion:
On understanding the reviews as extracted from secondary sources the researcher
came to know in any country, determining the currency rates fluctuations is a very
tough task. Thus, there are various factors, which can be considered in order to
determine the reasons behind such fluctuations of the home currency.
16
Chapter: 3
Profile of the Economy
3.1 Introduction
India got freedom from British rule on Aug 15, 1947. At that time the Indian rupee was
linked to the British pound and its value was at par with the American dollar. There was
no foreign borrowing on India's balance sheet. To finance welfare and development
activities, especially with the introduction of the Five-Year Plan in 1951, the government
started external borrowings. This required the devaluation of the rupee. After
independence, Indian chooses to adopt a fixed rate currency regime. The rupee was
pegged at 4.79 against a dollar between 1948 and 1966. India faced a serious balance of
payment crisis in 1991 and was forced to sharply devalue its currency. The country was
in the grip of high inflation, low growth and the foreign reserves were not even worth to
meet three weeks of imports. Under this situation, the currency was devalued to 17.90
against a dollar.
India being a developing economy with high inflation, depreciation of the currency is
quite natural. Depreciation of rupee is good, so long as it is not volatile. A random
depreciation that we have seen in the last few months is bad and it has hurt the economy.
Right from the beginning of year 2013, the value of rupee has been depreciating.
High growth coupled with a market driven exchange rate bears well for the economy.
However, when growth falters and macroeconomic parameters start appearing
vulnerable, one of the first casualties is the exchange rate. Currently, there is no clarity on
whether we have seen the worst of the storm or it is just the beginning. The problems are
manifold. Persistent high inflation and fiscal deficit, increasing subsidies, faltering
exports and slowing industrial production point towards an economy, which is
moderating in growth. Monetary policy has so far been ineffective in reversing the
inflation trajectory. Fiscal stimulus appears non-existent, especially when the government
17
has added to the subsidy bill by giving a go ahead to the food security bill. In this
weakened environment, the rupee has depreciated by close to 20% in the past few
months.
Secondly, the extent of volatility in the global economy hasn’t helped. Besides the
Eurozone crisis, the downgrade of the US economy has led to flight of capital in order to
boost the US home economy. The US dollar has become scarce and unlike its peers, India
needs to attract sufficient foreign funds to close the fiscal and current account gap. The
fact that a weakening of the Indian economy has happened at the same time as a global
debt crisis has elevated the exchange problem.
The appreciation in the US dollar has led to the decrease in the value of Indian rupee. The
value of US dollar has been rising ever since the US Federal Reserve has announced
quantitative easing. This has hit not only the emerging markets and assets of India but
also of other countries like Thailand, Brazil and Indonesia. Just as in other countries, the
foreign institutional investors (FIIs) have also started withdrawing their investments in
the Indian bond market. With growing concern for increasing risks in the global
environment, massive redemptions through the global exchange traded funds (ETFs) are
taking place. This has further initiated the selling by the FIIs in the equity market of India
leading to depreciation in the Indian rupee. The Reserve Bank of India does not wish to
intervene and control this depreciation as it is initiated by global factors that are beyond
the control of RBI. Moreover, the trade deficit of India has also not escalated further
decreasing any hope of appreciation in Indian rupee in close future.
Meanwhile the Indian economy, like any bank facing a run on its resources, is under
intense pressure. This is aggravated because our banking sector is both small and under-
capitalised and not well configured to take on rapid outflows of this nature. The rupee,
like the currency of any country nowadays, is underpinned by the working economy and
its fundamentals. And all parameters of these assessments are also very weak at present.

18
Indian officials and central bankers say their economy is only one of several emerging
markets that are suffering from the flight of investors back towards the US, where the
prospect of an end to the Federal Reserve’s ultra-easy monetary policies has made dollar
assets more attractive. The Historical Evolution of rupee can be traced from the chart
given below.
3.2 Effect of Depreciation
ü Trade deficit will widen because of costlier imports, worsening the current account
deficit.
ü Fuel price will keep petroleum subsidy in check, but fertilizer subsidy will rise.
ü Spending on any kind of foreign exchange denominated spending will increase.
ü Capital inflow will slow or reverse.
ü Spending on discretionary goods will increase.
ü Forex reserves could fall putting pressure on rupee.
ü In case of weak demand companies may not be able to pass on higher inputs costs.
ü The government and the RBI have issued a series of measures in recent days
designed to reduce the current account deficit and bolster the rupee, including
increases in the import duty on gold, the end of duty exemptions for flat screen
televisions brought in by airline passengers and restrictions on outward direct
investment by Indian companies and individuals.
ü Exports are unable to leverage the weak rupee fast enough given the speed of its
descent. In fact many exporters are caught out because of fixed price contracts in
rupees wherein they cannot get the benefits of its rapid fall. The balance of
payments is tilting sharply against us.
ü The Indian stock- market will take a hiding as opposed to a beating.
ü Global rating agencies will revise our rating downwards to “Junk” status, making
international borrowing difficult and even more expensive.
19
ü If the automated devaluation brought on by the rupee makes some asset classes
attractive, there may be slight recovery because of arbitrage opportunities and
bottom fishing.
Further, recent trends indicate a significant worsening of both trade and current accounts.
Both exports and imports actually declined in 2012-13 compared with the previous year,
but even so the trade deficit still increased by nearly 4 per cent, or more than $7 billion.
In April 2013, exports were 2 per cent higher than in April 2012—but imports were 11
per cent higher and non-oil imports were 15 per cent more. So the trade deficit increased
by more than 26 per cent in April 2013 compared with the previous year (Finance
Ministry, Monthly Economic Report for April 2013).
There are several ways in which the falling rupee immediately has an inflationary impact,
one of the most important of which is the price of energy. Since the misguided decontrol
of oil prices, it is not only the globally traded price of fuel but also the exchange rate that
determines domestic oil prices.
What is more, the increasing costs of imports can also affect exports, thereby wiping out
any global cost advantage accruing from the devaluation. For example, important export
sectors such as gems and jewellery, automobiles, machinery and chemicals are all very
import-dependent, and their rising costs could nullify the impact of the devaluation on
their ability to sell more cheaply in export markets. This is made worse by the fact that in
the current depressed global trade context, buyers are able to renegotiate contracts once
the exchange rate has changed. Indeed, many global buyers even in sectors such as
garments and leather goods now insist on contracts and invoicing in rupee terms. This
allows them to benefit completely from rupee depreciation, while the local producers are
forced to bear the rising domestic costs. This means that the falling rupee need not
generate any significant increase in exports as may be hoped.
20
3.3 Reason for Depreciation
ü One of the more obvious reasons why the current depreciation is not to be
welcomed is the effect on domestic living standards. There are several ways in
which the falling rupee immediately has an inflationary impact, one of the most
important of which is the price of energy. Since the misguided decontrol of oil
prices, it is not only the globally traded price of fuel but also the exchange rate that
determines domestic oil prices. Both durable consumer goods such as automobiles,
white goods and electronic items and non-durable goods such as soaps and
toiletries are all likely to become more expensive. And, of course, food inflation-
the most worrying aspect of recent price movements-is likely to go up as a well.
ü As per the data reported, FIIs (Foreign Institutional investors) are showing some
disinterest in Indian markets lately. Sluggish economy and recovery in stock
markets of developed economies like US and Japan are believed to be the key
reasons. Since FIIs inflows have played important role in keeping rupee at current
levels, an intense selling activity by them does not augur well for the near term
direction of the rupee.
ü Consistently high inflation has resulted into Indian goods becoming expensive in
the global markets, thus making it less competitive, especially when compared to
goods from China. Thus, rupee may have hardly any support by way of higher
exports. Lastly, gold imports, another key reason why the deficit is high and rupee
under pressure, may not slow down in a hurry.
ü The value of rupee follows the simple demand and supply rule of economics. If
the demand for the dollar in India is more than its supply, dollar appreciates and
21
rupee depreciates. Similarly, when the supply of dollars in India increases its
demand, the value of dollar decreases in terms of rupees.
ü The central banks of Eurozone and Japan are printing excessive money due to
which their currency is devalued. On the other hand, US Fed has shown signs to
end their stimulus. Hence, making the US dollar stronger against the other
currencies including the Indian rupee, at least in the short term.
ü Oil price is one of the most important factors that put stress on the Indian Rupee.
India is in the unhappy situation where it has to import a bulk of its oil
requirements to satisfy local demand, which is rising year-on-year. In International
markets, prices of oil are quoted in dollars. Therefore, as the domestic demand for
oil increases or the price of oil increases in the international market, the demand
for dollars also increases to pay our suppliers from whom we import oil. This,
increase in demand for dollar weakens the rupee further.
ü Our equity market has been volatile for some time now. So, the FII’s are in a
dilemma whether to invest in India or not. Even though they have brought in
record inflows to the country in this year chances are they may be thinking of
taking their money out of the equity market which might again results in less
inflow of dollars in India. Therefore, decrease in supply and increase in demand of
dollars results in the weakening of the rupee against the dollar.
On the investment front - steady decline in GDP growth, constant and continuing
contractions in industrial output, spiraling inflation, growing instance of financial
corruption, policy confusions etc. do not help in portraying India as a favoured
investment destination. It is here that the government has a very crucial role to play. In
22
reality the only role the government has played till date is to try and correct certain policy
nuances (FDI regulations etc.) but has done precious little to address the concerns of the
domestic economy.
The government would do better if it were to concentrate majorly on the domestic
economy. Foreign investment is a consequence of good domestic growth and not a
consequence of domestic fiscal and regulatory policy alone. The fiscal and domestic
policy regimes come secondary - primarily it is the fundamentals of the Indian economy,
which will attract foreign investment and thereby help the rupee in regaining some value.
23
Chapter: 4
Company Profile
Fortune Financial Services (India) Limited was incorporated in the year 1991 by Mr. J.
T. Poonja, Chairman and Mr.Nimish C Shah, Vice Chairman and Managing Director.
Fortune Group which comprises the holding company Fortune Financial Services (India)
Limited and its wholly-owned subsidiaries, is engaged in providing a range of Financial
Services right from Equities and Derivatives trading, Equity Research, Commodities
Trading, Portfolio Management Services, Distribution of Mutual Funds, IPO & Insurance
products and also Investment banking services.
4.1 Background and Inception of Fortune Financial Services India Ltd
In the year 1991 Mr. J.T. Poonja and Mr. Nimish C. Shah incorporated Fortune Financial
Services (India) Private Limited as a Non-Banking Financial Company (NBFC). Besides
core investment banking and corporate advisory services, Fortune's also focused on fund
based activities such as lease, hire purchase, bill discounting and inter-corporate loans. In
1993 Fortune became a SEBI registered Category - I Merchant Banker.
In the year 1994 in anticipation of a potential IPO, the name of the Company was
changed to Fortune Financial Services (India) Ltd. Opened an office in New Delhi to
increase the scope of activities. Fortune declared dividend @15%. Authorized Capital of
Fortune was increased to Rs.600 lacs.
Fortune Financial became the 1st Indian company to go in for a buyback of its shares,
subsequent to the guidelines for Buyback of shares coming into effect from Jan 1999.In
the year 2000 Acquired Corporate Membership of Bombay Stock Exchange Limited
(BSE). In 2005 commenced F&O operations on the National Stock Exchange (NSE).
Fortune was involved with varied domestic assignments - follow on issues, buyback
program, open offers and IPOs for Indian mid-sized corporate clients.
24
4.2 Subsidiaries of Fortune Financial Services India Ltd
M/s. Fortune Financial Services (India) Ltd
M/s. Fortune Financial Services (India) Ltd. is listed on the Bombay Stock Exchange Ltd
and is SEBI registered Category I Merchant Banker. It has recently got approval from
SEBI to launch its Portfolio Management Services (PMS). FFSIL has four business
verticals viz. Fortune Equity Brokers (India) Limited, Fortune Commodities &
Derivatives (India) Ltd., Fortune Credit Capital Ltd. and Fortune Financial India
Insurance Brokers Limited.
M/s. Fortune Equity Brokers (India) Ltd
M/s. Fortune Equity Brokers (India) Ltd. is 100% subsidiary company of M/s. Fortune
Financial Services (India) Ltd. It offers broking services in the Cash and Future & Option
Segments of the National Stock Exchange of India Ltd and the Bombay Stock Exchange
Limited. It is also a Depository Participant of Central Depository Services (India) Ltd.
M/s. Fortune Commodities & Derivatives (India) Ltd
M/s. Fortune Commodities & Derivatives (India) Ltd. is subsidiary company of M/s.
Fortune Financial Services (India) Ltd. and engaged in the business of commodities
broking. It is having memberships with the MCX and NCDEX, two leading Indian
Commodities Exchanges.
M/s. Fortune Credit Capital Ltd.
Fortune Credit Capital Ltd. is 100% subsidiary company of M/s. Fortune Financial
Services Ltd. It is formed for the purpose of financing, lending to the clients. The
Company has received license from RBI for NBFC operations.
25
M/s. Fortune Financial India Insurance Brokers Limited
M/s. Fortune Financial India Insurance Brokers Limited is 100% subsidiary company of
Fortune Financial India Insurance Brokers Limited and formed for the purpose of
providing insurance broking and related products and services.
4.3 Nature of Business
Fortune Financial Services is a broking company. The company offers a
complete range of trade service on the BSE (Bombay Stock Exchange) and the NSE
(National Stock Exchange). Whether the clients come in to the company’s
conventionally located offices and trade in a dedicated ambience or issue
instructions over the phone, our highly trained team and sophisticated equipment
ensure smooth transactions and prompt service.
• Investment Advisory Service
• Facilitation Services to Retail Investors, Corporate.
• Depository Services
• Investment options includes
i. Online trading (Includes equity, derivatives)
ii. Commodities trading
iii. Mutual Funds
iv. Portfolio management Services
4.4 Vision & Mission
Core Purpose of Fortune Financial Services is to be a well-respected and preferred global
financial services organization enabling wealth creation for all their customers. Values of
Fortune Financial Services core purpose are complemented by their organizational
values. Living these values, they believe, helps them to achieve their core purpose.
26
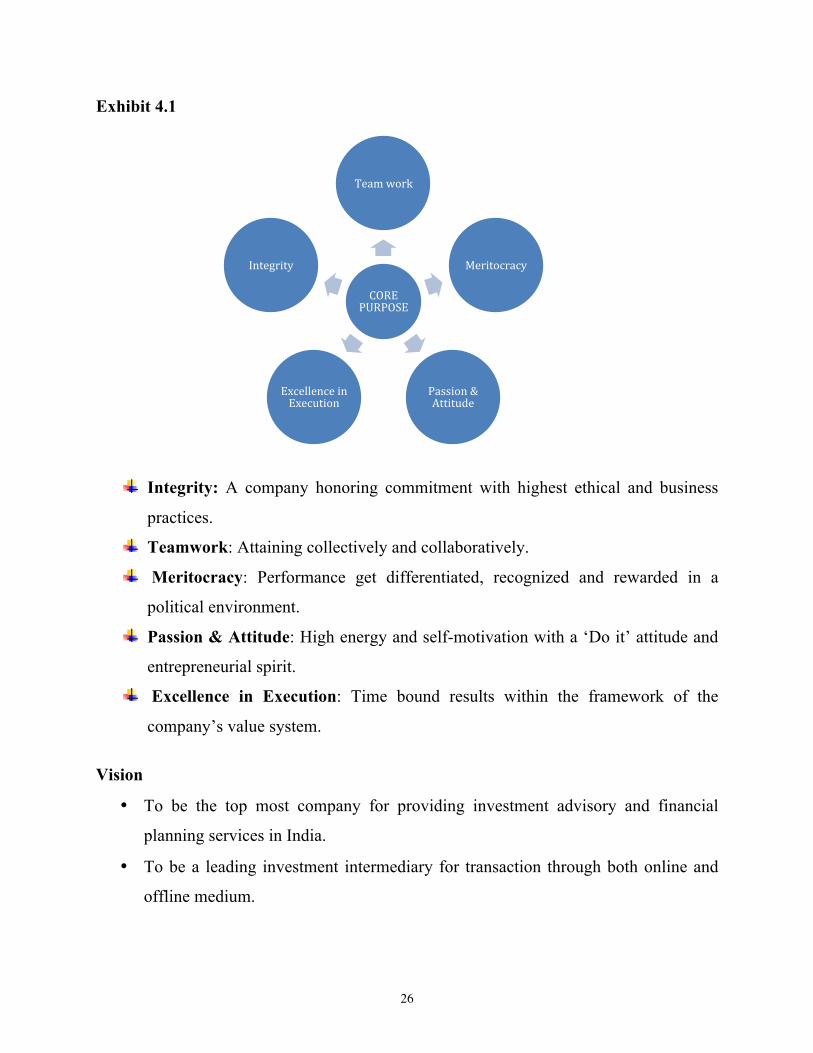
Exhibit 4.1
Integrity: A company honoring commitment with highest ethical and business
practices.
Teamwork: Attaining collectively and collaboratively.
Meritocracy: Performance get differentiated, recognized and rewarded in a
political environment.
Passion & Attitude: High energy and self-motivation with a ‘Do it’ attitude and
entrepreneurial spirit.
Excellence in Execution: Time bound results within the framework of the
company’s value system.
Vision
• To be the top most company for providing investment advisory and financial
planning services in India.
• To be a leading investment intermediary for transaction through both online and
offline medium.
CORE PURPOSE
Team work
Meritocracy
Passion & Attitude
Excellence in Execution
Integrity
27
Mission
• To educate and empower the individual investors to make investment decisions
through quality advice and superior service.
Superior service for
• Integrity
• Transference
• Professionalism
• Client driven approach
• Long term relationship
• Broad outlook
4.5 Services of Fortune Financial Services India Ltd
Fortune - Investment Banking, a Category I SEBI Registered Merchant Bank focuses on
providing corporate advisory services to Indian mid-sized corporate clients in both the
domestic and international capital markets.
Fortune retained its focus on mid-market corporate clients offering a variety of financial
solutions. Our Investment Banking services offered are:
Ø Equity / Debt Syndication
o Capital / Debt Restructuring
o Structured Financial Products
o Mezzanine Financing
Ø Issue Management
o Initial Public Offerings / Offer For Sale
o Rights Issues
o Preferential Issue / Private Placement
28
o Open Offer pursuant to Acquisition
o Buybacks / Delisting / ESOP
o Stock Option Schemes
Ø Mergers & Acquisitions and Corporate Advisory
o Buy-side / Sell-side Advisory
o Leveraged Acquisitions
o Cross-Border Transactions / Joint Ventures
Ø Fund Raising Advisory
o Offshore Fund Raising
o ECB/ FCCB / GDRs
By applying our knowledge capital, we believe in building lifetime client relationships by
providing unquestionable integrity, seamless execution and innovative solutions while
striving to assist our clients achieve their financial goals. We follow a client centric
approach to protect and enhance our client's wealth.
Our distinguished client base has evolved from our extensive experience and deep
understanding of the capital markets. We focus on identifying and understanding client
needs and persistently providing value-enhancing strategies that will benefit the client
over a sustained period of time.
With growing interest for Indian corporate clients from international investors, Fortune
pioneered grooming, advising and assisting mid-market companies to access international
capital markets. In the past two years, Fortune has been involved with:
Ø 10 Fund raising assignments in Indian capital markets of Rs.27.62 billion
Ø 2 corporate buyback program
Ø 2 management open offers
Ø 15 international issues where US$ 600 Million was raised
29
4.6 Area of Operation of Fortune Financial Services India Ltd
Maharashtra, Delhi, Karnataka, Tamil Nadu, Chandigarh, Andhra Pradesh, Goa
4.7 Shareholding Pattern of Fortune Financial Services India Ltd
Promoters having more than 50% holdings of Fortune financial Services India Ltd. There
are no government holdings and domestic institutions holding but FIIs having 42.5 % of
holdings. The public and other individuals having only 6.2 % of holdings in the company.
1.3% of holdings in the hands of non-promoter’s corporate holdings.
4.8 Board of Directors
Mr. J.T. Poonja
Co-Founder & Executive Chairman
Mr. J. T. Poonja is first generation entrepreneur and has over 43 years of experience in
Financial Service Sector ranging from Banking, Merchant Banking and Institutional
Broking Activities. He presently oversees the group operations, expansion and
extensively involved in strategic planning of Fortune's future growth plan.
Mr. Nimish C. Shah
Co-Founder, Vice Chairman & Managing Director
Nimish C Shah is first generation entrepreneur and has over 23 years of experience in
Indian Capital Market. His core acumen lies in Investment Banking, Institutional & HNI
Broking. He presently oversees assignments relating to structuring custom financial
solutions for clients, assisting companies in raising capital (private equity / venture
capital, debt and equity), mergers and acquisitions, strategic partnerships, valuations,
other merchant banking activity. He is also actively involved in pitching ideas and
30
concepts to prospective clients. He looks after the core business development and
contributes to evolving new growth strategies
Mr. Vishal Trehan
CEO-Broking & Distribution
Vishal Trehan, finance professional (Gold Medalist) has over 15 years of experience in
Indian Capital Markets. He has vast knowledge in all fields related to Equities and
Commodities Operations (both Front Office & Back Office), Surveillance & Risk
Management includes evolved real time tools for surveillance, and Chief Architect for
Technology initiatives includes developing CTCL & Internet software, DP Operations
(NSDL & CDSL), Compliance, Strategic Planning, Distribution with new innovative
initiatives. His role at Fortune includes expanding group presence geographically in Sales
- Direct & alternate channels and also looking after Operations, Technology and
Compliance.
Mr. B B Tantri
Chief Operating Officer
B. B. Tantri has over 38 years of total experience in Banking, Airlines, Financial Sectors
and Capital Market Industries. His varied and rich experience makes him a complete
team leader of the Company's operation and back office functions.
Mr. Muthu Kummar
Head - Corporate Affair
Muthu Kummar has over 26 years of experience in the areas of Finance, Accounting,
Taxation, EDP and Secretarial. He looks after planning, sourcing and disbursements of
financial resources of the Company, monitoring and managing the day-to-day working
capital requirements and ensures compliance to group policies and various statutes.
31
Mr. Pranav Kumar
National Head – Corporate Sales
Pranav Kumar has over 12 years of experience in the Financial Services Industry
including strategic planning and market analysis. He has worked with Kotak Securities
and KARVY group in similar roles prior to his joining Fortune. He also has hands on
experience in operational and legal nuances of the secondary markets. He has been a
front-runner in leveraging his relationships across big corporate and HNI clients to define
and drive mutually profitable partnerships. At Fortune he is responsible for originating
and managing corporate relationships across all product categories at a national level.
Mr. Sanjay Makhija
Head-Institutional Dealing
Sanjay Makhija has over a decade experience in the capital markets. He has experience in
setting up start-ups to taking charge of a large institutional desk. He has been successful
is advising and managing money of clients as a portfolio manager. He started his career
in the capital market as an equity analyst and moved through various positions in his
career and currently heads the Institutional Equities business at Fortune Group.
Mr. Naveen Sharma
EVP – Broking & Distribution
Mr. Naveen Sharma has over 22 years of experience in Indian Capital market and has a
vast knowledge in the field of Equity broking, Mutual Fund, Commodity market and
Insurance. Being a vast experienced person he has a great record of developing retail
network of branches in the Northern part of India. My role at Fortune includes
development of retail business such as creation of new franchisees and networking of
branches in the North.
32
Mr. Kalyansundaram
EVP – Funds & Settlement
Kalyanasundaram has done his Masters in Commerce and completed CAIIB (Part-I). He
is having good exposure in Industrial Financing and handling NBFCs with Credit
appraisal and credit proposal, having good contacts with Govt. organizations and IAS
officials. He is having experience of more than 35 years in similar field and he had also
managed recovery portfolio.
4.9 Competitors of Fortune Financial Services India Ltd
Indiabulls
Indiabull is an Indian company headquartered in Gurgaon (NCR Delhi), with its presence
in the Real Estate, Infrastructure, Financial Services, and Securities, Retail, Multiplex and
Power sectors. In middle of 1999, Sameer Gehlaut and his close IIT Delhi friend Rajiv
Rattan bought a defunct securities company with a NSE membership and started offering
brokerage services later joined by their friend Saurabh Mittal. In December 1999, the
company built one of the first online platforms in India for offering Internet brokerage
services. In mid 2000, Indiabulls Financial Services received venture capital funding
from Mr. Lakshmi Mittal & Mr. Harish Fabiani.
Indiabulls Group is one of India's large Business houses. The Group has several
businesses, which cover a wide spectrum of Real Estate, Financial Services, Securities,
Power and Chartered Aviation. Many of the companies are public entities and are listed
on Indian stock markets.
Edelweiss Capital
Edelweiss Capital is a financial services company based in Mumbai, India. Edelweiss
Capital Limited provides investment banking, institutional equities, private client
33
broking, asset management, wealth management, insurance broking and wholesale
financing services to corporate, institutional and high net worth individual clients. It
operates from 43 other offices in 19 Indian cities. Since its commencement of business in
1996, it has grown into a diversified Indian financial services company organized under
agency and capital business lines operated by the Company and its thirteen subsidiaries.
Edelweiss employs over 2900 professionals across 297 offices and branches spread
across 144 cities of India.
Future Capital
Future Capital is a provider of financial services across consumer and wholesale
businesses, with aspirations to grow into a significant financial conglomerate.
Conceptualized around a unique positioning of a financial services business, integrated
with a retail chain, Future Capital is establishing financial superstores within the Retail
stores of Future Group such as Big Bazaar, E-zone and Home Town to create India’s first
‘consumer-centric’ retailer of financial products and services.
Motilal Oswal
Motilal Oswal Securities Ltd. (MOSL) was founded in 1987 as a small sub-broking unit,
with just two people running the show. Focus on customer-first-attitude, ethical and
transparent business practices, respect for professionalism, research-based value investing
and implementation of cutting-edge technology have enabled us to blossom into an over
1600-member team.
Today Motilal is a well diversified financial services firm offering a range of financial
products and services such as Wealth Management, Broking & Distribution, Commodity,
Broking, Portfolio Management Services, Institutional Equities, Private
Equity, Investment Banking Services and Principal Strategies.
34
Eko India Financial Services
Eko India Financial Services Pvt. Ltd. is an Indian financial service company, which is a
business correspondent (BC) service for State Bank of India (SBI) and ICICI Bank,
India's top two largest banks, and provides no-frills bank accounts and deposit,
withdrawal and remittance services to customers (nearly 80% of whom are migrants or
the unbanked section of the population) through mobile banking. With Bharti AXA Life
Insurance Company, it provides Bharti AXA Life - Bachat Bima, micro-
insurance policies.
Brothers Abhishek and Abhinav Sinha in 2007 and two other founders who left after a
year, and allows low-wage immigrants workers in the Indian urban areas to remit money
to their homes using mobile phones established it. Sanjay Bhargava was the first
Chairman. He made important contributions to the business model of the company and
invented a security method that enabled a low-end mobile phone to be used to initiate
transactions securely.
Peerless Group
Peerless Group is an Indian business conglomerate with its head quarters located
at Kolkata, West Bengal. It was established in 1932 by industrialist Radhyashyam
Roy in Narayanganj, Bangladesh. Its major holding company is Peerless General Finance
& Investment Co Ltd, which is the India's largest Registered Residuary Non-banking
Company. It has subsidiaries like Peerless Hospital, Bengal Peerless (real estate), Kaizen
Holidays, Peerless Hotels, and Peerless Securities.
4.10 Infrastructural facilities:
Fortune Financial services outlets are designed to be places where retail investors can
come in touch with investment opportunities in an atmosphere of convenience and
35
comfort. The look and feel of the offices across India projects a consistent branch image
for the company. The features that enable a unique facility for retailing financial services
include among others: Easily visible branches set up in the commercial spaces of
potential investment zones ranging between 750 sft to 1000 sft.
Ø Most branches are located in the ground floor sporting huge glass frontage
promoting easy accessibility and reflecting our attitude of complete transparency.
Ø The major portion of the branch area dedicated for customer use. The furniture is
in CKD formats to add flexibility in using the branch for investor’s purposes.
Ø Connectivity to NSE for trading facilities.
Ø TV and other electronic mediums to facilitate real time update and dissemination
of information to our customers. Each branch comprises of trained and qualified
investment advisors to take care of the needs of the customers.
36
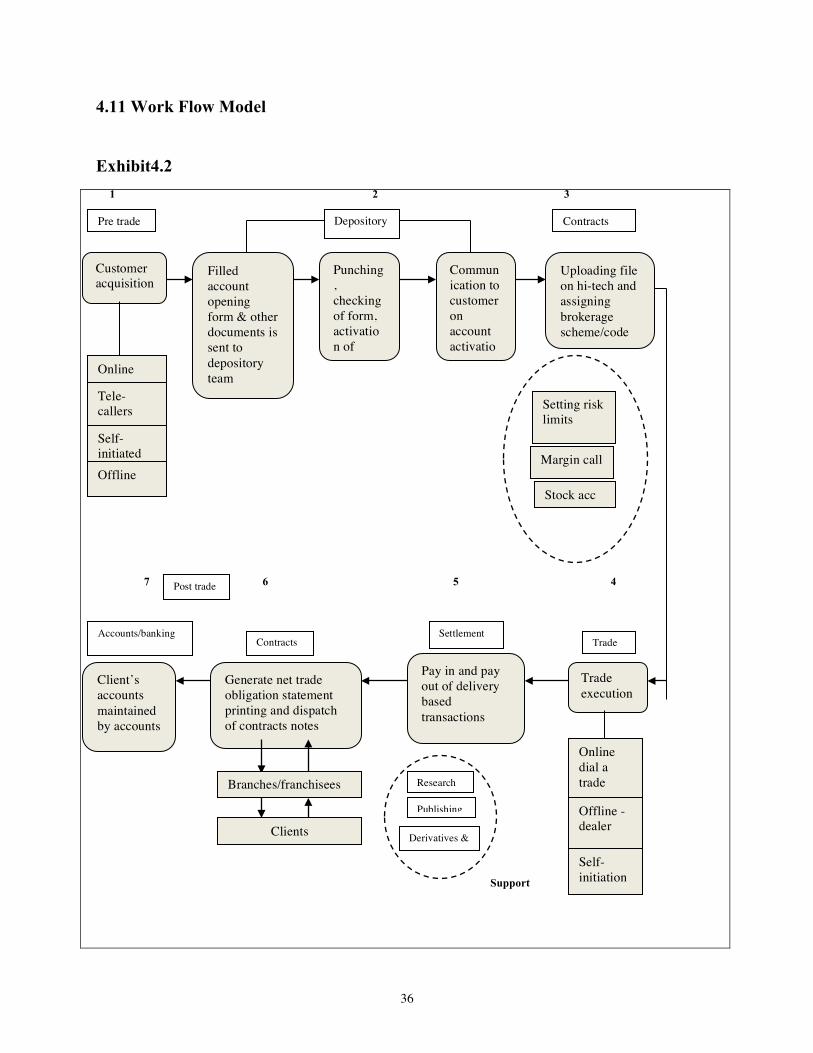
4.11 Work Flow Model
Exhibit4.2
1 2 3
7 6 5 4
Support
Pre trade Contracts Depository
Uploading file on hi-tech and assigning brokerage scheme/code
Communication to customer on account activatio
Punching, checking of form, activation of
Filled account opening form & other documents is sent to depository team
Customer acquisition
Online
Tele-callers Setting risk
limits Self-initiated Margin call Offline
Stock acc
Post trade
Accounts/banking
Client’s accounts maintained by accounts
Generate net trade obligation statement printing and dispatch of contracts notes
Pay in and pay out of delivery based transactions
Trade execution
Contracts Settlement
Trade
Online dial a trade
Offline - dealer Clients
Branches/franchisees Research
Publishing
Self-initiation
Derivatives & commodities
37
4.12 Future Plans and Prospectus
The Fortune Financial services India Ltd has following Future Plans and Prospectus
v Branches / Semi branches servicing affluent / aggressive traders through high skill
financial advisor.
v To become a market leader
v New initiatives Portfolio management Services and commodities trading
v The company has a good network of franchisee and offices in north India and is
planning open more offices in south India
4.13 Mckinsey’s 7S Frame Work
The McKinsey 7S Framework is a management model developed by well-known
business consultants Robert H. Waterman, Jr. and Tom Peters (who also developed the
MBWA-- "Management By Walking Around" motif, and authored In Search of
Excellence) in the 1980s. This was a strategic vision for groups, to include businesses,
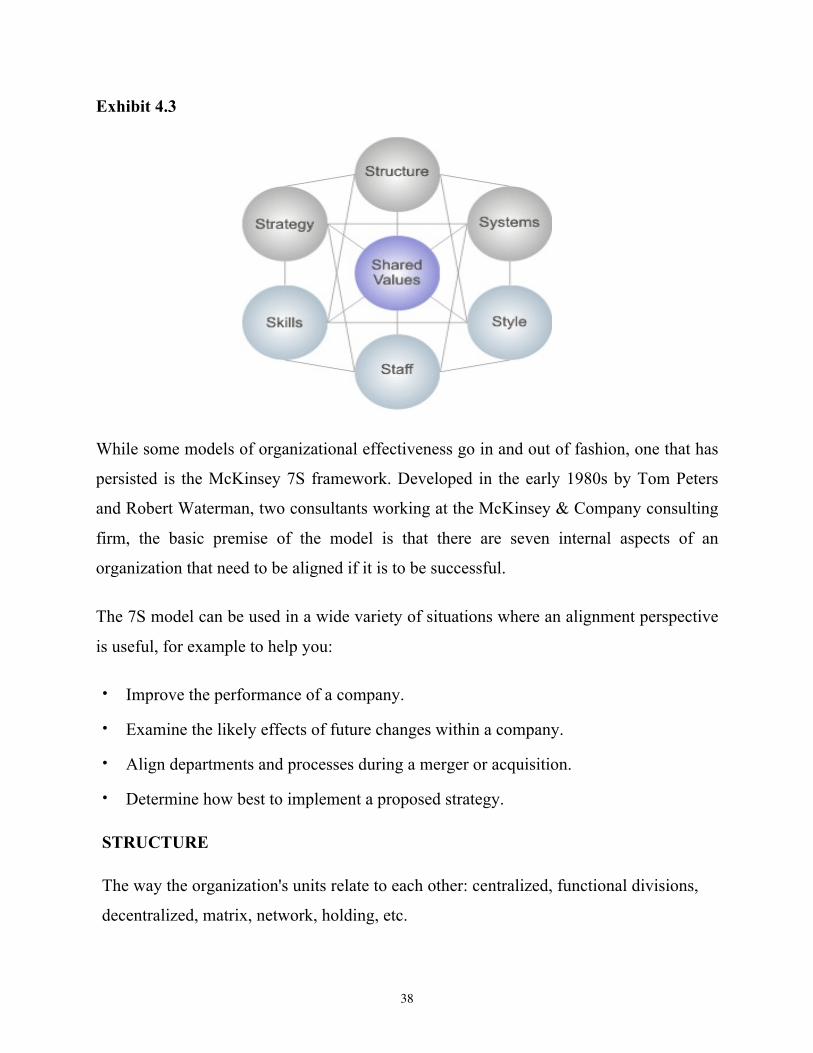
business units, and teams. The 7S are structure, strategy, systems, skills, style, staff and
shared values.
The model is most often used as a tool to assess and monitor changes in the internal
situation of an organization. The model is based on the theory that, for an organization to
perform well, these seven elements need to be aligned and mutually reinforcing. So, the
model can be used to help identify what needs to be realigned to improve performance, or
to maintain alignment (and performance) during other types of change.
38
Exhibit 4.3
While some models of organizational effectiveness go in and out of fashion, one that has
persisted is the McKinsey 7S framework. Developed in the early 1980s by Tom Peters
and Robert Waterman, two consultants working at the McKinsey & Company consulting
firm, the basic premise of the model is that there are seven internal aspects of an
organization that need to be aligned if it is to be successful.
The 7S model can be used in a wide variety of situations where an alignment perspective
is useful, for example to help you:
• Improve the performance of a company.
• Examine the likely effects of future changes within a company.
• Align departments and processes during a merger or acquisition.
• Determine how best to implement a proposed strategy.
STRUCTURE
The way the organization's units relate to each other: centralized, functional divisions,
decentralized, matrix, network, holding, etc.
39
STRATEGY
Fortune aims at improving its customer base by providing integrated financial
services to all customers. Most prominent part of Fortune’s growth strategy is focus
on in house research to cater to deferent segments of client and meet their rising
expectation. Fortune believes in-house research is not only an essential part of
business requirement it also gives control over quality of input and relative advantage
in this intense business environment. Today fortune’s client base has increased to
73% n capital market and the branch and franchise network to 186 rom 49 in the
previous year.
SYSTEM
The systems are the routine processes and procedure followed within the
organization. In Fortune the core operation include
o Customer Acquisition: - the offline method of acquisition of customers through the
brokers is followed for this purpose.
o Research: -the research is done mainly at the head office in Mumbai. The
fundamental analysis of the deferent companies through balance sheet analysis of
the deferent companies through balance sheet analysis, profit and loss statement and
technical analysis with regards to various sectors, the volatility in these sectors is
also done at the head office.
o Dealing: - the dealing system refers to the actual trading activities that are done
through advice. The orders are placed according to the needs of the investors. The
volume generated through these activities forms the core revenue for the company.
o Back Office Operation: - this part of support operations handles the risk associated.
The software needed for these operations handles this and makes sure that all the
norms are met in any form of the transaction.
40
STYLE
The way in which key managers behave in achieving organizational goals is considered
to be the style variable; this variable is thought to encompass the cultural style of the
organization. Democratic style has been followed in fortune, which allows individual
department to take necessary decision. The style of operation that is followed towards
the customer is much focused and it is aimed to give utmost attention to the customer.
Personalized care is taken to satisfy with any of the problems faced by the clients.
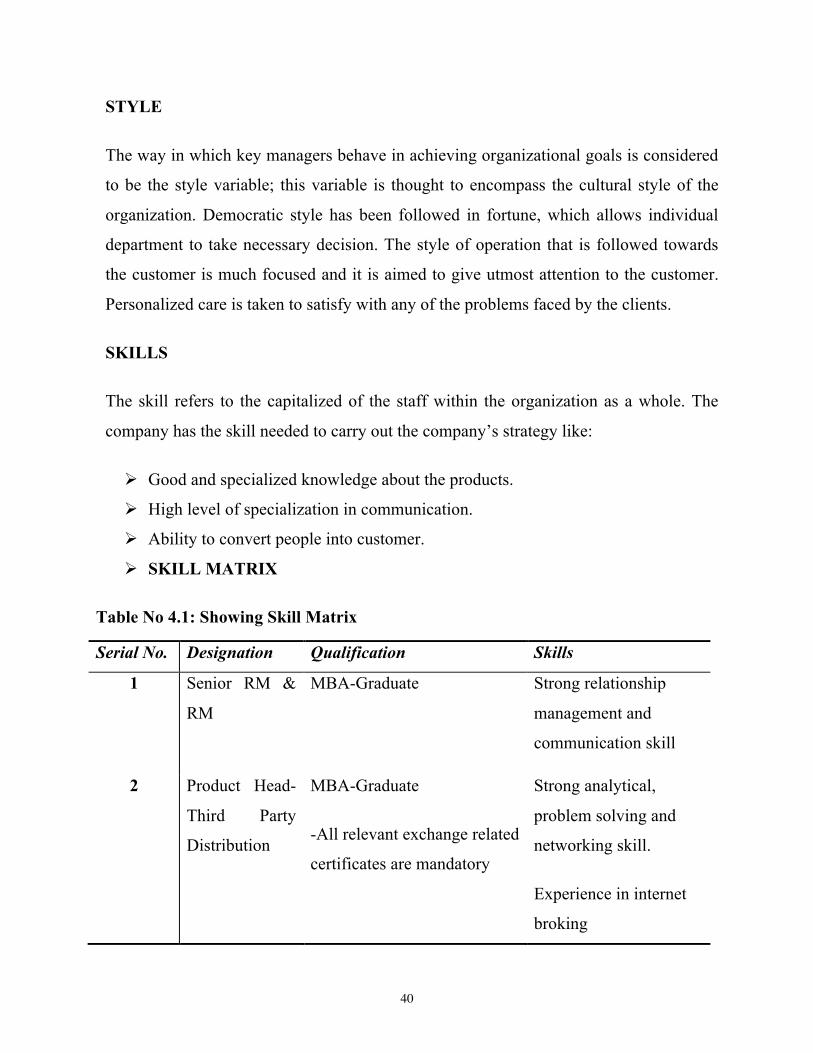
SKILLS
The skill refers to the capitalized of the staff within the organization as a whole. The
company has the skill needed to carry out the company’s strategy like:
Ø Good and specialized knowledge about the products.
Ø High level of specialization in communication.
Ø Ability to convert people into customer.
Ø SKILL MATRIX
Table No 4.1: Showing Skill Matrix
Serial No. Designation Qualification Skills
1 Senior RM &
RM
MBA-Graduate Strong relationship
management and
communication skill
2 Product Head-
Third Party
Distribution
MBA-Graduate
-All relevant exchange related
certificates are mandatory
Strong analytical,
problem solving and
networking skill.
Experience in internet
broking
41
STAFF
The term staff refers to the organization introduces young recruits into the main stream of
the activities and the manners in which they manage their careers in the new interns
develop employees and shape basic value.
The employees in all the departments are given training for 6months where they will be
given all the necessary skill that is needed for their respective job. The efficiency of the
existing employees is also measured to know the growth and their relative position in the
organization. There are 1600 employees all over the country.
SHARED VALUES
The shared values, originally termed as super ordinate goals, refer to the significant
meaning or guiding concepts that organizational members share. Shared values are
considered to be the foundation of ethics, community and culture. When people’s values
are met and matched, they feel a sense of satisfaction, harmony, or rapport. When their
values are not met or matched, people often feel dissatisfied, incongruent, or violated.
o Customer- personalized attention is the key.
o Integrity- highest ethical standards are used in all the transactions.
o Mutual Respect- trusts in working relationship.
o Quality Advice- scientific approach in quantifying the risk.
4.14 SWOT Analysis
SWOT analysis is a strategic planning method used to evaluate the Strengths, Weakness,
Opportunities, and Threats involved in a project or in a business venture. It involves
specifying the objective of the business venture or project and identifying the internal and
external factors that are favorable and unfavorable to achieving that objective. A SWOT
analysis must first start with defining a desired end state or objective. Identification of
42
SWOT is essential because subsequent steps in the process of planning for achievement
of the selected objective may be derived from the SWOT.
First, the decision makers have to determine whether the objective is attainable, given
the SWOT. If the objective is NOT attainable a different objective must be selected and
the process repeated. The SWOT analysis is often used in academia to highlight and
identify strengths, weaknesses, opportunities and threats. It is particularly helpful in
identifying areas for development.
The usefulness of SWOT analysis is not limited to profit-seeking organizations. SWOT
analysis may be used in any decision-making situation when a desired end-state
(objective) has been defined. The aim of any SWOT analysis is to identify the key
internal and external factors that are important to achieving the objective. These come
from within the company's unique value chain. SWOT analysis groups key pieces of
information into two main categories:
The strengths and weaknesses internal to the organization, such as people (Human
Resources, Properties, process and procedures followed in the organization, products etc.
The opportunities and threats presented by the external environment to the organization
which affects its success or survival such as Social, Technological, Economic,
Environmental and Political factors.
Strengths
• Experience of more than decades of trust and creditability in the Indian stock
market
• Strong industry focus leading to innovative and informed strategic advisory
services
• Deep understanding of Indian mid market corporate client
• Debt free group
43
• Comprehensive range of financial services for HNI & retail investors
• Non exclusive working relationship with leading international investments banks
• Dedicated research team for technical and fundamental analysis
• A well equipped customer team, which will assist a new comer in the matters
relating to transaction billing, De-mat & other technical queries
Weakness
• Highly risk oriented business
• Slight entry level of investors
• The company does not conduct any promotion campaign, though the competitors
are aggressively doing the same.
• Concentrated much on HNIs and corporate clients which ignores small investors
Opportunities
• Booming financial market both country wide and worldwide
• Increase in varied domestic assignment – follow on issues. Buyback program,
open offers, IPOs
• Strong momentum In franchise in the last two year
• Overseas fund raising of approximately US$ 500 million in the last 18 months
• Critical mass and experience across the globe
• All factors, which aid to the well functioning of the capital market will pave the
way to the expansion of most of the brokerage firms
Threats
• Unexpected change in the capital market such as rules and regulation etc.
• Increasing competition in the industry
• Fast change in the technology
• Increasing number in the defaulters and threat of security in terminals
44
Chapter: 5
Data Analysis & Interpretation
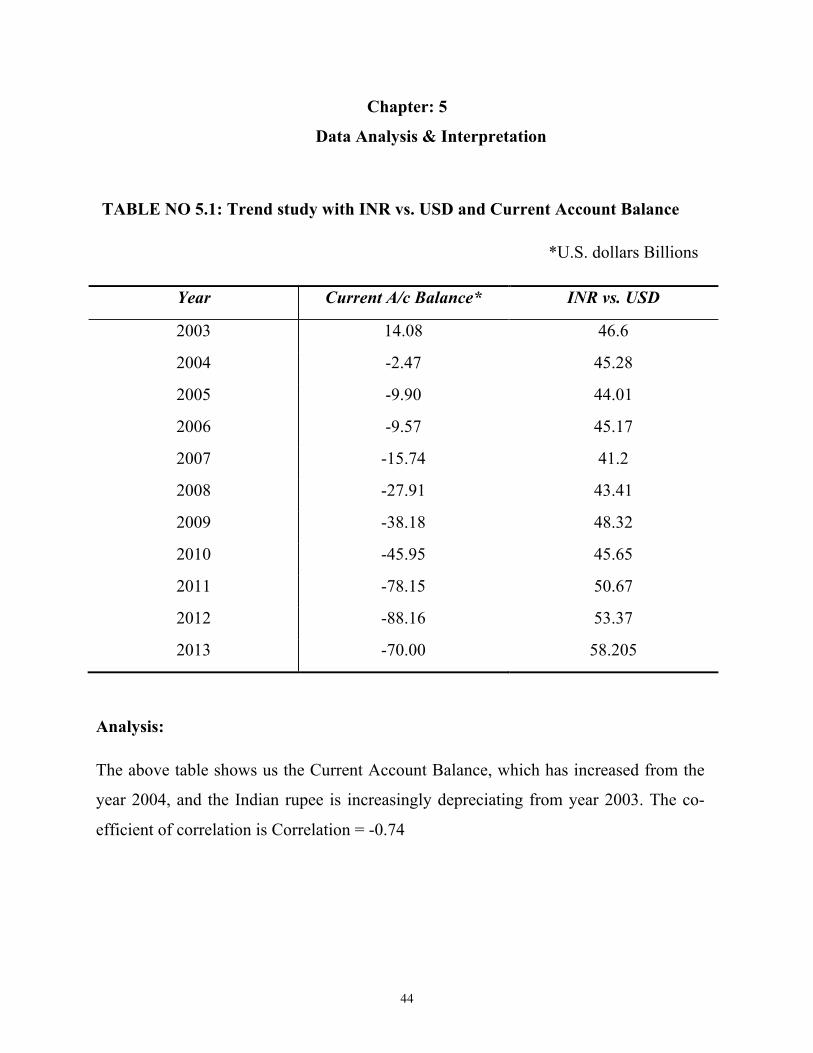
TABLE NO 5.1: Trend study with INR vs. USD and Current Account Balance
*U.S. dollars Billions
Year Current A/c Balance* INR vs. USD
2003 14.08 46.6
2004 -2.47 45.28
2005 -9.90 44.01
2006 -9.57 45.17
2007 -15.74 41.2
2008 -27.91 43.41
2009 -38.18 48.32
2010 -45.95 45.65
2011 -78.15 50.67
2012 -88.16 53.37
2013 -70.00 58.205
Analysis:
The above table shows us the Current Account Balance, which has increased from the
year 2004, and the Indian rupee is increasingly depreciating from year 2003. The co-
efficient of correlation is Correlation = -0.74
45
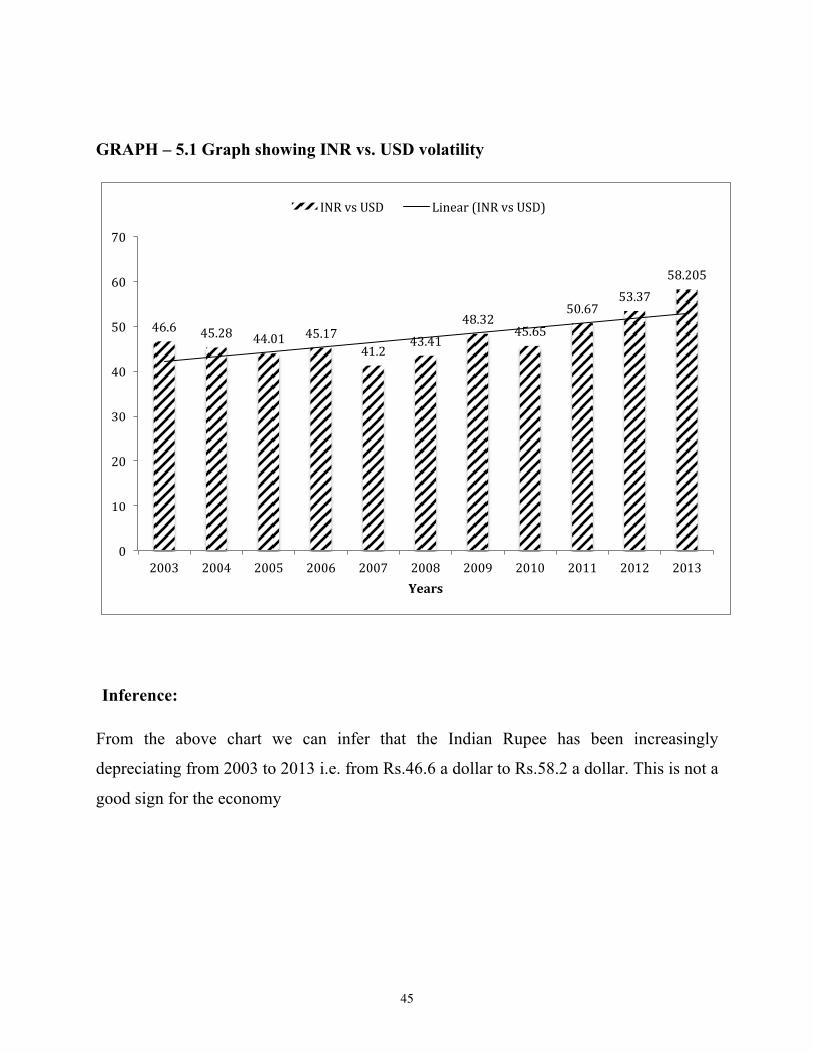
GRAPH – 5.1 Graph showing INR vs. USD volatility
Inference:
From the above chart we can infer that the Indian Rupee has been increasingly
depreciating from 2003 to 2013 i.e. from Rs.46.6 a dollar to Rs.58.2 a dollar. This is not a
good sign for the economy
46.6 45.28 44.01 45.17 41.2
43.41 48.32
45.65
50.67 53.37
58.205
0
10
20
30
40
50
60
70
2003 2004 2005 2006 2007 2008 2009 2010 2011 2012 2013 Years
INR vs USD Linear (INR vs USD)
46
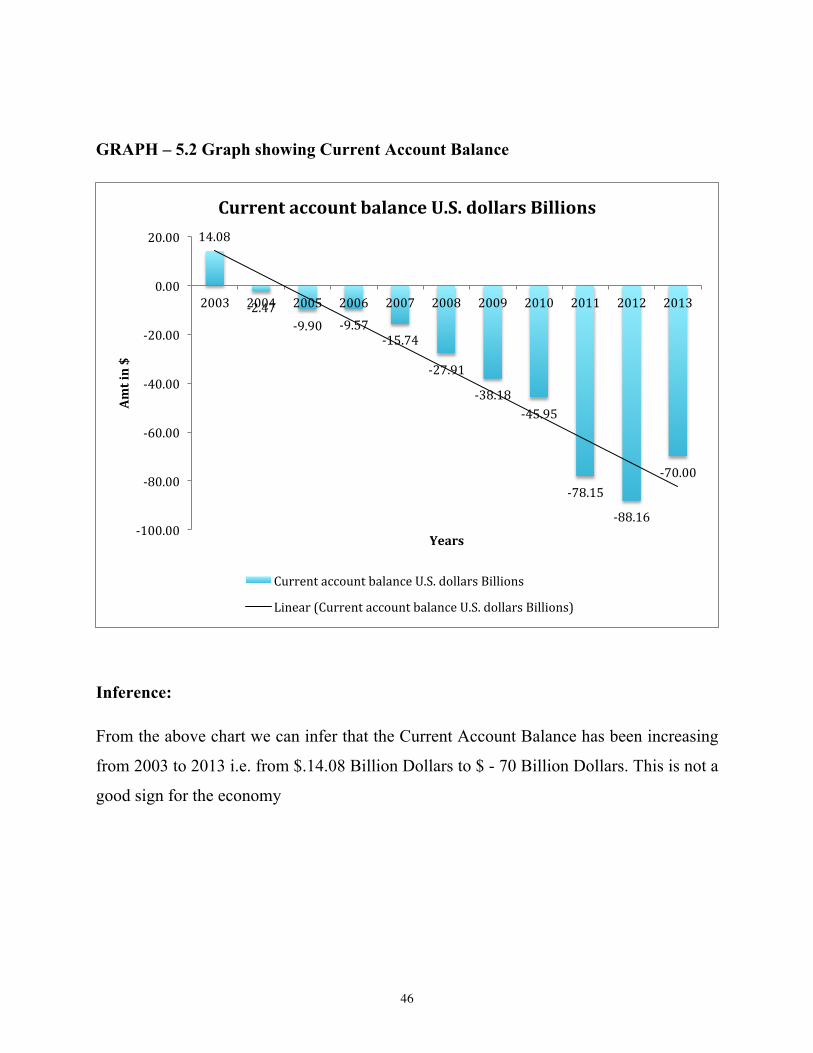
GRAPH – 5.2 Graph showing Current Account Balance
Inference:
From the above chart we can infer that the Current Account Balance has been increasing
from 2003 to 2013 i.e. from $.14.08 Billion Dollars to $ - 70 Billion Dollars. This is not a
good sign for the economy
14.08
-‐2.47 -‐9.90 -‐9.57
-‐15.74
-‐27.91
-‐38.18 -‐45.95
-‐78.15
-‐88.16
-‐70.00
-‐100.00
-‐80.00
-‐60.00
-‐40.00
-‐20.00
0.00
20.00
2003 2004 2005 2006 2007 2008 2009 2010 2011 2012 2013
Amt in $
Years
Current account balance U.S. dollars Billions
Current account balance U.S. dollars Billions
Linear (Current account balance U.S. dollars Billions)
47
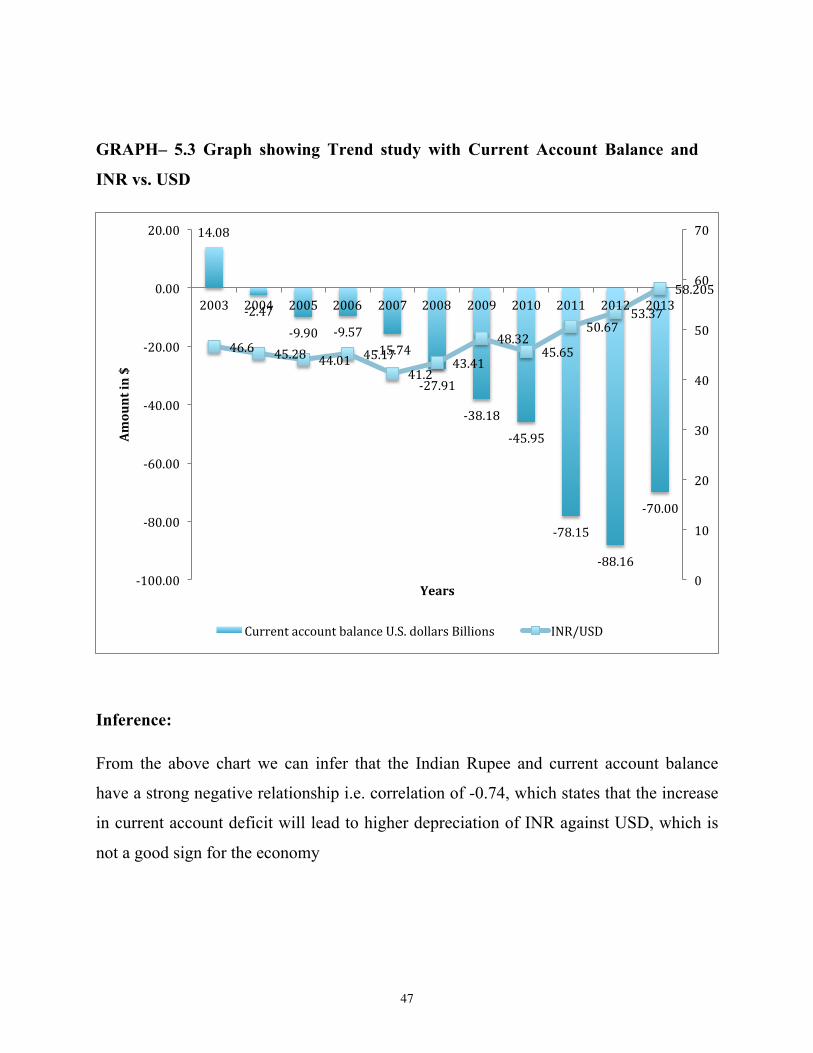
GRAPH– 5.3 Graph showing Trend study with Current Account Balance and
INR vs. USD
Inference:
From the above chart we can infer that the Indian Rupee and current account balance
have a strong negative relationship i.e. correlation of -0.74, which states that the increase
in current account deficit will lead to higher depreciation of INR against USD, which is
not a good sign for the economy
14.08
-‐2.47 -‐9.90 -‐9.57
-‐15.74
-‐27.91
-‐38.18
-‐45.95
-‐78.15
-‐88.16
-‐70.00
46.6 45.28 44.01 45.17 41.2
43.41
48.32 45.65
50.67 53.37
58.205
0
10
20
30
40
50
60
70
-‐100.00
-‐80.00
-‐60.00
-‐40.00
-‐20.00
0.00
20.00
2003 2004 2005 2006 2007 2008 2009 2010 2011 2012 2013
Amount in $
Years
Current account balance U.S. dollars Billions INR/USD
48
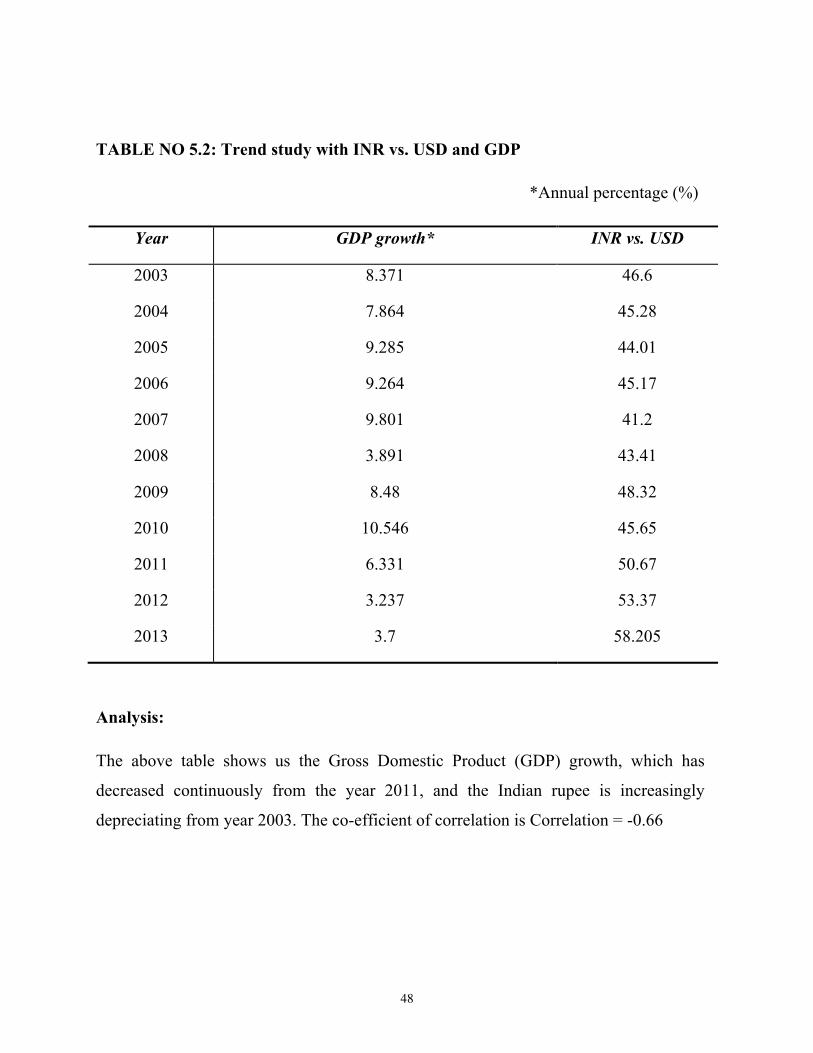
TABLE NO 5.2: Trend study with INR vs. USD and GDP
*Annual percentage (%)
Year GDP growth* INR vs. USD
2003 8.371 46.6
2004 7.864 45.28
2005 9.285 44.01
2006 9.264 45.17
2007 9.801 41.2
2008 3.891 43.41
2009 8.48 48.32
2010 10.546 45.65
2011 6.331 50.67
2012 3.237 53.37
2013 3.7 58.205
Analysis:
The above table shows us the Gross Domestic Product (GDP) growth, which has
decreased continuously from the year 2011, and the Indian rupee is increasingly
depreciating from year 2003. The co-efficient of correlation is Correlation = -0.66
49
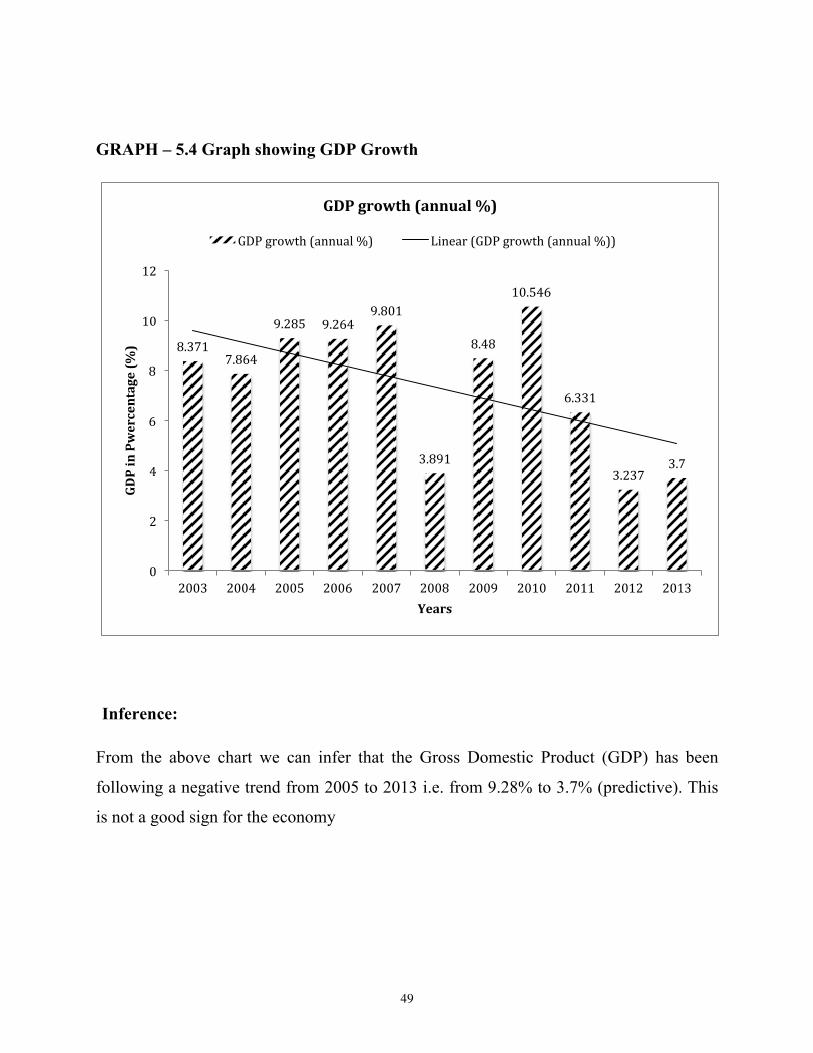
GRAPH – 5.4 Graph showing GDP Growth
Inference:
From the above chart we can infer that the Gross Domestic Product (GDP) has been
following a negative trend from 2005 to 2013 i.e. from 9.28% to 3.7% (predictive). This
is not a good sign for the economy
8.371 7.864
9.285 9.264 9.801
3.891
8.48
10.546
6.331
3.237 3.7
0
2
4
6
8
10
12
2003 2004 2005 2006 2007 2008 2009 2010 2011 2012 2013
GDP in Pwercentage (%
)
Years
GDP growth (annual %)
GDP growth (annual %) Linear (GDP growth (annual %))
50
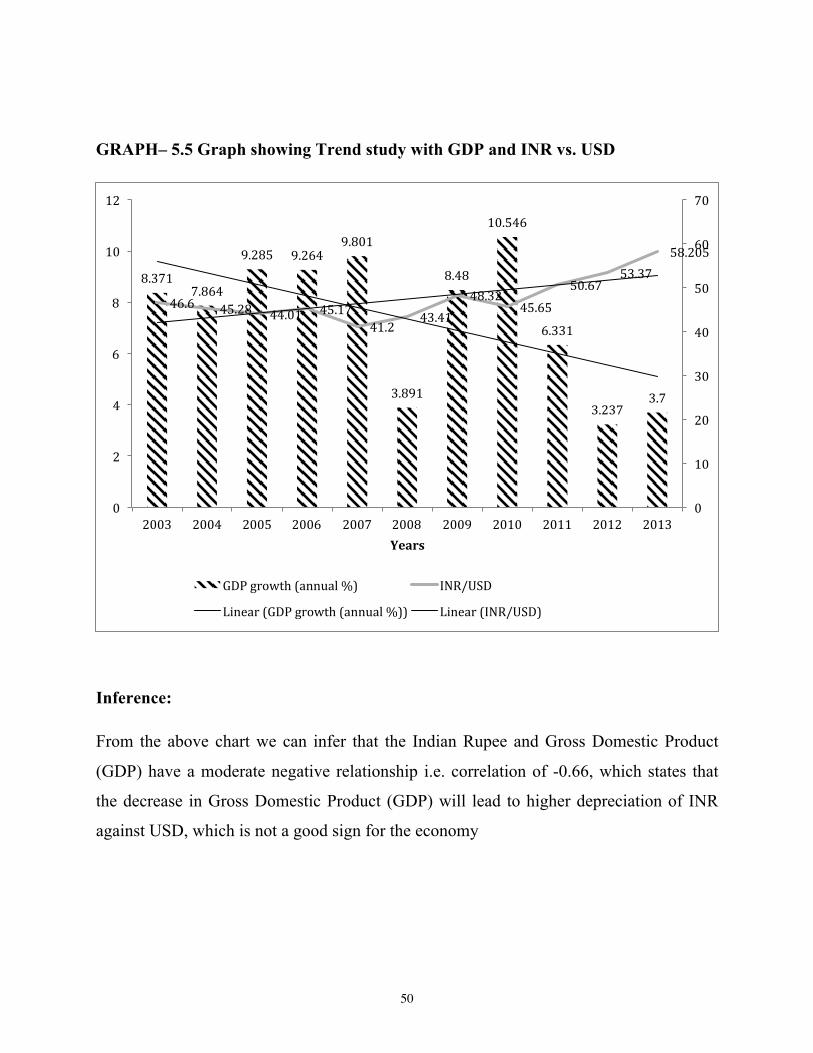
GRAPH– 5.5 Graph showing Trend study with GDP and INR vs. USD
Inference:
From the above chart we can infer that the Indian Rupee and Gross Domestic Product
(GDP) have a moderate negative relationship i.e. correlation of -0.66, which states that
the decrease in Gross Domestic Product (GDP) will lead to higher depreciation of INR
against USD, which is not a good sign for the economy
8.371 7.864
9.285 9.264 9.801
3.891
8.48
10.546
6.331
3.237 3.7
46.6 45.28 44.01 45.17 41.2
43.41 48.32
45.65 50.67
53.37 58.205
0
10
20
30
40
50
60
70
0
2
4
6
8
10
12
2003 2004 2005 2006 2007 2008 2009 2010 2011 2012 2013 Years
GDP growth (annual %) INR/USD
Linear (GDP growth (annual %)) Linear (INR/USD)
51
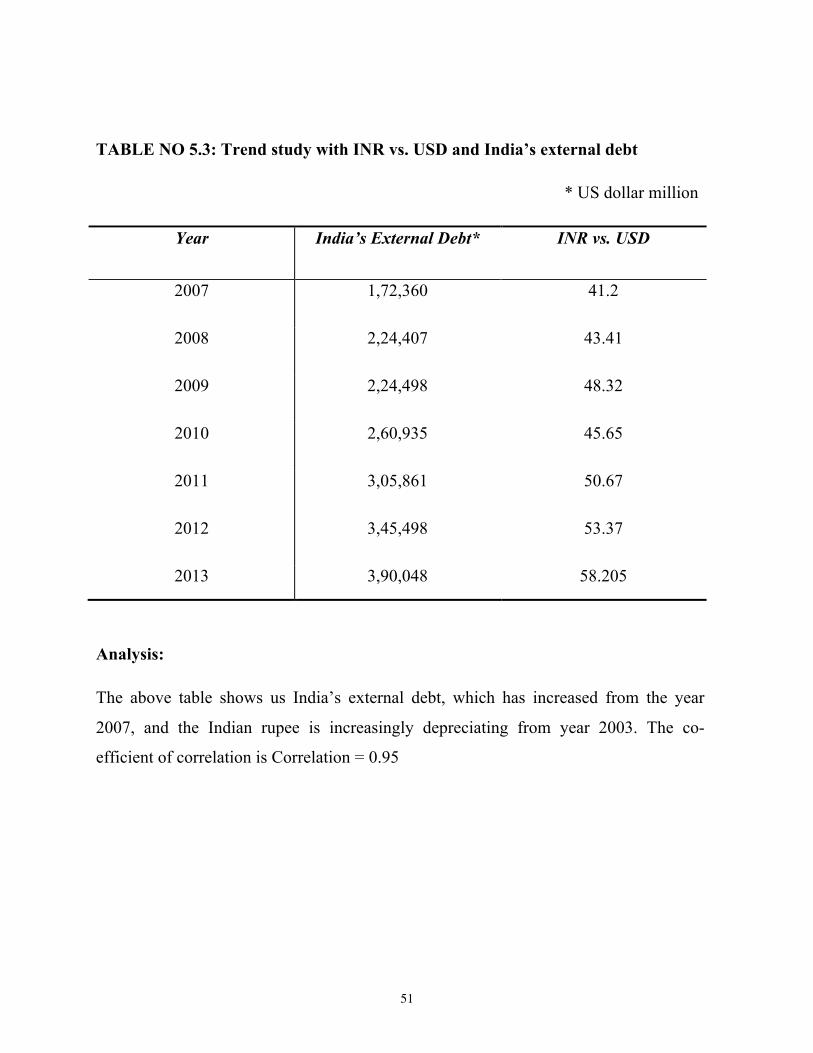
TABLE NO 5.3: Trend study with INR vs. USD and India’s external debt
* US dollar million
Year India’s External Debt* INR vs. USD
2007 1,72,360 41.2
2008 2,24,407 43.41
2009 2,24,498 48.32
2010 2,60,935 45.65
2011 3,05,861 50.67
2012 3,45,498 53.37
2013 3,90,048 58.205
Analysis:
The above table shows us India’s external debt, which has increased from the year
2007, and the Indian rupee is increasingly depreciating from year 2003. The co-
efficient of correlation is Correlation = 0.95
52
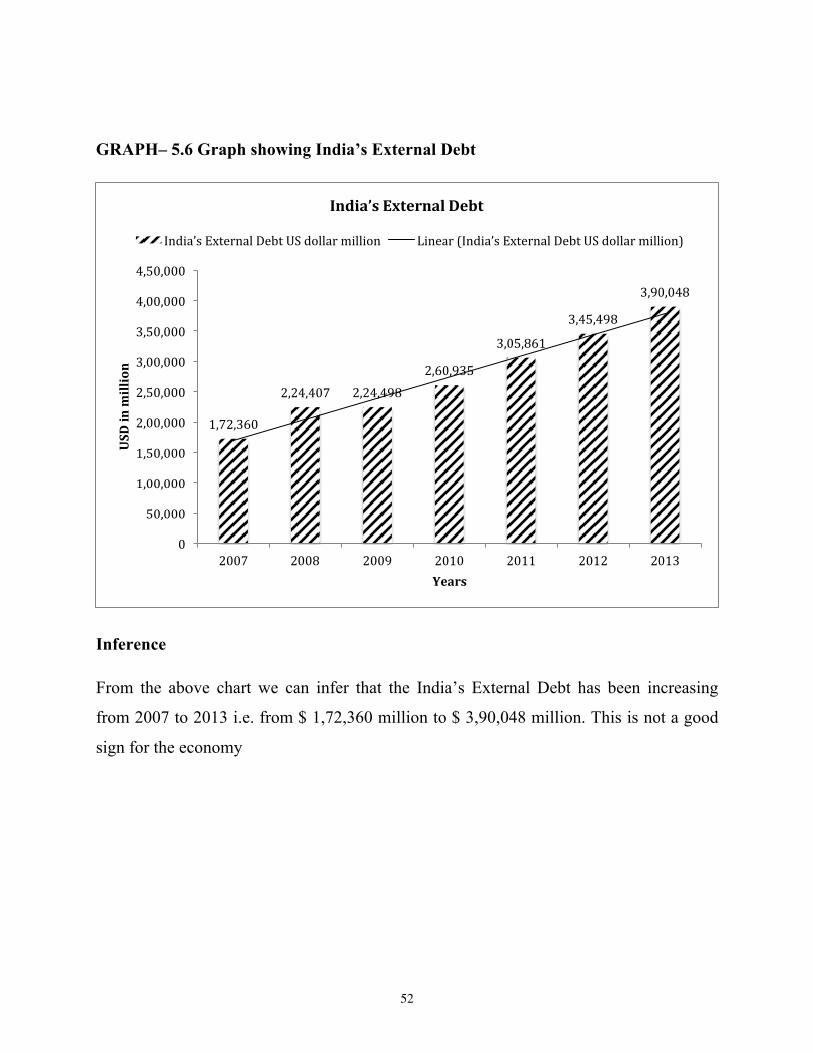
GRAPH– 5.6 Graph showing India’s External Debt
Inference
From the above chart we can infer that the India’s External Debt has been increasing
from 2007 to 2013 i.e. from $ 1,72,360 million to $ 3,90,048 million. This is not a good
sign for the economy
1,72,360
2,24,407 2,24,498 2,60,935
3,05,861
3,45,498
3,90,048
0
50,000
1,00,000
1,50,000
2,00,000
2,50,000
3,00,000
3,50,000
4,00,000
4,50,000
2007 2008 2009 2010 2011 2012 2013
USD in million
Years
India’s External Debt
India’s External Debt US dollar million Linear (India’s External Debt US dollar million)
53
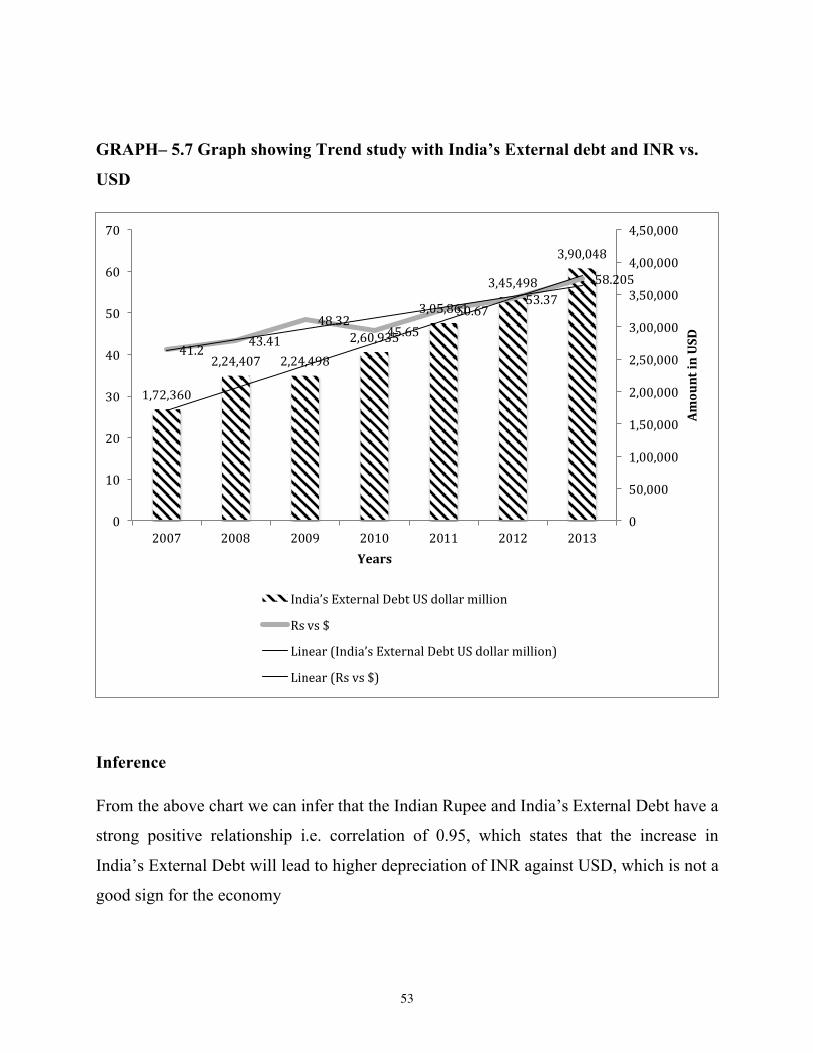
GRAPH– 5.7 Graph showing Trend study with India’s External debt and INR vs.
USD
Inference
From the above chart we can infer that the Indian Rupee and India’s External Debt have a
strong positive relationship i.e. correlation of 0.95, which states that the increase in
India’s External Debt will lead to higher depreciation of INR against USD, which is not a
good sign for the economy
1,72,360
2,24,407 2,24,498
2,60,935
3,05,861
3,45,498
3,90,048
41.2 43.41
48.32 45.65
50.67 53.37
58.205
0
50,000
1,00,000
1,50,000
2,00,000
2,50,000
3,00,000
3,50,000
4,00,000
4,50,000
0
10
20
30
40
50
60
70
2007 2008 2009 2010 2011 2012 2013
Amount in USD
Years
India’s External Debt US dollar million
Rs vs $
Linear (India’s External Debt US dollar million)
Linear (Rs vs $)
54
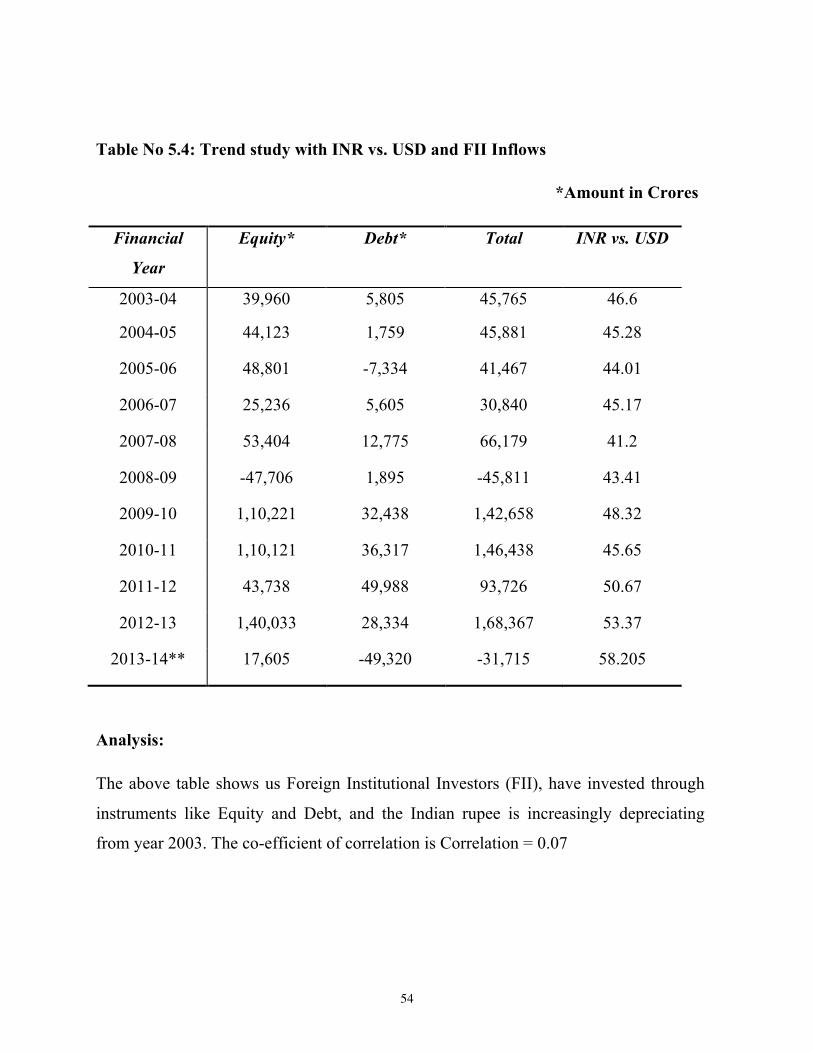
Table No 5.4: Trend study with INR vs. USD and FII Inflows
*Amount in Crores
Financial
Year
Equity* Debt* Total INR vs. USD
2003-04 39,960 5,805 45,765 46.6
2004-05 44,123 1,759 45,881 45.28
2005-06 48,801 -7,334 41,467 44.01
2006-07 25,236 5,605 30,840 45.17
2007-08 53,404 12,775 66,179 41.2
2008-09 -47,706 1,895 -45,811 43.41
2009-10 1,10,221 32,438 1,42,658 48.32
2010-11 1,10,121 36,317 1,46,438 45.65
2011-12 43,738 49,988 93,726 50.67
2012-13 1,40,033 28,334 1,68,367 53.37
2013-14** 17,605 -49,320 -31,715 58.205
Analysis:
The above table shows us Foreign Institutional Investors (FII), have invested through
instruments like Equity and Debt, and the Indian rupee is increasingly depreciating
from year 2003. The co-efficient of correlation is Correlation = 0.07
55
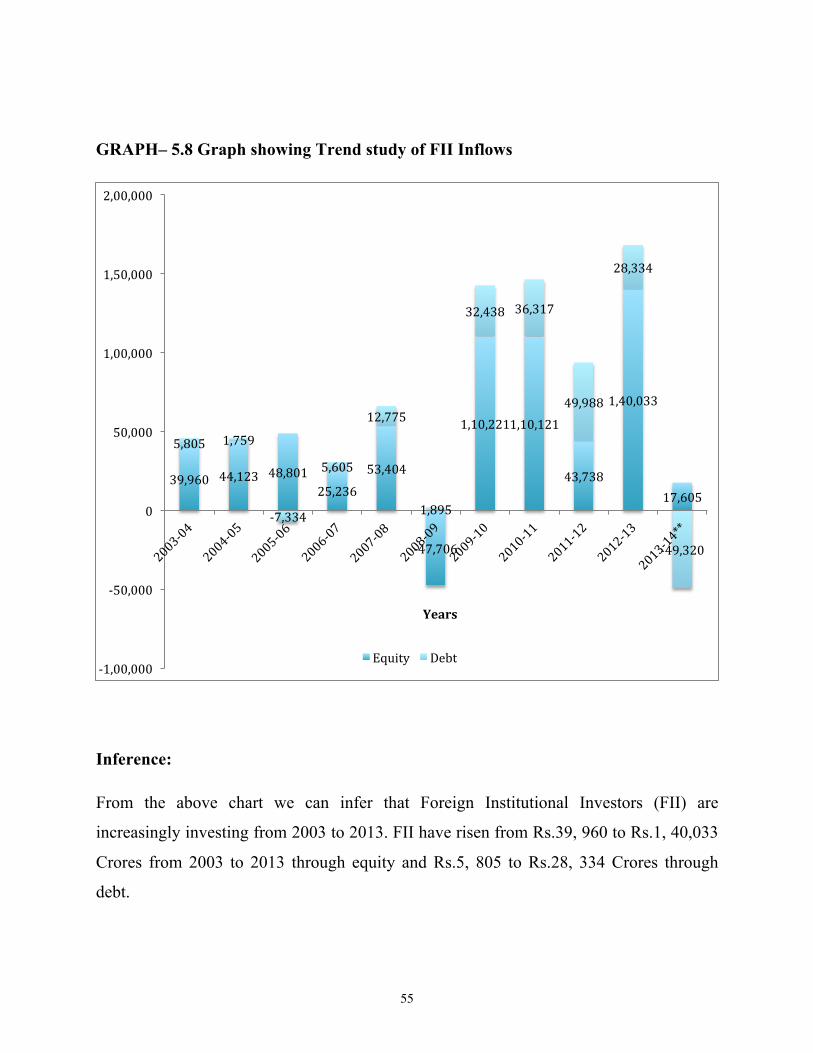
GRAPH– 5.8 Graph showing Trend study of FII Inflows
Inference:
From the above chart we can infer that Foreign Institutional Investors (FII) are
increasingly investing from 2003 to 2013. FII have risen from Rs.39, 960 to Rs.1, 40,033
Crores from 2003 to 2013 through equity and Rs.5, 805 to Rs.28, 334 Crores through
debt.
39,960 44,123 48,801 25,236
53,404
-‐47,706
1,10,221 1,10,121
43,738
1,40,033
17,605
5,805 1,759
-‐7,334
5,605
12,775
1,895
32,438 36,317
49,988
28,334
-‐49,320
-‐1,00,000
-‐50,000
0
50,000
1,00,000
1,50,000
2,00,000
Years
Equity Debt
56
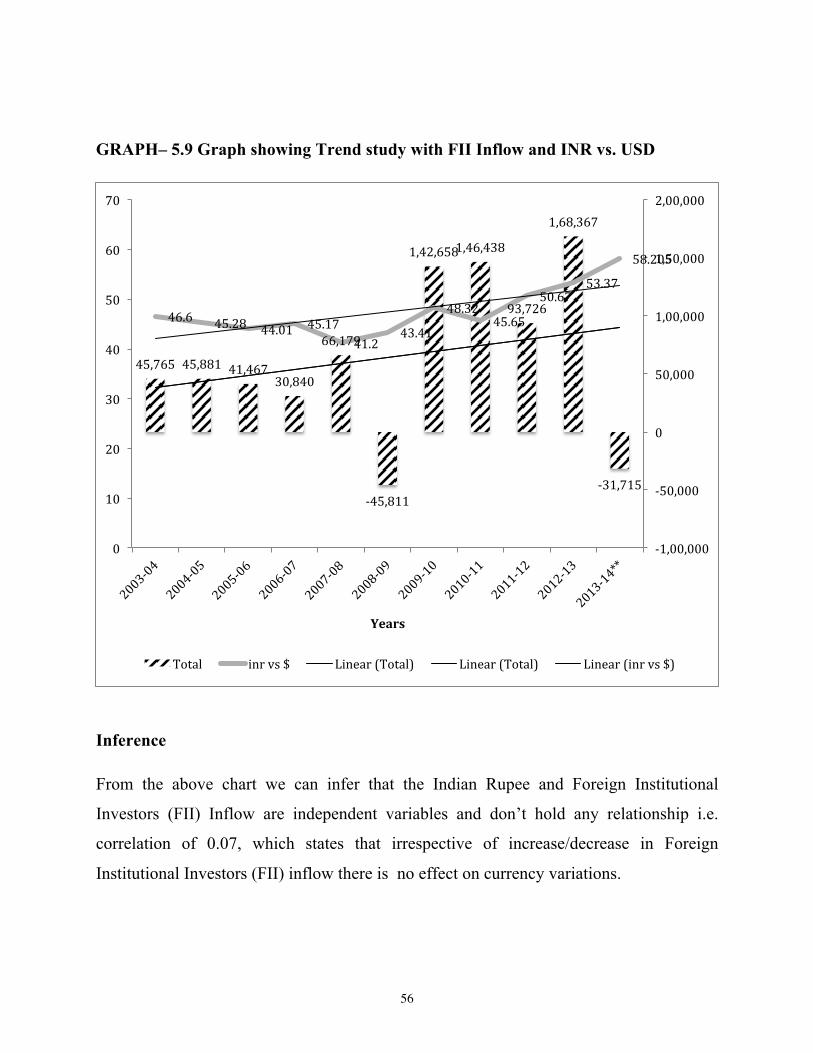
GRAPH– 5.9 Graph showing Trend study with FII Inflow and INR vs. USD
Inference
From the above chart we can infer that the Indian Rupee and Foreign Institutional
Investors (FII) Inflow are independent variables and don’t hold any relationship i.e.
correlation of 0.07, which states that irrespective of increase/decrease in Foreign
Institutional Investors (FII) inflow there is no effect on currency variations.
45,765 45,881 41,467 30,840
66,179
-‐45,811
1,42,658 1,46,438
93,726
1,68,367
-‐31,715
46.6 45.28 44.01 45.17 41.2
43.41
48.32 45.65
50.67 53.37
58.205
-‐1,00,000
-‐50,000
0
50,000
1,00,000
1,50,000
2,00,000
0
10
20
30
40
50
60
70
Years
Total inr vs $ Linear (Total) Linear (Total) Linear (inr vs $)
57
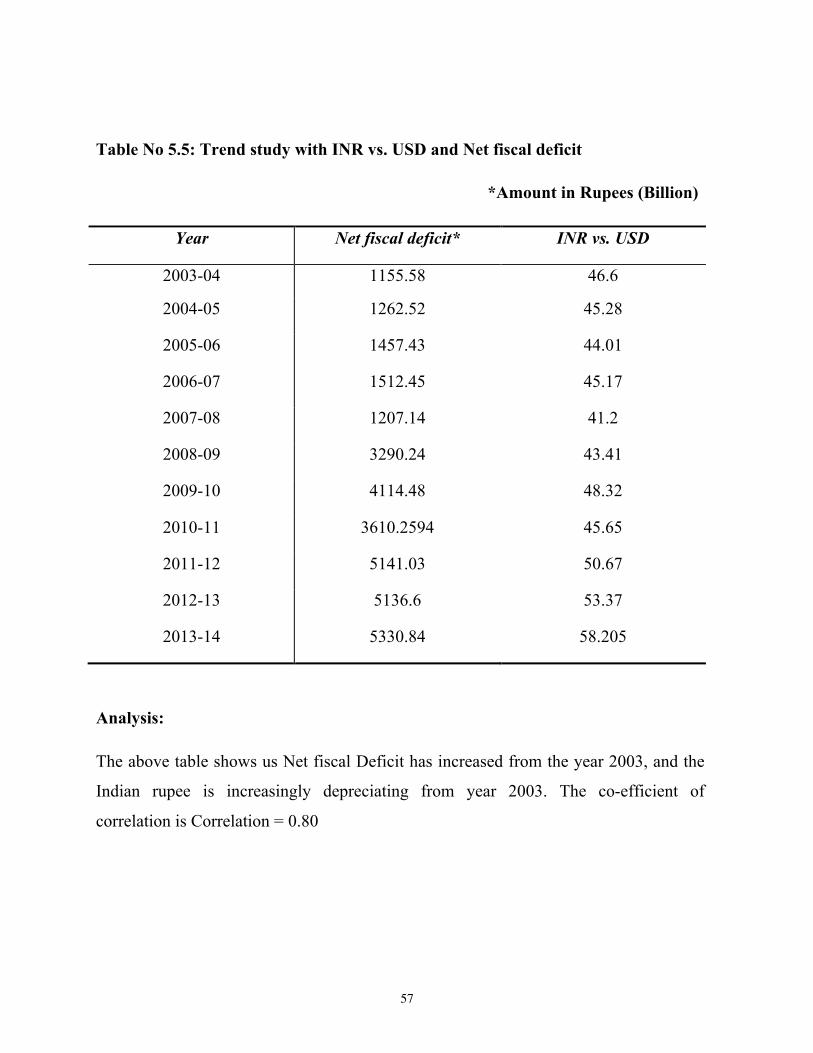
Table No 5.5: Trend study with INR vs. USD and Net fiscal deficit
*Amount in Rupees (Billion)
Year Net fiscal deficit* INR vs. USD
2003-04 1155.58 46.6
2004-05 1262.52 45.28
2005-06 1457.43 44.01
2006-07 1512.45 45.17
2007-08 1207.14 41.2
2008-09 3290.24 43.41
2009-10 4114.48 48.32
2010-11 3610.2594 45.65
2011-12 5141.03 50.67
2012-13 5136.6 53.37
2013-14 5330.84 58.205
Analysis:
The above table shows us Net fiscal Deficit has increased from the year 2003, and the
Indian rupee is increasingly depreciating from year 2003. The co-efficient of
correlation is Correlation = 0.80
58
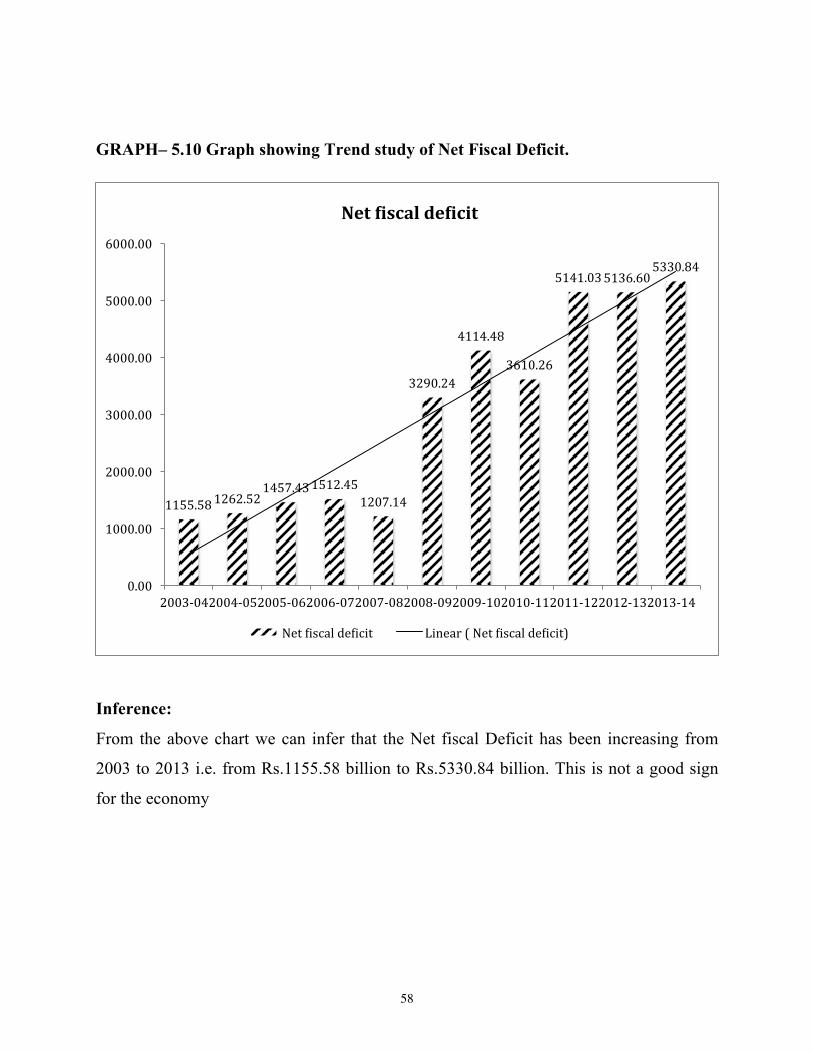
GRAPH– 5.10 Graph showing Trend study of Net Fiscal Deficit.
Inference:
From the above chart we can infer that the Net fiscal Deficit has been increasing from
2003 to 2013 i.e. from Rs.1155.58 billion to Rs.5330.84 billion. This is not a good sign
for the economy
1155.58 1262.52 1457.43 1512.45
1207.14
3290.24
4114.48
3610.26
5141.03 5136.60 5330.84
0.00
1000.00
2000.00
3000.00
4000.00
5000.00
6000.00
2003-‐04 2004-‐05 2005-‐06 2006-‐07 2007-‐08 2008-‐09 2009-‐10 2010-‐11 2011-‐12 2012-‐13 2013-‐14
Net Fiscal deFicit
Net \iscal de\icit Linear ( Net \iscal de\icit)
59
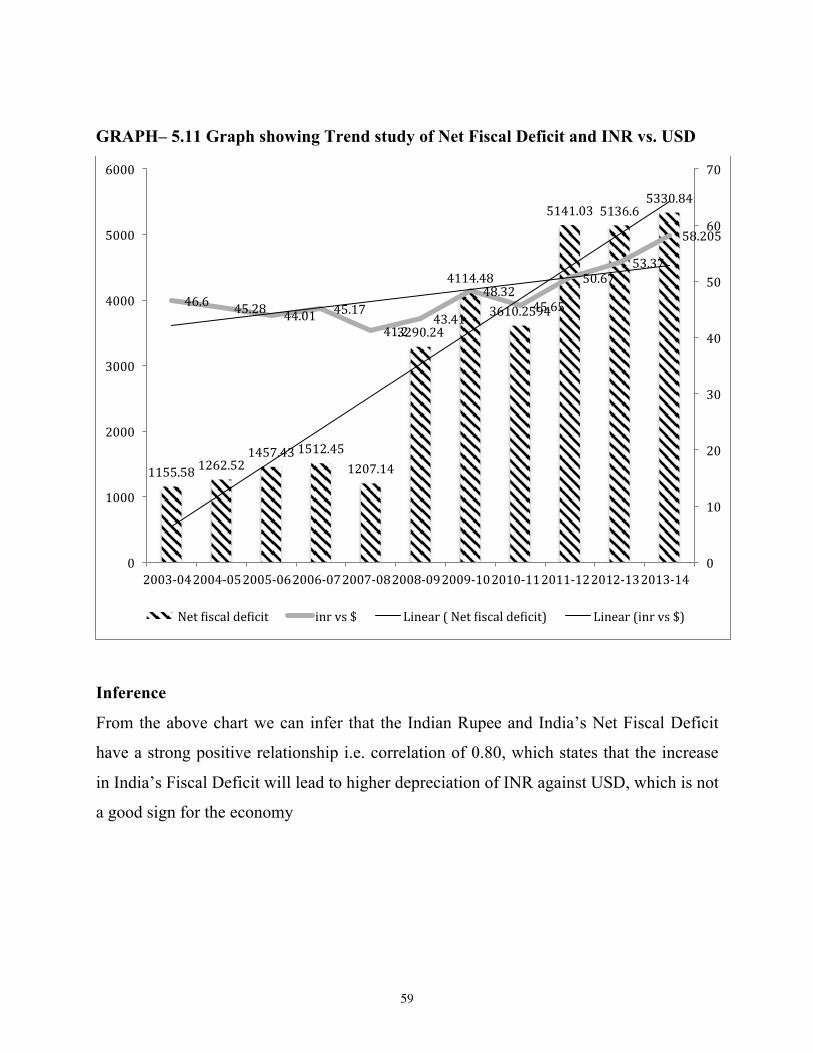
GRAPH– 5.11 Graph showing Trend study of Net Fiscal Deficit and INR vs. USD
Inference
From the above chart we can infer that the Indian Rupee and India’s Net Fiscal Deficit
have a strong positive relationship i.e. correlation of 0.80, which states that the increase
in India’s Fiscal Deficit will lead to higher depreciation of INR against USD, which is not
a good sign for the economy
1155.58 1262.52 1457.43 1512.45
1207.14
3290.24
4114.48
3610.2594
5141.03 5136.6 5330.84
46.6 45.28 44.01 45.17
41.2 43.41
48.32 45.65
50.67 53.37
58.205
0
10
20
30
40
50
60
70
0
1000
2000
3000
4000
5000
6000
2003-‐04 2004-‐05 2005-‐06 2006-‐07 2007-‐08 2008-‐09 2009-‐10 2010-‐11 2011-‐12 2012-‐13 2013-‐14
Net \iscal de\icit inr vs $ Linear ( Net \iscal de\icit) Linear (inr vs $)
60
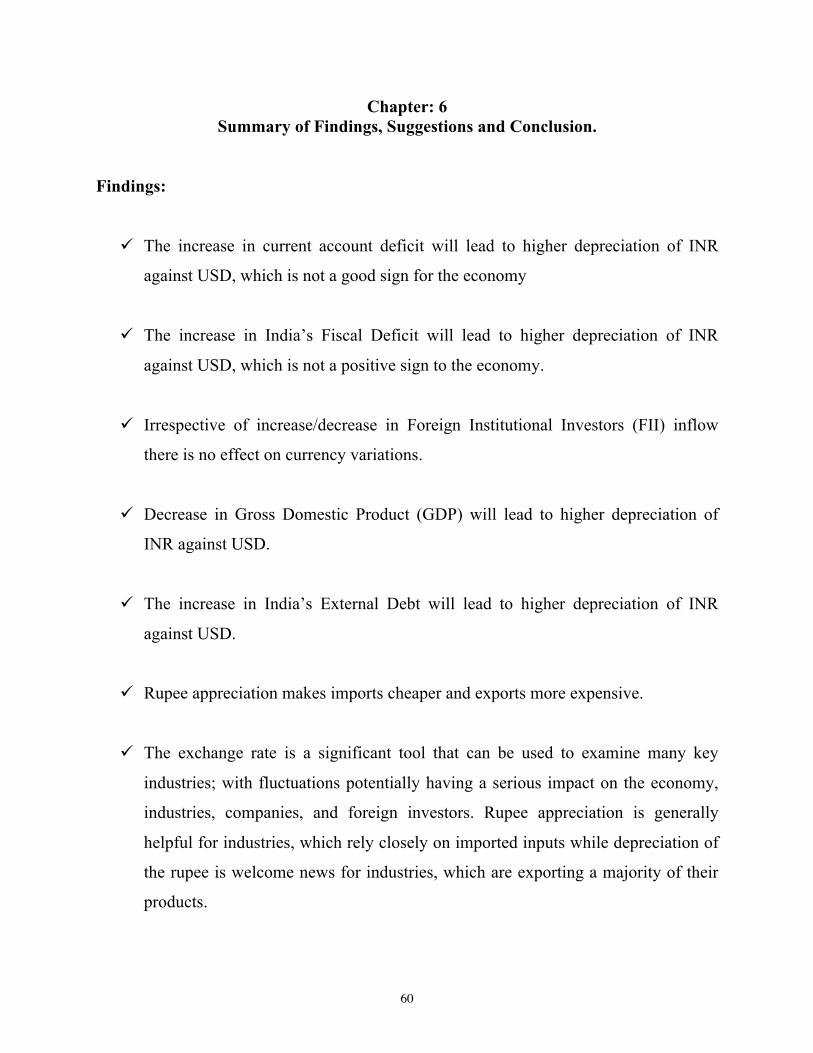
Chapter: 6 Summary of Findings, Suggestions and Conclusion.
Findings:
ü The increase in current account deficit will lead to higher depreciation of INR
against USD, which is not a good sign for the economy
ü The increase in India’s Fiscal Deficit will lead to higher depreciation of INR
against USD, which is not a positive sign to the economy.
ü Irrespective of increase/decrease in Foreign Institutional Investors (FII) inflow
there is no effect on currency variations.
ü Decrease in Gross Domestic Product (GDP) will lead to higher depreciation of
INR against USD.
ü The increase in India’s External Debt will lead to higher depreciation of INR
against USD.
ü Rupee appreciation makes imports cheaper and exports more expensive.
ü The exchange rate is a significant tool that can be used to examine many key
industries; with fluctuations potentially having a serious impact on the economy,
industries, companies, and foreign investors. Rupee appreciation is generally
helpful for industries, which rely closely on imported inputs while depreciation of
the rupee is welcome news for industries, which are exporting a majority of their
products.
61
Suggestion/steps to control excessive fluctuations
ü The government should guarantee minimum exchange rate and if the market
moves sharply against the exporters then they should be compensated with
subsidy.
ü A range may be fixed around a particular rate say 4% around Rs.60 and the rupee
movement should be restricted around that range.
ü Hedging of currency is another option, which needs to be made popular in India.
It can be done in various ways like forward contracts or buying options. Forward
contract is the one in which future price is locked in. It can really provide
safeguard against risk and help to survive in foreign market. Small and medium
enterprises should be allowed to book forward contract without underlying
exposures or past records of export or import.
ü Incentives should be given to control cost and to remain competitive in the global
market.
ü Forecasting is required for floating currencies by planners of long run horizons. It
should take into account exchange rate system, forecast horizons [may be short,
medium or long run] and exchange rate units. Accuracy, correlation with actual
value and degree of predictability should also be taken into account.
ü Government needs to rework its economic policy and the firms, their business
models and strategies for their success in the fluctuating foreign market.
ü Weaker rupee is not the only solution to boost our export; in fact we should try to
consider other factors like improving infrastructure, lower interest rate for working
62
capital finance, improvement in global demand and increasing competitiveness in
global market.
ü At global level attention should be given to real assets such as gold, commodities
and real assets.
ü If we really wish to confine the variability of our exchange rate to a relatively
lower range, we need to make frequent use of monetary policy provided we can
keep into account its domestic impacts also in mind.
63
Conclusion:
The rupee’s decline affects everyone in the economy because it feeds directly and
indirectly into general inflation, which is a continuing problem even as output growth
decelerates, and therefore hits common people hard. There are several ways in which the
falling rupee immediately has an inflationary impact, one of the most important of which
is the price of energy. Since the misguided decontrol of oil prices, it is not only the
globally traded price of fuel but also the exchange rate that determines domestic oil
prices. Going by the way the economies in the euro zone and the US have been behaving,
it would be naive to expect that the export earnings would be contributing significantly to
foreign exchange inflows in the near future. The govt should concentrate On correcting
the economic fundamentals rather than indulge in soap operas in a run up to the election.
A better co-ordination with RBI is required rather than blame game. Apart from all the
political parties should come together in fixing the problem and getting back the investors
confidence.