chapter # 01 introduction
TRANSCRIPT

Chapter # 01
INTRODUCTION:
1.1 About The Project:
This project is about the financial evaluation of cement industry. There is a lot of opportuinities
available in the cement sector.To avail this opprtuinty we will decide to find out what growth at
future prospect of cement industry available to investors. First of all we have taken the share prices
of all cement companies from the kse 100 index of last two years and then compare it with the kse
100 index prices and find the market return and through these prices we find the variance and
covariance between market and securities and with the help of this variance and covariance we
find beta of the whole sector. Through kse 100 index we find the market rate (y). Then we use that
beta in capital asset pricing model to find the required rate of return. Then we use that required rate
of return in Weighted Average Cost Of Capital and find the discount rate of 16 different
companies and at the end, we will take industy average use that discount rate in capital budgeting
techniques and see whether the project is suitable to make investment in them or not.
1.2 Selection Of Cement Sector:
Pakistan is exporting cement to India, Afghanistan and middle East. There is a large opportunity
available in this sector where we can earn profit and expand our business. There are also entry
barrier faced by the investors because of heavy initial amount of investment is required and current
political situation. Cement sector is growing about 36% in previous year this growth is expected in
future as well, as industry growth and profit of companies are encouraging for us to find out the
real situation to make or break it.
1.3 Significance Of Study:
Due to the political and law order situation the investor does not invest in pakistan. Two things can
attract the investor,
1. Profit
2. Growth
1
The profit of cement industry is very high in Pakistan. The companies in this industry are earning
huge profits in millions.
This study finds out the current opportunities available in the cement industry and the significance
of their investment in cement sector. We hope that this study will help investors who are willing to
invest and get the short return.
1.4 Objectives Of Study:
Understanding and application of five different capital budgeting tools and techniques to
invest in project
To have complete know how about the capital budgeting process
1.5 History Of Cement Industry:
Growth of cement industry is rightly considered a barometer for economic activity. In 1947,
Pakistan had inherited 4 cement plants with a total capacity of 0.5 million tons. Some expansion
took place in 1956-66 but could not keep pace with the economic development and the country had
to resort to imports of cement in 1976-77 and continued to do so till 1994-95. The industry was
privatized in 1990 which led to setting up of new plants. Although an oligopoly market, there
exists fierce competition between members of the cartel today. Cement is one of the most
important industries of Pakistan. Limestone and gypsum are the main raw materials for
manufacturing of cement and they are present in abundance in Pakistan along with good supply of
Natural gas. Cement is one of major industries of Pakistan. Pakistan is rich in cement raw material.
Currently many cement plants are operating in private sector. Pakistan Cement Industry has huge
potential for export of cement to neighbouring countries like India, U.A.E, Afghanistan, Iraq &
Russian States. There has been a robust growth of cement demand seen both in domestic and
exports market during the financial year ended June 30, 2009. The industry achieved an overall
growth of 36% with domestic demand of cement increased by 24.95% whereas the exports
increased by 111.86%. The overall growth achieved by many cement factories for the year under
review was 111.29% consisting of domestic and export markets at 71.02% and 335.12%
respectively.
2

Pakistan Cement industry has been successful to capture export markets of various GCC and
African countries which are new markets for the Country other than the conventional export
markets of Afghanistan and Iraq.
Source: www.cement.com.pk/
Cement is the adhesive which holds the construction material such as bricks and tiles. But more
importantly it is the largest contributor to the modern miracle we refer to as concrete.
We would not be touching on too many details in this post. After all, as with all other topics, we
are now in the “grazing the field” mode. The article hopes to create awareness on this subject of
cements along with a few details on choosing the grade.
1.5.1 Types of Cement
Broadly speaking there are two categories of cement.
1. Ordinary Portland cement
2. Blended/composite cement
3
Portland cement
This type of cement is prepared by grinding clinker along with gypsum. This is available in several
grades such as 33, 43, and 53. This type of cement can be used for all normal work.
So, the higher the grade, the more compressive strength your building would have.
Blended/composite cement
In this type of cement, high-quality clinker is inter-ground with gypsum and a performance
enhancing cementitious material such as slag or Pozzolana. It comprises Portland slag cement or
Fly-ash-based Portland Pozzolana cement. It may be used in all general construction such as
concreting, brick joining, plaster and special construction. It gives the concrete better long-term
strength and durability.
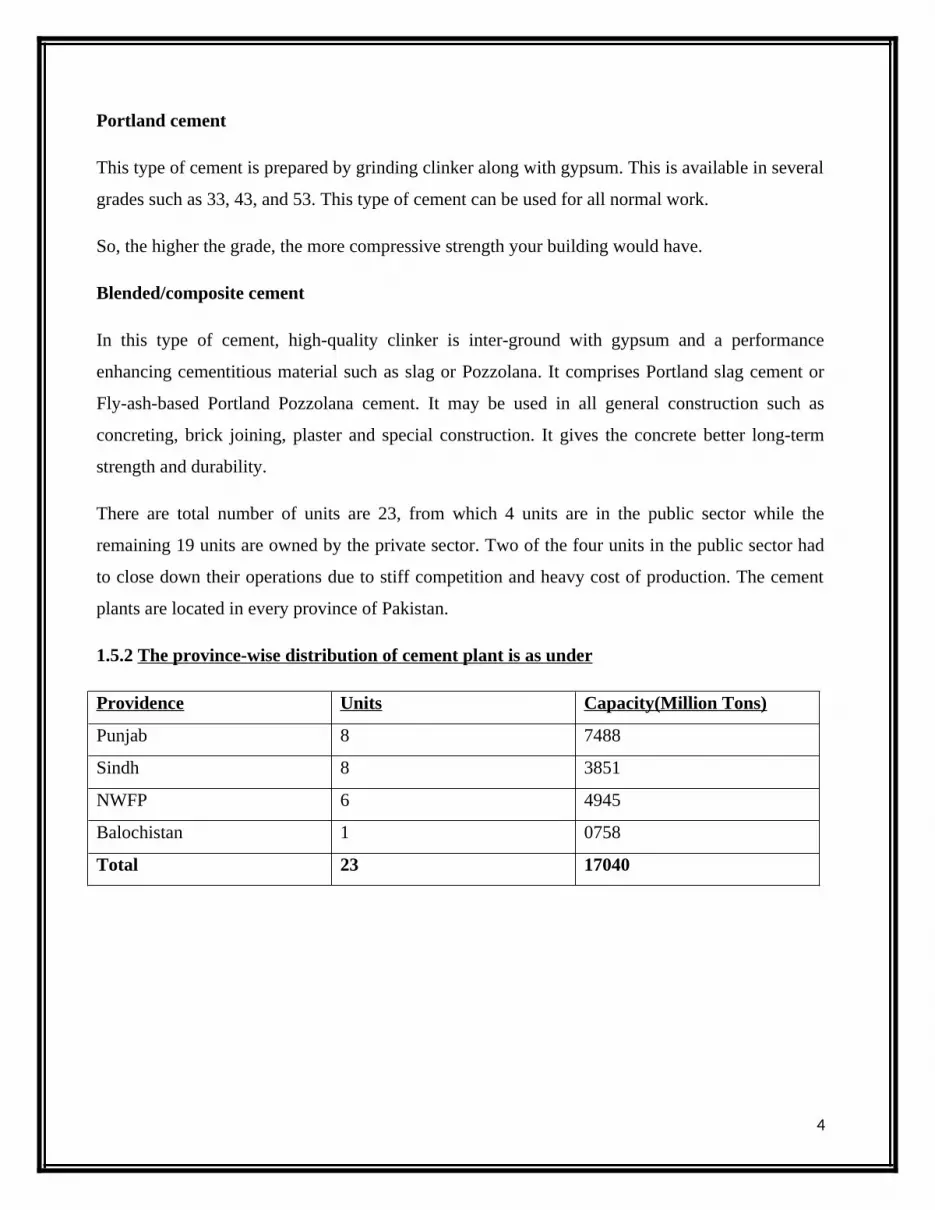
There are total number of units are 23, from which 4 units are in the public sector while the
remaining 19 units are owned by the private sector. Two of the four units in the public sector had
to close down their operations due to stiff competition and heavy cost of production. The cement
plants are located in every province of Pakistan.
1.5.2 The province-wise distribution of cement plant is as under
Providence Units Capacity(Million Tons)
Punjab 8 7488
Sindh 8 3851
NWFP 6 4945
Balochistan 1 0758
Total 23 17040
4

Source: www.cement.com.pk/
5

Chapter # 02
METHODOLOGY:
We have evaluate this project on the basis of cash flows.
2.1 Estimation Of Cash Flows:
Cash flow estimation is an important tool for any kind of investment decision. There are many
variables involved but the most important are the company future sales growth and profit margin.
The capital budgeting techniques such as payback period, net present value, internal rate of return
and profitability index can be prepared through these three parts of cash flows estimation. These
parts are as follows;
2.1.2 Parts of Cash Flows:
1. Initial Cash Outlay
2. Interim Cash Flow
3. Terminal Cash Flow
2.1.2.1 Initial Cash Outlay:
Initial cash outlay includes the capital expenditures which we incurred at the beginning of the
business. These capital expenditures includes land, building, machinery and other assets. Through
initial cash outlay, We check investment required to start a particular business. Large project
require more working capital such as cost of inventory etc.The intial cash outlay is obtain by
adding the capital expenditure with the net working capital.
Assumption Of Initial Cash Outlay:
We have analyze the financial statements of all the cement sector companies and compare with
each other and then find the most recent constructed company i-e bestway and use its financial
statement as a base and then it increase 15% inflation and use that in our initial cash outlay.
6

2.1.2.2 Interim Cash Flow:
The amount of net savings comes after the deducting of cost of sales and other operating,
administrative and distribution expenses from the net sales. Then we will subtract the non cash
expense (depreciation & amortization) from these net savings the result we get the profit before tax
and the tax is charge on this profit and get profit after taxation. At the end we will added back the
depreciation in net profit after taxation to get the free interim cash flow.
Assumption Of Interim Cash Flow:
To anlzyze the average sales and the expenses incurred by all companies we will get the
incremental cash flow and that incremental cash flow will increase with the 15% Inflation rate in
each year upto tenth year.
2.1.2.3 Terminal Cash Flow:
The interim cash flow we will get at the end of the terminal year if there is any salvage or residual
value of asset will left we will add in them and the tax is charged on the selling of the capital asset
will less from that amount and if there is increase or decrease in net working capital we will add or
subtract from that and finally we get the terminal cash flow.
Assumption Of Terminal Cash Flow:
We will assume that value of our plant & machinery will increase 15% profit on cost and property
value will increase 40% profit on cost after the terminal year of the project.
2.2 Discounted Rate:
First of all we have taken the share prices of all cement companies from the kse 100 index of last
two years and then compare it with the kse 100 index prices and find the market return and through
these prices we find the variance and covariance between market and securities and with the help
of this variance and covariance we find beta of the whole companies. Through kse 100 index we
find the market rate (y). we use that beta in capital asset pricing model to find the required rate of
return. Then we use that required rate of return in Weighted Average Cost Of Capital and find the
discount rate of 16 different companies and at the end, we will take industy average use that
discount rate in capital budgeting techniques.
7

2.3 Tools and Techniques:
There are different methods of capital budgeting which we will use to evaluate the cement sector.
These are
1. Payback period method
2. Discounted Payback period
3. Net Present Value
4. Internal Rate of return
5. Profitability Index
2.3.1 Payback Period Method:
It is a tool of analysis that in how much period the initial investment of the project will return
back. The payback period does not use to measure the profitability of the project. It will also
ignore the time value of money.
2.3.2 Discounted Payback period:
Discounted payback period tells us that in how many number of years will it be undertaken the
initial expenditure. The advantages of discounted payback method is that it should not ignoring
time value of money.
2.3.3 Net Present Value:
Net present value will come after deducting the initial cash outflow from the present value of cash
inflows. It is one of an important tool to evaluate the project whether the project will be profitable
for us or not. If the Net present value of the project is positive then the project will be accepted. If
it is negative the project will not be suitable to make investment in them.
8

2.3.4 Internal Rate of return:
It is the discount rate where the negative cash flows of investment will be equal to the positive
cash flows of investment.The more the internal rate of return the more the profitable it will be the
project. To find the internal rate of return we assume two different which one give value higher to
the initial cash outlay and other value will be lower than that and use that values and rates in
interpolation and get internal rate of return.
2.3.5 Profitability Index:
Profitability index is an important tool which gives the relationship between the cost and the net
present value. If the Profitability index will be 1 or more than 1, the project will be acceptable for
investment and if it is less than 1 it means that the net present value will be less than initial cash
ouflow. Higher the profitability index higher the profit.
2.4 Acceptance Criteria Of Project:
We select the project on the basis of two major capital budgeting techniques.
1. Net Present Value or (NPV)
2. Internal Rate Of Return or (IRR)
It is one of an important tool to evaluate the project whether the project will be profitable for us or
not. If the Net present value of the project is positive then the project will be accepted. If it is
negative the project will not be suitable to make investment in them.
It is the discount rate where the negative cash flows of investment will be equal to the positive
cash flows of investment.The more the internal rate of return the more the profitable it will be the
project. The higher the internal rate of return, the more the profitable the project will be.
Note:
We mostly use the internal rate of return (IRR) while selecting the project but in case of capital
rationing the Profitability index (PI) will be used to make the project desirable.
9

Chapter # 03
CASH FLOWS:
3.1 INITIAL CASH OUTLAY: Rs in “000”
Table # 1
Land 779018
Plant and Machinery 19828304
Furniture and fixtures 44687
Building 6208733
Computer and Accessories 50758
Quarry Equipments 840973
Office Equipments 104924
Vehicle including(cement bulkers) 686211
Generators 9055280
Other Assets (Lab Equipment etc) 156618
Add: Working Capital 2008777
Initial Cash Outlay 39,764,283
We have analyze the financial statements of all the cement sector companies and compare to each
other and then find the most recent constructed company i-e bestway and use its financial
statement as a base and then it increase 15% inflation and use that in our initial cash outlay.
10

3.2 INTERIM CASH FLOW: (RS in “000”)
Table # 2
No.of
years
1 2 3 4 5 6 7 8 9 10
Increme
ntal
cash
flow RS 3,677,884 4,229,567 4,864,002 5,593,602 6,432,642 7,397,538 8,507,169 9,783,245 11,250,731 12,938,341
Depreci
ation (-) 2281593 2110715 1954913 1812616 1682448 1563195 1453789 1353281 1260830 1175686
Profit
before
tax= 1,396,291 2,118,852 2,909,089 3,780,986 4,750,194 5,834,343 7,053,380 8,429,964 9,989,901 11,762655
Paid tax
35 %
(-) 488702 741598.2 1018181 1323345 1662568 2042020 2468683 2950487 3496465 4116929
Profit
After
tax= 907,589 1,377,254 1,890,908 2,457,641 3,087,626 3,792,323 4,584,697 5,479,477 6,493,436 7,645,726
Depreci
ation
added
back 2281593 2110715 1954913 1812616 1682448 1563195 1453789 1353281 1260830 1175686
Net cash
flow
(RS) 3,189,182 3,487,969 3,845,821 4,270,257 4,770,074 5,355,518 6,038,486 6,832,758 7,754,266 8,821,412
After preparing the initial cash outlay the next step is interim cash flow. It is prepared by
subtracting the non cash expenses i.e depreciation from the incremental cash flow and get profit
before tax and then deducted the tax paid from the profit before tax and find the profit after tax and
at the end we added back the amount of depreciation and find the net cash flow.
3.2.1 Computation of Incremental cash flow: (RS in “000”
11
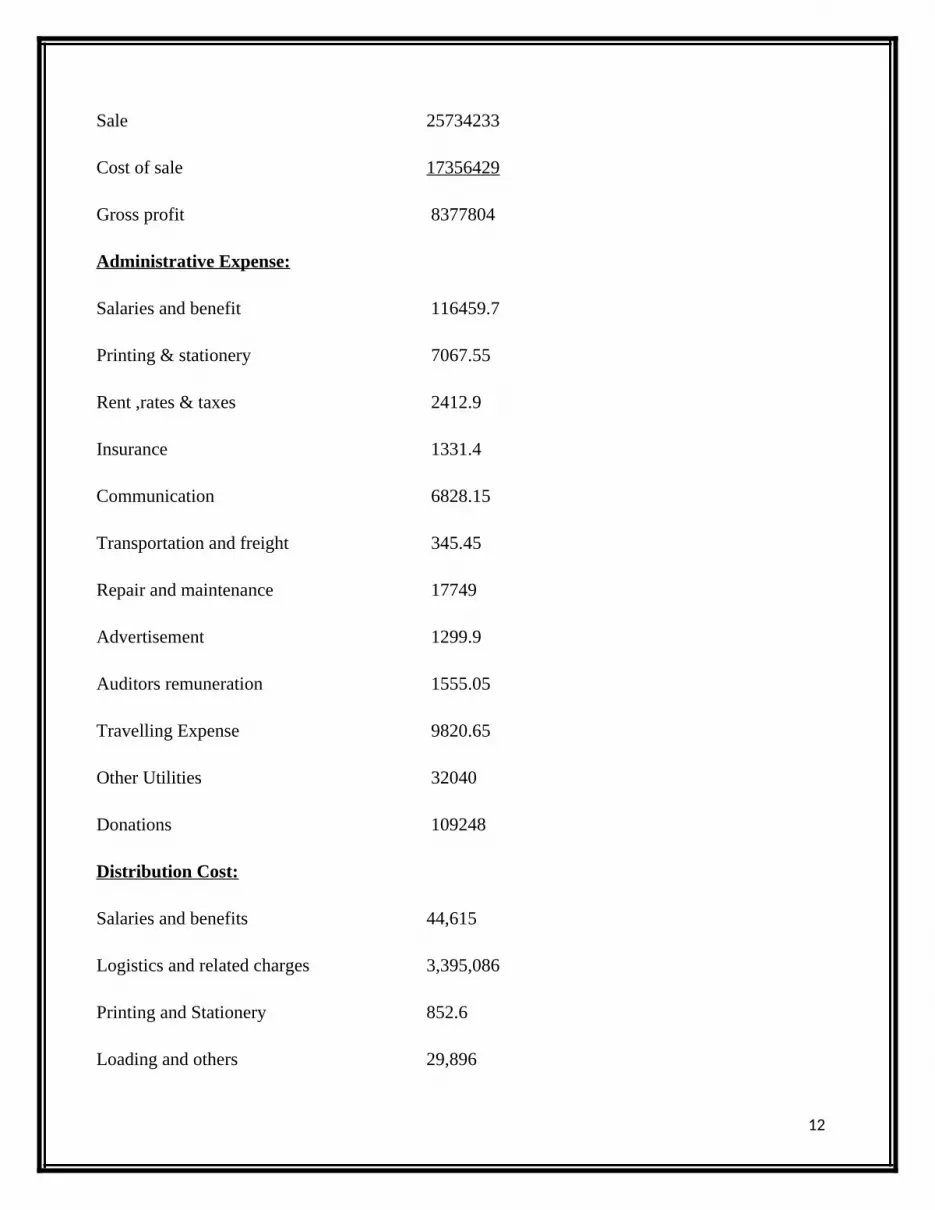
Sale 25734233
Cost of sale 17356429
Gross profit 8377804
Administrative Expense:
Salaries and benefit 116459.7
Printing & stationery 7067.55
Rent ,rates & taxes 2412.9
Insurance 1331.4
Communication 6828.15
Transportation and freight 345.45
Repair and maintenance 17749
Advertisement 1299.9
Auditors remuneration 1555.05
Travelling Expense 9820.65
Other Utilities 32040
Donations 109248
Distribution Cost:
Salaries and benefits 44,615
Logistics and related charges 3,395,086
Printing and Stationery 852.6
Loading and others 29,896
12

Rent, rates and taxes 6,864
Repairs 16379
Fee subscription and periodicals 636
Entertainment 609
Sales Promotion and advertisement 10,199
Insurance 11,442
Other distribution cost 10874
Add: Finance Cost 597643
Other Charges 270663
Other Operating Income (1997)
Incremental Cash Flow 3,677,884
To analyze the financial statements of cement companies and check the trend of previous three
year sales to how much it will increase or decrease every year and on the basis of this assumption
we will find that the average sale of all companies will decrease upto 10 to 15%.
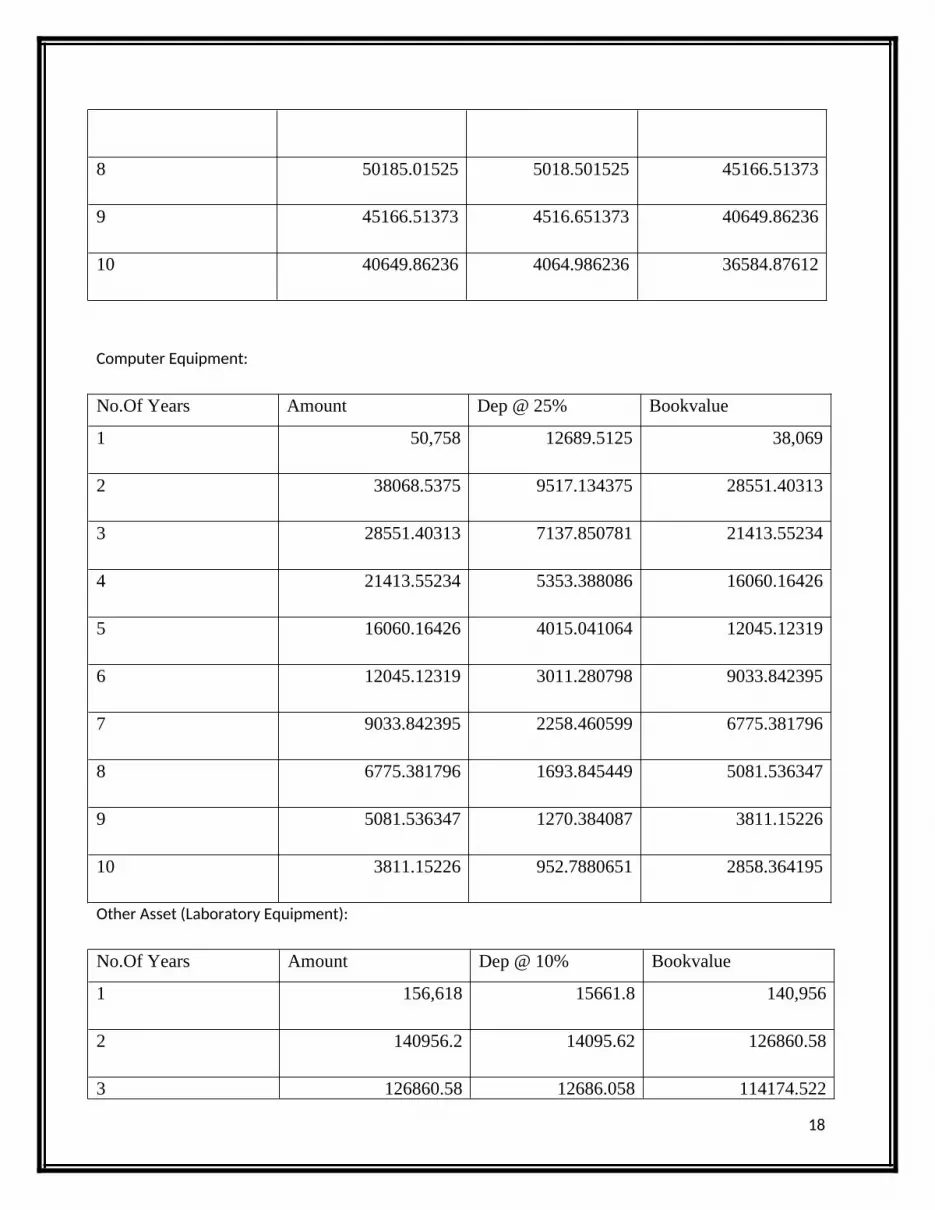
3.2.2 COMPUTATION OF DEPRECIATION: (RS in “000”)
13

Building:
No.Of Years Amount Dep @ 5% Bookvalue
1 6,208,733 310436.6475 5,898,296
2 5,898,296 294914.8151 5,603,381
3 5603381.487 280169.0744 5323212.413
4 5323212.413 266160.6207 5057051.792
5 5057051.792 252852.5896 4804199.203
6 4804199.203 240209.9601 4563989.243
7 4563989.243 228199.4621 4335789.78
8 4335789.78 216789.489 4119000.291
9 4119000.291 205950.0146 3913050.277
10 3913050.277 195652.5138 3717397.763
Plant & Machinery:
No.Of Years Amount Dep @ 5% Bookvalue
1 19828303.95 991415.1975 18836888.75
2 18836888.75 941844.4376 17895044.31
3 17895044.31 894752.2157 17000292.1
4 17000292.1 850014.605 16150277.49
5 16150277.49 807513.8747 15342763.62
6 15342763.62 767138.181 14575625.44
7 14575625.44 728781.2719 13846844.17
8 13846844.17 692342.2083 13154501.96
14

9 13154501.96 657725.0979 12496776.86
10 12496776.86 624838.843 11871938.02
Generator:
No.Of Years Amount Dep @ 10% Bookvalue
1 9,055,280 905527.98 8,149,752
2 8149751.82 814975.182 7334776.638
3 7334776.638 733477.6638 6601298.974
4 6601298.974 660129.8974 5941169.077
5 5941169.077 594116.9077 5347052.169
6 5347052.169 534705.2169 4812346.952
7 4812346.952 481234.6952 4331112.257
8 4331112.257 433111.2257 3898001.031
9 3898001.031 389800.1031 3508200.928
10 3508200.928 350820.0928 3157380.835
Quarry Equipment:
No.Of Years Amount Dep @5% Bookvalue
1 840,973 42048.6675 798,925
2 798924.6825 39946.23413 758978.4484
3 758978.4484 37948.92242 721029.526
4 721029.526 36051.4763 684978.0497
15
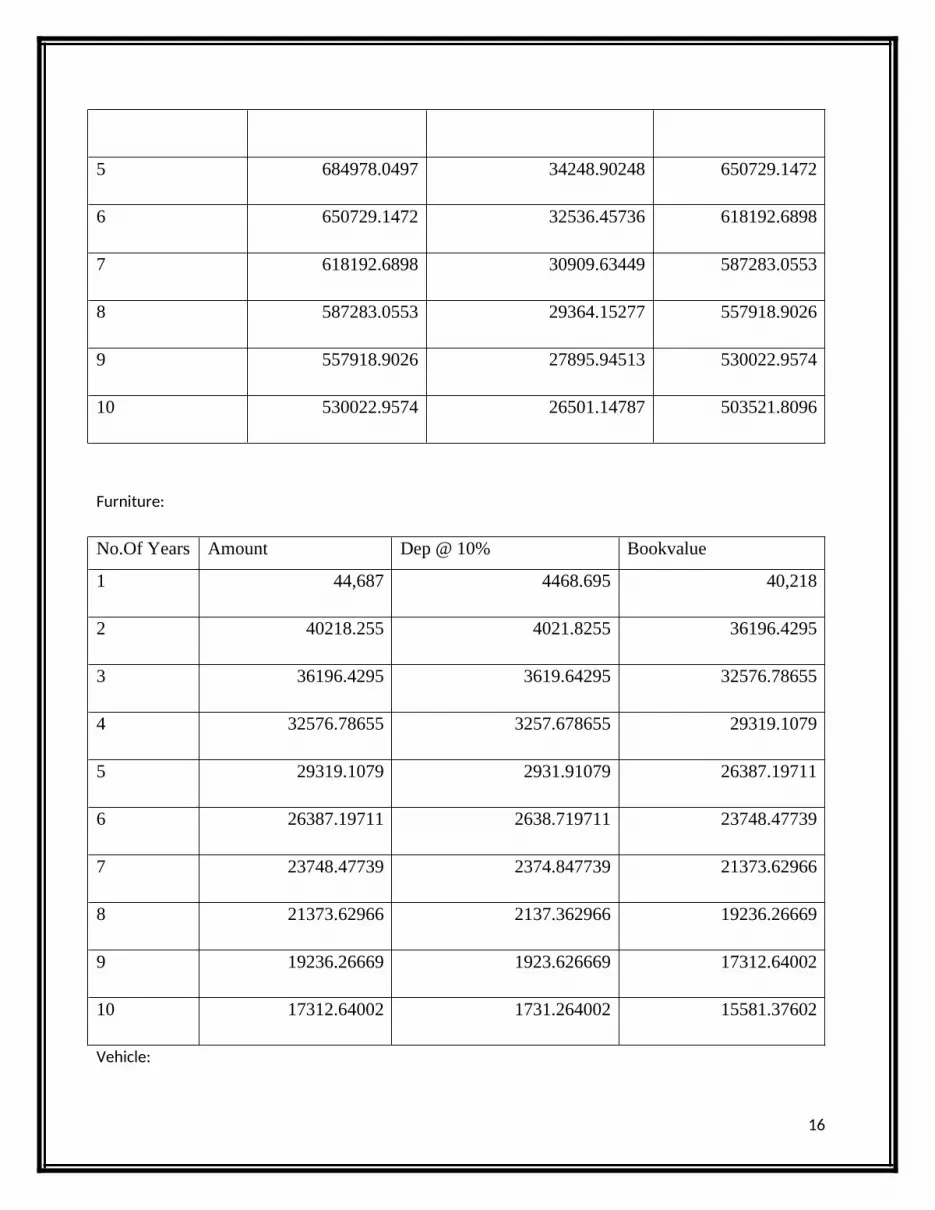
5 684978.0497 34248.90248 650729.1472
6 650729.1472 32536.45736 618192.6898
7 618192.6898 30909.63449 587283.0553
8 587283.0553 29364.15277 557918.9026
9 557918.9026 27895.94513 530022.9574
10 530022.9574 26501.14787 503521.8096
Furniture:
No.Of Years Amount Dep @ 10% Bookvalue
1 44,687 4468.695 40,218
2 40218.255 4021.8255 36196.4295
3 36196.4295 3619.64295 32576.78655
4 32576.78655 3257.678655 29319.1079
5 29319.1079 2931.91079 26387.19711
6 26387.19711 2638.719711 23748.47739
7 23748.47739 2374.847739 21373.62966
8 21373.62966 2137.362966 19236.26669
9 19236.26669 1923.626669 17312.64002
10 17312.64002 1731.264002 15581.37602
Vehicle:
16

No.Of Years Amount Dep @ 15% Bookvalue
1 686,211 102931.605 583,279
2 583279.095 87491.86425 495787.2308
3 495787.2308 74368.08461 421419.1461
4 421419.1461 63212.87192 358206.2742
5 358206.2742 53730.94113 304475.3331
6 304475.3331 45671.29996 258804.0331
7 258804.0331 38820.60497 219983.4282
8 219983.4282 32997.51422 186985.9139
9 186985.9139 28047.88709 158938.0268
10 158938.0268 23840.70403 135097.3228
Office Equipment:
No.Of Years Amount Dep @ 10% Bookvalue
1 104,924 10492.44 94,432
2 94431.96 9443.196 84988.764
3 84988.764 8498.8764 76489.8876
4 76489.8876 7648.98876 68840.89884
5 68840.89884 6884.089884 61956.80896
6 61956.80896 6195.680896 55761.12806
7 55761.12806 5576.112806 50185.01525
17
8 50185.01525 5018.501525 45166.51373
9 45166.51373 4516.651373 40649.86236
10 40649.86236 4064.986236 36584.87612
Computer Equipment:
No.Of Years Amount Dep @ 25% Bookvalue
1 50,758 12689.5125 38,069
2 38068.5375 9517.134375 28551.40313
3 28551.40313 7137.850781 21413.55234
4 21413.55234 5353.388086 16060.16426
5 16060.16426 4015.041064 12045.12319
6 12045.12319 3011.280798 9033.842395
7 9033.842395 2258.460599 6775.381796
8 6775.381796 1693.845449 5081.536347
9 5081.536347 1270.384087 3811.15226
10 3811.15226 952.7880651 2858.364195
Other Asset (Laboratory Equipment):
No.Of Years Amount Dep @ 10% Bookvalue
1 156,618 15661.8 140,956
2 140956.2 14095.62 126860.58
3 126860.58 12686.058 114174.522
18

4 114174.522 11417.4522 102757.0698
5 102757.0698 10275.70698 92481.36282
6 92481.36282 9248.136282 83233.22654
7 83233.22654 8323.322654 74909.90388
8 74909.90388 7490.990388 67418.9135
9 67418.9135 6741.89135 60677.02215
10 60677.02215 6067.702215 54609.31993
3.2.3 Total Depreciation:
years Building
plant
&
mach Generator Quarry Furniture Vehicle Office Computer Other SUM
1 310437 991415 905528 42049 4468.7 102932 10492 12689.5 15661.8 2395674
2 294915 941844 814975 39946 4021.8 87492 9443.2 9517.13 14095.6 2216252
3 280169 894752 733478 37949 3619.6 74368 8498.9 7137.85 12686.1 2052661
4 266161 850015 660130 36051 3257.7 63213 7649 5353.39 11417.5 1903251
5 252853 807514 594117 34249 2931.9 53731 6884.1 4015.04 10275.7 1766575
6 240210 767138 534705 32536 2638.7 45671 6195.7 3011.28 9248.14 1641361
7 228199 728781 481235 30910 2374.8 38821 5576.1 2258.46 8323.32 1526485
8 216789 692342 433111 29364 2137.4 32998 5018.5 1693.85 7490.99 1420953
9 205950 657725 389800 27896 1923.6 28048 4516.7 1270.38 6741.89 1323881
10 195653 624839 350820 26501 1731.3 23841 4065 952.788 6067.7 1234480
Interpretation:
19
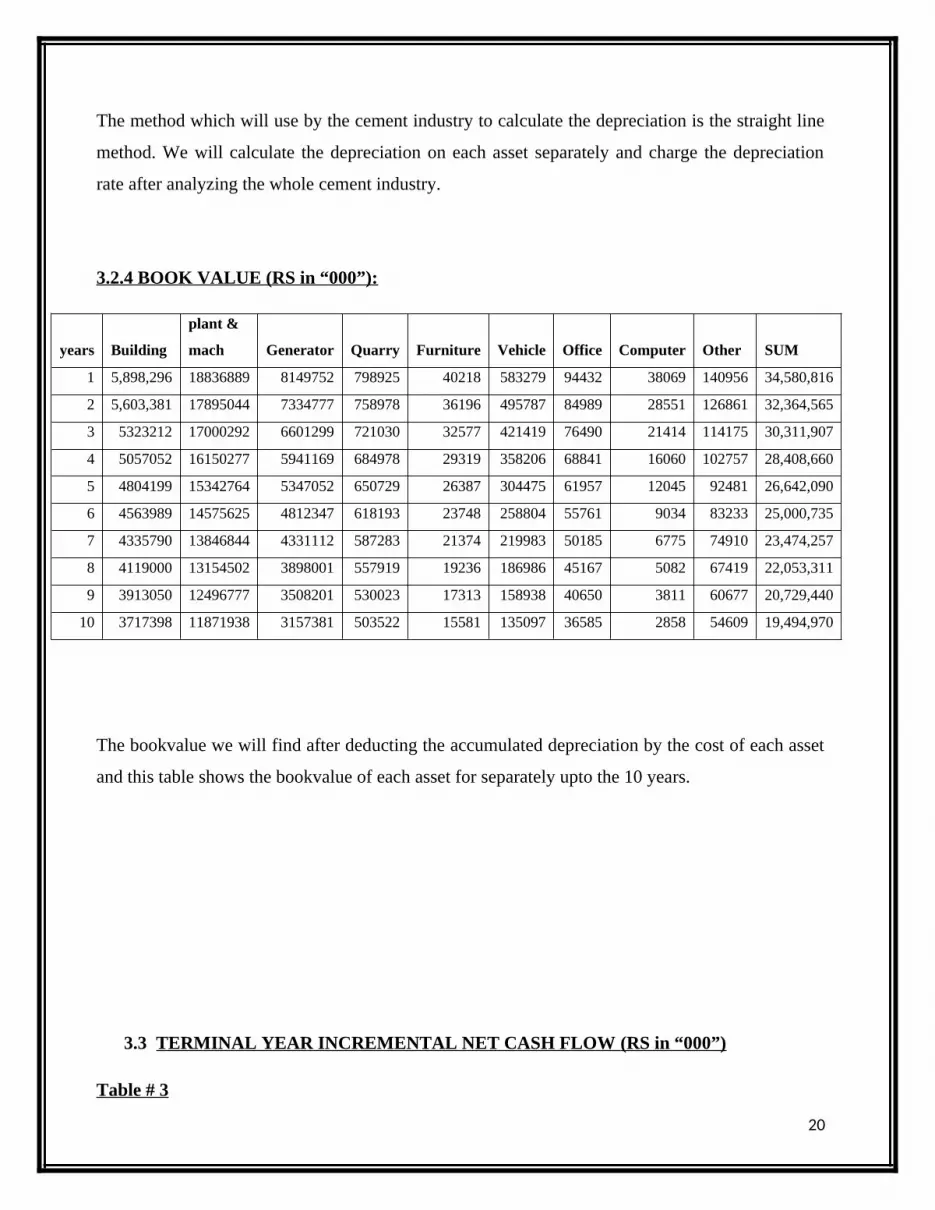
The method which will use by the cement industry to calculate the depreciation is the straight line
method. We will calculate the depreciation on each asset separately and charge the depreciation
rate after analyzing the whole cement industry.
3.2.4 BOOK VALUE (RS in “000”):
years Building
plant &
mach Generator Quarry Furniture Vehicle Office Computer Other SUM
1 5,898,296 18836889 8149752 798925 40218 583279 94432 38069 140956 34,580,816
2 5,603,381 17895044 7334777 758978 36196 495787 84989 28551 126861 32,364,565
3 5323212 17000292 6601299 721030 32577 421419 76490 21414 114175 30,311,907
4 5057052 16150277 5941169 684978 29319 358206 68841 16060 102757 28,408,660
5 4804199 15342764 5347052 650729 26387 304475 61957 12045 92481 26,642,090
6 4563989 14575625 4812347 618193 23748 258804 55761 9034 83233 25,000,735
7 4335790 13846844 4331112 587283 21374 219983 50185 6775 74910 23,474,257
8 4119000 13154502 3898001 557919 19236 186986 45167 5082 67419 22,053,311
9 3913050 12496777 3508201 530023 17313 158938 40650 3811 60677 20,729,440
10 3717398 11871938 3157381 503522 15581 135097 36585 2858 54609 19,494,970
The bookvalue we will find after deducting the accumulated depreciation by the cost of each asset
and this table shows the bookvalue of each asset for separately upto the 10 years.
3.3 TERMINAL YEAR INCREMENTAL NET CASH FLOW (RS in “000”)
Table # 3
20

Incremental cash flow for the year terminal year before project windup considerations
RS.
8,821,412
Residual value (+) 23512841
Taxes paid 35 %(-) 1132549
working capital (+)
2008777
Terminal year incremental net cash flow= Rs.33210481
3.3.1 Computation of Terminal Cash Flow (RS in “000”)
Explanation
Book value(RS)
(1)
Profit(RS)
(2)
Residual value(RS)=
(1+2)
Plant machinery
building and other
equipment15% profit 19,494,970 2924246 22422216
Property value with
40% increment 779,018 311607 1090625
Total Profit=RS. 3235853
Total Residual value=RS. 23512841
Note:The tax rate 35% on profit
Taxes Paid 35% of Profit= RS. 3235853 *35%
Taxes Paid 35% of Profit= 1132549
Chapter # 04
CAPITAL ASSET PRICING MODEL (CAPM):
21

ATTOCK CEMENT:
Ke=Rfr+ B(Rm-Rfr)
Ke=14%+ 0.566270498(0.1487% - 14%)
Ke=6.16%
BESTWAY CEMENT:
Ke= Rfr + B (Rm-Rfr)
Ke=14% +(-0.01832119)(0.1487% - 14%)
Ke=14.25%
CHERAT CEMENT :
Ke= Rfr + B (Rm-Rfr)
Ke=14%+0.536491(0.1487% - 14%)
Ke=6.59%
DEWAN CEMENT:
Ke= Rfr + B (Rm-Rfr)
Ke=14%+1.065102 (0.1487% - 14%)
Ke=-0.753%
FAUJI CEMENT:
Ke= Rfr + B (Rm-Rfr)
Ke=14% +0.907649(0.1487% - 14%)
Ke=1.43%
FECTO CEMENT:
22
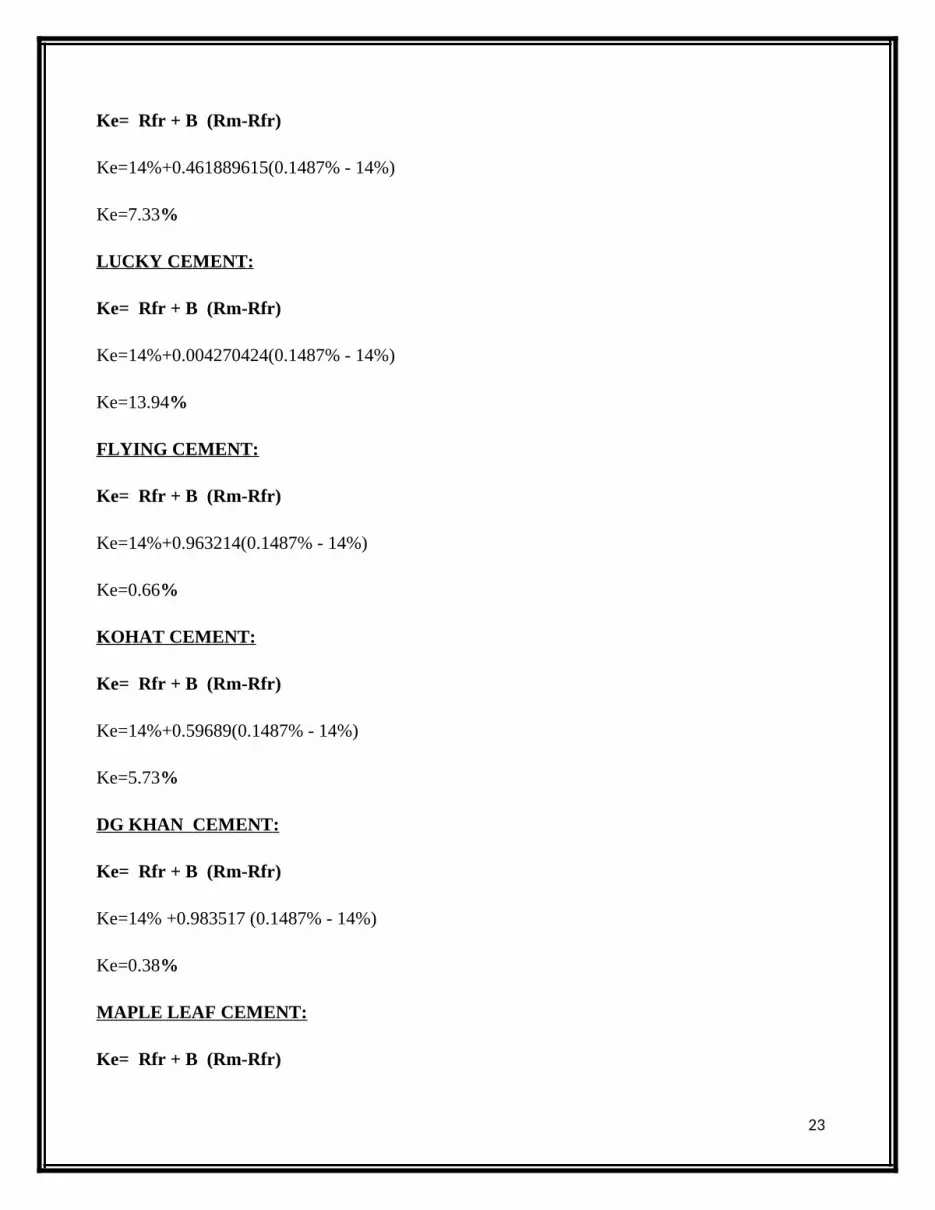
Ke= Rfr + B (Rm-Rfr)
Ke=14%+0.461889615(0.1487% - 14%)
Ke=7.33%
LUCKY CEMENT :
Ke= Rfr + B (Rm-Rfr)
Ke=14%+0.004270424(0.1487% - 14%)
Ke=13.94%
FLYING CEMENT:
Ke= Rfr + B (Rm-Rfr)
Ke=14%+0.963214(0.1487% - 14%)
Ke=0.66%
KOHAT CEMENT :
Ke= Rfr + B (Rm-Rfr)
Ke=14%+0.59689(0.1487% - 14%)
Ke=5.73%
DG KHAN CEMENT :
Ke= Rfr + B (Rm-Rfr)
Ke=14% +0.983517 (0.1487% - 14%)
Ke=0.38%
MAPLE LEAF CEMENT :
Ke= Rfr + B (Rm-Rfr)
23
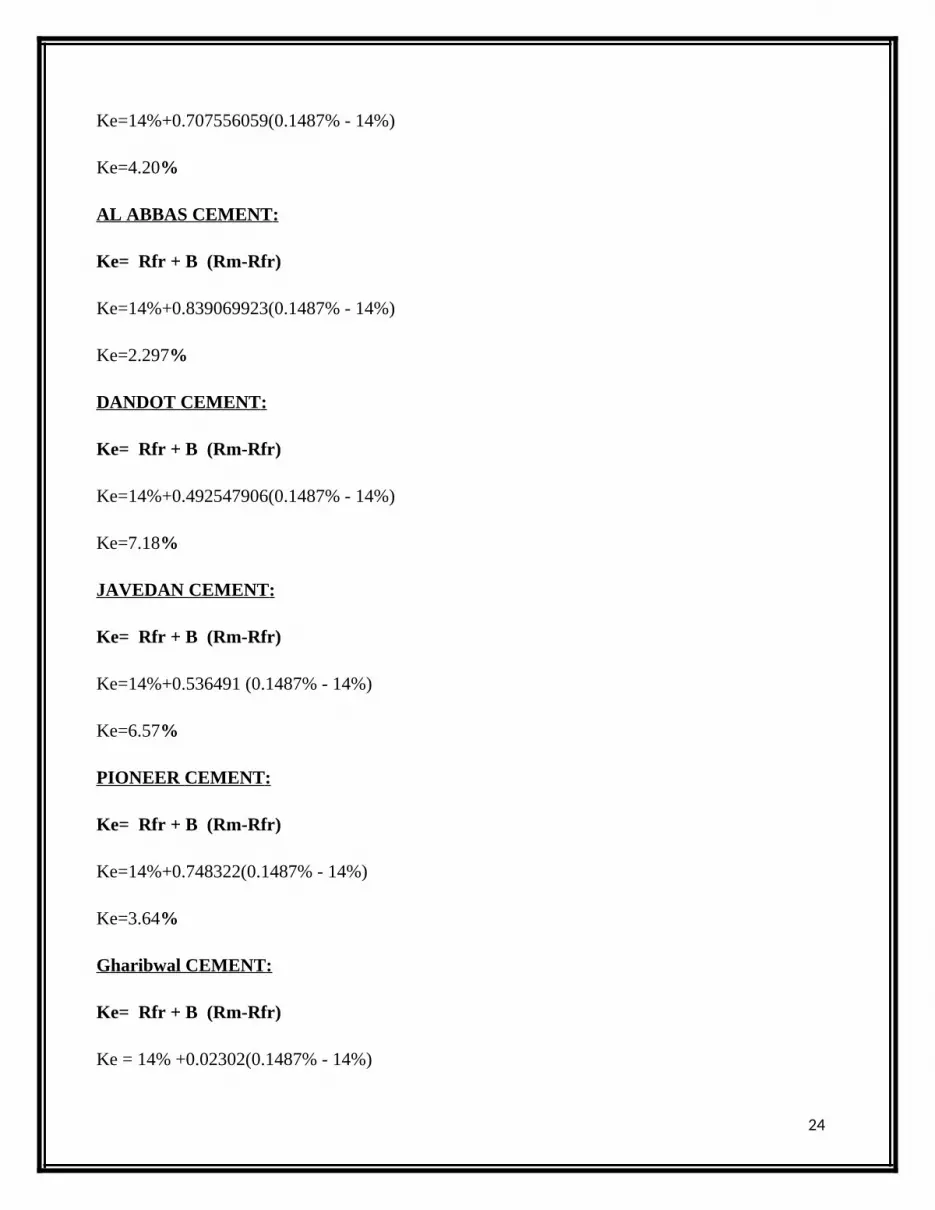
Ke=14%+0.707556059(0.1487% - 14%)
Ke=4.20%
AL ABBAS CEMENT :
Ke= Rfr + B (Rm-Rfr)
Ke=14%+0.839069923(0.1487% - 14%)
Ke=2.297%
DANDOT CEMENT :
Ke= Rfr + B (Rm-Rfr)
Ke=14%+0.492547906(0.1487% - 14%)
Ke=7.18%
JAVEDAN CEMENT :
Ke= Rfr + B (Rm-Rfr)
Ke=14%+0.536491 (0.1487% - 14%)
Ke=6.57%
PIONEER CEMENT :
Ke= Rfr + B (Rm-Rfr)
Ke=14%+0.748322(0.1487% - 14%)
Ke=3.64%
Gharibwal CEMENT :
Ke= Rfr + B (Rm-Rfr)
Ke = 14% +0.02302(0.1487% - 14%)
24

Ke=13.68%
Calculation:
First of all we have taken the share prices of all cement companies from the kse 100 index of last
two years and then compare it with the kse 100 index prices and find the market return and through
these prices we find the variance and covariance between market and securities and with the help
of this variance and covariance we find beta of the whole companies. Through kse 100 index we
find the market rate (y). Then we use that beta in capital asset pricing model to find the required
rate of return.
Chapter # 05
25

WEIGHTED AVERAGE COST OF CAPITAL:
ATTOCK CEMENT:
“000” weights
common
stock
734691 0.634892
Debts 422500 0.365108
Sum 1157191 1
WACC =Ke * We + Kd (1 - T) * Wi
WACC = 6.16%* 0.634892+14.85%(1-.35) * 0.365108
WACC = 0.0391 + 0.035242050
WACC =7.44 %
BESTWAY CEMENT:
“000” weights
common stock 3609503 0.173017
Debts 17252626 0.826983
Sum 20862129 1
WACC =Ke * We + Kd (1 - T) * Wi
WACC =14.25%*0.173017+13.96%(1 - .35) * 0.826983
WACC =0.024655+ 0.075040
WACC =9.97%
CHERAT CEMENT:
26

Cost weights
common
stock
2245965 0.673763
Debts 1087500 0.326237
Sum 3333465 1
WACC =Ke * We + Kd (1 - T) * Wi
WACC =6.59%*0.673763+14.45%(1 - .35) * 0.326237
WACC = 0.0444 + 0.030642
WACC =7.51 %
DG KHAN CEMENT:
Cost Weights
common stock 25811470 0.657835
Debts 13425553 0.342165
Sum 39237023 1
WACC =Ke * We + Kd (1 - T) * Wi
WACC = 0.38% * 0.657835 + 14.02 % (1 - .35) * 0.342165
WACC = 0.00249977 + 0.03118
WACC = 3.37%
DEWAN CEMENT:
Cost weights
common
stock
3628099 0.514515
Debts 3423392 0.485485
27

Sum 7051491 1
WACC =Ke * We + Kd (1 - T) * Wi
WACC =-0.753%*0.514515+15.28%(1 - .35)*0.485485
WACC =- 0.00387 + 0.04822
WACC =4.44 %
FAUJI CEMENT:
Cost Weights
common
stock
9610685 0.425419
Debts 12980414 0.574581
Sum 22591099 1
WACC =Ke * We + Kd (1 - T) * Wi
WACC =1.43%*0.425419+14.15%(1 - .35)*0.574581
WACC = + 0.05285
WACC =5.90 %
FECTO CEMENT:
Cost weights
common
stock
551600 0.421216
Debts 757943 0.578784
Sum 1309543 1
WACC =Ke * We + Kd (1 - T) * Wi
WACC =7.33%*0.421216+15.12%(1 - .35) * 0.578784
28
WACC = 0.030875+ 0.05688
WACC = 8.78%
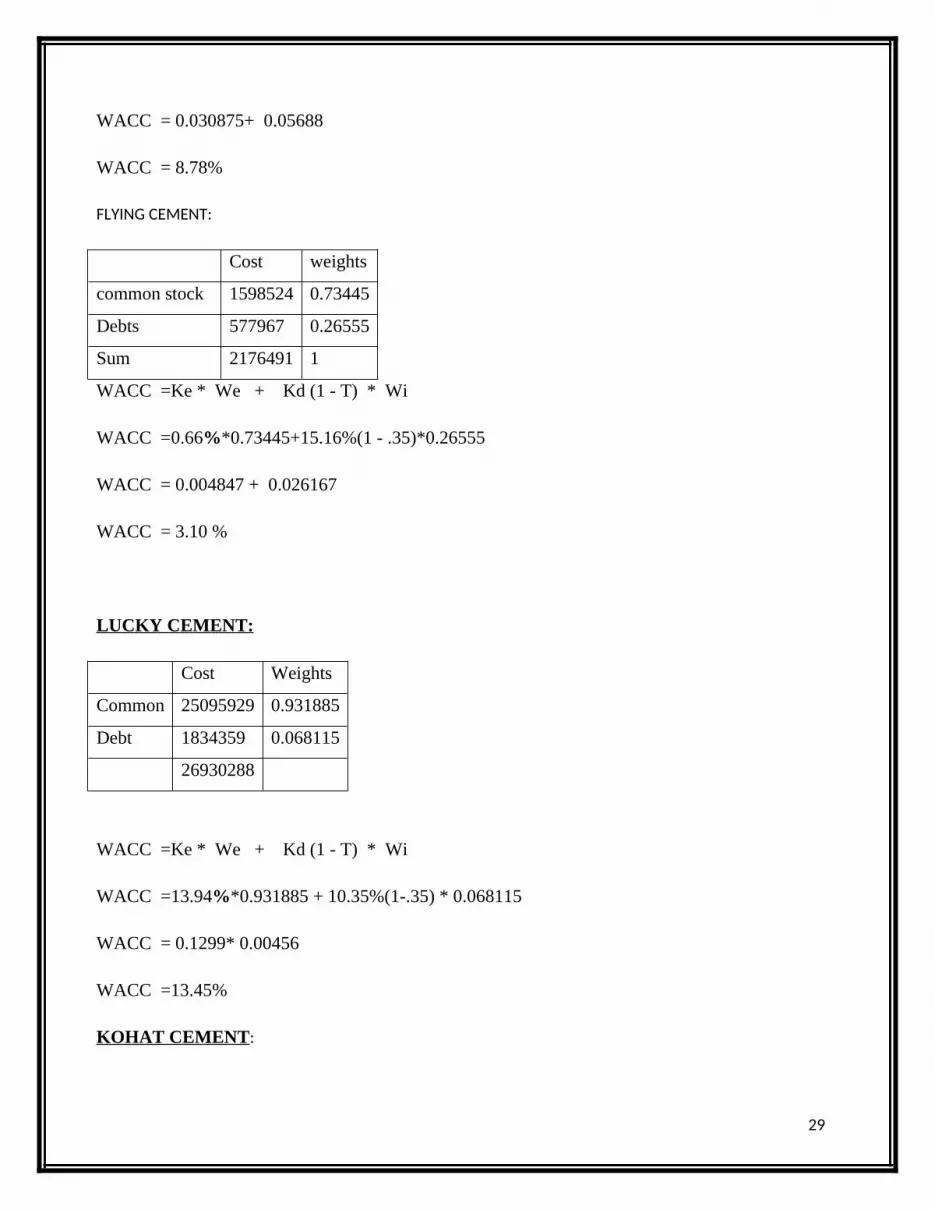
FLYING CEMENT:
Cost weights
common stock 1598524 0.73445
Debts 577967 0.26555
Sum 2176491 1
WACC =Ke * We + Kd (1 - T) * Wi
WACC =0.66%*0.73445+15.16%(1 - .35)*0.26555
WACC = 0.004847 + 0.026167
WACC = 3.10 %
LUCKY CEMENT:
Cost Weights
Common 25095929 0.931885
Debt 1834359 0.068115
26930288
WACC =Ke * We + Kd (1 - T) * Wi
WACC =13.94%*0.931885 + 10.35%(1-.35) * 0.068115
WACC = 0.1299* 0.00456
WACC =13.45%
KOHAT CEMENT:
29
Cost Weights
Common Stock 1338851124 0.305105
Debt 304932000
0
0.694895
438817112
4
WACC =Ke * We + Kd (1 - T) * Wi
WACC =5.73%*0.305105+14.58%(1-.35) * 0.694895
WACC =0.017483+0.101
WACC =11.85%
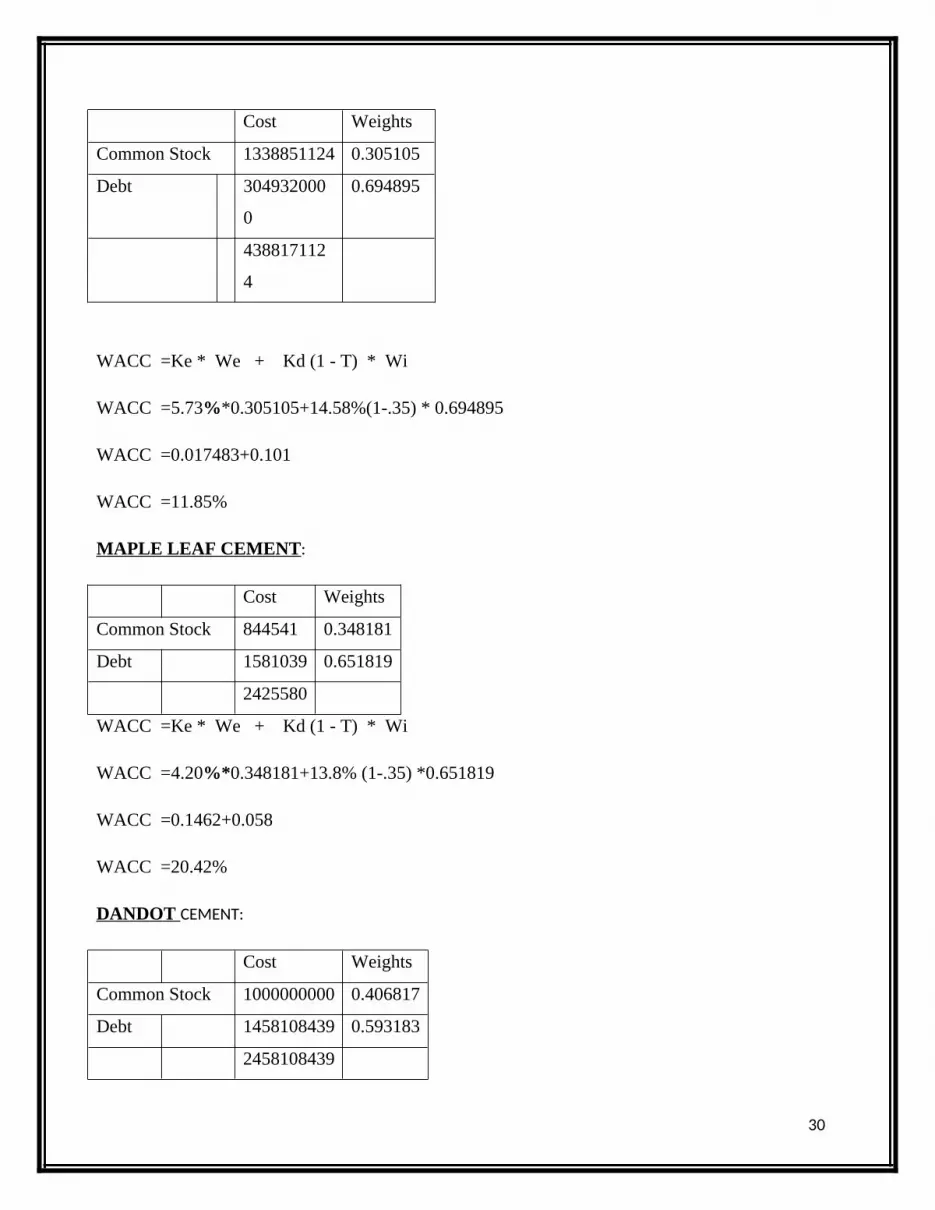
MAPLE LEAF CEMENT:
Cost Weights
Common Stock 844541 0.348181
Debt 1581039 0.651819
2425580
WACC =Ke * We + Kd (1 - T) * Wi
WACC =4.20%*0.348181+13.8% (1-.35) *0.651819
WACC =0.1462+0.058
WACC =20.42%
DANDOT CEMENT:
Cost Weights
Common Stock 1000000000 0.406817
Debt 1458108439 0.593183
2458108439
30
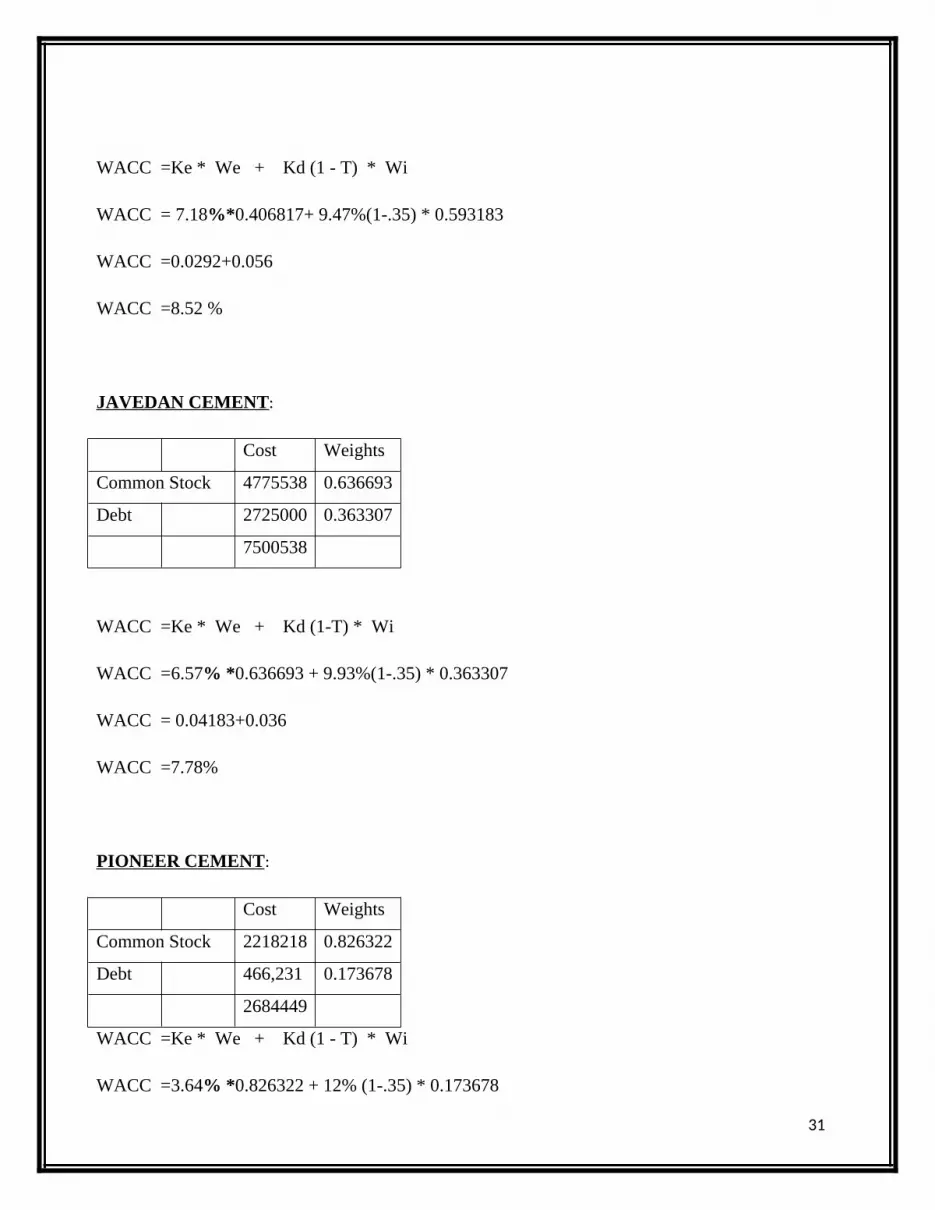
WACC =Ke * We + Kd (1 - T) * Wi
WACC = 7.18%*0.406817+ 9.47%(1-.35) * 0.593183
WACC =0.0292+0.056
WACC =8.52 %
JAVEDAN CEMENT:
Cost Weights
Common Stock 4775538 0.636693
Debt 2725000 0.363307
7500538
WACC =Ke * We + Kd (1-T) * Wi
WACC =6.57% *0.636693 + 9.93%(1-.35) * 0.363307
WACC = 0.04183+0.036
WACC =7.78%
PIONEER CEMENT:
Cost Weights
Common Stock 2218218 0.826322
Debt 466,231 0.173678
2684449
WACC =Ke * We + Kd (1 - T) * Wi
WACC =3.64% *0.826322 + 12% (1-.35) * 0.173678
31

WACC =0.03008+0.013
WACC =4.31%
Gharibwal CEMENT:
Cost Weights
Common Stock 2318864 0.408358
Debt 3359640 0.591642
5678504
WACC =Ke * We + Kd (1 - T) * Wi
WACC = 13.68%* 0.408358 + 12.78% (1-.35) * 0.591642
WACC =0.05586+0.049
WACC =10.49%
Calculation:
First we will find the common equity and debt of each company and allocate the
weights and use the “Ke” from the CAPM. The “kd”will come from the rate of borrowing debts
for each company and hence we will find the weighted average cost of capital.
32

Chapter # 06
CAPITAL BUDGETING TECHNIQUES:
Capital budgeting is an important function of business. It helps the investor whether to invest in the
project or not. It is basically a guideline for future outcomes from starting every business. There
are different methods which are used in capital budgeting techniques.
1. Payback period method
2. Discounted Payback period
3. Net Present Value
4. Internal Rate of return
5. Profitability Index
6.1 PAYBACK PERIOD METHOD (RS in “000”):
Years Cash flows Cumulative C.F
0 (B)(39746283)
1 3677884 3677884
2 4229567 7907451
3 4864002 12771453
4 5593602 18365055
5 6432642 24797697
6 (a) 7397538 (C)32195235
7 (D)8507169 40702404
33

8 9783245 50485649
9 11250731 61736380
10 33210481 94946861
a + (b - c) / d
6 + 39746283 - 32195235 / 8507169
6 years 10months & 17days
Interpretation:
The payback period will show that our initial investment will payback within 6 years 10 months
and 17 days.
6.2 DISCOUNTED PAYBACK METHOD (RS in “000”) :
Years Cash flows Present Value of C.F P.V C.PV
0 (B)(39746283
1 36778843677884/(1+0.0849)1 3390067 3390067
2 42295674229567/(1+0.0849)2 359349 6983557
3 48640024864002/(1+0.0849)3 3809119 10792677
4 55936025593602/(1+0.0849)4 4037688 14830365
5 64326426432642/(1+0.0849)5 4279971 19110336
6 73975387397538/(1+0.0849)6 4536793 23647129
34

7 85071698507169/(1+0.0849)7 4809026 28456155
8 97832459783245/(1+0.0849)8 5097594 33553749
9 (a) 1125073111250731/(1+0.0849)9 5403478 (C)38957227
10 3321048133210481/(1+0.0849)10 14702056(D) 53659283
= a + (b - c) / d
= 9 + (39746283-38957227 ) / 14702056
= 9.05 years
Notes:
The rate which we will use for discounting method will come from the average of weighted
average cost of capital of all cement companies.
6.3 NET PRESENT VALUE (RS in “000”) :
Pv of C.F – I.C.O
= 53659283 - 39746283
= 13913000
Interpretation:
The present value of our project will be higher than our initial cash outlay which shows that the
result of net present value will be positive and this is profitable for us make investment in the
cement sector.
35

6.4 PROFITABILITY INDEX:
= PV of C.F / I.C.O
= 53659283 / 39746283
= 1.35%
Interpretation:
The present value of our project will be higher than our initial cash outlay which shows that the
result of profitability index will be more than 1% and that shows the positive sign for us to invest
in this project.
6.5 INTERNAL RATE OF RETURN (RS in “000”) :
Discounting at 11%
years cash flow pv of cf
0 (B)(39746283)
1 36778843677884/(1+0.11)1 = 3313409
2 42295674229567/(1+0.11)2 = 3432811
3 48640024864002/(1+0.11)3 = 3556516
4 55936025593602/(1+0.11)4 = 3684679
5 64326426432642/(1+0.11)5 = 3817460
6 73975387397538/(1+0.11)6= 3955026
7 85071698507169/(1+0.11)7= 4097550
8 9783245 9783245/(1+0.11)8= 4245209
36

9 1125073111250731/(1+0.11)9=4398189
10 33210481 33210481/(1+0.11)10=11696216
46197065
Difference + 6450782
Discounting at 16%
years cash flow pv of cf
0 (B)(39746283)
1 36778843677884/(1+0.16)1 =3170590
2 42295674229567/(1+0.16)2 =3143257
3 48640024864002/(1+0.16)3 = 3116160
4 55936025593602/(1+0.16)4 = 3089297
5 64326426432642/(1+0.16)5 = 3062665
6 73975387397538/(1+0.16)6= 3036262
7 85071698507169/(1+0.16)7= 3010088
8 97832459783245/(1+0.16)8= 2984139
9 1125073111250731/(1+0.16)9= 2958413
10 3321048133210481/(1+0.16)10=7528272
29633663
Difference - 10112620
37

By Using Interpolation:
=.11 + .05 (6450782/ 6450782 – (-10112620)
= 12.95%
Interpretation:
We take two different discount rates which will give us two different values i.e one is higher than
our initial cash outlay and other is lower than our initial cash outlay and then by using the method
of interpolation and find the internal rate of return. That rate of return will be higher than the
project discount rate so, the project will be acceptable for us.
38

Chapter # 07
RESULTS:
Serial No. Techniques Results
1. Payback method 6 years 10months & 17days
2. Discounted Payback Method 9.05 year
3. Internal Rate Of Return 12.95%
4. Net Present Value 13913000
5. Profitability Index 1.35%
39

Chapter # 08
CONCLUSION:
We collected the data of all cement companies from their respected company’s website. And then
make our own cash flows and then we find capital asset pricing model and weighted average cost
of capital and applied in different capital budgeting techniques to find out whether to invest in that
project or not. The payback period gives us the return of our investment in 6 years 10 months and
17 days. The discounted payback method will give the return in 9.05 year and internal rate of
return will give us the return of 12.95% in order to take two different rates which will give us two
different values i.e one is higher than our initial cash outlay and other is lower than our initial cash
outlay and then by using the method of interpolation and find the internal rate of return. That rate
of return will be higher than the project discount rate so, the project will be acceptable for us.
which is higher than our discounted rate 8.49%. The net present value of the project will be
13913000 and that shows that the present value of our project will be higher than our initial cash
outlay which cause the result of net present value will be positive and this is profitable for us make
investment in the cement sector and our project profitability index will be 1.35% and it explains
that the present value of our project will be higher than our initial cash outlay which shows that the
result of profitability index will be more than 1% and that shows the positive sign for us to invest
in this project. The all capital budgeting techniques are favorable for our decision to invest in this
project.
40
Chapter # 09
FUTURE RECOMMENDATIONS:
As it is now obvious that to start the cement business it is very profitable for the investor.
Interested investors should avail the opportunity to invest in the cement sector so that they can get
the maximum return with maximum risk. Government of Pakistan is also supporting the export of
cement so, the future of cement sector is very bright and attracted for all cement sector investors.
The investor should came and take the start in cement sector. We strongly recommended the
domestic and foreign investors to come and start the business in cement sector of Pakistan.
41
REFERENCE:
Karachi stock Exchange (www.kse.com) Date: 8/7/2012
Business Recorder (www.brecorder.com) Date: 8/7/2012
Attock Cement Co. (www.attockcement.com) Date: 8/7/2012
Bestway Cement Co. (www.bestwaycement.com) Date: 8/7/2012
Cherat Cement Co. (www.cheratcement.com) Date: 8/7/2012
Dewan Cement Co. (www.dewancement.com) Date: 8/7/2012
Fauji Cement Co. (www.faujicement.com) Date: 8/7/2012
Fecto Cement Co. (www.fectocement.com) Date: 8/7/2012
Lucky Cement Co. (www.luckycement.com) Date: 8/7/2012
Flying Cement Co. (www.flyingcement.com) Date: 8/7/2012
Kohat Cement Co. (www.kohatcement.com) Date: 8/7/2012
DG Khan Cement Co. (www.dgkhancement.com) Date: 8/7/2012
Maple Leaf Cement Co. (www.mapleleafcement.com) Date: 8/7/2012
Al Abbas Cement Co. (www.alabbascement.com) Date: 8/7/2012
Dandot Cement Co. (www.dandotcement.com) Date: 8/7/2012
Javedan Cement Co. (www.javedancement.com) Date: 8/7/2012
Pioneer Cement Co. (www.pioneercement.com) Date: 8/7/2012
Gharibwal Cement Co. (www.gharibwalcement.com) Date: 8/7/2012
42

43