changing food habit and perceived health-related
TRANSCRIPT

1
CHANGING FOOD HABIT AND PERCEIVED HEALTH-RELATED
QUALITY OF LIFE AMONG ADULTS IN OYO STATE, NIGERIA
BY
GRACE OYELADUN AKINRINADE
B.Sc. (Edu.) Home Economics (Abraka), M.Sc. Human Nutrition (Ibadan) Matric. No.: 72089
A Thesis in the Department of Human Nutrition, Submitted to the Faculty of Public Health,
in partial fulfillment of the requirements for the Degree of
DOCTOR OF PHILOSOPHY of the
UNIVERSITY OF IBADAN
SEPTEMBER 2018

ii
CERTIFICATION
I certify that this work was carried out by Akinrinade, Grace Oyeladun in the
Department of Human Nutrition, Faculty of Public Health, College of Medicine,
University of Ibadan; under my supervision.
------------------------------------------------
(Supervisor) Dr. O.T Adepoju
Department of Human Nutrition, University of Ibadan, Nigeria
iii
ABSTRACT
Studies have revealed culture, climate and economy as drivers of eating habits and
patterns among people and groups, while changing food culture and habits influence
nutritional status of all age groups. The burden of food-related morbidity and
mortality due to unhealthy diet has become public health concern in recent times. The
implications of distorted eating behaviour and changing food habit on nutritional
status and Perceived Health-related Quality of Life (PHQoL) of adults in Oyo State is
unclear. This study was carried out to investigate changing food habits, eating
behaviour, and PHQoL of adults in Oyo State, Nigeria.
This descriptive cross-sectional study used a mixed method approach. One Local
Government Area (LGA) per senatorial district and two wards (one rural, one urban)
per LGA were selected using simple random sampling and 589 household heads aged
50 – 70 years were selected using systematic random sampling. Twelve Focus Group
Discussions (FGDs) were conducted using FGD guide to explore earlier food culture.
A semi-structured, interviewer-administered questionnaire was used to collect
information on socio-demographic and anthropometric characteristics, food habits,
eating behaviour, 24-hour dietary recall and PHQoL. Energy and nutrients intake
were determined using adapted total dietary assessment software. Adequacy of
dietary intake was categorised as inadequate (<80%), adequate (80-120%) and excess
(>120%). Body weight and height were measured and Body Mass Index (BMI) was
calculated and categorised using WHO standards. Qualitative data were analysed
thematically. Quantitative data were analysed using descriptive statistics, Pearson
product moment correlation and Multiple regression at α0.05.
Respondents were majorly rural dwellers (56.4%), farmers (50.2%) and mean age
was 62.3±14.6 years. All respondents reported changes in food habit from pap, maize
porridge, amala, pounded yam, beans and bean cake to indomie, spaghetti, semovita
and wheat, with less consumption of fruits. Poor land fertility (69.7%), changes in

iv
food processing method (77.4%), time factor (72.4 %) and absence of wildly grown
indigenous vegetables (73.0%) were reported as some of the causes for changing food
pattern. Those with bad eating behavior constituted 58.1%. Respondents believed that
changing food habits could lead to decreased life expectancy (77.0%), increased
prevalence of non-communicable diseases (74.5%) and frequent illness (75.3%).
There was significant difference in nutrient intake pattern of energy, protein, fat,
vitamin A, calcium, zinc and iron between rural and urban respondents. Energy,
protein, vitamin A, calcium, phosphorus and zinc intake were 1839.0±647.0kcal,
62.3±34.4g, 24302.8±14884.3IU, 165.0±140.7mg, 279.3±248.7mg and 11.0±5.9mg
respectively. Prevalence of underweight, overweight and obesity was 13.4%, 19.2%
and 10.7% respectively. Energy (r=0.17), protein (r=0.12) and zinc (R=0.20) intake
had positive significant correlations with PHQoL.
Transition from indigenous to westernised food habits and bad eating behaviour is
high among adults in Oyo State. Burden of overweight and obesity (29.9%) and
dietary intake are positively correlated with perceived health-related quality of life.
Promotion of healthy eating habits and life styles is needed among the respondents.
Keywords: Food habits, Food culture, Health-related quality of life.
Word count: 496

v
DEDICATION
Oh Lord my God, to you, firstly, is this work dedicated. For “by your great hands”
you lead my journey of life and knowledge.
“By your faithfulness” I am an achiever of your purpose and destiny. To you only be
all the glory, honour, adoration, power and majesty, forever, and ever, Amen.
Secondly, this project is dedicated in a special way to my husband, my better half
who by God’s grace gave me the privilege to undergo this study. And to my children,
grandchildren, brothers and sisters, family members on both sides, my in-laws, my
colleagues in Home Economics Department, School of Vocational and Technical
Education, Federal College of Education (Special) Oyo.

vi
ACKNOWLEDGEMENTS
With a heart full of gratitude, I hereby appreciate the Department of Human
Nutrition, University of Ibadan for the great privilege and opportunity given to me
that enabled me to undergo the degree of Doctor of Philosophy and for providing both
human and material resources needed for the successful completion of this study. I
promise to remain a good ambassador of my Alma-mata
I appreciate my supervisor, Dr. O. T. Adepoju for his advice, support, corrections,
and encouragement towards the successful completion of this study. I sincerely
appreciate his constructive and helpful suggestions given during the course of this
study. I cherish his sincerity, accessibility, willingness, love and interest in this study.
May the Lord God bless you, grant your heart desires and make you to enjoy good
health and long life.
I will ever remain grateful to late Prof. I. O. Akinyele (of blessed memory) who was
the Head of Department at the commencement of this study and my M.Sc. thesis
supervisor. As a result of his interest in my progress, he handed me over to Dr.
Adepoju as my supervisor, May his soul rest in peace.
My profound gratitude goes to the Head of Department of Human Nutrition, Dr. O.T.
Adepoju, for his support and encouragement towards the successful completion of
this study. May the Lord continue to make you relevant in your academic career
throughout your life.
My sincere gratitude also goes to Dr. R. A. Sanusi for his sincerity, easy disposition
and constructive contribution to this work. I am highly grateful to him. My special
thanks goes to Dr. Mrs. Grace Fadupin for her healthful contributions and corrections
to the research work. May God continue to strengthen you and grant you good health
throughout your life time.
I am also grateful to Dr. Ariyo for his humility and readiness to help, and to all other
lecturers whose names are not mentioned here, and to all technocrats in the
Department of Human Nutrition for their friendliness and all efforts they have made
to the success of this study. God bless you all. My gratitude also goes to all

vii
administrative staff in the Department of Human Nutrition for their support and
assistance throughout the course of study. I say thank you all.
My deep and sincere appreciation also goes to Dr. Mathew Akpa of the Department
of Epidemiology and Medical Statistics. A very humble, God fearing, and dedicated
man who designed the method for this study and also analysed the data. Worthy of
recognition also are Messers Samson Olorunju, Oludare Odewenwa, Bolaji Oladeji,
and Paul Olaoye for their efforts in putting the statistical analysis and report together.
And to Dr. Theo Ajobiewe, I say a big thank you for all the support accorded me for
the success of this work. God bless you sir.
My special thanks goes to the Research Assistant group which include Akinkunmi,
Victoria Ojo (RIP), Sunday Oladiran, Igbagboyemi Deniran, Jide Bamigbade and
Ayo for their great contribution to the success of collection of data from the
respondents at the rural and urban levels of all the local governments.
Worthy of appreciation also is Chief and Chief Mrs Adeseun Peluola, the Chief Jagun
of Anko Eruwa, a good leader by example and a good representative of MBC Club,
for hosting the researcher and her assistants in their home for two weeks. I also
appreciate all MBC members for their constant admonition and encouragement
throughout the course of this study. Most importantly, I recorgnise the contributions
of Chief Jide Ogunkanmi, Chief Mrs Bisi Ogunkanmi (of blessed memory), Mr.&
Mrs Sayo Oyerinde, Mr& Mrs Bayo Adeyemo, Mr&Mrs Funsho Fatokun,,etc. The
whole of MBC have made this success to God be the glory.
I hereby recognize the efforts of LGA group leaders as follows: Folake Oke, Idowu
Toyin, Chief Ojedepo Olaniyi, and Ibrahim, all from Ibarapa LGA. Mr. Biyi
Awojobi, Segun Adedokun, Mrs. Taiwo, Sulaimon Ganiyu, Adenrele Funmilayo
from Iwajowa, LGA and Mr. Yemi Afolabi, Mr. Abiola and Mr. Aderibigbe Tajudeen
from Atiba LGA.
I will always remain grateful to my husband and children for their support and
encouragement both financially and spiritually. And finally unto God eternal,
immortal, invisible, the only wise God, be honoured and glorified forever and ever
Amen.

viii
TABLE OF CONTENTS
CONTENTS PAGE
Title Page i
Certification ii
Abstract iii
Dedication v
Acknowledgment vi
Table of Contents viii
List of Tables xii
List of Figures xiv
List of Acronyms xvii
CHAPTER ONE: INTRODUCTION 1
1.1 Background to the Study 1
1.2 Statement of Problem 4
1.3 Justification for the study 5
1.4 Research Questions 6
1.5 Objectives 7
1.6 Scope of the study 8
CHAPTER TWO: LITERATURE REVIEW 9
2.1 The concept of adulthood 9
2.1.1 Definition of ‘adults’ 9
2.2 Determination of adulthood biologically, socially, historically, 11
and legally
2.3 Classification of adulthood 13
2.4 Physiological changes in adulthood 15
2.5 Fundamental needs of nutrition 15
2.6 Nutritional needs in adulthood 16
2.7 The concept of healthy behaviour 17

ix
2.7.1 Importance of nutrition to quality of life and healthy behaviour 20
2.8 Origin of food culture and habits 21
2.8.1 Food and culture 22
2.8.2 Food habits 23
2.8.3 Food choices 24
2.8.3.1 Determinants of food choices and eating behaviour 26
2.8.3.2 Factors that influence the way people choose food 28
2.8.3.3 Factors responsible for poor food choices 29
2.8.3.4 Other factors that can influence eating behaviour 31
2.8.4 World’s cultural food pattern 36
2.9 Nutritional advantages of traditional food 43
2.10 Changing food habits 44
2.11 Effects of changing from traditional food to westernized food 45
2.12 Food culture and development 47
2.13 Types and problems of malnutrition 48
2.14 Malnutrition among adults 49
2.15 Role of nutrition in health and diseases 50
2.16 Changes in nutrient needs with age 51
2.17 Nutritional role in healthy adulthood 51
2.18 Nutritional requirement for healthy ageing 52
2.19 Changing food culture and nutritional status 53
2.20 The growing ageing population 54
2.21 Factors responsible for ageing 55
2.22 Antidote of ageing 57
2.23 Global assessment of nutrition and development 57
2.24 Dietary guideline for adulthood 58
CHAPTER THREE: METHODOLOGY 60
3.1 Study design 60
3.2 Study area 60
3.2.1 Brief history of Atiba local government 64
3.2.2 Brief history of Iwajowa local government 65
3.2.3 Brief history of Ibarapa local government 65
3.3 Sampling technique 67

x
3.4 Study population 67
3.4.1 Inclusion criteria 68
3.4.2 Exclusion criteria 68
3.5 Sample size determination 68
3.6 Data collection technique 69
3.7 Instrument for data collection 70
3.7.1 Respondents’ socio-demographic and socio-economic data 70
3.7.2 Focus group discussion 70
3.7.3 Food culture and habits 74
3.7.4 24-hour dietary recall 74
3.7.5 Health Related Quality of Life (QoL) of respondents 74
3.7.6 Body mass index determination 76
3.8 Translation of protocol 78
3.9 Questionnaire validity 78
3.10 Data analysis 78
3.11 Ethical consideration 79
CHAPTER FOUR: RESULT 80
4.1 Socio-demographic characteristics of respondent 80
4.2 Socio-economic characteristics of respondents 83
4.3 Changes in food habits of adults in Oyo state: Focus group 85
discussions
4.4 Household characteristics of respondents 92
4.5 Association between socio-demographic characteristics and 96
LGA of respondents
4.6 Association between socio-economic characteristics and 98
LGA of respondents
4.7 Association between socio-demographic variables and 100
locality of respondents
4.8 Association Between socio-economic variables and locality 102
of respondents
4.9 Frequency of consumption of root tubers and products 104
4.10 Frequency of consumption of cereals, legumes and products 106
4.11 Frequency of consumption of meat and allied products 109

xi
4.12 Frequency of consumption of beverages and other drinks 111
4.13 Frequency of consumption of fruits and vegetables 113
4.14 Frequency of consumption of oil and seed nuts 115
4.15 Changing food culture of respondents 117
4.16 Changes in common food of respondents 121
4.17 Perceived causes of changing food pattern on societal health 124
impact
4.18 Lifestyle behaviour (pattern) of respondents 126
4.19 Respondents’ eating behaviour pattern 128
4.20 Perceived health related quality of life of respondents 130
4.21 Correlation between domains of health related quality of life 132
4.22 Nutrient intake of respondents by LGA and locality 134
4.23 Nutritional status of the respondents 137
4.24 Relationship between respondents’ Body Mass Index and 139
locality
4.25 Association between socio-demographic variables and the 141
adequacy of Iron
4.26 Association between Socio-economic Variables and the 143
Level of Adequacy of Iron
4.27 Association between socio-demographic variables and the 145
level of adequacy of dietary Fibre
4.28 Socio-demographic variables and the level of adequacy of 147
Vitamin A
4.29 Socio-economic variables and the level of adequacy of 149
Vitamin A
4.30 Socio-demographic variables and the level of adequacy of 151
Vitamin C
4.31 Socio-economic variables and the level of adequacy of 153
Vitamin C
4.32 Correlation between age, BMI and eating behaviour 155
4.33 Correlation between age, BMI, health related quality of life and 157
nutrients adequacy
4.34 Pearson’s correlation of nutrients adequacy 159

xii
4.35 Pearson’s Correlation between age, BMI, eating styles and 162
subscales of HRQOL
4.36 Correlation between eating styles 164
4.37 Association between HRQOL and socio-economic variables 166
4.38 Association between HRQOL and socio-demographic variables 168
4.39 Binary logistic regression of HRQOL and significant 170
socio-economic and socio-demographic variables
4.40 Association between eating behaviour and socio-economic 172
variables
4.41 Association between eating behaviour and socio-demographic 174
variables
4.42 Binary logistic regression of eating behaviour on significant 176
socio-economic and socio-demographic variables
CHAPTER FIVE: DISCUSSION 178
5.1 Discussion 178
5.2 Conclusion 192
5.3 Recommendation 193
5.4 Contribution to Knowledge 194
Reference 195
Appendices 207
Questionnaire 209
Ethical Approval 217
Letter of Introduction from the department to Local Government 218
Letter of approval to proceed on research work from the three 221
Local Governments

xiii
LIST OF TABLES
Table 3.1: Sample size allocation by Wards 69
Table 4.1: Socio demographic characteristics of respondents 82
Table 4.2: Socio-economic characteristics of respondents 84
Table 4.4: Household characteristics 94
Table 4.4: Household characteristics of respondents continued 95
Table 4.5: Association between socio-demographic characteristics and
LGA of respondents 97
Table 4.6: Association between socio-economic characteristics and LGA
of respondents 97
Table 4.7: Association between socio-demographic variables and locality
of respondents 101
Table 4.8: Association between socio-economic variables and locality of
respondents 103
Table 4.9: Frequency of consumption of roots, tuber, and products 105
Table 4.10: Frequency of consumption of cereals, legumes, and
products 108
Table 4.11: Frequency of consumption of meat and allied products 110
Table 4.12: Frequency of consumption of beverages and other drinks 112
Table 4.13: Frequency of consumption of fruits and vegetables 114
Table 4.14: Frequency of consumption of oil and seed nuts 116
Table 4.15a: Changing food culture of respondents 118
Table 4.15b: Changing food culture of respondents (continued) 119
Table 4.16a: Changes in common food of respondents 122
Table 4.16b: Changes in common Food of respondents (continued) 123
Table 4.17: Perceived causes of changing food pattern and societal health125
impact
Table 4.18: Lifestyle behaviour (pattern) of respondents 127

xiv
Table 4.19: Respondents eating behaviour pattern 129
Table 4.20: Perceived health related quality of life of respondents 131
Table 4.21: Correlation between domains of health related quality of life 133
Table 4.22a: Nutrient intake of respondents by LGA and locality 135
Table 4.22b: Nutrient intake of respondents by LGA and locality
(continued) 136
Table 4.23: Nutritional status of the respondents 138
Table 4.24: Relationship between respondent’s Body Mass index and
locality 140
Table 4.25: Association between socio-demographic variables and adequacy of
Iron 142
Table 4.26: Association between socio-economic variables and adequacy
of Ironintake 144
Table 4.27: Association between socio-economic variables and adequacy of
dietary fibre intake 146
Table 4.28: Socio-demographic variables and adequacy of Vitamin
A intake 148
Table 4.29: Socio-economic variables and the level of adequacy of
vitamin A 150
Table 4.30 Socio-demographic variables and the level of adequacy of
Vitamin C 152
Table 4.31 Socio-economic variables and the level of adequacy of
Vitamin C 154
Table 4.32: Correlation between age, BMI and eating behaviours 156
Table 4.33: Correlation between nutrient intake and health-related
quality of life 158
Table 4.34a: Pearson correlation of nutrients adequacy 160
Table 4.34b: Pearson correlation of nutrients adequacy continued 161
Table 4.35: Correlation between age, BMI, eating styles and subscales
of HRQL 163
Table 4.36: Pearson correlation between eating styles 165

xv
Table 4.37: Association between health related quality of life and
socio-economic variables 167
Table 4.38: Association between health related quality of life andsocio-
demographic variables 169
Table 4.39: Binary logistic regression of health related quality of life 171
and significant socio-economic and socio-demographic variables
Table 4.40: Association between eating behaviour and socio-economic variables
173
Table 4.41: Association between eating behaviour and socio-demographicvariables
175
Table 4.42: Binary logistic regression of eating behaviour on significant
socio-economic and socio-demographic variables (95% CI)177

xvi
LIST OF FIGURES
Figure 3.1: Map of Nigeria showing Oyo state 62
Figure 3.2: Map of Oyo state showing the three senatorial districts 63
Figure 3.3: Addressing some of the respondents during the focus group
discussion 71
Figure 3.4: A cross-section of the male respondents during focus group
discussion 71
Figure 3.5: A cross-section of the female respondents during focus group
discussion 72
Figure 3.6: A sample of the food model used during the interview 72
Figue 3r.7: Interviewing the respondents 73
Figure 3.8: A respondent taking his weight measurement 77

xvii
ACRONYM
BMI - Body Mass Index
BP – Body Pain
CDE - Chronic Energy Deficiency
FGDs – Focus Group Discussion
GH – General Health
HRQL – Health Related Quality of Life
LGAs – Local Government Areas
MEH – Mental Health
MH - Mental Health
PF – Physical Function
PHCN – Power Holding Corporation of Nigeria
PHH – Physical Health
PHQL – Perceived Health Related Quality of Life
RE – Role Emotion
RH – Reported Health
RP – Role Play
SF – Social Function
SPSS – Statistics Package for Social Science
TDA – Total Dietary Assessment
VT – Vitality

1
CHAPTER ONE
INTRODUCTION
1.1 BACKGROUNDTO THESTUDY
The conceptofcultureisbroaderthanraceorethnicity;itencompasseslanguage,
communicationstyles,socialvalues,andreligiousbehaviours. Culture shapeshow
people view theworld,theirattitudesabouthealthandtheir
foodpreferences(Boyle,2003).The
conceptualizationofcultureisbynomeansasimplematter.Onepossiblewaytothinkab
out
itisthat“cultureistosocietywhatmemoryistoindividual”.Itincludeswhatworkedinth
e experience ofsociety sothatitwasworthtransmittingtofuturegenerations(Henry
&
Eunkook,2002).Culturalcuisinesreflectthegeography,climate,andhistoryoftheloca
tion where a culturedeveloped.
Withineachculture(andwithindifferentregionswherethecultureisdisposed)peoplem
ay prefer certainfoods,foodpreparationmethods,andfoodcomplicationsfor
mealsand snacks. Thediversitywithin a cultureis asas
importantdiversitybetweencultures. People fromthesameculture orethnicgroup
tendtohave hadsomesimilar experiences. Within
eachgroup,however,individualsmayvary
intermsofincome,socialclass,religion,age,
education,geographicorigin,andthelengthoftimethattheyhavelivedinaparticularpla
ce (Boyle, 2003).
All people at all timeshavehad folkways and mores and institutional formwhich
served to
passontheirculturetoadultsaswellaschildrenandyouth.Thechangingpatternsofsocia
l

2
andeconomiclifeareinconstantinterplaywithadultfoodcultureandhabits(Mishra,20
05). Certainrelatively
recentchangessuchasincreasedfacilitiesofcommunicationand
transportation,intensifiedurbanization,increasing proportionsofolder
agegroupsinthe population,growingincrementofleisure
forworkingpeopleinindustrialcountries, widened

3
activitiesforwomen,technologicalchangesinindustryandbusiness,andchanges
infoodcultureandhabitsofmany
peopleallovertheworldaresignificantly occurring (Tull, 1996).Dietandattitudetofo
odhavechangedmarkedly inrecentyearsintheUnitedKingdom
(UK)andwillcontinuetodoso.Demandforabetterquality offoodhasrisen,andpeople
aspiretoeatbothmorehealthilyandtobuyfoodthathasareduced impactonthe
environment.Butconsumersalsowantaffordabilityandfoodthatfitstheirlifestylesa
demonstratedbythedemandforconvenienceandbypeopleeatingoutsideofthehomem
ore often (Cabinet office2008).
The belief thatfood habitsseldomor never change,andor difficulttochange
isnottrue becauseinmany
countriesthecurrentstaplefoodsarenotthesameasthoseeatenevena
centuryago.Therefore,foodhabitsandcustomdochange,andtheyareinfluencedinma
ny differentways(HumanNutritioninDevelopingWorld,2013).Foodculture
isincredibly
malleable.Itchangesverymuch,veryquicklyandwe’regoingthroughaperiodofimme
nse changeagain.Peoplearoundtheworldarechanging theirdiets
becauseofsoaringfood prices,andfast-changingdietsarefortheworstformany
people. Ahugenumberof peopleespeciallyintheworld’spoorestcountriesarecutting
backonthequantityorquality ofthefoodtheyeatbecauseofrising foodprices.
ThefindingsoftheSurveyintheUnited
StatesonWorldchangingeatinghabitsasfoodpricessoarbyThompson,MickCNN(20
11) showedthat39%globally
putblameonrisingfoodcostandanother33%citedhealth
reasonsfortheirchangingeating habits,while54%ofthepeoplewere noteating
thesame kindoffoodasthey
didtwoyearsago.Thisstudyalsoshowedtheeffectofglobalization ontheworlddiet,
withbothpastaandpizzaranking among thetopthreefavoritefoodsin
manycountries.Foodpreferencesaremadeasaresultoftheadjustmentsthataregenerat
ed by socialandeconomicchangesthattakeplacethroughoutsociety. Theissuehereis
oftennotwhatfoods areeaten,butrather howmuchof eachfood iseatenandhowthe

4
consumptionisdistributedwithinthesociety orwithinthefamily
(HNDW,2013).Social
factorsandculturalpracticesinmostcountriesoftheworldhavea very
greatinfluenceon what peopleeat, how theypreparefood, theirfeedingpracticesand
the food theyprefer.
Culturalfoodpractices areveryrarelythemainor evenan
importantcauseofmalnutrition.
Onthecontrary,manypracticesaredesignedtopromoteandprotecthealth. Agood
exampleisseenintheprovisionofrichenergy-
densefoodforwomenduringthefirstmonth following
childbirth.However,itistruethatsometraditionalfoodpracticesandtaboosin
somesocietiesmay contributetonutrientdeficienciesamongparticulargroupsofthe
population. Therefore,Nutritionistsneedtohave agoodknowledge offood
habitsand practicesofthecommunitiesinwhichthey worksothatthey
canhelptoreinforcethe positivehabits as wellas striveto changeanynegativeones
(FLS, 2013).
Thetraditionaldietsofmostsocietiesindevelopingcountriesaregood.Usually,onlymi
nor
changesareneededtoenablethemtosatisfythenutrientrequirementsofallmembersoft
he family,althoughthequantity
offoodeatenisamorecommonproblemthanthequality (Marvynundated).
Nigerians’food pattern isbasedonthree mainmealsasitobtainsin
manyotherAfricancountries.FoodintakeinOyo
StateasinmanyotherpartsofNigeriais alsobasedonthree mainmeals daily.The
mealsarecomposedofcereals,orroots/tubers, with saucefrom green leaves, oil and
meat/fish dependingon theeconomicsituation ofthe
household.Inruralareas,peopleeatthe sametypeof dishesbasedontraditionalstaple
foods,whereastheurbanpopulationincorporatesmore modernfoodsintotheirdiet.In
urban areasinNigeria,asinother countriesinAfrica,alotof food
isconsumedoutdoors,
mostlyonthestreets,whichisnotthecaseinruralareas.Foodsoldonthestreetsbyvendor

5
s
ismostlycomposedofjuiceandfriedfoods.Nutritionalinadequaciesinfluencenotonly
the
adult’shealthbutalsotheriskformajorchronicdiseasesinadulthood(Leonie,Christop
her, Urban andLena, 2005).
Aroundtheworld,moretraditionalmealsandrecipesareyielding tosoftdrinks,sodas,
burgers,andotherhighlyprocessedandstandardizeditems.Many
fastfoodsarefriedand are
highinfatandsalt,butlowinfiber,vitamins,andsomeminerals.The highlevelof
consumptionoffastfoodsisfundingaglobalepidemicthatmay leadtoobesity
andother chronic illnesses.Astudy
titled“Man’schangingfoodculture”(2010),observedthatthe
eatingoffastfoodshasbecomeasignificantpartofnotonlytheyoungergeneration’sdiet
butalsooftheadults' dietintheUnitedStates,andincreasingly throughouttheworld.
However,thenutritionalvalueoftheseproductsisbeing
questioned,andstudiesindicate thatconsumptionofsomeofthesefoodsmay
berelatedtoanincreasedhealthrisk,
especiallyinadultsofdifferentcategories;hence,theconsumptionoffastfoodsmay be
equated with badeating habits.
1.2 STATEMENT OF PROBLEM
The endof
secondworldwarrevealedsignificantchangesinfoodconsumptionpattern,
fromeatingfreshfoodsinaseasonwhichcanbepreparedathometohavingawidevariety
offoodsavailablealltheyearfromaroundtheworld(Albon& Mukharji,2008).
Consequently,itisoften notveryeasytomaintain agood
eatingpatterninthismodernfast world,where manymealsare
eatenawayfromhome;neitherisiteasytosticktoahealth andvarieddietbecausemany
individualsfinditeasiertopickupdough-nutormeatpieat
lunchtimethantomakeadecentlunchtotaketoworkevery day.Thisoftenleadstobad
eatinghabits,junkdietandnutritionalproblems(Lisa,2002).Ithasbeenestimatedthatin
awesterndiet,anaveragepersonconsumesapproximately4.5kilogramsofjunkchemi

6
cals peryear.These chemicalsincludecolorants,preservatives,stabilizers,
emulsifiers, antioxidant,anti-cakingagents,fillers,flavour,andmany
otheritemsfoundonfoodlabels (Srilakshmi, 2008).
Affluencehasgivenmorepeopletheopportunitytoindulgein‘fastfood’andsugar-rich
‘Fizzy’drinkswhicharenowa regular partofthediet.This,togetherwiththelackof
exercisehasledtoariseinthenumberofadultsandchildrenwhoareoverweightandobes
e
(Lisa,2002).Mostrecentexperienceofbothadultsandchildrenisthatofbeingatincreas
ed riskofobesity
whichisapointertothefactthatpeoplearenotgoodatchoosingahealthy
dietandmaintainingcorrectbodyweight.Cultureinfluencesfoodhabitbydictatingwh
at isacceptable toeat,the place of birthinfluencesthe food thata person willbe
exposedtoand helps to shapethe dietarypattern that is oftenfollowed forlife
(Brown2008).
Thepopulationofmaturedadultsisincreasing,andassessmentoftheirnutritionalstatus
has beenneglectedovertheyears.According
totheUNpopulationprojection,theglobal
populationaged60yearsorover,numbered962millionin2017,more
thantwiceaslarge asin1980whentherewere 382millionolder
personsworldwide.Thenumber ofolder
personsisexpectedtodoubleagainby2050whenitisprojectedtoreachnearly2.1billion
. However, two third ofthe world’s older persons livedin thedevelopingregions
wheretheir numbersaregrowingfasterthaninthedevelopedregions.
In2050,itisexpectedthatnearly 8 in 10 of theworld’s older persons will be
livingin thedevelopingregions(UN, 2017).
The“eatwellplatemodel”reflectsfindingsthataMediterraneantypeofdietprotects
againstdiet-
relateddiseasessuchasdiabetesandcoronaryheartdisease.Consequently,it
impliesthateatingahealthydiet,shouldallowtheprovisionofvitaminsneededtomaint
ain
healthwithoutresortingtosupplementing(Albon&Mukherji,2008;andLashernsetal.

7
, 2000). The adults and elderlynutritional status emerged as aproblem in
thetwentieth centuryas a resultofthe
increasingnumberofadults(individualsaged≥65years)andthey presenta
challengetothoseconcernedwiththeirphysicalandemotionalwell-
being(Mattithiasetal., 2001).
1.3 JUSTIFICATIONFOR THE STUDY
Meeting the needofagrowingandwealthierpopulationofthemid-adultsandmatured-
adults(age 40years andabove) isa greatchallenge thatrequiresa considerationof
the
provisionofadequatenutritionwhichisparamountinthemaintenanceoftheirfunctiona
l capacity(WHO, 1989). Thereissuchahugequantity
ofnutritioninformationandmisinformationinthe
marketplacethatmakesitverydifficulttodifferentiatebetweenwhatisfactorfiction(Li
sa,
2002).Inthelightofthis,ByersandMarshal(1995),Jervel(1995),Popkin(1998),Darnt
ol, Niskidaand
James,(2004)andNishidaandMucavele(2005)suggestedthatreportsonthe
prevalence of diet-related non-communicablediseasesindeveloped anddeveloping
countriesneedtobeassessed,andthatthere isalsotheneedtoestimatethegeneralpublic
knowledge aboutfood, nutrition,nutritionalstatus,andhealth.
Therefore,itisimportantto assessthefood culture andhabitsofadultstoknowtheir
nutrientintakeandnutritional statusforappropriate
nutritionalinterventionforthepromotionofanactivelifestyleand
healthyliving.Also,theburdenoffood-
relatedillhealthmeasuredintermsofmortalityand
morbidityissimilartothatattributedtosmoking,andamajorityoftheburdenisattribute
d to unhealthydiet ratherthan to foodbornediseases (Alborn &Mulkherji, 2008).
Foradultstolivelong andhealthy, meeting thenutritionalneedsofthisgroupmustbe
ensured(Oyewumi,2009).Eatingfreshfruits,drinkingcleanwater,avoidingheavyme
tals, engaginginphysicalexercise,and

8
livingahealthyandqualitylifestyleisessentials,hence,
itisimportanttodevelopaninformationdatabasespecificallyforearly-adults(18-
40years), mid-adults(40-62years),andoldadults(62-
85years)forplanningandsolving socio- economic and nutritionalproblems of
adults.
AnInternationalFoodInformationCouncilSurvey
opinedthat93%percentofAmericans
believethatfoodcanhavehealthbenefitsbesidestheirnutritivevalueandcandelay the
onsetofaging orreducetheriskofseriousandchronicdiseases(Amy,2008).Therefore,
theprincipletodealwiththeproblemofbadeating habits,junkdiets,nutritionproblems,
andmakingahealthy foodchoice,wheneatingaway fromhomeonaregularbasisisthe
focusof thisproject.Thissituation,therefore,necessitatesthe acquisitionof more
knowledge innutritionfor designingadequate plansfor food, health,andeconomic
resources to meet the challenges of thefutureincreasein theold adult population.
1.4 RESEARCH QUESTIONS
What arethe food habits of adults in Oyo State, South West Nigeria?
Whataretherelationshipsbetweensocio-
demographic,householdcharacteristics,and foodhabits of adults in OyoState,
South West Nigeria?
Whataretherelationshipsbetweensocio-
economic,householdcharacteristicsand nutritional status of adults in Oyo State,
South West Nigeria?
What is the level of malnutrition amongadultsin Oyo state, South
West, Nigeria?
Whatisthelevelofhealth-
relatedqualityoflifeofadultsinOyoState,SouthWest Nigeria?
Whataretherelationshipsbetweensocio-
demographic,householdcharacteristicsand health-related qualityof lifeof adults
in Oyo State, South West Nigeria?

9
1.5 OBJECTIVES
General Objective
Thegeneralobjectiveofthisstudy
wastoassessfoodhabits,nutritionalstatus,andhealth- related qualityof lifeof adults
in Oyo State, South West Nigeria.
SpecificObjectives
Thespecificobjectives of this studyareto:
Determinesocio-demographicandsocio-
economichouseholdcharacteristicsthat influencefoodhabits andperceived
qualityof lifeof adults in Oyo State.
AssesschangesinfoodhabitsthatinfluencenutritionalstatusandHealthRelat
ed QualityofLifeofadults in Oyo State.
Examine therelationships betweensocio-demographic andsocio-
economic household characteristicsthat influencethe nutritional statusand
Health Related Qualityof Lifeof adults in Oyo State.
Determinetheeffectofchangingfoodcultureandhabitsonhealth-
relatedqualityof lifeof adultsin Oyo State.
1.6 SCOPE OFTHESTUDY
TherearemanyimportantissuestobestudiedinthenutritionofadultsinNigeria:howev
er, forthe purposeof this study, the followingunderlisted areas willbe covered:
Demographic characteristics of respondents
Determination ofchanges in foodcultureandhabits of therespondent
Determination ofnutrients adequacy(energy, protein, Vind minerals).
Anthropometric measurement (usingMUAC and Heights&weight).
Bodymass index/MUAC todeterminenutritional status.
Determination ofnutritional vulnerability.

10
Determinationofsomeexistingrelationshipbetweensocio-
economicvariablesand nutritional status.
Forthepurposeofthisstudy ‘adult’istakenaspeopleaged18-85yearsforbothmaleand
female(Center for productivelongevity, 2013).

11
CHAPTER TWO
LITERATURE REVIEW
2.1 The concept ofadulthood
Mostpeopletendtothinkabout‘adult’intermsofage,butnosingleagecandefineanadult
withinasociety,letaloneonacomparativebasis;wherelegalandsocialliabilitycomesint
o the actatdifferent age (CPL,2013). Sometimeswe
thinkaboutadultinrelationtovoting, age, gettingmarried,fightingforone’scountry,
holdingproperty, buyingadrink or cigarettes,being sued,incurring
sentences,obtaining credit,driving avehicle,engaging in paidlabour or
attendingvariousformsof entertainmentallof whichhave aged-related
restrictionappliedtothem.Hence,wecannotsay anindividualbecomesafulladultatany
specificage. As aresult, awiderangeof concepts is invoked when weusetheterm
‘adult’. The wordcanrefer toa stage inthelifecycle:eachindividualisfirsta
child,thenayouth, thenanadult.Itcanrefertostatus,anacceptanceby society
thatthepersonconcernedhas
completedtheirnovitiateandare(orshouldbe)incorporatedmorefullyintothecommuni
ty. Itcanrefertoasocialsubset:oradultsasdistinct fromchildrenoritcanincludeasetof
ideas and values(Alan 2004)
2.1.1 Definitionof‘adults’
Theproblem ofdefining an adult– and non-adultis so great that at times
thosebodies with thegreatestexperienceofmaking
suchdefinitiongaveup.Hence,UNESCOin1976 determined that adultis both self-
recognizingandrecognized byothers (Alan, 2004).
Adulthoodreferstoagrownup,maturein age, size,strength,etcofadultpersons,aman
orawomanwhoisfullygrownuporapersonwhohasreachedtheageofmaturity now
generally18years (Webster New World CollegeDictionary). Anadult, accordingto
theAmerican HeritageDictionaryof EnglishLanguageis a fully grown,

12
matureorganismthat has
completed its final stage of metamorphosis.Adulthoodisthe
periodinthehumanlifespaninwhichfullphysicalandintellectual maturity
hasbeenattained. Adulthoodis,therefore,commonly thoughtofasbeginningat
age20–21years. Inevery culture,thereisaseriesofexpectationaboutthosewhoclaim
andarerecognizedasan
adult,thoughthiswillvaryfromindividualtoindividualandfrom culture
toculture.Characteristicssuchasfar-sightedness,self-control,establishedand
acceptablevalues,security,experience,andautonomyareamongthemostcommonone
advanced,thoughnotallofuswouldclaimthat to beadults,apersonneedstopossessall
thesetraits.
However,Westernhumanisteducators,Houle,andCarlRogersascitedbyAlan(2004)h
ave
developedthreemainelementsthatseemtoliewithintheconstructofadulthood.Theyare
maturity, perspective,and autonomy. Thesethreeelements aredescribed below:
2.1.1.1
Maturity:Humanmaturityisnotjustastate(thoughthecharacteristicsofmaturity
canbe recognizedina person) butalsoanidea shouldbe aimedat ratherthan
achievedin full.Nevertheless,itstillincludestheidea of
thefulldevelopmentandutilizationof allthe
individualtalentandtheprocessofmovingtowardsevergreatermaturity isone
acknowledged as beingassociated with adulthood.
2.1.1.2 Perspectives:Adultsare expectedto
behavewithagreatersenseofperspective especially
inanoccasionwhensuchadultsseethemselvesasbeingmoreimportantthan
theyareseenbyothers;suchperspectivesthatleadtosotunderjudgment
aboutthemselves
andaboutothers.Hence,adultsareexpectedtohaveaccumulatedexperiencesthatifdra
wn upon,willhelpthemachieveamorebalancedapproachtolife
andtosociety,tobemore developed in theirthinkingin relation to others.
2.1.1.3 Autonomy: This third element ofadulthood meansresponsibility. Oneof
thekey conceptsofbeinganadultandnotbeingchildishisthat ofbeing

13
responsibleforoneself, one’sdeedsanddevelopment.Onestudy
definespeopleas‘adult’becausethey have assumed responsibilityfor
managingtheirown lives. Therefore, to saysomeoneis an adult istosay
thatheisentitled,forexample,forawide-rangefreedomoflifestyleandtoafull
participationinthemaking ofsocialdecisionanditisalsoto saythatheisobliged,among
otherthings,tobemindfulofhisowndeepestinterestsandtocarry afullshareofthe
burdensinvolvedinconductingsocietyandtransmittingitsbenefits.Hisadulthoodconsi
sts of his fullemployment ofsuch rights and hisfull subjection to such
responsibilities (Alan, 2004).
2.1.2 Theglobal perception ofthe termadulthood
Inmostpartoftheworld, includingmostoftheUnitedStates,partsoftheUnitedKingdom
(England,NorthernIreland,Wales),IndiaandChina,thelegaladultageis18 years
(historically21years) formostpurposes, with some notable exceptions:
Scotland (United Kingdom) and the Netherlands (16years)
BritishColumbia,NewBrunswick,NewfoundlandandLabrador,NorthwestT
erritories, Nova Scotia,Nunavut,YukonTerritory
inCanada;NebraskaandAlabamainTheUnited States, and South Korea(19years)
Indonesia and Japan(20years) (Adult Wikipedia freeEncyclopedia).
Aneventrelating totheoncoming ofadulthoodiscoming ofage,whichencompasses
passinga seriesofteststodemonstratethata personispreparedforadulthood,or
reaching
aspecifiedage.Mostmodernsocietiesdeterminelegaladulthoodbasedonreaching a
legallyspecifiedagewithoutrequiringademonstrationofphysicalmaturity
orpreparation
foradulthood.However,ithasbeendiscoveredthatitbecomesnecessarytocopewithone
's own behaviour,especiallyin uncomfortable situations, and also thebehaviour of
others.
2.2 Determination ofadulthoodbiologically,socially, historically andlegally
AccordingtoCentreforProductiveLongevity(2013),determinationsofadulthoodareo
ften inconsistentandcontradictory;apersonmaybebiologicallyanadult,andhaveadult

14
behaviourbutstillbetreatedasachildiftheyarebelowthelegalageofmaturity.
Conversely,onemaylegallybeanadultbutpossessnoneofthematurityandresponsibilit
y thatmaydefinean
adultcharacter.Biologically,anadultisahumanbeingorotherorganism
thatisofreproductiveage(sexualmaturity).Inhumancontext,thetermadultadditionall
y hasmeaningsassociated withsocialandlegalconcepts;for
example,alegaladultisalegal
conceptforapersonwhohasattainedtheageofmaturityandisthereforeregardedas
independent,self-
sufficient,andresponsible.Biologicaladulthoodgenerally,therefore,
beginsaround10or11yearsof ageforgirlsand11or12 yearsof ageforboys,thoughthis
willvaryfrompersontoperson,becausetheterm‘adult’ismostoftenusedwithoutthe
adjectivesocial orbiological, andsincethe term is frequentlyusedto referto
socialadults, some writershavetakenthe meaningof thetwo words
phrase‘biological adult’ to begin at the end ofphysical maturation ratherthan
theonset of puberty.
Socially: Socially,adulthoodsplitsintotwo
formsafterthesocialconstructofadolescencewas created.
Thus,therearenowtwoprimary formsofadults:biologicaladults(peoplewho
haveattainedreproductiveability,arefertile,orwhohaveevidenceofsecondary sex
characteristics)andsocialadults(peoplewhoarerecognizedbytheirculture
and/orlawas being adults) (CPL, 2013).
Historically: Historically andcross-
culturally,adulthoodhasbeendeterminedprimarily by thestartof
puberty(theappearanceofsecondary
sexcharacteristicssuchasmenstruationinwomen, ejaculationinmen,and pubic
hairinbothsexes).Inthepast,apersonusuallymovedfrom
thestatusofachilddirectlytothestatusofadult,oftenwiththisshiftbeingmarkedbysome
typeofcoming-of-agetest or ceremony(CPL, 2013).
Legally: Legally,adulthoodmeansthatone canengageina contract.The same or a
different minimum agemaybeapplicable to,forexample,parents losingparenting
rights andduties regarding thepersonconcerned,parentslosing

15
financialresponsibility,marriage,voting, having ajob,serving
inthemilitary,buying/possessing firearms(iflegalatall),driving, travelling
abroad,involvementwithalcoholicbeverages(iflegalatall),smoking,sex, gambling
(bothlottery andcasino)beingaprostituteoraclientofaprostitute(iflegalat
all),beingamodeloractorinpornography,runningforPresidency,etc.Thelegaldefiniti
on
ofenteringadulthoodusuallyvariesbetweenages16and21years,dependingontheregio
n in question. Some cultures in Africadefine‘adult’at age13years. (CPL)(2013)
2.3 Classificationofadulthood
In the past, the effectiveadultyears were regarded as comprisingtwo stages;
Earlyadulthood which is from 18 to 40yearsand
Matureadulthoodwhichisfrom40to65years;afterwhichretirement
beginsandthe ‘elderly’orolderadultisrelegatedtoenjoying“thegoldenyears”.That
picture nolonger portraysdemographicrealitiesbecausepeopleareliving
substantiallylongerlivesinbetter health.
Inlightofthis,theCenterforProductiveLongevity (2013)proposedaconceptof
adulthood that falls into threestages:
Thefirst stageofearlyadulthood from 18-40
Thesecond stageofmid-adulthood from 40-62
A new stageof matured-adulthood, from 62-85
Firstly,CPL
(2013)foundthatproductiveactivities(i.e.activitiesthathadvalues)areas
importantafactor forolderpeopleas foryoungerpeopleinattainingasecureand
balanced life. Productive activitiesinclude continuedemployment forpay,
entrepreneurial endeavours,variouskindsofvoluntary
efforts,childcareandeldercare,andanythingelse that adds value to the society.
Secondly,thebelief thathumanintelligence
grows,increases,andmaturesuptotheage of around 18,further
maturationthenceases,andthatallintellectualdevelopmentthereafter

16
takeplacesimply by thelearningexperience.Thisbeliefhasthe
dysfunctionaleffectof
givingsupporttotheviewthatnofurtherintellectualgrowthoccursaftertheageof60or
65 and, indeed that we all godownhillfrom there.
However,50yearsofresearchby oneoftheco-authorsandcolleagueofCPL(2013)
discoveredthatadultsinmanagementlevelworkshave demonstrated thatthisbelief
isnot true.Theirstudy showedconclusively
thataperson’spotentialcapability(i.e.skillsin action)continuestoincreasenotonly
throughchildhoodandadolescencebutalso throughoutthewhole ofadultlife
uptoandevenbeyondtheage of85yearsfor people
workingatthislevel.Thisgrowthisatruematurationofinnatehumanpotential.Individ
uals havebeenfoundtoprogresswithintheirrespective capability
boundsbutnottocrossover betweenbonds.Thus,older adultswillcontinuetomature
withintheir bondseven after retirement, so longas theyremain engaged in
ordinaryactivelife.
Thisgrowthoccursatitsownrateandcannotspeedup by specialeducationalor
occupationalopportunities;neitherdoesitneedanysuchopportunitiestoadvance.Itsi
mply requires the ongoingstimuli of aperson’s everydaylife.
Erickson’sviewascitedbyWilliams(1973)isthatofthreestagesinaman’slifespanbef
ore hecompleteshisdevelopment,whichisinlinewiththebeliefofCPL (2013).
Ithasthree stageswhich are: (i) Youngadulthood (ii) Adulthood (iii) Senescence
Youngadulthood(18-
40):Inthisperiodofyoungadulthood,theindividualnowlaunched
onhisownmustresolvethecoreproblemsofintimacy
versusisolation.Ifheachieveshis
goals,heisabletobuildanintimaterelationship.Ifnot,hebecomesincreasingly
isolated from others. These are theyears ofcareerbeginning, ofestablishing one’s
ownhome, ofstartingyoung childrenontheirwaythroughthesamelifestages
andearlystrugglestomakeone’swayin the world.
Adulthood (age40-60): Duringtheperiod ofadulthood, the coreproblem
theindividual facesis‘generatively’versus‘self-

17
absorption’.Thechildrenhavenowgrownandgoneto
maketheirownlivesinturn.Thesearetheyearsof“empty nest”(whenchildrenleave
home)thecoming totermswithwhatlifehasofferedandoffinding
expressionforstored learningin passingon life’s teaching.
Senescence (age 60-80):Inthe laststage of life (oldage,senescence) the finalcore
problemisresolvedbetween‘integrity’ and‘despair’.Dependingon one’s resources
atthis stage,there
iseitherapredominantsenseofwholenessandcompleteness,orasenseof
distaste,ofbitterness,ofrevulsion,andofwonderingwhatlifewasallabout.Iftheoutco
me
oflife’sbasicexperiencesandaproblemhasbeenpositive,theindividualarrivesatolda
ge arich person,richinthewisdomoftheyears.Building oneachpreviouslevel,his
psychological growth hasreached its positivehuman resolution (William, 1973).
2.4 Physiological changes inadulthood
Bodygrowthdeclinesin
adulthood.Physically,earlyandmiddleadulthoodismarkedbya
slow,gradualdeclineinbody functioning,whichacceleratesatoldage.
Themusclemass continuestoincreasethroughthemid-20s,thereaftergradually
decreasing. Theskeletal massincreasesuntilage30or soandthenbeginstodecrease
firstinthepelvisandspine andlastinthe(peripheralskeleton)fingersandtoes.
Throughoutadulthood,thereisa
progressivedepositionofcholesterolinthearteries,andtheheartmuscle eventually
grows weaker even in theabsenceof detectablediseases(TheNew
EncyclopediaBritannica).
There isalsoclearevidencethatwithincreasingage,adultsdisplay aslow,very
gradual tendency
towarddecreasingspeedofresponseintheexecutionofintellectualandphysical tasks.
Slowingratesofelectricalactivity intheolderadultbrainhavebeenlinkedtothe
slowing ofbehaviouritself. Thisdeclineinthe
rateofcentralnervoussystemprocessing doesnotnecessarily imply
asimilarchangeinlearning,memory,orotherintellectual

18
functions.However,thelearningcapacityofyoungadultsissuperiortothatofolderadu
lts,
intheirabilitytoorganizenewinformationintermsofitscontentormeaning.Olderadul
ts, Ontheotherhand,are equalorsuperiortoyoung adultsintheircapacity
toretaingeneral information and in their accumulated cultural
knowledge(EncyclopediaBritannica).
2.5 Fundamental needs of nutrition
Foodisfundamentaltohuman survival,inmorethan justoneway.First,
foodisbasicfor
avertinghungerandmaintaininghealthforeveryhumanbeing.Secondly,foodsatisfie
sour
palateandmakesushappyandemotionallyandsociallycontent.Thirdly,foodconstitu
tes a formofculturalexpression.The food we eatshouldbe safe,palatable,
affordable,andof thequality
thatcanmaintainmental,emotional,physiologicalandphysicalhealth.Even
withglobalizationthathasseenfood movementstoandfromdifferentpartsof the
world, formostpopulationsinAfrica,foodisstillverylocale-specific,especially
intherural
farmingareaswhereitisproduced.Manylocallyproducedfoodshavebothnutritionala
nd intrinsic value (Oniong’oet al. 2003).
Humansneedfood inthe rightproportionand combinationfor survival.
Foodsprovide caloriesandother
substancesneededforgrowthandoptimalhealth(Srilakshmi,2006).
Goodhealthdependsonadequatefoodsupply andthis, in turn,dependsonsound
agriculturalpolicy andgoodfooddistributionsystem(Davisonetal.,1975).Although
peopleeat foodformanyreasons,themost compellingreasonisthat
calories,nutrients,and othersubstancesare
neededforgrowthandhealth(SizeandWhitney,2000).Therefore,
betternutritionandhealthy
livingrequireanunderstandingoffactorsthatinfluencewhat weeat, sincethe
healthand the nutrition of adultis important as their eating behaviourand
nutrition will affect theirfuturehealth. (Oniang’oet al., 2003).

19
Good nutritioniscrucialtohealththroughoutthelifecycle. Appropriate
nutritionalintake isimportantstarting fromthepre-conceptionstageandcontinuing
throughtotheageing process.
Humannutritionalneedchangethroughoutthelifecycle,requiring adjustmentin
thetypesand amountseatentomaintainoptimal healthandgrowth(Oniong’o
etal.,2003).
Therefore,humannutrientrequirementsdependontheage,sex,body
compositionand natureofthe activity
ofindividuals.Anadultrequiresnutrientsformaintenance,whileinfants
andchildrenneedthemfor
bothmaintenanceandgrowth.Nutrientrequirementsduring childhood
areproportionaltothe children’sgrowth rate(AlbonandMukherji, 2005).
Nutrientrequirementsarerelatedtobody weightandheightamongadults.However,
there are inter-individualdifferencesinthe
nutrientrequirement,evenbetweenindividualsof thesameage,sex,andbody
weight.Nutritionalrequirementsforthematuredadultsand older-
adultsarenotfundamentallydifferentfromthoseoftheyoungadult(Mitchelletal.
1976).
2.6 Nutritional needs inadulthood
Adultsneedfoodtomaintainandrepairthebodyandkeephealthy. Theamountofdaily
activityaffectsenergy
andnutrientrequirement,andmealsshouldbeplannedaccording to theseneeds.
Nutrientsrequirementsaredeterminedtosomeextentbybodysize. Onthe
whole,womenneedlessfoodthanmen,buttheyneedmoreironbecauseofmenstruatio
n
andtheirnutrientsrequirementschangeduringpregnancyandafterthebirthofababy.S
ince the
majorityofadultsarewithintheiractivelife,mealsforactivelifepeoplemustprovide
sufficientenergywhilekeepingtodietarygoalsofreducedsaturatedfatsandincreased
carbohydrate food. Extrawater and saltshould betaken in veryhot weather(Tull,
1996).
Asaresultofchangesinnutritionalrequirementsaswemovethroughdifferentlifestage

20
s
whichplaceextrademandsonthebody,theseextrademandsplacedonthebodymustbe
metbyourdailydietstomaintainthebestofhealth. Therefore,tobefitandhealthy
throughoutadulthooditisimportanttotakeintoaccounttheextrademandsplacedonth
e bodybythese changes throughawidevarietyof regular nutritious foods such as:
Wateron adailybasis.
Enough kilojoules forenergy, with carbohydratesas the preferable
source.
Adequate protein forcellmaintenanceand repair.
Fat-soluble andwater-soluble vitamins.
Essential minerals such as iron, calcium and zinc.
Foodcontainingplant-
derivedphotochemicals,whichmayprotectagainstheart diseases, diabetes,
somecancers, arthritis,and osteoporosis.
Avarieddietthatconcentratesonfruits,vegetables,wholegrain,legumes,dair
y foods,and lean meats canmeet thesebasicrequirements(FLS, 2013).
2.7 The concept ofhealthybehaviour
Healthy behaviourasaconcepthasreceivedconsiderableattentionfromresearchers
particularly thoseinthefieldofhealthpromotionandhealthmaintenance.The various
definitionhasbeensuggestedandabroadandinclusivedefinitionofhealthby Kasland
Cobbascited by Adegoke(2010)isany activity undertaken
byapersonbelievinghimself
tobehealthyforthepurposeofpreventingdiseaseordetectingitinanyasymptomaticsta
ge. Inthebroadersenseaccording
toOlayinka,citingGlanz,LewisandRimer(1997)healthy
behaviourreferstotheactionsofindividuals,groups,andorganizationtothoseactions,
determinants,correlates,andconsequences,including socialchange,policy
development and implementation, aimed at improving copingskills and
enhancequalityof life.
Healthy
behavioursincludeobservableovertactions,thementaleventsandfeedingstates

21
thatcanbe reportedandmeasured.For instance,personalattributessuchasbeliefs,
expectations,motives, values,perception,andothercognitiveelements,personality
characteristics,effectiveandemotionalstatestraits,andovertbehaviouralpatterns,act
ions, andhabitsthatrelate
tohealthmaintenance,healthrestoration,andhealthimprovement. (Adegoke, 2010)
QualityoflifeisdefinedinPublichealthandMedicineasaperson’sperceivedphysicala
nd mentalhealthover time.These includefactorssuchashealthrisks,andconditions,
functionalstatus,socialsupport,andsocioeconomicstatus(PANE,2012).Anindividu
al’s demographic characteristics,socioeconomic condition,adequate and
appropriatenutrition, accesstobasicsocialamenitiessuchasfood,waterandelectricity
havebeenfoundtobe highlycorrelated to health and nutrition status of allpeople.
Factorssuchas age,gender, townshipstatus,andethnicity,whicharefundamentalto
demography,cancontributeinoneformortheothertothequality oflifeandnutritional
statusoftheadults.SomeresearchesonnutritionalassessmentinAfricaobservedthatso
me olderpeopleindevelopingcountriesenterold-ageafteralifetimeofpoverty and
deprivation,adietthatisinadequateinquality andquantity,alifetime
ofdiseaseandpoor access to health care(Olayinka, 2006).
Therefore,healthylifestyles,early detectionofdiseases,immunization,andinjury
preventionhavebeenfoundtobe effectiveinpromoting
thehealthandlongevityofolder adults. Theenjoymentsoffoodandnutritionalwell-
beingalong withotherenvironmental influenceshavean influenceonhealth-
relatedqualityoflifeandtheageingprocess(PANE, 2012). Beginningearly
inlife,eatinganutritiousdiet,maintaininghealthybodyweight,anda
physicallyactivelifestyle arekeyinfluential factors in helpingindividuals avoid the
physicaland mental deterioration associatedwith ageing(Kornman, 2006).
Ingeneral,qualityoflife(QoLorQOL)istheperceivedqualityofanindividual'sdailylif
e, thatis,anassessmentoftheirwell-
beingorlackthereof.Thisincludesallemotional,social, spiritual and physical
aspects of the individual's life.In health care,health-related quality
oflife(HRQoL)isanassessmentofhowtheindividual's well-being

22
maybeaffectedover time byadisease, disability, or disorder (in this
casefoodhabits).
Aswithanysituationinvolvingmultipleperspectives,patients'andphysicians'ratingof
the sameobjective situationhas
beenfoundtodiffersignificantly.Consequently,health- relatedquality
oflifeisnowusually assessedusingpatientquestionnaires.Theseareoften
multidimensionalandcover physical,social,emotional,cognitive,work-orrole-
related,
andspiritualaspectsaswellasawidevarietyofdiseaserelatedsymptoms,therapyinduc
ed side effects, and even thefinancial impact of medical conditions.
Inthisstudy,theHealthrelatedquality oflifewasusedtoassesshowthe
respondentswell- beingmay
beaffectedbytheireatinghabit.Thiswellbeingwasassessedunderdiverse sections,
called subscaleswhich include,
RolePhysical(RP):Thissubscaleassessestheeaseofperformingsomethingsby
therespondent.Italsoassessesifthey are limitedinanykindortheyaccomplished less.
Physical Functioning(PF): This assesses the physical functioningof
therespondent and questions about the abilityto climb several flights, to
moderate activity, to batheor dress self.
BodilyPain(BP):Thissubscalelooksatiftheirbodyhasbeeninanywayaffected with
bodilypain.
GeneralHealth(GH):Thissubscalelooksatthegeneralhealthoftherespondents. It
e x a m i n e s w h e t h e r t h e y
getsickeasily,iftheyarehealthyasanybody,iftheirhealth worsens or iftheirhealthis
excellent.
RoleEmotional(RE):Thissubscaleassessestheemotionalwellbeingofthe
respondents, looking at iftheyworked lesscarefullyor theyaccomplished less.
ReportedHealthtransition(RH):Thissubscalecomparesthepresentstateofthe
respondent’s health compared to ayear preceding the interview.

23
PhysicalHealth(PHH):Thissubscaleisanoverallscaleforthephysicalhealthof
therespondentsandincorporatesothersubscalesliketheRolePhysical (RP),Bodily
Pain (BP), General Health (GH)
Vitality(VT):Thissubscalelooksattheoverallvitalityoftherespondents,assessing if
they’vefeltworn out or tired in theprecedingdays.
MentalHealth(MEH): Thissubscalelooksattheoverallhealthoftherespondents.
ItincorporatesothersubscaleslikeVitality (VT),SocialFunctioning(SF),Role-
Emotional (RE),and Mental Health (MH)
SocialFunctioning(SF):Thissubscaleassessestheoverallsocialimpactaspectof the
respondent’s life.
2.7.1 Importanceof nutritionto quality oflifeandhealthy behavior
Forhumanbeings,foodisacriticalcontributortophysical well-being;itis
amajorsource ofpleasure,worry andstress,amajoroccupantofwake-
uptimeandacrosstheworld,the singlegreatest categoryof expenditures(Rozinet al.,
1999). The healthandNutritionof adultsareimportantastheir
eatingbehaviourandnutritionwill affecttheirfuture health.Numerous studieshave
reportedonthesignificantimpactof dietary
intakeonhealth,independenceandqualityoflifeinthepeopleofallages(Young
HeeLee,updated; Wickrama etal.,2012) froma baseline datafroma larger
intervention study ofmid-lifeandolderAfrican-Americansincorporatedaquasi-
experimentaldesign, theresultofthefindingshowedthatolder
AfricanAmericanswithmorecumulative life adversity,asreflectedby
highlifedissatisfaction,hadsignificantpoorereating behaviours including
theconsumptionofahigh-fatdietandlowintakeof fruitsand vegetables.Older
AfricanAmericans'dietarychoiceswerealsoassociatedwiththeirperceivedsocialsup
port.
Moreimportantly,perceivedsocialsupportactedasabuffertomitigatetheinfluenceofl
ife dissatisfaction on olderAfricanAmericans' eating
behaviours.Lifedissatisfaction places olderAfrican Americansat risk of
unhealthyeatingbehaviours.

24
Therefore,whenplanningthecareofmaturedadults,itmustbeunderstoodthatfoodhab
its make asignificantcontributionto theirwell-being andfoodhabitsofalladultsare
determinednotonly by lifetimepreferencesandphysiologicalchangesbutby
suchfactors as livingarrangements, finances, transportation, and disabilities
(Bengmark,2006).
2.8 Originof foodcultureand habits
The culturalbackgrounddetermineswhatis eatenaswellaswhenandhow. A
peoples’ culture
hasalotofinfluenceonthekindoffoodpeopleeatineachcommunity.Inevery
partofsociety,peoplehavediversefeedinghabitsthathavebeen inheritedfrom
generationtogeneration(Oniong’oetal.,2003).Theyexactdeepinfluenceonthebehav
iour of thepeople.Theculturalbackground determineswhatshallbe
eatenaswellaswhenand howitshallbeeaten(Whitney
andRolfes,2008).Foodhabitsarebaseduponfood
availability,economicorsymbolism,the agriculturalpracticeofthepeople,economy
and marketpractices,historyandtraditions,andthegeography
oftheland(William,1973). Culture influencesfoodhabits bydictating
whatisorisnotacceptabletoeat(Amy,2008).
Whatisacceptableasfoodinonepartoftheworldmay berejectedinanotherplace,
thereforepeoplelearnfromtheircultureandsociety whichanimalsandplantsare
consideredas food and thosethat arenot (Brown,2008).
Allpeople havetheirlikesanddislikesandtheirbeliefsaboutfood,andmany peopleare
conservativeintheirfoodhabit.Theytendtolikewhattheirmotherscookedforthemwh
en they
wereyoung,thefoodtheywereservedonfestiveoccasionsortheeatingwithfriends and
families awayfrom home duringtheir childhood (Mattithias, 2001).
Food,cooking,andeatingplayacentralroleineveryculture. Eatingisneverapurely
biologicalactivity sincetheconsumptionoffood,whetheritissimplyorelaborately
prepared, isalways imbued withmeaning,which isunderstoodand communicated
in various symbolic ways (Mervyn, 2012).Preparing
foodforconsumptionandeating socially,areactivitiesthatare conductedfor

25
purposesotherthannutrition,hence,the symbolicmeaningoffoodsometimeshaslittle
to dowiththefooditself,andeatingsocially haslesstodowithnutritionthanwith
communication and relationships (Anastassiaet al.,
2011).Thetechniquesutilizedtoprepareandprocessfoodsandthewaysofservingandc
onsuming themvary fromculture
toculture,whichalsohasanimportantinfluenceonthe socialand familyrelationship
(Adebusoyeet al., 2012).
2.8.1 Foodandculture
Cultureisusedtechnically todescribeanorganizedgroupofpeopleinteractingina
structuralsystemandcarryingouttheactivitiesnecessary toproduceandsustainlife
(Encyclopedia Americana,1989).Culturecanalsobe referredtoasa pattern of
thinking anddoingthatrunsthroughtheactivitiesofa
populationanddistinguishesthemfromall otherpeople (Encyclopedia Britannica,
2007).Culturedetermineswhat
foodis,hencewhatisconsideredtobefoodinoneculturemaybe
regardedwithdisgustormayactually
causeillnessinpeopleofanotherculture(Williams,1973).
TheAmericans valuemilkasbasicfood,whileinmanyotherculturesitisrejected
withrevulsionasananimalmucousdischarge.TheIfugaotribesmenof
NorthernLuzonin
Philippineareknownfortheirenjoymentofdragonfliesandlocustwhichtheyboil,drya
nd grind into apowder, while crickets, flyingred ants, beetles, and water
bugarefried inLard (Williams,1973). Aculturalgroupprovidesguidelinesregarding
acceptablefoods,food
combinations,eatingpatterns,andeatingbehaviour.Acceptanceoftheseguidelinescr
eates asenseof identityand belongingforthe individual (Havilandet al., 1990).
Withinparticularpeer,work,orcommunity,groupsimpactfoodbehaviours.Forinstan
ce, ayoung personatabasketballgamemayeatcertainfoodswhenaccompaniedby
friends,
andanotherkindoffoodswhenaccompaniedbyhisorherteacher.Etiquetteandeatingh
abits

26
alsovarydependingonwhetherthemealisformal,informalorspecial(Suchasamealon
abirthdayor religious holiday)(TheNew Encyclopedia Britannica, 2007 (a) Vol.
3).
2.8.2 Food habits
Foodhabitsareamongtheoldestandmostentrenchedaspectsofmany
culturesthatexert a deepinfluence
onthebehaviourofpeople(Oniong’oetal2003).Habitsrefertoany
regularlyrepeatedbehaviourthatrequireslittleornothoughtwhichisnotinnatebutlear
ned.
Ahabitcanbepartofanyactivityorbehaviourrangingfromeatingandsleepingtothinki
ng andreacting,whichisdeveloped throughreinforcementand repetition(The New
EncyclopediaBritannica2007(a)).Ouremotionandmotivation are
productsofhabits.Our appealsandfear, tasteinfood,
dressing,prejudices,andappetite are alllearned(The
EncyclopediaAmericana1989).Peoplesometimesselectfoodsoutofhabitsuchaseati
ng cerealsevery
morningforbreakfast.Eatingfamiliarfoodandnothavingtomakeany decision can
becomforting(Whitney&Rolfes, 2008). Foodhabits,likeother
formsofhumanbehaviour,are theproductofpersonal,cultural,
socialandpsychologicalinfluence(Williams,1973).The term‘eatinghabits’or ‘food
habits’refertowhy andhowpeopleeat,whichfoodthey eat,withwhom they
eat,aswell
asthewayspeopleobtain,store,use,anddiscardfood.Acrosssectionalstudy
conducted among 132medicalstudentsofthe
preclinicalphaseinaMalaysianUniversityobservedthat
morethanhalfofrespondentshadmealsregularly and40.2%hadmealsofatleastthree
timesperday.Smokingandalcoholconsumption were
significantlyassociatedwitheating habitinthisstudy.The
majority(73.5%)consumedfruitslessthanthreetimesperweek,51.5%
hadfriedfoodtwiceormore aweekand59.8%drankwater lessthan2litersdaily.Eating
habitsscorewassignificantlylowamong youngerstudents(18–
22 years),smokers,alcohol drinkersandthosewhodidnotexercise(p<0.05). Four

27
psychological factorsoutofsix weresignificantlyassociated with eatinghabits
(p<0.05). Mostof thestudents in this study hadhealthy eating
habits.Socialandpsychologicalfactors wereimportantdeterminantsof eatinghabits
amongmedical students (Kurubaranet al., 2012).
Kimuraetal.,(2012)inhisstudy inTosstowninJapanamongtheelderly inTosstown
Japanobservedthattheproportionoftheelderly whousually eatalone
was33.2%inthe
studypopulationof856.Evenamong697elderlysubjectswholivewithothers,136pers
ons
(19.5%)atealone.Theparticipantswhoatealoneweresignificantlydepressedaccordi
ngto theassessmentusingthe GDS-15score.Body
MassIndex(BMI)waslowerintheelderly subjectswho ate alone than
thosewithothers.A significantcloseassociationwasfound
betweeneatingaloneandlowerfooddiversity.Bythemultivariateanalysis,depression
was
independentlyassociatedwitheatingaloneinthelogisticregressionmodeladjustedfor
age,
sex,BodyMassIndex(BMI)andfooddiversityasconfoundingfactors.Fooddiversity
was alsosignificantly
associated,evenaftertheadjustmentoftheseconfoundingfactors. Individual, social,
cultural, religious, economic,environmental and political factors all
influencepeople’s eating habits.
2.8.3 Foodchoices
Thefoodchoicepeoplemakeisnotdrivenbyaneedfornutrientsorguidedby food
selectiongenes. Humansare
bornwithmechanismsthathelpthemdecidewhenandhow muchtoeat.
Aninbornattractiontosweettastingfoods,adislikeforbitterfoods,andthe
responseofthirstwhenwaterisneededallinfluencefoodandfluidintaketoanextent
(Brown, 2008). However,inborntraitsthataffectfoodchoicesarenotveryfine-
tuned;as peoplemayover consume sugarandsalt,for
example,andunderdo(forinstance,drinktoolittlewater in
responsetothirst)theirresponsetointernalcues(Brown,2008). Thestrongsymbolic,

28
emotional, and culturalmeaningsof foodcome to lifein theform
offoodpreferences. We choosefoodsbasedonourculturalbackground andother
learnedexperiencesthatgive us pleasure(WHO 2003).
Cultureisanotherfactorinfluencingfoodchoice.Cultureinfluencesfoodhabitsbydict
ating whatisor isnotacceptable toeat(Amy,2008).Whatisacceptable asfoodinone
partof theworldmayberejectedinanotherplace.
Therefore,peoplelearnfromtheircultureand society
whichanimalsandplantsareconsideredfoodandwhicharenot(Brown,2008).
Culturaltraditionsregardingfoodareflexible,andthey keepevolvingaspeoplemove
about, learn about new foods, and teach others (Sizer and Whitney, 2000).
Foodsgiveuspleasurewhenthey relieveourhungerpangs,delightourtastebuds,or
providecomfortandasenseofsecurity.Wefindfoodpleasurablewhenthey outwardly
demonstrateoursuperiorintelligence,ourcommitmenttototalfitness,or
ourprideinour ethnicheritage,andsowerejectfoodsthatbring
usdiscomfort,guilt,andunpleasant memories and thosethatrun contraryto our
values and beliefs (Brown, 2008).
Althoughmostpeoplerealizethatfoodhabitsaffecttheirhealth,theyoftenchoosefoodf
or otherreasonsapartfromnutrition.
Thesereasonsincludevariety,pleasure,traditions,
association,andnourishment,aswellastheability tocombinefavoritefoodswith a
nutritionally balanceddiet(WhitneyandRolfez,2008).Every
day,severaltimesaday, people make choicesthatinfluencetheir
body’shealthforbetterorworse,andthat each day’schoicesmay
benefitorharmthebody alittle. Butwhenthesechoicesarerepeated
overtheyearsanddecades,theconsequencesbecomemajor. Therefore,payingclose
attentiontogoodeatinghabitsnowcanbringhealthbenefitlater.Byandlarge,carelessn
ess
aboutfoodchoicecancontributetoomuchchronicdiseasesprevalenceinlaterlifeinclu
ding heart disease and cancer(Amy2008). Thereare many
factorsthatdeterminewhatfoodsapersoneats. Inaddition,topersonal
preferences,therearecultural,social,religious,economic,environmentalandevenpol
itical factors.Astudy onDietary diversityandfoodexpenditure

29
asindicatorsoffoodsecurityin
olderTaiwanesefoundthatitcostmoretoachieveagreaterDietaryDiversityScore(DD
S). Thefoodexpenditureofsubjectswitha dietary diversity
scoreof6was2.20timesgreater thanthedietarydiversity
score<3groupsaftercontrolling forcovariates. Eldersoflower socioeconomic
statustendedtochoose foods which wouldhave costless. The sub-group
ofelderswhoachievethehighestDDSwithlimitedmoneyofferapproachestofood-
money
management.Nutritionpolicydirectedtofoodinsecuregroup,liketheaged,couldempl
oy health promotionstrategies which reducefinancialbarriers to healthyeating.
Every
individualhasuniquelikesanddislikesconcerningfoods,whichisdevelopedover
time and areinfluenced bypersonalexperiences such asencouragement toeat,
exposureto afood,family
customsandrituals,advertising,andpersonalvalues(Stark,1975).People
decidewhattoeat,whentoeat,andevenwhethertoeatina
highlypersonalway,oftenbased onbehavioralor socialmotivesrather than
onawarenessof nutritionimportance to
health.Manydifferentfoodchoicescansupportgoodhealth;anunderstanding
ofnutrition helpstomakethe sensibleselectionmoreoften.
Somereasonsidentifiedformany people’s
choicesoffoodincludetaste,andotherwidely sharedpreferencesincludesweetnessof
sugar,orthesavourinessofsalt,andlikinghighfatfoods(Whitney andRolfes,2008).In
Europe,Simpsonetal.,(2011)inherstudyonthe
predictorsoftasteacuityinhealthyolder
Europeansreportedthatthemainpredictorsoftasteacuity
wereage,sex,socialclassand country, which had differential effects for each taste
quality. Thestudysuggeststhat socio-
demographicandculturalfactorsshouldbetakenintoaccountwhenconsideringtastea
cuity in older people.
Today,manypeopleeatfoodthatisaccessible,quickandeasytoprepare,andwithinthei
r financialmeans.Consumersvalueconvenienceandarewilling tospendmore

30
thanhalfof
theirfoodbudgetonmealsthatrequirelittleornofurtherpreparation.Theyfrequently
go out,bringhomeready-to-eatmeals,orhavefooddelivered.Evenwhenthey
ventureinto thekitchen,theywanttoprepareamealin15-
20minutes,usingnothinglessthanhalfa dozen ingredients which arealso
semiprepared (Sizer and Whitney, 2000).
2.8.3.1 Determinant offoodchoices andeating behavior
Generally,people’sdecisions of what toeat and wheretoeatare often based
onbehavioral orsocialmotives;andin
mostcases,theawarenessofnutritionimportancetohealthisnot
considered(AlbonandMukherji,2008).Cultureisanotherfactor
influencingfoodchoice. Culturemaybedefined as the wayof lifeof a group
ofpeople usuallyof onenationalityor froma particularlocality
(Micheletal.,1976).Cultureisanintegratedpatternofhuman
knowledge,beliefs,customs,taboos,codes,institution,tools,
techniquesandworksofart,
rituals,ceremonies,andotherrelatedcomponents.Italsoincludesallcapabilitiesandha
bits required bymanas amemberof society(Encyclopedia Britannia, 2007(a)).
Thereisnodoubtthatadietcompatiblewithhuman biologicalneedisessentialtothe
survivalofthespecies.Therefore,anunderstandingofthefactorsthatinfluencefoodhab
its willhelpagreatdealinitsmodification(Stilakshmi,2008).The
foodthatisconsumed actuallydepends uponavailable foodsupplies
andacceptabilityof thefoods by the consumers. There aretwo majorinfluences on
food consumption namely:foodsupplyand consumer demand(Caliendo, 1981).
Many
otherresearchershavetriedtoexplainthedeterminantsoffoodhabitsandnutrition
behaviour.However,many non-
biologicalinfluencesonfoodchoicesandbehaviourhave alsobeenidentified by
sociologistsandanthropologists.Forexample,whenMaslow’s hierarchyis applied
tofood habit, eatingfor survival evolves into eating to satisfytheneed

31
forsecurity,thenforbelongingness,thenforself–esteem,andfinallyforself-
actualization (Ikedan/d).
Differentframeworksoffoodchoicebehaviourhavebeendevelopedbysocialscientist
s. Infoodchoiceresearch thatinvestigateshowpeoplechoosethetype offoodthey
eat,the
theoreticalmodelsofbehaviourincludebothindividualandenvironmentalfactorsaffe
cting
themodificationofbehaviours.However,socialcognitivetheoryexaminestherelation
ship
andinteractionbetweenenvironmental,personalandbehavioralfactors,andfoundthat
food choicecomprises psychologicaland sociologicalaspectswhichincludefood
politicsand otherfactors(suchasreligion,vegetarianism,anddietary
law),economicissues(suchas
howfoodpriceandmarketingcampaignsinfluencechoice),andsensoryaspect(suchas
the studyoforganolepticqualitiesoffood).
Thefindingsshowedthattastepreferenceand sensory
attributemostlyguidepeople’sfoodchoice(WikipediaFoundationInc.,2012). Other
factorsincludecostavailability,convenience,cognitive restraints,andcultural
familiarity.
In Sweden, astudybyZadaPaialicet al., (2012)on the experienceof
elderlypeopleliving athomerelatedtoreceiving mealsdistributed by
amunicipalinthecountry reportedthat
theexperiencerelatedbytheparticipantsinthestudy indicatedthattheyweregenerally
satisfied,withthefooddistributionsystemfromtheirmunicipality.Thestudyalsoindic
ated thatthemealboxwasexperienced by theelderlypersonsparticipating
inthestudyas a
symbolofdependencyandlossofidentityasitbecameevidenttothemthatthey couldno
longergotothemarkettobuyandpreparefoodby themselves.Thisstudyindicatesthat
greater attention needs tobepaid towards meeting the practical and psychological
needs of
elderlypeople;fooddistributionshouldnotbeseenasafragmentarysocialsupportbutas
a pointtowardsbreaking theelderly socialisolation,toactively

32
involvethemindecision making, and preventingthem from havingfeelings of
dependencyand loneliness.
Moreover,environmentalcuesandincreasedportionsizesplay agreatroleinthechoice
andquantity
offoodeatenbyindividuals.Dietaryintakeandnutritionareresultsof“life-
style”whichistermedasthe complexinteractionof a large seriesof
social,culturaland
situationalinputs.Lifestylevariablesincludehouseholdstructuralfactors(numberofp
eople inthehousehold,age, sex,spacing betweenchildren,divisionofduty
inhouseholdtasks, decisionmaking
powerwithinhousehold,education,occupationandemploymentof
householdmembers,attitudestowardshealthy
families,childrearing,religion,socialand
culturaltraditions,migrationhistory;geographical,socialandeconomicresources,pla
ceof residence(urban/rural)and health status (Srilakshmi, 2006).
Goodnutritionalstatusis dependentuponeachpersonhaving an
appropriateintakeofmacro- andmicronutrients,combinedwithadequatehealthcare
andaccesstosafedrinking-water.
Nutritionalstatusalsodependsontheavailabilityofsufficientknowledgeaboutapprop
riate diet,taking
intoaccountlocalfoodhabitstopreventproblemsofundernutrition,andof diet-
relatednon-communicablediseases.Conditionsforachievingsatisfactory nutritional
statusandensuring continuedaccesstosufficientsuppliesofavariety ofsafefoodsat
affordablepricesandofsafedrinking-waterisimportantsothatallpeople,especially
the poor and vulnerablegroups, can havenutritionallyadequateand safediet (FAO,
1992).
2.8.3.2 Factors that influencetheway people choose food
Differenttypesof decisionsare involvedwhen anindividualmakesa food choice.
They involveacombinationoflifeinfluencingfactorssuchasGeography,
Lifestyle,Physiology, Psychology, Culture, Socialization, New food, Modern
food, etc.

33
2.8.3.2.1 Physical andenvironmental factor
Eithercreate orinhibitaccesstofoodstuff, season,locality
(soilorclimate)transportation andmarketing,distributioncostsandpermissibility
areenvironmentalfactorsthat contributeto food availability.
2.8.3.2.2 Physiological factors
Theseincludethephysiologicalneedforfood,basichungerandsatiety (thefeeling of
having hadenough)factors,linkedwithbothappetiteandaversiontofoods,thesensory
appealoffood,personalpreferencesoffoodchoice,andmany physiologically
therapeutic diet to which theindividual maybe adhering(AmyandBrown, 2008).
Thefindingsinastudy inSwedenonHome-LivingElderly people’sviewsonfoodsand
Mealsby Edforsetal.,(2012)indicatedthatfactorssuchasbuyingandtransportationof
food,quality
offood,cooking,widowhood,illness,andhomecareserviceinfluencetheir
dietarypattern.Also, eatingwasinmostcases,
relatedtotheiroralhealthanddentalstatus.
Somerespondentsthoughtthemeatfromfooddistributionwasleathery anddifficultto
chew. Inthestudyhabitsfoundedinpastlife,and
negativelifeeventsaffectedthefoodand meals in the present life
2.8.3.3 Factors responsible forpoorfoodchoices
Itisatragicfactthattoday,inanageofadvancedtechnology andscientificknowledge,
there arestillmanypeoplein theworld whosehealth and qualityof lifesuffer
through lack
offoodasaresultofwar,disaster,pollution,politicalfactors,povertyandpoorfoodchoic
es (Tull,1996). Wherethechoiceoffoodisseverely
inadequate,illness,malnutrition,and
deathonalargescalearetheusualresults(Amy,2008).Therefore,thefollowingaresom
e ofthefactorsthatcouldberesponsibleforpoorfoodchoicesasidentifiedby Williams
(1973):

34
2.8.3.3.1 Foodfads
Foodfadsarescientifically unsubstantiatedbeliefsaboutcertainfoods,whichmay
persist foratimeinagivencommunityorsociety.
Somemaybeperfectlyharmless,whileothers havemoreserious implications
concerningthe health and welfareof theirfollowers.
AfoodfaddistisonewhofollowssuchfoodcustomsSeaborgforatime. Hemay bean
individualfaddistwhosepracticemay
haveitsbasisonanacuteorchronicpsychological problemorhemay
belongtoagroupwhichthen,acceptedsomerigidstereotypeddietary practicein
thebelief thatitwillimprovehealth or curedisease.
2.8.3.3.2Foodmyths:Amythisa traditionallegendwithouta determinable basisof
fact; itisaninventedstory,idea,orconcept. Foodmythsare improvedstories
orbeliefsabout foodwhichoneaccepteduncritically,or,are
usedtojustifyone’sowndesires,interes,and practices.
2.8.3.3.3 Quack
Inmedicine,nutrition,andalliedfields,aquackisafraudulentpretenderwhoclaimstoha
ve
skill,knowledgeorqualificationswhichhedoesnotpossess.Hismotiveisusuallymone
y.
Byacruelhoax,hefeedsuponthephysicalandemotionalneedsofpeople.Thefoodquac
k exists becausefoodfaddistsexist.
2.8.3.3.4 FoodMisinformation
Tomisinformistogivefalseormisleadinginformation.Foodmisinformationisastatem
ent aboutfood which isnotbased upon or isnotinagreement
withscientificevidence. False
informationmayhavearisenoutofatraditionalfallacy,oritmayrepresentabeliefinmag
ic orfolklore.Itmaybebuiltuponoutrightlies,subtlerhalf-
truths,innuendos,andinferences that arethe stock-in-tradeof theindigenous quack.

35
2.8.3.3.5 Scientific nutritional concepts
Opposedtofoodmisinformationisthebodyofnutritionalconceptsthathavebeenbuilto
n scientificevidence. Scientifically
soundconceptsaretheresultofpersistentresearchand testingover manydecades.
Theyrepresent an organized, tested knowledge.
Mythsandfadsisanintriguingtestonone’sbeliefstonoticehowsome samplemyths
appear in thelight of facts that havebeenamassed byscientificobservers.
2.8.3.3.6 Fallacious Claims byFood Faddist
Typesofclaims:Foodfaddistsmake exaggeratedclaimsfor certaintypesoffood,they
assert that:
Certain foods willcurespecific conditions.
Certain foods areharmful and should beomitted from thediet.Certain
foodscombination is veryeffective asreducing diets and hasspecial
therapeuticeffects.
Only“natural food”canmeet bodyneeds and prevent diseases.
Dangersoffoodfadstohealth:Self-diagnosisandself-treatmentare always
dangerous. When theyarebased onquestionable sources, thedangers aremultiplied
(Williams, 1973).
2.8.3.4 Otherfactors that caninfluenceeating behaviour
2.8.3.4.1 Physiological Factors Influencing Eating Behaviour
Nutritionalstatusisaffectedbyawiderangeoffactorsthatmay leadtoan inadequateor
excessivenutrientintakeormayimpairtheiroptimalutilization.Thefactorsmostdirect
ly
influencingnutritionareanalyzedunderthecategoriesoffood,healthandcare,andeach
of these influenceeachother andare
allessentialcomponentsofgoodnutrition(FAOand
WHO,1992).Theresultofthestudyby Anastassiaetal.,(2011)one eating

36
habitsinolder peopleinGreece:
Theroleofage,dentalstatus,andchewydifficultiesrevealedthat
increasingagewasassociatedwithincreasedfrequency
ofconsumptionoffish,grains,and vegetables.
Impaireddentalstatusandchewingdifficultiesdidnotaffectthefrequency of
eatingmeat and otherdifficulties to chewfood,but itwas related to morefrequent
consumptionofsofterfood(chicken,fish,grains,anddairy products).
TheolderGreeks didnotexcludeanyfoodtype
fromtheirdiet,becauseofdentalimpairment. Toovercome
chewingproblems,theyusedvariouspreparationmethodstoconsumetheirfavouritefo
ods. Thedietary
patternsoftheolderparticipantsadheretothetraditionalMediterraneandiet greater
than thoseof theyounger ones,revealingthevariousculturaland social parameters
which influencefoodselection.
Theeatingbehaviourofeveryindividualbothyoungandold
areinfluencedbyacomplexset ofinteracting factors.
Theseincludethephysiologicalprocessesandpsychological
innerspringsofhunger,andhowearly childhoodexperiencesmayhaveaneffecton
subsequenteatingbehaviour,andthecauses of eating
difficulties.Toconsiderfoodand
eatingfromanindividualperspective,andtheunderlying physiologicalprocessesthat
influenceindividualbehavior,(AlbonandMukharji,2008)suggestedthefollowing
key areasfor exploration.
2.8.3.4.2 Physiological Processes ofEating
BehaviourHomeostatic:Themostactivephysiologicaldrivesinmanrelating
totheconceptof homeostasisarehungerandthirst. According
toCardwelletal.,(1998)ascitedby Albon
andMukherji,(2008)theterm“homeostatic”describesthemechanismbywhichourbo
dies try tokeepinternalprocessesinbalance.Thebody
worksbestwhenthereisacorrect balance of chemicals,nutrients,oxygen,andwater
available atthe correcttemperature.If
foodhasnotbeeneatenforsometime,thebodybecomesshortofenergyandphysiologic

37
al processes will(setinmotionthat)initiatewithinusadrivetoeat(hunger).
Thehungerwill besuppressedoncethe foodiseaten.Thereareother
mechanismsinplacethat telluswhen we
arefull.Thefoodeatenhastobedigestedbeforethenutrientsaremadeavailabletobeuse
d
bythebody.Hence,thereisaneedtoeatregularmealsinordertopreventintensehunger.
Severalmechanismsareputinplace toregulateour foodintake. Thesearereportedby
Cardwellet al., (1998)as cited byAlbon and Mukherji(2008) as:
ThepresenceofFoodintheStomach:Thereisamechanismbywhichsignalsa
resent fromthe stomach tothebrainforfeeling full(satisfaction) when the
normal-sized mealis eaten.Thesignalsaresensitivetothequality
offoodaswellasquantityasevidence
showsthatpeoplefeelfullquickerwithhigh-energy
foods.Thosewhohavetheir stomachreduced
eitherbecauseofdiseaseortohelpthemloseweightdo reportfeeling
fullaftereating very little.However,someindividualscompensateby
takingsmall, frequenthighcaloriefoods,andinonestudyreportedby
Sjostrom,(2004),25percent
ofpatientsregainedalltheweightthattheyhadoriginallylost;indicatingthatsto
mach sizewas not the onlyfactor in controllingfoodintake.
Cholecystokinimin(CCK): This hormoneis released from
thesmallduodenum when itregisters thepresenceof food.Injectionsof CCK
reducethe size ofmealsconsumed
byhumanandrats(AlbonandMukherji,2008). TheuseofCCKasanappetite
suppressantisbeinginvestigated,butaccording toHorowitzetal.,
(2005)itisunlikely that itwillproveto be helpful in treatingobesity.
Others:Anotherphysiologicalprocessthathasaneffectonappetiteisthelevelo
fblood glucose inthesystem. Enoughglucose isneededintheblood streamto
giveenergy. Whenthebloodglucoselevelislow,thebody
mayexperiencefaintandweaknessand there isthe needtolookfor food.
Peoplewho are diabeticandtake insulinhave tobe particularly
carefultobalanceinsulinwithsufficientfood,asthey areatriskof suddenly
havingadangerously lowlevelofbloodglucoseandfeelunconscious.The

38
blood glucoselevel is measured byglucose receptors in the bloodvessels,
liver andthe brain,particularly
thehypothalamus.However,thebloodglucoselevelinan individual does not
varymuch as thebodywillconvert fat stored into glucose.
TheRoleofHypothalamus:
Thisisasmallstructureatthebaseofthebrain(about
thesizeofathumb)thathasanimportantparttoplay intheregulationof eating
behaviour. Togetherwiththe pituitarygland,ithelpstocontrolmany
bodilyprocessesby regulating
theformattingandreleaseofhormones(ChemicalMessenger). Twomain
centresinthehypothalamusthataffecteatingbehaviouraretheVentralMedial
Nucleus (VMN) and theLateral Nuclear (LN).
Researchinthelate1940sshowedthatlesionstotheVMNinratsresultedinthera
ts overeatingto suchan extent that theybecamemassivelyoverweight.
Intheearly
1950s,itwasshownthatlesionintheLNinhibitedeatingbehaviourinrats so
thattheylostweight.
Reviewingtheevidence,heconcludedthattheresearchsupportstheideathathy
pothalamus hasanimportantroleineatingbehaviour,andinvolving
otherareasinthebrainconcerned with emotional responses, such as the
frontalcortexand the amygdale.
ImpulsivityonEating
Behaviour:Studieshaveshownthatpeoplethatareobesetendto
consumemorefoodmostespecially energy densefatty foodsthannon-
obesepeople.One ofthereasonsmaybethateating
behaviouristriggeredbythetasteand smelloffoodand that thesetriggershave
amorepowerful effect on obeseindividuals. This hasbeen suggestedmay
beduetoadeficitinimpulsecontrol.Inthestudy ofobesechildren,itwas
foundthatobesechildrenhavelessinhibitorycontrolthanthecontrolgroupofchildrenw
ith
normalweight,andobesechildrenwhohadepisodesofbingeingweremoreimpulsiveth
an those who did notbinge.

39
StressandDepression: Ithasbeenestablished thatthereisa strong
relationshipbetween
stressandeatingbecausemostpeoplewhenstressedupatonetimeortheotherhaveturne
d toa favorablefoodsuchaschocolate orother highfat,andcarbohydrate food.Also,a
connectionbetweeneatinganddepressionaswellasanassociationbetweendepression
and obesityhasbeen established.Depressionhasbeen shownseemsto affect
people’s eating habits in two different ways:
Itisassociatedwithhighlevelsofanxietyandsleeplessness,lackofappetite,andwe
ight lossin some people.
In others, it is characterized byincreased appetite,excessivesleep,and
weightgain.
Eatingasaresponsetostressisrelatedtothephysiologicalmechanismsinthebodythat
helpstodealwithsituationsofperceivedthreat(Marano,2006). Ina
situationofacutethreat,
forexample,whenonefeelsheisindangerofbeingattacked,thereisanimmediate
physiologicalresponsebythebody.Thisconsciouscontrolresponsepreparesanindivi
dual
for‘flight’orfight’.Thehormonecortisolproducedactivatesotherphysiologicalproce
sses
toincreasetheamountofoxygentothebrainandpreparethebodyforimmediateaction.I
n a timeofsuchacutestress,theremay
berapidbreathingtoincreaseoxygenlevelsandthe
heartbeatfastertogetoxygenintothebrainasquickly aspossible. Atthesametime,
energy, inthe form ofglucoseis mobilized from stores in thebodyreadytobeused
asfuel for muscles. When the danger has passed, the level of cortisol is reduced.
However,ina chronicstresssituation,
theproductionofcortisolisnotreduced.Asthebody perceivesitselftobe under
constantthreat,thereisa constantdemand for fuel. Insuch
situations,itappearsthatthebrainsendsout signalsthatmotivateeating high-density
energy-
richfoods,suchaschocolate.Theenergyfromthisfoodisstoredasabdominalfat,
closetotheliverwheremanyoftheenergy

40
metabolismprocessesoccur(Marano,2006).
Thedepositionofabdominalfatsendsmessagetothebraintocutoffthestressresponse,a
s
reserveshavebeenbuiltup.Thereis,thereforeadirectconnectionbetweeneating‘Comf
ort foods’ andthe reductionof stress.The connectionbetweenstressreductionand
eating energy– richfoodis a powerfulreinforcementand comforteatingis likelyto
becontinued as alearned behaviour even in the absenceof physiological cues
from thebody.
It has been concluded that notonlydo physiological stress mechanismresult in an
increase inconsumptionofenergy-richfoods,butalso,evenwithoutincreasing
calorieintake, chronically stressedindividualsmay actually
putonmoreweightthanexpectedfromthe calories theyconsume. Therefore,
theconclusion is that:
Stress influences the consumption ofhigh fat, high-sugar food;
Eatingtheseenergy-richfoodsunderstressleadstoputtingonmoreweightthan
expected.
2.8.4 World’s cultural foodpattern
Allovertheworld,culturalfoodpatternsdifferfromonecountrytoanother.Amongethn
ic groupanddifferenttribesinregionsandstateswithina givencountry,thereexista
lotof variationsinculturalfoodpatterns(Williams,1973).
Insomecountries,peopleenjoy insectsbutconsidercornandsoybeansfitonly
foranimalfeed,whiletherearesteamer
clamsandrawoysters’foodpassionsforsome,butabsolutedisquietingtoothers(Brow
n, 2008). Therefore,inevery
partofthesocietypeoplehavediversefeedinghabitsthathave been
inheritedfromgeneration to generation (Oniang’o et al, 2003).
Peoplelearnfromtheircultureandsocietywhichplantsandanimalsareconsideredasfo
od andwhichare not.HorsemeatisafavouritefoodinalargeareaofNorth-centralAsia.
Whileporkiswidely
consumedinNorthandSouthAmerica,Europe,andotherareas,but
itisavoidedbymany peopleinIslamiccountries. Bone-

41
marrowsoupandsautéedsnails
aredelicaciesinFrance,whilekidneypieistraditionalinEngland.The
dogisapopularfoodin
Borno,NewGuinea,thePhilippines,andothercountries,whereas,the
snakeisadelicacy in China.
All cultures havetheir “super foods”or staplefood, for examplein
RussiaandIreland, it is potatoes. InCentralAmerica,cornandyucca are
superfoods,inSomalia,itisrice. In many partsof
AfricaandinNigeriaspecifically,grainsandtuberformthebaseof‘super
foods’.Thesefoodsrefertoculturalsignificanceandnotnutritionalvalue(Brown,
2008). InAmericacommunity
life,forexample,anumberofdifferentculturalfoodpatternsare represented.Many
countrieshavecontributeddifferenttypesofdishes ormodeofcooking
toAmericaneatinghabits,andinturn,many ofthefoodhabitsofthesesubcultureshave
beenAmericanized.Nevertheless,alltraditionalfoodpatternshavestrong
meaningsand serve to bind families and cultural communities in closefellowship.
It should, however,be
notedthateachfoodpatternhasitsuniqueness,andamongpersonsofallcultures,individ
ual tastesvary,geographicpatternswithinacountry vary,andeconomic
factorsmakefora widedifference(Williams, 1973).
A fewsamplesof culturalfoodpattern oftheworldareasfollows:
2.8.4.1 JapaneseFoodCulture: InJapan,thediscussionaboutfoodcanbeserious,
passionateandanalytical.AsaresulttheJapanesetakegreatprideinthequalityandpurit
y
oftheirfood,thereforetheirfoodisdedicatedlyandcarefullypresented.Theaveragedai
ly caloricintake in Japanis
2,754calories,and85thintheworldcomparedto3,825inthe United States (no. 1)
and1,500 in theCongo (173rd) (Hays, 2013).
TheJapanesecuisineisoftenseafoodbasedanddoesnothaveany thickspicy sources
associatedwithChinesefood. Althoughsweetteriyaki-stylesourcesarecommon,the
artistic arrangements of thefooditems served areimportant, when compared with

42
American standard,theportionsaresmall,butalotofeffortsgointogetting
therightingredients, preparation,andpresentationespeciallyatfancyrestaurants.
TheJapaneseusechopsticks toeatallJapanesestylemeals.
Themethodscommonlyusedinfoodpreparationaregrilling,steaming,stir-
frying,deep-fryingandcombinationofbroilingandgrilling(Hays, 2013).
2.8.4.2 JapaneseFoodHabit: InJapan,the
traditionalmealisservedwithrice,vegetables
withfermentedsoybeanpastemisosoupandfruitsareofteneatenasa desert.
Manydishes areaccompanied with soysourceorwasabi (veryhot mustard
likegreen horseracedish).
Atypicalbreakfastismadeupofrice,misosoup,spinach,andegganditisgeneral
ly eaten between 7.00a.m.and 7.30 a.m. Italsoincludes juice,
coffee,eggsand toast of ricecommonlyreferred to asasa – gohan.
Lunchknownaslura–gohaniseatenbetween12.00noonand2.00p.m. Itis
generallymadeup ofquickmeals orsnack such as abowl ofnoodles, rice,
sandwiches, riceballs orChinesefood.
Dinner(Ban–gohan)iseatenbetween6.00p.m.and8.00p.m.
Generally,dinner
isaninformalmealwithmeatorfish,riceandmisosoup.Itisusuallymadeathom
e anditincludes:curry rice,porkcutlets,meatloaf–
likehamburgers,friedfish,stir friedchickenorporkdishes.
Drinkssuchasbeer,wine,hottea,cold tea,wateror
otherdrinksareservedwiththemeals.Oneservedfoundthat60%ofJapaneseval
ue eatingtogether asafamily.
2.8.4.2.1 Changing FoodHabits inJapan:
Inrecenttime,many JapanesehaveadoptedtheAmericanwayofeatingabigbreakfast,
lightlunch,andabig dinner. Thisfattierdiet hasbeenattributedtoanincreaseinheart
diseasesamong Japaneseandanincreaseinobesity.Althoughfish,vegetables,andrice
remainthestaplefoodinJapan,the Japaneseareincreasingly eatingsweeter,fatty and
calorie–richfoodasreflectedby thepopularityofHaagenDazicecream,crispy karma,
doughnuts, and four-pattyMaganacburgers.

43
Consumptionofriceandfreshfruitshasreducedbyhalfsince1970whilemeatconsumpt
ion hasrisenby40%and coffeedrinkinghastripledinthesameperiodoftime. Fish
consumptiondecreasedby15%inthe
1990sandthepercentageofpreparedfoodsincreasedby 65%in thesame period(Hay,
2013).
Busy childrenattendingafterschoolclassesarereportedly
eatingmoreandmorestarch food,frozenmicrowavesnacks,convenience store
sandwiches,a cupofnoodlesandrice balls.Manysalarymen eatalmostexclusivelyat
conveniencestores, shops,thatsellcrisps and Belgiumwafflesare a common sight
at shoppingareas.
2.8.4.2.2 More Japanese showing TraditionalDiet:
A studyof Tokyo Gas
Company’sUrbanLifeResearchInstitute,revealsthattheJapanesearegradually
moving
awayfromtraditionalfoodandtablemanners.Thestudywasconductedonsurveysonfo
od
habitsonabout3,300respondentsintheir20sto’80sintheTokyometropolitanareafrom
1990 – 2011. Theresultshowed that in 2011,65%of respondents wantedto
eatmisosoup at leastonceaday,downto
77%in1990.Inthe2011survey,lessthan50%ofrespondentsin
their20ssaidso.Askedwhetherthey mainly atericeorbreadforbreakfast,34%saidrice
inthe2011survey,comparedto44%in1990.Thepercentageofrespondentwhoatebrea
d forbreakfast roseto 40%in 2011, compared to 35%in 1990 (Yomiuri Shimbun,
2012).
2.8.4.3
FoodCultureinIreland:TherearemanyreferencestofoodanddrinkinearlyIrish
literature, but honeyseems to bewidelyeatenand used in thepreparationof meals.
Potato
appearedtohavebeenintroducedintoIrelandinthesecondhalfofthe16thcentury,initia
lly asagardencropbuteventually becamethemainfoodfieldcropofallthetenantand
labouringclasses. Asafoodsource,thepotatoisagoodsourceofenergy andalsoagood

44
sourceofmanyvitaminsandminerals,especiallyvitaminC(whenfresh). Therefore,
between the 18th – 19th centuries, anIrish diet ofpotatoes and buttermilk
wasverypopular.
2.8.4.3.1 FoodinIrelandtoday: Prevalenceofchanging the culture
inthe20thcentury and the usual modern selection offoods common to Western
cultures havebeen adopted in Ireland. Boththe United StateofAmerica
fastfoodculture andcontinentalEuropeandishes haveinfluencedthecountry,along
withotherworlddishesintroducedinasimilarfashion totherestoftheWesternworld.
Commonmealsincludepizza,curry,Chinesefood,and lately,some West
Africandisheshave beenmakingan appearance,supermarketshelvesnow contain
ingredientsforamong others,traditional, European,American(Mexican, Tex-
Mex),Indian,PolishandChinesedishes.Therefore,theproliferationoffastfoodhasledt
o increasing public
healthproblemsincludingobesity,andoneofthehighestratesofheart diseases in
theworld (CultureofIreland, 2009).
IntheNorth,theUlsterfry hasbeenparticularly citedasbeingamajorsourceforahigher
incidenceofcardiac problems,quotedasbeinga“heartattackonaplate”. Allthe
ingredientsarefried,althoughmorerecentlythetrendistogrillasmanyoftheingredient
s aspossible.
However,inrecentdevelopmentinthelastquarterofthecenturyusheredina
newIrishcuisine basedontraditionalingredientshandledinnewways. Thiscuisine is
basedonfreshvegetables,fish,especially salmonandtrout,oystersandothershellfish,
traditionalsodabread,handmadecheeses,andpotato.Traditionaldishes,suchasIrishst
ew, Dublin coddle, theIrishbreakfast,and potato bread havebeen re-awakened.
2.8.4.4 MexicanFoodCulture
AblendingofthefoodhabitsoftheSpanishshelterandnativeIndiantribesformedthebas
is
forthepresentfoodpatternsofthepeopleofMexicanheritagewholiveintheUnitedStat

45
es (chieflyintheSouthWest).Threemainfoodsarefundamentaltotheirpattern–
driedbeans,
chilipeppers,andcorns.Variationandadditionmaybefoundindifferentlocalities.Am
ong thoseofthedifferentincomelevel,foodgroupsincludelittlemilkfor
babies,littlemeat
(becauseofcost),occasionaleggs,vegetables,fruits,bread,andcerealsarealsoeaten.A
large amountof coffee is used,Chilipepper, onion andgarlic areused most
frequentlyand other herbs occasionally(Williams, 1973).
2.8.4.5 Cultural FoodHabits inMadagascar
Food Habits:RiceisthestapleoftheMalagasydiet. Itisusuallyaccompaniedbysome
formofkabaka(a proteindishsuchasfish,meat,chickenorbeans)insomepartsofthe
islanddishromazavamadeofgreenleafy
vegetablesinbrothiscommon.Generally,side
dishesservetoaddflavourtothericeratherthan
providenutrients.MostMalagasyentrees are preparedinoneof
fourways,fried,grilled,boiledinwater,orcookedwithcoconut juice.
AspicycondimentknownasLasaryinMalagasyandmadeofchillipeppers,green
mangos,orlemonscanbeaddedtoenhanceflavour. Mealsare
servedinthehouse,onthe
veranda,oronmatsplacedonthegroundoutsidethehouse.Lunchanddinnerleftoversar
e warmedforbreakfastthefollowing morning.
Breakfastconsistsofriceandateamadeof local herbs or leavesandsweetenedwith
sugar. Some other breakfast foods includeboiled manioc, maize, porridge,or
friedcakesmadeofriceflavor. Water istheusualbeverage
servedwithmeals.Ranoempago(waterboiledinthericecookingpot)issometimesserv
ed.
Vegetablesuchas carrots,cauliflower,cabbage, peppers, tomatoes,and zucchiniare
availableyear round.
Fruitssuchaspineapples,coconut,oranges,mangoes,bananas,and apples aresubject
to seasonal availability. Althoughawidevarietyof foods are available,
asignificantportionofthepopulationremainsundernourishedbecausethey
aregenerally unaffordable on a regularbasis(Madagascar,2013).

46
2.8.4.6 African FoodHabit
Socialfactorsandculturalpracticeinmostcountriesoftheworldhaveaverygreatinflue
nce onwhatpeopleeat,howthey preparefood,ontheirfeeding
practicesandthefoodsthey
prefer.Therefore,whatAfricancommunitieseatcanbeviewedinthecontextofdiverse
socio-
culturalandeconomicenvironments.Thefoodconsumedisnotthesamethroughout
the whole continent, buttherearesimilarities. However, Africans generallyeat
more grain foods but mostof them consumeless than oneservingof fruits
perday(Oniango, 2003).
Themain staples inAfrican foodinclude roots and tubers, bananasand
cereals,grainsand legumes. ThemainlegumesareBambara
nuts,cowpeas,Chesterbeans,hyacinthbeans,
mungbeans,Limabeans,groundnuts,pigeonpeas,andsoy beans.
Grainformthebulkof foodconsumedinAfrica,andthey
areimportantinthedietbecausethey providecomplex
carbohydrates,starch,vitamin,minerals,dietary
fibre,andphotochemicalcompounds. Theseare
oftencomplementedwithlegumesorfoodfroman animalsource thatisrichin
proteinandfatand oil. Otheringredientsthatareused toprepareAfrican soupsand
accomplishmentaregottenfromvegetableslikebeans,lentilsorgroundnutwithgreenl
eafy vegetables (Karen et al.,2001).
SnackscommonlyeateninAfricaincludeboiledorroastedrootsandtubers(yam,potato
es,
cassava,etc.)plantains,boiledorroastedgreenmaize,roastedgroundnutoroilseeds,fri
ed fish,insectssuchaslocustor termitesandfruitssuchasbananas,oranges,mangoes,
sugarcane, etc.(Kravchenko, 2008).
2.8.4.7 NigerianFoodHabits
Themain factors that have affected the eatinghabits and patterns ofpeople in
Nigeriahave beenidentifiedbyEne-
Obong(2001)asculture,climate,andeconomicfactors. Food

47
consumptionofthepeopleisclosely relatedtothetypeoffoodsgrownorproducedin
differentpartsof the country. IntraditionalNigeria
society,farmfamiliescultivatestarch
roots,tuber,cereals,legumes,fruits,andvegetables.Thefoodsmadeupoffamily food
basketwereoccasionally supplementedby
wildanddomesticatedanimals,whilelegumes,
cereals,wildherbs,fruits,andvegetablesmakesignificantcontributionsto
nutrientintakes of thepopulation (Ikeda,undated).
According toJosphine(2012),culture,climate,andeconomy
arethemainfactorsthathave
affectedtheeatingandpatternsofpeopleinNigeria.Basically,Nigeriacanbedividedint
o two main regions. Thetwo regions arethe Northand Southern Nigeria.
TheSouthernpartofNigeriastretchesinlandfromthecoastintoawidebeltofthe
tropicalrain forestandcoversapproximately
onequarterofthetotallandmassofNigeriaandinhabits about a third ofthe
totalpopulation.
2.8.4.7.1DietaryPatterninthe South:The basiccarbohydratefoodistapioca,
supplementedwithyamsor maize,andflour,redpalmoil,andpeppersare
addedtoalmost every
meal,greenleaves,andfisharealsoused.Availablefruitsincludeoranges,
grapefruit,pawpaw,andmangoes,butmany peoplewillnoteatthembecausethey are
associated withfeministandintestinalworms. Source of proteinaregoatmeat,cow
meat,fish,prawn,chicken,andbushmeat.Othersarepeas,nuts,andbeans.
Fadupin(2012)
inastudyonSocialsupport,environmentalconditionandnutritionalstatusoftheelderly
in Ibadan(South)reportedthatthemainsourcesoftheirenergyandproteinintakewere
from roots and tubers, cerealsand legumes respectively. Animal protein,
fruits,and vegetable werenot taken regularlyby66.0%, 77.0% and 64.0%of
therespondents respectively.
2.8.4.7.2 DietaryPatternoftheMiddleClass: Themiddleclassgroupiscomposed
ofclerks,schoolteachers,andsomebigtradersintheSouthernpartofNigeria.Eventhou
gh

48
EuropeanfoodshavenottotallyreplacedtheNigeriantraditionalfoodscompletely,so
me of them areused as supplements among educatedNigerians.
2.8.4.7.3The Savannah GrasslandoftheNorth:TheNorthernpart
occupiesabouttwo
thirdsofNigerialandmassandthepeoplearemostlyMuslimsandHausabythe
tribe.Common
staplefoodseateninthisareaincludemeat,milk,wheatproduct,rice,andmillet. The
Hausaswhoare thebulkofthepopulationeatmilletinvariousforms. Groundnutoiland
palmoilareused in cooking. The eatingpattern issuch that the head of
thehousehold eats first,followedby hissons,andfollowedby
hiswivesanddaughters. Theamountofmeat
andmilkeatenbyothermembersofthefamilyis usuallylessthanthateatenbytheheadof
the household.
2.8.4.7.4 MealPatterns ofUrbanDwellers in SouthernNigeria:
Inmosthouseholds,
twomealsadaywerenormallyeaten,andeachconsistedofalargeservingofcarbohydrat
e foodgarnishedwithlittlestewmade
withsmallpeppersgreenleaves,palmoil,onion,and other vegetablesanda
smallamountof meat. Garriisthe commoncarbohydrate food, with brown
rice,yam and corn meal.
2.9 Nutritional advantages oftraditional foods
Thetraditionaldietofmostsocietiesindevelopingcountriesaregood,butonly require
minorchangestoenablethemto
satisfythenutrientsrequirementofallmembersofthefamily. Thequantity
offoodeaten,however,isamorecommonproblemthanquality.For example,
toeatcertain protein-rich food such asinsects,snails,baboons,dogs, cats,and
someseafoodssuchasfishandlobsterare
beneficial(Brown,2008).Anotherhabitthatis nutritionally
goodistheconsumptionofanimalblood.SomeAfricantribespuncturethe
veinofacow, drawoutsomequantity
ofblood,stopthebleeding,andconsumetheblood aftermixingitwithmilk.

49
Bloodisrichfoodandmixingitwithmilkishighly nutritious.
Drinkingofsouredorcurdledmilkisanotherpracticefoundamongotherpeople.
Itissafer todrinkmilksourthanfresh,especially
incommunitieswheremilkingcannotbe hygienicallyproduced(Oniang’oet al.,
2003).
InsomecountriessuchasNigeria,IndonesiaandotherpartsofAfrica,somefoodsarepar
tly
fermentedbeforeconsumption.Nutritionally,thequalitiesoffermentedfoodsareimpr
oved and contaminatingbacterial arealso reduced (PAND, 2012).
The traditionaluse ofcertaindarkgreenleavesshouldalsobe
encouraged,because,green leavesare rich in iron, calcium,
ascorbicacid,andcarotene, andcontaina certain quantityof protein.Somedark
greenleavessuch asamaranthus,pumpkin,sweetpotatoesandcassava
leavesarerichinvitaminsthan cabbage andlettuce whicharevegetablesof European
origin. Inaddition,many fruitsarevery richinvitaminCandthetraditionalgrain
preparationmethodproduce a more nutritiousproductthan thosewithelaborate
machine milling(PAND, 2012).
Manyindigenous crops,includingwildplantsand animalspecies availablein
mostAfrican countries,offerhealth benefitsinadditiontoproviding
essentialnutrients.Severalother investigationshave
associatedtraditionalAfricanitemswithhealthbenefits,including variousgreenleafy
vegetables,grainlegumes,palmfruits,andmillets. Thesefooditems
wereidentifiedashealthy bysomeoftheintervieweesatthe
InternationalConferenceon Nutrition (ICN) (Raschkeet al., 2007).
2.10 Changing foodhabits
Overthepastdecades,emerging
scientificevidenceabouthealthandnutritionhasresulted
inchangingfoodconsumptionpatternintheUnitedStatesofAmericaandaroundthewo
rld. Pastsurveysrevealedthatatleasthalf
ofallconsumersreportedlymadeamajorchangein
theirdiets,withnutritionbeingsecondonlytotasteinimportancetoshoppers(Brown,

50
2008). Thechangingfood habits arerelated to increased awareness that dietcan be
associatedwithsomeof the leadingcausesof death-
heartdisease,cancer,anddiabetes,as wellas to other commonhealth conditions
such asosteoporosis, diverticulitis,and obesity.
Thesocialworldaffectstheprocessofphysicalandmentalageingindirectly throughits
effectonhealthanddirectlythroughphysicalstressontheorganism.Many
peopleassume thatillhealthisbroughtonby
ageing,althoughitistruethatoldageincreasesone`s
vulnerabilitytotheageingprocess(Stark,1995).Ageingdoesfinallytakeitstoll,butitdo
es nottake itstollatthe same chronological ageforallpeople.Some
peopleseemoldatage fifty,whereas,othersdonotbegintolookoractolduntilthey
areintheirlateseventies. Adultswithadequate incomescanafford an adequate
diet,goodhealthservices,befitting housingas wellas recreation and transportation
(Stark, 1995).
Oniang’o etal.,(2003)observed thatmanyAfrican countries havein thepast three
generationsexperiencedextensivechangesinfoodsupplyandinthe householddiet.
Inmany
partsoftheworld,staplefoodsarechangingandwillcontinuetochange.Maize,cassava,
andpotatoesare nowgrowninlargeamountinAfrica,whichoriginated outside the
continent sincemoreof thesefoods werenoteaten in Africamanyhundredyears ago;
itis evident that the food habitof millions of people has changed. Theimplication,
therefore,is thatmany
Africanshaveabandonedyamsandmilletformaizeandcassava,justasmany
Europeansabandoned barley,oats,andryeforwheatandpotatoes(Oniangoetal.,
2003). Today,exotic(untraditional) foods nowdominatemanyurbanareas in
Africa. Even in the
ruralareas,therangeoftraditionaldomesticfoodstuffhasbeenconsiderablyreduced,p
artly due tothe increasedcostofproductionandprocessing,andlaboriousdomestic
preparation methods. This has greatlyreduced the contribution of traditional diets
to thefamilydiet.
In Nigeria, food consumption pattern has been dynamicover theyears. Someof
thefactors contributory

51
tothechangeincludeculturalandagriculturalpractices,education,improved standard
of livingand population movementand urbanization (Ene-Obong, 2001).Today,
theoldtraditionalfoodculturalpracticesarenolongermaintained. Ene-
Obong(2001) observedthatduring
thecolonialdays,thecultivationofcashcropsaffectedagricultural andeatinghabits.
Inthe earlyseventies,mattersweremadeworsewith“oilboom”and consequently
urbanization. Withtheforeignexchange,revenue,accruinganddevaluation ofthe
naira,importationoffoodandotherproductsartificially becamecheaperinrelationto
domesticproduction,keeping
foodhabitschanging.Theproblemnowliesinguidingand fostering desirablechange
and to slow down undesirable ones.
2.11 Effect ofchangingfromtraditional foodtowesternizedfood
OneofthedifficultiesfacingtheAfricansoftodayisthenutritionalshiftfromtraditional
foodhabitstoprocessedandpackagedfoodproductsofWestern–
ownedCorporations.The
consumptionofthesenewfoodproductshasresultedintothe increasedintakeoftrans-
fatty
acids,preservatives,andsaturatedfat;andreducedintakeofdietaryfibre,vitalnutrients
and photochemical whencompared to the basicdietaryguideline (Raschkeet al.,
2007).
UrbanizationhasgreatlyinfluencedAfricanfeedinghabits.Inurbanareas,foodhabits
consistofhighconsumptionofprocessedfoodandsnacksthatmaybepreparedand
marketedunderunhygienicconditionsleadingtofoodcontamination.Many‘urbanites
’ havetakenupuntraditionalfoodaspartoftheirdailydiet(Oniang’oetal.,2003).
Majority ofthesefoodsaresnacks,whichareconsumedasmealsduringlunchorsupper.
Changes inlifestylesandeating
habitshaveledtoademandformore‘snack’foods;consequently,
snackinghasbecomea regular feeding
habit.Snackfoodshavebeenfoundtohaveahigh proportion of fat, starch,and high
sugarcontent. The shiftfromtraditionalindigenousfoodtoWesternizedfoodculture
hasbeentermed “nutritiontransition”andhasbeendirectly
implicatedintheriseoftype2diabetes, Cardiovascular

52
Diseases(CVDs),hypertension,obesity,cancer andrelatedNon- Communicable
Diseases(NCDs)throughout Africa(Reschkeet al., 2007).
Inessence,itcouldbesaidthatnon-communicablechronicdiseases
havesimplycomenot only toreplaceinfectionsandmalnutrition-
relateddiseasesinAfricabutalsotoinflicton
thevulnerablepopulationsapolarizedandprotracteddoubleburden ofdiseases,where
the
effectofthenutritiontransitionareadditivetotheexistinginfectionburden(Leonnie,20
05). Someofthemajorfactorscontributingtodoubleepidemicasnotedby thecohort
(respondents)inthestudyon“TheNeedforanonlinecollectionofTraditionalAfricanF
ood Habits”,include:urbanization,associatedeconomicpressureandmal-
distributionofwealth
33%,adoptionofwesternculturalbeliefs17%,adoptionofanunhealthy
monotonousdiet includingexcessiveenergyconsumptioninurbanareaandunder-
nutritioninruralareas
16%severalintervieweesidentifiedlackofavailableinfrastructure14%, including
lackof
basichealthcare,lossofarableland,lossofbiodiversityandreducedaccesstoqualityfoo
ds asthemajorcausesofthedoubleburden. Existingdiseaseburden 7% andlackof
knowledgeofwhatisconsideredas‘healthy diet’7%werealsoidentifiedasinfluential
factors (Raschkeet al., 2007).
In North Asia, astudyonthe nutrition knowledge,beliefs,and dietaryhabits
amongelderly peopleinNizwa,Oman,revealedthattheelderlyinthestudy
lackedknowledgeaboutthe
benefitsofnutritiousfoodsandmajorityofmenandwomenbelievedthattherewasnone
ed tochangethequantityandquality
ofnutritionwithincreasingage.Poorconsumptionof vegetables was
revealed.Thereisample availabilityoffoodstufffromdifferentpartsofthe
worldinOman.Amajorityoftheelderlyinthisstudylivedwiththeirfamily.
Findingsalso
showedthatnearly45%ofelderlypeopleinNizwawereoverweightorobese,andhadpo
or knowledgeofnutrition, alongwithnutritional

53
imbalancesandlowlevelsofphysical activity.Significantsex differences
existedinelderlypeoples’nutritionalknowledge
consumptionoffluids,milkandsweets,useofdietary requirementandexperienceof
appetite change(Al Riyami, 2010).
Lessonsfromstudies inmiddle-agedandolderadultsliving in MediterraneanIslands,
AthensandGreeceontheroleofdietary habitsandnutritionservicesrevealedthathigh
adherencetoaMediterraneantypeofdietora“healthydietary”patternwasassociatedwi
th reducedriskof cardiovascular disease inmiddle-agedandevenintheolder
peopleof the Mediterraneanislands.Mediterraneanislandsarechanging
thetraditionalMediterranean
diettowardsamorewesterndietarypattern.However,theelderly peoplelivinginthese
insularareasseemtobetterholdthetraditionalhealthydietaryhabitsthantheyoungeron
es. Thebeneficialeffectsonbloodpressureandlipidslevels,body
fat,andothersurrogate
markersofCVDriskaddbiologicalplausibilitytotheepidemiologicevidencethatsupp
orts aprotectiveeffect of theMediterranean diet (Stefanoet al., 2010).
2.12 Foodcultureanddevelopment
Culturaltraditionsregarding foodareflexibleandkeepevolvingas
peoplemoveandlearn aboutnewfoods andcultures(SizerandWhitney, 2000).Food
habitsareslowanddifficult tochangebecausefoodhasan
importantpsychologicalassociationwiththefamily andthe
community.Familiarfoodissatisfyingandreassuringparticularly
thetraditionalfoodsof childhood which evokeadeep seated emotional response
(Oniang’o, 2003).Though many
peopleareawarethattheirfoodhabitsaffecttheirhealth,they may choosefoodforother
reasons, amongwhich is poverty(Srilaskmi, 2006). Manypeople in the world
todaylivein abjectpoverty
(WorldBank,2001).TherearehugedifferencesintheGrossDomestic
Product(GDP)perpersonbetweencountries,from$68,800inLuxembourg to$600in
Malawi(CIA,2007),andinequalitieswithincountriesbetweenthevery
richandthevery poor(AlbonandMukherji,2008).Oneoftheconsequencesofpoverty
ispoorhealthas measuredby

54
lifeexpectancy,childhoodmortality,hungerandmalnutrition(Albonand Mukherji,
2008).
InahighlyurbanindustrializedsocietysuchasAmerica,inwhichvalueisplacedonthe
action, speedandproductivity,lunchforthebusinessmenmay
beaquicksnackwhichheeats
whilestandingatalunchcounter(Srilakshmi,2006).Theformofthefoodisgearedtowa
rds quickeating,fruitinjuiceform,andmeatinasandwich,whiletoaSpanishorLatin
Americanmerchant,suchaLunchisunthinkable.Hislesstenselyspacedcultureallows
him
toclosehisshopfortwohoursinthemiddleofthedaywhileheenjoysaleisurelymealand
siestaathomewithhisfamily.Foodinthe
familyrelationshipiseatentogetherandhelpsthe family groupto build closenessand
familysolidarity.Cultural beliefandreligionplayalargerole in the eatingpatterns
anddiet ofmillions of people aroundtheworld (Lisa,2002).
2.13 Types andproblems ofmalnutrition
Malnutritionisamajorprobleminbothdevelopedanddevelopingcountriesamongalla
ges
(FAOandWHO1992).Deficienciesinsomenutrientshavebeenreportedtocausedisea
ses whichcouldleadtoimpairedcognitivedevelopment(SimeonandMc Gregor,
1989).
Malnutritioncanberegardedasanabnormalintakeofnutrientsleadingtoalterednutriti
onal statusasmanifestedinover-nutrition;overnutritionleads,tochronic
diseasessuchas obesity andheartdiseases,whileunder-
nutrition,leadstodiseasessuchasmarasmus, beriberi,andscurvy
(Lisa,2002).Itisadeviationfromthe requiredamountsofoneormore nutrients needed
forgood health.
Malnutritioncanalsobedefinedasapathologicalstateresulting
fromrelativeorabsolute deficiency
orexcessofoneormoreessentialnutrients(Srilakshim,2006).Thiscomprises
fourforms viz:

55
Undernutrition:aconditionwhichresultswheninsufficientfoodiseatenovera
n extended period oftime.
Overnutrition:apathologicalstateresultingfromtheconsumptionofexcessive
quantityof food over anextended period oftime.
Imbalance: a pathological state resulting from disproportion among
essential nutrients withoutthe absolute deficiencyof anynutrient.
Specificdeficiency: apathological stateresultingfromarelativeor
absolutelackof an individual nutrient(Srilakshim, 2006).
2.14 Malnutritionamong adults
Numerousfactorsmaycontributetodevelopingmalnutritioninanadult.Thereducedba
sal energyrequirementcausedbylossesinfunctioningprotoplasm
andreducedphysical activitycombinetocreatelessdemandfor caloriesinadvancing
age(Williams,1973). As
anadultgrowsolderfromageof30years,hismetabolicratedecreasesby2%ayear,but
veryfewadultsreducetheirfoodintaketobalanceitwiththeirreducedenergyoutput(Lis
a, 2002). This leads to an energyimbalance and astate ofoverweight or obesity.
Deficiency
diseasestaketheirmainforminmalnutrition,themoresevereformsofwhich pertaining
to matured-adults includehypertension, diabetes, heart disease, obesity,etc
(AlbonandMukherji,2008).Poordietary habitsinyoungadulthood,as wellasanother
personal habit, tend to beset and accentuated in old age. Although surveysshow
adequate totalcalorie intakesontheaverage,there isfrequentevidence of
inadequatedistributionof theircalories infoodchoices.Forexample,
theremaybefeweranimal proteins, meat,egg, milk; more useofgrainsandother
starchinbreadandcereals,fewervegetablesandfruits, and moresweets and desserts
(Williams, 1973).
Adebusoyeetal.,(2012)conductedastudy inIbadan,ontheNutritionalStatusofOlder
PersonsPresentinaPrimary CareClinicinNigeria,theresultfindingrevealedthatthe
prevalence ofnutritional problemswas 61.9% (undernutrition was 7.8% and
overweightwas 54.1%). Beingunmarried(P<0.001), engagement
inajobaftertheageof 60years(P< 0.001), constipation(P< 0.009) rectalbleeding(P<

56
0.008), andoralproblems (mouth,teeth,andtongue)weresignificantly
(P<0.001)associatedwithundernutrition. Younger
age(P<0.050)andfemalegender(P<0.011)weresignificantly associatedwith being
overweight,logisticregressionanalysisshowedbeing unmarried OR=1,355(95%
CI 1,075–1,708)tobethemostimportantfactorforthedevelopmentofundernutrition.
Thehighprevalenceofnutritionalproblemsinthisstudy underscorestheneedfor
interventioninthis population. Correlation analysis(Pearson’s)showedapassive
association between BodyMassIndex(BMI)andMNAscores(r=0.152 P=0.001)
2.15 Roleofnutritioninhealth anddisease
Nutrition is definedas the artand scienceofhowan organismis nourishedfrom
thedayof conceptiontotheday ofterminationby
death.Nutritiondealswiththeintake,digestion, assimilationandultimate
utilizationofthevariousnutrientsinfoods.Foodisabiological
materialcapableofnurturingthebody
(Olowookere,2003).Humanbeingseattosurvive.
Theyalsoeattoexpressappreciations,senseofbelongingaspartoffamilycustoms,andf
or self-realization.People eataccording tolearned
behavioursregardingetiquette,mealand snackpatterns,acceptable foods, food
combinations,andportionsizes(Albonand Mukherji,2008).Food habitsthatare
mostlyclosely associatedwithfamily sentimentsare
themosttenaciousthroughoutlife.Longintochildhood,certainfoodsarevaluedforreas
ons totallyapart from anynutritional value.
Goodnutritionimpliesthepresenceofadietthatcontainsallthenutrientsthatarenecessa
ry fortheproperfunctioningofthebody.The
nutrientrequirementistheminimumamountofthe absorbednutrientthatisnecessary
formaintainingthenormalphysiologicalfunctionsof the body(Srilakshim, 2006).
Nutritionhasplayedasignificantroleinthelifeofevery individualanditwillcontinueto
affecttheindividualinmajorways,dependingontheirfoodselectionandchoices(Whit
ney and Rolfes, 2008). Many years ago,meat,milk, grains, nuts,
vegetables,andfruits were the only
foodavailableforconsumption.Todayfoodcompaniesofferthousandsofprepared
andpackagedfoods,many ofwhicharea mixtureofthosebasicfoodswiththe

57
inclusionof
artificialingredientstherebymakingmanyvarietiesoffoodstobeavailable.Theavaila
bility oftheseprocessedvarietiesmakesfoodchoicesdifficultratherthanbeingeasy
tomakea reasonablechoiceorplananutritiousdiet(Amy
2008).Everyday’schoiceoffood
influencesthebody’shealthforbetterorworse,asthechoicemaybenefitorharmthebod
y’s health. Whenchoicesare repeated over theyearsanddecades,the
consequencesbecome major(Albon and Mukherji, 2008).
Whereawidevarietyoffoods areavailable,people’s foodchoices are
influencedbymany
factors,andthemostinfluencingofthesefactorsisfoodpreference.Foodpreferencevari
es agreatdealamong peopleandleadstoawiderangeofspecificfoodchoiceswhichare
primarily learnedrather
thaninborn(Srilakshmi,2008).However,carelessnessaboutfood
choicescancontribute toa lotofchronic diseasesthatarecommoninlaterlife
(Sizerand Whitney, 2000).
2.16 Changes innutrient needs with age
Health, physiologic, andfunctionalchangesthatoccurwith ageing
affectnutrientneeds. Knowledgeofthenutrientrequirementsofmid-
adultsandmaturedadultsisgrowing, yetin
someinstances,thesituationsarenotadequately investigatedtoestablisha standard.
Therefore,itisworthy toknowthatpeopleofallagesneedmorethan40nutrientstostay
healthy.Withage,itbecomesmoreimportantthatdietcontainsenoughcalcium,fibre,ir
on, protein and thevitamins A, C, D, folacin,reducedcalories, select nutrient
densefoods, and enjoysmallerportionoffoodsnothighinfatsugar
andsodium,becausenoonefoodorpill providesallof thenutrients.
Hence,varietiesoffoodshouldbe eateninorder toderiveall the nutrientsrequired
bythe body.
2.17 Nutritional role inhealthy adulthood
Althoughhealthstatushasmultiplecontributory factors,nutritionisoneofthemajor
determinantsofsuccessfuladulthood.Foodisnotonlycriticaltoone’sphysiologicalwe

58
ll- beingbutalsocontributestothe social,cultural,andpsychologicalquality
oflife(Positionof AcademyofNutrition and Dietetic (PAND), 2012).
Primarily,nutritionhelpspromotehealthandfunctionality.Asasecondary andtertiary
strategy,MedicalNutritionTherapy
(MNT)isaneffectivediseasemanagementapproach
thatlessenschronicdiseaserisk,slowsdiseaseprogression,andreducesdiseasesympto
ms. Thus,theyearsattheendof thelifecyclecanbe
healthful,enjoyable,andproductive if chronicdiseases and condition can
beprevented or effectivelymanaged (PAND, 2012).
Healthy
lifestyles,earlydetectionofdiseases,immunizations,andinjurypreventionhave
proventobeeffectiveinpromotingthehealthandlongevity ofolder-adults.
Oneinevery eightpeopleinAmericaisanolder-
adult,definedbytheOlderAmericansAct(OAA)asan individual who is aged
60yearsand older (MaijaKatarinaet al., 2008).
Theenjoymentoffoodandnutritionalwell-beingalong withotherenvironmental
influenceshavean impactonhealth-relatedqualityoflife andtheageing process.
Qualityof lifeisdefinedinPublic
HealthandMedicineasapersonperceivedphysicalandmental healthover time,
includingfactorssuchashealthrisksandconditions, functionalstatus, social support,
and socioeconomicstatus (Mattithias, 2001).
Approximatelyonethirdofolder-
adultsareageingsuccessfullybasedonobjectivecriteria;
however,agreatnumberofolder-adultsperceivethemselvesbeingasageing
successfully
despitethepresenceofillnessanddisabilityofthemostcommoncausesofdeathofadults
aged65yearsandolder intheUnited States,five ofeighthave aknownnutritional
influence. Almost80%of old--adultshave onechronic condition,andhalfofallolder-
adults havetwo ormore. Morethan 39%of allnon-institutionalized persons aged
65years
andolderareinexcellenthealthandonly6.4%oftheseadultsneedhelpwiththeirpersona
l daily care (Bengmark, 2006). Preventing

59
c h ro n i c d i s e a s e s a n d r e d u c i n g associated
complicationsisanessentialstrategy forkeepingall-adultshealthy andindependentin
a communitydwelling.
2.18 Nutritional requirement forhealthy ageing
Nutritionisanimportantfactor contributingtothe healthandfunctionalability,
andtheimpact ofthenutritionalstateonphysicalandpsychologicalwell-being
ishighinmid-adultsand maturedadultsandespeciallyhigherintheelderly.
Moreover,matured-adultsandthe elderly aremorelikely
thanyoungeradultstobeinthe impairednutritionalstateandtobeat
higherrisk,orhighnutritionaldeficiency
intimeofhealthcareproblems(Mattithiasetal., 2001).
Asaresult,nutritionisregardedasapromisingapproachtomodulating theriskof
ageing- relateddiseasesby theeffectofcertainnutrientsongeneexpression.
Oneofthemost practicalapplicationsofnutritionalmodulationofchronic
diseasesassociatedwithageing asidentifiedby
Kornman(2006)isthenutrientsthatregulatetheexpressionof inflammatorygenes.
Theanti-inflammatorymoleculessuchaspolyphenolsmay be effectivein
delayingageingrelated diseases (Bengmark, 2006).
Recentstudieshaveshownapositiveeffectofdietary sourcesthatstimulateBone
Morphonic Protein(BMP) promoter,whichstimulates bone
formationandthusimproves bonemassintheelderly withosteoporosis.
FlavonoidsandStatinsoccurnaturallyinfood products and can promote
boneformation (Kravchenko, 2008). Thenutritionalrequirementsinmacro-
andmicro-nutrientsinthematured-adultsdifferfrom young adultsandmid-
adultsbecauseof ageing-associatedeffectsofnutrientsingestion,
absorption,andmetabolism. Ageingrelateddiseases,theeffectsofageing
onnutrients, drug-
nutrientinteractions,andsocialproblemsshouldbetakenintoaccountwhenanalysing
thenutritionalstatusofolderpersons(Mattithiasetal.,2001),aged60andabove(WHO,
2003).

60
Assessmentofdietary patternsfromthe participantsinthehealth,ageingandbody
composition studyfound that in old-adults, a diet consistent with current
guidelines, including
relativelyhighamountofvegetables,fruits,wholegrains,poultry,fish,andlow-
fatdairy productsmay beassociatedwithsuperiornutritionalstatus,quality
oflife,and survival (Lisa, 2006).
Inthis‘nutritiontransition’age,thereshouldbeadequatenutritionforhealthy
ageingand properfunctionalabilitytopreserveaminimumquality oflife.
Itbecomesobligatory to plan to meet the challenges of thefutureincreaseof
matured-adults and the elderly.
2.19 Changing foodcultureandnutritional status
Cultureis transmitted from onegeneration to another byinstitutionssuch as
family, schoo,andchurch(Encyclopedia AmericanaInternational,1989).Overa
periodof time, various
degreesofchangeoccurwithinanygivenculture.Changestakeplacewithinandamongt
he cultures by meansofecologicalandenvironmentalchangesby
diffusionofadvantageous culturaltraitsamongsocietiesatapproximately
equivalentstageofculturaldevelopment, byaccumulationoracquisitionofaforeign
culture,byrelativelysubjectpollutionorbythe
evolutionofcultureelementoveraperiodoftime(TheNewEncyclopediaBritannica,
2007).
Amongthemany effectsofrapidsocio-
culturalchangewithuprootinganddisplacingof
personsandfamiliesarechanginginthefoodhabitsofmillionsofpeople. Theabject
poverty ofsomeworkersandtheincreasedaffluenceofothershaveresultedfrom
Industrializationandchanging urbansub-urbanliving
pattern(Williams,1973).These newly
emergingpatternshavecontributedtochangesinfamilypatternsandvalues,hence,
thereinforcementofthegroupunityandstabilitythatwasformerlyfeltfromeatingtoget
her islost.Therefore,childrenwhoare lefttofendforthemselvesdeveloperraticeating
habits

61
andtendtofilltheirstomachswithadietthatisnutritionallyinadequatewhichleadtopoo
r food choicesand pooreatinghabits.
2.20 Thegrowing ageing population
Thedemographics oftheageingU.S.population
ischangingandgrowingdramatically as baby boomersreachanolderage.
Since1900,thepercentageofAmericansaged65years andmaturedadultshasmore
than tripled;from4.1% to13.1%of thepopulationin2010. Thenumberof
olderAmericansreached 40.4million persons in 2010. By2030, therewill
beabout72.1millionolderpersonrepresenting19.3%ofthepopulationinalmosttwicet
he numbertherewasin2007.
The85yearsandolderpopulationareexpectedtoincreaseto 6.6 million in 2020
(PAND, 2012).
Nigeria,like other countriesinAfrica witha similarsocio-economic condition,is
notan exception to thepoorhealth of thematured andelderlypeople. Despitethis
poor situation, thestatisticalprojectioninNigeria
between1990andtheyear2025showedanincreasein thenumberofelderly people. By
2025therewillbeanincreaseofover80%withmore
womenataratioof1to1.2.Furthermore,itwasclearfromtheprogressionthattheelderly
population in Nigeriawould be doubled by2015(Mattithias, 2001). The
observationof nutritionalassessmentsinAfrica revealed thatsomeolder people in
developingcountriesenteroldageafteralifetimeofpoverty
anddeprivation,adietthatis inadequateinquality andquantity
andalifetimeofdiseaseandpoor accesstohealthcare (Raschkeetal.,2007).
Therefore,people’sdemographiccharacteristics,suchassocio- economic
condition,adequate andappropriate nutrition,accesstobasicsocialamenities
suchasfood,water,electricity havebeenfoundtobehighly correlatedtohealthand
nutritionstatus.Otherfactorssuchasage,gender,townshipstatus,andethnicity,whicha
re fundamentaltodemography,cancontributeinoneformortheothertothequality
oflife andnutritionalstatusofthematured-
adultsandtheelderly(Steynetal.,2006).Alongwith generaltrendsfor
U.Spopulation,theHispanic,American,IndianandAlaskannative,

62
African,American,AsiaandHawaiianand PacificIslandpopulationsarealsonow
living longer.
2.21 Factors responsible forageing
Many factorsare responsibleforthevariationsintherateatwhichan individual’sage.
Some ofthefactorsfoundtohaveaninfluenceontheageing
processofallpeoplesinclude
nutritional,medical,cultural,social,biochemical,economic,psychological,andeduc
ational factors.
2.21.1 Nutrition:Poornutritionisagreatproblemamongoldadult.Low income,
poor
health,andinadequatetransportationtothemarketsmakeitdifficulttoeatwell(Stark,
1975). Nutrition and health influencelongevity.Itis notonlythe qualityof food
consumed
butalsothequantitythatcannourishthebodyingoodhealthslowsdowntherateofdiseas
es in thebodyandconsequentlyslows therate of ageingthat is important (Davison,
1975).
2.21.2
Culture:Ageingisabiologicalprocessthatcanbeinfluencedbysocialfactors
including culture andsocialorganizations.Culture,belief,andreligionplay
alargerolein the eatingpatternand diet of millions of people around the world
(Charles,1992).
2.21.3 Medical: Easy accesstomedicalfacilitiesandcarecouldhelptoelongatethe
lifespanofindividuals.Availabilityofmedicalcarecanslowdowntheageingprocess.B
ut whenpeoplefinditdifficulttopay formedicalservicesandcarewhenneeded,other
deterioratingfactors willcome in, ageinginclusive(Diane, Aldwin,and Carolyn,
2003).
2.21.4 Social:Many socialreasonsmay beresponsibleforgrowingoldrapidly. For
instance,participationinsomeformsofsocialactivitiescanacceleratetheageing
process. Themassivewastageofbody energy
throughrecklesssocialactivitiessuchasexcessive

63
smoking,drinkingofalcohol,drugabuse,anduncontrolledsexualactivity may leadto
premature ageing. Inanothervein,among ruralcommunitiesin Nigeria,socialand
economicproblems may accelerateachild’smaturity asaresultofthecompelling
needto assume adult responsibilities. In suchcases, children
maybeforcedtogenerateincomeby startingtoworkmuchearlierthantheyaredue.
Achildwhostartsworkearly inorderto
serveasafinancialpowerofapoorfamilyisthusrushedintomaturityandmaystartweari
ng the appearanceofafull adulttoo soon (Denga, 2005).
2.21.5 Economical: Poverty
oreconomicdownturniscapableofacceleratingageingas
peopleareoverstressingthemselvesunimaginably tomakeendsmeet,-ifapersonhasto
operatetwoormorebusinessesafterclosing
fromtheprimary/officialworkeachday,the amountofbody
batteringorfloggingissuchthatstresswithdistressmightresult. Therefore,
arepeatedor protractedincidenceofbodyabuse couldleadto prematureageing in
appearance(Harper, 2006). Oneoftheconsequencesofpoverty
ispoorhealthasmeasuredby life expectancy,
childhoodmortality,hungerandmalnutrition(Charles,1992).Inthemajorityworld,m
any familiesstruggle tofind the resourcestofeed children and adultsadequately,
and most prevalentformofmalnutritionisduetoinsufficientfoodbeing
available(Brown,2008). Hence,many
oftheworldproblemstodayareattributedtotheinteractionbetween
malnutritionanddiseases(Liametal.,1995).Ithasalsobeenobservedthatfeelingsof
anger, hate, irritation, aggression,rejection,melancholia anddejectionbring
aboutan emotional overload which is capable ofacceleratingageing(Dengerand
Udoli, 2005).
2.22 Antidoteofageing
2.22.1 Psychologicalmethod: Onepsychologicaleffectivewayoffightingthe
chronological ageingis to resolve to beyoung at heart. For example,

64
asixty(60)years old personmay deliberatelyandconsciously
decidetotakethingseasy,tochallengetheirfate andtorefuse toliedowninthefaceof
serioustrials,temptations,andtribulations. Such peopleshunsadism. They
perceivelifeasfullofprospects,possibilities,andpromises. They
exhibitanenormoussenseofhumour. They alwayslook neat,cheerfulandhappy
(Strawbridgeet al, 2002).
Anotherpsychologicalbehaviourthatcouldbe usedtoslowdowntherateofageing isto
actyoung,evenif youarealready60
yearsold.Adeterminationtocombatageingislargely psychological.
Forexample,whena65yearsoldmandyeshishairtoremovegray hair,
wearsalightpairofjeans,andatightT-shirttoreally looklikea35yearsoldyouthin
regressing. Heknowsthatitisdesirabletolookyoung;hence,thepsychology offeeling
youngand behavingyoungcango alongwayin slowingdown therate ofageing.
2.22.2 Physiologicalmethod: Oneoftheimportantanti-ageingremediesisregular
moderateexercisesbecausesedentary lifeisaninvitationtoprematureageing.
Themore thebody isexercised,thehealthieritbecomes.
Physicalexercisesgivepeopleayouthful
lookfaroutofproportiontotheirchronologicalage.Itimprovesappetitesforfoodandse
x, promotes the efficientcirculationof
blood,reducessnoringwhensleepingandreducesbody weight. Exerciseneednotbe
rigorousorvigorous,butitneedstoberegular. Therefore,
exercisessuchaswalking,jogging,tabletennis,squash,cycling,golf,swimming,etc.sh
ould beconsideredfortheregularpracticeof15–20minutesaday two-
threetimesperweek (Olowookere, 2003).
2.23 Global assessment of nutritionand development
AglobalassessmentofnutritionanddevelopmentbyFAO/WHO1992,affirmsthatcha
nges
indietandlifestyleassociatedwithurbanization,highincomeandlongevityhaveledtot
he emergence of diet-
relatednoncommunicablediseases(obesity,hypertensionandstroke, cardiovascular
diseases and diabetes mellitus) as major problem from excessive or

65
unbalanceddiets,oftencoupledwithunhealthy lifestylessuchasinadequatephysical
exercise, stress andabuseof alcoholand tobacco.
Althoughmostpeoplerealizethatfoodhabitsaffecttheirhealth,theyoften
choosefoodfor otherreasonsapartfromnutrition.
Thesereasonsincludevariety,pleasure,traditions,
association,andnourishment,aswellastheability tocombinefavouritefoodswitha
nutritionallybalanceddiet(WhitneyandRolfes,2008).Also,manyAfricancountriesh
ave inthepastthreegenerationsexperienced extensivechangesin
foodsuppliesandhousehold
clients.Exotic(untraditional)foodnowdominatesmanyurbanareasinAfrica.Evenint
he rural areas the rangeof traditional domesticfoodstuffhas
beenconsiderablyreduced partly due
totheincreasedcostofproductionandprocessing,andlongandlaboriousdomestic
preparation methods (Oniang’o, 2003).
2.24.1 Dietaryguidelineforadulthood
According toWHO,consumingahealthy diet throughout thelife-
coursehelpsprevent malnutritioninallitsformsaswellasarangeofnon-
communicablediseasesandconditions. Butthe increasedproductionof
processedfood, rapidurbanization,andchanginglifestyles
hasledtoashiftindietarypatterns.Peoplearenowconsumingmorefoodshighinenergy,
fats,freesugarsorsalt/sodium,andmany donoteatenoughfruit,vegetablesanddietary
fibresuchaswholegrains.Theexactmake-upofadiversified,balancedandhealthy diet
willvary dependingonindividualneeds(e.g.age,gender,lifestyle,degreeofphysical
activity),culturalcontext,locallyavailablefoods,anddietarycustoms.Butbasicprinci
ples of what constitutesahealthydiet remain the same.
ForAdults, a healthydiet contains:
Fruits, vegetables, legumes (e.g. lentils, beans), nuts and whole grains
(e.g. unprocessed maize, millet, oats, wheat, brownrice).
Atleast400g(5portions)offruitsandvegetablesaday(2)Potatoes,sweet
potatoes, cassava, and other starchyroots arenot classified as fruits or vegetables.

66
Lessthan10%oftotalenergyintakefromfreesugars(2,5)whichisequivalentto 50g
(oraround12levelteaspoons)forapersonofhealthybodyweightconsuming
approximately2000calories per day, but ideallyless than 5%of total energyintake
foradditionalhealthbenefits(5).Mostfreesugarsareaddedtofoodsordrinksby
themanufacturer,cookorconsumer,andcanalsobefoundinsugarsnaturally present in
honey, syrups,fruitjuices and fruitjuiceconcentrates.
Lessthan30%oftotalenergyintakefromfats(1,2,3).Unsaturatedfats(foundin
fish, avocado, nuts, sunflower, canola,and oliveoils) arepreferable to saturated
fats (foundinfattymeat,butter,palmandcoconutoil,cream,cheese, ghee,andlard)and
trans-fatsofallkinds, including bothindustrially producedtrans-fats(foundin
processedfood,fast food, snack food,friedfood,frozen pizza, pies,cookies,
biscuits,wafers,margarinesandspreads)andruminanttrans-fats(foundinmeatand
dairy foodsfromruminantanimals,suchascows,sheep,goats,camelsandothers).
Itissuggestedtoreducetheintakeofsaturatedfatstolessthan10%oftotalenergy
intakeandtrans-fatstolessthan1%oftotalenergyintake.Inparticular,industrially
produced trans-fats arenot part of ahealthydiet and should be avoided.
Lessthan5gofsalt(equivalenttoapproximately1teaspoon)perday(6)anduse iodized
salt.

67
CHAPTER THREE
METHODOLOGY
3.1. Study design
This study was descriptive cross-sectional in design, involving adults aged 40 to
80 years and set out to assess the relationship between household socio-
demographic and socio- economic characteristics as well as the food habit of
adults in Oyo State, and their perceived health-related quality of life. It involved
three Local Government Areas, one from each of the three Senatorial Districts in
Oyo state.
3.2 Study area
Oyostatewaspurposivelychosenforthestudybecauseofitsdiversityandpopulation.T
he stateislocatedintheSouthWestgeopoliticalzoneofNigeria;OyoStatewasoneofthe
threeStatescarvedoutoftheformerWesternStateofNigeria.Thethirty-
three(33)Local
GovernmentAreasofthestateisdistributedacrossthree(3)senatorialdistricts.TheStat
e coversapproximatelyanareaof28,454squarekilometersandisranked14thbysizein
Nigeria,itisboundedinthesouthby OgunState,inthenorthby KwaraState,inthewest
itispartlyboundedbyOgunStateandpartlybytheRepublicofBenin,whilein
theEastby OsunState.
Thelandscapeconsistsofoldhardrocksanddome-shapedhills,whichrise
gentlyfromabout500metresinthesouthernpartandreachingaheightofabout1,219
metresabovesealevelinthenorthernpart.SomeprincipalriverssuchasOgunRiver,Ob
a, Oyan, Otin, Ofiki, Sasa,Oni, Erinle and Osun River taketheir sources fromthis
highland.
OyoStatepopularlyreferredtoasthe“PaceSetterState”isoneofthe36Statesofthe
FederalRepublicofNigeria.Itcameintoexistencewiththebreak-upoftheoldWestern
StateofNigeriaduringtheStatecreationexercisein1976anditoriginallyincludedOsun

68
State,whichwassplitoffin1991.OyoStateishomogenous,mainlyinhabitedbythe
Yorubaethnicgroup,foundinthesouthwesternNigeriawhoareprimarilyagrarianbut
haveapredilectionforlivinginhigh-densityurbancenters.TheYorubaculturewas
originallyanoraltradition,andthemajorityofYorubapeoplearenativespeakersofYor
uba language.TheYorubaareamongthemosturbanizedpeopleinAfrica. For
centuriesbefore
thearrivaloftheBritishcolonialadministration,mostYorubaalreadylivedinwell-
structured urbancentresorganizedaroundpowerfulcity-
statescenteredaroundtheresidenceofthe Oba (king).

62
Figure3.1:MapofNigeria showing Oyo State

63
Figure3.2: MapofOyo Stateshowing the threesenatorial districts

64
3.2.1 Brief history of Atiba local government
AtibaLocalGovernmentArea came intopracticalexistence on4thDecember
1996.Itwas
carvedoutofthedefunctOyoLocalGovernment.Ithasapopulationof169,702basedon
the2006censusfigureandcoversalandmassofabout2,197.53km².
itisboundedintheNorth
bytheforestreserveandOrelopeLocalGovernment,intheSouthbyOyoEastandOyo
West LocalGovernment,intheEastbyOriire Local Governmentand
intheWestbytheSakiEast LocalGovernment.Ithasten wards namely:Oke
Afin1,OkeAfin2,Aremo,Basorun,
Agunpopo1,Agunpopo2,Agunpopo3,Asipa1,Asipa2,andAsipa3.Themajortowns
and villagesinthearea are Agunpopo,Oke-ebo,IsaleOyo,Sabo,Oke
Olola,Basorun,Aafin, Asipa, Koso, Sakutu, Agbaluasa, Aremo
Oke,Otefon,Ijawaya,Igbonla, Gboburo,Baale, Agba, Arinkinkin, Onire-Bara,
Ajiroba,AraOyo,Idi-Ogun and ahost of others.
ThemajoroccupationsofthepeopleofAtiba LocalGovernmentarefarming,trading,
transportation,traditionalframeworks,and
generalmerchandise.Thequalityofshelterinthe
LocalGovernmentmaybeclassifiedintothreetypes,whichvary
directlywithpopulation density.Thehighly
densecoreareasgenerallyhavepoorqualityhouses,whileinthe moderately
denseareas,whicharenewly developed,wellplannedresidentialestates,which are
generallyofgood quality.
TheLocalGovernmentisblessedwithtwobanksblockindustries,schools,privateseco
ndary schools,hotelsandpetrolstations.TheLocalGovernmenthasa poultry
farmwithabout500 birds.There arefiveboreholesinthe wholeoftheAtiba
LocalGovernment area.It has eight (8)maternity homes.They
includethoseatAafin,Koso,Idaogun,Ilowagbade,Otefon, Igbonla, Agunpopo,
andIsale-Oyo.Itcontrolsseven dispensarieswhich are:Aafin dispensary,Isale-
Oyodispensary,Ajiroba dispensary,Onire-bara dispensary,Igbonla
dispensary,Otefon dispensary,andIdaogundispensary.ItalsohashealthpostsatIsale-
Oyo and Onire-Bara.

65
TheybelongtotheYorubaethnicgroupandthepredominantcropsintheLocalGovern
ment Areaaremaize,yam,andcassava.Thecommonfoodsthey
consumeinclude;amalawith
gbegiriandewedu,koko,ekotutu(mouldedpap)withmoinmoinorakara,garri,egbo,b
eans e.t.c
3.2.2 Brief history of Iwajowalocal government
IwajowaisaLocalGovernmentAreainOyoState,Nigeria.Itsheadquartersare
inthetownofIwereIle.Iwere-ile wasa formerpowerfulwartownintheold
Oyoempire,dreadfulfor manyOyoindigenes,aswellastheAlaafintoattack.Iwere-
ilebecametheheadquartersofIwajowaLGinDecember1996uponthecreationofthecr
eationofthenewlocalgovernment under the Gen SanniAbacha'sregime.Other
villagesandsettlementsincludeIganna,Idiko- ile, Idi-Agemo, Ijeomeso,Ayetoro-
Ile,Ijio, Itasa, Ilaja-ile,Elekokan,Ofeegun,Tudi,Jokolo,
andAyegunWasinmin.Ithasanarea of2,529km²andapopulationof 102,980atthe
2006
census.IwajowaLocalGovernmentconstitutesthefollowingwards:Agbaakin1,Agb
aakin2,Iwere-Ile1,Iwere-Ile2,Iwere-Ile3,Iwere-Ile4, SabiGana 1, Sabi Gana 2,
SabiGana3 and Sabi Gana4.
The mostpredominant occupationsofpeople ofIwajowaLocalGovernmentare
farming,
trading,andtransportation.Theyoftenconsumefoodssuchasamala(madeupofeither
yam
flourorcassavafour)withsoupssuchasorunla(driedokra),ilasa(okraleaf),vegetable
s(efo tete, ebolo, yanrin), oregusi(melon); Poundedyam with soup; bush meat
and beans.
3.2.3 Briefhistory ofIbarapa local government
TheIbarapasisaYorubapeoplegrouplocatedintheSouthwesterncornerofOyoState.
The nameofthe
groupisderivedfromalocalcultivarofthemelonplant,knownlocallyasEgusi
Ibara,whichwashistorically acknowledgedby neighboring peoplessuchasthe
Egbas, Ibadans,and Oyostobeextensively

66
cultivatedinthearea.TheIbarapapeoplearesaidto
havemigratedintothearea,eitherasdissidentsoftheOldOyoEmpire,duringtheperiod
sof
constantinternecinewarfarebetweenthedifferentYorubastates,aswellasrefugeeses
caping the transatlantic and trans-Saharan slaveraidingbusiness of theday.
TheTapasegmentofthepopulationissaidtohavebeenformed by
theJihadriddenNupe refugeesfromthe northern Niger, who hadlosttheir
traditionalstate to Fula jihadists.The
predominantoccupationofthepeopleisfarming.Ibarapalandistraditionally
madeupof7 principaltownsknownastheIbarapaMeje(Ibarapa
Seven),andtheirsurrounding villages andfarmsteads.These towns
includeIgangan,Eruwa,Aiyete, Tapa,Idere,Igbo-Ora,and
lanlate.TapaandAiyeteare inIbarapaNorthlocalgovernmentarea,IdereandIgbo-
Ora are inIbarapa Central,whileLanlateandEruwaarelocated inIbarapa
Eastlocalgovernment. Thethreelocalgovernmentswerecreatedby
theFederalGovernmentofNigeriaauthorities in1996whenIbarapa Eastwas
carvedoutfromthe oldIbarapaLocalGovernmentwhile
IbarapaCentralandNorthwerecarvedoutoftheformer
IfelojuLocalGovernmentarea.The sevenprincipaltownscanbe subdivided
further,basedonthevillagesthatareorganized around each of them.In totality,
about 30 differentvillages litter thelandscape.
TheIbarapaareafallswithinlatitudes70.15ꞌ
Nand70.55ꞌNandlongitudes30Eand30.30ꞌ
E.Itislocatedapproximately100KmnorthofthecoastofLagos,andabout95Kmwesto
f
theOyostatecapitalandtheneighboringcityofIbadan.TheyborderYorubasofOnkoe
xtractiontotheNorth(Iwajowa,KajolaandIseyin(LGAs)andYorubasofOyoextracti
on
totheEast(Ibadan).TheYewasorEgbadostotheWest,andtheEgbastotheSouth,Thear
ea
isapproximately2,496km²ingeographicalsizeandconsistsmostlyofrollingsavanna
hwith forestssituatedalong thesouthernborderandinisolatedpatchesalong

67
withrivercoursessuchas theOgun.Thenaturalvegetationwasoriginally
rainforestbutthathasbeenmostly transformedintoderived type savannaasaresultof
several centuriesofslashesandburn
agriculturalpractices.Mostofthelandliesatelevationsrangingbetween120and200m
eters
abovesealevel,butrockyinselbergsandoutcropscanbeseenrisingto340meters(appro
x.1,115 ft). Theypredominantlyengagein farmingand trading.
IbarapaLocalGovernmentconstitutesthefollowingwards:Oke-
Oba,Anko,Isaba,Aborerin, New Eruwa, Sango, Oke-Imale,Isale Togun,
OkeOtun,Itabo.
Thecommonfoodsthey
consumeinclude;amala(madeupofeitheryamflourorcassava four)
withsoupssuchasmorogbo,ilasa(okra leaf),vegetables(efoteteabalaye), oregusi
(melon); Poundedyamwithsoup;bushmeatandbeans.Other
vegetablesconsumedinthe localityin thepast and present includeewuro, efoigbo,
eku, efo tete, shoko,ebolo.
3.3Sampling technique
Amulti-stagesampling technique wasemployedinselecting
householdsandrespondentsas follows:
Stage1:OyoStatewaspurposively selectedamongthesixstatesinSouthwestNigeria
becauseofitssizeanddiversityofpeople.Ithasthreesenatorialdistrictsnamely:OyoN
orth, Oyo Central, and Oyo Southsenatorial districts.
Stage2:ALocalGovernmentArea(LGA)wasrandomly selectedfromthe
samplingframeof theLocal Government Areas in each senatorial zoneusing
atableof random numbers.
Stage 3:AttheLocalGovernmentlevel,the sampling frame
oftheenumerationareasand
wardswasstratifiedintoruralandurbanenumerationareas/wards.Twowards(onerura
land oneurban)wereselectedfromthestratificationprocessusing

68
simplerandomsampling technique, and the households wereidentified through
the household listing.
Stage4:Asystematicrandomsamplingtechniquewasusedtoselectthe
householdforthestudy.
Stage 5:Atthehouseholdlevel,a
householdhead/othermembersofthehouseholdswere recruitedforthestudy
basedontheinclusioncriteriaafterobtainingthe respondent’sinformed consent.
3.4 Study population
Therespondentsforthisstudywereapparentlyhealthyadults,men,andwomenaged40
years and above.
3.4.1 Inclusioncriteria
Thestudyincludedmaleandfemaleadultvolunteerswhowereapparently
healthyandwere40years andaboveand areresidentsfor atleast 10years in the
Yorubacultureand habits.
3.4.2 Exclusioncriteria
Thestudy
excludedchildren,adolescents,pregnantandlactatingwomen;menandwomen
whowere belowthe ageof40years,the
respondentwhoshowapparentsignsofsicknessand ailment, and respondentswho
havenot resided upto 10years inthe Yorubasetting.
3.5 Sample sizedetermination
Thesamplesizewascalculatedusing Stewart, 2002formulabasedon
previousstudieson the prevalenceofchronicenergy

69
deficiency(CED)amongadultsinNigeria.Usinga samplesize formulaforthe single
proportion:
n = z2 (p)(1– p)
E2 (Stewart, 2002) Z= Critical value at 95% confidenceinterval = 1.96. p = assumedprevalenceofchronicenergydeficiency(CED)amongadultsinNigeriais 50% E = Level of precision at 5% precision =0.05
n = 1.962*(0.5) (0.5)
0.052
= 384.16 Introducing 20% attritionrate: 20%(384.16) = 76.832 n = 384.16 +76.832 = 460.992 n = is approximated to500respondents
Table 3.1:Sample sizeallocation by wards
LGA
ATIBA IWAJOWA IBARAPA EAST
Agunpopo 39460 Shabina 18086 Okolo 16922
OkeAfin 12800 Ilaji-Ile 11536 Anko 16969
Total 52260 29622 33891
Overalltotal 115773
=52260 x500 =29622x500 =33891 x500 115773
=226
115773
=128
115773
=146
Total Sample =500

70
Atotalnumber offivehundred(500) households,twohundredandtwenty-six(226)
householdsfromAtiba LGA,onehundred andtwenty-eighthouseholdsfrom
IwajowaLGA, andone hundredandforty-sixhouseholdsfromIbarapaLGA were
selected.A totalof 20% of therequiredsamplesizewas added to takecare of non-
respondent,therebyincreasing the
samplesizeto600respondents.However,thetotalnumber
ofhousehold/respondentsthat completedthestudywas589-AtibaLGA-
200households,IwajowaLGA-187households, andIbarapaLGA -202 households
completed thestudy.
3.6 Data collection technique
Avalidatedsemi-structured,interviewer-administeredquestionnaire
wasusedtoobtain informationfromrespondentsby
trainedresearchassistantswhoadministeredthe questionnaire andotherinstruments.
Focusgroupdiscussions were carriedout in each of the
wardschosenforthesurvey.Atotaloftwelvefocusgroupdiscussionswere
carriedout,six formen, and sixforwomen.
3.7 Instrument fordatacollection
Instrumentsfor data collectionwere tape recorderfor focusgroup
discussion,validated and pre-testedasemi-
structuredquestionnairewhichwasusedfordiscussionanddatacollection,
stadiometerandcalibratedweighing scaleformeasuring theheightandweightof
respondents. The questionnaire contained different sections such as:
3.7.1 Respondents’socio-demographic andsocio-economic data
Twenty-three itemsemi-structuredinterviewer-administeredquestionnaireswere
usedto collectdataonthesocio-demographicaswellasonthesocio-
economiccharacteristicsofthe respondents.The respondentswereamongmany

71
otheritemscategorisedbasedontheir Location (rural or urban),Age, sex,
ethnicity,marital status, typeof marriage, religion, level of Educationlevelof
income, occupation,typeof house, type of toilet facility,sourceof drinking
water,typeofcookingfuel,source/methodoflighteningandmethodofrefuse disposal
3.7.2 Focusgroupdiscussion
A totalof twelve focusgroup discussions (FGDs)(whichcomprisedof one
malegroup and
onefemalegroupperwardwitheachgroupconsisting10people)wereconductedinthet
hree
chosenLocalGovernmentAreas(LGAs)(Atiba,Ibarapa,andIwajowa)representingt
woper ward (onemale and theotherfemale).
Mostof therespondentswereadultmale andfemalewhowere betweenthe agesof
50years andabove.They werepredominantly
ofYorubaethnicgroupwhoresideinurbanandrural communitiesof
theselectedLocalGovernmentAreasandwere peoplewhowere
knowledgeableabouttheirimmediateenvironmentandcustodiansofculture
andtradition peculiar toeachcommunity.The interviewer teamconsistedof a
moderator,a recorder/ secretary,andatimekeeper. Well,structuredopen-
endedquestionsthatwere relevanttothe
studywerepreparedanddiscussedinaninteractivemannerwitheachparticipantgiving
equal opportunitiestocontribute. Theinteractive sessionwhichfocusedontheir
perceptions, opinions,beliefs, attitudes,andexperiencesabouttheir food
culture,preferencesandhabits lastedforaboutonehour ineachofthegroups.Their
responseswerewelldocumentedin
writing,ontapeandvideo(followingtheirpermissiontorecord)andwerelatertranslate
dfor data analysis.

72
Figure3.3: Addressingsomeofthe respondents during the focus group discussion
Figure3.4: A cross-sectionofthemale respondents during focus groupdiscussion

73
Figure3.5: Across-sectionofthefemalerespondents duringfocus group discussion
Figure3.6: Asample ofthe foodmodel used during the interview

74
Figure3.7: Interviewing the respondents
.7.3 Foodcultureandhabits
TheFoodcultureandhabitoftherespondentswereassessedusing well-structured
interviewer-administeredfoodfrequency
questionnaires.Informationwasobtainedonthe choice
offoodandpreferences.Thequestionnairecontaineditemsfromthesixclassesof
foodandvariablessuchasthenumberofconsumptionperday,perweek,occasionally,r
arely
andneverwasusedasindicators.Also,themealpatternoftherespondentswasassessed
using a24 items questionnairethat centered on the mealpattern and the attitudeof
therespondents towardsahealthyeatinglifestylelikehowmanytimesdothey
eatdaily?Mealskipping attitudes, snacking, portion sizes, food preparation, and
combinations,etcwere assessed.
3.7.4 24-hourdietary recall
Detailedinformationaboutallfoodsandbeveragesandthedietary
supplementsconsumed by
therespondentinthepast24hoursfrommidnighttomidnightthepreviousday was
collected.Twovisitsweremadetoeachrespondentandduring eachofthevisits,the

75
respondentsweremadetoremember
allthattheyconsumedwithinthelast24hoursandsuch
werenoted.Foodmodelsandpictureswereusedtodemonstratethecorrespondingqua
ntities
tohelprespondentsrememberandjudgeportionsizesoffoodtheyconsumedandthewe
ight wereappropriately
recordedingramsintherespondents’questionnaires.Fortheonesthey
boughtfromfood vendors,theamountwasnoted andthecorresponding
amountwasbought fromfoodvendorsinthe sameenvironmentandtheweightin
gramsorservingspoonsnoted andrecordedintherespondents’questionnaires.The
data wasanalysedfor the nutrient compositions using the total dietaryanalysis
software (TDA) and were categorised as inadequate (less than 80%), adequate
(80-120%)and excess (above120%)
3.7.5 HealthRelatedQuality ofLife(QoL) of respondents
Health-
relatedqualityoflifewasassessedusingapatientmultidimensionalquestionnairethat
coveredthe respondents’physical,social, emotional,cognitive, work- orrole-
related, and spiritualaspectsaswellasawidevariety ofdisease-
relatedsymptomsandtherapy-induced side effects.
TheHealth-relatedqualityoflifewasusedtoassesshowthe respondent’swell-
beingmay be affected bytheireatinghabit. This was assessed under several
subscales which include:
RolePhysical(RP):Thissubscaleassessestheeaseofperformingsomethingsby the
respondent.It also assesses if theyarelimited in anykind or theyaccomplished
less.
PhysicalFunctioning(PF):Thisassessesthephysicalfunctioningoftherespondenta
nd questions about the abilityto climb several flights, to moderate activity,to
batheor dress self.
Bodily Pain(BP):Thissubscalelooksasiftheirbody hasbeeninanyway affectedby
bodilypain.

76
GeneralHealth(GH):Thissubscalelooksatthegeneralhealthoftherespondents.Itlo
oks asifthey getsickeasily,ifthey areashealthy asanybody,iftheir
healthworsensoriftheir health is excellent.
RoleEmotional(RE):Thissubscaleassessestheemotionalwellbeingoftheresponde
nts, lookingat if theywork less carefullyortheyaccomplish less.
Reported Health transition(RH):
PhysicalHealth(PHH):Thissubscaleisanoverallscaleforthephysicalhealthofthe
respondentsandincorporatesothersubscalesliketheRolePhysical(RP),Bodily
Pain(BP), General Health (GH)
Vitality(VT):Thissubscalelooksattheoverallvitalityoftherespondents,assessingif
they’vefeltworn out or tired in theprecedingdays.
MentalHealth(MEH):Thissubscalelooksattheoverallhealthoftherespondents.It
incorporatesother subscaleslike Vitality (VT),SocialFunctioning(SF),Role-
Emotional (RE), and Mental Health(MH)
SocialFunctioning(SF):Thissubscaleassessestheoverallsocialimpactaspectofthe
respondent’s life.
Itemswerereverse-scoredsuchthathigher scoreswouldrepresentbetter HRQoL.To
combine the itemsoneachfactor intosingle-scale scores,rawresponsestothe
itemswere converted to standard(z)scores. Themean z-scores fortheitems in
each scalewere calculated.Simplemeanswereusedratherthanweighingtheitemsby
theirfactorloadings. Theresultingmeanswerethen converted to T-scores to
createadistribution ofscores scaled to100.Thecloserto100
arespondentscoreonanyofthesubscales,thebetteristheirhealth performanceon that
subscale.
3.7.6 Body mass index determination
Astadiometer wasusedtomeasure therespondents’height.The respondentswere
askedto standerectwiththeirlegsfully
straightenedonthebaseplate.Theirshoeswerepulledoff

77
andtheirheadbarsweremadetorestlightlyontheirhead.Thebarefeetwereplacedslight
ly
apartwhilethebackofthehead,shoulderblades,buttockandheelstouchedtheverticalb
oard. Theheight readings werethen taken to thenearest1 cm.
Figure3.8: Arespondent taking hisweight measurement

78
Thebody
weightsoftherespondentsweredoneonasmoothlevelsurfaceusingaweighing
scale.Therespondentsweremadetostanderectonthescalebarefootedwithnothingont
hem excepttheirlightclothing.The
weightmeasurementwasdisplayedandallowedtostabilize afterwhich itwas
recordedintherespondents’questionnairesinkilogrammes.Theresulting
weightinkilogramdivided by thesquareoftheheightina
centimeteroftherespondentwas used to calculate theindividual respondent’s
bodymass index(BMI).
3.8 Translationof protocol:
The instrumentfor data collectionwastranslatedintoYorubalanguageandback-
translatedto Englishtoensurecontentvalidity.Thistranslationwastoenhance
respondentswho donot understand EnglishLanguagebut understandYorubato
participateactivelyin thestudy.
3.9 Questionnairevalidity

79
Reviewofrelevantliterature,reviewedby
experts,statisticiansandresearcherswerecarried outtoensure
faceandcontentvalidity.Apre-testwasconductedinIdoLocalGovernment
Areatotestthevalidity andreliability ofthequestionnaire.Toconfirmthevalidity
ofthe instrument, analysis of thepre-test datawas doneusingCronbach’s
Alphacorrelation coefficientat (p<0.05)usingStatistical
PackageforSocialSciences (SPSS)Software (version 20).
3.10 Data analysis
Qualitativedatawereanalysedthematically
whilequantitativedatawereanalysedusing descriptive statistics.Data
entry,checking,cleaning,andanalysis weredone usingthe StatisticalPackage for
Social Sciences(SPSS)Software (version20).The 24-hourdietary
recallwasconvertedintothe weightoffood ingramsandanalysedfor nutrientintake
using theTotalDietaryAssessment(TDA)software.Descriptivestatistics,Chi-
squaretest,student t-test,correlation, andmultiple regression analyseswerecarried
outat5% levelof significance toelucidatetherelationshipbetweenthesocio-
demographicvariables,the nutritional status and food habits of respondents.
3.11 Ethical consideration
Ethicalapprovalwasobtained fromthe UI/UCHInstitutionalEthical review board.
Written informedconsentwasobtainedfromthestudy participants.Theprinciple
ofconfidentiality, beneficence,non-
magnificence,voluntaryparticipationandwithdrawalfromthestudyatany pointin
timewithoutrepercussion was ensured.
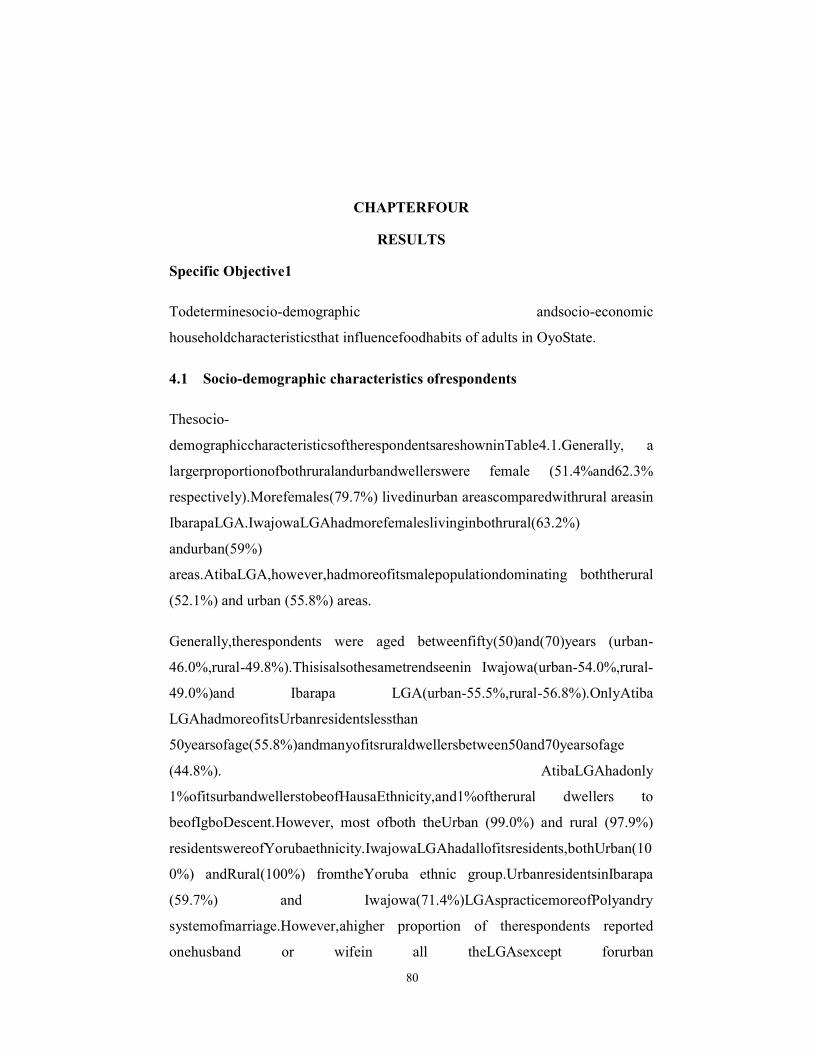
80
CHAPTERFOUR
RESULTS
Specific Objective1
Todeterminesocio-demographic andsocio-economic
householdcharacteristicsthat influencefoodhabits of adults in OyoState.
4.1 Socio-demographic characteristics ofrespondents
Thesocio-
demographiccharacteristicsoftherespondentsareshowninTable4.1.Generally, a
largerproportionofbothruralandurbandwellerswere female (51.4%and62.3%
respectively).Morefemales(79.7%) livedinurban areascomparedwithrural areasin
IbarapaLGA.IwajowaLGAhadmorefemaleslivinginbothrural(63.2%)
andurban(59%)
areas.AtibaLGA,however,hadmoreofitsmalepopulationdominating boththerural
(52.1%) and urban (55.8%) areas.
Generally,therespondents were aged betweenfifty(50)and(70)years (urban-
46.0%,rural-49.8%).Thisisalsothesametrendseenin Iwajowa(urban-54.0%,rural-
49.0%)and Ibarapa LGA(urban-55.5%,rural-56.8%).OnlyAtiba
LGAhadmoreofitsUrbanresidentslessthan
50yearsofage(55.8%)andmanyofitsruraldwellersbetween50and70yearsofage
(44.8%). AtibaLGAhadonly
1%ofitsurbandwellerstobeofHausaEthnicity,and1%oftherural dwellers to
beofIgboDescent.However, most ofboth theUrban (99.0%) and rural (97.9%)
residentswereofYorubaethnicity.IwajowaLGAhadallofitsresidents,bothUrban(10
0%) andRural(100%) fromtheYoruba ethnic group.UrbanresidentsinIbarapa
(59.7%) and Iwajowa(71.4%)LGAspracticemoreofPolyandry
systemofmarriage.However,ahigher proportion of therespondents reported
onehusband or wifein all theLGAsexcept forurban

81
residentsinIwajowaLGA,whichreportedahigherproportion(37.3%)havingtwo(2)
wives/ husbands.AtibaLGA hadthesameproportionof
peoplewithnoeducationandtertiary educationamong
itsurbanresidents(29.8%).InIbarapa(Urban-64.0%,Rural-66.2%),
Iwajowa(Urban-87.9%,Rural-64.7%)andGenerally (Urban-60.4%,Rural-
66.9%),more
peoplereportedhavingnoeducation,regardlessofthelocalityoftheirresidence(i.e.
ruralor Urban).
MostUrbanresidentsinthethreeLGAs,Atiba,IbarapaandIwajowaweretraders(61.5
%, 58.7%,and50.5%,respectively).Ina similarway,mostruralresidentswere
farmers except forIwajowaLGAwhichhad most of its residents as
traders(50.6%). ThemainreligionpractisedinAtibaLGAisIslam(Urban-
76.9%,Rural-51.6%)whilethat ofIbarapaisChristianity (Urban-77.7%,Rural-
65.8%).InIwajowaLGA,however,alarger
proportionofurbanresidentspractiseIslam(82.7)whilethemajority
oftheruralresidents areChristians (64.7).

82
Table 4.1:Socio demographic characteristicsofrespondents
Variable Atiba Urban
Rural
Ibarapa Urban
Rural
Iwajowa Urban
Rural
Combinedsample Urban Rural
n(%) n(%) n(%) n(%) n(%) n(%) n(%) n(%) Sex Male 58(55.8) 50(52.1) 26(20.3) 43(58.1) 41(41.0) 32(36.8) 125(37.7) 125(48.6) Female 46(44.2) 46(47.9) 102(79.7) 31(41.9) 59(59.0) 55(63.2) 207(62.3) 132(51.4) Agegroup <50years 58(55.8) 36(39.6) 20(15.6) 9(12.2) 1(1.0) 5(5.7) 79(23.8) 52(20.2) 50 –70years 30(28.8) 43(44.8) 71(55.5) 42(56.8) 54(54.0) 43(49.4) 155(46.7) 128(49.8) >70years 16(15.4) 15(15.6) 37(28.9) 23(31.1) 45(45.0) 39(44.9) 98(29.5) 77(30.0)
Ethnicity
Yoruba 103(99.0) 94(97.9) 127(100.0 72(97.3) 100(100.0 87(100.0 330(99.7) 253(98.4) ) ) ) Igbo 0(0.0) 1(1.0) 0(0.0) 0(0.0) 0(0.0) 0(0.0) 0(0.0) 1(0.4) Hausa 1(1.0) 0(0.0) 0(0.0) 0(0.0) 0(0.0) 0(0.0) 1(0.3) 0(0.0) Others 0(0.0) 1(1.0) 0(0.0) 2(2.7) 0(0.0) 0(0.0) 0(0.0) 3(1.2) Marital status Married 94(91.3) 83(87.4) 84(65.6) 60(81.1) 62(62.0) 56(64.4) 240(72.5) 199(77.7) Divorce/Sepa 0(0.0) 0(0.0) 10(7.8) 3(4.1) 8(8.0) 5(5.7) 18(5.4) 8(3.1) rate Widow 9(8.7) 12(12.6) 34(26.6) 11(14.9) 30(30.0) 26(29.9) 73(22.1) 49(19.1) Type of marriage Monogamy 59(57.3) 66(69.5) 50(40.3) 38(51.4) 28(28.6) 53(62.4) 137(42.2) 157(61.8) Polygamy/Pol 44(42.7) 29(30.5) 74(59.7) 36(48.6) 70(71.4) 32(37.6) 188(57.8) 97(38.2) ahandry No of wives orhusband 1 48(68.6) 64(74.4) 48(58.5) 41(59.4) 17(28.8) 50(72.5) 113(53.6) 155(69.2) 2 17(24.3) 16(18.6) 19(23.2) 19(27.5) 22(37.3) 15(21.7) 58(27.5) 50(22.3) >2 3(4.3) 2(2.3) 7(8.5) 8(11.6) 9(15.3) 4(5.8) 40(19.0) 19(8.5) Education category None 31(29.8) 66(69.5) 80(64.0) 47(66.2) 87(87.9) 55(64.7) 198(60.4) 168(66.9) Primary 22(21.2) 19(20.0) 26(20.8) 16(22.5) 10(10.1) 24(28.2) 58(17.7) 59(23.5) Secondary 20(19.2) 8(8.4) 15(12.0) 7(9.9) 1(1.0) 3(3.5) 36(11.0) 18(7.2) Tertiary 31(29.8) 2(2.1) 4(3.2) 1(1.4) 1(1.0) 3(3.5) 36(11.0) 6(2.4) Occupation category None 1(1.0) 1(1.1) 15(11.9) 1(1.4) 11(11.1) 14(16.1) 27(8.2) 16(6.3) Trade/busines 64(61.5) 35(36.8) 74(58.7) 23(31.1) 50(50.5) 44(50.6) 188(57.3) 102(39.8) s Farmers 9(8.7) 45(47.4) 17(13.5) 43(58.1) 27(27.3) 20(23.0) 53(16.2) 108(42.2) Civilservants 15(14.6) 1(1.1) 3(2.4) 0(0.0) 0(0.0) 2(2.3) 18(5.5) 3(1.2) Artisans 14(13.6) 13(13.7) 17(13.5) 7(9.5) 11(11.1) 7(8.0) 42(12.8) 27(105) Religion category Christianity
19(18.3)
45(47.4)
95(77.2)
48(65.8)
15(15.3)
55(64.7)
129(39.7)
148(58.5)
Islam 80(76.9) 49(51.6) 28(22.8) 25(34.2) 81(82.7) 30(35.3) 189(58.2) 104(41.1) Others 5(4.8) 1(1.1) 0(0.0) 0(0.0) 2(2.0) 0(0.0) 7(2.2) 1(0.4)

83
4.2 Socio-economic characteristics ofrespondents
The socio-economiccharacteristicsoftherespondentsare showninTable4.2.Self-
employmentisthemajoremployment typeamong
therespondents.Mostoftherespondents reportedthattheyareself-
employed,regardlessofthelocality oftheirresidence.InIbarapa
LGAforinstance,94.3%ofitsruralresidentsareself-
employed.RespondentsinIbarapaand Iwajowaaremajorly low-
incomeearners.AmongurbandwellersinIbarapaLGA,66.4% earnless
than₦10,000amonth. Thisissimilar to 55.6%amongruraldwellers inthesame
LGA. IwajowaLGAhas
74.0%ofitsurbandwellers,and80.5%ofitsruraldwellersearning
lessthan₦10,000.AtibaLGA,however,hasmore(48.9%)ruraldwellersearninglesst
han
₦10,000,andmore(51.9%)urbandwellersearningbetween₦10,000and₦49,000.In
allthe LGAs, less moneyis spent on food. Most of the respondents
acrossallstrata in alltheLGAs reported spendingless than ₦10,000 on food.

84
Table 4.2: Socio-economiccharacteristics ofrespondents
Variable Atiba Ibarapa Iwajowa Combinedsample
Urban Rural Urban Rural Urban Rural Urban Rural
n(%) n(%) n(%) n(%) n(%) n(%) n(%) n(%)
Employment
status
Unemployed
2(1.9)
1(1.1)
6(5.1)
2(2.9)
7(7.2)
7(7.2)
Self-employed 74(71.2) 80(84.2) 91(77.8) 66(94.3) 88(90.7) 59(75.6)
Wage-earner 9(8.7) 3(3.2) 12(10.3) 1(1.4) 2(2.1) 4(5.1)
Retired 4(3.8) 10(10.5) 8(6.8) 1(1.4) 0(0.0) 4(5.1)
Others 15(14.4) 1(1.1) 0(0.0) 0(0.0) 0(0.0) 0(0.0)
Incomelevel <10,000
29(27.9)
46(48.9)
83(66.4)
40(55.6)
74(74.0)
70(80.5)
186(56.5)
156(61.7)
10,000 – 49,000
54(51.9) 44(46.8) 39(31.2) 20(40.3) 24(24.0) 16(18.4) 117(35.6) 89(35.2)
=/>50,000 21(20.2) 4(4.3) 3(2.4) 3(4.2) 2(2.0) 1(1.1) 26(7.9) 8(3.2)
Amount on
food <10,000
62(60.2)
76(80.9)
111(90.2)
62(86.1)
91(91.0)
84(96.6)
10,000-19,000 11(10.7) 8(8.5) 8(6.5) 5(6.9) 4(4.0) 3(3.4)
20,000-29,000 19(18.4) 7(7.4) 1(0.8) 3(4.2) 1(1.0) 0(0.0)
30,000-39,000 10(9.7) 1(1.1) 0(0.0) 1(1.4) 2(2.0) 0(0.0)
40,000-49,000 1(1.0) 0(0.0) 3(2.4) 0(0.0) 0(0.0) 0(0.0)

85
Specific Objective2
Toidentifychanges in food habits of adults in Oyo State
4.3 Changes in foodhabits ofadults inOyo State:Focus groupdiscussions
Mostoftherespondents(77.8%)wereadultmaleandfemalewhowerebetweentheages
of50yearsandabove.TheywerepredominantlyofYorubaethnicgroupwholivedinur
banand ruralcommunitiesof the selectedLocalGovernmentAreasandwerepeople
who were
knowledgeableabouttheirimmediateenvironmentandcustodiansofculture
andtradition peculiar to each community.Many
oftheparticipants(40.5%)wereoflowsocio-economicstatusbasedonresponsesto
someofthequestions. Morethanone-
third(37.9%)oftheparticipantscanreadandwrite judging
fromtheresponsestoissuesraisedandspokenwords.Abouthalf(50.2%)ofthe
participantsengagedinsubsistentfarmingandasmallproportionoftheirfarmproduce
served
thepurposeofgeneratingincomeforthefamily.Manyofthewomenreportedlyjoinedt
heir husbandstowork onthefarm.It could alsobeinferred
thatparticipantsmainlysourcedtheir
foodsfromsubsistencefarming,althoughsomeother fooditemswere
boughtinthemarket. Narrating
theirexperiencesandordealintheirjob,oneoftheparticipantsinarural
communitystated that:
“OurmajorproblemhereistheFulanisrearing
theircattletograzeourcropsandfarmland. This practiceis hindering our
commitmentto farmingbecausetheyaredisruptingand eating upour farm alot.
Please, discussourplight withpeoplein authoritysothat theycan cometo our
rescue”.
Anothermaleparticipantrevealedthattheywerepredominantlyagrariansashereporte
dthat, “Ifwecangobacktoourformerway
ofcultivationwhenwecanleaveourcropsforalong

86
timebeforeharvestingandnotnecessarily
usechemicalsandfertilizer.Thisstepwillbeof help to resuscitateourfood habits”.
Oneof theparticipants pointed out
that,“Ourdietinthepastmadeushealthywithstrongbonesbutnowfoodseatendon’tgiv
emuch energy.Mostofthefoodsweeatdon’tgowellinthebody systemsoit
leadstostrokeand otherdiseases. Magi andsugar arewhat weeat in thefoodnowand
wehaveno choice. This is due to civilization, andimpatienceof everyoneeven in
thekitchen.”Participantsalsopointedoutthat,improvementintechnology
infarmingisaffectingthe
qualityoffarmproductsinthepresenttime.Intheiropinion,theadditionoffertilizerand
chemicalstoplantswasobservedtobe detrimentaltopeople’shealth.Moreover,
improvementsinspeciesof farmseedlingswerealsonotedtobe
harmfultopeople’shealth.
Theyarguedthatseedlingsusedonfarmsinthepastweremuchbetterthanwhatthey use
now in terms of farmyield, nutrition, and taste. Accordingto some
participants,“You seeinthe pastour parentsdonotplantyamsandmaize
withchemicals. Whenwe consumedsuchfoods there isnofear of harm tothe
body.Butpresently,applicationsof
chemicalsappliedtoyam,cassava,maize,etc,arecausingharmtothebody
andwedon’t know what to do”.Another participant added that,
“Inthepastwhenyouroastmaizeduring
maizeseasonsyouwillperceivethearoma(scent) fromafardistance.Butnowyou
can’tperceivesuch aroma asaresultof thechemical applicationduring
planting.Thoughchemicalsappliedtothefarmhaveadvantages,italso
hasdisadvantages.Forexample,applyingherbicidesonthefarminsteadofclearingthe
bush forfarming wouldreducethestressofclearingbutitisalso destroying
wildvegetables causingthem to go into extinction”.
Food culture and eatinghabits of adults’ foodintherightqualityandquantity
isessentialtolife;itisalsoimportanttoeatitatthe
righttime.Breakfastwhichisthefirstmealoftheday iseatenevery day
inalltheindexof
urbanandruralcommunitiesexceptduringthefastingperiod.However,thetype/kindo

87
ffood takenasbreakfastvariesfromoneareatoanotherlargely
onavailabilityandaffordability. Thebreakfast is madeup
largelyofcarbohydrateand protein; forinstance,some community
membersprefereating lightmeal(liquidhotpapor‘koko’withakara ormoinmoin,
pap mouldedinleaves,beans,whitemaizeporridgeor‘egbo’andrice)orheavy
meal(‘amala’ and‘gbegiri’,poundedyamandvegetables)asbreakfast.According
tosomewomen participants in an urbancommunity,
“Wetakekoko (hot pap)and eat eko tutu (pap mould in leaves)”
“Wetakehot pap andeat eko tutu and ifthereis ricewecook it. . .” “Amala
and‘gbegiri’(beans soup), some prefer ’moinmoin’ and hot pap
‘Moinmoin’and‘ekotutu’(papmouldinleaves,(Someofthefemaleparticipantsfrom
urbancommunitystated)
Adultmen inanurban community,however, pointed outthatthere are
differencesinfood
consumptionpatternsinyesteryearscomparedwithtodayinthatinthepastfoodareprep
ared athomeandeatenatleisurebutthecaseisnotsotoday.According tooneofthemale
participants,
“Yes,thereisdifference,inthetimepastwhen‘Onini’(oldendayscoininNigeria)wasb
eing spentwheneverwewakeup,ourparents will giveus‘Onini’tobuyhotpap and
akaraorour parentswouldprepareitfor
usathomebutnowyouhavemoreof‘koko’hawkedinthe morning.Weare
freetoeatwhateverwelikeinthepastbutnowwecan’t.Weeatwhatwe
see.Evenhotpapthatweusually takewiththe
spooninthetimepastisnotavailableagain instead wetake‘koko’ now and
buy‘amala’from arestaurant”.
Participantsalsopointedoutthattherearemarked differencesbetweenthe manners
inwhich lunchiseaten.Intheir opinion,foodcomposition
andpreparationintheoldendaysisquite differentfromtheway
itiscombinedandpreparedtoday.They pointedoutthatmostofthe
ingredientsusedinthepreparationofmealsnowadaysare tooartificial.One ofthe
participants pointed out that,

88
“The soupisquitedifferent.Inthepastwe don’teat‘Maggi’,
cannedtomatoesandHausa’s
onions,thekindofonionsweconsumedthenwasleafyonions,locustbeans,andourmot
hers
usedastonetogrindpeppernotmillingmachine.Wegotothefarmtohuntanimalsforsou
p. Wecookbushmeatandokrotogetherwhichisusually
sweettotaste.Butit’snotavailable in present days”.
In terms of effectsof foodsconsumed inthe
presentday,almostallparticipantsinallthe communitieswere
unanimousinresponding thatsomeofthefoodseatenthesedaysare not
healthytothebody,andaredetrimentaltopeople’swellbeing.Accordingtothemmosto
fthe
foodspeopleareeatingtodayareloadedwithcondimentsandseasoningswhichtheype
rceive to be unhealthy. As oneof theparticipants pointed out,
“Inthepast,weconsumed‘obeosiki’(egusisoup),okro,‘ilasa’,‘morogbo’,‘obeajara’.
But, nowsomeofourwomendon’tknowhowtocook‘ilasa’or‘morogbo’.‘Obe
ajara’is very goodforthebody.Inthepastwhen
youcooksoupwith‘enmiarugbo’leaves,thesoupworks wellin
thebody.Presently,thesoupweconsumecontaincurry,Maggi,etc,whichcauseharmt
othebodylike cancer, ulcer,etc.Inthepast,our parentsusedlocustbeanand‘ogiri’.
Thiscivilizationis reallycausingharm to us in this present day”.
Itwasalsoaddedthatfoodpreparation,processing
andthematerialsusedhavesignificant effectsonhealth.For
instance,anotherparticipantpointedoutthatcookingpotsusedinthe
preparationoffoodhelpinthepreservationofsuchfoodmostespeciallysoupandalsoha
ve aneffectonhealth.Intheiropinionsont h e
westernizationoflifestyle,theperceivedhealthoutcomesofalltheseareareductioninli
feexpectancy anda reductioninbodyfunctioning. Accordingto one of
themaleparticipants,“Inaddition,inthepast,theyuseearthenpottocooksoup,butnowi
tisaluminumpotwhich hassomedepositof chemicalsinside. Someof the
diseaseswesufferareasaresult of the

89
chemicalsweconsumethroughtheinteractionbetweenfoodandmodernday
pot.Also,an earthen pot keeps soup warm for alongtime than the aluminumpot”.
A femaleparticipant added
furtherthat,“Inthepast,weused‘ewedu’butitisdifferentnow.Thereasonisthat;thewa
yweplant‘ewedu’atpresentaffectsitsqualitybecauseweareencouragedtoaddsomec
hemicalstothe
soilbeforeplantingorevenafterplanting.Bythetimewecooksuch‘ewedu’itwillnotdr
awl andthetextureisharsh.By
nowyouwillnoticethedifferencebetweenthe‘ewedu’planted
withorwithoutchemicalsbecausethelatterwillbevery greenishthantheother.Even
vegetablesandothercropssuchas yam,cassavaareplantedwithchemicals.
Inthetimepast, therewereno such things”(amiddleaged
femaleparticipant,Iganna).
Another participant added that“Theeffectisthatitreducesthelongevity
oflifeandcausesbody weakness.Nophysical activities like
before”.“OurbodieswerequitestrongthanthepresentdaybecausenowweconsumeM
aggialotin soups which affect ourbodyand makes us weak”.
Regardingthetimebreakfastiseaten,amajorityoftheparticipantspointedoutthatbrea
kfast iseatenbetween7 amand8am.However,aparticipantnotedtherecould bean
exceptionin
whichbreakfastcouldbeeatenlatestby9am.Inaddition,afemaleparticipantinoneofth
e
urbanareaspointedoutthatbreakfastiscompulsoryforeveryoneinordertoavoidillhea
lth. Accordingto her,
“Wemusteatbreakfastearly topreventunforeseenhealthissue.So,weeatasearly
as7am even if it is a small meal(hot pap) and later wewilleat another food”.
Whenaskedaboutthepeculiartherapeuticfoodsintheircommunity,aparticipantpoint
edoutthattherearetherapeuticfoodsinthecommunity(hotpap,‘ekotutu’,‘moinmoin’
,‘akara’,‘amala’,poundedyamandporridge);suchfoodswerebelievedtohelpthesickt
orecover on time.In her words, thetherapeuticfoods are“Ogi,(hot-

90
pap),andekotutu,(papmouldedinsideleaves),moinmoinandakara.Itisbelievedthat
when ahot pap isgiven to anyonethat is sick, he/she will get well”.
Othercommonindigenoustherapeuticvegetablesmentionedare‘ugwu’,bitterleaf,‘g
bure’and ‘gbagba’.
Foodstakenfor lunchinallthecommunitiessampledare made upof
carbohydrate,protein, andvitaminslargely.For instance,amala (madeof
eitheryamor cassavaflour) withsoup (‘morogbo’, ‘ilasa’ [okroleaves],vegetables
[‘efo tete abalaye’]or ‘egusi’ [melon]with
vegetables);poundedyamwithsoup;meatandbeans.Itwasalsonotedthatthe common
vegetablesinthe pastandthe presentare ‘efo tete abalaye’, ‘ewuro’,‘igbo’, ‘pekun’
‘efo tete’, ‘shoko’and ‘ebolo’. As oneof the femaleparticipants pointed out,
“Somepeopleifchancedcanpound
yam,somebeansbutmajorly,weeat‘amala’(yamflour)
and‘ilasa’soupwhichcontainlocustbeans.Uptodate,wedon’tuseMaggi®fordrawso
up
(elastic/vegetablesoup)weuselocustbeans.Whenpreparedforsomeonethatjustgave
birth totake,itnourishesherbody.Butnowweuse Maggifor stew althoughinthe
olden days our mothers used leafyonions and locust beans for stew”.
Dinner iseateninallthe communitiesalthoughthecontentofdinnervaries fromone
communitytoanother.‘Ekotutuwithmoinmoin/Akara
poundedyam,riceandspaghettiare
commonfooditemseatenasdinneralthoughthisislargely dependentoneachfamily’s
economic powerandability.It wasfurtherstressedthatpoundedyamisone
ofthemajor mealfor dinner inthetimepast,however,it’snota commonfoodfor
dinner again because someyouthoftodaywhoaresaddledwiththeresponsibility
ofpreparingthemealcannot poundyam.
Accordingtosomefemalediscussantsintheurbanareas,someofthemodernfoodscom
mon inthecommunityandconsumedmostby
thechildrenarecannedfoods,noodles,rice,
Spaghetti,Semovita,andwheat.Itwasalsomentionedthatchildrenaremadetoeatfruit
sand vegetables inaddition to thesemodern foods.

91
Whilemakingacomparisononhealthbenefitsoffoodspreparedandeatenintheyestery
ears
andthepresent,itwaspointedoutbysomefemaleparticipantsthattheoldendayfoodspr
eparedandeatenwerehealthier
thanthepresentones.Thiswassobecausefoodsinthose
periodswerecultivatedwithlittleornochemicalsaddedtotheplanting
processunlikewhat obtainsinthepresentday.
Accordingtooneofthefemalediscussantsinanurbancommunity,“Intheoldendays'fo
ods,theprocessingmethodespeciallyplantingisquitedifferent.Present
dayfoodsareplantedwithchemicalsandfertilizerthereby resultinginearly
maturingand harvestingof foodcrops”.
A femaleparticipant in oneurban communityalsoexplained that“Also,
vegetableswithoutfertilizer taste goodandpalatable than fertilized
ones”.Varioustypesoffruitswerementionedtobecommoninmostoftheindexurbanc
ommunities
andtheywereeatenregularly.Suchfruitsincludebutnotlimitedtomangoes,cashew,or
ange, pineapple, pawpaw, banana and plantain. However, oneof
thefemaleparticipants in another
urbancommunitywasofcontraryviewontheavailability
ofthesefruits.Accordingtoher, fruits are costlyand notmanypeople can affordto
buyitthesedays.
In her words,“Butwedon’thaveaccesstofruitslikebeforeduetoavailability
andcost.Wehavetobuy themfromafewpeoplethatareplantingthemon
theirfarms.Even ifourhusbands gotothe
farmandbringfruitsinsteadofgivingitoutfreelyweselltomakemoney.Unlikebeforet
hat, wehavefruits on an individual’s farm, it is scarcetodayand
weconsumefewerfruits.”

92
Specific Objective3
Toidentify relationshipsbetweensocio-demographicandsocio-
economichousehold characteristics that influencethe nutritional status of adults
in Oyo State
4.4: Householdcharacteristics ofrespondents
Table 4.4 shows the householdcharacteristics ofthe respondents.Generally, and
in each of thethree LGAsofAtiba,Ibarapa,and
Iwajowa,mostoftherespondentshadahouseholdsize that consistsof lessthanor
exactlysix(6)members. OnlyUrban dwellers in Atiba LGAhad ahigh proportion
(49.5%) having ahousehold sizeof morethan sixpeople.
AtibaLGAhaslessofitsurbandwellers(41.3%)owning
houses.Thisisnotthesameasits ruraldwellerswith72.3%
owninghouses.InIbarapaandIwajowaLGAs,mostof the respondentsownedtheir
personalhouses.IwajowaLGA, however,reportedhigher
proportionsinboththeruralandurbanlocalitiesthanIbarapaandAtibaLGAs(93.8%,8
5.7% respectively).
Exceptfor
urbandwellersinAtibaLGA,whichreportedahigherproportionofitsresidents
livinginFlatswithbedrooms(49.5%),mostoftherespondentsreportedlivinginothert
ypes of accommodation.Inthe ruralArea ofIwajowa,however, the proportionwho
livedinflats with bedroom and other types of accommodation was the
same(31.4%).
Mudwasthemainmaterialusedinmostoftherespondents’houses,withonlyurbanresi
dents
inAtibaLGAbeingtheonlyexceptionalcase.IntheUrbanareaofAtibaLGA,most(74.
0%) of thehouses in which therespondents lived were built with concrete blocks.
Themajorflooringmaterialusedinallthe
LGAs,regardlessofthestrata,wasconcrete.Only

93
RuralresidencesinAtibaLGAweredifferent,where62.1%usednoformofflooringma
terial whatsoever.
InalltheLGAs,themainroofingmaterialusedwascorrugatedironroofing sheets,with
respondentsreporting from64.4%inAtiba-Urbanto100%inIbarapa-
RuralandIwajowa- Rural.AlltherespondentsinIbaraparuralandIwajowa
ruralusedcorrugated iron sheetsas the main roofingmaterial.
Themainsourceofdrinkingwaterwasgenerally borehole.However,mostoftherural
residentsinAtibaLGA(47.4%)usedSurfacewaterasthemainsourceofdrinking
water. Also,urbanresidentsinIwajowaLGAusedwellwatermostly
(42.0%)astheirmainsource of drinkingwater.
MostoftherespondentsintheurbanareasusedKeroseneasthemainsourceofcookingf
uel. Atiba LGA,forinstance,
had58.7%ofitsurbanpopulationusingKerosene,whichissimilartothatofIbarapaLG
A,with55.2%.However,alargeproportionofurbanresidentsinIwajowaLGA
(42.9%) used Charcoalas the mainsourceoffuel forcooking.
Thepublicpowersupply wasthemainsourceoflighting
inmosturbanareasoftheLGAs.
However,IwajowaLGAhadmostofitsurbanresidents(47.5%)usingcandlelightasas
ource
oflightingasagainstthoseofIbarapa(54.7%)andAtibaLGA(69.2%)whichreportedp
ublic powerasasource oflighting.Mostruralareashada lowproportion
ofitsdwellersusing public
power,exceptforIwajowaLGAwhere47.7%ofruraldwellersusethepublic power
supply.
Regardlessofthe locality,alltheLGAs reporteda higherproportionofdwellers
hadnotoilet facility
inthehousehold.Thesevaluesrangefrom48.1%inurbanAtibaLGAto97.9%in
ruralAtibaLGA.RuralresidentsinAtibaLGAhadnopitlatrine(0%)andonly veryfew
(2.1%) hada watercloset in the household.

94
Ahighproportionoftherespondentsrespondedtonothaving any formofrefuse
management.ThistrendisthesameinalltheLGAs,regardlessofthelocality.Ruralresi
dents of AtibaLGA, for instance,had99% of themwithnorefuse
managementscheme, whichis similar to that
ofIwajowa(92.0%)andIbarapa (98.6), all in the same localities (Rural).

95
Table 4.4: Householdcharacteristics of respondents
Variable Atiba Urban
Rural
Ibarapa Urban
Rural
Iwajowa Urban
Rural
Combinedsample Urban Rural
n (%) n (%) n (%) n (%) n (%) n (%) n (%) n (
n (%) Total household category ≤ 6 52(50.5) 60(63.2) 113(88.3) 58(78.4) 79(80.6) 77(80.6) 244(74.2) 195(76.2) >6 51(49.5) 35(36.8) 15(11.7) 16(21.6) 19(19.4) 10(11.5) 85(25.8) 61(23.8) House ownership No
61(58.7)
23(27.7)
35(30.4)
22(34.9)
14(14.3)
5(6.2)
110(34.7)
50(22.0)
Yes 43(41.3) 60(72.3) 80(69.6) 41(65.1) 84(85.7) 76(93.8) 207(65.3) 177(78.0) Type of house A room 15(15.8) 22(23.7) 33(25.8) 18(25.0) 11(11.0) 2(2.3) 59(18.3) 42(16.7) Self- 33(34.7) 22(23.7) 28(21.9) 17(23.6) 21(21.0) 6(7.0) 82(25.4) 45(17.9) contained Flat with 47(49.5) 16(17.2) 16(12.5) 9(12.5) 11(11.0) 27(31.4) 74(22.9) 52(20.7) bedrooms Others (e.g. 0(0.0) 33(35.5) 51(39.8) 28(38.9) 11(11.0) 27(31.4) 108(33.4) 112(44.6) face Me Building materials Wood 2(1.9) 4(4.3) 0(0.0) 2(2.7) 0(0.0) 0(0.0) Mud 22(21.2) 82(87.2) 66(51.6) 64(86.5) 66(66.0) 67(77.0) Concrete 77(74.0) 8(8.5) 41(32.0) 8(10.8) 22(22.0) 20(23.0) block Others 3(2.9) 0(0.0) 21(16.4) 0(0.0) 12(12.0) 0(0.0) Flooring materials None 3(2.9) 59(62.1) 5(4.1) 34(46.6) 7(7.0) 2(2.3) Wood 7(6.7) 1(1.1) 0(0.0) 1(1.4) 2(2.0) 5(5.8) Concrete 80(76.9) 34(35.8) 117(95.1) 38(52.1) 91(91.0) 79(91.9) Tiles 12(11.5) 0(0.0) 1(0.8) 0(0.0) 0(0.0) 0(0.0) Terrazzo 2(1.9) 0(0.0) 0(0.0) 0(0.0) 0(0.0) 0(0.0) Others 0(0.0) 1(1.1) 0(0.0) 0(0.0) 0(0.0) 0(0.0) Roofing materials Thatched
2(1.9)
4.4.3)
0(0.0)
0(0.0)
0(0.0)
0(0.0)
roof Ironsheets 67(64.4) 84(91.3) 126(98.4) 74(100.0) 99(99.0) 87(100.0) Aluminium/ 31(29.8) 4(4.3) 2(1.6) 0(0.0) 1(1.0) 0(0.0) corrugated sheets Concrete 2(1.9) 0(0.0) 0(0.0) 0(0.0) 0(0.0) 0(0.0) Others 2(1.9) 0(0.0) 0(0.0) 0(0.0) 0(0.0) 0(0.0)

96
Table 4.4: Householdcharacteristics ofrespondents(continued)
Variable Atiba Urban
Rural
Ibarapa Urban
Rural
Iwajowa Urban
Rural
Combined sample Urban
Rural
n (%) n (%) n (%) n (%) n (%) n (%) n (%) n (%)
Mainsource of drinking water Surface
4(3.8)
45(47.4)
5(3.9)
13(17.6)
9(9.0)
4(4.6)
82(24.7)
68(26.6)
water Well 37(35.6) 16(16.8) 22(17.2) 1(1.4) 42(42.0) 15(17.2) 101(30.4) 32(12.5) Borehole 45(43.3) 34(35.8) 37(28.9) 60(81.1) 10(10.0) 54(62.1) 92(27.7) 148(57.8) Others 18(17.3) 0(0.0) 19(14.8) 0(0.0) 20(20.0) 8(9.2) 57(17.2) 8(3.1) Mainsource of cooking fuel Wood
19(18.3)
88(91.7)
26(20.8)
66(89.2)
40(40.8)
56(65.1)
85(26.0)
210(82.0)
Charcoal 18(17.3) 4(4.2) 29(23.2) 2(2.7) 42(42.9) 14(16.3) 89(27.2) 20(7.8) Kerosene 61(58.7) 2(2.1) 69(55.2) 6(8.1) 16(16.3) 16(18.6) 146(44.6) 24(9.4) Others 0(0.0) 2(2.1) 0(0.0) 0(0.0) 0(0.0) 0(0.0) 7(2.1) 2(0.8) Mainsource oflighting None
0(0.0)
16(16.7)
1(0.8)
0(0.0)
0(0.0)
1(1.2)
1(0.3)
17(6.6)
Candle/ 28(26.9) 55(57.3) 36(28.1) 35(47.3) 47(47.5) 40(46.5) 111(33.5) 130(50.8) Lantern Publicpower 72(69.2) 0(0.0) 70(54.7) 4(5.4) 40(40.4) 41(47.7) 182(55.0) 45(17.6) (e.g. PHCN) Alternative 4(3.8) 25(26.0) 21(16.4) 35(47.3) 12(12.1) 4(4.7) 37(11.2) 64(25.0) sources (generators, solar inverters etc) Toilet facility
in household
None(e.g. 50(48.1) 94(97.9) 99(77.3) 72(97.3) 78(78.0) 80(92.0) 227(68.4) 246(95.7) open bush,
surface
water)
Pit latrine 20(19.2) 0(0.0) 20(15.6) 2(2.7) 21(21.0) 6(6.9) 61(18.4) 8(3.1) Watercloset 34(32.7) 2(2.1) 9(7.0) 0(0.0) 1(1.0) 1(1.1) 44(13.3) 3(1.2) Refuse
management None
75(72.1)
95(99.0)
124(96.9)
73(98.6)
99(99.0)
80(92.0)
298(89.8)
248(96.5)
Burning 11(10.6) 0(0.0) 1(0.8) 1(1.4) 0(0.0) 1(1.1) 14(4.2) 5(1.9) Cityservices 16(15.4) 0(0.0) 3(2.3) 0(0.0) 1(1.0) 4(4.6) 20(6.0) 4(1.6)

97
4.5: Association betweensocio-demographic characteristics
andLGAofrespondents
Table4.5showstheassociationbetweenLGAsandSocio-
demographicfactors.Sex,age,
maritalstatus,typeofmarriage,occupation,numberofwivesandreligionaresomevari
ables that weresignificantlyassociated with thelocalgovernment ofthe
residenceof therespondents.
TheassociationbetweenethnicityandtheLGAoftherespondentswas,however,not
significant.
The proportionof femaleswasmore inalltheLGAs,exceptfor Atibawhichhadmore
male (54.0%)thanfemale(46%).Mostrespondentswereaged50-70years,only
AtibaLGA
reportedahigherproportioninthoselessthan50yearsold.ThemajorethnicgroupisYor
uba. Married respondents weremorethan other maritalgroupsacrossalltheLGAs.
MonogamyisthemainmarriagetypepractisedinAtibaLGA(89.4%),whileIbarapa(5
5.6) andIwajowa(55.7%)practisespolygamy/polyandry.Inallthe
LGAs,theproportionthathad
noeducationwerehigherthanthosewithprimary,Secondary
orhigherlevelofeducation. More
peoplewereintotrade/businessasanoccupationinall theLGAs.There were more
Muslimsthanother
religiousgroupsinAtiba(64.8%)andIwajowa(60.7%).IbarapaLGA had
moreChristians (73.0%) than otherreligious groups.

98
Table 4.5: Associationbetweensocio-demographic characteristics and LGA ofrespondents Variable Atiba
Ibarapa Iwajowa Chi-square P
n (%) n (%) n (%)
Sex Male
108(54.0)
69(34.2)
73(39.0)
17.50
<0.001
Female 92(46.0) 133(65.8) 114(61.0) Age group <50 years
96(48.0)
29(14.4)
6(3.2)
132.66
<0.001
50 –70 73(36.5) 113(55.9) 97(51.9) >70 years 31(15.5) 60(29.7) 84(44.9) Ethnicity Yoruba
197(98.5)
199(99.0)
187(100.0)
5.78
0.45
Igbo 1(0.5) 0(0.0) 0(0.0) Hausa 1(0.5) 0(0.0) 0(0.0) Others 1(0.5) 2(1.0) 0(0.0) Maritalstatus Married
177(89.4)
144(71.3)
118(63.1)
40.33
<0.001
Divorced/separated 0(0.0) 13(6.4) 13(7.0) Widow 21(10.6) 45(22.3) 56(29.9) Type of marriage Monogamy
125(63.1)
88(44.4)
81(44.3)
18.38
<0.001
Polygamy/polyandry 73(36.9) 110(55.6) 102(55.7) Wives group 1
112(71.8)
89(58.9)
67(52.3)
14.32
0.01
2 33(21.2) 38(25.2) 37(28.9) >2 11(7.1) 24(15.9) 24(18.8) Education category None
97(48.7)
127(64.8)
142(77.2)
64.82
<0.001
Primary 41(20.6) 42(21.4) 34(18.5) Secondary 28(14.1) 22(11.2) 4(2.2) Tertiary 33(16.6) 5(2.6) 4(2.2) Occupation category None
2(1.0)
16(8.0)
25(13.4)
39.26
<0.001
Trade/business 99(50.0) 97(48.5) 94(50.5) Farmers 54(27.3) 60(30.0) 47(25.3) Civilservants 16(8.1) 3(1.5) 2(1.1) Artisans 27(13.6) 24(12.0) 18(9.7) Religion category Christian
64(32.2)
143(73.0)
70(38.3)
79.23
<0.001
Islam 129(64.8) 53(27.0) 111(60.7) Others 6(3.0) 0(0.0) 2(1.1)

99
4.6 Association betweensocio-economiccharacteristics andLGA
ofrespondents
TheassociationbetweensocioeconomicvariablesandtheLGAoftherespondents
isshowninTable 4.6.The associationbetween allthe socio-economic variables
andtheLGAofrespondentsweresignificant.MoreoftherespondentsinIwajowa LGA
(77.0%)earnedlessthan₦10,000 thanrespondentsfromAtibaLGA
(37.9%)andIbarapaLGA(62.4%),thisassociationissignificant(p<0.001).Those
thatearnedbetween₦10,000and₦49,000 weremoreinAtibaLGA(49.5%)
thanIbarapa(34.5%)and Iwajowa(21.4%).Theassociationbetween House
ownershipandLGA of Residentswassignificant(p<0.001).IwajowaLGA had the
highestproportionofitsresidentswithpersonalhouses(89.4%) thanIbarapa (68.0%)
and AtibaLGA(55.1%). Ahigher proportion ofrespondents usedwood as the
main sourceof cookingfuel in Atiba(53.5%) thanIbarapa(46.2%).

100
Table 4.6 Associationbetweensocio-economiccharacteristics andLGA ofrespondents
Variable Atiba Ibarapa Iwajowa Chi- P n (%) n (%) n (%) Income category <10,000
75(37.9)
123(62.4)
144(77.0)
71.25
<0.001
10,000– 49,000 98(49.5) 68(34.5) 40(21.4) >/=50,000 25(12.6) 6(3.0) 3(1.6) Totalhousehold category
</=6 112(56.6) 171(84.7) 156(84.3) 54.57 <0.001
>6 86(43.4) 31(15.3) 29(15.7)
House ownership No
84(44.9)
57(32.0)
19(10.6)
52.71
<0.001
Yes 103(55.1) 121(68.0) 160(89.4)
Type ofhousecategory
A room 37(19.7) 51(25.5) 13(7.0) 88.58 <0.001 Self-contained 55(29.3) 45(22.5) 27(14.5)
Flatwithbedrooms 63(33.5) 25(12.5) 38(20.4)
Others (e.g. facemeIfaceyou) 33(17.6) 79(36.5) 108(58.1)
Mainsource drinkingwatercategory
Surface/rain water 49(24.6) 63(31.2) 38(20.3) 30.83 <0.001
Well 53(26.6) 23(11.4) 57(30.5)
Borehole 79(39.7) 97(48.0) 64(34.2)
Others 18(9.0) 19(9.4) 28(15.0)
The mainsource ofcookingfuelcategory Wood
107(53.5)
92(46.2)
96(52.2)
48.24
<0.001
Charcoal 22(11.0) 31(15.6) 56(30.4)
Kerosene 63(31.5) 75(37.7) 32(17.4)
Others 8(4.0) 1(0.5) 0(0.0)
The mainsource oflighting category None
16(8.0)
1(0.5)
1(0.5)
50.96
<0.001
Candle/lantern 83(41.5) 71(35.1) 87(47.0)
Public power supply(e.g.PHCH) 72(36.0) 74(36.6) 81(43.8)
Alternative sources (e.g. solar, generator) 29(14.5) 56(27.7) 16(8.6)
Toiletfacilityin household None (e.g. open bush, surfacewater
144(72.0)
171(84.7)
158(84.5)
43.91
<0.001
Pitlatrine 20(10.0) 22(10.9) 27(14.4)
Watercloset 36(18.0) 9(4.5) 2(1.1)
Refusemanagementin the household
None 170(85.0) 197(97.5) 179(95.7) 27.24 <0.001
Burning 14(7.0) 2(1.0) 3(1.6)
Cityservice 16(8.0) 3(1.5) 5(2.7)

101
4.7 Association betweensocio-demographic variables andlocality
ofrespondents
Table4.7 shows the association between the localityof therespondents and some
socio-demographic variables. While those of sex(p<0.05),Type of marriage
(p<0.05),number of wives(p<0.05),educationallevel(p<0.05),occupation
(p<0.05),andReligion(p<0.05)weresignificant,thoseofageandethnicity were
notsignificantly associated.UrbanrespondentspractisedPolyandry (57.8%)asa
formof marriage morethan rural respondents(38.2%).Ina similar way,the
proportionofmaleresidinginruralareas(48.6%)wasmorethanthoseresidingin urban
areas(37.7%). The proportionwithnoeducationlivinginruralareas (66.9%) was
morethan thoseresidingin urban areas (60.4%).

102
Table 4.7 Association betweensocio-demographic variables andlocality ofrespondents Variable Urban Rural Chi P n(%) n(%) square Sex Male
125(37.7)
125(48.6)
7.16
0.01
Female 207(63.3) 132(51.4)
Agegroup <50 years
79(23.8)
52(20.2)
1.13
0.57
50 -70 years 155(46.7) 128(49.8)
>70 years 98(29.5) 77(30.0)
Ethnicity Yoruba
330(99.7)
253(98.4)
5.95
0.11
Igbo 0(0.0) 1(0.4)
Hausa 1(0.3) 0(0.0)
Others 0(0.0) 3(1.2)
Typeofmarriage Monogamy
137(42.2)
157(61.8)
22.04
<0.001
Polygamy/polyandry 188(57.8) 97(38.2)
Wives group 1
113(53.6)
155(69.2)
14.27
<0.001
2 58(27.5) 50(22.3)
>2 40(19.0) 19(8.5)
Education category None
198(60.4)
168(66.9)
20.01
<0.001
Primary 58(17.7) 59(23.5)
Secondary 36(11.0) 18(7.2)
Tertiary 36(11.0) 6(2.4)
Occupation category None
27(8.2)
16(6.3)
53.01
<0.001
Trade/business 188(57.3) 102(39.8)
Farmers 53(16.2) 108(42.2)
Civil servants 18(5.5) 3(1.2)
Artisans 42(12.8) 27(10.5)
Religioncategory Christian
129(39.7)
148(58.5)
21.83
<0.001
Islam 189(58.2) 104(41.1)
Others 7(2.2) 1(0.4)

103
4.8 Association betweensocio-economic variables andlocality ofrespondents
Theassociationbetweenthelocality
oftherespondentsandsomesocioeconomicvariables are
showninTable4.8.Houseownership(p<0.001),typeofhouse(p<0.05),mainsourceof
drinkingwater(p<0.001),mainsourceofcooking
fuel(p<0.001),mainsourceoflighting (p<0.001),toiletfacility
(p<0.001),income(p<0.05),andrefusemanagementinhousehold
(p<0.05),wereallsignificantly relatedtotheirlocalgovernmentofresidence.Thetotal
householdsizewas,however,notrelatedtothelocality
oftherespondents.Theproportion withthe householdsizeof
atleast6membersthatdwelledinruralareas(76.2%) wasmore than thosethat dwellin
urban areas (74.2%).

104
Urban Rural Chi P
Table 4.8:Associationbetweensocio-economicvariables andlocality of respondents Variable n(%) n(%) square
Income category <10,000
186(56.5)
156(61.7)
6.15
0.05
10,000 – 49,000 117(35.6) 89(35.2)
>/=50,000 26(7.9) 8(3.2)
Total householdcategory </=6
244(74.2)
195(76.2)
0.31
0.58
>6 85(25.8) 61(23.8)
Houseownership No
110(34.7)
50(22.0)
10.23
<0.001
Yes 207(65.3) 177(78.0)
Typeof house category a room
59(18.3)
42(16.7)
8.66
0.03
Self-contained 82(25.4) 45(17.9)
Flat with bedrooms 74(22.9) 52(20.7)
Others(e.g. facemeI face you) 108(33.4) 112(44.6)
The mainsource of drinking water
category Surface/rain water
82(24.7)
68(26.6)
78.60
<0.001
Well 101(30.4) 32(12.5)
Borehole 92(27.7) 148(57.8)
Others 57(17.2) 8(3.1)
The mainsourceofcookingfuel Wood
85(26.0)
210(82.0)
181.01
<0.001
Charcoal 89(27.2) 20(7.8)
Kerosene 146(44.6) 24(9.4)
Others 7(2.1) 2(0.8)
The mainsourceoflightingcategory None
1(0.3)
17(6.6)
97.63
<0.001
Candle/lantern 111(33.5) 130(50.8)
Publicpower supply 182(55.0) 45(17.6)
Alternative sources (e.g. solar, 37(11.2) 64(25.0)
generator, inverters)
Toilet facility inhousehold None(e.g. open bush, surfacewater,
227(68.4)
246(95.7)
68.81
<0.001
Pit latrine 61(18.4) 8(3.1)
Watercloset 44(13.3) 3(1.2)
Refusemanagement in the household None
298(89.8)
248(96.5)
10.12
0.01
Burning 14(4.2) 5(1.9)
Cityservice 20(6.0) 4(1.6)

105
Specific Objective4
TodeterminetheeffectofchangingfoodcultureandhabitsonHealthrelatedquality
oflife of adults in Oyo State
4.9 Frequency ofconsumption ofroots, tubers,and products
Thefrequencyofconsumptionofdifferentroots,tubers,andtheirproductsisgiveninTa
ble4.9.Majority
oftherespondentsdidnotconsumegari(39.6%),lafun(32.1%)andfufu (49.1%)at all.
Morepeople (20.7%) responded toeatingroastedyamtwiceweeklythan any other
time. While 38.7%of respondentsconsumedyamflour once daily,18.5%
consumed poundedyamoncedaily.Foryamporridge andfriedyam,30.2%and
31.4%rarelyconsume them respectively. Asimilar foodconsumption pattern
wasobserved in Cocoyam, Cocoyam fried,
Sweetpotatoescookedandsweetpotatoesfried,wheremore proportionofthe
respondents reported notconsumingitat all.

106
Food No Rarely D1ce D3ce W1ce W2ce W3ce M2ce M3ce
n n (%) n (%) n (%) n (%) n (%) n (%) n (%) n (%)
Gari 233(39.6) 172(29.2) 18(3.1) 9(1.3) 81(13.8) 36(6.1) 13(2.2) 21(3.6) 7(1.2)
Table 4.9:Frequency ofconsumption ofroots, tuber, andproducts descriptio n (%)
Lafun 189(32.1) 64(10.8) 172(29.2) 39(6.6) 38(6.5) 35(5.9) 42(7.1) 7(1.2) 3(0.5)
Fufu Yam roasted
289(49.1)
31(5.3)
169(28.7)
99(16.8)
21(3.6)
108(18.3)
3(0.5)
17(2.9)
61(10.4)
107(18.2)
19(3.2)
122(20.7)
10(1.7)
86(14.6)
14(2.4)
14(2.4)
3(0.5)
5(0.8)
Yam flour
45(7.6)
88(15.0)
228(38.7)
36(6.1)
47(8.0)
62(10.5)
71(12.1)
6(1.0)
6(1.0)
Pounded yam
62(10.5)
101(22.3)
109(18.5)
15(2.6)
97(16.5)
86(14.6)
52(8.8)
28(4.8)
9(1.5)
Yam porridge
189(32.1)
220(37.3)
22(3.7)
6(1.0)
75(12.7)
36(6.1)
17(2.9)
18(3.1)
6(1.0)
Yam fried
221(37.5)
219(37.2)
23(3.9)
3(0.5)
60(10.2)
25(4.2)
15(2.5)
19(3.2)
4(0.7)
Cocoyam
372(63.2)
156(26.5)
9(1.5)
3(0.5)
25(4.2)
10(1.7)
4(0.7)
8(1.47)
2(0.3)
Cocoyam fried
427(72.5)
125(21.2)
7(1.2)
2(0.3)
17(2.9)
3(0.5)
1(0.2)
5(0.8)
2(0.3)
Sweet potatoes
369(62.6) 160(27.2) 7(1.2) 1(0.2) 26(4.4) 10(1.7) 4(0.7) 9(1.5) 3(0.5)
cooked Sweet potatofried
430(73.0) 118(20.0) 8(1.4) 0(0.0) 18(3.1) 5(0.8) 4(0.7) 6(1.0) 0(0.0)
D1ce-oncedaily,D3ce-thricedaily,W1ce-onceweekly,W2ce-twiceweekly,W3ce-thrice weekly, M1ce-oncemonthly, andM3ce-thricemonthly

107
4.10 Frequency ofconsumption ofcereals, legumes,and products
Thefrequencyofconsumptionofdifferentmaizefooditemsis
giveninTable4.10.Majority
oftherespondents(69.6%)tookogi/pap/kokooncedaily,whileonly
2.7%didnottakeitat all. Similarly,for Eko agidi,6.1% didnotconsume itatall,51.6%
ateitonce daily.Tuwo masara,Kokoro,SapalaAbariandIrowasnottakenatallby
mostoftherespondents.The
proportionthatreportednottakingthesefooditemsatallwas,47.4%,68.1%,64.3%,and
94.2%,respectively.CookedMaizewasrarelyconsumedby 36.2%oftherespondents.
Guguru(Popcorn)wasconsumedonceweeklyby
8.1%oftherespondents,while44.0%did not consumeitat all.
Thefrequency
ofconsumptionofvariousRicefooditemsisalsoshown.Amongthosewho
consumedwhiterice,19.9%didsoonce daily,asagainst4.8%whoateJollofricewiththe
samefrequency.FriedRiceandTuwo-
Shinkafawerenoteatenatallbyalargeproportionof
therespondents.Theproportionreportedis78.6%and85.1%respectively.WhileWhite
Rice wasconsumedthricedaily
by1.4%oftherespondents,noneoftheotherfooditems(Jollof rice, Fried rice, and
Tuwo-shinkafa)was eaten atallwith that frequency.
Differentbeans/cowpeasfooditemsandthefrequency
oftheirconsumptionarealsoshown
inTable4.9.Morepeopleatecookedbeansthriceweekly
(23.8%),whileonly1.9%didnot take itatall. Similarly,
forMoinmoin,24.1%ateitonce daily.Akaraikoko,Ekuru,Gbegiri
werenottakenatallbymostof therespondents.While23.8%tookcookedbeansthrice
weekly, only20.2%tookmoinmoin with thesame frequency.
Table4.9alsoshowsthefrequencyofconsumptionofvariouswheatfooditemssuchasw
hole
wheatbread,whitebread,biscuit,wheatflourboiled,andconfectionaries.Alargepropo
rtion of respondents did not takewheat products. Thefood items areWhole wheat

108
bread,Biscuit,
Wheatflourboiled,andConfectionaries,withthereportedproportionsbeing
91.5%,31.9%,
85.6%,and23.4%respectively.Also,BiscuitsandConfectionariesweretakenrarelyby
35.5%and30.1%respectively. However,a sizeablenumberate White
breadeitheronce, twice
orthriceweekly,with18.0%,17.7%,13.8%beingtheproportions reported respectivel
y.

109
Table 4.10 Frequency ofconsumption ofcereals, legumes, andproducts
Food descripti on
No Rarely D1ce D3ce W1ce W2ce W3ce M1ce M3ce
Ogi pap koko Eko
16(2.7) 36(6.1)
33(5.6) 60(10.2)
410(69.6) 304(51.6)
26(4.4) 25(4.2)
25(4.2) 42(7.1)
33(5.6) 41(7.0)
39(6.6) 59(10.0)
3(0.5) 11(1.9)
4(0.6) 11(1.9)
agidi Tuwo
279(47.4)
147(25.0)
23(3.9)
6(1.0)
38(6.5)
22(3.7)
18(3.1)
35(5.9)
21(3.6)
masara Maize
106(18.0)
213(36.2)
52(8.8)
7(1.1)
70(11.9)
48(8.1)
40(6.8)
23(3.9)
30(5.1)
cooked Kokoro
401(68.1)
112(19.0)
14(2.4)
2(0.3)
28(4.8)
7(1.2)
4(0.7)
12(2.0)
9(1.5)
Sapala/ abari Iro
379(64.3) 555(94.2)
138(23.4) 23(3.9)
8(1.4) 2(0.3)
1(0.2) 0(0.0)
20(3.4) 3(0.5)
6(1.0) 0(0.0)
2(0.3) 3(0.5)
26(4.4) 1(0.2)
9(1.5) 2(0.4)
Guguru 259(44.0) 171(29.0) 20(3.4) 0(0.0) 48(8.1) 23(3.9) 13(2.2) 41(7.0) 14(2.4)
White rice Jollof
35(5.9) 229(38.9)
77(13.1) 171(29.0)
117(19.9) 28(4.8)
19(3.3) 1(0.2)
88(14.9) 58(9.8)
100(17.0) 29(4.9)
105(17.8) 20(3.4)
18(3.1) 30(5.1)
30(5.1) 23(3.9)
rice Fried
463(78.6)
89(15.1)
8(1.4)
0(0.0)
8(1.4)
1(0.2)
2(0.3)
13(2.2)
5(0.9)
rice Tuwo
501(85.1)
55(9.3)
4(0.7)
0(0.0)
6(1.0)
7(1.2)
3(0.5)
6(1.0)
7(1.2)
shinkafa Beans
11(1.9)
61(10.4)
103(17.5)
25(4.2)
90(15.3)
118(20.0)
140(23.8)
17(2.9)
24(4.1)
cooked Moinmoi
20(3.4)
78(13.2)
142(24.1)
11(1.9)
77(13.1)
108(18.3)
119(20.2)
16(2.7)
18(3.1)
n Akara
23(3.9)
78(13.2)
187(31.7)
16(2.7)
74(12.6)
93(15.8)
97(16.5)
11(1.9)
10(1.7)
Akara ikoko Ekur
473(80.3) 204(34.6)
78(13.2) 138(23.4)
13(2.2) 33(5.6)
2(0.4) 12(2.0)
12(2.0) 62(10.5)
1(0.2) 51(8.7)
2(0.3) 41(7.0)
6(1.0) 24(4.1)
2(0.3) 24(4.1)
Gbegiri 173(29.4) 137(23.3) 34(5.8) 12(2.0) 60(10.2) 45(7.6) 46(7.8) 46(7.8) 36(6.1)
Whole wheat bread White
539(91.5)
53(9.0)
35(5.9)
109(18.5)
4(0.7)
53(9.0)
1(0.2)
8(1.3)
0(0.0)
106(18.0)
5(0.8)
104(17.7)
1(0.2)
81(13.8)
3(0.5)
36(6.1)
1(0.2)
39(6.6)
bread Biscuit
188(31.9)
209(35.5)
32(5.4)
5(0.9)
54(9.2)
25(4.2)
43(7.3)
13(2.2)
20(3.3)
Wheat flour boiled Confecti
504(85.6)
138(23.4)
47(8.0)
177(30.1)
7(1.2)
44(7.5)
1(0.2)
5(0.9)
7(1.2)
72(12.2)
9(1.5)
59(10.0)
6(1.0)
51(8.7)
4(0.7)
17(2.9)
4(0.7)
26(4.4)
onaries D1ce-oncedaily,D2ce-twicedaily,D3ce-thricedaily,W1ce-onceweekly,W2ce-twiceweekly, W3ce-thriceweekly,M1ce-oncemonthly,M2ce-twicemonthly, andM3ce-thricemonthl

110
4.11 Frequency ofconsumptionofmeat andallied products
Thefrequencyof consumptionofmeatand alliedproductsfooditemsis
giveninTable4.11.
Beefandfishweretakenoncedaily,bymostofthosewhoconsumedthem(19.7%and39.
2%
respectively).However,chicken,egg,andtinnedmilkwereconsumedrarelybymorepe
ople.
Theproportionofrespondentswhotooktheseproductsrarelywas,28.5%,20.2%,and19
.5% respectively.

111
Table 4.11 Frequency ofconsumptionofmeat andallied products
Food
description
No Rarely D1ce D3ce W1ce W2ce W3ce M1ce M3ce
Beef 70(11.9) 93(15.8) 116(19.7) 42(7.1) 63(10.7) 66(11.2) 70(11.9) 42(7.1) 27(4.6)
Chicken 137(23.3) 168(28.5) 57(9.7) 6(1.0) 50(8.5) 30(5.1) 35(5.9) 78(13.2) 28(4.7)
Fish 15(2.5) 43(7.3) 231(39.2) 56(9.6) 50(8.5) 62(10.5) 118(20.0) 5(0.8) 9(1.5)
Egg 72(12.2) 119(20.2) 80(13.6) 13(2.2) 94(16.0) 87(14.8) 77(13.1) 19(3.2) 28(4.7)
Fresh milk 437(74.2) 101(17.1) 8(1.4) 3(0.5) 11(1.9) 7(1.2) 4(0.7) 13(2.2) 5(0.8)
Tinnedmilk 75(12.7) 115(19.5) 37(6.3) 5(0.8) 95(16.1) 99(16.8) 69(11.7) 50(8.5) 44(7.4)
Cheese 131(22.2) 121(20.5) 32(5.4) 5(0.8) 92(15.6) 70(11.9) 53(9.0) 44(7.5) 41(7.0)
Yoghurt 478(81.2) 68(11.5) 9(1.5) 2(0.3) 5(0.8) 6(1.0) 3(0.5) 12(2.0) 6(1.0)
Others 27(4.6) 2(0.3) 3(0.5) 1(0.2) 0(0.0) 2(0.3) 2(0.3) 0(0.0) 0(0.0)
D1ce-oncedaily,D3ce-thricedaily,W1ce-onceweekly,W2ce-twiceweekly,W3ce-thriceweekly, M1ce-oncemonthly, andM3ce-thricemonthly

112
4.12 Frequency ofconsumptionofbeverages andotherdrinks
Thefrequency
ofconsumptionoftea,beveragesandotherdrinksispresentedinTable4.12.
Coffeewasnotconsumedatallbymostrespondents(91.0%),while21.2%and24.4%rar
ely tookbeveragesorLiptontea respectively.However, 18.7%
consumedbeveragestwice weekly whileonly
15.3%consumeditonceweekly.Morepeopletookbeverages(18.7%) thanLipton
tea(10.5%) twiceweekly.
Table4.11alsoshowsthefrequencyofconsumptionofsomedrinks. The majority
(82.0%)of
therespondentsdidnottakealcoholicdrinks,whileonly2.7%tookitoncedaily.Carbona
ted drinkswererarely takenby
35.7%while20.5%didnottakethematall.Similarly,37.7%
consumedmalteddrinksrarelyand25.8%didnotconsumeitatall.Juiceswerenotconsu
med at all by56.7%of therespondents and only32.6%consumed itrarely.

113
Table 4.12 Frequency ofconsumption ofbeverages andotherdrinks Food
description
No Rarely D1ce D3ce W1ce W2ce W3ce M1ce M3ce
Tea lipton 129(21.9) 144(24.4) 36(6.1) 3(0.5) 90(15.3) 62(10.5) 44(7.5) 49(8.3) 32(5.4)
Beverages 52(8.8) 125(21.2) 55(9.3) 7(1.2) 85(14.4) 110(18.7) 70(11.9) 39(6.6) 46(7.8)
Coffee 536(91.0) 38(6.5) 3(0.5) 2(0.3) 6(1.0) 0(0.0) 0(0.0) 2(0.3) 0(0.0)
Carbonated
drinks
121(20.5) 210(35.7) 15(2.5) 5(0.8) 80(13.6) 41(7.0) 21(3.6) 63(10.7) 33(5.6)
Malted
drinks
152(25.8) 222(37.7) 11(1.9) 3(0.5) 72(12.2) 21(3.6) 14(2.4) 61(10.4) 33(5.6)
Alcohol
icdrinks
483(82.0) 32(5.4) 16(2.7) 3(0.5) 16(2.7) 10(1.7) 12(2.0) 11(1.9) 6(1.0)
Juices 334(56.7) 192(32.6) 9(1.5) 2(0.3) 13(2.2) 6(1.0) 3(0.5) 24(4.1) 6(1.0)
D1ce-oncedaily,D3ce-thricedaily,W1ce-onceweekly,W2ce-twiceweekly,W3ce-thriceweekly,
M1ce-oncemonthly, andM3ce-thricemonthly

114
4.13 Frequency ofconsumptionoffruits andvegetables
Table4.13showsthefrequency
ofconsumptionofsomefruits.Morepeopletakeabanana (21.6%)
thanPlantain(18.3%) orpawpaw (16.3%) once weekly.21.1%consumedcitrus
fruitsoncedaily.Mostoftherespondentsrarelyconsumedmango(45.8%),Pawpaw(3
3.1%), Pineapple (37.2%), Cashew (42.4%),andplantain(22.4%). Otherfruitslike
Guava, Watermelon,Apple,Pear,andCarrotwerenotconsumedatall by
mostoftherespondents.
ThefrequencyofconsumptionofvegetablesisalsopresentedinTable4.12.Vegetables
were classifiedintoleafyandnon-leafyvegetables.
Leafyvegetableswereconsumedoncedailyby mostofthe
respondents(31.2%),whilemore people(28.4%)didnotconsume non-leafy
vegetablesatall.However,20.2%oftherespondentsand14.8%consumedleafy
vegetables and non-leafyvegetablesthriceweeklyrespectively.

115
Table 4.13 Frequency ofconsumptionoffruits andvegetables Food descript ion
No Rarely D1ce D3ce W1ce W2ce W3ce M1ce M3ce
Citrus 30(5.1) 107(18.2) 124(21.1) 26(4.5) 70(11.9) 88(14.9) 96(16.3) 13(2.2) 35(6.0) fruits Mango 222(37.7) 270(45.8) 25(4.2) 3(0.5) 27(4.6) 15(2.5) 10(1.7) 10(1.7) 7(1.1) Pawpaw 56(9.5) 195(33.1) 42(7.1) 6(1.0) 96(16.3) 94(16.0) 54(9.2) 21(3.6) 25(4.2) Guava 311(52.8) 179(30.4) 15(2.5) 1(0.2) 32(5.4) 16(2.7) 5(0.8) 18(3.1) 12(2.1) Pineappl 158(26.8) 219(37.2) 15(2.5) 4(0.7) 70(11.9 27(4.6) 12(2.0) 48(8.1) 36(6.1) e Water 194(32.9) 184(31.2) 23(3.9) 5(0.8) 58(9.8) 34(5.8) 27(4.6) 31(5.3) 33(5.6) melon Cashew 172(29.2) 250(42.4) 29(4.9) 5(0.8) 42(7.1) 21(3.6) 23(3.9) 28(4.8) 19(3.3) Apple 299(50.8) 167(28.4) 20(3.4) 3(0.5) 39(6.6) 19(3.2) 4(0.7) 23(3.9) 15(2.5) Pear 485(82.3) 75(2.7) 6(1.0) 1(0.2) 10(1.7) 3(0.5) 2(0.3) 6(1.0) 1(0.2) Carrot 237(40.2) 213(36.2) 11(1.9) 1(0.2) 34(5.8) 15(2.5) 10(1.7) 39(6.6) 29(5.0) Banana 32(5.4) 124(21.1) 30(5.1) 8(1.3) 127(21.6) 115(19.5) 79(13.4) 32(5.4) 42(7.1) Plantain 66(11.2) 132(22.4) 29(4.9) 4(0.6) 108(18.3) 95(16.1) 72(12.2) 41(7.0) 42(7.1) Leafy 15(2.5) 52(8.8) 184(31.2) 60(10.2) 53(9.0) 91(15.4) 119(20.2) 4(0.7) 11(1.9) vegetabl es Non 167(28.4) 89(15.1) 52(8.8) 15(2.5) 75(12.7) 75(12.7) 87(14.8) 12(2.0) 17(2.9) leafy vegetabl es D1ce-oncedaily,D3ce-thricedaily,W1ce-onceweekly,W2ce-twice weekly,W3ce-thriceweekly,M1ce-oncemonthly, andM3ce-thricemonthly

116
4.14 Frequency ofconsumptionofoil andseed nuts
Differentoilandseednutsandthefrequency
oftheirconsumptionisshowninTable4.14. Majority
oftherespondentsdidnottakecashewnutandoilpalmnut.Theproportionsof
peoplethatdidnot takeitat allare respectively
66.9%and76.9%.Peanuts(26.7%)and coconuts(34.6%)weretakenrarely
bymostoftherespondents.CoconutandPeanutswere taken onceweeklyby11.9%
and 16.1% of the respondents respectively.

117
Table 4.14 Frequency of consumption of oil andseed nuts
Food
description
No Rarely D1ce D3ce W1ce W2ce W3ce M1ce M3ce
Peanuts 96(16.3) 157(26.7) 55(9.3) 7(1.2) 95(16.1) 70(11.9) 65(11.0) 22(3.7) 8(3.7)
Cashew nut 394(66.9) 135(22.9) 12(2.0) 3(0.5) 10(1.7) 9(1.5) 8(1.4) 11(1.9) 7(1.2)
Oilpalmnut 453(76.9) 92(15.6) 9(1.5) 3(0.5) 10(1.7) 7(1.2) 3(0.5) 10(1.7) 2(0.3)
Coconut 121(20.5) 204(34.6) 13(2.2) 3(0.5) 70(11.9) 35(5.9) 20(3.4) 79(13.4) 44(7.5)
Refined oil 27(4.6) 2(0.3) 1(0.2) 0(0.0) 0(0.0) 0(0.0) 1(0.2) 0(0.0) 1(0.2)
D1ce-oncedaily,D3ce-thricedaily,W1ce-onceweekly,W2ce-twiceweekly,W3ce-thrice
weekly,M1ce-oncemonthly, andM3ce-thricemonthly.

118
4.15 Changing foodcultureofrespondents
ThechangingfoodcultureofrespondentsisshowninTable4.15.As
againstthepracticein thepast20-
30yearsago,amajorityofrespondents(63.2%)eatthreesquaremeals.However,
theregularity
wasbetterinthepastthanpresent(50.3vs40.9).Mostrespondentsprepared their own
mealsinthe past(94.5%) thanthe present(84.0%), justasa higher proportionused
grindingstones in thepast (84.4%) than the present(54.8%).
Theproportionofrespondentswhotookbreakfastinthepastandpresentaresimilarand
more
peopletakeitbetween9amand10aminthepresent(22.8%)thaninthepast(19.1%).Als
o, peopletakebrunchmoreinthepast(47.4%)thanpresently
(39.0%).Presently,mostpeople takebrunchbetween11amand12noon
(48.7%)thaninthepast(39.6%).Theregularity of taking
dinneroftenhasimproved(50.4%)fromwhatwasobtainedin thepast(48.2%).
Similarly,morepeopletakeafterlunchbetween4and5presently (54.7%)thaninthe
past (50.8%).

119
Table 4.15a:Changingfoodcultureofrespondents
Culture Past(inthelast20-30years)
Present
n (%) n (%)
Howmany squaremealsdo you take perday? One
3(0.5)
4(0.7)
Two 26(4.4) 69(11.4) Three 335(57.0) 383(63.2) four or more 224(38.1) 150(24.8) Howoften doyou take thesemeals? Rarely
8 (1.4)
13 (2.3)
Occasionally 18 (3.1) 69 (12.0) Often 263(45.2) 258(44.9) veryoften 293(50.3) 235 (40.9) Do you normallytake breakfast? No
13(2.2)
15(2.5)
Yes 576(97.8) 574(97.5) Whattime did you normallytake breakfast? before 7am
104(18.2)
87(15.2)
7 -9am 358(62.7) 354(62.0) 9 -10am 109(19.1) 130(22.8) Howoften doyou normally take breakfast? Rarely
17(3.0)
15(2.6)
Occasionally 11(1.9) 38(6.7) Often 280(49.1) 274(48.2) veryoften 262(46.0) 242(42.5) Do you takebrunch? No
310(52.6)
359(61.0)
Yes 279(47.4) 230(39.0) Whattimedoyounormallytakebrunchinthe morning? between 10-11am
168(60.4)
115(51.3)
11 -12pm 110(39.6) 109(48.7) Howoften doyou normally take brunch? Rarely
16(5.9)
25(10.9)
Occasionally 33(12.3) 56(24.5) Often 153(56.9) 102(44.5) veryoften 67(24.9) 46(20.1) Do you takelunch? No
15(2.5)
23(3.9)
Yes 574(97.5) 566(96.1) Whattime doyou normally take lunch? 12pm
28(4.9)
28(5.0)
between 12-1pm 91(16.0) 67(11.9) between 1 -2pm 234(41.3) 225(39.8) between 2 -3pm 208(36.7) 236(41.8) after3pm 6(1.1) 9(1.6) Howoften doyou normally take lunch? Rarely
14(2.5)
21(3.8)
Occasionally 14(2.5) 40(7.2) Often 258(46.6) 259(46.9) veryoften 268(48.4) 232(42.0)

120
Table 4.15b:Changingfoodcultureofrespondents (Continued) Culture Past(inthelast20-30years) Presentn (%) n (%)
Do you takesnacks after lunch? No
389(66.0)
400(67.9)
Yes 200(34.0) 189(16.0) Howoftendoyounormallytakesnacksafter lunch? Rarely
20(10.2)
22(11.8)
Occasionally 29(14.7) 54(29.0) Often 96(48.7) 80(43.0) veryoften 52(26.4 30(16.1) Whattimedoyounormallytakesnacksafter lunch? 4pm
52(26.9)
41(22.7)
between 4-5pm 98(50.8) 99(54.7) between 5-6pm 43(22.3) 41(22.7) Do you normallytake dinner? No
5(0.8)
9(1.5)
Yes 584(99.2) 580(98.5) Howoften doyou normally take dinner? Rarely
14(2.4)
13(2.3)
Occasionally 10(1.7) 28(4.9) Often 276(48.2) 286(50.4) veryoften 273(47.6) 240(42.3) Whattime doyou normally takedinner? 6pm
17(2.9)
15(2.6)
between 6-8pm 227(39.2) 189(32.9) between 8-10pm 304(52.5) 351(61.0) after10pm 31(5.4) 20(3.5) Howoften doyouprepare yourmeals? every meal
551(94.5)
475(82.0)
oncein a day 28(4.8) 94(16.2) oncea week 4(0.7) 9(1.6) Oncea month 0(0.0) 1(0.2)
Whattypeofcookingutensilsdoyouusein preparing your meals? LocalClay pots No 37(6.3) 435(73.9) Yes 552(93.7) 154(26.1) Localgrinding Stones No 92(15.6) 266(45.2) Yes 497(84.4) 323(54.8) Aluminiumpots No 546(92.7) 33(5.6) Yes 43(7.3) 556(94.4)

121
Aluminiumplates and spoons No 509(86.4) 97(16.5) Yes 80(13.6) 492(83.5) GrindingMachines No 569(96.6) 205 (34.8) Yes 20(3.4) 384 (65.2) Others Yes 6(100) 14(100)

122
4.16. Changes incommonfoodofrespondents
ThechangingpatterninthecommonfoodofrespondentsshowninTable4.16showsast
eady declineintheconsumptionoflegumes.Forinstance,beansare
lesstakennow(95.8%)than
inthepast(96.6%).Also,osasaisnoteatenpresently(26.7%)likeitwasinthepast(45.7
%), justaspapondoislesstakennow(45.0%) than itwasinthe past(92.5%).
Thispatternof steady
declineisalsoseenintheconsumptionofvegetables.Eweduislessconsumednow
(95.8%)thanbefore(98.3%),andthisis similartotheconsumption
ofeweiroko,whichis less consumed now (67.4%) than in thepast (82.0%)
Cerealshavebecome
commonfoodformostoftherespondents.Asagainstwhatobtainedin
thepast(75.6%),peopleconsume rice more now(95.4%).Also,noodlesare
eatenmore presently than20-
30yearsback(75.6%).However,ekotutuislesseatennow(93.9%)than
previously(97.8%)
Consumptionofmeatandfishshowsaninteresting
pattern,asfoodslikebushmeatandeja
odoshowedadecline,otherfoodslikesawaandtitusfish are
moreconsumednowthanin the past.For instance,93% of the
respondentstooktitusfishnow than inthe past(50.4%). Also, more(97.6%)
tookbushmeat in the past thannow
(76.2%).There’sasharpincreaseinthepatternofconsumingcondimentsnowthanprev
iously.Maggi,
forinstance,wasconsumedbyfewerpeople(21.4%)inthepastthanpresently(88.6%).
This is similar to the consumptionof curry(75.0%vs 9.7%).

123
Table 4.16a: Changesincommonfoodofrespondents
Commonfood Past
(In the last20-30 years)
Presently
(Now)
No
n (%)
Yes
n (%)
No
n (%)
Yes
n (%)
Cereals
eko_tutu
13(2.2)
576 (97.8)
36(6.1)
553(93.9)
ogi_koko 11(1.9) 578(98.1) 19(3.2) 570(96.8)
Egbo 28(4.8) 561(95.2) 91(15.4) 498(84.6)
Noddles 573(97.3) 16(2.7) 144(24.4) 445(75.6)
Rice 144(24.4) 445(75.6) 27(4.6) 562(95.4)
Spaghetti 27(4.6) 562(95.4) 139(23.6) 450(76.4)
Macaroni 562(95.6) 26(4.4) 136(23.1) 453(76.9)
Legumes
cooked_beans 20(3.4) 569(96.6) 25(4.2) 564(95.8)
Akara 9(1.5) 580(98.5) 25(4.2) 564(95.8)
Moinmoin 9(1.5) 580(98.5) 27(4.6) 562(95.4)
Iru 14(2.4) 575 (97.6) 29 (4.9) 560(95.1)
Otili 35(5.9) 554(94.1) 226(38.4) 363(61.6)
Popondo 44(7.5) 545(92.5) 324(55.0) 265(45.0)
gbomode_gungi 49(8.3) 540(91.7) 323(54.8) 266(45.2)
Osasa 320(54.3) 269(45.7) 432(73.3) 157(26.7)
Roots and Tubers
roasted_yam 30(5.1) 559(94.9) 89(15.1) 500(84.9)
boiled_yam 9(1.5) 580(98.5) 17(2.9) 572(97.1)
pounded_yam 13(2.2) 576 (97.8) 22(3.7) 567(96.3)
amala_lafun 37(6.3) 552(93.7) 48(8.1) 541(91.9)
amala_dudu 13(2.2) 576 (97.8) 26(4.4) 563(95.6)
Semovita 535 (90.8) 54 (9.2) 87(14.8) 502(85.2)
Wheat 549(93.2) 40(6.8) 281(47.7) 308 (52.3)
amala_pupa 249(42.3) 340 (57.7) 355 (60.3) 234 (39.7)

124
No n (%)
Yes n (%)
No n (%)
Yes n (%)
Vegetables
Ewedu 10(1.7) 579(98.3) 25(4.2) 564(95.8) Ilasa 12(2.0) 577(98.0) 49(8.3) 540(91.7) Morogbo 128(21.7) 461(78.3) 151 (25.6) 438 (74.4) Gbure 27(4.6) 562(95.4) 54(9.2) 535(90.8) egusi_osiki 7(1.2) 582(98.8) 24(4.1) 565(95.9) efo_soko 7(1.2) 582(98.8) 24(4.1) 565(95.9) efo_tete 9(1.5) 580(98.5) 50 (8.5) 539(91.5) Ewuro 11(1.9) 578(98.1) 35(5.9) 554(94.1) obe_ajara 150 (25.5) 439 (74.5) 202 (34.3) 387 (65.7) Pekun 250(42.4) 339 (57.6) 277(47.0) 312(53.0) Ogbo 224 (38.0) 365 (62.0) 235(39.9) 354 (60.1) Ebolo 22(3.7) 567(96.3) 75(12.7) 514(87.3) amunu_tutu 29 (4.9) 560 (95.1) 81(13.8) 508(86.2) woro_wo 118(20.0) 471(80.0) 175 (29.7) 414 (70.3) ata_ijosin 21(3.6) 568 (96.4) 122 (20.7) 467 (79.3) ewe_iroko 106(18.0) 483 (82.0) 192 (32.6) 397 (67.4) Ugwu 199 (33.8) 390 (66.2) 107 (18.2) 482 (81.8) MeatandFishProducts
bush meat 14(2.4) 575 (97.6) 140(23.8) 449 (76.2) red_meat 20 (3.4) 569 (96.6) 48 (8.1) 541 (91.9) eja_gbigbe 18 (3.1) 571 (96.9) 29 (4.9) 560 (95.1) eja_odo 16 (2.7) 573 (97.3) 34(5.8) 555 (94.2) Kote 326 (55.3) 263 (44.7) 41(7.0) 548 (93.0) Sawa 299 (50.8) 290 (49.2) 39 (6.6) 550 (93.4) Titus 292 (49.6) 297 (50.4) 41(7.0) 548 (93.0) Condiments Ogiri
278 (47.2)
311 (52.8)
373 (63.3)
216 (36.7)
Curry 532 (90.3) 57 (9.7) 147(25.0) 442 (75.0) Magi 463 (78.6) 126 (21.4) 67 (11.4) 522 (88.6) Cashew 58 (9.8) 531 (90.2) 30 (5.1) 559 (94.9) Oranges 17 (2.9) 572 (97.1) 22(3.7) 567 (96.3) Pawpaw 16 (2.7) 573 (97.3) 24(4.1) 565 (95.9) Apples 422 (71.6) 167 (28.4) 120(20.4) 469 (79.6)
Table 4.16b:Changes incommonFoodofRespondents(Continued)
Commonfood Past(In the last20-30 years) Presently(Now)

125
4.17. Perceived causes ofchanging food patternandsocietal health impact
Generally,mostof therespondentsbelievedthatthere’sa change inthechemical/
organolepticpropertiesoffood(81.7%).Theyalsobelievethatthese changes areinthe
form ofLownutritionalvalue(83.3%),poorshelflife (79.8%)anda
poormethodofpreparation
(78.2%),amongotherthings.Therespondentsalsopostulatedthatsome
ofthesechanges
couldbeasaresultofusingchemicallymodifiedseedsforplanting(78.1%),useofherbi
cides (77.9%),useoforganicfertilizers(71.6%)andabsence/extinctionofwildly
grown indigenous vegetables (73.0%), amongothers.
Someoftheimpactsofthesechangesidentifiedby
therespondentsincludedecreasedlife expectancy
(77.0%),increasedprevalenceofNCDs(74.5%),decreasedworkcapacity (75.2%),
frequent illness(75.3%), andreduced physicalactivities (72.5%).

126
Table 4.17: Perceived causes ofchanging foodpatternandsocietal health impact Yes No n(%) n(%)
Doyouthinkthereis/arechemical/organoleptic properties offood Likely Chemical /organoleptic change
450(81.7) 101(18.3)
Poor taste 425(72.2) 119(21.9) Low nutritionalValue 455(83.3) 91(16.7) Poor shelflife 435(79.8) 110(20.2) Poor method ofpreparation 420(78.2) 117(21.8) Others 38(6.5) 88(14.9) Likely causes of the Chemical /organoleptic
change Useof Herbicides
447(77.9)
127(22.1)
Useof inorganicfertilizers 422(71.6) 153(26.0) Poor land fertility 400(69.7) 174(30.3) Useof processed inorganic feeds for animals 441(76.7) 134(23.3) Changes in the processing method 446(77.4) 130(22.6) Timefactor(decreased planting season) 415(72.4) 158(27.6) Useof chemicallymodified seed for planting 450(78.1) 126(21.9) Absence/extinction of wildly grown indigenous 414(73.0) 153(27.0) vegetables
Others 5(20.8) 19(79.2) Likely impact ofthechanges in foodcultures on
societal Health Decreased life expectancy
445(77.0)
133(22.6)
Increased prevalenceofNCDs 433(74.5) 148(25.5) Decreased work capacity 443(75.2) 138(23.8) Frequent illness 437(75.3) 143(24.7) Reduced physical activities 420(72.5) 159(27.5) Others_specify 32(51.6) 30(48.4)

127
4.18. Lifestylebehaviour(pattern) ofrespondents
TheLifestylepatternof the respondents(Table 4.18)
showedthatlackofphysicalexercise
wasthemostprevalentlifestylepatternamongtherespondentswith64.8%havingnoph
ysical exerciseatall.Otheridentifiedlifestylepatternsare Smoking
(3.6%),Alcoholuse(16.3%),
Heartailment(18.1%)andDiabetes(1.2%).However,about28%oftherespondentsre
ported havingno health problem.

128
Table 4.18: Lifestyle behaviour(pattern) ofrespondents Lifestyle Yes No n(%) n(%) ________
Smoking 21(3.6) 568(96.4) Alcohol use 96(16.3) 493(83.7) Physical exercise 205(35.2) 378(64.8) Heart ailment 106 (18.1) 481(81.9) Diabetes 7(1.2) 579(98.3) Anyhealth problem 163(27.7) 424(72.0)

129
4.19: Respondents eating behaviourpattern
Theeatingbehaviorpatternoftherespondentsshowsthatmajorityofthemusually
skipbreakfast(86.7%),eatatafoodrestaurantatleastthreetimesaweek(65.9%),
eatsnacksalot(62.8%),snackmoreatnight(72.4%) andsometime snackeven when
theyarenot hungry(49.6%). Half (50.0%) of therespondents reported they have a
sweettooth.Abouthalf (47.9%)oftherespondentsreportedthattheir
emotionsaffectwhattheyeatand howmuchtheyeat.However,onlyafewofthe
respondentschosehealthy
foods(3.2%)andwatchthe portion sizes of their food (4.1%).

130
Table 4.19: Respondents eating behaviourpattern
Variables Poor
n (%)
Average
n (%)
Good
n (%)
Non
response n
(%)
Istop for fast food breakfaston mywayto 14(2.4) 65(11.0) 459(77.9) 46(7.8)
Work
Myemotions affect whatand howmuch Ieat 60(10.2) 282(47.9) 207(35.1) 34(5.8)
Iuse low fat food product 361(61.3) 159(27.0) 18(3.1) 44(7.5)
Icarefullywatch the portion sizesof myfood 275(46.7) 235(39.9) 24(4.1) 48(8.1)
Ichoose Healthyfoods to prevent 290(49.3) 189(32.1) 19(3.2) 85(14.4)
heartdisease
Ieatmeatlessmeals fromtime to time 17(2.9) 118(20.0) 367(62.3) 83(14.1)
becauseIthink that is healthier for me
Iama snacker 47(8.0) 122(20.7) 370(62.8) 43(7.3)
Isnack more atnight 18(3.1) 98(16.6) 426(72.4) 40(6.8)
Irarelyeatbreakfast 8(1.4) 33(5.6) 511(86.7) 30(5.1)
Itryto limitintake of red meat (beef) 19(32) 169(28.7) 336(57.1) 57(9.7)
Ihave a sweet tooth 21(3.6) 224(38.0) 294(50.0) 42(7.1)
Isometimes snack even when Iamnothungry 30(5.1) 185(31.4) 292(49.6) 76(12.9)
Ieatoutbecauseitismoreconvenientthan 10(1.7) 65(11.0) 455(77.3) 52(8.8)
eating athome
Preparing meals athome 14(2.4) 63(10.7) 566(79.1) 40(6.8)
Iwillratherbuytakeoutfoodandbringithome 14(2.4) 68(11.5) 444(75.4) 54(9.2)
than cook
I have at least three to four servings of 275(46.7) 208(35.3) 20(3.4) 77(13.1)
vegetables perday
Myeating habits are veryroutine 90(15.3) 340(57.7) 90(15.2) 62(10.5)
IfIdonotfeelhungry,Iwillskipamealeven 81(13.8) 180(30.6) 256(43.4) 64(10.9)
if it is time to eat
Whenchoosingfastfood,Ipickaplacethat 240(40.8) 177(30.1) 37(6.3) 127(21.6
offerhealthyfoods )
Ieatata fast food restaurantat 47(8.0) 65(11.0) 388(65.9) 83(14.1)
least three times a week

131
4.20 Perceived health relatedquality oflifeofrespondents
Theoverallhealth-
relatedqualityoflife(Table4.20)showedthattherespondentsperformed
bestintheroleofEmotional(Mean=69.58±30.20)andleastonthereportedhealthTrans
ition (Mean=42.02±27.35)domains,whiletheoverallreportedquality
oflifeforallthe respondents was 65.93±15.69.
The respondentslivingintheurbanareasreportedbetter-perceivedquality
oflifeinallthe domainsof theHRQL exceptinthe
Generalhealth(62.47±18.37vs63.19±16.39), mental health (63.16±14.83
vs63.77±14.15) and socialhealth (60.99±36.25vs 64.45±31.27)
domains.UrbanresidentsinIbarapaLGAhadahigherperceivedhealth-
relatedqualityoflife inallthe domainsthan urban residentsinotherLGAs exceptfor
thesocialfunctioningand Reportedhealthtransitiondomains.The pattern
washowever notthe same among respondents livingin rural areas.

132
Table 4.20 Perceived health relatedqualityoflifeofrespondents ATIBA IBARAPA IWAJOWA COMBINE MEAN
Mean±SD Mean±SD Mean±SD DMean±SD Mean±SD
Physical functionin g
Urban
Rural
66.13±38.55
68.87±28.90
71.88±31.68
63.51±31.25
59.56±30.75
63.47±29.77
66.37±34.00
65.50±29.88
65.99±32.24
Role physical
Urban Rural
63.28±32.72 65.56±28.39
72.27±28.85 62.67±31.24
63.06±29.60 66.16±28.43
66.68±30.56 64.93±29.17
65.92±29.95
Bodily pain
Urban Rural
56.63±21.07 55.83±20.86
63.91±24.50 55.00±22.53
55.50±28.08 63.79±22.68
59.10±24.88 58.29±22.24
58.74±23.75
General Health
Urban Rural
67.69±17.95 66.09±15.36
61.95±18.35 63.04±16.49
57.70±17.59 60.11±17.02
62.47±18.37 63.19±16.39
62.78±17.52
Vitality Urban Rural
61.60±15.71 65.17±17.32
70.65±17.83 64.44±19.19
66.06±19.10 65.92±14.69
66.43±17.95 65.21±17.01
65.90±17.54
Mental health
Urban Rural
57.74±14.79 62.34±11.90
65.74±15.06 63.24±17.51
65.50±13.09 65.81±13.13
63.16±14.83 63.77±14.15
63.43±14.53
Social functionin g
Urban
Rural
38.34±33.20
60.16±30.04
70.70±32.05
52.70±31.87
72.13±33.80
79.17±26.32
60.99±36.25
64.45±31.27
62.50±34.18
Role Emotional
Urban Rural
65.22±31.30 67.71±28.62
75.91±29.17 63.06±33.02
68.50±30.99 74.33±26.90
70.33±30.66 68.61±29.64
69.58±30.20
Reported Health Transition
Urban
Rural
57.45±31.33
45.83±29.39
38.48±23.67
38.85±25.89
37.00±26.47
33.05±18.48
43.98±28.52
39.49±25.61
42.02±27.35
Physical Health
Urban Rural
64.42±23.29 65.14±18.79
67.63±20.40 61.83±18.64
59.22±20.99 63.08±17.19
64.09±21.73 63.49±18.20
63.83±20.25
Mental Health
Urban Rural
57.68±15.46
63.99±14.35
70.03±14.99
62.04±16.69
67.25±16.72
68.90±13.77
65.32±16.50
65.09±15.09
65.22±15.89
Health related quality oflife
Urban Rural
63.43±17.35 66.17±14.73
69.80±15.56 63.46±15.14
64.37±16.71 66.88±13.03
66.17±16.69 65.63±14.32
65.93±15.69

133
4.21: Correlation between domains
ofhealthrelatedquality oflife
Table 4.21showsthecorrelationbetweenthedomains(subscales) ofthe Health-
related Quality
ofLife.Theroleofphysicalsubscalehadasignificantpositivecorrelationwiththe
othersubscalesofHRQL(p<0.01).Similarly,Bodily
pain(BP),General(GH),andVitality (VT)subscales of HRQL had
significantpositivecorrelations with othersubscales (p<0.01).
ThosethatdowellontheBodily pain,GeneralHealthandVitality
subscalesoftheHRQL
willalsodowellontheothersubscales.ThecorrelationbetweenBMI
andHRQL(andits subscales), withvaluesrangingfromfrom-0.06 to
0.04,arenotsignificant. However,having agoodquality oflife(asmeasured by
theReportedHealthTransition(RH)subscale),also
meanthavingagoodqualityoflifeonthePhysicalhealth(PHH)subscale(r=0.30,p<0.0
1), MentalHealth(MEH)subscale(r=0.14,p<0.01)andtheoverallhealth-
relatedQualityofLife (HQRL) scale (r=0.31, p<0.01).

134
Table 4.21: Correlation between domains ofhealthrelatedquality oflife
Variables PF RP BP GH VT MH SF RE RH PHH MEH HRQL
1. PF 1.00
2. RP 0.61** 1.00
3. BP 0.33** 0.46** 1.00
4. GH 0.35** 0.49** 0.52** 1.00
5. VT 0.32** 0.49** 0.53** 0.53** 1.00
6. MH 0.08 0.25** 0.33** 0.37** 0.56** 1.00
7. SF 0.13* 0.27** 0.38** 0.17** 0.34** 0.36** 1.00
8. RE 0.49** 0.86** 0.43** 0.46** 0.49** 0.27** 0.26** 1.00
9. RH 0.27** 0.21** 0.16** 0.25** 0.17** 0.05 0.03 0.15 1.00
10. PHH 0.83** 0.86** 0.64** 0.71** 0.56** 0.29** 0.28** 0.74** 0.30** 1.00
11. MEH 0.36** 0.66** 0.56** 0.53** 0.81** 0.73** 0.63** 0.73** 0.14** 0.65** 1.00
12. HRQL 0.70** 0.85** 0.67** 0.70** 0.72** 0.51** 0.46** 0.80** 0.31** 0.94** 0.86** 1.00
PF-Physicalfunction,RP-Rolephysical,BP-Bodilypain,GH-General,VT-Vitality,MH- Mentalhealth,SF-Socialfunctioning,RE-Roleemotional,RH-ReportedhealthTransition, PHH-Physical health, MEH-Mentalhealth, HRQL-Health related qualityof life **-Correlation is significant atthe 0.01 level *-Correlation is significant
atthe 0.05 level

135
4.22. Nutrient intakeofrespondents by LGA andlocality
Thenutrient intakeof therespondents accordingto theirLGAs and localityis
reported in Table 4.22. Themean nutrient intakeof therespondents for calorie,
protein, CHO, fat, vitamin A, folate, calcium, iron and zinc was
1839.47±647.59, 62.26±34.42, 39.31±121.25, 37.63±20.55,
24302.82±14884.25, 75.0±132.6, 164.9±140, 15.78±6.35, and 10.95±5.85
respectively. Calorie, protein, carbohydrate andfatintakesignificantlydiffer from
one Local Government to theother and across localities (p<0.05).Inasimilar vein,
themean monounsaturated and polyunsaturated fat, vitamin, calcium, iron, and
zinc intakediffered significantlyfrom each other across the localities (p<0.05).

136
Table 4.22a: Nutrient intakeofrespondents byLGA andlocality
ATIBA IBARAPA IWAJOWA Total Mean±SD Mean±SD Mean±SD Mean±SD F Sig. calorie
intake
Urban 1963.89±588.40 1591.66±508.23 1747.53±768.69 1839.47±647.59 16.495 <0.001*
Rural 2297.98±504.07 1611.87±727.28 1778.54±561.42
protein
intake
Urban 70.50±29.95 51.75±17.12 56.45±28.48 62.26±34.42 6.172 0.002
Rural 70.04±19.86 52.43±26.19 68.54±57.02
CHO intake Urban 323.92±91.92 271.74±96.77 302.89±146.55 309.31±121.25 17.028 <0.001
Rural
410.07±105.84
274.52±145.36
272.25±86.31
dietary Urban 3.34±4.75 2.18±3.14 3.15±5.10 3.59±5.65 1.148 0.319
fibre intake fatintake
Rural
Urban
5.31±7.42
41.00±17.26
4.72±5.73
32.70±13.04
3.01±6.28
34.84±19.80
37.63±20.55
3.447
0.033
Rural 40.92±14.24 33.12±24.54 41.28±28.08
saturated
fatintake
Urban 3.98±3.04 2.17±1.58 3.85±7.16 3.74±5.63 .125 0.882
Rural 3.80±4.39 5.01±10.66 3.81±3.70
mono_fat
intake
Urban 5.18±3.52 3.44±2.63 8.30±8.18 5.58±5.82 3.129 0.046
Rural 5.57±5.50 5.87±7.90 5.84±5.59
poly_fat
intake
Urban 4.19±4.60 1.91±2.35 4.05±2.93 3.74±3.73 3.174 0.044
Rural 2.73±2.28 4.65±4.28 4.89±4.22
cholesterol
intake
Urban 90.18±107.96 54.39±65.62 43.46±27.11 78.61±117.49 2.845 0.060
Rural 114.69±198.32 70.56±103.98 86.90±105.25
water Urban 1817.33±783.21 1859.14±896.66 1909.32±558.23 2068.68±2070.2 2.078 0.127 vit_a intake
Rural
Urban
3003.87±4557.18
28355.87±15224.44
1660.61±1094.9
22866.13±12364.43
2064.76±712.19
29028.54±19612.75
24302.82±14884.25
13.647
<0.001
Rural
26413.83±14674.76
11243.23±6750.83
26876.90±12463.71
vit_c intake
Urban
10.45±13.46
18.57±25.81
24.03±28.60
18.28±28.93
1.073
0.344
Rural 19.69±46.28 18.04±22.22 20.06±26.40
thiamin
intake
Urban 0.58±0.59 0.32±0. 0.45±1.03 0.52±0.75 .659 0.518
Rural 0.59±0.49 0.74±1.1145 0.45±0.70

137
Table 4.22b: Nutrient intakeofrespondents byLGA andlocality(Continued)
ATIBA IBARAPA IWAJOWA Total F Sig. Mean±SD Mean±SD Mean±SD Mean±SD
Riboflavin intake
Urban 0.51±0.54 0.26±0.33 0.33±0.70 0.43±0.55 1.248 0.289
Rural 0.44±0.40 0.68±0.78 0.36±0.47
niacin intake
Urban
5.71±5.44
3.23±3.82
4.20±7.48
5.12±6.13
.874
0.418
Rural 5.49±4.39 7.79±8.85 4.53±5.66
vit_b6 intake
Urban 0.30±0.32 0.24±0.28 0.27±0.20 0.36±0.45 2.944 0.055
Rural 0.32±0.35 0.71±0.78 0.33±0.42
folate intake
Urban
94.12±117.44
45.80±87.92
61.04±190.71
75.0±132.6
1.526
0.220
Rural 91.79±103.97 106.37±190.25 54.94±93.79
vit_B12 intake
Urban
1.95±1.82
1.28±0.90
1.47±0.72
1.94±1.94
1.343
0.263
Rural 2.25±1.21 2.07±1.58 2.41±3.36
calcium intake
Urban
213.18±194.40
140.85±111.97
119.81±83.29
164.9±140.70
4.202
0.016
Rural 179.31±125.99 188.50±122.57 143.39±150.55
phosphoru s intake
Urban
312.75±264.80
186.41±133.70
231.29±205.70
279.32±248.70
1.209
0.300
Rural 311.78±174.55 335.65±233.33 291.63±360.48
sodium intake
Urban
727.06±682.54
469.25±566.82
504.77±450.40
585.20±587.3
2.157
0.118
Rural 651.01±605.67 641.06±507.32 516.48±622.53
potassium intake
Urban
560.51±490.15
401.58±360.94
500.65±359.12
526.22±463.0
.084
0.920
Rural 506.95±384.40 633.26±437.87 557.65±623.73
zincintake
Urban
11.97±7.40
9.05±3.93
10.09±4.80
10.95±5.85
8.020
<0.001
Rural 13.65±5.03 9.65±5.11 10.92±6.67
ironintake Urban 17.21±6.12 13.45±4.93 14.91±7.49 15.78±6.35 15.332 <0.001
Rural 20.04±5.20 14.12±7.50 14.67±4.88
magnessiu mintake
Urban 143.31±54.40 113.80±51.91 136.6±74.71 191.61±836.82 1.049 0.352
Rural 168.39±58.18 126.95±71.71 403.03±1859.10

138
4.23. Nutritional status oftherespondents
Thenutritionalstatusofthe respondentsisshownintable4.23,the
resultshowedthatabout 18.4%ofthe respondentswere underweight,60.2%were
ofnormalweight,and2.5%were overweight, while8.9%were obesein
AtibaLGA.InIbarapaLGA,alargerpercentage
(52.6%)oftherespondentsfallwithinthenormalBMI
range,16.0%oftherespondentsfell undertheunderweight category,
21.4%wereoverweight, while10.2%wereobese. In
IwajowaLGA,thepercentageoftheunderweightrespondentsis16.3%,57.2%wereno
rmal, 13.3%wereoverweight,while 13.3%wereobese.

139
Table 4.23: Nutritional status ofthe respondents
Placeof Residence
ATIBALGA
Urban
n (%)
Rural
n (%)
Total
n (%)
Underweight 5(5.0) 11(12.20) 16(8.4)
Normal
55(54.5)
60(66.7)
115(60.2)
Overweight
26(25.7)
17(18.9)
43(22.5)
Obese
15(14.9)
2(2.2)
17(8.9)
IBARAPA
Underweight
17(13.9)
14(19.4)
31(16.0)
Normal
53 (43.4)
49(68.1)
102(52.6)
Overweight
36(29.5)
5(6.9)
41(21.1)
Obese
16(13.1)
4(5.6)
20(10.3)
IWAJOWA
Underweight
9(10.3)
18(22.8)
27(16.3)
Normal
51(58.6)
44(55.7)
95(57.2)
Overweight
12(13.8)
10(12.7)
22(13.3)
Obese
15(17.2)
7(8.9)
22(13.3)

140
4.24 Relationship betweenrespondent’s Body Massindex andlocality
ThelocalityofrespondentsinAfijioLGAwassignificantlyassociatedwiththeirBody
Mass Index(BMI)(p<0.05).Similarly,there’sastatistically
significantrelationshipbetweenthe BMIofrespondents inIbarapaLGAand their
locality(P<0.05).
InAtibaLGA,for instance,theproportionobese washigher intheurbanareas(14.9%)
than the ruralareas(2.2%),while thosethatwereunderweightwerehigherinthe
ruralareas (12.0%)thanthe urbanareas(5.0%).Theproportionofrespondentsthat
were overweightin OyoIbarapawashigherintheurbanlocality
(29.5%)thanrurallocalities(6.9%).This relationship is statisticallysignificant
(p<0.05)

141
Table 4.24:Relationship betweenrespondent’s Body Mass index and locality Placeof Residence Chi P-value
ATIBALGA
Urban
n (%)
Rural
n (%)
Total
n (%)
Square
Underweight 5(5.0) 11(12.20) 16(8.4) 13.704 0.003
Normal
55(54.5)
60(66.7)
115(60.2)
Overweight
26(25.7)
17(18.9)
43(22.5)
Obese
15(14.9)
2(2.2)
17(8.9)
IBARAPA
Underweight
17(13.9)
14(19.4)
31(16.0)
19.495
<0.001
Normal
53 (43.4)
49(68.1)
102(52.6)
Overweight
36(29.5)
5(6.9)
41(21.1)
Obese
16(13.1)
4(5.6)
20(10.3)
IWAJOWA
Underweight
9(10.3)
18(22.8)
27(16.3)
6.236
0.101
Normal
51(58.6)
44(55.7)
95(57.2)
Overweight
12(13.8)
10(12.7)
22(13.3)

142
4.25 Association betweensocio-demographic variables andadequacy
ofIron
Table4.25showstheassociationbetweensocio-demographicvariablesandthe
levelofadequacy
ofiron.Religion(P<0.001)andMaritalStatus(P<0.05)weresignificantly
associatedwith Levelofadequacy Iron.Mostoftherespondentsreportedhaving
anadequatetoanexcess levelofIron,withreportedproportionsashighas85.7%.Ina
similarmanner, afewer proportionofthe respondentsreportedhavinganinadequate
levelofiron.More male (75.30%) than Female (66.90%) hadan excess level of
zinc. Also, the proportion that had an
excessIronintakewashigheramongrespondentsfromMonogamousmarriages(75.6
%)than those from polygamousmarriages(63.6%).

143
Table 4.25: Association betweensocio-demographic variables and adequacy ofIron
Variable LevelofAdeq Inadequate
uacyIron
Adequate
Excess
Chi-square P
Agegroup
<50 years
1(2.20)
7(15.80)
37(82.20)
5.55
0.24
50 – 70 8(6.60) 30(24.60) 84(68.90)
>70 years 12(4.80) 25(30.90) 53(65.40)
Sex
Male
4(4.10)
20(20.60)
73(75.30)
1.98
0.37
Female 8(5.30) 42(27.80) 101(66.90)
Maritalstatus
Married
10(5.70)
40(22.70)
126(71.60)
11.73
0.02
Divorced/separated 0(0) 6(75.00) 2(25.00)
Widow 2(3.20) 16(25.40) 45(71.40)
Type of marriage
Monogamy
5(3.7)
28(20.7)
102(75.6)
4.19
0.12
Polygamy/polyandry 7(6.4) 33(30) 70(63.6)
Wives group
1
4(3.10)
27(21.30)
96(75.60)
2.71
0.61
2 3(6.70) 13(28.90) 29(64.40)
>2 1(4.80) 6(28.60) 14(66.70)
Education category
None
7(4.20)
45(27.30)
113(68.50)
6.09
0.41
Primary 5(10.20) 9(18.40) 35(71.40)
Secondary 0(0) 4(26.70) 11(73.30)
Tertiary 0(0) 3(20.00) 12(80.00)
Occupation category
None
0(0)
10(40.00)
15(60.00)
10.83
0.21
Trade/business 10(8.40) 30(25.20) 79(66.40)
Farmers 2(2.70) 17(22.70) 56(74.70)
Civilservants 0(0) 1(14.30) 6(85.70)
Artisans 0(0) 4(19.00) 17(81.00)
Religion category
Christian
9(7.80)
26(22.40)
81(69.80)
24.78
<0.001
Islam 2(1.60) 35(27.60) 90(70.90)
Others 1(100.00) 0(0) 0(0)

144
4.26: Association betweensocio-economic variables andthe level ofadequacy
ofIron
Theassociationbetweensocio-economicvariablesandthe levelofadequacy ofiron
isshowninTable4.26.None ofthesocioeconomicvariableswere significantly
associatedwiththe Levelofthe adequacy ofIron.The proportionwiththe
excesslevelofIron intakewashigheramong respondentswithahouseholdsizegreaterthan6
(74.60%)thanthosewithahouseholdsizelesserthan6(68.4%).Among those havingan
inadequatelevelof Ironintake,thoselivinginaroomhadmoreproportion
(8.70%)thanthoseliving inflatwithbedrooms(3.30%)andanothertypeof accommodation
(4.40%).

145
Incomecategory <10,000
7(4.40)
40(25.30)
111(70.30)
0.74
0.95
10,000–49,000 4(5.20) 20(26.00) 53(68.80) >/=50,000 1(9.10) 2(18.20) 8(72.70) Totalhouseholdcategory </=6 10(5.30) 49(26.20) 128(68.40) 0.90 0.64 >6 2(3.40) 13(22.00) 44(74.60) Houseownership No 4(6.20) 16(24.60) 45(69.20) 0.33 0.85 Yes 7(4.30) 40(24.80) 114(70.80) Typeofhousecategory A room 4(8.70) 10(21.70) 32(69.60) 6.20 0.40 Self-contained 0(0) 9(20.50) 35(79.50) Flatwithbedrooms 2(3.30) 18(29.50) 41(67.20) Others(e.g.facemeI faceyou) 4(4.40) 25(27.80) 61(67.80) Main source of drinking watercategory Surface/rainwater 2(3.30) 11(18.00) 48(78.70) 5.87 0.44 Well 2(3.80) 17(32.70) 33(63.50) Borehole 7(6.70) 24(23.10) 73(70.20) Others 1(3.30) 10(33.30) 19(63.30) Mainsourceofcookingfuel category Wood 5(3.70) 30(22.10) 101(74.30) 8.96 0.18 Charcoal 1(2.60) 14(35.90) 24(61.50) Kerosene 6(8.80) 16(23.50) 46(67.60) Others 0(0) 2(66.70) 1(33.30) Main source of lighting category None 0(0) 2(33.30) 4(66.70) 3.36 0.76 Candle/lantern 4(3.70) 25(22.90) 80(73.40) Public power supply(e.g. 5(5.50) 27(29.70) 59(64.80) PHCH) Alternativesources(e.g.solar, 3(7.50) 8(20.00) 29(72.50) generator) Toiletfacilityinhousehold None(e.g.openbush,surface
9(4.30)
53(25.10)
149(70.60)
8.78
0.07
water Pitlatrine 0(0) 6(27.30) 16(72.70) Watercloset 3(20.00) 3(20.00) 9(60.00) Refuse management in household None 11(4.80) 58(25.10) 162(70.10) 3.52 0.48 Burning 0(0) 1(11.10) 8(88.90) Cityservice 1(12.50) 3(37.50) 4(50.00)
Poor
5(4.70)
26(24.30)
76(71.00)
0.64
0.96 Average 2(4.10) 11(22.40) 36(73.50) Rich 5(5.40) 25(27.20) 62(67.40)
Table 4.26: Association betweensocio-economicvariables andadequacy ofIron
Variable LevelofAdequacyIron Chi-square P Inadequate Adequate Excess
Quintile3 levels

146
4.27 Association betweensocio-economic variablesandadequacy ofdietary fibre
Table4.27showstheassociationbetweensocioeconomic variablesandthelevel
ofadequacy ofdietaryfibreintake.Noneofthesocioeconomicvariablesis significantly
relatedtothelevelofadequacyofdietary fibre.Mostofthe
respondentshadinadequatedietaryfibreintake,withreportedproportionsranging
from95% to100%.Inasimilar way,fewerpeoplehadadequate toexcesslevelof dietary
fibreintake.The proportionwithan inadequatelevelofdietary fibreintakewas
thesameforthoseusingCharcoal,Kerosene,andothersasthe mainsourceofcooking fuel
(100%),which washigher than that ofthoseusingwood (97.80%).

147
Table 4.27:Association betweensocio-economicvariables andadequacy
ofdietaryfibreintake
Variables LevelofAdequacyDietaryFibre Chi-square
P
Variable Category Inadequate Adequate Excess
Incomecategory
<10,000 156(98.70) 2(1.30) 0(0) 3.31 0.51 10,000–49,000 76(98.70) 0(0) 1(1.30)
>/=50,000 11(100.00) 0(0) 0(0)
Totalhousehold </=6 185(98.90) 1(0.50) 1(0.50) >6 58(98.30) 1(1.70) 0(0)
Houseownership
No 65(100.00) 0(0) 0(0) 1.23 0.54 Yes 158(98.10) 2(1.20) 1(0.60)
Typeofhouse A room 45(97.80) 0(0) 1(2.20) 6.34 0.39 Self-contained 43(97.70) 1(2.30) 0(0) Flatwithbedrooms 61(100.00) 0(0) 0(0)
Others(e.g.facemeIface you
89(98.90) 1(1.10) 0(0)
The mainsourceofdrinking water
watercategory Surface/rainwater
59(96.70)
1(1.60)
1(1.60)
Well 52(100.00) 0(0) 0(0) Borehole 103(99.00) 1(1.00) 0(0)
Others 30(100.00) 0(0) 0(0)
Mainsourceofcooking fuel
Wood 133(97.80) 2(1.50) 1(0.70) 2.46 0.87 Charcoal 39(100.00) 0(0) 0(0)
Kerosene 68(100.00) 0(0) 0(0)
Others 3(100.00) 0(0) 0(0)
Main source of lighting
None 6(100.00) 0(0) 0(0) 7.43 0.28
Candle/lantern 108(99.10) 1(0.90) 0(0) Public power supply(e.g.
91(100.00) 0(0) 0(0)
PHCH)
Alternative sources (e.g. solar,generator)
38(95.00) 1(2.50) 1(2.50)
Toilet facility in household
None (e.g. open bush ,surface water
208(98.60) 2(0.90) 1(0.50) 0.53 0.97
Pitlatrine 22(100.00) 0(0) 0(0)
Watercloset 15(100.00) 0(0) 0(0)
Refuse management household
None 228(98.70) 2(0.90) 1(0.40) 0.22 0.99
Burning 9(100.00) 0(0) 0(0)
Cityservice 8(100.00) 0(0) 0(0)
Quintile 3 levels Poor 104(97.20) 2(1.90) 1(0.90) 4.00 0.41
Average 49(100.00) 0(0) 0(0) Rich 92(100.00) 0(0) 0(0)

148
4.28: Socio-demographic variables andadequacy ofVitaminA intake
Theassociationbetweenthelevelofadequacy ofVitaminAandSocio demographic
variables isshown inTable 4.28. Allthe respondents(100%)had an
excesslevelofVitamin Aintake.Consequently,theCorresponding Chisquare and
Pvalues couldn’t be reported.
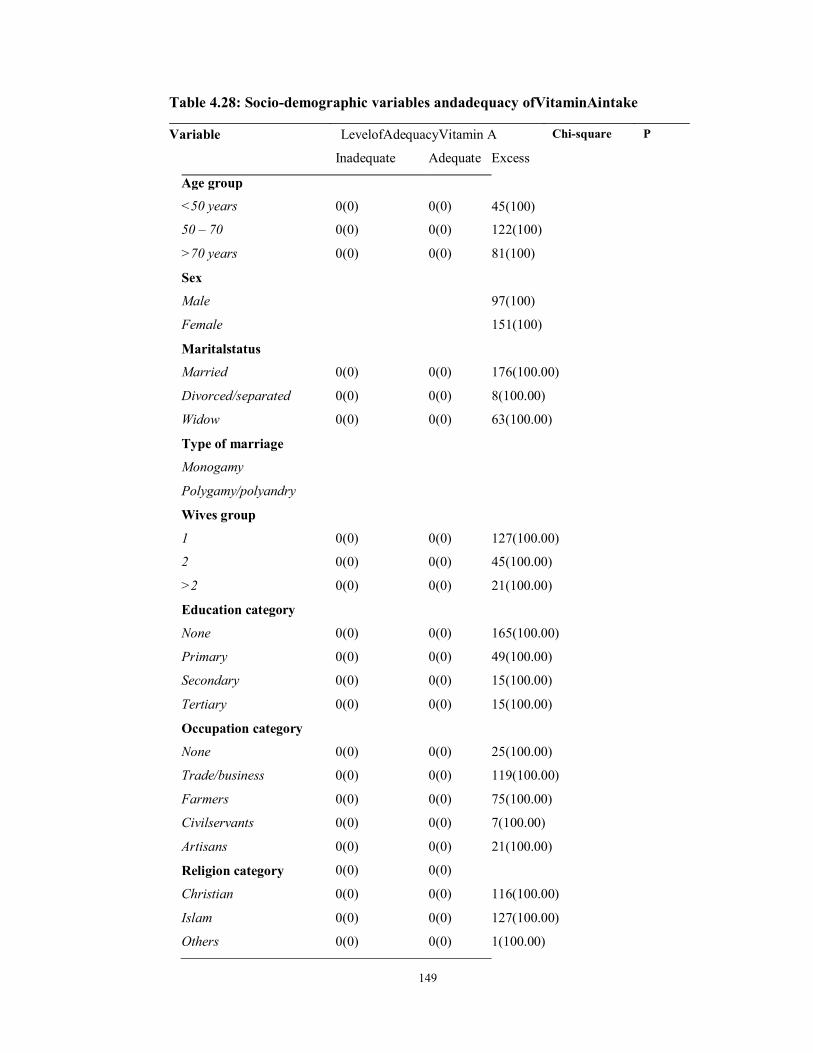
149
Table 4.28: Socio-demographic variables andadequacy ofVitaminAintake Variable LevelofAdequacyVitamin A Chi-square P
Inadequate Adequate Excess
Age group
<50 years
0(0)
0(0)
45(100)
50 – 70 0(0) 0(0) 122(100)
>70 years 0(0) 0(0) 81(100)
Sex
Male
97(100)
Female 151(100)
Maritalstatus
Married
0(0)
0(0)
176(100.00)
Divorced/separated 0(0) 0(0) 8(100.00)
Widow 0(0) 0(0) 63(100.00)
Type of marriage
Monogamy
Polygamy/polyandry
Wives group
1
0(0)
0(0)
127(100.00)
2 0(0) 0(0) 45(100.00)
>2 0(0) 0(0) 21(100.00)
Education category
None
0(0)
0(0)
165(100.00)
Primary 0(0) 0(0) 49(100.00)
Secondary 0(0) 0(0) 15(100.00)
Tertiary 0(0) 0(0) 15(100.00)
Occupation category
None
0(0)
0(0)
25(100.00)
Trade/business 0(0) 0(0) 119(100.00)
Farmers 0(0) 0(0) 75(100.00)
Civilservants 0(0) 0(0) 7(100.00)
Artisans 0(0) 0(0) 21(100.00)
Religion category 0(0) 0(0)
Christian 0(0) 0(0) 116(100.00)
Islam 0(0) 0(0) 127(100.00)
Others 0(0) 0(0) 1(100.00)

150
4.29 Socio-economic variables andthe level ofadequacy ofvitaminA
Table4.29showstheassociationbetweenthelevelofadequacy ofvitaminAand
Sociodemographic variables.Interestingly,allthe respondents(100%) hadan excess
level of adequacyof vitamin A intake while noneof therespondents fellwithin the
adequateandthe inadequate categoriesof vitaminA intake.Consequently,the
CorrespondingChisquareandPvaluescouldn’tbereportedastherewasnothing to
comparewith.

151
None (e.g. surfacewater Pitlatrine
open bush, 0(0) 0(0)
0(0)
0(0)
211(100.00)
22(100.00) Watercloset 0(0) 0(0) 15(100.00) Refuse management household None
in
0(0)
0(0)
231(100.00) Burning 0(0) 0(0) 9(100.00) Cityservice 0(0) 0(0) 8(100.00) Quintile 3leves Poor
0(0)
0(0)
107(100.00)
Average 0(0) 0(0) 49(100.00) Rich 0(0) 0(0) 92(100.00)
Table 4.29:Socio-economic variables andthe level ofadequacy ofvitaminA Variable LevelofAdequacyVitamin A Chi-square P
Inadequate Adequate Excess
Income category <10,000
0(0)
0(0)
158(100.00)
10,000 – 49,000 0(0) 0(0) 77(100.00) >/=50,000 0(0) 0(0) 11(100.00) Totalhousehold category </=6
0(0)
0(0)
187(100.00)
>6 0(0) 0(0) 59(100.00) House ownership No
0(0)
0(0)
65(100.00)
Yes 0(0) 0(0) 161(100.00) Type ofhousecategory A room
0(0)
0(0)
46(100.00)
Self-contained 0(0) 0(0) 44(100.00) Flatwithbedrooms Others(e.g.facemeIface you)
0(0) 0(0) 61(100.00)
Main source watercategory Surface/rain water
drinking 0(0)
0(0)
61(100.00)
Well 0(0) 0(0) 52(100.00) Borehole 0(0) 0(0) 104(100.00) Others 0(0) 0(0) 30(100.00) Main source fuelcategory Wood
of cooking 0(0)
0(0)
136(100.00)
Charcoal 0(0) 0(0) 39(100.00) Kerosene 0(0) 0(0) 68(100.00) Others 0(0) 0(0) 3(100.00) Main source category None
of lighting
0(0)
0(0)
6(100.00)
Candle/lantern 0(0) 0(0) 109(100.00) Public power su pply(e.g. 0(0) 0(0) 91(100.00)
PHCH) Alternative sources (e.g. solar, generator) Toiletfacilityin household
0(0) 0(0) 40(100.00)

152
4.30 Socio-demographic variables andthe level ofadequacy ofVitaminC
Thelevelofadequacy ofVitaminCanditsassociationwithsociodemographic
variablesisshowninTable4.30.Withproportionsrangingfrom85.70%to
100%,mostoftherespondentshadan inadequatelevelofVitaminC intake.No
sociodemographic variable hada significantassociationwiththe levelof adequacy
ofVitaminC.Theproportionthatreportedhavingexcesslevelof
VitaminCwashigherinpeoplelessthan50years(2.2%)thanthosebetween 50and70years
(0.80%),andthoseolder than 70years (1.20%). Similarly,the proportionwithan excess
levelofVitaminCwashigheramong CivilServants (14.30%) thanfarmers(1.30%)
andTraders(0.80%). Theproportionof the respondentshaving an
inadequatelevelofVitaminCwashigheramong divorced or
seperatedandwidowedrespondents(100% than Marriedrespondents (97.20%).
Thosewithtwowives(wivesgroup) hadmore respondentswith an
adequatelevelofVitaminC(4.80%)thanthosewithmorethantwowives(wives group)
(0%) oronewife(Wives group)(0%).

153
Table 4.30 Socio-demographic variables andthe level ofAdequacy ofVitaminC Variable LevelofAdequacy Vitamin C Chi- P
square Inadequate Adequate Excess
Age group <50 years
43(95.60)
1(2.20)
1(2.20)
2.34
0.67
50 – 70 120(98.40) 1(0.80) 1(0.80) >70 years 80(98.80) 0(0) 1(1.20) Sex Male
95(97.90)
1(1.00)
1(1.00)
1.14
0.93
Female 148(98.0) 1(0.70) 2(1.30) Maritalstatus Married
171(97.20)
2(1.10)
3(1.70)
2.06
0.73
Divorced/separated 8(100.00) 0(0) 0(0) Widow 63(100.00) 0(0) 0(0) Type of marriage Monogamy
133(98.5)
0(0)
2(1.5)
2.626
0.27
Polygamy/polyandry 107(97.3) 2(1.8) 1(0.9) Wives group 1
125(98.40)
0(0)
2(1.60)
9.26
0.06
2 45(100.00) 0(0) 0(0) >2 20(95.20) 1(4.80) 0(0) Education category None
164(99.40)
0(0)
1(0.60)
13.32
0.04
Primary 47(95.90) 1(2.00) 1(2.00) Secondary 14(93.30) 1(6.70) 0(0) Tertiary 14(93.30) 0(0) 1(6.70) Occupation category None
25(100.00)
0(0)
0(0)
11.37
0.18
Trade/business 117(98.30) 1(0.80) 1(0.80) Farmers 73(97.30) 1(1.30) 1(1.30) Civilservants 6(85.70) 0(0) 1(14.30) Artisans 21(100.00) 0(0) 0(0) Religion category Christian
114(98.30)
0(0)
2(1.70)
2.29
0.68
Islam 124(97.60) 2(1.60) 1(0.80) Others 1(100.00) 0(0) 0(0)

154
4.31 Socio-economic variables andthe level ofadequacy ofVitaminC
Table4.31showstheassociationbetweenthelevelofAdequacyofVitaminCand
socioeconomicvariables.Themainsourceoflightinghadasignificantassociation
withthelevelofadequacyofVitaminC(P<0.05).Theproportionthatreported havingan
excesslevelofVitaminCadequacywashigheramongthosewithnosource
oflightingintheirhomes(16.7%)thanthoseusingpublicpower(2.20%)or
Candle/lantern(0%).Generally,veryhighproportionsoftherespondentshad inadequate
levels of Vitamin C adequacy (87.5% to 100%), while a small
proportionhadadequatetoexcesslevelsofadequacy ofVitaminC.amongthose
withexcesslevelofVitaminCadequacy,thoseusingCityserviceasameansof
Refusemanagementinthe householdhadahigherproportion(12.50%)thanthose with no
means of Refusemanagement in household (0.90%)

155
None (e.g. surfacewater Pitlatrine
open bush, 206(97.60) 22(100.00)
2(0.90)
0(0)
3(1.40)
0(0)
0.90 0.93
Watercloset 15(100.00) 0(0) 0(0) Refuse management household None
in 227(98.30)
2(0.90)
2(0.90)
9.01
0.06Burning 9(100.00) 0(0) 0(0) Cityservice 7(87.50) 0(0) 1(12.50) Quintile 3leves Poor
106(99.10)
0(0)
1(0.90)
4.84
0.30
Average 49(100.00) 0(0) 0(0) Rich 88(95.70) 2(2.20) 2(2.20)
Table 4.31 Socio-economic variables andthe level ofadequacy ofVitaminC Variable LevelofAdequacy Vitamin C Chi- P
square Inadequate Adequate Excess
Income category <10,000
155(98.10)
1(0.60)
2(1.30)
0.52
0.97
10,000 – 49,000 75(97.40 1(1.30) 1(1.30) >/=50,000 11(100.00) 0(0) 0(0) Totalhousehold category ≤6
182(97.30)
2(1.10)
3(1.60)
1.61
0.45
>6 59(100.00) 0(0) 0(0) House ownership No
63(96.90)
0(0)
2(3.10)
2.92
0.23
Yes 158(98.10) 2(0.90) 1(0.60) Type ofhousecategory A room
46(100.00)
0(0)
0(0)
3.75
0.71
Self-contained 43(97.70) 0(0) 1(2.30) Flatwithbedrooms 60(98.40) 1(1.60) 0(0) Others(e.g.facemeIface you)
87(96.70) 1(1.10) 2(2.20)
Main source watercategory Surface/rain water
drinking 61(100.00)
0(0)
0(0)
7.02
0.32
Well 52(100.00) 0(0) 0(0) Borehole 99(95.20) 2(1.90) 3(2.90) Others 30(100.00) 0(0) 0(0) Main source fuelcategory Wood
of cooking 132(97.10)
2(1.50)
2(1.50)
2.27
0.89
Charcoal 39(100.00) 0(0) 0(0) Kerosene 67(98.50) 0(0) 1(1.50) Others 3(100.00) 0(0) 0(0) Main source category None
of lighting 5(83.30)
0(0)
1(16.70)
14.93
0.02
Candle/lantern 108(99.10) 1(0.90) 0(0) Public power supply(e.g. PHCH) Alternative sources (e.g.
88(96.70) 40(100.00)
1(1.10) 0(0)
2(2.20) 0(0)
solar, generator) Toiletfacilityin household

156
Specific Objective3
Toidentify relationshipsbetweensocio-demographicandsocio-economichousehold
characteristics that influencefoodhabits ofadults in Oyo state.
4.32: Correlation betweenage, BMI andeating behavior
InTable4.32,thecorrelationbetweenageandBMIwas-0.27(p<0.001)indicatingthatolder
peopletendtohavelowerBMIinthisstudy.Olderparticipantsalsotendtohavelowscores
onmealskipping (r=-0.01,p<0.001)andculture/lifestylescalesofeatingbehaviour
questionnaire(r=-0.12,p<0.001).ThecorrelationbetweenBMI
andsnacking/convenience was-0.12(p<0.001),indicating thatthose whoate
snacksandconvenience foods tendmore
tohavelowerBMI.Alleatingbehavioursweresignificantly positively correlated with eac
h other.

157
Table 4.32: Correlationbetween age, BMI andEating behaviours
Variables 1 2 3 4 5 6 7 8
1. Age
2. BMI
1.00
-0.27**
1.00
3. Low-fatEating2 -0.02 0.08 1.00
4. Snackingandconvenience2 -0.07 -0.12** 0.34** 1.00
5. Emotionaleating2 -0.05 0.03 0.25** 0.55** 1.00
6. Planningahead2 -0.05 -0.05 0.44** 0.64** 0.53** 1.00
7. Mealskipping2 -.01** 0.07 0.35** 0.56** 0.52** 0.45** 1.00
8. Cultural/LifestyleBehaviour2 -.12** -0.02 0.30** 0.56** 0.59** 0.55** 0.44** 1.00
Note: **Correlationissignificantattheα=0.01

158
4.33: Correlation betweenage, BMI andhealth-relatedquality
oflifeandnutrientadequacy
Thecorrelationbetweennutrientintakeandhealth-relatedqualityoflife(anditssubscales)
isshowninTable 4.34.Calorie(r=0.1,p<0.01),protein(r=0.12,p<0.05), carbohydrate
(r=0.15,p<0.01),Zinc(r=0.20,p<0.01)andiron intake(r=0.17,p<0.01)hadpositive
significantcorrelationwithphysicalfunction. While none of thenutrientsintake
correlated significantlywith anyofGH(General),VT(Vitality),and MH(Mental Health)
subscales of HRQL,vitaminC(r=-0.12,p<0.05) andsodiumintake (r=-0.14,p<0.01)
correlated negatively withRP(RolePhysical)subscaleoftheHRQL.Similarly,BP(Bodily
pain) correlatednegativelywithcarbohydrate(r=-0.1,p<0.05),Sodium(r=-
0.12,p<0.05),andIron intake(r=-0.12,p<0.05).Iron(r=-0.13,p<0.05),Calcium(r=-
0.12,p<0.05)andcarbohydrate intake(r=-
0.13,p<0.05)hadsignificantnegativecorrelationwithSocialFunctioningsubscale
oftheHRQL.WhileonlySodiumintakenegativelycorrelatedsignificantlywithRE(r=-
0.15, p<0.01); calories (r=0.15, p<0.01),chlorine(r=0.17, p<0.01),
potassium(r=0.12,p<0.05), zinc (r=0.21, p<0.01) andiron intake (r=0.17, p<0.01)
correlated positivelyand significantly withRH(ReportedHealthtransition).Only
zincintake(r=0.12,p<0.05)correlated significantlywith PHH(Physical Health).

159
Table 4.33: Correlationbetweennutrient intakeandhealth-relatedquality oflife
Variables PF RP BP GH VT MH SF RE RH PHH MEH HRQL
CaloriesIntake 0.17** 0.05 -0.02 0.02 0.08 -0.02 -0.04 0.00 0.15** 0.10 0.00 0.07
ProteinIntake 0.12* -0.03 -0.02 0.01 -0.01 -0.01 -0.02 -0.09 0.07 0.04 -0.05 0.01
CHOIntake 0.15** 0.01 -0.13* 0.00 -0.04 -0.05 -0.13* -0.05 0.17** 0.05 -0.09 0.00 DfIntake 0.09 0.04 -0.06 0.06 -0.04 0.02 -0.09 -0.05 0.01 0.06 -0.05 0.02
FatIntake 0.07 -0.03 0.00 0.01 0.07 -0.04 0.00 -0.08 0.09 0.02 -0.02 0.01
Saturated FatIntake 0.04 0.08 0.00 -0.01 0.04 -0.06 0.07 0.07 0.09 0.05 0.04 0.05
Mono FatIntake 0.05 0.07 0.00 -0.01 0.04 -0.06 0.07 0.07 0.09 0.05 0.04 0.05
Poly FatIntake 0.05 0.08 0.01 -0.01 0.04 -0.06 0.05 0.08 0.09 0.05 0.04 0.06
CholesterolIntake 0.08 -0.05 0.01 0.05 0.03 0.07 -0.02 -0.03 0.07 0.03 0.01 0.03
VitA Intake -0.05 -0.08 0.05 -0.02 0.03 -0.03 0.08 -0.05 0.03 -0.05 0.01 -0.03
VitCIntake -0.01 -0.12* 0.02 -0.05 0.02 0.05 -0.04 -0.07 0.00 -0.06 -0.02 -0.04
ThiaminIntake 0.03 0.01 0.00 0.04 -0.02 0.01 -0.09 -0.02 -0.02 0.03 -0.04 0.00
RiboflavinIntake 0.02 -0.05 -0.03 0.00 0.00 0.08 -0.06 -0.08 -0.01 -0.02 -0.03 -0.03
NiacinIntake 0.05 0.02 -0.02 0.05 -0.02 0.03 -0.08 -0.03 0.02 0.04 -0.03 0.01
VitB6Intake 0.04 0.00 -0.03 0.03 -0.03 0.01 -0.06 -0.01 0.09 0.02 -0.03 0.01
FolateIntake 0.04 0.00 -0.01 0.05 -0.03 0.01 -0.11 -0.04 -0.02 0.03 -0.06 -0.01
VitB12Intake 0.06 0.04 0.09 0.02 0.10 0.02 -0.04 0.02 -0.02 0.07 0.03 0.06
Calcium Intake 0.06 -0.11 -0.08 0.04 0.03 0.09 -0.12* -0.10 0.11 -0.02 -0.04 -0.02
Phosphorus Intake 0.10 0.02 0.00 0.08 0.05 0.08 -0.03 0.01 0.08 0.08 0.04 0.07
Sodium Intake 0.01 -0.14** -0.12* -0.04 -0.03 0.08 -0.11 -0.15** 0.05 -0.08 -0.08 -0.09
Potassium Intake 0.11 -0.05 -0.01 0.04 0.05 0.08 -0.10 -0.03 0.12* 0.04 0.00 0.03
ZincIntake 0.20** 0.05 -0.07 0.08 0.00 0.01 -0.01 -0.03 0.21** 0.12* -0.01 0.08
IronIntake 0.17** 0.01 -0.12* 0.03 -0.03 -0.02 -0.13* -0.07 0.17** 0.07 -0.09 0.01
Msgnessium Intake 0.06 -0.03 0.02 -0.01 0.04 -0.03 0.05 -0.04 0.04 0.02 0.00 0.01
PF-Physical function,RP-Rolephysical,BP-Bodilypain,GH-General,VT-Vitality,MH-Mental health,SF-Socialfunctioning,RE-Roleemotional,RH-ReportedhealthTransition,PHH-Physical health,MEH-Mentalhealth,HRQL-Healthrelatedqualityoflife **-Correlationis significantatthe 0.01level
*-Correlationis significantatthe
0.05level

160
Specific Objective4
Todeterminetheeffectofchangingfoodcultureandhabitsonhealthrelatedqualityoflife of
adults in Oyo State.
4.34: Pearsoncorrelationofnutrients adequacy
Table 4.34showsthecorrelationbetweennutrientsadequacy.Mostof the nutrientswere
significantlyand positivelycorrelated with Calorie, except saturated, monounsaturated,
and poly unsaturated fats,cholesterolandVitamin
B6.ThosewhohadadequatePolyfatalsohad adequate Vit.B6(r=0.13,p<0.05) and
Sodium(r=0.13,p< 0.05).Ina similar manner, respondentswho hadadequate
vitaminC(r=0.13,p<0.05), riboflavin(r=0.31,p<0.01),niacin(r=0.1,p<0.05), vitamin B6
(r=0.18, p<0.05), folate(r=0.15, p<0.05), vitamin B12(r=0.33, p<0.01), calcium
(r=0.32, p<0.01), phosphorous (r=0.40, p<0.01),sodium(r=0.29, p<0.01),
potassium(r=0.28, p<0.01), zinc (r=0.35,p<0.01)
andmagnesium(r=0.20,p<0.01).However, thosethathad adequate vitaminA
hadinadequate amountsof thiamin(r=-0.14,p<0.05), riboflavin(r=-0.17,
p<0.01),niacin(r=-0.18,p<0.01),vitaminB6(r=-0.27,p<0.01),folate(r=-
0.14,p<0.05),calcium (r=-0.14,p<0.05),phosphorous(r=-0.16,p<0.05),sodium(r=-
0.25,p<0.01),andpotassium(r=-
0.21,p<0.01).Thistrendofpositivecorrelationsimpliesanindividualthathadaparticularnut
rient
inadequateamountwillhavetheothernutrientinadequateamount.ForInstance,respondents
that
hadcalciuminadequateamount,alsohadphosphorus(r=0.65,p<0.01),sodium(r=0.82,p<0.
001), potassium(r=0.61,p<0.001), zinc (r=0.17,p<0.001) andiron(r=0.18,p<0.001)
inadequate amount. Similarly,respondentswithadequatelevelof potassiumalsohadzinc
(r=0.18,p<0.01), iron (r=0.16, p<0.05) andmagnesium(r=0.62, p<0.001)in
adequate amounts.

161
Table 4.34a: Pearsoncorrelationofnutrients adequacy Variables 1 2 3 4 5 6 7 8 9 10 11 12 13 14
1. Adequacy_calor ie 1 2. Adequacy_prot 0.80* ein * 1 3. 0.94* 0.65 Adequacy_cho * ** 1 0.29* 0.26 4.Adequacy_df * ** 0.33** 1 0.72* 0.67 5.Adequacy_fat * ** 0.50** -0.01 1 6. Adequacy_satur - atedfat -0.03 0.12 -0.05 -0.02 0.01 1 7. Adequacy_mon - o fat -0.03 0.01 -0.04 -0.02 0.01 1.00** 1 8. Adequacy_poly fat 0.02 0.04 0.01 0.06 0.02 0.93** 0.94** 1 9. Adequacy_chol 0.18 esterol 0.11 ** 0.04 0.03 0.13* 0.00 0.02 0.06 1 10. 0.44* 0.49 0.56* Adequacy_vitA * ** 0.32** -0.16* * -0.02 -0.02 -0.01 -0.03 1 11. Adequacy_Vit C 0.02 0.06 0.02 0.31** -0.05 -0.05 -0.04 0.01 0.13* -0.12 1 12. Adequacy_ 0.30* Thiamin * 0.36 0.33** 0.80** 0.04 0.00 0.01 0.08 0.09 -0.14* 0.25** 1 13. Adequacy_Ribo 0.29* 0.37 flavin * ** 0.30** 0.78** 0.04 0.01 0.02 0.11 0.31** -0.17** 0.25** 0.94** 1 14. Adequacy_Niac 0.29* 0.38 in * ** 0.30** 0.81** 0.03 0.01 0.02 0.11 0.15* -0.18** 0.25** 0.96** 0.96** 1 15. Adequacy_Vit 0.21 B6 0.08 ** 0.05 0.52** 0.01 -0.02 -0.01 0.13* 0.18** -0.27** 0.36** 0.55** 0.63** 0.70** 16. Adequacy_folat 0.30* 0.32 e * ** 0.34** 0.81** -0.01 0.01 0.01 0.07 0.15* -0.14* 0.21* 0.96** 0.94** 0.93** 17. Adequacy_Vit 0.32 0.18* B12 0.14* ** 0.04 0.13* * -0.01 -0.01 0.09 0.33** 0.03 0.15* 0.20** 0.26** 0.32** 18. Adequacy_Calc 0.27* ium * 0.18 0.32** 0.52** 0.04 0.00 0.00 0.08 0.32** -0.14* 0.28** 0.51** 0.59** 0.55** 19.Adequacy_P 0.30* 0.41 hosphorus * ** 0.27** 0.68** 0.12 -0.01 0.00 0.11 0.40** -0.16* 0.34** 0.81** 0.85** 0.87** 20. Adequacy_Sodi 0.17* 0.16 um * * 0.21** 0.59** -0.03 0.02 0.03 0.13* 0.29** -0.25** 0.37** 0.53** 0.61** 0.62** 21. Adequacy_pota 0.22* 0.28 ssium * ** 0.23** 0.54** 0.05 -0.03 -0.03 0.07 0.28** -0.21** 0.60** 0.62** 0.66** 0.67** 22. 0.30* 0.36 Adequacy_zinc * ** 0.27** 0.10 0.14* 0.01 0.01 0.07 0.35** 0.22** 0.00 0.09 0.21** 0.18** 23. 0.46* 0.37 0.22* Adequacy_iron * ** 0.48** 0.17** * -0.01 -0.01 0.03 0.08 0.10 -0.02 0.23** 0.23** 0.24** 24.Adequacy_m 0.68* 0.54 0.029 agnessium * ** 0.72** 0.57** ** -0.02 -0.01 0.06 0.20** 0.18** 0.27** 0.62** 0.61** 0.61**
Note:** Correlationissignificantatthe 0.01 level(2-tailed) * Correlation issignificantatthe0.05level(2-tailed)

162
Table 4.34b: Pearsoncorrelationofnutrientsadequacycontinued
Variables 25 26 27 28 29 30 31 32 33 34
25.Adequacy_VitB6 1
26.Adequacy_folate 0.45** 1
27.Adequacy_VitB12 0.49** 0.13* 1
28.Adequacy_Calcium 0.38** 0.55** 0.21** 1
29.Adequacy_Phosphorus 0.74** 0.74** 0.56** 0.65** 1
30.Adequacy_Sodium 0.53** 0.53** 0.26** 0.82** 0.67** 1
31.Adequacy_potassium 0.70** 0.56** 0.42** 0.61** 0.82** 0.62** 1
32.Adequacy_zinc 0.18** 0.11 0.35** 0.17** 0.29** 0.12 0.18** 1
33.Adequacy_iron 0.11 0.24** 0.15** 0.18** 0.24** 0.14* 0.16* 0.25** 1
34.Adequacy_magnessium 0.33** 0.59** 0.25** 0.48** 0.63** 0.38** 0.62** 0.39** 0.36** 1 Note:** Correlationissignificantatthe 0.01 level(2-tailed) * Correlation issignificantatthe0.05level(2-tailed)

163
4.35: Correlation betweenage,BMI, eating styles andsubscales ofHRQL
Table4.35showsthecorrelationbetweenage,BMI,eating stylesandsubscalesof Health-
RelatedQuality ofLife.MealSkippingandCultural/lifestylecorrelatednegativelywithage
(r=-0.011,p<0.01;andr=-0.12,p<0.01respectively),thusolderrespondentsskipmealsless,
andeatlessinaculturalstyle.Similarly,BMIcorrelatednegatively withSnackingand
Convenienceeatingstyle(r=-0.12,p<0.01).EmotionalEatingcorrelatedsignificantly with
Rolephysical(RP)(r=0.10,p<0.05)andbodily pain(BP)(r=0.10,p<0.05)subscalesofthe
Health-relatedQuality ofLife.TheGeneralHealthsubscalecorrelatedsignificantly with
Lowfat eating (r=0.14, p<0.01), Emotional eating (r=0.18, p<0.01),
planningahead(r=0.08, p<0.05),andcultural/lifestyle
behaviour(r=0.17,p<0.01).Thesepositivecorrelations indicatethatthosethatpractiseany
ofemotionaleatingstyle,planningaheadstyle,and cultural/lifestyle behavioureating
stylewilldowellonthegeneralhealthsubscale.Thisis
similartotheRH(reportedHealthtransitionsubscale) thathadapositive(andsignificant)
correlationwithallthesubscalesofHRQL.RoleEmotional(RE) subscale hadanegative
correlation with Meal skippingeatingstyle (r=-0.09, p<0.05).

164
Table 4.35:CorrelationbetweenAge, BMI, eating styles andsubscales ofHRQL Variables
Age
BMI
PF
RP
BP
GH
VT
MH
SF
RE
RH
PHH
MEH
HRQL
Age
1.00
BMI
-0.27**
1.00
Lowfateating 2
-0.02
0.08
0.05
0.06
0.12**
0.14**
0.09*
0.04
0.02
0.06
0.11**
0.10*
0.08
0.11**
Snacking convinience2
and -0.07
-.12**
.14**
0.05
-0.01
0.03
-0.01
-0.04
0.07
0.02
0.17**
0.09*
0.01
0.07
Emotionaleating2
-0.05
0.03
-0.04
0.10*
0.10*
0.18**
0.16**
0.23**
0.28**
0.10*
0.14**
0.09*
0.26**
0.18**
Planningahead2
-0.05
-0.05
0.01
0.06
0.06
0.08*
0.07
0.07
0.16**
0.04
0.13**
0.06
0.11**
0.09*
Mealskipping2
-.011**
0.07
-0.04
-0.07
-0.04
0.01
0.02
0.02
0.10*
-0.09*
0.11**
-0.05
0.01
-0.02
Cultural / Lifes Behaviour2
tyle
-0.12**
-0.02
0.00
0.01
0.08
0.17**
0.09*
0.12**
0.14**
0.01
0.12**
0.07
0.12**
0.10*
PF-Physical function,RP-Rolephysical,BP-Bodily pain, GH-General,VT-Vitality,MH-Mental health,SF-Socialfunctioning,RE-Roleemotional,RH-ReportedHealthTransition,PHH-Physical health,MEH-Mentalhealth,HRQL-Healthrelatedqualityoflife **-Correlationis significantatthe 0.01level
*-Correlationis significantatthe 0.05level

165
4.36. Correlation betweeneating styles
Table4.36belowshowsthecorrelationbetweendifferentstylesofeating.Alltheeatingstyles
hada significantcorrelationwith eachother(p<0.01). Thecorrelationswere positive
andin mostcaseshigh(r>0.5).ExceptforthecorrelationbetweenLowfateating
styleandother eating
styles,thecorrelationcoefficientswerewellabove0.4.Respondentswhoatelowfat
alsotendtosnackmore(r=0.34,p<0.01),atemoreemotionally (r=0.25,p<0.01),Planning
aheadeating (r=0.44,p<0.01),Skipping
Meal(r=0.35,p<0.01)andCultural/Lifestyleeating
(r=0.30,p<0.01).Thosethatskipmealsalsotendtoeatinacultural/lifestylemanner(r=0.44,
p<0.01)

166
Table 4.36: Pearsoncorrelation betweeneating styles
Variables 1 2 3 4 5 6
1.Lowfateating2 2.Snackingand convenience2
1.00 0.34**
1.00
3.Emotionaleating2 4.Planningahead2
0.25**
0.44**
0.55**
0.64**
1.00 0.53**
1.00
5.Mealskipping2 0.35** 0.56** 0.52** 0.45**
1.00
6.Cultural/LifestyleBehaviour2 0.30** 0.56** 0.59** 0.55** 0.44** 1.00
Note:** Correlationissignificantatthe 0.01 level(2-tailed) * Correlation issignificantatthe0.05level(2-tailed)

167
4.37. Association betweenhealthrelatedquality oflifeandsocioe-conomic
variables Table4.37showstheassociationbetweenHealth-RelatedQuality ofLifeandSocio-
economic variables.TheassociationbetweentheType ofhousethe respondentslivedand
theirhealth-relatedquality oflife
wassignificant(p<0.05).However,respondentswholived inotherscategory
ofhouses(e.g.facemeI faceyou)haveahigherproportion(89.50%)of
themwithgoodquality oflifethanFlatwithbedrooms(79.40%),Self-contained(81.50%),
or Aroom (89.0%).Inasimilar manner,the Main sourceofcooking
fuelcategory(p<0.05), Incomecategory (p<0.001),Totalhouseholdcategory
(p<0.001)weresignificantly related withhealth-relatedquality oflife.
RespondentswhousedAlternativesourcesofelectricity (e.g.solar,generator)
reportedahigherproportion(89.0%)having agoodhealth-related quality
oflifethanthoseusingPublicpowersupply (e.g.PHCN)(79.9%),Candle/lantern (87.4%)
orNo sourceofelectricity(77.8%).

168
Income category <10,000
302(89.1)
37(10.9)
14.404
0.001
10,000 – 49,000 163(79.9) 41(20.1) ≥50,000 23(69.7) 10(30.3) Totalhousehold category ≤6
383(88.20)
51(11.8)
17.46
<0.001
>6 107(73.80) 38(26.2) House ownership No
126(79.70)
32(20.3)
3.34
0.068
Yes 327(86.1) 53(13.9) Type ofhousecategory A room
89(89.0)
11(11.0)
9.23
0.026
Self-contained 101(81.50) 23(18.50) Flatwithbedrooms 100(79.40) 26(20.6) Others (e.g. facemeIfaceyou) 196(89.50) 23(10.5) Mainsourcedrinkingwater category Surface/rain water
130(87.80)
18(12.20)
3.199
0.362
Well 106(80.90) 25(19.10) Borehole 204(85.4) 35(14.60) Others 52(81.20) 12(18.80) Mainsourceofcookingfuel category Wood
255(86.7)
39(13.3)
10.526
0.015
Charcoal 97(89.8) 11(10.2) Kerosene 130(78.3) 36(21.70) Others 6(66.70) 3(33.3) Main source of lighting category None
14(77.8)
4(22.2)
7.358
0.061
Candle/lantern 209(87.4) 30(12.6) Public power supply(e.g. PHCH) Alternativesources(e.g.solar,
179(79.9) 89(89.0)
45(20.1) 11(11.0)
generator) Toiletfacilityin household None(e.g.openbush,surface
405(86.2)
65(13.8)
5.734
0.057
water Pitlatrine
54(80.6)
13(19.40)
Watercloset 34(73.90) 12(26.1) Refuse management in household None
460(85.0)
81(15.0)
2.09
0.352
Burning 16(84.2) 3(15.8) Cityservice 17(73.9) 6(26.1)
Poor
203(86.8)
31(13.2)
0.52
0.97 Average 105(89.0) 13(11.0) Rich 185(80.10) 46(19.9)
Table 4.37: Association betweenhealthrelatedquality oflifeandsocio-economicvariables Health Related qualityofLife Variable Good Poor Chi-square P Quintile 3levels

169
4.38: Association betweenhealthrelatedquality oflifeandsocio-
demographicvariables
TheassociationbetweenHealth-RelatedQualityofLifeandSocio-
demographicvariablesis showninTable4.38.More male
respondents(85.40%)reportedhavinggoodhealth-related
Qualityoflifethanthefemalerespondents(83.9%).Interestingly,respondentswithaTertiar
y levelofeducation(33.3%)reported havingapoorhealth-relatedquality oflife
muchmore thanrespondentswithsecondary(20.8%),primary
(14.0%)ornoeducation(12.9%).Thisis
similartoamaritalstatuswheretheproportionofDivorced/separatedrespondents(96%)that
hadagoodhealth-relatedquality oflifewasmorethanthatofwidowed(92.6%)orMarried
(81.8%)respondents.Thisassociationbetweenmaritalstatusandhealth-
relatedqualityoflife issignificant(p<0.05), aswellasthatof
Age(p<0.05),Education(p<0.05) andReligion (p<0.05).

170
Table 4.38: Association betweenHealthRelatedQuality ofLifeand Socio-
demographicvariables Health Related qualityofLife Variable Good Poor Chi-square P
Age group <50 years
96(73.8)
34(26.2)
19.90
<0.001
50 – 70 236(84.60) 43(15.4) >70 years 161(92.5) 13(7.5) Sex Male
211(85.40)
36(14.60)
0.244
0.621
Female 282(83.9) 7(16.1) Maritalstatus Married
356(81.8)
79(18.2)
10.97
0.004
Divorced/separated 24(96) 1(4) Widow 112(92.6) 9(7.4) Type of marriage Monogamy
241(82.8)
50(17.2)
0.268
0.3
Polygamy/polyandry 243(86.2) 39(13.8) Education category None
317(87.1)
47(12.9)
13.456
0.004
Primary 98(86.0) 16(14.0) Secondary 42(79.2) 11(20.8) Tertiary 28(66.7) 14(33.3) Occupation category None
40(95.2)
2(4.8)
8.47
0.076
Trade/business 236(82.2) 51(17.8) Farmers 142(88.8) 18(11.2) Civilservants 16(76.2) 5(23.8) Artisans 56(82.4) 12(17.6) Religion category Christian
245(89.7)
28(10.3)
12.47
0.002
Islam 234(80.4) 57(19.6) Others 5(62.5) 3(37.5)

171
4.39: Binary logistic regressionof health related quality oflifeand significant
socio-economicandsocio-demographic variables
Table4.39showstheresultofthebinary logisticregressionofhealth-relatedqualityoflife
onselectedsocio-demographicandsocioeconomicvariables.Theselected variables were
the onesthatwere significantlyassociatedwithHealth-relatedQualityoflife
inTables4.32and 4.33above.Althoughnotsignificant,thosewith tertiary
educationwereabout2timesmore likely tohaveapoorquality
oflifethanthosewithnoeducation(OR=1.739,P=0.199).
However,AgehadasignificantassociationwithHealth-relatedquality oflife(OR=0.962,
P<0.01), showingthatasone advancein age, suchis likelyto haveapoor qualityof life.

172
Table 4.39: Binary LogisticRegressionofhealthrelatedquality oflifeand significant socio-economicand socio-demographic variables
95%C.I.forOR
OR P Lower Upper
Religion
Others(ref)
Christian .248 .090 .050 1.243 Islam .527 .432 .107 2.602 Marital Status Married(ref)
Divorced/Seperated .242 .172 .032 1.856 Widow .571 .179 .252 1.292
Education
None(ref)
Primary .635 .199 .318 1.270 Secondary .745 .490 .323 1.719 Tertiary 1.739 .199 .748 4.045 Age .962 .001 .941 .984 Constant 5.471 .115

173
4.40. Association betweeneating behaviourandsocioeconomicvariables
Houseownership(p<0.001), Main sourceof lightingcategory(p<0.05)and Quintile
(wealth Index) (p<0.05) hada significantassociationwitheatingbehaviourasshown
inTable4.40.
Respondentswhoearnedmorethan₦50,000/monthhadthehighestproportionofpeoplewit
h goodeating behaviour(91.2%). Waterclosetusershadahigherproportion(89.4%)of
respondentshavinggoodeating behaviourthanthosewithnotoiletfacility.However,those
withnosourceofelectricity hadahigherproportion(100%)havinggoodeatingbehavior
thanthosethatusecandle/lantern(82.4%),publicpowersupply (e.g.PHCN)(89.4%),or
alternative sources(e.g.solar,generator)(84.2%).Average familiesreportedhigher
proportions(19.3%)havingbadeatingbehaviourthanPoor(17.0%)orRichfamilies(8.2%).
Thetablealsoshowedthattheproportionofnutritionally healthy tenants(95.60%)were
significantlyhigher thanthe percentageof nutritionallyhealthyhouseowners (81.9%).

174
Table 4.40. Association betweeneatingbehaviour and socio-economicvariables
EatingBehaviour Variable
Good
Poor
Chi-square
P
Income category <10,000
289(85.3)
50(14.7)
0.944
0.624
10,000 – 49,000 178(86.4) 28(13.6) ≥50,000 31(91.2) 3(8.8) Totalhousehold category ≤6
378(86.50)
59(13.5)
0.088
0.766
>6 124(85.50) 21(14.5) House ownership No
153(95.60)
7(4.4)
17.61
<0.001
Yes 312(81.9) 69(18.1) Type ofhousecategory A room
87(86.1)
11(11.0)
0.126
0.989
Self-contained 108(85.0) 19(15.0) Flatwithbedrooms 108(86.4) 17(13.6) Others (e.g. facemeIfaceyou) 188(86.20) 30(13.8) The mainsource of drinking category
water
Surface/rain water 123(82.60) 26(17.40) 2.403 0.493 Well 115(87.10) 17(12.9) Borehole 210(87.9) 29(12.10) Others 55(84.60) 10(15.40) The mainsourceofcookingfuelcategory Wood
252(85.7)
42(14.3)
3.736
0.291
Charcoal 89(82.4) 19(17.6) Kerosene 150(88.8) 19(11.2) Others 9(100.0) 0(0) The mainsource oflighting category None
18(100)
0(0)
7.874
0.049
Candle/lantern 197(82.4) 42(17.6) Public power supply(e.g.PHCH) 202(89.4) 24(10.6) Alternative sources (e.g. solar, generator)
85(84.2) 16(15.8)
Toiletfacilityin household None (e.g. open bush, surfacewater
402(85.5)
68(14.5)
0.579
0.749
Pitlatrine 60(87.0) 9(13.0) Watercloset 42(89.4) 5(10.6) Refusemanagementin the household None
467(85.8)
77(14.2)
0.219
0.896
Burning 17(89.5) 2(10.5) Cityservice 20(87.0) 3(13.0) Quintile 3levels Poor
195(83.0)
40(17.0)
11.097
0.004
Average 96(80.7) 23(19.3) Rich 213(91.8) 19(8.2)

175
4.41. Association betweeneating behaviourandsocio-demographic variables.
InTable4.41theassociationofsocio-
demographicvariableswitheatingBehaviourisshown. Education(p<0.05)
andOccupation(p<0.05) hada significantassociationwitheating
behaviour.Theassociationofothersocio-demographicvariableswitheating
behaviourwas notsignificant;therespondentsgenerally showedthatthey
hadgoodeatingbehaviour.The proportionofmales(88.0%)thathadgoodeating
behaviourwasmorethanthatoffemales (84.5%). However, morefemale(15.5%) than
Male (12%) amongmarriedpeople (86.7%) reportedhavinggoodeating
habitthandivorced(84.6%)orwidowedrespondents(84.3%).
Morerespondents(17.9%)withnoeducationreportedhavingbadeatingbehaviourthanthos
e with primary(8.5%), secondary (7.4%) ortertiary (4.8%)education. On thecontrary,
respondentswithnoeducationhadthe lowestproportion(82.1%) amongthosewithgood
eatingbehaviour, while respondents with tertiary education had thehighest proportion
(95.2%) amongthose with good eatinghabits.

176
Table 4.41: Association betweeneatingbehaviour andsocio-demographic variables
EatingBehaviour Variable
Good
Bad
Chi-square
P
Age group <50 years
120(91.6)
11(8.4)
4.75
0.093
50 – 70 241(85.20) 42(14.8) >70 years 143(83.1) 29(16.9) Sex Male
220(88.0)
30(12.0)
1.439
0.230
Female 284(84.5) 52(15.5) Maritalstatus Married
379(86.7)
58(13.3)
0.521
0.771
Divorced/separated 22(84.6) 4 (15.4) Widow 102(84.3) 19(15.7) Type of marriage Monogamy
255(87.0)
38(13.0)
0.073
0.788
Polygamy/polyandry 245(86.3) 39(13.7) Education category None
298(82.1)
65(17.9)
12.369
0.006
Primary 107(91.5) 10(8.5) Secondary 50(92.6) 4(7.4) Tertiary 40(95.2) 2(4.8) Occupation category None
32(76.2)
10(23.8)
9.998
0.04
Trade/business 242(84.0) 46(16.0) Farmers 141(87.6) 20(12.4) Civilservants 20(95.2) 1(4.8) Artisans 65 (94.2) 4(5.8) Religion category Christian
236(85.8)
39(14.2)
0.913
0.633
Islam 253(86.6) 39(13.4) Others 6(75.0) 2(25.0)

177
4.42: Binary logistic regressionofeating behaviouronsignificant socioe-conomic
andsocio-demographic variables
Theresultsofthebinary logisticregressionofeating behaviourlifestyleonselectedsocio-
demographicandsocio-economic variables areshowninTable4.42.Variablesthatwere
significantly associatedwitheatingbehaviourlifestyleinTables4.35and4.36abovewere
selectedandincludedinthelogisticregressionmodel.Onlyhouseownershipwasstatisticall
y significant in the logistic regression model. Thosewhoown houses were about 4
times more likelyto havepoor eating behaviour than
thosewith no houses (95% CI: 1.813, 9.419).

178
Table 4.42: Binary logisticregressionofeatingbehaviour onsignificant socioe-conomicandsocio-demographic variables(95%CI) OR P Lower Upper
Occupation None(Ref)
Trade/Business 1.018 0.967 .441 2.352 Farmers .633 0.326 .254 1.577 Civil Servants .541 0.611 .051 5.787 Artisans .397 0.163 .108 1.454
Education None(Ref)
Primary .707 0.373 .330 1.516 Secondary .784 0.678 .248 2.475 Tertiary .511 0.431 .096 2.710
House ownership
No(Ref)
Yes 4.132 0.001 1.813 9.419
QUINTILE_grp
Poor (Ref)
Average 1.092 0.778 .592 2.015 Rich .562 0.096 .286 1.107 Constant .087 0.000

178
CHAPTERFIVE
DISCUSSION, CONCLUSION, AND RECOMMENDATION
5.1 DISCUSSION
5.1.1 Changes in foodhabits ofadults inOyo State
Oneofthemajorobjectivesofthisstudy istoidentifythechangesinthefoodhabitsofthe
adultpopulationinOyostate.Thefindingsclearlyshowedthattheeatinghabitofthepeople is
no longeras healthyastheyused to be. Thefocusgroupdiscussion with the
adultpopulation
studiedrevealedthattheeffectofurbanization,modernization,andwesterndietontheadults
studiedfood habitcannotbe overemphasized. Some of the discussantslamented the
gradual erosion ofthe traditional/ indigenous diets due to thepreferenceforthe ready-
to-eat foods in themarket.Itwas
gatheredfromthestudythatcaregiversnolongerknowhowthetraditional
foodswerepreparedanditwaspointedoutbysomefemaleparticipantsthatoldendaysfoods
preparedandeatenwerehealthierthanthepresentdayonesbecausemostofthefarmproduce
hadlosttheir palatability,aroma aswellastheir nutritionalvalues.
Thesewereattributedto the use of fertilizers insteadof
bushfallowing,herbicidesinsteadof weedingthatenrichthe soil, Maggi in lieu of locust
beans andgrindingmachine instead of theusual grindingstone. Accordingtooneof
thewomen discussantsinanurbancommunity,“Theolden days'crop
processingmethodsespecially planting wasquitedifferent.MostPresentday cropsare
plantedwithchemicalsandfertilizerthereby resultinginearly maturingandharvestingof
foodcrops”.Thiswascorroboratedby otherrespondentswhoexplainedthat“Vegetables
withoutfertilizer taste good and palatable than theones grown with fertilizer”.

179
Also“Inthepast,weused‘ewedu’butitisdifferentnow;thereasonisthat,thewayweplant
‘ewedu’thesedaysaffectitsqualitybecauseweareencouragedtoaddsomechemicalstothe
soilbeforeplantingoreven afterplanting.Bythetime wecook such ‘ewedu’, it would
have
lostitssliminess.Henceagreatdifferenceexistsbetweenthe‘ewedu’plantedwithorwithout
chemicalsbecausethelatterwillbeverygreenishthantheformer.Evenmostvegetablesand
othercropssuchasyam,cassavaareplantedwithchemicals.Inthetimepast,thereisnosuch
thing”(Amiddle-agedfemaleparticipant,Iganna).
Inallthe communities sampled, respondentshadagood breakfastattitude. Also,
skipping lunchwasnotacommonattitudeandnutritionally
richfoodcontainingacombination of
carbohydrate,proteinandvitaminssourceswerecommonly chosenforlunch.Suchfoodfor
lunch includes;‘amala’ (made of eitheryamflouror cassava) withsoup(‘morogbo’,
‘ilasa’ [okro leaves],vegetables[‘efo tete abalaye’]or ‘egusi’
[melon]withvegetables);pounded
yamwithsoup;meatandbeans.Itwasalsonotedthatthecommonvegetablesinthepastand
thepresentare‘efoteteabalaye’,‘ewuro,‘igbo’,‘eku’‘efotete’,‘shoko’and‘ebolo’.Asone
of thefemaleparticipantspointed out,
“Some people if chancedcan poundyam, some cook beans but majorlyweeat
‘amala’(yam flour) and‘ilasa’ soupwhich
containslocustbeansanduptilldatewedon’tuse Maggifor draw soup instead
weuselocust beans.When ‘ilasa’ is eaten bysomeonethat had justgiven
birth,itnourishedher body.Butnow we use Maggifor stew althoughinthe olden daysour
mothers used leafyonions and locust beans for stew”.
Dinneriseateninallthecommunitiesalthoughitscontentvariesfromonecommunity to
another.‘Ekotutuwithmoinmoin/akarapounded
yam,riceandspaghettiwerecommonfood
itemsareeatenasdinneralthoughthisislargelydependentoneachfamily’seconomicpower
and ability.It was furtherstressed that poundedyam was oneof themajormeal
fordinnerin the time past,however, it’s nolonger a commonfood for dinner because

180
theyouthof today who aresaddled with theresponsibilityof preparingthe meal cannot
poundyam.
Accordingtosomefemalediscussantsintheurbanareas,someofthemodernfoodscommon
inthecommunity andconsumedmostly bychildrenarecannedfoods,noodles,rice,
Spaghetti, Semovita, andwheat.Itwasalsomentionedthatchildrenweremade toeatfruits
and vegetables in addition to thesemodern foods.
Varioustypeoffruitssuchas;mango,cashew,orange,pineapple, pawpaw, banana,and
plantainwasmentionedtobe commoninmostof the indexurbancommunities.
However, findingsdidindicatepoortasteandaroma,non-
availabilityandunaffordabilityaskeyreasons for
thedeclineinfreshfruitconsumption,hencetheincreasing incidenceofNon-
communicablediseases,unlikeintheoldendayswhensuchdiseaseswere notthingsof
concern.Thiswas emphasizedbyoneofthe femaleparticipantsin anurban
communitywho didconfesstotheunaffordabilityofthefruitsthesedays“Butwedon’t
haveaccesstofruits likebeforeduetonon-availability andcost.Wehavetobuy
itfromafewpeoplethatare planting
itontheirfarms.Evenifourhusbandgoestothefarmandbringsfruitsinsteadof
givingitoutfreely weselltomakemoney.Unlikebeforethat,wehadfruitsonindividuals’
farm, it is scarcetodayand so, we consumefewerfruits.”
Locally raisedchickenandfishwerereportedtoberegularly consumedby thefocusgroup
discussants.Intimepast,bushmeatandfreshwaterfisheswerereportedlycommonand
consumed, butbeef andfrozen fish suchasMackerels,Titusand Sardine arethe most
commonspeciesavailable nowadays.Changesinthemeatconsumptionpattern
betweenthe oldendaysandthepresenttimearelargely
duetothehighprevalenceofwesterndietsand reductioninthepopulationofgameskilled
asbush meat;resultinginthe highcostof
bushmeat.Inaddition,concernwasraisedonthequalityoffishbeingproducedinthepresent
day,pointing outthatmostofthespecies offishraisedaregenetically modifiedwitha
consequent reduction in their qualityand taste.

181
Eating of‘ewedu’ wasconsideredatabooinoneofthecommunitiesasitwasbelievedor
perceivedtocausefibroid.Inanotherurbancommunity,eating of‘eba’wasnotcommon
although theirchildren do soak ‘gaari’in water to eat.
Somefemaleparticipantsintheurbancommunitiessuggestedwaysofimproving eating
culture throughnutritioneducationwhichcouldbeorganisedfor women
ofdifferentgroups and in different communities. Accordingto one oftheseparticipants,
“You canorganise nutritioneducation andcreateawarenessamong women
fromdifferent
groupsandcommunity.Thisinformationwillbedisseminatedamongustothosewhodonot
attend becauseitwillhelpus to changeoureating habitand cookingpattern forbetter”
5.1.2 The Influence ofsocio-demographic and household characteristic
onrespondents’foodhabit
Generally,a larger proportionof bothruralandurbandwellerswerefemale.More females
live inruralareaswhile larger percentagesof the urbandwellers(IbarapaLGA)were
male.Thismay beduetothefactthatwomenaremoreinvolvedinfarmingandagro-
processingandtradingactivitieswhicharepredominantoccupationsinruralareasofNigeria
. Ogunlela(2009)hadsimilarfindingswhenheopinedthatruralwomen,morethantheirmale
counterparts,tooktheleadinagriculturalactivities,makingupto60-80percentofthelabour
force.Itisironicalthattheircontributionstoagriculture andruraldevelopmentare seldom
noticed.
Generally,therespondentswereagedbetweenfifty (50)and(70)years.Thereasonforthe
agedistributionintheruralareaisnotfar-fetched-itcouldbeduetothefactthatmoreyouth
migrantsinurbancentresthantheelderly.OfuokuandChukwuji(2012)revealedthatthe rate
of migrationfrom ruraltourbancenters wascommonamongages11-20and21-30.
Therefore,about60% oftheproductiveyouthsinruralareasmigratetourbancentres.
Thus,theyouthswhoarethemostproductivegroupofpeopleinruralareasmigratetothe
urbancentreleavingbehindtheelderly(above50 years)andthechildrenwhoareabout40%
of thetotal population in therural areas.
Findingsalsorevealedthathigherpercentagesofthepeopleinbothruralandurbanareeither
poorlyeducatedorhadnoformaleducation.Thismaybetraceabletopooracademicfacilities

182
, poorenlightenmentaswellaspooraccesstoformaleducationintheareas.Morethanhalfof
urbanresidentsinthethreeLGAs,Atiba,Ibarapa,andIwajowaweretraders.Inasimilarway,
mostrural residents were farmersexcept forIwajowaLGAwhich had halfofits residents
as traders. This findingis similarto that of Ogunlela(2009).
The mainreligionpractisedinAtibaLGA isIslamwhileIbarapa recordedmore Christians
thanother religions.InIwajowaLGA,however,a larger proportionofurbanresidents
practiceIslamwhileamajority oftheruralresidentswereChristians.Thisfindingisinline
withthatof Olowookereetal.,(2012) who reported a similar trendinreligiondistribution
amongruralcommunitiesofNigeria.Theimplicationisthat traditionalreligionisgradually
fading awayfrom where itwas formallybeingpractised.
Educationandoccupationweresignificantly associatedwitheating
behaviour(Table4.79). Theassociationofothersocio-demographicvariableswitheating
behaviourwasnot
significant;therespondentsgenerallyshowedthattheyhadgoodeatingbehaviour.Therewa
s
nosignificantdifferenceintheproportionofmalesandfemalerespondentsthathadahealthy
eating habiteventhoughmoremalesseemtoeathealthierthanfemales.Thefindingsalso
revealedthatagoodeatinghabitcanbeinfluencedby maritalstatus.Thestudy showedthat
alargerpercentageofthemarriedrespondentsreportedagoodeatinghabitthanthedivorced
orthewidowed.Thiscanbetracedtothesupportthatthemarriedcouplesgetfromeachother
intheformsoffinance,encouragement,andmotivationwhichthedivorcedandthewidowed
may notbeabletoaccess.Theroleofeducationinenhancingagoodeating habitcannotbe
overlooked.Thestudy revealedastatistically significant(p<0.001)pooreatingbehaviour
amongtherespondentswithnoformaleducationasagainstthosewithprimary,secondaryor
tertiaryeducation.
Theresultsofthebinary logisticregressionofeatingbehaviourlifestyleonselected socio-
demographicand socioeconomicvariables areshown in Table 4.79
5.1.3 Influenceofsocio-economic characteristics onrespondents’foodhabits

183
Mostoftherespondentsreportedthatthey wereself-employed,regardlessofthelocality of
theirresidence.InIbarapaLGAforinstance,94.3%ofitsruralresidentswereself-employed.
Okoli et al., (2014) had asimilar resultwhereitwas reported that amajorityof peoplein
theruralcommunityofNigeriawereself-employed.Thismaybeasaresultofthelocalization
of infrastructurefacilitiesin the citieswhich has, in turn, restricted the employer
oflabour to theurbanareas.By implication,industries,andwhite-
collarjobsproviderscannotfindthe
enablingenvironmentintheruralareasofNigerialeaving theruraldwellerswithnoother
options than to engagein farming, trading,andafew artisans’ works.
Respondentsin Ibarapa andIwajowaweremajorlylow-incomeearners. Amongurban
dwellersinIbarapaLGA,about66.4%oftherespondentsearnlessthan₦10,000(US$62.50)
permonthwhichisnotdifferentfromthetrend(55.6%)observedamongtheruraldwellers
inthesameLGA.Thepresentstudy confirmstheresultofOnuetal.,(2010)where itwas
reportedthat57.8%ofthe respondentsearnedlessthanN10,000.00(US$62.50)a month
which madeitdifficult for them to afford decent houses.
InalltheLGAs,lessmoney isspentonfood.Mostoftherespondentsacrossallstratainall the
LGAsreportedspendinglessthan₦10,000amonthonfood.Thisissobecausetheyearn
lessthan#10,000andtheycan’tspendmorethantheirincomeandalsobecausetheygetmost
oftheirfoodfromthefarm.ThepresentfindingssupportthatofImoetal.,(2013)whoaffirms
that 66.3%of therespondents earn less than #10,000 in a month.
5.1.4 Householdcharacteristics
Mostof the respondentsinthethreeLGAsof Atiba,Ibarapa,andIwajowahadahousehold
sizethatconsistedoflessthanorexactlysix(6)members.Theimplicationisthatmoreofthe
respondentsoperateanuclearfamilytypewhichisatrendthatispeculiartotheurbancenters.
AkewusholaandAkinlabi(2013) hadsimilarresultswhererespondentswith4-6household
sizehad 30.0%which was the highest.
Mudwasthemainmaterialusedinmostoftherespondents’houses,amajority ofthe
respondentslivedinmud/mudroof type ofhouses.Asimilar result was reportedina
survey carriedoutinJigawastateNigeria. In theUrban area ofAtibaLGA,

184
amajorityofthehouses
inwhichtherespondentslivedwerebuiltwithconcreteblocks.Manyoftheruralresidents
inAtibaLGAusedsurfacewaterastheirmainsourceofdrinkingwater.Also,urbanresidents
inIwajowa LGAusedwellwatermostlyastheirmainsourceofdrinkingwater.Theresultof
Tasietal.,(2016)issimilartothepresentstudy whereitwasreportedthatopenwellisthe
commonsourceofwaterintheruralvillagesofKano.FatioyeandJohn-Adewole(2013)also
reportedthatthemajorsourceofpotablewaterinthecommunity ishand-dug well;someof
which was not havingagood depth to avoid seepageof contaminants intoit.
Mostruralareashadalowproportionofitsdwellersusingpublicpower;revealing thefact
thatmostruralareasdonothaveaccesstopublicpower. Lackofthisbasicamenityhasbeen a
factorimpedingthe growthanddevelopment ofruralareas.Regardlessofthelocality,all
theLGAs reporteda higher proportionof itsdwellerswithnotoilet facilities.Thisisthe
situationwithmany ruralhouseholdsindevelopingcountries.Ahighproportionofthe
respondentsreportednothavinganyformofrefusemanagement,meaningthattherewasno
properway ofdisposingofwasteinthestudy areas.FatioyeandJohn-Adewole(2013)
recordedsimilarfindingswhenthey reportedthatthelittleknowledgethatthecommunity
occupantshadabout environmental and wastemanagement andcontrol was inadequate;
hence, the poor environmental management.
5.1.5 Foodconsumption patternofrespondents
Morethanone-thirdoftherespondentsdidnotconsumegarriatall,whileonlya
fewconsumed itonce inaweek,which isthe highestproportionof those
whoategarriatall.Onyemauwa (2010) reportedsimilar
findingswhereheaffirmedthatanaveragehouseholdof 8persons consumed 25kilograms
(kg)of garriat acostofN2,500 representing 5%ofmonthly
householdincome.Majorityofrespondentsreportednotconsumingcookedorfriedcocoya
m andsweetpotatoes.Thisfinding isatvariancewiththefindings
ofAgbelemoge(2013)who reported almostallrespondentsconsumedcocoyamin South-
westernNigeria aspartof the familymenu.
Tuwomasara,Kokoro,SapalaAbariandIro werenottakenatallby alargerpercentageof
therespondents.Thisisbelievedtobeduetothefactthatthesetraditionalfoodsarenolonger

185
relishedbytheindigenouspeople,andthewomenmay notknowhowtocooktheproducts.
Tuwomasaraispopularlyconsumedinthenorthernpartofthecountryandisnottoocommon
in theSouth-west, except wheretheHausasareliving.
Fried Rice and Tuwo Shinkafawerenot eaten at all byalargeproportion
oftherespondents. Thisisbelievedthatthese
foodsarenottraditionaltothem,unlikewhitericewhichwas consumed
regularlybytherespondents.Akarakoko,Ekuru,andGbegiriwhicharetraditionalfoods
ofthe Southwestregionof
Nigeriawerenotconsumedatallbyalargepercentageofrespondents.Apossibleexplanation
forthisobservationmaybeduetothefactthattherespondentsmaynothavebeenconsuming
thesefooditemsorthefooditemsmightbetime-consuming inpreparation.Aboutone-third
oftherespondentsrarelyconsumebiscuitsandconfectionaries.Thereasonforthismaybebe
causeBiscuitsandConfectionarieswereknowntobefooditemsconsumedbychildrenand
not adults.Coffeewas not consumed atallbymostrespondents, while othersrarelytook
beverages and tea.
Thepresentfindingsshowthatrespondentshadlittleornoinformationonthebenefitsof
coffeeto human
health.Fruitslikeguava,watermelon,apple,pear,andcarrotwerenoteatenatallby many
ofthe
respondents.Thismaybeduetorespondents’lackofaccesstothesefruits,mostofwhichare
seasonal and not readilyavailable.Leafyvegetableswereconsumedoncedailybyone-
thirdoftherespondents,while28.4%did notconsume
vegetablesatall.Thepresentfindingsagree withElodieandYves(2010) who
reportedthatthedietsofurbanpopulationsweregrossly deficientinmicronutrientssuchas
vitamin A.
Morethanhalfoftherespondentsdidnotconsumejuiceatallwhileothersconsumeditrarely.
Thismay beduetothefactthatthejuicesweremoreexpensiveandtherespondentscould not
afford itcomparetoother carbonated
drinks.Amajorityoftherespondentsdideatmeatregularly
withtheirmeals,while61.3%didnot

186
haveaplanformealsaheadoftime.About47.0%oftherespondentsdon’teatuntiltheyhave
finishedthewholepackagewhenthey buysnackfoods,while66.5%don’treplacesupper
withasnack,instead ofplanning meals.Outoftherespondents,79.1%didn’tagreetohate
cooking.Theimplicationofthesefindingsisthatrespondentswereawareoftheconsequence
s of eatingmeatless meals.Itcouldalso beinferredfrom thepresentfindingsthat
respondents do not seethe reason whytheyhad to plan theirmeal forthecomingweek.
5.1.6 Relationshipbetweensocio-demographicandsocio-
economicvariables,nutrient adequacy andnutritional status ofadults
Oneofthemajorobjectivesofthisstudywastoassesstherelationshipbetweenrespondents’
nutritionalstatusandtheirsocio-demographicandsocio-economic status.Itwasobserved
fromthestudy thatnutrientinadequacywasacommonchallengetothemajority ofthe
respondentsin bothruraland urban areas. VitaminB6 inadequacywashigheramong
individualsinmonogamousmarriages(97.0%)thanthoseinpolygamousmarriages(94.5%
).
TheproportionoffarmersandCivilservantswithB6inadequacywasthesame(6.70%)while
theyequally sharedthesameproportionofexcessamountsofvitaminB6(2.70%).These
inadequaciesmaybeduetothecomplaintsthatfruitsandvegetablesarenolongerpalatable
astheyusedtobeandmore,thatthefewavailablefruitsthesedaysaretooexpensiveforboth
ruralandurbandwellerstoaffordaspointedoutduringthefocusgroupdiscussion.However,
thesimilartrendin theproportionwithexcessvitaminB6among farmersandcivilservants
couldbe attributabletothefarmers’ better accesstomore vegetablesandthecivilservants
better understandingof theimportanceas wellasthe available sources of thevitamins.
Therewasnosignificantdifferenceinthelevelofadequacy offolateamongthegenders.
However, a muchlarger percentage of therespondentsshowedfolateinadequacy.This
inadequateleveloffolatesreportedamongrespondentsbythepresentfindingsmaybedue
tolackofaccesstofoodsourceslikelegumes,leafy green vegetables,andsomefruits,so
lowerintakescanbeexpectedwherethestapledietconsistsofunfortified wheat,maize,or
rice,andwhenthe intakeof legumesandfolate-rich vegetablesandfruitsislow.Theresult
ofStelutietal.,(2011)issimilartopresentfindingswherepeoplealsoreportedlowintakeof

187
folate,vitaminB6andvitaminB12.Thiscouldpossibly beasaresultoflackofaccessto
vitamin-rich dietarysources.
Calciumandphosphorusareimportantmineralsessentialforthebody functionsand
metabolismwhichwerebothrevealedtobe inadequateamongallthecategoriesofthe
respondents.However,thecivilservantcategory showedabettertrendforphosphoruswith
abouthalfoftherespondentswhowerecivilservantshaving phosphorusadequacy.This
couldbetraceabletothevitalrolethateducationplaysinunderstandingnutritionknowledge.
Theproportionoftherespondentswithinadequatelevelsofintakeofcalorieandsodiumwas
nottoodifferentfromeachother.Ahigherpercentageoftherespondents hadvery poor
intakewhichcouldbeattributedtothefactthatsuchelderlyrespondents maydeliberately
avoidfoodsthat are rich in sodiumandhighincalorie.The implicationisthat
respondentswereelderly,thereisahightendencythatthey lacksodiumcalorie.Thisisa
disease common among elders.
Levelofeducationandtypeofoccupationwere thetwosocio-demographiccharacteristics
whichhadasignificantassociationwiththe levelofadequacy
ofPotassium.Thisimpliesthat peoplewitha
lowlevelofeducationmightbepronetopotassiumdeficiency thanpeoplewho
arewelleducated.Also,respondentswhoseoccupationsareinlinewithhealtheducationmay
facelessriskoflackofpotassiumwhereasrespondentswhoseoccupationhasnothing todo
with health maybeproneto therisk attached to potassiumdeficiency.
Table4.24showstheassociationbetweensocio-demographicvariablesandthe
levelofadequacy ofironofboththeruralandurban respondents.About11.10%and
88.9%ofthe respondents hadadequate aswellas excess Ironlevelrespectively.
Noneofthesocio-economicvariables wassignificantly
associatedwiththelevelofadequacy ofiron.However,therespondents’ housing type was
significantly associated with the adequacy of iron. Amongtheiron inadequacy
group,thosewitharoomhadmoreproportionthanthoseliving ina flatwith bedrooms and
other types of accommodation.

188
5.1.7 Dietaryfibre
Itwasshowninthestudy thatofalltheSocio-demographicvariablesassessed,itwasonly
ageoftherespondents thatshowedastatistically significant(p<0.05)positiveassociation
withtherespondents’dietary fibre.Alargerpercentageoftherespondentshadinadequate
dietary Fiberintakewhichwasalmostthesameforbothmonogamousandpolygamous
maritalgroups,respectively.Itcouldbeinferred fromthefindingsthatthe higherthe agethe
highertheadequacy ofdietary fiberwhilethelowertheagethelessadequateisthedietary
fiber.Notwithstanding,noneofthesocio-economicvariablesshowedany statistically
significant relationship with the adequacyof dietaryfibre.
VitaminAisanindispensablenutrientwithenormousimportanceinthebody rangingfrom
itsanti-oxidativeroletoitsroleinvisionandnourishing theskin.Inthisstudy,thedietof
boththe urbanandruraldwellers alike wasinadequate inrelationtoVitaminA content.
NosignificantrelationshipwasseenbetweenVitaminAadequacy andtherespondents’
socio-demographicandsocio-economicstatus.Thismay beduetotheinability ofthe
respondentstoafford some vitaminsrichfood itemsor maybe asa resultof their poor
educationallevelwhichmighthavepreventedthemfromunderstanding theroleofeating
varietiesoffruitsandvegetablesinmeeting vitaminArequirement.Nidhietal.,(2008)had
similarfindingswhereitwasreportedthatSixty percentoftheirrespondentshadvitaminA
deficiencyas assessed byxeropthalmia, rough andscalyskin.
Thelevelofadequacy ofVitaminCanditsassociationwithsocio-demographicvariables
revealsthattheproportionoftherespondentshaving aninadequatelevelofVitaminCwas
higheramongDivorced/separatedandwidowedrespondents,thanmarriedrespondents.La
ck
ofvitaminCreportedforrespondentsinthesecategoriesisapointertotherespondents’poor
nutritioneducationonfood preparationandhowwater-soluble vitaminslike
VitaminCand theB-
Vitaminscanbeconserved.AsimilarresultwasreportedbyNidhietal.,(2008)where
itwasdiscoveredthatforty-fivepercentoftheslumwomenhadadeficiency ofvitaminC,
which was observed bysponginess and swellingof gums.

189
Therewas astrong negativecorrelation (p<0.001) between ageandbodymassindex
indicatingthattheolderonebecomesthelowerthebody massindex(BMI).Older
participantsalsotend tohave lowscoresonMealskippingandCulture/Lifestylescalesof
Eatingbehavioursquestionnaires.Therewasalsoastrongnegativecorrelationbetween
BMI and Snacking/convenience (p<0.001).Thisindicatesthatthosewhoeatsnacksand
conveniencefoods moretend to havelowerBMI. Thisfinding
mightbebecauseolderrespondentsdonoteatjunks thatcan increasethelevel
offatintheirbody whileyoungerrespondentstendtoeatmorejunkswhichexplainedthe
reasonwhycorrelationexistedforageandBMI.Also,youngerrespondentstendtoskipmore
mealsthanolder respondents. Thereasonfor thisisbecauseyounger
respondentswhowere
stillinactiveserviceorwhowereengagedinoneformofworkortheothermayskipbreakfast
and takelunchand dinner.
There wasanegativecorrelationbetweenage,andintakesofallfoodnutrients(thoughnot
statistically significant)exceptforVitaminCintakewhichshowedapositivecorrelation.
VitaminCintakehad anon-significantpositivecorrelationwith
Age(r=0.01)indicatingthat older participantstakemore
VitaminC.Thecorrelationbetweennutrientsintake andBMI wasmostly
positive,thisshowsthatthemorenutrient-richfoodonetakes,thehigherthe BMI.
Themeasureoftherelationshipbetweennutrientsadequacy andageshowsthecorrelation
betweenBMIandNutrientsadequacy. Agecorrelatedpositively withsomeofthenutrients
adequacies.Althoughthesecorrelationswerenotstatistically significant,itindicatedthatas
onegrowsolder,NutrientslikeCalorie,Protein,Fat,andVitaminC,becomesmoreadequate.
Thismay besobecauseoneisgettingoutofhisorherproductiveagewhenmoreenergyis
needed to do work.
Mostofthenutrientsweresignificantly andpositivelycorrelatedwithCalorieintake.The
correlationcoefficientsbetweennutrientsadequacy aspresentedinTable 4.34alsoshowed
thatallthenutrientshadapositivecorrelationwitheachother,andmostofthesecorrelations
weresignificant.However, thecorrelationbetweenIronandVitaminB6adequacies,Zinc
andFolateadequacies,&zincandPotassiumadequacieswere positivebutnotsignificant.
Thistrendof positivecorrelationsimpliesanindividualthathasa particularnutrient

190
inadequateamountwillhavetheothernutrientinadequateamount.ForInstance,respondent
s thathadCalciuminadequate amountalsohadadequate Phosphorus, Sodium,
Potassium,
Zinc,Ironandmagnesium.Similarly,respondentswithanadequatelevelofPotassiumalso
had ZincIronand Magnesiumin adequate amounts.
AlltheeatingstyleshadasignificantcorrelationwitheachotherasshowninTable4.36.The
correlationswerepositiveandin most caseshigh. Exceptforthe correlation betweenlow-
fat eating styleandothereating styles,thecorrelationcoefficientswerewellabove0.4.
Respondentswhoatelowfatalsotendtosnackmore,atemoreemotionally,planningahead
eating,skipping a meal and cultural/lifestyleeating. Thosethat skip mealsalso tend to
eat in a cultural/lifestylemanner.
5.1.8 Nutrients adequacy and health-relatedquality oflifeofadults
Age correlatedsignificantly,thoughnegatively,withPhysicalfunction (PF), Role-
physical (RP),Bodily
pain(BP),General(GH),Vitality(VT),roleemotional(RE)andothers.Thus,
olderrespondentshaveapoorerqualityoflifeintheirrespectivesubscales.Theroleofphysic
al SubscalehadasignificantpositivecorrelationwiththeothersubscalesofHRQL(p<0.01).
Similarly,Bodily pain(BP),General(GH),andVitality (VT)SubscalesoftheHRQL had
significant positive correlations with othersubscales(p<0.01). The correlation between
BMI andHRQL(anditssubscales)arenotsignificant.However,havingagoodqualityoflife
(as
measuredbytheReportedHealthTransition(RH)subscale)alsomeanthavingagoodquality
oflifeonthePhysicalhealth(PHH)subscale,MentalHealth(MEH)subscale,andtheoverall
health-related QualityofLife(HQRL) scale.
TheGeneralHealth Subscalecorrelated significantlywithLow-fateating,Emotional
eating, planning
aheadandcultural/lifestyleBehaviour.Thesepositivecorrelationsindicatethat
thosethatpracticeanyofemotionaleating style, planningaheadstyle,andcultural/lifestyle
behavioureating stylewilldowellonthegeneralhealthsubscale.ThisissimilartotheRH
(reported Healthtransitionsubscale) thathadapositive(andsignificant)

191
correlationwithall the subscales of HRQL.Role Emotional(RE) subscale hada
negative correlationwithmeal skippingeatingstyle.
The associationbetweentheTypeofhousethe respondentslivedandtheirhealth-related
quality oflifewassignificant(p<0.05).However,respondentswholivedinothercategories
ofhouses(e.g.facemeIfaceyou)haveahigherproportionofthemwithgoodqualityoflife
thanFlatwithbedrooms, Self-contained,oraroom.Inasimilar manner, the Mainsourceof
cookingfuelcategory (p<0.05),Incomecategory (p<0.001),Totalhouseholdcategory
(p<0.001)weresignificantlyrelated with health-related qualityof life. Respondents
who use alternativesourcesofelectricity (e.g.solar,generator)
reportedahigherproportionhavinga goodhealth-relatedquality oflifethanthoseusinga
publicpowersupply,Candle/lanternor No sourceof electricity.
Theassociationbetweenhealth-relatedquality oflifeandsocio-demographicvariablesis
showedthanMalerespondentsreportedgoodhealth-relatedquality oflifethanfemale
respondents.
Interestingly,respondentswithatertiarylevelofeducationreportedpoorhealth-
relatedqualityoflife muchmorethanrespondentswithsecondary, primary
ornoeducation.
Thisissimilartoamaritalstatuswheretheproportionofdivorced/separatedrespondentsthat
hadthegoodhealth-relatedqualityoflifeweremorethanthatofwidowedormarried
respondents.Thisassociationbetweenmaritalstatusandhealth-relatedqualityoflifeis
significant (p<0.05),as that of Age(p<0.05), Education (p<0.05) and Religion
(p<0.05). Table4.39showstheresultofthebinarylogisticregressionofhealth-
relatedqualityoflife onselectedsocio-demographicandsocioeconomicvariables.
Theselected variables were the onesthatweresignificantlyassociatedwithhealth-
relatedqualityoflifeinTables4.75and
4.76above.Althoughnotsignificant,thosewithtertiaryeducationwereabouttwice(2times)
morelikelytohaveapoorqualityoflifethanthosewithnoeducation(OR=1.739,p=0.199).
However,agehadasignificantassociationwithhealth-relatedqualityoflife(OR=0.962,
P<0.01), showingthatasone advancein age, suchis likelyto haveapoor qualityof life.
Houseownership(p<0.001), Main sourceof lightingcategory(p<0.05)and Quintile

192
(wealth
Index)(p<0.05)hadasignificantassociationwitheatingbehaviourasshownintable4.78.
Respondents who earnedmorethan ₦50,000 had the highest proportion ofpeople with
good
eatingbehaviour.Waterclosetusershadahigherproportionofrespondentshavinggood
eatingbehaviourthanthosewithnotoiletfacilitye.g.openbush,surfacewater,andPitlatrine.
However,thosewithnosourceofelectricityhaveahigherproportionhavinggoodeating
behaviorthanthosethat useCandle/lantern, Publicpowersupply,or alternativesources
(e.g.
solar,generator).Averagefamiliesreportedhigherproportionshavingbadeatingbehaviour
thanpoororrichfamilies.Thetablealsoshowsthattheproportionwithno housesandgood
eatingbehaviour was more than thosewith housesand goodeatingbehaviour.
Ahighproportionoftherespondentsreportedahighperceivedhealth-relatedqualityoflife,
justasmosthadanormalBodyMassIndex.However,asizeableproportionwaseitherobese,
underweightoroverweightrespectively.TherelationshipbetweenHRQoL andBMI was
significant(P<0.05).Allthrough,the proportionwithhighHRQoL washigherthanthose
withlowHRQoL.However,amongthosewithlowHRQoL,thehighestproportionwasthose
whowereoverweight,whilethatofthosewithhighHRQoL washighestamong thosewith
normalBMI.Therelationshipbetweentherespondents'Locality andtheirBMIwasalso
statisticallysignificant(p<0.001)one.Mostoftheunderweightrespondentswereintherural
area.In contrast, thosewho wereobeseweremajorlyresident in urbanareas.
5.2 CONCLUSION
Respondentsofthisstudy revealedthattherewerechangesintheirdietary habitsandfood
culturethroughthe
gradualerosionoftraditionalindigenousfoodsystem.Urbanisationandfood
transitionwasreportedtodivertconsumers’attentionfromlocally availablefoodsto
modernizedprocessedfoods.Erosionof food culture wasattributedtotheuse of fertilisers
andherbicideswhichwereperceivedtoberesponsiblefor the reductioninorganoleptic
propertiesandnutritionalquality ofthepresentday foods.Useofherbicideswasalso

193
attributedtoareductionintheavailability ofwildly-grownvegetables,therebyreducing
dietarydiversification.
Majorityofrespondentswereself-employedandbelongedtoalowsocio-
economicclasswith
lowincome,resultinginpooraccesstonutritiousfoods,andhencethepoornutritionalstatus
ofmany oftherespondents.Educationandoccupationweresignificantlyassociatedwith
eatingbehavior,themore educatedbeingwasmoreinvolvedinfrequentsnackingandeating
awayfromhome.Therewasan
inadequateintakeofmicronutrientsamongbothurbanandrural dwellers.The
ruraldwellersshowedmuchbetterfoodchoicesandhabitsthantheurban
dwellers,assnackingandmealskippingwashigheramongtheurbandwellersthantheirrural
counterparts.
Majority ofrespondentsreportedahighperceivedhealth-relatedquality oflife,andmore
thanhalfhadnormalBodyMassIndex.Mostoftherespondentswithalowperceivedhealth-
relatedqualityoflifewereoverweight.Mostoftheunderweightrespondentswereintherural
areawhilethosewhowereobeseweremajorlyresidentintheurbanareas.Olderrespondents
(≥50years)reportedlyhadapoorerhealth-relatedquality oflifeintermsofbody pain,
generalhealth,andvitality.Malerespondentsreportedgoodhealth-
relatedqualityoflifethan
femalerespondents,whilerespondentswithatertiarylevelofeducationreportedpoorhealth
- relatedqualityof lifethan respondentswithsecondary, primaryor noeducation. The
proportionofdivorced/separatedrespondentsthathadagoodhealth-relatedquality oflife
wasmore thanthatofwidowedormarriedrespondents.Respondentswithnoeducationhad
pooreatingbehavior,andlowfruitconsumptionandperceivedthehealth-relatedquality of
lifewereboth common in rural and urban areas.
5.3 RECOMMENDATION
There hasbeenachange fromindigenousfoodculture to westernisedfoodhabitswith
frequentsnackingandconsumptionof ready-to-eatfoods basedonconvenienceandlackof
mealplanningamongtherespondents,especially thoselivinginurbanareas.Also, the

194
consumptionoffreshfruitsandvegetableswasvery lowamongurbanresidentsdueto the
cost of purchase.
Itisthereforerecommendedthatcookinganddaily mealplanningshouldbeencouraged
amongboth urban and rural dwellers to reduceoreliminate unhealthysnacking.
Consumptionofhealthy snackssuchasfreshfruitsandvegetablesaswellaslocal
traditionalsnacksshouldbepromotedinthestudy areatopreventconsumptionofhigh
energy, low nutrient-denseunhealthysnacks.
Use ofindigenouscondiments,additives,andspicescoupledwiththededicationoftime
toandencouragingcookingathomeby caregiverswillpromotehealthy eatingatthe
household level and improve the level of health-related qualityof lifein thestudyarea.
Promotionofourtraditionalindigenousfoodsandhealthylifestylesamongtherespondents
willimprovetheirhealth-related qualityof life.
Furtherstudiesonreductioninorganolepticpropertiesandpalatabilityoffooditemsfrom
the studied localitywillbeneeded to affirm or dispute the claim of respondents.
5.4 CONTRIBUTION TO KNOWLEDGE
Thestudyreveals and establishes that:
There isagradualerosionofourtraditionalindigenousfoodsystemandchangesindietary
habitsandfoodcultureof bothruralandurbandwellers throughurbanisationandfood
transition. Thepeople inthe urban areasnack morethan therural dwellers
Fertilizer, herbicidesandotherchemicalsuse incrop productionarethreatstowildly-
grown vegetables, dietarydiversification and health-related qualityof life.
Theeatingbehaviorofthepeopleisinfluencedby theiroccupation,location,andlevelof
education.Theruraldwellershadmuchbetterfoodchoicesandhabitsthantheurbandwellers
The shiftfromtraditionalindigenousfoodstowesterndiethasreducedthehealth-related
qualityof lifeof both therural and urban dwellers.

195
Pooreating habitandculturepre-disposesbothurbanandruraldwellerstomicronutrients
deficiencies.

196
REFERENCES
Aboaba,O.I.(2003).AssessmentofNutritionalstatusoftheelderlyinOgunState,Nigeria. Ph.D. Thesis.
AdamuA.,AdjeiN.K.G.andKubuga C.K.(2012).EffectofDietary Patternsonthe NutritionalStatusofUpperPrimary SchoolChildrenTamaleMetropolis,Pakinstan. Journal of Nutrition. 11 (7): 591– 609.
AdebusoyeL.A.Ajayi,O. andOgunniyi,A.O.(2012).Nutritional Statusof Older Persons presentinaPrimary CareClinicinNigeria.JournalofNutritioninGerontology and Geriatrics UniversityCollegeHospital,Ibadan, Nigeria.
AdegokeBA(2010).Intergrating Animations,NarrativesantTextualInformation for ImprovingPhysicsLearning.ElectronicJournalofresearchinEducationalPsychology, v8 n2 p725-748.
Adeoye,O. A. andAdeoye B.K. (2002).Gender, Age, andReligion asDeterminantsof Eating HabitofYouthin Ikenne LocalGovernmentofOgun State,NigeriaBabcock University, Ilisan-Remo,Ogun State, Nigeria.
Adu,O.B., Falade,A.M.,Nwabutu, S.J.,Elemo, B.O. andMagbagbeola,O.A. (2009).Nutritional StatusofUndergraduatesinaNigerianUniversity in South-WestNigeria, Departmentof Biochemistry, Lagos State University, P.M.B.1087,Apapa, Lagos and Departmentof Biochemistry CollegeofMedicine,University of Lagos, Idi-Araba, Lagos State,Nigeria.
Adult Wikipedia free encyclopedia. https://en.m.wikipedia.org/wiki/Adult.
Agbelemoge A. (2013). Utilization of Cocoyam in Rural Households in SouthwesternNigeria: Africa Journalof Food, agriculture,Nutrition andDevelopmentVolume13No. 4 September2013

197
Akarolo-Anthony S.N.,Odubore F.O. Yilme S.,AragbadaO.,OdonyeG.,Hu-Frank, Willett W., Spiegelman D. and Adebamowo C. A. (2013). The pattern ofdietary carbohydrate intake among urbanized adult Nigerians.Int J Food Sci Nutr. 2013May;64(3): 292–299
Akewushola, R.O andAkinlabi, B.H. (2013).The Role of Microfinance Institutionson PovertyAlleviationinNigeria:ACase Studyof IJEBU-ODE LocalGovernment,Ogun State. International JournalofEconomics and Management SciencesVol.2,No.11, 2013, pp. 01-16.
Akume G.T.; Ayuba,Y.S. andObeya,R. (2008). CounsellingforHealthy LivinginOld Age inA.A.Ekoja andE.O. Sunday (Eds.)2008. Adulthood and Ageingin Nigeria. The Nigeria SocietyforEducational Psychologistspp. 71 – 77.
Alan Rogers (2004). TeachingAdults. Third Edition Open University Press.
Al-Riyami,A.,Al-Hadabi S.,AbdElAty,M.A., Al-Kharusi,H.,MorsiM. and JajuS (2010). Nutritionknowledge,beliefs, anddietaryhabits among elderlypeopleinNizwa,Oman: implicationsforpolicy.EasternMediterranean Health Journal(EMHJ),Vol.16No.8, 2010
Albon D. &Mukherji P. (2008). Food and Health in EarlyChildhood.
AllainT. J., Wilson A. O.,AlfredR.,Gomo Z.,AdamchakD. J.,Matenga J.A. (1997).Diet and nutritional status in elderly Zimbabweans, Age and Ageing 1997; 26:463-470
Amy B. (2008). Understanding Food Principles & Preparation 3rd Edition) Thomson Wedsworth AustraliaBrazilCanada.
AnastessiaK. andOlga B. (2011).EatingHabitsinOlder PeopleinGreece:TheRoleofAge, Dental Status andChewing Difficulties, Journal ofHomepage: www.elsevier.com/locate/archger.
AntigoneK.,Mark W.,Antonia I.E. P. (1989). FoodHabits andHealthofElderly in Spata, GreeceiApplicationof Survey Instrument,DepartmentofMedicine, PrinceHenry’s HospitalMonarchUniversity, St.KildaRoad,Melbourne,Australia and Departmentof Nutrition and Biochemistry,Athens Schoolof Public Health, 196 Leoforos Alexandra’s, Athens, Greece.
Austard, S.N. (1997). Why we Age. New York: Wiley.
Bengmark, S. (2006).ImpactsofNutritiononAging and DeceasedCurrentOpinionin Clinical Nutrition and theMetabolic Care9 (1) 27

198
Blankson, H.A. (2012).The anthropometricstatusof elderlywomeninrural ghana and factors associatedwithlowbody massindex.JournalofNutritionHealthAging.2012;16 (10):875-9
Bowling,A. (2005). Ageing Well:Quality of LifeinOld Age. Keynes:OpenUniversity Press.
Boyle,M.A (2003). CommunityNutritionin Action 3rd Edition. WordsworthThompson Learning Belmont, C.A
Brown, J.E. (2008).‘NutritionNow’,FifthEdition International StudentEditionThomson Wadsworth.Australia, Canada, etc.
Byers,T. andMarshal,T. (1995).TheEmergence ofChronicDiseasesinDeveloping Countries.UnitedNationsAdministrativeCommitteeonNutrition(ACC/SCN)13:16 – 19.
Cabinet O. (2008). foodmatters towards astrategyfor 21cent. Thestrategyunit
Caliendo M.A. (1981).Nutrition& PreventiveHelthCareMacmillan PublishingCo., Inc., New York Collins Macmillan Publishers London.
CardiologyResearch and Practice (2011). Article ID901651, Volume 2011 7 pages
Centerfor ProductiveLongevity(CPL,2013). TheEvolutionofAdulthood:Anewstage. http://www.ctrpl.org/materials-of-interest/papers-reports/the-evolution-of-adulthood-a-new-stage/3 15 sept 2013.
Charles W. Van W.III (1992). Handbook ofsocio0logyNutrition J.B. Lippincolt Company.
CheserekM.J,Tuitoek P.J, Waudo J.N,Msuya J.M,Kikafunda J.K.(2012).Anthropometric characteristics andnutritionalstatusofolder adults inthe LakeVictoria BasinofEast Africa:region,sex, and agedifferences. Peer reviewed,SAfrJClinNutr2012;25(2):67-72
Chris W. (2008). FoodHabits and SocialChangeEatingfast Foodtomaketimeforslow food.Kellogg’s Future Foundation An Experian Company.
Cultureof Ireland (2009). en.wikipedia.org/wiki/file:Dublin Paddy’s Day 054 JPG.DanburyConnecticut 06816
Dapi Le´onie.N,NouedouiChristophe, JanlertUrban andHaglin Lena (2005).Adolescents’ foodhabits and nutritional status in urban and rural areas in Cameroon, Africa’ Scandinavian Journal of Nutrition..49 (4): 151 –158

199
Darton,H.I.,Niskida,C. and James, W.P.T. (2004).A LifeCourseApproachtoDiet, Nutrition, and PreventionofChronicDiseases. PublicHealthNutrition7(1A):101–121.
Davison S., Passmore, R., Brock J.F. Truswell, A.S. (1975). Human Nutrition and Dietetics sixth Edition.TheEnglish Language Book Society&Churchill Livingstone.
DeGrootC. P.G.Mandvan Staveren W.A (2010).Nutritional concerns, health, andsurvival in old age. Biogerontology.2010 October;11(5): 597–602.
Denga,D.I.&Udoh, P.B. (2005).Howto growoldslowly and carefully,Calabar: Rapid Educational Publishers Limited.
Denga, H.M. (1996). Counsellingthe Aged in an ailing economy.Unpublished Paper.
Di-Maria G.,RoseA.A.E. (2005).NutritioninOlderAdults: Interventional andAssessment can help curb the growingthreat of malnutrition.
Diane, F.G. andAldwin,C.M. (2003). Health, Illness, andOptimal Ageing, Biological and Psychological Perspectives. Thousand Oaks: Sage Publication.
Drama R. (2011).Meeting your NutritionalNeeds as you AgeError! Hyperlink reference not valid
EdforsE. and WestergrenA. (2012).Home-LivingElderly People'sViews on Food andMeal.Journal of AgingResearch, Article ID 761291, 9 pages
Elodie, B. andYves, M.P(2010). Micronutrient adequacy of women’s diet in urban Burkina Faso. Thejournal of Nutrition. Vol 140(11)pg20795-20855
EncyclopediaAmericana(1989). www.worldcat.org
EneO., andHenrietta N.(undated)Nutrition Science and Practice:Emergency Issues and Problemsin FoodConsumptionDietQuality andHealthConsumption Pattern and Food intakeof Nigerians 35th inaugurallecture.
Ene-ObongH.N,EnuguG.I., andUwaegbuteA.C (2001).DeterminantsofHealth and Nutritional Statusof RuralNigerian Women.JHealth PopulationNutrition2001 Dec;19(4):320-330
Fadupin., G. T. (2012). Social Support, Environmental Condition andNutritional Status of the Elderlyin Ibadan.Nigerian Journal of Nutritional Sciences

200
Falaye, F.Y. (2009).AspectofHumanDevelopment and Learning. Ibadan:University Press. Finch, C.E. and Tanizi, R.E. (1997).Genetics of Ageing Science, 278– 407, 411.
Fischler, C. (1980). Foodhabits,social change, andthenature/culturedilemma Followsocial scienceinformation volume19 (6): 937 SAGE.
Food and Agricultural Organisation (FAO) & World Health Organisation WHO)1992.International Conference onNutrition.Nutrition andDevelopment – A good Assessment.
Food and Lifestages (FLS,2013).health.vic.gov.au/bhcv2/bhcarticles.nsf/food and yourlife stage.
Fragkadekis,G.A., Papandreou andGkouskou,K.(2012).NutritioninTertiary Education: Biological and Social Approaches. Journal of Social Sciences 8 (i): 104– 109, 2012.
Frangilho, E.A., Ranschennbach, B.S., Roe, D.A. and Williamson, D.F. (1992).Characteristics related to elderlypersons not eating forone or moredays:Implications formeal program. American Journal of PublicHealth 82: boanboin.
George, B.O. (1993). Influenceof Age, Sex andNutrientsonintakeofbonedensity ofrural Nigerian Adults Ph.D. Thesis. U.I. 1993 xviii 172leaven.
Giuli C, PapaR,MocchegianiE, MarcelliniF(2012).Dietaryhabits and ageingina sample of Italian older people.JNutrition Health Aging.2012 ;16 (9):795-872
Glanz,K., Lewis, F.M. andRimer, B.K.(1997).HealthBehaviour sandHealthEducation:Theory,Research,and Practise. San Francisco: Jossey-Bass.
Goel P.K.(2006).Dietaryhabits andnutritionalstatusof elderlyinarural area.Helpage India- Research& Development Journal vol. 12 no. 1 January2006
Hansen, J.,Holm, L., Frawer, L.,Robinson, P. and Sandoe, P. (2003).BeyondtheKnowledge ofdeficit:recentresearchintolay and export attitudetofoodrisks,Appetite,Vol.41, pp. 111 – 121.
Harper, S. (2006). Ageing Societies: Myths,Challenges, andOpportunities. NewYork: Panthewn Book.
Hays Jeffrey (2013). DietHealthy Foods, Eating Habits,and Customs in Japan.
Health and Wellness.Journal of the AcademyofNutrition and Dietetics Vol. 112.No. 8. Hélène P. andBryna S. (2005).Determinants

201
ofHealthyEatinginCommunity-dwelling Elderly People. Canadian Journal of PublicHealthVolume 96, Supplement3, S27-31
HenryC.T. andEunkookM. S. (2002)Culturalinfluencesonpersonality. Ann.Rev. Psychol 2002.53:133-60.
Human Nutrition in Developing World (HNDW)(2013).
IftikharA, Anis L.,Graham P., and P., P. (2011).Relationshipbetween anthropometric variables andnutrientintakein apparently healthymale elderly individuals:Astudy from Pakistan. Nutrition J.2011; 10: 111.
Ihedioha, L.N. (1998). Social-personal adjustmentof agedwomen: Implicationsfor counselling: The counselor, 16(2), 200-205.
ii. (2000) Nutrition and Environmental No. 21: 5– 40.
iii. (2000) Nutrition and AgricultureNo. 20: 5– 52.
Ikeda, Joenne P.(undated)Culture, Food, andNutritionin IncreasinglyCulturallyDiverse Societyin Western Culture.
Imonikebe, BridgetU.(2009). FeedingHabit and Problemsofthe Aged Peoplein IsokoNorth and South LocalGovernmentAreasofDelta State,Nigeria. African Research Review Vol. 3 (5), October 2009. Pp. 113-120
Jane Wilde,Kevin P. Balanda, SteveBarron,Emma Jurkington, and PaulaTelly (undated) CanadianGuideline’sforbody weight classificationinAdults, Instituteof Public Health in Ireland. wttp://www.ho-sl.
Jervel, I. (1995). PoorNutrition andChronicDiseases. UnitedNationsAdministrative Coordination Sub-Committeeon Nutrition (ACC/SCN)News 13: 10 – 14.
John M.deCastro (2002).Age-RelatedChanges inthe Social, Psychological, andTemporal Influenceson Food Intake in Free-Living, Healthy,AdultHumans.JGerontolA Biol Sci Med Sci 57 (6): M368-M377.
Jonathan D. and Rachael D. S. (undated) Food Culture inAmerica Greenwood Press Westport, Connecticut, London.
Josephine W. (2012). Food Habits in Nigeria.AnM.Sc. Thesis.
Karen andDonald (2001).Nutrition amongOlderAdultsinAfrica:The Situation atthe Beginningof theMillennium.
KenTont (1993).ElderlyCare,aworldperspectiveChapman&Hall London,GlasgoreNew York Tokyo Madra.

202
Kimura Y, Wada T.,Okumiya K., Ishimoto Y., Fukutomi E., Kasahara Y., Chen W., Sakamoto R., Fujisawa M., OtsukaK.,Matsubayashi K. (2012).EatingAloneamongCommunity-DwellingJapaneseElderly:AssociationwithDepression and Food Diversity. J Nutr Health Aging;16 (8):721-6
KornmanKS(2006).Interleukin1 genetics,inflammatory mechanisms, andnutrigenic opportunities to modulatediseases of aging. Am JClin Nutr. 2006.
Kouris-blazos A., Wahlqvist M. l. TrichopoulouA., Polychronopoulos E.,Trichopoulos D. (1996). Health andNutritional StatusofElderly GreekMigrantstoMelbourne, Australia, Age, and Ageing. 25:177-18
Kravchenko, J.S. (2008).Nutrition andthe Elderly. Duke University,Durban,N.C.USA, Elsevier Inc.
KurubaranG. S.ARAl-Dubai, AhmadM.Q., Al-abedAAAl-abed, RizalAM and SyedM Aljunid (2012). Social andpsychologicalfactors affecting eating habits among university studentsinaMalaysianmedicalschool:a cross-sectionalstudy. Nutrition Journal, 11:48
Lasheras C., Fernandez S., and PattersonA.M. (2000).Mediterranean diet and agewith respect to overallsurvival in institutionalized,nonsmoking elderly people. Am J Clin Nutr April vol. 71 no. 4 987-992
Leanne B. andNicoleN.(Undated)Nutrition andtheElderly:Arethe Seniorsin your Life Eating Well? http://www.sparkpeople.com/resource/nutrition-articlesasp?idz 869.
LeonieN.D.,Christophe N.U. J. and LenaH.(2005).Adolescent’s FoodHabits and Nutritional Status in Urban and Rural Areas in Cameroon, Africa.
LiamC., Bruce S., Sue F. (1995).GNVQAdvnced Health and SocialCare SecondEd.Stanley– Thomas (Publishers) Ltd.
LisaG.D. (2010).Thehospitalityindustry handbookonNutrition andMizteu Planning P.O.Box24309, Langdowne7779.Man’s Changing food culture(MCFC)(2010).
Lisa G.D. (2002).Thehospitalityindustry handbookonNutrition andMizteu Planning P.O.Box24309, Langdowne7779.
Madegascar (2013). Countries and theirCulture. Ja-ma Cultureof Madagascer.
MaijaK.K., SeppoV.P.K.,Ritva S. P. (2008). ResearchReportofNational PublicHealth Institution,Department ofHealth and Functional Capacity, Mannerheimintie,166, FIN– 00300 Helsinki Finland.

203
Man’s Changing Food Culture(2010). Highlightsof Dawn. Marcia L. P. and Susan S.(undated)DietaryMonotony and FoodCravingsinYoung and ElderlyAdultsMonellChemical SensesCenter,3500Market Street, Philadelphia P.A. 19104, USA.
Maria, R.M., Oliveira, Kally, C.P., Fogaca and Varia, A. Leandro– M. (2009).Nutritional Status and FunctionalCapacityofHospitalised elderlyinNutrition Journal Instituteof Brosciences,UNESP– SIO. Paulo StateUniversity,Rubiao District, Botucatu– Sao Paulo, 18, 618– 000 MB510, Brazil.
MaryAnn J., Sohyon P.,Dawn P., Jacquelyn W.,McclellandK. B.,Andrey A. (2005). Nutrition Education: Issues forOlder Adults.
Mattithias P., andHerbert L. (2001).NutritionintheElderly Best Practice andResearch ClinicalGastroenterologyvol.15,No.6pp. 869–884doi:10.1053/bega.2001.0246, http://www.idealibrary.com on IDEAL Berlin Germany.
Mervyn C. (2012)Culture, Food and IdentityCulture and Development Sixth in a series.
Mishra Sanjaya (2005). Research methodsin thesocial sciences. British Journal of Educational Technology,Volume 36, Issue3
Mitchell R.&Anderson D. (1976).Nutritioninhealth anddisease.J.B. LippincottCompany PhiladelphiaNew York/San Jose/Toronto.
Muhammad F.A. and Naleena D.M. (2012).Nutritionalstatus and eating practices among children aged 4-6 years oldinselected urban area andruralkindergartenin Selangor, Malaysia. Asian Journal of Clinical Nutrition 4(4):116-131, 2012
Nishida,C. andMucavele, P. (2005).MonitoringtheRapidlyEmerging PublicHealth Problem of Over Weight and Obesity. SCN NewsNo. 29: 5– 12.
NorimahA.K.& Haja M.M.K. (2003).Nutritional Status and Food HabitsofMiddle-aged Adults in Selected Areas of Selangor.Mal JNutr9(2): 125-136.
Ofuoku,A.U.,&Chukwuji,C.O. (2012).The impactofrural-urbanmigrationonplantation agriculture inthe Niger Deltaregion, Nigeria. Journal ofRural Social Sciences 27(1):137-151.
Ogunlela, I. O and Muktar, A.A (2009). “Gender Issues in Agriculture and RuralDevelopmentinNigeria:Theroleof Women”inHumanity and Social Sciences Journal 4 (1): 19-30, IDOSI Publishers

204
OkoliC,EnnaM.(2014)A cross-sectionalstudy onknowledge of, attitudestowards and practice of malariaprevention. South Afr J InfectDis 2014; 29(1): 37-42.
OlasunboO. I. andOlubode K.A. (2006). Socio-demographic andnutritional assessment of the elderlyYorubas in Nigeria.Asia Pac J Clin Nutr 2006;15 (1): 95-101
OlderAdults LivinginMediterranean Islands:TheRoleofDietaryHabits andNutrition Services.
Oldwage–Theron, WH, Samuel, F.,Globler,C. andEgal,A.A. (2008).Anaemia Prevalence and Dietaryintake of elderly persons living in a peri-urban settlement in South Africa.Journal of FamilyEcology and Consumer Sciences.Volume36.
Olowookere S.A., Fatiregun A.A.,Adewole IF (2012).Knowledge and attitudesregarding HIV/AIDS and antiretroviraltherapy among patients ataNigeriantreatment clinic.The Journalof InfectioninDeveloping Countries [Internet].2012;6(11):809–16.Available from: http://www.jidc.org/index.php/journal/article/view/2086
Olowookere, J. (2003).Ageing andthekey tolongevity. Triumph–providentialpublishers Ilisa-Sagamu & Ibadan.
Olusanya,O. (1985).Changing FoodconsumptionpatternsinselectedRural andUrban Areas in Oyo and Ogun States,Nigeria. Ph.D.
Oniang’o R.,Mutuku J.,Malaba S. J. (2003).ContemporaryAfrican FoodHabits andtheir nutritional andhealth ImplicationAsia Pacific J.ClimNutrition2003;12(3);231–236.
Onu,V.,&Onu,A. J.C. (2012).UrbanResidentialHousing and Low-incomeEarners:A studyof MakurdiMetropolis, Benuestate, Nigeria.European Scientific Journal,8(28),231-246.
Oyediran,A.O. (2009). Beliefs, Preparationfor andAttitudeTowards Ageing, Death and DyingAmongRetiring Civil Servants in NigeriaA research proposal.
Papalia,D.E.&Olds, S.W. (1995). HumanDevelopment(6th ed.)NewYork: McGraw- Hill Incorporated
Popkin BM.(1998).TheNutritiontransition anditshealth implicationsinlower-income countries. PublicHealthNutr.1998.
PositionoftheAcademy ofNutrition andDietetics (2012). Food and NutritionforOlder Adults: PromotingHealth and Wellness. JournaloftheAcademy ofNutrition and Dietetics Vol. 112.No. 8.

205
RaschkeV.Oltersdorf, U.Elmalfa I., WahlquistM.L.,Kousi– BlazezA. andChema, B.S.B. (2007)TheNeedfor anOnlineCollectionofTraditionalAfrican FoodHabits.African Journal of Food, Agriculture and Development Vol. 7, No. 1 Vienna, Australia.
Riches,G. (2002). “Food Banks and Food Security: WelfareReform, HumanRight, and Social Policy, LessonsfromCanada”, Social Policy andAdministration,Vol.36,No.6 pp. 648 – 663.
Rozin, P., Fischler C., Imada S., SarubinA., WrzesniewskiA. (1999).Attitudestofood and theroleoffoodintheUSA, Japan, Flemish Belgium and France: PossibleImplications for theDiet-Health Debate:ArticleNo.Appe.1999.0244, availableonline at htt://www.idealibrary.com on/deal.
Saltman,R.B.,Dubois, H.F.W.,& Chawla,M. (2006).The ImpactofAgeing onlong-term careinEurope, andsomepotentialpolicy responses. International JournalofHealth Services 36 (4); 719-746.
Sara R. J. and JohnM. R. (2008). Stated choice experimentation, contextualinfluences and food choice: A casestudy. Food Quality and Preference19 (2008)539–564
SimpsonE.E.A.,Rae-Gordon, Parr H., O’Connor JacquelineM., Bonham M., PolitoA., MeunierN.,Andriollo-Sanchez M., Intorre F.,Coudray C., Strain J.J., Stewart-Knox Barbara (2011). Predictorsoftaste acuity inhealthy olderEuropeans.Appetite58 (2012) 188–195
Sitter and Lengyel (2011).Nutritionalstatus and eatinghabitsofolderManitobans after relocatingto a personal carehome.
Sizer S. F.& Whitney E.N. (2000).Nutrition Concepts andControversiesEightEdition Wasworth Thomson Learning – Australia.CanadaDenmark etc.
Srilakshmi, B. (2006). Nutrition Science. The new age international(P)limited,publishers new Delhi etc.
Srilakshmi, B. (2008).Diabetes.Thenew ageinternational(P)limited,publishersnew Delhi etc.
Stark R. (1975). Social Problems(CRM)RandomHousewithRonald L,Akers,RobertC. Atchley, James F. Blackwell,Katherine Brior, Scott Brior, AchieBrodsley,Howard S. Erlanger etc.
StefanoT. and Evangelos P. (2010). Lessons from StudiesinMiddle-Aged andOlderAdults LivinginMediterranean Islands:TheRoleofDietary Habits andNutrition Services. CardiologyResearch and PracticeVolume2011 (2011), Article ID901651, 7 pages

206
Steyn,N.P.Dr. andNal, J.N. Dr. (2006).Dietary IntakeofAdult Womenin SouthAfrica, Kenya andNigeria withafocusontheuseofspreads,Chronic Diseases of Lifestyle Unit, Medical ResearchCouncil, P.O. Box19075 Tygerberg, 7505 South Africa.
Strawbridge, W.J.;Mallhagen, M.I. and Cohen, R.O. (2002). SuccessfulAgeing and Well- being: Self-relatedComparedwithRowe and KalinGervatologist42(6)6727–33 PMID 12451153.
TheEncyclopediaAmerican International (1989).EditionCompletedinThirtyVolume13thEdition Vol. 13 pg. 662. Grolier Incorporated, International Headquarter.
TheEncyclopediaAmericana International (1989).EditionCompleted inThirtyVolumes 13th Edition Vol. 8 pg. 664.
The Free Library (2003).Nutrition of Older Person in Sudan; A Gender Perspective.
The New Encyclopedia& Britannica (2007).15thEdition Pg.784Encyclopedia Britannica Inc. Jacob B. SafraChairmanoftheChairmenofthe Board Jorge Aguilr–Cauz, Prestilen Chicago.
TheNew Encyclopedia Britannica (2007).15th Edition Vol. 5 pg. 602.
Thompson Mick (2011). World Changes Eating Habits has Food Prices Soar (CNN) Trichopoulou A., Orfanos P., Norat T., Bueno-de-Mesquita B., Ocké M. C, Peeters P.
HM, Van der Schouw Yvonne T. (2005). Modified Mediterranean diet and survival: EPIC-elderly prospective cohort study. BMJ 2005; 330:991
TullA. (1996). Food andNutrition.New editionin colourOxfordUniversity Press, Great Clarendon Street, OxfordOx2 6 DP.
United Nations (UN)(1990) Someoptions forimprovingnutiriton in the 1995.
UnitedNations(UN, 2017). World PopulationAgeing2017Highlights.Department of Economic and Social Affairs. United Nations NewYork, 2017.
Wahlquist,M.L. and BlazolAK. (1998). FoodBasedDietary Guideline forOlderAdults: Healthy Aging and PreventionofChronicnon communicablediseases inNutrition GuidelinesforElderly,joint WHO/TuftUniversity ConsultativeorNutrition Boston USA pg. 12.
Wahlquist, M.L. and BlazolA K. (1999). FoodBased DietaryGuideline– FBDGs in ACCL SCN New Nutrition and Healthy AgingNo. 19, 24-26.
Watson J. (2011). National AdultNutrition Survey

207
Webster’sNew WorldCollegeDictionary ThirdEdition.Victoria NeufeldEditor-in-chief Macmillan USA. David B. Guralnik Editor-in-chief Emeritus. Websters.yourdictionary.com
WhitneyE.&Rolfes S. R. (2008).Understanding NutritionEleventhEditionThomson Winds worth Australia, Canada.
WHO (1989). Guidelines and Standards for Wastewater. International Experiencesin Formulation Guideline.
WHO (1999). Global Movement for Active Ageing In: Ageing and Health WHO. Geneva
WHO(2003). Theworldhealth report– shapingthefuture. www.who.int/whr/2003/en/
Wickrama,KA S, RalstonPA, O'NealC W, IlichJ Z, HarrisCM,Coccia C, Young-Clark I,LemacksJ (2012). LifeDissatisfaction andEatingBehaviors amongOlder AfricanAmericans:The ProtectiveRoleof Social Support.JNutrHealthAging.2012;16 (9):743-8
Wikipedia, thefreeEncyclopaedia (2012). Mediterranean Diets.
Williams S.,Rodwell (1973).Nutrition&DietTherapy Second edition.TheC.V.MobbyCompany Saint Loui
Woods J. L, Walker K. Z., Iuliano-Burns S., Strauss B. J (2009). Malnutrition on the menu: Nutritional status of institutionalised elderly Australians in low-level care. The Journal of Nutrition, Health and Aging, July 2009.
World Bank (2001). The World Bank annual report 2001: Year in review (English). Washington, DC: World Bank. www.foodproductiondesign.com/news (2012/02) Social Media Changing America FoodCulture. www.thefreelibrary.com/nutrition (2012).NutritionofOlder Personsin Sudan:AGendePerspective.
Yomiuri S. (2012). In Food Diet, healthyfood, EatingHabits and Customs in Japan.
YoungHee Lee, Jongeun Lee,MiyongT.Kimi, andHae-Ra Han (undated) In-Depth AssessmentoftheNutritional StatusofKoreanAmericanElderly GeneticNursing, Volume 30, Number 5.
Zada Pajdic, Lena Person,Albert Westergrenm BerggreVanga andKirsti Skordath (2012). TheExperiencesof People Living atHomeRelatedtoReceivingMealsin Journalof Food Research www.ccsenettorg/jfr Sweden.

EFFECT OFCHANGESINFOTHE NUTR
208
APPENDICES
SINFOOD CULTURE AND HABITS ON NUTRITIONAL STATUS
QuestionnaireID
State
SenatorialDistrict
LGA
Ward
HouseholdNo
PhoneNo.

209
ANDHEALTHRELATEDQUALITYOFLIFEOFADULTS INOYOSTATE InformedConsentForm Greetings, My NameisAKINRINADEGraceapostgraduatestudentoftheDepartmentofHuman Nutrition, Facultyof Public Health, Collegeof Medicine, UniversityofIbadan, Nigeria.Iam presently carryingoutastudy onthe“EFFECTOFCHANGESIN FOODCULTUREAND HABITSONTHENUTRITIONALSTATUSANDHEALTHRELATEDQUALITYOFLIFE OFADULTS IN OYOSTATE” Confidentiality andConsent: Iwillaskyousomequestions,someofwhichmaybepersonal.Yourparticipationinthis study isentirelyvoluntary.Theinformationprovidedwillbekeptconfidentialandwillnot bedisclosedtoathirdparty.Nonameisrequiredinfilling thequestionnaire.This questionnairewillrequireabout20minutesofyourtime.Pleasetryandgivehonestresponses tothequestionsasmuchaspossible.Youarefreetoaskquestionswhereitisnotclear.Thank you Do I haveyouragreement to proceed? Yes [ ] No [ ] Respondent’s Signature _______ Date ____________ Signatureof respondent indicates informedconsent was provided. AKINRINADE Grace

210
S/N DemographicCharacteristics 1. Ageatlastbirthday(inyears)
Sex Male(1) Female(2)
2. Ethnicity Yoruba(1) Igbo(2) Hausa(3) Others(4)Specify………………...
3. MaritalStatus Single(1) Married(2) Divorced/Separated(3) Widow(4) 4. Type of
Marriage Monogamy(1) Polygamy(2)
5. Noofwives 6. Highest
Education None(1) Primary(2) Secondary(3) Tertiary(4)
7. Occupation Trader(1) Artisan(2) CivilServant(3) Others(4)Pleasespecify
8. Religion Christianity(1) Islam(2) Traditional(3) Others(4)Pleasespecify
9. Employment status
Not applicable (suspension litigationetc)(1)
Unemployed (2)
Self employed (3)
Wage–Earner (4)
Retired (5)
PrivateCompany(7) Other(8) Pleasespecify
10. Incomelevelinamonth LessthanN10,000(1) N20,000–N29,000(3) N40,000–N49,000(5)
N10,000–N19,000(2) N30,000–N39,000(4) N50,000&above(6)
11. Amountspentonfoodina month
LessthanN10,000(1) N20,000–N29,000(3) N40,000–N49,000(5)
N10,000–N19,000(2) N30,000–N39,000(4) N50,000&above(6)
HouseholdCharacteristics 12. TotalnumberofpeopleintheHousehold:
Numberofpersonsperroom:
13. Houseownership No(0) Yes(1) 14. Type of
house Aroom(1) A RoomandParlor(2) Selfcontained(3)
2-3bedroomApartment(4) Bungalow(5) ADuplex(6)
15. Building material Wood(1) Mud(2) ConcreteBrick(3) Other(4) Please specify 16. Flooringmaterial None(1) Wood(2) Concrete(3)
Tiles(4) Terrazzo(5) Other(8)Pleasespecify 17. Roofingmaterial Thatched roof
(1) Aluminium sheet(2)
Corrugated sheets(3)
Concrete(4) Others(5)
18. Main source of drinkingwater
Surfacewater (stream,river,pond) (1)
SurfaceWell (2) DeepWell(3)
Publicwatertap (4) Municipalwatersupply (5) Watersupply(tankersand vendors)(6)
Boreholeinresidence(7) Packagedwater(sachetandbottledwater)(8) Other(9)Pleasespecify
19. Main source of Cookingfuel
Wood(1) Charcoal(2) Kerosene(3) Gas(4) Electricity(5) Other(6)Pleasespecify
Questionnaire Demographic Characteristics Thankyouforcompletingquestions!

211
Household properties(Wealthindex)
Gadgets Furniture Properties Radio No(0) Yes(1) Table No(0) Yes(1) Land No(0) Yes(1) Television No(0) Yes(1) Chair No(0) Yes(1) Clock No(0) Yes(1) Camera/Camcorder No(0) Yes(1) Sofa No(0) Yes(1) Waterpump No(0) Yes(1) Cassetteplayer No(0) Yes(1) Bed No(0) Yes(1) Grinder/Blender No(0) Yes(1) DVD/VCDPlayer No(0) Yes(1) Armoire No(0) Yes(1) Waterheater No(0) Yes(1) Mobilephone No(0) Yes(1) Cabinet No(0) Yes(1) Washingmachine No(0) Yes(1) Computer No(0) Yes(1) Window Micro-wave No(0) Yes(1) Digitaldecoder (DSTV,Startimesetc)
No(0) Yes(1) WithShutters No(0) Yes(1) Air-conditioner No(0) Yes(1)
Watch No(0) Yes(1) Withglass No(0) Yes(1) Refrigerator No(0) Yes(1) Vehicle Withscreen No(0) Yes(1) Generator No(0) Yes(1)
Bicycle No(0) Yes(1) Withcurtains No(0) Yes(1) Animals No(0) Yes(1) Motorcycle No(0) Yes(1) Bankaccount No(0) Yes(1) Tricycle No(0) Yes(1) Domesticservant No(0) Yes(1) Car No(0) Yes(1) Truck No(0) Yes(1)
Thankyouforcompletingquestions!
20. Main source of Lighting
None(1) Candle(2) Lantern(3) Publicpowersupply(4)
(PHCN) Alternativesources(5) (Generator,Solar,In Other(6)Pleasespecify
21. Toiletfacility Openbush(1) Surface water (stream, river, pond etc)(2)
Pitlatrine(3)
Watercloset(4) Other(5)Pleasespecify 22. Refuse
disposal Method
Openbush(1) Surfacewater(streams,riversetc)(2) Burning(3)
Refusedump(4) Incinerator(5) Cityservice(6)
Other(7)Pleasespecify

212
Foodfrequency Questionnaire No. FoodDescription No Rarely Daily Weekly Monthly
Once 2ce 3ce Once 2ce 3ce Once 2ce 3ce 1. CASSAVA : 1. Gari
2. Lafun 3. Fufu 4. Others (Pleasespecify)
2. YAMAND POTATOES 1. Yam(roasted/boiled)
2. Yam flour 3. Poundedyam 4. Yamporridge 5. Yam(fried) 6. Cocoyam(cooked) 7. Cocoyam(fried) 8. Sweet potatoes (cooked) 9. Sweet potatoes (fried) 10. Others (pleasespecify)
3. MAIZE: 11. Ogi/Pap/Koko 12. Eko/Agidi 13. Tuwo Masara 14. Maize grain(cooked/roasted) 15. Kokoro 16. Sapala/Abari 17. Iro 18. Guguru 19. Others (Pleasespecify)
4. RICE: 20. White Rice(cooked) 21. Jollofrice 22. Friedrice 23. Tuwoshinkafa 24. Others (Pleasespecify)
5. BEANS/COWPEAS 25. Beans (cooked/boiled)
26. Moin –moin 27. Akara 28. Akara Ikoko 29. Ekuru 30. Gbegiri 31. Others (Pleasespecify)
6. WHEAT: 32. Whole wheat bread 33. White bread 34. Biscuit 35. Wheatflour(boiled) 36. Confectionaries e.g. chinchin, puff- puff, buns,cookies etc.
37. Others (Pleasespecify) 7. MEAT AND ALLIED
PRODUCTS: 38. Beef
39. Poultry 40. Fish 41. Egg 42. Freshmilk 43. Tinnedmilk 44. Cheese 45. Yoghurts 46. Others (Pleasespecify)

213
8. TEA,BEVERAGESAND OTHER DRINKS
47. Tea (Lipton,toptea etc)
48. Beverages (Milo, Bourn vita, Richoco)
49. Coffee 50. Others (Pleasespecify)
9. FRUITS 51. Citrus fruits (oranges,grape,lemon,tangerines,lime)
52. Mango 53. Pawpaw
54. Guava 55. Pineapple 56. Watermelon 57. Cashew 58. Apple
59. Pear
60. Carrot 61. Banana 62. Plantain 63. Others (Pleasespecify)
10. OIL AND SEED NUTS 64. Peanut/Groundnut(boiled/roasted)
65. Cashewnut 66. Oil palmnut 67. Coconut
68. Others (Pleasespecify)
11. VEGETABLES 69. Leafy vegetables
70. Nonleafyvegetable (e.g.Okro)
71. Others (Pleasespecify) 12. Drinks
72. Carbonateddrinks (Coke, Fanta etc)
73. Malted drinks (maltina,guiness etc) 74. Alcoholic drinks (Gulder, Star etc) 75. Juice(Funman, Five Alive etc)

214
S
S
24hr DietaryRecall. Pleasetellmeeverythingyouateordrankafteryouwokeupyesterdaymorning.Includeallyouate and drankathome and away, even snacks, tea,coffee.Be specificaspossible.
Item No.
Food/Drink Description (type, volume, size/price)
Place Taken
Time Quantity Weight equiv. (g)
FOODINTAKE. Wasfoodintake usual? YE NO IfNO, How was itunusual?
FOOD HABITS? ProbeforSupplement(Iron,Vitamins,antimalarialdrugs, othersupplement)YES NO IfYESSpecify………………………………
Wasita Feastday? YE NO
Do you take Fermented beverages?(e.g. Alcohol) IfYESSpecify………………………
ProbeforSickness YES NO Do you Smoke?YES NO IfYESdid the sicknessaffectyourappetite YES
IfYES, how?IncreaseORDecrease
Anthropometric Measurements
Age(inyears) Weight(kg) %Bodyfat
Sex Height(cm) %Visceralfat
Thankyouforcompletingquestions! EapttingbehaviourpatternQuestionnaire (adaedfromSchulundtDG,PhD.VanderbiltUniversitySchoolofMedicineODAQuestionnaire) Readeachitemandthink ifyouagreeordisagreethat the itemdescribesyouand youreating habits. Marktheboxthatbestdescribes yourlevelofagreement with each statement.Ifa statementdoesnot apply toyou(forexample aquestionasksaboutwhatyoudoatwork youdonothavea job),then mark3 (neutralorN/A)box.

215
1 – Strongly disagree; 2 –Disagree;3 – Neutralor N/A; 4 – Agree; 5–Stronglyagree SA D N A SD 1 I stop forfastfoodbreakfaston my waytowork 1 2 3 4 5 2 MyemotionsaffectwhatandhowmuchI eat 1 2 3 4 5 3 I uselowfatfoodproduct 1 2 3 4 5 4 I carefullywatchtheportionsizesof my food 1 2 3 4 5 5 I buysnacksfromvendingmachine 1 2 3 4 5 6 I choosehealthyfoodstopreventheartdisease 1 2 3 4 5 7 I eatmeatlessmealsfromtimetotimebecauseIthinkthatishealthierforme 1 2 3 4 5 8 I taketimetoplan mealsforcomingweek 1 2 3 4 5 9 WhenI buysnackfoods,I eatuntilI havefinishedthewholepackage 1 2 3 4 5 10 I eatforcomfort 1 2 3 4 5 11 I ama snacker 1 2 3 4 5 12 I countfatgrams 1 2 3 4 5 13 I eatcookies,candybars,oricecreaminplaceofdinner 1 2 3 4 5 14 WhenI don’tplanmeals,I eatfastfood 1 2 3 4 5 15 I eat whenI amupset 1 2 3 4 5 16 I buy meateverytimeI gotothe grocerystore 1 2 3 4 5 17 I snackmoreat night 1 2 3 4 5 18 I rarelyeatbreakfast 1 2 3 4 5 19 I trytolimitintakeofredmeat(beef) 1 2 3 4 5 20 WhenI amina badmood,I eatwhateverI feellikeeating 1 2 3 4 5 21 Ineverknow whatIamgoingto eatforsupperwhen Igetup inthe morning 1 2 3 4 5 22 Isnacktwo to threetimesaday 1 2 3 4 5 23 Fish and poultryaretheonly meats Ieat 1 2 3 4 5 24 When Iamupset, Itend tostopeating 1 2 3 4 5 25 Ilike to eatvegetablesseasoned with fattymeat 1 2 3 4 5 26 IfIeata larger than usual lunch, Iwillskipsupper 1 2 3 4 5 27 Itake ashoppinglisttothe grocerystore 1 2 3 4 5 28 IfIambored, I willsnackmore 1 2 3 4 5 29 Ieatatchurchsocials. 1 2 3 4 5 30 Iamveryconsciousofhowmuch fatis in the foodIeat 1 2 3 4 5 31 Iusually keep cookiesin the house 1 2 3 4 5 32 Ihave aservingofmeatatevery meal 1 2 3 4 5 33 Iassociate success with food 1 2 3 4 5 34 Acomplete mealincludesameat, a starch, a vegetable,and bread 1 2 3 4 5 35 On Sunday, Ieata large mealwith myfamily 1 2 3 4 5 36 Instead ofplanningmeals, I willreplacesupperwith asnack 1 2 3 4 5 37 IfIeata larger than usual lunch, Iwillreplacesupper with asnack 1 2 3 4 5 38 IfIambusy,Iwilleatasnackinstead oflunch 1 2 3 4 5 39 SometimesIeatdessertmore than onceaday 1 2 3 4 5 40 Ireduce fat inrecipesbysubstitutingingredientsand cuttingportions 1 2 3 4 5 41 Ihave asweettooth 1 2 3 4 5 42 Isometimessnackeven when Iamnothungry 1 2 3 4 5 43 Ieatoutbecause itis more convenientthan eatingathome 1 2 3 4 5 44 Ihate to cook 1 2 3 4 5 45 Iwould ratherbuytakeoutfood and bringithome thancook 1 2 3 4 5 46 Ihave at least threetofourservings ofvegetablesperday 1 2 3 4 5 47 To me, cookiesare anidealsnackfood 1 2 3 4 5 48 Myeatinghabits are very routine 1 2 3 4 5 49 IfIdo not feelhungry, Iwillskipa mealeven ifitis time to eat 1 2 3 4 5

216
50 Whenchoosingfastfood, Ipicka placethatoffers healthyfoods 1 2 3 4 5 51 Ieatatafast food restaurantatleast threetimesa week 1 2 3 4 5
Thankyouforcompletingquestions!
HealthrelatedQuality oflife Yourhealthandwellbeing Thissurveyasksforyourviewsaboutyourhealth. Thisinformation willhelpkeeptrackofhowyoufeeland howwell youareabletodoyourusualactivities.Thank youforcompletingthissurvey! Foreachofthefollowingquestionspleasemarktheonethat bestdescribesyouranswer.
Excellent (1)
Verygood (2)
Good (3)
Fair (4)
Poor (5)
1. Ingeneral,wouldsayyourhealthis
3. Thefollowingquestionsareaboutactivitiesyoumightdoduringa typicalday.Doesyourhealthnowlimityouintheseactivities?Ifso,how much?
Yes,limited a lot (1)
Yes, limited a little (2)
No, not limited atall(3)
a. Vigorousactivitiessuchasrunning,lifting,heavyobjects,participatingin strenuoussport
b. Moderateactivities,suchasmovingtables.Pushingavacuumcleaner, bowling,or playinggolf
c. Liftingorcarryinggroceries d. Climbingseveralflightsofstairs e. Climbingone flightofstairs f. Bending,kneelingor stooping g. Walkingmorethanamile h. Walkingseveralhundredyards i. Bathingordressingyourself
4. Duringthepast4weeks,howmuchofthetimehaveyouhad anyofthefollowingproblemswithyourworkorotherregulardailyactivitiesasa resultofyourhysicalhealth?
Allofthe time (1)
Mostofthe time (2)
Some of thetime (3)
Alittleof thetime(4)
None of thetime(5) a. Cutdownontheamountoftimeyouspent
b. Accomplishedlessthanyouwouldlike c. Werelimitedinthe kindofworkorotheractivities d. Haddifficultyperformingtheworkorotheractivities
(forexample,ittookextraeffort)
5. Duringthepast4weeks,howmuchofthetimehaveyouhadanyofthefollowingproblemwithyourworkorotherregular dailyactivitiesasa resultofanyemotionalproblems
a. Cutdownontheamountoftimeyouspentonworkorother Activities
b. Accomplishedlessthanyouwouldlike c. Didworkorotheractivitieslesscarefullythanusual
Muchbetternowthan oneyear ago(1)
Somewhatbetternowthan oneyear ago(2)
Aboutthesameasoneyearago(3)
Somewhatworsenowthan oneyear ago(4)
Much worse now than one year ago (5)
2. Comparedtooneyearago,howwouldyourateyourhealthin generalnow?

217
Notatall
(1) Slightly (2)
Moderately (3)
Quitea bit (4)
Extremely (5)
6. Duringthepast4weeksto whatextenthasyourphysical healthoremotionalproblemsinterferedwithyournormal socialactivitieswithfamily,friends,neighborsorgroups?
None
(1) Very mild (2)
Mild (3)
Moderate (4)
Severe (5)
Verysevere (6)
7. Howmuchbodilypainhaveyouhadduringthepast 4 weeks?
Notatall
(1) Alittlebit (2)
Moderately (3)
Quitea bit (4)
Extremely (5)
8. Duringthepast4weeks,howmuchdidpaininterfere withyournormalwork(includingboth workoutside thehomeandhousework)?
9. Thesequestionsareabouthowyoufeelandhowthingshave
been withyouduring thepast4weeks. Foreachquestion, pleasegivetheoneanswerthatcomesclosesttothewayyou havebeenfeeling. Howmuch ofthetimespentduring the past4 weeks
Allofthe time (1)
Most of thetime (2)
Some of thetime (3)
Alittleof thetime (4)
None of thetime (5)
a. Didyoufeelfulloflife? b. Haveyoubeenverynervous? c. Haveyoufeltsodownindumpsthatnothingcouldcheeryou
up?
d. Haveyoufeltcalmandpeaceful? e. Didyouhavea lotofenergy? f. Haveyoufeltdown-heartedanddepressed g. Didyoufeelwornout? h. Haveyoubeenhappy? i. Didyoufeeltired? 10. During thepast4weeks, howmuch ofthetimehasyour
physicalhealthoremotionalproblemsinterferedwithyour socialactivities(likevisitingfriends,relatives,etc)
11. Howtrueorfalseiseachofthefollowingstatementsfor you?
Definitel y true (1)
Mostly true (2)
Don’t know (3)
Mostly false (4)
Definitel y false (5)
a. I seemto getsicka littleeasierthanotherpeople b. I amashealthyasanybodyI know c. I expectmyhealthto getworse d. Myhealthisexcellent
Thankyouforcompletingquestions!

218

219
DEPARTMENTOFHUMANNUTRITION FACULTYOFPUBLICHEALTH
COLLEGE OFMEDICINE
UNIVERSITYOFIBADAN, IBADAN, NIGERIA Tel: 02-7517822 Telegrams:UniversityIbadan Telex:Campus31128 NG Fax:(CollegeofMedicine)02-2411768 Email:[email protected] 27thSeptember,2013 TheHead, AtibaLocalGovernmentAdministration, OffaMeta,Oyo. OyoState Dear Sir, LEITEROFINTRODUCTION AKINRINADE,GraceOyeladun: Matric No.72089 This is to introduceAKINRINADE,GraceOyeladun(MatricNo.72089), is a M.Phil/Ph.D student in the Department of Human Nutrition, Faculty of Public Health, College of Medicine,Universityof Ibadan..She is currently undertakingaprojecttitled:"Effect of Changing Food culture and habit on the Nutritional Status and Health Related Quality of Life among Adults in Oyo State” I will appreciate your support, for her to collect the data for this project.

220
DEPARTMENTOFHUMANNUTRITION FACULTYOFPUBLICHEALTH
COLLEGE OFMEDICINE
UNIVERSITYOFIBADAN, IBADAN, NIGERIA Tel: 02-7517822 Telegrams:UniversityIbadan Telex:Campus31128 NG Fax:(CollegeofMedicine)02-2411768 Email:[email protected] 27thSeptember,2013 TheHead, Ibarapa EastLocalGovernment, Eruwa, OyoState. Dear Sir, LEITEROFINTRODUCTION AKINRINADE,GraceOyeladun: Matric No.72089 This is to introduceAKINRINADE,GraceOyeladun(MatricNo.72089), is a M.Phil/Ph.D student in the Department of Human Nutrition, Faculty of Public Health, College of Medicine,Universityof Ibadan..She is currently undertakingaprojecttitled:"Effect of Changing Food culture and habit on the Nutritional Status and Health Related Quality of Life among Adults in Oyo State” I will appreciate your support, for her to collect the data for this project.

221
DEPARTMENTOFHUMANNUTRITION FACULTYOFPUBLICHEALTH
COLLEGE OFMEDICINE
UNIVERSITYOFIBADAN, IBADAN, NIGERIA Tel: 02-7517822 Telegrams:UniversityIbadan Telex:Campus31128 NG Fax:(CollegeofMedicine)02-2411768 Email:[email protected] 27thSeptember,2013 TheHead, IwajowaLocalGovernmentAdministration, Iwara -Ile, OyoState Dear Sir, LEITEROFINTRODUCTION AKINRINADE,GraceOyeladun: Matric No.72089 This is to introduceAKINRINADE,GraceOyeladun(MatricNo.72089), is a M.Phil/Ph.D student in the Department of Human Nutrition, Faculty of Public Health, College of Medicine,Universityof Ibadan..She is currently undertakingaprojecttitled:"Effect of Changing Food culture and habit on the Nutritional Status and Health Related Quality of Life among Adults in Oyo State” I will appreciate your support, for her to collect the data for this project.

222
I
ATIBALOCALGOVERNMENT
P.M.B. 1043,Ofa-Meta.Oyo.OyoState. Tel:0815 887 0358
Alu/017/2 OUrRef AkinrinadeGraceOyeladun,
CollegeofMedicine, UniversityofIbadan, Ibadan
RE: LETTER OF INTRODUCTION
Sequel to the letter from the Department of Human nutrition,
faculty of public health, College of Medicine, University of Ibadan,
dated 27th September 2013 on the above subject, I am directed to
convey approval for you to proceed on your research work titled
"Effect of Changing Food culture and habit on the Nutritional
Status and Health Related Quality of Life among Adults in Oyo
State” in the Local Government. Thank you Akj\y\ E.O. (Mrs.) For; C~clirman, Atiba Local Gover111111::n Ofa-Meta, Oyo
11/3/2014

223

224

225
SD D N A SA
Respondents Eating BehaviourPattern Variables n(%) n(%) n(%) n(%) n(%)
1 I stop forfastfoodbreakfaston my wayto 304(51.6) 155(26.3) 46(7.8) 65(11.0) 14(2.4) Work 2MyemotionsaffectwhatandhowmuchI 78(13.2) 129(21.9) 34(5.8) 282(47.9) 60(10.2) Eat 3 I uselowfat foodproduct 151(25.6) 210(35.7) 44(7.5) 159(27.0) 18(3.1) 4Icarefullywatchtheportionsizesofmy 106(18.0) 169(28.7) 48(8.1) 235(39.9) 24(4.1) Food 5 I buysnacksfromvendingmachine 140(23.8) 64(10.9) 149(25.3) 21(3.6) 211(35.8) 6 I chooseHealthyfoodstoprevent 90(15.3) 200(34.0) 85(14.4) 189(32.1) 19(3.2) heartdisease 7 I eatmeatlessmealsfromtimetotime 130(22.1) 237(40.2) 83(14.1) 118(20.0) 17(2.9) becauseI thinkthatishealthierforme 8 I taketimetoplanmealsforcomingweek 169(28.7) 192(32.6) 57(9.7) 134(22.8) 30(5.1) 9 WhenI buysnackfoods,I eatuntilI have 135(22.9) 136(23.1) 94(16.0) 178(30.2) 41(7.0) finishedthewholepackage. 10I eatforcomfort 36(6.1) 75(12.7) 53(9.0) 305(51.8) 115(19.5) 11I ama snacker 152(25.8) 218(37.0) 43(7.3) 122(20.7) 47(8.0) 12I count fatgrams 203(34.5) 224(38.0) 52(8.8) 94(16.0) 12(2.0) 13I eat cookies,candybars,oricecreamin 299(50.8) 145(24.6) 60(10.2) 49(8.3) 33(5.6) placeofdinner 14WhenI don’tplanmeals,I eatfastfood 185(31.4) 156(26.5) 52(8.8) 151(25.6) 39(6.6) 15I eat whenI amupset 124(21.1) 161(27.3) 94(16.0) 158(26.8) 44(7.5) 16Ibuy meateverytimeIgotothe grocery 103(17.5) 219(37.2) 91(15.4) 148(25.1) 20(3.4) Store 17I snack moreat night 210(35.7) 216(36.7) 40(6.8) 98(16.6) 18(3.1) 18I rarelyeatbreakfast 337(57.2) 174(29.5) 30(5.1) 33(5.6) 8(1.4) 19I trytolimitintakeofred meat(beef) 100(17.0) 236(40.1 57(9.7) 169(28.7) 19(3.2) 20WhenIaminabadmood,Ieat whenever 84(14.3) 218(37.0) 113(19.2) 153(26.0) 11(1.9) I feellikeeating 21I neverknowwhatI amgoingtoeat for 142(24.1) 194(32.9) 54(9.2) 118(20.0) 71(12.1) supperwhenIwakeupinthemorning. 22I snacktwotothreetimesaday 160(27.2) 214(36.3) 62(10.5) 127(21.6) 18(3.1) 23FishandPoultryaretheonlymeatsI eat 137(23.3) 224(38.0) 73(12.4) 132(22.4) 16(2.7) 24WhenI amupset,I tendto stopeating. 141(23.9) 152(25.8) 97(16.5) 149(25.3) 43(7.3) 25Iliketoeatvegetablesseasoned withfatty 108(18.3) 199(33.8) 72(12.2) 169(28.7) 35(5.9) Meat 26IfIeatalargerthanusuallunch,I willskip 113(19.2) 164(27.8) 56(9.5) 174(29.5) 77(13.1) Lunch 27I takea shoppinglisttothegrocerystore 285(48.4) 154(26.1) 90(15.3) 47(8.0) 5(0.8)
SD= StronglyDisagree (1);Disagree=(2);N= NeutralorN/A(3); A= Agree(4); SA= StronglyAgree (5

226
Table 4.19b: Respondents Eating BehaviourPattern (Continued) Variables SD D N A SA n(%) n(%) n(%) n(%) n(%) 28IfI ambored,I will snack more 175(29.7) 187(31.7) 107(18.2) 102(17.3) 11(1.9) 29Ieatatreligious(church,mosque, 19(3.2) 65(11.0) 48(8.1) 273(46.3) 175(29.7) etc)socials 30Iamveryconsciousofhowmuch 136(23.1) 197(33.4) 73(12.4) 151(25.6) 21(3.6) fatisinthefoodI eat 31 I usually keep cookies in the 245(41.6) 160(27.2) 65(11.0) 81(13.8) 29(4.9) house 32I havea servingof meatatevery 65(11.0) 216(36.7) 59(10.0) 202(34.3) 43(7.3) Meal 33I associatesuccesswithfood 26(4.4) 79(13.4) 116(19.7) 242(41.1) 121(20.5) 34Acompletemealincludesa meat, 29(4.9) 113(19.2) 157(26.7) 224(38.0) 56(9.5) a starch,a vegetable,andbread 35OnSunday,Ieatalargemealwith 111(18.8) 199(33.8) 103(17.5) 107(18.2) 59(10.0) myfamily 36Insteadofplanningmeals,Iwill 188(31.9) 204(34.6) 81(13.8) 66(11.2) 44(7.5) replacesupperwitha snack 37IfI eata largerthanusuallunch, 125(21.2) 124(21.1) 87(14.8) 162(27.5) 81(13.8) Iwillreplacesupperwitha snack 38IfI ambusy,Iwilleata snack 139(23.6) 181(30.7) 81(13.8) 150(25.5) 30(5.1) insteadoflunch 39SometimesIeatdessertmorethan 196(33.3) 230(39.0) 81(13.8) 72(12.2) 4(0.7) oncea day 40I reducefatinrecipesby 155(26.3) 202(34.3) 95(16.1) 117(19.9) 15(2.5)
substituting ingredients and cutting portions.
41I havea sweettooth 157(26.7) 137(23.3) 42(7.1) 224(38.0) 21(3.6) 42IsometimessnackevenwhenI 152(25.8) 140(23.8) 76(12.9) 185(31.4) 30(5.1) am nothungry 43I eatoutbecauseitismore 296(50.3) 159(27.0) 52(8.8) 65(11.0) 10(1.7) convenientthaneatingathome 44I hatetocook 318(54.0) 148(25.1) 40(6.8) 63(10.7) 14(2.4) 45I willratherbuytakeoutfood 272(46.2) 172(29.2) 54(9.2) 68(11.5) 14(2.4) andbringit homethancook 46I haveatleastthreetofour 43(7.3) 232(39.4) 77(13.1) 208(35.3) 20(3.4) servingsof vegetablesperday 47Tome,cookiesareanidealsnack 113(19.2) 136(23.1) 141(23.9) 174(29.5) 18(3.1) Food 48Myeatinghabitsare veryroutine 12(2.0) 78(13.2) 62(10.5) 340(57.7) 90(15.3) 49IfIdo notfeelhungry,Iwillskip 95(16.1) 161(27.3) 64(10.9) 180(30.6) 81(13.8) a mealevenifitistimetoeat 50Whenchoosingfastfood,Ipick 146(24.8) 94(16.0) 127(21.6) 177(30.1) 37(6.3) a placethatofferhealthyfoods 51I eatata fastfoodrestaurantat 262(44.5) 126(21.4) 83(14.1) 65(11.0) 47(8.0) leastthreetimesaweek
SD= StronglyDisagree (1);Disagree=(2);N= NeutralorN/A(3); A= Agree(4); SA= StronglyAgree (5)