changes in dental plaque ph and blood glucose levels
TRANSCRIPT
Changes in Dental Plaque pH and Blood Glucose Levels
Following the Intake of Selected Drinks and Food
Jouhrah Hussain Khan
[BDS, Pakistan]
A thesis submitted in fulfilment of the requirement for the degree of
Master of Philosophy
Faculty of Medicine and Health
The University of Sydney
March 2020
ii
Dedication
First of all, I would like to dedicate this thesis to my parents: without their prayers, this would
have not been possible.
I would especially like to thank my mother—without her support and love, I would not be the
person I am today.
An exceptional thank you goes to my dearest husband, Dr Hamza Masood, who has been my
strength and support all this time. Thank you for believing in me and always motivating me.
My deepest and most special gratitude is reserved for you. Thank you for always being with
me through all the thick and thin of life.
iii
Statement of Originality
I hereby declare, to the best of my knowledge, that this thesis is my original work except where
references have been made. It has been submitted to the faculty of Medicine and Health, The
University of Sydney, School of Dentistry, Australia. I verify that this thesis has not been
published in any other institution or university.
__________________ Date: ____ / ____ / ____
Jouhrah Hussain Khan
iv
Acknowledgements
I would like to acknowledge a number of people—without their help and guidance, this thesis
would have not been possible.
Professor Joerg Eberhard: I would like to express my deepest gratitude to my supervisor. I
cannot thank him enough for his constant support and guidance. His encouragement gave me
the strength to complete my research and finish my thesis. I was truly blessed to have an
amazing mentor like him, who motivated me at every step of my master’s degree. I will always
treasure this journey.
Professor Jennie Brand-Miller: I would like to thank Professor Brand-Miller for her
continuous support. It has been a privilege and an honour to learn under such a senior and
revered individual in the field.
Dr Fiona Atkinson: I really appreciate her splendid guidance and suggestions she made
throughout this journey. The recommendations she gave really helped me improve my thesis.
Elif Inan Eroglu: Thank you to Elif for her unconditional support and help with finalising my
results section. She is a true example of the expression ‘a friend in need is a friend indeed’.
I would also like to thank the research staff at the Sydney University Glycaemic Index Research
Service for conducting the capillary glucose collection and analysis.
This thesis has been edited by the Elite Editing in accordance with standard D and E of the
Australian standards for Editing Practice.
v
Abstract
Background: Commonly consumed foods have a significant effect on our postprandial blood
glucose levels and dental plaque pH. Growing awareness of the detrimental effect of high-
glycaemic index (GI) foods means that people have become more conscious about their daily
dietary intake. This study was designed to investigate the effect of high-GI foods on
postprandial blood glucose levels and dental plaque pH.
Aim: The study aimed to evaluate the effect of some common carbohydrate food products on
dental plaque pH and their postprandial glucose response.
Material and Methods: Various food products were used in this study: white bread, chickpeas,
pasta, mashed potatoes, breakfast cereals and rice. A glucose drink of 25 g/250 mL was the
standard against which all the other food products were measured. Participants refrained from
any oral hygiene regime the night before and the next morning. Over a period of 2 hours, dental
plaque (0, 12, 22 and 62 minutes) and blood (‒5, 0, 15, 30, 45, 60, 90 and 120 minutes) samples
were collected before and after consumption of the test foods. A micro pH meter was used to
measure the acidity of plaque samples, and an automatic clinical chemistry auto analyser was
used for plasma glucose concentration measurement.
Results: In sub-study 1, a significant difference was found among the glucose 25 g and 50 g
solutions (p = 0.001). At all times, the glucose 25 g solutions displayed a smaller pH drop
compared with the glucose 50 g solutions. In Sub-study 2, for plaque pH, the maximum area
under the curve (AUC) was observed for white bread which was 62.9 ± 19.7 mmol/L, followed
by the glucose 25 g solution, mashed potatoes, pasta and chickpeas. There was a significant
difference between white bread and chickpeas (P = 0.004). For plasma glucose in sub-study 2,
the maximum incremental area under the curve (iAUC) was seen for the glucose 25 g solution
vi
(135.0 ± 52.3 mmol/L), followed by mashed potatoes, white bread, pasta and chickpeas. The
same pattern was observed for the GI values, with mashed potatoes showing the highest GI of
95.9, followed by white bread (77), pasta (46.8) and chickpeas (35.4). In Sub-study 3, Rice B
showed the maximum AUC (59.2 ± 22.2 mmol/L) and the maximum iAUC (110 ± 31.6
mmol/L) for plaque pH and plasma glucose, respectively. Rice B had the highest GI value at
84.2, followed by Bread A (82.3), Cereal A (76.8), Bread B (60.4), Rice A (55.5) and Cereal
B (43.1). In sub-studies 2 and 3, a linear correlation was seen between the AUC of plaque pH
and the GI.
Conclusion: This is the first study that simultaneously measured dental plaque pH and
postprandial blood glucose levels, and it has shown that foods with a high GI, which produces
higher postprandial plasma glucose levels, also produces greater plaque pH drops compared
with low-GI food. The outcome of this study will benefit health care providers by
demonstrating that food high in GI has a greater capacity to initiate dental decay than food with
a low GI.
Keywords: GI (glycaemic index), pH, dental plaque, glucose, food.
vii
Contents
Dedication ................................................................................................................................. ii Statement of Originality ......................................................................................................... iii Acknowledgements ................................................................................................................. iv
Abstract .................................................................................................................................... v
Contents .................................................................................................................................. vii List of Figures ......................................................................................................................... ix
List of Tables ............................................................................................................................ x
Chapter 1: Introduction .......................................................................................................... 1 1.1 Background ...................................................................................................................... 1
1.1.1 Dental caries and oral plaque pH .............................................................................. 1 1.1.2 GI .............................................................................................................................. 2 1.1.3 Potential relationship between plaque pH and GI .................................................... 2
1.2 Objective of Study ........................................................................................................... 3
Chapter 2: Literature Review ................................................................................................ 5 2.1 Caries ............................................................................................................................... 5
2.1.1 Definition .................................................................................................................. 5 2.1.2 Aetiology .................................................................................................................. 5 2.1.3 Signs and symptoms ................................................................................................. 6 2.1.4 Prevention ................................................................................................................. 7 2.1.5 Epidemiology ........................................................................................................... 8 2.1.6 Caries in Rodents ...................................................................................................... 9
2.2 Plaque .............................................................................................................................. 9 2.2.1 Definition .................................................................................................................. 9 2.2.2 Plaque formation ...................................................................................................... 9 2.2.3 Prevention ............................................................................................................... 10
2.3 pH .................................................................................................................................. 10 2.3.1 Definition ................................................................................................................ 10 2.3.2 Measuring plaque pH ............................................................................................. 11
2.4 GI ................................................................................................................................... 13 2.4.1 Definition ................................................................................................................ 13 2.4.2 Classification .......................................................................................................... 13 2.4.3 Measuring the GI .................................................................................................... 13
2.5 Buffering Capacity ........................................................................................................ 14 2.5.1 Definition ................................................................................................................ 14 2.5.2 Types of salivary buffering systems ....................................................................... 14 2.5.3 Measuring buffering capacity ................................................................................. 15
2.6 The Effect of Different Foods on Plaque pH ................................................................. 15 2.6.1 Effect of different breads on plaque pH ................................................................. 15 2.6.2 Effect of different drinks on plaque pH .................................................................. 17 2.6.3 Effect of different snacks on plaque pH ................................................................. 19 2.6.4 Effect of different yoghurts on plaque pH .............................................................. 20 2.6.5 Effect of different starchy food and fruits on plaque pH ........................................ 22
2.7 Hypothesis ..................................................................................................................... 24
viii
Chapter 3: Materials and Methods ...................................................................................... 25 3.1 Ethics Approval ............................................................................................................. 25 3.2 Subject Selection ........................................................................................................... 25 3.3 Measurement Technique ................................................................................................ 26
3.3.1 Measuring plaque pH ............................................................................................. 26 3.3.2 Measuring blood glucose ........................................................................................ 26 3.3.3 Measuring buffering capacity ................................................................................. 27
3.4 Test Food ....................................................................................................................... 28 3.4.1 Sub-study 1: Impact of carbohydrate amount on plaque pH .................................. 28 3.4.2 Sub-study 2: Impact of carbohydrate (GI) on plaque pH ....................................... 29 3.4.3 Sub-study 3: Impact of GI in a food type on plaque pH ........................................ 30
3.5 Statistical Analysis ........................................................................................................ 31
Chapter 4: Results ................................................................................................................. 32 4.1 Sub-study 1: Impact of Carbohydrate Amount on Plaque pH ....................................... 32 4.2 Sub-study 2: Impact of Carbohydrate (GI) on Plaque pH ............................................. 33
4.2.1 pH data .................................................................................................................... 33 4.2.2 Glucose data ........................................................................................................... 36 4.2.3 Correlations between plaque pH and plasma glucose concentration ..................... 40
4.3 Sub-study 3: Impact of GI in a Food Type on Plaque pH ............................................. 41 4.3.1 pH data .................................................................................................................... 41 4.3.2 Glucose data ........................................................................................................... 44 4.3.3 Correlation between plaque pH and GI .................................................................. 47
4.4 Post-hoc power analysis ................................................................................................ 48 4.5 Buffering Capacity ........................................................................................................ 48
Chapter 5: Discussion ............................................................................................................ 50
Chapter 6: Conclusion .......................................................................................................... 57
References .............................................................................................................................. 58
ix
List of Figures
Figure 1: Stephan Curve—pH curve of dental plaque after glucose rinse .............................. 11
Figure 2: Three GI classifications and examples of common carbohydrate foods ................. 13
Figure 3: Ex vivo dental plaque pH in healthy subjects (n = 8) after consumption of 25 g
and 50 g glucose solution (250 mL) ....................................................................... 33
Figure 4: Comparison in plaque pH drop after the consumption of four test foods and
control solution ....................................................................................................... 35
Figure 5: Comparison of all test foods (chickpeas, pasta, mashed potatoes and white
bread) with the standard glucose drink (25 g/250 mL) at four different time
points to determine their effect on plaque pH ........................................................ 36
Figure 6: Plasma glucose response curve for all test foods and the control glucose
solution ................................................................................................................... 39
Figure 7: All the plasma glucose response curves for the test foods (chickpeas, pasta,
mashed potatoes and white bread) compared with the standard glucose drink ...... 40
Figure 8: Correlation between the GI and AUC of plaque pH for all test foods/drinks
included in Sub-study 2 .......................................................................................... 41
Figure 9: Absolute plaque pH values after consumption of 25 g available carbohydrate
portions of the test foods and control glucose solution .......................................... 43
Figure 10: Comparison of all test foods (Bread A, Bread B, Cereal A, Cereal B, Rice A
and Rice B) with the standard glucose drink at four different time points to
determine their effect on plaque pH AUC .............................................................. 44
Figure 11: Plasma glucose response curve for all three test food pairs and the control
glucose solution ...................................................................................................... 46
Figure 12: Comparison of all test food pairs (Rice A, Rice B, Cereal A, Cereal B, Bread
A and Bread B) with the standard glucose drink (25 g available carbohydrates)
at all measured time points to determine their effect on blood glucose levels ....... 47
Figure 13: The relationship between the GI and the AUC of plaque pH for all six test
food pairs included in Sub-study 3 ......................................................................... 48
x
List of Tables
Table 1: Summary of papers on the effect of different breads on human dental plaque ......... 16
Table 2: Summary of papers on the effect of different drinks on human dental plaque ......... 18
Table 3: Summary of papers regarding the effect of different snacks on human dental
plaque ..................................................................................................................... 20
Table 4: Summary of papers on the effect of different yoghurts on human dental plaque ..... 21
Table 5: Summary of papers on the effect of starchy food and fruits on human dental
plaque pH ................................................................................................................ 23
Table 6: Nutritional information of the glucose used .............................................................. 28
Table 7: Nutritional information of test foods used in Sub-study 2 ........................................ 29
Table 8: Nutritional information of test foods used in Sub-study 3 ........................................ 30
Table 9: Mean ± SD absolute plaque pH values following consumption of 25 g and 50 g
glucose solution (250 mL) ...................................................................................... 32
Table 10: Mean ± SD plaque pH values of the test foods/drinks at four different time
points with the corresponding AUC and GI values ................................................ 34
Table 11: Comparison of plaque pH results produced by all the test foods/drinks to
determine their p-values ......................................................................................... 35
Table 12: Plasma glucose concentration (mmol/L) and overall glyceamic response,
quantitified as iAUC (mmol/L.min) ....................................................................... 37
Table 13: Comparison of all test foods/drinks (glucose, white bread, pasta, chickpeas and
mashed potatoes) with their corresponding p-values ............................................. 38
Table 14: Mean ± SD of plaque pH values of the tested foods at four different time points
with their corresponding AUC values and GI values ............................................. 42
Table 15: P-values for the difference in plaque pH across the three pairs of test foods ......... 43
Table 16: Mean plasma glucose concentration ± SD and overall glyceamic response
(iAUC) for all the six paired test foods .................................................................. 45
Table 17: Comparison of the paired test foods (Bread A/ Bread B, Cereal A/ Cereal B
and Rice A/ Rice B) and their P-values .................................................................. 45
Table 18: Salivary buffering capacity of all the subjects who participated in sub-studies 2
and 3 ....................................................................................................................... 49
1
Chapter 1: Introduction
1.1 Background
1.1.1 Dental caries and oral plaque pH
Dental caries, generally known as tooth decay, is the most common non-communicable and
widespread disease worldwide (1), (2). Dental caries is caused by acid-producing bacteria in
the dental plaque as a result of carbohydrate fermentation. These carbohydrates originate from
various food or drink sources. As a result of this fermentation process, the plaque power of
hydrogen (pH) drops, which leads to the demineralisation of the tooth surface. Data from
several studies (3-5) suggest foods that cause a larger drop in plaque pH have a greater
cariogenic potential—that is, a greater ability to cause dental caries. Because of this strong
association, measuring plaque pH has been adopted as the preferred method to determine the
cariogenic potential of different foods and drinks (6).
Over the past several decades, the Stephan Curve has played a very important role in the
research field of caries development and dental plaque pH. In the early 1940s, Robert Stephan
published several papers that introduced the concept of critical pH and also discussed the
production of acids within plaque when exposed to sugar (7, 8). These studies formed the basis
for the understanding of enamel demineralisation as a consequence of sugar metabolism by
bacteria in dental plaque. Stephan also found that multiple factors were involved in caries
development and that carbohydrates in the diet was one of these important factors. He also
found that both monosaccharides and disaccharides rapidly lower plaque pH and induce caries
formation in rats and hamsters (9).
2
1.1.2 GI
The concept of the glycaemic index (GI) was introduced in the scientific literature in 1981 (10).
It ranks different sources of carbohydrate-rich foods according to their effect on blood glucose
levels after they are consumed. Foods with higher GI values produce higher and extended
postprandial blood glucose levels compared with foods that are more slowly digested and
absorbed; these foods produce lower GI values. To determine the GI value of a food, blood
glucose responses are measured at regular intervals over a two-hour period. As stated by
Brouns et al. (11), the postprandial response produced by a certain food is then compared with
the postprandial response produced by a reference food (usually a glucose solution). Ideally,
the quantity of available carbohydrates must be the same in the test food and the reference food
portions.
In recent years measuring GI has gained importance, as low-GI foods have beneficial effects
in terms of managing blood glucose levels in patient with diabetes (12). Evidence shows that
foods with lower GI values have therapeutic and preventive effects on such patients (13, 14).
1.1.3 Potential relationship between plaque pH and GI
To date, only a few studies have explored the potential effect of carbohydrate digestibility, as
measured by postprandial glucose response or GI values, on dental plaque pH. Lingström and
colleagues (10) showed an interesting relationship between the GI and the area under the curve
(AUC) obtained by measuring plaque pH. Test foods were ranked according to their
postprandial glucose response, as assessed by the incremental area under the curve (iAUC). In
2000, a study investigated the plaque pH response of various breads and compared those results
with the GI values of breads obtained from an earlier investigation (15). It was seen that low-
GI breads were not only advantageous metabolically, but they were also less cariogenic,
because they produced a smaller drop in dental plaque pH compared with the higher GI breads.
3
To date, several studies have investigated plaque pH and GI separately and in great detail.
However, no study has undertaken a detailed investigated of GI and dental plaque pH
simultaneously using the same foods and subjects. This means there is a knowledge gap that it
would be helpful to fill to understand the effects of different foods on general and dental health.
1.2 Objective of Study
This research project aimed to simultaneously investigate the changes in dental plaque pH and
GI following the consumption of different foods and drinks. To achieve this, the study was
divided into three sub-studies.
Sub-study1:
This sub-study aimed to establish a dental plaque pH measurement procedure and evaluate the
effect of standardised glucose drinks of 25 g and 50 g as available carbohydrates on the pH of
dental plaque.
Sub-study 2:
This sub-study aimed to determine the effects of four different starchy foods, varying in GI and
consumed in portions of 25 g as available carbohydrates, on dental plaque pH.
Sub-study 3:
This sub-study aimed to measure the effect of three pairs of low- and high-GI carbohydrate
foods, consumed in portions of 25 g (per food item) as available carbohydrates and with a
similar texture and food volume in each food pair, on dental plaque pH.
To date, no previous study has investigated the association between plaque pH and GI
simultaneously. Although extensive research has been carried out on plaque pH and GI

4
separately, no detailed data exists that highlight the relationship between both the variables in
significant detail.
5
Chapter 2: Literature Review
2.1 Caries
2.1.1 Definition
Dental caries is a disease characterised by the demineralisation of tooth hard substances by
acids produced by dental plaque bacteria, which can be described as a community of
microorganisms (biofilm) (16).
2.1.2 Aetiology
Dental caries is one of the most frequent, complex and expensive-to-treat diseases worldwide,
and is one of the most common reasons children are hospitalised in developed countries (2, 17,
18). Its aetiology is multifactorial in nature, and the principal factors involved are the host
(saliva), microflora (plaque), diet and time (19). Therefore, it is very important to determine
the factors involved in caries formation and its prevention.
A recent review on dental caries highlighted the multifaceted nature of the disease (20). It starts
with the formation of a complex biofilm, called dental plaque, on a tooth surface. Bacteria
present in the plaque ferment dietary carbohydrates, especially sucrose, into acids. These acids,
if present for a long time, can cause a drop in plaque pH adjacent to the tooth surface and lead
to demineralisation of the enamel, the hard substance (21). However, dental caries onset and
activity is a complex process, and not every person who consumes carbohydrates will develop
caries. Several modifying risk factors influence the formation of dental caries: the presence of
certain micro-organisms; the consumption of free sugars; developmental defects of enamel;
socioeconomic conditions; and lack of protective procedures, including oral hygiene
maintenance (20).
6
When reviewing caries development and the role of carbohydrates, the classic study conducted
from 1945 to 1954 in the Vipeholm Hospital in Sweden cannot be ignored (22-25). During
phase I (carbohydrate study I) of the Vipeholm study, conducted between 1947 and 1949,
carbohydrate-rich food items were given either in a solution form with little tendency to stick
on the tooth surface or in a sticky consistency between meals (toffees) or at meals (new breads).
In the second phase conducted from 1949 to 1951, the daily amount and type of sugar
consumed by the participants was set similar to what was consumed by the participants in Lund.
The author concluded that the risk of sugar increasing caries activity is greatest when sugar is
consumed between meals, is in a form which increases its tendency to be retained on the tooth
surface or has a transiently high concentrations.
2.1.3 Signs and symptoms
Dental caries develop over time; it may show no symptoms at all or may be very painful. In its
initial stages, it may appear as a chalky white lesion on tooth hard surfaces that is usually due
to the loss of calcium and the accumulation of plaque. If the plaque is not allowed to accumulate
for long and the caries is detected in its early stages, it can be arrested and will progress no
further. If an initial lesion is not treated in time, it may become a surface defect and the chalky
white lesion may turn brown, forming a cavity in the superficial layer of the tooth known as
enamel. At this stage, mild pain and sensitivity can be felt. If not treated, the cavity may
increase in size and the lesion may become softer and further progress into the second layer of
the tooth, known as dentine. If the bacteria invade the dentine, there is increased pain and
sensitivity. The bacteria are capable of further invading the tooth, moving into deeper tissues,
causing pulp damage and possibly leading to abscess formation. Symptoms such as pain,
sensitivity and discomfort may grow with the extent of the invasion.
7
2.1.4 Prevention
Preventing dental caries and treating it once it is formed is one of a dentist’s main concerns.
The past 30 years have seen increasingly rapid advances in the field of dentistry, and recent
developments in this field have heightened the need for new methods and techniques to prevent
caries formation. Some of the most important and common preventive factors that may affect
caries prevention are as follows:
1. Reducing the frequent intake of food high in sucrose is a major preventive strategy.
Dietary sucrose has two major detrimental effects on plaque biofilm that leads to caries
formation. First, frequent consumption of sucrose increases the cariogenic potential of
the plaque biofilm. Second, continuous exposure to sucrose helps the mature plaque
biofilm produce organic acid as a by-product, resulting in an extended duration of
decreased pH (26, 27). The dentist’s aim is to counsel adult patients who have dental
caries to minimise the quantity and frequency of their acidic food consumption and to
consider substituting sucrose-containing foods with sugar-free alternatives.
2. Regularly removing plaque biofilm is an important factor in preventing caries
formation. Tooth brushing, dental flossing and rinsing are the best mechanical and
chemical aids patients can practise daily to maintain good oral hygiene. In addition to
regular toothbrushes, electric toothbrushes and oral irrigation devices may also be used
as oral hygiene tools. Alongside self-initiated oral hygiene, regular professional
cleaning is an effective part of caries reduction (28).
3. Local fluoride application has been proven to prevent dental caries and increase dental
enamel’s resistance to demineralisation. It is available in various forms, such as
varnishes, gels, creams, solutions and tablets (29). Applying fluoride to the teeth of
adults and children with a high risk of caries should be performed periodically.
8
4. Fluoridated community water has proven to be an effective factor in caries reduction.
There has been a 23‒25% reduction in caries formation in adults aged 17‒35 years in
Australia as a result of people’s regular exposure to fluoridated water (30, 31).
5. Saliva plays an important role in caries prevention by neutralising the acidic effect
produced in the plaque biofilm (32). Its buffering capacity assists in remineralisation.
Therefore, patients with low salivary flow rates are usually at high risk of caries
formation. Factors increasing the salivary flow rate include sugar-free and xylitol
chewing gums, non-cariogenic foods that require plenty of chewing, topical lubricants
and the prescription of salivary stimulants by health professionals.
2.1.5 Epidemiology
As stated in the book Oral Health and Dental Care in Australia (33), decay in deciduous teeth
in six-year-old children who visited school dental services decreased from 3.19% in 1978 to
2.58% in 2010. A similar pattern of decreasing caries rates was observed in children aged 12
from 4.79% in 1977 to 0.84% in 2000; this later increased to 1.34 in 2010. In a recent study,
conducted in an Australian population, a substantial increase of dental caries of 26.5% in 10–
11-year-old children was observed from just 2.8% in the two–three-year-old age group (34).
An average decrease of 2.09% was seen in decay formation in adults aged 15 years and above
from 1978‒1988 to 2004‒2006. Overall, dental caries is a prevailing condition in Australian
children, and it needs to be addressed by effective interventions introduced by policymakers
(35). Further research is mandatory to better understand that how sugar intake in our daily diet
changes caries prevalence. Despite the use of water fluoridation, an increase in caries activity
is seen, which is likely caused by a high consumption of food and soft drinks rich in
carbohydrates (36).
9
2.1.6 Caries in Rodents
As in humans, it is not uncommon to find caries in animals. Using animal models to better
understand caries initiation and progression has been in practice for a long time (37-39).
Animal models are considered essential for conducting experiments because they enable
increased control for variability compared with humans and the application of interventions
that are not possible in humans for ethical reasons (40). As in humans, rodents receiving more
sucrose in their diet have shown a higher incidence of carious lesions compared with the control
group (41, 42). A direct relationship between dietary sucrose consumption and caries activity
has been observed in different experimental animals, such as rats and hamsters (43, 44). Studies
have shown that the presence of Streptococcus mutans or Candida albicans and hyposalivation
favours caries formation in humans as well as in rats (38, 41, 45). Findings from a series of
animal experiments in the 1960s (46) led investigators to report that a carbohydrate-free diet
‘prevents the initiation of carious lesions’; however, a stringent restriction of carbohydrates in
humans is impractical because of their widespread occurrence in human foods and their
inclusion in dietary recommendations.
2.2 Plaque
2.2.1 Definition
‘Dental plaque is a complex biofilm that accumulates on the hard tissue (teeth) in the oral
cavity’ (47). It contains water-insoluble glucans, fructans, bacterial and salivary proteins, and
variable quantities of lipids, calcium, phosphorus, magnesium, fluoride and water (48).
2.2.2 Plaque formation
Plaque formation involves a series of events, and it takes up to two weeks for plaque to fully
mature. The process starts with the formation of an acquired dental pellicle, a thin protein-
based layer formed by saliva on the tooth surface (49). Within a few hours, several bacteria

10
attach to the dental pellicle. A clear progression of organisms is seen, with streptococci the
dominant species, followed by a growing number of Actinomyces (47). Eventually, because of
the continued bacterial adhesion, several micro-colonies develop on the tooth surface (27).
More bacterial species become involved, and these micro-colonies continue to grow and form
mature plaque. Dental plaque is not a uniform structure and varies from site to site and tooth
to tooth; therefore, in the same mouth, some areas may form caries and others may not (47).
Despite the large variety and number of bacteria in the mammalian oral cavity, studies have
demonstrated that mutans streptococci (MS) are the most common micro-organisms causing
dental caries (50). MS and lactobacilli produce organic acids causing a low pH in the oral
environment and increasing the risk of tooth cavitation. Species found in the human oral cavity
are predominantly Streptococcus mutans (51). Streptococcus mutans adhere and demineralise
the tooth surface by fermentation of carbohydrates, specifically sucrose and fructose, to organic
acids that lower the plaque pH below the critical pH, thus causing demineralisation (52).
2.2.3 Prevention
To prevent caries formation, plaque build-up must be avoided. Some basic oral hygiene
procedures, such as brushing, interdental flossing and antibacterial mouth rinses, can be used
to help reduce bacterial growth and minimise plaque build-up.
2.3 pH
2.3.1 Definition
The concentration of hydrogen ions in a solution is expressed by the pH, on a scale of 1‒14,
where 7 is the pH value of a neutral solution. Values < 7 are considered acidic and values > 7
are considered basic or alkali.
11
The demineralisation or dissolution of dental enamel is caused by acidogenic bacteria, which
produce an environment in which a rapid decline in the pH level of the tooth biofilm reaches
5.0 or below (20).
2.3.2 Measuring plaque pH
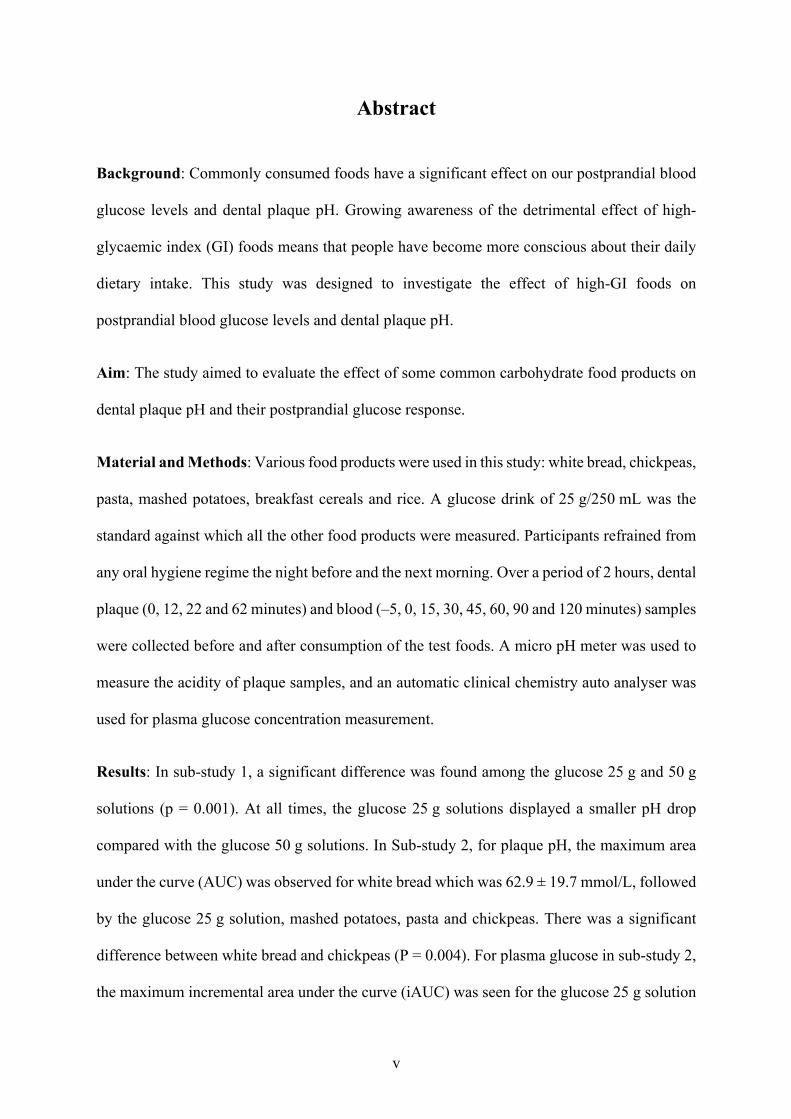
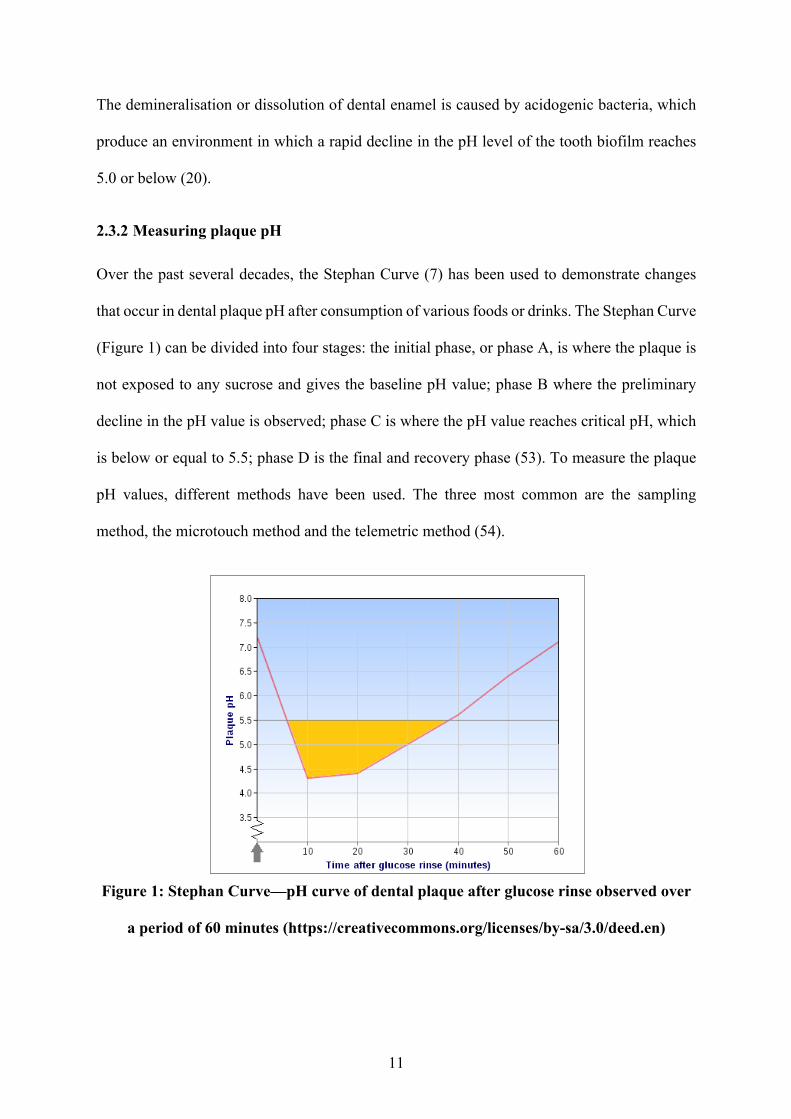
Over the past several decades, the Stephan Curve (7) has been used to demonstrate changes
that occur in dental plaque pH after consumption of various foods or drinks. The Stephan Curve
(Figure 1) can be divided into four stages: the initial phase, or phase A, is where the plaque is
not exposed to any sucrose and gives the baseline pH value; phase B where the preliminary
decline in the pH value is observed; phase C is where the pH value reaches critical pH, which
is below or equal to 5.5; phase D is the final and recovery phase (53). To measure the plaque
pH values, different methods have been used. The three most common are the sampling
method, the microtouch method and the telemetric method (54).
Figure 1: Stephan Curve—pH curve of dental plaque after glucose rinse observed over
a period of 60 minutes (https://creativecommons.org/licenses/by-sa/3.0/deed.en)
12
• The sampling/scraping method (55): a pooled plaque sample is collected each time from
any area on any tooth using a sterile instrument. It is then immediately dispersed in
distilled water. The amount of distilled water varies depending on personal choice. The
plaque sample is then vortexed. Ideally, it should be measured within 20 seconds. The
pH is measured with a pH meter, which is attached to a glass electrode. The electrode
is calibrated before each test is conducted.
• The touch/microtouch method (56): A palladium microtouch electrode with a diameter
of 0.1 mm (a Beetrode) is inserted into an interdental area just apical to the touchpoint
at two defined sites each time, in either the upper or lower jaw. There should not be any
dental restoration present there. The electrode is connected to a pH meter. A salt bridge
is created between the reference electrode and the subject in a potassium chloride
solution. The electrode is calibrated using a standard buffer solution before the start of
each test.
• The telemetric method (57): This system consists of a glass pH electrode with a
diameter of 2 mm. The electrode is mounted on the approximate surface of a natural
tooth crown and incorporated into a removable partial denture. A skin reference
electrode attached to a volunteer’s arm is used. The electrode is calibrated against
standard pH buffers before and after each test.
2.3.3 Organic acids produced by plaque
A number of organic acids are produced by the fermentation process of dental plaque. The
amount and pathway by which they are produced was well explained by Laurence J Walsh in
2006 (58). According to Walsh, large quantities of sucrose are fermented to lactate as one of
the major by-products; however, organic acids such as acetate, formate and pyruvate are also
produced by glucose fermentation. Streptococcus mutans has the capability of altering the
13
pathway of its acid production, depending on the supply of nutrients, and in low cariogenic
environments weaker acids such as acetate are formed.
2.4 GI
2.4.1 Definition
The GI is defined as the postprandial glucose response over a two-hour period after consuming
a food that usually has 50 grams of available carbohydrates compared with a reference food
that has 50 g of carbohydrates—either a glucose solution or white bread (59). In general, foods
containing carbohydrates that break down quickly during digestion have high GI values,
whereas foods that break down more slowly during digestion or contain sugar are inherently
less glycaemic, release glucose more gradually and have low GI values.
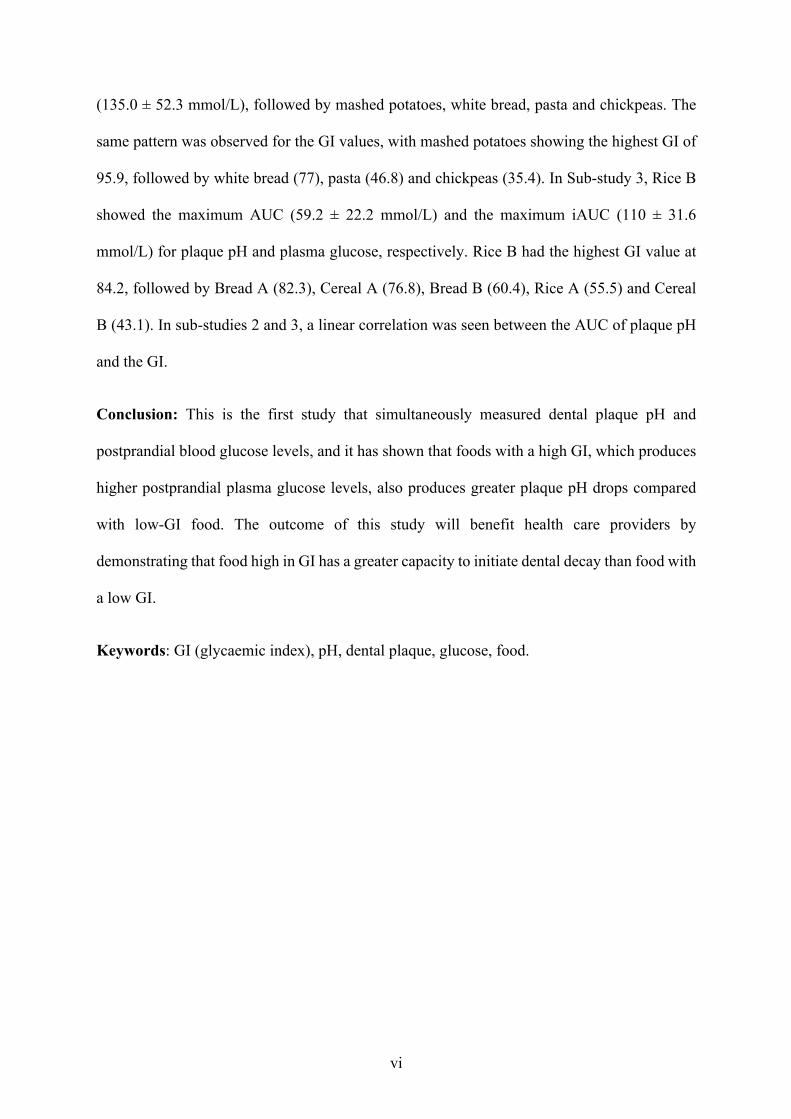
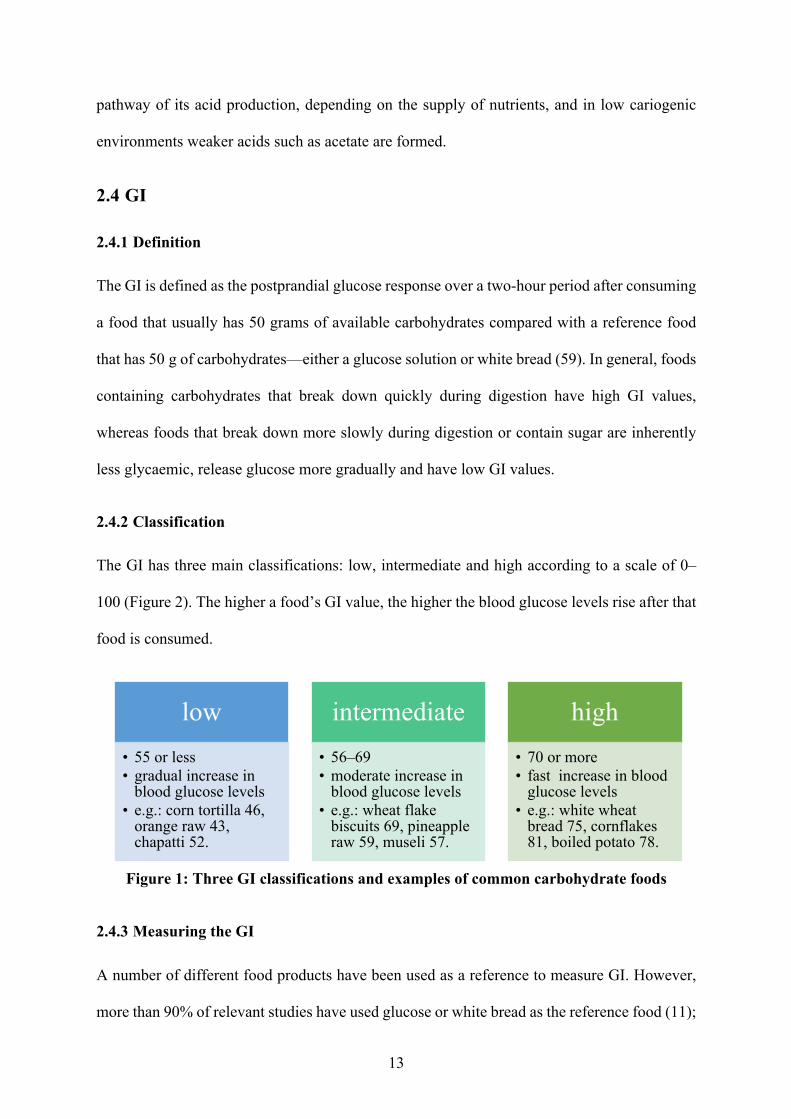
2.4.2 Classification
The GI has three main classifications: low, intermediate and high according to a scale of 0‒
100 (Figure 2). The higher a food’s GI value, the higher the blood glucose levels rise after that
food is consumed.
Figure 1: Three GI classifications and examples of common carbohydrate foods
2.4.3 Measuring the GI
A number of different food products have been used as a reference to measure GI. However,
more than 90% of relevant studies have used glucose or white bread as the reference food (11);
low
• 55 or less• gradual increase in
blood glucose levels• e.g.: corn tortilla 46,
orange raw 43, chapatti 52.
intermediate
• 56‒69• moderate increase in
blood glucose levels• e.g.: wheat flake
biscuits 69, pineapple raw 59, museli 57.
high
• 70 or more• fast increase in blood
glucose levels• e.g.: white wheat
bread 75, cornflakes 81, boiled potato 78.
14
pure glucose sugar (assigned a GI value of 100) is the most common choice of reference
food/drink. All the other foods are ranked on a scale of 0‒100 depending on their actual effect
on blood glucose levels compared with the response produced by the reference food. The
methodology used to determine the GI value of a food or drink is described in the International
Standard Organisation (60). Test foods and reference foods must be consumed in equal
available carbohydrate portions: either 25 g or 50 g available carbohydrate loads. The test must
be conducted early in the morning after an overnight fasting period of 10‒14 hours. Participants
are required to avoid any strenuous exercise, alcohol, cigarettes and food rich in fats, and to
consume carbohydrate-rich foods, 24 hours before a test session. Blood samples are collected
either by capillary or via arterialised venous blood samples at taken at regular intervals over a
two-hour period (0, 15, 30, 45, 60, 90 and 120 minutes). Fingertip capillary blood samples are
the gold standard, as capillary blood is most sensitive to acute changes in glycaemia (61). The
iAUC is measured using the trapezoidal rule, ignoring any area below the baseline (11, 60).
2.5 Buffering Capacity
2.5.1 Definition
‘The salivary buffering capacity is defined as the ability of saliva to buffer acids produced by
bacteria’ (62). Salivary buffering capacity is one of the major factors affecting caries formation,
as it neutralises the acidic environment and maintains pH levels above the ‘so-called’ critical
pH level (5.5), thereby preventing demineralisation (63, 64).
2.5.2 Types of salivary buffering systems
Three buffering systems are present in stimulated and unstimulated saliva. These three systems
are the bicarbonate, phosphate and the protein buffer systems (65). The effectiveness of these
three systems depends on the rate at which the saliva is produced (66). Among these three,
bicarbonates are believed to be the major buffering system, and its concentration varies
15
considerably from unstimulated to stimulated saliva. It is higher in stimulated saliva (24 mmol/l
at a flow rate above 2 ml/min) than in unstimulated saliva (5 mmol/1 at a flow rate of 0.3
ml/min) (67). In contrast, phosphates show a higher concentration in unstimulated saliva than
in stimulated saliva. A different variety of proteins with buffering capacities are found in whole
saliva, which may vary in their function and composition depending on the presence of
stimulated and unstimulated saliva (68).
2.5.3 Measuring buffering capacity
In 1959, Ericsson (69) measured the salivary buffering capacity by adding 3.0 mL of
hydrochloric acid (0.005N) to collected saliva samples (1.0 mL). After measuring the pH
values, the buffering capacity was categorised into three ranges: high (³ 5.6), medium (4.1‒
5.5) and low (£ 4). Since then, this test has been used as the standard for measuring salivary
buffering capacity (63). The disadvantage of Ericsson’s method is that it cannot be performed
as a chair-side test in clinical practice. Therefore, commercial methods for measuring saliva
buffering capacity have subsequently been developed. These include colorimetric strip-type
tests, the Saliva-Check Buffer, the Dentobuff Strip method and the CRT Buffer test (70).
2.6 The Effect of Different Foods on Plaque pH
A growing body of literature recognises the effects of different foods on plaque pH. Foods
found to influence plaque pH have been explored previously, and some of these studies are
discussed in this section.
2.6.1 Effect of different breads on plaque pH
Several authors have used various bread products to explore their effect on dental plaque ph.
Different types of breads, ranging from regular soft bread to traditionally baked sangak bread,
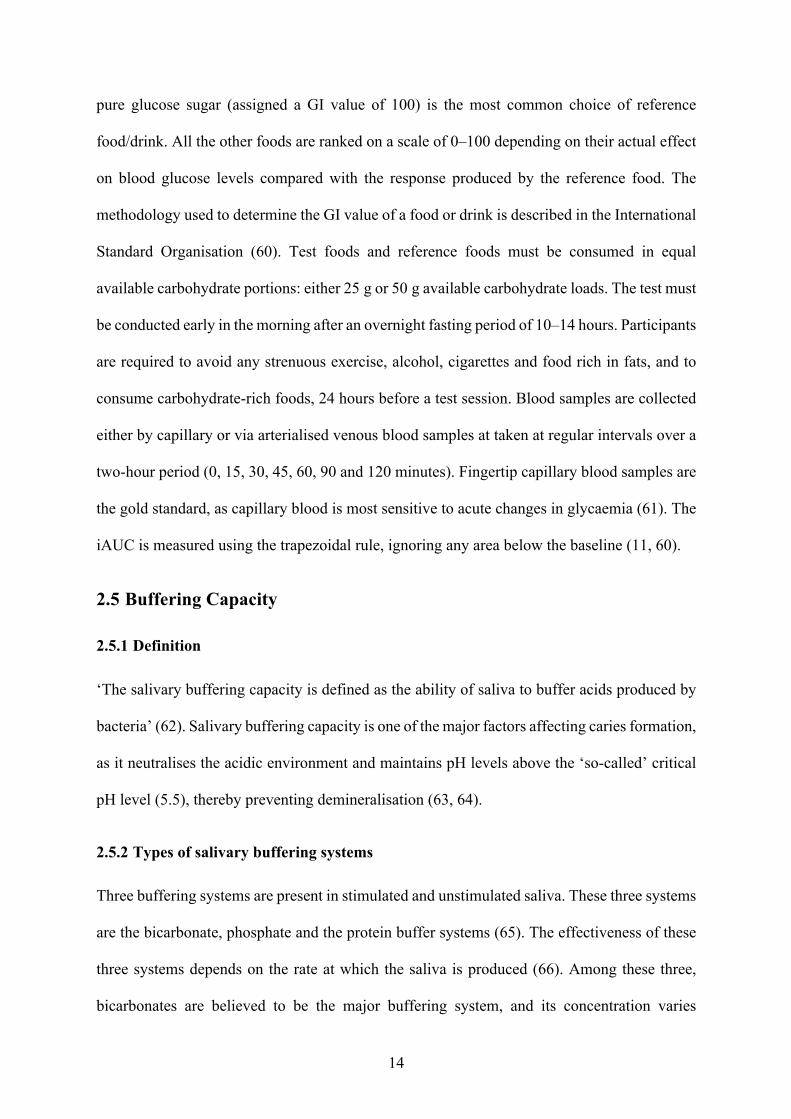
have been investigated (54, 71). For various bread types substantial variations in the minimum
16
plaque pH values have been observed, ranging from a minimum plaque value of 4.37 to 6.78
pH (54, 71). However, in most of the studies, bread was associated with a severe drop in plaque
pH (15, 54, 71). The variations may be best explained by factors that include the testing
methodology (54), bread ingredients, baking time and bread preparation methods (71). In
particular, previous studies have not had a consistent amount of carbohydrates in the breads,
with tested portions containing between ~2 to 25 g of available carbohydrates (Table 1). This
makes comparing these results difficult. In light of the publications mentioned above, it can be
concluded that bread possesses moderate to high levels of cariogenic potential, depending on
various factors. Table 1 summarises some of these prior studies.
Table 1: Summary of papers on the effect of different breads on human dental plaque
Author Year Test foods Quantity of available carbohydrates
Method Outcome
Lingstrom, Imfeld (54)
1993 5 g soft bread ‒ Sampling Microtouch Telemetric
Minimum pH by telemetric method = 4.37
pH ¯ after bread consumption
Lingstrom, Liljeberg (15)
2000 Barley kernel bread (BKB) BKB fermented sourdough White wheat bread Syrup-sweetened wheat-rye bread
25 g Microtouch Minimum pH seen in syrup-sweetened wheat‒rye bread = 5.75
pH ¯ after bread consumption
Mortazavi and Noin (71)
2011 10 g traditional sangak 10 g soft, bulky baguette
‒ Microtouch Minimum pH seen in baguette bread = 6.78
pH ¯ after bread consumption
17
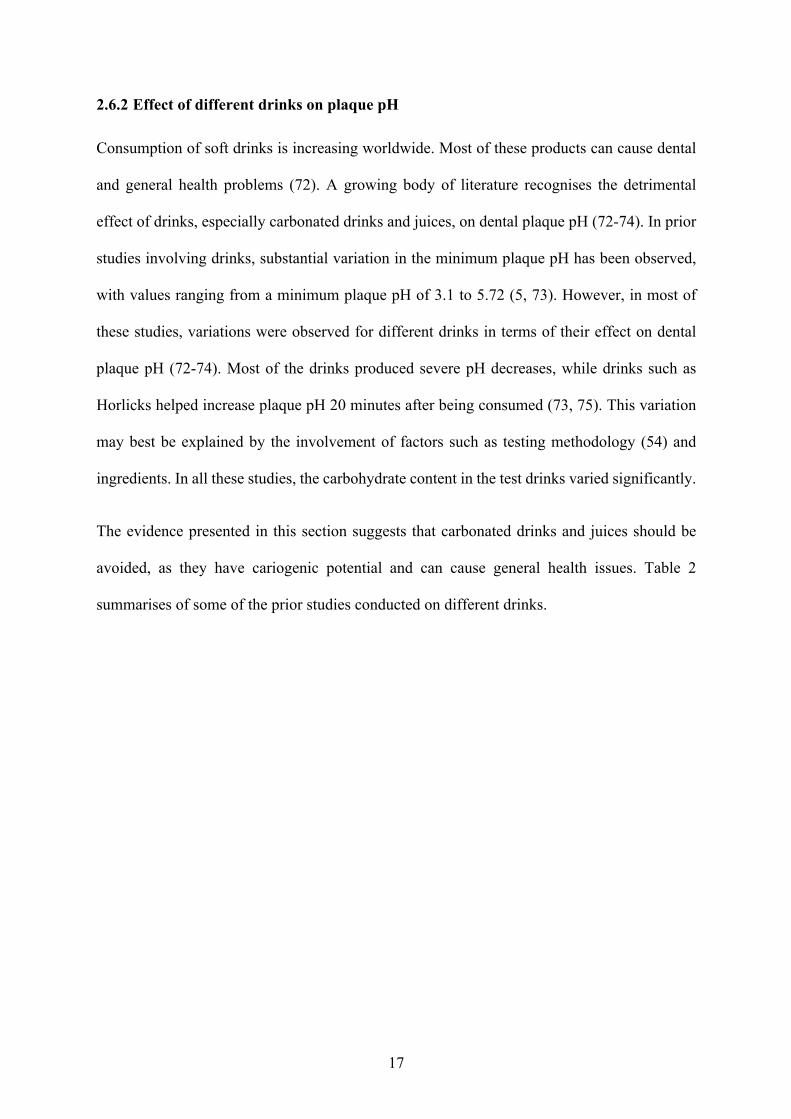
2.6.2 Effect of different drinks on plaque pH
Consumption of soft drinks is increasing worldwide. Most of these products can cause dental
and general health problems (72). A growing body of literature recognises the detrimental
effect of drinks, especially carbonated drinks and juices, on dental plaque pH (72-74). In prior
studies involving drinks, substantial variation in the minimum plaque pH has been observed,
with values ranging from a minimum plaque pH of 3.1 to 5.72 (5, 73). However, in most of
these studies, variations were observed for different drinks in terms of their effect on dental
plaque pH (72-74). Most of the drinks produced severe pH decreases, while drinks such as
Horlicks helped increase plaque pH 20 minutes after being consumed (73, 75). This variation
may best be explained by the involvement of factors such as testing methodology (54) and
ingredients. In all these studies, the carbohydrate content in the test drinks varied significantly.
The evidence presented in this section suggests that carbonated drinks and juices should be
avoided, as they have cariogenic potential and can cause general health issues. Table 2
summarises of some of the prior studies conducted on different drinks.
18
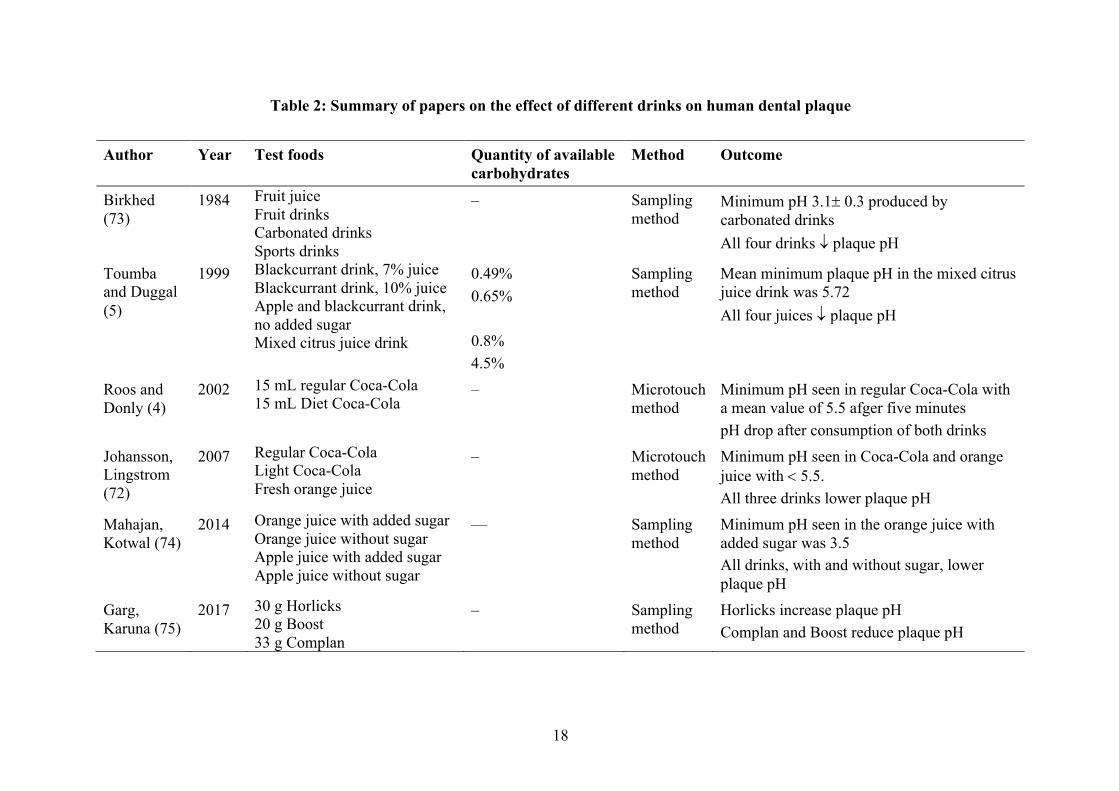
Table 2: Summary of papers on the effect of different drinks on human dental plaque
Author Year Test foods Quantity of available carbohydrates
Method Outcome
Birkhed (73)
1984 Fruit juice Fruit drinks Carbonated drinks Sports drinks
‒ Sampling method
Minimum pH 3.1± 0.3 produced by carbonated drinks
All four drinks ¯ plaque pH
Toumba and Duggal (5)
1999 Blackcurrant drink, 7% juice Blackcurrant drink, 10% juice Apple and blackcurrant drink, no added sugar Mixed citrus juice drink
0.49% 0.65% 0.8% 4.5%
Sampling method
Mean minimum plaque pH in the mixed citrus juice drink was 5.72
All four juices ¯ plaque pH
Roos and Donly (4)
2002 15 mL regular Coca-Cola 15 mL Diet Coca-Cola
‒ Microtouch method
Minimum pH seen in regular Coca-Cola with a mean value of 5.5 afger five minutes pH drop after consumption of both drinks
Johansson, Lingstrom (72)
2007 Regular Coca-Cola Light Coca-Cola Fresh orange juice
‒ Microtouch method
Minimum pH seen in Coca-Cola and orange juice with < 5.5. All three drinks lower plaque pH
Mahajan, Kotwal (74)
2014 Orange juice with added sugar Orange juice without sugar Apple juice with added sugar Apple juice without sugar
‒‒ Sampling method
Minimum pH seen in the orange juice with added sugar was 3.5 All drinks, with and without sugar, lower plaque pH
Garg, Karuna (75)
2017 30 g Horlicks 20 g Boost 33 g Complan
‒ Sampling method
Horlicks increase plaque pH Complan and Boost reduce plaque pH

19
2.6.3 Effect of different snacks on plaque pH
Snacks should represent a small portion of food eaten between proper full meals. The amount
of sucrose available in prepacked snacks is usually higher, which makes them taste better, and
they are usually cost-effective (76). Pre-sweetened snacks consumed frequently in between
meals carry a high risk of decreasing plaque pH and have limited nutritional benefits (77).
Sweet and sticky foods are generally considered to have greater cariogenic potential because
they are more difficult to remove from the tooth surface (78). For various snack foods
substantial variation in the minimum plaque pH has been observed, ranging from a minimum
plaque pH value of 4.4 to 5.64 (77). A growing body of literature recognises the cariogenicity
caused by popular snacks such as raisins, chocolates, biscuits and toffees (77, 79, 80). Table 3
summarises some of the studies that have investigated the effect of snacks.
20
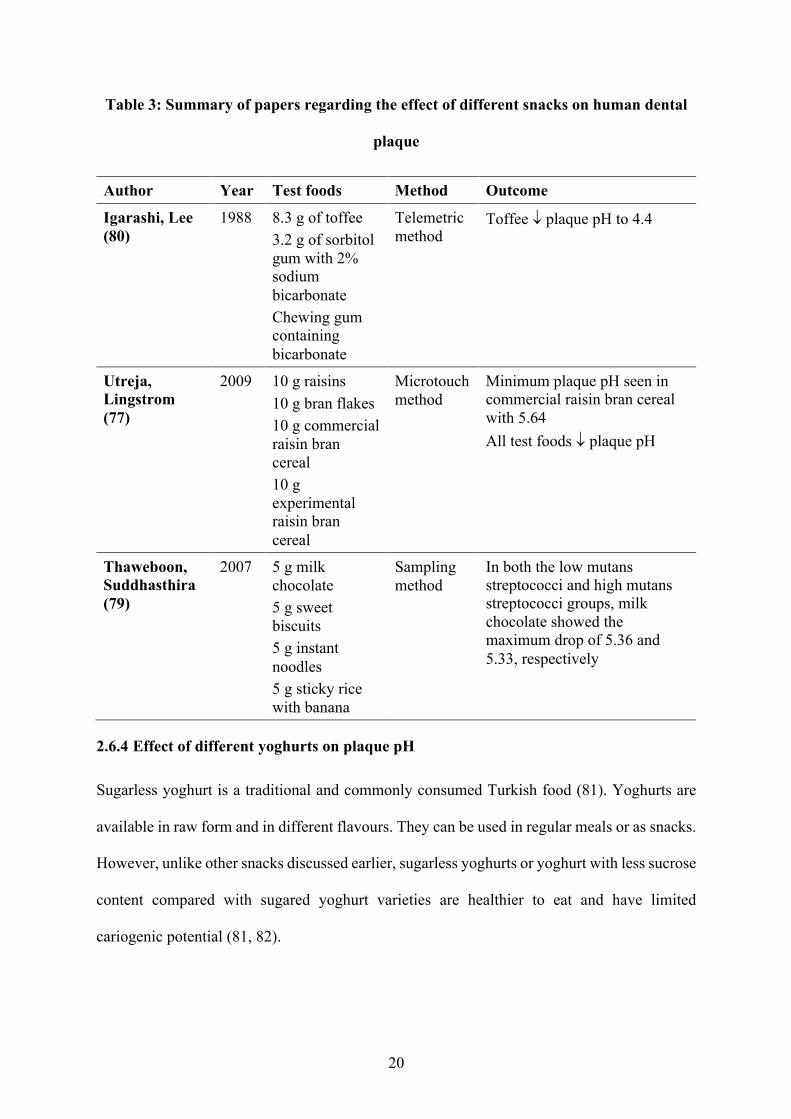
Table 3: Summary of papers regarding the effect of different snacks on human dental
plaque
Author Year Test foods Method Outcome
Igarashi, Lee (80)
1988 8.3 g of toffee 3.2 g of sorbitol gum with 2% sodium bicarbonate Chewing gum containing bicarbonate
Telemetric method
Toffee ¯ plaque pH to 4.4
Utreja, Lingstrom (77)
2009 10 g raisins 10 g bran flakes 10 g commercial raisin bran cereal 10 g experimental raisin bran cereal
Microtouch method
Minimum plaque pH seen in commercial raisin bran cereal with 5.64 All test foods ¯ plaque pH
Thaweboon, Suddhasthira (79)
2007 5 g milk chocolate 5 g sweet biscuits 5 g instant noodles 5 g sticky rice with banana
Sampling method
In both the low mutans streptococci and high mutans streptococci groups, milk chocolate showed the maximum drop of 5.36 and 5.33, respectively
2.6.4 Effect of different yoghurts on plaque pH
Sugarless yoghurt is a traditional and commonly consumed Turkish food (81). Yoghurts are
available in raw form and in different flavours. They can be used in regular meals or as snacks.
However, unlike other snacks discussed earlier, sugarless yoghurts or yoghurt with less sucrose
content compared with sugared yoghurt varieties are healthier to eat and have limited
cariogenic potential (81, 82).
21
A very limited variation in the minimum plaque pH of yoghurts has been observed in prior
studies, with values ranging from a minimum plaque pH of 5.54 to 5.72 (81, 82). However, in
most of these studies, variations have still been observed in different yoghurts.
In yoghurts, it is not only the amount of sugar present that makes a difference; other factors,
such as consistency, also play an essential role. Yoghurt with a thick texture decreases plaque
pH for a slightly longer period than yoghurt with a thinner consistency, indicating that
retentiveness plays a more vital role than the amount of sugar (82).
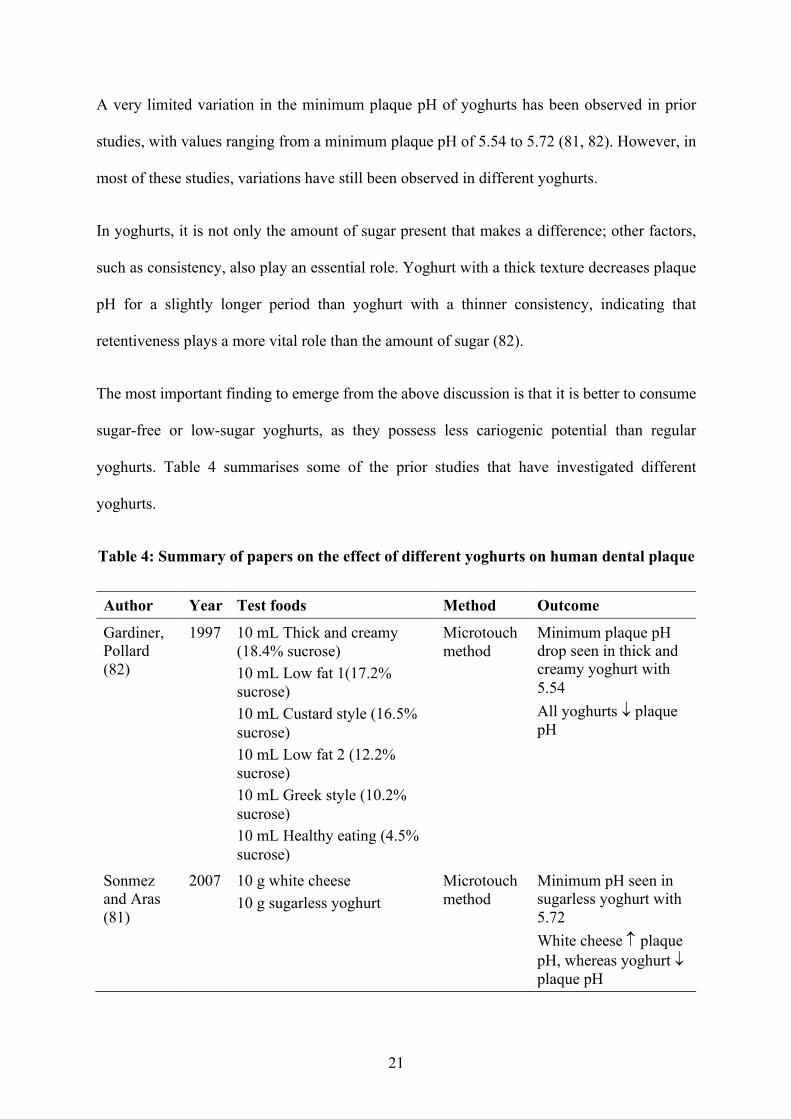
The most important finding to emerge from the above discussion is that it is better to consume
sugar-free or low-sugar yoghurts, as they possess less cariogenic potential than regular
yoghurts. Table 4 summarises some of the prior studies that have investigated different
yoghurts.
Table 4: Summary of papers on the effect of different yoghurts on human dental plaque
Author Year Test foods Method Outcome
Gardiner, Pollard (82)
1997 10 mL Thick and creamy (18.4% sucrose) 10 mL Low fat 1(17.2% sucrose) 10 mL Custard style (16.5% sucrose) 10 mL Low fat 2 (12.2% sucrose) 10 mL Greek style (10.2% sucrose) 10 mL Healthy eating (4.5% sucrose)
Microtouch method
Minimum plaque pH drop seen in thick and creamy yoghurt with 5.54 All yoghurts ¯ plaque pH
Sonmez and Aras (81)
2007 10 g white cheese 10 g sugarless yoghurt
Microtouch method
Minimum pH seen in sugarless yoghurt with 5.72 White cheese plaque pH, whereas yoghurt ¯ plaque pH
22
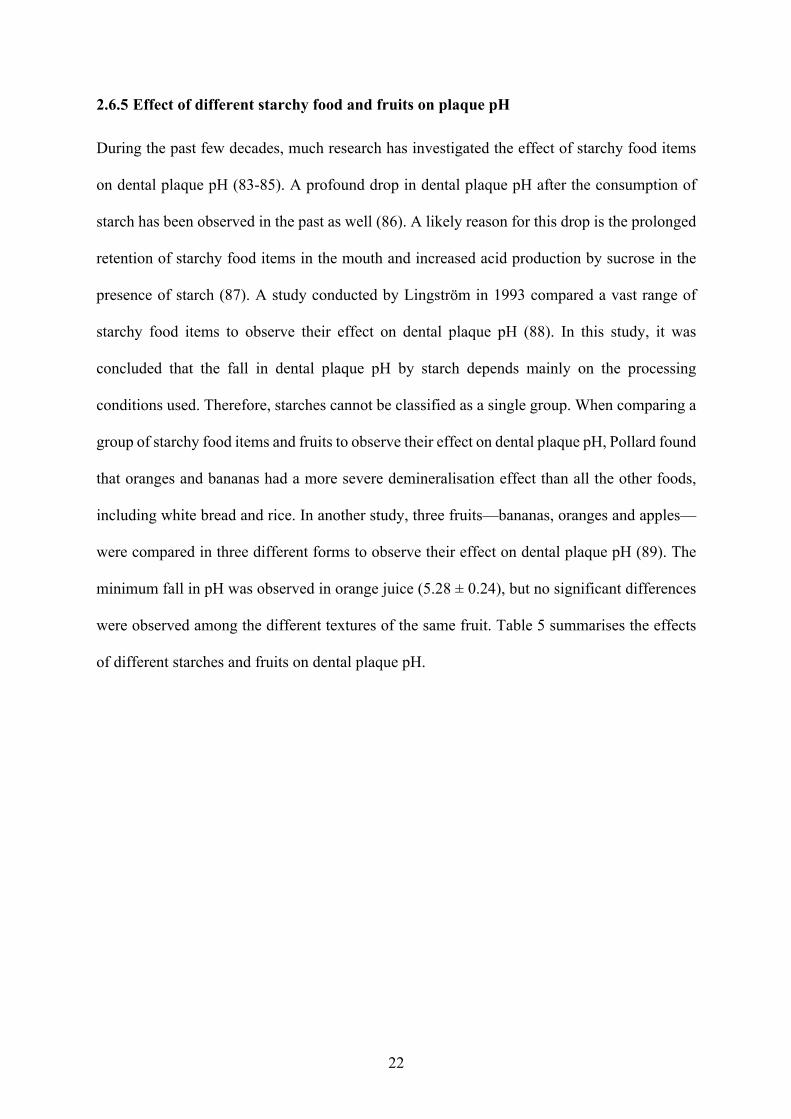
2.6.5 Effect of different starchy food and fruits on plaque pH
During the past few decades, much research has investigated the effect of starchy food items
on dental plaque pH (83-85). A profound drop in dental plaque pH after the consumption of
starch has been observed in the past as well (86). A likely reason for this drop is the prolonged
retention of starchy food items in the mouth and increased acid production by sucrose in the
presence of starch (87). A study conducted by Lingström in 1993 compared a vast range of
starchy food items to observe their effect on dental plaque pH (88). In this study, it was
concluded that the fall in dental plaque pH by starch depends mainly on the processing
conditions used. Therefore, starches cannot be classified as a single group. When comparing a
group of starchy food items and fruits to observe their effect on dental plaque pH, Pollard found
that oranges and bananas had a more severe demineralisation effect than all the other foods,
including white bread and rice. In another study, three fruits—bananas, oranges and apples—
were compared in three different forms to observe their effect on dental plaque pH (89). The
minimum fall in pH was observed in orange juice (5.28 ± 0.24), but no significant differences
were observed among the different textures of the same fruit. Table 5 summarises the effects
of different starches and fruits on dental plaque pH.
23
Table 5: Summary of papers on the effect of starchy food and fruits on human dental plaque pH
Author Year Test Foods Method Outcome Lingstrom, Birkhed (88)
1993 Spaghetti Macaroni Potato Rice Unsweetened bread Sweetened bread
Microtouch method Sampling method
Microtouch method continuously gave lower pH values than sampling method Minimum plaque pH was observed in sweetened bread for both the methods 6.0 ± 0.41 by the microtouch method and 6.43 ± 0.29 by the sampling method.
Pollard (90) 1995 5 g pasta 5 g banana 5 g Alpen 5 g oranges 5 g Weetabix 5 g white breads 5 g apples 5 g bran flakes 5 g cornflakes 5 g wholemeal bread
Sampling method
All test foods were not significantly different from each other. The maximum AUC was observed with pasta, which was 21.03 ± 9.29
Hussein, Pollard (89)
1996 35 g apple whole 5g banana 35g apple whole 35 g apple homogenised 35 g apple juice 35 g orange whole 35 g orange homogenised 35 g orange washed 35 g banana whole 35 g banana homogenised 35 g banana juice
Sampling method There was no significant difference between extrinsic sugars and intrinsic sugars (different forms of fruits) Maximum plaque pH drop was observed with orange juice at 5.28 ± 0.24
24
2.7 Hypothesis
We hypothesised that food with a high GI reduces dental plaque pH more than food with a
moderate or low GI.
25
Chapter 3: Materials and Methods
3.1 Ethics Approval
The study procedures were approved by the Human Research Ethics Committee at the
University of Sydney (Project number: 2017/801). All participants were given information
sheets about the project, and all participants gave written consent before participating.
3.2 Subject Selection
Participants were recruited via verbal advertisement on the University of Sydney campus and
enrolled in the study based on their inclusion and exclusion criteria. Participants were between
18 to 55 years old, healthy, non-smoking, and without any underlying diseases or conditions.
Exclusion criteria were any food allergies or orthodontic appliances. Individuals who were
willing to participate received a participant information sheet and signed informed consent
forms. Participants were instructed not to brush their teeth or undertake any other oral hygiene
regime the night before or the morning of the test. Consumption of legumes, tofu, lentils and
alcohol was limited 24 hours before the test day. Participants were instructed to refrain from
any unusual physical activity. They were also advised to have a restful sleep of at least six
hours and to stay hydrated before the test. All tests were conducted early in the morning,
between 6:30 am 11:30 am, after participants had undergone a 10‒12-hour overnight fast. All
participants in sub-studies 2 and 3 also gave one saliva sample (~ 1 mL) to measure their
buffering capacity.
26
3.3 Measurement Technique
3.3.1 Measuring plaque pH
Plaque pH was measured using the sampling technique (55). Before measuring plaque pH, the
pH electrode was calibrated against three standard solutions of pH 4.0, 7.0 and 10.0,
respectively. Before each use, the electrode was rinsed with distilled water and dried with tissue
paper. For Sub-study 1, after recording the baseline pH at time point 0, the second plaque
sample was taken two minutes after participants finished the test drink and then 12 and 32
minutes later, respectively. For sub-studies 2 and 3, the baseline pH was taken at time point 0,
the second sample was taken 12 minutes after participants finished the test food with 250 mL
of water and then 22 and 62 minutes later, respectively.
At each time point, a different quadrant of the oral cavity was randomly selected for plaque
sampling. A sterile plastic dental probe (SI551ST Periodontal 3-Piece Examination Kit, MDDI,
Australia) with a metal tip was used to collect supragingival plaque from the mesial, distal,
buccal and palatal/lingual surfaces of the teeth. A sufficient amount of dental plaque—
approximately 1 mm of the tip of the dental probe—was sampled at each time point. The dental
plaque collected was immediately suspended in 25 µL of distilled water in a 2.5 mL tube
(Eppendorf, Sigma-Aldrich, Australia) and vortexed for 20 seconds. Plaque pH was measured
by inserting the electrode into the solution (plaque and water), and each time, the pH was
recorded after 10 seconds. The electrode was washed, dried and calibrated at pH 7 before each
reading was taken.
3.3.2 Measuring blood glucose
Capillary blood samples (> 0.5 mL) were collected before and after consumption of test food
at ‒5, 0, 15, 30, 45, 60, 90 and 120 minutes. Participants warmed the hand to be sampled before
a blood sample was collected. Blood samples were collected by finger-pricking using a sterile,
27
single-use lancet device (Accu-Chek Safe-T-Pro Plus, Roche Diabetes Care GmbH, Germany).
Participants were given up to 12 minutes to consume the test food with 250 mL of water and
were not allowed to eat any other food or drink throughout the test session. Blood samples
were placed into anticoagulant-coated tubes (Eppendorf tubes, grade II; Sigma Chemical
Company, St Louis, MO, USA) containing 10 IU heparin salt. Following this, the tubes were
centrifuged at 10,000 g for one minute at room temperature. The plasma layer was pipetted
into uncoated tubes and stored at ‒30°C until analysis. The glucose concentrations in the
plasma samples were analysed in duplicate using a glucose hexokinase enzymatic assay
(Beckman Coulter Inc., USA) and an automatic centrifugal spectrophotometric clinical
chemistry analyser (Beckman Coulter AU480, Beckman Instruments Inc., USA). The
incremental area under each two-hour plasma glucose response iAUC was determined for each
test session using the average of the two fasting plasma samples as one baseline glucose
concentration and ignoring any area below fasting (60).
3.3.3 Measuring buffering capacity
Saliva buffering capacity was measured using Ericsson’s method (69). Saliva samples were
taken from all the participants in sub-studies 2 and 3.
Each participant was given a Salivette tube (Sarstedt AG & Co, Germany) for saliva collection
first thing in the morning before the start of the pH and blood glucose test. A single saliva
sample (> 1 mL) was collected from each participant. Participants removed the cotton swab
from the tube and chewed on it for five minutes to stimulate saliva production. After that, the
participants returned the swab into the Salivette tube and placed the cap back on the tube. The
tubes were centrifuged at 2000 g for two minutes at 20°C. Clear saliva was then pipetted into
uncoated Eppendorf tubes and stored at ‒30°C. Each saliva sample was then thawed and mixed
by inverting the tube a couple of times prior to measuring buffering capacity. 1.0 mL saliva
28
was mixed with 3.0 mL HCL solution (0.005 M). To prevent foaming, one drop of 2-Octanol
(Sigma-Aldrich 2-Octanol 97% Lot # BCBV5273, China) was added. The solution was then
mixed for 20 minutes to remove the CO2 using a mixing machine (Selby Suspension mixer,
Australia). A pH meter (SevenCompact™ pH/Ion S220, Switzerland) was used to measure the
saliva buffering capacity. Before use, the pH meter was calibrated against a standard buffering
solution. Between taking readings each time, the pH meter was calibrated with pH 7 solution.
All readings were noted when pH meter showed a stabilised reading.
3.4 Test Food
3.4.1 Sub-study 1: Impact of carbohydrate amount on plaque pH
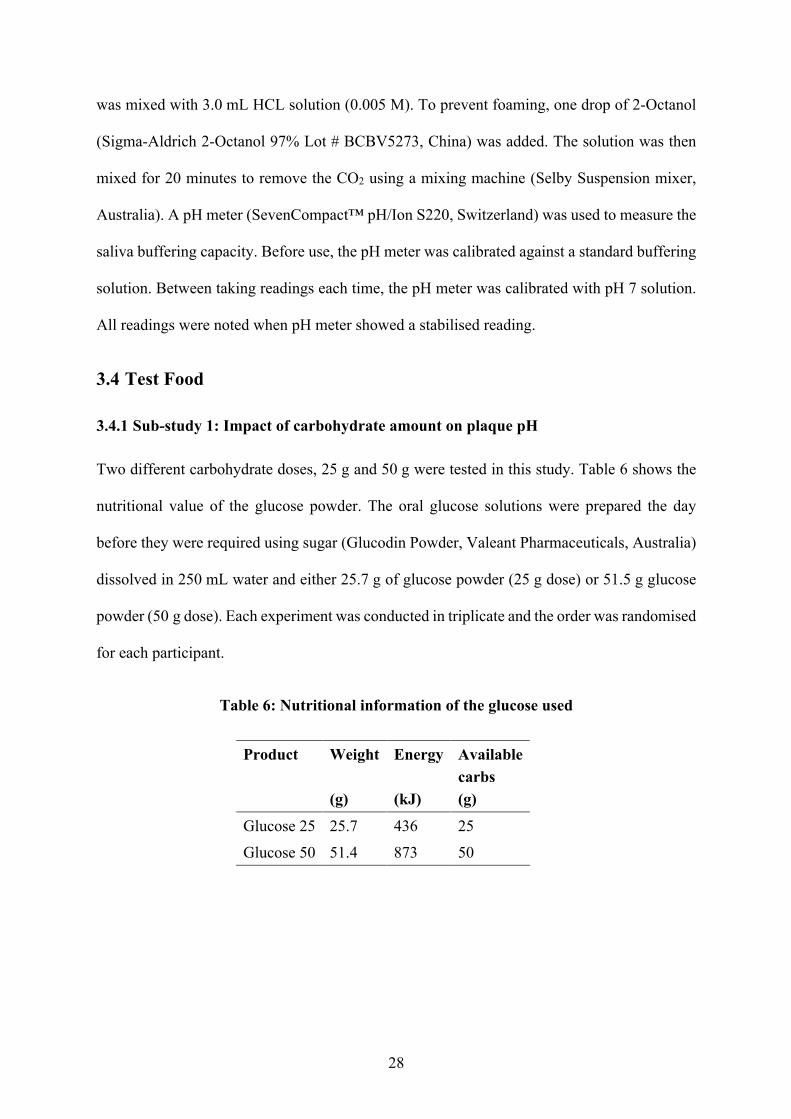
Two different carbohydrate doses, 25 g and 50 g were tested in this study. Table 6 shows the
nutritional value of the glucose powder. The oral glucose solutions were prepared the day
before they were required using sugar (Glucodin Powder, Valeant Pharmaceuticals, Australia)
dissolved in 250 mL water and either 25.7 g of glucose powder (25 g dose) or 51.5 g glucose
powder (50 g dose). Each experiment was conducted in triplicate and the order was randomised
for each participant.
Table 6: Nutritional information of the glucose used
Product Weight (g)
Energy (kJ)
Available carbs (g)
Glucose 25 25.7 436 25 Glucose 50 51.4 873 50

29
3.4.2 Sub-study 2: Impact of carbohydrate (GI) on plaque pH
In Sub-study 2, four different types of starchy carbohydrate food items, representing a range
of GI values, were compared with a reference drink (25.7 g glucose powder dissolved in
250 mL water). The four test food items were 58.5 g of white bread (Wonder White, White
Bread Vitamins & Minerals Sandwich, Goodman Fielder Limited, North Sydney, NSW,
Australia), 34.7 g of dry pasta (San Remo™ 500 g, San Remo Macaroni Co. Pty Ltd, Windsor
Gardens, SA, Australia), 131.6 g of tinned chickpeas (Edgell, Simplot Australia, Pty Ltd,
Mentone, VIC, Australia) and 37.1 g of dry instant mashed potatoes (Continental Deb,
Unilever Australia Ltd, North Rocks, NSW, Australia).
Each test portion contained 25 g of available carbohydrates. The powdered mashed potatoes
were mixed in 161.9 g of boiling water to create the edible portion. The pasta was boiled in
water for 12 minutes, after which the water was drained through a sieve. The water for the
tinned chickpeas was also drained. Table 7 shows the nutritional values for each test food. All
these values were taken from the ingredient tables at the back of the product packs and were
calculated and adjusted according to 25 g of available carbohydrates. The order in which the
test foods were given was random for each participant. Participants were given exactly 12
minutes to consume the test food with a glass of water (250 mL).
Table 7: Nutritional information of test foods used in Sub-study 2
Product Weight (g)
Energy (kJ)
Fat (g)
Available carbs (g)
Sugar (g)
Fibre (g)
Protein (g)
Bread 58.5 585 1.8 25 2.0 4.1 4.3 Pasta 34.7 531 0.6 25 0.8 1.0 4.1
Chickpeas 131.5 751 2.7 25 0.6 7.8 9.4 Mashed potatoes
37.1 602 2.7 25 1.7 ‒ 3.3
30
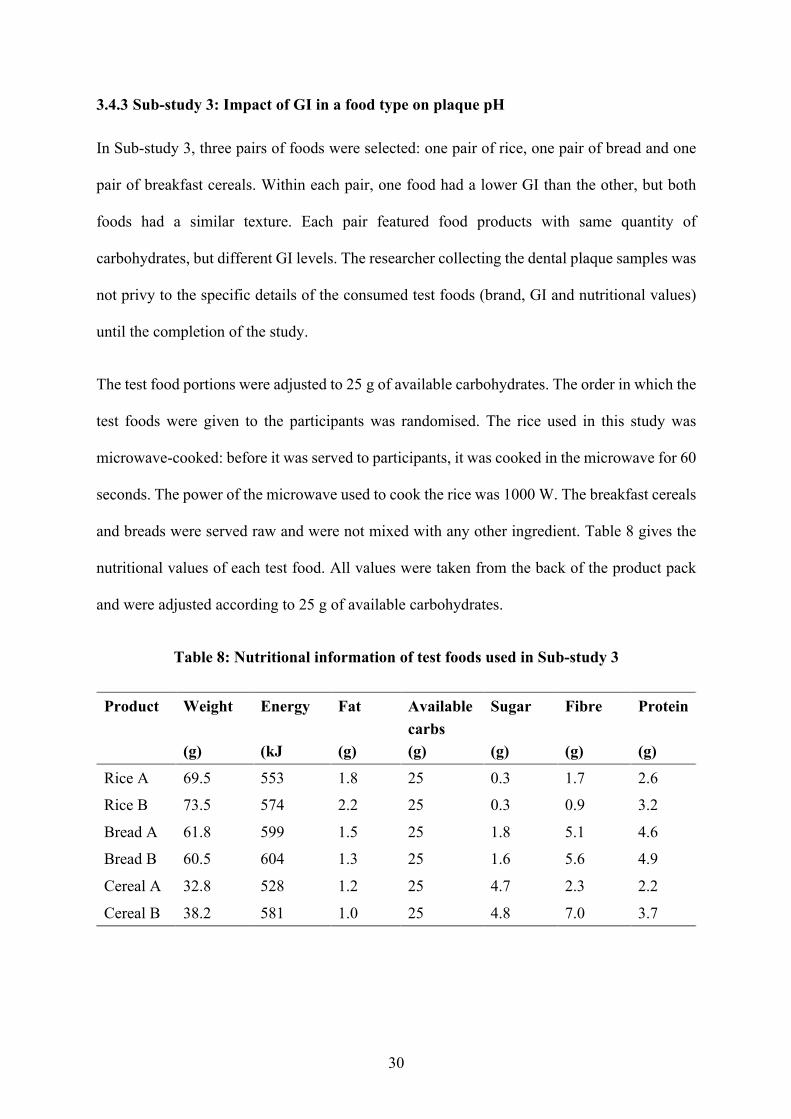
3.4.3 Sub-study 3: Impact of GI in a food type on plaque pH
In Sub-study 3, three pairs of foods were selected: one pair of rice, one pair of bread and one
pair of breakfast cereals. Within each pair, one food had a lower GI than the other, but both
foods had a similar texture. Each pair featured food products with same quantity of
carbohydrates, but different GI levels. The researcher collecting the dental plaque samples was
not privy to the specific details of the consumed test foods (brand, GI and nutritional values)
until the completion of the study.
The test food portions were adjusted to 25 g of available carbohydrates. The order in which the
test foods were given to the participants was randomised. The rice used in this study was
microwave-cooked: before it was served to participants, it was cooked in the microwave for 60
seconds. The power of the microwave used to cook the rice was 1000 W. The breakfast cereals
and breads were served raw and were not mixed with any other ingredient. Table 8 gives the
nutritional values of each test food. All values were taken from the back of the product pack
and were adjusted according to 25 g of available carbohydrates.
Table 8: Nutritional information of test foods used in Sub-study 3
Product Weight (g)
Energy (kJ
Fat (g)
Available carbs (g)
Sugar (g)
Fibre (g)
Protein (g)
Rice A 69.5 553 1.8 25 0.3 1.7 2.6 Rice B 73.5 574 2.2 25 0.3 0.9 3.2
Bread A 61.8 599 1.5 25 1.8 5.1 4.6 Bread B 60.5 604 1.3 25 1.6 5.6 4.9
Cereal A 32.8 528 1.2 25 4.7 2.3 2.2
Cereal B 38.2 581 1.0 25 4.8 7.0 3.7
31
3.5 Statistical Analysis
A p-value < 0.05 was considered statistically significant. Data were analysed using the
Statistical Package for the Social Sciences (SPSS) version 22 (SPSS Inc., United States). Data
were given as mean ± standard deviation (SD) unless otherwise stated. For Sub-study 1, a
paired sample t-test was conducted to determine the effect of different glucose amounts on
plaque pH at different time points. For Sub-study 2, a paired sample t-test was used to
investigate the effect of different foods on plaque pH and blood glucose levels at different time
points. Data on the AUC for pH and blood glucose were obtained using Excel. For the AUC
of plaque pH and blood glucose for different foods, data were analysed using analysis of
variance (ANOVA). Where ANOVA was significant, a Bonferroni post-hoc analysis was used
for multiple comparisons. For Sub-study 3, a paired sample t-test was conducted to determine
the effect of the same food types with different GI levels on plaque pH and blood glucose levels
at different time points. For the AUC of plaque pH and blood glucose, data were also analysed
using paired sample t-tests. Pearson correlation coefficients were calculated to test the
association between pH and blood glucose. A P-value <0.05 was considered statistically
significant.
32
Chapter 4: Results
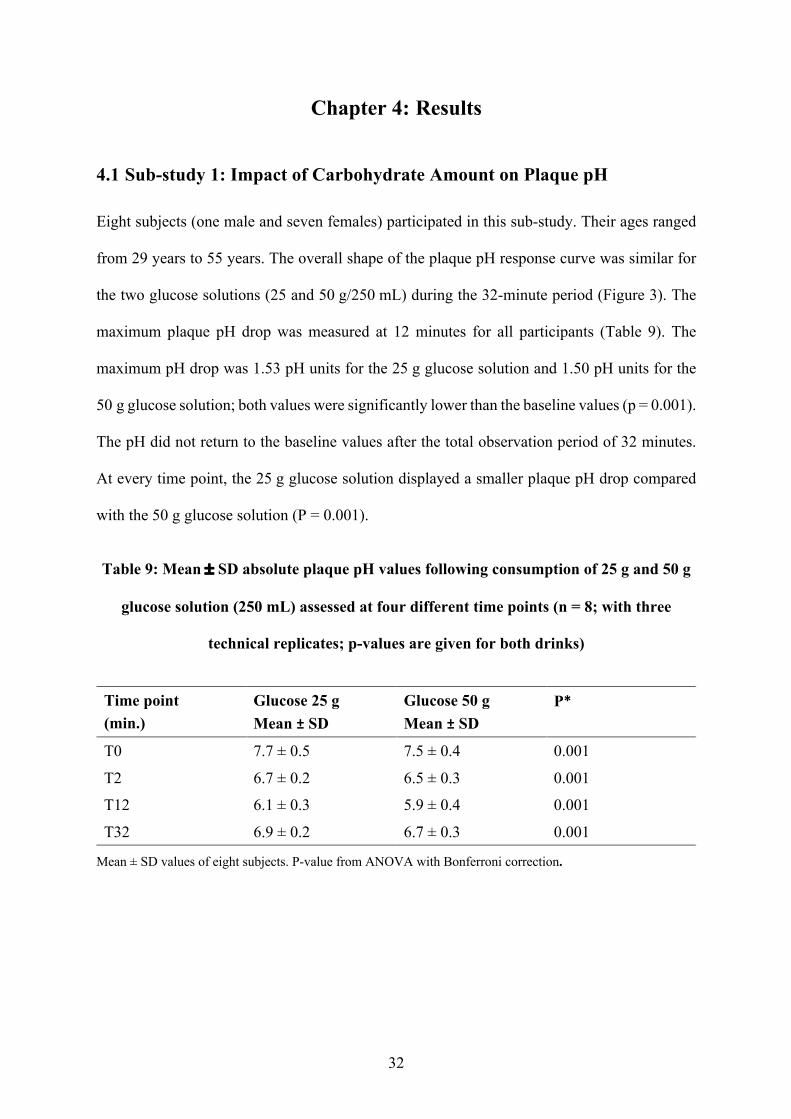
4.1 Sub-study 1: Impact of Carbohydrate Amount on Plaque pH
Eight subjects (one male and seven females) participated in this sub-study. Their ages ranged
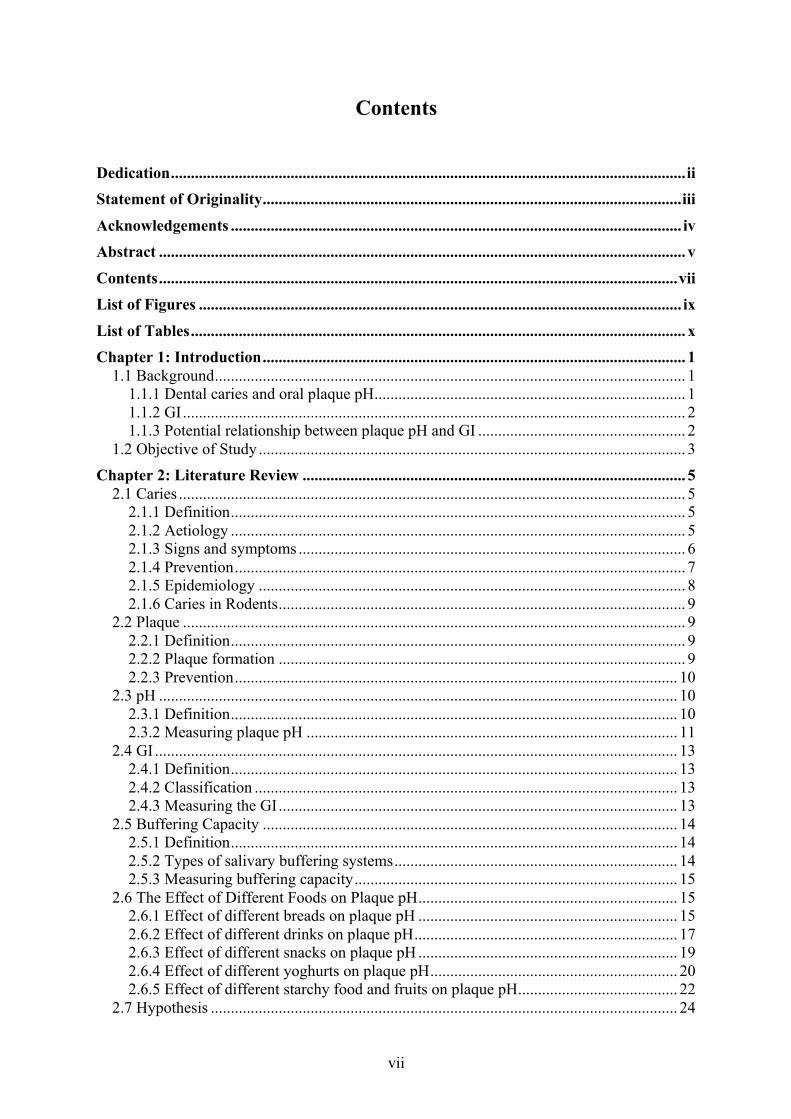
from 29 years to 55 years. The overall shape of the plaque pH response curve was similar for
the two glucose solutions (25 and 50 g/250 mL) during the 32-minute period (Figure 3). The
maximum plaque pH drop was measured at 12 minutes for all participants (Table 9). The
maximum pH drop was 1.53 pH units for the 25 g glucose solution and 1.50 pH units for the
50 g glucose solution; both values were significantly lower than the baseline values (p = 0.001).
The pH did not return to the baseline values after the total observation period of 32 minutes.
At every time point, the 25 g glucose solution displayed a smaller plaque pH drop compared
with the 50 g glucose solution (P = 0.001).
Table 9: Mean ± SD absolute plaque pH values following consumption of 25 g and 50 g
glucose solution (250 mL) assessed at four different time points (n = 8; with three
technical replicates; p-values are given for both drinks)
Time point (min.)
Glucose 25 g Mean ± SD
Glucose 50 g Mean ± SD
P*
T0 7.7 ± 0.5 7.5 ± 0.4 0.001
T2 6.7 ± 0.2 6.5 ± 0.3 0.001 T12 6.1 ± 0.3 5.9 ± 0.4 0.001
T32 6.9 ± 0.2 6.7 ± 0.3 0.001
Mean ± SD values of eight subjects. P-value from ANOVA with Bonferroni correction.
33
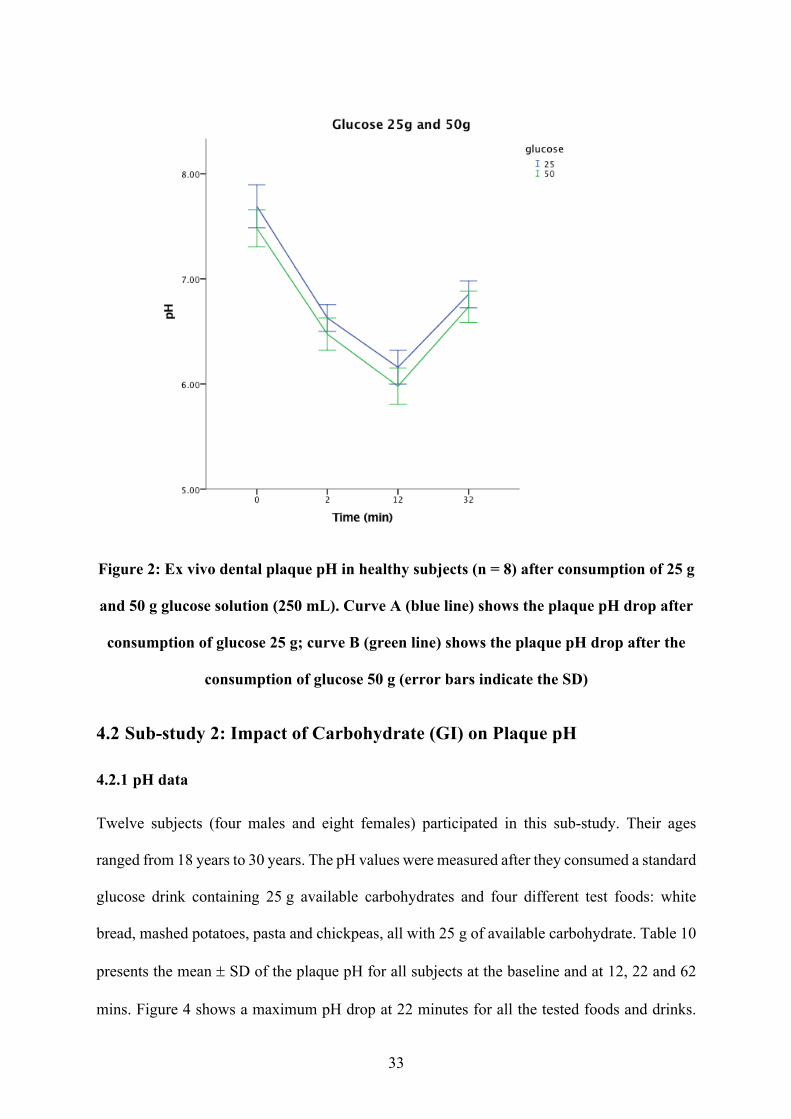
Figure 2: Ex vivo dental plaque pH in healthy subjects (n = 8) after consumption of 25 g
and 50 g glucose solution (250 mL). Curve A (blue line) shows the plaque pH drop after
consumption of glucose 25 g; curve B (green line) shows the plaque pH drop after the
consumption of glucose 50 g (error bars indicate the SD)
4.2 Sub-study 2: Impact of Carbohydrate (GI) on Plaque pH
4.2.1 pH data
Twelve subjects (four males and eight females) participated in this sub-study. Their ages
ranged from 18 years to 30 years. The pH values were measured after they consumed a standard
glucose drink containing 25 g available carbohydrates and four different test foods: white
bread, mashed potatoes, pasta and chickpeas, all with 25 g of available carbohydrate. Table 10
presents the mean ± SD of the plaque pH for all subjects at the baseline and at 12, 22 and 62
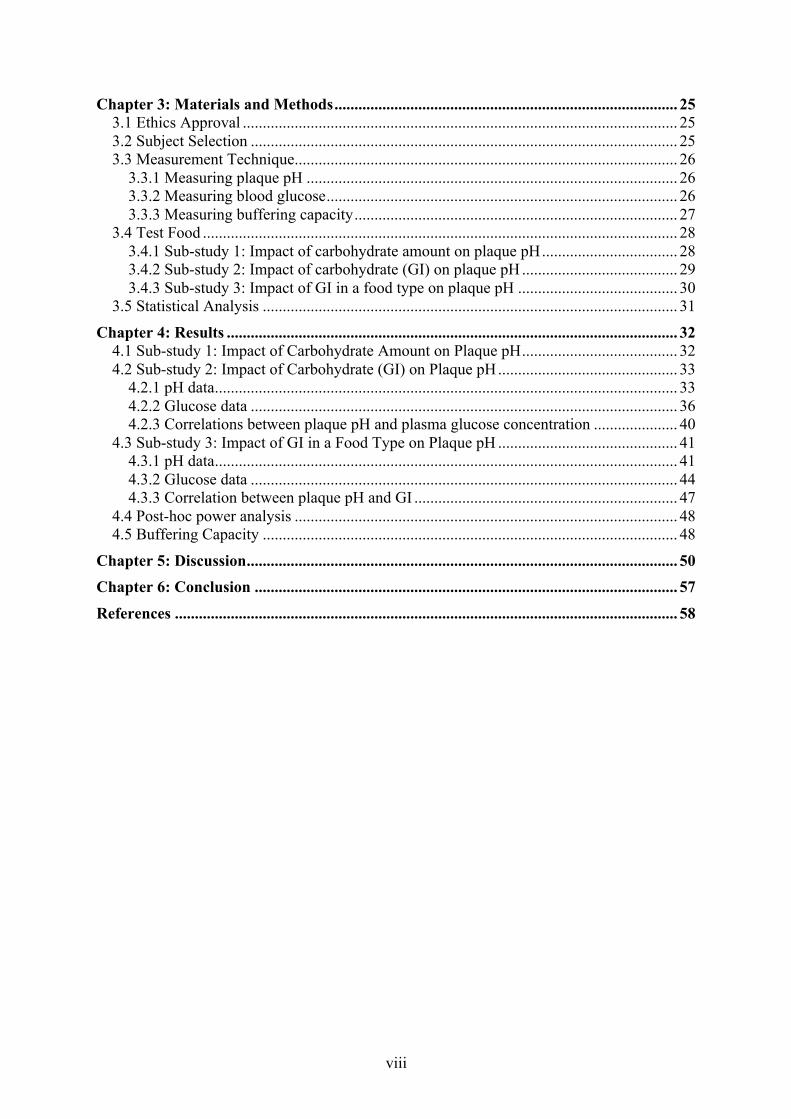
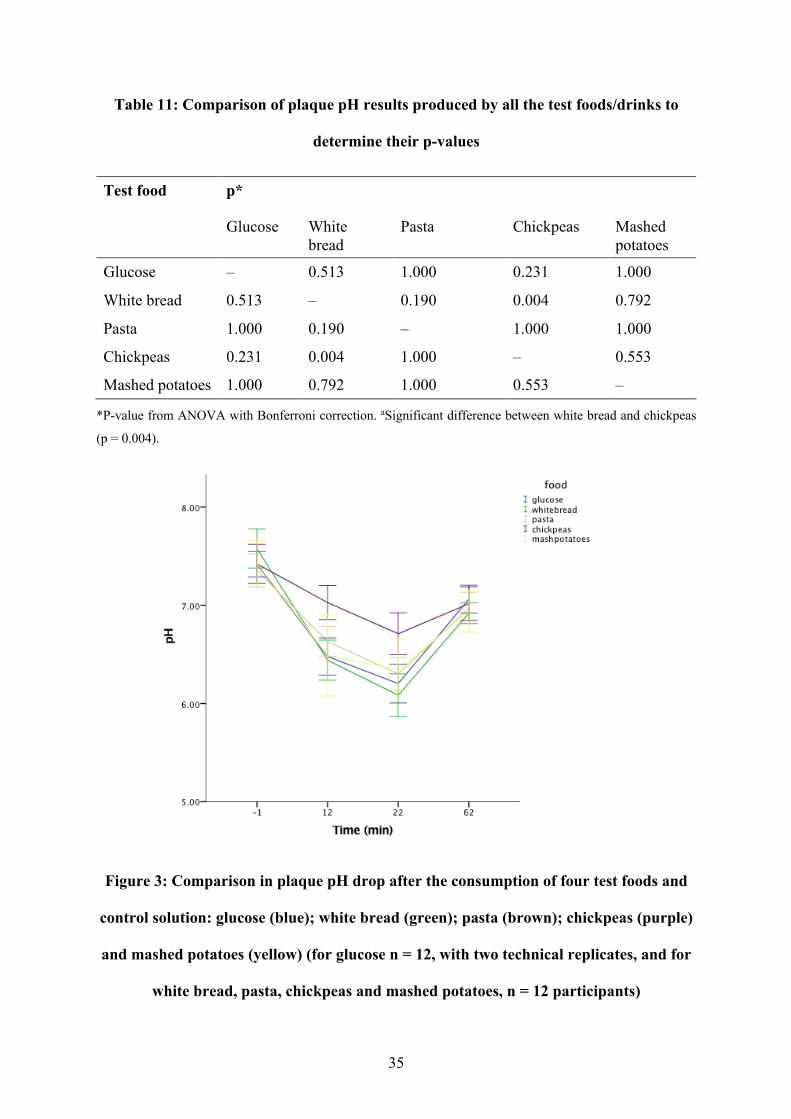
mins. Figure 4 shows a maximum pH drop at 22 minutes for all the tested foods and drinks.
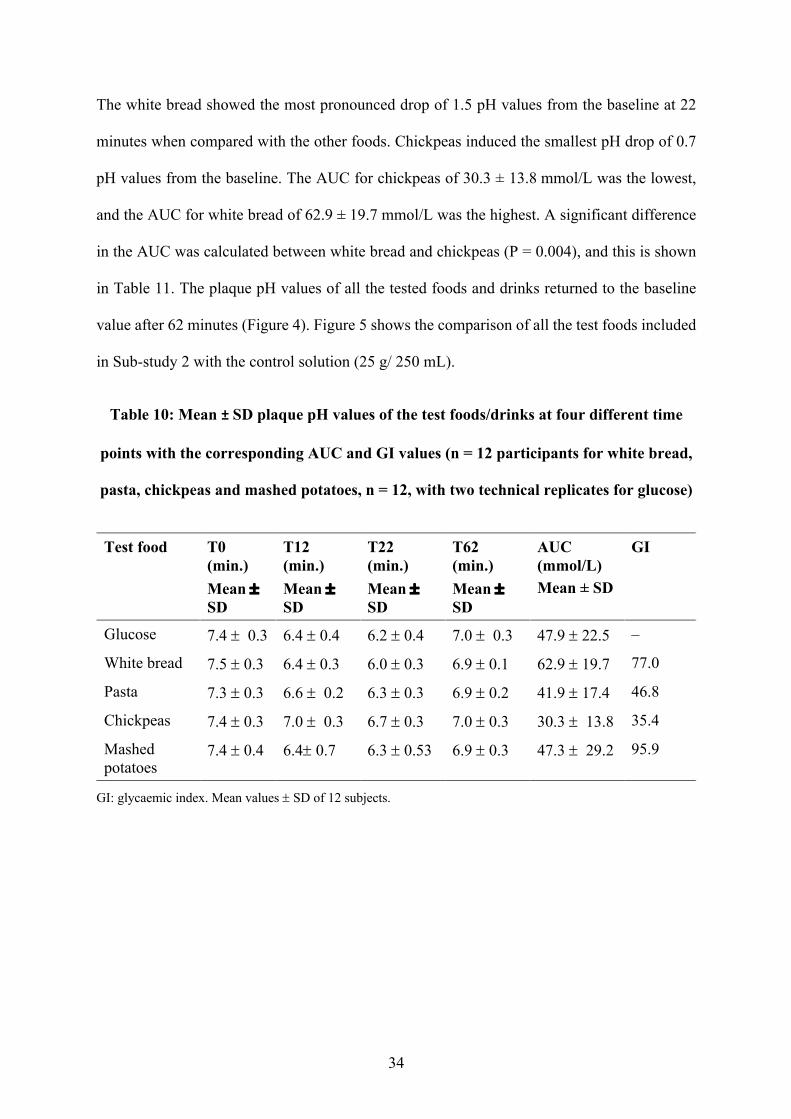
34
The white bread showed the most pronounced drop of 1.5 pH values from the baseline at 22
minutes when compared with the other foods. Chickpeas induced the smallest pH drop of 0.7
pH values from the baseline. The AUC for chickpeas of 30.3 ± 13.8 mmol/L was the lowest,
and the AUC for white bread of 62.9 ± 19.7 mmol/L was the highest. A significant difference
in the AUC was calculated between white bread and chickpeas (P = 0.004), and this is shown
in Table 11. The plaque pH values of all the tested foods and drinks returned to the baseline
value after 62 minutes (Figure 4). Figure 5 shows the comparison of all the test foods included
in Sub-study 2 with the control solution (25 g/ 250 mL).
Table 10: Mean ± SD plaque pH values of the test foods/drinks at four different time
points with the corresponding AUC and GI values (n = 12 participants for white bread,
pasta, chickpeas and mashed potatoes, n = 12, with two technical replicates for glucose)
Test food T0 (min.) Mean ± SD
T12 (min.) Mean ± SD
T22 (min.) Mean ± SD
T62 (min.) Mean ± SD
AUC (mmol/L) Mean ± SD
GI
Glucose 7.4 ± 0.3 6.4 ± 0.4 6.2 ± 0.4 7.0 ± 0.3 47.9 ± 22.5 ‒
White bread 7.5 ± 0.3 6.4 ± 0.3 6.0 ± 0.3 6.9 ± 0.1 62.9 ± 19.7 77.0
Pasta 7.3 ± 0.3 6.6 ± 0.2 6.3 ± 0.3 6.9 ± 0.2 41.9 ± 17.4 46.8
Chickpeas 7.4 ± 0.3 7.0 ± 0.3 6.7 ± 0.3 7.0 ± 0.3 30.3 ± 13.8 35.4
Mashed potatoes
7.4 ± 0.4 6.4± 0.7 6.3 ± 0.53 6.9 ± 0.3 47.3 ± 29.2 95.9
GI: glycaemic index. Mean values ± SD of 12 subjects.
35
Table 11: Comparison of plaque pH results produced by all the test foods/drinks to
determine their p-values
Test food p*
Glucose White bread
Pasta Chickpeas Mashed potatoes
Glucose ‒ 0.513 1.000 0.231 1.000
White bread 0.513 ‒ 0.190 0.004 0.792
Pasta 1.000 0.190 ‒ 1.000 1.000
Chickpeas 0.231 0.004 1.000 ‒ 0.553
Mashed potatoes 1.000 0.792 1.000 0.553 ‒
*P-value from ANOVA with Bonferroni correction. aSignificant difference between white bread and chickpeas
(p = 0.004).
Figure 3: Comparison in plaque pH drop after the consumption of four test foods and
control solution: glucose (blue); white bread (green); pasta (brown); chickpeas (purple)
and mashed potatoes (yellow) (for glucose n = 12, with two technical replicates, and for
white bread, pasta, chickpeas and mashed potatoes, n = 12 participants)
36
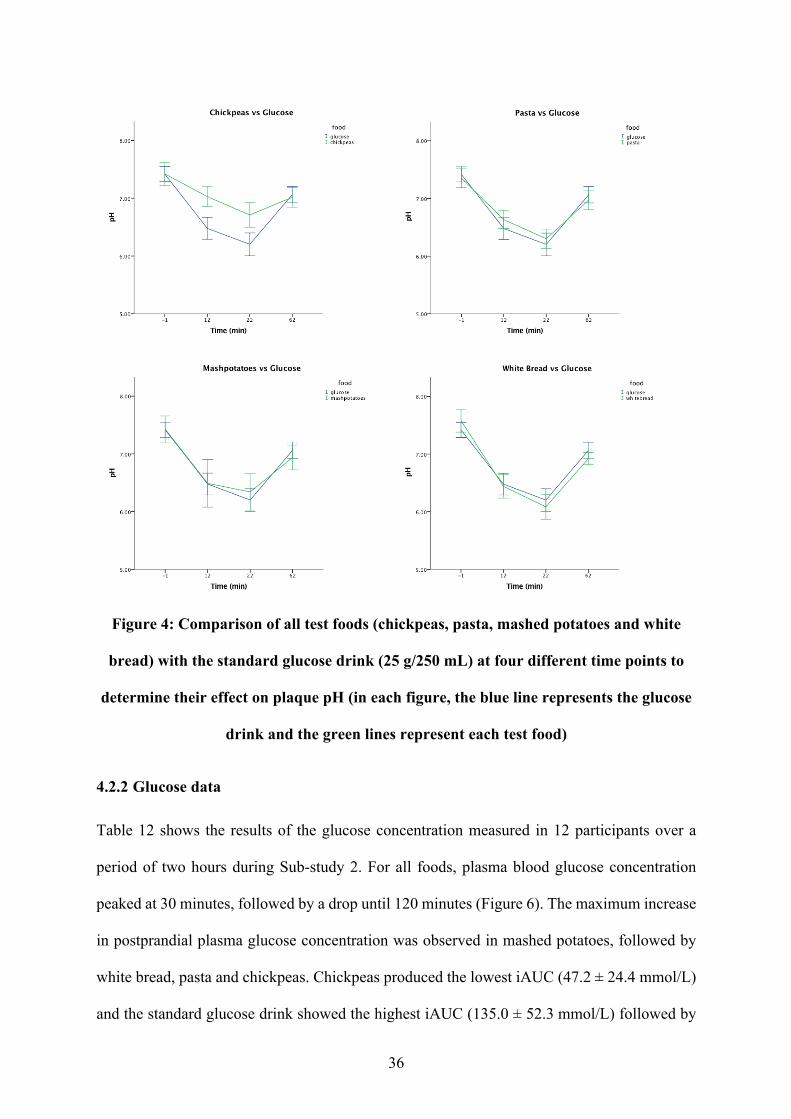
Figure 4: Comparison of all test foods (chickpeas, pasta, mashed potatoes and white
bread) with the standard glucose drink (25 g/250 mL) at four different time points to
determine their effect on plaque pH (in each figure, the blue line represents the glucose
drink and the green lines represent each test food)
4.2.2 Glucose data
Table 12 shows the results of the glucose concentration measured in 12 participants over a
period of two hours during Sub-study 2. For all foods, plasma blood glucose concentration
peaked at 30 minutes, followed by a drop until 120 minutes (Figure 6). The maximum increase
in postprandial plasma glucose concentration was observed in mashed potatoes, followed by
white bread, pasta and chickpeas. Chickpeas produced the lowest iAUC (47.2 ± 24.4 mmol/L)
and the standard glucose drink showed the highest iAUC (135.0 ± 52.3 mmol/L) followed by
37
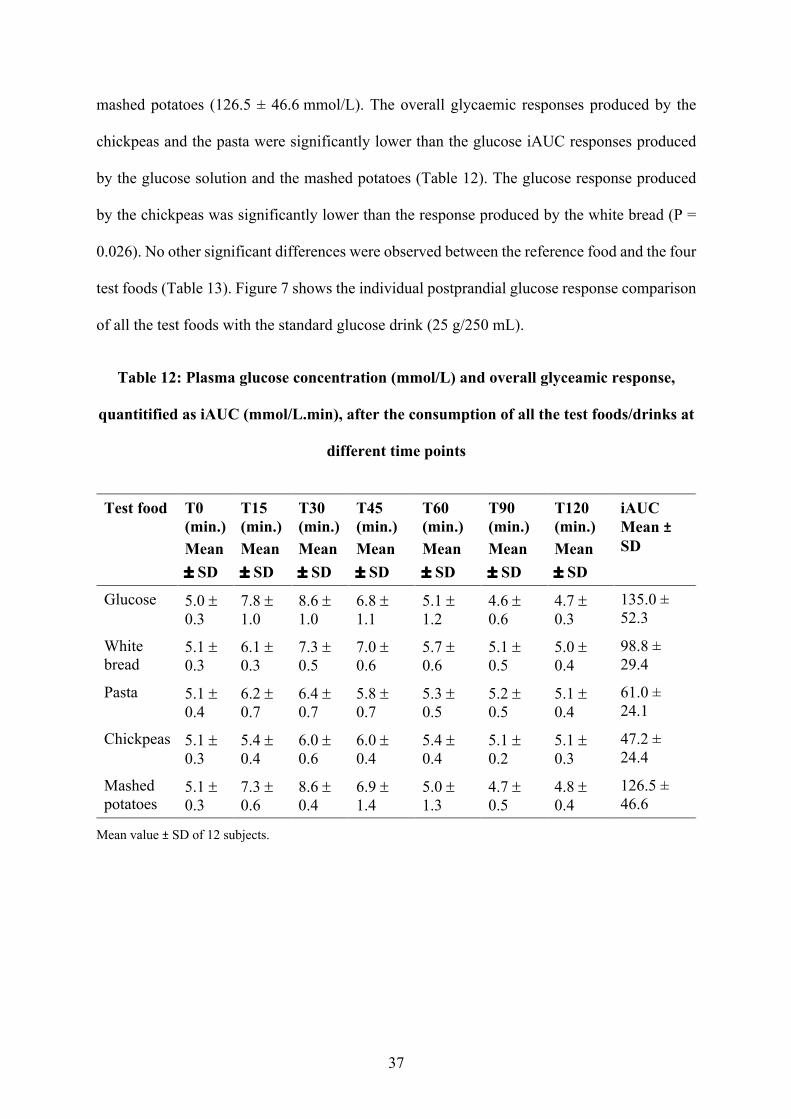
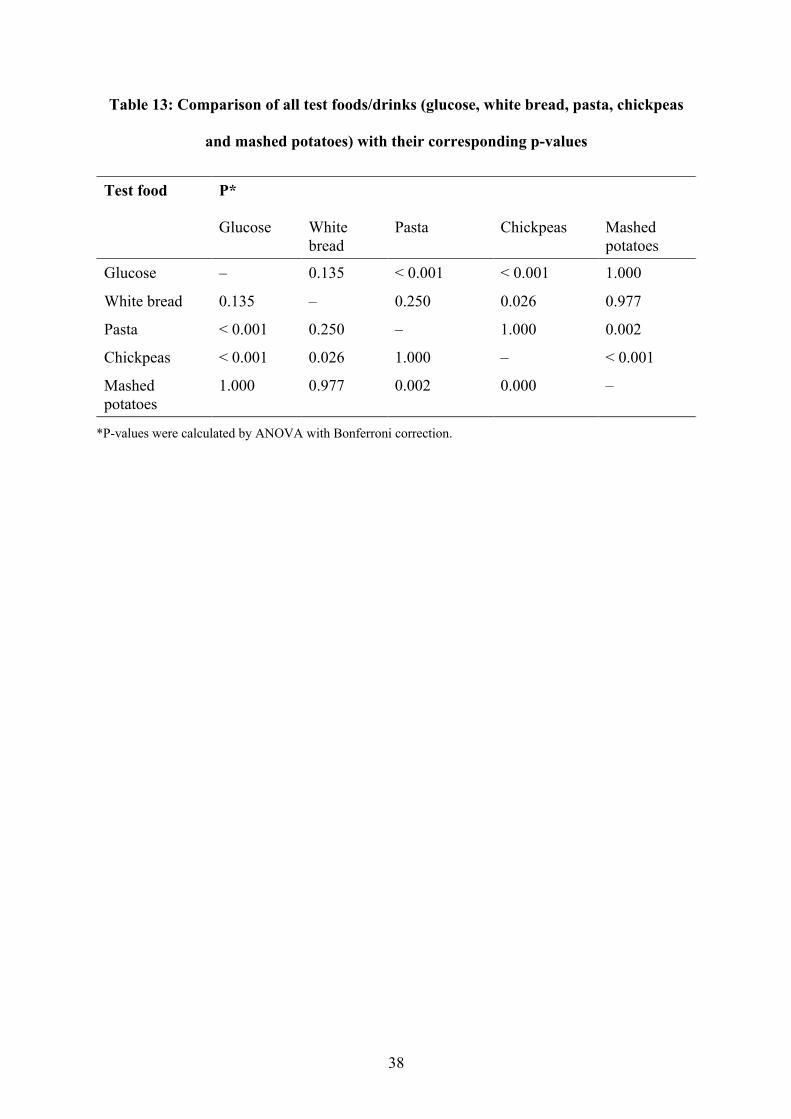
mashed potatoes (126.5 ± 46.6 mmol/L). The overall glycaemic responses produced by the
chickpeas and the pasta were significantly lower than the glucose iAUC responses produced
by the glucose solution and the mashed potatoes (Table 12). The glucose response produced
by the chickpeas was significantly lower than the response produced by the white bread (P =
0.026). No other significant differences were observed between the reference food and the four
test foods (Table 13). Figure 7 shows the individual postprandial glucose response comparison
of all the test foods with the standard glucose drink (25 g/250 mL).
Table 12: Plasma glucose concentration (mmol/L) and overall glyceamic response,
quantitified as iAUC (mmol/L.min), after the consumption of all the test foods/drinks at
different time points
Test food T0 (min.) Mean ± SD
T15 (min.) Mean ± SD
T30 (min.) Mean ± SD
T45 (min.) Mean ± SD
T60 (min.) Mean ± SD
T90 (min.) Mean ± SD
T120 (min.) Mean ± SD
iAUC Mean ± SD
Glucose 5.0 ± 0.3
7.8 ± 1.0
8.6 ± 1.0
6.8 ± 1.1
5.1 ± 1.2
4.6 ± 0.6
4.7 ± 0.3
135.0 ± 52.3
White bread
5.1 ± 0.3
6.1 ± 0.3
7.3 ± 0.5
7.0 ± 0.6
5.7 ± 0.6
5.1 ± 0.5
5.0 ± 0.4
98.8 ± 29.4
Pasta 5.1 ± 0.4
6.2 ± 0.7
6.4 ± 0.7
5.8 ± 0.7
5.3 ± 0.5
5.2 ± 0.5
5.1 ± 0.4
61.0 ± 24.1
Chickpeas 5.1 ± 0.3
5.4 ± 0.4
6.0 ± 0.6
6.0 ± 0.4
5.4 ± 0.4
5.1 ± 0.2
5.1 ± 0.3
47.2 ± 24.4
Mashed potatoes
5.1 ± 0.3
7.3 ± 0.6
8.6 ± 0.4
6.9 ± 1.4
5.0 ± 1.3
4.7 ± 0.5
4.8 ± 0.4
126.5 ± 46.6
Mean value ± SD of 12 subjects.
38
Table 13: Comparison of all test foods/drinks (glucose, white bread, pasta, chickpeas
and mashed potatoes) with their corresponding p-values
Test food P*
Glucose White bread
Pasta Chickpeas Mashed potatoes
Glucose ‒ 0.135 < 0.001 < 0.001 1.000
White bread 0.135 ‒ 0.250 0.026 0.977
Pasta < 0.001 0.250 ‒ 1.000 0.002
Chickpeas < 0.001 0.026 1.000 ‒ < 0.001
Mashed potatoes
1.000 0.977 0.002 0.000 ‒
*P-values were calculated by ANOVA with Bonferroni correction.
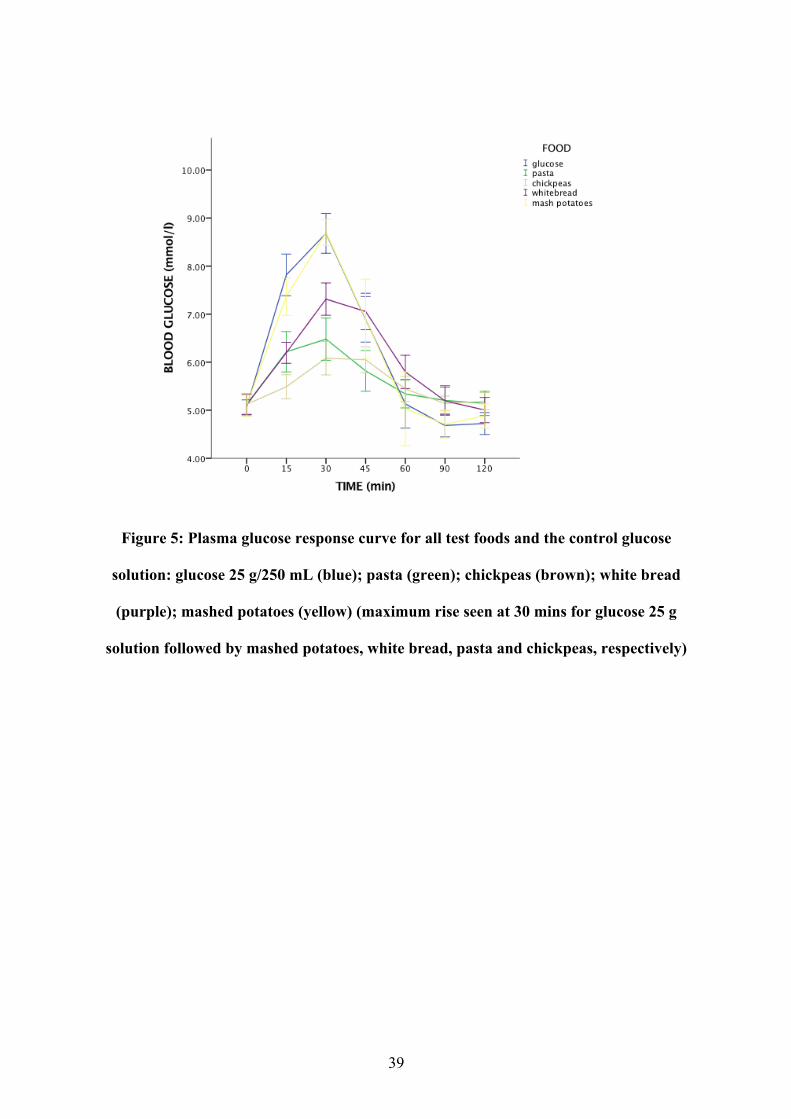
39
Figure 5: Plasma glucose response curve for all test foods and the control glucose
solution: glucose 25 g/250 mL (blue); pasta (green); chickpeas (brown); white bread
(purple); mashed potatoes (yellow) (maximum rise seen at 30 mins for glucose 25 g
solution followed by mashed potatoes, white bread, pasta and chickpeas, respectively)
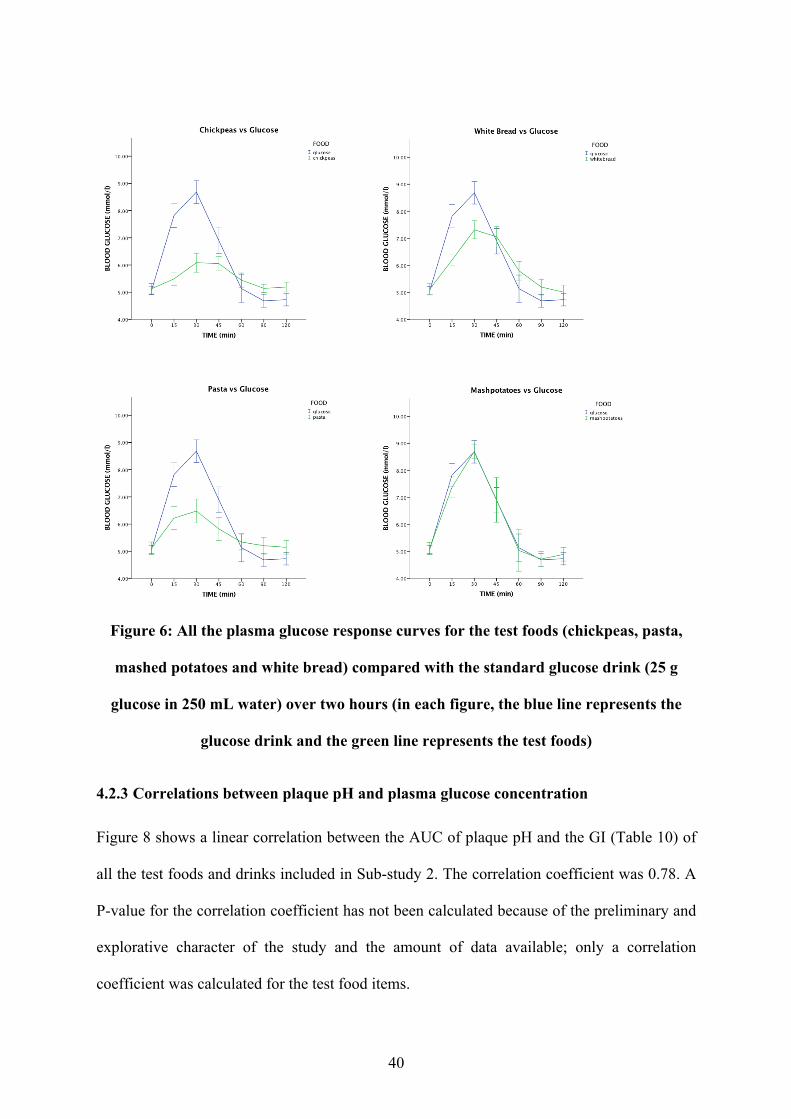
40
Figure 6: All the plasma glucose response curves for the test foods (chickpeas, pasta,
mashed potatoes and white bread) compared with the standard glucose drink (25 g
glucose in 250 mL water) over two hours (in each figure, the blue line represents the
glucose drink and the green line represents the test foods)
4.2.3 Correlations between plaque pH and plasma glucose concentration
Figure 8 shows a linear correlation between the AUC of plaque pH and the GI (Table 10) of
all the test foods and drinks included in Sub-study 2. The correlation coefficient was 0.78. A
P-value for the correlation coefficient has not been calculated because of the preliminary and
explorative character of the study and the amount of data available; only a correlation
coefficient was calculated for the test food items.
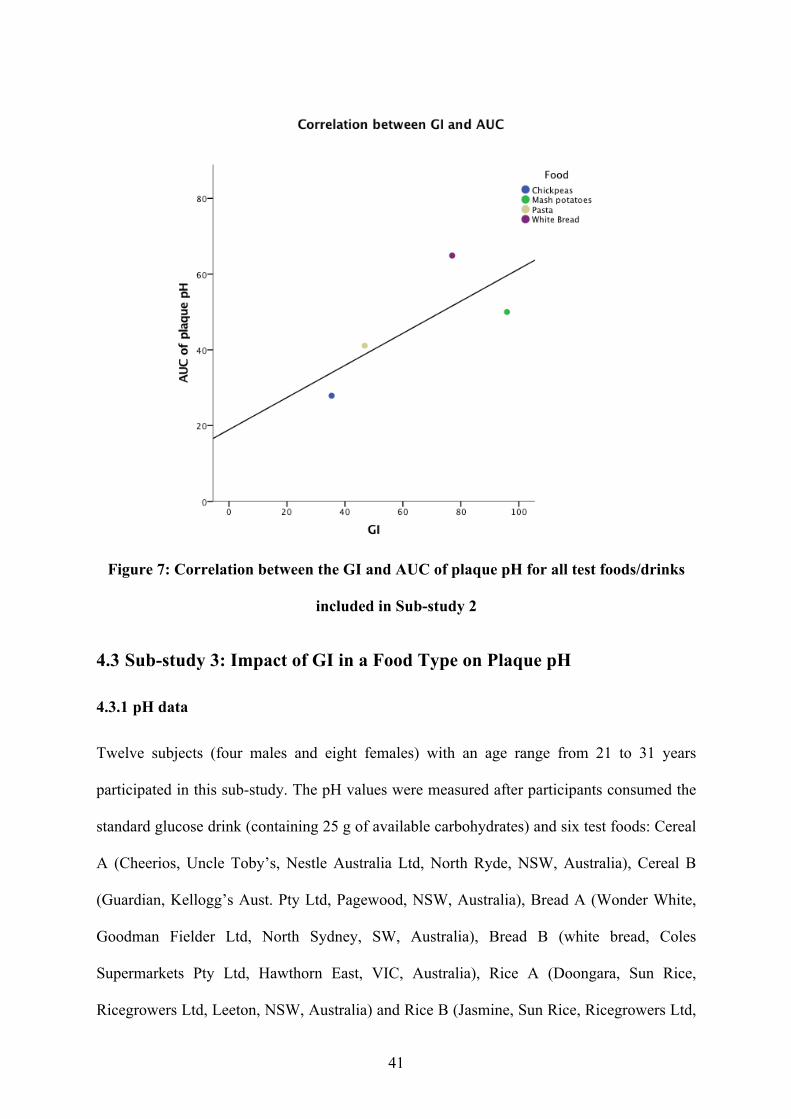
41
Figure 7: Correlation between the GI and AUC of plaque pH for all test foods/drinks
included in Sub-study 2
4.3 Sub-study 3: Impact of GI in a Food Type on Plaque pH
4.3.1 pH data
Twelve subjects (four males and eight females) with an age range from 21 to 31 years
participated in this sub-study. The pH values were measured after participants consumed the
standard glucose drink (containing 25 g of available carbohydrates) and six test foods: Cereal
A (Cheerios, Uncle Toby’s, Nestle Australia Ltd, North Ryde, NSW, Australia), Cereal B
(Guardian, Kellogg’s Aust. Pty Ltd, Pagewood, NSW, Australia), Bread A (Wonder White,
Goodman Fielder Ltd, North Sydney, SW, Australia), Bread B (white bread, Coles
Supermarkets Pty Ltd, Hawthorn East, VIC, Australia), Rice A (Doongara, Sun Rice,
Ricegrowers Ltd, Leeton, NSW, Australia) and Rice B (Jasmine, Sun Rice, Ricegrowers Ltd,
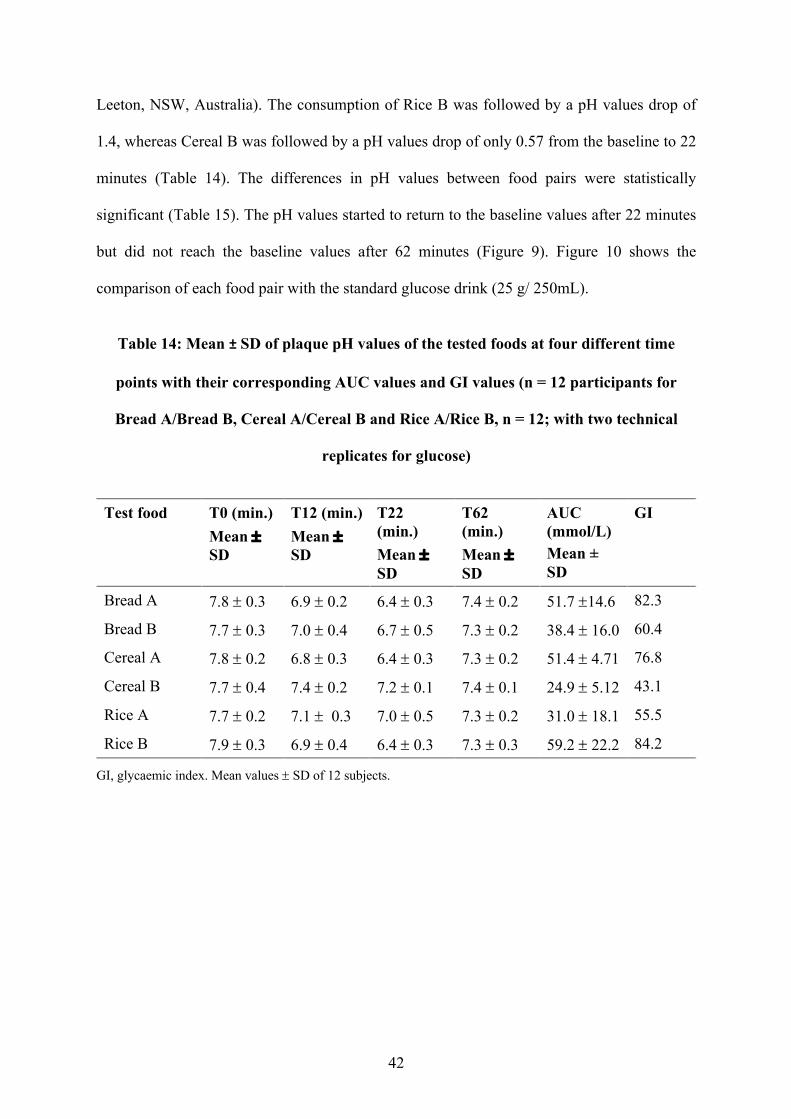
42
Leeton, NSW, Australia). The consumption of Rice B was followed by a pH values drop of
1.4, whereas Cereal B was followed by a pH values drop of only 0.57 from the baseline to 22
minutes (Table 14). The differences in pH values between food pairs were statistically
significant (Table 15). The pH values started to return to the baseline values after 22 minutes
but did not reach the baseline values after 62 minutes (Figure 9). Figure 10 shows the
comparison of each food pair with the standard glucose drink (25 g/ 250mL).
Table 14: Mean ± SD of plaque pH values of the tested foods at four different time
points with their corresponding AUC values and GI values (n = 12 participants for
Bread A/Bread B, Cereal A/Cereal B and Rice A/Rice B, n = 12; with two technical
replicates for glucose)
Test food T0 (min.) Mean ± SD
T12 (min.) Mean ± SD
T22 (min.) Mean ± SD
T62 (min.) Mean ± SD
AUC (mmol/L) Mean ± SD
GI
Bread A 7.8 ± 0.3 6.9 ± 0.2 6.4 ± 0.3 7.4 ± 0.2 51.7 ±14.6 82.3
Bread B 7.7 ± 0.3 7.0 ± 0.4 6.7 ± 0.5 7.3 ± 0.2 38.4 ± 16.0 60.4
Cereal A 7.8 ± 0.2 6.8 ± 0.3 6.4 ± 0.3 7.3 ± 0.2 51.4 ± 4.71 76.8
Cereal B 7.7 ± 0.4 7.4 ± 0.2 7.2 ± 0.1 7.4 ± 0.1 24.9 ± 5.12 43.1
Rice A 7.7 ± 0.2 7.1 ± 0.3 7.0 ± 0.5 7.3 ± 0.2 31.0 ± 18.1 55.5
Rice B 7.9 ± 0.3 6.9 ± 0.4 6.4 ± 0.3 7.3 ± 0.3 59.2 ± 22.2 84.2
GI, glycaemic index. Mean values ± SD of 12 subjects.
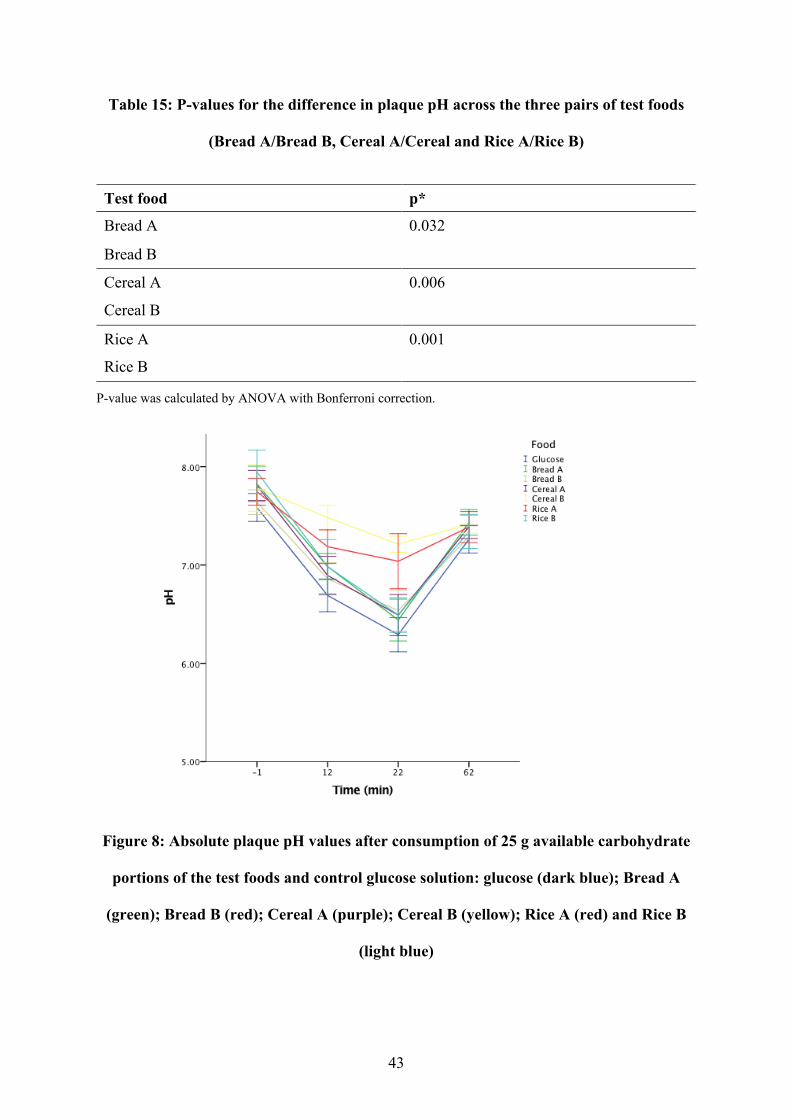
43
Table 15: P-values for the difference in plaque pH across the three pairs of test foods
(Bread A/Bread B, Cereal A/Cereal and Rice A/Rice B)
Test food p*
Bread A 0.032
Bread B
Cereal A 0.006
Cereal B
Rice A 0.001
Rice B
P-value was calculated by ANOVA with Bonferroni correction.
Figure 8: Absolute plaque pH values after consumption of 25 g available carbohydrate
portions of the test foods and control glucose solution: glucose (dark blue); Bread A
(green); Bread B (red); Cereal A (purple); Cereal B (yellow); Rice A (red) and Rice B
(light blue)
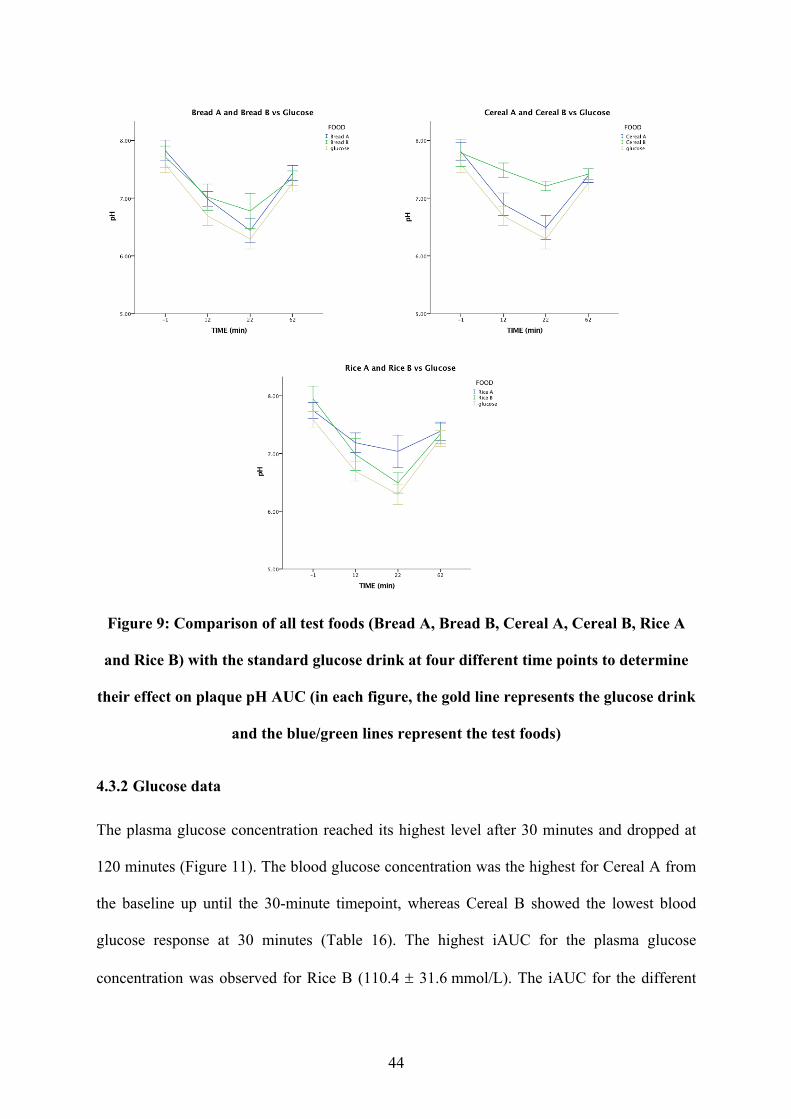
44
Figure 9: Comparison of all test foods (Bread A, Bread B, Cereal A, Cereal B, Rice A
and Rice B) with the standard glucose drink at four different time points to determine
their effect on plaque pH AUC (in each figure, the gold line represents the glucose drink
and the blue/green lines represent the test foods)
4.3.2 Glucose data
The plasma glucose concentration reached its highest level after 30 minutes and dropped at
120 minutes (Figure 11). The blood glucose concentration was the highest for Cereal A from
the baseline up until the 30-minute timepoint, whereas Cereal B showed the lowest blood
glucose response at 30 minutes (Table 16). The highest iAUC for the plasma glucose
concentration was observed for Rice B (110.4 ± 31.6 mmol/L). The iAUC for the different
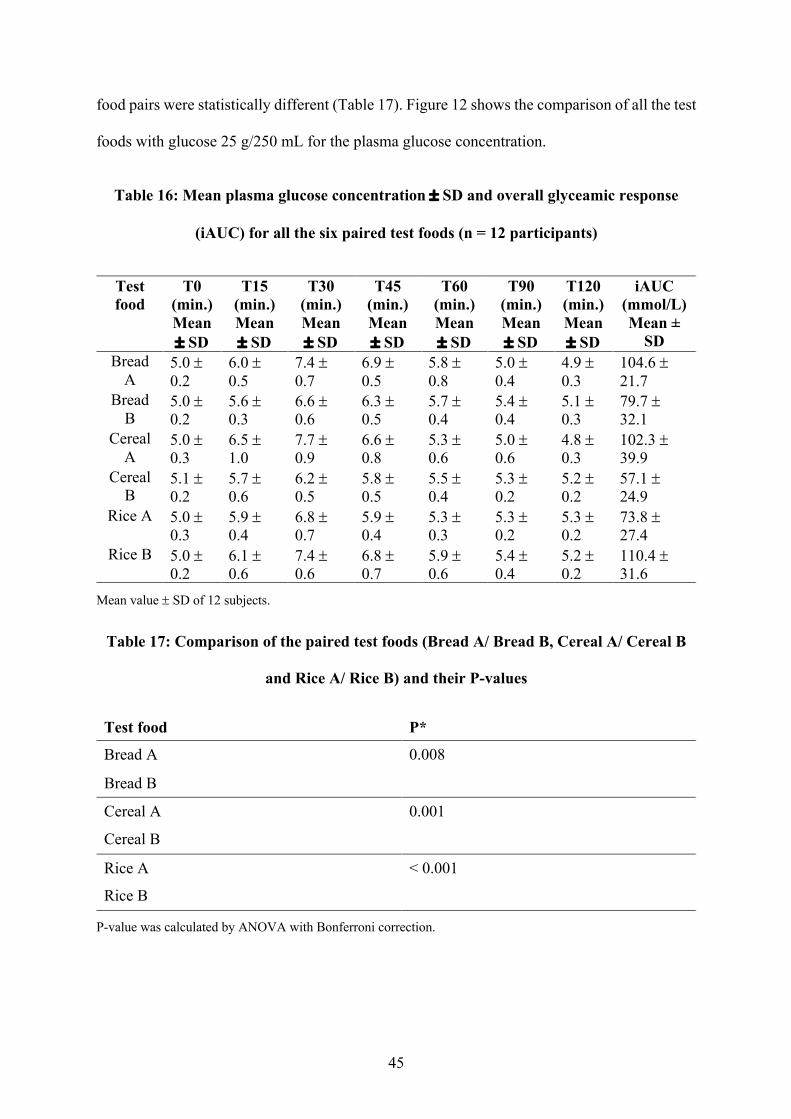
45
food pairs were statistically different (Table 17). Figure 12 shows the comparison of all the test
foods with glucose 25 g/250 mL for the plasma glucose concentration.
Table 16: Mean plasma glucose concentration ± SD and overall glyceamic response
(iAUC) for all the six paired test foods (n = 12 participants)
Test food
T0 (min.) Mean ± SD
T15 (min.) Mean ± SD
T30 (min.) Mean ± SD
T45 (min.) Mean ± SD
T60 (min.) Mean ± SD
T90 (min.) Mean ± SD
T120 (min.) Mean ± SD
iAUC (mmol/L) Mean ±
SD Bread
A 5.0 ± 0.2
6.0 ± 0.5
7.4 ± 0.7
6.9 ± 0.5
5.8 ± 0.8
5.0 ± 0.4
4.9 ± 0.3
104.6 ± 21.7
Bread B
5.0 ± 0.2
5.6 ± 0.3
6.6 ± 0.6
6.3 ± 0.5
5.7 ± 0.4
5.4 ± 0.4
5.1 ± 0.3
79.7 ± 32.1
Cereal A
5.0 ± 0.3
6.5 ± 1.0
7.7 ± 0.9
6.6 ± 0.8
5.3 ± 0.6
5.0 ± 0.6
4.8 ± 0.3
102.3 ± 39.9
Cereal B
5.1 ± 0.2
5.7 ± 0.6
6.2 ± 0.5
5.8 ± 0.5
5.5 ± 0.4
5.3 ± 0.2
5.2 ± 0.2
57.1 ± 24.9
Rice A 5.0 ± 0.3
5.9 ± 0.4
6.8 ± 0.7
5.9 ± 0.4
5.3 ± 0.3
5.3 ± 0.2
5.3 ± 0.2
73.8 ± 27.4
Rice B 5.0 ± 0.2
6.1 ± 0.6
7.4 ± 0.6
6.8 ± 0.7
5.9 ± 0.6
5.4 ± 0.4
5.2 ± 0.2
110.4 ± 31.6
Mean value ± SD of 12 subjects.
Table 17: Comparison of the paired test foods (Bread A/ Bread B, Cereal A/ Cereal B
and Rice A/ Rice B) and their P-values
Test food P*
Bread A 0.008
Bread B
Cereal A 0.001
Cereal B
Rice A < 0.001
Rice B
P-value was calculated by ANOVA with Bonferroni correction.
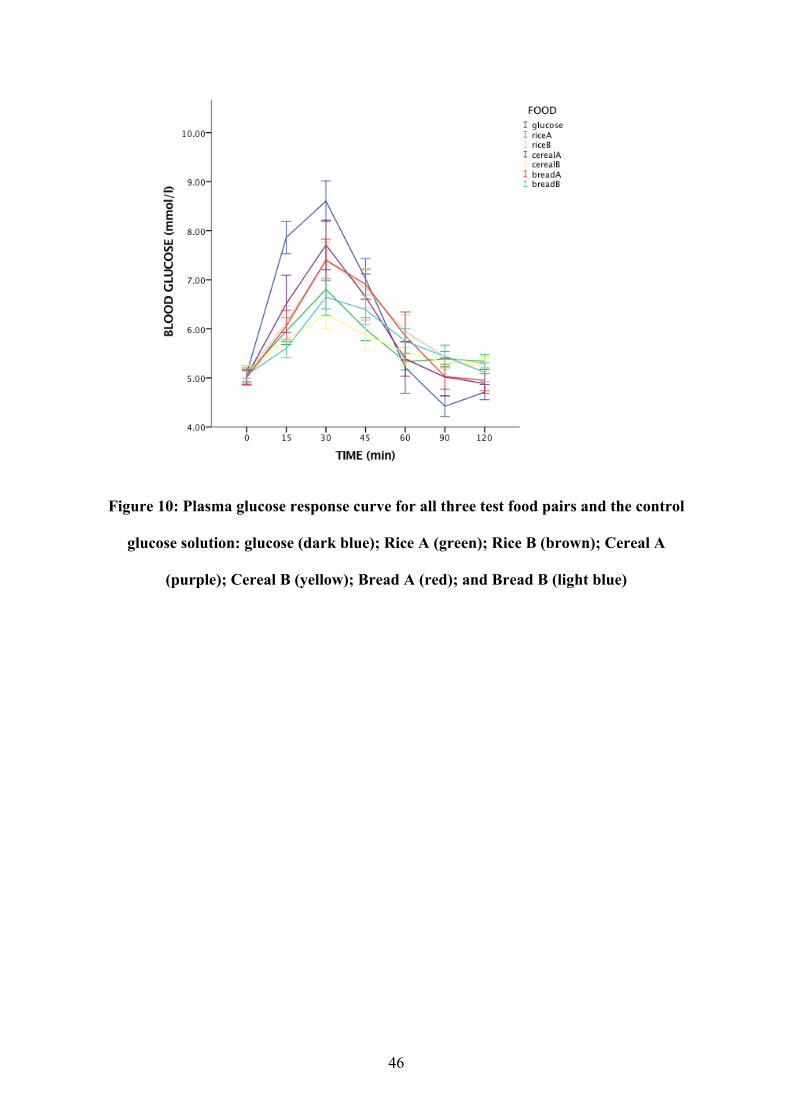
46
Figure 10: Plasma glucose response curve for all three test food pairs and the control
glucose solution: glucose (dark blue); Rice A (green); Rice B (brown); Cereal A
(purple); Cereal B (yellow); Bread A (red); and Bread B (light blue)
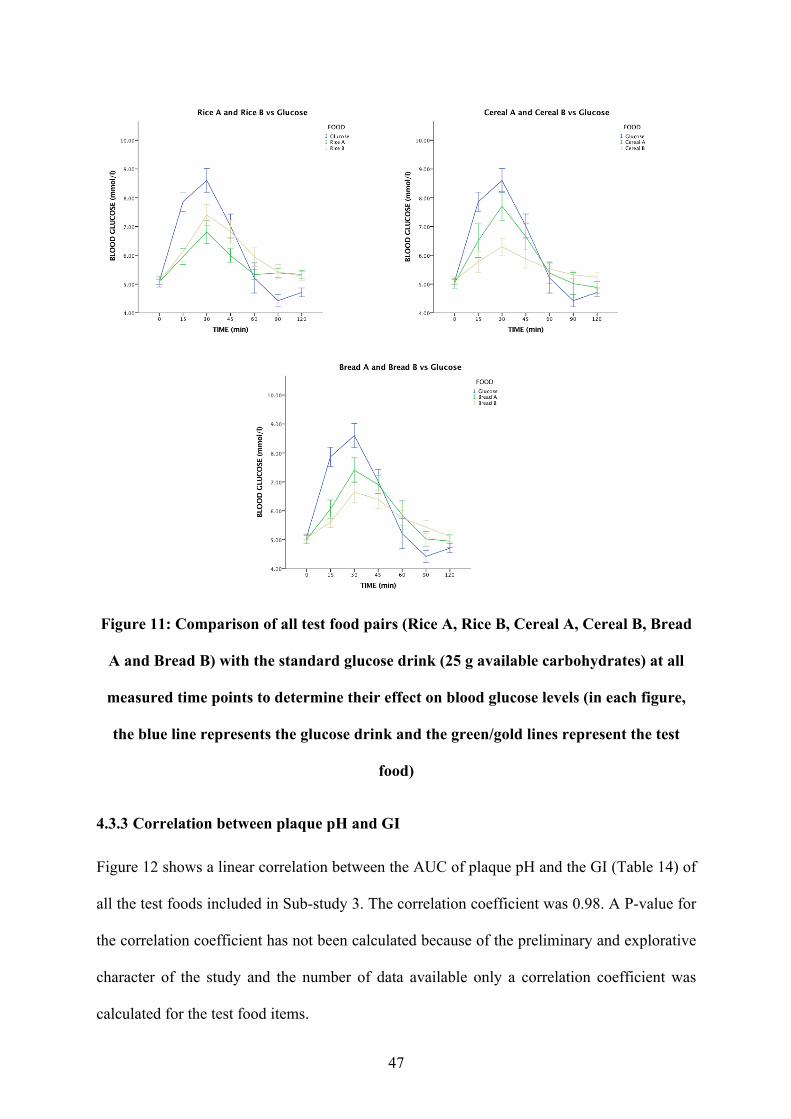
47
Figure 11: Comparison of all test food pairs (Rice A, Rice B, Cereal A, Cereal B, Bread
A and Bread B) with the standard glucose drink (25 g available carbohydrates) at all
measured time points to determine their effect on blood glucose levels (in each figure,
the blue line represents the glucose drink and the green/gold lines represent the test
food)
4.3.3 Correlation between plaque pH and GI
Figure 12 shows a linear correlation between the AUC of plaque pH and the GI (Table 14) of
all the test foods included in Sub-study 3. The correlation coefficient was 0.98. A P-value for
the correlation coefficient has not been calculated because of the preliminary and explorative
character of the study and the number of data available only a correlation coefficient was
calculated for the test food items.
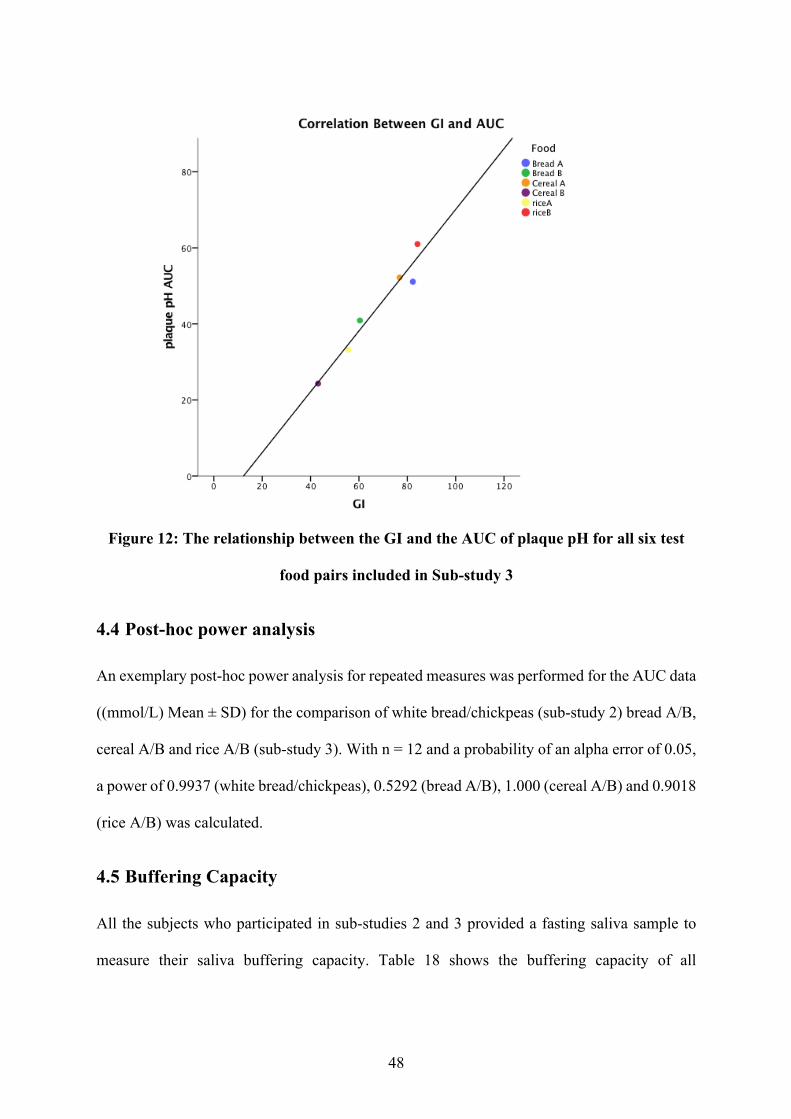
48
Figure 12: The relationship between the GI and the AUC of plaque pH for all six test
food pairs included in Sub-study 3
4.4 Post-hoc power analysis
An exemplary post-hoc power analysis for repeated measures was performed for the AUC data
((mmol/L) Mean ± SD) for the comparison of white bread/chickpeas (sub-study 2) bread A/B,
cereal A/B and rice A/B (sub-study 3). With n = 12 and a probability of an alpha error of 0.05,
a power of 0.9937 (white bread/chickpeas), 0.5292 (bread A/B), 1.000 (cereal A/B) and 0.9018
(rice A/B) was calculated.
4.5 Buffering Capacity
All the subjects who participated in sub-studies 2 and 3 provided a fasting saliva sample to
measure their saliva buffering capacity. Table 18 shows the buffering capacity of all

49
participants, which ranged from very low to normal. Fourteen out of eighteen participants fell
into the very low category.
Table 18: Salivary buffering capacity of all the subjects who participated in sub-studies
2 and 3
Participant no.
pH value Buffering capacity range
1 3.36 Very low
2 2.78 Very low 3 4.70 Normal
4 3.07 Very low 5 2.99 Very low
6 2.88 Very low
7 2.99 Very low 8 3.83 Low
9 2.94 Very low 10 4.09 Low
11 2.92 Very low 12 2.84 Very low
13 2.97 Very low
14 2.72 Very low 15 3.37 Very low
16 2.91 Very low 17 4.24 Low
18 3.25 Very low
50
Chapter 5: Discussion
The objective of this project was to identify the relationship between plaque pH and GI after
the consumption of different starchy food items. It was hypothesised that food items with a
higher GI would show a larger drop in dental plaque pH than food items with a lower GI.
Overall, the study confirmed this hypothesis and showed that high-GI food caused a more
significant drop in plaque pH compared with low-GI food.
In Sub-study 1, it was observed that the amount of glucose sugar (25 or 50 g available
carbohydrates dissolved in 250 mL water) significantly affected the plaque pH curve, with the
maximum drop in plaque pH recorded 12 minutes after the consumption of the glucose drink.
In sub-studies 2 and 3, a standard glucose solution containing 25 grams of available
carbohydrates was selected because test food portions containing 25 grams of available
carbohydrates were more representatives of realistic portion sizes for these foods. Therefore,
the results of the studies demonstrate how starch-based foods may influence dental caries risk
in real-world situations.
In Sub-study 2, four food items containing starch as their primary glucose source were studied:
white bread, mashed potatoes, pasta and chickpeas. Foods selected for this study varied in their
GI, texture and nutritional composition. Chickpeas, which produced the lowest postprandial
glycaemic response, showed the smallest drop in plaque pH compared with the other test foods.
It is likely that their high fibre content (7.8 g/portion) and intact structure slowed down the
digestion of the starch and the release of glucose. A slowly digested food results in lower
postprandial blood glucose levels (91). White bread showed the largest drop in plaque pH and
the second-highest GI, while mashed potatoes showed the highest GI and second-highest drop
in plaque pH values. Both mashed potatoes and white bread are highly processed foods; the
carbohydrates they contain are readily available for digestion and absorption, which contribute
51
to the high GI and larger pH drop compared with the other test foods. Food processing produces
major alterations in the structural and physical properties of the starch, which can result in a
more pronounced drop in plaque pH (83). Another explanation for the pronounced drop in
plaque pH caused by mashed potatoes and white bread is the texture of these foods. Food
texture is an important factor that influences the drop in plaque pH observed following
consumption. Foods with a thick or sticky consistency have the potential to adhere to tooth
surfaces for an extended period, causing greater drops in plaque pH (82). The Vipeholm study
showed that sugar, when consumed in between meals and in a consistency that increases its
retention on the tooth surface, increases caries activity (22). According to this study, bread
consumed once a day did not have as much cariogenic effect as compared to when it was
consumed more frequently during the day. These results are contrary to the present study, as
bread given just once to the participants lowered the plaque pH to a level which could result in
the demineralisation of tooth substance. Stephan, like Vipeholm, observed in one of his papers
published in the early 1940’s that an increased frequency of carbohydrate intake together with
longer duration of its mechanical retention on the tooth surface resulted in more significant
decalcification (92).
In Sub-study 3, three pairs of foods—two types of white bread, two types of white rice and two
types of breakfast cereal—were investigated. To examine the potential influence of GI on
plaque pH, the nutritional composition, texture and portion size were designed to be matched
as closely as possible within each food pair. There were some variations in the fibre quantity
and ingredients within each pair. For example, Cereal A had 2.3 g of fibre, and Cereal B had
7.0 g of fibre per portion. Cereal B’s higher soluble viscous fibre content is one factor that
likely contributed to the low plaque pH drop observed compared with Cereal A. Soluble
viscous fibres help lower GI (93). Low-GI foods release glucose slowly in systemic circulation,
with faster oxidation of fats and slower oxidation of carbohydrates (94). With low-GI foods,
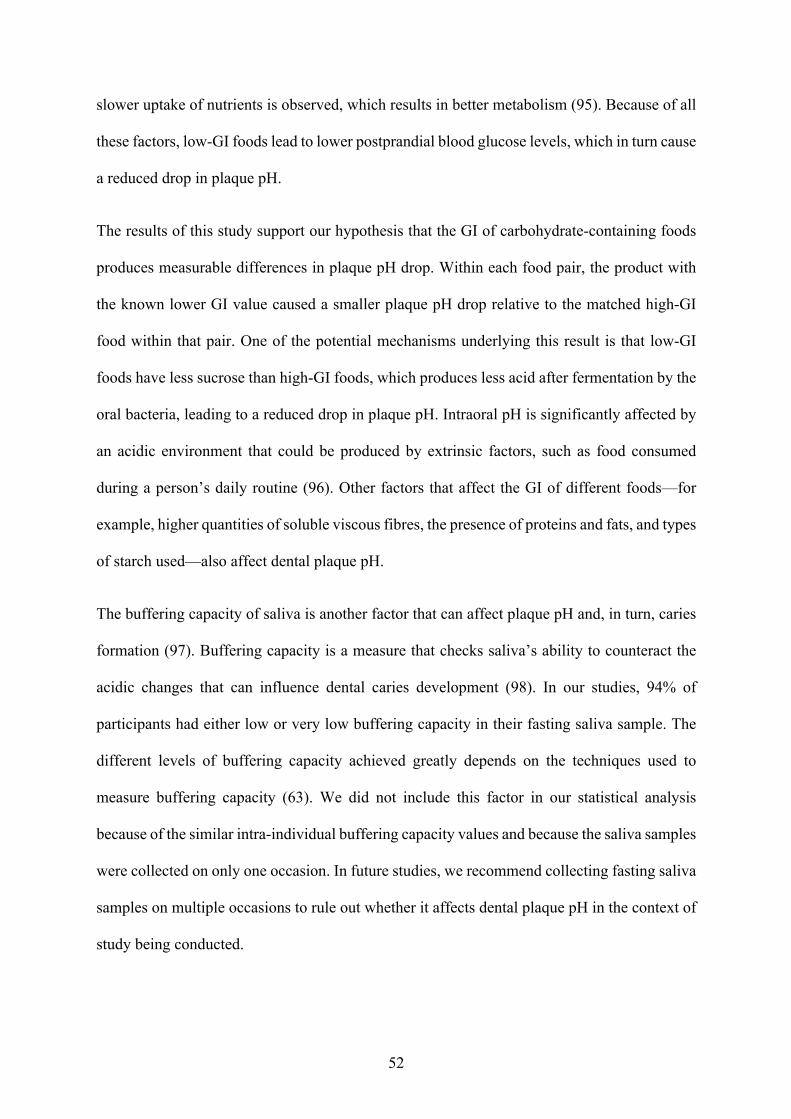
52
slower uptake of nutrients is observed, which results in better metabolism (95). Because of all
these factors, low-GI foods lead to lower postprandial blood glucose levels, which in turn cause
a reduced drop in plaque pH.
The results of this study support our hypothesis that the GI of carbohydrate-containing foods
produces measurable differences in plaque pH drop. Within each food pair, the product with
the known lower GI value caused a smaller plaque pH drop relative to the matched high-GI
food within that pair. One of the potential mechanisms underlying this result is that low-GI
foods have less sucrose than high-GI foods, which produces less acid after fermentation by the
oral bacteria, leading to a reduced drop in plaque pH. Intraoral pH is significantly affected by
an acidic environment that could be produced by extrinsic factors, such as food consumed
during a person’s daily routine (96). Other factors that affect the GI of different foods—for
example, higher quantities of soluble viscous fibres, the presence of proteins and fats, and types
of starch used—also affect dental plaque pH.
The buffering capacity of saliva is another factor that can affect plaque pH and, in turn, caries
formation (97). Buffering capacity is a measure that checks saliva’s ability to counteract the
acidic changes that can influence dental caries development (98). In our studies, 94% of
participants had either low or very low buffering capacity in their fasting saliva sample. The
different levels of buffering capacity achieved greatly depends on the techniques used to
measure buffering capacity (63). We did not include this factor in our statistical analysis
because of the similar intra-individual buffering capacity values and because the saliva samples
were collected on only one occasion. In future studies, we recommend collecting fasting saliva
samples on multiple occasions to rule out whether it affects dental plaque pH in the context of
study being conducted.
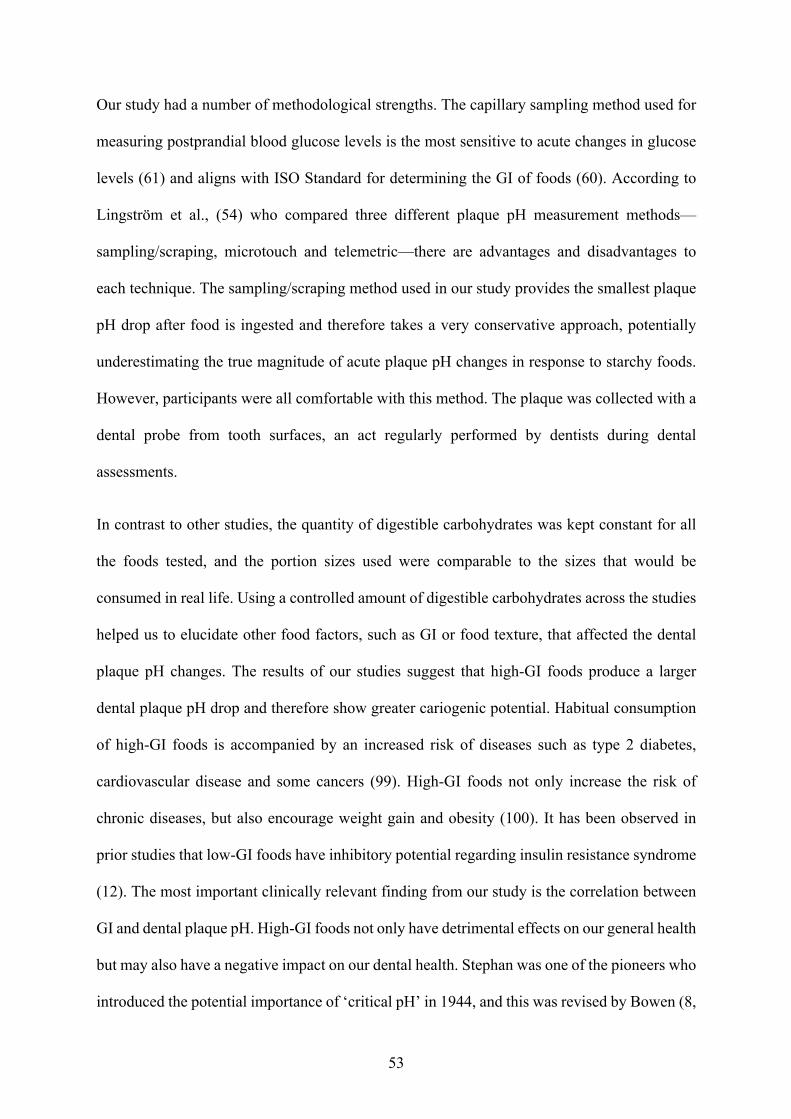
53
Our study had a number of methodological strengths. The capillary sampling method used for
measuring postprandial blood glucose levels is the most sensitive to acute changes in glucose
levels (61) and aligns with ISO Standard for determining the GI of foods (60). According to
Lingström et al., (54) who compared three different plaque pH measurement methods—
sampling/scraping, microtouch and telemetric—there are advantages and disadvantages to
each technique. The sampling/scraping method used in our study provides the smallest plaque
pH drop after food is ingested and therefore takes a very conservative approach, potentially
underestimating the true magnitude of acute plaque pH changes in response to starchy foods.
However, participants were all comfortable with this method. The plaque was collected with a
dental probe from tooth surfaces, an act regularly performed by dentists during dental
assessments.
In contrast to other studies, the quantity of digestible carbohydrates was kept constant for all
the foods tested, and the portion sizes used were comparable to the sizes that would be
consumed in real life. Using a controlled amount of digestible carbohydrates across the studies
helped us to elucidate other food factors, such as GI or food texture, that affected the dental
plaque pH changes. The results of our studies suggest that high-GI foods produce a larger
dental plaque pH drop and therefore show greater cariogenic potential. Habitual consumption
of high-GI foods is accompanied by an increased risk of diseases such as type 2 diabetes,
cardiovascular disease and some cancers (99). High-GI foods not only increase the risk of
chronic diseases, but also encourage weight gain and obesity (100). It has been observed in
prior studies that low-GI foods have inhibitory potential regarding insulin resistance syndrome
(12). The most important clinically relevant finding from our study is the correlation between
GI and dental plaque pH. High-GI foods not only have detrimental effects on our general health
but may also have a negative impact on our dental health. Stephan was one of the pioneers who
introduced the potential importance of ‘critical pH’ in 1944, and this was revised by Bowen (8,
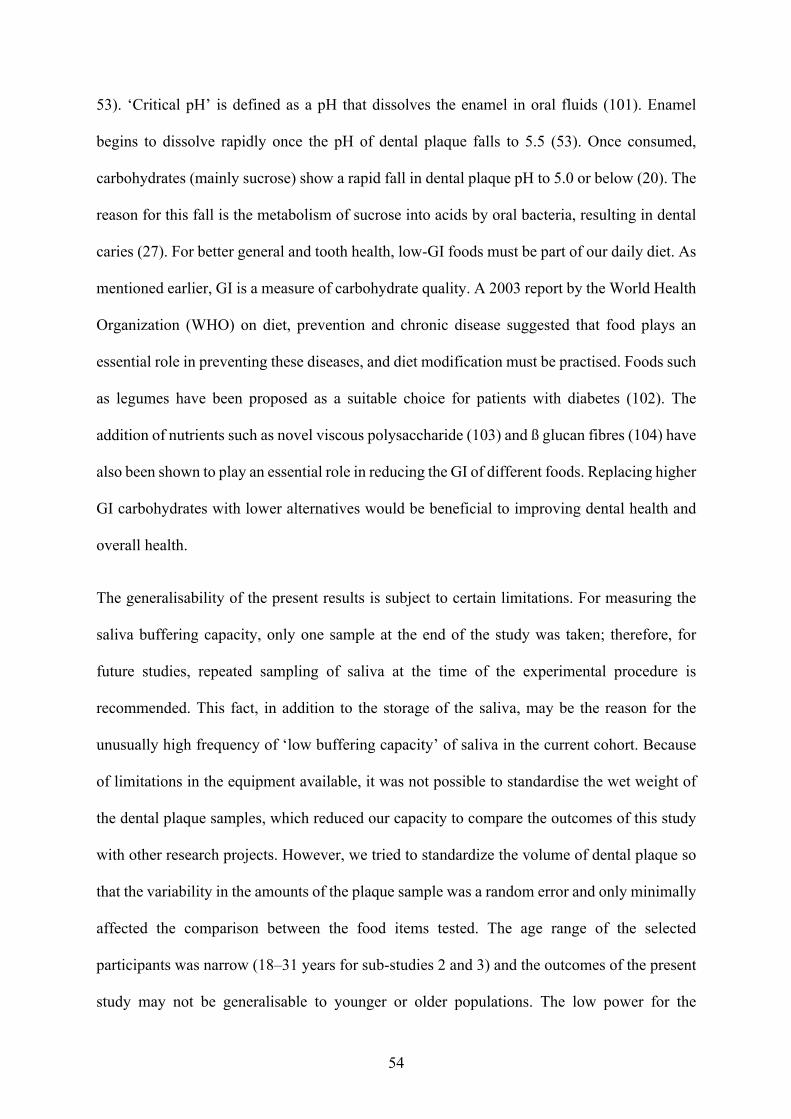
54
53). ‘Critical pH’ is defined as a pH that dissolves the enamel in oral fluids (101). Enamel
begins to dissolve rapidly once the pH of dental plaque falls to 5.5 (53). Once consumed,
carbohydrates (mainly sucrose) show a rapid fall in dental plaque pH to 5.0 or below (20). The
reason for this fall is the metabolism of sucrose into acids by oral bacteria, resulting in dental
caries (27). For better general and tooth health, low-GI foods must be part of our daily diet. As
mentioned earlier, GI is a measure of carbohydrate quality. A 2003 report by the World Health
Organization (WHO) on diet, prevention and chronic disease suggested that food plays an
essential role in preventing these diseases, and diet modification must be practised. Foods such
as legumes have been proposed as a suitable choice for patients with diabetes (102). The
addition of nutrients such as novel viscous polysaccharide (103) and ß glucan fibres (104) have
also been shown to play an essential role in reducing the GI of different foods. Replacing higher
GI carbohydrates with lower alternatives would be beneficial to improving dental health and
overall health.
The generalisability of the present results is subject to certain limitations. For measuring the
saliva buffering capacity, only one sample at the end of the study was taken; therefore, for
future studies, repeated sampling of saliva at the time of the experimental procedure is
recommended. This fact, in addition to the storage of the saliva, may be the reason for the
unusually high frequency of ‘low buffering capacity’ of saliva in the current cohort. Because
of limitations in the equipment available, it was not possible to standardise the wet weight of
the dental plaque samples, which reduced our capacity to compare the outcomes of this study
with other research projects. However, we tried to standardize the volume of dental plaque so
that the variability in the amounts of the plaque sample was a random error and only minimally
affected the comparison between the food items tested. The age range of the selected
participants was narrow (18–31 years for sub-studies 2 and 3) and the outcomes of the present
study may not be generalisable to younger or older populations. The low power for the
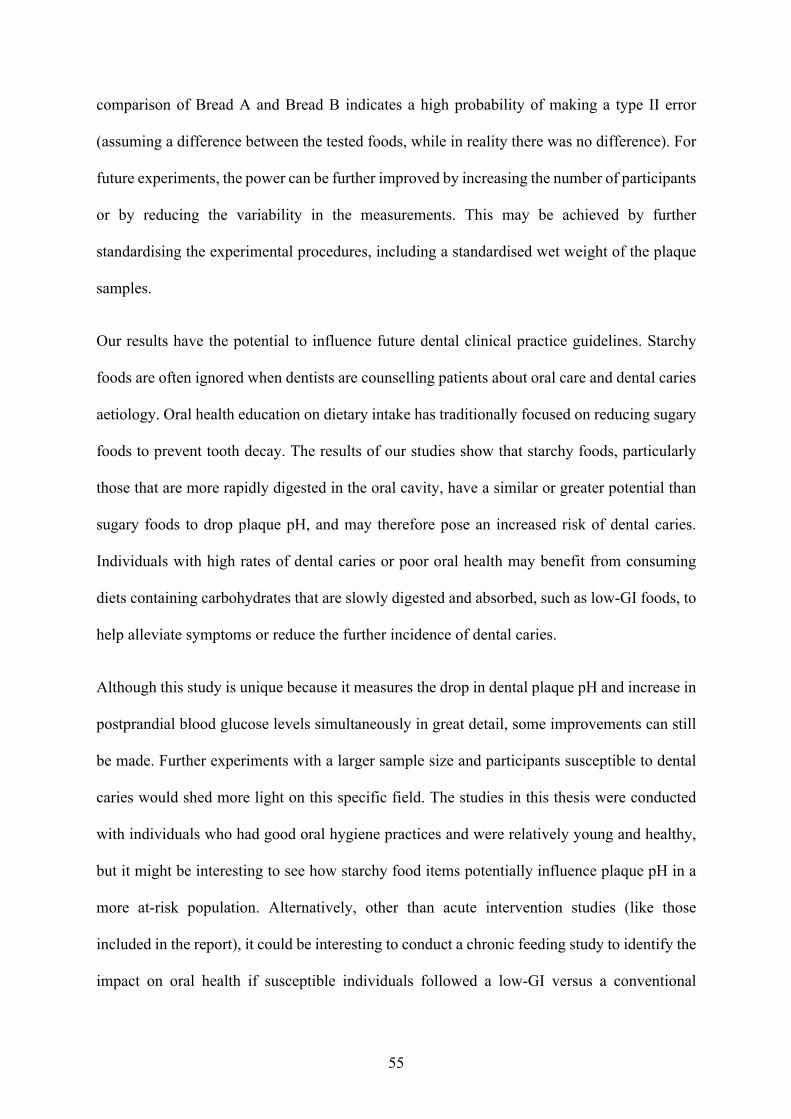
55
comparison of Bread A and Bread B indicates a high probability of making a type II error
(assuming a difference between the tested foods, while in reality there was no difference). For
future experiments, the power can be further improved by increasing the number of participants
or by reducing the variability in the measurements. This may be achieved by further
standardising the experimental procedures, including a standardised wet weight of the plaque
samples.
Our results have the potential to influence future dental clinical practice guidelines. Starchy
foods are often ignored when dentists are counselling patients about oral care and dental caries
aetiology. Oral health education on dietary intake has traditionally focused on reducing sugary
foods to prevent tooth decay. The results of our studies show that starchy foods, particularly
those that are more rapidly digested in the oral cavity, have a similar or greater potential than
sugary foods to drop plaque pH, and may therefore pose an increased risk of dental caries.
Individuals with high rates of dental caries or poor oral health may benefit from consuming
diets containing carbohydrates that are slowly digested and absorbed, such as low-GI foods, to
help alleviate symptoms or reduce the further incidence of dental caries.
Although this study is unique because it measures the drop in dental plaque pH and increase in
postprandial blood glucose levels simultaneously in great detail, some improvements can still
be made. Further experiments with a larger sample size and participants susceptible to dental
caries would shed more light on this specific field. The studies in this thesis were conducted
with individuals who had good oral hygiene practices and were relatively young and healthy,
but it might be interesting to see how starchy food items potentially influence plaque pH in a
more at-risk population. Alternatively, other than acute intervention studies (like those
included in the report), it could be interesting to conduct a chronic feeding study to identify the
impact on oral health if susceptible individuals followed a low-GI versus a conventional

56
(higher fibre, high-GI) diet. More information on measuring the buffering capacity of saliva
would help us to establish a greater degree of accuracy in this matter. The results of our study
could contribute to shaping dental clinical practices by providing greater insight on the use of
high carbohydrate foods and their effect on decreasing dental plaque pH and causing
demineralisation of the teeth.
57
Chapter 6: Conclusion
This study was designed to determine the effect of food with different GI values on changes in
dental plaque pH. The most significant finding from this study is that high-GI foods produce a
larger drop in dental plaque pH than low-GI food. The second major finding is that, regardless
of their texture, quantity or cooking conditions, high-GI foods will drop dental plaque pH. The
evidence from this study suggests that high-GI foods are not only harmful to health in general
but also have the potential to cause dental caries. This project is the first comprehensive
investigation of the relationship between GI and dental plaque pH. This new understanding
should help health care practitioners to provide information to consumers about the impact of
food high in GI on dental health.
58
References
1. Arantes R, Welch JR, Tavares FG, Ferreira AA, Vettore MV, Coimbra CEA, Jr. Human
ecological and social determinants of dental caries among the Xavante Indigenous
people in Central Brazil. PloS One. 2018;13(12):e0208312.
2. World Health Organization. Sugar and dental caries. 2017. Contract No.:
WHO/NMH/NHD/17.12.
3. Luoma H, Turtola LO, Kuokka IM, Kaartinen AJ. Plaque pH during and after ingestion
of solid sugar. J Dent Res. 1970;49(1):79-85.
4. Roos EH, Donly KJ. In vivo dental plaque pH variation with regular and diet soft
drinks. Pediatr Dent. 2002;24(4):350-3.
5. Toumba KJ, Duggal MS. Effect on plaque pH of fruit drinks with reduced carbohydrate
content. Br Dent J. 1999;186(12):626-9.
6. Jawale BA, Bendgude V, Mahuli AV, Dave B, Kulkarni H, Mittal S. Dental plaque pH
variation with regular soft drink, diet soft drink and high energy drink: an in vivo study.
J Contemp Dent Pract. 2012;13(2):201-4.
7. Stephan RM. Two factors of possible importance in relation to the etiology and
treatment of dental caries and other dental diseases. Science. 1940;92(2399):578-9.
8. Stephan RM. Some local factors in the development of cavities; plaques, acidity,
aciduric bacteria, proteolytic bacteria. J Dent Res. 1948;27(1):96-100.
9. Stephan RM. Relative importance of polysaccharides, disaccharides and
monosaccharides in the production of caries. J Am Dent Assoc. 1948;37(5):530-6.
10. Jenkins DJ, Wolever TM, Taylor RH, Barker H, Fielden H, Baldwin JM, et al.
Glycemic index of foods: a physiological basis for carbohydrate exchange. Am J Clin
Nutr. 1981;34(3):362-6.
11. Brouns F, Bjorck I, Frayn KN, Gibbs AL, Lang V, Slama G, et al. Glycaemic index
methodology. Nutr Res Rev. 2005;18(1):145-71.
12. Björck I, Elmståhl HL. The glycaemic index: importance of dietary fibre and other food
properties. Proc Nutr Soc. 2003;62(1):201-6.
13. Jenkins DJ, Wolever TM, Buckley G, Lam KY, Giudici S, Kalmusky J, et al. Low-
glycemic-index starchy foods in the diabetic diet. Am J Clin Nutr. 1988;48(2):248-54.
14. Miller JC. Importance of glycemic index in diabetes. Am J Clin Nutr. 1994;59(3
Suppl):747S-52S.
59
15. Lingström P, Liljeberg H, Björck I, Birkhed D. The relationship between plaque pH
and glycemic index of various breads. Caries Res. 2000;34(1):75-81.
16. Grigalauskiene R, Slabsinskiene E, Vasiliauskiene I. Biological approach of dental
caries management. Stomatologija. 2015;17(4):107-12.
17. Balhaddad AA, Kansara AA, Hidan D, Weir MD, Xu HHK, Melo MAS. Toward dental
caries: exploring nanoparticle-based platforms and calcium phosphate compounds for
dental restorative materials. Bioact Mater. 2019;4(1):43-55.
18. Opal S, Garg S, Jain J, Walia I. Genetic factors affecting dental caries risk. Aust Dent
J. 2015;60(1):2-11.
19. Gupta P, Gupta N, Singh HP. Prevalence of dental caries in relation to body mass index,
daily sugar intake, and oral hygiene status in 12-year-old school children in Mathura
City: a pilot study. Int J Pediatr. 2014;2014:921823.
20. Tinanoff N, Baez RJ, Diaz Guillory C, Donly KJ, Feldens CA, McGrath C, et al. Early
childhood caries epidemiology, aetiology, risk assessment, societal burden,
management, education, and policy: global perspective. Int J Paediatr Dent.
2019;29(3):238-48.
21. Shokouhi EB, Razani M, Gupta A, Tabatabaei N. Comparative study on the detection
of early dental caries using thermo-photonic lock-in imaging and optical coherence
tomography. Biomed Opt Express. 2018;9(9):3983-97.
22. Gustafsson BE, Quensel C-E, Lanke L S, Lundqvist C, Grahnén H, Bonow BE, Krasse
B. The Vipeholm dental caries study: the effect of different levels of carbohydrate
intake on caries activity in 436 individuals observed for five years. Acta Odontol Scand.
1953;11(3-4):232-364.
23. Quensel C-E, Gustafsson BE, Grahnén H. The Vipeholm dental caries study: reliability
of the method in the determination of caries activity. Acta Odontol Scand. 1953;11(3-
4):365-88.
24. Gustafsson BE. Survey of the literature on carbohydrates and dental caries. Acta Odont
Scand. 1953;11(3-4):207-31.
25. Krasse B. The Vipeholm dental caries study: recollections and reflections 50 years later.
J Dental Res. 2001;80(9):1785-8.
26. Paes Leme AF, Koo H, Bellato CM, Bedi G, Cury JA. The role of sucrose in cariogenic
dental biofilm formation—new insight. J Dental Res. 2006;85(10):878-87.
60
27. Kalesinskas P, Kacergius T, Ambrozaitis A, Peciuliene V, Ericson D. Reducing dental
plaque formation and caries development: a review of current methods and implications
for novel pharmaceuticals. Stomatologija. 2014;16(2):44-52.
28. Evans RW, Dennison PJ. The Caries Management System: an evidence-based
preventive strategy for dental practitioners. Application for children and adolescents.
Aust Dent J. 2009;54(4):381-9.
29. Aoun A, Darwiche F, Al Hayek S, Doumit J. The fluoride debate: the pros and cons of
fluoridation. Prev Nutr Food Sci. 2018;23(3):171-80.
30. Hopcraft MS, Yapp KE, Mahoney G, Morgan MV. Dental caries experience in young
Australian Army recruits 2008. Aust Dent J. 2009;54(4):316-22.
31. Hopcraft MS, Morgan MV. Pattern of dental caries experience on tooth surfaces in an
adult population. Community Dent Oral Epidemiol. 2006;34(3):174-83.
32. Stookey GK. The effect of saliva on dental caries. J Am Dent Assoc. 2008;139
Suppl:11S-7S.
33. Chrisopoulos S, Harford JE, Ellershaw A. Oral health and dental care in Australia: key
facts and figures 2015. Cat. no. DEN 229. Canberra: AIHW 2016.
34. Goldfeld S, Francis KL, Hoq M, Do L, O'Connor E, Mensah F. The impact of policy
modifiable factors on inequalities in rates of child dental caries in Australia. Int J
Environ Res Public Health. 2019;16(11).
35. Kruger E, Dyson K, Tennant M. Pre-school child oral health in rural Western Australia.
Aust Dent J. 2005;50(4):258-62.
36. Skinner J, Byun R, Blinkhorn A, Johnson G. Sugary drink consumption and dental
caries in New South Wales teenagers. Aust Dent J. 2015;60(2):169-75.
37. Thurnheer T, Giertsen E, Gmür R, Guggenheim B. Cariogenicity of soluble starch in
oral in vitro biofilm and experimental rat caries studies: a comparison. J Appl
Microbiol. 2008;105(3):829-36.
38. Ooshima T, Yoshida T, Aono W, Takei T, Izumitani A, Sobue S, et al. Changes with
time in the oral microflora and dental caries induction in hyposalivated rats fed on
sucrose diet. Microbiol Immunol. 1992;36(12):1223-31.
39. Larje O, Larson RH. Reduction of dental caries in rats by intermittent feeding with
sucrose substitutes. Arch Oral Biol. 1970;15(9):805-16.
40. Rekhter MD. How to evaluate plaque vulnerability in animal models of atherosclerosis?
Cardiovasc Res. 2002;54(1):36-41.
61
41. Michalek SM, McGhee JR, Shiota T, Devenyns D. Low sucrose levels promote
extensive Streptococcus mutans-induced dental caries. Infect Immun. 1977;16(2):712-
4.
42. Frostell G, Keyes PH, Larson RH. Effect of various sugars and sugar substitutes on
dental caries in hamsters and rats. J Nutr. 1967;93(1):65-76.
43. Shaw JH, Krumins I, Gibbons RJ. Comparison of sucrose, lactose, maltose and glucose
in the causation of experimental oral diseases. Arch Oral Biol. 1967;12(6):755-68.
44. Gustafson G, Stelling E, Abramson E, Brunius E. Experiments with various fats in a
cariogenic diet. IV. Experimental dental caries in golden hamsters. Acta Odontol
Scand. 1955;13(2):75-84.
45. Klinke T, Guggenheim B, Klimm W, Thurnheer T. Dental caries in rats associated with
Candida albicans. Caries Res. 2011;45(2):100-6.
46. Shaw JH, Griffiths D. Development and post-developmental influences on incidence
of experimental dental caries resulting from dietary supplementation by various
elements. Arch Oral Biol. 1961;5:301-22.
47. Rosan B, Lamont RJ. Dental plaque formation. Microbes Infect. 2000;2(13):1599-607.
48. Bowen WH, Koo H. Biology of Streptococcus mutans-derived glucosyltransferases:
role in extracellular matrix formation of cariogenic biofilms. Caries Res.
2011;45(1):69-86.
49. Sieber KR, Schmidt C, Baumann T, Lussi A, Carvalho TS. Acquired enamel pellicle
modification with casein and mucin in different concentrations and its impact on initial
dental erosion. Caries Res. 2019;53(4):457-66.
50. Tanzer JM, Livingston J, Thompson AM. The microbiology of primary dental caries in
humans. J Dent Educ. 2001;65(10):1028-37.
51. Ghazal TS, Levy SM, Childers NK, Carter KD, Caplan DJ, Warren JJ, et al. Mutans
streptococci and dental caries: a new statistical modeling approach. Caries Res.
2018;52(3):246-52.
52. Forssten SD, Bjöörklund M, Ouwehand AC. Streptococcus mutans, caries and
simulation models. Nutrients. 2010;2(3):290-8.
53. Bowen WH. The Stephan Curve revisited. Odontology. 2013;101(1):2-8.
54. Lingström P, Imfeld T, Birkhed D. Comparison of three different methods for
measurement of plaque-pH in humans after consumption of soft bread and potato chips.
J Dent Res. 1993;72(5):865-70.
62
55. Frostell G. A method for evaluation of acid potentialities of foods. Acta Odontol Scand.
1970;28(5):599-622.
56. Scheie AA, Fejerskov O, Lingström P, Birkhed D, Manji F. Use of palladium touch
microelectrodes under field conditions for in vivo assessment of dental plaque pH in
children. Caries Res. 1992;26(1):44-51.
57. Graf H, Mühlemann HR. Telemetry of plaque pH from interdental area. Helv Odontol
Acta. 1966;10(2):94-101.
58. Walsh LJ. Dental plaque fermentation and its role in caries risk assessment. Internat
Dent SA. 2006;1:4-13.
59. Pawlak DB, Ebbeling CB, Ludwig DS. Should obese patients be counselled to follow
a low-glycaemic index diet? Yes. Obes Rev. 2002;3(4):235-43.
60. International Organization for Standardization. ISO 26642:2010. Food products—
Determination of the glycaemic index (GI) and recommendation for food classification.
Geneva: ISO; 2010.
61. Ellison JM, Stegmann JM, Colner SL, Michael RH, Sharma MK, Ervin KR, et al. Rapid
changes in postprandial blood glucose produce concentration differences at finger,
forearm, and thigh sampling sites. Diabetes Care. 2002;25(6):961-4.
62. Khemiss M, Ben Khelifa M, Ben Saad H. Preliminary findings on the correlation of
saliva pH, buffering capacity, flow rate and consistency in relation to waterpipe tobacco
smoking. Libyan J Med. 2017;12(1):1289651.
63. Kitasako Y, Burrow MF, Stacey M, Huq L, Reynolds EC, Tagami J. Comparative
analysis of three commercial saliva testing kits with a standard saliva buffering test.
Aust Dent J. 2008;53(2):140-4.
64. Larsen MJ, Jensen AF, Madsen DM, Pearce EI. Individual variations of pH, buffer
capacity, and concentrations of calcium and phosphate in unstimulated whole saliva.
Arch Oral Biol. 1999;44(2):111-7.
65. Bardow A, Moe D, Nyvad B, Nauntofte B. The buffer capacity and buffer systems of
human whole saliva measured without loss of CO2. Arch Oral Biol. 2000;45(1):1-12.
66. Tenovuo J. Salivary parameters of relevance for assessing caries activity in individuals
and populations. Community Dent Oral Epidemiol. 1997;25(1):82-6.
67. Grøn P, Messer AC. An investigation of the state of carbon dioxide in human saliva.
Arch Oral Biol. 1965;10(5):757-63.
68. Castle D, Castle A. Intracellular transport and secretion of salivary proteins. Crit Rev
Oral Biol Med. 1998;9(1):4-22.

63
69. Ericsson, Y (1959) Clinical investigations of the salivary buffering action. Acta
Odontol Scand. 1959:131-65,.
70. Cheaib Z, Ganss C, Lamanda A, Turgut MD, Lussi A. Comparison of three strip-type
tests and two laboratory methods for salivary buffering analysis. Odontology.
2012;100(1):67-75.
71. Mortazavi S, Noin S. Plaque pH changes following consumption of two types of plain
and bulky bread. Dent Res J. 2011;8(2):80-4.
72. Johansson AK, Lingström P, Birkhed D. Effect of soft drinks on proximal plaque pH
at normal and low salivary secretion rates. Acta Odontol Scand. 2007;65(6):352-6.
73. Birkhed D. Sugar content, acidity and effect on plaque pH of fruit juices, fruit drinks,
carbonated beverages and sport drinks. Caries Res. 1984;18(2):120-7.
74. Mahajan N, Kotwal B, Sachdev V, Rewal N, Gupta R, Goyal S. Effect of commonly
consumed sugar containing and sugar free fruit drinks on the hydrogen ion modulation
of human dental plaque. J Indian Soc Pedod Prev Dent. 2014;32(1):26-32.
75. Garg D, Karuna YM, Srikant N, Bhandary M, Nayak AP, Rao A, et al. Evaluation of
plaque pH changes following consumption of health drinks by children: a pilot study.
J Clin Diagn Res. 2017;11(5):Zc05-zc8.
76. Drewnowski A. Fat and sugar: an economic analysis. J Nutr. 2003;133(3):838S-40S.
77. Utreja A, Lingström P, Evans CA, Salzmann LB, Wu CD. The effect of raisin-
containing cereals on the pH of dental plaque in young children. Pediatr Dent.
2009;31(7):498-503.
78. Luke GA, Gough H, Beeley JA, Geddes DA. Human salivary sugar clearance after
sugar rinses and intake of foodstuffs. Caries Res. 1999;33(2):123-9.
79. Thaweboon S, Suddhasthira T, Thaweboon B, Soo-Ampon S, Dechkunakorn S. Plaque
pH response to snack foods in children with different levels of mutans streptococci.
Southeast Asian J. Trop. Med. Public Health. 2007;38(3):598-603.
80. Igarashi K, Lee IK, Schachtele CF. Effect of chewing gum containing sodium
bicarbonate on human interproximal plaque pH. J Dent Res. 1988;67(3):531-5.
81. Sonmez IS, Aras S. Effect of white cheese and sugarless yoghurt on dental plaque
acidogenicity. Caries Res. 2007;41(3):208-11.
82. Gardiner JA, Pollard MA, Curzon ME. The effect of different concentrations of sugars
in two foods (yoghurts and baked beans) on plaque pH. Int Dent J. 1997;47(2):115-20.
83. Lingström P, Holm J, Birkhed D, Björck I. Effects of variously processed starch on pH
of human dental plaque. Scand J Dent Res. 1989;97(5):392-400.
64
84. Lingström P, Björck I, Drews A, Birkhed D. Effects of chemically modified starches
in suspensions and lozenges on pH of human dental plaque. Scand J Dent Res.
1991;99(1):30-9.
85. Lingström P, Birkhed D, Ruben J, Arends J. Effect of frequent consumption of starchy
food items on enamel and dentin demineralization and on plaque pH in situ. J Dent Res.
1994;73(3):652-60.
86. Mörmann JE, Mühlemann HR. Oral starch degradation and its influence on acid
production in human dental plaque. Caries Res. 1981;15(2):166-75.
87. Glor EB, Miller CH, Spandau DF. Degradation of starch and its hydrolytic products by
oral bacteria. J Dent Res. 1988;67(1):75-81.
88. Lingström P, Birkhed D, Granfeldt Y, Björck I. pH measurements of human dental
plaque after consumption of starchy foods using the microtouch and the sampling
method. Caries Res. 1993;27(5):394-401.
89. Hussein I, Pollard MA, Curzon ME. A comparison of the effects of some extrinsic and
intrinsic sugars on dental plaque pH. Int J Paediatr Dent. 1996;6(2):81-6.
90. Pollard MA. Potential cariogenicity of starches and fruits as assessed by the plaque-
sampling method and an intraoral cariogenicity test. Caries Res. 1995;29(1):68-74.
91. Jenkins DJ, Wolever TM, Jenkins AL, Thorne MJ, Lee R, Kalmusky J, et al. The
glycaemic index of foods tested in diabetic patients: a new basis for carbohydrate
exchange favouring the use of legumes. Diabetologia. 1983;24(4):257-64.
92. Stephan RM. Intra-oral hydrogen-ion concentrations associated with dental caries
activity. J Dent Res. 1944;23(4):257-66.
93. Scazzina F, Siebenhandl-Ehn S, Pellegrini N. The effect of dietary fibre on reducing
the glycaemic index of bread. Br J Nutr. 2013;109(7):1163-74.
94. Kaur B, Quek Yu Chin R, Camps S, Henry CJ. The impact of a low glycaemic index
(GI) diet on simultaneous measurements of blood glucose and fat oxidation: a whole
body calorimetric study. J Clin Transl Endocrinol. 2016;4:45-52.
95. Radulian G, Rusu E, Dragomir A, Posea M. Metabolic effects of low glycaemic index
diets. Nutr J. 2009;8:5.
96. Loke C, Lee J, Sander S, Mei L, Farella M. Factors affecting intra-oral pH: a review. J
Oral Rehabil. 2016;43(10):778-85.
97. Islas-Granillo H, Borges-Yañez SA, Medina-Solís CE, Galan-Vidal CA, Navarrete-
Hernández JJ, Escoffie-Ramirez M, et al. Salivary parameters (salivary flow, pH and
65
buffering capacity) in stimulated saliva of Mexican elders 60 years old and older. West
Indian Med J. 2014;63(7):758-65.
98. Hicks J, Garcia-Godoy F, Flaitz C. Biological factors in dental caries: role of saliva and
dental plaque in the dynamic process of demineralization and remineralization (part 1).
J Clin Pediatr Dent. 2003;28(1):47-52.
99. Lovegrove A, Kosik O, Bandonill E, Abilgos-Ramos R, Romero M, Sreenivasulu N, et
al. Improving rice dietary fibre content and composition for human health. J Nutr Sci
Vitaminol (Tokyo). 2019;65(Suppl):S48-S50.
100. Andersen SSH, Heller JMF, Hansen TT, Raben A. comparison of low glycaemic index
and high glycaemic index potatoes in relation to satiety: a single-blinded, randomised
crossover study in humans. Nutrients. 2018;10(11).
101. Dawes C. What is the critical pH and why does a tooth dissolve in acid? J Can Dent
Assoc. 2003;69(11):722-4.
102. Batra M, Sharma S, Seth V. The glycaemic index of fermented and non-fermented
legume-based snack food. Asia Pac J Clin Nutr. 1994;3(4):151-4.
103. Jenkins AL, Kacinik V, Lyon M, Wolever TM. Effect of adding the novel fiber,
PGX(R), to commonly consumed foods on glycemic response, glycemic index and
GRIP: a simple and effective strategy for reducing post prandial blood glucose levels—
a randomized, controlled trial. Nutr J. 2010;9:58.
104. Jenkins AL, Jenkins DJ, Zdravkovic U, Würsch P, Vuksan V. Depression of the
glycemic index by high levels of beta-glucan fiber in two functional foods tested in type
2 diabetes. Eur J Clin Nutr. 2002;56(7):622-8.