castor oil plant - agro productividad
TRANSCRIPT

Año 15 • Volumen 15 • Número 5 • mayo, 2022
Clonal propagation of Gmelina arborea Roxb grown in southeastern Mexico 3Analysis of structure and function of an agroecological beacon: The case of the
Agroecological Educational Center Los Álamos 13Maize tolerance to Spodoptera frugiperda ( J. E. Smith) leaf damage and insecticide
application 23
Effect of selenium on semen quality and fertility of rams 33Phenotypic diversity of wild tomato (Solanum lycopersicum L.) populations 41Nutritional composition of Rhynchophorus palmarum L. 1758 (Coleoptera:
Curculionidae) larvae in palm trees of the Mezquital Valley, Hidalgo, Mexico 55y más artículos de interés...
ISSN: 2594-0252
Colegio dePostgraduados
pág. 143pág. 143
Agribusiness potential of
castor oil plantcastor oil plant (Ricinus communis L.)
in Mexico

Contenido
AGROPRODUCTIVIDAD
®
Año 15 Volumen 15 Número 5 mayo, 2022
3 Clonal propagation of Gmelina arborea Roxb grown in southeastern Mexico
13 Analysis of structure and function of an agroecological beacon: The case of the Agroecological Educational Center Los Álamos
23 Maize tolerance to Spodoptera frugiperda ( J. E. Smith) leaf damage and insecticide application
33 Effect of selenium on semen quality and fertility of rams
41 Phenotypic diversity of wild tomato (Solanum lycopersicum L.) populations
55 Nutritional composition of Rhynchophorus palmarum L. 1758 (Coleoptera: Curculionidae) larvae in palm trees of the Mezquital Valley, Hidalgo, Mexico
61 Regional and dynamic specialization of beef production in Mexico (2000-2018)
69 Sensory optimization of a flavor mix for a milkshake-like beverage formulated with residual grain from the amaranth popping process
77 Perception of extension workers about rural development processes in Morelos, Mexico
85 In vitro establishment and multiplication of Aechmea fasciata (Lindl.) Baker, a bromeliad of commercial interest
93 Use of protected methionine in diets for finishing pigs
101 Isolation of bacteria from pulque with probiotic potential
109 Creole corns from the Yucatan Peninsula as an alternative in the diet of the Mexican hairless pig
117 Agroecological production experiences in four agricultural regions of Mexico
125 Nutrient content and in vitro degradability of the palm kernel meal produced in the state of Chiapas, Mexico, as feed for ruminants
133 The importance of forests in the conservation and prevalence of orchids in Megamexico
143 Agribusiness potential of castor oil plant (Ricinus communis L.) in Mexico

1AGROPRODUCTIVIDAD
Directrices para Autores/asNaturaleza de los trabajos: Las contribuciones que se reciban para su eventual publicación deben ser resultados originales derivados de un trabajo académico de alto nivel sobre los tópicos presentados en la sección de temática y alcance de la revista.
Extensión y formato: Los artículos deberán estar escritos en proce-sador de textos, con una extensión de 15 cuartillas, tamaño carta con márgenes de 2.5 centímetros, Arial de 12 puntos, interlineado doble, sin espacio entre párrafos. Las páginas deberán estar foliadas desde la primera hasta la última en el margen inferior derecho. La extensión total incluye abordaje textual, bibliografía, gráficas, figuras, imágenes y todo material adicional. Debe evitarse el uso de sangría al inicio de los párrafos. Las secciones principales del artículo deberán escribirse en mayúsculas, negritas y alineadas a la izquierda. Los subtítulos de las secciones se escribirán con mayúsculas sólo la primera letra, negri-tas y alineadas a la izquierda.
Exclusividad: Los trabajos enviados a Agro Productividad deberán ser inéditos y sus autores se comprometen a no someterlos simultánea-mente a la consideración de otras publicaciones; por lo que es necesa-rio adjuntar este documento: Carta de originalidad.
Comité Científico
Dr. Giuseppe CollaUniversity of Tuscia, Italia
0000-0002-3399-3622
Dra. Magaly Sánchez de Chial Universidad de Panamá, Panamá
0000-0002-6393-9299
Dra. Maritza EscalonaUniversidad de Ciego de Ávila, Cuba
0000-0002-8755-6356
Dr. Kazuo WatanabeUniversidad de Tsukuba, Japón
0000-0003-4350-0139
Dra. Ryoko Machida HiranoOrganización Nacional de Investigación en Agricultura y Alimentación (NARO-Japón)
0000-0002-7978-0235
Dr. Ignacio de los Ríos CarmenadoUniversidad Politécnica de Madrid, España
0000-0003-2015-8983
Dra. María de Lourdes Arévalo GalarzaColegio de Postgraduados, México
0000-0003-1474-2200
Dra. Lucero del Mar Ruiz PosadasColegio de Postgraduados, México
0000-0002-4922-3710
Comité EditorialDr. Jorge Cadena Iñiguez - Editor en JefeDra. Libia Iris Trejo Téllez - Directora adjuntaDr. Rafael Rodríguez Montessoro† - Director FundadorLic. BLS. Moisés Quintana Arévalo - Cosechador de metadatosM.A. Ana Luisa Mejia Sandoval - AsistenteTéc. Mario Alejandro Rojas Sánchez - DiseñadorLic. Hannah Infante Lagarda - FilologoM.C. Valeria Abigail Martínez Sias - Diagramador
Frecuencia de publicación: Cuando un autor ha publicado en la revista como autor principal o de correspondencia, deberá esperar tres números de ésta para publicar nuevamente como autor principal o de correspondencia.
Idiomas de publicación: Se recibirán textos en inglés con títulos, resúmenes y palabras clave en inglés.
ID Autores: El nombre de los autores se escribirán comenzando con el apellido o apellidos unidos por guion, sólo las iniciales del nombre, separados por comas, con un índice progresivo en su caso. Es indis-pensable que todos y cada uno de los autores proporcionen su núme-ro de identificador normalizado ORCID, para mayor información ingresar a (https://orcid.org).
Institución de adscripción: Es indispensable señalar la institución de adscripción y país de todos y cada uno de los autores, indicando ex-clusivamente la institución de primer nivel, sin recurrir al uso de siglas o acrónimos. Se sugiere recurrir al uso de la herramienta wyta (http://wayta.scielo.org/) de Scielo para evitar el uso incorrecto de nombres de instituciones.
AGROPRODUCTIVIDAD
®
Es responsabilidad del autor el uso de las ilustraciones, el material gráfico y el contenido creado para esta publicación.
Las opiniones expresadas en este documento son de exclusiva responsabilidad de los autores, y no reflejan necesariamente los puntos de vista del Colegio de Postgraduados, de la Edito-rial del Colegio de Postgraduados, ni de la Fundación Cole-gio de Postgraduados en Ciencias Agrícolas.
CCAABB AABBSSTTRRAACCTTSS
CCAABBII
Master Journal List
Año 15, Volumen 15, Número 5, mayo 2022, Agro productividad es una publicación mensual editada por el Colegio de Postgraduados. Carretera México-Texcoco Km. 36.5, Montecillo, Texcoco, Estado de México. CP 56230. Tel. 5959284427. www.colpos.mx. Editor responsable: Dr. Jorge Cadena Iñiguez. Reservas de Derechos al Uso Exclusivo No. 04-2017-031313492200-203. ISSN: 2594-0252, ambos otorgados por el Instituto Nacional del Derecho de Autor. Responsable de la última actualización de este número, M.C. Valeria Abigail Martínez Sias. Fecha de última modificación, 6 de junio de 2022.
Las opiniones expresadas por los autores no necesariamente ref lejan la postura del editor de la publicación.
Contacto principalJorge Cadena IñiguezGuerrero 9, esquina avenida Hidalgo, C.P. 56220, San Luis Huexotla, Texcoco, Estado de Mé[email protected]
Contacto de [email protected]
Bases de datos de contenido científico Directorios
Colegio dePostgraduadosS E C R E TA R Í A D E AG R I C U LTU R A Y D E S A R R O L LO R U R A L
AGRICULTURA

2 AGROPRODUCTIVIDAD
Anonimato en la identidad de los autores: Los artículos no debe-rán incluir en ni en cuerpo del artículo, ni en las notas a pie de página ninguna información que revele su identidad, esto con el fin de ase-gurar una evaluación anónima por parte de los pares académicos que realizarán el dictamen. Si es preciso, dicha información podrá agre-garse una vez que se acredite el proceso de revisión por pares.
Estructura de los artículos: Los artículos incluirán los siguientes elementos: Título, title, autores y adscripción, abstract, keywords, resumen, palabras clave, introducción, objetivos, materiales y mé-todos, resultados y discusión, conclusiones y literatura citada en for-mato APA.
Título: Debe ser breve y reflejar claramente el contenido, debe-rá estar escrito en español e inglés. Cuando se incluyan nombres científicos deben escribirse en itálicas. No deberá contener abre-viaturas ni exceder de 20 palabras, se usará solo letras mayúsculas, en negritas, centrado y no llevará punto final.Resumen y Abstract: Deberá integrarse un resumen en inglés y español (siguiendo ese orden), de máximo 250 palabras, donde se destaque obligatoriamente y en este orden: a) objetivo; b) diseño / metodología / aproximación; c) resultados; d) limitaciones / impli-caciones; e) hallazgos/ conclusiones. El resumen no deberá incluir citas, referencias bibliográficas, gráficas ni figuras.Palabras clave y Keywords: Se deberá incluir una lista de 3 a 5 palabras clave en español e inglés que permitan identificar el ámbito temático que aborda el artículo.Introducción: Se asentará con claridad el estado actual del co-nocimiento sobre el tema investigado, su justificación e importan-cia, así como los objetivos del trabajo. No deberá ser mayor a dos cuartillas.Materiales y Métodos: Se especificará cómo se llevó a cabo la investigación, incluyendo el tipo de investigación, diseño experi-mental (cuando se traten de investigaciones experimentales), equi-pos, substancias y materiales empleados, métodos, técnicas, proce-dimientos, así como el análisis estadístico de los datos obtenidos.Resultados y Discusión: Puede presentarse en una sola sección. En caso de presentarse de forma separada, la discusión debe enfo-carse a comentar los resultados (sin repetirlos), en términos de sus características mismas, su congruencia con la hipótesis planteada y sus semejanzas o diferencias con resultados de investigaciones similares previamente realizadas.Conclusiones: Son la generalización de los resultados obtenidos; deben ser puntuales, claras y concisas, y no deben llevar discusión, haciendo hincapié en los aspectos nuevos e importantes de los re-sultados obtenidos y que establezcan los parámetros finales de lo observado en el estudio.Agradecimientos: Son opcionales y tendrán un máximo de tres renglones para expresar agradecimientos a personas e institucio-nes que hayan contribuido a la realización del trabajo.Cuadros: Deben ser claros, simples y concisos. Se ubicarán in-mediatamente después del primer párrafo en el que se mencionen o al inicio de la siguiente cuartilla. Los cuadros deben numerarse progresivamente, indicando después de la referencia numérica el título del mismo (Cuadro 1. Título), y se colocarán en la parte superior. Al pie del cuadro se incluirán las aclaraciones a las que se hace mención mediante un índice en el texto incluido en el cuadro. Se recomienda que los cuadros y ecuaciones se preparen con el editor de tablas y ecuaciones del procesador de textos.Uso de siglas y acrónimos: Para el uso de acrónimos y siglas en el texto, la primera vez que se mencionen, se recomienda escri-bir el nombre completo al que corresponde y enseguida colocar la sigla entre paréntesis. Ejemplo: Petróleos Mexicanos (Pemex), después sólo Pemex.Elementos gráficos: Corresponden a dibujos, gráficas, diagra-mas y fotografías. Deben ser claros, simples y concisos. Se ubi-carán inmediatamente después del primer párrafo en el que se mencionen o al inicio de la siguiente cuartilla. Las figuras deben
numerarse progresivamente, indicando después de la referencia numérica el título del mismo (Figura 1. Título), y se colocarán en la parte inferior. Las fotografías deben ser de preferencia a colores y con una resolución de 300 dpi en formato JPG, TIF o RAW. El autor deberá enviar 2 fotografías adicionales para ilustrar la pági-na inicial de su contribución. Las gráficas o diagramas serán en formato de vectores (CDR, EPS, AI, WMF o XLS).Unidades. Las unidades de pesos y medidas usadas serán las aceptadas en el Sistema Internacional.Citas bibliográficas: deberán insertarse en el texto abriendo un paréntesis con el apellido del autor, el año de la publicación y la página, todo separado por comas. Ejemplo (Zheng et al., 2017). El autor puede introducir dos distintos tipos de citas:
Citas directas de menos de 40 palabras: Cuando se transcri-ben textualmente menos de 40 palabras, la cita se coloca entre comillas y al final se añade entre paréntesis el autor, el año y la página. Ejemplo:
Alineado al Plan Nacional de Desarrollo 2013-2018, (DOF, 2013), el Programa Sectorial de Desarrollo Agropecuario, Pesquero y Alimentario 2013-2018 establece “Construir un nuevo rostro del campo sustentado en un sector agroalimenta-rio productivo, competitivo, rentable, sustentable y justo que garantice la seguridad alimentaria del país” (DOF, 2013).
Citas indirectas o paráfrasis: Cuando se interpretan o se co-mentan ideas que son tomadas de otro texto, o bien cuando se expresa el mismo contenido pero con diferente estructura sintácti-ca. En este caso se debe indicar el apellido del autor y el año de la referencia de donde se toman las ideas. Ejemplo:
Los bajos rendimientos del cacao en México, de acuerdo con Avendaño et al. (2011) y Hernández-Gómez et al. (2015); se debe principalmente a la edad avanzada de las plantaciones.
Las referencias bibliográficas: al final del artículo deberán in-dicarse todas y cada una de las fuentes citadas en el cuerpo del texto (incluyendo notas, fuentes de los cuadros, gráficas, mapas, tablas, figuras etcétera). El autor(es) debe revisar cuidadosamente que no haya omisiones ni inconsistencias entre las obras citadas y la bibliografía. Se incluirá en la lista de referencias sólo las obras citadas en el cuerpo y notas del artículo. La bibliografía deberá presentarse estandarizada recurriendo a la norma APA, ordenarse alfabéticamente según los apellidos del autor. De haber dos obras o más del mismo autor, éstas se listan de manera cronológica iniciando con la más antigua. Obras de un mismo autor y año de publicación se les agregará a, b, c… Por ejemplo:
Ogata N. (2003a).Ogata N. (2003b).
Artículo de revista:Wang, P., Zhang, Y., Zhao, L., Mo, B., & Luo, T. (2017). Effect of Gamma Rays on Sophora davidii and Detection of DNA Polymorphism through ISSR Marker [Research article]. https://doi.org/10.1155/2017/8576404
Libro:Turner J. (1972). Freedom to build, dweller control of the housing process. New York: Macmillan.
Uso de gestores bibliográficos: Se dará prioridad a los artículos enviados con la bibliografía gestionada electrónicamen-te, y presentada con la norma APA. Los autores podrán recurrir al uso de cualquier gestor disponible en el mercado (Reference Manager, Crossref o Mendeley entre otros), o de código abierto tal como Refworks o Zotero.

Colegio dePostgraduados
3
Clonal propagation of Gmelina arborea Roxb grown in southeastern MexicoOrtega-Ramírez, Marynor E.1*; Castro-Osorio, Adrian2; Torres-Lamas, Secundino3; González-Cortés, Nicolás4
1 Universidad Autónoma de Chiapas, Facultad de Ciencias Agropecuarias -CV, Villaflores, Chiapas, México, C.P. 30470.
2 FYTEIA CAPITAL S. de RL de CV. 3 El Colegio de la Frontera Sur, Unidad Villahermosa. 4 Universidad Juárez Autónoma de Tabasco. Campus Tenosique. * Correspondence: [email protected], [email protected]
ABSTRACTObjective: To evaluate the clonal behavior of Gmelina arborea Roxb from mother plant cuttings in southeastern Mexico.Design/Methodology/Approach: A completely random design of three treatments with four repetitions was established; the treatments were concentrations of IBA (4000, 6000 and 3000 ppm). The following were evaluated: percentage of rooting, days until root formation, type of cutting, number of roots, length of roots and absorbent roots. Analysis of variance and Tukey’s test were performed with Statistix 9.0.Results: In the analysis of variance (ANOVA), significant factors were observed (callus and number of roots), and also, a fluctuation was observed in the percentage of rooting from 84% to 92%. Regarding the number of roots and cm of roots, there were significant differences in the presence of number of roots of the 6000 ppm treatment. Conclusions: The concentration of IBA in the rooting generates good results in different concentrations, depending on the cutting implemented, the factors callus and number of roots; significant records were obtained between treatments, favoring the acceleration of presence of roots.
Keywords: Vegetative propagation, Gmelina arborea Roxb, growth regulators.
INTRODUCTION The application of biotechnology to forest species constitutes bases and principles of research for tropical species. The tropical zones in Mexico are considered of great potential for the establishment and management of commercial forest plantations; considering their geographic position, they receive large amounts of solar energy. Gmelina arborea roxb
Citation: Ortega-Ramírez, M. E., Castro-Osorio, A., Torres-Lamas, S. & González-Cortés, N. (2022). Clonal propagation of Gmelina arborea Roxb grown in southeastern Mexico.Agro Productividad. https://doi.org/10.32854/agrop.v15i5.1870
Academic Editors: Jorge Cadena Iñiguez and Libia Iris Trejo Téllez
Received: November 1, 2020.Accepted: April 13, 2022.Published on-line: June 6, 2022.
Agro Productividad, 15(5). May. 2022. pp: 3-12.
This work is licensed under a Creative Commons Attribution-Non-Commercial 4.0 International license.
3

4 Agro productividad 2022. https://doi.org/10.32854/agrop.v15i5.1870
(Melina) is characterized by being a species of rapid growth and opportunistic in rainforests, classified as long-life pioneer, its capacity for regrowth presents a fast and vigorous growth. Project A3-S-131410 of the CONACyT-CONAFOR sectorial Fund developed a clonal propagation protocol of selected Gmelina arborea trees, early establishment and evaluation of progeny trials, and clonal trials for commercial forest plantations in southeastern Mexico. It was published on October 8, 2018, in the call for projects “2018-2”, which had the objective of establishing the first stages of an operative strategy for genetic improvement of Gmelina arborea, species used in commercial forest plantations of FYTEIA CAPITAL in southeastern Mexico. Therefore, this study has the objective of evaluating the clonal behavior of Gmelina arborea from cuttings obtained from mother plants in southeastern Mexico.
MATERIALS AND METHODS This project was conducted with the support of resources from the Sectorial Fund for Development Research and Forest Technological Innovation in the “La Huerta” plot, located in the Ranchería el Corralillo on Km 3.28 of the Fraccionamiento Pomoca-El Tigre Highway, Nacajuca, Tabasco. This study had the purpose of determining the optimal concentrations of IBA hormone (Indole-3-butyric acid) in solid solution under three concentrations, 3000 ppm, 4000 ppm and 6000 ppm, and to determine the concentration that generated roots in the shortest time; for this purpose, primary and secondary cuttings of Gmelina arborea were used as plant material.
Background of clones evaluated The genetic material evaluated is part of the Project A3-S-131410 of the CONACYT-CONAFOR sectorial Fund. Early establishment and evaluation of progeny trials and clonal trials of Gmelina arborea for commercial forest plantations in southeastern Mexico, published on October 8, 2018, call for projects “2018-2”, which had the objective of establishing the first stages of an operative strategy for genetic improvement of Gmelina arborea, species used in commercial forest plantations belonging to FYTEIA CAPITAL in southeastern Mexico. The genetic material to be propagated massively was obtained through the selection of candidate trees and then, after complying with dasometric and phenotypic traits, they were identified as plus trees. The technique of rough hewing (complete tree cutting) was applied, consisting in cutting the tree horizontally, leaving stumps of an average of 32 cm height (Ramos, 2016; Quispe, 2019). Later, at 11 weeks the harvest of reshoots was made (Figure 1), produced from each stump (Figure 1); for this purpose, the following was used: gps garmin etrex 10, map of the site, plastic bags (10 kg), permanent marker, pruning scissors, ice, thermal cooler.
Experimental design A completely random design of three treatments with four repetitions was established; the treatments were the IBA concentrations (Table 1):

5 Agro productividad 2022. https://doi.org/10.32854/agrop.v15i5.1870
Variables to be measured Percentage of rooting, Days until root formation Type of cutting (primary, secondary), Number of roots, Cm of roots, Absorbent Bloom. The values measured from each variable were analyzed parametrically using Statistix 9.0, Tukey’s test, ANOVA.
Preparation of the substrate Trays with 42 cavities were used (34 cm 37 cm) with a capacity of 175 cm3, they were filled with substrate made up of 80% bark and 20% Peat Moss and slow-release fertilizer was added (Figure 2).
Figure 1. Visualization of resprouts on stumps (a) and harvesting of resprouts emitted by stumps, activity carried out from 10 p.m. to 4 a.m.
Table 1. Completely random design of three treatments with four repetitions.
Treatment Repetition Concentration in PPM
1 R1 4000
2 R1 6000
3 R1 3000
4 R2 3000
5 R2 6000
6 R2 4000
7 R3 3000
8 R3 4000
9 R3 6000
10 R4 6000
11 R4 3000
12 R4 4000

6 Agro productividad 2022. https://doi.org/10.32854/agrop.v15i5.1870
Process of obtaining cuttings Performing cuts during the whole process of obtaining cuttings (Figure 3) was done with a scissor (Truper, stainless steel), disinfected before and after each cut, and performing the change in management of the genetic material. The cut of the reshoot was done in the basal part, the closest to the principal stalk.
Sectioned To select the primary and secondary cuttings (Figure 4), the cuts were performed in the inferior part of each cutting, the closest to the axillar bud; then, the withdrawal or cut of the leaf part of 50% was done, reducing the transpiration of those cuttings.
Figure 2. Substrate preparation: 80% bark and 20% Peat Moss.
Figure 3. Shoot preparation in mother plants of Gmelina arborea, the handling of the prepared shoots is done with latex gloves to avoid contamination of the material to be propagated.

7 Agro productividad 2022. https://doi.org/10.32854/agrop.v15i5.1870
Application of stimulant For the establishment of the cuttings, the IBA growth hormone, the preparation of the hormone and its concentration of 3000, 4000 and 6000 mg kg1 was applied (Figure 5); industrial talcum powder was mixed with indole-3-butyric acid (impregnable powder as active ingredient). Later, the cuttings were impregnated with IBA, following the quick immersion method, which consists in the inferior part of the cutting being introduced into the impregnable powder; therefore, it is established in the cavities with inert substrate, and pressured to the margin of the inferior part of the cutting with the aim of avoiding mobility and eliminating air bags. Once the trial is finished, they are introduced into the area where they will remain
Figure 4. Sectioning process to obtain primary and secondary cuttings, after which 50% of the leaf part of each cutting obtained is removed.
Figure 5. Application of AIB for stimulation and reaction of secondary and primary stake cofactors.

8 Agro productividad 2022. https://doi.org/10.32854/agrop.v15i5.1870
until starting the rooting and at the same time the temperature, irrigation and relative humidity is regulated and controlled.
RESULTS AND DISCUSSION Table 2 shows the results from the ANOVA (Value of F and degree of significance) during the trial in minimum time of rooting and optimal concentrations of root stimulating hormones in southeastern Mexico, through primary and secondary cuttings of Melina (Gmelina arborea Roxb), where significant statistical differences were found between the treatments evaluated and the variables measured. The variables that presented degrees of significance (P0.05) were the presence of callus with a mean of 1.38 and number of roots, which indicates that the variable measured of IBA concentration did not affect the percentage of rooting, later reflected in the type of cutting used during the trial (Primary and Secondary). Table 3 shows that the results obtained of the variable percentage of rooting are higher than those found in the study conducted by Ruiz et al. (2005), who obtained 71.8% with concentrations of 1000 ppm to 2000 ppm. Table 3 shows the means of the variables of each variable evaluated during the trial, according to the results shown in Table 2, and shows two groups in the variable number of roots where each concentration of IBA presents a mean of 4.66 (4000 ppm), 3.4286 (6000 ppm), and 3.2857 for concentration of 3000 ppm; this variable was significant.
Percentage of rooting Table 4 shows the factor “Percentage of rooting” and the results from each concentration according to its level, which did not have an impact on the number of cuttings rooted, but did impact the length, something that should be highlighted. With the three concentrations of IBA implemented at the beginning of the period of rooting, an average of 84% of rooting was found for the concentration of 3000 ppm, and likewise it is homogeneous in the concentration of 6000 ppm; and then, 4000 ppm is higher than the previous with 92% of rooting. Villegas et al. (2017) reported a percentage of rooting of 98% on average, stressing 100% of rooting at 15 dae (days after established), in addition to the type of material implemented being apical (principal) cuttings. Authors like Ovalle (2010) obtained a percentage of rooting of 100% in the species Gmelina arborea using three treatments (4000, 6000 and 8000 mg kg1), indicating that the factor that has most influence on rooting is the conditions within the rooting module.
Table 2. ANDEVA Results (F-value and degree of significance).
SOURCE OF VARIATION CALLUS VELLOS STACA ROOT NO. OF
ROOT CM MAJOR CM MINOR
Treatment 4,45 0,65 0,85 1,41 3,81 0,30 1,17
CV 32,14 171,14 35,61 29,57 94,04 85,68 133,93
Media 1,38 6,39 1,34 1,12 3,79 3,38 1,08
Significance * N.S N.S N.S * N. S N. S
Degrees of significance: P0.05 * Significant, P0.01** highly significant, N.S.Not significant.

9 Agro productividad 2022. https://doi.org/10.32854/agrop.v15i5.1870
Number of roots/cm of roots Table 2 shows the analysis of variance (ANOVA), where the factor number of roots obtained was significant, indicating that there is a concentration of IBA that causes the secondary and primary cuttings of the species Gmelina arborea to have a higher number of roots. Jovanovic et al. (2008), mentioned by Báez (2015), point out that the growth of the root is regulated by endogenous signals which contribute to the pattern of generation of new lateral roots. The analysis of roots of each treatment of the concentrations showed a f luctuation in 4000 and 3000 mg kg1, with a mean of three.
Table 4. Total number of cuttings, number of cuttings that obtained roots and percentage of rooting during the melina (Gmelina arborea Roxb) trial. By means of cuttings.
CONCENTRATION NO. OF SEEDLINGS
MAIN STAKE
SECONDARY STAKE
ROOTED SEEDLINGS
UNROOTED SEEDLINGS %
3000 84 56 28 71 12 84
4000 84 59 25 78 3 92
6000 84 51 33 71 12 84
Table 3. Comparison of means in the minimum rooting times and optimum concentrations of root stimulating hormones with Melina.
COMPARISON OF AVERAGES TREATMENT MEDIA HOMOGENEOUS
GROUP
Callus
2 1.4524 A
1 1.4286 A
3 1.2637 B
Staca
3 1.3929 A
1 1.3333 A
2 1.2976 A
No.of root
1 4.6667 A
2 3.4286 AB
3 3.2857 B
CM Minor
2 1.2738 A
3 0.9810 A
1 0.9774 A
CM Major
2 3.5807 A
1 3.3488 A
3 3.2381 A
Vellos
2 7.4167 A
1 6.2619 A
3 5.5119 A
Presence of Root
3 1.1548 A
1 1.1310 A
2 1.0714 A

10 Agro productividad 2022. https://doi.org/10.32854/agrop.v15i5.1870
Figure 7. Graph of the relationship between the ratio of major and minor cm of roots during the test of minimum rooting times in melina (Gmelina arborea Roxb). Using AIB 6,000 ppm.
0
5
10
15
20
1 2 3 4 5 6 7 8 9 10 11 12 13 14 15 16 17 18 19 20 21 22 23 24 25 26 27 28
6000 ppm15 dde
NO. ROOT CM ROOT
Table 5. Ratio of maximum, mean and minimum number of roots in each treatment during the melina (Gmelina arborea Roxb) trial. By means of stakes.
CONCENTRATION MAXIMUM MEAN MINIMUM
3000 15 4 1
4000 10 3 1
6000 13 3 1
Figure 6. Visualization of axillary buds (a) secondary and lignified stake at 8 dde and root development (b) at 28 dde.
a b
Table 5 and Figure 6 to 9, show a mean of 3.0 cm and a maximum number of roots of 19, with a concentration of 6000 mg kg1, which explains the concentration applied to secondary and primary cuttings.

11 Agro productividad 2022. https://doi.org/10.32854/agrop.v15i5.1870
Figure 8. Graph the ratio of major and minor cm of roots during the test of minimum rooting times in melina (Gmelina arborea Roxb). Using AIB at 4,000 ppm.
0
2
4
6
8
10
12
1 2 3 4 5 6 7 8 9 10 11 12 13 14 15 16 17 18 19 20 21 22 23
NO. ROOT CM ROOT
4000 ppm15 dde
Figure 9. Graph the ratio of major and minor cm of roots during the test of minimum rooting times in melina (Gmelina arborea Roxb). Using AIB at 3,000 ppm.
0
2
4
6
8
10
12
14
16
1 2 3 4 5 6 7 8 9 10 11 12 13 14 15 16 17 18 19 20 21 22 23 24 25
NO. ROOT CM ROOT
3000 ppm15 dde
CONCLUSIONS The factors that intervene in the vegetative propagation of the species Gmelina arborea are of utmost importance, with cuttings being a technique of massive clonal propagation that ensures the quality of plants. The concentration of IBA in rooting generates good results in different concentrations based on the type of cutting implemented, with apical cuttings having better quality in the root system with less centimeters and formation of absorbent bloom. In the trial, the factors callus and number of roots obtained significant records between treatments; the use of IBA concentrations favors the acceleration of the presence of adventitious roots.
REFERENCESRamos Huapaya, A. E., & Domínguez Torrejon, G. (2016). Selección de árboles de bolaina blanca (Guazuma
crinita Mart.) como candidatos a árboles “plus” para ensayos de rejuvenecimiento y brotación. Ecología Aplicada, 115-123.

12 Agro productividad 2022. https://doi.org/10.32854/agrop.v15i5.1870
Alegria, M. (1994). Tecnica de produccion de planta en viveros. Estado de Mexico: Chapingo.Báez Pérez, A., González Molina, L., Solís Moya, E., Bautista Cruz, A., Bernal Alarcón, M. (2015). Efecto
de la aplicación del ácido indol-3-butiríco en la producción y calidad de trigo (Triticum aestivum L.)*. Revista Mexicana de Ciencias Agrícolas. 6 (3). 523-537.
CONAFOR. (2009). Especies tropicales; pioneras en crecimiento acelerado en bosques naturales. especies forestales de interes comerciales en México.
CONAFOR. (2014). Plantaciones Forestales. CONAFOR.Mesén, F. (1998). Enraizamiento de estacas juveniles de espacies forestales: uso de propagadores de
subirrigacion. 1ª ed. Editorial Turrialba, Turrialba, Costa Rica p.36. Gill, A. M., & E, W. J. (1996). The effects of fragmantation of southheastern australian eucalypt forests by
urbanisation agriculture and pine plantation. For. Ecol. Manage, 85(1-3), 261-278.Iglesias-Gutierrez, L., Prieto-Ruiz, J.A., Alarcón-Bustamante, M. (1996). La propagacion vegetativa en
plantaciones forestales. Ciencias forestales de Mexico, 21 (79). 15-14.Martinez-Ruiz, R., Azpíroz-Rivero, H.S., Rodríguez de la O, J.L., Cetina-Alcala, V.M., Gutierrez-Espinosa,
M.A. (2006). Importancia de las Plantaciones Forestales de Eucalyptus. Ra Ximhai. 2 (3). 815-846.Levitus, & Richars. (2010). Morfogenesis en biotecnologia y mejoramiento vegetal II. Sradice, 26-36.Marina, R. Y. (2011). Desarrollo de una tecnica de mocropropagacion de cedro (Cedrela mantana). RIOBAMBA -
ECUADOR.Ovalle, J. (2010). Evaluación de concentraciones de auxinas para la propagación vegetativa comercial de
4 especies forestales: Melina (Gmelina arborea), Eucalipto (Eucaliptus urograndis), Pino (Pinus patula) y Pinabete (Abies guatemalensis) Pilones de Antigua, Antigua Guatemala (Doctoral dissertation, Tesis de pregrado. Universidad de San Carlos de Guatemala. Guatemala, Guatemala).
Quert, F. (1982). Diccionario de botanica. Labor S.A, 84-335. Madrid, EspañaQuispe Santos, A., & Ramos Huapaya, A. E. (2019). Técnicas de rejuvenecimiento en árboles clonales de
eucalipto urograndis (Eucalyptus grandis E. urophylla) en Palca Tarma – Junín. Revista Xilema, 29 (1). 36-46. Doi: 10.21704/x.v29i1.1348
Ramirez, M. E. (2007). Metodos de propagacion vegetativa de eucalyptus s.p metodo tradicional vs. cultivo in vitro. Venezuela.
Ruiz Garcia , R., Vargas Hernandez , J. J., Cetina Alcala, V. M., Villegas Monter, A. (2005). Efecto del ácido indolbutírico (AIB) y tipo de estaca en el enraizado de Gmelina arborea Roxb. Re. Fitotec, 28 (4). 319-326.
Stephanie, I. (2009). Clonación Vegetal. Multiprensa-Mexico, 13-19.Latsague-Vidal, M., Sáez-Delgado, P., Yáñez Delgado, J. (2009). Efecto del ácido indolbutirico en la capacidad
rizogenicade estacas de Eucryphia glufinosa. Bosque (Valdivia), 30 (2). 102-105. Doi: 10.4067/S0717-92002009000200006
Toro-Magaña, F. (1989). Algunas tecnicas de vivero para la produccion de plantulas de Pinus Michoacana. Tesis (Ing. Agrónomo Esp. en Bosques), UACH. División de Ciencias Forestales.
Trinidad, S. (2002). Evaluacion del crecimiento en vivero de plantulas de cinco especies de coniferas producidas en 3 mezclas de sustratos y 3 tamaños de contenedor. Mexico: UACH Chapingo.
Villega- Espinoza, J. P., Murillo-Cruz, R., Ávila-Arias, C., Hernández-Castro, W. (2017). Período óptimo de enraizamiento de clones superiores de Gmelina arborea Roxb. Revista de Ciencias Ambientales, 51 (1).1-15. Doi: 10.15359/rca.51-1.1
Zobel, & Talbert. (1988). Tecnica de mejoramiento genetico de arboles forestales. 1ª ed. Ciudad de Mexico, Mexico. Editorial LIMUSA.

Colegio dePostgraduados
13
Analysis of structure and function of an agroecological beacon: The case of the Agroecological Educational Center Los ÁlamosRíos y Valles-Boyselle, Fernando; Regalado-López, José*; Méndez-Espinoza, José A.; Ramírez-Juárez, Javier; Pérez-Ramírez, Nicolás; Ocampo-Fletes, Ignacio
Colegio de Postgraduados, Campus Puebla. Boulevard Forjadores de Puebla # 205, Santiago Momoxpan, San Pedro Cholula, Puebla, México. C. P. 72760.
* Correspondence: [email protected]
ABSTRACTObjective: To determine whether the Agroecological Educational Center Los Álamos (Centro Educativo Agroecologico Los Alamos, CEA), located in the state of Tlaxcala, Mexico, fulfills the elements of structure and function to be identified as an agroecological beacon.Design/Methodology/Approach: A mixed approach was used (quantitative and qualitative). A study case of the CEA was constructed to understand both the context and the structural and functional characteristics that currently configure it. First, an exhaustive review of secondary information related to the structure and functioning of agroecological beacons in other regions or countries was made. In a second stage, a comparative analysis of the structural and functional characteristics of agroecological beacons was conducted with the data generated in the study case. In the third stage, factors were analyzed that make possible or limit the CEA to develop as an agroecological beacon.Results: The CEA performs and fulfills with participant youth the function of agroecological beacon, since it is an efficient tool for education, training, knowledge exchange and promotion of agroecology. This favors its dissemination and scaling in the peasant communities where the young people who participate in the CEA are from.Study Limitations/Implications: The results are only applicable to the study case due to the limitations present in this methodology in terms of its results not allowing to elaborate general explanations.Findings/Conclusions: The CEA complies with sufficient elements to catalog it as a sectorial agroecological beacon, which is contributing a methodological and strategic light to respond to the challenge of inter-generational transmission of understanding, knowledge and agroecological projects in the peasant indigenous youth sphere.
Keywords: Agroecology, agroecological beacon, indigenous youth.
INTRODUCTION Currently, there are two challenges that threaten the welfare of people and the population; one is global warming with all its repercussions in the deterioration of natural resources and the environment; the other challenge, as important, is the one related with food insecurity within a context of climate change and greater resource scarcity, especially land and water (Pérez et al., 2018).
Citation: Ríos y Valles-Boyselle, F., Regalado-López, J., Méndez-Espinoza, J. A., Ramírez-Juárez, J., Pérez-Ramírez, N., & Ocampo-Fletes, I. (2022). Analysis of structure and function of an agroecological beacon: The case of the Agroecological Educational Center Los Álamos. Agro Productividad. https://doi.org/10.32854/agrop.v15i5.2068
Academic Editors: Jorge Cadena Iñiguez and Libia Iris Trejo Téllez
Received: June 22, 2020.Accepted: April 15, 2022.Published on-line: June 6, 2022.
Agro Productividad, 15(5). May. 2022. pp: 13-22.
This work is licensed under a Creative Commons Attribution-Non-Commercial 4.0 International license.

14 Agro productividad 2022. https://doi.org/10.32854/agrop.v15i5.2068
In face of these great challenges, proposals have been made to revert, evade, mitigate and/or adapt to climate change and to contribute to the production of nutritional, innocuous, sufficient and quality foods. One of these proposals is agroecological production systems in their diverse modalities and hierarchical levels; one of the modalities of these systems is agroecological beacons. An agroecological beacon is a unit for training and demonstration in agroecological methods, techniques and practices, within the rural sphere, which guides interested people in developing more sustainable productive systems. In this context, agroecological beacons exert the function of being “a potent tool for change and scaling of agroecology required in the rural world” (Infante, 2015). They are the answer to the question of: “How to put it into practice?” In this sense, Altieri and Yurjevic (1992) recognize that the dissemination and scaling of agroecology will be possible “only if its proposals are ‘a good business’ for the small-scale producer, and in addition, if they take into account their rationality”. For this reason, they emphasize the importance of demonstrative farms, where there are successful experiences of incorporation of both traditional peasant techniques and also new viable alternatives (Muñoz, 2003). In this way, the environmental knowledge and perceptions of peasant farmers are integrated into agricultural innovation schemes that link resource conservation and rural development, in search for a sustainability approach. In this sense, agroecological beacons develop and consolidate a demonstrative and educational function in the generation and exchange of knowledge, emphasizing participatory principles, processes and methodologies (Espinoza, 2016). The principle of teaching not being simply to transfer knowledge is fundamental; rather, it is creating possibilities for its construction. Therefore, agroecological beacons help for technical-productive and sustainable rural development aspects to advance thanks to the exchange in knowledge that is constructed and shared in the relationship between the beacons and the plots of peasant families that are connected to them (Infante, 2015). From this perspective, the research study was focused on the analysis of structural and functional elements with which agroecological beacons are characterized, to be able to determine, through a study case, the characteristics factors that make the CEA possible in order to develop under the identity and functioning of an agroecological beacon. This, highlighting its mission of benefiting young peasant and indigenous people who approach it, with the interest of exchanging and building agroecological understanding and new knowledge to apply in their communities of origin.
MATERIALS AND METHODSLocation of the CEA The CEA works based on a farm in the locality called Rancho Los Álamos, located in the municipality of Muñoz de Domingo Arenas, Tlaxcala, Mexico. The farm is situated in a plain of 50 hectares, in the high plateau of the northeast zone of the state of Tlaxcala. The research was carried out with a mixed approach, using quantitative and qualitative methods. The techniques used to gather information were: survey through the questionnaire; semi-structured interview with qualified informants; participant observation with discourse analysis; and documentation of official data such as texts, specialized

15 Agro productividad 2022. https://doi.org/10.32854/agrop.v15i5.2068
publications and research related with the structure and the function of agroecological beacons. To determine the characteristic factors that allow the identification of the CEA as an agroecological beacon, a study case was built based on the contribution by Coller (2000). From an agroecological perspective, the study was approached with the General Systems Theory (GST; Von Bertalanffy, 1976), considering the CEA from the category of agroecosystem (Altieri, 1999). Under this approach, the CEA was analyzed as a functional totality with the set of sub-systems and their interrelations and form of organization (García, 2006). Finally, the study turned to the theory offered by Infante (2015) to characterize agroecological beacons and, then, to make the comparative analysis of the CEA’s structure and function.
RESULTS AND DISCUSSIONStructure and functioning of the CEA Based on the General Systems Theory (GST) and the suggestions by García (2006), the CEA was analyzed as a “complex system” since it is the seat of a set of environmental, productive, educational, economic and social phenomena that can be grouped as sub-systems. These sub-systems are related between one another to carry out one or several functions. The system that makes up the CEA is based on the description of the interrelations that are established between the sub-systems, whose functions within each are not independent. From this analytical perspective, the following suggestion by García (2006) can be corroborated and taken advantage of: “the combination of relationships constitutes the structure that gives the system the form of organization which makes it function as a totality”. The sub-systems and the relationships that shape the structure of the CEA and its organization can be modelled and represented (Figure 1). The CEA, in addition to being described as a complex system, can be characterized by the specific intention of becoming organized and functioning as an “agroecosystem” (Altieri, 1983), with a single and multiple finality at the same time, namely: “to build an agroecological educational community that develops a strategy for education with the aim of integration, rootedness and innovative participation of young people in their communities of origin” (CEA, 2018). Therefore, the CEA can be characterized as a complex, dynamic and multifunctional system which, in addition to performing agrosilvopastoral activity, conserves biodiversity, guarantees healthy and varied foods, and serves as an educational center for peasant and indigenous youth, with which it contributes to the reconstitution of indigenous communities in the country.
Application of the agroecological paradigm in the CEA To reach the structural and functional configuration of an agroecosystem with an educational function, the implementation of an integral project for agroecological redesign and transition can be observed in the CEA. With this project, assuming the proposals of the “agroecological paradigm” (Altieri and Nicholls, 2000; Gliessman, 2001), a historical and

16 Agro productividad 2022. https://doi.org/10.32854/agrop.v15i5.2068
dynamic transition has taken place. For the CEA, the so-called Agroecological Transition Master Project, with a projection and historical trajectory of 20 years of implementation (CEA, 2019a), has allowed the strategic planning and integration of what Nicholls et al. (2015) describe as agroecological principles, processes and techniques. In its functioning, the CEA agroecosystem presents the emerging property of serving as a demonstrative field for the generation and exchange of knowledge and the application of agroecological technologies. Table 1 presents the agroecological practices suggested in the CEA. The emerging possibility of the CEA serving as experimental and demonstrative field is strengthened with the work and function of the educational team by planning and developing a strategy that focuses primarily on making the CEA a space for the exchange of local understandings and new knowledge that help young people in the process of integration and service in their communities of origin. The following testimony from a student exemplifies this experimental, demonstrative and educational function of the CEA:
“For me, the part of agricultural practices has been interesting about the CEA, where there is a fusion of the theory and the knowledge that we bring from our places of origin. This has been very satisfying and is what I find most interesting, seems to
Figure 1. Model of structure and function of the Agroecological Educational Center Los Álamos (CEA).

17 Agro productividad 2022. https://doi.org/10.32854/agrop.v15i5.2068
Table 1. Agroecological practices suggested in the CEA.
Soil and water conservation Suggested PracticeThe paths of waterSoil and water conservation techniquesSoil water management practices
In any part of the farm, erosion can be measured or soil conservation practices can be carried out
Agricultural diversity and biodiversity Suggested Practice
Concepts, laws, challenges Crop diversity systems can be practiced from June to September
Agricultural tillage y conservation tillage practices Suggested Practice
Tillage systemsConventional tillageConservation tillageZero tillage
Students can experiment on a small plot with the milpa system
Planting systems and cultivation systems Suggested PracticeTraditional planting systemsCrop polyculturesCrop rotationsAgroforestrySecondary vegetation (acahual), itinerant agriculture
Crop diversity systems can be practiced from June to September
Crop nutrition and fertilization Suggested PracticeFertilization without agrochemicalsCrop nutritionOrganic fertilizers
In the farm you can practice the elaboration of biols and different organic fertilizers
Integrated management of insects and diseases Suggested PracticeIntegrated insect managementVeterinary homeopathyBiological control of insects
In the farm you can practice any crop
Production, protection and conservation of seeds Suggested Practice
Seed typesSave techniques seedsTraditional systems
Safeguard the seeds at home and in situ in the milpa and cultivation vegetables
Management of weeds and stubble in postharvest Suggested Practice
Stubble management on the farm
Organic cattle Suggested PracticeAnimal integrationReproduction and fattening of chickens and rabbitsBreeding and production of laying hens. Egg productionBreeding and fattening of ruminantsApiculture and fish farming
It can be practiced with chickens, broiler chickens, cows and sheepWith the beekeeping course at the farm apiaryIn the management of carp and axolotls of the jagüey
Source: Reworked by the authors with data from the CEA (2019b).

18 Agro productividad 2022. https://doi.org/10.32854/agrop.v15i5.2068
me, and where I have been spending time without even noticing. I feel that when we practice we learn much more, we reaffirm the theoretical knowledge that we already have and we make it come alive” Elizabeth G. (CEA, 2019c).
Different testimonies from students reaffirm this emerging property of the CEA of serving as a demonstrative and educational experience of sustainable agriculture, even in a surface of 50 hectares, as is the case of Rancho Los Álamos:
“I see in the CEA that sustainable agriculture is implemented, which, although there are few workers, is maintained because they integrate the animals through the elaboration and application of compost, with which they substitute the conventional application of urea that we do in my town. Here they have a wide variety and rotation of crops. Insecticides are no longer applied, there is biological insect control right here. And I find it very interesting when hens and sheep are included, because then you have eggs and meat. The watering pools are a great way of capturing water. Thus, with these ways of managing the ranch they don’t have to spend so much, but rather this becomes more affordable” Antonio S. (CEA, 2019c). “In the CEA I learn what an agroecosystem is, because it has both entries and exits and there is the intention of generating synergy for everything to be supported. For example, capturing rain water that is stored in the watering pools and which are meant to be used for the orchards; rotation and diversification of crops; having and sowing different variety of seeds; the nursery that allows having the inputs there for sowing; and the important role that bees play here in this plot, in this land and also in the world. Thus, I can learn about it in a small scale and visualize it in a larger scale”. Denisse E. (CEA, 2019c).
Configuration of the educational strategy of the CEA As medullar part of the educational strategy, the CEA offers young people an integral training proposal that is structured and operates based on four educational areas: academic, sociocultural, human and spiritual. This program is in function of the young people recovering, valuing and appropriating their peasant identity. On the other hand, it has the aim of appropriating more knowledge, tools, values and abilities that allows them to be integrated and to participate economically, socially and culturally in their community, representing at the same time a new contribution in their locality (CEA, 2018a). The identification of the CEA with the mission of responding to the needs of young peasants and its own identity of Agrocological Educational Center has led it to design and implement a strategic proposal that includes the following:
1. Shaping a demonstrative agroecological community with young people that reaches a high degree of food sufficiency, health, information and communication management, satisfaction of energy (water, heat and housing), based on its educational work and practice, as testimony of learning.
19 Agro productividad 2022. https://doi.org/10.32854/agrop.v15i5.2068
2. Achieving inter- and pluri- cultural coexistence. This coexistence implicates the organization to develop a life in common, community self-diagnoses, and inter-cultural dialogue workshops, where valuing and appropriation of their own cultural identity are favored.
3. Elaborating a training program with integral and pluri-cultural curricular map, with participatory operation. The program can offer visits to example experiences, workshops, courses, talks, encounters and consulting.
4. Relating young people with communities and teachers that can share their knowledge and experiences, with the intention of responding to more than two problems, at least, from their communities of origin.
5. Learning and participating in productive practices for food elaboration, household improvement, and water and energy management; favoring with all this the exchange of local understandings, organization and teamwork, as well as the reutilization and recycling of water.
6. Learning and participating in the elaboration and execution of productive projects with added value, by producing and exchanging products.
Comparative analysis between the proposal by Infante (2015) and the case of the CEA The characteristic factors of structure and function of agroecological beacons can be determined through a comparative analysis, the academic approach by Infante (2015) about the conceptualization and characterization of agroecological beacons, as well as the emerging factors that result from the efficient interrelation between the structure and its function. Regarding the comparative analysis of the current reality of the CEA with the elements that constitute the proposal by Infante (2015), it can be observed that the CEA has all the necessary elements at the structural level, except the one of not working with peasant communities of the area where it is established. However, the relationship and the collaborative work developed by the CEA are rescued, with more than 20 peasant organizations or experiences with agroecological approach. Concerning the functional elements that characterize an agroecological beacon, it is observed that it is not supporting local producers to develop more sustainable agrarian systems, and it is also not achieving a scaling of agroecology in the municipality of Muñoz de Domingo Arenas, Tlaxcala. However, something to rescue is that, it does have the structure and the function of being a guide, a support and a reference for indigenous and peasant youth to set forth on productive projects directed at the construction of more sustainable agrarian systems, and for the propagation and implementation of agroecological knowledge and practices in the communities of origin of the youth that attend the CEA. The discussion about the comparative analysis between the current reality of the CEA and the function of agroecological beacons established by Infante (2015) could not be concluded without rescuing and valuing the work by the CEA focused on and concentrated in having as main indigenous and peasant youth recipients. The specific contributions that

20 Agro productividad 2022. https://doi.org/10.32854/agrop.v15i5.2068
add to Infante’s (2015) concern for implementing strategies to respond to the significant absence of young people in agroecological beacons are listed next. In this regard, it can be seen that in the CEA the following has been achieved:
1. The revaluation achieved in the youth for their identity and mission as peasants.2. The motivation and theoretical and practical backing with which young people emerge
from the CEA to undertake local rural development strategies or projects based on their own youth leadership.
3. The drive and desire promoted in young people to construct a generational transition of peasant labor, revaluing in the students the importance of protecting their identity and biocultural heritage as indigenous peoples.
4. The detonation of a youthful revolutionary impulse promoting resources and strategies to attain food sovereignty, self-management of productive projects, implementation of agroecology, and formulation of cooperative projects from an approach of solidary social economy.
5. The rescue of traditions and spiritual values present in the young people and in the rural communities that have ethical, social and cultural capital which favors strengthening of the social fabric, respect and care for Mother Earth, as well as resilience in face of injustice, violence or periods of crisis.
6. The correlation of institutions, professors, associations, individuals and enterprises to drive the empowerment of indigenous and peasant youth through an autonomous educational strategy that promotes rural and peasant development.
With the consideration and discussion of previous contributions, in the end it is evidenced that in the application of Infante’s (2015) theoretical approach to the current reality of the CEA, it does not have all the elements of structure and function to be able to catalog it 100% as a local agroecological beacon, because it is not structured in function of promoting the scaling of agroecology in the peasant family production units of the zone. However, the CEA does have sufficient elements and evidence to qualify it as a sectorial agroecological beacon, which is contributing a methodological and strategic light to respond to the challenge of inter-generational transmission of understanding, knowledge and agroecological projects in the youth scope.
Contributions to the debate and model of agroecological beacons The CEA is presented as a case that can contribute to the possibility of modelling a type of agroecological beacon, whose function is not linked to the scaling of agroecology at the level of a geographic zone, but rather to a level of population sector or profile of participants. In this sense, in the case of the CEA, it can contribute to the debate of the characterization, function and promotion of specific agroecological beacons for peasant indigenous youth. In this debate, the CEA can contribute the idea that it is not convenient to offer education and technical training in agroecology only as a series of courses, workshops and short activities, but rather as an encompassing, integral and intensive proposal, which

21 Agro productividad 2022. https://doi.org/10.32854/agrop.v15i5.2068
addresses the human, cultural, community, social and spiritual dimension that are lacking in order to make the following possible:
1. Agroecology takes root in young people as a desired lifestyle and in it they have been able to see and confirm the goodness, importance and profitability of this lifestyle as real testimonies, with which they break the stereotypes that being a peasant is not important for society and for the contemporary world.
2. The agroecological approach can be proven to be a possible, urgent and pertinent paradigm in face of the global crisis, profitable for its community. This importance is rooted by having compared, tested and proven several successful rural projects inside it, in which they have been able to practice, contribute and learn. In this sense, leaving their rural communities and knowing several projects is a significant strategy to open their mind, broaden their relational world, and root a conviction about the possibilities and integral goodness of agroecology.
3. Developing the necessary inner strength, at the emotional, volitional and spiritual level, which favors the capacity of rootedness and resilience to face some problems and temptations of rural youth such as hopelessness, addictions, lack of opportunities to undertake projects by age, the temptation to obtain fast money in activities linked to criminal groups, or the social stereotype that migrating from the communities is the best option.
Therefore, the CEA provides the need to take on the issue of generational transition of agroecologist youth decisively. This issue, from the experience and the model of the CEA, implies placing emphasis not on the amount of people who go through the agroecological beacon or on the number of courses or publications, and also not on the size of the property, but in the training proposal and quality; in the methodology and the accompaniment that is more pertinent to develop convictions and to validate the knowledge and the peasant identity; in the deep impact in the lives of young people that detonates their empowerment and resilience, their sense of community and the desire to conserve their cultural heritage; in the type of accompaniment and methodology that makes it possible to develop the capacity for leadership, negotiation and social communication for them to assume the challenge of making demonstrable and profitable the goodness of the agroecological approach applied from and with their community. The educational option and proposal of the CEA contributes to the reflection about agroecological beacons by young peasants, a whole complex system where many elements and relationships are at stake. For that reason, to cultivate in them the agroecological approach they must be understood and work with them should be done integrally, considering their family relationships, their wishes and beliefs, their life history, their desire to learn, but also for fun, understanding and valuation.
CONCLUSIONS The conclusion is a favorable appreciatory opinion, confirming that the CEA does have the elements to be catalogued as a sectorial agroecological beacon, which is contributing

22 Agro productividad 2022. https://doi.org/10.32854/agrop.v15i5.2068
methodological and strategic light to respond to the challenge of inter-generational transmission of agroecological understandings, knowledge and projects in the peasant indigenous youth sphere. The exception is that it is not being focused on the working relationship with peasant communities at the local level.
AKNOWLEDGEMENTS The authors thank the National Science and Technology Council (Consejo Nacional de Ciencia y Tecnología),
Colegio de Posgraduados Campus Puebla and the Agroecological Educational Center Los Álamos, for the
support given to conduct this study.
REFERENCESAltieri, M. A. (1983). Agroecología: Bases científicas de la agricultura alternativa, 1ª ed.; CETAL: Valparaiso, Chile.
325 p.Altieri, M., & Yurjevic, A. (1992). La Agroecología y el Desarrollo Rural Sostenible en América Latina, 1ª ed.; CEPAL:
Santiago, Chile. 235 p.Altieri, M. (1999). Agroecología: Bases científicas para una agricultura sustentable, 4ª ed.; Nordan-Comunidad.
Montevideo, Uruguay. 325 p.Altieri, M., & Nicholls, C. (2000). Agroecología: Teoría y Práctica para una Agricultura Sostenible, 1ª ed.; ONU-
PNUMA. México D. F., México. 257 p.CEA (Centro Ecológico Agroecológico Los Álamos). (2018). Desarrollo institucional del Rancho Los Álamos
como Centro Educativo Agroecológico. Rancho Los Álamos. Archivo Institucional. Muñoz de Domingo Arenas, Tlaxcala, México.
CEA (Centro Ecológico Agroecológico Los Álamos). (2019a). Propuesta de la transición agroecológica. Documento interno. Rancho Los Álamos: Inédito. Muñoz de Domingo Arenas, Tlaxcala, México.
CEA (Centro Ecológico Agroecológico Los Álamos). (2019b). Sugerencias de prácticas demostrativas y experimentales en el CEA. Documento interno. Rancho Los Álamos: Inédito. Muñoz de Domingo Arenas, Tlaxcala, México.
CEA (Centro Ecológico Agroecológico Los Álamos). (2019c). Consolidado de las entrevistas a los alumnos del CEA [16 de agosto de 2019]. Rancho Los Álamos: Documento interno inédito. Muñoz de Domingo Arenas, Tlaxcala, México.
Coller, X. (2000). Estudio de casos, 1ª ed.; CIS: Madrid, España. 139 p.Espinoza, J. A. (2016). Características estructurales y funcionales de un faro agroecológico a partir de las
experiencias de productores cacaoteros de las regiones de los departamentos de Nariño, Meta, Caquetá y Tolima. Medellín. Tesis doctoral, Universidad de Antioquia, Medellín, Colombia. 236 p.
García, R. (2006). Sistemas Complejos: Concepto, método y fundamentacion epistemologica de investigacion interdisciplinaria, 1ª ed.; Gedisa: Barcelona, España. 100 p.
Gliessman, S. R., Rosado-May, F., Guadarrama-Zugasti, C., Jedlicka, J., Cohn, A., Méndez, V., Cohen, R., Trujillo, L., Bacon, C., & Jaffe, R. (2007). Agroecología: Promoviendo una transición hacia la sostenibilidad. Ecosistemas, 16(1), 13-23.
Infante, L. A. (2015). Los faros agroecológicos definición y caracterización a partir de la experiencia de reconstrucción rural en el secano de Chile central. Agroecología, 10(1), 73-78.
Muñoz, E. (2005). Contribución de los faros agroecológicos como base demostrativa de los sistemas agrarios sostenibles. Instituto de Ciencia Animal, 1(2), 45-47.
Nicholls, C., Henao, A., & Altieri, M. A. (2015). Agroecología y el diseño de sistemas agrícolas resilientes al cambio climático. Agroecología, 10(1): 7-31.
Pérez, V. A., Leyva, T. D. A., & Gómez, M. F. C. (2018). Desafíos y propuestas para lograr la seguridad alimentaria hacia el año 2050. Revista Mexicana de Ciencias Agrícolas, 9(1), 1-15.
von Bertalanffy, L. (1976). General System Theory, 2ª ed.; George Braziller: Manhattan, NY, USA. 295 p.

Colegio dePostgraduados
23
Maize tolerance to Spodoptera frugiperda ( J. E. Smith) leaf damage and insecticide applicationHernández-Trejo, Antonia1; López-Santillán, José A.1*; Estrada-Drouaillet, Benigno1; Reséndiz-Ramírez, Zoila1, Varela-Fuentes, Sóstenes E.1; Coronado-Blanco, Juana M.1; Malvar, Rosa A.2
1 Universidad Autónoma de Tamaulipas, Facultad de Ingeniería y Ciencias, División de Estudios de Posgrado e Investigación, Centro Universitario Adolfo López Mateos, Cd. Victoria, Tamaulipas, México, C. P. 87000.
2 Misión Biológica de Galicia, Pazo de Salcedo, Carballeira 8 Salcedo, Pontevedra, España, C. P. 36143.* Correspondence: [email protected]
ABSTRACTObjective: To evaluate the tolerance of Tamaulipas native maize populations to the leaf damage caused by Spodoptera frugiperda.Design/Methodology/Approach: During the two agricultural cycles of 2019, the leaf damage by S. frugiperda and the grain yield decrease in 10 populations of native maize were evaluated In Güémez, Tamaulipas.Results: Leaf damage by S. frugiperda was minimal when synthetic insecticide (emamectin benzoate) was applied in the autumn-winter agricultural cycle; meanwhile, it was greater in the spring-summer cycle, but its levels remained lower than the rest of the S. frugiperda management strategies. Leaf damage was higher during the spring-summer cycle because the environmental temperature was higher than in the autumn-winter cycle.Study limitations/Implications: Spodoptera frugiperda is an important pest of maize. It is mainly controlled using synthetic insecticides, which cause environmental and human health risks. The use of tolerant cultivars is a strategy that reduces these risks.Findings/Conclusions: The TML2S3 and VHA maize populations were tolerant to S. frugiperda leaf damage in both agricultural cycles; it is considered as the base germplasm for a program aimed at enhancing this characteristic.
Keywords: fall armyworm control, yield decline, native populations, Zea mays.
INTRODUCTION The fall armyworm (Spodoptera frugiperda J. E. Smith) is one of the most important pest insects that attack maize (Real-Santillán et al., 2019) crops, in the tropical and subtropical regions of the American continent (Sauceda-Acosta et al., 2015). It has a high incidence in Mexico, mainly in the states of Guanajuato, Chiapas, Chihuahua, Sonora, Sinaloa, and Tamaulipas (Blanco et al., 2014). It causes leaf damage, mainly in the vegetative stage, and
Citation: Hernández-Trejo, A., López-Santillán, J. A., Estrada-Drouaillet, B., Reséndiz-Ramírez, Z., Varela-Fuentes, S. E., Coronado-Blanco, J. M., & Malvar, R. A. (2022). Maize tolerance to Spodoptera frugiperda ( J. E. Smith) leaf damage and insecticide application.Agro Productividad. https://doi.org/10.32854/agrop.v15i4.2135
Academic Editors: Jorge Cadena Iñiguez and Libia Iris Trejo Téllez
Received: September 25, 2021.Accepted: April 5, 2022.Published on-line: June 6, 2022.
Agro Productividad, 15(5). May. 2022. pp: 23-31.
This work is licensed under a Creative Commons Attribution-Non-Commercial 4.0 International license.
23 Image by dpexcel at Pixabay

24 Agro productividad 2022. https://doi.org/10.32854/agrop.v15i4.2135
consumes developing leaves in the whorl or shoot (García-Gutiérrez et al., 2012), reducing the photosynthetic capacity of the plant and, consequently, decreasing grain yield (Lima et al., 2010). In average, a larva can consume over 150 cm2 of leaf tissue (Rezende et al., 1994) and, in a single crop cycle, more than two generations can exist (Ramírez-Cabral et al., 2020). The foregoing shows the need to control this pest for which synthetic insecticides are commonly used (Sauceda-Acosta et al., 2015). Blanco et al. (2014) have estimated that 2,600 tons of different active ingredients are applied per year in Mexico, which favors the development of resistance among S. frugiperda populations, causes the elimination of non-target species —some of which are beneficial insects (Ayil-Gutiérrez et al., 2018) or pollinators—, and is a source of soil and water contamination (Botías and Sánchez-Bayo, 2018). The dependence on synthetic insecticides in agriculture highlights the various effects they cause and their contribution to the environmental imbalance, showing the need to implement strategies that favor the agroecological management of this pest and consequently reduce the aforementioned effects (Harrison et al., 2019). These alternatives include the use of botanical (Ayil-Gutiérrez et al., 2018) and biological (Kuzhuppillymyal-Prabhakarankutty et al., 2021) insecticides. Meanwhile, the use of cultivars with tolerance to S. frugiperda reduces the effects of leaf damage and grain yield (Blanco et al., 2014). This characteristic is highly important, since it is a response from the plant and does not involve reciprocity by the insect. Therefore, it does not cause selection pressure in its populations and does not induce the development of resistance in the pest (Peterson et al., 2017). In addition, this strategy is compatible with any control method for this pest (Harrison et al., 2019). S. frugiperda tolerant cultivars are achieved through genetic improvement, for which identifying and having base germplasm with characteristics that provide tolerance is necessary (Kumar, 2002). These characteristics are found in populations developed under the incidence of this insect, such as native populations (Sauceda-Acosta et al., 2015); these findings have been corroborated in studies carried out with Tamaulipas native maize. The objective of this study was to evaluate the tolerance of Tamaulipas native maize populations to leaf damage by S. frugiperda.
MATERIALS AND METHODSCrop location and management The experiments were established in the La Posta Zootécnica “Ingeniero Herminio García González” experimental field of the Facultad de Ingeniería y Ciencias of the Universidad Autónoma de Tamaulipas, in Güémez, Tamaulipas, Mexico, located at 193 masl, 23° 56’ 26” N and 99° 05’ 59” W. The experiments were carried out during the 2018-2019 autumn winter (OI) and 2019 spring summer (PV) agricultural cycles. Land preparation and crop management were carried out according to the maize production recommendations for the north-central zone of Tamaulipas (Reyes-Méndez, 2017a, 2017b), under irrigation conditions and with a population density of 50,000 plants ha—1.

25 Agro productividad 2022. https://doi.org/10.32854/agrop.v15i4.2135
Vegetal material and management strategies In both agricultural cycles, 10 populations developed from native maize germplasm from central-southern Tamaulipas were evaluated (Table 1) in four S. frugiperda management strategies: 1. synthetic insecticide (active ingredient: emamectin benzoate); 2. broad-spectrum biological-botanical insecticide (complex: Beauveria bassiana, Nomuraea rileyi, Metarhizium anisopliae, Paecilomyces fumosoroseus, and a multi-oleic active concentrate); 3. botanical insecticide (active ingredient: azadirachtin); and 4: control without application. The applications were made every 20 days with a previously-calibrated manual sprinkler, from the complete exposure of the fourth leaf until f lowering. The application of the dose followed the recommendations of the manufacturer of each product.
Experimental design and evaluated variables In each agricultural cycle, the experiments were established in a randomized complete block design with a split-plot arrangement and three replications. The experimental unit was 4 m2. S. frugiperda management strategies were established in the large plot, while the maize populations were established in the small plot. Leaf damage was evaluated under natural S. frugiperda infestation, using the visual scale of Fernández and Expósito (2000) —in which 0 means no visible leaf damage and 5 means 81-100% leaf damage and destruction of the whorl—, by direct observation at the time of complete exposure of the sixth, twelfth, and flag leaves. The decrease in grain yield was also determined based on the difference between the management strategy with synthetic insecticide (less leaf damage) and the control without application (greater leaf damage). These two management strategies showed the greatest contrast in terms of leaf damage. The comparison of plants with and without damage enable the classification of the populations as tolerant or sensitive.
Statistical analysis An analysis of variance and Tukey’s comparison of means test were performed with a 0.05 significance leaf damage level; additionally, a regression analysis between leaf damage in the populations and the decrease in maize grain yield —as a result of the damage caused by S. frugiperda— was carried out. The Software Statistical Analysis System (SAS, 2002)
Table 1. Maize populations derived from Tamaulipas native germplasm evaluated in this study.
PWL1S3 3001 2003 Padilla
TGL2S3 3007 2003 Tula
TML3S3 3012 2003 Tula
LlNL4S3 3033 2003 Llera
LlHL5S3 3040 2003 Llera
PWL6S3 3001 2003 Padilla
VCII - 2004 Centro-Sur
VHA - 2004 Centro-Sur
Cam 2011 2011 Hidalgo
Morado 1016 2016 Antiguo Morelos

26 Agro productividad 2022. https://doi.org/10.32854/agrop.v15i4.2135
was used to estimate the trend-line and the 95% confidence intervals for the expected value of the mean. The quadrants formed by this regression line and the perpendicular to the X axis were established at the point of average leaf damage of all populations. The confidence interval was also established for the mean of leaf damage with the σand σ values on the X axis. Regarding the damage caused by S. frugiperda, the populations located to the right of the σvalue on the X axis and below the lower limit of the confidence interval were considered tolerant and susceptible; those located above the upper limit were considered sensitive and susceptible. Populations located to the left of the value on the X axis and above the upper limit of the confidence interval were considered resistant and sensitive, while those on the left and below would be tolerant and resistant. The foregoing is based on the classification methodologies for tolerant and/or resistant maize cultivars developed by Widstrom et al. (1972), Butrón-Gómez et al. (1998), and Reséndiz-Ramírez et al. (2018).
RESULTS AND DISCUSSION Significant differences in the leaf damage caused by S. frugiperda were found between populations, agricultural cycles, and management strategies, as well as for the interactions of population management strategy and of cycle management strategy (Table 2). An independent analysis of the management strategies between populations only showed differences within the control and between agricultural cycles. Differences in leaf damage were observed in the control, as well as in the plants treated with either synthetic or botanical insecticides. In the same way, a significant population agricultural cycle interaction within the control was observed (Table 2). Regarding the independent analysis of each cycle, there was significance between populations only in the OI cycle. Likewise, the leaf damage caused by S. frugiperda was recorded when emamectin benzoate was applied in the OI agricultural cycle (0.0724, on a scale of 0 to 5) was lower than during the PV cycle (0.3812, on the same scale). However, its levels remained lower than the rest of the management strategies (Table 3). At the beginning of the PV agricultural cycle, the environmental conditions present a higher average temperature (minimum 23 °C and maximum 35 °C) than at the beginning of the OI cycle (minimum 13 °C and maximum 28 °C). Consequently, the greater amount of damage observed during the PV cycle in the control, when emamectin benzoate and
Table 2. Statistical significance of the combined analysis and for each management strategy of S. frugiperda leaf damage in maize.
Source Combined Control Synthetic Botanical Biological-Botanical
Population (P) 0.0224 0.0079 0.7065 0.0966 0.0684
Management strategy (MS) .0001 - - - -
Cycle (C) .0001 .0001 .0001 0.0285 0.2186
PMS 0.0465 - - - -
PC 0.1732 0.0420 0.2345 0.9822 0.4445
MSC .0001 - - - -

27 Agro productividad 2022. https://doi.org/10.32854/agrop.v15i4.2135
azadirachtin were applied, is likely the result of a greater incidence of S. frugiperda during this cycle, favored by a higher temperature (Cantú-Almaguer et al., 2010). In this sense, when a biological-botanical insecticide was applied during the OI cycle, the leaf damage caused by S. frugiperda was not different from that observed in the control, while it was 50% lower during the PV cycle (Table 3). Consequently, the higher temperature during the PV cycle seems to generate a better development of the populations of entomopathogenic microorganisms (Ghazanfar et al., 2020). On the one hand, no differences were observed between the different management strategies (application of synthetic, botanical, and biological-botanical insecticides) (Table 4) in the maize populations evaluated with regard to the damage caused by S. frugiperda. This showed that the application of these products prevented the expression of the variation of resistance against this insect among the populations (Kumar, 2002).
Table 3. S. frugiperda leaf damage1 in maize under different management strategies during the autumn-winter (OI) and spring-summer (PV) agricultural cycles.
Management autumn-winter 2018-2019 spring-summer 2019
Control1.0527 a 1.8462 a
B A
Synthetic0.0724 c 0.3812 d
B A
Botanical0.4748 b 0.6776 c
B A
Biological-Botanical1.1074 a 0.9405 b
A A1 Scale 0-5 (Fernández and Expósito, 2000). Means with different lowercase letters per column are statistically different (Tukey, p0.05). Means with different capital letters per row are statistically different (Tukey, p0.05).
Table 4. Leaf damage1 of S. frugiperda in maize populations with each management strategy and during each agricultural cycle.
PopulationControl
Synthetic Botanical Biological-BotanicalOI PV
Cam 0.894 ab 1.516 a 0.132 a 0.602 a 0.752 a
PWL1S3 2.139 a 1.878 a 0.312 a 0.740 a 1.216 a
TGL2S3 1.079 ab 2.217 a 0.130 a 0.166 a 1.327 a
TML3S3 0.338 b 1.941 a 0.328 a 0.743 a 1.065 a
LlNL4S3 1.656 ab 2.087 a 0.228 a 0.408 a 1.023 a
LlHL5S3 0.657 b 1.051 a 0.288 a 0.463 a 0.993 a
PWL6S3 0.776 ab 1.580 a 0.208 a 0.517 a 0.858 a
Morado 1.077 ab 2.210 a 0.252 a 0.732 A 0.953 a
VCII 0.785 ab 2.281 a 0.218 a 0.602 A 1.190 a
VHA 1.126 ab 1.700 a 0.179 a 0.731 A 0.860 a1 Scale 0-5 (Fernández and Expósito, 2000). OI: Autumn-winter; PV: Spring-summer. Means with different letters per column are statistically different (Tukey, p0.05).

28 Agro productividad 2022. https://doi.org/10.32854/agrop.v15i4.2135
On the other hand, differences were only observed between populations during the OI agricultural cycle, which corroborates the interaction of resistance to S. frugiperda in maize with environmental temperature (Ni et al., 2011). During the OI cycle, the TML3S3 and LlHL5S3 populations showed greater resistance to S. frugiperda than the PWL1S3 —which showed a 2.0 leaf damage— (Table 4), confirming the existing variation within the populations evaluated (Reséndiz-Ramírez et al., 2017). According to the relationship between the leaf damage and the decrease in grain yield during the OI agricultural cycle, the LlNL4S3 and PWL1S3 populations can be classified as susceptible to S. frugiperda since they presented a higher leaf damage at 1.56 (). This caused a decrease in grain yield of 11.67 and 25.04%, respectively, which indicates that they have a similar tolerance than the average of the evaluated populations (Figure 1). The PWL6S3 and TML3S3 populations with 0.76 and 0.33 leaf damage had a 15% decrease in grain yield, which puts them above the confidence interval of the regression line; therefore, they are classified as sensitive. Only the TML3S3 population showed resistance to this pest (Figure 1). According to the relationship between the leaf damage and the decrease in grain yield during the PV agricultural cycle (Figure 2), the PWL6S3, PWL1S3, and PWL3S3 populations were classified as sensitive to damage by S. frugiperda, since they presented a 23% decrease in grain yield and an average resistance; they suffered a leaf damage from 1.45 () to 2.23 (). Finally, the TML2S3 and VHA populations with average leaf damage showed a 5% decrease in grain yield (Figure 2) and are therefore considered tolerant. The VCII and
Figure 1. Relationship between the decrease in grain yield in maize populations and leaf damage caused by Spodoptera frugiperda in the 2018-2019 OI cycle. 1: Cam, 2: PWL1S3, 3: TGL2S3, 4: TML3S3, 5: LlNL4S3, 6: LlHL5S3, 7: PWL6S3, 8: Morado, 9: VCII, 10: VHA. : Mean, : Standard deviation. *Visual scale (Fernández and Expósito, 2000), 0: No visible damage and 5: 81-100% leaf area damaged, whorl destroyed.

29 Agro productividad 2022. https://doi.org/10.32854/agrop.v15i4.2135
Figure 2. Relationship between the decrease in grain yield in maize populations and the leaf damage caused by Spodoptera frugiperda during the 2019 PV cycle. 1: Cam, 2: PWL1S3, 3: TGL2S3, 4: TML3S3, 5: LlNL4S3, 6: LlHL5S3, 7: PWL6S3, 8: Morado, 9: VCII, 10: VHA. : Mean, : Standard deviation. *Visual scale (Fernández and Expósito, 2000), 0: No visible damage, 5: 81-100% leaf area damaged, whorl destroyed.
LlHL5S3 populations with leaf damage outside the interval formed by σand are considered susceptible and resistant to S. frugiperda (Figure 2). Overall, S. frugiperda caused more damage during the PV cycle than during the OI cycle, because the higher environmental temperature during the former cycle, at the beginning of the vegetative cycle of the crop favors the development of this pest (Cantú-Almaguer et al., 2010). The TML2S3 and VHA populations showed tolerance to leaf damage during both agricultural cycles and can, therefore, be used as a source of damage tolerance characteristics against this pest. It is important to consider that these two populations have hardiness characteristics and the populations evaluated for tolerance to S. frugiperda also showed genetic divergences. Therefore, they can be used as a source of variation for the genetic improvement of this characteristic.
CONCLUSIONS Variation in leaf damage tolerance caused by S. frugiperda was observed among the Tamaulipas native maize evaluated populations. TGL2S3 and VHA were more tolerant than the average of the evaluated germplasm; therefore, these populations can be considered as a source of this characteristic.
ACKNOWLEDGEMENTSThe authors would like to thank the Consejo Nacional de Ciencia y Tecnología (CONACYT) and the Facultad
de Ingeniería y Ciencias of the Universidad Autónoma de Tamaulipas for all the support they received.

30 Agro productividad 2022. https://doi.org/10.32854/agrop.v15i4.2135
REFERENCESAyil-Gutiérrez, B. A., Sánchez-Teyer, L. F., Vazquez-Flota, F., Monforte-González, M., Tamayo-Ordóñez, Y.,
Tamayo-Ordóñez, M. C., & Rivera, G. (2018). Biological effects of natural products against Spodoptera spp. Crop Protection, 114, 195-207. Doi: https://doi.org/10.1016/j.cropro.2018.08.032
Blanco, C. A., Pellegaud, J. G., Nava-Camberos, U., Lugo-Barrera, D., Vega-Aquino, P., Coello, J., Terán-Vargas, A. P., & Vargas-Camplis, J. (2014). Maize pests in México and challenges for the adoption of integrated pest management programs. Journal of Integrated Pest Management, 5(4), 1-9. https://doi.org/10.1603/IPM14006
Botías, C., & Sánchez-Bayo, F. (2018). Papel de los plaguicidas en la pérdida de polinizadores. Ecosistemas, 27(2), 34-41. https://doi.org/10.7818/ECOS.1314
Butrón-Gómez, A. M., Malvar-Pintos, R. A., Velasco, P., Revilla, P., & Ordás, A. (1998). Defense mechanisms of maize against pink stem borer. Crop Science, 38(5), 1159-1163. https://doi.org/10.2135/cropsci1998.0011183X003800050008x
Cantú-Almaguer, M. A., Reyes-Méndez, C. A., & Rodríguez-Del Bosque, L. A. (2010). La fecha de siembra: Una alternativa para incrementar la producción de maíz. Recuperado el 1 de marzo de 2022, de Fundación Produce Tamaulipas: http://www.producetamaulipas.net/folleto%20tecnico/2009-2010/La%20Fecha%20se%20Siembra%20en%20Maiz/Folleto%20Tecnico%20La%20fecha%20de%20Siembra%20en%20Maiz.pdf
Fernández, T. J. L., & Expósito, E. I. (2000). Nuevo método para el muestreo de Spodoptera frugiperda ( J. E. Smith) en el cultivo del maíz en Cuba. Centro Agrícola, 27(2), 32-38.
García-Gutiérrez, C., González-Maldonado, M. B., & Cortez-Mondaca, E. (2012). Uso de enemigos naturales y biorracionales para el control de plagas de maíz. Ra Ximhai, 8(3), 57-70.
Ghazanfar, M. U., Hagenbucher, S., Romeis, J., Grabenweger, G., & Meissle, M. (2020). Fluctuating temperatures influence the susceptibility of pest insects to biological control agents. Journal of Pest Science, 93(3), 1007-1018. https://doi.org/10.1007/s10340-020-01215-9
Harrison, D. R., Thierfelder, C., Baudron, F., Chinwada, P., Midega, C., Schaffner, U., & van den Berg, J. (2019). Agro-ecological options for fall armyworm (Spodoptera frugiperda JE Smith) management: Providing low-cost, smallholder friendly solutions to an invasive pest. Journal of Environmental Management, 243, 318-330. https://doi.org/10.1016/j.jenvman.2019.05.011
Kumar, H. (2002). Plant damage and grain yield reduction by fall armyworm and stem borers on certain maize hybrids containing resistance genes from varying sources under experimental and farmers field conditions. Crop Protection, 21(7), 563-573. https://doi.org/ 10.1016/S0261-2194(01)00146-6
Kuzhuppillymyal-Prabhakarankutty, L., Ferrara-Rivero, F. H., Tamez-Guerra, P., Gómez-Flores, R., Rodríguez-Padilla, M. C., & Ek-Ramos, M. J. (2021). Effect of Zea mays-Beauveria bassiana seed treatment on Spodoptera frugiperda. Applied Sciences, 11, 2887. https://doi.org/10.3390/app11072887
Lima, M. S., Silva, P. S. L., Oliveira, O. F., Silva, K. M. B., &. Freitas, F. C. (2010). Corn yield response to weed and fall armyworm controls. Planta Daninha, 28, 103-111. https://doi.org/10.1590/S0100-83582010000100013
Ni, X., Chen, Y., Hibbard, B. E., Wilson, J. P., Williams, W. P., Buntin, G. D., Ruberson, J. R., & Li, X. (2011). Foliar resistance to fall armyworm in corn germplasm lines that confer resistance to root-and ear-feeding insects. Florida Entomologist, 94(4), 971-981. https://doi.org/10.1653/024.094.0434
Peterson, R. K. D., Varella, A. C., & Higley, L. G. (2017). Tolerance: the forgotten child of plant resistance. PeerJ, 5, e3934. https://doi.org/10.7717/peerj.3934
Ramírez-Cabral, N., Medina-García, G., & Kumar, L. (2020). Increase of the number of broods of fall armyworm (Spodoptera frugiperda) as an indicator of global warming. Revista Chapingo Serie Zonas Aridas, 19(1), 1-16. http://dx.doi.org/10.5154/r.rchsza.2020.11. 0
Real-Santillán, R. O., Del-Val, E., Cruz-Ortega, R., Contreras-Cornejo, H. Á., González-Esquivel, C. E., & Larsen, J. (2019). Increased maize growth and P uptake promoted by arbuscular mycorrhizal fungi coincide with higher foliar herbivory and larval biomass of the fall Armyworm Spodoptera frugiperda. Mycorrhiza, 29(6), 615-622. https://doi.org/10.1007/s00572-019-00920-3
Reséndiz-Ramírez, Z., López-Santillán, J. A., Estrada-Drouaillet, B., Osorio-Hernández, E., Pecina-Martínez, J. A., & Mendoza-Castillo, M. C. (2017). Efectos genéticos de la resistencia a Spodoptera frugiperda en líneas de maíz derivadas de germoplasma nativo de Tamaulipas. Revista Mexicana de Ciencias Agrícolas, 8(6), 1329-1341.
Reséndiz-Ramírez, Z., López-Santillán, J. A., Estrada-Drouaillet, B., Osorio-Hernández, E., Pecina-Martínez, J. A., Mendoza-Castillo, M. C., & Reyes-Méndez, C. A. (2018). Aptitud combinatoria y resistencia al daño foliar de Spodoptera frugiperda ( J. E. Smith) en germoplasma de maíz nativo de Tamaulipas. Revista Mexicana de Ciencias Agrícolas, 9(1), 81-93.

31 Agro productividad 2022. https://doi.org/10.32854/agrop.v15i4.2135
Reyes-Méndez, C. A. (2017a). Maíz de riego para el norte y centro de Tamaulipas, ciclo O-I. In: Agenda Técnica Agrícola de Tamaulipas. SAGARPA-COFUPRO-INIFAP: Ciudad de México, México. pp. 329-331.
Reyes-Méndez, C. A. (2017b). Maíz de riego para el norte y centro de Tamaulipas, ciclo P-V. En: Agenda Técnica Agrícola de Tamaulipas. SAGARPA-COFUPRO-INIFAP: Ciudad de México, México. pp. 266-268.
Rezende, M. M. A., Cruz, I., & Della, L. T. M. C. (1994). Consumo foliar de milho e desenvolvimento de lagartas de Spodoptera frugiperda (Smith) parasitadas por Chelonus insularis (Cresson) (Hymenoptera: Braconidae). Anais da Sociedade Entomologica do Brasil, 23(3), 473-478.
SAS (Statistical Analysis Software). (2002). SAS Online Doc. Version 9.0 CD-ROM, SAS Institute, Inc., Cary, N.C, USA.
Sauceda-Acosta, C. P., Quintana-Quiroz, J. G., Lugo-García, G. A., Sauceda-Acosta, R. H., Borbón-Gracia, A., Sánchez-Soto, B. H., & Casillas-Álvarez, P. (2015). Gusano cogollero Spodoptera frugiperda J. E. Smith (Lepidoptera: Noctuidae) en maíz de primavera, en Guasave, Sinaloa. Entomología Mexicana, 2, 404-410.
Widstrom, N. W., Wiseman, B.R. and McMillian, W.W. (1972). Resistance among some maize inbreds and single crosses to fall armyworm injury. Crop Science, 12(3), 290-292. https://doi.org/10.2135/cropsci1972.0011183X001200030010x


Colegio dePostgraduados
33
Citation: Hernández-Carrillo, E., Sánchez-Pineda, H., Tórtora-Pérez, J., Cigarroa-Vázquez, F. A., Reyes-García, M., Peralta-Lailson, M., & Hernández-Marín, J. A. (2022). Effect of selenium on semen quality and fertility of rams.Agro Productividad. https://doi.org/10.32854/agrop.v15i5.2140
Academic Editors: Jorge Cadena Iñiguez and Libia Iris Trejo Téllez
Received: October 3, 2021.Accepted: April 25, 2022.Published on-line: June 6, 2022.
Agro Productividad, 15(5). May. 2022. pp: 33-39.
This work is licensed under a Creative Commons Attribution-Non-Commercial 4.0 International license.
Effect of selenium on semen quality and fertility of ramsHernández-Carrillo, Enrique1; Sánchez-Pineda, Héctor1; Tórtora-Pérez, Jorge2; Cigarroa-Vázquez, Francisco A.3*; Reyes-García, María1; Peralta-Lailson, Marisela1; Hernández-Marín, José A.4
1 Facultad de Medicina Veterinaria y Zootecnia, Universidad Autónoma de Chiapas, Calz. Emiliano Zapata km 8, Del. Frigorífico, Tuxtla Gutiérrez, Chiapas, México, C. P. 29060.
2 Facultad de Estudios Superiores Cuautitlán, Universidad Nacional Autónoma de México, Jiménez Cantú s/n, San Juan Atlamica, Cuautitlán Izcalli, Edo. de México, México, C. P. 54729.
3 Escuela de Estudios Agropecuarios Mezcalapa, Universidad Autónoma de Chiapas, Carretera Chicoasén-Malpaso km 24.3, San Miguel El Cocal, Copainalá, Chiapas, México, C. P. 29622.
4 Departamento de Veterinaria y Zootecnia, División de Ciencias de la Vida, Campus Irapuato-Salamanca, Universidad de Guanajuato, Carretera Irapuato-Silao km 9, Col. Ex-Hacienda del Copal, Irapuato, Guanajuato, México, C. P. 36824.
* Correspondence: [email protected]
ABSTRACTObjective: To evaluate the effect of different selenium (Se) doses on semen quality and fertility of rams.Design/Methodology/Approach: Se was administered subcutaneously each month to nine two-month-old rams (from April 2018 to February 2020). The treatments were: T1without Se, T20.1 mg Se kg1, and T30.3 mg Se kg1. Semen evaluations were carried out using an electroejaculator; a total of 180 ejaculations were analyzed. The rams with better semen quality (one per treatment) were subjected to a mating. The following variables were evaluated: volume (Vol), masal motility (MM), progressive motility (MP), sperm concentration per mL and ejaculation, acrosome integrity percentage, living spermatozoa, normal spermatozoa, and fertility percentage. The normal distribution variables were evaluated using an analysis of variance (ANOVA) and Tukey’s comparison test (Tukey, 0.05); the percentages were raised to the inverse sine in order to perform the appropriate ANOVA. Fertility was analyzed using a 2 test.Results: There was no difference in semen quality and fertility percentage (p0.05). The ejaculation volume showed differences between treatments (p0.05).Study Limitations/Implications: A study including a higher number of rams and a previous fieldwork practice should be carried out, in order to evaluate semen parameters. These evaluations would help to accurately estimate semen quality and fertility, as well as to corroborate the results.Findings/Conclusions: Se did not improve semen quality and fertility of rams.
Key words: Selenium, ovine, semen, electroejaculator, infertility.
Image by Alexas_Fotos at Pixabay 33

34 Agro productividad 2022. https://doi.org/10.32854/agrop.v15i5.2140
INTRODUCTION Selenium (Se) is an essential trace element to keep the physiological balance between animals (Kruzhel et al., 2014). In Mexico, soils and forage do not have enough Se, as a result of the volcanic origin of the soils and erosion. Other elements, such as sulphur and mercury, hinders its absorption by ruminants (29-35%). Additionally, ruminal bacteria capture Se for their own metabolism (Ramírez-Bribiesca et al., 2001). Therefore, the Se requirements of animals must be met in regions with deficient soils and forages (Saha et al., 2016). Currently, there are several options to provide Se to animals. It can be provided through organic or inorganic mineral salts, which can be included in the diet, water, mineral blocks, solutions for injections, or sustained release methods, such as ruminal bolus (Díaz-Sánchez et al., 2019). On the one hand, low Se concentrations are related to productive and reproductive problems in small ruminants (Mahmoud et al., 2013), as a result of their peroxide plasma levels, which quickly increase and damage capillary endothelium, red blood cells, seminal plasma, and muscle fibers (Monroy, 2017); these concentrations also cause nutritional muscular dystrophy (white muscle disease), lameness, and growth reduction (Tapia, 2015). On the other hand, a fertility reduction has also been recorded in rams that have a low semen quality (low sperm counting and an increase in sperm abnormalities) (Beckett and Arthur, 2005). The inclusion of Se in diets or its parenting applications has improved weight gain in lambs, fertility in ewes, and immune responses in sheep (Carbajal et al., 2013). Se also improved the antioxidative state, increased the testosterone and triiodothyronine (T3) levels in seminal plasma and blood serum, and protected spermatozoa from oxidative damage in bucklings, which is an important factor in the production of good quality semen (Kumar et al., 2013). Therefore, the objective of this study was to evaluate the effect of different doses of Se in semen quality and fertility of rams.
MATERIALS AND METHODSStudy area The research was carried out from April 2019 to February 2020 in the Lomas de San Rafael production unit, in Suchiapa, Chiapas, Mexico. The production unit is located at 16° 40’ 0’’ N and 93° 04’ 53’’ W, at 695 masl. The climate is subhumid warm with summer rains; the mean annual temperature and total annual precipitation ranges from 20 to 28 °C and from 800 to 1200 mm, respectively (INEGI, 2017).
Experimental animals Nine two-month-old, recently weaned Blackbelly rams were used in the experiment. The selection of animals and their distribution per treatments were completely random. Animals who weighed less than 12 kg and were one- or three-month-old were rejected. The rams were placed in a stable and received a corn-soy based diet, with 13.44% of raw protein, 4.35 kcal, and free access to water. Treatments were: T1, without Se (control); T2, 0.1 mg Se kg1; and T3, 0.3 mg Se kg1. Each treatment had three repetitions (three rams). Se, was provided subcutaneously each month, from April 2018 to February 2020;

35 Agro productividad 2022. https://doi.org/10.32854/agrop.v15i5.2140
a commercial brand —which included 10.95 mg sodium selenite, equivalent to 5 mg of selenium and vitamin E— was used.
Seminal evaluation In order to carry out the seminal analysis, two ejaculations from each ram were collected every fortnight, until the end of the study, and the macroscopic and microscopic characteristics of a total of 180 ejaculations were evaluated. The semen samples were obtained using a Bailey electroejaculator. In order to obtain the samples, each ram was placed in an ulna lateral position; subsequently, the prepuce area was cleaned, using anti-bacterial wipes. The electroejaculator was then introduced anally and operated in 3-5 second cycles, with a 3 second rest. The ejaculation was gathered using a cone attached to one of the ends of a collecting tube; a cover was used to protect the collecting tube from sunlight. This technique is time-efficient and does not require to train rams in order to collect semen (Arieta et al., 2014). The following seminal variables were evaluated: 1) Ejaculation volume (Vol.): it was determined using a measuring cylinder, with gradations of 0.1 mL-15 mL units (Carrillo-González and Hernández, 2016). The reading was carried out by direct observation of the collecting tube, taking advantage of its transparency. 2) Masal motility (MM): it was carried out at the time when each sample was collected. A sample of each ejaculation was placed in a microscope slide and was observed in a microscope with a 10X objective. Subsequently, a 0-5 scale value (0minimum; 5maximum) was provided to each sample; the values given to the samples depended on the movement vitality of the waves and the individual observation of the spermatozoa (Lozano et al., 2016). 3) Progressive motility (MP): it was carried out in a 1:100 dilution (9.9 mL saline solution and 0.1 mL of each ejaculation); it was diluted and a small drop was observed in the microscope with a 10X objective. Subsequently, a value was given depending on the progressive movement of the spermatozoa (Benítez-González et al., 2018). 4) mL sperm concentration (Conc. Esp. mL): A Neubauer chamber and a 1:200 dilution (1 mL saline solution and 1 mL diluted semen, previously prepared for the MP evaluation) were used (Carrillo-González and Hernández, 2016). The Neubauer chamber carrying the semen sample was observed in a microscope with a 40X objective. Subsequently, the heads of the spermatozoa located inside the five boxes of the two compartments were counted. Then, the average of the spermatozoa counted in the two compartments was multiplied by 107. 5) Sperm concentration per ejaculation (Conc. Esp. Ey.): the Conc. Esp. mL was multiplied by the volume of each ejaculation. 6) Complete acrosome percentage: a smear was carried out, using a 1:100 dilution, previously prepared with the Spermac Stain®. A 100X objective and immersion oil were used to observe the spermatozoa with the blue acrosome. In order to obtain the percentage value, 200 spermatozoa were counted and classified according to complete and damaged acrosome (Mancheno and Díaz, 2018). 7) Living spermatozoa percentage: it was obtained smearing an eosin-nigrosine stain, together with the diluted semen of each sample. Living and dead spermatozoa were counted in a microscope with a 40X objective. Living spermatozoa had a light color throughout their structure, while dead spermatozoa had a consistent dark color. A total of 100 spermatozoa were evaluated (Malejane et al., 2014).

36 Agro productividad 2022. https://doi.org/10.32854/agrop.v15i5.2140
8) Normal spermatozoa percentage: a 1:100 dilution (prepared beforehand) was smeared using a Spermac Stain®. They were observed with a 100X objective and immersion oil. In order to evaluate normal spermatozoa, 200 spermatozoa were counted. They were classified as normal or with primary and secondary abnormalities.
Fertility evaluation One ram per group was selected and those chosen had a good semen quality throughout the study; additionally, a mating was carried out for 60 days in a stable; for this purpose, 20 adult ewes per ram were selected. The pregnancy was established by means of a transrectal ultrasound; the fertility percentage was determined per each treatment.
Statistical analysis The semen characteristics were analyzed using the generalized linear model procedure (PROC GLM), through a completely random design; the characteristics evaluated (%) were raised to the inverse sine before the analysis took place. The Tukey Test (0.05) was used to compare the means of the treatments. Fertility was evaluated using the 2 test, in 32 contingency tables. All the statistical analysis were carried out using the SAS software (SAS, 2016).
RESULTS AND DISCUSSIONSemen quality analysis The volume of the ejaculations was higher in rams treated with 0.3 mg Se kg1 than in the rest of the treatments. The averages recorded in this study were similar to those obtained by Mahmoud et al. (2009), who found statistical differences in the volume of the ejaculations of rams treated with Se (0.97 mL) and without Se (0.84 mL). The increase in the volume of ejaculations is related to the action of Se and can be observed in the development of the primary and secondary sex glands, the spermatogenesis, and the prostate function, which increases the seminal plasma secretion (Kolodziej and Jacyno, 2005). The volume of the ejaculations found in this study differ from the results obtained
Table 1. Seminal variables of rams treated with different doses of selenium (Se).
VariablesSe (mg kg1)
0.0 0.1 0.3Volume (mL) 0.680.1b 0.790.1ab 0.910.12a
Mass motility (1 a 5) 2.510.3a 2.560.3a 2.860.4
Progressive motility (%) 60.1812a 51.3512a 62.8812
Concentration mL1 (107) 137.5659a 120.4458a 132.552
Ejaculate concentration1 (107) 93.5435a 95.1535a 120.5840
Whole acrosome (%) 86.5312a 87.6310a 87.5913
Live sperm (%) 81.2610a 80.9010a 80.9010
Normal spermatozoa (%) 84.210a 84.7310a 84.6110
Means EE with different letter in the same row are different (p0.05).

37 Agro productividad 2022. https://doi.org/10.32854/agrop.v15i5.2140
by Carrillo-Nieto et al. (2018), who used ruminal bolus with a Se (0.87 mL) supplement and did not record differences (p0.05) regarding the control group (0.91 mL). There were no differences regarding masal motility between treatments; these results match the findings of Duvos et al. (2017), who subcutaneously provided a Se supplement (2.54) to the animals, but did not record differences with the control group (2.50). These findings can be the result of a difference in sperm motility. Se is one of the co-factors of the glutathione peroxidase enzyme (GSH-Px), a powerful antioxidant that protects the sperm cells from the damage caused by reactive oxygen species (ROS; Tareq et al., 2010). Progressive motility was similar between treatments (p0.05). The means recorded in this research are similar to those found by Baiomy et al. (2009), who did not record statistical differences in rams with 0.2 mg kg1 and 0.5 mg kg1 Se treatments, obtaining an average of 82.5 and 86.67% progressive motility, respectively. Sperm concentration per mL was similar between treatments (p0.05). Regarding these results, Baiomy et al. (2009) and other authors have reported that adding inorganic Se to ram and bull diets does not improve semen quality. Additionally, Lovecamp et al. (2013) found that Se supplementation did not change the quality and quantity of fresh ejaculations in pigs. Therefore, the results of this research match those obtained by Carrillo-Nieto et al. (2018), who used ruminal bolus supplemented with Se (185 spermatozoa mL1). They did not record statistical differences regarding control (182 spermatozoa mL1). Finally, Duvos et al. (2017) reported 259 spermatozoa mL1 in animals that had received a Se supplement applied subcutaneously. Control had statistically similar results (262 spermatozoa mL1). Se, did not increase the sperm concentration per ejaculation (p0.05). The amount of Se in the supplement may not be enough to produce selenoproteins which help the Sertoli cells proliferation in the developing testicles. In its turn, Sertoli cells proliferation leads to an increase in the number of spermatozoa, which increases sperm concentration (Ahsan et al., 2014). The results of this research differ from the findings of Mahmoud et al. (2013), who recorded statistical differences with Ossimi sheep that received Se supplement through an intramuscular injection; the results of the treatments with Se and without Se were 106 and 314 ejaculated spermatozoa1, respectively. There was no difference between treatments regarding the living spermatozoa percentage (p0.05). These results differ from those recorded by Carrillo-Nieto et al. (2018), who reported 92.18% and 93.94% results in rams fed with ruminal bolus, with and without a Se supplement, respectively. The normal sperm percentage was similar between treatments (p0.05). These results do not match those obtained by Marín-Guzmán et al. (2000), who proved that sperm morphology is related to Se supplementing.
Fertility analysis Cerri et al. (2009) proved that both the Se deficiency and the excess of reactive oxygen species (oxidants) has a negative impact on fertility. Se treatments in this research achieved better quality values (Table 2), as a result of the increased number of spermatozoa per ejaculation and the oocyte integrity of the ewes (Das et al., 2006); however, no differences were recorded (p0.05).

38 Agro productividad 2022. https://doi.org/10.32854/agrop.v15i5.2140
CONCLUSIONS The subcutaneous application of Se did not improve the development, semen quality, and fertility of the rams; however, a 0.3 mg kg1 of Se dose significatively increased the volume of the ejaculation.
REFERENCESAhsan, U., Kamran, Z., Raza, I., Ahmad, S., Babar, W., Riaz, M. H., & Iqbal, Z. (2014). Role of selenium
in male reproduction. A review. Animal Reproduction Science, 146(1-2), 55-62. https://doi.org/10.1016/j.anireprosci.2014.01.009
Arieta, R. R. J., Fernández, F. J. A., & Menchaca, P. J. (2014). Métodos de extracción de semen bovino. Revista Electronica de Veterinaria, 15(5),109-120.
Baiomy, A. A., Mohamed, A. E. A., & Mottelib, A. A. (2009). Effect of dietary selenium and vitamina E supplementation on productive and reproductive perfomance in rams. Journal of Veterinary Medical Research, 19(1), 39-43. https://doi.org/10.21608/JVMR.2009.77807
Becket, G. J., & Arthur, J. R. (2005). Selenium and endocrine systems. Journal of Endocrinology, 184(3), 455-465. https://doi.org/10.1677/joe.1.05971
Benítez-González, E., Chamba-Ochoa, H., Sánchez-Sánchez, E., Luzón-Cevallos, F., & Sánchez-Carrillo, J. (2018). Evaluación comparativa de dos métodos de recuperación espermática de epidídimos bovinos post-mortem. Abanico Veterinario, 8(1), 59-74. http://dx.doi.org/10.21929/abavet2018.81
Carbajal, H. M. A., Aquí, Q. G., & Díaz, G. C. (2013). Uso de selenio en ovinos. Abanico Veterinario, 3(1), 44-54.Carrillo-Nieto, O., Domínguez-Vara, I. A., Huerta-Bravo, M., Jaramillo-Escutia, G., Díaz-Zarco, S., Vázquez-
Armijo, J. F., Pescador-Salas, N., & Revilla-Vázquez, A. (2018). Actividad de GSX-Px, concentración de selenio y calidad del eyaculado en sementales ovinos suplementados con selenio durante la época reproductiva. Agrociencia, 52(6), 827-839.
Carrillo-González, D., & Hernández, H. D. (2016). Caracterización seminal de individuos ovinos criollos colombianos de pelo en el departamento de Sucre. Revista Colombiana de Ciencia Animal, 8(2), 197-203.
Cerri, R. L. A., Rutigliano, H. M., Lima, F. S., Araújo, D. B., & Santos, J. E. P. (2009). Effect of source of supplemental selenium on uterine health and embryo quality in high-producing dairy cows. Theriogenology, 71(7), 1127-1137. https://doi.org/10.1016/j.theriogenology.2008.12.005
Das, S., Chattopadhyay, R., Ghosh, S., Goswami, S. K., Chakravarty, B. N., & Chaudhury, K. (2006). Reactive oxygen species level in follicular fluid-embryo quality marker in IVF? Human Reproduction, 21(9), 2403-2407. https://doi.org/10.1093/humrep/del156
Díaz-Sánchez, V., Olazábal-Fenochio, A., & Ibarra-Gudiño, C. (2019). Selenio, selenoproteínas y estrés oxidativo en pequeños rumiantes. Revisión. Abanico Agroforestal, 1, 1-12. http://dx.doi.org/10.37114/abaagrof/2019.1
Duvos, S. J. I., Fernández, A. F., & LLuberas, P. J. C. (2017). Selección de Carneros Merino Australiano, para su utilización en programas de reproducción, suplementando con selenio e incorporando nuevas metodologías en el análisis del semen. Tesis de doctorado. Universidad de la república, Montevideo, Uruguay. 72 p.
INEGI. (2017). Anuario estadístico y geográfico de Chiapas. Instituto Nacional de Estadística y Geografía e Informática. Recuperado el 3 de agosto de 2020, de INEGI: https://www.datatur.sectur.gob.mx/ITxEF_Docs/CHIS_ANUARIO_PDF.pdf
Kolodziej, A., & Jacyno, E. (2005). Effect of selenium and vitamin E supplementation on reproductive performance of young boars. Archives Animal Breeding, 48(1), 68-75. https://doi.org/10.5194/aab-48-68-2005
Table 2. Ovine fertility with different Se treatments.
Se (mg kg1)Females in pairing
Pregnant females Non-pregnant females Fertility percentage0.0 19 1 95a
0.1 20 0 100a
0.3 20 0 100a
Means with the same letter in the column are no different (p0.05).

39 Agro productividad 2022. https://doi.org/10.32854/agrop.v15i5.2140
Kruzhel, B., Bakowska, M., Vovk, S., Nowakowska, E., & Sergei, P. (2014). Selenium in the diet of ruminants. Acta Scientiarum Polunarum Zootechnica, 13(4), 5-16.
Kumar, P., Yadav, B., & Yadav, S. (2013). Effect of zinc and selenium supplementation on antioxidative status of seminal plasma and testosterone, T4 and T3 level in goat blood serum. Journal of Applied Animal Research, 41(4), 382-386. https://doi.org/10.1080/09712119.2013.783482
Lovercamp, K. W., Stewart, K. R., Lin, X., & Flowers, W. L. (2013). Effect of dietary selenium on boar sperm quality. Animal Reproduction Science, 138(4), 268-275. https://doi.org/10.1016/j.anireprosci.2013.02.016
Lozano, M. H., Carvajal, S. M., Manrique, P. C., & Grajales, L. H. (2016). Parámetros de calidad seminal y su relación con las variables medioambientales en ovinos bajo condiciones de trópico alto colombiano. Actas Iberoamericanas en Conservacion Animal, 8, 55-62.
Mahmoud, G. B., Abdel-Raheem, S. M., & Hussein, H. A. 2013. Effect of combination of vitamin E and selenium injections on reproductive performance and blood parameters of Ossimi rams. Small Ruminant Research, 113(1), 103-108. http://dx.doi.org/10.1016/j.smallrumres.2012.12.006
Malejane, C. M., Greyling, J. P. C., & Raito, M. B. (2014). Seasonal variation in semen quality of Dorper rams using different collection techniques. South African Journal of Animal Science, 44(1), 26-32. http://dx.doi.org/10.4314/sajas.v44i1.4
Mancheno, D. S. M., & Díaz, C. A. (2018). Efecto del método de extracción del semen en la calidad espermática de toros Sahiwal. Avances en Investigacion Agropecuaria, 22(2), 47-53.
Marin-Guzman, J., Mahan, D. C., & Pate, J. L. (2000). Effect of dietary selenium and vitamin E on spermatogenic development in boars. Journal of Animal Science, 78(6), 1537-1543. https://doi.org/10.2527/2000.7861537x
Monroy, C. A. (2017). El selenio como micronutriente en la Produccion Ovina. Tesis de Licenciatura, Universidad Autónoma del Estado de México, Toluca de Lerdo, Estado de México, México. 45 p.
Ramírez-Bribiesca, J. E., Tórtora, J. L., Huerta, M., Aguirre, A., & Hernández, L. M. (2001). Diagnosis of selenium status in grazing dairy goats on the Mexican Plateau. Small Ruminant Research, 41(1), 81-85. https://doi.org/10.1016/S0921-4488(01)00188-2
Saha, U., Fayiga, A., Hancock, D., & Sonon, L. (2016). Selenium in animal nutrition: Deficiencies in soils and forages, requirements, supplementation and toxicity. International Journal of Applied Agricultural Sciences, 2(6), 112-125. https://doi.org/10.11648/j.ijaas.20160206.15
SAS. Institute Inc. 2016. SAS/STAT® 14.2 User’s Guide. Cary, NC: SAS Institute Inc.Tapia, F. M. 2015. Minerales y Vitaminas: Aspectos Farmacologicos en la nutricion de Pequeños Rumiantes. In: Avances
en la producción de pequeños rumiantes en el noreste de México, Zapata, C. C. C., & Torres, R. M. L., Eds.; Fomento Editorial: Tamaulipas, México. pp:27-54.
Tareq, K., Sharmin, Q., Takagi, Y., Hamano, K., Sawada, T., & Tsujii, H. (2010). Effect of selenium and vitamin E on acrosome reaction in porcine spermatozoa. Reproductive Medicine and Biology, 9(2), 73-81. https://doi.org/10.1007/s12522-009-0041-x


Colegio dePostgraduados
41
Citation: Alvarado-Rodríguez, R. I., & Legaria-Solano, J. P. (2022). Phenotypic diversity of wild tomato (Solanum lycopersicum L.) populations.Agro Productividad. https://doi.org/10.32854/agrop.v15i5.2173
Academic Editors: Jorge Cadena Iñiguez and Libia Iris Trejo Téllez
Received: October 3, 2020.Accepted: April 19, 2022.Published on-line: June 6, 2022.
Agro Productividad, 15(5). May. 2022. pp: 41-53.
This work is licensed under a Creative Commons Attribution-Non-Commercial 4.0 International license.
Phenotypic diversity of wild tomato (Solanum lycopersicum L.) populationsAlvarado-Rodríguez, Rommel I.1; Legaria-Solano, Juan Porfirio2*
1 Postgrado en Biotecnología Agrícola, Universidad Autónoma Chapingo, Carretera Federal México-Texcoco km 38.5, Chapingo, Estado de México, México, C. P. 56230.
2 Universidad Autónoma Chapingo, Carretera Federal México-Texcoco km 38.5, Chapingo, Estado de México, México, C. P. 56230.
* Correspondence: [email protected]
ABSTRACTObjective: To produce information about the morpho-agronomic variability of 15 wild tomato populations from different areas of Mexico.Design/Methodology/Approach: A completely experimental design was used, comprised of 17 treatments (15 wild tomato populations and two commercial tomato populations) and 10 repetitions (individuals). The experimental unit was a plant (individual) which was subjected to an evaluation of 65 morpho-agronomic descriptors, proposed by Biodiversity International. An analysis of variance using repeated measurements was carried out and the mean differences were compared with Tukey’s multiple comparison test (p0.05). The quantitative and qualitative variables were subjected to a main component and multiple correspondence analyses, respectively.Results: A wide variability of the morphological traits and the quality attributes of the fruits —such as consistency and total soluble solids— was recorded. The main component and multiple correspondence analyses accounted for 67.41 and 42.06% of the phenotypic variation, respectively, in the first three components and dimensions. The more discriminatory characteristics belonged to fruits and cymes, based on which the populations were divided into four groups. The first group was made up of heirloom tomatoes with multiparous cyme, and red, small, and medium fruits; the second group was made up of cherry and grape tomatoes with uniparous and multiparous cymes, and yellow, orange, red, and very small fruits; the third group was made up of beef and cocktail tomatoes with uniparous and bifurcated cymes and red, orange, yellow, and small and medium fruits; finally, the fourth group was made up of purple beef tomatoes with uniparous cymes and medium size tomatoes.Study Limitations/Implications: A molecular characterization must be carried out in order to better understand the variability of these populations.Findings/Conclusions: All wild tomato populations show a wide genetic heritage. Fruits characteristics —such as size, shape, and color, as well as all types of cymes, and flowering days— contributed to the discrimination of the accessions. Indeterminate plants and red fruits showed higher °Brix than semi-determined plants and orange, yellow, and purple fruits; however, the latter had a better flavor. A new type of tomato leaf that had not been previously reported among the tomato descriptors was found; the leaf was described as “with sprout”.
Key words: Solanum lycopersicum L., native populations, morpho-agronomic characterization.
Image by congerdesign at Pixabay

42 Agro productividad 2022. https://doi.org/10.32854/agrop.v15i5.2173
INTRODUCTION Tomato (Solanum lycopersicum L.) is considered the most important vegetable at domestic and international level (FAOSTAT, 2020). Currently, Mexico is the main exporter of tomato. The country holds a 26.5% share of the market, out of which 99.8% is exported to the USA, amounting to US$2,601,163,000 (TRADE MAP, 2021). Mexico is considered as the center of domestication and genetic diversity of tomato (Peralta and Spooner, 2007). Recent studies confirm that tomato crops have lost genetic variability, as a result of the constant selection carried out by domestication processes, promoting autogamy (Chen and Tanksley, 2004). Additionally, other factors that have inf luenced autogamy include the genetic improvement of specific features, such as: higher productivity, shelf life, self-pruning, plant height, precociousness, and adaptation to different cultivation systems (Bai and Lindhout, 2007). Meanwhile, the fruit quality attributes have been left aside (Klee and Tieman, 2018). This reduced genetic base has made tomato crops very sensitive to biotic and/or abiotic stress; therefore, efforts have been made to recover and preserve wild germplasms, because they have a wide genetic variability, as a result of the extreme conditions they have endured during long periods, in their agroecology environment. Consequently, these plants constitute a genetic heritage of new genes of interest. They can also be used to recover lost genes which could take part of an introgression in modern cultivars —through conventional and/or biotechnological techniques. Likewise, they can help to develop new varieties capable of facing climate change, the new challenges posed by productive systems, and the market demand for innocuous products, which must have higher sensorial and nutritional values. Therefore, the aim of this study was to evaluate the variability of wild tomato populations, based on their morphological traits, with their immediate accession in time and space in mind, in order to develop a program for the improvement of the genetic features of agronomic and commercial interest.
MATERIALS AND METHODSBiological material Fifteen wild tomato populations samples (from different areas of Mexico) and two commercial varieties (control) were evaluated (Table 1).
Experimental design and agronomic management A completely randomized experimental design, with 17 treatments (15 wild tomato populations and 2 commercial tomato populations) and 10 repetitions (individuals), was used in the experiment. The experimental unit was one plant per bag. The plants were transplanted 35 days after the sow (dds) in a hydroponic system; there was 40 cm of separation between them and 1 m between rows. The nutrient solution proposed by Sánchez and Escalante (1989) was used. The plants were put under greenhouse conditions, with a 21-24 °C temperature and 60-70% relative humidity.

43 Agro productividad 2022. https://doi.org/10.32854/agrop.v15i5.2173
Evaluated variables The characterization was based on 65 morpho-agronomic descriptors, proposed by Biodiversity International (1996): 19 vegetative types and 46 reproductive types, and 29 quantitative and 36 qualitative types.
Statistical analysis The quantitative data were subject to an analysis of variance and a mean comparison test (Tukey, p0.05), using the SAS statistical software (version 9.4); in addition, the Pearson coefficient was estimated and a correlation matrix was developed to carry out a main component analysis, using the RStudio software (version 4.0.4). A description of the features of the qualitative data was carried out and the result was subjected to a multiple correspondence analysis, using the RStudio software (version 4.0.4).
RESULTS AND DISCUSSION All the wild tomato populations showed a high phenotypic variability during the vegetative and reproductive stages (Table 1). The results were: 53.33% had an indetermined habit, while 46.67% showed a semi-determined habit. The cymes of semi-determined plants were mostly finished in flower (71.43%) and the cymes of indetermined plants reverted to a vegetative shape (87.50%) with leaves
Table 1. Qualitative traits of tomato populations.
POP Accessions GH LT TI SP FS FSM FF Fruit type Fruit colour1 LBCh 76 S S VL S S I VF Ball Yellow
2 LBCh 231 S S EF S S I I Ball Red
3 LBCh 301 S S EF I R S VF Ball Orange
4 LBCh 188 I S VS S R V S Cherry Red
5 LBCh 86 S S EF S H V F Grape Red
6 LBCh 82 S S VS S R V VS Ball Red
7 LBCh 75 I S VS E F S VS kidney Red
8 LBCh 71 I W VS S R V I Cherry Yellow
9 LBCh 67 I W VS S S V I Cherry Orange
10 LBCh 61 I S VL E F S VS kidney Red
11 LBCh 2da 28 I W VS S R V F Cherry Orange
12 LBCh 2da 18 I S VS S F S VS kidney Red
13 LBCh 2da 11 S P EF S S S I Ball Purple
14 LBCh 2da 02 I S EF S C V F Grape Orange
15 LBCh 2da 09 S P EF S S S I Ball Purple
16 Rio Grande D S EF S H I I Saladette Red
17 Floradade D S EF S S I I Ball Red
POPpopulation; GHgrowth habit, Ssemi-determinate, Iindeterminate, Ddeterminate; LTleaf type, Sstandard, Wwith sprout, Ppotato leaf; TIterminal meristem of inflorescence, EFended in flower, VLvegetative reverted to leaf, VSvegetative reverted to sprout; SPstigma position, Ssame level as anthers, Iinserted, Eexserted; FSfruit shape, Ff lattened, Sslightly flattened, Rrounded, Hhigh rounded, Ccylindrical; FSMfruit size at maturity, Iintermediate, Ssmall, Vvery small; FFfruit firmness, VFvery firm, Ffirme, Iintermediate, Ssoft, VSvery soft. Rio Grande y Floradade correspond to control varieties.
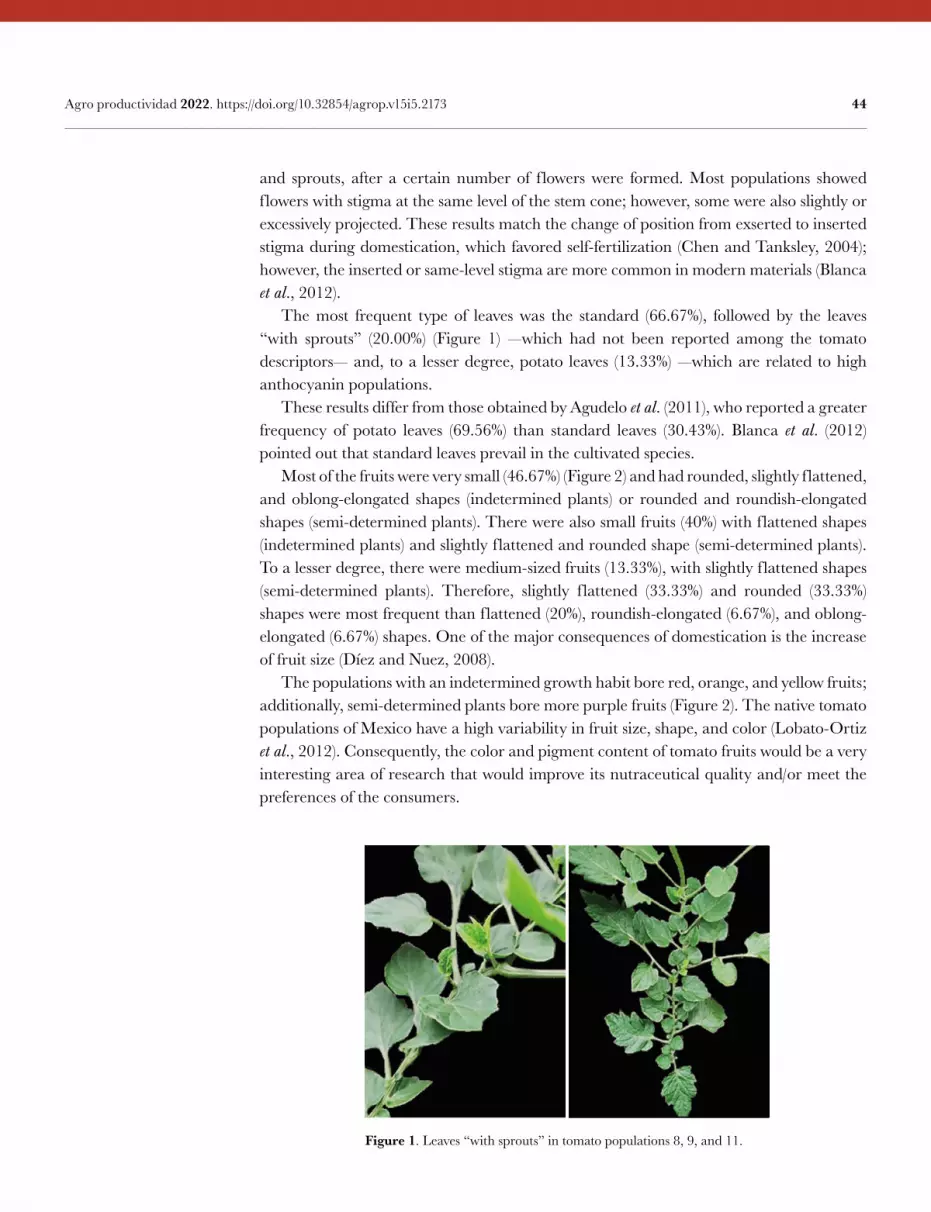
44 Agro productividad 2022. https://doi.org/10.32854/agrop.v15i5.2173
and sprouts, after a certain number of flowers were formed. Most populations showed flowers with stigma at the same level of the stem cone; however, some were also slightly or excessively projected. These results match the change of position from exserted to inserted stigma during domestication, which favored self-fertilization (Chen and Tanksley, 2004); however, the inserted or same-level stigma are more common in modern materials (Blanca et al., 2012). The most frequent type of leaves was the standard (66.67%), followed by the leaves “with sprouts” (20.00%) (Figure 1) —which had not been reported among the tomato descriptors— and, to a lesser degree, potato leaves (13.33%) —which are related to high anthocyanin populations. These results differ from those obtained by Agudelo et al. (2011), who reported a greater frequency of potato leaves (69.56%) than standard leaves (30.43%). Blanca et al. (2012) pointed out that standard leaves prevail in the cultivated species. Most of the fruits were very small (46.67%) (Figure 2) and had rounded, slightly flattened, and oblong-elongated shapes (indetermined plants) or rounded and roundish-elongated shapes (semi-determined plants). There were also small fruits (40%) with flattened shapes (indetermined plants) and slightly flattened and rounded shape (semi-determined plants). To a lesser degree, there were medium-sized fruits (13.33%), with slightly flattened shapes (semi-determined plants). Therefore, slightly flattened (33.33%) and rounded (33.33%) shapes were most frequent than flattened (20%), roundish-elongated (6.67%), and oblong-elongated (6.67%) shapes. One of the major consequences of domestication is the increase of fruit size (Díez and Nuez, 2008). The populations with an indetermined growth habit bore red, orange, and yellow fruits; additionally, semi-determined plants bore more purple fruits (Figure 2). The native tomato populations of Mexico have a high variability in fruit size, shape, and color (Lobato-Ortiz et al., 2012). Consequently, the color and pigment content of tomato fruits would be a very interesting area of research that would improve its nutraceutical quality and/or meet the preferences of the consumers.
Figure 1. Leaves “with sprouts” in tomato populations 8, 9, and 11.

45 Agro productividad 2022. https://doi.org/10.32854/agrop.v15i5.2173
Figure 2. Size, shape and color of fruits for seventeen populations. Numbers indicate tomato populations. The bar (5 cm) indicates a reference measurement.
Additionally, populations with high fruit consistency were found. On the one hand, after 20 days, the consistency of populations 5, 3, and 14 reached a medium point and turned soft after 40 days; likewise, the consistency of population 1 changed to medium after 60 days. On the other hand, the consistency of populations 13 and 15 —which were pigmented with anthocyanin— turned soft after 20 days; nevertheless, the integrity of their epidermis remained constant up to 30-40 days of shelf life. Control and other wild varieties showed an opposite behavior. Bonilla-Barrientos et al. (2014) reported a higher frequency of hard fruits (pepper-type) than medium fruits (cherry tomatoes) and soft fruits (kidney-shaped); these results are very similar to those obtained in this study.
Analysis of variance There were significative differences (p0.05) in all the evaluated variables. All the wild populations showed high phenotypic variability; however, the characteristics that helped to achieve a better discrimination were fruits and cymes (Table 2). Precocious materials and flowering were detected in populations 12, 8, 9, 14, and 7 (45-48 dds) and in populations 6, 2, and 3 (49-51 dds). Other populations behaved similarly to control —such as populations 5, 10, 15, and 13 (55-62 dds). Regarding fruit ripening, the populations were classified as early (8 and 9); medium, before control (12, 14, 7, and 6); and medium, similar to control (2 and 3); medium, after control (5, 10, 15, 13, 4, and 11); and late ripening (1).

46 Agro productividad 2022. https://doi.org/10.32854/agrop.v15i5.2173
The characterization of wild materials and semi-domestic plants shows a high diversity in days to the beginning of flowering (Carrillo and Chávez, 2010) and ripening time of the fruit (Chávez-Servia et al., 2011). On this regard, Mejía- Betancourt (2020) pointed out that precocious and compact modern materials are very helpful, as a result of the efficient use of greenhouse space and time, handling high sow densities, shortening the crop cycle, and obtaining a higher number of cycles per year. Additionally, they help to reduce the production costs, as a result of the reduced use of phytosanitary and nutrimental supplies. For practical purposes, the populations were grouped in four categories, based on the height of the first bunch. The first group was formed by populations 1 and 10 (40 cm); the second included populations 2, 5, and 15 (28-31 cm); the third included populations 14, 8, 13, 7, 16, 17, 4, 9, 3, and 12 (17-25 cm); finally, the fourth included populations 6 and 11 (12-16 cm). These results are similar to those obtained by Bonilla-Barrientos et al. (2014) in pepper, cherry, and kidney-shaped native varieties, which reached a 1.96-45.41 cm height. We must highlight those materials with bunches at very low heights (20 cm) suffer disadvantages, because they can be impacted by pathogens in open field production systems. This is not
Table 2. Quantitative traits of tomato populations.
POP FT FRT HC NFI IL FW NL PD ED NSF TSS1 73 105 44.75 a 11.70 b 46.60 b 71.76 bc 2.70 cd 4.70 b 5.50 ab 109.80 b 6.90 cdef
2 50 86 30.19 b 7.00 b 12.94 b 105.67 b 3.50 bc 5.00 a 6.10 a 102.70 bc 8.10 abc
3 51 85 20.50 bcd 17.70 b 30.25 b 24.12 efg 2.00 d 3.40 bcd 3.50 cdef 66.40 cde 8.10 abc
4 64 80 21.24 bcd 7.10 b 16.85 b 1.49 g 2.00 d 1.30 e 1.40 g 40.40 efg 9.70 a
5 55 78 29.70 b 78.30 a 117.10 a 7.92 fg 2.00 d 3.10 bcd 2.00 efg 23.60 fg 9.50 ab
6 49 80 15.70 cd 7.50 b 20.30 b 11.26 fg 2.00 d 2.50 cde 2.70 defg 67.00 cde 9.00 abc
7 48 80 22.50 bcd 12.20 b 33.50 b 44.31 de 6.90 a 3.20 bcd 5.00 bc 149.50 a 8.10 abc
8 46 62 24.00 bcd 6.00 b 11.70 b 2.43 g 2.00 d 1.60 de 1.60 fg 52.90 def 8.00 abc
9 46 64 21.00 bcd 5.90 b 17.25 b 3.56 g 2.00 d 1.70 de 1.90 efg 52.10 def 8.00 abc
10 60 87 44.10 a 8.20 b 28.30 b 53.90 cd 7.00 a 3.40 bcd 4.80 bc 62.70 cde 7.90 bcd
11 64 85 12.13 d 12.38 b 9.75 b 1.37 g 2.00 d 1.30 e 1.30 g 41.40 efg 7.80 bcd
12 45 81 17.25 bcd 12.13 b 30.88 b 27.16 def 7.40 a 2.50 cde 4.20 bcde 53.40 cdef 9.00 abc
13 62 80 22.88 bcd 16.13 b 45.75 b 36.82 def 2.00 d 3.80 bc 4.20 bcde 41.30 efg 5.60 defg
14 47 82 24.70 bcd 74.60 a 146.40 a 8.00 fg 2.00 d 3.50 bcd 2.20 efg 19.90 g 9.10 abc
15 60 81 28.30 bc 17.60 b 48.90 b 42.69 de 2.00 d 3.90 bc 4.40 bcd 84.70 bcd 5.50 efg
16 57 84 22.50 bcd 7.70 b 16.85 b 76.33 bc 2.30 d 6.00 a 5.10 bc 65.70 cde 4.70 fg
17 60 90 22.30 bcd 6.20 b 8.15 b 145.27 a 4.30 b 5.80 a 6.80 a 176.70 a 4.20 g
Media 55 82 24.93 18.14 39.04 39.06 3.18 3.34 3.69 71.19 7.60
C. V. - - 32.40 73.97 68.08 44.24 23.02 32.11 28.17 28.96 20.52
HSD - - 13.20 22.11 42.33 26.74 1.15 1.84 1.75 32.42 2.51
POPpopulation; FTf lowering time (days); FRTfruit ripening time (days); HCheight of the first fruit cluster (cm); NFInumber of flowers per inflorescence; ILinflorescence length (cm); FWfruit weight (g); NLnumber of locules per fruit; PDpolar diameter of fruit (cm); EDequatorial diameter of fruit (cm); NSFnumber of seeds per fruit; TSStotal soluble solids (°Brix); C. V.coefficient of variation; HSDTukey’s honestly significant difference test. Letter indicate significant differences between the means (P0.05).

47 Agro productividad 2022. https://doi.org/10.32854/agrop.v15i5.2173
an undesirable quality in intensive greenhouse crop systems, where making the best of the space, reducing the crop cycle, and obtaining higher yields is fundamental. The flower quantity was directly related to the cyme length (r0.95) and the cyme type. Populations 5 and 14 stood out with 4.7 bunches in average, a 115 cm length, and 70 flowers per cyme; the rest had simple, bifurcated, and trifurcated bunches, a 9-49 cm length, and 5-18 flowers per cyme, depending on the population. Other studies have found a high variability in cherry tomatoes regarding the number of flowers —from 7.4 to 177 (Boada et al., 2010)— and cyme length —from 58.5-77.6 cm in progenitors to 147.3 cm in hybrids (Yanokuchi et al., 1994). For practical purposes, the populations were regrouped according to fruit weight. The group with highest weight included populations 1, 2, and control (72-145 g); the medium group included populations 3, 12, 13, 15, 7, and 10 (24-54 g); and, finally, the lower group included populations 11, 4, 8, 9, 5, 14, and 6 (1-11 g). Chávez-Servia et al. (2011) obtained similar results using wild and semi-domesticated materials, recording 5.6-128.7 g per fruit. The populations were also divided in groups, according to the number of loculus per fruit. The first group included populations 7, 10, and 12 (5-10 loculus); the second group was comprised of population 2 and Floradade (3-6 loculus); the third group included population 1 and Río Grande (2 or 3 loculus); and populations 3, 4, 5, 6, 8, 9, 11, 13, 14, and 15 made up the final group (2 loculus). Wild species have less loculus per fruit (2-3) than modern varieties —which usually have 2.6-36 loculus, although the actual figure can range from 2 to 30 (Grandillo and Tanksley, 1996). Polar and equatorial diameter characteristics had a positive relation (r0.86), with values from 1.3 to 5.0 and 1.3 to 6.1, respectively. These results are higher than those recorded by Chávez-Servia et al. (2011) in wild and semi-domesticated populations: a 1.4- to 3.1-cm polar diameter and a 1.4- to 3.7-cm equatorial diameter. According to the reports of Bai and Lindhout (2007), we can conclude that all populations that show high values of loculus, as well as of fruit weight and diameter, are semi-domesticated biological materials. Regarding total soluble solids, all the wild populations obtained more °Brix (5.5-9.7) than Rio Grande and Floradade control plants (4.7 and 4.2, respectively). Overall, indetermined plants show higher °Brix (8.45 average) than semi-determined plants (7.52 average). Regarding the fruits, red tomatoes had the highest °Brix (8.76 average), followed by yellow (7.45 average), and purple (5.55 average); however, purple tomatoes had a better flavor. Additionally, very small tomatoes had 8.73 °Brix, the medium tomatoes, 7.50 °Brix, and small tomatoes, 7.37 °Brix. Crisanto-Juárez et al. (2010) recorded similar values for wild harvested fruits (4.5-9.3 °Brix). These results prove that these materials have excellent quality features for the improvement of modern materials.
Multiple correspondence analysis Taking into account the 34 morpho-agronomic qualitative characteristics, the analysis showed that the first three dimensions (Dim1, Dim2, and Dim3) accounted for 42.06% of

48 Agro productividad 2022. https://doi.org/10.32854/agrop.v15i5.2173
the total phenotypic variability. However, Garzón (2011) reported that the total variation of 36 accessions of cherry tomato accounted for 76.98% of the three first dimensions. The phenotypic variability of the populations was mainly represented by the characteristics of the fruit and the cyme; Chime et al. (2017) reported similar results. Four features with the highest contribution to the two first dimensions were selected, subsequently, the populations were classified in four groups (Figure 3, Table 3). Dim1 accounted for 17.17% of the variation and was represented by shape, firmness, multiparous characteristics, and style projected position; meanwhile, Dim2 accounted for 13.02% and was represented by the type of leaves, growth habit, color intensity of the hypocotyl, and fruit size and color. Group I was comprised of populations 7 (G), 10 ( J), and 12 (L), which had irregular transversal shaped features (iFT), low firmness in shelf life (dFE), f lattened shape (aFF), colorless epidermis (iCE), ‘cat-face’ appearance (pACF), slightly projected style (lPE), and multiparous bunch (mPI). Group II was more diverse and included populations 1 (A), 2 (B), 3 (C), 4 (D), 5 (E), 6 (F), 14 (N), and the Rio Grande (P) and Floradade (Q) control plants; they were characterized by a high fruit firmness in shelf life (fFE), semi-determined growth (sHC), and medium-sized plants (iTP). Group III included populations 13 (M) and 15 (O), which had the usual features for greenish-purple unripe fruits (vmCF), purple ripe fruits (mCFM), potato leaves (ppTH), and
Figure 3. Qualitative traits associated with 15 wild tomato populations. A) vectors and eigenvalues; B) biplot with Dim1 and Dim2.

49 Agro productividad 2022. https://doi.org/10.32854/agrop.v15i5.2173
Table 3. Qualitative characteristics of 15 wild tomato populations. A) vectors and values provided by the authors; B) biplot Dim1 and Dim2.
No. Characteristics Code Dim1 Dim2 Dim31 Dark yellow seed aCS 0.6684402 2.0297843 2.0881350
2 Purple hypocotyl mCH 1.0915815 3.8292992 3.9739250
3 Potato leaf ppTH 1.0915815 3.8292992 3.9739250
4 Purple color of ripe fruit mCFM 1.0915815 3.8292992 3.9739250
5 Green-purple color of immature fruit vmCF 1.0915815 3.8292992 3.9739250
6 lntermediate facility to separate the fruit iSP 1.2132500 2.2585527 1.0104040
7 Leaflets with wavy margin oMF 0.7440139 1.6607922 0.3125941
8 Hypocotyl with high intensity staining alH 0.0089196 3.4410878 1.7452220
9 lnflorescence ending in flower fPV 1.1645026 2.4048689 0.8925949
10 Semi-determinate growth habit sHC 1.2628357 1.2238481 0.0333420
11 lntermediate height plant iTP 1.2944758 1.4165056 0.1365200
12 High firmness fruit on shelf (10 ds) fFE 1.3976733 0.6467704 0.9987624
13 Fruit with slightly cleft base IFB 0.9743000 0.9013400 0.9734923
14 Small size fruit pTF 0.7561467 2.6603956 0.7735197
15 lntermediate foliage density iDF 0.3894345 1.8728563 0.0277012
16 Gray seed gCS 1.1993170 0.7731033 0.1997073
17 Multiparous inflorescence mPI 3.0136009 0.2436924 0.4061571
18 Low firmness fruit on shelf (10ds) dFE 3.8586452 0.0072673 0.3857630
19 Fruits of intermediate firmness at harvest iFC 5.1271148 0.0381446 0.2380655
20 Fruit with irregular cross section iFT 5.8700385 0.2078257 0.1033894
21 Flattened shaped fruit aFF 5.8700385 0.2078257 0.1033894
22 Fruit with irregular apex scar iCA 5.8700385 0.2078257 0.1033894
23 Fruit with indented apex iFA 5.8708385 0.2078257 0.1033894
24 Slightly exserted style IPE 4.5409601 0.3207046 0.0731773
25 Fruit with cat-face appearance pACF 4.5409601 0.3207046 0.0731773
26 Large height plant aTP 1.5123073 1.6146075 0.5467456
27 Fruit with colorless epidermis iCE 2.0324658 0.3782076 0.8280825
28 lnflorescence ending in vegetative and/or flower aPV 0.9250148 1.9872506 0.6346747
29 lndeterminate growth habit iHC 1.5123073 1.6146075 0.5467456
30 Dark brown seed oCS 0.0386171 2.1683382 1.3910380
31 Pericarp with intermediate intensity ilP 1.3232791 0.5456709 2.8052140
32 High foliage density aDF 0.4023615 2.0551404 0.0500720
33 Very small fruit size mTF 0.1701719 2.7182851 0.0849405
34 Hypocotyl with low intensity staining blH 0.1710982 3.3076166 0.4143379
35 Small size seed pTS 0.2033297 4.9517903 0.5795743
36 Yellow color of ripe fruit aCFM 0.1893568 2.1148779 0.0718591
37 Yellow pericarp aCP 0.4490272 5.2368754 0.4117801
38 Leaf type with sprout bTH 0.3150106 5.5416175 1.2303180
39 lntermediate firmness fruit on shelf (10 ds) iFE 0.2137655 3.7368020 1.5691100
40 Green hypocotyl vCH 0.1599537 4.2070902 0.6804410
Eigenvalue 0.34833078 0.26523764 0.23946287
Percent variance 17.17 13.08 11.81
Cumulative percent variance 17.17 30.25 42.06

50 Agro productividad 2022. https://doi.org/10.32854/agrop.v15i5.2173
purple hypocotyls (mCH). Group IV was comprised of populations 8 (H), 9 (I), and 11 (K), which had yellow pericarps (aCP), medium firmness in shelf life (iFE), green hypocotyls (vCH), and leaves “with sprouts” (bTH).
Main component analysis Based on 28 morpho-agronomic quantitative characteristics, the analysis showed that the first three components (CP1, CP2, and CP3) accounted for 67.41% of the observed phenotypic variation. CP1 and CP2 contributed 55.48% and they were mainly related to fruit and cyme features; these results are similar to the findings of Carrillo and Chávez (2010) and Bonilla-Barrientos et al. (2014), who isolated a total variability of 68.5% and 77.03%, respectively. CP1 and CP2 were taken into account to associate the populations, which were divided into three groups (Figure 4, Table 4). Group I was divided into two subgroups, gathering all the colors of the fruits. The first included populations 3 (C), 13 (M), 15 (O), 2 (B), and Rio Grande (P), while the second subgroup was comprised of populations 1 (A) and Floradade (Q). Group II included populations 4 (D), 5 (E), 6 (F), 8 (H), 14 (N), 9 (I), and 11 (K). Finally, Group III was made up of populations 7 (G), 10 ( J), and 12 (L).
Figure 4. Quantitative traits associated with 15 wild tomato populations. A) vectors and eigenvalues; B) biplot with Dim1 and Dim2

51 Agro productividad 2022. https://doi.org/10.32854/agrop.v15i5.2173
Table 4. Quantitative characteristics of 15 wild tomato populations. A) vectors and values provided by the authors; B) biplot CP1 and CP2.
No. Trait Code PC1 PC2 PC31 Seedling emergence EP 0.14198804 0.11521405 0.12579729
2 Sympodium length LS 0.13320737 0.17528546 0.35529871
3 Sympodium diameter DS 0.18321171 0.08319585 0.00757643
4 Leaves per sympodium HS 0.07523910 0.10923667 0.25064273
5 Leaflets per leaf FH 0.14068266 0.27455916 0.12154306
6 Leaf length LH 0.11393586 0.09477567 0.20869656
7 Leaf width AH 0.14493577 0.07362487 0.13757391
8 Height of the first fruit cluster AR 0.17529247 0.02925165 0.31747032
9 Flowering time OF 0.11597196 0.17869755 0.00578613
10 Flowlers per inflorescence FI 0.08574209 0.08963171 0.36935312
11 lnflorescence length Ll 0.04857321 0.05337954 0.42025007
12 Number of petals NP 0.17782611 0.33828452 0.02959308
13 Number of sepals NS 0.15265601 0.37798700 0.02001142
14 Corolla diameter DCO 0.21288692 0.12456773 0.20616778
15 Calyx diameter DCA 0.18580503 0.12907483 0.23916102
16 Stamen length LE 0.18568266 0.23435240 0.06262061
17 Number of stamens NE 0.16737826 0.35399539 0.06575172
18 Total length of the pedicel LP 0.05029053 0.28628617 0.15991232
19 Abscission zone length LA 0.22620119 0.13930400 0.08418366
20 Ripening time DM 0.20394520 0.08432035 0.09869649
21 Pedicel scar width AC 0.27931441 0.00396691 0.12167903
22 Fruit weight PF 0.26249150 0.07044068 0.13380377
23 Polar diameter of fruit DP 0.25179816 0.12224396 0.01619772
24 Equatorial diameter of fruit DE 0.27961214 0.03989131 0.08083599
25 Number of locules per fruit LF 0.11858295 0.39097791 0.03009091
26 Pericarp thickness GP 0.26439998 0.10644528 0.02280295
27 Columella thickness GC 0.25827506 0.12926713 0.12077907
28 Number of seeds per fruit SF 0.21938254 0.05610109 0.17912647
29 Total soluble solids GB 0.18806195 0.14116580 0.25398408
Eigenvalue 11.69699 4.39148 3.45959
Standard deviation 3.4204 2.0956 1.8800
Percent variance 40.34 15.14 11.93
Cumulative percent variance 40.34 55.48 67.41
CONCLUSIONS Wild populations showed a high phenotypic variability in the vegetative and reproductive stages; the fruit and cyme characteristics made the most important contribution to their discrimination. We discovered a type of leaf that had never been reported among tomato descriptors and called it “with sprouts”. Materials with high °Brix values, high firmness in shelf life, and intense red and purple colors were detected. These elements are related to

52 Agro productividad 2022. https://doi.org/10.32854/agrop.v15i5.2173
bioactive compounds with high antioxidant capacity with great potential for the genetic improvement of modern varieties.
ACKNOWLEDGMENTS The authors would like to thank El Consejo Nacional de Ciencia y Tecnología for its economic support,
which facilitated the RIAR studies, and the Universidad Autónoma Chapingo for providing the opportunity
to be included in its postgraduate program. Additionally, the authors would like to thank the advisory
committee, which took part in their scientific education, and to Mr Noé Alarcón Cruz (PhD), who provided
the accessions.
REFERENCESAgudelo, A. A. G., Ceballos, A. N., & Orozco, F. J. (2011). Caracterización morfológica del tomate tipo cereza
(Solanum lycopersicum Linnaeus). Agronomía, 19(2), 44-53. Bai, Y., & Lindhout, P. (2007). Domestication and breeding of tomatoes: what have we gained and what can we
gain in the future? Annals of Botany, 100(1), 1085-1094. https://doi.org/10.1093/aob/mcm150Bioversity International. (1996). Descriptores para el tomate (Lycopersicon spp.). Recuperado el 22 de marzo de
2022, de https://www.bioversityinternational.org/fileadmin/_migrated/uploads/tx_news/Descriptores_para_el_tomate__Lycopersicon_spp.__489.pdf
Blanca, J., Cañizares, J., Cordero, L., Pascual, L., Díez, M. J., & Nuez, F. (2012). Variation revealed by SNP genotyping and morphology provides insight into the origin of the tomato. PLoS ONE, 7(10), e48198. https://doi.org/10.1371/journal.pone.0048198
Boada, H. M. Y., Mejía, R. J. L., Ceballos, A. N., & Orozco, F. J. (2010). Evaluación agronómica de treinta introducciones de tomate silvestre tipo cereza (Solanum lycopersicum L.). Agronomía, 18(2), 59–67.
Bonilla-Barrientos, O., Lobato-Ortiz, R., García-Zavala, J. J., Cruz-Izquierdo, S., Reyes-López, D., Hernández-Leal, E., & Hernández-Bautista, A. (2014). Diversidad agronómica y morfológica de tomates arriñonados y tipo pimiento de uso local en Puebla y Oaxaca, México. Revista Fitotecnia Mexicana, 37(2), 129-139. https://doi.org/10.35196/rfm.2014.2.129
Carrillo, R. J. C., & Chávez, S. J. L. (2010). Caracterización agromorfológica de muestras de tomate de Oaxaca. Revista Fitotecnia Mexicana, 33(4), 1-6.
Chávez-Servia, J. L., Carrillo-Rodríguez, J. C., Vera-Guzmán, A. M., Rodríguez-Guzmán, E., & Lobato-Ortíz, R. (2011). Utilizacion actual y potencial del jitomate silvestre mexicano. SINAREFI: Oaxaca, México. 72 p.
Chen, K.-Y., & Tanksley, S. (2004). High-resolution mapping and functional analysis of se2.1: A major stigma exsertion Quantitative Trait Locus associated with the evolution from allogamy to autogamy in the genus Lycopersicon. Genetics, 168, 1563-1573. http://dx.doi.org/10.1534/genetics.103.022558
Chime, A. O., Aiwansoba, R. O., Osawaru, M. E., & Ogwu, M. C. (2017). Morphological evaluation of tomato (Solanum lycopersicum Linn.) cultivars. Makara Journal of Science, 21(2), 97-106. https://doi.org/10.7454/mss.v21i2.7421
Crisanto-Juárez, A. U., Vera-Guzmán, A. M., Chávez-Servia, J. L., & Carrillo-Rodríguez, J. (2010). Calidad de frutos de tomates silvestres (Lycopersicon esculentum var. cerasiforme Dunal) de Oaxaca, México. Revista Fitotecnia Mexicana, 33(4), 7-13. https://doi.org/10.35196/rfm.2010.Especial_4.7
Díez, M. J., & Nuez, F. (2008). Tomato. In: Vegetables II, Prohens, J. & Nuez, F., Eds.; Springer: Berlin, Germany. pp. 249-323. https://doi.org/10.1007/978-0-387-74110-9
FAOSTAT. (2020). Datos sobre alimentacion y agricultura. Organización de las Naciones Unidas para la Alimentación y la Agricultura. Recuperado el 2 de marzo de 2020, de FAOSTAT: http://www.fao.org/faostat/es/#data/QC
Garzón, R. J. P. (2011). Caracterización y evaluación morfoagronómica de la colección de tomate tipo cherry de la Universidad Nacional de Colombia sede Palmira. Tesis de maestría, Universidad Nacional de Colombia, Palmira, Colombia. 56 p.
Grandillo, S., & Tanksley, S. D. (1996). QTL analysis of horticultural traits differentiating the cultivated tomato from the closely related species Lycopersicon pimpinellifolium. Theoretical and Applied Genetics, 92(1), 935-951. https://doi.org/10.1007/BF00224033
Klee, H. J., & Tieman, D. M. (2018). The genetics of fruit f lavour preferences. Nature Reviews Genetics, 19, 347-356. https://doi.org/10.1038/s41576-018-0002-5

53 Agro productividad 2022. https://doi.org/10.32854/agrop.v15i5.2173
Lobato-Ortíz, R., Rodríguez-Guzmán, E., Carrillo-Rodríguez, J. C., Chávez-Servia, J. L., Sánchez-Peña, P., & Aguilar-Meléndez, A. (2012). Exploracion, colecta y conservacion de recursos genéticos de jitomate: avances en la Red de Jitomate. SINAREFI: Texcoco, Estado de México, México. 56 p.
Mejía-Betancourt, F. A. (2020). Manejo de esquejes enraizados para la producción de jitomate en alta densidad de población, bajo invernadero e hidroponía. Tesis de maestría. Universidad Autónoma Chapingo, Texcoco, Estado de México, México.
Peralta, E. I., & Spooner, M. D. (2007). History, origin and early cultivation of tomato (Solanaceae). In: Genetic Improvement of Solanaceous Crops, Razdan, M. & Mattoo, A., Eds.; Science Publishers: USA. pp. 1-24.
Rodríguez-Valdés, A., Florido-Bacallao, M., Dueñas-Hurtado, F., Muñoz-Calvo, L. J., Hanson, P., & Álvarez-Gil, M. (2017). Caracterización morfoagronómica en líneas de tomate (Solanum lycopersicum L.) con resistencia a begomovirus. Cultivos Tropicales, 38(2), 70-79.
Sánchez, F., & Escalante, E. (1989). Hidroponía: un sistema de produccion de plantas. 3a ed.; Universidad Autónoma Chapingo: Texcoco, Estado de México, México.
Tengö, M., & Belfrage, K. (2004). Local management practices for dealing with change and uncertainty: A cross-scale comparison of cases in Sweden and Tanzania. Ecology and Society, 9(3), 1-22. https://doi.org/10.5751/ES-00672-090304
TRADE MAP. (2021). Datos comerciales mensuales, trimestrales y anuales. Estadísticas del comercio para el desarrollo internacional de las empresas. Consultado el 12 de marzo de 2021, en TRADE MAP: https://www.trademap.org/Country_SelProductCountry.aspx?nvpm=3%7c484%7c%7c%7c%7c0702%7c%7c%7c4%7c1%7c1%7c2%7c1%7c%7c2%7c1%7c%7c1
Yanokuchi, Y., Fujino, M., Ishii, T., & Uchiumi, T. (1994). Inheritance of the sideshootless character and the length of pedicel in cherry tomatoes. Tohoku Agricultural Research, 47, 277-278. http://www.naro.affrc.go.jp/org/tarc/to-noken/DB/DATA/047/047-277.pdf


Colegio dePostgraduados
55
Nutritional composition of Rhynchophorus palmarum L. 1758 (Coleoptera: Curculionidae) larvae in palm trees of the Mezquital Valley, Hidalgo, MexicoRodríguez-Ortega, Leodan T.1; Rodríguez-Ortega, Alejandro1*; Hernández-Guzmán, Filogonio J.; Callejas-Hernández, Judith; Pro-Martínez, Arturo2; González-Cerón, Fernando2; Noguez-Estrada, Juan1
1 Universidad Politécnica de Francisco I. Madero, Domicilio conocido s/n, Tepatepec, Francisco I. Madero, Hidalgo, Mexico, C. P. 42660.
2 Colegio de Posgraduados, Campus Montecillo, Carretera México-Texcoco km 36.5, Montecillo, Estado de México, México, C. P. 56230.
* Correspondence: [email protected]
ABSTRACTObjective: To determinate the nutritional composition of larvae of the Rhynchophorus palmarum L. 1758 (Coleoptera: Curculionidae) beetle in palm trees of the Mezquital Valley, Hidalgo, Mexico.Design/Methodology/Approach: In January 2020, 250 g of South American Palm Weevil (Rhynchophorus palmarum) larvae were collected from damaged Canary Island date palms (Phoenix canariensis). The larvae were gathered at the Universidad Politécnica de Francisco I. Madero, located in Tepatepec, Hidalgo, Mexico. They were placed in a plastic jar and later in a freezer for conservation and transportation to the Departamento de Nutrición Animal y Bioquímica, Facultad de Medicina Veterinaria y Zootecnia, Universidad Nacional Autónoma de México, where their nutritional composition was evaluated by proximate chemical analysis.Results: In their proximate composition, the larvae of R. palmarum presented a protein concentration of 25.52% (dry basis) and of 9.04% (wet basis), ether extract of 19.77%, dry matter of 35.74%, humidity of 64.26%, ashes of 0.70%, crude fiber of 1.64%, nitrogen-free extract of 4.58%, calcium of 0.20%, and phosphorus of 0.31%.Study Limitations/Implications: No previous research about the use of this insect as human food in Mexico was found.Findings/Conclusions: We conclude that these larvae can be exploited for human and livestock food (as a protein and energy supplement) and even to enrich and prepare conventional foods for society.
Keywords: worm, beetle, protein, food, entomophagy.
INTRODUCTION The polyphagous feeding habit of Rhynchophorus palmarum L. allows it to develop its life cycle in various crops, such as sugarcane (Saccharum officinarum), oil palm (Elaeis guineensis), pineapple (Ananas comosus), coconut (Cocos nucifera), and banana (Musa Paradisiaca). During their life period (30.714.3 days), females cause direct damage, laying 245155 eggs that
Citation: Rodríguez-Ortega, L. T., Rodríguez-Ortega, A., Hernández-Guzmán, F. J., Callejas-Hernández, J., Pro-Martínez, A., González-Cerón, F., & Noguez-Estrada, J. (2022). Nutritional composition of Rhynchophorus palmarum L. 1758 (Coleoptera: Curculionidae) larvae in palm trees of the Mezquital Valley, Hidalgo, Mexico. Agro Productividad. https://doi.org/10.32854/agrop.v15i5.2189
Academic Editors: Jorge Cadena Iñiguez and Libia Iris Trejo Téllez
Received: December 2, 2021.Accepted: April 16, 2022.Published on-line: June 6, 2022.
Agro Productividad, 15(5). May. 2022. pp: 55-60.
This work is licensed under a Creative Commons Attribution-Non-Commercial 4.0 International license.

56 Agro productividad 2022. https://doi.org/10.32854/agrop.v15i5.2189
hatch in 2-4 days. The eggs are deposited in a hole in the palm trunk made by the female with its rostrum. In its turn, the larva enters the stem and feeds exclusively on living tissues for a period of 52 to 62 days, causing the death of the host, as a result of the destruction of the apical meristem. This insect can also cause indirect damage, because it is a vector of the Bursaphelenchus cocophilus nematode, which causes the disease known as red ring, an additional limitation to the production and performance of its hosts (Rodríguez- Currea et al., 2017). Likewise, Sumano et al. (2012) reported this insect as a severe pest of coconut (C. nucifera L.) and oil palm (E. guineensis Jacq.) crops in the neotropics. Meanwhile, Vargas et al. (2013) showed that some of the insects considered as pests have a high nutritional quality: they provide proteins and supplements such as minerals and vitamins. In some cases, they are raised and sold to the population who considers them a delicacy. Additionally, Tejada-de Hernández (1992) reported that, based on the study of the chemical composition of food, we can determine not only the proportion of the elements and macromolecules that make them up, but also infer their nutritional quality and lay the foundations for a greater knowledge, therefore increasing their appreciation. This is an important factor, in the case of products (such as insects) that can be attractive for consumption by both humans and animals. Invertebrate consumption can provide significant amounts of animal protein, especially to indigenous communities during the most difficult times of the year. Espinosa et al. (2020) report that the consumption of insects is known as entomophagy and that it is part of the culture of some countries —such as Mexico, Thailand, and China. According to these authors, Ecuador is another country where lemon ants and this beetle (R. palmarum L.) are consumed. R. palmarum L. is native to the Ecuadoran Amazon region and has become one of the country’s traditional dishes. Another similar concept is anthropo-entomophagy, mentioned by Sancho et al. (2015). This activity constitutes the main nutritional and food resource of 130 countries in Africa and the Americas, where the largest population of active entomophages lives. There are 113 registered entomophagous countries, with more than 3,000 ethnic groups that consume at least 1,500 species of insects in their diet. Based on this information, we determined the nutritional composition of the larvae of the Hynchophorus palmarum L. 1758 (Coleoptera: Curculionidae) beetle in palm trees of the Mezquital Valley, Hidalgo, Mexico.
MATERIALS AND METHODS In January 2020, larvae of the South American Palm Weevil (Rhynchophorus palmarum L. 1758) were collected from damaged Canary Island date palms (Phoenix canariensis) in the gardens of the Universidad Politécnica de Francisco I. Madero, located in Tepatepec, Hidalgo, Mexico (Figure 1). Palm trees over 6 m high with stress symptoms were felled with a chainsaw. Once the central leaves were cut, the galleries were exposed and the larvae were collected (Figure 1). Subsequently, they were deposited in a plastic jar and placed in a freezer for conservation and transport to the Departamento de Nutrición Animal y Bioquímica, Facultad de Medicina Veterinaria y Zootecnia, Universidad Nacional Autónoma de México (UNAM), where they were analyzed. The nutritional composition and concentrations of calcium

57 Agro productividad 2022. https://doi.org/10.32854/agrop.v15i5.2189
and phosphorus of 250 g of fully developed larvae —4 cm long, 2 cm wide, and an average weight of 9.2 g— were evaluated through a proximate analysis. Each analysis was performed in triplicate and the averages were calculated. The results are presented as a wet basis, which was determined by drying them in an oven at 50 °C for 72 h; the dry matter content was calculated by difference. The crude protein was evaluated using the Kjeldahl method, the ether extract was obtained using a Soxhlet extractor, and the ash content was determined by the calcination method using a Linbert TZ45T muffle. Crude fiber was determined by two digestions —one acid and the other alkaline— in an ANKOM 200/220 fiber analyzer and the nitrogen-free extract was calculated by difference: the protein, fat, mineral salt, and crude fiber percentages are subtracted from 100% of the dry matter (AOAC, 1990). Gross energy was determined using the methodology described in Standards for Bomb Calorimetry and Combustion Methods (Tejada, 1992). The determination of calcium (Ca) was made by the precipitation method —forming calcium oxalate— and the concentration of phosphorus (P) by the ammonium phosphomolybdate method by visible UV (AOAC, 1990).
RESULTS AND DISCUSSION Figure 2 shows the specimens of larvae, pupae, adults, and cocoons of the black palm weevil females and males found at the study site. Table 1 shows the proximate chemical composition on a wet basis of the South American Palm Weevil larvae and compares them with three edible Lepidoptera larvae in the state of Hidalgo, Mexico. R. palmarum larvae have 25.52% crude protein and are surpassed by C. redtenbacheri (31.23%), A. remingtoni (33.69%), and A. hesperiaris (37.79%). As can be seen,
Figure 1. Larvae and galleries of the R. palmarum weevil.

58 Agro productividad 2022. https://doi.org/10.32854/agrop.v15i5.2189
Figure 2. South American Palm Weevil (Rhynchophorus palmarum) larvae, pupae, adults, and cocoons; the weevil is a pest of the Canary Island date palm (Phoenix canariensis) in the Mezquital Valley, Hidalgo, Mexico (A, female; B, male).
these insects have a high nutritional value (Ramos et al., 2012; Rodríguez-Ortega et al., 2020). We determined that the concentration of digestible protein in the South American Palm Weevil larva is lower (17.68%) than the concentration reported for the Lepidoptera A. remingtoni larva (33.69%). On the one hand, the South American Palm Weevil larva contains 4.58% nitrogen-free extract (Table 1), a slightly higher percentage than A. hesperiaris (4.21%), but lower than C. redtenbacheri (5.46%) and A. remingtoni (6.07%). On the other hand, insects in the larval stage accumulate a greater amount of fat, which they use during their metamorphosis into beetles. This phenomenon was observed in the South American Palm Weevil larvae analyzed, which registered 19.77% of ether extract (Table 1). The ash concentration was 0.7%, a value slightly lower than the larvae of the other insects (Table 1). These results are similar to those reported by Espinosa et al. (2020), who also indicate that the ash represents the total content of minerals in food. Minerals are essential for several body functions. They act as catalysts in a large number of metabolic reactions: for example, calcium is a constituent of bone tissue and iron is an important part of the blood. Therefore, their intake is indispensable, because human beings cannot synthesize them. Consequently, the mineral concentration of insect larvae is very attractive when used as food. In this case, it can be used as a supplement in the feed fortification for animal consumption or in the preparation of new food products for society (Rodríguez-Ortega et al., 2016). Table 1 also shows the Ca (0.02%) and P (0.31%) concentrations; these values are exceeded by the percentages of the other insects, except Ca in Comadia redtenbacheri. These concentrations can cover a person’s daily needs, depending on their age, sex, activity performed, and physiological state; these results match the findings of Ramos-Elorduy et al. (1998). The humidity concentration was similar to that reported by Maceda et al. (2021), who fed larvae with three types of plant tissue. Additionally, Ramos-Elorduy et al. (1990) point out that 100% of the insects they have analyzed provide more energy than chicken, 95% more than wheat and rye, 87% more than corn, 84% more than vegetables, 70% more than fish, lentils, and beans, 63% more than beef, and 50% more than soybean, among other conventional foods. Comparing

59 Agro productividad 2022. https://doi.org/10.32854/agrop.v15i5.2189
our data with the findings of those authors, we were able to determined that these beetle larvae have good protein, fat, and minerals percentages and should be considered as part of entomophagy diets. The Food and Agriculture Organization of the United Nations (FAO) established in 2013 that the consumption of insects —which has been part of the traditional diet of millions of people— is an alternative nutrient source (especially of protein) (Espinosa et al., 2020). Finally, the good nutritional characteristics of the larvae of R. palmarum position them as a food rich in digestible proteins and with a good caloric content, representing a food alternative for humans or for livestock.
CONCLUSIONS In Mexico, particularly in the state of Hidalgo, there are no reports of Rhynchophorus palmarum as an edible insect and it is only considered a new pest of the Phoenix canariensis palm tree. However, according to the results reported in this research, we conclude that, as a result of their high nutritional value, these larvae can be exploited as human or livestock food, used as a protein and energy supplement, and even consumed to enrich and prepare conventional foods for society.
REFERENCESAOAC. (1990). Official methods of analysis. Association of Official Analytical Chemist 15th Ed. Washington,
DC., USA. 1298 p. Espinosa, M. A., Hidalgo, A. A., & Mayorga, L. E. (2020). Valor nutricional y caracterización de los ácidos
grasos del chontacuro Rhynchophorus palmarum L. InfoAnalítica, 8(1), 127-138.
Table 1. Nutritional composition of South American Palm Weevil (Rhynchophorus palmarum) larvae and three edible Lepidoptera (Agathymus remingtoni, Aegiale hesperiaris, and Comadia redtenbacheri) larvae in the state of Hidalgo, Mexico.
Rhynchophoruspalmarum (%)
Agathymus remingtoni (%)
Aegiale hesperiaris (%)
Comadia redtenbacheri (%)
Variable Rodríguez-Ortega et al. (2020) Ramos et al. (2012) Ramos et al. (2012)
Dry material 35.74 35.76 NA NA
Humidity 64.26 64.24 77.15 58.30
Crude protein (Nitrogen 6.25) 9.04 12.05 8.64 10.09
Ethereal extract 19.77 15.97 7.98 23.43
Ash 0.70 0.82 1.05 0.87
Crude fiber 1.64 0.85 0.96 1.85
Nitrogen free extract 4.58 6.07 4.21 5.46
Calcium** 0.02 0.40 0.02237 0.01269
Phosphorus** 0.31 0.56 0.57 0.33
Crude protein** 25.52 33.69 37.79 31.23
Pepsin digestible protein 0.2%** 17.68 30.84 NA NA
True protein** 22.68 NA NA NA
NANot analyzed. Methods: humidity (AOAC 2015 934.01), protein (AOAC 2015 2001.11), ether extract (AOAC 1990 920.39), ash (AOAC 2015 942.05), crude fiber (AOAC 2015 962.09). **Results are expressed on a dry basis.

60 Agro productividad 2022. https://doi.org/10.32854/agrop.v15i5.2189
Maceda, S. J. C., & Chañi, P. L. O. (2021). Larva de Rhynchophorus palmarum L. (Coleoptera: Curculionidae): Efecto de la dieta en la síntesis de ácidos grasos esenciales. Revista Verde, 16(2), 122-130.
Sancho, D., Álvarez, G. M. J., & Fernández, S. L. R. (2015). Insectos y alimentación. Larvas de Rhynchophorus palmarum L, un alimento de los pobladores de la Amazonía Ecuatoriana. Entomotropica, 30(14), 135-149.
Sumano, L. D., Sánchez, S. S., Romero, N. J., & Sol, S. A. (2012). Eficacia de captura de Rhynchophorus palmarum L. (Coleoptera: Dryophthoridae) con diferentes diseños de trampas en Tabasco, México. Fitosanidad, 16(1), 43-48.
Ramos-Elorduy, J., & Pino, M. J. M. (1990). Contenido calórico de algunos insectos comestibles en México. Revista Sociedad Química de México, 34(2), 56-68.
Ramos-Elorduy, J., Muñoz, J. L., & Pino, J. M. (1998). Determinación de minerales en algunos insectos comestibles de México. Journal of the Mexican Chemical Society, 42(1), 18-33.
Ramos, R. B., Quintero, S. B., Ramos-Elorduy, J., Pino, M. J. M., Ángeles, C. S. C., García, P. A., & Barrera, G. V. D. (2012). Análisis químico y nutricional de tres insectos comestibles de interés comercial en la zona arqueológica del municipio de San Juan Teotihuacán y en Otumba, en el Estado de México. Interciencia, 37(12), 914-920.
Rodríguez-Currea, H. J., Marulanda-López, J. F., & Amaya, C. (2017). Metodología de manejo de Rhynchophorus palmarum L. 1758 (Coleoptera: Curculionidae) a base de cairomonas, feromonas y semioquímicos en plantaciones de chontaduro (Bactris gasipaes (Arecales: Arecaceae)) en Riosucio, Caldas. Boletín Científico, Museo de Historia Natural, 21(1), 59-67. https://doi.org/10.17151/bccm.2017.21.1.5
Rodríguez-Ortega, A., Pino-Moreno, J. M., Ángeles-Campos, S. C., García-Pérez, Á., Barrón-Yánez, R. M., & Callejas-Hernández, J. (2016). Valor nutritivo de larvas y pupas de gusano de seda (Bombyx mori) (Lepidoptera: Bombycidae). Revista Colombiana de Entomología, 42(1), 69-74.
Rodríguez-Ortega, L. T., González-Hernández, H.; Valdez-Carrasco J. M., Pro-Martínez, A., González-Cerón, F., Rodríguez-Ortega, A. (2020). Nutritional quality of the white worm (Agathymus remingtoni Stallings & Turner Lepidoptera: Hesperiidae) of maguey lechuguilla (Agave lechuguilla Torrey). Agroproductividad, 13(8), 69-72. https://doi.org/10.32854/agrop.vi.1734
Tejada-de Hernández, I. (1992). Control de calidad y análisis de alimento para animales. Sistema de Educación Continua en Producción Animal, A. C.: México. 397 p.
Vargas, G. E., Espinoza, G., Ruiz, C., & Rojas, R. (2013). Valor nutricional de la larva de Rhynchophorus palmarum L.: comida tradicional en la Amazonía Peruana. Revista de la Sociedad Química del Perú, 79(1), 64-70.

Colegio dePostgraduados
61
Regional and dynamic specialization of beef production in Mexico (2000-2018)Rebollar-Rebollar, Eulogio1; Del Moral-Barrera, Laura E.1; Rebollar-Rebollar, Samuel2; Rebollar-Rebollar, Alfredo2*; Hernández-Martínez, Juvencio3
1 Universidad Autónoma del Estado de México, Facultad de Economía, Paseo Universidad s/n, Col. Universitaria, Toluca, Estado de México, México, C. P. 50130.
2 Universidad Autónoma del Estado de México, Centro Universitario Temascaltepec, Carretera Toluca-Tejupilco km 67.5, Barrio de Santiago, Temascaltepec, Estado de México, México, C. P. 51300.
3 Univerisidad Autónoma del Estado de México, Centro Universitario Texcoco, Av. Jardín Zumpango s/n. Fraccionamiento El Tejocote, Texcoco, Estado de México. C.P. 56259
* Correspondence: [email protected]
ABSTRACTObjective: To determine the growth, specialization, and dynamics of beef carcass production in eight regions of Mexico, in the 2000-2018 period.Design/Methodology/Approach: The annual growth rates from 2000 to 2018 in each of the regions were calculated. Based on this information, we were able to determine the relative and dynamic specialization of beef production through Regional Analysis Techniques, such as the Location Quotient and the Differential-Structural Method.Results: During the 2000-2018 period, the domestic beef carcass production had diverse annual growth. Most of the location quotients greater than the unit were obtained in Chiapas and Sonora, while Sinaloa and Chihuahua obtained lower location quotients. The results of the Differential-Structural Method showed that Sinaloa was the most dynamic region, while Veracruz and Sonora have been left behind and showed little specialization in all sub-periods.Limitations/Implications: The differentiated annual growth between regions implied underdevelopment and intra-regional dynamism over time. The change in the productive calling of some regions involved a transformation from being specialized to non-specialized. The dynamics of the regions was determined by hypothetical gains, while the underdevelopment was related to hypothetical losses of various magnitudes.Findings/Conclusions: Sinaloa had the highest growth and dynamism of all the regions. Veracruz and Sonora were left behind and showed little specialization throughout the analyzed period.
Keywords: Growth, cattle, regional analysis techniques.
INTRODUCTION Poultry, beef, and pork meat are the main sources of animal origin protein, which is the basis of human nutrition. In 2018, Mexico produced 6.94 million tons of carcass meat of the following species: poultry (47.98%), beef (28.53%), pork (21.61%), and sheep, goats, and turkey (1.88%) (SIAP, 2020).
Citation: Rebollar-Rebollar, E., Del Moral-Barrera, L. E., Rebollar-Rebollar, S., Rebollar-Rebollar, A., & Hernández-Martínez, J. (2022). Regional and dynamic specialization of beef production in Mexico (2000-2018).Agro Productividad. https://doi.org/10.32854/agrop.v15i5.2178
Academic Editors: Jorge Cadena Iñiguez and Libia Iris Trejo Téllez
Received: November 18, 2020.Accepted: April 14, 2022.Published on-line: June 6, 2022.
Agro Productividad, 15(5). May. 2022. pp: 61-68.
This work is licensed under a Creative Commons Attribution-Non-Commercial 4.0 International license.
61 Image by Bruno /Germany at Pixabay

62 Agro productividad 2022. https://doi.org/10.32854/agrop.v15i5.2178
Beef has a high protein value and it has great social and economic importance in Mexico (Puebla-Albiter et al., 2018). It is the second most important productive activity (SIAP, 2020). However, the sector’s productive structure has undergone substantial changes at regional level. From 2000 to 2018, the domestic beef production registered an annual average growth rate (TCMA) of 2.02%, increasing from 1.40 million tons (mt) in 2000 to 1.98 mt in 2018. The cattle production dynamism in the country showed disparities between regions (Puebla-Albiter et al., 2018). In 2018, Veracruz (Ver) and Jalisco ( Jal) contributed 25.06% of the national production, while Chiapas (Chis) and Sinaloa (Sin) accounted for 10.69%, while Sonora (Son) and Chihuahua (Chih) contributed 8.13% (SIAP, 2020). This reflects the differences in the beef production behavior between different regions of Mexico. Therefore, the objective of this work was to determine the beef carcass production growth, specialization, and dynamics in eight regions of Mexico from 2000 to 2018. The aim was to generate indicators that allow the implementation of policy strategies that encourage the production of this type of meat.
MATERIALS AND METHODS To determine the regional dynamics of beef carcass production (2000-2018), Mexico was divided into eight production regions: Veracruz (Ver), Jalisco ( Jal), Chiapas (Chis), Sinaloa (Sin), Sonora (Son), Chihuahua (Chih), and Baja California (BC), which together accounted for 51% of the national total (SIAP, 2020). All other Mexican states were grouped in a region called the rest of Mexico (rM). The study period was divided into three sub-periods: 2000-2006, 2007-2012, and 2013-2018. To determine the beef production behavior, the annual growth rates (2000-2018) in each of the regions were calculated. To determine the relative specialization and production dynamics, Regional Analysis Techniques (TAR) were used, including the Location Quotient and the Differential-Structural Method (MDE) (Boisier, 1980). The dynamism and specialization indicators were obtained from the SECRE (sector-region) matrix, which is a double-entry table, where the rows are the sectors and the columns are the regions (Boisier, 1980). The sectors were the years of study and the columns, the regions (Del Moral-Barrera et al., 2008). The analysis variable was beef carcass production measured in thousands of tons, which was processed with the TAREA software (Lira and Quiroga, 2003) and Microsoft Excel - 2013. The Location Quotient (Qij) indicates the proportion of beef production in a specific year (sector “i”) in a given region (region “j”), compared to the relative size of the same activity at the national level. This quotient was used to measure the relative or inter-regional specialization of cattle production for each year, using formula 1.
QV
V
V
Vijij
iji
ijj
ijji
=∑
∑
∑∑ (1)

63 Agro productividad 2022. https://doi.org/10.32854/agrop.v15i5.2178
Where VijValue of V for sector “i” in region “j”; ⋅∑ Viji Value of V for the regional total; ⋅∑ Vijj Value of V for the national total of the sector “i”;⋅ ∑∑ Vijji Value of V for the national total of sector “i” and region “j”.
The values of Qij are:
Qij1 indicates that the relative size of sector “i” in region “j” is identical to the relative size of the same sector in the country. Therefore, there is no regional specialization in that sector (year).Qij1 indicates that the relative size of sector “i” in region “j” is smaller than the relative size of the same sector in the country. Consequently, there is no regional specialization in that sector (year).Qij1 indicates that the relative size of sector “i” in region “j” is greater than the relative size of the same sector in the country. In this case, there is a regional specialization in sector “i” (year).
The Differential-Structural Method consists of comparing the change observed in a variable during a period, both at regional and national level. This change is compared with what would have happened in the region, if the variable in question had shown an identical behavior, both in the region and in the country. The method determines changes both in the regions’ relative position and in the territories’ productive structure over time (Boisier, 1980). The Differential-Structural Method is divided into three components: total effect (ET), differential effect (ED), and structural effect (EE). The ET compares the final value (year t) of the variable under study, in region j, with the hypothetical value that the said variable would have had, if the region had had the same growth behavior as the country. The “expected or hypothetical” value is obtained by applying the national variation coefficient (rSR) to the initial value of the variable in year zero. ET is obtained using formula 2.
ET V t V rSRj ij ijin
in= ( )− ( )
== ∑∑ 011 * (2)
VijValue of variable V for year i, in region j. 0Year zero or initial year (given the study period, year zero would be 2000, until 2017). tFinal year (given the study period, year t would be 2001, consecutively, until 2018). rSRNational variation coefficient.
rSRV t
Vijji
ijji
=( )
( )
∑∑
∑∑ 0
A positive ET indicates a “hypothetical gain” or an expected gain of the activity in the study region, because the regional growth is higher than the national growth. A negative

64 Agro productividad 2022. https://doi.org/10.32854/agrop.v15i5.2178
ET indicates a “hypothetical loss” of activity in the region, since the activity growth is lower in the study region than in country (Boisier, 1980). The ET is explained by the combination of two effects: differential effect and structural effect.
ET ED EEj j j= +
The differential effect compares the final value (year t) of the variable under study, recorded in year i, in region j, with the hypothetical value of the said variable during the same year. The said effect represents the comparison of the production dynamics for each year i, in region j, with the national dynamics during the same year. It is expressed through formula 3.
ED V t V rSj ij ij iin= ( )− ( )
{ }=∑ 01 * (3)
rSiAnnual variation coefficient at national level
rSV t
Viijj
ijj
=( )
( )
∑
∑ 0
If a region obtains a positive differential effect, the annual production in the said region surpassed the national production for the same year. Consequently, the regions with positive differential effects were identified as dynamic (Boisier, 1980) and competitive (Lira and Quiroga, 2003) and they also had better productive conditions (Del Moral-Barrera et al., 2008). Regions with a negative ED were underdeveloped and non-competitive, and had worse production conditions. The structural effect is the consequence of the fact that, on a national scale, production grows more on some years than in others. Consequently, in years (sectors) of rapid growth (SRC) at the national level, regions that have a specialized productive structure will tend to show positive relative changes. Meanwhile, in years (sectors) of slow growth (SLC), regions with specialized productive structure will present negative relative changes. The EE reflects the relative weight of the different years (sectors) at the regional level, compared to the relative weight of the same years at the national level (Boisier, 1980). The EE is expressed through formula 4.
EE rSV
V
V
Vj iij
iji
ijj
ijji
=( )( )
−( )
( )
∑
∑
∑∑*
0
0
0
0 ( )== ∑∑ * Viji
nin 011 (4)
A positive EE indicates that the region specializes in SRC at the national level, while a negative EE indicates that the region specializes in SLC at the national level (Lira and Quiroga, 2003).

65 Agro productividad 2022. https://doi.org/10.32854/agrop.v15i5.2178
RESULTS AND DISCUSSION During the 2000-2018 period, the national beef carcass production underwent diverse cyclical annual growth, which caused changes in its productive distribution (Table 1). From 2001 to 2002, the national production grew 3.74%, as consequence of the greater contribution made by Sin and Son. This behavior was motivated by the income and world population increase, in addition to changes in diets and the global meat trade liberalization reported in the previous year (Dyck and Nelson, 2003). During 2004 and 2005, production maintained positive growth; however, Jal, Chis, Son, and Chih reported negative increases. Since the end of 2005, a noticeable growth in the price of corn significantly impacted production costs in all branches of intensive livestock farming, both in Mexico and abroad (SAGARPA, 2009). From 2010 to 2011, national beef production increased by 3.39% due to the participation of Chih (10.42%) and Son (7.97%). This dynamic was the result of favorable market conditions and it was influenced by the increase in the calf export price, which benefited producers and exporters (Cruz-Jiménez and García-Sánchez, 2014). From 2016 to 2017, national production increased by 2.57%, driven by the general growth in most regions. The wide availability of feed grains and pastures, combined with
Table 1. Annual growth rates of beef production per region, 2000-2018 (%).
Year Ver Jal Chis Sin Son Chih BC rM National
2000-2001 3.27 2.67 2.78 13.80 0.00 0.37 1.63 0.03 0.43
2001-2002 1.51 1.00 3.32 16.45 10.34 3.31 8.62 4.45 3.74
2002-2003 1.08 2.21 7.37 2.39 4.73 6.80 3.71 3.20 2.47
2003-2004 3.99 1.33 3.10 0.75 4.96 1.88 12.94 5.17 2.66
2004-2005 3.69 1.00 3.16 0.90 3.66 0.75 12.38 0.81 0.91
2005-2006 7.85 1.34 0.46 0.70 4.40 1.61 10.36 3.31 3.55
2006-2007 1.41 0.39 1.09 1.73 0.97 0.82 5.77 1.23 1.37
2007-2008 3.73 0.13 0.54 2.91 2.23 19.99 4.32 1.41 1.96
2008-2009 3.58 0.27 5.95 2.55 0.23 8.08 3.05 1.98 2.27
2009-2010 4.12 4.21 0.49 0.09 5.95 1.35 12.35 1.02 2.33
2010-2011 3.15 3.46 2.33 0.33 7.97 10.42 7.07 2.40 3.39
2011-2012 4.18 2.41 3.75 29.56 9.39 6.52 6.90 1.86 0.92
2012-2013 3.83 4.76 1.21 14.27 0.52 19.73 2.92 1.84 0.76
2013-2014 1.96 2.13 2.19 3.67 4.72 3.37 0.67 3.95 1.13
2014-2015 2.23 0.49 1.04 2.03 1.70 0.71 0.66 1.65 0.99
2015-2016 1.28 6.33 0.69 1.40 3.68 5.81 2.31 1.23 1.81
2016-2017 2.31 4.77 9.54 10.82 4.16 2.88 3.52 2.58 2.57
2017-2018 0.11 5.17 0.99 5.01 6.18 8.40 3.23 2.25 2.80
Ver: Veracruz, Jal: Jalisco, Chis: Chiapas, Sin: Sinaloa, Son: Sonora, Chih: Chihuahua, BC: Baja California, rM: rest of Mexico. Source: Table prepared by the authors based on data from the Sistema de Información Agroalimentaria y Pesquera (SIAP, 2020).

66 Agro productividad 2022. https://doi.org/10.32854/agrop.v15i5.2178
the high beef prices in the country, encouraged ranchers to fatten their cattle for longer periods (FIRA, 2017). Positive production growth continued during 2018 —particularly in Son (6.18) and Chih (8.40). Such increases were consequence of the gradual growth of the cattle herd and the relative stability of grain prices that influenced the growth of national production (FIRA, 2019).
Regional relative specialization Production specialization is a source of increased competitiveness for a given sector (Bustamante-Lara et al., 2020). During the analyzed period, Chis was the region that reported the highest number of location quotients greater than the unit, which indicated that the relative size of cattle production was greater than the relative size of the same activity at the national level. This indicator reflected that Chis specialized in beef production during this period. In contrast, Sin recorded the highest number of location quotients lower than the unit, which indicated that the meat production relative size in that region was smaller than the activity’s relative size in the country. This value indicated a regional specialization absence of the activity. During the 2000-2006 sub-period, Chis and Son recorded location quotients greater than the unit, indicating that these regions specialized in beef production, while Sin and BC showed a relative lack of specialization in this livestock activity. In the 2007-2012 sub-period, Chis and Son continued to specialize, reporting coefficients greater than the unit; they were joined by Ver, which also reported numbers greater than one. Sin continued to show a lack of specialization and Jal started to behave the same way (Table 2). From 2013 to 2018, Sin, Jal, and BC recorded location quotients greater than the unit. The first two regions maintained a similar behavior to the previous sub-period. For its part, Ver no longer specialized in bovine production; just like Chih, it recorded location quotients lower than the unit.
Regional dynamics of beef production The results of the Differential-Structural Method showed that the dynamics of beef production in Mexico was different between the regions and periods studied. During 2000-2006, BC and Sin obtained a positive total effect (ET), as a consequence of the contribution of the differential effect (ED) and the structural effect (EE). This implied that these territories were dynamic and specialized, a behavior that entails hypothetical gains of 9.90 and 8.72 thousand t, respectively. Ver, Jal, Chis, Son, and Chih obtained a negative ET, as a consequence of a greater contribution made by the negative ED. This meant that the territories were left behind (in terms of growth), reflecting hypothetical losses of various magnitudes (Table 3). During 2007-2012, Sin, Chih, and Chis obtained a positive ET, resulting from the greater contribution made by the likewise positive ED. However, only Sin continued with the dynamic trend and the same productive calling as during the previous sub-period; in practice, this dynamism meant 19.34 thousand tons of expected profit. The rest of the

67 Agro productividad 2022. https://doi.org/10.32854/agrop.v15i5.2178
Table 2. Location quotients of beef production per region in Mexico (2000-2018).
Year Ver Jal Chis Sin Son Chih BC rM2000 1.03 1.16 1.07 0.82 1.14 0.99 0.88 0.96
2001 1.06 1.13 1.04 0.92 1.14 0.99 0.86 0.96
2002 1.03 1.10 1.04 1.04 1.21 0.99 0.76 0.97
2003 1.02 1.05 1.09 0.99 1.24 1.03 0.77 0.97
2004 0.95 1.03 1.09 0.97 1.15 1.02 0.85 1.00
2005 0.98 1.01 1.05 0.97 1.09 1.00 0.94 1.00
2006 1.02 0.99 1.02 0.94 1.10 0.95 1.00 0.99
2007 1.02 0.98 1.01 0.95 1.10 0.95 1.05 0.99
2008 1.04 0.97 1.00 0.96 1.05 1.12 0.98 0.99
2009 1.05 0.95 1.03 0.96 1.03 1.18 0.93 0.98
2010 1.07 0.96 1.02 0.94 1.06 1.14 1.02 0.97
2011 1.07 0.96 1.01 0.90 1.11 1.21 1.06 0.96
2012 1.01 0.98 1.03 1.16 1.00 1.13 0.98 0.97
2013 0.98 1.03 1.05 1.00 1.00 0.91 1.01 1.00
2014 0.95 1.00 1.02 1.03 0.94 0.87 1.00 1.03
2015 0.97 0.99 1.02 1.00 0.92 0.86 0.99 1.03
2016 0.96 1.03 1.01 0.99 0.87 0.89 1.00 1.03
2017 0.96 1.05 0.89 1.07 0.88 0.89 1.01 1.03
2018 0.93 1.08 0.87 1.10 0.91 0.94 1.01 1.02
Ver: Veracruz, Jal: Jalisco, Chis: Chiapas, Sin: Sinaloa, Son: Sonora, Chih: Chihuahua, BC: Baja California, rM: rest of Mexico. Source: Table prepared by the authors, based on the interpretation of TAREA software.
Table 3. Coefficients obtained from the application of the DifferentialStructural Method in the beef producing regions in Mexico (thousands of tons).
Region
Periods
2000-2006 2007-2012 2013-2018
ET ED EE ET ED EE ET ED EE
Ver 1.04 1.21 0.17 2.40 2.46 0.06 31.47 22.12 9.35
Jal 28.88 28.70 0.18 2.28 5.14 2.86 13.24 15.12 1.88
Chis 5.68 5.58 0.10 2.03 2.01 0.01 23.03 18.70 4.32
Sin 8.72 8.55 0.17 19.34 19.30 0.04 8.72 5.09 3.63
Son 2.92 2.90 0.02 7.89 7.82 0.07 9.55 6.67 2.88
Chih 2.87 2.86 0.01 12.86 12.83 0.04 18.04 14.81 3.23
BC 9.90 9.87 0.03 2.36 2.31 0.06 0.15 2.97 3.12
rM 22.77 22.83 0.06 19.30 19.32 0.02 11.34 43.93 32.59
ET: total effect, ED: differential effect, EE; structural effect. Source: Table prepared by the authors, based on the interpretation of TAREA software.

68 Agro productividad 2022. https://doi.org/10.32854/agrop.v15i5.2178
regions recorded a negative ET, as a consequence of the greater relative weight of ED values, which were also negative. In the 2013-2018 sub-period, Jal achieved a positive ET, caused by the contribution made by the ED, changing its behavior in the previous sub-periods, from an underdeveloped region to a dynamic region. In the rest of the regions, the ET was negative, resulting in underdeveloped territories, with worse productive conditions.
CONCLUSIONS During the study period, beef carcass production in Mexico revealed discrepancies in relation to growth and dynamism between the regions. Chiapas and Sinaloa recorded the highest amount of positive growth in the analyzed years. Chiapas and Sonora specialized in beef production in the first two sub-periods, but stopped specializing and changed their productive calling during the third sub-period. Sinaloa was dynamic and specialized in the first two sub-periods, but became underdeveloped and lacked specialization in the last sub-period. Chiapas and Chihuahua were originally underdeveloped, became dynamic in the second sub-period, and returned to an underdeveloped state in the third sub-period. In contrast, Veracruz and Sonora remained underdeveloped and showed little specialization throughout the entire period.
REFERENCESBoisier, S. (1980). Técnicas de análisis regional con informacion limitada, ILPES: Santiago de Chile, Chile, 170 p. Bustamante-Lara, T. I., Vargas-Canales, J. M., Díaz-Sánchez, F., & Rosas-Vargas, R. (2020). Especialización
y competitividad en el sector agrícola mexicano: caso fresa. AgroProductividad, 13(8), 31-37. https://doi.org/10.32854/agrop.vi.1697
Cruz-Jiménez, J., & García-Sánchez, R. C. (2014). El mercado de la carne de bovino en México, 1970-2011. Estudios Sociales, 22(43), 89-110.
Del Moral-Barrera, L. E., Ramírez-Gómez, B. P., & Muñoz-Jumilla, A. R. (2008). Crecimiento regional de la producción de carne de cerdo en México, 1980-2005. Análisis Economico, 23(52), 271-290.
Dyck, J. H., & Nelson, K. E. (2003). Structure of Global Markets for Meat, Agriculture Information Bulletin Number 785, USDA: Washington, D. C., USA. 36 p.
FIRA. (2017). Carne de bovino. Panorama Agroalimentario. Dirección de Investigación y Evaluación Económica y Sectorial. Fideicomisos Instituidos en Relación con la Agricultura. Recuperado el 11 de marzo de 2021, de FIRA: https://www.gob.mx/cms/uploads/attachment/file/200639/Panorama_Agroalimentario_Carne_de_bovino_2017__1_.pdf
FIRA. (2019). Carne de bovino. Panorama Agroalimentario. Dirección de Investigación y Evaluación Económica y Sectorial. Fideicomisos Instituidos en Relación con la Agricultura. Recuperado el 15 de marzo de 2021, de FIRA: https://www.inforural.com.mx/wp-content/uploads/2019/12/Panorama-Agroalimentario-Carne-de-bovino-2019.pdf
Lira, L. & Quiroga, B. (2003). Técnicas de análisis regional. ILPES: Santiago de Chile, Chile. 120 p.Puebla-Albiter, S., Rebollar-Rebollar, S., Gómez-Tenorio, G., Hernández-Martínez, J., & Guzmán-Soria, E.
(2018). Factores determinantes de la oferta regional de carne bovina en México, 1994-2013. Region y Sociedad, 30(72): 1-17. https://doi.org/10.22198/rys.2018.72.a895
SAGARPA. (2009). Situación actual y perspectivas de la carne de porcino en México. Secretaría de Agricultura, Ganadería, Desarrollo Rural, Pesca y Alimentación. Recuperado el 30 de marzo de 2021, de http://cva.org.mx/files/SITUACION%20ACTUAL%20PORCICULTURA%2009.pdf
SIAP. (2020). Base de datos. Servicio de Información Agroalimentaria y Pesquera. Recuperado el 30 de marzo de 2021, de https://nube.siap.gob.mx/cierre_pecuario/

Colegio dePostgraduados
69
Sensory optimization of a flavor mix for a milkshake-like beverage formulated with residual grain from the amaranth popping processNúñez-Limón, Doris1; Herrera-Corredor, José A.1; Alatriste-Pérez, Ismael2; Ramírez-Rivera, Emmanuel J.3; López-Espíndola, Mirna1*
1 Colegio de Postgraduados, Campus Córdoba, Carretera Fed. Córdoba-Veracruz km 348, Amatlán de los Reyes, Veracruz, México, C. P. 94946.
2 Universidad Tecnológica del Centro de Veracruz, Av. Universidad No. 350, Carretera Federal Cuitláhuac-La Tinaja, Localidad Dos Caminos, Cuitláhuac, Veracruz, México, C. P. 94910.
3 Tecnológico Nacional de México/Instituto Tecnológico Superior de Zongolica, Carretera a la Compañía s/n, Tepetlitlanapa km 4. Zongolica, Veracruz, México, C. P. 95005.
* Correspondence: [email protected]
ABSTRACTObjective: To identify an optimal combination of sweet, coffee, and chocolate flavors to maximize liking of sensory attributes in a beverage formulated with residual grain from amaranth popping.Design/Methodology/Approach: We evaluated nine mixtures formulated with refined sucrose, instant coffee, and cocoa powder. Formulations were plotted in the simplex coordinate system. We prepared a milkshake-like beverage using residual grain from the amaranth popping process (RGAPP) as base. Sucrose, coffee, and cocoa were used as flavoring agents. We conducted a consumer study to identify the optimal mixture that maximized liking, acceptability, and purchase intent.Results: When testing the overall liking of the prepared milkshake-like product, we observed favorable reactions to those formulations that contained more sucrose and cocoa powder. Consumers found formulations 1 (30% coffee and 70% sucrose), 2 (70% sucrose and 30% cocoa powder), and 7 (30% sucrose and 70% cocoa powder) tastier than the others. The formulations with high coffee and low sucrose content were the least liked. Formulation 8 (70% coffee and 30% cocoa powder) had the lowest overall liking score for the milkshake-like beverage.Study Limitations/Implications: The results represent a segment of mostly young consumers (81%), between 18 and 24 years old.Recommendations/Conclusions: Consumers showed interest in the developed products as they usually drink different kinds of beverages in the morning. There was a significant difference between formulations, mainly due to the different levels of sucrose. The use of flavorings is a viable strategy for the development of milkshake-like beverages formulated with residual grain from the amaranth popping process aimed to harness the benefits that this ingredient can offer to human nutrition.
Keywords: Amaranth, Residual grain, Popping, Milk-shake, Optimization.
Citation: Núñez-Limón, D., Herrera-Corredor, J. A., Alatriste-Pérez, I., Ramírez-Rivera, E. J., & López-Espíndola, M. (2022). Sensory optimization of a flavor mix for a milkshake-like beverage formulated with residual grain from the amaranth popping process. Agro Productividad. https://doi.org/10.32854/agrop.v15i5.2182
Academic Editors: Jorge Cadena Iñiguez and Libia Iris Trejo Téllez
Received: November 20, 2020.Accepted: April 10, 2022.Published on-line: June 6, 2022.
Agro Productividad, 15(5). May. 2022. pp: 69-76.
This work is licensed under a Creative Commons Attribution-Non-Commercial 4.0 International license.
Image by Mamangue73 at Pixabay 69

70 Agro productividad 2022. https://doi.org/10.32854/agrop.v15i5.2182
INTRODUCTION In Mexico, amaranth is mainly consumed in its popped form. The popping process has several purposes: to provide f lavor, color, texture, and aroma to amaranth grains; improving the antioxidant activity (Muyonga et al., 2014); and reducing the impact of antinutritional agents such as tannins, oxalates, and phytates (Gamel et al., 2006). The anatomical composition of amaranth varies naturally, due to the position of its grains in the panicle and their maturation speed and other factors. This variation has consequences on the popping process since it causes differences in grains’ popping ability. The amount of unpopped grain —or residual grain from the amaranth popping process (RGAPP)— can reach up to 10% of the total grain weight. This grain is usually separated from popped grain and is not used for the production of amaranth bars (alegrias) to avoid product rejection. Using this byproduct —which has already gone through a thermal process— in milkshake-like beverages could be an option for its commercial use. Consumer lifestyle has changed throughout the years. Although it has been shown that breakfast is important for a healthy lifestyle, a considerable number of teenagers and adults go out in the morning without having this meal (Hallström et al., 2011). While this situation is related to socioeconomic factors, it is also true that today’s accelerated lifestyles reduce the time people dedicates to prepare food. One way to reduce the time spent preparing breakfast is to drink milkshake-like beverages made by blending premixed dehydrated ingredients with milk. Although RGAPP has potential as an ingredient for the preparation of milkshake-like beverages, amaranth’s characteristic aroma and flavor could limit consumer acceptance. Tanimola et al. (2016) found that using amaranth in pasta can reduce liking by 1.7 (f lavor) and 1.3 (aroma) units in the hedonic scale, compared with products prepared with wheat flour. Zula et al. (2020) found a similar pattern in bread: color, f lavor, aroma, and texture acceptance decreased when the amount of amaranth in bread formulations increased. One way to improve liking and acceptance is to use a mixture of ingredients that blend adequately with amaranth. Coffee, chocolate, and sucrose are common flavors, familiar among consumers (Holkar et al., 2019). This makes them excellent candidates for the formulation of milkshake-like beverages to drink during breakfast. Therefore, the objective of this study was to identify an optimal combination of sucrose, coffee, and chocolate flavors that maximizes sensory attribute liking for a beverage based on popped amaranth residual grain.
MATERIALS AND METHODS Amaranth was provided by the company NUTRIAMTO S. de R. L. de C. V., located in the Mixteca region, Villa de Chilapa de Díaz municipality, Oaxaca, Mexico. The following ingredients were used for the flavor mixture in the optimization process: Hershey’s® unsweetened cocoa powder bought in bulk; unbranded refined sucrose bought in bulk; and Nescafé® Classic instant coffee. San Marcos® whole milk was used to prepare the milkshake.

71 Agro productividad 2022. https://doi.org/10.32854/agrop.v15i5.2182
Mixture design Flavor mixtures were distributed in the simplex coordinate system, making sure that the mixtures had at least two ingredients. Nine formulations were established (Table 1). Sucrose, instant coffee, and cocoa were weighed in powder form. The RGAPP flour content was kept constants for all formulations.
Mixture preparation for the beverageThree-hundred g of RGAPP f lour were mixed with 200 g of the corresponding f lavoring mixture, according to the formulations shown in Table 1. The mixing process was carried out manually, gradually adding the formula ingredients until a completely uniform blend was obtained. The mixtures were stored in 1-kg airtight plastic bags and preserved at room temperature until they were used in the consumer study. During the study, the beverages were prepared using 30 g of mixture (RGAPP f lour with the corresponding f lavoring mixture) per 250 mL of milk. The ingredients were blended using a conventional blender.
Consumer study The consumer study was conducted at the Universidad Tecnológica del Centro de Veracruz and the Colegio de Postgraduados - Campus Córdoba. Samples were served in 3-oz souffle cups with approximately 40 mL of milkshake. A three-part questionnaire was used to collect the consumers’ responses: 1) Demographics (age, gender, occupation, whether or not and how often the respondents consume amaranth); 2) Liking of each of the sample’s attributes —appearance, color, aroma, particles, f lavor, aftertaste, and overall liking— in the nine point hedonic scale, where 1=dislike extremely, 5=neither like nor dislike, 9=like extremely (Saw-Eaw et al., 2007); and 3) Acceptance, purchase intent, and purchase intent with information about the benefits of amaranth responses were collected in a binomial scale (yes/no). Consumer age was distributed as follows: 81% were 18-24 years old; 11%, 25-34 years old; 5%, 35-44 years old; and 3%, 45-54 years old. The gender of the evaluators was distributed as follows: 45% were women and 55% were men. According to their occupation, 85% were
Table 1. Ingredient percentage for each formulation.
Formulation Coffee (%) Sucrose (%) Cocoa (%)1 30 70 0
2 0 70 30
3 25 50 25
4 70 30 0
5 50 25 25
6 25 25 50
7 0 30 70
8 70 0 30
9 30 0 70

72 Agro productividad 2022. https://doi.org/10.32854/agrop.v15i5.2182
students, 13% workers, and 2% both (they studied and worked). Most of the consumers (68% relative frequency) live in Córdoba, Fortín de las Flores, Cuitláhuac, and Yanga (in Veracruz State, México), whereas the rest (38%) live in different parts of the Veracruz State, Mexico. When asked whether they regularly eat amaranth, 51% of consumers responded they actually do, 48% answered that they do not, and 1% said that they were not acquainted with amaranth.
Experimental design To avoid fatigue bias, each consumer evaluated only two out of the nine formulations. A balanced incomplete-block design was used (Plan 11.3a, Cochran and Cox, 1957). Since the original design only has eight repetitions per formulation, the design was replicated sevenfold. Each formulation was assessed 56 times by a total of 252 consumers. Mean comparisons were conducted using Tukey’s test (significance level, 0.05). Data analysis and charts were developed with R in the RStudio integrated development environment.
RESULTS AND DISCUSSION Table 2 shows the average liking results regarding the appearance, color, aroma, particles, f lavor, aftertaste, and overall liking of the milkshake-like beverages. The analysis of variance identified the liking differences between formulations, taking into consideration each attribute independently. There was a significant difference in appearance liking. Formulation 2 (70% sucrose and 30% cocoa powder) and formulation 8 (70% coffee and 30% cocoa powder) obtained the highest and lowest scores, respectively. Color and aroma liking were similar for the nine formulations. There were significant differences in the liking of particle sensation in the beverage. The highest particles liking scores were achieved by formulations 1 (30% coffee and 70% sucrose) and 2 (70% sucrose
Table 2. Difference between formulations per attribute*.
Formulation Appearance Color Aroma Particles Flavor Aftertaste Overall Liking
1 5.301.83ab 5.452.12a 6.191.53a 5.181.71ab 5.331.86ab 5.231.85ab 5.461.71ab
2 5.591.77a 5.751.50a 5.801.50a 5.451.81a 5.932.04a 5.501.83ª 5.781.92a
3 5.291.93ab 5.751.60a 6.211.82a 4.641.73ab 4.781.77abc 4.681.90abc 4.851.75abc
4 4.982.38ab 5.461.79a 6.451.67a 4.561.73abc 3.871.92cd 4.091.75cd 4.451.83bc
5 5.001.80ab 5.751.73a 6.451.59a 4.501.87abc 3.752.04cd 4.301.69bcd 4.252.00cd
6 5.501.55ab 5.821.53a 5.691.76a 4.521.65abc 4.451.88bc 4.571.88abc 4.641.92bc
7 5.381.45ab 5.891.63a 5.471.92a 4.801.82ab 4.641.98bc 4.571.95abc 5.091.79abc
8 4.482.08b 5.212.13a 5.522.12a 3.521.90c 2.962.12d 3.302.15d 3.291.75d
9 5.051.60ab 5.481.61a 5.551.73a 4.352.02bc 4.091.92cd 4.092.04cd 4.311.61cd
p-value 0.0403 0.507 0.054 5.18e-06 7.29e-15 4.58e-08 9.36e-12
* Mean values standard deviation. Means with the same letter in the same column are not significantly different according to Tukey’s test (0.05). Formulations: 1 (30% coffee and 70% sucrose); 2 (70% sucrose and 30% cocoa powder); 3 (25% coffee, 50% sucrose, and 25% cocoa powder); 4 (70% coffee and 30% sucrose); 5 (50% coffee, 25% sucrose, and 25% cocoa powder); 6 (25% coffee, 25% sucrose, and 50% cocoa powder); 7 (30% sucrose and 70% cocoa powder); 8 (70% coffee and 30% cocoa powder); 9 (30% coffee and 70% cocoa powder).

73 Agro productividad 2022. https://doi.org/10.32854/agrop.v15i5.2182
and 30% cocoa powder). The highest effect of particles was observed in formulation 8 (70% coffee and 30% cocoa powder), with a 3.52 liking score, which indicates that consumers moderately disliked this combination. All formulations had the same amount of RGAPP f lour. It is therefore possible that the remaining ingredients had an effect on particle perception. Likewise, a significant difference (p-value7.3eσ15) regarding f lavor was found. Formulations 1 and 2 had the highest liking scores, while formulation 8 had the lowest. This result was probably a consequence of the high concentration of coffee and the lack of sucrose in this formulation. This pattern was also recorded in the aftertaste and overall liking attributes. On one end, formulations (particularly 2) with the highest percentages of sucrose had higher liking scores in the appearance, particles, f lavor, aftertaste, and overall liking categories. On the other end, formulation 8, with a high percentage of coffee and no sucrose, had the lowest liking scores for the same attributes. This behavior suggests that sucrose concentration and the sweet f lavor may have inf luenced the consumers’ responses regarding particles, aftertaste, and overall liking. However, it is unlikely that this inf luence reached the appearance attribute, since it was evaluated before the consumer tasted the sample. Most consumers identified the taste of amaranth (83%); among them, 43% thought that amaranth was an adequate flavor —which confirms that the amount of amaranth in the formulation was adequate—, while 25% identified a slight taste of amaranth. Only 15% identified an intense flavor, while 17% did not identify the flavor. Some consumers described strange flavors, such as burnt, earth, and medicine.
Impact of sensory attributes on acceptance and purchase intent Table 3 shows the results for the multiple logistic regression analysis. Based on the p-values for each attribute’s coefficients (estimated values), the most relevant attributes for the acceptance of the milkshake-like beverage (regardless of the formulation) were flavor (p0.0024), aftertaste (p0.0364), and overall liking (p7.6e-10). The following attributes had an impact on purchase intent (regardless of the formulation): appearance (p0.0460), color (p0.0313), f lavor (p0.0005), and overall liking (p7.6e-10). As it can be seen, aftertaste was not critical to consumers, but appearance
Table 3. Key attributes for acceptance according to the logistic regression analysis.
Attribute Estimate Pr (|z|)Appearance 0.14 0.1437
Color 0.01 0.8971
Aroma 0.10 0.2331
Particles 0.12 0.2720
Flavor 0.39 0.0024*
Aftertaste 0.27 0.0364*
Overall liking 0.99 7.6e-10*
* Pr (|z|) values that indicate a statistically significant relation between attributes and product acceptance.

74 Agro productividad 2022. https://doi.org/10.32854/agrop.v15i5.2182
and color were. According to Piqueras-Fiszman and Spence (2015), a product’s appearance is a sensory characteristic that may determine consumers’ expectations about the product before they consume it. Consumers took into consideration more attributes for purchase intent (four) than for acceptance (three) (Table 4). After consumers were informed about the benefits of amaranth and asked again whether or not they would buy the product, only two attributes had an impact on purchase intent: appearance (p0.084) and overall liking (p0.0010). This trend —a significant change observed in consumers’ answers— was confirmed with McNemar’s test (p2.2e-16). In this test, 178 answers changed from ‘would not buy’ to ‘would buy’ after consumers were informed about the benefits of amaranth.
Optimization Formulations 2 (70% sucrose and 30% cocoa powder) and 7 (30% sucrose and 70% cocoa powder) had the highest appearance liking rating (Figure 1a). However, regarding color (Figure 1b) —which is a specific characteristic of appearance—, most formulations (2, 3, 5, 6, 7, and 9) obtained 5.5 liking scores. Formulation 7 (30% sucrose and 70% cocoa powder) obtained the highest score. This suggests that there are other appearance characteristics that could have had an impact on liking. Most formulations had favorable aroma liking scores (Figure 1c). However, unlike color, the highest liking scores were observed in the formulations with a higher percentage of coffee and sucrose. The highest aroma liking scores were recorded with formulations 1 (30% coffee and 70% sucrose) and 4 (70% coffee and 30% sucrose). According to Mahmud et al. (2020), aroma is a decisive factor for beverages, particularly for coffee. Liking of particle sensation in beverages (Figure 1d) was low, since no formulation obtained favorable scores. Liking scores for flavor, aftertaste, and overall liking (Figures 1e, 1f, and 1g) were higher for the formulations with a higher sucrose concentration. Likewise, the optimal region obtained when the attributes’ optimal regions were superimposed also pointed towards the formulations with a higher sucrose concentration (Figure 1h).
Table 4. Key attributes for purchase intent according to the logistic regression analysis.
AttributePurchase intent
Purchase intent after providing information regarding amaranth
benefitsEstimate Pr (|z|) Estimate Pr (|z|)
Appearance 0.22 0.0460* 0.17 0.0284*
Color 0.22 0.0313* 0.10 0.1722
Aroma 0.13 0.1563 0.02 0.6976
Particles 0.12 0.3105 0.09 0.3060
Flavor 0.47 0.0005* 0.14 0.2065
Aftertaste 0.15 0.2612 0.06 0.5505
Overall liking 0.95 7.06e-08* 0.40 0.0010*
* Pr (|z|) values that indicate a statistically significant relation between attributes and purchase intent.

75 Agro productividad 2022. https://doi.org/10.32854/agrop.v15i5.2182
Figure 1. Optimal areas of attribute liking. Score of 5.5 or higher in the hedonic scale indicates a favorable
liking.

76 Agro productividad 2022. https://doi.org/10.32854/agrop.v15i5.2182
CONCLUSIONS Formulations showed liking differences for appearance, particles, f lavor, aftertaste, and overall liking. Acceptance and purchase intent were determined by flavor, aftertaste, and overall liking. A favorable change in purchase intent was observed when consumers were informed about the benefits of amaranth. Sucrose and cocoa powder were the decisive ingredients for the liking level. The optimal region for the milkshake-like beverage formulation was in a sweet taste slightly combined with chocolate.
REFERENCESCochran, W. G., & Cox, G. M. (1957). Experimental Design. 2a ed.; John Wiley & Sons: New York, USA. 640 p.Gamel, T. H., Linssen, J. P., Mesallam, A. S., Damir, A. A., & Shekib, L. A. (2006). Seed treatments affect
functional and antinutritional properties of amaranth flours. Journal of the Science of Food and Agriculture, 86(7), 1095-1102. https://doi.org/10.1002/JSFA.2463
Hallström, L., Vereecken, C. A., Ruiz, J. R., Patterson, E., Gilbert, C. C., Catasta, G., Díaz, L. E., Gómez-Martínez, S., González-Gross, M., Gottrand, F., Hegyi, A., Lehoux, C., Mouratidou, T., Widham, K., Åström, A., Moreno, L. A., & Sjöström, M. (2011). Breakfast habits and factors influencing food choices at breakfast in relation to socio-demographic and family factors among European adolescents. The HELENA Study. Appetite, 56(3), 649-657. https://doi.org/10.1016/j.appet.2011.02.019
Holkar, C. R., Jadhav, A. J., & Pinjari, D. V. (2019). A critical review on the possible remediation of sediment in cocoa/coffee flavored milk. Trends in Food Science & Technology, 86(1), 199-208. https://doi.org/10.1016/j.tifs.2019.02.035
Mahmud, M. M. C., Shellie, R. A., & Keast, R. (2020). Unravelling the relationship between aroma compounds and consumer acceptance: Coffee as an example. Comprehensive Reviews in Food Science and Food Safety, 19(5), 2380-2420. https://doi.org/10.1111/1541-4337.12595
Muyonga, J. H., Andabati, B., & Ssepuuya, G. (2014). Effect of heat processing on selected grain amaranth physicochemical properties. Food Science & Nutrition, 2(1), 9-16. https://doi.org/10.1002/fsn3.75
Piqueras-Fiszman, B., & Spence, C. (2015). Sensory expectations based on product-extrinsic food cues: An interdisciplinary review of the empirical evidence and theoretical accounts. Food Quality and Preference, 40(1), 165-179. https://doi.org/10.1016/j.foodqual.2014.09.013
Saw-Eaw, A., Chompreeda, P., Prinyawiwatkul W, Haruthaithanasan, V., Suwonsichon, T., Saidu, J. E., & Xu, Z. 2007. Acceptance and purchase intent of US consumers for nonwheat rice butter cakes. Journal of Food Science, 72(2), s92-7. https://doi.org/10.1111/j.1750-3841.2006.00256.x
Tanimola, A. R., Otegbayo, B., & Akinoso, R. (2016). Chemical, functional, rheological and sensory properties of amaranth flour and amaranth flour based paste. African Journal of Food Science, 10(11), 313-319. https://doi.org/10.5897/AJFS2016.1422
Zula, A. T., Ayele, D. A., & Egigayhu, W. A. (2020). Proximate, antinutritional, microbial, and sensory acceptability of bread formulated from wheat (Triticum aestivum) and amaranth (Amaranthus caudatus). International Journal of Food Science, 2020(1), 1-5. https://doi.org/10.1155/2020/9429584

Colegio dePostgraduados
77
Perception of extension workers about rural development processes in Morelos, MexicoRomán-Montes de Oca, Erika1*; García-Flores, Alejandro1; Ayala-Enríquez, María I.1; Licea-Reséndiz, Jesús E.1
1 Universidad Autónoma del Estado de Morelos. Avenida Universidad No. 1001, Chamilpa, Cuernavaca, Morelos, México. C. P. 62209.
* Correspondence: [email protected]
ABSTRACTObjective: To determine the problems that extension workers face during their work to promote rural development, from their own perspective.Design/Methodology/Approach: The research was carried out with extension workers, who took part of the 2019 Rural Development Program (PDR) in Morelos, Mexico. An exploratory-descriptive methodology, with a non-probabilistic convenience test, was carried out. The tool comprised 25 items. Thirty-one extension workers and 6 technicians of various programs were interviewed.Results: Most of the extension workers were men, 86% of their professional profiles are related to agricultural sciences, 10% has a master degree, and 45% has some kind of proficiency certificate. The interviewees pointed out that they were not paid enough for their services, that each technician had to work with too many producers, and that a short-term contract is not enough to achieve the development processes. The main activities carried out were related to the program.Study Limitations/Implications: As a result of the SARS COVID pandemic, the interviews were carried out remotely and we could not get in touch with more extension workers.Findings/Conclusions: Extension workers demand long-term contracts, appropriate payments, and a lower technician:producer ratio, in order to make their work more efficient and to contribute to the development of families and communities. They also mentioned that they would like to focus on extension activities and that their involvement in management issues aimed at exercising the resources of government programs should not be a priority.
Keywords: Rural extension, communitary agricultural work, capacities, rural development.
INTRODUCTION Government policies seek to improve development and, therefore, to increase and improve production through infrastructure, equipment, supplies, and extension services support. These services are very important. From several decades onward, Mexico has
Citation: Román-Montes de Oca, E., García-Flores, A., Ayala-Enríquez, M. I., & Licea-Reséndiz, J. E. (2022). Perception of extension workers about rural development processes in Morelos, Mexico. Agro Productividad. https://doi.org/10.32854/agrop.v15i5.2240
Academic Editors: Jorge Cadena Iñiguez and Libia Iris Trejo Téllez
Received: March 16, 2022.Accepted: May 16, 2022.Published on-line: June 6, 2022.
Agro Productividad, 15(5). May. 2022. pp: 77-84.
This work is licensed under a Creative Commons Attribution-Non-Commercial 4.0 International license.
77 Image by CESAR AUGUSTO RAMIREZ VALLEJO at Pixabay
78 Agro productividad 2022. https://doi.org/10.32854/agrop.v15i5.2240
implemented technology transfer, training, and technical support programs, in order to help producers to obtain higher income from their harvests, consequently improving the quality of life of their families. Extension is the service provided by the technicians recruited by government, education, and research or private programs, which facilitates the access of rural actors to knowledge, information, and technologies (López-Barbosa, 2021). However, the term extension can be defined from different angles. Some authors restrict its definition to technology transfer and technical support, while others point out that extension includes several economic, productive, social, environmental, and even psychological subjects. They claim that it should be holistic and inclusive, because respecting the needs of the producers themselves is vital. The main problems could be solved based on a participatory appraisal. Knowledge must not only be considered from a technical-productive point of view, but it also must take into account the lore, customs, and traditions of the producers. Providing this knowledge exchange from an eclectic point of view would facilitate its appropriation (López-Barbosa, 2021; Méndez-Sastoque, 2006). The technician role is fundamental for extension. According to the Secretaría de Agricultura y Desarrollo Rural (SADER, 2016), extension workers provide agricultural knowledge to producers and exhort them to adopt new and improved ways to work with their crops and livestock. Extension workers favor the achievement of the processes of the said development. Other authors point out that extension workers must think about rural life beyond the territorialization of primary activities, acknowledging its multidimensional character and fully understanding that, besides the economic and productive point of view, rural life also includes social, cultural, political, and environmental aspects. Additionally, they must acknowledge that agricultural activities are part of a broader whole, involved in territorial dynamics, which include local, regional, domestic, and international levels (Mayoral-García et al., 2015). Extension workers are also trained in different aspects, in order to achieve a development in the family unit, group of producers, or communities where they carry out their work. Extension workers are essential actors in rural development processes, and they must have different characteristics that allow them to complete objectives required by extension. These characteristics include: an active engagement; a professional behavior; self-training; values and principles; capacity to transmit knowledge and show the producers new and improved production techniques; acknowledging the main problems of the community in order to look for joint solutions; and combining the knowledge of the producers to strengthen their capacities in their rural environments (López-Alcocer and Castro-Ibáñez, 2010; Medina et al., 2015). In order to face and solve problems, these professionals must work in coordination with other involved actors, and they require training that, sometimes, goes beyond the capacities acquired through a sound technical-scientific education (Méndez-Sastoque, 2006). Therefore, education and research institutions must find a break-even point between the education offer and the social demand that the agricultural professionals carry on their shoulders (Méndez-Sastoque, 2006). From a holistic point of view, the work of the extension workers requires commitment, a clear vision about the rural development processes, and an institutional environment

79 Agro productividad 2022. https://doi.org/10.32854/agrop.v15i5.2240
that guides, fosters, and encourages them (López-Barbosa, 2021). Therefore, they must feel the support of an income and a solid contract, that will allow them to focus their whole attention in the development of the inhabitants, instead of worrying about how long they will be paid or which extra activities they must fulfill, because they are under a government contract. Medium and long-term contracts would allow workers to achieve better results. Extension workers must also have guarantees about their quality of life, in order to contribute with greater interest and authenticity to their full-time jobs as extension workers and, consequently, to the rural development processes. Rural development boosts territorial resources, involving inhabitants or interested parties as driving subjects of their own development, through the implementation or development of capacities to improve the economic, social, political, cultural, and environmental quality of life of the inhabitants. As a result of the importance of extension workers for rural development processes, the objective of this research was to determine, from the extension workers’ perspective, the problems they face in their work in favor of rural development. The assumption was that the activities of extension professionals are not aimed at a holistic extension —i.e., to achieve the development of a family or community—, as a result of the short-term nature of their contracts and the extra activities they must carry out on behalf of the contracting institutions.
MATERIALS AND METHODS The research was carried out with extension workers who took part in the 2019 Rural Development Program (PDR), in Morelos, Mexico. The Rural Development Program was 1 out of 11 support programs implemented in 2019 by the Secretaría de Agricultura y Desarrollo Rural (SADER), under the U category (other grants). The overall objective of the program was to sustainably increase the productivity of the family production units (UPFs), aimed to improve the income of rural populations. The program was made up of four components: I. Capacity development, extension, and rural assistance. II. Economic integration of productive chains. III. Strengthening of family production units (UPFs). IV. Technology research and transfer (SADER-FAO, 2019). The target population was the formal or informal UPFs, located in municipalities of rural priority attention areas, and formal or informal family production units, located in highly and extremely marginalized areas (SADER-FAO, 2019). A descriptive and exploratory method was used in this research, in order to describe the characteristics of a set of individuals and areas of interest (Monje-Álvarez, 2011). Exploratory studies can be used to obtain information about the possibility of carrying out more complete research about a particular context, to explore new problems, to identify concepts or promising variables, and to establish priorities for future research (Hernández-Sampieri et al., 2006). Descriptive research specifies properties, characteristics, and important features of any analyzed phenomenon (Hernández-Sampieri et al., 2006). The sample was a non-probabilistic convenience test: an easy, efficient, and economic sampling, which allows the use of other methods as data is gathered (Monje-Álvarez, 2011). The main interest is not measurement, but to understand the full complexity of

80 Agro productividad 2022. https://doi.org/10.32854/agrop.v15i5.2240
the phenomena and the social processes (Martínez-Salgado, 2012). A data gathering tool —including semi-structured questions— was sent via Google Forms to 31 technicians who took part in the PDR 2019. The tool included 25 items. Additionally, six extension technicians from several programs were interviewed. Data was gathered from April to July 2020. The data was systematized using Excel® and, subsequently, it was analyzed. In addition, literature research was carried out, in order to obtain information about extension and its importance.
RESULTS AND DISCUSSIONGeneral aspects of extension workers Out of the interviewed technicians, 77% are men and 23% are women. Despite a majority of men, the involvement of women in these programs is increasing. This increase is the result of the need to get a work that will allow women to contribute to the economic income of their families. Additionally, they mentioned their good performance in the communities helps them to obtain contracts for new programs. Women have an easier access to the domestic environment of families, which helps them to not only participate in productive aspects, but also organizational or commercial aspects, such as health, culture, environment, and education, among others (Esquisabel, 2018). Regarding the age range, 50% are 31-50 years old; this category can be considered as optimal for the development of this activity, taking into account that people work from 25 until 60 years old (Mayoral-García et al., 2015). The lower percentage included 20-to-30-year-old technicians, who have just obtained their bachelor degree and who have just entered the work market. The age range was distributed as follows: 20-30 (17%), 31-40 (30%), 41-50 (20%), 51-60 (27%), and 61-70 years old (6%). The prevailing professional profiles were those linked with agricultural sciences (86%), followed by biotechnology (7%), and administration, accounting, and business (7%). Ten percent of the interviewees has a master degree. Exceedingly few technicians from the social area are hired; this situation can be related to a productive approach by those in charge of the program. There is also a lack of holistic knowledge, which includes different factors that must be considered to achieve rural development. Landini (2013a) carried out a study aimed at determining the profile of extension workers who work for the Argentinian public extension system and found that most technicians obtained a master degree on rural development or extension. Despite having technical careers, extension workers must also be aware about the areas of their work in which they are not proficient; therefore, they constantly seek to update their knowledge about the subjects required in their work areas, both technical and non-technical subjects.
Training Forty-five percent of extension workers have some kind of proficiency certificate, including: teaching in-person human capital training group courses (EC00217); development of rural investment project design (EC0020); facilitation of innovation processes to improve competitiveness (EC00489); facilitation of innovation processes to improve competitiveness among people, social groups, and economic organizations

81 Agro productividad 2022. https://doi.org/10.32854/agrop.v15i5.2240
(EC00818); evaluation of the qualifications of candidates, based on competitiveness standards (EC0076); and citric harvesting (EC0093). The rest does not have any kind of certification. They attend the appropriate training offered by the institutions on the subjects that producers require the most. The main objective of the PDR is to contribute to the improvement of the income of the rural population. Therefore, determining if the technicians were trained in regional development aspects —to carry out their work and to comply with the objectives of the program— was fundamental. Forty-seven percent of the workers said that they were trained; however, the training was not always related to regional development. The training mainly included program operation guidelines, project development, and the use of platforms to meet requirements or to submit reports; other workers mentioned training about technical issues. Forty-three percent did not attend training and 10% did not answer the question. Without a clear idea and without an institutional environment that promotes, guides, and encourages it, it is very difficult to achieve rural development (López-Barbosa, 2021). Therefore, technicians must be involved in these ideas; otherwise, they will not know where to go, to whom they must turn, or how they can take part of the rural development processes. Sixty-eight percent of the technicians provide training and consultancy to producers or groups, based on the needs they mention during their meetings; six percent said that they base these training and consultancy on their own decisions, because they do not have enough time to carry out a participative appraisal; the rest of the extension workers did not answer the question. The technicians mainly provide training in four areas: production (87%), organization (45%), management (32%), and commercialization (9.6%). Production is the most important subject for producers and, as a consequence, also for technicians, because their certifications are mainly about this subject. These results match those obtained in the Caazapá, Canindeyú, and Central regions in Paraguay, where extension workers were asked about the subjects, they wanted to be trained in. The three most mentioned areas were commercialization, to learn how to “persuade” producers, and several technical subjects (Landini, 2013b). Additionally, Landini (2013b) pointed out that the thematic areas in which extension workers are most interested include: first, technical issues and then, rural extension methodologies. Regarding the way in which the training and technology transfer are carried out, the extension workers pointed out that it was through consultancy, exchange tours with producers from Morelos and Michoacan, demonstration plots, trainings, and mainly through work sessions in collaboration with the Instituto Nacional de Investigaciones Forestales, Agrícolas y Pecuarias (INIFAP). However, only 2% of the technicians said that the lore of the producers was considered during the knowledge exchange. Nevertheless, the combination of knowledge must be considered, because the producers’ traditional lore is aimed at production systems management, which guarantees their physical and social reproduction (Sánchez-Olarte et al., 2015). Therefore, this lore should be included, along with eclectic knowledge.
82 Agro productividad 2022. https://doi.org/10.32854/agrop.v15i5.2240
Contribution of field work to rural development Ninety percent of the interviewed service providers was hired as a field technician, 7%, as project designer, and 3%, as strategic planner. Field technicians received $20,000.00 MXN for their services; strategic planners received $30,000 MXN, and project designers received $25,000.00 MXN. The terms of their contracts were variable: the strategic planners were hired for 12 months, the project designers for 11 and 10 months, and the UPF technicians for 7, 5.5, and 3 months. The argument was that the different times were the result of a gap at the beginning of the program; the technicians pointed out that the time was not enough to carry out the proposed methodology and that the situation got worse due to COVID 19. Therefore, they suggested that they should be hired at least for a year, in order to appropriately implement the methodology of the territorial development project (PRODETER). A longer contract period would allow them to achieve a good performance in their jobs. The work of the extension workers is very complex; it is not only aimed at technology transfer, but also at carrying out a more comprehensive job —that includes production, organization, management, social, and commercialization aspects—, mainly with the UPFs, helping them to achieve their development. If people are to take part in the answer to their problems and, consequently, appropriate the solutions and projects, a long-term field work must be carried out. Therefore, systematic technical accompaniment must be provided properly and on time, considering different aspects of rural life (Cadena-Íñiguez et al., 2018). Non-explicit purposes, guidance, and inefficiency in the use of resources in extension strategies, and creativity to adopt and adapt different short-term models have created an environment of dissatisfaction, despondency, and even uncertainty among the actors in charge of extension and the extension services in the Mexican agricultural sector (Rendón-Medel et al., 2015). Based on experience, to generate results in extension services, four consecutive cycles are needed in the case of agricultural production units (Santos-Chávez et al., 2019). The activities that extension workers carried out with the UPFs’ members were mainly project formulation and follow-up, organization and entrepreneurial development of the work groups, productive chain integration, technical support, file integration, resource management, intervention plan development, request for quotation, accounting logs development, and georeferencing. These activities are mainly ref lected in the implementation of the program. Ultimately, the work of the technicians was to identify, develop, and kickstart projects that would benefit the groups that took part of the program and that would obtain assets to improve their production systems. However, an alleged accompaniment never took place, and a set of educational processes did not favor an integral and sustainable rural development (López-Barbosa, 2021). Although most of the professionals pointed out that they carry out the activities according to the producers’ needs and based on a participatory appraisal, producers continue to prefer benefits in kind, while government institutions give priority to the spending of resources, because some of the activities required by government institutions from producers include spending of resources before a given deadline. Technicians mentioned that —and as a result of the hiring gap— they spent most of their time carrying out administrative and management activities, in order to exercise the resources.

83 Agro productividad 2022. https://doi.org/10.32854/agrop.v15i5.2240
Each field technician provided services for at least 31 producers from 16 municipalities; the highest coverage was found in Tepalcingo, while Puente de Ixtla and Totolapan had the lowest number of technicians (Table 1). Thirty localities from a highly and extremely marginalized area were benefited. The number of producers was too high regarding the period of the contract and, as a result of it, the workers could not carry out all the activities included in the work plan. The technicians also mentioned that going from a community to another or to the capital of the state —to carry out the necessary procedures to follow-up the producers’ needs or to implement the program— took a great effort, as a result of the lack of time to perform all the activities. Therefore, the heads of the programs must be aware of the technician:producer ratio. Extension workers should be able to provide their services to a smaller number of producers, spending enough time working with them, because the main objective of the programs is to contribute to the improvement of the quality of life of families and not only to exercise the resources of the said programs. Technicians provided their services to more than 30 producers during their work contract. We must mention that their work has an influence; however, they must not be considered as the only actors and actions that can contribute to the improvement of the rural population of marginalized areas. Rural development depends on several actors, mainly the producer, government institutions, professionals from several specialties, and communities, among others. The work of technicians as facilitators and the involvement of various actors can achieve rural development.
Table 1. Percentage of municipalities where extension workers provided their services.
Municipality Technicians (%)
Ayala 3
Axochiapan 7
Jonacatepec 4
Ocuituco 7
Puente de Ixtla 1
Temoac 6
Tepalcingo 24
Tepoztlán 8
Tetela del Volcán 4
Tlalnepantla 10
Tlaltizapán 2
Tlaquiltenango 8
Tlayacapan 6
Totolapan 1
Yecapixtla 3
Zacualpan 6

84 Agro productividad 2022. https://doi.org/10.32854/agrop.v15i5.2240
CONCLUSIONS The involvement of extension professionals is required to favor rural development processes. They must be aware of rural development. This will help them to know how to perform their work, because the responsibility is not exclusively theirs. Instead, it depends on different actors who can contribute to the welfare of families. Therefore, a holistic and eclectic work with the producers must be carried out. Technicians cannot mainly be focused in the productive area and in complying with the requisites for the exercising of the resources of a government program; they must also be authentically involved, based on their own conviction. Extension workers should sign long-term contracts, have a decent salary, and work with a lower technician:producer ratio, in order to work in an efficient manner and to contribute to the development of families and communities.
REFERENCESCadena-Iñiguez, P., Rendón-Medel, R., Rodríguez-Vázquez, H., Camacho-Villa, C., Santellano-Estrada, E.,
Guevara-Hernández, F., & Govaerts, B. (2018). Propuesta metodológica-interinstitucional para un nuevo extensionismo en México. Revista Mexicana de Ciencias Agrícolas, 9(8), 1777-1785. https://doi.org/10.29312/remexca.v9i8.826
Esquisabel, E. (2018). Mujeres extensionistas Descripción del trabajo de las promotoras asesoras del Programa Cambio Rural en el cinturón hortícola platense con perspectiva de género (1993-2017). Tesis de grado. Universidad Nacional de La Plata. La Plata, Buenos Aires, Argentina. 45 p.
Hernández-Sampieri, R., Fernández-Collado, C., & Baptista-Lucio, P. (2006). Metodología de la investigacion. 6ª ed.; McGraw-Hill Interamericana: Distrito Federal, México. 882 p.
Landini, F. (2013a). Perfil de los extensionistas rurales argentinos del sistema público. Mundo Agrario, 14(27), 1-23.
Landini, F. (2013b). Necesidades formativas de los extensionistas rurales paraguayos desde la perspectiva de su función, sus problemas y sus intereses. Trabajo y Sociedad, 1(20), 149-160.
López-Alcocer, F., & Castro-Ibáñez, J. P. (2010). Redimensionamiento del extensionismo agrícola como práctica educativa comunitaria ante los embates neoliberales: Bases conceptuales empezando con un diagnostico local. Revista Científica UDO Agrícola, 10(1), 88-93.
López-Barbosa, L. A. (2021). Los proyectos de desarrollo rural territorial en Guanajuato. Reflexiones sobre el último suspiro del extensionismo rural en México. In: Experiencias e investigaciones en los procesos de desarrollo rural, Román-Montes de Oca, E., Coord.; UAEM: Morelos, México. pp. 163-197.
Mayoral-García, M. B., Cruz-Chávez, P. R., Duarte-Osuna, J. D., & Juárez-Mancilla, J. (2015). El perfil del extensionista rural en Baja California Sur (BCS), México. Revista Global de Negocios, 3(3), 43-54.
Martínez-Salgado, C. (2012). El muestreo en investigación cualitativa: principios básicos y algunas controversias. Ciencia & Saúde Colectiva, 17(3), 613-619. https://doi.org/10.1590/S1413-81232012000300006
Medina, J., Castellanos, H., Aguirre, R., & Zagal, Á. (2015) Impulsa SAGARPA Extensionismo Holístico a través de nuevo perfil de extensionistas. Enlace: La Revista de la Agricultura de Conservacion, 6(25), 37-40.
Méndez-Sastoque, M. J. (2006). Los retos de la extensión ante una nueva y cambiante noción de lo rural. Revista Facultad Nacional de Agronomía Medellín, 59(2), 3407-3423.
Monje-Álvarez, C. A. (2011). Metodología de la investigacion cuantitativa y cualitativa, guía didáctica. USCO: Neiva, Colombia. 217 p.
Rendón-Medel, R., Roldán-Suárez, E., Hernández-Hernández, B., & Cadena-Íñiguez, P. (2015). Los procesos de extensión rural en México. Revista Mexicana de Ciencias Agrícolas, 6(1), 151-161.
SADER/FAO. (2019). Términos de Referencia para el monitoreo estatal, Programa de Desarrollo Rural. México.Sánchez-Olarte, J., Argumedo-Macías, A., Álvarez-Gaxiola, J. F., Méndez-Espinoza, J. A., & Ortiz-Espejel,
B. (2015). Conocimiento tradicional en prácticas agrícolas en el sistema del cultivo de amaranto en Tochimilco, Puebla. Agricultura, Sociedad y Desarrollo, 12(2), 237-254.
Santos-Chávez, V. M., Álvarez-Macías, A., Pérez-Gachuz, F., & Pérez-Sosa, L. (2019). El extensionismo rural mexicano: Análisis coyuntural con enfoque de políticas públicas. Revista Mexicana de Ciencias Agrícolas, 10(1), 63-77. https://doi.org/10.29312/remexca.v10i1.1117
SADER. (2016). Extensionista, gestor del desarrollo. Secretaría de Agricultura y Desarrollo Rural. Recuperado el 10 de febrero de 2022, de SADER: https://www.gob.mx/agricultura/articulos/extensionista-gestor-del-desarrollo

Colegio dePostgraduados
85
In vitro establishment and multiplication of Aechmea fasciata (Lindl.) Baker, a bromeliad of commercial interestGarrido-Aguilar, Danika C.1; Villanueva-Couoh, Eduardo1*; Pinzón-López, Luis L.; Reyes-Ramírez, Arturo1
1 Institutito Tecnológico de Conkal, División de Estudios de Posgrado e Investigación, Antigua Carretera Mérida-Motul km 16.3, Conkal, Yucatán, México, C. P. 97345.
* Correspondence: [email protected]
ABSTRACTObjective: To develop a protocol for the aseptic in vitro establishment and multiplication of Aechmea fasciata (Lindl.) Baker.Design/Methodology/Approach: Different concentrations of NaClO (2, 3, 4, and 5%) were assessed for the aseptic establishment of A. fasciata. During the shoot induction stage, the three following treatments were tested: T16-benzyladeninenaphthalene-1-acetic acid (BAANA; 52 mg L1); T2zeatin2,4-dichlorophenoxyacetic acid (Zea2,4-D; 52 mg L1); and T3control with no plant growth regulators. During the shoot multiplication stage, three more treatments were assessed: T1Zea2,4-D (2.51 mg L1); T2Zea2,4-D (52 mg L1); and T3Zea2,4-Dgibberellic acid (AG3) (2.513.5 mg L1). To assess the number of cellular events, different nitrate concentrations were tested in the medium (18.8, 39.4, and 60 mM NO3
). Finally, during the shoot regeneration stage, nine treatments derived from the combination of three concentrations of kinetin (KIN: 0, 0.1, and 0.5 mg L1) and of indole-3-acetic acid (AIA: 0, 0.3, and 0.4) were assessed. Completely randomized designs were used in each stage. Duncan’s test (p0.05) was used to compare the means during the shoot induction and multiplication stages. A regression analysis was carried out to study the aseptic establishment and a non-parametric test (Kruskal-Wallis) was made to assess the “amount of microshoots during regeneration” variable.Results: A. fasciata aseptic explants with 4% NaClO were established. Shoot induction was most effective with the BAANA (52 mg L1) treatment. The highest callus production was reported with the Zea2,4-D (52 mg L1) treatment. The largest number of microshoots was obtained with high nitrate doses. Meanwhile, the most successful regeneration was achieved with the 0.1 mg KIN L1 and 0.4 mg AIA L1 treatment.Study Limitations/Implications: The application of Zea and 2,4-D during multiplication induced callus formation.Findings/Conclusions: Apical bud explants in an MS medium with BA and ANA present organogenesis. The use of Zea and 2,4-D forms calluses in the already established in vitro shoots, which regenerate with the use of KIN and AIA. Better microshoot coloring and development were achieved with MS salts, which have a medium nitrate content.
Keywords: Plant growth regulators (RCV), Microshoots, Bromeliads, Tropical forest, Endangered species.
Citation: Garrido-Aguilar, D. C., Villanueva-Couoh, E., Pinzón-López, L. L., & Reyes-Ramírez, A. (2022). In vitro establishment and multiplication of Aechmea fasciata (Lindl.) Baker, a bromeliad of commercial interest.Agro Productividad. https://doi.org/10.32854/agrop.v15i5.2139
Academic Editors: Jorge Cadena Iñiguez and Libia Iris Trejo Téllez
Received: October 2, 2021.Accepted: April 23, 2022.Published on-line: June 6, 2022.
Agro Productividad, 15(5). May. 2022. pp: 85-91.
This work is licensed under a Creative Commons Attribution-Non-Commercial 4.0 International license.
Image by bernswaelz at Pixabay 85

86 Agro productividad 2022. https://doi.org/10.32854/agrop.v15i5.2139
INTRODUCTION Bromeliaceae are one of the main components of tropical forests. Their tank-shaped anatomy enables the development of microhabitats (Martinelli et al., 2008). Microhabitats created by bromeliads establish interactions among different species and consequently contribute to the stability of forest ecosystems (Dal-Vesco et al., 2014). However, a number of bromeliad species are endangered due to soil loss, forest fragmentation, and illegal exploitation of plants with high ornamental and commercial value (Balke et al., 2008; Negrelle et al., 2012). As a consequence of the severe habitat loss of bromeliads and their high commercial demand, a need to develop protocols or techniques for the propagation of species in vulnerable conditions has arisen. One of them is the Brazilian bromeliad Aechmea fasciata, one of the most valued and commercialized ornamental species due to its shape and inflorescence (Ping-Lung et al., 2010). The most common multiplication methods used for this species include seed propagation and vegetative bud propagation —which usually produces 4 to 8 shoots. However, these traditional methods are not adequate for the massive propagation that is required to commercialize this plant and satisfy the market’s demands, since both techniques lead to low production levels and a slow growth —approximately 2 to 3 years (Martins et al., 2013). One of the main alternatives for massive plant production is micropropagation. This method has several advantages over conventional propagation: a large number of plants can be produced from a small tissue segment, in a short period of time, and in a significantly reduced space, free of pests and disease (Guerra and Dal-Vesco, 2010; Pickens et al., 2006). Micropropagation is considered an important technique to optimize bromeliad production and thus satisfy the ornamental plant market. It is currently necessary to develop in vitro cultivation protocols to propagate bromeliads. These protocols should allow for a sustainable exploitation of wild species that will satisfy the local market’s demands, while reducing overexploitation and recovering endangered species. Therefore, this research seeks to develop a protocol for the aseptic in vitro establishment and multiplication of Aechmea fasciata (Lindl.) Baker, a species with ornamental potential.
MATERIALS AND METHODSVegetable matter A. fasciata plants were kept in greenhouse conditions. Apical bud explants taken from the shoots were used for the aseptic establishment and shoot induction. To reduce and avoid the proliferation of pathogenic microorganisms, donor plants were sprinkled every other day with a solution made of 5 g L1 of Agri-mycin® 500 (a. i. tribasic copper sulfate, streptomycin sulfate, and oxytetracycline hydrochloride) and 5 g L1 of Amistar® (a. i. azoxystrobin and difenoconazole).
Aseptic establishment A pre-disinfecting measure was carried out in the lab: the explants were washed with commercial detergent for 5 minutes and then rinsed. Afterwards, the explants were submerged in 100% acetic acid for 20 minutes and then placed in 100% hydrogen peroxide for 10 minutes. Finally, they were soaked in a 5 g L1 solution of Agri-mycin® 500 for 30

87 Agro productividad 2022. https://doi.org/10.32854/agrop.v15i5.2139
minutes, after which they were rinsed with distilled water. Once under aseptic conditions, the first superficial disinfection was carried out with 70% ethanol for 1 minute. The explants were subsequently immersed in four concentrations of NaClO (2, 3, 4, and 5% a. i.) for 20 minutes, adding a drop of Tween™ 20. All explants were rinsed thrice with sterile distilled water mixed with 100 mg of citric acid L1. The culture medium consisted of MS inorganic salts, supplemented with Morel and Wetmore vitamins (1951) and 2 g L1 of activated charcoal. Incubation conditions were a 16/8 h light/dark photoperiod. The number of contaminated explants was assessed 15 days after sowing.
Culture media The formula proposed by Murashige and Skoog (1962) was used as culture media, adding Morel and Wetmore vitamins (1951), enriching it with 3% sucrose, and using 2.25 g L1 of Phytagel (Sigma Aldrich) as gelling agent. In each experiment, the appropriate plant growth regulators (RCV) were added to the medium. The media pH was adjusted to 6.0 with KOH or HCl 1 N. Finally, the media were sterilized in an autoclave at a temperature of 120 °C and a pressure of 1.05 kg cm2 for 15 minutes.
Shoot induction and multiplication Three treatments were assessed in the shoot induction stage: T16-benzyladeninenaphtalene-1-acetic acid (BAANA; 5.02.0 mg L1); T2zeatin2,4-dichlorophenoxyacetic acid (Zea2,4-D; 5.02.0 mg L1); and T3control with no RCV in apical bud explants. The following variables were assessed: number of shoots per explant (the shoots resulting from individuation); shoot length (the length of shoots resulting from individuation, measured in mm); and number of leaves. Considering the presence of calluses as response variable, three treatments were assessed in the multiplication stage: T1Zea2,4-D (2.51.0 mg L1); T2Zea2,4-D (5.02.0 mg L1); T3Zea2,4-Dgibberellic acid (AG3), (2.51.03.5 mg L1).
Modification of nitrate concentration in MS medium An experiment was conducted where the nitrate concentration NO3
−( ) in the MS medium salts was modified. Three treatments were assessed (T118.8 mM, T239.4 mM, T360 mM), in order to determine which one had the largest number of cellular events.
Shoot regeneration based on A. Fasciata calluses In the shoot regeneration stage, the effects of nine treatments —resulting from the combination of three kinetin concentrations (KIN: 0, 0.1, 0.5 mg L1) with three indole-3-acetic acid concentrations (AIA: 0, 0.3, 0.4 mg L1)— were assessed, in order to identify the concentration required to achieve shoot formation.
Statistical model A completely randomized design was chosen. Four repetitions per treatment were randomly sown for shoot induction; eight repetitions per treatment, for multiplication;

88 Agro productividad 2022. https://doi.org/10.32854/agrop.v15i5.2139
five repetitions per treatment, for callus-based shoot regeneration; and six repetitions per treatment, for the assessment of nitrate concentration. Each jar with an explant was considered an experimental unit. Data were analyzed separately for each test with the Infostat software v. 2016, while the means were compared using Duncan’s test (p0.05). To analyze the “contamination” variable, the presence or absence of bacterial or fungal colonies on the explant surface was assessed. A regression analysis was carried out based on the data obtained. A non-parametric Kruskal-Wallis test was used to analyze callus-based shoot regeneration.
RESULTS AND DISCUSSION The apical bud contamination decreased when the concentration of NaClO in the disinfecting solution increased. The lower number of contaminated explants was obtained with treatments T3 and T4 (4 and 5% NaClO, respectively), with a value of p0.034 (Figure 1). Although less contaminated explants were obtained with the 5% NaClO treatment, necrosis was observed, probably due to NaClO-induced cytotoxicity. Rodríguez et al. (2001) suggest that high contamination levels in bromeliad in vitro cultures are caused by leaf shape and arrangement, since the union between leaves and stalks is a suitable reservoir for the development of microorganisms —particularly bacteria and fungi. However, the disinfection method used in this work enabled the elimination of contamination and the successful establishment of the A. fasciata apical bud explants. Shoots were produced after a 20-day development, as a consequence of the disinfection process applied to the explants and their in vitro establishment. Shoot production had a better response with BAANA (5.02.0 mg L1) than with the Zea2,4-D (5.02.0 mg L1) treatment and the control with no RCV (Table 1). The high redifferentiation potential of the apical bud explants accounts for their organogenic response, since they contain the vegetative apical meristem which, owing to its characteristics and cell types, allows them to achieve a higher regeneration rate (Firoozabady and Moy, 2004). The results of this study agree with Skoog and Miller’s model of organogenesis (1957), according to which vegetative bud differentiation is fostered by the auxin/cytokinin balance, favorable to cytokinin (Segura, 2008). Saucedo et al. (2008) suggest that adding auxin to the culture
Figure 1. Effect of four different NaClO concentrations (T12%, T23%, T34%, and T45% with a 20-minute immersion) on the aseptic establishment of A. fasciata apical buds.
0
2
4
6
8
10
12
0 1 2 3 4
Num
ber o
f con
tam
inat
ed
expl
ants
(bud
s)
Treatments (NaClO %)
y=-2.1571x+11.429R2=0.9324

89 Agro productividad 2022. https://doi.org/10.32854/agrop.v15i5.2139
medium could directly influence the number of shoots, because an adequate cytokinin/auxin balance hinders the elongation of shoots, inhibits rooting, and stimulates the emission of shoots. During the multiplication stage, the assessed treatments resulted in the formation of calluses instead of shoots. No significant differences were found in the variance analysis regarding the “callus presence” variable; however, the Zea2,4-D (5.02.0 mg L1) treatment showed a higher callus development (Figure 2). These results match the findings of Obukosia et al. (2005), who found that a high 2,4-D concentration leads to callus formation in the chrysanthemum. Similarly, Ping-Lung et al. (2010) report callus formation when a combination of 2.0 mg 2,4-D L1 and 1.0 mg ANA L1 is used in A. fasciata ovary explants. The formation of calluses instead of shoots could be explained by an inadequate balance between endogenous and exogenous regulators or by the influence of the A. fasciata genotype on the response to in vitro morphogenesis. The largest amount of microshoots was obtained with 60 mM NO3
, which produced an average of 213.43 microshoots, while 18.8 mM NO3
yielded an average of 28 shoots. Although there was no statistical difference in the amount of microshoots produced by treatments with 60 and 39.4 mM NO3
(the latter producing an average of 166.67 microshoots), better development and coloring (bright green) were observed in the microshoots produced with a concentration of 39.4 mM NO3
(Figure 3). These results match the findings of Droste et al. (2005), who found higher survival rates among
Table 1. Response of plant growth regulators (RCV) in apical buds during A. fasciata shoot induction.
Treatments Number of leaves Number of shoots Length of shoots (cm)
Control (No RCV) Unanswered Unanswered Unanswered
T1 (BAANA; 5.02.0 mg L1) 7.50 a 6.75 b 1.75 a
T2 (Zea2,4-D; 5.02.0 mg L1) 6.25 a 2.25 a 1.58 a
Values with a different letter in each column indicate statistical differences (Duncan, p0.05). BA6-benzyladenine; ANAnaphtalene-1-acetic acid; Zeazeatin; 2,4-D2,4-dichlorophenoxyacetic acid.
Figure 2. Cellular response during A. fasciata multiplication with Zea2,4-D (5.02.0 mg L1).

90 Agro productividad 2022. https://doi.org/10.32854/agrop.v15i5.2139
Figure 3. Cellular response of A. fasciata calluses to nitrate concentrations in the MS medium. A) 18.8 mM NO3 ;
B) 39.4 mM NO3 ; and C) 60 mM NO3
.
A B C
Tillandsioideae seedlings, a subfamily of the Bromeliaceae, using the MS medium with 50 and 25% macronutrient concentrations. One morphological characteristic of this species are its epidermal-trichome-covered leaves, which are important for the absorption of water, amino acids, and moisture. For this reason, the roots no longer fulfill that function and they are apparently used exclusively for anchorage purposes. Therefore, they have become independent from their substrata and developed the ability to colonize nutrient-poor habitats (Estrada-Méndez, 1995). Based on this information and on the results of this work, these in vitro cultured species might require, instead of low or high nitrate concentrations, intermediate quantities of the total content of the MS medium. A non-parametric analysis was necessary to examine the behavior of the values provided by the “number of shoots” variable in relation to the different treatments in the shoot regeneration based on A. fasciata calluses. The Kruskal-Wallis test was used to determine that there is no significant difference with a value of x212.50 and p0.13. However, the 0.1 mg KIN L1 and 0.4 mg AIA L1 treatment produced more microshoots than the other treatments. Similarly, Dal-Vesco et al. (2014) report a high shoot proliferation rate regarding Vriesea reitzii callus regeneration in an MS medium supplemented with 0.7 mg of AIA L1. Meanwhile, Alves et al. (2006) report a regeneration rate of 60 V. reitzii shoots, obtained by cultivating the leaf’s basal region in a MS medium supplemented with KIN and two cytokinins (BAP and 2-iP).
CONCLUSIONS The aseptic establishment of A. fasciata apical buds succeeded when they were immersed in 4% a. i. NaClO for 20 minutes. The highest shoot average was produced by the BAANA (5.02.0 mg L1) treatment. The application of Zea2,4-D (5.02.0 mg L1) to the MS medium during the multiplication stage produces calluses. The MS medium with the 60 mM NO3
treatment produces more A. fasciata microshoots, with no statistical difference, with the 39.4 mM NO3
treatment. However, better coloring and development were observed with 39.4 mM NO3
. Callus-based shoot regeneration was

91 Agro productividad 2022. https://doi.org/10.32854/agrop.v15i5.2139
achieved in an MS medium with 0.1 mg KIN L1 and with 0.4 mg AIA L1. This proves that mass production is feasible, if alternative sources for in vitro culture are used.
REFERENCESAlves, G. M., Dal-Vesco, L. L., & Guerra, M. P. (2006). Micropropagation of the Brazilian endemic bromeliad
Vriesea reitzii trough nodule clusters culture. Scientia Horticulturae, 110(2), 204-207. https://doi.org/10.1016/.j.scienta.2006.06.014
Balke, M., Gómez-Zurita, J., Ribera, I., Viloria, A., Zillikens, A., Steiner, J., Garcia, M., Hendrich, L., & Vogler, A. (2008). Ancient associations of aquatic beetles and tank bromeliads in the Neotropical forest canopy. Proceedings of the National Academy of Sciences, 105(17), 6356-6361. https://doi.org/10.1073/pnas.0710368105
Dal-Vesco, L. L., Pescador, R., Corredor, P. J. P., Welter, L. J., & Guerra, M. P. (2014). In vitro propagation of Vriesea ritzii, a native epiphyte bromeliad from the Atlantic rainforest. Acta Scientiarum. Biological Sciences, 36(3), 271-278. https://doi.org/187131652002
Droste, A., Machado-da Silva, A., Vieira, M. A., & Winck-de Almeida, J. (2005). In vitro culture of Vriesea gigantea and Vriesea philippocoburgii: Two vulnerable bromeliads native to Southern Brazil. Brazilian Archives of Biology and Technology, 48(5), 717-722. https://doi.org/10.1590/s1516-89132005000600006
Firoozabady, E., & Moy, Y. (2004). Regeneration of pineapple plants via somatic embriogenesis and organogenesis. In Vitro Cellular & Developmental Biology, 40(1), 67-74. https://doi.org/10.1079/ivp2003494
Guerra, M. P., & Dal-Vesco, L. L. (2010). Strategies for the micropropagation of bromeliads. In: Protocols for in vitro Propagation of Ornamental Plants: Methods in Molecular Biology, JAIN, S. M., OCHATT, S. J., Eds.; Human Press: New York, USA. pp. 47-66. https://doi.org/10.1007/978-1-60327-114-1_6
Martinelli, G., Vieira, C. M., Gonzalez, M., Leitman, P., Piratininga, A., Ferreira Da Costa, A., Forzza, R. C. (2008). Bromeliaceae of the Brazilian Atlantic Forest: checklist, distribution and conservation. Rodriguésia, 59(1), 258. https://doi.org/10.1590/2175-7860200859114
Martins, P. R. J., Schmildt, R. E., Alexandre, S. R., Santos, R. B., & Magevski, G. C. (2013). Effect of synthetic auxins on in vitro and ex vitro bromeliad rooting. Pesquisa Agropecuária Tropical, 43(2), 138-146. https://doi.org/10.1590/s1983-40632013000200009
Estrada-Méndez, V. H. (1995). Ecología de las bromelias epífitas. EUNED, 3(2), 20-23.Morel G., & Wetmore, R. H. (1951). Fern callus tissue culture. American Journal of Botany, 38(2), 141-143.
https://doi.org/10.2307/2437837Murashige, T. Y., & Skoog, F. (1962). A revised medium for rapid growth and biossays with tabacco tissue
culture. Physiologia Plantarum, 15(3), 473-497. https://doi.org/10.1111/j.1399-3054.1962.tb08052.xNegrelle, B. R. R., Darcy, M., & Adilson, A. (2012). Bromeliad ornamental species: conservation issues and
challenges related to commercialization. Acta Scientiarum Biological Sciences, 34(1), 91-100. https://doi.org/10.4025/actascibiolsci.v34i1.7314
Obukosia, S. D., Kimani, E., Waithaka, K., Mutitu, E., & Kimani, P. M. (2005). Effects of growth regulators and genotypes on pyrethrum in vitro. In Vitro Cell & Development Biology, 41(2),162-166. https://doi.org/10.1079/IVP2oo4620
Pickens, K. A., Wolf. J., Affolter, J. M., & Wetzstein, H. Y. (2006). Adventitious bud development and regeneration in Tillandsia eizii. In Vitro Cellular & Developmental Biology, 42(4), 348-353. https://doi.org/10.1079/IVP2006779
Ping-Lung, H., Li-Jen, L., Chi-Chu, T., Zin-Hang, L. (2010). Micropropagation of bromeliad Aechmea fasciata via floral organ segments and effects of acclimatization on plantlet growth. Plant Cell, Tissue and Organ Culture, 21(1),112-143. https://doi.org/10.1007/s11240-010-9843-0
Rodríguez-de Francisco, L. E., Santiago, B. Y., Rosales, S. Y., Igarza, C. Y., Fornet, H. E., González, G. M. V., Más, B. A., Castro, V. T., Cantillo, A. R., & Vega, P. R. (2001). Micropropagación de Ananas comosus (L.) Merr. (Piña), cultivar cabezona. Micropropagacion Ananas, 67(18), 29-34.
Saucedo, A. S. G., Ramos, G. L. E., Varas, G. E., & Carmigniani, C. F. (2008). Propagación clonal in vitro de piña (Ananas comusus L. Merr) variedades Champaka y Hawaiana. Ciencia y Tecnología, 1: 49-54.
Segura, J. (2008). Introduccion al desarrollo. Concepto de hormona vegetal. In: Fundamentos de fisiología vegetal, 2a ed.; Azcon, J., & Talon, M., Eds.; McGraw-Hill: Barcelona, España. pp. 349-376.
Skoog, F., & Miller, C. O. 1957. Chemical regulation of growth and organ formation in plant tissues cultured in vitro. Symposia of Society for Experimental Biolology, 11(1), 118-131.


Colegio dePostgraduados
93
Use of protected methionine in diets for finishing pigsTrujano-San Luis, David1; Figueroa-Velasco, José L.1*; Martínez-Aispuro, José A.1; Sánchez-Torres, María T.1; Cordero-Mora, José L.1; Ruíz-Flores, Agustín2; Crosby-Galván, María M.1
1 Colegio de Postgraduados, Campus Montecillo, Programa de Ganadería, Carr. México-Texcoco km 36.5, Montecillo, Estado de México, México, C. P. 56230.
2 Posgrado en Producción Animal, Departamento de Zootecnia, Universidad Autónoma Chapingo, Carretera México-Texcoco km 38. 5, Chapingo, Estado de México, C. P. 56230.
* Correspondence: [email protected]
ABSTRACTObjective: To evaluate the substitution of regular DL-methionine (RM) by protected DL-methionine (PM) in the productive performance of finishing pigs.Design/Methodology/Approach: 50 pigs (56.852.02 kg of live weight) distributed in a completely randomized experimental design were used. The treatments consisted of the substitution of MR by MP (0, 25, 50, 75, and 100%) in diets for finishing I and II pigs.Results: As the MP in the diet increased, the gain of final live weight (LWF) and backfat thickness (BFT) in finishing I increased linearly (p0.05), while feed:gain ratio (FGR) decreased linearly (p0.07). PM at finishing II phase linearly (p0.10) improved feed intake, FGR, and longissimus muscle area.Study Limitations/Implications: Feeding pigs by including protected amino acids improves their productive response.Findings/Conclusions: The use of protected methionine in diets for finishing I pigs improves some productive response variables.
Keywords: Synthetic amino acids, absorption, bioavailability, pigs.
INTRODUCTION Adding synthetic amino acids (AA) to pig diets prevents deficiencies and the excess of crude protein, decreasing N excretion and environmental pollution (Gloaguen et al., 2014). In pig production, the second or third limiting AA related to the production of feed is methionine (Met); including a synthetic version of this AA is essential when the main ingredients do not meet the requirement (NRC, 2012).
Citation: Trujano-San Luis, D., Figueroa-Velasco, J. L., Martínez-Aispuro, J. A., Sánchez-Torres, M. T., Cordero-Mora, J. L., Ruíz-Flores, A. & Crosby-Galván, M. M. (2022). Use of protected methionine in diets for finishing pigs. Agro Productividad. https://doi.org/10.32854/agrop.v15i5.2024
Academic Editors: Jorge Cadena Iñiguez and Libia Iris Trejo Téllez
Received: May 4, 2021.Accepted: May 19, 2022.Published on-line: June 6, 2022.
Agro Productividad, 15(5). May. 2022. pp: 93-100.
This work is licensed under a Creative Commons Attribution-Non-Commercial 4.0 International license.
Image by chx69 at Pixabay

94 Agro productividad 2022. https://doi.org/10.32854/agrop.v15i5.2024
Synthetic AAs are more rapidly absorbed than protein AAs and this may result in a transient imbalance between AAs in the systemic circulation of pigs, which may influence AA bioavailability (Yang and Liao, 2019). Likewise, the metabolic inefficiency of AA can be largely attributed to catabolizing enzymes that are mainly present in pancreatic juice and some of the other digestive organs (Wu, 2009). The use of protected AA which can resist stomach conditions and allow a slow release in the intestine can help to overcome the above-mentioned bioavailability limitations (Piva et al., 2007). Protected AAs are used in ruminants in order to overcome ruminal conditions and be used in the small intestine. Commercially available protected AAs include lysine and methionine, which have successfully improved productive parameters in ruminants (Lee et al., 2012; Zanton et al., 2014). Feeding protected methionine (PM) to pigs instead of regular methionine (RM) increased weight gain and feed intake (Figueroa-Velasco et al., 2020). However, it was not determined whether using a single source or a combination of both (regular and protected) achieved a better result. Meanwhile in finishing pigs, the use of protected lysine (PL) instead of regular lysine (RL) did not affect growth and carcass characteristics (Prandini et al., 2013). Sun et al. (2020a; 2020b) observed that the use of PL and PM improves the balance of absorbed AA and contributes to the reduction of AA supplemental levels in the diet of broiler chickens and laying hens, improving the efficiency and bioavailability of AA, without negative effects on productive performance. For their part, Prandini et al. (2013) mention that PL —compared to RL and lysine bound to the proteins of the macro ingredients— improved AA bioavailability in pigs, as a result of its slower release and absorption rate. This could reduce the crude protein (CP) content and improve the efficiency of the use of synthetic AA in the diet. Owing to the favorable results obtained by the use of protected AA in ruminants and non-ruminants, the substitution or combination of RM by PM in diets for pigs was assumed to improve the productive response, as a consequence of the greater bioavailability and the synchronization of absorption of the AA obtained from the intact protein of the ingredients. Therefore, the objective of this study was to evaluate the effect of substituting regular synthetic DL-Met (RM) by protected DL-Met (PM) on the productive variables, carcass characteristics, and urea concentration of finishing pigs.
MATERIALS AND METHODSThe study was carried out at the Experimental Farm of Colegio de Postgraduados, in Texcoco, State of Mexico, Mexico, at an altitude of 2,241 m. The climate is temperate sub-humid with summer rains, with a mean annual temperature of 15.2 °C and an average annual rainfall of 644.8 mm. Pigs were managed according to the technical specifications for the production, care, and use of lab animals, complying with the Official Mexican Standard NOM-062-ZOO-1999 (SAGARPA, 2001). Fifty hybrid pigs (Landrace Yorkshire Duroc) were used in this study. The group consisted of 35 barrows and 15 sows, with 56.852.02 kg of initial live weight (LWI). Treatments consisted of substituting regular synthetic Met (RM, 0% PM control diet) by

95 Agro productividad 2022. https://doi.org/10.32854/agrop.v15i5.2024
25, 50, 75, and 100% protected methionine (PM). PM concentrations for finishing stage I were: 0, 0.025, 0.050, 0.075, and 0.100% MS of the diet. For finishing stage II, they were: 0, 0.046, 0.093, 0.139, and 0.185% MS of the diet. The evaluation period in both stages was 28 d. PM concentrations were established taking into consideration the requirements suggested by the NRC (2012). The PM contained 85% encapsulated DL-methionine (Mepron® Evonik, Germany). The diets (Table 1) were formulated with the Excel Solver command (Microsoft Excel, 2007), based on sorghum-soybean meal, added with synthetic AA [L-lysine-HCl, DL-
Table 1. Basal diets used to evaluate the substitution of regular methionine by protected methionine in finishing I and finishing II pigs.
Ingredient (%) Finishing I Finishing IISorghum grain 82.51 82.96
Soybean meal 14.48 13.48
Soybean oil 0.66 0.77
L-lysine (50%) 0.64 0.71
DL-methionine 0.10 0.16
Protected methionine (PM) 0.00 0.00
L-threonine 0.07 0.10
L-tryptophan 0.00 0.14
Vitamins premix† 0.17 0.17
Minerals premix¶ 0.17 0.17
NaCl 0.30 0.30
CaCO3 0.86 1.00
Calculated content (%)
Metabolizable energy (Mcal kg1) 3.30 3.300
Crude protein 15.20 15.00
Calcium 0.59 0.64
Phosphorus 0.34 0.33
Lysine 0.85 0.93
Threonine 0.52 0.57
Tryptophan 0.15 0.16
Methionine 0.31 0.37
MethionineCysteine 0.48 0.53
Determined content (%)
Crude protein 14.95 14.75
Calcium 0.56 0.58
Phosphorus 0.30 0.30† Contribution per kg of feed: Vitamin A, 15,000 IU; vitamin D3, 2,500 IU; vitamin E, 37.5 IU; vitamin K, 2.5 mg; thiamin, 2.25 mg; ribof lavin, 6.25 mg; niacin, 50 mg; pyridoxine, 2.5 mg; cyanocobalamin, 0.0375 mg; biotin, 0.13 mg; choline chloride, 563 mg; pantothenic acid, 20 mg; folic acid, 1.25 mg. ¶ Contribution per kg of feed: Fe, 150 mg; Zn, 150 mg; Mn, 150 mg; Cu, 10 mg; Se, 0.15 mg; I, 0.9 mg; Cr, 0.2 mg.

96 Agro productividad 2022. https://doi.org/10.32854/agrop.v15i5.2024
methionine (Evonik Industries AG., Parsippany, NJ, USA), L-threonine ( Jefo Nutrition Inc., Saint-Hyacinthe, Quebec, Canada), L-tryptophan (CPB Aurum, Mexico)]; these AAs covered the requirements suggested by the NRC (2012). The feed of the finishing stage II included 5 mg kg1 of ractopamine (Paylean™, Elanco, Mexico) and the formulation requirements of the diets were adjusted based on the recommendation of the NRC (2012) when thisσ-adrenergic is added. The pigs were housed in individual pens equipped with a hopper feeder and nipple drinker. Food and water were provided ad libitum. The pens were cleaned and the health status of the pigs was inspected on a daily basis. Backfat thickness (BFT) and longissimus muscle area (LMA) were measured at the tenth rib with real-time ultrasound (SonoVet 600, Medison, Inc., Cypress, CA, USA) at the beginning and at the end of each phase. These data —along with the initial live weight (LWI) and final live weight (LWF) were used to estimate the fat free lean gain (FFLG), as well as the lean meat percentage (LMP), the initial lean meat percentage (LMPI), and the final lean meat percentage (LMPF), using the equation number five proposed by Burson and Berg (2001). At the end of each stage, blood samples were taken from the anterior vena cava, using 10-mL Vacutainer® tubes with heparin (BD Vacutainer, Franklin Lakes, NJ, 07417, USA). The samples were placed on ice. Subsequently, they were centrifuged at 1286 g for 20 min using a Sigma 2-16K centrifuge (Osterade am Harz, 37520, Germany) to separate the plasma from cells. Plasma from each sample was transferred to a polypropylene tube and stored in a freezer (EUR251P7W Tappan, Electrolux Home Products North American, Augusta, GA, 30907, USA) at 20 °C, until the urea was determined. Laboratory analysis. The plasma urea nitrogen concentration (PUN) of the blood samples was determined with a spectrophotometer (Varian Cary UV vis Spectrophotometer, Victoria, Australia) using the methodology proposed by Chaney and Marbach (1962). The crude protein (PC) of the feed was determined by the macro-Kjeldahl method (AOAC, 2005). The calcium (Ca) and phosphorous (P) concentration of the feed was determined with an atomic absorption spectrophotometer (Perkin Elmer 4000, Lambda 2 series, Perkin Elmer Inc., Norwalk, CT, USA), following Karl et al. (1979). Response variables. The following variables were analyzed: growth performance [average daily feed intake (ADFI), average daily gain (ADG), feed:gain ratio (FGR), LWF, and FFLG)], carcass characteristics (BFT, LMP, and LMA), and PUN. Statistical analysis. The experimental design was a completely randomized with five treatments and 10 replicates. Each pig housed in an individual pen was considered an experimental unit. The normality and homogeneity of the data were evaluated with the Shapiro-Wilk and Levene’s tests, respectively. An analysis of variance was performed with the data using the GLM procedure of SAS (2010) and the effect of PM concentration was determined with orthogonal polynomials to detect linear or quadratic trends (p0.10). Initial live weight and sex were used as covariates (p0.10) for LWF, ADG, ADFI, FGR, FFLG, and LMP. Meanwhile, the initial LMA and BFT were used as covariates (p0.10) of their respective final measurements.

97 Agro productividad 2022. https://doi.org/10.32854/agrop.v15i5.2024
RESULTS AND DISCUSSION In finishing stage I, ADG (p0.009), LWF (p0.01), and BFT (p0.01) had a linear increase and FGR had a linear decrease (p0.07) as the level of PM inclusion in the diet increased (Table 2). The percentage of lean meat in the carcass showed a quadratic trend (p0.06), as a result of the substitution of RM by PM, increasing when 25 or 50% of RM was replaced by PM. The use of RM or PM did not affect (p0.10) the other carcass characteristics. Table 3 shows the results of finishing stage II. Adding PM did not seem to have an effect (p0.10) on ADG, LWF, FFLG, BFT, and LMP. However, ADFI (p0.08) and LMA (p0.09) increased and FGR had a linear decrease (p0.10) in response to the substitution for RM in the diet by an increasing amount of PM. The PUN behaved in a quadratic manner (p0.06): the highest concentrations were recorded with the control treatment and the treatments with the highest amount of PM; meanwhile, replacing 25 and 50% of the RM with PM resulted in the lowest concentration. In the present experiment, proportional improvements in growth performance were observed during finishing stage I in response to the substitution of RM by PM. However, only improvements in FGR and LMA were observed during finishing stage II. These differences between both stages match the findings of Figueroa-Velasco et al. (2020) who observed that the positive effect of using PM in fattening pig feed is differential at every stage. Pigs fed with PM at starting and finishing phases increased their feed intake and weight gain, while PM improved protein synthesis (lean meat percentage and longissimus muscle area) in finishing pigs (Figueroa-Velasco et al., 2020). During finishing II stage, the higher ADFI was reflected in lower FGR in pigs fed with a higher PM concentration, although there was no statistical improvement in ADG. However, the treatments with the highest PM content had the highest LMA values. The
Table 2. Response of finishing I pigs (50 to 75 kg of weight) fed with five levels of protected methionine.
Treatment (Protected methionine, %)SEM
p Value0 25 50 75 100 Lineal Quadratic
Growth performance
ADG (kg) 0.68 0.70 0.75 0.76 0.83 0.03 0.009 0.57
ADFI (kg d1) 2.61 2.63 2.65 2.56 2.77 0.15 0.60 0.61
FGR 3.74 3.79 3.53 3.35 3.31 0.21 0.07 0.94
LWI (kg) 53.56 58.53 56.32 56.58 58.19 0.97 - -
LWF (kg) 72.53 78.05 77.43 77.80 81.47 2.49 0.01 0.57
FFLG (kg d1) 0.23 0.23 0.25 0.23 0.27 0.01 0.23 0.66
Carcass characteristics and plasma urea nitrogen
BFT (mm) 9.40 10.59 10.46 11.51 10.21 0.40 0.07 0.02
LMA (cm2) 26.81 28.71 28.55 28.09 27.57 1.10 0.79 0.20
LMP 52.69 53.56 53.57 53.05 52.29 0.55 0.48 0.06
PUN (mg dL1) 13.44 14.17 13.11 11.71 13.49 1.12 0.51 0.67
SEM: standard error of the mean; ADG: average daily gain; ADFI: average daily feed intake; FGR: feed:gain ratio; LWI: initial live weight; LWF: final live weight; FFLG: fat free lean gain; BFT: backfat thickness; LMA: longissimus muscle area; LMP: lean meat percentage.

98 Agro productividad 2022. https://doi.org/10.32854/agrop.v15i5.2024
higher ADFI could have been caused by a higher bioavailability of methionine and the resulting imbalance with other AAs led the pig to consume more feed to compensate their diminished bioavailability. The imbalance of AAs is confirmed by the highest PUN in the treatments that contained the highest amount of PM. The PUN is a biological indicator of the efficient use of the AA of the diet, because this blood metabolite is very sensitive to changes in the contribution of CP and AA in the feed (Lents et al., 2013). This imbalance caused a greater intake of food —in order to be able to ingest a greater quantity of other AAs—, since the growth potential allowed pigs to continue synthesizing muscle protein, resulting in a greater LMA accumulation. The use of PM can increase its availability and absorption in the animal’s organism (Piva et al., 2007). This can be potentially reflected in a better productive response, since a greater availability of methionine in standard diets for pigs improves ADG, LW, FGR, BFT, and LMP (Chen et al., 2014; Shen et al., 2014). Piva et al. (2007) showed that protected AA can be fully and slowly released in the intestine, which could allow a greater constancy in plasma concentration between time lapses in feed intake (Prandini et al., 2013). The better metabolic efficiency of microencapsulated (protected) AAs compared to synthetic AAs traditionally used in pig feed may be due to their slower rate of release and absorption in the gastrointestinal tract (Prandini et al., 2013). This allows for greater bioavailability by reducing the transient imbalance between AAs in the systemic circulation (Wu, 2009). Furthermore, synthetic AAs are rapidly absorbed through the gastrointestinal tract and are available for metabolic purposes (Wu, 2009). Meanwhile, protein-bound AAs are released into the gastrointestinal lumen after the digestive processes take place, at a rate that varies among feed ingredients (Wu, 2009; NRC, 2012). The differential absorption rate of protein-bound and synthetic AAs may decrease the use of AAs for protein synthesis throughout the body. This imbalance could
Table 3. Response of finishing I pigs (75 to 100 kg of weight) fed with five levels of protected methionine.
Treatment (Protected methionine, %)SEM
p value0 25 50 75 100 Lineal Quadratic
Growth performance
ADG (kg) 0.77 0.73 0.78 0.78 0.79 0.03 0.47 0.80
ADFI (kg d1) 2.82 2.80 2.88 2.84 3.10 0.12 0.08 0.12
FGR 3.67 3.69 3.67 3.65 3.98 0.10 0.10 0.13
LWF (kg) 96.88 97.50 99.36 97.83 99.56 3.18 0.50 0.78
FFLG (kg d1) 0.24 0.25 0.27 0.25 0.28 0.01 0.16 0.81
Carcass characteristics and plasma urea nitrogen
BFT (mm) 14.48 13.57 14.05 14.03 14.47 0.61 0.82 0.34
LMA (cm2) 32.36 33.16 33.76 32.39 34.67 0.74 0.09 0.72
LMP 50.88 51.68 52.34 50.95 51.42 0.46 0.81 0.12
PUN (mg dL1) 25.27 19.89 19.52 23.71 22.28 1.80 0.71 0.06
EEM: standard error of the mean; ADG: average daily gain; ADFI: average daily feed intake; FGR: feed:gain ratio; LWF: live weight final; FFLG: fat free lean gain; BFT: backfat thickness; LMA: longissimus muscle area; LMP: lean meat percentage.

99 Agro productividad 2022. https://doi.org/10.32854/agrop.v15i5.2024
lead to the oxidation of rapidly absorbed crystalline AAs, as well as of AAs absorbed at a later stage from intact proteins (Yen et al., 2004).
CONCLUSION The substitution of regular synthetic methionine by protected methionine in the diet of finishing I pigs (50-75 kg of weight) improves weight gain and feed:gain ratio. However, the dietary use of protected methionine in pigs from 75 to 100 kg does not have a clear effect on the productive variables and carcass characteristics.
REFERENCESAOAC. (2005). Official Methods of Analysis. Association of Analytical Chemists 18th Ed. Washington, DC,
USA. 28 p.Burson, D., Berg, E. (2001). Procedures for estimating pork carcass composition. Pork quality facts. National Pork
Producers Council. Des Moines IA, USA. Recuperado el 21 de marzo de 2022, de https://porkgateway.org/wp-content/uploads/2015/07/procedures-for-estimating-pork-carcass-composition.pdf
Chaney, A. L., & Marbach E. P. (1962). Modified reagents for determination of urea and ammonia. Clinical Chemistry, 8(2): 130-132. https://doi.org/10.1093/clinchem/8.2.130
Chen, Y., Li, D., Dai, Z., Piao, X., Wu, Z., Wang, B., Zhu, Y., & Zeng, Z. (2014). L-Methionine supplementation maintains the integrity and barrier function of the small-intestinal mucosa in post-weaning piglets. Amino Acids, 46(4), 1131-1142. https://doi.org/ 10.1007/s00726-014-1675-5
Figueroa-Velasco, J. L., Trujano-San-Luis, D., Martínez-Aispuro, J. A., Sánchez-Torres, M. T., Crosby-Galván, M. M., Ruíz-Flores, A., & Cordero-Mora, J. L. (2020). Effectiveness and optimum level of protected methionine in fattening pig diets. Revista Colombiana de Ciencias Pecuarias, 33(4), 217-227. https://doi.org/10.17533/udea.rccp.v33n4a02
Gloaguen, M., Le Floc’h, N., Corrent, E., Primot, Y., & van Milgen, J. (2014). The use of free amino acids allows formulating very low crude protein diets for piglets. Journal of Animal Science, 92(2), 637-644. https://doi.org/10.2527/jas.2013-6514
Karl, R. F., McDowell, L. R., Miles, P. H., Wilkinson, N. S., Funk, J. D., & Corad, J. H. (1979). Métodos de análisis de minerales para tejidos de plantas y animales. 2a ed.; Departamento de Ciencia Animal: Florida, USA. 39 p.
Lee, C., Hristov, A. N., Cassidy, T. W., Heyler, K. S., Lapierre, H., Varga, G. A., de Veth, M.J., Patton, R. A., & Parys, C. (2012). Rumen-protected lysine, methionine, and histidine increase milk protein yield in dairy cows fed a metabolisable protein-deficient diet. Journal of Dairy Science, 95(10), 6042-6056. https://doi.org/10.3168/jds.2012-5581
Lents, C. A., Rempel, L. A., Klindt, J., Wise, T., Nonneman, D., & Freking, B. A. (2013). The relationship of plasma urea nitrogen with growth traits and age at first estrus in gilts. Journal of Animal Science, 91(7), 3137-3142. https://doi.org/10.2527/jas.2012-5778
Microsof Excel (2007) Microsoft Corporation. 1985- 2001. USA. Redmond, WA, USA. NRC. (2012). Nutrient requirements tables and feed ingredient composition. National Research Council. 11th
ed.; National Academy Press: Washington, DC. USA. 400 p.Piva, A., Pizzamiglio, V., Morlacchini, M., Tedeschi, M., & Piva, G. (2007). Lipid microencapsulation allows
slow release of organic acids and natural identical f lavor along the swine intestine. Journal of Animal Science, 85(2), 486-493. https://doi.org/10.2527/jas.2006-323
Prandini, A., Sigolo, S., Morlacchini, M., Grilli, E., & Fiorentini, L. (2013). Microencapsulated lysine and low-protein diets: effects on performance, carcass characteristics and nitrogen excretion in heavy growing–finishing pigs. Journal of Animal Science, 91(9), 4226-4234. https://doi.org/10.2527/jas.2013-6412
SAGARPA NOM-062-ZOO. (1999). Especificaciones técnicas para la producción, cuidado y uso de los animales de laboratorio. Norma Oficial Mexicana-NOM-062-ZOO-1999. Recuperado el 9 de septiembre de 2020, de NOM-062-ZOO-1999: https://www.gob.mx/cms/uploads/attachment/file/203498/NOM-062-ZOO-1999_220801.pdf
SAS. (2010). The SAS system for Windows V8. Statistical Analysis System SAS 9.3 Institute, Cary, NC, USA.Shen, Y. B., Weaver, A. C., & Kim, S. W. (2014). Effect of feed grade L-methionine on growth performance
and gut health in nursery pigs compared with conventional DL-methionine. Journal of Animal Science, 92(152), 5530-5539. https://doi.org/10.2527/jas.2014-7830

100 Agro productividad 2022. https://doi.org/10.32854/agrop.v15i5.2024
Sun, M., Jiao, H., Wang, X., Uyanga, V. A., Zhao, J., & Lin, H. (2020a). Encapsulated crystalline lysine and DL-methionine have higher efficiency than the crystalline form in broilers. Poultry Science, 99(12), 6914-6924. https://doi.org/10.1016/j.psj.2020.09.023
Sun, M., Zhao, J., Wang, X., Jiao, H., & Lin, H. (2020b). Use of encapsulated L-lysine-HCl and DL-methionine improves postprandial amino acid balance in laying hens. Journal of Animal Science, 98(10), 315. https://doi.org/10.1093/jas/skaa315
Wu, G. (2009). Amino acids: metabolism, functions, and nutrition. Amino Acids, 37(1), 1-17. https://doi.org/10.1007/s00726-009-0269-0.
Yang, Z., & Liao, S. F. (2019). Physiological effects of dietary amino acids on gut health and functions of swine. Frontiers in Veterinary Science, 6(1), 169. https://doi.org/10.3389/fvets.2019.00169
Yen, J. T., Kerr, B. J., Easter, R. A., & Parkhurst, A. M. (2004). Difference in rates of net portal absorption between crystalline and protein-bound lysine and threonine in growing pigs fed once daily. Journal of Animal Science, 82(4),1079–1090. https://doi.org/10.2527/2004.8241079x
Zanton, G. I., Bowman, G. R., Vázquez-Añón, M., & Rode, L. M. (2014). Meta-analysis of lactation performance in dairy cows receiving supplemental dietary methionine sources or postruminal infusion of methionine. Journal Dairy Science, 97(11), 7085-7101. https://doi.org/ 10.3168/jds.2014-8220

Colegio dePostgraduados
101
Isolation of bacteria from pulque with probiotic potential Valencia-Franco, Edgar1; Crosby-Galván, María M.2; Galicia-Juárez, Liliana3; Hernández-Sánchez, David2; Pérez-Sato, Marcos1; García y González, Ethel C.4; Ponce-Covarrubias, José L.4*
1 Benemérita Universidad Autónoma de Puebla, Facultad de Ciencias Agrícolas y Pecuarias. Avenida Reforma 167, Tlatlauquitepec, Puebla, México. C. P. 73900.
2 Colegio de Postgraduados, Recursos Genéticos y Productividad-Ganadería. Carretera México-Texcoco km 36.5, Montecillo, Estado de México, México. C. P. 56230.
3 Centro Especializado de Atención Primaria a la Salud (CEAPS), Avenida Zaragoza esq. Francisco I. Madero, Nopaltepec, Estado de México, México. C. P. 55975.
4 Universidad Autónoma de Guerrero, Escuela Superior de Medicina Veterinaria y Zootecnia No. 3, Carretera Acapulco-Zihuatanejo km 106+900, Colonia Las Tunas, Tecpan de Galeana, Guerrero, México. C. P. 40900.
* Correspondence: [email protected]
ABSTRACTObjective: To isolate bacteria from pulque with probiotic potential for animal feed.Design/Methodology/Approximation: Samples were taken from pulque in the municipalities Tlatlauquitepec, Puebla; Otumba and Tequexquinahuac, Estado de Mexico. For the samples, pH, moisture, ash, and protein were determined. The bacteria colonies were isolated and identified morphologically. Gram dyeing and the catalase test were conducted in pre-selected strains from colonies. In the end, strains with probiotic potential, resistance to pH, biliary salts and antimicrobial activity were identified. Results: For pH, moisture, ash, and protein in pulque samples from Tlatlauquitepec, the results were 3.3, 96.17%, 5.98% and 0.352 g 100 mL1; from Otumba, 3.25, 97.67% and 0.1763 g 100 mL1; and from Tequexquinahuac, 2.25, 97.55%, 4.65% and 0.1765 g 100 mL1. Six different strains were isolated (C2, C3 and C4 in Tequexquinahuac; C5 and C6 in Otumba; and C1 in Tlatlauquitepec). It was found that strain C1 could grow in a pH of 3.0 with survival of 84 % and 73% in biliary salts. Study Limitations/Implications: Bacteria from pulque present probiotic characteristics that can be used for animal feed.Findings/Conclusions: Strain C1 grew in pH of 3.0 and showed high percentage of survival, which is why it can be used as probiotic in animal feed.
Keywords: Viscous alcoholic beverage, fermentation of agave nectar, intestinal microbiota, pathogenic microorganisms.
Citation: Valencia-Franco, E., Crosby-Galván, M. M., Galicia-Juárez, L., Hernández-Sánchez, D., Pérez-Sato, M., García y González, E. C., & Ponce Covarrubias, J. L. (2022). Isolation of bacteria from pulque with probiotic potential. Agro Productividad. https://doi.org/10.32854/agrop.v15i5.2181
Academic Editors: Jorge Cadena Iñiguez and Libia Iris Trejo Téllez
Received: November 19, 2020.Accepted: April 14, 2022.Published on-line: June 6, 2022.
Agro Productividad, 15(5). May. 2022. pp: 101-108.
This work is licensed under a Creative Commons Attribution-Non-Commercial 4.0 International license.

102 Agro productividad 2022. https://doi.org/10.32854/agrop.v15i5.2181
INTRODUCTION Pulque is a viscous, non-distilled, alcoholic beverage that is produced and consumed in Mexico, product of the fermentation of Agave nectar (Escalante et al., 2008). The fermentation is produced in non-aseptic conditions, which favors the presence of microorganisms (Kluyveromyces, Zymomona, Leuconostoc and Lactobacillus) which are found in fermented products with probiotic potential (FAO-WHO, 2006; Valadez-Blanco et al., 2012). Probiotics are an alternative to reduce the use of antibiotics because they are innocuous additives constituted by live microorganisms that improve immune-modulating properties (Angmo et al., 2016). For this, they must be able to survive the passage through the digestive tract, and to resist the action of gastric juices and of biliary salts at the start of the duodenum (Hernández-García et al., 2019). In the search for strains that can be used as probiotics, fermented foods such as pulque are an option, where species that belong to the genera Leuconostoc and Lactobacillus perform viscous and lactic acid fermentation, while the species Zymomonas mobilis and Saccharomyces cerevisiae perform alcoholic fermentation (Escalante et al., 2008). Taking into consideration that pulque contains a consortium of microorganisms, it can be considered an important source of probiotics; therefore, the objective of this study was to isolate bacteria with probiotic potential from pulque, which can be used for animal feed.
MATERIALS AND METHODSOrigin of pulque and sampling In this study samples were taken in three municipalities that produce pulque in central Mexico: 1) Ocotlan, Tlatlauquitepec, Puebla (19° 51’ 05’’ LN and 97° 29’ 46’’ LW), 2) Tequexquinahuac (19° 30’ 00’’ LN and 98° 53’ 00’’ LW) and 3) and Otumba (19° 42’ 55’’ LN and 98° 49 ’00’’ LW) in Estado de Mexico (INEGI, 2009). In each site, 500 mL of pulque were sampled. The samples were deposited in sterile containers and conserved in ice during their transport to the Animal Nutrition laboratory, Colegio de Posgraduados, Campus Montecillo, where the proximal chemical analysis was performed.
Proximal chemical analysis: pH, moisture, ash and protein The pH was determined with a potentiometer (Hanna HI 98107) in 100 mL of pulque. Moisture and ash were determined by the freeze-drying method, techniques described in AOAC (1995). The determination of total nitrogen was carried out by the micro Kjeldahl method, using 0.5 mL of pulque and 2 mL of concentrated H2SO4; it was catalyzed and digested until it had an emerald green coloration. It was cooled and transferred to a distiller tube where 30 mL of NaOH at 40% were added. Later, an Erlenmeyer flask with 6 mL of H3BO3 at 4% with indicator was placed and the distiller was turned on. Finally, titration of the distillate was conducted with HCl 0.05 N.
Isolation and morphologic identification of colonies Inside a gas extracting hood (LABCONCO class II type A2), serialized dilutions were carried out (101 to 106) using 9 mL of saline solution and 1 mL of the pulque sample, and aliquots of 0.5 mL from each dilution were sown by surface extension in Petri dishes

103 Agro productividad 2022. https://doi.org/10.32854/agrop.v15i5.2181
with Man-Rogosa-Sharpe-Agar (MRS) medium, methodology described by Cervantes-Contreras and Pedroza-Rodríguez (2007).
Pre-selection of strains: Gram dyeing and catalase test Catalase-negative colonies and Gram-positive bacillus were selected. Gram dyeing was made taking a sample from the isolated colony and deposited in a slide together with a drop of distilled water; it was left to dry, and the smear was fixed by heat (Harrigan, 1976). Selection of strains with probiotic potential: resistance to pH, biliary salts, and antimicrobial activity After the biochemical tests, strains were selected with characteristics that define probiotics such as survival to the digestion process, which is why the strains selected were subjected to tests such as resistance to acid pH, biliary salts and their action described by Gómez-Zavaglia et al. (1998) and Da Silva-Ferrari et al. (2016).
RESULTS AND DISCUSSIONPhysicochemical characteristics In this study the pH ranged from 2.55 to 3.30 (Table 1), values that are below the limits of quality included in the Mexican norm NMX-V-037-1972 (Secretaría de Economía, 1972), which range from 3.5 to 4.0. With higher fermentation there is an increase in the production of lactic acid from lactic acid bacteria as in the production of ethanol through microorganisms of genera Zymomonas and Saccharomyces (alcoholic fermentation), reducing the sugar content and acidifying the medium (Escalante et al., 2008). This is an ideal characteristic for pulque, since it is given by different microorganisms that give rise to the three fermentative processes: lactic, alcoholic, and viscous (Lappe-Oliveras et al., 2008). For its part, moisture was similar between the three samples evaluated, with ranges of 96.17 to 97.67% (Table 1); this was parallel to what was reported by Anderson et al. (2009), who found 98% of moisture in pulque samples. Regarding ash, 5.98% and 4.65% were found in this study in Tlatlauquitepec and Tequexquinahuac, respectively, which were results higher than those found by other studies that report lower contents (from 0.3 to 0.5%). These results are because of the way that the Agave nectar extraction is performed, since a large amount of solids with the minerals that could be in the form of ash in pulque are separated when this is done (Escalante et al., 2016). Finally, 0.352, 0.1763 and 0.1765 g of protein 100 mL1 were obtained in Tlatlauquitepec, Otumba and Tequexquinahuac (Table 1). Results of 0.14 to 0.31 g protein 100 mL1 were found by León-de la O et al. (2012), while Anderson et al. (2009) reported 0.6 g protein 100 mL1. The concentrations of protein and pH in pulque are quite variable,
Table 1. Proximal chemical analysis of pulque samples from the three municipalities sampled.
Samples Hp Humidity (%) Ash (%) Protein (g 100 mL1)Tlatlauquitepec 3.30 96.17 5.98 0.352
Otumba 3.25 97.55 4.10 0.1765
Tequexquinahuac 2.55 97.67 4.65 0.1763

104 Agro productividad 2022. https://doi.org/10.32854/agrop.v15i5.2181
since they are determined by the time of fermentation (Escalante et al., 2008). Values of 0.37 g protein 100 mL1 have been reported at the beginning of the nectar’s fermentation; 48 h later, the concentration decreases to 0.10 g protein 100 mL1 (Cervantes-Contreras and Pedroza-Rodríguez, 2007). Therefore, the characterization of pulque is complex since it involves factors that intervene in its production: microorganisms, type of maguey and of soil, climate, time of harvest, and innocuousness practices that were conducted during the process (Angmo et al., 2016).
Isolation and morphological identification of colonies Six strains were isolated in the study (C); C2, C3 and C4 correspond to Tequexquinahuac, C5 and C6 to Otumba; and C1 to Tlatlauquitepec (Table 2). The strains C2, C3, C4 and C5 have morphological characteristics associated to yeasts. The characteristics found in this study agree with what was reported by Escalante et al. (2016): white, creamy colonies, large and with regular edges. The strains C1 and C6 presented morphological characteristics of Lactobacillus spp. (Figure 1a), which were reported in studies carried out by León-de la O et al. (2012).
Table 2. Morphological characteristics of the colonies isolated from pulque collected in three municipalities.
Characteristic Tlatlauquitepec Tequexquinahuac Otumba
C1 C2 C3 C4 C5 C6Size Small Medium Large Medium Large Small
Colour White White Cream White White Cream
Form Round Concave Round Round Round Round
Elevation Convex Convex Flat Convex Convex Flat
Area Lisa Lisa Lisa With reliefs Lisa Lisa
Borders Continuos Continuos Continuos Irregulares Continuos Continuos
Reflected light Bright Bright Opaque Bright Bright Opaque
Appearance Creamy Creamy Creamy Secas Creamy Creamy
Figure 1. Strain C1 isolated from the sample from Tlatlauquitepec, Puebla (a), and its Gram dyeing (b).
a b

105 Agro productividad 2022. https://doi.org/10.32854/agrop.v15i5.2181
Table 3. Gram dyeing and catalase test of the isolated strains.
Samples Strains Gram stain Form Catalase TestTlatlauquitepec 1 Positive Bacilli Negative
Tequexquinahuac
2 Positive Leaven Positive
3 Positive Leaven Positive
4 Positive Leaven Positive
Otumba 5 Negative Bacilli Positive
6 Positive Bacilli Positive
When performing Gram dyeing and the catalase test in the six isolated strains, only C1 fulfilled the characteristics that distinguish lactic acid bacteria of the genus Lactobacillus, which are: positive Gram dyeing, bacillus shape and negative catalase (Table 3; Figure 1b). Therefore, it was the only one selected for the probiotic potential tests. For a microorganism to be considered probiotic, it must be viable at the moment of consumption. Although there is still not an adequate dose, the food industry and the Food and Drug Administration (FDA) recommend an amount of 10-6 CFU mL1 (Tripathi and Giri, 2014). The CFU of each dilution corresponds to each strain obtained presented in Table 4; as can be seen, C1 from Tlatlauquitepec was the one that presented a higher concentration (2106 CFU mL1) which is within the recommendations to be supplied as probiotic. In its part, C4 was the one that obtained the lowest recount. The CFU mL1 values obtained in the samples analyzed are low compared to what was reported by Escalante et al. (2008) who describe that lactic acid bacteria predominate during the first hours of fermentation of the Agave nectar with pulque (BAL; 1.5108 CFU mL1), followed by aerobic mesophilic bacteria (1.2107 CFU mL1) and yeasts (8.8106 CFU mL1), stating as so until the end of the fermentation.
Probiotic potential tests The C1 strain isolated from Tlatlauquitepec grew with pH of 3.0 and showed a survival of 84% (Table 5). Similar data were found by González-Vázquez et al. (2015) when they subjected the sample isolated from pulque to a pH of 1.5 for 4 h and found survival of
Table 4. Counting of colony forming units (CFU mL1) per municipality sampled.
Samples StrainsDilutions
101 102 103 104 105 106
Tlatlauquitepec M1 UCT UCT 232 60 12 2
Tequexquinahuac
M2 UCT UCT UCT 646 130 -
M3 UCT UCT UCT 16 - -
M4 134 - - - - -
Otumba M5 UCT 98 20 4 - -
M6 UCT 232 - - - -
UNCUncountable. The dash means bacteria growth.

106 Agro productividad 2022. https://doi.org/10.32854/agrop.v15i5.2181
60% of the L. casei strain. For their part, Cervantes-Elizarrarás et al. (2019) determined the probiotic properties of 10 BAL strains of the genus Lactobacillus isolated from pulque, subjecting the strains to a pH of 2 during 2 h, obtaining a survival of 63.2 to 96.3%. Escalante et al. (2016) mention that when the tolerance of BAL to a medium with pH of 3.0 is evaluated in vitro, it should be done for 3 h, average time that digestion takes. The results obtained indicate that C1 can be a candidate to be used as probiotic (González-Vázquez et al., 2015). The resistance of the strains to conditions of acid pH has been attributed to the different regulation mechanisms of intracellular pH and alkalization of the external environment through decarboxylation and deamination reactions (Tripathi and Giri, 2014).
Biliary salts The in vitro evaluation of the strain selected was conducted at a concentration of 0.5% of biliary salts, incubating it at 37 °C during 24 h. C1 showed a survival of 73% (Table 5). These results are similar to those found by Castro-Rodríguez et al. (2015) where four strains of L. mesenteroides isolated from pulque had a survival of 88 to 99% subjected to 0.5% of biliary salts. For their part, Cervantes-Elizarrarás et al. (2015) obtained different results from those in this study, where three out of the ten strains of BAL isolated from pulque showed a resistance to biliary salts (0.5%) of 52.5 to 55.7%, and the remaining strains obtained a resistance of 58.8 to 66%. The capacity for resistance to biliary salts is attributed primarily to the presence of the hydrolase enzyme of biliary salts, which is secreted by some lactic acid bacteria of the genus Lactobacillus (Begley et al., 2006). The results obtained both in the pH test and in that of biliary salts indicate that the C1 strain is a candidate to be probiotic. A probiotic strain is capable of surviving as it passes through the stomach (pH3.0) and small intestine (biliary salts 0.5%) (Hernández-Mancipe et al., 2019), places where these two natural and important barriers are found in mammals.
Table 5. Percentage of survival of the C1 strain isolated from Tlatlauquitepec.
Dilutions Control(UFC mL1)
Acidified Hp 3(UFC mL1) Survival (%) Control
(UFC mL1)Bile salts 0.5%(UFC mL1) Survival (%)
101 UCT UCT UCT UCT UCT UCT
102 UCT UCT UCT UCT UCT UCT
103 UCT UCT UCT UCT UCT UCT
104 UCT UCT UCT UCT UCT UCT
105 UCT UCT UCT UCT UCT UCT
106 390 380 97.43 310 156 50.32
107 80 76 95 92 89 96.73
108 13 8 61.53 - - -
Mean 84.65 201 122.5 73.53
UNC: Uncountable, CFU: colony forming units (CFU). The dash means without bacteria development.

107 Agro productividad 2022. https://doi.org/10.32854/agrop.v15i5.2181
Antimicrobial activity against pathogenic bacteria The C1 strain did not show antimicrobial activity against the pathogenic bacteria E. coli ATCC 25922 and Salmonella typhimutium ATCC 14028 (Figure 2). In a study carried out by Cervantes-Elizarrarás et al. (2019), the authors found that 4 out of 10 strains of BAL isolated from pulque did not present antimicrobial activity against Escherichia coli and Staphylococcus aureus. There are reports that lactic acid bacteria and Leuconostoc mesenteroides P45 isolated from pulque have activity against enteropathogenic bacteria E. coli (EPEC), L. monocytogenes, S. enterica serovar Typhi and Typhimuriu (Giles-Gómez et al., 2016). The lack of antimicrobial activity presented by the C1 strain can be attributed to the absence of conditions for anaerobiosis.
Figure 2. Results from the antimicrobial activity of strain C1.
CONCLUSIONS It was found that the strain from Tlatlauquitepec, Puebla (C1), grew in pH of 3.0 and showed a high percentage of survival; therefore, it can be used as probiotic in animal feed. However, it did not show antimicrobial activity against pathogenic bacteria E. coli ATCC 25922 and Salmonella typhimutium ATCC 14028.
REFERENCESAnderson, R. K., Calvo, J., Serrano, G., & Payne, G. C. (2009). Estudio del estado de nutrición y los hábitos
alimentarios de comunidades otomíes en el Valle del Mezquital de México. Salud Publica de México, 51(4), 25-31.
Angmo, K., Kumari, A., Savitri, & Bhalla, T. C. (2016). Probiotic characterization of lactic acid bacteria isolated from fermented foods and beverage of Ladakh. Lebensmittel-Wissenschaft und Technologie, 66(4), 428-435. https://doi.org/10.1016/j.lwt.2015.10.057
AOAC. (1995). Official Methods of analysis of AOAC. Switzerland: Editorial AOAC International. Retrieved on April 5, 2022, from: http://learn.embracerace.org/aoac_official_methods_of_analysis_1995.pdf
Begley, M., Hill, C., Hill, C., & Gahan, C. G. M. (2006). Bile salt hydrolase activity in probiotics. Applied and Environmental Microbiology, 72(3), 1729-1738. https://doi.org/10.1128/AEM.72.3.1729-1738.2006
Castro-Rodríguez, D., Hernández-Sánchez, H., & Yáñez-Fernández, J. (2015). Probiotic properties of Leuconostoc mesenteroides isolated from aguamiel of Agave salmiana. Probiotics and Antimicrobial Proteins, 7, 107-117. https://doi.org/10.1007/s12602-015-9187-5

108 Agro productividad 2022. https://doi.org/10.32854/agrop.v15i5.2181
Cervantes-Contreras, M., & Pedroza-Rodríguez, A. M. (2007). El pulque: características microbiológicas y contenido alcohólico mediante espectroscopia Raman. Nova 5(8), 135-146. https://doi.org/10.22490/24629448.382
Cervantes-Elizarrarás, A. C., Cruz-Cansino, N. S., Ramírez-Moreno, E., Vega-Sánchez, V., Velázquez-Guadarrama, N., Zafra-Rojas, Q. Y., & Piloni-Martini, J. (2019). In vitro probiotic potential of lactic acid bacteria isolated from aguamiel and pulque and antibacterial activity against pathogens. Applied Sciences, 9(3), 601. https://doi.org/10.3390/app9030601
Da Silva-Ferrari, I., Viana-de Souza, J., Lacerda-Ramos, C., Matiuzzi-de Costa, M., Freitas-Schuwan, R., & Silvia-Dias, F. (2016). Selection of autochthonous lactic acid bacteria from goat dairies and their addition to evaluate the inhibition of Salmonella typhi in artisanal cheese. Food Microbiology, 60, 29-38. https://doi.org/10.1016/j.fm.2016.06.014
Escalante, A., Giles-Gómez, M., Hernández, G., Córdova-Aguilar, M. S., López-Munguía, A., Gosset, G., & Bolívar, F. (2008). Analysis of bacterial community during the fermentation of pulque, a traditional Mexican alcoholic beverage, using a polyphasic approach. International Journal of Food Microbiology, 124(2), 126-134. https://doi.org/10.1016/j.ijfoodmicro.2008.03.003
Escalante, A., López-Soto, D. R., Velázquez-Gutiérrez, J. E., Giles-Gómez, M., Bolívar, F., & López-Munguía, A. (2016). Pulque, a traditional mexican alcoholic fermented beverage: historical, microbiological, and technical aspects. Frontiers in Microbiology, 7, 1026. https://doi.org/103389/fmicb.2016.011026
FAO-WHO. (2006). Probiotics in food, health and nutritional properties and guidelines for evaluation. Retrieved on April 5, 2022, from FAO: https://www.fao.org/3/a0512e/a0512e.pdf
Giles-Gómez, M., Sandoval-García, J.G., Matus, V., Campos-Quintana, I., Bolívar, F., & Escalante, A. (2016). In vitro and in vivo probiotic assessment of Leuconostoc mesenteroides P45 isolated from pulque, a Mexican traditional alcoholic beverage. Springerplus, 5, 708. https://doi.org/10.1186/s40064-016-2370-7
Gómez-Zavaglia, A., Kociubinsky, G., Pérez, P., & De Antoni, G. (1998). Isolation and characterization of Bifidobacterium Strains for Probiotics Formulation. Journal of Food Protection, 61(7), 865-873. https://doi.org/10.4315/0362-028x-61.7.865
González-Vázquez, R., Azaola-Espinosa, A., Mayorga-Reyes, L., Reyes-Nava, L.A., Shah, N. P., & Rivera-Espinoza, Y. (2015). Isolation, identification and partial characterization of a Lactobacillus casei strain with bile salt hydrolase activity from pulque. Probiotics and Antimicrobial Proteins, 7(4), 242-248. https://doi.org/10.1007/s12602-015-9202-x
Harrigan, W. F., & McCance M. E. (1976). Laboratory Methods in Food and Dairy Microbiology; Academic Press Inc. Limited: London, UK. 760 p.
Hernández-Mancipe, L. E., Londoño-Velez, J. I., Hernández-Garcpia, K. A., & Torres-Hernández, L. C. (2019). Los sistemas biofloc: una estrategia eficiente en la producción acuícola. Revista CES Medicina Veterinaria y Zootecnia, 14(1), 70-99. https://doi.org/10.21615/cesmvz.14.1.6
Hernández-García, J. E., Sebastián-Frizzo, L., Rodríguez-Fernández, J. C., Valdez-Paneca, G., Virginia-Zbrun, M., & Calero-Herrera, I. (2019). Evaluación in vitro del potencial probiótico de Lactobacillus acidophilus SS80 and Streptococcus thermophilus SS77. Revista de Salud Animal, 41(1), 1-13.
INEGI. (2009). Compendio de información geográfica municipal de los Estados Unidos Mexicanos Tlahuapan, Puebla. Retrieved on April 5, 2022, from INEGI: https://www.inegi.org.mx/contenidos/app/mexicocifras/datos_geograficos/21/21180.pdf
Lappe-Oliveras, P., Moreno-Terrazas, R., Arrizón-Gaviño, J., Herrera-Suárez, T., García-Mendoza, A., & Gschaedler-Mathis, A. (2008). Yeast associated with the production of Mexican alcoholic nondistilled and distilled Agave beverages. FEMS Yeast Research, 8(7), 1037-1052. https://doi.org/10.1111/j.1567-1364.2008.00430.x
León-de la O, D. I., Méndez-Colín, D. S., Rodríguez-Padilla, D. P., Puente-Hurle, L., García-Sorrondegui, F. I., & Salgado-Brito, R. (2012). Análisis bromatológico y aislamiento de microorganismos con potencial probiótico del pulque. Investigacion Universitaria Multidisciplinaria, 11(11), 115-122.
Secretaría de Economía (1972). Pulque manejado a granel. Norma mexicana NMX-V-037-1972. Recuperado el 6 de abril de 2022, de: https://media.gotomexico.today/reglament/nmx-v-037-1972.pdf
Tripathi, M. K., & Giri, S. K. (2014). Probiotic functional foods: Survival of probiotics during processing and storage. Journal of Functional Foods, 9, 225-241. https://doi.org/10.1016/j.jff.2014.04.030
Valadez-Blanco, R., Bravo-Villa, G., Santos-Sánchez, N. F., Velasco-Almendarez, S. I., & Montville, T. J. (2012). The artisanal production of pulque, a traditional beverage of the Mexican Highlands. Probiotics and Antimicrobial Proteins, 4(2), 140-144. https://doi.org/10.1007/s12602-012-9096-9

Colegio dePostgraduados
109 Image by JamonSeleccion at Pixabay
Creole corns from the Yucatan Peninsula as an alternative in the diet of the Mexican hairless pigBautista-Rodríguez, Carlos F.; Herrera-Guzmán, Carlos J.; Candelaria-Martínez, Bernardino2; Ramírez-Bautista, Marco A.2; Chiquini-Medina, Ricardo A.2*
Tecnológico Nacional de México/Instituto Tecnológico de Chiná, Calle 11 s/n entre 22 y 28 Centro, Chiná, Campeche, México. C. P. 24520
* Correspondence: [email protected]
ABSTRACTObjective: The Mexican hairless pig (Sus scrofa) is a species with high degree of rusticity and environmental adaptation, capable of being included in genetic improvement programs and participant in food sovereignty. As a monogastric animal, its diet is diverse, which could include grains and fodders. However, there are few records about current alternatives used in its diet that are capable of improving the yields and quality of the meat. In the Yucatan Peninsula there are native corns with fodder potential, capable of being used in animal feed. The objective of this review was to show the potential of native corns, and their capacity to be used in the diet of the Mexican hairless pig.Design/Methodology/Approximation: A systematic review of the literature from the period 2000 to 2020 was carried out, where the potential of Creole corns to be used in animal feed was documented, both because of their yields in grain and their plant biomass production.Results: Based on the information analyzed, the use of San Pableño, Dzit bacal, and Nal Tel breeds is recommended, for their inclusion in the diet of the Mexican hairless pig due to their nutritional, mineral and antioxidant value.Study Limitations/Implications: There are studies pending to allow understanding the form and quantity to supply them in the diet.Findings/Conclusions: Creole corns that are present in the Yucatan Peninsula present high rusticity and agroclimatic adaptation, with productive potential to compete with the commercial varieties and hybrids, in the production of corn grain and fodder, reason why they can be used in the diet of the Mexican hairless pig, since it is an animal species of great adaptation.
Keywords: nutrition of Sus scrofa, corn breeds and varieties, corn ensilage, Ibero-American pigs, nutritional content of Creole corn.
INTRODUCTION Mexico is considered to be the center of origin of corn, due to the existence of a broad diversity of native breeds and varieties (Massieu-Trigo and Lechuga-Montenegro, 2002). These have propagated to other countries of Latin America, such as Guatemala, Colombia, Peru and Brazil (Alemán-Pérez et al., 2020).
Citation: Bautista-Rodríguez, C. F., Herrera-Guzmán, C. J., Candelaria-Martínez, B., Ramírez-Bautista, M. A., Chiquini-Medina, R. A. (2022). Creole corns from the Yucatan Peninsula as an alternative in the diet of the Mexican hairless pig.Agro Productividad. https://doi.org/10.32854/agrop.v15i5.2162
Academic Editors: Jorge Cadena Iñiguez and Libia Iris Trejo Téllez
Received: October 28, 2021.Accepted: April 23, 2022.Published on-line: June 6, 2022.
Agro Productividad, 15(5). May. 2022. pp: 109-115.
This work is licensed under a Creative Commons Attribution-Non-Commercial 4.0 International license.
109

110 Agro productividad 2022. https://doi.org/10.32854/agrop.v15i5.2162
In Mexico, Creole corns occupy the first place in agriculture (Hortelano-Santa Rosa et al., 2012), since they represent close to 75% of national corn production (Tadeo-Robledo et al., 2015) and there is the presence of more than 61 endemic breeds (Arias et al., 2007). This is despite the existence of commercial hybrids produced by government institutions and by large international companies (Monsanto, Pioneer, Syngenta), which lead the global seed market (Tadeo-Robledo et al., 2015). The productive potential of corn breeds is due to its capacity for environmental adaptation, which has allowed the development of the diversity of species present in Mexico, which have guaranteed the supply of foods among the vulnerable population (Hortelano-Santa Rosa et al., 2012), and can be used in animal nutrition, through the inclusion of these in the diet of monograstic animals. The Mexican hairless pig is a species with great potential to be included in food security projects. This is due to its characteristics of environmental adaptability, in addition to high rusticity and productive capacity, added to the quality of its meat. Likewise, since it is a monogastric species, it presents great tolerance to diets rich in fiber, such as fodders, which can represent an option in animal nutrition (Ramos-Canché et al. 2020). In the Yucatan Peninsula, there are genetic materials of high yield in production of grain and fodder, which have not been used in their totality in areas such as the agriculture and livestock sector (Villalobos-González et al., 2019) as in the case of animal nutrition. The objective of this article is to present an updated review on the fodder potential of native corns and their inclusion in the diet of the Mexican hairless pig (Sus scrofa), to provide knowledge that can help to improve the sustainable production and the genetic conservation of both species.
MATERIALS AND METHODS A systematic review of national and international articles and publications was conducted, about the corn breeds and varieties present in the Yucatan Peninsula and their potential in fodder production, as well as their capacity to be used in the diet of the Mexican hairless pig. Sources used. The search for information was performed through the indexed databases: Google Scholar, Scielo, Dialnet and Redalyc. Only articles from indexed journals were considered as sources of information, considering mainly primary sources. Strategies for the search. The consultation of information was conducted with the words “razas de maíz” “forraje” “Península de Yucatán”, “razas de maíz” “caracterización” “Península de Yucatán”, “maíces nativos” “potencial forrajero”, “ensilaje de maíz” “ganancia de peso” “en cerdos”, “características” “cerdo pelón mexicano” “investigación” (“corn breeds” “fodder” “Yucatan Peninsula”, “ corn breeds” “characterization” “Yucatan Peninsula”, “native corns” “fodder potential”, “corn ensilage” “weight gain” “in pigs”, “characteristics” “Mexican hairless pig” “research”). A range of 20 years (2000-2020) was considered in the publications, and titles in Spanish and English were taken into consideration, published within this range of years in the search engines. Criteria of inclusion and exclusion. Only scientific articles were considered, while reviews, theses and gray literature were excluded.

111 Agro productividad 2022. https://doi.org/10.32854/agrop.v15i5.2162
Extraction of the data and data analysis. The literature review resulted in a total of 219 publications related to corn breeds, corn varieties and use of fodder in pigs in Mexico, in the Yucatan Peninsula and outside the country. The abstracts and complete documents were taken into consideration to select the information, and a total of 58 scientific articles were obtained, which were considered in this review. Results of the documental review were organized into sub-themes to ease their analysis and discussion.
Corn breeds and varieties present in the Yucatan Peninsula In the Yucatan Peninsula, among the principal corn breeds that have been recorded and which are still conserved until today, the following stand out: Naál Xóy, Xnúc Naál Blanco, Gallito Amarillo, Dzit Bacal, Mejeén Naál, Rosa San Juan, Cháck-Chóp, Teél Cháck, Sáck Teél, San Pableño, Ejú-Criollo Morado, Xmején Naál Tsitbacal and Clavo Chia-paneco (Villalobos-González et al., 2019). Likewise, the following breeds and varieties are recognized: San Pableño amarillo, blanco, rojo, Nal Xoy amarillo, Nal Xoy blanco, palomero amarillo, tabloncillo, Nal Tel (Sak Nal Tel, Kan Nal Tel, Chac Nal Tel), Xʼmejen Naal (Sak Xʼmejen naal, Kʼan Xʼmejen naal, Chac Xʼmejen naal), pix cristo, Sak tux (González-Valdivia et al., 2016). The breeds Nal t’eel, Xmejen nal, T’síit bakal and Xnuuk nal are the most representative and with highest presence in the states that make up the Yucatan Peninsula (Cázares-Sánchez et al., 2015). In this sense, Villalobos-González et al. (2019) evaluated local varieties present in the Yucatan Peninsula, highlighting the breeds Naál Xóy and Dzit Bacal as the ones with the highest grain yield, of 4,751 and 4,417 kg. Likewise, studies performed by Ku-Pech et al. (2020) mention the persistence in the use of the breeds Nal Xoy, Xnuk Nal which is due to their characteristics of resistance and rusticity, and the use of the breed Nal Tel because of its precociousness, together with Dzit Bacal, because of its high yields.
Fodder potential of native corns Sánchez-Hernández et al. (2011), when comparing the fodder potential of corn genotypes with different sowing densities (50,000; 62,500 and 83,333 plants ha1), showed the superiority of Creole corns with a yield of 57 t ha1 of green matter at a density of 83,333 plants, in comparison with the hybrid H-520 which contributed 36.4 t ha1 of fodder and the control variety VS-536 with a yield of 36 t ha1, both managed at 62,500 plants ha1. These results highlight the importance of understanding the fodder potential of the Creole materials that are useful in the agriculture and livestock sector. Similar results were found by Godina-Rodríguez et al. (2020) who, when evaluating the fodder potential of native corns of the central zone of Mexico, found a great potential for the production of total dry matter of genotypes such as Ratón Tuxpeño Norteño, with means of 8.8 ton ha1; these values are higher than those found with commercial hybrids such as A6-069-B with means of 3.1 ton ha1, showing the importance of the improvement and rescue of corn genetic materials for fodder production. For their part, Villalobos-González et al. (2019) evaluated 13 native corn accessions from the Yucatan Peninsula, pointing to the breeds Ejú-criollo Morado, San Pableño and Xmején Naál Tsitbacal, with the best means of plant height (370, 340 and 337 cm,

112 Agro productividad 2022. https://doi.org/10.32854/agrop.v15i5.2162
respectively), and regarding grain yields, Naál Xóy, Dzit bacal and San Pableño (4751, 4417 and 4017 kg ha1, respectively). This allows concluding that there was high genetic variability, which could serve in terms of the rescue and improvement of native breeds with productive purposes. A distinctive characteristic of native breeds is their adaptation and great rusticity to agroecological conditions, which ensures production compared to commercial hybrids, which totally depend on the agronomic management that is characteristic of technological packages. In this regard, Conceição-dos Santos et al. (2019) mention the breeds Dzit bacal, with an efficient use of water and climatic adaptation, as well as the breed Xmején nal, due to its precociousness, with potential to be used in the Yucatan Peninsula in fodder and grain production, respectively.
Nutritional content of native corns from the Yucatan Peninsula Studies performed in native corns to know the variation in the composition of the grain have shown to have a high nutritional content in the native precocious breeds, such as Nal t’eel and Xmejen nal, which have presented high concentrations of protein (10.80-11.9% and 10.2-11.9%) and triptophan (0.00080-0.12% and 0.094-0.129%). Meanwhile, the breeds of type T’síit bakal and Xnuuk nal present higher lysine concentration (2.97 g) and lower protein concentration (10.54 and 10.62%). The average of fiber ranged between 1.13 and 1.57%, with Nal tʼeel occupying the first place. This variation in the chemical composition of native corn populations is a determining factor for the genetic improvement, and for their inclusion in animal nutrition (Cázares-Sánchez et al., 2015). For their part, Chí-Sánchez et al. (2021) studied the mineral concentration of various native corn varieties present in the Yucatan Peninsula, where the genotypes Xnuuk-nal anaranjado stood out, with ranges of P of 52.66 mg kg1, and concentrations of K of 3693.36 mg kg1, S of 71.99 mg kg1, Mg of 831.91 mg kg1 and Na of 1831.94 mg kg1, followed by Xnuuk-nal anaranjado with high concentration of Ca (127.68 mg kg1). Likewise, Xʼmejen nal anaranjado was outstanding, with a high concentration of Zn (36.8 mg kg1) and Cu (1169.4 mg kg1). Therefore, these native corns can be used in the genetic improvement and in nutritional management programs, both for humans and for animals. Grain coloring is an important factor in mineral and nutritional content, aspect which is very present in the native corn varieties. The orange grains with high content of carotenoids, f lavonoids and anthocyanins stand out, which presently confer antioxidant properties, to be considered in the food industry (Zhirkova et al. 2016).
Potential use of corn fodder in the diet of the Mexican hairless pig In the Yucatan Peninsula, the Mexican hairless pig is bred in three types of production systems (backyard, extensive and intensive), with drove sizes between 9, 56 and 96 animals. The diet in these systems is based primarily on the use of wheat bran, corn and balanced meals, as well as fodder of tree species such as breadnut (Brosimum alicastrum). Corn is used in the intensive systems, in proportions of 42% as feed, and 60% as supplement, and the use of fodders occupies percentages of 10 to 70% in pigs’ diets (Hernández et al., 2020).

113 Agro productividad 2022. https://doi.org/10.32854/agrop.v15i5.2162
An alternative in their diet can be the inclusion of corn ensilage, with which the fodder potential of the native corn species could be exploited, and the production costs in intensive systems can be reduced (Villalobos-González et al., 2019). The fodder potential of the corn breeds and varieties present in the Yucatan Peninsula provides the possibility of being used in the production of corn ensilage, alternative feed in times of low water levels (Villalobos-González et al., 2019). A distinctive characteristics of the native varieties is that races of short, intermediate and long cycle can be found, so that they can be farmed in different regions and under different climate conditions (González-Valdivia et al., 2016). It is important to consider that the use of fodders and ensilages in pigs’ diets should not exceed 20% of the portion (González et al., 2020). Likewise, studies conducted by Weber et al. (2008) to understand the effect of the inclusion of different sources of fiber (dry distillery grains with soluble elements, soy husk or citrus pulp), showed that in proportions of 7.5% they are capable of increasing the content of pro-inflammatory and anti-inflammatory cytokinins of the intestinal tissue. Studies performed with ensilage of a mixture of yucca roots (Manihot esculenta Crantz) and corn residues in Yorkshire Landrace CC21 pigs showed acceptability to diets with alternative supplements, although significant differences from the inclusion of ensilage were not manifested, and no animal deaths or digestive type disorders were found (Cabrera and Lezcano, 2012). The inclusion of corn ensilage in pigs’ diets have been successfully used by Kanengoni et al. (2015) in native breeds of growing South African Windsnyer pigs and in Large White Landrace crosses, attaining an acceptability of the corn ensilage in high and low proportions, for both pig breeds, both native and in the crosses, influencing the breeds in acceptability of the feed. Likewise, Capraro et al. (2017) showed that the use of corn ensilage improved the quality of the dorsal fat during the seasoning process, without generating effects in the loss of condiments for ham elaboration. In this sense, Sun et al. (2018) mention that there was a decreasing line in the final weight and average weight gain with the use of full-plant corn ensilage in proportions of 20, 30 and 40% in the diet of growing pigs (Duroc Landrace Large White), with means of fiber between 3.0 and 4.5%, as well as in the apparent digestibility of the nutrients. However, the daily food intake increased linearly, concluding that the inclusion of full-plant corn ensilage, supplied at between 20 and 30%, can ensure the yield and improve the health of growing pigs. On the other hand, Lyu et al. (2020) reported that the use of corn ensilage in the diet of mestizo pigs Duroc A (Landrace  Northeastern Indigenous) did not cause health problems in the pigs’ health, which were able to tolerate high concentrations of it (80% in the inclusion of fodders); and contrary to the common idea, the pigs fed with corn ensilage improved the load capacity of the livestock, without causing violent falls in the yield. In addition, the yields reached in final weights with corn ensilage were close to the conventional management with fodders with a difference of 13.2%. Corn ensilage can represent an option for the diet of the Mexican hairless pig. However, there are no data from studies carried out in Mexico on the inclusion of corn ensilage in pigs’ diets, and particularly of the Mexican hairless pig. Therefore, studies are necessary

114 Agro productividad 2022. https://doi.org/10.32854/agrop.v15i5.2162
which allow understanding the behavior of omnivores, as well as the portion and the adequate way of providing these foods. Likewise, studies are necessary on the nutritional contribution of native corn ensilage, due to the effect of the grain color, stage of cutting, and ensilage process, as well as the quality of the corn ensilage. With this, the production and rescue of native corn species is incentivized, which are at risk of genetic loss.
CONCLUSIONS Creole corns present high rusticity and agroclimatic adaptation in the Yucatan Peninsula, and there is also a large diversity of them. The ones that stand out are San Pableño, Dzit bacal, and Nal Tel type breeds, which present productive potential to compete with the commercial varieties and hybrids in maize production for grain and fodder, in addition to having nutritional, mineral and antioxidant value. Therefore, they can be used in the diet of the Mexican hairless pig, since it is an animal species with great adaptation. However, there are still studies pending that would allow understanding the form and amount to supply them in the diet. This translates into scientific research areas for the Yucatan Peninsula, and especially for the state of Campeche.
AKNOWLEDGEMENTS The authors thank the National Science and Technology Council (Consejo Nacional de Ciencia y Tecnología,
CONACyT), for the scholarship granted to the first author to carry out graduate studies.
REFERENCESAlemán-Pérez, R. D., Ortiz-Tenemaza, R. V., Domínguez-Brito, J., Bravo-Medina, C. A., Alba-Roja, J. L.,
Rodríguez-Guerra, Y., Pico-Angulo, C., & Freile-Almeida, J. (2020). Desarrollo productivo de dos variedades locales de maíz (Zea mays L.) con la aplicación de fertilizante mineral y orgánico en la Amazonía Ecuatoriana. Revista Ciencia y Tecnología, 13(1), 9-16. https://doi.org/10.18779/cyt.v13i1.343
Arias, L. M., Latournerie, L., Montiel, S. & Sauri, E. (2007). Cambios recientes en la diversidad de maíces criollos de Yucatán, México. Ecosistemas y Recursos Agropecuarios, 23(1), 69-74. https://doi.org/10.19136/era.a23n1.310
Cabrera, L. R., & Lezcano, P. (2012). Uso de ensilado de raíces de yuca y residuos de granos de maíz en la ceba de cerdos. Revista Computadorizada de Produccion Porcina, 19(3), 196-200.
Capraro, D., Buccioni, A., Piasentier, E. & Spanghero, M. (2017). Feeding finishing heavy pigs with corn silages: Effects on backfat fatty acid composition and ham weight losses during seasoning. Italian Journal of Animal Science, 16(4), 588-592. https://doi.org/10.1080/1828051X.2017.1302825
Cázares-Sánchez, E., Chávez-Servía, J. L., Salinas-Moreno, Y., Castillo-González, F., & Ramírez-Vallejo, P. (2015). Variación en la composición del grano entre poblaciones de maíz (Zea mays L.) nativas de Yucatán, México. Agrociencia, 49(1), 15-30.
Chí-Sánchez, F. A., Alvarado-López, C. J., Cristóbal-Alejo, J., González-Moreno, A., & Reyes-Ramírez, A. (2021). Contenido mineral de maíces criollos de Yucatán: Análisis mediante -Fluorescencia de Rayos X. Terra Latinoamericana, 39(1), 1-12. https://doi.org/10.28940/terra.v39i0.454
Conceição-dos Santos, L. F., Garruña, R., Andueza-Noh, R. H., Latournerie-Moreno, L., Mijangos-Cortés, J. O., & Pineda-Doporto, A. (2019). Comportamiento agronómico y fisiológico de maíces nativos del sureste de México. Revista Mexicana de Ciencias Agrícolas, 10(6), 1247-1258. https://doi.org/10.29312/remexca.v10i6.908
Godina-Rodríguez, J. E., Martínez-Garay, J. R., Mendoza-Pedroza, S. I., Joaquín-Cancino, S., & Rocandio-Rodríguez, M. (2020). Rendimiento de forraje y composición morfológica de maíces nativos en condiciones semiáridas. Revista Mexicana de Ciencias Agrícolas, 1(24), 59-68. https://doi.org/10.29312/remexca.v0i24.2358
González, A., Figueroa, V., Batista, C., Casal, A., Álvarez, A., Saadoun, A., & Astigarraga, L. (2020). Inclusión de forrajes con distinta relación de fibra soluble e insoluble en la dieta de cerdos. Archivos de Zootecnia, 69(268), 424-431. https://doi.org/10.21071/az.v69i268.5390

115 Agro productividad 2022. https://doi.org/10.32854/agrop.v15i5.2162
González-Valdivia, N. A., Cetzal-Ix, W., Basu, S. K., Pérez-Ramírez, I., Martínez-Puc, J. F., & Zandi, P. (2016). Conservation of the genetic diversity of local corn (Zea mays L.) in the Yucatan Peninsula, Mexico. Annales Universitatis Paedagogicae Cracoviensis Studia Naturae, 1(1), 71-84.
Hernández, A. Á., García-Munguía, C. A., García-Munguía, A. M., Ortiz-Ortiz, J. R., Sierra Vásquez, Á. C., & Morales Flores, S. (2020). Sistema de producción del Cerdo Pelón Mexicano en la Península de Yucatán. Nova Scientia, 12(24), 1-22. https://doi.org/10.21640/ns.v12i24.2234
Hortelano-Santa Rosa, R., Gil-Muñoz, A., Santacruz-Varela, A., López-Sánchez, H., López, P. A., & Miranda-Colín, S. (2012). Diversidad fenotípica de maíces nativos del altiplano centro-oriente del estado de Puebla, México. Revista Fitotecnia Mexicana, 35(2), 97-109.
Kanengoni, A. T., Chimonyo, M., Ndimba, B. K., & Dzama, K. (2015). Feed preference, nutrient digestibility and colon volatile fatty acid production in growing South African Windsnyer-type indigenous pigs and Large White Landrace crosses fed diets containing ensiled maize cobs. Livestock Science, 171(1), 28-35. https://doi.org/10.1016/j.livsci.2014.10.018
Ku-Pech, E. M., Mijangos-Cortés, J. O., Andueza-Noh, R. H., Chávez-Pesqueira, M., Simá-Polanco, P., Simá-Gómez, J. L., & Arias-Reyes, L. M. (2020). Estrategias de manejo de la milpa maya en Xoy, Peto, Yucatán. Ecosistemas y Recursos Agropecuarios, 7(1), e2244. https://doi.org/10.19136/era.a7n1.2244
Lyu, Y., Li, J., Hou, R., Zhu, H., Zhu, W., Hang, S., & Ouyang, Z. (2020). Goats or pigs? Sustainable approach of different raising systems fed by maize silage. Journal of Cleaner Production, 254(1), 120151. https://doi.org/10.1016/j.jclepro.2020.120151
Massieu-Trigo, Y., & Lechuga-Montenegro, J. (2002). El maíz en México: Biodiversidad y cambios en el consumo. Análisis Economico, 17(36), 281-303.
Ramos-Canché, M. E., Aguilar-Urquizo, E., Chay-Canul, A. J., Piñeiro-Vázquez, Á. T., Velázquez-Madrazo, P. A., Magaña Magaña, M. A., Toledo-López, V., & Sanginés-García, J. R. (2020). Dietary levels of energy and protein on productive performance and carcass traits of growing female Mexican hairless pigs. Animal Feed Science and Technology, 259(44), 114269. https://doi.org/10.1016/j.anifeedsci.2019.114269
Sánchez-Hernández, M. A., Aguilar-Martínez, C. U., Valenzuela-Jiménez, N., Sánchez-Hernández, C., Jiménez-Rojas, M. C., & Villanueva-Verduzco, C. (2011). Densidad de siembra y crecimiento de maíces forrajeros. Agronomía Mesoamericana, 22(2), 281-295.
Sun, J., Yang, Z., Yang, C., Wu, X., Li, S., Yang, W., Xue, F., Li, H., Li, X., & Jiang, S. (2018). Effects of diets with different proportions of whole plant corn silage on performance, nutrient utilization, hematological indexes and serum oxidative stress indexes of growing pigs. Chinese Journal of Animal Nutrition, 30(5), 1703-1712.
Tadeo-Robledo, M., Zamudio-González, B., Espinosa-Calderón, A., Turrent-Fernández, A., Cárdenas-Marcelo, A. L., López-López, C., Arteaga-Escamilla, I., & Valdivia-Bernal, R. (2015). Rendimiento de maíces nativos e híbridos en diferente fecha de siembra y sus unidades calor. Revista Mexicana de Ciencias Agrícolas, 6(1), 33-43.
Villalobos-González, A., López-Hernández, M. B., Valdivia-González, N. A., Arcocha-Gómez, E., & Medina-Méndez, J. (2019). Variabilidad genética de características morfológicas de maíz nativo (Zea mays L.) en la Península de Yucatán, México. AgroProductividad, 12(11), 15-20. https://doi.org/10.32854/agrop.vi0.1486
Weber, T. E., Ziemer, C. J., & Kerr, B. J. (2008). Effects of adding fibrous feedstuffs to the diet of young pigs on growth performance, intestinal cytokines, and circulating acute-phase proteins. Journal of Animal Science, 86(4), 871-881. https://doi.org/10.2527/jas.2007-0330
Zhirkova, E. V., Skorokhodova, M. V., Martirosyan, V. V., Sotchenko, E. F., Malkina, V. D., & Shatalova, T. A. (2016). Chemical composition and antioxidant activity of corn hybrids grain of different pigmentation. Foods and Raw Materials, 4(2), 85-91.


Colegio dePostgraduados
117
Agroecological production experiences in four agricultural regions of MexicoHernández-Vázquez, Benjamín; Schwentesius-Rinderman, Rita*; Rivas-García, Tomás
Universidad Autónoma Chapingo. Carretera México-Texcoco km 38.5, Chapingo, Estado de México, México, C. P. 56230.
* Correspondence: [email protected]
ABSTRACTObjective: To analyze experiences with various activities and practices carried out in different agroecological regions of Mexico, involving diverse crops, but excluding the use of chemicals.Design/Methodology/Approach: Surveys were conducted in four agricultural regions of Mexico (Texcoco, Estado de México; Vicente Guerrero, Tlaxcala; Michoacan; and Tetela del Volcán, Morelos); they tackled a broad description, background, inputs, and agroecological practices, in order to enable a descriptive analysis.Results: Out of all the agroecological units, 60% are ejidos and 40% are small private properties. Producers are between 25 and 68 years old. Plots range from 0.50 to 20 ha. The main crops are corn (Zea mays ssp. mays) and avocado (Persea americana Mill.). Forty-five percent of the crops are rainfed and 36% are irrigated/rainfed. Half of the producers perform crop rotation, while 40% prefers crop association. After 15 years of experience, the number of producers who did not use chemical herbicides increased from 59% to 95%. Crop nutrition is based on such elements as compost (27%) and manure (23%). Fifty percent of the producers manage pests and diseases through agroecological practices. Sixty-eight-point-two percent receive technical advice, while 77.3% are familiar with the decree to phase out the use of glyphosate.Study Limitations/Implications: Currently, 13.6% of producers are still transitioning and continue to perform chemical control of pests and diseases, as well as chemical fertilization.Findings/Conclusions: It is indeed possible to produce crops and obtain healthy food while caring for biodiversity, making use of environmental-friendly local resources, and achieving soil conservation.
Keywords: Agroecological, Chemical-free, Zea mays, Persea americana, Healthy crops.
INTRODUCTIONFood security means that all people should have access to safe and nutritious food, which in turn will allow them to lead a healthy life (FAO, 2009). Meeting these food needs calls for sufficient production, in terms of availability and access for the population. However, agricultural environments are increasingly limited, mainly as a result of demographic changes (structure, distribution, and concentration), as well as of the effects of climate change (OMS-FAO, 2018) that directly affect production systems and crops. Moreover, these changes also affect farmlands. This is relevant because, in order to guarantee food security, agricultural production must be carried out in healthy substrates,
Citation: Hernández-Vázquez, B., Schwentesius-Rinderman, R., & Rivas-García,T. (2022). Agroecological production experiences in four agricultural regions of Mexico.Agro Productividad. https://doi.org/10.32854/agrop.v15i5.2195
Academic Editors: Jorge Cadena Iñiguez and Libia Iris Trejo Téllez
Received: December 18, 2021.Accepted: April 18, 2022.Published on-line: June 6, 2022.
Agro Productividad, 15(5). May. 2022. pp: 117-124.
This work is licensed under a Creative Commons Attribution-Non-Commercial 4.0 International license.
117 Image by Andy H at Pixabay

118 Agro productividad 2022. https://doi.org/10.32854/agrop.v15i5.2195
with no physical, chemical or biological limitations, with sustainable productivity, and with minimal environmental degradation (FAO, 2015; Montanarella et al., 2015; IICA, 2021). The increase of food production can be achieved by either the enhancement of crop capacity in existing agricultural land or the expansion of the area of crop production, or both (Van Wart et al., 2013). In Mexico, 18 million hectares are allocated to agricultural production (SIAP, 2020); however, some authors argue that the agricultural frontier amounts to 31 million hectares (Turrent et al., 2012). Nonetheless, increasing productivity could reduce this agricultural frontier. Therefore, production systems must become more efficient, in order to meet the food demand of a population that is estimated to surpass 138 million by 2030 (Torres-Torres y Rojas-Martínez, 2018). This food demand must be met in volume and quality, avoiding soil degradation and preserving biodiversity. Production systems must focus on the search and implementation of productive practices and technologies; they must also promote healthy products, appreciate cultural settings, preserve resources, and be economically viable for producers and consumers. The experiences accumulated by generations of producers, along with new technologies and technical monitoring, will have a major impact in the search for food security. Many practices carried out by producers are part of traditional agriculture, a lore transmitted through experience from one generation to the next one. Consequently, much of this information and lore could be lost. Therefore, lines of research that enable an optimal development and expansion of such knowledge should be designed. In accordance with social movements and government initiatives that seek to phase out the use of glyphosate, transition and conversion processes from conventional agricultural production systems (monocropping, use of agrochemicals, etc.) to agroecological production systems (agrobiodiversity, nutrient recycling, etc.) have been promoted in recent decades. Their aim is to further food security and sovereignty (Cevallos et al., 2019) and to move towards healthy agrifood models that are ecologically responsible, economically viable, socially just, culturally relevant, and environmentally friendly. Hence, the objective of this work was to analyze experiences with various activities and practices carried out in different agroecological regions of Mexico, involving diverse crops and excluding the use of chemicals. The aim was to document, assess, and potentiate their replication and expansion, consequently contributing to the development of tools that enable the production of healthier and better food.
MATERIALS AND METHODS This work relied on field visits and surveys conducted in four agricultural regions of Mexico, known as agroecological centers, which were chosen because they have produced crops without the use of agrochemicals. The goal was to gather the experiences related to these production systems and to determine how they can be replicated and expanded to other agricultural zones. The agroecological centers were: 1) Texcoco, Estado de México, Mexico, particularly the producers who take part in the Tianguis Orgánico Chapingo (TOCH); 2) Grupo Vicente Guerrero, Tlaxcala, Mexico (Tlaxcala); 3) Ario de Rosales and Uruapan, Michoacan, Mexico (Michoacán), which have considerable experience

119 Agro productividad 2022. https://doi.org/10.32854/agrop.v15i5.2195
in organic avocado production; and 4) Tetela del Volcán, Morelos, Mexico (Tetela), an agroecological center currently transitioning towards chemical-free production. The visits took place from March to August 2021. Field observations were made of the prevailing conditions in the crop plots, the activities performed, and the tools and inputs used. Depending on the phenological state of the crops, the quality of the harvested products was analyzed. Meanwhile, surveys were conducted with the managers and owners of the production units. These included open and closed questions distributed in four sections concerning an overall description, background, inputs, and management practices within the production units. A database was created with the gathered data; a descriptive analysis of the production units and the agroecological farming systems practiced in the various centers under study was developed from the said database.
RESULTS AND DISCUSSION A total of 22 production units were visited: 45.5% belong to the agroecological center of the Tianguis Orgánico Chapingo; 22.7%, to Michoacan; 18.2%, to Vicente Guerrero, Tlaxcala; and 13.6%, to Tetela del Volcán, Morelos. Sixty-percent of all agroecological centers are ejidos and 40% belong to small owners. Out of all producers, 73% are men and 27% are women. Their ages range from 25 to 68 years old; most of them (45%) were 50 to 70 years old and 14% belong to the 40-50 years old range. Regarding the size and distribution of production units, we found diversity within and between agricultural centers, as well as among producers. Some centers feature very large plots (such as avocado orchards), while others have small plots distributed in different lots (for example, the Texcoco and Tlaxcala centers). The two largest plots (20 ha) were used for the production of fruit crops. Others plots have 14, 8, 7, and 4 ha. However, the largest number of plots ranged from 0.5 to 4 ha. Corn (Zea mays ssp. mays) and avocado (Persea americana Mill.) were the main crop species; they accounted for 32% and 36% of all the crops, respectively. Nevertheless, vegetable crops, maguey (Agave salmiana), coffee (Coffea sp.), and even forage grasses were also found (Figure 1). The diversity of crops in these places proves that healthy food can be produced using agroecological practices that do not involve chemicals. Moreover, these practices contribute to one of the principles of agroecology: exploring agrodiversity as an instrument for a healthy, diverse, and abundant production of food, while preserving the common goods (Sarandón, 2020). In the agroecological centers, producers practiced rainfed agriculture (45%), agriculture with irrigation (8%), and a combination of both production systems (36%). Units with access to irrigation are mainly focused in the production of vegetables, while rainfed production is practiced with annual crops, mainly corn and beans (Phaseolus vulgaris L.), as well as other cereals and legumes. In the case of avocado production, there are differences between centers: rainfed agriculture is practiced in the Michoacán center, while in Tetela —in addition to rainfed production— a fertigation system is used for the nutrition of orchards. The main sources of water for irrigation are wells and springs. Crop rotation is practiced in half the units under study. This agroecological practice depends on the crop species, since annual or short cycle crops —as well as the different

120 Agro productividad 2022. https://doi.org/10.32854/agrop.v15i5.2195
Figure 1. Main species cultivated in the production units of the agroecological centers in four regions of Mexico.
seasons in which those crops are established— enable rotation. In contrast, perennial crops such as avocado, coffee or forage grasses limit this practice. Another activity (associated crops) is carried out in less than 40% of the units considered in this work. Cereals can be associated with legumes and, in some cases, with other species. Corn, wheat (Trititicum aestivum L.), beans, broad beans (Vicia faba L.), and zucchini (Cucurbita spp.) stand out among these crop species. This practice is mainly carried out in the Texcoco and Tlaxcala centers, which are focused on the production of annual crops. Texcoco is an outstanding case, since vegetable producers practice crop association and rotation, mainly with short-cycle vegetables that allow them to grow several crops on small surfaces and in short periods. Additionally, these practices maintain a constant production and contribute to the enrichment of soil fauna diversity (Rodrigues et al., 2016). Regarding the last time they used chemicals, more than 50% of interviewees did not specify a date or have not kept an exact record. However, some have gone chemical-free for a year, while others have spent 18 years without using chemicals in the production of their crops. This reveals that transitioning towards a chemical-free agriculture entails a transformation process in which various actions must be implemented in order to achieve the agroecological production goals. In the particular case of glyphosate, 59% of producers used this product when applying chemicals. As a result of the transition towards agroecological crops, currently 95% of units use neither glyphosate, nor other chemically synthesized herbicides. Consequently, the management of weeds is now carried out using two methods: manual (22.73%) and mechanical (31.83%) (Figure 2). The agricultural system, the crops, the phenological state, and the area, as well as the producer’s ability to acquire tools and equipment, all contribute to determine the method and the moment when weed control will be carried out. In areas larger than 1 ha, mechanical control prevails. In addition, 30% of producers combine manual and mechanical methods. In avocado production centers and in places where perennial crops are present, weed management may vary. In Michoacan, for instance, weeds are allowed to grow until they complete their biological cycle, before they are cut out. In Tetela, weeds are cut in their early stages using manual weeding machines. In both centers, the remains are
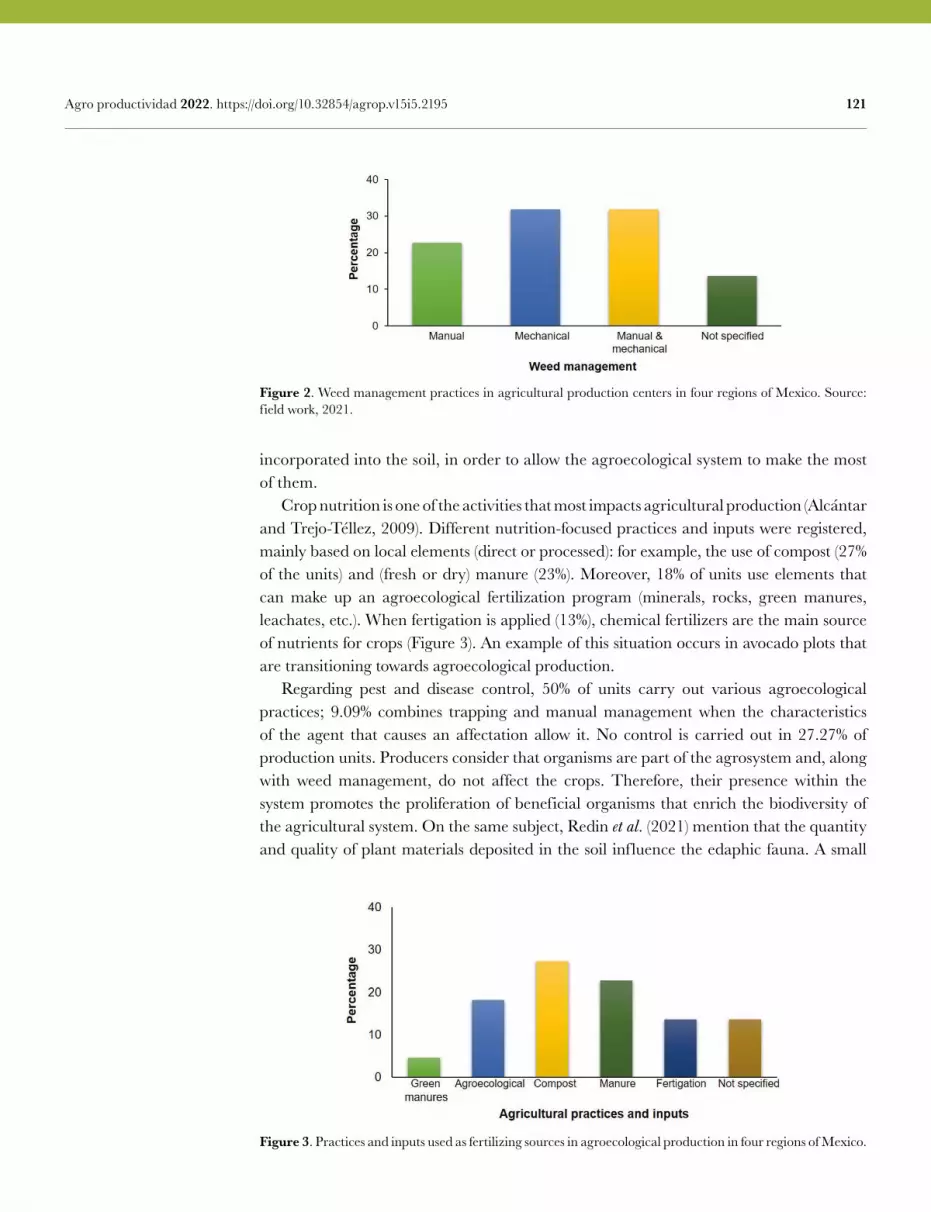
121 Agro productividad 2022. https://doi.org/10.32854/agrop.v15i5.2195
Figure 2. Weed management practices in agricultural production centers in four regions of Mexico. Source: field work, 2021.
incorporated into the soil, in order to allow the agroecological system to make the most of them. Crop nutrition is one of the activities that most impacts agricultural production (Alcántar and Trejo-Téllez, 2009). Different nutrition-focused practices and inputs were registered, mainly based on local elements (direct or processed): for example, the use of compost (27% of the units) and (fresh or dry) manure (23%). Moreover, 18% of units use elements that can make up an agroecological fertilization program (minerals, rocks, green manures, leachates, etc.). When fertigation is applied (13%), chemical fertilizers are the main source of nutrients for crops (Figure 3). An example of this situation occurs in avocado plots that are transitioning towards agroecological production. Regarding pest and disease control, 50% of units carry out various agroecological practices; 9.09% combines trapping and manual management when the characteristics of the agent that causes an affectation allow it. No control is carried out in 27.27% of production units. Producers consider that organisms are part of the agrosystem and, along with weed management, do not affect the crops. Therefore, their presence within the system promotes the proliferation of beneficial organisms that enrich the biodiversity of the agricultural system. On the same subject, Redin et al. (2021) mention that the quantity and quality of plant materials deposited in the soil influence the edaphic fauna. A small
Figure 3. Practices and inputs used as fertilizing sources in agroecological production in four regions of Mexico.

122 Agro productividad 2022. https://doi.org/10.32854/agrop.v15i5.2195
percentage of units (13.6%) still carry out chemical control, especially when combating fruit crop diseases (Tetela). However, they are transitioning and they hope that, in the short term, this practice will go hand in hand with chemical-free weed management (Figure 4). Figure 5 shows that nearly three quarters of producers receive technical advice (68.18%). This is an important finding, because when producers were questioned about their knowledge about alternatives to the use of glyphosate, the same percentage (68.18%) responded they were not aware of any alternatives. In personal communication, they mentioned that they associate an alternative to the use of a similar product or a product that fulfills the functions of glyphosate. Nonetheless, 77.27% of interviewees are aware of the decree that establishes actions for the phasing out of products that contain glyphosate as an active ingredient (DOF, 2020). The various agroecological practices registered in this study not only maintain a healthy production, but they also contribute to a reduction in the use of chemicals. Employing traditional lore, together with technical support, makes it possible to move from conventional, agrochemical-dependent agriculture to a kind of agriculture that has understood that the main alternatives to reduce the use of chemicals lie in cultural and biological management methods (Shimada et al., 2021).
Figure 4. Main practices and input used for pest and disease control in agroecological production in four regions of Mexico.
Figure 5. Consultancy and awareness about alternatives to the use of herbicides and of the decree for the gradual reduction of the use of glyphosate in agroecological centers in four regions of Mexico.

123 Agro productividad 2022. https://doi.org/10.32854/agrop.v15i5.2195
The results of this work show the experiences of the producers themselves in agroecological systems. This will enable further exploration, particularly in each one of the different study areas (nutrition, weed management, pests and diseases, among others).
CONCLUSIONS Producers from the agroecological centers in Texcoco, Tlaxcala, Michoacan, and Tetela perceive that agroecological production is viable, friendly to their environmental and cultural surroundings, and it also allows them to obtain healthy food. The experiences of the agroecological centers result in a successful production of crops without using synthetic products. They may be replicated in other production units adjacent to the centers themselves and even in other agricultural regions throughout the country, once they have been adapted to their particular characteristics. Agroecological production systems reveal that producing crops and obtaining healthy food products, free of toxic agents for consumers, is indeed possible while still respecting biodiversity, using environmental-friendly local resources, and achieving soil conservation.
REFERENCIASAlcántar-González, G., & Trejo-Téllez, L. I. (2009). Nutricion de cultivos, Mundi Prensa: Texcoco, Estado de
México, México. 454 p.Cevallos, S. M., Urdaneta, O. F., & Jaimes, E. (2019). Desarrollo de sistemas de producción agroecológica:
Dimensiones e indicadores para su estudio. Revista de Ciencias Sociales, 25(3), 172-185. https://doi.org/10.31876/rcs.v25i3.27365
DOF. (2020). Decreto por el que se establecen las acciones que deberán realizar las dependencias y entidades que integran la Administración Pública Federal, en el ámbito de sus competencias, para sustituir gradualmente el uso, adquisición, distribución, promoción e importación de la sustancia química denominada glifosato y de los agroquímicos utilizados en nuestro país que lo contienen como ingrediente activo, por alternativas sostenibles y culturalmente adecuadas, que permitan mantener la producción y resulten seguras para la salud humana, la diversidad biocultural del país y el ambiente. Recuperado el 1 de abril de 2022, de DOF: https://www.dof.gob.mx/nota_detalle.php?codigo=5609365&fecha=31/12/2020
FAO. (2009). Declaracion de la Cumbre Mundial sobre la Seguridad Alimentaria. Organización de las Naciones Unidas para la Alimentación y la Agricultura. Recuperado el 10 de octubre de 2020, de FAO: http://www.fao.org/tempref/docrep/fao/Meehttp://www.fao.org/fileadmin/templates/wsfs/Summit/Docs/Final_Declaration/K6050S_WSFS_OEWG_06.pdfting/018/k6050s.pdf
FAO. (2015). Los suelos sanos son la base para la produccion de alimentos saludables. Organización de las Naciones Unidas para la Alimentación y la Agricultura. Recuperado el 10 de octubre de 2020, de FAO: http://www.fao.org/3/a-i4405s.pdf
IICA. (2021). Healthy Soils: the bedrock of sustainable food systems in Latin America and the Caribbean. Inter-American Institute for Cooperation on Agriculture. Retrieved on October 10, 2020, from IICA: https://repositorio.iica.int/bitstream/handle/11324/18585/BVE21088330i.pdf?sequence=10& isAllowed=y
Montanarella, L., Badraoui, M., Chude, V., Costa, D. S. B. I., Mamo, T., Yemefack, M., Aulang, M. S., Yagi, K., Hong, S. Y., Vijarnsorn, P., Zhang, G. L., Arrouays, D., Black, H., Krasilnikov, P., Sobocá, J., Alegre, J., Henriquez, C. R., Mendonça-Santos, M. L., Taboada, M., Espinosa-Victoria, D., Alshankiti, A., Panah, S. K. A., Sheikh, E. A. E. M. E., Hempel, J., Pennock, D., Arbenstain M. C., & McKenzie, N. (2015). Status of the World’s Soil Resources. Retrieved on October 10, 2020, of FAO: https://www.fao.org/3/i5199e/I5199E.pdf
OMS-FAO. (2018). Sistemas alimentarios seguros y sostenibles en una era de cambio climático acelarado. Organización de las Naciones Unidas para la Alimentación y la Agricultura. Recuperado el 21 de septiembre de 2020, de FAO: https://www.who.int/es/news-room/events/international-food-safety-conference/background-documents

124 Agro productividad 2022. https://doi.org/10.32854/agrop.v15i5.2195
Redin, M., Canepelle, E., Carlson, W. T., Maisa-da Silva, D., Guerra, D., & Drescher, M. S. (2021). Single cultivation versus sweet potato and popcorn intercropping : benefits over edaphic fauna in ecological-based system. Soil and Plant Nutrition, 68(5), 484–490. https://doi.org/10.1590/0034-737X202168050013
Rodrigues, D. M., Ferreira, L. O., Silva, N. R. da, Guimarães, E. dos S., Martins, I. C. F., & Oliveira, F. de A. (2016). Diversidade de artrópodes da fauna edáfica em agroecossistemas de estabelecimento agrícola familiar na Amazônia Oriental. Revista de Ciências Agrárias, 59(1), 32–38. https://doi.org/10.4322/rca.2097
Sarandón, S. J. (2020). Biodiversidad, agroecología y agricultura sustentable. EDULP: La Plata, Buenos Aires, Argentina. 429 p. https://doi.org/10.35537/10915/109141
Shimada, B. S., Simon, M. V., & Cunha, L. S. (2021). Cultural control: A sustainable method of pest and disease control. Journal of Experimental Agriculture International, 43(6), 19-26. https://doi.org/10.9734/jeai/2021/v43i630698
SIAP. (2020). Estadística de Producción Agrícola. Servicio de Información Agroalimentaria y Pesquera. Recuperado el 12 de noviembre de 2020, de SIAP: http://infosiap.siap.gob.mx/gobmx/datosAbiertos.php
Torres-Torres, F., & Rojas-Martínez, A. (2018). Suelo agrícola en México: Retrospección y prospectiva para la seguridad alimentaria. Realidad, Datos y Espacio Revista Internacional de Estadística y Geografía, 9(3), 137-155.
Turrent, F. A., Wise, T. A., & Garvey, E. (2012). Achieving Mexico’s Maize Potential, GDEI/Tufts University: Medford, MA., USA. 40 p.
van Wart, J., Kersebaum, K. C., Peng, S., Milner, M., & Cassman, K. G. (2013). Estimating crop yield potential at regional to national scales. Field Crops Research, 143(1), 34-43. https://doi.org/10.1016/j.fcr.2012.11.018

Colegio dePostgraduados
125
Nutrient content and in vitro degradability of the palm kernel meal produced in the state of Chiapas, Mexico, as feed for ruminantsEscobar-España, José C.1; Bárcena-Gama, José R.2*; Ley-De Coss, Alejandro3; Crosby-Galván, María M.2
1 Facultad de Ciencias Agrícolas Campus IV, Universidad Autónoma de Chiapas (UNACH). Entronque Carretera Costera y Pueblo de Huehuetán, Huehuetán, Chiapas, México, C. P. 30660.
2 Colegio de Postgraduados Campus Montecillo. Programa de Recursos Genéticos y Productividad-Ganadería. Carretera Federal México-Texcoco km 36.5, Montecillo, Estado de México, México. C. P. 56230.
3 Facultad de Ciencias Agronómicas Campus V, Universidad Autónoma de Chiapas (UNACH), Carretera Ocozocoautla-Villaflores km 84.5, Villaflores, Chiapas, México, C. P. 30470.
* Correspondence: [email protected]
ABSTRACTObjective: The objective of this study was to determine the nutritional content of palm kernel meal (PM) produced in the state of Chiapas, Mexico, as feed for ruminants.Design/Methodology/Approach: The following were determined: content of dry matter (DM), total protein (TP), ethereal extract (EE), ash, neutral detergent fiber (NDF), acid detergent fiber (ADF), amino acids, long chain fatty acids (LCFA), minerals, polyphenols, and the in vitro degradability of DM (IDDM), of the NDF (IDNDF), and of the ADF (IDADF).Results: The contents were: DM 92.23%, TP 10.56%, EE 7.2%, ash 3,09%, NDF 76,56% and ADF 57,20%. The PM had low concentration of lysine (0.3%), methionine (0.228%) and tryptophan (0.095%), and high contents of lauric acid (50.49%), palmitic acid (10.92%), stearic acid (19.725%), oleic acid (13.56%), copper (23.3 mg kg1), iron (230.5 mg kg1), zinc (78.47 mg kg1) and total phenols (7.8 mg g1), although the IDDM (46.02%), IDNDF (29.91%) and IDADF (27.61%) were low.Findings/Conclusions: The PM, as byproduct of the oil agroindustry, has some important nutritional characteristics to be used as feed for ruminants. It is recommended to conduct a chemical analysis of this byproduct before including it in balanced meals to have an adequate balance of nutrients.
Keywords: palm kernel meal, chemical composition, degradability, byproduct.
INTRODUCTION Oil palm (Elaeis guineensis Jacq.) is a plant from which oil is extracted from its fruit, primarily for human consumption, whether from pressing or using solvents (Stein et al., 2015). During the extraction process, byproducts are generated that can be an alternative to be used in animal feed (Pang et al., 2018), such as the palm kernel meal (PM; Figure 1).
125 Image by tk tan at Pixabay
Citation: Escobar-España, J. C., Bárcena-Gama, J. R., Ley-De Coss, A., & Crosby-Galván, M. M. (2022). Nutrient content and in vitro degradability of the palm kernel meal produced in the state of Chiapas, Mexico, as feed for ruminants.Agro Productividad. https://doi.org/ 10.32854/agrop.v15i5.2235
Academic Editors: Jorge Cadena Iñiguez and Libia Iris Trejo Téllez
Received: February 27, 2022.Accepted: May 4, 2022.Published on-line: June 6, 2022.
Agro Productividad, 15(5). May. 2022. pp: 125-131.
This work is licensed under a Creative Commons Attribution-Non-Commercial 4.0 International license.

126 Agro productividad 2022. https://doi.org/10.32854/agrop.v15i5.2235
In Mexico, the total surface sown is 82,150.60 ha, located primarily in the states of Chiapas, Tabasco, Campeche and Veracruz, and 54,600.52 ha are harvested; Chiapas is the main producer, with a surface sown of 43,468.17 ha and 34,215.05 ha harvested (SIAP, 2015). It is estimated that the production of PM is 13,169.37 t per year, approximately (García and Yañez, 2010), which represents an important source of nutrients for the animal diet. The PM has been used in production systems as an ingredient in diets for birds, pigs (Zumbado et al., 1992; Kperegbeyi and Ikperite, 2011), sheep (Freitas et al., 2017), goats (Ebrahimi et al., 2012), cattle (Oladokun et al., 2016), and fish (Mazón et al., 2018). However, the results reported are inconsistent mainly due to the variation in the content and the availability of nutrients. The ethereal extract (EE) can be higher than 6% (Oliveira et al., 2015), raw protein (RP) varies from 10 to more than 14% (Freitas et al., 2017), and there are contents of neutral detergent fiber (NDF) higher than 60% (Stein et al., 2015), acid detergent fiber (ADF) higher than 40% (Sulabo et al., 2013) and lignin (Lig) over 20% (Fereira et al., 2012), which means that the digestibility of the PM can be low and that it would be a more appropriate food for ruminants. It is important to highlight that Shahidi and Nazck (2006) consider that the PM can also be a natural source of antioxidants in meat, since there are high contents of polyphenols. Presently, in Mexico, PM is a byproduct with high demand for the diet of animals due to its low cost, and it is commercialized primarily for ruminants. The scientific information on the nutrient content of PM is scarce in Mexico, and the results are quite variable. It is important to generate information about the chemical composition of the PM to include it in balanced meals and to have an adequate balance of nutrients for animals. Therefore, the objective of this study was to determine the nutritional content (DM, RP, EE, ash, NDF, ADF, lignin), long chain fatty acids, content of amino acids, minerals, total phenols, and in vitro degradability of the DM (IDDM), of the NDF (IDNDF), and of the ADF (IDADF) of the PM as byproduct of the oil industry in the state of Chiapas, Mexico.
MATERIALS AND METHODSChemical analyses A homogeneous sample of PM was obtained, which was ground through a 1 mm sieve with a Willey mill (Arthur H. Thomas, Philadelphia, PA). The dry matter (DM), raw protein (RP), ethereal extract (EE) and ash (ash) were determined according to the
Figure 1. a) Oil palm, b) Bunch of fruits, c) From fruits, d) Palm kernel meal.
a cb d

127 Agro productividad 2022. https://doi.org/10.32854/agrop.v15i5.2235
AOAC (2005). The contents of NDF, ADF and lignin (Lig) were determined according to Van Soest et al. (1991). All the analyses were made by triplicate in the Ruminant Nutrition laboratory of the Livestock program of Colegio de Postgraduados Campus Montecillo. The amino acid profile was determined through the AMINONIR® near infrared technique (Sedghi et al., 2014), in the company Evonik® S. A. de C. V. Measuring the content of calcium (Ca), magnesium (Mg), copper (Cu), iron (Fe) and zinc (Zn) was carried out in a GBC atomic absorption spectrophotometer model SavantAA. Selenium (Se) in a spectrophotometer of coupled plasma in optical emission of brand Horiba Scientific, model Ultima 2 (ICP-OES). Phosphorus (P) was determined in an Ultra-Violeta (UV) spectrophotometer brand Jenway, Model 6715, in the National Laboratory for Research and Agrifood and Forestry Service (Laboratorio Nacional de Investigación y Servicio Agroalimentario y Forestal, LANISAF) at Universidad Autónoma Chapingo, Texcoco, Estado de México. The long chain fatty acid (LCFA) profile was determined with the methodology of esterification and trans-esterification by Sukhija and Palmquist (1988), modified by Palmquist and Jenkins (2003) and Jenkins, (2010), in a Hewlett Packard 6890 chromatograph with automatic injector, arranged from a silica capillary column (100 m 0.25 m of thickness, Sp-2560, Supelco Brand). The concentration of total phenols was determined according to Makkar (2002) and the phenolic compounds according to Aguiñiga-Sánchez et al. (2017). In vitro degradability of DM, NDF and ADF The in vitro degradability of DM, NDF and ADF of the PM was determined in a Daisy II® ANKOM® incubator model with 25 m pore. The ruminal liquid from a Holstein bull (550 kg PV) was used as inoculum, with a permanent cannula in the rumen fed with a diet based on oats hay with grain and alfalfa hay. The samples were inoculated and incubated for 3, 6, 9, 12, 24, 48 and 72 h, following the methodology by Curzaynz et al. (2020).
RESULTS AND DISCUSSION The RP content (Table 1) of PM was 10.55%, value lower than 13.24, 15.9 and 19.4% reported by Fereira et al. (2012), Abubakr et al. (2014) and Tipu et al. (2014), respectively. That of EE was 7.27%, value higher than 1.3 and 6.3% reported by Stein et al. (2015) and Sulabo et al. (2013), respectively, although lower than 9.1 and 12.1% reported by Abubakr et al. (2014) and Tipu et al. (2014). The content of NDF and ADF was 76.5 and 57.2%, values higher than 77.9 and 49.4% reported by Stein et al. (2015), although lower than 72.3 and 47.6% reported by Abubakr et al. (2014), respectively (Table 1). The content of amino acids was low, particularly of essential amino acids such as lysine, methionine, threonine, phenylalanine, and tryptophan (Table 1). This indicates that the protein from the PM is of low quality, which could limit its use in diets for non-ruminants. The concentrations of calcium (Ca), phosphorus (P) and magnesium (Mg) are low, compared to other ingredients such as corn, although copper (Cu), iron (Fe) and zinc (Zn) are relatively high (Table 1). These values should be considered when PM is included in balanced meals, since it can be deficient in macronutrients but entail metabolic risks from the excess of Cu and Zn.

128 Agro productividad 2022. https://doi.org/10.32854/agrop.v15i5.2235
Balandrán-Quintana et al. (2019) mention that the nutritional value of an oily ingredient is practically given by the extraction method of the oil used, since it can affect the nutrient content. The most frequently used methods are from mechanical extraction or pressing, solvents, and hydrothermal techniques. Extraction from pressing is the one mainly used in Mexico the, which seems to leave more oil and less nutrients in the PM, in contrast with the extraction with supercritical carbon dioxide, which seems to be a more efficient technique for oil extraction and to concentrate more certain nutrients. The fat from the PM is made up primarily by saturated fatty acids (SFA), mainly lauric, palmitic and stearic, which make up 81% and present low concentration of unsaturated fatty acids (UFA), mainly oleic (Table 2). The presence of phenols in the PM is a very important nutritional characteristic due to their high content and concentration of hydroxybenzoic acid (Table 2). The degradability of the DM was determined traditionally at 24 h because of the daily consumption of the animal. The results show that the IDDM, IDNDF and IDADF and the digestion rate (Kd) of PM were low (Table 3). These results agree with those reported by FEDNA (2015). The degradability of a nutrient allows estimating the nutritional value of a food or a diet and predicting the productive behavior of the animal. The low degradability
Table 1. Chemical analysis for content of amino acids and minerals in palm kernel meal (PM).
Nutrients (%) Aminoacids (%) MineralsDry material 92.23 lysine 0.37 Phosphorus (%) 0.16
total protein 10.55 methionine 0.22 Calcium (%) 0.12
Ethereal Extract 7.27 threonine 0.36 Magnesium (%) 0.19
NDF 76.56 tryptophan 0.09 Copper (mg kg1) 23.30
ADF 57.20 Leucine 0.79 Iron (mg kg1) 230.55
Cellulose 23.75 isoleucine 0.42 Zinc (mg kg1) 78.47
hemicellulose 19.75 histidine 0.21
lignin 31.30 valine 0.63
ashes 3.09 Phenylalanine 0.52
NDF: Neutral detergent fiber; ADF: Acid detergent fiber.
Table 2. Long chain fatty acids and phenolic acids in palm kernel meal.
Fatty acid (%) Phenolic acidscaprylic 4.34 Totals 7.800.50 mg g1
capric 4.12 gallic 0.0070.0003 g g1
Undecanoic 0.15 ferulic 0.0020.0001 g g1
lauric 50.49 hydroxybenzoic 0.2760.0228 g g1
myristoleic 7.67 protocatechuic 0.0080.0002 g g1
palmitic 10.82
stearic 19.72
oleic 13.56
linoleic 1.95

129 Agro productividad 2022. https://doi.org/10.32854/agrop.v15i5.2235
of the PM is due to the high concentrations of fiber (ADF) and lignin, which is given by the presence of the pit or hard husk that covers the kernel and, also, due to the high fat content that affects the growth of cellulolytic bacteria and ruminal fermentation (Chanjula et al., 2010). Other factors that affect the chemical composition of the PM is the efficiency of oil extraction from the kernel, the residual endocarp, agronomic tasks, and the oil extraction method used (Balandrán-Quintana et al., 2019).
CONCLUSIONS The palm kernel meal produced in the state of Chiapas is a byproduct with nutritional characteristics that can be used in animal feed, particularly because of its content of protein and fat. However, it should be considered to be a rough food due to its high fiber content and low digestibility, characteristics that make it a more appropriate food to be included in balanced meals for ruminants, although in limited amounts. Due to the variability in the nutritional composition and low digestibility of palm kernel meal, it should be analyzed prior to its incorporation in the diets for animals. It is suggested to research more about its potential as a source of natural antioxidants from its high content of total phenols.
REFERENCESAbubakr, A., Alimon, A. R., Yaakub, H., Abdullah, N., & Ivan, M. (2014). Effect of feeding palm oil by-
products based diets on total bacteria, cellulolytic bacteria and methanogenic archaea in the rumen of goats. PLoS ONE, 9(4), 1–6. https://doi.org/10.1371/journal.pone.0095713
Aguiñiga-Sánchez, I., Cadena-Íñiguez, J., Santiago-Osorio, E., Gómez-García, G., Mendoza-Núñez, V. M., Rosado-Pérez, J., Ruíz-Ramos, M., Cisneros-Solano, V. M., Ledesma-Martínez, E., de Jesus Delgado-Bordonave, A., & Soto-Hernández, R. M. (2017). Chemical analyses and in vitro and in vivo toxicity of fruit methanol extract of Sechium edule var. Nigrum spinosum. Pharmaceutical Biology, 55(1), 1638–1645. https://doi.org/10.1080/13880209.2017.1316746
AOAC. (2005). Association of Official Analytical Chemists. In A. of O. A. Chemists. (Ed.), Association of Official Analytical Chemists. (18th ed.).
Balandrán-Quintana, R. R., Mendoza-Wilson, A. M., Ramos-Clamont Montfort, G., & Huerta-Ocampo, J. Á. (2019). Plant-Based Proteins. In: Proteins: Sustainable Source, Processing and Applications. https://doi.org/10.1016/b978-0-12-816695-6.00004-0
Table 3. In vitro degradability and digestion rate of the palm kernel meal.
Time Hour
Digestibilidad (% MS)Dry biomass NDF ADF
0 1.46 0.00 0.00
3 1.99 0.78 0.81
6 5.60 2.24 1.81
9 6.41 2.75 2.56
18 16.94 7.62 6.77
24 27.94 15.97 13.41
48 32.97 18.79 16.48
72 34.38 20.90 17.34
96 46.02 29.91 27.61
Kd/% h 3.80 4.80 4.30
NDF: Neutral detergent fiber; ADF: Acid detergent fiber.

130 Agro productividad 2022. https://doi.org/10.32854/agrop.v15i5.2235
Chanjula, P., Mesang, A., & Pongprayoon, S. (2010). Effects of dietary inclusion of palm kernel cake on nutrient utilization, rumen fermentation characteristics and microbial populations of goats fed Paspalum plicatulum hay-based diet. Songklanakarin Journal of Science and Technology, 32(6), 527–536.
Curzaynz, K., Bárcena-Gama, R., Hernandez, D., Crosby-Galván, M., Escobar-España, J., Santillán-Gómez, E., & Cabañas-Martínez, O. (2020). Corn Based-diets containing corn dried distillers grains with solubles on performance, ruminal fermentation, in vitro methane emissions, carcass and meat quality of lambs. Asian Journal of Research in Animal and Veterinary Sciences, 5(2), 30–40.
Ebrahimi, M., Rajion, M. A., Goh, Y. M., & Sazili, A. Q. (2012). Impact of different inclusion levels of oil palm (Elaeis guineensis Jacq.) fronds on fatty acid profiles of goat muscles. Journal of Animal Physiology and Animal Nutrition, 96(6), 962–969. https://doi.org/10.1111/j.1439-0396.2011.01206.x
FEDNA (Fundación Española para el Desarrollo de la Nutrición Animal). 2015. Harina de extracción de palmiste. Recuperado el 30 de abril de 2022, de FEDNA: http://www.fundacionfedna.org/node/440
Fereira, A. C., Oliveira, R. L., Bagaldo, A. R., De Carvalho, G. G. P., Da Silva, R. N. V., & De Oliveira, P. A. (2012). Intake, digestibility and intake behaviour in cattle fed different levels of palm kernel cake. Revista MVZ Cordoba, 17(3), 3105–3112.
Freitas, T. B., Felix, T. L., Pedreira, M. S., Silva, R. R., Silva, F. F., Silva, H. G. O., & Moreira, B. S. (2017). Effects of increasing palm kernel cake inclusion in supplements fed to grazing lambs on growth performance, carcass characteristics, and fatty acid profile. Animal Feed Science and Technology, 226(February), 71–80. https://doi.org/10.1016/j.anifeedsci.2017.02.009
García N., J. A., & Yañez A., E. E. (2010). Generación y uso de biomasa en plantas de beneficio de palma de aceite en Colombia. Revista Palmas, 31(2), 41–48.
Jenkins, T. C. (2010). Technical note: Common analytical errors yielding inaccurate results during analysis of fatty acids in feed and digesta samples. Journal of Dairy Science, 93(3), 1170–1174. https://doi.org/10.3168/jds.2009-2509
Kperegbeyi, J. I., & Ikperite, S. E. (2011). The effectiveness of replacing maize with palm kernel. Journal of Environmental Issues and Agriculture in Developing Countries, 3(1), 145–149.
Makkar, H. P. S. (2002). Applications of the in vitro gas method in the evaluation of feed resources, and enhancement of nutritional value of tannin-rich tree/browse leaves and agro-industrial by-products. Animal Production and Health Section, International Atomic Energy Agency, 23–40.
Mazón, E., Herrera, M., Mazón, M., García, A., Delgado, M., & Guzmán, J. L. (2018). Digestibilidad aparente de dietas con torta de palmiste sobre el rendimiento productivo de la especie nativa Cichlasoma festae en la etapa de cría. Revista Ecuatoriana de Investigaciones Agropecuaria, 2(2), 28. https://doi.org/10.31164/reiagro.v2n2.4
Oladokun, A. A., Rahman, W. A., & Suparjo, N. M. (2016). Prospect of Maximising Palm Kernel Cake Utilization for Livestock and Poultry in Malaysia: A Review. Journal of Biology, Agriculture and Healthcare, 6(13), 107–113.
Oliveira, R., Faria, M., Silva, R., Bezerra, L., Carvalho, G., Pinheiro, A., Simionato, J., & Leão, A. (2015). Fatty acid profile of milk and cheese from dairy cows supplemented a diet with palm kernel cake. Molecules, 20(8), 15434–15448. https://doi.org/10.3390/molecules200815434
Palmquist, D. L., & Jenkins, T. C. (2003). Challenges with fats and fatty acid methods. Journal of Animal Science, 81(12), 3250–3254. https://doi.org/10.2527/2003.81123250x
Pang, D., Yan, T., Trevisi, E., & Krizsan, S. J. (2018). Effect of grain- or by-product-based concentrate fed with early- or late-harvested first-cut grass silage on dairy cow performance. Journal of Dairy Science, 101(8), 7133–7145. https://doi.org/10.3168/jds.2018-14449
Sedghi, M., Golian, A., Kolahan, F., Moussavi, A. H., & Afsar, A. (2014). Broiler diets formulated based on digestible amino acid values as determined by in vivo and prediction methods. Iranian Journal of Applied Animal Science, 4, 361–366.
Shahidi, F., & Nazck, M. (2006). Phenolics in Food and Nutraceuticals (P. CRC (ed.); 5th ed.).SIAP. (2015). Servicio de Informacion Agroalimentaria y Pesquera. Recuperado el 25 de abril de 2022, de SIAP:
https://www.gob.mx/siap/acciones-y-programas/produccion-agricola-33119Stein, H. H., Casas, G. A., Abelilla, J. J., Liu, Y., & Sulabo, R. C. (2015). Nutritional value of high fiber co-
products from the copra, palm kernel, and rice industries in diets fed to pigs. Journal of Animal Science and Biotechnology, 6(1), 1–9. https://doi.org/10.1186/s40104-015-0056-6
Sukhija, P. S., & Palmquist, D. L. (1988). Rapid method for determination of total fatty acid content and composition of feedstuffs and feces. Journal of Agricultural and Food Chemistry, 36(6), 1202–1206.
Sulabo, R. C., Ju, W. S., & Stein, H. H. (2013). Amino acid digestibility and concentration of digestible and metabolizable energy in copra meal, palm kernel expellers, and palm kernel meal fed to growing pigs. Journal of Animal Science, 91(3), 1391–1399. https://doi.org/10.2527/jas.2012-5281

131 Agro productividad 2022. https://doi.org/10.32854/agrop.v15i5.2235
Tipu, M. A., Ahmad, F., Khalique, A., Haque, M. N.,Mirza, R. H., & Tayyab, U. (2014). Replacement of cotton seed cake with palm kernel cake in growing Nili-Ravi buffalo male calves. The Journal of Animal & Plant Sciences, 24(Suppl.1): 24–27.
Van Soest, P. J., Robertson, J. B., & Lewis, B. A. (1991). Methods for dietary fiber, neutral detergent fiber, and nonstarch polysaccharides in relation to animal nutrition. Journal of Dairy Science, 74(10), 3583–3597. https://doi.org/10.3168/jds.S0022-0302(91)78551-2
Zumbado, M., Madrigal, S., & Marin, M. (1992). Composición y valor nutrimental del palmiste o coquito integral de palma africana (Elaeis guinensis) en pollo de engorde. Agronomía Costarricense, 16(1), 83–89.


Colegio dePostgraduados
133
Citation: Gutiérrez–Rodríguez, Brandon E. (2022). The importance of forests in the conservation and prevalence of orchids in Megamexico.Agro Productividad. https://doi.org/ 10.32854/agrop.v15i5.2187
Academic Editors: Jorge Cadena Iñiguez and Libia Iris Trejo Téllez
Received: December 1, 2021.Accepted: April 19, 2022.Published on-line: June 6, 2022.
Agro Productividad, 15(5). May. 2022. pp: 133-141.
This work is licensed under a Creative Commons Attribution-Non-Commercial 4.0 International license.
The importance of forests in the conservation and prevalence of orchids in MegamexicoGutiérrez–Rodríguez, Brandon E.1*
1 Instituto de Ecología A. C., Carretera antigua a Coatepec km 351, El Haya, Xalapa, Veracruz, México, C. P. 91073
* Correspondence: [email protected]
ABSTRACTObjective: To describe the threats to forests and the repercussions that these imply for the maintenance and conservation of orchids in their natural habitat.Design/Methodology/Approach: A comprehensive reference search on orchids and their habitats was performed. The physiological and morphological characteristics of orchids in Megamexico are described according to their life forms; additionally, the way in which these adaptations respond to the environment in which they thrive is explained. In this regard, threats to orchids and forests are listed. Therefore, emphasis is placed on the implications that habitat loss would have for the prevalence of many orchid species in this biogeographical region.Results: The humid forests of the mountain ranges of Megamexico host an impressive orchid richness, where there are far more epiphytic life forms than terrestrial ones. However, these ecosystems face a major threat from anthropogenic activities. As a result of the constant threats faced by forests —such as deforestation, arsons, land use change, etc.—, epiphytic orchids are the most threatened species, due to the loss of their habitat and the ecological requirements they need to survive.Study Limitations/Implications: This study describes the threats to many orchid species as a result of habitat loss and illegal looting.Findings/Conclusions: Forest conservation is vital for orchid maintenance and conservation because genetic diversity and ecological interactions among orchid species and other organisms are maintained.
Keywords: Orchidaceae, epiphytes, conservation, Megamexico.
INTRODUCTION Megamexico is a defined biogeographical region based on the geographic affinities and the endemism of the phanerogamic flora of Mexico. It stretches from the Sonoran, Chihuahuan, and Tamaulipan deserts in northern Mexico, and the southern United States of America, to central and northern Nicaragua (Rzedowski, 1991). This region stands out in the world for its complex geological history (Ferrusquía-Villafranca, 1998), its rugged topography (Mastretta-Yanes et al., 2015), and its climatic heterogeneity; these characteristics encourage the presence of almost all types of world vegetation (Rzedowski, 1991).

134 Agro productividad 2022. https://doi.org/10.32854/agrop.v15i5.2187
Therefore, tropical evergreen forest (TEF), tropical sub-deciduous forest, tropical deciduous forest, thorn forest, xeric shrubland, grassland, oak forest, coniferous forest, mountain mesophyll forest (MMF) and aquatic and sub-aquatic vegetation are found in this biogeographic region (Rzedowski, 1991) (Figure 1). The presence of these types of vegetation favors the presence of a great diversity of flora and fauna species.
IMPORTANCE OF ORCHIDS IN MEGAMEXICO Orchidaceae is one of the most diverse groups of plants in Megamexico (Villaseñor, 2016). Undoubtedly, orchids are one of the more charismatic and striking families of f lowering plants (Figure 2). They belong to the most diverse family of angiosperms and they have the greatest morphological variation (Christenhusz and Byng, 2016). This group of plants encompasses about 30,000 species, grouped in 736 to 880 genera (Givnish et al., 2015). Orchids have complex physiology and morphology which have allowed them to adapt to the forests where they live. Based on their life form, there are terrestrial, lithophyte (growing on rocks), and epiphytic (growing on trees without causing a negative effect) species. Particularly, epiphytes show CAM photosynthesis; meanwhile, most of the terrestrial species are C3. All orchids develop small, powder-like seeds. The roots of
Figure 1. Types of vegetation found in Megamexico.

135 Agro productividad 2022. https://doi.org/10.32854/agrop.v15i5.2187
epiphytes develop a velamen, a special tissue that allows them to absorb water from the environment. These characteristics are a response to their eco-physiological adaptations, such as the range of light tolerance, temperature, and humidity (Krömer et al., 2007). According to Benzing (1990), epiphytism, along with CAM photosynthesis, is the result of a set of adaptations developed to survive the conditions of the canopy. This has favored their expansion in the forest canopy, especially in the case of tropical forest orchids living in humid environments. The great diversity of orchids is given by their ability to occupy a wide range of ecological niches (Ricklefs and Renner, 1994), their association with specific pollinators, and their dispersing capabilities (Tremblay, 1992; Jersáková et al., 2006). Consequently, these factors have promoted their diversification and reduced their vulnerability to extinction (Ricklefs and Renner, 1994). Gutiérrez-Rodríguez et al. (2022) reported 1,732 orchid species in Megamexico, which are taxonomically grouped into 189 genera, 36 subtribes, and 17 tribes. From this number, 982
Figure 2. Orchid diversity in the mountain mesophyll forest (MMF) and tropical evergreen forest (TEF).

136 Agro productividad 2022. https://doi.org/10.32854/agrop.v15i5.2187
species are endemic —i.e., just over 50% are exclusive to this region, making it an important area for orchid diversity. Seventy percent of orchids (1,226 species) are epiphytes, while the remaining are terrestrial. The most diverse areas (characterized by a high degree of orchid endemism) are located in the humid forests of the mountain ranges of southeastern Mexico, central Guatemala, and central Nicaragua. In these areas, epiphytes were considerably more abundant than terrestrial species (Gutiérrez–Rodríguez et al., 2022). Terrestrial orchids thrive best in environments with clearly defined seasonality. For example, they usually comprise most of the orchid flora of oak forest, and pine-oak forests, as well as of sub and tropical deciduous forests. This type of vegetation is common in the north, center, and west of Megamexico, as well as in some parts of the south of this region. By contrast, an abundant presence of epiphytes is encouraged in forests where humidity is extremely high. This type of forest is located in the central-southern and southeastern Megamexico, as well as in high elevations of the main mountain systems.
Threats to orchids The flower is the most attractive part of orchids (Van Der Pijl and Dodson, 1966). Their beauty and the amazing morphological variation of their flowers have attracted the attention of scientists, botanists, growers, and nature photographers. However, many species are sought, looted, and trafficked by sellers, collectors, and people in general (Espejo-Serna et al., 2002) (Figure 3). Compared to other plant families, orchid species face many threats
Figure 3. Orchids face several threats, including trafficking and illegal sale.

137 Agro productividad 2022. https://doi.org/10.32854/agrop.v15i5.2187
(both natural and of human origin). Orchids are one of the most illegally trafficked and most vulnerable groups in Megamexico and around the world. In the countries that make up Megamexico, orchids figure prominently on many of the threatened species lists. For example, 188 species are included in the Mexican NOM-059-SEMARNAT endangered species list (SEMARNAT, 2010). Hágsater and Soto-Arenas (1998), Kull et al. (2006), García-Franco (2018), and many others have reported that the abundance of various species has been decreasing to critical levels in recent decades. In addition, many species are used for ornamental purposes. Furthermore, some species have economic value; such is the case of Vanilla, used as a flavoring around the world. The Environmental Management Units (EMUs) have been a viable and sustainable method for the conservation of many orchids. Nevertheless, it has not been convenient for many others, because it is almost impossible to recreate the ecological conditions found in their natural habitats. This is particularly true about those orchids that have a symbiotic relationship with fungi and depend on them to survive. The same phenomenon takes place with those species that serve as a home for other organisms (e.g., Myrmecophila Rolfe and Caularthron Raf.) and that benefit from them, protecting these orchids from defoliators. Others depend on anthills to germinate, such as Epidendrum flexuosum G. Mey. and Coryanthes picturata Rchb. f.
Epiphytic orchids are in serious risk of extinction Different orchid groups have different resilience levels (Kull et al., 2006). Some of the species are more resistant to disturbance than others. Particularly, some terrestrial orchids seem to be favored by these disturbances, like some of the species belonging to the Bletia Ruiz & Pav. genus which are commonly found on the roadsides. Somehow, terrestrial orchids —such as Dichromanthus aurantiacus (Lex.) Salazar & Soto Arenas— are not as threatened as epiphytes: they can survive the disturbance and even colonize degraded areas like pastures. By contrast, some Habenaria Willd and Lepanthes Sw. species do not tolerate these disturbances and are highly susceptible to changes.
THE ROLE OF FORESTS IN THE MAINTENANCE OF ORCHIDS Cloud immersion, vast water availability, and shade in mountain habitats provide favorable microclimates for the prevalence of epiphytic orchids (Gutiérrez-Rodríguez et al., 2022). Epiphytic orchids are at the highest risk of extinction, because the environments in which they thrive are being destroyed. MMF are the most threatened ecosystems (Challenger, 1998; Morales and Armenteras, 2013; Téllez-Velasco and Tejeda-Sartorius, 2017), followed by TEF (Gómez-Pompa et al., 1972). These forests are vitally important, due to the extraordinary biodiversity they house (Challenger, 1998) (Figure 4). Particularly, these ecosystems have the greatest orchid diversity, especially of epiphytes. This abundance is the result of a simple phenomenon: the total area of treetops in tropical forests is considerably larger than the ground area. Therefore, the niche available for plants is greater (Gravendeel et al., 2004). Hernández-Pérez et al. (2017) have shown that tree height can impact epiphyte abundance, richness, and diversity. In the same way, De Andrade-Kersten et al. (2009) have proven that the

138 Agro productividad 2022. https://doi.org/10.32854/agrop.v15i5.2187
greatest epiphytes diversity is found in the medium-superior strata of trees, especially in the branches (García-González et al., 2021). TEF distribution matches the high rainfall areas of Megamexico and is one of the most exuberant ecosystems. TEF structure consists of one herbaceous, one shrub, and two arboreal strata. Epiphytes and lianas are very abundant (Challenger, 1998). Meanwhile, MMF is the ecosystem which covers the smallest area (Mullingan and Burke, 2005). Although its area is so small, it is home to a greater diversity of flora and fauna species per surface unit (Rzedowski, 1978; Challenger, 1998; CONABIO, 2010). This type of ecosystem is immersed in clouds that cover the vegetation (Hamilton et al., 1995). The persistence of this forest depends on relatively high humidity, rugged topography, soil with a high amount of organic matter, and a temperate climate (Velázquez et al., 2000). The MMF structure is formed by canopy trees, sub-canopy trees, lianas, arborescent ferns, shrub stratum, climbing plants, epiphytes, and saprophytes.
THREATS TO FORESTS Forests are home to a large number of plants. However, forests are threatened by several factors, most of them related to anthropogenic causes. For example, some of the major threats reported by CONABIO (2010) include: deforestation, illegal logging, livestock, agriculture, climate change, droughts, fragmentation, road construction, arson, and urban areas expansion. Nowadays, MMF and TEF face extreme threats on multiple fronts, including: change in land use; transformation of lower areas into agroecosystems (e.g., coffee plantations), livestock, urban expansion, fragmentation, creation of roads, illegal selective logging, and natural resources overexploitation. Vegetation is almost impossible to regenerate when forests are felled, and/or fragmented, because environmental conditions change drastically. Consequently, these ecosystems are impossible to restore (Gómez-Pompa et al., 1972; García-Franco, 2018). Climate change also poses serious problems for orchid prevalence and conservation, as well as for MMF (Foster, 2001; CONABIO, 2010). This phenomenon has had implications
Figure 4. Tropical evergreen forest (left) and mountain mesophyll forest (right) are the ecosystems with more orchid species.

139 Agro productividad 2022. https://doi.org/10.32854/agrop.v15i5.2187
for hydrological processes affecting precipitation patterns and cloud abundance (Foster, 2001). The absence of clouds in the MMF is a result of the decrease in cloud formation and evapotranspiration. Consequently, vegetation is no longer immersed in clouds and there is not enough humidity to maintain species that require high humidity levels. This situation leads to local extinctions (Foster, 2001). If we consider all the threats faced by these forests, the scene is discouraging. Fires and excessive logging devastate the trees, which fulfill many functions, including being the orchids’ habitat; consequently, orchid flora is also destroyed. A similar situation has been reported with the increased mortality of epiphytic orchids, as a result of branches falling and the death of old trees (Kull et al., 2006). Despite their great numbers, the conservation of orchids living in these types of ecosystems faces an enormous challenge. The loss and transformation of forests compromise orchids growing there. Also, given the noticeable lack of protected natural areas in these ecosystems, taking care of them is a priority. Menchaca et al. (2012) proposed an alternative to meet this suggestion; they recommend recognizing orchids as a non-timber forest resource that can also be used by rural communities.
CONCLUSIONS Forests not only house a high level of biodiversity, but also provide vital habitats for many species, especially epiphytic orchids. For many reasons, some types of orchids cannot grow on disturbed sites or in ex situ conditions and, therefore, cannot be cultivated. While ex situ conservation and tissue culture are a feasible alternative for many species, forest conservation is essential for the maintenance of orchids; consequently, an uninterrupted gene flow between in situ populations allows genetic variation. Also, it enables orchids to maintain their interactions with other organisms. Many authors have reached this conclusion (e. g., Hágsater et al., 2005; Tejeda-Sartorius et al., 2017). Orchids play an important role in water intake and nutrient recycling (García-Franco and Toledo-Aceves, 2008). In addition, their absence in these ecosystems would entail an unprecedented biodiversity loss which would affect all the species that interact with orchids —for example, the wide range of their pollinators, etc. It is clear that, in the best-preserved areas, there is a greater diversity and abundance of species. However, in highly disturbed forest areas, this diversity and abundance are much lower and even orchids may be absent. We must raise awareness and motivation about taking care of our natural resources, because, if the forests disappear, orchids will follow. Ultimately, if any of the endemic orchid species of our study area disappears, it will not only disappear from Megamexico, but it will also disappear from the planet. Its lineage would be lost forever.
Acknowledgements The author would like to thank Matías Amezcua and Ethian Rafael Durán Licona who provided some
of the orchid photographs. Likewise, the author would like to thank Sonia Gallina Tessaro and Fernando
González García who encouraged him to write this document and Victoria Sosa who reviewed the
manuscript.

140 Agro productividad 2022. https://doi.org/10.32854/agrop.v15i5.2187
REFERENCESBenzing, D. H. (1990). Epiphytism: a preliminary overview. In: Vascular epiphytes. General biology and related
biota, Ashton, P. S., Hubbell, S. P., Janzen, D. H., Marshall, A. G., Raven, P. H., & Tomlinson, P. B., Eds.; Cambridge University Press: Cambridge, England. pp. 1-42.
Challenger, A. (1998). Utilizacion y conservacion de los ecosistemas terrestres de México: Pasado, presente y futuro. UNAM Agrupación Sierra Madre, S. C.: Distrito Federal, México. 847 pp.
Christenhusz, M. J. M., & Byng, J. W. (2016). The number of known plants species in the world and its annual increase. Phytotaxa, 261: 201-217. https://doi.org/10.11646/phytotaxa.261.3.1
CONABIO. (2010). El bosque mesofilo de montaña en México: amenazas y oportunidades para su conservacion y manejo sostenible. Comisión Nacional para el Conocimiento y Uso de la Biodiversidad. Recuperado el 2 de abril de 2021, de CONABIO: https://bioteca.biodiversidad.gob.mx/janium/Documentos/6529.pdf
De Andrade-Kersten, R., Borgo, M., & Menezes, S. S. (2009). Diversity and distribution of vascular epiphytes in an insular Brazilian coastal forest. Revista de Biología Tropical, 57: 749-759. http://dx.doi.org/10.15517/rbt.v57i3.5489
Espejo-Serna, A., García-Cruz, J., López-Ferrari, A R., Jiménez-Machorro, R., & Sánchez-Saldaña, L. (2002). Orquídeas del Estado de Morelos, Herbario AMO/UAM: Distrito Federal, México. 403 p.
Ferrusquia-Villafranca, I. (1998). Geología de México: una sinopsis. In: Diversidad biológica de México: orígenes y distribución, Ramamoorthy, T. P., Bye, R., Lot, A., & Fa, J., Eds.; Instituto de Biología, UNAM: Distrito Federal, México. pp. 3-108.
Foster, P. N. (2001). The potential negative impacts of global climate change on tropical montane cloud forest. Earth-Science Reviews, 55: 73-106. http://dx.doi.org/10.1016/S0012–8252(01)00056–3
García-Franco, J. G., & Toledo-Aceves, T. (2008). Epífitas vasculares: bromelias y orquídea. In: Agroecosistemas cafetaleros de Veracruz biodiversidad, manejo y conservación, Manson, R. H., Hernández–Ortiz, V., Gallina, S., & Mehltreter, K., Eds.; INECOL/SEMARNAT: Ciudad de México, México. pp. 69-82.
García-Franco, J. G. (2018). La fragmentación del bosque de niebla y su efecto en la comunidad de orquídeas (Orchidaceae). Agroproductividad, 10: 13-18.
García-González, A., Plasencia-Vázquez, A. H., Serrano-Rodríguez, A., Riverón-Giró, F. B., Ferrer-Sánchez, Y., & Zamora-Crescencio, P. (2021). Assemblage of vascular epiphytes associated to seasonally inundated forest in the Southeastern Mexico: Challenges for its conservation. Global Ecology and Conservation, 25: e01404. http://dx.doi.org/10.1016/j.gecco.2020.e01404
Givnish, T. J., Spalink, D., Ames, M., Lyon, S. P., Hunter, S. J., Zuluaga, A., Iles, W. J. D., Clements, A. A., Arroyo, M. T. K., Leebens-Mack, J., Endara, L., Kriebel, R., Neubig, K. M., Whitten, W. M., Williams, N. H., & Cameron, K. M. (2015). Orchid phylogenomics and multiple drivers of their extraordinary diversification. Proceedings of the Royal Society B: Biological Sciences, 7: 20151553. http://dx.doi.org/10.1098/rspb.2015.1553
Gómez-Pompa, A., Vázquez-Yanes, C., & Guevara, S. (1972). The tropical rain forest: A nonrenewable resource. Science, 177: 762-765. http://dx.doi.org/10.1126/science.177.4051.762
Gravendeel, B., Smithson, A., Slik, F. J. W., & Schuiteman, A. (2004). Epiphytism and pollinator specialization: Drivers for orchid diversity? Philosophical Transactions: Biological Sciences, 359: 1523-1535. http://dx.doi.org/10.1098/rstb.2004.1529
Gutiérrez-Rodríguez, B. E., M. Vásquez–Cruz & Victoria Sosa. (2022). Areas of endemism of the orchids of Megamexico: functional attributes and elevation. Plant Diversity. https://doi.org/10.1016/j.pld.2022.03.004
Hágsater, E., & Soto-Arenas, S. A. (1998). Orchid conservation in Mexico. Selbyana, 19: 15-19.Hágsater, E., Soto-Arenas, M. Á., Salazar-Chávez, G. A., Jiménez-Machorro, R., López-Rosas, M. A., &
Dressler, R. L. (2005). Las orquídeas de México. Instituto Chinonin: México. 304 p.Hamilton, L. S., Juvik, J. O., & Scatena F. N. (1995). Tropical montane cloud forest of central Veracruz, Mexico.
Columbia University: New York, USA. 407 p.Hernández-Pérez, E., Solano, E., & Ríos-Gómez, R. (2017). Host affinity and vertical distribution of epiphytic
orchids in a montane cloud forest in Mexico. Botanical Sciences, 96: 200-217. http://dx.doi.org/10.17129/botsci.1869
Jersáková, J., Johnson, S. D., & Kindlmann, P. (2006). Mechanisms and evolution of deceptive pollination in orchids. Biological Reviews of the Cambridge Philosophical Society, 81: 219-235. http://dx.doi.org/10.1017/s1464793105006986
Krömer, T., Kessler, M., & Gradstein, S. R. (2007). Vertical stratification of vascular epiphytes in submontane and montane forest of the Bolivian Andes: The importance of the understory. Plant Ecology, 189: 261-278. http://dx.doi.org/10.1007/s11258-006-9182-8.
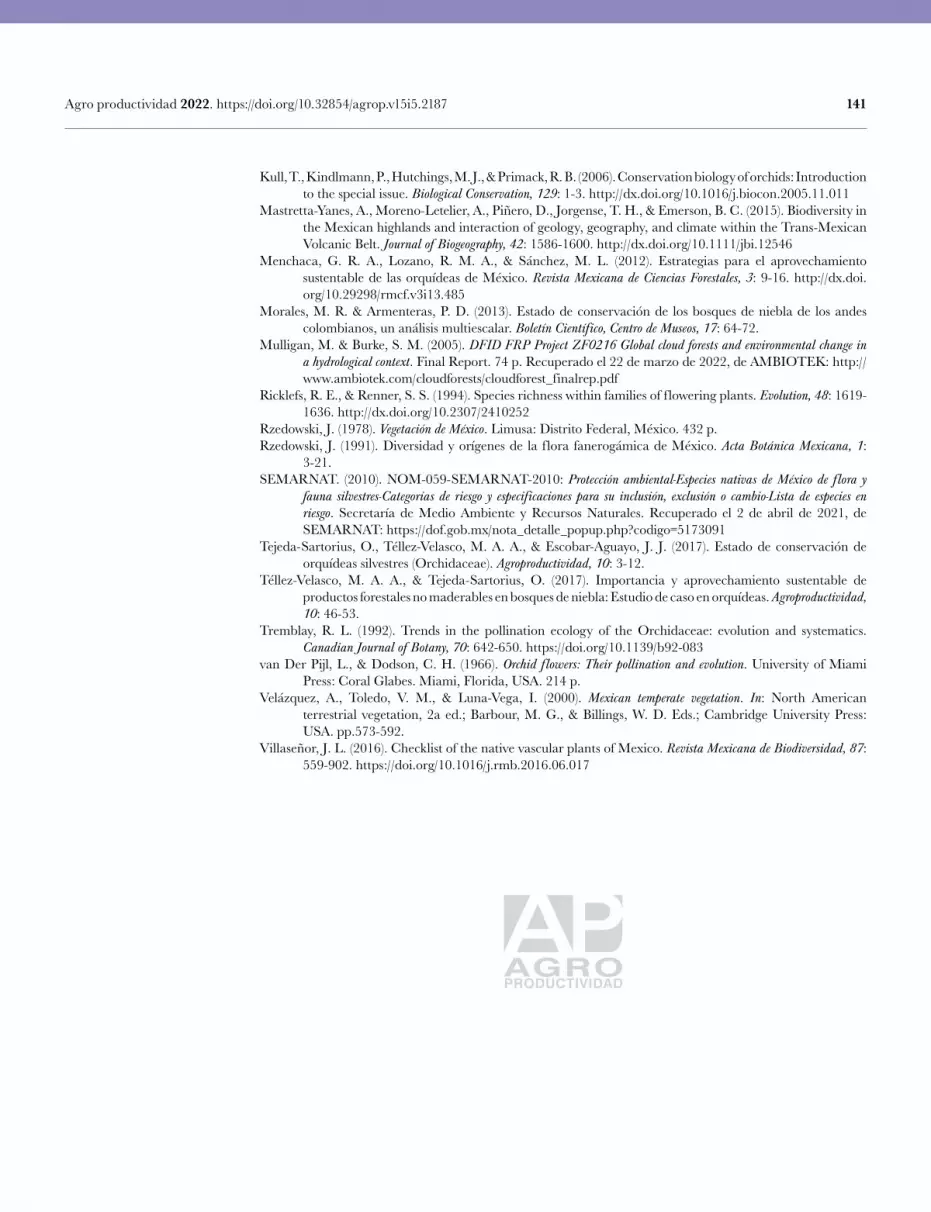
141 Agro productividad 2022. https://doi.org/10.32854/agrop.v15i5.2187
Kull, T., Kindlmann, P., Hutchings, M. J., & Primack, R. B. (2006). Conservation biology of orchids: Introduction to the special issue. Biological Conservation, 129: 1-3. http://dx.doi.org/10.1016/j.biocon.2005.11.011
Mastretta-Yanes, A., Moreno-Letelier, A., Piñero, D., Jorgense, T. H., & Emerson, B. C. (2015). Biodiversity in the Mexican highlands and interaction of geology, geography, and climate within the Trans-Mexican Volcanic Belt. Journal of Biogeography, 42: 1586-1600. http://dx.doi.org/10.1111/jbi.12546
Menchaca, G. R. A., Lozano, R. M. A., & Sánchez, M. L. (2012). Estrategias para el aprovechamiento sustentable de las orquídeas de México. Revista Mexicana de Ciencias Forestales, 3: 9-16. http://dx.doi.org/10.29298/rmcf.v3i13.485
Morales, M. R. & Armenteras, P. D. (2013). Estado de conservación de los bosques de niebla de los andes colombianos, un análisis multiescalar. Boletín Científico, Centro de Museos, 17: 64-72.
Mulligan, M. & Burke, S. M. (2005). DFID FRP Project ZF0216 Global cloud forests and environmental change in a hydrological context. Final Report. 74 p. Recuperado el 22 de marzo de 2022, de AMBIOTEK: http://www.ambiotek.com/cloudforests/cloudforest_finalrep.pdf
Ricklefs, R. E., & Renner, S. S. (1994). Species richness within families of f lowering plants. Evolution, 48: 1619-1636. http://dx.doi.org/10.2307/2410252
Rzedowski, J. (1978). Vegetacion de México. Limusa: Distrito Federal, México. 432 p.Rzedowski, J. (1991). Diversidad y orígenes de la flora fanerogámica de México. Acta Botánica Mexicana, 1:
3-21.SEMARNAT. (2010). NOM-059-SEMARNAT-2010: Proteccion ambiental-Especies nativas de México de flora y
fauna silvestres-Categorías de riesgo y especificaciones para su inclusion, exclusion o cambio-Lista de especies en riesgo. Secretaría de Medio Ambiente y Recursos Naturales. Recuperado el 2 de abril de 2021, de SEMARNAT: https://dof.gob.mx/nota_detalle_popup.php?codigo=5173091
Tejeda-Sartorius, O., Téllez-Velasco, M. A. A., & Escobar-Aguayo, J. J. (2017). Estado de conservación de orquídeas silvestres (Orchidaceae). Agroproductividad, 10: 3-12.
Téllez-Velasco, M. A. A., & Tejeda-Sartorius, O. (2017). Importancia y aprovechamiento sustentable de productos forestales no maderables en bosques de niebla: Estudio de caso en orquídeas. Agroproductividad, 10: 46-53.
Tremblay, R. L. (1992). Trends in the pollination ecology of the Orchidaceae: evolution and systematics. Canadian Journal of Botany, 70: 642-650. https://doi.org/10.1139/b92-083
van Der Pijl, L., & Dodson, C. H. (1966). Orchid flowers: Their pollination and evolution. University of Miami Press: Coral Glabes. Miami, Florida, USA. 214 p.
Velázquez, A., Toledo, V. M., & Luna-Vega, I. (2000). Mexican temperate vegetation. In: North American terrestrial vegetation, 2a ed.; Barbour, M. G., & Billings, W. D. Eds.; Cambridge University Press: USA. pp.573-592.
Villaseñor, J. L. (2016). Checklist of the native vascular plants of Mexico. Revista Mexicana de Biodiversidad, 87: 559-902. https://doi.org/10.1016/j.rmb.2016.06.017


Colegio dePostgraduados
143
Agribusiness potential of castor oil plant (Ricinus communis L.) in Mexico Vasco-Leal, José F.1; Cuellar-Nuñez, Liceth1; Vivanco-Vargas Martín1*; Solís-Lozano, Juan A.1; Díaz-Calzada María E.1; Sánchez Rayas F.1; Méndez Gallegos S. de J.2
1 Universidad Autónoma de Querétaro. Querétaro, Querétaro. México, C.P. 76010.2 Posgrado de Innovación en Manejo de Recursos Naturales. Colegio de Postgraduados, Campus San Luis
Potosí. Salinas de Hidalgo, San Luis Potosí. México, C.P. 78622.* Correspondence: [email protected]
ABSTRACTObjective: To describe the agribusiness potential of the castor oil plant in Mexico through the collection and analysis of agricultural, industrial and commercial information that allows decision making for the formulation of future productive projects to generate economic, social and technological impacts.Design/Methodology/Approach: The study is descriptive with a transactional design. The information was collected on national and international agrifood statistical and documentary information platforms.Results: Different attempts have been made in Mexico in commercial and research projects related to the cultivation, production and transformation of castor oil, with results that are not very encouraging due to the lack of knowledge about productive, technological and commercial processes. However, on the other hand, the need for the industrial sector to import oil to produce high-value products is evident.Study Limitations/Implications: Isolated efforts have been made by each of the actors in the castor oil agribusiness, which has prevented the sector’s consolidation.Findings/Conclusions: An intelligent management of agricultural production must be implemented through the establishment of commercial crops with the adoption of basic technological packages applied to each region in particular, with great attention to the availability of planting seed, which should have agronomic potential, use of nutrition and management of pests and diseases, as well as to foresee all the cultural tasks of maintenance of the crop and harvesting modality that guarantee yield in the field and quality raw material. Currently, there is a deficit in the castor oil market in the country, which leads to high business prospects and business opportunities.
Keywords: Agroindustry, international trade, import substitution, productive projects, added value.
INTRODUCTION The castor oil plant (Ricinus communis L.) is an inedible crop. Its agricultural production is exploited predominantly in arid and semi-arid regions of the world (Kallamadi et al., 2015)a non-edible oilseed crop of the tropics assumes commercial importance due to its great utilization value in industry, medicine and agriculture. The present investigation has been
Citation: Vasco-Leal, J. F., Cuellar-Nuñez, L., Vivanco-Vargas M.,Solís-Lozano, J. A., Díaz-Calzada, M. E., Sánchez-Rayas, F., & Méndez-Gallegos., S de J. (2022). Agribusiness potential of castor oil plant (Ricinus communis L.) in Mexico.Agro Productividad. https://doi.org/10.32854/agrop.v15i5.2267
Academic Editors: Jorge Cadena Iñiguez and Libia Iris Trejo Téllez
Received: January 15, 2022.Accepted: May 6, 2022.Published on-line: June 6, 2022.
Agro Productividad, 15(5). May. 2022. pp: 143-152.
This work is licensed under a Creative Commons Attribution-Non-Commercial 4.0 International license.
143 Image by Alejandro Sánchez

144 Agro productividad 2022. https://doi.org/10.32854/agrop.v15i5.2267
undertaken to assess the extent of genetic diversity in 31 accessions of castor representing seven geographic areas in the world using RAPD (random amplified polymorphic DNA. The center of origin is quite contested; some authors consider it to be probably native of the region of Ethiopia in Eastern Africa, others from the Northwest and Southwest of Asia, or from the Arabic Peninsula, subcontinent of India and China (Rukhsar et al., 2018). This plant is distributed from sea level up to 2,500 masl (Naik, 2018), and a water requirement between 75 mm and 1.178 mm has been reported, depending on the type of soil, irrigation method and location (Ramanjaneyulu et al., 2013). This plant is mistakenly considered to be a weed, because of the places where it is seen to grow, although in should actually be considered to be a crop, which requires an adequate agronomic management. The cultivation of castor oil plant should be thought of as a competitive production system, which does not jeopardize food security and does not compete with the lands destined to food production (Navas). The expansion of its cultivation happened primarily due to its ability to adapt to different environmental conditions and the various possibilities of use of its main product, the oil extracted from its seeds ( Jachmanian et al., 2009), which has a broad possibility of applications of high value such as being considered as a bioenergetics crop because its oil can be converted into biofuel (biodiesel, bioturbosine) for the automotive or aeronautic sector; for domestic use as a pharmaceutical in the elaboration of different products such as a laxative agent for the digestive system; as well as for shampoo, cream, cosmetics, detergents, medicinal soaps, lubricants, nylon, paper, perfume, plastics, laminates, paints, polyurethane, coating, textiles, dyes, and illumination with torches, among other functions (Mutlu and Meier, 2010; Ogunniyi, 2006; Freire, 2001). The residue from the oil extraction is considered an agroindustrial byproduct that can be used as organic fertilizer or feed for animals (prior elimination or decrease of ricin, a toxin present in the seed); this residue contains approximately 40% of raw protein, although it is deficient in the essential amino acids lysine, methionine and tryptophan (Kole, 2011). Likewise, seeds and leaves are used for the preparation of extracts to control insects, pests, rodents, mollusks and phytopathogens, with successful results (Cuadra, 1981; Upasani et al., 2003; Rodríguez, 2005).
Agribusiness productive projects carried out in Mexico In Mexico different attempts have been made in commercial and research projects that refer to the cultivation, production and transformation of the castor oil plant, in states like Michoacán, Chiapas and Oaxaca, without any success. This is because of the absence of an established productive chain, the lack of transference of knowledge and technology by the agricultural institutes and/or research centers of the country, the low productivity expressed in the cultivation fields, and the low interest from the government sector in terms of federal subsidies. According to Fernández-Carpio et al. (2012), improved varieties from Brazil were sown in the state of Michoacán, which have adapted with difficulty to the agroecological conditions of the state, presenting in the crops susceptibility to attacks from pests and diseases, and also, low production yield in the field.

145 Agro productividad 2022. https://doi.org/10.32854/agrop.v15i5.2267
For its part, the State Commission on Bioenergetics was created in the state of Chiapas in the year 2006, with the objective of producing biofuels from the castor oil plant and another alternative crop, project that did not have good results due to insufficient planning from the state commission in terms of scientific research, technical information, specialized consultancy, and almost null information that producers received on the agronomic management of the plantations (Valero-Padilla et al., 2011). Meanwhile, in the state of Oaxaca, there are various castor oil extraction plants that are functioning, one of which dates from the year 1935; that is where they elaborated the ricin oil for the use of illumination in lamps for the households, pharmaceutical use, and even as purgative. The agricultural production of the grain has been decreased, although the base price in the production plant is around ten thousand pesos per ton (El Universal, 2018). For their part, Rodríguez Hernández et al. (2013) performed a study of the competitiveness of the castor oil plant compared to traditional crops such as corn and bean in the region of Valles Centrales in Oaxaca, place where the castor oil crops are established; in their research, the authors deduce that according to the results, agricultural producers require technological changes during the cultivation, such as use of improved seeds, application of soil fertilization, harvest and postharvest technology, factors that could impact the increase in yield per area sown; also, to make the prices per ton more attractive. This is why the need to describe the agribusiness potential of the castor oil plant in Mexico becomes clear, through the collection and analysis of agricultural, industrial and commercial information, to allow decision making for the formulation of future productive projects that generate economic, social and technological impacts.
MATERIALS AND METHODS A descriptive type study with trans-sectional design was suggested for the information analysis. The statistical data on the castor oil plant in Mexico and the world was obtained from sources of information such as the informatics program called Agrifood Consultation Information System (Sistema de Informacion Agroalimentaria de Consulta, SIACON), as well as international archives such as Trade Statistics for International Business Development (https://www.trademap.org/) and the Food and Agriculture Organization of the United Nations (http://www.fao.org/statistics/es/).
RESULTS AND DISCUSSIONNational context The incipient development of this crop present in the country opens a great opportunity to conduct research that generates technological innovations, in the different stages of cultivation, sowing, development, harvest and post-harvest, because many of the innovations generated do not reach agro-industrial producers, since the process of transference of innovation is deficient in space and time, and it does not achieve the consolidation of the full use of knowledge and technology.

146 Agro productividad 2022. https://doi.org/10.32854/agrop.v15i5.2267
Ecosystem of the castor oil agribusinesses in Mexico The Higher Education Institutions and Research Institutions have developed various scientific, technological and innovation projects with the interest of generating information and analyzing the agro-industrial potential of the castor oil plant. The research group that belongs to the Universidad Autónoma de Querétaro and Colegio de Postgraduados Campus San Luis Potosí, has coordinated research studies for the quantification of nutraceutical and chemical properties in castor oil plant leaves (Vasco et al., 2021), the evaluation of morphology and phenology (García-Herrera et al., 2019), growth, development and field yield of wild materials (García-Herrera et al., 2019a), the physicochemical characterization of seeds and oils (Vasco et al., 2018; Isaza et al., 2018; Mosquera et al., 2016; Perdomo et al., 2013), in addition to establishing castor oil crops from research and demonstrative platforms for the transference of knowledge and technology to the productive sector. Likewise, there are different government agencies in charge of formulating public policies and sectorial strategies that have attempted to stimulate the agroindustry of the castor oil plant through different plans and programs that support the cultivation and the transformation into oil for industrial use or bioenergetics (DOF, 2018). In this context, the companies that demand oil in the country have shown interest in having raw material of Mexican origin, with the objective of substituting imports and minimizing the dependency on international suppliers, avoiding the exit of foreign currency through such commercial transactions, and fostering the national agricultural production to consolidate this productive chain, in addition to generating employment in the rural zones, among others. However, the results in the production zones have not been encouraging and therefore the import process is the main alternative to satisfy these needs. Finally, there are various companies that supply machinery and equipment, which have found the opportunity for creating, fabricating, importing and transferring the technology necessary to solve the problems of cleaning the fruit, classifying the grain, extraction, refining and transformation of the oil into high value products. Next, Table 1 presents the actors of the agribusiness sector ecosystem of the castor oil plant in Mexico.
Agricultural production in Mexico According to the information provided by SIACON (2022) and described in Table 2, the surface sown in Mexico between the years 2016 and 2020 shows a decrease of 89% by going from 9,520 to 1,044 hectares; this indicator shows the decreasing trend that is reflected in the production of the castor oil grain. In turn, the yield per hectare had an upwards trend, showing a minimum of 1.41 ton/ha and a maximum of 3.55 ton/ha. For its part, the mean rural price per ton of grain of castor oil plant between the years 2016 and 2020 ranged between 277.94 and 384.63 US dollars, generating production values of the castor oil grain in Mexico between the years 2016 and 2020, from 33 thousand US dollars (2019) to 3.4 million US dollars (2016).
Agricultural production of the castor oil plant per state According to the results presented in Table 3, the state of Sonora is the state with highest productive interest, since it has the Castor Fields plant which has the objective of

147 Agro productividad 2022. https://doi.org/10.32854/agrop.v15i5.2267
Table 1. Actors of the castor oil plant agribusiness in Mexico
Ciencia, Tecnología e Innovación Instituciones Federales y/o Estatales
Empresas Demandantes
Empresas que Proveen
Maquinaria y Equipos
Universidad Autónoma de Querétaro Secretaria de Agricultura Desarrollo Rural(SADER)
ASA(Ciudad de México)
REINMAC
Universidad Nacional Autónoma de México Secretaria de Energía(SENER)
ARTLUX (Querétaro) DERTEK
Universidad Autónoma Chapingo Secretaria de Medio Ambiente y Recursos Naturales, (SEMARNAT),
BIOR(Baja California)
GRIMA BIODIESEL
Universidad Autónoma de Nuevo León Secretaria de Hacienda y Crédito Público (SHCP)
Agracast(Nayarit)
Universidad Autónoma Agraria Antonio Narro Secretarias Estatales de Desarrollo y Fomento al Sector Agrícola
Castorfields (Sonora)
Colegio de Postgraduados Fideicomisos Instituidos en Relación con la Agricultura (FIRA)
GRIMA BIODIESEL (Puebla)
Instituto Tecnológico de Perote Financiera Nacional Rural de Desarrollo Agropecuario, Rural, Forestal y Pesquero (FND)
SOLBEN(Nuevo León)
Instituto Tecnológico del Roque AGROASEMEX DERTEK(Oaxaca)
Instituto Politécnico Nacional Servicio Nacional de Inspección y Certificación de Semillas (SNICS)
Industria Torres Barriga(Oaxaca)
INIFAP Campo experimental:Valles CentralesBajíoValle del GuadianaRosario IzapaValle del FuerteNorman E. Borlaug
Sistema Nacional de Investigación y Transferencia de Tecnología para el Desarrollo Rural Sustentable (SNITT)
Oleoquímicos de México(Tamaulipas)
Red Mexicana de Bioenergéticos (REMBIO) Comisión Nacional del Agua(CONAGUA)
Grupo Neoken(Nuevo León)
Egon Meyer(Estado de México)
Source: Prepared by the authors.
Table 2. Agricultural production of the castor oil crop in Mexico 2016 to 2020.2016 2017 2018 2019 2020
Planted area (ha) 9,520 1,888 321.50 304.50 1,044Harvested area (ha) 6,622 1,768 101.50 33.50 953Production (ton) 9,321.68 3,478 281.64 119 3,123
Yield (t ha1) 1.41 1.97 2.77 3.55 3.28
Rural price media (US$/t) 367.01 384.63 374.22 277.94 341.35Production value (US$) 3,421,112.63 1,337,736.43 105,394.06 33,074.66 1,066,021.57Source: Prepared by the authors with data obtained from SIACON (2022).

148 Agro productividad 2022. https://doi.org/10.32854/agrop.v15i5.2267
ensuring the supply of castor oil grain to the industrial plant Castor Produkte for its future transformation in ricin oil at competitive prices (Grupo Alego, 2016). Likewise, it shows that the state of Sinaloa went from being a producing state for the year 2016, to lacking representativeness in the four years after. For its part, in the year 2020 the state of Nayarit presented a new drive in the area sown of castor oil crop, with a total of 201.68 ha; it should be highlighted that it is the agricultural productive development with the highest yields per area planted in the country, having as reference the period covered between the year 2016 and 2020, while other states such as Tlaxcala and Baja California have lower proportion of agricultural crops. According to this, the castor oil crop in Mexico has been established primarily in the northwest region of the country in recent years, where industries of great interest in the castor grain and oil have been installed, which are in agreement with the establishment of agricultural crops. Imports of castor oil in Mexico Presently, the agribusiness exploitation of this raw material is an urgent need in face of the demand for the national market and low offer of the Mexican agricultural production; therefore, this productive sector has required importing the oil primarily from India with an approximate value of 31 million US dollars, between the years 2016 and 2020 (TRADEMAP, 2022). This evidences a high dependency on the imports of the cited product from this country, which can generate adverse situations in the supply in face of occasional changes in the conditions of the international market, agroclimate problems, and geopolitical events, among others, which can place at risk the offer of raw material for its agribusiness exploitation (Table 4).
Table 3. Statistical data of the agricultural production of castor in States of Mexico.
Year Mexican state P.A (ha) H.A (ha) P (t) Y (t ha1) RPM (US$/t) P.V (US$)
2020
Baja California 34.69 34.69 60.35 1.74 377.19 22,763.41
Nayarit 201.68 201.68 817.33 4.05 513.78 419,931.33
Sonora 756.63 716.63 2,245.43 3.13 277.61 623,363.91
Tlaxcala 51 0 0 0 0 0
2019
Baja California 9 9 18 2.0 378.45 6,812.03
Sonora 244.50 24.50 101 4.12 260.03 26,262.66
Tlaxcala 51 0 0 0 0 0
2018
Baja California 53 53 80.34 1.52 375.93 30,203.01
Nayarit 20 20 93.60 4.68 501.25 46,917.29
Sonora 248.50 28.50 107.70 3.78 262.52 28,273.68
2017Nayarit 340 340 1,196.80 3.52 526.31 629,894.74
Sonora 1,548 1,428 2,281.20 1.60 310.29 707,841.60
2016
Nayarit 300 300 405 1.35 496.14 200,936.84
Sinaloa 1,000 1,000 930 0.93 300.75 279,699.25
Sonora 8,220 5,322 7,986.68 1.50 368.17 2,940,477.19
Note: P.A (Planted area), H.A (Harvested area), P (Production), Y (Yield), RPM (Rural price media) P.V (Production value). Source: Prepared by authors with data obtained from SIACON (2022).

149 Agro productividad 2022. https://doi.org/10.32854/agrop.v15i5.2267
International castor oil market Production and area harvested in the main producing countries of castor oil plant According to data from FAO (2021) expressed in Table 5, between the years 2016 and 2019, the largest area of castor oil plant harvested in the world has been concentrated in India, becoming the highest offeror of this product in the international market.
Global imports of castor oil in the world According to Table 6, with information from TRADEMAP (2022), the statistics of international trade of castor oil identified with the tax fraction 151530, the approximate value of imports trade of castor oil for the year 2020 in the world was 879 million dollars. The largest importer for this tax fraction was China with an import value of 362 million dollars, followed by Germany (88 million USD), United States of America (81 million USD), and France (78 million USD). It should be highlighted that the trend in global imports of the product according to the figures reported is increasing, with the exception of the year 2020, derived from the conditions from the sanitary contingency generated by COVID-19.
Table 4. Importation of castor oil in Mexico (2016-2020)
Countries2016 2017 2018 2019 2020
(thousand US$)India 5,516 6,179 6,699 6,325 6,461
Germany 106 102 88 24 137
Brazil 77 85 120 30 332
USA 66 296 146 170 45
Spain 287 515 633 498 302
World totals 6,068 7,345 7,728 7,047 7,276
Source: Prepared by authors data obtained from TRADEMAP (2022).
Table 5. World’s top seed producers/harvested area (2016-2019).
Countries2016 2017 2018 2019
Production(t)
Harvestedarea (ha)
Production(t)
Harvestedarea (ha)
Production(t)
Harvestedarea (ha)
Production(t)
Harvestedarea (ha)
India 1,376,000 1,037,000 1,568,000 960,000 1,567,560 824,130 1,196,680 751,320
China 40,000 23,000 55,000 30,000 27,000 16,000 36,000 21,000
Mozambique 77,475 202,110 79,944 206,734 82,598 218,521 85,089 224,007
Etiopia 10,000 6,354 9,287 5,759 10,919 6,599 11,157 6,587
Brasil 24,620 44,351 13,481 47,147 14,224 46,075 16,349 50,567
Tailandia 1,100 1,300 1,200 1,300 1,616 1,652 1,588 1,605
Myanmar 12,529 15,108 12,575 15,127 12,886 15,803 13,051 15,881
Paraguay 6,000 6,000 7,000 6,000 7,000 6,000 6,000 6,000
México 9,322 6,622 3,478 1,768 282 102 119 34
Source: Prepared by authors with data obtained from FAO (2021).

150 Agro productividad 2022. https://doi.org/10.32854/agrop.v15i5.2267
CONCLUSIONS Mexico has broad agricultural and commercial potential in the agribusiness of the castor grain and oil to supply the industrial sector, which leads to high prospects of business and entrepreneurial opportunities. The agribusiness projects that are undertaken ought to take into account the necessary agronomic management to generate productivity and competitiveness. There should be staff that has knowledge in the management of the castor oil crop or otherwise of oleaginous plants, so that the cultivation cycle can be planned according to specific technological packages for every agroclimate condition, ensuring the supply of improved seed for sowing, establishing calendars for the different phenological stages of the crop and contemplating needs for irrigation and nutrition to guarantee field yield and physicochemical quality in grain and oil.
REFERENCESCuadra, V.D. (1981). Ricinus communis L. Ariprospectos: Investigación en Química Aplicada (Folleto) Saltillo,
Coahuila, México. 4p.Kole, C. (2011). Wild crop Relatives: Genomic and Breeding Resources: Oliseeds, Springer, London, pp 254.
doi: 10.1007/978-3-642-14871-2 DOF (2008). Diario Oficial de la Federación. Ley de Promoción y Desarrollo de los Bioenergéticos. Disponible
en: https://www.diputados.gob.mx/LeyesBiblio/pdf/LPDB.pdf El Universal (2018). La Ultima aceitera que ilumina Oaxaca. Disponible en: http://www.eluniversal.com.mx/
Estados/historia-la-ultima-aceitera-que-alumbra-oaxaca FAOSTAT (2021). Food and Agriculture Organization of the United Nations. Disponible en: http://faostat.
fao.org. Freire, R.M. (2001). Ricinoquímica. O agronegocio da mamona no Brasil. Brasília. In: Azevedo, D.M.P., de Lima,
E.F. (Eds.), Embrapa Informacão Tecnológica: Cap. XIII, 295–335.Fernández Carpio, V., E. Andrio Enríquez y M. M. Elos. (2012). Aprovechamiento de la higuerilla (Ricinus
communis) para uso bioenergético en La Biodiversidad en Guanajuato: Estudio de Estado vol. I. México. Comision Nacional para el Conocimiento y Uso de la Biodiversidad (conabio)/Instituto de Ecología del Estado de Guanajuato (iee), pp. 234-240.
García-Herrera, E. J., Olivares-Ramírez, A., Amante-Orozco, A., Hernández-Ríos, I., Rossel-Kipping, E. D., Pimentel-López, J., ... & Gómez-González, A. (2019). Evaluación de colectas de higuerilla (Ricinus communis L.) del altiplano centro-norte de México. Agroproductividad, 12(1), 25-32. doi: 10.32854/agrop.v0i0.1334
Table 6. World imports of castor oil (2016-2021).
Countries2016 2017 2018 2019 2020 2021
(thousand US$)China 275,026 384,506 388,317 400,242 362,313 -
France 100,102 93,384 108,252 97,022 78,362 124,257
USA 72,577 96,784 98,609 100,167 81,448 145,932
Germany 45,641 91,755 92,457 115,484 88,327 122,961
Netherlands 35,841 48,196 49,331 57,862 45,526 -
Thailand 28,169 35,841 30,781 32,760 24,627 29,343
Italy 20,714 28,915 25,209 27,920 22,237 -
Japan 19,270 25,871 25,384 28,448 19,237 28,369
United Kingdom 11,685 14,601 17,566 18,786 15,436 16,718
Total in the world 733,459 983,119 989,487 1,036,354 879,099 -
Source: Prepared by authors with data obtained from TRADEMAP (2022).

151 Agro productividad 2022. https://doi.org/10.32854/agrop.v15i5.2267
García-Herrera, E. J., Cedillo-Martínez, I., Gómez-González, A., Hernández-Ríos, I., Amante-Orozco, A., & Rossel-Kipping, E. D. (2019a). Recolecta, establecimiento y caracterización de semilla de higuerilla (Ricinus communis L.) en el altiplano centro-norte de México. Agroproductividad, 12(3), 89-97. doi:10.32854/agrop.v0i0.1126
Grupo Alego (2016). Biofields Renewable & Sustainable. Disponible en: https://grupoalego.com/resources/files/ReporteSustentabilidad2016web.pdf
Isaza, C., Anaya, K., de Paz, J. Z., Vasco-Leal, J. F., Hernandez-Rios, I., & Mosquera-Artamonov, J.D. (2018). Image analysis and data mining techniques for classification of morphological and color features for seeds of the wild castor oil plant (Ricinus communis L.). Multimedia Tools and Applications, 77 (2), 2593-2610. doi:/10.1007/s11042-017-4438-y
Jachmanian I. Pérez G. E. Villamil J., Villamil J.J. (2009). El cultivo de tártago (Ricinus communis L.) en el Uruguay: Información preliminar. Instituto Nacional de Investigación Agropecuaria. Montevideo Uruguay. 20 p.
Kallamadi, P. R., Nadigatla, V. G. R., & Mulpuri, S (2015). Molecular diversity in castor (Ricinus communis L.). Industrial crops and products, 66, 271-281. doi:10.1016/j.indcrop.2014.12.061
Mosquera-Artamonov, J.D., Vasco-Leal, J.F., Acosta-Osorio, A.A., Hernandez-Rios, I., Ventura-Ramos, E., Gutiérrez- Cortez, E., & Rodríguez-García M.E. (2016). Optimization of castor seed oil extraction process using response surface methodology. Ingeniería e Investigacion, 36(3), 82-88. doi: 10.15446/ing.investig.v36n3.55632
Mutlu, H. y Meier, M. A. R. (2010). Castor oil as a renewable resource for the chemical industry. European Journal Lipid Science and Technology. 112:10–30. doi:10.1002/ejlt.200900138
Naik, S. N., Saxena, D. K., Dole, B. R., & Khare, S. K. (2018). Potential and perspective of castor biorefinery. In Waste Biorefinery (pp. 623-656). Doi:10.1016/B978-0-444-63992-9.00021-5
Ogunniyi, D.S., (2006). Castor oil: A vital industrial raw material. Bioresource Technology, 97, 1086–1091. doi:10.1016/j.biortech.2005.03.028
Perdomo, F. A., Acosta-Osorio, A. A., Herrera, G., Vasco-Leal, José F., Mosquera-Artamonov, J. D., Millán-Malo, B. & Rodríguez-García, M.E. (2013). Physicochemical characterization of seven Mexican Ricinus communis L. seeds & oil contents. Biomass and Bioenergy. 48:17-24. doi:10.1016/j.biombioe.2012.10.020
Ramanjaneyulu, A. V., Reddy, A. V., & Madhavi, A (2013). The impact of sowing date and irrigation regime on castor (Ricinus communis L.) seed yield, oil quality characteristics and fatty acid composition during post rainy season in South India. Industrial crops and products, 44, 25-31. doi:10.1016/j.indcrop.2012.10.008
Rodríguez, H.C. (2005). Plantas contra plagas 2; epazote, hierba de la cucaracha, paraíso, higuerilla y sabadilla. RAP-AL, RAPAM, SOMAS, CP e ITA Tlaxcala. Primera edición. Texcoco, Estado de México. México. 290p.
Rodríguez Hernández, R.Zamarripa Colmenero, A. (2013). Competitividad de la higuerilla (Ricinus communis) para biocombustible en relación a los cultivos actuales en el Edo. de Oaxaca, Mex. Revista Mexicana de Agronegocios, vol. 32, pp. 306-318
Rukhsar, Patel, M. P., Parmar, D. J., & Kumar, S (2018). Genetic variability, character association and genetic divergence studies in castor (Ricinus communis L.). Annals of Agrarian Science, 16(2), 143-148. doi:10.1016/j.aasci.2018.02.004
Severino L. S., Dick L. Auld, Marco Baldanzi, Magno J. D. Cândido, Grace Chen, William Crosby, D. Tang, Xiaohua He, P. Lakshmamma, C. Lavanya, Olga L. T. Machado, Thomas Mielke, Máira Milani, Travis D. Miller, J. B. Morris, Stephen. A. Morse, Alejandro A. Navas, Dartanhã J. Soares, Valdinei Sofiatti, Ming L. Wang, Maurício D. Zanotto and Helge Zieler. (2012). A Review on the Challenges for Increased Production of Castor. Agronomy Journal. Volume 104 (4). doi:10.2134/agronj2011.0210
SIACON (2022). Sistema de Información Agroalimentaria de Consulta (SIACON). Secretaría de Agricultura y Desarrollo Rural (SADER)
TRADEMAP (2021), Estadísticas del comercio para el desarrollo internacional de las empresas. Disponible en: https://www.trademap.org/Index.aspx
Upasani, S.M., Kotkar, H.M., Mendki, P.S y Maheshwari V.L. (2003). Partial characterization and insecticidal properties of Ricinus communis L. foliage flavonoids. Pest Management Science. 59 (12), 1349-1354. doi:10.1002/ps.767
Valero Padilla, J., Cortina Villar, H. S., & Vela Coiffier, M. P. (2011). El proyecto de biocombustibles en Chiapas: experiencias de los productores de piñón (Jatropha curcas) en el marco de la crisis rural. Estudios sociales (Hermosillo, Son.), 19(38), 119-144.

152 Agro productividad 2022. https://doi.org/10.32854/agrop.v15i5.2267
Vasco-Leal, J. F., Hernández-Ríos, I., Méndez-Gallegos, S. D. J., Ventura-Ramos Jr, E., Cuellar-Núñez, M. L., & Mosquera- Artamonov, J. D. (2017). Relación entre la composición química de la semilla y la calidad de aceite de doce accesiones de Ricinus communis L. Revista Mexicana de Ciencias Agrícolas, 8(6), 1343-1356. doi:10.29312/remexca.v8i6.299
Vasco-Leal, J.F., Mosquera-Artamonov, J. D, Hernández-Ríos, I., Méndez-Gallegos, S. D. J., Perea-Flores, M.J., Peña-Aguilar, J.M., Rodriguez-García, M.E. (2018). Physicochemical characteristics of seeds from wild and cultivated castor bean plants (Ricinus communis L.). Ingeniería e Investigacion, vol. 38 No. 1, (24-30). doi:10.15446/ing.investig.v38n1.63453
Vasco-Leal, J.F., Cuellar-Nuñez, M.L., Luzardo-Ocampo, I., Ventura-Ramos, E., Loarca-Piña, G., & Rodríguez-García, M.E. (2021). Valorization of Mexican Ricinus communis L. leaves as a source of minerals and antioxidant compounds. Waste and Biomass Valorization. 12(4). 2071-2088. doi: 10.1007/ s12649-020-01164-5