carbon deposition on bimetallic co�ni/al 2o 3 catalyst during steam reforming of glycerol
TRANSCRIPT
Cg
CR
a
AA
KCCGS
1
ddosb(oatmccaaa(aTi
0d
Catalysis Today 164 (2011) 268–274
Contents lists available at ScienceDirect
Catalysis Today
journa l homepage: www.e lsev ier .com/ locate /ca t tod
arbon deposition on bimetallic Co–Ni/Al2O3 catalyst during steam reforming oflycerol
hin Kui Cheng, Say Yei Foo, Adesoji A. Adesina ∗
eactor Engineering & Technology Group, School of Chemical Engineering, The University of New South Wales, Anzac Parade, Kensington, Sydney, NSW 2052, Australia
r t i c l e i n f o
rticle history:vailable online 3 November 2010
eywords:arbon depositionatalyst deactivationlycerol
a b s t r a c t
This paper reports the nature and kinetics of carbon deposition on bimetallic Co–Ni/Al2O3 catalyst duringthe steam reforming of glycerol. Reaction runs were carried out under stoichiometrically excess steamconditions between 773 and 823 K. Total organic carbon content of used catalysts varied between 18 and30 wt.%. Carbon deposition occurred on the calcined Al2O3 support probably due to the presence of weakacid centres. Thermogravimetric analysis revealed two types of carbonaceous pools on catalyst surface—arelatively smaller deposit reactive with both H2 and O2 and a larger reservoir that could only be gasified
team reformingwith O2. Gas composition analysis showed that only CH4 and H2O were produced during H2-TPR whileCO2 and H2O were produced during TPO. FTIR characterisation confirmed the presence of C–O, C–C, C–H,O–H and C C bonds in the carbon residue. Carbon deposition rate has an order of 0.55 with respect toglycerol partial pressure and order of −0.22 for steam. Indeed, a Langmuir–Hinshelwood kinetic modelinvolving dissociative adsorption of glycerol and molecular chemisorption of steam adequately capturedthe carbon deposition rate behaviour. Catalyst regeneration using a TPO–TPR–TPO–TPR scheme restored
ertie
the physicochemical prop. Introduction
Coke deposition is one of the most common causes of catalysteactivation in hydrocarbon-mediated reactions. The nature of theeposited carbon and its removal kinetics have been the subjectf much inquiry in hydrocarbon-related operations [1–5]. Thesetudies revealed that dissociative chemisorption of the hydrocar-on substrate produced surface atomic carbon or CyH1−y speciesC� species) which may undergo further dehydropolymerizationn the catalyst surface to form amorphous film (C�) with furtherging leading to graphitic carbon. In some cases, it has been shownhat these carbon atoms also dissolved and diffused through the
etal to active growth areas such as grain boundaries where pre-ipitation took place to form amorphous vermicular (or whisker)arbon (C�). This diffusion/precipitation step is possible with met-ls that can dissolve the carbon atoms to form carbides, such as Nind Co metals. Under severe and prolonged reaction conditions, themorphous carbon may be further converted into graphitic carbon
C�). Various techniques had been explored to evaluate the char-cteristics of carbon deposits, viz. FTIR, TEM, 13C NMR, etc. [6–8].emperature-programmed reaction has also been useful in thedentification of different forms of carbon present through reaction∗ Corresponding author. Tel.: +61 2 9385 5268; fax: +61 2 9385 5966.E-mail address: [email protected] (A.A. Adesina).
920-5861/$ – see front matter © 2010 Elsevier B.V. All rights reserved.oi:10.1016/j.cattod.2010.10.040
s to the same level as the fresh catalyst.© 2010 Elsevier B.V. All rights reserved.
with different gasifying agents [9–11], viz.
C(s) + O2(g) → CO2(g) �H298K = −393.5 kJ mol−1 (1)
C(s) + 2H2(g) → CH4(g) �H298K = −74.5 kJ mol−1 (2)
C(s) + H2O(g) → CO(g) + H2(g) �H298K = 131.3 kJ mol−1 (3)
C(s) + CO2(g) → 2CO(g) �H298K = 172.5 kJ mol−1 (4)
Syngas production from natural gas or crude oil, however, leadsto increased greenhouse gas emission in the long-term. Thus, car-bohydrate (CxHyOz) reforming has attracted significant attentionin recent years as it offers renewability and potential for net zeroCO2 emission during the production of syngas. Glycerol (C3H8O3), aby-product of biodiesel manufacture with relatively low utility, is afavoured reforming substrate in the closed loop design of a biorefin-ery. Although the steam reforming of the oxygen-bearing moleculeis expected to experience relatively lower carbon deposition com-pared to propane, we have observed significant organic carboncontent in the used catalyst even with feed composition contain-ing stoichiometrically excess steam [12]. In view of the paucity of
information on the control and minimisation of coke with this car-bon substrate, the objective of the present study was to determinethe behaviour of the carbon deposition kinetics during glycerolsteam reforming and the nature of the carbonaceous residue viapost-reaction analysis of the used catalyst using a combination ofspectroscopic and thermal analysis techniques.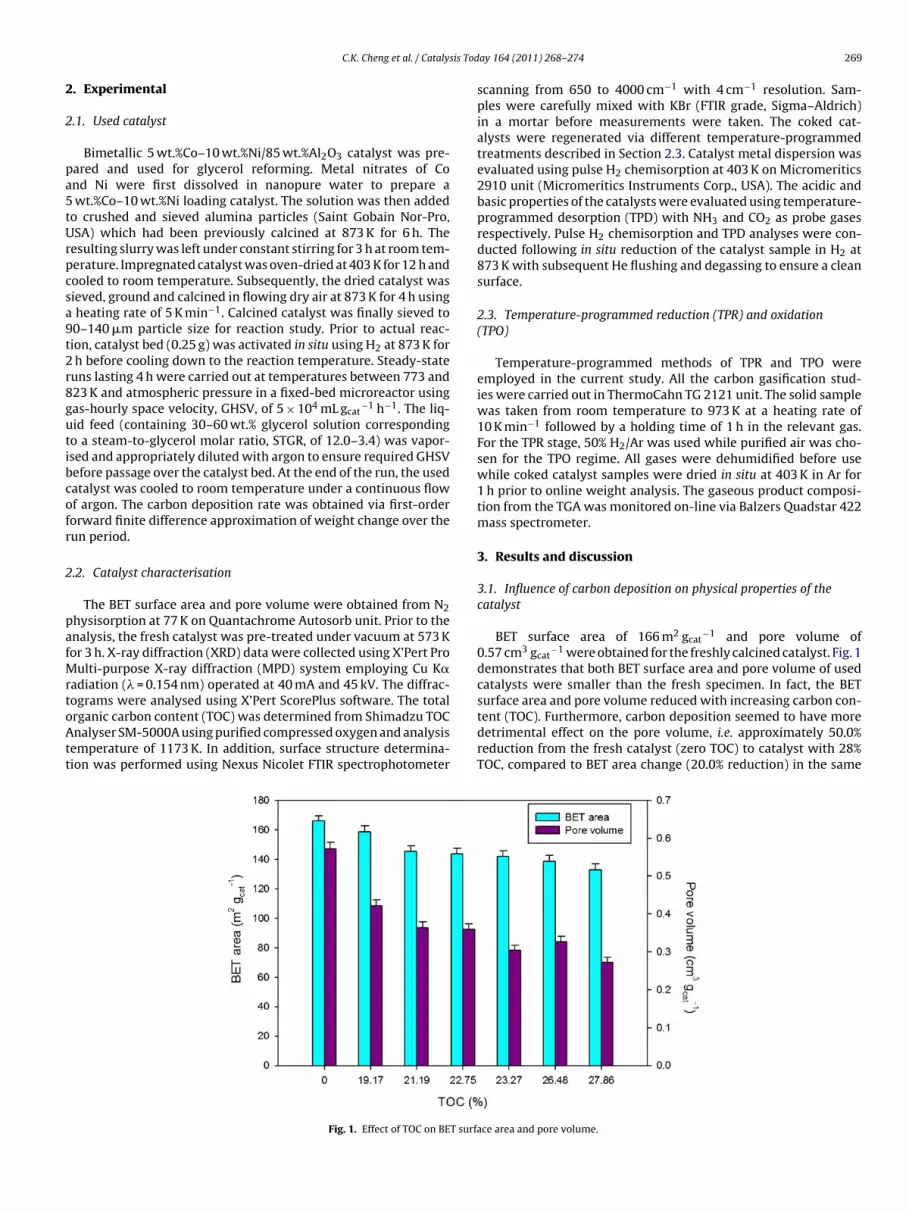
sis Tod
2
2
pa5tUrpcsa9t2r8gutibcofr
2
pafMrtoAtt
C.K. Cheng et al. / Cataly
. Experimental
.1. Used catalyst
Bimetallic 5 wt.%Co–10 wt.%Ni/85 wt.%Al2O3 catalyst was pre-ared and used for glycerol reforming. Metal nitrates of Cond Ni were first dissolved in nanopure water to prepare awt.%Co–10 wt.%Ni loading catalyst. The solution was then added
o crushed and sieved alumina particles (Saint Gobain Nor-Pro,SA) which had been previously calcined at 873 K for 6 h. The
esulting slurry was left under constant stirring for 3 h at room tem-erature. Impregnated catalyst was oven-dried at 403 K for 12 h andooled to room temperature. Subsequently, the dried catalyst wasieved, ground and calcined in flowing dry air at 873 K for 4 h usingheating rate of 5 K min−1. Calcined catalyst was finally sieved to0–140 �m particle size for reaction study. Prior to actual reac-ion, catalyst bed (0.25 g) was activated in situ using H2 at 873 K forh before cooling down to the reaction temperature. Steady-state
uns lasting 4 h were carried out at temperatures between 773 and23 K and atmospheric pressure in a fixed-bed microreactor usingas-hourly space velocity, GHSV, of 5 × 10⁴ mL gcat
−1 h−1. The liq-id feed (containing 30–60 wt.% glycerol solution correspondingo a steam-to-glycerol molar ratio, STGR, of 12.0–3.4) was vapor-sed and appropriately diluted with argon to ensure required GHSVefore passage over the catalyst bed. At the end of the run, the usedatalyst was cooled to room temperature under a continuous flowf argon. The carbon deposition rate was obtained via first-orderorward finite difference approximation of weight change over theun period.
.2. Catalyst characterisation
The BET surface area and pore volume were obtained from N2hysisorption at 77 K on Quantachrome Autosorb unit. Prior to thenalysis, the fresh catalyst was pre-treated under vacuum at 573 Kor 3 h. X-ray diffraction (XRD) data were collected using X’Pert Pro
ulti-purpose X-ray diffraction (MPD) system employing Cu K�adiation (� = 0.154 nm) operated at 40 mA and 45 kV. The diffrac-
ograms were analysed using X’Pert ScorePlus software. The totalrganic carbon content (TOC) was determined from Shimadzu TOCnalyser SM-5000A using purified compressed oxygen and analysisemperature of 1173 K. In addition, surface structure determina-ion was performed using Nexus Nicolet FTIR spectrophotometer
Fig. 1. Effect of TOC on BET surfa
ay 164 (2011) 268–274 269
scanning from 650 to 4000 cm−1 with 4 cm−1 resolution. Sam-ples were carefully mixed with KBr (FTIR grade, Sigma–Aldrich)in a mortar before measurements were taken. The coked cat-alysts were regenerated via different temperature-programmedtreatments described in Section 2.3. Catalyst metal dispersion wasevaluated using pulse H2 chemisorption at 403 K on Micromeritics2910 unit (Micromeritics Instruments Corp., USA). The acidic andbasic properties of the catalysts were evaluated using temperature-programmed desorption (TPD) with NH3 and CO2 as probe gasesrespectively. Pulse H2 chemisorption and TPD analyses were con-ducted following in situ reduction of the catalyst sample in H2 at873 K with subsequent He flushing and degassing to ensure a cleansurface.
2.3. Temperature-programmed reduction (TPR) and oxidation(TPO)
Temperature-programmed methods of TPR and TPO wereemployed in the current study. All the carbon gasification stud-ies were carried out in ThermoCahn TG 2121 unit. The solid samplewas taken from room temperature to 973 K at a heating rate of10 K min−1 followed by a holding time of 1 h in the relevant gas.For the TPR stage, 50% H2/Ar was used while purified air was cho-sen for the TPO regime. All gases were dehumidified before usewhile coked catalyst samples were dried in situ at 403 K in Ar for1 h prior to online weight analysis. The gaseous product composi-tion from the TGA was monitored on-line via Balzers Quadstar 422mass spectrometer.
3. Results and discussion
3.1. Influence of carbon deposition on physical properties of thecatalyst
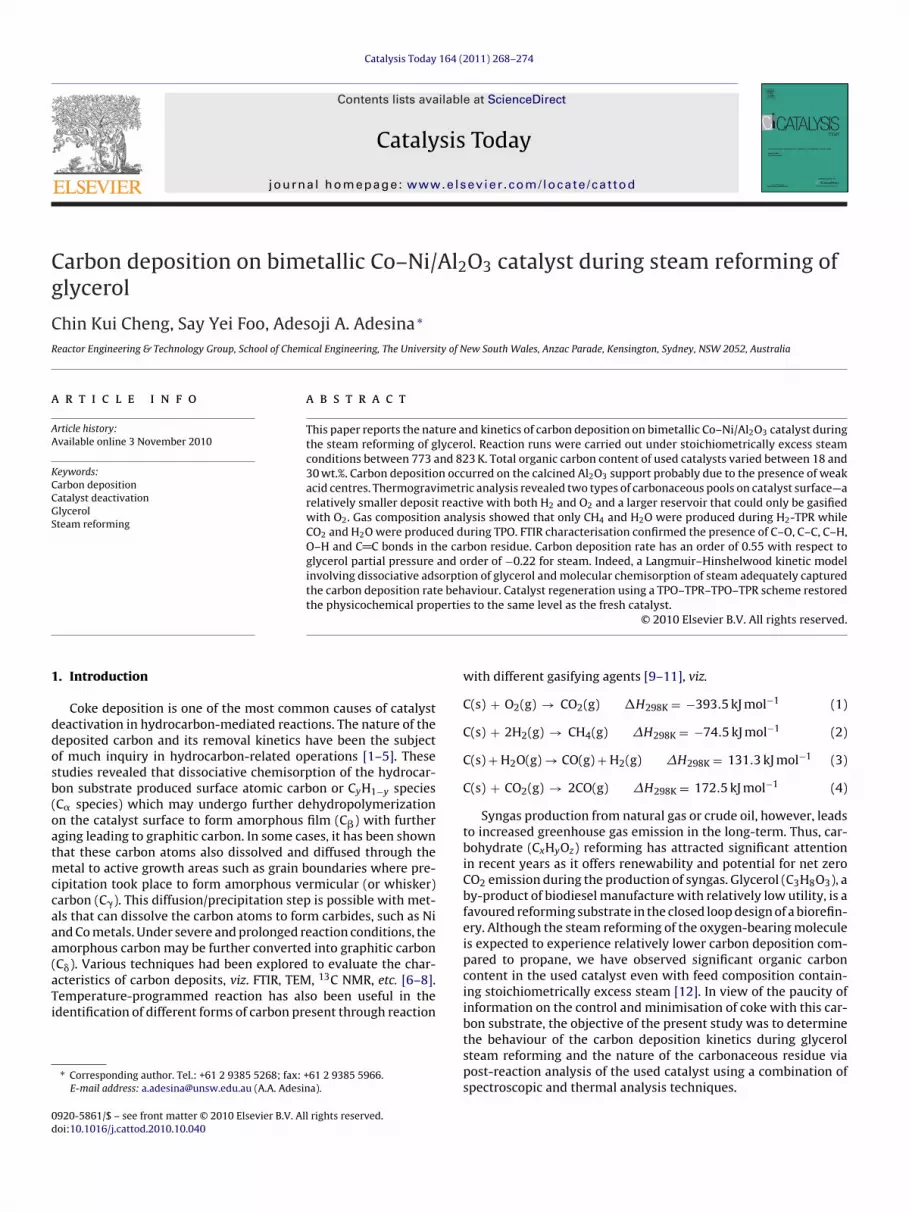
BET surface area of 166 m2 gcat−1 and pore volume of
0.57 cm3 gcat−1 were obtained for the freshly calcined catalyst. Fig. 1
demonstrates that both BET surface area and pore volume of usedcatalysts were smaller than the fresh specimen. In fact, the BET
surface area and pore volume reduced with increasing carbon con-tent (TOC). Furthermore, carbon deposition seemed to have moredetrimental effect on the pore volume, i.e. approximately 50.0%reduction from the fresh catalyst (zero TOC) to catalyst with 28%TOC, compared to BET area change (20.0% reduction) in the samece area and pore volume.
270 C.K. Cheng et al. / Catalysis Today 164 (2011) 268–274
F
Tat
acsPi
3
w
r
wrvbcpwbad
egiatcgc
C
C
lwL
ln (Pressure)
4321
-3.2
-3.0
-2.8
-2.6
-2.4
-2.2
Glycerol
Steam
Slope = 0.5513
R2 = 0.9532
Slope = -0.2213
R2 = 0.934
-1
0.001300.001280.001260.001240.001220.00120
ln (
r co
kin
g)
ln (
r co
kin
g)
-3.3
-3.2
-3.1
-3.0
-2.9
-2.8
EA = 40.9 kJ mol
-1
R2 = 0.999
a
b
ig. 2. TOC concentration as function of partial pressure of reactants at 823 K.
OC range. It would seem that carbonaceous residue from glyceroldsorption blocked/narrowed the micro-channels located insidehe porous alumina support rather than the pore mouths.
Fig. 2 shows the influence of partial pressure of glycerol (Pglycerol)nd steam (Psteam) on residual TOC concentration on the usedatalysts at 823 K. Higher Pglycerol clearly enhanced carbon depo-ition regardless of the Psteam employed. Nevertheless, at a fixedglycerol, carbon deposition seemed somewhat inhibited by increas-ng Psteam.
.2. Coke formation and removal
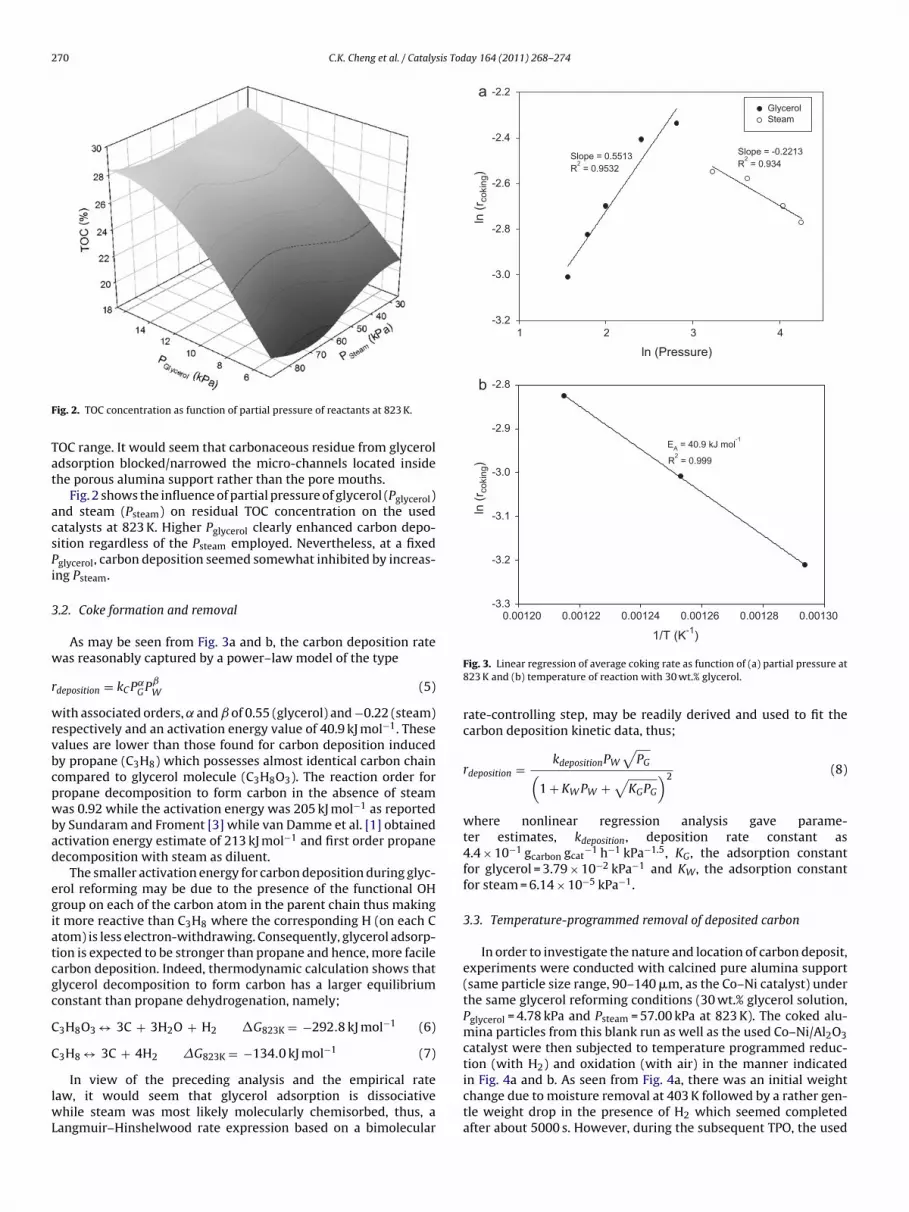
As may be seen from Fig. 3a and b, the carbon deposition rateas reasonably captured by a power–law model of the type
deposition = kCP˛G Pˇ
W (5)
ith associated orders, ˛ and ˇ of 0.55 (glycerol) and −0.22 (steam)espectively and an activation energy value of 40.9 kJ mol−1. Thesealues are lower than those found for carbon deposition inducedy propane (C3H8) which possesses almost identical carbon chainompared to glycerol molecule (C3H8O3). The reaction order forropane decomposition to form carbon in the absence of steamas 0.92 while the activation energy was 205 kJ mol−1 as reported
y Sundaram and Froment [3] while van Damme et al. [1] obtainedctivation energy estimate of 213 kJ mol−1 and first order propaneecomposition with steam as diluent.
The smaller activation energy for carbon deposition during glyc-rol reforming may be due to the presence of the functional OHroup on each of the carbon atom in the parent chain thus makingt more reactive than C3H8 where the corresponding H (on each Ctom) is less electron-withdrawing. Consequently, glycerol adsorp-ion is expected to be stronger than propane and hence, more facilearbon deposition. Indeed, thermodynamic calculation shows thatlycerol decomposition to form carbon has a larger equilibriumonstant than propane dehydrogenation, namely;
3H8O3 ↔ 3C + 3H2O + H2 �G823K = −292.8 kJ mol−1 (6)
3H8 ↔ 3C + 4H2 �G823K = −134.0 kJ mol−1 (7)
In view of the preceding analysis and the empirical rateaw, it would seem that glycerol adsorption is dissociative
hile steam was most likely molecularly chemisorbed, thus, aangmuir–Hinshelwood rate expression based on a bimolecular
1/T (K )
Fig. 3. Linear regression of average coking rate as function of (a) partial pressure at823 K and (b) temperature of reaction with 30 wt.% glycerol.
rate-controlling step, may be readily derived and used to fit thecarbon deposition kinetic data, thus;
rdeposition = kdepositionPW
√PG(
1 + KW PW +√
KGPG
)2(8)
where nonlinear regression analysis gave parame-ter estimates, kdeposition, deposition rate constant as4.4 × 10−1 gcarbon gcat
−1 h−1 kPa−1.5, KG, the adsorption constantfor glycerol = 3.79 × 10⁻² kPa−1 and KW, the adsorption constantfor steam = 6.14 × 10⁻⁵ kPa−1.
3.3. Temperature-programmed removal of deposited carbon
In order to investigate the nature and location of carbon deposit,experiments were conducted with calcined pure alumina support(same particle size range, 90–140 �m, as the Co–Ni catalyst) underthe same glycerol reforming conditions (30 wt.% glycerol solution,Pglycerol = 4.78 kPa and Psteam = 57.00 kPa at 823 K). The coked alu-mina particles from this blank run as well as the used Co–Ni/Al2O3catalyst were then subjected to temperature programmed reduc-
tion (with H2) and oxidation (with air) in the manner indicatedin Fig. 4a and b. As seen from Fig. 4a, there was an initial weightchange due to moisture removal at 403 K followed by a rather gen-tle weight drop in the presence of H2 which seemed completedafter about 5000 s. However, during the subsequent TPO, the used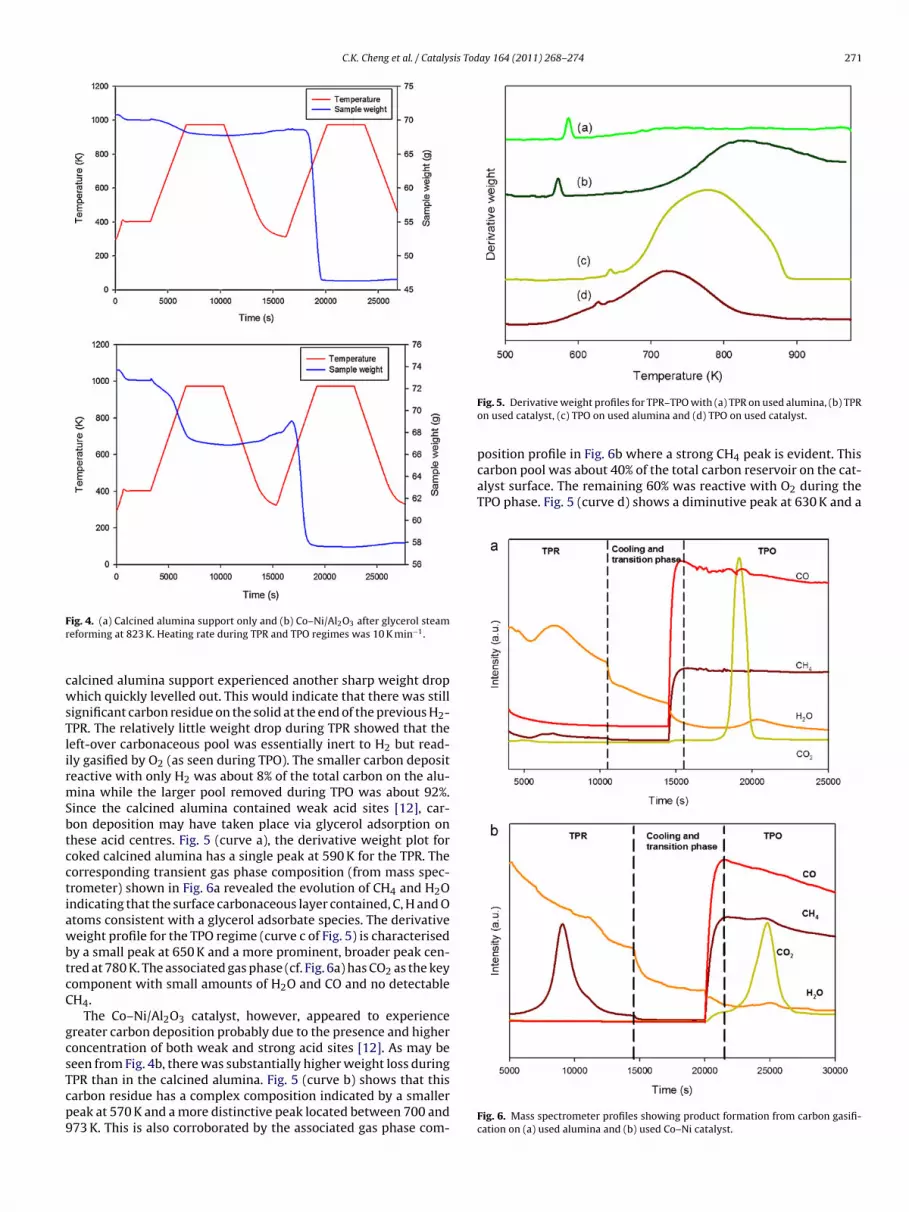
C.K. Cheng et al. / Catalysis Today 164 (2011) 268–274 271
Fr
cwsTlirmSbtcctiawbtcC
gcsTcp9
position profile in Fig. 6b where a strong CH4 peak is evident. Thiscarbon pool was about 40% of the total carbon reservoir on the cat-alyst surface. The remaining 60% was reactive with O2 during theTPO phase. Fig. 5 (curve d) shows a diminutive peak at 630 K and a
ig. 4. (a) Calcined alumina support only and (b) Co–Ni/Al2O3 after glycerol steameforming at 823 K. Heating rate during TPR and TPO regimes was 10 K min−1.
alcined alumina support experienced another sharp weight drophich quickly levelled out. This would indicate that there was still
ignificant carbon residue on the solid at the end of the previous H2-PR. The relatively little weight drop during TPR showed that theeft-over carbonaceous pool was essentially inert to H2 but read-ly gasified by O2 (as seen during TPO). The smaller carbon depositeactive with only H2 was about 8% of the total carbon on the alu-ina while the larger pool removed during TPO was about 92%.
ince the calcined alumina contained weak acid sites [12], car-on deposition may have taken place via glycerol adsorption onhese acid centres. Fig. 5 (curve a), the derivative weight plot foroked calcined alumina has a single peak at 590 K for the TPR. Theorresponding transient gas phase composition (from mass spec-rometer) shown in Fig. 6a revealed the evolution of CH4 and H2Ondicating that the surface carbonaceous layer contained, C, H and Otoms consistent with a glycerol adsorbate species. The derivativeeight profile for the TPO regime (curve c of Fig. 5) is characterised
y a small peak at 650 K and a more prominent, broader peak cen-red at 780 K. The associated gas phase (cf. Fig. 6a) has CO2 as the keyomponent with small amounts of H2O and CO and no detectableH4.
The Co–Ni/Al2O3 catalyst, however, appeared to experiencereater carbon deposition probably due to the presence and higheroncentration of both weak and strong acid sites [12]. As may beeen from Fig. 4b, there was substantially higher weight loss during
PR than in the calcined alumina. Fig. 5 (curve b) shows that thisarbon residue has a complex composition indicated by a smallereak at 570 K and a more distinctive peak located between 700 and73 K. This is also corroborated by the associated gas phase com-Fig. 5. Derivative weight profiles for TPR–TPO with (a) TPR on used alumina, (b) TPRon used catalyst, (c) TPO on used alumina and (d) TPO on used catalyst.
Fig. 6. Mass spectrometer profiles showing product formation from carbon gasifi-cation on (a) used alumina and (b) used Co–Ni catalyst.
272 C.K. Cheng et al. / Catalysis Tod
FT
bsgst
cbcHeTailb
3
p
TP
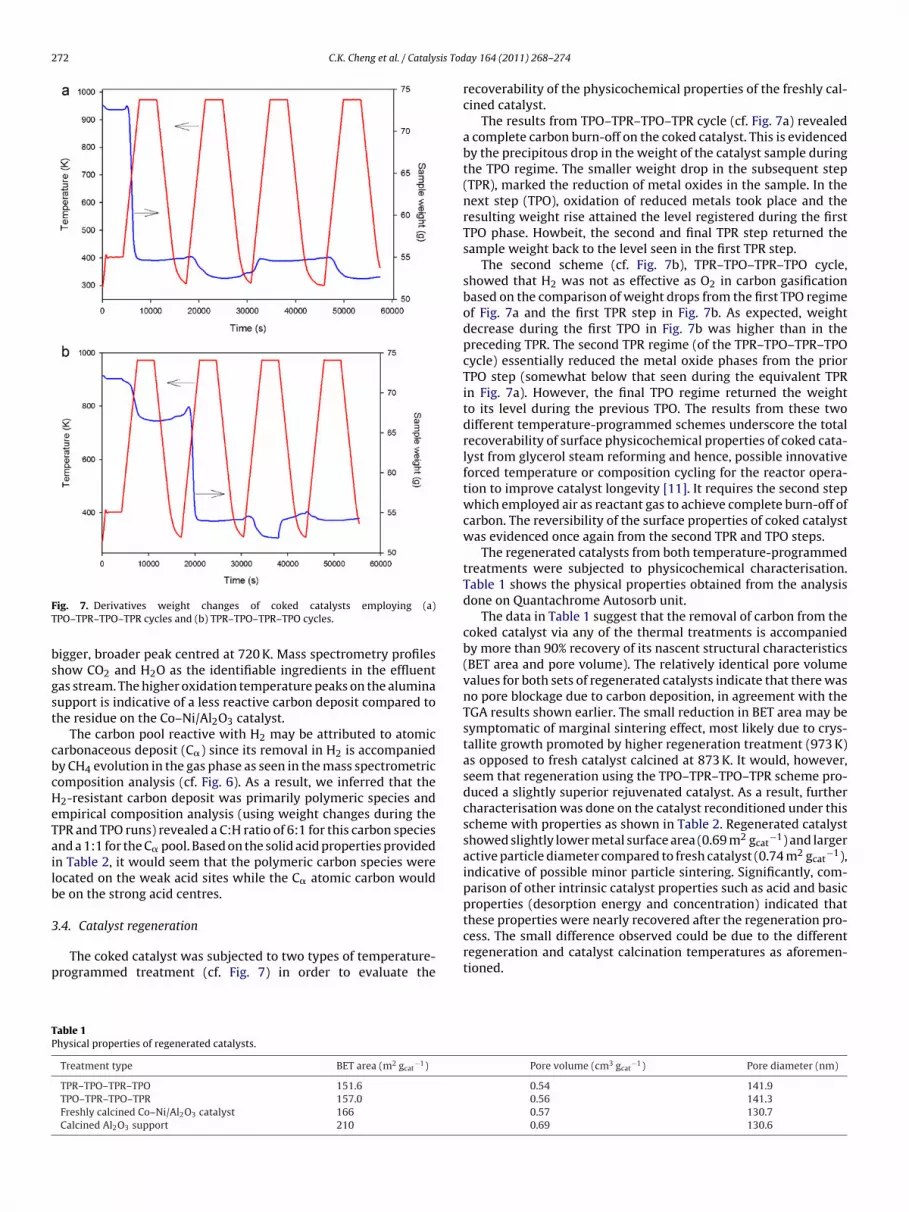
ig. 7. Derivatives weight changes of coked catalysts employing (a)PO–TPR–TPO–TPR cycles and (b) TPR–TPO–TPR–TPO cycles.
igger, broader peak centred at 720 K. Mass spectrometry profileshow CO2 and H2O as the identifiable ingredients in the effluentas stream. The higher oxidation temperature peaks on the aluminaupport is indicative of a less reactive carbon deposit compared tohe residue on the Co–Ni/Al2O3 catalyst.
The carbon pool reactive with H2 may be attributed to atomicarbonaceous deposit (C�) since its removal in H2 is accompaniedy CH4 evolution in the gas phase as seen in the mass spectrometricomposition analysis (cf. Fig. 6). As a result, we inferred that the2-resistant carbon deposit was primarily polymeric species andmpirical composition analysis (using weight changes during thePR and TPO runs) revealed a C:H ratio of 6:1 for this carbon speciesnd a 1:1 for the C� pool. Based on the solid acid properties providedn Table 2, it would seem that the polymeric carbon species wereocated on the weak acid sites while the C� atomic carbon woulde on the strong acid centres.
.4. Catalyst regeneration
The coked catalyst was subjected to two types of temperature-rogrammed treatment (cf. Fig. 7) in order to evaluate the
able 1hysical properties of regenerated catalysts.
Treatment type BET area (m2 gcat−1)
TPR–TPO–TPR–TPO 151.6TPO–TPR–TPO–TPR 157.0Freshly calcined Co–Ni/Al2O3 catalyst 166Calcined Al2O3 support 210
ay 164 (2011) 268–274
recoverability of the physicochemical properties of the freshly cal-cined catalyst.
The results from TPO–TPR–TPO–TPR cycle (cf. Fig. 7a) revealeda complete carbon burn-off on the coked catalyst. This is evidencedby the precipitous drop in the weight of the catalyst sample duringthe TPO regime. The smaller weight drop in the subsequent step(TPR), marked the reduction of metal oxides in the sample. In thenext step (TPO), oxidation of reduced metals took place and theresulting weight rise attained the level registered during the firstTPO phase. Howbeit, the second and final TPR step returned thesample weight back to the level seen in the first TPR step.
The second scheme (cf. Fig. 7b), TPR–TPO–TPR–TPO cycle,showed that H2 was not as effective as O2 in carbon gasificationbased on the comparison of weight drops from the first TPO regimeof Fig. 7a and the first TPR step in Fig. 7b. As expected, weightdecrease during the first TPO in Fig. 7b was higher than in thepreceding TPR. The second TPR regime (of the TPR–TPO–TPR–TPOcycle) essentially reduced the metal oxide phases from the priorTPO step (somewhat below that seen during the equivalent TPRin Fig. 7a). However, the final TPO regime returned the weightto its level during the previous TPO. The results from these twodifferent temperature-programmed schemes underscore the totalrecoverability of surface physicochemical properties of coked cata-lyst from glycerol steam reforming and hence, possible innovativeforced temperature or composition cycling for the reactor opera-tion to improve catalyst longevity [11]. It requires the second stepwhich employed air as reactant gas to achieve complete burn-off ofcarbon. The reversibility of the surface properties of coked catalystwas evidenced once again from the second TPR and TPO steps.
The regenerated catalysts from both temperature-programmedtreatments were subjected to physicochemical characterisation.Table 1 shows the physical properties obtained from the analysisdone on Quantachrome Autosorb unit.
The data in Table 1 suggest that the removal of carbon from thecoked catalyst via any of the thermal treatments is accompaniedby more than 90% recovery of its nascent structural characteristics(BET area and pore volume). The relatively identical pore volumevalues for both sets of regenerated catalysts indicate that there wasno pore blockage due to carbon deposition, in agreement with theTGA results shown earlier. The small reduction in BET area may besymptomatic of marginal sintering effect, most likely due to crys-tallite growth promoted by higher regeneration treatment (973 K)as opposed to fresh catalyst calcined at 873 K. It would, however,seem that regeneration using the TPO–TPR–TPO–TPR scheme pro-duced a slightly superior rejuvenated catalyst. As a result, furthercharacterisation was done on the catalyst reconditioned under thisscheme with properties as shown in Table 2. Regenerated catalystshowed slightly lower metal surface area (0.69 m2 gcat
−1) and largeractive particle diameter compared to fresh catalyst (0.74 m2 gcat
−1),indicative of possible minor particle sintering. Significantly, com-parison of other intrinsic catalyst properties such as acid and basic
properties (desorption energy and concentration) indicated thatthese properties were nearly recovered after the regeneration pro-cess. The small difference observed could be due to the differentregeneration and catalyst calcination temperatures as aforemen-tioned.Pore volume (cm3 gcat−1) Pore diameter (nm)
0.54 141.90.56 141.30.57 130.70.69 130.6
C.K. Cheng et al. / Catalysis Today 164 (2011) 268–274 273
Table 2Physicochemical properties of regenerated catalyst after temperature-programmed heat treatment.
Properties Type of sites Regenerated catalyst Fresh catalyst Calcined support
Dispersion (%) 0.69 0.74 N/AMetal surface area (m2 gcat
−1) 0.69 0.74 N/AActive particle diameter (nm) 146.5 136.0 N/ANH3 desorption energy, �HNH3 (kJ mol−1) Weak site 37.00 35.46 68.90
Strong site 82.80 87.30 N/ACO2 desorption energy, �HCO2 (kJ mol−1) Weak site 63.54 62.42 63.20
Strong site 53.52 55.97 68.40Acid concentration (�mol m−2) Weak site 1.39 1.50 2.13
Strong site 2.76 2.90 N/A−2 0.14 0.21 0.14
0.39 0.42 0.329.92 7.33 15.407.07 6.98 N/A
3
lBsoepitsh11atgb
tdc(Xcs(
Fu
Basic concentration (�mol m ) Weak siteStrong site
Acid:basic sites ratio Weak siteStrong site
.5. FTIR and XRD analyses
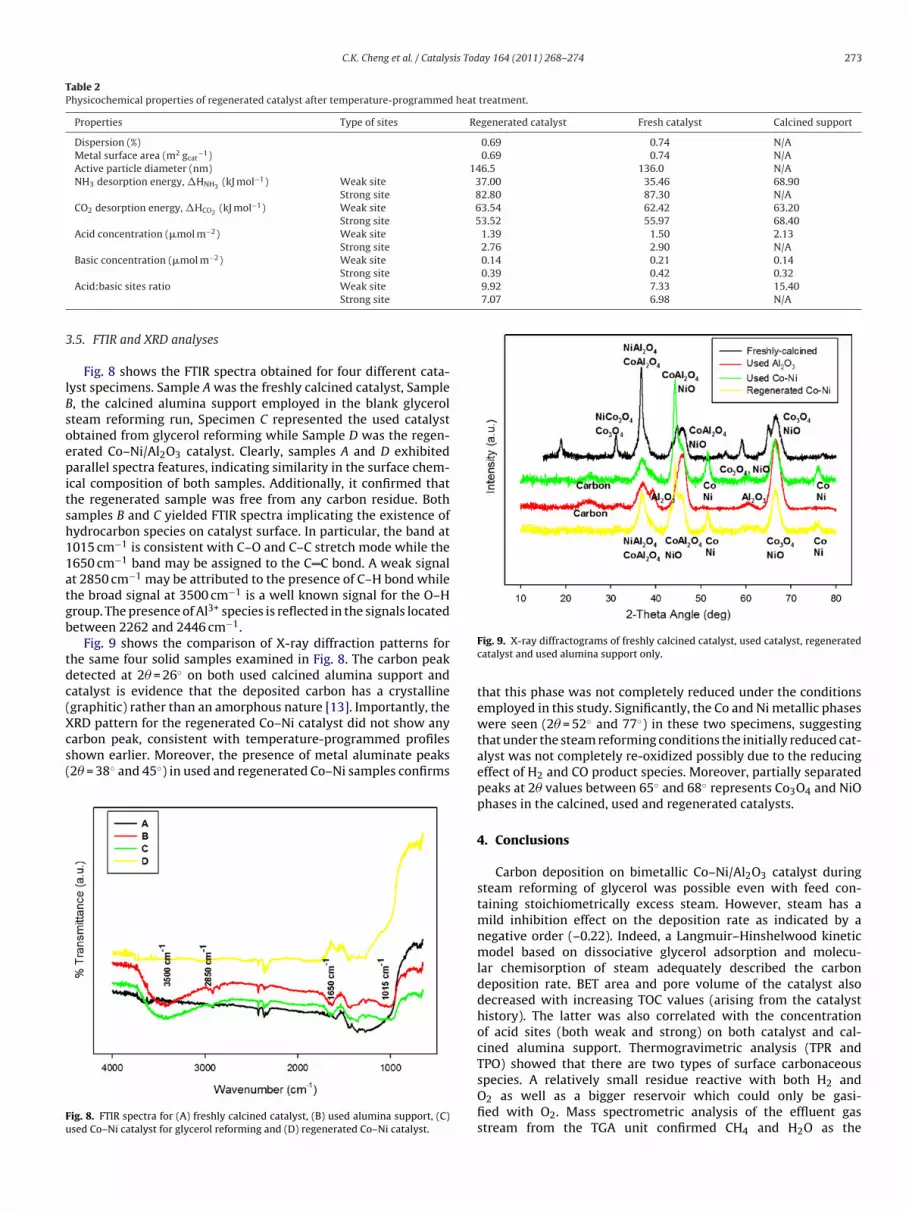
Fig. 8 shows the FTIR spectra obtained for four different cata-yst specimens. Sample A was the freshly calcined catalyst, Sample, the calcined alumina support employed in the blank glycerolteam reforming run, Specimen C represented the used catalystbtained from glycerol reforming while Sample D was the regen-rated Co–Ni/Al2O3 catalyst. Clearly, samples A and D exhibitedarallel spectra features, indicating similarity in the surface chem-
cal composition of both samples. Additionally, it confirmed thathe regenerated sample was free from any carbon residue. Bothamples B and C yielded FTIR spectra implicating the existence ofydrocarbon species on catalyst surface. In particular, the band at015 cm−1 is consistent with C–O and C–C stretch mode while the650 cm−1 band may be assigned to the C C bond. A weak signalt 2850 cm−1 may be attributed to the presence of C–H bond whilehe broad signal at 3500 cm−1 is a well known signal for the O–Hroup. The presence of Al3+ species is reflected in the signals locatedetween 2262 and 2446 cm−1.
Fig. 9 shows the comparison of X-ray diffraction patterns forhe same four solid samples examined in Fig. 8. The carbon peaketected at 2� = 26◦ on both used calcined alumina support andatalyst is evidence that the deposited carbon has a crystalline
graphitic) rather than an amorphous nature [13]. Importantly, theRD pattern for the regenerated Co–Ni catalyst did not show anyarbon peak, consistent with temperature-programmed profileshown earlier. Moreover, the presence of metal aluminate peaks2� = 38◦ and 45◦) in used and regenerated Co–Ni samples confirmsig. 8. FTIR spectra for (A) freshly calcined catalyst, (B) used alumina support, (C)sed Co–Ni catalyst for glycerol reforming and (D) regenerated Co–Ni catalyst.
Fig. 9. X-ray diffractograms of freshly calcined catalyst, used catalyst, regeneratedcatalyst and used alumina support only.
that this phase was not completely reduced under the conditionsemployed in this study. Significantly, the Co and Ni metallic phaseswere seen (2� = 52◦ and 77◦) in these two specimens, suggestingthat under the steam reforming conditions the initially reduced cat-alyst was not completely re-oxidized possibly due to the reducingeffect of H2 and CO product species. Moreover, partially separatedpeaks at 2� values between 65◦ and 68◦ represents Co3O4 and NiOphases in the calcined, used and regenerated catalysts.
4. Conclusions
Carbon deposition on bimetallic Co–Ni/Al2O3 catalyst duringsteam reforming of glycerol was possible even with feed con-taining stoichiometrically excess steam. However, steam has amild inhibition effect on the deposition rate as indicated by anegative order (–0.22). Indeed, a Langmuir–Hinshelwood kineticmodel based on dissociative glycerol adsorption and molecu-lar chemisorption of steam adequately described the carbondeposition rate. BET area and pore volume of the catalyst alsodecreased with increasing TOC values (arising from the catalysthistory). The latter was also correlated with the concentrationof acid sites (both weak and strong) on both catalyst and cal-cined alumina support. Thermogravimetric analysis (TPR and
TPO) showed that there are two types of surface carbonaceousspecies. A relatively small residue reactive with both H2 andO2 as well as a bigger reservoir which could only be gasi-fied with O2. Mass spectrometric analysis of the effluent gasstream from the TGA unit confirmed CH4 and H2O as the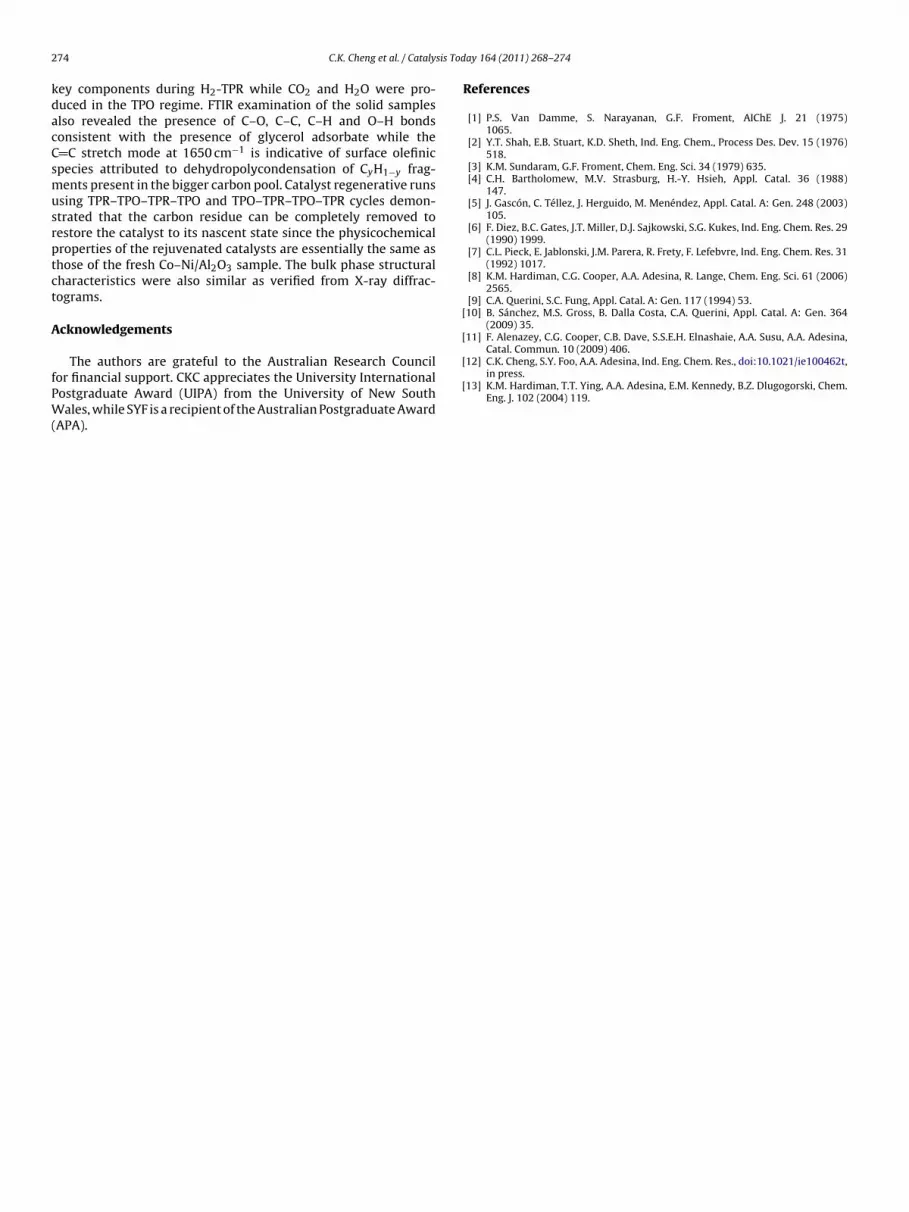
2 sis Tod
kdacCsmusrptct
A
fPW(
[
[11] F. Alenazey, C.G. Cooper, C.B. Dave, S.S.E.H. Elnashaie, A.A. Susu, A.A. Adesina,Catal. Commun. 10 (2009) 406.
74 C.K. Cheng et al. / Cataly
ey components during H2-TPR while CO2 and H2O were pro-uced in the TPO regime. FTIR examination of the solid sampleslso revealed the presence of C–O, C–C, C–H and O–H bondsonsistent with the presence of glycerol adsorbate while the
C stretch mode at 1650 cm−1 is indicative of surface olefinicpecies attributed to dehydropolycondensation of CyH1−y frag-ents present in the bigger carbon pool. Catalyst regenerative runs
sing TPR–TPO–TPR–TPO and TPO–TPR–TPO–TPR cycles demon-trated that the carbon residue can be completely removed toestore the catalyst to its nascent state since the physicochemicalroperties of the rejuvenated catalysts are essentially the same ashose of the fresh Co–Ni/Al2O3 sample. The bulk phase structuralharacteristics were also similar as verified from X-ray diffrac-ograms.
cknowledgements
The authors are grateful to the Australian Research Councilor financial support. CKC appreciates the University Internationalostgraduate Award (UIPA) from the University of New Southales, while SYF is a recipient of the Australian Postgraduate Award
APA).
[
[
ay 164 (2011) 268–274
References
[1] P.S. Van Damme, S. Narayanan, G.F. Froment, AIChE J. 21 (1975)1065.
[2] Y.T. Shah, E.B. Stuart, K.D. Sheth, Ind. Eng. Chem., Process Des. Dev. 15 (1976)518.
[3] K.M. Sundaram, G.F. Froment, Chem. Eng. Sci. 34 (1979) 635.[4] C.H. Bartholomew, M.V. Strasburg, H.-Y. Hsieh, Appl. Catal. 36 (1988)
147.[5] J. Gascón, C. Téllez, J. Herguido, M. Menéndez, Appl. Catal. A: Gen. 248 (2003)
105.[6] F. Diez, B.C. Gates, J.T. Miller, D.J. Sajkowski, S.G. Kukes, Ind. Eng. Chem. Res. 29
(1990) 1999.[7] C.L. Pieck, E. Jablonski, J.M. Parera, R. Frety, F. Lefebvre, Ind. Eng. Chem. Res. 31
(1992) 1017.[8] K.M. Hardiman, C.G. Cooper, A.A. Adesina, R. Lange, Chem. Eng. Sci. 61 (2006)
2565.[9] C.A. Querini, S.C. Fung, Appl. Catal. A: Gen. 117 (1994) 53.10] B. Sánchez, M.S. Gross, B. Dalla Costa, C.A. Querini, Appl. Catal. A: Gen. 364
(2009) 35.
12] C.K. Cheng, S.Y. Foo, A.A. Adesina, Ind. Eng. Chem. Res., doi:10.1021/ie100462t,in press.
13] K.M. Hardiman, T.T. Ying, A.A. Adesina, E.M. Kennedy, B.Z. Dlugogorski, Chem.Eng. J. 102 (2004) 119.