cancer in new brunswick 2007-2013
TRANSCRIPT

CaNCER in New Brunswick
2007-2013
To provide feedback or offer suggestions, please contact:
New Brunswick Cancer Network, Department of Health P.O. Box 5100, HSBC Place, 2nd Floor Fredericton, New Brunswick E3B 5G8 Phone: 1-506-453-5521 Fax: 1-506-453-5522
This report is available online at: www2.gnb.ca/content/gnb/en/departments/health/publications.html Également offert en français sous le titre: Le cancer au Nouveau-Brunswick 2007-2013
www.gnb.ca/health
ISBN - 978-1-4605-1826-7 – bilingual paper ISBN - 978-1-4605-1827-4 – English pdf
2007-2013 New Brunswick Cancer Report | I
Message from the New Brunswick Cancer Network
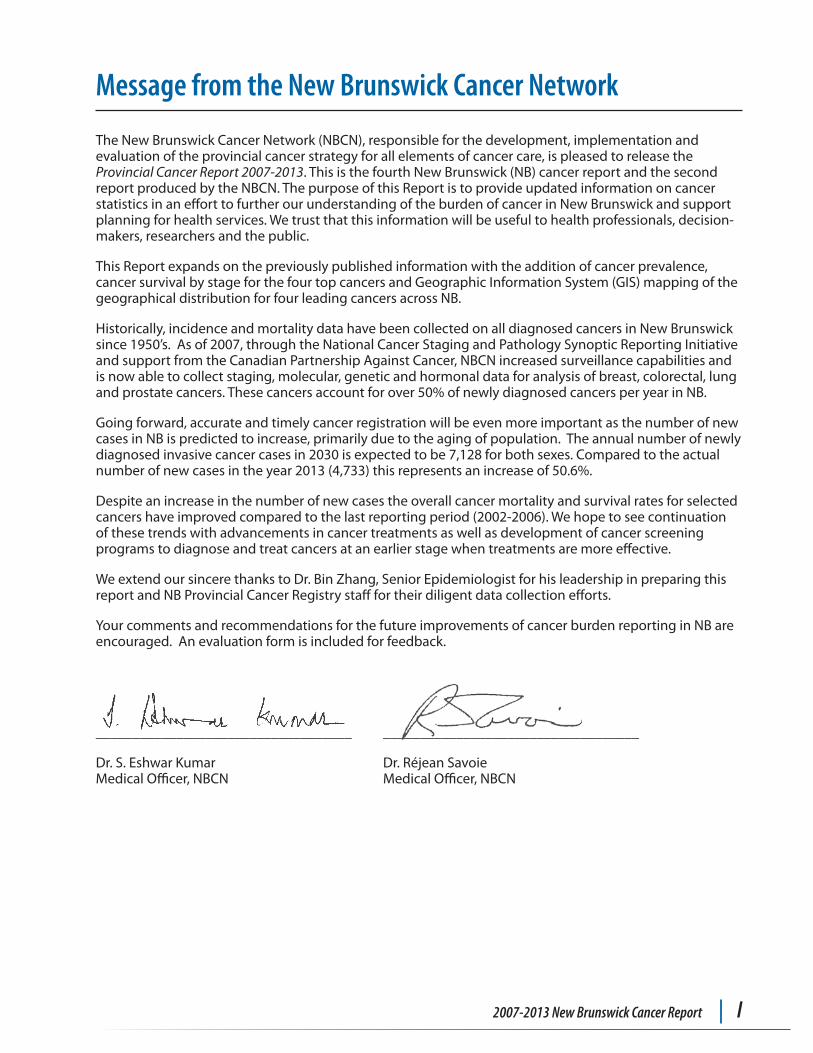
The New Brunswick Cancer Network (NBCN), responsible for the development, implementation and evaluation of the provincial cancer strategy for all elements of cancer care, is pleased to release the Provincial Cancer Report 2007-2013. This is the fourth New Brunswick (NB) cancer report and the second report produced by the NBCN. The purpose of this Report is to provide updated information on cancer statistics in an effort to further our understanding of the burden of cancer in New Brunswick and support planning for health services. We trust that this information will be useful to health professionals, decision-makers, researchers and the public.
This Report expands on the previously published information with the addition of cancer prevalence, cancer survival by stage for the four top cancers and Geographic Information System (GIS) mapping of the geographical distribution for four leading cancers across NB.
Historically, incidence and mortality data have been collected on all diagnosed cancers in New Brunswick since 1950’s. As of 2007, through the National Cancer Staging and Pathology Synoptic Reporting Initiative and support from the Canadian Partnership Against Cancer, NBCN increased surveillance capabilities and is now able to collect staging, molecular, genetic and hormonal data for analysis of breast, colorectal, lung and prostate cancers. These cancers account for over 50% of newly diagnosed cancers per year in NB.
Going forward, accurate and timely cancer registration will be even more important as the number of new cases in NB is predicted to increase, primarily due to the aging of population. The annual number of newly diagnosed invasive cancer cases in 2030 is expected to be 7,128 for both sexes. Compared to the actual number of new cases in the year 2013 (4,733) this represents an increase of 50.6%.
Despite an increase in the number of new cases the overall cancer mortality and survival rates for selected cancers have improved compared to the last reporting period (2002-2006). We hope to see continuation of these trends with advancements in cancer treatments as well as development of cancer screening programs to diagnose and treat cancers at an earlier stage when treatments are more effective.
We extend our sincere thanks to Dr. Bin Zhang, Senior Epidemiologist for his leadership in preparing this report and NB Provincial Cancer Registry staff for their diligent data collection efforts.
Your comments and recommendations for the future improvements of cancer burden reporting in NB are encouraged. An evaluation form is included for feedback.
___________________________________ ___________________________________
Dr. S. Eshwar Kumar Dr. Réjean Savoie Medical Officer, NBCN Medical Officer, NBCN
II | Department of Health
Acknowledgments
The New Brunswick Cancer Network wishes to acknowledge the contributions of the following individuals in producing this cancer report.
Cancer in New Brunswick 2007-2013 Steering Committee:
Dr. Bin Zhang (Chair Steering Committee) Senior Epidemiologist Health Analytics, Department of Health, NB
Linda Varner NB Colon Cancer Screening Program Implementation Manager NBCN, Department of Health, NB
Murielle Munro Administrative Support NBCN, Department of Health, NB
NBCN would also like to thank the following individuals and organizations for providing information in the preparation of this cancer report.
Jenna Clarkson Business Analyst Primary Health Care, Department of Health, NB
Shirley Koch Coordinator of Cancer Screening NBCN, Department of Health, NB
Suzanne Leonfellner Coordinator of Cancer Diagnosis, Staging and Surgery and Manager of NB Cancer Registry NBCN, Department of Health, NB
NBCN would like to acknowledge the following individuals:
Dr. Grlica Bolesnikov Director of Operations (Acting), NBCN, Department of Health, NB
Roberte Vautier Coordinator of Palliative, Support and Primary Care, NBCN, Department of Health, NB
Erica Craig Provincial Pharmacy Director, NBCN, Department of Health, NB
Lisa Lemieux Administrative Support, NBCN, Department of Health, NB
New Brunswick Provincial Cancer Registry
Maurice Levesque, CTR Supervisor - Administrative Service Officer 5
Raymonde LeBlanc Cleveland, CTR Administrative Service Officer 3
Cynthia MacDonald Administrative Service Officer 3
Lisa Margaris, CHIM Administrative Service Officer 3
Sheila McCrea, CTR Administrative Service Officer 3
Laurie Orford Administrative Service Officer 2
Service New Brunswick
Robert Breau Manager, Registration, Systems and Data Unit
Corporate Communications Branch, Service New Brunswick
Anne Moore Administrative Officer
Public Health Agency of Canada
Dr. Alain Demers Senior Epidemiologist
Dr. Dianne Zakaria Epidemiologist / Biostatistician
Statistics Canada Demography Division
2007-2013 New Brunswick Cancer Report | III
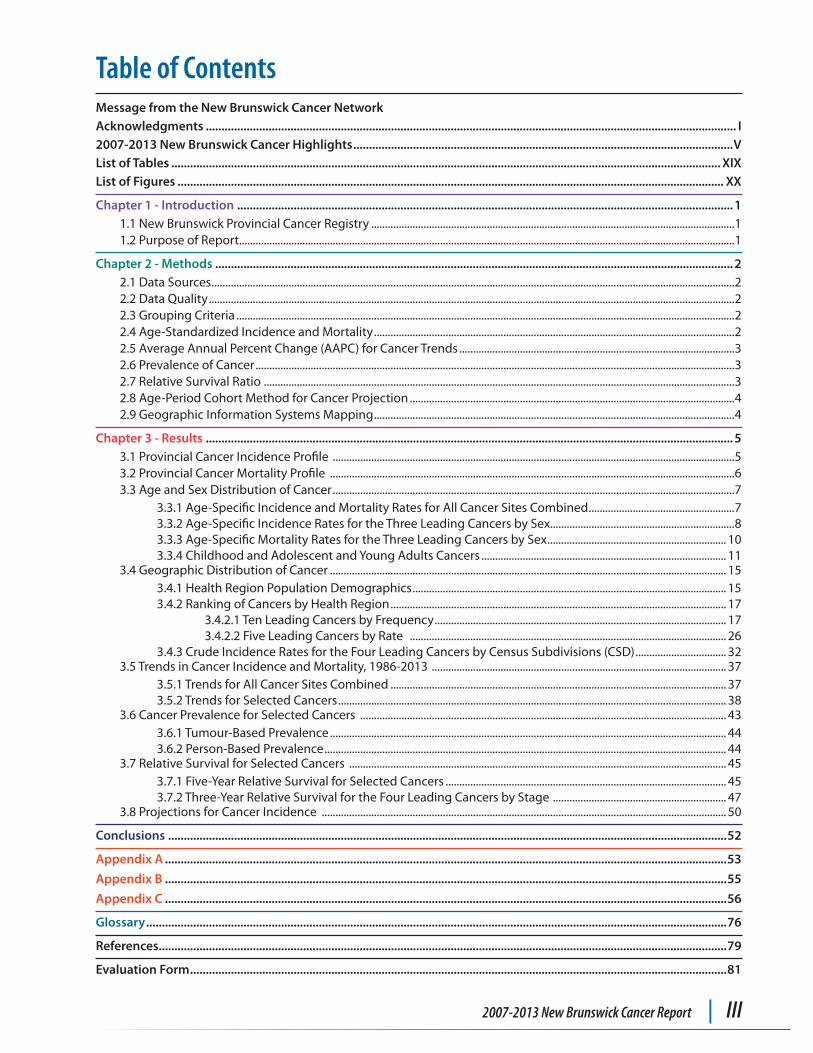
Table of ContentsMessage from the New Brunswick Cancer NetworkAcknowledgments ......................................................................................................................................................................... I2007-2013 New Brunswick Cancer Highlights .........................................................................................................................VList of Tables ............................................................................................................................................................................... XIXList of Figures .............................................................................................................................................................................. XX
Chapter 1 - Introduction .............................................................................................................................................................. 11.1 New Brunswick Provincial Cancer Registry ....................................................................................................................................11.2 Purpose of Report....................................................................................................................................................................................1
Chapter 2 - Methods ..................................................................................................................................................................... 22.1 Data Sources ..............................................................................................................................................................................................22.2 Data Quality ...............................................................................................................................................................................................22.3 Grouping Criteria .....................................................................................................................................................................................22.4 Age-Standardized Incidence and Mortality ...................................................................................................................................22.5 Average Annual Percent Change (AAPC) for Cancer Trends ....................................................................................................32.6 Prevalence of Cancer ..............................................................................................................................................................................32.7 Relative Survival Ratio ...........................................................................................................................................................................32.8 Age-Period Cohort Method for Cancer Projection ......................................................................................................................42.9 Geographic Information Systems Mapping ...................................................................................................................................4
Chapter 3 - Results ........................................................................................................................................................................ 53.1 Provincial Cancer Incidence Profile ..................................................................................................................................................53.2 Provincial Cancer Mortality Profile ...................................................................................................................................................63.3 Age and Sex Distribution of Cancer ..................................................................................................................................................7
3.3.1 Age-Specific Incidence and Mortality Rates for All Cancer Sites Combined .....................................................73.3.2 Age-Specific Incidence Rates for the Three Leading Cancers by Sex...................................................................83.3.3 Age-Specific Mortality Rates for the Three Leading Cancers by Sex ................................................................. 103.3.4 Childhood and Adolescent and Young Adults Cancers ......................................................................................... 11
3.4 Geographic Distribution of Cancer ................................................................................................................................................ 153.4.1 Health Region Population Demographics .................................................................................................................. 153.4.2 Ranking of Cancers by Health Region .......................................................................................................................... 17
3.4.2.1 Ten Leading Cancers by Frequency .......................................................................................................... 173.4.2.2 Five Leading Cancers by Rate ................................................................................................................... 26
3.4.3 Crude Incidence Rates for the Four Leading Cancers by Census Subdivisions (CSD) ................................. 323.5 Trends in Cancer Incidence and Mortality, 1986-2013 ........................................................................................................... 37
3.5.1 Trends for All Cancer Sites Combined .......................................................................................................................... 373.5.2 Trends for Selected Cancers ............................................................................................................................................. 38
3.6 Cancer Prevalence for Selected Cancers ..................................................................................................................................... 433.6.1 Tumour-Based Prevalence ................................................................................................................................................ 443.6.2 Person-Based Prevalence .................................................................................................................................................. 44
3.7 Relative Survival for Selected Cancers ......................................................................................................................................... 453.7.1 Five-Year Relative Survival for Selected Cancers ...................................................................................................... 453.7.2 Three-Year Relative Survival for the Four Leading Cancers by Stage ............................................................... 47
3.8 Projections for Cancer Incidence ................................................................................................................................................... 50
Conclusions ..................................................................................................................................................................................52
Appendix A ...................................................................................................................................................................................53
Appendix B ...................................................................................................................................................................................55
Appendix C ...................................................................................................................................................................................56
Glossary .........................................................................................................................................................................................76
References .....................................................................................................................................................................................79
Evaluation Form ...........................................................................................................................................................................81

IV | Department of Health
2007-2013 New Brunswick Cancer Report | V
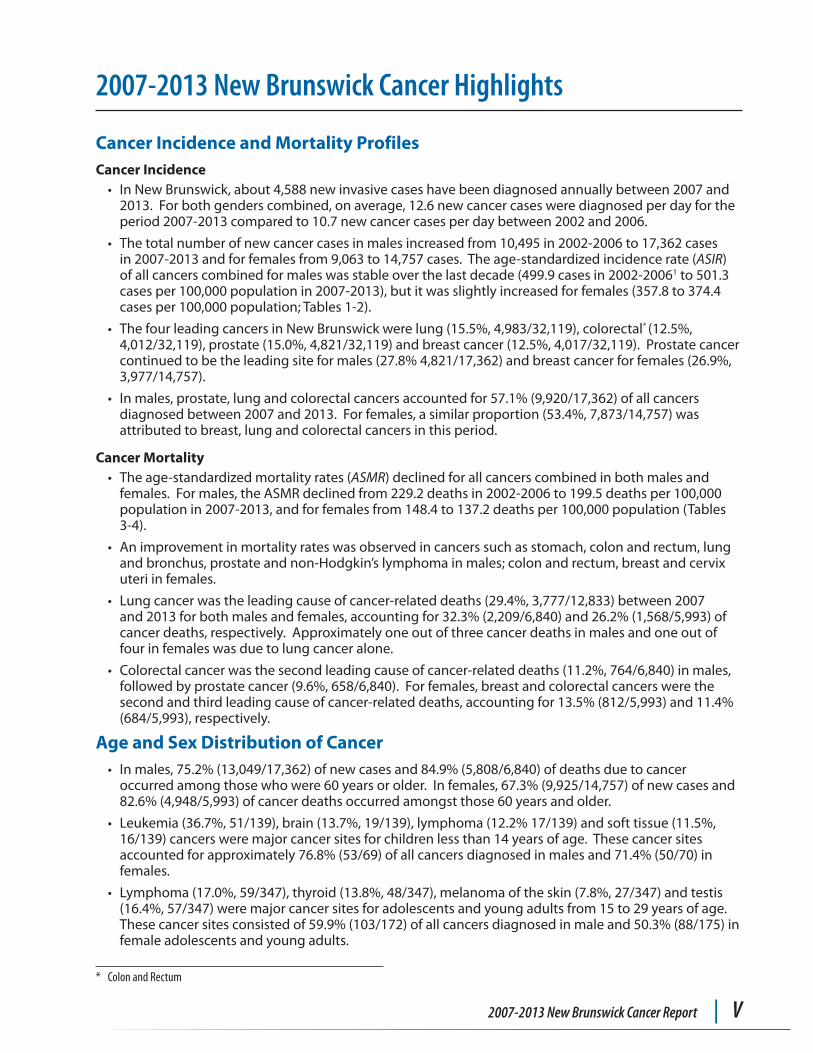
2007-2013 New Brunswick Cancer Highlights
Cancer Incidence and Mortality ProfilesCancer Incidence• In New Brunswick, about 4,588 new invasive cases have been diagnosed annually between 2007 and
2013. For both genders combined, on average, 12.6 new cancer cases were diagnosed per day for the period 2007-2013 compared to 10.7 new cancer cases per day between 2002 and 2006.
• The total number of new cancer cases in males increased from 10,495 in 2002-2006 to 17,362 cases in 2007-2013 and for females from 9,063 to 14,757 cases. The age-standardized incidence rate (ASIR) of all cancers combined for males was stable over the last decade (499.9 cases in 2002-20061 to 501.3 cases per 100,000 population in 2007-2013), but it was slightly increased for females (357.8 to 374.4 cases per 100,000 population; Tables 1-2).
• The four leading cancers in New Brunswick were lung (15.5%, 4,983/32,119), colorectal* (12.5%, 4,012/32,119), prostate (15.0%, 4,821/32,119) and breast cancer (12.5%, 4,017/32,119). Prostate cancer continued to be the leading site for males (27.8% 4,821/17,362) and breast cancer for females (26.9%, 3,977/14,757).
• In males, prostate, lung and colorectal cancers accounted for 57.1% (9,920/17,362) of all cancers diagnosed between 2007 and 2013. For females, a similar proportion (53.4%, 7,873/14,757) was attributed to breast, lung and colorectal cancers in this period.
Cancer Mortality• The age-standardized mortality rates (ASMR) declined for all cancers combined in both males and
females. For males, the ASMR declined from 229.2 deaths in 2002-2006 to 199.5 deaths per 100,000 population in 2007-2013, and for females from 148.4 to 137.2 deaths per 100,000 population (Tables 3-4).
• An improvement in mortality rates was observed in cancers such as stomach, colon and rectum, lung and bronchus, prostate and non-Hodgkin’s lymphoma in males; colon and rectum, breast and cervix uteri in females.
• Lung cancer was the leading cause of cancer-related deaths (29.4%, 3,777/12,833) between 2007 and 2013 for both males and females, accounting for 32.3% (2,209/6,840) and 26.2% (1,568/5,993) of cancer deaths, respectively. Approximately one out of three cancer deaths in males and one out of four in females was due to lung cancer alone.
• Colorectal cancer was the second leading cause of cancer-related deaths (11.2%, 764/6,840) in males, followed by prostate cancer (9.6%, 658/6,840). For females, breast and colorectal cancers were the second and third leading cause of cancer-related deaths, accounting for 13.5% (812/5,993) and 11.4% (684/5,993), respectively.
Age and Sex Distribution of Cancer• In males, 75.2% (13,049/17,362) of new cases and 84.9% (5,808/6,840) of deaths due to cancer
occurred among those who were 60 years or older. In females, 67.3% (9,925/14,757) of new cases and 82.6% (4,948/5,993) of cancer deaths occurred amongst those 60 years and older.
• Leukemia (36.7%, 51/139), brain (13.7%, 19/139), lymphoma (12.2% 17/139) and soft tissue (11.5%, 16/139) cancers were major cancer sites for children less than 14 years of age. These cancer sites accounted for approximately 76.8% (53/69) of all cancers diagnosed in males and 71.4% (50/70) in females.
• Lymphoma (17.0%, 59/347), thyroid (13.8%, 48/347), melanoma of the skin (7.8%, 27/347) and testis (16.4%, 57/347) were major cancer sites for adolescents and young adults from 15 to 29 years of age. These cancer sites consisted of 59.9% (103/172) of all cancers diagnosed in male and 50.3% (88/175) in female adolescents and young adults.
* Colon and Rectum
VI | Department of Health
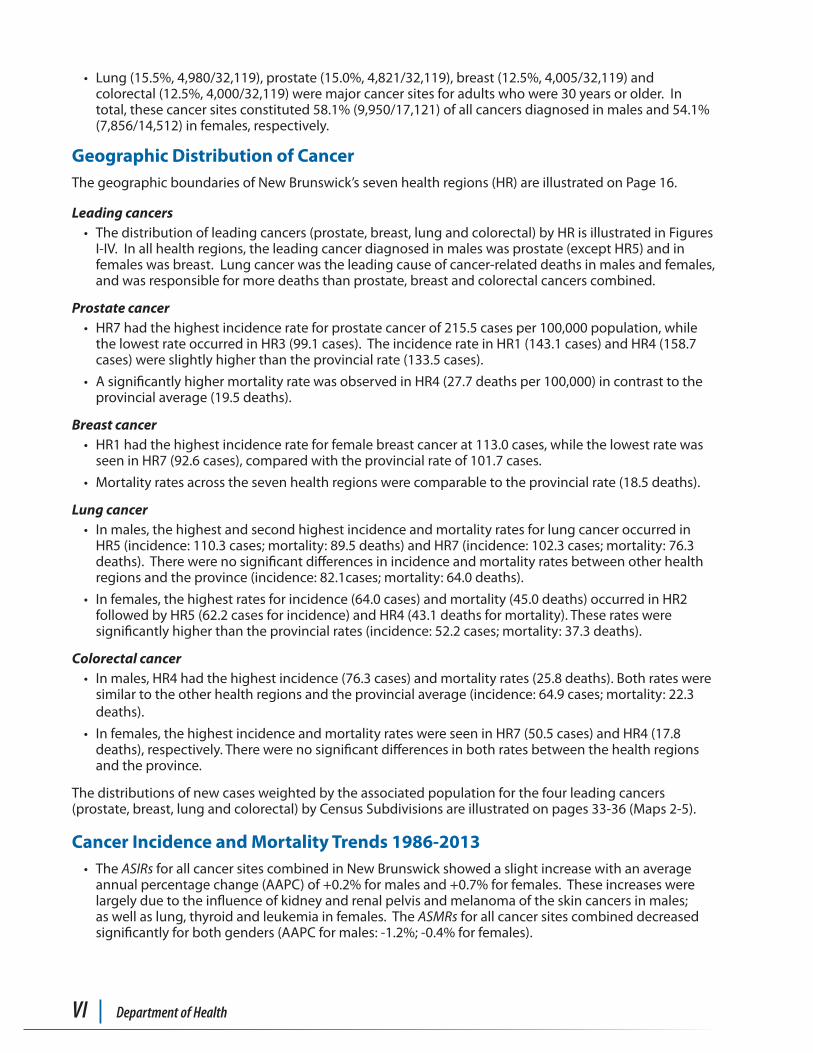
• Lung (15.5%, 4,980/32,119), prostate (15.0%, 4,821/32,119), breast (12.5%, 4,005/32,119) and colorectal (12.5%, 4,000/32,119) were major cancer sites for adults who were 30 years or older. In total, these cancer sites constituted 58.1% (9,950/17,121) of all cancers diagnosed in males and 54.1% (7,856/14,512) in females, respectively.
Geographic Distribution of CancerThe geographic boundaries of New Brunswick’s seven health regions (HR) are illustrated on Page 16.
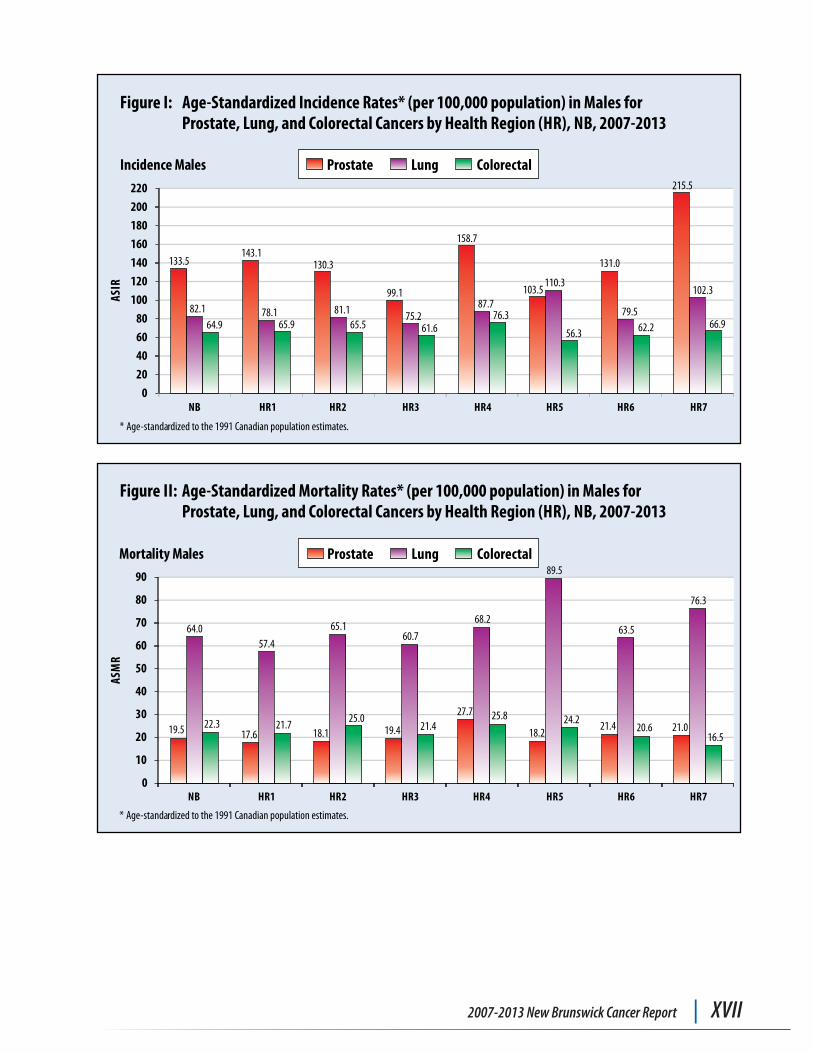
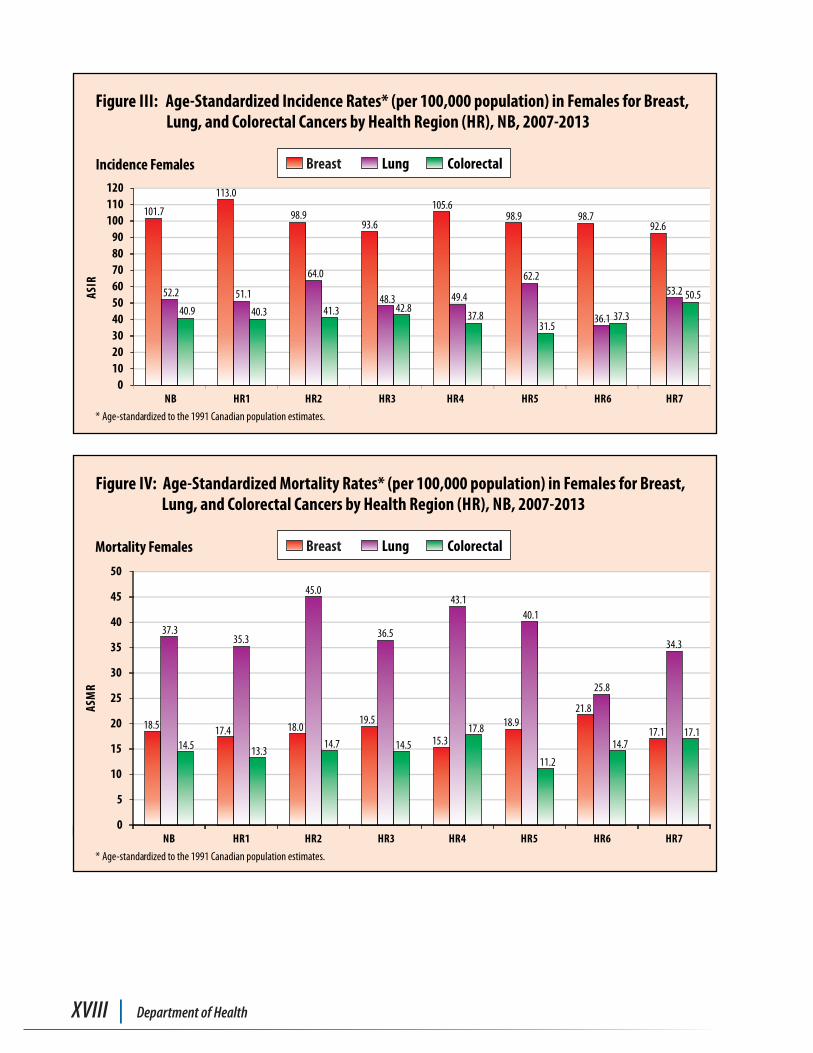
Leading cancers• The distribution of leading cancers (prostate, breast, lung and colorectal) by HR is illustrated in Figures
I-IV. In all health regions, the leading cancer diagnosed in males was prostate (except HR5) and in females was breast. Lung cancer was the leading cause of cancer-related deaths in males and females, and was responsible for more deaths than prostate, breast and colorectal cancers combined.
Prostate cancer• HR7 had the highest incidence rate for prostate cancer of 215.5 cases per 100,000 population, while
the lowest rate occurred in HR3 (99.1 cases). The incidence rate in HR1 (143.1 cases) and HR4 (158.7 cases) were slightly higher than the provincial rate (133.5 cases).
• A significantly higher mortality rate was observed in HR4 (27.7 deaths per 100,000) in contrast to the provincial average (19.5 deaths).
Breast cancer• HR1 had the highest incidence rate for female breast cancer at 113.0 cases, while the lowest rate was
seen in HR7 (92.6 cases), compared with the provincial rate of 101.7 cases.
• Mortality rates across the seven health regions were comparable to the provincial rate (18.5 deaths).
Lung cancer• In males, the highest and second highest incidence and mortality rates for lung cancer occurred in
HR5 (incidence: 110.3 cases; mortality: 89.5 deaths) and HR7 (incidence: 102.3 cases; mortality: 76.3 deaths). There were no significant differences in incidence and mortality rates between other health regions and the province (incidence: 82.1cases; mortality: 64.0 deaths).
• In females, the highest rates for incidence (64.0 cases) and mortality (45.0 deaths) occurred in HR2 followed by HR5 (62.2 cases for incidence) and HR4 (43.1 deaths for mortality). These rates were significantly higher than the provincial rates (incidence: 52.2 cases; mortality: 37.3 deaths).
Colorectal cancer• In males, HR4 had the highest incidence (76.3 cases) and mortality rates (25.8 deaths). Both rates were
similar to the other health regions and the provincial average (incidence: 64.9 cases; mortality: 22.3 deaths).
• In females, the highest incidence and mortality rates were seen in HR7 (50.5 cases) and HR4 (17.8 deaths), respectively. There were no significant differences in both rates between the health regions and the province.
The distributions of new cases weighted by the associated population for the four leading cancers (prostate, breast, lung and colorectal) by Census Subdivisions are illustrated on pages 33-36 (Maps 2-5).
Cancer Incidence and Mortality Trends 1986-2013• The ASIRs for all cancer sites combined in New Brunswick showed a slight increase with an average
annual percentage change (AAPC) of +0.2% for males and +0.7% for females. These increases were largely due to the influence of kidney and renal pelvis and melanoma of the skin cancers in males; as well as lung, thyroid and leukemia in females. The ASMRs for all cancer sites combined decreased significantly for both genders (AAPC for males: -1.2%; -0.4% for females).
2007-2013 New Brunswick Cancer Report | VII
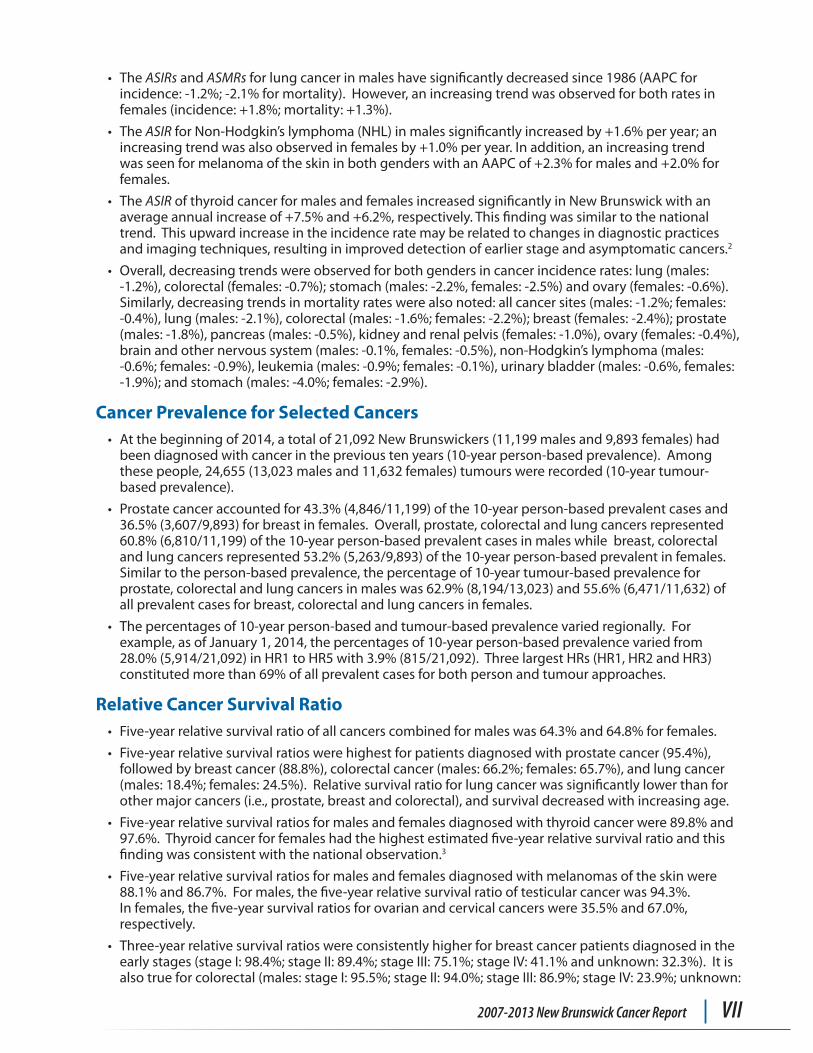
• The ASIRs and ASMRs for lung cancer in males have significantly decreased since 1986 (AAPC for incidence: -1.2%; -2.1% for mortality). However, an increasing trend was observed for both rates in females (incidence: +1.8%; mortality: +1.3%).
• The ASIR for Non-Hodgkin’s lymphoma (NHL) in males significantly increased by +1.6% per year; an increasing trend was also observed in females by +1.0% per year. In addition, an increasing trend was seen for melanoma of the skin in both genders with an AAPC of +2.3% for males and +2.0% for females.
• The ASIR of thyroid cancer for males and females increased significantly in New Brunswick with an average annual increase of +7.5% and +6.2%, respectively. This finding was similar to the national trend. This upward increase in the incidence rate may be related to changes in diagnostic practices and imaging techniques, resulting in improved detection of earlier stage and asymptomatic cancers.2
• Overall, decreasing trends were observed for both genders in cancer incidence rates: lung (males: -1.2%), colorectal (females: -0.7%); stomach (males: -2.2%, females: -2.5%) and ovary (females: -0.6%). Similarly, decreasing trends in mortality rates were also noted: all cancer sites (males: -1.2%; females: -0.4%), lung (males: -2.1%), colorectal (males: -1.6%; females: -2.2%); breast (females: -2.4%); prostate (males: -1.8%), pancreas (males: -0.5%), kidney and renal pelvis (females: -1.0%), ovary (females: -0.4%), brain and other nervous system (males: -0.1%, females: -0.5%), non-Hodgkin’s lymphoma (males: -0.6%; females: -0.9%), leukemia (males: -0.9%; females: -0.1%), urinary bladder (males: -0.6%, females: -1.9%); and stomach (males: -4.0%; females: -2.9%).
Cancer Prevalence for Selected Cancers• At the beginning of 2014, a total of 21,092 New Brunswickers (11,199 males and 9,893 females) had
been diagnosed with cancer in the previous ten years (10-year person-based prevalence). Among these people, 24,655 (13,023 males and 11,632 females) tumours were recorded (10-year tumour-based prevalence).
• Prostate cancer accounted for 43.3% (4,846/11,199) of the 10-year person-based prevalent cases and 36.5% (3,607/9,893) for breast in females. Overall, prostate, colorectal and lung cancers represented 60.8% (6,810/11,199) of the 10-year person-based prevalent cases in males while breast, colorectal and lung cancers represented 53.2% (5,263/9,893) of the 10-year person-based prevalent in females. Similar to the person-based prevalence, the percentage of 10-year tumour-based prevalence for prostate, colorectal and lung cancers in males was 62.9% (8,194/13,023) and 55.6% (6,471/11,632) of all prevalent cases for breast, colorectal and lung cancers in females.
• The percentages of 10-year person-based and tumour-based prevalence varied regionally. For example, as of January 1, 2014, the percentages of 10-year person-based prevalence varied from 28.0% (5,914/21,092) in HR1 to HR5 with 3.9% (815/21,092). Three largest HRs (HR1, HR2 and HR3) constituted more than 69% of all prevalent cases for both person and tumour approaches.
Relative Cancer Survival Ratio• Five-year relative survival ratio of all cancers combined for males was 64.3% and 64.8% for females.
• Five-year relative survival ratios were highest for patients diagnosed with prostate cancer (95.4%), followed by breast cancer (88.8%), colorectal cancer (males: 66.2%; females: 65.7%), and lung cancer (males: 18.4%; females: 24.5%). Relative survival ratio for lung cancer was significantly lower than for other major cancers (i.e., prostate, breast and colorectal), and survival decreased with increasing age.
• Five-year relative survival ratios for males and females diagnosed with thyroid cancer were 89.8% and 97.6%. Thyroid cancer for females had the highest estimated five-year relative survival ratio and this finding was consistent with the national observation.3
• Five-year relative survival ratios for males and females diagnosed with melanomas of the skin were 88.1% and 86.7%. For males, the five-year relative survival ratio of testicular cancer was 94.3%. In females, the five-year survival ratios for ovarian and cervical cancers were 35.5% and 67.0%, respectively.
• Three-year relative survival ratios were consistently higher for breast cancer patients diagnosed in the early stages (stage I: 98.4%; stage II: 89.4%; stage III: 75.1%; stage IV: 41.1% and unknown: 32.3%). It is also true for colorectal (males: stage I: 95.5%; stage II: 94.0%; stage III: 86.9%; stage IV: 23.9%; unknown:
VIII | Department of Health
32.8%; females: stage I: 91.9%; stage II: 86.2%; stage III: 79.3%; stage IV: 17.8%; unknown: 10.1%) and lung cancer (males: stage I: 63.1%; stage II: 40.3%; stage III: 30.7%; stage IV: 3.6%; occult: not available; females: stage I: 61.8%; stage II: 57.1%; stage III: 22.2%; stage IV: 4.9%; occult: not available). The three-year relative survival ratios for prostate cancer were as follows: stage I: 98.5%; stage II: 100%; stage III: 100%; stage IV: 31.4%; unknown: 15.3%.
Projections for Cancer Incidence • Based on the continuation of past and current trends, males will have an estimated total of 4,020 new
cases (i.e., 11 new cases per day) of cancer in 2030; for females, the estimated new cancer cases are expected to be 3,108 (9 new cases per day). These represent a 60.8% increase in incidence for males and a 39.2% increase for females when compared to the actual counts in 2013.
• Three types of cancer are expected to account for the majority of new cases in each gender between 2016 and 2030: prostate, lung and colorectal in males and breast, lung and colorectal in females.
2007-2013 New Brunswick Cancer Report | IX
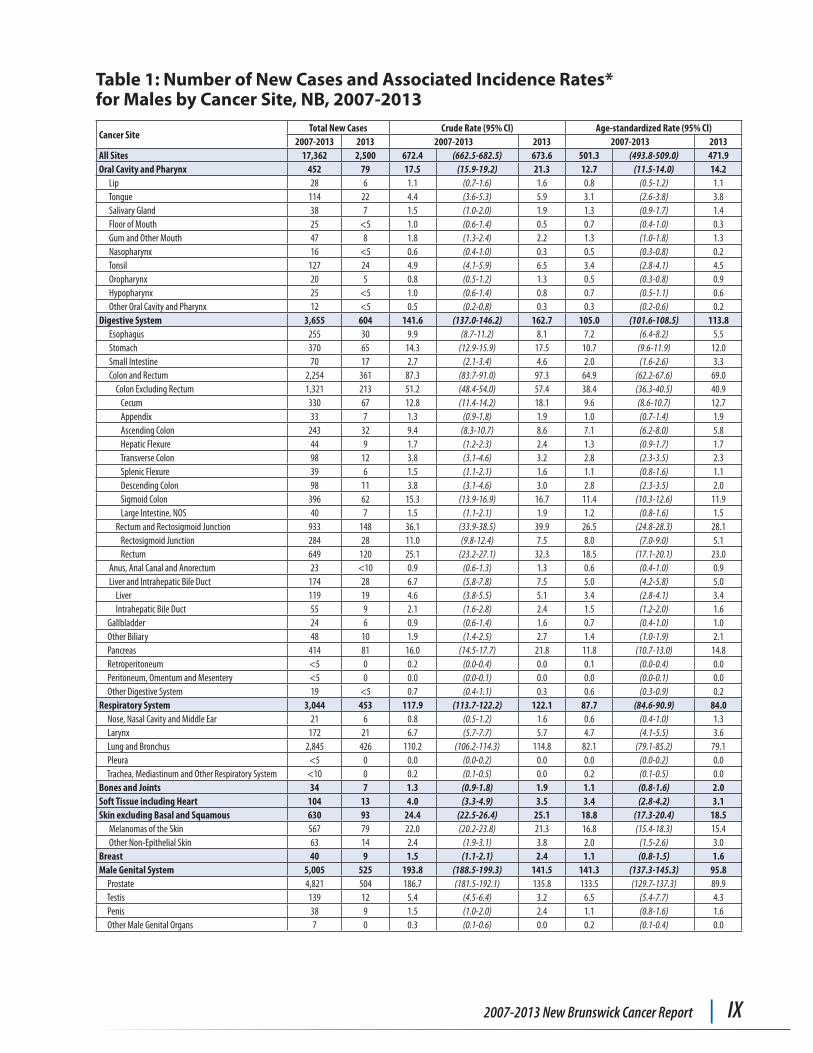
Table 1: Number of New Cases and Associated Incidence Rates* for Males by Cancer Site, NB, 2007-2013
Cancer SiteTotal New Cases Crude Rate (95% CI) Age-standardized Rate (95% CI)
2007-2013 2013 2007-2013 2013 2007-2013 2013All Sites 17,362 2,500 672.4 (662.5-682.5) 673.6 501.3 (493.8-509.0) 471.9Oral Cavity and Pharynx 452 79 17.5 (15.9-19.2) 21.3 12.7 (11.5-14.0) 14.2 Lip 28 6 1.1 (0.7-1.6) 1.6 0.8 (0.5-1.2) 1.1 Tongue 114 22 4.4 (3.6-5.3) 5.9 3.1 (2.6-3.8) 3.8 Salivary Gland 38 7 1.5 (1.0-2.0) 1.9 1.3 (0.9-1.7) 1.4 Floor of Mouth 25 <5 1.0 (0.6-1.4) 0.5 0.7 (0.4-1.0) 0.3 Gum and Other Mouth 47 8 1.8 (1.3-2.4) 2.2 1.3 (1.0-1.8) 1.3 Nasopharynx 16 <5 0.6 (0.4-1.0) 0.3 0.5 (0.3-0.8) 0.2 Tonsil 127 24 4.9 (4.1-5.9) 6.5 3.4 (2.8-4.1) 4.5 Oropharynx 20 5 0.8 (0.5-1.2) 1.3 0.5 (0.3-0.8) 0.9 Hypopharynx 25 <5 1.0 (0.6-1.4) 0.8 0.7 (0.5-1.1) 0.6 Other Oral Cavity and Pharynx 12 <5 0.5 (0.2-0.8) 0.3 0.3 (0.2-0.6) 0.2Digestive System 3,655 604 141.6 (137.0-146.2) 162.7 105.0 (101.6-108.5) 113.8 Esophagus 255 30 9.9 (8.7-11.2) 8.1 7.2 (6.4-8.2) 5.5 Stomach 370 65 14.3 (12.9-15.9) 17.5 10.7 (9.6-11.9) 12.0 Small Intestine 70 17 2.7 (2.1-3.4) 4.6 2.0 (1.6-2.6) 3.3 Colon and Rectum 2,254 361 87.3 (83.7-91.0) 97.3 64.9 (62.2-67.6) 69.0 Colon Excluding Rectum 1,321 213 51.2 (48.4-54.0) 57.4 38.4 (36.3-40.5) 40.9 Cecum 330 67 12.8 (11.4-14.2) 18.1 9.6 (8.6-10.7) 12.7 Appendix 33 7 1.3 (0.9-1.8) 1.9 1.0 (0.7-1.4) 1.9 Ascending Colon 243 32 9.4 (8.3-10.7) 8.6 7.1 (6.2-8.0) 5.8 Hepatic Flexure 44 9 1.7 (1.2-2.3) 2.4 1.3 (0.9-1.7) 1.7 Transverse Colon 98 12 3.8 (3.1-4.6) 3.2 2.8 (2.3-3.5) 2.3 Splenic Flexure 39 6 1.5 (1.1-2.1) 1.6 1.1 (0.8-1.6) 1.1 Descending Colon 98 11 3.8 (3.1-4.6) 3.0 2.8 (2.3-3.5) 2.0 Sigmoid Colon 396 62 15.3 (13.9-16.9) 16.7 11.4 (10.3-12.6) 11.9 Large Intestine, NOS 40 7 1.5 (1.1-2.1) 1.9 1.2 (0.8-1.6) 1.5 Rectum and Rectosigmoid Junction 933 148 36.1 (33.9-38.5) 39.9 26.5 (24.8-28.3) 28.1 Rectosigmoid Junction 284 28 11.0 (9.8-12.4) 7.5 8.0 (7.0-9.0) 5.1 Rectum 649 120 25.1 (23.2-27.1) 32.3 18.5 (17.1-20.1) 23.0 Anus, Anal Canal and Anorectum 23 <10 0.9 (0.6-1.3) 1.3 0.6 (0.4-1.0) 0.9 Liver and Intrahepatic Bile Duct 174 28 6.7 (5.8-7.8) 7.5 5.0 (4.2-5.8) 5.0 Liver 119 19 4.6 (3.8-5.5) 5.1 3.4 (2.8-4.1) 3.4 Intrahepatic Bile Duct 55 9 2.1 (1.6-2.8) 2.4 1.5 (1.2-2.0) 1.6 Gallbladder 24 6 0.9 (0.6-1.4) 1.6 0.7 (0.4-1.0) 1.0 Other Biliary 48 10 1.9 (1.4-2.5) 2.7 1.4 (1.0-1.9) 2.1 Pancreas 414 81 16.0 (14.5-17.7) 21.8 11.8 (10.7-13.0) 14.8 Retroperitoneum <5 0 0.2 (0.0-0.4) 0.0 0.1 (0.0-0.4) 0.0 Peritoneum, Omentum and Mesentery <5 0 0.0 (0.0-0.1) 0.0 0.0 (0.0-0.1) 0.0 Other Digestive System 19 <5 0.7 (0.4-1.1) 0.3 0.6 (0.3-0.9) 0.2Respiratory System 3,044 453 117.9 (113.7-122.2) 122.1 87.7 (84.6-90.9) 84.0 Nose, Nasal Cavity and Middle Ear 21 6 0.8 (0.5-1.2) 1.6 0.6 (0.4-1.0) 1.3 Larynx 172 21 6.7 (5.7-7.7) 5.7 4.7 (4.1-5.5) 3.6 Lung and Bronchus 2,845 426 110.2 (106.2-114.3) 114.8 82.1 (79.1-85.2) 79.1 Pleura <5 0 0.0 (0.0-0.2) 0.0 0.0 (0.0-0.2) 0.0 Trachea, Mediastinum and Other Respiratory System <10 0 0.2 (0.1-0.5) 0.0 0.2 (0.1-0.5) 0.0Bones and Joints 34 7 1.3 (0.9-1.8) 1.9 1.1 (0.8-1.6) 2.0Soft Tissue including Heart 104 13 4.0 (3.3-4.9) 3.5 3.4 (2.8-4.2) 3.1Skin excluding Basal and Squamous 630 93 24.4 (22.5-26.4) 25.1 18.8 (17.3-20.4) 18.5 Melanomas of the Skin 567 79 22.0 (20.2-23.8) 21.3 16.8 (15.4-18.3) 15.4 Other Non-Epithelial Skin 63 14 2.4 (1.9-3.1) 3.8 2.0 (1.5-2.6) 3.0Breast 40 9 1.5 (1.1-2.1) 2.4 1.1 (0.8-1.5) 1.6Male Genital System 5,005 525 193.8 (188.5-199.3) 141.5 141.3 (137.3-145.3) 95.8 Prostate 4,821 504 186.7 (181.5-192.1) 135.8 133.5 (129.7-137.3) 89.9 Testis 139 12 5.4 (4.5-6.4) 3.2 6.5 (5.4-7.7) 4.3 Penis 38 9 1.5 (1.0-2.0) 2.4 1.1 (0.8-1.6) 1.6 Other Male Genital Organs 7 0 0.3 (0.1-0.6) 0.0 0.2 (0.1-0.4) 0.0
X | Department of Health
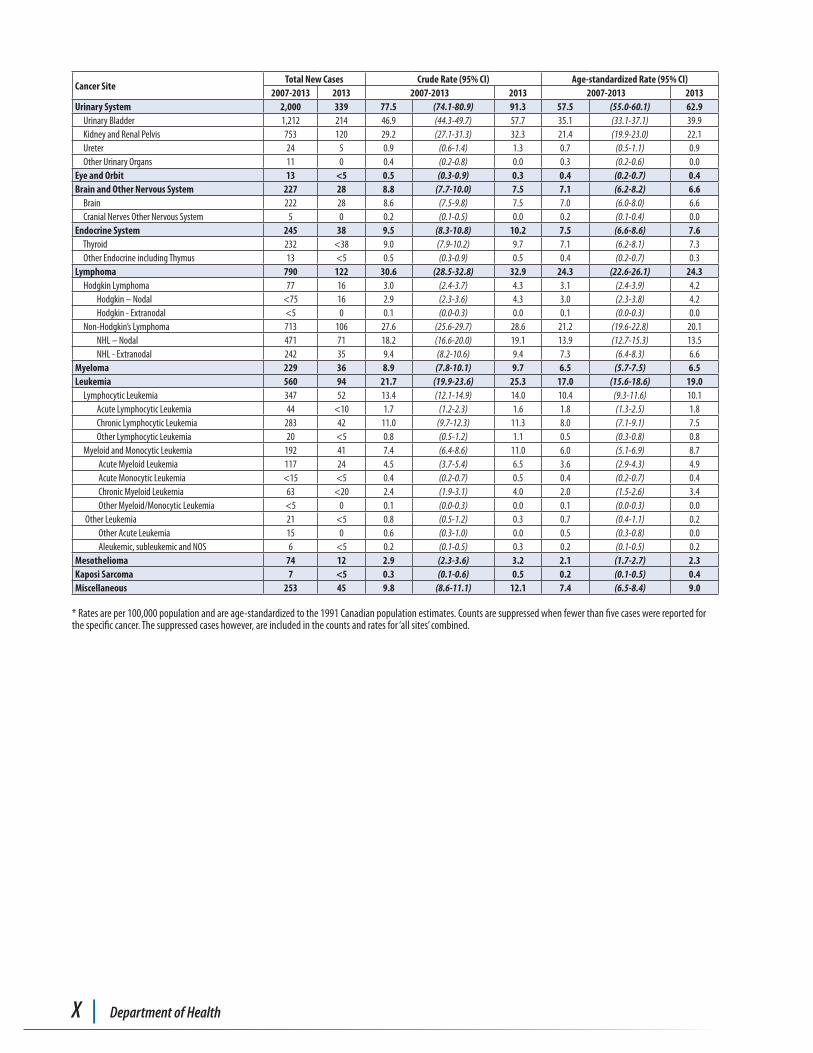
Cancer SiteTotal New Cases Crude Rate (95% CI) Age-standardized Rate (95% CI)
2007-2013 2013 2007-2013 2013 2007-2013 2013Urinary System 2,000 339 77.5 (74.1-80.9) 91.3 57.5 (55.0-60.1) 62.9 Urinary Bladder 1,212 214 46.9 (44.3-49.7) 57.7 35.1 (33.1-37.1) 39.9 Kidney and Renal Pelvis 753 120 29.2 (27.1-31.3) 32.3 21.4 (19.9-23.0) 22.1 Ureter 24 5 0.9 (0.6-1.4) 1.3 0.7 (0.5-1.1) 0.9 Other Urinary Organs 11 0 0.4 (0.2-0.8) 0.0 0.3 (0.2-0.6) 0.0Eye and Orbit 13 <5 0.5 (0.3-0.9) 0.3 0.4 (0.2-0.7) 0.4Brain and Other Nervous System 227 28 8.8 (7.7-10.0) 7.5 7.1 (6.2-8.2) 6.6 Brain 222 28 8.6 (7.5-9.8) 7.5 7.0 (6.0-8.0) 6.6 Cranial Nerves Other Nervous System 5 0 0.2 (0.1-0.5) 0.0 0.2 (0.1-0.4) 0.0Endocrine System 245 38 9.5 (8.3-10.8) 10.2 7.5 (6.6-8.6) 7.6 Thyroid 232 <38 9.0 (7.9-10.2) 9.7 7.1 (6.2-8.1) 7.3 Other Endocrine including Thymus 13 <5 0.5 (0.3-0.9) 0.5 0.4 (0.2-0.7) 0.3Lymphoma 790 122 30.6 (28.5-32.8) 32.9 24.3 (22.6-26.1) 24.3 Hodgkin Lymphoma 77 16 3.0 (2.4-3.7) 4.3 3.1 (2.4-3.9) 4.2 Hodgkin – Nodal <75 16 2.9 (2.3-3.6) 4.3 3.0 (2.3-3.8) 4.2 Hodgkin - Extranodal <5 0 0.1 (0.0-0.3) 0.0 0.1 (0.0-0.3) 0.0 Non-Hodgkin’s Lymphoma 713 106 27.6 (25.6-29.7) 28.6 21.2 (19.6-22.8) 20.1 NHL – Nodal 471 71 18.2 (16.6-20.0) 19.1 13.9 (12.7-15.3) 13.5 NHL - Extranodal 242 35 9.4 (8.2-10.6) 9.4 7.3 (6.4-8.3) 6.6Myeloma 229 36 8.9 (7.8-10.1) 9.7 6.5 (5.7-7.5) 6.5Leukemia 560 94 21.7 (19.9-23.6) 25.3 17.0 (15.6-18.6) 19.0 Lymphocytic Leukemia 347 52 13.4 (12.1-14.9) 14.0 10.4 (9.3-11.6) 10.1 Acute Lymphocytic Leukemia 44 <10 1.7 (1.2-2.3) 1.6 1.8 (1.3-2.5) 1.8 Chronic Lymphocytic Leukemia 283 42 11.0 (9.7-12.3) 11.3 8.0 (7.1-9.1) 7.5 Other Lymphocytic Leukemia 20 <5 0.8 (0.5-1.2) 1.1 0.5 (0.3-0.8) 0.8 Myeloid and Monocytic Leukemia 192 41 7.4 (6.4-8.6) 11.0 6.0 (5.1-6.9) 8.7 Acute Myeloid Leukemia 117 24 4.5 (3.7-5.4) 6.5 3.6 (2.9-4.3) 4.9 Acute Monocytic Leukemia <15 <5 0.4 (0.2-0.7) 0.5 0.4 (0.2-0.7) 0.4 Chronic Myeloid Leukemia 63 <20 2.4 (1.9-3.1) 4.0 2.0 (1.5-2.6) 3.4 Other Myeloid/Monocytic Leukemia <5 0 0.1 (0.0-0.3) 0.0 0.1 (0.0-0.3) 0.0 Other Leukemia 21 <5 0.8 (0.5-1.2) 0.3 0.7 (0.4-1.1) 0.2 Other Acute Leukemia 15 0 0.6 (0.3-1.0) 0.0 0.5 (0.3-0.8) 0.0 Aleukemic, subleukemic and NOS 6 <5 0.2 (0.1-0.5) 0.3 0.2 (0.1-0.5) 0.2Mesothelioma 74 12 2.9 (2.3-3.6) 3.2 2.1 (1.7-2.7) 2.3Kaposi Sarcoma 7 <5 0.3 (0.1-0.6) 0.5 0.2 (0.1-0.5) 0.4Miscellaneous 253 45 9.8 (8.6-11.1) 12.1 7.4 (6.5-8.4) 9.0
* Rates are per 100,000 population and are age-standardized to the 1991 Canadian population estimates. Counts are suppressed when fewer than five cases were reported for the specific cancer. The suppressed cases however, are included in the counts and rates for ‘all sites’ combined.
2007-2013 New Brunswick Cancer Report | XI
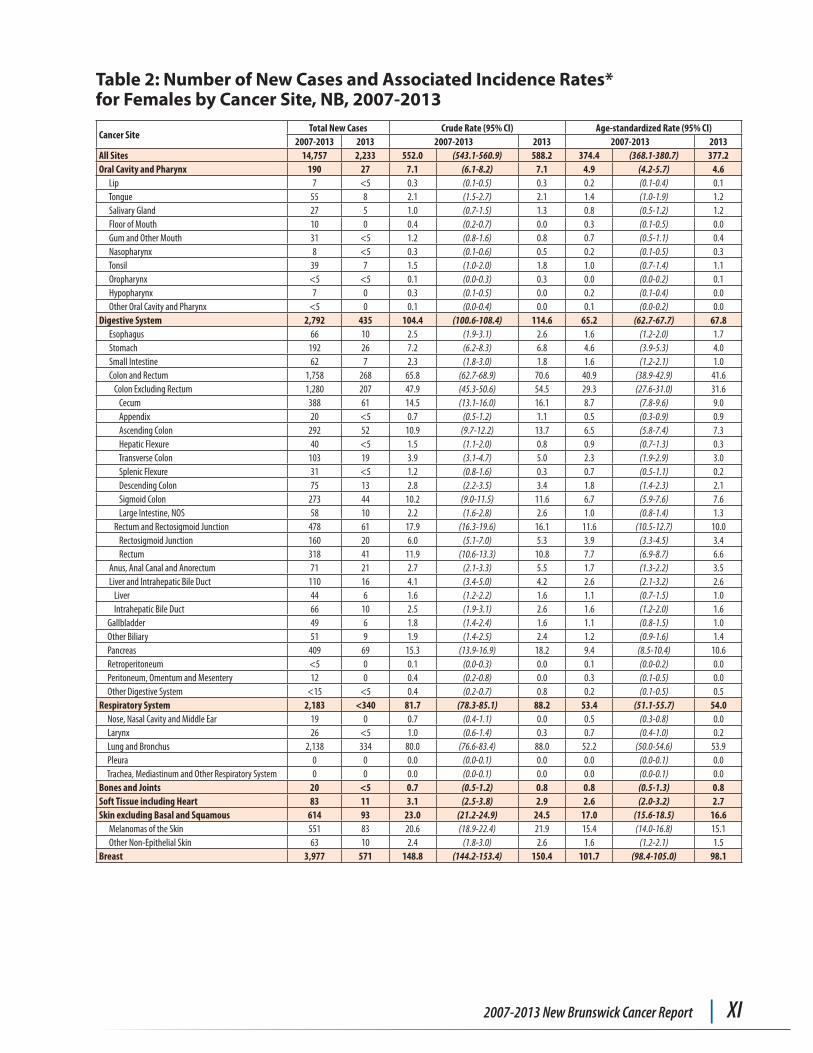
Table 2: Number of New Cases and Associated Incidence Rates* for Females by Cancer Site, NB, 2007-2013
Cancer SiteTotal New Cases Crude Rate (95% CI) Age-standardized Rate (95% CI)
2007-2013 2013 2007-2013 2013 2007-2013 2013All Sites 14,757 2,233 552.0 (543.1-560.9) 588.2 374.4 (368.1-380.7) 377.2Oral Cavity and Pharynx 190 27 7.1 (6.1-8.2) 7.1 4.9 (4.2-5.7) 4.6 Lip 7 <5 0.3 (0.1-0.5) 0.3 0.2 (0.1-0.4) 0.1 Tongue 55 8 2.1 (1.5-2.7) 2.1 1.4 (1.0-1.9) 1.2 Salivary Gland 27 5 1.0 (0.7-1.5) 1.3 0.8 (0.5-1.2) 1.2 Floor of Mouth 10 0 0.4 (0.2-0.7) 0.0 0.3 (0.1-0.5) 0.0 Gum and Other Mouth 31 <5 1.2 (0.8-1.6) 0.8 0.7 (0.5-1.1) 0.4 Nasopharynx 8 <5 0.3 (0.1-0.6) 0.5 0.2 (0.1-0.5) 0.3 Tonsil 39 7 1.5 (1.0-2.0) 1.8 1.0 (0.7-1.4) 1.1 Oropharynx <5 <5 0.1 (0.0-0.3) 0.3 0.0 (0.0-0.2) 0.1 Hypopharynx 7 0 0.3 (0.1-0.5) 0.0 0.2 (0.1-0.4) 0.0 Other Oral Cavity and Pharynx <5 0 0.1 (0.0-0.4) 0.0 0.1 (0.0-0.2) 0.0Digestive System 2,792 435 104.4 (100.6-108.4) 114.6 65.2 (62.7-67.7) 67.8 Esophagus 66 10 2.5 (1.9-3.1) 2.6 1.6 (1.2-2.0) 1.7 Stomach 192 26 7.2 (6.2-8.3) 6.8 4.6 (3.9-5.3) 4.0 Small Intestine 62 7 2.3 (1.8-3.0) 1.8 1.6 (1.2-2.1) 1.0 Colon and Rectum 1,758 268 65.8 (62.7-68.9) 70.6 40.9 (38.9-42.9) 41.6 Colon Excluding Rectum 1,280 207 47.9 (45.3-50.6) 54.5 29.3 (27.6-31.0) 31.6 Cecum 388 61 14.5 (13.1-16.0) 16.1 8.7 (7.8-9.6) 9.0 Appendix 20 <5 0.7 (0.5-1.2) 1.1 0.5 (0.3-0.9) 0.9 Ascending Colon 292 52 10.9 (9.7-12.2) 13.7 6.5 (5.8-7.4) 7.3 Hepatic Flexure 40 <5 1.5 (1.1-2.0) 0.8 0.9 (0.7-1.3) 0.3 Transverse Colon 103 19 3.9 (3.1-4.7) 5.0 2.3 (1.9-2.9) 3.0 Splenic Flexure 31 <5 1.2 (0.8-1.6) 0.3 0.7 (0.5-1.1) 0.2 Descending Colon 75 13 2.8 (2.2-3.5) 3.4 1.8 (1.4-2.3) 2.1 Sigmoid Colon 273 44 10.2 (9.0-11.5) 11.6 6.7 (5.9-7.6) 7.6 Large Intestine, NOS 58 10 2.2 (1.6-2.8) 2.6 1.0 (0.8-1.4) 1.3 Rectum and Rectosigmoid Junction 478 61 17.9 (16.3-19.6) 16.1 11.6 (10.5-12.7) 10.0 Rectosigmoid Junction 160 20 6.0 (5.1-7.0) 5.3 3.9 (3.3-4.5) 3.4 Rectum 318 41 11.9 (10.6-13.3) 10.8 7.7 (6.9-8.7) 6.6 Anus, Anal Canal and Anorectum 71 21 2.7 (2.1-3.3) 5.5 1.7 (1.3-2.2) 3.5 Liver and Intrahepatic Bile Duct 110 16 4.1 (3.4-5.0) 4.2 2.6 (2.1-3.2) 2.6 Liver 44 6 1.6 (1.2-2.2) 1.6 1.1 (0.7-1.5) 1.0 Intrahepatic Bile Duct 66 10 2.5 (1.9-3.1) 2.6 1.6 (1.2-2.0) 1.6 Gallbladder 49 6 1.8 (1.4-2.4) 1.6 1.1 (0.8-1.5) 1.0 Other Biliary 51 9 1.9 (1.4-2.5) 2.4 1.2 (0.9-1.6) 1.4 Pancreas 409 69 15.3 (13.9-16.9) 18.2 9.4 (8.5-10.4) 10.6 Retroperitoneum <5 0 0.1 (0.0-0.3) 0.0 0.1 (0.0-0.2) 0.0 Peritoneum, Omentum and Mesentery 12 0 0.4 (0.2-0.8) 0.0 0.3 (0.1-0.5) 0.0 Other Digestive System <15 <5 0.4 (0.2-0.7) 0.8 0.2 (0.1-0.5) 0.5Respiratory System 2,183 <340 81.7 (78.3-85.1) 88.2 53.4 (51.1-55.7) 54.0 Nose, Nasal Cavity and Middle Ear 19 0 0.7 (0.4-1.1) 0.0 0.5 (0.3-0.8) 0.0 Larynx 26 <5 1.0 (0.6-1.4) 0.3 0.7 (0.4-1.0) 0.2 Lung and Bronchus 2,138 334 80.0 (76.6-83.4) 88.0 52.2 (50.0-54.6) 53.9 Pleura 0 0 0.0 (0.0-0.1) 0.0 0.0 (0.0-0.1) 0.0 Trachea, Mediastinum and Other Respiratory System 0 0 0.0 (0.0-0.1) 0.0 0.0 (0.0-0.1) 0.0Bones and Joints 20 <5 0.7 (0.5-1.2) 0.8 0.8 (0.5-1.3) 0.8Soft Tissue including Heart 83 11 3.1 (2.5-3.8) 2.9 2.6 (2.0-3.2) 2.7Skin excluding Basal and Squamous 614 93 23.0 (21.2-24.9) 24.5 17.0 (15.6-18.5) 16.6 Melanomas of the Skin 551 83 20.6 (18.9-22.4) 21.9 15.4 (14.0-16.8) 15.1 Other Non-Epithelial Skin 63 10 2.4 (1.8-3.0) 2.6 1.6 (1.2-2.1) 1.5Breast 3,977 571 148.8 (144.2-153.4) 150.4 101.7 (98.4-105.0) 98.1
XII | Department of Health
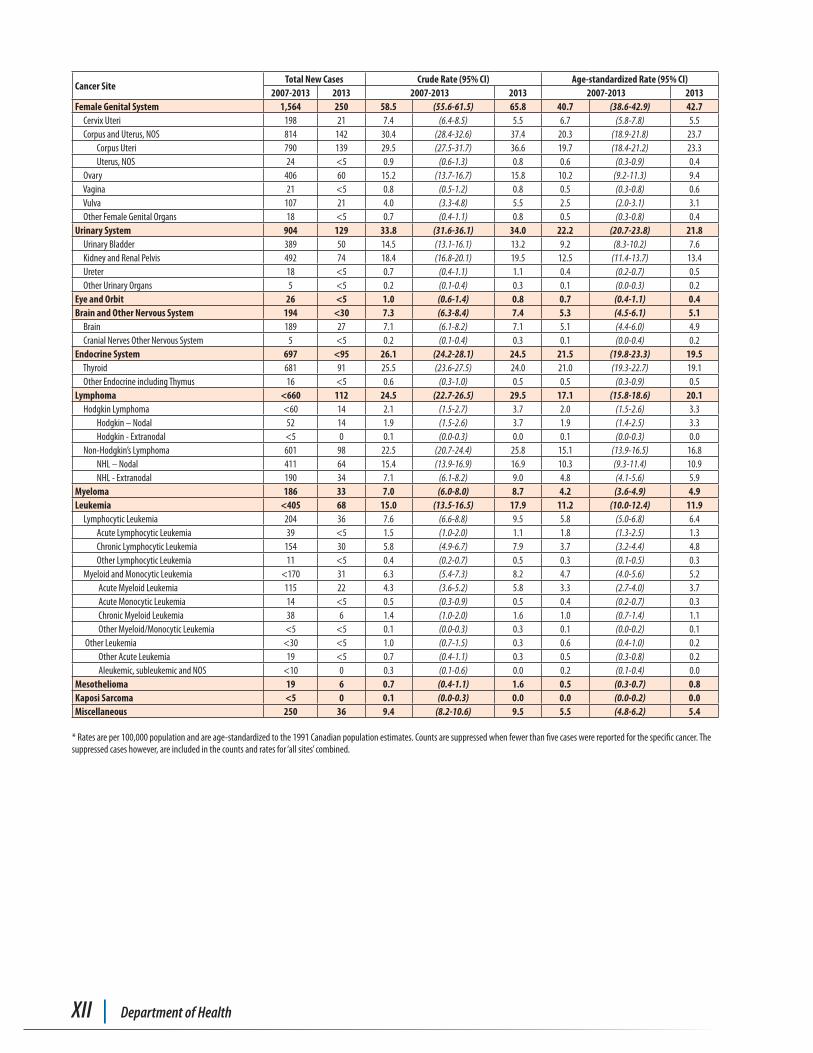
Cancer SiteTotal New Cases Crude Rate (95% CI) Age-standardized Rate (95% CI)
2007-2013 2013 2007-2013 2013 2007-2013 2013Female Genital System 1,564 250 58.5 (55.6-61.5) 65.8 40.7 (38.6-42.9) 42.7 Cervix Uteri 198 21 7.4 (6.4-8.5) 5.5 6.7 (5.8-7.8) 5.5 Corpus and Uterus, NOS 814 142 30.4 (28.4-32.6) 37.4 20.3 (18.9-21.8) 23.7 Corpus Uteri 790 139 29.5 (27.5-31.7) 36.6 19.7 (18.4-21.2) 23.3 Uterus, NOS 24 <5 0.9 (0.6-1.3) 0.8 0.6 (0.3-0.9) 0.4 Ovary 406 60 15.2 (13.7-16.7) 15.8 10.2 (9.2-11.3) 9.4 Vagina 21 <5 0.8 (0.5-1.2) 0.8 0.5 (0.3-0.8) 0.6 Vulva 107 21 4.0 (3.3-4.8) 5.5 2.5 (2.0-3.1) 3.1 Other Female Genital Organs 18 <5 0.7 (0.4-1.1) 0.8 0.5 (0.3-0.8) 0.4Urinary System 904 129 33.8 (31.6-36.1) 34.0 22.2 (20.7-23.8) 21.8 Urinary Bladder 389 50 14.5 (13.1-16.1) 13.2 9.2 (8.3-10.2) 7.6 Kidney and Renal Pelvis 492 74 18.4 (16.8-20.1) 19.5 12.5 (11.4-13.7) 13.4 Ureter 18 <5 0.7 (0.4-1.1) 1.1 0.4 (0.2-0.7) 0.5 Other Urinary Organs 5 <5 0.2 (0.1-0.4) 0.3 0.1 (0.0-0.3) 0.2Eye and Orbit 26 <5 1.0 (0.6-1.4) 0.8 0.7 (0.4-1.1) 0.4Brain and Other Nervous System 194 <30 7.3 (6.3-8.4) 7.4 5.3 (4.5-6.1) 5.1 Brain 189 27 7.1 (6.1-8.2) 7.1 5.1 (4.4-6.0) 4.9 Cranial Nerves Other Nervous System 5 <5 0.2 (0.1-0.4) 0.3 0.1 (0.0-0.4) 0.2Endocrine System 697 <95 26.1 (24.2-28.1) 24.5 21.5 (19.8-23.3) 19.5 Thyroid 681 91 25.5 (23.6-27.5) 24.0 21.0 (19.3-22.7) 19.1 Other Endocrine including Thymus 16 <5 0.6 (0.3-1.0) 0.5 0.5 (0.3-0.9) 0.5Lymphoma <660 112 24.5 (22.7-26.5) 29.5 17.1 (15.8-18.6) 20.1 Hodgkin Lymphoma <60 14 2.1 (1.5-2.7) 3.7 2.0 (1.5-2.6) 3.3 Hodgkin – Nodal 52 14 1.9 (1.5-2.6) 3.7 1.9 (1.4-2.5) 3.3 Hodgkin - Extranodal <5 0 0.1 (0.0-0.3) 0.0 0.1 (0.0-0.3) 0.0 Non-Hodgkin’s Lymphoma 601 98 22.5 (20.7-24.4) 25.8 15.1 (13.9-16.5) 16.8 NHL – Nodal 411 64 15.4 (13.9-16.9) 16.9 10.3 (9.3-11.4) 10.9 NHL - Extranodal 190 34 7.1 (6.1-8.2) 9.0 4.8 (4.1-5.6) 5.9Myeloma 186 33 7.0 (6.0-8.0) 8.7 4.2 (3.6-4.9) 4.9Leukemia <405 68 15.0 (13.5-16.5) 17.9 11.2 (10.0-12.4) 11.9 Lymphocytic Leukemia 204 36 7.6 (6.6-8.8) 9.5 5.8 (5.0-6.8) 6.4 Acute Lymphocytic Leukemia 39 <5 1.5 (1.0-2.0) 1.1 1.8 (1.3-2.5) 1.3 Chronic Lymphocytic Leukemia 154 30 5.8 (4.9-6.7) 7.9 3.7 (3.2-4.4) 4.8 Other Lymphocytic Leukemia 11 <5 0.4 (0.2-0.7) 0.5 0.3 (0.1-0.5) 0.3 Myeloid and Monocytic Leukemia <170 31 6.3 (5.4-7.3) 8.2 4.7 (4.0-5.6) 5.2 Acute Myeloid Leukemia 115 22 4.3 (3.6-5.2) 5.8 3.3 (2.7-4.0) 3.7 Acute Monocytic Leukemia 14 <5 0.5 (0.3-0.9) 0.5 0.4 (0.2-0.7) 0.3 Chronic Myeloid Leukemia 38 6 1.4 (1.0-2.0) 1.6 1.0 (0.7-1.4) 1.1 Other Myeloid/Monocytic Leukemia <5 <5 0.1 (0.0-0.3) 0.3 0.1 (0.0-0.2) 0.1 Other Leukemia <30 <5 1.0 (0.7-1.5) 0.3 0.6 (0.4-1.0) 0.2 Other Acute Leukemia 19 <5 0.7 (0.4-1.1) 0.3 0.5 (0.3-0.8) 0.2 Aleukemic, subleukemic and NOS <10 0 0.3 (0.1-0.6) 0.0 0.2 (0.1-0.4) 0.0Mesothelioma 19 6 0.7 (0.4-1.1) 1.6 0.5 (0.3-0.7) 0.8Kaposi Sarcoma <5 0 0.1 (0.0-0.3) 0.0 0.0 (0.0-0.2) 0.0Miscellaneous 250 36 9.4 (8.2-10.6) 9.5 5.5 (4.8-6.2) 5.4
* Rates are per 100,000 population and are age-standardized to the 1991 Canadian population estimates. Counts are suppressed when fewer than five cases were reported for the specific cancer. The suppressed cases however, are included in the counts and rates for ‘all sites’ combined.
2007-2013 New Brunswick Cancer Report | XIII
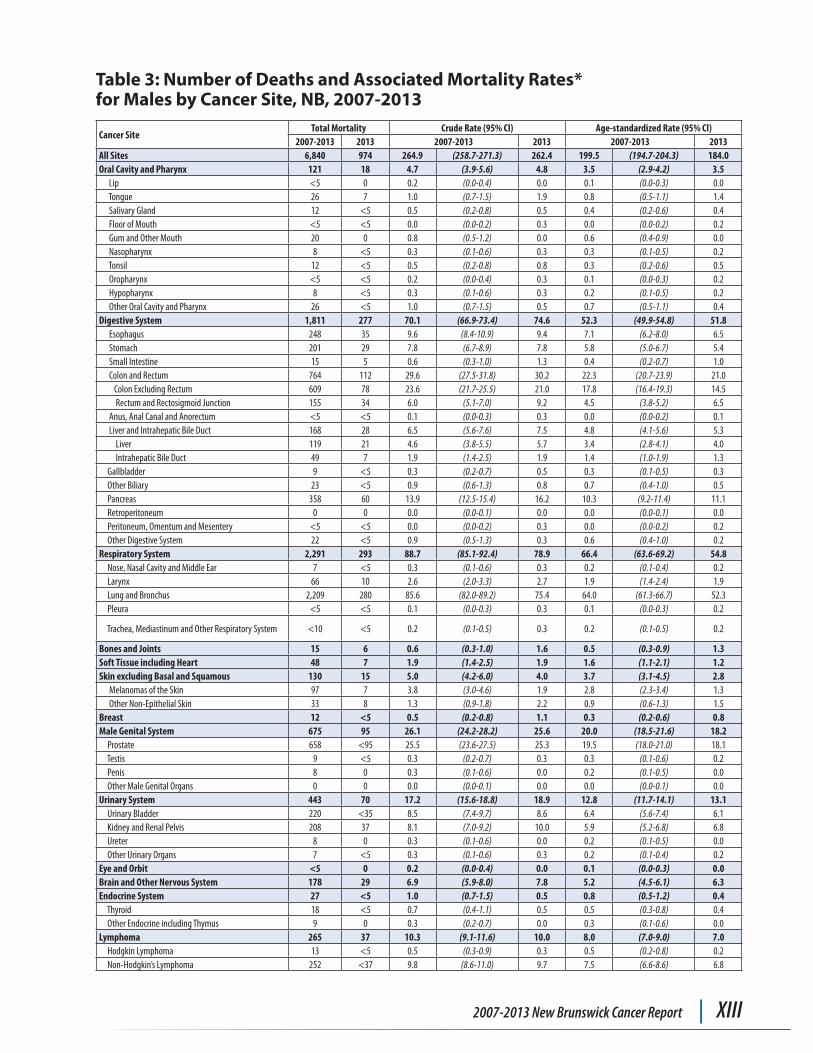
Table 3: Number of Deaths and Associated Mortality Rates* for Males by Cancer Site, NB, 2007-2013
Cancer SiteTotal Mortality Crude Rate (95% CI) Age-standardized Rate (95% CI)
2007-2013 2013 2007-2013 2013 2007-2013 2013All Sites 6,840 974 264.9 (258.7-271.3) 262.4 199.5 (194.7-204.3) 184.0Oral Cavity and Pharynx 121 18 4.7 (3.9-5.6) 4.8 3.5 (2.9-4.2) 3.5 Lip <5 0 0.2 (0.0-0.4) 0.0 0.1 (0.0-0.3) 0.0 Tongue 26 7 1.0 (0.7-1.5) 1.9 0.8 (0.5-1.1) 1.4 Salivary Gland 12 <5 0.5 (0.2-0.8) 0.5 0.4 (0.2-0.6) 0.4 Floor of Mouth <5 <5 0.0 (0.0-0.2) 0.3 0.0 (0.0-0.2) 0.2 Gum and Other Mouth 20 0 0.8 (0.5-1.2) 0.0 0.6 (0.4-0.9) 0.0 Nasopharynx 8 <5 0.3 (0.1-0.6) 0.3 0.3 (0.1-0.5) 0.2 Tonsil 12 <5 0.5 (0.2-0.8) 0.8 0.3 (0.2-0.6) 0.5 Oropharynx <5 <5 0.2 (0.0-0.4) 0.3 0.1 (0.0-0.3) 0.2 Hypopharynx 8 <5 0.3 (0.1-0.6) 0.3 0.2 (0.1-0.5) 0.2 Other Oral Cavity and Pharynx 26 <5 1.0 (0.7-1.5) 0.5 0.7 (0.5-1.1) 0.4Digestive System 1,811 277 70.1 (66.9-73.4) 74.6 52.3 (49.9-54.8) 51.8 Esophagus 248 35 9.6 (8.4-10.9) 9.4 7.1 (6.2-8.0) 6.5 Stomach 201 29 7.8 (6.7-8.9) 7.8 5.8 (5.0-6.7) 5.4 Small Intestine 15 5 0.6 (0.3-1.0) 1.3 0.4 (0.2-0.7) 1.0 Colon and Rectum 764 112 29.6 (27.5-31.8) 30.2 22.3 (20.7-23.9) 21.0 Colon Excluding Rectum 609 78 23.6 (21.7-25.5) 21.0 17.8 (16.4-19.3) 14.5 Rectum and Rectosigmoid Junction 155 34 6.0 (5.1-7.0) 9.2 4.5 (3.8-5.2) 6.5 Anus, Anal Canal and Anorectum <5 <5 0.1 (0.0-0.3) 0.3 0.0 (0.0-0.2) 0.1 Liver and Intrahepatic Bile Duct 168 28 6.5 (5.6-7.6) 7.5 4.8 (4.1-5.6) 5.3 Liver 119 21 4.6 (3.8-5.5) 5.7 3.4 (2.8-4.1) 4.0 Intrahepatic Bile Duct 49 7 1.9 (1.4-2.5) 1.9 1.4 (1.0-1.9) 1.3 Gallbladder 9 <5 0.3 (0.2-0.7) 0.5 0.3 (0.1-0.5) 0.3 Other Biliary 23 <5 0.9 (0.6-1.3) 0.8 0.7 (0.4-1.0) 0.5 Pancreas 358 60 13.9 (12.5-15.4) 16.2 10.3 (9.2-11.4) 11.1 Retroperitoneum 0 0 0.0 (0.0-0.1) 0.0 0.0 (0.0-0.1) 0.0 Peritoneum, Omentum and Mesentery <5 <5 0.0 (0.0-0.2) 0.3 0.0 (0.0-0.2) 0.2 Other Digestive System 22 <5 0.9 (0.5-1.3) 0.3 0.6 (0.4-1.0) 0.2Respiratory System 2,291 293 88.7 (85.1-92.4) 78.9 66.4 (63.6-69.2) 54.8 Nose, Nasal Cavity and Middle Ear 7 <5 0.3 (0.1-0.6) 0.3 0.2 (0.1-0.4) 0.2 Larynx 66 10 2.6 (2.0-3.3) 2.7 1.9 (1.4-2.4) 1.9 Lung and Bronchus 2,209 280 85.6 (82.0-89.2) 75.4 64.0 (61.3-66.7) 52.3 Pleura <5 <5 0.1 (0.0-0.3) 0.3 0.1 (0.0-0.3) 0.2
Trachea, Mediastinum and Other Respiratory System <10 <5 0.2 (0.1-0.5) 0.3 0.2 (0.1-0.5) 0.2
Bones and Joints 15 6 0.6 (0.3-1.0) 1.6 0.5 (0.3-0.9) 1.3Soft Tissue including Heart 48 7 1.9 (1.4-2.5) 1.9 1.6 (1.1-2.1) 1.2Skin excluding Basal and Squamous 130 15 5.0 (4.2-6.0) 4.0 3.7 (3.1-4.5) 2.8 Melanomas of the Skin 97 7 3.8 (3.0-4.6) 1.9 2.8 (2.3-3.4) 1.3 Other Non-Epithelial Skin 33 8 1.3 (0.9-1.8) 2.2 0.9 (0.6-1.3) 1.5Breast 12 <5 0.5 (0.2-0.8) 1.1 0.3 (0.2-0.6) 0.8Male Genital System 675 95 26.1 (24.2-28.2) 25.6 20.0 (18.5-21.6) 18.2 Prostate 658 <95 25.5 (23.6-27.5) 25.3 19.5 (18.0-21.0) 18.1 Testis 9 <5 0.3 (0.2-0.7) 0.3 0.3 (0.1-0.6) 0.2 Penis 8 0 0.3 (0.1-0.6) 0.0 0.2 (0.1-0.5) 0.0 Other Male Genital Organs 0 0 0.0 (0.0-0.1) 0.0 0.0 (0.0-0.1) 0.0Urinary System 443 70 17.2 (15.6-18.8) 18.9 12.8 (11.7-14.1) 13.1 Urinary Bladder 220 <35 8.5 (7.4-9.7) 8.6 6.4 (5.6-7.4) 6.1 Kidney and Renal Pelvis 208 37 8.1 (7.0-9.2) 10.0 5.9 (5.2-6.8) 6.8 Ureter 8 0 0.3 (0.1-0.6) 0.0 0.2 (0.1-0.5) 0.0 Other Urinary Organs 7 <5 0.3 (0.1-0.6) 0.3 0.2 (0.1-0.4) 0.2Eye and Orbit <5 0 0.2 (0.0-0.4) 0.0 0.1 (0.0-0.3) 0.0Brain and Other Nervous System 178 29 6.9 (5.9-8.0) 7.8 5.2 (4.5-6.1) 6.3Endocrine System 27 <5 1.0 (0.7-1.5) 0.5 0.8 (0.5-1.2) 0.4 Thyroid 18 <5 0.7 (0.4-1.1) 0.5 0.5 (0.3-0.8) 0.4 Other Endocrine including Thymus 9 0 0.3 (0.2-0.7) 0.0 0.3 (0.1-0.6) 0.0Lymphoma 265 37 10.3 (9.1-11.6) 10.0 8.0 (7.0-9.0) 7.0 Hodgkin Lymphoma 13 <5 0.5 (0.3-0.9) 0.3 0.5 (0.2-0.8) 0.2 Non-Hodgkin’s Lymphoma 252 <37 9.8 (8.6-11.0) 9.7 7.5 (6.6-8.6) 6.8
XIV | Department of Health
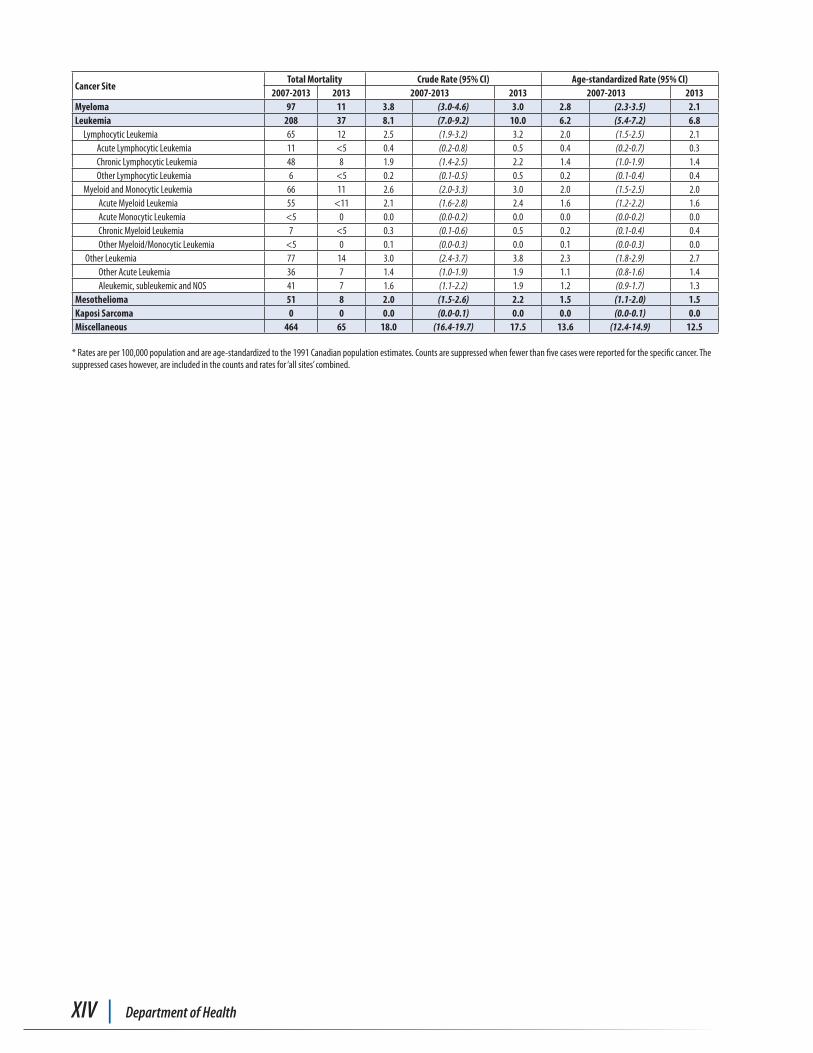
Cancer SiteTotal Mortality Crude Rate (95% CI) Age-standardized Rate (95% CI)
2007-2013 2013 2007-2013 2013 2007-2013 2013Myeloma 97 11 3.8 (3.0-4.6) 3.0 2.8 (2.3-3.5) 2.1Leukemia 208 37 8.1 (7.0-9.2) 10.0 6.2 (5.4-7.2) 6.8 Lymphocytic Leukemia 65 12 2.5 (1.9-3.2) 3.2 2.0 (1.5-2.5) 2.1 Acute Lymphocytic Leukemia 11 <5 0.4 (0.2-0.8) 0.5 0.4 (0.2-0.7) 0.3 Chronic Lymphocytic Leukemia 48 8 1.9 (1.4-2.5) 2.2 1.4 (1.0-1.9) 1.4 Other Lymphocytic Leukemia 6 <5 0.2 (0.1-0.5) 0.5 0.2 (0.1-0.4) 0.4 Myeloid and Monocytic Leukemia 66 11 2.6 (2.0-3.3) 3.0 2.0 (1.5-2.5) 2.0 Acute Myeloid Leukemia 55 <11 2.1 (1.6-2.8) 2.4 1.6 (1.2-2.2) 1.6 Acute Monocytic Leukemia <5 0 0.0 (0.0-0.2) 0.0 0.0 (0.0-0.2) 0.0 Chronic Myeloid Leukemia 7 <5 0.3 (0.1-0.6) 0.5 0.2 (0.1-0.4) 0.4 Other Myeloid/Monocytic Leukemia <5 0 0.1 (0.0-0.3) 0.0 0.1 (0.0-0.3) 0.0 Other Leukemia 77 14 3.0 (2.4-3.7) 3.8 2.3 (1.8-2.9) 2.7 Other Acute Leukemia 36 7 1.4 (1.0-1.9) 1.9 1.1 (0.8-1.6) 1.4 Aleukemic, subleukemic and NOS 41 7 1.6 (1.1-2.2) 1.9 1.2 (0.9-1.7) 1.3Mesothelioma 51 8 2.0 (1.5-2.6) 2.2 1.5 (1.1-2.0) 1.5Kaposi Sarcoma 0 0 0.0 (0.0-0.1) 0.0 0.0 (0.0-0.1) 0.0Miscellaneous 464 65 18.0 (16.4-19.7) 17.5 13.6 (12.4-14.9) 12.5
* Rates are per 100,000 population and are age-standardized to the 1991 Canadian population estimates. Counts are suppressed when fewer than five cases were reported for the specific cancer. The suppressed cases however, are included in the counts and rates for ‘all sites’ combined.
2007-2013 New Brunswick Cancer Report | XV
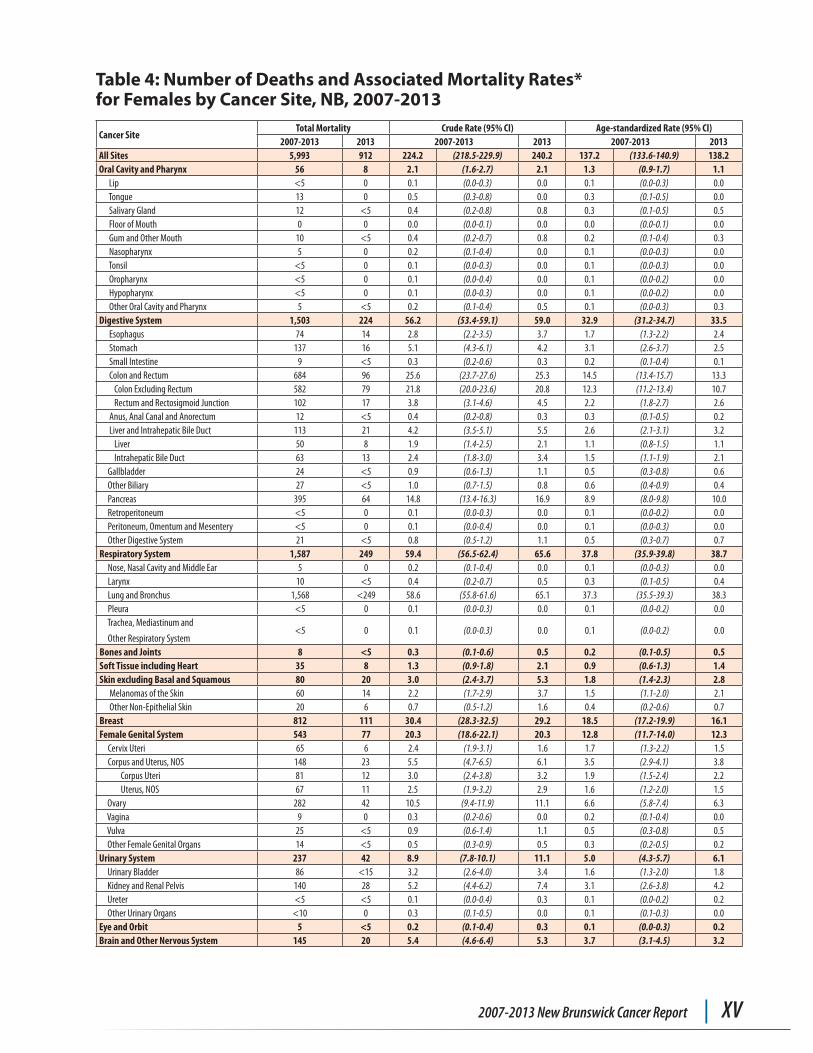
Table 4: Number of Deaths and Associated Mortality Rates* for Females by Cancer Site, NB, 2007-2013
Cancer SiteTotal Mortality Crude Rate (95% CI) Age-standardized Rate (95% CI)
2007-2013 2013 2007-2013 2013 2007-2013 2013All Sites 5,993 912 224.2 (218.5-229.9) 240.2 137.2 (133.6-140.9) 138.2Oral Cavity and Pharynx 56 8 2.1 (1.6-2.7) 2.1 1.3 (0.9-1.7) 1.1 Lip <5 0 0.1 (0.0-0.3) 0.0 0.1 (0.0-0.3) 0.0 Tongue 13 0 0.5 (0.3-0.8) 0.0 0.3 (0.1-0.5) 0.0 Salivary Gland 12 <5 0.4 (0.2-0.8) 0.8 0.3 (0.1-0.5) 0.5 Floor of Mouth 0 0 0.0 (0.0-0.1) 0.0 0.0 (0.0-0.1) 0.0 Gum and Other Mouth 10 <5 0.4 (0.2-0.7) 0.8 0.2 (0.1-0.4) 0.3 Nasopharynx 5 0 0.2 (0.1-0.4) 0.0 0.1 (0.0-0.3) 0.0 Tonsil <5 0 0.1 (0.0-0.3) 0.0 0.1 (0.0-0.3) 0.0 Oropharynx <5 0 0.1 (0.0-0.4) 0.0 0.1 (0.0-0.2) 0.0 Hypopharynx <5 0 0.1 (0.0-0.3) 0.0 0.1 (0.0-0.2) 0.0 Other Oral Cavity and Pharynx 5 <5 0.2 (0.1-0.4) 0.5 0.1 (0.0-0.3) 0.3Digestive System 1,503 224 56.2 (53.4-59.1) 59.0 32.9 (31.2-34.7) 33.5 Esophagus 74 14 2.8 (2.2-3.5) 3.7 1.7 (1.3-2.2) 2.4 Stomach 137 16 5.1 (4.3-6.1) 4.2 3.1 (2.6-3.7) 2.5 Small Intestine 9 <5 0.3 (0.2-0.6) 0.3 0.2 (0.1-0.4) 0.1 Colon and Rectum 684 96 25.6 (23.7-27.6) 25.3 14.5 (13.4-15.7) 13.3 Colon Excluding Rectum 582 79 21.8 (20.0-23.6) 20.8 12.3 (11.2-13.4) 10.7 Rectum and Rectosigmoid Junction 102 17 3.8 (3.1-4.6) 4.5 2.2 (1.8-2.7) 2.6 Anus, Anal Canal and Anorectum 12 <5 0.4 (0.2-0.8) 0.3 0.3 (0.1-0.5) 0.2 Liver and Intrahepatic Bile Duct 113 21 4.2 (3.5-5.1) 5.5 2.6 (2.1-3.1) 3.2 Liver 50 8 1.9 (1.4-2.5) 2.1 1.1 (0.8-1.5) 1.1 Intrahepatic Bile Duct 63 13 2.4 (1.8-3.0) 3.4 1.5 (1.1-1.9) 2.1 Gallbladder 24 <5 0.9 (0.6-1.3) 1.1 0.5 (0.3-0.8) 0.6 Other Biliary 27 <5 1.0 (0.7-1.5) 0.8 0.6 (0.4-0.9) 0.4 Pancreas 395 64 14.8 (13.4-16.3) 16.9 8.9 (8.0-9.8) 10.0 Retroperitoneum <5 0 0.1 (0.0-0.3) 0.0 0.1 (0.0-0.2) 0.0 Peritoneum, Omentum and Mesentery <5 0 0.1 (0.0-0.4) 0.0 0.1 (0.0-0.3) 0.0 Other Digestive System 21 <5 0.8 (0.5-1.2) 1.1 0.5 (0.3-0.7) 0.7Respiratory System 1,587 249 59.4 (56.5-62.4) 65.6 37.8 (35.9-39.8) 38.7 Nose, Nasal Cavity and Middle Ear 5 0 0.2 (0.1-0.4) 0.0 0.1 (0.0-0.3) 0.0 Larynx 10 <5 0.4 (0.2-0.7) 0.5 0.3 (0.1-0.5) 0.4 Lung and Bronchus 1,568 <249 58.6 (55.8-61.6) 65.1 37.3 (35.5-39.3) 38.3 Pleura <5 0 0.1 (0.0-0.3) 0.0 0.1 (0.0-0.2) 0.0 Trachea, Mediastinum and
Other Respiratory System<5 0 0.1 (0.0-0.3) 0.0 0.1 (0.0-0.2) 0.0
Bones and Joints 8 <5 0.3 (0.1-0.6) 0.5 0.2 (0.1-0.5) 0.5Soft Tissue including Heart 35 8 1.3 (0.9-1.8) 2.1 0.9 (0.6-1.3) 1.4Skin excluding Basal and Squamous 80 20 3.0 (2.4-3.7) 5.3 1.8 (1.4-2.3) 2.8 Melanomas of the Skin 60 14 2.2 (1.7-2.9) 3.7 1.5 (1.1-2.0) 2.1 Other Non-Epithelial Skin 20 6 0.7 (0.5-1.2) 1.6 0.4 (0.2-0.6) 0.7Breast 812 111 30.4 (28.3-32.5) 29.2 18.5 (17.2-19.9) 16.1Female Genital System 543 77 20.3 (18.6-22.1) 20.3 12.8 (11.7-14.0) 12.3 Cervix Uteri 65 6 2.4 (1.9-3.1) 1.6 1.7 (1.3-2.2) 1.5 Corpus and Uterus, NOS 148 23 5.5 (4.7-6.5) 6.1 3.5 (2.9-4.1) 3.8 Corpus Uteri 81 12 3.0 (2.4-3.8) 3.2 1.9 (1.5-2.4) 2.2 Uterus, NOS 67 11 2.5 (1.9-3.2) 2.9 1.6 (1.2-2.0) 1.5 Ovary 282 42 10.5 (9.4-11.9) 11.1 6.6 (5.8-7.4) 6.3 Vagina 9 0 0.3 (0.2-0.6) 0.0 0.2 (0.1-0.4) 0.0 Vulva 25 <5 0.9 (0.6-1.4) 1.1 0.5 (0.3-0.8) 0.5 Other Female Genital Organs 14 <5 0.5 (0.3-0.9) 0.5 0.3 (0.2-0.5) 0.2Urinary System 237 42 8.9 (7.8-10.1) 11.1 5.0 (4.3-5.7) 6.1 Urinary Bladder 86 <15 3.2 (2.6-4.0) 3.4 1.6 (1.3-2.0) 1.8 Kidney and Renal Pelvis 140 28 5.2 (4.4-6.2) 7.4 3.1 (2.6-3.8) 4.2 Ureter <5 <5 0.1 (0.0-0.4) 0.3 0.1 (0.0-0.2) 0.2 Other Urinary Organs <10 0 0.3 (0.1-0.5) 0.0 0.1 (0.1-0.3) 0.0Eye and Orbit 5 <5 0.2 (0.1-0.4) 0.3 0.1 (0.0-0.3) 0.2Brain and Other Nervous System 145 20 5.4 (4.6-6.4) 5.3 3.7 (3.1-4.5) 3.2
XVI | Department of Health
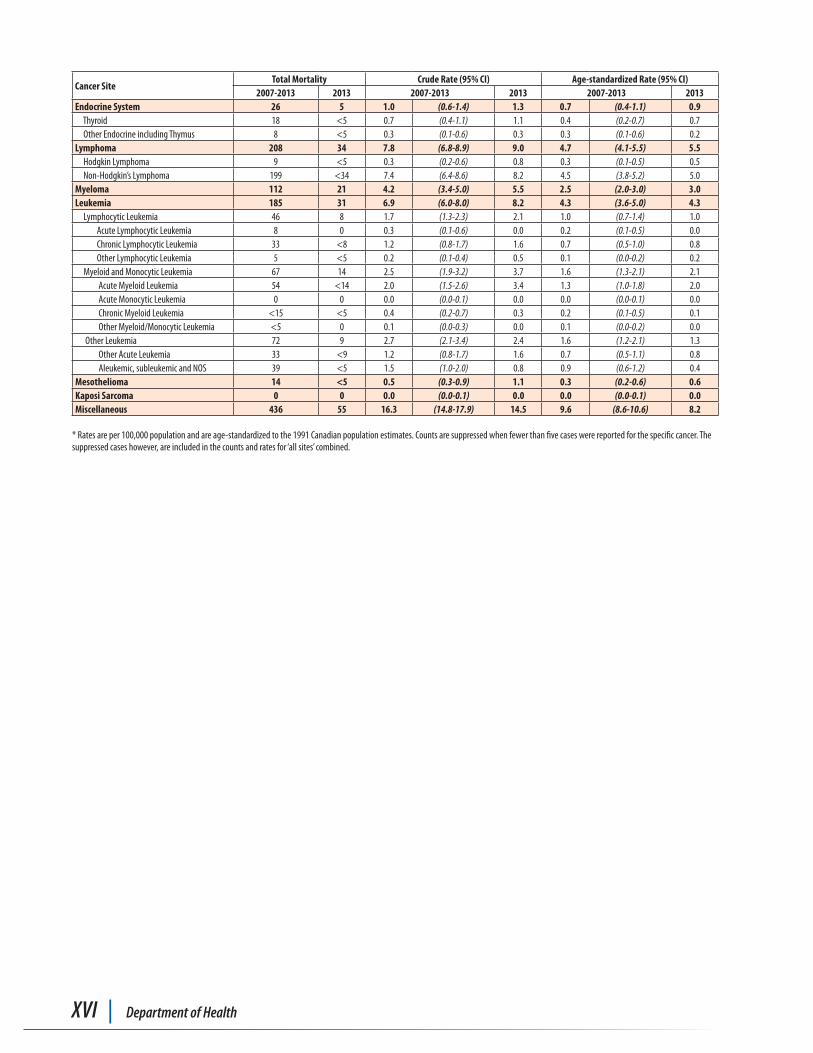
Cancer SiteTotal Mortality Crude Rate (95% CI) Age-standardized Rate (95% CI)
2007-2013 2013 2007-2013 2013 2007-2013 2013Endocrine System 26 5 1.0 (0.6-1.4) 1.3 0.7 (0.4-1.1) 0.9 Thyroid 18 <5 0.7 (0.4-1.1) 1.1 0.4 (0.2-0.7) 0.7 Other Endocrine including Thymus 8 <5 0.3 (0.1-0.6) 0.3 0.3 (0.1-0.6) 0.2Lymphoma 208 34 7.8 (6.8-8.9) 9.0 4.7 (4.1-5.5) 5.5 Hodgkin Lymphoma 9 <5 0.3 (0.2-0.6) 0.8 0.3 (0.1-0.5) 0.5 Non-Hodgkin’s Lymphoma 199 <34 7.4 (6.4-8.6) 8.2 4.5 (3.8-5.2) 5.0Myeloma 112 21 4.2 (3.4-5.0) 5.5 2.5 (2.0-3.0) 3.0Leukemia 185 31 6.9 (6.0-8.0) 8.2 4.3 (3.6-5.0) 4.3 Lymphocytic Leukemia 46 8 1.7 (1.3-2.3) 2.1 1.0 (0.7-1.4) 1.0 Acute Lymphocytic Leukemia 8 0 0.3 (0.1-0.6) 0.0 0.2 (0.1-0.5) 0.0 Chronic Lymphocytic Leukemia 33 <8 1.2 (0.8-1.7) 1.6 0.7 (0.5-1.0) 0.8 Other Lymphocytic Leukemia 5 <5 0.2 (0.1-0.4) 0.5 0.1 (0.0-0.2) 0.2 Myeloid and Monocytic Leukemia 67 14 2.5 (1.9-3.2) 3.7 1.6 (1.3-2.1) 2.1 Acute Myeloid Leukemia 54 <14 2.0 (1.5-2.6) 3.4 1.3 (1.0-1.8) 2.0 Acute Monocytic Leukemia 0 0 0.0 (0.0-0.1) 0.0 0.0 (0.0-0.1) 0.0 Chronic Myeloid Leukemia <15 <5 0.4 (0.2-0.7) 0.3 0.2 (0.1-0.5) 0.1 Other Myeloid/Monocytic Leukemia <5 0 0.1 (0.0-0.3) 0.0 0.1 (0.0-0.2) 0.0 Other Leukemia 72 9 2.7 (2.1-3.4) 2.4 1.6 (1.2-2.1) 1.3 Other Acute Leukemia 33 <9 1.2 (0.8-1.7) 1.6 0.7 (0.5-1.1) 0.8 Aleukemic, subleukemic and NOS 39 <5 1.5 (1.0-2.0) 0.8 0.9 (0.6-1.2) 0.4Mesothelioma 14 <5 0.5 (0.3-0.9) 1.1 0.3 (0.2-0.6) 0.6Kaposi Sarcoma 0 0 0.0 (0.0-0.1) 0.0 0.0 (0.0-0.1) 0.0Miscellaneous 436 55 16.3 (14.8-17.9) 14.5 9.6 (8.6-10.6) 8.2
* Rates are per 100,000 population and are age-standardized to the 1991 Canadian population estimates. Counts are suppressed when fewer than five cases were reported for the specific cancer. The suppressed cases however, are included in the counts and rates for ‘all sites’ combined.
2007-2013 New Brunswick Cancer Report | XVII
Figure I: Age-Standardized Incidence Rates* (per 100,000 population) in Males for Prostate, Lung, and Colorectal Cancers by Health Region (HR), NB, 2007-2013
133.5143.1
130.3
99.1
158.7
103.5
131.0
215.5
82.1 78.1 81.1 75.287.7
110.3
79.5
102.3
64.9 65.9 65.5 61.676.3
56.3 62.2 66.9
0
20
40
60
80
100
120
140
160
180
200
220
NB HR1 HR2 HR3 HR4 HR5 HR6 HR7
ASIR
Incidence Males Prostate Lung Colorectal
* Age-standardized to the 1991 Canadian population estimates.
19.5 17.6 18.1 19.4
27.7
18.221.4 21.0
64.057.4
65.160.7
68.2
89.5
63.5
76.3
22.3 21.7 25.021.4
25.8 24.220.6
16.5
0
10
20
30
40
50
60
70
80
90
NB HR1 HR2 HR3 HR4 HR5 HR6 HR7
ASM
R
Mortality Males Prostate Lung Colorectal
Figure II: Age-Standardized Mortality Rates* (per 100,000 population) in Males for Prostate, Lung, and Colorectal Cancers by Health Region (HR), NB, 2007-2013
* Age-standardized to the 1991 Canadian population estimates.
XVIII | Department of Health
Figure III: Age-Standardized Incidence Rates* (per 100,000 population) in Females for Breast, Lung, and Colorectal Cancers by Health Region (HR), NB, 2007-2013
* Age-standardized to the 1991 Canadian population estimates.
101.7
113.0
98.993.6
105.698.9 98.7
92.6
52.2 51.1
64.0
48.3 49.4
62.2
36.1
53.2
40.9 40.3 41.3 42.837.8
31.537.3
50.5
0102030405060708090
100110120
NB HR1 HR2 HR3 HR4 HR5 HR6 HR7
ASIR
Incidence Females Lung ColorectalBreast
Figure IV: Age-Standardized Mortality Rates* in Females for Breast, Lung, and Colorectal Cancers by Health Region (HR), NB, 2007-2013
Figure IV: Age-Standardized Mortality Rates* (per 100,000 population) in Females for Breast, Lung, and Colorectal Cancers by Health Region (HR), NB, 2007-2013
18.5 17.4 18.019.5
15.3
18.921.8
17.1
37.335.3
45.0
36.5
43.140.1
25.8
34.3
14.5 13.314.7 14.5
17.8
11.2
14.717.1
0
5
10
15
20
25
30
35
40
45
50
NB HR1 HR2 HR3 HR4 HR5 HR6 HR7
ASM
R
Mortality Females
* Age-standardized to the 1991 Canadian population estimates.
Lung ColorectalBreast
2007-2013 New Brunswick Cancer Report | XIX
List of Tables
Table 1: Number of New Cases and Associated Incidence Rates for Males by Cancer Site, NB, 2007-2013....................................................................................................................................................................... 56
Table 2: Number of New Cases and Associated Incidence Rates for Females by Cancer Site, NB, 2007-2013....................................................................................................................................................................... 58
Table 3: Number of Deaths and Associated Mortality Rates for Males by Cancer Site, NB, 2007-2013....................................................................................................................................................................... 60
Table 4: Number of Deaths and Associated Mortality Rates for Females by Cancer Site, NB, 2007-2013.... 62
Table 5: Number of New Cases and Associated Rates for Children (Ages 0-14) and Adolescents and Young Adults (Ages 15-29) by Cancer Type and Sex, New Brunswick, 1986-2006 vs. 2007-2013.. 64
Table 6: Male Incidence: Ranking of the Ten Leading Cancers by Frequency, Health Region and NB, 2007-2013......................................................................................................................... 65
Table 7: Male Mortality: Ranking of the Ten Leading Cancers by Frequency, Health Region and NB, 2007-2013......................................................................................................................... 65
Table 8: Female Incidence: Ranking of the Ten Leading Cancers by Frequency, Health Region and NB, 2007-2013......................................................................................................................... 66
Table 9: Female Mortality: Ranking of the Ten Leading Cancers by Frequency, Health Region and NB, 2007-2013......................................................................................................................... 66
Table 10: Ranking of the Five Leading Cancers in the Health Regions Compared to the Province Using Age-Standardized Incidence Rates, Males, 2007-2013................ 67
Table 11: Ranking of the Five Leading Cancers in the Health Regions Compared to the Province Using Age-Standardized Mortality Rates, Males, 2007-2013.................. 67
Table 12: Ranking of the Five Leading Cancers in the Health Regions Compared to the Province Using Age-Standardized Incidence Rates, Females, 2007-2013............ 68
Table 13: Ranking of the Five Leading Cancers in the Health Regions Compared to the Province Using Age-Standardized Mortality Rates, Females, 2007-2013............. 68
Table 14: Average Annual Percent Change (AAPC) in Age-Standardized Incidence Rates for the Ten Leading Cancers by Sex, NB, 1986-2013........................................................................................ 69
Table 15: Average Annual Percent Change (AAPC) in Age-Standardized Mortality Rates for the Ten Leading Cancers by Sex, NB, 1986-2013........................................................................................ 70
Table 16: 10-Year Tumour-based Prevalence Counts by Cancer Sites Prior to January 1, 2014, NB.................. 71
Table 17: 10-Year Person-based Prevalence Counts by Cancer Sites Prior to January 1, 2014, NB.................... 71
Table 18: Age-Specific Relative Survival Ratios (95% CI) for Selected Cancers at One, Three and Five Years, Males, NB, 2007-2013............................................................................................. 72
Table 19: Age-Specific Relative Survival Ratios (95% CI) for Selected Cancers at One, Three and Five Years, Females, NB, 2007-2013........................................................................................ 73
Table 20: Relative Survival Ratios (95% CI) by Stage for Four Leading Cancers at One, Two and Three Years, NB, 2007-2013.......................................................................................................... 74
Table 21: Actual and Projected Five-Year Cancer Incidence Cases for the Ten Leading Age-Standardized Incidence Rates (ASIRs), Males, NB......................................................... 75
Table 22: Actual and Projected Five-Year Cancer Incidence Cases for the Ten Leading Age-Standardized Incidence Rates (ASIRs), Females, NB..................................................... 75
XX | Department of Health
List of Figures
Figure 1: Percentage Distribution of Cancer Incidence for the Ten Leading Cancers by Sex, NB, 2007-2013..................................................................................................................................................................... 5
Figure 2: Percentage Distribution of Cancer Mortality for the Ten Leading Cancers by Sex, NB, 2007-2013 .................................................................................................................................................................... 6
Figure 3: Age-Specific Incidence Rates (per 100,000 population) for All Cancer Sites Combined by Sex, NB, 2007-2013 ....................................................................................................................... 7
Figure 4: Age-Specific Mortality Rates (per 100,000 population) for All Cancer Sites Combined by Sex, NB, 2007-2013 ....................................................................................................................... 8
Figure 5: Age-Specific Incidence Rates (per 100,000 population) for the Three Leading Cancers, Males, NB, 2007-2013................................................................................................................................................ 9
Figure 6: Age-Specific Incidence Rates (per 100,000 population) for the Three Leading Cancers, Females, NB, 2007-2013........................................................................................................................................... 9
Figure 7: Age-Specific Mortality Rates (per 100,000 population) for the Three Leading Cancers, Males, NB, 2007-2013.............................................................................................................................................. 10
Figure 8: Age-Specific Mortality Rates (per 100,000 population) for the Three Leading Cancers, Females, NB, 2007-2013......................................................................................................................................... 11
Figure 9: Number of New Cases and Associated Percentage of Distribution of Cancer Incidence in Children (Ages 0-14) and Adolescents and Young Adults (Ages 15-29), NB, 1986-2006 vs. 2007-2013................................................................................................................................................................... 12
Figure 10: Number of Deaths and Associated Percentage Distribution of Cancer Mortality in Children (Ages 0-14) and Adolescents and Young Adults (Ages 15-29), NB, 1986-2006 vs. 2007-2013..... 14
Figure 11: Percentage Distribution of Cancer Incidence for the Ten Leading Cancers by Sex, Health Region 1, NB, 2007-2013......................................................................................................................... 19
Figure 12: Percentage Distribution of Cancer Mortality for the Ten Leading Cancers by Sex, Health Region 1, NB, 2007-2013......................................................................................................................... 19
Figure 13: Percentage Distribution of Cancer Incidence for the Ten Leading Cancers by Sex, Health Region 2, NB, 2007-2013......................................................................................................................... 20
Figure 14: Percentage Distribution of Cancer Mortality for the Ten Leading Cancers by Sex, Health Region 2, NB, 2007-2013......................................................................................................................... 20
Figure 15: Percentage Distribution of Cancer Incidence for the Ten Leading Cancers by Sex, Health Region 3, NB, 2007-2013......................................................................................................................... 21
Figure 16: Percentage Distribution of Cancer Mortality for the Ten Leading Cancers by Sex, Health Region 3, NB, 2007-2013......................................................................................................................... 21
Figure 17: Percentage Distribution of Cancer Incidence for the Ten Leading Cancers by Sex, Health Region 4, NB, 2007-2013......................................................................................................................... 22
Figure 18: Percentage Distribution of Cancer Mortality for the Ten Leading Cancers by Sex, Health Region 4, NB, 2007-2013......................................................................................................................... 22
Figure 19: Percentage Distribution of Cancer Incidence for the Ten Leading Cancers by Sex, Health Region 5, NB, 2007-2013......................................................................................................................... 23
Figure 20: Percentage Distribution of Cancer Mortality for the Ten Leading Cancers by Sex, Health Region 5, NB, 2007-2013......................................................................................................................... 23
2007-2013 New Brunswick Cancer Report | XXI
Figure 21: Percentage Distribution of Cancer Incidence for the Ten Leading Cancers by Sex, Health Region 6, NB, 2007-2013......................................................................................................................... 24
Figure 22: Percentage Distribution of Cancer Mortality for the Ten Leading Cancers by Sex, Health Region 6, NB, 2007-2013......................................................................................................................... 24
Figure 23: Percentage Distribution of Cancer Incidence for the Ten Leading Cancers by Sex, Health Region 7, NB, 2007-2013......................................................................................................................... 25
Figure 24: Percentage Distribution of Cancer Mortality for the Ten Leading Cancers by Sex, Health Region 7, NB 2007-2013.......................................................................................................................... 25
Figure 25: Age-Standardized Incidence and Mortality Rates for Prostate Cancer by Health Region, NB and Canada, 2007-2013.................................................................................................................................. 26
Figure 26: Age-Standardized Incidence and Mortality Rates for Female Breast Cancer by Health Region, NB and Canada, 2007-2013.................................................................................................... 27
Figure 27: Age-Standardized Incidence and Mortality Rates for Male Lung Cancer by Health Region, NB and Canada, 2007-2013.................................................................................................................................. 28
Figure 28: Age-Standardized Incidence and Mortality Rates for Female Lung Cancer by Health Region, NB and Canada, 2007-2013.................................................................................................... 28
Figure 29: Age-Standardized Incidence and Mortality Rates for Male Colorectal Cancer by Health Region, NB and Canada, 2007-2013....................................................................................................29
Figure 30: Age-Standardized Incidence and Mortality Rates for Female Colorectal Cancer by Health Region, NB and Canada, 2007-2013.................................................................................................... 29
Figure 31: Age-Standardized Incidence and Mortality Rates (per 100,000 population) for Female Thyroid Cancer by Health Region, NB and Canada, 2007-2013............................................... 30
Figure 32: Age-Standardized Incidence and Mortality Rates (per 100,000 population) for Male Bladder Cancer by Health Region, NB and Canada, 2007-2013................................................... 31
Figure 33: Trends in Age-Standardized Incidence Rates for All Cancer Sites Combined by Sex, NB and Canada, 1986-2013.................................................................................................................................. 37
Figure 34: Trends in Age-Standardized Mortality Rates for All Cancer Sites Combined by Sex, NB and Canada, 1986-2013.................................................................................................................................. 38
Figure 35: Trends in Age-Standardized Incidence Rates for the Five Leading Cancers, Males, NB, 1986-2013........................................................................................................................................................... 39
Figure 36: Trends in Age-Standardized Mortality Rates for the Five Leading Cancers, Males, NB, 1986-2013........................................................................................................................................................... 39
Figure 37: Trends in Age-Standardized Incidence Rates for the Five Leading Cancers, Females, NB, 1986-2013........................................................................................................................................................... 40
Figure 38: Trends in Age-Standardized Mortality Rates for the Five Leading Cancers, Females, NB, 1986-2013........................................................................................................................................................... 40
Figure 39: Average Annual Percentage Change in Age-Standardized Incidence Rates for the Ten Leading Cancers, Males, NB, 1986-2013.................................................................................................. 41
Figure 40: Average Annual Percentage Change in Age-Standardized Mortality Rates for the Ten Leading Cancers, Males, NB, 1986-2013.................................................................................................. 42
Figure 41: Average Annual Percentage Change in Age-Standardized Incidence Rates for the Ten Leading Cancers, Females, NB, 1986-2013.............................................................................................. 42
Figure 42: Average Annual Percentage Change in Age-Standardized Mortality Rates for the Ten Leading Cancers, Females, NB, 1986-2013.............................................................................................. 43
XXII | Department of Health
Figure 43: Five-Year Relative Survival Ratios for Selected Cancers with 95% Confidence Intervals, Males, NB, 2007-2013............................................................................................................................................. 46
Figure 44: Five-Year Relative Survival Ratios for Selected Cancers with 95% Confidence Intervals, Females, NB, 2007-2013......................................................................................................................................... 46
Figure 45: Three-Year Relative Survival Ratios for Female Breast Cancer by Stage with 95% Confidence Intervals, NB, 2007-2013...................................................................................................... 47
Figure 46: Three-Year Relative Survival Ratios for Male Prostate Cancer by Stage with 95% Confidence Intervals, NB, 2007-2013...................................................................................................... 48
Figure 47: Three-Year Relative Survival Ratios for Male Colorectal Cancer by Stage with 95% Confidence Intervals, NB, 2007-2013...................................................................................................... 48
Figure 48: Three-Year Relative Survival Ratios for Female Colorectal Cancer by Stage with 95% Confidence Intervals, NB, 2007-2013...................................................................................................... 49
Figure 49: Three-Year Relative Survival Ratios for Male Lung Cancer by Stage with 95% Confidence Intervals, NB, 2007-2013...................................................................................................... 49
Figure 50: Three-Year Relative Survival Ratios for Female Lung Cancer by Stage with 95% Confidence Intervals, NB, 2007-2013...................................................................................................... 50
Figure 51: Age-Standardized Incidence Rates (ASIRs) and Number of New Cases (left scale) for All Cancer Sites Combined with Projected Estimates for the Years 2020, 2025 and 2030 (right scale), Males, NB........................................................................................................................ 51
Figure 52: Age-Standardized Incidence Rates and Number of New Cases (left scale) for All Cancer Sites Combined with Projected Estimates for the Years 2020, 2025 and 2030 (right scale), Females, NB................................................................................................................... 51
2007-2013 New Brunswick Cancer Report | 1
Chapter 1 - Introduction
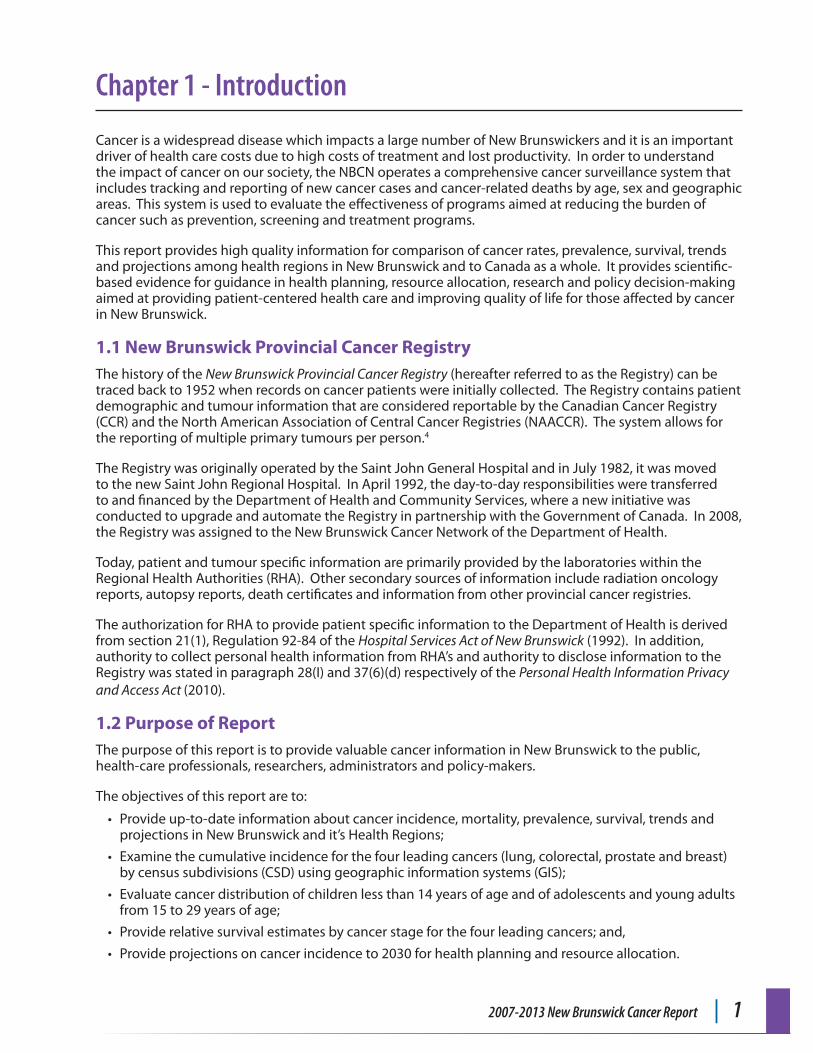
Cancer is a widespread disease which impacts a large number of New Brunswickers and it is an important driver of health care costs due to high costs of treatment and lost productivity. In order to understand the impact of cancer on our society, the NBCN operates a comprehensive cancer surveillance system that includes tracking and reporting of new cancer cases and cancer-related deaths by age, sex and geographic areas. This system is used to evaluate the effectiveness of programs aimed at reducing the burden of cancer such as prevention, screening and treatment programs.
This report provides high quality information for comparison of cancer rates, prevalence, survival, trends and projections among health regions in New Brunswick and to Canada as a whole. It provides scientific-based evidence for guidance in health planning, resource allocation, research and policy decision-making aimed at providing patient-centered health care and improving quality of life for those affected by cancer in New Brunswick.
1.1 New Brunswick Provincial Cancer RegistryThe history of the New Brunswick Provincial Cancer Registry (hereafter referred to as the Registry) can be traced back to 1952 when records on cancer patients were initially collected. The Registry contains patient demographic and tumour information that are considered reportable by the Canadian Cancer Registry (CCR) and the North American Association of Central Cancer Registries (NAACCR). The system allows for the reporting of multiple primary tumours per person.4
The Registry was originally operated by the Saint John General Hospital and in July 1982, it was moved to the new Saint John Regional Hospital. In April 1992, the day-to-day responsibilities were transferred to and financed by the Department of Health and Community Services, where a new initiative was conducted to upgrade and automate the Registry in partnership with the Government of Canada. In 2008, the Registry was assigned to the New Brunswick Cancer Network of the Department of Health.
Today, patient and tumour specific information are primarily provided by the laboratories within the Regional Health Authorities (RHA). Other secondary sources of information include radiation oncology reports, autopsy reports, death certificates and information from other provincial cancer registries.
The authorization for RHA to provide patient specific information to the Department of Health is derived from section 21(1), Regulation 92-84 of the Hospital Services Act of New Brunswick (1992). In addition, authority to collect personal health information from RHA’s and authority to disclose information to the Registry was stated in paragraph 28(I) and 37(6)(d) respectively of the Personal Health Information Privacy and Access Act (2010).
1.2 Purpose of ReportThe purpose of this report is to provide valuable cancer information in New Brunswick to the public, health-care professionals, researchers, administrators and policy-makers.
The objectives of this report are to:
• Provide up-to-date information about cancer incidence, mortality, prevalence, survival, trends and projections in New Brunswick and it’s Health Regions;
• Examine the cumulative incidence for the four leading cancers (lung, colorectal, prostate and breast) by census subdivisions (CSD) using geographic information systems (GIS);
• Evaluate cancer distribution of children less than 14 years of age and of adolescents and young adults from 15 to 29 years of age;
• Provide relative survival estimates by cancer stage for the four leading cancers; and,
• Provide projections on cancer incidence to 2030 for health planning and resource allocation.
2 | Department of Health
Chapter 2 - Methods
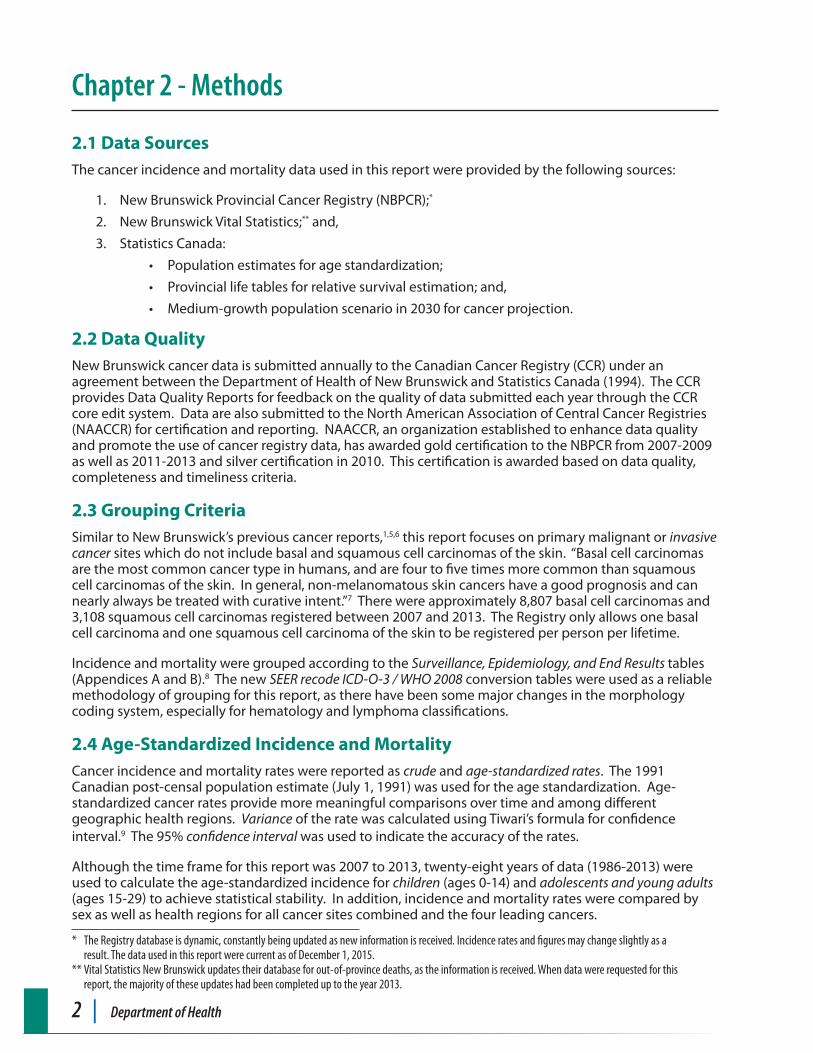
2.1 Data SourcesThe cancer incidence and mortality data used in this report were provided by the following sources:
1. New Brunswick Provincial Cancer Registry (NBPCR);*
2. New Brunswick Vital Statistics;** and,
3. Statistics Canada:
• Population estimates for age standardization;
• Provincial life tables for relative survival estimation; and,
• Medium-growth population scenario in 2030 for cancer projection.
2.2 Data QualityNew Brunswick cancer data is submitted annually to the Canadian Cancer Registry (CCR) under an agreement between the Department of Health of New Brunswick and Statistics Canada (1994). The CCR provides Data Quality Reports for feedback on the quality of data submitted each year through the CCR core edit system. Data are also submitted to the North American Association of Central Cancer Registries (NAACCR) for certification and reporting. NAACCR, an organization established to enhance data quality and promote the use of cancer registry data, has awarded gold certification to the NBPCR from 2007-2009 as well as 2011-2013 and silver certification in 2010. This certification is awarded based on data quality, completeness and timeliness criteria.
2.3 Grouping CriteriaSimilar to New Brunswick’s previous cancer reports,1,5,6 this report focuses on primary malignant or invasive cancer sites which do not include basal and squamous cell carcinomas of the skin. “Basal cell carcinomas are the most common cancer type in humans, and are four to five times more common than squamous cell carcinomas of the skin. In general, non-melanomatous skin cancers have a good prognosis and can nearly always be treated with curative intent.”7 There were approximately 8,807 basal cell carcinomas and 3,108 squamous cell carcinomas registered between 2007 and 2013. The Registry only allows one basal cell carcinoma and one squamous cell carcinoma of the skin to be registered per person per lifetime.
Incidence and mortality were grouped according to the Surveillance, Epidemiology, and End Results tables (Appendices A and B).8 The new SEER recode ICD-O-3 / WHO 2008 conversion tables were used as a reliable methodology of grouping for this report, as there have been some major changes in the morphology coding system, especially for hematology and lymphoma classifications.
2.4 Age-Standardized Incidence and MortalityCancer incidence and mortality rates were reported as crude and age-standardized rates. The 1991 Canadian post-censal population estimate (July 1, 1991) was used for the age standardization. Age-standardized cancer rates provide more meaningful comparisons over time and among different geographic health regions. Variance of the rate was calculated using Tiwari’s formula for confidence interval.9 The 95% confidence interval was used to indicate the accuracy of the rates.
Although the time frame for this report was 2007 to 2013, twenty-eight years of data (1986-2013) were used to calculate the age-standardized incidence for children (ages 0-14) and adolescents and young adults (ages 15-29) to achieve statistical stability. In addition, incidence and mortality rates were compared by sex as well as health regions for all cancer sites combined and the four leading cancers.
* The Registry database is dynamic, constantly being updated as new information is received. Incidence rates and figures may change slightly as a result. The data used in this report were current as of December 1, 2015.
** Vital Statistics New Brunswick updates their database for out-of-province deaths, as the information is received. When data were requested for this report, the majority of these updates had been completed up to the year 2013.
2007-2013 New Brunswick Cancer Report | 3
2.5 Average Annual Percent Change (AAPC) for Cancer TrendsA joinpoint statistical model,10 developed by the National Cancer Institute (NCI), was used to determine when and how often the change(s) occurred in the age-standardized incidence and mortality rates over time. The Annual Percentage Change (APC) is defined as a percentage increase or decrease of the rates in a fixed pre-specified interval, where the change in rates is assumed constant. However, it is not always true that a single APC can accurately characterize the trend over an entire period of interest. The joinpoint model can produce a summary measure (i.e., Average Annual Percentage Change (AAPC)) which best fits the data and allows us to determine how long the APC remained constant, and when it changed over a period of multiple years. That is, the AAPC is computed as a weighted average of the APCs from the joinpoint model where the weights equal to the lengths of the APC intervals assumed.11 In this report, the AAPCs for all cancer sites combined and the ten leading cancers were computed using the age-standardized incidence or mortality rates over the 1986-2013 period to achieve statistical stability.
2.6 Prevalence of CancerPrevalence is an indicator of primary interest in health planning and resource allocation because it measures the burden of cancer in the population as well as on the health care system.12 Cancer prevalence is defined as the percent of cancer patients alive on a certain date (i.e., index date) in a population who were previously diagnosed with cancer. Estimating prevalence requires current, accurate information about both the incidence and vital status of cancer patients. In this report, the Byrne et al. 13 counting method was used to estimate prevalence from incidence and follow-up data collected by the Registry; and the calculated prevalence were reported by health region, sex and cancer type.
There are two different types of prevalence: complete prevalence and limited-duration prevalence. Complete prevalence is defined as the proportion of cancer patients alive on an index date, who were diagnosed with cancer, regardless of how long ago the diagnosis was made; however, limited-duration prevalence refers to the proportion of cancer patients alive on an index date who had a diagnosis of cancer within the past x years (e.g. x = 5, 10 or 20 years).12 Limited-duration prevalence was used in this report.
Two different counting approaches, i.e., by person (person-based) or by tumour (tumour-based) were used to estimate prevalence. For example, a person diagnosed with two primary tumours of cancer A and one of cancer B in the 5 years preceding the index date, for the person-based prevalence, this individual would be counted once under cancer A, once under cancer B and once under all cancer sites combined. For the tumour-based prevalence, the same person would contribute twice to cancer A, once to cancer B and three times to all cancer sites combined. In contrast to person-based prevalence, tumour-based prevalence is more useful in reflecting the demand for health care, because multiple cancers in a person are usually treated independently.14
2.7 Relative Survival Ratio Relative survival ratio analysis based on the Period Analysis Method15 was applied to patients diagnosed with invasive primary cancer between 2007 and 2013. This method provides more up-to-date estimates of long-term patient survival compared to traditional methods.16 To achieve statistical stability and reliability, a five-year relative survival ratio was produced for the following common cancer sites: lung, colorectal, prostate, testicular, thyroid, melanomas of the skin, ovarian, cervical and female breast cancers as well as for all cancer sites combined. Individual records were excluded from the analyses when: 1) the year of birth or death was unknown; 2) diagnosis was established either through autopsy or death certificate only; 3) alive with no survival time, and 4) diagnosis made prior to 2007.
The relative survival ratio is a ratio between the observed survival rate of a group of cancer patients and the expected survival rate of the general population who have the same characteristics but without cancer.17 Expected survival time for individuals of the general population was estimated from the sex-specific provincial life tables published by Statistics Canada. In particular, Dickman et al.18 and Ederer II19 methods were used to estimate the expected survival time and the associated variance. The observed survival time for cancer patients was calculated as the difference in days between the date of diagnosis and the date of last observation (i.e., date of death or the end of study). The width of the confidence
4 | Department of Health
interval reflects the degree of accuracy of the estimated rates. A narrower confidence interval indicates that the estimated rates have higher precision and vice versa. In general, a small number of cases often results in a wide confidence interval for the estimated survival rate.
In this report, a further investigation of survival was conducted for the four leading cancers (prostate, breast, lung and colorectal) using available cancer staging information (2008 for breast and colorectal, 2009 for prostate and 2010 for lung). The objectives were to: 1) examine cancer survival estimates by stage; and 2) understand the relationships between cancer survival estimates and age, sex and time after diagnosis. The registry used the Collaborative Staging System to derive the extent of disease at the time of diagnosis based on tumour size, extension of the primary tumour, lymph node involvement, and metastases.
2.8 Age-Period Cohort Method for Cancer ProjectionThe age-period-cohort method, developed by the Norway Cancer Registry, was used to project the number of new cases in 2020, 2025 and 2030. This method makes no assumption about changes in exposure or other risk factors. Rather, the projection process relies entirely on the extrapolation of past incidence rates, when taking age, period, and birth-cohort effects into consideration. Two different link functions (i.e., Power and Poisson link functions) were applied in the model fitting process. The Power link function provided more stable estimates compared with the Poisson link function, especially for those cancer sites with a significantly increasing or decreasing AAPC over time. For the projected population of New Brunswick in 2030, a medium-population growth scenario20 was assumed as the base population to compute the number of new cancer cases in 2030. Also, data from 1986-2010 were utilized as the baseline time period in the model.
2.9 Geographic Information Systems MappingThe Geographic Information Systems (GIS)21 is a powerful analytical and visual tool used to differentiate results at different geographic levels. In this report, GIS was used to map the distribution of cancer incidence weighted by population across various census subdivisions in New Brunswick. Algorithms for the selection of multiple cutoff points for cumulative incidence of the four leading cancers are included in the map legends.
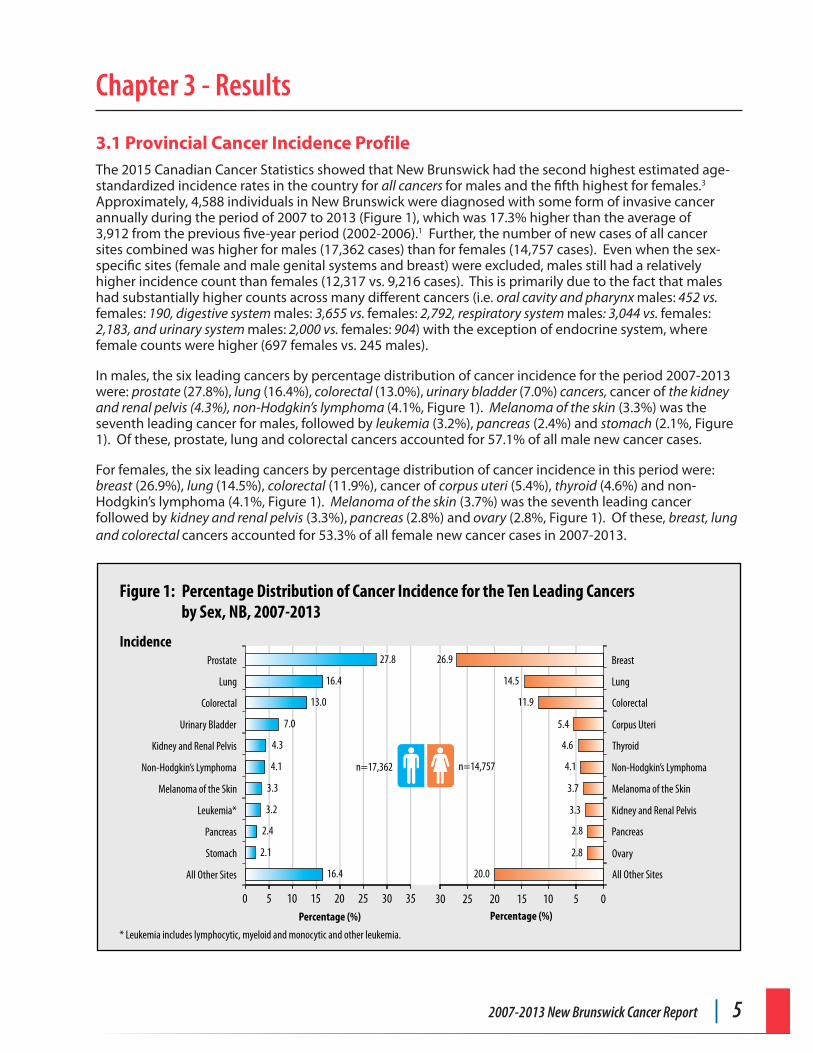
2007-2013 New Brunswick Cancer Report | 5
Chapter 3 - Results
3.1 Provincial Cancer Incidence Profile The 2015 Canadian Cancer Statistics showed that New Brunswick had the second highest estimated age-standardized incidence rates in the country for all cancers for males and the fifth highest for females.3 Approximately, 4,588 individuals in New Brunswick were diagnosed with some form of invasive cancer annually during the period of 2007 to 2013 (Figure 1), which was 17.3% higher than the average of 3,912 from the previous five-year period (2002-2006).1 Further, the number of new cases of all cancer sites combined was higher for males (17,362 cases) than for females (14,757 cases). Even when the sex-specific sites (female and male genital systems and breast) were excluded, males still had a relatively higher incidence count than females (12,317 vs. 9,216 cases). This is primarily due to the fact that males had substantially higher counts across many different cancers (i.e. oral cavity and pharynx males: 452 vs. females: 190, digestive system males: 3,655 vs. females: 2,792, respiratory system males: 3,044 vs. females: 2,183, and urinary system males: 2,000 vs. females: 904) with the exception of endocrine system, where female counts were higher (697 females vs. 245 males).
In males, the six leading cancers by percentage distribution of cancer incidence for the period 2007-2013 were: prostate (27.8%), lung (16.4%), colorectal (13.0%), urinary bladder (7.0%) cancers, cancer of the kidney and renal pelvis (4.3%), non-Hodgkin’s lymphoma (4.1%, Figure 1). Melanoma of the skin (3.3%) was the seventh leading cancer for males, followed by leukemia (3.2%), pancreas (2.4%) and stomach (2.1%, Figure 1). Of these, prostate, lung and colorectal cancers accounted for 57.1% of all male new cancer cases.
For females, the six leading cancers by percentage distribution of cancer incidence in this period were: breast (26.9%), lung (14.5%), colorectal (11.9%), cancer of corpus uteri (5.4%), thyroid (4.6%) and non-Hodgkin’s lymphoma (4.1%, Figure 1). Melanoma of the skin (3.7%) was the seventh leading cancer followed by kidney and renal pelvis (3.3%), pancreas (2.8%) and ovary (2.8%, Figure 1). Of these, breast, lung and colorectal cancers accounted for 53.3% of all female new cancer cases in 2007-2013.
* Leukemia includes lymphocytic, myeloid and monocytic and other leukemia.
16.4
2.1
2.4
3.2
3.3
4.1
4.3
7.0
13.0
16.4
27.8
0 5 10 15 20 25 30 35
All Other Sites
Stomach
Pancreas
Leukemia*
Melanoma of the Skin
Non-Hodgkin’s Lymphoma
Kidney and Renal Pelvis
Urinary Bladder
Colorectal
Lung
Prostate
Percentage (%)
n=17,362
Incidence
20.0
2.8
2.8
3.3
3.7
4.1
4.6
5.4
11.9
14.5
26.9
051015202530
All Other Sites
Ovary
Pancreas
Kidney and Renal Pelvis
Melanoma of the Skin
Non-Hodgkin’s Lymphoma
Thyroid
Corpus Uteri
Colorectal
Lung
Breast
Percentage (%)
n=14,757
Figure 1: Percentage Distribution of Cancer Incidence for the Ten Leading Cancers by Sex, NB, 2007-2013
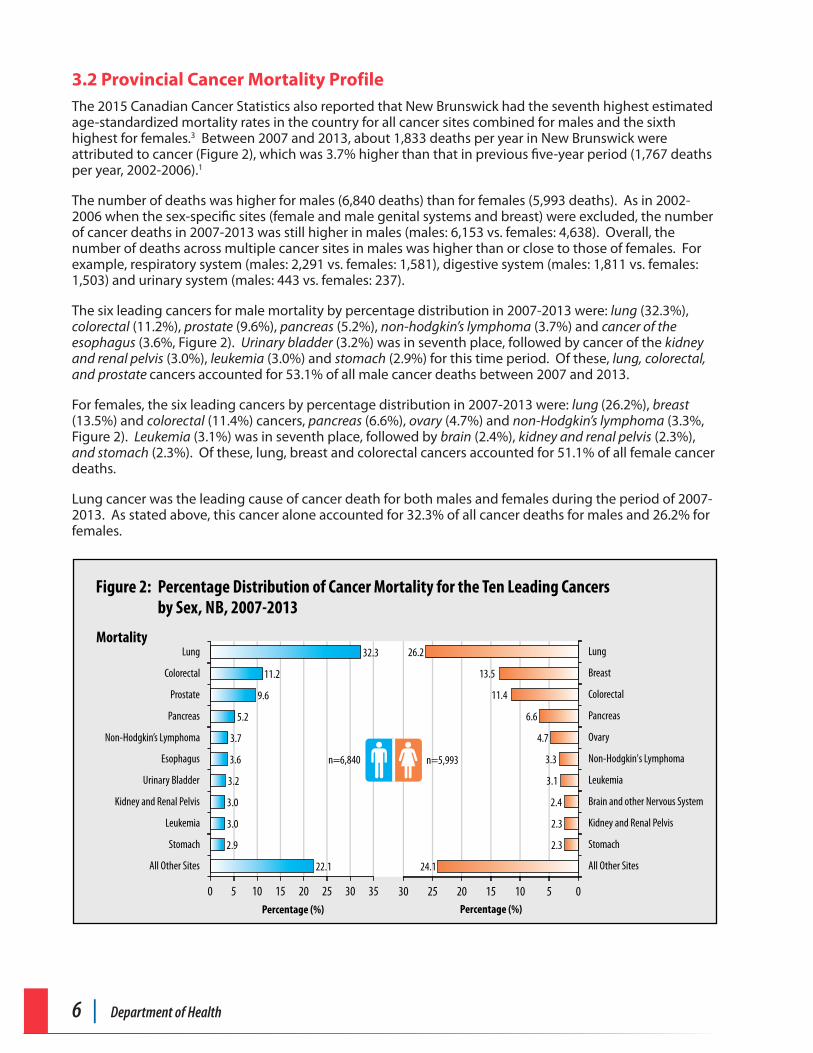
6 | Department of Health
3.2 Provincial Cancer Mortality Profile The 2015 Canadian Cancer Statistics also reported that New Brunswick had the seventh highest estimated age-standardized mortality rates in the country for all cancer sites combined for males and the sixth highest for females.3 Between 2007 and 2013, about 1,833 deaths per year in New Brunswick were attributed to cancer (Figure 2), which was 3.7% higher than that in previous five-year period (1,767 deaths per year, 2002-2006).1
The number of deaths was higher for males (6,840 deaths) than for females (5,993 deaths). As in 2002-2006 when the sex-specific sites (female and male genital systems and breast) were excluded, the number of cancer deaths in 2007-2013 was still higher in males (males: 6,153 vs. females: 4,638). Overall, the number of deaths across multiple cancer sites in males was higher than or close to those of females. For example, respiratory system (males: 2,291 vs. females: 1,581), digestive system (males: 1,811 vs. females: 1,503) and urinary system (males: 443 vs. females: 237).
The six leading cancers for male mortality by percentage distribution in 2007-2013 were: lung (32.3%), colorectal (11.2%), prostate (9.6%), pancreas (5.2%), non-hodgkin’s lymphoma (3.7%) and cancer of the esophagus (3.6%, Figure 2). Urinary bladder (3.2%) was in seventh place, followed by cancer of the kidney and renal pelvis (3.0%), leukemia (3.0%) and stomach (2.9%) for this time period. Of these, lung, colorectal, and prostate cancers accounted for 53.1% of all male cancer deaths between 2007 and 2013.
For females, the six leading cancers by percentage distribution in 2007-2013 were: lung (26.2%), breast (13.5%) and colorectal (11.4%) cancers, pancreas (6.6%), ovary (4.7%) and non-Hodgkin’s lymphoma (3.3%, Figure 2). Leukemia (3.1%) was in seventh place, followed by brain (2.4%), kidney and renal pelvis (2.3%), and stomach (2.3%). Of these, lung, breast and colorectal cancers accounted for 51.1% of all female cancer deaths.
Lung cancer was the leading cause of cancer death for both males and females during the period of 2007-2013. As stated above, this cancer alone accounted for 32.3% of all cancer deaths for males and 26.2% for females.
Figure 2: Percentage Distribution of Cancer Mortality for the Ten Leading Cancers by Sex, NB, 2007-2013
22.1
2.9
3.0
3.0
3.2
3.6
3.7
5.2
9.6
11.2
32.3
0 5 10 15 20 25 30 35
All Other Sites
Stomach
Leukemia
Kidney and Renal Pelvis
Urinary Bladder
Esophagus
Non-Hodgkin’s Lymphoma
Pancreas
Prostate
Colorectal
Lung
Percentage (%)
n=6,840
Mortality
24.1
2.3
2.3
2.4
3.1
3.3
4.7
6.6
11.4
13.5
26.2
051015202530
All Other Sites
Stomach
Kidney and Renal Pelvis
Brain and other Nervous System
Leukemia
Non-Hodgkin's Lymphoma
Ovary
Pancreas
Colorectal
Breast
Lung
Percentage (%)
n=5,993
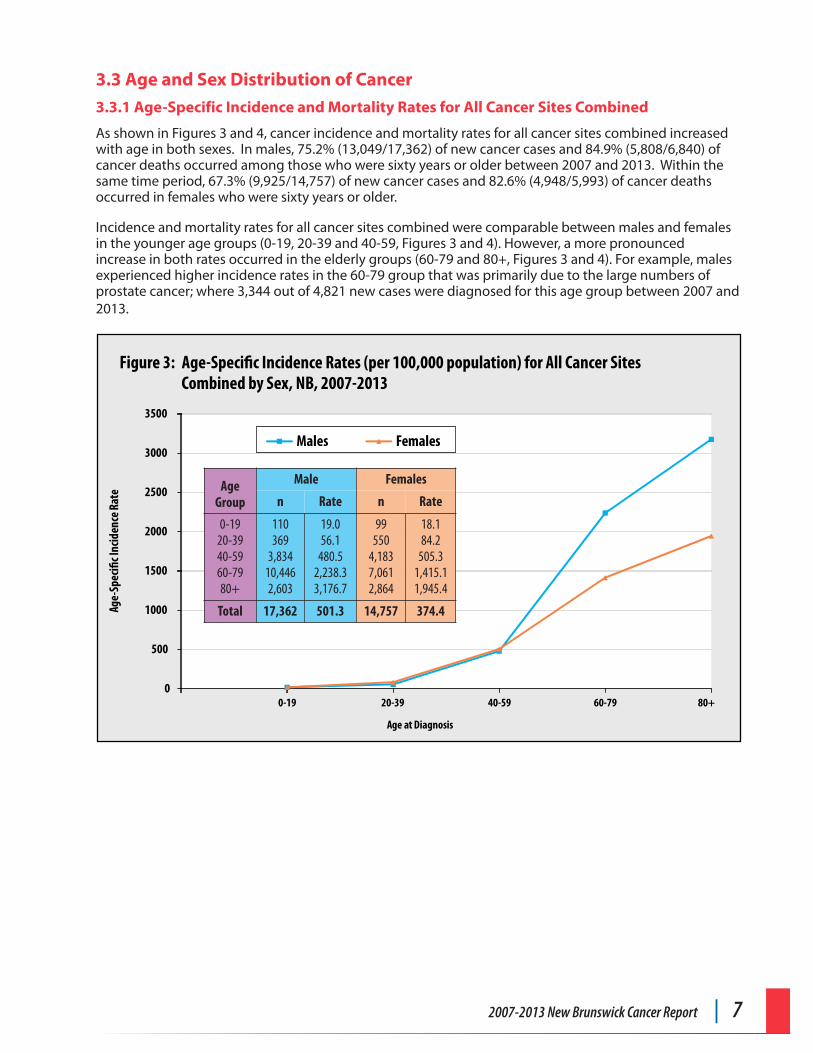
2007-2013 New Brunswick Cancer Report | 7
3.3 Age and Sex Distribution of Cancer
3.3.1 Age-Specific Incidence and Mortality Rates for All Cancer Sites Combined
As shown in Figures 3 and 4, cancer incidence and mortality rates for all cancer sites combined increased with age in both sexes. In males, 75.2% (13,049/17,362) of new cancer cases and 84.9% (5,808/6,840) of cancer deaths occurred among those who were sixty years or older between 2007 and 2013. Within the same time period, 67.3% (9,925/14,757) of new cancer cases and 82.6% (4,948/5,993) of cancer deaths occurred in females who were sixty years or older.
Incidence and mortality rates for all cancer sites combined were comparable between males and females in the younger age groups (0-19, 20-39 and 40-59, Figures 3 and 4). However, a more pronounced increase in both rates occurred in the elderly groups (60-79 and 80+, Figures 3 and 4). For example, males experienced higher incidence rates in the 60-79 group that was primarily due to the large numbers of prostate cancer; where 3,344 out of 4,821 new cases were diagnosed for this age group between 2007 and 2013.
0
500
1000
1500
2000
2500
3000
3500
0-19 20-39 40-59 60-79 80+
Age-
Spec
ific I
ncid
ence
Rat
e
Age at Diagnosis
Figure 3: Age-Specific Incidence Rates (per 100,000 population) for All Cancer Sites Combined by Sex, NB, 2007-2013
Males Females
AgeGroup
Male Females
n Rate n Rate
0-1920-3940-5960-7980+
1103693,83410,4462,603
19.056.1480.52,238.33,176.7
995504,1837,0612,864
18.184.2505.31,415.11,945.4
Total 17,362 501.3 14,757 374.4
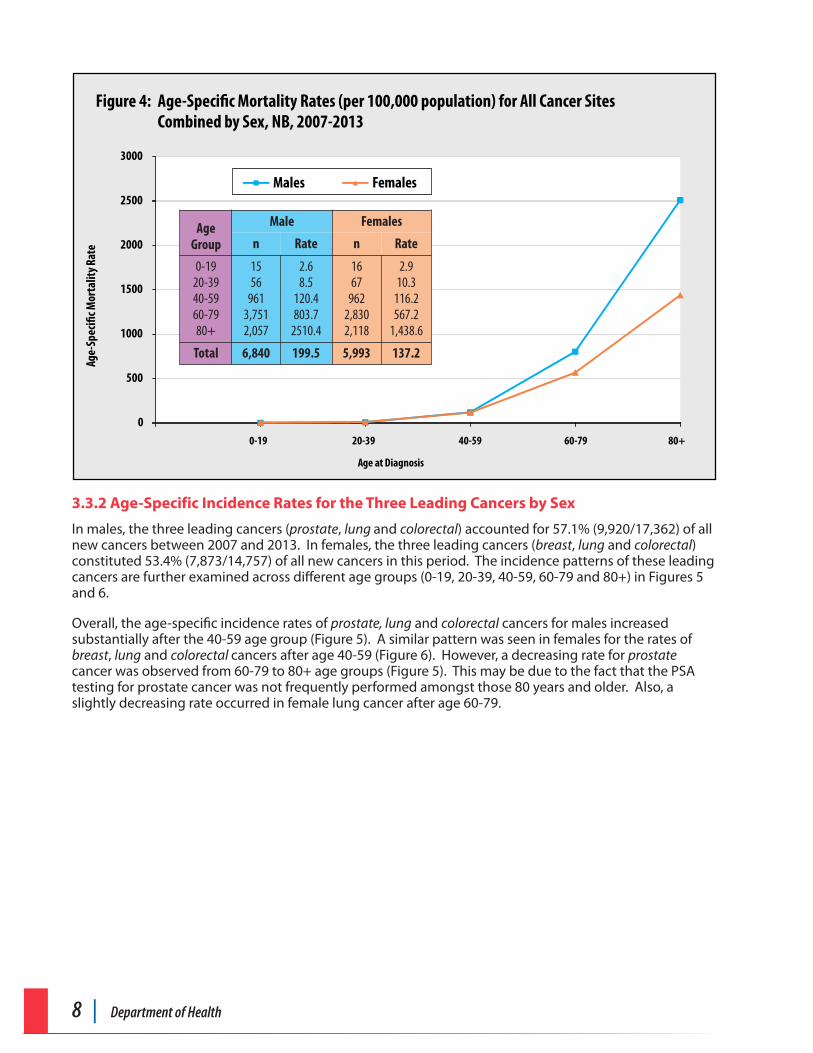
8 | Department of Health
0
500
1000
1500
2000
2500
3000
Age-
Spec
ific M
orta
lity R
ate
Males Females
AgeGroup
Male Females
n Rate n Rate
0-1920-3940-5960-7980+
15569613,7512,057
2.68.5120.4803.72510.4
16679622,8302,118
2.910.3116.2567.21,438.6
Total 6,840 199.5 5,993 137.2
Figure 4: Age-Specific Mortality Rates (per 100,000 population) for All Cancer Sites Combined by Sex, NB, 2007-2013
0-19 20-39 40-59 60-79 80+
Age at Diagnosis
3.3.2 Age-Specific Incidence Rates for the Three Leading Cancers by Sex
In males, the three leading cancers (prostate, lung and colorectal) accounted for 57.1% (9,920/17,362) of all new cancers between 2007 and 2013. In females, the three leading cancers (breast, lung and colorectal) constituted 53.4% (7,873/14,757) of all new cancers in this period. The incidence patterns of these leading cancers are further examined across different age groups (0-19, 20-39, 40-59, 60-79 and 80+) in Figures 5 and 6.
Overall, the age-specific incidence rates of prostate, lung and colorectal cancers for males increased substantially after the 40-59 age group (Figure 5). A similar pattern was seen in females for the rates of breast, lung and colorectal cancers after age 40-59 (Figure 6). However, a decreasing rate for prostate cancer was observed from 60-79 to 80+ age groups (Figure 5). This may be due to the fact that the PSA testing for prostate cancer was not frequently performed amongst those 80 years and older. Also, a slightly decreasing rate occurred in female lung cancer after age 60-79.
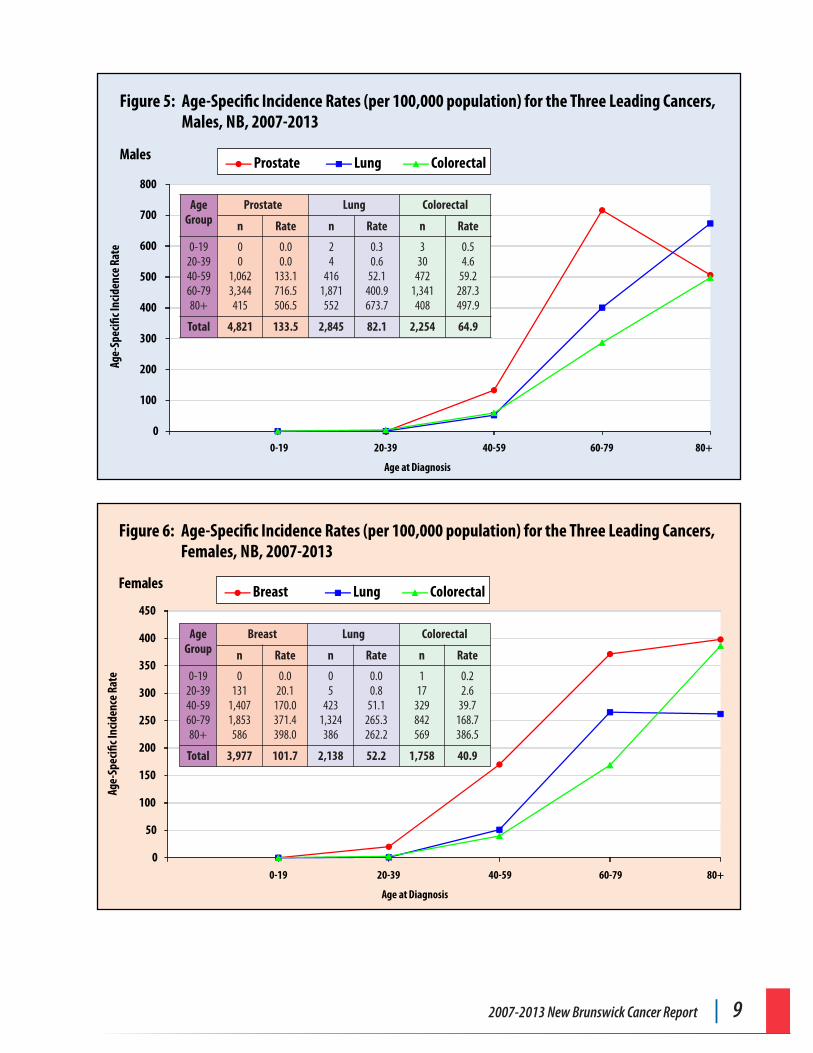
2007-2013 New Brunswick Cancer Report | 9
0
100
200
300
400
500
600
700
800
Age-
Spec
ific I
ncid
ence
Rat
e
Age at Diagnosis
Figure 5: Age-Specific Incidence Rates (per 100,000 population) for the Three Leading Cancers, Males, NB, 2007-2013
0-19 20-39 40-59 60-79 80+
Males Prostate Lung Colorectal
AgeGroup
Prostate Lung Colorectal
n Rate n Rate n Rate
0-1920-3940-5960-7980+
00
1,0623,344415
0.00.0133.1716.5506.5
244161,871552
0.30.652.1400.9673.7
3304721,341408
0.54.659.2287.3497.9
Total 4,821 133.5 2,845 82.1 2,254 64.9
Figure 6: Age-Specific Incidence Rates (per 100,000 population) for the Three Leading Cancers, Females, NB, 2007-2013
0
50
100
150
200
250
300
350
400
450
Age-
Spec
ific I
ncid
ence
Rat
e
Age at Diagnosis
0-19 20-39 40-59 60-79 80+
Females Breast Lung Colorectal
AgeGroup
Breast Lung Colorectal
n Rate n Rate n Rate
0-1920-3940-5960-7980+
01311,4071,853586
0.020.1170.0371.4398.0
054231,324386
0.00.851.1265.3262.2
117329842569
0.22.639.7168.7386.5
Total 3,977 101.7 2,138 52.2 1,758 40.9
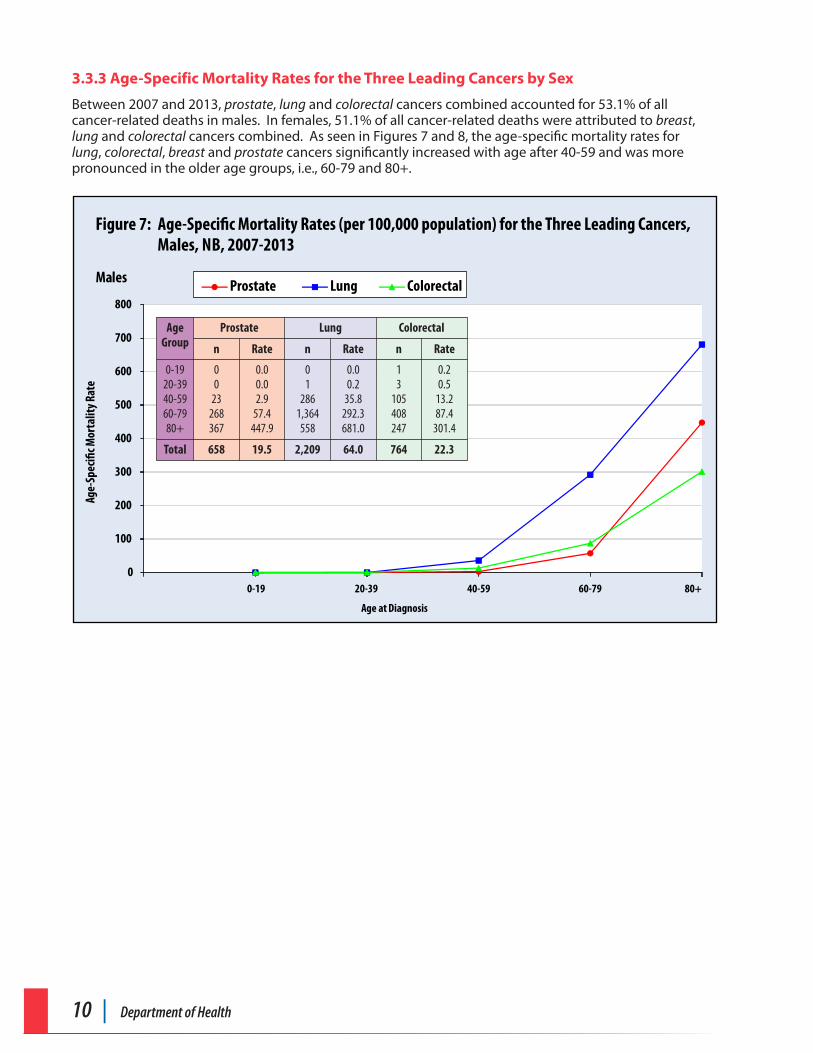
10 | Department of Health
3.3.3 Age-Specific Mortality Rates for the Three Leading Cancers by Sex
Between 2007 and 2013, prostate, lung and colorectal cancers combined accounted for 53.1% of all cancer-related deaths in males. In females, 51.1% of all cancer-related deaths were attributed to breast, lung and colorectal cancers combined. As seen in Figures 7 and 8, the age-specific mortality rates for lung, colorectal, breast and prostate cancers significantly increased with age after 40-59 and was more pronounced in the older age groups, i.e., 60-79 and 80+.
Age at Diagnosis
Figure 7: Age-Specific Mortality Rates (per 100,000 population) for the Three Leading Cancers, Males, NB, 2007-2013
0-19 20-39 40-59 60-79 80+
Males Prostate Lung Colorectal
0
100
200
300
400
500
600
700
800
Age-
Spec
ific M
orta
lity R
ate
AgeGroup
Prostate Lung Colorectal
n Rate n Rate n Rate
0-1920-3940-5960-7980+
0023268367
0.00.02.957.4447.9
012861,364558
0.00.235.8292.3681.0
13105408247
0.20.513.287.4301.4
Total 658 19.5 2,209 64.0 764 22.3
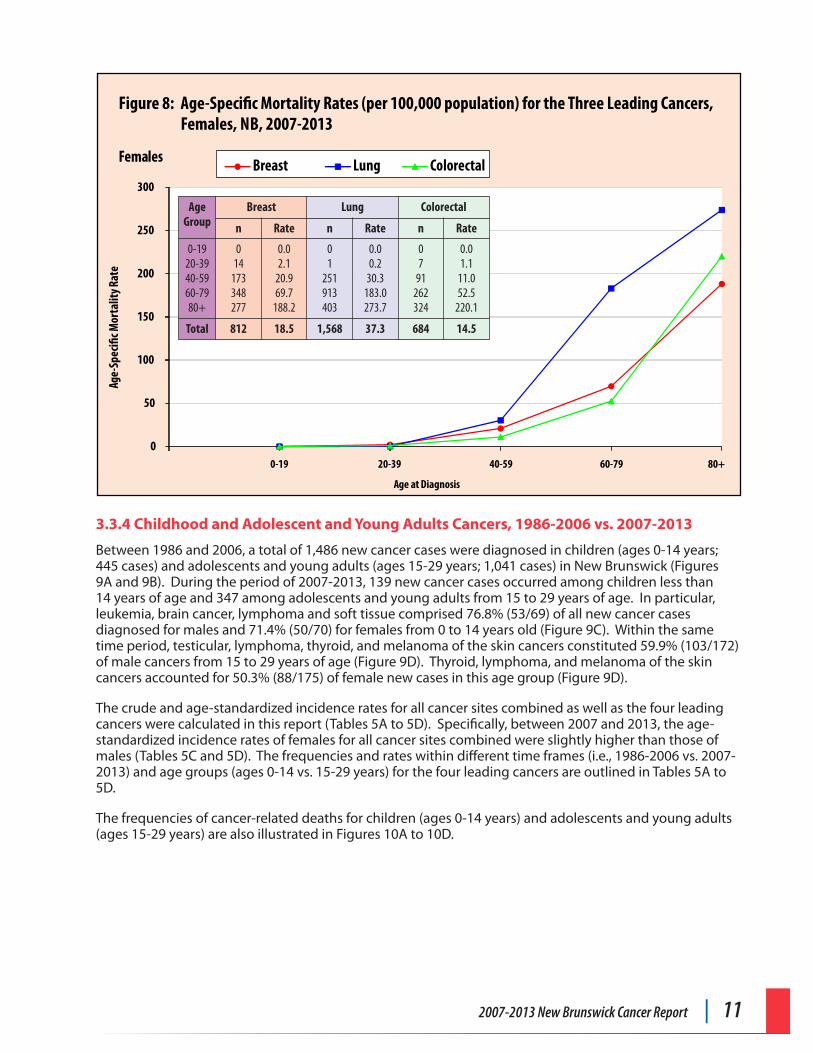
2007-2013 New Brunswick Cancer Report | 11
Figure 8: Age-Specific Mortality Rates (per 100,000 population) for the Three Leading Cancers, Females, NB, 2007-2013
Females Breast Lung Colorectal
0
50
100
150
200
250
300
Age-
Spec
ific M
orta
lity R
ate
Age at Diagnosis
0-19 20-39 40-59 60-79 80+
AgeGroup
Breast Lung Colorectal
n Rate n Rate n Rate
0-1920-3940-5960-7980+
014173348277
0.02.120.969.7188.2
01251913403
0.00.230.3183.0273.7
0791262324
0.01.111.052.5220.1
Total 812 18.5 1,568 37.3 684 14.5
3.3.4 Childhood and Adolescent and Young Adults Cancers, 1986-2006 vs. 2007-2013
Between 1986 and 2006, a total of 1,486 new cancer cases were diagnosed in children (ages 0-14 years; 445 cases) and adolescents and young adults (ages 15-29 years; 1,041 cases) in New Brunswick (Figures 9A and 9B). During the period of 2007-2013, 139 new cancer cases occurred among children less than 14 years of age and 347 among adolescents and young adults from 15 to 29 years of age. In particular, leukemia, brain cancer, lymphoma and soft tissue comprised 76.8% (53/69) of all new cancer cases diagnosed for males and 71.4% (50/70) for females from 0 to 14 years old (Figure 9C). Within the same time period, testicular, lymphoma, thyroid, and melanoma of the skin cancers constituted 59.9% (103/172) of male cancers from 15 to 29 years of age (Figure 9D). Thyroid, lymphoma, and melanoma of the skin cancers accounted for 50.3% (88/175) of female new cases in this age group (Figure 9D).
The crude and age-standardized incidence rates for all cancer sites combined as well as the four leading cancers were calculated in this report (Tables 5A to 5D). Specifically, between 2007 and 2013, the age-standardized incidence rates of females for all cancer sites combined were slightly higher than those of males (Tables 5C and 5D). The frequencies and rates within different time frames (i.e., 1986-2006 vs. 2007-2013) and age groups (ages 0-14 vs. 15-29 years) for the four leading cancers are outlined in Tables 5A to 5D.
The frequencies of cancer-related deaths for children (ages 0-14 years) and adolescents and young adults (ages 15-29 years) are also illustrated in Figures 10A to 10D.
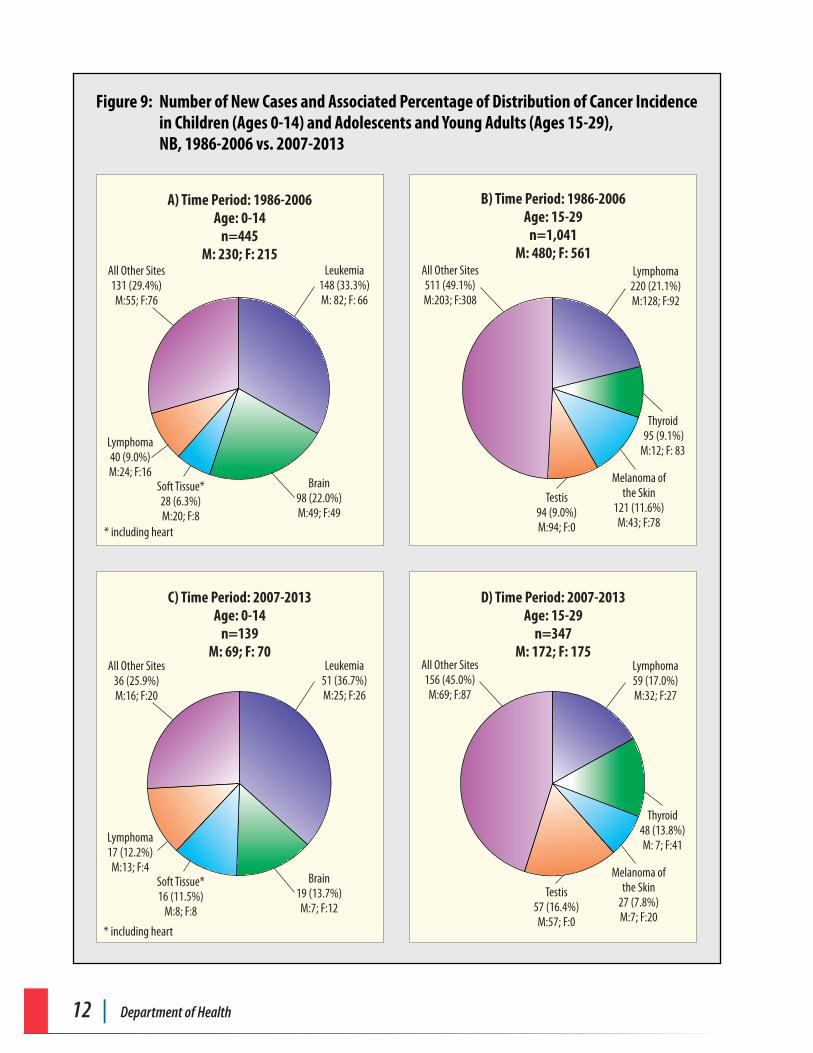
12 | Department of Health
Figure 9: Number of New Cases and Associated Percentage of Distribution of Cancer Incidence in Children (Ages 0-14) and Adolescents and Young Adults (Ages 15-29), NB, 1986-2006 vs. 2007-2013
A) Time Period: 1986-2006Age: 0-14
n=445M: 230; F: 215
B) Time Period: 1986-2006Age: 15-29
n=1,041M: 480; F: 561
C) Time Period: 2007-2013Age: 0-14
n=139M: 69; F: 70
D) Time Period: 2007-2013Age: 15-29
n=347M: 172; F: 175
All Other Sites 131 (29.4%) M:55; F:76
Leukemia148 (33.3%)M: 82; F: 66
Soft Tissue*28 (6.3%) M:20; F:8
Lymphoma40 (9.0%) M:24; F:16
Brain98 (22.0%) M:49; F:49
All Other Sites36 (25.9%)M:16; F:20
Leukemia51 (36.7%)M:25; F:26
Soft Tissue*16 (11.5%)
M:8; F:8
* including heart
* including heart
Lymphoma17 (12.2%)M:13; F:4
Brain19 (13.7%)M:7; F:12
All Other Sites511 (49.1%) M:203; F:308
Lymphoma220 (21.1%)M:128; F:92
Testis94 (9.0%)M:94; F:0
Melanoma of the Skin
121 (11.6%)M:43; F:78
Thyroid 95 (9.1%) M:12; F: 83
All Other Sites156 (45.0%)M:69; F:87
Lymphoma59 (17.0%)M:32; F:27
Testis57 (16.4%)M:57; F:0
Melanoma ofthe Skin
27 (7.8%)M:7; F:20
Thyroid48 (13.8%)M: 7; F:41
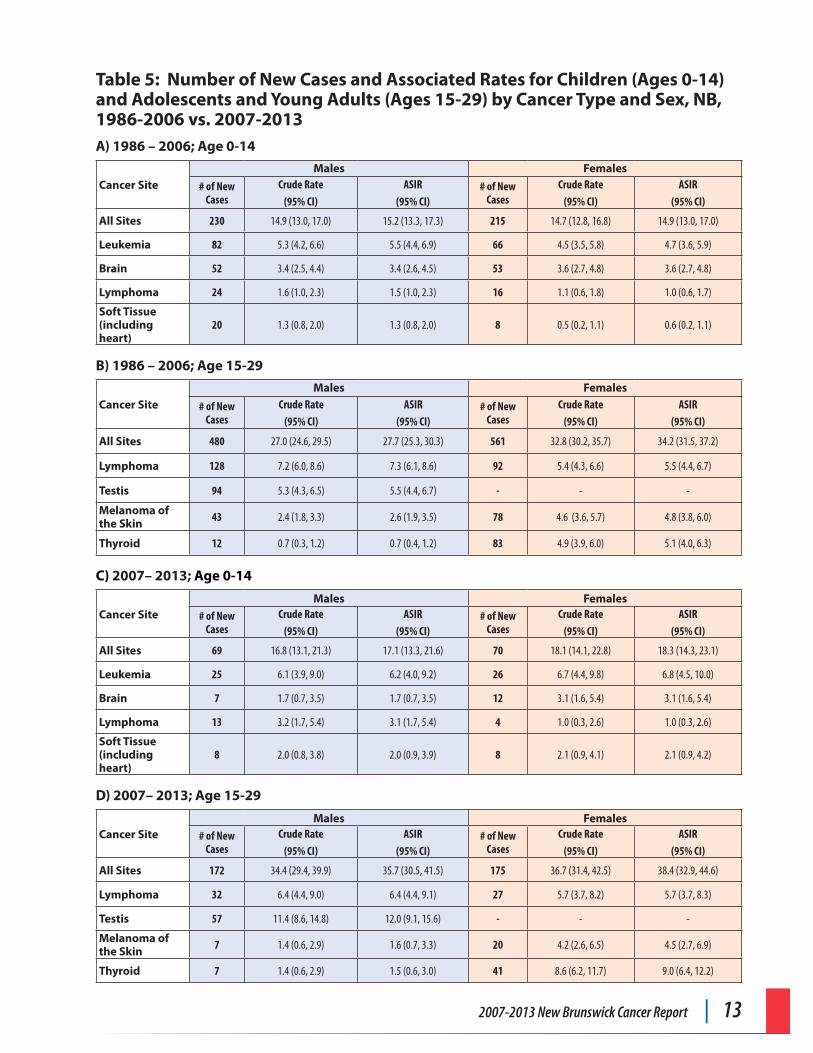
2007-2013 New Brunswick Cancer Report | 13
Table 5: Number of New Cases and Associated Rates for Children (Ages 0-14) and Adolescents and Young Adults (Ages 15-29) by Cancer Type and Sex, NB, 1986-2006 vs. 2007-2013A) 1986 – 2006; Age 0-14
Cancer SiteMales Females
# of New Cases
Crude Rate
(95% CI)
ASIR
(95% CI)# of New
CasesCrude Rate
(95% CI)
ASIR
(95% CI)
All Sites 230 14.9 (13.0, 17.0) 15.2 (13.3, 17.3) 215 14.7 (12.8, 16.8) 14.9 (13.0, 17.0)
Leukemia 82 5.3 (4.2, 6.6) 5.5 (4.4, 6.9) 66 4.5 (3.5, 5.8) 4.7 (3.6, 5.9)
Brain 52 3.4 (2.5, 4.4) 3.4 (2.6, 4.5) 53 3.6 (2.7, 4.8) 3.6 (2.7, 4.8)
Lymphoma 24 1.6 (1.0, 2.3) 1.5 (1.0, 2.3) 16 1.1 (0.6, 1.8) 1.0 (0.6, 1.7)
Soft Tissue (including heart)
20 1.3 (0.8, 2.0) 1.3 (0.8, 2.0) 8 0.5 (0.2, 1.1) 0.6 (0.2, 1.1)
B) 1986 – 2006; Age 15-29
Cancer SiteMales Females
# of New Cases
Crude Rate
(95% CI)
ASIR
(95% CI)# of New
CasesCrude Rate
(95% CI)
ASIR
(95% CI)
All Sites 480 27.0 (24.6, 29.5) 27.7 (25.3, 30.3) 561 32.8 (30.2, 35.7) 34.2 (31.5, 37.2)
Lymphoma 128 7.2 (6.0, 8.6) 7.3 (6.1, 8.6) 92 5.4 (4.3, 6.6) 5.5 (4.4, 6.7)
Testis 94 5.3 (4.3, 6.5) 5.5 (4.4, 6.7) - - -
Melanoma of the Skin 43 2.4 (1.8, 3.3) 2.6 (1.9, 3.5) 78 4.6 (3.6, 5.7) 4.8 (3.8, 6.0)
Thyroid 12 0.7 (0.3, 1.2) 0.7 (0.4, 1.2) 83 4.9 (3.9, 6.0) 5.1 (4.0, 6.3)
C) 2007– 2013; Age 0-14
Cancer SiteMales Females
# of New Cases
Crude Rate
(95% CI)
ASIR
(95% CI)# of New
CasesCrude Rate
(95% CI)
ASIR
(95% CI)
All Sites 69 16.8 (13.1, 21.3) 17.1 (13.3, 21.6) 70 18.1 (14.1, 22.8) 18.3 (14.3, 23.1)
Leukemia 25 6.1 (3.9, 9.0) 6.2 (4.0, 9.2) 26 6.7 (4.4, 9.8) 6.8 (4.5, 10.0)
Brain 7 1.7 (0.7, 3.5) 1.7 (0.7, 3.5) 12 3.1 (1.6, 5.4) 3.1 (1.6, 5.4)
Lymphoma 13 3.2 (1.7, 5.4) 3.1 (1.7, 5.4) 4 1.0 (0.3, 2.6) 1.0 (0.3, 2.6)
Soft Tissue (including heart)
8 2.0 (0.8, 3.8) 2.0 (0.9, 3.9) 8 2.1 (0.9, 4.1) 2.1 (0.9, 4.2)
D) 2007– 2013; Age 15-29
Cancer SiteMales Females
# of New Cases
Crude Rate
(95% CI)
ASIR
(95% CI)# of New
CasesCrude Rate
(95% CI)
ASIR
(95% CI)
All Sites 172 34.4 (29.4, 39.9) 35.7 (30.5, 41.5) 175 36.7 (31.4, 42.5) 38.4 (32.9, 44.6)
Lymphoma 32 6.4 (4.4, 9.0) 6.4 (4.4, 9.1) 27 5.7 (3.7, 8.2) 5.7 (3.7, 8.3)
Testis 57 11.4 (8.6, 14.8) 12.0 (9.1, 15.6) - - -
Melanoma of the Skin 7 1.4 (0.6, 2.9) 1.6 (0.7, 3.3) 20 4.2 (2.6, 6.5) 4.5 (2.7, 6.9)
Thyroid 7 1.4 (0.6, 2.9) 1.5 (0.6, 3.0) 41 8.6 (6.2, 11.7) 9.0 (6.4, 12.2)
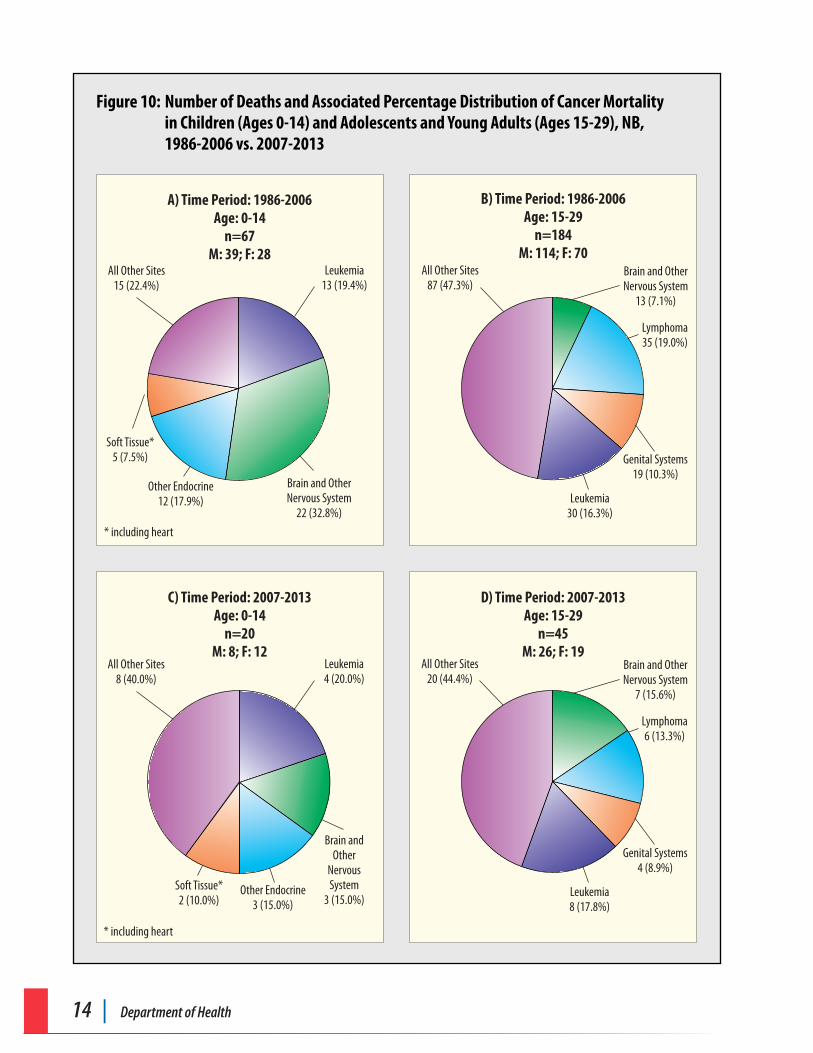
14 | Department of Health
Figure 10: Number of Deaths and Associated Percentage Distribution of Cancer Mortality in Children (Ages 0-14) and Adolescents and Young Adults (Ages 15-29), NB, 1986-2006 vs. 2007-2013
A) Time Period: 1986-2006Age: 0-14
n=67M: 39; F: 28
B) Time Period: 1986-2006Age: 15-29
n=184M: 114; F: 70
C) Time Period: 2007-2013Age: 0-14
n=20M: 8; F: 12
D) Time Period: 2007-2013Age: 15-29
n=45M: 26; F: 19
All Other Sites 15 (22.4%)
Leukemia13 (19.4%)
Other Endocrine 12 (17.9%)
Soft Tissue*5 (7.5%)
Brain and Other Nervous System
22 (32.8%)
All Other Sites87 (47.3%)
Brain and Other Nervous System
13 (7.1%)
Leukemia 30 (16.3%)
Genital Systems19 (10.3%)
Lymphoma35 (19.0%)
All Other Sites 8 (40.0%)
Leukemia4 (20.0%)
Other Endocrine 3 (15.0%)
Soft Tissue*2 (10.0%)
Brain and Other
Nervous System
3 (15.0%)
All Other Sites20 (44.4%)
Brain and Other Nervous System
7 (15.6%)
Leukemia 8 (17.8%)
Genital Systems4 (8.9%)
Lymphoma6 (13.3%)
* including heart
* including heart
2007-2013 New Brunswick Cancer Report | 15
3.4 Geographic Distribution of Cancer
3.4.1 Health Region Population Demographics
New Brunswick is divided into two Regional Health Authorities which include seven different health regions (HRs). The population of each health region varies from about 27,000 in HR5 to approximately 203,400 in HR1. Of the 753,000 New Brunswickers (2010), 73.1% are located in HR1, HR2 and HR3, while 26.9% residents live in the northern areas of HR4, HR5, HR6 and HR7 (Map 1).
Given the variation in population distribution among health regions, larger health regions (HR1, HR2 and HR3) generally have more new cancer cases and deaths than smaller health regions (HR4, HR5, HR6 and HR7). Different ratios of males to females across different health regions (HR7 = 0.97 and HR5 = 0.95) also have an impact on the distribution of cancer incidence and mortality. In the next section, we examine the frequency distributions of the ten leading cancers by health region.
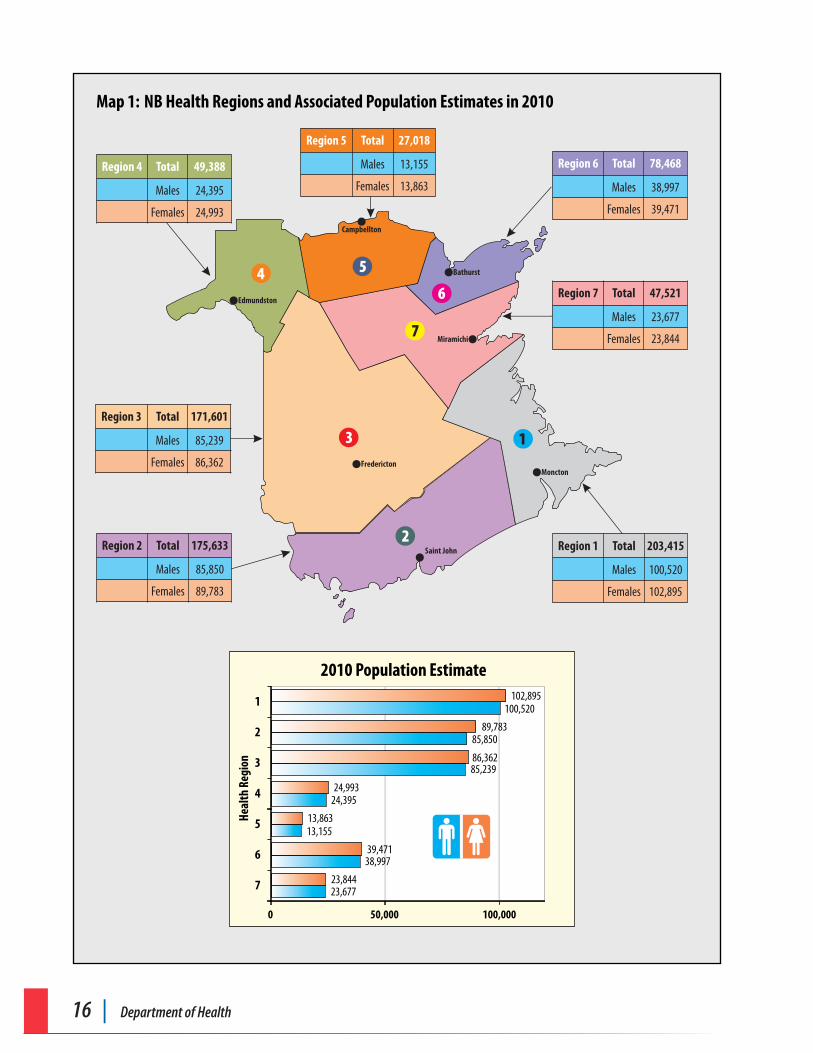
16 | Department of Health
Map 1: NB Health Regions and Associated Population Estimates in 2010
Fredericton
Saint John
Moncton
Edmundston
Campbellton
Bathurst
Miramichi
4 5
6
2
7
3 1
Region 1 Total 203,415
Males 100,520
Females 102,895
Region 7 Total 47,521
Males 23,677
Females 23,844
Region 6 Total 78,468
Males 38,997
Females 39,471
Region 5 Total 27,018
Males 13,155
Females 13,863
Region 4 Total 49,388
Males 24,395
Females 24,993
Region 3 Total 171,601
Males 85,239
Females 86,362
Region 2 Total 175,633
Males 85,850
Females 89,783
23,677
38,997
13,155
24,395
85,239
85,850
100,520
23,844
39,471
13,863
24,993
86,362
89,783
102,895
0 50,000 100,000
7
6
5
4
3
2
1
2010 Population Estimate
Heal
th R
egio
n
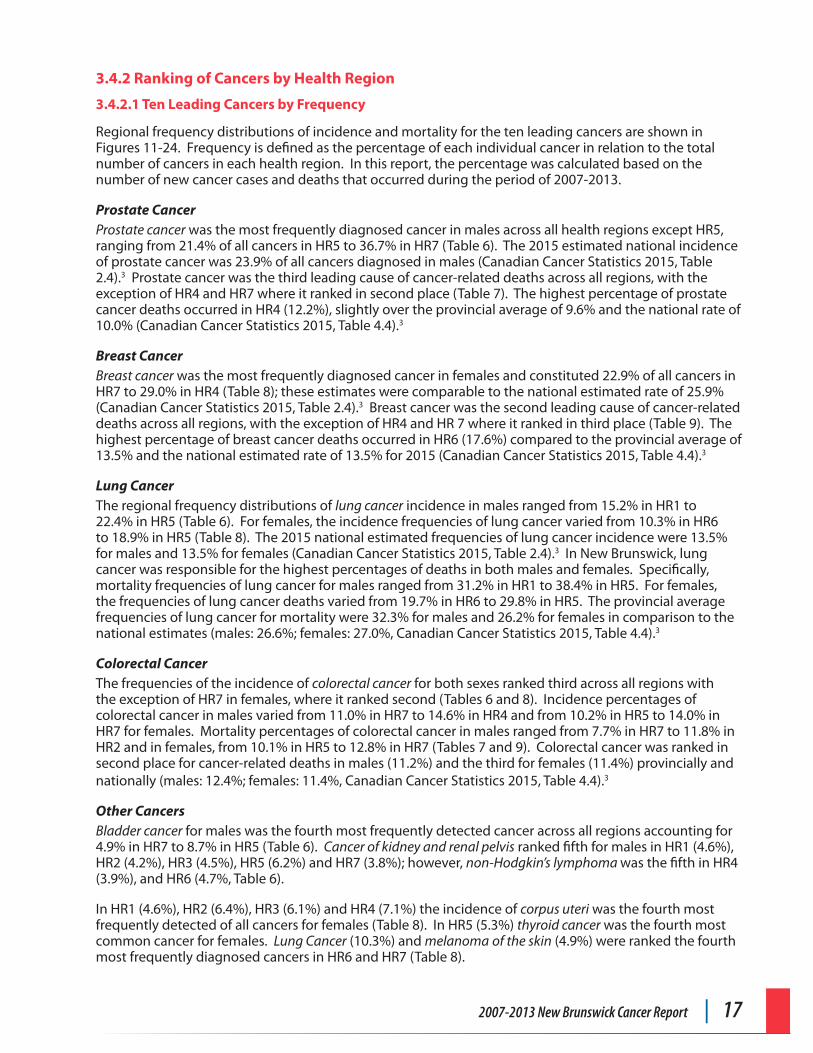
2007-2013 New Brunswick Cancer Report | 17
3.4.2 Ranking of Cancers by Health Region
3.4.2.1 Ten Leading Cancers by Frequency
Regional frequency distributions of incidence and mortality for the ten leading cancers are shown in Figures 11-24. Frequency is defined as the percentage of each individual cancer in relation to the total number of cancers in each health region. In this report, the percentage was calculated based on the number of new cancer cases and deaths that occurred during the period of 2007-2013.
Prostate CancerProstate cancer was the most frequently diagnosed cancer in males across all health regions except HR5, ranging from 21.4% of all cancers in HR5 to 36.7% in HR7 (Table 6). The 2015 estimated national incidence of prostate cancer was 23.9% of all cancers diagnosed in males (Canadian Cancer Statistics 2015, Table 2.4).3 Prostate cancer was the third leading cause of cancer-related deaths across all regions, with the exception of HR4 and HR7 where it ranked in second place (Table 7). The highest percentage of prostate cancer deaths occurred in HR4 (12.2%), slightly over the provincial average of 9.6% and the national rate of 10.0% (Canadian Cancer Statistics 2015, Table 4.4).3
Breast CancerBreast cancer was the most frequently diagnosed cancer in females and constituted 22.9% of all cancers in HR7 to 29.0% in HR4 (Table 8); these estimates were comparable to the national estimated rate of 25.9% (Canadian Cancer Statistics 2015, Table 2.4).3 Breast cancer was the second leading cause of cancer-related deaths across all regions, with the exception of HR4 and HR 7 where it ranked in third place (Table 9). The highest percentage of breast cancer deaths occurred in HR6 (17.6%) compared to the provincial average of 13.5% and the national estimated rate of 13.5% for 2015 (Canadian Cancer Statistics 2015, Table 4.4).3
Lung CancerThe regional frequency distributions of lung cancer incidence in males ranged from 15.2% in HR1 to 22.4% in HR5 (Table 6). For females, the incidence frequencies of lung cancer varied from 10.3% in HR6 to 18.9% in HR5 (Table 8). The 2015 national estimated frequencies of lung cancer incidence were 13.5% for males and 13.5% for females (Canadian Cancer Statistics 2015, Table 2.4).3 In New Brunswick, lung cancer was responsible for the highest percentages of deaths in both males and females. Specifically, mortality frequencies of lung cancer for males ranged from 31.2% in HR1 to 38.4% in HR5. For females, the frequencies of lung cancer deaths varied from 19.7% in HR6 to 29.8% in HR5. The provincial average frequencies of lung cancer for mortality were 32.3% for males and 26.2% for females in comparison to the national estimates (males: 26.6%; females: 27.0%, Canadian Cancer Statistics 2015, Table 4.4).3
Colorectal Cancer The frequencies of the incidence of colorectal cancer for both sexes ranked third across all regions with the exception of HR7 in females, where it ranked second (Tables 6 and 8). Incidence percentages of colorectal cancer in males varied from 11.0% in HR7 to 14.6% in HR4 and from 10.2% in HR5 to 14.0% in HR7 for females. Mortality percentages of colorectal cancer in males ranged from 7.7% in HR7 to 11.8% in HR2 and in females, from 10.1% in HR5 to 12.8% in HR7 (Tables 7 and 9). Colorectal cancer was ranked in second place for cancer-related deaths in males (11.2%) and the third for females (11.4%) provincially and nationally (males: 12.4%; females: 11.4%, Canadian Cancer Statistics 2015, Table 4.4).3
Other CancersBladder cancer for males was the fourth most frequently detected cancer across all regions accounting for 4.9% in HR7 to 8.7% in HR5 (Table 6). Cancer of kidney and renal pelvis ranked fifth for males in HR1 (4.6%), HR2 (4.2%), HR3 (4.5%), HR5 (6.2%) and HR7 (3.8%); however, non-Hodgkin’s lymphoma was the fifth in HR4 (3.9%), and HR6 (4.7%, Table 6).
In HR1 (4.6%), HR2 (6.4%), HR3 (6.1%) and HR4 (7.1%) the incidence of corpus uteri was the fourth most frequently detected of all cancers for females (Table 8). In HR5 (5.3%) thyroid cancer was the fourth most common cancer for females. Lung Cancer (10.3%) and melanoma of the skin (4.9%) were ranked the fourth most frequently diagnosed cancers in HR6 and HR7 (Table 8).
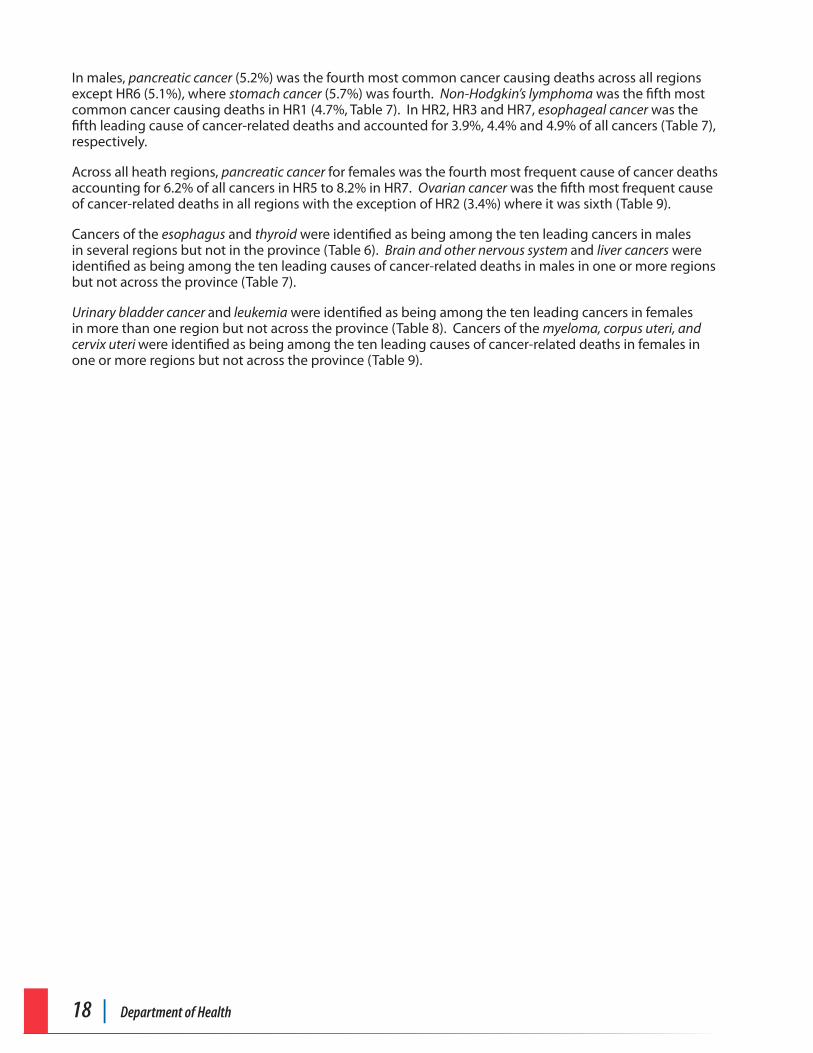
18 | Department of Health
In males, pancreatic cancer (5.2%) was the fourth most common cancer causing deaths across all regions except HR6 (5.1%), where stomach cancer (5.7%) was fourth. Non-Hodgkin’s lymphoma was the fifth most common cancer causing deaths in HR1 (4.7%, Table 7). In HR2, HR3 and HR7, esophageal cancer was the fifth leading cause of cancer-related deaths and accounted for 3.9%, 4.4% and 4.9% of all cancers (Table 7), respectively.
Across all heath regions, pancreatic cancer for females was the fourth most frequent cause of cancer deaths accounting for 6.2% of all cancers in HR5 to 8.2% in HR7. Ovarian cancer was the fifth most frequent cause of cancer-related deaths in all regions with the exception of HR2 (3.4%) where it was sixth (Table 9).
Cancers of the esophagus and thyroid were identified as being among the ten leading cancers in males in several regions but not in the province (Table 6). Brain and other nervous system and liver cancers were identified as being among the ten leading causes of cancer-related deaths in males in one or more regions but not across the province (Table 7).
Urinary bladder cancer and leukemia were identified as being among the ten leading cancers in females in more than one region but not across the province (Table 8). Cancers of the myeloma, corpus uteri, and cervix uteri were identified as being among the ten leading causes of cancer-related deaths in females in one or more regions but not across the province (Table 9).
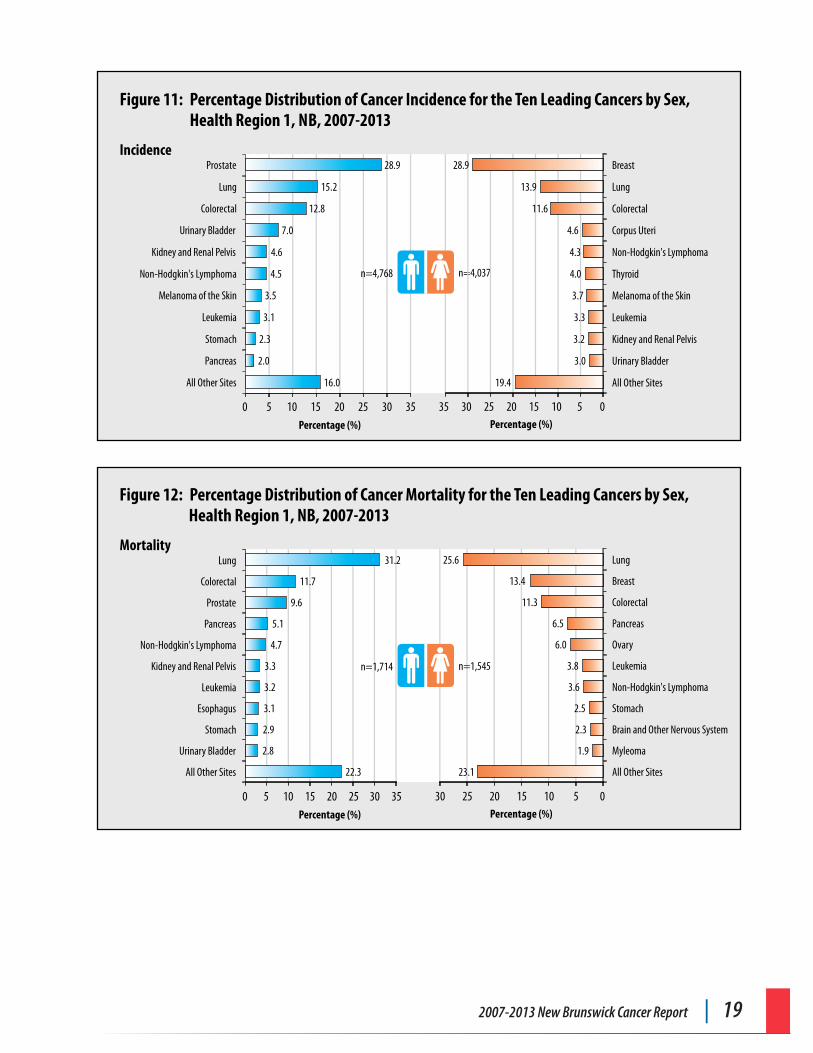
2007-2013 New Brunswick Cancer Report | 19
0 5 10 15 20 25 30 35Percentage (%)
n=4,768
Incidence
Percentage (%)
n=4,037
Figure 11: Percentage Distribution of Cancer Incidence for the Ten Leading Cancers by Sex, Health Region 1, NB, 2007-2013
19.4
3.0
3.2
3.3
3.7
4.0
4.3
4.6
11.6
13.9
28.9
05101520253035
All Other Sites
Urinary Bladder
Kidney and Renal Pelvis
Leukemia
Melanoma of the Skin
Thyroid
Non-Hodgkin's Lymphoma
Corpus Uteri
Colorectal
Lung
Breast
All Other Sites
Pancreas
Stomach
Leukemia
Melanoma of the Skin
Non-Hodgkin's Lymphoma
Kidney and Renal Pelvis
Urinary Bladder
Colorectal
Lung
Prostate
16.0
2.0
2.3
3.1
3.5
4.5
4.6
7.0
12.8
15.2
28.9
0 5 10 15 20 25 30 35Percentage (%)
Mortality
Percentage (%)
Figure 12: Percentage Distribution of Cancer Mortality for the Ten Leading Cancers by Sex, Health Region 1, NB, 2007-2013
051015202530
22.3
2.8
2.9
3.1
3.2
3.3
4.7
5.1
9.6
11.7
31.2
All Other Sites
Urinary Bladder
Stomach
Esophagus
Leukemia
Kidney and Renal Pelvis
Non-Hodgkin's Lymphoma
Pancreas
Prostate
Colorectal
Lung
23.1
1.9
2.3
2.5
3.6
3.8
6.0
6.5
11.3
13.4
25.6
All Other Sites
Myleoma
Brain and Other Nervous System
Stomach
Non-Hodgkin's Lymphoma
Leukemia
Ovary
Pancreas
Colorectal
Breast
Lung
n=1,714 n=1,545
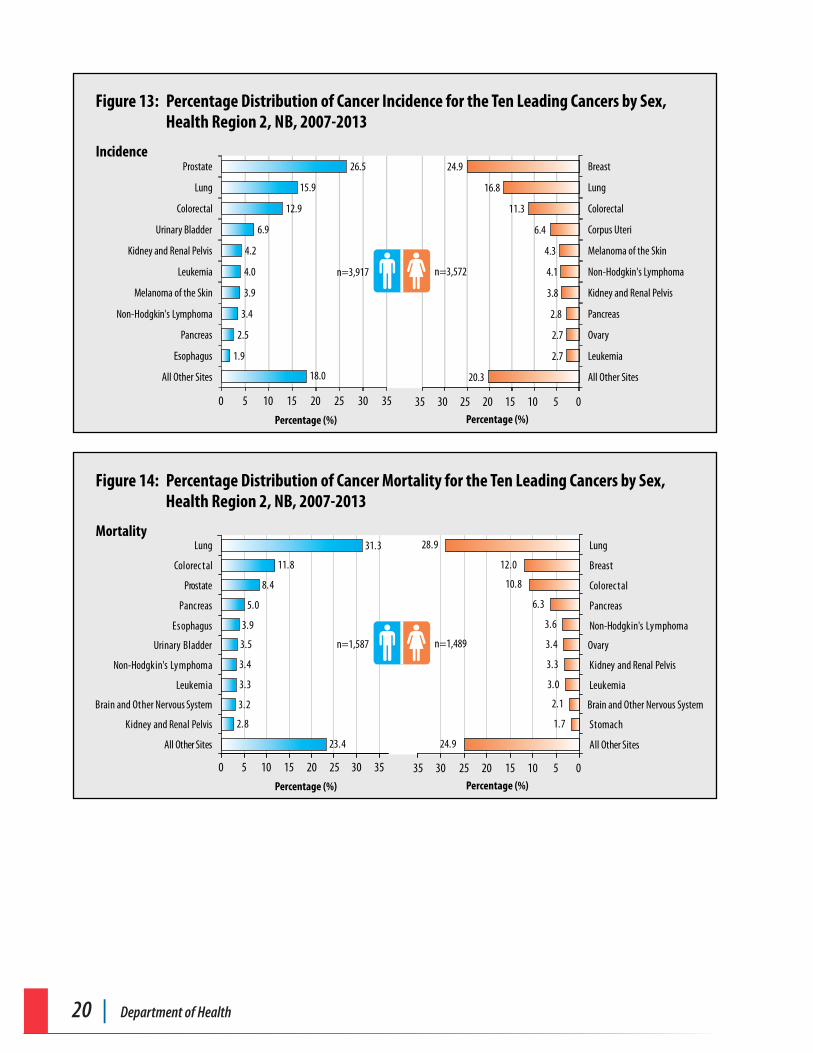
20 | Department of Health
0 5 10 15 20 25 30 35
Percentage (%)
Incidence
Percentage (%)
Figure 13: Percentage Distribution of Cancer Incidence for the Ten Leading Cancers by Sex, Health Region 2, NB, 2007-2013
05101520253035
20.3
2.7
2.7
2.8
3.8
4.1
4.3
6.4
11.3
16.8
24.9
All Other Sites
Leukemia
Ovary
Pancreas
Kidney and Renal Pelvis
Non-Hodgkin's Lymphoma
Melanoma of the Skin
Corpus Uteri
Colorectal
Lung
Breast
All Other Sites
Esophagus
Pancreas
Non-Hodgkin's Lymphoma
Melanoma of the Skin
Leukemia
Kidney and Renal Pelvis
Urinary Bladder
Colorectal
Lung
Prostate
18.0
1.9
2.5
3.4
3.9
4.0
4.2
6.9
12.9
15.9
26.5
n=3,917 n=3,572
0 5 10 15 20 25 30 35
Percentage (%)
Mortality
Percentage (%)
Figure 14: Percentage Distribution of Cancer Mortality for the Ten Leading Cancers by Sex, Health Region 2, NB, 2007-2013
05101520253035
n=1,587 n=1,489
23.4
2.8
3.2
3.3
3.4
3.5
3.9
5.0
8.4
11.8
31.3
All Other Sites
Kidney and Renal Pelvis
Brain and Other Nervous System
Leukemia
Non-Hodgkin's Lymphoma
Urinary Bladder
Esophagus
Pancreas
Prostate
Colorec tal
Lung
24.9
1.7
2.1
3.0
3.3
3.4
3.6
6.3
10.8
12.0
28.9
All Other Sites
Stomach
Leukemia
Kidney and Renal Pelvis
Non-Hodgkin's Lymphoma
Pancreas
Colorec tal
Breast
Lung
Ovary
Brain and Other Nervous System
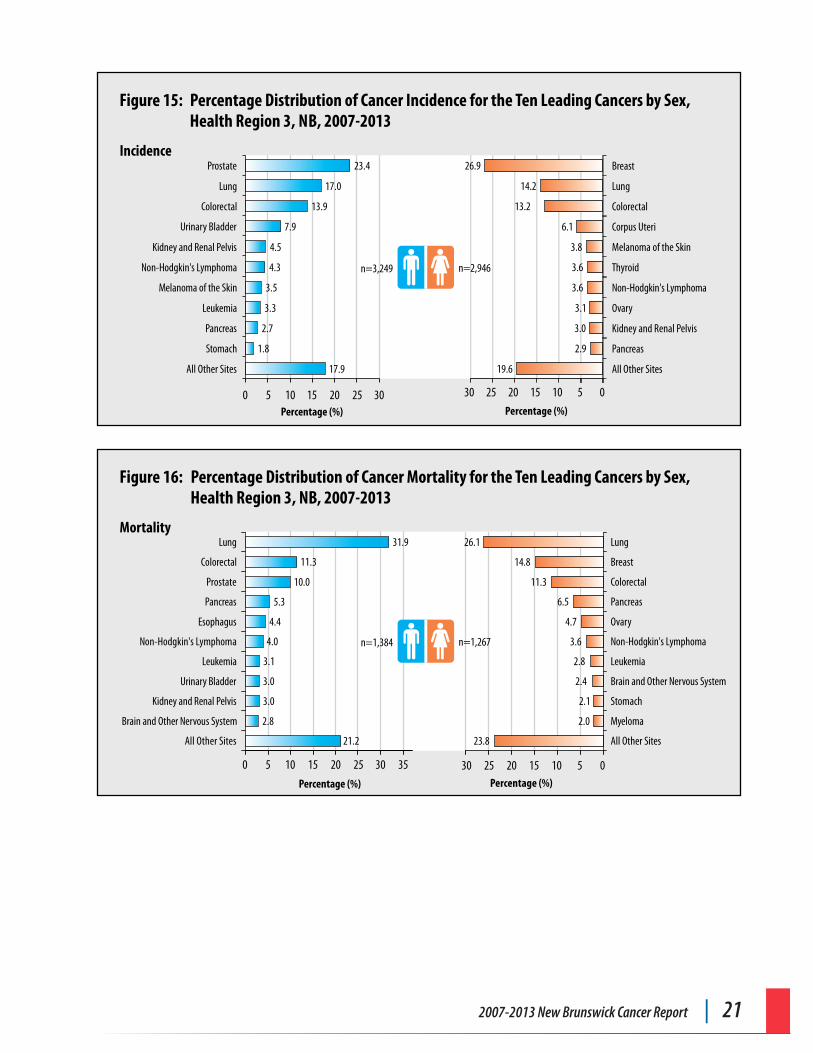
2007-2013 New Brunswick Cancer Report | 21
Percentage (%)
Incidence
Percentage (%)
Figure 15: Percentage Distribution of Cancer Incidence for the Ten Leading Cancers by Sex, Health Region 3, NB, 2007-2013
19.6
2.9
3.0
3.1
3.6
3.6
3.8
6.1
13.2
14.2
26.9
051015202530
All Other Sites
Pancreas
Kidney and Renal Pelvis
Ovary
Non-Hodgkin's Lymphoma
Thyroid
Melanoma of the Skin
Corpus Uteri
Colorectal
Lung
Breast
17.9
1.8
2.7
3.3
3.5
4.3
4.5
7.9
13.9
17.0
23.4
0 5 10 15 20 25 30
All Other Sites
Stomach
Pancreas
Leukemia
Melanoma of the Skin
Kidney and Renal Pelvis
Urinary Bladder
Colorectal
Lung
Prostate
n=3,249 n=2,946Non-Hodgkin's Lymphoma
Percentage (%)
Mortality
Percentage (%)
Figure 16: Percentage Distribution of Cancer Mortality for the Ten Leading Cancers by Sex, Health Region 3, NB, 2007-2013
051015202530
23.8
2.0
2.1
2.4
2.8
3.6
4.7
6.5
11.3
14.8
26.1
All Other Sites
Myeloma
Stomach
Brain and Other Nervous System
Leukemia
Non-Hodgkin's Lymphoma
Ovary
Pancreas
Colorectal
Breast
Lung
All Other Sites
Brain and Other Nervous System
Kidney and Renal Pelvis
Urinary Bladder
Leukemia
Non-Hodgkin's Lymphoma
Esophagus
Pancreas
Prostate
Colorectal
Lung
0 5 10 15 20 25 30 35
21.2
2.8
3.0
3.0
3.1
4.0
4.4
5.3
10.0
11.3
31.9
n=1,384 n=1,267
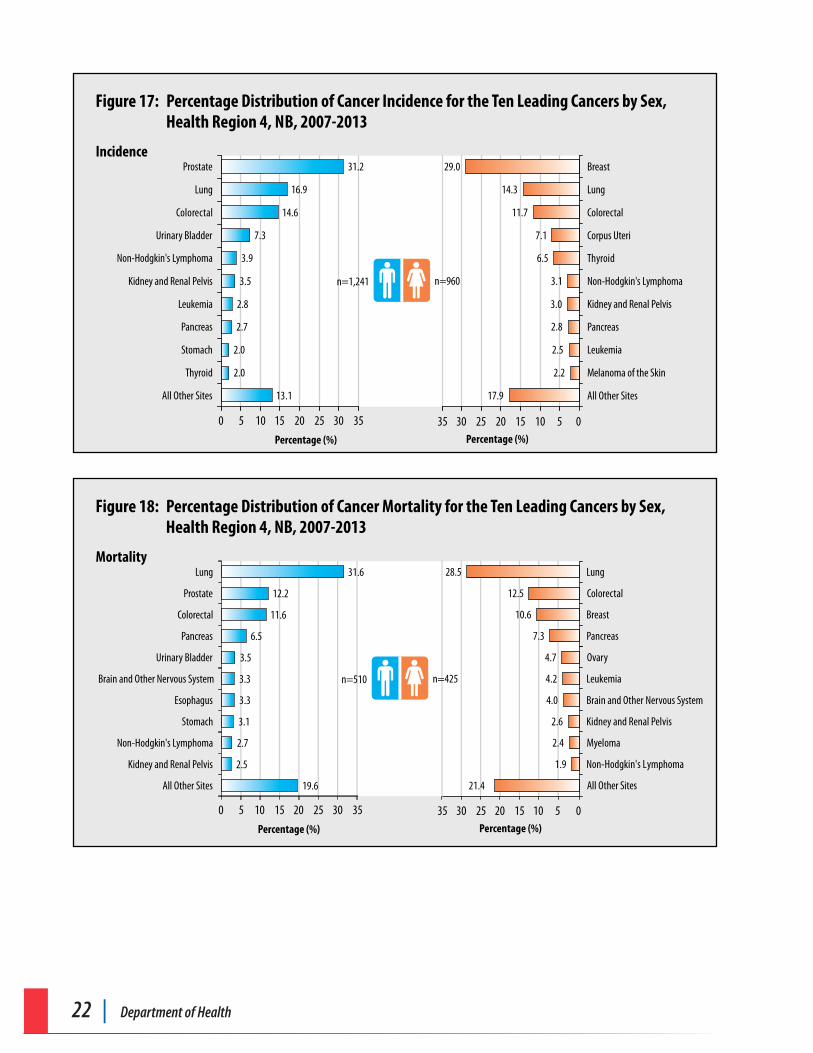
22 | Department of Health
0 5 10 15 20 25 30 35
Percentage (%)
Incidence
Percentage (%)
Figure 17: Percentage Distribution of Cancer Incidence for the Ten Leading Cancers by Sex, Health Region 4, NB, 2007-2013
05101520253035
17.9
2.2
2.5
2.8
3.0
3.1
6.5
7.1
11.7
14.3
29.0
All Other Sites
Melanoma of the Skin
Leukemia
Pancreas
Kidney and Renal Pelvis
Non-Hodgkin's Lymphoma
Thyroid
Corpus Uteri
Colorectal
Lung
Breast
13.1
2.0
2.0
2.7
2.8
3.5
3.9
7.3
14.6
16.9
31.2
All Other Sites
Thyroid
Stomach
Pancreas
Leukemia
Kidney and Renal Pelvis
Non-Hodgkin's Lymphoma
Urinary Bladder
Colorectal
Lung
Prostate
n=1,241 n=960
Percentage (%) Percentage (%)
Figure 18: Percentage Distribution of Cancer Mortality for the Ten Leading Cancers by Sex, Health Region 4, NB, 2007-2013
051015202530
0 5 10 15 20 25 30 35 35
19.6
2.5
2.7
3.1
3.3
3.3
3.5
6.5
11.6
12.2
31.6
All Other Sites
Kidney and Renal Pelvis
Non-Hodgkin's Lymphoma
Stomach
Esophagus
Brain and Other Nervous System
Urinary Bladder
Pancreas
Colorectal
Prostate
Lung
21.4
1.9
2.4
2.6
4.0
4.2
4.7
7.3
10.6
12.5
28.5
All Other Sites
Non-Hodgkin's Lymphoma
Myeloma
Kidney and Renal Pelvis
Brain and Other Nervous System
Leukemia
Ovary
Pancreas
Breast
Colorectal
LungMortality
n=510 n=425
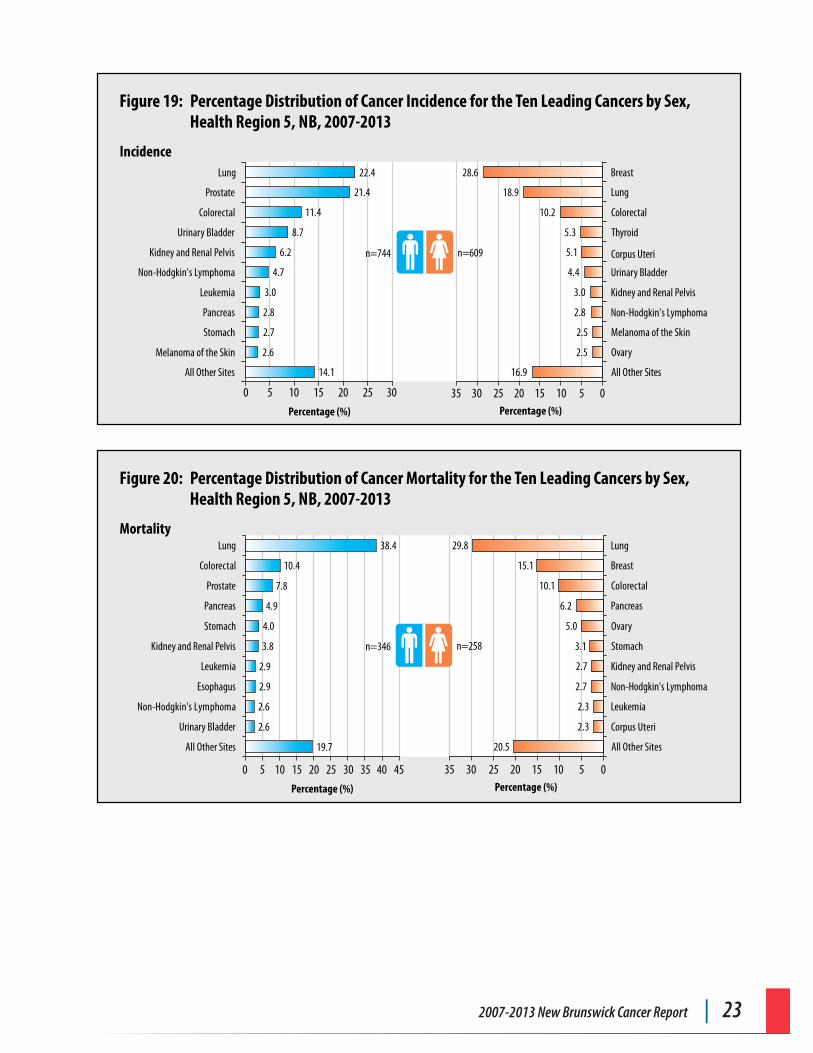
2007-2013 New Brunswick Cancer Report | 23
Incidence
Figure 19: Percentage Distribution of Cancer Incidence for the Ten Leading Cancers by Sex, Health Region 5, NB, 2007-2013
14.1
2.6
2.7
2.8
3.0
4.7
6.2
8.7
11.4
21.4
22.4
All Other Sites
Melanoma of the Skin
Stomach
Pancreas
Leukemia
Non-Hodgkin's Lymphoma
Kidney and Renal Pelvis
Urinary Bladder
Colorectal
Prostate
Lung
16.9
2.5
2.5
2.8
3.0
4.4
5.1
5.3
10.2
18.9
28.6
All Other Sites
Ovary
Melanoma of the Skin
Non-Hodgkin's Lymphoma
Kidney and Renal Pelvis
Urinary Bladder
Corpus Uteri
Thyroid
Colorectal
Lung
Breast
0 5 10 15 20 25 30
Percentage (%) Percentage (%)
05101520253035
n=744 n=609
19.7
2.6
2.6
2.9
2.9
3.8
4.0
4.9
7.8
10.4
38.4
All Other Sites
Urinary Bladder
Non-Hodgkin's Lymphoma
Esophagus
Leukemia
Kidney and Renal Pelvis
Stomach
Pancreas
Prostate
Colorectal
Lung
20.5
2.3
2.3
2.7
2.7
3.1
5.0
6.2
10.1
15.1
29.8
All Other Sites
Corpus Uteri
Leukemia
Non-Hodgkin's Lymphoma
Kidney and Renal Pelvis
Stomach
Ovary
Pancreas
Colorectal
Breast
Lung
Percentage (%) Percentage (%)
Figure 20: Percentage Distribution of Cancer Mortality for the Ten Leading Cancers by Sex, Health Region 5, NB, 2007-2013
051015202530
0 5 10 15 20 25 30 35 40 45 35
Mortality
n=346 n=258
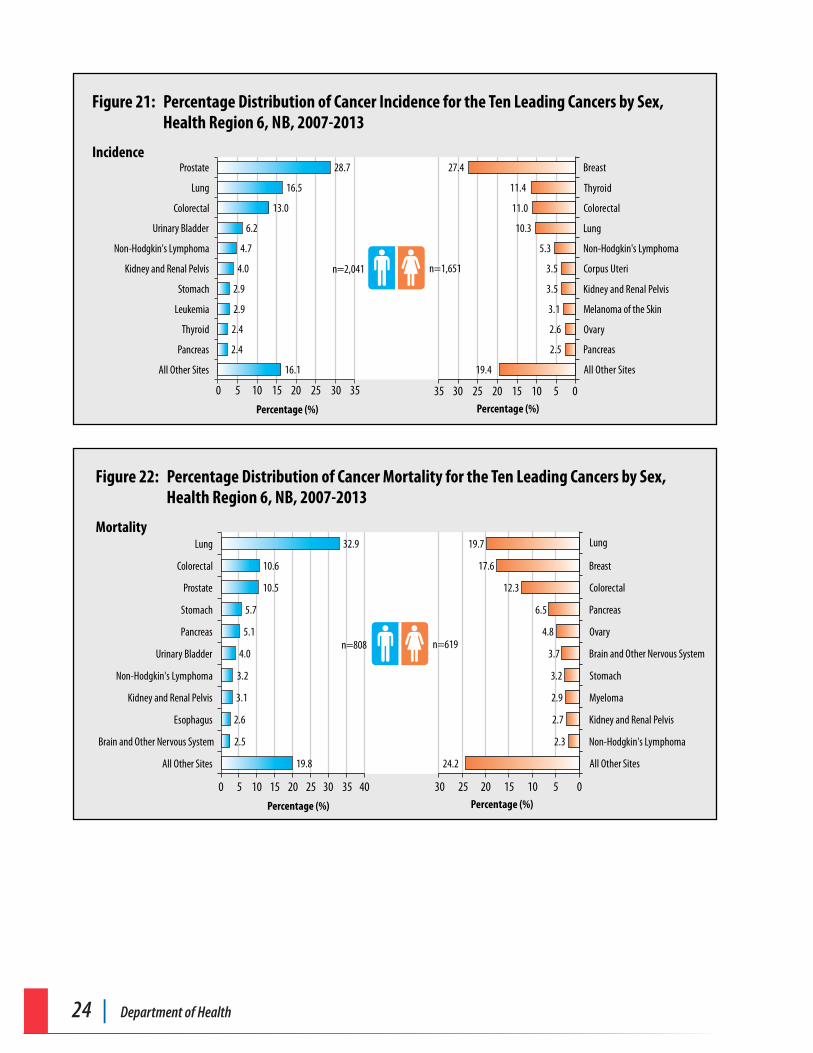
24 | Department of Health
Incidence
Figure 21: Percentage Distribution of Cancer Incidence for the Ten Leading Cancers by Sex, Health Region 6, NB, 2007-2013
0 5 10 15 20 25 30 35
Percentage (%) Percentage (%)
05101520253035
16.1
2.4
2.4
2.9
2.9
4.0
4.7
6.2
13.0
16.5
28.7
All Other Sites
Pancreas
Thyroid
Leukemia
Stomach
Kidney and Renal Pelvis
Non-Hodgkin's Lymphoma
Urinary Bladder
Colorectal
Lung
Prostate
19.4
2.5
2.6
3.1
3.5
3.5
5.3
10.3
11.0
27.4
11.4
All Other Sites
Pancreas
Ovary
Melanoma of the Skin
Kidney and Renal Pelvis
Corpus Uteri
Non-Hodgkin's Lymphoma
Lung
Colorectal
Thyroid
Breast
n=2,041 n=1,651
Percentage (%) Percentage (%)
Figure 22: Percentage Distribution of Cancer Mortality for the Ten Leading Cancers by Sex, Health Region 6, NB, 2007-2013
051015202530
0 5 10 15 20 25 30 35 40
Mortality
19.8
2.5
2.6
3.1
3.2
4.0
5.1
5.7
10.5
10.6
32.9
All Other Sites
Brain and Other Nervous System
Esophagus
Kidney and Renal Pelvis
Non-Hodgkin's Lymphoma
Urinary Bladder
Pancreas
Stomach
Prostate
Colorectal
Lung
24.2
2.3
2.7
2.9
3.2
3.7
4.8
6.5
12.3
17.6
19.7
All Other Sites
Non-Hodgkin's Lymphoma
Kidney and Renal Pelvis
Myeloma
Stomach
Brain and Other Nervous System
Ovary
Pancreas
Colorectal
Breast
Lung
n=808 n=619
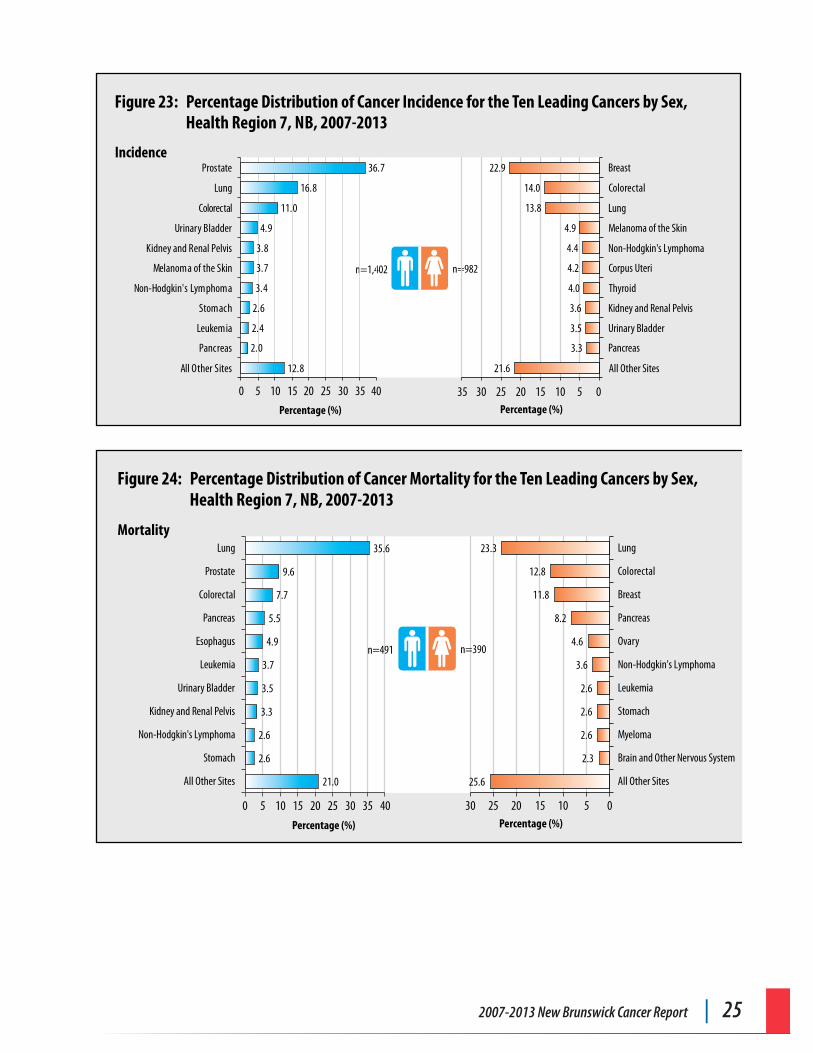
2007-2013 New Brunswick Cancer Report | 25
Incidence
Figure 23: Percentage Distribution of Cancer Incidence for the Ten Leading Cancers by Sex, Health Region 7, NB, 2007-2013
0 5 10 15 20 25 30 35 40
Percentage (%)
n=1,402 n=982
12.8
2.0
2.4
2.6
3.4
3.7
3.8
4.9
11.0
16.8
36.7
All Other Sites
Pancreas
Leukemia
Stomach
Non-Hodgkin's Lymphoma
Melanoma of the Skin
Kidney and Renal Pelvis
Urinary Bladder
Colorectal
Lung
Prostate
21.6
3.3
3.5
3.6
4.0
4.2
4.4
4.9
13.8
14.0
22.9
All Other Sites
Pancreas
Urinary Bladder
Kidney and Renal Pelvis
Thyroid
Corpus Uteri
Non-Hodgkin's Lymphoma
Melanoma of the Skin
Lung
Colorectal
Breast
Percentage (%)
05101520253035
Percentage (%) Percentage (%)
Figure 24: Percentage Distribution of Cancer Mortality for the Ten Leading Cancers by Sex, Health Region 7, NB, 2007-2013
051015202530
0 5 10 15 20 25 30 35 40
Mortality
21.0
2.6
2.6
3.3
3.5
3.7
4.9
5.5
7.7
9.6
35.6
All Other Sites
Stomach
Non-Hodgkin's Lymphoma
Kidney and Renal Pelvis
Urinary Bladder
Leukemia
Esophagus
Pancreas
Colorectal
Prostate
Lung
25.6
2.3
2.6
2.6
2.6
3.6
4.6
8.2
11.8
12.8
23.3
All Other Sites
Brain and Other Nervous System
Myeloma
Stomach
Leukemia
Non-Hodgkin's Lymphoma
Ovary
Pancreas
Breast
Colorectal
Lung
n=491 n=390
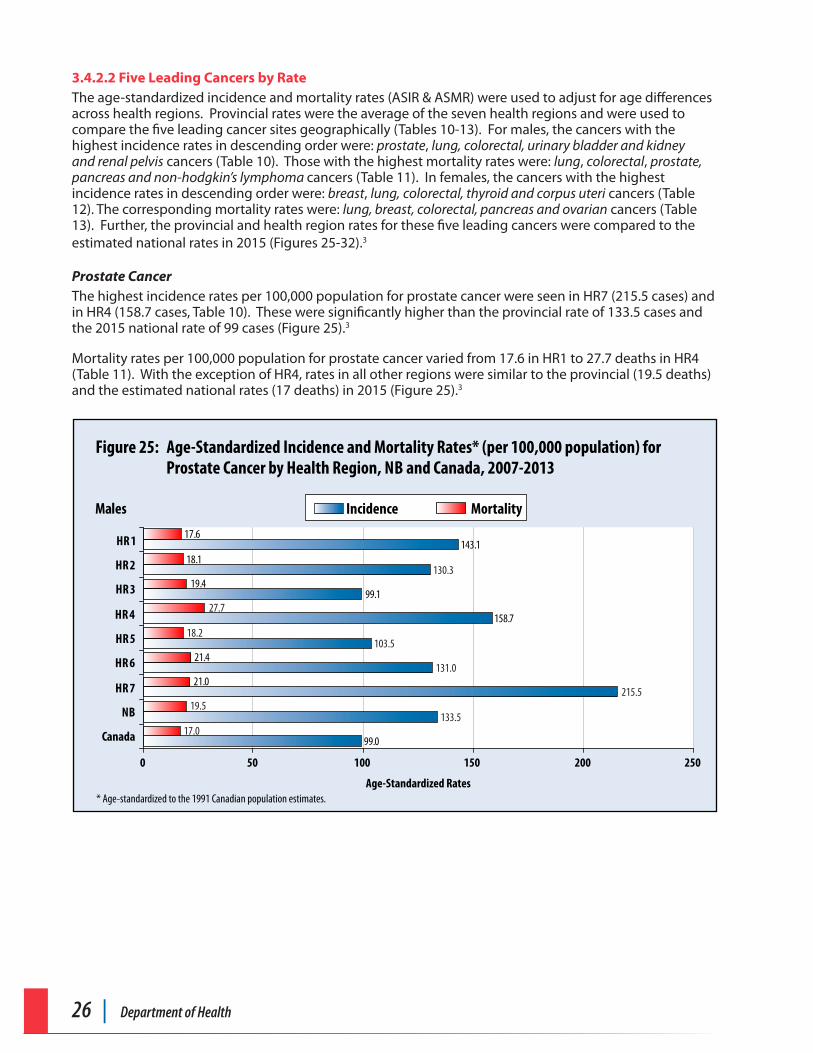
26 | Department of Health
3.4.2.2 Five Leading Cancers by Rate The age-standardized incidence and mortality rates (ASIR & ASMR) were used to adjust for age differences across health regions. Provincial rates were the average of the seven health regions and were used to compare the five leading cancer sites geographically (Tables 10-13). For males, the cancers with the highest incidence rates in descending order were: prostate, lung, colorectal, urinary bladder and kidney and renal pelvis cancers (Table 10). Those with the highest mortality rates were: lung, colorectal, prostate, pancreas and non-hodgkin’s lymphoma cancers (Table 11). In females, the cancers with the highest incidence rates in descending order were: breast, lung, colorectal, thyroid and corpus uteri cancers (Table 12). The corresponding mortality rates were: lung, breast, colorectal, pancreas and ovarian cancers (Table 13). Further, the provincial and health region rates for these five leading cancers were compared to the estimated national rates in 2015 (Figures 25-32).3
Prostate CancerThe highest incidence rates per 100,000 population for prostate cancer were seen in HR7 (215.5 cases) and in HR4 (158.7 cases, Table 10). These were significantly higher than the provincial rate of 133.5 cases and the 2015 national rate of 99 cases (Figure 25).3
Mortality rates per 100,000 population for prostate cancer varied from 17.6 in HR1 to 27.7 deaths in HR4 (Table 11). With the exception of HR4, rates in all other regions were similar to the provincial (19.5 deaths) and the estimated national rates (17 deaths) in 2015 (Figure 25).3
* Age-standardized to the 1991 Canadian population estimates.
Figure 25: Age-Standardized Incidence and Mortality Rates* (per 100,000 population) for Prostate Cancer by Health Region, NB and Canada, 2007-2013
99.1
99.0
143.1
158.7
21.0
21.4
19.4
18.1
17.6
0 50 100 150 200 250
Canada
NB
HR 7
HR 6
HR 5
HR 4
HR 3
HR 2
HR 1
Males Incidence Mortality
Age-Standardized Rates
130.3
103.5
133.5
131.0
215.5
17.0
19.5
18.2
27.7
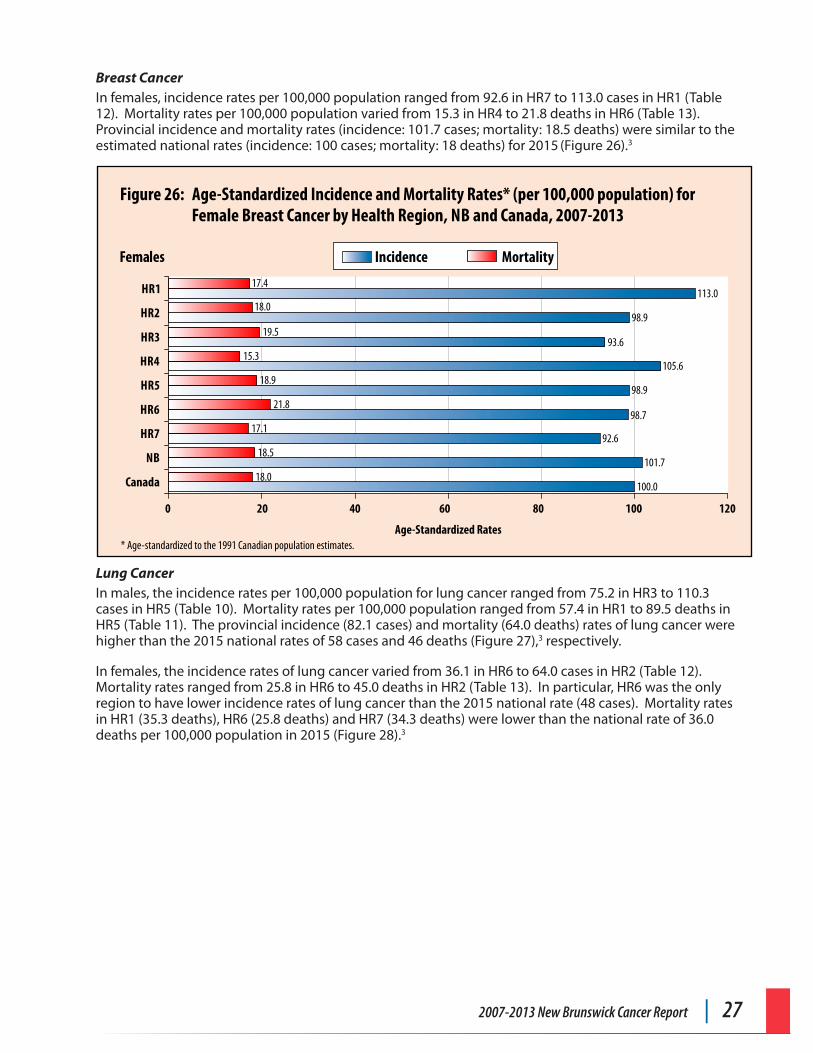
2007-2013 New Brunswick Cancer Report | 27
Breast CancerIn females, incidence rates per 100,000 population ranged from 92.6 in HR7 to 113.0 cases in HR1 (Table 12). Mortality rates per 100,000 population varied from 15.3 in HR4 to 21.8 deaths in HR6 (Table 13). Provincial incidence and mortality rates (incidence: 101.7 cases; mortality: 18.5 deaths) were similar to the estimated national rates (incidence: 100 cases; mortality: 18 deaths) for 2015 (Figure 26).3
* Age-standardized to the 1991 Canadian population estimates.
Figure 26: Age-Standardized Incidence and Mortality Rates* (per 100,000 population) for Female Breast Cancer by Health Region, NB and Canada, 2007-2013
0 20 40 60 80 120100
Females Incidence Mortality
98.9
93.6
100.0
98.9
113.0
105.6
98.7
92.6
101.718.0
18.5
17.1
21.8
18.9
15.3
19.5
18.0
17.4
Canada
NB
HR7
HR6
HR5
HR4
HR3
HR2
HR1
Age-Standardized Rates
Lung CancerIn males, the incidence rates per 100,000 population for lung cancer ranged from 75.2 in HR3 to 110.3 cases in HR5 (Table 10). Mortality rates per 100,000 population ranged from 57.4 in HR1 to 89.5 deaths in HR5 (Table 11). The provincial incidence (82.1 cases) and mortality (64.0 deaths) rates of lung cancer were higher than the 2015 national rates of 58 cases and 46 deaths (Figure 27),3 respectively.
In females, the incidence rates of lung cancer varied from 36.1 in HR6 to 64.0 cases in HR2 (Table 12). Mortality rates ranged from 25.8 in HR6 to 45.0 deaths in HR2 (Table 13). In particular, HR6 was the only region to have lower incidence rates of lung cancer than the 2015 national rate (48 cases). Mortality rates in HR1 (35.3 deaths), HR6 (25.8 deaths) and HR7 (34.3 deaths) were lower than the national rate of 36.0 deaths per 100,000 population in 2015 (Figure 28).3
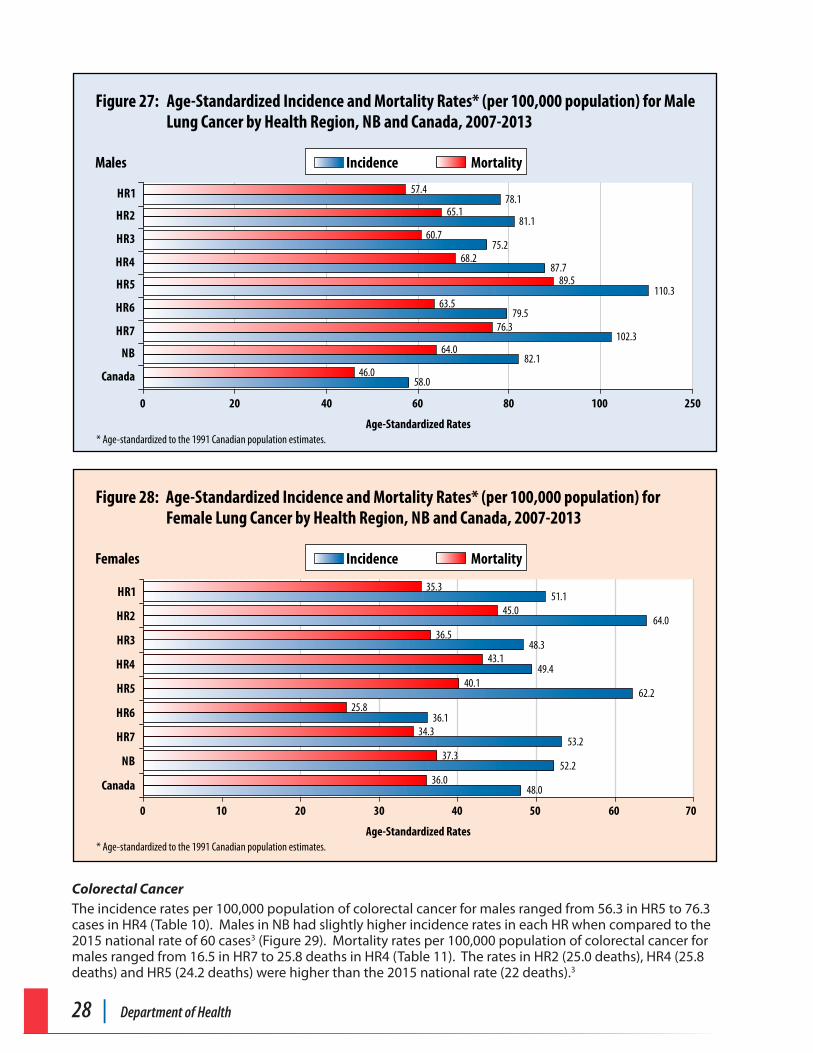
28 | Department of Health
* Age-standardized to the 1991 Canadian population estimates.
Figure 27: Age-Standardized Incidence and Mortality Rates* (per 100,000 population) for Male Lung Cancer by Health Region, NB and Canada, 2007-2013
0 20 40 60 80 250
Males Incidence Mortality
Age-Standardized Rates
81.1
75.2
58.0
110.3
78.1
87.7
79.5
102.3
82.146.0
64.0
76.3
63.5
89.5
68.2
60.7
65.1
57.4
Canada
NB
HR7
HR6
HR5
HR4
HR3
HR2
HR1
100
* Age-standardized to the 1991 Canadian population estimates.
Figure 28: Age-Standardized Incidence and Mortality Rates* (per 100,000 population) for Female Lung Cancer by Health Region, NB and Canada, 2007-2013
0 10 20 30 40 7050 60
Females Incidence Mortality
Age-Standardized Rates
64.0
48.3
48.0
62.2
51.1
49.4
36.1
53.2
52.236.0
37.3
34.3
25.8
40.1
43.1
36.5
45.0
35.3
Canada
NB
HR7
HR6
HR5
HR4
HR3
HR2
HR1
Colorectal CancerThe incidence rates per 100,000 population of colorectal cancer for males ranged from 56.3 in HR5 to 76.3 cases in HR4 (Table 10). Males in NB had slightly higher incidence rates in each HR when compared to the 2015 national rate of 60 cases3 (Figure 29). Mortality rates per 100,000 population of colorectal cancer for males ranged from 16.5 in HR7 to 25.8 deaths in HR4 (Table 11). The rates in HR2 (25.0 deaths), HR4 (25.8 deaths) and HR5 (24.2 deaths) were higher than the 2015 national rate (22 deaths).3
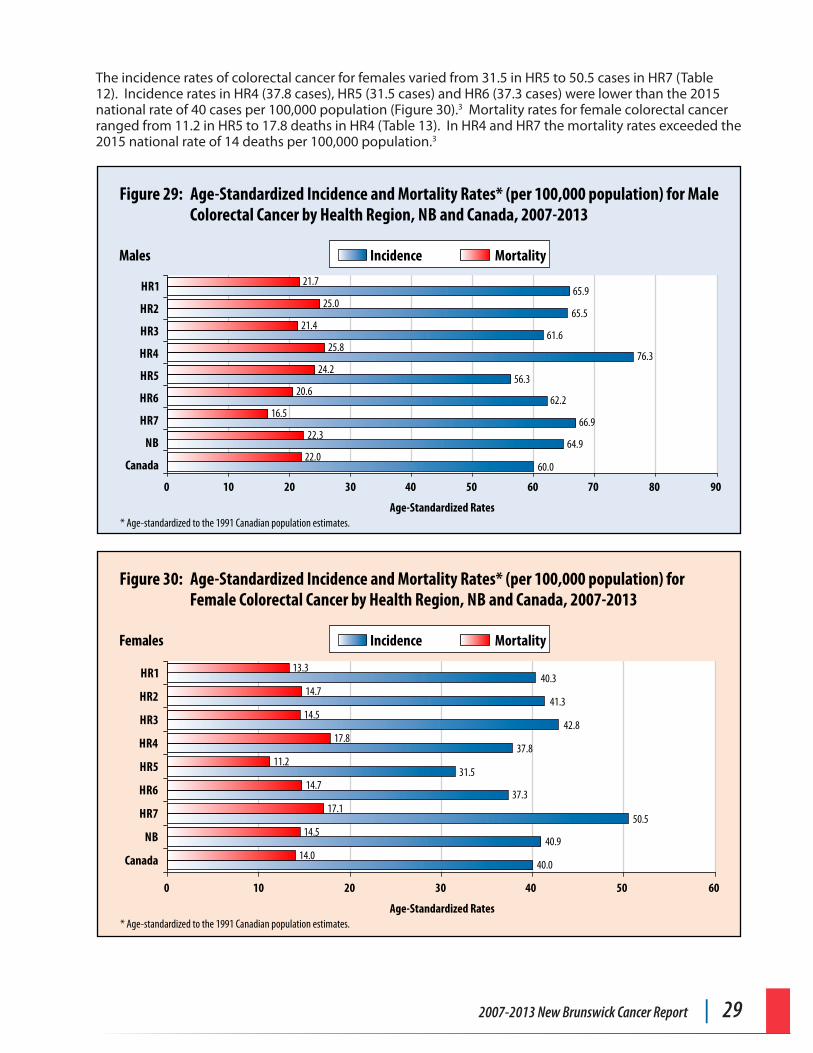
2007-2013 New Brunswick Cancer Report | 29
The incidence rates of colorectal cancer for females varied from 31.5 in HR5 to 50.5 cases in HR7 (Table 12). Incidence rates in HR4 (37.8 cases), HR5 (31.5 cases) and HR6 (37.3 cases) were lower than the 2015 national rate of 40 cases per 100,000 population (Figure 30).3 Mortality rates for female colorectal cancer ranged from 11.2 in HR5 to 17.8 deaths in HR4 (Table 13). In HR4 and HR7 the mortality rates exceeded the 2015 national rate of 14 deaths per 100,000 population.3
* Age-standardized to the 1991 Canadian population estimates.
Figure 29: Age-Standardized Incidence and Mortality Rates* (per 100,000 population) for Male Colorectal Cancer by Health Region, NB and Canada, 2007-2013
0 10 20 30 40 90
Males Incidence Mortality
Age-Standardized Rates
50 60 70 80
61.6
65.5
60.0
56.3
65.9
76.3
62.2
66.9
64.922.0
22.3
16.5
20.6
24.2
25.8
21.4
25.0
21.7
Canada
NB
HR7
HR6
HR5
HR4
HR3
HR2
HR1
* Age-standardized to the 1991 Canadian population estimates.
Figure 30: Age-Standardized Incidence and Mortality Rates* (per 100,000 population) for Female Colorectal Cancer by Health Region, NB and Canada, 2007-2013
0 10 20 30 40 50 60
Females Incidence Mortality
Age-Standardized Rates
42.8
41.3
40.0
31.5
40.3
37.8
37.3
50.5
40.914.0
14.5
17.1
14.7
11.2
17.8
14.5
14.7
13.3
Canada
NB
HR7
HR6
HR5
HR4
HR3
HR2
HR1
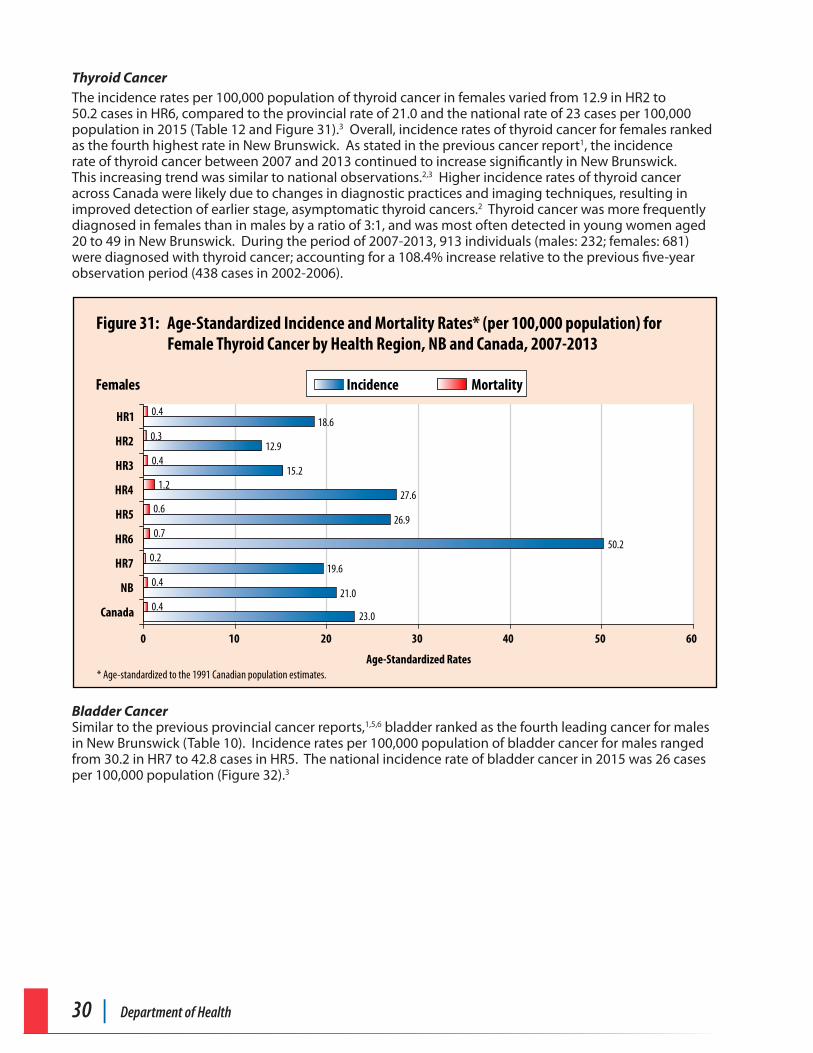
30 | Department of Health
Thyroid CancerThe incidence rates per 100,000 population of thyroid cancer in females varied from 12.9 in HR2 to 50.2 cases in HR6, compared to the provincial rate of 21.0 and the national rate of 23 cases per 100,000 population in 2015 (Table 12 and Figure 31).3 Overall, incidence rates of thyroid cancer for females ranked as the fourth highest rate in New Brunswick. As stated in the previous cancer report1, the incidence rate of thyroid cancer between 2007 and 2013 continued to increase significantly in New Brunswick. This increasing trend was similar to national observations.2,3 Higher incidence rates of thyroid cancer across Canada were likely due to changes in diagnostic practices and imaging techniques, resulting in improved detection of earlier stage, asymptomatic thyroid cancers.2 Thyroid cancer was more frequently diagnosed in females than in males by a ratio of 3:1, and was most often detected in young women aged 20 to 49 in New Brunswick. During the period of 2007-2013, 913 individuals (males: 232; females: 681) were diagnosed with thyroid cancer; accounting for a 108.4% increase relative to the previous five-year observation period (438 cases in 2002-2006).
* Age-standardized to the 1991 Canadian population estimates.
Figure 31: Age-Standardized Incidence and Mortality Rates* (per 100,000 population) for Female Thyroid Cancer by Health Region, NB and Canada, 2007-2013
0 10 20 30 40
Females Incidence Mortality
Age-Standardized Rates
50 60
12.9
21.0
19.6
50.2
27.6
18.6
26.9
23.0
15.2
0.4
0.3
0.4
1.2
0.6
0.7
0.2
0.4
0.4Canada
NB
HR7
HR6
HR5
HR4
HR3
HR2
HR1
Bladder CancerSimilar to the previous provincial cancer reports,1,5,6 bladder ranked as the fourth leading cancer for males in New Brunswick (Table 10). Incidence rates per 100,000 population of bladder cancer for males ranged from 30.2 in HR7 to 42.8 cases in HR5. The national incidence rate of bladder cancer in 2015 was 26 cases per 100,000 population (Figure 32).3
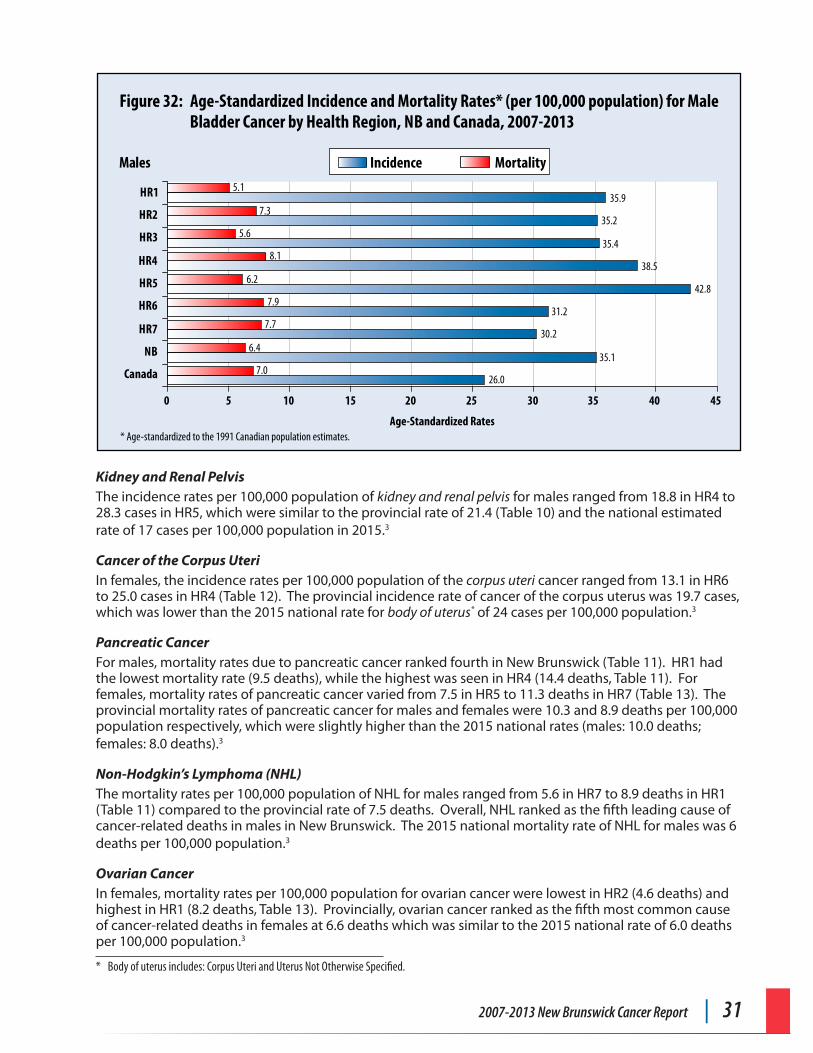
2007-2013 New Brunswick Cancer Report | 31
* Age-standardized to the 1991 Canadian population estimates.
Figure 32: Age-Standardized Incidence and Mortality Rates* (per 100,000 population) for Male Bladder Cancer by Health Region, NB and Canada, 2007-2013
0 5 10 15 20 45
Males Incidence Mortality
Age-Standardized Rates
25 30 35 40
35.4
35.2
26.0
42.8
35.9
38.5
31.2
30.2
35.17.0
6.4
7.7
7.9
6.2
8.1
5.6
7.3
5.1
Canada
NB
HR7
HR6
HR5
HR4
HR3
HR2
HR1
Kidney and Renal PelvisThe incidence rates per 100,000 population of kidney and renal pelvis for males ranged from 18.8 in HR4 to 28.3 cases in HR5, which were similar to the provincial rate of 21.4 (Table 10) and the national estimated rate of 17 cases per 100,000 population in 2015.3
Cancer of the Corpus UteriIn females, the incidence rates per 100,000 population of the corpus uteri cancer ranged from 13.1 in HR6 to 25.0 cases in HR4 (Table 12). The provincial incidence rate of cancer of the corpus uterus was 19.7 cases, which was lower than the 2015 national rate for body of uterus* of 24 cases per 100,000 population.3
Pancreatic CancerFor males, mortality rates due to pancreatic cancer ranked fourth in New Brunswick (Table 11). HR1 had the lowest mortality rate (9.5 deaths), while the highest was seen in HR4 (14.4 deaths, Table 11). For females, mortality rates of pancreatic cancer varied from 7.5 in HR5 to 11.3 deaths in HR7 (Table 13). The provincial mortality rates of pancreatic cancer for males and females were 10.3 and 8.9 deaths per 100,000 population respectively, which were slightly higher than the 2015 national rates (males: 10.0 deaths; females: 8.0 deaths).3
Non-Hodgkin’s Lymphoma (NHL)The mortality rates per 100,000 population of NHL for males ranged from 5.6 in HR7 to 8.9 deaths in HR1 (Table 11) compared to the provincial rate of 7.5 deaths. Overall, NHL ranked as the fifth leading cause of cancer-related deaths in males in New Brunswick. The 2015 national mortality rate of NHL for males was 6 deaths per 100,000 population.3
Ovarian CancerIn females, mortality rates per 100,000 population for ovarian cancer were lowest in HR2 (4.6 deaths) and highest in HR1 (8.2 deaths, Table 13). Provincially, ovarian cancer ranked as the fifth most common cause of cancer-related deaths in females at 6.6 deaths which was similar to the 2015 national rate of 6.0 deaths per 100,000 population.3
* Body of uterus includes: Corpus Uteri and Uterus Not Otherwise Specified.
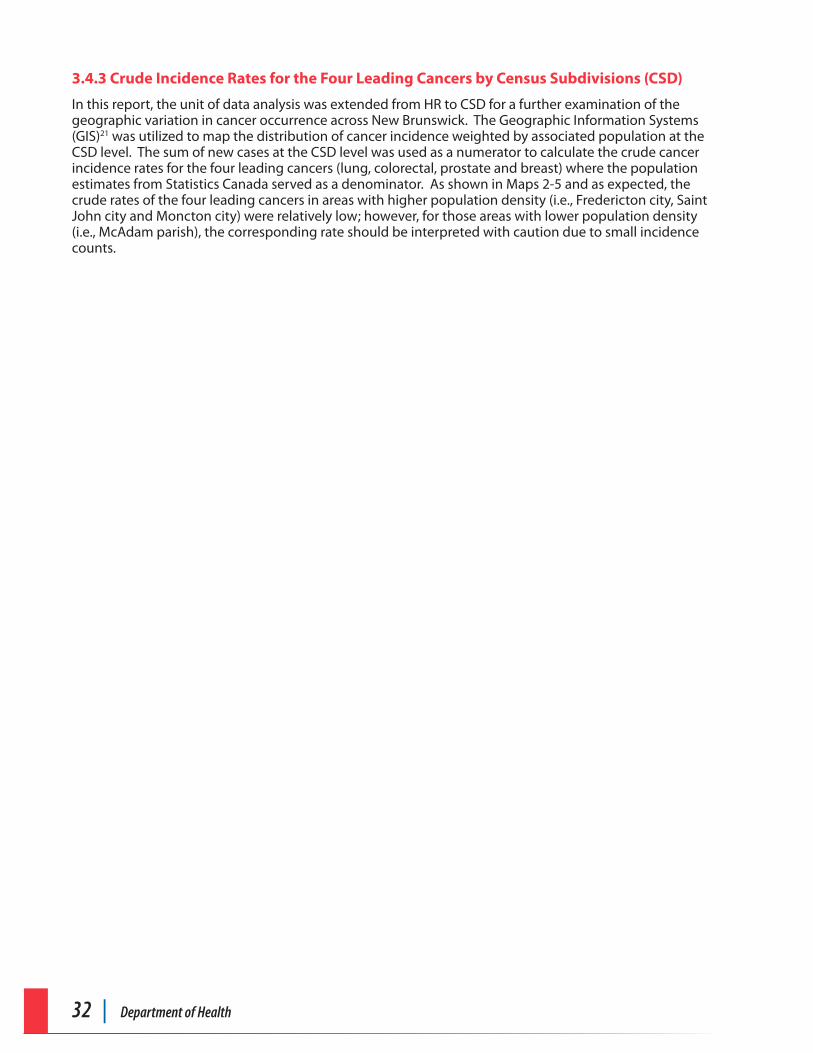
32 | Department of Health
3.4.3 Crude Incidence Rates for the Four Leading Cancers by Census Subdivisions (CSD)
In this report, the unit of data analysis was extended from HR to CSD for a further examination of the geographic variation in cancer occurrence across New Brunswick. The Geographic Information Systems (GIS)21 was utilized to map the distribution of cancer incidence weighted by associated population at the CSD level. The sum of new cases at the CSD level was used as a numerator to calculate the crude cancer incidence rates for the four leading cancers (lung, colorectal, prostate and breast) where the population estimates from Statistics Canada served as a denominator. As shown in Maps 2-5 and as expected, the crude rates of the four leading cancers in areas with higher population density (i.e., Fredericton city, Saint John city and Moncton city) were relatively low; however, for those areas with lower population density (i.e., McAdam parish), the corresponding rate should be interpreted with caution due to small incidence counts.
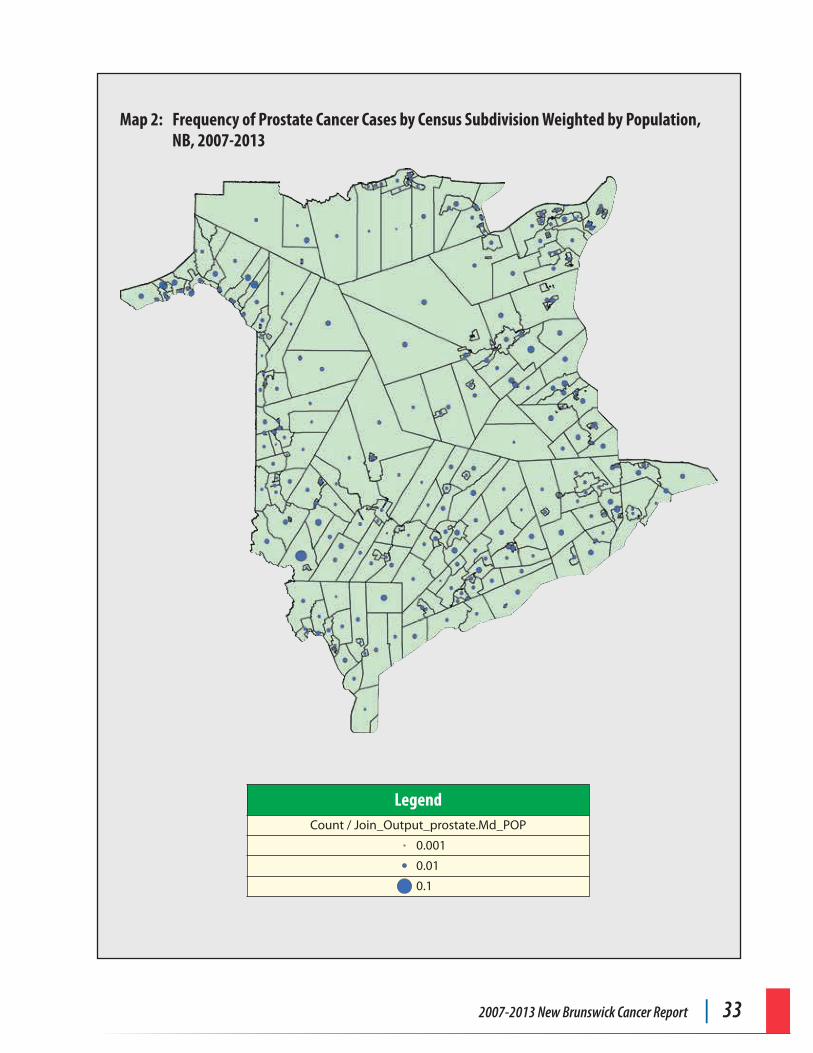
2007-2013 New Brunswick Cancer Report | 33
Map 2: Frequency of Prostate Cancer Cases by Census Subdivision Weighted by Population, NB, 2007-2013
LegendCount / Join_Output_prostate.Md_POP
0.001
0.01
0.1
34 | Department of Health
Map 3: Frequency of Breast Cancer Cases by Census Subdivision Weighted by Population, NB, 2007-2013
LegendCount / Join_Output_breast.ModifyPOP
0.001
0.01
0.1
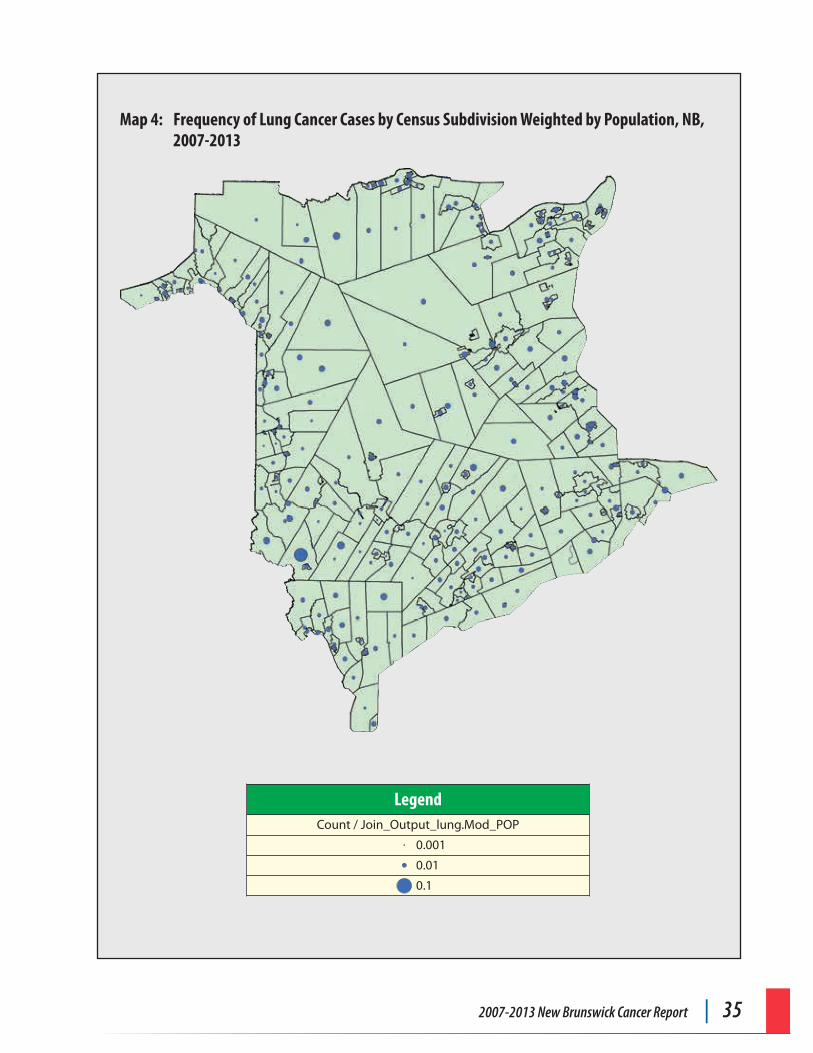
2007-2013 New Brunswick Cancer Report | 35
Map 4: Frequency of Lung Cancer Cases by Census Subdivision Weighted by Population, NB, 2007-2013
LegendCount / Join_Output_lung.Mod_POP
0.001
0.01
0.1
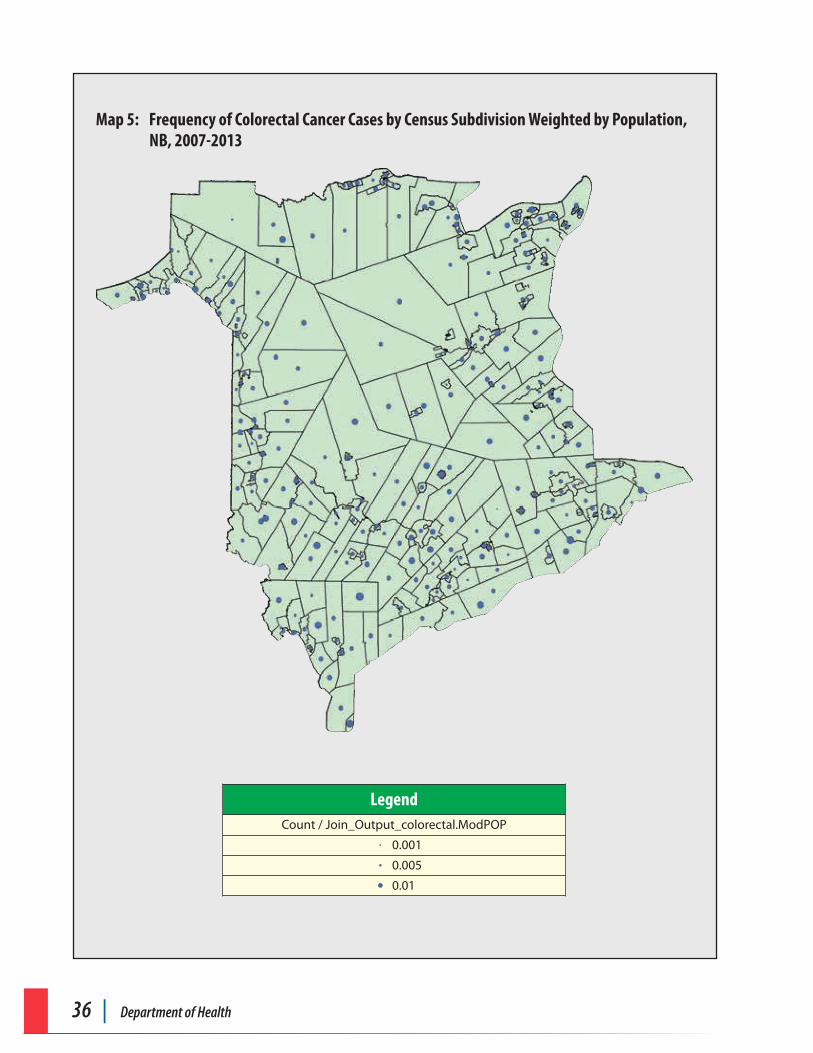
36 | Department of Health
Map 5: Frequency of Colorectal Cancer Cases by Census Subdivision Weighted by Population, NB, 2007-2013
LegendCount / Join_Output_colorectal.ModPOP
0.001
0.005
0.01
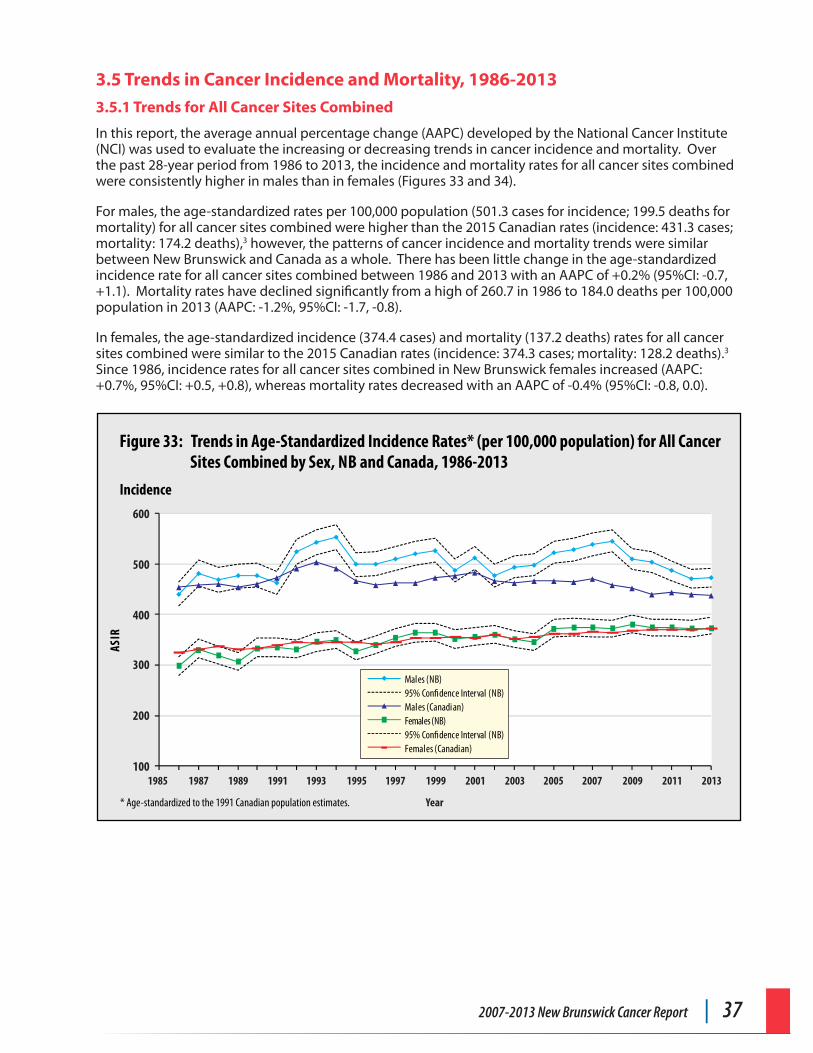
2007-2013 New Brunswick Cancer Report | 37
3.5 Trends in Cancer Incidence and Mortality, 1986-2013
3.5.1 Trends for All Cancer Sites Combined
In this report, the average annual percentage change (AAPC) developed by the National Cancer Institute (NCI) was used to evaluate the increasing or decreasing trends in cancer incidence and mortality. Over the past 28-year period from 1986 to 2013, the incidence and mortality rates for all cancer sites combined were consistently higher in males than in females (Figures 33 and 34).
For males, the age-standardized rates per 100,000 population (501.3 cases for incidence; 199.5 deaths for mortality) for all cancer sites combined were higher than the 2015 Canadian rates (incidence: 431.3 cases; mortality: 174.2 deaths),3 however, the patterns of cancer incidence and mortality trends were similar between New Brunswick and Canada as a whole. There has been little change in the age-standardized incidence rate for all cancer sites combined between 1986 and 2013 with an AAPC of +0.2% (95%CI: -0.7, +1.1). Mortality rates have declined significantly from a high of 260.7 in 1986 to 184.0 deaths per 100,000 population in 2013 (AAPC: -1.2%, 95%CI: -1.7, -0.8).
In females, the age-standardized incidence (374.4 cases) and mortality (137.2 deaths) rates for all cancer sites combined were similar to the 2015 Canadian rates (incidence: 374.3 cases; mortality: 128.2 deaths).3 Since 1986, incidence rates for all cancer sites combined in New Brunswick females increased (AAPC: +0.7%, 95%CI: +0.5, +0.8), whereas mortality rates decreased with an AAPC of -0.4% (95%CI: -0.8, 0.0).
Figure 33: Trends in Age-Standardized Incidence Rates* (per 100,000 population) for All Cancer Sites Combined by Sex, NB and Canada, 1986-2013
Incidence
ASIR
600
500
400
300
200
100
Year
1985 1987 1989 1991 1993 1995 1997 1999 2001 2003 2005 2007 2009 2011 2013
95% Confidence Interval (NB)
95% Confidence Interval (NB)
Males (NB)
Males (Canadian)Females (NB)
Females (Canadian)
* Age-standardized to the 1991 Canadian population estimates.
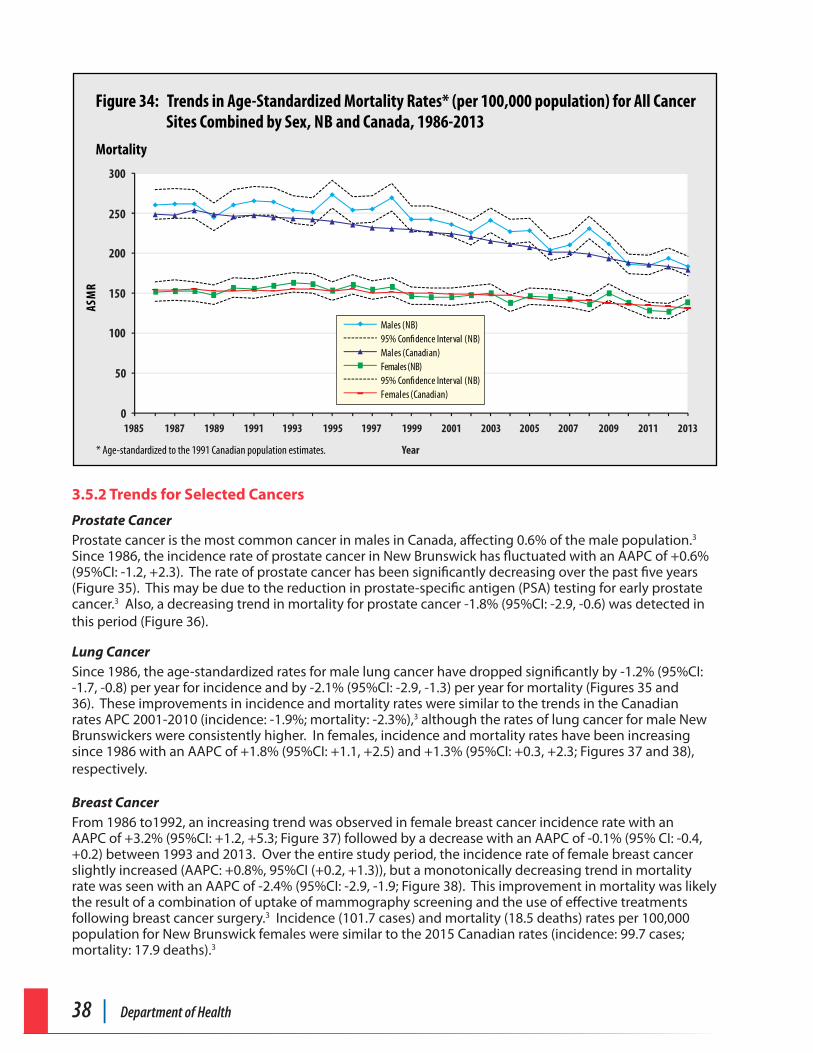
38 | Department of Health
Figure 34: Trends in Age-Standardized Mortality Rates* (per 100,000 population) for All Cancer Sites Combined by Sex, NB and Canada, 1986-2013
Mortality
ASM
R
300
250
200
150
100
50
Year* Age-standardized to the 1991 Canadian population estimates.
1985 1987 1989 1991 1993 1995 1997 1999 2001 2003 2005 2007 2009 2011 20130
95% Confidence Interval (NB)
95% Confidence Interval (NB)
Males (NB)
Males (Canadian)Females (NB)
Females (Canadian)
3.5.2 Trends for Selected Cancers
Prostate CancerProstate cancer is the most common cancer in males in Canada, affecting 0.6% of the male population.3 Since 1986, the incidence rate of prostate cancer in New Brunswick has fluctuated with an AAPC of +0.6% (95%CI: -1.2, +2.3). The rate of prostate cancer has been significantly decreasing over the past five years (Figure 35). This may be due to the reduction in prostate-specific antigen (PSA) testing for early prostate cancer.3 Also, a decreasing trend in mortality for prostate cancer -1.8% (95%CI: -2.9, -0.6) was detected in this period (Figure 36).
Lung CancerSince 1986, the age-standardized rates for male lung cancer have dropped significantly by -1.2% (95%CI: -1.7, -0.8) per year for incidence and by -2.1% (95%CI: -2.9, -1.3) per year for mortality (Figures 35 and 36). These improvements in incidence and mortality rates were similar to the trends in the Canadian rates APC 2001-2010 (incidence: -1.9%; mortality: -2.3%),3 although the rates of lung cancer for male New Brunswickers were consistently higher. In females, incidence and mortality rates have been increasing since 1986 with an AAPC of +1.8% (95%CI: +1.1, +2.5) and +1.3% (95%CI: +0.3, +2.3; Figures 37 and 38), respectively.
Breast Cancer From 1986 to1992, an increasing trend was observed in female breast cancer incidence rate with an AAPC of +3.2% (95%CI: +1.2, +5.3; Figure 37) followed by a decrease with an AAPC of -0.1% (95% CI: -0.4, +0.2) between 1993 and 2013. Over the entire study period, the incidence rate of female breast cancer slightly increased (AAPC: +0.8%, 95%CI (+0.2, +1.3)), but a monotonically decreasing trend in mortality rate was seen with an AAPC of -2.4% (95%CI: -2.9, -1.9; Figure 38). This improvement in mortality was likely the result of a combination of uptake of mammography screening and the use of effective treatments following breast cancer surgery.3 Incidence (101.7 cases) and mortality (18.5 deaths) rates per 100,000 population for New Brunswick females were similar to the 2015 Canadian rates (incidence: 99.7 cases; mortality: 17.9 deaths).3
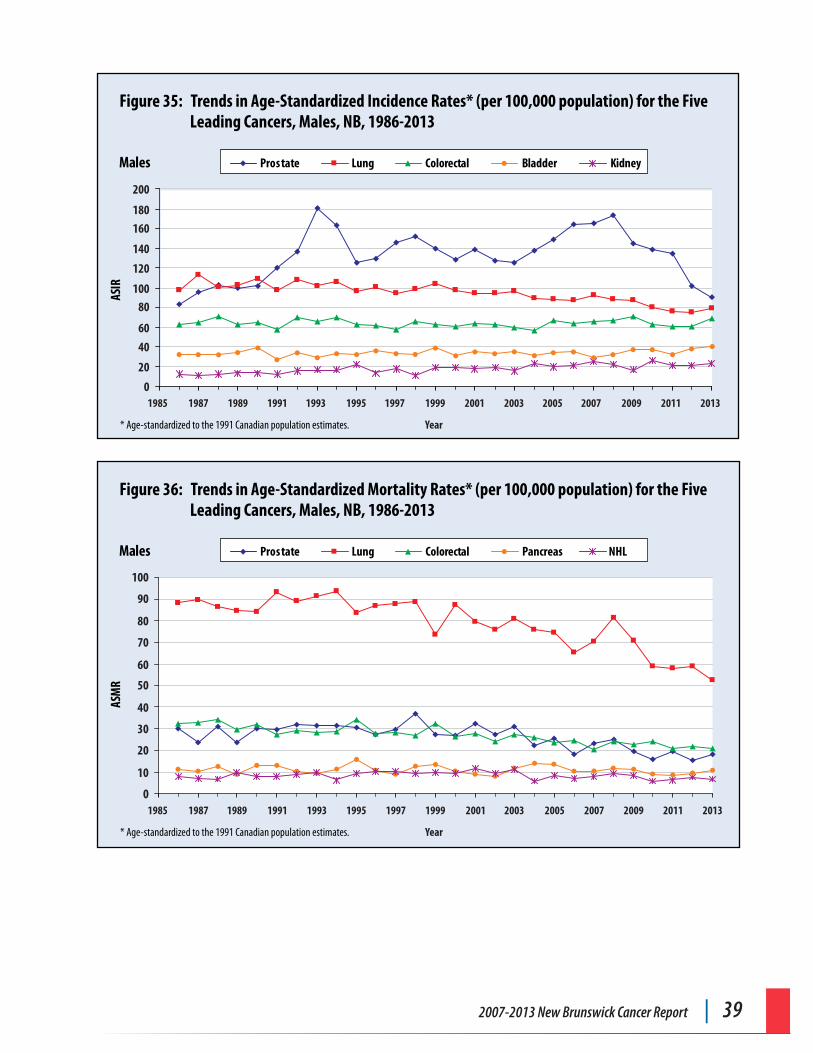
2007-2013 New Brunswick Cancer Report | 39
Figure 35: Trends in Age-Standardized Incidence Rates* (per 100,000 population) for the Five Leading Cancers, Males, NB, 1986-2013
Males
Year* Age-standardized to the 1991 Canadian population estimates.
1985 1987 1989 1991 1993 1995 1997 1999 2001 2003 2005 2007 2009 2011 2013
ASIR
200
180
160
140
120
10080
40
60
20
0
Prostate Lung Colorectal Bladder Kidney
Figure 36: Trends in Age-Standardized Mortality Rates* (per 100,000 population) for the Five Leading Cancers, Males, NB, 1986-2013
Males
Year* Age-standardized to the 1991 Canadian population estimates.
1985 1987 1989 1991 1993 1995 1997 1999 2001 2003 2005 2007 2009 2011 2013
Prostate Lung Colorectal Pancreas NHL
ASM
R
0
10
20
30
40
50
60
70
80
90
100
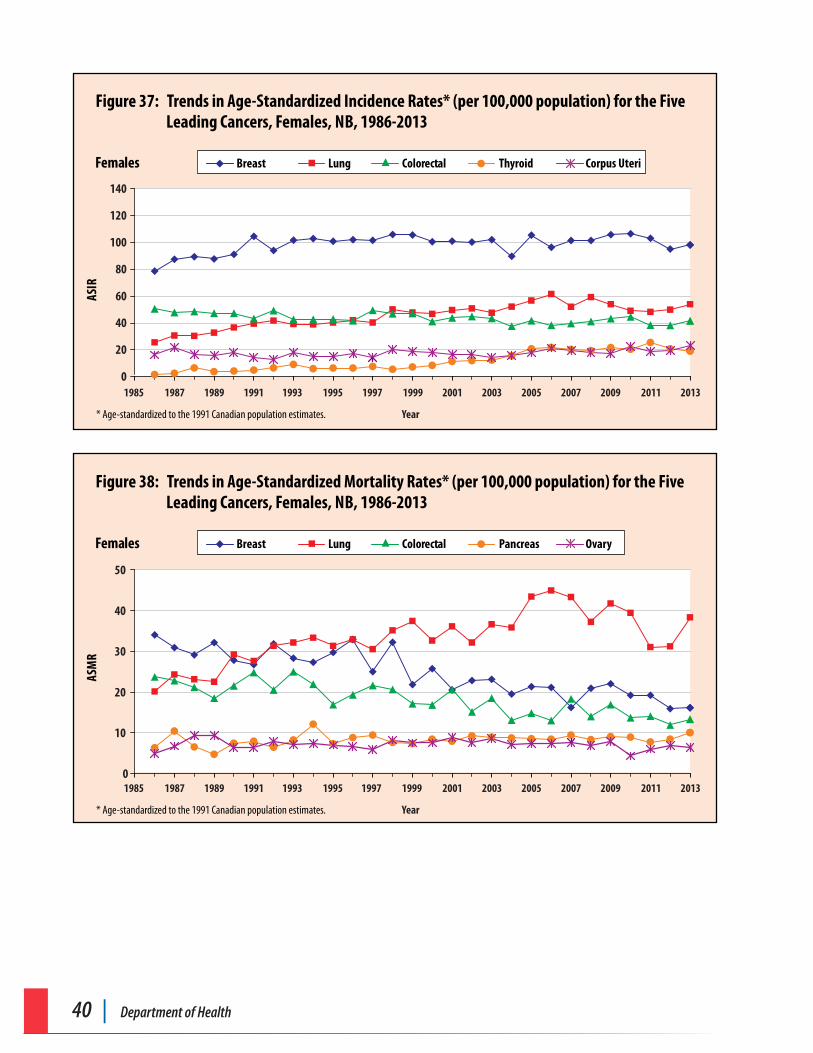
40 | Department of Health
Figure 37: Trends in Age-Standardized Incidence Rates* (per 100,000 population) for the Five Leading Cancers, Females, NB, 1986-2013
Females
Year* Age-standardized to the 1991 Canadian population estimates.
1985 1987 1989 1991 1993 1995 1997 1999 2001 2003 2005 2007 2009 2011 2013
ASIR
Breast Lung Colorectal Thyroid Corpus Uteri
0
20
40
60
80
100
120
140
0
10
20
30
40
50
Figure 38: Trends in Age-Standardized Mortality Rates* (per 100,000 population) for the Five Leading Cancers, Females, NB, 1986-2013
Females
Year* Age-standardized to the 1991 Canadian population estimates.
1985 1987 1989 1991 1993 1995 1997 1999 2001 2003 2005 2007 2009 2011 2013
ASM
R
Breast Lung Colorectal Pancreas Ovary
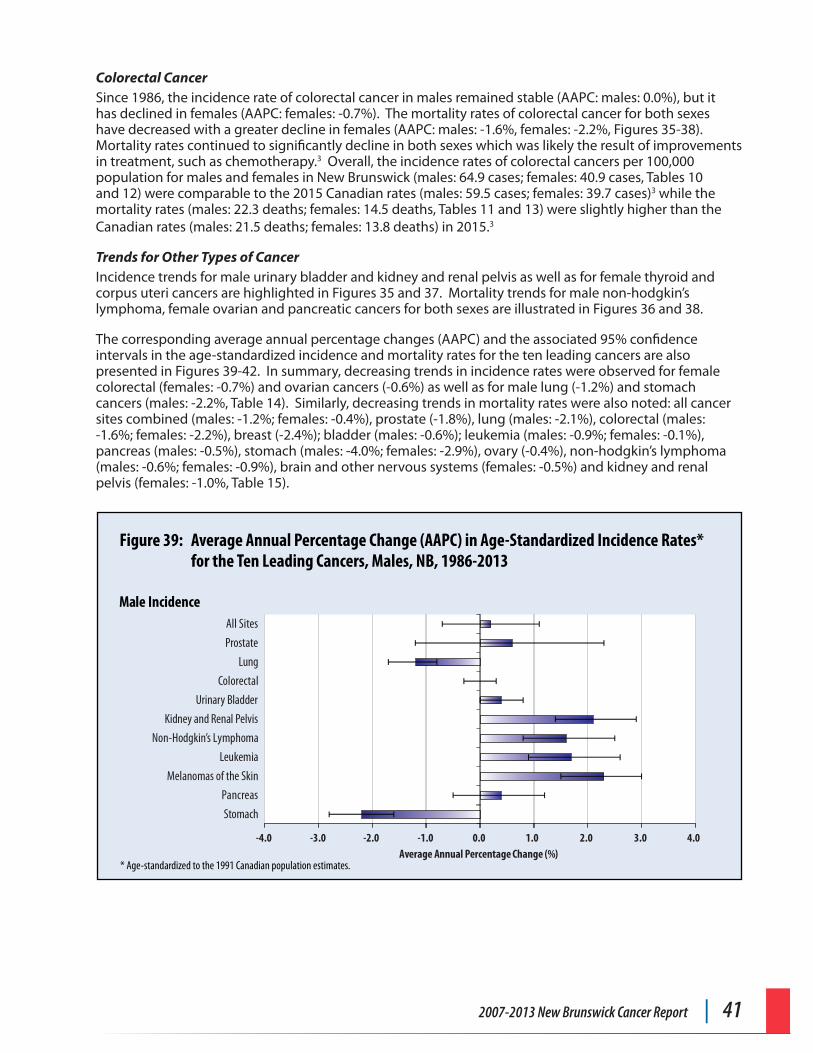
2007-2013 New Brunswick Cancer Report | 41
Colorectal CancerSince 1986, the incidence rate of colorectal cancer in males remained stable (AAPC: males: 0.0%), but it has declined in females (AAPC: females: -0.7%). The mortality rates of colorectal cancer for both sexes have decreased with a greater decline in females (AAPC: males: -1.6%, females: -2.2%, Figures 35-38). Mortality rates continued to significantly decline in both sexes which was likely the result of improvements in treatment, such as chemotherapy.3 Overall, the incidence rates of colorectal cancers per 100,000 population for males and females in New Brunswick (males: 64.9 cases; females: 40.9 cases, Tables 10 and 12) were comparable to the 2015 Canadian rates (males: 59.5 cases; females: 39.7 cases)3 while the mortality rates (males: 22.3 deaths; females: 14.5 deaths, Tables 11 and 13) were slightly higher than the Canadian rates (males: 21.5 deaths; females: 13.8 deaths) in 2015.3
Trends for Other Types of CancerIncidence trends for male urinary bladder and kidney and renal pelvis as well as for female thyroid and corpus uteri cancers are highlighted in Figures 35 and 37. Mortality trends for male non-hodgkin’s lymphoma, female ovarian and pancreatic cancers for both sexes are illustrated in Figures 36 and 38.
The corresponding average annual percentage changes (AAPC) and the associated 95% confidence intervals in the age-standardized incidence and mortality rates for the ten leading cancers are also presented in Figures 39-42. In summary, decreasing trends in incidence rates were observed for female colorectal (females: -0.7%) and ovarian cancers (-0.6%) as well as for male lung (-1.2%) and stomach cancers (males: -2.2%, Table 14). Similarly, decreasing trends in mortality rates were also noted: all cancer sites combined (males: -1.2%; females: -0.4%), prostate (-1.8%), lung (males: -2.1%), colorectal (males: -1.6%; females: -2.2%), breast (-2.4%); bladder (males: -0.6%); leukemia (males: -0.9%; females: -0.1%), pancreas (males: -0.5%), stomach (males: -4.0%; females: -2.9%), ovary (-0.4%), non-hodgkin’s lymphoma (males: -0.6%; females: -0.9%), brain and other nervous systems (females: -0.5%) and kidney and renal pelvis (females: -1.0%, Table 15).
Figure 39: Average Annual Percentage Change (AAPC) in Age-Standardized Incidence Rates* for the Ten Leading Cancers, Males, NB, 1986-2013
Male Incidence
* Age-standardized to the 1991 Canadian population estimates.
-4.0 -3.0 -2.0 -1.0 0.0 1.0 2.0 3.0 4.0
Stomach
Pancreas
Melanomas of the Skin
Leukemia
Non-Hodgkin’s Lymphoma
Kidney and Renal Pelvis
Urinary Bladder
Colorectal
Lung
Prostate
All Sites
Average Annual Percentage Change (%)
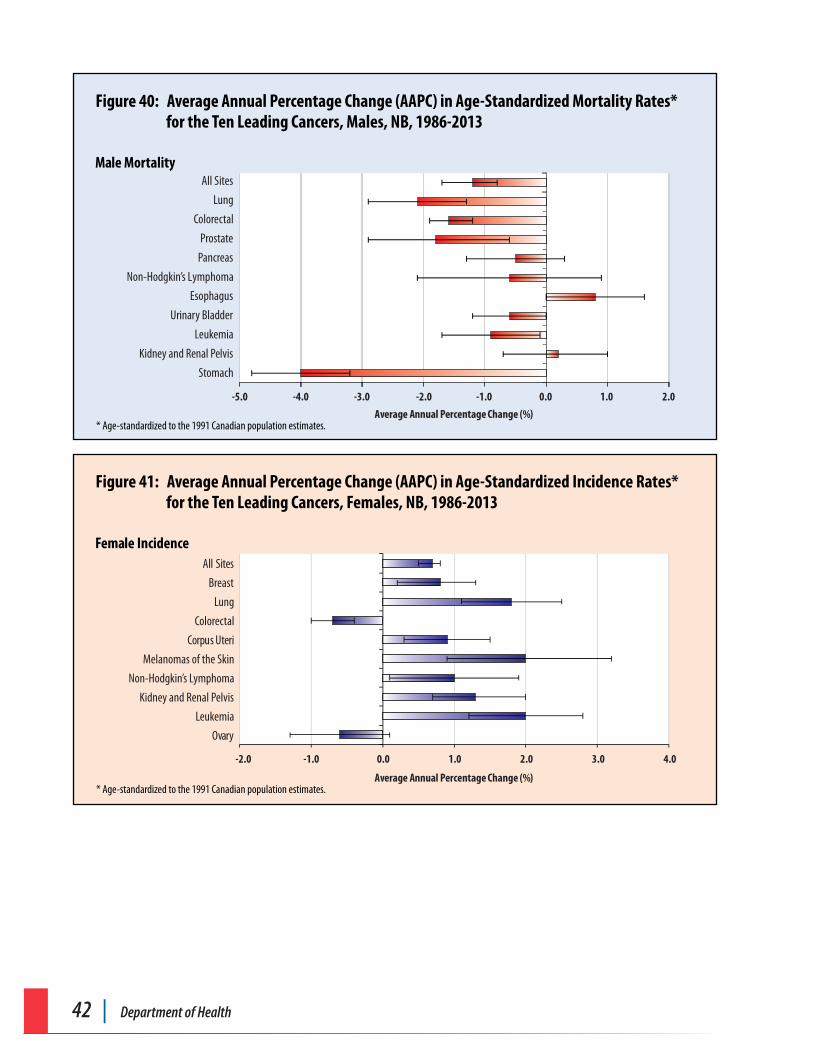
42 | Department of Health
Figure 40: Average Annual Percentage Change (AAPC) in Age-Standardized Mortality Rates*for the Ten Leading Cancers, Males, NB, 1986-2013
Male Mortality
* Age-standardized to the 1991 Canadian population estimates.
-5.0 -4.0 -3.0 -2.0 -1.0 0.0 1.0 2.0
Stomach
Kidney and Renal Pelvis
Leukemia
Urinary Bladder
Esophagus
Non-Hodgkin’s Lymphoma
Pancreas
Prostate
Colorectal
Lung
All Sites
Average Annual Percentage Change (%)
Figure 41: Average Annual Percentage Change (AAPC) in Age-Standardized Incidence Rates* for the Ten Leading Cancers, Females, NB, 1986-2013
Female Incidence
* Age-standardized to the 1991 Canadian population estimates.
Average Annual Percentage Change (%)
-2.0 -1.0 0.0 1.0 2.0 3.0 4.0
Ovary
Leukemia
Kidney and Renal Pelvis
Non-Hodgkin’s Lymphoma
Melanomas of the Skin
Corpus Uteri
Colorectal
Lung
Breast
All Sites
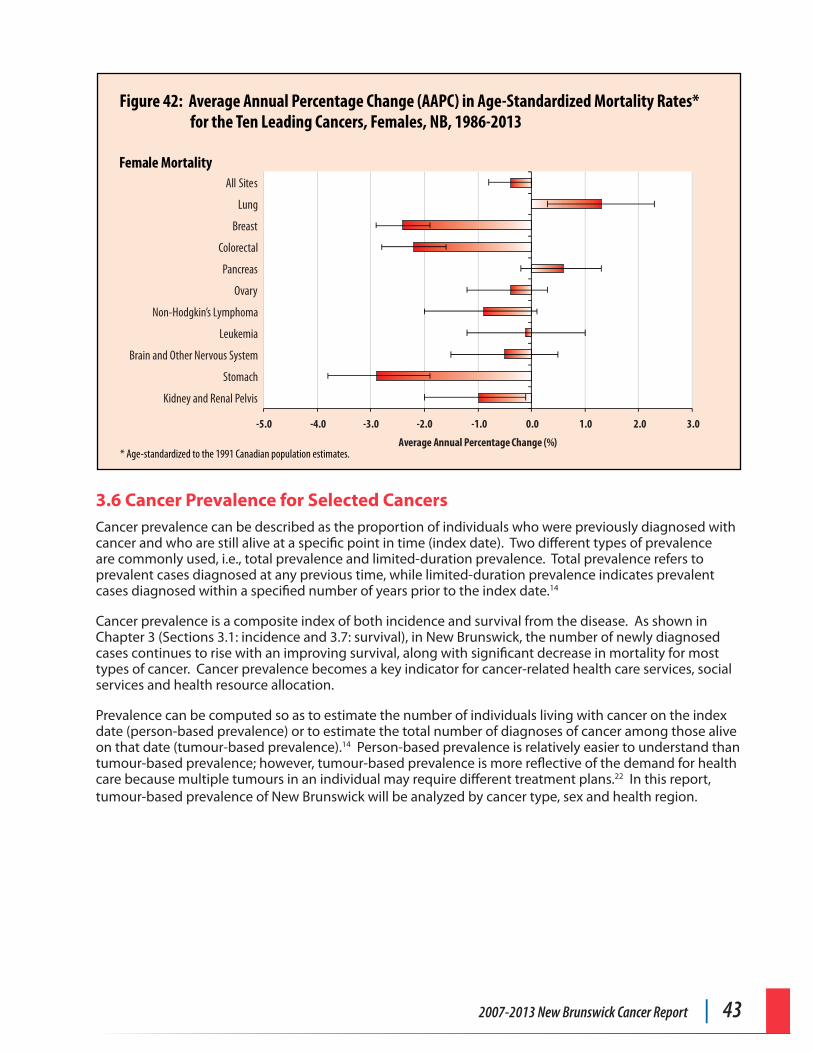
2007-2013 New Brunswick Cancer Report | 43
Figure 42: Average Annual Percentage Change (AAPC) in Age-Standardized Mortality Rates* for the Ten Leading Cancers, Females, NB, 1986-2013
Female Mortality
* Age-standardized to the 1991 Canadian population estimates.
Average Annual Percentage Change (%)
-5.0 -4.0 -3.0 -2.0 -1.0 0.0 1.0 2.0 3.0
Kidney and Renal Pelvis
Stomach
Brain and Other Nervous System
Leukemia
Non-Hodgkin’s Lymphoma
Ovary
Pancreas
Colorectal
Breast
Lung
All Sites
3.6 Cancer Prevalence for Selected Cancers Cancer prevalence can be described as the proportion of individuals who were previously diagnosed with cancer and who are still alive at a specific point in time (index date). Two different types of prevalence are commonly used, i.e., total prevalence and limited-duration prevalence. Total prevalence refers to prevalent cases diagnosed at any previous time, while limited-duration prevalence indicates prevalent cases diagnosed within a specified number of years prior to the index date.14
Cancer prevalence is a composite index of both incidence and survival from the disease. As shown in Chapter 3 (Sections 3.1: incidence and 3.7: survival), in New Brunswick, the number of newly diagnosed cases continues to rise with an improving survival, along with significant decrease in mortality for most types of cancer. Cancer prevalence becomes a key indicator for cancer-related health care services, social services and health resource allocation.
Prevalence can be computed so as to estimate the number of individuals living with cancer on the index date (person-based prevalence) or to estimate the total number of diagnoses of cancer among those alive on that date (tumour-based prevalence).14 Person-based prevalence is relatively easier to understand than tumour-based prevalence; however, tumour-based prevalence is more reflective of the demand for health care because multiple tumours in an individual may require different treatment plans.22 In this report, tumour-based prevalence of New Brunswick will be analyzed by cancer type, sex and health region.
44 | Department of Health
3.6.1 Tumour-Based Prevalence
Among persons alive on January 1, 2014 in New Brunswick, a total of 24,655 primary cancer cases (13,023 for males and 11,632 for females) had been diagnosed in the previous ten years for all cancer sites combined (Table 16).
By cancer type:• Around 59.5% (14,665 /24,655) of 10-year prevalent cases were either prostate (23.0%, 5,667/24,655)
or breast (17.6%, 4,345/24,655), followed by colorectal (12.7%, 3,122/24,655) and lung cancers (6.2%, 1,531/24,655).
• Despite the higher incidence of lung cancer in the study period, the number of 10-year prevalent colorectal cancer cases were about 2 times greater, which reflects the poor prognosis of those diagnosed with lung cancer.
By sex:• Prostate (43.5%, 5,667/13,023), colorectal (13.6%, 1,765/13,023) and lung cancers (5.9%, 762/13,023)
accounted for 62.9% (8,194/13,023) of all prevalent cases in males.
• Breast (37.4%, 4,345/11,632), colorectal (11.7%, 1,357/11,632) and lung cancers (6.6%, 769/11,632) accounted for 55.6% (6,471/11,632) of all prevalent cases in females.
By health region: • As of January 1, 2014, the percentages of 10-year prevalent cancer cases were as follows: HR1: 28.1%
(6,927/24,655), HR2: 23.2% (5,731/24,655), HR3: 18.7% (4,599/24,655), HR4: 6.7% (1,661/24,655), HR5: 3.8% (944/24,655), HR6: 12.1% (2,976/24,655) and HR7: 7.4% (1,832/24,655). Larger HRs (HR1, HR2 and HR3) consisted of 70.0% (17,257/24,655) of all prevalent cases in New Brunswick.
3.6.2 Person-Based Prevalence
Table 17 presents the 10-year person-based prevalence for the four leading cancers (prostate, breast, lung and colorectal) for those who were alive on January 1, 2014.
By cancer type: • More than half of the 10-year prevalent cases (57.2%, 12,073/21,092) were either prostate (23.0%,
4,846/21,092) or breast (17.1%, 3,607/21,092), followed by colorectal (11.8%, 2,498/21,092) and lung cancer (5.3%, 1,122/21,092).
• Similar to the tumour-based prevalence ratio (i.e., the number of prevalent colorectal cancer cases was about 2 times greater than that of lung cancer), the person-based ratio between these two cancers was 2.2, which again reflects the poor prognosis for those diagnosed with lung cancer.
By sex: • Prostate (43.3%, 4,846/11,199), colorectal (12.6%, 1,414/11,199) and lung cancers (4.9%, 550/11,199)
accounted for 60.8% (6,810/11,199) of all prevalent cases in males.
• Breast (36.5%, 3,607/9,893), colorectal (11.0%, 1,084/9,893) and lung cancers (5.8%, 572/9,893) accounted for 53.2% (5,263/9,893) of all prevalent cases in females.
By health region: • As of January 1, 2014, the percentages of 10-year prevalent cancer cases were as follows: HR1: 28.0%
(5,914/21,092), HR2: 22.5% (4,743/21,092), HR3: 18.8% (3,962/21,092), HR4: 7.1% (1,491/21,092), HR5: 3.9% (815/21,092), HR6: 12.4% (2,616/21,092) and HR7: 7.4% (1,551/21,092). Larger HRs (HR1, HR2 and HR3) consisted of 69.3% of all prevalent cases in New Brunswick.
2007-2013 New Brunswick Cancer Report | 45
3.7 Relative Survival for Selected Cancers
3.7.1 Five-Year Relative Survival for Selected Cancers
Similar to incidence and mortality rates, population-based cancer survival rate is a measure of cancer severity and prognosis. For example, when examining across cancer types by patient age and cancer stage at diagnosis, survival estimates can be used to establish priority areas for improving prognosis.23 Examined over time and in conjunction with incidence and mortality trends, survival estimates represent an important indicator of progress in cancer control.24 The relative survival ratio (RSR) is utilized to estimate survival time between individuals diagnosed with cancer to those who are free of cancer. Specifically, the RSR is defined as the ratio of the observed survival for a group of individuals diagnosed with cancer to the survival expected for people in the same general population.25 A five-year relative survival ratio of 90% for a particular cancer indicates that patients with that cancer had a 90% likelihood of living for five years after diagnosis compared to similar people without cancer in the general population. It is important to realize that RSR is an “average” estimate and does not reflect an individual’s survival time.
Cancer survival refers to the amount of time between first diagnosis and death of a cancer patient. It is generally influenced by many factors such as age, sex, histological subtype, cancer stage, location of disease, presence of co-morbidity, availability and quality of early detection, diagnostic and treatment services. The stage of cancer at diagnosis is known to be an important determinant of cancer survival. Monitoring survival by stage provides valuable information on the effectiveness of cancer detection and treatment efforts. However, it is important to note that although the RSR for breast cancer stage was computed, factors such as lead time associated with the introduction of screening programs were not investigated. Furthermore, since the age of the patient at diagnosis was observed to be an important determinant of prognosis, the RSRs for selected cancers were also examined by age at diagnosis (0-44, 45-49, 50-74 and 75+).
In this report, the five-year RSRs were calculated for the following cancer sites: all cancer sites combined, lung, colorectal, melanomas of the skin, and thyroid cancers for both sexes, prostate and testicular cancers for males and breast, ovarian, cervical, and corpus and uterus cancers for females. Overall, the five-year RSR of all cancer sites combined for males was 63.4% and 64.8% for females, respectively.
In males, the five-year RSR was highest for prostate cancer (95.4%), followed by testicular cancer (94.3%), thyroid cancer (89.8%), melanomas of the skin (88.1%), colorectal cancer (66.2%) and lung cancer (18.4%, Figure 43). In females, the highest five-year RSR was for thyroid cancer (97.6%), followed by breast cancer (88.8%), melanomas of the skin (86.7%), corpus and uterus (81.6%), cervical cancer (67.0%), colorectal cancer (65.7%), ovarian cancer (35.5%) and lung cancer (24.5%, Figure 44).
The estimated five-year RSRs (prostate: 95.4%; female thyroid: 97.6%; female breast: 88.8% and female colorectal cancer: 65.7%; Tables 18 and 19) were similar to the 2015 Canadian estimates (prostate: 96%, females thyroid: 99%, female breast: 88%, females colorectal: 65%).3 Caution should be exercised when interpreting the estimated RSR for male thyroid cancer due to the relatively small number of new cases between 2007 and 2013, i.e., 33 cases per year.
The five-year RSRs tended to be poorer among those diagnosed at an older age (Tables 18 and 19). Lower survival at an older age may be attributed to factors such as the provision of less aggressive treatment due to high level of co-morbidity, as well as less favorable stage distribution.26 Significant differences in the five-year RSR estimates were observed for female breast, prostate and ovarian cancers when the data analysis was conducted based on four different age groups (0-44, 45-49, 50-74 and 75+; Tables 18 and 19). For example, the five-year RSR among females with breast cancer in the 50-74 year age group was 93.2% (95%CI: 90.8, 94.9), which was statistically significantly higher than the ratio for those who were 75 years or older (73.2%, 95%CI: 66.1, 79.0).
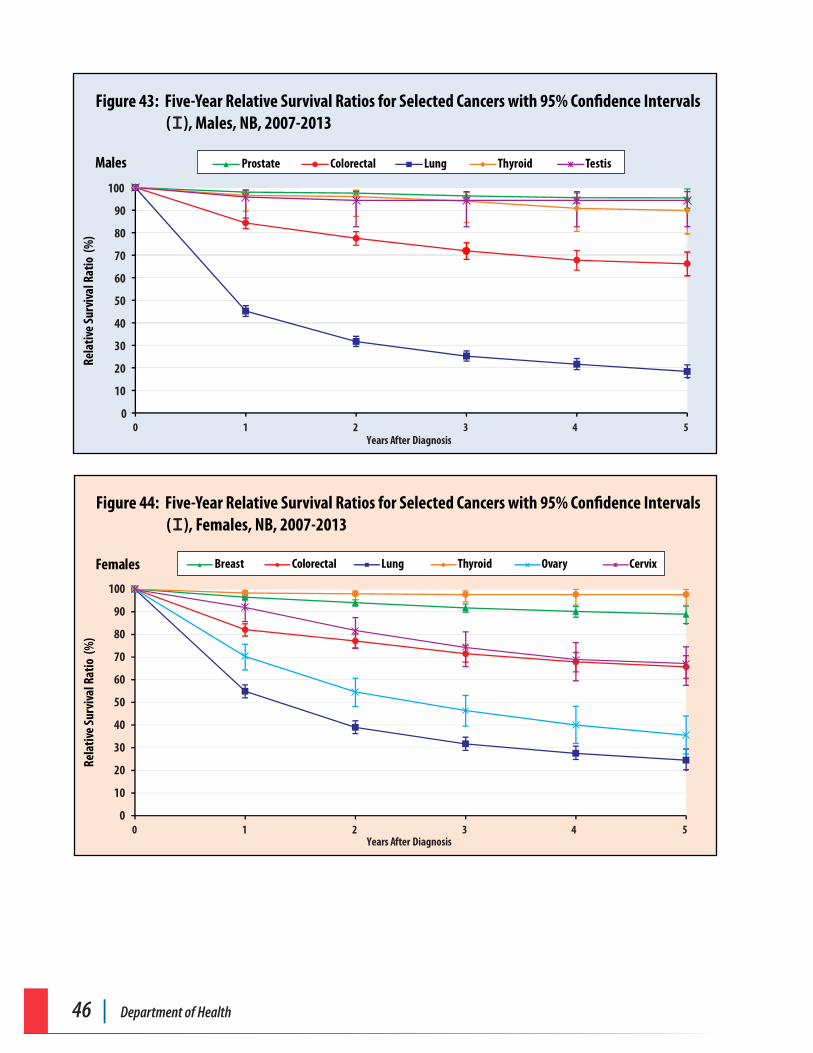
46 | Department of Health
Figure 43: Five-Year Relative Survival Ratios for Selected Cancers with 95% Confidence Intervals ( ), Males, NB, 2007-2013І
Males
0
10
20
30
40
50
60
70
80
90
100
0 1 2 3 4 5
Rela
tive
Surv
ival
Rat
io (
%)
Years After Diagnosis
Prostate Colorectal Lung Thyroid Testis
Figure 44: Five-Year Relative Survival Ratios for Selected Cancers with 95% Confidence Intervals ( ), Females, NB, 2007-2013І
Females
0
10
20
30
40
50
60
70
80
90
100
0 1 2 3 4 5
Rela
tive
Surv
ival
Rat
io (
%)
Years After Diagnosis
Breast Colorectal Lung Thyroid Ovary Cervix
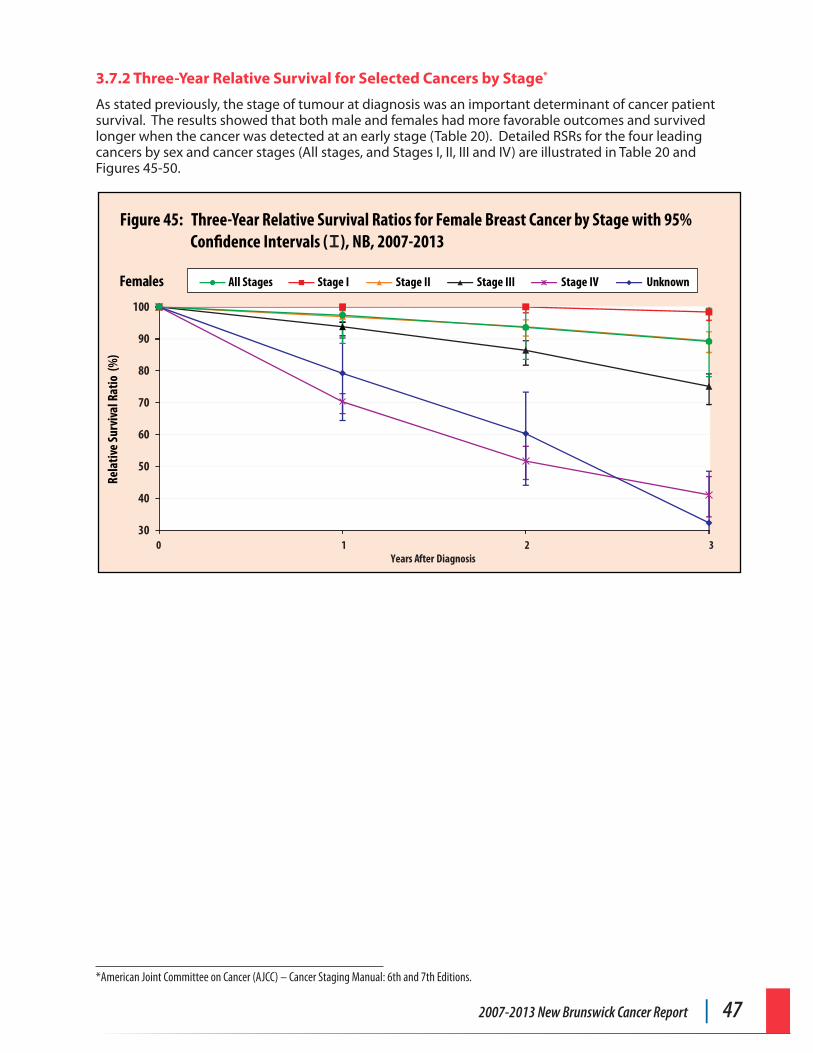
2007-2013 New Brunswick Cancer Report | 47
3.7.2 Three-Year Relative Survival for Selected Cancers by Stage*
As stated previously, the stage of tumour at diagnosis was an important determinant of cancer patient survival. The results showed that both male and females had more favorable outcomes and survived longer when the cancer was detected at an early stage (Table 20). Detailed RSRs for the four leading cancers by sex and cancer stages (All stages, and Stages I, II, III and IV) are illustrated in Table 20 and Figures 45-50.
Figure 45: Three-Year Relative Survival Ratios for Female Breast Cancer by Stage with 95% Confidence Intervals ( ), NB, 2007-2013І
Females
Rela
tive
Surv
ival
Rat
io (
%)
Years After Diagnosis
Stage I Stage II Stage III Stage IV UnknownAll Stages
30
40
50
60
70
80
90
100
0 1 2 3
*American Joint Committee on Cancer (AJCC) – Cancer Staging Manual: 6th and 7th Editions.
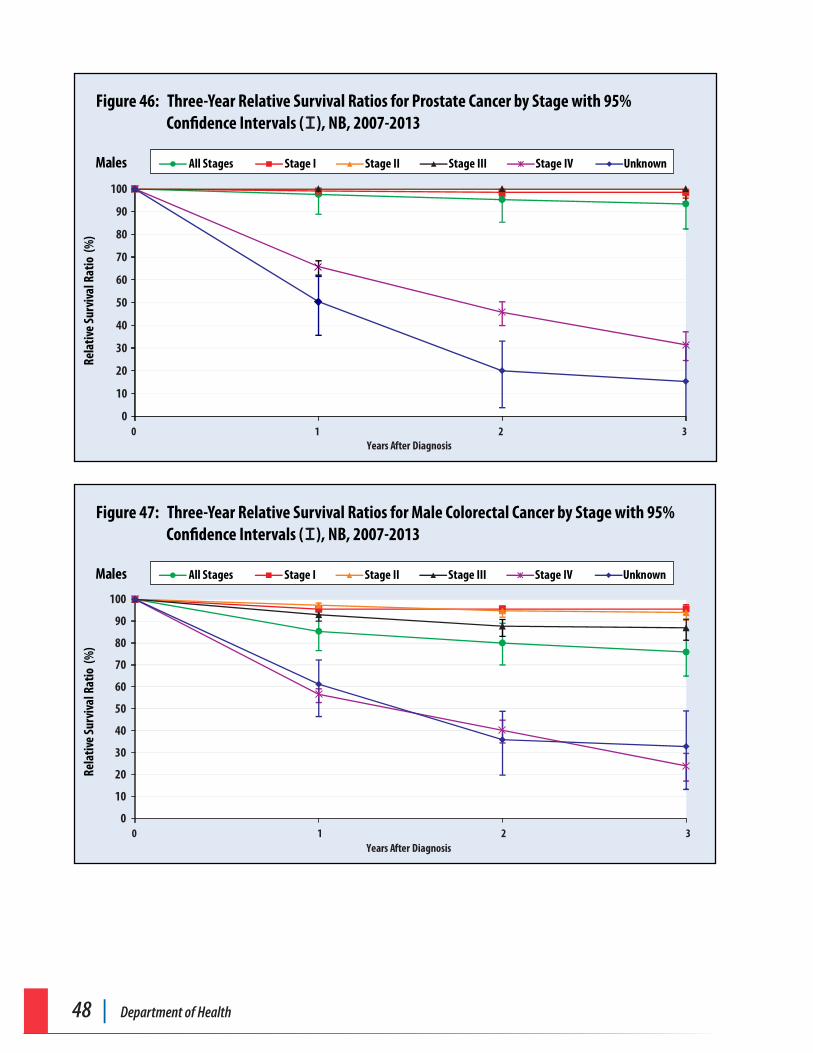
48 | Department of Health
Figure 46: Three-Year Relative Survival Ratios for Prostate Cancer by Stage with 95% Confidence Intervals ( ), NB, 2007-2013І
Males
Rela
tive
Surv
ival
Rat
io (
%)
Years After Diagnosis
All Stages Stage I Stage II Stage III Stage IV Unknown
0
10
20
30
40
50
60
70
80
90
100
0 1 2 3
Figure 47: Three-Year Relative Survival Ratios for Male Colorectal Cancer by Stage with 95% Confidence Intervals ( ), NB, 2007-2013І
Males
Rela
tive
Surv
ival
Rat
io (
%)
Years After Diagnosis
All Stages Stage I Stage II Stage III Stage IV Unknown
0
10
20
30
40
50
60
70
80
90
100
0 1 2 3
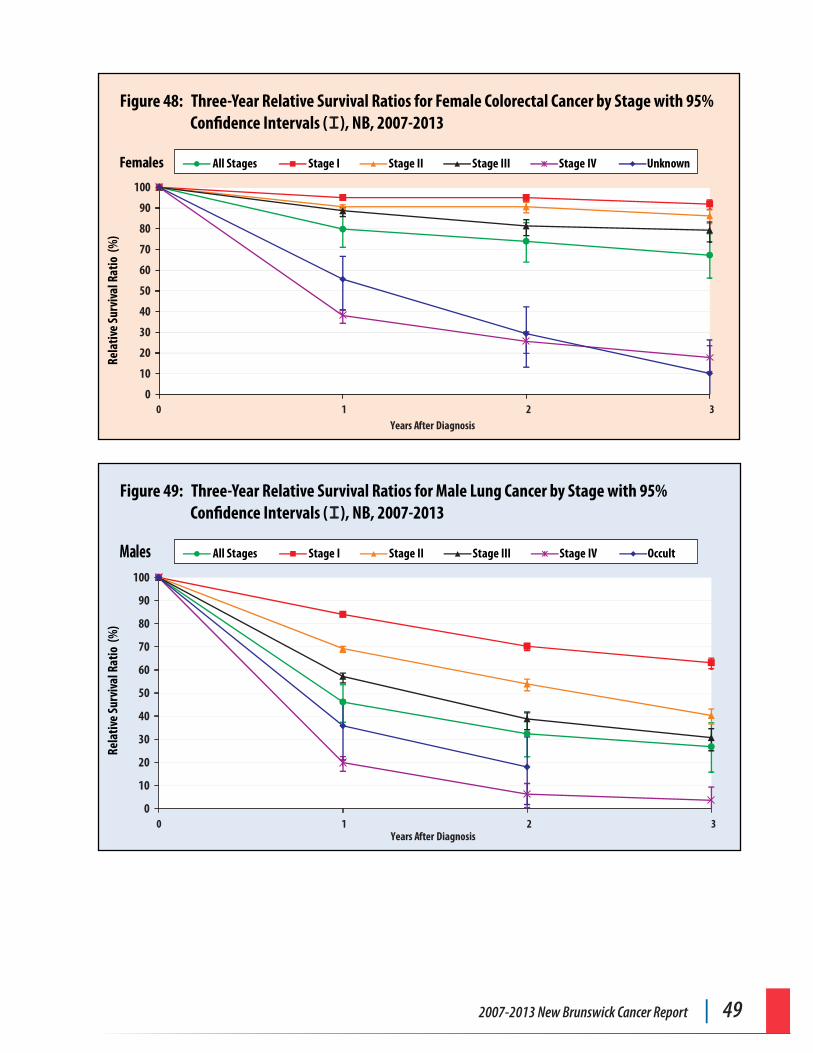
2007-2013 New Brunswick Cancer Report | 49
Figure 48: Three-Year Relative Survival Ratios for Female Colorectal Cancer by Stage with 95% Confidence Intervals ( ), NB, 2007-2013І
Females
Re
lativ
e Su
rviv
al R
atio
(%
)
Years After Diagnosis
All Stages Stage I Stage II Stage III Stage IV Unknown
0
10
20
30
40
50
60
70
80
90
100
0 1 2 3
Figure 49: Three-Year Relative Survival Ratios for Male Lung Cancer by Stage with 95% Confidence Intervals ( ), NB, 2007-2013І
Males
Rela
tive
Surv
ival
Rat
io (
%)
Years After Diagnosis
All Stages Stage I Stage II Stage III Stage IV Occult
0
10
20
30
40
50
60
70
80
90
100
0 1 2 3
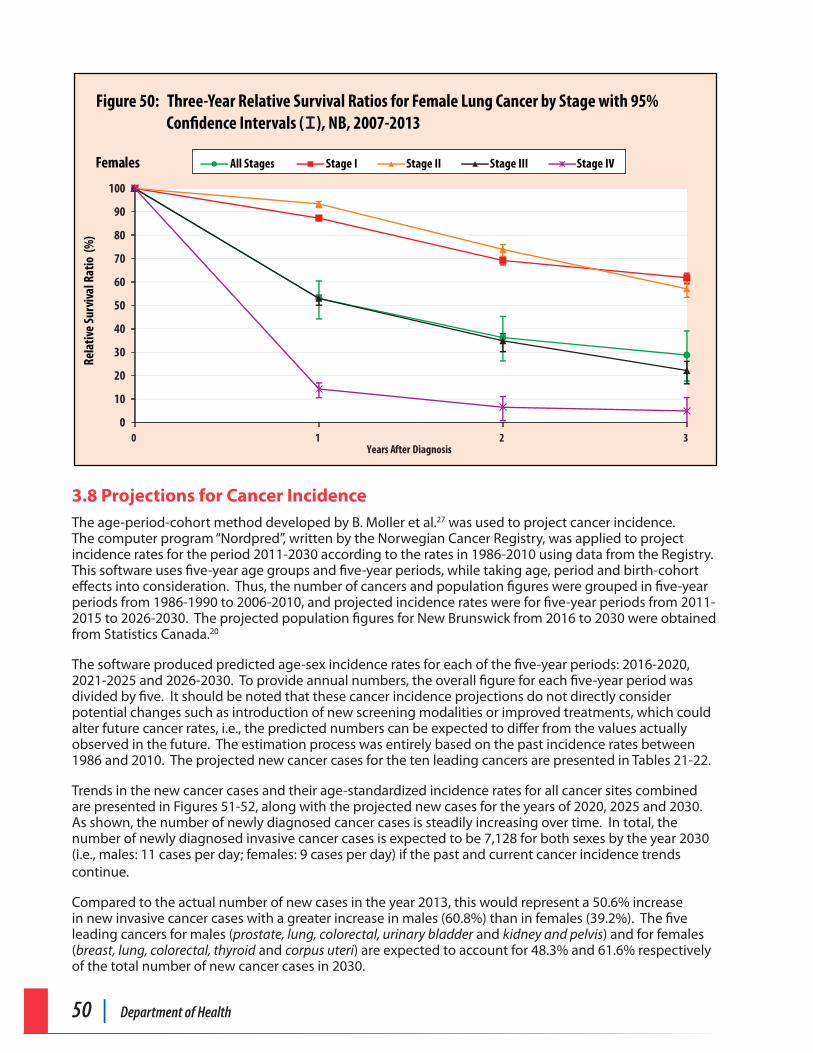
50 | Department of Health
Figure 50: Three-Year Relative Survival Ratios for Female Lung Cancer by Stage with 95% Confidence Intervals ( ), NB, 2007-2013І
Females
Rela
tive
Surv
ival
Rat
io (
%)
Years After Diagnosis
All Stages Stage I Stage II Stage III Stage IV
0
10
20
30
40
50
60
70
80
90
100
0 1 2 3
3.8 Projections for Cancer Incidence The age-period-cohort method developed by B. Moller et al.27 was used to project cancer incidence. The computer program “Nordpred”, written by the Norwegian Cancer Registry, was applied to project incidence rates for the period 2011-2030 according to the rates in 1986-2010 using data from the Registry. This software uses five-year age groups and five-year periods, while taking age, period and birth-cohort effects into consideration. Thus, the number of cancers and population figures were grouped in five-year periods from 1986-1990 to 2006-2010, and projected incidence rates were for five-year periods from 2011-2015 to 2026-2030. The projected population figures for New Brunswick from 2016 to 2030 were obtained from Statistics Canada.20
The software produced predicted age-sex incidence rates for each of the five-year periods: 2016-2020, 2021-2025 and 2026-2030. To provide annual numbers, the overall figure for each five-year period was divided by five. It should be noted that these cancer incidence projections do not directly consider potential changes such as introduction of new screening modalities or improved treatments, which could alter future cancer rates, i.e., the predicted numbers can be expected to differ from the values actually observed in the future. The estimation process was entirely based on the past incidence rates between 1986 and 2010. The projected new cancer cases for the ten leading cancers are presented in Tables 21-22.
Trends in the new cancer cases and their age-standardized incidence rates for all cancer sites combined are presented in Figures 51-52, along with the projected new cases for the years of 2020, 2025 and 2030. As shown, the number of newly diagnosed cancer cases is steadily increasing over time. In total, the number of newly diagnosed invasive cancer cases is expected to be 7,128 for both sexes by the year 2030 (i.e., males: 11 cases per day; females: 9 cases per day) if the past and current cancer incidence trends continue.
Compared to the actual number of new cases in the year 2013, this would represent a 50.6% increase in new invasive cancer cases with a greater increase in males (60.8%) than in females (39.2%). The five leading cancers for males (prostate, lung, colorectal, urinary bladder and kidney and pelvis) and for females (breast, lung, colorectal, thyroid and corpus uteri) are expected to account for 48.3% and 61.6% respectively of the total number of new cancer cases in 2030.
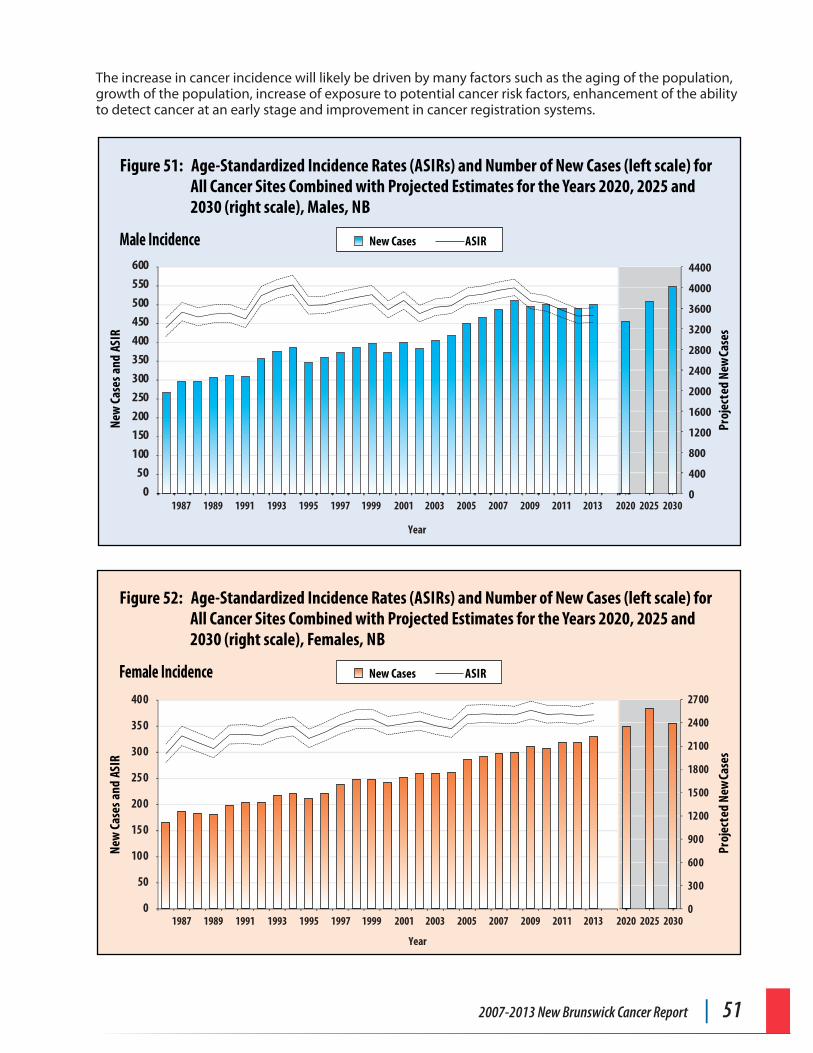
2007-2013 New Brunswick Cancer Report | 51
The increase in cancer incidence will likely be driven by many factors such as the aging of the population, growth of the population, increase of exposure to potential cancer risk factors, enhancement of the ability to detect cancer at an early stage and improvement in cancer registration systems.
Figure 51: Age-Standardized Incidence Rates (ASIRs) and Number of New Cases (left scale) for All Cancer Sites Combined with Projected Estimates for the Years 2020, 2025 and 2030 (right scale), Males, NB
Male Incidence
New Cases ASIR
New
Cas
es a
nd A
SIR
Proj
ecte
d Ne
w Ca
ses
0
400
800
1200
1600
2000
2400
2800
3200
3600
4000
4400
0
50
100
150
200
250
300
350
400
450
500
550
600
Year
1987 1989 1991 1993 1995 1997 1999 2001 2003 2005 2007 2009 2011 2013 2020 20302025
Figure 52: Age-Standardized Incidence Rates (ASIRs) and Number of New Cases (left scale) for All Cancer Sites Combined with Projected Estimates for the Years 2020, 2025 and 2030 (right scale), Females, NB
Year
Female Incidence
New Cases ASIR
0
50
100
150
200
250
300
350
400
1987 1989 1991 1993 1995 1997 1999 2001 2003 2005 2007 2009 2011 2013
New
Cas
es a
nd A
SIR
0
300
600
900
1200
1500
1800
2100
2400
2700
2020 2030
Proj
ecte
d Ne
w Ca
ses
2025
52 | Department of Health
Conclusions
The current cancer statistics show continued improvements in the rates and survival for some selected cancers when compared to the last reporting period i.e., 2002-2006. As a new chapter, cancer prevalence is reported to provide useful information for health planning and health resource allocation. It is projected that there will be 7,128 new cancer cases by 2030 in New Brunswick, which represents a 50.6% increase from the 2013 actual numbers. The burden of cancer in New Brunswick will continue to grow, especially with our aging population.
One of the long-term goals of the New Brunswick Cancer Network is to reduce the incidence, morbidity, and mortality of cancer in New Brunswick. Having a robust cancer surveillance system is an effective way to achive this goal through continuous communication of the statistical evidence to the public, clinicans, researchers and policy makers to increase awareness of the magnitude of the cancer burden and support implementation of the cancer control measures in NB.
Ongoing efforts are needed to address the increase in new cancer cases and growing cancer survivor population, as shown in this report. With this inevitable increase, new strategies and services need to be developed in cancer prevention, early detection, treatment and support for cancer patients and their caregivers in the community such as cancer patient navigation and palliative care and to improve the quality of life for those affected by cancer.
Continued public-oriented awareness campaigns on the association between cancer and potential modifiable risk factors and early prevention measures such as cancer screening, tobacco cessation and healthy living are necessary.
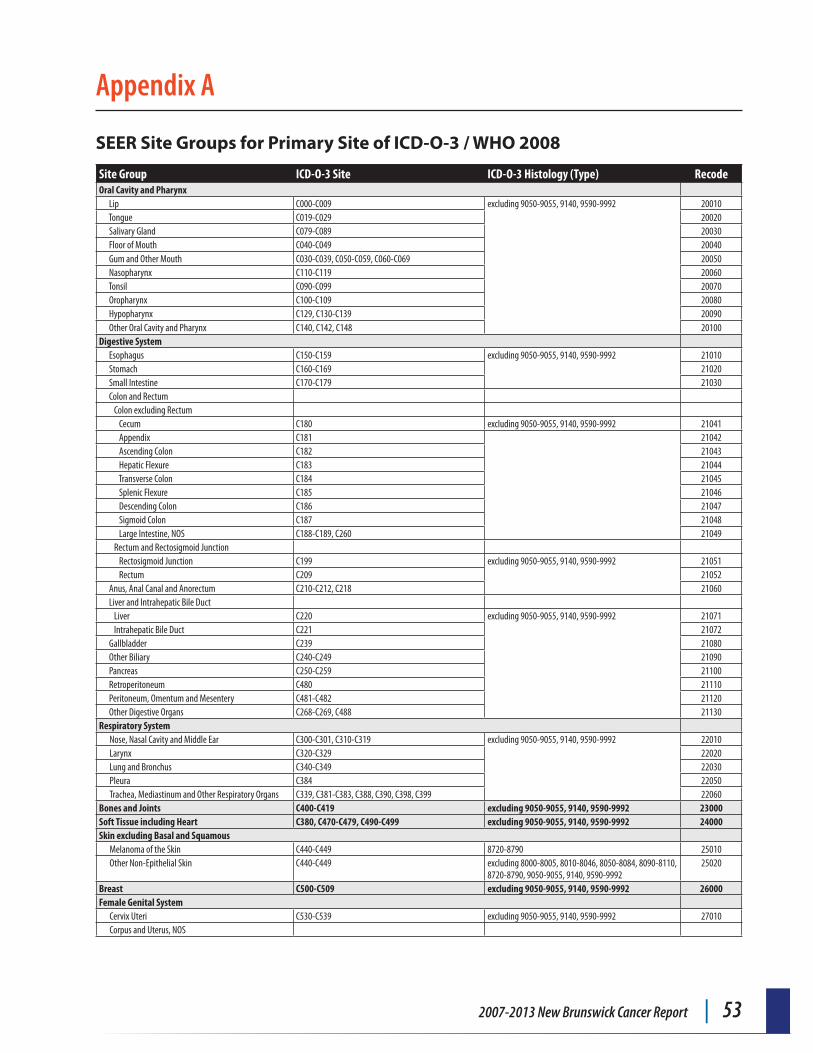
2007-2013 New Brunswick Cancer Report | 53
Appendix A
SEER Site Groups for Primary Site of ICD-O-3 / WHO 2008
Site Group ICD-O-3 Site ICD-O-3 Histology (Type) RecodeOral Cavity and Pharynx Lip C000-C009 excluding 9050-9055, 9140, 9590-9992 20010 Tongue C019-C029 20020 Salivary Gland C079-C089 20030 Floor of Mouth C040-C049 20040 Gum and Other Mouth C030-C039, C050-C059, C060-C069 20050 Nasopharynx C110-C119 20060 Tonsil C090-C099 20070 Oropharynx C100-C109 20080 Hypopharynx C129, C130-C139 20090 Other Oral Cavity and Pharynx C140, C142, C148 20100Digestive System Esophagus C150-C159 excluding 9050-9055, 9140, 9590-9992 21010 Stomach C160-C169 21020 Small Intestine C170-C179 21030 Colon and Rectum Colon excluding Rectum Cecum C180 excluding 9050-9055, 9140, 9590-9992 21041 Appendix C181 21042 Ascending Colon C182 21043 Hepatic Flexure C183 21044 Transverse Colon C184 21045 Splenic Flexure C185 21046 Descending Colon C186 21047 Sigmoid Colon C187 21048 Large Intestine, NOS C188-C189, C260 21049 Rectum and Rectosigmoid Junction Rectosigmoid Junction C199 excluding 9050-9055, 9140, 9590-9992 21051 Rectum C209 21052 Anus, Anal Canal and Anorectum C210-C212, C218 21060 Liver and Intrahepatic Bile Duct Liver C220 excluding 9050-9055, 9140, 9590-9992 21071 Intrahepatic Bile Duct C221 21072 Gallbladder C239 21080 Other Biliary C240-C249 21090 Pancreas C250-C259 21100 Retroperitoneum C480 21110 Peritoneum, Omentum and Mesentery C481-C482 21120 Other Digestive Organs C268-C269, C488 21130Respiratory System
Nose, Nasal Cavity and Middle Ear C300-C301, C310-C319 excluding 9050-9055, 9140, 9590-9992 22010Larynx C320-C329 22020Lung and Bronchus C340-C349 22030Pleura C384 22050Trachea, Mediastinum and Other Respiratory Organs C339, C381-C383, C388, C390, C398, C399 22060
Bones and Joints C400-C419 excluding 9050-9055, 9140, 9590-9992 23000Soft Tissue including Heart C380, C470-C479, C490-C499 excluding 9050-9055, 9140, 9590-9992 24000Skin excluding Basal and Squamous
Melanoma of the Skin C440-C449 8720-8790 25010Other Non-Epithelial Skin C440-C449 excluding 8000-8005, 8010-8046, 8050-8084, 8090-8110,
8720-8790, 9050-9055, 9140, 9590-999225020
Breast C500-C509 excluding 9050-9055, 9140, 9590-9992 26000Female Genital System
Cervix Uteri C530-C539 excluding 9050-9055, 9140, 9590-9992 27010Corpus and Uterus, NOS
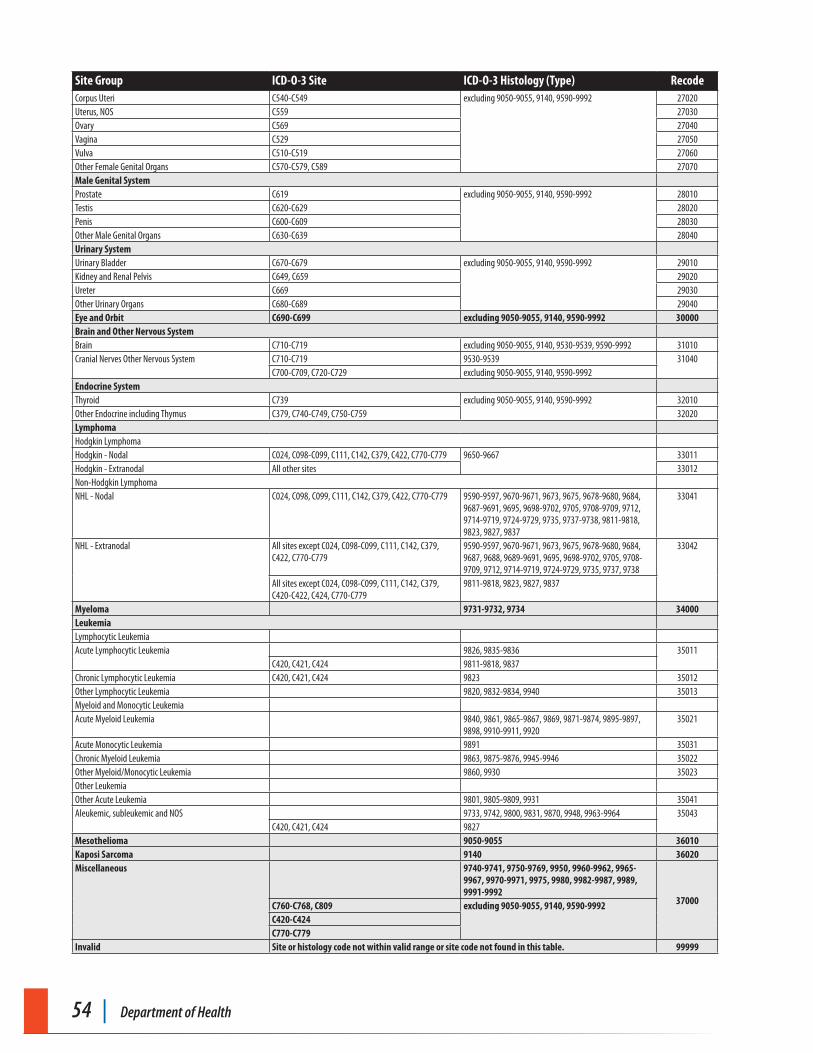
54 | Department of Health
Site Group ICD-O-3 Site ICD-O-3 Histology (Type) RecodeCorpus Uteri C540-C549 excluding 9050-9055, 9140, 9590-9992 27020Uterus, NOS C559 27030Ovary C569 27040Vagina C529 27050Vulva C510-C519 27060Other Female Genital Organs C570-C579, C589 27070Male Genital SystemProstate C619 excluding 9050-9055, 9140, 9590-9992 28010Testis C620-C629 28020Penis C600-C609 28030Other Male Genital Organs C630-C639 28040Urinary SystemUrinary Bladder C670-C679 excluding 9050-9055, 9140, 9590-9992 29010Kidney and Renal Pelvis C649, C659 29020Ureter C669 29030Other Urinary Organs C680-C689 29040Eye and Orbit C690-C699 excluding 9050-9055, 9140, 9590-9992 30000Brain and Other Nervous SystemBrain C710-C719 excluding 9050-9055, 9140, 9530-9539, 9590-9992 31010Cranial Nerves Other Nervous System C710-C719 9530-9539 31040
C700-C709, C720-C729 excluding 9050-9055, 9140, 9590-9992Endocrine SystemThyroid C739 excluding 9050-9055, 9140, 9590-9992 32010Other Endocrine including Thymus C379, C740-C749, C750-C759 32020LymphomaHodgkin LymphomaHodgkin - Nodal C024, C098-C099, C111, C142, C379, C422, C770-C779 9650-9667 33011Hodgkin - Extranodal All other sites 33012Non-Hodgkin LymphomaNHL - Nodal C024, C098, C099, C111, C142, C379, C422, C770-C779 9590-9597, 9670-9671, 9673, 9675, 9678-9680, 9684,
9687-9691, 9695, 9698-9702, 9705, 9708-9709, 9712, 9714-9719, 9724-9729, 9735, 9737-9738, 9811-9818, 9823, 9827, 9837
33041
NHL - Extranodal All sites except C024, C098-C099, C111, C142, C379, C422, C770-C779
9590-9597, 9670-9671, 9673, 9675, 9678-9680, 9684, 9687, 9688, 9689-9691, 9695, 9698-9702, 9705, 9708-9709, 9712, 9714-9719, 9724-9729, 9735, 9737, 9738
33042
All sites except C024, C098-C099, C111, C142, C379, C420-C422, C424, C770-C779
9811-9818, 9823, 9827, 9837
Myeloma 9731-9732, 9734 34000LeukemiaLymphocytic LeukemiaAcute Lymphocytic Leukemia 9826, 9835-9836 35011
C420, C421, C424 9811-9818, 9837Chronic Lymphocytic Leukemia C420, C421, C424 9823 35012Other Lymphocytic Leukemia 9820, 9832-9834, 9940 35013Myeloid and Monocytic LeukemiaAcute Myeloid Leukemia 9840, 9861, 9865-9867, 9869, 9871-9874, 9895-9897,
9898, 9910-9911, 992035021
Acute Monocytic Leukemia 9891 35031Chronic Myeloid Leukemia 9863, 9875-9876, 9945-9946 35022Other Myeloid/Monocytic Leukemia 9860, 9930 35023Other LeukemiaOther Acute Leukemia 9801, 9805-9809, 9931 35041Aleukemic, subleukemic and NOS 9733, 9742, 9800, 9831, 9870, 9948, 9963-9964 35043
C420, C421, C424 9827Mesothelioma 9050-9055 36010Kaposi Sarcoma 9140 36020Miscellaneous 9740-9741, 9750-9769, 9950, 9960-9962, 9965-
9967, 9970-9971, 9975, 9980, 9982-9987, 9989, 9991-9992
37000C760-C768, C809 excluding 9050-9055, 9140, 9590-9992C420-C424C770-C779
Invalid Site or histology code not within valid range or site code not found in this table. 99999
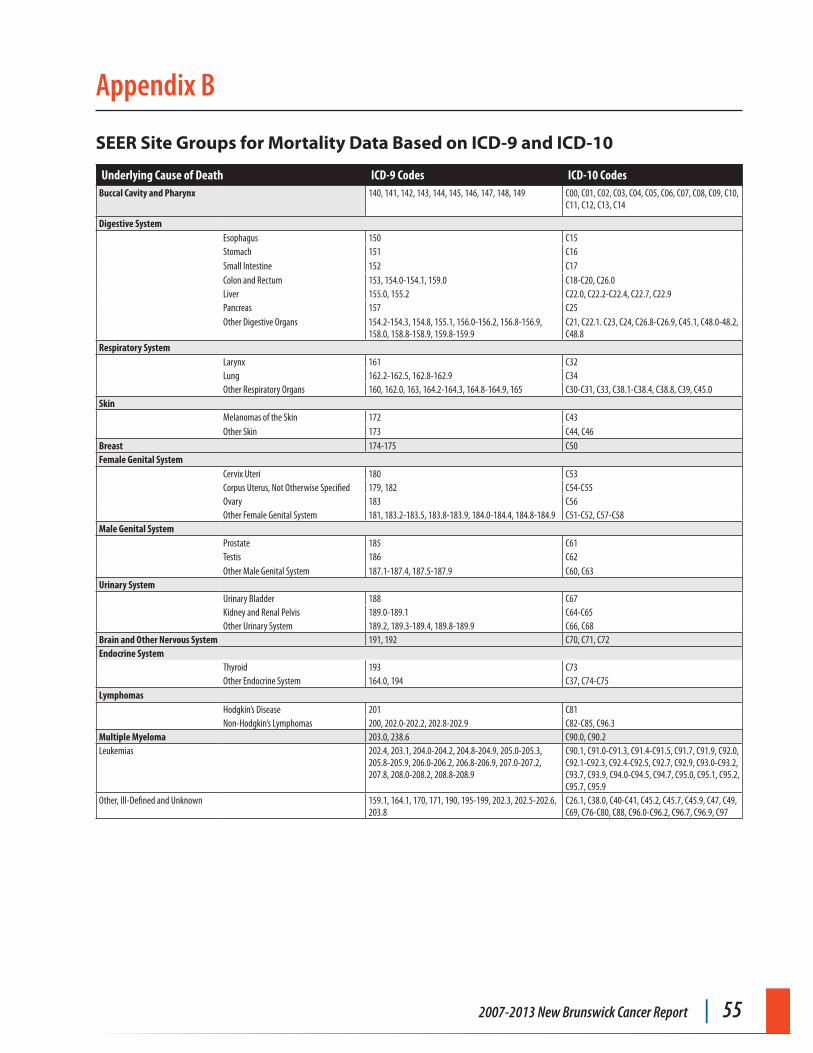
2007-2013 New Brunswick Cancer Report | 55
Appendix B
SEER Site Groups for Mortality Data Based on ICD-9 and ICD-10
Underlying Cause of Death ICD-9 Codes ICD-10 CodesBuccal Cavity and Pharynx 140, 141, 142, 143, 144, 145, 146, 147, 148, 149 C00, C01, C02, C03, C04, C05, C06, C07, C08, C09, C10,
C11, C12, C13, C14
Digestive SystemEsophagus 150 C15Stomach 151 C16Small Intestine 152 C17Colon and Rectum 153, 154.0-154.1, 159.0 C18-C20, C26.0Liver 155.0, 155.2 C22.0, C22.2-C22.4, C22.7, C22.9Pancreas 157 C25Other Digestive Organs 154.2-154.3, 154.8, 155.1, 156.0-156.2, 156.8-156.9,
158.0, 158.8-158.9, 159.8-159.9C21, C22.1. C23, C24, C26.8-C26.9, C45.1, C48.0-48.2, C48.8
Respiratory SystemLarynx 161 C32Lung 162.2-162.5, 162.8-162.9 C34Other Respiratory Organs 160, 162.0, 163, 164.2-164.3, 164.8-164.9, 165 C30-C31, C33, C38.1-C38.4, C38.8, C39, C45.0
SkinMelanomas of the Skin 172 C43Other Skin 173 C44, C46
Breast 174-175 C50Female Genital System
Cervix Uteri 180 C53Corpus Uterus, Not Otherwise Specified 179, 182 C54-C55Ovary 183 C56Other Female Genital System 181, 183.2-183.5, 183.8-183.9, 184.0-184.4, 184.8-184.9 C51-C52, C57-C58
Male Genital SystemProstate 185 C61Testis 186 C62Other Male Genital System 187.1-187.4, 187.5-187.9 C60, C63
Urinary SystemUrinary Bladder 188 C67Kidney and Renal Pelvis 189.0-189.1 C64-C65Other Urinary System 189.2, 189.3-189.4, 189.8-189.9 C66, C68
Brain and Other Nervous System 191, 192 C70, C71, C72Endocrine System
Thyroid 193 C73Other Endocrine System 164.0, 194 C37, C74-C75
LymphomasHodgkin’s Disease 201 C81Non-Hodgkin’s Lymphomas 200, 202.0-202.2, 202.8-202.9 C82-C85, C96.3
Multiple Myeloma 203.0, 238.6 C90.0, C90.2Leukemias 202.4, 203.1, 204.0-204.2, 204.8-204.9, 205.0-205.3,
205.8-205.9, 206.0-206.2, 206.8-206.9, 207.0-207.2, 207.8, 208.0-208.2, 208.8-208.9
C90.1, C91.0-C91.3, C91.4-C91.5, C91.7, C91.9, C92.0, C92.1-C92.3, C92.4-C92.5, C92.7, C92.9, C93.0-C93.2, C93.7, C93.9, C94.0-C94.5, C94.7, C95.0, C95.1, C95.2, C95.7, C95.9
Other, Ill-Defined and Unknown 159.1, 164.1, 170, 171, 190, 195-199, 202.3, 202.5-202.6, 203.8
C26.1, C38.0, C40-C41, C45.2, C45.7, C45.9, C47, C49, C69, C76-C80, C88, C96.0-C96.2, C96.7, C96.9, C97
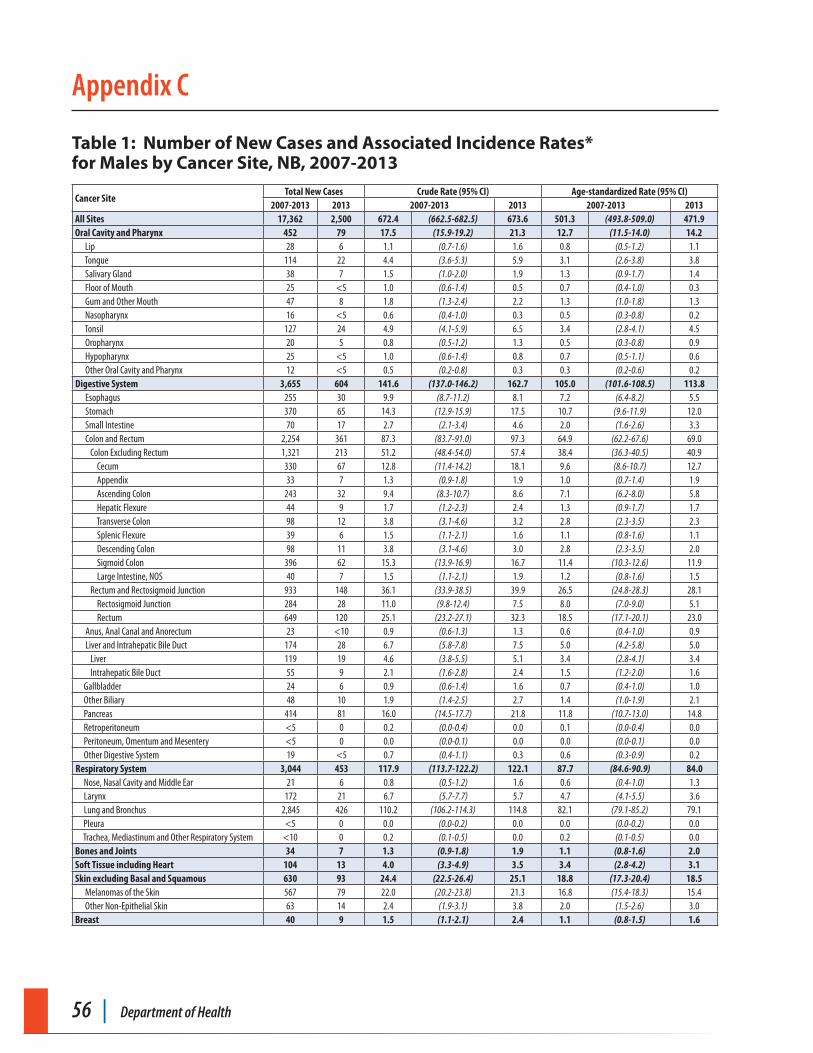
56 | Department of Health
Appendix C
Table 1: Number of New Cases and Associated Incidence Rates* for Males by Cancer Site, NB, 2007-2013
Cancer SiteTotal New Cases Crude Rate (95% CI) Age-standardized Rate (95% CI)
2007-2013 2013 2007-2013 2013 2007-2013 2013All Sites 17,362 2,500 672.4 (662.5-682.5) 673.6 501.3 (493.8-509.0) 471.9Oral Cavity and Pharynx 452 79 17.5 (15.9-19.2) 21.3 12.7 (11.5-14.0) 14.2 Lip 28 6 1.1 (0.7-1.6) 1.6 0.8 (0.5-1.2) 1.1 Tongue 114 22 4.4 (3.6-5.3) 5.9 3.1 (2.6-3.8) 3.8 Salivary Gland 38 7 1.5 (1.0-2.0) 1.9 1.3 (0.9-1.7) 1.4 Floor of Mouth 25 <5 1.0 (0.6-1.4) 0.5 0.7 (0.4-1.0) 0.3 Gum and Other Mouth 47 8 1.8 (1.3-2.4) 2.2 1.3 (1.0-1.8) 1.3 Nasopharynx 16 <5 0.6 (0.4-1.0) 0.3 0.5 (0.3-0.8) 0.2 Tonsil 127 24 4.9 (4.1-5.9) 6.5 3.4 (2.8-4.1) 4.5 Oropharynx 20 5 0.8 (0.5-1.2) 1.3 0.5 (0.3-0.8) 0.9 Hypopharynx 25 <5 1.0 (0.6-1.4) 0.8 0.7 (0.5-1.1) 0.6 Other Oral Cavity and Pharynx 12 <5 0.5 (0.2-0.8) 0.3 0.3 (0.2-0.6) 0.2Digestive System 3,655 604 141.6 (137.0-146.2) 162.7 105.0 (101.6-108.5) 113.8 Esophagus 255 30 9.9 (8.7-11.2) 8.1 7.2 (6.4-8.2) 5.5 Stomach 370 65 14.3 (12.9-15.9) 17.5 10.7 (9.6-11.9) 12.0 Small Intestine 70 17 2.7 (2.1-3.4) 4.6 2.0 (1.6-2.6) 3.3 Colon and Rectum 2,254 361 87.3 (83.7-91.0) 97.3 64.9 (62.2-67.6) 69.0 Colon Excluding Rectum 1,321 213 51.2 (48.4-54.0) 57.4 38.4 (36.3-40.5) 40.9 Cecum 330 67 12.8 (11.4-14.2) 18.1 9.6 (8.6-10.7) 12.7 Appendix 33 7 1.3 (0.9-1.8) 1.9 1.0 (0.7-1.4) 1.9 Ascending Colon 243 32 9.4 (8.3-10.7) 8.6 7.1 (6.2-8.0) 5.8 Hepatic Flexure 44 9 1.7 (1.2-2.3) 2.4 1.3 (0.9-1.7) 1.7 Transverse Colon 98 12 3.8 (3.1-4.6) 3.2 2.8 (2.3-3.5) 2.3 Splenic Flexure 39 6 1.5 (1.1-2.1) 1.6 1.1 (0.8-1.6) 1.1 Descending Colon 98 11 3.8 (3.1-4.6) 3.0 2.8 (2.3-3.5) 2.0 Sigmoid Colon 396 62 15.3 (13.9-16.9) 16.7 11.4 (10.3-12.6) 11.9 Large Intestine, NOS 40 7 1.5 (1.1-2.1) 1.9 1.2 (0.8-1.6) 1.5 Rectum and Rectosigmoid Junction 933 148 36.1 (33.9-38.5) 39.9 26.5 (24.8-28.3) 28.1 Rectosigmoid Junction 284 28 11.0 (9.8-12.4) 7.5 8.0 (7.0-9.0) 5.1 Rectum 649 120 25.1 (23.2-27.1) 32.3 18.5 (17.1-20.1) 23.0 Anus, Anal Canal and Anorectum 23 <10 0.9 (0.6-1.3) 1.3 0.6 (0.4-1.0) 0.9 Liver and Intrahepatic Bile Duct 174 28 6.7 (5.8-7.8) 7.5 5.0 (4.2-5.8) 5.0 Liver 119 19 4.6 (3.8-5.5) 5.1 3.4 (2.8-4.1) 3.4 Intrahepatic Bile Duct 55 9 2.1 (1.6-2.8) 2.4 1.5 (1.2-2.0) 1.6 Gallbladder 24 6 0.9 (0.6-1.4) 1.6 0.7 (0.4-1.0) 1.0 Other Biliary 48 10 1.9 (1.4-2.5) 2.7 1.4 (1.0-1.9) 2.1 Pancreas 414 81 16.0 (14.5-17.7) 21.8 11.8 (10.7-13.0) 14.8 Retroperitoneum <5 0 0.2 (0.0-0.4) 0.0 0.1 (0.0-0.4) 0.0 Peritoneum, Omentum and Mesentery <5 0 0.0 (0.0-0.1) 0.0 0.0 (0.0-0.1) 0.0 Other Digestive System 19 <5 0.7 (0.4-1.1) 0.3 0.6 (0.3-0.9) 0.2Respiratory System 3,044 453 117.9 (113.7-122.2) 122.1 87.7 (84.6-90.9) 84.0 Nose, Nasal Cavity and Middle Ear 21 6 0.8 (0.5-1.2) 1.6 0.6 (0.4-1.0) 1.3 Larynx 172 21 6.7 (5.7-7.7) 5.7 4.7 (4.1-5.5) 3.6 Lung and Bronchus 2,845 426 110.2 (106.2-114.3) 114.8 82.1 (79.1-85.2) 79.1 Pleura <5 0 0.0 (0.0-0.2) 0.0 0.0 (0.0-0.2) 0.0 Trachea, Mediastinum and Other Respiratory System <10 0 0.2 (0.1-0.5) 0.0 0.2 (0.1-0.5) 0.0Bones and Joints 34 7 1.3 (0.9-1.8) 1.9 1.1 (0.8-1.6) 2.0Soft Tissue including Heart 104 13 4.0 (3.3-4.9) 3.5 3.4 (2.8-4.2) 3.1Skin excluding Basal and Squamous 630 93 24.4 (22.5-26.4) 25.1 18.8 (17.3-20.4) 18.5 Melanomas of the Skin 567 79 22.0 (20.2-23.8) 21.3 16.8 (15.4-18.3) 15.4 Other Non-Epithelial Skin 63 14 2.4 (1.9-3.1) 3.8 2.0 (1.5-2.6) 3.0Breast 40 9 1.5 (1.1-2.1) 2.4 1.1 (0.8-1.5) 1.6
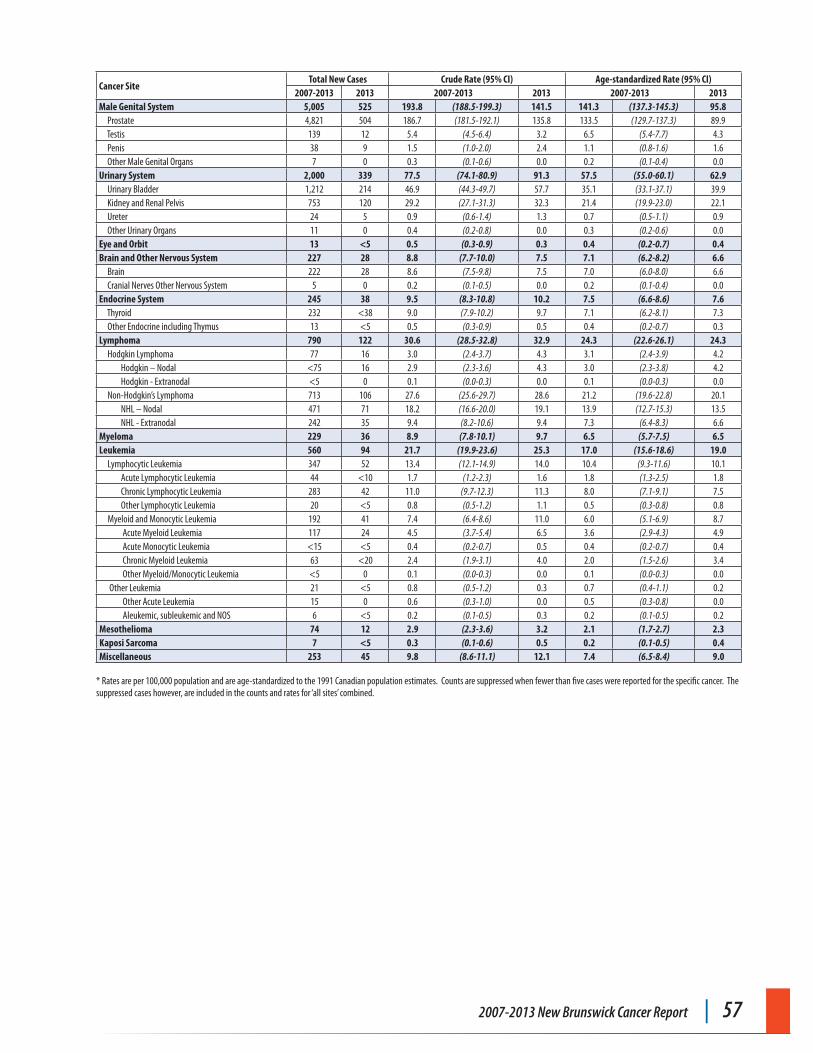
2007-2013 New Brunswick Cancer Report | 57
Cancer SiteTotal New Cases Crude Rate (95% CI) Age-standardized Rate (95% CI)
2007-2013 2013 2007-2013 2013 2007-2013 2013Male Genital System 5,005 525 193.8 (188.5-199.3) 141.5 141.3 (137.3-145.3) 95.8 Prostate 4,821 504 186.7 (181.5-192.1) 135.8 133.5 (129.7-137.3) 89.9 Testis 139 12 5.4 (4.5-6.4) 3.2 6.5 (5.4-7.7) 4.3 Penis 38 9 1.5 (1.0-2.0) 2.4 1.1 (0.8-1.6) 1.6 Other Male Genital Organs 7 0 0.3 (0.1-0.6) 0.0 0.2 (0.1-0.4) 0.0Urinary System 2,000 339 77.5 (74.1-80.9) 91.3 57.5 (55.0-60.1) 62.9 Urinary Bladder 1,212 214 46.9 (44.3-49.7) 57.7 35.1 (33.1-37.1) 39.9 Kidney and Renal Pelvis 753 120 29.2 (27.1-31.3) 32.3 21.4 (19.9-23.0) 22.1 Ureter 24 5 0.9 (0.6-1.4) 1.3 0.7 (0.5-1.1) 0.9 Other Urinary Organs 11 0 0.4 (0.2-0.8) 0.0 0.3 (0.2-0.6) 0.0Eye and Orbit 13 <5 0.5 (0.3-0.9) 0.3 0.4 (0.2-0.7) 0.4Brain and Other Nervous System 227 28 8.8 (7.7-10.0) 7.5 7.1 (6.2-8.2) 6.6 Brain 222 28 8.6 (7.5-9.8) 7.5 7.0 (6.0-8.0) 6.6 Cranial Nerves Other Nervous System 5 0 0.2 (0.1-0.5) 0.0 0.2 (0.1-0.4) 0.0Endocrine System 245 38 9.5 (8.3-10.8) 10.2 7.5 (6.6-8.6) 7.6 Thyroid 232 <38 9.0 (7.9-10.2) 9.7 7.1 (6.2-8.1) 7.3 Other Endocrine including Thymus 13 <5 0.5 (0.3-0.9) 0.5 0.4 (0.2-0.7) 0.3Lymphoma 790 122 30.6 (28.5-32.8) 32.9 24.3 (22.6-26.1) 24.3 Hodgkin Lymphoma 77 16 3.0 (2.4-3.7) 4.3 3.1 (2.4-3.9) 4.2 Hodgkin – Nodal <75 16 2.9 (2.3-3.6) 4.3 3.0 (2.3-3.8) 4.2 Hodgkin - Extranodal <5 0 0.1 (0.0-0.3) 0.0 0.1 (0.0-0.3) 0.0 Non-Hodgkin’s Lymphoma 713 106 27.6 (25.6-29.7) 28.6 21.2 (19.6-22.8) 20.1 NHL – Nodal 471 71 18.2 (16.6-20.0) 19.1 13.9 (12.7-15.3) 13.5 NHL - Extranodal 242 35 9.4 (8.2-10.6) 9.4 7.3 (6.4-8.3) 6.6Myeloma 229 36 8.9 (7.8-10.1) 9.7 6.5 (5.7-7.5) 6.5Leukemia 560 94 21.7 (19.9-23.6) 25.3 17.0 (15.6-18.6) 19.0 Lymphocytic Leukemia 347 52 13.4 (12.1-14.9) 14.0 10.4 (9.3-11.6) 10.1 Acute Lymphocytic Leukemia 44 <10 1.7 (1.2-2.3) 1.6 1.8 (1.3-2.5) 1.8 Chronic Lymphocytic Leukemia 283 42 11.0 (9.7-12.3) 11.3 8.0 (7.1-9.1) 7.5 Other Lymphocytic Leukemia 20 <5 0.8 (0.5-1.2) 1.1 0.5 (0.3-0.8) 0.8 Myeloid and Monocytic Leukemia 192 41 7.4 (6.4-8.6) 11.0 6.0 (5.1-6.9) 8.7 Acute Myeloid Leukemia 117 24 4.5 (3.7-5.4) 6.5 3.6 (2.9-4.3) 4.9 Acute Monocytic Leukemia <15 <5 0.4 (0.2-0.7) 0.5 0.4 (0.2-0.7) 0.4 Chronic Myeloid Leukemia 63 <20 2.4 (1.9-3.1) 4.0 2.0 (1.5-2.6) 3.4 Other Myeloid/Monocytic Leukemia <5 0 0.1 (0.0-0.3) 0.0 0.1 (0.0-0.3) 0.0 Other Leukemia 21 <5 0.8 (0.5-1.2) 0.3 0.7 (0.4-1.1) 0.2 Other Acute Leukemia 15 0 0.6 (0.3-1.0) 0.0 0.5 (0.3-0.8) 0.0 Aleukemic, subleukemic and NOS 6 <5 0.2 (0.1-0.5) 0.3 0.2 (0.1-0.5) 0.2Mesothelioma 74 12 2.9 (2.3-3.6) 3.2 2.1 (1.7-2.7) 2.3Kaposi Sarcoma 7 <5 0.3 (0.1-0.6) 0.5 0.2 (0.1-0.5) 0.4Miscellaneous 253 45 9.8 (8.6-11.1) 12.1 7.4 (6.5-8.4) 9.0
* Rates are per 100,000 population and are age-standardized to the 1991 Canadian population estimates. Counts are suppressed when fewer than five cases were reported for the specific cancer. The suppressed cases however, are included in the counts and rates for ‘all sites’ combined.
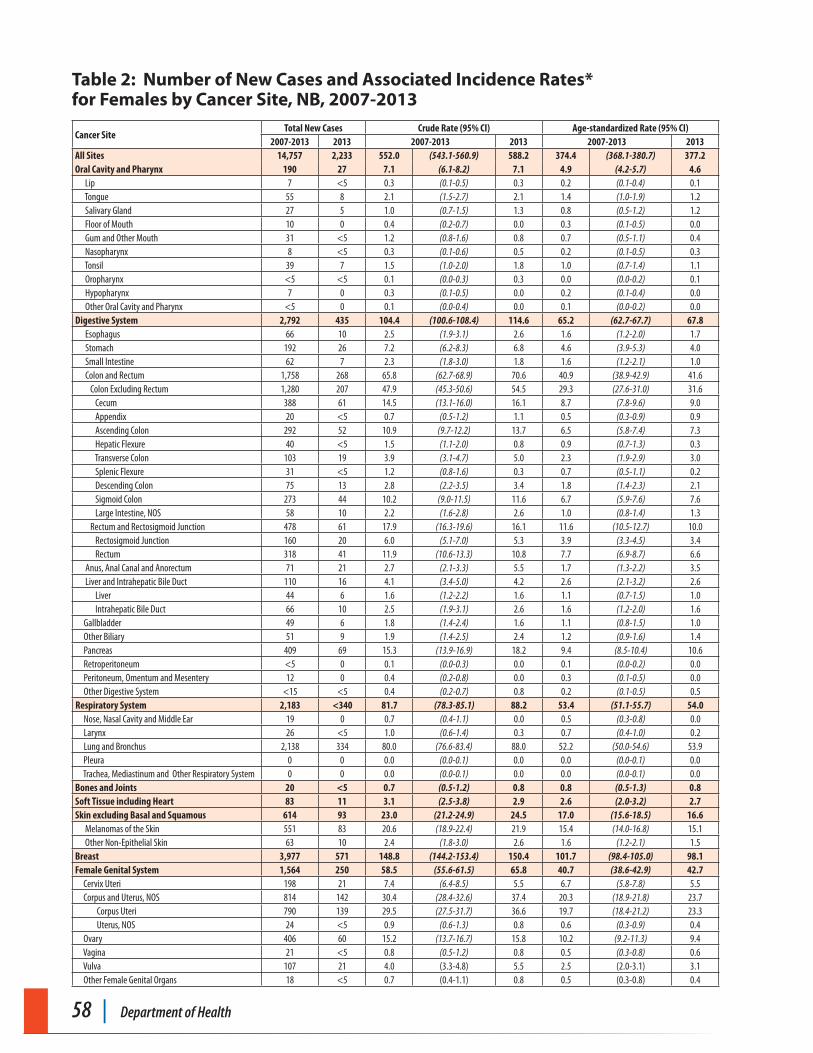
58 | Department of Health
Table 2: Number of New Cases and Associated Incidence Rates* for Females by Cancer Site, NB, 2007-2013
Cancer SiteTotal New Cases Crude Rate (95% CI) Age-standardized Rate (95% CI)
2007-2013 2013 2007-2013 2013 2007-2013 2013All Sites 14,757 2,233 552.0 (543.1-560.9) 588.2 374.4 (368.1-380.7) 377.2Oral Cavity and Pharynx 190 27 7.1 (6.1-8.2) 7.1 4.9 (4.2-5.7) 4.6 Lip 7 <5 0.3 (0.1-0.5) 0.3 0.2 (0.1-0.4) 0.1 Tongue 55 8 2.1 (1.5-2.7) 2.1 1.4 (1.0-1.9) 1.2 Salivary Gland 27 5 1.0 (0.7-1.5) 1.3 0.8 (0.5-1.2) 1.2 Floor of Mouth 10 0 0.4 (0.2-0.7) 0.0 0.3 (0.1-0.5) 0.0 Gum and Other Mouth 31 <5 1.2 (0.8-1.6) 0.8 0.7 (0.5-1.1) 0.4 Nasopharynx 8 <5 0.3 (0.1-0.6) 0.5 0.2 (0.1-0.5) 0.3 Tonsil 39 7 1.5 (1.0-2.0) 1.8 1.0 (0.7-1.4) 1.1 Oropharynx <5 <5 0.1 (0.0-0.3) 0.3 0.0 (0.0-0.2) 0.1 Hypopharynx 7 0 0.3 (0.1-0.5) 0.0 0.2 (0.1-0.4) 0.0 Other Oral Cavity and Pharynx <5 0 0.1 (0.0-0.4) 0.0 0.1 (0.0-0.2) 0.0Digestive System 2,792 435 104.4 (100.6-108.4) 114.6 65.2 (62.7-67.7) 67.8 Esophagus 66 10 2.5 (1.9-3.1) 2.6 1.6 (1.2-2.0) 1.7 Stomach 192 26 7.2 (6.2-8.3) 6.8 4.6 (3.9-5.3) 4.0 Small Intestine 62 7 2.3 (1.8-3.0) 1.8 1.6 (1.2-2.1) 1.0 Colon and Rectum 1,758 268 65.8 (62.7-68.9) 70.6 40.9 (38.9-42.9) 41.6 Colon Excluding Rectum 1,280 207 47.9 (45.3-50.6) 54.5 29.3 (27.6-31.0) 31.6 Cecum 388 61 14.5 (13.1-16.0) 16.1 8.7 (7.8-9.6) 9.0 Appendix 20 <5 0.7 (0.5-1.2) 1.1 0.5 (0.3-0.9) 0.9 Ascending Colon 292 52 10.9 (9.7-12.2) 13.7 6.5 (5.8-7.4) 7.3 Hepatic Flexure 40 <5 1.5 (1.1-2.0) 0.8 0.9 (0.7-1.3) 0.3 Transverse Colon 103 19 3.9 (3.1-4.7) 5.0 2.3 (1.9-2.9) 3.0 Splenic Flexure 31 <5 1.2 (0.8-1.6) 0.3 0.7 (0.5-1.1) 0.2 Descending Colon 75 13 2.8 (2.2-3.5) 3.4 1.8 (1.4-2.3) 2.1 Sigmoid Colon 273 44 10.2 (9.0-11.5) 11.6 6.7 (5.9-7.6) 7.6 Large Intestine, NOS 58 10 2.2 (1.6-2.8) 2.6 1.0 (0.8-1.4) 1.3 Rectum and Rectosigmoid Junction 478 61 17.9 (16.3-19.6) 16.1 11.6 (10.5-12.7) 10.0 Rectosigmoid Junction 160 20 6.0 (5.1-7.0) 5.3 3.9 (3.3-4.5) 3.4 Rectum 318 41 11.9 (10.6-13.3) 10.8 7.7 (6.9-8.7) 6.6 Anus, Anal Canal and Anorectum 71 21 2.7 (2.1-3.3) 5.5 1.7 (1.3-2.2) 3.5 Liver and Intrahepatic Bile Duct 110 16 4.1 (3.4-5.0) 4.2 2.6 (2.1-3.2) 2.6 Liver 44 6 1.6 (1.2-2.2) 1.6 1.1 (0.7-1.5) 1.0 Intrahepatic Bile Duct 66 10 2.5 (1.9-3.1) 2.6 1.6 (1.2-2.0) 1.6 Gallbladder 49 6 1.8 (1.4-2.4) 1.6 1.1 (0.8-1.5) 1.0 Other Biliary 51 9 1.9 (1.4-2.5) 2.4 1.2 (0.9-1.6) 1.4 Pancreas 409 69 15.3 (13.9-16.9) 18.2 9.4 (8.5-10.4) 10.6 Retroperitoneum <5 0 0.1 (0.0-0.3) 0.0 0.1 (0.0-0.2) 0.0 Peritoneum, Omentum and Mesentery 12 0 0.4 (0.2-0.8) 0.0 0.3 (0.1-0.5) 0.0 Other Digestive System <15 <5 0.4 (0.2-0.7) 0.8 0.2 (0.1-0.5) 0.5Respiratory System 2,183 <340 81.7 (78.3-85.1) 88.2 53.4 (51.1-55.7) 54.0 Nose, Nasal Cavity and Middle Ear 19 0 0.7 (0.4-1.1) 0.0 0.5 (0.3-0.8) 0.0 Larynx 26 <5 1.0 (0.6-1.4) 0.3 0.7 (0.4-1.0) 0.2 Lung and Bronchus 2,138 334 80.0 (76.6-83.4) 88.0 52.2 (50.0-54.6) 53.9 Pleura 0 0 0.0 (0.0-0.1) 0.0 0.0 (0.0-0.1) 0.0 Trachea, Mediastinum and Other Respiratory System 0 0 0.0 (0.0-0.1) 0.0 0.0 (0.0-0.1) 0.0Bones and Joints 20 <5 0.7 (0.5-1.2) 0.8 0.8 (0.5-1.3) 0.8Soft Tissue including Heart 83 11 3.1 (2.5-3.8) 2.9 2.6 (2.0-3.2) 2.7Skin excluding Basal and Squamous 614 93 23.0 (21.2-24.9) 24.5 17.0 (15.6-18.5) 16.6 Melanomas of the Skin 551 83 20.6 (18.9-22.4) 21.9 15.4 (14.0-16.8) 15.1 Other Non-Epithelial Skin 63 10 2.4 (1.8-3.0) 2.6 1.6 (1.2-2.1) 1.5Breast 3,977 571 148.8 (144.2-153.4) 150.4 101.7 (98.4-105.0) 98.1Female Genital System 1,564 250 58.5 (55.6-61.5) 65.8 40.7 (38.6-42.9) 42.7 Cervix Uteri 198 21 7.4 (6.4-8.5) 5.5 6.7 (5.8-7.8) 5.5 Corpus and Uterus, NOS 814 142 30.4 (28.4-32.6) 37.4 20.3 (18.9-21.8) 23.7 Corpus Uteri 790 139 29.5 (27.5-31.7) 36.6 19.7 (18.4-21.2) 23.3 Uterus, NOS 24 <5 0.9 (0.6-1.3) 0.8 0.6 (0.3-0.9) 0.4 Ovary 406 60 15.2 (13.7-16.7) 15.8 10.2 (9.2-11.3) 9.4 Vagina 21 <5 0.8 (0.5-1.2) 0.8 0.5 (0.3-0.8) 0.6 Vulva 107 21 4.0 (3.3-4.8) 5.5 2.5 (2.0-3.1) 3.1 Other Female Genital Organs 18 <5 0.7 (0.4-1.1) 0.8 0.5 (0.3-0.8) 0.4
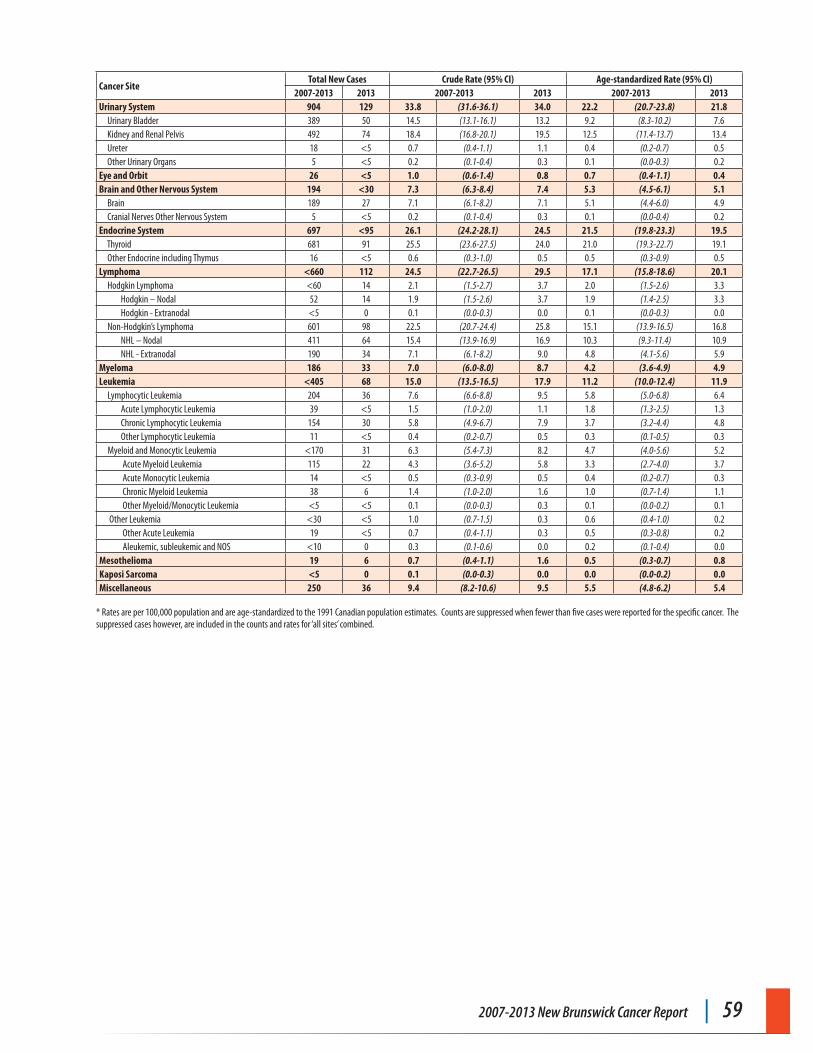
2007-2013 New Brunswick Cancer Report | 59
Cancer SiteTotal New Cases Crude Rate (95% CI) Age-standardized Rate (95% CI)
2007-2013 2013 2007-2013 2013 2007-2013 2013Urinary System 904 129 33.8 (31.6-36.1) 34.0 22.2 (20.7-23.8) 21.8 Urinary Bladder 389 50 14.5 (13.1-16.1) 13.2 9.2 (8.3-10.2) 7.6 Kidney and Renal Pelvis 492 74 18.4 (16.8-20.1) 19.5 12.5 (11.4-13.7) 13.4 Ureter 18 <5 0.7 (0.4-1.1) 1.1 0.4 (0.2-0.7) 0.5 Other Urinary Organs 5 <5 0.2 (0.1-0.4) 0.3 0.1 (0.0-0.3) 0.2Eye and Orbit 26 <5 1.0 (0.6-1.4) 0.8 0.7 (0.4-1.1) 0.4Brain and Other Nervous System 194 <30 7.3 (6.3-8.4) 7.4 5.3 (4.5-6.1) 5.1 Brain 189 27 7.1 (6.1-8.2) 7.1 5.1 (4.4-6.0) 4.9 Cranial Nerves Other Nervous System 5 <5 0.2 (0.1-0.4) 0.3 0.1 (0.0-0.4) 0.2Endocrine System 697 <95 26.1 (24.2-28.1) 24.5 21.5 (19.8-23.3) 19.5 Thyroid 681 91 25.5 (23.6-27.5) 24.0 21.0 (19.3-22.7) 19.1 Other Endocrine including Thymus 16 <5 0.6 (0.3-1.0) 0.5 0.5 (0.3-0.9) 0.5Lymphoma <660 112 24.5 (22.7-26.5) 29.5 17.1 (15.8-18.6) 20.1 Hodgkin Lymphoma <60 14 2.1 (1.5-2.7) 3.7 2.0 (1.5-2.6) 3.3 Hodgkin – Nodal 52 14 1.9 (1.5-2.6) 3.7 1.9 (1.4-2.5) 3.3 Hodgkin - Extranodal <5 0 0.1 (0.0-0.3) 0.0 0.1 (0.0-0.3) 0.0 Non-Hodgkin’s Lymphoma 601 98 22.5 (20.7-24.4) 25.8 15.1 (13.9-16.5) 16.8 NHL – Nodal 411 64 15.4 (13.9-16.9) 16.9 10.3 (9.3-11.4) 10.9 NHL - Extranodal 190 34 7.1 (6.1-8.2) 9.0 4.8 (4.1-5.6) 5.9Myeloma 186 33 7.0 (6.0-8.0) 8.7 4.2 (3.6-4.9) 4.9Leukemia <405 68 15.0 (13.5-16.5) 17.9 11.2 (10.0-12.4) 11.9 Lymphocytic Leukemia 204 36 7.6 (6.6-8.8) 9.5 5.8 (5.0-6.8) 6.4 Acute Lymphocytic Leukemia 39 <5 1.5 (1.0-2.0) 1.1 1.8 (1.3-2.5) 1.3 Chronic Lymphocytic Leukemia 154 30 5.8 (4.9-6.7) 7.9 3.7 (3.2-4.4) 4.8 Other Lymphocytic Leukemia 11 <5 0.4 (0.2-0.7) 0.5 0.3 (0.1-0.5) 0.3 Myeloid and Monocytic Leukemia <170 31 6.3 (5.4-7.3) 8.2 4.7 (4.0-5.6) 5.2 Acute Myeloid Leukemia 115 22 4.3 (3.6-5.2) 5.8 3.3 (2.7-4.0) 3.7 Acute Monocytic Leukemia 14 <5 0.5 (0.3-0.9) 0.5 0.4 (0.2-0.7) 0.3 Chronic Myeloid Leukemia 38 6 1.4 (1.0-2.0) 1.6 1.0 (0.7-1.4) 1.1 Other Myeloid/Monocytic Leukemia <5 <5 0.1 (0.0-0.3) 0.3 0.1 (0.0-0.2) 0.1 Other Leukemia <30 <5 1.0 (0.7-1.5) 0.3 0.6 (0.4-1.0) 0.2 Other Acute Leukemia 19 <5 0.7 (0.4-1.1) 0.3 0.5 (0.3-0.8) 0.2 Aleukemic, subleukemic and NOS <10 0 0.3 (0.1-0.6) 0.0 0.2 (0.1-0.4) 0.0Mesothelioma 19 6 0.7 (0.4-1.1) 1.6 0.5 (0.3-0.7) 0.8Kaposi Sarcoma <5 0 0.1 (0.0-0.3) 0.0 0.0 (0.0-0.2) 0.0Miscellaneous 250 36 9.4 (8.2-10.6) 9.5 5.5 (4.8-6.2) 5.4
* Rates are per 100,000 population and are age-standardized to the 1991 Canadian population estimates. Counts are suppressed when fewer than five cases were reported for the specific cancer. The suppressed cases however, are included in the counts and rates for ‘all sites’ combined.
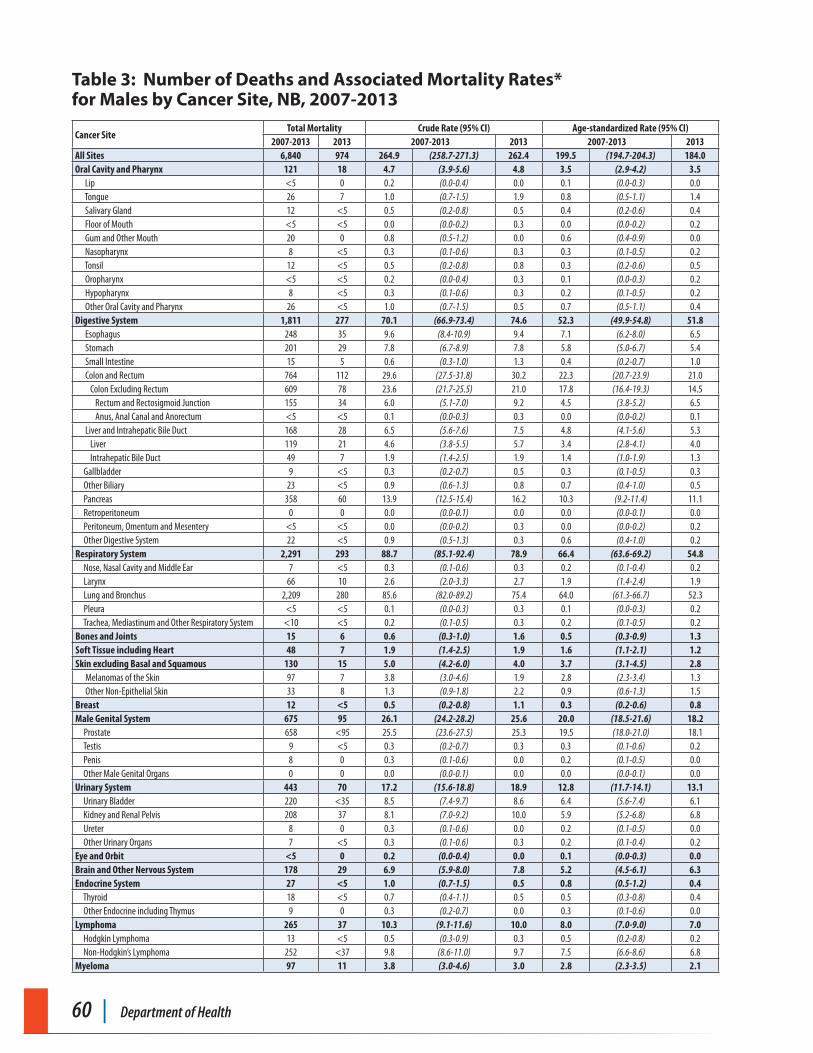
60 | Department of Health
Table 3: Number of Deaths and Associated Mortality Rates* for Males by Cancer Site, NB, 2007-2013
Cancer SiteTotal Mortality Crude Rate (95% CI) Age-standardized Rate (95% CI)
2007-2013 2013 2007-2013 2013 2007-2013 2013All Sites 6,840 974 264.9 (258.7-271.3) 262.4 199.5 (194.7-204.3) 184.0Oral Cavity and Pharynx 121 18 4.7 (3.9-5.6) 4.8 3.5 (2.9-4.2) 3.5 Lip <5 0 0.2 (0.0-0.4) 0.0 0.1 (0.0-0.3) 0.0 Tongue 26 7 1.0 (0.7-1.5) 1.9 0.8 (0.5-1.1) 1.4 Salivary Gland 12 <5 0.5 (0.2-0.8) 0.5 0.4 (0.2-0.6) 0.4 Floor of Mouth <5 <5 0.0 (0.0-0.2) 0.3 0.0 (0.0-0.2) 0.2 Gum and Other Mouth 20 0 0.8 (0.5-1.2) 0.0 0.6 (0.4-0.9) 0.0 Nasopharynx 8 <5 0.3 (0.1-0.6) 0.3 0.3 (0.1-0.5) 0.2 Tonsil 12 <5 0.5 (0.2-0.8) 0.8 0.3 (0.2-0.6) 0.5 Oropharynx <5 <5 0.2 (0.0-0.4) 0.3 0.1 (0.0-0.3) 0.2 Hypopharynx 8 <5 0.3 (0.1-0.6) 0.3 0.2 (0.1-0.5) 0.2 Other Oral Cavity and Pharynx 26 <5 1.0 (0.7-1.5) 0.5 0.7 (0.5-1.1) 0.4Digestive System 1,811 277 70.1 (66.9-73.4) 74.6 52.3 (49.9-54.8) 51.8 Esophagus 248 35 9.6 (8.4-10.9) 9.4 7.1 (6.2-8.0) 6.5 Stomach 201 29 7.8 (6.7-8.9) 7.8 5.8 (5.0-6.7) 5.4 Small Intestine 15 5 0.6 (0.3-1.0) 1.3 0.4 (0.2-0.7) 1.0 Colon and Rectum 764 112 29.6 (27.5-31.8) 30.2 22.3 (20.7-23.9) 21.0 Colon Excluding Rectum 609 78 23.6 (21.7-25.5) 21.0 17.8 (16.4-19.3) 14.5 Rectum and Rectosigmoid Junction 155 34 6.0 (5.1-7.0) 9.2 4.5 (3.8-5.2) 6.5 Anus, Anal Canal and Anorectum <5 <5 0.1 (0.0-0.3) 0.3 0.0 (0.0-0.2) 0.1 Liver and Intrahepatic Bile Duct 168 28 6.5 (5.6-7.6) 7.5 4.8 (4.1-5.6) 5.3 Liver 119 21 4.6 (3.8-5.5) 5.7 3.4 (2.8-4.1) 4.0 Intrahepatic Bile Duct 49 7 1.9 (1.4-2.5) 1.9 1.4 (1.0-1.9) 1.3 Gallbladder 9 <5 0.3 (0.2-0.7) 0.5 0.3 (0.1-0.5) 0.3 Other Biliary 23 <5 0.9 (0.6-1.3) 0.8 0.7 (0.4-1.0) 0.5 Pancreas 358 60 13.9 (12.5-15.4) 16.2 10.3 (9.2-11.4) 11.1 Retroperitoneum 0 0 0.0 (0.0-0.1) 0.0 0.0 (0.0-0.1) 0.0 Peritoneum, Omentum and Mesentery <5 <5 0.0 (0.0-0.2) 0.3 0.0 (0.0-0.2) 0.2 Other Digestive System 22 <5 0.9 (0.5-1.3) 0.3 0.6 (0.4-1.0) 0.2Respiratory System 2,291 293 88.7 (85.1-92.4) 78.9 66.4 (63.6-69.2) 54.8 Nose, Nasal Cavity and Middle Ear 7 <5 0.3 (0.1-0.6) 0.3 0.2 (0.1-0.4) 0.2 Larynx 66 10 2.6 (2.0-3.3) 2.7 1.9 (1.4-2.4) 1.9 Lung and Bronchus 2,209 280 85.6 (82.0-89.2) 75.4 64.0 (61.3-66.7) 52.3 Pleura <5 <5 0.1 (0.0-0.3) 0.3 0.1 (0.0-0.3) 0.2 Trachea, Mediastinum and Other Respiratory System <10 <5 0.2 (0.1-0.5) 0.3 0.2 (0.1-0.5) 0.2Bones and Joints 15 6 0.6 (0.3-1.0) 1.6 0.5 (0.3-0.9) 1.3Soft Tissue including Heart 48 7 1.9 (1.4-2.5) 1.9 1.6 (1.1-2.1) 1.2Skin excluding Basal and Squamous 130 15 5.0 (4.2-6.0) 4.0 3.7 (3.1-4.5) 2.8 Melanomas of the Skin 97 7 3.8 (3.0-4.6) 1.9 2.8 (2.3-3.4) 1.3 Other Non-Epithelial Skin 33 8 1.3 (0.9-1.8) 2.2 0.9 (0.6-1.3) 1.5Breast 12 <5 0.5 (0.2-0.8) 1.1 0.3 (0.2-0.6) 0.8Male Genital System 675 95 26.1 (24.2-28.2) 25.6 20.0 (18.5-21.6) 18.2 Prostate 658 <95 25.5 (23.6-27.5) 25.3 19.5 (18.0-21.0) 18.1 Testis 9 <5 0.3 (0.2-0.7) 0.3 0.3 (0.1-0.6) 0.2 Penis 8 0 0.3 (0.1-0.6) 0.0 0.2 (0.1-0.5) 0.0 Other Male Genital Organs 0 0 0.0 (0.0-0.1) 0.0 0.0 (0.0-0.1) 0.0Urinary System 443 70 17.2 (15.6-18.8) 18.9 12.8 (11.7-14.1) 13.1 Urinary Bladder 220 <35 8.5 (7.4-9.7) 8.6 6.4 (5.6-7.4) 6.1 Kidney and Renal Pelvis 208 37 8.1 (7.0-9.2) 10.0 5.9 (5.2-6.8) 6.8 Ureter 8 0 0.3 (0.1-0.6) 0.0 0.2 (0.1-0.5) 0.0 Other Urinary Organs 7 <5 0.3 (0.1-0.6) 0.3 0.2 (0.1-0.4) 0.2Eye and Orbit <5 0 0.2 (0.0-0.4) 0.0 0.1 (0.0-0.3) 0.0Brain and Other Nervous System 178 29 6.9 (5.9-8.0) 7.8 5.2 (4.5-6.1) 6.3Endocrine System 27 <5 1.0 (0.7-1.5) 0.5 0.8 (0.5-1.2) 0.4 Thyroid 18 <5 0.7 (0.4-1.1) 0.5 0.5 (0.3-0.8) 0.4 Other Endocrine including Thymus 9 0 0.3 (0.2-0.7) 0.0 0.3 (0.1-0.6) 0.0Lymphoma 265 37 10.3 (9.1-11.6) 10.0 8.0 (7.0-9.0) 7.0 Hodgkin Lymphoma 13 <5 0.5 (0.3-0.9) 0.3 0.5 (0.2-0.8) 0.2 Non-Hodgkin’s Lymphoma 252 <37 9.8 (8.6-11.0) 9.7 7.5 (6.6-8.6) 6.8Myeloma 97 11 3.8 (3.0-4.6) 3.0 2.8 (2.3-3.5) 2.1
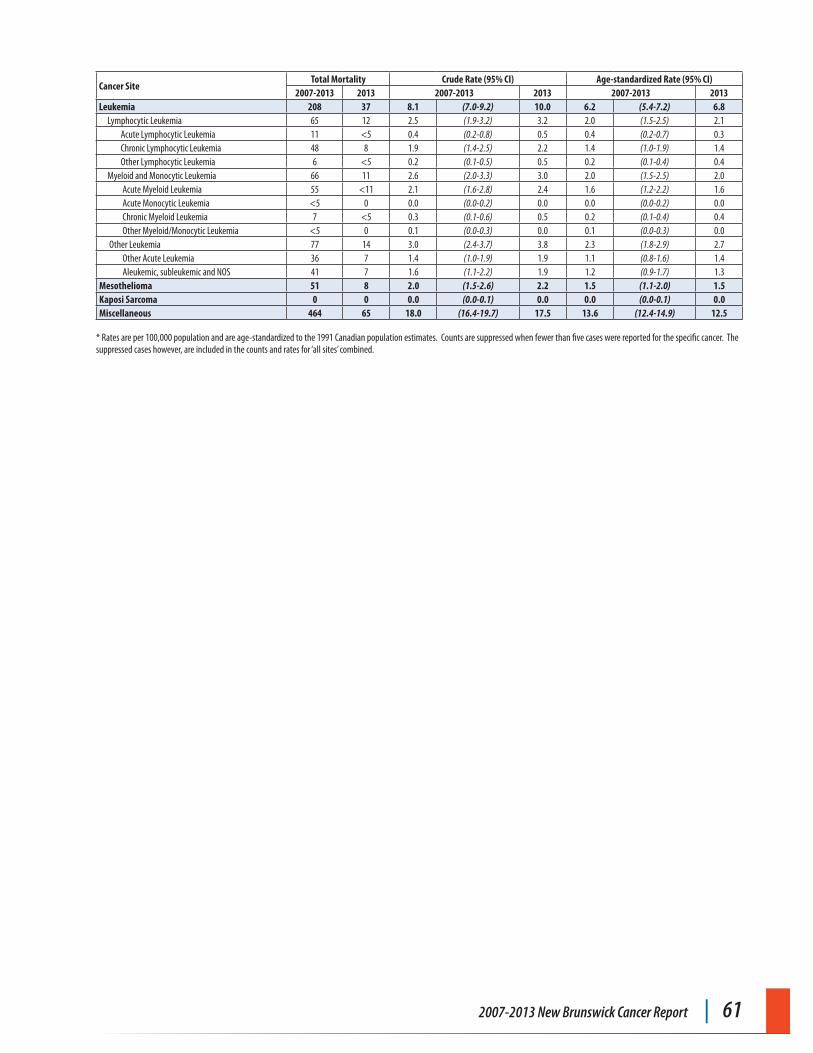
2007-2013 New Brunswick Cancer Report | 61
Cancer SiteTotal Mortality Crude Rate (95% CI) Age-standardized Rate (95% CI)
2007-2013 2013 2007-2013 2013 2007-2013 2013Leukemia 208 37 8.1 (7.0-9.2) 10.0 6.2 (5.4-7.2) 6.8 Lymphocytic Leukemia 65 12 2.5 (1.9-3.2) 3.2 2.0 (1.5-2.5) 2.1 Acute Lymphocytic Leukemia 11 <5 0.4 (0.2-0.8) 0.5 0.4 (0.2-0.7) 0.3 Chronic Lymphocytic Leukemia 48 8 1.9 (1.4-2.5) 2.2 1.4 (1.0-1.9) 1.4 Other Lymphocytic Leukemia 6 <5 0.2 (0.1-0.5) 0.5 0.2 (0.1-0.4) 0.4 Myeloid and Monocytic Leukemia 66 11 2.6 (2.0-3.3) 3.0 2.0 (1.5-2.5) 2.0 Acute Myeloid Leukemia 55 <11 2.1 (1.6-2.8) 2.4 1.6 (1.2-2.2) 1.6 Acute Monocytic Leukemia <5 0 0.0 (0.0-0.2) 0.0 0.0 (0.0-0.2) 0.0 Chronic Myeloid Leukemia 7 <5 0.3 (0.1-0.6) 0.5 0.2 (0.1-0.4) 0.4 Other Myeloid/Monocytic Leukemia <5 0 0.1 (0.0-0.3) 0.0 0.1 (0.0-0.3) 0.0 Other Leukemia 77 14 3.0 (2.4-3.7) 3.8 2.3 (1.8-2.9) 2.7 Other Acute Leukemia 36 7 1.4 (1.0-1.9) 1.9 1.1 (0.8-1.6) 1.4 Aleukemic, subleukemic and NOS 41 7 1.6 (1.1-2.2) 1.9 1.2 (0.9-1.7) 1.3Mesothelioma 51 8 2.0 (1.5-2.6) 2.2 1.5 (1.1-2.0) 1.5Kaposi Sarcoma 0 0 0.0 (0.0-0.1) 0.0 0.0 (0.0-0.1) 0.0Miscellaneous 464 65 18.0 (16.4-19.7) 17.5 13.6 (12.4-14.9) 12.5
* Rates are per 100,000 population and are age-standardized to the 1991 Canadian population estimates. Counts are suppressed when fewer than five cases were reported for the specific cancer. The suppressed cases however, are included in the counts and rates for ‘all sites’ combined.
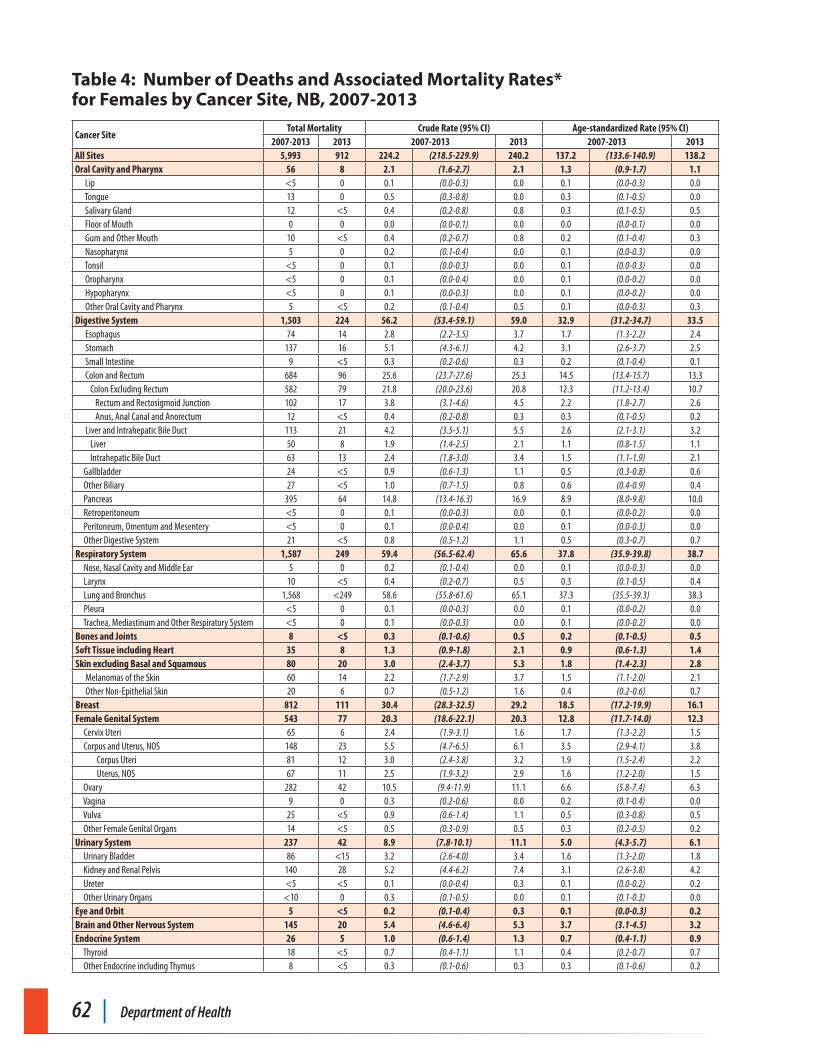
62 | Department of Health
Table 4: Number of Deaths and Associated Mortality Rates* for Females by Cancer Site, NB, 2007-2013
Cancer SiteTotal Mortality Crude Rate (95% CI) Age-standardized Rate (95% CI)
2007-2013 2013 2007-2013 2013 2007-2013 2013All Sites 5,993 912 224.2 (218.5-229.9) 240.2 137.2 (133.6-140.9) 138.2Oral Cavity and Pharynx 56 8 2.1 (1.6-2.7) 2.1 1.3 (0.9-1.7) 1.1 Lip <5 0 0.1 (0.0-0.3) 0.0 0.1 (0.0-0.3) 0.0 Tongue 13 0 0.5 (0.3-0.8) 0.0 0.3 (0.1-0.5) 0.0 Salivary Gland 12 <5 0.4 (0.2-0.8) 0.8 0.3 (0.1-0.5) 0.5 Floor of Mouth 0 0 0.0 (0.0-0.1) 0.0 0.0 (0.0-0.1) 0.0 Gum and Other Mouth 10 <5 0.4 (0.2-0.7) 0.8 0.2 (0.1-0.4) 0.3 Nasopharynx 5 0 0.2 (0.1-0.4) 0.0 0.1 (0.0-0.3) 0.0 Tonsil <5 0 0.1 (0.0-0.3) 0.0 0.1 (0.0-0.3) 0.0 Oropharynx <5 0 0.1 (0.0-0.4) 0.0 0.1 (0.0-0.2) 0.0 Hypopharynx <5 0 0.1 (0.0-0.3) 0.0 0.1 (0.0-0.2) 0.0 Other Oral Cavity and Pharynx 5 <5 0.2 (0.1-0.4) 0.5 0.1 (0.0-0.3) 0.3Digestive System 1,503 224 56.2 (53.4-59.1) 59.0 32.9 (31.2-34.7) 33.5 Esophagus 74 14 2.8 (2.2-3.5) 3.7 1.7 (1.3-2.2) 2.4 Stomach 137 16 5.1 (4.3-6.1) 4.2 3.1 (2.6-3.7) 2.5 Small Intestine 9 <5 0.3 (0.2-0.6) 0.3 0.2 (0.1-0.4) 0.1 Colon and Rectum 684 96 25.6 (23.7-27.6) 25.3 14.5 (13.4-15.7) 13.3 Colon Excluding Rectum 582 79 21.8 (20.0-23.6) 20.8 12.3 (11.2-13.4) 10.7 Rectum and Rectosigmoid Junction 102 17 3.8 (3.1-4.6) 4.5 2.2 (1.8-2.7) 2.6 Anus, Anal Canal and Anorectum 12 <5 0.4 (0.2-0.8) 0.3 0.3 (0.1-0.5) 0.2 Liver and Intrahepatic Bile Duct 113 21 4.2 (3.5-5.1) 5.5 2.6 (2.1-3.1) 3.2 Liver 50 8 1.9 (1.4-2.5) 2.1 1.1 (0.8-1.5) 1.1 Intrahepatic Bile Duct 63 13 2.4 (1.8-3.0) 3.4 1.5 (1.1-1.9) 2.1 Gallbladder 24 <5 0.9 (0.6-1.3) 1.1 0.5 (0.3-0.8) 0.6 Other Biliary 27 <5 1.0 (0.7-1.5) 0.8 0.6 (0.4-0.9) 0.4 Pancreas 395 64 14.8 (13.4-16.3) 16.9 8.9 (8.0-9.8) 10.0 Retroperitoneum <5 0 0.1 (0.0-0.3) 0.0 0.1 (0.0-0.2) 0.0 Peritoneum, Omentum and Mesentery <5 0 0.1 (0.0-0.4) 0.0 0.1 (0.0-0.3) 0.0 Other Digestive System 21 <5 0.8 (0.5-1.2) 1.1 0.5 (0.3-0.7) 0.7Respiratory System 1,587 249 59.4 (56.5-62.4) 65.6 37.8 (35.9-39.8) 38.7 Nose, Nasal Cavity and Middle Ear 5 0 0.2 (0.1-0.4) 0.0 0.1 (0.0-0.3) 0.0 Larynx 10 <5 0.4 (0.2-0.7) 0.5 0.3 (0.1-0.5) 0.4 Lung and Bronchus 1,568 <249 58.6 (55.8-61.6) 65.1 37.3 (35.5-39.3) 38.3 Pleura <5 0 0.1 (0.0-0.3) 0.0 0.1 (0.0-0.2) 0.0 Trachea, Mediastinum and Other Respiratory System <5 0 0.1 (0.0-0.3) 0.0 0.1 (0.0-0.2) 0.0Bones and Joints 8 <5 0.3 (0.1-0.6) 0.5 0.2 (0.1-0.5) 0.5Soft Tissue including Heart 35 8 1.3 (0.9-1.8) 2.1 0.9 (0.6-1.3) 1.4Skin excluding Basal and Squamous 80 20 3.0 (2.4-3.7) 5.3 1.8 (1.4-2.3) 2.8 Melanomas of the Skin 60 14 2.2 (1.7-2.9) 3.7 1.5 (1.1-2.0) 2.1 Other Non-Epithelial Skin 20 6 0.7 (0.5-1.2) 1.6 0.4 (0.2-0.6) 0.7Breast 812 111 30.4 (28.3-32.5) 29.2 18.5 (17.2-19.9) 16.1Female Genital System 543 77 20.3 (18.6-22.1) 20.3 12.8 (11.7-14.0) 12.3 Cervix Uteri 65 6 2.4 (1.9-3.1) 1.6 1.7 (1.3-2.2) 1.5 Corpus and Uterus, NOS 148 23 5.5 (4.7-6.5) 6.1 3.5 (2.9-4.1) 3.8 Corpus Uteri 81 12 3.0 (2.4-3.8) 3.2 1.9 (1.5-2.4) 2.2 Uterus, NOS 67 11 2.5 (1.9-3.2) 2.9 1.6 (1.2-2.0) 1.5 Ovary 282 42 10.5 (9.4-11.9) 11.1 6.6 (5.8-7.4) 6.3 Vagina 9 0 0.3 (0.2-0.6) 0.0 0.2 (0.1-0.4) 0.0 Vulva 25 <5 0.9 (0.6-1.4) 1.1 0.5 (0.3-0.8) 0.5 Other Female Genital Organs 14 <5 0.5 (0.3-0.9) 0.5 0.3 (0.2-0.5) 0.2Urinary System 237 42 8.9 (7.8-10.1) 11.1 5.0 (4.3-5.7) 6.1 Urinary Bladder 86 <15 3.2 (2.6-4.0) 3.4 1.6 (1.3-2.0) 1.8 Kidney and Renal Pelvis 140 28 5.2 (4.4-6.2) 7.4 3.1 (2.6-3.8) 4.2 Ureter <5 <5 0.1 (0.0-0.4) 0.3 0.1 (0.0-0.2) 0.2 Other Urinary Organs <10 0 0.3 (0.1-0.5) 0.0 0.1 (0.1-0.3) 0.0Eye and Orbit 5 <5 0.2 (0.1-0.4) 0.3 0.1 (0.0-0.3) 0.2Brain and Other Nervous System 145 20 5.4 (4.6-6.4) 5.3 3.7 (3.1-4.5) 3.2Endocrine System 26 5 1.0 (0.6-1.4) 1.3 0.7 (0.4-1.1) 0.9 Thyroid 18 <5 0.7 (0.4-1.1) 1.1 0.4 (0.2-0.7) 0.7 Other Endocrine including Thymus 8 <5 0.3 (0.1-0.6) 0.3 0.3 (0.1-0.6) 0.2
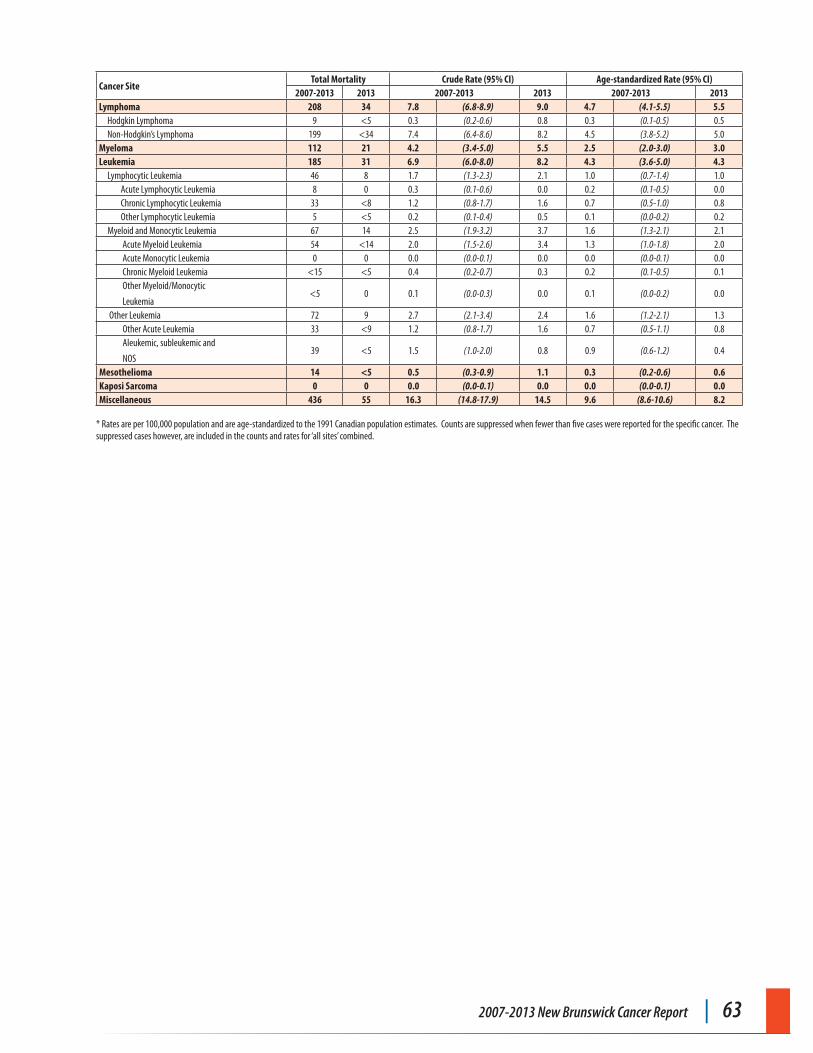
2007-2013 New Brunswick Cancer Report | 63
Cancer SiteTotal Mortality Crude Rate (95% CI) Age-standardized Rate (95% CI)
2007-2013 2013 2007-2013 2013 2007-2013 2013Lymphoma 208 34 7.8 (6.8-8.9) 9.0 4.7 (4.1-5.5) 5.5 Hodgkin Lymphoma 9 <5 0.3 (0.2-0.6) 0.8 0.3 (0.1-0.5) 0.5 Non-Hodgkin’s Lymphoma 199 <34 7.4 (6.4-8.6) 8.2 4.5 (3.8-5.2) 5.0Myeloma 112 21 4.2 (3.4-5.0) 5.5 2.5 (2.0-3.0) 3.0Leukemia 185 31 6.9 (6.0-8.0) 8.2 4.3 (3.6-5.0) 4.3 Lymphocytic Leukemia 46 8 1.7 (1.3-2.3) 2.1 1.0 (0.7-1.4) 1.0 Acute Lymphocytic Leukemia 8 0 0.3 (0.1-0.6) 0.0 0.2 (0.1-0.5) 0.0 Chronic Lymphocytic Leukemia 33 <8 1.2 (0.8-1.7) 1.6 0.7 (0.5-1.0) 0.8 Other Lymphocytic Leukemia 5 <5 0.2 (0.1-0.4) 0.5 0.1 (0.0-0.2) 0.2 Myeloid and Monocytic Leukemia 67 14 2.5 (1.9-3.2) 3.7 1.6 (1.3-2.1) 2.1 Acute Myeloid Leukemia 54 <14 2.0 (1.5-2.6) 3.4 1.3 (1.0-1.8) 2.0 Acute Monocytic Leukemia 0 0 0.0 (0.0-0.1) 0.0 0.0 (0.0-0.1) 0.0 Chronic Myeloid Leukemia <15 <5 0.4 (0.2-0.7) 0.3 0.2 (0.1-0.5) 0.1 Other Myeloid/Monocytic
Leukemia<5 0 0.1 (0.0-0.3) 0.0 0.1 (0.0-0.2) 0.0
Other Leukemia 72 9 2.7 (2.1-3.4) 2.4 1.6 (1.2-2.1) 1.3 Other Acute Leukemia 33 <9 1.2 (0.8-1.7) 1.6 0.7 (0.5-1.1) 0.8 Aleukemic, subleukemic and
NOS39 <5 1.5 (1.0-2.0) 0.8 0.9 (0.6-1.2) 0.4
Mesothelioma 14 <5 0.5 (0.3-0.9) 1.1 0.3 (0.2-0.6) 0.6Kaposi Sarcoma 0 0 0.0 (0.0-0.1) 0.0 0.0 (0.0-0.1) 0.0Miscellaneous 436 55 16.3 (14.8-17.9) 14.5 9.6 (8.6-10.6) 8.2
* Rates are per 100,000 population and are age-standardized to the 1991 Canadian population estimates. Counts are suppressed when fewer than five cases were reported for the specific cancer. The suppressed cases however, are included in the counts and rates for ‘all sites’ combined.
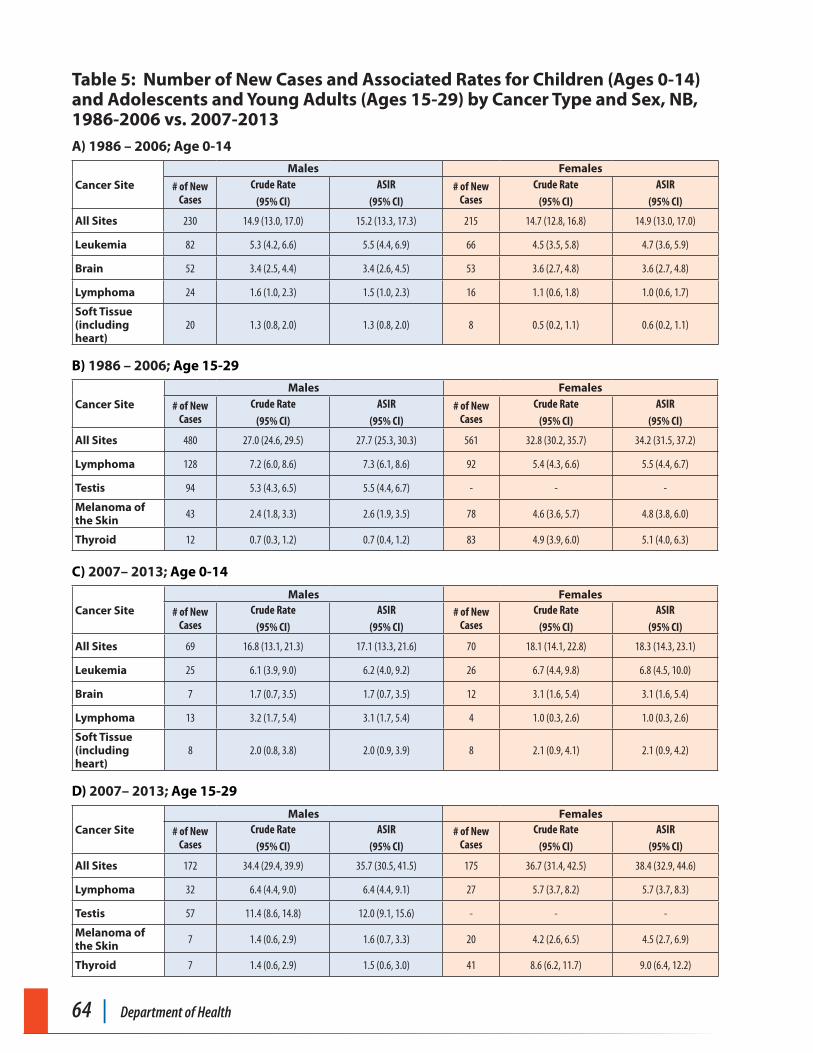
64 | Department of Health
Table 5: Number of New Cases and Associated Rates for Children (Ages 0-14) and Adolescents and Young Adults (Ages 15-29) by Cancer Type and Sex, NB, 1986-2006 vs. 2007-2013A) 1986 – 2006; Age 0-14
Cancer SiteMales Females
# of New Cases
Crude Rate
(95% CI)
ASIR
(95% CI)# of New
CasesCrude Rate
(95% CI)
ASIR
(95% CI)
All Sites 230 14.9 (13.0, 17.0) 15.2 (13.3, 17.3) 215 14.7 (12.8, 16.8) 14.9 (13.0, 17.0)
Leukemia 82 5.3 (4.2, 6.6) 5.5 (4.4, 6.9) 66 4.5 (3.5, 5.8) 4.7 (3.6, 5.9)
Brain 52 3.4 (2.5, 4.4) 3.4 (2.6, 4.5) 53 3.6 (2.7, 4.8) 3.6 (2.7, 4.8)
Lymphoma 24 1.6 (1.0, 2.3) 1.5 (1.0, 2.3) 16 1.1 (0.6, 1.8) 1.0 (0.6, 1.7)
Soft Tissue (including heart)
20 1.3 (0.8, 2.0) 1.3 (0.8, 2.0) 8 0.5 (0.2, 1.1) 0.6 (0.2, 1.1)
B) 1986 – 2006; Age 15-29
Cancer SiteMales Females
# of New Cases
Crude Rate
(95% CI)
ASIR
(95% CI)# of New
CasesCrude Rate
(95% CI)
ASIR
(95% CI)
All Sites 480 27.0 (24.6, 29.5) 27.7 (25.3, 30.3) 561 32.8 (30.2, 35.7) 34.2 (31.5, 37.2)
Lymphoma 128 7.2 (6.0, 8.6) 7.3 (6.1, 8.6) 92 5.4 (4.3, 6.6) 5.5 (4.4, 6.7)
Testis 94 5.3 (4.3, 6.5) 5.5 (4.4, 6.7) - - -
Melanoma of the Skin 43 2.4 (1.8, 3.3) 2.6 (1.9, 3.5) 78 4.6 (3.6, 5.7) 4.8 (3.8, 6.0)
Thyroid 12 0.7 (0.3, 1.2) 0.7 (0.4, 1.2) 83 4.9 (3.9, 6.0) 5.1 (4.0, 6.3)
C) 2007– 2013; Age 0-14
Cancer SiteMales Females
# of New Cases
Crude Rate
(95% CI)
ASIR
(95% CI)# of New
CasesCrude Rate
(95% CI)
ASIR
(95% CI)
All Sites 69 16.8 (13.1, 21.3) 17.1 (13.3, 21.6) 70 18.1 (14.1, 22.8) 18.3 (14.3, 23.1)
Leukemia 25 6.1 (3.9, 9.0) 6.2 (4.0, 9.2) 26 6.7 (4.4, 9.8) 6.8 (4.5, 10.0)
Brain 7 1.7 (0.7, 3.5) 1.7 (0.7, 3.5) 12 3.1 (1.6, 5.4) 3.1 (1.6, 5.4)
Lymphoma 13 3.2 (1.7, 5.4) 3.1 (1.7, 5.4) 4 1.0 (0.3, 2.6) 1.0 (0.3, 2.6)
Soft Tissue (including heart)
8 2.0 (0.8, 3.8) 2.0 (0.9, 3.9) 8 2.1 (0.9, 4.1) 2.1 (0.9, 4.2)
D) 2007– 2013; Age 15-29
Cancer SiteMales Females
# of New Cases
Crude Rate
(95% CI)
ASIR
(95% CI)# of New
CasesCrude Rate
(95% CI)
ASIR
(95% CI)
All Sites 172 34.4 (29.4, 39.9) 35.7 (30.5, 41.5) 175 36.7 (31.4, 42.5) 38.4 (32.9, 44.6)
Lymphoma 32 6.4 (4.4, 9.0) 6.4 (4.4, 9.1) 27 5.7 (3.7, 8.2) 5.7 (3.7, 8.3)
Testis 57 11.4 (8.6, 14.8) 12.0 (9.1, 15.6) - - -
Melanoma of the Skin 7 1.4 (0.6, 2.9) 1.6 (0.7, 3.3) 20 4.2 (2.6, 6.5) 4.5 (2.7, 6.9)
Thyroid 7 1.4 (0.6, 2.9) 1.5 (0.6, 3.0) 41 8.6 (6.2, 11.7) 9.0 (6.4, 12.2)
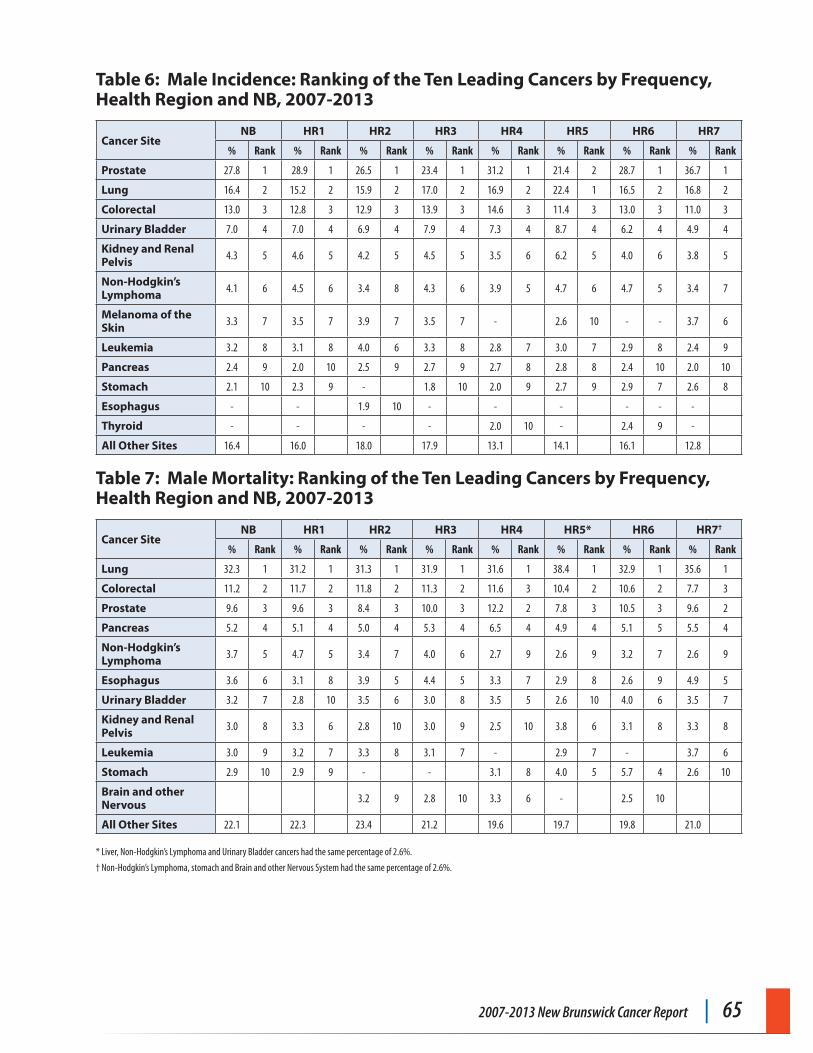
2007-2013 New Brunswick Cancer Report | 65
Table 6: Male Incidence: Ranking of the Ten Leading Cancers by Frequency, Health Region and NB, 2007-2013
Cancer SiteNB HR1 HR2 HR3 HR4 HR5 HR6 HR7
% Rank % Rank % Rank % Rank % Rank % Rank % Rank % Rank
Prostate 27.8 1 28.9 1 26.5 1 23.4 1 31.2 1 21.4 2 28.7 1 36.7 1
Lung 16.4 2 15.2 2 15.9 2 17.0 2 16.9 2 22.4 1 16.5 2 16.8 2
Colorectal 13.0 3 12.8 3 12.9 3 13.9 3 14.6 3 11.4 3 13.0 3 11.0 3
Urinary Bladder 7.0 4 7.0 4 6.9 4 7.9 4 7.3 4 8.7 4 6.2 4 4.9 4
Kidney and Renal Pelvis 4.3 5 4.6 5 4.2 5 4.5 5 3.5 6 6.2 5 4.0 6 3.8 5
Non-Hodgkin’s Lymphoma 4.1 6 4.5 6 3.4 8 4.3 6 3.9 5 4.7 6 4.7 5 3.4 7
Melanoma of the Skin 3.3 7 3.5 7 3.9 7 3.5 7 - 2.6 10 - - 3.7 6
Leukemia 3.2 8 3.1 8 4.0 6 3.3 8 2.8 7 3.0 7 2.9 8 2.4 9
Pancreas 2.4 9 2.0 10 2.5 9 2.7 9 2.7 8 2.8 8 2.4 10 2.0 10
Stomach 2.1 10 2.3 9 - 1.8 10 2.0 9 2.7 9 2.9 7 2.6 8
Esophagus - - 1.9 10 - - - - - -
Thyroid - - - - 2.0 10 - 2.4 9 -
All Other Sites 16.4 16.0 18.0 17.9 13.1 14.1 16.1 12.8
Table 7: Male Mortality: Ranking of the Ten Leading Cancers by Frequency, Health Region and NB, 2007-2013
Cancer SiteNB HR1 HR2 HR3 HR4 HR5* HR6 HR7†
% Rank % Rank % Rank % Rank % Rank % Rank % Rank % Rank
Lung 32.3 1 31.2 1 31.3 1 31.9 1 31.6 1 38.4 1 32.9 1 35.6 1
Colorectal 11.2 2 11.7 2 11.8 2 11.3 2 11.6 3 10.4 2 10.6 2 7.7 3
Prostate 9.6 3 9.6 3 8.4 3 10.0 3 12.2 2 7.8 3 10.5 3 9.6 2
Pancreas 5.2 4 5.1 4 5.0 4 5.3 4 6.5 4 4.9 4 5.1 5 5.5 4
Non-Hodgkin’s Lymphoma 3.7 5 4.7 5 3.4 7 4.0 6 2.7 9 2.6 9 3.2 7 2.6 9
Esophagus 3.6 6 3.1 8 3.9 5 4.4 5 3.3 7 2.9 8 2.6 9 4.9 5
Urinary Bladder 3.2 7 2.8 10 3.5 6 3.0 8 3.5 5 2.6 10 4.0 6 3.5 7
Kidney and Renal Pelvis 3.0 8 3.3 6 2.8 10 3.0 9 2.5 10 3.8 6 3.1 8 3.3 8
Leukemia 3.0 9 3.2 7 3.3 8 3.1 7 - 2.9 7 - 3.7 6
Stomach 2.9 10 2.9 9 - - 3.1 8 4.0 5 5.7 4 2.6 10
Brain and other Nervous 3.2 9 2.8 10 3.3 6 - 2.5 10
All Other Sites 22.1 22.3 23.4 21.2 19.6 19.7 19.8 21.0
* Liver, Non-Hodgkin’s Lymphoma and Urinary Bladder cancers had the same percentage of 2.6%.
† Non-Hodgkin’s Lymphoma, stomach and Brain and other Nervous System had the same percentage of 2.6%.
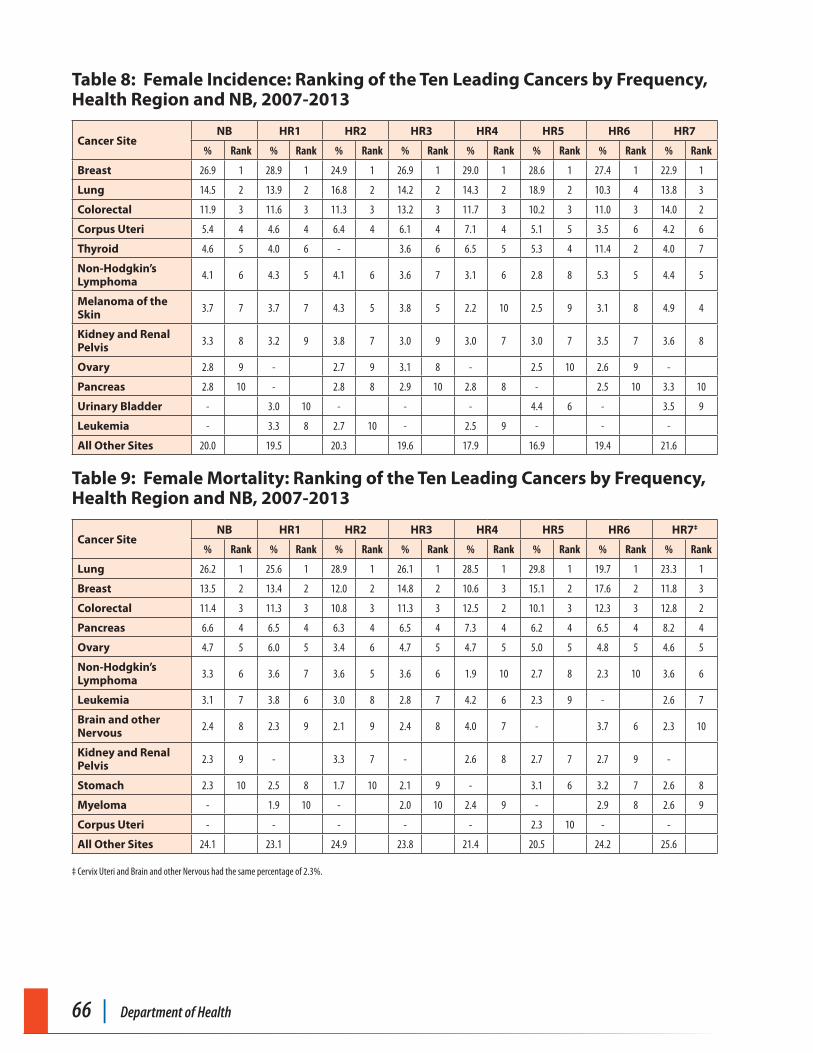
66 | Department of Health
Table 8: Female Incidence: Ranking of the Ten Leading Cancers by Frequency, Health Region and NB, 2007-2013
Cancer SiteNB HR1 HR2 HR3 HR4 HR5 HR6 HR7
% Rank % Rank % Rank % Rank % Rank % Rank % Rank % Rank
Breast 26.9 1 28.9 1 24.9 1 26.9 1 29.0 1 28.6 1 27.4 1 22.9 1
Lung 14.5 2 13.9 2 16.8 2 14.2 2 14.3 2 18.9 2 10.3 4 13.8 3
Colorectal 11.9 3 11.6 3 11.3 3 13.2 3 11.7 3 10.2 3 11.0 3 14.0 2
Corpus Uteri 5.4 4 4.6 4 6.4 4 6.1 4 7.1 4 5.1 5 3.5 6 4.2 6
Thyroid 4.6 5 4.0 6 - 3.6 6 6.5 5 5.3 4 11.4 2 4.0 7
Non-Hodgkin’s Lymphoma 4.1 6 4.3 5 4.1 6 3.6 7 3.1 6 2.8 8 5.3 5 4.4 5
Melanoma of the Skin 3.7 7 3.7 7 4.3 5 3.8 5 2.2 10 2.5 9 3.1 8 4.9 4
Kidney and Renal Pelvis 3.3 8 3.2 9 3.8 7 3.0 9 3.0 7 3.0 7 3.5 7 3.6 8
Ovary 2.8 9 - 2.7 9 3.1 8 - 2.5 10 2.6 9 -
Pancreas 2.8 10 - 2.8 8 2.9 10 2.8 8 - 2.5 10 3.3 10
Urinary Bladder - 3.0 10 - - - 4.4 6 - 3.5 9
Leukemia - 3.3 8 2.7 10 - 2.5 9 - - -
All Other Sites 20.0 19.5 20.3 19.6 17.9 16.9 19.4 21.6
Table 9: Female Mortality: Ranking of the Ten Leading Cancers by Frequency, Health Region and NB, 2007-2013
Cancer SiteNB HR1 HR2 HR3 HR4 HR5 HR6 HR7‡
% Rank % Rank % Rank % Rank % Rank % Rank % Rank % Rank
Lung 26.2 1 25.6 1 28.9 1 26.1 1 28.5 1 29.8 1 19.7 1 23.3 1
Breast 13.5 2 13.4 2 12.0 2 14.8 2 10.6 3 15.1 2 17.6 2 11.8 3
Colorectal 11.4 3 11.3 3 10.8 3 11.3 3 12.5 2 10.1 3 12.3 3 12.8 2
Pancreas 6.6 4 6.5 4 6.3 4 6.5 4 7.3 4 6.2 4 6.5 4 8.2 4
Ovary 4.7 5 6.0 5 3.4 6 4.7 5 4.7 5 5.0 5 4.8 5 4.6 5
Non-Hodgkin’s Lymphoma 3.3 6 3.6 7 3.6 5 3.6 6 1.9 10 2.7 8 2.3 10 3.6 6
Leukemia 3.1 7 3.8 6 3.0 8 2.8 7 4.2 6 2.3 9 - 2.6 7
Brain and other Nervous 2.4 8 2.3 9 2.1 9 2.4 8 4.0 7 - 3.7 6 2.3 10
Kidney and Renal Pelvis 2.3 9 - 3.3 7 - 2.6 8 2.7 7 2.7 9 -
Stomach 2.3 10 2.5 8 1.7 10 2.1 9 - 3.1 6 3.2 7 2.6 8
Myeloma - 1.9 10 - 2.0 10 2.4 9 - 2.9 8 2.6 9
Corpus Uteri - - - - - 2.3 10 - -
All Other Sites 24.1 23.1 24.9 23.8 21.4 20.5 24.2 25.6
‡ Cervix Uteri and Brain and other Nervous had the same percentage of 2.3%.
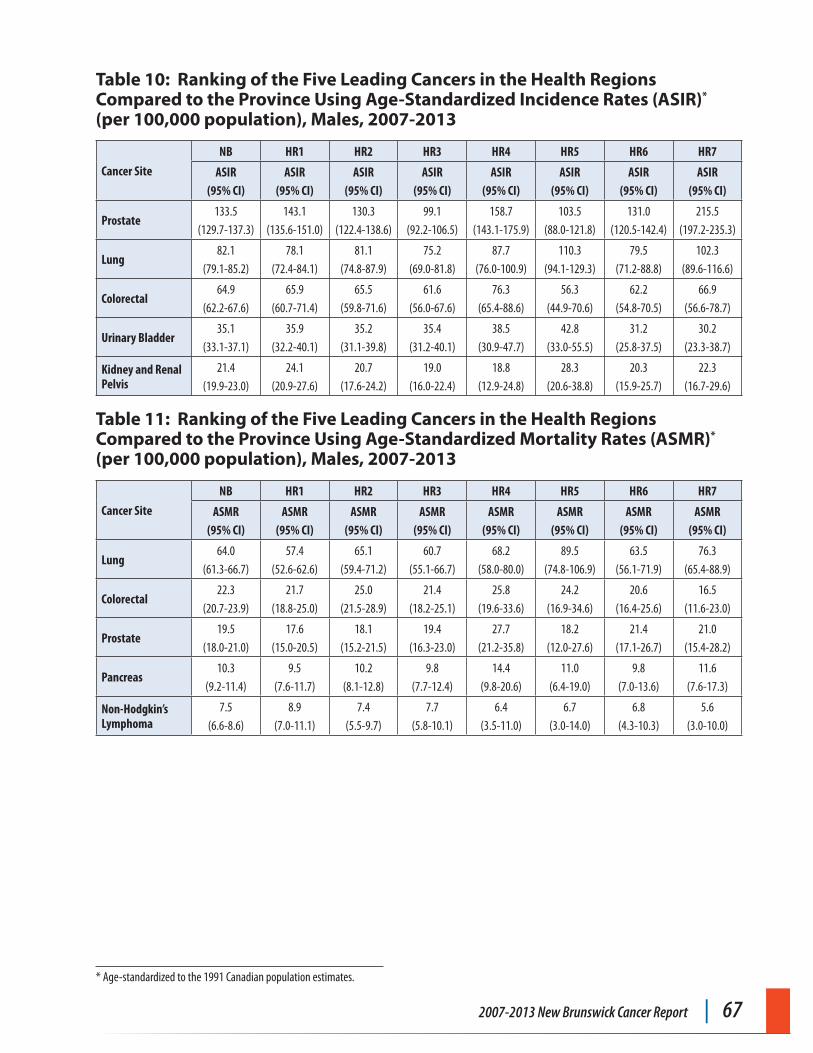
2007-2013 New Brunswick Cancer Report | 67
Table 10: Ranking of the Five Leading Cancers in the Health Regions Compared to the Province Using Age-Standardized Incidence Rates (ASIR)* (per 100,000 population), Males, 2007-2013
Cancer Site
NB HR1 HR2 HR3 HR4 HR5 HR6 HR7
ASIR(95% CI)
ASIR(95% CI)
ASIR(95% CI)
ASIR(95% CI)
ASIR(95% CI)
ASIR(95% CI)
ASIR(95% CI)
ASIR(95% CI)
Prostate133.5
(129.7-137.3)143.1
(135.6-151.0)130.3
(122.4-138.6)99.1
(92.2-106.5)158.7
(143.1-175.9)103.5
(88.0-121.8)131.0
(120.5-142.4)215.5
(197.2-235.3)
Lung 82.1
(79.1-85.2)78.1
(72.4-84.1)81.1
(74.8-87.9)75.2
(69.0-81.8)87.7
(76.0-100.9)110.3
(94.1-129.3)79.5
(71.2-88.8)102.3
(89.6-116.6)
Colorectal64.9
(62.2-67.6)65.9
(60.7-71.4)65.5
(59.8-71.6)61.6
(56.0-67.6)76.3
(65.4-88.6)56.3
(44.9-70.6)62.2
(54.8-70.5)66.9
(56.6-78.7)
Urinary Bladder35.1
(33.1-37.1)35.9
(32.2-40.1)35.2
(31.1-39.8)35.4
(31.2-40.1)38.5
(30.9-47.7)42.8
(33.0-55.5)31.2
(25.8-37.5)30.2
(23.3-38.7)
Kidney and Renal Pelvis
21.4(19.9-23.0)
24.1(20.9-27.6)
20.7(17.6-24.2)
19.0(16.0-22.4)
18.8(12.9-24.8)
28.3(20.6-38.8)
20.3(15.9-25.7)
22.3(16.7-29.6)
Table 11: Ranking of the Five Leading Cancers in the Health Regions Compared to the Province Using Age-Standardized Mortality Rates (ASMR)* (per 100,000 population), Males, 2007-2013
Cancer Site
NB HR1 HR2 HR3 HR4 HR5 HR6 HR7
ASMR(95% CI)
ASMR(95% CI)
ASMR(95% CI)
ASMR(95% CI)
ASMR(95% CI)
ASMR(95% CI)
ASMR(95% CI)
ASMR(95% CI)
Lung 64.0
(61.3-66.7)57.4
(52.6-62.6)65.1
(59.4-71.2)60.7
(55.1-66.7)68.2
(58.0-80.0)89.5
(74.8-106.9)63.5
(56.1-71.9)76.3
(65.4-88.9)
Colorectal22.3
(20.7-23.9)21.7
(18.8-25.0)25.0
(21.5-28.9)21.4
(18.2-25.1)25.8
(19.6-33.6)24.2
(16.9-34.6)20.6
(16.4-25.6)16.5
(11.6-23.0)
Prostate19.5
(18.0-21.0)17.6
(15.0-20.5)18.1
(15.2-21.5)19.4
(16.3-23.0)27.7
(21.2-35.8)18.2
(12.0-27.6)21.4
(17.1-26.7)21.0
(15.4-28.2)
Pancreas10.3
(9.2-11.4)9.5
(7.6-11.7)10.2
(8.1-12.8)9.8
(7.7-12.4)14.4
(9.8-20.6)11.0
(6.4-19.0)9.8
(7.0-13.6)11.6
(7.6-17.3)
Non-Hodgkin’s Lymphoma
7.5(6.6-8.6)
8.9(7.0-11.1)
7.4(5.5-9.7)
7.7(5.8-10.1)
6.4(3.5-11.0)
6.7(3.0-14.0)
6.8(4.3-10.3)
5.6(3.0-10.0)
* Age-standardized to the 1991 Canadian population estimates.
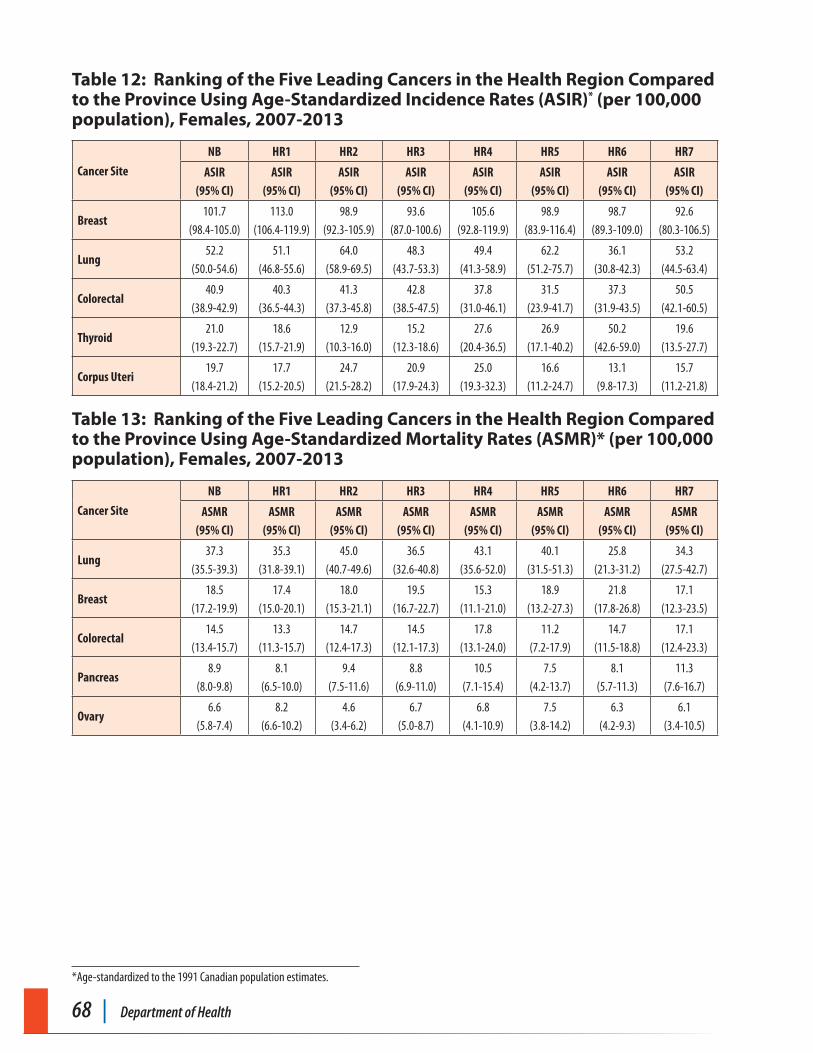
68 | Department of Health
Table 12: Ranking of the Five Leading Cancers in the Health Region Compared to the Province Using Age-Standardized Incidence Rates (ASIR)* (per 100,000 population), Females, 2007-2013
Cancer Site
NB HR1 HR2 HR3 HR4 HR5 HR6 HR7
ASIR(95% CI)
ASIR(95% CI)
ASIR(95% CI)
ASIR(95% CI)
ASIR(95% CI)
ASIR(95% CI)
ASIR(95% CI)
ASIR(95% CI)
Breast101.7
(98.4-105.0)113.0
(106.4-119.9)98.9
(92.3-105.9)93.6
(87.0-100.6)105.6
(92.8-119.9)98.9
(83.9-116.4)98.7
(89.3-109.0)92.6
(80.3-106.5)
Lung 52.2
(50.0-54.6)51.1
(46.8-55.6)64.0
(58.9-69.5)48.3
(43.7-53.3)49.4
(41.3-58.9)62.2
(51.2-75.7)36.1
(30.8-42.3)53.2
(44.5-63.4)
Colorectal40.9
(38.9-42.9)40.3
(36.5-44.3)41.3
(37.3-45.8)42.8
(38.5-47.5)37.8
(31.0-46.1)31.5
(23.9-41.7)37.3
(31.9-43.5)50.5
(42.1-60.5)
Thyroid21.0
(19.3-22.7)18.6
(15.7-21.9)12.9
(10.3-16.0)15.2
(12.3-18.6)27.6
(20.4-36.5)26.9
(17.1-40.2)50.2
(42.6-59.0)19.6
(13.5-27.7)
Corpus Uteri19.7
(18.4-21.2)17.7
(15.2-20.5)24.7
(21.5-28.2)20.9
(17.9-24.3)25.0
(19.3-32.3)16.6
(11.2-24.7)13.1
(9.8-17.3)15.7
(11.2-21.8)
Table 13: Ranking of the Five Leading Cancers in the Health Region Compared to the Province Using Age-Standardized Mortality Rates (ASMR)* (per 100,000 population), Females, 2007-2013
Cancer Site
NB HR1 HR2 HR3 HR4 HR5 HR6 HR7
ASMR(95% CI)
ASMR(95% CI)
ASMR(95% CI)
ASMR(95% CI)
ASMR(95% CI)
ASMR(95% CI)
ASMR(95% CI)
ASMR(95% CI)
Lung 37.3
(35.5-39.3)35.3
(31.8-39.1)45.0
(40.7-49.6)36.5
(32.6-40.8)43.1
(35.6-52.0)40.1
(31.5-51.3)25.8
(21.3-31.2)34.3
(27.5-42.7)
Breast18.5
(17.2-19.9)17.4
(15.0-20.1)18.0
(15.3-21.1)19.5
(16.7-22.7)15.3
(11.1-21.0)18.9
(13.2-27.3)21.8
(17.8-26.8)17.1
(12.3-23.5)
Colorectal14.5
(13.4-15.7)13.3
(11.3-15.7)14.7
(12.4-17.3)14.5
(12.1-17.3)17.8
(13.1-24.0)11.2
(7.2-17.9)14.7
(11.5-18.8)17.1
(12.4-23.3)
Pancreas8.9
(8.0-9.8)8.1
(6.5-10.0)9.4
(7.5-11.6)8.8
(6.9-11.0)10.5
(7.1-15.4)7.5
(4.2-13.7)8.1
(5.7-11.3)11.3
(7.6-16.7)
Ovary6.6
(5.8-7.4)8.2
(6.6-10.2)4.6
(3.4-6.2)6.7
(5.0-8.7)6.8
(4.1-10.9)7.5
(3.8-14.2)6.3
(4.2-9.3)6.1
(3.4-10.5)
Appendix C
*Age-standardized to the 1991 Canadian population estimates.
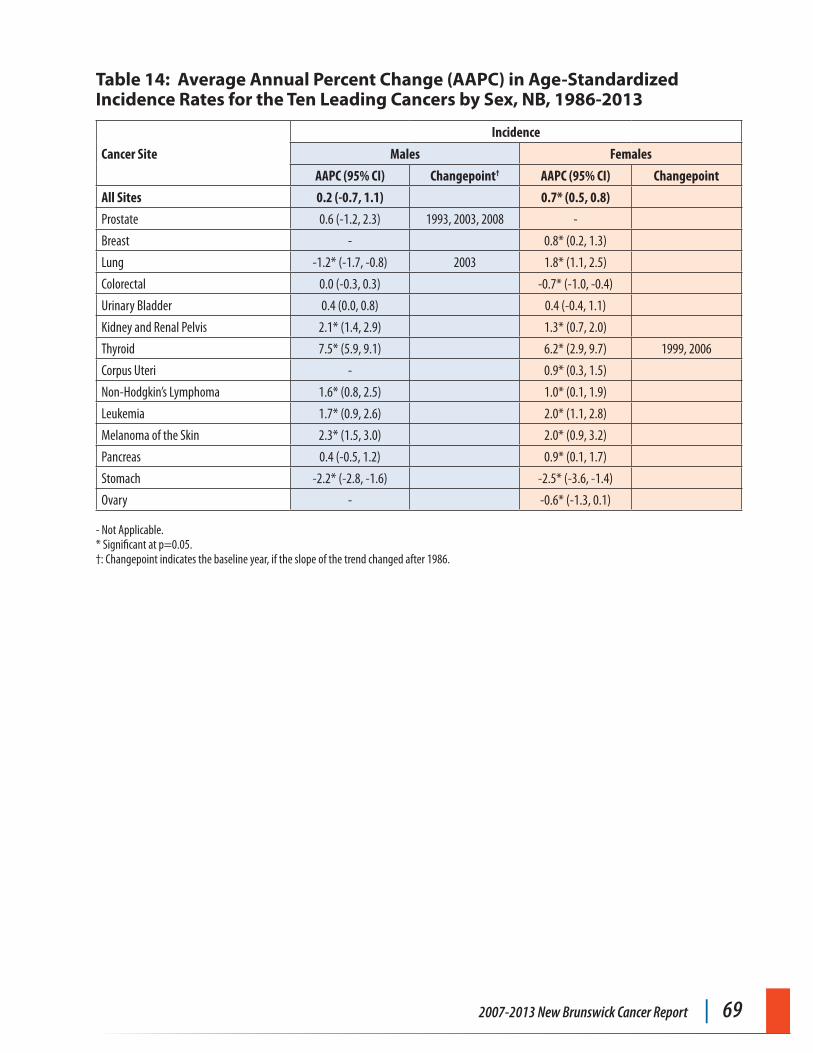
2007-2013 New Brunswick Cancer Report | 69
Table 14: Average Annual Percent Change (AAPC) in Age-Standardized Incidence Rates for the Ten Leading Cancers by Sex, NB, 1986-2013
Cancer Site
Incidence
Males Females
AAPC (95% CI) Changepoint† AAPC (95% CI) Changepoint
All Sites 0.2 (-0.7, 1.1) 0.7* (0.5, 0.8)
Prostate 0.6 (-1.2, 2.3) 1993, 2003, 2008 -
Breast - 0.8* (0.2, 1.3)
Lung -1.2* (-1.7, -0.8) 2003 1.8* (1.1, 2.5)
Colorectal 0.0 (-0.3, 0.3) -0.7* (-1.0, -0.4)
Urinary Bladder 0.4 (0.0, 0.8) 0.4 (-0.4, 1.1)
Kidney and Renal Pelvis 2.1* (1.4, 2.9) 1.3* (0.7, 2.0)
Thyroid 7.5* (5.9, 9.1) 6.2* (2.9, 9.7) 1999, 2006
Corpus Uteri - 0.9* (0.3, 1.5)
Non-Hodgkin’s Lymphoma 1.6* (0.8, 2.5) 1.0* (0.1, 1.9)
Leukemia 1.7* (0.9, 2.6) 2.0* (1.1, 2.8)
Melanoma of the Skin 2.3* (1.5, 3.0) 2.0* (0.9, 3.2)
Pancreas 0.4 (-0.5, 1.2) 0.9* (0.1, 1.7)
Stomach -2.2* (-2.8, -1.6) -2.5* (-3.6, -1.4)
Ovary - -0.6* (-1.3, 0.1)
- Not Applicable. * Significant at p=0.05. †: Changepoint indicates the baseline year, if the slope of the trend changed after 1986.
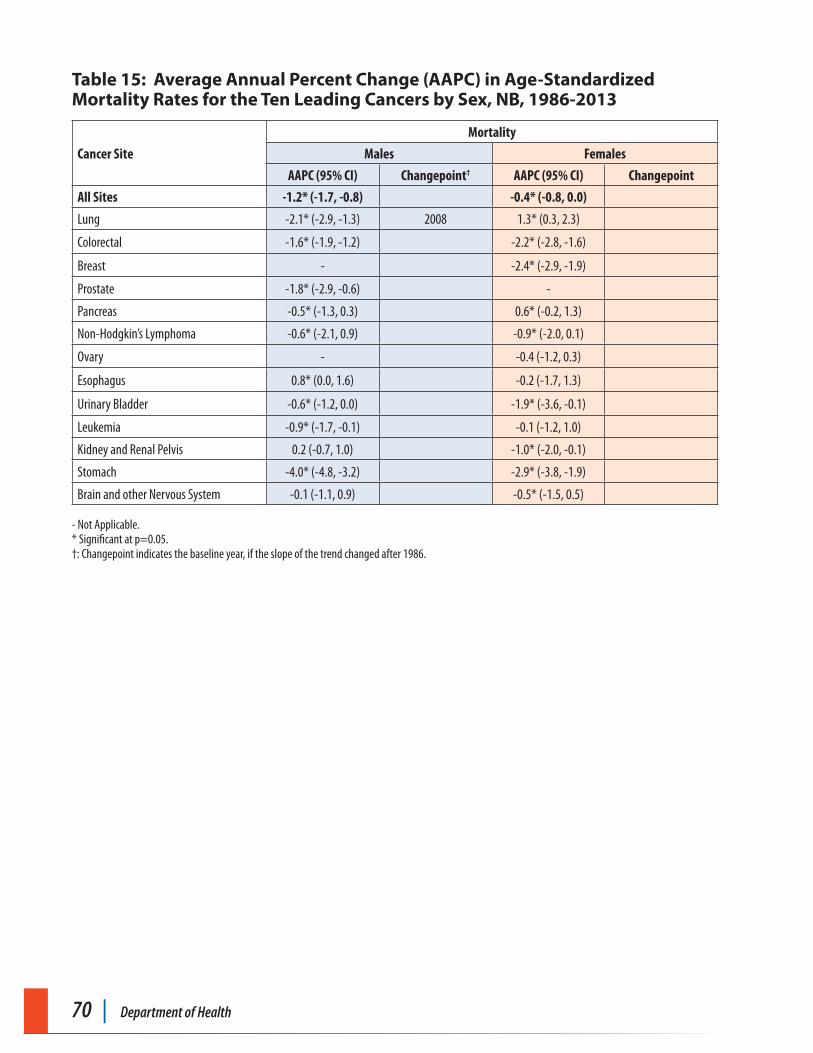
70 | Department of Health
Table 15: Average Annual Percent Change (AAPC) in Age-Standardized Mortality Rates for the Ten Leading Cancers by Sex, NB, 1986-2013
Cancer Site
Mortality
Males Females
AAPC (95% CI) Changepoint† AAPC (95% CI) Changepoint
All Sites -1.2* (-1.7, -0.8) -0.4* (-0.8, 0.0)
Lung -2.1* (-2.9, -1.3) 2008 1.3* (0.3, 2.3)
Colorectal -1.6* (-1.9, -1.2) -2.2* (-2.8, -1.6)
Breast - -2.4* (-2.9, -1.9)
Prostate -1.8* (-2.9, -0.6) -
Pancreas -0.5* (-1.3, 0.3) 0.6* (-0.2, 1.3)
Non-Hodgkin’s Lymphoma -0.6* (-2.1, 0.9) -0.9* (-2.0, 0.1)
Ovary - -0.4 (-1.2, 0.3)
Esophagus 0.8* (0.0, 1.6) -0.2 (-1.7, 1.3)
Urinary Bladder -0.6* (-1.2, 0.0) -1.9* (-3.6, -0.1)
Leukemia -0.9* (-1.7, -0.1) -0.1 (-1.2, 1.0)
Kidney and Renal Pelvis 0.2 (-0.7, 1.0) -1.0* (-2.0, -0.1)
Stomach -4.0* (-4.8, -3.2) -2.9* (-3.8, -1.9)
Brain and other Nervous System -0.1 (-1.1, 0.9) -0.5* (-1.5, 0.5)
- Not Applicable. * Significant at p=0.05. †: Changepoint indicates the baseline year, if the slope of the trend changed after 1986.
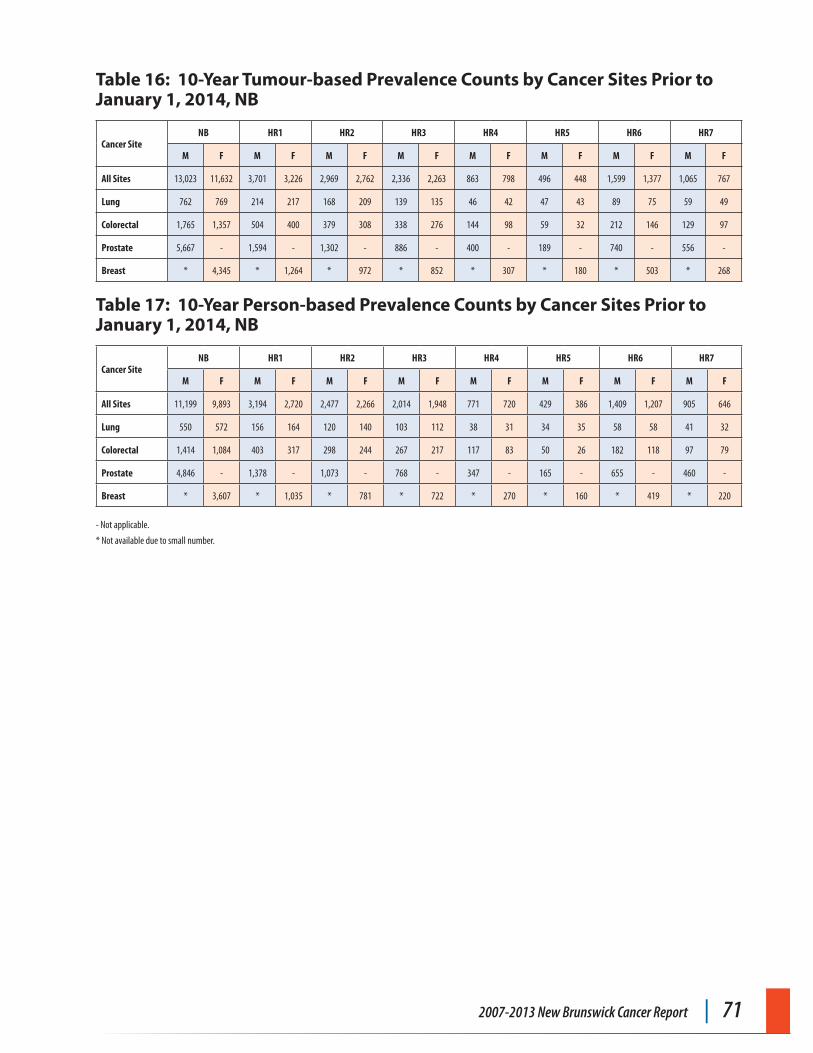
2007-2013 New Brunswick Cancer Report | 71
Table 16: 10-Year Tumour-based Prevalence Counts by Cancer Sites Prior to January 1, 2014, NB
Cancer SiteNB HR1 HR2 HR3 HR4 HR5 HR6 HR7
M F M F M F M F M F M F M F M F
All Sites 13,023 11,632 3,701 3,226 2,969 2,762 2,336 2,263 863 798 496 448 1,599 1,377 1,065 767
Lung 762 769 214 217 168 209 139 135 46 42 47 43 89 75 59 49
Colorectal 1,765 1,357 504 400 379 308 338 276 144 98 59 32 212 146 129 97
Prostate 5,667 - 1,594 - 1,302 - 886 - 400 - 189 - 740 - 556 -
Breast * 4,345 * 1,264 * 972 * 852 * 307 * 180 * 503 * 268
Table 17: 10-Year Person-based Prevalence Counts by Cancer Sites Prior to January 1, 2014, NB
Cancer SiteNB HR1 HR2 HR3 HR4 HR5 HR6 HR7
M F M F M F M F M F M F M F M F
All Sites 11,199 9,893 3,194 2,720 2,477 2,266 2,014 1,948 771 720 429 386 1,409 1,207 905 646
Lung 550 572 156 164 120 140 103 112 38 31 34 35 58 58 41 32
Colorectal 1,414 1,084 403 317 298 244 267 217 117 83 50 26 182 118 97 79
Prostate 4,846 - 1,378 - 1,073 - 768 - 347 - 165 - 655 - 460 -
Breast * 3,607 * 1,035 * 781 * 722 * 270 * 160 * 419 * 220
- Not applicable.
* Not available due to small number.
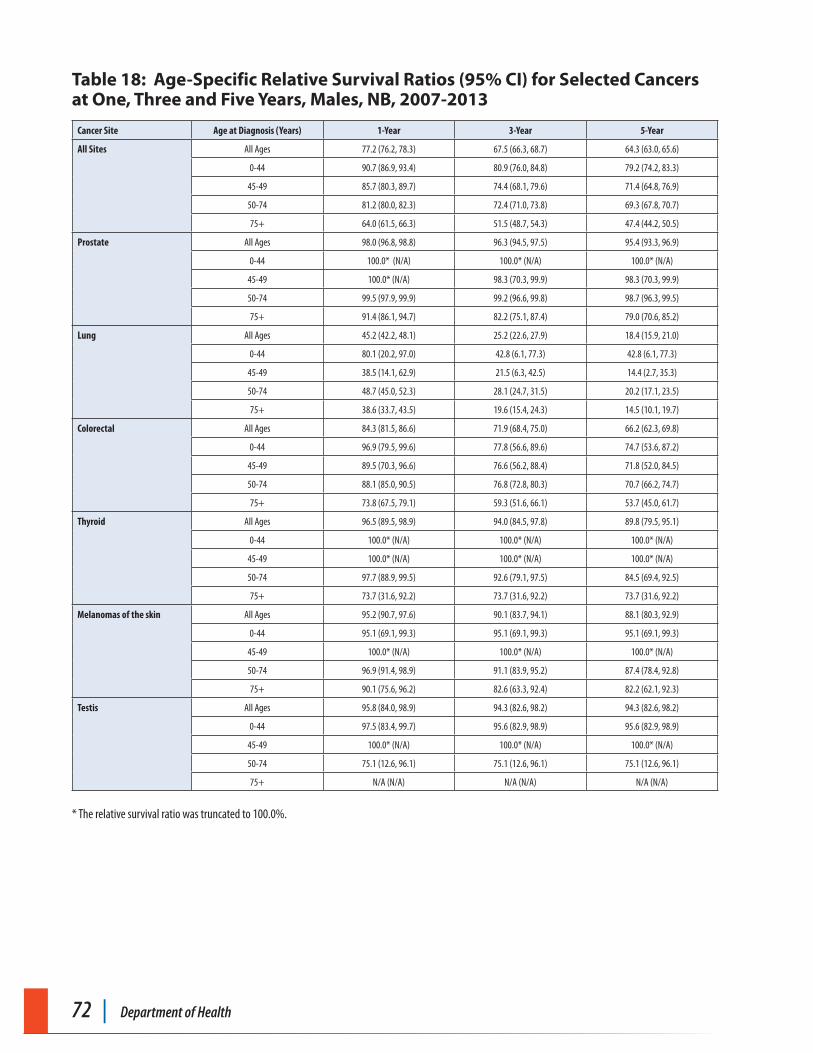
72 | Department of Health
Table 18: Age-Specific Relative Survival Ratios (95% CI) for Selected Cancers at One, Three and Five Years, Males, NB, 2007-2013
Cancer Site Age at Diagnosis (Years) 1-Year 3-Year 5-Year
All Sites All Ages 77.2 (76.2, 78.3) 67.5 (66.3, 68.7) 64.3 (63.0, 65.6)
0-44 90.7 (86.9, 93.4) 80.9 (76.0, 84.8) 79.2 (74.2, 83.3)
45-49 85.7 (80.3, 89.7) 74.4 (68.1, 79.6) 71.4 (64.8, 76.9)
50-74 81.2 (80.0, 82.3) 72.4 (71.0, 73.8) 69.3 (67.8, 70.7)
75+ 64.0 (61.5, 66.3) 51.5 (48.7, 54.3) 47.4 (44.2, 50.5)
Prostate All Ages 98.0 (96.8, 98.8) 96.3 (94.5, 97.5) 95.4 (93.3, 96.9)
0-44 100.0* (N/A) 100.0* (N/A) 100.0* (N/A)
45-49 100.0* (N/A) 98.3 (70.3, 99.9) 98.3 (70.3, 99.9)
50-74 99.5 (97.9, 99.9) 99.2 (96.6, 99.8) 98.7 (96.3, 99.5)
75+ 91.4 (86.1, 94.7) 82.2 (75.1, 87.4) 79.0 (70.6, 85.2)
Lung
All Ages 45.2 (42.2, 48.1) 25.2 (22.6, 27.9) 18.4 (15.9, 21.0)
0-44 80.1 (20.2, 97.0) 42.8 (6.1, 77.3) 42.8 (6.1, 77.3)
45-49 38.5 (14.1, 62.9) 21.5 (6.3, 42.5) 14.4 (2.7, 35.3)
50-74 48.7 (45.0, 52.3) 28.1 (24.7, 31.5) 20.2 (17.1, 23.5)
75+ 38.6 (33.7, 43.5) 19.6 (15.4, 24.3) 14.5 (10.1, 19.7)
Colorectal All Ages 84.3 (81.5, 86.6) 71.9 (68.4, 75.0) 66.2 (62.3, 69.8)
0-44 96.9 (79.5, 99.6) 77.8 (56.6, 89.6) 74.7 (53.6, 87.2)
45-49 89.5 (70.3, 96.6) 76.6 (56.2, 88.4) 71.8 (52.0, 84.5)
50-74 88.1 (85.0, 90.5) 76.8 (72.8, 80.3) 70.7 (66.2, 74.7)
75+ 73.8 (67.5, 79.1) 59.3 (51.6, 66.1) 53.7 (45.0, 61.7)
Thyroid All Ages 96.5 (89.5, 98.9) 94.0 (84.5, 97.8) 89.8 (79.5, 95.1)
0-44 100.0* (N/A) 100.0* (N/A) 100.0* (N/A)
45-49 100.0* (N/A) 100.0* (N/A) 100.0* (N/A)
50-74 97.7 (88.9, 99.5) 92.6 (79.1, 97.5) 84.5 (69.4, 92.5)
75+ 73.7 (31.6, 92.2) 73.7 (31.6, 92.2) 73.7 (31.6, 92.2)
Melanomas of the skin All Ages 95.2 (90.7, 97.6) 90.1 (83.7, 94.1) 88.1 (80.3, 92.9)
0-44 95.1 (69.1, 99.3) 95.1 (69.1, 99.3) 95.1 (69.1, 99.3)
45-49 100.0* (N/A) 100.0* (N/A) 100.0* (N/A)
50-74 96.9 (91.4, 98.9) 91.1 (83.9, 95.2) 87.4 (78.4, 92.8)
75+ 90.1 (75.6, 96.2) 82.6 (63.3, 92.4) 82.2 (62.1, 92.3)
Testis All Ages 95.8 (84.0, 98.9) 94.3 (82.6, 98.2) 94.3 (82.6, 98.2)
0-44 97.5 (83.4, 99.7) 95.6 (82.9, 98.9) 95.6 (82.9, 98.9)
45-49 100.0* (N/A) 100.0* (N/A) 100.0* (N/A)
50-74 75.1 (12.6, 96.1) 75.1 (12.6, 96.1) 75.1 (12.6, 96.1)
75+ N/A (N/A) N/A (N/A) N/A (N/A)
* The relative survival ratio was truncated to 100.0%.
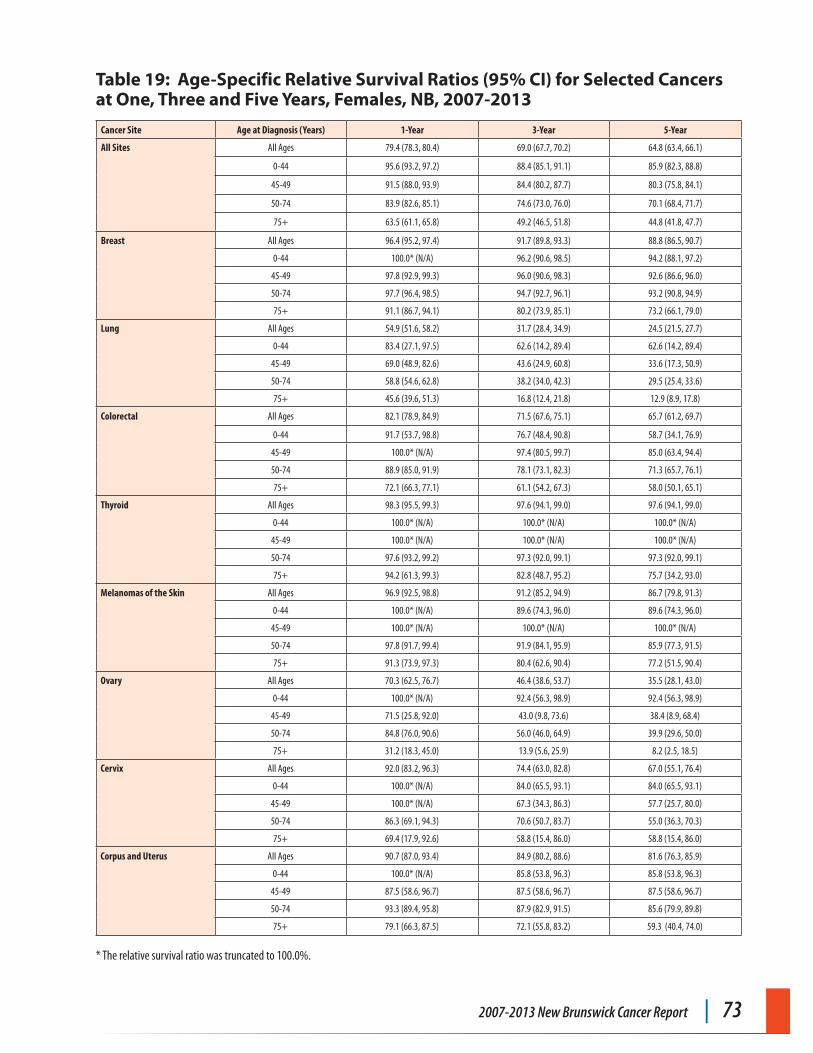
2007-2013 New Brunswick Cancer Report | 73
Table 19: Age-Specific Relative Survival Ratios (95% CI) for Selected Cancers at One, Three and Five Years, Females, NB, 2007-2013
Cancer Site Age at Diagnosis (Years) 1-Year 3-Year 5-Year
All Sites All Ages 79.4 (78.3, 80.4) 69.0 (67.7, 70.2) 64.8 (63.4, 66.1)
0-44 95.6 (93.2, 97.2) 88.4 (85.1, 91.1) 85.9 (82.3, 88.8)
45-49 91.5 (88.0, 93.9) 84.4 (80.2, 87.7) 80.3 (75.8, 84.1)
50-74 83.9 (82.6, 85.1) 74.6 (73.0, 76.0) 70.1 (68.4, 71.7)
75+ 63.5 (61.1, 65.8) 49.2 (46.5, 51.8) 44.8 (41.8, 47.7)
Breast All Ages 96.4 (95.2, 97.4) 91.7 (89.8, 93.3) 88.8 (86.5, 90.7)
0-44 100.0* (N/A) 96.2 (90.6, 98.5) 94.2 (88.1, 97.2)
45-49 97.8 (92.9, 99.3) 96.0 (90.6, 98.3) 92.6 (86.6, 96.0)
50-74 97.7 (96.4, 98.5) 94.7 (92.7, 96.1) 93.2 (90.8, 94.9)
75+ 91.1 (86.7, 94.1) 80.2 (73.9, 85.1) 73.2 (66.1, 79.0)
Lung All Ages 54.9 (51.6, 58.2) 31.7 (28.4, 34.9) 24.5 (21.5, 27.7)
0-44 83.4 (27.1, 97.5) 62.6 (14.2, 89.4) 62.6 (14.2, 89.4)
45-49 69.0 (48.9, 82.6) 43.6 (24.9, 60.8) 33.6 (17.3, 50.9)
50-74 58.8 (54.6, 62.8) 38.2 (34.0, 42.3) 29.5 (25.4, 33.6)
75+ 45.6 (39.6, 51.3) 16.8 (12.4, 21.8) 12.9 (8.9, 17.8)
Colorectal All Ages 82.1 (78.9, 84.9) 71.5 (67.6, 75.1) 65.7 (61.2, 69.7)
0-44 91.7 (53.7, 98.8) 76.7 (48.4, 90.8) 58.7 (34.1, 76.9)
45-49 100.0* (N/A) 97.4 (80.5, 99.7) 85.0 (63.4, 94.4)
50-74 88.9 (85.0, 91.9) 78.1 (73.1, 82.3) 71.3 (65.7, 76.1)
75+ 72.1 (66.3, 77.1) 61.1 (54.2, 67.3) 58.0 (50.1, 65.1)
Thyroid All Ages 98.3 (95.5, 99.3) 97.6 (94.1, 99.0) 97.6 (94.1, 99.0)
0-44 100.0* (N/A) 100.0* (N/A) 100.0* (N/A)
45-49 100.0* (N/A) 100.0* (N/A) 100.0* (N/A)
50-74 97.6 (93.2, 99.2) 97.3 (92.0, 99.1) 97.3 (92.0, 99.1)
75+ 94.2 (61.3, 99.3) 82.8 (48.7, 95.2) 75.7 (34.2, 93.0)
Melanomas of the Skin All Ages 96.9 (92.5, 98.8) 91.2 (85.2, 94.9) 86.7 (79.8, 91.3)
0-44 100.0* (N/A) 89.6 (74.3, 96.0) 89.6 (74.3, 96.0)
45-49 100.0* (N/A) 100.0* (N/A) 100.0* (N/A)
50-74 97.8 (91.7, 99.4) 91.9 (84.1, 95.9) 85.9 (77.3, 91.5)
75+ 91.3 (73.9, 97.3) 80.4 (62.6, 90.4) 77.2 (51.5, 90.4)
Ovary All Ages 70.3 (62.5, 76.7) 46.4 (38.6, 53.7) 35.5 (28.1, 43.0)
0-44 100.0* (N/A) 92.4 (56.3, 98.9) 92.4 (56.3, 98.9)
45-49 71.5 (25.8, 92.0) 43.0 (9.8, 73.6) 38.4 (8.9, 68.4)
50-74 84.8 (76.0, 90.6) 56.0 (46.0, 64.9) 39.9 (29.6, 50.0)
75+ 31.2 (18.3, 45.0) 13.9 (5.6, 25.9) 8.2 (2.5, 18.5)
Cervix All Ages 92.0 (83.2, 96.3) 74.4 (63.0, 82.8) 67.0 (55.1, 76.4)
0-44 100.0* (N/A) 84.0 (65.5, 93.1) 84.0 (65.5, 93.1)
45-49 100.0* (N/A) 67.3 (34.3, 86.3) 57.7 (25.7, 80.0)
50-74 86.3 (69.1, 94.3) 70.6 (50.7, 83.7) 55.0 (36.3, 70.3)
75+ 69.4 (17.9, 92.6) 58.8 (15.4, 86.0) 58.8 (15.4, 86.0)
Corpus and Uterus All Ages 90.7 (87.0, 93.4) 84.9 (80.2, 88.6) 81.6 (76.3, 85.9)
0-44 100.0* (N/A) 85.8 (53.8, 96.3) 85.8 (53.8, 96.3)
45-49 87.5 (58.6, 96.7) 87.5 (58.6, 96.7) 87.5 (58.6, 96.7)
50-74 93.3 (89.4, 95.8) 87.9 (82.9, 91.5) 85.6 (79.9, 89.8)
75+ 79.1 (66.3, 87.5) 72.1 (55.8, 83.2) 59.3 (40.4, 74.0)
* The relative survival ratio was truncated to 100.0%.
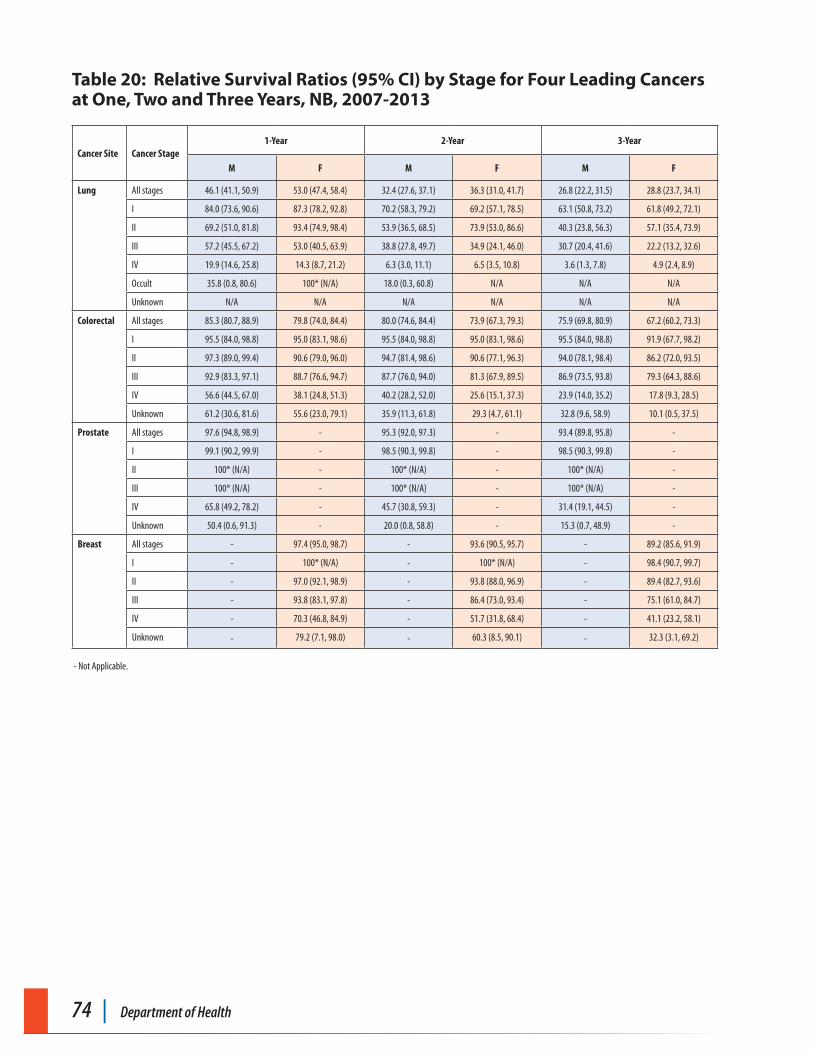
74 | Department of Health
Table 20: Relative Survival Ratios (95% CI) by Stage for Four Leading Cancers at One, Two and Three Years, NB, 2007-2013
Cancer Site Cancer Stage1-Year 2-Year 3-Year
M F M F M F
Lung All stages 46.1 (41.1, 50.9) 53.0 (47.4, 58.4) 32.4 (27.6, 37.1) 36.3 (31.0, 41.7) 26.8 (22.2, 31.5) 28.8 (23.7, 34.1)
I 84.0 (73.6, 90.6) 87.3 (78.2, 92.8) 70.2 (58.3, 79.2) 69.2 (57.1, 78.5) 63.1 (50.8, 73.2) 61.8 (49.2, 72.1)
II 69.2 (51.0, 81.8) 93.4 (74.9, 98.4) 53.9 (36.5, 68.5) 73.9 (53.0, 86.6) 40.3 (23.8, 56.3) 57.1 (35.4, 73.9)
III 57.2 (45.5, 67.2) 53.0 (40.5, 63.9) 38.8 (27.8, 49.7) 34.9 (24.1, 46.0) 30.7 (20.4, 41.6) 22.2 (13.2, 32.6)
IV 19.9 (14.6, 25.8) 14.3 (8.7, 21.2) 6.3 (3.0, 11.1) 6.5 (3.5, 10.8) 3.6 (1.3, 7.8) 4.9 (2.4, 8.9)
Occult 35.8 (0.8, 80.6) 100* (N/A) 18.0 (0.3, 60.8) N/A N/A N/A
Unknown N/A N/A N/A N/A N/A N/A
Colorectal All stages 85.3 (80.7, 88.9) 79.8 (74.0, 84.4) 80.0 (74.6, 84.4) 73.9 (67.3, 79.3) 75.9 (69.8, 80.9) 67.2 (60.2, 73.3)
I 95.5 (84.0, 98.8) 95.0 (83.1, 98.6) 95.5 (84.0, 98.8) 95.0 (83.1, 98.6) 95.5 (84.0, 98.8) 91.9 (67.7, 98.2)
II 97.3 (89.0, 99.4) 90.6 (79.0, 96.0) 94.7 (81.4, 98.6) 90.6 (77.1, 96.3) 94.0 (78.1, 98.4) 86.2 (72.0, 93.5)
III 92.9 (83.3, 97.1) 88.7 (76.6, 94.7) 87.7 (76.0, 94.0) 81.3 (67.9, 89.5) 86.9 (73.5, 93.8) 79.3 (64.3, 88.6)
IV 56.6 (44.5, 67.0) 38.1 (24.8, 51.3) 40.2 (28.2, 52.0) 25.6 (15.1, 37.3) 23.9 (14.0, 35.2) 17.8 (9.3, 28.5)
Unknown 61.2 (30.6, 81.6) 55.6 (23.0, 79.1) 35.9 (11.3, 61.8) 29.3 (4.7, 61.1) 32.8 (9.6, 58.9) 10.1 (0.5, 37.5)
Prostate All stages 97.6 (94.8, 98.9) - 95.3 (92.0, 97.3) - 93.4 (89.8, 95.8) -
I 99.1 (90.2, 99.9) - 98.5 (90.3, 99.8) - 98.5 (90.3, 99.8) -
II 100* (N/A) - 100* (N/A) - 100* (N/A) -
III 100* (N/A) - 100* (N/A) - 100* (N/A) -
IV 65.8 (49.2, 78.2) - 45.7 (30.8, 59.3) - 31.4 (19.1, 44.5) -
Unknown 50.4 (0.6, 91.3) - 20.0 (0.8, 58.8) - 15.3 (0.7, 48.9) -
Breast All stages - 97.4 (95.0, 98.7) - 93.6 (90.5, 95.7) - 89.2 (85.6, 91.9)
I - 100* (N/A) - 100* (N/A) - 98.4 (90.7, 99.7)
II - 97.0 (92.1, 98.9) - 93.8 (88.0, 96.9) - 89.4 (82.7, 93.6)
III - 93.8 (83.1, 97.8) - 86.4 (73.0, 93.4) - 75.1 (61.0, 84.7)
IV - 70.3 (46.8, 84.9) - 51.7 (31.8, 68.4) - 41.1 (23.2, 58.1)
Unknown - 79.2 (7.1, 98.0) - 60.3 (8.5, 90.1) - 32.3 (3.1, 69.2)
- Not Applicable.
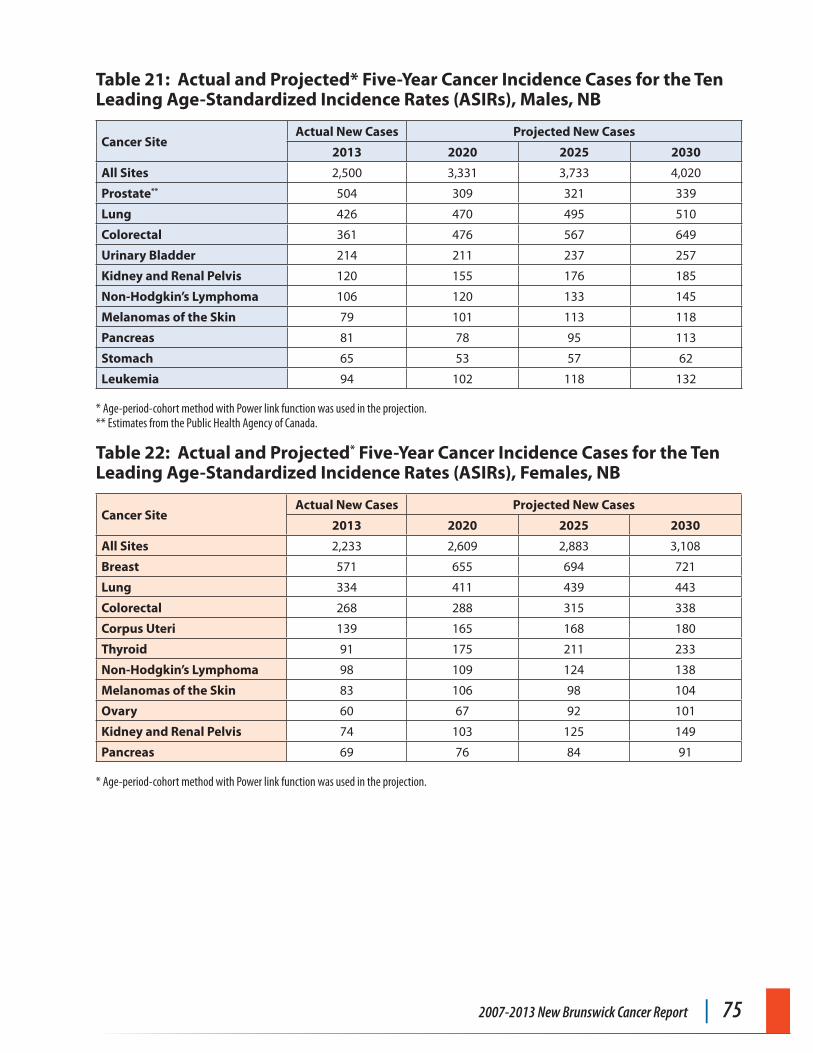
2007-2013 New Brunswick Cancer Report | 75
Table 21: Actual and Projected* Five-Year Cancer Incidence Cases for the Ten Leading Age-Standardized Incidence Rates (ASIRs), Males, NB
Cancer SiteActual New Cases Projected New Cases
2013 2020 2025 2030
All Sites 2,500 3,331 3,733 4,020
Prostate** 504 309 321 339
Lung 426 470 495 510
Colorectal 361 476 567 649
Urinary Bladder 214 211 237 257
Kidney and Renal Pelvis 120 155 176 185
Non-Hodgkin’s Lymphoma 106 120 133 145
Melanomas of the Skin 79 101 113 118
Pancreas 81 78 95 113
Stomach 65 53 57 62
Leukemia 94 102 118 132
* Age-period-cohort method with Power link function was used in the projection. ** Estimates from the Public Health Agency of Canada.
Table 22: Actual and Projected* Five-Year Cancer Incidence Cases for the Ten Leading Age-Standardized Incidence Rates (ASIRs), Females, NB
Cancer SiteActual New Cases Projected New Cases
2013 2020 2025 2030
All Sites 2,233 2,609 2,883 3,108
Breast 571 655 694 721
Lung 334 411 439 443
Colorectal 268 288 315 338
Corpus Uteri 139 165 168 180
Thyroid 91 175 211 233
Non-Hodgkin’s Lymphoma 98 109 124 138
Melanomas of the Skin 83 106 98 104
Ovary 60 67 92 101
Kidney and Renal Pelvis 74 103 125 149
Pancreas 69 76 84 91
* Age-period-cohort method with Power link function was used in the projection.
76 | Department of Health
Glossary
CancerCancer is a disease in which cells divide and multiply without control. Cancer cells can invade nearby tissues and spread to other parts of the body. There are several main types of cancer. Carcinoma is cancer that begins in the skin or in tissues that line or cover internal organs. Sarcoma is cancer that begins in bone, cartilage, fat, muscle, blood vessels, or other connective or supportive tissue. Leukemia is cancer that starts in blood-forming tissue such as bone marrow, and causes white blood cells to be produced. Lymphoma is cancer that begins in the cells of the immune system.
Regional Health Authority (RHA)Two Regional Health Authorities exist in New Brunswick. Both are responsible for consolidating and managing programs and services previously delivered by the eight former RHAs. Former RHAs 1 (Beauséjour), 4, 5 and 6 were consolidated under Vitalité Health Network. Former RHAs 1 (South East), 2, 3 and 7 were consolidated under Horizon Health Network.
New Brunswick Provincial Cancer RegistryA central depository for cancer incidence data in New Brunswick, which is located in Saint John and managed by the New Brunswick Cancer Network (NBCN) of the Department of Health.
Incidence (new cases)The number of newly diagnosed cancer cases during a defined time period in a specified population.
Mortality (deaths)The number of deaths attributed to a particular type of cancer during a defined time period in a specified population. Included are deaths of those whose cancer was diagnosed in an earlier time period, people with a new diagnosis during the time period, and persons for whom a diagnosis of cancer is recorded only at time of death.
Vital StatisticsA unit of Service New Brunswick that compiles mortality information and other data such as the number of births and marriages data.
Invasive Cancer (Behavior Code 3)Invasive cancer is a cancer that has spread beyond the layer of tissue in which it developed and is growing into surrounding healthy tissue.
SEER (The Surveillance, Epidemiology, and End Results) Cancer ClassificationThe Surveillance, Epidemiology, and End Results (SEER) Classification is a method of grouping cancer by the type of tissue in which the cancer originates (histological type) and by primary site, or the location in the body where the cancer first developed.
ICD-O-3The third edition of the International Classification of Diseases for Oncology (ICD-O-3), published by the World Health Organization, is used in tumour or cancer registries for coding the site (topography) and the histology (morphology) of neoplasms, usually obtained from a pathology report.
ICD-10Published by the World Health Organization, the Tenth Revision of the International Classification of Diseases (ICD-10) classifies diseases into certain categories for recording morbidity and mortality data.
VarianceA statistic measures how spread out the distribution (e.g., mean) is in a data set.
2007-2013 New Brunswick Cancer Report | 77
Joinpoint /Joinpoint modelJoinpoint is statistic software for the analysis of trends using joinpoint models, where several different lines are connected together at the “joinpoints”. A joinpoint model, developed by National Cancer Institute, is used to determine when and how often the change(s) occurred in the age-standardized incidence and mortality rates overtime.
PrevalenceThe proportion of individuals who were previously diagnosed with cancer and who are still alive at a given point in time.
New Brunswicker / Resident of New BrunswickFor cancer incidence and mortality data, a patient is considered a New Brunswicker – or resident of New Brunswick – if they were a permanent resident at the time of diagnosis or death.
Stage of CancerThe stage of cancer is the anatomic extent of the cancer at the time of diagnosis and before the application of definitive treatment.
All Sites or All Cancers or All Cancer Sites CombinedThis refers to the total of all malignant cancer sites combined, as defined in the SEER tables in Appendices A and B. It excludes non-melanoma skin cancer (basal and squamous cell carcinoma of the skin) and invasive ovarian cancers with the following morphology: 8442/3, 8462/3, 8472/3 and 8473/3.
RankThe cancers with the highest age-standardized rates or frequencies are numbered in descending order.
Age-Specific RateA ratio between age-specific new cases or deaths due to cancer and the population size of a specified age range where the new cases or deaths were generated. It is expressed as an age-specific incidence or age-specific mortality rate per 100,000 population.
Crude RateA ratio between the total number of new cases or deaths due to cancer and the total population in the same geographic area (for a specific time period) and multiplied by 100,000 population.
Age-Standardized Incidence / Mortality Rate (ASIR, ASMR)It is calculated as a weighted average of the age-specific rates (usually in 5 year age groups) in the population of interest, where the weight for each age group is the proportion of the standard population (i.e., 1991 Canadian population estimates) in that age group.
Confidence Interval (CI) A statistic gives an estimated range of values which is likely to include an unknown population parameter, the estimated range being calculated from a given set of sample data. For example, a 95% confidence interval means that if we were to take 100 different samples and compute a 95% confidence interval for each sample, then approximately 95 of the 100 confidence intervals contain the true parameter such as a mean or a rate.
Childhood and Adolescent and Young Adult CancersTypes of cancers found in children (ages 0-14) and adolescents and young adults (ages 15-29) in New Brunswick.
All Other SitesIn some sections of this report, the ten leading cancer sites were selected for analysis. Those sites not included in the ten leading were grouped and labeled as ‘All Other Sites’ so that all cancer sites were accounted for.
78 | Department of Health
Annual Percent Change (APC)APC is used to assess the rate of change over time of an incidence or mortality rate. It is defined as a percentage increase or decrease of the rates in a fixed pre-specified interval where the change in rates is assumed constant.
Relative Survival Ratio (RSR)RSR is defined as the ratio of the observed survival for a group of persons diagnosed with cancer to the survival that would be expected for members of the general population, who are free of the cancer of interest. Estimates of the RSR greater than 100% are possible, which indicates the observed survival of the cancer patients is better the expected survival of the general population.
2007-2013 New Brunswick Cancer Report | 79
References
1. Zhang B, Fowler M, Strong DE, Pilgrim W, Varner L, Leonfellner S, Beaulieu G, Coulombe D, Bolesnikov G, Savoie R and Kumar SE. Cancer in New Brunswick 2002-2006. New Brunswick Cancer Network, New Brunswick Department of Health. July 2010.
2. Kent WD, Hall SF, Isotalo PA, et al. Increased Incidence of Differentiated Thyroid Carcinoma and Detection of Subclinical Disease. CMAJ 2007; 177: 1357-61.
3. Canadian Cancer Society / National Cancer Institute of Canada: Canadian Cancer Statistics 2015, Toronto, Canada, 2015.
4. Howe HL, Edwards BK, Young JL, Shen T, West DW, Hutton M, Correa CN. A Vision for Cancer Incidence and Surveillance in the United States. Cancer Causes and Control 2003, 14: 663-672.
5. Balram C, Bourque R, Levesque M, O’Shea C, Gilbert C, Heissner C, Zaidi, D. Cancer in New Brunswick: 1992-1996. Provincial Epidemiology Service Division, Department of Health and Wellness, New Brunswick, 2000.
6. Liu J, Pilgrim W, Leonfellner S, Casey W, Galvin C, Bourque R, Levesque M and Balram C. Cancer in New Brunswick 1997-2001. Department of Health, New Brunswick, 2004.
7. Greene FL, Page DL, Fleming ID, Fritz AG, Balch CM, Haller DG, Morrow M (Eds.). AJCC Cancer Staging Manual, Sixth Edition. American Joint Committee on Cancer. New York: Springer, 2002.
8. National Cancer Institute: Site Recode ICD-O-3/WHO 2008 Definition. (https://seer.cancer.gov/siterecode).
9. Tiwari RC, Clegg LX, Zou Z. Efficient interval estimation for age-adjusted cancer rates. Stat Methods Med Res 2006 Dec;15(6):547-69.
10. Kim HJ, Fay MP, Feuer EJ, Midthune DN. Permutation Tests for Joinpoint Regression with Applications to Cancer Rates. Stat Med 2001; 20: 655.
11. National Cancer Institute: Cancer Trends Progress Report - Methodology for Characterizing Trends. Retrieved; [accessed 2016 October]. (http://progressreport.cancer.gov/methodology).
12. Mariotto A, Gigli A, Capocaccia R, Tavilla A, Clegg LX, Depry M , Scoppa S, et al. Complete and Limited Duration Cancer Prevalence Estimates. SEER Cancer Statistics Review, 1973-1999, National Cancer Institute. Bethesda, MD.
13. Byrne J, Kessler LG, Devesa SS. The prevalence of cancer among adults in the United States: 1987. Cancer 1992; 68:2154-9.
14. Ellison, LF, Wilkins K. Cancer prevalence in the Canadian population. Ottawa: Statistics Canada, Catalogue no. 82-003-XPE. Health Reports, Vol.20, no.1, March 2009.
15. Brenner H, Hakulinen T. Deriving Up-to-Date Estimates of Long-Term Patient Survival. Journal of Clinical Epidemiology 1997; 50(2): 211-16.
16. Brenner H, Hakulinen T. Up-to-Date Long-Term Survival Curves of Patients with Cancer by Period Analysis. Journal of Clinical Oncology 2002; 20: 826-32.
17. Ellison LF, Gibbons L. Five-Year Relative Survival from Prostate, Breast, Colorectal and Lung Cancer. Statistics Canada Catalogue 82-003, Health Reports 2001; 13(1):1-12.
18. Dickman PW, Auvinen A, Voutilainen ET, et al. Measuring Social Class Differences in Cancer Patient Survival: Is it Necessary to Control for Social Class Differences in General Population Mortality? A Finnish Population-Based Study. Journal of Epidemiology and Community Health 1998; 52: 727-34.
19. Ederer F, Heise H. Instructions to IBM 650 Programmers in Processing Survival Computations. Methodological Note No. 10, End Results Evaluation Section. Bethesda, MD: National Cancer Institute, 1959.
20. Statistics Canada. Table 052-0005 - Projected population, by projection scenario, age and sex, as of July 1, Canada, provinces and territories, annual (persons), M1, CANSIM [online database], Ottawa. (http://www5.statcan.gc.ca/cansim, accessed: January, 11 2017).
80 | Department of Health
21. ESRI 2011. ArcGIS Desktop: Release 10. Redlands, CA: Environmental Systems Research Institute.
22. Capocaccia R, Colonna M, Corazziari I, et al. Measuring cancer prevalence in Europe: the EUROPREVAL project. Annals of Oncology 2002; 13: 831-9.
23. Du WB, Chia KS, Sankaranarayanan R, Sankila R, Seow A, Lee HP. Population Based Survival Analysis of Colorectal Cancer Patients in Singapore, 1968-1992. Int J Cancer 2002; 99: 460-465.
24. Dickman, PW, Adami HO. Interpreting Trends in Cancer Patient Survival. Int J Med 2006; 260: 103-117.
25. Ederer, F, Axtell, LM, Cutler, SJ. The Relative Survival Rate: A Statistical Methodology. Natl Cancer Inst Monogr. 1961; 6: 101-121.
26. Canadian Cancer Society / National Cancer Institute of Canada: Canadian Cancer Statistics 2006, Toronto, Canada, 2006.
27. Moller B, Fekjaer H, Hakulinen T, Sigvaldason H, Storm H, Talbäck M, Haldorsen T. Prediction of Cancer Incidence in the Nordic Countries: Empirical Comparison of Different Approaches. Statistics in Medicine 2003; 22: 2751-2766.
2007-2013 New Brunswick Cancer Report | 81
Evaluation Form
We would like to hear from you. If you wish to provide feedback that would help us improve future publications, please fill out the following evaluation form. This form should be returned to:
Department of Health New Brunswick Cancer Network
P.O. Box 5100 520 King Street, Carleton Place, 2nd Floor
Fredericton, NB E3B 5G8 OR
Fax Form to 506-453-5522
1. We would like to know more about our readers. Please check the box that best describes you as a reader of this report:
T Health-care policy-maker or planner
T Involved in cancer care, prevention or treatment services
T Physician
T Other health-care professional
T Researcher
T Teacher
T Journalist
T Cancer patient or cancer survivor
T Other:____________________________________________________________________
2. Please rate each section of the report based on its usefulness:
Not useful Somewhat useful Very useful
Provincial Cancer Incidence Profile T T T
Provincial Cancer Mortality Profile T T T
Age and Sex Distribution of Cancer T T T
Geographic Distribution of Cancer T T T
Cancer Trends T T T
Prevalence of Cancer T T T
Relative Survival Ratios for Selected Cancers T T T
Projections for Cancer Incidence T T T
3. Does each individual figure and table provide useful information?
_____________________________________________________________________________________________________________________________________________________________________________________________________________________________________________
4. Do you have any further suggestions for future publications?
___________________________________________________________________________________________________________________________________________________________________________________________________________________________________________________________________________________________________________________________________________________________________________________________________________