canaccord sustainability --energy & power technologies a light read canaccord genuity led and...
TRANSCRIPT
Canaccord Genuity is the global capital markets group of Canaccord Financial Inc. (CF : TSX | CF. : LSE)
The recommendations and opinions expressed in this research report accurately reflect the Investment Analyst’s personal, independent
and objective views about any and all the Designated Investments and Relevant Issuers discussed herein. For important information,
please see the Important Disclosures section in the appendix of this document or visit Canaccord Genuity’s Online
Disclosure Database.
Jonathan Dorsheimer
1.617.371.3875
Josh Baribeau, CFA
1.617.371.3892
Sustainability -- Energy & Power Technologies
A Light Read
Canaccord Genuity LED and Lighting Monthly
What a difference a year makes. Last fall we compiled our annual virtual shopping
basket of LED replacement bulbs from the major big box retailers. Not surprisingly,
prices have continued to come down and performance is improving. Our quick surveys
indicate that Home Depot remains the undisputed leader in replacement bulbs, at least
if the number of SKUs are any indication, followed by Lowe’s in a distant second, then
some national hardware and other retailers. Apples-to-apples pricing is down by 34%
since May 2011, and performance is up 15%. Like the disparity between retailers, there
is still a surprising disparity between product pricing and product availability, which we
take to mean that not all OEMs have fully committed to what we believe is an inevitable
transition. How this will affect the incumbents if they do not get their act together
remains to be seen.
Edison-style replacement bulbs represent the largest opportunity worldwide, with
approximately 14B sockets. Many of the other outdoor, commercial and industrial
applications are adopting LED lighting and controls at an impressive clip as well;
however, bulbs are generating the most investor attention currently – likely due to the
TAM and growth rates, plus the ease of retail channel checks and product
testing/teardowns. The hoopla from everyone’s favorite love-it-or-hate-it stock, Cree
(CREE : NASDAQ : $59.03 | HOLD), also contributed. BJ Lee, chairman of Epistar, one
of the world’s largest LED companies, recently predicted 600M bulbs could be shipped
in 2013, up from 200M in 2012. If China takes an aggressive stance, we could see 1B
lamps as soon as 2014. Yes, it is a great market, but we believe it will be challenging to
make any money in this highly competitive and price-sensitive space. The firms who
emerge successfully have to treat this market somewhat as an investment for brand
awareness or for market share in a Trojan Horse-type of strategy, or find a way to add
additional value such as with controls.
As for our original basket of LEDs: All of the products we originally purchased well over
two years ago that met the wife approval factor (three didn’t) continue to operate inside
our homes without any complaints or issues, and continue to save us money on our
energy bills. Who said being on the sell-side doesn’t have any perks?
2
A Light Read 11 September 2013
BULB UPDATE
A search of Home Depot’s website for “LED bulb” yielded 575 items compared to Lowe’s,
which only had 130 items. In fairness 149 of the 575 were what we would categorize in
other categories, such as colored/Christmas lights, solar lighting and nightlights;
however, even excluding these items HD still has more than 3x the number of SKUs that
Lowe’s has. Anecdotal store visits around New England at least help confirm Lowe’s
limited commitment to the trend thus far – HD devotes a significantly larger amount of
shelf space to LED bulbs compared to Lowe’s. Last year, we noted that Home Depot
listed 373 products and Lowe’s had 80, so we have seen a y/y increase of over 50% for
both stores.
The largest brand at Home Depot remains Philips, with 186 SKUs followed by HD’s
private label EcoSmart with 63. TCP and Feit Electric are third and fourth with 39 and
34 products, respectively. Lowe’s biggest brand is Utilitech with 54 SKUs, followed by
Sylvania with 37. Array, the legacy brand of the company formerly known as Nexxus
Lighting (currently under restructuring as Revolution Lighting) lists 15 SKUs, which we
assume is excess inventory from the large-ish sell-in a few years ago. Prices on the Array
products are heavily discounted from a year ago, but interestingly not enough to indicate
a fire sale.
The other big-box retailers here in the US have a less coherent strategy, at least online.
Walmart’s web returned zero results for “LED bulb,” yet it suggested we search for “Feit
LED bulb” which initially yielded 511 results. However, it really directed us to other
online retailers such as Unbeatablewholesale.com, Toolking.com, Wayfare.com, etc., and
the product count changed every time we loaded one of these pages. Through all the
confusion it was pretty cool to see that Walmart had rolledback iPads by $50 each, but
we digress. Ironically the world’s largest retailer, one of the most progressive in
converting its own stores to LED fixtures, simply hasn’t figured out how to sell LEDs yet.
ACE Hardware returned 71 products from our search but it was clear that about half
were duplicates, segmented between the electrical and home goods departments.
TrueValue gave us 45 items, although most were flashlights; the same goes for Target.
Interestingly the retailer that probably comes in 3rd place behind HD and Lowe’s, and a
distant one at that, is Best Buy. The consumer electronics retailer has about 39 legitimate
LED bulb SKUs, spread between Philips, Samsung, Sylvania and the Cree-
designed/manufactured Insignia brand.
Our shopping basket
In mid-2011 we purchased 11 retail products to do some unscientific and purely
subjective benchmark testing. At the time, the basket cost Canaccord $443.62. We can
still find comparable products at HD and Lowe’s today. Pricing now even more so than
back then is skewed by local utility rebates; however, a basket of comparable products
would only cost $290.83 today – a 34% decrease. The range of product pricing itself has
tightened by 23%. A 15% improvement in efficiency coupled with the price decreases has
allowed an impressive 79% increase in the amount of light a dollar can buy.
Given a much larger selection of available products we expanded the basket last fall. In
the interest of our shareholders we converted our shopping cart to a virtual one. In less
3
11 September 2013 A Light Read
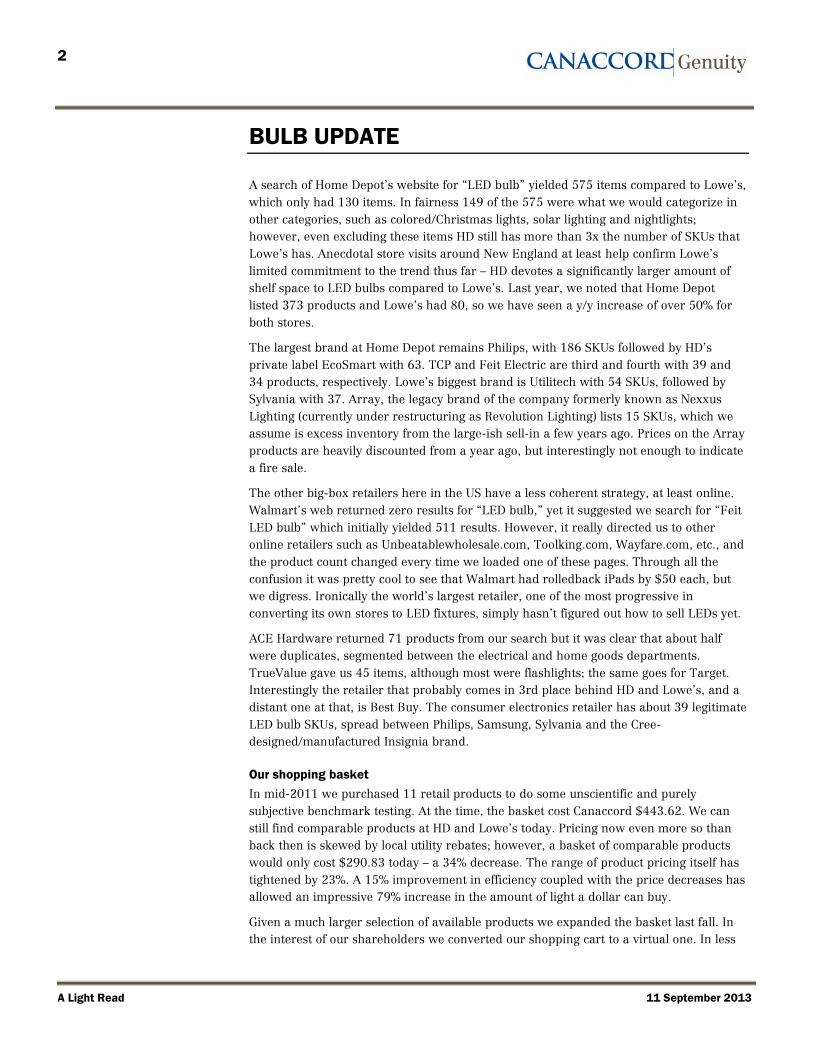
than a year the cost of the expanded basket declined by 19%, the range of pricing
tightened by 33% and efficiency improved by 6%. Part of the strong price declines are
likely subsidy-related given the second year of relatively modest efficiency improvements.
We suspect there is also some degree of overdriving fewer LEDs to reduce costs but only
slightly improve efficiency and power consumption.
Figure 1: Year-over-year comparison summary
Original Basket
2011 2013 DifferenceBasket ASP $443.62 $290.83 -34%Range $17.97 - $69.98 $9.97 - $49.98 -23%avg. lm/$ 15.9 28.4 79%avg. efficacy (lm/W) 52.7 60.5 15%
More Comprehensive Basket
2012 2013 DifferenceBasket ASP $618.57 $499.60 -19%Range $9.97 - $69.98 $9.97 - $49.98 -33%avg. lm/$ 31.9 35.7 12%avg. efficacy (lm/W) 59 62.8 6%
Source: Canaccord Genuity
We are introducing six new products for 2013 which are not included in the above
analysis for consistency. They will be included next year. The most notable additions are
the Cree bulbs, which generated a lot of buzz earlier this year. The average cost of light
in this year’s sample is 30.1 lumens per dollar in the R/PAR category and 42.9 lumens
per dollar in the A-lamp category. The average efficiency is 60.2 lumens per watt in the
R/PAR category and 67.2 lm/W for A-lamps.
4
A Light Read 11 September 2013
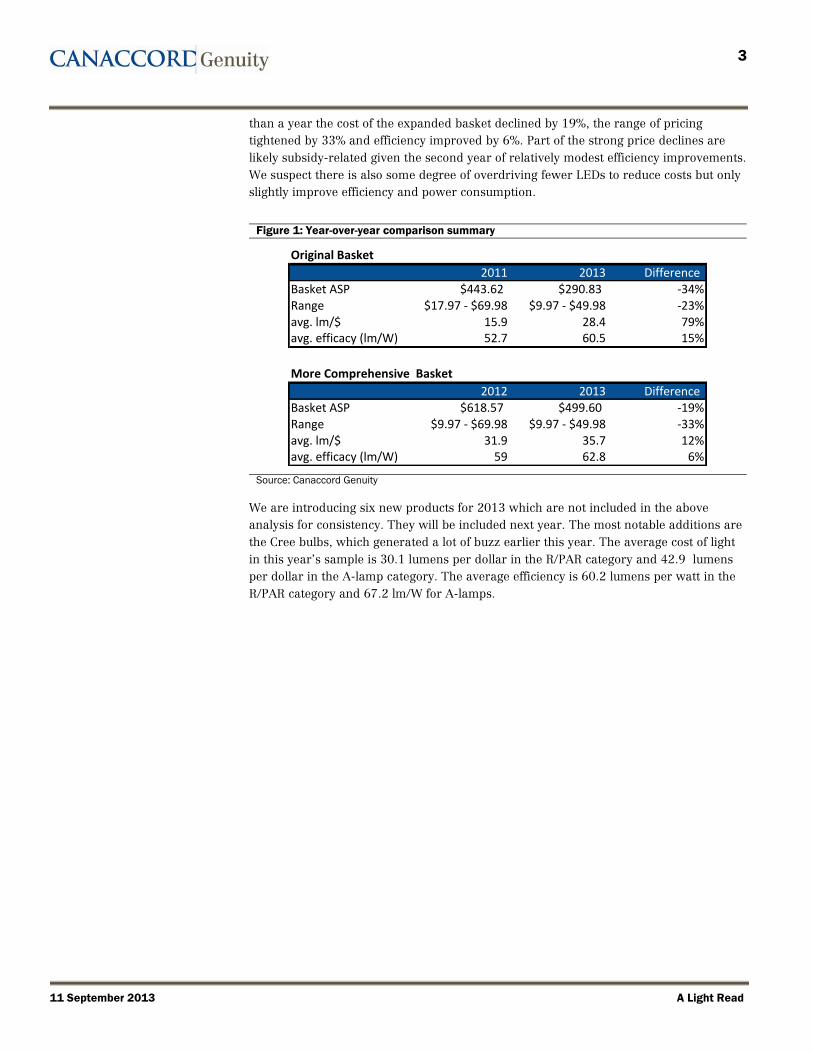
Figure 2: LED bulb comparison
Store Type Replaces CCT Price lm/$ W Lumens lm/W NoteR/PAR
Home Depot EcoSmart LED Bulb with integrated trim 65W 2700K 24.97$ 26.0 9.5 650 68.4Home Depot EcoSmart PAR30 75W 3000K 31.97$ 23.5 13.0 750 57.7Home Depot Philips PAR30 60W 3000K 31.97$ 20.3 10.0 650 65.0Lowe's Array R30 45W 3000K 34.98$ 14.5 7.8 507 65.0Lowe's Sylvania PAR38 indoor/outdoor 75W 3000K 49.98$ 18.0 18.0 900 50.0Lowe's Array PAR38 85W 3000K 39.99$ 24.6 18.0 985 54.7Home Depot Philips PAR30 75W 3000K 20.97$ 35.8 13.0 750 57.7Home Depot EcoSmart PAR38 75W 3000K Discontinued in 2013Home Depot Philips PAR38 120W 3000K 27.97$ 42.9 19.5 1200 61.5Lowe's Utilitech PAR38 75W 2700K 19.98$ 37.5 13.0 750 57.7 3000K in 2012Home Depot TCP PAR38 90W 3000K 24.99$ 42.0 17.0 1050 61.8 *New for 2013Home Depot TCP PAR30 65W 2700K 13.99$ 46.5 12.0 650 54.2 *New for 2013Home Depot Cree BR30 65W 2700K 21.97$ 29.6 9.5 650 68.4 *New for 2013
Avg 30.1 60.2
A LineHome Depot EcoSmart A19 40W 3000K 9.97$ 45.1 6.0 450 75.0Home Depot Feit Electric A19 40W 3000K 9.97$ 33.1 5.5 330 60.0Lowe's Sylvania A19 40W 3000K 14.99$ 23.3 8.0 350 43.8Lowe's GE A19 40W 3000K 30.07$ 15.0 9.0 450 50.0Home Depot Philips A19 60W 2700K 11.97$ 69.3 11.0 830 75.5Home Depot EcoSmart A19 60W 3000K 9.97$ 80.2 12.0 800 66.7Home Depot EcoSmart A19 Daylight 60W 5000K 21.97$ 38.7 12.0 850 70.8Home Depot GE A19 Dimmable 60W 3000K 47.97$ 16.7 13.0 800 61.5Lowe's Utilitech A19 60W 3000K 14.98$ 53.4 12.0 800 66.7Lowe's Samsung A19 60W 2700K 14.98$ 60.1 13.0 900 69.2Lowe's Sylvania A19 Soft White 75W 2700K 29.98$ 36.7 14.0 1100 78.6Home Depot Cree A19 40W 2700K 9.97$ 45.1 6.0 450 75.0 *New for 2013Home Depot Cree A19 60W 2700K 12.97$ 61.7 9.5 800 84.2 *New for 2013Home Depot TCP 40W 2700K 19.99$ 22.5 7.0 450 64.3 *New for 2013
Avg 42.9 67.2
Source: Canaccord Genuity
Much of Cree’s buzz has to do with the notion that it “broke the $10 threshold” for an
incandescent replacement. The problem with that mindset is that Cree’s warm white
60W-eq is $12.97. The lesser-used 40W equivalent is indeed below $10, but there are
already other 40W-eq products out there for the same price. There is even an EcoSmart
60W-eq currently selling for below $10. The company has done a great job marketing
this product and getting Home Depot to position it with some of the best real-estate in
the company, including the first four slots that come up under our faithful “LED bulb”
search online. Checks indicate that the product is selling very well, but we remain
confident that the margins are dilutive to Cree’s Lighting Systems business – both effects
of which were evident in Cree’s most recent quarter (sharp increase in sales, sharp
decline in GMs).
The difference between Cree and many of the other brand-name products is that the
bulb reaches the $12.97 price point without subsidies. It cannot be coincidence that the
$12.97 pricing exactly matched that of Philips’ 60W-eq product, which is the incumbent
A-line champion, according to our research. However, the Philips product is subsidized.
Interestingly, we noticed it has since been reduced to $11.97, likely in hopes of clawing
back some lost share to Cree.
We believe that Cree’s initial A-line product is not subsidized because it did not meet
Energy Star’s required light distribution pattern. We suspect that time-to-market was the
overriding factor in releasing this product. The company has since released a redesigned
5
11 September 2013 A Light Read
second variation with an almost identical form factor, the same SKU but an improved
optical pattern. It is currently beginning Energy Star’s 6,000 hour testing phase, so we
should have some clarity on that in the March timeframe. We assume that it will also
have a better cost structure but cannot quantify the impact until we get our hands on
one, tear it apart and analyze it. Stay tuned for updates here.
MONTHLY SALES DATA
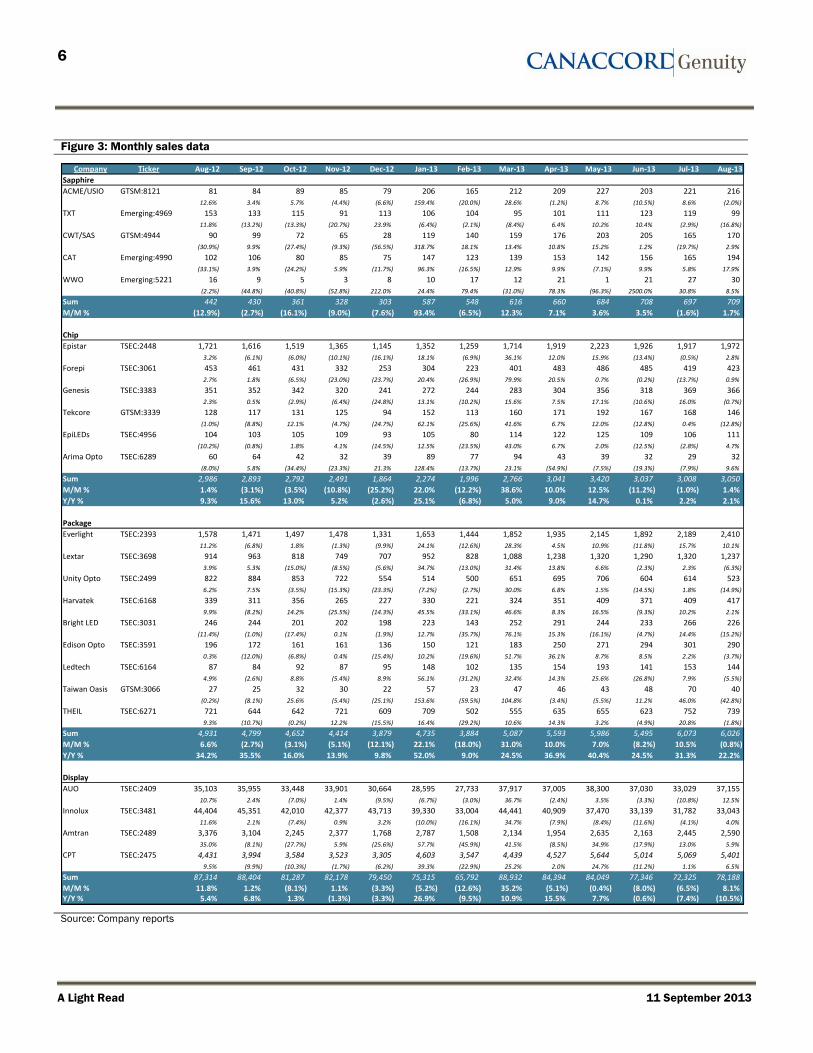
Sapphire sales resumed their upward climb in August, up around 2% m/m, with the
biggest gain from Crystal Applied Technology. Chip sales had a slightly smaller monthly
increase, up by 1.4%. Leader Epistar was up 2.8% and expects third quarter revenues to
remain unchanged or be slightly lower. The company’s largest revenue segment is still
backlighting, and the increase in demand for LED lighting is not sufficient to offset a
decrease in demand for LED backlighting this quarter. Package sales in August were
down slightly, with the strong 10% gains by leader Everlight offset by declines at the
smaller suppliers.
In the display space, revenues were up 8.1% m/m but were still down 10.5% y/y. AUO
shipped over 10.47 million units of large-sized panels, an increase of 18.9% from the
previous month. Small- and-medium-sized panel shipments were 15.73 million units, up
by 17.2% month-over-month. During August Innolux shipped 11.5 million units of large-
sized products, a decrease of 2.3% m/m. Shipments for small-and-medium-sized
products were 33.2 million units, a decrease of 2.2% m/m.
6
A Light Read 11 September 2013
Figure 3: Monthly sales data
Company Ticker Aug-12 Sep-12 Oct-12 Nov-12 Dec-12 Jan-13 Feb-13 Mar-13 Apr-13 May-13 Jun-13 Jul-13 Aug-13
Sapphire
ACME/USIO GTSM:8121 81 84 89 85 79 206 165 212 209 227 203 221 216
12.6% 3.4% 5.7% (4.4%) (6.6%) 159.4% (20.0%) 28.6% (1.2%) 8.7% (10.5%) 8.6% (2.0%)
TXT Emerging:4969 153 133 115 91 113 106 104 95 101 111 123 119 99
11.8% (13.2%) (13.3%) (20.7%) 23.9% (6.4%) (2.1%) (8.4%) 6.4% 10.2% 10.4% (2.9%) (16.8%)
CWT/SAS GTSM:4944 90 99 72 65 28 119 140 159 176 203 205 165 170
(30.9%) 9.9% (27.4%) (9.3%) (56.5%) 318.7% 18.1% 13.4% 10.8% 15.2% 1.2% (19.7%) 2.9%
CAT Emerging:4990 102 106 80 85 75 147 123 139 153 142 156 165 194
(33.1%) 3.9% (24.2%) 5.9% (11.7%) 96.3% (16.5%) 12.9% 9.9% (7.1%) 9.9% 5.8% 17.9%
WWO Emerging:5221 16 9 5 3 8 10 17 12 21 1 21 27 30
(2.2%) (44.8%) (40.8%) (52.8%) 212.0% 24.4% 79.4% (31.0%) 78.3% (96.3%) 2500.0% 30.8% 8.5%
Sum 442 430 361 328 303 587 548 616 660 684 708 697 709
M/M % (12.9%) (2.7%) (16.1%) (9.0%) (7.6%) 93.4% (6.5%) 12.3% 7.1% 3.6% 3.5% (1.6%) 1.7%
Chip
Epistar TSEC:2448 1,721 1,616 1,519 1,365 1,145 1,352 1,259 1,714 1,919 2,223 1,926 1,917 1,972
3.2% (6.1%) (6.0%) (10.1%) (16.1%) 18.1% (6.9%) 36.1% 12.0% 15.9% (13.4%) (0.5%) 2.8%
Forepi TSEC:3061 453 461 431 332 253 304 223 401 483 486 485 419 423
2.7% 1.8% (6.5%) (23.0%) (23.7%) 20.4% (26.9%) 79.9% 20.5% 0.7% (0.2%) (13.7%) 0.9%
Genesis TSEC:3383 351 352 342 320 241 272 244 283 304 356 318 369 366
2.3% 0.5% (2.9%) (6.4%) (24.8%) 13.1% (10.2%) 15.6% 7.5% 17.1% (10.6%) 16.0% (0.7%)
Tekcore GTSM:3339 128 117 131 125 94 152 113 160 171 192 167 168 146
(1.0%) (8.8%) 12.1% (4.7%) (24.7%) 62.1% (25.6%) 41.6% 6.7% 12.0% (12.8%) 0.4% (12.8%)
EpiLEDs TSEC:4956 104 103 105 109 93 105 80 114 122 125 109 106 111
(10.2%) (0.8%) 1.8% 4.1% (14.5%) 12.5% (23.5%) 43.0% 6.7% 2.0% (12.5%) (2.8%) 4.7%
Arima Opto TSEC:6289 60 64 42 32 39 89 77 94 43 39 32 29 32
(8.0%) 5.8% (34.4%) (23.3%) 21.3% 128.4% (13.7%) 23.1% (54.9%) (7.5%) (19.3%) (7.9%) 9.6%
Sum 2,986 2,893 2,792 2,491 1,864 2,274 1,996 2,766 3,041 3,420 3,037 3,008 3,050
M/M % 1.4% (3.1%) (3.5%) (10.8%) (25.2%) 22.0% (12.2%) 38.6% 10.0% 12.5% (11.2%) (1.0%) 1.4%
Y/Y % 9.3% 15.6% 13.0% 5.2% (2.6%) 25.1% (6.8%) 5.0% 9.0% 14.7% 0.1% 2.2% 2.1%
Package
Everlight TSEC:2393 1,578 1,471 1,497 1,478 1,331 1,653 1,444 1,852 1,935 2,145 1,892 2,189 2,410
11.2% (6.8%) 1.8% (1.3%) (9.9%) 24.1% (12.6%) 28.3% 4.5% 10.9% (11.8%) 15.7% 10.1%
Lextar TSEC:3698 914 963 818 749 707 952 828 1,088 1,238 1,320 1,290 1,320 1,237
3.9% 5.3% (15.0%) (8.5%) (5.6%) 34.7% (13.0%) 31.4% 13.8% 6.6% (2.3%) 2.3% (6.3%)
Unity Opto TSEC:2499 822 884 853 722 554 514 500 651 695 706 604 614 523
6.2% 7.5% (3.5%) (15.3%) (23.3%) (7.2%) (2.7%) 30.0% 6.8% 1.5% (14.5%) 1.8% (14.9%)
Harvatek TSEC:6168 339 311 356 265 227 330 221 324 351 409 371 409 417
9.9% (8.2%) 14.2% (25.5%) (14.3%) 45.5% (33.1%) 46.6% 8.3% 16.5% (9.3%) 10.2% 2.1%
Bright LED TSEC:3031 246 244 201 202 198 223 143 252 291 244 233 266 226
(11.4%) (1.0%) (17.4%) 0.1% (1.9%) 12.7% (35.7%) 76.1% 15.3% (16.1%) (4.7%) 14.4% (15.2%)
Edison Opto TSEC:3591 196 172 161 161 136 150 121 183 250 271 294 301 290
0.3% (12.0%) (6.8%) 0.4% (15.4%) 10.2% (19.6%) 51.7% 36.1% 8.7% 8.5% 2.2% (3.7%)
Ledtech TSEC:6164 87 84 92 87 95 148 102 135 154 193 141 153 144
4.9% (2.6%) 8.8% (5.4%) 8.9% 56.1% (31.2%) 32.4% 14.3% 25.6% (26.8%) 7.9% (5.5%)
Taiwan Oasis GTSM:3066 27 25 32 30 22 57 23 47 46 43 48 70 40
(0.2%) (8.1%) 25.6% (5.4%) (25.1%) 153.6% (59.5%) 104.8% (3.4%) (5.5%) 11.2% 46.0% (42.8%)
THEIL TSEC:6271 721 644 642 721 609 709 502 555 635 655 623 752 739
9.3% (10.7%) (0.2%) 12.2% (15.5%) 16.4% (29.2%) 10.6% 14.3% 3.2% (4.9%) 20.8% (1.8%)
Sum 4,931 4,799 4,652 4,414 3,879 4,735 3,884 5,087 5,593 5,986 5,495 6,073 6,026
M/M % 6.6% (2.7%) (3.1%) (5.1%) (12.1%) 22.1% (18.0%) 31.0% 10.0% 7.0% (8.2%) 10.5% (0.8%)
Y/Y % 34.2% 35.5% 16.0% 13.9% 9.8% 52.0% 9.0% 24.5% 36.9% 40.4% 24.5% 31.3% 22.2%
Display
AUO TSEC:2409 35,103 35,955 33,448 33,901 30,664 28,595 27,733 37,917 37,005 38,300 37,030 33,029 37,155
10.7% 2.4% (7.0%) 1.4% (9.5%) (6.7%) (3.0%) 36.7% (2.4%) 3.5% (3.3%) (10.8%) 12.5%
Innolux TSEC:3481 44,404 45,351 42,010 42,377 43,713 39,330 33,004 44,441 40,909 37,470 33,139 31,782 33,043
11.6% 2.1% (7.4%) 0.9% 3.2% (10.0%) (16.1%) 34.7% (7.9%) (8.4%) (11.6%) (4.1%) 4.0%
Amtran TSEC:2489 3,376 3,104 2,245 2,377 1,768 2,787 1,508 2,134 1,954 2,635 2,163 2,445 2,590
35.0% (8.1%) (27.7%) 5.9% (25.6%) 57.7% (45.9%) 41.5% (8.5%) 34.9% (17.9%) 13.0% 5.9%
CPT TSEC:2475 4,431 3,994 3,584 3,523 3,305 4,603 3,547 4,439 4,527 5,644 5,014 5,069 5,401
9.5% (9.9%) (10.3%) (1.7%) (6.2%) 39.3% (22.9%) 25.2% 2.0% 24.7% (11.2%) 1.1% 6.5%
Sum 87,314 88,404 81,287 82,178 79,450 75,315 65,792 88,932 84,394 84,049 77,346 72,325 78,188
M/M % 11.8% 1.2% (8.1%) 1.1% (3.3%) (5.2%) (12.6%) 35.2% (5.1%) (0.4%) (8.0%) (6.5%) 8.1%Y/Y % 5.4% 6.8% 1.3% (1.3%) (3.3%) 26.9% (9.5%) 10.9% 15.5% 7.7% (0.6%) (7.4%) (10.5%)
Source: Company reports
7
11 September 2013 A Light Read
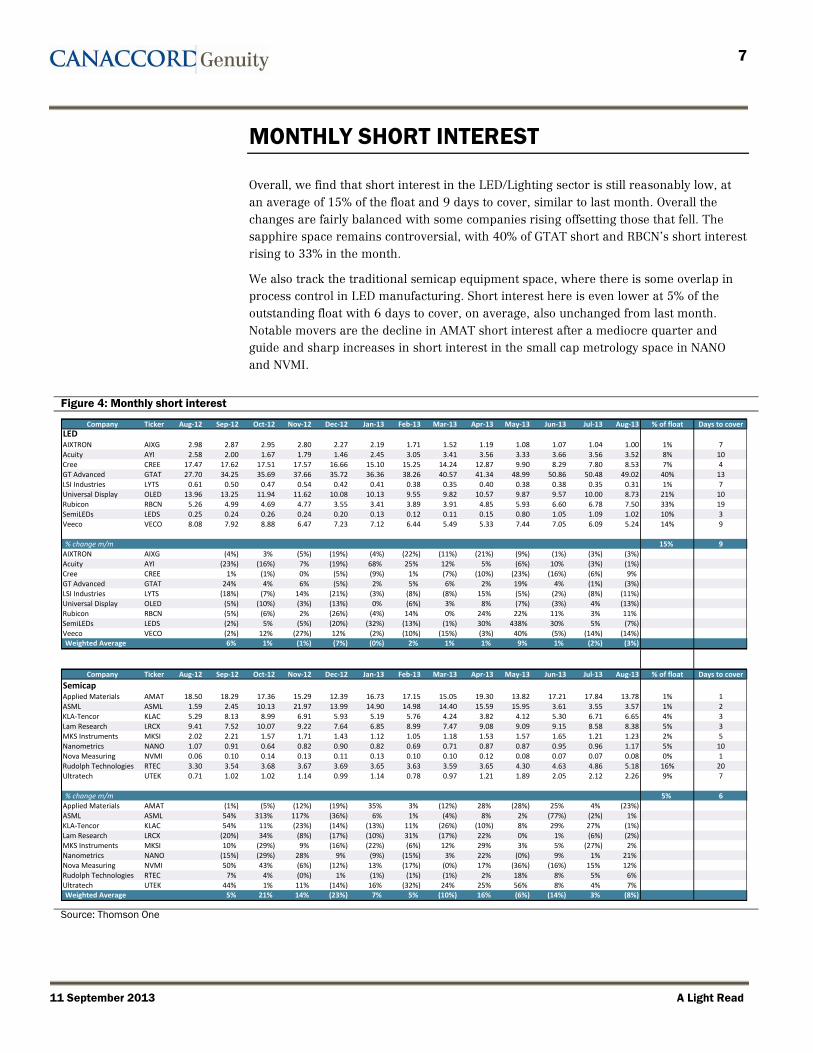
MONTHLY SHORT INTEREST
Overall, we find that short interest in the LED/Lighting sector is still reasonably low, at
an average of 15% of the float and 9 days to cover, similar to last month. Overall the
changes are fairly balanced with some companies rising offsetting those that fell. The
sapphire space remains controversial, with 40% of GTAT short and RBCN’s short interest
rising to 33% in the month.
We also track the traditional semicap equipment space, where there is some overlap in
process control in LED manufacturing. Short interest here is even lower at 5% of the
outstanding float with 6 days to cover, on average, also unchanged from last month.
Notable movers are the decline in AMAT short interest after a mediocre quarter and
guide and sharp increases in short interest in the small cap metrology space in NANO
and NVMI.
Figure 4: Monthly short interest
Company Ticker Aug-12 Sep-12 Oct-12 Nov-12 Dec-12 Jan-13 Feb-13 Mar-13 Apr-13 May-13 Jun-13 Jul-13 Aug-13 % of float Days to coverLEDAIXTRON AIXG 2.98 2.87 2.95 2.80 2.27 2.19 1.71 1.52 1.19 1.08 1.07 1.04 1.00 1% 7Acuity AYI 2.58 2.00 1.67 1.79 1.46 2.45 3.05 3.41 3.56 3.33 3.66 3.56 3.52 8% 10Cree CREE 17.47 17.62 17.51 17.57 16.66 15.10 15.25 14.24 12.87 9.90 8.29 7.80 8.53 7% 4GT Advanced GTAT 27.70 34.25 35.69 37.66 35.72 36.36 38.26 40.57 41.34 48.99 50.86 50.48 49.02 40% 13LSI Industries LYTS 0.61 0.50 0.47 0.54 0.42 0.41 0.38 0.35 0.40 0.38 0.38 0.35 0.31 1% 7Universal Display OLED 13.96 13.25 11.94 11.62 10.08 10.13 9.55 9.82 10.57 9.87 9.57 10.00 8.73 21% 10Rubicon RBCN 5.26 4.99 4.69 4.77 3.55 3.41 3.89 3.91 4.85 5.93 6.60 6.78 7.50 33% 19SemiLEDs LEDS 0.25 0.24 0.26 0.24 0.20 0.13 0.12 0.11 0.15 0.80 1.05 1.09 1.02 10% 3Veeco VECO 8.08 7.92 8.88 6.47 7.23 7.12 6.44 5.49 5.33 7.44 7.05 6.09 5.24 14% 9
% change m/m 15% 9AIXTRON AIXG (4%) 3% (5%) (19%) (4%) (22%) (11%) (21%) (9%) (1%) (3%) (3%)Acuity AYI (23%) (16%) 7% (19%) 68% 25% 12% 5% (6%) 10% (3%) (1%)Cree CREE 1% (1%) 0% (5%) (9%) 1% (7%) (10%) (23%) (16%) (6%) 9%GT Advanced GTAT 24% 4% 6% (5%) 2% 5% 6% 2% 19% 4% (1%) (3%)LSI Industries LYTS (18%) (7%) 14% (21%) (3%) (8%) (8%) 15% (5%) (2%) (8%) (11%)Universal Display OLED (5%) (10%) (3%) (13%) 0% (6%) 3% 8% (7%) (3%) 4% (13%)Rubicon RBCN (5%) (6%) 2% (26%) (4%) 14% 0% 24% 22% 11% 3% 11%SemiLEDs LEDS (2%) 5% (5%) (20%) (32%) (13%) (1%) 30% 438% 30% 5% (7%)Veeco VECO (2%) 12% (27%) 12% (2%) (10%) (15%) (3%) 40% (5%) (14%) (14%)Weighted Average 6% 1% (1%) (7%) (0%) 2% 1% 1% 9% 1% (2%) (3%)
Company Ticker Aug-12 Sep-12 Oct-12 Nov-12 Dec-12 Jan-13 Feb-13 Mar-13 Apr-13 May-13 Jun-13 Jul-13 Aug-13 % of float Days to cover
SemicapApplied Materials AMAT 18.50 18.29 17.36 15.29 12.39 16.73 17.15 15.05 19.30 13.82 17.21 17.84 13.78 1% 1ASML ASML 1.59 2.45 10.13 21.97 13.99 14.90 14.98 14.40 15.59 15.95 3.61 3.55 3.57 1% 2KLA-Tencor KLAC 5.29 8.13 8.99 6.91 5.93 5.19 5.76 4.24 3.82 4.12 5.30 6.71 6.65 4% 3Lam Research LRCX 9.41 7.52 10.07 9.22 7.64 6.85 8.99 7.47 9.08 9.09 9.15 8.58 8.38 5% 3MKS Instruments MKSI 2.02 2.21 1.57 1.71 1.43 1.12 1.05 1.18 1.53 1.57 1.65 1.21 1.23 2% 5Nanometrics NANO 1.07 0.91 0.64 0.82 0.90 0.82 0.69 0.71 0.87 0.87 0.95 0.96 1.17 5% 10Nova Measuring NVMI 0.06 0.10 0.14 0.13 0.11 0.13 0.10 0.10 0.12 0.08 0.07 0.07 0.08 0% 1Rudolph Technologies RTEC 3.30 3.54 3.68 3.67 3.69 3.65 3.63 3.59 3.65 4.30 4.63 4.86 5.18 16% 20Ultratech UTEK 0.71 1.02 1.02 1.14 0.99 1.14 0.78 0.97 1.21 1.89 2.05 2.12 2.26 9% 7
% change m/m 5% 6Applied Materials AMAT (1%) (5%) (12%) (19%) 35% 3% (12%) 28% (28%) 25% 4% (23%)ASML ASML 54% 313% 117% (36%) 6% 1% (4%) 8% 2% (77%) (2%) 1%KLA-Tencor KLAC 54% 11% (23%) (14%) (13%) 11% (26%) (10%) 8% 29% 27% (1%)Lam Research LRCX (20%) 34% (8%) (17%) (10%) 31% (17%) 22% 0% 1% (6%) (2%)MKS Instruments MKSI 10% (29%) 9% (16%) (22%) (6%) 12% 29% 3% 5% (27%) 2%Nanometrics NANO (15%) (29%) 28% 9% (9%) (15%) 3% 22% (0%) 9% 1% 21%Nova Measuring NVMI 50% 43% (6%) (12%) 13% (17%) (0%) 17% (36%) (16%) 15% 12%Rudolph Technologies RTEC 7% 4% (0%) 1% (1%) (1%) (1%) 2% 18% 8% 5% 6%Ultratech UTEK 44% 1% 11% (14%) 16% (32%) 24% 25% 56% 8% 4% 7%Weighted Average 5% 21% 14% (23%) 7% 5% (10%) 16% (6%) (14%) 3% (8%)
Source: Thomson One
8
A Light Read 11 September 2013
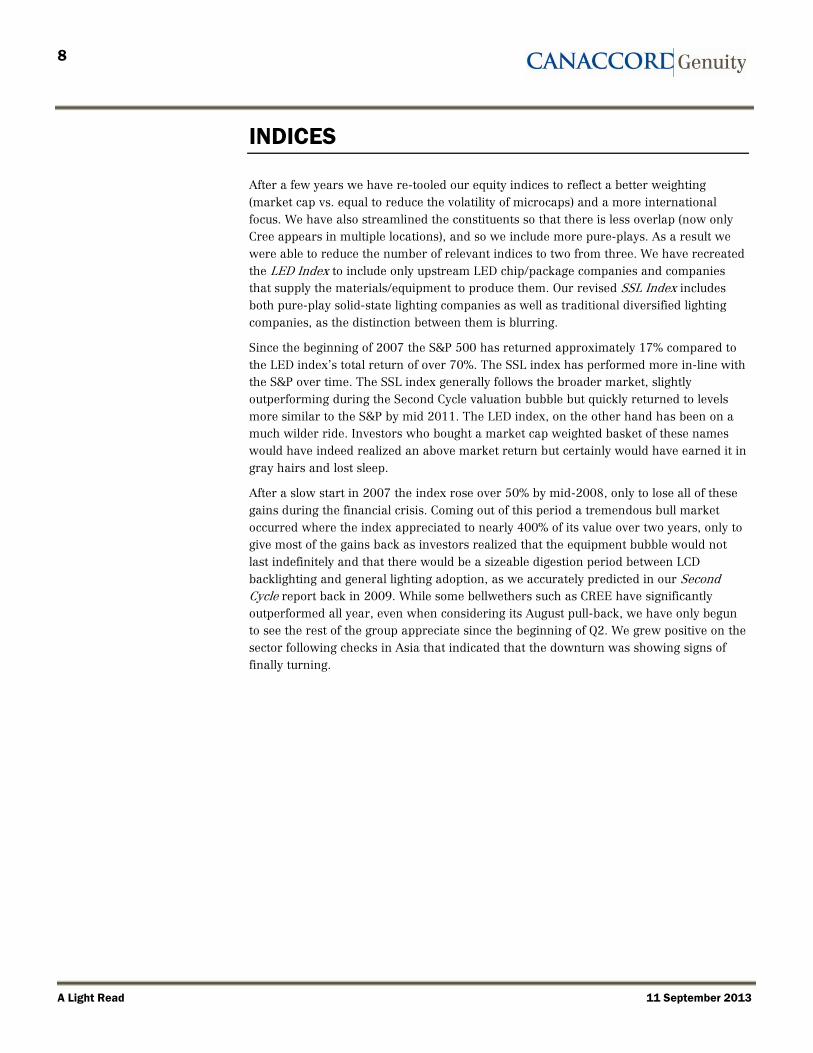
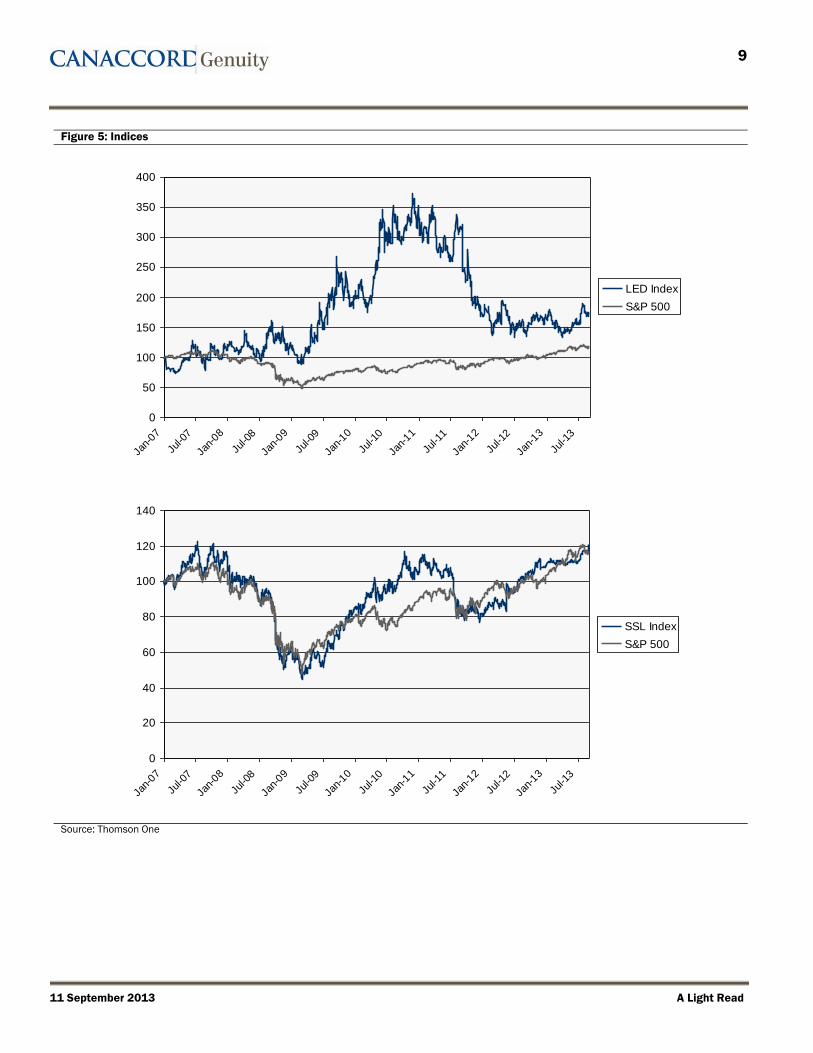
INDICES
After a few years we have re-tooled our equity indices to reflect a better weighting
(market cap vs. equal to reduce the volatility of microcaps) and a more international
focus. We have also streamlined the constituents so that there is less overlap (now only
Cree appears in multiple locations), and so we include more pure-plays. As a result we
were able to reduce the number of relevant indices to two from three. We have recreated
the LED Index to include only upstream LED chip/package companies and companies
that supply the materials/equipment to produce them. Our revised SSL Index includes
both pure-play solid-state lighting companies as well as traditional diversified lighting
companies, as the distinction between them is blurring.
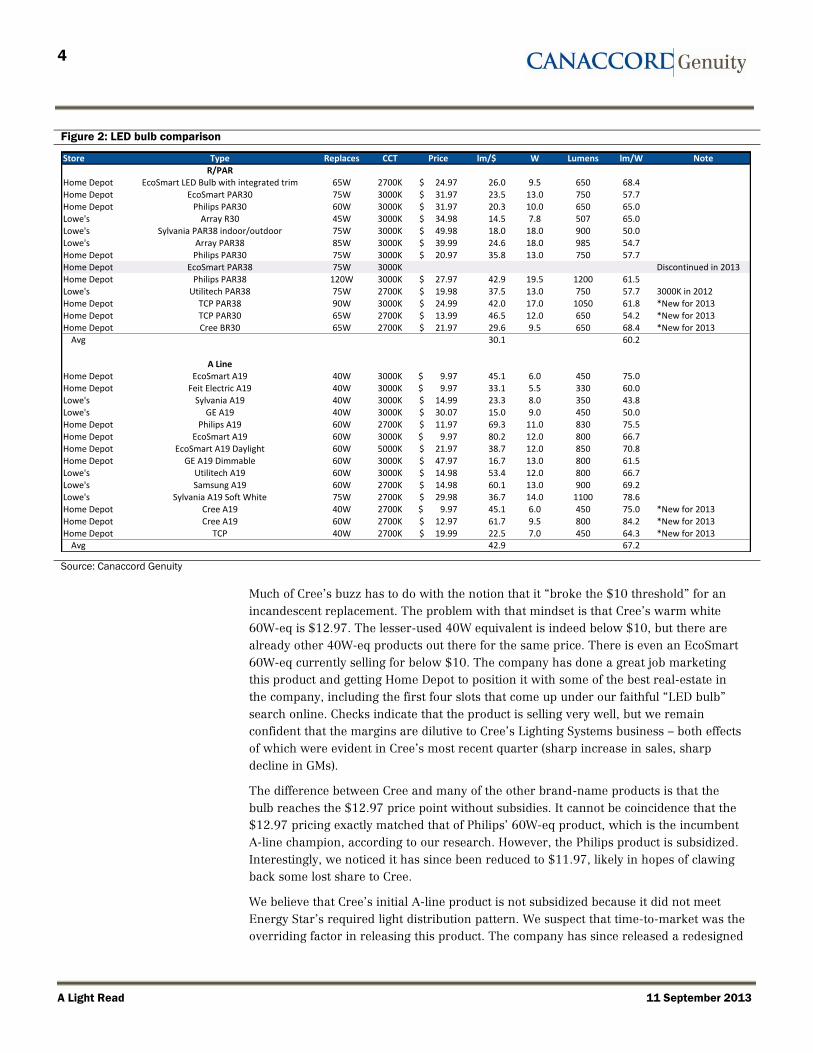
Since the beginning of 2007 the S&P 500 has returned approximately 17% compared to
the LED index’s total return of over 70%. The SSL index has performed more in-line with
the S&P over time. The SSL index generally follows the broader market, slightly
outperforming during the Second Cycle valuation bubble but quickly returned to levels
more similar to the S&P by mid 2011. The LED index, on the other hand has been on a
much wilder ride. Investors who bought a market cap weighted basket of these names
would have indeed realized an above market return but certainly would have earned it in
gray hairs and lost sleep.
After a slow start in 2007 the index rose over 50% by mid-2008, only to lose all of these
gains during the financial crisis. Coming out of this period a tremendous bull market
occurred where the index appreciated to nearly 400% of its value over two years, only to
give most of the gains back as investors realized that the equipment bubble would not
last indefinitely and that there would be a sizeable digestion period between LCD
backlighting and general lighting adoption, as we accurately predicted in our Second
Cycle report back in 2009. While some bellwethers such as CREE have significantly
outperformed all year, even when considering its August pull-back, we have only begun
to see the rest of the group appreciate since the beginning of Q2. We grew positive on the
sector following checks in Asia that indicated that the downturn was showing signs of
finally turning.
9
11 September 2013 A Light Read
Figure 5: Indices
0
50
100
150
200
250
300
350
400
Jan-
07
Jul-0
7
Jan-
08
Jul-0
8
Jan-
09
Jul-0
9
Jan-
10
Jul-1
0
Jan-
11
Jul-1
1
Jan-
12
Jul-1
2
Jan-
13
Jul-1
3
LED Index
S&P 500
0
20
40
60
80
100
120
140
Jan-
07
Jul-0
7
Jan-
08
Jul-0
8
Jan-
09
Jul-0
9
Jan-
10
Jul-1
0
Jan-
11
Jul-1
1
Jan-
12
Jul-1
2
Jan-
13
Jul-1
3
SSL Index
S&P 500
Source: Thomson One
10
A Light Read 11 September 2013
APPENDIX: IMPORTANT DISCLOSURES
Analyst Certification: Each authoring analyst of Canaccord Genuity whose name appears on the front page of this research hereby
certifies that (i) the recommendations and opinions expressed in this research accurately reflect the authoring analyst’s personal, independent and objective views about any and all of the designated investments or relevant issuers discussed herein that are within such authoring analyst’s coverage universe and (ii) no part of the authoring analyst’s compensation was, is, or will be, directly or indirectly, related to the specific recommendations or views expressed by the authoring analyst in the research.
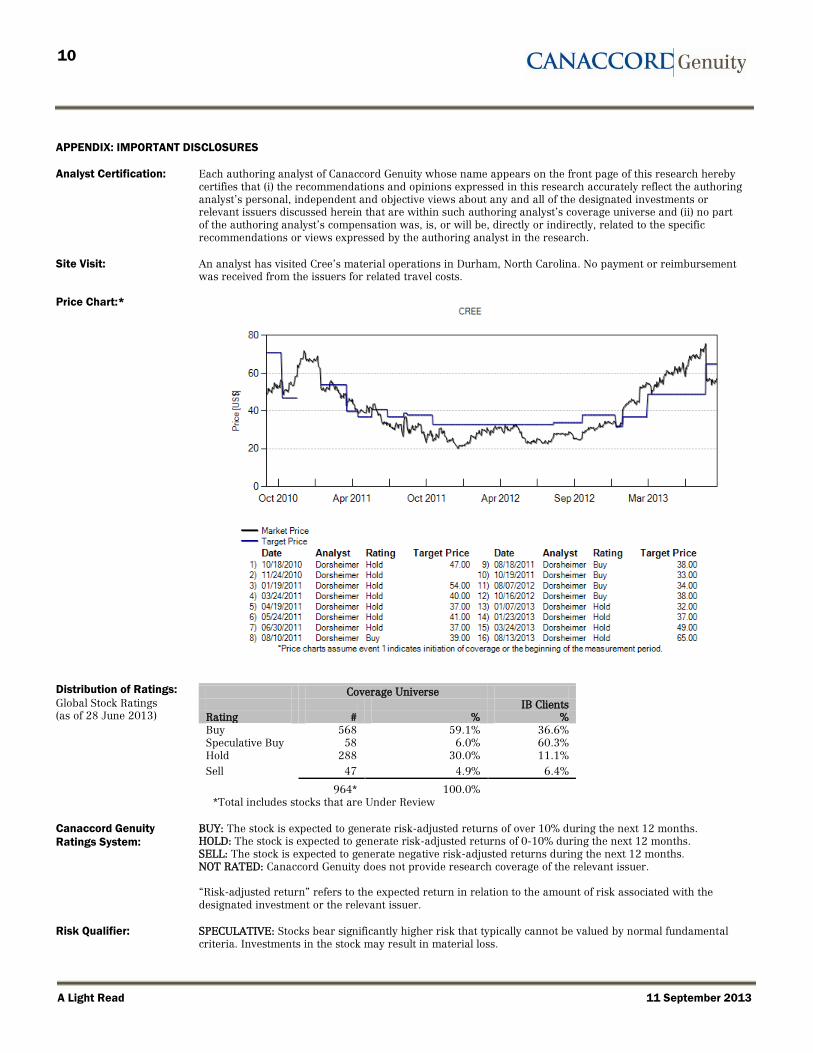
Site Visit: An analyst has visited Cree’s material operations in Durham, North Carolina. No payment or reimbursement
was received from the issuers for related travel costs.
Price Chart:*
Distribution of Ratings:
Global Stock Ratings (as of 28 June 2013)
Coverage Universe IB Clients Rating # % % Buy 568 59.1% 36.6% Speculative Buy 58 6.0% 60.3% Hold 288 30.0% 11.1%
Sell 47 4.9% 6.4%
964* 100.0% *Total includes stocks that are Under Review
Canaccord Genuity
Ratings System:
BUY: The stock is expected to generate risk-adjusted returns of over 10% during the next 12 months. HOLD: The stock is expected to generate risk-adjusted returns of 0-10% during the next 12 months. SELL: The stock is expected to generate negative risk-adjusted returns during the next 12 months. NOT RATED: Canaccord Genuity does not provide research coverage of the relevant issuer. “Risk-adjusted return” refers to the expected return in relation to the amount of risk associated with the designated investment or the relevant issuer.
Risk Qualifier: SPECULATIVE: Stocks bear significantly higher risk that typically cannot be valued by normal fundamental criteria. Investments in the stock may result in material loss.
11
11 September 2013 A Light Read
Canaccord Genuity Research Disclosures as of 11 September 2013
Company Disclosure Cree 5, 7
1 The relevant issuer currently is, or in the past 12 months was, a client of Canaccord Genuity or its affiliated companies. During this period, Canaccord Genuity or its affiliated companies provided the following services to the relevant issuer:
A. investment banking services.
B. non-investment banking securities-related services.
C. non-securities related services.
2 In the past 12 months, Canaccord Genuity or its affiliated companies have received compensation for Corporate Finance/Investment Banking services from the relevant issuer.
3 In the past 12 months, Canaccord Genuity or any of its affiliated companies have been lead manager, co-lead manager or co-manager of a public offering of securities of the relevant issuer or any publicly disclosed offer
of securities of the relevant issuer or in any related derivatives.
4 Canaccord Genuity acts as corporate broker for the relevant issuer and/or Canaccord Genuity or any of its affiliated companies may have an agreement with the relevant issuer relating to the provision of Corporate
Finance/Investment Banking services.
5 Canaccord Genuity or one or more of its affiliated companies is a market maker or liquidity provider in the securities of the relevant issuer or in any related derivatives.
6 In the past 12 months, Canaccord Genuity, its partners, affiliated companies, officers or directors, or any authoring analyst involved in the preparation of this research has provided services to the relevant issuer for
remuneration, other than normal course investment advisory or trade execution services.
7 Canaccord Genuity or one or more of its affiliated companies intend to seek or expect to receive compensation for Corporate Finance/Investment Banking services from the relevant issuer in the next six months.
8 The authoring analyst, a member of the authoring analyst’s household, or any individual directly involved in the preparation of this research, has a long position in the shares or derivatives, or has any other financial interest in the relevant issuer, the value of which increases as the value of the underlying equity increases.
9 The authoring analyst, a member of the authoring analyst’s household, or any individual directly involved in the preparation of this research, has a short position in the shares or derivatives, or has any other financial interest in the relevant issuer, the value of which increases as the value of the underlying equity decreases.
10 Those persons identified as the author(s) of this research, or any individual involved in the preparation of this research, have purchased/received shares in the relevant issuer prior to a public offering of those shares, and such person’s name and details are disclosed above.
11 A partner, director, officer, employee or agent of Canaccord Genuity or its affiliated companies, or a member of his/her household, is an officer, or director, or serves as an advisor or board member of the relevant issuer and/or one of its subsidiaries, and such person’s name is disclosed above.
12 As of the month end immediately preceding the date of publication of this research, or the prior month end if publication is within 10 days following a month end, Canaccord Genuity or its affiliated companies, in the aggregate, beneficially owned 1% or more of any class of the total issued share capital or other common equity securities of the relevant issuer or held any other financial interests in the relevant issuer which are significant in relation to the research (as disclosed above).
13 As of the month end immediately preceding the date of publication of this research, or the prior month end if publication is within 10 days following a month end, the relevant issuer owned 1% or more of any class of the total issued share capital in Canaccord Genuity or any of its affiliated companies.
14 Other specific disclosures as described above.
“Canaccord Genuity” is the business name used by certain wholly owned subsidiaries of Canaccord Financial Inc., including Canaccord Genuity Inc., Canaccord Genuity Limited, Canaccord Genuity Corp., and Canaccord Genuity (Australia) Limited, an affiliated company that is 50%-owned by Canaccord Financial Inc.
The authoring analysts who are responsible for the preparation of this research are employed by Canaccord Genuity Corp. a Canadian broker-dealer with principal offices located in Vancouver, Calgary, Toronto, Montreal, or Canaccord Genuity Inc., a US broker-dealer with principal offices located in New York, Boston, San Francisco and Houston, or Canaccord Genuity Limited., a UK broker-dealer with principal offices located in London (UK) and Dublin (Ireland), or Canaccord Genuity (Australia) Limited, an Australian broker-dealer with principal offices located in Sydney and Melbourne.
In the event that this is compendium research (covering six or more relevant issuers), Canaccord Genuity and its affiliated companies may choose to provide by reference specific disclosures of the subject companies or
12
A Light Read 11 September 2013
its policies and procedures regarding the dissemination of research. To access this material or for more information, please refer to http://disclosures.canaccordgenuity.com/EN/Pages/default.aspx or send a request to Canaccord Genuity Corp. Research, Attn: Disclosures, P.O. Box 10337 Pacific Centre, 2200-609 Granville
Street, Vancouver, BC, Canada V7Y 1H2 or [email protected].
The authoring analysts who are responsible for the preparation of this research have received (or will receive) compensation based upon (among other factors) the Corporate Finance/Investment Banking revenues and general profits of Canaccord Genuity. However, such authoring analysts have not received, and will not receive, compensation that is directly based upon or linked to one or more specific Corporate
Finance/Investment Banking activities, or to recommendations contained in the research.
Canaccord Genuity and its affiliated companies may have a Corporate Finance/Investment Banking or other relationship with the issuer that is the subject of this research and may trade in any of the designated investments mentioned herein either for their own account or the accounts of their customers, in good faith or in the normal course of market making. Accordingly, Canaccord Genuity or their affiliated companies, principals or employees (other than the authoring analyst(s) who prepared this research) may at any time have a long or short position in any such designated investments, related designated investments or in
options, futures or other derivative instruments based thereon.
Some regulators require that a firm must establish, implement and make available a policy for managing conflicts of interest arising as a result of publication or distribution of research. This research has been prepared in accordance with Canaccord Genuity’s policy on managing conflicts of interest, and information barriers or firewalls have been used where appropriate. Canaccord Genuity’s policy is available upon request.
The information contained in this research has been compiled by Canaccord Genuity from sources believed to be reliable, but (with the exception of the information about Canaccord Genuity) no representation or warranty, express or implied, is made by Canaccord Genuity, its affiliated companies or any other person as to its fairness, accuracy, completeness or correctness. Canaccord Genuity has not independently verified the facts, assumptions, and estimates contained herein. All estimates, opinions and other information contained in this research constitute Canaccord Genuity’s judgement as of the date of this research, are subject to
change without notice and are provided in good faith but without legal responsibility or liability.
Canaccord Genuity’s salespeople, traders, and other professionals may provide oral or written market commentary or trading strategies to our clients and our proprietary trading desk that reflect opinions that are contrary to the opinions expressed in this research. Canaccord Genuity’s affiliates, principal trading desk, and investing businesses may make investment decisions that are inconsistent with the recommendations or
views expressed in this research.
This research is provided for information purposes only and does not constitute an offer or solicitation to buy or sell any designated investments discussed herein in any jurisdiction where such offer or solicitation would be prohibited. As a result, the designated investments discussed in this research may not be eligible for sale in some jurisdictions. This research is not, and under no circumstances should be construed as, a solicitation to act as a securities broker or dealer in any jurisdiction by any person or company that is not legally permitted to carry on the business of a securities broker or dealer in that jurisdiction. This material is prepared for general circulation to clients and does not have regard to the investment objectives, financial situation or particular needs of any particular person. Investors should obtain advice based on their own individual circumstances before making an investment decision. To the fullest extent permitted by law, none of Canaccord Genuity, its affiliated companies or any other person accepts any liability whatsoever for any direct or consequential loss arising from or relating to any use of the information contained in this research.
For Canadian Residents: This research has been approved by Canaccord Genuity Corp., which accepts sole responsibility for this research and its dissemination in Canada. Canadian clients wishing to effect transactions in any designated investment discussed should do so through a qualified salesperson of Canaccord Genuity Corp. in their particular province or territory.
For United States
Residents:
Canaccord Genuity Inc., a US registered broker-dealer, accepts responsibility for this research and its dissemination in the United States. This research is intended for distribution in the United States only to certain US institutional investors. US clients wishing to effect transactions in any designated investment discussed should do so through a qualified salesperson of Canaccord Genuity Inc. Analyst(s) preparing this report that are not employed by Canaccord Genuity Inc. are resident outside the United States and are not associated persons or employees of any US regulated broker-dealer. Such analyst(s) may not be subject to Rule 2711 restrictions on communications with a subject company, public appearances and trading securities held by a research analyst account.
For United Kingdom and
European Residents:
This research is distributed in the United Kingdom and elsewhere Europe, as third party research by Canaccord Genuity Limited, which is authorized and regulated by the Financial Conduct Authority. This research is for distribution only to persons who are Eligible Counterparties or Professional Clients only and is exempt from the general restrictions in section 21 of the Financial Services and Markets Act 2000 on the communication of invitations or inducements to engage in investment activity on the grounds that it is being distributed in the United Kingdom only to persons of a kind described in Article 19(5) (Investment Professionals) and 49(2) (High Net Worth companies, unincorporated associations etc) of the Financial
13
11 September 2013 A Light Read
Services and Markets Act 2000 (Financial Promotion) Order 2005 (as amended). It is not intended to be distributed or passed on, directly or indirectly, to any other class of persons. This material is not for distribution in the United Kingdom or elsewhere in Europe to retail clients, as defined under the rules of the Financial Conduct Authority.
For Jersey, Guernsey
and Isle of Man
Residents:
This research is sent to you by Canaccord Genuity Wealth (International) Limited (CGWI) for information purposes and is not to be construed as a solicitation or an offer to purchase or sell investments or related financial instruments. This research has been produced by an affiliate of CGWI for circulation to its institutional clients and also CGWI. Its contents have been approved by CGWI and we are providing it to you on the basis that we believe it to be of interest to you. This statement should be read in conjunction with your client agreement, CGWI's current terms of business and the other disclosures and disclaimers contained within this research. If you are in any doubt, you should consult your financial adviser. CGWI is licensed and regulated by the Guernsey Financial Services Commission, the Jersey Financial Services Commission and the Isle of Man Financial Supervision Commission. CGWI is registered in Guernsey and is a wholly owned subsidiary of Canaccord Financial Inc.
For Australian
Residents: This research is distributed in Australia by Canaccord Genuity (Australia) Limited ABN 19 075 071 466 holder of AFS Licence No 234666. To the extent that this research contains any advice, this is limited to general advice only. Recipients should take into account their own personal circumstances before making an investment decision. Clients wishing to effect any transactions in any financial products discussed in the research should do so through a qualified representative of Canaccord Genuity (Australia) Limited. Canaccord Genuity Wealth Management is a division of Canaccord Genuity (Australia) Limited.
For Singapore
Residents:
This research is distributed pursuant to 32C of the Financial Advisers under an arrangement between each of the Canaccord Genuity entities that publish research and Canaccord Genuity Singapore Pte. Ltd who are an exempt financial adviser under section 23(1)(d) of the Financial Advisers Act. This research is only intended for persons who fall within the definition of accredited investor, expert investor or institutional investor as defined under section 4A of the Securities and Futures Act It is not intended to be distributed or passed on, directly or indirectly, to any other class of persons. Recipients of this report can contact Canaccord Genuity Singapore Pte. Ltd. (Contact Person: Tom Gunnersen’s tel # is +852 3919 2561) in respect of any matters arising from, or in connection with, the [analyses or report].
For Hong Kong
Residents:
This research is distributed in Hong Kong by Canaccord Genuity (Hong Kong) Limited who is licensed by the Securities and Futures Commission. This research is only intended for persons who fall within the definition of professional investor as defined in the Securities and Futures Ordinance. It is not intended to be distributed or passed on, directly or indirectly, to any other class of persons. Recipients of this report can contact Canaccord Genuity (Hong Kong). Ltd. (Contact Person: Tom Gunnersen’s tel # is +852 3919 2561) in respect of any matters arising from, or in connection with, the research.
Additional information is available on request.
Copyright © Canaccord Genuity Corp. 2013. – Member IIROC/Canadian Investor Protection Fund Copyright © Canaccord Genuity Limited 2013. – Member LSE, authorized and regulated by the Financial Conduct Authority.
Copyright © Canaccord Genuity Inc. 2013. – Member FINRA/SIPC
Copyright © Canaccord Genuity (Australia) Limited 2013. – Participant of ASX Group, Chi-x Australia and of the NSX. Authorized and regulated by ASIC. All rights reserved. All material presented in this document, unless specifically indicated otherwise, is under copyright to Canaccord Genuity Corp., Canaccord Genuity Limited, Canaccord Genuity Inc. or Canaccord Financial Inc. None of the material, nor its content, nor any copy of it, may be altered in any way, or transmitted to or distributed to any other party, without the prior express written permission of the entities listed above.