calcification and organic production on a hawaiian coral reef
TRANSCRIPT

(This is a sample cover image for this issue. The actual cover is not yet available at this time.)
This article appeared in a journal published by Elsevier. The attachedcopy is furnished to the author for internal non-commercial researchand education use, including for instruction at the authors institution
and sharing with colleagues.
Other uses, including reproduction and distribution, or selling orlicensing copies, or posting to personal, institutional or third party
websites are prohibited.
In most cases authors are permitted to post their version of thearticle (e.g. in Word or Tex form) to their personal website orinstitutional repository. Authors requiring further information
regarding Elsevier’s archiving and manuscript policies areencouraged to visit:
http://www.elsevier.com/copyright
Author's personal copy
Calcification and organic production on a Hawaiian coral reef
K.E.F. Shamberger a,b,⁎, R.A. Feely b, C.L. Sabine b, M.J. Atkinson c, E.H. DeCarlo c, F.T. Mackenzie c,P.S. Drupp c, D.A. Butterfield d
a School of Oceanography, University of Washington, Seattle, WA, 98195, USAb NOAA Pacific Marine Environmental Laboratory, 7600 Sand Point Way NE, Seattle, WA 98115, USAc Department of Oceanography, School of Ocean and Earth Science and Technology, University of Hawaii at Manoa, Honolulu, HI 96822, USAd Joint Institute for the Study of Atmosphere and Ocean, University of Washington, Seattle, WA 98195, USA
a b s t r a c ta r t i c l e i n f o
Article history:Received 1 February 2011Received in revised form 20 July 2011Accepted 10 August 2011Available online xxxx
Keywords:Coral reefCalcificationProductionCO2
Ocean acidificationKaneohe
Net ecosystem calcification rates (NEC) and net photosynthesis (NP) were determined from CO2 seawaterparameters on the barrier coral reef of Kaneohe Bay, Oahu, Hawaii. Autosamplers were deployed to collectsamples on the barrier reef every 2 h for six 48-hour deployments, two each in June 2008, August 2009, andJanuary/February 2010. NEC on the Kaneohe Bay barrier reef increased throughout the day and decreased atnight. Net calcification continued at low rates at night except for six time periods when net dissolution wasmeasured. The barrier reef was generally net photosynthetic (positive NP) during the day and net respiring(negative NP) at night. NP controlled the diel cycles of the partial pressure of CO2 (pCO2) and aragonitesaturation state (Ωarag), resulting in high daytime Ωarag levels when calcification rates were at their peak.However, the NEC and NP diel cycles can become decoupled for short periods of time (several hours) withoutaffecting calcification rates. On a daily basis, net ecosystem production (NEP) of the barrier reef was found tobe sometimes net photosynthetic and sometimes net respiring and ranged from −378 to 80 mmol m−2 d−1
when calculated using simple box models. Daily NEC of the barrier reef was positive (net calcification) for alldeployments and ranged from 174 to 331 mmol CaCO3 m−2 d−1. Daily NEC was strongly negativelycorrelated with average daily pCO2 (R2=0.76) which ranged from 431 to 622 μatm. Daily NEC of the KaneoheBay barrier reef is similar to or higher than daily NEC measured on other coral reefs even though Ωarag levels(mean Ωarag=2.85) are some of the lowest measured in coral reef ecosystems. It appears that whilecalcification rate and Ωarag are correlated within a single coral reef ecosystem, this relationship does notnecessarily hold between different coral reef systems. It can be expected that ocean acidification will not affectcoral reefs uniformly and that some may be more sensitive to increasing pCO2 levels than others.
© 2011 Elsevier B.V. All rights reserved.
1. Introduction
The partial pressure of atmospheric carbon dioxide (pCO2) hasincreased from approximately 280 to 390 ppm since the industrialrevolution because of anthropogenic activities, namely burning offossil fuels, cement production, and land use changes (Keeling et al.,2005; Solomon et al., 2007). About 30% of anthropogenic CO2
emissions have been absorbed by the oceans resulting in an oceanicuptake of about 148 Pg C through 2008 (Sabine et al., 2011). Whenanthropogenic CO2 enters the surface ocean, it causes a decrease in thepH of ocean water, a process referred to as “ocean acidification”(Bacastow and Keeling, 1973; Raven et al., 2005). The average pH ofthe global open ocean and coastal ocean has decreased by about 0.1from preindustrial times to today due to ocean acidification,corresponding to approximately a 30% increase in the acidity (i.e.
concentration of hydrogen ions) of ocean waters (Andersson et al.,2005; Caldeira and Wickett, 2005; Feely et al., 2004, 2008a, b; Orr etal., 2005; Sabine et al., 2004). Ocean acidification has also resulted in adecrease in the concentration of carbonate ions (CO3
2−) by about 16%since the industrial revolution (Andersson et al., 2005; Orr et al.,2005). A decrease in the concentration of CO3
2− ([CO32−]) results in a
decrease in the saturation state of seawater with respect to CaCO3 (Ω).Ω is a measure of the stability of CaCO3 in seawater and is defined asthe product of the concentrations of calcium ions ([Ca2+]) and CO3
2−
divided by the stoichiometric solubility product of the form of CaCO3
(such as aragonite or calcite) being investigated (K⁎sp):
Ω = Ca2 +h i
CO2−3
h i= K�
sp: ð1Þ
If Ωb1, seawater is undersaturated with respect to the form ofCaCO3 under consideration and that form of CaCO3 should dissolveand if ΩN1, seawater is supersaturated and CaCO3 should theoreti-cally precipitate. The full seawater carbonic acid system, including Ω,
Marine Chemistry 127 (2011) 64–75
⁎ Corresponding author at: School of Oceanography, University of Washington,Seattle, WA, 98195, USA. Tel.: +1 508 289 2722; fax: +1 206 526 6815.
E-mail address: [email protected] (K.E.F. Shamberger).
0304-4203/$ – see front matter © 2011 Elsevier B.V. All rights reserved.doi:10.1016/j.marchem.2011.08.003
Contents lists available at SciVerse ScienceDirect
Marine Chemistry
j ourna l homepage: www.e lsev ie r.com/ locate /marchem
Author's personal copy
can be calculated from temperature, salinity, and two of the fourmeasurable CO2 system parameters (total alkalinity (TA), dissolvedinorganic carbon (DIC), pCO2, and pH). It has been predicted thatatmospheric CO2 could exceed 500 ppm by 2050 and 800 ppm by theend of the century with a corresponding decrease in open and coastalocean surface water pH of about 0.4 and a 50% decrease in [CO3
2−] by2100 (Andersson et al., 2005; Orr et al., 2005; Solomon et al., 2007;Steinacher et al., 2009). Such striking changes in ocean chemistrycould have serious impacts on marine ecosystems, especially thosedominated by calcifying organisms (Doney et al., 2009; Fabry et al.,2008; Kleypas et al., 2006; Raven et al., 2005).
Laboratory studies on individual coral species and coral reefmesocosms have demonstrated, in most cases, that the calcificationrate of corals decreases with increasing seawater pCO2 and decreasingsaturation state with respect to aragonite (Ωarag), even in supersat-urated waters (Andersson et al., 2009; Gattuso et al., 1998; Langdonand Atkinson, 2005; Langdon et al., 2000, 2003; Leclercq et al., 2000,2002; Marubini and Atkinson, 1999; Marubini et al., 2001, 2003;Marubini and Thake, 1999; Ohde and Hossain, 2004). There is alsorecent evidence that coral calcification is affected by changes inbicarbonate ion concentration ([HCO3
−]), rather than [CO32−] or Ωarag,
but if this is the case, howocean acidification inhibits coral calcificationwhile also increasing [HCO3
−] has not been resolved (Hofmann et al.,2010; Jury et al., 2010). Nevertheless, data from coral laboratoryexperiments have been used to predict that coral reef calcificationcould decrease globally by 17–35% by 2100 (Andersson et al., 2005;Gattuso et al., 1999; Kleypas et al., 1999; Langdon et al., 2003).
It is difficult to isolate the effects of CO2 among the multipleparameters that affect calcification in the field such as light, tempera-ture, nutrients, and heterotrophic coral feeding (Atkinson and Cuet,2008), but there are somefielddata that demonstrate thenegative effectof high pCO2/low Ωarag on coral calcification. For example, theabundance of calcifying organisms, including corals, decreased to zeroas distance fromCO2-releasing coldwater hydrothermal vents andΩarag
decreased (Hall-Spencer et al., 2008). Corals were not found in waterswith Ωaragb2.5 (Hall-Spencer et al., 2008). However, the relationshipbetween calcification of coral reef ecosystems and increasing pCO2
levels is not well understood because field data from coral reefs arelacking. In addition, few studies have investigated the relationshipbetween diel and seasonal changes in CO2 and coral reef ecosystemcalcification (Ohde and van Woesik, 1999; Silverman et al. 2007a,b;Yates and Halley, 2006). In this study, a method was developed tomeasure the calcification rate of a coral reef in the field usingautosamplers that allowed for evenly spaced sampling throughout theday and night. The relationship between coral reef ecosystemcalcification and pCO2 was investigated on the barrier reef in KaneoheBay, HI on both diel and seasonal time scales. Kaneohe Bay is an ideallocation for ocean acidification research because of a wealth coral andwater chemistry research previously performed there (Fagan andMackenzie, 2007; Langdon and Atkinson, 2005; Laws and Allen, 1996;Ringuet andMackenzie, 2005; Smith et al., 1981; Tanaka andMackenzie,2005) and because aMoored Autonomous pCO2 (MAPCO2) system thatmeasures air and seawater pCO2 is located in Kaneohe Bay (Drupp et al.,2011; Solomon et al., in preparation). pCO2 and calcification rate dataexist for a few other coral reef ecosystems (Bates et al., 2010; Gattuso etal., 1993; Gattuso et al., 1996; Silverman et al., 2007a, b) and as a highlatitude coral reef, Kaneohe Bay is characterized by high pCO2 levels andΩarag levels that are lowcompared toother coral reef systems. This studyprovides a valuable opportunity to compare calcification rate data froma lowΩarag Hawaiian coral reef ecosystem to calcification rate data fromhigher Ωarag coral reef systems.
2. Study site
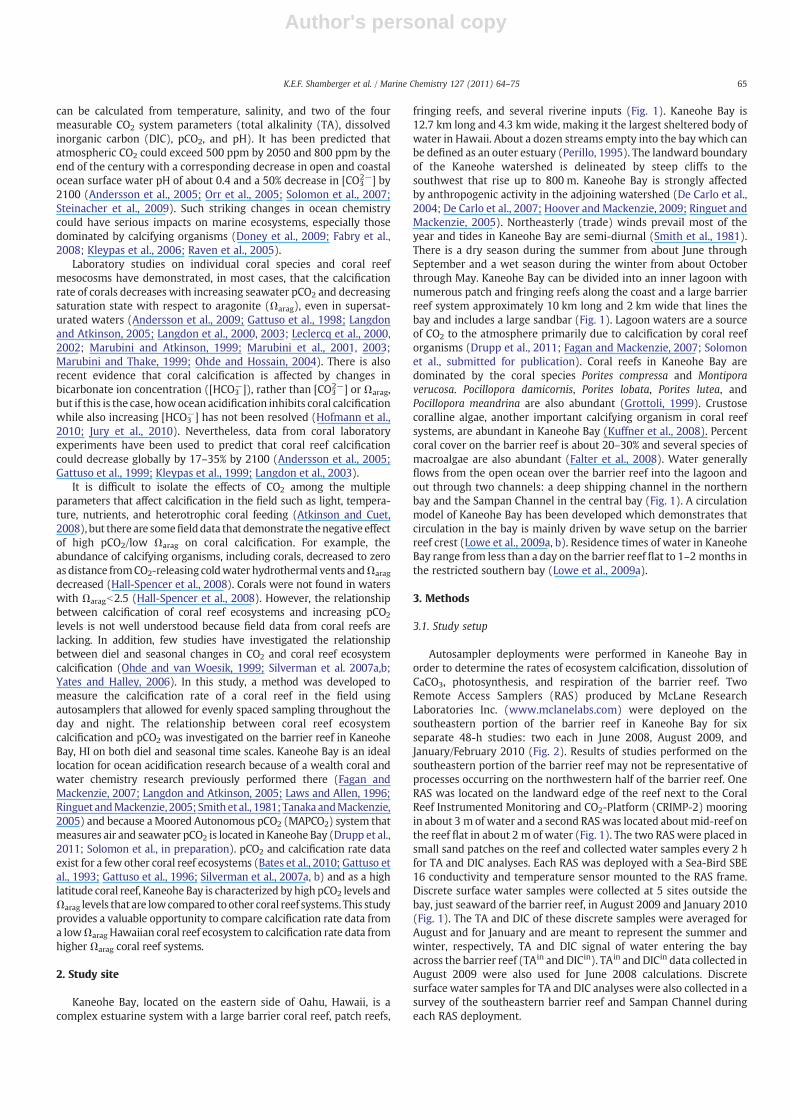
Kaneohe Bay, located on the eastern side of Oahu, Hawaii, is acomplex estuarine system with a large barrier coral reef, patch reefs,
fringing reefs, and several riverine inputs (Fig. 1). Kaneohe Bay is12.7 km long and 4.3 kmwide, making it the largest sheltered body ofwater in Hawaii. About a dozen streams empty into the bay which canbe defined as an outer estuary (Perillo, 1995). The landward boundaryof the Kaneohe watershed is delineated by steep cliffs to thesouthwest that rise up to 800 m. Kaneohe Bay is strongly affectedby anthropogenic activity in the adjoining watershed (De Carlo et al.,2004; De Carlo et al., 2007; Hoover and Mackenzie, 2009; Ringuet andMackenzie, 2005). Northeasterly (trade) winds prevail most of theyear and tides in Kaneohe Bay are semi-diurnal (Smith et al., 1981).There is a dry season during the summer from about June throughSeptember and a wet season during the winter from about Octoberthrough May. Kaneohe Bay can be divided into an inner lagoon withnumerous patch and fringing reefs along the coast and a large barrierreef system approximately 10 km long and 2 km wide that lines thebay and includes a large sandbar (Fig. 1). Lagoon waters are a sourceof CO2 to the atmosphere primarily due to calcification by coral reeforganisms (Drupp et al., 2011; Fagan and Mackenzie, 2007; Solomonet al., submitted for publication). Coral reefs in Kaneohe Bay aredominated by the coral species Porites compressa and Montiporaverucosa. Pocillopora damicornis, Porites lobata, Porites lutea, andPocillopora meandrina are also abundant (Grottoli, 1999). Crustosecoralline algae, another important calcifying organism in coral reefsystems, are abundant in Kaneohe Bay (Kuffner et al., 2008). Percentcoral cover on the barrier reef is about 20–30% and several species ofmacroalgae are also abundant (Falter et al., 2008). Water generallyflows from the open ocean over the barrier reef into the lagoon andout through two channels: a deep shipping channel in the northernbay and the Sampan Channel in the central bay (Fig. 1). A circulationmodel of Kaneohe Bay has been developed which demonstrates thatcirculation in the bay is mainly driven by wave setup on the barrierreef crest (Lowe et al., 2009a, b). Residence times of water in KaneoheBay range from less than a day on the barrier reef flat to 1–2 months inthe restricted southern bay (Lowe et al., 2009a).
3. Methods
3.1. Study setup
Autosampler deployments were performed in Kaneohe Bay inorder to determine the rates of ecosystem calcification, dissolution ofCaCO3, photosynthesis, and respiration of the barrier reef. TwoRemote Access Samplers (RAS) produced by McLane ResearchLaboratories Inc. (www.mclanelabs.com) were deployed on thesoutheastern portion of the barrier reef in Kaneohe Bay for sixseparate 48-h studies: two each in June 2008, August 2009, andJanuary/February 2010 (Fig. 2). Results of studies performed on thesoutheastern portion of the barrier reef may not be representative ofprocesses occurring on the northwestern half of the barrier reef. OneRAS was located on the landward edge of the reef next to the CoralReef Instrumented Monitoring and CO2-Platform (CRIMP-2) mooringin about 3 m of water and a second RASwas located about mid-reef onthe reef flat in about 2 m of water (Fig. 1). The two RAS were placed insmall sand patches on the reef and collected water samples every 2 hfor TA and DIC analyses. Each RAS was deployed with a Sea-Bird SBE16 conductivity and temperature sensor mounted to the RAS frame.Discrete surface water samples were collected at 5 sites outside thebay, just seaward of the barrier reef, in August 2009 and January 2010(Fig. 1). The TA and DIC of these discrete samples were averaged forAugust and for January and are meant to represent the summer andwinter, respectively, TA and DIC signal of water entering the bayacross the barrier reef (TAin and DICin). TAin and DICin data collected inAugust 2009 were also used for June 2008 calculations. Discretesurface water samples for TA and DIC analyses were also collected in asurvey of the southeastern barrier reef and Sampan Channel duringeach RAS deployment.
65K.E.F. Shamberger et al. / Marine Chemistry 127 (2011) 64–75
Author's personal copy
The CRIMP-2 mooring was deployed on the landward edge of thebarrier reef in June 2008 (Fig. 1). At the CRIMP-2 site, a SeaBird 37Microcat measured surface water (~0.5 m) temperature and conduc-tivity. Accuracies of temperature and conductivity measurementswere approximately 0.002 °C and 0.003 mS cm−1, respectively. pCO2
in the surface seawater (pCO2sw) and air pCO2 (pCO2air) weredetermined with a Moored Autonomous pCO2 (MAPCO2) systemevery 3 h (see Drupp et al. (2011) and Solomon et al. (in preparation)for more details). The MAPCO2 system measures CO2 with a LI-CORmodel 820 Non-Dispersive Infrared (NDIR) sensor and the accuracy ofair and seawater pCO2 measurements, based on laboratory and in situcomparisons, was approximately 2 μatm. During the 48-h RASdeployments, the mooring was programmed to collect data everyhour. The data were transmitted to NOAA's Pacific Marine Environ-mental Laboratory (PMEL) via Iridium satellite once per day and wereposted to the web at www.pmel.noaa.gov/co2.
3.2. Sample collection and analysis
It is often difficult or impossible to take water samples on shallowcoral reefs at night when calcification rates are lowest and net
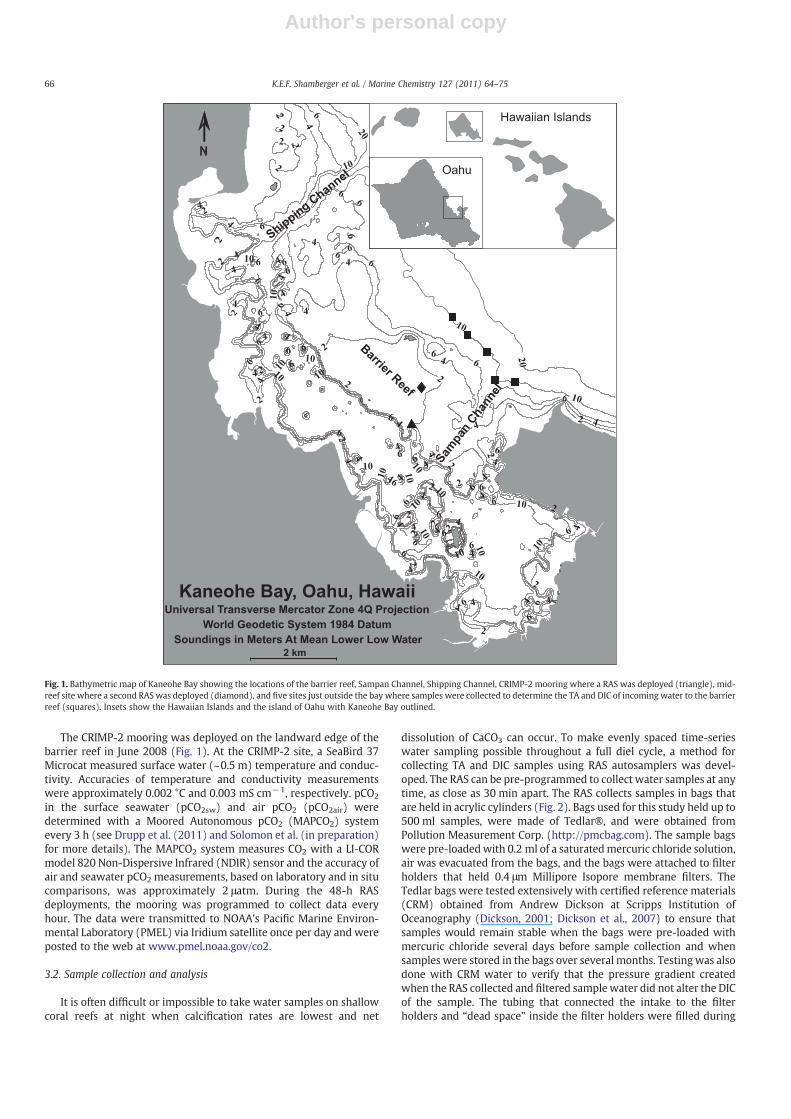
dissolution of CaCO3 can occur. To make evenly spaced time-serieswater sampling possible throughout a full diel cycle, a method forcollecting TA and DIC samples using RAS autosamplers was devel-oped. The RAS can be pre-programmed to collect water samples at anytime, as close as 30 min apart. The RAS collects samples in bags thatare held in acrylic cylinders (Fig. 2). Bags used for this study held up to500 ml samples, were made of Tedlar®, and were obtained fromPollution Measurement Corp. (http://pmcbag.com). The sample bagswere pre-loadedwith 0.2 ml of a saturatedmercuric chloride solution,air was evacuated from the bags, and the bags were attached to filterholders that held 0.4 μm Millipore Isopore membrane filters. TheTedlar bags were tested extensively with certified reference materials(CRM) obtained from Andrew Dickson at Scripps Institution ofOceanography (Dickson, 2001; Dickson et al., 2007) to ensure thatsamples would remain stable when the bags were pre-loaded withmercuric chloride several days before sample collection and whensamples were stored in the bags over several months. Testing was alsodone with CRM water to verify that the pressure gradient createdwhen the RAS collected and filtered sample water did not alter the DICof the sample. The tubing that connected the intake to the filterholders and “dead space” inside the filter holders were filled during
Fig. 1. Bathymetric map of Kaneohe Bay showing the locations of the barrier reef, Sampan Channel, Shipping Channel, CRIMP-2 mooring where a RAS was deployed (triangle), mid-reef site where a second RAS was deployed (diamond), and five sites just outside the bay where samples were collected to determine the TA and DIC of incoming water to the barrierreef (squares). Insets show the Hawaiian Islands and the island of Oahu with Kaneohe Bay outlined.
66 K.E.F. Shamberger et al. / Marine Chemistry 127 (2011) 64–75
Author's personal copy
set up with surface seawater from southern Kaneohe Bay that wasfiltered through a 0.8 μm and then a 0.2 μm Pall Corporation Supormembrane disc filter. For the June 2008 deployments, surfaceseawater for the RAS tubing and filter holders was autoclaved afterit was filtered, but autoclaving decreased the DIC of the water byabout 25% so autoclaving was abandoned for subsequent deploy-ments. Discrete samples of the filtered (filtered and autoclaved forJune deployments) seawater were collected on the same day that aRAS was set up andwere analyzed for TA and DIC. It was assumed thatthe TA and DIC of the filtered water in the tubing and filter holderswere constant from the time the RAS was set up until the sampleswere collectedwithin the following 5 days or less. TA and DIC samplescollected by the RASwere corrected for an average volume of 6.9 ml offiltered seawater in the tubing and filter holders combined. Thiscorrection changed TA data by 0.6–2.6 μmol kg−1 for all deploymentsand DIC by 0.2–3.5 μmol kg−1 for August and January data and 5.0–8.7 μmol kg−1 for June data.
Discrete water samples were collected in 500 ml borosilicatebottles held a few centimeters below the surface and allowed to fillslowly. Approximately 20–25 ml was removed from each bottle toallow headspace for expansion and each sample was spiked with0.2 ml of a saturated mercuric chloride solution to inhibit biologicalactivity. The bottles were sealed with Apiezon grease and securedwith tape or rubber bands with plastic clamps. Bag and bottlesamples were analyzed for both DIC and TA. DIC was analyzed by
coulometric titration (DOE, 1994; Johnson et al., 1985; Johnson et al.,1987; Ono et al., 1998) and TA was measured by an open cellpotentiometric titration method (Dickson et al., 2007). Bottle sampleswere filtered using 0.4 μm Millipore Isopore membrane filtersimmediately preceding TA analyses (bag samples were filtered duringcollection by a RAS) but not prior to DIC analyses. The accuracies ofDIC and TA measurements, established with certified referencematerials obtained from Andrew Dickson at Scripps Institution ofOceanography (Dickson, 2001; Dickson et al., 2007), were~1 μmol kg−1 and ~2 μmol kg−1, respectively. Analyses of replicatesamples yielded a mean precision of~1 μmol kg−1 and ~2 μmol kg−1
for DIC and TA analyses, respectively.
3.3. Calculations
pCO2 andΩarag were calculated from salinity, temperature, TA, andDIC data using the CO2SYS program by Lewis andWallace (1998)withconstants from Mehrbach et al. (1973) refit by Dickson and Millero(1987).
As water circulates from the open ocean across the Kaneohe Baybarrier reef, biogeochemical processes occurring on the reef alter thechemistry of the water. Changes in water chemistry can therefore beused to calculate rates of biogeochemical processes. This approachintegrates across the entire width of the Kaneohe Bay barrier reef andtakes into account processes occurring within the reef ecosystem as awhole. Changes in TA were used to calculate calcification rates, amethod referred to as the alkalinity anomaly technique (Smith andKey, 1975):
NEC = ΔTAhρ= 2Δtð Þ: ð2Þ
NEC is the net ecosystem calcification rate in mmol m−2 h−1
(gross calcification minus dissolution), ΔTA is the difference betweenTAin and TA collected by a RAS every two hours at the CRIMP-2mooring (μmol kg−1), h is the average depth of water on the barrierreef (2 m), ρ is the density of seawater (kg m−3), and Δt (h) is theresidence time of water on the barrier reef. The current velocity (u, inm s−1) across the barrier reef and the width of the reef (L, in m) wereused to determine Δt. The width of the barrier reef was approximatedas the distance from the CRIMP-2 mooring to the second mostnortheastern discrete sample site outside of the bay (L=2432.8 m)(Fig. 1). This may be an overestimation of the width of the reef andwould result in an underestimation of NEC. It has been demonstratedthat current velocity across the barrier reef is dominantly wave drivenand increases linearly with offshore wave height (Lowe et al., 2009b).Offshore wave height data were provided by the Coastal DataInformation Program (CDIP), Integrative Oceanography Division,operated by the Scripps Institution of Oceanography. Offshore waveheight data were acquired from CDIP wave buoy 098, locatedapproximately 4 miles southeast of Mokapu point (~21.415 N and157.678 W). Wave height data were converted to current velocity onthe barrier reef using a linear relationship from Lowe et al. (2009b).The uncertainty in current velocity using this linear relationship withoffshore wave height is ±15%. Eq. (2) is divided by 2 because twomoles of TA are consumed (produced) for every mole of CaCO3 that isproduced (dissolved). A positive NEC represents net ecosystemcalcification and a negative NEC represents net ecosystem dissolutionof CaCO3.
In most coral reef systems, changes in TA are caused mainly bycalcification and dissolution of CaCO3. On the other hand, calcification,dissolution, photosynthesis, respiration, and air–sea exchange of CO2
(FCO2) all cause changes in the DIC content of seawater. Netphotosynthesis and respiration (NP in mmol m−2 h−1) can therefore
A B C D
E
F
GH
IJ
K
L
M1 2
3
4
5
Fig. 2. Remote Access Sampler (RAS) produced by McLane Research Laboratories Inc.(www.mclanelabs.com). A) Stainless steel or titanium frame, B) multi-port valve,C) intake line, D) tubing from valve to filter holders, E) filter holder, F) water filledacrylic cylinder which holds sample bags, G) tubing from cylinder to valve, H) valve tocontroller cable, I) communication port, J) controller/battery housing, K) pump tocontroller cable, L) pump, M) tubing from pump to valve. The RAS collects samples bypumping water out of the cylinders holding the sample bags (arrows 1–3) therebycreating a pressure gradient that pulls water into the intake line (arrow 4), through afilter (arrow 5), and into the sample bags inside the cylinders.
67K.E.F. Shamberger et al. / Marine Chemistry 127 (2011) 64–75
Author's personal copy
be calculated using changes in DIC and taking into account NEC andFCO2:
NP = ΔDIChρ=Δt–NEC + FCO2: ð3Þ
ΔDIC is the difference between DICin and DIC collected by a RASevery 2 h at the CRIMP-2 mooring (μmol kg−1). Positive NPrepresents net photosynthesis and negative NP represents netrespiration. FCO2 was calculated using the following equation:
FCO2 = ks pCO2sw–pCO2airð Þ ð4Þ
where k is the gas transfer velocity, s is the solubility of CO2 calculatedas a function of salinity and temperature, and pCO2sw and pCO2air arethe pCO2 of surface water and air, respectively, measured by theCRIMP-2 mooring. The wind speed parameterization of Ho et al.(2006) was used to calculate k which ranged from 0.01 to27.00 cm h−1. Hourly wind speed data were obtained by a Model05103 R.M. Young Co. wind speed anemometer located about 5.5 mabove sea level at the Hawaii Institute of Marine Biology (HIMB) onCoconut Island in southern Kaneohe Bay. Wind speed data werecorrected to 10-m height using the procedure of Johnson (1999). Lightdata were also obtained at HIMB by a LI-COR Pyranometer Model LI-200X and a LI-COR Quantameter LI190SZ. Here, a positive FCO2represents a flux of CO2 from the water to the atmosphere and anegative FCO2 represents a flux of CO2 from the atmosphere to thewater. The magnitude of FCO2 was small compared to NEC and NP forthe Kaneohe Bay barrier reef.
In addition to the ΔTA/ΔDIC-based calculations above (Eqs. (2)and (3)), hourly NEC and NP were also estimated using simple boxmodels to represent the changes in TA and DIC on the Kaneohe Baybarrier reef:
d= dt TAaveð Þ = u= L TAin–TAout
� �–1= hρð Þ4 2NEC ð5Þ
d= dt DICaveð Þ = u = L DICin–DICout
� �–1= hρð Þ4 FCO2 + NEC + NPð Þ ð6Þ
where TAave and DICave are the averages of TAin and TA and DICin andDIC collected every 2 h at the CRIMP-2 location, respectively.
For both sets of calculations, thewater column over the barrier reefwas assumed to be well mixed. Data were used to calculate NEC andNP only for deployments when temperature, salinity, and pCO2 datacollected at the surface by the CRIMP-2 mooring matched datacollected by a RAS in the same location at the bottom of the watercolumn. TAin and DICin were assumed to remain constant during thedeployments. In order to remove the effects of any changes in salinityon NEC and NP calculations, TA and DIC data were normalized to asalinity of 35 (nTA and nDIC, respectively) by multiplying TA and DICdata by the ratio of 35 to the measured in situ salinity. It was assumedthat any potential biases of normalizing TA and DIC to a constantsalinity of 35 were insignificant because changes in salinity on thebarrier reef were small compared to biogeochemically inducedchanges in TA and DIC (Friis et al., 2003). A Monte Carlo methodwas used to evaluate the uncertainty associated with NEC and NP.Multiple time periods covering a wide range of hourly NEC and NPvalues from each deployment were tested. ΔTA/ΔDIC and box modelcalculations were run 10,000 times for each chosen time period usingpseudorandom numbers that were normally distributed around theactual value of each input parameter (see Eqs. (5) and (6))(MacCready and Quay, 2001). The range of pseudorandom numberswas based on the uncertainty associated with each input parameter.Uncertainty in NEC and NP for both ΔTA/ΔDIC and box modelcalculations was mainly due to the uncertainty associated with thelinear relationship between offshore wave height and current speedand with averaging of TAin and DICin values. The uncertainty inNEC was about 2–7 mmol m−2 h−1 for both ΔTA/ΔDIC and box
model calculations. Uncertainty in NEC was greater than5 mmol m− 2 h− 1 only when hourly NEC was greater than18 mmol m− 2 h− 1. Uncertainty in NP was usually about 3–7 mmol m−2 h−1 for both ΔTA/ΔDIC and box model calculations.However, when NP was greater than 42 mmol m−2 h−1, theuncertainty in NP could be as high as 13 mmol m−2 h−1. On average,the percent error for both NEC and NP calculations was about±30%.For both ΔTA/ΔDIC and box model calculations, a summation ofhourly NEC and NP over 24 h was performed to calculate daily NECand net ecosystem production (NEP) in mmol m−2 d−1.
4. Results
RAS autosamplers were successfully deployed on the barrier reefof Kaneohe Bay and collected water samples for TA and DIC analyses.Average nDIC of ocean water entering the barrier reef (nDICin) wasthe same for August 2009 and January/February 2010 (1988±7 and1986±4 μmol kg−1, respectively) and very similar to open oceansurface water nDIC at the Hawaii Ocean Time-series (HOT) program'sstation ALOHA in the North Pacific subtropical gyre (average fromJune 2008–December 2009: 1984±6 μmol kg−1) (HOT Data Organi-zation and Graphical System (HOT-DOGS): http://hahana.soest.hawaii.edu/hot/hot-dogs/). Average incoming nTA (nTAin) waslower in August 2009 than in January/February 2010 (2276±17and 2284±9 μmol kg−1, respectively) but not statistically different.nTA is fairly constant and without a seasonal cycle at Station ALOHA(Dore et al., 2003, 2009). nTA of water entering Kaneohe Bay waslower than surface water nTA at station ALOHA (average from June2008–December 2009: 2307±3 μmol kg−1) but some recirculationof water exiting the Kaneohe Bay channels is known to occur (Lowe etal., 2009a, b).
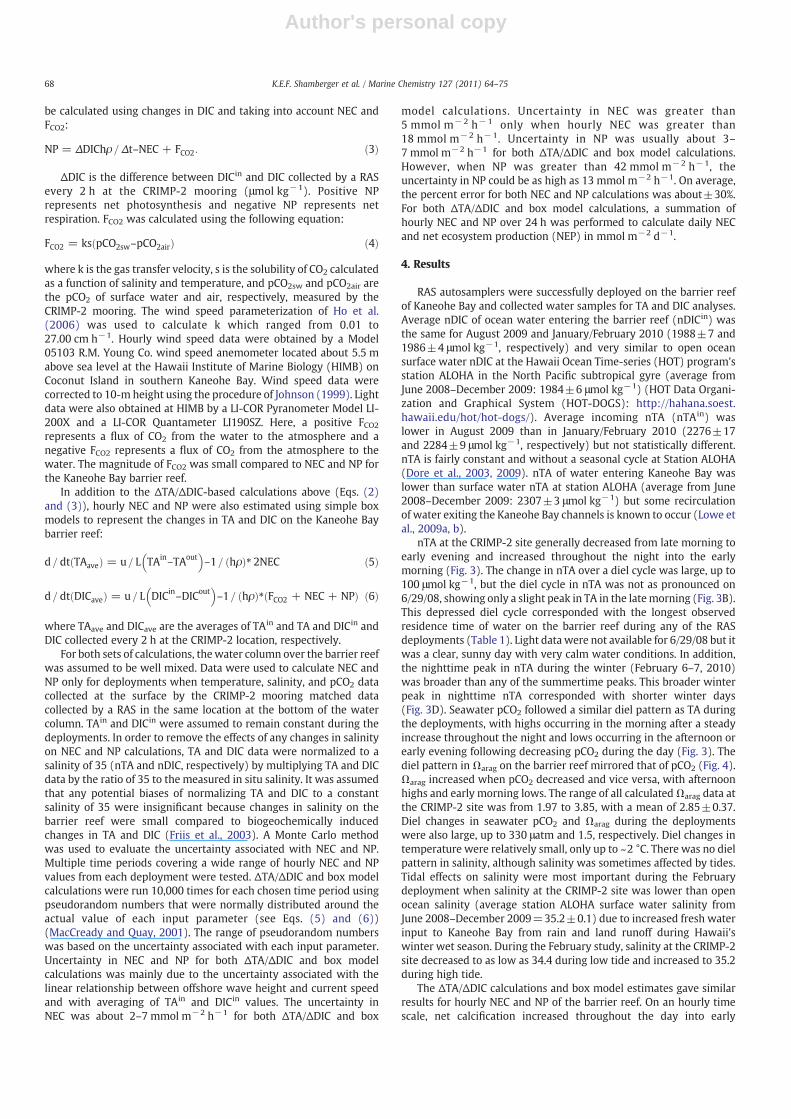
nTA at the CRIMP-2 site generally decreased from late morning toearly evening and increased throughout the night into the earlymorning (Fig. 3). The change in nTA over a diel cycle was large, up to100 μmol kg−1, but the diel cycle in nTA was not as pronounced on6/29/08, showing only a slight peak in TA in the latemorning (Fig. 3B).This depressed diel cycle corresponded with the longest observedresidence time of water on the barrier reef during any of the RASdeployments (Table 1). Light data were not available for 6/29/08 but itwas a clear, sunny day with very calm water conditions. In addition,the nighttime peak in nTA during the winter (February 6–7, 2010)was broader than any of the summertime peaks. This broader winterpeak in nighttime nTA corresponded with shorter winter days(Fig. 3D). Seawater pCO2 followed a similar diel pattern as TA duringthe deployments, with highs occurring in the morning after a steadyincrease throughout the night and lows occurring in the afternoon orearly evening following decreasing pCO2 during the day (Fig. 3). Thediel pattern in Ωarag on the barrier reef mirrored that of pCO2 (Fig. 4).Ωarag increased when pCO2 decreased and vice versa, with afternoonhighs and early morning lows. The range of all calculatedΩarag data atthe CRIMP-2 site was from 1.97 to 3.85, with a mean of 2.85±0.37.Diel changes in seawater pCO2 and Ωarag during the deploymentswere also large, up to 330 μatm and 1.5, respectively. Diel changes intemperature were relatively small, only up to ~2 °C. There was no dielpattern in salinity, although salinity was sometimes affected by tides.Tidal effects on salinity were most important during the Februarydeployment when salinity at the CRIMP-2 site was lower than openocean salinity (average station ALOHA surface water salinity fromJune 2008–December 2009=35.2±0.1) due to increased fresh waterinput to Kaneohe Bay from rain and land runoff during Hawaii'swinter wet season. During the February study, salinity at the CRIMP-2site decreased to as low as 34.4 during low tide and increased to 35.2during high tide.
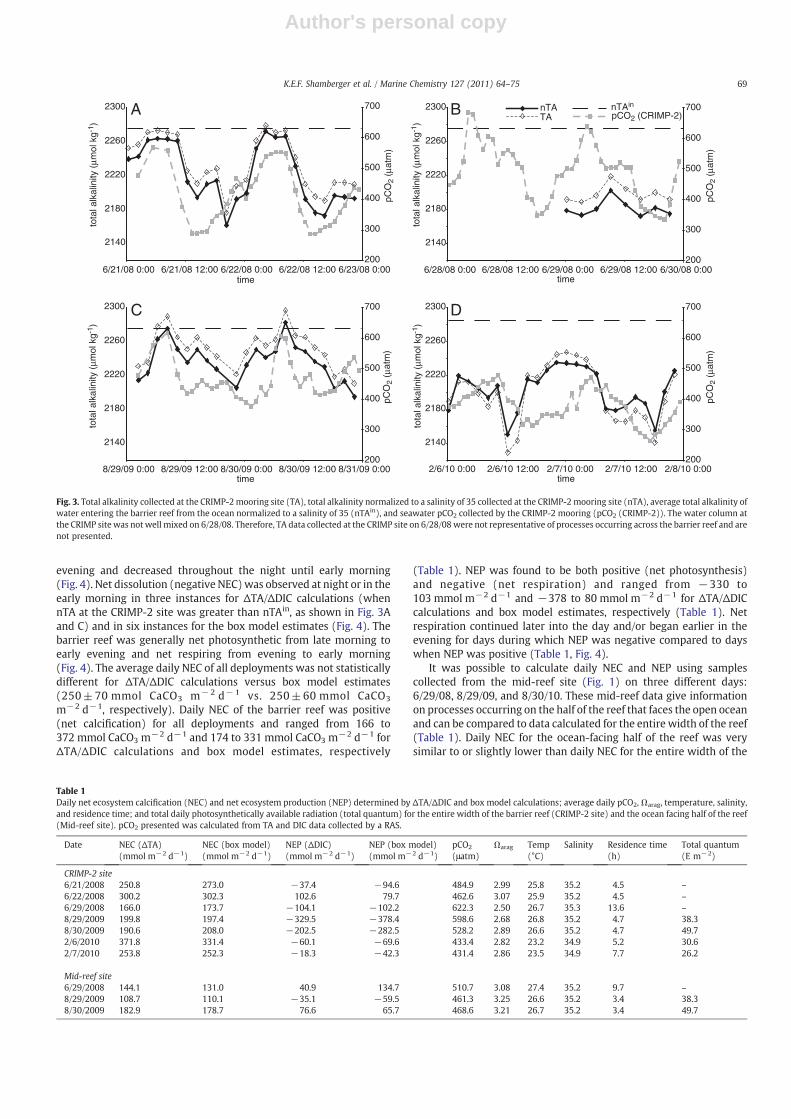
The ΔTA/ΔDIC calculations and box model estimates gave similarresults for hourly NEC and NP of the barrier reef. On an hourly timescale, net calcification increased throughout the day into early
68 K.E.F. Shamberger et al. / Marine Chemistry 127 (2011) 64–75
Author's personal copy
evening and decreased throughout the night until early morning(Fig. 4). Net dissolution (negative NEC)was observed at night or in theearly morning in three instances for ΔTA/ΔDIC calculations (whennTA at the CRIMP-2 site was greater than nTAin, as shown in Fig. 3Aand C) and in six instances for the box model estimates (Fig. 4). Thebarrier reef was generally net photosynthetic from late morning toearly evening and net respiring from evening to early morning(Fig. 4). The average daily NEC of all deployments was not statisticallydifferent for ΔTA/ΔDIC calculations versus box model estimates(250±70 mmol CaCO3 m− 2 d− 1 vs. 250±60 mmol CaCO3
m−2 d−1, respectively). Daily NEC of the barrier reef was positive(net calcification) for all deployments and ranged from 166 to372 mmol CaCO3 m−2 d−1 and 174 to 331 mmol CaCO3 m−2 d−1 forΔTA/ΔDIC calculations and box model estimates, respectively
(Table 1). NEP was found to be both positive (net photosynthesis)and negative (net respiration) and ranged from −330 to103 mmol m−2 d−1 and −378 to 80 mmol m−2 d−1 for ΔTA/ΔDICcalculations and box model estimates, respectively (Table 1). Netrespiration continued later into the day and/or began earlier in theevening for days during which NEP was negative compared to dayswhen NEP was positive (Table 1, Fig. 4).
It was possible to calculate daily NEC and NEP using samplescollected from the mid-reef site (Fig. 1) on three different days:6/29/08, 8/29/09, and 8/30/10. These mid-reef data give informationon processes occurring on the half of the reef that faces the open oceanand can be compared to data calculated for the entire width of the reef(Table 1). Daily NEC for the ocean-facing half of the reef was verysimilar to or slightly lower than daily NEC for the entire width of the
2180
2220
2260
2300
6/21/08 0:00 6/21/08 12:00 6/22/08 0:00 6/22/08 12:00 6/23/08 0:00time
tota
l alk
alin
ity (
μmol
kg-
1 )
pCO
2 (μ
atm
)
2140
nTA nTAin
pCO2 (CRIMP-2)A
200
300
400
500
600
700TA
2140
2180
2220
2260
2300
6/28/08 0:00 6/28/08 12:00 6/29/08 0:00 6/29/08 12:00 6/30/08 0:00time
tota
l alk
alin
ity (
μmol
kg-
1 )
2140
2180
2220
2260
2300
8/29/09 0:00 8/29/09 12:00 8/30/09 0:00 8/30/09 12:00 8/31/09 0:00time
tota
l alk
alin
ity (
μmol
kg-
1 )
pCO
2 (μ
atm
)
C
2140
2180
2220
2260
2300
2/6/10 0:00 2/6/10 12:00 2/7/10 0:00 2/7/10 12:00 2/8/10 0:00time
tota
l alk
alin
ity (
μmol
kg-
1 )
pCO
2 (μ
atm
)
200
300
400
500
600
700
200
300
400
500
600
700D
200
300
400
500
600
700
pCO
2 (μ
atm
)
B
Fig. 3. Total alkalinity collected at the CRIMP-2mooring site (TA), total alkalinity normalized to a salinity of 35 collected at the CRIMP-2 mooring site (nTA), average total alkalinity ofwater entering the barrier reef from the ocean normalized to a salinity of 35 (nTAin), and seawater pCO2 collected by the CRIMP-2 mooring (pCO2 (CRIMP-2)). The water column atthe CRIMP site was not well mixed on 6/28/08. Therefore, TA data collected at the CRIMP site on 6/28/08 were not representative of processes occurring across the barrier reef and arenot presented.
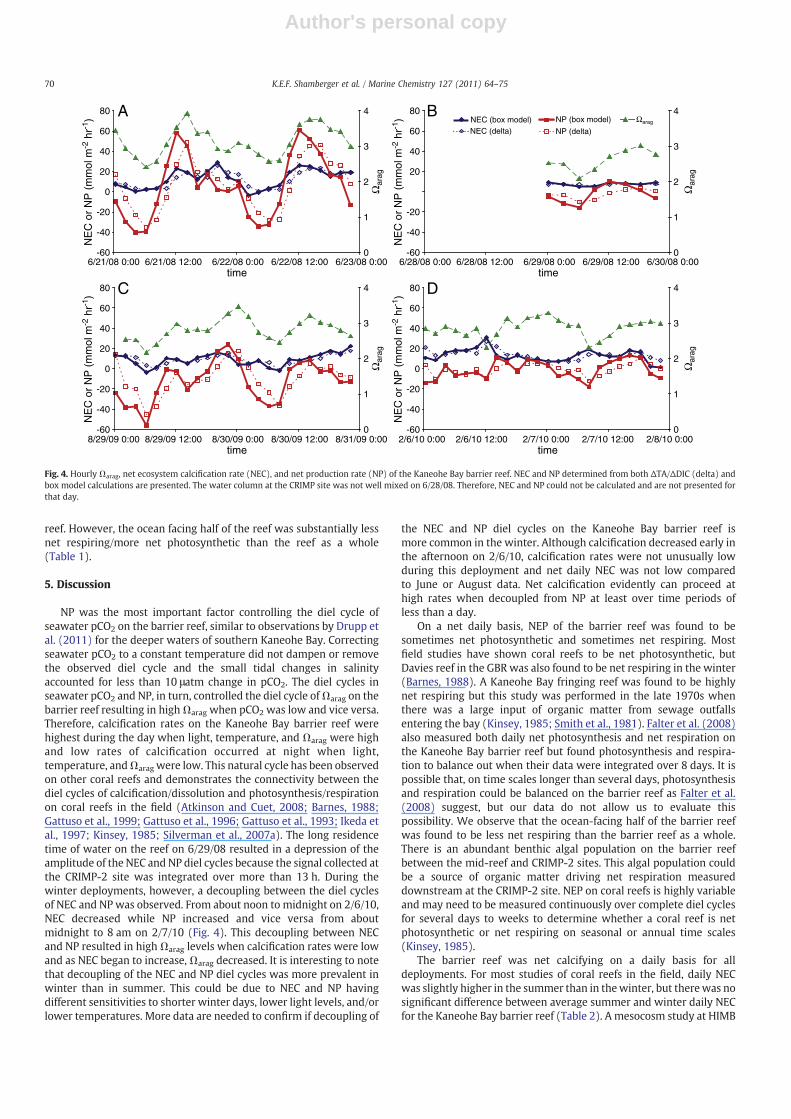
Table 1Daily net ecosystem calcification (NEC) and net ecosystem production (NEP) determined by ΔTA/ΔDIC and box model calculations; average daily pCO2,Ωarag, temperature, salinity,and residence time; and total daily photosynthetically available radiation (total quantum) for the entire width of the barrier reef (CRIMP-2 site) and the ocean facing half of the reef(Mid-reef site). pCO2 presented was calculated from TA and DIC data collected by a RAS.
Date NEC (ΔTA)(mmol m−2 d−1)
NEC (box model)(mmol m−2 d−1)
NEP (ΔDIC)(mmol m−2 d−1)
NEP (box model)(mmol m−2 d−1)
pCO2
(μatm)Ωarag Temp
(°C)Salinity Residence time
(h)Total quantum(E m−2)
CRIMP-2 site6/21/2008 250.8 273.0 −37.4 −94.6 484.9 2.99 25.8 35.2 4.5 –
6/22/2008 300.2 302.3 102.6 79.7 462.6 3.07 25.9 35.2 4.5 –
6/29/2008 166.0 173.7 −104.1 −102.2 622.3 2.50 26.7 35.3 13.6 –
8/29/2009 199.8 197.4 −329.5 −378.4 598.6 2.68 26.8 35.2 4.7 38.38/30/2009 190.6 208.0 −202.5 −282.5 528.2 2.89 26.6 35.2 4.7 49.72/6/2010 371.8 331.4 −60.1 −69.6 433.4 2.82 23.2 34.9 5.2 30.62/7/2010 253.8 252.3 −18.3 −42.3 431.4 2.86 23.5 34.9 7.7 26.2
Mid-reef site6/29/2008 144.1 131.0 40.9 134.7 510.7 3.08 27.4 35.2 9.7 –
8/29/2009 108.7 110.1 −35.1 −59.5 461.3 3.25 26.6 35.2 3.4 38.38/30/2009 182.9 178.7 76.6 65.7 468.6 3.21 26.7 35.2 3.4 49.7
69K.E.F. Shamberger et al. / Marine Chemistry 127 (2011) 64–75
Author's personal copy
reef. However, the ocean facing half of the reef was substantially lessnet respiring/more net photosynthetic than the reef as a whole(Table 1).
5. Discussion
NP was the most important factor controlling the diel cycle ofseawater pCO2 on the barrier reef, similar to observations by Drupp etal. (2011) for the deeper waters of southern Kaneohe Bay. Correctingseawater pCO2 to a constant temperature did not dampen or removethe observed diel cycle and the small tidal changes in salinityaccounted for less than 10 μatm change in pCO2. The diel cycles inseawater pCO2 and NP, in turn, controlled the diel cycle ofΩarag on thebarrier reef resulting in highΩarag when pCO2 was low and vice versa.Therefore, calcification rates on the Kaneohe Bay barrier reef werehighest during the day when light, temperature, and Ωarag were highand low rates of calcification occurred at night when light,temperature, andΩarag were low. This natural cycle has been observedon other coral reefs and demonstrates the connectivity between thediel cycles of calcification/dissolution and photosynthesis/respirationon coral reefs in the field (Atkinson and Cuet, 2008; Barnes, 1988;Gattuso et al., 1999; Gattuso et al., 1996; Gattuso et al., 1993; Ikeda etal., 1997; Kinsey, 1985; Silverman et al., 2007a). The long residencetime of water on the reef on 6/29/08 resulted in a depression of theamplitude of the NEC and NP diel cycles because the signal collected atthe CRIMP-2 site was integrated over more than 13 h. During thewinter deployments, however, a decoupling between the diel cyclesof NEC and NP was observed. From about noon to midnight on 2/6/10,NEC decreased while NP increased and vice versa from aboutmidnight to 8 am on 2/7/10 (Fig. 4). This decoupling between NECand NP resulted in highΩarag levels when calcification rates were lowand as NEC began to increase,Ωarag decreased. It is interesting to notethat decoupling of the NEC and NP diel cycles was more prevalent inwinter than in summer. This could be due to NEC and NP havingdifferent sensitivities to shorter winter days, lower light levels, and/orlower temperatures. More data are needed to confirm if decoupling of
the NEC and NP diel cycles on the Kaneohe Bay barrier reef ismore common in the winter. Although calcification decreased early inthe afternoon on 2/6/10, calcification rates were not unusually lowduring this deployment and net daily NEC was not low comparedto June or August data. Net calcification evidently can proceed athigh rates when decoupled from NP at least over time periods ofless than a day.
On a net daily basis, NEP of the barrier reef was found to besometimes net photosynthetic and sometimes net respiring. Mostfield studies have shown coral reefs to be net photosynthetic, butDavies reef in the GBR was also found to be net respiring in the winter(Barnes, 1988). A Kaneohe Bay fringing reef was found to be highlynet respiring but this study was performed in the late 1970s whenthere was a large input of organic matter from sewage outfallsentering the bay (Kinsey, 1985; Smith et al., 1981). Falter et al. (2008)also measured both daily net photosynthesis and net respiration onthe Kaneohe Bay barrier reef but found photosynthesis and respira-tion to balance out when their data were integrated over 8 days. It ispossible that, on time scales longer than several days, photosynthesisand respiration could be balanced on the barrier reef as Falter et al.(2008) suggest, but our data do not allow us to evaluate thispossibility. We observe that the ocean-facing half of the barrier reefwas found to be less net respiring than the barrier reef as a whole.There is an abundant benthic algal population on the barrier reefbetween the mid-reef and CRIMP-2 sites. This algal population couldbe a source of organic matter driving net respiration measureddownstream at the CRIMP-2 site. NEP on coral reefs is highly variableand may need to be measured continuously over complete diel cyclesfor several days to weeks to determine whether a coral reef is netphotosynthetic or net respiring on seasonal or annual time scales(Kinsey, 1985).
The barrier reef was net calcifying on a daily basis for alldeployments. For most studies of coral reefs in the field, daily NECwas slightly higher in the summer than in thewinter, but therewas nosignificant difference between average summer and winter daily NECfor the Kaneohe Bay barrier reef (Table 2). A mesocosm study at HIMB
A B
C D
-60
-40
-20
0
20
40
60
80
6/21/08 0:00 6/21/08 12:00 6/22/08 0:00 6/22/08 12:00 6/23/08 0:00time
6/28/08 0:00 6/28/08 12:00 6/29/08 0:00 6/29/08 12:00 6/30/08 0:00time
8/29/09 0:00 8/29/09 12:00 8/30/09 0:00 8/30/09 12:00 8/31/09 0:00time
2/6/10 0:00 2/6/10 12:00 2/7/10 0:00 2/7/10 12:00 2/8/10 0:00time
NE
C o
r N
P (
mm
ol m
-2 h
r-1)
-60
-40
-20
0
20
40
60
80
NE
C o
r N
P (
mm
ol m
-2 h
r-1)
-60
-40
-20
20
40
60
80
NE
C o
r N
P (
mm
ol m
-2 h
r-1)
-60
-40
-20
0
20
40
60
80
NE
C o
r N
P (
mm
ol m
-2 h
r-1)
0
1
2
3
4
NEC (delta)NEC (box model)
NP (delta)
NP (box model) Ωarag
Ωar
ag
0
1
2
3
4
Ωar
ag
0
1
2
3
4
Ωar
ag
0
1
2
3
4
Ωar
ag
Fig. 4. Hourly Ωarag, net ecosystem calcification rate (NEC), and net production rate (NP) of the Kaneohe Bay barrier reef. NEC and NP determined from both ΔTA/ΔDIC (delta) andbox model calculations are presented. The water column at the CRIMP site was not well mixed on 6/28/08. Therefore, NEC and NP could not be calculated and are not presented forthat day.
70 K.E.F. Shamberger et al. / Marine Chemistry 127 (2011) 64–75
Author's personal copy
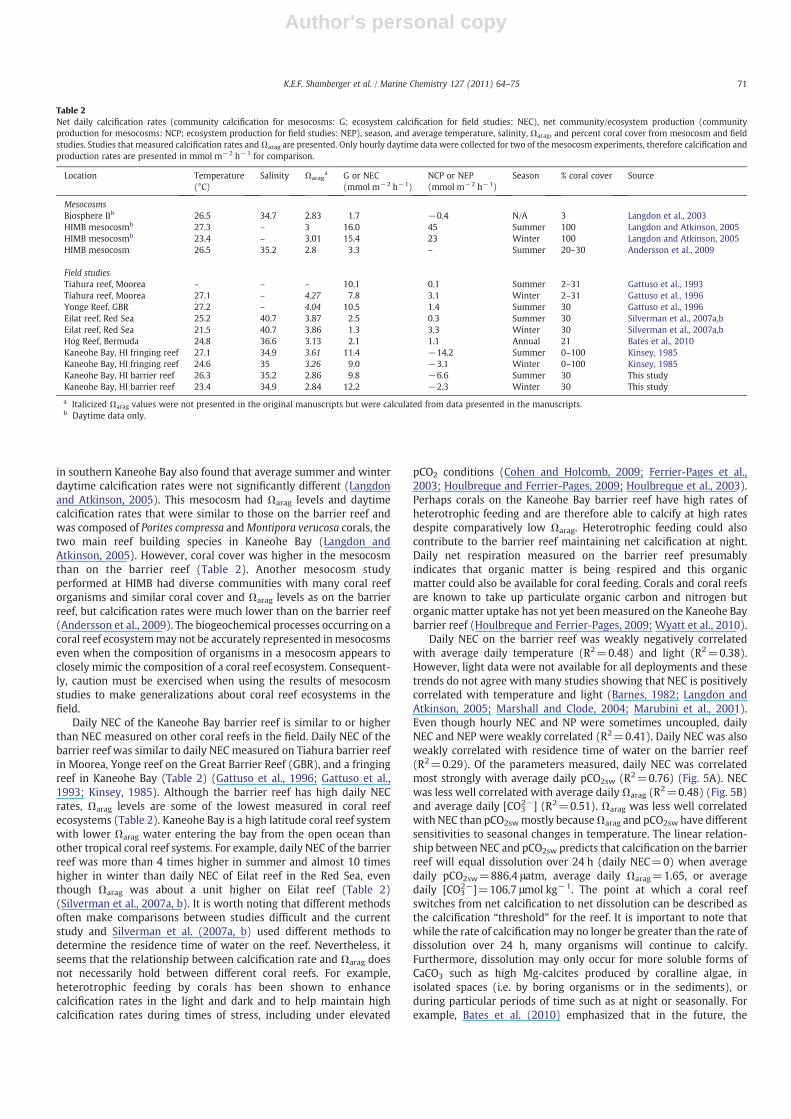
in southern Kaneohe Bay also found that average summer and winterdaytime calcification rates were not significantly different (Langdonand Atkinson, 2005). This mesocosm had Ωarag levels and daytimecalcification rates that were similar to those on the barrier reef andwas composed of Porites compressa andMontipora verucosa corals, thetwo main reef building species in Kaneohe Bay (Langdon andAtkinson, 2005). However, coral cover was higher in the mesocosmthan on the barrier reef (Table 2). Another mesocosm studyperformed at HIMB had diverse communities with many coral reeforganisms and similar coral cover and Ωarag levels as on the barrierreef, but calcification rates were much lower than on the barrier reef(Andersson et al., 2009). The biogeochemical processes occurring on acoral reef ecosystemmay not be accurately represented inmesocosmseven when the composition of organisms in a mesocosm appears toclosely mimic the composition of a coral reef ecosystem. Consequent-ly, caution must be exercised when using the results of mesocosmstudies to make generalizations about coral reef ecosystems in thefield.
Daily NEC of the Kaneohe Bay barrier reef is similar to or higherthan NEC measured on other coral reefs in the field. Daily NEC of thebarrier reef was similar to daily NEC measured on Tiahura barrier reefin Moorea, Yonge reef on the Great Barrier Reef (GBR), and a fringingreef in Kaneohe Bay (Table 2) (Gattuso et al., 1996; Gattuso et al.,1993; Kinsey, 1985). Although the barrier reef has high daily NECrates, Ωarag levels are some of the lowest measured in coral reefecosystems (Table 2). Kaneohe Bay is a high latitude coral reef systemwith lower Ωarag water entering the bay from the open ocean thanother tropical coral reef systems. For example, daily NEC of the barrierreef was more than 4 times higher in summer and almost 10 timeshigher in winter than daily NEC of Eilat reef in the Red Sea, eventhough Ωarag was about a unit higher on Eilat reef (Table 2)(Silverman et al., 2007a, b). It is worth noting that different methodsoften make comparisons between studies difficult and the currentstudy and Silverman et al. (2007a, b) used different methods todetermine the residence time of water on the reef. Nevertheless, itseems that the relationship between calcification rate and Ωarag doesnot necessarily hold between different coral reefs. For example,heterotrophic feeding by corals has been shown to enhancecalcification rates in the light and dark and to help maintain highcalcification rates during times of stress, including under elevated
pCO2 conditions (Cohen and Holcomb, 2009; Ferrier-Pages et al.,2003; Houlbreque and Ferrier-Pages, 2009; Houlbreque et al., 2003).Perhaps corals on the Kaneohe Bay barrier reef have high rates ofheterotrophic feeding and are therefore able to calcify at high ratesdespite comparatively low Ωarag. Heterotrophic feeding could alsocontribute to the barrier reef maintaining net calcification at night.Daily net respiration measured on the barrier reef presumablyindicates that organic matter is being respired and this organicmatter could also be available for coral feeding. Corals and coral reefsare known to take up particulate organic carbon and nitrogen butorganic matter uptake has not yet been measured on the Kaneohe Baybarrier reef (Houlbreque and Ferrier-Pages, 2009; Wyatt et al., 2010).
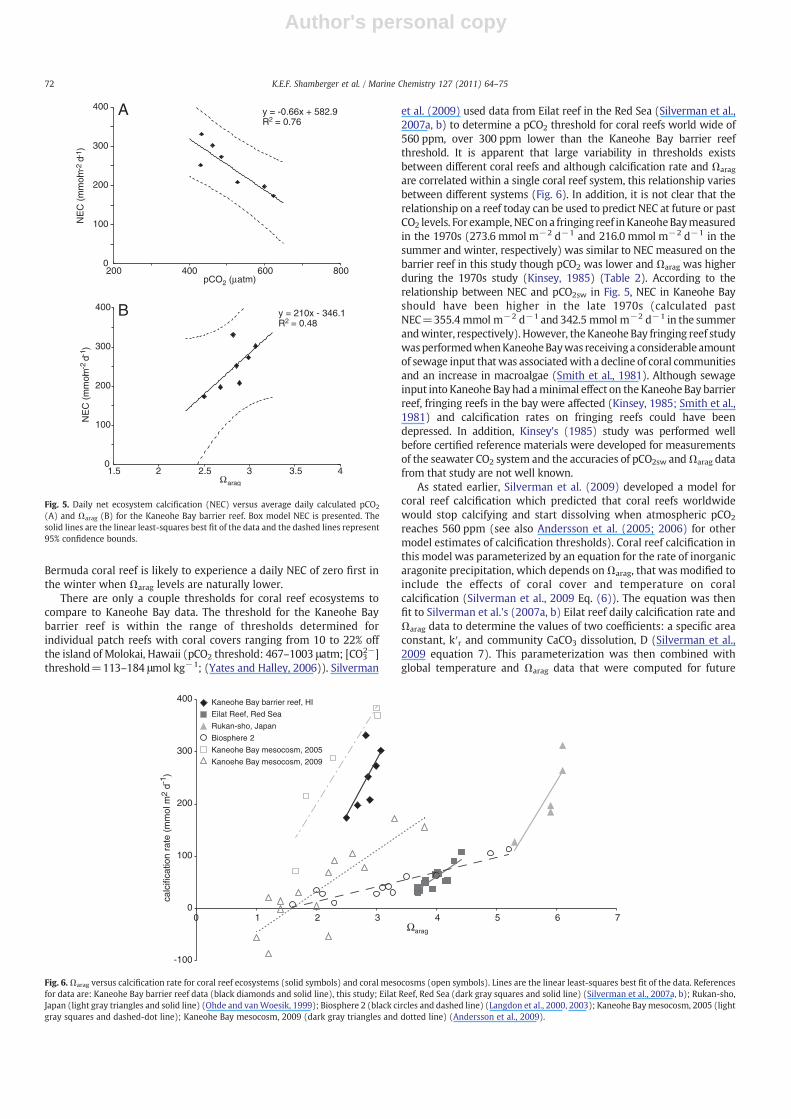
Daily NEC on the barrier reef was weakly negatively correlatedwith average daily temperature (R2=0.48) and light (R2=0.38).However, light data were not available for all deployments and thesetrends do not agree with many studies showing that NEC is positivelycorrelated with temperature and light (Barnes, 1982; Langdon andAtkinson, 2005; Marshall and Clode, 2004; Marubini et al., 2001).Even though hourly NEC and NP were sometimes uncoupled, dailyNEC and NEP were weakly correlated (R2=0.41). Daily NEC was alsoweakly correlated with residence time of water on the barrier reef(R2=0.29). Of the parameters measured, daily NEC was correlatedmost strongly with average daily pCO2sw (R2=0.76) (Fig. 5A). NECwas less well correlated with average daily Ωarag (R2=0.48) (Fig. 5B)and average daily [CO3
2−] (R2=0.51). Ωarag was less well correlatedwith NEC than pCO2swmostly becauseΩarag and pCO2sw have differentsensitivities to seasonal changes in temperature. The linear relation-ship between NEC and pCO2sw predicts that calcification on the barrierreef will equal dissolution over 24 h (daily NEC=0) when averagedaily pCO2sw=886.4 μatm, average daily Ωarag=1.65, or averagedaily [CO3
2−]=106.7 μmol kg−1. The point at which a coral reefswitches from net calcification to net dissolution can be described asthe calcification “threshold” for the reef. It is important to note thatwhile the rate of calcificationmay no longer be greater than the rate ofdissolution over 24 h, many organisms will continue to calcify.Furthermore, dissolution may only occur for more soluble forms ofCaCO3 such as high Mg-calcites produced by coralline algae, inisolated spaces (i.e. by boring organisms or in the sediments), orduring particular periods of time such as at night or seasonally. Forexample, Bates et al. (2010) emphasized that in the future, the
Table 2Net daily calcification rates (community calcification for mesocosms: G; ecosystem calcification for field studies: NEC), net community/ecosystem production (communityproduction for mesocosms: NCP; ecosystem production for field studies: NEP), season, and average temperature, salinity, Ωarag, and percent coral cover from mesocosm and fieldstudies. Studies that measured calcification rates andΩarag are presented. Only hourly daytime data were collected for two of the mesocosm experiments, therefore calcification andproduction rates are presented in mmol m−2 h−1 for comparison.
Location Temperature(°C)
Salinity Ωaraga G or NEC
(mmol m−2 h−1)NCP or NEP(mmol m−2 h−1)
Season % coral cover Source
MesocosmsBiosphere IIb 26.5 34.7 2.83 1.7 −0.4 N/A 3 Langdon et al., 2003HIMB mesocosmb 27.3 – 3 16.0 45 Summer 100 Langdon and Atkinson, 2005HIMB mesocosmb 23.4 – 3.01 15.4 23 Winter 100 Langdon and Atkinson, 2005HIMB mesocosm 26.5 35.2 2.8 3.3 – Summer 20–30 Andersson et al., 2009
Field studiesTiahura reef, Moorea – – – 10.1 0.1 Summer 2–31 Gattuso et al., 1993Tiahura reef, Moorea 27.1 – 4.27 7.8 3.1 Winter 2–31 Gattuso et al., 1996Yonge Reef, GBR 27.2 – 4.04 10.5 1.4 Summer 30 Gattuso et al., 1996Eilat reef, Red Sea 25.2 40.7 3.87 2.5 0.3 Summer 30 Silverman et al., 2007a,bEilat reef, Red Sea 21.5 40.7 3.86 1.3 3.3 Winter 30 Silverman et al., 2007a,bHog Reef, Bermuda 24.8 36.6 3.13 2.1 1.1 Annual 21 Bates et al., 2010Kaneohe Bay, HI fringing reef 27.1 34.9 3.61 11.4 −14.2 Summer 0–100 Kinsey, 1985Kaneohe Bay, HI fringing reef 24.6 35 3.26 9.0 −3.1 Winter 0–100 Kinsey, 1985Kaneohe Bay, HI barrier reef 26.3 35.2 2.86 9.8 −6.6 Summer 30 This studyKaneohe Bay, HI barrier reef 23.4 34.9 2.84 12.2 −2.3 Winter 30 This study
a Italicized Ωarag values were not presented in the original manuscripts but were calculated from data presented in the manuscripts.b Daytime data only.
71K.E.F. Shamberger et al. / Marine Chemistry 127 (2011) 64–75
Author's personal copy
Bermuda coral reef is likely to experience a daily NEC of zero first inthe winter when Ωarag levels are naturally lower.
There are only a couple thresholds for coral reef ecosystems tocompare to Kaneohe Bay data. The threshold for the Kaneohe Baybarrier reef is within the range of thresholds determined forindividual patch reefs with coral covers ranging from 10 to 22% offthe island of Molokai, Hawaii (pCO2 threshold: 467–1003 μatm; [CO3
2−]threshold=113–184 μmol kg−1; (Yates and Halley, 2006)). Silverman
et al. (2009) used data from Eilat reef in the Red Sea (Silverman et al.,2007a, b) to determine a pCO2 threshold for coral reefs world wide of560 ppm, over 300 ppm lower than the Kaneohe Bay barrier reefthreshold. It is apparent that large variability in thresholds existsbetween different coral reefs and although calcification rate and Ωarag
are correlated within a single coral reef system, this relationship variesbetween different systems (Fig. 6). In addition, it is not clear that therelationship on a reef today can be used to predict NEC at future or pastCO2 levels. For example, NECona fringing reef inKaneoheBaymeasuredin the 1970s (273.6 mmol m−2 d−1 and 216.0 mmol m−2 d−1 in thesummer and winter, respectively) was similar to NEC measured on thebarrier reef in this study though pCO2 was lower and Ωarag was higherduring the 1970s study (Kinsey, 1985) (Table 2). According to therelationship between NEC and pCO2sw in Fig. 5, NEC in Kaneohe Bayshould have been higher in the late 1970s (calculated pastNEC=355.4 mmol m−2 d−1 and 342.5 mmol m−2 d−1 in the summerandwinter, respectively). However, theKaneohe Bay fringing reef studywasperformedwhenKaneoheBaywas receivinga considerable amountof sewage input thatwas associatedwith a decline of coral communitiesand an increase in macroalgae (Smith et al., 1981). Although sewageinput into Kaneohe Bay had aminimal effect on the Kaneohe Bay barrierreef, fringing reefs in the bay were affected (Kinsey, 1985; Smith et al.,1981) and calcification rates on fringing reefs could have beendepressed. In addition, Kinsey's (1985) study was performed wellbefore certified reference materials were developed for measurementsof the seawater CO2 system and the accuracies of pCO2sw andΩarag datafrom that study are not well known.
As stated earlier, Silverman et al. (2009) developed a model forcoral reef calcification which predicted that coral reefs worldwidewould stop calcifying and start dissolving when atmospheric pCO2
reaches 560 ppm (see also Andersson et al. (2005; 2006) for othermodel estimates of calcification thresholds). Coral reef calcification inthis model was parameterized by an equation for the rate of inorganicaragonite precipitation, which depends onΩarag, that was modified toinclude the effects of coral cover and temperature on coralcalcification (Silverman et al., 2009 Eq. (6)). The equation was thenfit to Silverman et al.'s (2007a, b) Eilat reef daily calcification rate andΩarag data to determine the values of two coefficients: a specific areaconstant, k′r and community CaCO3 dissolution, D (Silverman et al.,2009 equation 7). This parameterization was then combined withglobal temperature and Ωarag data that were computed for future
y = -0.66x + 582.9R2 = 0.76
pCO2 (μatm)
NE
C (
mm
ol m
-2d-
1 )
1.5 2 2.5 3 3.5 40
100
200
300
400
200 400 600 8000
100
200
300
400
y = 210x - 346.1R2 = 0.48
Ωarag
NE
C (
mm
ol m
-2d-1
)
A
B
Fig. 5. Daily net ecosystem calcification (NEC) versus average daily calculated pCO2
(A) and Ωarag (B) for the Kaneohe Bay barrier reef. Box model NEC is presented. Thesolid lines are the linear least-squares best fit of the data and the dashed lines represent95% confidence bounds.
-100
0
100
200
300
400
0 1 2 3 4 5 6 7
calc
ifica
tion
rate
(m
mol
m2
d-1)
Ωarag
Eilat Reef, Red Sea
Kaneohe Bay barrier reef, HI
Rukan-sho, Japan
Biosphere 2
Kaneohe Bay mesocosm, 2005
Kanoehe Bay mesocosm, 2009
Fig. 6.Ωarag versus calcification rate for coral reef ecosystems (solid symbols) and coral mesocosms (open symbols). Lines are the linear least-squares best fit of the data. Referencesfor data are: Kaneohe Bay barrier reef data (black diamonds and solid line), this study; Eilat Reef, Red Sea (dark gray squares and solid line) (Silverman et al., 2007a, b); Rukan-sho,Japan (light gray triangles and solid line) (Ohde and vanWoesik, 1999); Biosphere 2 (black circles and dashed line) (Langdon et al., 2000, 2003); Kaneohe Baymesocosm, 2005 (lightgray squares and dashed-dot line); Kaneohe Bay mesocosm, 2009 (dark gray triangles and dotted line) (Andersson et al., 2009).
72 K.E.F. Shamberger et al. / Marine Chemistry 127 (2011) 64–75
Author's personal copy
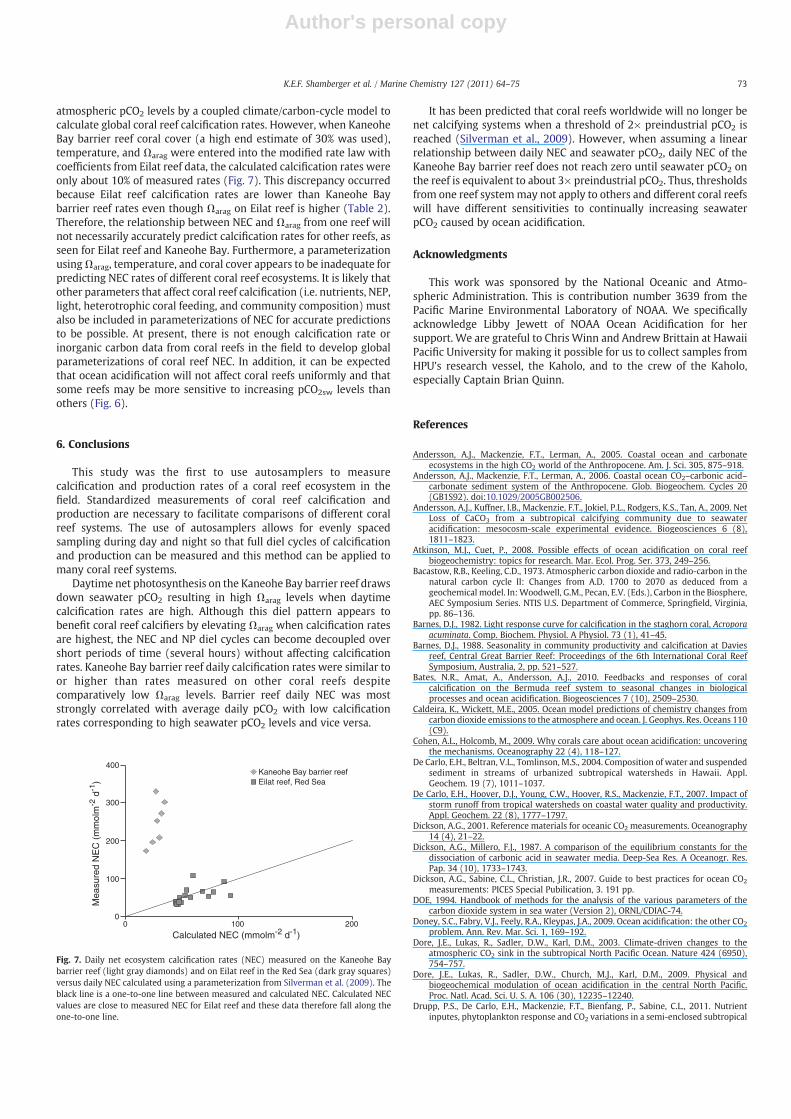
atmospheric pCO2 levels by a coupled climate/carbon-cycle model tocalculate global coral reef calcification rates. However, when KaneoheBay barrier reef coral cover (a high end estimate of 30% was used),temperature, and Ωarag were entered into the modified rate law withcoefficients from Eilat reef data, the calculated calcification rates wereonly about 10% of measured rates (Fig. 7). This discrepancy occurredbecause Eilat reef calcification rates are lower than Kaneohe Baybarrier reef rates even though Ωarag on Eilat reef is higher (Table 2).Therefore, the relationship between NEC and Ωarag from one reef willnot necessarily accurately predict calcification rates for other reefs, asseen for Eilat reef and Kaneohe Bay. Furthermore, a parameterizationusingΩarag, temperature, and coral cover appears to be inadequate forpredicting NEC rates of different coral reef ecosystems. It is likely thatother parameters that affect coral reef calcification (i.e. nutrients, NEP,light, heterotrophic coral feeding, and community composition) mustalso be included in parameterizations of NEC for accurate predictionsto be possible. At present, there is not enough calcification rate orinorganic carbon data from coral reefs in the field to develop globalparameterizations of coral reef NEC. In addition, it can be expectedthat ocean acidification will not affect coral reefs uniformly and thatsome reefs may be more sensitive to increasing pCO2sw levels thanothers (Fig. 6).
6. Conclusions
This study was the first to use autosamplers to measurecalcification and production rates of a coral reef ecosystem in thefield. Standardized measurements of coral reef calcification andproduction are necessary to facilitate comparisons of different coralreef systems. The use of autosamplers allows for evenly spacedsampling during day and night so that full diel cycles of calcificationand production can be measured and this method can be applied tomany coral reef systems.
Daytime net photosynthesis on the Kaneohe Bay barrier reef drawsdown seawater pCO2 resulting in high Ωarag levels when daytimecalcification rates are high. Although this diel pattern appears tobenefit coral reef calcifiers by elevating Ωarag when calcification ratesare highest, the NEC and NP diel cycles can become decoupled overshort periods of time (several hours) without affecting calcificationrates. Kaneohe Bay barrier reef daily calcification rates were similar toor higher than rates measured on other coral reefs despitecomparatively low Ωarag levels. Barrier reef daily NEC was moststrongly correlated with average daily pCO2 with low calcificationrates corresponding to high seawater pCO2 levels and vice versa.
It has been predicted that coral reefs worldwide will no longer benet calcifying systems when a threshold of 2× preindustrial pCO2 isreached (Silverman et al., 2009). However, when assuming a linearrelationship between daily NEC and seawater pCO2, daily NEC of theKaneohe Bay barrier reef does not reach zero until seawater pCO2 onthe reef is equivalent to about 3× preindustrial pCO2. Thus, thresholdsfrom one reef systemmay not apply to others and different coral reefswill have different sensitivities to continually increasing seawaterpCO2 caused by ocean acidification.
Acknowledgments
This work was sponsored by the National Oceanic and Atmo-spheric Administration. This is contribution number 3639 from thePacific Marine Environmental Laboratory of NOAA. We specificallyacknowledge Libby Jewett of NOAA Ocean Acidification for hersupport. We are grateful to Chris Winn and Andrew Brittain at HawaiiPacific University for making it possible for us to collect samples fromHPU's research vessel, the Kaholo, and to the crew of the Kaholo,especially Captain Brian Quinn.
References
Andersson, A.J., Mackenzie, F.T., Lerman, A., 2005. Coastal ocean and carbonateecosystems in the high CO2 world of the Anthropocene. Am. J. Sci. 305, 875–918.
Andersson, A.J., Mackenzie, F.T., Lerman, A., 2006. Coastal ocean CO2–carbonic acid–carbonate sediment system of the Anthropocene. Glob. Biogeochem. Cycles 20(GB1S92). doi:10.1029/2005GB002506.
Andersson, A.J., Kuffner, I.B., Mackenzie, F.T., Jokiel, P.L., Rodgers, K.S., Tan, A., 2009. NetLoss of CaCO3 from a subtropical calcifying community due to seawateracidification: mesocosm-scale experimental evidence. Biogeosciences 6 (8),1811–1823.
Atkinson, M.J., Cuet, P., 2008. Possible effects of ocean acidification on coral reefbiogeochemistry: topics for research. Mar. Ecol. Prog. Ser. 373, 249–256.
Bacastow, R.B., Keeling, C.D., 1973. Atmospheric carbon dioxide and radio-carbon in thenatural carbon cycle II: Changes from A.D. 1700 to 2070 as deduced from ageochemical model. In:Woodwell, G.M., Pecan, E.V. (Eds.), Carbon in the Biosphere,AEC Symposium Series. NTIS U.S. Department of Commerce, Springfield, Virginia,pp. 86–136.
Barnes, D.J., 1982. Light response curve for calcification in the staghorn coral, Acroporaacuminata. Comp. Biochem. Physiol. A Physiol. 73 (1), 41–45.
Barnes, D.J., 1988. Seasonality in community productivity and calcification at Daviesreef, Central Great Barrier Reef: Proceedings of the 6th International Coral ReefSymposium, Australia, 2, pp. 521–527.
Bates, N.R., Amat, A., Andersson, A.J., 2010. Feedbacks and responses of coralcalcification on the Bermuda reef system to seasonal changes in biologicalprocesses and ocean acidification. Biogeosciences 7 (10), 2509–2530.
Caldeira, K., Wickett, M.E., 2005. Ocean model predictions of chemistry changes fromcarbon dioxide emissions to the atmosphere and ocean. J. Geophys. Res. Oceans 110(C9).
Cohen, A.L., Holcomb, M., 2009. Why corals care about ocean acidification: uncoveringthe mechanisms. Oceanography 22 (4), 118–127.
De Carlo, E.H., Beltran, V.L., Tomlinson, M.S., 2004. Composition of water and suspendedsediment in streams of urbanized subtropical watersheds in Hawaii. Appl.Geochem. 19 (7), 1011–1037.
De Carlo, E.H., Hoover, D.J., Young, C.W., Hoover, R.S., Mackenzie, F.T., 2007. Impact ofstorm runoff from tropical watersheds on coastal water quality and productivity.Appl. Geochem. 22 (8), 1777–1797.
Dickson, A.G., 2001. Reference materials for oceanic CO2 measurements. Oceanography14 (4), 21–22.
Dickson, A.G., Millero, F.J., 1987. A comparison of the equilibrium constants for thedissociation of carbonic acid in seawater media. Deep-Sea Res. A Oceanogr. Res.Pap. 34 (10), 1733–1743.
Dickson, A.G., Sabine, C.L., Christian, J.R., 2007. Guide to best practices for ocean CO2
measurements: PICES Special Pubilication, 3. 191 pp.DOE, 1994. Handbook of methods for the analysis of the various parameters of the
carbon dioxide system in sea water (Version 2), ORNL/CDIAC-74.Doney, S.C., Fabry, V.J., Feely, R.A., Kleypas, J.A., 2009. Ocean acidification: the other CO2
problem. Ann. Rev. Mar. Sci. 1, 169–192.Dore, J.E., Lukas, R., Sadler, D.W., Karl, D.M., 2003. Climate-driven changes to the
atmospheric CO2 sink in the subtropical North Pacific Ocean. Nature 424 (6950),754–757.
Dore, J.E., Lukas, R., Sadler, D.W., Church, M.J., Karl, D.M., 2009. Physical andbiogeochemical modulation of ocean acidification in the central North Pacific.Proc. Natl. Acad. Sci. U. S. A. 106 (30), 12235–12240.
Drupp, P.S., De Carlo, E.H., Mackenzie, F.T., Bienfang, P., Sabine, C.L., 2011. Nutrientinputes, phytoplankton response and CO2 variations in a semi-enclosed subtropical
00 100 200
100
200
300
400
Calculated NEC (mmolm-2 d-1)
Mea
sure
d N
EC
(m
mol
m-2
d-1
)
Kaneohe Bay barrier reefEilat reef, Red Sea
Fig. 7. Daily net ecosystem calcification rates (NEC) measured on the Kaneohe Baybarrier reef (light gray diamonds) and on Eilat reef in the Red Sea (dark gray squares)versus daily NEC calculated using a parameterization from Silverman et al. (2009). Theblack line is a one-to-one line between measured and calculated NEC. Calculated NECvalues are close to measured NEC for Eilat reef and these data therefore fall along theone-to-one line.
73K.E.F. Shamberger et al. / Marine Chemistry 127 (2011) 64–75

Author's personal copy
embayment, Kaneohe Bay, Hawaii. Aquat. Geochem.http://dx.doi.org/10.1007/s10498-010-9115-y.
Fabry, V.J., Seibel, B.A., Feely, R.A., Orr, J.C., 2008. Impacts of ocean acidification onmarine fauna and ecosystem processes. ICES J. Mar. Sci. 65 (3), 414–432.
Fagan, K.E., Mackenzie, F.T., 2007. Air-sea CO2 exchange in a subtropical estuarine-coralreef system, Kaneohe Bay, Oahu, Hawaii. Mar. Chem. 106 (1–2), 174–191.
Falter, J.L., Lowe, R.J., Atkinson, M.J., Monismith, S.G., Schar, D.W., 2008. Continuousmeasurements of net production over a shallow reef community using a modifiedEulerian approach. J. Geophys. Res. Oceans 113 (C7).
Feely, R.A., Sabine, C.L., Lee, K., Berelson, W., Kleypas, J., Fabry, V.J., et al., 2004. Impactof anthropogenic CO2 on the CaCO3 system in the oceans. Science 305 (5682),362–366.
Feely, R.A., Sabine, C.L., Hernandez-Ayon, J.M., Ianson, D., Hales, B., 2008a. Evidence forupwelling of corrosive “acidified” water onto the continental shelf. Science 320(5882), 1490–1492.
Feely, R.A., Fabry, V.J., Guinotte, J.M., 2008b. Ocean acidification of the North PacificOcean. PICES Press 16 (1), 22–26.
Ferrier-Pages, C., Witting, J., Tambutte, E., Sebens, K.P., 2003. Effect of naturalzooplankton feeding on the tissue and skeletal growth of the scleractinian coralStylophora pistillata. Coral Reefs 22 (3), 229–240.
Friis, K., Kortzinger, A., Wallace, D.W.R., 2003. The salinity normalization of marineinorganic carbon chemistry data. Geophys. Res. Lett. 30 (2).
Gattuso, J.P., Pichon, M., Delesalle, B., Frankignoulle, M., 1993. Community metabolismand air–sea CO2 fluxes in a coral reef ecosystem (Moorea, French-Polynesia). Mar.Ecol. Prog. Ser. 96 (3), 259–267.
Gattuso, J.P., Pichon, M., Delesalle, B., Canon, C., Frankignoulle, M., 1996. Carbon fluxesin coral reefs .1. Lagrangian measurement of community metabolism and resultingair–sea CO2 disequilibrium. Mar. Ecol. Prog. Ser. 145 (1–3), 109–121.
Gattuso, J.P., Frankignoulle, M., Bourge, I., Romaine, S., Buddemeier, R.W., 1998. Effect ofcalcium carbonate saturation of seawater on coral calcification. Glob. Planet.Change 18 (1–2), 37–46.
Gattuso, J.P., Allemand, D., Frankignoulle, M., 1999. Photosynthesis and calcification atcellular, organismal and community levels in coral reefs: a review on interactionsand control by carbonate chemistry. Am. Zool. 39 (1), 160–183.
Grottoli, A.G., 1999. Variability of stable isotopes and maximum linear extension inreef-coral skeletons at Kaneohe Bay, Hawaii. Mar. Biol. 135 (3), 437–449.
Hall-Spencer, J.M., Rodolfo-Metalpa, R., Martin, S., Ransome, E., Fine, M., Turner, S.M., etal., 2008. Volcanic carbon dioxide vents show ecosystem effects of oceanacidification. Nature 454 (7200), 96–99.
Ho, D.T., Law, C.S., Smith, M.J., Schlosser, P., Harvey, M., Hill, P., 2006. Measurements ofair–sea gas exchange at high wind speeds in the Southern Ocean: implications forglobal parameterizations. Geophys. Res. Lett. 33 (16).
Hofmann, G.E., Barry, J.P., Edmunds, P.J., Gates, R.D., Hutchins, D., Klinger, T., et al.,2010. The effect of ocean acidification on calcifying organisms in marineecosystems: an organism-to-ecosystem perspective. Annu. Rev. Ecol. Evol. Syst.41, 127–147.
Hoover, D.J., Mackenzie, F.T., 2009. Fluvial fluxes of water, suspended particulatematter, and nutrients and potential impacts on tropical coastal water biogeo-chemistry: Oahu, Hawai'i. Aquat. Geochem. 15 (4), 547–570.
Houlbreque, F., Ferrier-Pages, C., 2009. Heterotrophy in tropical Scleractinian Corals.Biol. Rev. 84 (1), 1–17.
Houlbreque, F., Tambutte, E., Ferrier-Pages, C., 2003. Effect of zooplankton availabilityon the rates of photosynthesis, and tissue and skeletal growth in the scleractiniancoral Stylophora pistillata. J. Exp. Mar. Biol. Ecol. 296 (2), 145–166.
Ikeda, Y., Hata, H., Suzuki, A., Kayanne, H., 1997. Diurnal carbon flux at the BarrierReef in Palau: Proceedings of the 8th International Coral Reef Symposium, 1,pp. 965–970.
Johnson, H.K., 1999. Simple expressions for correcting wind speed data for elevation.Coast. Eng. 36 (3), 263–269.
Johnson, K.M., King, A.E., Sieburth, J.M., 1985. Coulometric DIC analyses for marinestudies: an introduction. Mar. Chem. (16), 61–82.
Johnson, K.M., Sieburth, J.M., Williams, P.J.L., Brandstrom, L., 1987. Coulometric totalcarbon-dioxide analysis for marine studies — automation and calibration. Mar.Chem. 21 (2), 117–133.
Jury, C.P., Whitehead, R.F., Szmant, A.M., 2010. Effects of variations in carbonatechemistry on the calcification rates of Madracis auretenra (=Madracis mirabilissensu Wells, 1973): bicarbonate concentrations best predict calcification rates.Glob. Change Biol. 16 (5), 1632–1644.
Keeling, C.D., Piper, S.C., Bacastow, R.B.,Wahlen,M.,Whorf, T.P., Heinmann,M., et al., 2005.Atmospheric CO2 and 13CO2 exchange with the terrestrial biosphere and oceans from1978 to 2000: observations and carbon cycle implications. In: Ehleringer, J.R., Cerling,T.E., Dearing, M.D. (Eds.), A History of Atmospheric CO2 and Its Effects on Plants,Animals, and Ecosystems. Springer Verlag, New York, pp. 83–113.
Kinsey, D.W., 1985. Metabolism, calcification and carbon production. I. Systemslevel studies: Proceedings of the 5th International Coral Reef Symposium, 4,pp. 505–526.
Kleypas, J.A., Buddemeier, R.W., Archer, D., Gattuso, J.P., Langdon, C., Opdyke, B.N., 1999.Geochemical consequences of increased atmospheric carbon dioxide on coral reefs.Science 284 (5411), 118–120.
Kleypas, J.A., Feely, R.A., Fabry, V.J., Langdon, C., Sabine, C.L.,., Robbins, L.L., 2006. Impactsof increasing ocean acidification on coral reefs and other marine calcifiers: a guidefor future research, report of a workshop held 18–20 April 2005, St. Petersburg, FL.NSF, NOAA, and the U.S. Geological Survey. sponsored by.
Kuffner, I.B., Andersson, A.J., Jokiel, P.L., Rodgers, K.S., Mackenzie, F.T., 2008. Decreasedabundance of crustose coralline algae due to ocean acidification. Nat. Geosci. 1 (2),114–117.
Langdon, C., Atkinson, M.J., 2005. Effect of elevated pCO2 on photosynthesis andcalcification of corals and interactions with seasonal change in temperature/irradiance and nutrient enrichment. J. Geophys. Res. Oceans 110 (C9),C09S07.
Langdon, C., Takahashi, T., Sweeney, C., Chipman, D., Goddard, J., Marubini, F., et al.,2000. Effect of calcium carbonate saturation state on the calcification rate of anexperimental coral reef. Glob. Biogeochem. Cycles 14 (2), 639–654.
Langdon, C., Broecker, W.S., Hammond, D.E., Glenn, E., Fitzsimmons, K., Nelson, S.G., etal., 2003. Effect of elevated CO2 on the community metabolism of an experimentalcoral reef. Glob. Biogeochem. Cycles 17 (1), 1011.
Laws, E.A., Allen, C.B., 1996. Water quality in a subtropical embayment more than adecade after diversion of sewage discharges. Pac. Sci. 50 (2), 194–210.
Leclercq, N., Gattuso, J.P., Jaubert, J., 2000. CO2 partial pressure controls the calcificationrate of a coral community. Glob. Change Biol. 6 (3), 329–334.
Leclercq, N., Gattuso, J.P., Jaubert, J., 2002. Primary production, respiration, andcalcification of a coral reef mesocosm under increased CO2 partial pressure. Limnol.Oceanogr. 47 (2), 558–564.
Lewis, E., Wallace, D.W.R., 1998. In: ORNL/CDIAC-105 (Ed.), Program Developed for CO2
System Calculations. Carbon Dioxide Information Analysis Center, Oak RidgeNational Laboratory, U.S. Department of Energy, Oak Ridge, TN.
Lowe, R.J., Falter, J.L., Monismith, S.G., Atkinson, M.J., 2009a. Wave-driven circulation ofa coastal reef-lagoon system. J. Phys. Oceanogr. 39 (4), 873–893.
Lowe, R.J., Falter, J.L., Monismith, S.G., Atkinson, M.J., 2009b. A numerical study ofcirculation in a coastal reef-lagoon system. J. Geophys. Res. Oceans 114.
MacCready, P., Quay, P., 2001. Biological export flux in the Southern Ocean estimatedfrom a climatological nitrate budget. Deep-Sea Res. II Top. Stud. Oceanogr. 48 (19–20), 4299–4322.
Marshall, A.T., Clode, P., 2004. Calcification rate and the effect of temperature in azooxanthellate and an azooxanthellate scleractinian reef coral. Coral Reefs 23 (2),218–224.
Marubini, F., Atkinson, M.J., 1999. Effects of lowered pH and elevated nitrate on coralcalcification. Mar. Ecol. Prog. Ser. 188, 117–121.
Marubini, F., Thake, B., 1999. Bicarbonate addition promotes coral growth. Limnol.Oceanogr. 44 (3), 716–720.
Marubini, F., Barnett, H., Langdon, C., Atkinson, M.J., 2001. Dependence of calcificationon light and carbonate ion concentration for the hermatypic coral Poritescompressa. Mar. Ecol. Prog. Ser. 220, 153–162.
Marubini, F., Ferrier-Pages, C., Cuif, J.P., 2003. Suppression of skeletal growth inscleractinian corals by decreasing ambient carbonate-ion concentration: a cross-family comparison. Proc. R. Soc. Lond. B Biol. Sci. 270 (1511), 179–184.
Mehrbach, C., Culberso, Ch, Hawley, J.E., Pytkowic, Rm, 1973. Measurement of apparentdissociation-constants of carbonic-acid in seawater at atmospheric-pressure.Limnol. Oceanogr. 18 (6), 897–907.
Ohde, S., Hossain, M.M.M., 2004. Effect of CaCO3 (aragonite) saturation state ofseawater on calcification of Porites coral. Geochem. J. 38 (6), 613–621.
Ohde, S., van Woesik, R., 1999. Carbon dioxide flux and metabolic processes of a coralreef, Okinawa. Bull. Mar. Sci. 65 (2), 559–576.
Ono, T., Watanabe, S., Okuda, K., Fukasawa, M., 1998. Distribution of total carbonate andrelated properties in the North Pacific along 30°N. J. Geophys. Res. Oceans 103(C13), 30873–30883.
Orr, J.C., Fabry, V.J., Aumont, O., Bopp, L., Doney, S.C., Feely, R.A., et al., 2005.Anthropogenic ocean acidification over the twenty-first century and its impact oncalcifying organisms. Nature 437 (7059), 681–686.
Perillo, G.M.E., 1995. Definition and geomorphologic classifications of estuaries. In:Perillo, G.M.E. (Ed.), Geomorphology and Sedimentology of Estuaries, Develop-ments in Sedimentology. Elsevier Science BV, pp. 17–46.
Raven, J.A., Caldeira, K., Elderfield, H., Hoegh-Guldberg, O., Liss, P., Riebesell, U., et al.,2005. Ocean Acidification Due to Increasing Atmospheric Carbon Dioxide. TheRoyal Society, London.
Ringuet, S., MacKenzie, F.T., 2005. Controls on nutrient and phytoplankton dynamicsduring normal flow and storm runoff conditions, Southern Kaneohe Bay, Hawaii.Estuaries 28 (3), 327–337.
Sabine, C.L., Feely, R.A., Gruber, N., Key, R.M., Lee, K., Bullister, J.L., et al., 2004. Theoceanic sink for anthropogenic CO2. Science 305 (5682), 367–371.
Sabine, C.L., Feely, R.A., Wanninkhof, R., Takahashi, T., Khatiwala, S., Park, G., 2011.Global oceans [The Global Ocean Carbon Cycle] in State of the Climate in 2010. Bull.Am. Meteorol. Soc. 92 (6), S100–S105.
Silverman, J., Lazar, B., Erez, J., 2007a. Community metabolism of a coral reef exposed tonaturally varying dissolved inorganic nutrient loads. Biogeochemistry 84 (1),67–82.
Silverman, J., Lazar, B., Erez, J., 2007b. Effect of aragonite saturation, temperature, andnutrients on the community calcification rate of a coral reef. J. Geophys. Res. Oceans112 (C5).
Silverman, J., Lazar, B., Cao, L., Caldeira, K., Erez, J., 2009. Coral reefs may start dissolvingwhen atmospheric CO2 doubles. Geophys. Res. Lett. 36.
Smith, S.V., Key, G.S., 1975. Carbon-dioxide and metabolism in marine environments.Limnol. Oceanogr. 20 (3), 493–495.
Smith, S.V., Kimmerer, W.J., Laws, E.A., Brock, R.E., Walsh, T.W., 1981. Kaneohe baysewage diversion experiment — perspectives on ecosystem responses tonutritional perturbation. Pac. Sci. 35 (4), 279–402.
Solomon, S., Quin, D., Manning, M., Marquis, M., Averyt, K., Tignor, M.M.B., et al., 2007.Contribution of Working Group I to the Fourth Assessment Report of theIntergovernmental Panel on Climate Change. Cambridge University Press, Cam-bridge, UK, and New York.
Solomon, R.F., De Carlo, E.H., Drupp, P.S., Mackenzie, F.T., Jones, S.M., Shamberger, K.E.F.et al., submitted for publication. The Role of local climatic variability in the
74 K.E.F. Shamberger et al. / Marine Chemistry 127 (2011) 64–75

Author's personal copy
exchange of CO2 between the ocean and atmosphere in a tropical coral reefenvironment. Marine Chemistry.
Steinacher, M., Joos, F., Frolicher, T.L., Plattner, G.K., Doney, S.C., 2009. Imminent oceanacidification in the Arctic projected with the NCAR global coupled carbon cycle-climate model. Biogeosciences 6 (4), 515–533.
Tanaka, K., Mackenzie, F.T., 2005. Ecosystem behavior of southern Kaneohe Bay, Hawaii:a statistical and modeling approach. Ecol. Model. 188 (2–4), 296–326.
Wyatt, A.S.J., Lowe, R.J., Humphries, S., Waite, A.M., 2010. Particulate nutrient fluxesover a fringing coral reef: relevant scales of phytoplankton production andmechanisms of supply. Mar. Ecol. Prog. Ser. 405, 113–130.
Yates, K.K., Halley, R.B., 2006. CO32− concentration andpCO2 thresholds for calcification and
dissolution on the Molokai reef flat, Hawaii. Biogeosciences Discuss. 3, 123–154.
75K.E.F. Shamberger et al. / Marine Chemistry 127 (2011) 64–75