ca final nov'20
TRANSCRIPT
CA Final Nov'20
SCM & PEDivya Jadi Booti| 1
CA Final Nov'20
The world fame Taj Mahal is situated on the bank of Yamuna River in the city of Agra, Uttar Pradesh, known for its beautiful design and is counted as one of the Seven Wonders of the World; the city attracts a lot of tourist from all around the world. The Tourism is one of the main sources of livelihood for its residents. Consequently, cleanliness and maintenance of garden area within the Taj Mahal campus is of prime importance in order to sustain and develop this industry.
The local government has recently employed a contractor to clean and maintain the garden area within the Taj Mahal campus. The contractor uses cleaning machines pulled by horses to avoid pollution. The contractor has been selected through an online competitive tendering/bidding process. Majority of the litter comprises of plastic waste (bags, bottles etc.) while some portion also includes glass, aluminium cans, paper and cardboard. A detailed log is held by the contractor about the waste that has been cleaned, time taken tor the clean-up, number of horses used, etc. This log is also checked and signed by local government officials. This record is used to process payments at the end of the month.
In addition to contracting, the local government has also placed bins at various locations within the campus for the public to dispose their waste. The Nagar Nigam’s workers clean these bins every morning. Again, detailed logs of the man power and other resources employed are kept by the respective department. In addition, the government has started a mobile messaging system, whereby the public can message the concerned department if they find litter anywhere in the campus. Depending on whether it is from overflowing bins or scattered waste, the Nagar Nigam’s workers will take action to clean it within 12 hours. A detailed log of these operations is also maintained. Patrons can also suggest measures for improving cleanliness on the above mentioned areas.
Due to its importance to the economy, the local government has allotted substantial budget for these operations. At the same time, it is essential to know if this is sufficient for the purpose of maintaining the cleanliness of the campus. Therefore, the government wants to assess whether the city is getting “good value for money” from expenditure. The “value for money” concept can be looked at from three perspective’: (i) economy, (ii) efficiency and (iii) effectiveness. The internal audit department that has been requested to undertake this study has requested for guidelines on whether the audit should focus on economy and efficiency of the Taj Mahal campus cleaning operations or on effectiveness of the same. Economy and efficiency audit assess whether the same level of service can be procured at lower cost or resources while effectiveness audit assess whether better service can be procured at same cost.
Depending on the outcome of the audits, if required, policy decisions like requesting for additional funding from the state government, alternate policy measures like levying penalty for littering etc. can be taken.
1
CA Final Nov'20
2 |SCM & PEDivya Jadi Booti
Required :
(i) Recommend guidelines to assess economy efficiency and effectiveness of Taj Mahal and campus cleaning, operations. [8]
(ii) Identify challenges involved in assessment of effectiveness. [6]
(iii) Recommend general guidelines, how the audit team may conclude the audit based on the combined outcomes of economy, efficiency and effectiveness. [6]
Performance Evaluation Model Value for Money Framework
A n s w e r
(i) Economy, efficiency and effectiveness are three dimensions of value for money. Economy and efficiency audit of an operation focuses on the consumption of resources and the output achieved. Whereas effectiveness audit of an operations focuses on the compari-son of outputs achieved with the desired level of output.
Economy
The Dimension of economy assesses the financial aspects of the activity i.e. are the objectives of the activity being achieved at reasonable cost?
To look at economy of cleaning and maintaining (of the garden area in-side the campus of Taj-Mahal) operations, the cleaning expenses need to be bifurcated into different cost centres such as payments made to the contractor, the expenses of emptying waste from bins, and mobile messaging system. At this stage only the competitive tendering process may be reviewed to ensure that the contractor getting the order is offering the required quality of service at the lowest price, similar way bins are procured at lowest possible price etc.
Further subcategories of these expenses into cost head such as labour, material, disposal van expenses etc. also need to be collated from the cost records. (This will help in compari-son over a period as well).
Then afterwards, these shall be compared to the budgets that were approved by the local government of Agra. If the quality of cleaning has been achieved, by staying within budget, the operation is economical. However, if the actuals exceed the budgeted, then government shall make comparison of cost with cost of similar cleaning operation. On comparison, if found that cost incurred by Agra local government is more; then the cleaning operations are said to be non-economical and these may not be efficient too.
Efficiency
Efficiency assesses the volume of input consumed to derive the desired output i.e.
CA Final Nov'20
SCM & PEDivya Jadi Booti| 3
are the resources and funds being consumed to get maximum output?
Efficiency of cleaning and maintaining operations can be determined by checking the log records maintained for cleaning operation by the contractor and municipality workers. These would have details of activities carried out and the resources utilized for each of them.
For each of these services (be it cleaning and maintaining garden or emptying out bins or mobile messaging system), the cost drivers can be identified, and certain metrics can be developed for analysis. For example, cost of cleaning per square metre of garden can be computed or cost of emptying each bin can be computed or cost to respond each call.
While analysing these activities, certain operational considerations have to be given. For example, certain stretches or corners of the garden (where landscaping structure is complex) may take more time or resources to clean. Cost of emptying and re-clean the bin used for dry and wet waste may be different. Therefore, if resources for operations are disproportionate for certain parts of the gardens, then multiple categories of garden shall be formed and cost for each category need to be worked out. But data to get this information will depend on the extent of details maintained in the logs. This information has to be tracked over some period of time in order to understand trends in operations and related expenses.
The data collected from the mobile messaging system should also be investigated. Frequency and area of the campus regarding which complaints are frequent or maximum? Reasons for these lapses need to be taken from the contractor (for cleaning the garden) and the concerned Nagar Nigam workers (for emptying bins) in order to find out whether resources are being employed properly.
Effectiveness
As mentioned earlier that effectiveness of cleaning and maintaining operations would focus on how the actual cleanliness of garden area inside the campus compares with the desired level as laid out when budget was allocated. To assess whether performance has been met, the target.
To begin with, it should be clear as to what constitutes litter. From an operational angle, it would be difficult to clean out every bit of dry leaf (falling from tree) lying on garden floor. However, it is possible to pick up every plastic bag or bottle or empty soft drink can. Hence, the government authorities must be clear on what constitutes litter? and tolerance level for each types of litter e.g. tolerance level of aluminium can and dry leaves will be different, because few of dry leaf may left behind even after cleaning. Quantity of waste collected would be the indicator to make the above assessment.
Certain other parameters like safety standards can also be defined. Safety problems could be cuts from sharp objects like glass. Assessment has to be made whether these standards have been met.
For this, the primary source of information about cleanliness would be feedback from the patrons. These could be in the form of complaints received directly or those through the
CA Final Nov'20
4 |SCM & PEDivya Jadi Booti
mobile messaging system would provide data to work out the metrics. This would be an indicator of “customer satisfaction”. The measure for can be how many mobile messages are responded within the time-cap of 12 hours. Other inputs could also be the suggestions given by the patrons about the ways to improve cleanliness.
Observation by making surprise visits to inspect immediately after the cleaning operations would also provide sufficient evidence about the effectiveness of operations.
(ii) Challenges Involved in assessment of effectiveness would be:
• Defining what constitutes litter? These are subjective guidelines, the perception of which may differ from person to person. One can consider dry leaves that have been fallen from trees as litter other may not.
• Establishing the tolerance level of waste (litter) or acceptable level of cleanliness? High amount of subjectivity is also involved in determination of level.
• Frequency of cleaning and when to measure the effectiveness, it is obvious the cleanli-ness will not be at same level throughout the day.
• Certain forms of litter out of operational control such as animals’ or birds’ dropping, are they also considered as part of litter or ignored when effectiveness is measured. Basically, what matrix of desired objective contain is critical to determine the level of effectiveness.
• Indicator of effectiveness- There has to be a conscious civic sense of duty not to litter, failing which this initiative will most likely be ineffective. Therefore, while measuring performance for effectiveness, collection of more litter does not necessarily indicate effective operations. More litter requires more cleaning and more resources, therefore is actually not a positive indicator of effectiveness. On the contrary, in the long run, lesser litter collected to maintain desired level of cleanliness would be a good indicator of effectiveness.
(iii) The outcome of the audits can indicate achievement of any or none of the three parameters of economy, efficiency and effectiveness of cleaning and maintaining (of the garden area in-side the campus of Taj-Mahal) operations. To form an integrated conclusion based on the different outcomes of individual audits, the audit team may consider the following guidelines:
(a) Has the objective of the cleaning operation been achieved as per the guidelines in the relevant policy or white paper (based upon which budget is allocated)? i.e. have the operations been effective?
(b) If the answer to (a) is yes, are the expenses within budget. If so, then the operations are economical and efficient. Given that the operations have been effective at the same time economy and efficiency have been achieved, the team can conclude that the cleaning operations policy has been a success.
A cost-over run can also be justified if the operations have been effective. In that
CA Final Nov'20
SCM & PEDivya Jadi Booti| 5
case, the audit team has to conclude whether all expenses incurred are indeed justified and that the resources have been put to the best possible use. If not, can the operations be made more economical or efficient?
(c) If the answer to (a) is no, the operation has not been effective, then next question is → is the difference from the target is marginal or huge? If the operations have not been entirely effective, but only by a marginal gap say 95% success, then analysis of expenses can be made similar to the point (b) mentioned above. However, if the operations have been ineffective to a larger extent, then the cleaning drive initiative has been ineffective. The local government has to look at alternate solutions of tackling the problem. These could include imposing heavy penalty for littering, requesting for additional funding from the state government to employ better resources etc.
Therefore, it can be seen that achievement of one objective does not automatically lead to achievement of other objectives. A holistic approach would be needed to draw conclusions about the performance of the cleaning operations.
NEC Furniture Ltd. is a leading manufacturer and supplier of furniture for students of pre-pri-mary classes. The full cost of one set (comprising one Table and one chair) is ` 900 per set. The company has fixed its selling price so as to earn 30% return on investment of `45,00,000. The company produces and sells 6,000 sets per annum. Relevant cost data per annum are as follows:
Cost Component Budget Actual Actual Cost p.a. (`)
Direct Material 90,000 sq. ft. 1,00,000 sq. ft. 16,50,000Direct Labour 35,000 hrs. 40,000 hrs 10,32,000Mechanical Assembly 60,000 hrs. 60,000 hrs. 12,00,000Machine Setup 5,000 hrs. 5,000 hrs. 1,68,000
It has been revealed that the actual and budgeted operating levels are the same, Actual and standard rates of material purchase and labour rate per hour are also the same. Any variance in cost is solely on account of difference in the material usage and hours required to complete the production. A competitor has introduced a product very similar to product of the company at an aggressive price of `820 per set which has resulted in downtrend in the sales volume the company. The management has called urgent meeting of the marketing team. After the meeting, following recommendations of the marketing team are approved by the management:
(a) To maintain the company’s existing sales volume and amount of present return on investment, reduce the selling price by 10%.
(b) To make slight improvement in design to have edge over the competitors which will also reduce the direct material cost by `30 per set.
(c) To make the table and chair more attractive, print picture of Disney • character on them, which will cost ` 5 per set.
2
CA Final Nov'20
6 |SCM & PEDivya Jadi Booti
Required :
(i) Calculate the present selling price and profit per unit from the above. Also calculate the mark-up % on the full cost per unit. [4]
(ii) Identify the non-value-added activities in the production process. [2]
(iii) (a) Calculate the new target cost per unit and new revised cost per unit after implemen-tation of above recommendations. [2]
(b) How much reduction in cost is required to achieve the new target cost ? [2]
(iv) Recommend what strategy the company should adopt to attain the target cost calculated above. [10]
Target Costing Target Cost and Strategy to achieve the target cost
A n s w e r
(i) Present selling price per unit (set) is ₹1,125 i.e. ₹ 900 (full cost per set) + ₹ 225 (desired return per set - refer working note below)
Profit per unit (set) is ₹225 (refer working note below)
Mark-up = (Profit per set / Full cost per set) × 100 i.e. (₹225/ ₹900) × 100 = 25% or 225/1,125=20%
Working Note – Desired Return per set
(30% of ₹45,00,000) / 6,000 sets
13,50,000 / 6,000 sets
₹225 per set
(ii) Machine setup is the time required to get the machines and the assembly line ready for production. NEC furniture limited spent 5,000 hours on setting up, which does not add value to the furniture set directly. Hence, it is a non-value add activity.
(iii) (a) New Target Cost per unit (set)
Particular Amount (₹)
Target Price (1,125 – 10% of 1,125) 1,012.50Less: Desired Return per set 225.00Target Cost per unit (set) 787.50
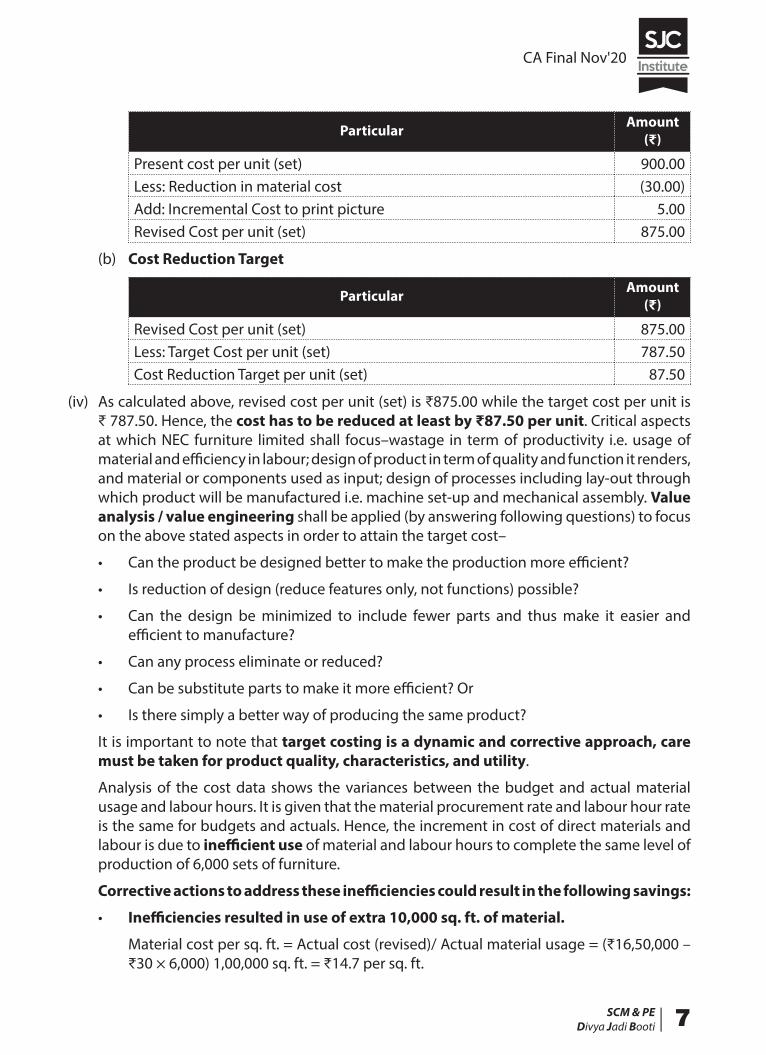
Revised Cost per unit (set)
CA Final Nov'20
SCM & PEDivya Jadi Booti| 7
Particular Amount (₹)
Present cost per unit (set) 900.00Less: Reduction in material cost (30.00)Add: Incremental Cost to print picture 5.00Revised Cost per unit (set) 875.00
(b) Cost Reduction Target
Particular Amount (₹)
Revised Cost per unit (set) 875.00Less: Target Cost per unit (set) 787.50Cost Reduction Target per unit (set) 87.50
(iv) As calculated above, revised cost per unit (set) is ₹875.00 while the target cost per unit is ₹ 787.50. Hence, the cost has to be reduced at least by ₹87.50 per unit. Critical aspects at which NEC furniture limited shall focus–wastage in term of productivity i.e. usage of material and efficiency in labour; design of product in term of quality and function it renders, and material or components used as input; design of processes including lay-out through which product will be manufactured i.e. machine set-up and mechanical assembly. Value analysis / value engineering shall be applied (by answering following questions) to focus on the above stated aspects in order to attain the target cost–
• Can the product be designed better to make the production more efficient?
• Is reduction of design (reduce features only, not functions) possible?
• Can the design be minimized to include fewer parts and thus make it easier and efficient to manufacture?
• Can any process eliminate or reduced?
• Can be substitute parts to make it more efficient? Or
• Is there simply a better way of producing the same product?
It is important to note that target costing is a dynamic and corrective approach, care must be taken for product quality, characteristics, and utility.
Analysis of the cost data shows the variances between the budget and actual material usage and labour hours. It is given that the material procurement rate and labour hour rate is the same for budgets and actuals. Hence, the increment in cost of direct materials and labour is due to inefficient use of material and labour hours to complete the same level of production of 6,000 sets of furniture.
Corrective actions to address these inefficiencies could result in the following savings:
• Inefficiencies resulted in use of extra 10,000 sq. ft. of material.
Material cost per sq. ft. = Actual cost (revised)/ Actual material usage = (₹16,50,000 – ₹30 × 6,000) 1,00,000 sq. ft. = ₹14.7 per sq. ft.
CA Final Nov'20
8 |SCM & PEDivya Jadi Booti
Therefore, inefficiencies resulted in extra cost = 10,000 sq. ft. × ₹14.7 per sq. ft. = ₹1,47,000.
If corrective action is taken, for 6,000 sets of furniture this translates to a saving of ₹24.50 per unit.
• Inefficiencies resulted in extra 5,000 hours to be spent in production.
Labour cost per hr. = Actual cost / Actual labour hrs. = ₹10,32,000 / 40,000 hrs. = ₹25.8 per hr.
Therefore, inefficiencies resulted in extra cost = 5,000 hrs. × ₹25.8 per hour = ₹1,29,000.
If corrective action is taken, for 6,000 sets of furniture this translates to a saving of ₹21.5 per unit.
• Machine setup cost is a non-value-added cost. Value analysis can be done to determine if the setup time of 5,000 hours/₹1,68,000/- can be reduced. However, since these activities have been carried out for a reason, care should be taken to ensure that this change should not adversely impact the production activity later down the stream.
• Mechanical assembly cost are costs incurred during the production process on the assembly line. Value analysis can be done to determine if the production process can be made more efficient. For example, the process can be streamlined, such that steps can be combined that can be handled by fewer people (process centring).
Jal Cleaning and Distribution Services Ltd. (JCDSL) was established with an aim for supply and distribution of water in Nagpur and as well as supply of water to the various local authori-ties for distribution to villages and other small cities adjacent to Nagpur under “MISSION PA ANI”. This involved planning, operating, treating, maintaining, and distributing water resources in the country’s urban centres and other areas mandated by State Government. The mission statement is “To provide clean and economical water for healthy life to the public”.
There are two operational divisions of JCDSL viz Water Distribution Operation (WDO) for distribution of water through pipes and Water Packaging Operation (WPO) for supplying water in packaged drinking water bottles. The state government ensures that JCDSL does not take advantage of its monopoly position in the regional area by increasing prices. The government controls majority of services through its water regulatory body which determines an acceptable margin level (ROCE) and ensures that the pricing of JCDSL within these areas does not break this level. The other operation i.e. Water Packing Operation (WPO) is not regulated by government and JCDSL is free to charge a market rate for water supply in bottles. The company is free to use water for Water Packaging Operation but the total use of water for Water Packing Operation (WPO) cannot exceed 35% of the total supply of water by the company. The company is presently using 20% of total water supply for packaging operation. The brand name of packaged drinking water is “Swachh-Jal” which is packed in transparent plastic bottles.
3
CA Final Nov'20
SCM & PEDivya Jadi Booti| 9
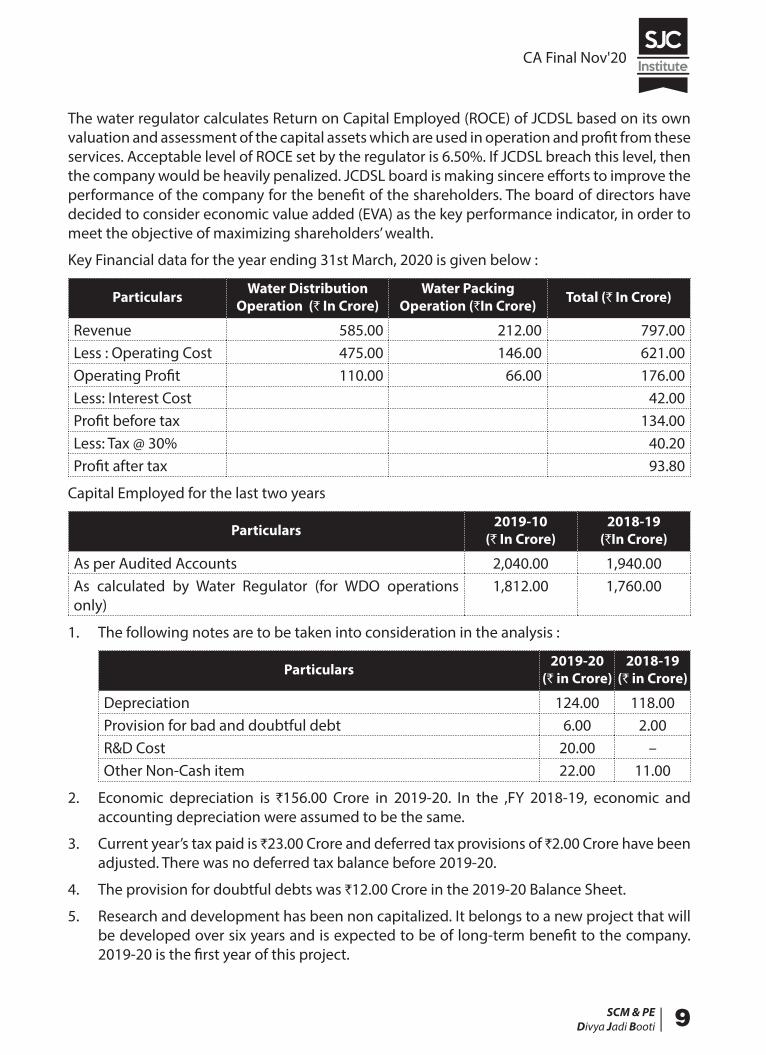
The water regulator calculates Return on Capital Employed (ROCE) of JCDSL based on its own valuation and assessment of the capital assets which are used in operation and profit from these services. Acceptable level of ROCE set by the regulator is 6.50%. If JCDSL breach this level, then the company would be heavily penalized. JCDSL board is making sincere efforts to improve the performance of the company for the benefit of the shareholders. The board of directors have decided to consider economic value added (EVA) as the key performance indicator, in order to meet the objective of maximizing shareholders’ wealth.
Key Financial data for the year ending 31st March, 2020 is given below :
Particulars Water Distribution Operation (` In Crore)
Water Packing Operation (`In Crore) Total (` In Crore)
Revenue 585.00 212.00 797.00Less : Operating Cost 475.00 146.00 621.00Operating Profit 110.00 66.00 176.00Less: Interest Cost 42.00Profit before tax 134.00Less: Tax @ 30% 40.20Profit after tax 93.80
Capital Employed for the last two years
Particulars 2019-10 (` In Crore)
2018-19 (`In Crore)
As per Audited Accounts 2,040.00 1,940.00As calculated by Water Regulator (for WDO operations only)
1,812.00 1,760.00
1. The following notes are to be taken into consideration in the analysis :
Particulars 2019-20 (` in Crore)
2018-19 (` in Crore)
Depreciation 124.00 118.00Provision for bad and doubtful debt 6.00 2.00R&D Cost 20.00 –Other Non-Cash item 22.00 11.00
2. Economic depreciation is `156.00 Crore in 2019-20. In the ,FY 2018-19, economic and accounting depreciation were assumed to be the same.
3. Current year’s tax paid is `23.00 Crore and deferred tax provisions of `2.00 Crore have been adjusted. There was no deferred tax balance before 2019-20.
4. The provision for doubtful debts was `12.00 Crore in the 2019-20 Balance Sheet.
5. Research and development has been non capitalized. It belongs to a new project that will be developed over six years and is expected to be of long-term benefit to the company. 2019-20 is the first year of this project.
CA Final Nov'20
10 |SCM & PEDivya Jadi Booti
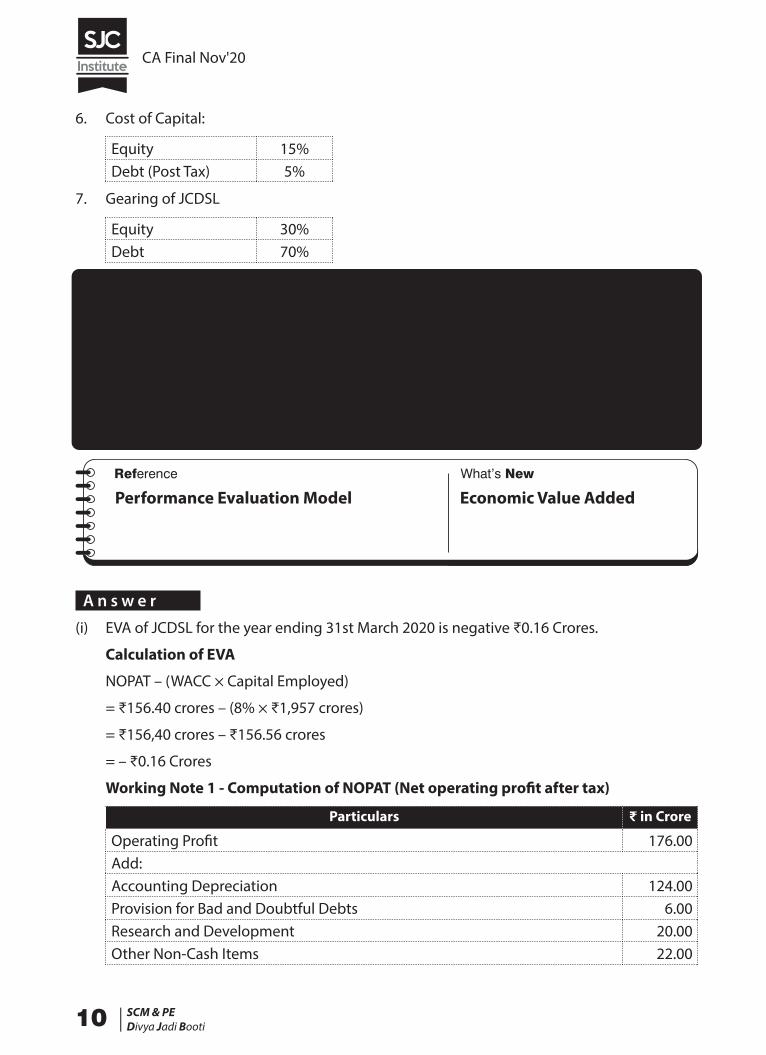
6. Cost of Capital:
Equity 15%Debt (Post Tax) 5%
7. Gearing of JCDSL
Equity 30%Debt 70%
Required :
(i) Calculate EVA of JCDSL for the year ending 31 March, 2020 based on the above information.
[6]
(ii) Evaluate the financial performance of JCDSL using EVA. [4]
(iii) Assess whether JCDSL comply with its acceptable ROCE level. [3]
(iv) Advise how JCDSL can improve its performance in terms of profitability and EVA in future.
[7]
Performance Evaluation Model Economic Value Added
A n s w e r
(i) EVA of JCDSL for the year ending 31st March 2020 is negative ₹0.16 Crores.
Calculation of EVA
NOPAT – (WACC × Capital Employed)
= ₹156.40 crores – (8% × ₹1,957 crores)
= ₹156,40 crores – ₹156.56 crores
= – ₹0.16 Crores
Working Note 1 - Computation of NOPAT (Net operating profit after tax)
Particulars ₹ in Crore
Operating Profit 176.00Add:Accounting Depreciation 124.00Provision for Bad and Doubtful Debts 6.00Research and Development 20.00Other Non-Cash Items 22.00
CA Final Nov'20
SCM & PEDivya Jadi Booti| 11
Less:Economic Depreciation 156.00Tax Paid 23.00Tax Saving on Interest (₹42crores × 30%) 12.60NOPAT 156.40
Working Note 2 - Computation of Capital Employed
Particulars ₹ in Crore
Capital Employed as on 31.03.2019 1,940.00Add:Provision for Bad and Doubtful Debts as on 31.03.2019 (i.e. ₹12 - ₹6 crore) 6.00Other Non-Cash Items (incurred in 2018-19) 11.00Adjusted Opening Capital Employed 1,957.00
Working Note 3 - Calculation of WACC
[(Ke × Ve) + (Kd × Vd)]/ (Ve + Vd)]
= 15% × 0.30 + 5% × 0.70
= 8%
(ii) Evaluation of Financial Performance
Presently, JCDSL is distorting value (negative EVA of ₹16 lacs) as it is not able to meet the economic cost of its own capital, hence detrimental to shareholder’s interest. The negative EVA raise the question on sustainability of business, hence perpetual succession become doubtful.
The prominent reason of negative EVA may be a higher cost of equity for JSDSL i.e. 15%. Here it is worth noting that despite around 73.40% (585/797) of the revenue to JCDSL i s from WDO which is regulated one and wherein demand is guaranteed in future. Hence, investing risk shall be low.
Another major reason of negative EVA may be cap on ROCE in case of WDO hence NOPAT can’t be raised beyond a level. JCDSL can focus on WPO to increase its NOPAT (to make it enough for break-even) or it can slash its capital employed by selling unutilized or under-utilized assets.
(iii) ROCE of WDO is 6.25% (see working note below), hence JCDSL is complying with the acceptable cap limit of 6.50%.
Working Note – Computation of ROCE from WDO
ROCE = Operating Profit
Capital Employed
×100%
= (₹110 crores / ₹1,760 crores ) × 100
= 6.25%
CA Final Nov'20
12 |SCM & PEDivya Jadi Booti
(iv) AdviseIn order to improve performance in term of EVA or profitability JCDSL may apply any of the initiative either individually or in any combination– operating profits can be made to grow without employing more capital in both operations, but especially in WDO i.e. greater efficiency; additional capital shall be invested in WPO where the return is more than the cost of obtaining the capital, i.e. profitable growth; capital shall be divested from those projects that do not cover the cost of capital, i.e. liquidate unproductive capital.Operating margin from WPO is 31.13% (66.00/212.00) compared to 18.80% (110.00/585.00) of WDO. JCDSL may use the WDO activities as a trusted source of cash profit to reinvest in expansion of the WPO. There is scope of expansion in WPO, because the JCDSL currently using 20% of total water supply for packing operation against the upper cap of 35%. Hence, JCDSL shall expand the WPO (non-regulated businesses) to extent of 175% [(35%/20%) × 100] of current level using the cash generated by the regulated operation i.e. WDO.Further, JCDSL may improve profitability by controlling costs within WDO activities through performance measurement. The regulatory body cannot argue that the company is overcharging its customers to increase profit margin. This is possible through strict observance of expenses and using cost savings techniques through efficiency improve-ments. In order to control cost within WDO, targets should be based on minimal variances and adopting cost reduction methods. It is important here to note that there is only a limited scope for increase in the operating profit of WDO due to ROCE cap. The maximum allowed operating profit can be only ₹114.4 crore i.e. 6.50% of ₹1,760 crore of capital employed.Thus, JCDSL should go to expand its WPO as this is producing higher operating profit margins.
‘Mahesh is a canteen contractor at Jamshedpur. He manages office Canteen of 1,200 employees where tea and snacks are served between 9 am to 5 pm. He has employed four supervisors for managing cash. Mahesh pays ` 400 per working day to every supervisor. The office remains closed on Saturday and Sunday. A solution provider has approached Mahesh for managing Cash. He has advised Mahesh to install an automated payment mechanism for accepting payments through machines. Every employee of office will swipe smart card for making the payment. The complete system would cost ` 3,35,000 with working life of 4 years with annual maintenance of ` 60,000. Only one supervisor will be required after the installation of machines.
Required :Advise Mahesh on his plan of installation of automated payment mechanism. (Ignore the time value of money.) [5]
Relevant Costing Evaluation of proposal and other factors
4
CA Final Nov'20
SCM & PEDivya Jadi Booti| 13
A n s w e r
(a) Advise
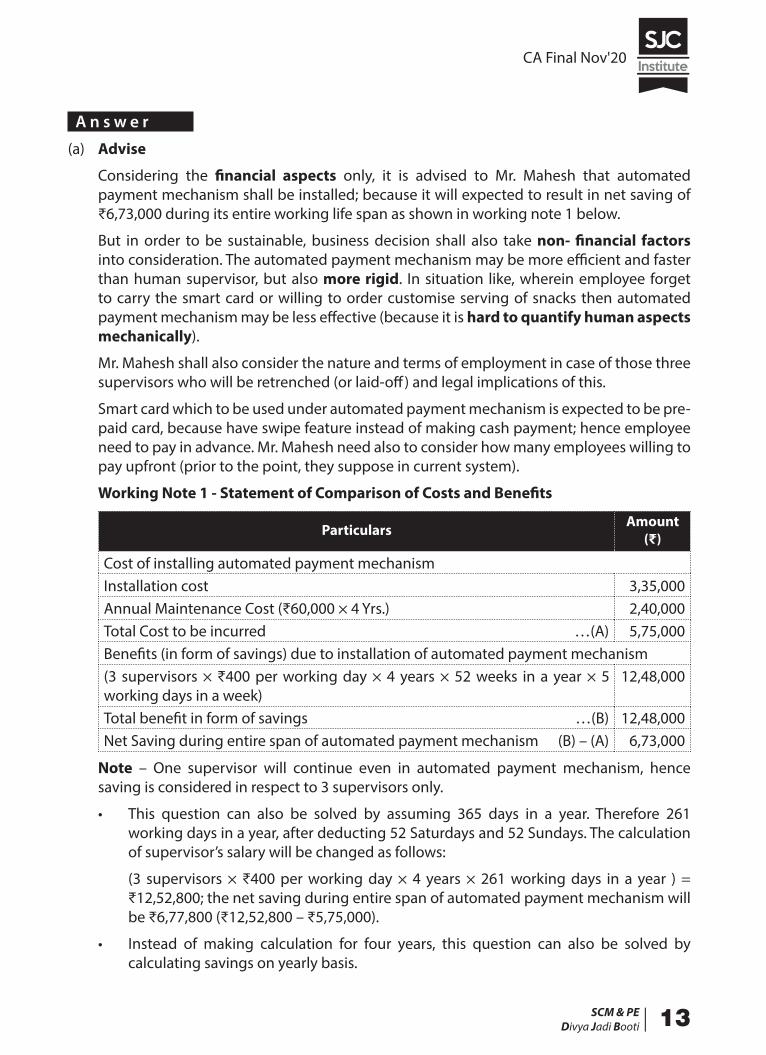
Considering the financial aspects only, it is advised to Mr. Mahesh that automated payment mechanism shall be installed; because it will expected to result in net saving of ₹6,73,000 during its entire working life span as shown in working note 1 below.
But in order to be sustainable, business decision shall also take non- financial factors into consideration. The automated payment mechanism may be more efficient and faster than human supervisor, but also more rigid. In situation like, wherein employee forget to carry the smart card or willing to order customise serving of snacks then automated payment mechanism may be less effective (because it is hard to quantify human aspects mechanically).
Mr. Mahesh shall also consider the nature and terms of employment in case of those three supervisors who will be retrenched (or laid-off) and legal implications of this.
Smart card which to be used under automated payment mechanism is expected to be pre- paid card, because have swipe feature instead of making cash payment; hence employee need to pay in advance. Mr. Mahesh need also to consider how many employees willing to pay upfront (prior to the point, they suppose in current system).
Working Note 1 - Statement of Comparison of Costs and Benefits
Particulars Amount (₹)
Cost of installing automated payment mechanismInstallation cost 3,35,000Annual Maintenance Cost (₹60,000 × 4 Yrs.) 2,40,000Total Cost to be incurred …(A) 5,75,000Benefits (in form of savings) due to installation of automated payment mechanism(3 supervisors × ₹400 per working day × 4 years × 52 weeks in a year × 5 working days in a week)
12,48,000
Total benefit in form of savings …(B) 12,48,000Net Saving during entire span of automated payment mechanism (B) – (A) 6,73,000
Note – One supervisor will continue even in automated payment mechanism, hence saving is considered in respect to 3 supervisors only.
• This question can also be solved by assuming 365 days in a year. Therefore 261 working days in a year, after deducting 52 Saturdays and 52 Sundays. The calculation of supervisor’s salary will be changed as follows:
(3 supervisors × ₹400 per working day × 4 years × 261 working days in a year ) = ₹12,52,800; the net saving during entire span of automated payment mechanism will be ₹6,77,800 (₹12,52,800 – ₹5,75,000).
• Instead of making calculation for four years, this question can also be solved by calculating savings on yearly basis.
CA Final Nov'20
14 |SCM & PEDivya Jadi Booti
• Alternate non-financial factors are also possible.
State the most appropriate pricing policy to be adopted in the following independent situations:
(Situations need not be copied. Only policy name is required.)
(i) The company manufactures original equipment and does railways contract work. Other companies are also there in the market who also undertake similar projects.
(ii) Patented Drug for COV1D 19 ready to be launched in the market.
(iii) A bike manufacturer is launching an innovative, technologically advanced bike in the highly priced segment.
(iv) A company making a variant of sanitizers, trying to enter the market. The same varieties of sanitizers are already successfully capturing the market.
(v) A successful mobile manufacturing company has built into its latest tablet, an additional sliding screen and improved processing capabilities so that the tablet is almost a laptop.
[5]
Pricing Strategies Different strategies
A n s w e r
(i) Sealed Bid Pricing(ii) Skimming Pricing(iii) Premium Pricing/ Skimming Pricing(iv) Market Price(v) Demand Based Pricing
TSC Box Ltd. is a manufacturer and supplier of android set up boxes for various DTH operators. This is very popular with the operators as it converts normal TV to a smart TV. To ensure supply of good quality products to meet the expectations of the viewers, it has set up quality control department that regularly conducts quality inspection and submits it report to the management on weekly basis.
As per the latest quality inspection report submitted by the department, it reflects that the current rejection rate is 7% of units input into the manufacturing system due to poor quality.
5
6
CA Final Nov'20
SCM & PEDivya Jadi Booti| 15
3,000 units of input go through the process every day. As per analysis, for each rejection, there is loss of ` 150 to the company. The management is very much worried due to high rate of rejection of input units.
The management has asked for suggestions from the quality; control department in this regard. The department has suggested implementation of new system for inspection for early detection of defective units. This change would result in drop of rejection rate to 4% from earlier 7%. The cost of new system will be ` 12,000 per day.
Required :
(i) Analyse the proposed new system for inspection and suggest if it , would be beneficial for the company. [3]
(ii) Also Calculate the minimum reduction in number of rejections each day upto which the proposed system will be beneficial. [2]
Total Quality Management Minimum reduction in number of Rejections
A n s w e r
(i) Analysis of the Proposal
The company wants to reduce the cost of poor quality on account of rejected items from the manufacturing system. The current rejection rate is 7% that is proposed to be improved to 4% of units input.
The expected benefit to the company can be worked out as follows:
The units of input each day = 3,000. At the current rate of 7%, 210 units of input are rejected each day. It is proposed to reduce rejection rate to 4%, that is 120 units of input rejected each day. Therefore, new system would reduce the number of units rejected by 90 units each day. The resultant cost of poor quality would reduce by `13,500 each day (90 units of input × `150 cost of one rejected unit).
The cost of implementation of the new system on the inspection process would be ̀ 12,000 each day.
The net benefit to the company on implementing the proposal would be `1,500 each day. Therefore, the company should implement the proposal.
(ii) Let the number of reductions in rejections each day due to proposed system be R.
At `150 per unit, benefits from reduction in rejection would be `150 × R.
Point, at which this will be equal to the cost of new system of 12,000 per day:
Solving `150 × R = `12,000; R = 80 units
Therefore, minimum reduction in number of rejections each day up to which the proposed system will be beneficial is 80 units.
CA Final Nov'20
16 |SCM & PEDivya Jadi Booti
TRISEL Ltd. makes three products X, Y and Z in Divisions A, B and C respectively. The division X is currently working at 60%, Y is working at 80% and Z is working at 100% of the total production capacity.
The following information is given :
Figures `/unit
Particulars X Y Z
Direct Material 10 25 (Excl. Material X) 35 (Excl. Material X)Direct Labour 6 8 10Variable Overhead 2 3 4Total Production Capacity, 15,000 units 5,000 units 2,500 UnitsExternal Demand 7,500 Units 5,000 Units 3,000 unitsSelling price to External Customers 30 83 90
The company has to incur additional fixed cost of ̀ 9,000 for using every 10%’ of idle production capacity. Production capacity cannot be enhanced beyond total production capacity.
Product X can be used as input material for Y and Z. Product X is available in the market at ` 30 per unit. Each unit of Y and Z need one unit of X as their input material.
X supplies the product without any defects, error free for direct use at shop floor without any further quality inspection to Y and Z. If Y gets transfer of material from X, it can be directly used, but if it buys from outside vendor, it has to pay ` 30 plus quality inspection charges of ` 2. Z gets material from outside vendor at ̀ 30. If it buys from X, it has to slightly alter the product X which will cost ` 3 as alteration cost.
X wants to fix uniform transfer price for both Y and Z. This price will be for divisional transfer only and it has nothing to do with outside sales.
Required:
Recommend the best strategy for each division and company as a whole. [10]
Divisional Transfer Pricing Best Strategy using Maximum TP
A n s w e r
Recommendations
Decision on Internal Transfer Price
Division Y’s cost of material X from outside is 30 in addition inspection charge of 2 is required
7
CA Final Nov'20
SCM & PEDivya Jadi Booti| 17
to be incurred for outside purchase. Therefore, Division Y would be able to pay equal to total outside cost for internally transferred material X i.e. 32 which it can be directly use.
Division Z’s cost of material X from outside is also 30. However, division Z will not pay anything more than 27, since it will have to alter the material transferred from X and incur 3 as alteration cost. Therefore, Division Z would be able to pay only 27 for the product transferred.
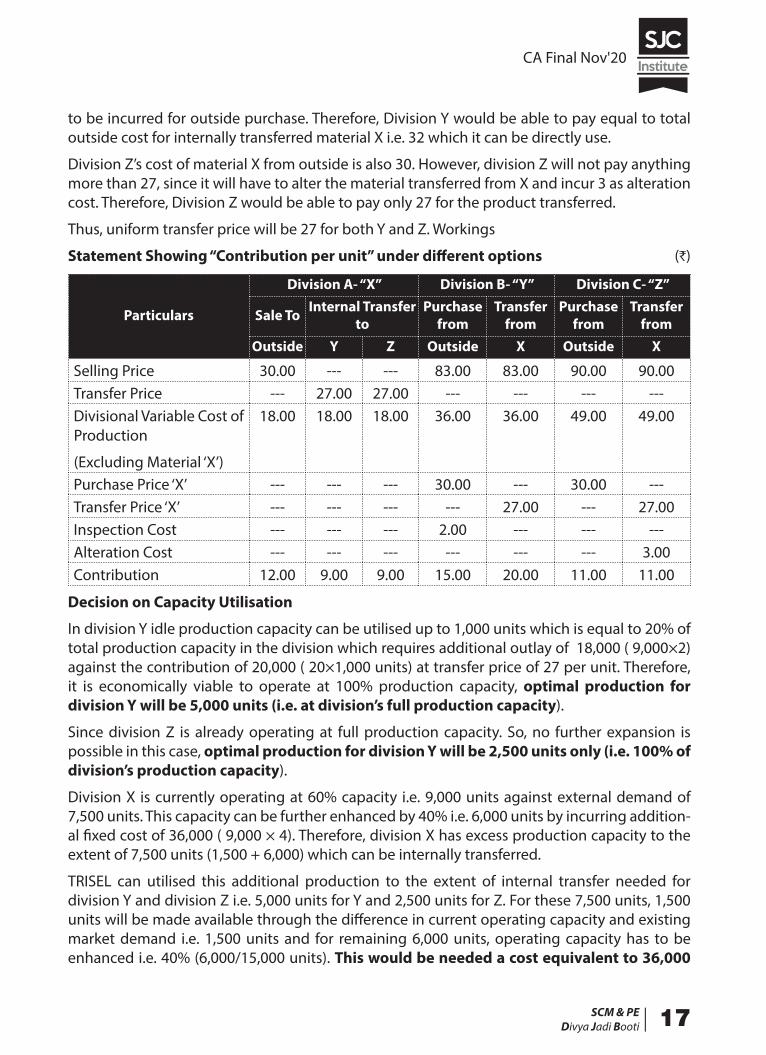
Thus, uniform transfer price will be 27 for both Y and Z. Workings
Statement Showing “Contribution per unit” under different options (`)
Particulars
Division A- “X” Division B- “Y” Division C- “Z”
Sale To Internal Transfer to
Purchase from
Transfer from
Purchase from
Transfer from
Outside Y Z Outside X Outside X
Selling Price 30.00 --- --- 83.00 83.00 90.00 90.00Transfer Price --- 27.00 27.00 --- --- --- ---Divisional Variable Cost of 18.00 18.00 18.00 36.00 36.00 49.00 49.00
Purchase Price ‘X’ --- --- --- 30.00 --- 30.00 ---Transfer Price ‘X’ --- --- --- --- 27.00 --- 27.00Inspection Cost --- --- --- 2.00 --- --- ---Alteration Cost --- --- --- --- --- --- 3.00Contribution 12.00 9.00 9.00 15.00 20.00 11.00 11.00
Decision on Capacity Utilisation
In division Y idle production capacity can be utilised up to 1,000 units which is equal to 20% of total production capacity in the division which requires additional outlay of 18,000 ( 9,000×2) against the contribution of 20,000 ( 20×1,000 units) at transfer price of 27 per unit. Therefore, it is economically viable to operate at 100% production capacity, optimal production for division Y will be 5,000 units (i.e. at division’s full production capacity).
Since division Z is already operating at full production capacity. So, no further expansion is possible in this case, optimal production for division Y will be 2,500 units only (i.e. 100% of division’s production capacity).
Division X is currently operating at 60% capacity i.e. 9,000 units against external demand of 7,500 units. This capacity can be further enhanced by 40% i.e. 6,000 units by incurring addition-al fixed cost of 36,000 ( 9,000 × 4). Therefore, division X has excess production capacity to the extent of 7,500 units (1,500 + 6,000) which can be internally transferred.
TRISEL can utilised this additional production to the extent of internal transfer needed for division Y and division Z i.e. 5,000 units for Y and 2,500 units for Z. For these 7,500 units, 1,500 units will be made available through the difference in current operating capacity and existing market demand i.e. 1,500 units and for remaining 6,000 units, operating capacity has to be enhanced i.e. 40% (6,000/15,000 units). This would be needed a cost equivalent to 36,000
Production
(Excluding Material ‘X’)
CA Final Nov'20
18 |SCM & PEDivya Jadi Booti
(= 9,000 × 4) against a contribution of 54,000 (= 9 × 6,000). Thus, expansion is completely feasible.
Optimal production for division X will be 15,000 units (i.e. at division’s full production capacity).
Workings
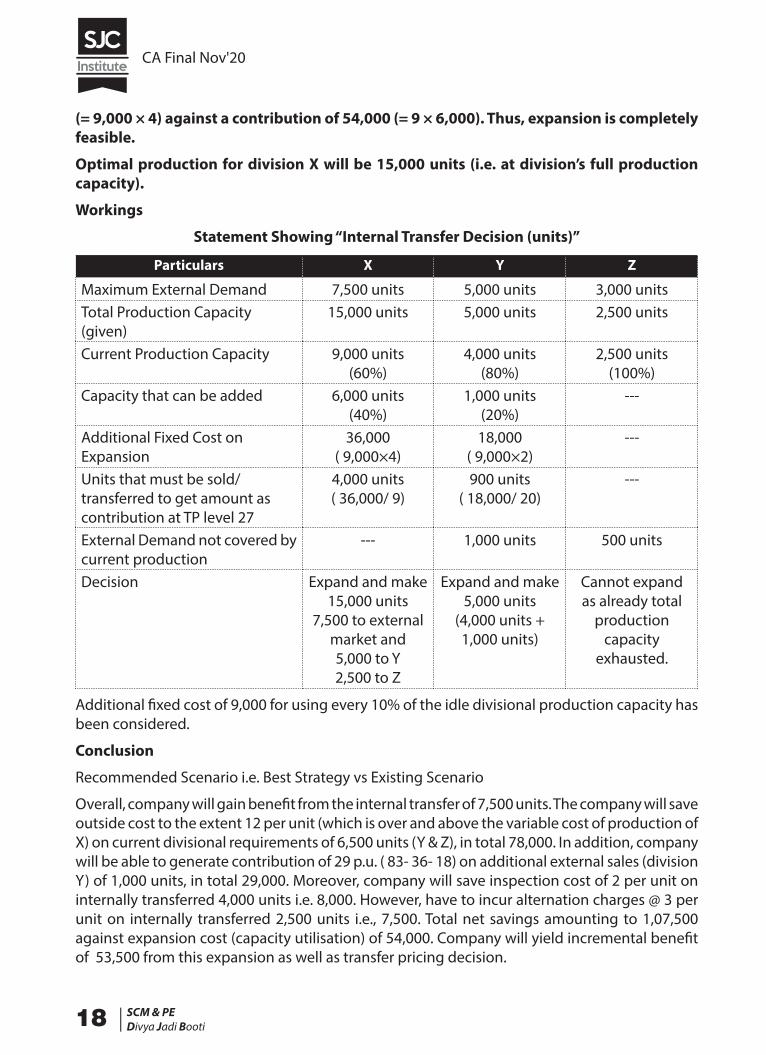
Statement Showing “Internal Transfer Decision (units)”
Particulars X Y Z
Maximum External Demand 7,500 units 5,000 units 3,000 unitsTotal Production Capacity (given)
15,000 units 5,000 units 2,500 units
Current Production Capacity 9,000 units(60%)
4,000 units(80%)
2,500 units(100%)
Capacity that can be added 6,000 units(40%)
1,000 units(20%)
---
Additional Fixed Cost on Expansion
36,000( 9,000×4)
18,000( 9,000×2)
---
Units that must be sold/ transferred to get amount as contribution at TP level 27
4,000 units( 36,000/ 9)
900 units( 18,000/ 20)
---
External Demand not covered by current production
--- 1,000 units 500 units
Decision Expand and make 15,000 units
7,500 to external market and5,000 to Y2,500 to Z
Expand and make 5,000 units
(4,000 units + 1,000 units)
Cannot expand as already total
production capacity
exhausted.
Additional fixed cost of 9,000 for using every 10% of the idle divisional production capacity has been considered.
Conclusion
Recommended Scenario i.e. Best Strategy vs Existing Scenario
Overall, company will gain benefit from the internal transfer of 7,500 units. The company will save outside cost to the extent 12 per unit (which is over and above the variable cost of production of X) on current divisional requirements of 6,500 units (Y & Z), in total 78,000. In addition, company will be able to generate contribution of 29 p.u. ( 83- 36- 18) on additional external sales (division Y) of 1,000 units, in total 29,000. Moreover, company will save inspection cost of 2 per unit on internally transferred 4,000 units i.e. 8,000. However, have to incur alternation charges @ 3 per unit on internally transferred 2,500 units i.e., 7,500. Total net savings amounting to 1,07,500 against expansion cost (capacity utilisation) of 54,000. Company will yield incremental benefit of 53,500 from this expansion as well as transfer pricing decision.
CA Final Nov'20
SCM & PEDivya Jadi Booti| 19
Workings
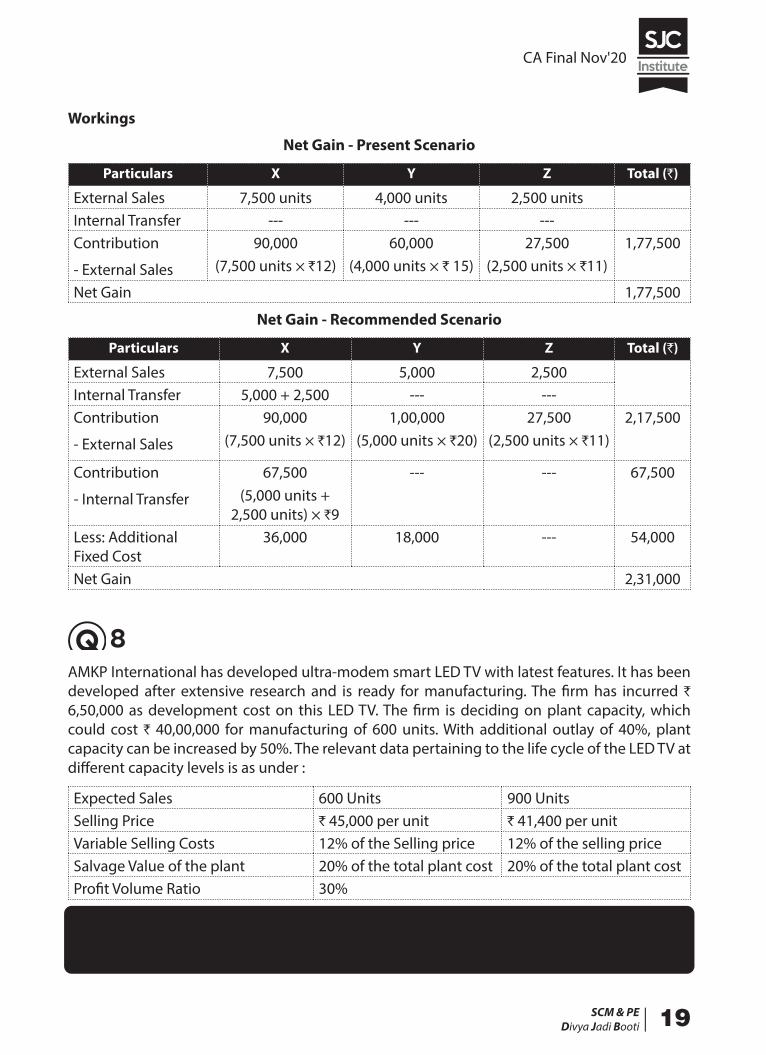
Net Gain - Present Scenario
Particulars X Y Z Total (`)
External Sales 7,500 units 4,000 units 2,500 unitsInternal Transfer --- --- ---Contribution
- External Sales
90,000(7,500 units × `12)
60,000(4,000 units × ` 15)
27,500(2,500 units × `11)
1,77,500
Net Gain 1,77,500
Net Gain - Recommended Scenario
Particulars X Y Z Total (`)
External Sales 7,500 5,000 2,500Internal Transfer 5,000 + 2,500 --- ---Contribution
- External Sales
90,000(7,500 units × `12)
1,00,000(5,000 units × `20)
27,500(2,500 units × `11)
2,17,500
Contribution
- Internal Transfer
67,500(5,000 units +
2,500 units) × `9
--- --- 67,500
Less: Additional Fixed Cost
36,000 18,000 --- 54,000
Net Gain 2,31,000
AMKP International has developed ultra-modem smart LED TV with latest features. It has been developed after extensive research and is ready for manufacturing. The firm has incurred ` 6,50,000 as development cost on this LED TV. The firm is deciding on plant capacity, which could cost ` 40,00,000 for manufacturing of 600 units. With additional outlay of 40%, plant capacity can be increased by 50%. The relevant data pertaining to the life cycle of the LED TV at different capacity levels is as under :
Expected Sales 600 Units 900 UnitsSelling Price ` 45,000 per unit ` 41,400 per unitVariable Selling Costs 12% of the Selling price 12% of the selling priceSalvage Value of the plant 20% of the total plant cost 20% of the total plant costProfit Volume Ratio 30%
Required :
Advise AMKP International regarding the ‘Optimal Plant Capacity’ to install. The LED TVs life cycle is two years. (Note: Ignore the time value of money.) [10]
8
CA Final Nov'20
20 |SCM & PEDivya Jadi Booti
Life Cycle Costing Evaluation of proposal
A n s w e r
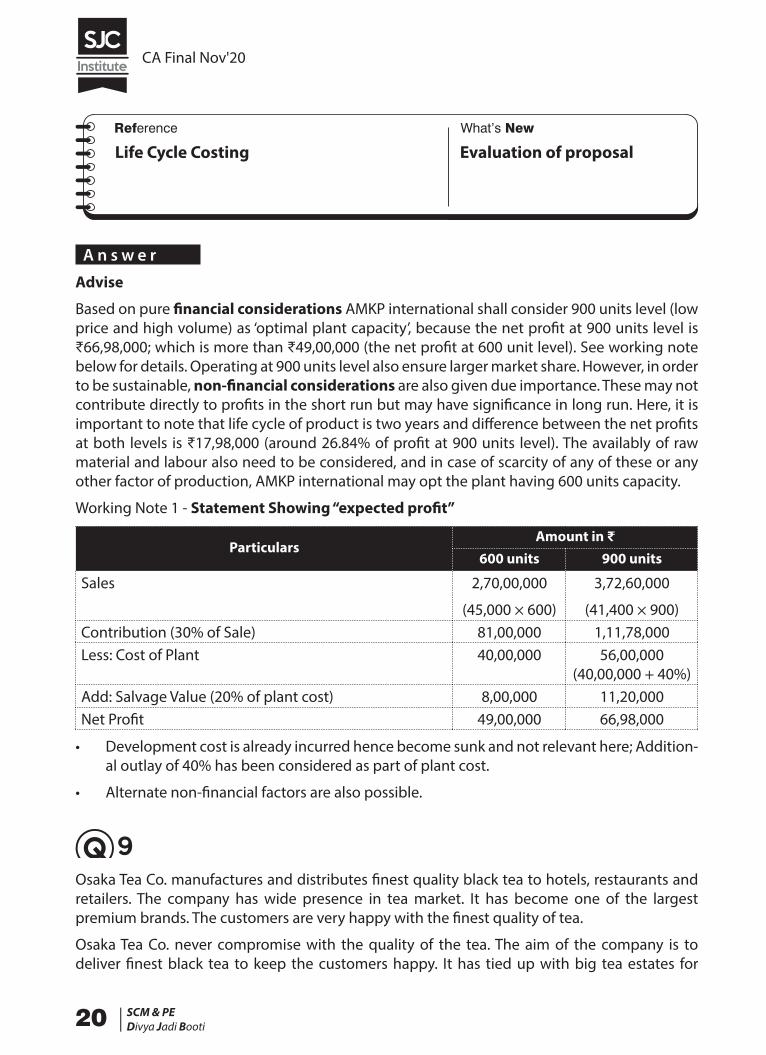
Advise
Based on pure financial considerations AMKP international shall consider 900 units level (low price and high volume) as ‘optimal plant capacity’, because the net profit at 900 units level is ₹66,98,000; which is more than ₹49,00,000 (the net profit at 600 unit level). See working note below for details. Operating at 900 units level also ensure larger market share. However, in order to be sustainable, non-financial considerations are also given due importance. These may not contribute directly to profits in the short run but may have significance in long run. Here, it is important to note that life cycle of product is two years and difference between the net profits at both levels is ₹17,98,000 (around 26.84% of profit at 900 units level). The availably of raw material and labour also need to be considered, and in case of scarcity of any of these or any other factor of production, AMKP international may opt the plant having 600 units capacity.
Working Note 1 - Statement Showing “expected profit”
ParticularsAmount in ₹
600 units 900 units
Sales 2,70,00,000
(45,000 × 600)
3,72,60,000
(41,400 × 900)Contribution (30% of Sale) 81,00,000 1,11,78,000Less: Cost of Plant 40,00,000 56,00,000
(40,00,000 + 40%)Add: Salvage Value (20% of plant cost) 8,00,000 11,20,000Net Profit 49,00,000 66,98,000
• Development cost is already incurred hence become sunk and not relevant here; Addition-al outlay of 40% has been considered as part of plant cost.
• Alternate non-financial factors are also possible.
Osaka Tea Co. manufactures and distributes finest quality black tea to hotels, restaurants and retailers. The company has wide presence in tea market. It has become one of the largest premium brands. The customers are very happy with the finest quality of tea.
Osaka Tea Co. never compromise with the quality of the tea. The aim of the company is to deliver finest black tea to keep the customers happy. It has tied up with big tea estates for
9
CA Final Nov'20
SCM & PEDivya Jadi Booti| 21
procurement of finest tea leaves directly from the estate for processing in its own plants. The tea leaves go through various processes like plucking, withering, brushing, oxidising, grading, drying, sorting and shaping etc. Then these are packed in beautiful plastic jars for distribution to the hotels, restaurants and retailers.
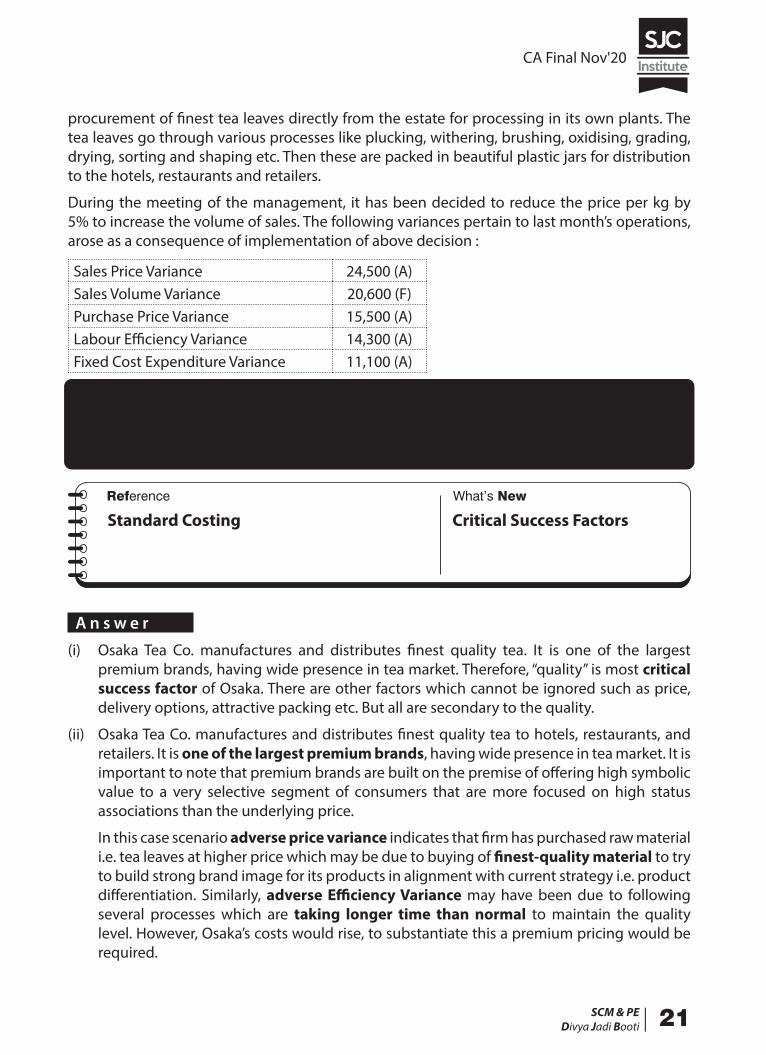
During the meeting of the management, it has been decided to reduce the price per kg by 5% to increase the volume of sales. The following variances pertain to last month’s operations, arose as a consequence of implementation of above decision :
Sales Price Variance 24,500 (A)Sales Volume Variance 20,600 (F)Purchase Price Variance 15,500 (A)Labour Efficiency Variance 14,300 (A)Fixed Cost Expenditure Variance 11,100 (A)
Required :
(i) Identify the ‘Critical Success Factor’ for Osaka Tea Co. [1]
(ii) Evaluate the management’s decision with the ‘Overall Corporate Strategy’ and ‘Critical Success Factors’. [9]
Standard Costing Critical Success Factors
A n s w e r
(i) Osaka Tea Co. manufactures and distributes finest quality tea. It is one of the largest premium brands, having wide presence in tea market. Therefore, “quality” is most critical success factor of Osaka. There are other factors which cannot be ignored such as price, delivery options, attractive packing etc. But all are secondary to the quality.
(ii) Osaka Tea Co. manufactures and distributes finest quality tea to hotels, restaurants, and retailers. It is one of the largest premium brands, having wide presence in tea market. It is important to note that premium brands are built on the premise of offering high symbolic value to a very selective segment of consumers that are more focused on high status associations than the underlying price.
In this case scenario adverse price variance indicates that firm has purchased raw material i.e. tea leaves at higher price which may be due to buying of finest-quality material to try to build strong brand image for its products in alignment with current strategy i.e. product differentiation. Similarly, adverse Efficiency Variance may have been due to following several processes which are taking longer time than normal to maintain the quality level. However, Osaka’s costs would rise, to substantiate this a premium pricing would be required.
CA Final Nov'20
22 |SCM & PEDivya Jadi Booti
It is also important to note that adverse sales price variance and favourable sales volume variance, indicates that market is price sensitive. However, the net impact of the same is negative on the profitability. Osaka then could no longer make a profit simply by pricing its products e.g. reduce the price per kg by 5%. Osaka is intending to expand its market to retail market and street shops by reducing the price which is opposing its current strategy.
In this scenario, it is important for Osaka to have a perception of exclusivity in alignment with present strategy. Therefore, management should monitor the trends of variances on regular basis and take appropriate action in case of evidence of any decline in quality (i.e. Critical Success Factor).
ZAINA Private Limited is a manufacturing company of electrical equipment. The company is facing the possibility of a strike by its direct production workers engaged on the assembly of one of its machines. The Trade Union is demanding an increase of 8% backdated to the beginning of its financial year (1st April), but the company expects that if a strike takes place, it will last four weeks after which the Union will settle for an increase of 6% similarly backdated.
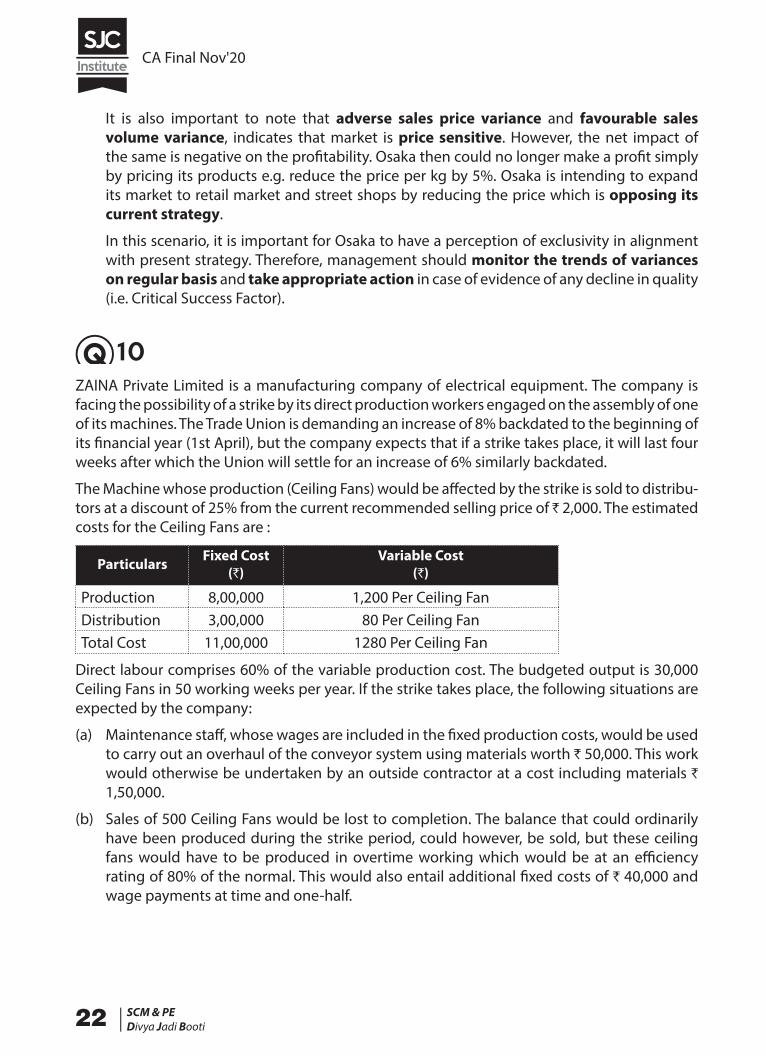
The Machine whose production (Ceiling Fans) would be affected by the strike is sold to distribu-tors at a discount of 25% from the current recommended selling price of ` 2,000. The estimated costs for the Ceiling Fans are :
Particulars Fixed Cost(`)
Variable Cost(`)
Production 8,00,000 1,200 Per Ceiling FanDistribution 3,00,000 80 Per Ceiling FanTotal Cost 11,00,000 1280 Per Ceiling Fan
Direct labour comprises 60% of the variable production cost. The budgeted output is 30,000 Ceiling Fans in 50 working weeks per year. If the strike takes place, the following situations are expected by the company:
(a) Maintenance staff, whose wages are included in the fixed production costs, would be used to carry out an overhaul of the conveyor system using materials worth ` 50,000. This work would otherwise be undertaken by an outside contractor at a cost including materials ` 1,50,000.
(b) Sales of 500 Ceiling Fans would be lost to completion. The balance that could ordinarily have been produced during the strike period, could however, be sold, but these ceiling fans would have to be produced in overtime working which would be at an efficiency rating of 80% of the normal. This would also entail additional fixed costs of ` 40,000 and wage payments at time and one-half.
10
CA Final Nov'20
SCM & PEDivya Jadi Booti| 23
Required :
(i) Calculate the profit or loss with and without strike.
(ii) Taking, purely economic point of view, advise the management to allow the strike to go ahead, rather than agree to the Union’s demand.
(iii) List any two factors, not considered in yours above evaluation that may have adverse financial effects for the company, if the strike were to take place. [10]
Relevant Costing Evaluation of strike and no strike
A n s w e r
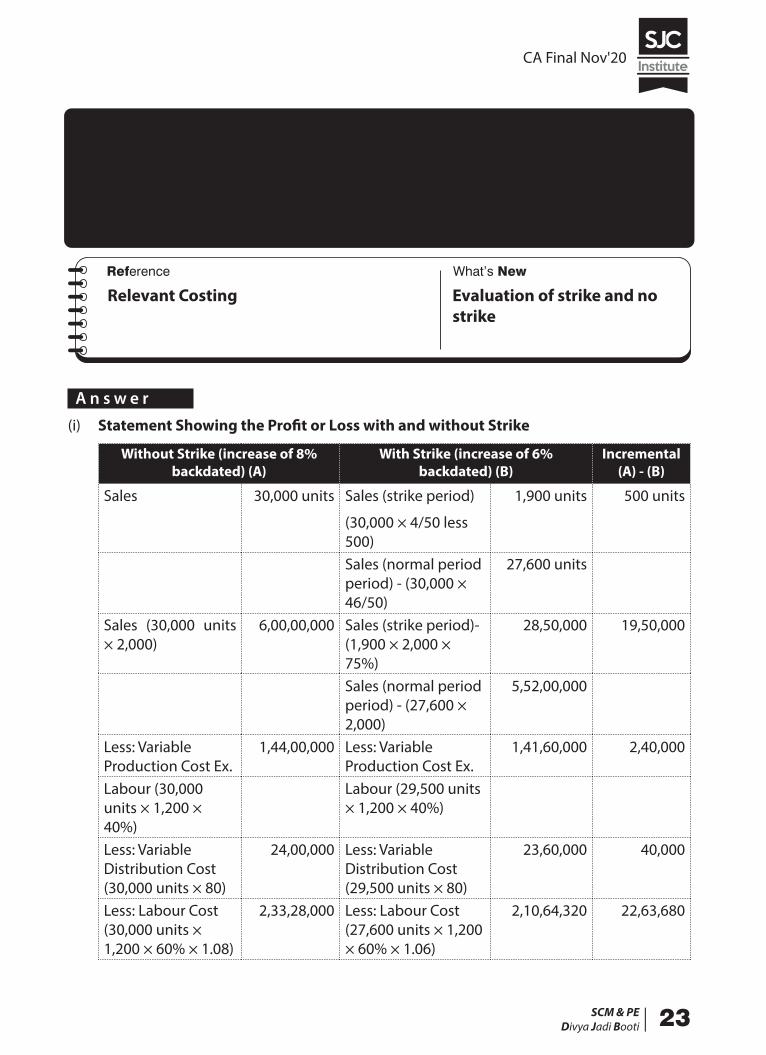
(i) Statement Showing the Profit or Loss with and without Strike
Without Strike (increase of 8% backdated) (A)
With Strike (increase of 6% backdated) (B)
Incremental (A) - (B)
Sales 30,000 units Sales (strike period)
(30,000 × 4/50 less 500)
1,900 units 500 units
Sales (normal period period) - (30,000 × 46/50)
27,600 units
Sales (30,000 units × 2,000)
6,00,00,000 Sales (strike period)- (1,900 × 2,000 × 75%)
28,50,000 19,50,000
Sales (normal period period) - (27,600 × 2,000)
5,52,00,000
Less: Variable Production Cost Ex.
1,44,00,000 Less: Variable Production Cost Ex.
1,41,60,000 2,40,000
Labour (30,000 units × 1,200 × 40%)
Labour (29,500 units × 1,200 × 40%)
Less: Variable Distribution Cost (30,000 units × 80)
24,00,000 Less: Variable Distribution Cost (29,500 units × 80)
23,60,000 40,000
Less: Labour Cost (30,000 units × 1,200 × 60% × 1.08)
2,33,28,000 Less: Labour Cost (27,600 units × 1,200 × 60% × 1.06)
2,10,64,320 22,63,680
CA Final Nov'20
24 |SCM & PEDivya Jadi Booti
Less: Labour Cost Strike Pdn.
N.A. Less: Labour Cost Strike Pdn. (1,900 units / 0.80× 1,200 × 60% × 1.06 × 1.5)
27,18,900 (27,18,900)
Less: Additional Fixed Cost (labour)
N.A. Less: Additional Fixed Cost (labour)
40,000 (40,000)
Less: Maintenance Cost
1,50,000 Less: Maintenance Cost
50,000 1,00,000
Less: Fixed Cost 11,00,000 Less: Fixed Cost 11,00,000 0Profit/ (Loss) 1,86,22,000 Profit/ (Loss) 1, 65,56,780 20,65,220
(ii) If there is no strike, it will yield a financial advantage of 20,65,220. Therefore, from a purely economic point of view, management should accept union’s demand.
(iii) These factors, not considered in above evaluation, that may have adverse effects, if the strike were to take place are:
• There will be knock on effect of wage increase and all other workers will start demanding it.
• Customers gone to competitors may not even return.
• Loss of goodwill.
• Behavioural effects after strike period and their impact on work.
• Strain in relation between trade union, labour, and and management.
This question can also be solved by taking complete sales of 29,500 units (27,600 units + 1,900 units at discounted rate i.e., 1,500 per unit (if strike takes place); therefore, revenue will be 4,42,50,000 [=29,500 × 1,500] and profit will be 27,56,780 [= 4,42,50,000 – 4,14,93,220 (total cost)]. Hence, if there is no strike, it will yield a financial advantage of 1,58,65,220 [= 1,86,22,000 – 27,56,780]. So, from a purely economic point of view, management should accept union’s demand.
KRI Sanitation Ltd. manufactures a single product and the standard cost system is followed. Standard cost per unit is calculated as below :
Particulars Amount (`)
Direct Materials (4 kg. @ ` 7 kg.) 28Direct Labour (5 Hours @ ` 9 per hour) 45Variable overheads (6 Hours @ ` 2 per hour) 12
The other data for the month of June 2020 is given below :
Particulars Budgeted Actual
Production and Sales 15,000 units 13,800 Units
11
CA Final Nov'20
SCM & PEDivya Jadi Booti| 25
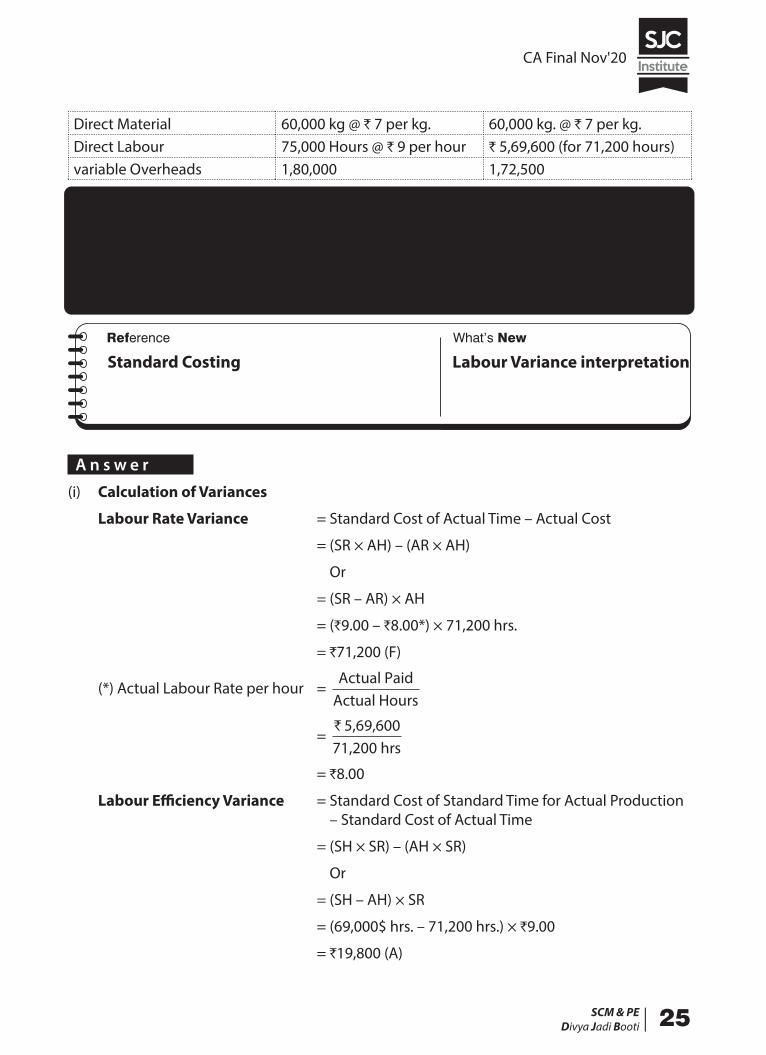
Direct Material 60,000 kg @ ` 7 per kg. 60,000 kg. @ ` 7 per kg.Direct Labour 75,000 Hours @ ` 9 per hour ` 5,69,600 (for 71,200 hours)variable Overheads 1,80,000 1,72,500
Required :
(i) Calculate following variances :
• Direct Labour Rate Variance
• Direct Labour Efficiency Variance
(ii) Interpret the result.
Standard Costing Labour Variance interpretation
A n s w e r
(i) Calculation of Variances
Labour Rate Variance = Standard Cost of Actual Time – Actual Cost
= (SR × AH) – (AR × AH)
Or
= (SR – AR) × AH
= (`9.00 – `8.00*) × 71,200 hrs.
= `71,200 (F)
(*) Actual Labour Rate per hour = Actual Paid
Actual Hours
= ` 5,69,60071,200 hrs
= `8.00
Labour Efficiency Variance = Standard Cost of Standard Time for Actual Production – Standard Cost of Actual Time
= (SH × SR) – (AH × SR)
Or
= (SH – AH) × SR
= (69,000$ hrs. – 71,200 hrs.) × `9.00
= `19,800 (A)
CA Final Nov'20
26 |SCM & PEDivya Jadi Booti
($) Standard Hours = Actual Production × Std. hrs. per unit
= 13,800 units × 5 hrs.
= 69,000 hrs.
(ii) Interpretation of Variances
The favourable rate variance indicates that expenditure was 71,200 less than the standard because a lower than standard rate was paid for each hour of labour (i.e. ̀ 8 per hr. against ̀ 9 per hr.), this could mean that less skilled labour was used than provided for in the standard; and this then lowered efficiency with the result that the efficiency was lower than expected, result in adverse efficiency variance of `19,800; and perhaps poor materials handling and high rates of rejections too (this is indicated by adverse material usage variance of `33,600. This throughout analysis shows a positive impact of `17,800 on profit for which labour rate variance is the main contributor.
Workings
Material Usage Variance = Standard Cost of Standard Quantity for Actual Production – Standard Cost of Actual Quantity
= (SQ × SP) – (AQ × SP)
Or
= (SQ – AQ) × SP
= (55,200$ kg. – 60,000 kg.) × `7.00
= `33,600 (A)
Standard Quantity = Actual Production × Std. Qty. per unit
= 13,800 units × 4 kg.
= 55,200 kg.
Note- Ignored Variable Overheads.