building energy analysis (bea): a methodology to assess building energy labelling
TRANSCRIPT

www.elsevier.com/locate/enbuild
Energy and Buildings 39 (2007) 709–716
Building Energy Analysis (BEA): A methodology to assess
building energy labelling
F.J. Rey *, E. Velasco, F. Varela
Thermal Engineering Group, School of Industrial Engineering, University of Valladolid, Paseo del Cauce, s/n 47011 Valladolid, Spain
Received 31 May 2006; received in revised form 5 July 2006; accepted 22 July 2006
Abstract
The building sector, one of the fastest growing in terms of energy consumption, accounts for over 40% of final energy, a figure which is growing.
Building energy legislation at EU level is found in EU Directive 93/73/CEE [Directive 93/73/EEC of the Council of 13 September 1993 on the
Limitation of the Carbon Dioxide Emissions through the Improvement of Energy Efficiency (SAVE) 1993], EU directive 2002/91/CE called
Energy Performance of Buildings Directive EPBD [Directive 2002/91/EC of the European Parliament and of the Council of 16 December 2002 on
the Energy Performance of Buildings] and the EU Green Paper [Commission of the European Committees, Green Paper, Towards an European
Strategy for the Security of Energy Supply, Brussels, 2000]. This give a clear view of the need and priority that the EU has for reducing energy
consumption in the building sector, both for furthering in compliance of international agreements (Kyoto protocol and forthcoming commitments)
as well as for reducing its energy dependency, and hence for leading its development towards sustainability.
The implementation of the EPBD has as its primary aim the establishment and application of energy certification programs. The aim of energy
certification programs is to guarantee energy saving and to reduce CO2 emission as a consequence of the EU commitment to comply with the Kyoto
protocol.
Obtaining energy effectiveness labelling means the achievement of energy quality, allowing a decrease in CO2 kilograms emitted from lighting,
heating and cooling buildings without any loss in terms of comfort.
This work proposes a new methodology called Building Energy Analysis (BEA) that allows implementation of EPBD on energy certification of
buildings.
In this paper we analyse the different steps of BEA methodology (heat and cooling load, energy demand, energy consumption and CO2
emission). The program ends with energy labelling of the building.
In addition, we present a practical study of a small health centre that is analyzed with BEA methodology and we compare it with other energy
simulation programs like Hourly Analysis Program (HAP) and PowerDOE. The results of energy labelling are very similar for both simulation
programs.
# 2006 Elsevier B.V. All rights reserved.
Keywords: Energy labelling; Building certification
1. Introduction
A building is a highly complex energy system, especially
when allowing a high degree of interaction with its surrounding
environment with the aim of improving its energy performance.
Therefore, given the relevance of the building sector in energy
consumption, the introduction of rigorous energy analysis tools
able to appropriately assess operational energy implications of
different design options should be promoted [4].
* Corresponding author. Tel.: +34 983423366; fax: +34 983423363.
E-mail address: [email protected] (F.J. Rey).
0378-7788/$ – see front matter # 2006 Elsevier B.V. All rights reserved.
doi:10.1016/j.enbuild.2006.07.009
Developed countries need a high rate of energy consumption
to maintain their standard of living and comfort. The current
challenge is to seek sustainable development, maintaining
activity, transformation and progress levels while adapting needs
to the existing resources and therefore achieving energy saving.
This increasing concern for the preservation of the
environment and particularly with regard to climate change
has led the European Union to establish some specific
commitments, such as Kyoto protocol. Promoting energy
efficiency forms a key part of the series of policies and
measures needed to comply with the Kyoto protocol.
These aspects have led to the adoption of EPBD on energy
performance in buildings whose objectives are [1–3]:
F.J. Rey et al. / Energy and Buildings 39 (2007) 709–716710
(a) E
stablishing a calculation method for the integrated energyperformance of buildings.
(b) A
pplication of minimum requirements on the energyperformance of new buildings.
(c) E
nergy certification of buildings.(d) E
nergy audits in large buildings.(e) R
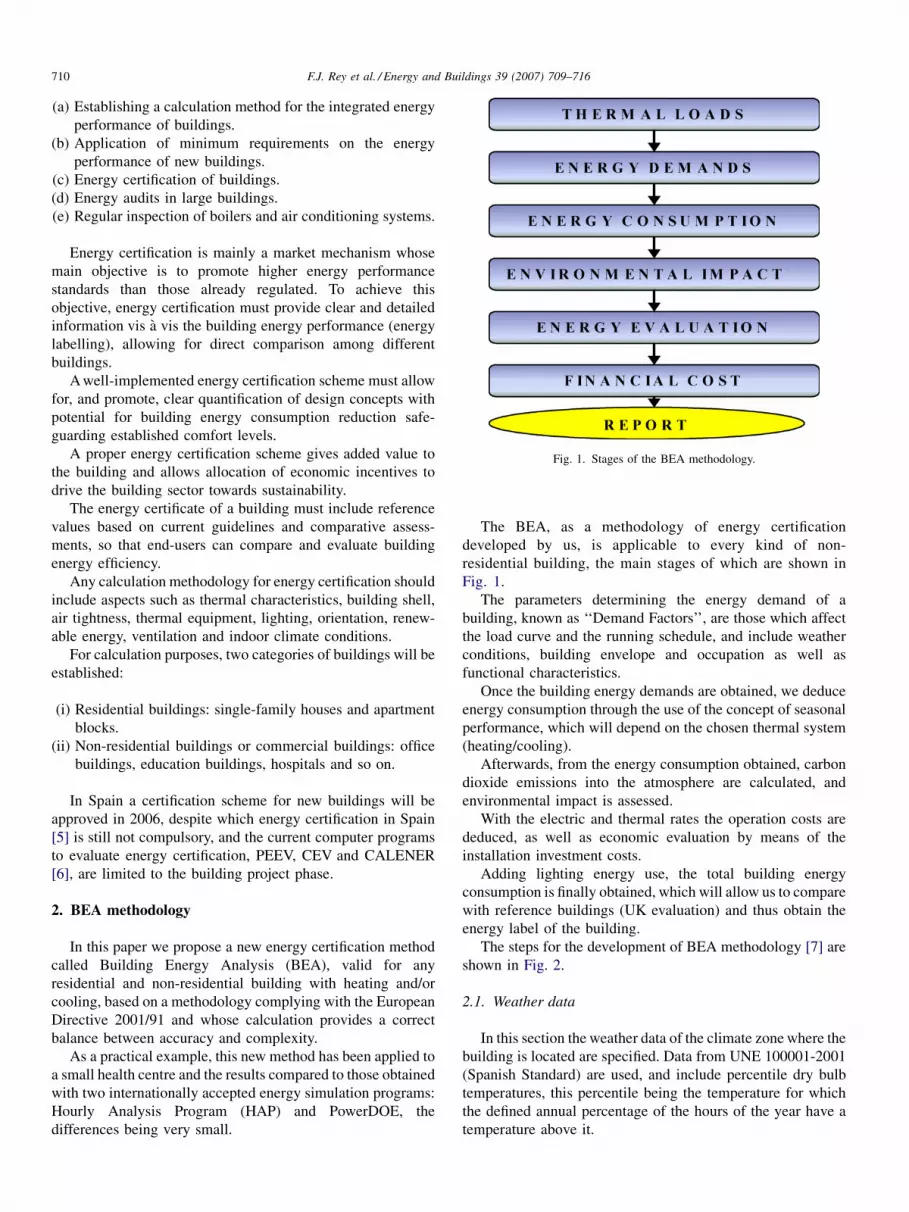
egular inspection of boilers and air conditioning systems.Fig. 1. Stages of the BEA methodology.
Energy certification is mainly a market mechanism whose
main objective is to promote higher energy performance
standards than those already regulated. To achieve this
objective, energy certification must provide clear and detailed
information vis a vis the building energy performance (energy
labelling), allowing for direct comparison among different
buildings.
A well-implemented energy certification scheme must allow
for, and promote, clear quantification of design concepts with
potential for building energy consumption reduction safe-
guarding established comfort levels.
A proper energy certification scheme gives added value to
the building and allows allocation of economic incentives to
drive the building sector towards sustainability.
The energy certificate of a building must include reference
values based on current guidelines and comparative assess-
ments, so that end-users can compare and evaluate building
energy efficiency.
Any calculation methodology for energy certification should
include aspects such as thermal characteristics, building shell,
air tightness, thermal equipment, lighting, orientation, renew-
able energy, ventilation and indoor climate conditions.
For calculation purposes, two categories of buildings will be
established:
(i) R
esidential buildings: single-family houses and apartmentblocks.
(ii) N
on-residential buildings or commercial buildings: officebuildings, education buildings, hospitals and so on.
In Spain a certification scheme for new buildings will be
approved in 2006, despite which energy certification in Spain
[5] is still not compulsory, and the current computer programs
to evaluate energy certification, PEEV, CEV and CALENER
[6], are limited to the building project phase.
2. BEA methodology
In this paper we propose a new energy certification method
called Building Energy Analysis (BEA), valid for any
residential and non-residential building with heating and/or
cooling, based on a methodology complying with the European
Directive 2001/91 and whose calculation provides a correct
balance between accuracy and complexity.
As a practical example, this new method has been applied to
a small health centre and the results compared to those obtained
with two internationally accepted energy simulation programs:
Hourly Analysis Program (HAP) and PowerDOE, the
differences being very small.
The BEA, as a methodology of energy certification
developed by us, is applicable to every kind of non-
residential building, the main stages of which are shown in
Fig. 1.
The parameters determining the energy demand of a
building, known as ‘‘Demand Factors’’, are those which affect
the load curve and the running schedule, and include weather
conditions, building envelope and occupation as well as
functional characteristics.
Once the building energy demands are obtained, we deduce
energy consumption through the use of the concept of seasonal
performance, which will depend on the chosen thermal system
(heating/cooling).
Afterwards, from the energy consumption obtained, carbon
dioxide emissions into the atmosphere are calculated, and
environmental impact is assessed.
With the electric and thermal rates the operation costs are
deduced, as well as economic evaluation by means of the
installation investment costs.
Adding lighting energy use, the total building energy
consumption is finally obtained, which will allow us to compare
with reference buildings (UK evaluation) and thus obtain the
energy label of the building.
The steps for the development of BEA methodology [7] are
shown in Fig. 2.
2.1. Weather data
In this section the weather data of the climate zone where the
building is located are specified. Data from UNE 100001-2001
(Spanish Standard) are used, and include percentile dry bulb
temperatures, this percentile being the temperature for which
the defined annual percentage of the hours of the year have a
temperature above it.
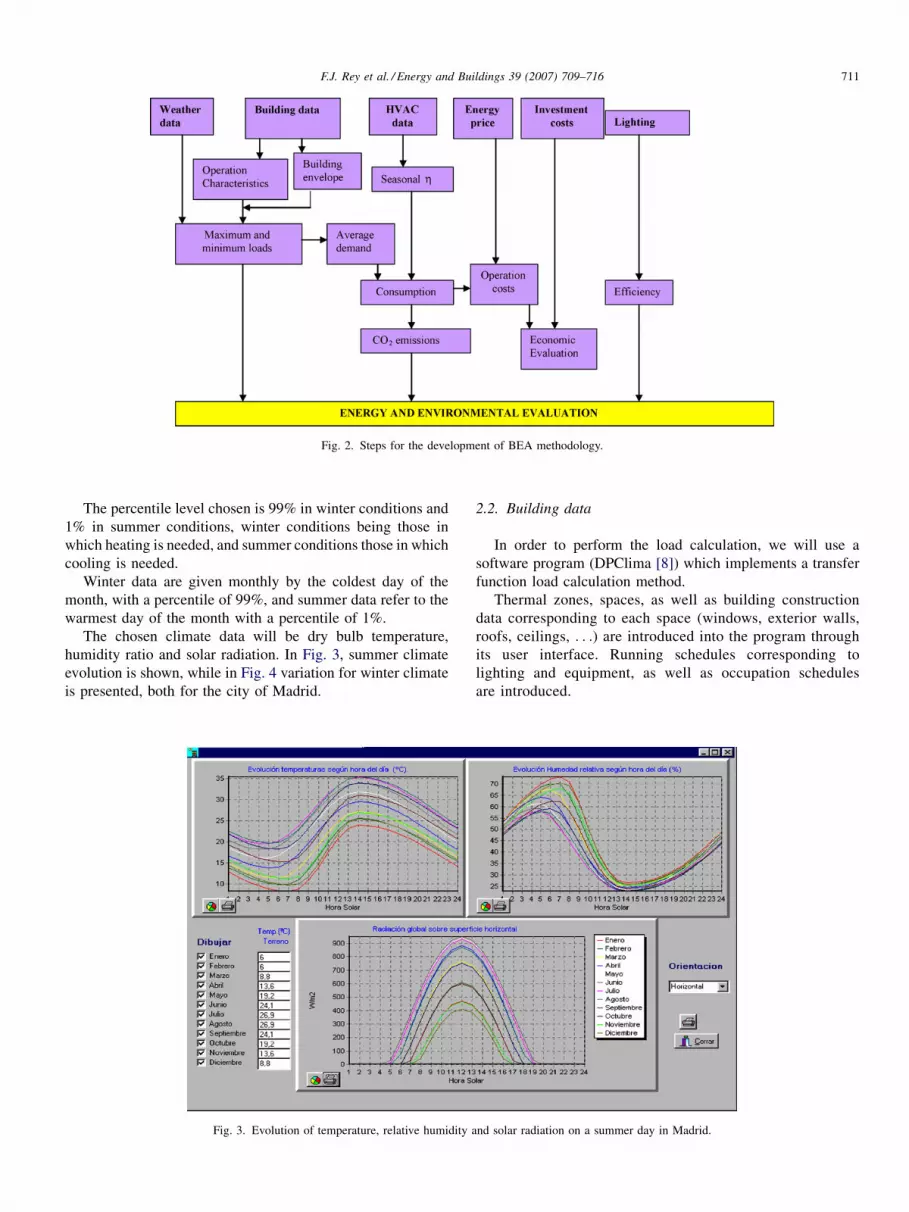
Fig. 2. Steps for the development of BEA methodology.
F.J. Rey et al. / Energy and Buildings 39 (2007) 709–716 711
The percentile level chosen is 99% in winter conditions and
1% in summer conditions, winter conditions being those in
which heating is needed, and summer conditions those in which
cooling is needed.
Winter data are given monthly by the coldest day of the
month, with a percentile of 99%, and summer data refer to the
warmest day of the month with a percentile of 1%.
The chosen climate data will be dry bulb temperature,
humidity ratio and solar radiation. In Fig. 3, summer climate
evolution is shown, while in Fig. 4 variation for winter climate
is presented, both for the city of Madrid.
Fig. 3. Evolution of temperature, relative humidity a
2.2. Building data
In order to perform the load calculation, we will use a
software program (DPClima [8]) which implements a transfer
function load calculation method.
Thermal zones, spaces, as well as building construction
data corresponding to each space (windows, exterior walls,
roofs, ceilings, . . .) are introduced into the program through
its user interface. Running schedules corresponding to
lighting and equipment, as well as occupation schedules
are introduced.
nd solar radiation on a summer day in Madrid.

Fig. 4. Evolution of temperature, relative humidity and solar radiation on a winter day in Madrid.
F.J. Rey et al. / Energy and Buildings 39 (2007) 709–716712
As we are in the case of non-residential buildings, working
days and holidays must be distinguished. We will consider
working days as weekdays (Monday to Friday) and holidays as
weekends and non-working days.
Thus, for each zone, occupation, lighting and other load
schedules are defined for weekdays and holidays separately. In
Fig. 5 the window corresponding to weekdays is shown.
2.3. Heating load, cooling load and energy demand
calculations
Once the data needed are introduced, the program
calculates heating and cooling loads. This calculation
Fig. 5. Working d
program is designed for dimensioning purposes, so loads
are calculated in extreme meteorological conditions, that is to
say, building load is obtained for the coolest and warmest day
of each month.
For winter months, the Maximum Load Curve is defined as
the building load curve on the coolest day of the month, i.e.,
where winter climate data have been used to dimension the
heating installation. By contrast, the Minimum Load Curve is
defined as the building load curve on the warmest day of the
month, i.e., where summer climate data have been used to
dimension the cooling installation. The Medium Load Curve is
obtained from both as the arithmetic media, and this is the curve
used for energy demand calculation purposes.
ay schedule.
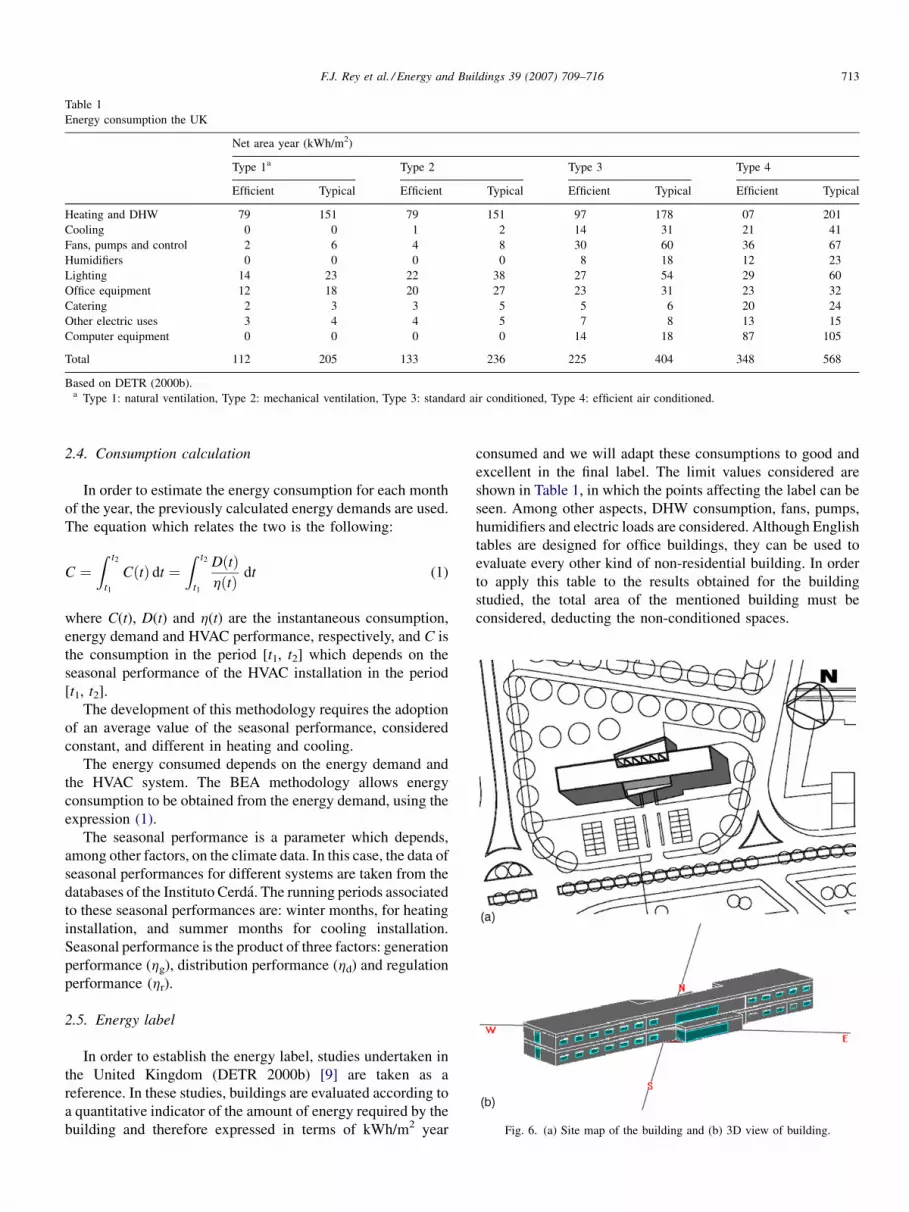
Table 1
Energy consumption the UK
Net area year (kWh/m2)
Type 1a Type 2 Type 3 Type 4
Efficient Typical Efficient Typical Efficient Typical Efficient Typical
Heating and DHW 79 151 79 151 97 178 07 201
Cooling 0 0 1 2 14 31 21 41
Fans, pumps and control 2 6 4 8 30 60 36 67
Humidifiers 0 0 0 0 8 18 12 23
Lighting 14 23 22 38 27 54 29 60
Office equipment 12 18 20 27 23 31 23 32
Catering 2 3 3 5 5 6 20 24
Other electric uses 3 4 4 5 7 8 13 15
Computer equipment 0 0 0 0 14 18 87 105
Total 112 205 133 236 225 404 348 568
Based on DETR (2000b).a Type 1: natural ventilation, Type 2: mechanical ventilation, Type 3: standard air conditioned, Type 4: efficient air conditioned.
Fig. 6. (a) Site map of the building and (b) 3D view of building.
F.J. Rey et al. / Energy and Buildings 39 (2007) 709–716 713
2.4. Consumption calculation
In order to estimate the energy consumption for each month
of the year, the previously calculated energy demands are used.
The equation which relates the two is the following:
C ¼Z t2
t1
CðtÞ dt ¼Z t2
t1
DðtÞhðtÞ dt (1)
where C(t), D(t) and h(t) are the instantaneous consumption,
energy demand and HVAC performance, respectively, and C is
the consumption in the period [t1, t2] which depends on the
seasonal performance of the HVAC installation in the period
[t1, t2].
The development of this methodology requires the adoption
of an average value of the seasonal performance, considered
constant, and different in heating and cooling.
The energy consumed depends on the energy demand and
the HVAC system. The BEA methodology allows energy
consumption to be obtained from the energy demand, using the
expression (1).
The seasonal performance is a parameter which depends,
among other factors, on the climate data. In this case, the data of
seasonal performances for different systems are taken from the
databases of the Instituto Cerda. The running periods associated
to these seasonal performances are: winter months, for heating
installation, and summer months for cooling installation.
Seasonal performance is the product of three factors: generation
performance (hg), distribution performance (hd) and regulation
performance (hr).
2.5. Energy label
In order to establish the energy label, studies undertaken in
the United Kingdom (DETR 2000b) [9] are taken as a
reference. In these studies, buildings are evaluated according to
a quantitative indicator of the amount of energy required by the
building and therefore expressed in terms of kWh/m2 year
consumed and we will adapt these consumptions to good and
excellent in the final label. The limit values considered are
shown in Table 1, in which the points affecting the label can be
seen. Among other aspects, DHW consumption, fans, pumps,
humidifiers and electric loads are considered. Although English
tables are designed for office buildings, they can be used to
evaluate every other kind of non-residential building. In order
to apply this table to the results obtained for the building
studied, the total area of the mentioned building must be
considered, deducting the non-conditioned spaces.
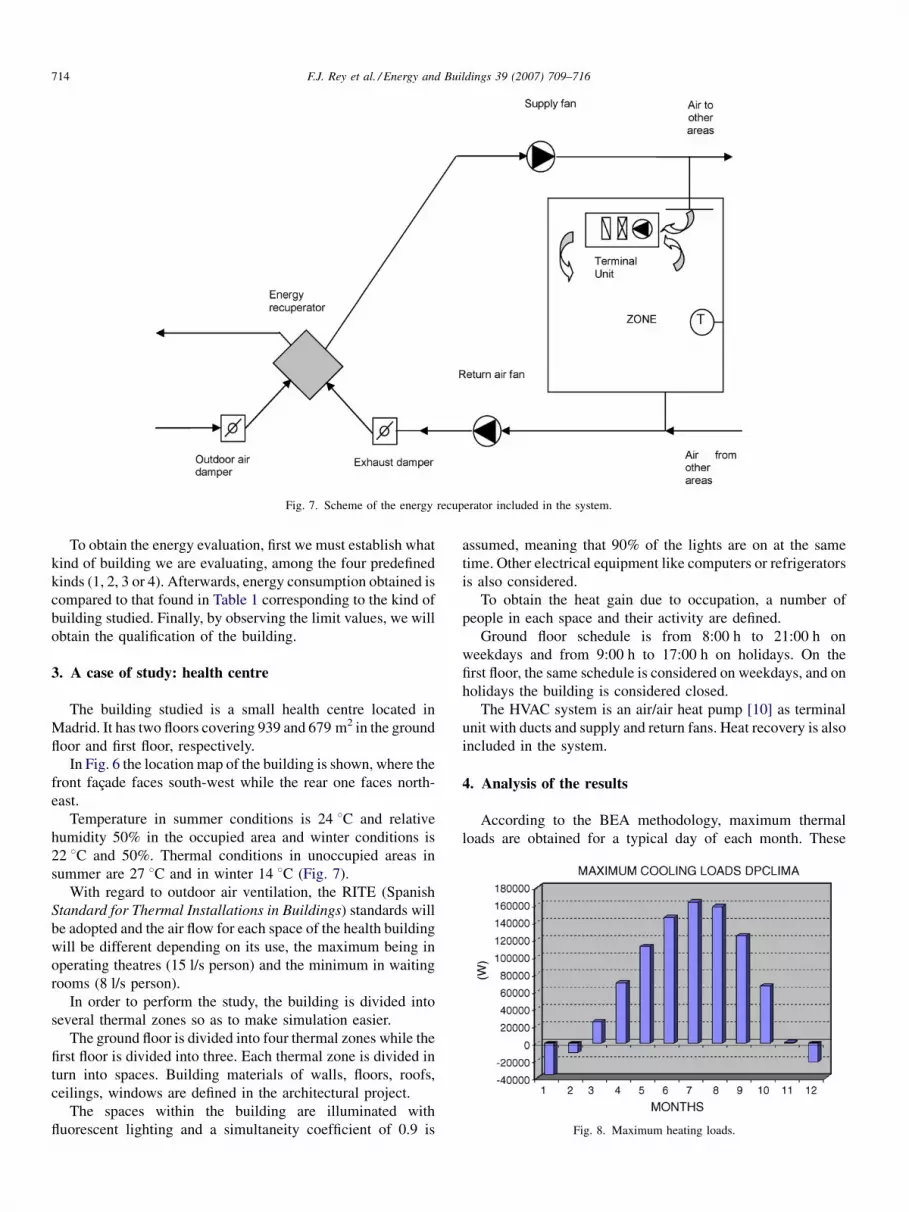
Fig. 7. Scheme of the energy recuperator included in the system.
Fig. 8. Maximum heating loads.
F.J. Rey et al. / Energy and Buildings 39 (2007) 709–716714
To obtain the energy evaluation, first we must establish what
kind of building we are evaluating, among the four predefined
kinds (1, 2, 3 or 4). Afterwards, energy consumption obtained is
compared to that found in Table 1 corresponding to the kind of
building studied. Finally, by observing the limit values, we will
obtain the qualification of the building.
3. A case of study: health centre
The building studied is a small health centre located in
Madrid. It has two floors covering 939 and 679 m2 in the ground
floor and first floor, respectively.
In Fig. 6 the location map of the building is shown, where the
front facade faces south-west while the rear one faces north-
east.
Temperature in summer conditions is 24 8C and relative
humidity 50% in the occupied area and winter conditions is
22 8C and 50%. Thermal conditions in unoccupied areas in
summer are 27 8C and in winter 14 8C (Fig. 7).
With regard to outdoor air ventilation, the RITE (Spanish
Standard for Thermal Installations in Buildings) standards will
be adopted and the air flow for each space of the health building
will be different depending on its use, the maximum being in
operating theatres (15 l/s person) and the minimum in waiting
rooms (8 l/s person).
In order to perform the study, the building is divided into
several thermal zones so as to make simulation easier.
The ground floor is divided into four thermal zones while the
first floor is divided into three. Each thermal zone is divided in
turn into spaces. Building materials of walls, floors, roofs,
ceilings, windows are defined in the architectural project.
The spaces within the building are illuminated with
fluorescent lighting and a simultaneity coefficient of 0.9 is
assumed, meaning that 90% of the lights are on at the same
time. Other electrical equipment like computers or refrigerators
is also considered.
To obtain the heat gain due to occupation, a number of
people in each space and their activity are defined.
Ground floor schedule is from 8:00 h to 21:00 h on
weekdays and from 9:00 h to 17:00 h on holidays. On the
first floor, the same schedule is considered on weekdays, and on
holidays the building is considered closed.
The HVAC system is an air/air heat pump [10] as terminal
unit with ducts and supply and return fans. Heat recovery is also
included in the system.
4. Analysis of the results
According to the BEA methodology, maximum thermal
loads are obtained for a typical day of each month. These

Fig. 9. Minimum heating loads.
Fig. 10. Monthly heating demand.
Fig. 11. Monthly cooling demand.
Fig. 12. Monthly heating consumption.
Fig. 13. Monthly cooling.
Table 2
Consumption, emissions and qualification
Methodology Consumption
(kWh/m2)
Environmental impact
(kg CO2/m2)
Qualification
BEA 227.19 125.15 Good
HAP 240.16 130.88 Good
PowerDOE 275.31 151.01 Good
F.J. Rey et al. / Energy and Buildings 39 (2007) 709–716 715
thermal loads are valid for the design of the HVAC systems
which are to be included in the building.
In Figs. 8 and 9, the heating and cooling thermal loads
throughout the year are shown.
Figs. 10 and 11 show the heating and cooling energy
demands for each month of the year.
By means of the BEA methodology energy consumption can
be obtained, and these results are shown in Figs. 12 and 13.
In Table 2, the energy consumption in every case is shown,
together with CO2 emissions and energy label.
As can be seen in Fig. 14 through the comparison of the
monthly energy consumption of the three methods, BEA differs
from the other two. This is logical since we are dealing with a
statistical model compared to two detailed hourly simulation
tools. However, the trend of the three methods is very similar.
The most important thing to point out is that when the time
interval is expanded into the whole year, these values are much
closer, the difference between BEA and HAP [11] being around
5% and between BEA and PowerDOE [12] about 17%. If the
goal of energy consumption estimation is energy labelling, this
qualification coincides in the three methods.

Fig. 14. Comparison of monthly energy consumptions.
F.J. Rey et al. / Energy and Buildings 39 (2007) 709–716716
Energy evaluation according to BEA methodology is
obtained adding the monthly energy consumptions of the
building and dividing it by the useful area. In our case, this
consumption is 227.19 kW/m2.
The environmental impact caused by CO2 emissions produced
by the building throughout a year, taking into account that the
only source is electricity, amounts to 125.189 kg CO2/m2.
Comparing this obtained value with the table DETR (2000)
for a building type 3, we obtain an energy label of ‘‘GOOD’’.
In order to test the BEA method, two different energy
simulations have been performed in the same building, both
carried out with two internationally well known software tools:
HAP and PowerDOE. The comparison of the results of monthly
energy consumption is shown in Fig. 14.
5. Conclusions
� BEA evaluates energy consumption including final energy
and CO2 emissions.
� I
t is applicable to any kind of new buildings and may beadapted to existing buildings.
� T
his methodology allows energy and environmental analysis,as well as an economic feasibility study.
� B
EA evaluates energy savings achieved in each of theconsidered alternatives.
� T
he methodology provides the results in a simple andstraightforward way.
� I
t provides the building energy characteristics and specifiesits energy performance.
� I
t allows the improvement of the building energy featuresanalysing different systems.
� T
he BEA methodology has been applied to a health centrelocated in Madrid (Spain) showing a very simple method of
energy labelling.
� T
he comparison between the BEA method and two otherinternationally well known energy simulation tools (HAP and
PowerDOE), in a time interval of a year, shows an acceptable
margin of error.
Acknowledgements
This work forms part of the research being carried out within
the framework of the ‘‘Tri-recuperacion de energıa residual a
baja temperatura mediante un sistema combinado’’, project
supported by the Regional Education and Culture Ministry at
the Regional Government of Castilla y Leon. Reference number
VA 059/04.
References
[1] Directive 93/73/EEC of the Council of 13 September 1993 on the
Limitation of the Carbon dioxide Emissions through the Improvement
of Energy Efficiency (SAVE) 1993.
[2] Directive 2002/91/EC of the European Parliament and of the Council of 16
December 2002 on the Energy Performance of Buildings.
[3] Commission of the European Committees, Green Paper, Towards an
European Strategy for the Security of Energy Supply, Brussels, 2000.
[4] X. Garcıa Casals, Analysis of building energy regulation and certification
in Europe. Their role, limitation and differences, Energy and Buildings 38
(5) (2006) 381–392.
[5] F.J. Rey, E. Velasco, F. Varela, Certificacion Energetica de edificios
en Espana, Metodo AEV-AEE, in: Workshop HVAC&R, Valladolid,
2005.
[6] Calener software program (Certificacion energetica de edificios) IDAE.
[7] F.J. Rey, E. Velasco, F. Varela, BEA, A new Spanish methodology
for energy effectiveness in buildings, Study of a practical example,
in: Proceedings of the Third European Congress ECEMEI, Lisboa,
2004.
[8] J.M. Pinazo Ojer, DPclima Software, Universidad Politecnica de Valencia,
2004.
[9] Department of Environment, Transport and the Regions, 2000b. Energy &
Environmental Management. DETR, London, 2000.
[10] F.J. Rey, E. Velasco, F. Varela, Energy certification of buildings, compar-
ison heat pump-gas boiler, in: Workshop ENEBC, Madrid, 2004.
[11] Hourly Analysis Program (HAP) Carrier.
[12] Power Doe Software Program.