breast tomosynthesis: accuracy of tumor measurement compared with digital mammography and...
TRANSCRIPT

ACTA RADIOLOGICA
Breast tomosynthesis: Accuracy of tumor measurement compared with
digital mammography and ultrasonography
DANIEL FÖRNVIK 1 , SOPHIA ZACKRISSON 2 , OTTO LJUNGBERG 3 , TONY SVAHN 1 , PONTUS TIMBERG 1 , ANDERS TINGBERG 1 & INGVAR ANDERSSON 2
1 Department of Medical Radiation Physics, Lund University, Malmö University Hospital, Malmö, Sweden; 2 Diagnostic Centre of Imaging and Functional Medicine, Malmö University Hospital, Malmö, Sweden; 3 Department of Pathology, Malmö University Hospital, Malmö, Sweden
ORIGINAL ARTICLE
Act
a R
adio
l Dow
nloa
ded
from
info
rmah
ealth
care
.com
by
Uni
vers
ity o
f L
und
For
pers
onal
use
onl
y.
Background: Mammographic tumor size measurement can be diffi cult because breast struc-tures are superimposed onto a two-dimensional (2D) plane, potentially obscuring the tumor outline. Breast tomosynthesis (BT) is a 3D X-ray imaging technique in which low-dose images are acquired over a limited angular range at a total dose comparable to digital mammography (DM). These low-dose images are used to mathematically reconstruct a 3D image volume of the breast, thus reducing the problem of superimposed tissue. Purpose: To investigate whether breast cancer size can be more accurately assessed with breast tomosynthesis than with digital mammography and ultrasonography (US), by reducing the disturbance effect of the projected anatomy. Material and Methods: A prototype BT system was used. The main inclusion criterion for BT examination was subtle but suspicious fi ndings of breast cancer on 2D mammography. Sixty-two women with 73 breast cancers were included. BT, DM, and US sizes were mea-sured independently by experienced radiologists without knowledge of the pathology results, which were used as reference. Results: The tumor outline could be determined in signifi cantly more cases with BT (63) and US (60) than DM (49). BT and US size correlated well with pathology ( R �0.86 and R �0.85, respectively), and signifi cantly better than DM size ( R� 0.71). Accordingly, staging was sig-nifi cantly more accurate with BT than with DM. Conclusion: The study indicates that BT is superior to DM in the assessment of breast tumor size and stage.
Key words: Breast; cancer measurement; cancer staging; comparative studies
Daniel F ö rnvik, Department of Medical Radiation Physics, Malm ö University Hospital, SE-205 02 Malm ö , Sweden (tel. + 46 40 33 86 59, fax. + 46 40 33 78 20, e-mail. [email protected])
Submitted September 4, 2009; accepted for publication November 27, 2009
Accurate size prediction of an invasive breast cancer is important in preoperative planning and as a prog-nostic indicator (1–4). With the increased use of breast-conserving surgery and neoadjuvant chemotherapy, the ability to correctly determine maximum tumor extent noninvasively is essential (5, 6). Although pathological measurement is regarded as the gold standard, impor-tant therapeutic decisions must be made on the basis of the tumor size assessed by imaging, as the pathological tumor staging is not yet available.
Preoperative tumor size is commonly measured on mammography and/or ultrasonography (US). The latter is widely available and is particularly valuable in patients with dense breasts, but is known to underesti-mate tumor size (7).
DOI 10.3109/02841850903
Mammographic tumor size measurement is not infrequently made diffi cult since breast structures are superimposed onto a two-dimensional (2D) plane, and this may obscure the tumor outline. In addition, mam-mographic estimates of tumor extent may be infl u-enced by variations in the distance between the tumor and the fi lm/detector, and compression of the breast during examination. Moreover, standard imaging pro-jections do not always capture the maximum tumor extent. These problems may be compounded by cer-tain tumor growth patterns. A tomographic technique such as breast tomosynthesis (BT) would overcome one of the major problems, i.e., reducing the obscuring effect of overlying and underlying breast tissues. Our hypothesis was that size measurements using BT may
524447 © 2010 Informa UK Ltd. (Informa Healthcare, Taylor & Francis AS)

Accuracy of BT, DM, and US in tumor size measurement 241
Act
a R
adio
l Dow
nloa
ded
from
info
rmah
ealth
care
.com
by
Uni
vers
ity o
f L
und
For
pers
onal
use
onl
y.
be more accurate than using digital mammography (DM). This study was designed to evaluate the accu-racy of size measurements in BT, DM, and US using pathological size as a gold standard.
Material and Methods
Patient population Two groups of women were included: women recalled from screening with subtle fi ndings suspicious for malignancy and women referred for clinical symptoms, with subtle or negative fi ndings of malignancy on DM. The Regional Ethical Vetting Board at Lund University (Dnr 159/2006) approved the study, and all patients gave their informed consent.
A total of 74 patients with breast malignancies who underwent BT were included in the study and imaged within a period of 19 months (June 2006 to December 2007). All patients also underwent DM and US exami-nations followed by needle biopsy and surgery. Eight women were excluded since they underwent preopera-tive treatment with chemotherapy. Two women were excluded due to mAs values not complying with the study protocol. One woman was excluded due to distant metas-tasis. In one case, the tissue material was insuffi cient for accurate measurement on pathology, leaving 62 women with 73 malignant breast tumors for evaluation. The age of the patients averaged 60 years (range 42–79 years).
Image acquisition DM was performed using standard craniocaudal (CC) and mediolateral oblique (MLO) projections on dedi-cated digital units (Mammomat Novation; Siemens, Erlangen, Germany). BT was performed on a prototype unit adapted from the Mammomat Novation (Siemens, Erlangen, Germany) (8), and the examinations were carried out immediately following diagnostic DM/US examinations. In patients with suspicious fi ndings on US only, BT was performed in the MLO view; other-wise, one of the two views in which the fi nding was least visible on DM was chosen for BT. This resulted in 6% CC and 94% MLO views of the total BT exami-nations. The principles have been described in more detail in an earlier study (9).
The BT prototype is based on a different amor-phous selenium detector than the DM unit, optimized for very low exposures with rapid readout. It has a pixel size of 85�85 µm in full-resolution mode (DM: 70�70 µm) (8). The BT images were acquired using the same tube voltage and the same anode/fi lter (W/Rh) combination as used for the DM images, determined by the automatic exposure control (AEC) of the DM unit. The entire BT scan, 25 projection images acquired over
an angular range of 50º, was performed using a tube loading twice that of a single DM image, resulting in approximately the same absorbed dose as a two-view mammography. One-millimeter-thick slices parallel to the detector plane were reconstructed using fi ltered backprojection (10).
US was performed on a dedicated unit (Acuson Sequoia; Siemens, Erlangen, Germany) by radiologists specialized in breast imaging. US measurements of the largest tumor extent were recorded on the static images on the diagnostic examination using built-in electronic calipers.
BT, DM, and US images were viewed on a Mam-moreport workstation (Siemens, Erlangen, Germany) using two 5-megapixel fl at-panel monitors (Dome C5i; Planar Systems Inc., Beaverton, Oreg., USA), calibrated according to the DICOM Grayscale Standard Display Function (11). The ambient light level was around 3 lux. During the size measurements, the ability to scroll, zoom, and alter the window level of the images was available.
Radiographic analysis One radiologist (S.Z.) measured the tumor size on BT and DM. Previous results were unknown to the observer, and the size measurements were done independently for each modality (BT and DM). Both DM views were dis-played simultaneously, and the tumor size was measured on both using a calibrated built-in software tool (Syngo Mammoreport; Siemens, Erlangen, Germany). A second reading was performed (I.A.), but only to determine interobserver variation. The evaluation in this study was based on measurements of the fi rst radiologist (S.Z.). The BT size measurement was performed in the slice with the largest tumor extension. The longest axis of a breast tumor was measured to the nearest millimeter using a distance measurement tool in the workstation software. Spicules of a stellate lesion were not included, but rather the nucleus of the tumor (12). In cases with suspicious calcifi cations only, the greatest extent of the microcalci-fi cations was measured. Size measurements were only recorded for CC and MLO views; other views including magnifi cation projections were excluded. Tumors were classifi ed as not measurable in cases of architectural dis-tortion without defi nable borders or in cases where the tumor was partially obscured by dense tissue.
Characteristics that hampered size determination were also noted, e.g., growth pattern of the tumor and breast density. Tumor type was classifi ed as well-defi ned, diffuse borders, spiculated, or architectural distortion. Breast density was classifi ed into three categories based on the American College of Radiology Breast Imaging Reporting and Data System (BI-RADS) (13), as follows: category 1 corresponding to BI-RADS 1 (fatty breast), category 2 corresponding to BI-RADS
Acta Radiol 2010 (3)

D. Förnvik et al.242
Act
a R
adio
l Dow
nloa
ded
from
info
rmah
ealth
care
.com
by
Uni
vers
ity o
f L
und
For
pers
onal
use
onl
y.
2 and 3 (scattered fi broglandular densities or hetero-geneously dense), and category 3 corresponding to BI-RADS 4 (dense breast tissue).
Pathologic analysis The breast specimens were sent to the Department of Pathology where they were immediately examined by a pathologist specialized in breast pathology. The tumor, if any, was identifi ed and cut sagitally into parallel slices, approximately 5 mm in thickness. The slice with the cut surface exhibiting the largest dimen-sions of the tumor was identifi ed. By using a combina-tion of palpation and inspection, the largest and the perpendicular diameters were measured to the nearest millimeter (14). The largest diameter was chosen as the tumor size.
Each slice of breast tissue was stretched over a paper towel, and the entire specimen was then immersed in 10% buffered formalin. After fi xation for about 24 hours, blocks of tissue (approximately 4�6 cm in size) including the tumor and its surroundings were cut out from the tissue slices, dehydrated, and embedded in paraffi n. Histological sections, approximately 4 µm in thickness, were cut from paraffi n blocks, deparaf-fi nized, and stained with hematoxylin-eosin. By using large-sized sections, the entire sagittal extension of most of the tumors (i.e., those less than 4�6 cm) could be included in one section. The largest dimension of the tumor exhibited in the histological section was identi-fi ed and measured. In a minority of cases, the exten-sions of the tumor seen in the histological sections were found to be signifi cantly greater than those that had been estimated on the gross specimens. This was usually the case when the tumor was less well delineated and its margins diffi cult to identify grossly, e.g., diffusely growing lobular carcinomas or spiculated carcinomas of tubular or ductal type. In such cases, the largest dimension of the tumor measured on the histological section was considered to constitute the tumor size, instead of the gross measure. In summary, tumor size
Acta Radiol 2010 (3)
Table 1. Number of measurable tumors, by modality
BT
DM
(same view as BT)
Measurable 63 38*
Not measurable 5 11
Not visible 5 24*
Imaging error† 0 0
Total 73 73
BT: breast tomosynthesis; DM: digital mammography; US: ultrasound.
*Statistical signifi cance: P �0.05, using χ 2 test for comparison of proportio
†Tumor was not captured in the image projection.
thus was considered equivalent to the largest sagittal extension regardless of whether this was derived from gross or histological measurements.
Statistical analysis Scatter plots for each of the imaging measurements versus the pathology measurements and linear regression analysis were generated using the MedCalc program (version 9.6.4.0; MedCalc Software, Mariakerke, Belgium). Calculation of Pearson’s R was done in order to compare different imaging measurement methods with the pathological size. Hypothesis tests for diffe-rences between correlations and proportions were done using paired t and c 2 tests, respectively. The size differ-ences in millimeters between imaging modality mea-surements and pathology measurements were plotted, following the approach of BLAND and ALTMAN (15). The measurements were considered concordant if they were within 2 mm. P values for comparative perfor-mance in size determination were calculated. Interob-server variations for BT and DM were compared using the McNemar test for discordant classifi cations and paired t test for size measurement comparison. Over- and underclassifi cation of pathologic tumor staging (pTNM) based on clinical staging (TNM) size for the respective modalities was examined using the c 2 test for comparison of proportions.
Results
Types of tumor, visibility, and density Of the 73 malignant breast tumors, 43 (59%) were invasive ductal cancers (IDC), 14 (19%) invasive lob-ular cancers (ILC), fi ve (7%) tubular cancers, fi ve (7%) ductal carcinoma in situ (DCIS), two (3%) intracystic papillary carcinoma, one (1%) IDC with DCIS, one (1%) mucinous carcinoma, one (1%) tubular cancer with DCIS, and one (1%) lobular carcinoma in situ (LCIS). The median pathologic tumor size was 15 mm (range 5–50 mm).
DM
(complementary view)
DM
(two views) US
39* 49* 60
10 6 3
22* 18* 10
2 0 0
73 73 73
n to BT.

Accuracy of BT, DM, and US in tumor size measurement 243
Act
a R
adio
l Dow
nloa
ded
from
info
rmah
ealth
care
.com
by
Uni
vers
ity o
f L
und
For
pers
onal
use
onl
y.
Signifi cantly more tumors could be measured on BT (63, 86%) than on DM (49, 67%), whether we com-pared with one or two views, but only marginally more than on US (60, 82%) (Table 1, Fig. 1). Fewer tumors were not measurable on BT compared with the same DM view, although this difference was not statisti-cally signifi cant (Fig. 2). A signifi cantly larger number of malignancies were not visible on DM compared with BT (24 and fi ve, respectively). When combining the information from the two DM views, the number of measurable tumors increased to 49 and those not measurable and not visible decreased to six and 18, respectively. There was no signifi cant difference in the estimation of the number of tumors classifi ed as measurable by the initial and second observer for BT and DM (63 and 66 for BT, and 49 and 46 for DM, respectively) ( P �0.05).
In seven BT examinations, tumor size was measured on the basis of the extent of calcifi cations, compared with eight cases on DM. The remaining tumors were measured on the basis of the soft-tissue component.
BT was less sensitive to the density of the breast parenchyma compared with DM in terms of propor-tion of measurable tumors (Table 2). Accordingly, the greatest difference was seen in women with dense paren-chyma, although statistical signifi cance between BT and DM (2-views) was only observed for intermediate parenchyma and not for dense parenchyma, probably due to small sample size. US was slightly better than BT in dense breasts.
Size agreement between respective imaging methods and pathology BT had the highest proportion (62%) of concordant cases with pathology, although this was not statistically signifi cant from DM and US (Table 3).
Fig. 3 shows the deviations in the size of the tumors determined with BT, DM, and US, respectively, com-pared with the size determined on pathology. Com-pared with pathology, tumor size was underestimated signifi cantly ( P �0.05) for all imaging modalities, although this was least apparent for BT. Notable was that above a tumor size of around 20 mm, the deviation increased considerably for all imaging modalities. Of those above 20 mm, 38% (6/16) were growing multifo-cally or diffusely infi ltrating and another 19% (3/16) represented tumors with extensive growth of DCIS, in some cases only partially calcifi ed.
The correlation coeffi cients ( R ) of BT, DM, and US to pathologic size were 0.86 (residual standard devia-tion (RSD) 4.1 mm), 0.71 (RSD 6.1 mm), and 0.85
Fig. 1. A 67-year-old asymptomatic woman with a measurable tumor on breast tomosynthesis but not measurable on digital mammography. A. Tomosynthesis in the oblique view shows a well-defi ned spiculated tumor (circle) whose largest diameter was measured to be 12 mm. B. On the corresponding 2D view, an ill-defi ned area of increased density is seen (circle). On histopathology, a 15-mm invasive ductal carcinoma grade 3 was found.
Fig. 2. A 49-year-old asymptomatic woman with a visible but not mea-surable tumor. Tomosynthesis (as well as 2D mammography) shows a large area of architectural distortion (circle) without a measurable tumor nucleus in the center. On histopathology, a 5-mm invasive ductal carci-noma grade 2 was found as well as a 22-mm ductal carcinoma in situ.
Acta Radiol 2010 (3)

D. Förnvik et al.244
Table 2. Percentage of measurable tumors in relation to breast density classifi cation
Total BT
DM
(same view as BT)
DM
(complementary view)
DM
(two views) US
n % % % % %
1) fatty
parenchyma
22 91 73 68 87 77
2) intermediate
parenchyma
37 84 43* 54* 59* 81
3) dense
parenchyma
14 86 43* 33†* 57 93
Abbreviations as in Table 1.
*Statistical signifi cance: P �0.05, using χ 2 test for comparison of proportion to BT.
†Two breast cancers were not captured in the image projection and hence excluded.
Act
a R
adio
l Dow
nloa
ded
from
info
rmah
ealth
care
.com
by
Uni
vers
ity o
f L
und
For
pers
onal
use
onl
y.
(RSD 4.0 mm), respectively ( P �0.001). The BT corre-lation coeffi cient was signifi cantly higher compared with DM ( P �0.035). US also had higher correlation coeffi cient compared with DM ( P �0.050). In addition, a separate calculation of the correlation coeffi cient was done for tumors up to and including 20 mm. The correlation coeffi cients for BT ( n �50), DM ( n �40), |and US ( n �47) were 0.91 (RSD 2.1 mm), 0.74 (RSD 3.3 mm), and 0.83 (RSD 2.8 mm), respectively ( P �0.001). There was no statistically signifi cant dif-ference in the size measurement of tumors by the initial and second observer for BT and DM ( P �0.05).
Table 4 shows that 79% (58/73) were correctly staged on BT, compared with 52% (38/73) on DM ( P �0.0009). US showed no major differences compared to BT ( P �0.05).
Discussion
Accurate measurement of tumor extent is impor-tant for tumor staging, which in turn is an important parameter for decisions on treatment. The main fi nd-ings in this study were a better correlation between tumor size measured on BT and pathology compared with DM and pathology; furthermore, a signifi cantly larger proportion of the tumors were measurable with BT. Accordingly, tumor staging was signifi cantly more accurate on BT compared with DM.
Acta Radiol 2010 (3)
Table 3. Size agreement, by imaging modality and pathological size ( n , (%
BT
DM
(same view as BT)
Median size 13 mm 12 mm
Range 3–44 mm 4–50 mm
Overestimation 8 (13) 5 (13)
No size discrepancy 39 (62) 19 (50)
Underestimation 16 (25) 14 (37)
Total 63 (100) 38 (100)
Abbreviations as in Table 1.
The patient material was primarily selected for a fea-sibility study of tomosynthesis and has been described in more detail earlier (9). Basically, only cases that were diffi cult to interpret in 2D digital mammography were chosen for the study. BT was performed in the view where the cancer was least or not visible. In the majority of the cases, this was the oblique view. It can be argued that this principle of case selection could have introduced a bias in favor of BT. However, the aim of the study was to see whether the new technique could offer improved information compared with the existing standard digital mammography. The most expedient way to accomplish this goal in a limited series was to choose diffi cult cases. The impact of the superior accuracy of tumor measurement in BT in an unselected patient material or in a screening material remains to be demonstrated.
There are two important mechanisms explaining why a tumor is not seen or diffi cult to outline on 2D mammography: the anatomical noise (dense breast parenchyma) and the growth pattern of the tumor. For instance, some lobular invasive cancers grow in multiple small foci or even in single rows of cells, diffusely infi l-trating the normal breast structures without forming an evident tumor on the mammogram. It appears from Fig. 3 that there was a better correlation between size measurements on imaging and pathology up to a tumor size of about 20 mm compared with larger tumors.
))
DM
(complementary view)
DM
(two views) US
12 mm 12 mm 12 mm
5–54 mm 5–54 mm 5–38 mm
4 (10) 6 (12) 5 (8)
22 (56) 25 (51) 34 (57)
13 (33) 18 (37) 21 (35)
39 (100) 49 (100) 60 (100)

Accuracy of BT, DM, and US in tumor size measurement 245
Act
a R
adio
l Dow
nloa
ded
from
info
rmah
ealth
care
.com
by
Uni
vers
ity o
f L
und
For
pers
onal
use
onl
y.
The anatomical noise may be the main factor obscuring smaller tumors—a problem that is signifi cantly reduced by tomosynthesis—while the growth pattern seems to be the main problem with the larger tumors—a problem that is only marginally reduced by BT. The problematic growth patterns included multifocal or diffusely infi l-trating lobular invasive carcinoma, architectural distor-tion without evident tumor mass, and grade 3 tumors with nonspecifi c characteristics making them diffi cult to differentiate from normal glandular tissue. The larger tumors were usually palpable and chosen for BT due to an apparent discrepancy between the physical fi ndings and the fi ndings on DM.
A limitation of the current study was that only one breast was examined with BT; thus, nonspecifi c asym-metrical densities were not readily appreciated. Another source of major deviation was the presence of extensive calcifi cation representing DCIS but also containing inva-sive components. The true extent of such calcifi cations may be diffi cult to assess on pathology. Due to their
small size and often scattered distribution they may not be captured by the thin histological sections used for microscopy. However, on BT and DM, the calci-fi ed component can be measured quite accurately and thus falsely recorded as overestimated on BT and DM. The solid components, which may represent invasive or noninvasive disease, were more easily identifi ed and measured on US.
Pathologic tumor assessment of a resected breast tumor may involve another uncertainty. The plane of slicing that was chosen may not have captured the maximum tumor extent, and, because of the slicing technique, it may be hard to measure the tumor extent in the orthogonal plane.
Another explanation for underestimation of tumor size on BT and DM is that the approximation of the tumor outline in spiculated cancers was too conserva-tive. Most previous studies of 2D mammography also showed an underestimation, which was also true for US (16–20). The problem relates to the fact that it is not
Fig. 3. Deviation of breast tomosynthesis (BT) measured breast cancer sizes ( n �63) (A), digital mammography (DM) (same view as BT) measured sizes ( n �38) (B), DM (complementary view) measured sizes ( n �39) (C), DM (two views) measured sizes ( n �49) (D), and ultrasonography (US) measured sizes ( n �60) (E) from pathology sizes. The mean of the deviation (thick dashed lines) and ±1.96 SD limits (thin dashed lines) are illustrated on each graph.
Acta Radiol 2010 (3)
D. Förnvik et al.246
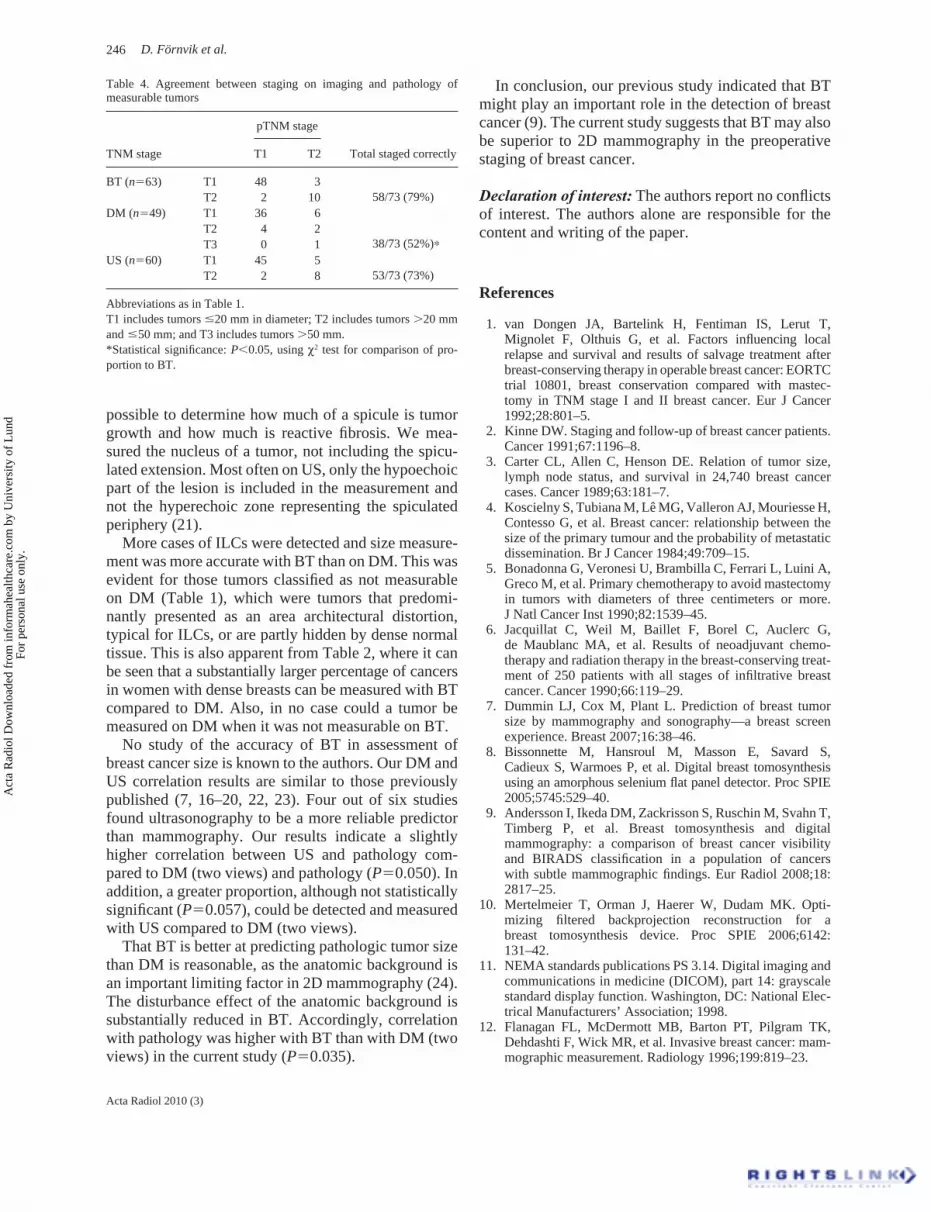
Table 4. Agreement between staging on imaging and pathology of measurable tumors
pTNM stage
TNM stage T1 T2 Total staged correctly
BT (n�63) T1 48 3
58/73 (79%)T2 2 10
DM (n�49) T1 36 6
38/73 (52%)∗T2 4 2
T3 0 1
US (n�60) T1 45 5
53/73 (73%)T2 2 8
Abbreviations as in Table 1.
T1 includes tumors �20 mm in diameter; T2 includes tumors �20 mm
and � 50 mm; and T3 includes tumors �50 mm.
*Statistical signifi cance: P �0.05, using χ 2 test for comparison of pro-
portion to BT.
Act
a R
adio
l Dow
nloa
ded
from
info
rmah
ealth
care
.com
by
Uni
vers
ity o
f L
und
For
pers
onal
use
onl
y.
possible to determine how much of a spicule is tumor growth and how much is reactive fi brosis. We mea-sured the nucleus of a tumor, not including the spicu-lated extension. Most often on US, only the hypoechoic part of the lesion is included in the measurement and not the hyperechoic zone representing the spiculated periphery (21).
More cases of ILCs were detected and size measure-ment was more accurate with BT than on DM. This was evident for those tumors classifi ed as not measurable on DM (Table 1), which were tumors that predomi-nantly presented as an area architectural distortion, typical for ILCs, or are partly hidden by dense normal tissue. This is also apparent from Table 2, where it can be seen that a substantially larger percentage of cancers in women with dense breasts can be measured with BT compared to DM. Also, in no case could a tumor be measured on DM when it was not measurable on BT.
No study of the accuracy of BT in assessment of breast cancer size is known to the authors. Our DM and US correlation results are similar to those previously published (7, 16–20, 22, 23). Four out of six studies found ultrasonography to be a more reliable predictor than mammography. Our results indicate a slightly higher correlation between US and pathology com-pared to DM (two views) and pathology ( P �0.050). In addition, a greater proportion, although not statistically signifi cant ( P �0.057), could be detected and measured with US compared to DM (two views).
That BT is better at predicting pathologic tumor size than DM is reasonable, as the anatomic background is an important limiting factor in 2D mammography (24). The disturbance effect of the anatomic background is substantially reduced in BT. Accordingly, correlation with pathology was higher with BT than with DM (two views) in the current study ( P �0.035).
Acta Radiol 2010 (3)
In conclusion, our previous study indicated that BT might play an important role in the detection of breast cancer (9). The current study suggests that BT may also be superior to 2D mammography in the preoperative staging of breast cancer.
Declaration of interest: The authors report no confl icts of interest. The authors alone are responsible for the content and writing of the paper.
References
van Dongen JA, Bartelink H, Fentiman IS, Lerut T, 1. Mignolet F, Olthuis G, et al. Factors infl uencing local relapse and survival and results of salvage treatment after breast-conserving therapy in operable breast cancer: EORTC trial 10801, breast conservation compared with mastec-tomy in TNM stage I and II breast cancer. Eur J Cancer 1992;28:801–5. Kinne DW. Staging and follow-up of breast cancer patients. 2. Cancer 1991;67:1196–8. Carter CL, Allen C, Henson DE. Relation of tumor size, 3. lymph node status, and survival in 24,740 breast cancer cases. Cancer 1989;63:181–7. Koscielny S, Tubiana M, Lê MG, Valleron AJ, Mouriesse H, 4. Contesso G, et al. Breast cancer: relationship between the size of the primary tumour and the probability of metastatic dissemination. Br J Cancer 1984;49:709–15. Bonadonna G, Veronesi U, Brambilla C, Ferrari L, Luini A, 5. Greco M, et al. Primary chemotherapy to avoid mastectomy in tumors with diameters of three centimeters or more. J Natl Cancer Inst 1990;82:1539–45. Jacquillat C, Weil M, Baillet F, Borel C, Auclerc G, 6. de Maublanc MA, et al. Results of neoadjuvant chemo-therapy and radiation therapy in the breast-conserving treat-ment of 250 patients with all stages of infi ltrative breast cancer. Cancer 1990;66:119–29. Dummin LJ, Cox M, Plant L. Prediction of breast tumor 7. size by mammography and sonography—a breast screen experience. Breast 2007;16:38–46. Bissonnette M, Hansroul M, Masson E, Savard S, 8. Cadieux S, Warmoes P, et al. Digital breast tomosynthesis using an amorphous selenium fl at panel detector. Proc SPIE 2005;5745:529–40. Andersson I, Ikeda DM, Zackrisson S, Ruschin M, Svahn T, 9. Timberg P, et al. Breast tomosynthesis and digital mammography: a comparison of breast cancer visibility and BIRADS classifi cation in a population of cancers with subtle mammographic fi ndings. Eur Radiol 2008;18:2817–25. Mertelmeier T, Orman J, Haerer W, Dudam MK. Opti-10. mizing fi ltered backprojection reconstruction for a breast tomosynthesis device. Proc SPIE 2006;6142:131–42. NEMA standards publications PS 3.14. Digital imaging and 11. communications in medicine (DICOM), part 14: grayscale standard display function. Washington, DC: National Elec-trical Manufacturers’ Association; 1998. Flanagan FL, McDermott MB, Barton PT, Pilgram TK, 12. Dehdashti F, Wick MR, et al. Invasive breast cancer: mam-mographic measurement. Radiology 1996;199:819–23.
Accuracy of BT, DM, and US in tumor size measurement 247
Act
a R
adio
l Dow
nloa
ded
from
info
rmah
ealth
care
.com
by
Uni
vers
ity o
f L
und
For
pers
onal
use
onl
y.
American College of Radiology. Breast imaging reporting 13. and data system (BI-RADS). 2nd edition. Reston, VA: American College of Radiology; 1995. Elston CW, Ellis IO. Systemic pathology. In: Elston CW, 14. Ellis IO, editors. The breast, 3rd edition, vol. 13. Edinburgh: Churchill Livingstone; 1998. p. 385–434. Bland JM, Altman DG. Statistical methods for assessing 15. agreement between two methods of clinical measurement. Lancet 1986;1:307–10. Segara D, Krop IE, Garber JE, Winer E, Harris L, Bellon JR, 16. et al. Does MRI predict pathologic tumor response in women with breast cancer undergoing preoperative chemotherapy? J Surg Oncol 2007;96:474–80. Pritt B, Ashikaga T, Oppenheimer RG, Weaver DL. Infl u-17. ence of breast cancer histology on the relationship between ultrasound and pathology tumor size measurements. Mod Pathol 2004;17:905–10. Bosch AM, Kessels AG, Beets GL, Rupa JD, Koster D, 18. van Engelshoven JM, et al. Preoperative estimation of the pathological breast tumour size by physical examination, mammography and ultrasound: a prospective study on 105 invasive tumours. Eur J Radiol 2003;48:285–92.
Hieken TJ, Harrison J, Herreros J, Velasco JM. Correlating 19. sonography, mammography, and pathology in the assess-ment of breast cancer size. Am J Surg 2001;182:351–4. Pierie JPEN, Perre CI, Levert LM, de Hooge P. Clinical 20. assessment, mammography and ultrasonography as methods of measuring the size of breast cancer: a comparison. Breast 1998;7:247–50. Teuber J. Echomammography: technique and results. 21. In: Friedrich M, Sickles EA, editors. Radiological diag-nosis of breast diseases. Berlin: Springer-Verlag; 1997. p. 181–220. Davis PL, Staiger MJ, Harris KB, Ganott MA, 22. Klementaviciene J, McCarty KS Jr, et al. Breast cancer mea-surements with magnetic resonance imaging, ultrasonog-raphy, and mammography. Breast Cancer Res Treat 1996; 37:1–9. Fornage BD, Toubas O, Morel M. Clinical, mammographic, 23. and sonographic determination of preoperative breast cancer size. Cancer 1987;60:765–71. Bochud FO, Valley JF, Verdun FR, Hessler C, Schnyder P. 24. Estimation of the noisy component of anatomical back-grounds. Med Phys 1999;26:1365–70.
Acta Radiol 2010 (3)