breast density segmentation: a comparison of clustering and region based techniques
TRANSCRIPT
Breast Density Segmentation: A Comparison of
Clustering and Region Based Techniques
A. Torrent1, A. Bardera2, A. Oliver1, J. Freixenet1, I. Boada2, M. Feixes2,R. Martı1, X. Llado1, J. Pont3, E. Perez3, S. Pedraza3, and J. Martı1
1 Computer Vision and Robotics Group, University of Girona, Catalonia, [email protected]
2 Graphics & Imaging Laboratory, University of Girona, Catalonia, Spain3 Department of Radiology, Hospital Josep Trueta of Girona, Catalonia, Spain
Abstract. This paper presents a comparison of two clustering based al-gorithms and one region based algorithm for segmenting fatty and densetissue in mammographic images. This is a crucial step in order to obtaina quantitative measure of the density of the breast. The first algorithmis a multiple thresholding algorithm based on the excess entropy, thesecond one is based on the Fuzzy C-Means clustering algorithm, and thethird one is based on a statistical analysis of the breast. The performanceof the algorithms is exhaustively evaluated using a database of full-fielddigital mammograms containing 150 CC and 150 MLO images and ROCanalysis (ground-truth provided by an expert). Results demonstrate thatthe use of region information is useful to obtain homogeneous region seg-mentation, although clustering algorithms obtained better sensitivity.
1 Introduction
Recent studies have shown that the performance of mammographic Computer-Aided Detection systems decreases as the density of the breast increases, eitherdecreasing the sensitivity [1,2] or increasing the specificity [3]. Thus, the seg-mentation of breast density is beneficial not only for estimating the quantityof breast dense tissue, but also for establishing specific abnormalities detectionprocedures according to the type of tissue (i.e. fatty or dense).
The different algorithms proposed so far for breast density segmentation canbe classified into two main categories: clustering or region based. In the formercategory, each pixel is classified using only its characteristics, i.e. without takingthe information of neighboring pixels into account. Examples of algorithms be-longing to this category are the works of Boyd et al. [4] and Sivaramakrishna etal. [5] who used a gray-level thresholding technique to segment the breast intodense and fatty regions, or the proposals of Aylward et al. [6] and Ferrari et al [7],who used Gaussian mixtures for segmenting the breast in five and four regionsrespectively. On the other hand, region based algorithms relies on classifying thepixels of the mammogram taking neighborhood information into account, i.e.considering the class of its neighbors. Examples of this approach are the work ofSaha et al. [8] who used a fuzzy affinity function, or the works of Zwiggelaar and
E.A. Krupinski (Ed.): IWDM 2008, LNCS 5116, pp. 9–16, 2008.c© Springer-Verlag Berlin Heidelberg 2008
10 A. Torrent et al.
Denton [9] and Petroudi et al. [10] where textural features were used to take thespatial distribution of the pixel and its neighborhood into account.
In this paper we provide a quantitative comparison among two clusteringbased algorithms and one region based. The evaluation of our experiments isdone using the well-known ROC analysis. Note that one of the goals of our workis to provide a novel benchmark for automatic mammographic density quan-tification from which newly developed techniques could be directly compared.Remember that nowadays this is usually done by manual inspection of the seg-mented images. The rest of this paper is organized as follows. The followingSection describe the analyzed algorithms. Afterwards, experimental results arepresented and the application of our work to breast density classification is de-scribed. The paper ends with the conclusions.
2 Breast Density Segmentation
2.1 Thresholding Based on Excess Entropy (EE)
This approach is based on information theory. Given a sequence of randomvariables X0, X1, . . . taking values x in X with probability distribution p(x),its structure can be expressed by the excess entropy [11], which is defined by:
E =∞∑
L=1
(hx(L) − hx) = limL→∞
[H(XL) − hxL] (1)
where hx(L) = H(XL|XL−1 . . . X1) is the entropy of a symbol conditioned on ablock of L − 1 adjacent symbols, H(XL) is the Shannon entropy of a sequenceof L random variables, and hx is the entropy rate of the sequence [11,12].
From the assumption that a medical image is structured in regions, the opti-mal thresholding should provide us with the maximum structure, i.e., the max-imum excess entropy. In consequence, this proposal consists in quantizing thehistogram by using the maximization of excess entropy. In the context of animage, X represents the set of clusters or bins of the image histogram and xL
is given by a set of L neighbor intensity values. To compute the excess entropy,the concept of neighborhood has to be defined. This notion is unique and un-ambiguous in 1D, because only two neighbors per intensity value are possible.However, the extension to 2D or 3D introduces ambiguity, since the voxels canbe selected in different ways [11].
On the other hand, excess entropy (1) has been defined from L-block entropieswhen L → ∞. In practice, L-block entropies for high L can not be computedsince the number of elements of the joint histogram is given by NL, where N isthe cardinality of the system (the number of clusters or bins of the segmentedimage histogram). Thus, a tradeoff between the accuracy of the measure and thenumber of clusters has to be assumed.
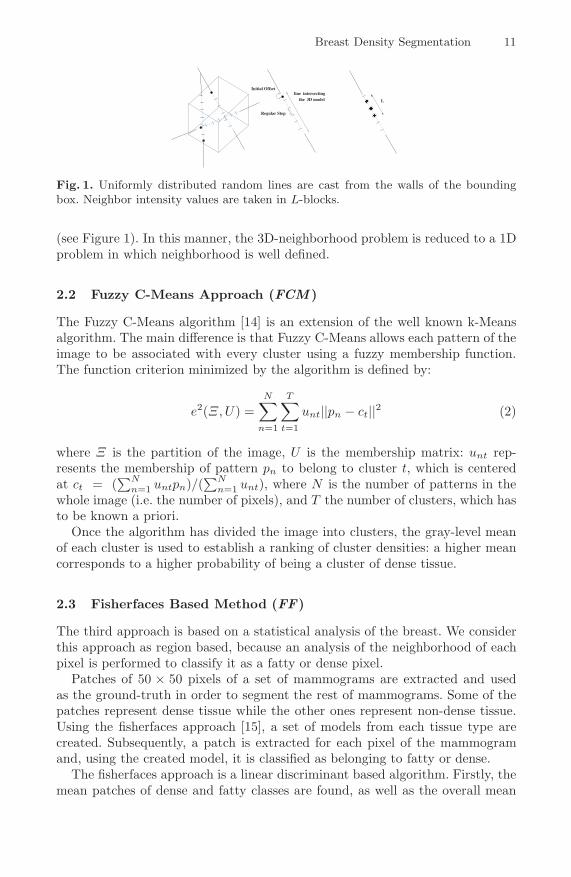
To overcome the neighborhood problem, the uniformly distributed randomlines approach is used [13]. Points chosen on each line provide us with the inten-sities to calculate the L-block entropies, required to compute the excess entropy
Breast Density Segmentation 11
L3D modelthe intersectingline
Regular Step
Initial Offset
����
������
Fig. 1. Uniformly distributed random lines are cast from the walls of the boundingbox. Neighbor intensity values are taken in L-blocks.
(see Figure 1). In this manner, the 3D-neighborhood problem is reduced to a 1Dproblem in which neighborhood is well defined.
2.2 Fuzzy C-Means Approach (FCM )
The Fuzzy C-Means algorithm [14] is an extension of the well known k-Meansalgorithm. The main difference is that Fuzzy C-Means allows each pattern of theimage to be associated with every cluster using a fuzzy membership function.The function criterion minimized by the algorithm is defined by:
e2(Ξ, U) =N∑
n=1
T∑
t=1
unt||pn − ct||2 (2)
where Ξ is the partition of the image, U is the membership matrix: unt rep-resents the membership of pattern pn to belong to cluster t, which is centeredat ct = (
∑Nn=1 untpn)/(
∑Nn=1 unt), where N is the number of patterns in the
whole image (i.e. the number of pixels), and T the number of clusters, which hasto be known a priori.
Once the algorithm has divided the image into clusters, the gray-level meanof each cluster is used to establish a ranking of cluster densities: a higher meancorresponds to a higher probability of being a cluster of dense tissue.
2.3 Fisherfaces Based Method (FF)
The third approach is based on a statistical analysis of the breast. We considerthis approach as region based, because an analysis of the neighborhood of eachpixel is performed to classify it as a fatty or dense pixel.
Patches of 50 × 50 pixels of a set of mammograms are extracted and usedas the ground-truth in order to segment the rest of mammograms. Some of thepatches represent dense tissue while the other ones represent non-dense tissue.Using the fisherfaces approach [15], a set of models from each tissue type arecreated. Subsequently, a patch is extracted for each pixel of the mammogramand, using the created model, it is classified as belonging to fatty or dense.
The fisherfaces approach is a linear discriminant based algorithm. Firstly, themean patches of dense and fatty classes are found, as well as the overall mean
12 A. Torrent et al.
patch. Subsequently, each patch is subtracted from the mean of its correspondingclass, and this value is used to compute the between-class scatter (the dispersionamong each class means) and the within-class scatter (the overall sum of thedispersion inside each class). The final aim is to find the subspace where boththe between-class scatter is maximized and the within-class minimized. Subse-quently, each patch of the training is projected in this subspace and a model iscreated. When classifying a new patch, it is also projected into that subspaceand classified according to the most similar class using the k-Nearest Neighboralgorithm.
In contrast to both described approaches, in this work we do not perform afinal classification of the pixels between both classes, but we give a membership(Φ) for each pixel. This is found as:
Φ =12
1dD+1 − 1
dF +11
dD+1 + 1dF +1
+12
(3)
where dD and dF are the Euclidean distances between the patch centered at thepixel and the closest dense and fatty instances, respectively. Note that the first andfinal fractions are constant values that normalize this value between 0 (when it issure the patch is not dense tissue) and 1 (it is sure that the patch is dense tissue).
3 Experimental Results
To evaluate the proposed methods we used a database of digital mammograms,containing 125 CC and 125 MLO views of the same breast of 75 women (thereare 50 complete cases including left and right mammograms, and 25 where onlyone view is provided). The mammograms are acquired using a full-field digitalmammograph (Siemens Mammomat Novation), and stored in DICOM format ina PACS server. The mammograms are 70 micron pixel edge.
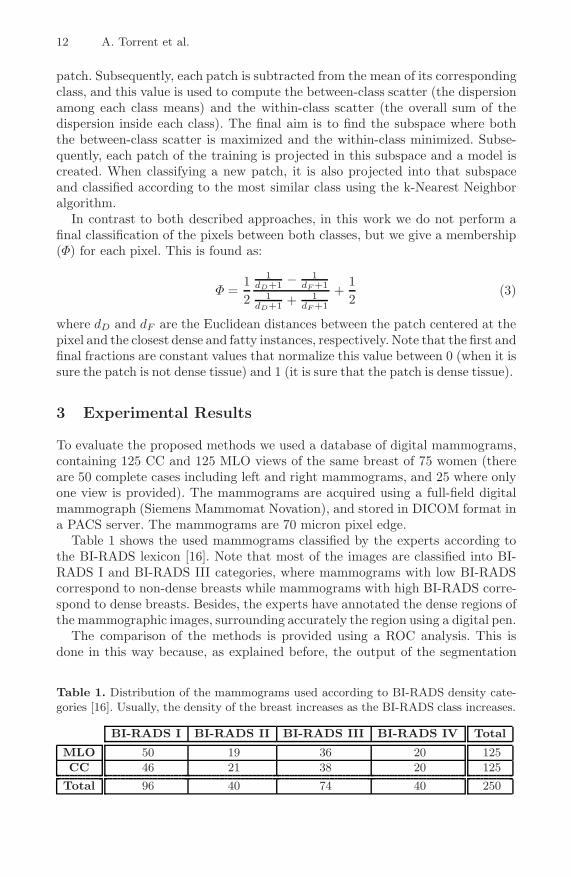
Table 1 shows the used mammograms classified by the experts according tothe BI-RADS lexicon [16]. Note that most of the images are classified into BI-RADS I and BI-RADS III categories, where mammograms with low BI-RADScorrespond to non-dense breasts while mammograms with high BI-RADS corre-spond to dense breasts. Besides, the experts have annotated the dense regions ofthe mammographic images, surrounding accurately the region using a digital pen.
The comparison of the methods is provided using a ROC analysis. This isdone in this way because, as explained before, the output of the segmentation
Table 1. Distribution of the mammograms used according to BI-RADS density cate-gories [16]. Usually, the density of the breast increases as the BI-RADS class increases.
BI-RADS I BI-RADS II BI-RADS III BI-RADS IV Total
MLO 50 19 36 20 125
CC 46 21 38 20 125
Total 96 40 74 40 250
Breast Density Segmentation 13
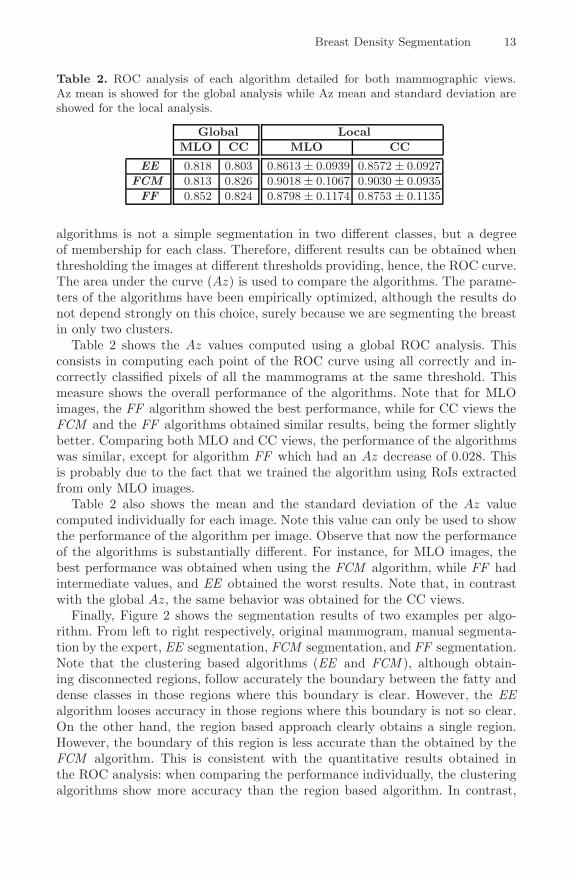
Table 2. ROC analysis of each algorithm detailed for both mammographic views.Az mean is showed for the global analysis while Az mean and standard deviation areshowed for the local analysis.
Global Local
MLO CC MLO CC
EE 0.818 0.803 0.8613 ± 0.0939 0.8572 ± 0.0927
FCM 0.813 0.826 0.9018 ± 0.1067 0.9030 ± 0.0935
FF 0.852 0.824 0.8798 ± 0.1174 0.8753 ± 0.1135
algorithms is not a simple segmentation in two different classes, but a degreeof membership for each class. Therefore, different results can be obtained whenthresholding the images at different thresholds providing, hence, the ROC curve.The area under the curve (Az) is used to compare the algorithms. The parame-ters of the algorithms have been empirically optimized, although the results donot depend strongly on this choice, surely because we are segmenting the breastin only two clusters.
Table 2 shows the Az values computed using a global ROC analysis. Thisconsists in computing each point of the ROC curve using all correctly and in-correctly classified pixels of all the mammograms at the same threshold. Thismeasure shows the overall performance of the algorithms. Note that for MLOimages, the FF algorithm showed the best performance, while for CC views theFCM and the FF algorithms obtained similar results, being the former slightlybetter. Comparing both MLO and CC views, the performance of the algorithmswas similar, except for algorithm FF which had an Az decrease of 0.028. Thisis probably due to the fact that we trained the algorithm using RoIs extractedfrom only MLO images.
Table 2 also shows the mean and the standard deviation of the Az valuecomputed individually for each image. Note this value can only be used to showthe performance of the algorithm per image. Observe that now the performanceof the algorithms is substantially different. For instance, for MLO images, thebest performance was obtained when using the FCM algorithm, while FF hadintermediate values, and EE obtained the worst results. Note that, in contrastwith the global Az, the same behavior was obtained for the CC views.
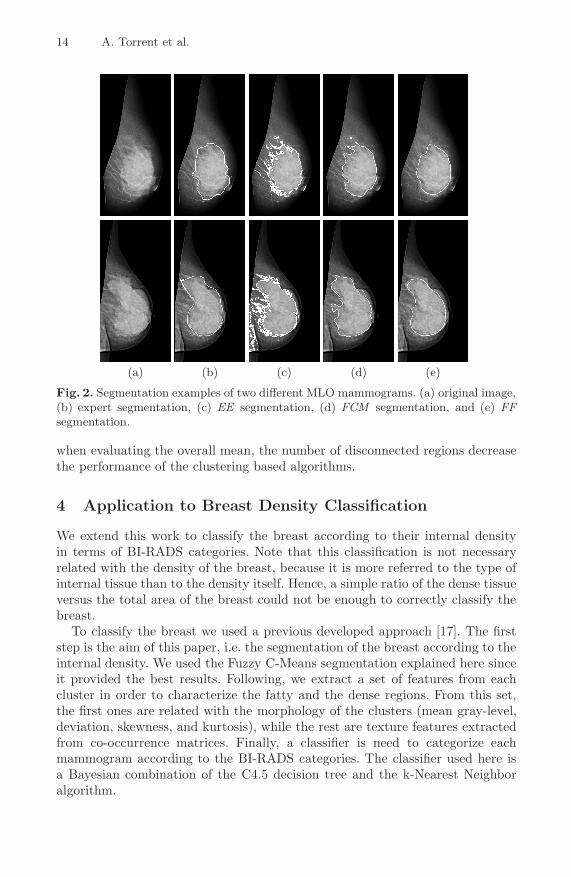
Finally, Figure 2 shows the segmentation results of two examples per algo-rithm. From left to right respectively, original mammogram, manual segmenta-tion by the expert, EE segmentation, FCM segmentation, and FF segmentation.Note that the clustering based algorithms (EE and FCM ), although obtain-ing disconnected regions, follow accurately the boundary between the fatty anddense classes in those regions where this boundary is clear. However, the EEalgorithm looses accuracy in those regions where this boundary is not so clear.On the other hand, the region based approach clearly obtains a single region.However, the boundary of this region is less accurate than the obtained by theFCM algorithm. This is consistent with the quantitative results obtained inthe ROC analysis: when comparing the performance individually, the clusteringalgorithms show more accuracy than the region based algorithm. In contrast,
14 A. Torrent et al.
(a) (b) (c) (d) (e)
Fig. 2. Segmentation examples of two different MLO mammograms. (a) original image,(b) expert segmentation, (c) EE segmentation, (d) FCM segmentation, and (e) FFsegmentation.
when evaluating the overall mean, the number of disconnected regions decreasethe performance of the clustering based algorithms.
4 Application to Breast Density Classification
We extend this work to classify the breast according to their internal densityin terms of BI-RADS categories. Note that this classification is not necessaryrelated with the density of the breast, because it is more referred to the type ofinternal tissue than to the density itself. Hence, a simple ratio of the dense tissueversus the total area of the breast could not be enough to correctly classify thebreast.
To classify the breast we used a previous developed approach [17]. The firststep is the aim of this paper, i.e. the segmentation of the breast according to theinternal density. We used the Fuzzy C-Means segmentation explained here sinceit provided the best results. Following, we extract a set of features from eachcluster in order to characterize the fatty and the dense regions. From this set,the first ones are related with the morphology of the clusters (mean gray-level,deviation, skewness, and kurtosis), while the rest are texture features extractedfrom co-occurrence matrices. Finally, a classifier is need to categorize eachmammogram according to the BI-RADS categories. The classifier used here isa Bayesian combination of the C4.5 decision tree and the k-Nearest Neighboralgorithm.
Breast Density Segmentation 15
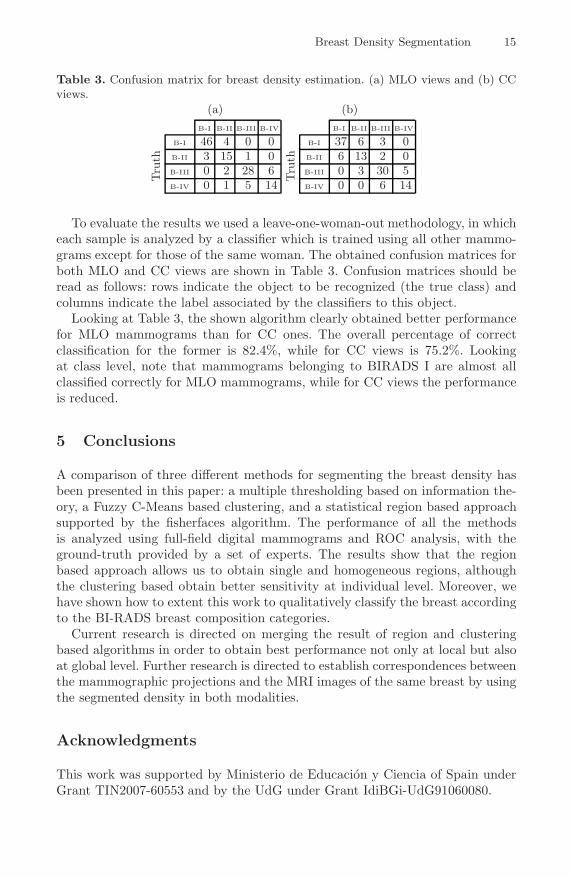
Table 3. Confusion matrix for breast density estimation. (a) MLO views and (b) CCviews.
B-I B-II B-III B-IV
Tru
thB-I 46 4 0 0B-II 3 15 1 0B-III 0 2 28 6B-IV 0 1 5 14
B-I B-II B-III B-IV
Tru
th
B-I 37 6 3 0B-II 6 13 2 0B-III 0 3 30 5B-IV 0 0 6 14
(a) (b)
To evaluate the results we used a leave-one-woman-out methodology, in whicheach sample is analyzed by a classifier which is trained using all other mammo-grams except for those of the same woman. The obtained confusion matrices forboth MLO and CC views are shown in Table 3. Confusion matrices should beread as follows: rows indicate the object to be recognized (the true class) andcolumns indicate the label associated by the classifiers to this object.
Looking at Table 3, the shown algorithm clearly obtained better performancefor MLO mammograms than for CC ones. The overall percentage of correctclassification for the former is 82.4%, while for CC views is 75.2%. Lookingat class level, note that mammograms belonging to BIRADS I are almost allclassified correctly for MLO mammograms, while for CC views the performanceis reduced.
5 Conclusions
A comparison of three different methods for segmenting the breast density hasbeen presented in this paper: a multiple thresholding based on information the-ory, a Fuzzy C-Means based clustering, and a statistical region based approachsupported by the fisherfaces algorithm. The performance of all the methodsis analyzed using full-field digital mammograms and ROC analysis, with theground-truth provided by a set of experts. The results show that the regionbased approach allows us to obtain single and homogeneous regions, althoughthe clustering based obtain better sensitivity at individual level. Moreover, wehave shown how to extent this work to qualitatively classify the breast accordingto the BI-RADS breast composition categories.
Current research is directed on merging the result of region and clusteringbased algorithms in order to obtain best performance not only at local but alsoat global level. Further research is directed to establish correspondences betweenthe mammographic projections and the MRI images of the same breast by usingthe segmented density in both modalities.
Acknowledgments
This work was supported by Ministerio de Educacion y Ciencia of Spain underGrant TIN2007-60553 and by the UdG under Grant IdiBGi-UdG91060080.
16 A. Torrent et al.
References
1. Ho, W.T., Lam, P.W.T.: Clinical performance of computer-assisted detection(CAD) system in detecting carcinoma in breasts of different densities. ClinicalRadiology 58, 133–136 (2003)
2. Obenauer, S., Sohns, C., Werner, C., Grabbe, E.: Impact of breast densityon computer-aided detection in full-field digital mammography. J. Digit. Imag-ing 19(3), 258–263 (2006)
3. Brem, R.F., Hoffmeister, J.W., Rapelyea, J.A., Zisman, G., Mohtashemi, K., Jin-dal, G., DiSimio, M.P., Rogers, S.K.: Impact of breast density on computer-aideddetection for breast cancer. Am. J. Roentgenol. 184(2), 439–444 (2005)
4. Boyd, N.F., Byng, J.W., Jong, R.A., Fishell, E.K., Little, L.E., Miller, A.B., Lock-wood, G.A., Tritchler, D.L., Yaffe, M.J.: Quantitative classification of mammo-graphic densities and breast cancer risk: results from the Canadian national breastscreening study. J. Natl Cancer Inst. 87, 670–675 (1995)
5. Sivaramakrishna, R., Obuchowski, N.A., Chilcote, W.A., Powell, K.A.: Automaticsegmentation of mammographic density. Acad. Radiol. 8(3), 250–256 (2001)
6. Aylward, S.R., Hemminger, B.H., Pisano, E.D.: Mixture modelling for digital mam-mogram display and analysis. Int. Work. Dig. Mammography, 305–312 (1998)
7. Ferrari, R.J., Rangayyan, R.M., Borges, R.A., Frere, A.F.: Segmentation of thefibro-glandular disc in mammograms via Gaussian mixture modelling. Med. Biol.Eng. Comput. 42, 378–387 (2004)
8. Saha, P.K., Udupa, J.K., Conant, E.F., Chakraborty, P., Sullivan, D.: Breast tissuedensity quantification via digitized mammograms. IEEE Trans. Med. Imag. 20(8),792–803 (2001)
9. Zwiggelaar, R., Denton, E.R.E.: Optimal segmentation of mammographic images.In: Int. Work. Dig. Mammography, pp. 751–757 (2004)
10. Petroudi, S., Brady, M.: Breast density segmentation using texture. In: Astley,S.M., Brady, M., Rose, C., Zwiggelaar, R. (eds.) IWDM 2006. LNCS, vol. 4046,pp. 609–615. Springer, Heidelberg (2006)
11. Feldman, D.P., Crutchfield, J.P.: Structural information in two-dimensional pat-terns: Entropy convergence and excess entropy (2002)
12. Cover, T.M., Thomas, J.A.: Elements of Information Theory. Wiley Series inTelecommunications (1991)
13. Bardera, A., Feixas, M., Boada, I., Sbert, M.: High-dimensional normalized mutualinformation for image registration using random lines. In: Pluim, J.P.W., Likar,B., Gerritsen, F.A. (eds.) WBIR 2006. LNCS, vol. 4057, pp. 264–271. Springer,Heidelberg (2006)
14. Bezdek, J.C.: Pattern Recognition With Fuzzy Objective Function Algorithms.Plenum Press, New York (1981)
15. Belhumeur, P.N., Hespanha, J.P., Kriegman, D.J.: Eigenfaces vs Fisherfaces:Recognition using class specific linear projection. IEEE Trans. Pattern Anal. Ma-chine Intell. 19(7), 711–720 (1997)
16. American College of Radiology: Illustrated Breast Imaging Reporting and DataSystem BIRADS. 3rd edn. American College of Radiology (1998)
17. Oliver, A., Freixenet, J., Martı, R., Pont, J., Perez, E., Denton, E., Zwiggelaar,R.: A novel breast tissue density classification methodology. IEEE Trans. Inform.Technol. Biomed. 12(1), 55–65 (2008)