brain structure and cerebrovascular risk in cognitively impaired patients
TRANSCRIPT
Brain Morphology and Cerebrovascular Risk in Mild CognitiveImpairment and Dementia: SCOBHI-P study
Jing He1a, Ana-Maria Iosif1b, Dong Young Lee1a,2, Oliver Martinez1a, Ding Ding3, OwenCarmichael1a, James A. Mortimer4,*, Qianhua Zhao3, Shugang Chu3, Qihao Guo3,Douglas Galasko5, David Salmon5, Qi Dai6, Yougui Wu4, Ron Petersen7, Zhen Hong3,Amy R. Borenstein4,*, and Charles DeCarli1a,*1a Department of Neurology and Imaging of Dementia and Aging (IDeA) Laboratory, Center forNeuroscience, University of California at Davis1b Department of Public Health Sciences, University of California at Davis2 Department of Neuropsychiatry, Seoul National University, College of Medicine, Korea3 Department of Biostatistics and Epidemiology, Institute of Neurology, Fudan UniversityShanghai, P.R. China4 Department of Epidemiology and Biostatistics, College of Public Health, University of SouthFlorida, Tampa, FL5 Department of Neurosciences, University of California-San Diego, San Diego, CA6 Vanderbilt-Ingram Cancer Center, Vanderbilt University Medical Center, Nashville, TN7 Department of Neurology, Mayo Clinic, Rochester, MN
AbstractObjective—To investigate associations between MRI brain morphology, cerebrovascular risk(VR), clinical diagnosis and cognition among elders living in urban Shanghai.
Design—Cross-sectional study.
Setting—Memory Disorders Clinic and community normal control (NC) subject recruitment.
Participants—Ninety-six older subjects, 32 with normal cognition, 30 with amnestic MCI(aMCI) and 34 with dementia.
Main outcome measures—Each subject received medical history, neurological/physicalexams, neuropsychological evaluations, brain MRI and apolipoprotein E-ε4 (APOE -ε4) genotypetest. MRI volumes were assessed using a semi-automatic method.
Results—Brain volume (BV) was significantly smaller in the demented compared with NC (p <0.001) or aMCI (p = 0.043). Hippocampal volume (HV) was lower, and white matterhyperintensity volume (WMH) was higher, in aMCI (HV: p = 0.028; WMH: p = 0.041) anddementia (HV: p < 0.001; WMH: p = 0.002) compared with NC. APOE -ε4 presence wassignificantly associated with reduced HV (p = 0.02). Systolic blood pressure was positivelyassociated with VR score (p = 0.037); diastolic blood pressure (p = 0.021) and VR score (p =
Please address all correspondence to: Charles DeCarli, MD, Department of Neurology, 4860 Y Street, Suite 3700, Sacramento, CA95817, Phone: (916) 734-8413, Fax: (916) 734-6526, [email protected].*Contributed equally to the manuscript.
NIH Public AccessAuthor ManuscriptArch Neurol. Author manuscript; available in PMC 2011 October 1.
Published in final edited form as:Arch Neurol. 2010 October ; 67(10): 1231–1237. doi:10.1001/archneurol.2010.230.
NIH
-PA Author Manuscript
NIH
-PA Author Manuscript
NIH
-PA Author Manuscript
0.036) were both positively associated with WMH. WMH (p = 0.029) and VR (p = 0.031) wereboth higher among the demented than NC.
Conclusion—MRI brain morphology changes were significantly associated clinical diagnosis, inaddition, blood pressure was highly associated with VR score and WMH. These results suggestthat MRI is a valuable measure of brain injury in a Chinese cohort and can serve to assess theeffects of various degenerative and cerebrovascular pathologies.
KeywordsDementia; Mild Cognitive Impairment; Magnetic Resonance Imaging; white matterhyperintensities; hippocampal volume; cerebrovascular risk; apolipoprotein E genotype; cognition
IntroductionAs the worldwide population of older adults increases, age-related diseases such ascerebrovascular (CVD) and Alzheimer’s (AD) diseases present an increasing public healthissue. Substantial numbers of longitudinal and cross-sectional studies have been publishedcomparing the etiology, epidemiology and pathology of dementia, MCI and aging acrossrace and ethnic groups [1–13]. Studies of different races are particularly important as recentcensus data show increasing racial and ethnic diversity in the elderly population of theUnited States [1,14]. However, relatively few studies have been performed on persons ofChinese ethnicity.
Because the largest increase in dementia cases is expected to occur primarily in developingcountries [15–17], early diagnosis will be needed for effective treatment or prevention.Structural brain imaging is widely used to study the morphological changes of the brain,particularly those associated with AD and CVD processes [8–21]. Neuroimaging also canhelp in predicting the probability of developing future dementia as well as measureprogression of underlying neurodegenerative diseases [22].
In this study, we compared quantitative magnetic resonance imaging (MRI) measures andcerebrovascular risk factors among three cognitive groups in the Shanghai Community BrainHealth Initiative–pilot phase (SCOBHI-P). The SCOBHI-P is based on community-dwellingcontrols and cases seen at a memory disorders clinic who are residents of Shanghai, China.The goals of SCOBHI-P were to investigate the biological and cognitive changes amongelders with normal cognition, mild cognitive impairment (MCI) and dementia and evaluateassociations between MRI markers and performance on neuropsychological tests..
Design & MethodsParticipants
Subject Recruitment—Cases with MCI and dementia were evaluated at Hua ShanHospital (HH) in Shanghai, China. One hundred and nine cases of dementia and MCI fromthe Memory Disorders Clinic (MDC) at HH who were initially diagnosed from May 2007 toNovember 2008 were invited to participate. Of these, 54 were recruited (53.2%), 42 refused,8 were unreachable and 1 had a stroke. Controls with normal cognition were obtained from aname list provided by the government, which contained information on all residents. Weselected a resident group in the Jing’an district of Shanghai (smaller than a neighborhood)consisting of five buildings in the Jingansi Temple Community (JTC). Potential controlswere approached at the door to describe the study. Of 71 potential participants from thename list, 10 refused (14%). An additional three names on the name list were unreachable.The recruitment rate in the community was 81.6%. When the 58 residents in the community
He et al. Page 2
Arch Neurol. Author manuscript; available in PMC 2011 October 1.
NIH
-PA Author Manuscript
NIH
-PA Author Manuscript
NIH
-PA Author Manuscript
were clinically evaluated, two met study criteria for dementia (3.5%) and 12 met Petersencriteria for MCI (20.6%). These 14 individuals were added to the case pool. Of the 112 casesand controls, 12 had the MRI evaluation but did not complete the proxy interview andneuropsychological tests and therefore were excluded from the study. The remaining 100subjects included 32 normal controls, 34 MCI and 34 dementia cases. Of the 34 participantswith MCI, 4 (12%) were determined to have non-amnestic MCI (naMCI), while 30 (88%)had amnestic MCI (aMCI). Because the number of naMCI was too small to study as agroup, we restricted analysis to 96 subjects, 32 of whom were cognitively normal, 30 wereaMCI, and 34 were demented.
Clinical Evaluation—All participants received a multidisciplinary clinical evaluation inthe HH MDC. These evaluations included detailed medical history, physical andneurological examinations. They were also evaluated with the Clinical Dementia Rating [23](CDR) scale. A neuropsychological battery was administered by the study psychometristthat included the modern Chinese Cognitive Abilities Screening Instrument (mc-CASI)[24],WAIS-R Digit Span [25], Bell Cancellation Test [26], WMS Logical Memory Test [27](immediate and delayed recall), Rey-Osterrieth Complex Figure test (ROCF) [28] (copyingand recall), Stroop Test [29], Auditory Verbal Learning Test (AVLT) [30], Category VerbalFluency Test, WAIS-R Similarities Test [27], Trail-making Test [31], Clock-Drawing Test[32], Boston Naming Test [33] and Chinese version of the Mattis Dementia Rating Scale(Mattis DRS) [34]. All participants were genotyped for Apolipoprotein E [35]. In addition,all subjects received two blood pressure measurements in a seated position. Informationabout diagnosed stroke, TIA, hypertension, diabetes and coronary artery disease wereelicited in the interview. Each subject (case proxy, control proxy and control) wasadministered a risk factor questionnaire to obtain data on demographics, socioeconomicstatus (SES), physical activity, mental activity, smoking/alcohol consumption, family historyof memory problems and other diseases, social activity, personal medical history,interviewer-inspected prescription and non-prescription medications, hormonal history(women), quality of life and sleep, perceptions of stigma associated with dementia, foodpreferences at age 50, and activities of daily living (IADL and ADL). We interviewedcontrols about themselves and control informants about the control in a separate room. Noneof the cases (dementia or MCI) were interviewed directly; instead data for cases werecollected from proxy informants.
Diagnosis (normal cognition, MCI, dementia) was made according to standardized criteria.Each participant was initially diagnosed by four study neurologists (ZH, QZ, QG, DD) in aconsensus diagnostic conference. In addition, two international consensus diagnosticteleconferences were held, including U.S. team members (DG, DS, RP, ARB, JM) for 9MCI subjects and 8 difficult-to-diagnose cases. Dementia was diagnosed using DSM-IV[36] criteria for dementia. AD was diagnosed using NINCDS-ADRDA [37] criteria.Vascular dementia was diagnosed using the NINDS-AIREN [38] criteria. MCI wasdiagnosed using Petersen MCI criteria [39,40]. Normal cognitive function was diagnosed ifthere was no clinically significant cognitive impairment.
MRI AcquisitionBrain images were obtained at HH in Shanghai. We used a series of MRI acquisitionprotocols developed at the UCD Imaging of Dementia & Aging Laboratory (IDeA Lab),which are suitable for the GE 1.5T MRI system. Imaging parameters were as follows:
1. Axial spin echo, T2 weighted double echo image with TE1 equal to 20 ms, TE2equal to 90 ms, TR equal to 2420 ms, a field of view of 24 cm and a slice thicknessof 3 mm.
He et al. Page 3
Arch Neurol. Author manuscript; available in PMC 2011 October 1.
NIH
-PA Author Manuscript
NIH
-PA Author Manuscript
NIH
-PA Author Manuscript
2. Coronal 3D spoiled gradient recalled echo (IR-prepped SPGR) acquisition, T1weighted image with TR equal to 9.1 ms, a flip angle of 15 degrees, a field of viewof 24 cm and a slice thickness of 1.5 mm.
3. Axial high resolution Fluid Attenuated Inversion Recovery (FLAIR) image with aTE of 120 ms, a TR of 9000 ms, a TI of 2200 ms, a 24 cm field of view, and a slicethickness of 3 mm.
Qualitative assessment of all available image sequences was used to assist with clinicaldiagnosis, but the clinical diagnostic team was blind to results of quantitative analyses. Theimages were sent to the IDeA Laboratory and image quantification was performed by a raterwho was blinded to age, sex, educational achievement and diagnostic status.
Image AnalysisBrain and WMH Volumes—Analysis of brain and WMH volumes was based on theFLAIR sequence, which was designed to enhance WMH segmentation [41]. Brain andWMH segmentation was performed in a two-step process according to previously reportedmethods [42]. In brief, non-brain elements were manually removed from the image byoperator guided tracing of the dura matter within the cranial vault including the middlecranial fossa, but excluding the posterior fossa and cerebellum. The resulting measure of thecranial vault was defined as the total cranial volume (TCV) to correct for differences in headsize amongst the subjects. Image intensity nonuniformities [43] were then removed from theimage and the resulting corrected image was modeled as a mixture of two Gaussianprobability functions with the segmentation threshold determined at the minimumprobability between these two distributions. Then, a single Gaussian distribution was fittedto the image data using an a priori threshold of 3.5 standard deviations in pixel intensityabove the mean to identify WMH. Intra and inter rater reliability for these methods are highand have been published previously [44].
Hippocampal volumes—Boundaries for the hippocampus were manually tracedaccording to previously reported methods [1] which emphasize analysis of the anterior 2/3of the hippocampus. Intra-rater reliability for right and left hippocampus using this methodwas excellent, with intraclass correlation coefficients of 0.98 for right side and 0.96 for leftside.
MRI Infarctions—Cerebral infarction on MRI was determined according to previouslypublished protocols [44,45]. MRI infarction was determined from the size, location andimaging characteristics of the lesion based on review of the double echo, FLAIR and 3-dimensional T1 high-resolution image. Lesions 3 mm or larger qualified for consideration ascerebral infarcts. Other necessary imaging characteristics included: 1) CSF density on T1weighted or FLAIR image and 2) If the infarct was in the basal ganglia area, distinctseparation from the circle of Willis vessels. Previously reported kappa values for agreementbetween the three raters were generally very good, ranging from 0.73 to 0.90 [44].
Cerebrovascular risk factorsMedical histories as well as review of medical records were used to create a summedcomposite score for cerebrovascular risk. The presence or absence of five cerebrovascularrisk factors (i.e, stroke, TIA, hypertension, diabetes and coronary artery disease) wassystematically assessed from the informant interview and the subject’s medical record.Blood pressure was measured twice and averaged. Hypertension was defined as measuredsystolic or diastolic pressures exceeding 140/90 mm Hg or controlled by medication(informed from medical history). The total VR score ranged from 0 to 60%, with a mean of22.9% (0.189 SD) in all subjects.
He et al. Page 4
Arch Neurol. Author manuscript; available in PMC 2011 October 1.
NIH
-PA Author Manuscript
NIH
-PA Author Manuscript
NIH
-PA Author Manuscript
Data AnalysesSince MRI measures of brain volume, WMH and hippocampal volume are each known tovary by sex and age [1,20,21], all MRI variables were divided by total cranial volume(TCV) [1,44]. The distribution of normalized WMH was skewed. Therefore WMH volumeswere first divided by TCV and then log transformed to better approximate a normaldistribution for analysis as previously described [1].
Data were then analyzed in JMP8 (SAS institute, Cary, NC). Analyses of variance(ANOVA) models with clinical diagnosis as the grouping variable were used to detect groupdifferences in demographic variables, MRI measures and cerebrovascular risk factor scores.Chi-square analysis was used to test group differences in sex and MRI infarct prevalence.Analyses of covariance (ANCOVA) were used to further assess associations betweencerebrovascular risk factors, presence of MRI infarcts, APOE -ε4 genotype, and cognitivesyndromes for each of the 3 MRI measures while controlling for age, education and gender.An ANCOVA approach was also used to evaluate the association of the 3 MRI measureswith neuropsychological tests. The Tukey–Kramer method was used for all post-hocanalyses. Logistic regression was used to investigate the association between risk factors andcognitive syndromes or presence of MRI infarcts. P values < 0.05 were consideredstatistically significant.
ResultsSubject Characteristics
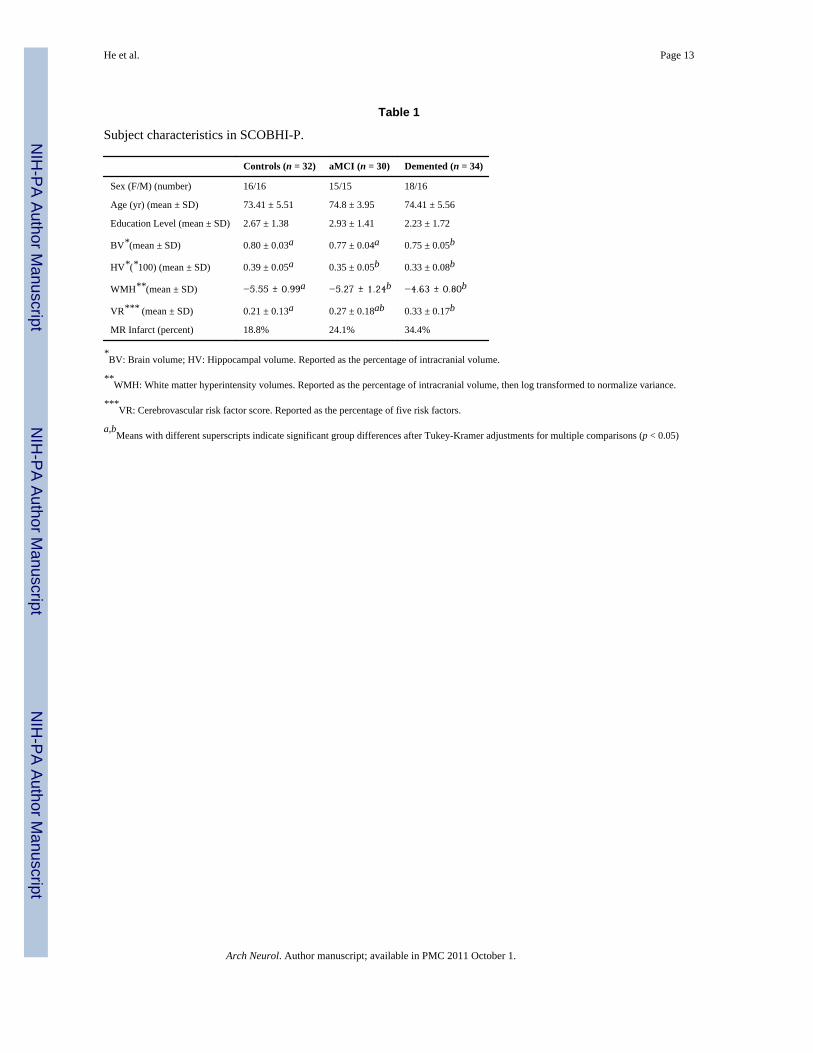
Subject characteristics are summarized in Table 1. There were no significant differencesacross diagnostic groups in age, sex, and education.
Quantitative MRIFor each MRI measure, ANOVA models were carried out with clinical diagnosis as theoutcome variable. Demented subjects had significantly smaller BV than normal controls (p <0.001) and aMCI subjects (p = 0.04). HV was significantly lower, and WMH wassignificantly higher, for aMCI (HV: p = 0.03; WMH: p = 0.04) and demented subjects (HV:p < 0.001; WMH: p < 0.01) as compared to normal controls (Figure 1). Chi-square testingindicated that the percent with MRI infarct did not significantly differ across cognitivesyndrome groups.
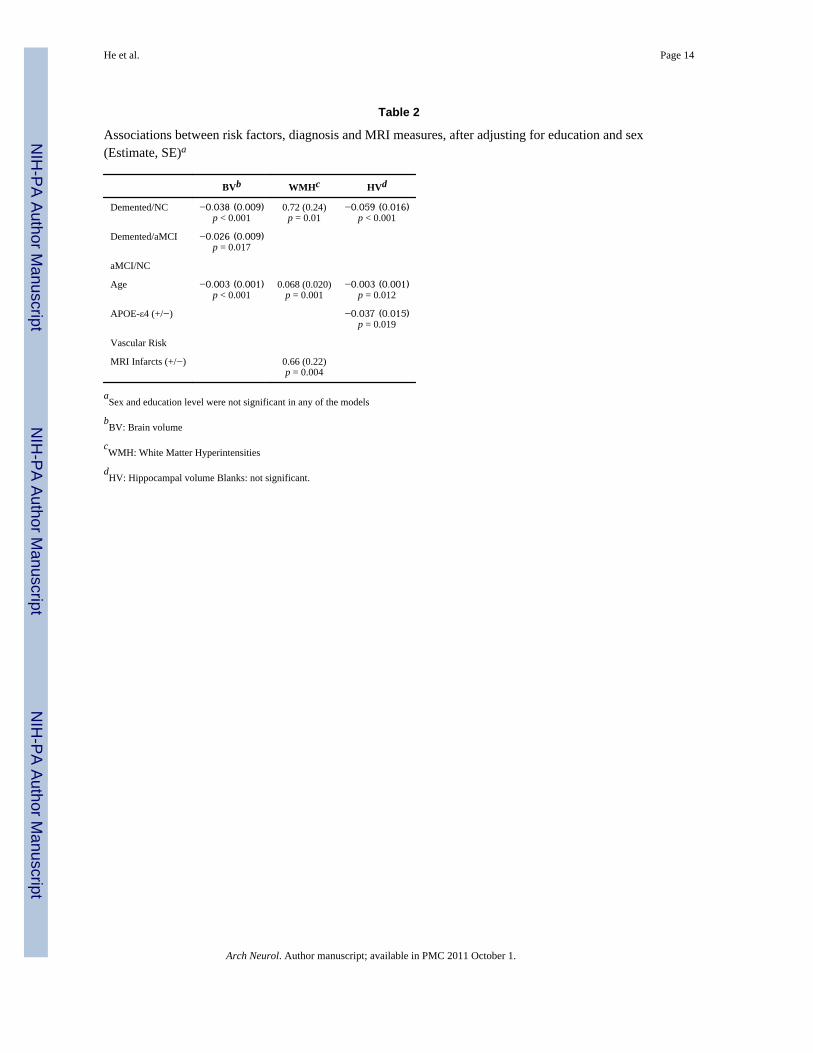
Secondary analyses used ANCOVA models to examine the association between diagnosis,age, APOE-ε4, VR, MRI infarcts, and MRI measures, after controlling for education leveland sex (Table 2). Older age was significantly associated with decreased BV (p < 0.001) andHV (p = 0.01) and increased WMH (p = 0.001); APOE-ε4 presence was associated withdecreased HV (p = 0.02); history of MRI infarct was significantly associated with increasedWMH (p = 0.004). Post-hoc Tukey-Kramer analysis showed that, after adjusting forcovariates, demented subjects had significantly smaller BV than normal controls (p < 0.001)and aMCI (p = 0.017), and had significantly higher WMH volumes than normal controls (p= 0.01). HV volume was also significantly lower among NC compared to demented, but didnot differ between demented and aMCI.
Vascular Risk FactorsGiven the findings of increased WMH in association with cognitive impairment, we furtherexplored the association between VR, cognitive status and MRI measures. VR scores rangedfrom 0 to 60% with the average VR score being 27% ± 17%; 85.4% of all participants had atleast one vascular risk factor; of subjects with a VR greater than zero, 97.6% hadhypertension. In addition, 81 (84.4%) members of this sample were hypertensive (average
He et al. Page 5
Arch Neurol. Author manuscript; available in PMC 2011 October 1.
NIH
-PA Author Manuscript
NIH
-PA Author Manuscript
NIH
-PA Author Manuscript

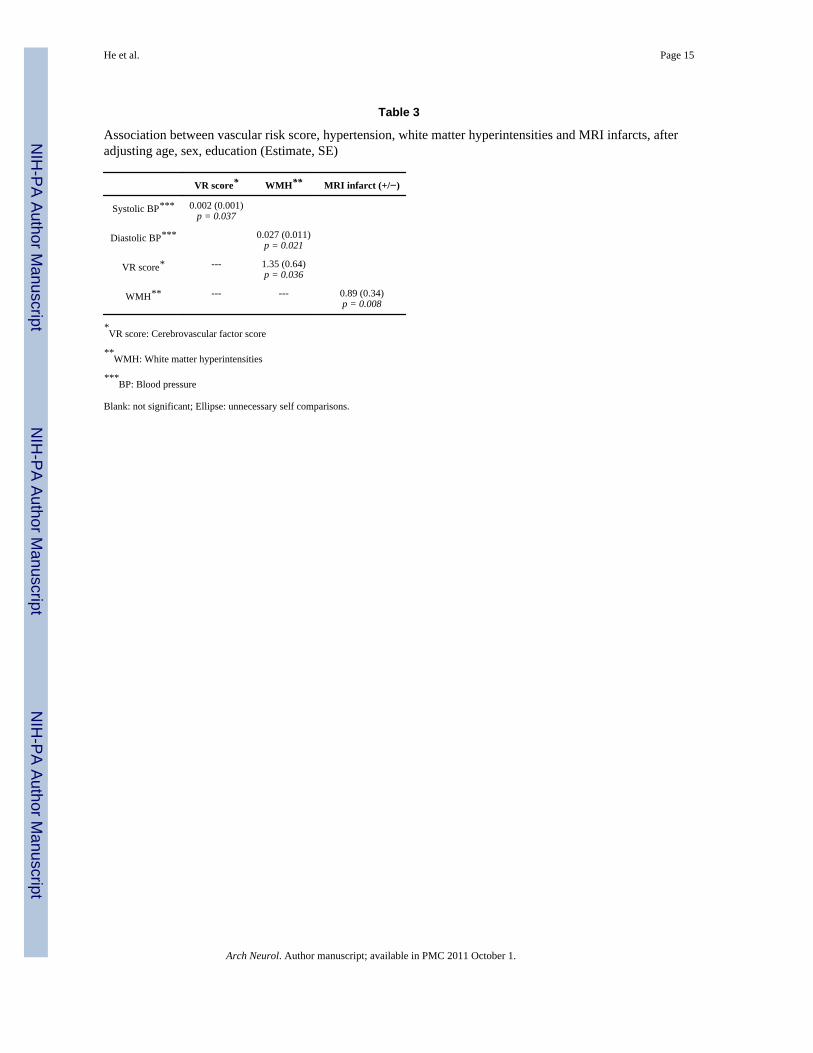
BP: 152.16 ± 21.62/77.57 ± 10.39 mmHg) at baseline, despite the fact that most receivedtreatment. The prevalence of MRI infarcts in this sample was 25.8%. ANOVA resultsrevealed that the mean VR score in demented patients was significantly higher than incontrols (p = 0.026; Table 1). After adjusting for age, sex and education, ANCOVAestimates showed that higher systolic pressure was associated with increased VR score (p =0.037); higher diastolic pressure (p = 0.021) and VR score (p = 0.036) were both associatedwith increased WMH. Using WMH, blood pressure and VR score together as independentvariables in a logistic regression model predicting MRI infarct, we found that increasedWMH were significantly associated with the an increased risk of MRI infarct (p = 0.008;Table 3).
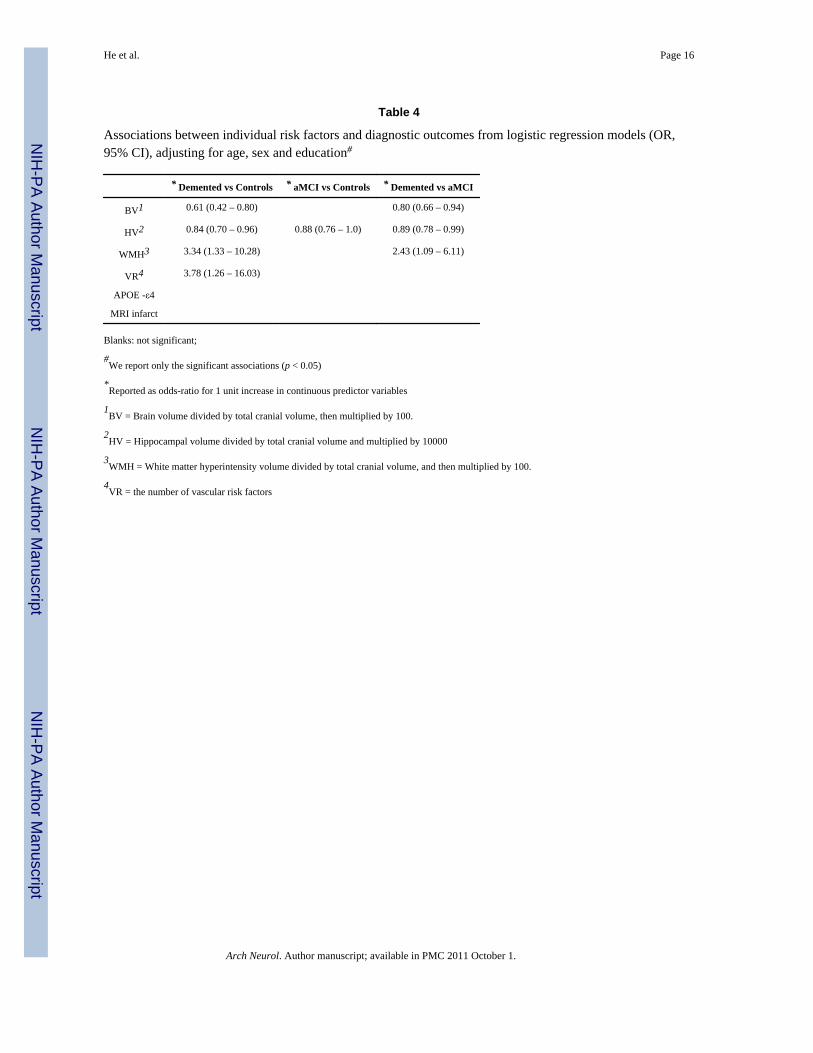
Associations with Clinical SyndromeLogistic regression analyses were used to examine the effects of all risk factors(demographic, MRI measures, vascular risk factors and APOE ε4) in modifying the risk ofpossessing the cognitive syndromes. Three separate models were fit to allow comparisonsbetween demented and NC, aMCI and NC, and demented and aMCI groups (see Table 4).When comparing demented and normal control groups, we found reduced BV (p = 0.002)and HV (p = 0.024), and increased WMH (p = 0.029) and VR (p = 0.031) to beindependently and significantly associated with an increased risk of dementia. With eachincrease of 1% of BV, the odds of dementia were reduced nearly 40% (OR: 0.61, 95% CI:0.42–0.80). With each 0.01% increase in HV, the odds for dementia were 16% lower (OR:0.84, 95% CI: 0.70 – 0.96). Conversely, a 1% increase in WMH volume was associated witha three-fold increase in the odds of dementia (OR: 3.34, 95% CI: 1.33 – 10.28). Similarly,the presence of each VR was associated with a nearly four times increased odds of dementia(OR: 3.78, 95% CI 1.26 – 16.03).
Similarly, when comparing aMCI to dementia every 1% increase in BV was associated with20% lower odds for dementia (OR: 0.80, 95% CI: 0.66 – 0.94) and every 0.01% increase inHV was associated with a 11% decrease in the odds for dementia (OR: 0.89, 95% CI: 0.78–0.99). Conversely each 1% increase in WMH was associated with 2.43 times greater odds ofdementia (OR: 2.43, 95% CI: 1.09 – 6.11)..
When comparing aMCI to controls, we found that normalized HV volume increase of 0.01%was associated with a 12% reduction in the odds for aMCI (OR: 0.88, 95% CI: 0.76 – 1.0)(Table 4).
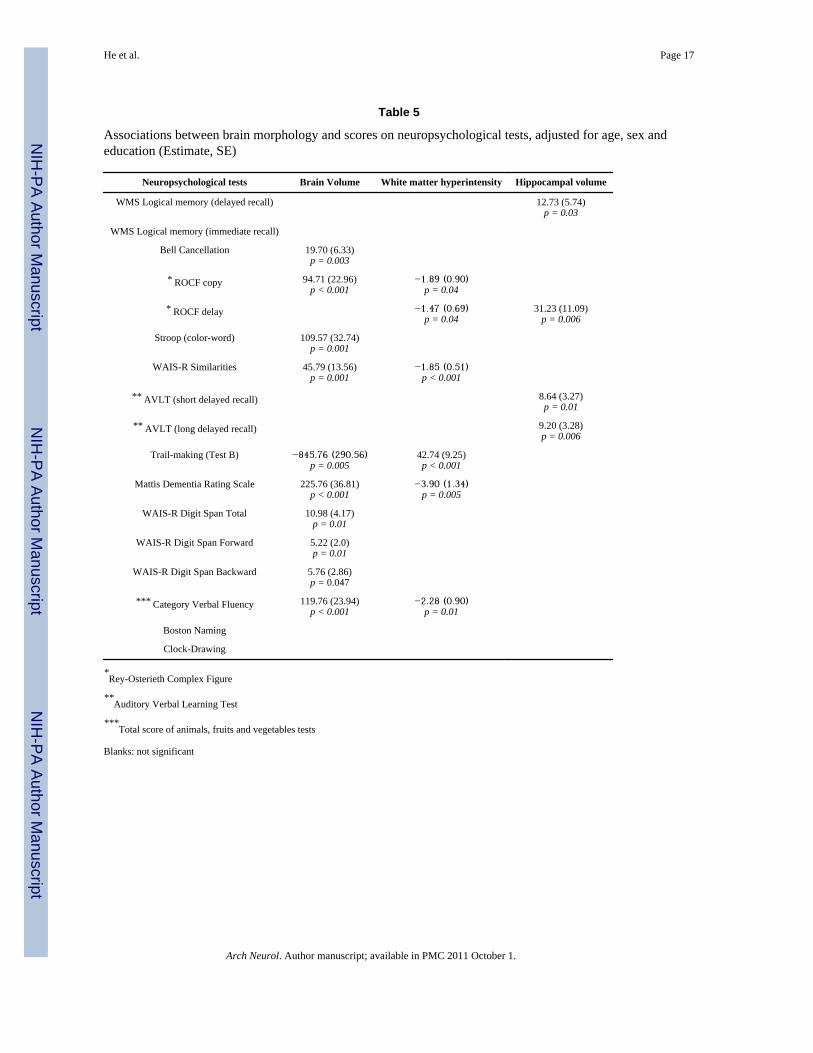
Neuropsychological test scores and MRI measuresFinally, separate ANCOVA models controlling for age, education and gender were used toassess the associations between MRI measures (BV, WMH and HV) and performance onindividual neuropsychological tests listed in Table 5. We found that increased BV wassignificantly associated with higher scores for Bell Cancellation Test (p = 0.003), ROCFcopying (p < 0.001), Stroop Test color-word (p = 0.001), WAIS-R Similarities Test (p =0.001), Mattis DRS (p < 0.001), WAIS Digit Span Test total score (p < 0. 01) and CategoryVerbal Fluency Test (p < 0.001), and lower scores for Trail-making Test (p = 0.005).Increased WMH was associated with worse performance on ROCF coping (p = 0.04) anddelayed recall (p = 0.04) tests, WAIS-R Similarities Test (p < 0.001), Mattis DRS (p =0.005) and Category Verbal Fluency (p = 0.01), and higher score in Trail-making Test (p <0.001). Increased HV was significantly associated with higher scores for WMS LogicalMemory delayed recall test (p = 0.03), ROCF delayed recall test (p = 0.006) and AVLTshort (p = 0.01) and long delayed recall (p = 0.006) tests.
He et al. Page 6
Arch Neurol. Author manuscript; available in PMC 2011 October 1.
NIH
-PA Author Manuscript
NIH
-PA Author Manuscript
NIH
-PA Author Manuscript
DiscussionImaging-based volumetric measurements are widely used to characterize and assist in thediagnoses of patients with dementia and MCI, particularly of the hippocampus, which isrecognized as a brain region where AD pathology is likely to first appear [19,46–48]. Globalbrain atrophy and WMH are also recognized as structural brain measures associated withaging and dementia [1,49–52]. However, most of the studies from which these findings arederived were conducted in Caucasian populations. Our study in a Chinese sample foundsimilar volumetric differences in brain, hippocampus and white matter hyperintensitiesbetween diagnostic groups. Furthermore, we found that these MRI measures were alsoassociated with previously described risk factors such as age and vascular risk; and for thehippocampus, APOE-ε4 as well. These findings are similar to those of previously reportedMRI studies of predominantly white populations [46,53]. Since hippocampal atrophy showsthe earliest and most consistent morphologic change in AD, our findings support thehypothesis that APOE-ε4 also is also a risk factor for amnestic MCI and dementia in aChinese population.
Cerebrovascular risk factors such as hypertension were common in this Chinese sample, andsystolic blood pressure was found to be significantly and positively associated with VRscore. The average VR score (0.27 ± 0.16) was higher than for Caucasians in our previousstudy (0.22 ± 0.20) [1], and VR was found to be significantly associated with the prevalenceof MRI infarcts. Although the prevalence of hypertension in SCOBHI-P (men: 85.1%;women: 83.7%) was similar to that of the Framingham study [44] (men: 87%; women: 82%)and 96.4% of subjects were receiving treatment, their blood pressures were less wellcontrolled (men: 154.8 ± 21.5/80.9 ± 10.2 mmHg; women: 158.5 ± 76.4) than those ofFramingham participants (men; 139 ± 18.8/68.2 ± 11.9 mmHg; women: 141 ± 20.8/67.5 ±10.8 mmHg). We believe that this finding might explain the higher prevalence of MRIinfarcts in this Chinese study as compared to the Framingham study [44].
The combinations of MRI volumes and VR score reliably distinguished groups ofindividuals with normal cognition, aMCI and dementia. Whereas demented subjects differedsignificantly from the two other groups on measures of BV, WMH and HV, aMCI differedsignificantly from normal controls only on HV; VR score also differed significantly betweendemented individuals and controls. MCI has been recognized to be the transitional statebetween normal cognition and dementia [40], and individuals with aMCI are thought todisplay early manifestations of AD pathology with 13% per year on average converting toAD [54,55]. Our analysis of the three diagnostic groups confirmed that hippocampal atrophyis the earliest brain structure change in aMCI, while brain atrophy, WMH burden andvascular risk factors were more strongly associated with the dementia syndrome. Again,these findings are remarkably consistent with previous reports utilizing Caucasianpopulations.
Our results also showed that brain atrophy was significantly associated with performance onthe Bell Cancellation test, ROCF copying test, Stroop copy and word test, WAIS-RSimilarities and Digit Span tests, Trail-making Test B, Mattis DRS and Category VerbalFluency test; WMH volume was significantly associated with ROCF delayed recall andcopy tests, WAIS-R similarities, Trail-making test B, Mattis DRS and Category VerbalFluency test, although the significance of the relationship between WMH and ROCF testsare likely marginal given the number of individual analyses performed (no Bonferroniadjustments were made, since the purpose of this exercise is to look at the pattern offindings, making adjustments for multiple comparisons less relevant.). HV was significantlyassociated with WMS logical memory delayed recall test, ROCF delayed recall test andAVLT short and long-delayed recall tests. These findings suggest that despite age,
He et al. Page 7
Arch Neurol. Author manuscript; available in PMC 2011 October 1.
NIH
-PA Author Manuscript
NIH
-PA Author Manuscript
NIH
-PA Author Manuscript
educational and cultural differences, structural brain changes are consistently associatedwith cognitive measures. The presence of a strong association between hippocampal volumeand memory performance, especially in delayed recall tests, supports the theory thathippocampus has a relatively specific role in retaining information after a delay [56,57] andalso supports the notion that delayed memory impairments and hippocampal atrophy arecardinal features of AD even in a Chinese population where vascular disease is relativelycommon. In contrast, hypertension was common in this Chinese cohort and less well treatedwhen compared to a reference Caucasian cohort. Given that blood pressure was positivelyassociated with WMH, and that increasing WMH correlated with more impaired cognitivesyndrome, it is possible that poorly controlled blood pressure may have been partiallyresponsible for cognitive impairment in our group. Control of blood pressure and likelyother vascular risk factors, therefore, might be expected to decrease the prevalence ofdementia in this population.
Our study, however, has several limitations. The participants of this study were recruited notonly from the community, but also from the memory disorder clinic and, therefore, may notreflect the general population. In addition, although most of our dementia patients werediagnosed with AD, a minority of subjects had vascular dementia. If the study populationwere strictly limited to AD dementia we may have found brain differences morecharacteristic of AD associated with dementia. This limitation, however, is likely to beminimal as we found a significant reduction in hippocampal volume, similar to previousfindings in AD cohorts. More likely, these data reflect a much higher prevalence ofcomorbid cerebrovascular disease among our Chinese study group, even though a highpercentage of dementia subjects were diagnosed with AD.
ConclusionChina is a country with a large older population that has received relatively little study.Despite obvious cultural differences from previously reported, predominantly Caucasianstudies, we identified similar genetic factors and structural brain differences associated withdementia in this population. The greatest difference between this sample and otherCaucasian samples appears to relate to the high frequency of vascular brain injury (e.g. MRIInfarction) and the high frequency of vascular risk factors, especially hypertension. Sincecerebrovascular disease is a treatable disorder, further study and possible treatment arewarranted.
References1. DeCarli C, et al. Brain Behavior Relationships Among African Americans, Whites, and Hispanics.
Alzheimer Disease & Associated Disorders 2008;22(4):382–391. [PubMed: 19068502]2. Gurland BJ, et al. Rates of dementia in three ethnoracial groups. International Journal of Geriatric
Psychiatry 1999;14(6):481–493. [PubMed: 10398359]3. Mungas D, Reed BR, Tomaszewski FS. Criterion-referenced validity of a neuropsychological test
battery: equivalent performance in elderly Hispanics and non-Hispanic Whites. J Int NeuropsycholSoc 2005;11:620–630. [PubMed: 16212690]
4. Tang MX, et al. Incidence of AD in African-Americans, Caribbean Hispanics, and Caucasians innorthern Manhattan. Neurology 2001;56(1):49–56. [PubMed: 11148235]
5. Bachman DL, et al. Comparison of Alzheimer’s disease risk factors in white and African Americanfamilies. Neurology 2003;60(8):1372–1374. [PubMed: 12707449]
6. Evans DA, et al. Incidence of Alzheimer disease in a biracial urban community -Relation toapolipoprotein E allele status. Archives of Neurology 2003;60(2):185–189. [PubMed: 12580702]
7. Fillenbaum GG, et al. The prevalence and 3-year incidence of dementia in older Black and Whitecommunity residents. Journal of Clinical Epidemiology 1998;51(7):587–595. [PubMed: 9674666]
He et al. Page 8
Arch Neurol. Author manuscript; available in PMC 2011 October 1.
NIH
-PA Author Manuscript
NIH
-PA Author Manuscript
NIH
-PA Author Manuscript
8. Fitzpatrick AL, et al. Incidence and prevalence of dementia in the cardiovascular health study.Journal of the American Geriatrics Society 2004;52(2):195–204. [PubMed: 14728627]
9. Sandberg G, et al. The prevalence of the neuropathological lesions of Alzheimer’s disease isindependent of race and gender. Neurobiology of Aging 2001;22(2):169–175. [PubMed: 11182466]
10. Sencakova D, et al. Hippocampal atrophy correlates with clinical features of Alzheimer disease inAfrican Americans. Archives of Neurology 2001;58(10):1593–1597. [PubMed: 11594917]
11. Wilkins CH, et al. The neuropathology of Alzheimer disease in African American and whiteindividuals. Archives of Neurology 2006;63(1):87–90. [PubMed: 16401740]
12. Graves AB, Larson EB, Edland SD, Bowen JD, McCormick WC, McCurry SM, Rice MM,Wenzlow A, Uomoto JM. Prevalence of dementia and its subtypes in the Japanese-Americanpopulation of King County, WA: The Kame Project. American Journal of Epidemiology1996;144:760–771. [PubMed: 8857825]
13. Borenstein AR, Wu Y, Mortimer JA, Schellenberg GD, McCormick WC, Bowen JD, McCurry S,Larson EB. Developmental and vascular risk factors for Alzheimer’s disease. Neurobiology ofAging 2005;26(3):325–334. [PubMed: 15639310]
14. Census 2000. Vol. 2000. Washington, DC: US Census Bureau; 2000.15. Ferri CP, et al. Global prevalence of dementia: a Delphi consensus study. Lancet 2005;366(9503):
2112–2117. [PubMed: 16360788]16. Lam LCW, Tam WC, Victor WCL, et al. Screening of Mild Cognitive Impairment in Chinese
Older Adults - A Multistage Validation of the Chinese Abbreviated Mild Cognitive ImpairmentTest. Neuroepidemiology 2008;2008(30):6–12. [PubMed: 18204291]
17. Wimo A, Jonsson L, Winblad B. An estimate of the worldwide prevalence and direct costs ofdementia in 2003. Dementia and Geriatric Cognitive Disorders 2006;21(3):175–181. [PubMed:16401889]
18. DeCarli C. The role of cerebrovascular disease in dementia. Neurologist 2003;9(3):123–136.[PubMed: 12808409]
19. Jack C, Petersen RC, O’Brien PC, et al. MR-based hippocampal volumetry in the diagnosis ofAlzheimer’s disease. Neurology 1992;1992(42):183–188. [PubMed: 1734300]
20. Jack CR, et al. Medial temporal atrophy on MRI in normal aging and very mild Alzheimer’sdisease. Neurology 1997;49(3):786–794. [PubMed: 9305341]
21. Murphy D, DeCarli CD, Daly E, et al. Volumetric magnetic resonance imaging in men withdementia of the Alzheimer type: correlations with disease severity. Biol Psychiatry 1993;1993(34):612–621. [PubMed: 8292690]
22. Petersen RC, et al. Practice parameter: Early detection of dementia: Mild cognitive impairment (anevidence-based review) - Report of the Quality Standards Subcommittee of the AmericanAcademy of Neurology. Neurology 2001;56(9):1133–1142. [PubMed: 11342677]
23. Morris JC. THE CLINICAL DEMENTIA RATING (CDR) - CURRENT VERSION ANDSCORING RULES. Neurology 1993;43(11):2412–2414. [PubMed: 8232972]
24. Teng EL, Homma HKA, Imai Y, Larson E, Graves A, Sugimoto K, Yamaguchi T, Sasaki H, ChiuD, White LR. The Cognitive Abilities Screening Instrument (CASI): a practical test for cross-cultural epidemiologic studies of dementia. Int Psychogeriatr 1994;1994(6):45–56. [PubMed:8054493]
25. Wechsler, D. WAIS-R Manual: Wechsler Adult Intelligence Scale-Revised Corporation. NewYork: Psychological; 1981.
26. Gauthier L, Dehaut F, Joanette Y. THE BELLS TEST - A QUANTITATIVE ANDQUALITATIVE TEST FOR VISUAL NEGLECT. International Journal of ClinicalNeuropsychology 1989;11(2):49–54.
27. Wechsler, D. Wechsler Memory Scale - Revised Manual. San Antonio: Psychological Corporation;1987.
28. Rey A. L-examen psychologique dans les cas d’encephalopathie traumatique. Arch Psychologie1941;1941(28):286–340.
29. Golden, C. Stroop Color and Word Test. Vol. 1978. Chicago: Stoelting Company;
He et al. Page 9
Arch Neurol. Author manuscript; available in PMC 2011 October 1.
NIH
-PA Author Manuscript
NIH
-PA Author Manuscript
NIH
-PA Author Manuscript
30. Schmidt, M. Rey Auditory Verbal Learning Test. A Handbook. Vol. 1996. Los Angeles: WesternPsychological Services; 1996.
31. Reitan RM. Validity of the trail making test as an indicator of organic brain damage. Percept MotSkills 1958;8:271–276.
32. Rouleau I, et al. QUANTITATIVE AND QUALITATIVE ANALYSES OF CLOCK DRAWINGSIN ALZHEIMERS AND HUNTINGTONS-DISEASE. Brain and Cognition 1992;18(1):70–87.[PubMed: 1543577]
33. Kaplan, EFGH.; Weintraub, S. Boston Naming Test. Vol. 1983. Philadelphia: Lea & Fibiger; 1983.34. Chan AS, et al. Clinical validity of the Chinese version of Mattis Dementia Rating Scale in
differentiating dementia of Alzheimer’s type in Hong Kong. Journal of the InternationalNeuropsychological Society 2003;9(1):45–55. [PubMed: 12570357]
35. Hixson JE, Vernier DT. Restriction isotyping of human apolipoprotein E by gene amplification andcleavage with Hhal. J Lipid Res 1990;31:545–548. [PubMed: 2341813]
36. Diagnostic and Statistical Manual of Mental Disorders. 4. Washington DC: APA; 2000.37. McKhann G, et al. CLINICAL-DIAGNOSIS OF ALZHEIMERS-DISEASE - REPORT OF THE
NINCDS-ADRDA WORK GROUP UNDER THE AUSPICES OF DEPARTMENT-OF-HEALTH-AND-HUMAN-SERVICES TASK-FORCE ON ALZHEIMERS-DISEASE. Neurology1984;34(7):939–944. [PubMed: 6610841]
38. Roman GC, et al. VASCULAR DEMENTIA - DIAGNOSTIC-CRITERIA FOR RESEARCHSTUDIES - REPORT OF THE NINDS-AIREN INTERNATIONAL WORKSHOP. Neurology1993;43(2):250–260. [PubMed: 8094895]
39. Petersen RC. Mild cognitive impairment as a diagnostic entity. Journal of Internal Medicine2004;256(3):183–194. [PubMed: 15324362]
40. Petersen RC, et al. Mild cognitive impairment - Clinical characterization and outcome. Archives ofNeurology 1999;56(3):303–308. [PubMed: 10190820]
41. Jack CR, et al. FLAIR histogram segmentation for measurement of leukoaraiosis volume. Journalof Magnetic Resonance Imaging 2001;14(6):668–676. [PubMed: 11747022]
42. Decarli C, et al. METHOD FOR QUANTIFICATION OF BRAIN, VENTRICULAR, ANDSUBARACHNOID CSF VOLUMES FROM MR IMAGES. Journal of Computer AssistedTomography 1992;16(2):274–284. [PubMed: 1545026]
43. DeCarli C, et al. Local histogram correction of MRI spatially dependent image pixel intensitynonuniformity. Jmri-Journal of Magnetic Resonance Imaging 1996;6(3):519–528.
44. DeCarli C, et al. Measures of brain morphology and infarction in the framingham heart study:establishing what is normal. Neurobiology of Aging 2005;26(4):491–510. [PubMed: 15653178]
45. DeCarli C, et al. Predictors of brain morphology for the men of the NHLBI twin study. Stroke1999;30(3):529–536. [PubMed: 10066847]
46. Lehtovirta M, et al. VOLUMES OF HIPPOCAMPUS, AMYGDALA AND FRONTAL-LOBE INALZHEIMER PATIENTS WITH DIFFERENT APOLIPOPROTEIN-E GENOTYPES.NeuroscieNce 1995;67(1):65–72. [PubMed: 7477910]
47. Jack CR Jr, Xu PRYC, et al. Hippocampal atrophy and apolipoprotein E genotype areubdeoebdebtkt associated with Alzheimer’s disease. Ann Neurol 1998;43(3):303–310. [PubMed:9506546]
48. Convit A, et al. Hippocampal atrophy in early Alzheimer’s disease: anatomic specificity andvalidation. Psychiatr Q 1993;64:371–387. [PubMed: 8234547]
49. Petersen RC, et al. Memory and MRI-based hippocampal volumes in aging and AD. Neurology2000;54(3):581–587. [PubMed: 10680786]
50. Killiany RJ, et al. Use of structural magnetic resonance imaging to predict who will getAlzheimer’s disease. Annals of Neurology 2000;47(4):430–439. [PubMed: 10762153]
51. Brickman AM, et al. Measuring cerebral atrophy and white matter hyperintensity burden to predictthe rate of cognitive decline in Alzheimer disease. Archives of Neurology 2008;65(9):1202–1208.[PubMed: 18779424]
52. Fox NC, Warrington EK, Rossor MN. Serial magnetic resonance imaging of cerebral atrophy inpreclinical Alzheimer’s disease. Lancet 1999;353(9170):2125–2125. [PubMed: 10382699]
He et al. Page 10
Arch Neurol. Author manuscript; available in PMC 2011 October 1.
NIH
-PA Author Manuscript
NIH
-PA Author Manuscript
NIH
-PA Author Manuscript
53. Cherbuin N, et al. Neuroimaging and APOE genotype: a systematic qualitative review. DementGeriatr Cogn Disord 2007;24(5):348–362. [PubMed: 17911980]
54. Morris JC, et al. Mild cognitive impairment represents early-stage Alzheimer disease. Archives ofNeurology 2001;58(3):397–405. [PubMed: 11255443]
55. Petersen RC, Morris JC. Mild cognitive impairment as a clinical entity and treatment target.Archives of Neurology 2005;62(7):1160–1163. [PubMed: 16009779]
56. Kramer JH, Schuff N, Reed BR, et al. Hippocampal volume and retention in Alzheimer’s disease.Journal of the International Neuropsychological Society 2004;10(4):639–643. [PubMed:15327742]
57. Kohler S, et al. Memory impairments associated with hippocampal versus parahippocampal-gyrusatrophy: an MR volumetry study in Alzheimer’s disease. Neuropsychologia 1998;36(9):901–914.[PubMed: 9740363]
He et al. Page 11
Arch Neurol. Author manuscript; available in PMC 2011 October 1.
NIH
-PA Author Manuscript
NIH
-PA Author Manuscript
NIH
-PA Author Manuscript
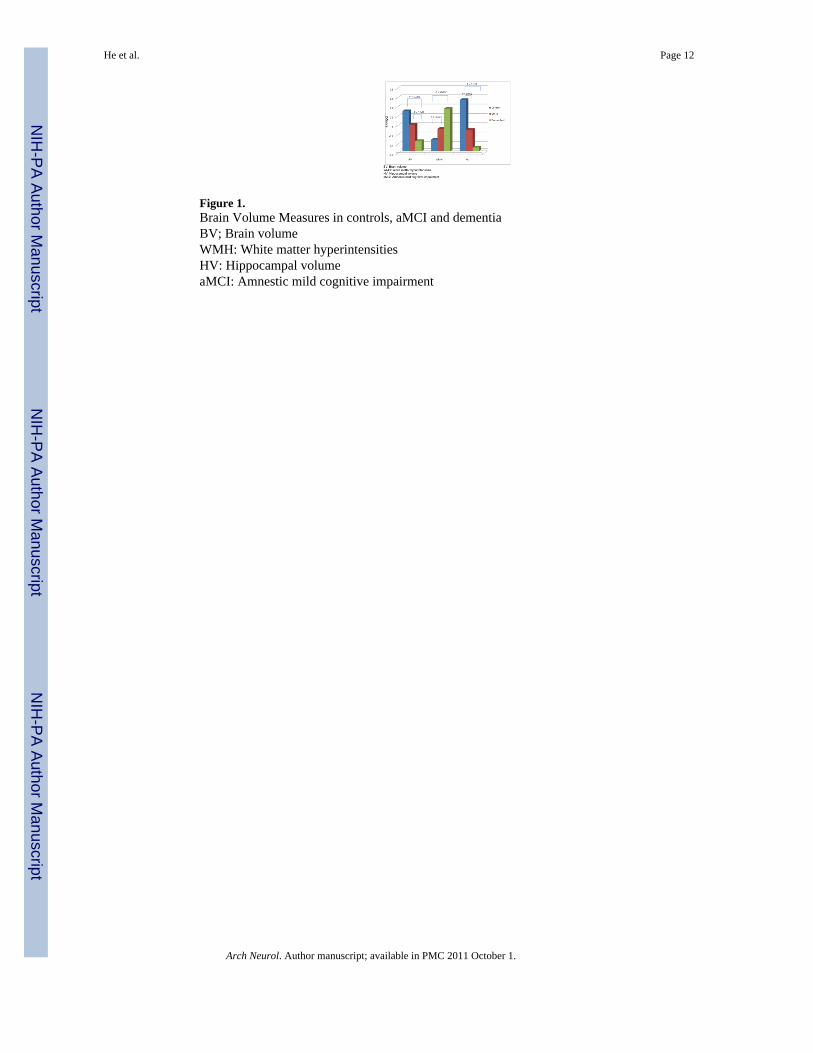
Figure 1.Brain Volume Measures in controls, aMCI and dementiaBV; Brain volumeWMH: White matter hyperintensitiesHV: Hippocampal volumeaMCI: Amnestic mild cognitive impairment
He et al. Page 12
Arch Neurol. Author manuscript; available in PMC 2011 October 1.
NIH
-PA Author Manuscript
NIH
-PA Author Manuscript
NIH
-PA Author Manuscript
NIH
-PA Author Manuscript
NIH
-PA Author Manuscript
NIH
-PA Author Manuscript
He et al. Page 13
Table 1
Subject characteristics in SCOBHI-P.
Controls (n = 32) aMCI (n = 30) Demented (n = 34)
Sex (F/M) (number) 16/16 15/15 18/16
Age (yr) (mean ± SD) 73.41 ± 5.51 74.8 ± 3.95 74.41 ± 5.56
Education Level (mean ± SD) 2.67 ± 1.38 2.93 ± 1.41 2.23 ± 1.72
BV*(mean ± SD) 0.80 ± 0.03a 0.77 ± 0.04a 0.75 ± 0.05b
HV*(*100) (mean ± SD) 0.39 ± 0.05a 0.35 ± 0.05b 0.33 ± 0.08b
WMH**(mean ± SD) −5.55 ± 0.99a −5.27 ± 1.24b −4.63 ± 0.80b
VR*** (mean ± SD) 0.21 ± 0.13a 0.27 ± 0.18ab 0.33 ± 0.17b
MR Infarct (percent) 18.8% 24.1% 34.4%
*BV: Brain volume; HV: Hippocampal volume. Reported as the percentage of intracranial volume.
**WMH: White matter hyperintensity volumes. Reported as the percentage of intracranial volume, then log transformed to normalize variance.
***VR: Cerebrovascular risk factor score. Reported as the percentage of five risk factors.
a,bMeans with different superscripts indicate significant group differences after Tukey-Kramer adjustments for multiple comparisons (p < 0.05)
Arch Neurol. Author manuscript; available in PMC 2011 October 1.
NIH
-PA Author Manuscript
NIH
-PA Author Manuscript
NIH
-PA Author Manuscript
He et al. Page 14
Table 2
Associations between risk factors, diagnosis and MRI measures, after adjusting for education and sex(Estimate, SE)a
BVb WMHc HVd
Demented/NC −0.038 (0.009)p < 0.001
0.72 (0.24)p = 0.01
−0.059 (0.016)p < 0.001
Demented/aMCI −0.026 (0.009)p = 0.017
aMCI/NC
Age −0.003 (0.001)p < 0.001
0.068 (0.020)p = 0.001
−0.003 (0.001)p = 0.012
APOE-ε4 (+/−) −0.037 (0.015)p = 0.019
Vascular Risk
MRI Infarcts (+/−) 0.66 (0.22)p = 0.004
aSex and education level were not significant in any of the models
bBV: Brain volume
cWMH: White Matter Hyperintensities
dHV: Hippocampal volume Blanks: not significant.
Arch Neurol. Author manuscript; available in PMC 2011 October 1.
NIH
-PA Author Manuscript
NIH
-PA Author Manuscript
NIH
-PA Author Manuscript
He et al. Page 15
Table 3
Association between vascular risk score, hypertension, white matter hyperintensities and MRI infarcts, afteradjusting age, sex, education (Estimate, SE)
VR score* WMH** MRI infarct (+/−)
Systolic BP*** 0.002 (0.001)p = 0.037
Diastolic BP*** 0.027 (0.011)p = 0.021
VR score* --- 1.35 (0.64)p = 0.036
WMH** --- --- 0.89 (0.34)p = 0.008
*VR score: Cerebrovascular factor score
**WMH: White matter hyperintensities
***BP: Blood pressure
Blank: not significant; Ellipse: unnecessary self comparisons.
Arch Neurol. Author manuscript; available in PMC 2011 October 1.
NIH
-PA Author Manuscript
NIH
-PA Author Manuscript
NIH
-PA Author Manuscript
He et al. Page 16
Table 4
Associations between individual risk factors and diagnostic outcomes from logistic regression models (OR,95% CI), adjusting for age, sex and education#
* Demented vs Controls * aMCI vs Controls * Demented vs aMCI
BV1 0.61 (0.42 – 0.80) 0.80 (0.66 – 0.94)
HV2 0.84 (0.70 – 0.96) 0.88 (0.76 – 1.0) 0.89 (0.78 – 0.99)
WMH3 3.34 (1.33 – 10.28) 2.43 (1.09 – 6.11)
VR4 3.78 (1.26 – 16.03)
APOE -ε4
MRI infarct
Blanks: not significant;
#We report only the significant associations (p < 0.05)
*Reported as odds-ratio for 1 unit increase in continuous predictor variables
1BV = Brain volume divided by total cranial volume, then multiplied by 100.
2HV = Hippocampal volume divided by total cranial volume and multiplied by 10000
3WMH = White matter hyperintensity volume divided by total cranial volume, and then multiplied by 100.
4VR = the number of vascular risk factors
Arch Neurol. Author manuscript; available in PMC 2011 October 1.
NIH
-PA Author Manuscript
NIH
-PA Author Manuscript
NIH
-PA Author Manuscript
He et al. Page 17
Table 5
Associations between brain morphology and scores on neuropsychological tests, adjusted for age, sex andeducation (Estimate, SE)
Neuropsychological tests Brain Volume White matter hyperintensity Hippocampal volume
WMS Logical memory (delayed recall) 12.73 (5.74)p = 0.03
WMS Logical memory (immediate recall)
Bell Cancellation 19.70 (6.33)p = 0.003
* ROCF copy 94.71 (22.96)p < 0.001
−1.89 (0.90)p = 0.04
* ROCF delay −1.47 (0.69)p = 0.04
31.23 (11.09)p = 0.006
Stroop (color-word) 109.57 (32.74)p = 0.001
WAIS-R Similarities 45.79 (13.56)p = 0.001
−1.85 (0.51)p < 0.001
** AVLT (short delayed recall) 8.64 (3.27)p = 0.01
** AVLT (long delayed recall) 9.20 (3.28)p = 0.006
Trail-making (Test B) −845.76 (290.56)p = 0.005
42.74 (9.25)p < 0.001
Mattis Dementia Rating Scale 225.76 (36.81)p < 0.001
−3.90 (1.34)p = 0.005
WAIS-R Digit Span Total 10.98 (4.17)p = 0.01
WAIS-R Digit Span Forward 5.22 (2.0)p = 0.01
WAIS-R Digit Span Backward 5.76 (2.86)p = 0.047
*** Category Verbal Fluency 119.76 (23.94)p < 0.001
−2.28 (0.90)p = 0.01
Boston Naming
Clock-Drawing
*Rey-Osterieth Complex Figure
**Auditory Verbal Learning Test
***Total score of animals, fruits and vegetables tests
Blanks: not significant
Arch Neurol. Author manuscript; available in PMC 2011 October 1.