bombay gravity high and eruption of deccan flood basalts (india) from a shallow secondary plume
TRANSCRIPT
Tecronophysics, 206 (1992) 341-350 Elsevier Science Publishers B.V., Amsterdam
341
Bombay gravity high and eruption of Deccan flood basalts (India) from a shallow secondary plume
J.G. Negi, P.K. Agrawal, A.P. Singh and O.P. Pandey
Theoretical Geophysics Group, National Geophysical Research Institute, Uppal Road, Hyderabad 500007, India
(Received April 22, 1991; revised version accepted October 28,1991)
ABSTRACT
Negi, J.G., Agrawal, P.K., Singh, A.P. and Pandey, O.P., 1992. Bombay gravity high and eruption of Deccan flood basalts (India) from a shallow secondary plume. Tectonophysics, 2061 341-350.
The western margin of India, especially the area surrounding the gravity high of Bombay, is covered by a thick pile of Deccan flood basalts. The massive eruption is one of the largest continental volcanic events at the Cretaceous/Tertiary biological mass extinction boundary (_ 65 Ma ago). The area is characterized by several hidden tectonic features, and their origin and evolution have remained controversial. In the search for magma source. structure, attention was focused on an unusual oval-shaped positive gravity anomaly over the Bombay coastal zone. The gravity analysis indicates the presence of two subsurface structures at depths of 4.5 f 0.5 km and 18 f 2 km. These depths correspond to the top of the crustal basaltic layer and an upwarped Moho discontinuity, respectively. The positive gravity anomaly in three-dimensional analysis reveals a possible magma conduit structure and the near absence of the granitic layer. The unusually shallow Moho layer coincides with the region of a broad high heat flow anomaly (average heat flow more than 80 mW/m?. The geophysical signatures from the neighborhood show that the asthenosphere has welled up considerably and is located at a depth of about 40 km. High heat flow and asthenospheric depth estimates suggest melting conditions at very shallow depths.
It is suggested that the highly differentiated magma associated with the major eruptive phase of Deccan Traps did not originate at the D” layer. It is hypothesized that magma was brought to the surface by a major secondary plume at a much shallower depth within the lithosphere and possibly at the crust-mantle boundary, as a consequence of subcrustal erosion and secondary melting caused by the extreme velocity of India during the late Cretaceous and early Tertiary. Substantial melting of the base of the lithosphere due to frictional heating might have resulted in the accumulation of a large quantity of magma below the thinned lithosphere at the pre-existing fracture zone near the continental margin. The presence of a magmatic conduit structure above the Moho, derived from the inversion of gravity data and other tectonic conditions, suggests a possible triggering of the magma reservoir by a large bolide impact (_ 10 km diameter) at the Cretaceous/Tertiary boundary near Bombay.
Intraduction
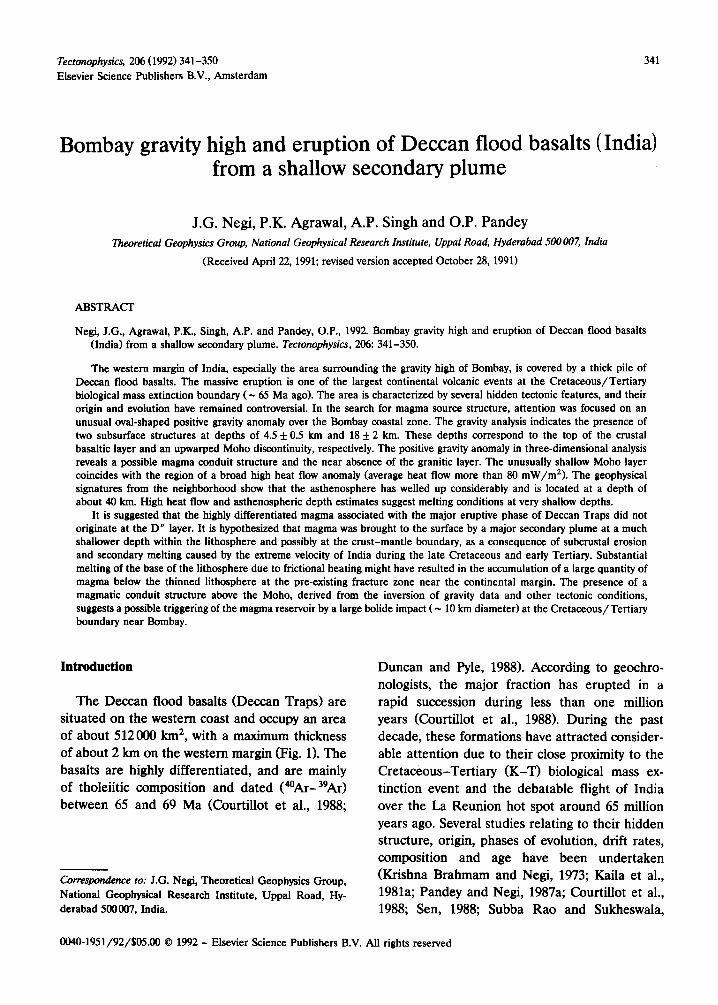
The Deccan flood basalts (Deccan Traps) are situated on the western coast and occupy an area of about 512000 km2, with a maximum thickness of about 2 km on the western margin (Fig. 1). The basalts are highly differentiated, and are mainly of tholeiitic composition and dated (40Ar-39Ar) between 65 and 69 Ma (Courtillot et al., 1988;
Duncan and Pyle, 1988). According to geochro- nologists, the major fraction has erupted in a rapid succession during less than one million years (Courtillot et al., 1988). During the past decade, these formations have attracted consider- able attention due to their close proximity to the Cretaceous-Tertiary (K-T) biological mass ex- tinction event and the debatable flight of India over the La Reunion hot spot around 65 million years ago. Several studies relating to their hidden structure, origin, phases of evolution, drift rates, composition and age have been undertaken
Correspondence to: J.G. Negi, Theoretical Geophysics Group, (Krishna Brahmam and Negi, 1973; Kaila et al.,
National Geophysical Research Institute, Uppal Road, Hy- 1981a; Pandey and Negi, 1987a; Courtillot et al., derabad 500007, India. 1988; Sen, 1988; Subba Rao and Sukheswala,
0040-1951/92/$05.00 8 1992 - Elsevier Science Publishers B.V. All rights reserved
342
Fig. 1. Location
68” 7z0 76* 60” r I f 1 I
-h
(+70
I - INDEX ------I
. . . 2 . . .
m Positive Bouguer prowity
m Lifhospheric profile I t I I I L
68’ 7Z” 76* 80°
map of the outcrop of the Deccan Traps, the gravity highs and therma springs, as well as the
profiles. Figures in brackets indicate the maximum Bouguer gravity value in the zone.
DSS and tithospheric
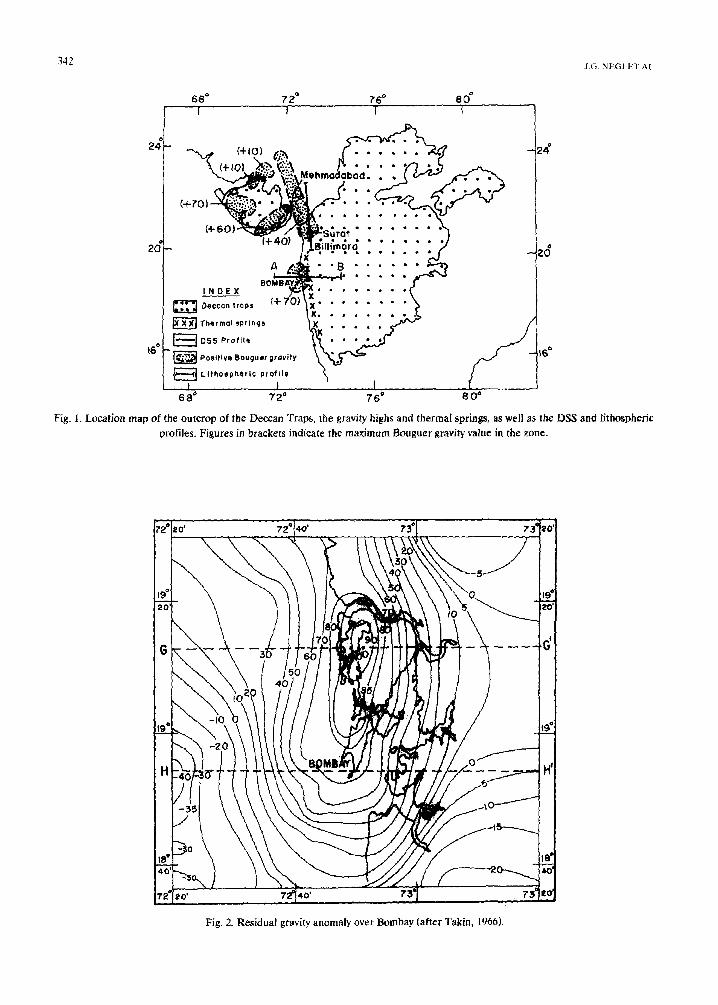
Fig. 2. Residual gravity anomaly over Bombay (after T&in, 1966).
1988; White and McKenzie, 1989). However, it is not yet understood whether such a votuminous
eruption was caused by a rising plume originating
in the lower mantle (Morgan, 1972) or some other mechanism.
The areas comprising the Trap rocks on the west coast are characterized by a number of positive gravity anomalies (Fig. 1). The most prominent of these is an oval-shaped gravity high situated near Bombay, which extends beyond 60 km (Fig. 2) from Bombay into the Arabian Sea.
The anomaly has been studied by Glennie (1951) and Takin (1966). However, these pre-plate tec- tonic studies could not provide much insight into its evolutionary history, due to the lack of rele- vant geoscientific info~ation at that time. In the
present paper, we attempt to analyse the gravity anomaly and related geophysical signatures of the west coast, in order to examine its possible origin and relationship with the Deccan flood basalts.
The Bouguer gravity anomaly
The prominent Bombay gravity anomaly first received attention from Glennie (1951) and sub- sequently from Takin (1966). Takin used a few available gravity values obtained by the Survey of India and computed the rest of the values on land, using a model density of 2.67 g/cm3. The data includes the gravity measurements made on board H.M.5. Owen during the Indian Ocean Expedition cruises of 1961-63. The Bouguer cor- rection applied to sea values was also based on a density of 2.67 g/cm3 for the topography and 1.03 g/cm3 for sea water. The terrain correction was not applied, as its value rarely exceeded 1 mGal. The accuracy of the data was considered to be about 5-10 mgal.
The regional field in the area was removed by Takin (1966) by drawing a series of E-W profiles with almost identical spacings. The profiles exhib- ited a conspicuous common regional character, with a uniform gradient from west to east. The regional field was subtracted from the observed anomaly fieId to derive the residual Bouguer anomaly shown in Fig. 2. The elongated oval- shaped positive residual gravity anomaly (100
mGa1) is bounded by latitudes 18”40’ and 19”30’N and longitudes 72’20’ and 73”20’E, covering an area of approximately 100 km X 100 km. The contours exhibit a sharp gradient of about 3 mgai/km on its east, reflecting the continental divide. The gradient on its west, however, is only about 1.25 mGal/km, perhaps indicating a deeper flank and characterizing a westward dip of the structure. Its northern limit is not well defined, but the southern margin is clearly demarcated up to 18”45’N. Takin (1966) interpreted a profile in terms of subsurface structures of high density.
Geologically, there is no variation on the sur- face across the entire area of the anomaly. High- density basaltic formations (2.82 g/cm31 are ex- posed over and to the east of Bombay. The thick- ness of the trap rocks in this region is about 2 km (Krishnan, 1968; Negi et al., 1983, 1986a). The basaltic rocks continue westwards for a consider- able distance in the offshore region. Takin (1966) compared the gravity anomaly with the available geological map of the Bombay and Bassein areas and found no correlation. He did conclude that the cause of the gravity anomaly was below the basaltic layer.
Spectral analysis and results
It is well known that the inte~retation of potential field data suffers from non-uniqueness. However, a first order estimate of possible sub- surface density/magnetic source horizons can be provided by the technique of spectral analysis (Spector and Grant, 1970; Negi et al., 1983,1986a; Negi and Agrawal, 1986). Interestingly, Negi and
Agrawal(1986) had earlier shown that the depth estimates obtained by this technique in other parts of the Deccan Trap area match well with the depth sections of deep-seismic sounding (DSS). Thus an amplitude-frequent response of the Bombay gravity high anomaly was obtained, in order to estimate the mean or average depth of the density interface. For this purpose, the anomaly map was digitized at an equal spacing of 1 km by linearly interpolating the contours in between, and taking care to ensure that essential parts of the anomaly were included. A radial
344
5r
-2 - . .
-3 - .
0 2 4 6 6 IO 1212TI/L
FREOUENCY (In Radians/km)
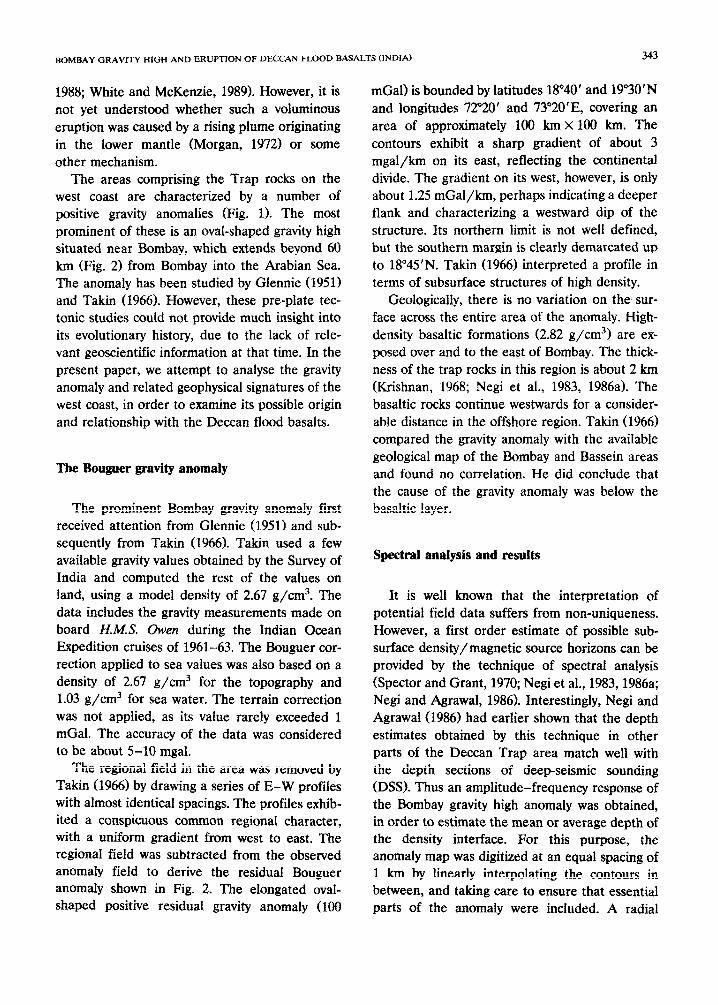
Fig. 3. Radial spectrum of the gravity anomaly over Bombay.
spectrum R&Y) was then computed (Fig. 3) ac- cording to the method outlined earlier in Negi and Agrawal (1986) using the following equation:
Q(S) = (1/27r)&*rrss(S cos 8, S sin 6) df3
(1)
J.G. NEGI ET AL
where Sg(u, v) is a two-dimensional spectrum, given by (4a2/,rr2)S& v) exp(-2sd), u = S cos 8, u = S sin 8, S, is the spectrum of a ran- dom density distribution, d is the depth, and u is a constant.
The computed spectrum of the gravity anomaly exhibits an exponential amplitude decay with in- creasing frequency. Such a spectrum may be ex- pected over an arrangement of sources at differ- ent depths, where the sources at greater depths are stronger. Each layer of the sources is well resolved and produces a linear spectrum. Two linear segments in the lower frequency and higher frequency ranges are obtained by the standard least squares technique, with proper weighting attached to data point in each segments. These two segments yield source depths of 17.7 km and 4.4 km below the surface. It may be noted here that the depths obtained from the spectral analy- sis are the average-but maximum-depths of random point mass sources, and thus usually
72-40’ ‘Y 730 I-
73’20’
I \
!O’
; _-----
H
Initial depth
contour Interval = 1.5 km.
I 16e40’ - I I
!O’ 72.40’ I I .
73Q 73’20’
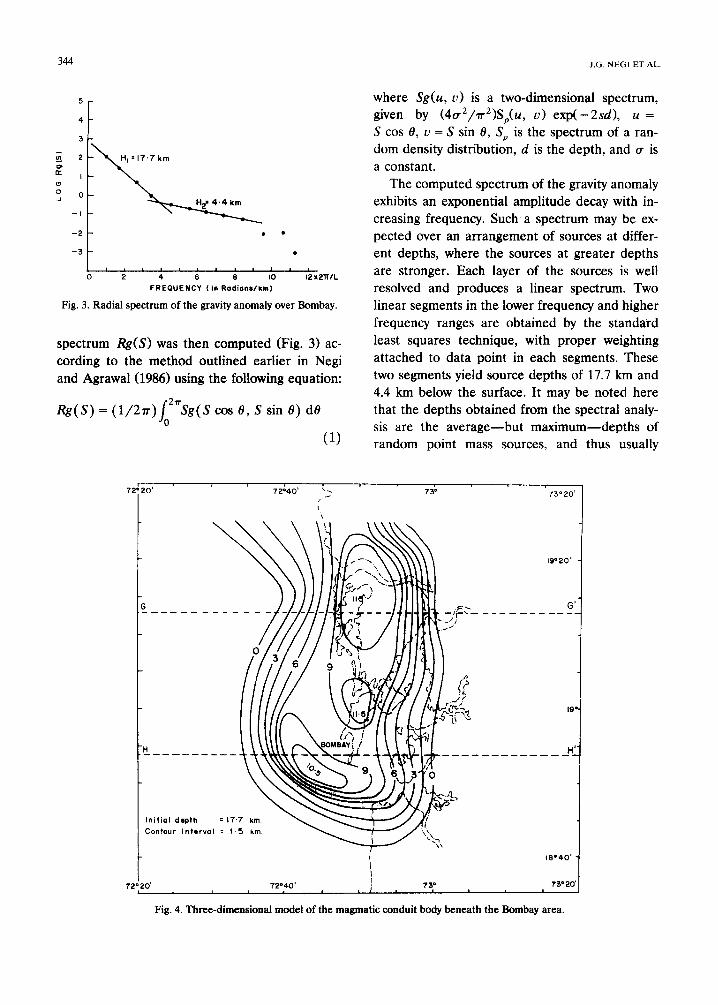
Fig. 4. Three-dimensional model of the magrnatic conduit body beneath the Bombay area.
FFECT DUE TO MODEL
‘Mono’ . __
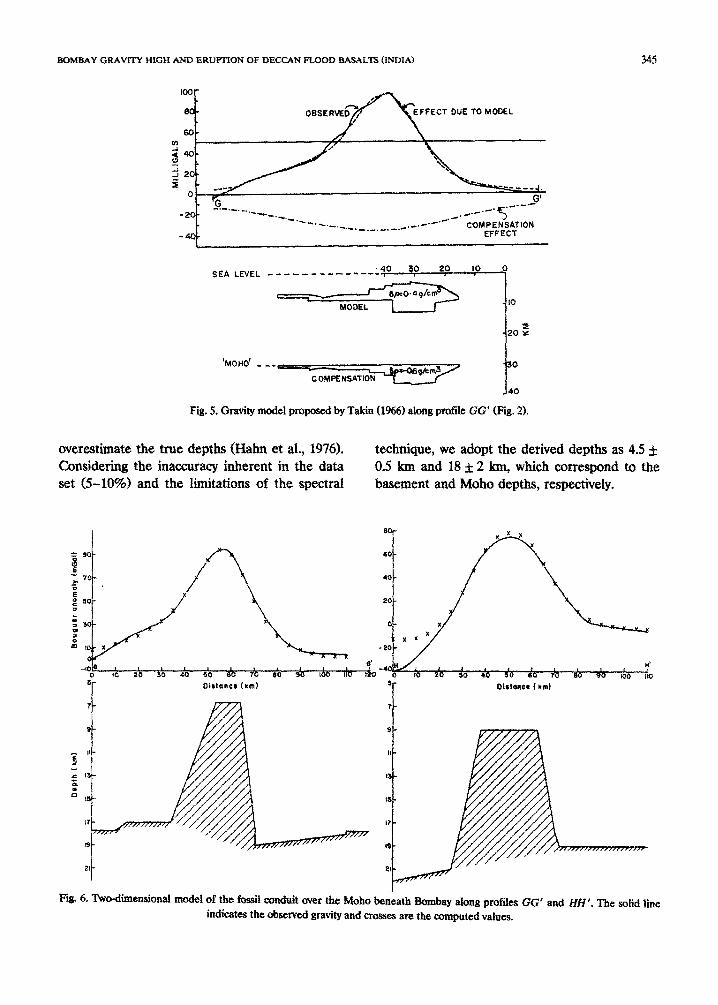
Fig. 5, Gravity model proposed by Takin (1966) along profile GG’ (Fig. 2).
overestimate the true depths (Hahn et al., 1976). technique, we adopt the derived depths as 4.5 f ~nside~g the ina~ra~ inherent in the data 0.5 km and 18 f 2 km, which correspond to the set (S-IO%) and the limitation of the spectral basement and Moho depths, respectivelyv.
Distance (km)
Fii. 6. Two-dimensional model of the fossil conduit owr tbe Moho beneath Bombay along pr&les GG’ and NH’. The solid line
indicates the &served gravity and crosses are the imputed values.
346
The results of the spectral analysis are ex- tended in order to model the three-dimensional causative body over the Moho boundary. Since the Moho depth derived by us conforms ex- tremely well with the DSS findings of upwarped crust in the nearby region, we take an initial depth of 17.7 km and a density contrast of 0.43 g/cm3 between the lower crust and upper mantle to compute relief values by using the GRAMOD (1981) program, developed by Paterson, Grant and Watson Ltd. A contour map of the relief of the area is presented in Figure 4. A conduit pipe like structure with a maximum relief of 11.5 km above the Moho level is clearly projected in the northern part of the anomaly. The relief in the southwest attains a value of 10.5 km, while in the east and west it follows the gravity contours. It may be noted that spectral results differ signifi- cantly from those obtained by Takin (1966) (Fig. 5), who found the corresponding depth levels at 30 km for the Moho and 10 km for the elongated causative body. In order to facilitate a better comparison with his results, a cross-section of the relief picture along GG’ (the profile along which Takin modelled the gravity anomaly) and HH ’ is presented in Figure 6. It is clear that in our single body model the high-density mantle material rises up to a height of about 11.5 km from the Moho level. In contrast. Takin obtained hvo discon-
LG. NEGI ET‘AI..
netted bodies of different densities at average depths of 30 km and 10 km.
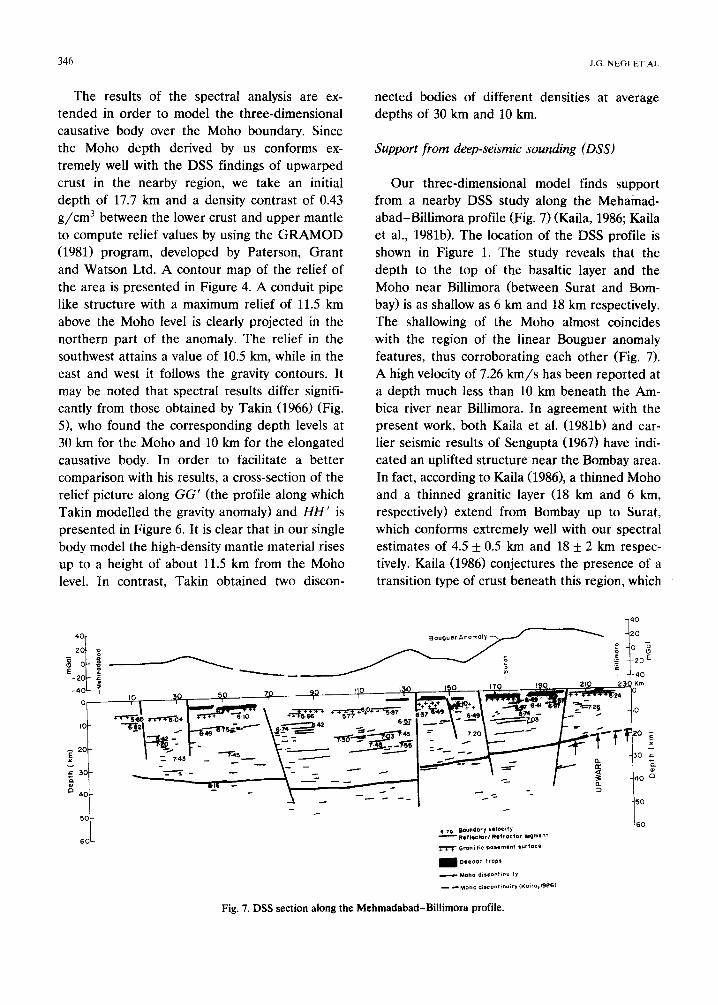
Support from deep-seismic sounding (DSS)
Our three-dimensional model finds support from a nearby DSS study along the Mehamad- abad-Billimora profile (Fig. 7) (Kaila, 1986; Kaila et al., 1981b). The location of the DSS profile is shown in Figure 1. The study reveals that the depth to the top of the basaltic layer and the Moho near Billimora (between Surat and Bom- bay) is as shallow as 6 km and 18 km respectively. The shallowing of the Moho almost coincides with the region of the linear Bouguer anomaly features, thus corroborating each other (Fig. 7). A high velocity of 7.26 km/s has been reported at a depth much less than 10 km beneath the Am- bica river near Billimora. In agreement with the present work, both Kaila et al. (1981b) and ear- lier seismic results of Sengupta (1967) have indi- cated an uplifted structure near the Bombay area. In fact, according to Kaila (19861, a thinned Moho and a thinned granitic layer (18 km and 6 km, respectively) extend from Bombay up to Surat, which conforms extremely well with our spectral estimates of 4.5 _t 0.5 km and 18 f 2 km respec- tively. Kaila (1986) conjectures the presence of a transition type of crust beneath this region, which
BOMBAYGRA~ITYHIGHANDERUPTI~N~FDE~CANFL~~DBA~ALTS(INDIA) 341
is similar to the Afar Triangle adjacent to the Red Sea. It is argued that during the Cretaceous period the thick basaltic layer might have been in
an almost molten state due to magmatic injection from the upper mantle (Kaila, 1986). The 3-D relief model thus establishes a genetic link be- tween the two adjacent regions.
Geothermal gradient, heat jlow and lithospheric thickness
On the basis of our three-dimensional mag- matic conduit pipe like body, it may be surmised that the genesis of magma indeed has deeper links, and that the thermal anomalies due to such fossil conduits are obviously to be expected as a result of uprising of the partial melt. Recently, Pandey et al. (1992) have studied in detail the thermal field of the western part of the Indian region. The observed geothermal gradient and heat flow values are found to be extremely high
70. 7z” 74O 76’
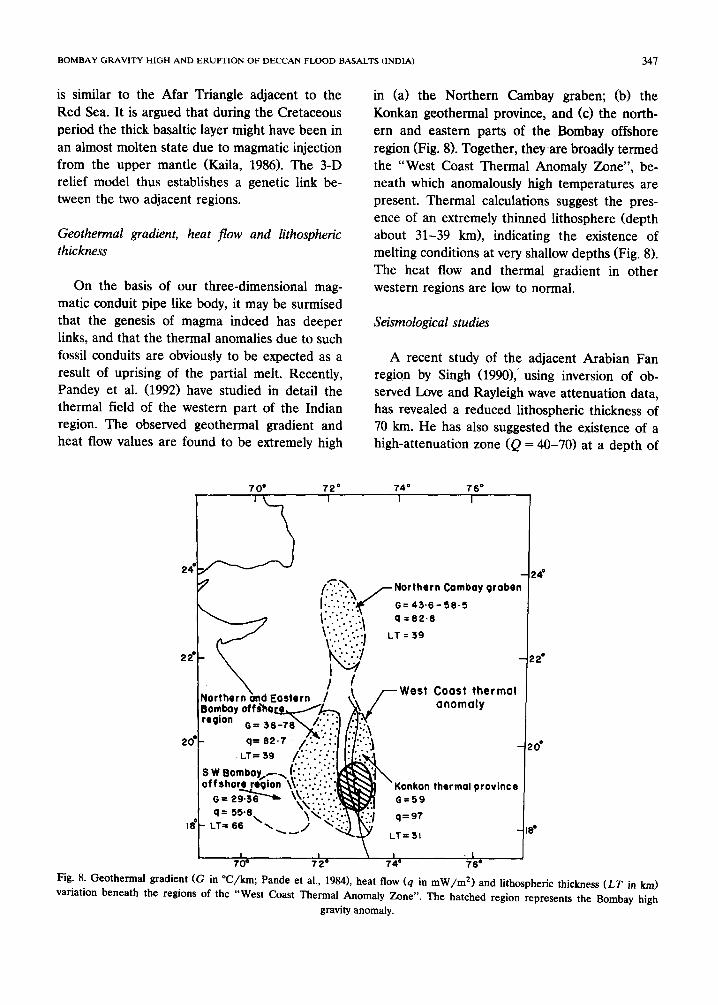
in (a) the Northern Cambay graben; (b> the
Konkan geothermal province, and cc> the north- ern and eastern parts of the Bombay offshore
region (Fig. 8). Together, they ;are broadly termed the “West Coast Thermal Anomaly Zone”, be- neath which anomalously high temperatures are present. Thermal calculations suggest the pres- ence of an extremely thinned lithosphere (depth about 31-39 km), indicating the existence of melting conditions at very shallow depths (Fig. 8). The heat flow and thermal gradient in other western regions are low to normal.
Seismological studies
A recent study of the adjacent Arabian Fan region by Singh (1990), using inversion of ob- served Love and Rayleigh wave attenuation data, has revealed a reduced lithospheric thickness of 70 km. He has also suggested the existence of a high-attenuation zone <Q = 40-70) at a depth of
Northern Comboy groben
6143.6-56.5
west Coast thermal
Konkon thermol province
Fig. 8. Geothermal gradient (G in “C/km; Pande et al., 19841, heat flow (q in mW/m*) and lithospheric thickness (LT in variation beneath the regions of the “West Coast Thermal Anomaly Zone”. The hatched region represents the Bombay
gravity anomaly.
km) high
348 J.G. NEGl ET AL.
60-160 km, reflecting substantial thinning of the Indian lithosphere beneath it. The high-attenua- tion zone in the upper mantle is ascribed to high temperatures and partial melting conditions.
Discussions and conclusions
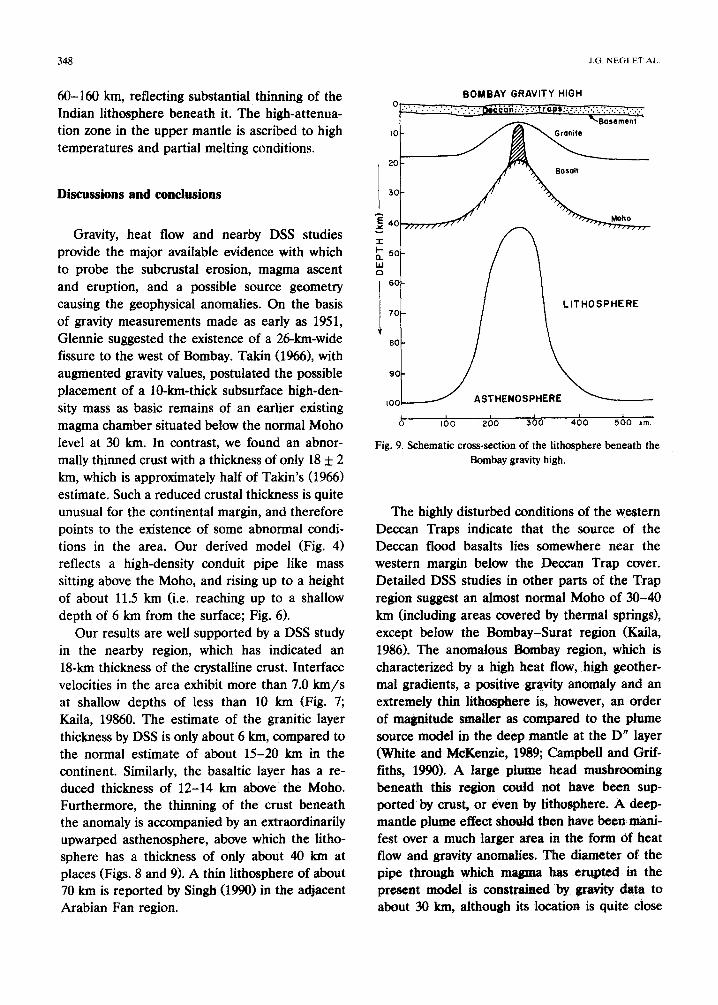
Gravity, heat flow and nearby DSS studies provide the major available evidence with which to probe the subcrustal erosion, magma ascent and eruption, and a possible source geometry causing the geophysical anomalies. On the basis of gravity measurements made as early as 1951, Glennie suggested the existence of a 26km-wide fissure to the west of Bombay. Takin (1966), with augmented gravity values, postulated the possible placement of a lo-km-thick subsurface high-den- sity mass as basic remains of an earlier existing magma chamber situated below the normal Moho level at 30 km. In contrast, we found an abnor- mally thinned crust with a thickness of only 18 f 2 km, which is approximately half of Takin’s (1966) estimate. Such a reduced crustal thickness is quite unusual for the continental margin, and therefore points to the existence of some abnormal condi- tions in the area. Our derived model (Fig. 4) reflects a high-density conduit pipe like mass sitting above the Moho, and rising up to a height of about 11.5 km (i.e. reaching up to a shallow depth of 6 km from the surface; Fig. 6).
Our results are well supported by a DSS study in the nearby region, which has indicated an l&km thickness of the crystalline crust. Interface velocities in the area exhibit more than 7.0 km/s at shallow depths of less than 10 km (Fig. 7; Kaila, 19860. The estimate of the granitic layer thickness by DSS is only about 6 km, compared to the normal estimate of about 15-20 km in the continent. Similarly, the basaltic layer has a re- duced thickness of 12-14 km above the Moho. Furthermore, the thinning of the crust beneath the anomaly is accompanied by an extraordinarily upwarped asthenosphere, above which the litho- sphere has a thickness of only about 40 km at places (Figs. 8 and 9). A thin lithosphere of about 70 km is reported by Singh (1990) in the adjacent Arabian Fan region.
BOMBAY GRAVITY HIGH
LITHOSPHERE
ASTHENOSPHERE
I 0 100 200 300 400 500 km
Fig. 9. Schematic cross-section of the lithosphere beneath the Bombay gravity high.
The highly disturbed conditions of the western Deccan Traps indicate that the source of the Deccan flood basalts lies somewhere near the western margin below the Deccan Trap cover. Detailed DSS studies in other parts of the Trap region suggest an almost normal Moho of 30-40 km (including areas covered by thermal springs), except below the Bombay-Surat region (Kaila, 1986). The anomalous Bombay region, which is characterized by a high heat flow, high geother- mal gradients, a positive gravity anomaly and an extremely thin lithosphere is, however, an order of magnitude smaller as compared to the plume source model in the deep mantle at the D” layer (White and McKenzie, 1989; Campbell and Grif- fiths, 1990). A large plume head mushrooming beneath this region could not have been sup- ported by crust, or even by lithosphere. A deep- mantle plume effect should then have been mani- fest over a much larger area in the form of heat flow and gravity anomalies. The diameter of the pipe through which magma has erupted in the present model is constrained by gravity data to about 30 km, although its location is quite close
BOMBAY GRAVITY HIGH AND ERUPnON OF DECCAN FLOOD BASALTS (INDIA) 349
to the mantle plume suggested by Campbell and Griffiths (1!390). The inferred lithosp~eric struc- ture from the present model, and the highly dif- ferentiated nature of the Deccan basalts, suggest that the Deccan magmas did not originate at the D” layer. Rather, they appear to have been erupted through a secondary plume of 30&m diameter at a much shallower depth within the lithosphere, and possibly at the crust-mantle boundary. A critical evaluation of geochemical data (Mg ratios and representative analyses of a large data base from Deccan basalts) supports this view (Pandey and Negi, 1987a; Sen, 1988). Such a shallow plume origin can also explain the highly differentiated nature of the Deccan Trap magmas. This inference has links with the super- mobility of the Indian plate during the Late Cre- taceous.
The Indian subcontinent is known to have experienced a considerable increase in velocity gradient during the period from 80 to 53 Ma (Negi et al., 1986b; Powell, 1979). Its velocity jumped during this period from 3-5 cm/yr to > 20 cm/yr. The high speed can explain the substantial melt generation at the base of the lithosphere due to frictional heating. It would cause the rise of isotherms, subcrustal melting and consequent thinning of the lithosphere be- neath the region, as revealed by the analysis of gravity and thermal fields (Negi et al., 1986b; Pandey and Negi, 1987b). Such a phenomenon would result in the accumulation of a large quan- tity of magma below the thermal lithosphere.
On the basis of a detailed study of volcanic episodes in the Deccan and magnetostratigraphic correlation, Courtillot (1990) proposed the erup- tion of the major volcanic phase of the Deccan Traps at 65.7 f 2.0 Ma. According to him, the dominant eruptions lasted for only some 10000 years at the time of the K/T boundary. A similar short duration for the main phase of volcanism has also been inferred by Officer et al. (1987). If we accept this postulated short duration, then a possible triggering of magma flow by a large size (> 10 km diameter) bolide impact at the K/T boundary near Bombay is a distinct possibility. Stoke’s law would also not permit such a large lava flow in such a short time from the deep
mantle. The remains of the tabular intrusive body (i.e. the secondary plume from the crust-mantle
boundary) are still present below the Bombay high gravity anomaly. The western part of the Indian peninsula is also a weak zone, crossed by a number of deep-seated faults, fractures and dyke intrusions (Chandrasekharam, 1985). A large number of hot springs are also present (Gupta et al., 1975; Saxena and Gupta, 1987). Such a weak- ened crust would allow the triggered magma to reach the surface quickly. A schematic cross-sec- tion illustrating the upwarped crustal and litho- spheric boundary is shown in Figure 9. However, it should be mentioned that the interpretation given above is by no means unique although, in view of the available geological and geophysical data, it appears quite probable. It would be inter- esting to follow up the secondary plume hypothe- sis and shallow evolution of magma by collecting more geochemical and geophysical data around the Bombay region.
We are extremely grateful to Dr U. Raval for many helpful discussions. Thanks are also due to Messrs P.V. Swamy and Anish I&mar for their help in the preparation of the manuscript and the drafting of the figures. The permission accorded by the Director, National Geophysical Research Institute, Hyderabad to publish this work is grate- fully acknowledged.
References
Campbell, I.H. and Griffiths, R.W., 1990. Implications of mantle plume structure for the evolution of flood basalts. Earth Planet. Sci. L&t., 99: 79-93.
Chandrasekharam, D., 1985. Structure and evolution of the western continental margin of India deduced from gravity, seismic, geomagnetic and geochronological studies. Phys. Harth Planet. Inter., 41: 186-198.
Courtillot, V., 1990. Deccan volcanism at the Cretaceous- Tertiary boundary: past climatic crises as a key to the future. Paleogeogr. Paleoclimatol. Palaeoecol., 189: 291- 299.
Courtillot, V., Peraud, G., Mahtski, H., Vandamme, D., Moreau, M.G. and Besse, J., 1988. Deccan flood basalts and the Cretaceous/Tertiary boundary. Nature, 333: 843- 846.
350 J.G. NECil El- AI.
Duncan, R.A. and Pyle, D.G., 1988. Rapid eruption of the Deccan flood basalts at the Cretaceous/Tertiary bound- ary. Nature 333: 841-843.
Glennie, E.A., 1951. Density or geological corrections to gravity anomalies for the Deccan Trap area in India. Month. Not. R. Astron. Sot., Geophys. Suppl., 6: 179.
GRAMOD, 1981. Gravity model-fitting program developed by M/s. Paterson, Grant and Watson Limited, Toronto.
Gupta, M.L., Narain, H. and Gaur, V.K., 1975. Geothermal provinces of India as indicated by studies of thermal springs, terrestrial heat flow, and other parameters. Pro- ceedings of the 2nd UN Symposium on the Development and Use of Geothermal Resources, San Francisco, Calif., May 20-29, pp. 387-396.
Hahn, A., Kind, E.G. and Mishra, DC., 1976. Depth estima- tion of magnetic sources by means of Fourier amplitude spectra. Geophys. Prospect., 24: 287-306.
Kaila, K.L., 1986. Tectonic framework of Narmada-Son linea- ment-a continental rift system in central India from deep seismic soundings, in: Reflection Seismology: a Global
Perspective. Geodyn. Ser., vol. 13, AGU Publications, pp. 133-1.50.
Kaila, K.L., Krishna, V.G. and Mall, D.M., 1981b. Crustal structure along Mehmadabad-Billimora profile in the Cambay basin, India, from deep seismic soundings. Tectonophysics, 76: 99-130.
Kaila, K.L., Murthy, P.R.K., Rao, V.K. and Kharetchko, G.E., 1981a. Crustal structure from deep seismic sounding along the Koyna II (Kelsi-Loni) profile in the Deccan Trap area, India. Tectonophysics, 73: 365-384.
Krishna Brahmam, N. and Negi, J.G., 1973. Rift valleys be- neaths the Deccan Traps (India). Geophys. Res. Bull., 11: 207-237.
Krishnan, M.S. 1968. Geology of India and Burma, 5th edi- tion. Higginbothams, India.
Morgan, W.J., 1972. Deep mantle convection plumes and plate motions. Bull. Am. Assoc. Pet. Geol., 56: 203-213.
Negi. J.G. and Agrawal, P.K. 1986. Delineation of crustal layers by the spectral analysis of the Bouguer gravity data: a case history for Deccan Traps (India). Tectonophysics, 122: 135-147.
Negi, J.G., Agrawal, P.K. and Rao, K.N.N., 1983. Three-di- mensional model of the Koyna area of Maharashtra state (India) based on the spectral analysis of aeromagnetic data. Geophysics, 48: 964-974.
Negi, J.G., Dimri, V.P., Agrawal, P.K. and Pandey, O.P., 1986a. A spectral analysis of the aeromagnetic profiles for thickness estimation of flood basalts of India. Bull. Aust. Sot. Explor. Geophys., 17: 105-111.
Negi, J.G., Pandey, O.P. and Agrawal, P.K. 1986b. Super-mo-
bility of hot Indian lithosphere. Tectonophysics, 131: 147- 156.
Officer, C., Hallam, A., Drake, C.L. and Devine, J.D., 1987. Late Cretaceous and paroxysmal Cretaceous-Tertiary ex- tinctions. Nature, 326: 143-149.
Pande, D.K., Misra, K.N. and Sharma, S., 1984. source bed
history of Bombay offshore region, in: Oil and Gas fields, Proceedings of the 27th International Geological Congress, Moscow, 13: 211-244.
Pandey, O.P. and Negi, J.G., 1987a. A new theory of the
origin and evolution of the Deccan Traps (India). Tectono- physics, 142: 329-335.
Pandey, O.P. and Negi, J.G., 1987b. Signals of degeneration of the subcrustal part of the Indian lithosphere since the break-up of Gondwanaland. Phys. Earth Planet. Inter. 48: l-4.
Pandey, O.P., Negi, J.G., Agrawal, P.K. and Singh, A.P., 1992. Heat flow, Lithospheric thinning and occurrences of hy- drocarbons in younger sedimentary basins. (Manuscript in preparation.)
Powell, C. McA., 1979. A speculative tectonic history of Pakistan surroundings: some constraints from the Indian Ocean. In: A. Farah and K.A. de Jong (Editors), Geody- namics of Pakistan. Geol. Surv. Pakistan, Quetta, pp. S-24.
Saxena, V.K. and Gupta, M.L., 1987. Evaluation of reservoir temperatures and local utilisation of geothermal waters of the Konkan coast, India. J. Volcanol. Geotherm. Res., 33: 337-342.
Sen, G., 1988. Possible depth of origin of primary Deccan tholeiite magma. In: K.V. Subba Rao (Editor), Deccan Flood Basalts. Mem. Geol. Sot. India, 10: 35-51.
Sen Gupta, S.N., 1967. Structure of the gulf of Cambay. Proc. symp. Upper Mantle Project, Hyderabad. GRB and NGRI Pull., 8: 334-341.
Singh, D.D., 1990. Q-structure beneath the north and Central Indian ocean from the inversion of observed Love and Rayleigh wave attenuation data. Phys. Earth Planet. Inter., 59: 243-258.
Spector, A. and Grant, F.S., 1970. Statistical models for interpreting aeromagnetic data. Geophysics, 35: 293-302.
Subba Rao, K.V. and Sukheswala, R.N. (Editors), 1981. Dec- can volcanism and related basalt provinces in other parts of the world. Geol. Sot. India Mem., 3: l-474.
Takin, M., 1966. An interpretation of the positive gravity anomaly over Bombay on the West Coast of India, Geo-
phys. J. R. Astron. Sot., 11: 527-537. White, R. and McKenzie, D., 1989. Magmatism at rift zones:
the generation of volcanic continental margins and flood basalts. J. Geophys. Res., 94: 7685-7729.