geochemical stratigraphy of deccan flood basalts of the bijasan ghat section, satpura range, india...
TRANSCRIPT
Geochemical stratigraphy of Deccan flood basalts of the Bijasan Ghat
section, Satpura Range, India
H.C. Shetha, J.J. Mahoneyb, D. Chandrasekharama,*
aDepartment of Earth Sciences, Indian Institute of Technology, Powai, Bombay 400 076, IndiabSchool of Ocean and Earth Science and Technology, University of Hawaii, Honolulu, HI 96822, USA
Received 26 September 2002; revised 13 April 2003; accepted 15 April 2003
Abstract
The ,240-m-thick Bijasan Ghat section exposes Deccan basalt flows and dykes that have major and trace element compositions
suggestive of variable amounts of contamination by continental material. Most flows and a dyke are chemically similar to lavas of the
Poladpur Formation in the southwestern Deccan. One flow and one dyke are similar to lavas of the Bushe Formation in the southwest, and one
dyke is similar to lavas of the Mahabaleshwar Formation in the southwest. The type-sections of these formations are located ,350 km to the
south of Bijasan Ghat, but many Poladpur-type lavas, a few Mahabaleshwar-like lavas and dykes, and a few broadly Bushe-like lavas and
dykes have recently been identified in the Satpura region. Lavas resembling the thick Ambenali Fm. of the southwest are absent from Bijasan
Ghat and nearby areas. Our data further extend the known outcrop area of Poladpur-like flows (estimated at $3 £ 105 km2), one of the most
widespread Deccan magma types. Seven ‘giant plagioclase basalt’ flows encountered in seven different sections in this region cannot
unambiguously be correlated at present, either physically or chemically, and therefore are of little use in deciphering the complicated
stratigraphic and structural make-up of the regional lava pile.
q 2003 Elsevier Ltd. All rights reserved.
Keywords: Deccan; Flood basalt; Geochemistry; Petrogenesis; Satpura; Tapi; Stratigraphy
1. Introduction
Considerable advances have been made over the last two
decades in understanding the regional lava stratigraphy of
the Deccan flood basalt province of India (see Sen, 2001 for
a recent review). The province has a present-day area of
500,000 km2 (e.g. Wadia, 1975) on land and a large
additional area offshore of western India; an unknown, but
probably large amount of the province’s original extent has
been lost to erosion since the formation of the province
,65 million years ago (Ma). The Deccan lava pile is
particularly well exposed in the southwestern part of the
province (Fig. 1) in the Western Ghats range, and the
stratigraphic framework of this region is now known quite
well from extensive field, geochemical (including isotopic)
and palaeomagnetic work (e.g. Cox and Hawkesworth,
1985; Beane et al., 1986; Subbarao, 1988; Lightfoot et al.,
1990; Peng et al., 1994). On the basis of geochemical
characteristics and field markers, the Western Ghats
sequence, with a total stratigraphic thickness of
,3,000 m, has been divided into three subgroups and
eleven formations (Table 1). Many of the formations have
been subdivided into members and chemical types.
Geochemical stratigraphic work in the central part of
the Deccan province (Fig. 1) has identified the Thakur-
vadi, Khandala and Poladpur Formations (Fms.) to the
ENE of the Western Ghats (Subbarao et al., 1994; Peng,
1998). The Poladpur, Ambenali and Mahabaleshwar Fms.
also extend into the southeastern Deccan for hundreds of
kilometres from their type sections in the southwest (e.g.
Mitchell and Widdowson, 1991; Bilgrami, 1999). Lavas
isotopically and chemically resembling the Ambenali,
Poladpur, and Khandala Fms also have been documented
in the northeastern part of the province (Mhow,
Chikaldara, and Jabalpur areas) but, because most of the
Khandala- and Poladpur-like lavas have systematically
higher Pb isotopic ratios than their Western Ghats
counterparts, they appear to have been erupted from
different vents (Peng et al., 1998). Recent work on
1367-9120/03/$ - see front matter q 2003 Elsevier Ltd. All rights reserved.
doi:10.1016/S1367-9120(03)00116-0
Journal of Asian Earth Sciences 23 (2004) 127–139
www.elsevier.com/locate/jseaes
* Corresponding author. Tel.: þ91-22-2576-7263; fax: þ91-22-2572-
3480/2576-7253.
E-mail address: [email protected] (D. Chandrasekharam).
sections in the Tapi River valley and western Satpura
Range, north of the Western Ghats (Sheth et al., 1997;
Chandrasekharam et al., 1999, 2000; Mahoney et al.,
2000), has identified a considerable volume of Poladpur-
like lavas and a few Mahabaleshwar-like and broadly
Bushe-like lavas and dykes, as well as flows and dykes
that have no known counterparts in the southwestern
Deccan. Unlike the northeastern Deccan, no Ambenali-
type lavas have been encountered in this region. Also, the
broadly Bushe- and Mahabaleshwar-like lavas are not in
the same stratigraphic order as in the southwestern
Deccan.
The Satpura region is one of structural complexity;
field relationships are often complicated and stratigraphic
correlations unclear. As in the Western Ghats, geochem-
ical characteristics of the lavas are a powerful tool for
stratigraphic correlation, and for interpreting regional
structure and tectonics. Here, we present major and
trace element data for lava flows and dykes from the
Bijasan Ghat section (Fig. 1) and for a few ‘giant
plagioclase basalt’ (GPB) flows from nearby sections, and
discuss their implications for the regional stratigraphy and
structure.
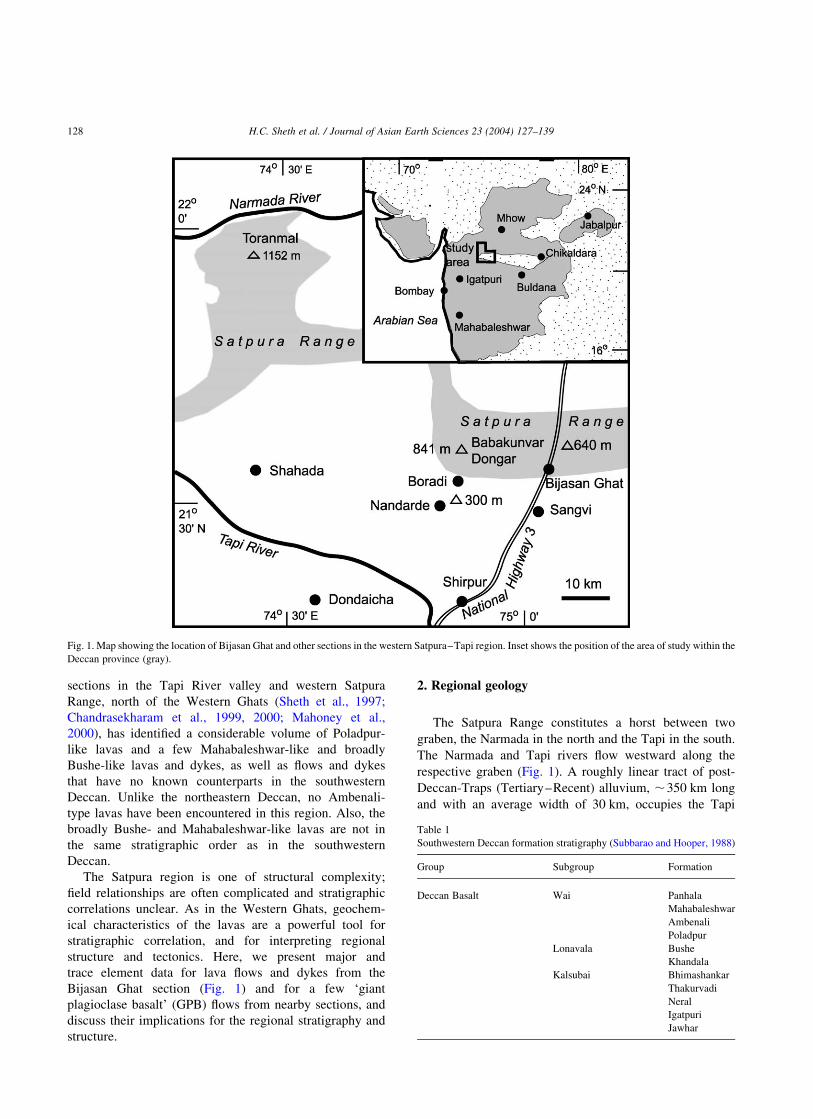
2. Regional geology
The Satpura Range constitutes a horst between two
graben, the Narmada in the north and the Tapi in the south.
The Narmada and Tapi rivers flow westward along the
respective graben (Fig. 1). A roughly linear tract of post-
Deccan-Traps (Tertiary–Recent) alluvium, ,350 km long
and with an average width of 30 km, occupies the Tapi
Fig. 1. Map showing the location of Bijasan Ghat and other sections in the western Satpura–Tapi region. Inset shows the position of the area of study within the
Deccan province (gray).
Table 1
Southwestern Deccan formation stratigraphy (Subbarao and Hooper, 1988)
Group Subgroup Formation
Deccan Basalt Wai Panhala
Mahabaleshwar
Ambenali
Poladpur
Lonavala Bushe
Khandala
Kalsubai Bhimashankar
Thakurvadi
Neral
Igatpuri
Jawhar
H.C. Sheth et al. / Journal of Asian Earth Sciences 23 (2004) 127–139128
Valley, and isolated inliers of the Deccan Traps are exposed
in it. The alluvium thickens from south to north, in general,
and extends to a depth of ,200 m below mean sea level in
places (as identified from borings), where it is .400 m thick
(e.g. Ravishanker, 1987). On the basis of seismic reflection
and refraction data, Kaila (1988) inferred the presence of
Mesozoic sedimentary basins below the Deccan Traps in the
Narmada and Tapi graben; the Narmada Mesozoic basin
averages 1000 m deep and the Tapi Mesozoic basin 1800 m
deep.
The Deccan lava pile in the Tapi Valley, seen in
discontinuous sections, has a complex structure and
shows variable, tectonically controlled dips in many
places. Guha (1995) concluded that physical correlation
of basalt flows across the Tapi Valley is not possible as
there is not sufficient continuity between even nearby
sections as a result of faulting. Moreover, he inferred the
presence of major faults, both basin-marginal and
sympathetic. Stratigraphic sequences must be deciphered
for three isolated sectors: the southern (flows south of the
alluvium), the central (flows of inliers exposed within
the alluvium), and the northern (flows exposed north of
the alluvium). Flow stratigraphic relationships remain
largely unknown.
The contact between the Satpura horst and the Tapi
graben is marked by the Satpura Foothill Fault, expressed by
steep fault scarps along its 300-km-length (Guha, 1995).
However, although the exposed part of the Satpura Foothill
Fault dips southward at a high angle, its geometry at depth is
unknown. Available seismic profiles across the Tapi basin
(Kaila, 1988) do not reveal any significant low-angle
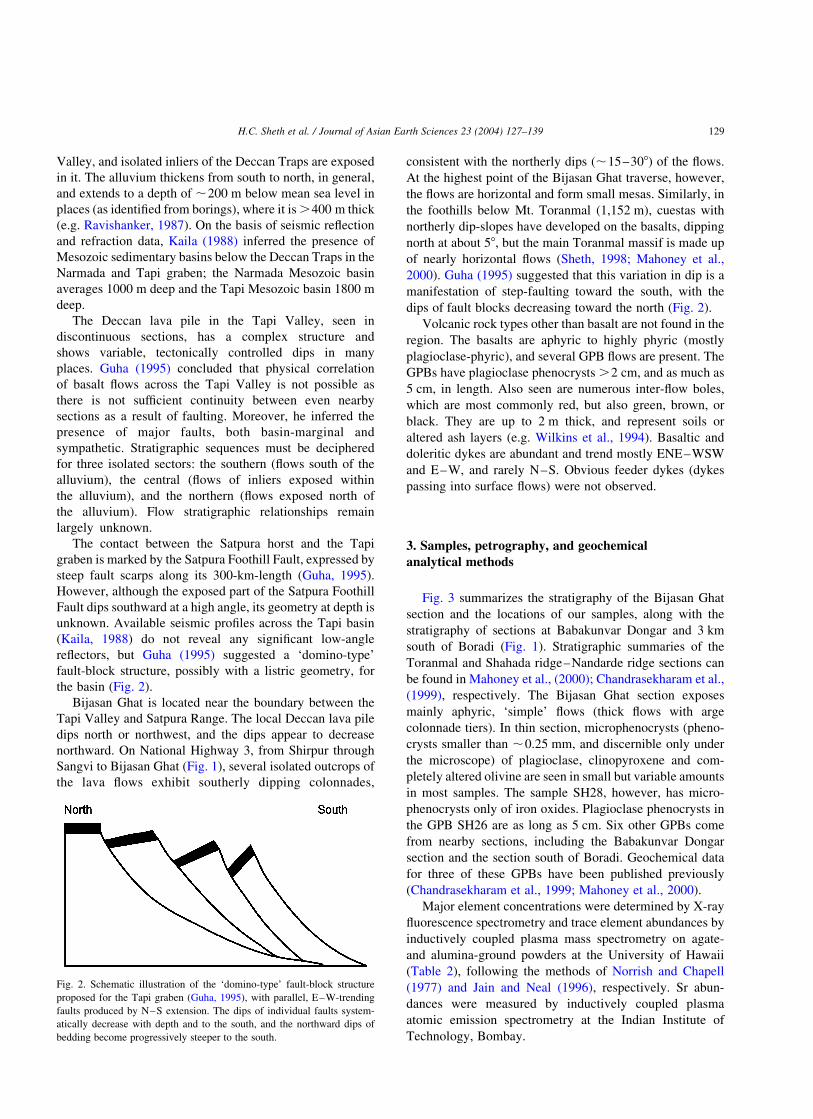
reflectors, but Guha (1995) suggested a ‘domino-type’
fault-block structure, possibly with a listric geometry, for
the basin (Fig. 2).
Bijasan Ghat is located near the boundary between the
Tapi Valley and Satpura Range. The local Deccan lava pile
dips north or northwest, and the dips appear to decrease
northward. On National Highway 3, from Shirpur through
Sangvi to Bijasan Ghat (Fig. 1), several isolated outcrops of
the lava flows exhibit southerly dipping colonnades,
consistent with the northerly dips (,15–308) of the flows.
At the highest point of the Bijasan Ghat traverse, however,
the flows are horizontal and form small mesas. Similarly, in
the foothills below Mt. Toranmal (1,152 m), cuestas with
northerly dip-slopes have developed on the basalts, dipping
north at about 58, but the main Toranmal massif is made up
of nearly horizontal flows (Sheth, 1998; Mahoney et al.,
2000). Guha (1995) suggested that this variation in dip is a
manifestation of step-faulting toward the south, with the
dips of fault blocks decreasing toward the north (Fig. 2).
Volcanic rock types other than basalt are not found in the
region. The basalts are aphyric to highly phyric (mostly
plagioclase-phyric), and several GPB flows are present. The
GPBs have plagioclase phenocrysts .2 cm, and as much as
5 cm, in length. Also seen are numerous inter-flow boles,
which are most commonly red, but also green, brown, or
black. They are up to 2 m thick, and represent soils or
altered ash layers (e.g. Wilkins et al., 1994). Basaltic and
doleritic dykes are abundant and trend mostly ENE–WSW
and E–W, and rarely N–S. Obvious feeder dykes (dykes
passing into surface flows) were not observed.
3. Samples, petrography, and geochemical
analytical methods
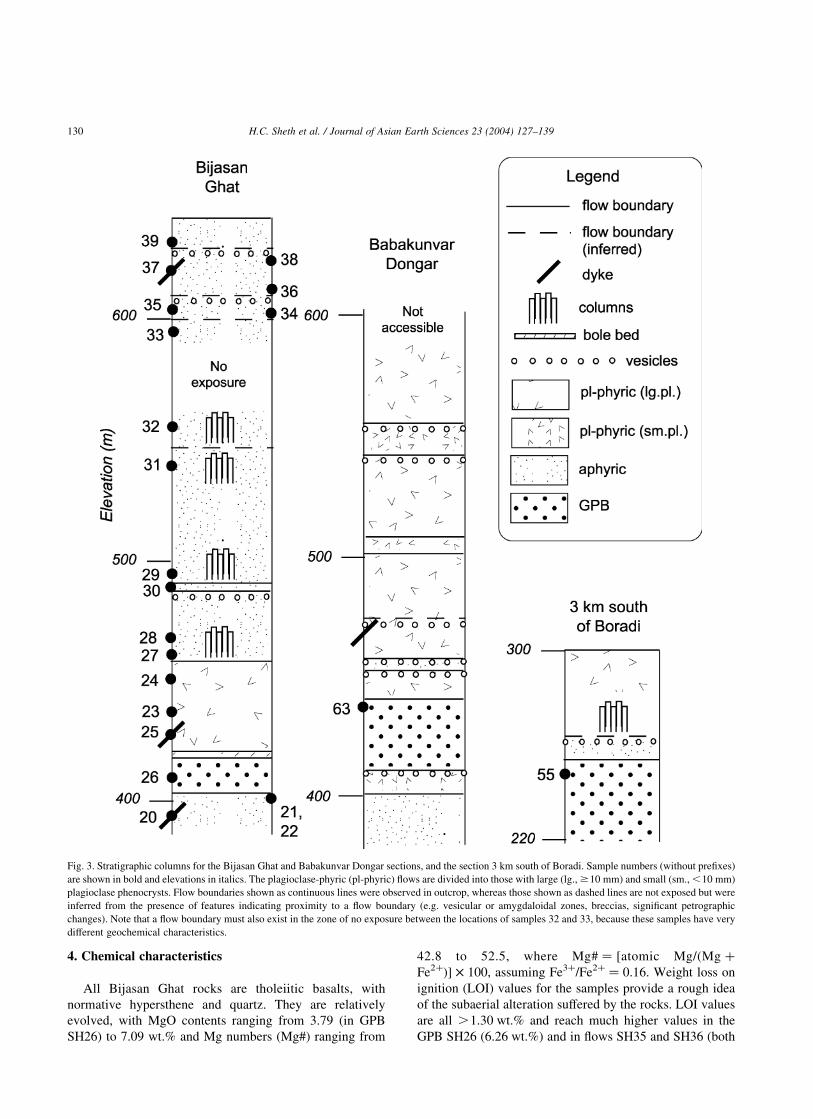
Fig. 3 summarizes the stratigraphy of the Bijasan Ghat
section and the locations of our samples, along with the
stratigraphy of sections at Babakunvar Dongar and 3 km
south of Boradi (Fig. 1). Stratigraphic summaries of the
Toranmal and Shahada ridge–Nandarde ridge sections can
be found in Mahoney et al., (2000); Chandrasekharam et al.,
(1999), respectively. The Bijasan Ghat section exposes
mainly aphyric, ‘simple’ flows (thick flows with arge
colonnade tiers). In thin section, microphenocrysts (pheno-
crysts smaller than ,0.25 mm, and discernible only under
the microscope) of plagioclase, clinopyroxene and com-
pletely altered olivine are seen in small but variable amounts
in most samples. The sample SH28, however, has micro-
phenocrysts only of iron oxides. Plagioclase phenocrysts in
the GPB SH26 are as long as 5 cm. Six other GPBs come
from nearby sections, including the Babakunvar Dongar
section and the section south of Boradi. Geochemical data
for three of these GPBs have been published previously
(Chandrasekharam et al., 1999; Mahoney et al., 2000).
Major element concentrations were determined by X-ray
fluorescence spectrometry and trace element abundances by
inductively coupled plasma mass spectrometry on agate-
and alumina-ground powders at the University of Hawaii
(Table 2), following the methods of Norrish and Chapell
(1977) and Jain and Neal (1996), respectively. Sr abun-
dances were measured by inductively coupled plasma
atomic emission spectrometry at the Indian Institute of
Technology, Bombay.
Fig. 2. Schematic illustration of the ‘domino-type’ fault-block structure
proposed for the Tapi graben (Guha, 1995), with parallel, E–W-trending
faults produced by N–S extension. The dips of individual faults system-
atically decrease with depth and to the south, and the northward dips of
bedding become progressively steeper to the south.
H.C. Sheth et al. / Journal of Asian Earth Sciences 23 (2004) 127–139 129
4. Chemical characteristics
All Bijasan Ghat rocks are tholeiitic basalts, with
normative hypersthene and quartz. They are relatively
evolved, with MgO contents ranging from 3.79 (in GPB
SH26) to 7.09 wt.% and Mg numbers (Mg#) ranging from
42.8 to 52.5, where Mg# ¼ [atomic Mg/(Mg þ
Fe2þ)] £ 100, assuming Fe3þ/Fe2þ ¼ 0.16. Weight loss on
ignition (LOI) values for the samples provide a rough idea
of the subaerial alteration suffered by the rocks. LOI values
are all .1.30 wt.% and reach much higher values in the
GPB SH26 (6.26 wt.%) and in flows SH35 and SH36 (both
Fig. 3. Stratigraphic columns for the Bijasan Ghat and Babakunvar Dongar sections, and the section 3 km south of Boradi. Sample numbers (without prefixes)
are shown in bold and elevations in italics. The plagioclase-phyric (pl-phyric) flows are divided into those with large (lg., $10 mm) and small (sm., ,10 mm)
plagioclase phenocrysts. Flow boundaries shown as continuous lines were observed in outcrop, whereas those shown as dashed lines are not exposed but were
inferred from the presence of features indicating proximity to a flow boundary (e.g. vesicular or amygdaloidal zones, breccias, significant petrographic
changes). Note that a flow boundary must also exist in the zone of no exposure between the locations of samples 32 and 33, because these samples have very
different geochemical characteristics.
H.C. Sheth et al. / Journal of Asian Earth Sciences 23 (2004) 127–139130
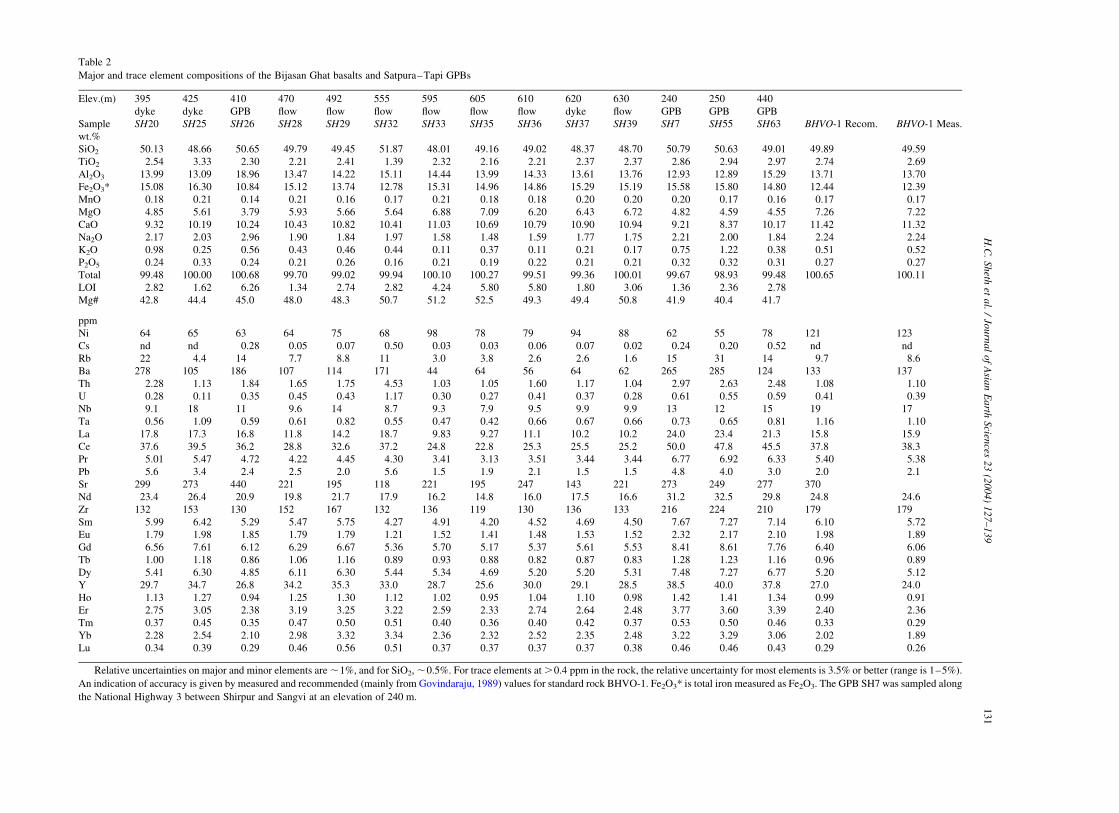
Table 2
Major and trace element compositions of the Bijasan Ghat basalts and Satpura–Tapi GPBs
Elev.(m) 395 425 410 470 492 555 595 605 610 620 630 240 250 440
dyke dyke GPB flow flow flow flow flow flow dyke flow GPB GPB GPB
Sample SH20 SH25 SH26 SH28 SH29 SH32 SH33 SH35 SH36 SH37 SH39 SH7 SH55 SH63 BHVO-1 Recom. BHVO-1 Meas.
wt.%
SiO2 50.13 48.66 50.65 49.79 49.45 51.87 48.01 49.16 49.02 48.37 48.70 50.79 50.63 49.01 49.89 49.59
TiO2 2.54 3.33 2.30 2.21 2.41 1.39 2.32 2.16 2.21 2.37 2.37 2.86 2.94 2.97 2.74 2.69
Al2O3 13.99 13.09 18.96 13.47 14.22 15.11 14.44 13.99 14.33 13.61 13.76 12.93 12.89 15.29 13.71 13.70
Fe2O3* 15.08 16.30 10.84 15.12 13.74 12.78 15.31 14.96 14.86 15.29 15.19 15.58 15.80 14.80 12.44 12.39
MnO 0.18 0.21 0.14 0.21 0.16 0.17 0.21 0.18 0.18 0.20 0.20 0.20 0.17 0.16 0.17 0.17
MgO 4.85 5.61 3.79 5.93 5.66 5.64 6.88 7.09 6.20 6.43 6.72 4.82 4.59 4.55 7.26 7.22
CaO 9.32 10.19 10.24 10.43 10.82 10.41 11.03 10.69 10.79 10.90 10.94 9.21 8.37 10.17 11.42 11.32
Na2O 2.17 2.03 2.96 1.90 1.84 1.97 1.58 1.48 1.59 1.77 1.75 2.21 2.00 1.84 2.24 2.24
K2O 0.98 0.25 0.56 0.43 0.46 0.44 0.11 0.37 0.11 0.21 0.17 0.75 1.22 0.38 0.51 0.52
P2O5 0.24 0.33 0.24 0.21 0.26 0.16 0.21 0.19 0.22 0.21 0.21 0.32 0.32 0.31 0.27 0.27
Total 99.48 100.00 100.68 99.70 99.02 99.94 100.10 100.27 99.51 99.36 100.01 99.67 98.93 99.48 100.65 100.11
LOI 2.82 1.62 6.26 1.34 2.74 2.82 4.24 5.80 5.80 1.80 3.06 1.36 2.36 2.78
Mg# 42.8 44.4 45.0 48.0 48.3 50.7 51.2 52.5 49.3 49.4 50.8 41.9 40.4 41.7
ppm
Ni 64 65 63 64 75 68 98 78 79 94 88 62 55 78 121 123
Cs nd nd 0.28 0.05 0.07 0.50 0.03 0.03 0.06 0.07 0.02 0.24 0.20 0.52 nd nd
Rb 22 4.4 14 7.7 8.8 11 3.0 3.8 2.6 2.6 1.6 15 31 14 9.7 8.6
Ba 278 105 186 107 114 171 44 64 56 64 62 265 285 124 133 137
Th 2.28 1.13 1.84 1.65 1.75 4.53 1.03 1.05 1.60 1.17 1.04 2.97 2.63 2.48 1.08 1.10
U 0.28 0.11 0.35 0.45 0.43 1.17 0.30 0.27 0.41 0.37 0.28 0.61 0.55 0.59 0.41 0.39
Nb 9.1 18 11 9.6 14 8.7 9.3 7.9 9.5 9.9 9.9 13 12 15 19 17
Ta 0.56 1.09 0.59 0.61 0.82 0.55 0.47 0.42 0.66 0.67 0.66 0.73 0.65 0.81 1.16 1.10
La 17.8 17.3 16.8 11.8 14.2 18.7 9.83 9.27 11.1 10.2 10.2 24.0 23.4 21.3 15.8 15.9
Ce 37.6 39.5 36.2 28.8 32.6 37.2 24.8 22.8 25.3 25.5 25.2 50.0 47.8 45.5 37.8 38.3
Pr 5.01 5.47 4.72 4.22 4.45 4.30 3.41 3.13 3.51 3.44 3.44 6.77 6.92 6.33 5.40 5.38
Pb 5.6 3.4 2.4 2.5 2.0 5.6 1.5 1.9 2.1 1.5 1.5 4.8 4.0 3.0 2.0 2.1
Sr 299 273 440 221 195 118 221 195 247 143 221 273 249 277 370
Nd 23.4 26.4 20.9 19.8 21.7 17.9 16.2 14.8 16.0 17.5 16.6 31.2 32.5 29.8 24.8 24.6
Zr 132 153 130 152 167 132 136 119 130 136 133 216 224 210 179 179
Sm 5.99 6.42 5.29 5.47 5.75 4.27 4.91 4.20 4.52 4.69 4.50 7.67 7.27 7.14 6.10 5.72
Eu 1.79 1.98 1.85 1.79 1.79 1.21 1.52 1.41 1.48 1.53 1.52 2.32 2.17 2.10 1.98 1.89
Gd 6.56 7.61 6.12 6.29 6.67 5.36 5.70 5.17 5.37 5.61 5.53 8.41 8.61 7.76 6.40 6.06
Tb 1.00 1.18 0.86 1.06 1.16 0.89 0.93 0.88 0.82 0.87 0.83 1.28 1.23 1.16 0.96 0.89
Dy 5.41 6.30 4.85 6.11 6.30 5.44 5.34 4.69 5.20 5.20 5.31 7.48 7.27 6.77 5.20 5.12
Y 29.7 34.7 26.8 34.2 35.3 33.0 28.7 25.6 30.0 29.1 28.5 38.5 40.0 37.8 27.0 24.0
Ho 1.13 1.27 0.94 1.25 1.30 1.12 1.02 0.95 1.04 1.10 0.98 1.42 1.41 1.34 0.99 0.91
Er 2.75 3.05 2.38 3.19 3.25 3.22 2.59 2.33 2.74 2.64 2.48 3.77 3.60 3.39 2.40 2.36
Tm 0.37 0.45 0.35 0.47 0.50 0.51 0.40 0.36 0.40 0.42 0.37 0.53 0.50 0.46 0.33 0.29
Yb 2.28 2.54 2.10 2.98 3.32 3.34 2.36 2.32 2.52 2.35 2.48 3.22 3.29 3.06 2.02 1.89
Lu 0.34 0.39 0.29 0.46 0.56 0.51 0.37 0.37 0.37 0.37 0.38 0.46 0.46 0.43 0.29 0.26
Relative uncertainties on major and minor elements are ,1%, and for SiO2, ,0.5%. For trace elements at .0.4 ppm in the rock, the relative uncertainty for most elements is 3.5% or better (range is 1–5%).
An indication of accuracy is given by measured and recommended (mainly from Govindaraju, 1989) values for standard rock BHVO-1. Fe2O3* is total iron measured as Fe2O3. The GPB SH7 was sampled along
the National Highway 3 between Shirpur and Sangvi at an elevation of 240 m.
H.C
.S
heth
eta
l./
Jou
rna
lo
fA
sian
Ea
rthS
ciences
23
(20
04
)1
27
–1
39
13
1
5.80 wt.%). Alteration has arguably caused some redis-
tribution of the mobile elements in some of the samples (see
below), as K, Rb and often U can be affected at rather
modest levels of alteration, and Ba and Na can be affected at
higher levels (e.g. Cox and Hawkesworth, 1985; Mahoney
et al., 1985, 2000; Beane et al., 1986; Lightfoot and
Hawkesworth, 1988). With advanced subaerial alteration,
many more elements, including Si, Ca, P, Ni, Sr, Y and the
lanthanide rare earths, can be affected, although elements
such as Al, Nb, Zr, Fe, Cr and Ti are relatively resistant (e.g.
Mahoney et al., 2000 and references therein).
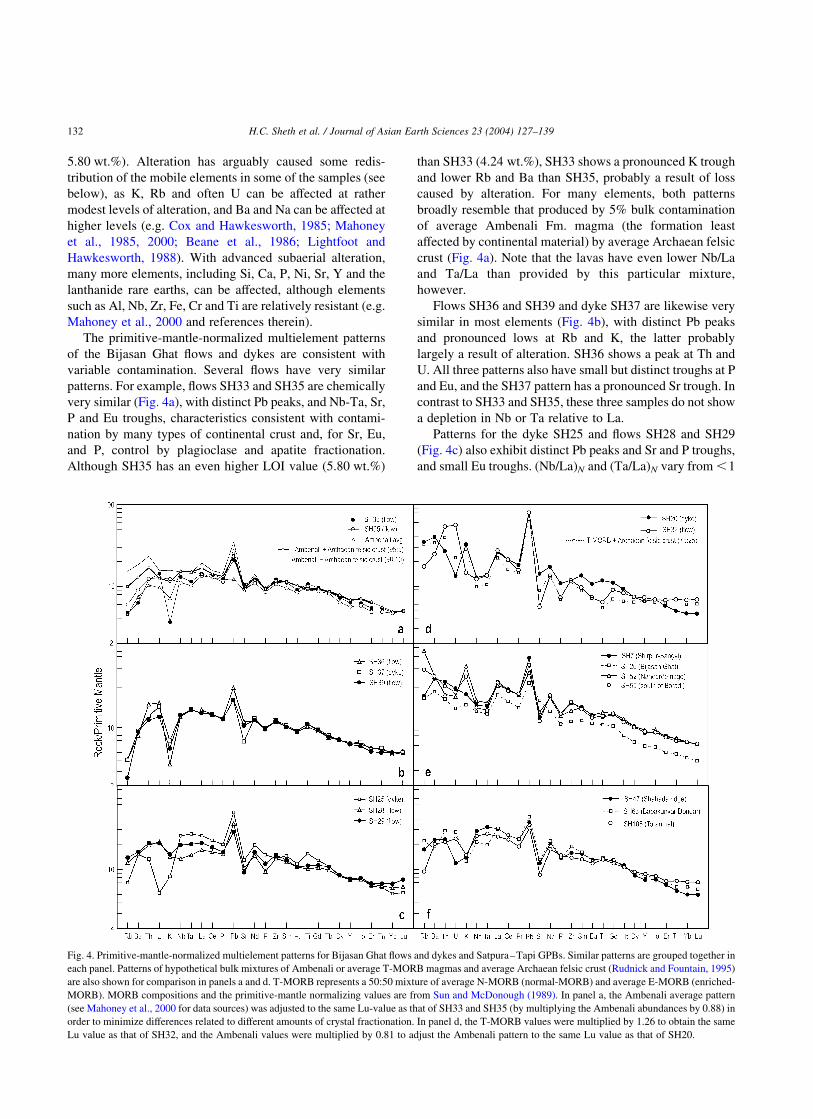
The primitive-mantle-normalized multielement patterns
of the Bijasan Ghat flows and dykes are consistent with
variable contamination. Several flows have very similar
patterns. For example, flows SH33 and SH35 are chemically
very similar (Fig. 4a), with distinct Pb peaks, and Nb-Ta, Sr,
P and Eu troughs, characteristics consistent with contami-
nation by many types of continental crust and, for Sr, Eu,
and P, control by plagioclase and apatite fractionation.
Although SH35 has an even higher LOI value (5.80 wt.%)
than SH33 (4.24 wt.%), SH33 shows a pronounced K trough
and lower Rb and Ba than SH35, probably a result of loss
caused by alteration. For many elements, both patterns
broadly resemble that produced by 5% bulk contamination
of average Ambenali Fm. magma (the formation least
affected by continental material) by average Archaean felsic
crust (Fig. 4a). Note that the lavas have even lower Nb/La
and Ta/La than provided by this particular mixture,
however.
Flows SH36 and SH39 and dyke SH37 are likewise very
similar in most elements (Fig. 4b), with distinct Pb peaks
and pronounced lows at Rb and K, the latter probably
largely a result of alteration. SH36 shows a peak at Th and
U. All three patterns also have small but distinct troughs at P
and Eu, and the SH37 pattern has a pronounced Sr trough. In
contrast to SH33 and SH35, these three samples do not show
a depletion in Nb or Ta relative to La.
Patterns for the dyke SH25 and flows SH28 and SH29
(Fig. 4c) also exhibit distinct Pb peaks and Sr and P troughs,
and small Eu troughs. (Nb/La)N and (Ta/La)N vary from ,1
Fig. 4. Primitive-mantle-normalized multielement patterns for Bijasan Ghat flows and dykes and Satpura–Tapi GPBs. Similar patterns are grouped together in
each panel. Patterns of hypothetical bulk mixtures of Ambenali or average T-MORB magmas and average Archaean felsic crust (Rudnick and Fountain, 1995)
are also shown for comparison in panels a and d. T-MORB represents a 50:50 mixture of average N-MORB (normal-MORB) and average E-MORB (enriched-
MORB). MORB compositions and the primitive-mantle normalizing values are from Sun and McDonough (1989). In panel a, the Ambenali average pattern
(see Mahoney et al., 2000 for data sources) was adjusted to the same Lu-value as that of SH33 and SH35 (by multiplying the Ambenali abundances by 0.88) in
order to minimize differences related to different amounts of crystal fractionation. In panel d, the T-MORB values were multiplied by 1.26 to obtain the same
Lu value as that of SH32, and the Ambenali values were multiplied by 0.81 to adjust the Ambenali pattern to the same Lu value as that of SH20.
H.C. Sheth et al. / Journal of Asian Earth Sciences 23 (2004) 127–139132
(SH28) to ,1, where N is the estimated primitive mantle
ratio (Sun and McDonough, 1989). The dyke SH25 appears
to have lost Rb, K, and U and has a marked Ti peak.
The patterns for dyke SH20 and flow SH32 (Fig. 4d) have
more pronounced Pb peaks and larger troughs at Nb and Ta.
The lows at P, Sr, and Eu are variable. SH20 has a small Ti
peak, whereas SH32 shows a Th-U peak. The dyke SH20
may have lost some U, whereas SH32 may have lost Rb and
K. The Ambenali magma type of the Deccan resembles
average T-MORB (transitional MORB) in isotopic charac-
teristics and many element ratios (e.g. Mahoney, 1988;
Lightfoot and Hawkesworth, 1988), and the SH32 pattern is
rather similar, from Nb to Lu, to a hypothetical 75:25 mixture
of T-MORB and average Archaean felsic crust. The pattern
of the dyke SH20 is only roughly similar to it, because SH20
has significantly higher concentrations of the middle rare
earths (Sm–Tb) and Sr, P, and Ti.
Patterns for GPBs of the region (Fig. 4e and f) all have
distinct Pb peaks, and all except SH105 have P troughs. All
GPBs except SH26 (from Bijasan Ghat) also have Sr
troughs, and many have small troughs at Eu. Several
(Fig. 4e) have pronounced Nb–Ta troughs and two have K
peaks and RbN .ThN. The GPBs SH47 and SH105 lack
Nb–Ta troughs (Fig. 4f). As a group, the GPBs are more
enriched in the light rare earths than the other flows and
dykes, with (La/Sm)N ¼ 2.69 2 3.18 and (La/
Yb)N ¼ 4.87 2 8.51. In comparison, the Bijasan Ghat
basalts have (La/Sm)N ¼ 1.29 2 2.82 and (La/
Yb)N ¼ 2.85 2 5.75.
5. Regional geochemical comparisons and stratigraphic
correlation
To compare our samples to the geochemically well-
characterized southwestern Deccan formations, we used
three approaches: (i) binary plots of incompatible element
abundances and element-element ratios, (ii) comparison of
the primitive-mantle-normalized multielement patterns of
the Bijasan Ghat samples with patterns of the southwestern
lavas, and (iii) discriminant function analysis employing
major elements and several commonly analyzed trace
elements.
5.1. Binary chemical diagrams
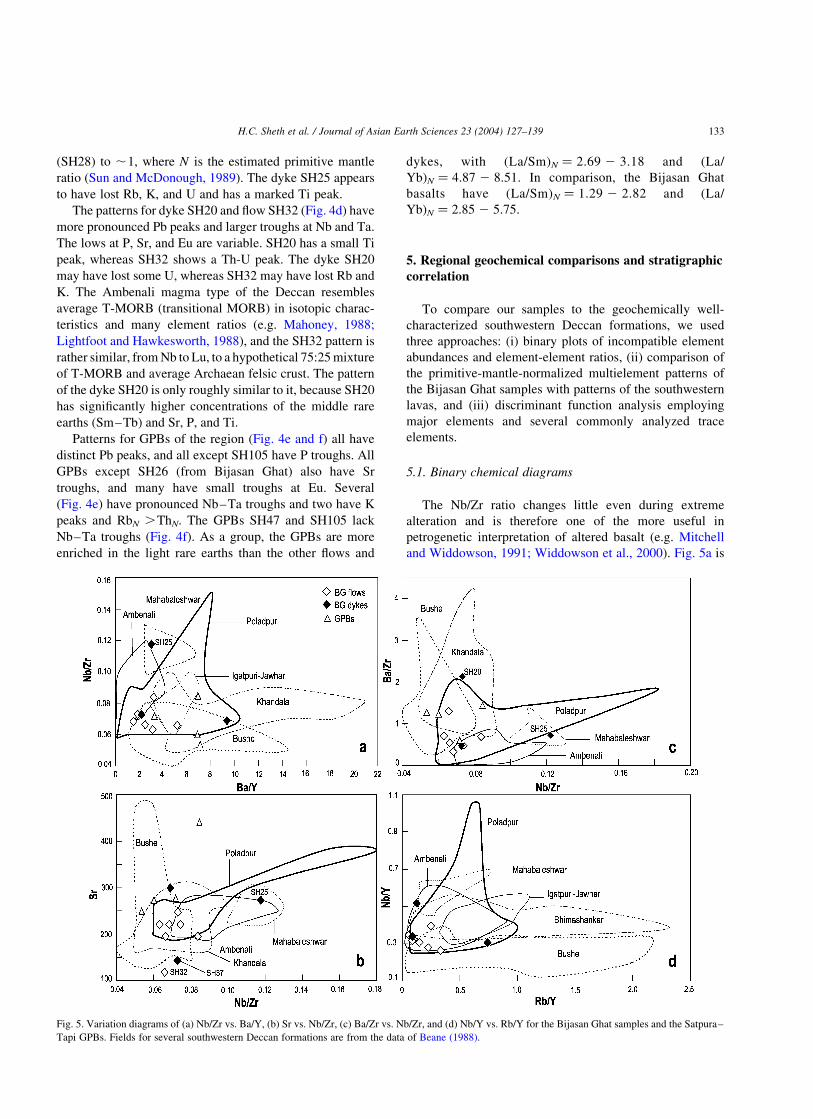
The Nb/Zr ratio changes little even during extreme
alteration and is therefore one of the more useful in
petrogenetic interpretation of altered basalt (e.g. Mitchell
and Widdowson, 1991; Widdowson et al., 2000). Fig. 5a is
Fig. 5. Variation diagrams of (a) Nb/Zr vs. Ba/Y, (b) Sr vs. Nb/Zr, (c) Ba/Zr vs. Nb/Zr, and (d) Nb/Y vs. Rb/Y for the Bijasan Ghat samples and the Satpura–
Tapi GPBs. Fields for several southwestern Deccan formations are from the data of Beane (1988).
H.C. Sheth et al. / Journal of Asian Earth Sciences 23 (2004) 127–139 133
a plot of Nb/Zr vs. Ba/Y. Y is also resistant to alteration, and
Ba is less mobile than K or Rb. Both ratios are insensitive to
fractional crystallization of minerals common in basalt.
Data for the Bijasan Ghat flow samples and dykes SH20 and
SH37 fall within the Poladpur Fm. field, mostly in the area
of overlap among it and the Khandala, Ambenali and Bushe
Fm. fields. The data point for dyke SH25 falls within the
Mahabaleshwar Fm field. In plots of Sr vs. Nb/Zr (Fig. 5b)
and of Ba/Zr vs. Nb/Zr (Fig. 5c), data for most Bijasan Ghat
flow samples are again seen to plot in the area of overlap
between the Poladpur, Khandala, Ambenali and Bushe Fm.
fields. The data point for dyke SH25 again lies well within
the Mahabaleshwar Fm. field in Fig. 5a and b. In a plot of
Nb/Y vs. Rb/Y (Fig. 5d), most Bijasan Ghat flow samples
fall again within the area of overlap between the Poladpur,
Ambenali and Bushe Fm. fields, and the data point for dyke
SH25 falls within the Ambenali Fm. field, just outside the
edge of the Mahabaleshwar Fm. field.
Thus, based on the element-ratio plots, most of the
Bijasan Ghat rocks could be grouped with either the
Poladpur or Ambenali Fms. The difficulty of distinguishing
some Ambenali and Poladpur compositions on the basis of
the most commonly analyzed trace elements is well
recognized (e.g. Cox and Hawkesworth, 1985; Devey and
Lightfoot, 1986). Lightfoot et al. (1990) proposed that Ba
contents can be used to distinguish between Ambenali and
Poladpur lavas, with the Ambenali generally having
,100 ppm Ba and the Poladpur generally .100 ppm Ba.
We disagree; Ba is certainly useful in discriminating the
Mahabaleshwar Fm. (Ba .100 ppm) from the Ambenali
Fm., but all Ambenali Fm. flows and the great majority of
Poladpur Fm. flows contain Ba ,100 ppm (Beane, 1988;
P.R. Hooper, pers. comm., 2003), the exception being a
group of coarsely plagioclase-phyric Poladpur Fm. flows.
Five of the Bijasan Ghat flows have Ba p100 ppm; another
flow (SH28) and a dyke (SH25) have values of ,100 ppm
within analytical error. Because Ba may have been some-
what mobile during alteration, the Ba evidence is somewhat
ambiguous. The best evidence, in the absence of isotopic
data, for the Poladpur-Fm. affinity of the Bijasan Ghat flows
in question is the large Pb spikes in their primitive-mantle-
normalized multielement patterns (Fig. 4). These flows are
evidently contaminated by Pb-rich continental material, and
therefore none of them can be linked with the Ambenali Fm.
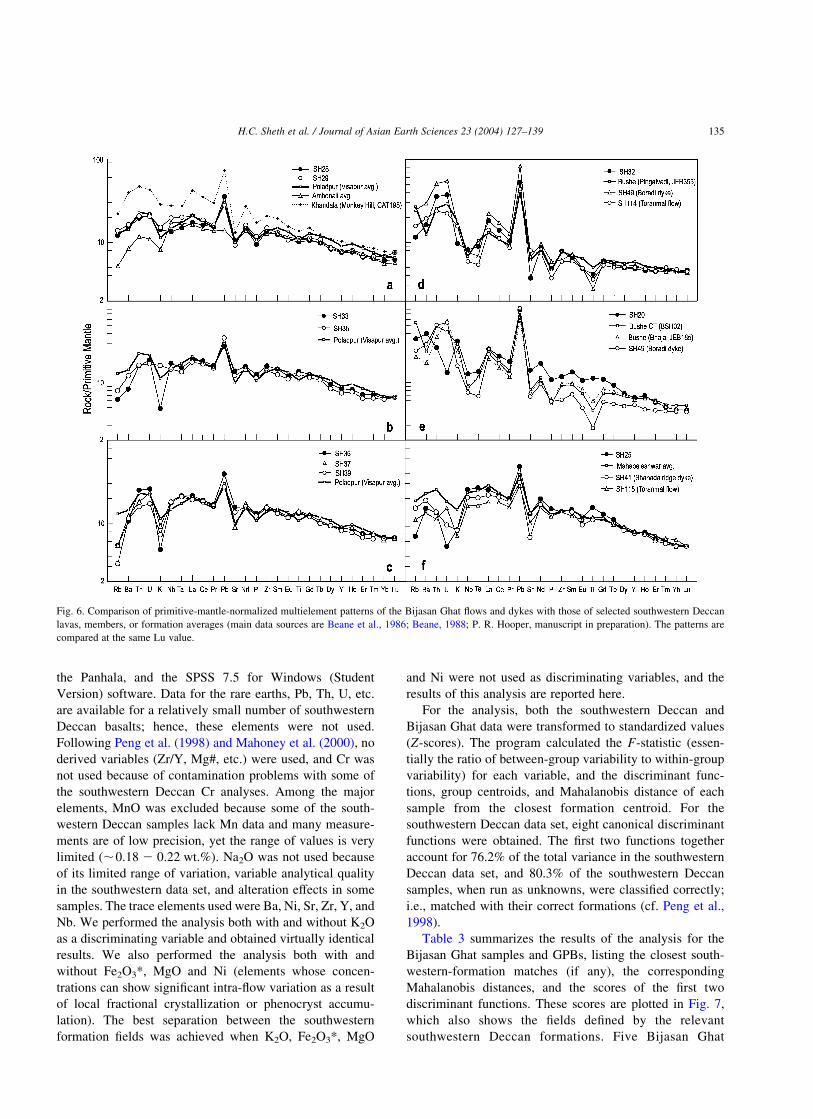
5.2. Comparison of multielement patterns
The primitive-mantle-normalized multielement patterns
of flows SH28 and SH29 (Fig. 6a) are rather similar to that
of the Visapur member of the Poladpur Fm. in most
elements, whereas they are distinct from the Ambenali Fm.
pattern in their large Pb peaks, relative enrichments in Rb,
Ba, Th and U, and in Nb–Ta–La relationships. Like
Poladpur Fm. lavas, the Bijasan Ghat samples have much
flatter patterns than Khandala Fm. lavas. Patterns for
Bijasan Ghat flows SH33 and SH35 and, to a lesser extent,
flows SH36 and SH39 and dyke SH37, also are Poladpur-
like (Fig. 6b and c).
Bushe Fm. patterns are flatter than those of the
Poladpur from Sr to Lu, and have much larger Pb peaks
and more pronounced Nb–Ta and Ti troughs, in particular
(e.g. Lightfoot et al., 1990; Mahoney et al., 2000). Bijasan
Ghat flow SH32 has Bushe-type characteristics, the closest
Bushe Fm. member to flow SH32 being the Pingalvadi
(Fig. 6d). SH32, however, has a lower Sr abundance than
Bushe Fm. basalts and its pattern also shows a sizeable
Eu–Ti trough. Broadly Bushe-like patterns have been
reported for dyke SH49 from Boradi (Chandrasekharam
et al., 1999) and several flows (e.g. SH114) from
Toranmal (Mahoney et al., 2000). The dyke SH20 also
shows a few similarities with the Bushe Fm., but is much
more enriched in the elements from Sr to Tb (Fig. 6e).
The pattern of the dyke SH25, however, is similar to the
average Mahabaleshwar Fm. pattern in many elements
except, in particular, for the higher Nb/La and Ta/La and
a much larger Ti peak in the SH25 pattern (Fig. 6f). Also
shown for comparison in Fig. 6f are patterns of
Mahabaleshwar-like dyke SH41 from the Shahada ridge
(Chandrasekharam et al., 1999) and Mahabaleshwar-like
flow SH115 from Toranmal (Mahoney et al., 2000).
In summary, none of the Bijasan Ghat patterns resembles
the Ambenali Fm. pattern. Ambenali-like lavas are also
absent in the nearby Toranmal section (Mahoney et al.,
2000). Patterns of most Bijasan Ghat flows and dyke SH37
are similar to those of the Poladpur Fm. in the southwestern
Deccan, whereas flow SH32 and dyke SH20 display general
similarities to Bushe Fm. lavas. However, the Bushe Fm.
underlies the Poladpur Fm. (Table 1). Therefore, the Bushe-
like flow SH32, sandwiched between a group of Poladpur-
like flows, cannot be correlated with the Bushe Fm. if the
Poladpur-like Bijasan Ghat flows in fact belong to the
Poladpur Fm. Peng et al. (1998) and Mahoney et al. (2000)
also found several broadly Bushe-like flows interspersed
within thick Wai-Subgroup-type sequences in the north-
eastern Deccan and at Toranmal, respectively; these flows
have combined Nd–Sr–Pb isotopic characteristics outside
the range measured for Bushe Fm. lavas. On the other hand,
the presence of the rather Mahabaleshwar-Fm.-like dyke
SH25 within a Poladpur-Fm.-like lava sequence is consist-
ent with the southwestern Deccan stratigraphic order, and
with relationships in sections near Shahada and Nandarde,
which expose Poladpur-Fm.-type lavas intruded by Maha-
baleshwar-Fm.-like dykes (Fig. 1; Sheth et al., 1997;
Chandrasekharam et al., 1999, 2000).
5.3. Discriminant function analysis
To further evaluate the Bijasan Ghat basalts, we
performed a discriminant function analysis using the
major elements and several of the most commonly analyzed
trace elements, a southwestern Deccan data set consisting of
623 samples from all the southwestern formations except
H.C. Sheth et al. / Journal of Asian Earth Sciences 23 (2004) 127–139134
the Panhala, and the SPSS 7.5 for Windows (Student
Version) software. Data for the rare earths, Pb, Th, U, etc.
are available for a relatively small number of southwestern
Deccan basalts; hence, these elements were not used.
Following Peng et al. (1998) and Mahoney et al. (2000), no
derived variables (Zr/Y, Mg#, etc.) were used, and Cr was
not used because of contamination problems with some of
the southwestern Deccan Cr analyses. Among the major
elements, MnO was excluded because some of the south-
western Deccan samples lack Mn data and many measure-
ments are of low precision, yet the range of values is very
limited (,0.18 2 0.22 wt.%). Na2O was not used because
of its limited range of variation, variable analytical quality
in the southwestern data set, and alteration effects in some
samples. The trace elements used were Ba, Ni, Sr, Zr, Y, and
Nb. We performed the analysis both with and without K2O
as a discriminating variable and obtained virtually identical
results. We also performed the analysis both with and
without Fe2O3*, MgO and Ni (elements whose concen-
trations can show significant intra-flow variation as a result
of local fractional crystallization or phenocryst accumu-
lation). The best separation between the southwestern
formation fields was achieved when K2O, Fe2O3*, MgO
and Ni were not used as discriminating variables, and the
results of this analysis are reported here.
For the analysis, both the southwestern Deccan and
Bijasan Ghat data were transformed to standardized values
(Z-scores). The program calculated the F-statistic (essen-
tially the ratio of between-group variability to within-group
variability) for each variable, and the discriminant func-
tions, group centroids, and Mahalanobis distance of each
sample from the closest formation centroid. For the
southwestern Deccan data set, eight canonical discriminant
functions were obtained. The first two functions together
account for 76.2% of the total variance in the southwestern
Deccan data set, and 80.3% of the southwestern Deccan
samples, when run as unknowns, were classified correctly;
i.e., matched with their correct formations (cf. Peng et al.,
1998).
Table 3 summarizes the results of the analysis for the
Bijasan Ghat samples and GPBs, listing the closest south-
western-formation matches (if any), the corresponding
Mahalanobis distances, and the scores of the first two
discriminant functions. These scores are plotted in Fig. 7,
which also shows the fields defined by the relevant
southwestern Deccan formations. Five Bijasan Ghat
Fig. 6. Comparison of primitive-mantle-normalized multielement patterns of the Bijasan Ghat flows and dykes with those of selected southwestern Deccan
lavas, members, or formation averages (main data sources are Beane et al., 1986; Beane, 1988; P. R. Hooper, manuscript in preparation). The patterns are
compared at the same Lu value.
H.C. Sheth et al. / Journal of Asian Earth Sciences 23 (2004) 127–139 135
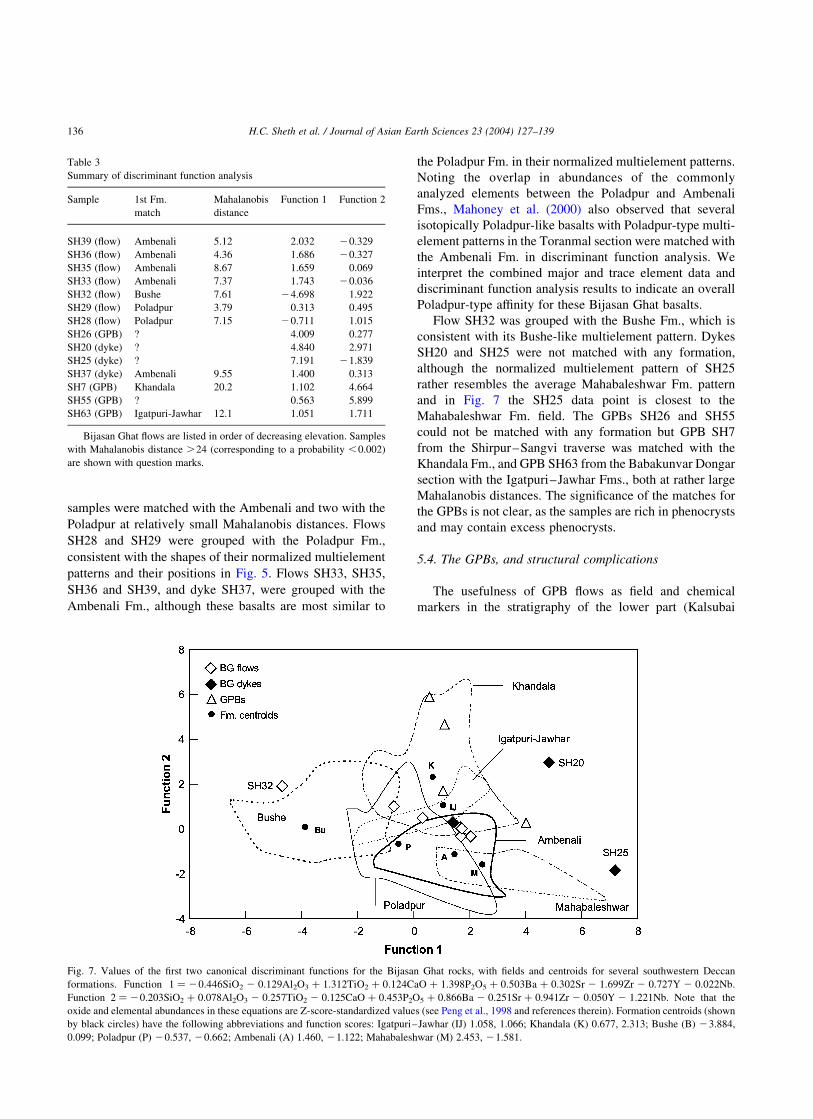
samples were matched with the Ambenali and two with the
Poladpur at relatively small Mahalanobis distances. Flows
SH28 and SH29 were grouped with the Poladpur Fm.,
consistent with the shapes of their normalized multielement
patterns and their positions in Fig. 5. Flows SH33, SH35,
SH36 and SH39, and dyke SH37, were grouped with the
Ambenali Fm., although these basalts are most similar to
the Poladpur Fm. in their normalized multielement patterns.
Noting the overlap in abundances of the commonly
analyzed elements between the Poladpur and Ambenali
Fms., Mahoney et al. (2000) also observed that several
isotopically Poladpur-like basalts with Poladpur-type multi-
element patterns in the Toranmal section were matched with
the Ambenali Fm. in discriminant function analysis. We
interpret the combined major and trace element data and
discriminant function analysis results to indicate an overall
Poladpur-type affinity for these Bijasan Ghat basalts.
Flow SH32 was grouped with the Bushe Fm., which is
consistent with its Bushe-like multielement pattern. Dykes
SH20 and SH25 were not matched with any formation,
although the normalized multielement pattern of SH25
rather resembles the average Mahabaleshwar Fm. pattern
and in Fig. 7 the SH25 data point is closest to the
Mahabaleshwar Fm. field. The GPBs SH26 and SH55
could not be matched with any formation but GPB SH7
from the Shirpur–Sangvi traverse was matched with the
Khandala Fm., and GPB SH63 from the Babakunvar Dongar
section with the Igatpuri–Jawhar Fms., both at rather large
Mahalanobis distances. The significance of the matches for
the GPBs is not clear, as the samples are rich in phenocrysts
and may contain excess phenocrysts.
5.4. The GPBs, and structural complications
The usefulness of GPB flows as field and chemical
markers in the stratigraphy of the lower part (Kalsubai
Table 3
Summary of discriminant function analysis
Sample 1st Fm.
match
Mahalanobis
distance
Function 1 Function 2
SH39 (flow) Ambenali 5.12 2.032 20.329
SH36 (flow) Ambenali 4.36 1.686 20.327
SH35 (flow) Ambenali 8.67 1.659 0.069
SH33 (flow) Ambenali 7.37 1.743 20.036
SH32 (flow) Bushe 7.61 24.698 1.922
SH29 (flow) Poladpur 3.79 0.313 0.495
SH28 (flow) Poladpur 7.15 20.711 1.015
SH26 (GPB) ? 4.009 0.277
SH20 (dyke) ? 4.840 2.971
SH25 (dyke) ? 7.191 21.839
SH37 (dyke) Ambenali 9.55 1.400 0.313
SH7 (GPB) Khandala 20.2 1.102 4.664
SH55 (GPB) ? 0.563 5.899
SH63 (GPB) Igatpuri-Jawhar 12.1 1.051 1.711
Bijasan Ghat flows are listed in order of decreasing elevation. Samples
with Mahalanobis distance .24 (corresponding to a probability ,0.002)
are shown with question marks.
Fig. 7. Values of the first two canonical discriminant functions for the Bijasan Ghat rocks, with fields and centroids for several southwestern Deccan
formations. Function 1 ¼ 20.446SiO2 2 0.129Al2O3 þ 1.312TiO2 þ 0.124CaO þ 1.398P2O5 þ 0.503Ba þ 0.302Sr 2 1.699Zr 2 0.727Y 2 0.022Nb.
Function 2 ¼ 20.203SiO2 þ 0.078Al2O3 2 0.257TiO2 2 0.125CaO þ 0.453P2O5 þ 0.866Ba 2 0.251Sr þ 0.941Zr 2 0.050Y 2 1.221Nb. Note that the
oxide and elemental abundances in these equations are Z-score-standardized values (see Peng et al., 1998 and references therein). Formation centroids (shown
by black circles) have the following abbreviations and function scores: Igatpuri–Jawhar (IJ) 1.058, 1.066; Khandala (K) 0.677, 2.313; Bushe (B) 23.884,
0.099; Poladpur (P) 20.537, 20.662; Ambenali (A) 1.460, 21.122; Mahabaleshwar (M) 2.453, 21.581.
H.C. Sheth et al. / Journal of Asian Earth Sciences 23 (2004) 127–139136
Subgroup) of the Western Ghats sequence has been well
documented (Hooper et al., 1988). The Kalsubai Subgroup
has six GPBs. They are not present together in any single
vertical section and are all similar in appearance. Therefore,
the chances of miscorrelation in the field are high, and
chemical ‘fingerprinting’ is required to check stratigraphic
correlations. Despite the wide compositional range of each
GPB, all can be distinguished straightforwardly on chemical
variation diagrams and/or with isotopic ratios (Hooper et al.,
1988; Peng et al., 1994).
In the southwestern Deccan, GPBs are found only within
the lower formations (Kalsubai Subgroup). The presence of
several GPBs in chemically Wai-Subgroup-like sequences
in the Satpura–Tapi region suggests that the region’s
eruptive history is at least partly independent of the
southwestern Deccan’s. Most highly plagioclase-phyric
flows and GPBs may not have flowed great distances,
because of their expected high viscosity (e.g. Mahoney,
1988). If so, the GPBs of the Satpura–Tapi region are
unlikely to be stratigraphically equivalent to any of the
GPBs of the Kalsubai Subgroup.
In the Satpura–Tapi region, no section we have studied
has more than one GPB flow. Within this region, field-based
correlation of the GPBs is rendered impossible by faulting,
erosion, and discontinuous exposures. Therefore, geochem-
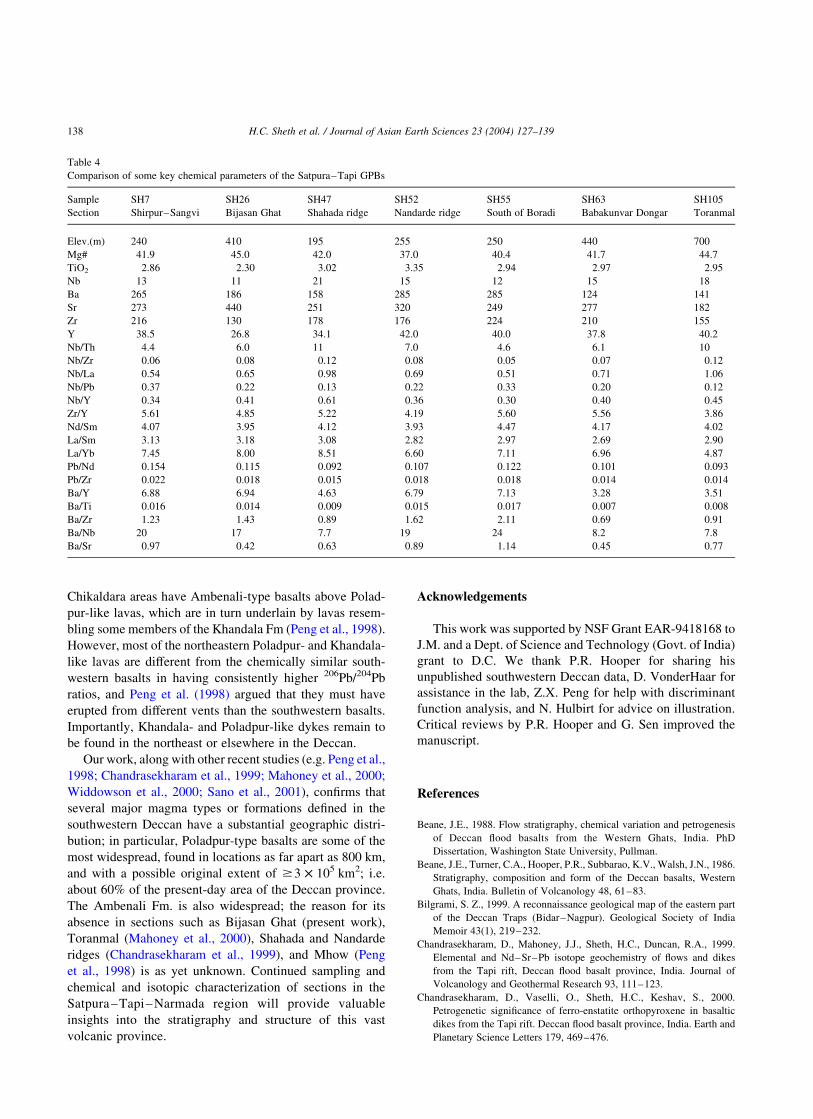
ical data are essential for correlation. Consider the following
ratios of incompatible, alteration-resistant elements in three
of the Satpura–Tapi GPBs: Shahada ridge GPB SH47:
Nb/Zr ¼ 0.12 (^0.008), Nb/Y ¼ 0.60 (^0.042); Nandarde
ridge GPB SH52: Nb/Zr ¼ 0.08 (^0.006), Nb/Y ¼ 0.35
(^0.024); Toranmal GPB SH105: Nb/Zr ¼ 0.12 (^0.008),
Nb/Y ¼ 0.45 (^0.031). (The 2s errors on these ratios are
7%, calculated using a value of 5% (the maximum) for
errors on individual element concentrations.) SH47 appears
very similar to SH105 in many alteration-resistant incom-
patible elements (Table 4; Fig. 4f), but there are also
significant differences between the two; particularly in the
heavy rare earths. SH47 has phenocrysts only of plagio-
clase, whereas SH105 also contains microphenocrysts of
plagioclase, olivine, and clinopyroxene. For these two
flows, ratios of the light rare earths to the heavy ones (e.g.
La/Yb) are also substantially different. Also, based on
available chemical and isotopic data (Chandrasekharam
et al., 1999; Mahoney et al., 2000), no lava flow overlying
the Shahada ridge GPB can be correlated with any flow
overlying the Toranmal GPB.
The Nandarde ridge GPB (SH52) may be the same as the
GPB sampled 3 km south of Boradi (SH55) because the
normalized multielement patterns and key inter-element
ratios for both are similar (Fig. 4e, Table 4). However, some
ratios are substantially different (e.g. Nb/Th, Zr/Y). Note
that the Nandarde ridge and the section 3 km south of
Boradi are only a few kilometres apart, although there is no
physical continuity between them.
Like the Toranmal section, the Bijasan Ghat section is
made up mostly of simple flows with large colonnades. Yet
the GPBs (Toranmal: SH105, Bijasan Ghat: SH26) are
different (Fig. 4e and f; Table 4); for example, SH105 Nb/
Zr ¼ 0.12 (^0.008); SH26 Nb/Zr ¼ 0.08 (^0.006). Also,
the Shirpur–Sangvi GPB SH7 appears distinct from the
Bijasan Ghat GPB SH26, SH7 having Nb/Zr ¼ 0.06
(^0.004). The Bijasan Ghat and Babakunvar Dongar
sections are both situated along the same segment of the
Satpura range (Fig. 1), and are both made up of simple
flows. The Bijasan Ghat GPB SH26 is very similar to the
Babakunvar Dongar GPB SH63 in ratios of the alteration-
resistant incompatible elements (e.g. Nb/Zr, Nb/Th, Nb/Pb
and Nb/Y; Table 4). The primitive-mantle-normalized
patterns of both (Fig. 4e and f) are also similar in many
elements except, in particular, for the negative Sr and Eu
anomalies in the SH63 pattern, which the SH26 pattern
lacks. We conclude that the seven GPBs in our area of study
are not correlateable based on the existing geochemical
data, with the possible exception of SH52 and SH55, and
SH26 and SH63. Isotopic data are required for the
unambiguous correlation of these GPBs. Presently, how-
ever, the GPBs of this region, unlike those of the Western
Ghats, appear not to be very useful as either field or
chemical stratigraphic marker horizons.
6. Discussion and concluding remarks
The existence of Poladpur-like basalts along the
Bijasan Ghat section is not too surprising, because
chemically and isotopically Poladpur-like basalts consti-
tute a large part of the thick Toranmal section only
,70 km away. A few broadly Mahabaleshwar-like and
Bushe-like flows are also present at Toranmal. Noting the
presence of Bushe-like dykes at Toranmal and in the
Tapi Valley (Sheth, 1998; Chandrasekharam et al., 1999),
and that the Bushe-like Toranmal flows are not in the
southwestern Deccan stratigraphic order, Mahoney et al.
(2000) suggested that the Bushe-like flows may have had
relatively local feeder vents. The Bushe-like Bijasan Ghat
flow SH32, sandwiched between Poladpur-like flows, also
may have had a relatively local source.
Subbarao et al. (1994) noted that the southerly regional
formational dips of the southwestern Deccan flatten out and
become slightly northerly to the north of Igatpuri and
slightly easterly to the east of Igatpuri. Also, the lower
formations (Kalsubai Subgroup) extend north to Kondaibar,
near the Tapi River, and appear to dip below the surface
south of the latitude of Toranmal. These observations are
consistent with the presence of Poladpur-like flows at
Toranmal and Bijasan Ghat. Wai-Subgroup-like lavas are
also known from the area between Buldana and Igatpuri
(Subbarao et al., 1994; Peng, 1998), and from the
northeastern Deccan (Mahoney, 1988; Peng et al., 1998).
Flows with Poladpur- and Khandala-like chemical compo-
sitions dominate at Mhow, with a few Bushe-like flows,
and Ambenali-like flows are absent. The Jabalpur and
H.C. Sheth et al. / Journal of Asian Earth Sciences 23 (2004) 127–139 137
Chikaldara areas have Ambenali-type basalts above Polad-
pur-like lavas, which are in turn underlain by lavas resem-
bling some members of the Khandala Fm (Peng et al., 1998).
However, most of the northeastern Poladpur- and Khandala-
like lavas are different from the chemically similar south-
western basalts in having consistently higher 206Pb/204Pb
ratios, and Peng et al. (1998) argued that they must have
erupted from different vents than the southwestern basalts.
Importantly, Khandala- and Poladpur-like dykes remain to
be found in the northeast or elsewhere in the Deccan.
Our work, along with other recent studies (e.g. Peng et al.,
1998; Chandrasekharam et al., 1999; Mahoney et al., 2000;
Widdowson et al., 2000; Sano et al., 2001), confirms that
several major magma types or formations defined in the
southwestern Deccan have a substantial geographic distri-
bution; in particular, Poladpur-type basalts are some of the
most widespread, found in locations as far apart as 800 km,
and with a possible original extent of $3 £ 105 km2; i.e.
about 60% of the present-day area of the Deccan province.
The Ambenali Fm. is also widespread; the reason for its
absence in sections such as Bijasan Ghat (present work),
Toranmal (Mahoney et al., 2000), Shahada and Nandarde
ridges (Chandrasekharam et al., 1999), and Mhow (Peng
et al., 1998) is as yet unknown. Continued sampling and
chemical and isotopic characterization of sections in the
Satpura–Tapi–Narmada region will provide valuable
insights into the stratigraphy and structure of this vast
volcanic province.
Acknowledgements
This work was supported by NSF Grant EAR-9418168 to
J.M. and a Dept. of Science and Technology (Govt. of India)
grant to D.C. We thank P.R. Hooper for sharing his
unpublished southwestern Deccan data, D. VonderHaar for
assistance in the lab, Z.X. Peng for help with discriminant
function analysis, and N. Hulbirt for advice on illustration.
Critical reviews by P.R. Hooper and G. Sen improved the
manuscript.
References
Beane, J.E., 1988. Flow stratigraphy, chemical variation and petrogenesis
of Deccan flood basalts from the Western Ghats, India. PhD
Dissertation, Washington State University, Pullman.
Beane, J.E., Turner, C.A., Hooper, P.R., Subbarao, K.V., Walsh, J.N., 1986.
Stratigraphy, composition and form of the Deccan basalts, Western
Ghats, India. Bulletin of Volcanology 48, 61–83.
Bilgrami, S. Z., 1999. A reconnaissance geological map of the eastern part
of the Deccan Traps (Bidar–Nagpur). Geological Society of India
Memoir 43(1), 219–232.
Chandrasekharam, D., Mahoney, J.J., Sheth, H.C., Duncan, R.A., 1999.
Elemental and Nd–Sr–Pb isotope geochemistry of flows and dikes
from the Tapi rift, Deccan flood basalt province, India. Journal of
Volcanology and Geothermal Research 93, 111–123.
Chandrasekharam, D., Vaselli, O., Sheth, H.C., Keshav, S., 2000.
Petrogenetic significance of ferro-enstatite orthopyroxene in basaltic
dikes from the Tapi rift. Deccan flood basalt province, India. Earth and
Planetary Science Letters 179, 469–476.
Table 4
Comparison of some key chemical parameters of the Satpura–Tapi GPBs
Sample SH7 SH26 SH47 SH52 SH55 SH63 SH105
Section Shirpur–Sangvi Bijasan Ghat Shahada ridge Nandarde ridge South of Boradi Babakunvar Dongar Toranmal
Elev.(m) 240 410 195 255 250 440 700
Mg# 41.9 45.0 42.0 37.0 40.4 41.7 44.7
TiO2 2.86 2.30 3.02 3.35 2.94 2.97 2.95
Nb 13 11 21 15 12 15 18
Ba 265 186 158 285 285 124 141
Sr 273 440 251 320 249 277 182
Zr 216 130 178 176 224 210 155
Y 38.5 26.8 34.1 42.0 40.0 37.8 40.2
Nb/Th 4.4 6.0 11 7.0 4.6 6.1 10
Nb/Zr 0.06 0.08 0.12 0.08 0.05 0.07 0.12
Nb/La 0.54 0.65 0.98 0.69 0.51 0.71 1.06
Nb/Pb 0.37 0.22 0.13 0.22 0.33 0.20 0.12
Nb/Y 0.34 0.41 0.61 0.36 0.30 0.40 0.45
Zr/Y 5.61 4.85 5.22 4.19 5.60 5.56 3.86
Nd/Sm 4.07 3.95 4.12 3.93 4.47 4.17 4.02
La/Sm 3.13 3.18 3.08 2.82 2.97 2.69 2.90
La/Yb 7.45 8.00 8.51 6.60 7.11 6.96 4.87
Pb/Nd 0.154 0.115 0.092 0.107 0.122 0.101 0.093
Pb/Zr 0.022 0.018 0.015 0.018 0.018 0.014 0.014
Ba/Y 6.88 6.94 4.63 6.79 7.13 3.28 3.51
Ba/Ti 0.016 0.014 0.009 0.015 0.017 0.007 0.008
Ba/Zr 1.23 1.43 0.89 1.62 2.11 0.69 0.91
Ba/Nb 20 17 7.7 19 24 8.2 7.8
Ba/Sr 0.97 0.42 0.63 0.89 1.14 0.45 0.77
H.C. Sheth et al. / Journal of Asian Earth Sciences 23 (2004) 127–139138

Cox, K.G., Hawkesworth, C.J., 1985. Geochemical stratigraphy of the
Deccan Traps at Mahabaleshwar, Western Ghats, India, with impli-
cations for open system magmatic processes. Journal of Petrology 26,
355–377.
Devey, C.W., Lightfoot, P.C., 1986. Volcanological and tectonic control of
stratigraphy and structure in the western Deccan Traps. Bulletin of
Volcanology 48, 195–207.
Govindaraju, K., 1989. 1989 Compilation of working values and sample
descriptions for 272 geostandards. Geostandards Newsletter 13, 1–113.
Guha, S., 1995. Tectonic framework and evolution of the Tapi basin - an
intracratonic half-graben in west-central India. Indian Minerals 49,
61–78.
Hooper, P.R., Subbarao, K.V., Beane, J.E., 1988. The giant plagioclase
basalts (GPBs) of the Western Ghats, Deccan Traps. Geological Society
of India Memoir 10, 135–144.
Jain, J.C., Neal, C.R., 1996. Report of the ICP-MS facility, 1993–1996.
Notre Dame Univ. Open File Report, p. 30
Kaila, K.L., 1988. Mapping the thickness of Deccan Trap flows in India
from DSS studies and inferences about a hidden Mesozoic basin in the
Narmada–Tapti region. Geological Society of India Memoir 10,
91–116.
Lightfoot, P., Hawkesworth, C., 1988. Origin of Deccan Trap lavas:
evidence from combined trace element and Sr-, Nd- and Pb-isotopic
studies. Earth and Planetary Science Letters 91, 89–104.
Lightfoot, P.C., Hawkesworth, C.J., Devey, C.W., Rogers, N.W., van
Calsteren, P.W.C., 1990. Source and differentiation of Deccan Trap
lavas: implications of geochemical and mineral chemical variations.
Journal of Petrology 31, 1165–1200.
Mahoney, J.J., 1988. Deccan Traps. In: Macdougall, J.D., (Ed.),
Continental Flood Basalts, Kluwer, Dordrecht, pp. 151–194.
Mahoney, J.J., Macdougall, J.D., Lugmair, G.W., Gopalan, K., Krishna-
murthy, P., 1985. Origin of contemporaneous tholeiitic and K-rich
alkalic lavas: a case study from the northern Deccan plateau, India.
Earth and Planetary Science Letters 73, 39–53.
Mahoney, J.J., Sheth, H.C., Chandrasekharam, D., Peng, Z.X., 2000.
Geochemistry of flood basalts of the Toranmal section, northern Deccan
Traps, India: implications for regional Deccan stratigraphy. Journal of
Petrology 41, 1099–1120.
Mitchell, C.H., Widdowson, M., 1991. A geological map of the southern
Deccan Traps, India and its structural implications. Journal of
Geological Society of London 148, 495–505.
Norrish, K., Chapell, B.W., 1977. X-ray fluorescence spectrometry. In:
Zussman, J., (Ed.), Physical Methods in Determinative Mineralogy,
second ed., Academic Press, New York, pp. 201–272.
Peng, Z.X., 1998. Geochemical studies of the northwestern, central and
northeastern Deccan Traps, India: sources, petrogenesis, and relations
to southwestern Deccan stratigraphy, PhD Dissertation, University of
Hawaii, Honolulu.
Peng, Z.X., Mahoney, J.J., Hooper, P.R., Harris, C., Beane, J.E., 1994. A
role for lower continental crust in flood basalt genesis? Isotopic and
incompatible element study of the lower six formations of the
western Deccan Traps. Geochimica et Cosmochimica Acta 58,
267–288.
Peng, Z.X., Mahoney, J.J., Hooper, P.R., Macdougall, J.D., Krishnamurthy,
P., 1998. Basalts of the northeastern Deccan Traps India: isotopic and
elemental geochemistry and relation to southwestern Deccan strati-
graphy. Journal of Geophysical Research 103, 29843–29865.
Ravishanker, 1987. Neotectonic activity along the Tapi–Satpura lineament
in central India. Indian Minerals 41, 19–30.
Rudnick, R., Fountain, D.M., 1995. Nature and composition of the
continental crust: a lower crustal perspective. Reviews of Geophysics
33, 267–309.
Sano, T., Fujii, T., Deshmukh, S.S., Fukuoka, T., Aramaki, S., 2001.
Differentiation processes of Deccan Trap basalts: contribution from
geochemistry and experimental petrology. Journal of Petrology 42,
2175–2195.
Sen, G., 2001. Generation of Deccan Trap magmas. Proceedings of the
Indian Academy of Sciences (Earth and Planetary Sciences) 110,
409–431.
Sheth, H.C., 1998. Geochemistry, petrogenesis, stratigraphy and structure
of Deccan flood basalts of the western Satpura–Tapi region, India. PhD
Dissertation, Indian Institute of Technology, Bombay.
Sheth, H.C., Duncan, R.A., Chandrasekharam, D., Mahoney, J.J., 1997.
Deccan Trap dioritic gabbros from the western Satpura–Tapi region.
Current Science 72, 755–757.
Subbarao, K.V., (ed.), 1988. Deccan Flood Basalts. Geological Society of
India Memoir 10, 393.
Subbarao, K.V., Hooper, P.R., 1988. Reconnaissance map of the Deccan
Basalt Group in the Western Ghats, India. Geological Society of India
Memoir 10 (enclosure).
Subbarao, K.V., Chandrasekharam, D., Navaneethakrishnan, P., Hooper,
P.R., 1994. Stratigraphy and structure of parts of the central Deccan
basalt province: eruptive models. In: Subbarao, K.V., (Ed.), Volcanism,
Wiley, New Delhi, pp. 321–332.
Sun, S.-s., McDonough, W.F., 1989. Chemical and isotopic systematics of
oceanic basalts: implications for mantle composition and processes.
Geological Society of London Special Publication 42, 313–345.
Wadia, D.N., 1975. Geology of India, fourth ed., Tata McGraw-Hill, New
Delhi, p. 508.
Widdowson, M., Pringle, M.S., Fernandez, O.A., 2000. A post K–T
Boundary (Early Palaeocene) age for Deccan-type feeder dykes, Goa,
India. Journal of Petrology 41, 1177–1194.
Wilkins, A., Subbarao, K.V., Ingram, G., Walsh, J.N., 1994. Weathering
regimes within the Deccan basalts. In: Subbarao, K.V., (Ed.),
Volcanism, Wiley, New Delhi, pp. 217–231.
H.C. Sheth et al. / Journal of Asian Earth Sciences 23 (2004) 127–139 139