biochemical studies of the effect of folic acid in hypothyroidism
TRANSCRIPT


1
Acknowledgement
My sincere gratitude is truly to Prof. Dr. Ehab Mostafa Mohamed, professor of Biochemistry, Faculty of Science, Tanta University for
his interest and co-operation through this work.
I am greatly indebted to Prof. Dr. Wafaa Mohamad Ibrahim, professor of medical Biochemistry, Faculty of Medicine, TantaUniversity for suggesting the problem, effective assistance and
valuable advice through the work.
I am especially grateful to Prof. Dr. Ehab Moustafa Tousson, Assistant professor of cell biology and Histology, Faculty of Science, Tanta University for his invaluable efforts, kind encouragement andgiving full facilities for proper research work. Really, I owe to him
much more than can be expressed.
Finally, my deep thanks are also to my parents, brother, sister, fiancée
and to all who offered to me any help that made this work an existing
reality.
Mohammed Mansour
2
Abstract
Although thyroid hormone is an important hormonal regulator
of testis physiology during development period, its role in the post-
pubertal and adult testes is still controversial. This study evaluated
some biochemical parameters in post-pubertal hypothyroidism and its
impact on testicular function. In addition, the ameliorating role of
folic acid supplementation was investigated and these findings were
well supported by the histopathological, immunohistochemical and
ultrastructural investigations. Fifty male albino rats were randomly
divided into five groups (group I, Control; group II, Folic acid; group
III, propylthiouracil (PTU)-induced hypothyroid group; group IV,
Co-treatment; group V, Post-treatment).
Plasma total homocysteine (tHcy), NO metabolites,
malondialdehyde (MDA) levels and GSSG/GSH ratio, and testicular
MDA significantly increased in rats of hypothyroid group as
compared to controls (groups I, II). However, testicular ferric
reducing antioxidant power, testosterone, sperm count and sperm
motility significantly decreased in hypothyroid group as compared to
control group. Furthermore, specific activities of some testicular
enzymes and morphological analyses showed significant alterations
in different studied groups. The biochemical disturbances at least in
part disrupted spermatogenesis in these experimental models.
On the other hand, folic acid supplemented after restoration of
the euthyroid state (group V) presented better amelioration to
spermatogenesis over its concurrent supplementation with
hypothyroidism (group IV). These findings postulate an indirect
3
negative impact of post-pubertal hypothyroidism on testicular
function through development of these alterations. This is plus the
observed role of folic acid supplementation in enhancing
spermatogenesis, boosting sperm concentration and building up the
antioxidant status against the oxidants in the present study. If
confirmed in human beings, our results could propose that folic acid
can be used as an adjuvant therapy with thyroxin replacement therapy
in hypothyroidism disorders.
Keywords: Hypothyroidism; Homocysteine; Nitric oxide;
Testis; Folic acid; Rat; Ultrastructure; Proliferating cell nuclear
antigen.
4
List of Contents
Subject PageAbstract 2
List of contents 4
List of figures 6
List of tables 14
List of abbreviations 16
Chapter I: Introduction and Aim of the work 19
Chapter II: Review of LiteratureNormal thyroid gland functionThyroid hormone synthesis, secretion, andtransportPhysiological effects of thyroid hormonesMetabolism and excretion of thyroid hormonesThyroid hormone half-life and TSH levels Thyroid dysfunctionAntithyroid drugsRole of the thyroid hormones inreproduction and reproductive tractdevelopment of malesSimilarities and differences in the role ofthyroid hormones in reproduction anddevelopmentActions of thyroid hormone on testisdevelopmentThyroid hormone and the adult testisFolate and homocysteine metabolismFolates as antioxidantsNitric Oxide (NO)Overview of testis structural organizationTesticular enzymes
232325
283131323335
36
37
394045484951
Chapter III: Materials and MethodsExperimental animals & study designDetermination of serum total triiodothyronine(T3) level
545460
5
Determination of serum thyroid stimulatinghormone (TSH) levelDetermination of plasma total homocysteine(tHcy), reduced glutathione (GSH) and oxidizedglutathione (GSSG) concentrations by HPLCDetermination of plasma nitrites and nitratesconcentrations by HPLCDetermination of plasma malondialdehyde(MDA) concentration by HPLCDetermination of the testosterone concentrationby HPLCDetermination of testicular thiobarbituric acid-reactive substances (TBARS) level[malondialdehyde (MDA)]Estimation of testicular total antioxidant capacity(TAC) by ferric reducing antioxidant power(FRAP)Determination of epididymal sperm count andmotilityEstimation of testicular total protein contentEstimation of testicular lactate dehydrogenase(LDH) activity Estimation of testicular gammaglutamyltranspeptidase (GGT) activity Estimation of testicular acid phosphatase (ACP)activity Estimation of testicular sorbitol dehydrogenase(SDH) activityHistological and immunohistochemicalinvestigationTransmission electron microscopy examinationStatistical analysis
64
67
70
72
74
76
78
81
8284
86
88
91
93
9899
Chapter IV: Results 100
Chapter V: Discussion 167
Chapter VI: Summary 192
Chapter VII: References 201
6
List of Figures
Figure Legend Page
1Structural formulas of thyroid hormones andrelated compounds
24
2 Synthesis of thyroid hormones 26
3
Schematic diagram depicting the feedbackregulation of thyroid hormone synthesis andsecretion, and thyroid hormone receptor (TR)mediated actions
30
4 Antithyroid drugs 35
5 Biochemistry of folate and homocysteine 44
6Chemical structures and atom numberingsystem of folates
46
7Mechanistic pathway for oxidation of folicacid
47
8Schematic representation of testis structuralorganization
50
9Schematic representation of the experimentalanimal design
57
10Standard curve of triiodothyronine (T3)concentration
63
11Standard curve of thyroid stimulatinghormone concentration
66
12The chromatogram of the reducedglutathione, homocysteine and oxidizedglutathione standard separated by HPLC
69
13The chromatogram of the nitrites and nitratesstandard separated by HPLC
71
14The chromatogram of the MDA standardseparated by HPLC
73
15The chromatogram of the serum testosteronehormone standard separated by HPLC
75
16 Malondialdehyde (MDA) standard curve 77
17Ferric reducing antioxidant power (FRAP)standard curve
80
18 Protein standard curve using standard bovine 84
7
serum albumin (BSA)
19
Serum triiodothyronine (T3; ng/dl) levels incontrol (group I), folic acid (group II), hypothyroid (group III), co-treatment (groupIV) and post-treatment (group V) groups. Values are given as mean± SEM
107
20Serum triiodothyronine (T3; ng/dl) levels eachweek in post-treatment (group V) groupthroughout the study period
108
21
Serum thyroid stimulating hormone (TSH;µIU/ml) levels in control (group I), folic acid(group II), hypothyroid (group III), co-treatment (group IV) and post-treatment(group V) groups. Values are given as mean±SEM
108
22
Plasma total homocysteine (tHcy; µM) levelsin control (group I), folic acid (group II), hypothyroid (group III), co-treatment (groupIV) and post-treatment (group V) groups. Values are given as mean± SEM
112
23
Plasma total nitric oxide metabolites (tNOx;µM) levels in control (group I), folic acid(group II), hypothyroid (group III), co-treatment (group IV) and post-treatment(group V) groups. Values are given as mean±SEM
113
24
Plasma malondialdehyde (pMDA; nM) andtesticular malondialdehyde (tMDA; nmol/gtissue) levels in control (group I), folic acid(group II), hypothyroid (group III), co-treatment (group IV) and post-treatment(group V) groups. Values are given as mean±SEM
116
25
Plasma oxidized glutathione: reducedglutathione ratio (GSSG/GSH ratio) andtesticular ferric reducing antioxidant power(tFRAP; µmol Fe+2/g tissue) levels in control
119
8
(group I), folic acid (group II), hypothyroid(group III), co-treatment (group IV) and post-treatment (group V) groups. Values are givenas mean± SEM
26
Plasma testosterone (ng/ml) levels in control(group I), folic acid (group II), hypothyroid(group III), co-treatment (group IV) and post-treatment (group V) groups. Values are givenas mean± SEM
122
27
Sperm count ((No. /g epididymis wt.)×106)and sperm motility (%) in control (group I), folic acid (group II), hypothyroid (group III), co-treatment (group IV) and post-treatment(group V) groups. Values are given as mean±SEM
123
28
Lactate dehydrogenase specific activities(LDH; mU/mg protein) in control (group I), folic acid (group II), hypothyroid (group III), co-treatment (group IV) and post-treatment(group V) groups. Values are given as mean±SEM
126
29
Gamma-glutamyl transpeptidase (GGT;mU/mg protein), acid phosphatase (ACP;mU/mg protein) and sorbitol dehydrogenase(SDH; nmol NADH produced/min/mgprotein) specific activities in control (groupI), folic acid (group II), hypothyroid (groupIII), co-treatment (group IV) and post-treatment (group V) groups. Values are givenas mean± SEM
127
30Correlation of serum total triiodothyronine(T3) with plasma total homocysteine (tHcy) indifferent studied groups
129
31Correlation of serum total triiodothyronine(T3) with plasma total nitric oxide metabolites(tNOx) in different studied groups
130
32 Correlation of plasma total homocysteine 131
9
(tHcy) with plasma malondialdehyde(pMDA) in different studied groups
33Correlation of serum total triiodothyronine(T3) with testicular malondialdehyde (tMDA)in different studied groups
133
34
Correlation of testicular ferric reducingantioxidant power (FRAP) with testicularmalondialdehyde (tMDA) in different studiedgroups
134
35Correlation of testicular malondialdehyde(tMDA) with testosterone in different studiedgroups
135
36Correlation of testicular malondialdehyde(tMDA) with sperm count in different studiedgroups
136
37Correlation of serum total triiodothyronine(T3) with testicular acid phosphatase specificactivity (ACP) in different studied groups
137
38Correlation of plasma total homocysteine(tHcy) with sperm motility in differentstudied groups
138
39-41
Photomicrographs of control rat testes stainedby haematoxylin and eosin stains showingnormal structure of seminiferous tubules(black arrows), lumen of seminiferous tubulesfully packed with sperms (stars) and Leydigcells (white arrow)
142
42-44
Photomicrographs of rat testes in folic acidgroup stained by haematoxylin and eosinstains showing normal structure ofseminiferous tubules (white arrows in Fig. 42), lumen of seminiferous tubules fullypacked with sperms (stars) and Leydig cells(white arrows in Fig. 43)
143
45-47Photomicrographs of rat testes in hypothyroidgroup stained by haematoxylin and eosinstains showing marked morphological
144
10
changes (white arrows in Fig. 45), widelumen of seminiferous tubules with lack ofsperms (stars) and small number of Leydigcells (white arrows in Fig. 47)
48-50
Photomicrographs of rat testes in co-treatmentgroup stained by haematoxylin and eosinstains showing normal distribution of thespermatogenic cells (white star and arrow inFig. 48), narrow lumen of seminiferoustubules with increased number of sperms(black star in Fig. 49) and increased numberof Leydig cells (white arrow in Fig. 50)
145
51-53
Photomicrographs of rat testes in post-treatment group stained by haematoxylin andeosin stains showing normal structure of theseminiferous tubules, narrow lumen ofseminiferous tubules fully packed withsperms (white and black stars) and increasednumber of Leydig cells (white arrow)
147
54-58
Normal and abnormal sperm morphology. Fig. 54: Normal sperm form. Figs. 55 & 56:Bent neck, 57: Double head and 58: Bent andcoiled tail
148
59&60
Photo electron micrographs (TEM) ofportions of seminiferous tubules of control rattestes (X 2500). Fig. 59: TEM of control rattestes showing the basement tubularmembrane of the seminiferous tubule andSertoli cell (S). Fig. 60: TEM of control rattestes showing normal structure of primaryspermatocytes (1ry sp), Golgi complex (Gx)and large number of mitochondria (M)
152
61&62
Photo electron micrographs (TEM) ofportions of seminiferous tubules of controland folic acid groups’ rat testes. Fig. 61:TEM of control rat testis showing secondaryspermatocyte nucleus (N) and mitochondria
153
11
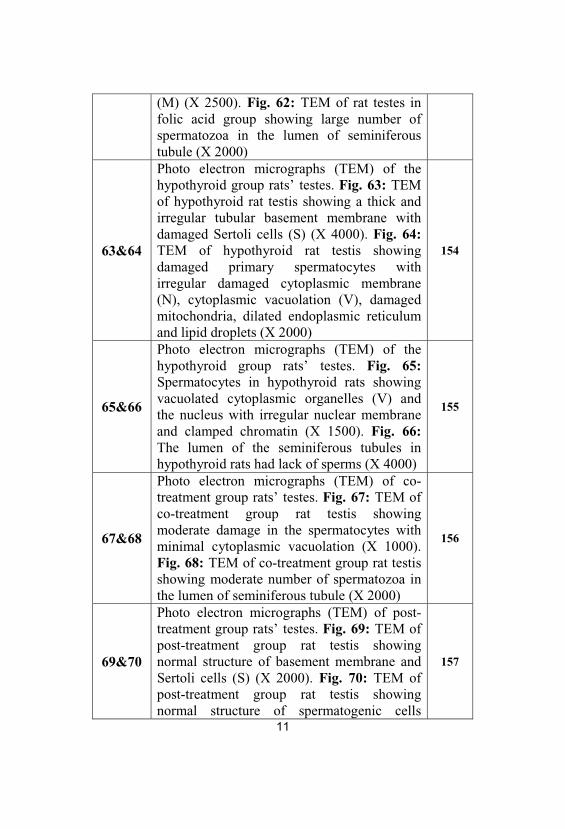
(M) (X 2500). Fig. 62: TEM of rat testes infolic acid group showing large number ofspermatozoa in the lumen of seminiferoustubule (X 2000)
63&64
Photo electron micrographs (TEM) of thehypothyroid group rats’ testes. Fig. 63: TEMof hypothyroid rat testis showing a thick andirregular tubular basement membrane withdamaged Sertoli cells (S) (X 4000). Fig. 64:TEM of hypothyroid rat testis showingdamaged primary spermatocytes withirregular damaged cytoplasmic membrane(N), cytoplasmic vacuolation (V), damagedmitochondria, dilated endoplasmic reticulumand lipid droplets (X 2000)
154
65&66
Photo electron micrographs (TEM) of thehypothyroid group rats’ testes. Fig. 65:Spermatocytes in hypothyroid rats showingvacuolated cytoplasmic organelles (V) andthe nucleus with irregular nuclear membraneand clamped chromatin (X 1500). Fig. 66:The lumen of the seminiferous tubules inhypothyroid rats had lack of sperms (X 4000)
155
67&68
Photo electron micrographs (TEM) of co-treatment group rats’ testes. Fig. 67: TEM ofco-treatment group rat testis showingmoderate damage in the spermatocytes withminimal cytoplasmic vacuolation (X 1000).Fig. 68: TEM of co-treatment group rat testisshowing moderate number of spermatozoa inthe lumen of seminiferous tubule (X 2000)
156
69&70
Photo electron micrographs (TEM) of post-treatment group rats’ testes. Fig. 69: TEM ofpost-treatment group rat testis showingnormal structure of basement membrane andSertoli cells (S) (X 2000). Fig. 70: TEM ofpost-treatment group rat testis showingnormal structure of spermatogenic cells
157
12
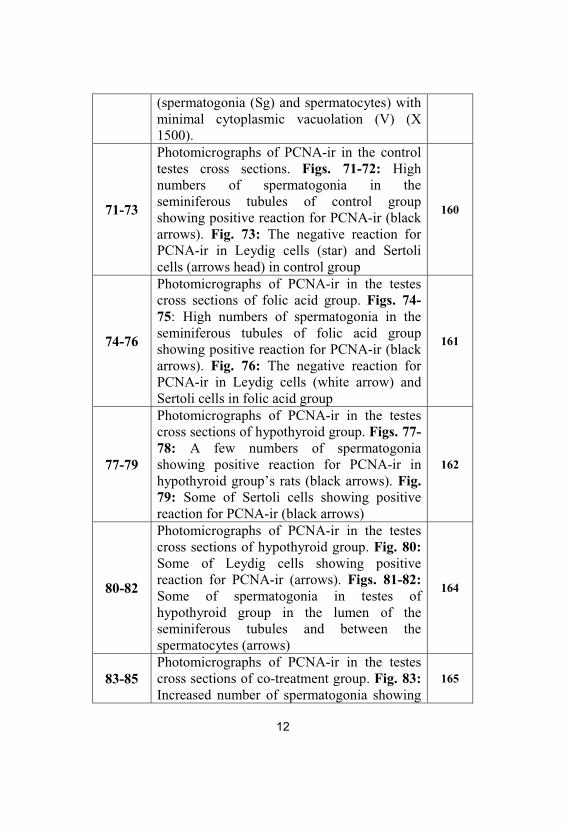
(spermatogonia (Sg) and spermatocytes) withminimal cytoplasmic vacuolation (V) (X1500).
71-73
Photomicrographs of PCNA-ir in the controltestes cross sections. Figs. 71-72: Highnumbers of spermatogonia in theseminiferous tubules of control groupshowing positive reaction for PCNA-ir (blackarrows). Fig. 73: The negative reaction forPCNA-ir in Leydig cells (star) and Sertolicells (arrows head) in control group
160
74-76
Photomicrographs of PCNA-ir in the testescross sections of folic acid group. Figs. 74-75: High numbers of spermatogonia in theseminiferous tubules of folic acid groupshowing positive reaction for PCNA-ir (blackarrows). Fig. 76: The negative reaction forPCNA-ir in Leydig cells (white arrow) andSertoli cells in folic acid group
161
77-79
Photomicrographs of PCNA-ir in the testescross sections of hypothyroid group. Figs. 77-78: A few numbers of spermatogoniashowing positive reaction for PCNA-ir inhypothyroid group’s rats (black arrows). Fig. 79: Some of Sertoli cells showing positivereaction for PCNA-ir (black arrows)
162
80-82
Photomicrographs of PCNA-ir in the testescross sections of hypothyroid group. Fig. 80:Some of Leydig cells showing positivereaction for PCNA-ir (arrows). Figs. 81-82:Some of spermatogonia in testes ofhypothyroid group in the lumen of theseminiferous tubules and between thespermatocytes (arrows)
164
83-85Photomicrographs of PCNA-ir in the testescross sections of co-treatment group. Fig. 83:Increased number of spermatogonia showing
165
13
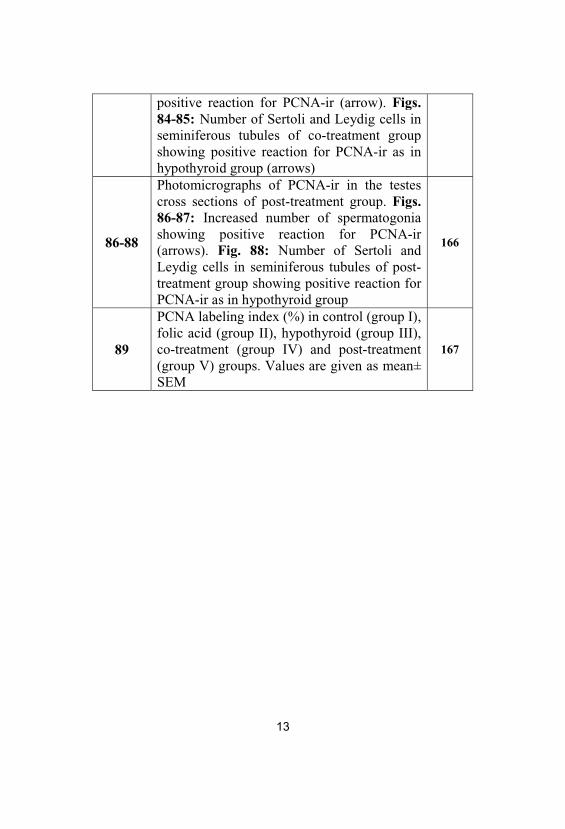
positive reaction for PCNA-ir (arrow). Figs. 84-85: Number of Sertoli and Leydig cells inseminiferous tubules of co-treatment groupshowing positive reaction for PCNA-ir as inhypothyroid group (arrows)
86-88
Photomicrographs of PCNA-ir in the testescross sections of post-treatment group. Figs. 86-87: Increased number of spermatogoniashowing positive reaction for PCNA-ir(arrows). Fig. 88: Number of Sertoli andLeydig cells in seminiferous tubules of post-treatment group showing positive reaction forPCNA-ir as in hypothyroid group
166
89
PCNA labeling index (%) in control (group I), folic acid (group II), hypothyroid (group III), co-treatment (group IV) and post-treatment(group V) groups. Values are given as mean±SEM
167
14
List of Tables
Table Legend Page
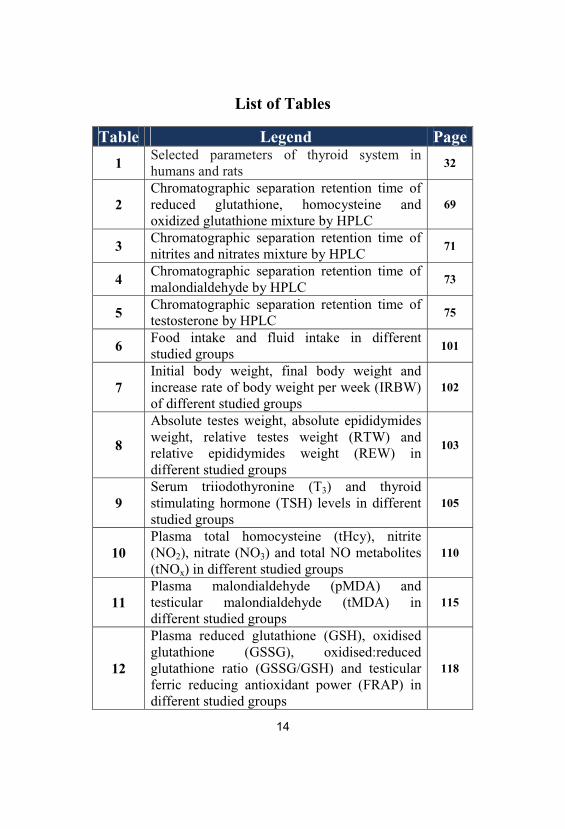
1Selected parameters of thyroid system inhumans and rats
32
2Chromatographic separation retention time ofreduced glutathione, homocysteine andoxidized glutathione mixture by HPLC
69
3Chromatographic separation retention time ofnitrites and nitrates mixture by HPLC
71
4Chromatographic separation retention time ofmalondialdehyde by HPLC
73
5Chromatographic separation retention time oftestosterone by HPLC
75
6Food intake and fluid intake in differentstudied groups
101
7Initial body weight, final body weight andincrease rate of body weight per week (IRBW)of different studied groups
102
8
Absolute testes weight, absolute epididymidesweight, relative testes weight (RTW) andrelative epididymides weight (REW) indifferent studied groups
103
9Serum triiodothyronine (T3) and thyroidstimulating hormone (TSH) levels in differentstudied groups
105
10Plasma total homocysteine (tHcy), nitrite(NO2), nitrate (NO3) and total NO metabolites(tNOx) in different studied groups
110
11Plasma malondialdehyde (pMDA) andtesticular malondialdehyde (tMDA) indifferent studied groups
115
12
Plasma reduced glutathione (GSH), oxidisedglutathione (GSSG), oxidised:reducedglutathione ratio (GSSG/GSH) and testicularferric reducing antioxidant power (FRAP) indifferent studied groups
118
15
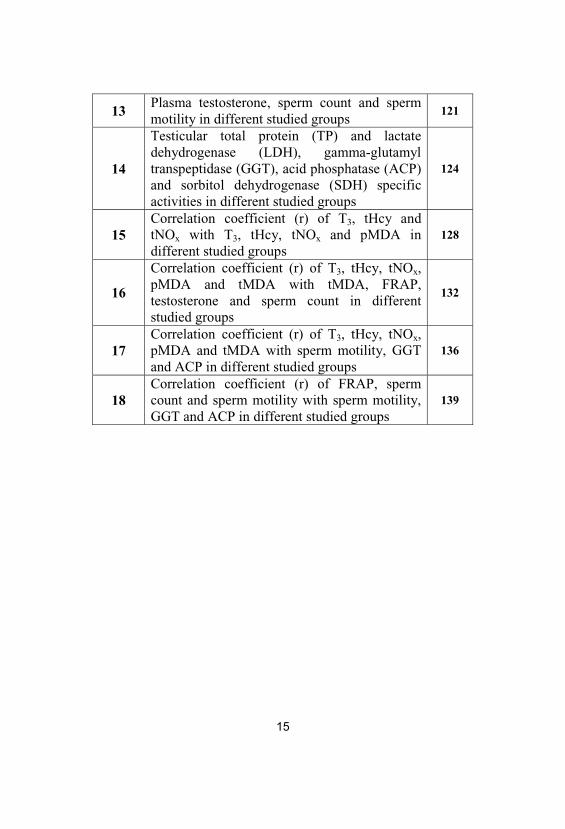
13Plasma testosterone, sperm count and spermmotility in different studied groups
121
14
Testicular total protein (TP) and lactatedehydrogenase (LDH), gamma-glutamyltranspeptidase (GGT), acid phosphatase (ACP)and sorbitol dehydrogenase (SDH) specificactivities in different studied groups
124
15Correlation coefficient (r) of T3, tHcy andtNOx with T3, tHcy, tNOx and pMDA indifferent studied groups
128
16
Correlation coefficient (r) of T3, tHcy, tNOx, pMDA and tMDA with tMDA, FRAP, testosterone and sperm count in differentstudied groups
132
17Correlation coefficient (r) of T3, tHcy, tNOx, pMDA and tMDA with sperm motility, GGTand ACP in different studied groups
136
18Correlation coefficient (r) of FRAP, spermcount and sperm motility with sperm motility, GGT and ACP in different studied groups
139
16
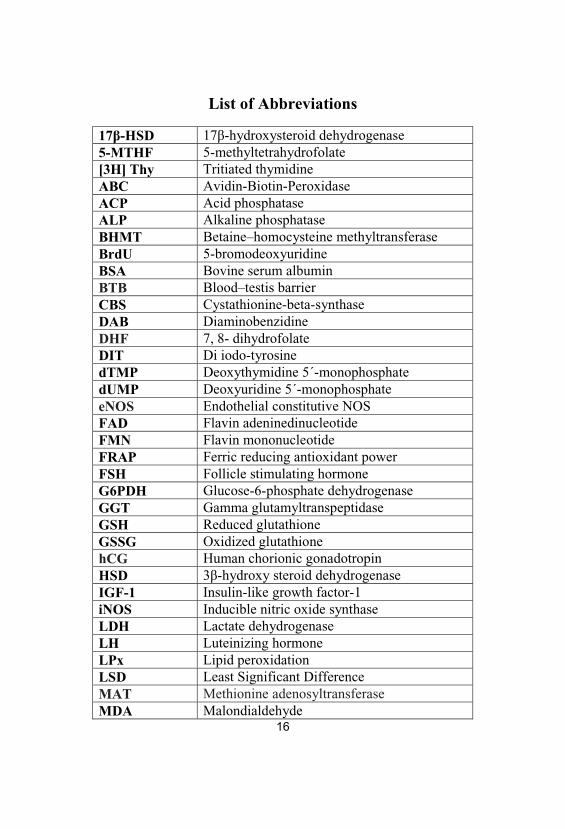
List of Abbreviations
17 -HSD 17 -hydroxysteroid dehydrogenase5-MTHF 5-methyltetrahydrofolate[3H] Thy Tritiated thymidineABC Avidin-Biotin-PeroxidaseACP Acid phosphataseALP Alkaline phosphataseBHMT Betaine–homocysteine methyltransferaseBrdU 5-bromodeoxyuridineBSA Bovine serum albuminBTB Blood–testis barrierCBS Cystathionine-beta-synthaseDAB DiaminobenzidineDHF 7, 8- dihydrofolateDIT Di iodo-tyrosinedTMP Deoxythymidine 5 -monophosphatedUMP Deoxyuridine 5 -monophosphateeNOS Endothelial constitutive NOSFAD Flavin adeninedinucleotideFMN Flavin mononucleotideFRAP Ferric reducing antioxidant powerFSH Follicle stimulating hormoneG6PDH Glucose-6-phosphate dehydrogenaseGGT Gamma glutamyltranspeptidaseGSH Reduced glutathioneGSSG Oxidized glutathionehCG Human chorionic gonadotropinHSD 3 -hydroxy steroid dehydrogenaseIGF-1 Insulin-like growth factor-1iNOS Inducible nitric oxide synthaseLDH Lactate dehydrogenaseLH Luteinizing hormoneLPx Lipid peroxidationLSD Least Significant DifferenceMAT Methionine adenosyltransferaseMDA Malondialdehyde
17
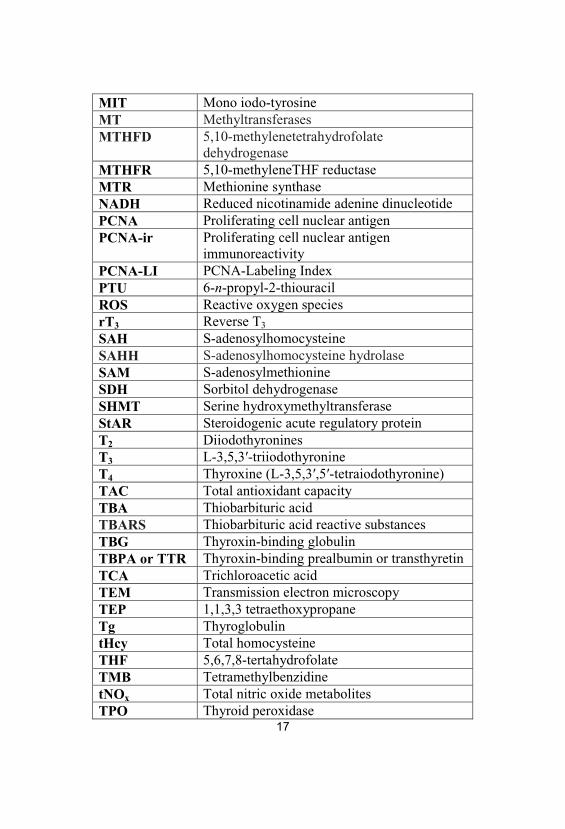
MIT Mono iodo-tyrosineMT MethyltransferasesMTHFD 5,10-methylenetetrahydrofolate
dehydrogenaseMTHFR 5,10-methyleneTHF reductaseMTR Methionine synthaseNADH Reduced nicotinamide adenine dinucleotidePCNA Proliferating cell nuclear antigenPCNA-ir Proliferating cell nuclear antigen
immunoreactivityPCNA-LI PCNA-Labeling IndexPTU 6-n-propyl-2-thiouracilROS Reactive oxygen speciesrT3 Reverse T3
SAH S-adenosylhomocysteineSAHH S-adenosylhomocysteine hydrolaseSAM S-adenosylmethionineSDH Sorbitol dehydrogenaseSHMT Serine hydroxymethyltransferaseStAR Steroidogenic acute regulatory proteinT2 DiiodothyroninesT3 L-3,5,3 -triiodothyronineT4 Thyroxine (L-3,5,3 ,5 -tetraiodothyronine)TAC Total antioxidant capacityTBA Thiobarbituric acidTBARS Thiobarbituric acid reactive substancesTBG Thyroxin-binding globulinTBPA or TTR Thyroxin-binding prealbumin or transthyretinTCA Trichloroacetic acidTEM Transmission electron microscopyTEP 1,1,3,3 tetraethoxypropaneTg ThyroglobulintHcy Total homocysteineTHF 5,6,7,8-tertahydrofolateTMB TetramethylbenzidinetNOx Total nitric oxide metabolitesTPO Thyroid peroxidase
18
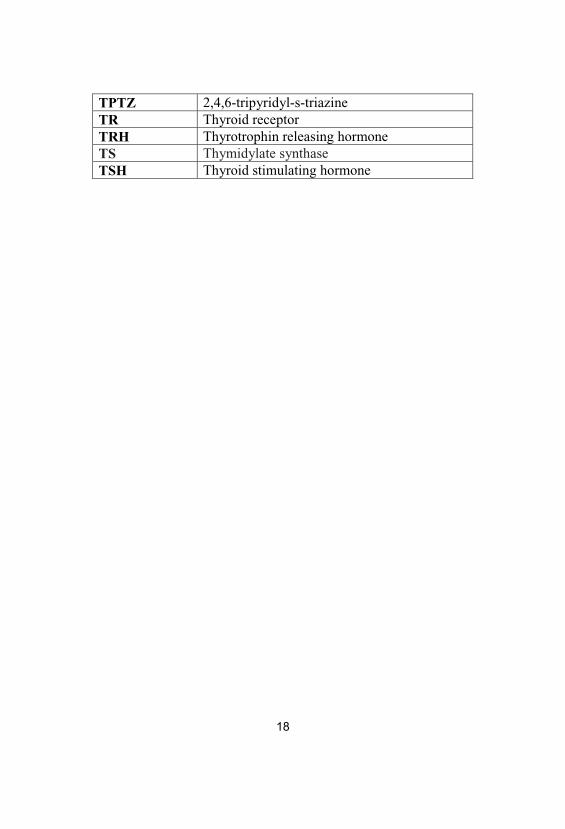
TPTZ 2,4,6-tripyridyl-s-triazineTR Thyroid receptorTRH Thyrotrophin releasing hormoneTS Thymidylate synthaseTSH Thyroid stimulating hormone
19
Introduction & Aim of the work
Appropriate level of thyroid hormone is essential for normal
development and metabolism in most vertebrate tissues, and altered
thyroid status adversely affects them (Toshihiro, 2010). For many
years, the testis was regarded as a thyroid hormone unresponsive
organ, but consistent evidence accumulated in the past two decades
has definitively changed this classical view (Oppenheimer et al.,
1974; Wajner et al., 2009).
The findings that thyroid hormone receptors and
iodothyronine deiodinases are present in human and rat testes from
neonatal to adult life (Buzzard et al. 2000; Wajner et al., 2007),
confirm that thyroid hormone plays a key role in testicular
development. It is now established that T3 regulates the maturation
and growth of testis, controlling Sertoli cell and Leydig cell
proliferation and differentiation during testicular development in rats
and other mammal species (Mendis-Handagama and Ariyaratne,
2005). Clinical literature indicates that most patients with thyroid
hormone disorders experience some kind of sexual dysfunction,
which improves or normalizes when patients become euthyroid
(Krassas and Pontikides, 2004; Wagner et al., 2008).
On the other hand, although there is general agreement that
thyroid hormone is an important hormonal regulator of testis
physiology during development period, its role in the post-pubertal
and adult testes is still controversial. Furthermore, most experimental
studies to date have focused on thyroid hormone effects on the
20
developing testes and only limited data are available on its role in
spermatogenesis (Wagner et al., 2009).
Propylthiouracil (PTU) is known to inhibit thyroid hormone
synthesis and conversion of peripheral T4 to T3 and thereby reduces
serum T3 concentration. PTU is also used in treating hyperthyroid
conditions like Graves disease. It has been linked with several side
effects such as transient leukopenia, jaundice, hepatomegaly and
vasculitis (Chiao et al., 2002). Thus, chemical induction of
hypothyroid state by antithyroid drugs as PTU has been widely
established to investigate the role of thyroid hormones in testicular
physiology (Sahoo et al., 2008; Zamoner et al., 2008).
Hypothyroidism has been reported to induce mild
hyperhomocysteinemia and endothelial dysfunction through reduced
endothelial NO bioavailability (Adrees et al., 2009; Virdis et al.,
2009). However, the impact of hyperhomocysteinemia and
endothelial dysfunction on testicular function is unclear. Besides,
regulatory role of thyroid hormone in testicular physiology is well
established (Sahoo et al., 2008), however, its effect on testicular
antioxidant defense system is inadequate (Sahoo et al., 2005, 2007,
2008).
Thyroid hormone is a major regulator of oxygen consumption
and mitochondrial energy metabolism. During oxidative metabolism
in mitochondria, highly reactive oxygen species (ROS) are naturally
generated in small amounts as byproducts. If not disposed off
quickly, they can attack biomolecules in their vicinity and cause
impairment of cellular functions (Sahoo et al., 2008). One of the
21
main targets of ROS is the testes as sperm plasma membrane contains
a high amount of unsaturated fatty acids, and so it is particularly
susceptible to lipid peroxidation. This peroxidative damage destroys
the structure of lipid matrix in the membranes of spermatozoa, and it
is associated with loss of motility and impairment of spermatogenesis
(De Lamirande et al., 1997).
Folic acid has been reported to have an antioxidant power
against ROS and an alleviating role in hyperhomocysteinemia and the
associated endothelial dysfunction (Antoniades et al., 2007; Moens
et al., 2008). Also, progressive folate deficiency was suggested to
develop with hypothyroidism (Diekman et al., 2001). This
deficiency may be responsible for reduced sperm concentration
(Wallock et al., 2001).
Supporting this assumption, a high affinity folate binding
protein has been identified in human semen and prostate gland (Holm
et al., 1991). This finding supports the connection between folate
status and male reproductive function. This further illustrates the
need for an intact folate cycle to maintain normal spermatogenesis
and the positive effect of folic acid on sperm parameters (Forges et
al., 2007). Likewise, complex changes in folic acid metabolism occur
in thyroid dysfunction with increases in tetrahydrofolate and
decreases in methyltetrahydrofolate in hypothyroid rat liver (Nair et
al., 1994). It is, however, suggested, that changes in folate level may
be responsible for the increased serum homocysteine level in patients
with hypothyroidism (Lien et al., 2000).
22
The present study represents a contribution to declare the
effect of low thyroid hormone status on total plasma homocysteine
level and oxidative stress parameters. To achieve this purpose, the
following biomarkers were estimated:
• Estimation of total triiodothyronine hormone (T3) concentration.
• Estimation of thyroid stimulating hormone (TSH) concentration.
• Estimation of total homocysteine (tHcy), reduced glutathione
(GSH) and oxidized glutathione (GSSG) concentrations.
• Estimation of nitrites and nitrates concentrations.
• Estimation of plasma and testicular malondialdehyde (MDA)
concentration.
• Estimation of testicular total antioxidant capacity (TAC).
Additionally, to assess the impact of these biomarkers on
testicular function in PTU-induced hypothyroidism at the post-
pubertal stage of male rats, the following investigations were carried
out:
• Estimation of testosterone concentration.
• Determination of epididymal sperm count and motility.
• Estimation of testicular total protein.
• Estimation of testicular lactate dehydrogenase (LDH), gamma
glutamyltranspeptidase (GGT), acid phosphatase (ACP) and
sorbitol dehydrogenase (SDH) specific activities.
• Histological, immunohistochemical and transmission electron
microscopy (TEM) investigations of testicular tissue.
23
The current study also aimed to elucidate the role of folic acid
supplementation in enhancing spermatogenesis, boosting sperm
concentration and building up the antioxidant status as a concurrent
treatment with hypothyroidism and as a post-treatment after
restoration of the euthyroid state.
Review of Literature
Normal thyroid gland function
The thyroid gland in humans is a brownish-red organ located
in the neck, just below the larynx with two lobes connected by an
isthmus and consists of low cuboidal epithelial cells arranged to form
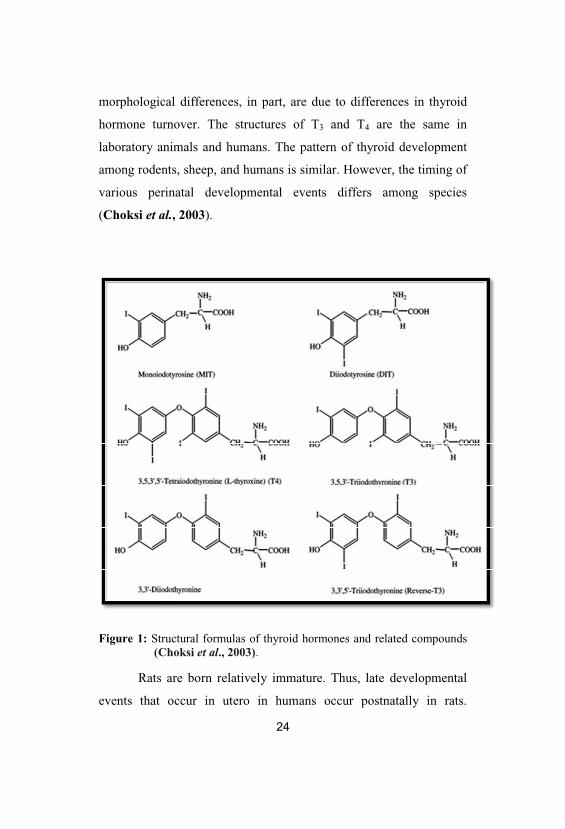
small sacs known as follicles. The two principle thyroid hormones
are thyroxine (T4 or L-3,5,3 ,5 -tetraiodothyronine) and
triiodothyronine (T3 or L-3,5,3 -triiodothyronine). These hormones
are composed of two tyrosyl residues linked through an ether linkage
and substituted with four or three iodine residues, respectively. T3 is
the biologically active hormone and T4, the major thyroid hormone
secreted from the thyroid gland, is considered a precursor or
prohormone. Deiodination of T4 in peripheral tissues (e.g., liver)
leads to production of T3 (which has two iodines on the inner ring
and one iodine on the outer ring of the molecule) and reverse T3 (rT3;
which has one iodine on the inner ring and two iodines on the outer
ring of the molecule); rT3 has no known biological activity (Fig. 1;
Choksi et al., 2003).
The gross structure of the thyroid gland in laboratory animals
is similar to that described for humans. However, there are
morphological differences in the follicles. It is proposed that the
morphological differences, in part, are due to differences in thyroid
hormone turnover. The structures of T3 and T4 are the same in
laboratory animals and humans. The pattern of thyroid development
among rodents, sheep, and humans is similar. However, the timing of
various perinatal developmental events differs among species
(Choksi et al., 2003).
Figure 1: Structural formulas of thyroid hormones and related compounds(Choksi et al., 2003).
Rats are born relatively immature. Thus, late developmental
events that occur in utero in humans occur postnatally in rats.
25
Thyroid development in sheep, comparatively, appears to occur
mostly in utero. The developmental life stage at which thyroid
receptor (TR) binding first occurs is one example of the differences
among species in thyroid development. TR binding occurs mid- to
late-gestation (average gestation is 3 weeks) in rats, during the latter
two-thirds of gestation (average gestation is 20.5 weeks) in sheep,
and between gestational weeks 10 and 16 (average gestation is 39
weeks) in humans (Fisher and Brown, 2000).
Thyroid hormone synthesis, secretion, and transport
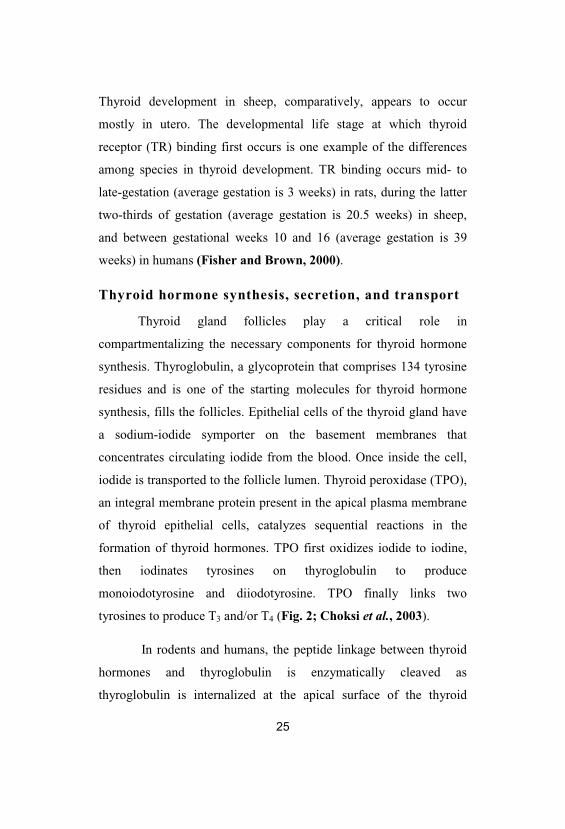
Thyroid gland follicles play a critical role in
compartmentalizing the necessary components for thyroid hormone
synthesis. Thyroglobulin, a glycoprotein that comprises 134 tyrosine
residues and is one of the starting molecules for thyroid hormone
synthesis, fills the follicles. Epithelial cells of the thyroid gland have
a sodium-iodide symporter on the basement membranes that
concentrates circulating iodide from the blood. Once inside the cell,
iodide is transported to the follicle lumen. Thyroid peroxidase (TPO),
an integral membrane protein present in the apical plasma membrane
of thyroid epithelial cells, catalyzes sequential reactions in the
formation of thyroid hormones. TPO first oxidizes iodide to iodine,
then iodinates tyrosines on thyroglobulin to produce
monoiodotyrosine and diiodotyrosine. TPO finally links two
tyrosines to produce T3 and/or T4 (Fig. 2; Choksi et al., 2003).
In rodents and humans, the peptide linkage between thyroid
hormones and thyroglobulin is enzymatically cleaved as
thyroglobulin is internalized at the apical surface of the thyroid
epithelial cells by endocytosis. Lysosomes, which contain hydrolytic
enzymes, fuse with the endosomes and release the hormones. Free
thyroid hormones diffuse into blood where they reversibly complex
with liver-derived binding proteins for transport to other tissues (Fig.
2; Choksi et al., 2003).
Figure 2: Synthesis of thyroid hormones (Nilsson, 2001).
The chemical nature of these liver-derived binding proteins
and the proportion of T3 and T4 binding to these proteins vary
considerably among animal species. T3 and T4, in different species,
27
can reversibly bind to three different liver-derived binding proteins:
thyroxine-binding globulin (TBG), transthyretin (TTR; also called
thyroid-binding prealbumin, TBPA), and albumin. Lipoproteins also
bind a small fraction of the available thyroid hormones (Robbins,
2000).
Thyroid hormones also interact with TBG, TTR, and albumin
in rodents and other animals. The amino acid sequences of the
thyroid hormone binding proteins show a high degree of sequence
homology (70 to 90%) between human and rodent species (Power et
al., 2000). Compared to humans, albumin appears to be the major
binding protein in adult rodents. Rodents contain a gene that can
encode the TBG protein, but it is expressed at very low levels in adult
animals (Tani et al., 1994). As in humans, T3 and T4 have higher
affinity for TBG than TTR or albumin in rodents. However, since
TBG is expressed at low levels, almost all T4 and T3 bind to TTR and
albumin in adult rodents (Choksi et al., 2003).
Thyroid stimulating hormone (TSH), secreted by the anterior
pituitary gland, regulates thyroid hormone synthesis and secretion in
humans and laboratory animals. Thyrotrophin releasing hormone
(TRH) is secreted by the hypothalamus and regulates pituitary TSH
secretion. Control of circulating concentrations of thyroid hormone is
regulated by negative feedback loops within the hypothalamic-
pituitary-thyroid (H-P-T) axis (Choksi et al., 2003). In general, blood
concentrations of thyroid hormones above normal levels inhibit the
release of TRH and TSH. When thyroid hormone serum levels are
decreased, TRH and TSH release is stimulated. Increased TSH levels
28
are associated with increased thyroid cell proliferation and
stimulation of T3 and T4 production (Fig. 3; Choksi et al., 2003).
Physiological effects of thyroid hormones
The mechanism of cellular T3 uptake is an area that continues
to be under study. Cellular entry of T3 through a carrier-mediated
process is one proposed mechanism of action (Hennemann et al.,
2001). In vitro studies show the presence of specific T3 and T4
binding sites/carriers in different laboratory animal and human tissues
(Hennemann et al., 2001). An alternative mechanism of cellular
transport is the presence of selective and specific interaction of
thyroid hormone binding proteins with cell surface receptors. Reports
have noted the presence of receptors for TBG and TTR on some cells
(Robbins, 2000). The function of these receptors is unclear, but it is
proposed they could be involved in targeting thyroid hormones to
specific subcellular sites. Potential species and sex differences in
cellular T3 uptake are currently not defined (Choksi et al., 2003).
Upon entry into the cell, T3 is transported to the nucleus for
interaction with TR (Fig. 3). It has been suggested that a combination
of mechanisms (diffusion, cytosolic binding proteins, interaction with
cytosolic receptors) plays a role in transporting T3 from the cytosol to
the nucleus. Species and sex differences in intracellular transport of
T3 are not completely understood currently (Choksi et al., 2003).
29
TRs function as hormone-activated transcription factors and
act by modulating gene expression. Similar to other nuclear receptors,
the TR consists of a transactivation domain, a DNA-binding domain,
and a ligand-binding and dimerization domain (O’Shea and
Williams, 2002). TR binds DNA in the absence of hormone, usually
leading to transcriptional repression (Fig. 3). After the cellular uptake
of thyroid hormones through transmembrane transporters, the
precursor T4 is mainly converted into T3 by type 2 deiodinase (D2)
located on the endoplasmic reticulum. In the nucleus, T3 binding to
thyroid receptor (RXR-TR heterodimer) leads to dissociation of
corepressors and binding of coactivators. This allows the
transcriptional machinery assembly and induction of transcription
(Fig. 3; Wagner et al., 2009).
Hormone binding is associated with a conformational change
in the receptor leading to transcriptional activation. The primary
functions of T3 are to regulate carbohydrate and protein metabolism
in all cells. Thus, changes in T3 can affect all organ systems of the
body with profound effects on the cardiovascular, nervous, immune,
and reproductive systems. In the developing animal and human, the
thyroid regulates growth and metabolism, and plays a critical role in
tissue development and differentiation (Choksi et al., 2003).
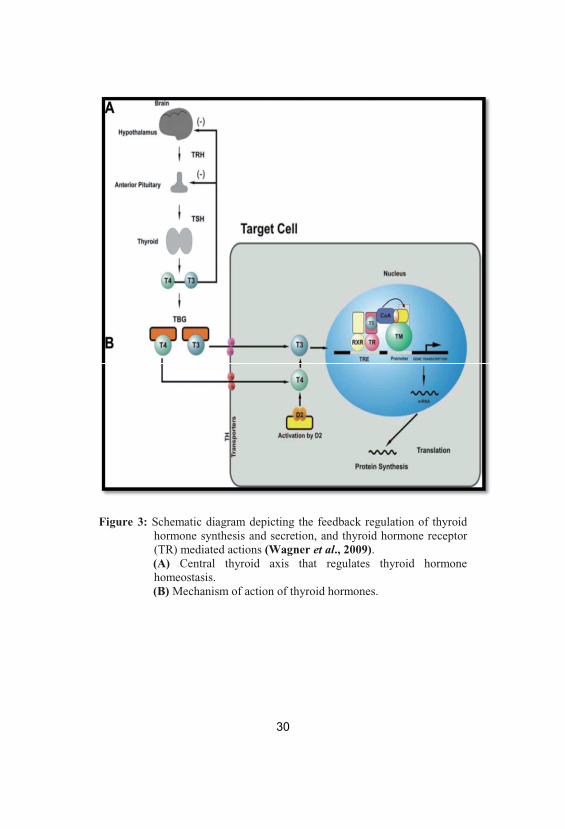
Figure 3: Schematic diagram depicting the feedback regulation of thyroidhormone synthesis and secretion, and thyroid hormone receptor(TR) mediated actions (Wagner et al., 2009). (A) Central thyroid axis that regulates thyroid hormonehomeostasis. (B) Mechanism of action of thyroid hormones.
31
Metabolism and excretion of thyroid hormones
Thyroid hormone activity can be regulated by three separate
enzymatic pathways: deiodination, glucuronidation, and sulfation.
Deiodination in humans is typically associated with production and
metabolism of T3 and plays a major role in metabolism of thyroid
hormones (Choksi et al., 2003).
Approximately, 80% of the intracellular production and
metabolism of thyroid hormones proceeds by sequential enzymatic
removal of iodine from the molecules (Kelly, 2000). Type I and type
II deiodinases, which remove iodine from the 5 position on thyroid
hormones, convert T4 to T3 in peripheral tissues. Type I deiodinases
also may remove iodine substituents from the 5 position on thyroid
hormones, which leads to the formation of rT3 from T4.
Approximately, 85% of T3 in the blood is produced by the action of
Type I deiodinase in a variety of organs (Crantz and Larsen, 1980).
Type III deiodinases, which remove iodine from the 5 position on
thyroid hormones, catalyze the conversion of T4 and T3 to rT3 and
diiodothyronines (T2), respectively. T2 molecules are in turn
deiodinated to form monoiodothyronines. Deiodinase enzyme
activity can be regulated by T3 and T4 levels and independently of the
other deiodinases (Kelly, 2000).
Thyroid hormone half-life and TSH levels
There are significant differences between human and rodent
thyroid hormone pharmacokinetics, associated with differences in
32
thyroid gland morphology (Table 1). The basis for the difference in
half-lives is not completely understood, but it is proposed that the
lack of high-affinity T4 binding proteins (e.g., TBG) in the adult rat
plays a role. The lack of high-affinity T4 binding proteins in the rat is
proposed to lead to a higher serum level of unbound T4, which is
more susceptible to removal by metabolism and excretion (Choksi et
al., 2003).
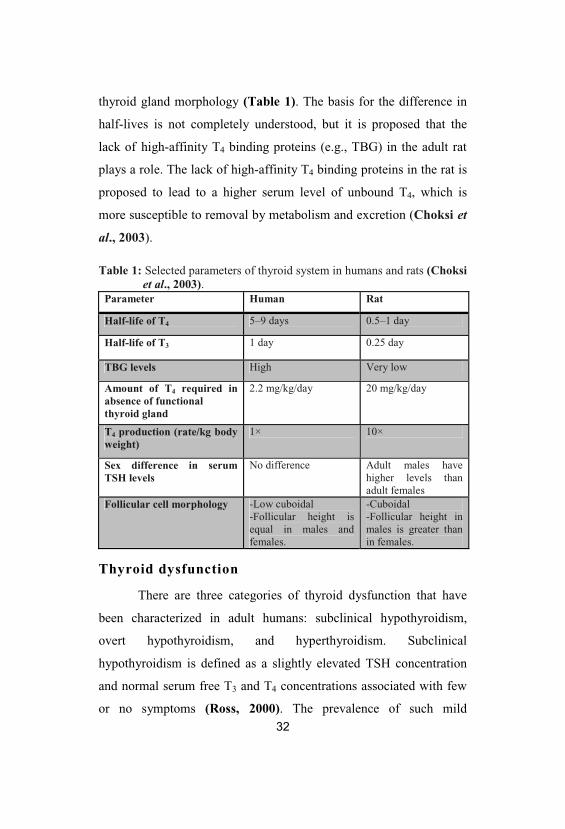
Table 1: Selected parameters of thyroid system in humans and rats (Choksiet al., 2003).
Parameter Human Rat
Half-life of T4 5–9 days 0.5–1 day
Half-life of T3 1 day 0.25 day
TBG levels High Very low
Amount of T4 required inabsence of functionalthyroid gland
2.2 mg/kg/day 20 mg/kg/day
T4 production (rate/kg bodyweight)
1× 10×
Sex difference in serumTSH levels
No difference Adult males havehigher levels thanadult females
Follicular cell morphology -Low cuboidal-Follicular height isequal in males andfemales.
-Cuboidal-Follicular height inmales is greater thanin females.
Thyroid dysfunction
There are three categories of thyroid dysfunction that have
been characterized in adult humans: subclinical hypothyroidism,
overt hypothyroidism, and hyperthyroidism. Subclinical
hypothyroidism is defined as a slightly elevated TSH concentration
and normal serum free T3 and T4 concentrations associated with few
or no symptoms (Ross, 2000). The prevalence of such mild
33
hypothyroidism increases with age for both sexes. Although there can
be various causes of this condition, many subclinical hypothyroidism
patients are positive for thyroid peroxidase (TPO) antibodies, which
may lead to overt hypothyroidism (Choksi et al., 2003).
Overt hypothyroidism or underactive thyroid gland is the
most common clinical disorder of thyroid function (Braverman and
Utiger, 2000). It is best defined as high serum TSH concentration and
a low free T4 serum concentration. Insufficient iodine levels or low
iodine intake are a major cause of overt hypothyroidism. However, in
areas where iodine intake is adequate, the most common cause of
hypothyroidism is Hashimoto’s thyroiditis, an autoimmune disease
caused by autoantibodies to TPO. Other autoimmune diseases and
radiation also are causes of hypothyroidism. Overall, women are
more susceptible to autoimmune disease than men, suggesting they
may be more susceptible to the development of hypothyroidism
(Choksi et al., 2003).
Hyperthyroidism (or thyrotoxicosis) is characterized by an
increase in serum T3 and T4 and a decrease in serum TSH. The most
common cause of hyperthyroidism is Graves’ disease which is the
production of antibodies to TSH receptor (Choksi et al., 2003).
Antithyroid drugs
Antithyroid drugs are relatively simple molecules known as
thionamides, which contain a sulfhydryl group and a thiourea moiety
within a heterocyclic structure (Fig. 4). Propylthiouracil (6-n-propyl-
2-thiouracil; PTU), methimazole (1-methyl-2-mercaptoimidazole,
Tapazole®) and carbimazole, a methimazole analogue are the most
34
common antithyroid agents. These agents are actively concentrated
by the thyroid gland against a concentration gradient (Ahmed et al.,
2008).
Their primary effect is to inhibit thyroid hormone synthesis
by interfering with thyroid peroxidase–mediated iodination of
tyrosine residues in thyroglobulin, an important step in the synthesis
of thyroxine and triiodothyronine (Fig. 2). Propylthiouracil, but not
methimazole or carbimazole, can block the conversion of thyroxine
to triiodothyronine within the thyroid and in peripheral tissues, but
this effect is not clinically important in most instances (Chiao et al.,
2002). Notably, PTU does not inhibit the action of the sodium-
dependent iodide transporter located on follicular cells' basolateral
membranes. Inhibition of this step requires competitive inhibitors
such as perchlorate and thiocyanate. Propylthiouracil (PTU) is
commonly used to treat hyperthyroidism conditions such as Graves’
disease. PTU is theoretically preferred over methimazole (MMZ) in
Graves’ disease relapse during the postpartum period because of its
lower milk: serum concentration ratio (Momotani et al., 2000).
However, PTU is associated with various side effects,
including agranulocytosis (Cho et al., 2005) which is a decrease of
white blood cells in the blood, jaundice, hepatomegaly (Deidiker
and deMello, 1996), and vasculitis (Chastain et al., 1999).
Symptoms and signs of agranulocytosis include infectious lesions of
the throat, the gastrointestinal tract and skin with an overall feeling of
illness and fever (Cho et al., 2005).
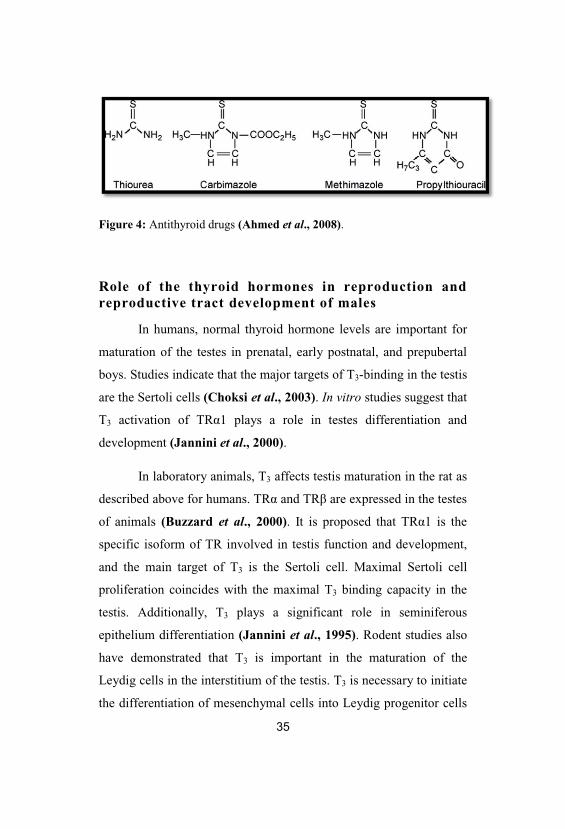
Figure 4: Antithyroid drugs (Ahmed et al., 2008).
Role of the thyroid hormones in reproduction andreproductive tract development of males
In humans, normal thyroid hormone levels are important for
maturation of the testes in prenatal, early postnatal, and prepubertal
boys. Studies indicate that the major targets of T3-binding in the testis
are the Sertoli cells (Choksi et al., 2003). In vitro studies suggest that
T3 activation of TR 1 plays a role in testes differentiation and
development (Jannini et al., 2000).
In laboratory animals, T3 affects testis maturation in the rat as
described above for humans. TR and TR are expressed in the testes
of animals (Buzzard et al., 2000). It is proposed that TR 1 is the
specific isoform of TR involved in testis function and development,
and the main target of T3 is the Sertoli cell. Maximal Sertoli cell
proliferation coincides with the maximal T3 binding capacity in the
testis. Additionally, T3 plays a significant role in seminiferous
epithelium differentiation (Jannini et al., 1995). Rodent studies also
have demonstrated that T3 is important in the maturation of the
Leydig cells in the interstitium of the testis. T3 is necessary to initiate
the differentiation of mesenchymal cells into Leydig progenitor cells
36
and works in concert with other hormones (e.g., luteinizing hormone
(LH) and insulin-like growth factor-1 (IGF-1)) in the promotion of
Leydig cell development (Mendis-Handagama and Ariyarante,
2001).
Similarities and differences in the role of thyroidhormones in reproduction and development
Thyroid hormones play a central role in the development of
several laboratory animal and human systems. Overall, studies
indicate that the role of thyroid hormones in development of
reproductive structure and function is similar in humans and rodents
of both sexes. Additionally, alterations in thyroid status in humans
and rats during pregnancy also appear to be similar. T3 appears to
play a significant role in male reproductive tract development in
rodents and humans. Comparatively, T3 plays a significant role in
female reproductive tract development in rats, but not in humans.
Despite the general similarities in the role of T3 on reproduction and
reproductive tract development, the exact roles of these hormones
(e.g., mechanisms of action and interactions with other hormones)
have not been fully evaluated (Choksi et al., 2003).
Furthermore, physiological differences in various stages of
development may produce significant differences in the role of T3 in
development of the reproductive tract. For example, maximal Sertoli
cell proliferation occurs from late gestation through postnatal day 12
in rodents. In humans, it occurs from mid-gestation through 1 year of
age and from about 10 years of age through puberty (Sharpe et al.,
2003). Such differences are likely to translate into species differences
37
in the outcomes of exposures to thyroid toxicants (Choksi et al.,
2003).
Actions of thyroid hormone on testis development
The role of thyroid hormone in testicular development and
function has received much attention since the report that functional
TRs are present in human and rat testes from neonatal to adult life
(Buzzard et al. 2000; Jannini et al., 2000). These findings changed
the classical view of the testis as a thyroid hormone unresponsive
organ, indicating that thyroid hormone could have direct effects on
testis (Wagner et al., 2009).
It is now well established that thyroid hormone plays an
important role in proper testis development. In the immature rat
testis, altered thyroid status has marked effects on Sertoli cells
proliferative capacity and differentiation leading to modifications in
testis size, Sertoli cells number and sperm production in adult life
(Wagner et al., 2008). These T3 effects, initially described in rodents
(Cooke et al., 1991; Joyce et al., 1993; Kirby et al., 1993), were
subsequently identified in different vertebrate species (Jannini et al.,
1995; Kirby et al., 1996; Majdic et al., 1998; Matta et al., 2002;
Jansen et al., 2007; Weng et al., 2007).
Interestingly, neonatal-prepubertal hypothyroidism induced in
rats and then followed by a subsequent recovery to euthyroidism led
to a significant increase of 80 and 140%, respectively, in adult testis
size and daily sperm production, compared to control animals (Kirby
et al., 1992 and Joyce et al., 1993). Later, these surprising findings

38
were shown to be caused by the extension of the proliferative period
of Sertoli cells and delay in their maturation (Tarulli et al., 2006).
Conversely, transient juvenile hyperthyroidism was shown to
have opposite effects to those of hypothyroidism resulting in
premature cessation of Sertoli cell proliferation, with a concomitant
stimulation of their maturation, and an eventual 50% decrease in
adult testis size and a consequent reduction in sperm production (van
Haaster et al., 1993). These results suggest that thyroid hormone is
able to affect maturation and growth of the testis by inhibiting
immature Sertoli cells proliferation, while stimulating their functional
differentiation. Indeed, subsequently, in vitro studies have shown that
T3 can act directly on Sertoli cells to decrease proliferation and
stimulate maturation (Jansen et al., 2007).
In parallel to the effects on Sertoli cell proliferation, transient
neonatal hypothyroidism was shown to arrest the process of Leydig
cell differentiation and allowed continuous precursor mesenchymal
cells to proliferate in the prepubertal testis (Mendis-Handagama
and Ariyaratne, 2005). As a consequence of the increased number
of precursor mesenchymal cells accumulated in the testicular
interstitium, a significant increase in the size of the adult Leydig cell
population was observed in the adult testis when euthyroidism was
restored (Maran et al., 2000a). On the other hand, neonatal-
prepubertal hyperthyroidism was shown to stimulate the onset of
Leydig cell differentiation by increasing the number of mesenchymal
cells produced and recruited into the differentiation pool to increase
39
the number of differentiated Leydig cells in the prepubertal period
(Mendis-Handagama and Ariyaratne, 2001).
Thyroid hormone and the adult testis
It is now generally accepted that thyroid hormone is an
important hormonal regulator of immature testis. Nevertheless only
limited data are available concerning its role on adult testis
physiology. Previous studies on congenital hypothyroid and
thyroidectomized animals showed histological alterations of testes in
adult animals associated with reduced testosterone levels (Oncu et
al., 2004; Sakai et al., 2004; Sahoo et al., 2007). Of note, the
infertility described in the hypothyroid rat seems to be partially
reversed by T4 treatment (Umezu et al., 2004). Recently, the impact
of altered thyroid status in the histoarchitecture of the seminiferous
tubules in the adult testis has been evaluated using different rat
models (Wagner et al., 2009).
The results of the previous studies indicate that
hypothyroidism adversely affects spermatogenesis, suggesting that
thyroid hormone might play an important role not only in controlling
normal testicular development, but also in maintaining normal
testicular function and spermatogenesis (Wagner et al., 2009).
However, hypothyroidism is a complex hormonal dysfunction that
has been associated with reduced secretion of gonadotropin-releasing
hormones, follicle stimulating hormone (FSH) and luteinizing
hormone (LH), and testosterone (Maran et al., 2000b). Moreover,
systemic hormones are the first step regulators of spermatogenesis
while paracrine and autocrine factors synthesized by testicular cells
40
are also involved in local control of germ cell development (Sofikitis
et al., 2008). Thus, the thyroid hormone effects on normal
spermatogenesis may either be direct or indirect (Wagner et al.,
2009).
Furthermore, changes in thyroid status (hypo- and
hyperthyroidism) have been shown to induce marked alterations in
the enzymatic and non enzymatic antioxidant defenses and oxidative
stress parameters in the testis of adult rats (Sahoo et al., 2005, 2007,
2008; Zamoner et al., 2007). These alterations were found to be
associated with a decline in number of sperms and disturbances in
histoarchitecture of the seminiferous tubules (Sahoo et al., 2005,
2008). Taken together, these studies indicate that oxidative
impairments associated with altered thyroid status may, at least in
part, contribute toward testicular dysfunction, which eventually leads
to the testicular degenerative morphology observed in different
studies (Wagner et al., 2009).
Folate and homocysteine metabolism
Folates are a group of inter-convertible co-enzymes, differing
by their oxidation state, number of glutamic acid moieties and one
carbon substitutions. They are involved in amino acid metabolism,
purine and pyrimidine synthesis, and methylation of a large number
of nucleic acids, proteins and lipids. Of particular interest is the
interface between folate metabolism and the
homocysteine/methionine cycle. Homocysteine, a sulfhydryl-
containing amino acid that is not used in protein synthesis, originates
41
exclusively from the one-carbon-donating metabolism of methionine,
and it is remethylated into methionine with folates acting as methyl
donors (Lucock, 2000).
In most mammalian cells, accumulating homocysteine is
removed either by remethylation into methionine or by trans-
sulfuration into cysteine (Fowler, 2005). In the transsulfuration
pathway (Fig. 5), homocysteine is condensed with serine in an
irreversible reaction catalyzed by cystathionine-beta-synthase (CBS)
to form cystathionine, which in turn is reduced to cysteine and alpha-
ketobutyrate by cystathionine lyase. Both of these enzymes depend
on pyridoxal-5-phosphate, an active from of vitamin B6. During the
remethylation into methionine (Fig. 5), a methyl group provided by
5-methyltetrahydrofolate (5-methylTHF) is transferred to
homocysteine by methionine synthase (MTR). In this ubiquitous
reaction, cobalamin (vitamin B12) is involved as an intermediate
carrier of the methyl group (Forges et al., 2007).
Alternatively, homocysteine can also be remethylated into
methionine by betaine–homocysteine methyltransferase (BHMT), in
which the methyl group is provided by betaine that is transformed
into dimethylglycine. However, in contrast with the MTR reaction,
this alternative pathway seems to be limited to the liver; in particular,
the possibility of a BHMT-expression in human gonads has not yet
been investigated (Delgado-Reyes et al., 2001).
Whatever the remethylation pathway, the resulting methionine
will be either incorporated into various peptides or transformed into
S-adenosylmethionine (SAM) by methionine adenosyltransferase,
42
which transfers an adenosyl group from ATP to methionine. SAM is
the universal methyl donor in a large number of methylation
reactions, and thus plays a key role in cellular function. During these
reactions, which are catalyzed by specific methyltransferases, SAM
has a methyl group removed to form S-adenosylhomocysteine
(SAH). Finally, SAH is hydrolyzed in a reversible reaction into
homocysteine. The total sequence of the preceding reactions is called
the homocysteine/methionine cycle (Forges et al., 2007).
This cycle could not turn accurately without the normal
functioning of a second cycle, the folate cycle. The methyl donating
5-methylTHF originates from 5,10-methyleneTHF by the flavine
adenine dinucleotide-dependent 5,10-methyleneTHF reductase
(MTHFR). After the remethylation of homocysteine to methionine,
demethylated THF will be converted again into 5,10-methyleneTHF
during the conversion of serine to glycine (Forges et al., 2007).
MTHFR has a pivotal regulatory function in the folate cycle,
as it directs the folate pool toward the remethylation of homocysteine
at the expense of DNA and RNA synthesis (Fowler, 2001); besides
its conversion to 5-methylTHF by MTHFR, 5,10-MethyleneTHF is
also a one-carbon donor in the synthesis of thymidylate by
methylation of deoxyuridine 5 -monophosphate (dUMP) to
deoxythymidine 5 -monophosphate (dTMP). Moreover, 5,10-
MethyleneTHF after conversion into 5,10-methenyltetrahydrofolate
(MethenylTHF) and further into 10-formyltetrahydrofolate
(FormylTHF), shares in the synthesis of purines (Forges et al., 2007).
43
After the release of their one-carbon unit, all of these
substituted folates are converted to THF which is finally recycled into
MethyleneTHF during the conversion of serine to glycine by the
enzyme serine hydroxymethyltransferase (SHMT) (Fig. 5). An
impaired function of these metabolic pathways leads to accumulation
of homocysteine, either by insufficient transsulfuration (through CBS
mutations or vitamin B6 deficiency) or by a blockage of
remethylation pathway (Forges et al., 2007).
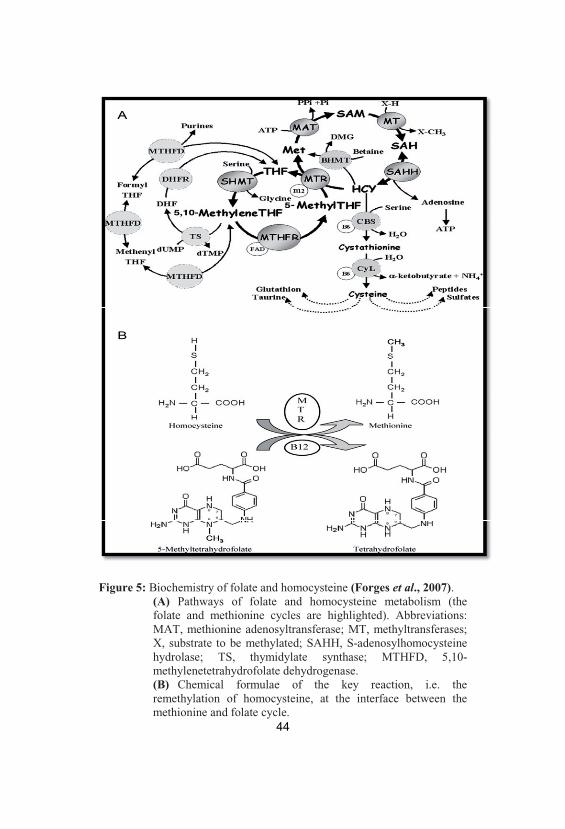
Figure 5: Biochemistry of folate and homocysteine (Forges et al., 2007). (A) Pathways of folate and homocysteine metabolism (thefolate and methionine cycles are highlighted). Abbreviations:MAT, methionine adenosyltransferase; MT, methyltransferases;X, substrate to be methylated; SAHH, S-adenosylhomocysteinehydrolase; TS, thymidylate synthase; MTHFD, 5,10-methylenetetrahydrofolate dehydrogenase. (B) Chemical formulae of the key reaction, i.e. theremethylation of homocysteine, at the interface between themethionine and folate cycle.
45
Folates as antioxidants
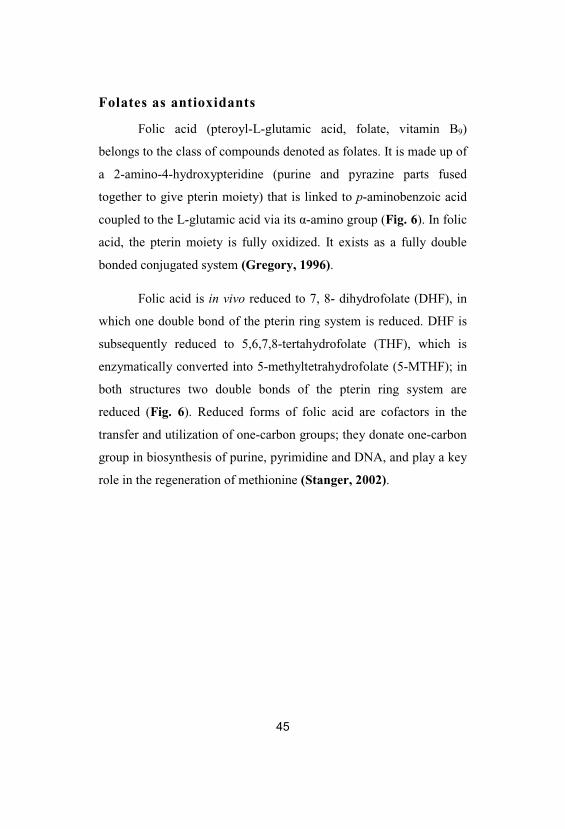
Folic acid (pteroyl-L-glutamic acid, folate, vitamin B9)
belongs to the class of compounds denoted as folates. It is made up of
a 2-amino-4-hydroxypteridine (purine and pyrazine parts fused
together to give pterin moiety) that is linked to p-aminobenzoic acid
coupled to the L-glutamic acid via its -amino group (Fig. 6). In folic
acid, the pterin moiety is fully oxidized. It exists as a fully double
bonded conjugated system (Gregory, 1996).
Folic acid is in vivo reduced to 7, 8- dihydrofolate (DHF), in
which one double bond of the pterin ring system is reduced. DHF is
subsequently reduced to 5,6,7,8-tertahydrofolate (THF), which is
enzymatically converted into 5-methyltetrahydrofolate (5-MTHF); in
both structures two double bonds of the pterin ring system are
reduced (Fig. 6). Reduced forms of folic acid are cofactors in the
transfer and utilization of one-carbon groups; they donate one-carbon
group in biosynthesis of purine, pyrimidine and DNA, and play a key
role in the regeneration of methionine (Stanger, 2002).
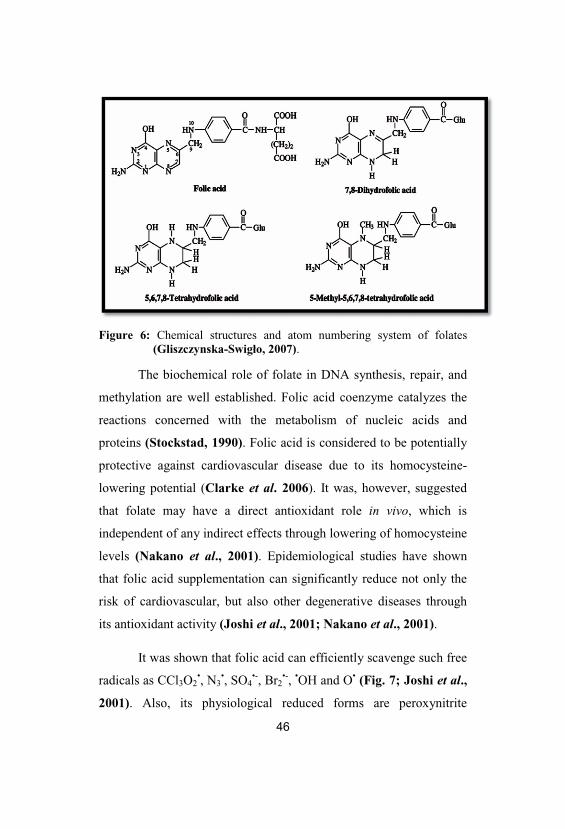
Figure 6: Chemical structures and atom numbering system of folates(Gliszczynska-Swigło, 2007).
The biochemical role of folate in DNA synthesis, repair, and
methylation are well established. Folic acid coenzyme catalyzes the
reactions concerned with the metabolism of nucleic acids and
proteins (Stockstad, 1990). Folic acid is considered to be potentially
protective against cardiovascular disease due to its homocysteine-
lowering potential (Clarke et al. 2006). It was, however, suggested
that folate may have a direct antioxidant role in vivo, which is
independent of any indirect effects through lowering of homocysteine
levels (Nakano et al., 2001). Epidemiological studies have shown
that folic acid supplementation can significantly reduce not only the
risk of cardiovascular, but also other degenerative diseases through
its antioxidant activity (Joshi et al., 2001; Nakano et al., 2001).
It was shown that folic acid can efficiently scavenge such free
radicals as CCl3O2•, N3
•, SO4•-, Br2
•-, •OH and O• (Fig. 7; Joshi et al.,
2001). Also, its physiological reduced forms are peroxynitrite
scavengers and inhibitors of lipid peroxidation (Nakano et al., 2001;
Rezk et al., 2003). Activity of folic acid against the radical-mediated
oxidative damage in human whole blood was also reported (Stocker
et al., 2003). Folic acid exists in lactam and lactim tautomeric forms.
Its lactim form has a hydroxyl group on the purine-type ring. In its
reactions with oxidizing radicals, this hydroxyl group is expected to
play an important role (Fig. 7). In spite of being water soluble
molecule, folic acid can inhibit lipid peroxidation also (Joshi et al.,
2001). The scavenging and repair of thiyl radicals by folic acid makes
it a potential vitamin to be called as an antioxidant (Joshi et al.,
2001).
Figure 7: Mechanistic pathway for oxidation of folic acid (Joshi et al., 2001).
48
Nitric Oxide (NO)
Although nitric oxide (NO) was described initially as a
vasodilatory chemokine, it plays a major role in vascular biology in
terms of anti–thrombotic, anti–inflammatory and anti–proliferative
effects (Esplugues, 2002). On the other hand, NO is a free radical,
reactive against other biomolecules and can combine with superoxide
anion (another free radical) to form an unstable intermediate
peroxynitrite which may initiate tissue injury. Peroxynitrite may also
decompose to form a strong oxidant with characteristics similar to
hydroxyl radical. Nitric oxide, peroxynitrite and hydroxyl radical are
capable of oxidizing lipids, proteins, and nucleic acids (Zhang and
Li, 2006).
There are three distinct isoforms of nitric oxide synthase in
humans, endothelial constitutive NOS (eNOS), neuronal NOS, and
inducible NOS (iNOS). Cells containing cNOS rapidly produce small
amounts of NO in response to agonists that raise cytosolic levels of
free Ca2+, whereas cells expressing iNOS produce large amounts of
NO for extended periods after a lag of several hours during which
time the enzyme is induced (Rabelink and Luscher, 2006).
The constitutive isoform was distinguished from the inducible
form based on the dependence of the constitutive enzyme activity on
calmodulin. Other cofactors required for all enzyme forms are flavin
mononucleotide, flavin adenine dinucleotide, heme and
tetrahydrobiopterin (Wendy et al., 2001). The constitutive enzyme
49
require calcium ion (Ca2+) for activity while the inducible enzyme
does not. The inducible form represents a newly synthesized enzyme,
which is expressed in response to specific stimuli, such as endotoxin
and cytokines leading to NO generation for many hours without
further stimulation (Wendy et al., 2001). It is expressed in multiple
cell types, including macrophages, vascular smooth muscle cells,
vascular endothelial cells and hepatocytes (Madar et al., 2005).
The functional NOS protein is a dimer formed of two
identical subunits. There are three distinct domains in each NOS
subunit; a reductase domain, a calmodulin-binding domain and an
oxygenase domain (Li and Poulos, 2005). The endothelial NO
signaling pathways are involved in penile erection, spermatogenesis,
dynamics of the blood–testis barrier, sperm motility, capacitation,
acrosome reaction and fertilization (Lee and Cheng, 2004). In this
context, any alteration of NO bioavailability may have direct
consequences on male reproductive functions.
Overview of testis structural organization
The testes are mainly comprised of tightly coiled seminiferous
tubules, which are supported by loose interstitial connective tissue
where the steroidogenic Leydig cells are located (Griffin and
Wilson, 2002). Each tubule consists of a basement membrane, elastic
fibers, and peritubular myoid cells. Within the basement membrane,
the seminiferous tubules are lined by a columnar epithelium
composed of germ cells and the somatic Sertoli cells. Adjacent
Sertoli cells are connected by tight specialized junctions to form a
diffusion barrier, the so-called blood–testis barrier (BTB), which
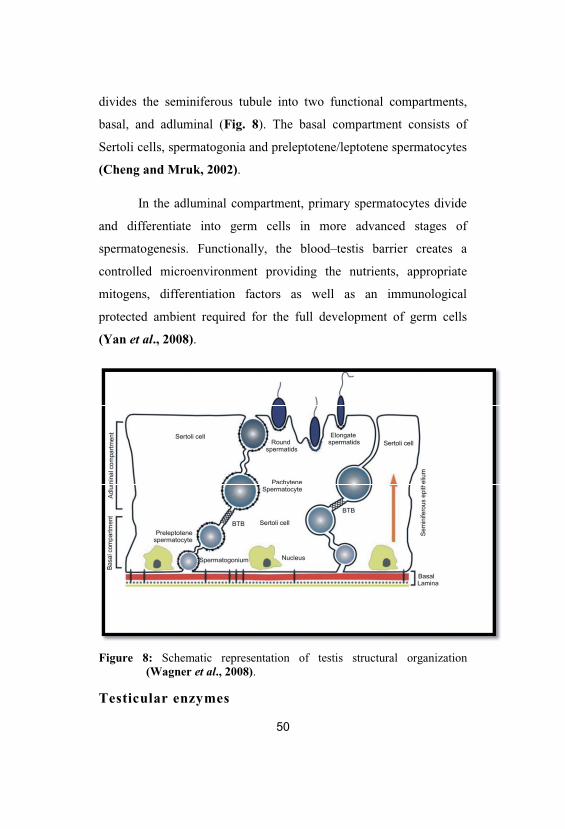
divides the seminiferous tubule into two functional compartments,
basal, and adluminal (Fig. 8). The basal compartment consists of
Sertoli cells, spermatogonia and preleptotene/leptotene spermatocytes
(Cheng and Mruk, 2002).
In the adluminal compartment, primary spermatocytes divide
and differentiate into germ cells in more advanced stages of
spermatogenesis. Functionally, the blood–testis barrier creates a
controlled microenvironment providing the nutrients, appropriate
mitogens, differentiation factors as well as an immunological
protected ambient required for the full development of germ cells
(Yan et al., 2008).
Figure 8: Schematic representation of testis structural organization(Wagner et al., 2008).
Testicular enzymes
51
During spermatogenesis and maturation, several enzymes play
an important role in the stabilization of testicular tissue. These are
lactate dehydrogenase (LDH), sorbitol dehydrogenase (SDH),
alkaline phosphatase (ALP), acid phosphatase (ACP), gamma
glutamyle transpeptidase (GGT), glucose-6-phosphate dehydrogenase
(G6PDH), -glucuronidase and hyaluronidase. They are the testicular
‘marker’ enzymes important for the energy metabolism in testicular
cells. The activities of these marker enzymes in the testis have been
correlated with the cell differentiation in the germinal epithelium
during spermatogenesis (Shen and Lee, 1984; Abdul-Ghani et al.,
2008).
Specific activities of some testicular enzymes (LDH, LDH
isozyme-X, hyaluronidase, ACP and SDH) are associated with
postmeiotic spermatogenic cells. Besides, other enzymes ( -
glucuronidase, GGT, G6PDH, isocitrate dehydrogenase,
glyceraldehydes dehydrogenase, -glycerophosphate dehydrogenase
and malate dehydrogenase) are associated with premeiotic
spermatogenic cells, Sertoli cells or interstitial cells (Shen and Lee,
1984).
To meet the high-energy demand of spermatozoa, these highly
differentiated cells appear to depend on extracellular glucose,
fructose and exogenous pyruvate and lactate; consequently, both
mitochondrial ATP production (in the midpiece) and glycolysis (in
the principal piece) seem to be necessary (Boussouar and
Benahmed, 2004). Spermatids possess all enzyme activities that
constitute the glycolytic pathway. However, glucose metabolism
52
cannot maintain the cellular ATP content, and exposure of isolated
spermatids to glucose without other energy substrates soon results in
ATP depletion (Grootegoed and Den Boer, 1987). Therefore, lactate
might play a crucial role in germ cell survival, and alteration of its
production and/or transport may be a potential candidate for some
forms of male infertility (Yan et al., 2010).
Lactate dehydrogenase, widely present in postmeiotic
spermatogenic cells, plays an important role in testis energy
production and biotransformation. LDH-X is a special enzyme
produced at the phase of primary spermatogenic cells. Since
inhibition of LDH and LDH-X activities may induce denaturalization
of spermatogenic cells (Sinha et al., 1997), LDH and LDH-X
activities can be used in evaluating the function of spermatogenic
cells (Yan et al., 2010).
Indeed, lactate dehydrogenase is responsible for driving
glycolysis when O2 is limited, by carrying NADH-mediated
reduction of pyruvate to lactate (Upreti et al., 1996). After the
pachytene stage, because the spermatogenic cells are located above
the tight junction of Sertoli cell in the testicular convoluted tubules, it
is difficult to get nutrition from the testicular interstitium, and
glycolysis is the dominating energy metabolism pathway in the testis.
Therefore, LDH is the major enzyme in the glycometabolism of
spermatogenic cells. The activity of LDH is related to the
spermatogenesis, sperm capacitation and fertilization, and can be
used as an important predictive indicator of sperm production. If the
53
activity of LDH is suppressed, the energy supply will be hampered,
and gradually results in the degeneration of sperm (Yan et al., 2010).
Sorbitol dehydrogenase mainly exists in the convoluted
seminiferous tubule and the mitochondria of spermatogenic cells. The
SDH level has been used as an indicator for secondary maturation of
sex organs (Mills and Means, 1972). Since spermatozoa contain a
small amount of cytosol, the glycolytic pathway would not be a main
source of energy, which emphasizes the role of SDH in converting
sorbitol to fructose, which is faster than glucose in energy production
(Abdul-Ghani et al., 2008). Furthermore, the resultant NADH, a by-
product of SDH activity, can donate electrons to the electron
transport system to synthesize ATP (Kobayashi et al., 2002). The
SDH activity increases markedly throughout the maturation of germ
cells and decreases during the depletion of germ cells (Pant et al.,
2004). Thus, SDH can be regarded as the maker enzyme of testicular
maturation and sperm functional maturation (Yan et al., 2010).
The activity of alkaline phosphatase (ALP) is related to the
mitosis of spermatogenic cells and glucose transport. Besides, acid
phosphatase (ACP) located in lysosome of leydig cells is involved in
the protein synthesis by abduction of sex hormones. Changes in the
activity of ALP and ACP may be used as an indicator of
spermatogenesis function and testicular degeneration, which may be a
consequence of suppressed testosterone and indicative of lytic
activity (Kaur et al., 1999). Specific activities of postmeiotic
testicular enzymes are associated with more mature germ cells. So,
their specific activities progressively increase from the late
54
premeiotic spermatocytes to spermatids and then to spermatozoa
(Shen and Lee, 1984).
On the other hand, -glucuronidase and GGT are Sertoli cell
marker enzymes and their activities vary inversely with number of
spermatozoa. With the onset of puberty, the specific activities of
these enzymes and other premeiotic testicular enzymes as G6PDH
fall dramatically (Srivastava et al., 1990).
Materials and Methods
Experimental animals & study design
The experiment was performed on fifty male Swiss albino rats
(Rattus norvigicus) weighing 120 g (±10) and of 6-7 weeks’ age.
They were obtained from laboratory farms, Zoology Department,
Faculty of Science, Tanta University, Egypt. The rats were kept in the
laboratory for one week before the experimental work and maintained
on a standard rodent diet composed of 20% casein, 15% corn oil,
55% corn starch, 5% salt mixture and 5% vitaminzed starch
(Egyptian Company of Oils and Soap, Kafr-Elzayat, Egypt), and
water available ad libitum. The temperature in the animal room was
maintained at 23±2°C with a relative humidity of 55±5%. Light was
on a 12:12 hr light-dark cycle. All the experiments were done in
compliance with the guiding principles in the care and use of
laboratory animals. The rats were equally divided into five groups (10
rats each; Fig. 9).
55
Group I: Control group in which rats never received any treatment
(euthyroid).
Group II: Folic acid group in which rats received folic acid (0.011
µmol/g body weight/day; El Nasr Pharmaceutical
Chemicals Co., Egypt) only for four weeks (form 2nd
week to 6th week) orally by a stomach tube (Matte et al.,
2007).
Group III: Hypothyroid group in which a chemical experimental rat
model of hypothyroidism that mimics hypothyroidism in
humans has been developed. Rats received 0.05% 6-n-
propyl-2-thiouracil (PTU; Amoun Pharmaceutical
Chemicals Co., Egypt) in drinking water for 6 weeks
(Sahoo et al., 2008) to cover a complete spermatogenic
cycle in rats (De Kretser, 1982).
Group IV: Co-treatment group in which rats received 0.05% PTU in
drinking water and folic acid (0.011 µmol/g body
weight/day) simultaneously according to Lalonde et al.
(1993) and Matte et al. (2007). The dose period of PTU
was six weeks as in hypothyroid group. However, folic
acid was administered orally by a stomach tube for 4
weeks from the second to sixth week after evidence of
hypothyroidism had been established at the end of the
second week.
Group V: Post-treatment group in which rats received 0.05% PTU
in drinking water for 6 weeks as in hypothyroid group.
Additionally, folic acid was administered for another 4
56
weeks (from 7th week to 10th week) while PTU was
withdrawn after the sixth week to establish the euthyroid
state (Sahoo et al., 2008).
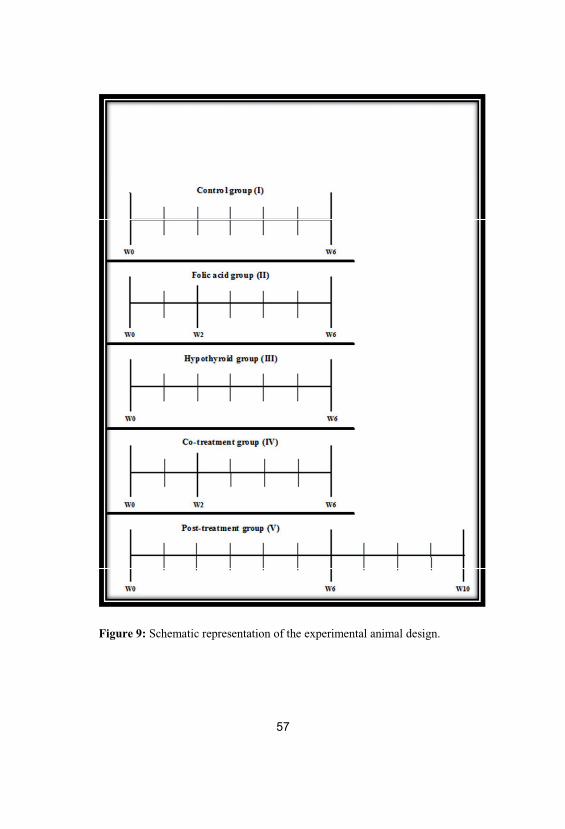
Figure 9: Schematic representation of the experimental animal design.
58
Rats were monitored closely during the treatment period.
Food intake, fluid intake and body weight were recorded weekly
throughout the experimental period. At the end of the experimental
period, rats from each group were euthanized with anesthetic ether
and subjected to a complete necropsy after 10–12 hr of fasting. Testes
and epididymides were removed, carefully cleaned from adhering
connective tissue in cold saline and weighed. Testes were quickly
stored at -20°C until analysis. On the other hand, epididymides were
prepared for fertility evaluation (sperm count and motility).
Blood samples were individually collected from each rat from
the orbital sinus vein and divided into two parts:
A- The first part was collected in plain tubes, allowed to clot at 37°C
for 15 minutes and then centrifuged at 4000 rpm for 10 minutes.
The serum obtained was then separated and divided to several
aliquots to be thawed only once on demand and stored at -20°C
for determination of the following:
Serum total triiodothyronine hormone (T3) concentration.
Serum thyroid stimulating hormone (TSH) concentration.
B- The second part was transferred to EDTA-containing glass tubes
to obtain blood plasma. Plasma samples were subjected directly
to High Performance Liquid Chromatography (HPLC) analysis.
Plasma samples were deproteinized by 75% aqueous HPLC grade
methanol in a ratio 1:4 (plasma : methanol) v/v then centrifuged
at 3000 xg for 5 min at 4°C and the supernatants were separated
and used for HPLC analysis of the following:
59
Plasma total homocysteine (tHcy), reduced glutathione (GSH)
and oxidized glutathione (GSSG) concentrations.
Plasma nitrites and nitrates concentrations.
Plasma malondialdehyde (MDA) concentration.
Testosterone concentration.
A 10 % (w/v) homogenate of testis was prepared in ice-cold
normal saline using a chilled glass-teflon porter-Elvehjem tissue
grinder tube, and then centrifuged at 3000 rpm for 15 min. The
supernatant was used for estimation of testicular malondialdehyde
concentration (MDA). Also, another 10 % (w/v) homogenate of testes
was prepared in ice-cold phosphate buffer (0.067 M, pH 7.0) and
centrifuged to estimate total antioxidant capacity (TAC) through
ferric reducing antioxidant power (FRAP). The same procedure was
made to 10 % (w/v) homogenate of testes in Tris-HCl buffer (10 mM,
pH 7.4) for determination of the following:
Testicular total protein concentration.
Testicular lactate dehydrogenase (LDH) activity.
Testicular gamma glutamyltranspeptidase (GGT)
activity.
Testicular acid phosphatase (ACP) activity.
Testicular sorbitol dehydrogenase (SDH) activity.
60
Rats from each group were also prepared for histological,
immunohistochemical and transmission electron microscopy (TEM)
investigations.
Determination of serum total triiodothyronine (T3) level
Principle
Determination of total triiodothyronine T3 was carried out
according to Chopra et al. (1971) using kits of Biocheck, Inc (USA).
The T3 ELISA test was determined by Competitive Enzyme
Immunoassay. The essential reagents required for a solid phase
enzyme immunoassay included immobilized antibody, enzyme-
antigen conjugate and native antigen. Upon mixing immobilized
antibody, enzyme-antigen conjugate and a serum containing the
native antigen, a competition reaction resulted between the native
antigen and the enzyme antigen conjugate for a limited number of
insolubilized binding sites. The enzyme activity in the antibody-
bound fraction is inversely proportional to the native antigen
concentration. By utilizing several different serum references of
known antigen concentration, a dose response curve (Fig. 10) can be
generated from which the antigen concentration of an unknown can
be ascertained.
Reagents
1) Serum references: Different concentrations of serum references
ranged from 0-10 ng/ml.
2) Enzyme conjugate: Triiodothyronine-horseradish peroxidases
(HRP) conjugated in a bovine albumin-stabilizing matrix.
61
3) Assay reagent: Buffer containing binding protein inhibitors and
anti T3 mouse antibodies (mAb).
4) Antibody coated micro plate: wells coated with goat anti mouse
antibodies and packaged in an aluminum bag with a drying agent.
5) Washing solution: 40 x concentrated.
6) Tetramethylbenzidine (TMB) substrate.
7) Stop reagent: 0.5 N H2SO4.
Reagent preparation
Contents of wash concentrate were diluted to 1000 ml with
distilled water in a suitable storage container.
Procedure
1) The microplates wells for each serum references and samples
were formatted to be assayed.
2) 50 l of the appropriate serum references, control and specimens
were pipetted into assign well.
3) 50 l of assay reagent was added to all the wells.
4) The microplate was swirled gently for 10 seconds to mix and
cover.
5) The microplate was incubated for 30 minutes at room temperature
(20-250C).
6) 50 l of triiodothyronine-enzyme conjugate solution was added to
all wells.
7) The microplate was swirled gently for 10 seconds to mix and
cover.
8) The microplate was incubated for 30 minutes at room temperature
(20-25Co).
62
9) The contents of the microplate were discarded by aspiration.
10) 300 l of wash buffer was added and the microplate was decanted
or aspirated. The last was repeated four additional times for a
total of five washes. A Dynix automatic washer was used and air
bubbles was avoided.
11) 100 l of TMB-substrate was added to all wells in the same order
to minimize the reaction time differences between wells.
12) The microplate was incubated for 10 minutes at room temperature
(20-250C).
13) 100 l of stop reagent was added to each well in the same order.
14) The absorbance was read in each well at 450 nm in a Dynix plate
reader.
15) The results were read within 10 minutes of adding the stop
solution.
Calculation
The absorbance for each serum references was plotted against
corresponding T3 concentration in ng/ml on linear graph paper
(Fig. 10).
The absorbance of each sample was used to determine the
corresponding concentration of T3 in ng/dl from the standard
curve.
Total T3 (ng/dl) = the concentration on the (x) axis in (ng/ml)
x100
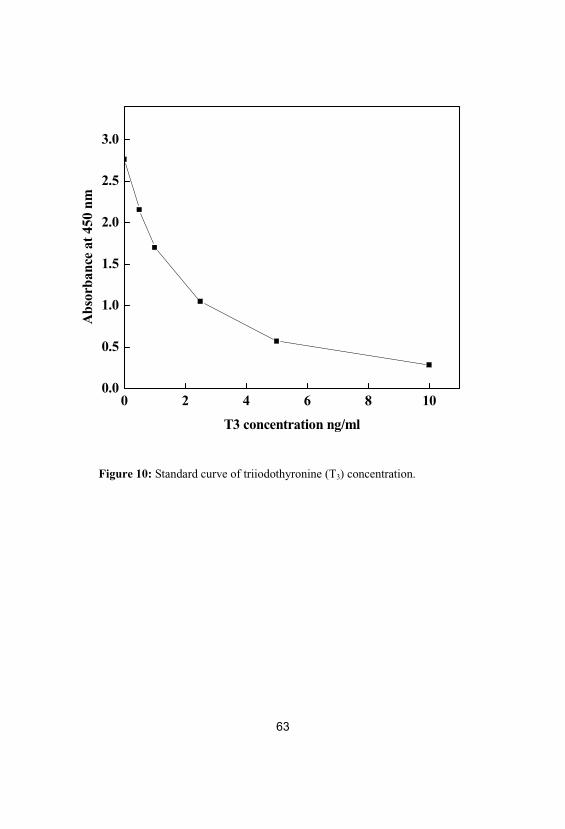
63
Figure 10: Standard curve of triiodothyronine (T3) concentration.
0 2 4 6 8 100.0
0.5
1.0
1.5
2.0
2.5
3.0
Abs
orba
nce
at45
0nm
T3 concentration ng/ml
64
Determination of serum thyroid stimulating hormone (TSH)level
Principle
Determination of serum thyroid stimulating hormone was
carried out according to Engall (1980) using kits of Biocheck, Inc
(USA). The TSH ELISA test is based on the principle of a solid
phase enzyme- linked immunosorbent assay. The assay system
utilized a unique monoclonal antibody directed against a distinct
antigenic determinant on the intact TSH molecule. Mouse
monoclonal anti TSH antibody was used for solid phase
immobilization. A goat anti-TSH antibody is the antibody enzyme
(horseradish peroxidase) conjugate solution. The test sample was
allowed to react simultaneously with the two antibodies, resulting in
the TSH molecule being sandwiched between the solid phase and
enzyme linked antibodies. A solution of tetramethylbenzidine (TMB)
reagent was added and blue color was formed. The color developed
was stopped with the addition of stop solution, changing the color to
yellow. The concentration of TSH is directly proportional to the color
intensity of the test sample. Absorbance was measured
spctrophotometrically at 450 nm.
Reagents
1) Murine monoclonal anti-TSH-coated microtiter wells.
2) Set of reference standards ranged from 0.5-25 IU/ml.
3) Enzyme conjugate reagent.
4) Tetramethylbenzidine (TMB) reagent.
5) Stop reagent: 1N HCL.
65
Procedure
1) Desired number of coated wells was secured in the holder.
2) 100 l of different concentrations of standards, specimens, and
controls were dispensed into appropriate wells.
3) 100 l of enzyme conjugate reagent was dispensed into each well.
4) Wells were thoroughly mixed for 30 seconds.
5) Wells were incubated at room temperature (18-25)0C for 60
minutes.
6) Incubation mixture was removed by flicking plate contents into
waste container.
7) Wells were rinsed and flicked 5 times with distilled water.
8) Wells were stroked sharply onto absorbent paper or paper towels
to remove all residual water droplets.
9) 100 l of TMB reagent was dispensed into each well that was
gently mixed for 10 seconds.
10) Wells were incubated at room temperature for 20 minutes.
11) 100 l of stop solution was added to each well for stopping the
reaction.
12) Wells were mixed for 30 seconds. It was important to make sure
that all the blue color changed to yellow color completely.
Absorbance was read at 450 nm with a Dynix plate reader within
15 minutes.
Calculation
A standard curve was constructed by plotting the absorbance of
each standard references against each concentration in IU/ml,
with absorbance values on y axis, and concentrations on the x
axis (Fig. 11).
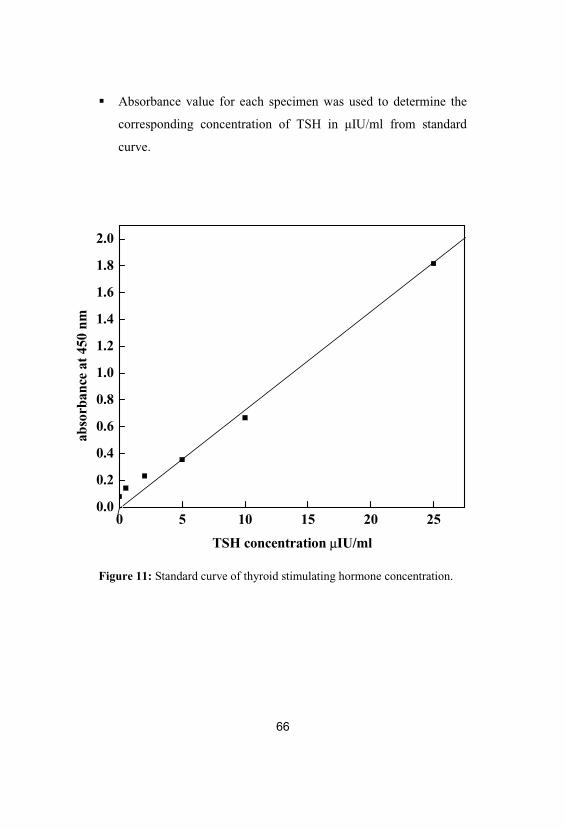
66
Absorbance value for each specimen was used to determine the
corresponding concentration of TSH in IU/ml from standard
curve.
Figure 11: Standard curve of thyroid stimulating hormone concentration.
0 5 10 15 20 250.0
0.2
0.4
0.6
0.8
1.0
1.2
1.4
1.6
1.8
2.0
abso
rban
ceat
450
nm
TSH concentration µIU/ml
67
Determination of plasma total homocysteine (tHcy), reducedglutathione (GSH) and oxidized glutathione (GSSG)concentrations by HPLC
Principle
Total plasma homocysteine (tHcy), reduced glutathione
(GSH) and oxidised glutathione (GSSG) were determined by HPLC
using the method of Jayatilleke and Shaw (1993). The HPLC
instrument was Agilent HPLC system from Agilent Technologies
(USA) consisting of:
Agilent 1200 series quaternary pump with micro vacuum
degasser number: G1354A.
Agilent 1200 series the thermostated column compartment
number: G1316A.
Agilent 1200 series manual injector number: G1328A.
Agilent 1200 series wavelength detector number: G1314B.
Standard flow cell for Agilent 1200 series variable wavelength
detector; 10-mm path length, 14-µl volume, pressure tight to 40
bars number: G1314B#018.
Agilent chemstation chromatography data system software.
Reagents
1) Homocysteine and glutathione (reduced and oxidized) reference
standards were purchased from Sigma Aldrich and dissolved in
75% methanol as stock solution of 1 mg/ml and diluted before
application to HPLC.
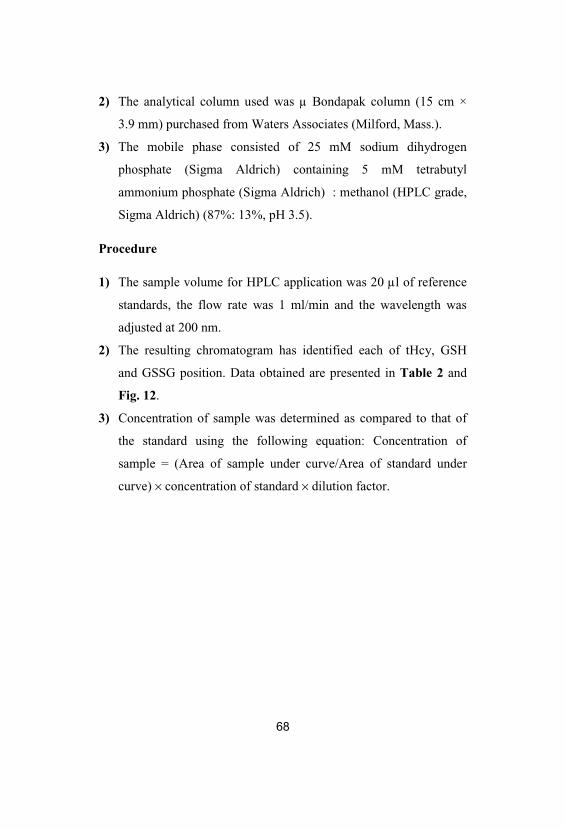
68
2) The analytical column used was µ Bondapak column (15 cm ×
3.9 mm) purchased from Waters Associates (Milford, Mass.).
3) The mobile phase consisted of 25 mM sodium dihydrogen
phosphate (Sigma Aldrich) containing 5 mM tetrabutyl
ammonium phosphate (Sigma Aldrich) : methanol (HPLC grade,
Sigma Aldrich) (87%: 13%, pH 3.5).
Procedure
1) The sample volume for HPLC application was 20 µl of reference
standards, the flow rate was 1 ml/min and the wavelength was
adjusted at 200 nm.
2) The resulting chromatogram has identified each of tHcy, GSH
and GSSG position. Data obtained are presented in Table 2 and
Fig. 12.
3) Concentration of sample was determined as compared to that of
the standard using the following equation: Concentration of
sample = (Area of sample under curve/Area of standard under
curve) × concentration of standard × dilution factor.
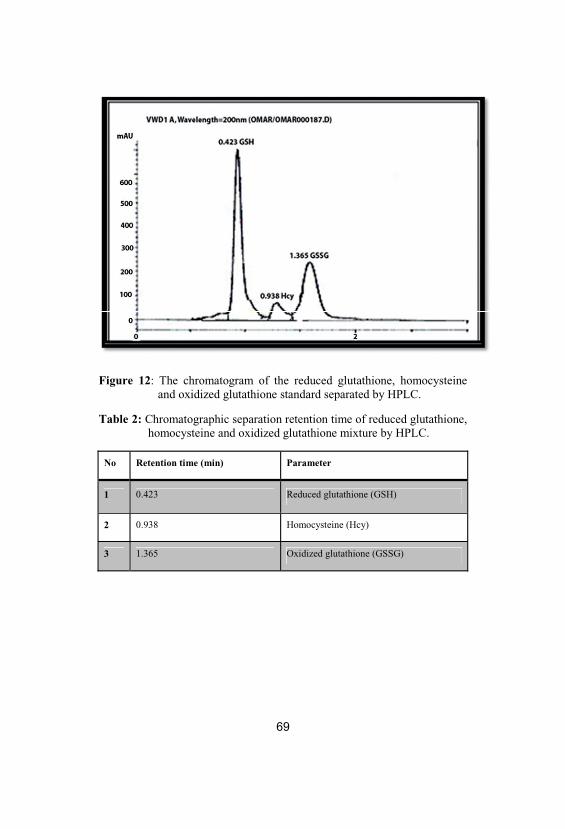
Figure 12: The chromatogram of the reduced glutathione, homocysteineand oxidized glutathione standard separated by HPLC.
Table 2: Chromatographic separation retention time of reduced glutathione, homocysteine and oxidized glutathione mixture by HPLC.
No Retention time (min) Parameter
1 0.423 Reduced glutathione (GSH)
2 0.938 Homocysteine (Hcy)
3 1.365 Oxidized glutathione (GSSG)
70
Determination of plasma nitrites and nitrates concentrationsby HPLC
Principle
Nitrites (NO2) and nitrates (NO3) were determined according
to the method of Papadoyannis et al. (1999) by HPLC. The HPLC
instrument was Agilent HPLC system from Agilent Technologies
(USA).
Reagents
1) Sodium nitrite and sodium nitrate reference standard obtained
from Sigma-Aldrich Co. Ltd. were used for the preparation of
stock standard mixture in a concentration of 1 mg/ml for each one
and diluted before application to HPLC to determine the retention
time for either nitrite or nitrate separation. Nitrite and nitrate
concentrations were equal in the mixture solution.
2) The mobile phase consisted of 0.1 M NaCl : methanol in a ratio
v/v (45%:55%). The analytical column was anion exchange
PRP-x100, Hamitton, 150 x 4.1 mm, 10 µm purchased from
Phenomenex (USA).
Procedure
1) The sample volume for HPLC application was 20 µl, the flow rate
was 2 ml/min and the wavelength was adjusted to 230 nm.
2) The resulting chromatogram identified each of nitrite and nitrate
positions and retention time. Data obtained are presented in Table 3
and Fig. 13.
3) Concentration in the sample was calculated as compared to that
of the standard using the following equation: Concentration of
sample = (Area of sample under curve/Area of standard under
curve) × concentration of standard × dilution factor.
Figure 13: The chromatogram of the nitrites and nitrates standard separatedby HPLC.
Table 3: Chromatographic separation retention time of nitrites and nitratesmixture by HPLC.
No Retention time (min) Parameter
1 2. 289 Sodium nitrite
2 3.147 Sodium nitrate
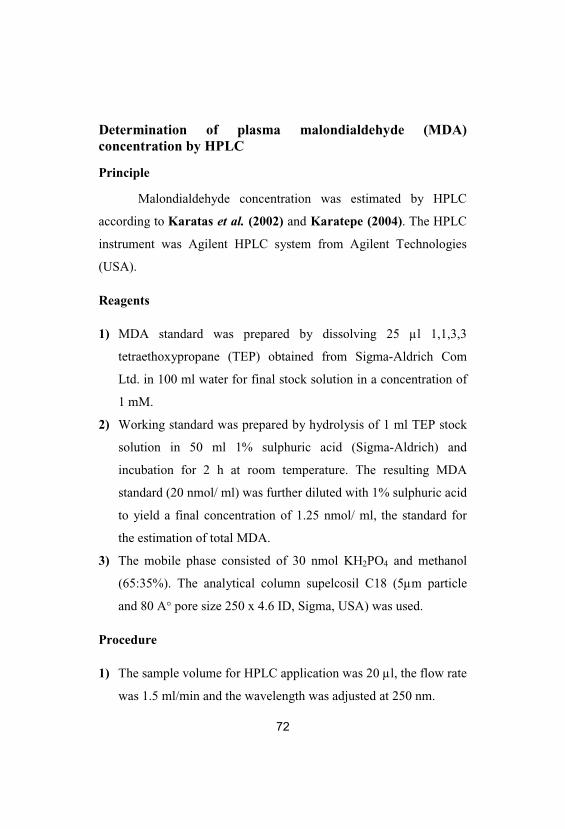
72
Determination of plasma malondialdehyde (MDA)concentration by HPLC
Principle
Malondialdehyde concentration was estimated by HPLC
according to Karatas et al. (2002) and Karatepe (2004). The HPLC
instrument was Agilent HPLC system from Agilent Technologies
(USA).
Reagents
1) MDA standard was prepared by dissolving 25 µl 1,1,3,3
tetraethoxypropane (TEP) obtained from Sigma-Aldrich Com
Ltd. in 100 ml water for final stock solution in a concentration of
1 mM.
2) Working standard was prepared by hydrolysis of 1 ml TEP stock
solution in 50 ml 1% sulphuric acid (Sigma-Aldrich) and
incubation for 2 h at room temperature. The resulting MDA
standard (20 nmol/ ml) was further diluted with 1% sulphuric acid
to yield a final concentration of 1.25 nmol/ ml, the standard for
the estimation of total MDA.
3) The mobile phase consisted of 30 nmol KH2PO4 and methanol
(65:35%). The analytical column supelcosil C18 (5µm particle
and 80 A° pore size 250 x 4.6 ID, Sigma, USA) was used.
Procedure
1) The sample volume for HPLC application was 20 µl, the flow rate
was 1.5 ml/min and the wavelength was adjusted at 250 nm.
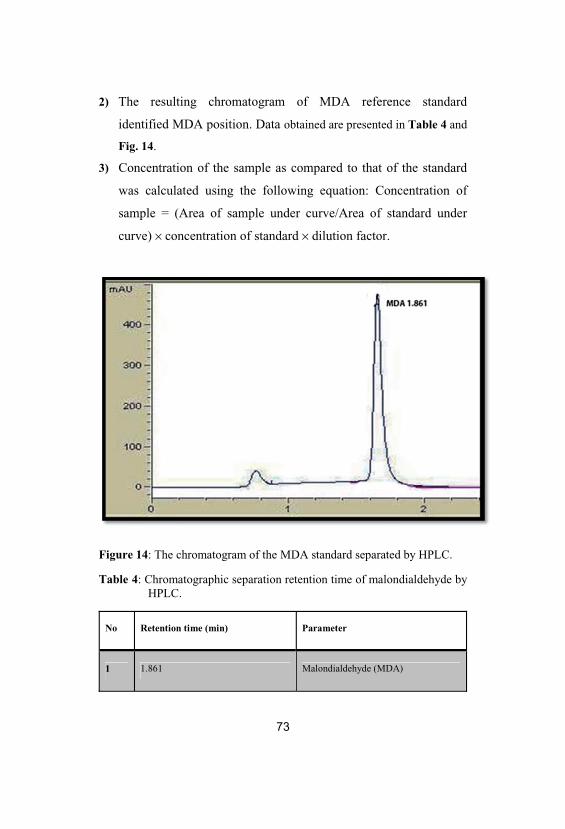
2) The resulting chromatogram of MDA reference standard
identified MDA position. Data obtained are presented in Table 4 and
Fig. 14.
3) Concentration of the sample as compared to that of the standard
was calculated using the following equation: Concentration of
sample = (Area of sample under curve/Area of standard under
curve) × concentration of standard × dilution factor.
Figure 14: The chromatogram of the MDA standard separated by HPLC.
Table 4: Chromatographic separation retention time of malondialdehyde byHPLC.
No Retention time (min) Parameter
1 1.861 Malondialdehyde (MDA)
74
Determination of the testosterone concentration by HPLC
Principle
The deproteinized plasma samples were extracted by the use
of Strata SPE (solid phase extraction) C18. After extraction, the
sample was ready for HPLC application according to Gonzalo-
Lumbreras et al. (2003). The HPLC instrument was Agilent HPLC
system from Agilent Technologies (USA).
Reagents
1) Testosterone reference standard was purchased from Sigma, (St.
Louis, MO). Different concentrations were prepared from every
standard in 75% aqueous HPLC grade methanol and injected to
the system.
2) The mobile phase was water–acetonitrile (57:43 v/v) for
testosterone hormone. The analytical column: C18 (25 cm x 4
mm) was used.
Procedure
1) The sample volume for HPLC application was 20 µl, the flow rate
was 2 ml/min and the wave length was adjusted at 245 nm.
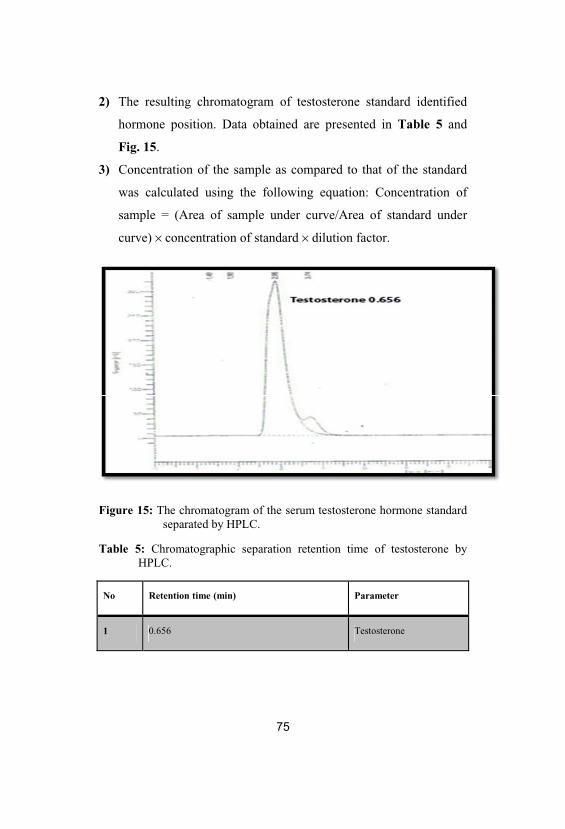
2) The resulting chromatogram of testosterone standard identified
hormone position. Data obtained are presented in Table 5 and
Fig. 15.
3) Concentration of the sample as compared to that of the standard
was calculated using the following equation: Concentration of
sample = (Area of sample under curve/Area of standard under
curve) × concentration of standard × dilution factor.
Figure 15: The chromatogram of the serum testosterone hormone standardseparated by HPLC.
Table 5: Chromatographic separation retention time of testosterone byHPLC.
No Retention time (min) Parameter
1 0.656 Testosterone
76
Determination of testicular thiobarbituric acid-reactivesubstances (TBARS) level [malondialdehyde (MDA)]
Principle
Lipid peroxidation in testes tissue was estimated
colorimetrically by measuring thiobarbituric acid reactive substances
(TBARS) by the method of Mesbah et al. (2004). The method is
based on the determination of malondialdehyde (MDA), an end
product of lipid peroxidation, which can react with thiobarbituric acid
(TBA) to yield a pink colored complex exhibiting a maximum
absorption at 532nm.
Reagents
1) (10% w/v) testes homogenate in ice-cold normal saline
2) (20% w/v) trichloroacetic acid (TCA)
3) (0.67% w/v) thiobarbituric acid (TBA)
Procedure
1) In a centrifuge tube, 0.5 ml of trichloroacetic acid (TCA; 20%)
and 1ml thiobarbituric acid (TBA; 0.67%) were added to 0.5ml of
the testes homogenate.
2) The mixture was heated to 100 °C for 15 min. and after cooling
4ml n-butyl alcohol was added.
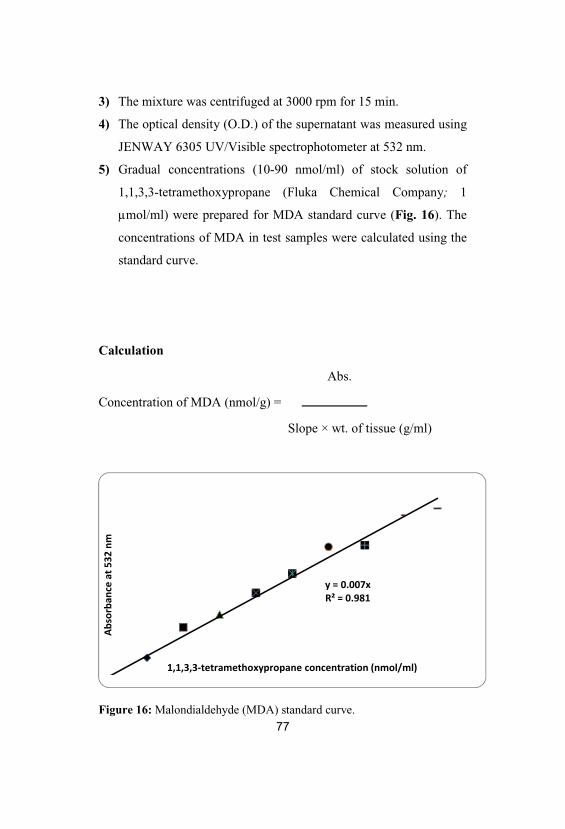
77
3) The mixture was centrifuged at 3000 rpm for 15 min.
4) The optical density (O.D.) of the supernatant was measured using
JENWAY 6305 UV/Visible spectrophotometer at 532 nm.
5) Gradual concentrations (10-90 nmol/ml) of stock solution of
1,1,3,3-tetramethoxypropane (Fluka Chemical Company; 1
µmol/ml) were prepared for MDA standard curve (Fig. 16). The
concentrations of MDA in test samples were calculated using the
standard curve.
Calculation
Abs.
Concentration of MDA (nmol/g) =
Slope × wt. of tissue (g/ml)
Figure 16: Malondialdehyde (MDA) standard curve.
78
Estimation of testicular total antioxidant capacity (TAC) byferric reducing antioxidant power (FRAP)
Principle
The method measures the ferric reducing antioxidant power
(FRAP) of testicular homogenate. At low pH, when a ferric
tripyridyltriazine (Fe+3-TPTZ) complex is reduced to the ferrous form
(Fe+2), an intense blue color (Fe+2-TPTZ) with an absorption
maximum at 593 nm develops. Hence, the color formation is the
reducing ability of the sample according to Benzie and Strain (1996,
1999).
Reagents
1) Acetate buffer (300 mM, pH 3.6): 0.31 g sodium acetate
trihydrate and 1.6 ml acetic acid were completed to 100 ml by
distilled water, and then pH was adjusted to 3.6.
79
2) 2,4,6-tripyridyl-s-triazine (TPTZ) (Fluka Chemicals,
Switzerland): 10 mmol in 40 mmol of HCl.
10 mmol TPTZ (M.W. =312.3) was prepared by dissolving
0.03 g of TPTZ in 10 ml of 40 mmol of HCl.
40 mmol HCl (M.W. =36.5) was prepared by diluting 300 l
of HCl in 100 ml of distilled water.
3) FeCl3.6H2O: 20 mM (M.W. =270.3): was prepared by dissolving
0.053 g of FeCl3.6H2O in 10 ml of distilled water.
4) Working solution of the assay was freshly prepared as required by
mixing 25 ml of acetate buffer with 2.5 ml of TPTZ and 2.5 ml of
FeCl3.6H2O.
5) Aqueous solutions of known concentration, in the range of 100-
1000 µmol/L (FeSO4.7H2O) were used (Fig. 17) for calibration.
Procedure
1) 900 µl freshly prepared working reagent was warmed to 37°C
then a reagent blank reading was taken at 593 nm (M1).
2) 30 µl of sample was then diluted with 90 µl distilled H2O and
added to the working solution.
3) Absorbance (A) readings were taken after 5 seconds and every
one minute thereafter for 4 minutes using JENWAY 6305
UV/Visible spectrophotometer.
4) A at 593nm between the final reading selected and the M1
reading was calculated for each sample and related to A 593nm
of a Fe standard solution tested in parallel.
Calculation
Testicular ferric reducing antioxidant power (FRAP) (µmol Fe+2/g) =
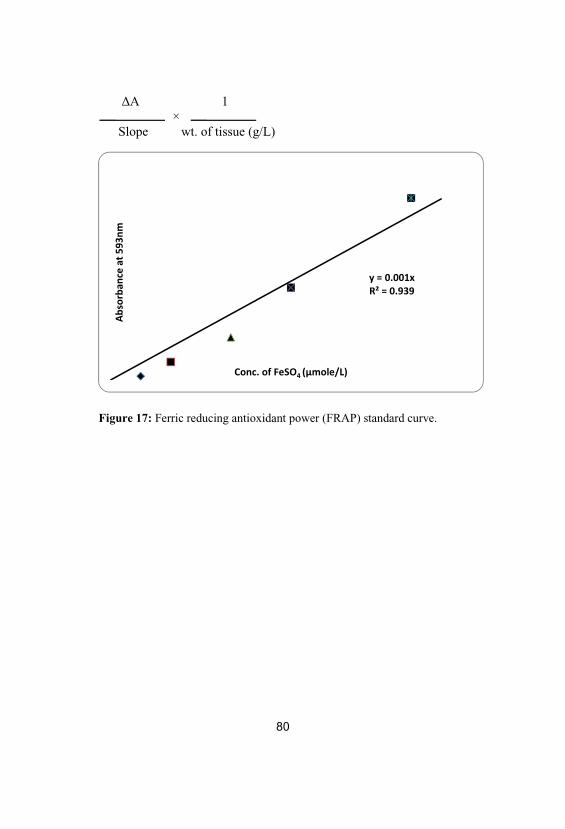
80
A 1 ×
Slope wt. of tissue (g/L)
Figure 17: Ferric reducing antioxidant power (FRAP) standard curve.
81
Determination of epididymal sperm count and motility
Procedure
1) By laparotomy, the left and right caudal parts of the epididymis
were carefully separated from the testes, finely minced in 5 ml of
Hanks’ buffered salt medium, and incubated at room temperature
for 15 min to provide the migration of all spermatozoa from
epididymal tissue to fluid (Cheng et al., 2006).
2) The diluted sperm suspension (10 ml) was transferred to the
hemocytometer (Improved Neubauer, Weber, UK), and the
settled sperms were counted with a light microscope at 400×
magnification (million/ml) (Seed et al., 1996).
3) The sperm count was then calculated relative to the epididymal
wt. (sperm/g).
4) The motility assay was conducted by observing the sperm
suspension on a slide glass at 37˚C. The percentage of motile
spermatozoa was determined by counting more than 200
spermatozoas randomly in 10 selected fields under a light
microscope (Olympus microscope), and the mean number of
motile sperm × “100/total number of sperms” was calculated
(Seed et al., 1996; Cheng et al., 2006).
5) The sperms abnormality was determined microscopically.
82
Estimation of testicular total protein content
Principle
The protein concentration in testicular homogenate was detected
by the method of Lowry et al. (1951) as modified by Tsuyosh and
James (1978).
Reagents
1) Working Biuret reagent: 3g CuSO4.5H2O and 5g KI were
dissolved in 500 ml of 0.2N NaOH containing 9g sodium
potassium tartarate, then the volume of this solution was raised up
to one liter by 0.2N NaOH. The working reagent was freshly
prepared by adding 2.3% sodium carbonate to stock reagent in the
ratio 7:1.
2) Folin-Ciocalteau reagent: Stock reagent (2N) was purchased from
Sigma Chemical Company. The stock solution was diluted with
distilled water (1:20) the day of use.
3) Stock standard bovine serum albumin (BSA, 200 mg/dl).
4) Working standard protein solution (2 mg/ml). Set of standard
protein concentrations were prepared from the working standard
protein solution in the concentrations of (10-200 µg/ml; Fig. 18)
5) Phosphate buffer (0.067 M, pH 7.0).
Procedure
83
1) 100 l of homogenate (10% w/v) and 0.9 ml phosphate buffer
were added to 4ml working Biuret reagent and vortexed.
2) The mixture was allowed to stand for 10 min at room
temperature.
3) 125 l of folin were added, vortexed and left for 30 min at room
temperature.
4) A blank tube (1ml of phosphate buffer instead of sample) was
prepared in a similar manner.
5) The absorbance was measured at 650 nm using JENWAY 6305
UV/Visible spectrophotometer.
Calculation
Abs. 10-3
Concentration of protein (mg/g) = ×
Slope wt. of tissue (g/ml)
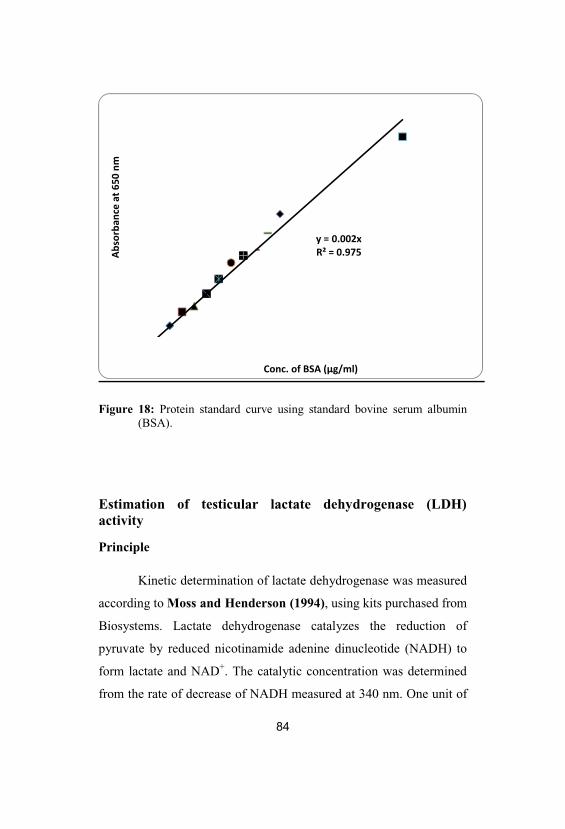
84
Figure 18: Protein standard curve using standard bovine serum albumin(BSA).
Estimation of testicular lactate dehydrogenase (LDH)activity
Principle
Kinetic determination of lactate dehydrogenase was measured
according to Moss and Henderson (1994), using kits purchased from
Biosystems. Lactate dehydrogenase catalyzes the reduction of
pyruvate by reduced nicotinamide adenine dinucleotide (NADH) to
form lactate and NAD+. The catalytic concentration was determined
from the rate of decrease of NADH measured at 340 nm. One unit of
85
LDH activity is the amount of enzyme that decreases 1 mol NADH+
per minute under standard assay conditions.
Pyruvate + NADH + H+ lactate + NAD+
Reagents
1) Reagent A (Tris 100 mM, pyruvate 2.75 mM, sodium chloride
222 mM, pH 7.2).
2) Reagent B (NADH 1.55 mM, sodium azide 9.5 g/L).
3) Working reagent: the contents of the reagent B were poured into
the reagent A and mixed gently.
Procedure
1) 1.0 ml of the working reagent and 0.02 ml of the homogenate
supernatant were pipetted into the cuvette.
2) The reagents were mixed and the cuvette was inserted into the
spectrophotometer with turning on the stop watch.
3) After 30 seconds, initial absorbance was recorded and at 1 min.
intervals, thereafter for 3 minutes.
4) The average difference between consecutive absorbance values
per min was calculated ( A/min.).
Calculation
The LDH specific activity (U/mg protein) in the sample was
calculated using the following general formula:
A/min. × Vt 1×
Ext. coeff. × Vs Protein conc. (mg/ml)
86
The millimolar extinction coefficient of NADH at 340 nm is
6.2, the light path (l) is 1 cm, the total reaction volume (Vt) is 1.02 ml
and the sample volume (Vs) is 0.02 ml.
Estimation of testicular gamma glutamyltranspeptidase(GGT) activity
Principle
Gamma glutamyltranspeptidase (GGT) was estimated
according to Saw et al. (1983), using kits purchased from Siemens
where the enzyme catalyses the acyl transfer reaction between the -
carboxamide group of peptide-bound glutamine residue and the -
amino group of a peptide-bound lysine residue as following:
87
L- -Glutamyl-3-carboxy-4-nitroanilid + Glycylglycine L- -
Glutamyl-glycylglycine + 5-amino-2-nitrobenzoate
The rate of the development of yellow colored indicator 5-
amino-2-nitrobenzoate is directly proportional to GGT activity in the
sample and was quantified by measuring the increase in absorbance
at 405 nm. One unit of GGT activity is the amount of enzyme that
produces 1 mol 5-amino-2- nitrobenzoate per minute.
Reagents
1) Reagent 1 (R1 Buffer)
Tris buffer (pH 8.2; 120 mM)
Glycylglycine (160 mM)
Sodium azide (12 mM)
2) Reagent 2 (R2 Starter)
L- -glutamyl-3-carboxy-4-nitroanilide (4.0 mM)
Sodium azide (12 mM)
Procedure
1) 1.0 ml of working solution was added to 100 l of the sample and
pipetted in a test tube.
2) Initial absorbance after 30 seconds was read after mixing the
sample well and timer was started simultaneously. Absorbance
was read again after 1, 2 and 3 minutes.
88
3) The mean absorbance change per minute ( A/min) was
determined.
Calculation
Gamma glutamyltranspeptidase (GGT) specific activity (U/mg
protein) was calculated using the formula:
1158 x A /min
Protein conc. (mg/L)
Estimation of testicular acid phosphatase (ACP) activity
Principle
Acid phosphatase activity was measured by the method of
Babson and Ready (1959), using kits purchased from (QCA, S.A.).
Colorimetric estimation of acid phosphatase depends on hydrolysis of
89
p-nitrophenyl phosphate in acidic pH medium by the action of acid
phosphatase present in the sample. Then, the liberated p-nitrophenol
is quantified spectrophotometrically at 405 nm. One unit of ACP
activity is the amount of enzyme that produces 1 mol p-nitrophenol
per minute.
Reagents
1) NaOH 0.02 N.
2) Working reagent {the substrate was dissolved with the buffer
solution; 1 tablet/4ml acetate buffer (5M, pH 5.0)}.
Procedure
1) To each tube (blank & sample), 0.5 ml of working reagent was
added.
2) 0.1 ml of homogenate supernatant was added into sample tube
only.
3) Then, contents were mixed and incubated at 37°C for exactly 30
min.
4) 5 ml of NaOH 0.02 N was pipetted in all tubes.
5) 0.1 ml of sample was added into blank tube only.
6) The tubes were mixed again and each sample was measured
against blank of each sample at 405 nm.
Calculation
90
Acid phosphatase activity (U/mg protein) =
101 x “Abs. of sample- Abs. of blank”
Protein conc. (mg/L)
91
Estimation of testicular sorbitol dehydrogenase (SDH)activity
Principle
Sorbitol dehydrogenase (SDH) activity was determined by the
method of Chauncey et al. (1988). It depends on the interconversion
of D-sorbitol and D-fructose in the presence of NAD+. The reaction
sequence is as follows:
D-Sorbitol + NAD+ D-Fructose + NADH + H+SDH
The increase in NADH absorbance can be followed at 340
nm. One unit of SDH activity is the amount of enzyme that produces
1 mol NADH+ per minute under specified conditions.
Reagents
1) Tris-HCl buffer: 50 mM, pH 8.6
2) D-Sorbitol: 400 mM in Tris-HCl buffer
3) NAD+: 4.7 mM in Tris-HCl buffer
Procedure
1) 75 µl of the testicular supernatant fraction was mixed with 0.78
ml Tris-HCl buffer, 100 µl sorbitol and 100 µl NAD+ solutions in
a quartz micro-cuvette.
2) After mixing, the change in optical density at 340 nm was
followed for 3 minutes using JENWAY 6305 UV/Visible
spectrophotometer.
92
Calculation
Using the millimolar extinction coefficient of NADH of 6.22
µmol-1cm-1, the activity of the enzyme was calculated. Testicular
SDH specific activity (µmol of NADH developed/min/mg protein) =
A/min. × total volume of reaction mixture6.22 × volume of assay× protein conc. (mg protein/ml)
93
Histological and immunohistochemical investigation
Rats from each group were anesthetized with anesthetic ether.
The thorax was opened with surgical incision on the sternum and the
perfusion was done from left ventricle and right atrium for
histological, immunohistochemical and ultrastructural investigations
according to Latendresse et al. (2002).
A rinsing solution was perfused before the fixation solution
(Bouin s fluid). Due to the narrow testicular artery branches from
the abdominal aorta near the renal artery, it is probably
constricted and occluded during the perfusion process. Perfusion
with rinsing solution helped overcome this problem. To make
rinsing solution, 9.0 g NaCl, 25g Polyvinyl Pyrrolidone, 0.25g
Heparin, and 5.0g Procain-HCL were dissolved in one liter of
water by thorough stirring. The pH was adjusted to 7.35 with 1N
NaOH and twice filtered through Millipore filters of 3.0 m or
less pore size. The perfusion of both solutions was performed
using a scalp vein attached to a 50cc syringe.
Testes were immediately removed taking care to handle
specimens gently to minimize trauma to the delicate seminiferous
tubules prior to placement of each testis into fixative solution.
94
The tunica albuginea was pierced at each pole 5 times with a 21-
gauge needle to aid in the penetration of the fixative solution.
Fixation time was limited to 24 hours and tissues were transferred
to 70% ethyl alcohol. Alcohol was changed 3 times daily for 2
days before transferring the specimens to a saturated solution of
70% ethyl alcohol and lithium carbonate to neutralize the picric
acid in Bouin’s fluid. The ethyl alcohol-lithium carbonate
solution was changed 3 or more times until the yellow color of
Bouin’s fluid was almost completely depleted from the tissue.
Testes were stored in 70% ethyl alcohol until they were
processed.
The fixed testes were dehydrated through a graded series of
ethanol and embedded in paraffin according to standard
procedures. Paraffin sections (5 m thick) were mounted on
gelatin chromalum–coated glass slides and stored at room
temperature until further processing. Some paraffin sections were
used for Haematoxylin and eosin stains and the rest of paraffin
sections were used for proliferating cell nuclear antigen (PCNA)
immunohistochemical staining.
Haematoxylin and eosin stains
The histopathology was carried out according to Bancroft and
Stevens (1990) using Harris Hematoxylin and eosin staining
technique.
Reagents
95
1) Harris Haematoxylin: One g of hematoxylin was dissolved in
10 ml of absolute ethyl alcohol, then 20 g ammonium or
potassium alum were added and dissolved in 190 ml distilled
water. The haematoxylin solution was boiled and 0.5 g mercuric
oxide (red) was added and immediately immersed into ice cold
water. Then, glacial acetic acid was added, filtered and the
solution was stored in a well-stopper bottle.
2) Acidic alcohol (1%): One gram of acidic alcohol was dissolved
into 100 ml of distilled water.
3) Blueing agent: Lithium carbonate solution (1%) was added to
2% ammonium solution, then 7g sodium bicarbonate and 40 g
magnesium sulfate were dissolved in 2000 ml water, then 1%
formalin was added to prevent the growth of mold.
4) Eosin: One g eosin Y was dissolved into 20 ml distilled water,
heated then cooled and 80 ml of 95% ethanol were added.
Further, 25 ml from this solution were taken, added to 75 ml of
80% ethanol and filtered before using it.
Procedure
1) Paraffin sections were stained with Harris Hematoxyline for 5
min.
2) Sections were differentiated in 1% acidic ethanol for 5-30
seconds then Blueing agent was added.
3) Sections were stained with eosin for 2-5 minutes then washed by
water until the desired shades of red or pink were obtained and
then dehydrated in 90%, 96% and 100% ethanol for 5 minutes.
96
4) Sections were cleaned in two changes of xylene 5 minutes each or
longer for better cleaning.
5) Sections were covered with clean cover slips then dried and
microscopically examined. All stained slides were viewed by
using Olympus microscope and images were captured by a digital
camera (Cannon 620). Brightness and contrast were adjusted
using Adobe Photoshop software (version 7.0; Adobe Systems,
Mountain View, CA).
Proliferating cell nuclear antigen immunohistochemistry
Principle
Proliferating cell nuclear antigen immunoreactivity (PCNA-ir)
was performed according to Taghavi et al. (2009). Testicular
distribution of PCNA receptor subunits were examined in
deparaffinized sections (5 µm) using an Avidin-Biotin-Peroxidase
(ABC) immunohistochemical method (Elite–ABC, Vector
Laboratories, CA, USA) with PCNA monoclonal antibody (dilution
1:100; DAKO Japan Co, Tokyo, Japan).
Procedure
1) Sections were deparaffinized, rehydrated, washed in phosphate
buffered saline (PBS) (3 x 5 min) and endogenous peroxidase
activity was quenched using 0.3% H2O2 in methanol for 30 min.
97
Subsequently, samples were washed in PBS and incubated with
blocking solution at room temperature for 10 minutes
2) Then, samples were washed in PBS, incubated with mouse PCNA
monoclonal antibody (dilution 1:100; DAKO Japan Co, Tokyo,
Japan) and left in a moist chamber at room temperature, for one
hour.
3) After rinsing with PBS, sections were incubated with biotinylated
anti mouse-PCNA primary antibody (secondary antibody) in
moist chamber for 30-60 min and then rinsed with PBS.
4) Samples were incubated with Streptavidin Peroxidase at room
temperature for 10 min and washed with PBS.
5) The antibody-peroxidase complex was developed using the
diaminobenzidine (DAB) chromogen at 18-24 C for 2-5min.
DAB functions as the substrate for the peroxidase enzyme,
forming a brown colored end-product that precipitates at the site
of the antigen enabling localization of that antigen within tissue.
6) The sections were washed with PBS, counterstained with
Haematoxylin for 1 min to counter-stain nuclei a light blue color.
In this manner a greater contrast between PCNA positive nuclei
and nuclei which are not PCNA positive was achieved. 7) Slides were washed with tap water then PBS for 30 seconds,
dehydrated through ascending grades of alcohol, delipidated in
xylene and cover-slipped with Mount-Quick (Daido Sangyo,
Tokyo).
8) All stained slides were viewed using Olympus microscope and
images were captured by a digital camera (Cannon 620).
98
Brightness and contrast were adjusted using Adobe Photoshop
software (version 7.0; Adobe Systems, Mountain View, CA).
PCNA-Labeling Index (PCNA-LI)
1) Slides were examined under the light microscope with a
magnification ×200 and thin sections were evaluated for PCNA
immunostaining.
2) Microscopic fields were chosen at random. Five fields per slide
were evaluated. Only the basal germ cells of the seminiferous
tubules were counted as the PCNA-LI for each seminiferous
tubule and was estimated as a percentage of immunolabeled cells
(cells with brown nuclear staining was positive PCNA
immunoreactivity) to all basal cells (Abdel-Dayem, 2009).
3) The mean PCNA index in each case was obtained by dividing the
sum of all PCNA indices by the number of seminiferous tubules
in which the calculation was carried out. For each specimen the
mean± SEM was calculated.
Transmission electron microscopy (TEM) examination
Procedure
1) Small pieces (1 mm) of control and treated perfused tissues were
freshly cut and fixed in 3% glutaraldehyde (pH 7.4) in phosphate
buffer and post fixed in 2% osmium tetroxide in phosphate
buffer.
2) Following fixation, tissues were dehydrated at increasing
concentrations of ethanol.
99
3) They were then embedded in araldite resin.
4) Ultrathin sections were cut using an ultratome and stained by
uranyl acetate saturated in 70% ethanol and lead citrate. Ultrathin
sections of rat testes and images processing were performed in the
Faculty of Medicine, Tanta University using a JEOL transmission
electron microscope (JEM-1200. Ex, Japan).
Statistical analysis
The analysis was done using the Statistical Package for the
Social Sciences (SPSS software version 16) on a personal computer.
Data were presented as the mean± standard error of mean (SEM) and
statistically analyzed by one-way ANOVA (Analysis of Variance)
followed by the Least Significant Difference (LSD) tests.
100
Significance at P<0.05 was considered statistically significant. LSD
comparisons were performed to assess the significance of differences
between groups according to Daniel (1991) and Bailey (1994).
Pearson correlation coefficient (r): the reliability of an
estimate depends on the relationship between two variables and
measure of this closeness is such a measure, commonly symbolized
as "r".
Results
In the present study, there were no deaths in rats and rats
received 0.05% 6-n-propyl-2-thiouracil (PTU) in drinking water
(group III) had lower activity and loss of appetite as compared to
other groups. On the other hand, rats treated with folic acid alone
(group II) or after restoration of euthyroid state (group V) showed
higher activity than other groups.
The data of Table 6 showed that food intake and fluid intake
showed significant decrease in hypothyroid (group III), co-treatment
(group IV) and initial six weeks of post-treatment (group V) groups
as compared to control (group I) and folic acid (group II) groups.
Meanwhile, they showed a non significant change in folic acid (group
II) and extra four weeks of post-treatment (group V) groups as
compared to control group (group I).
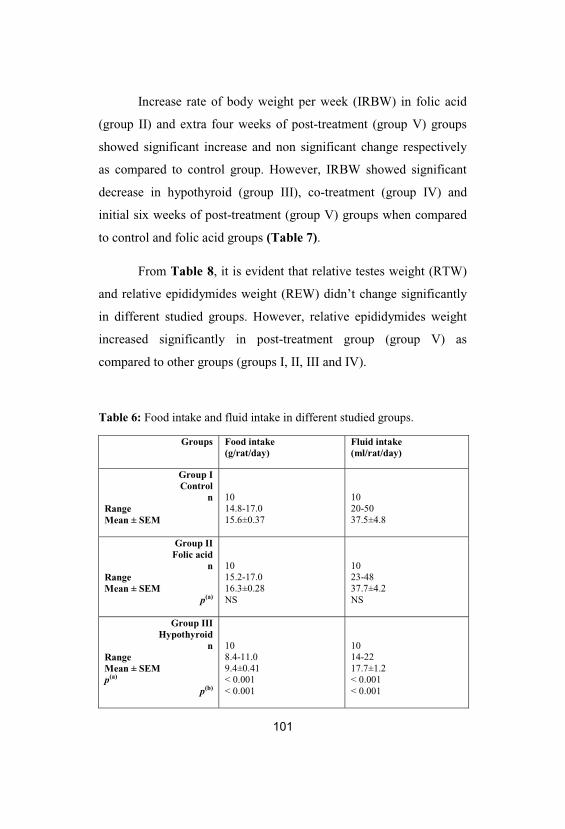
101
Increase rate of body weight per week (IRBW) in folic acid
(group II) and extra four weeks of post-treatment (group V) groups
showed significant increase and non significant change respectively
as compared to control group. However, IRBW showed significant
decrease in hypothyroid (group III), co-treatment (group IV) and
initial six weeks of post-treatment (group V) groups when compared
to control and folic acid groups (Table 7).
From Table 8, it is evident that relative testes weight (RTW)
and relative epididymides weight (REW) didn’t change significantly
in different studied groups. However, relative epididymides weight
increased significantly in post-treatment group (group V) as
compared to other groups (groups I, II, III and IV).
Table 6: Food intake and fluid intake in different studied groups.
Groups Food intake(g/rat/day)
Fluid intake(ml/rat/day)
Group IControl
nRangeMean ± SEM
1014.8-17.015.6±0.37
1020-5037.5±4.8
Group IIFolic acid
nRangeMean ± SEM
p(a)
1015.2-17.016.3±0.28NS
1023-4837.7±4.2NS
Group IIIHypothyroid
nRangeMean ± SEMp(a)
p(b)
108.4-11.09.4±0.41< 0.001< 0.001
1014-2217.7±1.2< 0.001< 0.001
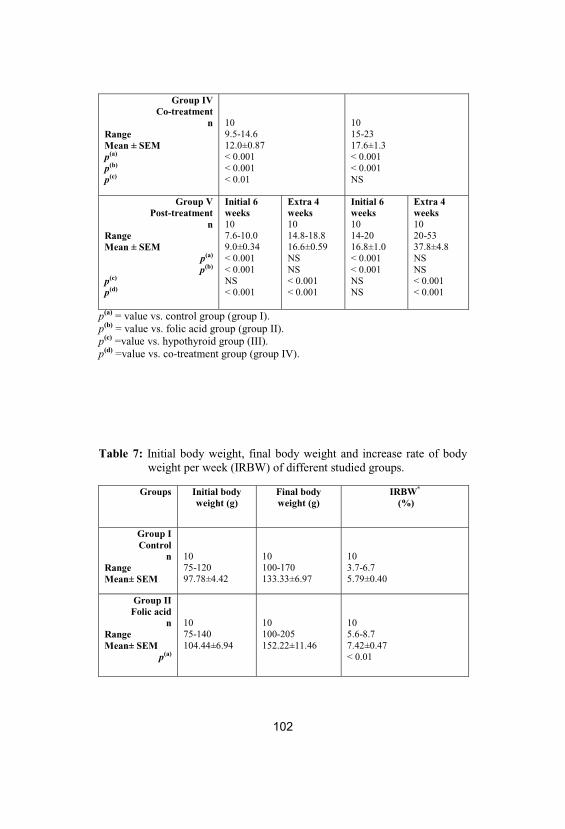
102
Group IVCo-treatment
nRangeMean ± SEMp(a)
p(b)
p(c)
109.5-14.612.0±0.87< 0.001< 0.001< 0.01
1015-2317.6±1.3< 0.001< 0.001NS
Group VPost-treatment
nRangeMean ± SEM
p(a)
p(b)
p(c)
p(d)
Initial 6weeks107.6-10.09.0±0.34< 0.001< 0.001NS< 0.001
Extra 4weeks1014.8-18.816.6±0.59NSNS< 0.001< 0.001
Initial 6weeks1014-2016.8±1.0< 0.001< 0.001NSNS
Extra 4weeks1020-5337.8±4.8NSNS< 0.001< 0.001
p(a) = value vs. control group (group I). p(b) = value vs. folic acid group (group II). p(c) =value vs. hypothyroid group (III). p(d) =value vs. co-treatment group (group IV).
Table 7: Initial body weight, final body weight and increase rate of bodyweight per week (IRBW) of different studied groups.
Groups Initial bodyweight (g)
Final bodyweight (g)
IRBW*
(%)
Group IControl
nRangeMean± SEM
1075-12097.78±4.42
10100-170133.33±6.97
103.7-6.75.79±0.40
Group IIFolic acid
nRangeMean± SEM
p(a)
1075-140104.44±6.94
10100-205152.22±11.46
105.6-8.77.42±0.47< 0.01
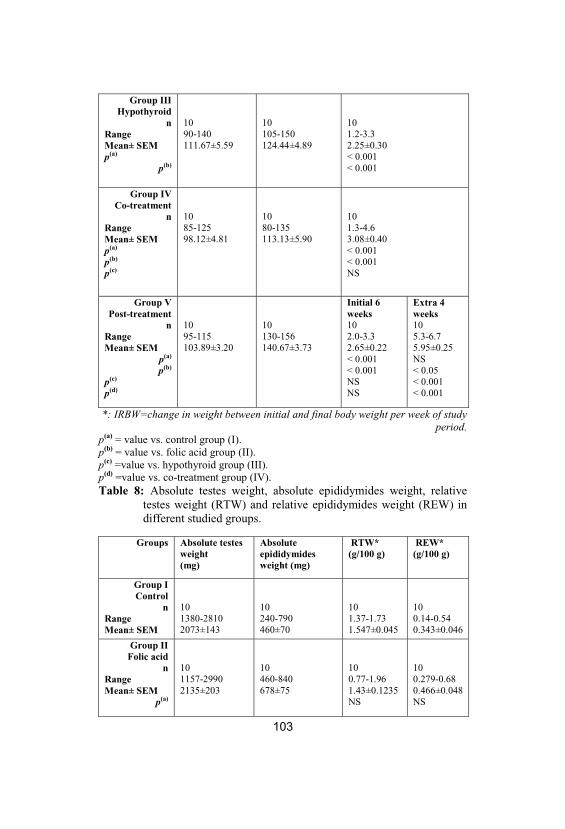
103
Group IIIHypothyroid
nRangeMean± SEMp(a)
p(b)
1090-140111.67±5.59
10105-150124.44±4.89
101.2-3.32.25±0.30< 0.001< 0.001
Group IVCo-treatment
nRangeMean± SEMp(a)
p(b)
p(c)
1085-12598.12±4.81
1080-135113.13±5.90
101.3-4.63.08±0.40< 0.001< 0.001NS
Group VPost-treatment
nRangeMean± SEM
p(a)
p(b)
p(c)
p(d)
1095-115103.89±3.20
10130-156140.67±3.73
Initial 6weeks102.0-3.32.65±0.22< 0.001< 0.001NSNS
Extra 4weeks105.3-6.75.95±0.25NS< 0.05< 0.001< 0.001
*: IRBW=change in weight between initial and final body weight per week of studyperiod.
p(a) = value vs. control group (I). p(b) = value vs. folic acid group (II). p(c) =value vs. hypothyroid group (III). p(d) =value vs. co-treatment group (IV). Table 8: Absolute testes weight, absolute epididymides weight, relative
testes weight (RTW) and relative epididymides weight (REW) indifferent studied groups.
Groups Absolute testesweight(mg)
Absoluteepididymidesweight (mg)
RTW* (g/100 g)
REW*(g/100 g)
Group IControl
nRangeMean± SEM
101380-28102073±143
10240-790460±70
101.37-1.731.547±0.045
100.14-0.540.343±0.046
Group IIFolic acid
nRangeMean± SEM
p(a)
101157-29902135±203
10460-840678±75
100.77-1.961.43±0.1235NS
100.279-0.680.466±0.048NS
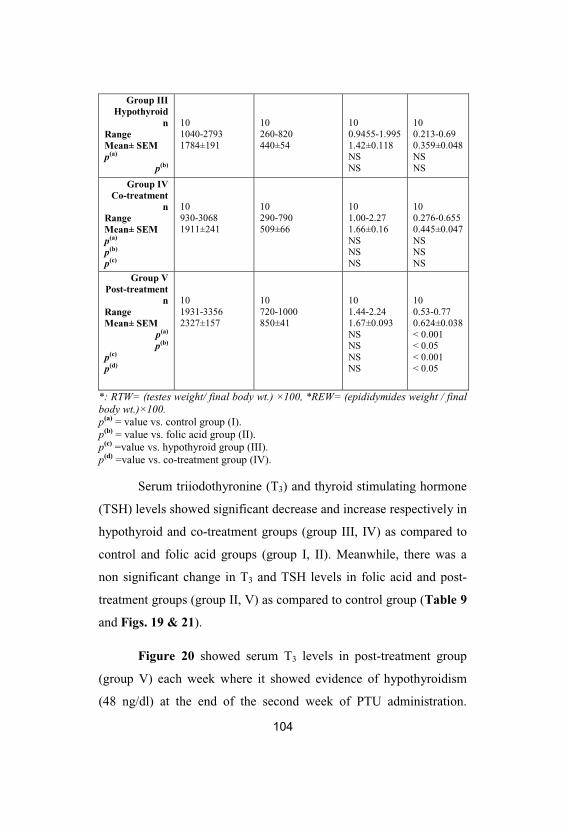
104
Group IIIHypothyroid
nRangeMean± SEMp(a)
p(b)
101040-27931784±191
10260-820440±54
100.9455-1.9951.42±0.118NSNS
100.213-0.690.359±0.048NSNS
Group IVCo-treatment
nRangeMean± SEMp(a)
p(b)
p(c)
10930-30681911±241
10290-790509±66
101.00-2.271.66±0.16NSNSNS
100.276-0.6550.445±0.047NSNSNS
Group VPost-treatment
nRangeMean± SEM
p(a)
p(b)
p(c)
p(d)
101931-33562327±157
10720-1000850±41
101.44-2.241.67±0.093NSNSNSNS
100.53-0.770.624±0.038< 0.001< 0.05< 0.001< 0.05
*: RTW= (testes weight/ final body wt.) ×100, *REW= (epididymides weight / finalbody wt.)×100. p(a) = value vs. control group (I). p(b) = value vs. folic acid group (II). p(c) =value vs. hypothyroid group (III). p(d) =value vs. co-treatment group (IV).
Serum triiodothyronine (T3) and thyroid stimulating hormone
(TSH) levels showed significant decrease and increase respectively in
hypothyroid and co-treatment groups (group III, IV) as compared to
control and folic acid groups (group I, II). Meanwhile, there was a
non significant change in T3 and TSH levels in folic acid and post-
treatment groups (group II, V) as compared to control group (Table 9
and Figs. 19 & 21).
Figure 20 showed serum T3 levels in post-treatment group
(group V) each week where it showed evidence of hypothyroidism
(48 ng/dl) at the end of the second week of PTU administration.
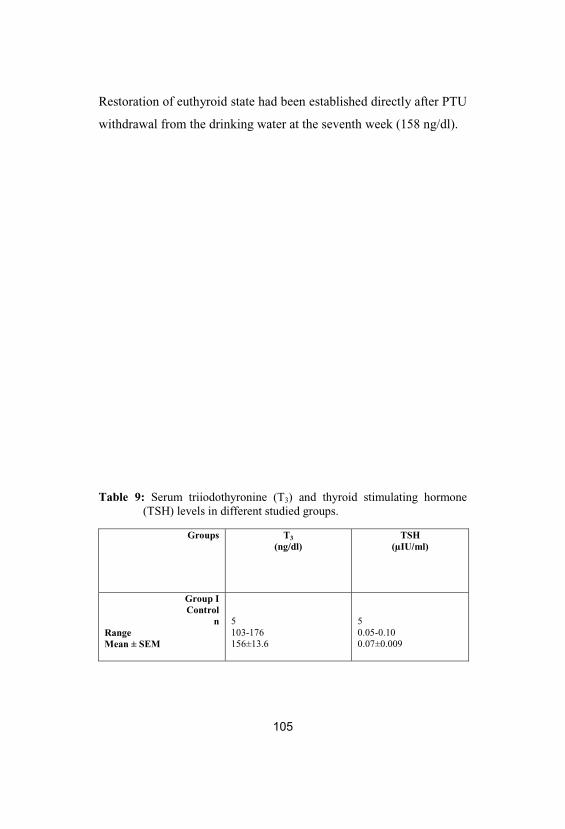
105
Restoration of euthyroid state had been established directly after PTU
withdrawal from the drinking water at the seventh week (158 ng/dl).
Table 9: Serum triiodothyronine (T3) and thyroid stimulating hormone(TSH) levels in different studied groups.
Groups T3
(ng/dl)TSH
(µIU/ml)
Group IControl
nRangeMean ± SEM
5103-176156±13.6
50.05-0.100.07±0.009
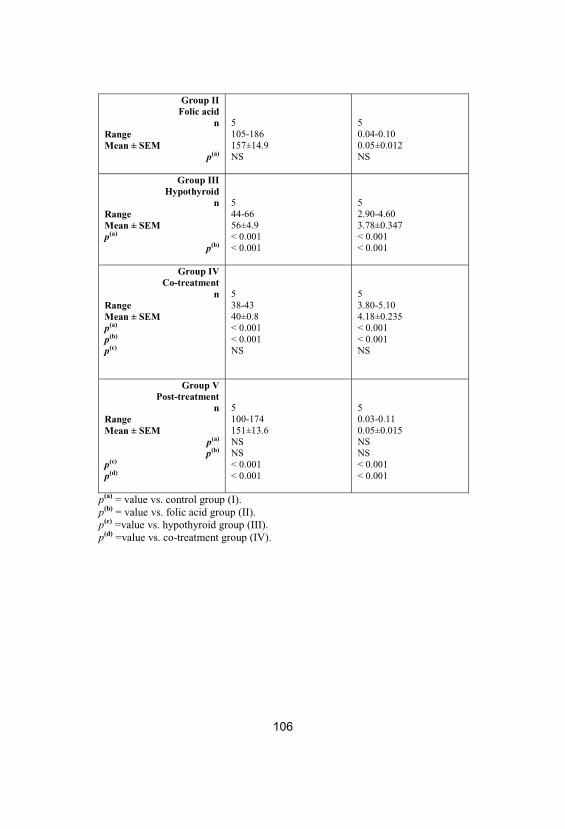
106
Group IIFolic acid
nRangeMean ± SEM
p(a)
5105-186157±14.9NS
50.04-0.100.05±0.012NS
Group IIIHypothyroid
nRangeMean ± SEMp(a)
p(b)
544-6656±4.9< 0.001< 0.001
52.90-4.603.78±0.347< 0.001< 0.001
Group IVCo-treatment
nRangeMean ± SEMp(a)
p(b)
p(c)
538-4340±0.8< 0.001< 0.001NS
53.80-5.104.18±0.235< 0.001< 0.001NS
Group VPost-treatment
nRangeMean ± SEM
p(a)
p(b)
p(c)
p(d)
5100-174151±13.6NSNS< 0.001< 0.001
50.03-0.110.05±0.015NSNS< 0.001< 0.001
p(a) = value vs. control group (I). p(b) = value vs. folic acid group (II). p(c) =value vs. hypothyroid group (III). p(d) =value vs. co-treatment group (IV).
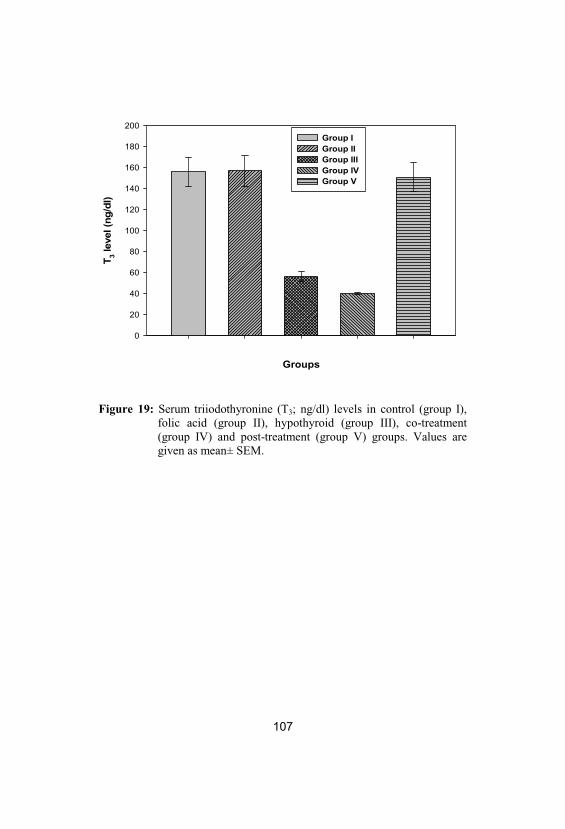
107
Groups
T 3 lev
el (n
g/dl
)
0
20
40
60
80
100
120
140
160
180
200Group IGroup IIGroup IIIGroup IVGroup V
Figure 19: Serum triiodothyronine (T3; ng/dl) levels in control (group I), folic acid (group II), hypothyroid (group III), co-treatment(group IV) and post-treatment (group V) groups. Values aregiven as mean± SEM.
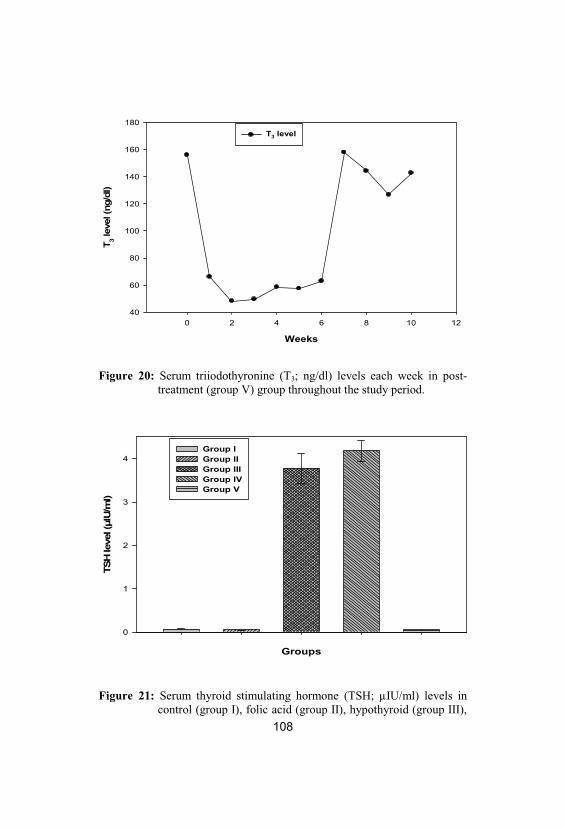
108
Weeks
0 2 4 6 8 10 12
T 3 lev
el (n
g/dl
)
40
60
80
100
120
140
160
180T3 level
Figure 20: Serum triiodothyronine (T3; ng/dl) levels each week in post-treatment (group V) group throughout the study period.
Groups
TSH
leve
l (μI
U/m
l)
0
1
2
3
4Group IGroup IIGroup IIIGroup IVGroup V
Figure 21: Serum thyroid stimulating hormone (TSH; µIU/ml) levels incontrol (group I), folic acid (group II), hypothyroid (group III),
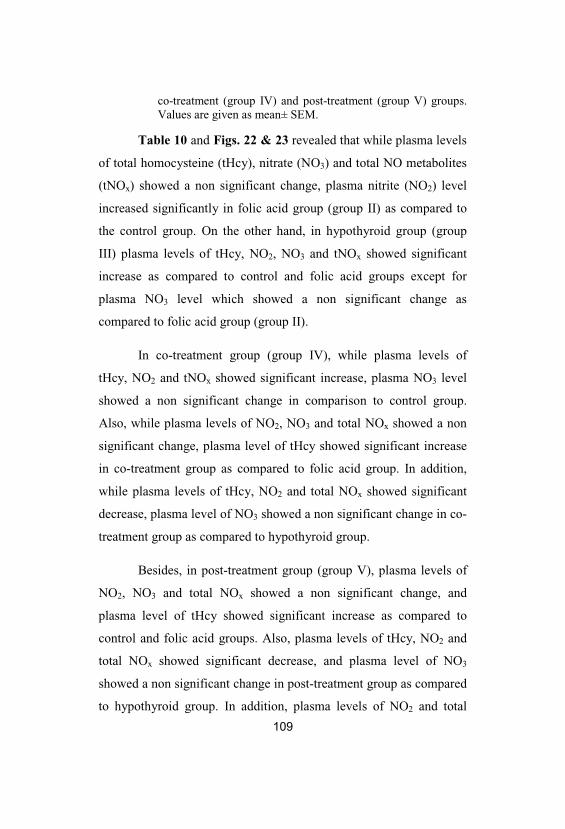
109
co-treatment (group IV) and post-treatment (group V) groups. Values are given as mean± SEM.
Table 10 and Figs. 22 & 23 revealed that while plasma levels
of total homocysteine (tHcy), nitrate (NO3) and total NO metabolites
(tNOx) showed a non significant change, plasma nitrite (NO2) level
increased significantly in folic acid group (group II) as compared to
the control group. On the other hand, in hypothyroid group (group
III) plasma levels of tHcy, NO2, NO3 and tNOx showed significant
increase as compared to control and folic acid groups except for
plasma NO3 level which showed a non significant change as
compared to folic acid group (group II).
In co-treatment group (group IV), while plasma levels of
tHcy, NO2 and tNOx showed significant increase, plasma NO3 level
showed a non significant change in comparison to control group.
Also, while plasma levels of NO2, NO3 and total NOx showed a non
significant change, plasma level of tHcy showed significant increase
in co-treatment group as compared to folic acid group. In addition,
while plasma levels of tHcy, NO2 and total NOx showed significant
decrease, plasma level of NO3 showed a non significant change in co-
treatment group as compared to hypothyroid group.
Besides, in post-treatment group (group V), plasma levels of
NO2, NO3 and total NOx showed a non significant change, and
plasma level of tHcy showed significant increase as compared to
control and folic acid groups. Also, plasma levels of tHcy, NO2 and
total NOx showed significant decrease, and plasma level of NO3
showed a non significant change in post-treatment group as compared
to hypothyroid group. In addition, plasma levels of NO2 and total
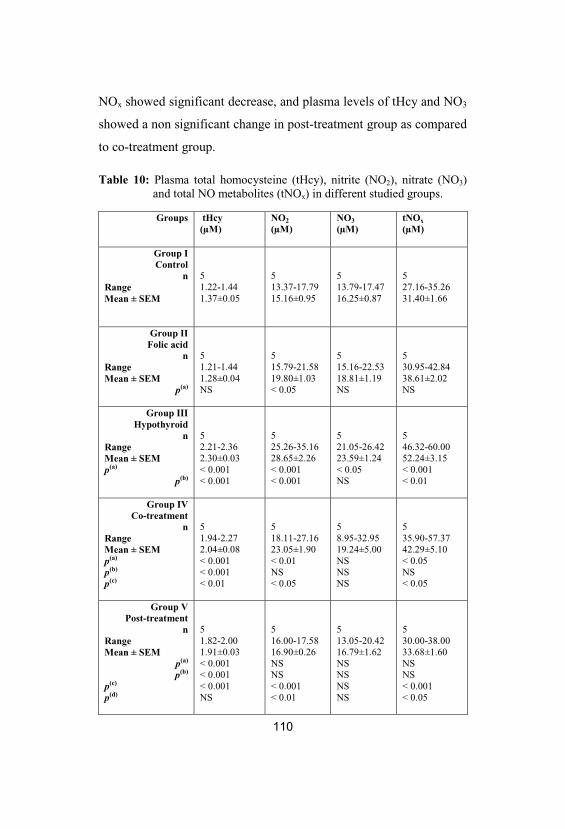
110
NOx showed significant decrease, and plasma levels of tHcy and NO3
showed a non significant change in post-treatment group as compared
to co-treatment group.
Table 10: Plasma total homocysteine (tHcy), nitrite (NO2), nitrate (NO3)and total NO metabolites (tNOx) in different studied groups.
Groups tHcy(µM)
NO2
(µM)NO3
(µM)tNOx
(µM)
Group IControl
nRangeMean ± SEM
51.22-1.441.37±0.05
513.37-17.7915.16±0.95
513.79-17.4716.25±0.87
527.16-35.2631.40±1.66
Group IIFolic acid
nRangeMean ± SEM
p(a)
51.21-1.441.28±0.04NS
515.79-21.5819.80±1.03< 0.05
515.16-22.5318.81±1.19NS
530.95-42.8438.61±2.02NS
Group IIIHypothyroid
nRangeMean ± SEMp(a)
p(b)
52.21-2.362.30±0.03< 0.001< 0.001
525.26-35.1628.65±2.26< 0.001< 0.001
521.05-26.4223.59±1.24< 0.05NS
546.32-60.0052.24±3.15< 0.001< 0.01
Group IVCo-treatment
nRangeMean ± SEMp(a)
p(b)
p(c)
51.94-2.272.04±0.08< 0.001< 0.001< 0.01
518.11-27.1623.05±1.90< 0.01NS< 0.05
58.95-32.9519.24±5.00NSNSNS
535.90-57.3742.29±5.10< 0.05NS< 0.05
Group VPost-treatment
nRangeMean ± SEM
p(a)
p(b)
p(c)
p(d)
51.82-2.001.91±0.03< 0.001< 0.001< 0.001NS
516.00-17.5816.90±0.26NSNS< 0.001< 0.01
513.05-20.4216.79±1.62NSNSNSNS
530.00-38.0033.68±1.60NSNS< 0.001< 0.05

111
p(a) = value vs. control group (I). p(b) = value vs. folic acid group (II). p(c) =value vs. hypothyroid group (III). p(d) =value vs. co-treatment group (IV).
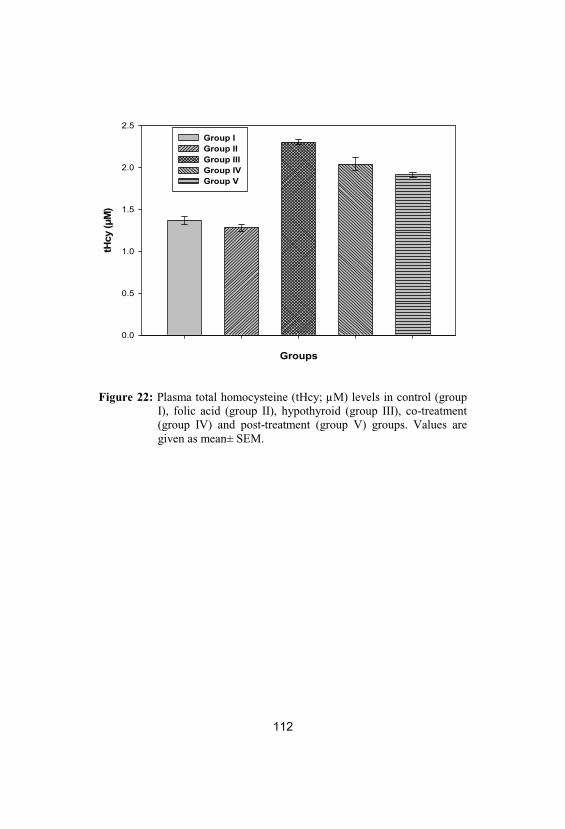
112
Groups
tHcy
(μM
)
0.0
0.5
1.0
1.5
2.0
2.5Group IGroup IIGroup IIIGroup IVGroup V
Figure 22: Plasma total homocysteine (tHcy; µM) levels in control (groupI), folic acid (group II), hypothyroid (group III), co-treatment(group IV) and post-treatment (group V) groups. Values aregiven as mean± SEM.
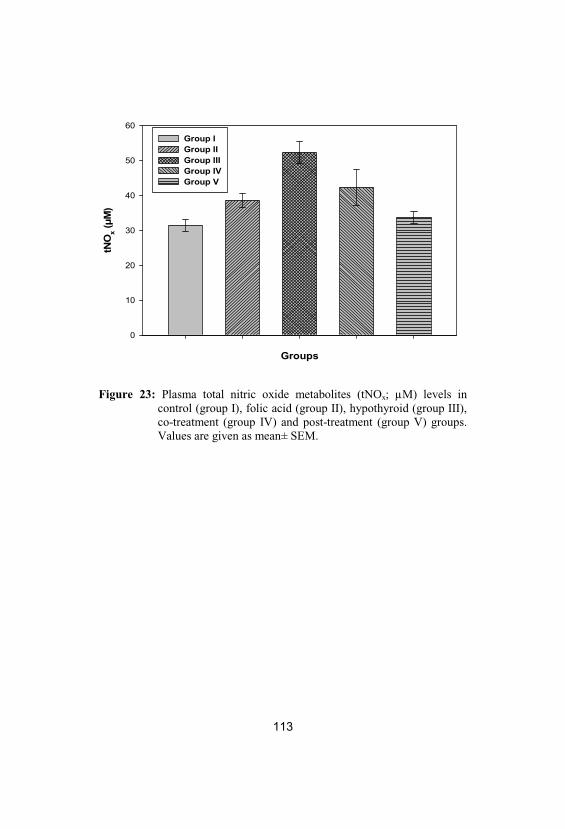
113
Groups
tNO
x(μ
M)
0
10
20
30
40
50
60Group IGroup IIGroup IIIGroup IVGroup V
Figure 23: Plasma total nitric oxide metabolites (tNOx; µM) levels incontrol (group I), folic acid (group II), hypothyroid (group III), co-treatment (group IV) and post-treatment (group V) groups. Values are given as mean± SEM.
114
In Table 11 and Fig. 24, there was a non significant
difference between control and folic acid groups (group I, II) as
regard plasma and testicular MDA levels. There was also significant
increase in plasma and testicular MDA levels in hypothyroid group
(group III) as compared to control and folic acid groups. On the other
hand, plasma and testicular MDA levels showed significant increases
and non significant changes respectively in co-treatment group
(group IV) as compared to control and folic acid groups. In addition,
plasma and testicular MDA levels showed significant decrease in co-
treatment group as compared to hypothyroid group.
Moreover, plasma and testicular MDA levels showed
significant increase in post-treatment group (group V) as compared to
control and folic acid groups except for testicular MDA level which
showed a non significant change as compared to folic acid group.
Meanwhile, plasma and testicular MDA levels showed significant
decrease in post-treatment group (group V) as compared to
hypothyroid group (group III). Additionally, plasma and testicular
MDA levels showed significant increase and non significant change
respectively in post-treatment group (group V) as compared to co-
treatment group (group IV).
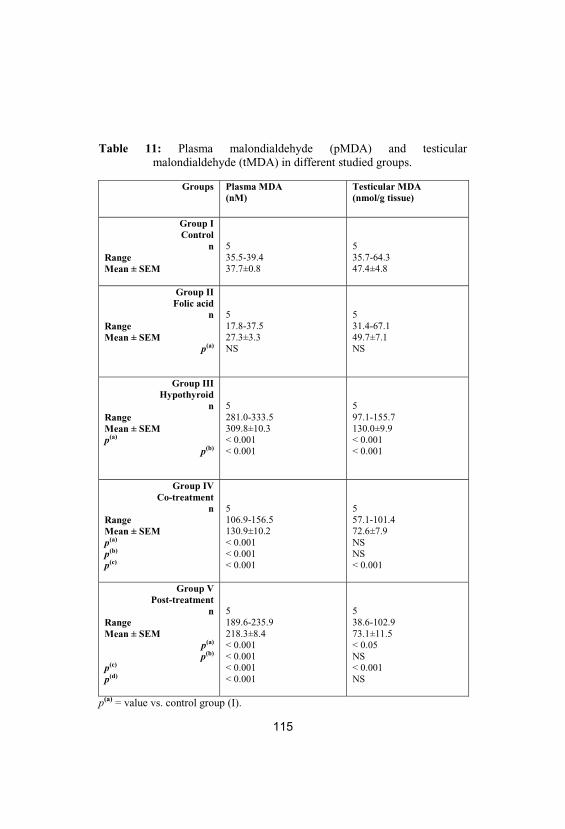
115
Table 11: Plasma malondialdehyde (pMDA) and testicularmalondialdehyde (tMDA) in different studied groups.
Groups Plasma MDA(nM)
Testicular MDA(nmol/g tissue)
Group IControl
nRangeMean ± SEM
535.5-39.437.7±0.8
535.7-64.347.4±4.8
Group IIFolic acid
nRangeMean ± SEM
p(a)
517.8-37.527.3±3.3NS
531.4-67.149.7±7.1NS
Group IIIHypothyroid
nRangeMean ± SEMp(a)
p(b)
5281.0-333.5309.8±10.3< 0.001< 0.001
597.1-155.7130.0±9.9< 0.001< 0.001
Group IVCo-treatment
nRangeMean ± SEMp(a)
p(b)
p(c)
5106.9-156.5130.9±10.2< 0.001< 0.001< 0.001
557.1-101.472.6±7.9NSNS< 0.001
Group VPost-treatment
nRangeMean ± SEM
p(a)
p(b)
p(c)
p(d)
5189.6-235.9218.3±8.4< 0.001< 0.001< 0.001< 0.001
538.6-102.973.1±11.5< 0.05NS< 0.001NS
p(a) = value vs. control group (I).
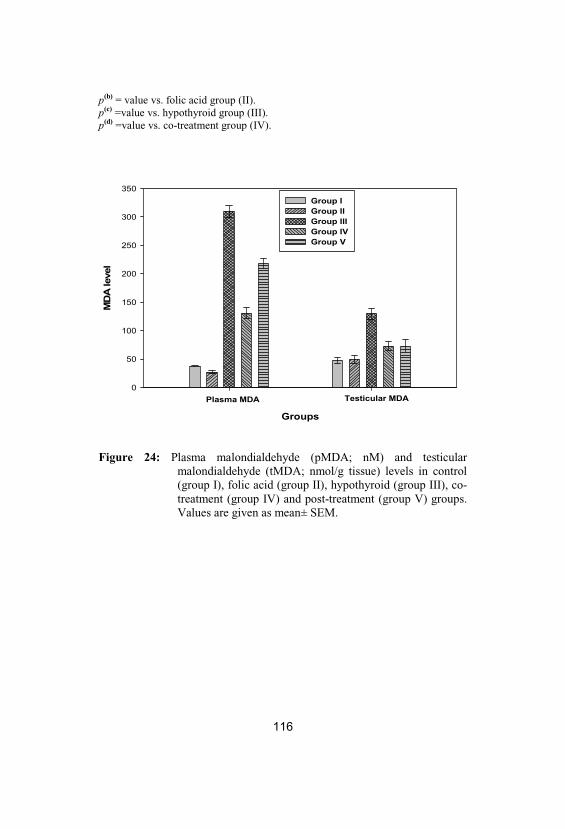
116
p(b) = value vs. folic acid group (II). p(c) =value vs. hypothyroid group (III). p(d) =value vs. co-treatment group (IV).
Groups
MD
A le
vel
0
50
100
150
200
250
300
350Group IGroup IIGroup IIIGroup IVGroup V
Plasma MDA Testicular MDA
Figure 24: Plasma malondialdehyde (pMDA; nM) and testicularmalondialdehyde (tMDA; nmol/g tissue) levels in control(group I), folic acid (group II), hypothyroid (group III), co-treatment (group IV) and post-treatment (group V) groups. Values are given as mean± SEM.
117
The results shown in Table 12 and Fig. 25 revealed that
plasma GSH and GSSG/GSH ratio had significant decrease and
increase respectively in folic acid group (group II) as compared to
control group. Besides, plasma GSSG and testicular FRAP (testicular
FRAP) in folic acid group showed a non significant change as
compared to the control group.
In hypothyroid group (group III), plasma GSSG and
GSSG/GSH ratio showed significant increase as compared to the
control group. Meanwhile, plasma GSH and testicular FRAP showed
a non significant change and significant decrease respectively as
compared to control group. Also, while plasma GSSG, GSSG/GSH
ratio and testicular FRAP showed a non significant change, plasma
GSH level showed significant increase in hypothyroid group as
compared to folic acid group.
On the other hand, in co-treatment group (group IV), plasma
GSH, GSSG, GSSG/GSH ratio and testicular FRAP showed a non
significant change as compared to control and folic acid groups
except for plasma GSH and GSSG/GSH ratio which showed
significant decrease and increase respectively as compared to control
group. In comparison to hypothyroid group, while plasma GSSG,
GSSG/GSH ratio and testicular FRAP showed a non significant
change, plasma GSH showed significant decrease in co-treatment
group (group IV).
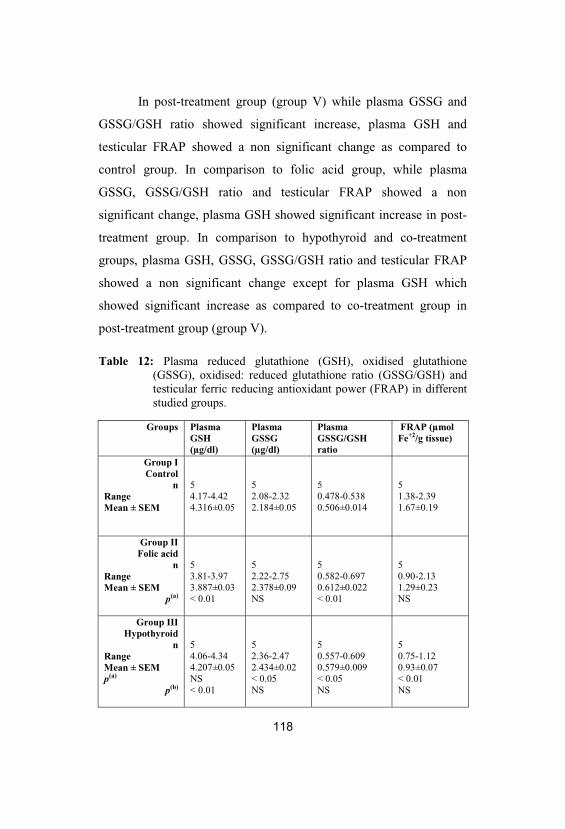
118
In post-treatment group (group V) while plasma GSSG and
GSSG/GSH ratio showed significant increase, plasma GSH and
testicular FRAP showed a non significant change as compared to
control group. In comparison to folic acid group, while plasma
GSSG, GSSG/GSH ratio and testicular FRAP showed a non
significant change, plasma GSH showed significant increase in post-
treatment group. In comparison to hypothyroid and co-treatment
groups, plasma GSH, GSSG, GSSG/GSH ratio and testicular FRAP
showed a non significant change except for plasma GSH which
showed significant increase as compared to co-treatment group in
post-treatment group (group V).
Table 12: Plasma reduced glutathione (GSH), oxidised glutathione(GSSG), oxidised: reduced glutathione ratio (GSSG/GSH) andtesticular ferric reducing antioxidant power (FRAP) in differentstudied groups.
FRAP (µmolFe+2/g tissue)
PlasmaGSSG/GSHratio
PlasmaGSSG(µg/dl)
PlasmaGSH(µg/dl)
Groups
51.38-2.391.67±0.19
50.478-0.5380.506±0.014
52.08-2.322.184±0.05
54.17-4.424.316±0.05
Group IControl
nRangeMean ± SEM
50.90-2.131.29±0.23NS
50.582-0.6970.612±0.022< 0.01
52.22-2.752.378±0.09NS
53.81-3.973.887±0.03< 0.01
Group IIFolic acid
nRangeMean ± SEM
p(a)
50.75-1.120.93±0.07< 0.01NS
50.557-0.6090.579±0.009< 0.05NS
52.36-2.472.434±0.02< 0.05NS
54.06-4.344.207±0.05NS< 0.01
Group IIIHypothyroid
nRangeMean ± SEMp(a)
p(b)
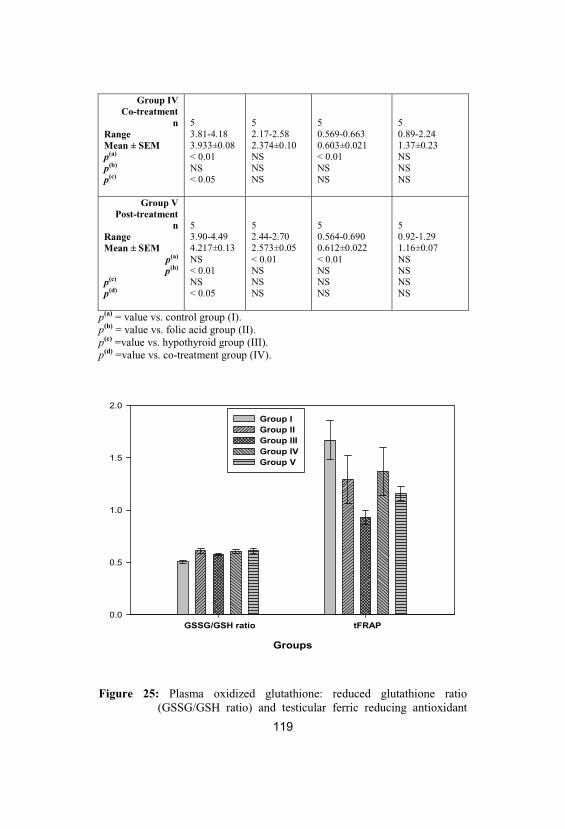
119
50.89-2.241.37±0.23NSNSNS
50.569-0.6630.603±0.021< 0.01NSNS
52.17-2.582.374±0.10NSNSNS
53.81-4.183.933±0.08< 0.01NS< 0.05
Group IVCo-treatment
nRangeMean ± SEMp(a)
p(b)
p(c)
50.92-1.291.16±0.07NSNSNSNS
50.564-0.6900.612±0.022< 0.01NSNSNS
52.44-2.702.573±0.05< 0.01NSNSNS
53.90-4.494.217±0.13NS< 0.01NS< 0.05
Group VPost-treatment
nRangeMean ± SEM
p(a)
p(b)
p(c)
p(d)
p(a) = value vs. control group (I). p(b) = value vs. folic acid group (II). p(c) =value vs. hypothyroid group (III). p(d) =value vs. co-treatment group (IV).
Groups
0.0
0.5
1.0
1.5
2.0Group IGroup IIGroup IIIGroup IVGroup V
GSSG/GSH ratio tFRAP
Figure 25: Plasma oxidized glutathione: reduced glutathione ratio(GSSG/GSH ratio) and testicular ferric reducing antioxidant
120
power (tFRAP; µmol Fe+2/g tissue) levels in control (group I), folic acid (group II), hypothyroid (group III), co-treatment(group IV) and post-treatment (group V) groups. Values aregiven as mean± SEM.
Data in Table 13 and Figs. 26 & 27 showed that while
plasma testosterone and sperm count exhibited non significant
change, sperm motility exhibited significant increase in folic acid
group as compared to control group. Also, there was significant
decrease in plasma testosterone, sperm count and sperm motility in
hypothyroid group as compared to control and folic acid groups.
Plasma testosterone and sperm motility showed significant decrease
and sperm count showed a non significant change in co-treatment
group as compared to control and folic acid groups.
Moreover, in comparison to hypothyroid group, while sperm
count and motility showed significant increase, plasma testosterone
level showed a non significant change in co-treatment group. In post-
treatment group, while plasma testosterone level showed significant
decrease as compared to control and folic acid groups, its level
showed a non significant change as compared to hypothyroid and co-
treatment groups (group III, IV). On the other hand, sperm count
showed significant increase in post-treatment group as compared to
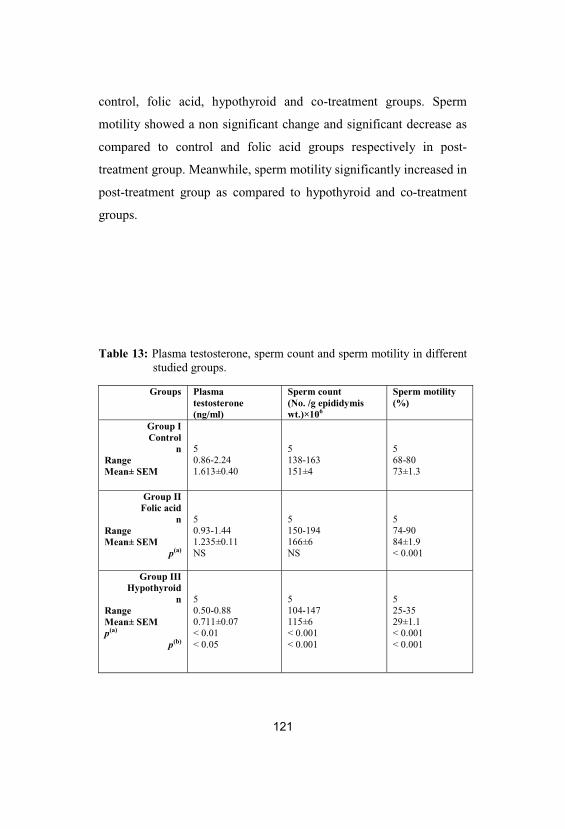
121
control, folic acid, hypothyroid and co-treatment groups. Sperm
motility showed a non significant change and significant decrease as
compared to control and folic acid groups respectively in post-
treatment group. Meanwhile, sperm motility significantly increased in
post-treatment group as compared to hypothyroid and co-treatment
groups.
Table 13: Plasma testosterone, sperm count and sperm motility in differentstudied groups.
Groups Plasmatestosterone(ng/ml)
Sperm count (No. /g epididymiswt.)×106
Sperm motility(%)
Group IControl
nRangeMean± SEM
50.86-2.241.613±0.40
5138-163151±4
568-8073±1.3
Group IIFolic acid
nRangeMean± SEM
p(a)
50.93-1.441.235±0.11NS
5150-194166±6NS
574-9084±1.9< 0.001
Group IIIHypothyroid
nRangeMean± SEMp(a)
p(b)
50.50-0.880.711±0.07< 0.01< 0.05
5104-147115±6< 0.001< 0.001
525-3529±1.1< 0.001< 0.001
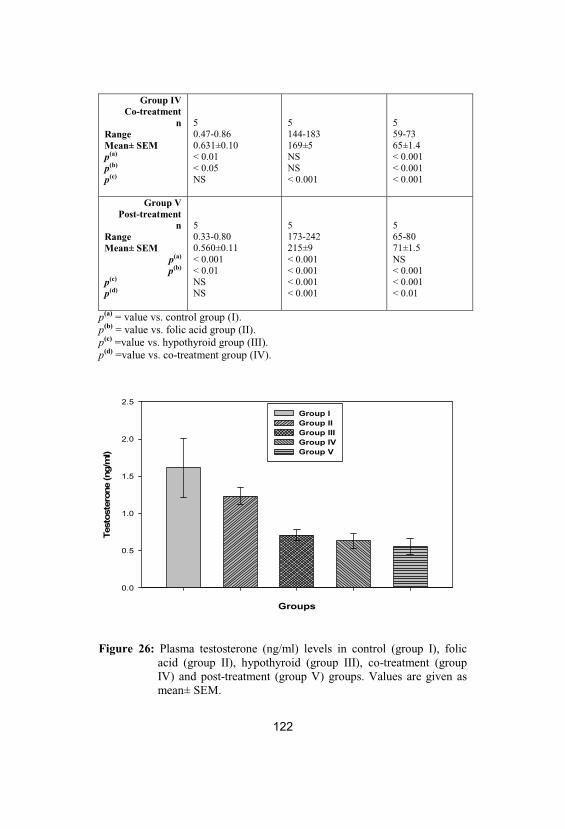
122
Group IVCo-treatment
nRangeMean± SEMp(a)
p(b)
p(c)
50.47-0.860.631±0.10< 0.01< 0.05NS
5144-183169±5NSNS< 0.001
559-7365±1.4< 0.001< 0.001< 0.001
Group VPost-treatment
nRangeMean± SEM
p(a)
p(b)
p(c)
p(d)
50.33-0.800.560±0.11< 0.001< 0.01NSNS
5173-242215±9< 0.001< 0.001< 0.001< 0.001
565-8071±1.5NS< 0.001< 0.001< 0.01
p(a) = value vs. control group (I). p(b) = value vs. folic acid group (II). p(c) =value vs. hypothyroid group (III). p(d) =value vs. co-treatment group (IV).
Groups
Test
oste
rone
(ng/
ml)
0.0
0.5
1.0
1.5
2.0
2.5Group IGroup IIGroup IIIGroup IVGroup V
Figure 26: Plasma testosterone (ng/ml) levels in control (group I), folicacid (group II), hypothyroid (group III), co-treatment (groupIV) and post-treatment (group V) groups. Values are given asmean± SEM.
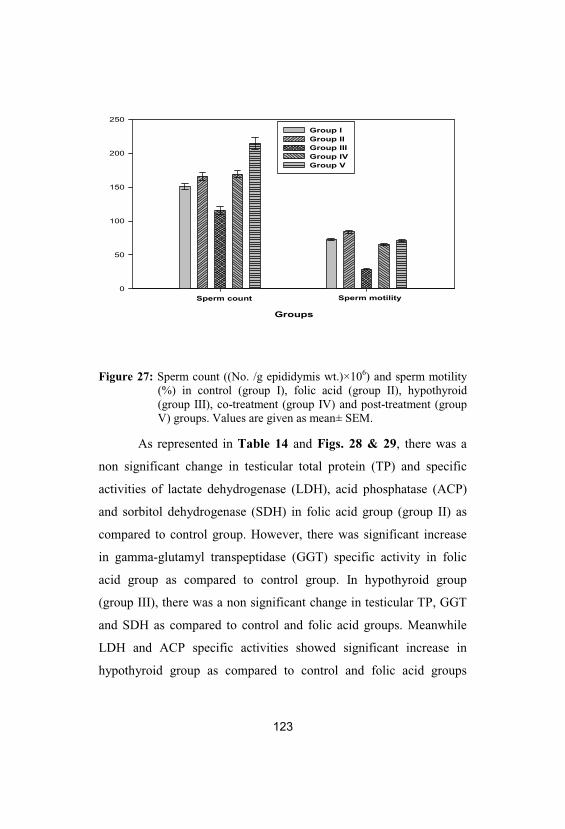
123
Groups
0
50
100
150
200
250Group IGroup IIGroup IIIGroup IVGroup V
Sperm count Sperm motility
Figure 27: Sperm count ((No. /g epididymis wt.)×106) and sperm motility(%) in control (group I), folic acid (group II), hypothyroid(group III), co-treatment (group IV) and post-treatment (groupV) groups. Values are given as mean± SEM.
As represented in Table 14 and Figs. 28 & 29, there was a
non significant change in testicular total protein (TP) and specific
activities of lactate dehydrogenase (LDH), acid phosphatase (ACP)
and sorbitol dehydrogenase (SDH) in folic acid group (group II) as
compared to control group. However, there was significant increase
in gamma-glutamyl transpeptidase (GGT) specific activity in folic
acid group as compared to control group. In hypothyroid group
(group III), there was a non significant change in testicular TP, GGT
and SDH as compared to control and folic acid groups. Meanwhile
LDH and ACP specific activities showed significant increase in
hypothyroid group as compared to control and folic acid groups
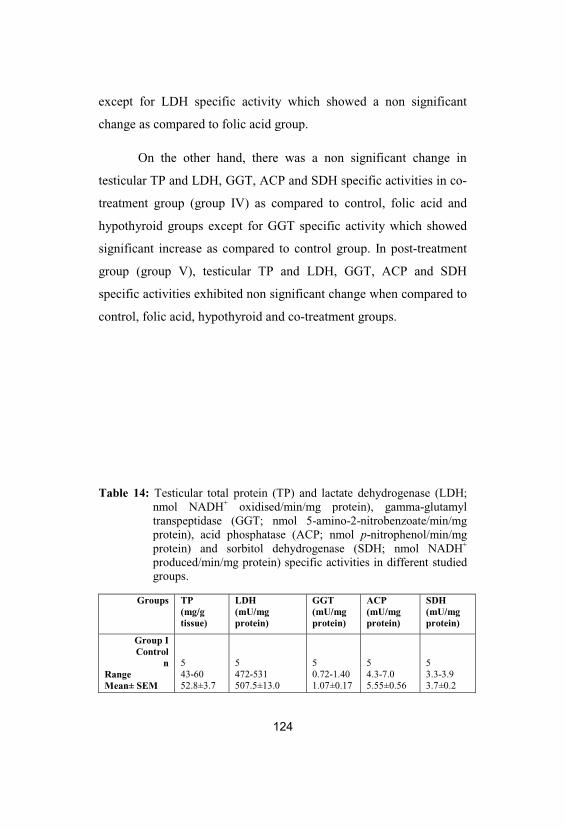
124
except for LDH specific activity which showed a non significant
change as compared to folic acid group.
On the other hand, there was a non significant change in
testicular TP and LDH, GGT, ACP and SDH specific activities in co-
treatment group (group IV) as compared to control, folic acid and
hypothyroid groups except for GGT specific activity which showed
significant increase as compared to control group. In post-treatment
group (group V), testicular TP and LDH, GGT, ACP and SDH
specific activities exhibited non significant change when compared to
control, folic acid, hypothyroid and co-treatment groups.
Table 14: Testicular total protein (TP) and lactate dehydrogenase (LDH;nmol NADH+ oxidised/min/mg protein), gamma-glutamyltranspeptidase (GGT; nmol 5-amino-2-nitrobenzoate/min/mgprotein), acid phosphatase (ACP; nmol p-nitrophenol/min/mgprotein) and sorbitol dehydrogenase (SDH; nmol NADH+
produced/min/mg protein) specific activities in different studiedgroups.
Groups TP (mg/gtissue)
LDH(mU/mgprotein)
GGT(mU/mgprotein)
ACP(mU/mgprotein)
SDH(mU/mgprotein)
Group IControl
nRangeMean± SEM
543-6052.8±3.7
5472-531507.5±13.0
50.72-1.401.07±0.17
54.3-7.05.55±0.56
53.3-3.93.7±0.2
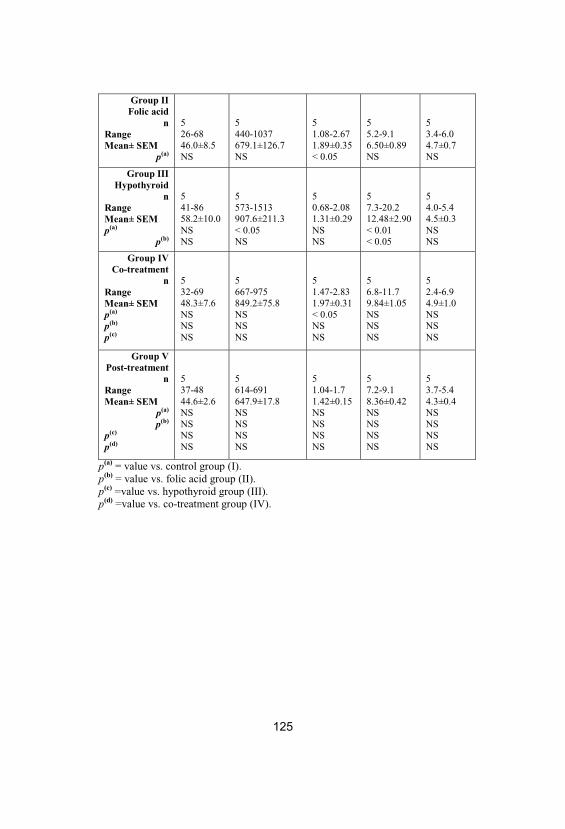
125
Group IIFolic acid
nRangeMean± SEM
p(a)
526-6846.0±8.5NS
5440-1037679.1±126.7NS
51.08-2.671.89±0.35< 0.05
55.2-9.16.50±0.89NS
53.4-6.04.7±0.7NS
Group IIIHypothyroid
nRangeMean± SEMp(a)
p(b)
541-8658.2±10.0NSNS
5573-1513907.6±211.3< 0.05NS
50.68-2.081.31±0.29NSNS
57.3-20.212.48±2.90< 0.01< 0.05
54.0-5.44.5±0.3NSNS
Group IVCo-treatment
nRangeMean± SEMp(a)
p(b)
p(c)
532-6948.3±7.6NSNSNS
5667-975849.2±75.8NSNSNS
51.47-2.831.97±0.31< 0.05NSNS
56.8-11.79.84±1.05NSNSNS
52.4-6.94.9±1.0NSNSNS
Group VPost-treatment
nRangeMean± SEM
p(a)
p(b)
p(c)
p(d)
537-4844.6±2.6NSNSNSNS
5614-691647.9±17.8NSNSNSNS
51.04-1.71.42±0.15NSNSNSNS
57.2-9.18.36±0.42NSNSNSNS
53.7-5.44.3±0.4NSNSNSNS
p(a) = value vs. control group (I). p(b) = value vs. folic acid group (II). p(c) =value vs. hypothyroid group (III). p(d) =value vs. co-treatment group (IV).
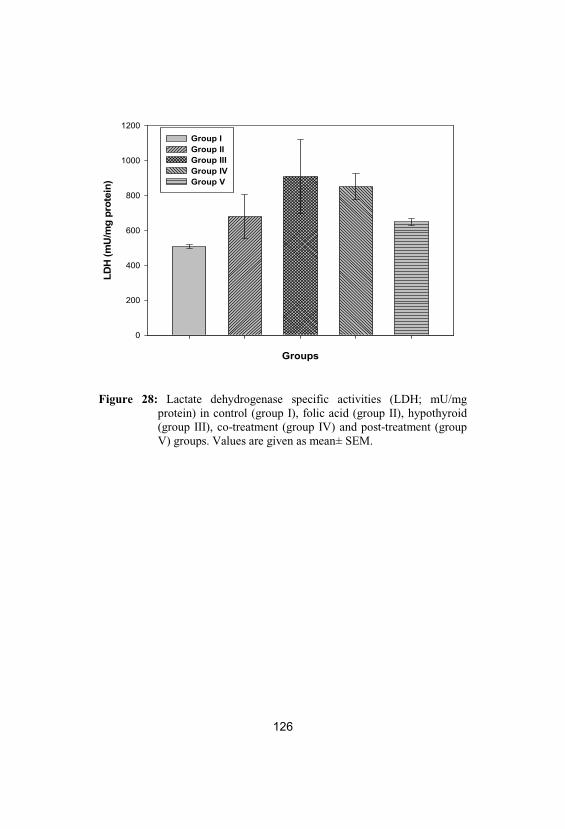
126
Groups
LDH
(mU
/mg
prot
ein)
0
200
400
600
800
1000
1200Group IGroup IIGroup IIIGroup IVGroup V
Figure 28: Lactate dehydrogenase specific activities (LDH; mU/mgprotein) in control (group I), folic acid (group II), hypothyroid(group III), co-treatment (group IV) and post-treatment (groupV) groups. Values are given as mean± SEM.
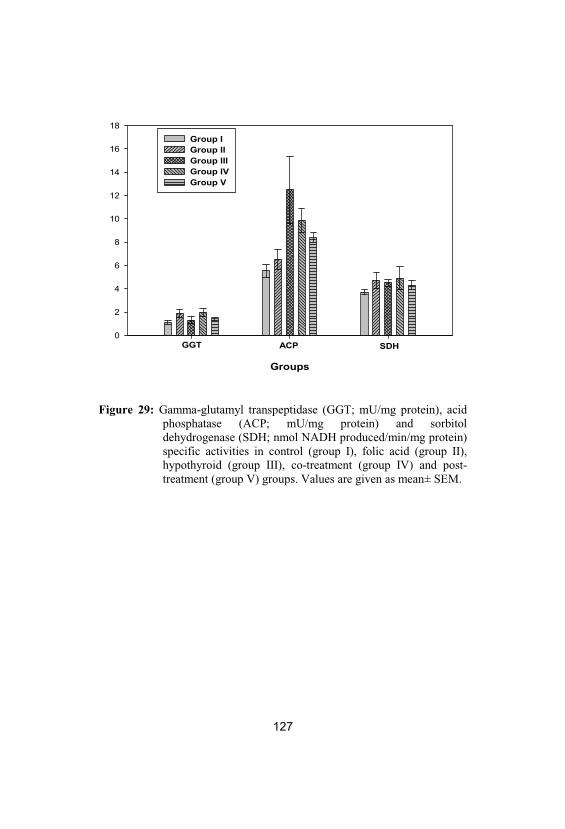
127
Groups
0
2
4
6
8
10
12
14
16
18Group IGroup IIGroup IIIGroup IVGroup V
GGT ACP SDH
Figure 29: Gamma-glutamyl transpeptidase (GGT; mU/mg protein), acidphosphatase (ACP; mU/mg protein) and sorbitoldehydrogenase (SDH; nmol NADH produced/min/mg protein)specific activities in control (group I), folic acid (group II), hypothyroid (group III), co-treatment (group IV) and post-treatment (group V) groups. Values are given as mean± SEM.
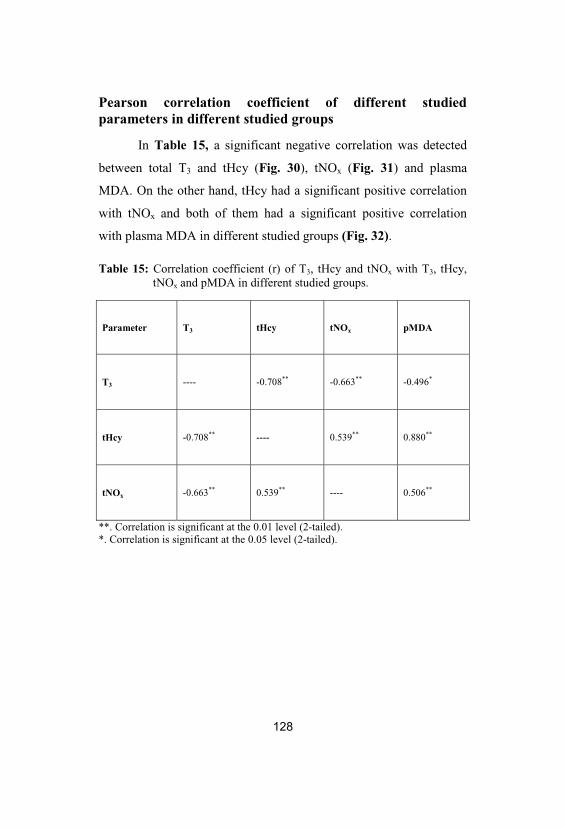
128
Pearson correlation coefficient of different studiedparameters in different studied groups
In Table 15, a significant negative correlation was detected
between total T3 and tHcy (Fig. 30), tNOx (Fig. 31) and plasma
MDA. On the other hand, tHcy had a significant positive correlation
with tNOx and both of them had a significant positive correlation
with plasma MDA in different studied groups (Fig. 32).
Table 15: Correlation coefficient (r) of T3, tHcy and tNOx with T3, tHcy, tNOx and pMDA in different studied groups.
Parameter T3 tHcy tNOx pMDA
T3 ---- -0.708** -0.663** -0.496*
tHcy -0.708** ---- 0.539** 0.880**
tNOx -0.663** 0.539** ---- 0.506**
**. Correlation is significant at the 0.01 level (2-tailed). *. Correlation is significant at the 0.05 level (2-tailed).
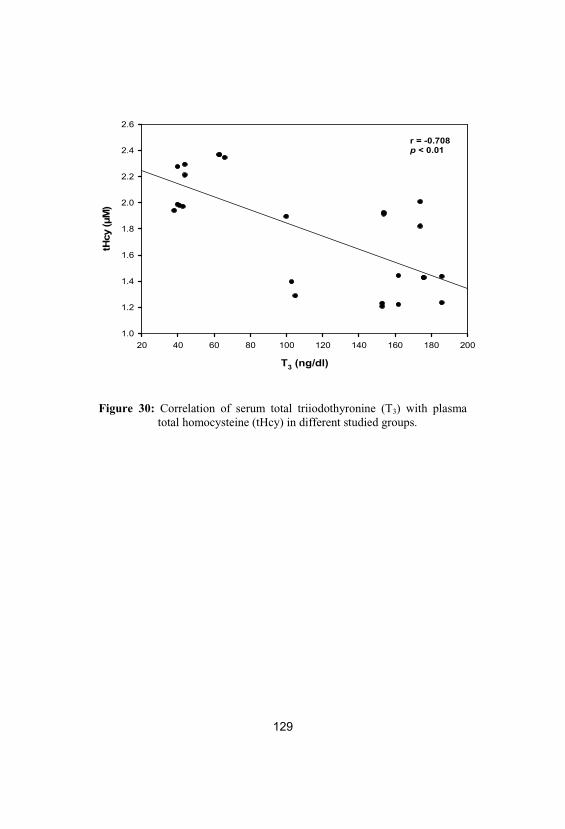
129
T3 (ng/dl)
20 40 60 80 100 120 140 160 180 200
tHcy
(μM
)
1.0
1.2
1.4
1.6
1.8
2.0
2.2
2.4
2.6
r = -0.708p < 0.01
Figure 30: Correlation of serum total triiodothyronine (T3) with plasmatotal homocysteine (tHcy) in different studied groups.
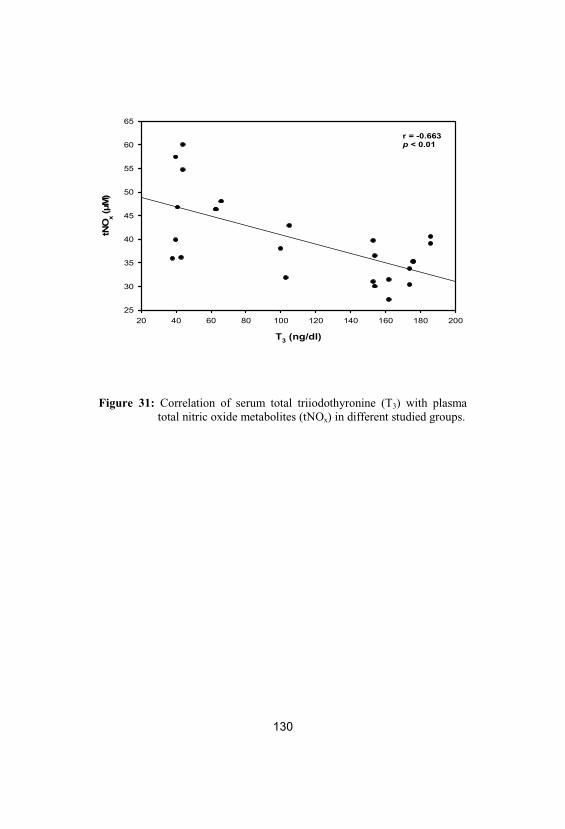
130
T3 (ng/dl)
20 40 60 80 100 120 140 160 180 200
tNO
x(μ
M)
25
30
35
40
45
50
55
60
65
r = -0.663p < 0.01
Figure 31: Correlation of serum total triiodothyronine (T3) with plasmatotal nitric oxide metabolites (tNOx) in different studied groups.
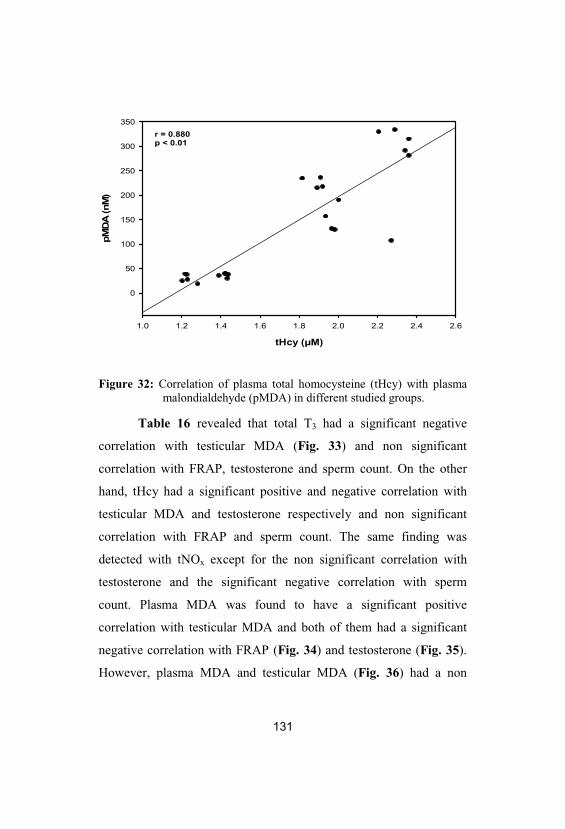
131
tHcy (μM)
1.0 1.2 1.4 1.6 1.8 2.0 2.2 2.4 2.6
pMD
A(n
M)
0
50
100
150
200
250
300
350r = 0.880p < 0.01
Figure 32: Correlation of plasma total homocysteine (tHcy) with plasmamalondialdehyde (pMDA) in different studied groups.
Table 16 revealed that total T3 had a significant negative
correlation with testicular MDA (Fig. 33) and non significant
correlation with FRAP, testosterone and sperm count. On the other
hand, tHcy had a significant positive and negative correlation with
testicular MDA and testosterone respectively and non significant
correlation with FRAP and sperm count. The same finding was
detected with tNOx except for the non significant correlation with
testosterone and the significant negative correlation with sperm
count. Plasma MDA was found to have a significant positive
correlation with testicular MDA and both of them had a significant
negative correlation with FRAP (Fig. 34) and testosterone (Fig. 35).
However, plasma MDA and testicular MDA (Fig. 36) had a non
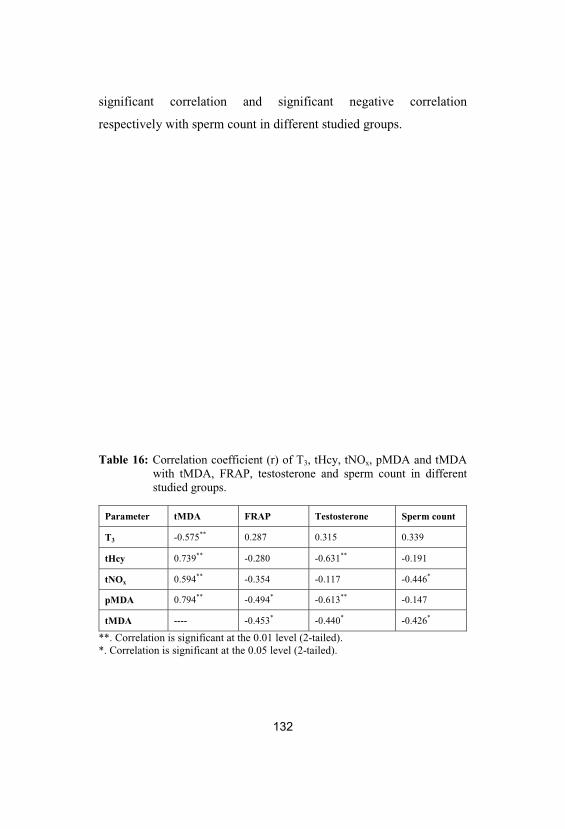
132
significant correlation and significant negative correlation
respectively with sperm count in different studied groups.
Table 16: Correlation coefficient (r) of T3, tHcy, tNOx, pMDA and tMDAwith tMDA, FRAP, testosterone and sperm count in differentstudied groups.
Parameter tMDA FRAP Testosterone Sperm count
T3 -0.575** 0.287 0.315 0.339
tHcy 0.739** -0.280 -0.631** -0.191
tNOx 0.594** -0.354 -0.117 -0.446*
pMDA 0.794** -0.494* -0.613** -0.147
tMDA ---- -0.453* -0.440* -0.426*
**. Correlation is significant at the 0.01 level (2-tailed). *. Correlation is significant at the 0.05 level (2-tailed).
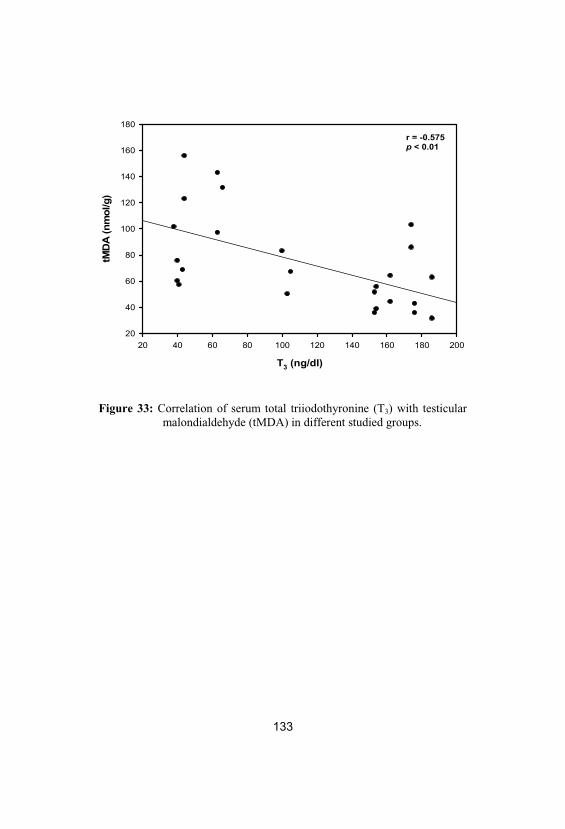
133
T3 (ng/dl)
20 40 60 80 100 120 140 160 180 200
tMD
A(n
mol
/g)
20
40
60
80
100
120
140
160
180r = -0.575p < 0.01
Figure 33: Correlation of serum total triiodothyronine (T3) with testicularmalondialdehyde (tMDA) in different studied groups.
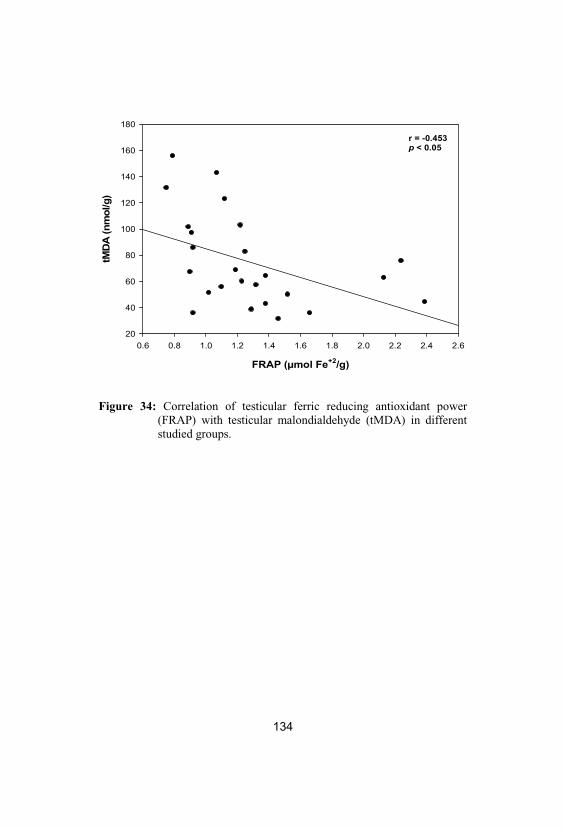
134
FRAP (μmol Fe+2/g)
0.6 0.8 1.0 1.2 1.4 1.6 1.8 2.0 2.2 2.4 2.6
tMD
A(n
mol
/g)
20
40
60
80
100
120
140
160
180
r = -0.453p < 0.05
Figure 34: Correlation of testicular ferric reducing antioxidant power(FRAP) with testicular malondialdehyde (tMDA) in differentstudied groups.
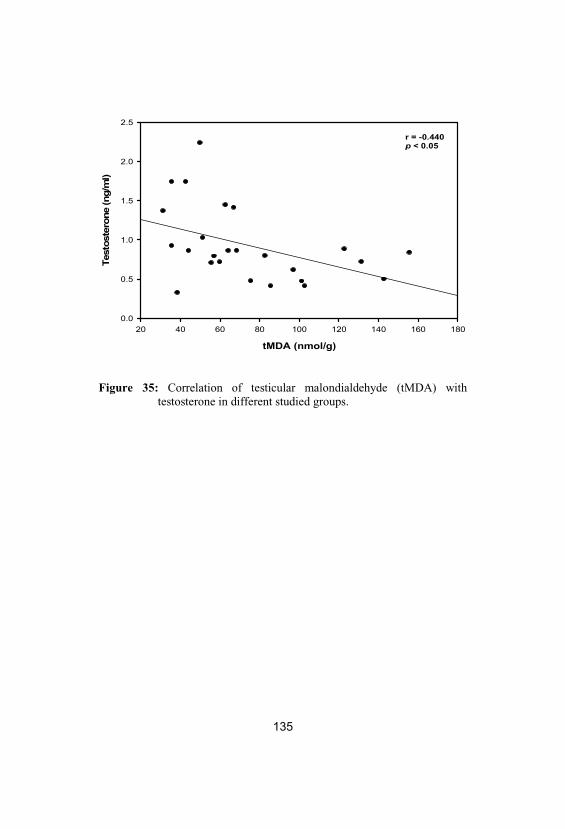
135
tMDA (nmol/g)
20 40 60 80 100 120 140 160 180
Test
oste
rone
(ng/
ml)
0.0
0.5
1.0
1.5
2.0
2.5
r = -0.440p < 0.05
Figure 35: Correlation of testicular malondialdehyde (tMDA) withtestosterone in different studied groups.
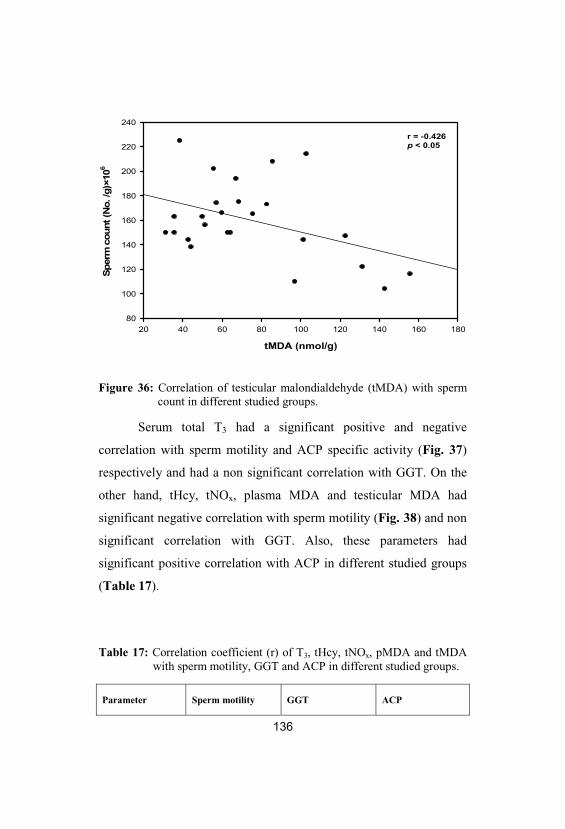
136
tMDA (nmol/g)
20 40 60 80 100 120 140 160 180
Sper
mco
unt(
No.
/g)×
106
80
100
120
140
160
180
200
220
240
r = -0.426p < 0.05
Figure 36: Correlation of testicular malondialdehyde (tMDA) with spermcount in different studied groups.
Serum total T3 had a significant positive and negative
correlation with sperm motility and ACP specific activity (Fig. 37)
respectively and had a non significant correlation with GGT. On the
other hand, tHcy, tNOx, plasma MDA and testicular MDA had
significant negative correlation with sperm motility (Fig. 38) and non
significant correlation with GGT. Also, these parameters had
significant positive correlation with ACP in different studied groups
(Table 17).
Table 17: Correlation coefficient (r) of T3, tHcy, tNOx, pMDA and tMDAwith sperm motility, GGT and ACP in different studied groups.
Parameter Sperm motility GGT ACP
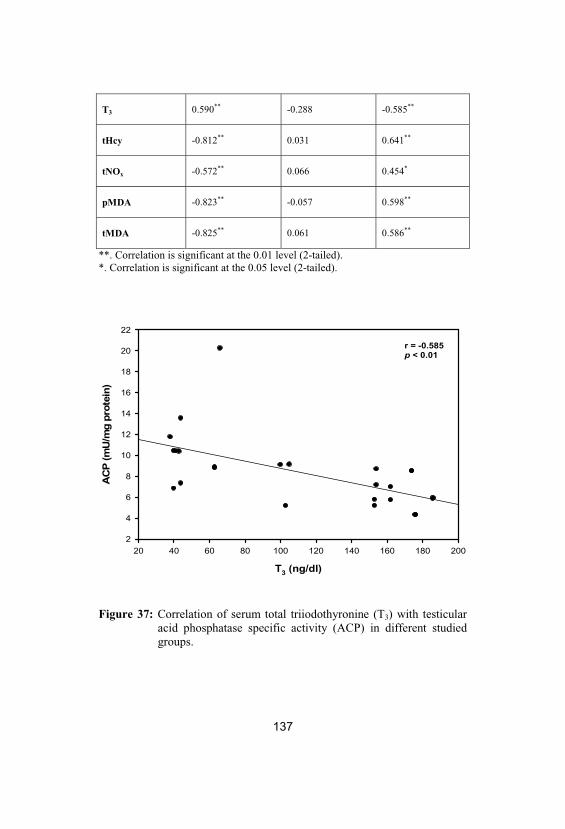
137
T3 0.590** -0.288 -0.585**
tHcy -0.812** 0.031 0.641**
tNOx -0.572** 0.066 0.454*
pMDA -0.823** -0.057 0.598**
tMDA -0.825** 0.061 0.586**
**. Correlation is significant at the 0.01 level (2-tailed). *. Correlation is significant at the 0.05 level (2-tailed).
T3 (ng/dl)
20 40 60 80 100 120 140 160 180 200
AC
P(m
U/m
gpr
otei
n)
2
4
6
8
10
12
14
16
18
20
22
r = -0.585p < 0.01
Figure 37: Correlation of serum total triiodothyronine (T3) with testicularacid phosphatase specific activity (ACP) in different studiedgroups.
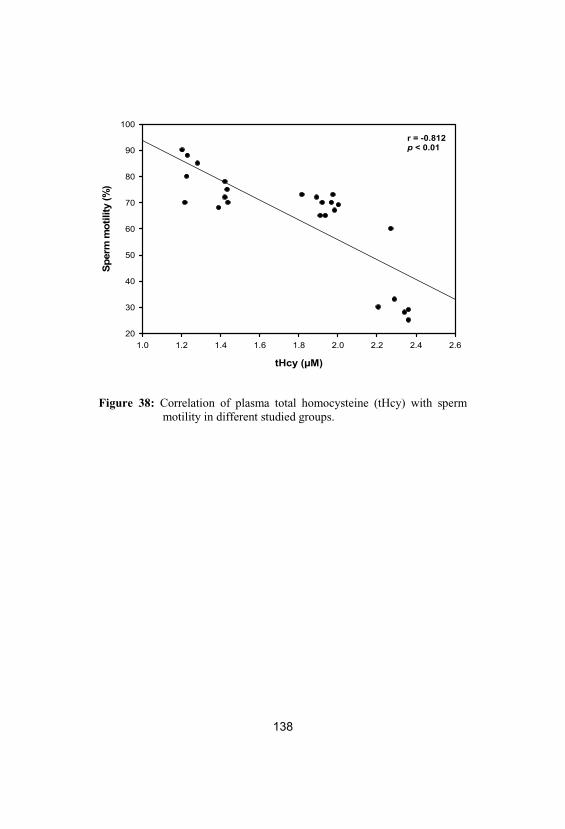
138
tHcy (μM)
1.0 1.2 1.4 1.6 1.8 2.0 2.2 2.4 2.6
Sper
mm
otili
ty(%
)
20
30
40
50
60
70
80
90
100
r = -0.812p < 0.01
Figure 38: Correlation of plasma total homocysteine (tHcy) with spermmotility in different studied groups.
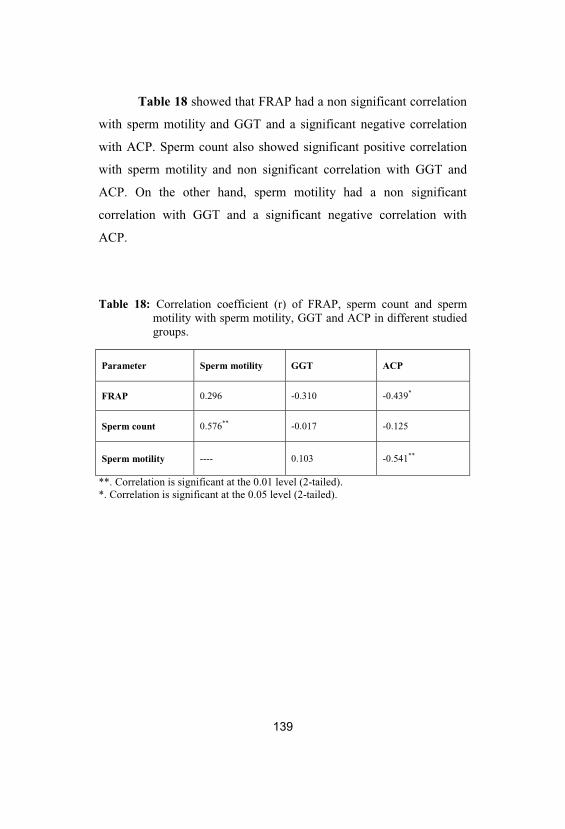
139
Table 18 showed that FRAP had a non significant correlation
with sperm motility and GGT and a significant negative correlation
with ACP. Sperm count also showed significant positive correlation
with sperm motility and non significant correlation with GGT and
ACP. On the other hand, sperm motility had a non significant
correlation with GGT and a significant negative correlation with
ACP.
Table 18: Correlation coefficient (r) of FRAP, sperm count and spermmotility with sperm motility, GGT and ACP in different studiedgroups.
Parameter Sperm motility GGT ACP
FRAP 0.296 -0.310 -0.439*
Sperm count 0.576** -0.017 -0.125
Sperm motility ---- 0.103 -0.541**
**. Correlation is significant at the 0.01 level (2-tailed). *. Correlation is significant at the 0.05 level (2-tailed).
140
Light Microscopic Examination
Histopathological study showed that cycle of spermatogenesis
was regular in all male rats in the control and folic acid groups (group
I, II) (Figs. 39-44). The structural components of the testis were the
seminiferous tubules and interstitial cells known as Leydig cells
(Figs. 41 & 43). Two types of cells were identified in rat
seminiferous tubules, the Sertoli cells and the spermatogenic cells.
Sertoli cells were found resting on the thin basal lamina (basement
membrane) while the spermatogenic cells were arranged in many
layers (spermatogonia, primary spermatocytes, secondary
spermatocytes, spermatids and sperms) (Figs. 40 & 41).
However, the light microscopy examination of the testes of
the hypothyroid group (group III) revealed a significant decrease in
the number of spermatogenic cells in the seminiferous tubules (Figs.
45-47). The seminiferous tubules had been thickened in basement
membrane together with focal areas of vacuolar degenerative changes
which appeared in the cytoplasm of the spermatogenic epithelium and
in the Sertoli cells (Figs. 46 & 47). Further, abnormal distribution of
spermatozoa was seen in the lumen of the seminiferous tubules and
little Leydig cell numbers were also found (Fig. 47). Marked
morphological changes such as degeneration of germinal epithelium
and sloughing of germ cells into the tubular lumen were also found in
the hypothyroid group (group III) (Fig. 45). A significant decrease in
primary spermatogonia and round spermatid number was recorded by
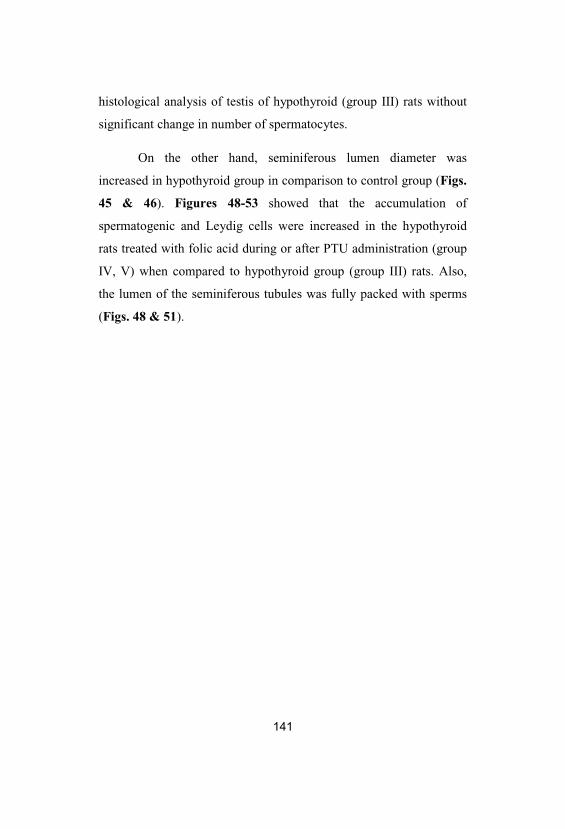
141
histological analysis of testis of hypothyroid (group III) rats without
significant change in number of spermatocytes.
On the other hand, seminiferous lumen diameter was
increased in hypothyroid group in comparison to control group (Figs.
45 & 46). Figures 48-53 showed that the accumulation of
spermatogenic and Leydig cells were increased in the hypothyroid
rats treated with folic acid during or after PTU administration (group
IV, V) when compared to hypothyroid group (group III) rats. Also,
the lumen of the seminiferous tubules was fully packed with sperms
(Figs. 48 & 51).
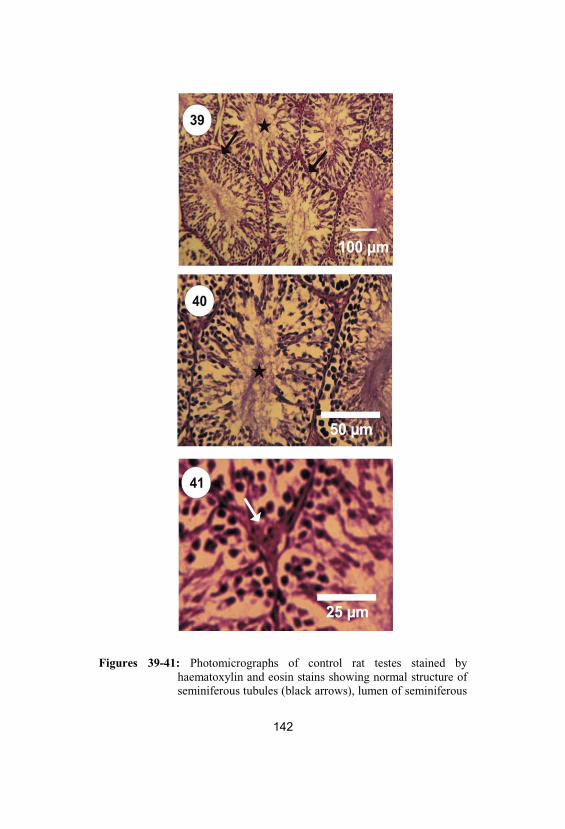
Figures 39-41: Photomicrographs of control rat testes stained byhaematoxylin and eosin stains showing normal structure ofseminiferous tubules (black arrows), lumen of seminiferous
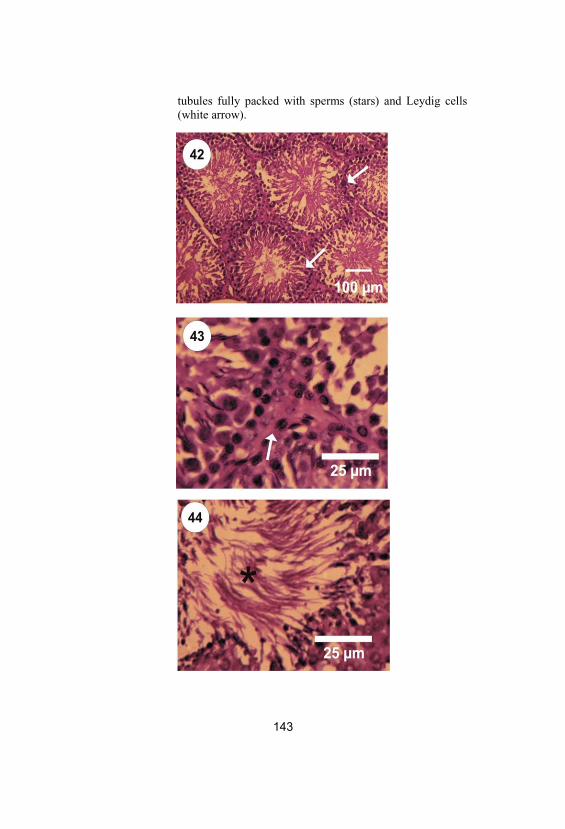
tubules fully packed with sperms (stars) and Leydig cells(white arrow).
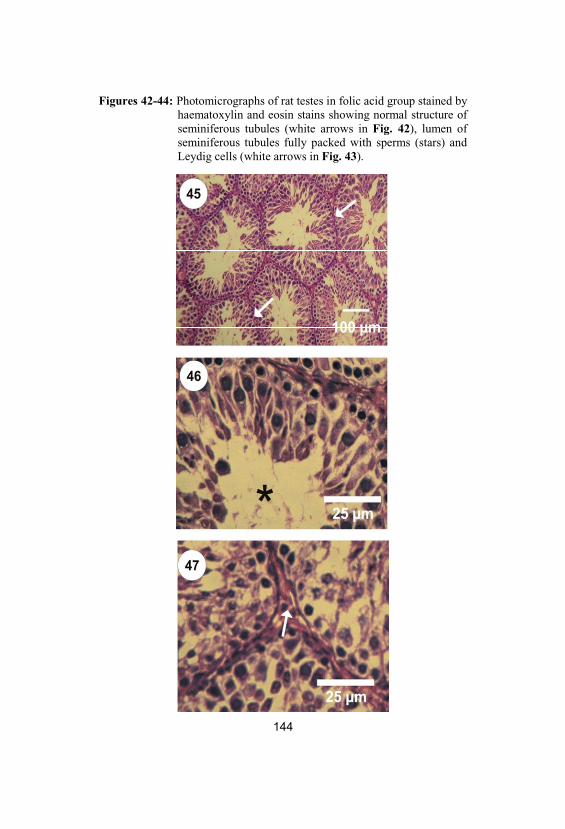
Figures 42-44: Photomicrographs of rat testes in folic acid group stained byhaematoxylin and eosin stains showing normal structure ofseminiferous tubules (white arrows in Fig. 42), lumen ofseminiferous tubules fully packed with sperms (stars) andLeydig cells (white arrows in Fig. 43).
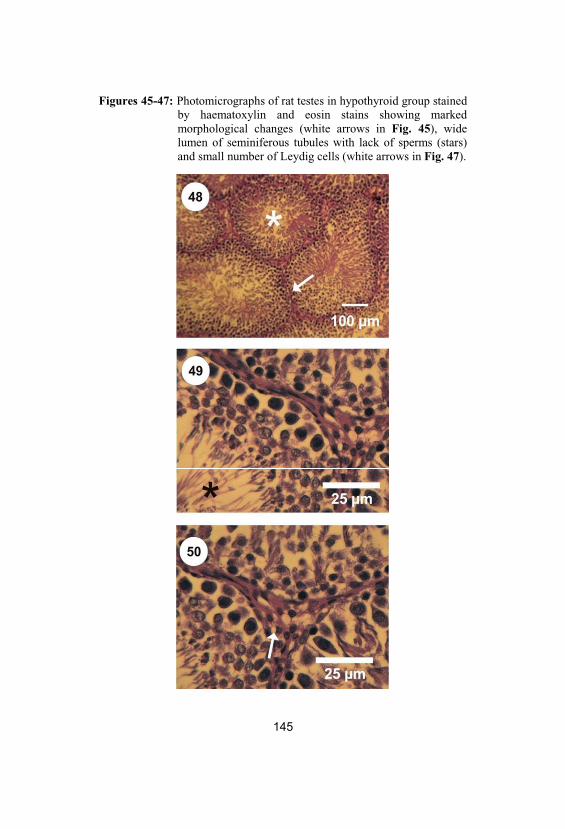
Figures 45-47: Photomicrographs of rat testes in hypothyroid group stainedby haematoxylin and eosin stains showing markedmorphological changes (white arrows in Fig. 45), widelumen of seminiferous tubules with lack of sperms (stars)and small number of Leydig cells (white arrows in Fig. 47).
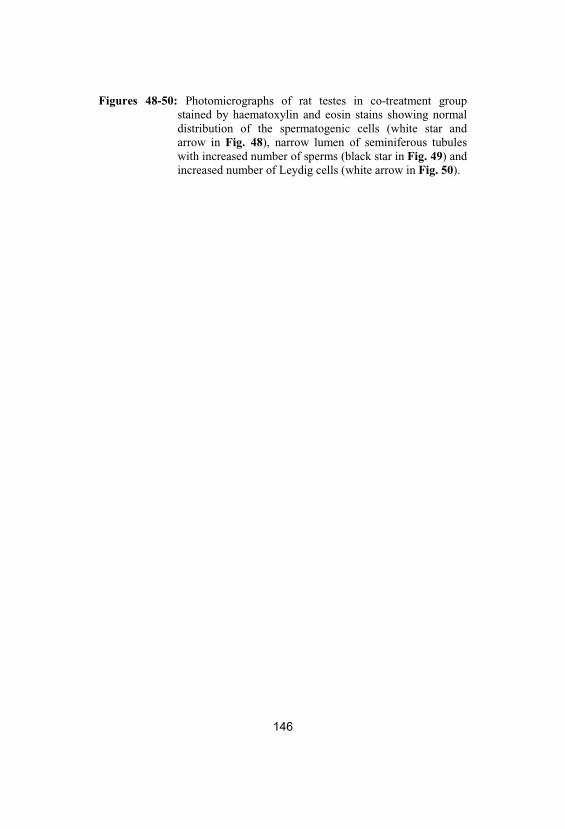
146
Figures 48-50: Photomicrographs of rat testes in co-treatment groupstained by haematoxylin and eosin stains showing normaldistribution of the spermatogenic cells (white star andarrow in Fig. 48), narrow lumen of seminiferous tubuleswith increased number of sperms (black star in Fig. 49) andincreased number of Leydig cells (white arrow in Fig. 50).
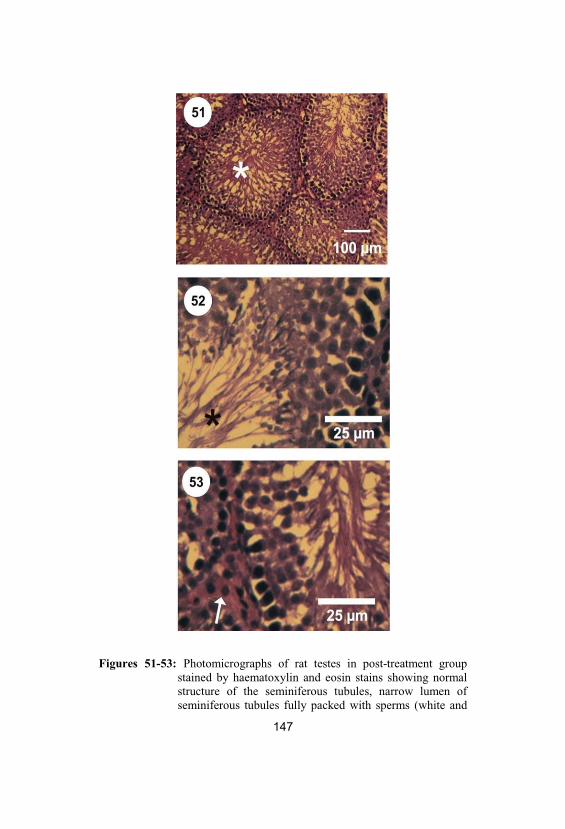
Figures 51-53: Photomicrographs of rat testes in post-treatment groupstained by haematoxylin and eosin stains showing normalstructure of the seminiferous tubules, narrow lumen ofseminiferous tubules fully packed with sperms (white and
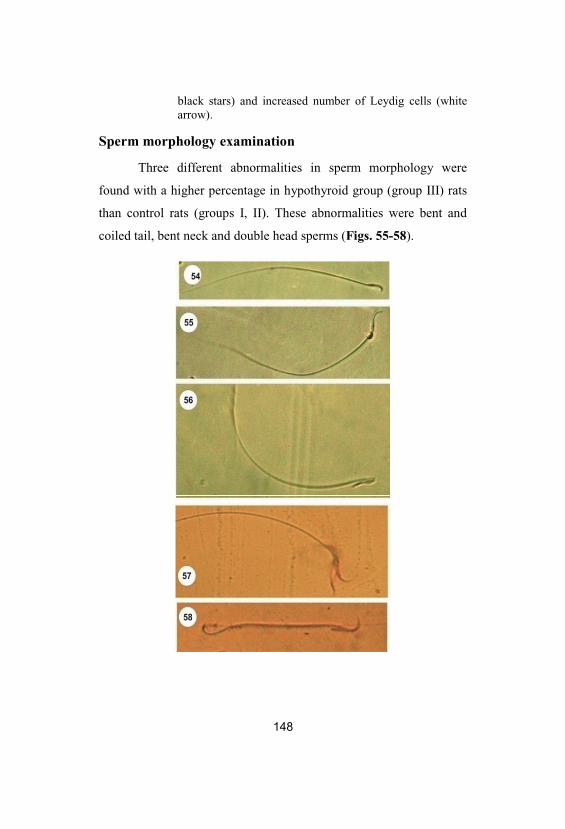
black stars) and increased number of Leydig cells (whitearrow).
Sperm morphology examination
Three different abnormalities in sperm morphology were
found with a higher percentage in hypothyroid group (group III) rats
than control rats (groups I, II). These abnormalities were bent and
coiled tail, bent neck and double head sperms (Figs. 55-58).
149
Figures 54-58: Normal and abnormal sperm morphology. Fig. 54: Normalsperm form. Figs. 55 & 56: Bent neck, 57: Double headand 58: Bent and coiled tail.
Transmission electron microscopy (TEM) Examination
The electron micrographs of control rat testes showed its
normal structure completely enveloped by a thick capsule, tunica
albuginea, which is composed mainly of dense collagenous fibrous
connective tissue. The parenchyma was made up of seminiferous
tubules. Among the tubules, interstitial cells (Leydig cells) were
located in contact with few thin walled capillaries. The seminiferous
tubules of control rats showed all stages of spermatogenic cells
(spermatogonia, primary spermatocytes, secondary spermatocytes,
spermatids and sperms; Figs. 60 & 61), Sertoli cells resting on the
thin basal lamina (Fig. 59) and the lumen of seminiferous tubules
filled with mature spermatozoa.
The spermatogonia are large diploid cells which lie against
the boundary tissue of the seminiferous tubules and divide
mitotically. Two types of spermatocytes (primary and secondary
spermatocytes) were identified in testes of control rats (Figs. 60 &
61). The primary spermatocytes were characterized by the presence
of intercellular bridges between these cells, spherical nuclei with
finely granular nucleoplasm and chromatin accumulation while the
secondary spermatocytes were smaller in size than the late primary
spermatocytes and were rarely seen among the germinal cells of
seminiferous tubules. Their life span is short and enters into the
second meiotic division producing the spermatids. Also, the lumen of
150
the seminiferous tubules in folic acid group testes was fully packed
with sperms (Fig. 62).
The electron micrographs of the seminiferous tubules in
hypothyroid group rats’ testes showed different cellular alterations
(Figs. 63-66). The seminiferous tubules appeared with moderate
damaged tubules with a thick and irregular tubular basement
membrane (Fig. 63).
Spermatogonia were less affected while the primary and
secondary spermatocytes were clearly affected; the cells were
compact and reduced in sizes in comparison to control group with
flattened nucleus and cytoplasm (Figs. 64 & 65). The smooth
endoplasmic reticulum and Golgi apparatus were dilated and the
mitochondria were condensed and appeared darkly outlined. The
nucleus was less damaged and had chromatin condensation at
periphery of the nuclear membrane which is irregular in some areas.
The Sertoli cells showed more damage as cytoplasmic vacuolation,
degenerative mitochondria, dilated endoplasmic reticulum and lipid
droplets (Fig. 63). The lumen of the seminiferous tubules in
hypothyroid group rats’ testes had low number of sperms (Fig. 66).
The electron micrographs of the seminiferous tubules in co-
treatment (group IV) showed minimal damaged tubules where its
basement membrane was more thickened with fibrous connective
tissue than in control groups (group I, II). The Sertoli cells were less
affected and spermatocytes showed moderate damage with minimal
cytoplasmic vacuolation (Fig. 67). The electron micrographs of the
seminiferous tubules in post-treatment (group V) showed normal
151
distribution of spermatogenic cells and normal structure of
spermatocytes (Fig. 70). Only the Sertoli cells were less affected
(Fig. 69) and the lumen of the seminiferous tubules was fully packed
with sperms.
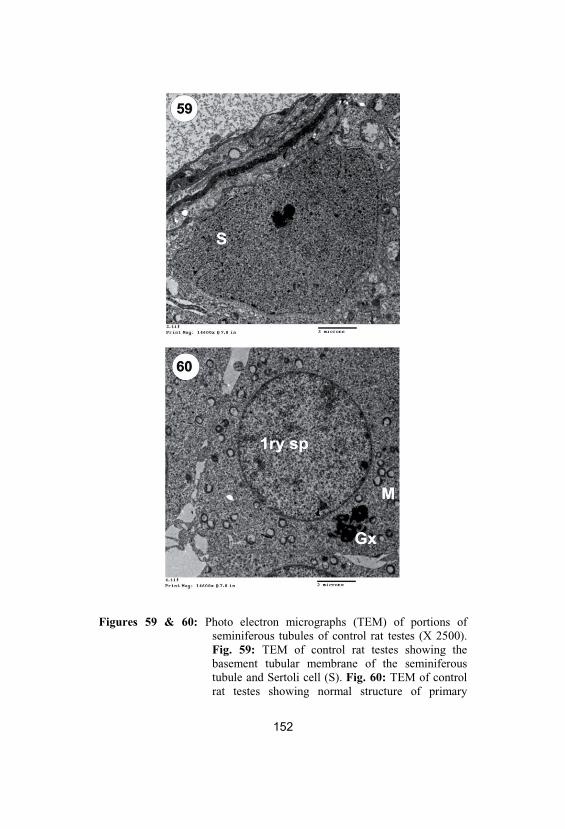
Figures 59 & 60: Photo electron micrographs (TEM) of portions ofseminiferous tubules of control rat testes (X 2500). Fig. 59: TEM of control rat testes showing thebasement tubular membrane of the seminiferoustubule and Sertoli cell (S). Fig. 60: TEM of controlrat testes showing normal structure of primary
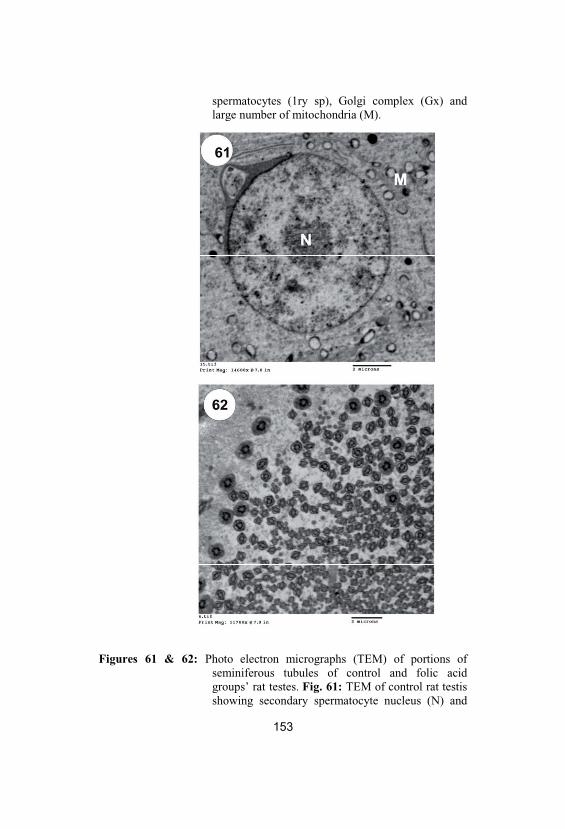
spermatocytes (1ry sp), Golgi complex (Gx) andlarge number of mitochondria (M).
Figures 61 & 62: Photo electron micrographs (TEM) of portions ofseminiferous tubules of control and folic acidgroups’ rat testes. Fig. 61: TEM of control rat testisshowing secondary spermatocyte nucleus (N) and
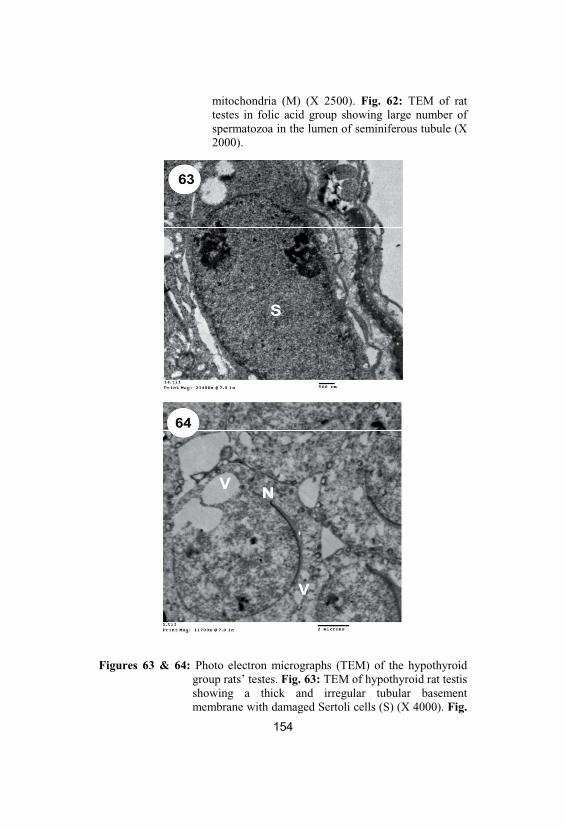
mitochondria (M) (X 2500). Fig. 62: TEM of rattestes in folic acid group showing large number ofspermatozoa in the lumen of seminiferous tubule (X2000).
Figures 63 & 64: Photo electron micrographs (TEM) of the hypothyroidgroup rats’ testes. Fig. 63: TEM of hypothyroid rat testisshowing a thick and irregular tubular basementmembrane with damaged Sertoli cells (S) (X 4000). Fig.
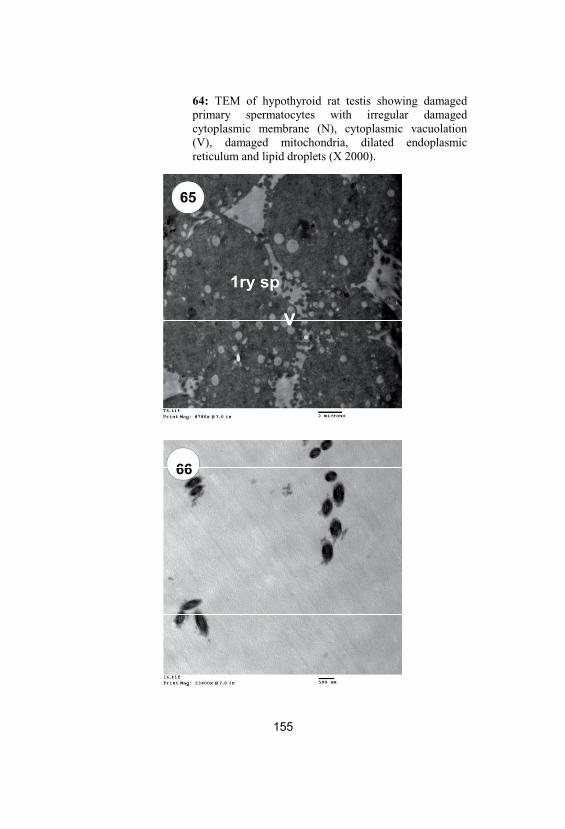
64: TEM of hypothyroid rat testis showing damagedprimary spermatocytes with irregular damagedcytoplasmic membrane (N), cytoplasmic vacuolation(V), damaged mitochondria, dilated endoplasmicreticulum and lipid droplets (X 2000).
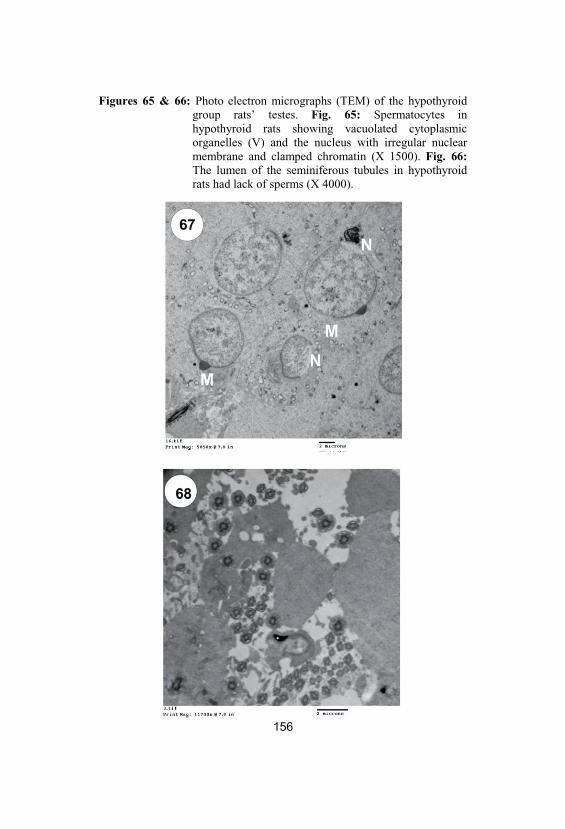
Figures 65 & 66: Photo electron micrographs (TEM) of the hypothyroidgroup rats’ testes. Fig. 65: Spermatocytes inhypothyroid rats showing vacuolated cytoplasmicorganelles (V) and the nucleus with irregular nuclearmembrane and clamped chromatin (X 1500). Fig. 66:The lumen of the seminiferous tubules in hypothyroidrats had lack of sperms (X 4000).
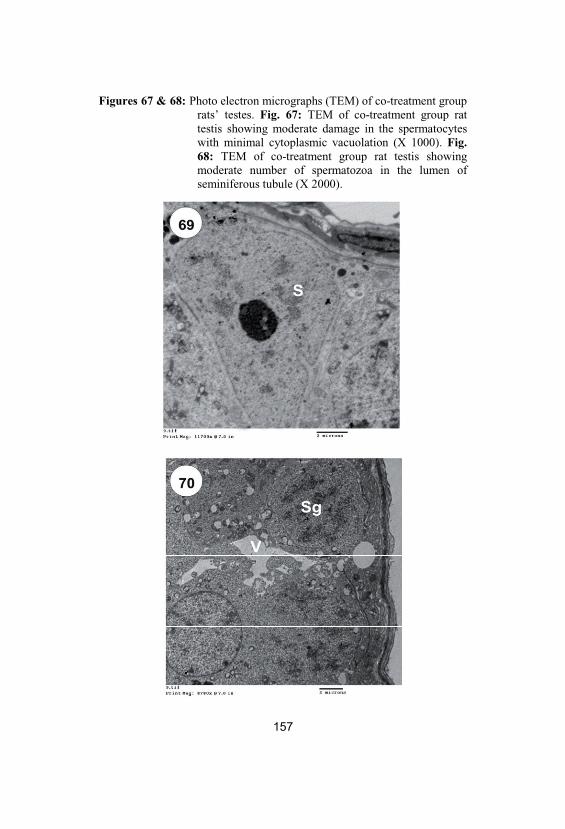
Figures 67 & 68: Photo electron micrographs (TEM) of co-treatment grouprats’ testes. Fig. 67: TEM of co-treatment group rattestis showing moderate damage in the spermatocyteswith minimal cytoplasmic vacuolation (X 1000). Fig. 68: TEM of co-treatment group rat testis showingmoderate number of spermatozoa in the lumen ofseminiferous tubule (X 2000).
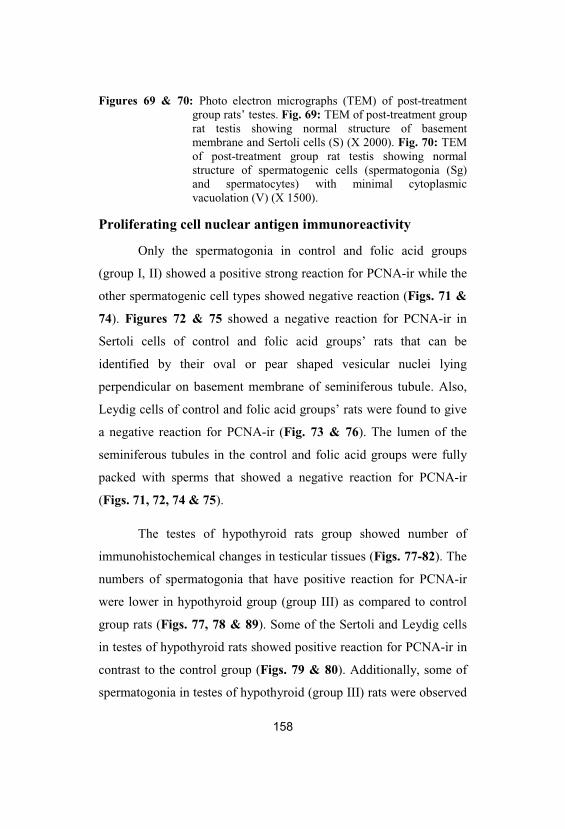
158
Figures 69 & 70: Photo electron micrographs (TEM) of post-treatmentgroup rats’ testes. Fig. 69: TEM of post-treatment grouprat testis showing normal structure of basementmembrane and Sertoli cells (S) (X 2000). Fig. 70: TEMof post-treatment group rat testis showing normalstructure of spermatogenic cells (spermatogonia (Sg)and spermatocytes) with minimal cytoplasmicvacuolation (V) (X 1500).
Proliferating cell nuclear antigen immunoreactivity
Only the spermatogonia in control and folic acid groups
(group I, II) showed a positive strong reaction for PCNA-ir while the
other spermatogenic cell types showed negative reaction (Figs. 71 &
74). Figures 72 & 75 showed a negative reaction for PCNA-ir in
Sertoli cells of control and folic acid groups’ rats that can be
identified by their oval or pear shaped vesicular nuclei lying
perpendicular on basement membrane of seminiferous tubule. Also,
Leydig cells of control and folic acid groups’ rats were found to give
a negative reaction for PCNA-ir (Fig. 73 & 76). The lumen of the
seminiferous tubules in the control and folic acid groups were fully
packed with sperms that showed a negative reaction for PCNA-ir
(Figs. 71, 72, 74 & 75).
The testes of hypothyroid rats group showed number of
immunohistochemical changes in testicular tissues (Figs. 77-82). The
numbers of spermatogonia that have positive reaction for PCNA-ir
were lower in hypothyroid group (group III) as compared to control
group rats (Figs. 77, 78 & 89). Some of the Sertoli and Leydig cells
in testes of hypothyroid rats showed positive reaction for PCNA-ir in
contrast to the control group (Figs. 79 & 80). Additionally, some of
spermatogonia in testes of hypothyroid (group III) rats were observed
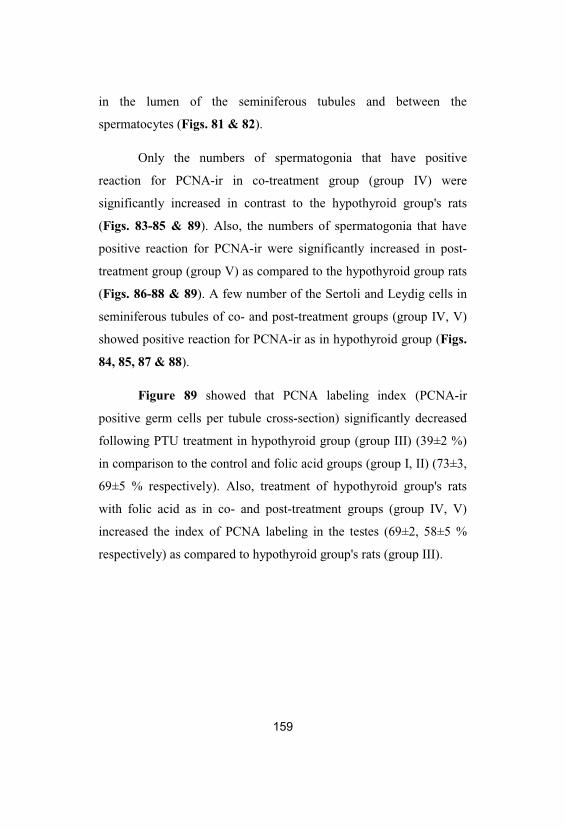
159
in the lumen of the seminiferous tubules and between the
spermatocytes (Figs. 81 & 82).
Only the numbers of spermatogonia that have positive
reaction for PCNA-ir in co-treatment group (group IV) were
significantly increased in contrast to the hypothyroid group's rats
(Figs. 83-85 & 89). Also, the numbers of spermatogonia that have
positive reaction for PCNA-ir were significantly increased in post-
treatment group (group V) as compared to the hypothyroid group rats
(Figs. 86-88 & 89). A few number of the Sertoli and Leydig cells in
seminiferous tubules of co- and post-treatment groups (group IV, V)
showed positive reaction for PCNA-ir as in hypothyroid group (Figs.
84, 85, 87 & 88).
Figure 89 showed that PCNA labeling index (PCNA-ir
positive germ cells per tubule cross-section) significantly decreased
following PTU treatment in hypothyroid group (group III) (39±2 %)
in comparison to the control and folic acid groups (group I, II) (73±3,
69±5 % respectively). Also, treatment of hypothyroid group's rats
with folic acid as in co- and post-treatment groups (group IV, V)
increased the index of PCNA labeling in the testes (69±2, 58±5 %
respectively) as compared to hypothyroid group's rats (group III).
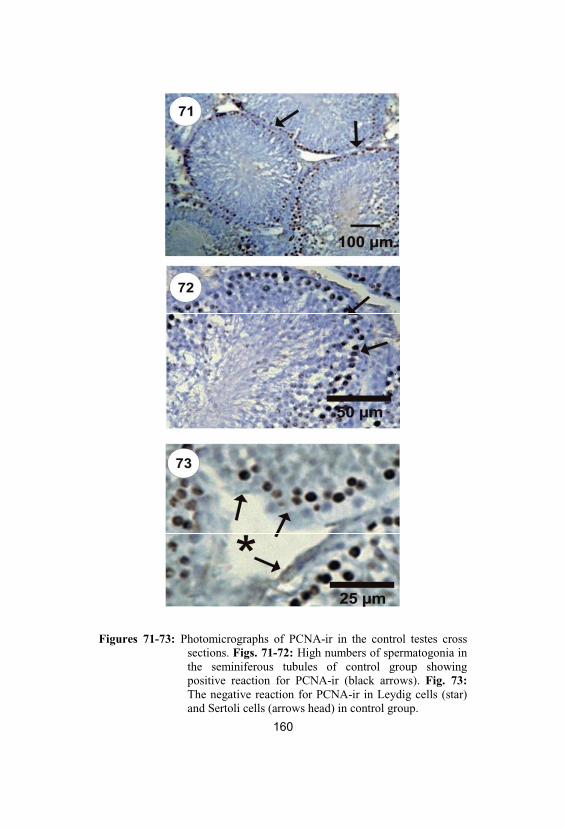
Figures 71-73: Photomicrographs of PCNA-ir in the control testes crosssections. Figs. 71-72: High numbers of spermatogonia inthe seminiferous tubules of control group showingpositive reaction for PCNA-ir (black arrows). Fig. 73:The negative reaction for PCNA-ir in Leydig cells (star)and Sertoli cells (arrows head) in control group.
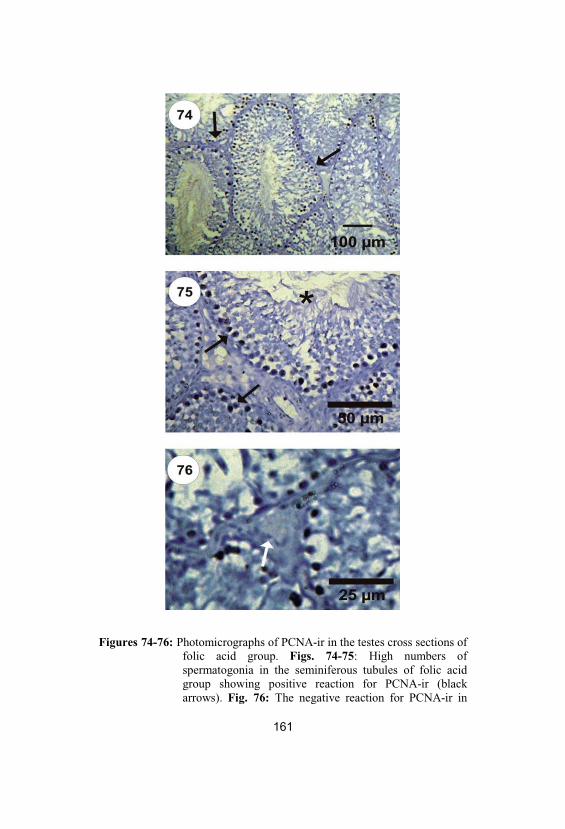
Figures 74-76: Photomicrographs of PCNA-ir in the testes cross sections offolic acid group. Figs. 74-75: High numbers ofspermatogonia in the seminiferous tubules of folic acidgroup showing positive reaction for PCNA-ir (blackarrows). Fig. 76: The negative reaction for PCNA-ir in
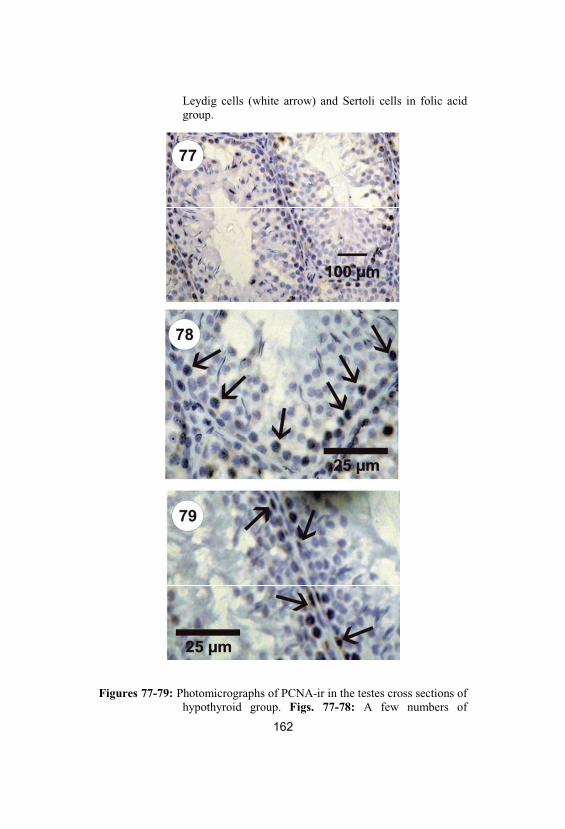
Leydig cells (white arrow) and Sertoli cells in folic acidgroup.
Figures 77-79: Photomicrographs of PCNA-ir in the testes cross sections ofhypothyroid group. Figs. 77-78: A few numbers of
163
spermatogonia showing positive reaction for PCNA-ir inhypothyroid group’s rats (black arrows). Fig. 79: Some ofSertoli cells showing positive reaction for PCNA-ir (blackarrows).
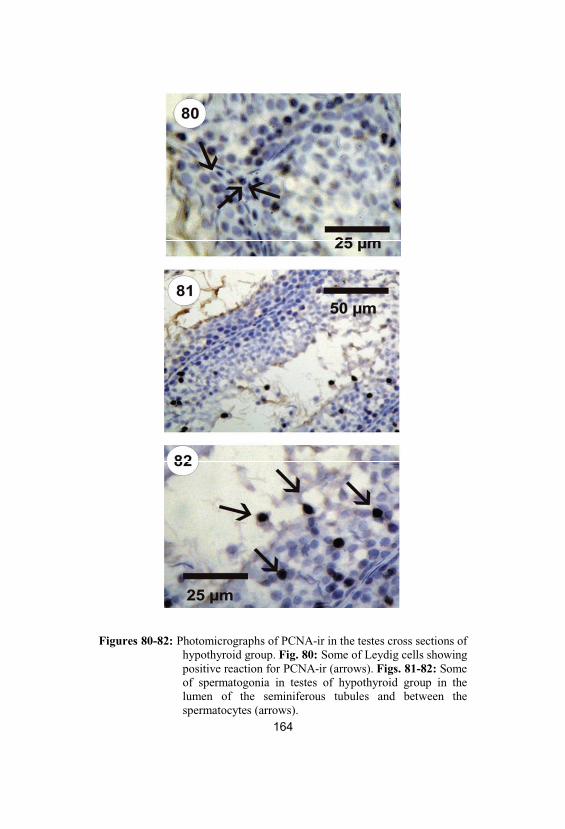
Figures 80-82: Photomicrographs of PCNA-ir in the testes cross sections ofhypothyroid group. Fig. 80: Some of Leydig cells showingpositive reaction for PCNA-ir (arrows). Figs. 81-82: Someof spermatogonia in testes of hypothyroid group in thelumen of the seminiferous tubules and between thespermatocytes (arrows).
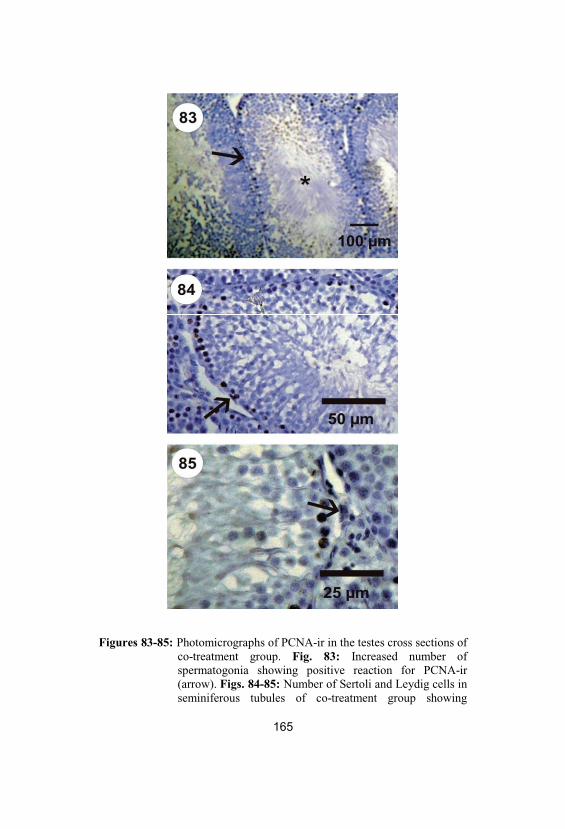
Figures 83-85: Photomicrographs of PCNA-ir in the testes cross sections ofco-treatment group. Fig. 83: Increased number ofspermatogonia showing positive reaction for PCNA-ir(arrow). Figs. 84-85: Number of Sertoli and Leydig cells inseminiferous tubules of co-treatment group showing
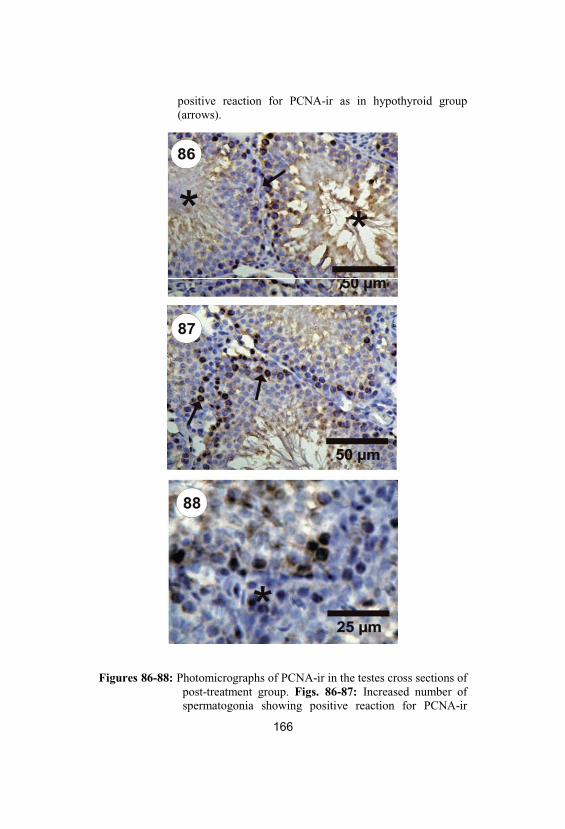
positive reaction for PCNA-ir as in hypothyroid group(arrows).
Figures 86-88: Photomicrographs of PCNA-ir in the testes cross sections ofpost-treatment group. Figs. 86-87: Increased number ofspermatogonia showing positive reaction for PCNA-ir
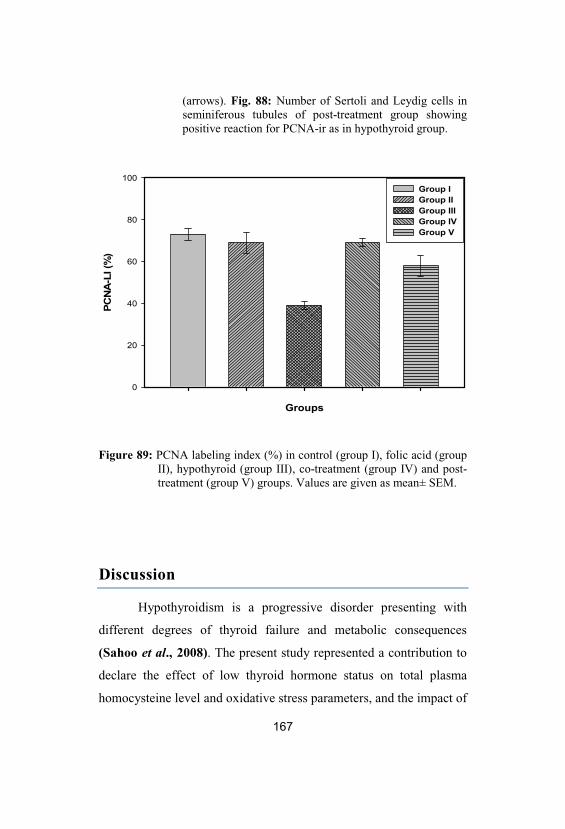
167
(arrows). Fig. 88: Number of Sertoli and Leydig cells inseminiferous tubules of post-treatment group showingpositive reaction for PCNA-ir as in hypothyroid group.
Groups
PCN
A-L
I (%
)
0
20
40
60
80
100Group IGroup IIGroup IIIGroup IVGroup V
Figure 89: PCNA labeling index (%) in control (group I), folic acid (groupII), hypothyroid (group III), co-treatment (group IV) and post-treatment (group V) groups. Values are given as mean± SEM.
Discussion
Hypothyroidism is a progressive disorder presenting with
different degrees of thyroid failure and metabolic consequences
(Sahoo et al., 2008). The present study represented a contribution to
declare the effect of low thyroid hormone status on total plasma
homocysteine level and oxidative stress parameters, and the impact of
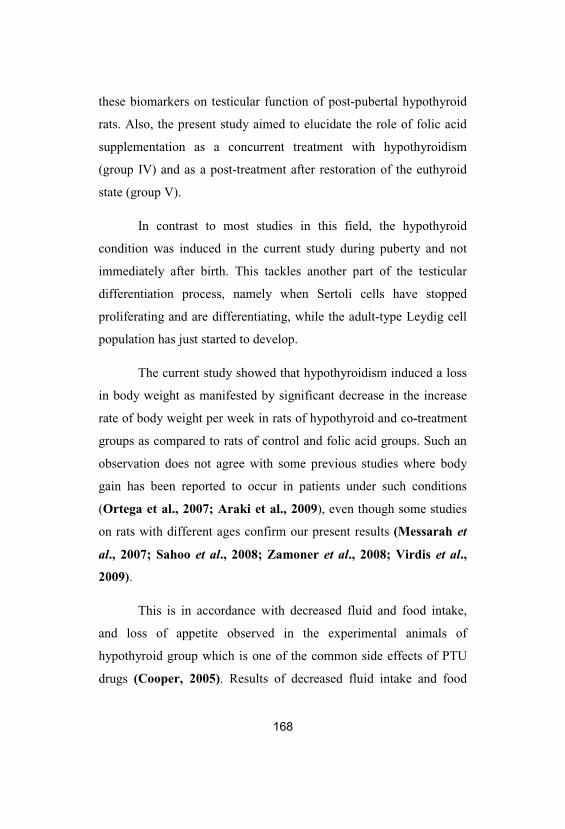
168
these biomarkers on testicular function of post-pubertal hypothyroid
rats. Also, the present study aimed to elucidate the role of folic acid
supplementation as a concurrent treatment with hypothyroidism
(group IV) and as a post-treatment after restoration of the euthyroid
state (group V).
In contrast to most studies in this field, the hypothyroid
condition was induced in the current study during puberty and not
immediately after birth. This tackles another part of the testicular
differentiation process, namely when Sertoli cells have stopped
proliferating and are differentiating, while the adult-type Leydig cell
population has just started to develop.
The current study showed that hypothyroidism induced a loss
in body weight as manifested by significant decrease in the increase
rate of body weight per week in rats of hypothyroid and co-treatment
groups as compared to rats of control and folic acid groups. Such an
observation does not agree with some previous studies where body
gain has been reported to occur in patients under such conditions
(Ortega et al., 2007; Araki et al., 2009), even though some studies
on rats with different ages confirm our present results (Messarah et
al., 2007; Sahoo et al., 2008; Zamoner et al., 2008; Virdis et al.,
2009).
This is in accordance with decreased fluid and food intake,
and loss of appetite observed in the experimental animals of
hypothyroid group which is one of the common side effects of PTU
drugs (Cooper, 2005). Results of decreased fluid intake and food
169
intake in hypothyroid group are in agreement with Sarandöl et al.
(2005) study on adult rats.
Meanwhile, there was significant increase in the increase rate
of body weight per week in folic acid group and during the extra four
weeks in post-treatment group (group V) as compared to control
group. This can be explained by the role of folic acid in enhancing
the growth rate due to its role in DNA synthesis (Sahina et al., 2003).
On the other hand, non significant change in relative testes
weight (RTW) was observed in different groups under study. This is
not similar to other studies with neonatal hypothyroidism which
showed significant decrease and increase in RTW in persistent and
transient hypothyroidism respectively (Sahoo et al., 2008; Zamoner
et al., 2008).
However, this could be explained by the different life stage in
which hypothyroidism was induced. In addition, relative
epididymides weight (REW) showed significant increase in post-
treatment group (group V) as compared to control, folic acid,
hypothyroid, co-treatment groups. This may be ascribable to the
increased daily sperm production in this group as presented later.
The present study also revealed significant decrease in serum
T3 level and significant increase in serum TSH level in the
hypothyroid and co-treatment groups (group III, IV) when compared
to the control and folic acid groups. This might be considered as a
sound argument in the induction of hypothyroidism indicating that
PTU is a good choice as an antithyroid drug for induction of
hypothyroid state. This finding is compatible with other studies that
170
used PTU as an antithyroid drug for induction of hypothyroidism at
different ages (Sarandöl et al., 2005; Sahoo et al., 2008; Zamoner
et al., 2008; Chattopadhyay et al., 2010).
The increase in TSH level can be explained by decreased
production of T3 from the thyroid gland that minimizes TSH
feedback inhibition resulting in an increase in its secretion by the
anterior pituitary gland (Choksi et al., 2003). In the post-treatment
group, T3 and TSH levels returned to its normal range after
withdrawing PTU from the drinking water confirming the nature of
PTU as a reversible goitrogen (Sahoo et al., 2008).
The present study contributed information towards
establishing an association between low thyroid hormone status and
hyperhomocysteinemia as it declared significant increase in plasma
total homocysteine (tHcy) levels in hypothyroid group when
compared to the control and folic acid groups. This finding is in line
with that of Adrees et al. (2009) and Orzechowska-Pawilojc et al.
(2009) who observed elevated tHcy levels in patients with subclinical
and overt hypothyroidism. Other studies showed that patients with
subclinical hypothyroidism do not have serum Hcy level affected
(Christ-Crain et al., 2003; Hueston et al., 2005). The role of
hypothyroidism in elevation of tHcy was confirmed by the significant
negative correlation between total T3 and tHcy as represented in the
present study.
The pathogenesis of elevated tHcy in hypothyroidism can be
explained by the fact that thyroid hormones markedly affect
riboflavin metabolism, mainly by stimulating flavokinase and thereby
171
the synthesis of flavin mononucleotide (FMN) and flavin
adeninedinucleotide (FAD) (Cakal et al., 2007).
Conceivably, these metabolic changes may affect
homocysteine metabolism because FMN and FAD serve as cofactors
for enzymes involved in the metabolism of vitamin B6, cobalamin,
and folate in homocysteine/methionine cycle. Consequently,
hyperhomocysteinemia in hypothyroidism can rise through reduced
activity of the flavoprotein methylenetetrahydrofolate reductase
(MTHFR) (Barbe et al., 2001).
It is, however, suggested, that changes in folate level (Lien et
al., 2000) or in activities of methionine synthase and cystathionine- -
synthase not only MTHFR (Diekman et al., 2001) may be
responsible for hyperhomocysteinemia in patients with
hypothyroidism. An alternative explanation of this effect could be
attributed to the reduced glomerular filtration rate in patients with
hypothyroidism linked to impaired renal Hcy clearance and
hyperhomocysteinemia (Barbe et al., 2001; Turhan et al., 2008).
In co-treatment and post-treatment groups of the present
study, there was a significant decrease in tHcy level when compared
to its level in hypothyroid group. This finding suggests the role of
folic acid supplementation in both groups to decrease tHcy level.
Confirming this finding, Assanelli et al. (2004), Stiefel et al. (2005)
and Clarke et al. (2006) concluded that folic acid supplementation
can decrease the elevated level of Hcy in conditions associated with
hyperhomocysteinemia.
172
Noteworthy, in post-treatment group, restoration of euthyroid
state shared with folic acid supplementation in lowering the level of
Hcy. This finding is in agreement with Diekman et al., (2001), and
Meek and Smallridge, (2006) studies on hypothyroid patients.
In addition, tHcy level in this group was not significantly
changed in comparison to co-treatment group. Also, tHcy level
significantly increased in both co-treatment and post-treatment
groups when compared to control or folic acid groups. These findings
suggest longer period of folic acid supplementation and thyroid
hormone replacement to restore tHcy normal level.
Besides, the present study showed that plasma total NO
metabolites (“NO2+NO3” or NOx) was significantly higher in the
hypothyroid group when compared to the control and folic acid
groups. This is consistent with the findings of Virdis et al. (2009)
who indicated that induced mild hypothyroidism in young rats
progressively induces endothelial dysfunction through reducing NO
availability. It was suggested that an increased expression and
function of inducible nitric oxide synthase (iNOS), resulting in
superoxide generation, accounts for an impaired NO availability
(Virdis et al., 2009). The significant negative correlation between
total T3 and total NOx in the current study further confirms the
relation between hypothyroidism and total NOx elevation.
This finding may be explained by the increased vascular
oxidative burden associated with homocysteinemia that induces
NADPH oxidase and inducible nitric oxide synthase activity,
173
contributing to increased superoxide radicals production in rat vessels
(Ungvari et al., 2003; Virdis et al., 2009).
Furthermore, Hcy is closely associated with endothelial
dysfunction through its impact on eNOS coupling by reducing supply
of eNOS substrate L-arginine and diminished tetrahydrobiopterin
bioavailability (Shirodaria et al., 2007; Jin et al., 2007). The
uncoupled form of eNOS is a major source of superoxide radicals
instead of nitric oxide, in the vascular wall (Rabelink and van
Zonneveld, 2006). These superoxide radicals react with nitric oxide
(NO) to form peroxynitrite radicals, leading to low endothelial NO
bioavailability and endothelial dysfunction (Antoniades et al., 2006).
This assumption was confirmed by the significant positive correlation
between tHcy and tNOx presented in the present study.
In co-treatment and post-treatment groups, significant
decrease in total NOx was observed when compared to the
hypothyroid group. This finding can be explained by the ability of 5-
MTHF, the circulating form of folic acid to prevent peroxynitrite-
mediated tetrahydrobiopterin oxidation and improve eNOS coupling
and dimerization. It is due to its ability to increase endothelial
tetrahydrobiopterin bioavailability in vessels through scavenging
ROS (such as peroxynitrite and superoxide) responsible for its
oxidation (Antoniades et al., 2007; Moens et al., 2008). This was
compatible with the significant positive correlation between plasma
MDA (marker of oxidative stress) and tNOx.
Concomitantly, the decrease in plasma total NOx in post-
treatment group was significant in comparison to co-treatment group.
174
This is similar to the study of Virdis et al. (2009) who reported that
thyroid hormone replacement therapy in hypothyroidism normalized
endothelium-dependent relaxations and restored NO availability in rat
arteries.
Thyroid hormones are associated with the oxidative and
antioxidative status of the organism. Thyroid hormones regulate
oxidative metabolism and thus play an important role in free radical
production. They regulate protein and antioxidant enzymes synthesis
and degradation (Pereira et al., 1994).
The significantly higher plasma and testicular MDA levels of
hypothyroid group in comparison to the respective controls (control
and folic acid groups) reflect an enhanced oxidative stress in
hypothyroidism. The results of Yilmaz et al. (2003) and Sarandöl et
al. (2005) who reported increased plasma, liver and muscle MDA
levels in adult hypothyroid rats are in line with our findings.
Moreover, Sahoo et al. (2006, 2008) demonstrated that mitochondrial
lipid peroxidation (LPx) levels and protein carbonylation were
elevated during persistent neonatal hypothyroidism in the testis.
Nevertheless, data on the oxidant status of hypothyroidism are
limited and controversial (Gredilla et al., 2001a; Gredilla et al.,
2001b; Yilmaz et al., 2003). This is as in hypothyroidism, a decrease
in free radical production is expected because of the metabolic
suppression brought about by the decrement in thyroid hormone
levels (Pereira et al., 1994; Messarah et al., 2007). Indeed,
Mogulkoc et al. (2005) reported low lipid peroxidation in testis and
renal tissues of hypothyroid rats. This relation between
175
hypothyroidism and oxidative damage was enhanced by the
significant negative correlation between total T3, and plasma and
testicular MDA as represented in the current study.
The enhanced oxidative stress in hypothyroidism is suggested
to develop due to oxidation of membrane lipids of cells as it was
reported that thyroid hormone affects almost all pathways of lipid
metabolism (Hoch, 1988). Furthermore, it is suggested to be
associated with the observed hyperhomocysteinemia as represented in
the present study by the significant positive correlation between tHcy,
and plasma and testicular MDA. Homocysteine is believed to exert its
effects through a mechanism involving oxidative damage (Das,
2003). Hcy is readily oxidized as a consequence of auto-oxidation
leading to the formation of homocystine, homocysteine-mixed
disulfides, and homocysteine thiolactone. During oxidation of the
sulfhydryl group, superoxide anion (O2•) and hydrogen peroxide
(H2O2) are generated, which account for the endothelial cytotoxicity
of homocysteine (Das, 2003).
Also, as mentioned above, Hcy induces NADPH oxidase and
inducible nitric oxide synthase activities and uncoupling of eNOS.
This contributes to increased superoxide radicals production in rat
vessels (Ungvari et al., 2003; Rabelink and van Zonneveld, 2006).
These free radicals can initiate lipid peroxidation as marked by
increased level of MDA.
Another explanation of this enhanced oxidative stress could
be attributed to folate deficiency associated with hypothyroidism as
reported by Lien et al. (2000) and Diekman et al. (2001). Folate
176
deficiency reduces Phosphatidylethanolamine methylation and could
thus alter membrane phospholipids organization and function (Das,
2003).
In the co-treatment and post-treatment groups, we observed
that lipid peroxidation significantly decreased in plasma and
testicular homogenate as compared to hypothyroid group. This
reflects the protective effect of folic acid against lipid peroxidation in
both groups. This seems reasonable, since folic acid has been
reported to have an antioxidant power against free radicals
responsible for lipid peroxidation (Joshi et al., 2001; Au-Yeung et
al., 2006).
Also, the present study demonstrated the role of folic acid in
reducing Hcy accumulation responsible in part for oxidative damage.
It should also be noted say that the dosage of folic acid supplemented
in the present study was enough to suppress lipid peroxidation in co-
and post- treatment groups. Additionally, it is of importance to note
that restoration of euthyroid state in post-treatment group shared with
folic acid in lowering lipid peroxidation. This is through its
regulation of oxidative metabolism, protein, and antioxidant enzymes
synthesis and degradation as previously mentioned (Pereira et al.,
1994; Varghese et al., 2001). On the other hand, the observed
significant increase in plasma and testicular MDA levels in post-
treatment group as compared to control group is in agreement with
Sahoo et al. (2006, 2008) who reported elevated mitochondrial lipid
peroxidation (LPx) and protein carbonylation during transient
neonatal hypothyroidism in the testes of rats.
177
Glutathione (GSH) exerts its antioxidant function by donating
electrons to radicals and changing to its oxidized form (GSSG),
which is subsequently reduced by the enzyme glutathione reductase
(Rice-Evans and Burdon, 1993). The significant increase in
GSSG/GSH ratio in hypothyroid group as compared to control group
is similar to that of Sahoo et al. (2008) in neonatal hypothyroid rat
testes. This finding corroborates the role of thyroid hormones in
triggering the biosynthesis of GSH (Fernandez and Videla, 1996).
Furthermore, it is well known that, glutathione interacts with reactive
species derived from NO oxidation and converts these species to less
toxic ones leading to depletion of GSH (Hummel et al., 2006).
In folic acid, co-treatment and post-treatment groups,
significant increase in GSSG/GSH ratio was observed in comparison
to control group. This finding may be explained by the consumption
of GSH in regeneration of folic acid (FA-OH from FA-O•) through
folic acid interaction with ROS (Joshi et al., 2001). This
consumption may cause the increment of GSSG (oxidized form) in
proportion to GSH (reduced form) by GSH donation of hydrogen to
(FA-O)• for regeneration of FA-OH.
Ferric reducing antioxidant power (FRAP) represents a single
assay to evaluate total antioxidant capacity (TAC) of plasma. FRAP
encompasses different enzymatic and non-enzymatic antioxidant
factors and it is easy to be measured (Erel, 2004). Studies of thyroid
hormone effect on testicular antioxidant defense system are
inadequate (Sahoo et al., 2005, 2007, 2008). In the present study,
there was a significant decrease in FRAP of testicular homogenate in
178
hypothyroid group as compared to control group. This reflects
oxidative stress as indicated by the significant negative correlation
between testicular MDA (marker of oxidative stress) and FRAP.
Furthermore, it reflects reduction of antioxidants effectiveness with
hypothyroidism as also reported by Yilmaz et al. (2003). However,
the resulted non significant correlation between total T3 and FRAP
may be explained by the role of folic acid in co-treatment (group IV)
in restoring FRAP without restoration of euthyroid state as presented
in the present study.
In addition, the non significant change in FRAP in co-
treatment and post-treatment groups as compared to control and folic
acid groups corroborates the antioxidant properties of folic acid.
However, it should also be noted say that in post-treatment group, the
restoration of euthyroid state shared with folic acid supplementation
in restoring TAC in testicular milieu. This finding confirms what
previously mentioned that thyroid hormones regulate protein, and
antioxidant enzymes synthesis and degradation (Varghese et al.,
2001). Conversely, Sahoo et al. (2007) reported that transient
hypothyroidism in adult rats seems to induce oxidative stress in testis
by reducing the levels of testicular enzymatic and nonenzymatic
defenses. This discrepancy may be due to the supplementation of
folic acid with restoration of euthyroid state in the post-treatment
group of the present study.
Although the effect of Hcy on male reproductive system is
unknown, it was reported that there may be a positive correlation
between the increase in plasma Hcy level and reduction of semen
179
parameters in patients (Wallock et al., 2001). In the current study, the
impact of hyperhomocysteinemia and oxidative stress on testicular
function; steroidogenesis and spermatogenesis was demonstrated.
The plasma testosterone level was significantly lower in the
hypothyroid group than those of the respective controls (control and
folic acid groups). However, the non significant correlation between
total T3 and testosterone was due to the observed effect of PTU itself
in inhibiting testosterone production as presented later. It has been
reported that hypothyroidism decreases testosterone concentration in
adult rats and mice, and this effect was attributed to a decrease in
response to luteinizing hormone (LH) (Sakai et al., 2004; Mendis-
Handagama and Ariyaratne, 2005). Nevertheless, some studies
demonstrated that levels of testosterone in adult rats were unaffected
by induced hypothyroidism (Kirby et al., 1992; Cristovao et al.
2002). These inconsistencies have been attributed to differences in
the age, duration of treatment, and method of inducing the
hypothyroid state in experimental animals (Mendis-Handagama and
Ariyaratne, 2005).
Concerning the literature data, the inhibitory mechanism of
hypothyroidism on testosterone production involved a decreased
activity of 3 -hydroxy steroid dehydrogenase (HSD), 17 -
hydroxysteroid dehydrogenase (17 -HSD) and post-cAMP pathways
in testicular interstitial cells (Jannini et al., 1995; Chiao et al.,
2000). Additionally, hypothyroidism was found to inhibit mRNA
expression of the steroidogenic acute regulatory protein (StAR) and
cytochrome P450 side chain cleavage enzyme (P450scc) function
180
(Manna et al., 2001; Chiao et al., 2002). Furthermore, the decreased
plasma testosterone concentration in hypothyroid condition was
pointed towards a decrease in the binding affinity of testosterone
binding protein, increase in the metabolic clearance rate and an
increased conversion to androstenedione (Jubiz, 1987).
Concerning the data of the present study, this decrement of
plasma testosterone can be explained by the direct inhibitory effect of
hyperhomocysteinemia as indicated by the significant negative
correlation between tHcy and testosterone. Llanos et al. (1985) and
Papadopoulos et al. (1987) reported that hyperhomocysteinemia
diminished directly testosterone production in rat Leydig cells.
Methylation defects by homocysteinemia affect other molecules than
DNA. Particularly, phospholipid methylation has been shown to be
highly active during the synthesis of phosphatidylcholine in rat
Leydig cells (Moger, 1985). The major methyl donor, S-
adenosylmethionine (SAM), was found to stimulate human chorionic
gonadotropin (hCG)-mediated testosterone synthesis in purified rat
Leydig cells in vitro, whereas S-adenosylhomocysteine (SAH) had
opposite effects (Papadopoulos et al., 1987). On the other hand, the
oxidative stress found in the present study can directly act to reduce
testosterone production in rat Leydig cells (Tsai et al., 2003) and this
was represented herein by the significant negative correlation
between testosterone, and plasma MDA and testicular MDA.
Besides, there was non significant change in plasma
testosterone level in co-treatment and post-treatment groups as
compared to hypothyroid group. This finding may be ascribable to
181
the direct action of PTU itself on Leydig cells to inhibit
steroidogenesis by regulating the function of P450scc and StAR
(Chiao et al., 2002).
Regarding spermatogenesis, it is influenced by a combination
of endocrine, genetic, and environmental factors, including nutrition
and lifestyle (Kuroki et al., 1999; Wong et al., 2000). Evidence is
increasing that nutritional factors are important in reproduction and
thus in spermatogenesis as well. Of main interest are the B vitamins
folate, cobalamin, and pyridoxine, which are involved in
homocysteine metabolism.
Impaired spermatogenesis was observed in the present study
as represented by significant decrease in sperm count and motility,
and increased percentage of sperm morphology abnormalities in
hypothyroid group in comparison to control and folic acid groups.
Also, this was confirmed by the significant positive correlation
between total T3 and sperm motility. Similarly, Francavilla et al.
(1991), Simorangkir et al. (1997) and Sahoo et al. (2008) reported
that rat epididymal sperm count reduced significantly in neonatal
hypothyroidism in comparison to their respective controls. However,
the non significant correlation between total T3 and sperm count in
the present study may be due to the role of folic acid in co-treatment
(group IV) and post-treatment (group V) in enhancing sperm count as
presented later.
This finding could be the result of several implications. First,
thyroid hormone itself has been shown to play an important role in
testicular physiology (Cooke et al., 2004; Holsberger and Cooke,
182
2005; Toshihiro, 2010). It is now established that tri-iodothyronine
(T3) regulates the maturation and growth of testis, in rats and other
mammal species, by inhibiting immature Sertoli cells proliferation
and stimulating their functional differentiation (Tarulli et al., 2006;
Jansen et al., 2007). Moreover, reduction of thyroid hormones level
induces decrement in plasma testosterone level as presented herein.
This leads to decreased number and forward motility of sperms (Del
Rio et al., 2001) due to the role of testosterone in spermatogenesis
(Sharpe, 1987).
Second, thiol metabolism is important for the stabilization of
sperm membranes and the protection of sperm DNA against damage
(Wallock et al., 2001; Forges et al., 2007). The auto-oxidation of
Hcy leads to the formation of homocystine, homocysteine thiolactone
and sulfydryl group. Homocysteine thiolactone is a highly reactive
Hcy derivative that can react easily with proteins. The increase in
plasma level of homocysteine thiolactone blocks intracellular protein-
carboxyl methylation reaction, which results in the inhibition of
sperm motility (Sastry and Janson, 1983). This effect was
manifested by the significant negative correlation between tHcy and
sperm motility in the present study.
Additionally, reactive oxygen species (ROS) are generated
during oxidation of sulfhydryl group of Hcy (Blom et al., 1995). The
production of ROS is a normal physiological event in various organs
including the testis. However, the overproduction of ROS causes
structural damage of sperm membranes as sperm plasma membrane
contains a high amount of unsaturated fatty acids, and so it is
183
particularly susceptible to peroxidative damage. This results in loss of
motility and impairment of spermatogenesis with the formation of
cytotoxic secondary products such as MDA (De Lamirande et al.,
1997). This effect was confirmed by the significant negative
correlation between testicular MDA, and sperm count and motility.
Also, it has also been suggested that the adverse reproductive
outcome in hyperhomocysteinemia may be related to homocysteine-
induced precocious atherosclerotic vascular alterations, impairing the
blood flow in the testicular arteries (Rossato, 2004).
Third, The NO signaling pathways are involved in penile
erection, spermatogenesis, dynamics of the blood–testis barrier,
sperm motility, capacitation, acrosome reaction and fertilization
(Rosselli et al., 1998; Herrero et al., 2003; Lee and Cheng, 2004).
In this context, any alteration of NO bioavailability, e.g. by
hyperhomocysteinemia, may have direct consequences on male
reproductive functions. This effect was confirmed by the significant
negative correlation between tNOx, and sperm count and motility.
Finally, progressive folate deficiency was suggested to develop with
hypothyroidism according to Diekman et al. (2001). This deficiency
may be responsible for reduced sperm concentration (Wallock et al.,
2001).
On the other hand, there was a significant increase in sperm
count and motility in co-treatment and post-treatment groups as
compared to hypothyroid group in the present study. This
corroborates the role of folic acid in enhancing spermatogenesis,
boosting sperm concentration and building up the antioxidant status
184
against the oxidants in the present study. Improvements in
spermatogenesis presented herein agree with the previously reported
benefits of folic acid supplementation on sperm quality and male
fertility (Audet et al., 2004; Forges et al., 2007).
The role of folic acid in lowering plasma tHcy, total NOx and
testicular MDA as presented herein coincided with folic acid
enhancement of spermatogenesis. Moreover, folic acid interacts
directly with endothelial nitric oxide synthase and bioavailability of
nitric oxide enhancing the blood flow in testicular arteries (Stanger,
2002). Supporting this assumption, a high affinity folate binding
protein has been identified in human semen and prostate gland (Holm
et al., 1991) as well as MTHFR activity, which proved to be five
times higher in the mouse testis than in other tissues (Chen et al.,
2001). These findings support the connection between folate status
and male reproductive function. This further illustrates the need for
an intact folate cycle to maintain normal spermatogenesis, and
suggests that the alternative homocysteine remethylation pathway is
also operating in the testis.
Besides, the current study revealed a significant increase in
sperm count in post-treatment group as compared to control, folic
acid, hypothyroid and co-treatment groups. Concomitantly, Kirby et
al. (1992) and Joyce et al. (1993) reported that transient neonatal
PTU-induced hypothyroidism increased daily sperm production in
adult rats and mice. However, Sahoo et al. (2008) reported
significant decrease in epididymal sperm count in persistent and
transient hypothyroid rats as compared to control rats. This
185
discrepancy may be attributed to differences in the age and duration
of PTU treatment.
From another point of view, during spermatogenesis and
maturation, several testicular ‘marker’ enzymes play an important
role in the stabilization of testicular tissue and the energy metabolism
in testicular cells. The activities of these marker enzymes have been
correlated with the cell differentiation in the germinal epithelium
during spermatogenesis (Abdul- Ghani et al., 2008). While specific
activities of postmeiotic enzymes; lactate dehydrogenase (LDH), acid
phosphatase (ACP) and sorbitol dehydrogenase (SDH) are associated
with more mature germ cells, specific activities of premeiotic
enzymes, e.g. gamma-glutamyl transpeptidase (GGT), are associated
with spermatogonia and premeiotic spermatocytes. It is thus possible
to correlate changes in these enzymes with changes in numbers of
spermatogenic cell types (Shen and Lee, 1984). The loss of certain
spermatogenic cells will be manifested directly in the decrease in the
specific activities of associated enzymes, and indirectly by increasing
specific activities of enzymes associated with other unaffected
spermatogenic cell types (Shen and Lee, 1984).
In the current study, there were significant increase in
testicular LDH and ACP specific activities and non significant
change in SDH specific activity in hypothyroid group as compared to
control group. This was confirmed in the current study by the
significant negative correlation between total T3 and ACP. Also, non
significant change in testicular GGT specific activity was observed in
hypothyroid group as compared to control group.
186
These findings can be attributed to the loss of premeiotic
spermatocytes, e.g. zygotene and pachytene spermatocytes, and a
subsequent increase in the proportion of postmeiotic cells in the
semineferous tubules of hypothyroid rats’ testes. Concomitantly, the
study of Simorangkir et al. (1997) reported the inability of the
spermatogenic cells to complete meiosis in immature neonatal
hypothyroid rat testes. Furthermore, Sahoo et al. (2008) showed
significant decrease in germ cell number specifically primary
spermatogonia in persistent neonatal hypothyroidism of rats.
In addition, changes in the specific activity of testicular ACP
of hypothyroid group reflect testicular degeneration, which may be a
consequence of suppressed testosterone production as represented
herein and indicative of lytic activity (Kaur et al., 1999). This was
further indicated by the significant positive correlation between ACP,
and tHcy, tNOx, plasma MDA and testicular MDA, and the
significant negative correlation between FRAP and ACP.
Meanwhile, in co-treatment group non significant changes in
LDH, ACP and SDH specific activities were observed in comparison
to control group. This seems reasonable, as folic acid was found to
alleviate oxidative stress and hyperhomocysteinemia affecting
testicular function as presented in the present study. However, a
significant increase in GGT specific activity was found in folic acid
and co-treatment groups as compared to control group. This further
indicates the role of folic acid in enhancing the development of
premeiotic spermatogenic cells in relation to postmeiotic ones
(Shalaby et al., 2010).
187
Furthermore, in post-treatment group there were non
significant changes in LDH, GGT, ACP and SDH specific activities
as compared to control group. This means that restoration of
euthyroid state accompanying with folic acid administration restored
the spermatocytes arrangement and number in semineferous tubules.
This also seems reasonable as thyroid hormone plays a key role in
testicular development (Buzzard et al., 2000; Wajner et al., 2007).
This is in addition to the role of thyroid hormones presented herein in
restoring the biochemical alterations found to be involved in
testicular degeneration. The biochemical alterations in the specific
activities of marker testicular enzymes associated with specific testes
cell types were well supported by the histopathological,
immunohistochemical and ultrastructural observations.
The present study performed a morphological analysis in the
testes of different groups under study. The light microscopy results in
hypothyroid group showed a disorganization of the seminiferous
tubules indicating significant structural alterations in the germinative
epithelium. Our results are in line with previous reports describing
that hypothyroidism of rats at different ages impairs testicular
growth, germ cell maturation and other developmental events
(Francavilla et al., 1991; Oncu et al., 2004; Sakai et al., 2004;
Holsberger and Cooke, 2005; Sahoo et al., 2007).
The results of transmission electron microscopy demonstrated
different cellular alterations in hypothyroid rat (group III) testes with
multiple disorganizations of cellular organelles. These findings are in
line with the results of PTU-induced congenital hypothyroidism of
188
rats as reported by Zamoner et al. (2008). In this context, an
implication of the present findings is that the deleterious effects of
hypothyroidism may be elicited, at least in part, by altering the
antioxidant defenses and increased ROS generation (Sahoo et al.,
2005, 2008), leading to oxidative stress in the organ as presented in
the present study.
In addition, the observed disorganizations of the cellular
organelles could be ascribed to cytoskeletal alterations as loss of
Sertoli cell intermediate filaments (IFs) integrity which are
cytoskeletal polymers that provide crucial structural support in the
nucleus and cytoplasm of eukaryotic cells (Zamoner et al., 2008).
Moreover, the morphological alterations observed in Sertoli cell
mitochondria and Golgi apparatus could be related to defective
cytoskeletal dynamics implying in cell damage (Zamoner et al.,
2008). Degenerative changes in testes of hypothyroid group rats
coincided with perturbation in testosterone production as presented in
the present study confirming the crucial role of testosterone in
spermatogenesis as reported by Sharpe (1987).
On the other hand, the observed alleviation of
histoarchitectural degeneration by folic acid supplementation in co-
and post-treatment groups coincided with the role of folic acid in
counteracting the oxidative stress and reducing plasma total
homocysteine level found to be in part responsible for this
degeneration. This further illustrates and confirms the need for an
intact folate cycle to maintain normal spermatogenesis, and suggests
that the alternative homocysteine remethylation pathway is also
189
operating in the testis. Noteworthy, restoration of euthyroid state in
post-treatment group shared with folic acid supplementation in
restoring the normal histoarchitecture of the testes as also reported by
Umezu et al. (2004) and Sahoo et al. (2008).
Proliferating cell nuclear antigen (PCNA) is a well-known 36-
kDa nuclear matrix protein, which is essential for cell cycle control
and multiple cell cycle pathways, including DNA replication, DNA
elongation (leading strand synthesis), and DNA excision repair
(Zhang et al., 1993; Madsen and Celis, 1995). Proliferating cell
nuclear antigen is useful for the diagnosis of germinal arrest because
there are significantly reduced PCNA levels in germinal arrest, which
is an indication of DNA synthesis deterioration (Zeng et al., 2001).
During normal spermatogenesis, controlled cell proliferation
is of fundamental importance, assuming highly coordinated
mechanisms between the mitotically inactive Sertoli cells and the
germ cells undergoing mitosis and meiosis. Mitosis counts, tritiated
thymidine ([3H] Thy) or 5-bromodeoxyuridine (BrdU) labeling have
traditionally been used for the assessment of cell proliferation.
However, these methods are less suitable for use under certain
experimental conditions (Kurki et al., 1988). Recently, the use of
immunocytochemical assays, based on antibodies to cell
proliferation-related antigens as PCNA, has been shown to be
effective in the assessment of cell proliferation (Abdel-Dayem,
2009).
Proliferating cell nuclear antigen expression and synthesis are
linked to cell proliferation (Kurki et al., 1988) and its presence
190
subsequent to immunohistochemical processing can be observed
microscopically. This technique may be used for the purpose of
providing direct visual evidence of cell proliferation under various
experimental conditions (Abdel-Dayem, 2009).
The results of the present study showed lower number of
spermatogonia that have positive reaction for PCNA-ir in
hypothyroid group as compared to controls (group I, II) indicating
that hypothyroidism adversely affects spermatogenesis and
proliferating capacity of spermatogonia. Also, PCNA-ir was not
detected in Sertoli cells and Leydig cells in the testes of control rats
in contrast to hypothyroid group rats. This finding confirmed the role
of thyroid hormone in regulating the maturation and growth of testis,
in postnatal rat testis, by inhibiting immature Sertoli cell and Leydig
cell proliferation and stimulating their functional differentiation as
reported by Holsberger et al. (2005) and Mendis-Handagama and
Ariyaratne (2005). Moreover, an abnormal distribution of
spermatogonia was seen in hypothyroid rat testes in contrast to
control testes, indicating a role of thyroid hormone in maintaining the
normal distribution of the spermatogenic cells in the seminiferous
tubules.
The increased number of PCNA-LI in spermatogonia of co-
and post-treatment groups as compared to hypothyroid group’s rats
corroborates the role of folic acid in enhancing spermatogenesis and
boosting sperm concentration. Moreover, folic acid supplementation
had a beneficial effect on spermatogenesis, possibly by increasing
cellular cohesion within the seminiferous epithelium, thus preventing
191
abnormal release of immature germ cells into the lumen (Bentivoglio
et al., 1993). Noteworthy, in post-treatment group, restoration of the
euthyroid state shared with folic acid supplementation in enhancing
spermatogenesis.
In conclusion, the current study indicated that post-pubertal
hypothyroidism in male rats was associated with
hyperhomocysteinemia, oxidative stress and other biochemical
alterations. These factors may, at least in part, contribute toward
testicular dysfunction, which eventually leads to the observed
testicular degenerative biochemistry and morphology. Indeed, this
postulates an indirect negative impact of post-pubertal
hypothyroidism on testicular function through development of these
factors. This is plus the direct impact of thyroid hormone on testicular
tissue through the presence of thyroid hormone receptors and
deiodinases in human and rat testes from neonatal to adult life as
mentioned before.
In addition, a role of folic acid supplementation in enhancing
spermatogenesis, boosting sperm concentration and building up the
antioxidant status against the oxidants was observed in the present
study. Moreover, folic acid supplemented with restoration of
euthyroid state as in post-treatment group revealed better
amelioration than folic acid supplemented concurrently with
hypothyroidism as in co-treatment group. So, folic acid
supplementation enhancement of spermatogenesis will be of major
interest to be used as an adjuvant therapy under these conditions.

192
Summary
In mammals, altered thyroid status is known to adversely
affect many organs and tissues. Nevertheless, the impact of thyroid
disorders on male reproduction remained controversial for several
193
years. Although there is now general agreement that thyroid hormone
is an important hormonal regulator of testis physiology during
development period, its role in the post-pubertal and adult testes is
still controversial.
Moreover, hypothyroidism has been reported to induce mild
hyperhomocysteinemia and endothelial dysfunction. However, the
impact of hyperhomocysteinemia and endothelial dysfunction on
testicular function is unclear. Besides, regulatory role of thyroid
hormone in testicular physiology is well established; however, its
effect on testicular antioxidant defense system is inadequate. On the
other hand, folic acid has been reported to have an antioxidant power
against free radicals, and an alleviating role in hyperhomocysteinemia
and the associated endothelial dysfunction. Also, progressive folate
deficiency was suggested to develop with hypothyroidism.
The present study aimed to declare the effect of low thyroid
hormone status on total plasma homocysteine level and oxidative
stress parameters. Additionally, the impact of these biomarkers on
testicular function in PTU-induced hypothyroidism at the post-
pubertal stage of male rats was investigated. It also aimed to elucidate
the role of folic acid supplementation in enhancing spermatogenesis,
boosting sperm concentration and building up the antioxidant status
as a concurrent treatment with hypothyroidism and as a post-
treatment after restoration of the euthyroid state.
The experiment was performed on fifty male albino rats
weighing 120 g (±10) and of 6-7 week’s age. All the experiments
were done in compliance with the guiding principles in the care and
194
use of laboratory animals. The rats were equally divided into five
groups:
Group I: Control group in which rats never received any treatment.
Group II: Folic acid group in which rats received folic acid (0.011
µmol/g body weight/day) only for four weeks (form 2nd
week to 6th week) orally by a stomach tube.
Group III: Hypothyroid group in which rats received 0.05% 6-n-
propyl-2-thiouracil (PTU) in drinking water for 6 weeks
to induce the hypothyroid state.
Group IV: Co-treatment group in which rats received 0.05% PTU in
drinking water and folic acid (0.011 µmol/g body
weight/day) concurrently. The dose period of PTU was
six weeks as in hypothyroid group. However, folic acid
was administered orally by a stomach tube for 4 weeks
form the second to sixth week after evidence of
hypothyroidism had been established at the end of the
second week.
Group V: Post-treatment group in which rats received 0.05% PTU
in drinking water for 6 weeks as in hypothyroid group.
Additionally, folic acid was administered for another 4
weeks (form 7th week to 10th week) while PTU was
withdrawn after the sixth week to establish the euthyroid
state.
Blood samples were individually collected from each rat and
divided into two parts. The first part was the serum samples subjected
195
to the estimation of serum total T3 and TSH concentrations. The
second part was plasma samples used for the determination of plasma
total homocysteine (tHcy), reduced glutathione (GSH), oxidized
glutathione (GSSG), nitrites, nitrates, malondialdehyde (MDA) and
testosterone concentrations.
Different homogenates of the testes were prepared and used
for estimation of testicular malondialdehyde (MDA) concentration,
ferric reducing antioxidant power (FRAP), total protein content,
lactate dehydrogenase (LDH) activity, gamma-
glutamyltranspeptidase (GGT) activity, acid phosphatase (ACP)
activity and sorbitol dehydrogenase (SDH) activity.
Additionally, sperm count and motility were evaluated for rats
of different studied groups. Testes of different studied groups' rats
were also prepared for histological, immunohistochemical and
ultrastructural investigations. The results of this study revealed the
followings:
Food intake, fluid intake and increase rate of body weight per
week showed significant decrease in hypothyroid group as
compared to control group. Meanwhile, restoration of euthyroid
state with folic acid supplementation (group V) normalized it. On
the other hand, relative testes and epididymides weight showed a
non significant change in different studied groups except for the
significant increase of relative epididymides weight in post-
treatment group when compared to control group.
Serum triiodothyronine (T3) and thyroid stimulating hormone
(TSH) levels showed significant decrease and increase
196
respectively in hypothyroid and co-treatment groups as compared
to controls. Meanwhile, there was a non significant change in T3
and TSH levels in folic acid and post-treatment groups as
compared to control group.
Plasma total homocysteine (tHcy) and total NO metabolites
(NOx), and plasma and testicular MDA showed significant
increase in hypothyroid group as compared to controls and
significant decrease in co-treatment and post-treatment groups as
compared to hypothyroid group.
Plasma GSSG/GSH ratio and testicular ferric reducing
antioxidant power (FRAP) showed significant increase and
decrease respectively in hypothyroid group as compared to
control group. Meanwhile, plasma GSSG/GSH ratio and
testicular FRAP showed a non significant change in co-treatment
and post-treatment groups as compared to hypothyroid group.
Plasma testosterone, sperm count and sperm motility exhibited
significant decrease in hypothyroid group as compared to
controls. Moreover, while sperm count and motility showed
significant increase, plasma testosterone level showed a non
significant change in co-treatment and post-treatment groups as
compared to hypothyroid group.
Testicular total protein (TP) and specific activities of testicular
GGT and SDH showed a non significant change in hypothyroid
group as compared to controls. Meanwhile, specific activities of
testicular LDH and ACP showed significant increase in
hypothyroid group as compared to control group. There was also
non significant change in testicular TP, and LDH, GGT, ACP and
197
SDH specific activities in co-treatment and post-treatment groups
as compared to control group.
Significant negative correlation was detected between total T3 and
tHcy, tNOx, plasma MDA and testicular MDA. On the other
hand, tHcy had a significant positive correlation with tNOx and
both of them had a significant positive correlation with plasma
MDA in different groups under study.
Levels of tHcy had a significant positive and negative correlation
with testicular MDA and testosterone respectively, and non
significant correlation with FRAP and sperm count. The same
finding was detected with tNOx levels except for the non
significant correlation between tNOx and testosterone, and the
significant negative correlation between tNOx and sperm count.
Plasma MDA was found to have a significant positive correlation
with testicular MDA and both of them had a significant negative
correlation with FRAP and testosterone. However, plasma and
testicular MDA had a non significant correlation and significant
negative correlation respectively with sperm count in different
studied groups.
Total T3 had a significant positive and negative correlation with
sperm motility and ACP specific activity respectively, and non
significant correlation with GGT specific activity. On the other
hand, tHcy, tNOx, and plasma and testicular MDA had significant
negative correlation with sperm motility and non significant
correlation with GGT specific activity. Also, these parameters
had significant positive correlation with ACP specific activity in
different studied groups. In addition, FRAP had a non significant
198
correlation with sperm motility and GGT specific activity, and a
significant negative correlation with ACP specific activity.
Histopathological study showed that cycle of spermatogenesis
was regular in all male rats in the controls. However, the testes of
the hypothyroid group showed a significant decrease in the
number of spermatogenic cells with focal areas of vacuolar
degenerative changes which appeared in the cytoplasm of the
spermatogenic epithelium and in the Sertoli cells. Furthermore,
abnormal distribution of spermatozoa was seen in the lumen of
the seminiferous tubules and little Leydig cell numbers were also
found. Accumulation of spermatogenic and Leydig cells were
increased in co-treatment and post-treatment groups when
compared to hypothyroid group.
The electron micrographs of control rat testes showed its normal
structure with normal structure of spermatogenic cells and its
organelles. However, the electron micrographs of the
seminiferous tubules in hypothyroid group rats’ testes showed
different cellular alterations with irregular organelles structure.
On the other hand, the electron micrographs of the seminiferous
tubules in co-treatment and post-treatment groups showed
minimal damaged tubules.
Proliferating cell nuclear antigen immunohistochemistry revealed
that only the spermatogonia in controls showed a positive strong
reaction for PCNA-immunoreactivity (PCNA-ir) while the other
spermatogenic cell types showed negative reaction. Meanwhile,
the testes of hypothyroid group showed many
immunohistochemical changes in testicular tissues. First, the
199
numbers of spermatogonia having positive reaction for PCNA-ir
were lower in hypothyroid group as compared to controls.
Second, some of the Sertoli and Leydig cells in testes of
hypothyroid group showed positive reaction for PCNA-ir in
contrast to the controls. Third, some of spermatogonia in testes of
hypothyroid rats were observed in the lumen of the seminiferous
tubules and between the spermatocytes. On the other hand, only
the numbers of spermatogonia that have positive reaction for
PCNA-ir were significantly increased in co-treatment and post-
treatment groups as compared to the hypothyroid group.
Conclusion
The pathogenesis of elevated tHcy in hypothyroidism can be
explained by the fact that thyroid hormones markedly affect
riboflavin metabolism mainly by stimulating flavokinase affecting
Hcy metabolism. Besides, the elevated level of tNOx in the
hypothyroid group's rats may be due to increased vascular oxidative
burden associated with homocysteinemia that induces NADPH
oxidase and inducible nitric oxide synthase activity, contributing to
increased superoxide radicals production that react with nitric oxide
(NO) to form peroxynitrite radicals.
The enhanced oxidative stress and decreased antioxidant
capacity in hypothyroidism of the present study are suggested to
develop due to oxidation of membrane lipids of cells by
hypothyroidism and to be associated with hyperhomocysteinemia
observed in the present study or due to folate deficiency.
200
Regarding testicular function, decrement of plasma
testosterone in hypothyroid group's rats can be explained by the direct
inhibitory effect of the observed hyperhomocysteinemia and
oxidative stress. Impaired spermatogenesis was also observed in the
present study in the hypothyroid group and could be the result of
reduced plasma testosterone level, hyperhomocysteinemia, oxidative
stress and progressive folate deficiency. Indeed, this postulates an
indirect negative impact of post-pubertal hypothyroidism on testicular
function through development of these factors.
From another point of view, the significant alterations in the
testicular enzymes in hypothyroid group's rats can be attributed to the
loss of premeiotic spermatocytes and a subsequent increase in the
proportion of postmeiotic cells in the semineferous tubules. These
findings were well supported by histopathological,
immunohistochemical and ultrastructural investigations which
showed that hypothyroidism had made several histoarchitectural
changes in the testes.
Additionally, folic acid was found to alleviate testicular
function degeneration observed in the hypothyroid group. This effect
is suggested to be associated with folic acid termination of factors
involved in this degeneration. However, better results were found in
case of using folic acid as an adjuvant therapy after restoring the
euthyroid state (post-treatment group) than what had been observed
in co-treatment group. If confirmed in human beings, these results
could propose that folic acid can be used as an adjuvant therapy with
thyroxin replacement therapy in hypothyroidism disorders.
201
References
Abdel-Dayem M. (2009): Histological and immunohistochemicalchanges in the adult rat testes after left experimentalvaricocele and possible protective effects of resveratrol. EgyptJ Histol; 32(1): 81-90.
Abdul-Ghani A S, Dabdoub N, Muhammad R, Abdul-Ghani R andQazzaz M. (2008): Effect of Palestinian honey onspermatogenesis in rats. J Med Food; 11(4): 799-802.
Adrees M, Gibney J, El-Saeity N and Boran G. (2009): Effects of 18months of L-T4 replacement in women with subclinicalhypothyroidism. Clin Endocrinol; 71(2): 298-303.
Ahmed O M, El-Gareib A W, El-bakry A M, Abd El-Tawab S M andAhmed R G. (2008): Thyroid hormones states and braindevelopment interactions. Int J Devl Neurosci; 26: 147-209.
Antoniades C, Shirodaria C, Crabtree M, Rinze R, Alp N, Cunnington C, Diesch J, Tousoulis D, Stefanadis C, Leeson P, Ratnatunga C, Pillai R and Channon K M. (2007): Alteredplasma versus vascular biopterins in human atherosclerosisreveal relationships between endothelial nitric oxide synthasecoupling, endothelial function, and inflammation. Circulation;116(24): 2851-2859.
Antoniades C, Shirodaria C, Warrick N, Cai S, de Bono J, Lee J, Leeson P, Neubauer S, Ratnatunga C, Pillai R, Refsum H andChannon K M. (2006): 5-Methyltetrahydrofolate rapidlyimproves endothelial function and decreases superoxideproduction in human vessels: effects on vasculartetrahydrobiopterin availability and endothelial nitric oxidesynthase coupling. Circulation; 114: 1193-1201.
Araki O, Ying H, Zhu X G, Willingham M C and Cheng S Y. (2009): Distinct dysregulation of lipid metabolism by unliganded
202
thyroid hormone receptor isoforms. Mol Endocrinol; 23(3):308-315.
Assanelli D, Bonanome A, Pezzini A, Albertini F, Maccalli P, GrassiM, Archetti S, Negrini R and Visioli F. (2004): Folic acid andVitamin E supplementation effects on homocysteinemia, endothelial function and plasma antioxidant capacity in youngmyocardial-infarction patients. Pharmacol Res; 49: 79-84.
Audet I, Laforest J P, Martineau G P and Matte J J. (2004): Effect ofvitamin supplements on some aspects of performance, vitaminstatus, and semen quality in boars. J Anim Sci; 82: 626-633.
Au-Yeung K K W, Yip J C W, Siow Y L and Karmin O. (2006):Folic acid inhibits homocysteine-induced superoxide anionproduction and nuclear factor kappa B activation inmacrophages. Can J Physiol Pharm; 84: 141-147.
Babson A L and Ready A P. (1959): Colourimetric method for thedetermination of total and prostatic acid phosphatase. Am JClin Pathol; 32: 89-91.
Bailey N T. (1994): In “Statistical methods in biology, 3rd edition". Clin. Perinat.; 14(1): 89-107.
Bancroft J D and Stevens G A. (1990): Theory and Practice ofHistological Techniques; 2nd Ed. Churchill Livingstone, London.
Barbe F, Klein M, Chango A, Fremont S, Gerard P, Weryha G, Gueant J L and Nicolas J P. (2001): Homocysteine, folate, vitamin B12, and transcobalamins in patients undergoingsuccessive hypo-and euthyroid states. J Clin Endocr Metab;86: 1845-1846.
Bentivoglio G, Melica F and Cristoforoni P. (1993): Folinic acid inthe treatment of human male infertility. Fertil Steril; 60: 698-701.
203
Benzie I F F and Strain J J. (1999): Ferric reducing/antioxidant powerassay: direct measure of total antioxidant activity of biologicalfluids and modified version for simultaneous measurement oftotal antioxidant power and ascorbic acid concentration. Method Enzymol; 299: 15-27.
Benzie I F F and Strain J J. (1996): The ferric reducing ability ofplasma (FRAP) as a measure of antioxidant power: the FRAPassay. Anal Biochem; 239: 70-76.
Blom H J, Kleinveld H A, Boers G H, Demacker P N, Hak-LemmersH L, Poele-Pothoff M T et al. (1995): Lipid peroxidation andsusceptibility of lowdensity lipoprotein to in vitro oxidation inhyperhomocysteinemia. Eur J Clin Invest; 25(3): 149-154.
Boussouar F and Benahmed M. (2004): Lactate and energymetabolism in male germ cells. Trends Endocrin Met; 15(7):345-350.
Braverman L E and Utiger R D. (2000): Introduction toHypothyroidism. In: Braverman L E, Utiger R D, editors. Werner and Ingbar’s, the thyroid, 8th Ed. Philadelphia:Lippincott Williams & Wilkins, 719-721.
Buzzard J J, Morrison J R, O’Bryan M K, Song Q and Wreford N G. (2000): Developmental expression of thyroid hormonereceptors in the rat testis. Biol Reprod; 62: 664-669.
Cakal B, Cakal E, Demirba B, Ozkaya M, Karaahmeto lu S, SerterR, Aral Y. (2007): Homocysteine and fibrinogen changes withL-thyroxine in subclinical hypothyroid patients. J KoreanMed Sci; 22(3): 431-435.
Chastain M A, Russo G G, Boh E E, Chastain J B, Falabella A andMillikan L E. (1999): Propylthiouracil hypersensitivity: reportof two patients with vasculitis and review of the literature. JAm Acad Dermatol; 41: 757-764.
204
Chattopadhyay S, Choudhury S, Roy A, Chainy G B N and SamantaL. (2010): T3 fails to restore mitochondrial thiol redox statusaltered by experimental hypothyroidism in rat testis. GenComp Endocr; 169: 39-47.
Chauncey B, Leite M V, Goldstein L. (1988): Renal sorbitolaccumulation and associated enzyme activities in diabetes. Enzyme; 39(4): 231-234.
Cheng C Y and Mruk D D. (2002): Cell junction dynamics in thetestis: Sertoli germ cell interactions and male contraceptivedevelopment. Physiol Rev; 82: 825-874.
Cheng D, Zheng X M, Li S W, Yang Z W and Hu L Q. (2006):Effects of epidermal growth factor on sperm content andmotility of rats with surgically induced varicoceles. Asian JAndrol; 8(6): 713-717.
Chen Z, Karaplis A C, Ackerman S L et al. (2001): Mice deficient inmethylenetetrahydrofolate reductase exhibithyperhomocysteinemia and decreased methylation capacity, with neuropathology and aortic lipid deposition. Hum MolGenet; 10: 433–443.
Chiao Y C, Cho W L and Wang P S. (2002): Inhibition oftestosterone production by propylthiouracil in rat Leydigcells. Biol Reprod; 67: 416-422.
Chiao Y C, Lin H, Wang S W and Wang P S. (2000): Direct effectsof propylthiouracil on testosterone secretion in rat testicularinterstitial cells. Brit J Pharmacol; 130: 1477-1482.
Choksi N Y, Jahnke G D, Hilaire C S and Shelby M. (2003): Role ofthyroid hormones in human and laboratory animalreproductive health. Birth Defects Res B; 68: 479-491.
Chopra I J, Solomon D H and Ho R S. (1971): A radioimmunoassayof triiodothyronine. J Clin Endocrinol; 833-865.
205
Cho Y Y, Shon H S and Yoon H D. (2005): Management of apregnant patient with Graves' disease complicated bypropylthiouracil induced agranulocytosis. Korean J internmed; 20(4): 335-338.
Christ-Crain M, Meier C, Guglielmetti M, Huber P R, Riesen W, Staub J J and Muller B. (2003): Elevated C-reactive proteinand homocysteine values: cardiovascular risk factors inhypothyroidism? A cross-sectional and a double-blind, placebocontrolled trial. Atherosclerosis; 166: 379-386.
Clarke Z L, Moat S J, Miller A L, Randall M D, Lewis M J and LangD. (2006): Differential effects of low and high dose folic acidon endothelial dysfunction in a murine model of mildhyperhomocysteinaemia. Eur J Pharmacol; 551: 92-97.
Cooke P S, Hess R A, Porcelli J and Meisami E. (1991): Increasedsperm production in adult rats after transient neonatalhypothyroidism. Endocrinology; 129:244-248.
Cooke P S, Holsberger D R, Witorsch R J, Sylvester P W, Meredith JM, Treinen K A and Chapin R E. (2004): Thyroid hormone, glucocorticoids and prolactin at the nexus of physiology, reproduction, and toxicology. Toxicol Appl Pharm; 194: 309-335.
Cooper D S. (2005): Antithyroid Drugs: a review. New Engl J Med;352: 905-917.
Crantz F R and Larsen P R. (1980): Rapid thyroxine to 3,5,3-triiodothyronine conversion and nuclear 3,5,3-triiodothyronine binding in rat cerebral cortex and cerebellum. J Clin Invest; 65: 935-938.
Cristovao F C, Bisi H, Mendonca B B, Bianco A C and Bloise W. (2002): Severe and mild neonatal hypothyroidism mediateopposite effects on Leydig cells of rats. Thyroid; 12: 13-18.
206
Daniel W. (1991): A foundation for analysis in the health. In: Wiley Jand sons (eds.). Biostatics, 5th edtion, New York.; 209-365.
Das U N. (2003): Folic Acid Says No to Vascular Diseases. Nutrition; 19: 686-692.
Deidiker R and deMello D E. (1996): Propylthiouracil-inducedfulminant hepatitis: case report and review of the literature. Pediatr Pathol Lab Med; 16: 845-852.
De Kretser D M. (1982): Sertoli cell-Leydig cell interaction in theregulation of testicular function. Int J Androl; 5: 11-17.
De Lamirande E, Jiang H, Zini A, Kodama H and Gagnon C. (1997):Reactive oxygen species and sperm physiology. Rev Reprod;2(1): 48-54.
Delgado-Reyes C V, Wallig M A and Garrow T A. (2001):Immunohistochemical detection of betaine-homocysteine S-methyltransferase in human, pig, and rat liver and kidney. Arch Biochem Biophys; 393: 184-186.
Del Rio A G, Palaoro L A, Blanco A M, Niepomniszcze H. (2001):Epididymal scanning electron microscopy study inhypothyroid rats. Arch Andrology; 46: 73-77.
Diekman M J M, van der Put N M, Blom H J, Tijssen J G P andWiersinga W M. (2001): Determinants of changes in plasmahomocysteine in hyperthyroidism and hypothyroidism. ClinEndocrinol; 54: 197-204.
Engall E. (1980): "Methods in Enzymology." Van Vunakis, H. andLangone, J.J. (eds.), Academic press, New York.; 70: 419-492.
207
Erel O. (2004): A novel automated method to measure totalantioxidant response against potent free radical reactions. ClinBiochem; 37: 112-119.
Esplugues J V. (2002): NO as a signaling molecule in the nervoussystem. Brit J Pharmacol; 135: 1079-1095.
Fernandez V and Videla L A. (1996): Hepatic glutathionebiosynthetic capacity in hyperthyroid rats. Toxicol Lett; 89:85-89.
Fisher D A and Brown R S. (2000): Thyroid Physiology in thePerinatal Period and During Childhood. In: Braverman L E, Utiger R D, editors. Werner and Ingbars, the thyroid, 8th Ed. Philadelphia, Lippincott Williams & Wilkins. 959-972.
Forges T, Monnier-Barbarino P, Alberto J M, Guéant-Rodriguez RM, Daval J L and Guéant J L. (2007): Impact of folate andhomocysteine metabolism on human reproductive health. Hum Reprod Update; 13(3): 225-238.
Fowler B. (2005): Homocysteine: overview of biochemistry, molecular biology, and role in disease processes. Semin VascMed; 5: 77-86.
Fowler B. (2001): The folate cycle and disease in humans. KidneyInt; 59(Suppl 78): 221-229.
Francavilla S, Cordeschi G, Properzi G, Di Cicco L, Jannini E A, Palmero S, Fugassa E, Loras B and D’Armiento M. (1991):Effect of thyroid hormone on the pre- and post-nataldevelopment of the rat testis. J Endocrinol; 129: 35-42.
Gliszczynska-Swigło A. (2007): Folates as antioxidants. Food Chem;101: 1480-1483.
Gonzalo-Lumbreras R, Pimentel-Trapero D and Izquierdo-HornillosR. (2003): Development and method validation fortestosterone and epitestosterone in human urine samples by
208
liquid chromatography applications. J Chromatogr Sci; 41(5):261-266.
Gredilla R, Barja G and Lopez-Torres M. (2001a): Thyroid hormoneinduced oxidative damage on lipids, glutathione and DNA inthe mouse heart. Free Radical Res; 35: 417-425.
Gredilla R, Lopez-Torres M, Portero-Otin M, Pamplona R and BarjaG. (2001b): Influence of hyper- and hypothyroidism on lipidperoxidation, unsaturation of phospholipids, glutathionesystem and oxidative damage to nuclear and mitochondrialDNA in mice skeletal muscle. Mol Cell Biochem; 221: 41-48.
Gregory J F. (1996): Vitamins. In: O Fennema (Ed.), Food ChemistryNew York, Basel, Hong Kong, Marcel Dekker, 590-599.
Griffin J E and Wilson J D. (2002): Disorders of the Testes and theMale Reproductive Tract. In: Williams Textbook ofEndocrinology, Eds PR Larsen, HM Kronenberg, S Melmed& KS Polonsky. New York: Saunders, 709-769.
Grootegoed J A and Den Boer P. (1987): Energy Metabolism inSpermatids: Review. In: Hamilton, D.W., Waites, G.H.M. (Eds.), Cellular and Molecular Events in Spermiogenesis. Cambridge University Press, 193-215.
Hennemann G, Docter R, Friesema E C H, De Jong M, Krenning E Pand Visser T J. (2001): Plasma membrane transport of thyroidhormones and its role in thyroid hormone metabolism andbioavailability. Endocr Rev; 22: 451-476.
Herrero M B, de Lamirande E and Gagnon C. (2003): Nitric oxide isa signaling molecule in spermatozoa. Curr Pharm Design; 9:419-25.
Hoch F L. (1988): Lipids and thyroid hormones. Prog Lipid Res; 27:199-270.
209
Holm J, Hansen S I and Hoier-Madsen M. (1991): A high-affinityfolate binding protein in human semen. Bioscience Rep; 11:237-242.
Holsberger D R and Cooke P S. (2005): Understanding the role ofthyroid hormone in Sertoli cell development: A mechanistichypothesis. Cell Tissue Res; 322: 133-140.
Holsberger D R, Kiesewetter S E and Cooke P S. (2005): Regulationof neonatal Sertoli cell development by thyroid hormonereceptor alpha1. Biol Reprod; 73(3): 396-403.
Hueston W J, King D E and Geesey M E. (2005): Serum biomarkersfor cardiovascular inflammation in subclinicalhypothyroidism. Clin Endocrinol; 63: 582-587.
Hummel S G, Fischer A J, Martin S M, Schafer F Q and Buettner GR. (2006): Nitric oxide as a cellular antioxidant: a little goesalong way. Free Radical Bio Med; 40: 501-506.
Jannini E A, Crescenzi A, Rucci N, Screponi E, Carosa E, de MatteisA, Macchia E, d’Amati G and D’Armiento M. (2000):Ontogenetic pattern of thyroid hormone receptor expression inthe human testis. J Clin Endocr Metab; 85: 3453-3457.
Jannini E A, Ulisse S and D’Armiento M. (1995): Thyroid hormoneand male gonadal function. Endocr Rev; 16: 443-459.
Jansen H T, Kirby J D, Cooke P S, Arambepola N and Iwamoto G A. (2007): Impact of neonatal hypothyroidism on reproduction inthe male hamster, Mesocricetus auratus. Physiol Behav; 90:771-781.
Jayatilleke E and Shaw S. (1993): A high performance liquidchromatographic assay for reduced and oxidized glutathionein biological samples. Anal Biochem; 214: 452-457.
210
Jin L, Caldwell R B, Li-Masters T and Caldwell R W. (2007):Homocysteine induces endothelial dysfunction via inhibitionof arginine transport. J Physiol Pharmacol; 58: 191-206.
Joshi R, Adhikari S, Patro B S, Chattopadhyay S and Mukherjee T. (2001): Free radical scavenging behavior of folic acid:evidence for possible antioxidant activity. Free Radical BioMed; 30: 1390-1399.
Joyce K L, Porcelli J and Cooke P S. (1993): Neonatal goitrogentreatment increases adult testis size and sperm production inthe mouse. J Androl; 14: 448-455.
Jubiz W. (1987): The Testes. In: Endocrinology: A Logical Approachfor Clinicians, 2nd Ed. Mc Graw-Hill Book Co., Singapore, 387-408.
Karatas F, Karatepe M and Baysar A. (2002): Determination of freemalondialdehyde in human serum by high performance liquidchromatography. Anal Biochem; 311: 76 -79.
Karatepe M. (2004): Simultaneous determination of ascorbic acid andmalondialdehyde in human serum by HPLC – UV. LC GC NAm; 22: 362-365.
Kaur R, Dhanuju C K and Kaur K. (1999): Effect of dietary seleniumon biochemical composition in rat testis. Indian J Exp Biol;37(5): 509-511.
Kelly G. (2000): Peripheral metabolism of thyroid hormones: areview. Altern Med Rev; 5: 306-333.
Kirby J D, Jetton A E, Ackland J F, Turek F W and Schwartz N B. (1993): Changes in serum immunoreactive inhibin-alphaduring photoperiod-induced testicular regression andrecrudescence in the golden hamster. Biol Reprod; 49: 483-488.
211
Kirby J D, Jetton A E, Cooke P S, Hess R A, Bunick D, Ackland J F, Turek F W and Schwartz N B. (1992): Developmentalhormonal profiles accompanying the neonatalhypothyroidism-induced increase in adult testicular size andsperm production in the rat. Endocrinology; 131: 559-565.
Kirby J D, Mankar M V, Hardesty D and Kreider D L. (1996):Effects of transient prepubertal 6-n-propyl-2-thiouraciltreatment on testis development and function in the domesticfowl. Biol Reprod; 55: 910-916.
Kobayashi T, Kaneko T, Iuchi Y, Matsuki S, Takahashi M, SasagawaI, Nakada T and Fujii J. (2002): Localization andphysiological implication of aldose reductase and sorbitoldehydrogenase in reproductive tracts and spermatozoa of malerats. J Androl; 23: 674-683.
Krassas G E and Pontikides N. (2004): Male reproductive function inrelation with thyroid alterations. Best Pract Res ClinEndocrinol Metab; 18(2): 183-195.
Kurki P, Ogata K and Tan E M. (1988): Monoclonal antibodies toproliferating cell nuclear antigen (PCNA)/cyclin as probes forproliferating cells by immunofluorescence microscopy andflow cytometry. J Immunol Meth; 109(1): 49-59.
Kuroki Y, Iwamoto T, Lee J W, Yoshiike M, Nozawa S, Nishida T, Ewis A A, Nakamura H, Toda T, Tokunaga K, Kotliarova SE, Kondoh N, Koh E, Namiki M, Shinka T and Nakahori Y. (1999): Spermatogenic ability is different among males indifferent Y chromosome lineage. J Hum Genet; 44: 289-292.
Lalonde R, Joyal C C and Botez M I. (1993): Effects of folic acid andfolinic acid on cognitive and motor behaviors in 20-month-oldrats. Pharmacol Biochem Be; 44: 703-707.
Latendresse J R, Warbrittion A R, Jonassen H and Creasy D M. (2002): Fixation of testes and eyes using a modified
212
Davidson’s fluid: comparison with Bouin’s fluid andconventional Davidson’s fluid. Toxicol Pathol; 30(4): 524-533.
Lee N P and Cheng C Y. (2004): Nitric oxide/nitric oxide synthase, spermatogenesis, and tight junction dynamics. Biol Reprod;70: 267-276.
Lien E A, Nedrebo B G, Varhaug J E, Nygard O, Aakvaag A andUeland P M. (2000): Plasma total homocysteine levels duringshort term iatrogenic hypothyroidism. J Clin Endocr Metab;85: 1049-1053.
Li H and Poulos T L. (2005): Structure, function studies on nitricoxide synthase. J Inorg Biochem; 99: 293-305.
Llanos M N, Ronco A M, Pino A M and Valladares L E. (1985): Thetransmethylations inhibitor 3-deazaadenosine inhibits in vitrotestosterone production by rat testis interstitial cellsstimulated with HCG. J Steroid Biochem; 23(1): 73-76.
Lowry O H, Rosebrough N J, Farr A L and Randall R J. (1951):Protein measurement with the folin phenol reagent. J BiolChem; 193: 265-275.
Lucock M. (2000): Folic acid: nutritional biochemistry, molecularbiology, and role in disease processes. Mol Genet Metab; 71:121-138.
Madar Z, Kalet-Litman S and Stark A H. (2005): Inducible nitricoxide synthase activity and expression in liver andhepatocytes of diabetic rats. Pharmacology; 73: 106-112.
Madsen P and Celis J E. (1995): S-Phase patterns of cyclin (PCNA)antigen staining resemble topographical patterns of DNAsynthesis. FEBS Lett; 193(1): 5-11.
213
Majdic G, Snoj T, Horvat A, Mrkun J, Kosec M and Cestnik V. (1998): Higher thyroid hormone levels in neonatal life resultin reduced testis volume in postpubertal bulls. Int J Androl;21: 352-357.
Manna P R, Kero J, Tena-Sempere M, Pakarinen P, Stocco D M andHuhtaniemi I T. (2001): Assessment of mechanisms ofthyroid hormone action in mouse Leydig cells: regulation ofthe steroidogenic acute regulatory protein, steroidogenesis, and luteinizing hormone receptor function. Endocrinology;142: 319-331.
Maran R R, Arunakaran J and Aruldhas M M. (2000a): T3 directlystimulates basal and modulates LH induced testosterone andestradiol production by rat Leydig cells in vitro. Endocr J; 47:417-428.
Maran R R, Arunakaran J, Jeyaraj D A, Ravichandran K, RavisankarB and Aruldhas M M. (2000b): Transient neonatalhypothyroidism alters plasma and testicular sex steroidconcentration in puberal rats. Endocr Res; 26: 411-429.
Matta S L, Vilela D A, Godinho H P and Franca L R. (2002): Thegoitrogen 6-n-propyl-2-thiouracil (PTU) given during testisdevelopment increases Sertoli and germ cell numbers per cystin fish: the tilapia (Oreochromis niloticus) model. Endocrinology; 143: 970-978.
Matte C, Scherer E B, Stefanello F M, Barschak A G, Vargas C R, Netto C A and Wyse A T. (2007): Concurrent folate treatmentprevents Na+,K+-ATPase activity inhibition and memoryimpairments caused by chronic hyperhomocysteinemia duringrat development. Int J Dev Neurosci; 25: 545-552.
Meek S and Smallridge R C. (2006): Effect of thyroid hormonereplacement on methionine-stimulated homocysteine levels inpatients with subclinical hypothyroidism: a randomized,
214
double-blind, placebo-controlled study. Endocr Pract; 12(5):529-534.
Mendis-Handagama S M and Ariyaratne H B. (2005): Leydig cells, thyroid hormones and steroidogenesis. Indian J Exp Biol; 43:939-962.
Mendis-Handagama S M and Ariyaratne H B. (2001): Differentiationof the adult Leydig cell population in the postnatal testis. BiolReprod; 65: 660-671.
Mesbah L, Soraya B, Narimane S and Jean P F. (2004): Protectiveeffect of flavonoides against the toxicity of vinblastinecyclophosphamide and paracetamol by inhibition of lipid-peroxidation and increase of liver glutathione. Haematologia;7: 59-67.
Messarah M, Boulakoud M S, Boumendjel A, Abdennour Ch and ElFeki A. (2007): The impact of thyroid activity variations onsome oxidizing-stress parameters in rats. C R Biol; 330: 107-112.
Mills N C and Means A R. (1972): Sorbitol dehydrogenase of rattestis: changes of activity during development, afterhypophysectomy and following gonadotrophic hormoneadministration. Endocrinology; 91: 147-156.
Moens A L, Champion H C, Claeys M J, Tavazzi B, Kaminski P M, Wolin M S, Borgonjon D J, Van Nassauw L, Haile A, ZvimanM, Bedja D, Wuyts F L, Elsaesser R S, Cos P, Gabrielson KL, Lazzarino G, Paolocci N, Timmermans J P, Vrints C J andKass D A. (2008): High-dose folic acid pretreatment bluntscardiac dysfunction during ischemia coupled to maintenanceof high-energy phosphates and reduces postreperfusion injury. Circulation; 117: 1810-1819.
Moger W H. (1985): Phospholipid methylation by intact rat Leydigcells. Biol Reprod; 33: 902-910.
215
Mogulkoc R, Baltaci A K, Oztekin E, Ozturk A and Sivrikaya A. (2005): Short term thyroxine administration leads to lipidperoxidation in renal and testicular tissues of rats withhypothyroidism. Acta Biol Hung; 56: 225-232.
Momotani N, Yamashita R, Makino F, Noh J Y, Ishikawa N and ItoK. (2000): Thyroid function in wholly breast-feeding infantswhose mothers take high doses of propylthiouracil. ClinEndocrinol; 53: 177-181.
Moss D W and Henderson A R. (1994): Lactate Dehydrogenase. 2ndEd., Textbook of Clinical Chemistry, Ch 20, Enzymes, 812-818.
Nair C P, Viswanathan G and Noronha J M. (1994): Folate-mediatedincorporation of ring- 2-carbon of histidine into nucleic acids:influence of thyroid hormone. Metabolism; 43: 1575-1578.
Nakano E, Higgins J A and Powers H J. (2001): Folate protectsagainst oxidative modification of human LDL. Brit J Nutr; 86:637-639.
Nilsson M. (2001): Iodide handling by the thyroid epithelial cell. ExpClin Endocr Diab; 109(1): 13-17.
Oncu M, Kavakli D, Gokcimen A, Gulle K, Orhan H and Karaoz E. (2004): Investigation on the histopathological effects ofthyroidectomy on the seminiferous tubules of immature andadult rats. Urol Int; 73: 59-64.
Oppenheimer J H, Schwartz H L and Surks M I. (1974): Tissuedifferences in the concentration of triiodothyronine nuclearbinding sites in the rat: liver, kidney, pituitary, heart, brain, spleen, and testis. Endocrinology; 95: 897-903.
Ortega E, Pannacciulli N, Bogardus C and Krakoff J. (2007): Plasmaconcentrations of free triiodothyronine predict weight changein euthyroid persons. Am J Clin Nutr; 85(2): 440-445.
216
O’Shea P J and Williams G R. (2002): Insight into the physiologicalactions of thyroid hormone receptors from geneticallyengineered mice. J Endocrinol; 175: 553-570.
Pant N, Murty R C and Srivastava S P. (2004): Male reproductivetoxicity of sodium arsenite in mice. Hum Exp Toxicol; 23(8):399-403.
Papadopoulos V, Kamtchouing P, Drosdowsky M A et al. (1987):Effects of the transmethylation inhibitor S-adenosyl-homocysteine and of the methyl donor S-adenosyl-methionineon rat Leydig cell function in vitro. J Steroid Biochem; 26:93-98.
Papadoyannis L N, Samanidou V F and Nitsos Ch C. (1999):Simultaneous determination of nitrite and nitrate in drinkingwater and human serum by high performance anion-exchangechromatography and UV detection. J Liq Chromatogr R T;22(13): 2023-2041.
Pereira B, Rosa L F, Safi D A, Bechara E J and Curi R. (1994):Control of superoxide dismutase, catalase and glutathioneperoxidase activities in rat lymphoid organs by thyroidhormones. J Endocrinol; 140: 73-77.
Power D M, Elias N P, Richardson S J, Mendes J, Soares C M andSantos C R A. (2000): Evolution of the thyroid hormone-binding protein, transthyretin. Gen Comp Endocr; 119: 241-255.
Rabelink T and Luscher T. (2006): Endothelial nitric oxide synthase:Host defense enzyme of the endothelium. Arterioscl ThromVas; 26: 267-271.
Rabelink T and van Zonneveld A J. (2006): Coupling eNOSuncoupling to the innate immune response. Arterioscl ThromVas; 26: 2585-2587.
Rezk B M, Haenen G R M M, van der Vijgh W J F and Bast A. (2003): Tetrahydrofolate and 5-methyltetrahydrofolate are
217
folates with high antioxidant activity. Identification of theantioxidant pharmacophore. FEBS Lett; 555: 601-605.
Rice-Evans C and Burdon R. (1993): Free radical-lipid interactionsand their pathological consequences. Prog Lipid Res; 32: 71-110.
Robbins J. (2000): Thyroid Hormone Transport Proteins and thePhysiology of Hormone Binding. In: Braverman L E, UtigerR D, editors. Werner and Ingbar’s, the thyroid, 8th Ed. Philadelphia: Lippincott Williams & Wilkins, 105-120.
Rossato M A. (2004): genetic polymorphism and male fertility. FertilSteril; 81: 1429-1430.
Rosselli M, Keller P J and Dubey R K. (1998): Role of nitric oxide inthe biology, physiology and pathophysiology of reproduction. Hum Reprod Update; 4: 3-24.
Sahina K, Ondercib M, Sahinb N, Ferit Gursuc M and Aydin S. (2003): Cold-induced elevation of homocysteine and lipidperoxidation can be alleviated by dietary folic acidsupplementation. Nutr Res; 23: 357-365.
Sahoo D, Roy A, Bhanja S and Chainy G. (2008): Hypothyroidismimpairs antioxidant defence system and testicular physiologyduring development and maturation. Gen Comp Endocr; 156:63-70.
Sahoo D, Roy A, Bhanja S and Chainy G. (2005): Experimentalhyperthyroidism-induced oxidative stress and impairment ofantioxidant defence system in rat testis. Indian J Exp Biol; 43:1058-1067.
Sahoo D, Roy A and Chainy G. (2006): PTU-induced neonatalhypothyroidism modulates antioxidative status and populationof rat testicular germ cells. Natl Acad Sci Lett; 29: 133-135.
218
Sahoo D, Roy A, Chattopadhyay S and Chainy G B N. (2007): Effectof T3 treatment on glutathione redox pool and itsmetabolizing enzymes in mitochondrial and post-mitochondrial fractions of adult rat testes. Indian J Exp Biol;45: 338-346.
Sakai Y, Yamashina S and Furudate S. (2004): Developmental delayand unstable state of the testes in the rdw rat with congenitalhypothyroidism. Dev Growth Differ; 46: 327-334.
Sarandöl E, Ta S, Dirican M and Serdar Z. (2005): Oxidative stressand serum paraoxonase activity in experimentalhypothyroidism: effect of vitamin E supplementation. CellBiochem Funct; 23: 1-8.
Sastry B V and Janson V E. (1983): Depression of human spermmotility by inhibition of enzymatic methylation. BiochemPharmacol; 32(8): 1423-1432.
Saw M, Stromme J, Iondon J and Theodorsen L. (1983): IFCCmethod for -glutamyl transferase. ( -glutamyl – peptide:amino acid -glutamyl transferase, EC 2.3.2.2). Clin ChimActa; 135: 315-338.
Seed J, Chapin R E, Clegg E D, Dostal L A, Foote R H, Hurtt M E etal. (1996): Methods for assessing sperm motility, morphology, and counts in the rat, rabbit, and dog: aconsensus report. Reprod Toxicol; 10(3): 237-244.
Shalaby M A, El Zorba H Y and Ziada R M. (2010): Reproductivetoxicity of methomyl insecticide in male rats and protectiveeffect of folic acid. Food Chem Toxicol; 48: 3221-3226.
Sharpe R M. (1987): Testosterone and spermatogenesis. JEndocrinol; 113: 1-2.
Sharpe R M, McKinnell C, Kivlin C and Fisher J S. (2003):Proliferation and functional maturation of Sertoli cells, and
219
their relevance to disorders of testis function in adulthood. Reproduction; 125: 769-784.
Shen R S and Lee I P. (1984): Selected testicular enzymes asbiochemical markers for procarbazine-induced testiculartoxicity. Arch Toxicol; 55: 233-238.
Shirodaria C, Antoniades C, Lee J, Jackson C E, Robson M D, Francis J M, Moat S J, Ratnatunga C, Pillai R, Refsum H, Neubauer S and Channon K M. (2007): Global improvementof vascular function and redox state with low-dose folic acid:implications for folate therapy in patients with coronary arterydisease. Circulation; 115: 2262-2270.
Simorangkir D R, Wreford N G and De Kretser D M. (1997):Impaired germ cell development in the testes of immature ratswith neonatal hypothyroidism. J Androl; 18: 186-193.
Sinha N, Narayan R and Saxena D K. (1997): Effect of endosulfan onthe testis of growing rats. Bull Environ Contam Toxicol;58(1): 79-86.
Sofikitis N, Giotitsas N, Tsounapi P, Baltogiannis D, Giannakis Dand Pardalidis N. (2008): Hormonal regulation ofspermatogenesis and spermiogenesis. J Steroid Biochem MolBiol; 109: 323–330.
Srivastava S P, Srivastava S, Saxena D K, Chandra S V and Seth P K. (1990): Testicular effects of di-n-butyl phthalate (DBP):Biochemical and histopathological alterations. Arch Toxicol;64: 148-152.
Stanger O. (2002): Physiology of folic acid in health and disease. Curr Drug Metab; 3: 211-223.
Stiefel P, Arguelles S, Garcia S, Jimenez L, Aparicio R, Carneado J, Machad A and Ayala A. (2005): Effects of short-termsupplementation with folic acid on different oxidative stress
220
parameters in patients with hypertension. Biochim BiophysActa; 1726: 152-159.
Stocker P, Lesgards J F, Vidal N, Chalier F and Prost M. (2003):ESR study of a biological assay on whole blood: antioxidantefficiency of various vitamins. Biochim Biophys Acta; 1621:1-8.
Stockstad E L R. (1990): Historical Perspective on key Advances inthe Biochemistry and Physiology of Folates. In: Picciano M. F.; Stokstad E. L. R.; Gregory J. F., eds. Folic acidmetabolism in health and disease. New York: Wiley-Liss; 1-21.
Taghavi M, Moallem S and Alavi S. (2009): The evaluation of singledose effects of methamphetamine on proliferation andapoptosis of sperm germ cells in mature rat. J Isfahan MedSchool; 27(97): 100-109.
Tani Y, Mori Y, Miura Y, Okamoto H, Inagaki A, Saito H and OisoY. (1994): Molecular cloning of the rat thyroxine-bindingglobulin gene and analysis of its promoter activity. Endocrinology; 135: 2731-2736.
Tarulli G, Stanton P, Lerchl A and Meachem S. (2006): Adult SertoliCells Are Not Terminally Differentiated in the DjungarianHamster: Effect of FSH on Proliferation and Junction ProteinOrganization. Biol Reprod; 74: 798-806.
Toshihiro I. (2010): Thyroid hormone and atherosclerosis. VascPharmacol; 52: 151-156.
Tousson E, Ali E M M, Ibrahim W, and Mansour M A. (2011):Proliferating cell nuclear antigen as a molecular biomarker forspermatogenesis in PTU-induced hypothyroidism of rats. Reprod Sci, doi: 10.1177/1933719110395401.
221
Tsai S C, Lu C C, Lin C S and Wang P S. (2003): Antisteroidogenicactions of hydrogen peroxide on rat Leydig cells. J CellBiochem; 90(6): 1276-1286.
Tsuyosh O and James K B. (1978): A simpilified method ofquantitating protein using the biuret and phenol reagents. Anal Biochem; 86: 193-200.
Turhan S, Sezer S, Erden G, Guctekin A, Ucar F, Ginis Z, Ozturk Oand Bingol S. (2008): Plasma homocysteine concentrationsand serum lipid profile as atherosclerotic risk factors insubclinical hypothyroidism. Ann Saudi Med; 28(2): 96-101.
Umezu M, Kagabu S, Jiang J Y, Niimura S and Sato E. (2004):Developmental hormonal profiles in rdw rats with congenitalhypothyroidism accompanying increased testicular size andinfertility in adulthood. J Reprod Develop; 50: 675-684.
Ungvari Z, Csiszar A, Edwards J G, Kaminski P M, Wolin M S, Kaley G and Koller A. (2003): Increased superoxideproduction in coronary arteries in hyperhomocysteinemia:role of tumor necrosis factor-alpha, NAD(P)H oxidase, andinducible nitric oxide synthase. Arterioscl Throm Vas; 23:418-424.
Upreti G C, Payne S R, Duganzich D M, Oliver J E and Smith J F. (1996): Enzyme leakage during cryopreservation of ramspermatozoa. Anim Reprod Sci; 41: 27-36.
Van Haaster L H, De Jong F H, Docter R and De Rooij D G. (1993):High neonatal triiodothyronine levels reduce the period ofSertoli cell proliferation and accelerate tubular lumenformation in the rat testis, and increase serum inhibin levels. Endocrinology; 133: 755-760.
Varghese S, Shameena B and Oommen O V. (2001): Thyroidhormones regulate lipid peroxidation and antioxidant enzyme
222
activities in Anabas testudinens (Bloch). Comp BiochemPhysiol; 128: 165-171.
Virdis A, Colucci R, Fornai M, Polini A et al. (2009): InducibleNitric Oxide Synthase Is Involved in Endothelial Dysfunctionof Mesenteric Small Arteries from Hypothyroid Rats. Endocrinology; 150(2): 1033-1042.
Wagner M S, Wajner S and Maia A. (2009): Is There a Role forThyroid Hormone on Spermatogenesis? Microsc ResTechniq; 72: 796-808.
Wagner M S, Wajner S and Maia A. (2008): The role of thyroidhormone in testicular development and function. JEndocrinol; 199: 351-365.
Wajner S M, Wagner M S and Maia A L. (2009): Clinicalimplications of altered thyroid status in male testicularfunction. Arq Bras Endocrinol Metabol; 53(8): 976-982.
Wajner S M, Wagner M S, Melo R C, Parreira G G, Chiarini-GarciaH, Bianco A C, Fekete C, Sanchez E, Lechan R M and MaiaA L. (2007): Type 2 iodothyronine deiodinase is highlyexpressed in germ cells of adult rat testis. J Endocrinol; 194:47-54.
Wallock L M, Tamura T, Mayr C A, Johnston K E, Ames B N, JacobR A. (2001): Low seminal plasma folate concentrations areassociated with lowsperm density and count in male smokersand nonsmokers. Fertil Steril; 75(2): 252-259.
Wendy K, Alderton W K, Chris E, Cooper C E and Knowles R G. (2001): Nitric oxide synthases: Structure, function andinhibition .Biochem J; 357: 593-615.
Weng Q, Saita E, Watanabe G, Takahashi S, Sedqyar M, Suzuki A K, Taneda S and Taya K. (2007): Effect of methimazole-inducedhypothyroidism on adrenal and gonadal functions in male
223
Japanese quail (Coturnix japonica). J Reprod Develop; 53:1335-1341.
Wong W Y, Thomas C M, Merkus J M, Zielhuis G A and Steegers-Theunissen R P. (2000): Male factor subfertility: possiblecauses and the impact of nutritional factors. Fertil Steril; 73:435-442.
Yan H H, Mruk D D and Cheng C Y. (2008): Junction restructuringand spermatogenesis: the biology, regulation, and implicationin male contraceptive development. Curr Top Dev Biol; 80:57-92.
Yan L, Yue D, Luo H, Jin X and Xu X. (2010): Effect of Vitamin Esupplementation on the enzymatic activity of selected markersin Aohan fine-wool sheep testis. Anim Reprod Sci; 122: 264-269.
Yilmaz S, Ozan S, Benzer F and Canatan H. (2003): Oxidativedamage and antioxidant enzyme activities in experimentalhypothyroidism. Cell Biochem Funct; 21: 325-330.
Zamoner A, Barreto K P, Filho D W, Sell F, Woehl V M, Guma F C, Pessoa-Pureur R and Silva F R. (2008): Propylthiouracil-induced congenital hypothyroidism upregulates vimentinphosphorylation and depletes antioxidant defenses inimmature rat testis. J Mol Endocrinol; 40: 125-135.
Zamoner A, Barreto K P, Filho D W, Sell F, Woehl V M, Guma F C, Silva F R and Pessoa-Pureur R. (2007): Hyperthyroidism inthe developing rat testis is associated with oxidative stress andhyperphosphorylated vimentin accumulation. Mol CellEndocrinol; 267: 116-126.
Zhang X and Li D. (2006): Peroxynitrite mediated oxidation damageand cytotoxicity in biological systems. Life Sci; 3: 41-44.
224
Zhang H, Xiong Y and Beach D. (1993): Proliferating cell nuclearantigen and p21 are components of multiple cell cycle kinasecomplexes. Mol Biol Cell; 4(9): 897-906.
Zeng L, Kong X T, Su J W, Xia T L, Na Y Q and Guo Y L. (2001):Evaluation of germ-cell kinetics in infertile patients withproliferating cell nuclear antigen proliferating index. Asian JAndrol; 3(1): 63-66.