bimodal emotion recognition using speech and physiological changes
TRANSCRIPT
15
Bimodal Emotion Recognition using Speech and Physiological Changes
Jonghwa Kim Institute of Computer Science, University of Augsburg
Germany
1. Introduction With exponentially evolving technology it is no exaggeration to say that any interface for human-robot interaction (HRI) that disregards human affective states and fails to pertinently react to the states can never inspire a user’s confidence, but they perceive it as cold, untrustworthy, and socially inept. Indeed, there is evidence that HRI is more likely to be accepted by the user if it is sensitive towards the user’s affective states, as expression and understanding of emotions facilitate to complete the mutual sympathy in human communication. To approach the affective human-robot interface, one of the most important prerequisites is a reliable emotion recognition system which guarantees acceptable recognition accuracy, robustness against any artifacts, and adaptability to practical applications. Emotion recognition is an extremely challenging task in several respects. One of the main difficulties is that it is very hard to uniquely correlate signal patterns with a certain emotional state because even it is difficult to define what emotion means in a precise way. Moreover, it is the fact that emotion-relevant signal patterns may widely differ from person to person and from situation to situation. Gathering “ground-truth” dataset is also problematical to build a generalized emotion recognition system. Therefore, a number of assumptions are generally required for engineering approach to emotion recognition. Most research on emotion recognition so far has focused on the analysis of a single modality, such as speech and facial expression (see (Cowie et al., 2001) for a comprehensive overview). Recently some works on emotion recognition by combining multiple modalities are reported, mostly by fusing features extracted from audiovisual modalities such as facial expression and speech. We humans use several modalities jointly to interpret emotional states in human communication, since emotion affects almost all modes, audiovisual (facial expression, voice, gesture, posture, etc.), physiological (respiration, skin temperature etc.), and contextual (goal, preference, environment, social situation, etc.) states. Hence, one can expect higher recognition rates through the integration of multiple modalities for emotion recognition. On the other hand, however, more complex classification and fusion problems arise. In this chapter, we concentrate on the integration of speech signals and physiological measures (biosignals) for emotion recognition based on a short-term observation. Several advantages can be expected when combining biosensor feedback with affective speech. First
Speach recognition
2
of all, biosensors allow us to continuously gather information on the users’ affective state while the analysis of emotions from speech should only be triggered when the microphone receives speech signals from the user. Secondly, it is much harder for the user to deliberately manipulate biofeedback than external channels of expression which allows us to largely circumvent the artifact of social masking. Finally, an integrated analysis of biosignals and speech may help to resolve ambiguities and compensate for errors. When combining multiple modalities, the following questions arise: (1) How to handle conflicting cases between the single modalities? For instance, a user may consciously or unconsciously conceal his/her real emotions by external channels of expression, but still reveal them by internal channels of expression. (2) At which level of abstraction should the single modalities be fused in order to increase the accuracy of the recognition results? (3) How should the window sizes of different modalities be synchronized when same emotional cues in the modalities occur with a time discrepancy? In the next section, we discuss selected previous work. Section 3 reports on the dataset we used and describes the features we extracted from speech signal 5-channel biosignal. Several fusion methods are presented including feature-level fusion, decision-level fusion, and a hybrid fusion scheme. In Section 4, we analyze the classification results with respect to the effect of bimodal integration. We conclude this work with a short outlook on future work.
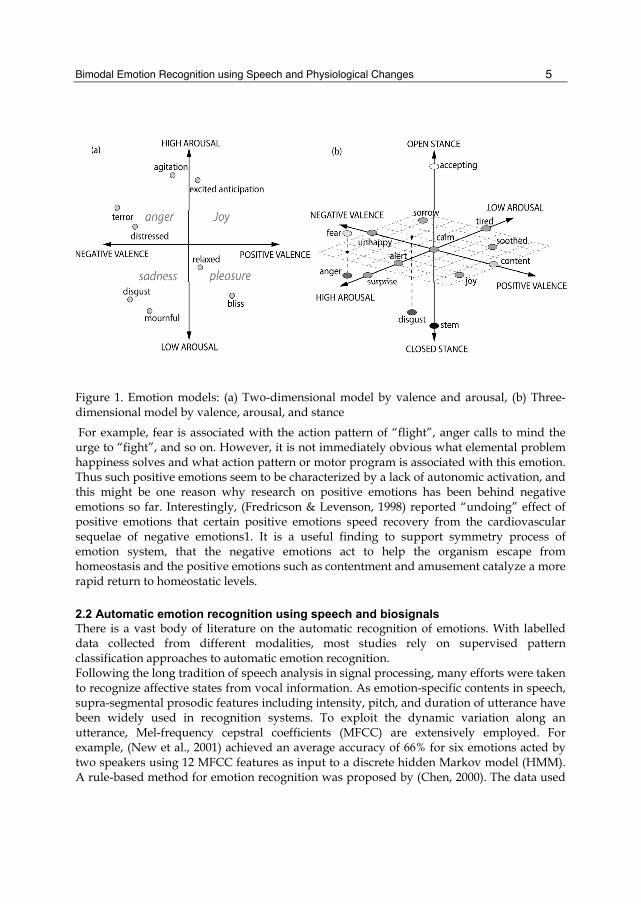
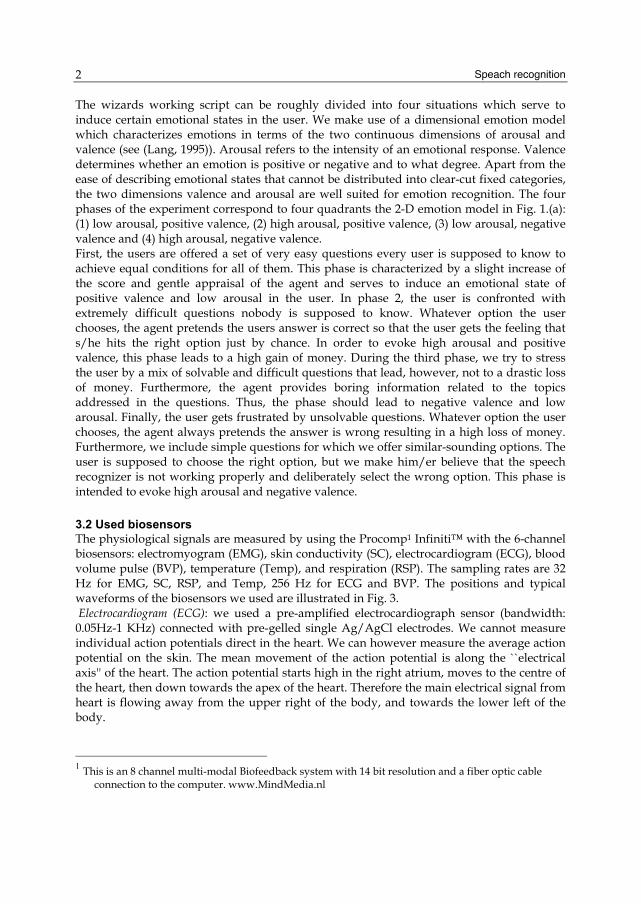
2. Related Work 2.1 Modeling of discrete emotions As people display the emotional expressions of others to their various degrees individually, it is not an easy task to judge or to model human emotions. The researchers often use two different methods to model emotions. One approach is to label the emotions in discrete categories, i.e. human judges have to choose from a prescribed list of word labels, e.g. joy, sadness, surprise, anger, love, fear, etc. One problem with this method is that the stimuli may contain blended emotions that can not adequately be expressed in words since the choice of words may be too restrictive and culturally dependent. Another way is to have multiple dimension or scales to categorize emotions. Instead of choosing discrete labels or words, observers can indicate their impression of each stimulus on several continuous scales, for example, pleasant-unpleasant, attention-rejection, simple-complicated, etc. Two common scales are valence and arousal. Valence represents the pleasantness of stimuli, with positive (or pleasant) on the end, and negative (or unpleasant) on the other. For example, happiness has a positive valence, while disgust has a negative valence. Another dimension is arousal (activation level). For example, sadness has low arousal, whereas surprise has high arousal level. The different emotional labels could be plotted at various positions on a two-dimensional plane spanned by these two axes to construct a 2D emotion model (Lang, 1995) (see Fig. 1.(a)). Recently, the low consistency of physiological configurations supported the hypothesis that ANS activation during emotions indicates the demands of a specific action tendency and action disposition, instead of reflecting emotions per se (Tooby & Cosmides, 1990; Lazarus, 1991; Davidson, 1993). (Scholsberg, 1954) suggested a three-dimensional model in which he had attention-rejection in addition to the 2D model. Researchers have summarized these associated action tendencies as “stance” in three-dimensional emotion model, i.e., arousal, valence, and stance (Fig. 1.(b)).
Bimodal Emotion Recognition using Speech and Physiological Changes
5
Figure 1. Emotion models: (a) Two-dimensional model by valence and arousal, (b) Three-dimensional model by valence, arousal, and stance
For example, fear is associated with the action pattern of “flight”, anger calls to mind the urge to “fight”, and so on. However, it is not immediately obvious what elemental problem happiness solves and what action pattern or motor program is associated with this emotion. Thus such positive emotions seem to be characterized by a lack of autonomic activation, and this might be one reason why research on positive emotions has been behind negative emotions so far. Interestingly, (Fredricson & Levenson, 1998) reported “undoing” effect of positive emotions that certain positive emotions speed recovery from the cardiovascular sequelae of negative emotions1. It is a useful finding to support symmetry process of emotion system, that the negative emotions act to help the organism escape from homeostasis and the positive emotions such as contentment and amusement catalyze a more rapid return to homeostatic levels.
2.2 Automatic emotion recognition using speech and biosignals There is a vast body of literature on the automatic recognition of emotions. With labelled data collected from different modalities, most studies rely on supervised pattern classification approaches to automatic emotion recognition. Following the long tradition of speech analysis in signal processing, many efforts were taken to recognize affective states from vocal information. As emotion-specific contents in speech, supra-segmental prosodic features including intensity, pitch, and duration of utterance have been widely used in recognition systems. To exploit the dynamic variation along an utterance, Mel-frequency cepstral coefficients (MFCC) are extensively employed. For example, (New et al., 2001) achieved an average accuracy of 66% for six emotions acted by two speakers using 12 MFCC features as input to a discrete hidden Markov model (HMM). A rule-based method for emotion recognition was proposed by (Chen, 2000). The data used
Speach recognition
2
in this work contained two foreign languages (Spanish and Sinhala) for the judges who did not comprehend either language and were therefore able to make their judgment based on vocal expression without being influenced by linguistic/semantic content. (Batliner et al., 2003) achieved about 40% for a 4-class problem with elicited emotions in spontaneous speech. Relatively little attention has been paid so far to physiological signals for emotion recognition compared to other channels of expression. A significant series of work has been conducted by Picard and colleagues at MIT Lab. For example, they showed that certain affective states may be recognized by using physiological measures including heart rate, skin conductivity, temperature, muscle activity, and respiration velocity (Picard et al., 2001). Eight emotions deliberately elicited from a subject in multiple weeks were classified with an overall accuracy of 81%. (Nasoz et al., 2003) used movie clips to elicit target emotions from 29 subjects and achieved the best recognition accuracy (83%) by applying the Marquardt Backpropagation algorithm. More recently, (Wagner et al., 2005) presented an approach to the recognition of emotions elicited by music using 4-channel biosignals which were recorded while the subject was listening to music songs, and reached an overall recognition accuracy of 92% for a 4-class problem. In order to improve the recognition accuracy obtained from unimodal recognition systems, many studies attempted to exploit the advantage of using multimodal information, especially by fusing audio-visual information. For example, (De Silva & Ng, 2000) proposed a rule-based singular classification of audio-visual data recorded from two subjects into six emotion categories. Moreover, they observed that some emotions are easier to identify with audio, such as sadness and fear, and others with video, such as anger and happiness. Using decision-level fusion in bimodal recognition system, a recognition rate of 72% has been reported. A set of singular classification methods was proposed by (Chen & Huang, 2000), in which audio-visual data collected from five subjects was classified into the Ekman’s six basic emotions (happiness, sadness, disgust, fear, anger, and surprise). They could improve the performance of decision-level fusion by considering the dominant modality, determined by empirical studies, in case significant discrepancy between the outputs of each unimodal classifier has been observed. Recently, a large-scale audio-visual dataset was collected by (Zeng et al., 2004), which contains five HCI-related affective responses (confusion, interest, boredom, and frustration) in addition to seven affects (the six basic emotions + neutral). To classify the 11 emotions subject-dependently, they used the SNoW (Sparse Network of Winnow) classifier with Naive Bayes as the update rule and achieved a recognition accuracy of almost 90% through bimodal fusion while the unimodal classifiers yielded only 45-56%. Most previous studies have shown that the performance of emotion recognition systems can be improved by the use of audio-visual information. However, it should be noted that the achieved recognition rates depend rather on the type of the underlying dataset, whether the emotions were from acted, elicited or real-life situation, than the used algorithms and classification methods. Moreover, apart from our previous work (Kim et al., 2005), work on the integration of biosignals and speech is rare. In this paper, we will investigate in how far the robustness of an emotion recognition system can be increased by integrating both vocal and physiological cues. We evaluate two fusion methods that combine bimodal information at different levels of abstraction as well as a hybrid integration scheme. Particularly we focus on shorter observations compared to or earlier work.
Bimodal Emotion Recognition using Speech and Physiological Changes
5
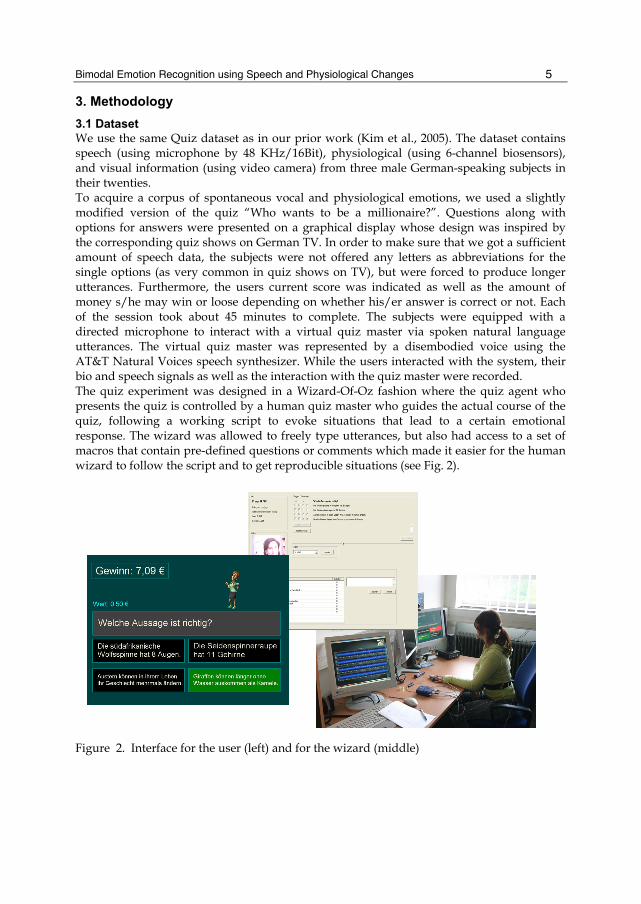
3. Methodology 3.1 Dataset We use the same Quiz dataset as in our prior work (Kim et al., 2005). The dataset contains speech (using microphone by 48 KHz/16Bit), physiological (using 6-channel biosensors), and visual information (using video camera) from three male German-speaking subjects in their twenties. To acquire a corpus of spontaneous vocal and physiological emotions, we used a slightly modified version of the quiz “Who wants to be a millionaire?”. Questions along with options for answers were presented on a graphical display whose design was inspired by the corresponding quiz shows on German TV. In order to make sure that we got a sufficient amount of speech data, the subjects were not offered any letters as abbreviations for the single options (as very common in quiz shows on TV), but were forced to produce longer utterances. Furthermore, the users current score was indicated as well as the amount of money s/he may win or loose depending on whether his/er answer is correct or not. Each of the session took about 45 minutes to complete. The subjects were equipped with a directed microphone to interact with a virtual quiz master via spoken natural language utterances. The virtual quiz master was represented by a disembodied voice using the AT&T Natural Voices speech synthesizer. While the users interacted with the system, their bio and speech signals as well as the interaction with the quiz master were recorded. The quiz experiment was designed in a Wizard-Of-Oz fashion where the quiz agent who presents the quiz is controlled by a human quiz master who guides the actual course of the quiz, following a working script to evoke situations that lead to a certain emotional response. The wizard was allowed to freely type utterances, but also had access to a set of macros that contain pre-defined questions or comments which made it easier for the human wizard to follow the script and to get reproducible situations (see Fig. 2). Figure 2. Interface for the user (left) and for the wizard (middle)
Speach recognition
2
The wizards working script can be roughly divided into four situations which serve to induce certain emotional states in the user. We make use of a dimensional emotion model which characterizes emotions in terms of the two continuous dimensions of arousal and valence (see (Lang, 1995)). Arousal refers to the intensity of an emotional response. Valence determines whether an emotion is positive or negative and to what degree. Apart from the ease of describing emotional states that cannot be distributed into clear-cut fixed categories, the two dimensions valence and arousal are well suited for emotion recognition. The four phases of the experiment correspond to four quadrants the 2-D emotion model in Fig. 1.(a): (1) low arousal, positive valence, (2) high arousal, positive valence, (3) low arousal, negative valence and (4) high arousal, negative valence. First, the users are offered a set of very easy questions every user is supposed to know to achieve equal conditions for all of them. This phase is characterized by a slight increase of the score and gentle appraisal of the agent and serves to induce an emotional state of positive valence and low arousal in the user. In phase 2, the user is confronted with extremely difficult questions nobody is supposed to know. Whatever option the user chooses, the agent pretends the users answer is correct so that the user gets the feeling that s/he hits the right option just by chance. In order to evoke high arousal and positive valence, this phase leads to a high gain of money. During the third phase, we try to stress the user by a mix of solvable and difficult questions that lead, however, not to a drastic loss of money. Furthermore, the agent provides boring information related to the topics addressed in the questions. Thus, the phase should lead to negative valence and low arousal. Finally, the user gets frustrated by unsolvable questions. Whatever option the user chooses, the agent always pretends the answer is wrong resulting in a high loss of money. Furthermore, we include simple questions for which we offer similar-sounding options. The user is supposed to choose the right option, but we make him/er believe that the speech recognizer is not working properly and deliberately select the wrong option. This phase is intended to evoke high arousal and negative valence.
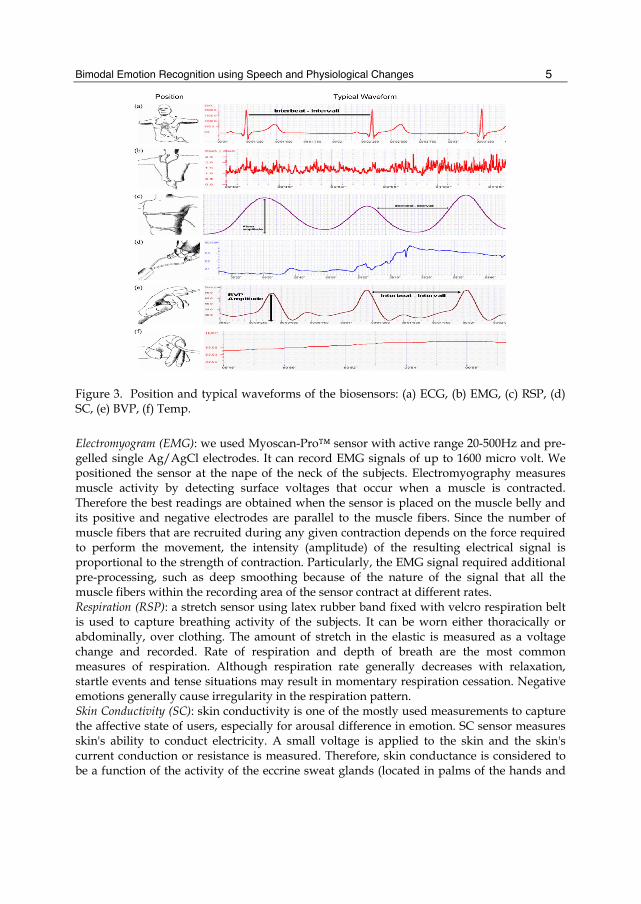
3.2 Used biosensors The physiological signals are measured by using the Procomp1 Infiniti™ with the 6-channel biosensors: electromyogram (EMG), skin conductivity (SC), electrocardiogram (ECG), blood volume pulse (BVP), temperature (Temp), and respiration (RSP). The sampling rates are 32 Hz for EMG, SC, RSP, and Temp, 256 Hz for ECG and BVP. The positions and typical waveforms of the biosensors we used are illustrated in Fig. 3. Electrocardiogram (ECG): we used a pre-amplified electrocardiograph sensor (bandwidth: 0.05Hz-1 KHz) connected with pre-gelled single Ag/AgCl electrodes. We cannot measure individual action potentials direct in the heart. We can however measure the average action potential on the skin. The mean movement of the action potential is along the ``electrical axis'' of the heart. The action potential starts high in the right atrium, moves to the centre of the heart, then down towards the apex of the heart. Therefore the main electrical signal from heart is flowing away from the upper right of the body, and towards the lower left of the body.
1 This is an 8 channel multi-modal Biofeedback system with 14 bit resolution and a fiber optic cable
connection to the computer. www.MindMedia.nl
Bimodal Emotion Recognition using Speech and Physiological Changes
5
Figure 3. Position and typical waveforms of the biosensors: (a) ECG, (b) EMG, (c) RSP, (d) SC, (e) BVP, (f) Temp. Electromyogram (EMG): we used Myoscan-Pro™ sensor with active range 20-500Hz and pre-gelled single Ag/AgCl electrodes. It can record EMG signals of up to 1600 micro volt. We positioned the sensor at the nape of the neck of the subjects. Electromyography measures muscle activity by detecting surface voltages that occur when a muscle is contracted. Therefore the best readings are obtained when the sensor is placed on the muscle belly and its positive and negative electrodes are parallel to the muscle fibers. Since the number of muscle fibers that are recruited during any given contraction depends on the force required to perform the movement, the intensity (amplitude) of the resulting electrical signal is proportional to the strength of contraction. Particularly, the EMG signal required additional pre-processing, such as deep smoothing because of the nature of the signal that all the muscle fibers within the recording area of the sensor contract at different rates. Respiration (RSP): a stretch sensor using latex rubber band fixed with velcro respiration belt is used to capture breathing activity of the subjects. It can be worn either thoracically or abdominally, over clothing. The amount of stretch in the elastic is measured as a voltage change and recorded. Rate of respiration and depth of breath are the most common measures of respiration. Although respiration rate generally decreases with relaxation, startle events and tense situations may result in momentary respiration cessation. Negative emotions generally cause irregularity in the respiration pattern. Skin Conductivity (SC): skin conductivity is one of the mostly used measurements to capture the affective state of users, especially for arousal difference in emotion. SC sensor measures skin's ability to conduct electricity. A small voltage is applied to the skin and the skin's current conduction or resistance is measured. Therefore, skin conductance is considered to be a function of the activity of the eccrine sweat glands (located in palms of the hands and
Speach recognition
2
soles of the feet) and the skin's pore size. We used Ag/AgCl electrodes fixed with two finger band and positioned at the index and ring finger of the non-dominant hand. Temperature (Temp): Temp is a highly sensitive temperature sensor and can monitor skin temperature changes smaller than 0.0001 (1/10000th) degree between 10°C – 45°C (50°F - 115°F ). The sensor can be applied on the finger, hands, or other parts of the body. Blood Volume Pulse (BVP): BVP sensor measures the relative blood flow in the hands (fingers) with near infrared light, using the method known as photoplethysmography. The sensor housed in a small finger worn package can be used to monitor HR, HRV (heart rate variability), bloodflow and pulse.
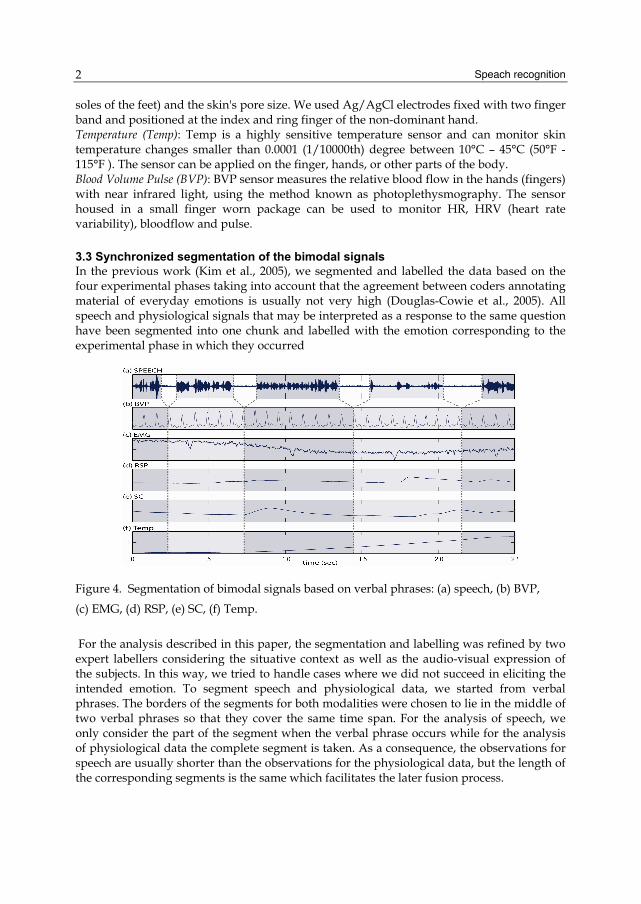
3.3 Synchronized segmentation of the bimodal signals In the previous work (Kim et al., 2005), we segmented and labelled the data based on the four experimental phases taking into account that the agreement between coders annotating material of everyday emotions is usually not very high (Douglas-Cowie et al., 2005). All speech and physiological signals that may be interpreted as a response to the same question have been segmented into one chunk and labelled with the emotion corresponding to the experimental phase in which they occurred
Figure 4. Segmentation of bimodal signals based on verbal phrases: (a) speech, (b) BVP,
(c) EMG, (d) RSP, (e) SC, (f) Temp.
For the analysis described in this paper, the segmentation and labelling was refined by two expert labellers considering the situative context as well as the audio-visual expression of the subjects. In this way, we tried to handle cases where we did not succeed in eliciting the intended emotion. To segment speech and physiological data, we started from verbal phrases. The borders of the segments for both modalities were chosen to lie in the middle of two verbal phrases so that they cover the same time span. For the analysis of speech, we only consider the part of the segment when the verbal phrase occurs while for the analysis of physiological data the complete segment is taken. As a consequence, the observations for speech are usually shorter than the observations for the physiological data, but the length of the corresponding segments is the same which facilitates the later fusion process.
Bimodal Emotion Recognition using Speech and Physiological Changes
5 In total, we got 343 samples for classification (343 x 6 channels = 2058 segments in total) from the dataset. Based on the four phases of the experiments, our labellers relied on dimensional rating (i.e. labelling within the 4 quadrants of the 2D emotion model). Disagreements between the ratings of the two labellers were discussed and resolved after the annotation process. Fig. 4 shows sample segmentation for data from the used channels. The length of the observations varies from 2 to 6 seconds for the speech and from 3 to 15 seconds for the biosignals. That is the observations are rather short-term compared to previous studies that start from a segment length between 50 and 300 seconds (Kim et al., 2004).
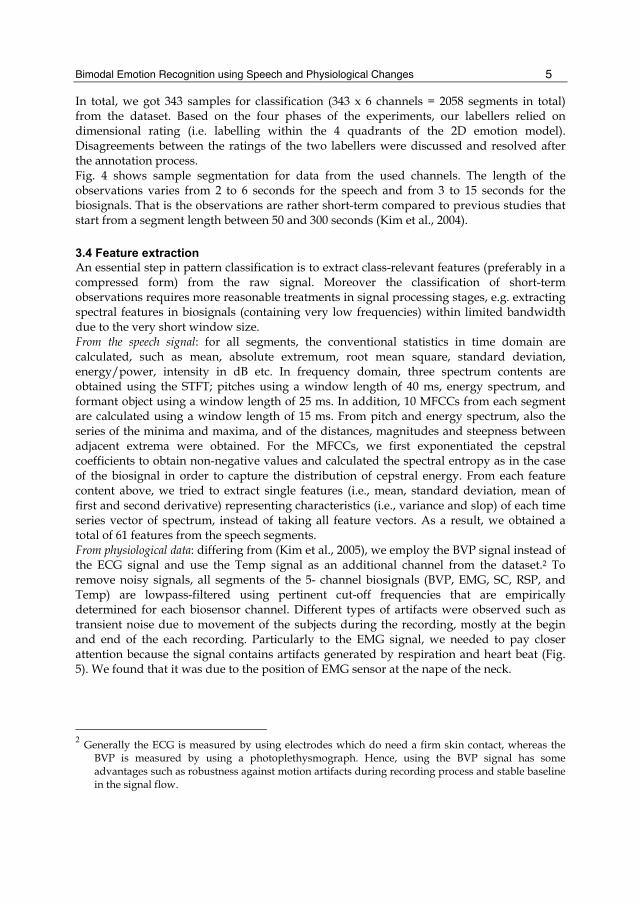
3.4 Feature extraction An essential step in pattern classification is to extract class-relevant features (preferably in a compressed form) from the raw signal. Moreover the classification of short-term observations requires more reasonable treatments in signal processing stages, e.g. extracting spectral features in biosignals (containing very low frequencies) within limited bandwidth due to the very short window size. From the speech signal: for all segments, the conventional statistics in time domain are calculated, such as mean, absolute extremum, root mean square, standard deviation, energy/power, intensity in dB etc. In frequency domain, three spectrum contents are obtained using the STFT; pitches using a window length of 40 ms, energy spectrum, and formant object using a window length of 25 ms. In addition, 10 MFCCs from each segment are calculated using a window length of 15 ms. From pitch and energy spectrum, also the series of the minima and maxima, and of the distances, magnitudes and steepness between adjacent extrema were obtained. For the MFCCs, we first exponentiated the cepstral coefficients to obtain non-negative values and calculated the spectral entropy as in the case of the biosignal in order to capture the distribution of cepstral energy. From each feature content above, we tried to extract single features (i.e., mean, standard deviation, mean of first and second derivative) representing characteristics (i.e., variance and slop) of each time series vector of spectrum, instead of taking all feature vectors. As a result, we obtained a total of 61 features from the speech segments. From physiological data: differing from (Kim et al., 2005), we employ the BVP signal instead of the ECG signal and use the Temp signal as an additional channel from the dataset.2 To remove noisy signals, all segments of the 5- channel biosignals (BVP, EMG, SC, RSP, and Temp) are lowpass-filtered using pertinent cut-off frequencies that are empirically determined for each biosensor channel. Different types of artifacts were observed such as transient noise due to movement of the subjects during the recording, mostly at the begin and end of the each recording. Particularly to the EMG signal, we needed to pay closer attention because the signal contains artifacts generated by respiration and heart beat (Fig. 5). We found that it was due to the position of EMG sensor at the nape of the neck.
2 Generally the ECG is measured by using electrodes which do need a firm skin contact, whereas the
BVP is measured by using a photoplethysmograph. Hence, using the BVP signal has some advantages such as robustness against motion artifacts during recording process and stable baseline in the signal flow.
Speach recognition
2
Figure 5. Example of EMG signal with heart beat artifacts and denoised signal
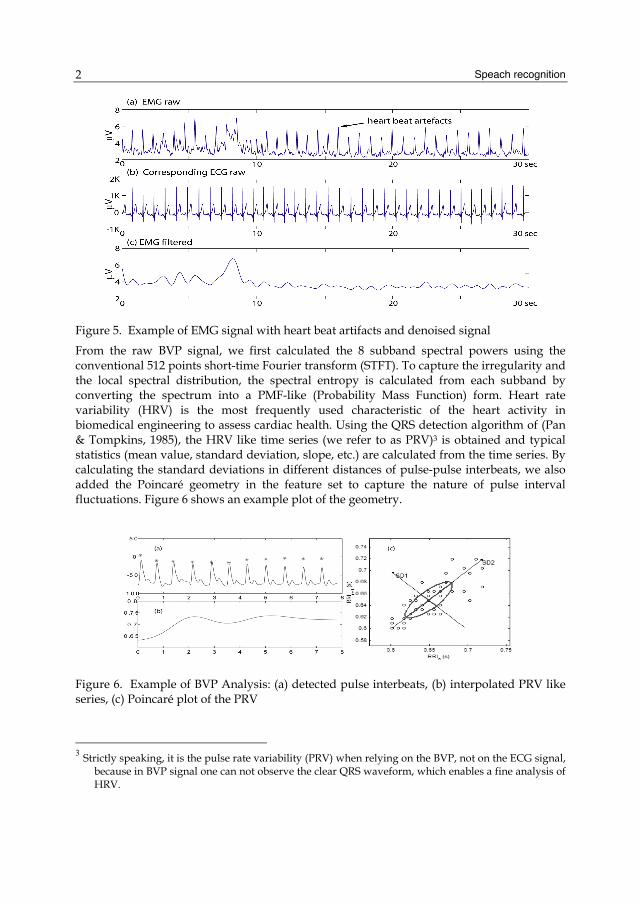
From the raw BVP signal, we first calculated the 8 subband spectral powers using the conventional 512 points short-time Fourier transform (STFT). To capture the irregularity and the local spectral distribution, the spectral entropy is calculated from each subband by converting the spectrum into a PMF-like (Probability Mass Function) form. Heart rate variability (HRV) is the most frequently used characteristic of the heart activity in biomedical engineering to assess cardiac health. Using the QRS detection algorithm of (Pan & Tompkins, 1985), the HRV like time series (we refer to as PRV)3 is obtained and typical statistics (mean value, standard deviation, slope, etc.) are calculated from the time series. By calculating the standard deviations in different distances of pulse-pulse interbeats, we also added the Poincaré geometry in the feature set to capture the nature of pulse interval fluctuations. Figure 6 shows an example plot of the geometry.
Figure 6. Example of BVP Analysis: (a) detected pulse interbeats, (b) interpolated PRV like series, (c) Poincaré plot of the PRV
3 Strictly speaking, it is the pulse rate variability (PRV) when relying on the BVP, not on the ECG signal,
because in BVP signal one can not observe the clear QRS waveform, which enables a fine analysis of HRV.
Bimodal Emotion Recognition using Speech and Physiological Changes
5 Lastly from the spectrum of the PRV time series, power spectrum densities (PSD) from three subbands are calculated from the ranges of VLF (0-0.04Hz), LF (0.05-0.15 Hz), and HF (0.16-0.4 Hz), respectively and the ratio of LF/HF. Since the RSP signal is quasi periodic we calculated similar types of features like the BVP features including the typical statistics, except for the geometric features and the PSDs. After appropriate detrending the signals using mean value and lowpass filter, we calculated the BRV (time series of the breathing rates) by detecting the peaks using the maxima ranks within zero-crossing.
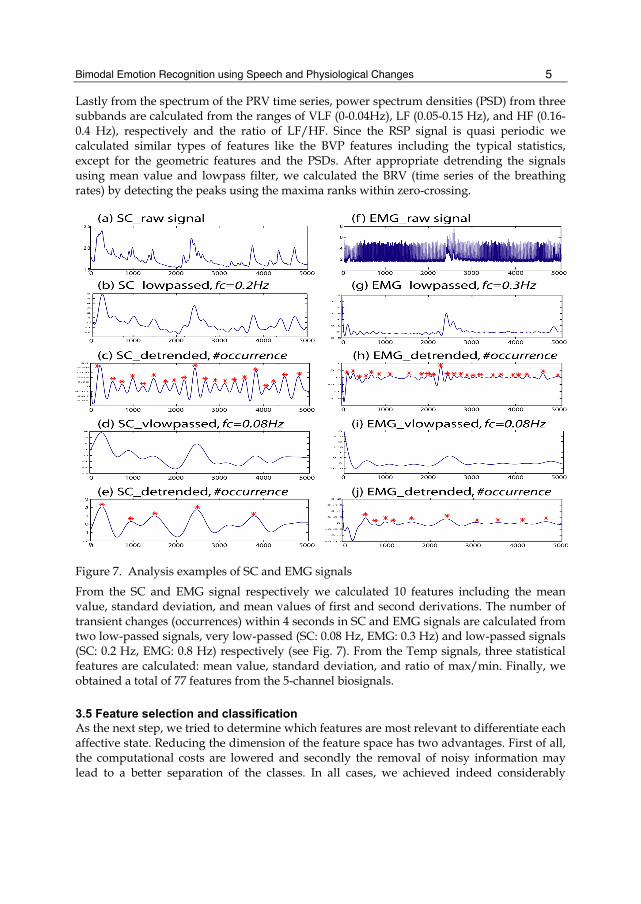
Figure 7. Analysis examples of SC and EMG signals
From the SC and EMG signal respectively we calculated 10 features including the mean value, standard deviation, and mean values of first and second derivations. The number of transient changes (occurrences) within 4 seconds in SC and EMG signals are calculated from two low-passed signals, very low-passed (SC: 0.08 Hz, EMG: 0.3 Hz) and low-passed signals (SC: 0.2 Hz, EMG: 0.8 Hz) respectively (see Fig. 7). From the Temp signals, three statistical features are calculated: mean value, standard deviation, and ratio of max/min. Finally, we obtained a total of 77 features from the 5-channel biosignals.
3.5 Feature selection and classification As the next step, we tried to determine which features are most relevant to differentiate each affective state. Reducing the dimension of the feature space has two advantages. First of all, the computational costs are lowered and secondly the removal of noisy information may lead to a better separation of the classes. In all cases, we achieved indeed considerably
Speach recognition
2
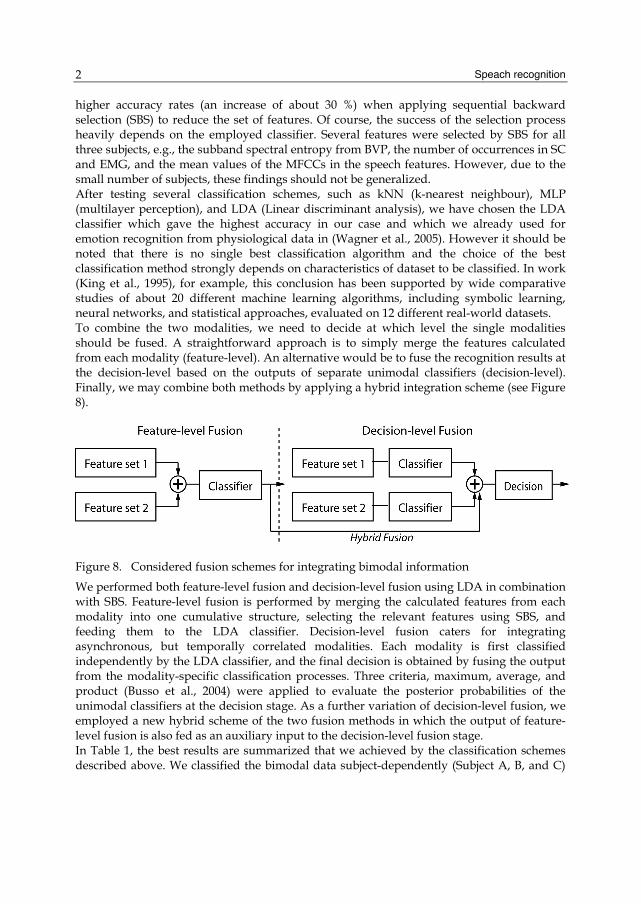
higher accuracy rates (an increase of about 30 %) when applying sequential backward selection (SBS) to reduce the set of features. Of course, the success of the selection process heavily depends on the employed classifier. Several features were selected by SBS for all three subjects, e.g., the subband spectral entropy from BVP, the number of occurrences in SC and EMG, and the mean values of the MFCCs in the speech features. However, due to the small number of subjects, these findings should not be generalized. After testing several classification schemes, such as kNN (k-nearest neighbour), MLP (multilayer perception), and LDA (Linear discriminant analysis), we have chosen the LDA classifier which gave the highest accuracy in our case and which we already used for emotion recognition from physiological data in (Wagner et al., 2005). However it should be noted that there is no single best classification algorithm and the choice of the best classification method strongly depends on characteristics of dataset to be classified. In work (King et al., 1995), for example, this conclusion has been supported by wide comparative studies of about 20 different machine learning algorithms, including symbolic learning, neural networks, and statistical approaches, evaluated on 12 different real-world datasets. To combine the two modalities, we need to decide at which level the single modalities should be fused. A straightforward approach is to simply merge the features calculated from each modality (feature-level). An alternative would be to fuse the recognition results at the decision-level based on the outputs of separate unimodal classifiers (decision-level). Finally, we may combine both methods by applying a hybrid integration scheme (see Figure 8).
Figure 8. Considered fusion schemes for integrating bimodal information
We performed both feature-level fusion and decision-level fusion using LDA in combination with SBS. Feature-level fusion is performed by merging the calculated features from each modality into one cumulative structure, selecting the relevant features using SBS, and feeding them to the LDA classifier. Decision-level fusion caters for integrating asynchronous, but temporally correlated modalities. Each modality is first classified independently by the LDA classifier, and the final decision is obtained by fusing the output from the modality-specific classification processes. Three criteria, maximum, average, and product (Busso et al., 2004) were applied to evaluate the posterior probabilities of the unimodal classifiers at the decision stage. As a further variation of decision-level fusion, we employed a new hybrid scheme of the two fusion methods in which the output of feature-level fusion is also fed as an auxiliary input to the decision-level fusion stage. In Table 1, the best results are summarized that we achieved by the classification schemes described above. We classified the bimodal data subject-dependently (Subject A, B, and C)
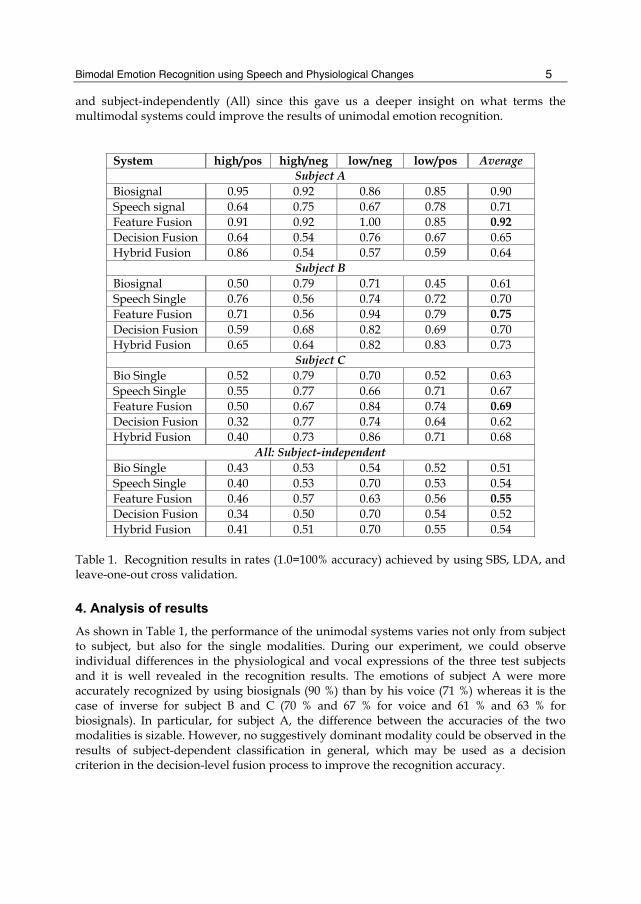
Bimodal Emotion Recognition using Speech and Physiological Changes
5 and subject-independently (All) since this gave us a deeper insight on what terms the multimodal systems could improve the results of unimodal emotion recognition.
System high/pos high/neg low/neg low/pos Average Subject A
Biosignal 0.95 0.92 0.86 0.85 0.90 Speech signal 0.64 0.75 0.67 0.78 0.71 Feature Fusion 0.91 0.92 1.00 0.85 0.92 Decision Fusion 0.64 0.54 0.76 0.67 0.65 Hybrid Fusion 0.86 0.54 0.57 0.59 0.64
Subject B Biosignal 0.50 0.79 0.71 0.45 0.61 Speech Single 0.76 0.56 0.74 0.72 0.70 Feature Fusion 0.71 0.56 0.94 0.79 0.75 Decision Fusion 0.59 0.68 0.82 0.69 0.70 Hybrid Fusion 0.65 0.64 0.82 0.83 0.73
Subject C Bio Single 0.52 0.79 0.70 0.52 0.63 Speech Single 0.55 0.77 0.66 0.71 0.67 Feature Fusion 0.50 0.67 0.84 0.74 0.69 Decision Fusion 0.32 0.77 0.74 0.64 0.62 Hybrid Fusion 0.40 0.73 0.86 0.71 0.68
All: Subject-independent Bio Single 0.43 0.53 0.54 0.52 0.51 Speech Single 0.40 0.53 0.70 0.53 0.54 Feature Fusion 0.46 0.57 0.63 0.56 0.55 Decision Fusion 0.34 0.50 0.70 0.54 0.52 Hybrid Fusion 0.41 0.51 0.70 0.55 0.54
Table 1. Recognition results in rates (1.0=100% accuracy) achieved by using SBS, LDA, and leave-one-out cross validation.
4. Analysis of results As shown in Table 1, the performance of the unimodal systems varies not only from subject to subject, but also for the single modalities. During our experiment, we could observe individual differences in the physiological and vocal expressions of the three test subjects and it is well revealed in the recognition results. The emotions of subject A were more accurately recognized by using biosignals (90 %) than by his voice (71 %) whereas it is the case of inverse for subject B and C (70 % and 67 % for voice and 61 % and 63 % for biosignals). In particular, for subject A, the difference between the accuracies of the two modalities is sizable. However, no suggestively dominant modality could be observed in the results of subject-dependent classification in general, which may be used as a decision criterion in the decision-level fusion process to improve the recognition accuracy.
Speach recognition
2
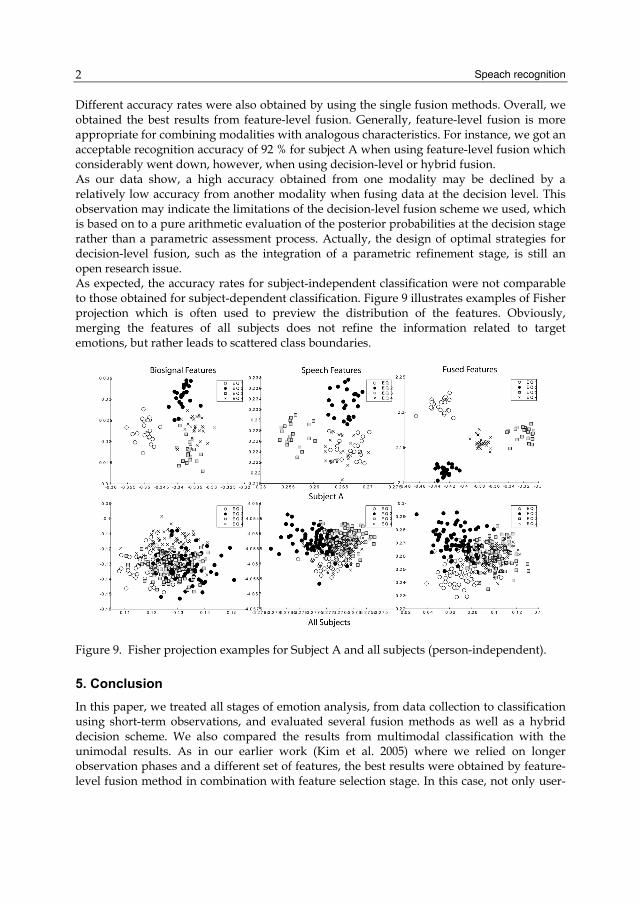
Different accuracy rates were also obtained by using the single fusion methods. Overall, we obtained the best results from feature-level fusion. Generally, feature-level fusion is more appropriate for combining modalities with analogous characteristics. For instance, we got an acceptable recognition accuracy of 92 % for subject A when using feature-level fusion which considerably went down, however, when using decision-level or hybrid fusion. As our data show, a high accuracy obtained from one modality may be declined by a relatively low accuracy from another modality when fusing data at the decision level. This observation may indicate the limitations of the decision-level fusion scheme we used, which is based on to a pure arithmetic evaluation of the posterior probabilities at the decision stage rather than a parametric assessment process. Actually, the design of optimal strategies for decision-level fusion, such as the integration of a parametric refinement stage, is still an open research issue. As expected, the accuracy rates for subject-independent classification were not comparable to those obtained for subject-dependent classification. Figure 9 illustrates examples of Fisher projection which is often used to preview the distribution of the features. Obviously, merging the features of all subjects does not refine the information related to target emotions, but rather leads to scattered class boundaries.
Figure 9. Fisher projection examples for Subject A and all subjects (person-independent).
5. Conclusion In this paper, we treated all stages of emotion analysis, from data collection to classification using short-term observations, and evaluated several fusion methods as well as a hybrid decision scheme. We also compared the results from multimodal classification with the unimodal results. As in our earlier work (Kim et al. 2005) where we relied on longer observation phases and a different set of features, the best results were obtained by feature-level fusion method in combination with feature selection stage. In this case, not only user-
Bimodal Emotion Recognition using Speech and Physiological Changes
5 dependent, but also user-independent emotion classification could be improved compared to the unimodal methods. We did not achieve the same high gains that were achieved for audio-visual data which seems to indicate that speech and physiological data contain less complementary information. Furthermore, in a natural setting like ours, we cannot exclude that the subjects are inconsistent in their emotional expression. Inconsistencies are less likely to occur in scenarios where actors are asked to deliberately express emotions via speech and mimics. In this case, it might be the reason why fusion algorithms lead to a greater increase of the recognition rate. Ambiguities in emotional expressions are also reflected by work on corpus annotation. For instance, (Cowie et al., 2005) noticed that the agreement between human coders labeling multimodal corpora of everyday emotions was lower when considering both audio and video than when relying on a single modality. Furthermore some important problems are pointed out, such as the use of posterior probabilities when fusing information with high disparity in accuracy. Most of the existing classifiers used in the literature are generalized methods based on statistics or estimating linear regression of given data. Such classifiers may not be able to capture emotion-specific features and to apply self-adapting decision rules that consider contextual information, for instance. Therefore, the design of an emotion-specific classification scheme is one of the most important issues for the future, and this issue becomes even more critical when classifying combined multimodal observations. To overcome these problems, we need to develop a multilayer fusion scheme with parametric refinement stages in each decision layer. More important issue in future work would be how to complementarily combine the multiple modalities, since it is obvious that combining modalities by equally weighting them does not always guarantee improving recognition accuracy. Toward the human-like analysis and finer resolution of recognizable emotion classes, an essential step would be therefore to find innate priority among the modalities to be preferred for each emotional state. A considerable scheme might be to decompose an emotion recognition problem into several refining processes using additional modalities, for example, arousal recognition through physiological channels, valence recognition by using audiovisual channels, and then resolving subtle uncertainty between adjacent emotion classes, or predicting even the “stance” in 3D emotion model, by cumulative analysis of user’s context information.
6. References Batliner, A.; Zeissler, V.; Frank, C.; Adelhardt, J.; Shi, R. P. & Nöth, E. (2003). We are not
amused-but how do you know? user states in a multi-modal dialogue system, In EUROSPEECH’03, Geneva, pp. 733–736.
Busso, C.; Deng, Z.; Yildirim, S.; Bulut, M.; Lee, C. H.; Kazemzaden, A.; Lee, S.; Neumann, U. & Narayanan, S. (2004). Analysis of emotion recognition using facial expression, speech and multimodal information, in ICMI’04, State College, Pennsylvania, USA, pp. 205–211
Chen, L. S.; & Huang, T. S. (2000). Emotional expressions in audiovisual human computer interaction,” in ICME-2000, pp. 423–426
Chen, L. S. (2000). Joint processing of audio-visual information for the recognition of emotional expression in human-computer interaction, Ph.D. dissertation, University of Illinois at Urbana-Champaign, Dept. of Electrical Engineering
Speach recognition
2
Cowie, R.; Douglas-Cowie, E.; Tsapatsoulis, N.; Votsis, G.; Kollias, S.; Fellenz, W. & Taylor, J. G. (2001). Emotion recognition in human-computer interaction, IEEE Signal Processing Mag., vol. 18, pp. 32–80
Davidson, R. J. (1993). Parsing affective space: Perspectives from neuropsychology and psychophysiology, Neuropsychology, vol. 7, no. 4, pp. 464–475
De Silva, L. C. & Ng, P. C. (2000). Bimodal emotion recognition, In: IEEE International Conf. on Automatic Face and Gesture Recognition, pp. 332–335
Douglas-Cowie, E.; Devillers, L.; Martin, J.-C.; Cowie, R.; Savvidou, S.; Abrilian, S. & Cox, C. (2005). Multimodal Databases of Everyday Emotion: Facing up to Complexity,” in InterSpeech, Lisbon
Fredricson, B. L. & Levenson, R. W. (1998). Positive emotions speed recovery from the cardiovascular sequelae of negative emotions, Cognition and Emotion, vol. 12, no. 2, pp. 191–220
Kim, J.; André, E.; Rehm, M.; Vogt, T. & Wagner, J. (2005). Integrating information from speech and physiological signals to achieve emotional sensitivity, in INTERSPEECH-2005, Lisbon, Portugal, pp. 809–812
Kim, K. H.; Bang, S. W. & Kim, S. R. (2004). Emotion recognition system using short-term monitoring of physiological signals. Med. Biol. Eng. Comput, vol. 42, no. 3, pp. 419–427
King, R. D.; Feng, C. & Shutherland, A. (1995). StatLog: Comparison of Classification Algorithms on Large Real-world Problems, Applied Artificial Intelligence, vol. 9(3), pp. 259–287
Lang, P. (1995). The emotion probe: Studies of motivation and attention, American Psychologist, vol. 50(5), pp. 372–385
Lazarus, R. S. (1991) Emotion and adaptation. Cambridge UK: Cambridge University Press Nasoz, F.; Alvarez, K.; Lisetti, C. & Finkelstein, N. (2003). Emotion recognition from
physiological signals for presence technologies, International Journal of Cognition, Technology, and Work - Special Issue on Presence, vol. 6(1)
Nwe, T. L.; Wei, F. S. & Silva, L. C. D. (2001). Speech based emotion classification, In IEEE Region 10 International Conference on Electrical Electronic Technology, vol. 1, pp. 297–301
Pan, J. & Tompkins, W. (1985). A real-time qrs detection algorithm, IEEE Trans. Biomed. Eng., vol. 32, no. 3
Picard, R.; Vyzas, E. & Healy, J. (2001). Toward machine emotional intelligence: Analysis of affective physiological state, IEEE Trans. Pattern Anal. and Machine Intell., vol. 23, no. 10, pp. 1175–1191
Scholsberg, H. (1954). Three dimensions of emotion, Psychological Review, vol. 61, pp. 81–88 Tooby, J. & Cosmides, L. (1990). The past explains the present: Emotional adaptations and
the structure of ancestral environments, Ethology and Sociobiology, vol. 11, pp. 375–424
Wagner, J.; Kim, J. & Andr´e, E. (2005). From physiological signals to emotions: Implementing and comparing selected methods for feature extraction and classification, In: ICME’05, Amsterdam
Zeng, Z.; Tu, J.; Liu, M.; Zhang, T.; Rizzolo, N.; Zhang, Z.; Huang, T. S.; Roth, D. & Levinson, S. (2004). Bimodal HCI-related affect recognition, in ICMI 2004