emotional functioning in eating disorders: attentional bias, emotion recognition and emotion...
TRANSCRIPT
Emotional functioning in eating disorders:attentional bias, emotion recognition and emotionregulation
A. Harrison*, S. Sullivan, K. Tchanturia and J. Treasure
Institute of Psychiatry, King’s College London, UK
Background. Interpersonal processes, anxiety and emotion regulation di!culties form a key part of conceptual
models of eating disorders (EDs), such as anorexia nervosa (AN) and bulimia nervosa (BN), but the experimental
findings to support this are limited.
Method. The Reading the Mind in the Eyes task, the Di!culties in Emotion Regulation Scale (DERS) and a
computerized pictorial (angry and neutral faces) Stroop task were administered to 190 women [50 with AN, 50 with
BN and 90 healthy controls (HCs)].
Results. Those with an ED showed attentional biases to faces in general (medium e"ect), but specifically to angry
faces over neutral faces (large e"ect) compared to HCs. The ED group also reported significantly higher emotion
regulation di!culties (large e"ect) than HCs. There was a small di"erence between the ED and HC groups for the
emotion recognition task (small-medium e"ect), particularly in the restricting AN (RAN) group. Depression and
attentional bias to faces significantly predicted emotion regulation di!culties in a regression model.
Conclusions. The data provide support for conceptualizations of EDs that emphasize the role of emotional
functioning in the development and maintenance of EDs. Further research will concentrate on exploring whether
these findings are state or trait features of EDs.
Received 13 September 2009 ; Revised 14 December 2009 ; Accepted 17 December 2009
Key words : Eating disorders, emotion recognition, emotion regulation, emotions.
Introduction
Di!culties with emotional and social functioning aretheorized to play an important role in the develop-ment and maintenance of eating disorders (EDs)(Schmidt & Treasure, 2006). The literature in this areahas been reviewed recently (Zucker et al. 2007). Severaldi!culties have been identified for people with EDs:(1) high levels of insecure and avoidant attachmentstyles (Ward et al. 2000), (2) limited social networks(Tiller et al. 1997), (3) high levels of submissive be-haviour and (4) unfavourable social comparisons(Troop et al. 2003 ; Connan et al. 2007), which contrib-ute to negative self-evaluation, a predisposing risk fac-tor for all forms of EDs (Fairburn, 1998). Interpersonalstress forms a central component of a neurodevelop-mental hypothesis for the aetiology of anorexianervosa (AN) (Connan et al. 2003) and problematic
interpersonal relationships are thought to be one of themaintaining factors for AN (Schmidt & Treasure,2006). The underlying factors that contribute to thisproblem in social and a"ective functioning have notyet been defined, although there is interest in atten-tional processes, emotion recognition and regulation.
Attentional biases
Posner & Petersen (1990) describe attentional bias asthe propensity to look for, and be attentive to, certaininformation in the environment. Power & Dalgleish(1997) assert that attentional processes are implicatedin the onset and maintenance of emotional disorders.There have been two systematic reviews and meta-analyses that have found attentional biases in partici-pants with EDs of medium e"ect sizes to food- andbody shape-related stimuli (Dobson & Dozois, 2004 ;Johansson et al. 2005). There has been less research onattentional biases to social or emotional stimuli inpeople with EDs. McManus et al. (1996) report datathat equate to a medium e"ect size for verbal stimulirelating to threats from others towards the self in a
* Address for correspondence : Mrs A. Harrison, Eating Disorders
Research Unit, Department of Academic Psychiatry, 5th Floor,
Bermondsey Wing, Guy’s Hospital, London SE1 9RT, UK.
(Email : [email protected])
Psychological Medicine, Page 1 of 11. f Cambridge University Press 2010doi:10.1017/S0033291710000036
ORIGINAL ARTICLE
mixed ED group compared to controls. Althoughother authors have explored a variety of threatening,disorder-salient stimuli/cues (Quinton, 2004 ; Meyeret al. 2005), attentional biases to ecologically valid,pictorial, social stimuli, such as faces, represent a newarea of research. Ashwin et al. (2006) developed a pic-torial Stroop task that assesses attentional biases tofaces (angry and neutral) compared to neutral stimuli(chairs) and found attentional biases to all faces (angryand neutral) in 17 males with Asperger syndrome butnot in controls. Using this task in an ED sample couldcontribute to filling the previously identified gap inthe literature. Anger is a highly salient and threateningemotion for individuals with EDs (Fox & Power, 2009 ;Ioannou & Fox, 2009) and is reported to contribute todisordered eating (Fox & Froom, 2009). Therefore, wewere interested in examining whether people withEDs had an attentional bias to angry faces.
Emotion recognition
A recent review of experimental paradigms inves-tigating emotion recognition in people with EDs(Oldershaw, 2009) reported a medium-sized e"ect.Individuals with AN were found to show di!cultieswith demanding tasks, such as labelling basic emot-ions in the absence of verbal cues (Zonnevijlle-Benderet al. 2002 ; Zonnevylle-Bender et al. 2004a, b), para-digms using verbal stimuli (Kucharska-Pietura et al.2004), forced-choice paradigms (Pollatos et al. 2008),and those utilizing complex emotions, such as ‘ inter-est ’, ‘ contempt’ and ‘shame’ (Kucharska-Pietura et al.2004). Individuals with AN (Harrison et al. 2009 ;Oldershaw, 2009; Russell et al. 2009) have more di!-culty labelling emotional states when restricted toviewing only the eyes in the Reading the Mind in theEyes task (Baron-Cohen et al. 2001).
Emotional regulation
Family members report that individuals with AN losetheir emotion regulation skills and are more irritable,moody and prone to temper tantrums (Smith, 2003).Gilboa-Schechtman et al. (2006), using the NegativeMood Regulation Scale (Catanzaro & Mearns, 1990)and the Trait Meta-Mood Scale (Salovey et al. 1995),found poorer emotional regulation strategies in theirED group compared to controls. Gratz & Roemer(2004) have developed a multi-dimensional approachto assessing emotion regulation. Their Di!culties inEmotion Regulation Scale (DERS) has shown sensi-tivity to change after emotion-focused group therapy(Gratz & Gunderson, 2006) in people with borderlinepersonality disorder. We decided to explore thismeasure in an ED sample because of its multifaceted
approach and the high co-morbidity between EDs,particularly bulimia nervosa (BN), and borderline per-sonality disorder (Sansone et al. 2004).
Ochsner’s (2008) model of social and emotionalprocessing posits that emotion recognition, regulationand attentional processes are interconnected skill sets,all required for successful social a"ective functioning.In a previous pilot study, we found that di!culties inemotional recognition in women with AN were asso-ciated with di!culties in self-reported emotion regu-lation (Harrison et al. 2009). In the present study, theaim was to extend this work by measuring attentionalbiases to faces using a pictorial Stroop task. The re-search aimed to address emotional functioning, bothtransdiagnostically (across all EDs) and between di-agnostic subtypes.
Based on the previously highlighted social andemotional functioning di!culties reported in peoplewith EDs, the first hypothesis was that the ED groupwould demonstrate a longer response time (greaterattentional bias) to name the colour of social stimuli(all faces) compared to non-social stimuli (chairs) thancontrols. A second hypothesis was that there would bea stronger attentional bias to angry faces compared toneutral faces in people with EDs. In addition, we pre-dicted di!culties in recognizing emotions from theeyes and in self-reported emotion regulation skills inthe ED group, compared to controls.
Method
Participants
All participants were female and were eligible to takepart in the study if they were aged between 18 and55 years and were not colour blind. Participants withEDs, either AN or BN, were recruited from the SouthLondon and Maudsley National Health Service (NHS)Foundation Trust Eating Disorder Services, the Insti-tute of Psychiatry Eating Disorders Research Unit’svolunteer database, through a circular email sent outto the sta" and students at King’s College London andthrough putting up posters in the local community. ADSM-IV (APA, 1994) diagnosis of an ED was obtainedeither from a clinician or through using the EatingDisorder Examination (EDE) Version 16 (Fairburn,2008) on the day of testing. The AN and HC groups arenot the same participants reported in our previouspublication using similar measures (Harrison et al.2009).
HCs were recruited from the local community usingadvertisements, through an email circulated to sta"and students at King’s College London and throughpersonal contacts. HCs were excluded if they reported
2 A. Harrison et al.
a personal or familial history (first-degree relative) of adiagnosed psychological disorder.
Measures and procedure
The study received ethical approval from the NHSResearch Ethics Committee (Oxfordshire C) and allparticipants provided informed consent. Participantscompleted the following measures.
Measures of emotional functioning
Pictorial Stroop task (Ashwin et al. 2006). This is a com-puterized task that records response times usingDMDX (Forster & Forster, 2003) computer software.The stimuli are presented in three blocks of 48, withtwo short rest periods. The social stimuli are male andfemale angry and neutral faces and the non-socialstimuli are pictures of chairs. The stimuli are pres-ented randomly on the computer screen in the coloursred, yellow, blue or green. The outcome variables aredescribed in detail in the data analysis section.
Reading the Mind in the Eyes task (Baron-Cohen et al.2001). In this task the participant is shown a series of36 sets of eyes on a computer screen. Around each setof eyes are four words and the participant selectswhich one of the four words most closely matcheswhat the person in the picture is thinking or feeling.A definition booklet is provided. There are no timelimits. The outcome variable is the percentage of cor-rect answers, with lower scores relating to greaterdi!culties with emotion recognition. A control taskcomponent is also included, in which the participant ispresented with 10 sets of eyes and asked to statewhether the eyes belong to either a male or a female.Hallerback et al. (2009, p. 139), using the Bland–Altman method to measure the limits of agreement(Bland & Altman, 1986), found the task had ‘fairlygood’ test–retest reliability.
DERS (Gratz & Roemer, 2004). The DERS is a 36-itemself-report scale measuring emotion regulation. Theparticipant is asked to rate their responses across afive-point scale : 1=almost never (0–10%), 2=some-times (11–35%), 3=about half the time (36–65%),4=most of the time (66–90%) and 5=almost always(91–100%). There are six discrete but interconnectedsubscales and also a total score. Higher scores indicategreater di!culties with emotion regulation. The sixsubscales are :
(1) Non-acceptance of emotional responses : a ten-dency towards having negative secondary re-sponses to one’s own negative emotions or notaccepting emotional reactions to distress.
(2) Di!culties in engaging in goal-directed behav-iour : di!culties concentrating and accomplishingtasks when experiencing negative emotions.
(3) Impulse control di!culties : di!culties with re-maining in control of behaviour when experi-encing negative emotions.
(4) Lack of emotional awareness : di!culties associ-ated with attending to and acknowledging emo-tions.
(5) Limited access to emotion regulation strategies : abelief that, once upset, little can be done to regulateemotions.
(6) Lack of emotion clarity : how much an individualknows and understands the emotions they are ex-periencing.
Cronbach’s a for this sample for the DERS total scorewas 0.94, which is comparable to Gratz & Roemer’s(2004) score of 0.93. Like Gratz & Roemer, Cronbach’sa values for the subscales were in the range 0.80–0.89.
Clinical measures
The 21-item Depression, Anxiety and Stress Scale (DASS-21 ; Lovibond & Lovibond, 1995b). This self-reportmeasure assess levels of depression, anxiety and stress(seven items each), and gives a total DASS score. TheDASS-21 uses a three-point scale that ranges from 0(did not apply to me over the past week) to 2 (appliedto me very much or most of the time over the pastweek). Participants in the HC group were excludedif they scored above the normal range of >5 for de-pression,>4 for anxiety and>8 for stress. Cronbach’sa for this sample was 0.92 for the total score, 0.96 forthe stress scale, 0.92 for the depression scale and 0.82for the anxiety scale, comparable to those published byLovibond & Lovibond (1995a) of 0.90 for stress, 0.91for depression and 0.84 for anxiety.
The Obsessive Compulsive Inventory Revised (OCI ; Foaet al. 2002). This inventory assesses the frequency andassociated distress of seven obsessive–compulsivesymptom domains : washing, checking, doubting, or-dering, obsessing, hoarding and mental neutraliza-tion. Participants in the HC group were excluded ifthey scored above the clinical cut-o" score of 18 (Foaet al. 2002). Cronbach’s a for this sample for the totalscore was 0.93.
The Eating Disorder Examination Questionnaire (EDE-Q;Fairburn & Beglin, 1994). This is a 36-item self-reportmeasure focusing on the past 28 days. Items address-ing ED attitudes are scored using a seven-point scale.Subscales and a global score are calculated, withscores of o4 on key items considered within the
Emotional functioning in eating disorders 3
clinical range. HCs scoring in the clinical range of o4were excluded.
The National Adult Reading Test (NART; Nelson &Willison, 1991). In this test the participant is asked toread out loud a list of non-phonetic words. A greaternumber of incorrect pronunciations relate to an in-creasingly lower pre-morbid IQ estimation score. TheNART IQ estimation correlates positively with full-score IQ, as measured using the British version of theWechsler Adult Intelligence Scale Revised (WAIS-R;Wechsler, 1981), ranging from r=0.77 (Crawford,1992) to r=0.81 (Crawford et al. 1989).
Data analysis
Construction of attentional bias variables
The Stroop task yields response times to each of therandomly presented 144 stimuli, which are femaleangry, female neutral, male angry and male neutralfaces, and chairs. To explore the hypothesis that therewould be di"erences in attentional bias to social stim-uli between the ED and HC groups, a social attentionalbias variable was derived by taking the mean responsetime (in milliseconds) to colour name all social stimuli(all faces, both male and female, angry and neutral)and subtracting from this the mean response time tocolour name non-social stimuli (chairs). A positivenumber relates to an attentional bias to social stimuli,with higher numbers indicating a stronger attentionalbias.To permit analysis of the hypothesis that there
would be a di"erence in attentional bias to angry facesbetween the ED and HC groups, an angry-threat at-tentional bias variable was derived and was calculatedby taking the mean response times to colour name theangry faces (both male and female) and subtractingthe mean response time to colour name the neutralfaces (both male and female). A positive number re-lates to an attentional bias to angry-threat stimuli, withhigher numbers indicating a stronger attentional bias.Data were explored for assumptions of normality.
Kolmogorov–Smirnov tests were significant (p<0.05)and visual inspections of histograms indicated thatdata were not normally distributed. Transformationswere unsuccessful. Therefore, medians are provided,along with the interquartile range (IQR). x2 tests wereused for categorical data and Spearman’s r was usedfor correlations. Rosenthal’s r (Rosenthal, 1991) wasused as an estimation of e"ect size, with 0.10 definedas a small e"ect, 0.30 a medium e"ect and 0.50 a largee"ect (Cohen, 1988, 1992). Hochberg’s (1988) correc-tion was used to correct conservatively for multipletesting, with corrected values displayed in parenth-
eses. This is a sequential correction thought to providebetter power, as it accounts for the fact that the num-ber of comparisons reduces each time a hypothesis isrejected. Hochberg’s correction was selected overother sequential methods because we were not con-cerned about potential dependencies between tests.
Results
The analysis plan was to examine emotional func-tioning for EDs as a whole, followed by subgroupanalysis of the diagnostic subtypes.
Clinical and demographic characteristics
The final sample consisted of 190 participants : 90 HCsand 100 in the ED group. Fifty of the ED group hadAN [35 had restricting anorexia nervosa (RAN) and 15had binge purge anorexia nervosa (BPAN)] and 50had BN. Of those in the ED group, 6% (n=6) were in-patients, 7% (n=7) were day patients, 72% (n=72)were out-patients and 15% (n=15) were not currentlyreceiving treatment. Of those in the ED group, 38%had a previous hospital admission.
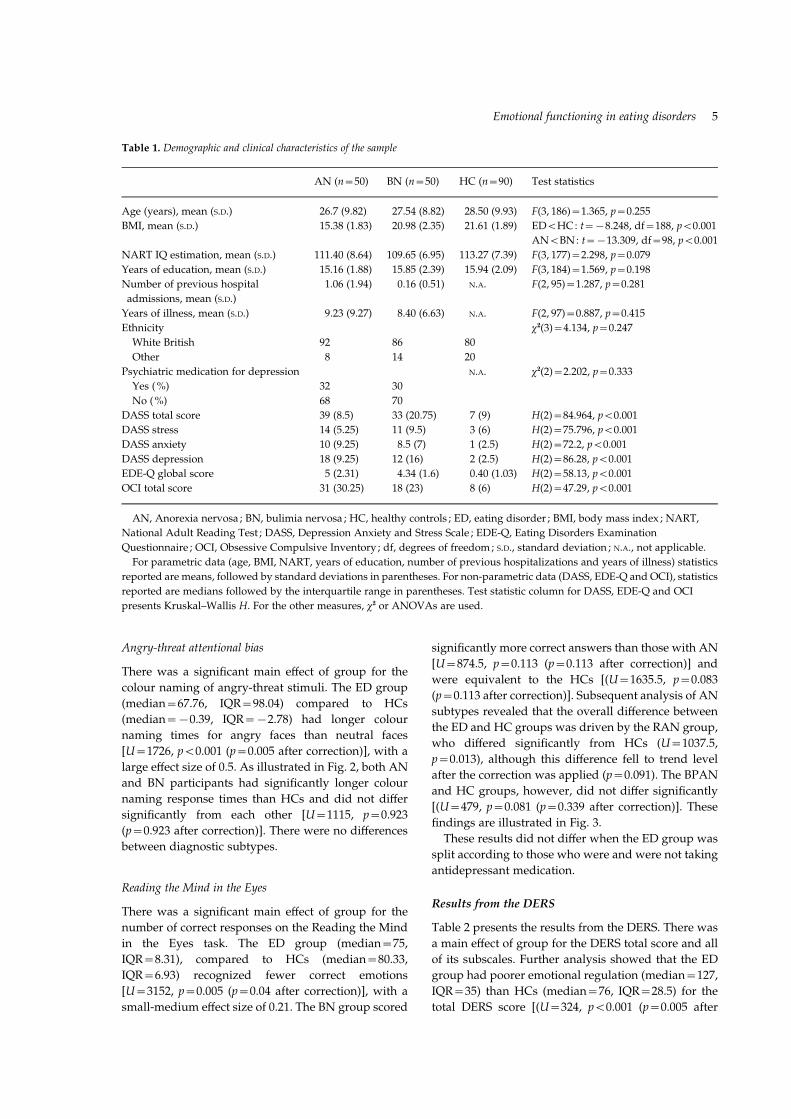
Table 1 provides demographic information anddata on the levels of disordered eating, depression,anxiety and obsessive–compulsive traits, all of whichwere significantly higher in the clinical groups. AsTable 1 illustrates, those with an ED had a significantlylower body mass index (BMI) than HCs. Those withBN had a significantly higher BMI than those withAN. There were no di"erences between the ED andHC groups regarding age, IQ score estimated usingthe NART, or years of education. The groups did notdi"er significantly regarding ethnicity. There were nodi"erences within the ED group regarding the use ofantidepressants, years of illness, or number of pre-vious hospital admissions.
Results from the Pictorial Stroop task and theReading the Mind in the Eyes task
Social attentional bias
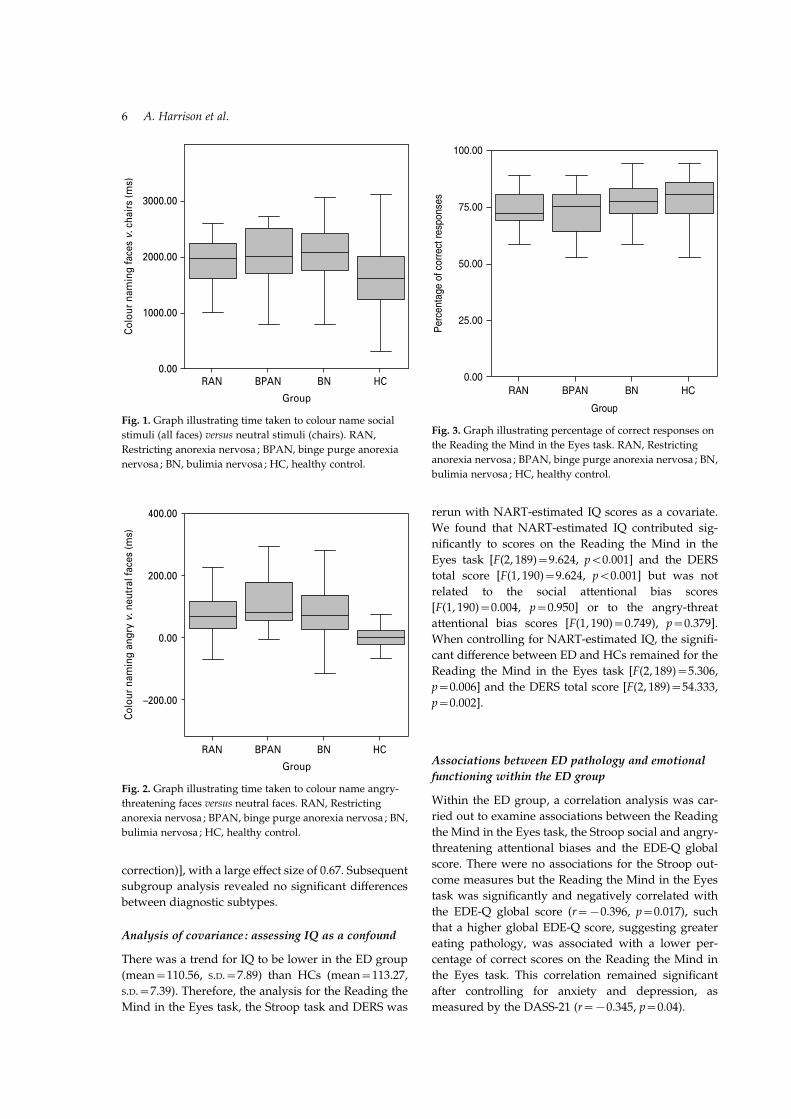
There was a significant main e"ect of group for thecolour naming of social stimuli. The ED group[median=1989.72, interquartile range (IQR)=607.33]compared to HCs (median=1608.64, IQR=789.32)had longer colour naming times [U=2441, p<0.001(p=0.007 after correction)], with a medium e"ect sizeof 0.35. As illustrated in Fig. 1, both AN and BN par-ticipants had significantly longer colour naming timesthan HCs and did not di"er significantly from eachother [U=874.5, p=0.113 (p=0.113 after correction)].There were no di"erences between diagnostic sub-types.
4 A. Harrison et al.
Angry-threat attentional bias
There was a significant main e"ect of group for thecolour naming of angry-threat stimuli. The ED group(median=67.76, IQR=98.04) compared to HCs(median=x0.39, IQR=x2.78) had longer colournaming times for angry faces than neutral faces[U=1726, p<0.001 (p=0.005 after correction)], with alarge e"ect size of 0.5. As illustrated in Fig. 2, both ANand BN participants had significantly longer colournaming response times than HCs and did not di"ersignificantly from each other [U=1115, p=0.923(p=0.923 after correction)]. There were no di"erencesbetween diagnostic subtypes.
Reading the Mind in the Eyes
There was a significant main e"ect of group for thenumber of correct responses on the Reading the Mindin the Eyes task. The ED group (median=75,IQR=8.31), compared to HCs (median=80.33,IQR=6.93) recognized fewer correct emotions[U=3152, p=0.005 (p=0.04 after correction)], with asmall-medium e"ect size of 0.21. The BN group scored
significantly more correct answers than those with AN[U=874.5, p=0.113 (p=0.113 after correction)] andwere equivalent to the HCs [(U=1635.5, p=0.083(p=0.113 after correction)]. Subsequent analysis of ANsubtypes revealed that the overall di"erence betweenthe ED and HC groups was driven by the RAN group,who di"ered significantly from HCs (U=1037.5,p=0.013), although this di"erence fell to trend levelafter the correction was applied (p=0.091). The BPANand HC groups, however, did not di"er significantly[(U=479, p=0.081 (p=0.339 after correction)]. Thesefindings are illustrated in Fig. 3.These results did not di"er when the ED group was
split according to those who were and were not takingantidepressant medication.
Results from the DERS
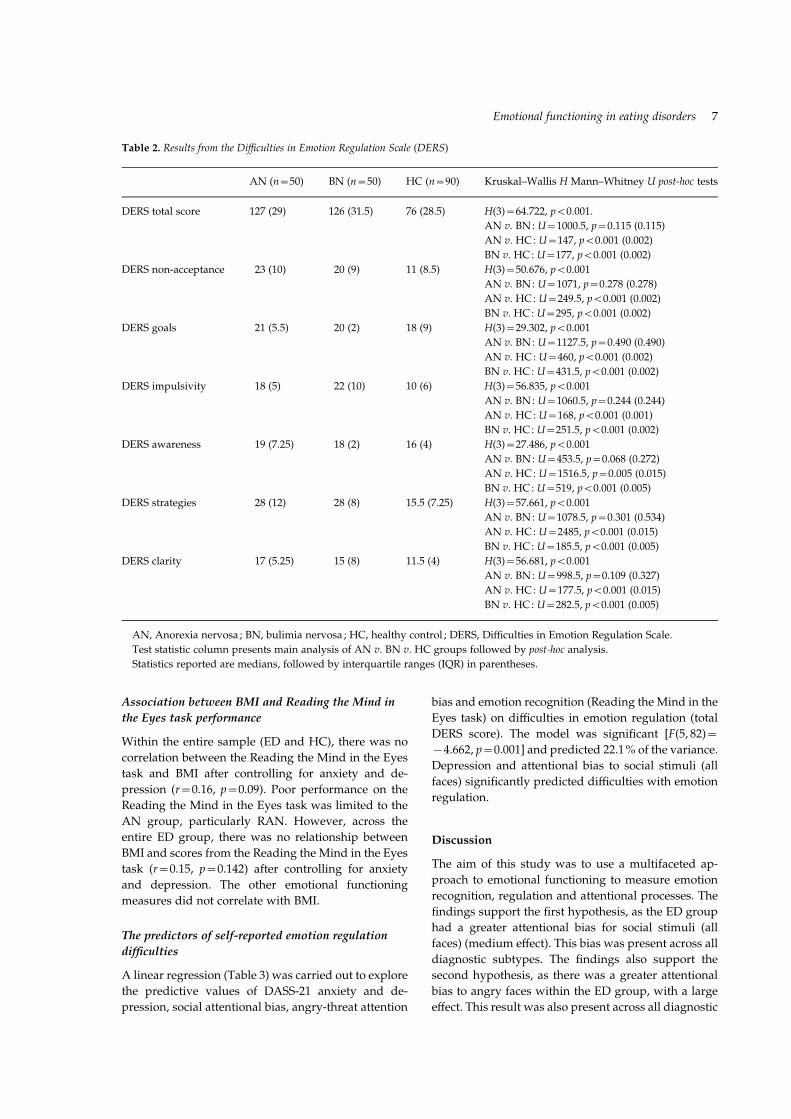
Table 2 presents the results from the DERS. There wasa main e"ect of group for the DERS total score and allof its subscales. Further analysis showed that the EDgroup had poorer emotional regulation (median=127,IQR=35) than HCs (median=76, IQR=28.5) for thetotal DERS score [(U=324, p<0.001 (p=0.005 after
Table 1. Demographic and clinical characteristics of the sample
AN (n=50) BN (n=50) HC (n=90) Test statistics
Age (years), mean (S.D.) 26.7 (9.82) 27.54 (8.82) 28.50 (9.93) F(3, 186)=1.365, p=0.255
BMI, mean (S.D.) 15.38 (1.83) 20.98 (2.35) 21.61 (1.89) ED<HC: t=x8.248, df=188, p<0.001
AN<BN: t=x13.309, df=98, p<0.001
NART IQ estimation, mean (S.D.) 111.40 (8.64) 109.65 (6.95) 113.27 (7.39) F(3, 177)=2.298, p=0.079
Years of education, mean (S.D.) 15.16 (1.88) 15.85 (2.39) 15.94 (2.09) F(3, 184)=1.569, p=0.198
Number of previous hospital
admissions, mean (S.D.)
1.06 (1.94) 0.16 (0.51) N.A. F(2, 95)=1.287, p=0.281
Years of illness, mean (S.D.) 9.23 (9.27) 8.40 (6.63) N.A. F(2, 97)=0.887, p=0.415
Ethnicity x2(3)=4.134, p=0.247
White British 92 86 80
Other 8 14 20
Psychiatric medication for depression N.A. x2(2)=2.202, p=0.333
Yes (%) 32 30
No (%) 68 70
DASS total score 39 (8.5) 33 (20.75) 7 (9) H(2)=84.964, p<0.001
DASS stress 14 (5.25) 11 (9.5) 3 (6) H(2)=75.796, p<0.001
DASS anxiety 10 (9.25) 8.5 (7) 1 (2.5) H(2)=72.2, p<0.001
DASS depression 18 (9.25) 12 (16) 2 (2.5) H(2)=86.28, p<0.001
EDE-Q global score 5 (2.31) 4.34 (1.6) 0.40 (1.03) H(2)=58.13, p<0.001
OCI total score 31 (30.25) 18 (23) 8 (6) H(2)=47.29, p<0.001
AN, Anorexia nervosa ; BN, bulimia nervosa ; HC, healthy controls ; ED, eating disorder ; BMI, body mass index ; NART,
National Adult Reading Test ; DASS, Depression Anxiety and Stress Scale ; EDE-Q, Eating Disorders Examination
Questionnaire ; OCI, Obsessive Compulsive Inventory ; df, degrees of freedom; S.D., standard deviation ; N.A., not applicable.
For parametric data (age, BMI, NART, years of education, number of previous hospitalizations and years of illness) statistics
reported are means, followed by standard deviations in parentheses. For non-parametric data (DASS, EDE-Q and OCI), statistics
reported are medians followed by the interquartile range in parentheses. Test statistic column for DASS, EDE-Q and OCI
presents Kruskal–Wallis H. For the other measures, x2 or ANOVAs are used.
Emotional functioning in eating disorders 5
correction)], with a large e"ect size of 0.67. Subsequentsubgroup analysis revealed no significant di"erencesbetween diagnostic subtypes.
Analysis of covariance : assessing IQ as a confound
There was a trend for IQ to be lower in the ED group(mean=110.56, S.D.=7.89) than HCs (mean=113.27,S.D.=7.39). Therefore, the analysis for the Reading theMind in the Eyes task, the Stroop task and DERS was
rerun with NART-estimated IQ scores as a covariate.We found that NART-estimated IQ contributed sig-nificantly to scores on the Reading the Mind in theEyes task [F(2, 189)=9.624, p<0.001] and the DERStotal score [F(1, 190)=9.624, p<0.001] but was notrelated to the social attentional bias scores[F(1, 190)=0.004, p=0.950] or to the angry-threatattentional bias scores [F(1, 190)=0.749), p=0.379].When controlling for NART-estimated IQ, the signifi-cant di"erence between ED and HCs remained for theReading the Mind in the Eyes task [F(2, 189)=5.306,p=0.006] and the DERS total score [F(2, 189)=54.333,p=0.002].
Associations between ED pathology and emotionalfunctioning within the ED group
Within the ED group, a correlation analysis was car-ried out to examine associations between the Readingthe Mind in the Eyes task, the Stroop social and angry-threatening attentional biases and the EDE-Q globalscore. There were no associations for the Stroop out-come measures but the Reading the Mind in the Eyestask was significantly and negatively correlated withthe EDE-Q global score (r=x0.396, p=0.017), suchthat a higher global EDE-Q score, suggesting greatereating pathology, was associated with a lower per-centage of correct scores on the Reading the Mind inthe Eyes task. This correlation remained significantafter controlling for anxiety and depression, asmeasured by the DASS-21 (r=x0.345, p=0.04).
RAN BPAN BN HC
–200.00
0.00
200.00
400.00
Group
Colo
ur n
amin
g an
gry
v. n
eutr
al fa
ces
(ms)
Fig. 2. Graph illustrating time taken to colour name angry-
threatening faces versus neutral faces. RAN, Restricting
anorexia nervosa ; BPAN, binge purge anorexia nervosa ; BN,
bulimia nervosa ; HC, healthy control.
RAN BPAN BN HC
Group
0.00
25.00
50.00
75.00
100.00
Perc
enta
ge o
f cor
rect
resp
onse
sFig. 3. Graph illustrating percentage of correct responses on
the Reading the Mind in the Eyes task. RAN, Restricting
anorexia nervosa ; BPAN, binge purge anorexia nervosa ; BN,
bulimia nervosa ; HC, healthy control.
RAN BPAN BN HCGroup
0.00
1000.00
2000.00
3000.00
Colo
ur n
amin
g fa
ces
v. c
hairs
(ms)
Fig. 1. Graph illustrating time taken to colour name social
stimuli (all faces) versus neutral stimuli (chairs). RAN,
Restricting anorexia nervosa ; BPAN, binge purge anorexia
nervosa ; BN, bulimia nervosa ; HC, healthy control.
6 A. Harrison et al.
Association between BMI and Reading the Mind inthe Eyes task performance
Within the entire sample (ED and HC), there was nocorrelation between the Reading the Mind in the Eyestask and BMI after controlling for anxiety and de-pression (r=0.16, p=0.09). Poor performance on theReading the Mind in the Eyes task was limited to theAN group, particularly RAN. However, across theentire ED group, there was no relationship betweenBMI and scores from the Reading the Mind in the Eyestask (r=0.15, p=0.142) after controlling for anxietyand depression. The other emotional functioningmeasures did not correlate with BMI.
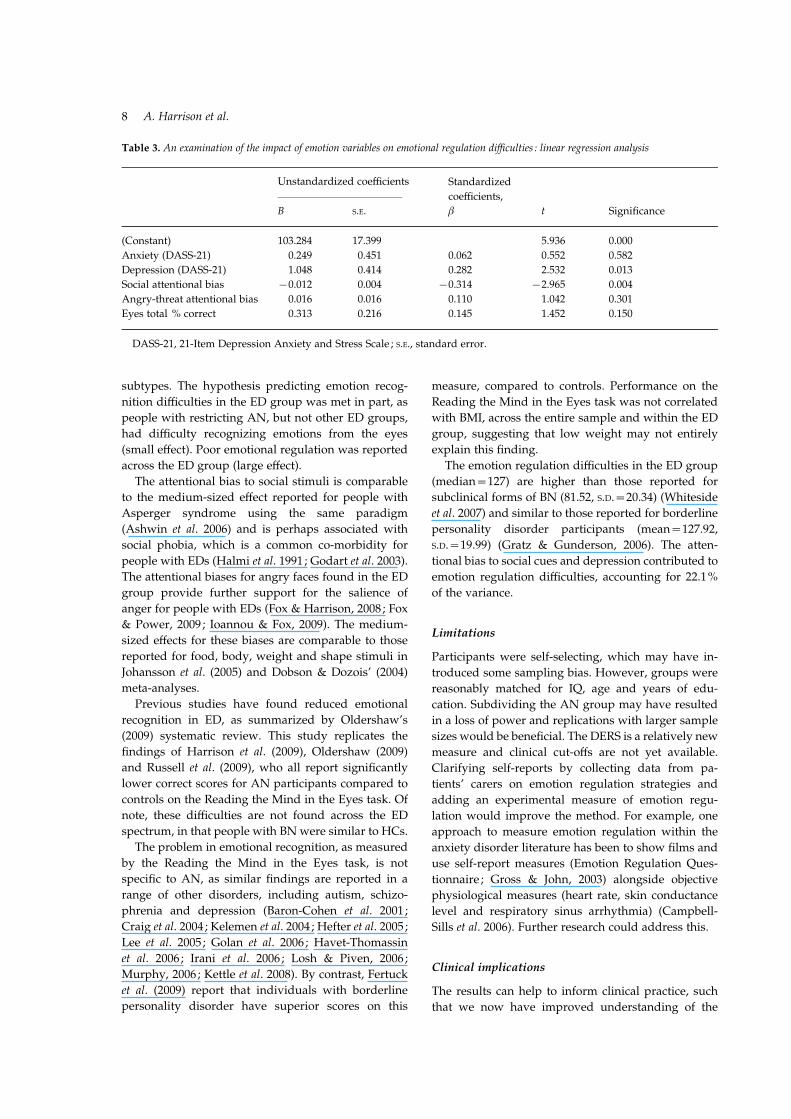
The predictors of self-reported emotion regulationdi!culties
A linear regression (Table 3) was carried out to explorethe predictive values of DASS-21 anxiety and de-pression, social attentional bias, angry-threat attention
bias and emotion recognition (Reading the Mind in theEyes task) on di!culties in emotion regulation (totalDERS score). The model was significant [F(5, 82)=x4.662, p=0.001] and predicted 22.1% of the variance.Depression and attentional bias to social stimuli (allfaces) significantly predicted di!culties with emotionregulation.
Discussion
The aim of this study was to use a multifaceted ap-proach to emotional functioning to measure emotionrecognition, regulation and attentional processes. Thefindings support the first hypothesis, as the ED grouphad a greater attentional bias for social stimuli (allfaces) (medium e"ect). This bias was present across alldiagnostic subtypes. The findings also support thesecond hypothesis, as there was a greater attentionalbias to angry faces within the ED group, with a largee"ect. This result was also present across all diagnostic
Table 2. Results from the Di!culties in Emotion Regulation Scale (DERS)
AN (n=50) BN (n=50) HC (n=90) Kruskal–Wallis H Mann–Whitney U post-hoc tests
DERS total score 127 (29) 126 (31.5) 76 (28.5) H(3)=64.722, p<0.001.
AN v. BN: U=1000.5, p=0.115 (0.115)
AN v. HC: U=147, p<0.001 (0.002)
BN v. HC: U=177, p<0.001 (0.002)
DERS non-acceptance 23 (10) 20 (9) 11 (8.5) H(3)=50.676, p<0.001
AN v. BN: U=1071, p=0.278 (0.278)
AN v. HC: U=249.5, p<0.001 (0.002)
BN v. HC: U=295, p<0.001 (0.002)
DERS goals 21 (5.5) 20 (2) 18 (9) H(3)=29.302, p<0.001
AN v. BN: U=1127.5, p=0.490 (0.490)
AN v. HC: U=460, p<0.001 (0.002)
BN v. HC: U=431.5, p<0.001 (0.002)
DERS impulsivity 18 (5) 22 (10) 10 (6) H(3)=56.835, p<0.001
AN v. BN: U=1060.5, p=0.244 (0.244)
AN v. HC: U=168, p<0.001 (0.001)
BN v. HC: U=251.5, p<0.001 (0.002)
DERS awareness 19 (7.25) 18 (2) 16 (4) H(3)=27.486, p<0.001
AN v. BN: U=453.5, p=0.068 (0.272)
AN v. HC: U=1516.5, p=0.005 (0.015)
BN v. HC: U=519, p<0.001 (0.005)
DERS strategies 28 (12) 28 (8) 15.5 (7.25) H(3)=57.661, p<0.001
AN v. BN: U=1078.5, p=0.301 (0.534)
AN v. HC: U=2485, p<0.001 (0.015)
BN v. HC: U=185.5, p<0.001 (0.005)
DERS clarity 17 (5.25) 15 (8) 11.5 (4) H(3)=56.681, p<0.001
AN v. BN: U=998.5, p=0.109 (0.327)
AN v. HC: U=177.5, p<0.001 (0.015)
BN v. HC: U=282.5, p<0.001 (0.005)
AN, Anorexia nervosa ; BN, bulimia nervosa ; HC, healthy control ; DERS, Di!culties in Emotion Regulation Scale.
Test statistic column presents main analysis of AN v. BN v. HC groups followed by post-hoc analysis.
Statistics reported are medians, followed by interquartile ranges (IQR) in parentheses.
Emotional functioning in eating disorders 7
subtypes. The hypothesis predicting emotion recog-nition di!culties in the ED group was met in part, aspeople with restricting AN, but not other ED groups,had di!culty recognizing emotions from the eyes(small e"ect). Poor emotional regulation was reportedacross the ED group (large e"ect).
The attentional bias to social stimuli is comparableto the medium-sized e"ect reported for people withAsperger syndrome using the same paradigm(Ashwin et al. 2006) and is perhaps associated withsocial phobia, which is a common co-morbidity forpeople with EDs (Halmi et al. 1991 ; Godart et al. 2003).The attentional biases for angry faces found in the EDgroup provide further support for the salience ofanger for people with EDs (Fox & Harrison, 2008 ; Fox& Power, 2009 ; Ioannou & Fox, 2009). The medium-sized e"ects for these biases are comparable to thosereported for food, body, weight and shape stimuli inJohansson et al. (2005) and Dobson & Dozois’ (2004)meta-analyses.
Previous studies have found reduced emotionalrecognition in ED, as summarized by Oldershaw’s(2009) systematic review. This study replicates thefindings of Harrison et al. (2009), Oldershaw (2009)and Russell et al. (2009), who all report significantlylower correct scores for AN participants compared tocontrols on the Reading the Mind in the Eyes task. Ofnote, these di!culties are not found across the EDspectrum, in that people with BN were similar to HCs.
The problem in emotional recognition, as measuredby the Reading the Mind in the Eyes task, is notspecific to AN, as similar findings are reported in arange of other disorders, including autism, schizo-phrenia and depression (Baron-Cohen et al. 2001 ;Craig et al. 2004 ; Kelemen et al. 2004 ; Hefter et al. 2005 ;Lee et al. 2005; Golan et al. 2006 ; Havet-Thomassinet al. 2006 ; Irani et al. 2006 ; Losh & Piven, 2006 ;Murphy, 2006 ; Kettle et al. 2008). By contrast, Fertucket al. (2009) report that individuals with borderlinepersonality disorder have superior scores on this
measure, compared to controls. Performance on theReading the Mind in the Eyes task was not correlatedwith BMI, across the entire sample and within the EDgroup, suggesting that low weight may not entirelyexplain this finding.
The emotion regulation di!culties in the ED group(median=127) are higher than those reported forsubclinical forms of BN (81.52, S.D.=20.34) (Whitesideet al. 2007) and similar to those reported for borderlinepersonality disorder participants (mean=127.92,S.D.=19.99) (Gratz & Gunderson, 2006). The atten-tional bias to social cues and depression contributed toemotion regulation di!culties, accounting for 22.1%of the variance.
Limitations
Participants were self-selecting, which may have in-troduced some sampling bias. However, groups werereasonably matched for IQ, age and years of edu-cation. Subdividing the AN group may have resultedin a loss of power and replications with larger samplesizes would be beneficial. The DERS is a relatively newmeasure and clinical cut-o"s are not yet available.Clarifying self-reports by collecting data from pa-tients’ carers on emotion regulation strategies andadding an experimental measure of emotion regu-lation would improve the method. For example, oneapproach to measure emotion regulation within theanxiety disorder literature has been to show films anduse self-report measures (Emotion Regulation Ques-tionnaire ; Gross & John, 2003) alongside objectivephysiological measures (heart rate, skin conductancelevel and respiratory sinus arrhythmia) (Campbell-Sills et al. 2006). Further research could address this.
Clinical implications
The results can help to inform clinical practice, suchthat we now have improved understanding of the
Table 3. An examination of the impact of emotion variables on emotional regulation di!culties : linear regression analysis
Unstandardized coe!cients Standardized
coe!cients,
t SignificanceB S.E. b
(Constant) 103.284 17.399 5.936 0.000
Anxiety (DASS-21) 0.249 0.451 0.062 0.552 0.582
Depression (DASS-21) 1.048 0.414 0.282 2.532 0.013
Social attentional bias x0.012 0.004 x0.314 x2.965 0.004
Angry-threat attentional bias 0.016 0.016 0.110 1.042 0.301
Eyes total % correct 0.313 0.216 0.145 1.452 0.150
DASS-21, 21-Item Depression Anxiety and Stress Scale ; S.E., standard error.
8 A. Harrison et al.
specific di!culties people with EDs may have inemotional functioning.
Conclusions
In summary, the results show that people with ANand BN report greater di!culties with emotion regu-lation and show greater attentional biases for sociala"ective cues (longer latencies to colour name faces,particularly angry faces) than controls. However, onlythose with AN, specifically RAN, have di!cultieswith recognizing emotions from the eyes. Depressionand attentional biases to social stimuli significantlypredicted di!culties with emotion regulation. Thesemay be state dependent or a trait present in those witha history of EDs.
Acknowledgements
We thank Dr C. Ashwin, Bath University, and Prof. S.Baron-Cohen from the Cambridge Autism ResearchCentre for providing us with the pictorial Stroop taskand the Reading the Mind in the Eyes task and ourcolleagues Dr M. Roberts and K. Davis from the EatingDisorders Unit who arranged this initial collaboration.Special thanks to A. Oldershaw from the Institute ofPsychiatry for her helpful comments on the paper. A.Harrison is supported by a Nina Jackson Research intoEating Disorders (RIED) studentship in collaborationwith the Psychiatry Research Trust (registered charityno. 284286). The research was also supported by aDepartment of Health National Institute for HealthResearch (NIHR) Programme Grant for AppliedResearch entitled ARIADNE (Applied Research intoAnorexia Nervosa and Not Otherwise Specified EatingDisorders), reference no. RP-PG-0606-1043.
Declaration of Interest
None.
References
APA (1994). Diagnostic and Statistical Manual of Mental
Disorders, 4th edn. American Psychiatric Association :
Washington, DC.Ashwin C, Wheelwright S, Baron-Cohen S (2006).
Attention bias to faces in Asperger syndrome :
a pictorial emotion Stroop study. Psychological
Medicine 36, 835–843.Baron-Cohen S, Wheelwright S, Hill J, Raste Y, Plumb I
(2001). The ‘Reading the Mind in the Eyes ’ test revised
version : a study with normal adults, and adults with
Asperger syndrome or high-functioning autism. Journal of
Child Psychology and Psychiatry 42, 241–251.
Bland JM, Altman DG (1986). Statistical methods for
assessing agreement between two methods of clinical
measurement. Lancet 1, 307–310.Campbell-Sills L, Barlow DH, Brown TA, Hofmann SG
(2006). E"ects of suppression and acceptance on emotional
responses of individuals with anxiety and mood disorders.
Behaviour Research and Therapy 44, 1251–1263.Catanzaro SJ, Mearns J (1990). Measuring generalized
expectancies for negative mood regulation : initial scale
development and implications. Journal of Personality
Assessment 54, 546–563.Cohen J (1988). Statistical Power Analysis for the Behavioural
Sciences, 2nd edn. Academic Press : New York.Cohen J (1992). A power primer. Psychological Bulletin 112,
155–159.Connan F, Campbell IC, Katzman M, Lightman SL,
Treasure J (2003). A neurodevelopmental model for
anorexia nervosa. Physiology and Behavior 79, 13–24.Connan F, Troop N, Landau S, Campbell IC, Treasure J
(2007). Poor social comparison and the tendency to
submissive behavior in anorexia nervosa. International
Journal of Eating Disorders 40, 733–739.Craig JS, Hatton C, Craig FB, Bentall RP (2004). Persecutory
beliefs, attributions and theory of mind : comparison of
patients with paranoid delusions, Asperger’s syndrome
and healthy controls. Schizophrenia Research 69, 29–33.Dobson KS, Dozois DJA (2004). Attentional biases in eating
disorders : a meta-analytic review of Stroop performance.
Clinical Psychology Review 23, 1001–1022.Fairburn CG (1998). Eating disorders. In Essentials of
Human Nutrition (ed. J. I. Mann and S. Truswell),
pp. 371–382. Oxford University Press : Oxford.Fairburn CG (2008). Cognitive Behavior Therapy and Eating
Disorders. Guilford Press : New York.Fairburn CG, Beglin SJ (1994). Assessment of eating
disorders : interview or self-report questionnaire?
International Journal of Eating Disorders 16, 363–370.Fertuck EA, Jekal A, Song I, Wyman B, Morris MC,
Wilson ST, Brodsky BS, Stanley B (2009). Enhanced
‘Reading the Mind in the Eyes ’ in borderline personality
disorder compared to healthy controls. Psychological
Medicine 39, 1979–1988.Foa EB, Huppert JD, Leiberg S, Langner R, Kichic R, Hajcak
G, Salkovskis PM (2002). The Obsessive-Compulsive
Inventory : development and validation of a short version.
Psychological Assessment 14, 485–495.Forster KI, Forster JC (2003). DMDX: a Windows display
program with millisecond accuracy. Behavior Research
Methods, Instruments and Computers 35, 116–124.Fox JRE, Froom K (2009). Eating disorders : a basic
emotion perspective. Clinical Psychology and Psychotherapy
16, 328–335.Fox JRE, Harrison A (2008). The relation of anger to disgust :
the potential role of coupled emotions within eating
pathology. Clinical Psychology and Psychotherapy 15, 86–95.Fox JRE, Power MJ (2009). Eating disorders and multi-level
models of emotion : an integrated model. Clinical
Psychology and Psychotherapy 16, 240–267.Gilboa-Schechtman E, Avnon L, Zubery E, Jeczmien P
(2006). Emotional processing in eating disorders : specific
Emotional functioning in eating disorders 9
impairment or general distress related deficiency?
Depression and Anxiety 23, 331–339.Godart NT, Flament MF, Curt F, Perdereau F, Jeammet P
(2003). Comorbidity between eating disorders and anxiety
disorders. International Journal of Eating Disorders 23,
253–270.Golan O, Baron-Cohen S, Hill J (2006). The Cambridge
Mindreading (CAM) Face-Voice Battery : testing complex
emotion recognition in adults with and without Asperger
syndrome. Journal of Autism and Developmental Disorders 36,
169–183.Gratz KL, Gunderson JG (2006). Preliminary data on an
acceptance-based emotion regulation group intervention
for deliberate self-harm among women with borderline
personality disorder. Behavior Therapy 37, 25–35.Gratz KL, Roemer L (2004). Multidimensional assessment of
emotion regulation and dysregulation : development,
factor structure, and initial validation of the di!culties in
emotion regulation scale. Journal of Psychopathology and
Behavioral Assessment 26, 41–54.Gross JJ, John OP (2003). Individual di"erences in two
emotion regulation processes : implications for a"ect,
relationships, and well-being. Journal of Personality and
Social Psychology 85, 348–362.Hallerback MU, Lugnegard T, Hjarthag F, Gillberg C
(2009). The Reading the Mind in the Eyes Test : test–retest
reliability of a Swedish version. Cognitive Neuropsychiatry
14, 127–143.Halmi KA, Eckert E, Marchi P, Sampugnaro V, Apple R,
Cohen J (1991). Comorbidity of psychiatric diagnoses
in anorexia nervosa. Archives of General Psychiatry 48,
712–718.Harrison A, Sullivan S, Tchanturia K, Treasure J (2009).
Emotion recognition and regulation in anorexia nervosa.
Clinical Psychology and Psychotherapy 16, 348–356.Havet-Thomassin V, Allain P, Etcharry-Bouyx F, Le Gall D
(2006). What about theory of mind after severe brain
injury? Brain Injury 20, 83–91.Hefter RL, Manoach DS, Barton JJ (2005). Perception
of facial expression and facial identity in subjects
with social developmental disorders. Neurology 65,
1620–1625.Hochberg Y (1988). A sharper Bonferroni procedure for
multiple tests of significance. Biometrika 75, 800–802.Ioannou K, Fox JRE (2009). Perception of threat from
emotions and its role in poor emotional expression within
eating pathology. Clinical Psychology and Psychotherapy 16,
336–347.Irani F, Platek SM, Panyavin IS, Calkins ME, Kohler C,
Siegel SJ, Schachter M, Gur RE, Gur RC (2006). Self face
recognition and theory of mind in patients with
schizophrenia and first-degree relatives. Schizophrenia
Research 88, 151–160.Johansson L, Ghaderi A, Andersson G (2005).
Stroop interference for food- and body-related words :
a meta-analysis. Eating Behaviors 6, 271–281.Kelemen O, Keri S, Must A, Benedek G, Janka Z (2004). No
evidence for impaired ‘ theory of mind’ in una"ected first-
degree relatives of schizophrenia patients. Acta Psychiatrica
Scandinavica 110, 146–149.
Kettle JWL, O’Brien-Simpson L, Allen NB (2008). Impaired
theory of mind in first episode schizophrenia : comparison
with community, university and depressed controls.
Schizophrenia Research 99, 96–102.Kucharska-Pietura K, Nikolaou V, Masiak M, Treasure J
(2004). The recognition of emotion in the faces and voice of
anorexia nervosa. International Journal of Eating Disorders
35, 42–47.Lee L, Harkness KL, Sabbagh MA, Jacobson JA (2005).
Mental state decoding abilities in clinical depression.
Journal of A"ective Disorders 86, 247–258.Losh M, Piven J (2006). Social-cognition and the broad
autism phenotype : identifying genetically meaningful
phenotypes. Journal of Child Psychology and Psychiatry 48,
105–112.Lovibond PF, Lovibond SH (1995a). The structure of
negative emotional states : comparison of the Depression
Anxiety Stress Scales (DASS) with the Beck Depression and
Anxiety Inventories. Behaviour Research and Therapy 33,
335–343.Lovibond SH, Lovibond PF (1995b). Manual for the
Depression Anxiety Stress Scales. Psychology Foundation :
Sydney.McManus F, Waller G, Chadwick P (1996). Biases in the
processing of di"erent forms of threat in bulimic and
comparison women. Journal of Nervous and Mental Disease
184, 547–554.Meyer C, Serpell L, Waller G, Murphy F, Treasure J, Leung
N (2005). Cognitive avoidance in the strategic processing of
ego threats among eating-disordered patients. International
Journal of Eating Disorders 38, 30–36.Murphy D (2006). Theory of mind in Asperger’s syndrome,
schizophrenia and personality disordered forensic
patients. Cognitive Neuropsychiatry 11, 99–111.Nelson HE, Willison J (1991). National Adult Reading Test
Manual, 2nd edn. NFER-Nelson : Windsor.Ochsner K (2008). The social-emotional processing stream:
five core constructs and their translational potential
for schizophrenia and beyond. Biological Psychiatry 64,
48–61.Oldershaw A (2009). Emotional Theory of Mind in Anorexia
Nervosa : State or Trait? Ph.D. thesis, Institute of Psychiatry,
King’s College London.Pollatos O, Herbert BM, Schandry R, Gramann K (2008).
Impaired central processing of emotional faces in anorexia
nervosa. Psychosomatic Medicine 70, 701–708.Posner MI, Petersen SE (1990). The attention system
of the human brain. Annual Review of Neuroscience 13,
25–42.Power M, Dalgleish T (1997). Cognition and Emotion : From
Order to Disorder. Psychology Press : Hove.Quinton S (2004). Processing of five types of ‘ threat ’
information in female dieters and non-dieters. European
Eating Disorders Reviews 6, 266–276.Rosenthal R (1991). Meta-Analytic Procedures for Social
Research, revised edn. Sage : Newbury Park, CA.Russell TA, Schmidt U, Doherty L, Young V, Tchanturia K
(2009). Aspects of social cognition in anorexia nervosa :
a"ective and cognitive theory of mind. Psychiatry Research
168, 181–185.
10 A. Harrison et al.
Salovey P, Mayer JD, Goldman SL, Turvey C, Palfai TP
(1995). Emotional attention, clarity, and repair : exploring
emotional intelligence using the Trait Meta-Mood Scale.
In Emotion, Disclosure, and Health (ed. J. W. Pennebaker),
pp. 125–154. American Psychological Association :
Washington, DC.Sansone R, Levitt J, Sansone L (2004). The prevalence of
personality disorders among those with eating disorders.
Eating Disorders 13, 7–21.Schmidt U, Treasure J (2006). Anorexia nervosa : valued and
visible. A cognitive-interpersonal maintenance model and
its implications for research and practice. British Journal of
Clinical Psychology 45, 343–366.Smith G (2003). Anorexia and Bulimia in the Family :
One Parent’s Practical Guide to Recovery. Wiley
Blackwell : UK.Tiller JM, Sloane G, Schmidt U, Troop N, Power M,
Treasure J (1997). Social support in patients with anorexia
nervosa and bulimia nervosa. International Journal of Eating
Disorders 21, 31–38.Troop NA, Allan S, Treasure J, Katzman M (2003). Social
comparison and submissive behaviour in eating disorder
patients. Psychology and Psychotherapy : Theory, Research and
Practice 76, 237–249.Ward A, Ramsey R, Turnbull S, Benedettini M, Treasure J
(2000). Attachment patterns in eating disorders : the past
in the present. International Journal of Eating Disorders 28,
370–376.Whiteside U, Chen E, Neighbors C, Hunter D, Lo T,
Larimer M (2007). Di!culties regulating emotions :
do binge eaters have fewer strategies to modulate
and tolerate negative a"ect? Eating Behaviors 8, 162–169.Zonnevijlle-Bender MJ, van Goozen SH, Cohen-Kettenis
PT, van Elburg A, van Engeland H (2002). Do adolescent
anorexia nervosa patients have deficits in emotional
functioning? [Erratum]. European Child and Adolescent
Psychiatry 11, 99.Zonnevylle-Bender MJ, van Goozen SH, Cohen-Kettenis
PT, van Elburg A, de Wildt M, Stevelmans E,
van Engeland H (2004a). Emotional functioning in
anorexia nervosa patients : adolescents compared to adults.
Depression and Anxiety 19, 35–42.Zonnevylle-Bender MJ, van Goozen SH, Cohen-Kettenis
PT, van Elburg TA, van Engeland H (2004b). Emotional
functioning in adolescent anorexia nervosa patients – a
controlled study. European Child and Adolescent Psychiatry
13, 28–34.Zucker NL, Losh M, Bulik CM, LaBar KS, Piven J,
Pelphrey KA (2007). Anorexia nervosa and autism
spectrum disorders : guided investigation of social
cognitive endophenotypes. Psychological Bulletin 133,
976–1006.
Emotional functioning in eating disorders 11